0001530804false2023FYhttp://fasb.org/us-gaap/2023#LongTermDebtAndCapitalLeaseObligationshttp://fasb.org/us-gaap/2023#LongTermDebtAndCapitalLeaseObligationsP30DP5Yhttp://fasb.org/us-gaap/2023#RevenueFromContractWithCustomerExcludingAssessedTaxhttp://fasb.org/us-gaap/2023#OtherCostOfOperatingRevenuehttp://fasb.org/us-gaap/2023#OtherNonoperatingIncomeExpensehttp://fasb.org/us-gaap/2023#RevenueFromContractWithCustomerExcludingAssessedTaxhttp://fasb.org/us-gaap/2023#OtherCostOfOperatingRevenuehttp://fasb.org/us-gaap/2023#OtherNonoperatingIncomeExpensehttp://fasb.org/us-gaap/2023#RevenueFromContractWithCustomerExcludingAssessedTaxhttp://fasb.org/us-gaap/2023#OtherCostOfOperatingRevenuehttp://fasb.org/us-gaap/2023#OtherNonoperatingIncomeExpenseP4Y00015308042023-01-012023-12-3100015308042023-06-30iso4217:USD00015308042024-01-31xbrli:shares00015308042022-01-012022-12-3100015308042021-01-012021-12-31iso4217:USDxbrli:shares00015308042023-12-3100015308042022-12-3100015308042021-12-3100015308042020-12-310001530804us-gaap:CommonStockMember2020-12-310001530804us-gaap:AdditionalPaidInCapitalMember2020-12-310001530804us-gaap:RetainedEarningsMember2020-12-310001530804us-gaap:AccumulatedOtherComprehensiveIncomeMember2020-12-310001530804us-gaap:ParentMember2020-12-310001530804us-gaap:NoncontrollingInterestMember2020-12-310001530804us-gaap:RetainedEarningsMember2021-01-012021-12-310001530804us-gaap:ParentMember2021-01-012021-12-310001530804us-gaap:NoncontrollingInterestMember2021-01-012021-12-310001530804us-gaap:AccumulatedOtherComprehensiveIncomeMember2021-01-012021-12-310001530804us-gaap:CommonStockMember2021-01-012021-12-310001530804us-gaap:AdditionalPaidInCapitalMember2021-01-012021-12-310001530804us-gaap:CommonStockMember2021-12-310001530804us-gaap:AdditionalPaidInCapitalMember2021-12-310001530804us-gaap:RetainedEarningsMember2021-12-310001530804us-gaap:AccumulatedOtherComprehensiveIncomeMember2021-12-310001530804us-gaap:ParentMember2021-12-310001530804us-gaap:NoncontrollingInterestMember2021-12-310001530804us-gaap:RetainedEarningsMember2022-01-012022-12-310001530804us-gaap:ParentMember2022-01-012022-12-310001530804us-gaap:NoncontrollingInterestMember2022-01-012022-12-310001530804us-gaap:AccumulatedOtherComprehensiveIncomeMember2022-01-012022-12-310001530804us-gaap:CommonStockMember2022-01-012022-12-310001530804us-gaap:AdditionalPaidInCapitalMember2022-01-012022-12-310001530804us-gaap:CommonStockMember2022-12-310001530804us-gaap:AdditionalPaidInCapitalMember2022-12-310001530804us-gaap:RetainedEarningsMember2022-12-310001530804us-gaap:AccumulatedOtherComprehensiveIncomeMember2022-12-310001530804us-gaap:ParentMember2022-12-310001530804us-gaap:NoncontrollingInterestMember2022-12-310001530804us-gaap:RetainedEarningsMember2023-01-012023-12-310001530804us-gaap:ParentMember2023-01-012023-12-310001530804us-gaap:NoncontrollingInterestMember2023-01-012023-12-310001530804us-gaap:AccumulatedOtherComprehensiveIncomeMember2023-01-012023-12-310001530804us-gaap:CommonStockMember2023-01-012023-12-310001530804us-gaap:AdditionalPaidInCapitalMember2023-01-012023-12-310001530804us-gaap:CommonStockMember2023-12-310001530804us-gaap:AdditionalPaidInCapitalMember2023-12-310001530804us-gaap:RetainedEarningsMember2023-12-310001530804us-gaap:AccumulatedOtherComprehensiveIncomeMember2023-12-310001530804us-gaap:ParentMember2023-12-310001530804us-gaap:NoncontrollingInterestMember2023-12-31trox:facility0001530804country:AUus-gaap:BondsMember2022-12-310001530804country:AUus-gaap:BondsMember2023-12-310001530804srt:MinimumMemberus-gaap:LandImprovementsMember2023-12-310001530804us-gaap:LandImprovementsMembersrt:MaximumMember2023-12-310001530804srt:MinimumMemberus-gaap:BuildingMember2023-12-310001530804srt:MaximumMemberus-gaap:BuildingMember2023-12-310001530804us-gaap:MachineryAndEquipmentMembersrt:MinimumMember2023-12-310001530804us-gaap:MachineryAndEquipmentMembersrt:MaximumMember2023-12-310001530804us-gaap:FurnitureAndFixturesMember2023-12-310001530804srt:MinimumMember2023-12-310001530804srt:MaximumMember2023-12-310001530804srt:MinimumMember2023-01-012023-12-310001530804srt:MaximumMember2023-01-012023-12-31trox:segment0001530804srt:NorthAmericaMember2023-01-012023-12-310001530804srt:NorthAmericaMember2022-01-012022-12-310001530804srt:NorthAmericaMember2021-01-012021-12-310001530804trox:SouthAndCentralAmericaMember2023-01-012023-12-310001530804trox:SouthAndCentralAmericaMember2022-01-012022-12-310001530804trox:SouthAndCentralAmericaMember2021-01-012021-12-310001530804trox:EuropeMiddleEastAndAfricaMember2023-01-012023-12-310001530804trox:EuropeMiddleEastAndAfricaMember2022-01-012022-12-310001530804trox:EuropeMiddleEastAndAfricaMember2021-01-012021-12-310001530804srt:AsiaPacificMember2023-01-012023-12-310001530804srt:AsiaPacificMember2022-01-012022-12-310001530804srt:AsiaPacificMember2021-01-012021-12-310001530804trox:TiO2Member2023-01-012023-12-310001530804trox:TiO2Member2022-01-012022-12-310001530804trox:TiO2Member2021-01-012021-12-310001530804trox:ZirconMember2023-01-012023-12-310001530804trox:ZirconMember2022-01-012022-12-310001530804trox:ZirconMember2021-01-012021-12-310001530804us-gaap:ProductAndServiceOtherMember2023-01-012023-12-310001530804us-gaap:ProductAndServiceOtherMember2022-01-012022-12-310001530804us-gaap:ProductAndServiceOtherMember2021-01-012021-12-31xbrli:pure0001530804us-gaap:HerMajestysRevenueAndCustomsHMRCMember2023-01-012023-12-310001530804us-gaap:HerMajestysRevenueAndCustomsHMRCMember2022-01-012022-12-310001530804us-gaap:HerMajestysRevenueAndCustomsHMRCMember2021-01-012021-12-310001530804us-gaap:HerMajestysRevenueAndCustomsHMRCMembercountry:GBsrt:WeightedAverageMember2023-01-012023-12-310001530804us-gaap:PositiveOutcomeOfLitigationMemberus-gaap:SettledLitigationMembertrox:AnadarkoLitigationMember2014-01-012014-12-310001530804us-gaap:InternalRevenueServiceIRSMember2023-01-012023-12-310001530804us-gaap:InternalRevenueServiceIRSMember2022-01-012022-12-310001530804us-gaap:AustralianTaxationOfficeMember2023-01-012023-12-310001530804us-gaap:AustralianTaxationOfficeMember2022-01-012022-12-310001530804us-gaap:SwissFederalTaxAdministrationFTAMember2023-01-012023-12-310001530804us-gaap:SwissFederalTaxAdministrationFTAMember2022-01-012022-12-310001530804us-gaap:StateAdministrationOfTaxationChinaMember2023-01-012023-12-310001530804us-gaap:StateAdministrationOfTaxationChinaMember2022-01-012022-12-310001530804country:AU2023-01-012023-12-310001530804country:AU2022-01-012022-12-310001530804us-gaap:HerMajestysRevenueAndCustomsHMRCMemberus-gaap:DomesticCountryMember2023-12-310001530804us-gaap:AustralianTaxationOfficeMemberus-gaap:ForeignCountryMember2023-12-310001530804us-gaap:TaxAndCustomsAdministrationNetherlandsMemberus-gaap:ForeignCountryMember2023-12-310001530804us-gaap:MinistryOfTheEconomyFinanceAndIndustryFranceMemberus-gaap:ForeignCountryMember2023-12-310001530804trox:TaxAndCustomsAdministrationSaudiArabiaMemberus-gaap:ForeignCountryMember2023-12-310001530804us-gaap:StateAdministrationOfTaxationChinaMemberus-gaap:ForeignCountryMember2023-12-310001530804us-gaap:SecretariatOfTheFederalRevenueBureauOfBrazilMemberus-gaap:ForeignCountryMember2023-12-310001530804trox:OtherMemberus-gaap:ForeignCountryMember2023-12-310001530804us-gaap:InternalRevenueServiceIRSMemberus-gaap:ForeignCountryMember2023-12-310001530804us-gaap:StateAndLocalJurisdictionMemberus-gaap:InternalRevenueServiceIRSMember2023-12-310001530804us-gaap:EmployeeStockOptionMember2023-01-012023-12-310001530804us-gaap:EmployeeStockOptionMember2022-01-012022-12-310001530804us-gaap:EmployeeStockOptionMember2021-01-012021-12-310001530804us-gaap:RestrictedStockUnitsRSUMember2023-01-012023-12-310001530804us-gaap:RestrictedStockUnitsRSUMember2022-01-012022-12-310001530804us-gaap:RestrictedStockUnitsRSUMember2021-01-012021-12-3100015308042022-03-1500015308042022-11-3000015308042022-11-012022-11-300001530804us-gaap:AccountsPayableMember2023-12-310001530804us-gaap:AccountsPayableMember2022-12-310001530804us-gaap:LandAndLandImprovementsMember2023-12-310001530804us-gaap:LandAndLandImprovementsMember2022-12-310001530804us-gaap:BuildingMember2023-12-310001530804us-gaap:BuildingMember2022-12-310001530804us-gaap:MachineryAndEquipmentMember2023-12-310001530804us-gaap:MachineryAndEquipmentMember2022-12-310001530804us-gaap:ConstructionInProgressMember2023-12-310001530804us-gaap:ConstructionInProgressMember2022-12-310001530804us-gaap:OtherMachineryAndEquipmentMember2023-12-310001530804us-gaap:OtherMachineryAndEquipmentMember2022-12-310001530804us-gaap:CostOfSalesMember2023-01-012023-12-310001530804us-gaap:CostOfSalesMember2022-01-012022-12-310001530804us-gaap:CostOfSalesMember2021-01-012021-12-310001530804us-gaap:SellingGeneralAndAdministrativeExpensesMember2023-01-012023-12-310001530804us-gaap:SellingGeneralAndAdministrativeExpensesMember2022-01-012022-12-310001530804us-gaap:SellingGeneralAndAdministrativeExpensesMember2021-01-012021-12-310001530804us-gaap:CustomerRelationshipsMember2023-12-310001530804us-gaap:CustomerRelationshipsMember2022-12-310001530804us-gaap:PatentedTechnologyMember2023-12-310001530804us-gaap:PatentedTechnologyMember2022-12-310001530804us-gaap:ComputerSoftwareIntangibleAssetMember2023-12-310001530804us-gaap:ComputerSoftwareIntangibleAssetMember2022-12-310001530804us-gaap:ComputerSoftwareIntangibleAssetMember2023-01-012023-12-310001530804us-gaap:ComputerSoftwareIntangibleAssetMember2022-01-012022-12-310001530804us-gaap:RelatedPartyMember2023-12-310001530804us-gaap:RelatedPartyMember2022-12-310001530804us-gaap:NonrelatedPartyMember2023-12-310001530804us-gaap:NonrelatedPartyMember2022-12-310001530804trox:HawkinsPointLandMember2023-01-012023-12-310001530804trox:HawkinsPointLandMember2022-01-012022-12-310001530804trox:HawkinsPointLandMember2021-01-012021-12-310001530804trox:MGTLoanMember2023-01-012023-12-310001530804trox:MGTLoanMember2022-01-012022-12-310001530804trox:MGTLoanMember2021-01-012021-12-310001530804trox:TermLoanFacilityMember2023-12-310001530804trox:TermLoanFacilityMember2022-12-310001530804trox:TermLoanFacility2022Member2023-12-310001530804trox:TermLoanFacility2022Member2022-12-310001530804trox:TermLoanFacility2023Member2023-12-310001530804trox:TermLoanFacility2023Member2022-12-310001530804trox:SeniorNotesDue2029Member2023-12-310001530804trox:SeniorNotesDue2029Member2022-12-310001530804trox:StandardBankTermLoanFacilityMember2023-12-310001530804trox:StandardBankTermLoanFacilityMember2022-12-310001530804trox:AustralianGovernmentLoanMember2023-12-310001530804trox:AustralianGovernmentLoanMember2022-12-310001530804trox:MGTLoanMember2023-12-310001530804trox:MGTLoanMember2022-12-310001530804trox:TermLoanFacilityMember2023-01-012023-12-310001530804trox:TermLoanFacilityMember2022-01-012022-12-310001530804trox:TermLoanFacility2022Member2023-01-012023-12-310001530804trox:TermLoanFacility2022Member2022-01-012022-12-310001530804trox:TermLoanFacility2023Member2023-01-012023-12-310001530804trox:StandardBankTermLoanFacilityMember2023-01-012023-12-310001530804trox:StandardBankTermLoanFacilityMember2022-01-012022-12-310001530804trox:TermLoanFacilityMember2021-03-112021-03-110001530804trox:TermLoanFacilityMember2021-03-110001530804us-gaap:RevolvingCreditFacilityMembertrox:CashFlowRevolverMember2021-03-112021-03-110001530804us-gaap:RevolvingCreditFacilityMembertrox:CashFlowRevolverMember2021-03-110001530804us-gaap:RevolvingCreditFacilityMemberus-gaap:LetterOfCreditMembertrox:CashFlowRevolverMember2021-03-110001530804trox:PriorTermLoanFacilityMemberus-gaap:RevolvingCreditFacilityMember2021-03-110001530804trox:PriorTermLoanFacilityMember2021-03-112021-03-110001530804us-gaap:RevolvingCreditFacilityMembertrox:CashFlowRevolverMember2021-01-012021-12-310001530804us-gaap:RevolvingCreditFacilityMembertrox:TermLoanFacilityMember2021-01-012021-12-310001530804trox:SecuredOvernightFinancingRateSOFRMembertrox:TermLoanFacilityMember2021-09-302021-09-300001530804trox:SecuredOvernightFinancingRateSOFRMemberus-gaap:RevolvingCreditFacilityMembertrox:CashFlowRevolverMember2022-04-042022-04-040001530804us-gaap:RevolvingCreditFacilityMembertrox:CashFlowRevolverMember2022-06-300001530804us-gaap:RevolvingCreditFacilityMembertrox:CashFlowRevolverMember2021-06-302021-06-300001530804us-gaap:RevolvingCreditFacilityMembertrox:CashFlowRevolverMember2022-01-012022-12-310001530804us-gaap:RevolvingCreditFacilityMembertrox:CashFlowRevolverMember2022-12-310001530804us-gaap:RevolvingCreditFacilityMembertrox:CashFlowRevolverMember2023-12-310001530804us-gaap:RevolvingCreditFacilityMembertrox:CashFlowRevolverMember2022-12-012022-12-310001530804trox:TermLoanFacility2022Member2022-04-042022-04-040001530804trox:TermLoanFacility2022Member2022-04-040001530804trox:TermLoanFacility2022Memberus-gaap:BaseRateMember2022-04-042022-04-040001530804trox:SecuredOvernightFinancingRateSOFRMembertrox:TermLoanFacility2022Member2022-04-042022-04-040001530804trox:TermLoanFacility2022Memberus-gaap:BaseRateMember2023-01-012023-12-310001530804trox:TermLoanFacility2023Member2023-08-012023-08-310001530804trox:TermLoanFacility2023Member2023-08-310001530804trox:TermLoanFacility2023Memberus-gaap:BaseRateMember2023-08-012023-08-310001530804trox:SecuredOvernightFinancingRateSOFRMembertrox:TermLoanFacility2023Member2023-08-012023-08-310001530804trox:SeniorNotesDue2029Member2021-03-150001530804trox:SeniorNotesDue2029Member2021-12-310001530804trox:SeniorNotesDue2026AndSeniorNotesDue2025Member2021-01-012021-12-310001530804trox:SeniorNotesDue2026Member2021-01-012021-12-310001530804trox:StandardBankTermLoanFacilityAmortizationLoanMemberus-gaap:NotesPayableToBanksMember2021-01-012021-12-31iso4217:ZAR0001530804trox:StandardBankTermLoanFacilityAmortizationLoanMemberus-gaap:NotesPayableToBanksMember2021-12-310001530804trox:StandardBankTermLoanFacilityMember2021-10-012021-10-010001530804trox:StandardBankTermLoanFacilityMember2021-10-010001530804us-gaap:RevolvingCreditFacilityMembertrox:StandardBankRevolvingCreditFacilityMember2021-10-012021-10-010001530804us-gaap:RevolvingCreditFacilityMembertrox:StandardBankRevolvingCreditFacilityMember2021-10-010001530804trox:JohannesburgInterbankAverageRateJIBARMembertrox:StandardBankTermLoanFacilityMember2021-10-012021-10-010001530804trox:UtilizationLessThanThirtyThreePercentMembertrox:JohannesburgInterbankAverageRateJIBARMemberus-gaap:RevolvingCreditFacilityMembertrox:StandardBankRevolvingCreditFacilityMember2021-10-012021-10-010001530804trox:JohannesburgInterbankAverageRateJIBARMemberus-gaap:RevolvingCreditFacilityMembertrox:StandardBankRevolvingCreditFacilityMembertrox:UtilizationBetweenThirtyThreePercentAndSixtySixPercentMember2021-10-012021-10-010001530804trox:JohannesburgInterbankAverageRateJIBARMembertrox:UtilizationGreaterThanSixtySixPercentMemberus-gaap:RevolvingCreditFacilityMembertrox:StandardBankRevolvingCreditFacilityMember2021-10-012021-10-010001530804us-gaap:LoansPayableMembertrox:AustralianGovernmentLoanMember2019-04-102019-04-100001530804us-gaap:LoansPayableMembertrox:AustralianGovernmentLoanMember2019-04-10iso4217:AUD0001530804us-gaap:LoansPayableMembertrox:AustralianGovernmentLoanMember2023-12-310001530804trox:MGTLoanMember2020-12-170001530804trox:MGTLoanMembersrt:MinimumMember2023-01-012023-12-310001530804trox:MGTLoanMembersrt:MaximumMember2023-01-012023-12-310001530804us-gaap:LoansPayableMembertrox:WorkingCapitalDebtAgreementInChinaTikonLoanMember2019-04-102019-04-100001530804us-gaap:LoansPayableMembertrox:WorkingCapitalDebtAgreementInChinaTikonLoanMember2021-01-012021-12-31iso4217:CNY0001530804trox:EmiratesRevolverMemberus-gaap:LineOfCreditMember2023-06-30iso4217:GBP0001530804trox:EmiratesRevolverMemberus-gaap:LineOfCreditMember2023-12-310001530804trox:SecuredOvernightFinancingRateSOFRMembertrox:EmiratesRevolverMemberus-gaap:LineOfCreditMember2023-01-012023-12-310001530804us-gaap:EurodollarMembertrox:EmiratesRevolverMemberus-gaap:LineOfCreditMember2023-01-012023-12-310001530804trox:EmiratesRevolverMembertrox:SterlingOvernightIndexAverageRateMemberus-gaap:LineOfCreditMember2023-01-012023-12-310001530804trox:EmiratesRevolverMemberus-gaap:LineOfCreditMember2023-01-012023-12-310001530804trox:SaudiBritishBankSABBCreditFacilityMemberus-gaap:NotesPayableToBanksMember2019-10-16iso4217:SAR0001530804trox:SaudiInterBankOfferedRateMembertrox:SaudiBritishBankSABBCreditFacilityMemberus-gaap:NotesPayableToBanksMember2019-10-162019-10-160001530804trox:SaudiBritishBankSABBCreditFacilityMemberus-gaap:NotesPayableToBanksMember2023-11-300001530804trox:SaudiBritishBankSABBCreditFacilityMemberus-gaap:NotesPayableToBanksMember2023-12-310001530804trox:SaudiBritishBankSABBCreditFacilityMemberus-gaap:NotesPayableToBanksMember2023-01-012023-12-310001530804trox:ItauUnibancoSACreditFacilityMemberus-gaap:NotesPayableToBanksMember2022-11-30iso4217:BRL0001530804trox:ItauUnibancoSACreditFacilityMemberus-gaap:NotesPayableToBanksMember2023-12-310001530804trox:ShortTermInsurancePremiumFinancingAgreementMember2022-08-012022-08-310001530804trox:ShortTermInsurancePremiumFinancingAgreementMember2022-08-310001530804trox:ShortTermInsurancePremiumFinancingAgreementMember2023-08-012023-08-310001530804trox:ShortTermInsurancePremiumFinancingAgreementMember2023-08-310001530804trox:ShortTermInsurancePremiumFinancingAgreementMember2023-12-310001530804trox:ShortTermInsurancePremiumFinancingAgreementMember2022-12-310001530804trox:WellsFargoRevolverMember2023-12-310001530804trox:WellsFargoRevolverMember2022-12-310001530804us-gaap:DesignatedAsHedgingInstrumentMemberus-gaap:InterestRateSwapMember2023-12-310001530804us-gaap:DesignatedAsHedgingInstrumentMemberus-gaap:InterestRateSwapMember2022-12-310001530804us-gaap:DesignatedAsHedgingInstrumentMemberus-gaap:EnergyRelatedDerivativeMember2023-12-310001530804us-gaap:DesignatedAsHedgingInstrumentMemberus-gaap:EnergyRelatedDerivativeMember2022-12-310001530804us-gaap:DesignatedAsHedgingInstrumentMember2023-12-310001530804us-gaap:DesignatedAsHedgingInstrumentMember2022-12-310001530804us-gaap:NondesignatedMemberus-gaap:ForeignExchangeContractMember2023-12-310001530804us-gaap:NondesignatedMemberus-gaap:ForeignExchangeContractMember2022-12-310001530804us-gaap:PrepaidExpensesAndOtherCurrentAssetsMember2023-12-310001530804us-gaap:PrepaidExpensesAndOtherCurrentAssetsMember2022-12-310001530804us-gaap:SalesMember2023-01-012023-12-310001530804us-gaap:OtherOperatingIncomeExpenseMember2023-01-012023-12-310001530804us-gaap:SalesMember2022-01-012022-12-310001530804us-gaap:OtherOperatingIncomeExpenseMember2022-01-012022-12-310001530804us-gaap:SalesMember2021-01-012021-12-310001530804us-gaap:OtherOperatingIncomeExpenseMember2021-01-012021-12-310001530804us-gaap:SalesMemberus-gaap:NondesignatedMemberus-gaap:ForeignExchangeContractMember2023-01-012023-12-310001530804us-gaap:NondesignatedMemberus-gaap:CostOfSalesMemberus-gaap:ForeignExchangeContractMember2023-01-012023-12-310001530804us-gaap:NondesignatedMemberus-gaap:OtherOperatingIncomeExpenseMemberus-gaap:ForeignExchangeContractMember2023-01-012023-12-310001530804us-gaap:SalesMemberus-gaap:NondesignatedMemberus-gaap:ForeignExchangeContractMember2022-01-012022-12-310001530804us-gaap:NondesignatedMemberus-gaap:CostOfSalesMemberus-gaap:ForeignExchangeContractMember2022-01-012022-12-310001530804us-gaap:NondesignatedMemberus-gaap:OtherOperatingIncomeExpenseMemberus-gaap:ForeignExchangeContractMember2022-01-012022-12-310001530804us-gaap:SalesMemberus-gaap:NondesignatedMemberus-gaap:ForeignExchangeContractMember2021-01-012021-12-310001530804us-gaap:NondesignatedMemberus-gaap:CostOfSalesMemberus-gaap:ForeignExchangeContractMember2021-01-012021-12-310001530804us-gaap:NondesignatedMemberus-gaap:OtherOperatingIncomeExpenseMemberus-gaap:ForeignExchangeContractMember2021-01-012021-12-310001530804us-gaap:DesignatedAsHedgingInstrumentMemberus-gaap:SalesMemberus-gaap:ForeignExchangeContractMember2023-01-012023-12-310001530804us-gaap:DesignatedAsHedgingInstrumentMemberus-gaap:CostOfSalesMemberus-gaap:ForeignExchangeContractMember2023-01-012023-12-310001530804us-gaap:DesignatedAsHedgingInstrumentMemberus-gaap:OtherOperatingIncomeExpenseMemberus-gaap:ForeignExchangeContractMember2023-01-012023-12-310001530804us-gaap:DesignatedAsHedgingInstrumentMemberus-gaap:SalesMemberus-gaap:ForeignExchangeContractMember2022-01-012022-12-310001530804us-gaap:DesignatedAsHedgingInstrumentMemberus-gaap:CostOfSalesMemberus-gaap:ForeignExchangeContractMember2022-01-012022-12-310001530804us-gaap:DesignatedAsHedgingInstrumentMemberus-gaap:OtherOperatingIncomeExpenseMemberus-gaap:ForeignExchangeContractMember2022-01-012022-12-310001530804us-gaap:DesignatedAsHedgingInstrumentMemberus-gaap:SalesMemberus-gaap:ForeignExchangeContractMember2021-01-012021-12-310001530804us-gaap:DesignatedAsHedgingInstrumentMemberus-gaap:CostOfSalesMemberus-gaap:ForeignExchangeContractMember2021-01-012021-12-310001530804us-gaap:DesignatedAsHedgingInstrumentMemberus-gaap:OtherOperatingIncomeExpenseMemberus-gaap:ForeignExchangeContractMember2021-01-012021-12-310001530804us-gaap:DesignatedAsHedgingInstrumentMemberus-gaap:SalesMembersrt:NaturalGasReservesMember2023-01-012023-12-310001530804us-gaap:DesignatedAsHedgingInstrumentMemberus-gaap:CostOfSalesMembersrt:NaturalGasReservesMember2023-01-012023-12-310001530804us-gaap:DesignatedAsHedgingInstrumentMemberus-gaap:OtherOperatingIncomeExpenseMembersrt:NaturalGasReservesMember2023-01-012023-12-310001530804us-gaap:DesignatedAsHedgingInstrumentMemberus-gaap:SalesMembersrt:NaturalGasReservesMember2022-01-012022-12-310001530804us-gaap:DesignatedAsHedgingInstrumentMemberus-gaap:CostOfSalesMembersrt:NaturalGasReservesMember2022-01-012022-12-310001530804us-gaap:DesignatedAsHedgingInstrumentMemberus-gaap:OtherOperatingIncomeExpenseMembersrt:NaturalGasReservesMember2022-01-012022-12-310001530804us-gaap:DesignatedAsHedgingInstrumentMemberus-gaap:SalesMembersrt:NaturalGasReservesMember2021-01-012021-12-310001530804us-gaap:DesignatedAsHedgingInstrumentMemberus-gaap:CostOfSalesMembersrt:NaturalGasReservesMember2021-01-012021-12-310001530804us-gaap:DesignatedAsHedgingInstrumentMemberus-gaap:OtherOperatingIncomeExpenseMembersrt:NaturalGasReservesMember2021-01-012021-12-310001530804us-gaap:InterestRateSwapMember2019-06-3000015308042023-03-27trox:derivative0001530804us-gaap:InterestRateSwapMember2023-03-270001530804us-gaap:InterestRateSwapMember2023-03-272023-03-270001530804trox:InterestRateSwap2Member2023-03-270001530804us-gaap:InterestRateSwapMember2023-05-1700015308042023-05-170001530804trox:InterestRateSwap2Member2023-05-170001530804us-gaap:DesignatedAsHedgingInstrumentMemberus-gaap:InterestRateSwapMemberus-gaap:CashFlowHedgingMember2023-12-310001530804us-gaap:InterestRateSwapMemberus-gaap:AccumulatedForeignCurrencyAdjustmentIncludingPortionAttributableToNoncontrollingInterestMember2023-01-012023-12-310001530804us-gaap:InterestRateSwapMemberus-gaap:AccumulatedForeignCurrencyAdjustmentIncludingPortionAttributableToNoncontrollingInterestMember2022-01-012022-12-310001530804us-gaap:InterestRateSwapMemberus-gaap:AccumulatedForeignCurrencyAdjustmentIncludingPortionAttributableToNoncontrollingInterestMember2021-01-012021-12-310001530804us-gaap:InterestRateSwapMemberus-gaap:AccumulatedForeignCurrencyAdjustmentIncludingPortionAttributableToNoncontrollingInterestMember2023-12-310001530804us-gaap:InterestRateSwapMemberus-gaap:AccumulatedForeignCurrencyAdjustmentIncludingPortionAttributableToNoncontrollingInterestMember2022-12-310001530804us-gaap:AccumulatedForeignCurrencyAdjustmentIncludingPortionAttributableToNoncontrollingInterestMember2022-12-310001530804us-gaap:NondesignatedMembertrox:ForeignExchangeContractSouthAfricanRandMember2023-12-310001530804trox:ForeignExchangeContractAustralianDollarsMemberus-gaap:NondesignatedMember2023-12-310001530804us-gaap:NondesignatedMembertrox:ForeignExchangeContractPoundSterlingMember2023-12-310001530804us-gaap:NondesignatedMembertrox:ForeignExchangeContractEuroMember2023-12-31iso4217:EUR0001530804us-gaap:NondesignatedMembertrox:ForeignExchangeContractSaudiRiyalMember2023-12-310001530804us-gaap:FairValueInputsLevel1Membertrox:TermLoanFacilityMember2023-12-310001530804us-gaap:FairValueInputsLevel1Membertrox:TermLoanFacilityMember2022-12-310001530804us-gaap:FairValueInputsLevel1Membertrox:TermLoanFacility2022Member2023-12-310001530804us-gaap:FairValueInputsLevel1Membertrox:TermLoanFacility2022Member2022-12-310001530804trox:TermLoanFacility2023Memberus-gaap:FairValueInputsLevel1Member2023-12-310001530804trox:TermLoanFacility2023Memberus-gaap:FairValueInputsLevel1Member2022-12-310001530804us-gaap:FairValueInputsLevel2Membertrox:StandardBankTermLoanFacilityMember2023-12-310001530804us-gaap:FairValueInputsLevel2Membertrox:StandardBankTermLoanFacilityMember2022-12-310001530804us-gaap:FairValueInputsLevel1Membertrox:SeniorNotesDue2029Member2023-12-310001530804us-gaap:FairValueInputsLevel1Membertrox:SeniorNotesDue2029Member2022-12-310001530804us-gaap:FairValueInputsLevel2Membertrox:AustralianGovernmentLoanMember2023-12-310001530804us-gaap:FairValueInputsLevel2Membertrox:AustralianGovernmentLoanMember2022-12-310001530804trox:MGTLoanMemberus-gaap:FairValueInputsLevel2Member2023-12-310001530804trox:MGTLoanMemberus-gaap:FairValueInputsLevel2Member2022-12-310001530804us-gaap:FairValueInputsLevel2Memberus-gaap:InterestRateSwapMember2023-12-310001530804us-gaap:FairValueInputsLevel2Memberus-gaap:InterestRateSwapMember2022-12-310001530804us-gaap:FairValueInputsLevel2Memberus-gaap:EnergyRelatedDerivativeMember2023-12-310001530804us-gaap:FairValueInputsLevel2Memberus-gaap:EnergyRelatedDerivativeMember2022-12-310001530804us-gaap:FairValueInputsLevel2Memberus-gaap:ForeignExchangeContractMember2023-12-310001530804us-gaap:FairValueInputsLevel2Memberus-gaap:ForeignExchangeContractMember2022-12-310001530804srt:MinimumMemberus-gaap:MeasurementInputDiscountRateMember2023-12-310001530804us-gaap:MeasurementInputDiscountRateMembersrt:MaximumMember2023-12-310001530804us-gaap:MeasurementInputRiskFreeInterestRateMembersrt:MinimumMember2023-12-310001530804us-gaap:MeasurementInputRiskFreeInterestRateMembersrt:MaximumMember2023-12-310001530804srt:MinimumMemberus-gaap:MiningPropertiesAndMineralRightsMember2023-12-310001530804us-gaap:MiningPropertiesAndMineralRightsMembersrt:MaximumMember2023-12-310001530804srt:MinimumMemberus-gaap:OtherMachineryAndEquipmentMember2023-12-310001530804us-gaap:OtherMachineryAndEquipmentMembersrt:MaximumMember2023-12-310001530804us-gaap:StandbyLettersOfCreditMembertrox:WellsFargoRevolverMember2023-12-310001530804us-gaap:GuaranteeOfIndebtednessOfOthersMembertrox:HawkinsPointMember2023-12-310001530804us-gaap:GuaranteeOfIndebtednessOfOthersMembertrox:AbsaRevolverMember2023-12-310001530804trox:UKHealthAndSafetyMatterMember2023-06-012023-06-300001530804trox:VenatorMaterialsPLCVSTronoxLimitedMembertrox:VenatorMaterialsPLCMember2019-05-012019-05-310001530804trox:VenatorMaterialsPLCVSTronoxLimitedMember2019-06-012019-06-300001530804trox:CristalNorthAmericaTiO2BusinessMemberus-gaap:DiscontinuedOperationsDisposedOfBySaleMember2019-05-012019-05-010001530804trox:VenatorMaterialsPLCVSTronoxLimitedMembertrox:VenatorMaterialsPLCMember2022-04-182022-04-180001530804us-gaap:AccumulatedTranslationAdjustmentMember2020-12-310001530804us-gaap:AccumulatedDefinedBenefitPlansAdjustmentMember2020-12-310001530804us-gaap:AccumulatedGainLossNetCashFlowHedgeParentMember2020-12-310001530804us-gaap:AccumulatedTranslationAdjustmentMember2021-01-012021-12-310001530804us-gaap:AccumulatedDefinedBenefitPlansAdjustmentMember2021-01-012021-12-310001530804us-gaap:AccumulatedGainLossNetCashFlowHedgeParentMember2021-01-012021-12-310001530804us-gaap:AccumulatedTranslationAdjustmentMember2021-12-310001530804us-gaap:AccumulatedDefinedBenefitPlansAdjustmentMember2021-12-310001530804us-gaap:AccumulatedGainLossNetCashFlowHedgeParentMember2021-12-310001530804us-gaap:AccumulatedTranslationAdjustmentMember2022-01-012022-12-310001530804us-gaap:AccumulatedDefinedBenefitPlansAdjustmentMember2022-01-012022-12-310001530804us-gaap:AccumulatedGainLossNetCashFlowHedgeParentMember2022-01-012022-12-310001530804us-gaap:AccumulatedTranslationAdjustmentMember2022-12-310001530804us-gaap:AccumulatedDefinedBenefitPlansAdjustmentMember2022-12-310001530804us-gaap:AccumulatedGainLossNetCashFlowHedgeParentMember2022-12-310001530804us-gaap:AccumulatedTranslationAdjustmentMember2023-01-012023-12-310001530804us-gaap:AccumulatedDefinedBenefitPlansAdjustmentMember2023-01-012023-12-310001530804us-gaap:AccumulatedGainLossNetCashFlowHedgeParentMember2023-01-012023-12-310001530804us-gaap:AccumulatedTranslationAdjustmentMember2023-12-310001530804us-gaap:AccumulatedDefinedBenefitPlansAdjustmentMember2023-12-310001530804us-gaap:AccumulatedGainLossNetCashFlowHedgeParentMember2023-12-3100015308042021-11-090001530804us-gaap:SubsequentEventMember2024-02-210001530804us-gaap:RestrictedStockUnitsRSUMember2023-01-012023-12-310001530804us-gaap:CommonClassAMember2019-03-270001530804trox:TronoxHoldingsPlcAmendedAndRestatedManagementEquityIncentivePlanMember2020-06-242020-06-240001530804srt:ManagementMembertrox:RestrictedStockUnitsRSUsTimeBasedAwardsMember2023-01-012023-12-310001530804trox:RestrictedStockUnitsRSUsTimeBasedAwardsMember2023-01-012023-12-310001530804trox:RestrictedStockUnitsRSUsTimeBasedAwardsMembersrt:DirectorMember2023-01-012023-12-310001530804trox:RestrictedStockUnitsRSUsPerformanceBasedAwardsMember2023-01-012023-12-310001530804us-gaap:ShareBasedCompensationAwardTrancheOneMembertrox:RestrictedStockUnitsRSUsPerformanceBasedAwardsMember2023-01-012023-12-310001530804trox:RestrictedStockUnitsRSUsPerformanceBasedAwardsMemberus-gaap:ShareBasedCompensationAwardTrancheTwoMember2023-01-012023-12-310001530804trox:RestrictedStockUnitsRSUsPerformanceBasedAwardsMember2022-01-012022-12-310001530804trox:RestrictedStockUnitsRSUsPerformanceBasedAwardsMember2021-01-012021-12-310001530804us-gaap:ShareBasedCompensationAwardTrancheOneMembertrox:RestrictedStockUnitsRSUsPerformanceBasedAwardsMember2022-01-012022-12-310001530804us-gaap:ShareBasedCompensationAwardTrancheOneMembertrox:RestrictedStockUnitsRSUsPerformanceBasedAwardsMember2021-01-012021-12-310001530804us-gaap:RestrictedStockUnitsRSUMember2022-12-310001530804us-gaap:RestrictedStockUnitsRSUMember2023-12-310001530804us-gaap:RestrictedStockUnitsRSUMember2022-01-012022-12-310001530804us-gaap:RestrictedStockUnitsRSUMember2021-01-012021-12-31trox:plan0001530804us-gaap:PensionPlansDefinedBenefitMember2022-10-012022-12-310001530804us-gaap:PensionPlansDefinedBenefitMemberus-gaap:RetirementPlanNameOtherMember2023-01-012023-12-310001530804us-gaap:PensionPlansDefinedBenefitMemberus-gaap:RetirementPlanNameOtherMember2022-01-012022-12-310001530804country:ZAus-gaap:DefinedBenefitPostretirementHealthCoverageMember2023-01-012023-12-310001530804country:ZAsrt:MaximumMemberus-gaap:DefinedBenefitPostretirementHealthCoverageMember2023-01-012023-12-310001530804us-gaap:PensionPlansDefinedBenefitMembercountry:US2022-12-310001530804us-gaap:PensionPlansDefinedBenefitMemberus-gaap:ForeignPlanMember2022-12-310001530804us-gaap:PensionPlansDefinedBenefitMembercountry:US2021-12-310001530804us-gaap:PensionPlansDefinedBenefitMemberus-gaap:ForeignPlanMember2021-12-310001530804country:USus-gaap:DefinedBenefitPostretirementHealthCoverageMember2022-12-310001530804us-gaap:ForeignPlanMemberus-gaap:DefinedBenefitPostretirementHealthCoverageMember2022-12-310001530804country:USus-gaap:DefinedBenefitPostretirementHealthCoverageMember2021-12-310001530804us-gaap:ForeignPlanMemberus-gaap:DefinedBenefitPostretirementHealthCoverageMember2021-12-310001530804us-gaap:PensionPlansDefinedBenefitMembercountry:US2023-01-012023-12-310001530804us-gaap:PensionPlansDefinedBenefitMemberus-gaap:ForeignPlanMember2023-01-012023-12-310001530804us-gaap:PensionPlansDefinedBenefitMembercountry:US2022-01-012022-12-310001530804us-gaap:PensionPlansDefinedBenefitMemberus-gaap:ForeignPlanMember2022-01-012022-12-310001530804country:USus-gaap:DefinedBenefitPostretirementHealthCoverageMember2023-01-012023-12-310001530804us-gaap:ForeignPlanMemberus-gaap:DefinedBenefitPostretirementHealthCoverageMember2023-01-012023-12-310001530804country:USus-gaap:DefinedBenefitPostretirementHealthCoverageMember2022-01-012022-12-310001530804us-gaap:ForeignPlanMemberus-gaap:DefinedBenefitPostretirementHealthCoverageMember2022-01-012022-12-310001530804us-gaap:PensionPlansDefinedBenefitMembercountry:US2023-12-310001530804us-gaap:PensionPlansDefinedBenefitMemberus-gaap:ForeignPlanMember2023-12-310001530804country:USus-gaap:DefinedBenefitPostretirementHealthCoverageMember2023-12-310001530804us-gaap:ForeignPlanMemberus-gaap:DefinedBenefitPostretirementHealthCoverageMember2023-12-310001530804us-gaap:PensionPlansDefinedBenefitMember2023-01-012023-12-310001530804us-gaap:PensionPlansDefinedBenefitMember2023-12-310001530804us-gaap:PensionPlansDefinedBenefitMember2022-01-012022-12-310001530804us-gaap:PensionPlansDefinedBenefitMember2021-01-012021-12-310001530804us-gaap:DefinedBenefitPostretirementHealthCoverageMember2023-01-012023-12-310001530804us-gaap:DefinedBenefitPostretirementHealthCoverageMember2022-01-012022-12-310001530804us-gaap:DefinedBenefitPostretirementHealthCoverageMember2021-01-012021-12-310001530804us-gaap:PensionPlansDefinedBenefitMembercountry:US2021-01-012021-12-310001530804us-gaap:PensionPlansDefinedBenefitMemberus-gaap:ForeignPlanMember2021-01-012021-12-310001530804country:USus-gaap:DefinedBenefitPostretirementHealthCoverageMember2021-01-012021-12-310001530804us-gaap:ForeignPlanMemberus-gaap:DefinedBenefitPostretirementHealthCoverageMember2021-01-012021-12-310001530804us-gaap:EquitySecuritiesMembercountry:US2023-12-310001530804us-gaap:EquitySecuritiesMemberus-gaap:ForeignPlanMember2023-12-310001530804us-gaap:EquitySecuritiesMembercountry:US2022-12-310001530804us-gaap:EquitySecuritiesMemberus-gaap:ForeignPlanMember2022-12-310001530804us-gaap:DebtSecuritiesMembercountry:US2023-12-310001530804us-gaap:DebtSecuritiesMemberus-gaap:ForeignPlanMember2023-12-310001530804us-gaap:DebtSecuritiesMembercountry:US2022-12-310001530804us-gaap:DebtSecuritiesMemberus-gaap:ForeignPlanMember2022-12-310001530804us-gaap:DefinedBenefitPlanRealEstateMembercountry:US2023-12-310001530804us-gaap:DefinedBenefitPlanRealEstateMemberus-gaap:ForeignPlanMember2023-12-310001530804us-gaap:DefinedBenefitPlanRealEstateMembercountry:US2022-12-310001530804us-gaap:DefinedBenefitPlanRealEstateMemberus-gaap:ForeignPlanMember2022-12-310001530804trox:DefinedBenefitPlanOtherMembercountry:US2023-12-310001530804us-gaap:ForeignPlanMembertrox:DefinedBenefitPlanOtherMember2023-12-310001530804trox:DefinedBenefitPlanOtherMembercountry:US2022-12-310001530804us-gaap:ForeignPlanMembertrox:DefinedBenefitPlanOtherMember2022-12-310001530804country:US2023-12-310001530804us-gaap:ForeignPlanMember2023-12-310001530804country:US2022-12-310001530804us-gaap:ForeignPlanMember2022-12-310001530804us-gaap:FairValueInputsLevel1Membertrox:GlobalEquitySecuritiesMember2023-12-310001530804us-gaap:FairValueInputsLevel2Membertrox:GlobalEquitySecuritiesMember2023-12-310001530804us-gaap:FairValueInputsLevel3Membertrox:GlobalEquitySecuritiesMember2023-12-310001530804trox:GlobalEquitySecuritiesMember2023-12-310001530804trox:GlobalCommingledEquityFundsMemberus-gaap:FairValueInputsLevel1Member2023-12-310001530804us-gaap:FairValueInputsLevel2Membertrox:GlobalCommingledEquityFundsMember2023-12-310001530804trox:GlobalCommingledEquityFundsMemberus-gaap:FairValueInputsLevel3Member2023-12-310001530804trox:GlobalCommingledEquityFundsMember2023-12-310001530804us-gaap:USTreasuryAndGovernmentMemberus-gaap:FairValueInputsLevel1Member2023-12-310001530804us-gaap:FairValueInputsLevel2Memberus-gaap:USTreasuryAndGovernmentMember2023-12-310001530804us-gaap:USTreasuryAndGovernmentMemberus-gaap:FairValueInputsLevel3Member2023-12-310001530804us-gaap:USTreasuryAndGovernmentMember2023-12-310001530804us-gaap:FairValueInputsLevel1Memberus-gaap:ForeignGovernmentDebtMember2023-12-310001530804us-gaap:FairValueInputsLevel2Memberus-gaap:ForeignGovernmentDebtMember2023-12-310001530804us-gaap:FairValueInputsLevel3Memberus-gaap:ForeignGovernmentDebtMember2023-12-310001530804us-gaap:ForeignGovernmentDebtMember2023-12-310001530804us-gaap:FairValueInputsLevel1Memberus-gaap:CorporateDebtSecuritiesMember2023-12-310001530804us-gaap:FairValueInputsLevel2Memberus-gaap:CorporateDebtSecuritiesMember2023-12-310001530804us-gaap:FairValueInputsLevel3Memberus-gaap:CorporateDebtSecuritiesMember2023-12-310001530804us-gaap:CorporateDebtSecuritiesMember2023-12-310001530804us-gaap:ForeignCorporateDebtSecuritiesMemberus-gaap:FairValueInputsLevel1Member2023-12-310001530804us-gaap:FairValueInputsLevel2Memberus-gaap:ForeignCorporateDebtSecuritiesMember2023-12-310001530804us-gaap:ForeignCorporateDebtSecuritiesMemberus-gaap:FairValueInputsLevel3Member2023-12-310001530804us-gaap:ForeignCorporateDebtSecuritiesMember2023-12-310001530804us-gaap:FairValueInputsLevel1Memberus-gaap:RealEstateFundsMember2023-12-310001530804us-gaap:FairValueInputsLevel2Memberus-gaap:RealEstateFundsMember2023-12-310001530804us-gaap:FairValueInputsLevel3Memberus-gaap:RealEstateFundsMember2023-12-310001530804us-gaap:RealEstateFundsMember2023-12-310001530804us-gaap:FairValueInputsLevel1Membertrox:InsuranceContractsMember2023-12-310001530804us-gaap:FairValueInputsLevel2Membertrox:InsuranceContractsMember2023-12-310001530804us-gaap:FairValueInputsLevel3Membertrox:InsuranceContractsMember2023-12-310001530804trox:InsuranceContractsMember2023-12-310001530804us-gaap:FairValueInputsLevel1Memberus-gaap:DefinedBenefitPlanCashAndCashEquivalentsMember2023-12-310001530804us-gaap:FairValueInputsLevel2Memberus-gaap:DefinedBenefitPlanCashAndCashEquivalentsMember2023-12-310001530804us-gaap:FairValueInputsLevel3Memberus-gaap:DefinedBenefitPlanCashAndCashEquivalentsMember2023-12-310001530804us-gaap:DefinedBenefitPlanCashAndCashEquivalentsMember2023-12-310001530804us-gaap:FairValueInputsLevel1Member2023-12-310001530804us-gaap:FairValueInputsLevel2Member2023-12-310001530804us-gaap:FairValueInputsLevel3Member2023-12-310001530804us-gaap:FairValueInputsLevel3Membertrox:InsuranceContractsMember2022-12-310001530804us-gaap:FairValueInputsLevel3Membertrox:InsuranceContractsMember2023-01-012023-12-310001530804us-gaap:FairValueInputsLevel1Membertrox:GlobalEquitySecuritiesMember2022-12-310001530804us-gaap:FairValueInputsLevel2Membertrox:GlobalEquitySecuritiesMember2022-12-310001530804us-gaap:FairValueInputsLevel3Membertrox:GlobalEquitySecuritiesMember2022-12-310001530804trox:GlobalEquitySecuritiesMember2022-12-310001530804trox:GlobalCommingledEquityFundsMemberus-gaap:FairValueInputsLevel1Member2022-12-310001530804us-gaap:FairValueInputsLevel2Membertrox:GlobalCommingledEquityFundsMember2022-12-310001530804trox:GlobalCommingledEquityFundsMemberus-gaap:FairValueInputsLevel3Member2022-12-310001530804trox:GlobalCommingledEquityFundsMember2022-12-310001530804us-gaap:USTreasuryAndGovernmentMemberus-gaap:FairValueInputsLevel1Member2022-12-310001530804us-gaap:FairValueInputsLevel2Memberus-gaap:USTreasuryAndGovernmentMember2022-12-310001530804us-gaap:USTreasuryAndGovernmentMemberus-gaap:FairValueInputsLevel3Member2022-12-310001530804us-gaap:USTreasuryAndGovernmentMember2022-12-310001530804us-gaap:FairValueInputsLevel1Memberus-gaap:ForeignGovernmentDebtMember2022-12-310001530804us-gaap:FairValueInputsLevel2Memberus-gaap:ForeignGovernmentDebtMember2022-12-310001530804us-gaap:FairValueInputsLevel3Memberus-gaap:ForeignGovernmentDebtMember2022-12-310001530804us-gaap:ForeignGovernmentDebtMember2022-12-310001530804us-gaap:FairValueInputsLevel1Memberus-gaap:CorporateDebtSecuritiesMember2022-12-310001530804us-gaap:FairValueInputsLevel2Memberus-gaap:CorporateDebtSecuritiesMember2022-12-310001530804us-gaap:FairValueInputsLevel3Memberus-gaap:CorporateDebtSecuritiesMember2022-12-310001530804us-gaap:CorporateDebtSecuritiesMember2022-12-310001530804us-gaap:ForeignCorporateDebtSecuritiesMemberus-gaap:FairValueInputsLevel1Member2022-12-310001530804us-gaap:FairValueInputsLevel2Memberus-gaap:ForeignCorporateDebtSecuritiesMember2022-12-310001530804us-gaap:ForeignCorporateDebtSecuritiesMemberus-gaap:FairValueInputsLevel3Member2022-12-310001530804us-gaap:ForeignCorporateDebtSecuritiesMember2022-12-310001530804us-gaap:FairValueInputsLevel1Memberus-gaap:RealEstateFundsMember2022-12-310001530804us-gaap:FairValueInputsLevel2Memberus-gaap:RealEstateFundsMember2022-12-310001530804us-gaap:FairValueInputsLevel3Memberus-gaap:RealEstateFundsMember2022-12-310001530804us-gaap:RealEstateFundsMember2022-12-310001530804us-gaap:FairValueInputsLevel1Membertrox:InsuranceContractsMember2022-12-310001530804us-gaap:FairValueInputsLevel2Membertrox:InsuranceContractsMember2022-12-310001530804trox:InsuranceContractsMember2022-12-310001530804us-gaap:FairValueInputsLevel1Memberus-gaap:DefinedBenefitPlanCashAndCashEquivalentsMember2022-12-310001530804us-gaap:FairValueInputsLevel2Memberus-gaap:DefinedBenefitPlanCashAndCashEquivalentsMember2022-12-310001530804us-gaap:FairValueInputsLevel3Memberus-gaap:DefinedBenefitPlanCashAndCashEquivalentsMember2022-12-310001530804us-gaap:DefinedBenefitPlanCashAndCashEquivalentsMember2022-12-310001530804us-gaap:FairValueInputsLevel1Member2022-12-310001530804us-gaap:FairValueInputsLevel2Member2022-12-310001530804us-gaap:FairValueInputsLevel3Member2022-12-310001530804us-gaap:FairValueInputsLevel3Membertrox:InsuranceContractsMember2021-12-310001530804us-gaap:FairValueInputsLevel3Membertrox:InsuranceContractsMember2022-01-012022-12-310001530804trox:SavingsAndInvestmentPlansMemberus-gaap:QualifiedPlanMember2023-01-012023-12-310001530804trox:SavingsAndInvestmentPlansMemberus-gaap:QualifiedPlanMember2013-01-012013-01-010001530804trox:SavingsAndInvestmentPlansMemberus-gaap:QualifiedPlanMember2022-01-012022-12-310001530804trox:SavingsAndInvestmentPlansMemberus-gaap:QualifiedPlanMember2021-01-012021-12-310001530804trox:RestorationPlanMemberus-gaap:NonqualifiedPlanMember2006-01-012006-12-310001530804trox:RestorationPlanMemberus-gaap:NonqualifiedPlanMember2023-01-012023-12-310001530804trox:RestorationPlanMemberus-gaap:NonqualifiedPlanMember2022-01-012022-12-310001530804trox:RestorationPlanMemberus-gaap:NonqualifiedPlanMember2021-01-012021-12-310001530804srt:MinimumMembertrox:SouthAfricaDefinedContributionPlansMember2023-01-012023-12-310001530804trox:SouthAfricaDefinedContributionPlansMembersrt:MaximumMember2023-01-012023-12-310001530804trox:SouthAfricaDefinedContributionPlansMember2023-01-012023-12-310001530804trox:SouthAfricaDefinedContributionPlansMember2022-01-012022-12-310001530804trox:SouthAfricaDefinedContributionPlansMember2021-01-012021-12-310001530804trox:CristalInternationalHoldingsBVMember2023-12-310001530804trox:CristalInternationalHoldingsBVMember2023-12-310001530804trox:OptionAgreementOptionToAcquireSpecialPurchaseVehicleMemberus-gaap:RelatedPartyMembertrox:AdvancedMetalIndustriesClusterCompanyLimitedMember2018-05-090001530804trox:SlaggerMembertrox:AdvancedMetalIndustriesClusterAndTohoTitaniumMetalCoLtdATTMMember2018-05-090001530804trox:OptionAgreementAmountsToBeReimbursedForCapitalExpendituresAndOperationalExpensesMemberus-gaap:RelatedPartyMembertrox:AMICMember2018-05-090001530804trox:OptionAgreementAmountsToBeReimbursedForCapitalExpendituresAndOperationalExpensesMembertrox:AMICMember2020-05-132022-12-310001530804us-gaap:RelatedPartyMembertrox:SlaggerMember2023-05-100001530804us-gaap:RelatedPartyMember2023-05-100001530804trox:OptionAgreementAmountLoanedForCapitalExpendituresAndOperationalExpensesInterestEarnedMemberus-gaap:RelatedPartyMembertrox:AdvancedMetalIndustriesClusterCompanyLimitedMember2023-12-310001530804trox:OptionAgreementAmountLoanedForCapitalExpendituresAndOperationalExpensesInterestEarnedMemberus-gaap:RelatedPartyMembertrox:AdvancedMetalIndustriesClusterCompanyLimitedMember2022-12-310001530804us-gaap:RelatedPartyMember2023-01-012023-12-310001530804us-gaap:RelatedPartyMember2022-01-012022-12-310001530804us-gaap:RelatedPartyMember2021-01-012021-12-310001530804trox:AdvancedMetalIndustriesClusterCompanyLimitedMembertrox:PurchasesOfFeedstockMaterialSettledAsInKindRepaymentOfTronoxLoansMembertrox:SlaggerMember2023-01-012023-12-310001530804trox:AdvancedMetalIndustriesClusterCompanyLimitedMembertrox:PurchasesOfFeedstockMaterialSettledAsInKindRepaymentOfTronoxLoansMembertrox:SlaggerMember2022-01-012022-12-310001530804trox:AdvancedMetalIndustriesClusterCompanyLimitedMembertrox:PurchasesOfFeedstockMaterialSettledAsInKindRepaymentOfTronoxLoansMembertrox:SlaggerMember2021-01-012021-12-310001530804trox:AdvancedMetalIndustriesClusterCompanyLimitedMembertrox:PurchasesOfFeedstockMaterialSettledInCashMembertrox:SlaggerMember2023-01-012023-12-310001530804trox:AdvancedMetalIndustriesClusterCompanyLimitedMembertrox:PurchasesOfFeedstockMaterialSettledInCashMembertrox:SlaggerMember2022-01-012022-12-310001530804trox:AdvancedMetalIndustriesClusterCompanyLimitedMembertrox:PurchasesOfFeedstockMaterialSettledInCashMembertrox:SlaggerMember2021-01-012021-12-310001530804trox:AdvancedMetalIndustriesClusterCompanyLimitedMembertrox:SlaggerMember2023-01-012023-12-310001530804trox:AdvancedMetalIndustriesClusterCompanyLimitedMembertrox:SlaggerMember2022-01-012022-12-310001530804trox:AdvancedMetalIndustriesClusterCompanyLimitedMembertrox:SlaggerMember2021-01-012021-12-310001530804trox:AdvancedMetalIndustriesClusterCompanyLimitedMembertrox:PurchasesOfFeedstockMaterialMemberus-gaap:RelatedPartyMembertrox:SlaggerMember2023-12-310001530804trox:AdvancedMetalIndustriesClusterCompanyLimitedMembertrox:PurchasesOfFeedstockMaterialMemberus-gaap:RelatedPartyMembertrox:SlaggerMember2022-12-310001530804us-gaap:RelatedPartyMembertrox:AMICMembertrox:AmendedTechnicalServicesAgreementMonthlyManagementFeeMember2023-01-012023-12-310001530804us-gaap:RelatedPartyMembertrox:AMICMembertrox:AmendedTechnicalServicesAgreementMonthlyManagementFeeMember2022-01-012022-12-310001530804us-gaap:RelatedPartyMembertrox:AMICMembertrox:AmendedTechnicalServicesAgreementMonthlyManagementFeeMember2021-01-012021-12-310001530804us-gaap:RelatedPartyMembertrox:AmendedTechnicalServicesAgreementOtherTechnicalSupportFeesMembertrox:AMICMember2023-01-012023-12-310001530804us-gaap:RelatedPartyMembertrox:AmendedTechnicalServicesAgreementOtherTechnicalSupportFeesMembertrox:AMICMember2022-01-012022-12-310001530804us-gaap:RelatedPartyMembertrox:AmendedTechnicalServicesAgreementOtherTechnicalSupportFeesMembertrox:AMICMember2021-01-012021-12-310001530804us-gaap:RelatedPartyMembertrox:AMICMember2023-01-012023-12-310001530804us-gaap:RelatedPartyMembertrox:AMICMember2022-01-012022-12-310001530804us-gaap:RelatedPartyMembertrox:AMICMember2021-01-012021-12-310001530804trox:AmendedTechnicalServicesAgreementMonthlyManagementFeeAndOtherTechnicalSupportFeesMemberus-gaap:RelatedPartyMembertrox:AMICMember2023-12-310001530804trox:AmendedTechnicalServicesAgreementMonthlyManagementFeeAndOtherTechnicalSupportFeesMemberus-gaap:RelatedPartyMembertrox:AMICMember2022-12-310001530804us-gaap:RelatedPartyMembertrox:AcquisitionOfAssetsProducingMetalGradeTiCl4Membertrox:AdvancedMetalIndustriesClusterCompanyLimitedMember2019-12-290001530804us-gaap:RelatedPartyMembertrox:AdvancedMetalIndustriesClusterAndTohoTitaniumMetalCoLtdATTMMembertrox:AcquisitionOfAssetsProducingMetalGradeTiCl4Member2019-12-290001530804trox:MGTLoanMembertrox:CristalMemberus-gaap:RelatedPartyMember2020-12-170001530804trox:MGTLoanMembersrt:MinimumMembertrox:CristalMemberus-gaap:RelatedPartyMember2023-01-012023-12-310001530804trox:MGTLoanMembertrox:CristalMemberus-gaap:RelatedPartyMembersrt:MaximumMember2023-01-012023-12-310001530804trox:MGTLoanMembertrox:CristalMemberus-gaap:RelatedPartyMember2023-12-310001530804trox:MGTLoanMembertrox:CristalMemberus-gaap:RelatedPartyMember2022-12-310001530804trox:MGTLoanMembertrox:CristalMemberus-gaap:RelatedPartyMember2023-01-012023-12-310001530804trox:MGTLoanMembertrox:CristalMemberus-gaap:RelatedPartyMember2022-01-012022-12-310001530804trox:MGTLoanMembertrox:CristalMemberus-gaap:RelatedPartyMember2021-01-012021-12-310001530804trox:PurchaseOfChlorineGasMemberus-gaap:RelatedPartyMember2023-01-012023-12-310001530804trox:PurchaseOfChlorineGasMemberus-gaap:RelatedPartyMember2022-01-012022-12-310001530804trox:PurchaseOfChlorineGasMemberus-gaap:RelatedPartyMember2021-01-012021-12-310001530804trox:PurchaseOfChlorineGasMemberus-gaap:RelatedPartyMember2023-12-310001530804trox:PurchaseOfChlorineGasMemberus-gaap:RelatedPartyMember2022-12-310001530804trox:MGTMember2023-01-012023-12-310001530804trox:MGTMember2022-01-012022-12-310001530804trox:MGTMember2021-01-012021-12-310001530804trox:ReceivableFromMGTProductSalesMemberus-gaap:RelatedPartyMembertrox:AdvancedMetalIndustriesClusterAndTohoTitaniumMetalCoLtdATTMMember2023-12-310001530804trox:ReceivableFromMGTProductSalesMemberus-gaap:RelatedPartyMembertrox:AdvancedMetalIndustriesClusterAndTohoTitaniumMetalCoLtdATTMMember2022-12-310001530804trox:TenLargestThirdPartyTiO2CustomersMemberus-gaap:CustomerConcentrationRiskMemberus-gaap:SalesRevenueNetMember2021-01-012021-12-31trox:customer0001530804trox:TenLargestThirdPartyTiO2CustomersMemberus-gaap:CustomerConcentrationRiskMemberus-gaap:SalesRevenueNetMember2022-01-012022-12-310001530804trox:TenLargestThirdPartyTiO2CustomersMemberus-gaap:CustomerConcentrationRiskMemberus-gaap:SalesRevenueNetMember2023-01-012023-12-310001530804country:US2023-01-012023-12-310001530804country:US2022-01-012022-12-310001530804country:US2021-01-012021-12-310001530804country:GB2023-01-012023-12-310001530804country:GB2022-01-012022-12-310001530804country:GB2021-01-012021-12-310001530804country:AU2021-01-012021-12-310001530804country:ZA2023-01-012023-12-310001530804country:ZA2022-01-012022-12-310001530804country:ZA2021-01-012021-12-310001530804country:SA2023-01-012023-12-310001530804country:SA2022-01-012022-12-310001530804country:SA2021-01-012021-12-310001530804trox:OtherForeignMember2023-01-012023-12-310001530804trox:OtherForeignMember2022-01-012022-12-310001530804trox:OtherForeignMember2021-01-012021-12-310001530804country:US2023-12-310001530804country:US2022-12-310001530804country:GB2023-12-310001530804country:GB2022-12-310001530804country:SA2023-12-310001530804country:SA2022-12-310001530804country:ZA2023-12-310001530804country:ZA2022-12-310001530804country:AU2023-12-310001530804country:AU2022-12-310001530804trox:OtherForeignMember2023-12-310001530804trox:OtherForeignMember2022-12-31
UNITED STATES
SECURITIES AND EXCHANGE COMMISSION
Washington, D.C. 20549
Form 10-K
(Mark One)
|
|
|
|
|
|
| ☒ |
ANNUAL REPORT PURSUANT TO SECTION 13 OR 15(d) OF THE SECURITIES EXCHANGE ACT OF 1934 |
For the Year ended December 31, 2023
OR
|
|
|
|
|
|
| ☐ |
TRANSITION REPORT PURSUANT TO SECTION 13 OR 15(d) OF THE SECURITIES EXCHANGE ACT OF 1934 |
For the transition period from to
1-35573
(Commission file number)
TRONOX HOLDINGS PLC
(Exact name of registrant as specified in its charter)
|
|
|
|
|
|
|
|
|
England and Wales |
|
98-1467236 |
| (State or other jurisdiction of incorporation or organization) |
|
(I.R.S. Employer Identification No.) |
|
|
|
|
|
|
|
|
|
|
|
|
|
|
|
263 Tresser Boulevard, Suite 1100 |
|
Laporte Road, Stallingborough |
Stamford, Connecticut 06901 |
|
Grimsby, North East Lincolnshire, DN40 2PR |
|
|
United Kingdom |
Registrant’s telephone number, including area code: (203) 705-3800
Securities registered pursuant to Section 12(b) of the Act:
|
|
|
|
|
|
|
|
|
Title of each class |
|
Name of each exchange on which registered |
Ordinary Shares, par value $0.01 per share |
|
New York Stock Exchange |
Trading Symbol: TROX
Securities registered pursuant to Section 12(g) of the Act: None
Indicate by check mark if the registrant is a well-known seasoned issuer, as defined in Rule 405 of the Securities Act. Yes ☒ No ☐
Indicate by check mark if the registrant is not required to file reports pursuant to Section 13 or 15(d) of the Act. Yes ☐ No ☒
Indicate by check mark whether the registrant (1) has filed all reports required to be filed by Section 13 or 15(d) of the Securities Exchange Act of 1934 during the preceding 12 months (or for such shorter period that the registrant was required to file such reports), and (2) has been subject to such filing requirements for the past 90 days. Yes ☒ No ☐
Indicate by check mark whether the registrant has submitted electronically every Interactive Data File required to be submitted pursuant to Rule 405 of Regulation S-T (§232.405 of this chapter) during the preceding 12 months (or for such shorter period that the registrant was required to submit such files). Yes ☒ No ☐
Indicate by check mark whether the registrant is a large accelerated filer, an accelerated filer, a non-accelerated filer, a smaller reporting company, or an emerging growth company. See the definitions of “large accelerated filer,” “accelerated filer,” “smaller reporting company” and “emerging growth company” in Rule 12b-2 of the Exchange Act.
|
|
|
|
|
|
|
|
|
|
|
|
|
|
|
Large accelerated filer |
☒ |
|
Accelerated filer |
☐ |
Non-accelerated filer |
☐ |
|
Smaller reporting company |
☐ |
Emerging growth company |
☐ |
|
|
|
If an emerging growth company, indicate by check mark if the registrant has elected not to use the extended transition period for complying with any new or revised financial accounting standards provided pursuant to Section 13(a) of the Exchange Act. ☐
Indicate by check mark whether the registrant has filed a report on and attestation to its management's assessment of the effectiveness of its internal control over financial reporting under Section 404(b) of the Sarbanes-Oxley Act (15 U.S.C. 7262(b)) by the registered public accounting firm that prepared or issued its audit report. ☒
If securities are registered pursuant to Section 12(b) of the Act, indicate by check mark whether the financial statements
of the registrant included in the filing reflect the correction of an error to previously issued financial statements. ☐
Indicate by check mark whether any of those error corrections are restatements that required a recovery analysis of incentive-based compensation received by any of the registrant’s executive officers during the relevant recovery period pursuant
to §240.10D-1(b). ☐
Indicate by check mark whether the registrant is a shell company (as defined in Rule 12b-2 of the Exchange Act). Yes ☐ No ☒
The aggregate market value of the ordinary shares held by non-affiliates of the registrant as of June 30, 2023 was approximately $1,515,118,314.
Indicate by check mark whether the registrant has filed all documents and reports required to be filed by Section 12, 13 or 15(d) of the Securities Exchange Act of 1934 subsequent to the distribution of securities under a plan confirmed by a court. Yes ☒ No ☐
As of January 31, 2024, the registrant had 156,793,755 ordinary shares outstanding.
DOCUMENTS INCORPORATED BY REFERENCE
Portions of the registrant’s proxy statement for its 2024 annual general meeting of shareholders are incorporated by reference in this Form 10-K in response to Part III Items 10, 11, 12, 13 and 14.
TRONOX HOLDINGS PLC
ANNUAL REPORT ON FORM 10-K
FOR THE FISCAL YEAR ENDED DECEMBER 31, 2023
INDEX
|
|
|
|
|
|
|
|
|
|
Page |
| Form 10-K Item Number |
|
|
|
|
|
|
|
|
|
|
|
|
|
|
|
|
|
|
|
|
|
|
|
|
|
|
|
|
|
|
|
|
|
|
|
|
|
|
|
|
|
|
|
|
|
|
|
|
|
|
|
|
|
|
|
|
|
|
|
|
|
|
|
|
|
|
|
|
|
|
|
|
|
|
|
|
|
|
|
|
|
|
|
|
SPECIAL NOTE REGARDING FORWARD-LOOKING STATEMENTS
We have made statements under the captions “Business,” “Risk Factors,” “Management’s Discussion and Analysis of Financial Condition and Results of Operations”, and in other sections of this Form 10-K that are forward-looking statements. Forward-looking statements also can be identified by words such as “future,” “anticipates,” “believes,” “estimates,” “expects,” “intends,” “plans,” “predicts,” “will,” “would,” “could,” “can,” “may,” and similar terms. These forward-looking statements, which are subject to known and unknown risks, uncertainties and assumptions about us, may include projections of our future financial performance based on our growth strategies and anticipated trends in our business. These statements are only predictions based on our current expectations and projections about future events. There are important factors that could cause our actual results, level of activity, performance or achievements to differ materially from the results, level of activity, performance or achievements expressed or implied by the forward-looking statements. In particular, you should consider the numerous risks and uncertainties outlined in “Risk Factors.”
These risks and uncertainties are not exhaustive. Other sections of this Form 10-K may include additional factors, which could adversely impact our business and financial performance. Moreover, we operate in a very competitive and rapidly changing environment. New risks and uncertainties emerge from time to time, and it is not possible for our management to predict all risks and uncertainties, nor can management assess the impact of all factors on our business or the extent to which any factor, or combination of factors, may cause actual results to differ materially from those contained in any forward-looking statements.
Although we believe the expectations reflected in the forward-looking statements are reasonable, we cannot guarantee future results, level of activity, performance or achievements. Moreover, neither we nor any other person assumes responsibility for the accuracy or completeness of any of these forward-looking statements. You should not rely upon forward-looking statements as predictions of future events. Unless otherwise required by applicable law, we are under no duty to update any of these forward-looking statements after the date of this Form 10-K to conform our prior statements to actual results or revised expectations and we do not intend to do so.
When considering forward-looking statements, you should keep in mind the risks, uncertainties and other cautionary statements made in this Form 10-K and the documents incorporated by reference, including, in particular, the factors discussed below. These factors may be revised or supplemented in subsequent reports on Forms 10-Q and 8-K.
Factors that may affect future results include, but are not limited to:
•the risk that our customers might reduce demand for our products;
•market conditions and price volatility for titanium dioxide (“TiO2”), zircon and other feedstock products, as well as global and regional economic downturns, that adversely affect the demand for our end-use products;
•the continued increase in exports from China of TiO2, both via chloride and sulfate technology, and expansion of Chinese TiO2 production capacity, including via chloride technology;
•changes in prices or supply availability for energy, other raw materials and/or shipping vessels;
•liability, production delays and additional expenses from environmental and industrial accidents;
•production curtailments, shutdowns or additional expenditures resulting from equipment upgrades, industrial accidents, equipment failures and deterioration of assets;
•the possibility that cybersecurity incidents or other security breaches may seriously impact our results of operations and financial condition;
•risks of operating a global business;
•war, political and social instability, and/or hostilities, in the regions in which we operate, including, but not limited to, the ongoing Russia and Ukraine and Middle East conflicts;
•fluctuations in currency exchange rates;
•the risk that the agreements governing our debt may restrict our ability to operate our business in certain ways, as well as impact our liquidity;
•our inability to obtain additional capital on favorable terms;
•the risk that we may not realize expected returns or there may be a delay in realizing expected returns on our capital projects, including Project newTRON and our Atlas Campaspe mining investment;
•an unpredictable regulatory environment in South Africa where we have significant mining and beneficiation operations, including amendments by the South African Department of Mineral Resources and Energy to the Mining Charter (as defined elsewhere herein);
•the risk that our TiO2 products are subject to increased regulatory scrutiny that may impede or inhibit widespread usage of TiO2 and/or diminish the Company's ability to sustain or grow its business or may add significant costs of doing business;
•ESG issues, including those related to climate change and sustainability, may subject us to additional costs and restrictions;
•extreme weather conditions could pose physical risks to our facilities and disrupt the operations of our supply chain and increase operational costs;
•the risk that our ability to use our tax attributes to offset future income may be limited;
•concentrated share ownership in the hands of Cristal (as defined elsewhere herein) may result in conflicts of interest and/or prevent minority shareholders from influencing the Company;
•the risk that we are dependent on, and compete with other mining and chemical businesses for, key human resources in the countries in which we operate; and
•impact of English law and our articles of association on our ability to manage our capital structure flexibly and the anti-takeover protections incorporated into our articles of association.
We are committed to providing timely and accurate information to the investing public, consistent with our legal and regulatory obligations. To that end, we use our website to convey information about our businesses, including the anticipated release of quarterly financial results, quarterly financial and statistical and business-related information. Investors can access announcements about the Company through our website available at http://www.tronox.com. Our website is included as an inactive textual reference only and the information contained therein or connected thereto shall not be deemed to be incorporated into this Form 10-K.
PART I
For the purposes of this discussion, references to “we,” “us,” and, “our” refer to Tronox Holdings plc, together with its consolidated subsidiaries (collectively referred to as “Tronox” or the "Company”). We are a public limited company formed under the laws of England and Wales. We are considered a domestic company in the United Kingdom and, as such, are required to comply with filing requirements in the United Kingdom. Additionally, we are not considered a “foreign private issuer” in the U.S.; therefore, we are required to comply with the reporting and other requirements imposed by the U.S. securities law on U.S. domestic issuers, which, among other things, requires reporting under accounting principles generally accepted in the United States of America (“U.S. GAAP”).
Item 1. Business
Overview
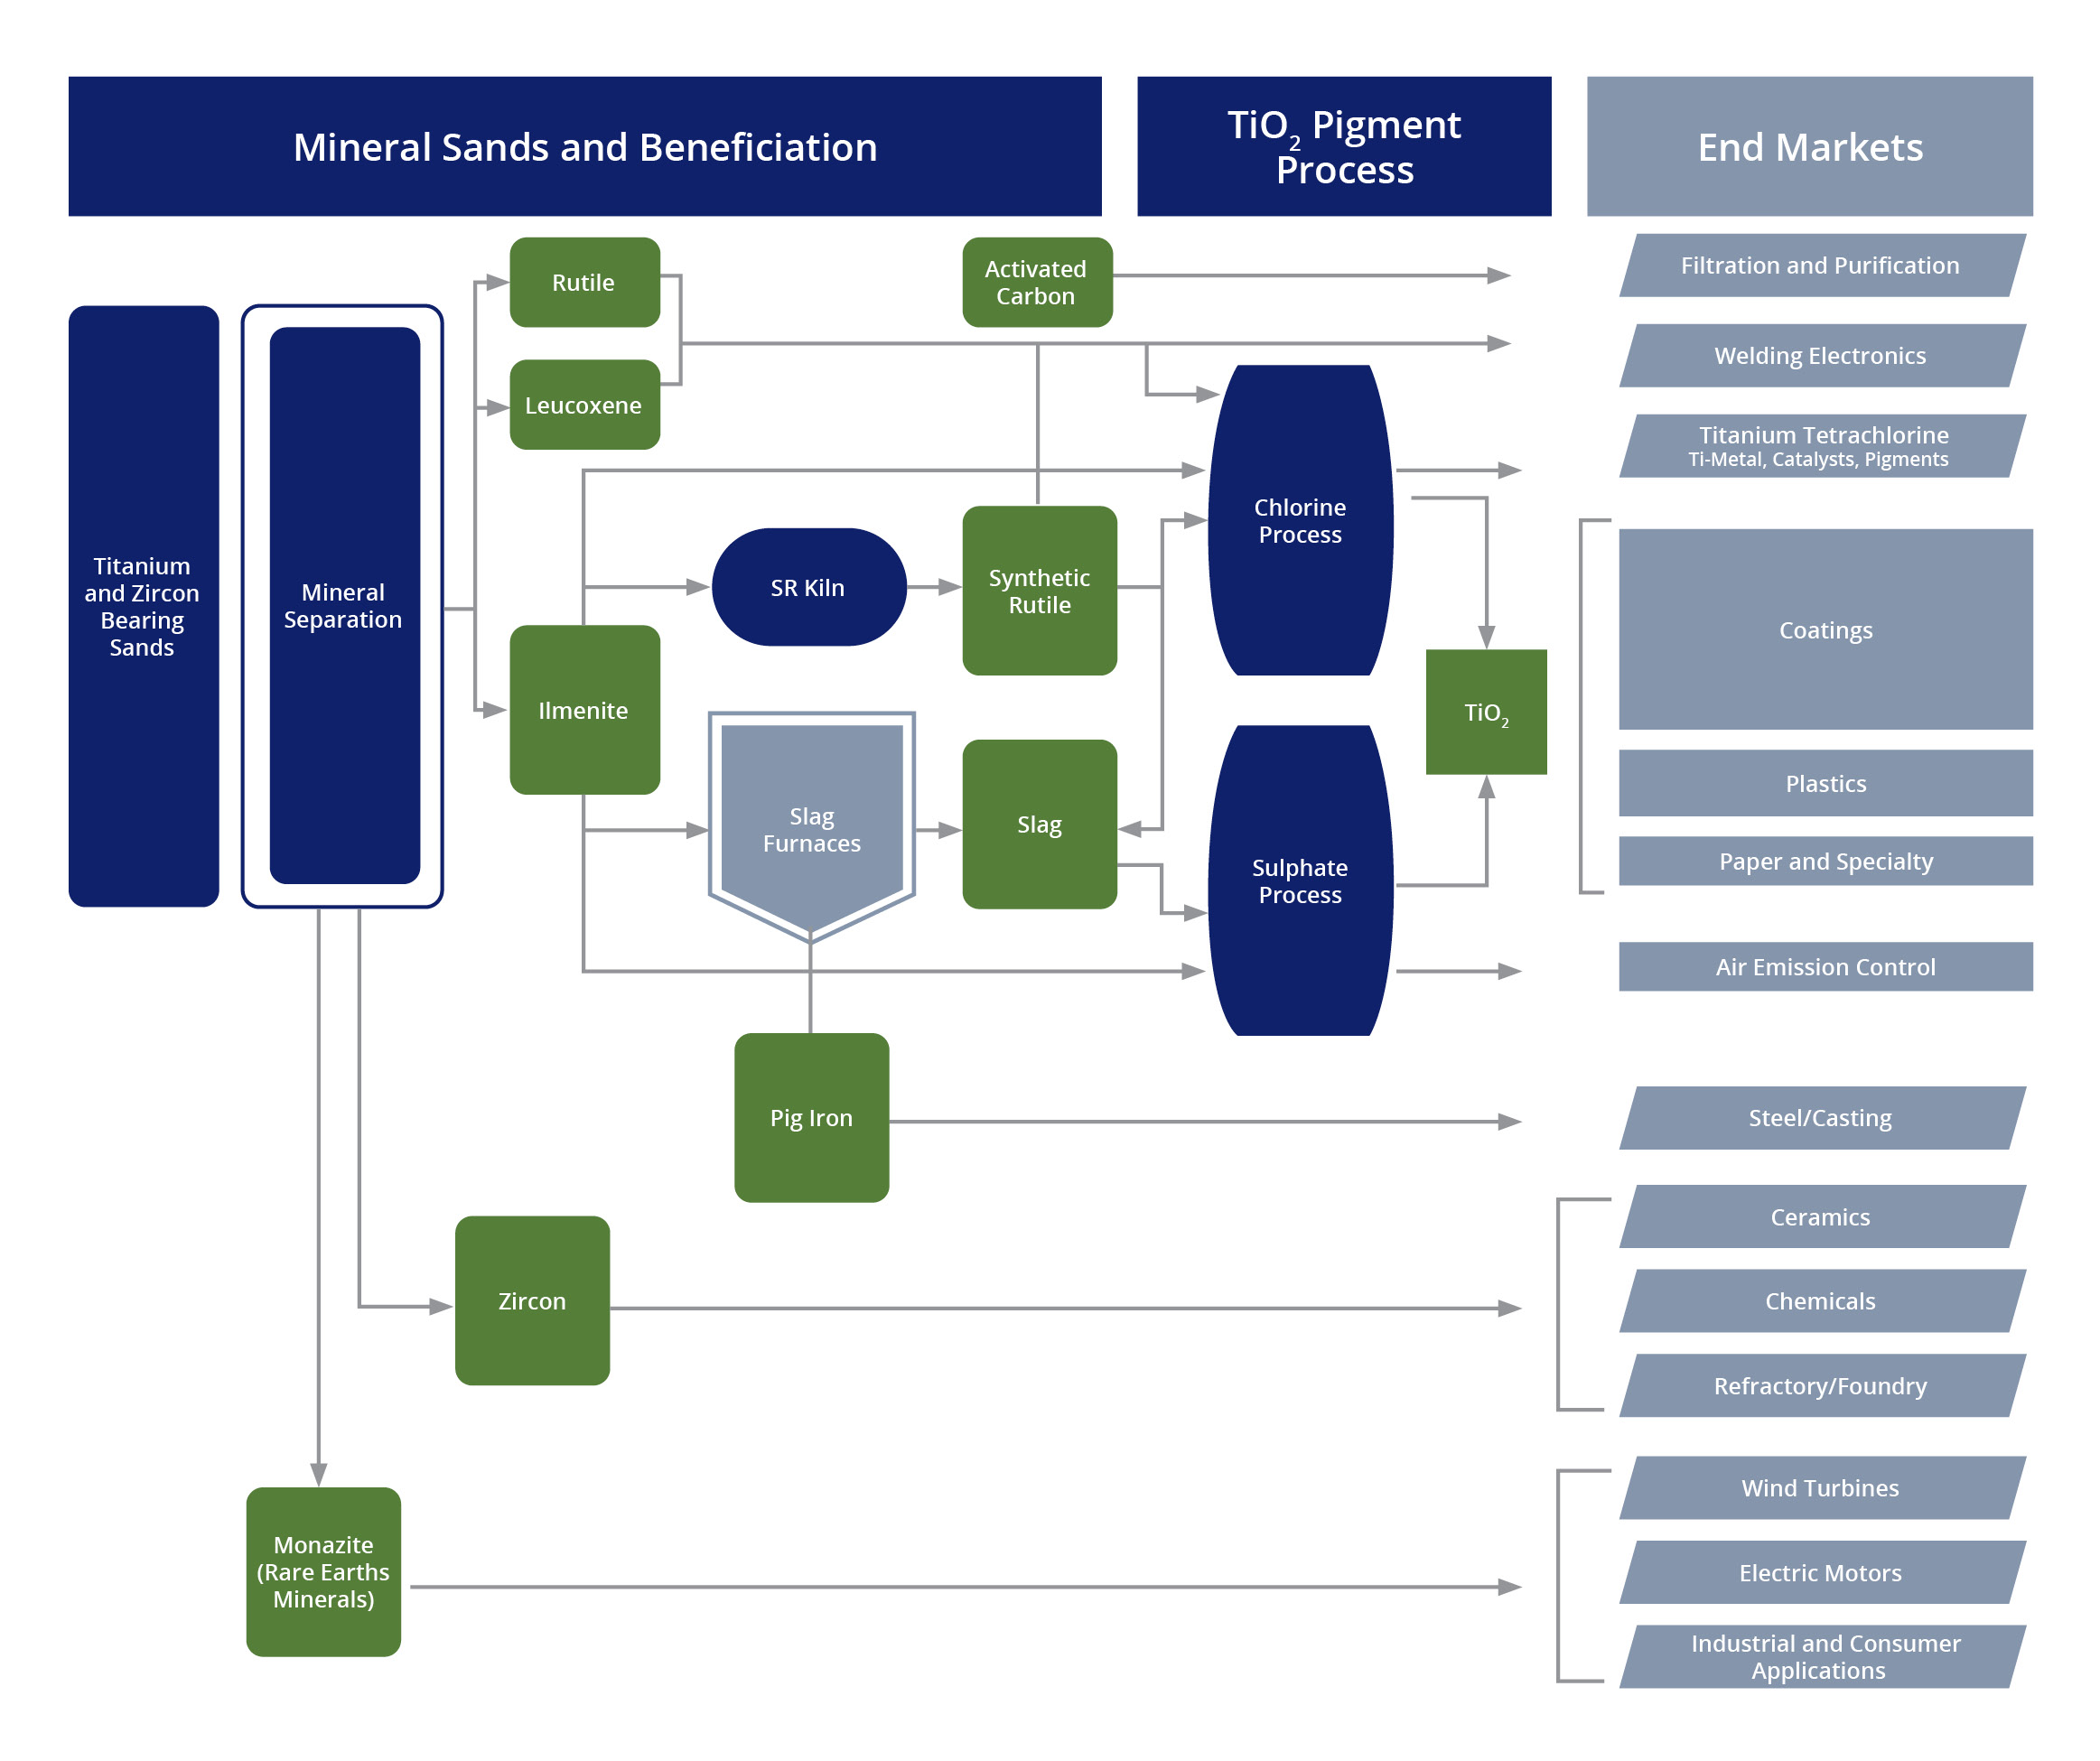
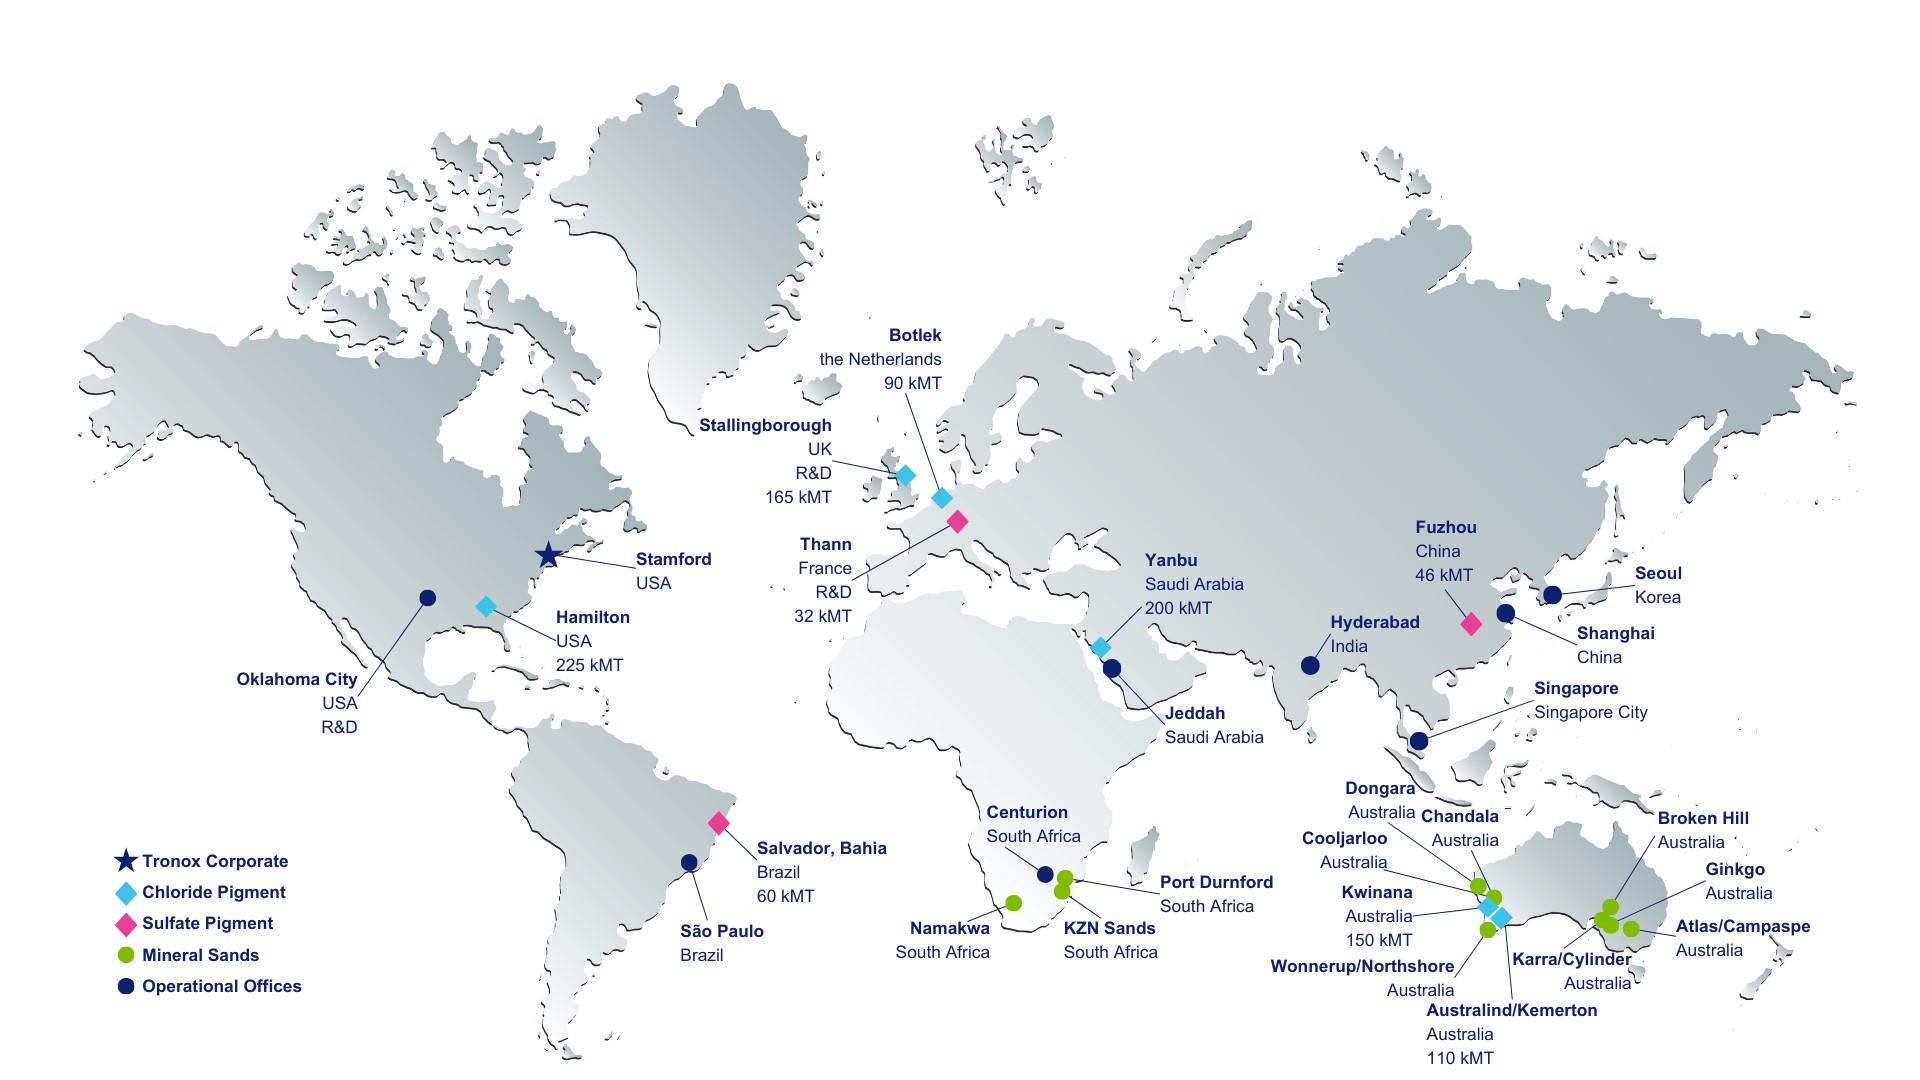
Tronox is the world’s leading vertically integrated manufacturer of TiO2 pigment. We operate titanium-bearing mineral sand mines and beneficiation and smelting operations in Australia and South Africa to produce feedstock materials that can be processed into TiO2 for pigment, high purity titanium chemicals, including titanium tetrachloride, and ultrafine TiO2 used in certain specialty applications. Our strategy is to be vertically integrated and produce enough feedstock materials to be as self-sufficient as possible in the production of TiO2 at our nine pigment facilities located in the United States, Australia, Brazil, UK, France, the Netherlands, China and the Kingdom of Saudi Arabia ("KSA"). We believe that vertical integration is the best way to achieve our ultimate goal of delivering low cost, high-quality pigment to our approximately 1,200 TiO2 customers throughout the world. The mining, beneficiation and smelting of titanium bearing mineral sands also creates meaningful quantities of co-products including zircon, pig iron and the rare-earth bearing mineral, monazite, which we also supply to customers around the world.
The following chart highlights the TiO2 value chain we participate in.
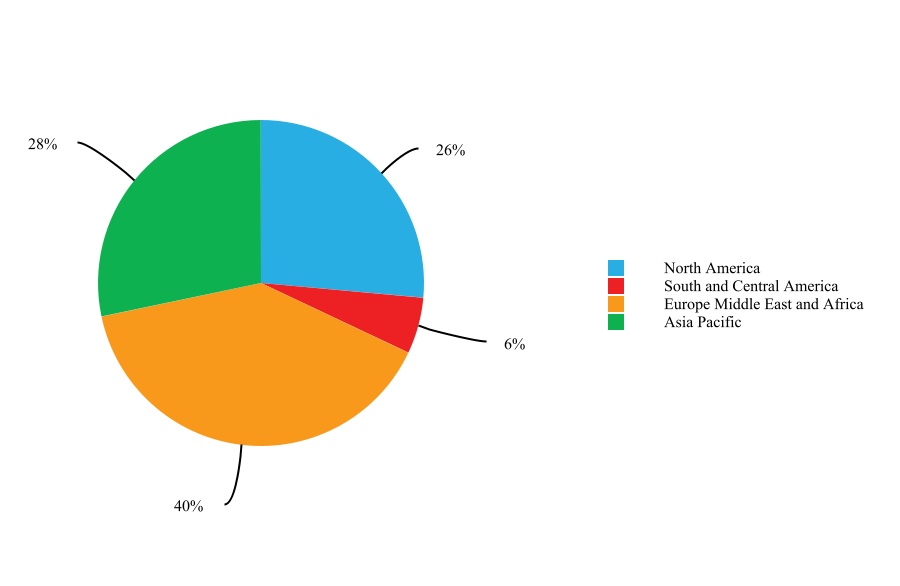
The following sets forth the percentage of our revenue derived from sales of our products by geographic region for the year ended December 31, 2023.
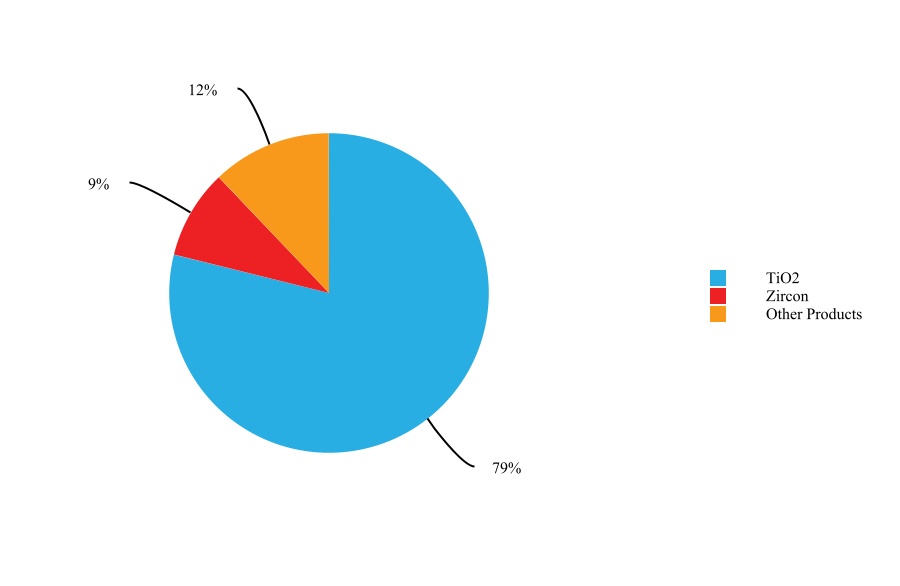
The below sets forth the percentage of our revenue derived from sales of our products for the year ended December 31, 2023.
For further financial information regarding our products and geographic regions, see the section entitled “Management’s Discussion and Analysis of Financial Condition and Results of Operations”, as well as Notes 3 and 23 of notes to our consolidated financial statements, each included elsewhere in this Form 10-K.
2023 Key Strategic Initiatives
The following sets forth the key strategic initiatives underway in 2023:
Become the Low Cost TiO2 Producer by Investing in our Business Processes and Strengthening Vertical Integration
Our ability to compete effectively in the TiO2 industry is determined by many factors, including innovation, reliability, product quality, customer service and price. The business processes that allow us to maximize the benefit of our vertical integration and global footprint --- the so-called “hidden factory” --- needs to be optimized if we are to successfully meet the pricing and other competitive pressures that characterize our industry. During 2023, we continued to progress with our multi-year IT-enabled transformation program that includes both operational and business transformation.
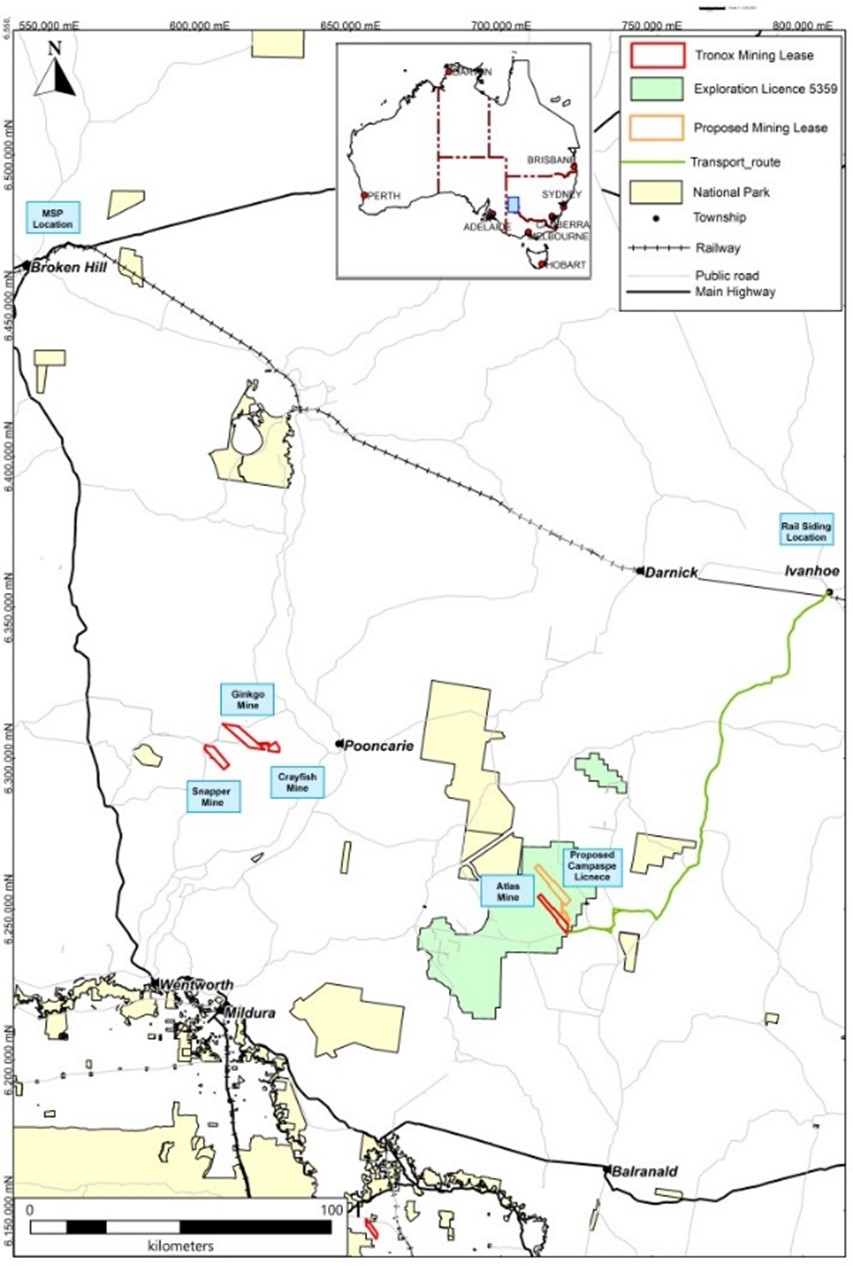
In addition, in terms of strengthening vertical integration, 2023 saw the commencement of a significant new mine in Eastern Australia called Atlas. Atlas has replaced feedstock supply from our Snapper / Ginkgo mines in Eastern Australia which is expected to cease mining operations in the first half of 2024. We believe Atlas is abundant in natural rutile and zircon, and will be a significant source of high grade ilmenite suitable for direct use, synthetic rutile production, or slag processing. The investment in Atlas is expected to generate returns above the Company's cost of capital and sustain Tronox's position as a leading low-cost producer.
Moreover, in 2023, we invested in expanding our Fairbreeze and Namakwa mines in South Africa. Like Atlas, we believe these expansions are extremely attractive mine development projects, rich in ilmenite, rutile and zircon that are expected to replace existing mines which are reaching end of life. We have numerous other mine development projects in earlier stages of development in Western Australia and on the Eastern and Western Capes of South Africa, all of which are intended to maintain our level of feedstock vertical integration. We are also continuing to evaluate opportunities to leverage our expertise in mining and the exposure we have to rare earth materials, including monazite, through our operations.
Capital Allocation
In addition to returning approximately $89 million in cash to shareholders in the form of dividends and investing $261 million of capital during 2023, we also strengthened our liquidity position by closing a $350 million incremental term loan. We believe the added liquidity from this incremental borrowing will enable us to continue our capital investment program — primarily, replacing mineral reserves for mines reaching end of life in South Africa — that we believe will increase shareholder value in the short-, medium- and long-term. At the end of 2023, we had cash on hand of $273 million and untapped short-term borrowing capacity of $488 million.
Develop Our Position as a Significant Supplier of Rare Earth Oxides
Tronox’s existing mining operations and tailing piles in South Africa and Australia contain significant quantities of monazite, a mineral containing rare earth elements (REEs) widely recognized as a critical mineral for the energy transformation underway to decarbonize the world’s economy. For these applications, REE must first be processed into an oxide form --- rare earth oxides or “REO” --- that can then be metallized for the production of permanent magnets. Every step of the REE supply chain today is dominated by China. China’s dominance of the processing of REO and production of permanent magnets is widely recognized as a serious strategic challenge by democratic governments around the world.
The separation, beneficiation and processing technologies that Tronox uses to turn titanium-bearing ores into TiO2 are applicable for turning monazite into REO. In the past, we sold our monazite in unconcentrated form as a waste product but given the increased value associated with REE, we are now seeking to maximize the value of our existing geologic resources and deploy our substantial technical know how and human capital to become a significant supplier of REO to non-Chinese producers of metals and permanent magnets.
Our Principal Products
TiO2
TiO2 Pigment
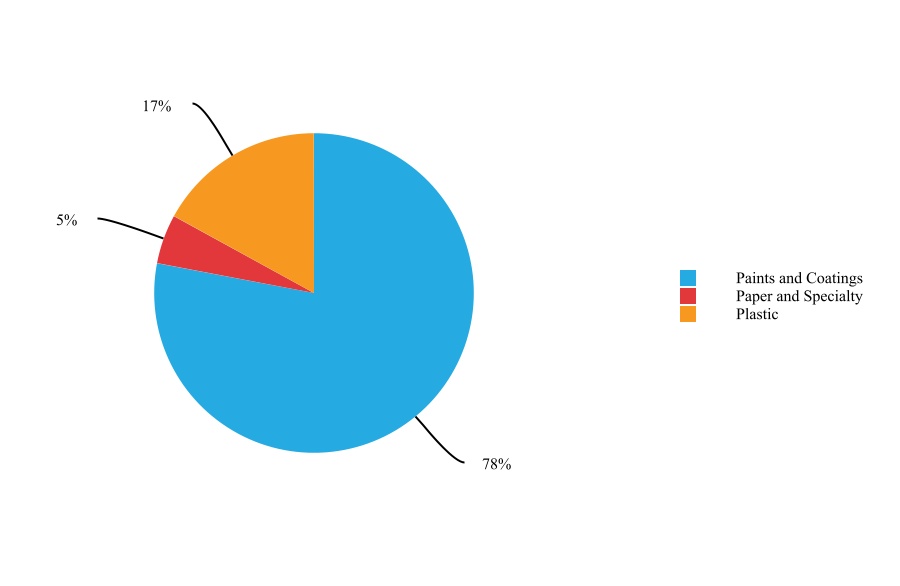
TiO2 pigment is used in a wide range of products due to its ability to impart whiteness, brightness, and opacity. TiO2 pigment is used extensively in the manufacture of paint and other coatings, plastics and paper, and in a wide range of other applications. Moreover, it is a critical component of everyday consumer applications due to its superior ability to cover or mask other materials effectively and efficiently relative to alternative white pigments and extenders. TiO2 pigment is considered to be a quality of life product. At present, it is our belief that there is no effective substitute for TiO2 pigment because no other white pigment has the physical properties for achieving comparable opacity and brightness or can be incorporated as cost effectively.
Ultrafine Specialty TiO2
We produce ultrafine TiO2 at our manufacturing facility in Thann, France. We market ultrafine TiO2 products under the CristalActiv® trademark. Ultrafine TiO2 has highly catalytic properties due to the relatively high surface area of each TiO2 molecule. The principal use of ultrafine TiO2 products is in NOx emission control products utilized in stationary, mobile and marine applications.
In 2023, we generated $2.2 billion in revenue from sales of TiO2.
Zircon
Zircon (ZrSiO4) is a co-product of mining mineral sands deposits for titanium feedstock. Zircon is used as an additive in ceramic glazes, which makes the ceramic glaze more water, chemical and abrasion resistant. It is also used for the production of zirconium metal and zirconium chemicals, in refractories, as molding sand in foundries, and for TV screen glass, where it adds its structural stability at high temperatures and resistance to abrasive and corrosive conditions. Zircon typically represents a relatively low proportion of the in-situ heavy mineral sands deposits we mine, but has a relatively high value compared to other heavy mineral products. Refractories containing zircon are expensive and are only used in demanding, high-wear and corrosive applications in the glass, steel and cement industries. Foundry applications use zircon when casting articles of high quality and value where accurate sizing is crucial, such as aerospace, automotive, medical, and other high-end applications.
In 2023, we generated $257 million in revenue from sales of zircon.
Other Products
High Purity Pig Iron
During the process of smelting ilmenite at our smelters to increase the concentration of titanium and produce titanium slag, high purity pig iron is produced as a co-product. High purity pig iron is used as a raw material in foundries for the production of high-quality ductile iron castings. Ductile iron is used extensively throughout the world for the production of safety critical automotive parts, such as engine blocks, brake calipers and steering knuckles in cars and trucks.
Monazite
Like zircon, monazite is a co-product of mining mineral sands deposits for titanium feedstock. Monazite is concentrated and processed to remove contaminants, such as uranium and thorium, before being separated into specific rare earth oxides (REOs) such as neodymium (Nd), praseodymium (Pr), terbium (Tb), and dysprosium (Dy). These REOs can then be metallized and formed into permanent magnets, particularly NdFeB magnets, that are needed to manufacture electric vehicle motors, wind turbines and other green economy applications.
Feedstock
Most TiO2 products are derived from three naturally occurring minerals which are commonly referred to as heavy minerals or mineral sands: ilmenite, leucoxene and rutile. Ilmenite, rutile, leucoxene, as well as titanium slag and synthetic rutile which are processed from ilmenite, are the primary feedstock materials that we use for the production of TiO2 pigment. Titanium slag is produced by smelting ilmenite in an electric arc furnace to separate titanium-oxide from the iron and other impurities. Synthetic rutile is produced by reducing ilmenite in a rotary kiln, followed by leaching under various conditions to remove the metallic iron from the reduced ilmenite grains. The purpose of both processes is to increase the titanium concentration of the ilmenite. There is substantial overlap amongst each of the aforementioned with the primary differentiating factor being the level of titanium content. For instance, rutile has the highest titanium dioxide content of approximately 94% to 96%, while ilmenite has the lowest of approximately 45% to 65%. As a result of our continued pursuit of our vertical integration strategy, we currently do not expect to actively sell feedstock going forward.
Titanium Tetrachloride
We sell titanium tetrachloride (“TiCl4”) from our facilities in Thann, France and Yanbu, KSA. At our Thann facility in France, we produce TiCl4 dedicated for merchant market sales to customers for use mainly in the production of various types of pigments and catalyst products. At our Yanbu facility, we produce excess TiCl4 which we both sell directly to a joint venture between Advanced Metal Industries Cluster and Toho Titanium Metal Co. Ltd. ("ATTM") for use at ATTM's titanium sponge plant facility that is adjacent to our Yanbu facility and in the merchant market.
In 2023, we generated $345 million in revenue from the sale of high purity pig iron, monazite, titanium tetrachloride and other products.
The demand for certain of our products during a given year is subject to seasonal fluctuations. See “Risk Factors –
Risks Relating to our Business - The markets for many of our products have seasonally affected sales patterns”.
Mining and Beneficiation of Mineral Sands Deposits
Our current operational mining and beneficiation of mineral sands deposits are comprised of the following:
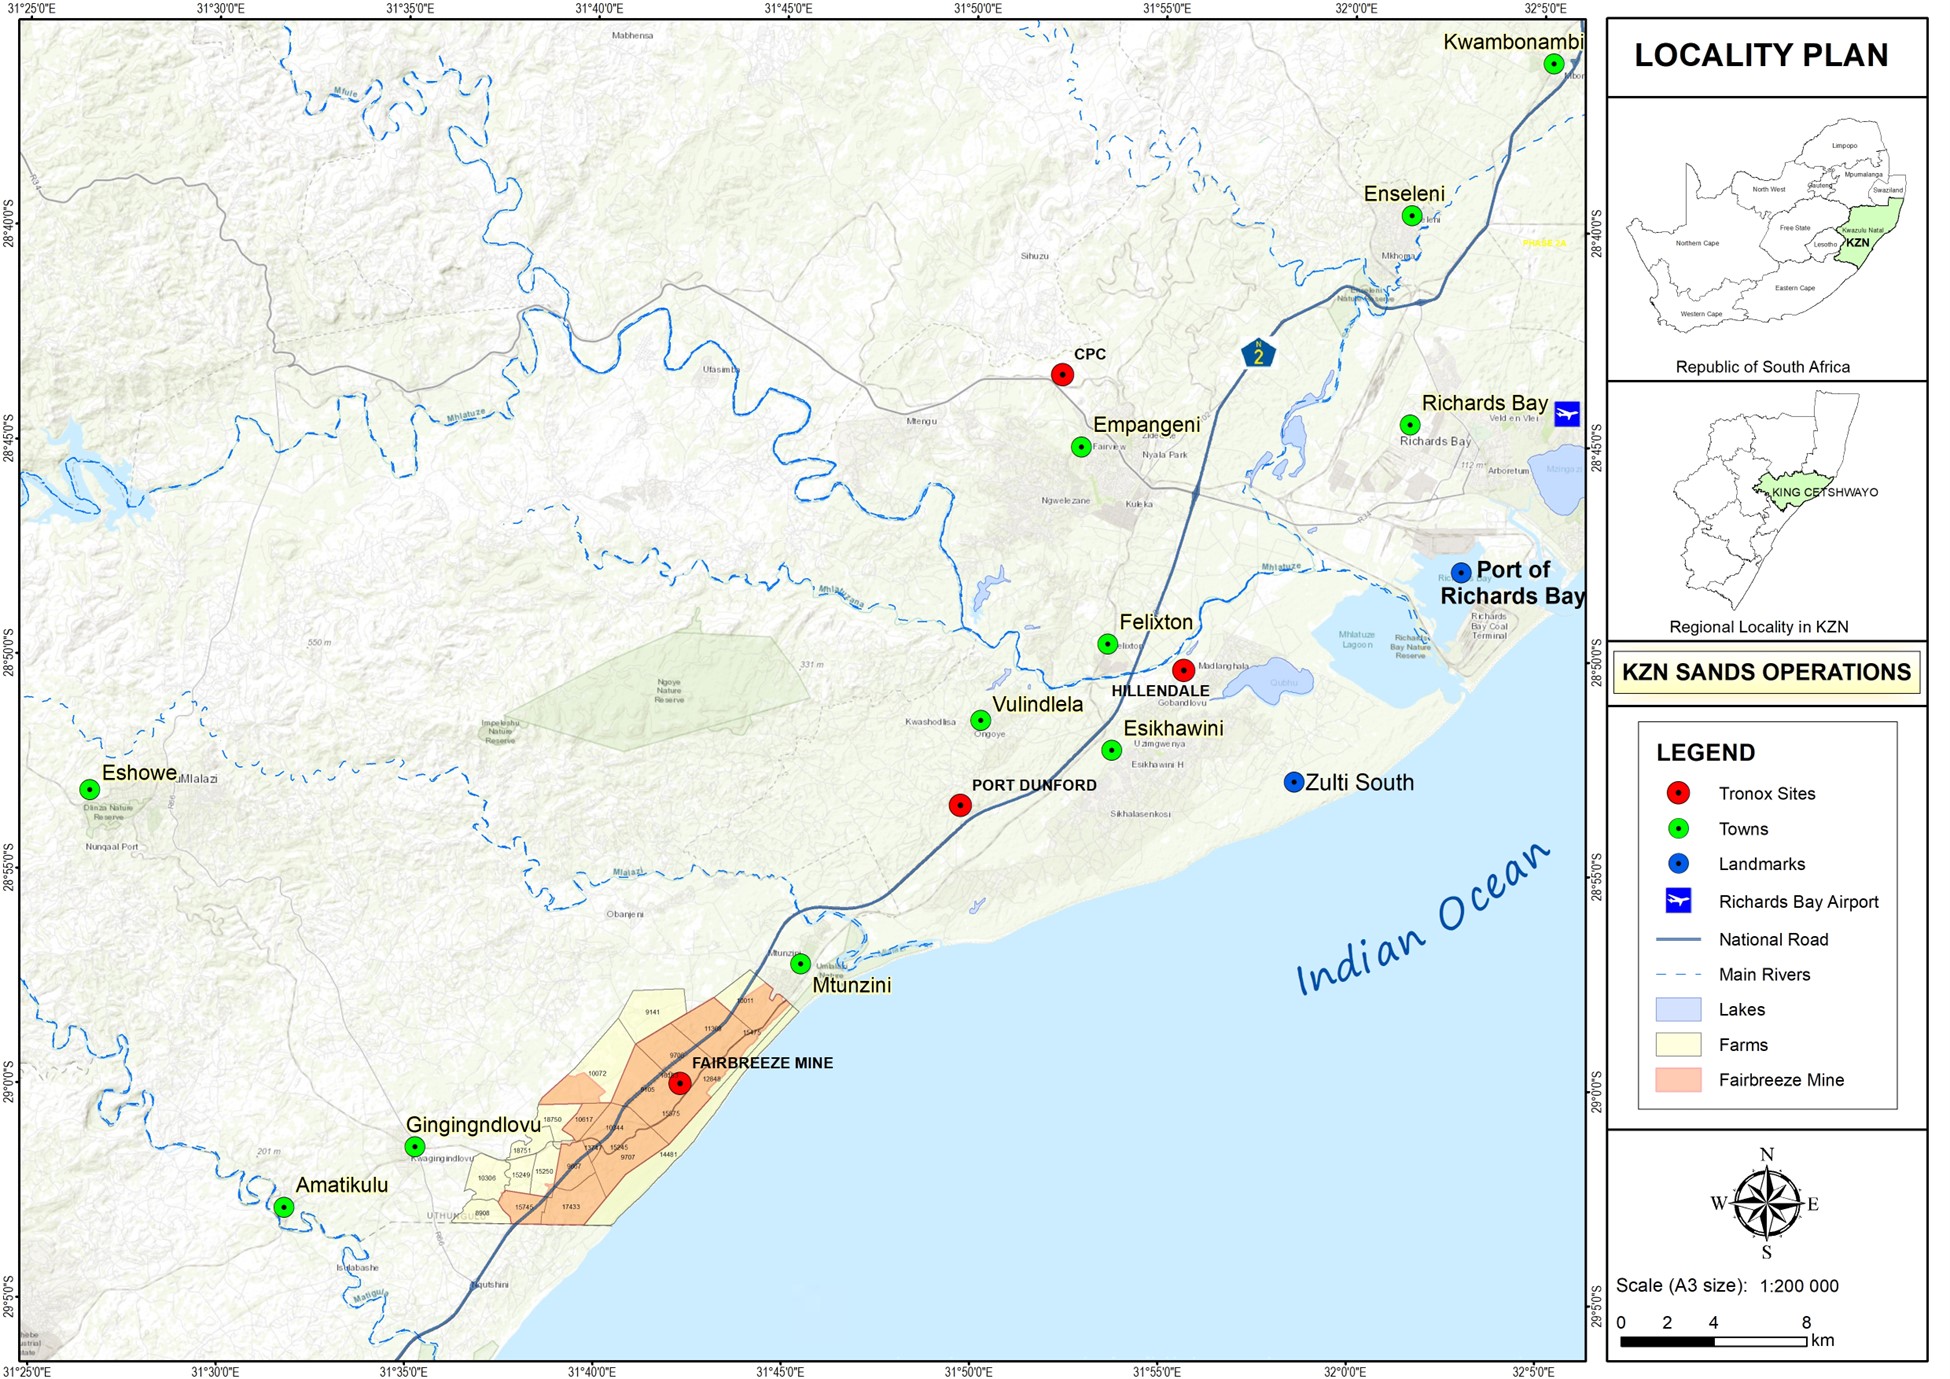
•KwaZulu-Natal (“KZN”) Sands operations located on the eastern coast of South Africa consisting of the Fairbreeze mine, a concentration plant, a mineral separation plant and two smelting furnaces that produce titanium slag;
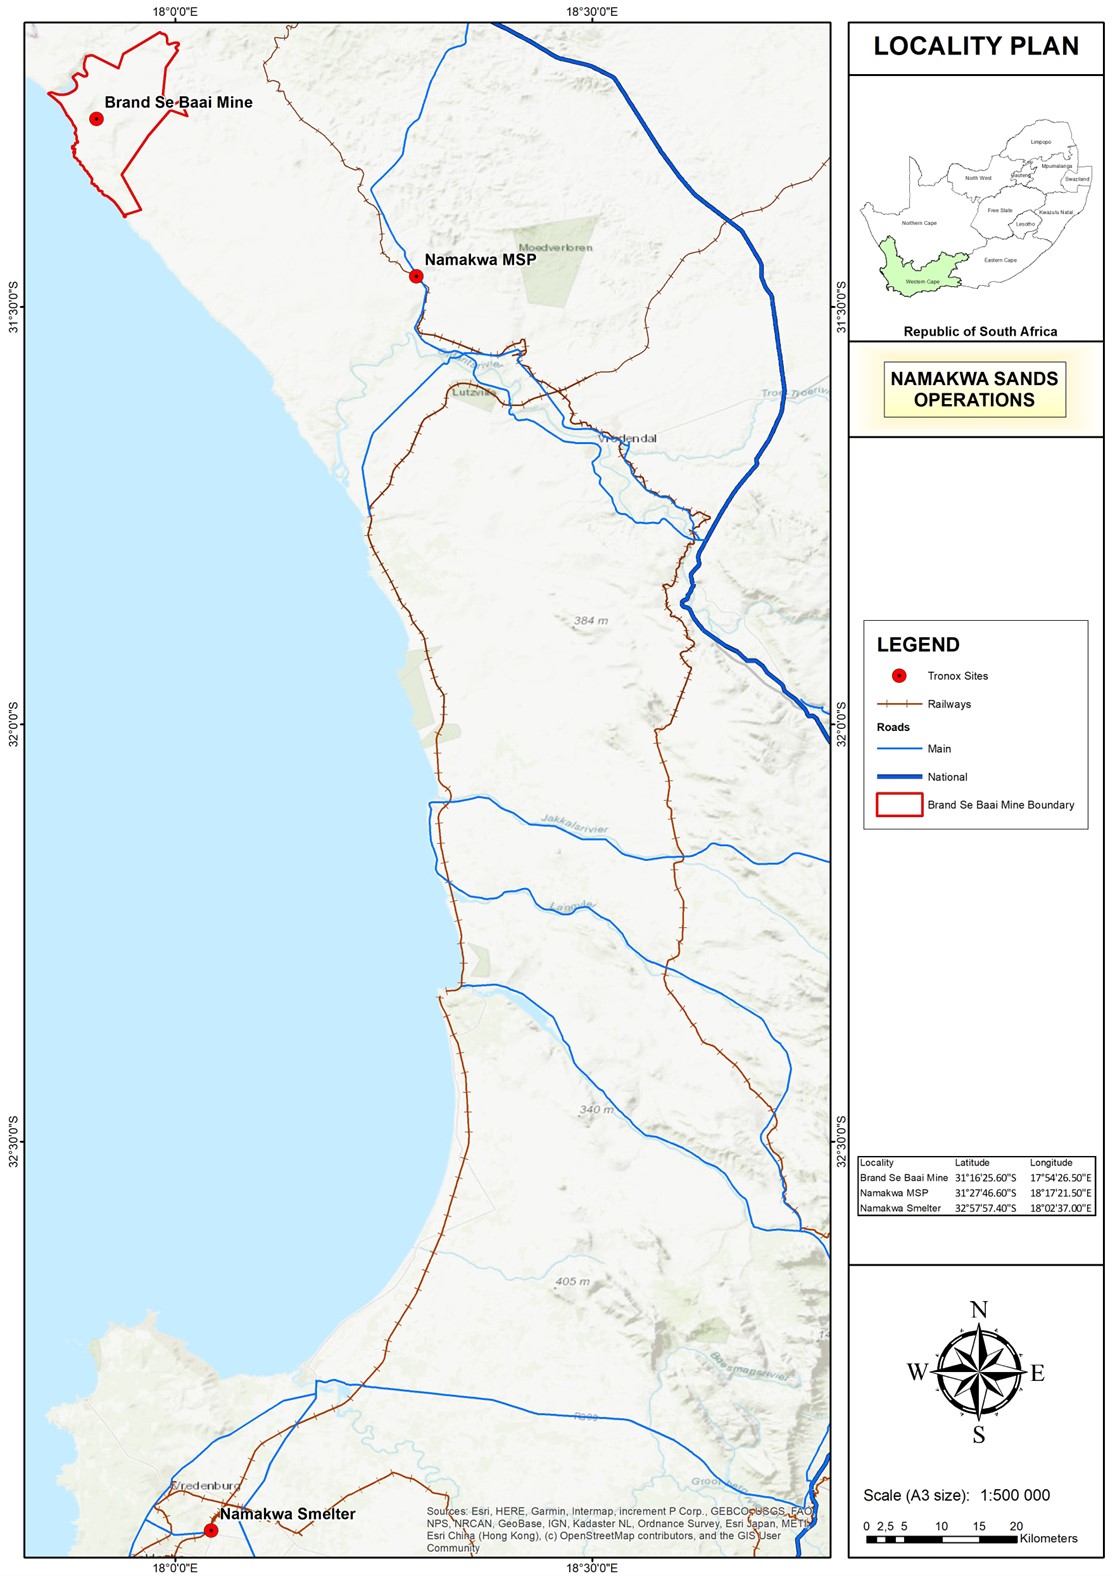
•Our Namakwa Sands operations located on the western coast of South Africa consisting of the Namakwa mine, two concentration plants, a mineral separation plant, as well as two smelting furnaces that produce titanium slag;
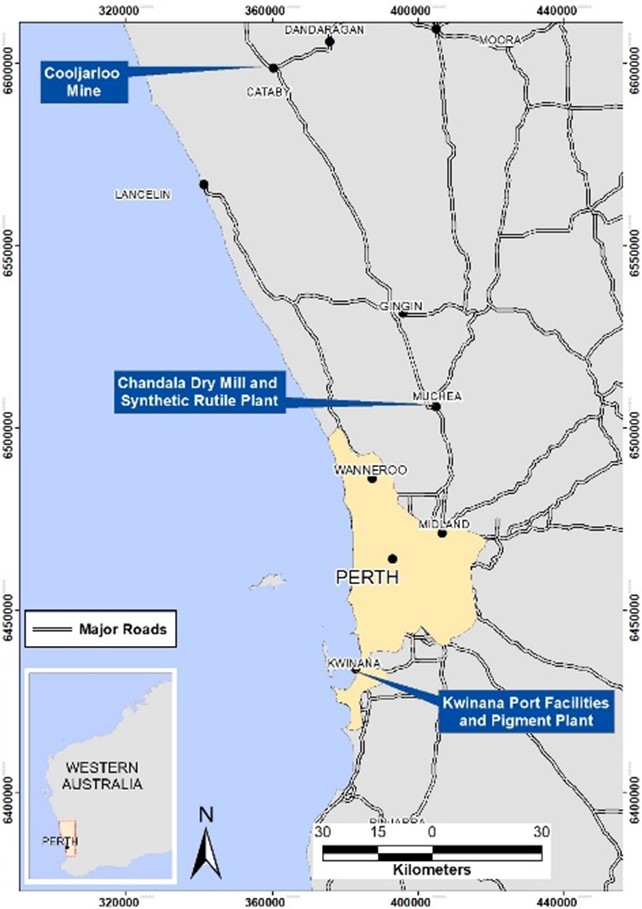
•Our Northern Operations complex in Western Australia consisting of the Cooljarloo dredge mine and floating heavy mineral concentration plant and the Chandala metallurgical site which includes a mineral separation plant and a synthetic rutile plant that produces synthetic rutile;
•Eastern Australia operations consisting of the Ginkgo mine, a floating heavy mineral concentration plant located there, the Atlas mine and a heavy mineral concentration plant located there and a mineral separation plant located at Broken Hill, New South Wales; and
•Perth Basin operations in Western Australia consisting of the Wonnerup mine and a mineral separation plant.
Zircon and monazite are often, but not always, found in mineral sands deposits containing ilmenite. They are extracted, alongside ilmenite and rutile, as part of the initial mineral sands separation process.
The mining of mineral sands deposits is conducted either “wet,” by dredging or hydraulic water jets, or “dry,” by using earth-moving equipment to excavate and transport the sands. The type of mining operation we deploy is dependent upon the characteristics of the ore body. Dredge mining is generally the favored method of mining mineral sands, provided that the ground conditions are suitable, water is readily available and the deposit is low in slime content. Dry mining techniques are generally preferred in situations involving hard ground, discontinuous ore bodies, small tonnage, high slimes contents and/or very high grades.
Regardless of the type of mining technique, the first step in the beneficiation process after the mineral sands have been mined is to utilize wet concentrator plants to produce a high grade of heavy mineral concentrate (typically approximately 90% to 98% heavy mineral content). Screened ore is first de-slimed, a process by which slimes are separated from larger particles of minerals, and then processed through a series of spiral separators that use gravity to separate the heavy mineral sands from lighter materials, such as quartz. Residue from the concentration process is pumped back into either the open pits or slimes dams for rehabilitation and water recovery.
After producing heavy mineral concentrate in our wet concentrator plants, we separate the non-magnetic (rutile, zircon and monazite) and magnetic (ilmenite) fractions utilizing a variety of techniques. Through the separation process, we produce zircon which is sold directly to customers, rutile and leucoxene which can immediately be used as feedstock material to make TiO2 pigment, and monazite which we currently sell in a relatively unconcentrated form but which we plan on further processing before sale to extract greater value.
Ilmenite is generally further refined for use in our TiO2 pigment manufacturing processes. Depending on the characteristics of the ilmenite we use two fundamental processes to refine ilmenite. Both processes involve the removal of iron and other non-titanium material.
•Titanium slag is made by smelting ilmenite in an electric arc furnace to separate titanium-oxide from the iron and other impurities. The result is two products: “slag” which contains 86% to 89% titanium dioxide and is considered a TiO2 feedstock material, and high purity pig iron which is ready for sale to end-use customers.
•Synthetic rutile is made by reducing ilmenite in a rotary kiln, followed by leaching under various conditions to remove the iron from the reduced ilmenite grains. Activated carbon is a byproduct of this process. Our synthetic rutile has a titanium dioxide content of approximately 89% to 92% and is also considered a TiO2 feedstock material.
Our current mining and beneficiation operations have an annual production capacity of approximately 832,000 metric tons (“MT”) of titanium feedstock, which is comprised of 182,000 MT of rutile and leucoxene, 240,000 MT of synthetic rutile and 410,000 MT of titanium slag. We currently have the capability to produce approximately 297,000 MT of zircon and 250,000 MT of pig iron per year.
Competitive Conditions of Mining and Feedstock Production
Globally, there are a large number of mining companies that mine mineral sand deposits containing ilmenite, as well as zircon. However, there is a smaller number of mining companies that are also involved in upgrading the underlying ilmenite to produce feedstock typically utilized by TiO2 producers.
Pigment producers procure a range of types of feedstocks from multiple feedstock producers to create varying blends of feedstock materials that maximize the efficiency and economic returns of their unique production technique under conditions applicable at the time of production. Pigment producers frequently switch the relative amount of each feedstock they procure based on a number of factors including: the relative cost of feedstocks, feedstock logistics costs, the cost of, and availability of, chemicals used to process feedstocks, as well as waste management costs.
Hence, there is a high degree of substitutability between and among titanium feedstocks.
Production of TiO2 Pigment
TiO2 pigment is produced using a combination of processes involving the manufacture of base pigment particles through either the chloride or sulfate process followed by surface treatment, drying and milling (collectively known as finishing). Currently, approximately 87% of our TiO2 pigment production capacity is produced using the chloride process and approximately 13% of our TiO2 production capacity is produced using the sulfate process.
We use the sulfate process at our manufacturing facility in Thann, France to produce ultrafine TiO2 products.
In the chloride process, feedstock (slag, synthetic rutile, natural rutile or ilmenite ores) are reacted with chlorine (the chlorination step) and carbon to form TiCl4 in a continuous fluid bed reactor. Purification of TiCl4 to remove impurities is accomplished using selective condensation and distillation processes. The purified TiCl4 is then oxidized in a vapor phase form to produce raw pigment particles and chlorine gas. The latter is recycled back to the chlorination step for reuse. Raw pigment is then typically slurried with water and dispersants prior to entering the finishing step. Due to the nature of the production process, the final pigment product is not sensitive to the feedstocks used to create it, as substantially all substances other than TiO2 are removed during the process. The chloride process currently accounts for substantially all of the industry-wide TiO2 production capacity in North America, and approximately 43% of industry-wide capacity globally.
In the sulfate process, ilmenite and/or slag are dissolved in concentrated sulfuric acid. After removing impurities, dissolved titanium is hydrolyzed and separated from the remaining sulfuric acid. The titanium hydrolysate is subsequently calcined in a rotary kiln to produce a raw TiO2. The product is then further finished in a similar way to TiO2 produced through the chloride process.
Commercial production of TiO2 pigment results in one of two different crystal forms: rutile, which is manufactured using either the chloride process or the sulfate process, or anatase, which is only produced using the sulfate process. Rutile TiO2 is preferred over anatase TiO2 for many of the largest end-use applications, such as coatings and plastics, because its higher refractive index imparts better hiding power at lower quantities than the anatase crystal form and it is more suitable for outdoor use because it is more durable.
The primary raw materials used in the production of chloride TiO2 pigment include titanium feedstock, chlorine and coke. As discussed above, we believe we are unique in the degree to which we produce our own high-grade titanium feedstock. Other chemicals used in the production of TiO2 are purchased from various companies under short and long-term supply contracts. In the past, we have been, and we expect that we will continue to be, successful in obtaining extensions to these and other existing supply contracts prior to their expiration. We expect the raw materials purchased under these contracts, and contracts that we enter into the near term, to meet our requirements over the next several years.
Marketing of TiO2
We supply and market TiO2 under the brand name TIONA® and CristalActiv® to approximately 1,200 customers in approximately 120 countries, including market leaders in each of the key end-use markets for TiO2, and we have supplied each of our top ten customers with TiO2 for more than 10 years. We have implemented a margin stabilization program which we believe provides relative certainty over availability of product and price stability to customers who choose to participate, and have also initiated a long-term partnership strategy that we believe will strengthen the commitments from our customers across all regions and products. The long-term partnership strategy and margin stabilization programs are key parts of our TiO2 marketing and sales strategy, enabling us to focus on predictability and reliability of TiO2 delivery across the supply and demand cycle.
The following sets forth the percentage of our TiO2 sales volume by end-use market for the year ended December 31, 2023:
In addition to price and product quality, we compete on the basis of technical support and customer service. We sell our products through both a direct sales force and third-party agents and distributors. Our direct sales, marketing and technical service organizations execute our sales and marketing strategy on a global basis. Due to the technical requirements of TiO2 applications, our technical service organization and direct sales offices are supported by a regional customer service staff located in each of our major geographic markets.
Our sales and marketing strategy focuses on aligning ourselves with customers growing faster than the market and effective customer management through the development and maintenance of strong relationships. We develop customer relationships and manage customer contact across multiple contact points within the organization including our sales, technical service and marketing, research and development, and customer service teams. These primary points of contact are supplemented by direct contact with plant operations personnel, supply chain specialists, and senior management. We believe that multiple points of customer contact facilitate efficient problem solving, supply chain support, formula optimization and co-development of products.
Competitive Conditions of TiO2 Pigment
The global market in which our TiO2 pigment business operates is highly competitive. Competition is based on a number of factors such as price, product quality and service. We face competition from both chloride process pigment producers and sulfate process pigment producers. Moreover, because transportation costs are minor relative to the cost of our product, there is also competition between products produced in one region versus products produced in another region.
We face competition from global competitors with headquarters in Europe, the United States and China, including Chemours, LB Group, Kronos Worldwide Inc., INEOS, and Venator. In addition, we compete with numerous regional producers particularly in Eastern Europe and China.
Research and Development
We have research and development facilities that aim to develop new products, service our products, and focus on applied research and development of both new and existing processes. The majority of scientists supporting our TiO2 pigment product development and testing are located in Oklahoma City, Oklahoma, USA and Stallingborough, UK, while the majority of scientists supporting our TiO2 ultrafine specialty business are located in Thann, France. In addition, the research and development personnel relating to our mineral sands operations are located in Australia and South Africa. Our research and development initiatives for concentration and separation of REOs is centered in Perth, Australia.
New process developments are focused on increased throughput, efficiency gains and general processing-related improvements for our customers. Ongoing development of process technology contributes to cost reduction, enhanced production flexibility, increased capacity, and improved consistency of product quality. Process technology research also pertains to concentration and separation of monazite into neodymium (Nd), praseodymium (Pr), terbium (Tb), and dysprosium (Dy), the types of REOs that are most in demand for EV and wind turbine applications.
Product development activities in paints and coatings were focused on product stewardship and sustainability improvements of the product line. Critical development efforts to address the changing regulatory environment were a key focus during 2023 extending across nearly all of the Company’s products and applications.
In order to enhance production flexibility, the Company continued to focus on technology transfer activities, including further expanding the product offerings at the Yanbu TiO2 production facility and creating options for the décor paper market in Europe. Moreover, specialty product development in plastics remains a primary objective, which along with an increased emphasis in higher volume plastics applications, are expected to drive further growth in these segments in the coming years. In line with Tronox’s sustainability goals, the Company’s process and product development teams continue to collaborate on more sustainable, lower carbon footprint technologies for all end use segments. In addition, the development of key competencies to support the rare earth initiatives continued to gain momentum. With regard to our TiO2 ultrafine specialty business, research and development activities are focused on a broad array of areas including direct lithium extraction, battery components, carbon capture and developing more effective materials for use in environmental catalysis.
Patents, Trademarks, Trade Secrets and Other Intellectual Property Rights
Protection of our proprietary intellectual property is important to our business. At December 31, 2023, we held 90 patents and 6 patent applications in the U.S., and approximately 600 in foreign counterparts, including both issued patents and pending patent applications. Our U.S. patents have expiration dates ranging through 2043. Additionally, we have 11 trademark registrations in the U.S. and 3 trademark applications in the U.S., as well as 312 trademark counterpart registrations and applications in foreign jurisdictions.
We also rely upon our unpatented proprietary technology, know-how and other trade secrets. The substantial majority of our patents and trade secrets relate to our chloride products, surface treatments, chlorination expertise, and oxidation process technology, and this proprietary chloride production technology is an important part of our overall technology position. However, much of the fundamental intellectual property associated with both chloride and sulfate pigment production is no longer subject to patent protection. At Namakwa Sands, we rely on intellectual property for our smelting technology, which was granted to us in perpetuity by Anglo American South Africa Limited for use on a worldwide basis, pursuant to a non-exclusive license.
While certain of our patents relating to our products and production processes are important to our long-term success, more important is the operational knowledge we possess. We also use and rely upon unpatented proprietary knowledge, continuing technological innovation and other trade secrets to develop and maintain our competitive position. We conduct research activities and protect the confidentiality of our trade secrets through reasonable measures, including confidentiality agreements and security procedures. We protect the trademarks that we use in connection with the products we manufacture and sell, and have developed value in connection with our long-term use of our trademarks. See “Risk Factors—If our intellectual property were compromised or copied by competitors, or if competitors were to develop similar intellectual property, our results of operations could be negatively affected. Further, third parties may claim that we infringe on their intellectual property rights which could result in costly litigation."
Human Capital
Tronox employs approximately 6,500 people across six continents, and we believe it is our rich diversity and exceptional operational and technical expertise that, combined with our vertical integration model, position Tronox as the world's leading vertically integrated manufacturer of titanium dioxide pigment. Recognizing the importance of our human capital, we have made People, Culture and Capabilities one of our five strategic pillars, and placed a priority around developing leaders who will help us effectively (i) acquire, develop and nurture our talent, and (ii) foster a culture that embodies the values that are important to us, starting with safety and operating our business responsibly.
People
Because we operate both titanium ore mines and titanium dioxide pigment plants, and because our operations span the world, we require specialty skills in mining and TiO2 pigment manufacturing. We also need people who are willing to learn skills across both mining and chemicals operations and who can help us extract value from our integrated model. The below map sets forth the approximate number of employees as of December 31, 2023, in each of the global regions in which we operate.
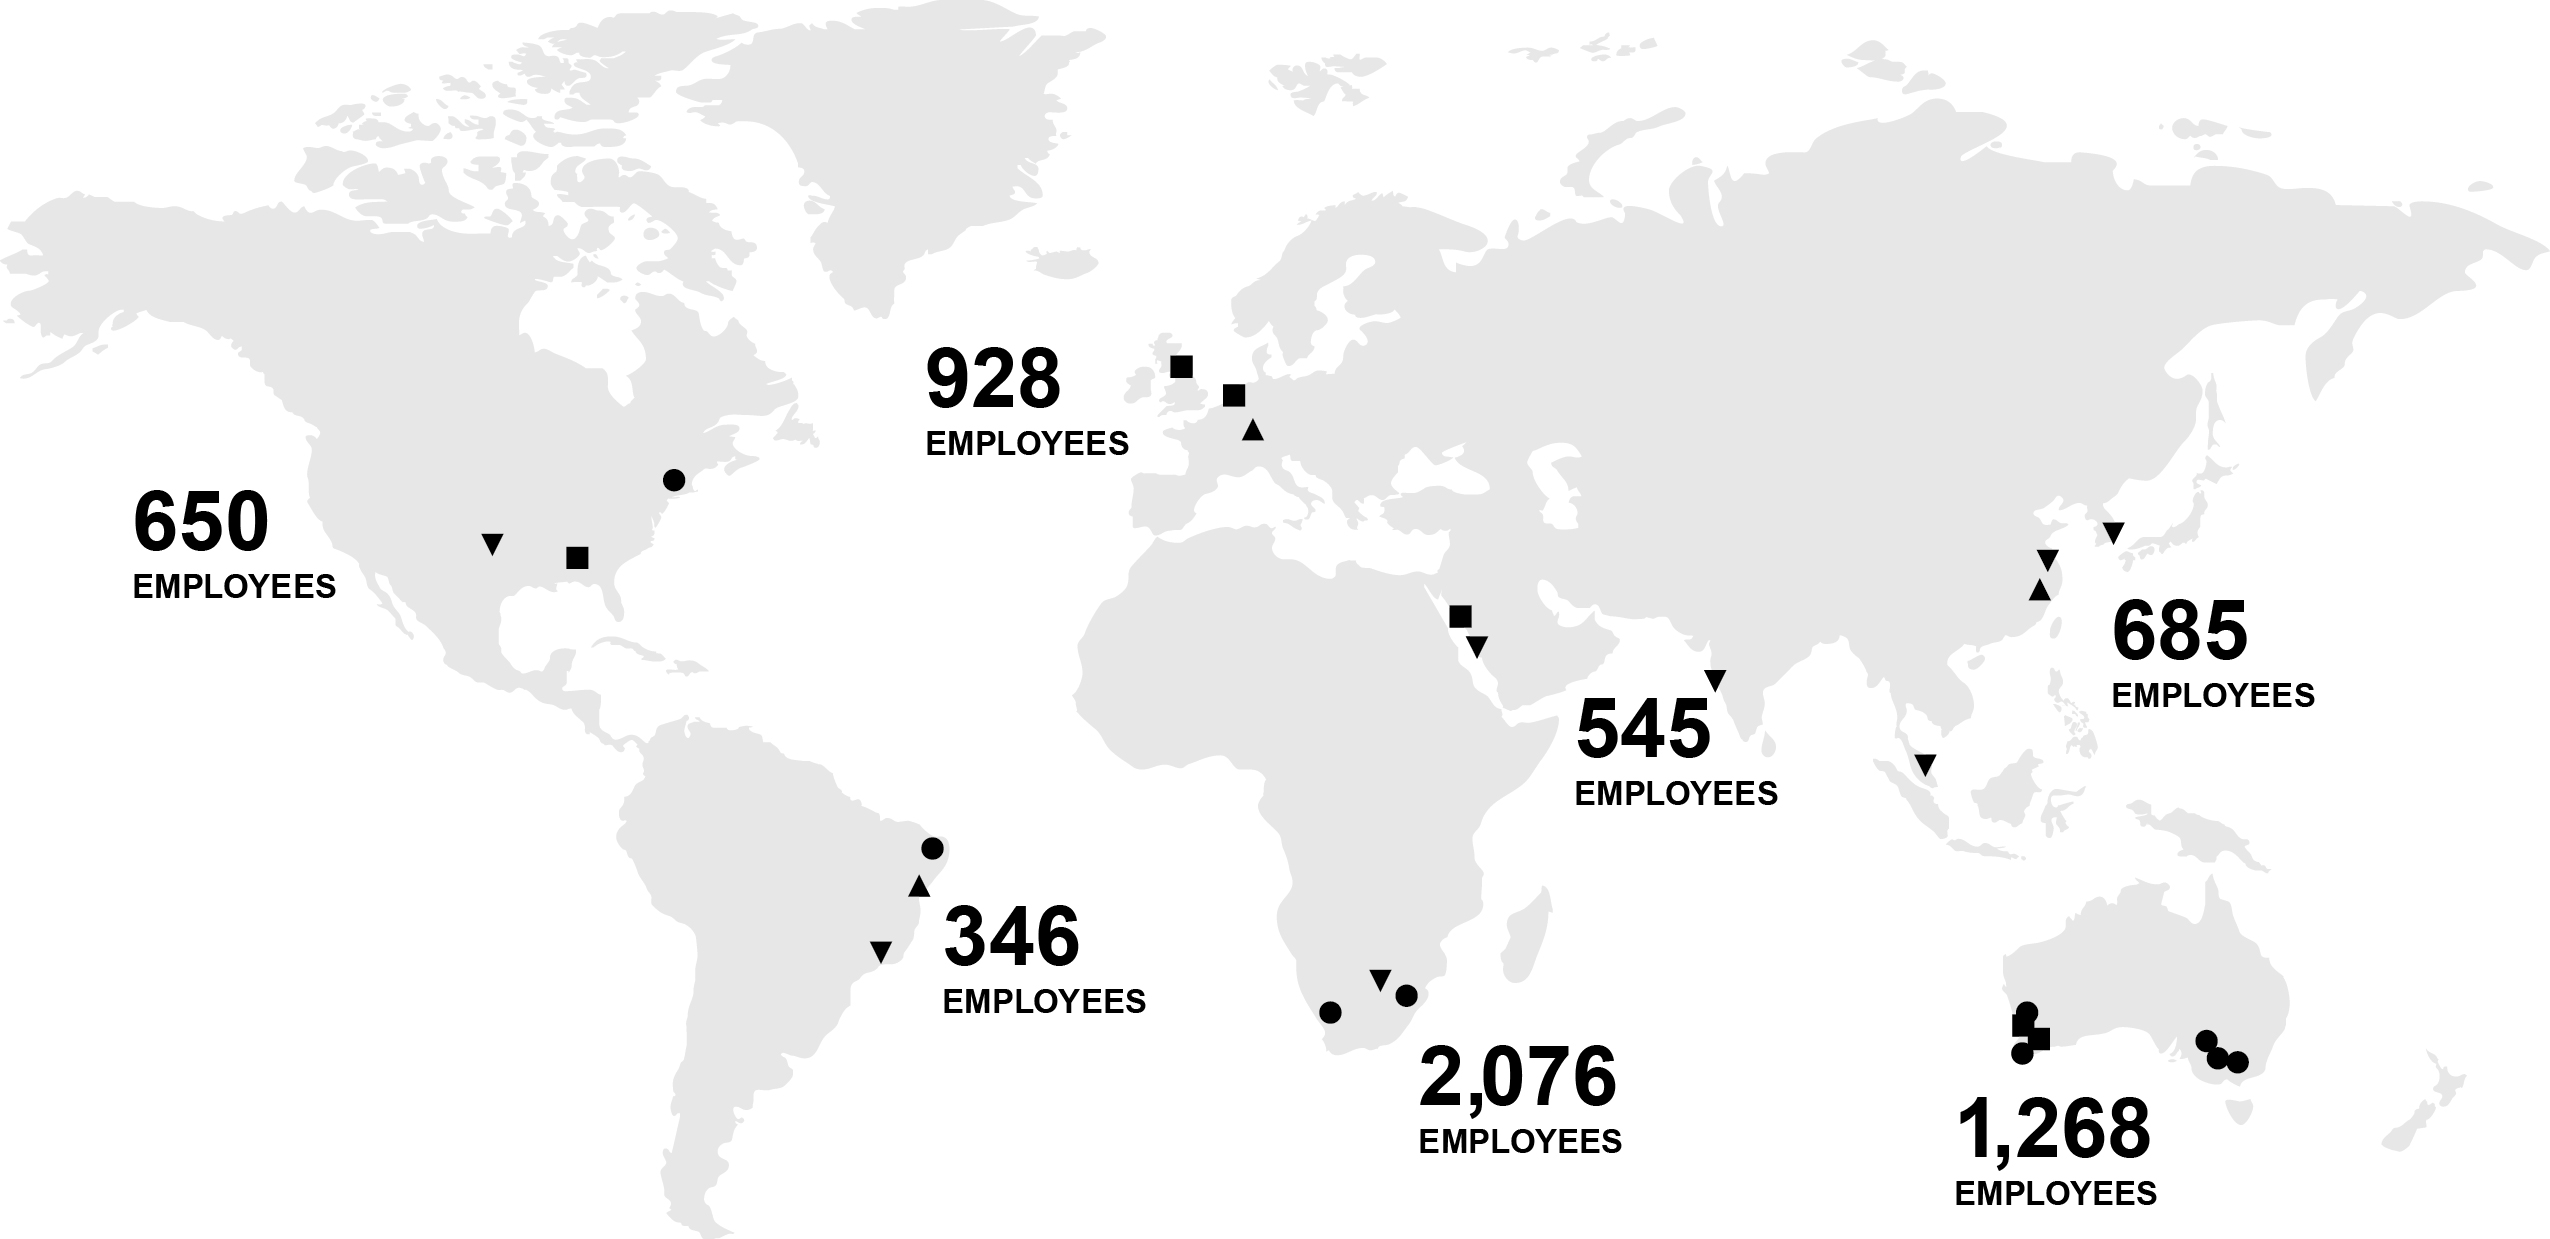
Accordingly, we place a high priority on knowledge transfer (including by relocating skilled leaders across countries and between mining and TiO2 pigment operations, by staffing high-potential employees in regions on global projects, and by enabling collaboration in global centers of excellence), and we place a high priority on fostering diversity, equity and inclusion. We are committed to creating an organization where leaders encourage a diverse workforce, where people feel valued and respected, have access to opportunities, and in which a variety of different voices are encouraged and heard. For instance, during 2023, we created and launched a cultural awareness program in which employees were invited to attend panel-style webinars to learn more about the cultures of the countries where we operate. In addition, in 2023, our D&I regional chapters focused on implementing global initiatives around cultural awareness and young talent programs. Our young talent program was launched in all regions, providing opportunities for new talent to network and learn about other areas of the business.
We also place an uncompromising focus on operating safe, reliable, and responsible facilities, and we measure our progress with both safety metrics and leading indicators. We believe every employee and contractor has a responsibility for safety, and we proactively identify and manage risk, conduct ourselves responsibly, exercise good judgement, and take accountability for our actions. In 2023, our employees worked more than 12 million hours with 29 recordable injuries and no fatalities from our operations, and our contractors worked more than 9 million hours with 17 recordable injuries and one fatality from our operations.
Culture
We aim to create an organizational culture where employees unleash their full value through living our values, and fostering a high-performance culture. We apply an "outward mindset" by which we mean that each employee should be highly aware of the organization's goals and how his or her individual actions affect the entire organization. To this end, in 2023, we completed a global organization culture survey. As a result of such survey, we gained further insight of the performance measures that link our culture to high performance. We believe we can have the most success fostering a high performance culture by setting high expectations for each other and modelling ways of work done well, enrolling our people into fulfilling our vision and strategy, and investing the success and fulfillment of our people.
Nearly all of our employees have been through training and development courses which instill the principles of working with an outward mindset. The consistent training and reinforcement of the importance of acting with an outward mindset has enabled us to transform our culture. We believe this cultural transformation is reflected in our results, starting with safety: our people truly care for one another, and not only other employees, but also our contractors, visitors and communities. Shaped by an outward mindset, our people have embraced our global diversity and are naturally inclusive.
Today, we are a collaborative group of people who naturally want to be helpful to others, and we adjust our own efforts to make our colleagues’ work easier, however we can.
Building on the foundation of applying an outward mindset, we have adopted a set of core values that describes our expectations of one another, starting with safety. Every performance review starts with a self-assessment and manager’s assessment of our consistency in living our values. Employees are encouraged – and provided a toolkit – to develop in the values where they are weak, and to help coach others in the values where they are strong.
Tronox Core Values
•We have an uncompromising focus on operating safe, reliable and responsible facilities.
•We honor our responsibility to create value for stakeholders.
•We treat others with respect, and act with personal and organizational integrity.
•We build our organization with diverse, talented people who make a positive difference and we invest in their success.
•We are adaptable, decisive and effective.
•We are trustworthy and reliable, and we build mutually rewarding relationships.
•We share accountability, and have high expectations for ourselves and one another.
•We do the right work the right way in every aspect of our business.
•We celebrate the joy of working together to accomplish great things.
Capabilities
At Tronox we lead with safety. To ensure we live this value with impact, a key focus of our strategy is to enhance the leadership capabilities of our workforce. In 2021, we launched a program in which approximately 100 of our leaders were trained in contemporary safety leadership practices. Further in 2022, an additional 350 supervisors and managers across all of our operating regions completed this hands-on leadership training. And in 2023, we provided such training to more of our regional leaders as well as continuing to educate the broader workforce.
In addition, our employees are further guided by our code of conduct and business ethics and we conduct annual global training to help them fully understand and comply with our code of conduct.
We also have a rigorous succession planning process with respect to key positions throughout the organization. We believe such process allows us to proactively develop the talent of the future and allows us to move with speed and agility when leadership changes are required. As part of the succession planning process, high potential leaders are identified and development plans are completed for each candidate.
Sustainability
Our business requires an unwavering focus on sustainable operating practices, and our commitment to sustainability supports our overall vision and strategy to be the world’s leading vertically integrated TiO2 producer. As such, we integrate sustainability into every aspect of our business—from our culture and our strategy to our operating practices. We believe sustainable operations enable us to better control costs and manage our environmental footprint. Sustainability also encompasses providing our employees with a safe, diverse workplace and offering them opportunities to grow and develop. Ultimately, safe, environmentally sustainable operations demonstrates our respect for our communities and supports our continued privilege to operate.
Our sustainability efforts are also focused on reducing Tronox’s carbon footprint. In 2022 we updated our carbon reduction roadmap first disclosed in 2021 that details our plans for reducing carbon emissions in the short-, medium- and long-term. Our roadmap covers 100% of our operations and is based on a detailed analysis of our carbon footprint and ways to reduce it. The roadmap is supported by well-resourced projects and initiatives. The majority of our greenhouse gas ("GHG") emissions are generated from our TiO2 slag furnaces in South Africa, synthetic rutile kiln in Western Australia, and TiO2 pigment plants in the United States, United Kingdom, France, Brazil, China, Netherlands, Australia, and Saudi Arabia.
In March 2022 we announced a 200 MW solar energy project in South Africa that was expected to reduce our global Scope 1 and 2 emissions by approximately 13% commencing in the first quarter 2024. As of the date hereof, we currently expect this solar energy project to be fully on-line during the first-half of 2024. We believe this project will be among South Africa’s first large-scale renewable energy projects since deregulation of the private electricity market in February 2022. In addition, during 2024, we anticipate announcing a second large renewable energy project in South Africa. When we set our 2025 carbon reduction target of 35% we anticipated that this project would be on-line during 2025; however, the timeline for this second renewable energy project has been delayed by factors beyond the Company's control. We anticipate the timeline to achieve the 35% emissions intensity reduction by 2025 will be updated to reflect our latest views on various project timelines. It remains our long-term goal to achieve “net zero” carbon emissions by 2050. We believe the Company’s dedication to these significant renewable energy projects are just two examples of how Tronox is committed to being a leader when it comes to corporate sustainability and protection of the environment.
In 2023, we received a Gold Rating by EcoVadis in recognition of our sustainability efforts. This Gold Rating places Tronox in the Top 5% of the 85,000 companies evaluated around the world by EcoVadis on their sustainability performance. The EcoVadis assessment focuses on four themes: the environment, labor and human rights, ethics, and sustainable procurement.
EcoVadis is a leading third-party independent assessment organization that evaluates companies' sustainability performance. Their methodology is based on international sustainability standards including the Global Reporting Initiative (GRI), United Nations Global Compact (UNGC) and ISO 26000.
Environmental, Health and Safety Authorizations
Mining
Our facilities and operations are subject to extensive general and industry-specific environmental, health and safety regulations in jurisdictions where we operate, but particularly South Africa and Australia. These regulations include those relating to mine rehabilitation, liability provision, water management, the handling and disposal of hazardous and non-hazardous materials, and occupational health and safety. The various legislation and regulations are subject to a number of internal and external audits. We believe our mineral sands operations are in compliance, in all material respects, with existing health, safety and environmental legislation and regulations.
Regulation of the Mining Industry in South Africa
The South African mining regulatory regime is comprehensive and requires regular reporting to applicable government departments. A failure to, among other things, comply with any such reporting requirements or the conditions of any mining license could result in extended mandatory shutdown periods, license and/or mining right suspensions or revocations all of which could impact our business.
In South Africa, the primary legislative enactments with which our mines are required to comply are the Mineral and Petroleum Resources Development Act (“MPRDA”) which governs the acquisition and retention of prospecting and mining rights. In addition, the Mine Health and Safety Act governs the manner in which mining must be conducted from a health and safety perspective, while the National Environmental Management Act (and its subsidiary legislation) provides the underlying framework with respect to environmental rules and regulation for which our operations must comply. For additional details regarding other South African legislative enactments that govern our mining licenses please see the section entitled “Risk Factors” set forth elsewhere in this Form 10-K.
Regulation of the Mining Industry in Australia
Each Australian state and territory has its own legislation regulating the exploration for and mining of minerals. Our key exploration and mining operations are regulated by the Mining Act 1978 (WA), the Mining Act 1992 (NSW) and their related regulations.
In Western Australia, State Agreements are contracts between the State and the proponents of major resources projects within Western Australia, and are intended to foster resource development and related infrastructure investments. These agreements are approved and ratified by the Parliament of Western Australia. The State Agreement relevant to the development of certain of our Western Australian operations is the agreement authorized by the Mineral Sands (Cooljarloo) Mining and Processing Agreement Act 1988 (WA). This agreement concluded in March 2020 and Tronox's rights and obligations are now covered by the Western Australian Mining Act.
Regulation of Finished Product Manufacturing
Our business is subject to extensive regulation by federal, state, local and foreign governments. Governmental authorities regulate the generation and treatment of waste and air emissions at our operations and facilities. At many of our operations, we also comply with worldwide, voluntary standards developed by the International Organization for Standardization (“ISO”), a nongovernmental organization that promotes the development of standards and serves as a bridging organization for quality and environmental standards, such as ISO 9002 for quality management and ISO 14001 for environmental management.
Chemical Registration
As a chemical manufacturer with global operations, we are subject to a wide array of regulations regarding the import, export, labelling, use, storage and disposal of our products. We are obliged to comply with the regulation of chemical substances and inventories under the Toxic Substances Control Act in the United States and the Registration, Evaluation and Authorization of Chemicals (“REACH”) regulation in Europe, as well as a growing list of analogous regimes in other parts of the world, including China, South Korea and Taiwan. Manufacturers and importers of chemical substances must register information regarding the properties of their existing chemical substances with the European Chemicals Agency (“ECHA”). REACH regulations require chemical substances which are newly imported or manufactured in the EU to be registered before being placed on the market, assessed for human health or environmental risk and for registrations to be updated periodically such as when new information emerges relevant to human health or environmental risks associated with the production or use of the substance. For additional information on this topic, see section entitled "Risk Factors - Risks Relating to our Legal and Regulatory Environment - Our TiO2 products are subject to increased regulatory scrutiny that may impede or inhibit widespread usage of TiO2 and / or diminish the Company's ability to sustain or grow its business or may add significant costs of doing business." Globally, our operations are subject to regulations that seek to reduce emissions of GHGs.
Greenhouse Gas Regulation
We currently report and manage GHG emissions as required by law for sites located in jurisdictions requiring such managing and reporting of GHGs, primarily the European Union and Australia. For additional information on this topic, see section entitled “Risk Factors – Risks Relating to our Legal and Regulatory Environment - ESG issues, including those related to climate change and sustainability, may subject us to additional costs and restrictions, including increased energy and raw material costs, which could have an adverse effect on our business, financial condition and results of operations, as well as damage our reputation.”
Available Information
Our public internet site is http://www.tronox.com. The content of our internet site is available for information purposes only and is included as an inactive textual reference. It should not be relied upon for investment purposes, nor is it incorporated by reference into this annual report on Form 10-K unless expressly noted. We make available, free of charge, on or through the investor relations section of our internet site, our annual reports on Form 10-K, quarterly reports on Form 10-Q, current reports on Form 8-K, proxy statements and Forms 3, 4 and 5 filed on behalf of directors and executive officers, as well as any amendments to those reports filed or furnished pursuant to the U.S. Securities and Exchange Act of 1934, as amended (the “Exchange Act”) as soon as reasonably practicable after we electronically file such material with, or furnish it to, the U.S. Securities and Exchange Commission (the “SEC”).
We file current, annual and quarterly reports, proxy statements and other information required by the Exchange Act with the SEC. Our SEC filings are also available to the public from the SEC’s internet site at http://www.sec.gov. The content of the SEC's internet site is available for informational purposes only and is included as an inactive textual reference. It should not be relied upon for investment purposes, nor is it incorporated by reference into this annual report on Form 10-K unless expressly noted.
Item 1A. Risk Factors
You should carefully consider the risk factors set forth below, as well as the other information contained in this Form 10-K, including our consolidated financial statements and related notes. This Form 10-K contains forward-looking statements that involve risks and uncertainties. Any of the following risks could materially and adversely affect our business, financial condition and results of operations. Additional risks and uncertainties not currently known to us or those we currently view to be immaterial may also materially and adversely affect our business, financial condition and results of operations. The following risk factors are not necessarily presented in order of relative importance and should not be considered to represent a complete set of all potential risks that could affect our business, financial condition and results of operations.
RISKS RELATING TO OUR BUSINESS
Market conditions, as well as global and regional economic downturns that adversely affect the demand for our end-use products, could adversely affect the results of our operations and the prices at which we can sell our products, thus, negatively impacting our financial results.
Our revenue and results of operations are significantly dependent on sales of TiO2 products and zircon. Demand for these products historically have been linked to global, regional and local GDP and discretionary spending, which can be negatively impacted by regional and world events or economic and market conditions. Such events can cause a decrease in demand for our products and market prices to fall, which may have an adverse effect on our results of operations and financial condition. A substantial portion of our products and raw materials are commodities that reprice as market supply and demand fundamentals change. Accordingly, product margins and the results of operations tend to vary with changes in the business cycle.
A significant portion of the demand for our TiO2 products comes from manufacturers of paint and plastics. A significant portion of the demand for zircon comes from the construction and other industrial end markets. Our customers may experience significant fluctuations in demand for their own end products because of economic conditions, changes in consumer demand, or increases in raw material and energy costs. In addition, with respect to the zircon market, we believe that China currently accounts for approximately 50% of the world’s demand for zircon. As such, any prolonged economic downturn in China could result in reduced zircon and TiO2 demand in China which could have a material adverse effect on our business and financial results.
The price of our products, in particular, TiO2, zircon, and pig iron, have been, and in the future may be, volatile. Price declines for our products will negatively affect our financial position and results of operations.
Historically, the global market for TiO2, zircon and pig iron have been volatile, and those markets are likely to remain volatile in the future. Prices for TiO2, zircon and pig iron may fluctuate in response to relatively minor changes in the supply of, and demand for, these products, market uncertainty and other factors beyond our control. Factors that affect the price of our products include, among other things:
•overall economic conditions;
•the level of customer demand particularly in the paint, plastics and construction industries;
•the level of production and exports of our products globally, including the impact of competitors increasing their capacity and exports;
•the level of production and cost of materials, such as chlorine, sulfuric acid and anthracite, used to produce our products, including rising prices of raw materials due to inflation;
•the cost of energy consumed in the production of TiO2 and zircon, including the price of natural gas, electricity and pet coke;
•domestic and foreign governmental relations, tariffs or other trade disputes, regulations and taxes;
•political conditions or hostilities and unrest in regions where we manufacture and/or export our TiO2, zircon and feedstock/other products; and
•major public health issues, such as COVID-19, which could cause, among other things, macroeconomic disruptions.
Pricing pressure with respect to our TiO2 products, zircon and pig iron can make it difficult to predict the cash we may have on hand at any given time, and a prolonged period of price declines may materially and adversely affect our financial position, liquidity, ability to finance planned capital expenditures and results of operations.
Our industry and the end-use markets in which we compete are highly competitive. This competition may adversely affect our results of operations and operating cash flows.
Each of our markets is highly competitive. Competition in the TiO2 industry is based on a number of factors such as price, product quality, and service. We face significant competition from major international and smaller regional competitors, especially producers in China. Chinese producers have significantly expanded their TiO2 production capacity in recent years and the volume of their exports, including via chloride technology, as well as have publicly announced their intention to continue to expand their TiO2 production capacity and aggressive exports efforts. We regard their product quality and technology as substantially on par with non-Chinese producers, particularly with respect to their chloride TiO2. Moreover, the increased Chinese TiO2 production capacity, along with the current economic downturn in China, is resulting in increasing quantities of TiO2 being exported to other regions of the world in which we compete. Currently, the United States government, pursuant to Section 301 of the Trade Act of 1974, has imposed a 25% duty on TiO2 products imported into the United States from China. Although we expect such 25% duty to continue to be imposed, there is no assurance that it will not be removed in the future. Any removal of the existing duty could cause additional imports of Chinese-produced TiO2 into the U.S. which may impact our business, financial condition and results of operations. In addition, in November 2023, the European Commission officially initiated an anti-dumping proceeding to investigate whether imports of TiO2 from China have been dumped into the European Union market and whether they have caused material injury to the EU TiO2 industry. We understand that the investigative process typically takes 12-14 months and there is no assurance that the outcome will result in duties being imposed on TiO2 imports from China.
We compete with a large number of mining companies with respect to zircon. Zircon producers generally compete on the basis of price, quality, logistics, delivery, payment terms and consistency of supply. Moreover, the increased Chinese zircon production capacity, along with the current economic downturn in China, is resulting in increasing quantities of zircon being exported to other regions of the world in which we compete.
Within the end-use markets in which we compete, competition between products is intense. We face substantial risk that our customers could switch to our competitors’ products in response to any number of developments including lower price offerings by our competitors for substantially the same products, new product development by competitors, increased commercial production of TiO2 via chloride technology by Chinese producers, greater acceptance of TiO2 produced via sulfate technology in end-market applications previously characterized by TiO2 produced via chloride technology, or with respect to zircon customers, switching to lower priced substitute products. Our inability to develop, produce or market our products to compete effectively against our competitors could have a material adverse effect on our business, financial condition, results of operations and cash flow.
An increase in the price of energy or other raw materials, or an interruption in our energy or other raw material supply, could have a material adverse effect on our business, financial condition and results of operations.
Our mining, beneficiation, smelting and production processes consume significant amounts of energy and raw materials, the costs of which can be subject to worldwide, as well as, local supply and demand, as well as other factors beyond our control. Fuel and energy linked to commodities, such as diesel, natural gas, heavy fuel oil and pet coke, and other consumables, such as chlorine, sulfuric acid, illuminating paraffin, electrodes, sulfur and anthracite, consumed in our TiO2 manufacturing and mining operations form an important part of our TiO2 operating costs. We have no control over the costs of these consumables, many of which are linked to some degree to the price of oil, and the costs of many of these raw materials may fluctuate widely for a variety of reasons, including changes in availability, major capacity additions or reductions, or significant facility operating problems. Moreover, the ongoing Russia and Ukraine conflict has resulted in, and may continue to result in, increased uncertainty with respect to the supply of energy and other energy-dependent commodities for our TiO2 production facilities located in the European Union and the United Kingdom, as well as other raw materials, such as anthracite, for our slag furnaces located in South Africa. Increased costs of electricity and disruptions in the supply of electricity due to long-standing operational issues at the sole, state-owned energy supplier in the Republic of South Africa, Eskom, could increase the costs of production, or disrupt operations, at our mines and beneficiation operations in that country. Availability of such consumables could also be impacted by transportation capacity constraints or other interruptions. These fluctuations could negatively affect our operating margins, our results of operations or planned capital expenditures. In addition, due to our global footprint and reliance on key raw materials from around the world, we are particularly reliant on shipping vessels to transport such raw materials as well as our finished goods. As a result of the current Middle East conflict, there is increasing pressure on shipping vessels to potentially avoid key shipping routes through the Red Sea and the Suez Canal which could result in a reduction of available shipping vessels and/or increased shipping costs. As the costs of raw materials, utilities, transportation and similar costs rise, our operating expenses will increase and could adversely affect our business, especially if we are unable to pass price increases relating to raw materials, utilities, transportation and similar costs through to our customers.
The markets for many of our products have seasonally affected sales patterns.
Historically, the demand for our products is subject to seasonal fluctuations. TiO2 is widely used in paint and other coatings where demand increases prior to the painting season in the Northern Hemisphere (spring and summer). Additionally, although zircon is generally a non-seasonal product, it is negatively impacted by the winter and Chinese New Year celebrations due to reduced zircon demand from China. We may be adversely affected by existing or future cyclical changes, and such conditions may be sustained or further aggravated by anticipated or unanticipated changes in regional weather conditions. For example, poor weather conditions in a region can lead to an abbreviated painting season, which can depress consumer sales of paint products that use TiO2.
We are dependent on, and compete with other mining and chemical businesses for, key human resources in the countries in which we operate, and our business will suffer if we are unable to hire or deploy highly skilled employees.
We compete with other chemical and mining companies, and other companies generally, in the countries in which we operate to attract and retain key human resources at all levels with the appropriate technical skills and operating and managerial experience necessary to continue operating and expanding our businesses. These operations use modern techniques and equipment and accordingly require various types of skilled workers. The success of our business will be materially dependent upon the skills, experience and efforts of our key officers and skilled employees. Competition for skilled employees may cost us in terms of higher labor costs or reduced productivity. In addition, certain of our production facilities and mining operations are situated in remote locations which may make it more difficult to attract and retain the skilled workers required. As a result, we may not be able to attract, retain and deploy skilled and experienced employees. Should we lose any of our key personnel or fail to attract, retain and deploy key qualified personnel or other skilled employees, our business may be harmed and our operational results and financial condition could be affected.
Given the nature of our chemical, mining and smelting operations, we face a material risk of liability, production delays and additional expenditures from industrial accidents.
Our business is exposed to, among other things, industrial accidents the occurrence of which could delay production, suspend operations, increase repair, maintenance or medical costs and, due to the vertical integration of our operations, could have an adverse effect on the productivity and results of operations of a particular manufacturing facility or on our business as a whole. Furthermore, during operational breakdowns resulting from any such industrial accident, the relevant facility may not be restored to full operations within the anticipated timeframe, which could result in further business losses. Over our operating history, we have incurred incidents of this nature. For instance, in 2023, as a result of a fire at the supplier of 100% of our Botlek, Netherlands TiO2 pigment plant's steam needs, such plant was forced to be taken offline for several months which impacted our 2023 financial results.
If any of the equipment on which we depend were severely damaged or were destroyed by fire or otherwise, we may be unable to replace or repair it in a timely manner or at a reasonable cost, which would impact our ability to produce and ship our products, which would have a material adverse effect on our business, financial condition and results of operations.
Equipment failures and deterioration of assets may lead to production curtailments, shutdowns or additional expenditures.
Our operations depend upon critical equipment that must be periodically maintained and upgraded in order to avoid suffering unanticipated breakdowns or failures. The occurrence of equipment failures or deterioration of assets could delay production, suspend operations, increase repair, maintenance or medical costs and, due to the vertical integration of our operations, could have an adverse effect on the productivity and results of operations of a particular manufacturing facility or on our business as a whole. In addition, assets critical to our mining and chemical processing operations may deteriorate due to wear and tear or otherwise sooner than we currently estimate. Such deterioration may result in additional maintenance spending and additional capital expenditures. If these assets do not generate the amount of future cash flows that we expect, and we are not able to refurbish them or procure replacement assets in an economically feasible manner, our future results of operations may be materially and adversely affected.
Our results of operations and financial condition could be seriously impacted by security breaches, including cybersecurity incidents.
We rely on information technology systems across our operations to manage our business including, but not limited to, our accounting, finance, and supply chain functions. Our information technology is provided by a combination of internal and external services and service providers. Further, our business involves the use, processing, storage and transmission of information about customers, suppliers and employees using such information technology systems. Our ability to effectively operate our business depends on the security, reliability and capacity of these systems.
Like most major corporations, during the normal course of business, we have been the target of cyberattacks, including phishing or ransomware attacks, from time to time, and we expect to be the target of such cyberattacks in the future. For instance, the Cristal business we acquired in April 2019 was subject to a significant cybersecurity attack in 2017. Failure to effectively prevent, detect and recover from security breaches, including attacks on information technology and infrastructure by hackers; viruses; breaches due to employee error or actions; or other disruptions could seriously harm our operations as well as the operations of our customers and suppliers. Such serious harm can involve, among other things, misuse of our assets, business disruptions, loss of data, unauthorized access to trade secrets and confidential business information, unauthorized access to personal information, legal claims or proceedings, reporting errors, processing inefficiencies, negative media attention, reputational harm, loss of sales, remediation and increased insurance costs, and interference with regulatory compliance. We have experienced, and expect to continue to experience, these types of cybersecurity threats and incidents, which may be material.
We have put in place training and security measures designed to protect against cyberattacks, phishing, security breaches and misappropriation or corruption of our systems, intentional or unintentional disclosure of confidential information, or disruption of our operations. As these threats continue to evolve, particularly around cybersecurity, we may be required to expend significant resources to enhance our control environment, processes, practices and other protective measures. Despite these efforts, we may not be able to prevent cyberattacks and other security breaches and such events could materially adversely affect our business, financial condition and results of operations.
Our ore resources and reserve estimates are based on a number of assumptions, including mining and recovery factors, future cash costs of production and ore demand and pricing. As a result, ore resources and reserve quantities actually produced may differ from current estimates.
The mineral resource and reserve estimates are estimates of the quantity and ore grades in our mines based on the interpretation of geological data obtained from drill holes and other sampling techniques, as well as from feasibility studies. The accuracy of these estimates is dependent on the assumptions and judgments made in interpreting the geological data in accordance with established guidelines and standards. Our mineral reserves represent the amount of ore that we believe can be economically mined and processed, and are estimated based on a number of factors.
There is significant uncertainty in any mineral reserve or mineral resource estimate. Factors that are beyond our control, such as the ability to secure mineral rights, the sufficiency of mineralization to support mining and beneficiation practices and the suitability of the market may significantly impact mineral resource and reserve estimates. The actual deposits encountered and the economic viability of mining a deposit may differ materially from our estimates. Since these mineral resources and reserves are estimates based on assumptions, we may revise these estimates in the future as we become aware of new developments. To maintain TiO2 feedstock and zircon production beyond the expected lives of our existing mines or to increase production materially above projected levels, we will need to access additional reserves through exploration or discovery.
If we are unable to innovate and successfully introduce new products, or new technologies or processes reduce the demand for our products or the price at which we can sell products, our results of operations could be adversely affected.
Our industries and the end-use markets into which we sell our products experience periodic technological change and product improvement. Our financial condition and results of operations could be adversely affected if we are unable to gauge the direction of commercial and technological progress in key end-use markets or if we fail to fund and successfully develop, manufacture and market products in such changing end-use markets.
In addition, new technologies or processes have the potential to replace or provide lower-cost alternatives to our products, such as new processes that reduce the amount of TiO2 or zircon content in consumer products which in turn could depress the demand and pricing for TiO2 or zircon, respectively. We cannot predict whether technological innovations will, in the future, result in a lower demand for our products or affect the competitiveness of our business. We may be required to invest significant resources to adapt to changing technologies, markets and competitive environments.
RISKS RELATING TO THE GLOBAL NATURE OF OUR BUSINESS
We are exposed to the risks of operating a global business.
We have operations in jurisdictions around the globe which subjects us to a number of risks, including:
•adapting to unfamiliar regional and geopolitical conditions and demands, including political instability, civil unrest, expropriation, nationalization of properties by a government, imposition of sanctions, changes to import or export regulations and fees, renegotiation or nullification of existing agreements, mining leases and permits;
•increased difficulties with regard to political and social attitudes, laws, rules, regulations and policies within countries that favor domestic companies over non-domestic companies, including customer- or government-supported efforts to promote the development and growth of local competitors;
•economic and commercial instability risks, including those caused by sovereign and private debt default, corruption, and new and unfamiliar laws and regulations at national, regional and local levels, including taxation regimes, tariffs and trade barriers, exchange controls, repatriation of earnings, and labor and environmental and health and safety laws and regulations;
•implementation of additional technological and cybersecurity measures and cost reduction efforts, including restructuring activities, which may adversely affect our ability to capitalize on opportunities;
•major public health issues, such as COVID-19, which could cause, and have caused, disruptions in our operations or workforce;
•war, political conditions, hostilities, including, but not limited to, the ongoing Russia and Ukraine and Middle East conflicts, or terrorist activities;
•difficulties enforcing intellectual property and contractual rights in certain jurisdictions; and
•unexpected events, including fires or explosions at facilities, and natural disasters, including as a result of climate-related events.
South Africa, where we have large mining assets and derive a significant portion of our revenue and profit, poses distinct operational risks which could affect our business, financial condition and results of operations.
In South Africa, we currently operate two significant mining assets, as well as accompanying separation plants and smelting operations, and derive a significant portion of our profit from the sale of zircon. Our mining and smelting operations depend on electrical power generated by Eskom, the sole, state-owned energy supplier. Eskom has not been able to reliably provide electrical power and as a result “load-shedding” (planned and unplanned rolling power outages) is expected for the foreseeable future. In addition, in 2021, Eskom received a governmental order to reduce by one-third its operating capacity to limit its greenhouse gas emissions. Although Eskom is currently appealing the government order, there is no assurance that Eskom will be successful in its appeal. We have also experienced increased electricity prices and future price increases are expected to occur. Capacity reductions, load shedding, and/or electricity price increases could have a material adverse effect on our business, financial conditions and results of operations.
Our operations in South Africa are reliant on services provided by the State-owned, sole provider of rail transport, Transnet Freight Rail and ocean transport, Transnet National Port Authority (collectively "Transnet"). Furthermore, Transnet provides extensive dockside services at both the ports of Richards Bay and Saldanha Bay from where we export bulk quantities of TiO2 feedstock to our pigment plants worldwide and pig iron. Like Eskom, Transnet faces chronic operational and financial challenges. In 2021, Port of Richards Bay, which is owned and operated by Transnet, was impacted by two separate events, including a significant fire, which damaged part of the Port's infrastructure, causing increased shipment delays. Such shipment delays at the port of Richards Bay continued in 2022 and 2023, and we believe such delays may continue in 2024 and beyond.
Delays or interruptions at either the rail service or the ports in which we receive and/or export material could have a negative impact on our business, financial condition and results of operations.
In addition, our KZN Sands operations currently use approximately 280,000 gigajoules of Sasol gas, which is available only from Sasol Limited. As such, an interruption in the supply of Sasol gas could have a material adverse effect on our business, financial conditions and results of operations.
In addition, under South African law, our South African mining operations are subject to water-use licenses that govern each operation. These licenses require, among other conditions, that mining operations achieve and maintain certain water quality limits for all water discharges, where applicable. Changes to water-use licenses could increase our costs of operations thereby affecting our operational results and financial condition.
The aforementioned operational risks, as well as any other foreseen or unforeseen operational risks primarily related to doing business in South Africa, could have a material adverse effect on our business, financial condition and results of operations.
As an emerging market, South Africa poses a challenging array of long-term political, social and economic risks.
South Africa continues to undergo political, social and economic challenges. For example, in 2021, unprecedented and politically motivated civil unrest in South Africa resulted in significant damage to the national supply chains and logistics. The primary area of unrest was near to our KZN operations. Changes to, or instability in, the economic, social or political environment in South Africa which cause civil unrest, shortages of production materials, interruptions to transportation networks, or labor unrest could result in production delays and production shortfalls, and materially impact our production and results of operations.
The South African government has recently embarked on a process of identifying and securing land for persons who were previously dispossessed of such land as a result of Apartheid policies. In December 2019, the South African government released a draft land expropriation bill for public comment. The land expropriation bill contemplates that, where it is in the “public interest”, land may be expropriated by the South African government, without compensation being payable to the current owners. While the South African government has indicated that such measures will be applied initially to state-owned land, it is possible that such measures may extend to agricultural and mining areas. In the event that the land on which the Namakwa Sands and KZN Sands operations are situated areas become the subject of a land claim under any such proposed or future land expropriation bill, it may have a material adverse effect on our business, financial condition and results of operations.
The South African government's exchange control regulations require resident companies to obtain the prior approval of the South African Reserve Bank to raise capital in any currency other than the Rand, and restrict the export of capital from South Africa. While the South African government has relaxed exchange controls in recent years, it is difficult to predict whether or how it will further change or abolish exchange control measures in the future. These exchange control restrictions could hinder our financial and strategic flexibility, particularly our ability to use South African capital to fund acquisitions, capital expenditures, and new projects outside of South Africa.
Our South African operations have been affected by inflation in South Africa in recent years. Employment costs and wages in South Africa have increased in recent years, resulting in significant cost pressures for the mining industry. Prolonged or heightened inflation and associated cost pressures could have a material adverse effect on our business, financial condition and results of operations.
Our South African operations have entered into various collective agreements with organized labor regulating wages and working conditions at our mines and smelter operations. There have been periods when various stakeholders have been unable to agree on dispute resolution processes, leading to threats of disruptive industrial action disputes. Due to the high level of employee union membership, our South African operations are at risk of production stoppages for indefinite periods due to strikes and other labor disputes. Although we believe that we have good labor relations with our South African employees, we may experience labor disputes in the future.
In addition, although we believe that our relationships with our various local communities are good, the areas in which our South African operations are situated are the traditional homelands of various tribal groupings that are historically politically volatile. This volatility persists today and frequently results in violent, destructive behaviors. In addition, the physical security situation continues to deteriorate and we have been the victim of immaterial theft and are aware that other industrial mining operations near ours are frequently the target of sophisticated mineral syndicates capable of stealing industrial minerals on a relatively large scale. Increased volatility, related civil unrest and further deterioration in the security situation may result in production stoppages and/or the destruction and theft of assets, any of which could have a material adverse effect on our business, financial condition and results of operations.
Political and social instability, and unrest, and actual, or potential, armed conflicts in the Middle East region may affect the Company's results of operations and financial position.
Our operations in KSA have been affected in the past, and may be affected in the future, by political, social and economic conditions from time to time prevailing in, or affecting, KSA or the wider Middle East region, including by rocket attacks from armed rebel groups. For example, since 2011, a number of countries in the Middle East region have witnessed, and are currently witnessing, significant social unrest, including widespread public demonstrations, and, in certain cases, armed conflict, terrorist attacks, diplomatic disputes, foreign military intervention and a change of government. In addition, there has recently been an increasing number of attacks on commercial shipping vessels in and around the Red Sea which could ultimately impact the availability of shipping routes and/or ocean freight, as well as increase the shipping costs, for raw material to our Yanbu pigment plant as well as TiO2 exports out of our Yanbu plant. Specifically, KSA faces a number of challenges arising mainly from the relatively high levels of unemployment among the Saudi youth population, requests for political and social changes, and the security threat posed by certain groups. Should KSA experience similar political and social unrest as found in other countries in the Middle East, the Saudi Arabian economy could be adversely affected, our TiO2 plant located in Yanbu could be temporarily disrupted or materially adversely affected and our business and operating results could be materially adversely affected.
Our results of operations may be adversely affected by fluctuations in currency exchange rates.
The financial condition and results of operations of our operating entities outside the U.S. are reported in various foreign currencies, primarily the South African Rand, Australian Dollars, Euros, Pound Sterling and Brazilian Real and then converted into U.S. dollars at the applicable exchange rate for inclusion in the financial statements. A significant portion of our costs are denominated in currencies other than the U.S. dollar. As a result, any volatility of the U.S. dollar against these foreign currencies creates uncertainty for, and may have a negative impact on, reported sales and operating margin. In addition, our operating entities often need to convert currencies they receive for their products into currencies in which they purchase raw materials or pay for services, which could result in a gain or loss depending on fluctuations in exchange rates. In order to manage this risk, we have from time to time, entered into forward contracts to buy and sell foreign currencies.
RISKS RELATING TO OUR DEBT AND CAPITAL STRUCTURE
We are a holding company that is dependent on cash flows from our operating subsidiaries to fund our debt obligations, capital expenditures and ongoing operations.
All of our operations are conducted, and all of our assets are owned, by our operating companies, which are our subsidiaries. We intend to continue to conduct our operations at the operating company level. Consequently, our cash flow and our ability to meet our obligations or make cash distributions depends upon the cash flow of our operating companies, and the payment of funds by our operating companies in the form of dividends or otherwise. The ability of our operating companies to make any payments to us depends on their earnings, the terms of their indebtedness, including the terms of any credit facilities, or indentures, and legal restrictions regarding the transfer of funds.
Our ability to service our debt and fund our planned capital expenditures and ongoing operations will depend on our ability to generate and increase cash flow, and our access to additional liquidity sources. Our ability to generate and increase cash flow is dependent on many factors, including many of other risks described in this section entitled “Risk Factors”.
The agreements and instruments governing our debt contain restrictions and limitations that could affect our ability to operate our business, as well as impact our liquidity.
As of December 31, 2023, our total principal amount of debt was approximately $2.8 billion. Our credit facilities contain covenants that could adversely affect our ability to operate our business, our liquidity, and our results of operations. These covenants may restrict, among other things, our and our subsidiaries' ability to:
•incur or guarantee additional indebtedness;
•complete asset sales, acquisitions or mergers;
•make investments and capital expenditures;
•prepay other indebtedness;
•enter into transactions with affiliates; and
•fund additional dividends or repurchase shares.
Certain of our indebtedness facilities and senior notes include requirements relating to the ratio of adjusted EBITDA to indebtedness or certain fixed charges. The breach of any covenants or obligations in our credit facilities, not otherwise waived or amended, could result in a default under the applicable debt obligations (and cross-defaults to certain other debt obligations) and could trigger acceleration of those obligations, which in turn could trigger other cross defaults under other existing or future agreements governing our long-term indebtedness. In addition, the secured lenders under the credit facilities could foreclose on their collateral, which includes equity interests in our subsidiaries, and exercise other rights of secured creditors. Any default under those credit facilities could adversely affect our growth, our financial condition, our results of operations and our ability to make payments on our credit facilities, and could force us to seek the protection of bankruptcy laws.
We may need additional capital in the future and may not be able to obtain it on favorable terms, and such capital expenditure projects may not realize expected investment returns.
Our business is capital intensive, and our success depends to a significant degree on our ability to maintain our manufacturing operations and invest in those operations to expand capacity and remain competitive from a cost perspective. We may require additional capital in the future to finance capital investments, for a variety of purposes, including (i) replacement of mines that are end of life, (ii) expansion or optimization of existing production facilities or mining operations, (iii) ongoing research and development activities, (iv) business development opportunities in rare earth or other critical minerals, and (v) general working capital needs. For instance, in 2020 we began the implementation of a multi-year global business transformation that includes the acquisition and implementation of new operational and financial systems, technology and processes, including a global ERP system. The implementation of our business transformation involves numerous risks, including (i) new information and operational technologies and systems not being properly designed, integrated, managed and implemented or a delay in such implementation, (ii) diversion of management's attention away from normal daily business operations, (iii) significant or material weaknesses in our financial controls or delays in timely reporting our results of operations, and (iv) initial dependence on unfamiliar systems while training personnel to use new systems. Such risks could significantly increase the program’s costs, cause us to fail to achieve the anticipated benefits from the program, and negatively impact our operations, including, our plant’s system safety, functionality and effectiveness. Although we have taken, and will continue to take, significant steps to mitigate the potential negative impact of the implementation of such new digital systems, there can be no assurance that these procedures will be completely successful.
Additionally, if we undertake these projects, they may not be completed on schedule, at the budgeted cost, or at all. Moreover, our revenue may not increase immediately upon the expenditure of funds on a particular project. As a result, we may not be able to realize our expected investment return, which could adversely affect our results of operations and financial condition.
RISKS RELATING TO OUR LEGAL AND REGULATORY ENVIRONMENT
Our South African mining rights are subject to onerous regulatory requirements imposed by legislation and the Department of Mineral Resources and Energy (the “DMRE”), the compliance with which could have a material adverse effect on our business, financial condition and results of operations.
Black economic empowerment (“BEE”) legislation was introduced into South Africa as a means to seek to redress the inequalities of the previous Apartheid system by requiring the inclusion of historically disadvantaged South Africans in the mainstream economy. Under BEE legislation, certain of our operations are required to be partially owned by historically disadvantaged South Africans --- known as “empowerment” --- and comply with other provisions of applicable BEE legislation that relate to matters such as mandatory procurement and employment opportunities for the communities in which we operate. On March 1, 2019, a new set of BEE rules and regulations relevant to our operation came into effect known as "Mining Charter III". Under the “empowerment” rules of Mining Charter III, certain of our operations require a 30% BEE shareholding that must be structured through a special purpose vehicle comprised of black entrepreneurs, the local community surrounding the relevant mining area and eligible employees. In addition, Mining Charter III sets forth more stringent requirements applicable to all of our South African operations, including: the procurement of goods and services from BEE compliant entities; race, age and gender based employment quotas; and, workers’ housing and living conditions. Uncertainty over the status of Mining Charter III arose when in September 2021, the South African High Court ruled that certain provisions of Mining Charter III were unconstitutional and that Mining Charter III cannot be considered binding legislation. Although the DMRE determined not to appeal such ruling, there is no assurance that all the provisions of Mining Charter III will take effect or that the DMRE as result of such ruling will not attempt to enforce the same or more onerous provisions through legislative amendments.
Prior to Mining Charter III, BEE in the South African mining sector was governed by Mining Charter II. Under Mining Charter II, our South African operations were “empowered” by a 26% ownership interest in two of our South African subsidiaries by Exxaro Resources Limited ("Exxaro") which prior to 2017 was greater than 50% owned by historically disadvantaged South Africans.
We believe that under Mining Charter III the two South African subsidiaries in which Exxaro previously held 26% became permanently “empowered” --- so-called, “once empowered always empowered”.
“Once empowered always empowered” means that a South African company that has had the requisite shareholding base consisting of historically disadvantaged South Africans as at December 31, 2014 will always qualify as an “empowered” entity for purposes of the retention of an existing mining right for the duration of that right. The question of whether the “once empowered always empowered” principle applies in the mining industry in South Africa has been subject to litigation between the Minerals Council of South Africa (the “Minerals Council”) (formerly the Chamber of Mines, an industry body that represents approximately 90% of the South African Mining Industry) and the DMRE. The South African High Court decided in the affirmative for the Minerals Council and such decision was subsequently confirmed on appeal. Thus, based on the High Court's ruling, the “once empowered always empowered” principle applies to our existing mining rights. In addition, the South African High Court in connection with its September 2021 decision with respect to the unconstitutionality of Mining Charter III also confirmed that “once empowered always empowered” applies to the renewal and transfer of mining rights. However, there is no assurance that DMRE may not enact new legislation that would undermine the court's ruling regarding the applicability of "once empowered always empowered" to the renewal and transfer of mining rights. In the event that "once empowered always empowered" does not ultimately apply to the renewal or transfer of mining rights it could have a material adverse effect on our business, financial condition and results of operations.
Our failure to comply with the anti-corruption laws of the U.S. and various international jurisdictions could negatively impact our reputation and results of operations.
Doing business on a global basis requires us to comply with the laws and regulations of the U.S. government and those of various international jurisdictions, and our failure to successfully comply with these rules and regulations may expose us to liabilities. In particular, our operations are subject to U.S. and foreign anti-corruption laws and regulations, such as the U.S. Foreign Corrupt Practices Act (“FCPA”), the U.K. Bribery Act 2010 (“U.K. Bribery Act”), as well as anti-corruption laws of the various jurisdictions in which we operate. Our global operations may expose us to the risk of violating, or being accused of violating, the foregoing or other anti-corruption laws. Such violations could be punishable by criminal fines, imprisonment, civil penalties, disgorgement of profits, injunctions, and exclusion from government contracts, as well as other remedial measures. Investigations of alleged violations can be very expensive, disruptive, and damaging to our reputation. Although we have implemented anti-corruption policies and procedures, there can be no guarantee that these policies, procedures, and training will effectively prevent violations by our employees or representatives in the future. Additionally, we face a risk that our distributors and other business partners may violate the FCPA, the U.K. Bribery Act, or similar laws or regulations. Such violations could expose us to FCPA and U.K. Bribery Act liability and/or our reputation may potentially be harmed by their violations and resulting sanctions and fines.
We are subject to many environmental, health and safety regulations.
Our operations and production facilities are subject to extensive environmental and health and safety laws and regulations at national, international and local levels in numerous jurisdictions relating to use of natural resources, pollution, protection of the environment, mine site remediation, transporting and storing raw materials and finished products, and storing and disposing of hazardous wastes among other materials. Moreover, certain environmental laws impose joint and several and/or strict liability for costs to clean up and restore sites where pollutants have been disposed or otherwise spilled or released. We cannot be certain that we will not incur significant costs and liabilities for remediation or damage to property, natural resources or persons as a result of spills or releases from our operations or those of a third party.
The costs of compliance with the extensive environmental, health and safety laws and regulations or the inability to obtain, update or renew permits required for operation or expansion of our business could negatively impact our results of operations or otherwise adversely affect our business. If we fail to comply with the conditions of our permits governing the production and management of regulated materials, mineral sands mining licenses or leases or the provisions of the relevant jurisdictional laws in which we operate, these permits, mining licenses or leases and mining rights could be canceled or suspended, and we could be prevented from obtaining new mining and prospecting rights, which could materially and adversely affect our business, operating results and financial condition. Additionally, we could incur substantial costs, including fines, damages, criminal or civil sanctions and remediation costs, or experience interruptions in our operations, for violations arising under these laws and regulations, including operating without the required permits, mining licenses or leases and/or mining rights. In the event of a catastrophic incident involving any of the raw materials we use, or chemicals or mineral products we produce, we could incur material costs as a result of addressing the consequences of such event.
Changes to existing laws governing operations, especially changes in laws relating to transportation of mineral resources, the treatment of land and infrastructure, contaminated land, the remediation of mines, tax royalties, waste handling and management, exchange control restrictions, environmental remediation, mineral rights, ownership of mining assets, or the rights to prospect and mine may have a material adverse effect on our future business operations and financial performance.
There is risk that onerous conditions may be attached to authorizations in the form of mining rights, water-use licenses, miscellaneous licenses and environmental approvals, or that the grant of these approvals may be delayed or not granted.
Our TiO2 products are subject to increased regulatory scrutiny, that may impede or inhibit widespread usage of TiO2 and / or diminish the Company’s ability to sustain or grow its business or may add significant costs of doing business.
Current regulatory and societal demands for increased protection against products which may cause cancer, genetic mutations or other long-term health problems are resulting in increased pressure for more stringent regulation of our TiO2 products. We expect these trends to continue and the ultimate cost of compliance could be material. In particular, changes to product safety regulations could limit the use of, and demand for, our TiO2 products, require investment in new product development or the way we manufacture our existing products, and increase regulatory compliance expenditures for us and our suppliers.
For instance, in 2020, the European Commission adopted a regulation classifying certain forms of TiO2 with a particular aerodynamic diameter as a Category 2 carcinogen by inhalation. However, in November 2022, the European Court of Justice annulled the European Commission's classification of TiO2 as a carcinogen primarily on the basis that there was no evidence that TiO2 may cause cancer when inhaled. The European Commission is currently appealing such decision. In the event that the European Commission's appeal is ultimately successful, the classification of TiO2 as a Category 2 Carcinogen could impact our business by inhibiting the marketing of products containing TiO2 to consumers, and subject our manufacturing operations to new regulations that could increase costs. In addition, notwithstanding the European Court of Justice decision, the proposed Category 2 classification and labelling requirements could have additional effects under other EU laws (e.g., those affecting medical and pharmaceutical applications, cosmetics, food packaging and food additives) and/or trigger heightened regulatory scrutiny in countries and local jurisdictions outside the EU based on health and safety grounds. For instance, the Health and Safety Executive in the U.K. has published the U.K.’s mandatory classification and labelling list, which includes the classification of TiO2 as a suspected carcinogen (in a powder form containing 1% or more of particles with aerodynamic diameter ≤ 10 μm). The classification became mandatory in the U.K. in October 2021.
In May 2021, the European Food Safety Authority (EFSA) announced new guidelines which concluded that a certain digestible form of TiO2 known as E171 is no longer considered safe as a food additive due to uncertainty for genotoxicity. Though we do not manufacture E171, the EFSA guidelines indicate additional regulatory review of our TiO2 products is likely which could result in more stringent qualifications and use-restriction being applied or to the introduction of further classifications. It is also possible that heightened regulatory scrutiny could lead to claims by consumers or those involved in the production of such products alleging adverse health impacts. In addition, there is no assurance that other materials which we add to our TiO2 products could also be subject to increased regulation which could impact the cost of labelling or the sales of our products. For instance, certain of our plastic grades are used in food contact materials and in October 2022, the European Commission launched a public consultation aiming to revise the European Union regulations on food contact materials. While the outcome of such consultation remains uncertain, any additional regulatory requirements on the use of food contact materials ultimately imposed by the European Commission could have a material adverse effect on our business, financial condition and results of operations.
ESG issues, including those related to climate change and sustainability, may subject us to additional costs and restrictions, including increased energy and raw material costs, which could have an adverse effect on our business, financial condition and results of operations, as well as damage our reputation.
Climate change resulting from increased concentrations of carbon dioxide and other greenhouse gases in the atmosphere could present risks to our present and future operations from natural disasters and extreme weather conditions, such as flooding, hurricanes, earthquakes and wildfires. Such extreme weather conditions could pose physical risks to our facilities and disrupt the operation of our supply chain, increase operational costs and have a material adverse effect on our business and results of operations. In addition, if any of the equipment on which we depend were severely damaged or were destroyed by environmental hazards or otherwise, we may be unable to replace or repair it in a timely manner or at a reasonable cost, which would impact our ability to produce and ship our products, which would have a material adverse effect on our business, financial condition or results of operations. For instance, in the fourth quarter of 2022, the region of New South Wales, Australia where our Eastern Operations mining operations are located experienced historic flooding which resulted in, among other things, a delay in the commissioning of our new Atlas Campaspe mine as well as prevented feedstock mined at such sites from being transported to our Australian pigment plants in a timely manner. Such flooding had an adverse effect on our business, financial condition and results of operations in 2022 and 2023. Moreover, the impacts of climate change on global water resources may result in water scarcity, which could impact our ability to access sufficient quantities of water in certain locations and result in increased costs. For instance, we use significant amounts of water in our South Africa operations. Certain regions of South Africa have experienced in the past, and are prone to, drought conditions resulting in water restrictions being imposed in such areas. A prolonged drought in a region of South Africa where our operations are located may lead to water use restrictions which could have a material adverse effect on our business, financial condition and results of operations.
The majority of our greenhouse gas emissions are generated from our TiO2 slag furnaces in South Africa, synthetic rutile kiln in Australia, and TiO2 pigment plants in the United States, United Kingdom, France, Brazil, China, Netherlands, Australia, and Saudi Arabia. Concerns about the relationship between greenhouse gases and global climate change, and an increased focus on carbon neutrality, may result in new or increased legal and regulatory requirements on both national and supranational levels, to monitor, regulate, control and tax emissions of carbon dioxide and other greenhouse gases. A number of governmental bodies have already introduced, or are contemplating, regulatory changes in response to climate change, including regulating greenhouse gas emissions. Any laws or regulations that are adopted to reduce emissions of greenhouse gases could, among other things, (i) cause an increase to our raw material costs, (ii) increase our costs to operate and maintain our facilities including potentially causing the operation or maintenance of certain sites to be uneconomical, and (iii) increase costs to administer and manage emissions programs.
In addition, companies across all industries are facing increasing scrutiny relating to their ESG policies. Increased focus and activism related to ESG may hinder the Company’s access to capital, as investors may reconsider their capital investment as a result of their assessment of the Company’s ESG practices. In particular, customers, investors and other stakeholders are increasingly focusing on environmental issues, including climate change, water use, and other sustainability concerns. Moreover, increased regulatory requirements, including in relation to various aspects of ESG including disclosure requirements, may result in increased compliance or input costs of energy, raw materials or compliance with emissions standards, which may cause disruptions in the manufacture of our products or an increase in operating costs. Any failure to achieve our ESG goals or a perception of our failure to act responsibly with respect to the environment or to effectively respond to new, or changes in, legal or regulatory requirements concerning environmental or other ESG matters, or increased operating or manufacturing costs due to increased regulation, could adversely affect our business, financial condition and results of operations, as well as our reputation.
If our intellectual property were compromised or copied by competitors, or if competitors were to develop similar intellectual property independently, our results of operations could be negatively affected. Further, third parties may claim that we infringe on their intellectual property rights which could result in costly litigation.
Our success depends to a significant degree upon our ability to protect and preserve our patents and unpatented proprietary technology, operational knowledge and other trade secrets (collectively "intellectual property rights"). The undetected or unremedied unauthorized use of our intellectual property rights or the legitimate development or acquisition of intellectual property related to our industry by third parties could reduce or eliminate any competitive advantage we have as a result of our intellectual property rights. If we must take legal action to protect, defend or enforce our intellectual property rights, any suits or proceedings could result in significant costs and diversion of our resources and our management’s attention, and we may not prevail in any such suits or proceedings. A failure to protect, defend or enforce our intellectual property rights could have an adverse effect on our financial condition and results of operations.
Although there are currently no pending or threatened proceedings or claims known to us that are material relating to alleged infringement, misappropriation or violation of the intellectual property rights of others, we may be subject to legal proceedings and claims in the future in which third parties allege that their patents or other intellectual property rights are infringed, misappropriated or otherwise violated by us or our products or processes. In the event that any such infringement, misappropriation or violation of the intellectual property rights of others is found, we may need to obtain licenses from those parties or substantially re-engineer our products or processes to avoid such infringement, misappropriation or violation. We might not be able to obtain the necessary licenses on acceptable terms or be able to re-engineer our products or processes successfully. Moreover, if we are found by a court of law to infringe, misappropriate or otherwise violate the intellectual property rights of others, we could be required to pay substantial damages or be enjoined from making, using or selling the infringing products or technology. We also could be enjoined from making, using or selling the allegedly infringing products or technology pending the final outcome of the suit. Any of the foregoing could adversely affect our financial condition and results of operations.
We may be subject to litigation, the disposition of which could have a material adverse effect on our results of operations.
The nature of our operations exposes us to possible litigation claims, including disputes with competitors, customers, equipment vendors, environmental groups and other non-governmental organizations, and providers of shipping services. Some of the lawsuits may seek fines or penalties and damages in large amounts, or seek to restrict our business activities. Because of the uncertain nature of any litigation and coverage decisions, we cannot predict the outcome of these matters or whether insurance claims may mitigate any damages to us. Litigation is very costly, and the costs associated with prosecuting and defending litigation matters could have a material adverse effect on our results of operations and financial condition. See Note 18 of notes to our consolidated financial statements, included elsewhere in this Form 10-K for further information regarding our commitments and contingencies.
Our flexibility in managing our labor force may be adversely affected by labor and employment laws in the jurisdictions in which we operate, many of which are more onerous than those of the U.S.; and some of our labor force has substantial workers' council or trade union participation, which creates a risk of disruption from labor disputes and new laws affecting employment policies.
The vast majority of our employees are located outside the U.S. In most of those countries, labor and employment laws are more onerous than in the U.S. and, in many cases, grant significant job protection to employees, including rights on termination of employment. Moreover, many of our workforce outside the U.S. belong to unions and/or are represented by a collective bargaining agreement. As such, in such jurisdictions we are required to consult with, and seek the consent or advice of, various employee groups or works’ councils that represent our employees for any changes to our activities or employee benefits. This requirement could have a significant impact on our flexibility in managing costs and responding to market changes.
RISKS RELATING TO ACCOUNTING AND TAXATION
If our intangible assets or other long-lived assets become impaired, we may be required to record a significant noncash charge to earnings.
We have a significant amount of intangible assets and other long-lived assets on our consolidated balance sheets. Under U.S. GAAP, we review our intangible assets and other long-lived assets for impairment when events or changes in circumstances indicate the carrying value may not be recoverable. Factors that may be considered a change in circumstances, indicating that the carrying value of our intangible assets and other long-lived assets may not be recoverable, include, but are not limited to, a significant decline in share price and market capitalization, changes in the industries in which we operate, particularly the impact of a downturn in the global economy, as well as competition or other factors leading to reduction in expected long-term sales or results of operations. We may be required to record a significant noncash charge in our financial statements during the period in which any impairment of our intangible assets and other long-lived assets is determined, negatively impacting our results of operations.
Our ability to use our tax attributes to offset future income may be limited.
Our ability to use net operating losses (“NOLs”) and Section 163(j) interest expense carryforwards generated by us could be substantially limited if we were to experience an “ownership change” as defined under Section 382 of the U.S. Internal Revenue Code of 1986, as amended ("the Code"). In general, an ownership change would occur if our “5-percent shareholders,” as defined under Section 382 of the Code and including certain groups of persons treated as “5-percent shareholders,” collectively increased their ownership in us by more than 50 percentage points over a rolling three-year period. Although we believe we have sufficient protection of our approximately $4.3 billion of NOLs and/or approximately $646 million of Section 163(j) interest expense carryforwards, there can be no assurance that an ownership change for U.S. federal and applicable state income tax purposes will not occur in the future. A corporation that experiences an ownership change will generally be subject to an annual limitation on the use of certain pre-ownership change losses and/or credits. Such a limitation could, for any given year, have the effect of increasing the amount of our U.S. federal and/or state income tax liability, which would negatively impact our financial condition and the amount of after-tax cash available for distribution to holders of our ordinary shares if declared by our board of directors.
We could be subject to changes in tax rates, adoption of new tax laws or additional tax liabilities.
We are subject to taxation in all of the jurisdictions in which we operate. Our future effective tax rate could be affected by, among other things, changes in statutory rates and other legislative changes, or changes in determinations regarding the jurisdictions in which we are subject to tax or changes in the valuation of our deferred tax assets and liabilities. From time to time, the U.S. federal, state and local and foreign governments make substantive changes to tax rules and their application, which could result in higher corporate taxes than would be incurred under existing tax law and could have an adverse effect on our results of operations or financial condition. From time to time, we are also subject to tax audits by various taxing authorities. Although we believe our tax positions are appropriate, the final determination of any future tax audits could be materially different from our income tax provisions, accruals and reserves and any such unfavorable outcome from a future tax audit could have a material adverse effect on our results of operations or financial condition.
Failure to meet some or all of our key financial and non-financial targets could negatively impact the value of our business and adversely affect our stock price.
From time to time, we may announce certain key financial and non-financial targets that are expected to serve as benchmarks for our performance for a given time period, such as, projections for our future revenue growth, Adjusted EBITDA, Adjusted diluted earnings per share and free cash flow. Our failure to meet one or more of these key financial targets may negatively impact our results of operations, stock price, and shareholder returns. The factors influencing our ability to meet these key financial targets include, but are not limited to, changes in the global economic environment relating to our TiO2 products and zircon, changes in our competitive landscape, including our relationships with new or existing customers, our ability to introduce new products, applications, or technologies, our inability to complete strategic projects on budget or on schedule, our undertaking an acquisition, joint venture, or other strategic arrangement, and other factors described within this Item 1A – Risk Factors, many of which are beyond our control.
RISKS RELATING TO INVESTING IN OUR ORDINARY SHARES
Concentrated ownership of our ordinary shares by Cristal may prevent minority shareholders from influencing significant corporate decisions and may result in conflicts of interest.
As of December 31, 2023, Cristal International Holdings B.V. (formerly known as Cristal Inorganic Chemical Netherlands Cooperatief W.A.), an affiliate of the National Titanium Dioxide Company Limited ("Cristal"), owned approximately 24% of our outstanding ordinary shares. As such, Cristal International may be able to influence fundamental corporate matters and transactions. This concentration of ownership, may delay, deter or prevent acts that would be favored by our other shareholders. The interests of Cristal International may not always coincide with our interests or the interests of our other shareholders. Also, Cristal International may seek to cause us to take courses of action that, in their judgment, could enhance their investment in us, but which might involve risks to our other shareholders or adversely affect us or our other shareholders.
In addition, under the shareholders agreement (the “Cristal Shareholders Agreement”) we entered into at the closing of the Cristal transaction with Cristal, as long as Cristal International and the three shareholders of Cristal (collectively, the “Cristal Shareholders”) collectively beneficially own at least 24,900,000 or more of our ordinary shares, they have the right to designate for nomination two directors of our board of directors (the “Board”). As long as the Cristal Shareholders collectively beneficially own at least 12,450,000 ordinary shares but less than 24,900,000 ordinary shares, they have the right to designate for nomination one director of the Board. The Cristal Shareholders Agreement also provides that as long as the Cristal Shareholders collectively beneficially own at least 12,450,000 ordinary shares they have certain preemptive rights. Also, pursuant to the Cristal Shareholders Agreement, we have filed a universal shelf registration statement which is currently effective and which would cover shares owned by Cristal.
As a result of these or other factors, including as a result of any offering of shares by Cristal, or the perception that such sales may occur, the market price of our ordinary shares could decline. In addition, this concentration of share ownership may adversely affect the trading price of our ordinary shares because investors may perceive disadvantages in owning shares in a company with significant shareholders or with significant outstanding shares with registration rights.
English law and provisions in our articles of association may have anti-takeover effects that could discourage an acquisition of us by others, even if an acquisition would be beneficial to our shareholders, and may prevent attempts by our shareholders to replace or remove our current management.
Certain provisions of the U.K. Companies Act 2006 (the “Companies Act”) and our articles of association may have the effect of delaying or preventing a change in control of us or changes in our management. For example, our articles of association include provisions that:
•maintain an advance notice procedure for proposed nominations of persons for election to our board of directors;
•provide certain mandatory offer provisions, including, among other provisions, that a shareholder, together with persons acting in concert, that acquires 30 percent or more of our issued shares without making an offer to all of our other shareholders that is in cash or accompanied by a cash alternative would be at risk of certain sanctions from our board of directors unless they acted with the prior consent of our board of directors or the prior approval of the shareholders; and
•provide that vacancies on our board of directors may be filled by a vote of the directors or by an ordinary resolution of the shareholders.
In addition, public limited companies are prohibited under the Companies Act from taking shareholder action by written resolution. These provisions, alone or together, could delay or prevent hostile takeovers and changes in control or changes in our management.
Although we do not anticipate being subject to the U.K. City Code on Takeovers and Mergers, such Takeover Code may still have anti-takeover effects in the event the Takeover Panel determines that such Code is applicable to us.
The U.K. City Code on Takeovers and Mergers (the “Takeover Code”) applies, among other things, to an offer for a public company whose registered office is in the U.K. (or the Channel Islands or the Isle of Man) and whose securities are not admitted to trading on a regulated market in the U.K. (or on any stock exchange in the Channel Islands or the Isle of Man) if the company is considered by the Panel on Takeovers and Mergers (the “Takeover Panel”) to have its place of central management and control in the U.K. (or the Channel Islands or the Isle of Man). This is known as the “residency test.” The test for central management and control under the Takeover Code is different from that used by the U.K. tax authorities. Under the Takeover Code, the Takeover Panel will determine whether we have our place of central management and control in the U.K. by looking at various factors, including the structure of our board of directors, the functions of the directors and where they are resident.
Given that currently all of the members of our Board of Directors reside outside the United Kingdom, we do not anticipate that we will be subject to the Takeover Code. However, if at the time of a takeover offer, the Takeover Panel determines that we have our place of central management and control in the U.K., we would be subject to a number of rules and restrictions, including but not limited to the following: (1) our ability to enter into deal protection arrangements with a bidder would be extremely limited; (2) we might not, without the approval of our shareholders, be able to perform certain actions that could have the effect of frustrating an offer, such as issuing shares or carrying out acquisitions or disposals; and (3) we would be obliged to provide equality of information to all bona fide competing bidders.
As a public limited company incorporated in England and Wales, certain capital structure decisions requires approval of our shareholders, which may limit our flexibility to manage our capital structure.
The Companies Act generally provides that a board of directors of a public limited company may only allot shares (or grant rights to subscribe for or convertible into shares) with the prior authorization of shareholders, such authorization stating the maximum amount of shares that may be allotted under such authorization and specifying the date on which such authorization will expire, being not more than five years, each as specified in the articles of association or relevant shareholder resolution. We obtained previous shareholder authority to allot additional shares for a period from May 3, 2023 through the end of the Company's 2024 annual general meeting of shareholder, or if earlier, the close of business on the date that is fifteen (15) months after May 3, 2023.
The Companies Act generally provides that existing shareholders of a company have statutory pre-emption rights when new shares in such company are allotted and issued for cash. However, it is possible for such statutory pre-emption right to be disapplied by either shareholders passing a special resolution at a general meeting, being a resolution passed by at least 75% of the votes cast, or by inclusion of relevant provisions in the articles of association of the company. Such a disapplication of statutory pre-emption rights may not be for more than five years. We obtained previous shareholder authority to disapply statutory pre-emption rights for a period from May 3, 2023 through the end of the Company's 2024 annual general meeting of shareholder, or if earlier, the close of business on the date that is fifteen (15) months of May 3, 2023.
The Companies Act generally prohibits a public limited company from repurchasing its own shares without the prior approval of its shareholders by ordinary resolution, being a resolution passed by a simple majority of votes cast, and subject to compliance with other statutory formalities. Such authorization may not be for more than five years from the date on which such ordinary resolution is passed. We obtained previous shareholder authority to repurchase shares for a period from May 3, 2023 through the end of the Company's 2024 annual general meeting of shareholder, of if earlier, the close of business on the date that is fifteen (15) months after May 3, 2023.
Transfers of our ordinary shares outside The Depository Trust may be subject to stamp duty or stamp duty reserve tax in the U.K., which would increase the cost of dealing in our shares.
Except for ordinary shares received by a holder deemed to be an affiliate of us for purposes of U.S. securities laws, our ordinary shares have been issued to a nominee for The Depository Trust Company (“DTC”) and corresponding book-entry interests credited in the facilities of DTC. On the basis of current law and HM Revenue and Customs (“HMRC”) practice, no charges to U.K. stamp duty or stamp duty reserve tax (“SDRT”) are expected to arise on the issue of the ordinary shares into DTC’s facilities or on transfers of book-entry interests in ordinary shares within DTC’s facilities.
Shareholders are strongly encouraged to hold their ordinary shares in book entry form through DTC. Transfers of shares held in book entry form through DTC currently do not attract a charge to stamp duty or SDRT in the U.K. A transfer of title in the shares from within the DTC system out of DTC, including to certificate shares, and any subsequent transfers that occur entirely outside the DTC system will attract a charge to stamp duty at a rate of 0.5% of any consideration, which is payable by the transferee of the shares.
Any such duty must be paid (and the relevant transfer document, if any, stamped by HMRC) before the transfer can be registered in our books. However, if those shares are redeposited into DTC, the redeposit will attract stamp duty or SDRT at the rate of 1.5% to be paid by the transferor.
We have put arrangements in place such that directly held ordinary shares cannot be transferred into the DTC system until the transferor of the ordinary shares has first delivered the ordinary shares to a depositary specified by us so that SDRT may be collected in connection with the initial delivery to the depositary. Any such ordinary shares will be evidenced by a receipt issued by the depositary. Before the transfer can be registered in our books, the transferor will also be required to put the depositary in funds to settle the resultant liability to SDRT, which will be charged at a rate of 1.5% of the value of the shares.
Our articles of association provide that the courts of England and Wales have exclusive jurisdiction to determine any dispute brought by a shareholder in that shareholder's capacity as such and certain other matters.
Our articles of association provide that the courts of England and Wales have exclusive jurisdiction to determine any dispute brought by a shareholder in that shareholder's capacity as such, or related to or connected with any derivative claim in respect of a cause of action vested in us or seeking relief on our behalf, against us and/or the board and/or any of the directors, former directors, officers, employees or shareholders individually, arising out of or in connection with our articles of association or (to the maximum extent permitted by applicable law) otherwise. This choice of forum provision may limit a shareholder's ability to bring a claim in a judicial forum that the shareholder believes is favorable for disputes with us or our directors, former directors, officers, employees or shareholders which may discourage lawsuits against us and our directors, former directors, officers, employees or shareholders.
There may be difficulty in effecting service of legal process and enforcing judgments against us and our directors and management.
We are incorporated under the laws of England and Wales and a substantial portion of our assets are located outside of the U.S. The U.S. and the U.K. do not currently have a treaty providing for the recognition and enforcement of judgments, other than arbitration awards, in civil and commercial matters. The enforceability of any judgment of a U.S. federal or state court in the U.K. will depend on the laws and any treaties in effect at the time, including conflicts of laws principles (such as those bearing on the question of whether a U.K. court would recognize the basis on which a U.S. court had purported to exercise jurisdiction over a defendant). In this context, there is doubt as to the enforceability in the U.K. of civil liabilities based solely on the federal securities laws of the U.S. In addition, awards for punitive damages in actions brought in the U.S. or elsewhere may be unenforceable in the U.K.. An award for monetary damages under U.S. securities laws would likely be considered punitive if it did not seek to compensate the claimant for loss or damage suffered and was intended to punish the defendant.
Item 1B. Unresolved Staff Comments
None.
Item 1C. Cybersecurity
Risk Management and Strategy
As part of our overall risk management system we maintain comprehensive policies and processes for assessing, identifying and managing material risks from cybersecurity threats, including risks relating to production, safety, reputation, intellectual property, procurement and business continuity. Cybersecurity risk management is included as part of our overall annual Enterprise Risk Management program. As part of this program, our enterprise risk professionals consult with internal cybersecurity subject matter experts to identify cyber risks and evaluate their severity and the efficacy of our mitigation efforts, with the results being reported to the executive leadership team and the Board of Directors.
Our cybersecurity risk management processes and policies include the following:
•We seek to deploy best practice cybersecurity standards promulgated by the National Institute of Standards and Technology Cybersecurity (NIST), the International Organization for Standardization and the Center for Internet Security.
•We employ a dedicated cybersecurity team who routinely conduct specific risk assessments and endeavor to mitigate identified risks. This team is responsible for implementing measures to detect, prevent and respond to threats and malicious activity. We also maintain a Security Operations Center (SOC) that provides a mechanism for addressing cyberthreats before they comprise data security.
•The cybersecurity team operates, maintains and monitors an integrated eco-system of security tools designed to detect, prevent and respond to threats and malicious activity. These tools include, but are not limited to, next generation firewalls, anti-malware, IPS / IDS, end point protection, encryption, email and cloud app security, privileged access management, vulnerability scanning / patching. These are a blend of on-premise, cloud and network hosted tools. Monitoring activities include threat hunting and use of multiple intelligence sources to manage and respond to events.
•Access to information is subject to authorization, review, classification and substantially controlled through multi-factor authentication.
•All employees and contractors who are issued a Tronox user account for our IT system must complete and pass cybersecurity training before being provided full system access.
•All employees and contractors with access to our IT systems must complete and pass a mandatory annual cybersecurity awareness training and acknowledgement of Tronox’s Acceptable Use Policy. Failure to complete the training successfully may result in further system access restrictions and HR escalation.
•We periodically orchestrate simulated phishing attacks on all IT system users and those who fall victim to the simulated attacks are required to take additional mandatory cybersecurity training.
•To reduce the risk of phishing attacks, we have identified groups of Tronox employees and contractors who do not require access to external emails in order to perform their work responsibilities and begun a process of blocking their external emails.
•We have a written Incident Response Plan that encompasses a range of activities to detect, respond to and recover from cybersecurity incidents, including compliance with applicable legal obligations and mitigation damage.
•We work closely with a number of regional and international bodies from which we draw intelligence and contribute to cybersecurity initiatives such as incident simulation exercises and development working groups.
•We regularly evaluate the appropriateness of cyber insurance coverage in light of the cyber risks we face and we do not currently carry cyber insurance.
Additionally, in connection with our cybersecurity risk management processes, we engage third-party subject matter experts to supplement our dedicated internal resources and to provide independent review of the Tronox-specific threat landscape as well as our mitigation efforts to counter known threats. These activities include:
•External penetration testing by certified third parties.
•Independent review of the Tronox Information Security Management System (ISMS).
•Participating in industry and government cyber incident exercises run by the National Cyber Security Center (UK Security Services).
•Utilizing a third party (KnowBe4) for the cybersecurity training and phishing tests described above.
•Regularly engaging with statutory auditors in support of specific activities such as SOX 404 audits.
•Engaging outside counsel with expertise in the field to advise on critical IT contracts as well as reporting and disclosure requirements.
Our cybersecurity risk management policies and processes extend to cyber risks posed by our third-party service providers. To manage that risk we have implemented a process to identify critical vendors and perform a reasonable level of due diligence on the adequacy of their cybersecurity policies, processes and capabilities.
Our business strategy, results of operations and financial condition have not been materially affected by risks from cybersecurity threats, including as a result of previous cybersecurity incidents, but we cannot provide assurance that they will not be materially affected in the future by such risks and any future material incidents. Like most major corporations we have been the target of cyberattacks from time to time and we expect to be the target of such attacks in the future. In the past three years, however, we have not experienced a material information security breach. As such, we have not incurred any material expenses from cybersecurity breaches or any expenses from fines, penalties or settlements related to a cybersecurity breach. See “Risk Factors” in Item 1A of this Annual Report on Form 10-K for more information on risks from cybersecurity threats that are reasonably likely to materially affect our business strategy, results of operations and financial condition.
Governance
Our entire Board of Directors provides oversight of the Company’s cybersecurity policies, processes and capabilities as part of their overall oversight of risk management. Once a year, our Vice President, Cyber Security reports to the Audit Committee providing a detailed update on the threat landscape, emerging trends and the Company’s mitigation efforts. This report also includes Tronox’s performance as measured by the NIST Cybersecurity Framework Scorecard. As needed on a periodic basis, our Vice President, Cyber Security updates the Audit Committee on specific cybersecurity events and newly emerging risks and the actions taken by the Company in response to those events and risks. The Audit Committee updates the full board on these matters as necessary. The full Board reviews and assesses cybersecurity risks in connection with its annual Enterprise Risk Management review.
In 2020, Tronox established an IT Security Council to help set corporate risk tolerance and related policy. The council meets quarterly, is chaired by the General Counsel and managed by our Vice President, Cyber Security with senior level representation from key functions and business units. On an annual basis, the Tronox Cybersecurity team reviews and updates the core governance documents, including the Acceptable Use Policy, the Information Security Policy, and the Incident Response Plan. These are then subject to review and approval by the Tronox Security Council with a summary provided to the Audit Committee as a component of the annual cybersecurity Enterprise Risk Management.
Day to day cybersecurity risk oversight governance is the responsibility of our Vice President, Cyber Security who has been with Tronox since 2017 and reports to our Senior Vice President, Integrated Supply Chain and Digital Transformation. Tronox’s Vice President, Cyber Security has over 30 years of IT experience, 20 years of security experience and was awarded a Member of the British Empire honor with respect to his work in the field. Previous roles include Interim Chief Information Security Office for Pacnet (Hong Kong) and Director of Security for Level 3 Communications along with multiple engagements for the UK government. He oversees a dedicated security team distributed globally with more than 15 members and over 100 years of aggregate cyber security experience.
Item 2. Properties
SUMMARY DISCLOSURE
Below are our primary offices and facilities at December 31, 2023. We believe our properties are in good operating condition, and are well maintained. Pursuant to separate financing agreements, substantially all our material U.S., European and Australian properties are pledged or encumbered to support or otherwise provide security for our indebtedness.
Our primary office locations consisted of the following:
|
|
|
|
|
|
|
|
|
|
|
|
|
|
|
| Location |
|
Owned/Leased |
|
Offices |
| Stamford, Connecticut |
|
Leased |
|
263 Tresser Boulevard, Suite 1100 |
| Stallingborough, United Kingdom |
|
Owned |
|
Laporte Road |
| Oklahoma City, Oklahoma |
|
Owned |
|
3301 NW 150 Street |
Overview of Our Vertical Integration
Tronox is the world's leading vertically integrated manufacturer of TiO2 pigment. We produce the majority of our internal TiO2 pigment feedstock requirements internally at our mine and mineral processing facilities. Our supply chain consists of mining operations in South Africa and Australia, separation and upgrading facilities located near our mines where we separate and process raw ore and then “upgrade” the titanium content of the raw ore to produce specialized chloride TiO2 feedstock materials (titanium slag and synthetic rutile) and nine TiO2 pigment production facilities located on six continents. The internal TiO2 feedstocks we produce include titanium slag, synthetic rutile, natural rutile, leucoxene, chloride ilmenite and sulfate ilmenite.
As part of our TiO2 value chain, we explore, acquire, mine and process heavy mineral sands to produce Heavy Mineral Concentrate (“HMC”) from which the Valuable Heavy Mineral (VHM) titanium and zircon products are made. HMC is produced from heavy mineral sands primarily through spiral gravity concentration at our mines. Mined material is transported to our nearby integrated mineral separation plants (MSP) to separate and concentrate VHMs by gravity, magnetic and electrostatic techniques. Multiple grades of titanium minerals and zircon may be produced from each MSP. The three titanium feedstocks which result from the MSP process (natural rutile, leucoxene and ilmenite) are each handled differently. Natural rutile and leucoxene are ordinarily shipped from the MSP to one of our TiO2 pigment production facilities. Depending on the TiO2 content of mined ilmenite, we either use it directly to produce TiO2 pigment or we upgrade it to produce titanium slag at our two South African smelter operations and synthetic rutile (SR) at our Chandala metallurgical complex in Western Australia. Our internally sourced titanium mineral products provide a secure, long-term low-cost supply of high-grade feedstock for our TiO2 pigment manufacturing facilities.
There is a high degree of substitutability among natural rutile, synthetic rutile, titanium slag, leucoxene and chloride ilmenite as titanium feedstocks for chloride pigment production. The commercial value of titanium feedstock is a function not only of TiO2 content and supply and demand balances, but also particle size, trace element geochemistry, logistics and other factors. The global TiO2 industry is a value-added supply chain, with final product prices for TiO2 pigment, typically significantly higher than that of chloride or sulfate ilmenite, the backbone of the global titanium mineral supply. The revenue assumptions for titanium feedstocks we applied to determine our reserve estimates, as described below, are based on market intelligence gathered from internal and external experts, sales contracts and historic pricing. The economic assessment is done on a minerals only basis and no value of downstream upgrading is attributed to the minerals units.
In 2023, we produced concentrates of ilmenite, rutile, leucoxene, and zircon from five operations:
–Namakwa Sands, Western Cape, South Africa;
–KwaZulu-Natal (“KZN”) Sands, KwaZulu-Natal, South Africa;
–Northern Operations, Western Australia;
–Southern Operations, Western Australia; and
–Eastern Operations, Murray Basin, New South Wales, Australia.
Ilmenite from our Namakwa and KZN Sands mines in South Africa is converted to titanium slag at our smelters at Saldanha Bay, Western Cape and Empangeni, KwaZulu-Natal, respectively. Ilmenite from our Cooljarloo mine in Western Australia is converted to SR at our Chandala metallurgical complex which is most commonly used as feedstock to our TiO2 pigment plants at Kwinana and Kemerton, both of which are south of Perth in Western Australia.
Mining Operations
Tronox owns and operates six mining and mineral processing operations, each including one or more heavy mineral sand (“HMS”) mines producing HMC which is separated into valuable co-products, primarily zircon and TiO2 feedstocks --- ilmenite, natural rutile or leucoxene --- in a dedicated mineral separation plant.
In South Africa, the Namakwa Sands operations include two open-pit mines at Brand-se-Baai, each with a dedicated primary gravity concentration plant and a secondary concentration plant (SCP) that processes the HMC from both primary plants. Products from the SCP are further processed to finished mineral products at a nearby MSP in Koekenaap. Ilmenite product is further processed into titanium slag and pig iron at a two-furnace smelter at Saldanha, Western Cape, South Africa which is two hundred kilometers south of Koekenaap. The KZN operations have an open pit hydraulic mine at Fairbreeze with a primary gravity concentration plant, a MSP at nearby Empangeni alongside a two-furnace smelter complex, and export facilities at the port of Richards Bay.
In Australia, the Northern Operations consist of the Cooljarloo dredge mine and floating primary gravity concentration plant, and the Chandala metallurgical complex, consisting of a mineral separation plant and SR plant. The Southern Operations consist of a dry open pit mine and primary concentration at Wonnerup and a mineral separation plant at Bunbury.
The Eastern Operations in the Murray Basin of Australia includes one operating dredge mine at Ginkgo which is supplemented by a dry open pit mine at Crayfish, a dry open pit mine at Atlas Campaspe and a mineral separation plant at Broken Hill, NSW. The Snapper mine ceased production in April 2022 after 12 years of production. The Gingko and Crayfish mines are expected to be mined until mid-2024. Construction at Atlas commenced in 2022 and ramped up to full production in the first quarter of 2023. The Atlas Campaspe mine is abundant in natural rutile and high value zircon and will be a significant source of high-grade ilmenite suitable for direct use or upgraded feedstock production.
Figure 1 Showing global site and offices including locations with resources and reserves.
Pigment Operations
Our pigment production facilities utilize the titanium mineral feedstock from our mining and processing operations to produce TiO2 pigment products. The following table lists our TiO2 pigment production facilities and capacity (in metric tonnes per year), by location:
|
|
|
|
|
|
|
|
|
|
|
|
|
|
|
|
|
|
|
|
|
| Facility |
|
Production |
|
TiO2
Capacity |
|
Process |
| Hamilton, Mississippi, USA |
|
TiO2 |
|
225,000 |
|
|
Chloride |
| Yanbu, Saudi Arabia |
|
TiO2 |
|
200,000 |
|
|
Chloride |
| Stallingborough, England, United Kingdom |
|
TiO2 |
|
165,000 |
|
|
Chloride |
| Kwinana, Western Australia |
|
TiO2 |
|
150,000 |
|
|
Chloride |
| Kemerton, Western Australia |
|
TiO2 |
|
110,000 |
|
|
Chloride |
| Botlek, the Netherlands |
|
TiO2 |
|
90,000 |
|
|
Chloride |
| Salvador, Bahia, Brazil |
|
TiO2 |
|
60,000 |
|
|
Sulfate |
| Fuzhou, Jiangxi Province, China |
|
TiO2 |
|
46,000 |
|
|
Sulfate |
| Thann, Alsace, France |
|
TiO2 |
|
32,000 |
|
|
Sulfate |
Aggregate Annual Production
TRONOX MINERAL SAND - AGGREGATE MINERAL PRODUCTION FOR THE PAST THREE YEARS
(metric tonnes per year)
|
|
|
|
|
|
|
|
|
|
|
|
|
|
|
|
|
|
|
|
|
| Product |
|
2023 |
|
2022 |
|
2021 |
Rutile(1) |
|
|
|
|
|
|
| Australia |
|
|
|
|
|
|
| Cooljarloo |
|
15,453 |
|
|
18,850 |
|
|
25,519 |
|
| Atlas-Campaspe |
|
61,576 |
|
|
— |
|
|
— |
|
| South Africa |
|
|
|
|
|
|
| Namakwa Sands |
|
27,929 |
|
|
31,304 |
|
|
28,994 |
|
| KZN Sands |
|
18,427 |
|
|
16,326 |
|
|
21,478 |
|
| All Other Properties |
|
29,154 |
|
|
92,644 |
|
|
65,603 |
|
| Total |
|
152,539 |
|
|
159,124 |
|
|
141,594 |
|
Ilmenite(2) |
|
|
|
|
|
|
| Australia |
|
|
|
|
|
|
| Cooljarloo |
|
126,675 |
|
|
143,049 |
|
|
185,481 |
|
| Atlas-Campaspe |
|
172,079 |
|
|
— |
|
|
— |
|
| South Africa |
|
|
|
|
|
|
| Namakwa Sands |
|
532,538 |
|
|
567,050 |
|
|
408,471 |
|
| KZN Sands |
|
318,771 |
|
|
290,407 |
|
|
429,271 |
|
| All Other Properties |
|
94,649 |
|
|
155,593 |
|
|
167,758 |
|
| Total |
|
1,244,712 |
|
|
1,156,099 |
|
|
1,190,981 |
|
Zircon(3) |
|
|
|
|
|
|
| Australia |
|
|
|
|
|
|
| Cooljarloo |
|
18,995 |
|
|
21,694 |
|
|
27,490 |
|
| Atlas-Campaspe |
|
25,763 |
|
|
— |
|
|
— |
|
| South Africa |
|
|
|
|
|
|
| Namakwa Sands |
|
89,803 |
|
|
107,967 |
|
|
112,844 |
|
| KZN Sands |
|
30,974 |
|
|
31,839 |
|
|
40,368 |
|
| All Other Properties |
|
14,376 |
|
|
38,233 |
|
|
39,123 |
|
| Total |
|
179,911 |
|
|
199,733 |
|
|
219,825 |
|
HMC(4) |
|
|
|
|
|
|
| Australia |
|
|
|
|
|
|
| Cooljarloo |
|
231,969 |
|
|
265,982 |
|
|
316,942 |
|
| Atlas-Campaspe |
|
398,607 |
|
|
— |
|
|
— |
|
| South Africa |
|
|
|
|
|
|
| Namakwa Sands |
|
2,350,156 |
|
|
1,576,618 |
|
|
1,663,243 |
|
| KZN Sands |
|
509,778 |
|
|
429,521 |
|
|
498,502 |
|
| All Other Properties |
|
202,249 |
|
|
321,902 |
|
|
436,146 |
|
| Total |
|
3,692,759 |
|
|
2,594,023 |
|
|
2,914,833 |
|
________________
(1) includes natural rutile + leucoxene
(2) includes multiple grades of TiO2 grades of ilmenite
(3) includes multiple grades of zircon
(4) HMC = Heavy Mineral Concentrate S-K Subpart 1300 requires us to describe our rights to access and mine the minerals we report as reserves and to disclose any change in mineral tenure of material significance.
Mineral Properties
Mining and Mineral Tenure
Our heavy mineral exploration and mining activities in South Africa and Australia are regulated by the South African Department of Mineral Resources, the Western Australia Department of Mines, Industry Regulation and Safety and the New South Wales Department of Planning, Industry and Environment. All exploration and mining activities are subject to multiple levels of environmental regulatory review, including approvals of environmental plans and public comment periods as pre-conditions to granting of mineral tenure.
Mineral Tenure - South Africa
Our two South African mineral sand mining processing chains are operated by Namakwa Sands and KZN Sands, both indirect, wholly-owned subsidiaries of Tronox Holdings plc. The South African Department of Mineral Resources and Energy (“DMRE”) is the regulatory administrator of mineral rights in South Africa, subject to the provisions of the Mineral and Petroleum Resources Development Act (“MPRDA”), No. 28 of 2004, as amended in 2016. The MPRDA vests all mineral rights in South Africa in the national government and establishes conditions for the acquisition and maintenance of prospecting and mining rights. Prospecting rights and mining rights may only be granted by the DMRE. Prospecting rights are granted for a maximum period of five years and can be renewed once for an extension of up to three years. Prospecting rights may be revoked for non-compliance with the terms of the prospecting right.
Mining right applications require additional approvals by the Department of Environmental Affairs (“DEA”) of an Environmental Management Program (“EMP”) and an Integrated Water and Land Use License.
Mining rights are valid for up to 30 years and may be extended by 30-year renewals, subject to compliance with conditions established in the EMP and by the MPRDA. Environmental permitting and compliance are co-administered by the regional offices of DEA and Development Planning. All rights, licenses and permits for Namakwa Sands and KZN Sands are in good standing.
On the Western Cape of South Africa, Tronox holds mining rights over an area of 19,205 hectares (47,457 acres) and surface rights totaling 17,111 hectares (43,542 acres) at the active mining site near Brand-se-Baai, commonly referred to as our Namakwa Sands operation. On the Eastern coast of South Africa, Tronox controls mining and prospecting rights covering approximately 4,041 hectares (9,986 acres) at KZN, where surface access rights are either owned directly by KZN Sands or secured by agreements with Mondi Ltd. A further 4,790 hectares (11,836 acres) of prospecting rights are held by a direct, wholly-owned subsidiary of KZN Sands at the nearby Port Durnford and Waterloo project areas which we are currently in the process of converting into a mining right.
Mineral Tenure - Australia
Our Australian mineral properties are divided into the Northern and Southern Operations on the Swan Coastal Plain of Western Australia and the Eastern Operations in the Murray Basin of New South Wales and Victoria. Mining tenements in Australia are managed at the State or Territorial level. In Western Australia, Mining Leases, Exploration Licenses and Retention Licenses are granted and administered by the Western Australian Department of Mines, Industry Regulation and Safety, and in New South Wales by the NSW Department of Planning, Industry and Environment, under the authority of the Western Australian Mining Act 1978 and the New South Wales Mining Act 1992, respectively. Principal environmental authorities are the Western Australian Department of Water and Environmental Regulation and the NSW Environment Protection Authority.
At the Northern Operations in Western Australia, Tronox controls mining leases, exploration and other licenses and rights covering a total 50,838 hectares (125,623 acres). Mining and Public Environmental Review plans are approved for the Cooljarloo mine and approval to extend the environmental plans for Dongara were recently approved. Environmental Protection Agency approval of Cooljarloo West has also been approved. The main Cooljarloo deposit covers 9,744 hectares (24,078 acres). We hold 14 mining leases at the Dongara project. Three older mining leases are held at our Jurien property, the site of a former heavy minerals open pit mine operated by another party in the 1970’s.
Tronox holds mining and exploration licenses totaling 533,500 hectares (1,318,307 acres) in the South Perth Basin and Murray Basin heavy mineral provinces of Australia.
The Southern Operations in the southwest of Western Australia comprises 29 mining leases, 3 exploration licenses, 3 retention licenses, 2 general purpose leases and 2 miscellaneous licenses totaling 9,100 hectares.
Tronox holds 5 mining leases, 16 exploration licenses and 2 retention licenses in our Eastern Operations in the Murray Basin of New South Wales, Victoria and South Australia. The tenements cover approximately 524,400 hectares (2,025 sq miles). Three mining leases west of Pooncarie, NSW cover approximately 6,720 hectares (16,605 acres) surrounding our active mines at Ginkgo, Crayfish and rehabilitation site at Snapper. One mining lease of 2,330 hectares is at the Atlas Campaspe mining project in NSW.
Mineral Sands - South Africa and Australia
HMS deposits are natural concentrations of granular minerals of high density (conventionally above about 2.85 gm/cm3). Titanium-rich HMS deposit source rocks are typically granitic and/or high-grade metamorphic crystalline rocks. The heavy mineral assemblage of a particular HMS deposit generally reflects the ilmenite, leucoxene, natural rutile and zircon contained in local and regional source rocks. Factors that influence the formation of HMS deposits include erosion of crystalline source rocks, fluvial transport to the coastline, longshore drift, coastal geomorphology, deposition of heavy minerals, and prolonged natural sorting of heavy minerals by water and wind, according to the density, size and shape of HM grains. Post-depositional geological processes that can affect the economic viability of a HMS deposit include in situ weathering, induration of the host sands, and natural preservation or destruction of the HMS deposit.
Not all heavy minerals have commercial value, and a distinction is made between the Total Heavy Minerals (“THM”) and VHM. Typical VHM assemblages include the titanium-iron oxide mineral, ilmenite (FeTiO3); rutile, a premium TiO2 feedstock mineral; leucoxene, a natural alteration product of weathered ilmenite; and zircon, a zirconium silicate (ZrSiO4) valuable for its use in a diverse range of industrial and construction applications. Other HM of commercial value, such as garnet, staurolite, kyanite and monazite, may be recovered as by-products.
Of interest recently is the potential use of monazite, both in contained ore bodies and in stockpiled sources located near the mineral separation processes at Namakwa Sands. Monazite has increasing commercial value due to a high concentration of rare earth metals which can be separated by well-established methods. Rare earths are expected to remain in high demand as demand grows for electric vehicles, wind turbines, and consumer goods that require rare earth-containing permanent magnets. We currently do not know the metallurgical recovery potential for the monazite as our processes have historically focused on traditional value minerals. Given the increasing importance of monazite, we are evaluating new processes to better understand the grade and recoverability of monazite in our mining tenements.
Reporting of Reserves and Resources
The following tables summarize our reserves and resources as well as their contained in situ total heavy minerals (THM) and heavy mineral (HM) assemblages as of December 31, 2023 based on long-term price assumptions. The sole purpose of the operational and related financial data presented is to demonstrate the economic feasibility of the mineral reserves for the purpose of reporting in accordance with subpart 1300 of Regulation S-K, and should not be used for other purposes. The information presented originates from comprehensive techno-economic modelling, which is subject to change as assumptions and inputs are updated, and as a result does not guarantee future operational or financial performance. Consistent with industry standards, Tronox values its mineral reserves based on the prices at which its titanium and zircon mineral products would sell on freely traded markets, as forecasted by third-party industry consultancies.
All of our reserves are reported on the basis of our 100% ownership of in-place, economically extractable ore, determined from comprehensive geological, mining, processing and economic models. Reserve classifications of proven or probable are based on the level of confidence in the appropriate resource estimates. Our residual resources are those areas of mineralized ground which have either had insufficient drilling to confidently define the shape, grade and recoverability of the valuable minerals as well as not yet having been subjected to a detailed assessment of the impact of validated “modifying factors” on the revenue generating potential of a deposit.
Our mineral resource and reserve estimates are based on extensive geological resource models modified by various mining and processing factors and assessed in a techno-economic model for commercial viability. This constitutes a Life-of-Mine-Plan (LOMP) for each operation. Our LOMP and reserve estimates are optimized with respect to anticipated revenues and costs. Assumptions are developed from our extensive experience and include mining parameters, processing recoveries, operating costs, foreign exchange, and rehabilitation. Each of our operations reconcile predicted mining and processing metrics with actual production and recovery data on a monthly basis. Our models are updated as necessary and used to determine ore boundaries based on economic assumptions, certain of which are set forth below the following tables. For reserves where there is substantial asset investment post the minerals production stage, parameters that best utilize the whole value chain may take precedence over maximizing value from the minerals business unit, therefore impacting the optimal mining shell and effective cut-off grade.
Not all HMS deposits are alike. Our reserves, as set forth in the table below, have a higher confidence level because we have undertaken sufficient drilling density and validation. Resources present unconfirmed continuity and variability in grade, HM assemblage, or other characteristics, as well as the indeterminate impact of modifying factors, and hence are not classified as reserves.
Within the broad category of resources, inferred resources have a lower level of geological confidence than do indicated resources with measured resources being the highest confidence level from a geological perspective. Only indicated resources and measured resources can be converted to reserves with proven reserves having a higher level of economically exploitable confidence than probable reserves. The following tables have been determined to be economically- exploitable by individuals competent and qualified to act under the new disclosure requirements as “Qualified Persons.” Each of the Qualified Persons is an employee of an indirect, wholly owned subsidiary of the Company.
For clarity, in the tables below, our reserves have been excised from the resources as they can be proven to be profitably mined and processed. The remaining deposit that exceeds cut-off grade, but have not yet been demonstrated to be profitable by virtue of either recoverable grade, operating cost or capital required to develop, are separately defined as resources.
The decrease in resources at all operating sites in 2023 as compared to 2022 is primarily attributed to mining depletion. In addition, as of December 31, 2023 the remaining resources for Crayfish, Ginkgo and Wonnerup were removed from the resources table because they were considered unlikely to ever be economically viable due to their being either too low in grade, too deeply buried, sterilized by previous mining operations or located within environmentally sensitive locations.
The decrease in reserves at all operating sites in 2023 as compared to 2022 is primarily attributed to mining depletion. In July 2023, mining ceased at Crayfish due to poor project economics. The remaining Crayfish material was removed from reserves.
TRONOX MINERAL SANDS - 2023-2022 RESOURCES(1)
|
|
|
|
|
|
|
|
|
|
|
|
|
|
|
|
|
|
|
|
|
|
|
|
|
|
|
|
|
|
|
|
|
|
|
|
|
|
|
|
|
|
|
|
|
|
|
|
|
|
|
|
|
|
|
|
|
|
|
|
|
|
|
|
|
|
|
|
|
|
|
|
|
|
|
|
|
|
|
2023 |
|
2022 |
| MINE / DEPOSIT |
|
Resource
Category |
|
Material
(million
tonnes) |
|
HM% |
|
Mineral Assemblage (% of THM) |
|
Change (+/-) from 2022 (%)1 |
|
Material
(million
tonnes) |
|
HM% |
|
Mineral Assemblage (% of THM) |
| Ilmenite |
|
Rutile and
Leucoxene |
|
Zircon |
|
|
Ilmenite |
|
Rutile and
Leucoxene |
|
Zircon |
Namakwa Sands Dry Mine - Western Cape RSA(2) |
|
|
Measured |
|
112 |
|
|
7.0 |
% |
|
32.6 |
|
|
6.1 |
|
|
7.8 |
|
|
|
|
104 |
|
|
8.0 |
% |
|
30.2 |
|
|
5.9 |
|
|
6.9 |
|
|
|
Indicated |
|
84 |
|
|
6.5 |
% |
|
28.3 |
|
|
5.6 |
|
|
6.9 |
|
|
|
|
86 |
|
|
6.5 |
% |
|
28.3 |
|
|
5.6 |
|
|
6.9 |
|
|
|
Measured + Indicated |
|
196 |
|
|
6.7 |
% |
|
30.8 |
|
|
5.9 |
|
|
7.4 |
|
|
|
|
190 |
|
|
7.3 |
% |
|
29.3 |
|
|
5.8 |
|
|
6.9 |
|
|
|
Inferred |
|
110 |
|
|
5.5 |
% |
|
35.1 |
|
|
8.1 |
|
|
6.6 |
|
|
|
|
110 |
|
|
5.5 |
% |
|
35.1 |
|
|
8.1 |
|
|
6.6 |
|
|
|
Total |
|
306 |
|
|
6.3 |
% |
|
32.3 |
|
|
6.7 |
|
|
7.1 |
|
|
2.0 |
|
|
300 |
|
|
6.7 |
% |
|
31.4 |
|
|
6.6 |
|
|
6.7 |
|
KZN Sands Hydraulic Mine - KwaZulu-Natal RSA(3) |
|
|
Measured |
|
38 |
|
|
4.1 |
% |
|
63.5 |
|
|
9.4 |
|
|
7.7 |
|
|
|
|
48 |
|
|
4.2 |
% |
|
64.3 |
|
|
8.1 |
|
|
7.7 |
|
|
|
Indicated |
|
— |
|
|
— |
% |
|
— |
|
|
— |
|
|
— |
|
|
|
|
1 |
|
|
2.0 |
% |
|
53.5 |
|
|
7.0 |
|
|
7.5 |
|
|
|
Measured + Indicated |
|
38 |
|
|
4.1 |
% |
|
63.5 |
|
|
9.4 |
|
|
7.7 |
|
|
|
|
49 |
|
|
4.1 |
% |
|
64.1 |
|
|
8.1 |
|
|
7.6 |
|
|
|
Inferred |
|
55 |
|
|
3.4 |
% |
|
54.6 |
|
|
7.1 |
|
|
7.1 |
|
|
|
|
56 |
|
|
3.4 |
% |
|
54.6 |
|
|
6.9 |
|
|
7.1 |
|
|
|
Total |
|
93 |
|
|
3.7 |
% |
|
58.2 |
|
|
8.0 |
|
|
7.4 |
|
|
(11.4) |
|
|
105 |
|
|
3.7 |
% |
|
59.1 |
|
|
7.4 |
|
|
7.3 |
|
Cooljarloo – Dredge Mine - Western Australia(4) |
|
|
Measured |
|
1 |
|
|
0.9 |
% |
|
54.9 |
|
|
7.2 |
|
|
9.3 |
|
|
|
|
10 |
|
|
1.6 |
% |
|
59.3 |
|
|
7.7 |
|
|
9.8 |
|
|
|
Indicated |
|
282 |
|
|
1.5 |
% |
|
61.3 |
|
|
6.7 |
|
|
10.5 |
|
|
|
|
282 |
|
|
1.5 |
% |
|
61.4 |
|
|
6.7 |
|
|
10.5 |
|
|
|
Measured + Indicated |
|
283 |
|
|
1.5 |
% |
|
61.3 |
|
|
6.7 |
|
|
10.5 |
|
|
|
|
292 |
|
|
1.5 |
% |
|
61.3 |
|
|
6.8 |
|
|
10.4 |
|
|
|
Inferred |
|
12 |
|
|
2.9 |
% |
|
58.0 |
|
|
7.3 |
|
|
9.0 |
|
|
|
|
12 |
|
|
2.9 |
% |
|
58.0 |
|
|
7.3 |
|
|
9.0 |
|
|
|
Total |
|
295 |
|
|
1.6 |
% |
|
61.2 |
|
|
6.8 |
|
|
10.4 |
|
|
(2.9) |
|
|
304 |
|
|
1.6 |
% |
|
61.1 |
|
|
6.8 |
|
|
10.4 |
|
Dongara Planned Dry Mine - Western Australia(5) |
|
|
Measured |
|
109 |
|
|
4.1 |
% |
|
50.2 |
|
|
9.0 |
|
|
10.8 |
|
|
|
|
109 |
|
|
4.1 |
% |
|
50.2 |
|
|
9.0 |
|
|
10.8 |
|
|
|
Indicated |
|
31 |
|
|
3.5 |
% |
|
53.7 |
|
|
9.1 |
|
|
12.4 |
|
|
|
|
31 |
|
|
3.5 |
% |
|
53.7 |
|
|
9.1 |
|
|
12.4 |
|
|
|
Measured + Indicated |
|
140 |
|
|
3.9 |
% |
|
52.0 |
|
|
9.1 |
|
|
11.6 |
|
|
|
|
140 |
|
|
3.9 |
% |
|
52.0 |
|
|
9.1 |
|
|
11.6 |
|
|
|
Inferred |
|
46 |
|
|
3.7 |
% |
|
56.1 |
|
|
8.9 |
|
|
9.2 |
|
|
|
|
46 |
|
|
3.7 |
% |
|
56.1 |
|
|
8.9 |
|
|
9.2 |
|
|
|
Total |
|
186 |
|
|
3.9 |
% |
|
52.1 |
|
|
9.0 |
|
|
10.7 |
|
|
0.0 |
|
|
186 |
|
|
3.9 |
% |
|
52.1 |
|
|
9.0 |
|
|
10.7 |
|
Atlas-Campaspe Dry Mine - New South Wales Australia(6) |
|
|
Measured |
|
27 |
|
|
2.5 |
% |
|
58.8 |
|
|
10.9 |
|
|
11.7 |
|
|
|
|
27 |
|
|
2.5 |
% |
|
58.8 |
|
|
10.9 |
|
|
11.7 |
|
|
|
|
|
|
|
|
|
|
|
|
|
|
|
|
|
|
|
|
|
|
|
|
|
|
|
|
|
|
|
|
|
|
|
|
|
|
|
|
|
|
|
|
|
|
|
|
|
|
|
|
|
|
|
|
|
|
|
|
|
|
|
|
|
|
|
|
|
|
|
|
|
|
|
|
|
|
Indicated |
|
— |
|
|
— |
% |
|
— |
|
|
— |
|
|
— |
|
|
|
|
— |
|
|
— |
% |
|
— |
|
|
— |
|
|
— |
|
|
|
Measured + Indicated |
|
27 |
|
|
2.5 |
% |
|
58.8 |
|
|
10.9 |
|
|
11.7 |
|
|
|
|
27 |
|
|
2.5 |
% |
|
58.8 |
|
|
10.9 |
|
|
11.7 |
|
|
|
Inferred |
|
83 |
|
|
3.1 |
% |
|
60.1 |
|
|
5.8 |
|
|
13.1 |
|
|
|
|
83 |
|
|
3.1 |
% |
|
60.1 |
|
|
5.8 |
|
|
13.1 |
|
|
|
Total |
|
110 |
|
|
3.0 |
% |
|
59.8 |
|
|
6.9 |
|
|
12.8 |
|
|
0.0 |
|
|
110 |
|
|
3.0 |
% |
|
59.8 |
|
|
6.9 |
|
|
12.8 |
|
Port Durnford - KwaZulu-Natal RSA(7) |
|
|
Measured |
|
143 |
|
|
4.5 |
% |
|
67.6 |
|
|
6.0 |
|
|
9.3 |
|
|
|
|
143 |
|
|
4.5 |
% |
|
67.6 |
|
|
6.0 |
|
|
9.3 |
|
|
|
Indicated |
|
340 |
|
|
4.1 |
% |
|
67.4 |
|
|
6.1 |
|
|
9.3 |
|
|
|
|
340 |
|
|
4.1 |
% |
|
67.4 |
|
|
6.1 |
|
|
9.3 |
|
|
|
Measured + Indicated |
|
483 |
|
|
4.2 |
% |
|
67.5 |
|
|
6.1 |
|
|
9.3 |
|
|
|
|
483 |
|
|
4.2 |
% |
|
67.5 |
|
|
6.1 |
|
|
9.3 |
|
|
|
Inferred |
|
466 |
|
|
3.5 |
% |
|
71.8 |
|
|
6.3 |
|
|
10.0 |
|
|
|
|
466 |
|
|
3.5 |
% |
|
71.8 |
|
|
6.3 |
|
|
10.0 |
|
|
|
Total |
|
949 |
|
|
3.9 |
% |
|
69.4 |
|
|
6.2 |
|
|
9.6 |
|
|
0.0 |
|
|
949 |
|
|
3.9 |
% |
|
69.4 |
|
|
6.2 |
|
|
9.6 |
|
Wonnerup Dry Mine - Western Australia(8) |
|
|
Measured |
|
— |
|
|
— |
% |
|
— |
|
|
— |
|
|
— |
|
|
|
|
13 |
|
|
4.6 |
% |
|
77.5 |
|
|
12.0 |
|
|
8.8 |
|
|
|
Indicated |
|
— |
|
|
— |
% |
|
— |
|
|
— |
|
|
— |
|
|
|
|
6 |
|
|
4.8 |
% |
|
86.9 |
|
|
3.3 |
|
|
7.6 |
|
|
|
Measured + Indicated |
|
— |
|
|
— |
% |
|
— |
|
|
— |
|
|
— |
|
|
|
|
19 |
|
|
4.6 |
% |
|
80.5 |
|
|
9.2 |
|
|
8.4 |
|
|
|
Inferred |
|
— |
|
|
— |
% |
|
— |
|
|
— |
|
|
— |
|
|
|
|
3 |
|
|
4.4 |
% |
|
84.0 |
|
|
4.0 |
|
|
8.3 |
|
|
|
Total |
|
— |
|
|
— |
% |
|
— |
|
|
— |
|
|
— |
|
|
(100.0) |
|
|
22 |
|
|
4.6 |
% |
|
81.0 |
|
|
8.5 |
|
|
8.4 |
|
Ginkgo-Crayfish Dredge/ Dry Mines - New South Wales Australia(9) |
|
|
Measured |
|
— |
|
|
— |
% |
|
— |
|
|
— |
|
|
— |
|
|
|
|
78 |
|
|
1.3 |
% |
|
47.9 |
|
|
18.2 |
|
|
12.4 |
|
|
|
Indicated |
|
— |
|
|
— |
% |
|
— |
|
|
— |
|
|
— |
|
|
|
|
— |
|
|
— |
% |
|
— |
|
|
— |
|
|
— |
|
|
|
Measured + Indicated |
|
— |
|
|
— |
% |
|
— |
|
|
— |
|
|
— |
|
|
|
|
78 |
|
|
1.3 |
% |
|
47.9 |
|
|
18.2 |
|
|
12.4 |
|
|
|
Inferred |
|
— |
|
|
— |
% |
|
— |
|
|
— |
|
|
— |
|
|
|
|
59 |
|
|
1.1 |
% |
|
47.9 |
|
|
17.9 |
|
|
13.0 |
|
|
|
Total |
|
— |
|
|
|
|
|
|
|
|
— |
|
|
(100.0) |
|
|
137 |
|
|
1.2 |
% |
|
47.9 |
|
|
18.1 |
|
|
12.6 |
|
Kara/Cylinder - New South Wales Australia(10) |
|
|
Measured |
|
— |
|
|
— |
% |
|
— |
|
|
— |
|
|
— |
|
|
|
|
— |
|
|
— |
% |
|
— |
|
|
— |
|
|
— |
|
|
|
Indicated |
|
165 |
|
|
4.4 |
% |
|
49.4 |
|
|
12.9 |
|
|
12.0 |
|
|
|
|
165 |
|
|
4.4 |
% |
|
49.4 |
|
|
12.9 |
|
|
12.0 |
|
|
|
Measured + Indicated |
|
165 |
|
|
4.4 |
% |
|
49.4 |
|
|
12.9 |
|
|
12.0 |
|
|
|
|
165 |
|
|
4.4 |
% |
|
49.4 |
|
|
12.9 |
|
|
12.0 |
|
|
|
Inferred |
|
26 |
|
|
2.8 |
% |
|
51.1 |
|
|
19.6 |
|
|
14.3 |
|
|
|
|
26 |
|
|
2.8 |
% |
|
54.4 |
|
|
24.4 |
|
|
14.2 |
|
|
|
Total |
|
191 |
|
|
4.1 |
% |
|
49.5 |
|
|
13.5 |
|
|
12.2 |
|
|
0.0 |
|
|
191 |
|
|
4.1 |
% |
|
49.8 |
|
|
13.9 |
|
|
12.2 |
|
| Total Resources |
|
|
Measured |
|
430 |
|
|
4.9 |
% |
|
50.2 |
|
|
7.1 |
|
|
9.0 |
|
|
|
|
532 |
|
|
4.4 |
% |
|
49.9 |
|
|
7.5 |
|
|
8.8 |
|
|
|
Indicated |
|
902 |
|
|
3.5 |
% |
|
55.4 |
|
|
7.7 |
|
|
9.8 |
|
|
|
|
911 |
|
|
3.6 |
% |
|
55.6 |
|
|
7.7 |
|
|
9.7 |
|
|
|
Measured + Indicated |
|
1,332 |
|
|
4.0 |
% |
|
53.3 |
|
|
7.5 |
|
|
9.5 |
|
|
|
|
1,443 |
|
|
3.9 |
% |
|
53.2 |
|
|
7.6 |
|
|
9.3 |
|
|
|
Inferred |
|
798 |
|
|
3.7 |
% |
|
60.6 |
|
|
7.1 |
|
|
9.4 |
|
|
|
|
861 |
|
|
3.5 |
% |
|
60.6 |
|
|
7.5 |
|
|
9.5 |
|
|
|
Total |
|
2,130 |
|
|
3.9 |
% |
|
56.0 |
|
|
7.4 |
|
|
9.4 |
|
|
(7.6) |
|
|
2,304 |
|
|
3.8 |
% |
|
55.8 |
|
|
7.6 |
|
|
9.4 |
|
(See footnotes below the following table.)
TRONOX MINERAL SANDS - 2023-2022 RESERVES
|
|
|
|
|
|
|
|
|
|
|
|
|
|
|
|
|
|
|
|
|
|
|
|
|
|
|
|
|
|
|
|
|
|
|
|
|
|
|
|
|
|
|
|
|
|
|
|
|
|
|
|
|
|
|
|
|
|
|
|
|
|
|
|
|
|
|
|
|
|
|
|
|
|
|
|
|
|
|
2023 |
|
2022 |
| MINE / DEPOSIT |
|
Reserve
Category |
|
Material
(million
tonnes) |
|
HM% |
|
Mineral Assemblage (% of THM) |
|
|
|
Material
(million
tonnes) |
|
HM% |
|
Mineral Assemblage (% of THM) |
| Ilmenite |
|
Rutile and
Leucoxene |
|
Zircon |
|
Change (+/-) from 2022 (%)1 |
|
Ilmenite |
|
Rutile and
Leucoxene |
|
Zircon |
Namakwa Sands Dry Mine - Western Cape RSA(2) |
|
|
Proven |
|
121 |
|
|
7.2 |
% |
|
37.8 |
|
|
8.8 |
|
|
9.1 |
|
|
|
|
136 |
|
|
7.4 |
% |
|
37.6 |
|
|
8.7 |
|
|
9.0 |
|
|
|
Probable |
|
545 |
|
|
5.7 |
% |
|
51.6 |
|
|
10.7 |
|
|
10.8 |
|
|
|
|
551 |
|
|
5.4 |
% |
|
53.8 |
|
|
11.2 |
|
|
11.4 |
|
|
|
Total Reserves |
|
666 |
|
|
5.9 |
% |
|
48.6 |
|
|
10.3 |
|
|
10.5 |
|
|
(3.0) |
|
|
687 |
|
|
5.8 |
% |
|
49.7 |
|
|
10.6 |
|
|
10.8 |
|
KZN Sands Hydraulic Mine KwaZulu-Natal RSA(3) |
|
|
Proven |
|
187 |
|
|
5.6 |
% |
|
61.3 |
|
|
7.6 |
|
|
7.5 |
|
|
|
|
198 |
|
|
5.6 |
% |
|
61.7 |
|
|
7.4 |
|
|
7.6 |
|
|
|
Probable |
|
15 |
|
|
3.9 |
% |
|
54.8 |
|
|
5.6 |
|
|
7.3 |
|
|
|
|
11 |
|
|
3.7 |
% |
|
51.8 |
|
|
5.0 |
|
|
7.0 |
|
|
|
Total Reserves |
|
202 |
|
|
5.5 |
% |
|
61.0 |
|
|
7.5 |
|
|
7.5 |
|
|
(2.9) |
|
|
209 |
|
|
5.5 |
% |
|
61.3 |
|
|
7.3 |
|
|
7.6 |
|
Cooljarloo – Dredge Mine - Western Australia(4) |
|
|
Proven |
|
177 |
|
|
1.7 |
% |
|
61.9 |
|
|
7.7 |
|
|
11.0 |
|
|
|
|
210 |
|
|
1.6 |
% |
|
61.5 |
|
|
7.7 |
|
|
10.7 |
|
|
|
Probable |
|
130 |
|
|
2.0 |
% |
|
60.5 |
|
|
8.3 |
|
|
12.3 |
|
|
|
|
130 |
|
|
2.0 |
% |
|
60.5 |
|
|
8.3 |
|
|
12.3 |
|
|
|
Total Reserves |
|
307 |
|
|
1.8 |
% |
|
61.2 |
|
|
8.0 |
|
|
11.6 |
|
|
(9.7) |
|
|
340 |
|
|
1.8 |
% |
|
61.1 |
|
|
8.0 |
|
|
11.4 |
|
Atlas-Campaspe Dry Mine - New South Wales Australia(6) |
|
|
Proven |
|
107 |
|
|
6.0 |
% |
|
60.7 |
|
|
11.5 |
|
|
12.7 |
|
|
|
|
110 |
|
|
6.3 |
% |
|
60.7 |
|
|
11.8 |
|
|
12.5 |
|
|
|
Probable |
|
— |
|
|
— |
% |
|
— |
|
|
— |
|
|
— |
|
|
|
|
— |
|
|
— |
% |
|
— |
|
|
— |
|
|
— |
|
|
|
Total Reserves |
|
107 |
|
|
6.0 |
% |
|
60.7 |
|
|
11.5 |
|
|
12.7 |
|
|
(2.2) |
|
|
110 |
|
|
6.3 |
% |
|
60.7 |
|
|
11.8 |
|
|
12.5 |
|
Wonnerup Dry Mine - Western Australia(8) |
|
|
Proven |
|
7 |
|
|
5.4 |
% |
|
71.1 |
|
|
18.4 |
|
|
9.4 |
|
|
|
|
9 |
|
|
5.3 |
% |
|
70.1 |
|
|
19.1 |
|
|
9.6 |
|
|
|
Probable |
|
4 |
|
|
5.7 |
% |
|
77.0 |
|
|
11.9 |
|
|
8.9 |
|
|
|
|
4 |
|
|
5.7 |
% |
|
77.5 |
|
|
11.4 |
|
|
8.8 |
|
|
|
Total Reserves |
|
11 |
|
|
5.5 |
% |
|
73.3 |
|
|
15.9 |
|
|
9.2 |
|
|
(16.2) |
|
|
13 |
|
|
5.4 |
% |
|
72.6 |
|
|
16.5 |
|
|
9.4 |
|
Ginkgo Dredge/ Dry Mines - New South Wales Australia(9) |
|
|
Proven |
|
4 |
|
|
1.3 |
% |
|
57.1 |
|
|
13.0 |
|
|
13.2 |
|
|
|
|
26 |
|
|
1.9 |
% |
|
51.5 |
|
|
16.3 |
|
|
12.7 |
|
|
|
Probable |
|
— |
|
|
— |
|
|
— |
|
|
— |
|
|
— |
|
|
|
|
— |
|
|
— |
% |
|
— |
|
|
— |
|
|
— |
|
|
|
Total Reserves |
|
4 |
|
|
1.3 |
% |
|
57.1 |
|
|
13.0 |
|
|
13.2 |
|
|
(84.7) |
|
|
26 |
|
|
1.9 |
% |
|
51.5 |
|
|
16.3 |
|
|
12.7 |
|
| Total Reserves |
|
|
Proven |
|
603 |
|
4.8 |
% |
|
54.3 |
|
|
9.0 |
|
|
9.5 |
|
|
|
|
689 |
|
|
4.7 |
% |
|
54.0 |
|
|
9.1 |
|
|
9.5 |
|
|
|
Probable |
|
694 |
|
5.0 |
% |
|
52.5 |
|
|
10.4 |
|
|
10.9 |
|
|
|
|
696 |
|
|
4.7 |
% |
|
54.4 |
|
|
10.9 |
|
|
11.4 |
|
|
|
Total Reserves |
|
1,297 |
|
|
4.9% |
|
53.3 |
|
|
9.8 |
|
|
10.2 |
|
|
(6.2) |
|
|
1,385 |
|
|
4.7% |
|
54.2 |
|
|
10.0 |
|
|
10.5 |
|
1.Mineral resources are exclusive of reserves. Mineral resources and reserves are reported using in-situ points of reference. The term “saleable product yield (recovery)” is used herein to refer to the conversion of contained, in-situ mineral to saleable products, which is equivalent to the term “metallurgical or processing recoveries” used in subpart 1300 of Regulation S-K.
2.For Namakwa Sands, price assumptions used for resource and reserve estimations are $1,840 per metric ton of Zircon, $248 per metric ton of Ilmenite and $1,328 per metric ton of Rutile. The cutoff grade used for the resource estimate is based on a break-even cutoff of 0.3% Zircon. Reserves are defined by a complex optimization process which is explained in detail in the Namakwa Sands TRS. Saleable product yield (recovery) used for our reserve estimates were 63% per metric ton of Zircon, 68% per metric ton of Ilmenite and 63% per metric ton of Rutile.
3.For KZN Sands, price assumptions used for resource and reserve estimations are $1,835 per metric ton of Zircon, $248 per metric ton of Ilmenite and $1,328 per metric ton of Rutile. The cutoff grade used for the resource estimate is based on a break-even cutoff of 1.5% ilmenite. Reserves are defined by a complex optimization process which is explained in detail in the KZN Sands TRS. Saleable product yield (recovery) used for our reserve estimates were 80% per metric ton of Zircon, 66% per metric ton of Ilmenite and 75% per metric ton of Rutile.
4.For Cooljarloo, price assumptions used for resource and reserve estimations are $1,378 per metric ton of Zircon, $293 per metric ton of Chloride Ilmenite, $973 per metric ton of Rutile and $911 per metric ton of Leucoxene. The cutoff grade used for the resource estimate is based on a nominal bottom cut of 1.0% HM. Reserves are defined by a complex optimization process which is explained in detail in the Cooljarloo TRS. Saleable product yield (recovery) used for our reserve estimates were 83% per metric ton of Zircon, 85% per metric ton of Chloride Ilmenite, 88% per metric ton of Rutile and 79% per metric ton of Leucoxene.
5.For Dongara, price assumptions used for preliminary resource economic assessments are $1,491 per metric ton of Zircon, $313 per metric ton of Chloride Ilmenite, $960 per metric ton of Rutile and $900 per metric ton of Leucoxene.
6.For Atlas-Campaspe, price assumptions used for resource and reserve estimations are $1,495 per metric ton of Zircon, $246 per metric ton of Chloride Ilmenite, $162 per metric ton of Sulfate Ilmenite, $1,088 per metric ton of Rutile and $314 per metric ton of Leucoxene (East). The cutoff grade used for the resource estimate is based on a nominal bottom cut of 1.0% HM. Reserves are defined by a complex optimization process which is explained in detail in the Atlas-Campaspe TRS. Saleable product yield (recovery) used for our reserve estimates were 79% per metric ton of Zircon, 96% per metric ton of Ilmenite, 92% per metric ton of Rutile and 87% per metric ton of Leucoxene.
7.For Port Durnford, price assumptions used for preliminary resource economic assessments are $1,835 per metric ton of Zircon, $248 per metric ton of Ilmenite and $1328 per metric ton of Rutile.
8.For Wonnerup, price assumptions used for resource and reserve estimations are $2,023 per metric ton of Zircon, $291 per metric ton of Chloride Ilmenite, $256 per metric ton of Sulfate Ilmenite, $333 per metric ton of Secondary Ilmenite and $1,122 per metric ton of Leucoxene.
9.For Ginkgo-Crayfish, price assumptions used for resource and reserve estimations are $1,495 per metric ton of Zircon, $246 per metric ton of Chloride Ilmenite, $162 per metric ton of Sulfate Ilmenite, $1,088 per metric ton of Rutile and $314 per metric ton of Leucoxene (East).
10.For Kara/Cylinder, price assumptions used for preliminary resource economic assessments are $1,356 per metric ton of Zircon, $239 per metric ton of Chloride Ilmenite, $168 per metric ton of Sulfate Ilmenite, $1,247 per metric ton of Rutile and $347 per metric ton of Leucoxene (East).
Abbreviations, Definitions, and Notations
Reserves —mineralized material inclusive of dilution, determined to be economically and legally exploitable as of December 31, 2023, classified as either Probable Reserves or Proven Reserves, based on level of confidence.
Resources – mineralized ground which has either had insufficient drilling to confidently define the shape, grade and recoverability of the valuable minerals as well as not yet having been subjected to a detailed assessment of the impact of validated modifying factors on the revenue generating potential of a deposit.
LOMP — Life-of-Mine-Plans (LOMPs) have been developed for each mine site by teams of Tronox professionals based on the mineral reserves and resources, realistic assumptions of geological, mining, metallurgical, economic, marketing, legal, environmental, social, governmental, engineering, operational and all other modifying factors in sufficient detail to demonstrate at the time of reporting that extraction is reasonably justified.
THM — total heavy minerals, densities >2.85 g/cm3 regardless of commercial value
VHM — valuable heavy minerals, including Ilmenite, Rutile, Leucoxene & zircon, reported as percentage of THM.
Minor computational discrepancies may be due to rounding.
Cooljarloo Dredge Mine reserves include Cooljarloo and Cooljarloo West
Key Assumptions — economic viability is determined by techno-economic modeling that integrates geological, analytical and geotechnical databases, mining parameters, metallurgical recoveries, known or forecast operating costs, cost of capital, and product sales prices at time of production. Historical sales prices by themselves are unreliable predictors of future prices, and our forecasts are based on our private contracts, internal and external market research.
Disclosures of mineral reserves traditionally include a cut-off grade, the grade in a mineral deposit below which material cannot be profitably mined and processed. However, economic exploitability is determined by many modifying factors other than grade, and most modern mining operations, including ours, use detailed computer models utilized by employees who possess the experience and technical expertise to identify what parts of a deposit are economically exploitable.
Production forecasts of commercial-quality titanium mineral and zircon concentrates from reserves are taken from our Life- of-Mine Plans. Mining recoveries are typically close to 100%, but metallurgical recoveries in each concentration step can vary widely, as a function of ore and mineral characteristics. We apply recovery factors based on actual operating data.
Mineral reserve estimates, life-of mine projections, and revenue assumptions are inherently forward-looking and subject to market conditions, uncertainties, and unanticipated events beyond our control.
INDIVIDUAL PROPERTY DISCLOSURE
Tronox Northern Operations (Cooljarloo)
Tronox Management Pty Ltd is a subsidiary of Tronox Holdings plc and is the operator of Tronox Northern Operations which includes:
•Cooljarloo Mine, 170 km north of Perth, where heavy mineral concentrates are produced from dredge mining operations. The net book value of Cooljarloo, inclusive of mining and beneficiary equipment located in Western Australia as well as relevant mining tenements, as of December 31, 2023 was $428 million;
•Cooljarloo West and Osprey deposits, which conjoin the Cooljarloo Mine operations;
•Chandala Processing Plant, 60 km north of Perth, where the heavy mineral concentrates (HMC) are separated into saleable mineral products and also where ilmenite is further upgraded to synthetic rutile;
•The laboratory and mineral testing facility is also located at the Chandala site.
Mining tenements in Australia are managed at the State or Territorial level. In Western Australia, Mining Leases, Exploration Licenses and Retention Licenses are granted and administered by the Western Australian Department of Mines, Industry Regulation and Safety.
Tronox operates under four (4) mining leases which are 100% held by Tronox Management Pty Ltd., a wholly owned subsidiary of Tronox Holdings plc as shown in the Table below.
Mining Tenement Schedule
|
|
|
|
|
|
|
|
|
|
|
|
|
|
|
|
|
|
|
|
|
|
|
|
|
|
|
| Region |
Tenement |
Tenement Type |
Area
(Ha) |
Grant Date |
Expiry/
Renewal Date |
Commitment US$/a |
Rent U$/a |
Status of Rights |
| Cooljarloo |
M70/1398 (Previously MSA 268) |
Mining Lease |
9,744 |
|
2-Mar-20 |
1-Mar-41 |
701,600 |
|
138,900 |
|
Active Mining Lease |
| Cooljarloo (West) |
M70/1314 |
Mining Lease |
3,782 |
|
18-Mar-15 |
17-Mar-36 |
272,300 |
|
53,915 |
|
EPA approval pending |
| Cooljarloo (West) |
M70/1333 |
Mining Lease |
420 |
|
4-Apr-16 |
3-Apr-37 |
30,310 |
|
6,000 |
|
EPA approval pending |
| Osprey |
M70/1413 |
Mining Lease |
1,319 |
|
5-Jul-22 |
4-Jul-23 |
132,000 |
|
31,680 |
|
Approvals process commenced |
Tronox has one active mine site at Cooljarloo that was originally controlled by a State Agreement Act with the State of Western Australia. This area was covered by State Agreement Act MSA 268 which was originally granted in 1989 for a period of 21 years. It was extended for a further 10-year term which expired in 2020. MSA 268 was replaced by Mining Lease M70/1398 which will expire in 2041.
Cooljarloo West is located within Mining Leases 70/1314 and 70/1333. Osprey is located within Mining Lease 70/1413. Granting of rights to mine are pending environmental approval.
The minerals in Western Australia belong to the Crown (the State of Western Australia) and Tronox is obligated to pay a 5% revenue- based royalty on saleable mineral products. This is factored into the valuation models and optimizations conducted by Tronox.
A private royalty of 10c/t of VHM is paid for a portion of the northern section of the Cooljarloo tenement. Based on the current mine plan, mining in this royalty agreement area will cease by 2025 and the amounts paid are not material to the business.
On Mining Lease 70/1333 Tronox agrees to pay the previous holder of the exploration lease a royalty of 1% of a previously agreed price for each tonne of Valuable Heavy Mineral recovered from the Mining Lease. The cost will also be immaterial to the business.
The Cooljarloo Mine is located at coordinates latitude 30°39'S and longitude 115°27'E.
Location of Western Australian Operations
Infrastructure
The Brand Highway is a major bitumen road running from Muchea, just North of Perth up to Geraldton, a provincial city 450 km north of Perth. The road runs just past the Western boundary of the Chandala site and just past the Eastern boundary of the Cooljarloo mine site. It is suitable for all weather and wide loads.
There is a 132 kV power line that also runs from Perth to Geraldton which passes near the Chandala site and through the mine site. Tronox has a substation on its property that draws and reticulates 22 kV power from the sub-station connected to the main high voltage distribution line. At the various locations power is ultimately transformed down to 415 V. The same situation exists for Chandala and it gets power from the same main line.
Two gas pipelines run just a kilometer to the West of the Chandala site. They are referred to as the Dampier to Bunbury Natural Gas pipeline (DBNG) and also the Parmelia line which originates just south of Geraldton. The Chandala Mineral Separation Plant currently gets supply for driers and re-heaters from the Parmelia line.
The countryside surrounding both Chandala and Cooljarloo is relatively flat. This made the construction of buildings and fixed plant straightforward. Storage ponds for solid waste from the MSP were able to be made quite shallow only being a few meters above natural ground level.
There is a large freshwater aquifer (Yarragadee) immediately to the west of the Brand highway adjacent to the Chandala site. Tronox has a borefield there that supplies the licensed 1 megaliter per annum of water that the site requires. Even in times of severe drought, supply from this aquifer has never been at risk. Cooljarloo draws from an extensive field of relatively shallow bores and also an extension of the Yarragadee aquifer. To limit pumping distances, it has been preferable to have multiple smaller bores around the site since the dredging operation has travelled more than 40 km within the mining lease area since 1989. Tailings disposal at Cooljarloo is all placed behind the dredging operations and incorporated into the rehabilitated profile. There is a registered waste disposal pit where wastes from the MSP, the Synthetic Rutile plant and from the Kwinana pigment plant are licensed to be stored. These pits cells are constructed above the water table and are clay lined. When each cell is full it is capped to minimize the ingress and egress of water.
The Chandala operation utilizes two port facilities. The Port of Fremantle is used for export of bagged and containerized mineral products and the Port of Bunbury is used for bulk shipments. Tronox rents storage and warehousing facilities at or nearby to those sites.
For Cooljarloo there is a well-equipped modern permanent single person’s quarters (SPQ), capable of accommodating up to 160 people or approximately 70% of the work force. At Chandala, employees and contractors are primarily sourced from the Perth metropolitan and surrounding areas.
History
Cooljarloo
The Cooljarloo tenements were originally pegged in 1972 by Kamilaroi Oil Company following the discovery of the Eneabba Deposits. They were subsequently obtained by Yalgoo Minerals Pty Ltd and Tific Pty Ltd in 1985 which became part of TiO2 Corporation NL (TiO2).
In 1988 prior to mining commencing, the Cooljarloo Joint Venture was formed between Kerr-McGee Chemical Corp and Minproc Ltd, subsequent reorganizations of both partners led to 100% ownership under Tronox in 2012.
No geological data generated by owners prior to the formation of the Cooljarloo Joint Venture is in use.
Cooljarloo West
In 1990 drilling by Peko Exploration Ltd delineated a zone of deep low-grade mineralization but further drilling failed to intercept economic mineralization. The tenements were relinquished in 1992.
Image Resources later pegged the area which were acquired by Tronox in 2005. Drilling completed by Tronox in 2007 delineated the deposits named Woolka Road, Harrier and Kestrel and Resources and Reserves are based only on data generated by Tronox.
Summary of Resources and Reserves
Cooljarloo Summary of Mineral Resources as of December 31, 2023
|
|
|
|
|
|
|
|
|
|
|
|
|
|
|
|
|
|
|
|
|
|
|
|
|
|
|
|
Mineral Assemblage (% of THM) |
|
| Mine / Deposit |
Resource Category |
Material (million tonnes) |
HM% |
Ilmenite |
Rutile + Leucoxene |
Zircon |
Change from 2022 (%) |
| Cooljarloo |
Measured |
1 |
0.9 |
54.9 |
7.2 |
9.3 |
|
|
Indicated |
202 |
1.6 |
61.6 |
6.2 |
10.1 |
|
|
Measured + Indicated |
203 |
1.6 |
61.6 |
6.2 |
10.1 |
|
|
Inferred |
12 |
2.9 |
58.0 |
7.3 |
9.0 |
|
|
Total |
215 |
1.7 |
61.3 |
6.3 |
10.0 |
|
| Cooljarloo West |
Measured |
— |
— |
— |
— |
— |
|
|
Indicated |
80 |
1.3 |
60.7 |
8.5 |
11.6 |
|
|
Measured + Indicated |
80 |
1.3 |
60.7 |
8.5 |
11.6 |
|
|
Inferred |
— |
— |
— |
— |
— |
|
|
Total |
80 |
1.3 |
60.7 |
8.5 |
11.6 |
|
|
Total Mineral Resources |
295 |
1.6 |
61.2 |
6.8 |
10.4 |
(2.9) |
(1) Mineral resources are exclusive of mineral reserves.
(2) Price assumptions used for resource and reserve estimations are $1,378 per metric ton of zircon, $293 per metric ton of Chloride Ilmenite, $973 per metric ton of Rutile and $911 per metric ton of Leucoxene. Mineral prices used in Reserve estimation are substantially in line with the prices for each of our products published quarterly by independent consulting companies.
For a comparison of the reported resources as of December 31, 2023 with the resources as of December 31, 2022, see table on page
34. The decrease in resources in 2023 as compared to 2022 is primarily attributable to mining depletion.
Cooljarloo Summary of Mineral Reserves as of December 31, 2023
|
|
|
|
|
|
|
|
|
|
|
|
|
|
|
|
|
|
|
|
|
|
|
|
|
|
|
|
Mineral Assemblage (% of THM) |
|
| Mine / Deposit |
Reserve Category |
Material (million tonnes) |
HM% |
Ilmenite |
Rutile + Leucoxene |
Zircon |
Change from 2022 (%) |
| Cooljarloo |
Proven |
177 |
1.7 |
61.9 |
7.7 |
11.0 |
|
|
Probable |
— |
— |
— |
— |
— |
|
|
Total |
177 |
1.7 |
61.9 |
7.7 |
11.0 |
|
| Cooljarloo West |
Proven |
— |
— |
— |
— |
— |
|
|
Probable |
130 |
2.0 |
60.5 |
8.3 |
12.3 |
|
|
Total |
130 |
2.0 |
60.5 |
8.3 |
12.3 |
|
|
Total Mineral Reserves |
307 |
1.8 |
61.2 |
8.0 |
11.6 |
(9.7) |
(1) Price assumptions used for resource and reserve estimations are $1,378 per metric ton of zircon, $293 per metric ton of Chloride Ilmenite, $973 per metric ton of Rutile and $911 per metric ton of Leucoxene. Mineral prices used in Reserve estimation are substantially in line with the prices for each of our products published quarterly by independent consulting companies.
(2) Conversion of in ground grade to saleable product yield (recovery), considering all the losses during mining and processing, is typically 85% for ilmenite, 88% for rutile, 79% for Leucoxene and 83% for zircon.
For a comparison of the reported reserves as of December 31, 2023 with the reserves as of December 31, 2022, see table on page
35. The decrease in reserves in 2023 as compared to 2022 is primarily attributable to mining depletion.
Condition of Property
The Cooljarloo project was established in 1988. Being situated on an historical coastline, the ore body is made up of conventional mineral sands strandlines and eminently suited to dredge mining and gravity concentration.
Since commencement, the operation has been running continuously and has thus far consumed 640 Mt of ore at approximately 2.8% HM grade. The current reserves are 307 Mt tons at 1.8% HM grade, which gives a further 15 years of life. The current resources, which are exclusive of reserves, are 295 Mt at 1.6% HM.
Extensive and systematic exploration drilling activities are conducted at Cooljarloo and adjacent deposits on an annual basis to upgrade resources and reserves. Final reserve delineation drilling is completed to a 50m x 40m or 50m x 20m spacing depending on the geological complexities of the orebody. Final drilling is completed three or more years in advance of the mining face to allow timely and accurate mine planning to be completed. Over the past 13 years there has been an average of 52,000 meters of drilling completely annually at Cooljarloo. Drilling will continue is 2024.
Cooljarloo mine has operated with 2 dredges in the one pond since 1999. The original Ellicott Cooljarloo1 dredge operates in tandem with the smaller capacity Neumann built Pelican dredge which was brought into service in 2012. These bucket wheel dredges operate in a purpose-built pond which sits within the ore mining limit. The original dredge and concentrator were sized to operate at 12 Mt per annum but the original dredge has progressively been expanded and addition of the second dredge has seen the project expand to a maximum of 25Mt per annum to counteract the impact of lower ore grades and also enable improved resource utilization through economies of scale and increased product values.
A wet concentrator also floats in the dredge pond and is on two pontoons covering 2,250 square meters. Spiral gravity concentrators separate the higher density valuable minerals from the lower density trash mineral and lowest density tailings quartz grains. The spiral circuit consists of five stages. Roughers, middlings, cleaners, recleaners and classifiers. Both dredges pump their feed simultaneously to the floating wet concentrator via floating pipelines and high voltage cables for power.
Over the past 36 years of operation the metallurgical circuitry of the wet plant has remained relatively unchanged save for expanding the throughput to approximately 2850 tph. This allowed the processing of lower grade ore which has been shown to have a better revenue to cost ratio compared to the original project assumptions. At the time of the capacity increase, spirals that were at the end of their useful life were replaced with more modern units, of higher efficiency, to cope with both additional throughputs, the lower average feed grade, higher clay fines in the ore and maintain an acceptable mineral recovery.
HMC at Cooljarloo is loaded by front end loader into 93 tonne triple road trains for haulage to the Chandala Mineral Separation Plant (MSP). Both the mine and MSP are based on physical separation processes. There is no need for chemical or physical alteration to achieve good product recovery and quality. Attritioning is a critical process step to ensure clean mineral surfaces that are responsive to the electrostatic HT separators. The attritioned HMC is presented by filter belt to a natural gas fired drier that not only removes the moisture but heats the mineral so that it is most responsive to the primary stage electrostatic separation circuit.
The unit operations at the MSP are many and varied but the significant ones are as follows:
•vibrating and reciprocating woven wire screening;
•mechanical slurry attritioning;
•gas fired fluid bed drying, reheating and cooling;
•HT Roll, Coronastat and Plate electrostatic separators;
•Rare Earth Drum, Rare Earth Roll, Induced Roll and Semi-Lift magnetic separators;
•Hydrosizing; and
•spiral gravity and centrifugal jig concentrators.
The equipment and infrastructure at both Cooljarloo and Chandala are in good order having been upgraded several times such that the total throughput of the mining operation now averages 21 Mt per annum and whilst the MSP has not needed capacity increase, updated technology and implementation of continuous improvement programs have resulted in significant increases in mineral recoveries.
Since Cooljarloo is an operating mine and processing plant, capital is mostly a sunk cost. There is minor stay in business capital incurred annually and there is US$55M of capital forecast with the move to the nearby Cooljarloo West dredging orebody expected in approximately 2033.
Tronox Eastern Operations (Atlas-Campaspe)
Tronox Mining Australia Ltd is a subsidiary of Tronox Holdings plc and is the operator of Tronox Eastern Operations which includes:
•The Ginkgo Mine, 110 km north of Wentworth in southwestern New South Wales, where heavy mineral concentrates are currently produced from dredge mining operations;
•The Snapper and Crayfish rehabilitation sites, adjacent to Ginkgo where former mineral sands mines are undergoing restoration following the completion of mining;
•The Atlas-Campaspe project in southwestern New South Wales, 120 km northeast of Mildura, where heavy mineral concentrates are currently produced from dry mining operations at Atlas and site development and approval activities have commenced for future mining operations at Campaspe;
•A rail siding and HMC stockpile facility at Ivanhoe, approximately 140 km northeast of the Atlas Mine, where HMC is dispatched to Broken Hill for further processing;
•Broken Hill Mineral Separation Plant in southwestern New South Wales, where the HMCs are separated into mineral products and either railed approximately 430 km to the Port of Adelaide or railed directly to Western Australia using the Trans Australian Railway; and
•Port of Adelaide, South Australia, where bulk mineral sands products from Broken Hill are loaded for export.
Mining tenements in Australia are managed at the State or Territorial level. In New South Wales, Mining Leases, Exploration Licenses and Assessment Leases are granted and administered by the New South Wales Department of Primary Industries Mineral Resources Division.
The Development Consent for Atlas and Campaspe was granted in June 2014 and construction of the Atlas Project was completed in early 2023. The Atlas deposit is secured by Mining Lease 1767. The Campaspe deposit is secured by the Atlas/Campaspe Mineral Sands Project Development Consent SSD_5012 from the Government of New South Wales. In November 2023 a mining lease application (MLA 639) was lodged over the Campaspe deposit, Grant of this tenement is pending.
The minerals in New South Wales belong to the Crown (the State of NSW) and Tronox is obligated to pay a 4% revenue-based royalty on all saleable minerals produced.
All the land encompassing the intended mining area has been purchased by Tronox so no mining compensation payments to landowners will be required as part of the Atlas-Campaspe Project.
The net book value of Atlas-Campaspe, inclusive of mining and beneficiary equipment located in New South Wales as well as relevant mining tenements, as of December 31, 2023 was $322 million.
The Atlas mine is located at coordinates latitude 33°53’S and longitude 143°21’E. The Campaspe mine is located at coordinates latitude 33°49’S and longitude 143°22’E.
Regional location of Atlas/Campaspe Project
Infrastructure
Atlas
The Atlas mine site is located in southwestern New South Wales, 120 km northeast of Mildura and 90 km north of Balranald. Access to the license area is via the Balranald Ivanhoe Hwy, the Boree Plains – Gol Gol road and then through the official Atlas Mine Access Road. The Atlas mine consists of a centrally based Wet Concentrator Plant (WCP) and a Dry Mining Unit (DMU) both rated to 500 tph.
An on-site 200-person accommodation village has been constructed to house the workforce and consists of permanent and demountable buildings and facilities such as: Administration and Office Building; Workshops; Process Area Crib Room and Amenities; Gymnasium; Basketball Court and Main Store. Electrical power is supplied directly from a centralized 5 Mwh diesel generation system.
Hydrological investigations identified a bore field location at the Northern end of the mine path, approximately 5km from the central start-up pit location. This bore field supplies water for the mining operations and ancillaries. A total of seven bore pumps supply the required volume.
A RO Plant and potable water treatment plant sized to deliver 115m3/hour has been installed to supply wash water for the HMC and potable water for site buildings, wash pads and the accommodation village.
A communication building is located adjacent to the communication tower for telecom and the Local Area Network (LAN). Data and telephone connection between the communications building, process area, administration area and accommodation village are via a buried fiber optic cable.
HMC from the Atlas mine is transported by a combination of trucks and train. The road network consists of approximately 37 km of existing unsealed roads between the Atlas-Campaspe Mine site access road and the intersection with the sealed Balranald-Ivanhoe Road. The remaining section is a 138 km long bitumen road leading to the Ivanhoe rail siding. HMC is loaded into a train for transport to the Broken Hill Mineral Separation Plant (BH MSP) over approximately 301 km of railway.
Campaspe Project Status and Site Development Works
At the conclusion of mining at Atlas production will transition to Campaspe. Detailed mine planning and final approvals are underway. The development of the Campaspe site and required plant to operate includes:
•fencing of the mine lease (47 km);
•construction of the access road (11 km);
•construction of the mine corridor road (5.4 km);
•construction of the process water dam (210,000 m3);
•development of the mining pit;
•development of the bore field and water reticulation systems;
•relocation of workshops and amenities;
•expansion of the accommodation village from 200 to 300 beds;
•construction of a Primary Concentration Plant (PCP) and
•relocation of Ginkgo/Snapper field booster pumps and piping
History
In the Murray Basin fine heavy mineral occurrences were identified from 1982 to 1986 by Rio Tinto. Subsequently many smaller, coarser and high-grade deposits were also identified, and these formed the first mineral sands mines to be developed in the region. Bemax Resources discovered the Ginkgo, Snapper and Crayfish deposits at Pooncarie in the early to mid-2000’s. Mining commenced at Ginkgo in 2005 and Snapper in 2010. Mining at Snapper was completed in April 2022 and Crayfish was completed in July 2023. Ginkgo is still being mined today by Tronox.
The Atlas-Campaspe Project replaces production from the completed Snapper and Crayfish deposits and the Ginkgo mining operation when it ceases production in mid-2024. Atlas commenced full production in early 2023.
Summary of Resources and Reserves
Atlas-Campaspe Summary of Mineral Resources as of December 31, 2023
|
|
|
|
|
|
|
|
|
|
|
|
|
|
|
|
|
|
|
|
|
|
|
|
|
|
|
|
Mineral Assemblage (% of THM) |
|
| Mine / Deposit |
Resource Category |
Material (million tonnes) |
HM% |
Ilmenite |
Rutile + Leucoxene |
Zircon |
Change from 2022 (%) |
| Atlas |
Measured |
9 |
2.4 |
57.9 |
14.1 |
8.3 |
|
|
Indicated |
— |
— |
— |
— |
— |
|
|
Measured + Indicated |
9 |
2.4 |
57.9 |
14.1 |
8.3 |
|
|
Inferred |
— |
— |
— |
— |
— |
|
|
Total |
9 |
2.4 |
57.9 |
14.1 |
8.3 |
|
| Campaspe |
Measured |
18 |
2.6 |
59.3 |
9.4 |
13.3 |
|
|
Indicated |
— |
— |
— |
— |
— |
|
|
Measured + Indicated |
18 |
2.6 |
59.3 |
9.4 |
13.3 |
|
|
Inferred |
83 |
3.1 |
60.1 |
5.8 |
13.1 |
|
|
Total |
101 |
3.0 |
60.0 |
6.4 |
13.1 |
|
|
Total Mineral Resources |
110 |
3.0 |
59.8 |
6.9 |
12.8 |
— |
(1) Mineral resources are exclusive of mineral reserves.
(2) Price assumptions used for resource and reserve estimations are $1,495 per metric ton of zircon, $246 per metric ton of Chloride Ilmenite, $162 per metric ton of Sulfate Ilmenite, $1,088 per metric ton of Rutile and $314 per metric ton of Leucoxene (East). Mineral prices used in reserve estimation are substantially in line with the prices for each of our products, published quarterly by independent consulting companies.
For a comparison of the reported resources as of December 31, 2023 with the resources as of December 31, 2022, see table on page
34.
Atlas-Campaspe Summary of Mineral Reserves as of December 31, 2023
|
|
|
|
|
|
|
|
|
|
|
|
|
|
|
|
|
|
|
|
|
|
|
|
|
|
|
|
Mineral Assemblage (% of THM) |
|
| Mine / Deposit |
Reserve Category |
Material (million tonnes) |
HM% |
Ilmenite |
Rutile + Leucoxene |
Zircon |
Change from 2022 (%) |
| Atlas |
Proven |
9 |
14.2 |
60.7 |
16.7 |
10.5 |
|
|
Probable |
— |
— |
— |
— |
— |
|
| Campaspe |
Proven |
98 |
5.3 |
60.7 |
10.3 |
13.2 |
|
|
Probable |
— |
— |
— |
— |
— |
|
|
Total Mineral Reserves |
107 |
6.0 |
60.7 |
11.5 |
12.7 |
(2.2) |
(1) Price assumptions used for resource and reserve estimations are $1,495 per metric ton of zircon, $246 per metric ton of Chloride Ilmenite, $162 per metric ton of Sulfate Ilmenite, $1,088 per metric ton of Rutile and $314 per metric ton of Leucoxene (East). Mineral prices used in reserve estimation are substantially in line with the prices for each of our products, published quarterly by independent consulting companies.
(2) Conversion of in ground grade to saleable product yield (recovery), considering all the losses during mining and processing, is typically 96% for ilmenite, 92% for rutile, 87% for Leucoxene and 79% for zircon.
For a comparison of the reported reserves as of December 31, 2023 with the reserves as of December 31, 2022, see table on page
35. The decrease in reserves in 2023 as compared to 2022 is primarily attributable to mining depletion.
Condition of Property
Construction at Atlas commenced in 2022 and ramped up to full production in the first quarter of 2023. The Atlas deposit is mined using a dry mining method for both the overburden stripping and ore extraction.
As the equipment and infrastructure (including the DMU, WCP and all associated infrastructure) at Atlas is new and within its first year of operational life it is in good condition.
Dry mining at Campaspe will replace production from Atlas when Atlas finishes in 2027. Detailed design work and additional approvals are presently being undertaken.
Extensive and systematic exploration drilling activities have been conducted at Atlas and Campaspe on an annual basis to upgrade resources and reserves. Final reserve delineation drilling is completed to 100m x 20m spacing. Final drilling is completed three or more years in advance of the mining face to allow timely and accurate mine planning to be completed. As such, all drilling has been completed at Atlas. Final infill drilling has also been completed for the first five (5) years of mining at Campaspe. Over the past 13 years there has been an average of 50,000 meters of drilling completed annually at Tronox’s Eastern Operations. Drilling will continue at Campaspe and surrounding areas in 2024.
Namakwa Mine
Tronox Mineral Sands Pty Ltd is a subsidiary of Tronox Holdings Plc and holds 100% of the rights at the Namakwa Sands Operations, which is located along the west coast of the Western Cape province, South Africa. The Namakwa Sands Operations includes:
•The Northern operations consisting of the Namakwa Sands Mine at Brand-se-Baai and the Mineral Separation Plant at Koekenaap.
•The Southern operations that consist of the Smelting Operations at Saldanha Bay along with administrative headquarters.
Run of mine production at the Namakwa Sands Mine comes from two shallow open-cast mines where excavators and front-end loaders extract free-flowing and lightly cemented sand. The ore is conveyed to two primary concentrator plants (PCP) that utilize wet spirals to produce a heavy mineral concentrate. These concentrates are pumped to a secondary concentrator plant (SCP) where wet high-intensity magnetic separators (WHIMS) and spirals are used to produce a zircon-rich non-magnetic concentrate, and a magnetic concentrate comprising mainly ilmenite. An ilmenite rich secondary stream from the SCP is reprocessed at a separate plant called the UMM Plant to produce a crude ilmenite. SCP and UMM concentrates are separately trucked to and treated at the MSP near Koekenaap, where a series of magnetic and electrical high-tension separators are employed to produce finale saleable ilmenite, rutile, and zircon products. These products are transported from the Mineral Separation Plant to the Smelter using the Saldanha-Sishen railway network.
The Southern Operations consist of the administrative headquarters and smelter operations and are located 3 km from the Saldanha export harbor. The smelting process comprises the carbonaceous reduction of ilmenite using DC arc furnaces to produce titanium slag and pig iron. The received rutile and zircon products as well as the titanium slag are stored in on-site silos from where it is distributed in bag, container, or bulk shipment format.
Mining tenements in South Africa are managed at a national level. In the Western Cape, Mining Rights and Prospecting Rights are granted and administered by the South African Department of Mineral Resources and Energy (DMR&E).
The Mining Rights for Namakwa are shown in the table and figure below.
Tronox Mining Rights, west coast of South Africa
|
|
|
|
|
|
|
|
|
|
|
|
| Area/Farm |
DMRE Reference number |
Area (ha) |
Current status |
| Goeraap 140 Portion 17 |
WC 30/5/1/2/2/114 MR |
250 |
active, expires 17 August 2038 |
| Graauwduinen 152 Portion 1 |
WC 30/5/1/2/2/114 MR |
2,978 |
active, expires 17 August 2038 |
| Hartebeeste Kom 156 Portion 1 & 2 |
WC 30/5/1/2/2/114 MR |
3,903 |
active, expires 17 August 2038 |
| Rietfontein Ext 151 Portion 1 & 2 |
WC 30/5/1/2/2/114 MR |
2,084 |
active, expires 17 August 2038 |
| Hartebeeste Kom 156 Portion 3 |
WC 30/5/1/2/2/113 MR |
1,790 |
active, expires 17 August 2038 |
| Houtkraal 143 Portion 3 |
WC 30/5/1/2/2/113 MR |
1,780 |
active, expires 17 August 2038 |
| Graauwduinen 152 Portion 2 |
WC 30/5/1/2/2/10040 MR |
599 |
active, expires 29 March 2046 |
| Graauwduinen 152 Remaining Extent |
WC 30/5/1/2/2/10040 MR |
1,776 |
active, expires 29 March 2046 |
| Rietfontein Ext 151 Remaining Extent |
WC 30/5/1/2/2/10040 MR |
2,536 |
active, expires 29 March 2046 |
| Houtkraal 143 Remainder of Portion 2 |
WC 30/5/1/2/2/10040 MR |
645 |
active, expires 29 March 2046 |
| Houtkraal 143 Remaining Extent |
WC 30/5/1/2/2/10040 MR |
864 |
active, expires 29 March 2046 |
The net book value of the Namakwa Sands mine, inclusive of mining and beneficiary equipment located in the Western Cape of South Africa as well as relevant mining tenements, as of December 31, 2023 was $357 million. The Namakwa Sands Mine is located at coordinates 31°16’S and 17°54’E.
Location of Western Cape operations
Infrastructure
Potable water is sourced from the Olifants River Irrigation Scheme canal system. Water is distributed to the MSP and Brand-se-Baai (BsB) for process and domestic use. Water is pumped to BsB via a 56 km pipeline at the rate of 280 m3/h. This line also provides water to farmers along the line and rehabilitation areas at the Namakwa Sands Mine. Namakwa Sands holds servitude rights in the area adjacent to the tar sealed road between the Mineral Separation Plant and the Mine. Seawater is used in the primary and secondary separation processes and is pumped via the seawater pump station installation close to the Namakwa Sands Mine.
ESCOM supplies the MSP via the 132 kV line from the Juno substation. A 132/22 kV, 20 MVA transformer from ESCOM supplies both the MSP and a local farm.
The minerals are transported with purpose-built trailers and trucks between the Namakwa Sands and the MSP at Koekenaap. The trucks travel on a tar seal road constructed for this purpose. A Sishen-Saldanha railway line connects the MSP and Smelter sites. The minerals are transported from the MSP to the Smelter/port storage in closed container trucks, to prevent mineral losses and contamination.
History
Exploration for heavy minerals along the coastal strip of southwest Africa led to the discovery and subsequent delineation of the Namakwa Sands deposit near Brand-se-Baai in 1987. In September 1994 Anglo Operations Ltd commenced mining and processing at the West mine ore body. In 2008 Exxaro Resources acquired the Namakwa operations from Anglo and then in 2012 Tronox acquired 74% of Namakwa Mineral Sands Pty Ltd. In 2021 Tronox acquired the whole of Namakwa Mineral Sands Pty Ltd.
Summary of Resources and Reserves
Namakwa Sands Summary of Mineral Resources as of December 31, 2023
|
|
|
|
|
|
|
|
|
|
|
|
|
|
|
|
|
|
|
|
|
|
|
|
Mineral Assemblage (% of THM) |
|
| Resource Category |
Material (million tonnes) |
HM% |
Ilmenite |
Rutile + Leucoxene |
Zircon |
Change from 2022 (%) |
| Measured |
112 |
7.0 |
32.6 |
6.1 |
7.8 |
|
| Indicated |
84 |
6.5 |
28.3 |
5.6 |
6.9 |
|
| Measured + Indicated |
196 |
6.7 |
30.8 |
5.9 |
7.4 |
|
| Inferred |
110 |
5.5 |
35.1 |
8.1 |
6.6 |
|
| Total Mineral Resources |
306 |
6.3 |
32.3 |
6.7 |
7.1 |
2.0 |
(1) Cutoff grade applied is 0.3% zircon
(2) Mineral Resources are exclusive of mineral reserves. Price assumptions used for resource and reserve estimations are $1,499 per metric ton of zircon, $194 per metric ton of Ilmenite and $925 per metric ton of Rutile.
For a comparison of the reported resources as of December 31, 2023 with the resources as of December 31, 2022, see table on page
34. The increase in resources in 2023 as compared to 2022 is primarily attributable to updated information.
Namakwa Sands Summary of Mineral Reserves as of December 31, 2023
|
|
|
|
|
|
|
|
|
|
|
|
|
|
|
|
|
|
|
|
|
|
|
|
Mineral Assemblage (% of THM) |
|
| Reserve Category |
Material (million tonnes) |
HM% |
Ilmenite |
Rutile + Leucoxene |
Zircon |
Change from 2022 (%) |
| Proven |
121 |
7.2 |
37.8 |
8.8 |
9.1 |
|
| Probable |
545 |
5.7 |
51.6 |
10.7 |
10.8 |
|
| Total Mineral Reserves |
666 |
5.9 |
48.6 |
10.3 |
10.5 |
(3.0) |
(1) Price assumptions used for resource and reserve estimations are $1,499 per metric ton of zircon, $194 per metric ton of Ilmenite and $925 per metric ton of Rutile. Mineral prices used in Reserve estimation are substantially in line with the prices for each of our products published quarterly by third-party industry consultancies.
(2) Conversion of in ground grade to saleable product yield (recovery), considering all the losses during mining and processing, is typically 68% for ilmenite, 63% for rutile, and 63% for zircon.
For a comparison of the reported reserves as of December 31, 2023 with the reserves as of December 31, 2022, see table on page
35. The decrease in reserves in 2023 as compared to 2022 is primarily attributable to mining depletion.
Condition of Property
The operations at Namakwa Sands were originally established by Anglo in 1996 and have operated continuously since that time. Open-cast mining, also known as strip mining, both classified as surface mining techniques, takes place in two distinct areas known as the East and West Mines. The East Mine comprises predominantly shallow mineral sands stripping, whereas the West Mine entails shallow stripping of mineral sands followed by a deeper open-cast mining operation recovering lightly cemented materials to about 40 meters.
More than 200,000 meters of drilling has been completed to date, to define the pre-mine Namakwa mineral resources base from surface down to bedrock. In-fill drilling, assaying and metallurgical test work will continue over the next decade with the strategy to upgrade current mineral resources to fully measured status, as well as converting mineral resources to mineral reserves, with a focus on proven mineral reserves realization.
The mining and mineral processing flowsheet and equipment of the Northern Operations have remained basically the same since the last throughput upgrade in 2008. The equipment and infrastructure at both mines are in sound working order, having been upgraded such that the total throughput of the mining operations now averages around 23 Mt per annum. A major mine development project, expected to be operational in 2026 is currently in the execution stage to extract and beneficiate the deeper lying ore in the East Mine beneath the shallow sands that are nearing its end of life.
Other changes include minor equipment replacements and technology updates, as well as circuit re-configurations as part of an embedded continuous improvement drive. Most recently, a small standalone scavenger plant has been added to the SCP flowsheet to augment attritioned magnetic concentrate production by consuming excess unattritioned ilmenite produced from the WHIMS circuit. Routine work maintenance programs are solidly entrenched, being directed by physical asset care plans targeting the maximum life and efficiency of plant, property and equipment holistically.
KZN Sands
Tronox KZN Sands Operations, which are located along the east coast of the Kwa-Zulu Natal province, South Africa are wholly owned subsidiaries of Tronox Holdings Plc, and include the:
•Fairbreeze Mine, immediately south of the Mtunzini township with the Primary Wet Plant (PWP) situated a further 8 km south of Mtunzini.
•Central Processing Complex (CPC), 50 road km north of Mtunzini, just outside the town of Empangeni, is where heavy mineral concentrates are processed into mineral products and ilmenite is further converted to titanium rich slag and pig iron in two direct current arc furnaces. The laboratory and mineral testing facilities are also located at CPC.
A hybrid mining method is employed at Fairbreeze Mine, utilizing track dozers to break lightly cemented ore layers in combination with high- pressure hydraulic mining using water monitor guns to pump slurried ore to the Primary Wet Concentrator (PWP) for wet gravity recovery of heavy minerals.
The resultant heavy mineral concentrate is trucked to the CPC, which is configured with relatively standard equipment to produce saleable ilmenite, rutile and zircon products. The ilmenite is dispatched to the bordering smelting process encompassing the carbonaceous reduction of ilmenite using DC arc furnaces to produce titanium slag and pig iron. The rutile and zircon products as well as the titanium slag are stored in on-site silos from where it is distributed in bag, container, or bulk shipment format destined for the Richards Bay harbor.
Mining tenements in South Africa are managed at a national government level. In KwaZulu-Natal, Mining Rights and Prospecting Rights are granted and administered by the regional office of the South African Department of Mineral Resources and Energy (DMRE).
The Mining Rights for Fairbreeze are shown in the table and figure below.
Tronox Mining Rights for Fairbreeze
|
|
|
|
|
|
|
|
|
|
|
|
| Area/Farm |
DMRE Reference number |
Area (ha) |
Current status |
| Fairbreeze A, B, C, D |
KZN 30/5/1/2/2/123 MR |
3,810 |
active, expires 24 March 2035 |
| Fairbreeze CX |
KZN 30/5/1/2/2/164 MR |
231 |
active, expires 04 August 2039 |
The net book value of the Fairbreeze mine, inclusive of mining and beneficiary equipment located in the Kwa-Zulu Natal province of South Africa as well as relevant mining tenements, as of December 31, 2023 was $344 million. The Fairbreeze Mine is located at coordinates 29°00’S and 31°42’E.
Mining Rights and Surface Ownership
Infrastructure
Fresh water is sourced from the Mhlathuze River upgraded installation that originally supplied the Hillendale Mine. This system was upgraded to a pipeline of 750 mm nominal diameter over approximately 33 km to the Fairbreeze Mine and discharging into the raw water dam, from where it is further distributed for mining and minerals processing, as well as potable use.
Bulk electricity supply for the Fairbreeze Mine is from 88 kV and 132 kV ESCOM power lines that run adjacent to the residue storage facilities and feeds the Fairbreeze substation.
Access to the PWP is from off ramps at Bridge 4 on the national highway N2, south of the town of Mtunzini. Road transport for HMC to the MSP at Empangeni, a distance of 50 km, is along the N2 highway utilizing side tipping trucks. Gypsum waste and MSP sand tailings are returned on the backhaul. There is another route between Fairbreeze and the MSP along the R102 that can be used in emergencies. Railway networks in and around the region are suitable for the cargo requirements of the harbor and local industry and are directly connected to the national network for import/export purposes. The Richards Bay harbor operates a very large coal-handling terminal and controls a wide range of import and export cargos. Durban also has port facilities that Tronox uses to export containerized and bagged product from.
History
Natal Mineral Sands (NMS), prospected for mineral sands on Hillendale and Fairbreeze in the northern coast of KwaZulu-Natal during the 1980’s. Iscor Limited purchased NMS in 1994 and mining activities commenced in 2001 at the Hillendale Mine. In 2012, Tronox announced the acquisition of 74% of KZN Mineral Sands operations. Production commenced at Fairbreeze in 2015 and in 2021 Tronox acquired the whole of the remaining portion it did not own of the KZN Sands operations.
Summary of Resources and Reserves
Fairbreeze Summary of Mineral Resources as of December 31, 2023
|
|
|
|
|
|
|
|
|
|
|
|
|
|
|
|
|
|
|
|
|
|
|
|
Mineral Assemblage (% of THM) |
|
| Resource Category |
Material (million tonnes) |
HM% |
Ilmenite |
Rutile + Leucoxene |
Zircon |
Change from 2022 (%) |
| Measured |
38 |
4.1 |
63.5 |
9.4 |
7.7 |
|
| Indicated |
— |
— |
— |
— |
— |
|
| Measured + Indicated |
38 |
4.1 |
63.5 |
9.4 |
7.7 |
|
| Inferred |
55 |
3.4 |
54.6 |
7.1 |
7.1 |
|
| Total Mineral Resources |
93 |
3.7 |
58.2 |
8.0 |
7.4 |
(11.4) |
(1) Cutoff grade applied is 1.5% ilmenite.
(2) Mineral Resources are exclusive of mineral reserves. Price assumptions used for resource and reserve estimations are $1,554 per metric ton of zircon, $205 per metric ton of Ilmenite and $1,183 per metric ton of Rutile.
For a comparison of the reported resources as of December 31, 2023 with the resources as of December 31, 2022, see table on page
34. The decrease in resources in 2023 as compared to 2022 is primarily attributable to mining depletion.
Fairbreeze Summary of Mineral Reserves as of December 31, 2023
|
|
|
|
|
|
|
|
|
|
|
|
|
|
|
|
|
|
|
|
|
|
|
|
Mineral Assemblage (% of THM) |
|
| Reserve Category |
Material (million tonnes) |
HM% |
Ilmenite |
Rutile + Leucoxene |
Zircon |
Change from 2022 (%) |
| Proven |
187 |
5.6 |
61.3 |
7.6 |
7.5 |
|
| Probable |
15 |
3.9 |
54.8 |
5.6 |
7.3 |
|
| Total Mineral Reserves |
202 |
5.5 |
61.0 |
7.5 |
7.5 |
(2.9) |
(1) Price assumptions used for resource and reserve estimations are $1,554 per metric ton of zircon, $205 per metric ton of Ilmenite and $1,183 per metric ton of Rutile. Mineral prices used in Reserve estimation are substantially in line with the prices for each of our products published quarterly by third-party industry consultancies.
(2) Conversion of in ground grade to saleable product yield (recovery), considering all the losses during mining and processing, is typically 76% for ilmenite, 75% for rutile, and 80% for zircon.
For a comparison of the reported reserves as of December 31, 2023 with the reserves as of December 31, 2022, see table on page
35. The decrease in reserves in 2023 as compared to 2022 is primarily attributable to updated information.
Condition of Property
In 2001, the Hillendale Mine started to supply HMC concentrate to the CPC, in Empangeni for further minerals processing to saleable mineral products. In 2015 after its useful life, and a production-break, most of the Hillendale Mine’s useful, movable equipment was transferred to the nearby newly established Fairbreeze Mine. Mining at Hillendale Mine was exclusively hydraulic mining, but due to the partially semi-consolidated nature of the Fairbreeze ore bodies, a hybrid open-cast mining method is employed at Fairbreeze Mine, utilizing track dozers to break up the ore where required to assist high- pressure hydraulic mining using water monitor guns to pump slurried ore to the PWP for wet gravity recovery of heavy minerals.
Close to 90,000 meters of drilling has been completed to date to define the pre-mine Fairbreeze mineral resources base from surface down to bedrock. Drilling, assaying and metallurgical test work will continue over the next decade with the strategy to upgrade current mineral resources to fully measured status, as well as converting mineral resources to mineral reserves, with a focus on proven mineral reserves realization. The equipment and infrastructure of the Fairbreeze Mine and PWP are in sound working order, having been upgraded as such that the total throughput of the mining operation averaged around 10 Mt per annum for the initial Phase 1 upgrade. Freshly supplied HMC continued to utilize the existing infrastructure at the CPC, Empangeni, being a fully functional mineral separation plant for zircon, ilmenite and rutile products and smelting operations using two DC arc furnaces to produce of TiO2 slag and pig iron, on the same site.
More recently a Phase 2 expansion of the operation at Fairbreeze Mine was commissioned in order to maintain heavy mineral concentrate (HMC) production due to lower THM grades in the ore. The expansion involves increasing the mining and PWP processing rate to about 16 Mt per annum, which require upgrades to the upfront desliming circuit, a further upgrade of the clay fines thickening and residue disposal equipment, rougher spiral capacity, increased concentrator building and additional process water pumping capacity. Mineral recoveries will be maintained following the expansion as will product quality. A residue storage facility (RSF) called MegaSebeka is currently in place and operational, however with the recent increase in mineral reserves, mine life and planned mining rate, an adjacent area called the Everglades RSF will be constructed nearby.
Otherwise, the MSP used to convert HMC into saleable mineral products is the same that was used for the KZN project’s original mining at Hillendale. Other changes include minor equipment replacements and technology updates, as well as circuit re-configurations as part of an embedded continuous improvement drive. Routine work maintenance programs are solidly entrenched, being directed by physical asset care plans targeting the maximum life and efficiency of plant, property and equipment holistically.
Further description of each of our mining projects described above are included in our exhibit filings.
Item 3. Legal Proceedings
Information required by this item is incorporated herein by reference to the section captioned “Notes to Consolidated Financial Statements, Note 18 - Commitments and Contingencies” of this Form 10-K.
SEC regulations require us to disclose certain information about administrative or judicial proceedings to which a governmental authority is party arising under federal, state or local environmental provisions if we reasonably believe that such proceedings may result in monetary sanctions above a stated threshold. Pursuant to the SEC regulations, the Company uses a threshold of $1 million or more for purposes of determining whether disclosure of any such proceedings is required.
Item 4. Mine Safety Disclosures
None.
PART II
Item 5. Market for Registrant’s Common Equity, Related Shareholder Matters and Issuer Purchases of Equity Securities
Market for our Ordinary Shares
Our ordinary shares trade on the New York Stock Exchange under the symbol “TROX.”
Holders of Record
As of January 31, 2024, there were approximately 56 holders of record of ordinary shares. This does not include the shareholders that held shares of our ordinary shares in a nominee or “street-name” accounts through banks or broker-dealers. See Item 12, Security Ownership of Certain Beneficial Owners and Management and Related Shareholder Matters.
Issuer Purchases of Equity Securities
|
|
|
|
|
|
|
|
|
|
|
|
|
|
|
|
|
|
| 2023 |
|
Total Number of Shares Purchased |
Weighted Average Price Paid per Share |
Total Number of Shares Purchased as Part of Publicly Announced Plan(1) |
Maximum Approximate Dollar Value that May Yet be Purchased Under the Plan(1) |
| October 1 - October 31 |
|
— |
|
$ |
— |
|
— |
|
$ |
250,536,235 |
|
| November 1 - November 30 |
|
— |
|
— |
|
— |
|
250,536,235 |
|
| December 1 - December 31 |
|
— |
|
— |
|
— |
|
250,536,235 |
|
| Total |
|
— |
|
$ |
— |
|
— |
|
$ |
250,536,235 |
|
(1) On November 9, 2021, the Company announced that the Company’s Board of Directors has authorized the repurchase of up to $300 million of the Company’s ordinary shares, par value $0.01 per share (the “ordinary shares”), through February 2024. There were no share repurchases made during the year ended December 31, 2023, see "Note 19" of notes to consolidated financial statements for further details. In connection with the expiration in February 2024 of the Company's existing share repurchase program, on February 21, 2024, the Company's Board of Directors authorized the repurchase of up to $300 million of the Company's stock through February 21, 2027.
Stock Performance Graph
The following graph presents the five-year cumulative total stockholder returns for our ordinary shares compared with the Standard & Poor’s (“S&P”) 500, the S&P MidCap 400 Chemicals and the S&P 400 Materials indices.
The graph assumes that the values of our ordinary shares, the S&P 500, the S&P MidCap 400 Chemicals index, and the S&P 400 Materials index were each $100 on December 31, 2018, and that all dividends were reinvested.
Item 6. Selected Financial Data
Not applicable.
Item 7. Management’s Discussion and Analysis of Financial Condition and Results of Operations
The following discussion should be read in conjunction with Tronox Holdings plc's consolidated financial statements and the related notes included elsewhere in this Annual Report on Form 10-K. This discussion and other sections in this Annual Report on Form 10-K contain forward-looking statements, within the meaning of the Private Securities Litigation Reform Act of 1995, that involve risks and uncertainties, and actual results could differ materially from those discussed in the forward-looking statements as a result of numerous factors. Forward-looking statements provide current expectations of future events based on certain assumptions and include any statement that does not directly relate to any historical or current fact. Forward-looking statements also can be identified by words such as “future,” “anticipates,” “believes,” “estimates,” “expects,” “intends,” “plans,” “predicts,” “will,” “would,” “could,” “can,” “may,” and similar terms. There are important factors that could cause our actual results, level of activity, performance or achievements to differ materially from the results, level of activity, performance or achievements expressed or implied by the forward-looking statements. In particular, you should consider the numerous risks and uncertainties outlined in Item 1A. “Risk Factors.”
This Management’s Discussion and Analysis of Financial Condition and Results of Operations contains certain financial measures, in particular the presentation of earnings before interest, taxes, depreciation and amortization (“EBITDA”) and Adjusted EBITDA, which are not presented in accordance with accounting principles generally accepted in the United States (“U.S. GAAP”). We are presenting these non-U.S. GAAP financial measures because we believe they provide us and readers of this Form 10-K with additional insight into our operational performance relative to earlier periods and relative to our competitors. We do not intend for these non-U.S. GAAP financial measures to be a substitute for any U.S. GAAP financial information. Readers of these statements should use these non-U.S. GAAP financial measures only in conjunction with the comparable U.S. GAAP financial measures. A reconciliation of net (loss) income to EBITDA and Adjusted EBITDA is also provided herein.
Executive Overview
Tronox Holdings plc (referred to herein as "Tronox", "we", "us", or "our") operates titanium-bearing mineral sand mines and beneficiation operations in Australia and South Africa to produce feedstock materials that can be processed into TiO2 for pigment, high purity titanium chemicals, including titanium tetrachloride, and Ultrafine© titanium dioxide used in certain specialty applications. Our strategy is to be vertically integrated and produce enough feedstock materials to be as self-sufficient as possible in the production of TiO2 at our nine pigment facilities located in the United States, Australia, Brazil, UK, France, the Netherlands, China and the Kingdom of Saudi Arabia (“KSA”). We believe that vertical integration is the best way to achieve our ultimate goal of delivering low cost, high-quality pigment to our coatings and other TiO2 customers throughout the world. The mining, beneficiation and smelting of titanium bearing mineral sands creates meaningful quantities of zircon, pig iron and the rare-earth bearing mineral, monazite, which we also supply to customers around the world.
We are a public limited company listed on the New York Stock Exchange and are registered under the laws of England and Wales.
Business Environment
The following discussion includes trends and factors that may affect future operating results:
In 2023, demand softness continued across both TiO2 and zircon end markets. As a result, Tronox ran its operations at the lowest utilization rates on record in order to manage inventories and free cash flow, though this resulted in higher production costs including unfavorable fixed cost absorption, lower of cost or market charges, and idle facility charges. We continued to proactively manage expenses and cash to mitigate the operational cost pressures.
Fourth quarter revenue increased 6% compared to the prior year, driven by higher TiO2 and other product sales volumes. For the fourth quarter of 2023 as compared to the fourth quarter of 2022, TiO2 revenue increased 9% driven by a 16% increase in volumes and a 1% exchange rate tailwind partially offset by a 6% decrease in average selling prices and a 2% unfavorable mix impact. Zircon sales volumes and average selling prices decreased 26% and 11%, respectively. Revenue from other products increased 38% from the fourth quarter 2022 to the fourth quarter of 2023 due to opportunistic sales of ilmenite and a portion of a rare earths tailings deposit in South Africa. Gross profit decreased for the fourth quarter of 2023 as compared to the fourth quarter of 2022 due to the unfavorable impact of average selling prices of TiO2, zircon and pig iron and unfavorable overhead absorption.
These unfavorable impacts were partially offset by lower commodity costs and favorable exchange rates.
Sequentially, revenue increased 4% in the fourth quarter of 2023 compared to the third quarter of 2023 primarily driven by higher zircon and other products sales volumes. TiO2 revenue decreased 7% in the fourth quarter of 2023 compared to the third quarter of 2023 driven by a 4% decrease in volumes, a 1% unfavorable product mix impact, a 1% decline in average selling prices and a 1% exchange rate headwind. Zircon sales volumes increased 82% partially offset by a 9% decrease in average selling prices in the fourth quarter of 2023 compared to the third quarter of 2023. Other products revenues increased 55% sequentially from the third quarter of 2023 to the fourth quarter of 2023 due to additional sales of pig iron, as well as opportunistic sales of ilmenite and a portion of a rare earths tailings deposit in South Africa. Gross profit decreased sequentially from the third quarter of 2023 to the fourth quarter of 2023 due to decreases in sales volumes and average selling prices of TiO2 and decreases in average selling prices of zircon and pig iron as well as increases in idle facility charges and higher production and commodity costs. These unfavorable impacts were partially offset by increases in sales volumes of zircon and other products as well as favorable impacts of foreign currency.
As of December 31, 2023, our total available liquidity was $761 million, including $273 million in cash and cash equivalents and $488 million available under revolving credit agreements. As of December 31, 2023, our total debt was $2.8 billion and net debt to trailing-twelve month Adjusted EBITDA was 4.9x. The Company also has no financial covenants on its term loans or bonds and only one springing financial covenant on its Cash Flow revolver facility, which we do not expect to be triggered based on our current scenario planning. Refer to Note 13 of notes to consolidated financial statements for further details.
Consolidated Results of Operations
Year Ended December 31, 2023 Compared to the Year Ended December 31, 2022
|
|
|
|
|
|
|
|
|
|
|
|
|
|
|
|
|
|
|
|
|
|
|
|
|
Year Ended December 31, |
|
|
2023 |
|
2022 |
|
Variance |
|
|
(Millions of U.S. Dollars) |
|
| Net sales |
$ |
2,850 |
|
|
$ |
3,454 |
|
|
$ |
(604) |
|
|
| Cost of goods sold |
2,388 |
|
|
2,622 |
|
|
(234) |
|
|
| Gross profit |
$ |
462 |
|
|
$ |
832 |
|
|
$ |
(370) |
|
|
| Gross Margin |
16.2 |
% |
|
24.1 |
% |
|
(7.9) |
pts |
|
|
|
|
|
|
|
|
| Selling, general and administrative expenses |
276 |
|
|
289 |
|
|
(13) |
|
|
| Venator settlement |
— |
|
|
85 |
|
|
(85) |
|
|
| Income from operations |
186 |
|
|
458 |
|
|
(272) |
|
|
| Interest expense |
(158) |
|
|
(125) |
|
|
(33) |
|
|
| Interest income |
18 |
|
|
9 |
|
|
9 |
|
|
| Loss on extinguishment of debt |
— |
|
|
(21) |
|
|
21 |
|
|
| Other income (expense), net |
3 |
|
|
(13) |
|
|
16 |
|
|
| (Loss) Income before income taxes |
49 |
|
|
308 |
|
|
(259) |
|
|
| Income tax (provision) benefit |
(363) |
|
|
192 |
|
|
(555) |
|
|
| Net (loss) income |
$ |
(314) |
|
|
$ |
500 |
|
|
$ |
(814) |
|
|
|
|
|
|
|
|
|
| Effective tax rate |
741 |
% |
|
(62) |
% |
|
803 pts |
|
|
|
|
|
|
|
|
EBITDA(1) |
$ |
464 |
|
|
$ |
693 |
|
|
$ |
(229) |
|
|
Adjusted EBITDA(1) |
$ |
524 |
|
|
$ |
875 |
|
|
$ |
(351) |
|
|
| Net (loss) income as % of Net Sales |
(11.0) |
% |
|
14.5 |
% |
|
(25.5) pts |
|
Adjusted EBITDA as % of Net Sales(1) |
18.4 |
% |
|
25.3 |
% |
|
(6.9) |
pts |
|
_____________________
(1) EBITDA, Adjusted EBITDA and Adjusted EBITDA as a % of Net Sales are Non-U.S. GAAP financials measures. Please refer to the “Non-U.S. GAAP Financial Measures” section of this Management’s Discussion and Analysis of Financial Condition and Results of Operations for a discussion of these measures and a reconciliation of these measures to Net (loss) income.
Net sales of $2,850 million for the year ended December 31, 2023 decreased by 17% compared to $3,454 million for the same period in 2022. Revenue decreased primarily due to lower TiO2 and zircon sales volumes. Net sales by type of product for the years ended December 31, 2023 and 2022 were as follows:
The table below presents reported revenue by product:
|
|
|
|
|
|
|
|
|
|
|
|
|
|
|
|
|
|
|
|
|
|
|
|
|
Year Ended
December 31, |
|
|
|
|
| (Millions of dollars, except percentages) |
2023 |
|
2022 |
|
Variance |
|
Percentage |
TiO2 |
$ |
2,248 |
|
|
$ |
2,693 |
|
|
$ |
(445) |
|
|
(17) |
% |
| Zircon |
257 |
|
|
438 |
|
|
(181) |
|
|
(41) |
% |
| Other products |
345 |
|
|
323 |
|
|
22 |
|
|
7 |
% |
| Total net sales |
$ |
2,850 |
|
|
$ |
3,454 |
|
|
$ |
(604) |
|
|
(17) |
% |
For the year ended December 31, 2023, TiO2 revenue decreased $445 million, or 17%, compared to the prior year due to a $416 million decrease in sales volumes and a decrease of $43 million in average selling prices. Foreign currency positively impacted TiO2 revenue by $14 million due primarily to the weakening of the Euro. Zircon revenues decreased $181 million primarily due to a 42% decrease in sales volumes partially offset by a 1% increase in average selling prices. Other products revenue increased $22 million primarily due to the sale of a portion of a rare earths tailings deposit in South Africa as well as an increase in pig iron sales volumes. These increases in other products were partially offset by a decrease in average selling prices of pig iron.
Gross profit of $462 million for the year ended December 31, 2023 was 16.2% of net sales compared to 24.1% of net sales for the same period in 2022. The decrease in gross margin is primarily due to:
•the net unfavorable impact of 7 points due to product mix and higher production and commodity costs,
•the unfavorable impact of 2 points due to increased cost structures and idle facility charges,
•the unfavorable impact of 2 points primarily due to a decrease in TiO2 and zircon selling prices, partially offset by
•the favorable impact of 1 point from the sale of a portion of a rare earths tailings deposit in South Africa, and
•the net favorable impact of approximately 2 points due to changes in foreign exchange rates. This is primarily due to the South African Rand and Australian dollar given costs in these regions are primarily incurred in local currencies while revenues are tied to the U.S. dollar whereas within our European region both revenues and costs of goods sold are denominated in Euros and as such did not have a significant impact to gross margin.
Selling, general and administrative ("SG&A") expenses decreased $13 million when comparing the year ended December 31, 2023 to the prior year. The SG&A expenses decrease was primarily driven by a $7 million decrease in employee costs primarily due to lower incentive compensation, $2 million of lower travel and entertainment expenses and lower amortization cost of $2 million. The remaining net decrease was driven by individually immaterial amounts.
Income from operations for the year ended December 31, 2023 of $186 million, decreased by $272 million or 59% compared to the same period in 2022 which is primarily attributable to lower sales volumes of TiO2 and zircon as well as higher production costs and unfavorable product mix partially offset by the lower selling, general and administrative expenses.
Interest expense for the year ended December 31, 2023 increased $33 million compared to the same period in 2022. The increase is primarily due to the increase in the effective interest rates and higher average outstanding debt balances.
Interest income for the year ended December 31, 2023 increased $8 million compared to the same period in 2022 primarily due to an overall increase in our cash investments and higher interest rates on those cash balances period over period.
Other income (expense), net for the year ended December 31, 2023 primarily consisted of $6 million of net realized and unrealized foreign currency gains and $6 million associated with the monthly technical service fee relating to the Jazan slagger we receive from AMIC partially offset by $9 million of other individually immaterial amounts.
We continue to maintain full valuation allowances related to the total net deferred tax assets in the United Kingdom. During the year ended December 31, 2023, the Company has applied a full valuation allowance against the deferred tax assets in Australia. Future provisions for income taxes associated with these jurisdictions include no tax benefits with respect to losses incurred and tax expense only to the extent of current tax payments. Additionally, we have valuation allowances against other specific tax assets.
The effective tax rate was 741% and (62)% for the years ended December 31, 2023 and 2022, respectively.
The effective tax rates for the year ended December 31, 2023 and 2022 are influenced by a variety of factors, primarily income and losses in jurisdictions with valuation allowances, non-taxable income and expenses, prior year accruals, and our jurisdictional mix of income at tax rates different than the U.K. statutory rate. Additionally, the effective tax rates for each year is significantly influenced by the release of the valuation allowance against deferred tax assets in Australia during the year ended December 31, 2022 and the subsequent reapplication of the valuation allowance against deferred tax assets in Australia during the year ended December 31, 2023. Refer to Note 5 of notes to consolidated financial statements for further information.
Net (loss) income as a percentage of net sales was (11.0)% for the year ended December 31, 2023 as compared to 14.5% for the year ended December 31, 2022. The primary driver of the year-over-year decrease in Net (loss) income as a percentage of net sales is the timing of the deferred tax assets' valuation allowance adjustments as well as the lower gross profit due to higher production costs and unfavorable product mix and lower selling prices. Adjusted EBITDA as a percentage of net sales was 18.4% for the year ended December 31, 2023, a decrease of 6.9 points from 25.3% in the prior year. The lower gross profit as a result of higher production costs and unfavorable product mix as well as lower selling prices as discussed above were the primary drivers of the year-over-year decrease in Adjusted EBITDA percentage.
Year Ended December 31, 2022 Compared to the Year Ended December 31, 2021
A discussion of our results of operations for the year ended December 31, 2022 versus December 31, 2021 is included in Part II, Item 7, “Management’s Discussion and Analysis of Financial Condition and Results of Operations - Results of Operation”, included in our Annual Report on Form 10-K for the year ended December 31, 2022.
Other Comprehensive Income (Loss)
There was an other comprehensive loss of $42 million for the year ended December 31, 2023 compared to other comprehensive loss of $27 million for the year ended December 31, 2022. This increase in comprehensive loss was primarily driven by net losses on derivative instruments of $13 million in the year ended December 31, 2023 as compared to net gains on derivative instruments of $30 million in the prior year as well as pension and postretirement losses of $14 million for the year ended December 31, 2023 as compared to pension and postretirement gains of $22 million in the prior year. In addition, we recognized unfavorable foreign currency translation adjustments of $15 million for the year ended December 31, 2023 as compared to unfavorable foreign currency translation adjustments of $79 million in the prior year.
A discussion of our comprehensive (loss) income for the year ended December 31, 2022 versus December 31, 2021 is included in Part II, Item 7, “Management’s Discussion and Analysis of Financial Condition and Results of Operations - Other Comprehensive (Loss) Income”, included in our Annual Report on Form 10-K for the year ended December 31, 2022.
Liquidity and Capital Resources
During 2023, our liquidity increased by $153 million to $761 million.
The table below presents our liquidity, including amounts available under our credit facilities, as of the following dates:
|
|
|
|
|
|
|
|
|
|
|
|
|
December 31,
2023 |
|
December 31,
2022 |
| Cash and cash equivalents |
$ |
273 |
|
|
$ |
164 |
|
| Available under the Cash Flow Revolver |
343 |
|
|
300 |
|
| Available under the Standard Credit Facility |
55 |
|
|
59 |
|
| Available under the Emirates Revolver |
64 |
|
|
60 |
|
| Available under the SABB Facility |
20 |
|
|
19 |
|
| Available under the Bank Itau Facility |
6 |
|
|
6 |
|
| Total |
$ |
761 |
|
|
$ |
608 |
|
Historically, we have funded our operations and met our commitments through cash generated by operations, issuance of unsecured notes, bank financings and borrowings under lines of credit. In the next twelve months, we expect that our operations will provide sufficient cash for our operating expenses, capital expenditures, interest payments and debt repayments, however, if necessary, we have the ability to borrow under our short-term credit facilities (see Note 13 of notes to consolidated financial statements). This is predicated on our achieving our forecast which could be negatively impacted by items outside of our control, including, among other things, macroeconomic conditions, inflationary pressures, political instability including the ongoing Russia and Ukraine and Middle East conflicts and any expansion of such conflicts, and supply chain disruptions. If negative events occur in the future, we may need to reduce our capital spend, cut back on operating costs, and other items within our control to maintain appropriate liquidity.
Working capital (calculated as current assets less current liabilities) was $1.4 billion at December 31, 2023, compared to $1.1 billion at December 31, 2022.
As of and for the year ended December 31, 2023, the non-guarantor subsidiaries of our Senior Notes due 2029 represented approximately 17% of our total consolidated liabilities, approximately 34% of our total consolidated assets, approximately 43% of our total consolidated net sales and approximately 55% of our Consolidated EBITDA (as such term is defined in the 2029 Indenture). In addition, as of December 31, 2023, our non-guarantor subsidiaries had $688 million of total consolidated liabilities (including trade payables but excluding intercompany liabilities), all of which would have been structurally senior to the 2029 Notes. See Note 13 of notes to consolidated financial statements for additional information.
At December 31, 2023, we had outstanding letters of credit and bank guarantees of $109 million. See Note 13 of notes to consolidated financial statements.
Principal factors that could affect our ability to obtain cash from external sources include (i) debt covenants that limit our total borrowing capacity; (ii) increasing interest rates applicable to our floating rate debt; (iii) increasing demands from third parties for financial assurance or credit enhancement; (iv) credit rating downgrades, which could limit our access to additional debt; (v) a decrease in the market price of our common stock and debt obligations; and (vi) volatility in public debt and equity markets.
As of December 31, 2023, our credit rating with Moody’s remained unchanged from December 31, 2022 at Ba3 stable outlook. As of December 31, 2023, our credit rating with Standard & Poor's remained unchanged from December 31, 2022 at B positive outlook, but the outlook was changed in August 2023 from positive to stable. See Note 13 of notes to consolidated financial statements.
Cash and Cash Equivalents
We consider all investments with original maturities of three months or less to be cash equivalents. As of December 31, 2023, our cash and cash equivalents were invested in money market funds and we also receive earnings credits for some balances left in our bank operating accounts. We maintain cash and cash equivalents in bank deposit and money market accounts that may exceed federally insured limits. The financial institutions where our cash and cash equivalents are held are highly rated and geographically dispersed, and we have a policy to limit the amount of credit exposure with any one institution. We have not experienced any losses in such accounts and believe we are not exposed to significant credit risk.
The use of our cash includes payment of our operating expenses, capital expenditures, servicing our interest and debt repayment obligations, cash taxes, making pension contributions and making quarterly dividend payments. Going forward, we expect to continue to invest in our businesses through cost reduction, as well as growth and vertical integration-related capital expenditures including projects such as newTRON and various mine development projects, continued reductions in our debt, continued dividends and share repurchases.
Repatriation of Cash
At December 31, 2023, we held $273 million in cash and cash equivalents in these respective jurisdictions: $98 million in the United States, $19 million in South Africa, $62 million in Australia, $40 million in Brazil, $12 million in Saudi Arabia, $17 million in China, $24 million in Europe and $1 million in India. Our credit facilities limit transfers of funds from subsidiaries in the United States to certain foreign subsidiaries. In addition, at December 31, 2023, we held less than $1 million of restricted cash which is in Australia related to performance bonds.
At December 31, 2023, Tronox Holdings plc had foreign subsidiaries with undistributed earnings. Although we would not be subject to income tax on these earnings, we have asserted that amounts in specific jurisdictions are indefinitely reinvested outside of the parent's taxing jurisdictions. These amounts could be subject to withholding tax if distributed, but the Company has made no provision for tax related to these undistributed earnings. The Company has removed its assertion that earnings in China are indefinitely reinvested, and the withholding tax accruals for potential repatriations from that jurisdiction are now reflected in the effective tax rate reconciliation in Note 5 to the consolidated financial statements.
Stock Repurchases
On November 9, 2021, the Company's Board of Directors authorized the repurchase of up to $300 million of the Company's stock through February 2024. During the year ended December 31, 2023, we made no repurchases of the Company's stock. In connection with the expiration in February 2024 of the Company's existing share repurchase program, on February 21, 2024, the Company's Board of Directors authorized the repurchase of up to $300 million of the Company's stock through February 21, 2027.
Cash Dividends on Ordinary Shares
On February 21, 2024, the Board declared a quarterly dividend of $0.125 per share to holders of our ordinary shares at the close of business on March 4, 2024, which will be paid on April 5, 2024.
Debt Obligations
2023 Term Loan Facility
In August 2023, the Borrower, the Company, certain of the Company’s subsidiaries, the incremental term lender party thereto and HSBC Bank USA, National Association, as Administrative Agent and Collateral Agent, entered into Amendment No. 3 to the Amended and Restated First Lien Credit Agreement (the "2023 Amendment"). The 2023 Amendment provides the Borrower with a new five -year incremental term loan facility ("the 2023 Term Loan Facility" and, the loans thereunder, the "2023 Incremental Term Loans") under its credit agreement in an aggregate initial principal amount of $350 million. A portion of the proceeds of the 2023 Term Loan Facility were used to repay $159 million of then-outstanding borrowings under the Company's existing revolving credit facilities and to enhance available liquidity for upcoming capital expenditures. Refer to Note 13 in notes to consolidated financial statements for further details.
At December 31, 2023 and 2022, our long-term debt, net of unamortized discount and debt issuance costs was $2.8 billion and $2.5 billion, respectively.
At December 31, 2023 and 2022, our net debt (the excess of our debt over cash and cash equivalents) was $2.6 billion and $2.4 billion, respectively. See Note 13 of notes to consolidated financial statements.
Off-Balance Sheet Arrangements
In March 2022, the Company entered into an accounts receivable securitization program ("Securitization Facility") with a financial institution, through our wholly-owned special purpose bankruptcy-remote subsidiary, Tronox Securitization LLC ("SPE"). The Securitization Facility permitted the SPE to sell accounts receivable up to $75 million.
In November 2022, the Company amended the receivable purchase agreement to expand the program to include receivables generated by its wholly-owned Australian operating subsidiaries, Tronox Pigment Pty Ltd., Tronox Pigment Bunbury Ltd. and Tronox Mining Australia Ltd. which increased the facility limit to $200 million and to extend the program term to November 2025.
In June 2023, the Company entered into an additional amendment (the "Second Amendment") to further include receivables generated by our wholly-owned European operating subsidiaries, Tronox Pigment Holland BV and Tronox Pigment UK Limited. Neither the facility limit nor the program term were changed as a result of the Second Amendment, and remain at $200 million and November 2025, respectively.
See "Note 7 - Accounts Receivable Securitization Program" in notes to consolidated financial statements for further details regarding this off-balance sheet program.
Cash Flows
Years Ended December 31, 2023 and 2022
The following table presents cash flow for the periods indicated:
|
|
|
|
|
|
|
|
|
|
|
|
|
Year Ended December 31, |
|
2023 |
|
2022 |
|
(Millions of U.S. dollars) |
| Net cash provided by operating activities |
$ |
184 |
|
|
$ |
598 |
|
| Net cash used in investing activities |
(255) |
|
|
(415) |
|
| Net cash provided by (used in) financing activities |
176 |
|
|
(250) |
|
| Effect of exchange rate changes on cash |
4 |
|
|
(1) |
|
| Net increase (decrease) in cash and cash equivalents |
$ |
109 |
|
|
$ |
(68) |
|
Cash Flows provided by Operating Activities — Cash provided by our operating activities is driven by net (loss) income adjusted for non-cash items and changes in working capital items.
The following table summarizes our net cash provided by operating activities for 2023 and 2022: Year Ended December 31, 2023 2022 (Millions of U.S. dollars) Net (loss) income $ (314) $ 500 Net adjustments to reconcile net (loss) income to net cash provided by operating activities 672 113 Income related cash generation 358 613 Net change in assets and liabilities (174) (15) Net cash provided by our operating activities $ 184 $ 598
Net cash provided by operating activities was $184 million in 2023 as compared to $598 million in 2022. The decrease of $414 million period over period is primarily due to a $255 million reduction in net (loss) income net of non-cash adjustments and an increase of $159 million use of cash for net assets and liabilities. The higher use of cash for working capital was primarily driven by increases in inventories of $151 million and decreases in accounts payable and accrued liabilities of $84 million partially offset by a decrease in accounts receivable of $84 million and a decrease in prepaids and other current assets of $37 million in the current year. Additionally, there was a use of cash for long-term other assets and liabilities of $36 million.
Cash Flows used in Investing Activities — Net cash used in investing activities for the year ended December 31, 2023 was $255 million as compared to $415 million for the year ended December 31, 2022. The $160 million decrease in use of cash year over year is primarily driven by lower capital expenditures of $261 million partially offset by $6 million of proceeds from the sale of assets in the current year.
Cash Flows provided by (used in) Financing Activities — Net cash provided by financing activities during the year ended December 31, 2023 was $176 million as compared to cash used in financing activities of $250 million for the year ended December 31, 2022. The current year is primarily comprised of proceeds from long-term debt of $347 million from our 2023 Term Loan Facility partially offset by repayments of long-term and short-term debt of $165 million. Additionally, during the current year, $89 million of cash used to pay dividends during the year ended December 31, 2023. In the prior year, we used $50 million of cash for repurchases of common stock of which there were none in the current year.
Years Ended December 31, 2022 and 2021
A discussion of our cash flows for the year ended December 31, 2022 versus 2021 is included in Part II, Item 7, “Management’s Discussion and Analysis of Financial Condition and Results of Operations - Cash Flows”, included in our Annual Report on Form 10-K for the year ended December 31, 2022.
Contractual Obligations
The following table sets forth information relating to our contractual obligations as of December 31, 2023:
|
|
|
|
|
|
|
|
|
|
|
|
|
|
|
|
|
|
|
|
|
|
|
|
|
|
|
|
|
|
|
|
|
Contractual Obligation Payments Due by Period(3) |
|
Total |
|
Less than
1 year |
|
1-3
years |
|
3-5
years |
|
More than
5 years |
|
|
|
(Millions of U.S. dollars) |
|
|
Long-term debt and lease financing (including interest)(1) |
$ |
3,697 |
|
|
$ |
215 |
|
|
$ |
445 |
|
|
$ |
1,547 |
|
|
$ |
1,490 |
|
Purchase obligations(2) |
2,554 |
|
|
285 |
|
|
340 |
|
|
454 |
|
|
1,475 |
|
| Operating leases |
231 |
|
|
36 |
|
|
44 |
|
|
31 |
|
|
120 |
|
Pension and other post-retirement benefit obligations(4) |
225 |
|
|
27 |
|
|
46 |
|
|
46 |
|
|
106 |
|
Asset retirement obligations and environmental liabilities(5) |
462 |
|
|
19 |
|
|
58 |
|
|
63 |
|
|
322 |
|
| Total |
$ |
7,169 |
|
|
$ |
582 |
|
|
$ |
933 |
|
|
$ |
2,141 |
|
|
$ |
3,513 |
|
__________________
(1)We calculated our various term loan facilities' interest at a SOFR plus an applicable margin. See Note 13 of notes to our consolidated financial statements.
(2)Includes obligations to purchase requirements of process chemicals, supplies, utilities and services. We have various purchase commitments for materials, supplies, and services entered into in the ordinary course of business. Included in the purchase commitments table above are contracts, which require minimum volume purchases that extend beyond one year or are renewable annually and have been renewed for 2024. Certain contracts allow for changes in minimum required purchase volumes in the event of a temporary or permanent shutdown of a facility. We believe that all of our purchase obligations will be utilized in our normal operations.
(3)The table excludes contingent obligations, as well as any possible payments for uncertain tax positions given the inability to estimate the possible amounts and timing of any such payments.
(4)Pension and other post-retirement benefit ("OPEB") obligations of $225 million include estimates of pension plan contributions and expected future benefit payments for unfunded pension and OPEB plans. Pension plan contributions are forecasted for 2024 only. Expected future unfunded pension and OPEB benefit payments are forecasted only through 2032. Contribution and unfunded benefit payment estimates are based upon current valuation assumptions. Estimates of pension contributions after 2024 and unfunded benefit payments after 2033 are not included in the table because the timing of their resolution cannot be estimated. Refer to Note 21 in notes to consolidated financial statements for further discussion on our pension and OPEB plans.
(5)Amounts are shown at the undiscounted and uninflated values.
Non-U.S. GAAP Financial Measures
EBITDA, Adjusted EBITDA, Adjusted net (loss) income attributable to Tronox and Diluted adjusted net income per share attributable to Tronox, which are used by management to measure performance, are not presented in accordance with U.S. GAAP. We define EBITDA as net (loss) income excluding the impact of income taxes, interest expense, interest income and depreciation, depletion and amortization. We define Adjusted EBITDA as EBITDA excluding the impact of nonrecurring items such as restructuring charges, gain or loss on debt extinguishments, impairment charges, gains or losses on sale of assets, acquisition-related transaction costs and pension settlements and curtailment gains or losses. Adjusted EBITDA also excludes non-cash items such as share-based compensation costs, pension and postretirement costs, and realized and unrealized foreign currency remeasurement gains and losses. We define Adjusted net income attributable to Tronox as net (loss) income attributable to Tronox excluding the impact of nonrecurring items which are the Company believes are not indicative of its core operating results such as restructuring charges, gain or loss on debt extinguishments, impairment charges, gains or losses on sale of assets, acquisition-related transaction costs and pension settlements and curtailment gains or losses. We define Diluted adjusted net income per share attributable to Tronox as Diluted net income per share excluding the impact of nonrecurring items which the Company believes are not indicative of its core operating results such as restructuring charges, gain or loss on debt extinguishments, impairment charges, gains or losses on sale of assets, acquisition-related transaction costs and pension settlements and curtailment gains or losses.
Management believes that EBITDA, Adjusted EBITDA, Adjusted net income attributable to Tronox and Diluted adjusted net income per share attributable to Tronox are useful to investors, as it is commonly used in the industry as a means of evaluating operating performance. We do not intend for these non-U.S. GAAP financial measures to be a substitute for any U.S. GAAP financial information. Readers of these statements should use these non-U.S. GAAP financial measures only in conjunction with the comparable U.S. GAAP financial measures. Since other companies may calculate EBITDA, Adjusted EBITDA, Adjusted net income attributable to Tronox and Diluted adjusted net income per share attributable to Tronox differently than we do, EBITDA, Adjusted EBITDA, Adjusted net income attributable to Tronox and Diluted adjusted net income per share attributable to Tronox, as presented herein, may not be comparable to similarly titled measures reported by other companies. Management believes these non-U.S. GAAP financial measures:
•reflect our ongoing business in a manner that allows for meaningful period-to-period comparison and analysis of trends in our business, as they exclude income and expense that are not reflective of ongoing operating results;
•provide useful information in understanding and evaluating our operating results and comparing financial results across periods; and
•provide a normalized view of our operating performance by excluding items that are either noncash or infrequently occurring.
These non-U.S. GAAP measures are the primary measures management uses for planning and budgeting processes, and to monitor and evaluate financial and operating results. In addition, Adjusted EBITDA is a factor in evaluating management’s performance when determining incentive compensation.
The following table reconciles net (loss) income to EBITDA and Adjusted EBITDA, Adjusted EBITDA as a % of net sales for the periods presented and Net Debt to Trailing Twelve Month Adjusted EBITDA as of December 31, 2023 and December 31,
2022:
|
|
|
|
|
|
|
|
|
|
|
|
|
|
|
|
|
|
|
|
|
Year Ended December 31, |
|
2023 |
|
2022 |
|
2021 |
| Net (loss) income (U.S. GAAP) |
(314) |
|
|
500 |
|
|
303 |
|
| Interest expense |
158 |
|
|
125 |
|
|
157 |
|
| Interest income |
(18) |
|
|
(9) |
|
|
(7) |
|
| Income tax provision |
363 |
|
|
(192) |
|
|
71 |
|
| Depreciation, depletion and amortization expense |
275 |
|
|
269 |
|
|
297 |
|
| EBITDA (non-U.S. GAAP) |
464 |
|
|
693 |
|
|
821 |
|
Share-based compensation(a) |
21 |
|
|
26 |
|
|
31 |
|
Transaction costs(b) |
— |
|
|
— |
|
|
18 |
|
Venator settlement(c) |
— |
|
|
85 |
|
|
— |
|
Loss on extinguishment of debt(d) |
— |
|
|
21 |
|
|
65 |
|
Foreign currency remeasurement(e) |
(6) |
|
|
3 |
|
|
(16) |
|
Pension settlement loss(f) |
— |
|
|
20 |
|
|
— |
|
Accretion expense and other adjustments to asset retirement and environmental obligations(g) |
22 |
|
|
19 |
|
|
15 |
|
Accounts receivable securitization program(h) |
12 |
|
|
3 |
|
|
— |
|
Other items(i) |
11 |
|
|
5 |
|
|
13 |
|
| Adjusted EBITDA (non-U.S. GAAP) |
$ |
524 |
|
|
$ |
875 |
|
|
$ |
947 |
|
|
|
|
|
|
|
|
Year Ended December 31, |
|
2023 |
|
2022 |
|
2021 |
| Net sales |
$ |
2,850 |
|
|
$ |
3,454 |
|
|
$ |
3,572 |
|
| Net (loss) income (U.S. GAAP) |
$ |
(314) |
|
|
$ |
500 |
|
|
$ |
303 |
|
| Net (loss) income (U.S. GAAP) as a % of Net sales |
(11.0) |
% |
|
14.5 |
% |
|
8.5 |
% |
| Adjusted EBITDA (non-U.S. GAAP) (see above) as a % of Net sales |
18.4 |
% |
|
25.3 |
% |
|
26.5 |
% |
|
|
|
|
|
|
|
December 31, |
|
|
|
2023 |
|
2022 |
|
|
| Long-term debt, net |
$ |
2,786 |
|
|
$ |
2,464 |
|
|
|
| Short-term debt |
11 |
|
|
50 |
|
|
|
| Long-term debt due within one year |
27 |
|
|
24 |
|
|
|
| (Less) Cash and cash equivalents |
(273) |
|
|
(164) |
|
|
|
| Net debt |
$ |
2,551 |
|
|
$ |
2,374 |
|
|
|
| Adjusted EBITDA (non-U.S. GAAP) (see above) |
$ |
524 |
|
|
$ |
875 |
|
|
|
| Net debt to trailing-twelve month Adjusted EBITDA (non-U.S. GAAP) (see above) |
4.9x |
|
2.7x |
|
|
|
|
|
|
|
|
________________
(a)Represents non-cash share-based compensation. See Note 20 of notes to consolidated financial statements.
(b)2021 amount represents the breakage fee and other costs associated with the termination of the TTI transaction which were primarily recorded in "Other income (expense), net" in the Consolidated Statements of Operations.
(c)Represents the breakage fee including interest associated with the Venator settlement which were recorded in "Venator settlement" in the Consolidated Statements of Operations.
(d)2022 amount represents the loss in connection with the redemption of the 6.5% Senior Secured Notes and the issuance of a new loan which closed in April 2022. 2021 amount represents the loss in connection with the following: 1) termination of its Wells Fargo Revolver, 2) amendment and restatement of its term loan facility including the new revolving credit facility, 3) termination of its Senior Notes due 2026 and its Senior Notes due 2025, 4) issuance of its Senior Notes due 2029 and 5) several voluntary prepayments made on the Term Loan Facility. See Note 13 of notes to consolidated financial statements.
(e)Represents realized and unrealized gains and losses associated with foreign currency remeasurement related to third-party and intercompany receivables and liabilities denominated in a currency other than the functional currency of the entity holding them, which are included in "Other (expense) income, net" in the Consolidated Statements of Operations.
(f)2022 amount represents a non-cash pension settlement loss due to the settling of low-dollar valued amounts in our U.S. Qualified Plan.
(g)Primarily represents accretion expense and other noncash adjustments to asset retirement obligations and environmental liabilities.
(h)Primarily represents expenses associated with the Company's accounts receivable securitization program which is used as a source of liquidity in the Company's overall capital structure.
(i)Includes noncash pension and postretirement costs, asset write-offs and other items included in “Selling general and administrative expenses”, “Cost of goods sold” and "Other income (expense), net in the Consolidated Statements of Operations.
The following table reconciles Net (loss) income attributable to Tronox to Adjusted net income attributable to Tronox for the periods presented:
|
|
|
|
|
|
|
|
|
|
|
|
|
|
|
|
|
|
|
Year Ended December 31, |
|
2023 |
|
2022 |
|
2021 |
| Net (loss) income attributable to Tronox Holdings plc (U.S. GAAP) |
$ |
(316) |
|
|
$ |
497 |
|
|
$ |
286 |
|
Transaction costs(a) |
— |
|
|
— |
|
|
18 |
|
Venator settlement(b) |
— |
|
|
85 |
|
|
— |
|
Loss on extinguishment of debt(c) |
— |
|
|
21 |
|
|
57 |
|
Pension settlement loss(d) |
— |
|
|
15 |
|
|
— |
|
Other(e) |
(1) |
|
|
(3) |
|
|
12 |
|
Withholding tax accrued(f) |
— |
|
|
4 |
|
|
— |
|
Tax valuation allowance(g) |
293 |
|
|
(301) |
|
|
(8) |
|
Brazilian tax credits(h) |
— |
|
|
— |
|
|
(3) |
|
Income tax expense - deferred tax assets(i) |
— |
|
|
(7) |
|
|
— |
|
| Adjusted net (loss) income attributable to Tronox Holdings plc (non-U.S. GAAP) (1)(2) |
$ |
(24) |
|
|
$ |
311 |
|
|
362 |
|
|
|
|
|
|
|
| Diluted net (loss) income per share (U.S. GAAP) |
$ |
(2.02) |
|
|
$ |
3.16 |
|
|
$ |
1.81 |
|
|
|
|
|
|
|
| Transaction costs, per share |
— |
|
|
— |
|
|
0.11 |
|
| Venator settlement, per share |
— |
|
|
0.54 |
|
|
— |
|
| Loss on extinguishment of debt, per share |
— |
|
|
0.13 |
|
|
0.36 |
|
| Pension settlement loss, per share |
— |
|
|
0.09 |
|
|
— |
|
| Other, per share |
(0.01) |
|
|
(0.02) |
|
|
0.08 |
|
| Withholding tax accrued |
— |
|
|
0.03 |
|
|
— |
|
| Tax valuation allowance, per share |
1.88 |
|
|
(1.92) |
|
|
(0.05) |
|
| Brazilian tax credits, per share |
— |
|
|
— |
|
|
(0.02) |
|
| Income tax expense - deferred tax assets, per share |
— |
|
|
(0.04) |
|
|
— |
|
| Diluted adjusted net (loss) income per share attributable to Tronox Holdings plc (non-U.S. GAAP) |
$ |
(0.15) |
|
|
$ |
1.98 |
|
|
$ |
2.29 |
|
|
|
|
|
|
|
| Weighted average shares outstanding, diluted (in thousands) |
156,397 |
|
|
157,110 |
|
|
157,945 |
|
________________
|
|
|
|
|
|
|
|
|
|
|
|
|
|
|
|
|
|
|
|
|
|
|
|
|
|
|
| (a) Represents breakage fee and other costs associated with termination of TTI Transaction which were primarily recorded in "Other income (expense)" in the Consolidated Statements of Operations. |
| (b) Represents the breakage fee including interest associated with the Venator settlement which were recorded in "Venator settlement" in the Consolidated Statements of Operations. |
| (c) 2022 amount represents the loss in connection with the redemption of the 6.5% Senior Secured Notes and the issuance of a new term loan which closed in April 2022. 2021 amount represents the loss in connection with the following: 1) termination of its Wells Fargo Revolver, 2) amendment and restatement of its term loan facility including the new revolving credit facility, 3) termination of its Senior Notes due 2026 and its Senior Notes due 2025, 4) issuance of its Senior Notes due 2029, and 5) certain discretionary prepayments made primarily on our term loan in the US. |
| (d) 2022 amount represents a non-cash pension settlement loss due to the settling of low-dollar valued amounts in our U.S. Qualified Plan. |
| (e) Represents other activity not representative of the ongoing operations of the Company. |
| (f) Represents potential withholding tax due to the Chinese government for historic distributable income generated. |
| (g) 2022 amount represents changes primarily within the Company's Australian deferred tax assets' valuation allowance. 2021 amount represents the reversal of the tax valuation allowance associated with unlimited live deferred tax assets within our Saudi Arabia jurisdiction. |
| (h) Represents a portion of Brazilian tax credits realized during 2021 generated from operations prior to the Cristal acquisition. |
| (i) Represents a charge to tax expense for the impact on deferred tax assets from a change in tax rates in a foreign tax jurisdiction. |
|
|
|
|
|
|
|
|
|
| (1) Only the pension settlement loss amount and certain other items have been tax impacted. No income tax impacts have been given to other items as they were recorded in jurisdictions with full valuation allowances. |
| (2) Diluted adjusted net income per share attributable to Tronox Holdings plc was calculated from exact, not rounded. Adjusted net income attributable to Tronox Holdings plc and share information. |
Critical Accounting Policies and Estimates
The preparation of financial statements in conformity with U.S. GAAP requires management to make certain estimates and assumptions regarding matters that are inherently uncertain and that ultimately affect the reported amounts of assets, liabilities, revenues and expenses, and the disclosure of contingent assets and liabilities. The estimates and assumptions are based on management’s experience and understanding of current facts and circumstances. These estimates may differ from actual results. Certain of our accounting policies are considered critical, as they are both important to reflect our financial position and results of operations and require significant or complex judgment on the part of management. The following is a summary of certain accounting policies considered critical by management.
Asset Retirement Obligations
To the extent a legal obligation exists, an asset retirement obligation (“ARO”) is recorded at its estimated fair value and accretion expense is recognized over time as the discounted liability is accreted to its expected settlement value. Because AROs represent financial obligations to be settled in the future, uncertainties exist in estimating the timing and amount of the associated costs to be incurred. Fair value is measured using expected future cash outflows, adjusted for expected inflation and discounted at our credit-adjusted risk-free interest rate. No market-risk premium has been included in our calculation of ARO balances since we can make no reliable estimate. Management believes these estimates and assumptions are reasonable; however, they are inherently uncertain. Refer to Notes 17 to the consolidated financial statements for a summary of the estimates and assumptions utilized. At December 31, 2023, AROs were $186 million of which the long-term portion of $172 million is recorded in "Asset retirement obligations" and the short-term portion of $14 million is recorded in "Accrued liabilities" in the Consolidated Balance Sheet.
Environmental Matters
Liabilities for environmental matters are recognized when remedial efforts are probable and the costs can be reasonably estimated. Such liabilities are based on our best estimate of the undiscounted future costs required to complete the remedial work. The recorded liabilities are adjusted periodically as remediation efforts progress or as additional technical, regulatory or legal information becomes available. Given the uncertainties regarding the status of laws, regulations, enforcement policies, the impact of other potentially responsible parties, technology and information related to individual sites, we do not believe it is possible to develop an estimate of the range or reasonably possible environmental loss in excess of our recorded liabilities. At December 31, 2023, environmental liabilities (both short term and long term) were $51 million.
For further discussion, see Environmental Matters included elsewhere in this section entitled, "Management’s Discussion and Analysis of Financial Condition and Results of Operations" and Notes 2 and 18 to the consolidated financial statements.
Income Taxes
We have operations in several countries around the world and are subject to income and similar taxes in these countries. The estimation of the amounts of income tax involves the interpretation of complex tax laws and regulations and how foreign taxes affect domestic taxes, as well as the analysis of the realizability of deferred tax assets, tax audit findings and uncertain tax positions. Although we believe our tax accruals are adequate, differences may occur in the future, depending on the resolution of pending and new tax matters.
Deferred tax assets and liabilities are determined based on temporary differences between the financial reporting and tax bases of assets and liabilities using enacted tax rates expected to apply to taxable income in the years in which those temporary differences are expected to be recovered or settled. A valuation allowance is provided against a deferred tax asset when it is more likely than not that all or some portion of the deferred tax asset will not be realized. We periodically assess the likelihood that we will be able to recover our deferred tax assets and reflect any changes in our estimates in the valuation allowance with a corresponding adjustment to earnings or other comprehensive income (loss) as appropriate. ASC 740, Income Taxes, requires that all available positive and negative evidence be weighed to determine whether a valuation allowance should be recorded.
The amount of income taxes we pay are subject to ongoing audits by federal, state and foreign tax authorities, which may result in proposed assessments. Our estimate of the potential outcome for any uncertain tax issue is highly judgmental. We assess our income tax positions, and record tax benefits for all years subject to examination based upon our evaluation of the facts, circumstances and information available at the reporting date. For those tax positions for which it is more likely than not that a tax benefit will be sustained, we record the amount that has a greater than 50% likelihood of being realized upon settlement with a taxing authority that has full knowledge of all relevant information. Interest and penalties are accrued as part of tax expense, where applicable. If we do not believe that it is more likely than not that a tax benefit will be sustained, no tax benefit is recognized.
See Notes 2 and 5 to the consolidated financial statements for additional information.
Contingencies
From time to time, we may be subject to lawsuits, investigations and disputes (some of which involve substantial amounts claimed) arising out of the conduct of our business, including matters relating to commercial transactions, prior acquisitions and divestitures including our acquisition of Cristal, employee benefit plans, intellectual property, and environmental, health and safety matters. We recognize a liability for any contingency that is probable of occurrence and reasonably estimable. We continually assess the likelihood of adverse judgments or outcomes in these matters, as well as potential ranges of possible losses (taking into consideration any insurance recoveries), based on a careful analysis of each matter with the assistance of outside legal counsel and, if applicable, other experts. Such contingencies are significant and the accounting requires considerable management judgments in analyzing each matter to assess the likely outcome and the need for establishing appropriate liabilities and providing adequate disclosures.
Refer to Notes 2 and 18 to the consolidated financial statements for additional information.
Long-Lived Assets
Key estimates related to long-lived assets (property, plant and equipment, mineral leaseholds, and intangible assets) include useful lives, recoverability of carrying values, and the existence of any asset retirement obligations. As a result of future decisions, such estimates could be significantly modified. The estimated useful lives of property, plant and equipment range from three to forty years, and depreciation is recognized on a straight-line basis. Useful lives are estimated based upon our historical experience, engineering estimates, and industry information. These estimates include an assumption regarding periodic maintenance. Mineral leaseholds are depreciated over their useful lives as determined under the units of production method. Intangible assets with finite useful lives are amortized on the straight-line basis over their estimated useful lives. The amortization methods and remaining useful lives are reviewed quarterly.
We evaluate the recoverability of the carrying value of long-lived assets that are held and used whenever events or changes in circumstances indicate that the carrying value may not be recoverable. Under such circumstances, we assess whether the projected undiscounted cash flows of our long-lived assets are sufficient to recover the carrying amount of the asset group being assessed. If the undiscounted projected cash flows are not sufficient, we calculate the impairment amount by discounting the projected cash flows using our weighted-average cost of capital. For assets that satisfy the criteria to be classified as held for sale, an impairment loss, if any, is recognized to the extent the carrying amount exceeds fair value, less cost to sell. The amount of the impairment of long-lived assets is written off against earnings in the period in which the impairment is determined.
Pension and Postretirement Benefits
We provide pension benefits for qualifying employees in the United States and internationally, with the largest in the United Kingdom. Because pension benefits represent financial obligations that will ultimately be settled in the future with employees who meet eligibility requirements, uncertainties exist in estimating the timing and amount of future payments, and significant estimates are required to calculate pension expense and liabilities relating to these plans. The company utilizes the services of independent actuaries, whose models are used to help facilitate these calculations. Several key assumptions are used in actuarial models to calculate pension expense and liability amounts recorded in the financial statements; the most significant variables in the models are the expected rate of return on plan assets, the discount rate, and the expected rate of compensation increase. Management believes the assumptions used in the actuarial calculations are reasonable, reflect the company’s experience and expectations for the future and are within accepted practices in each of the respective geographic locations in which it operates. However, actual results in any given year often differ from actuarial assumptions due to economic events and different rates of retirement, mortality, and turnover. Refer to Notes 2 and 21 to the consolidated financial statements for a summary of the plan assumptions and additional information on our pension arrangements.
Expected Return on Plan Assets — In forming the assumption of the long-term rate of return on plan assets, we consider the expected earnings on funds already invested, earnings on contributions expected to be made in the current year, and earnings on reinvested returns. The long-term rate of return estimation methodology for the plans is based on a capital asset pricing model using historical data and a forecasted earnings model. An expected return on plan assets analysis is performed which incorporates the current portfolio allocation, historical asset-class returns, and an assessment of expected future performance using asset-class risk factors. A 100 basis point change in these expected long-term rates of return, with all other variables held constant, would change our pension expense by approximately $2 million.
Discount Rate — The discount rates selected for estimation of the actuarial present value of the benefit obligations are determined based on the prevailing market rate for high-quality, fixed-income debt instruments with maturities corresponding to the expected timing of benefit payments as of the annual measurement date for each of the various plans. These rates change from year to year based on market conditions that affect corporate bond yields. A 100 basis points change in discount rates, with all other variables held constant, would have a less than $1 million impact to our pension expense. A 100 basis points reduction in discount rates would increase the PBO by approximately $34 million whereas a 100 basis point increase in discount rates would decrease the PBO of approximately $29 million.
Rates of Compensation Increase - We determine these rates based on review of the underlying long-term salary increase trend characteristic of the local labor markets and historical experience, as well as comparison to peer companies. A 100 basis points change in the expected rate of compensation increase, with all other variables held constant, would change our pension expense by approximately $1 million. A 100 basis points change in rate of compensation would change the PBO by approximately $5 million.
Recent Accounting Pronouncements
See Note 2 of notes to Consolidated Financial Statements for recently issued accounting pronouncements.
Environmental Matters
We are subject to a broad array of international, federal, state, and local laws and regulations relating to safety, pollution, protection of the environment, and the generation, storage, handling, transportation, treatment, disposal, and remediation of hazardous substances and waste materials. In the ordinary course of business, we are subject to frequent environmental inspections and monitoring, and occasional investigations by governmental enforcement authorities. Under these laws, we are or may be required to obtain or maintain permits or licenses in connection with our operations. In addition, under these laws, we are or may be required to remove or mitigate the effects on the environment of the disposal or release of chemical, petroleum, low-level radioactive and other substances at our facilities. We may incur future costs for capital improvements and general compliance under environmental, health, and safety laws, including costs to acquire, maintain, and repair pollution control equipment. Environmental laws and regulations are becoming increasingly stringent, and compliance costs are significant and will continue to be significant in the foreseeable future. There can be no assurance that such laws and regulations or any environmental law or regulation enacted in the future is not likely to have a material effect on our business. We believe we are in compliance with applicable environmental rules and regulations in all material respects.
Refer to Item 3. Legal Proceedings for further information.
Item 7A. Quantitative and Qualitative Disclosures About Market Risk
We are exposed to various market, credit, operational, and liquidity risks in the normal course of business, which are discussed below. We manage these risks through normal operating and financing activities and, when appropriate, with derivative instruments. We do not invest in derivative instruments for speculative purposes, but historically have entered into, and may enter into, derivative instruments for hedging purposes in order to reduce the exposure to fluctuations in interest rates, natural gas prices and exchange rates.
Market Risk
A substantial portion of our products and raw materials are commodities that reprice as market supply and demand fundamentals change. Accordingly, product margins and the level of our profitability tend to vary with changes in the business cycle. Our TiO2 prices may do so in the near term as ore prices and pigment prices are expected to fluctuate over the next few years. We try to protect against such instability through various business strategies. These include provisions in sales contracts allowing us to pass on higher raw material costs through timely price increases and formula price contracts to transfer or share commodity price risk, as well as using varying contract term lengths and selling to a diverse mix of customers by geography and industry to reap the benefits of a diverse portfolio.
Credit Risk
Credit risk is the risk that a borrower or a counterparty will fail to meet their obligations. A significant portion of our liquidity is concentrated in trade accounts receivable that arise from sales of our products to customers. In the case of TiO2, the high level of industry concentration has the potential to impact our overall exposure to credit risk, either positively or negatively, in that our customers may be similarly affected by changes in economic, industry or other conditions. We have significant exposure to credit risk in industries that are affected by cyclical economic fluctuations. We perform ongoing credit evaluations of our customers from time to time, as deemed appropriate, to mitigate credit risk but generally do not require collateral. Our contracts typically enable us to tighten credit terms if we perceive additional credit risk; however, historic losses due to write offs of bad debt have been relatively low. In addition, due to our international operations, we are subject to potential trade restrictions and sovereign risk in certain countries in which we operate. We maintain allowances for potential credit losses based on specific customer review and current financial conditions. During 2023, 2022 and 2021 our ten largest third-party customers represented 39%, 30%, and 28%, respectively, of our consolidated net sales. During 2023, 2022, and 2021, no single customer accounted for 10% of our consolidated net sales.
Interest Rate Risk
Interest rate risk arises from the possibility that changes in interest rates will impact our financial results. We are exposed to interest rate risk on our floating rate debt, the Term Loan Facility, 2022 Term Loan Facility, the 2023 Term Loan Facility, Standard Bank Term Loan Facility, Cash Flow Revolver, Standard Bank Revolver, Emirates Revolver and SABB Credit Facility balances. Using a sensitivity analysis as of December 31, 2023, a hypothetical 1% increase in interest rates would result in a net decrease to pre-tax income of approximately $7 million on an annualized basis. This is due to the fact that earnings on our interest earning financial assets of $115 million at December 31, 2023 would increase by the full 1%, offsetting the impact of a 1% increase in interest expense on our floating rate debt of $784 million.
During 2019, we entered into interest-rate swap agreements for a portion of our previous Term Loan Facility, which effectively convert the variable rate to a fixed rate for a portion of the loan. The agreements were to expire in September 2024.
On March 27, 2023, the Company entered into amendments with two of our existing interest rate swap agreements with the
counterparty banks. As a result of these amendments, the Company terminated two of our existing interest rate swap contracts which were indexed to LIBOR with an aggregate notional value of $500 million which had maturity dates of September 2024. At the time of these amendments, the Company determined that the interest payments hedged are still probable to occur, therefore, the gains accumulated of $11 million on the interest rate swaps prior to the amendments are being amortized into interest expense through September 22, 2024, the original maturity of the interest rate swap agreements.
We simultaneously entered into two SOFR-indexed forward starting interest rate swaps with the same counterparty banks
with no change to the aggregate notional value. The forward starting swaps will be effective from June 2023 and will mature
in March 2028 which will align with the maturity date of the Term Loan Facility. Indexing forward starting swaps to SOFR
will also ensure that the reference rates in our hedge instruments will align with the interest rate terms of the Term Loan
Facility which is expected to change from LIBOR to SOFR effective June 30, 2023 in anticipation of Reference Rate Reform
and pursuant to the loan agreement. We elected to apply the hedge accounting expedients in ASC Topic 848, Reference Rate
Reform on Financial Reporting related to the following: 1) the assertion that the future forecasted transaction is still probable
of occurring despite reference rate changes and 2) the assumption that the index of the future hedged transactions will match
the index of the corresponding hedge instruments for the assessment of effectiveness.
Additionally, on March 27, 2023, the Company entered into a new interest rate swap with a $200 million notional value
which matures in March 2028 and effectively converts the variable rate to a fixed rate for that portion of the 2022 Term Loan On May 17, 2023, the Company entered into an agreement with the counterparty bank to amend the remaining $250 million
Facility.
notional of the three original interest rate swap contracts of $750 million aggregate notional value. As a result of this
amendment, the Company changed the rate indexed in the contract from LIBOR to SOFR, effective June 30, 2023 in
anticipation of the Reference Rate Reform and to align the index rate in this contract to that in the Term Loan Facility, as
described above. This amendment did not change the notional value and the expiration date of this contract, which is set to
expire in September 2024. We completed a hedge effectiveness test as a result of this amendment and determined that this
hedge instrument continues to be highly effective, enabling us to continue to apply hedge accounting over the remaining term
of this hedge relationship.
As of December 31, 2023, the Company maintains a total of $950 million of interest rate swaps with the objective in using
the interest-rate swap agreements to add stability to interest expense and to manage the Company's exposure to interest rate
movements. These interest rate swaps have been designated as cash flow hedges and involve the receipt of variable amounts
from a counterparty in exchange for the Company making fixed-rate payments over the life of the agreements without
exchange of the underlying notional amount. The Company's objectives in using the interest rate swap agreements are to add
stability to interest expense and to manage its exposure to interest rate movements.
Currency Risk
Currency risk arises from the possibility that fluctuations in foreign exchange rates will impact our balance sheets due to the translation of our assets and liabilities denominated in foreign currencies, as well as our earnings due to the translation of certain of our subsidiaries’ Statements of Income from local currencies to U.S. dollars, as well as due to remeasurement of assets and liabilities denominated in currencies other than a subsidiary’s functional currency. A significant portion of our Adjusted EBITDA is derived from jurisdictions that are subject to currency risk with Australia, Europe and South Africa representing the largest contributors. We manufacture and market our products in a number of countries throughout the world and, as a result, are exposed to changes in foreign currency exchange rates, particularly in Australia, Brazil, China, South Africa, the Netherlands, France and the United Kingdom. The exposure is more prevalent in South Africa and Australia as the majority of revenues are earned in U.S. dollars while expenses are primarily incurred in local currencies. Since we are exposed to movements in the South African rand, the Australian Dollar, the Euro and the Pound Sterling versus the U.S. dollar, we may enter into forward contracts to buy and sell foreign currencies as “economic hedges” for these foreign currency transactions.
We periodically enter into foreign currency contracts used to hedge non-functional currency sales for our South African subsidiaries and forecasted non-functional currency cost of goods sold for our Australian subsidiaries. These foreign currency contracts are designated as cash flow hedges. Changes to the fair value of these foreign currency contracts are recorded as a component of other comprehensive income (loss) to the extent such contracts are effective, and are recognized in net sales or costs of goods sold in the period in which the forecasted transaction affects earnings or the transactions are no longer probable of occurring. As of December 31, 2023, we had no outstanding amounts to reduce the exposure of our Australian subsidiaries’ cost of sales to fluctuations in currency rates or to reduce the exposure of our South African subsidiaries' third party sales to fluctuations in currency rates. Refer to Note 13 in notes to consolidated financial statements.
From time to time, we enter into foreign currency contracts for the South African Rand, Australian Dollar, Euro, Pound Sterling, and Saudi Riyal to reduce exposure of our subsidiaries’ balance sheet accounts not denominated in our subsidiaries’ functional currency to fluctuations in foreign currency exchange rates. For accounting purposes, these foreign currency contracts are not considered hedges. The change in fair value associated with these contracts is recorded in “Other income (expense), net” within the Consolidated Statements of Operations and partially offsets the change in value of third party and intercompany-related receivables not denominated in the functional currency of the subsidiary. At December 31, 2023, there was (i) 837 million South African Rand (or approximately $46 million at the December 31, 2023 exchange rate), (ii) 153 million Australian dollars (or approximately $105 million at the December 31, 2023 exchange rate), (iii) 45 million Pound Sterling (or approximately $57 million at the December 31, 2023 exchange rate, (iv) 45 million Euro (or approximately $50 million at the December 31, 2023 exchange rate) and (v) 67 million Saudi Riyal (or approximately $18 million at the December 31, 2023 exchange rate) of notional amount of outstanding foreign currency contracts.
Item 8. Financial Statements and Supplementary Data
|
|
|
|
|
|
|
Page No. |
| Tronox Holdings Audited Annual Financial Statements |
|
|
|
|
|
|
|
|
|
|
|
|
|
|
|
Report of Independent Registered Public Accounting Firm
To the Board of Directors and Shareholders of Tronox Holdings plc
Opinions on the Financial Statements and Internal Control over Financial Reporting
We have audited the accompanying consolidated balance sheets of Tronox Holdings plc and its subsidiaries (the “Company”) as of December 31, 2023 and 2022, and the related consolidated statements of operations, of comprehensive (loss) income, of changes in shareholders' equity and of cash flows for each of the three years in the period ended December 31, 2023, including the related notes (collectively referred to as the “consolidated financial statements”). We also have audited the Company's internal control over financial reporting as of December 31, 2023, based on criteria established in Internal Control - Integrated Framework (2013) issued by the Committee of Sponsoring Organizations of the Treadway Commission (COSO).
In our opinion, the consolidated financial statements referred to above present fairly, in all material respects, the financial position of the Company as of December 31, 2023 and 2022, and the results of its operations and its cash flows for each of the three years in the period ended December 31, 2023 in conformity with accounting principles generally accepted in the United States of America. Also in our opinion, the Company maintained, in all material respects, effective internal control over financial reporting as of December 31, 2023, based on criteria established in Internal Control - Integrated Framework (2013) issued by the COSO.
Basis for Opinions
The Company's management is responsible for these consolidated financial statements, for maintaining effective internal control over financial reporting, and for its assessment of the effectiveness of internal control over financial reporting, included in Management’s Report on Internal Control over Financial Reporting appearing under Item 9A. Our responsibility is to express opinions on the Company’s consolidated financial statements and on the Company's internal control over financial reporting based on our audits. We are a public accounting firm registered with the Public Company Accounting Oversight Board (United States) (PCAOB) and are required to be independent with respect to the Company in accordance with the U.S. federal securities laws and the applicable rules and regulations of the Securities and Exchange Commission and the PCAOB.
We conducted our audits in accordance with the standards of the PCAOB. Those standards require that we plan and perform the audits to obtain reasonable assurance about whether the consolidated financial statements are free of material misstatement, whether due to error or fraud, and whether effective internal control over financial reporting was maintained in all material respects.
Our audits of the consolidated financial statements included performing procedures to assess the risks of material misstatement of the consolidated financial statements, whether due to error or fraud, and performing procedures that respond to those risks. Such procedures included examining, on a test basis, evidence regarding the amounts and disclosures in the consolidated financial statements. Our audits also included evaluating the accounting principles used and significant estimates made by management, as well as evaluating the overall presentation of the consolidated financial statements. Our audit of internal control over financial reporting included obtaining an understanding of internal control over financial reporting, assessing the risk that a material weakness exists, and testing and evaluating the design and operating effectiveness of internal control based on the assessed risk. Our audits also included performing such other procedures as we considered necessary in the circumstances. We believe that our audits provide a reasonable basis for our opinions.
Definition and Limitations of Internal Control over Financial Reporting
A company’s internal control over financial reporting is a process designed to provide reasonable assurance regarding the reliability of financial reporting and the preparation of financial statements for external purposes in accordance with generally accepted accounting principles. A company’s internal control over financial reporting includes those policies and procedures that
(i) pertain to the maintenance of records that, in reasonable detail, accurately and fairly reflect the transactions and dispositions of the assets of the company; (ii) provide reasonable assurance that transactions are recorded as necessary to permit preparation of financial statements in accordance with generally accepted accounting principles, and that receipts and expenditures of the company are being made only in accordance with authorizations of management and directors of the company; and (iii) provide reasonable assurance regarding prevention or timely detection of unauthorized acquisition, use, or disposition of the company’s assets that could have a material effect on the financial statements.
Because of its inherent limitations, internal control over financial reporting may not prevent or detect misstatements. Also, projections of any evaluation of effectiveness to future periods are subject to the risk that controls may become inadequate because of changes in conditions, or that the degree of compliance with the policies or procedures may deteriorate.
Critical Audit Matters
The critical audit matter communicated below is a matter arising from the current period audit of the consolidated financial statements that was communicated or required to be communicated to the audit committee and that (i) relates to accounts or disclosures that are material to the consolidated financial statements and (ii) involved our especially challenging, subjective, or complex judgments. The communication of critical audit matters does not alter in any way our opinion on the consolidated financial statements, taken as a whole, and we are not, by communicating the critical audit matter below, providing a separate opinion on the critical audit matter or on the accounts or disclosures to which it relates.
Realizability of Australia Deferred Tax Assets
As described in Notes 2 and 5 to the consolidated financial statements, as of December 31, 2023, the Company has $1.1 billion of net deferred tax assets, inclusive of valuation allowances associated with deferred tax assets of $1.9 billion. A valuation allowance is provided against a deferred tax asset when it is more likely than not that all or some portion of the deferred tax asset will not be realized. Management periodically assesses the likelihood that the Company will be able to recover the deferred tax assets and reflects any changes in estimates in the valuation allowance, with a corresponding adjustment to earnings or other comprehensive income (loss), as appropriate. All available positive and negative evidence is weighed to determine whether a valuation allowance should be recorded. During the year ended December 31, 2023, management identified negative evidence concerning the Company’s ability to realize the net balance of the Australia group deferred tax assets. This evidence primarily relates to losses generated during the current year and uncertainty regarding the region's ability to generate income in the near term. After weighing all the positive and negative evidence, management determined that it is more likely than not that the Australia deferred tax assets may not be realized. As a result, the Company recorded a $293 million non-cash charge to tax expense for the year ended December 31, 2023.
The principal considerations for our determination that performing procedures relating to the realizability of Australia deferred tax assets is a critical audit matter are the (i) significant judgment by management in determining whether it is more likely than not that the Australia deferred tax assets will not be realized in the future and (ii) a high degree of auditor judgment in evaluating audit evidence related to management’s assessment of the realizability of the Australia deferred tax assets.
Addressing the matter involved performing procedures and evaluating audit evidence in connection with forming our overall opinion on the consolidated financial statements. These procedures included testing the effectiveness of controls relating to the income tax process, including controls over management’s assessment of the realizability of deferred tax assets. These procedures also included, among others (i) evaluating the positive and negative evidence available to support management’s assessment of the realizability of the Australia deferred tax assets; (ii) testing the completeness and accuracy of underlying data used in management’s assessment; and (iii) testing the completeness and accuracy of the tax expense related to the establishment of the valuation allowance on the Australia deferred tax assets.
/s/ PricewaterhouseCoopers LLP
Stamford, Connecticut
February 21, 2024
We have served as the Company’s auditor since 2014.
TRONOX HOLDINGS PLC
CONSOLIDATED STATEMENTS OF OPERATIONS
(Millions of U.S. dollars, except share and per share data)
|
|
|
|
|
|
|
|
|
|
|
|
|
|
|
|
|
|
|
Year Ended December 31, |
|
2023 |
|
2022 |
|
2021 |
| Net sales |
$ |
2,850 |
|
|
$ |
3,454 |
|
|
$ |
3,572 |
|
| Cost of goods sold |
2,388 |
|
|
2,622 |
|
|
2,677 |
|
| Gross profit |
462 |
|
|
832 |
|
|
895 |
|
| Selling, general and administrative expenses |
276 |
|
|
289 |
|
|
318 |
|
| Venator settlement |
— |
|
|
85 |
|
|
— |
|
|
|
|
|
|
|
| Income from operations |
186 |
|
|
458 |
|
|
577 |
|
| Interest expense |
(158) |
|
|
(125) |
|
|
(157) |
|
| Interest income |
18 |
|
|
9 |
|
|
7 |
|
| Loss on extinguishment of debt |
— |
|
|
(21) |
|
|
(65) |
|
| Other income (expense), net |
3 |
|
|
(13) |
|
|
12 |
|
| Income before income taxes |
49 |
|
|
308 |
|
|
374 |
|
| Income tax (provision) benefit |
(363) |
|
|
192 |
|
|
(71) |
|
| Net (loss) income |
(314) |
|
|
500 |
|
|
303 |
|
| Net income attributable to noncontrolling interest |
2 |
|
|
3 |
|
|
17 |
|
| Net (loss) income attributable to Tronox Holdings plc |
$ |
(316) |
|
|
$ |
497 |
|
|
$ |
286 |
|
|
|
|
|
|
|
| (Loss) Earnings per share: |
|
|
|
|
|
| Basic |
$ |
(2.02) |
|
|
$ |
3.21 |
|
|
$ |
1.88 |
|
| Diluted |
$ |
(2.02) |
|
|
$ |
3.16 |
|
|
$ |
1.81 |
|
|
|
|
|
|
|
| Weighted average shares outstanding, basic (in thousands) |
156,397 |
|
|
154,867 |
|
|
152,056 |
|
| Weighted average shares outstanding, diluted (in thousands) |
156,397 |
|
|
157,110 |
|
|
157,945 |
|
See notes to consolidated financial statements.
TRONOX HOLDINGS PLC
CONSOLIDATED STATEMENTS OF COMPREHENSIVE (LOSS) INCOME
(Millions of U.S. dollars)
|
|
|
|
|
|
|
|
|
|
|
|
|
|
|
|
|
|
|
Year Ended December 31, |
|
2023 |
|
2022 |
|
2021 |
| Net (loss) income |
$ |
(314) |
|
|
$ |
500 |
|
|
$ |
303 |
|
| Other comprehensive income (loss): |
|
|
|
|
|
| Foreign currency translation adjustments |
(15) |
|
|
(79) |
|
|
(113) |
|
| Pension and postretirement plans (See Note 21): |
|
|
|
|
|
Actuarial (losses) gains, net of tax benefit of $5, tax expense of $4 and tax expense of $6 in 2023, 2022 and 2021, respectively |
(14) |
|
|
5 |
|
|
16 |
|
Amortization of unrecognized actuarial losses, net of tax expense of nil in 2023, tax benefit of $2 in 2022 and tax benefit of $2 in 2021 |
— |
|
|
2 |
|
|
4 |
|
Settlement loss reclassified from accumulated other comprehensive loss to the Consolidated Statements of Operations, net of nil taxes in 2023, tax benefit of $5 in 2022 and nil taxes in 2021 |
— |
|
|
15 |
|
|
— |
|
| Total pension and postretirement (losses) gains |
(14) |
|
|
22 |
|
|
20 |
|
Realized losses (gains) on derivative instruments reclassified from accumulated other comprehensive loss to the Consolidated Statements of Operations (net of tax benefit of $3 in 2023, net of tax expense of $1 in both 2022 and 2021. |
2 |
|
|
(23) |
|
|
(32) |
|
Unrealized (losses) gains on derivative financial instruments, (net of tax benefit of $1, tax expense of $5 and tax expense of $1 in 2023, 2022, 2021, respectively; See Note 14) |
(15) |
|
|
53 |
|
|
21 |
|
|
|
|
|
|
|
| Other comprehensive loss |
(42) |
|
|
(27) |
|
|
(104) |
|
|
|
|
|
|
|
| Total comprehensive (loss) income |
$ |
(356) |
|
|
$ |
473 |
|
|
$ |
199 |
|
|
|
|
|
|
|
| Comprehensive income (loss) attributable to noncontrolling interest: |
|
|
|
|
|
| Net income |
2 |
|
|
3 |
|
|
17 |
|
| Foreign currency translation adjustments |
4 |
|
|
3 |
|
|
(10) |
|
|
|
|
|
|
|
| Comprehensive income attributable to noncontrolling interest |
6 |
|
|
6 |
|
|
7 |
|
|
|
|
|
|
|
| Comprehensive (loss) income attributable to Tronox Holdings plc |
$ |
(362) |
|
|
$ |
467 |
|
|
$ |
192 |
|
See notes to consolidated financial statements.
TRONOX HOLDINGS PLC
CONSOLIDATED BALANCE SHEETS
(Millions of U.S. dollars, except share and per share data)
|
|
|
|
|
|
|
|
|
|
|
|
|
December 31, |
|
2023 |
|
2022 |
| ASSETS |
|
|
|
| Current Assets |
|
|
|
| Cash and cash equivalents |
$ |
273 |
|
|
$ |
164 |
|
|
|
|
|
Accounts receivable (net of allowance of $3 in 2023 and $4 in 2022) |
290 |
|
|
377 |
|
| Inventories, net |
1,421 |
|
|
1,278 |
|
| Prepaid and other assets |
141 |
|
|
135 |
|
| Income taxes receivable |
10 |
|
|
6 |
|
| Total current assets |
2,135 |
|
|
1,960 |
|
| Noncurrent Assets |
|
|
|
| Property, plant and equipment, net |
1,835 |
|
|
1,830 |
|
| Mineral leaseholds, net |
654 |
|
|
701 |
|
| Intangible assets, net |
243 |
|
|
250 |
|
| Lease right of use assets, net |
132 |
|
|
136 |
|
| Deferred tax assets |
917 |
|
|
1,233 |
|
| Other long-term assets |
218 |
|
|
196 |
|
| Total assets |
$ |
6,134 |
|
|
$ |
6,306 |
|
|
|
|
|
| LIABILITIES AND EQUITY |
|
|
|
| Current Liabilities |
|
|
|
| Accounts payable |
$ |
461 |
|
|
$ |
486 |
|
| Accrued liabilities |
230 |
|
|
252 |
|
| Short-term lease liabilities |
24 |
|
|
20 |
|
| Short-term debt |
11 |
|
|
50 |
|
| Long-term debt due within one year |
27 |
|
|
24 |
|
| Income taxes payable |
— |
|
|
18 |
|
| Total current liabilities |
753 |
|
|
850 |
|
| Noncurrent Liabilities |
|
|
|
| Long-term debt, net |
2,786 |
|
|
2,464 |
|
| Pension and postretirement healthcare benefits |
104 |
|
|
89 |
|
| Asset retirement obligations |
172 |
|
|
153 |
|
| Environmental liabilities |
48 |
|
|
51 |
|
| Long-term lease liabilities |
103 |
|
|
110 |
|
| Deferred tax liabilities |
149 |
|
|
153 |
|
| Other long-term liabilities |
39 |
|
|
33 |
|
| Total liabilities |
4,154 |
|
|
3,903 |
|
|
|
|
|
| Commitments and Contingencies - Note 18 |
|
|
|
| Shareholders’ Equity |
|
|
|
Tronox Holdings plc ordinary shares, par value $0.01 — 156,793,755 shares issued and outstanding at December 31, 2023 and 154,496,923 shares issued and outstanding at December 31, 2022 |
2 |
|
|
2 |
|
| Capital in excess of par value |
2,064 |
|
|
2,043 |
|
| Retained Earnings |
684 |
|
|
1,080 |
|
| Accumulated other comprehensive loss |
(814) |
|
|
(768) |
|
| Total Tronox Holdings plc shareholders’ equity |
1,936 |
|
|
2,357 |
|
| Noncontrolling interest |
44 |
|
|
46 |
|
| Total equity |
1,980 |
|
|
2,403 |
|
| Total liabilities and equity |
$ |
6,134 |
|
|
$ |
6,306 |
|
See notes to consolidated financial statements.
TRONOX HOLDINGS PLC
CONSOLIDATED STATEMENTS OF CASH FLOWS
(Millions of U.S. dollars)
|
|
|
|
|
|
|
|
|
|
|
|
|
|
|
|
|
|
|
Year Ended December 31, |
|
2023 |
|
2022 |
|
2021 |
| Cash Flows from Operating Activities: |
|
|
|
|
|
| Net (loss) income |
(314) |
|
|
500 |
|
|
303 |
|
| Adjustments to reconcile net (loss) income to net cash provided by operating activities: |
|
|
|
|
|
| Depreciation, depletion and amortization |
275 |
|
|
269 |
|
|
297 |
|
| Deferred income taxes |
330 |
|
|
(261) |
|
|
15 |
|
| Share-based compensation expense |
21 |
|
|
26 |
|
|
31 |
|
| Amortization of deferred debt issuance costs and discount on debt |
9 |
|
|
8 |
|
|
11 |
|
| Loss on extinguishment of debt |
— |
|
|
21 |
|
|
65 |
|
| Other non-cash affecting net (loss) income |
37 |
|
|
50 |
|
|
36 |
|
| Changes in assets and liabilities: |
|
|
|
|
|
| Decrease (increase) in accounts receivable, net |
84 |
|
|
233 |
|
|
(108) |
|
| (Increase) decrease in inventories, net |
(151) |
|
|
(255) |
|
|
53 |
|
| Decrease in prepaid and other assets |
37 |
|
|
47 |
|
|
53 |
|
| (Decrease) increase in accounts payable and accrued liabilities |
(84) |
|
|
(5) |
|
|
53 |
|
| Net changes in income tax payables and receivables |
(24) |
|
|
5 |
|
|
9 |
|
| Changes in other non-current assets and liabilities |
(36) |
|
|
(40) |
|
|
(78) |
|
| Cash provided by operating activities |
184 |
|
|
598 |
|
|
740 |
|
|
|
|
|
|
|
| Cash Flows from Investing Activities: |
|
|
|
|
|
| Capital expenditures |
(261) |
|
|
(428) |
|
|
(272) |
|
| Insurance proceeds |
— |
|
|
— |
|
|
1 |
|
|
|
|
|
|
|
| Proceeds from the sale of assets |
6 |
|
|
13 |
|
|
2 |
|
| Cash used in investing activities |
(255) |
|
|
(415) |
|
|
(269) |
|
|
|
|
|
|
|
| Cash Flows from Financing Activities: |
|
|
|
|
|
| Repayments of short-term debt |
(148) |
|
|
(113) |
|
|
— |
|
| Repayments of long-term debt |
(17) |
|
|
(516) |
|
|
(3,212) |
|
| Proceeds from short-term debt |
86 |
|
|
142 |
|
|
— |
|
| Proceeds from long-term debt |
347 |
|
|
396 |
|
|
2,472 |
|
| Repurchase of common stock |
— |
|
|
(50) |
|
|
— |
|
| Debt issuance costs |
(3) |
|
|
(4) |
|
|
(37) |
|
| Call premium paid |
— |
|
|
(18) |
|
|
(40) |
|
| Dividends paid |
(89) |
|
|
(87) |
|
|
(65) |
|
| Restricted stock and performance-based shares settled in cash for taxes |
— |
|
|
— |
|
|
(3) |
|
| Proceeds from the exercise of stock options |
— |
|
|
— |
|
|
8 |
|
| Cash provided by (used in) financing activities |
176 |
|
|
(250) |
|
|
(877) |
|
|
|
|
|
|
|
| Effects of exchange rate changes on cash and cash equivalents and restricted cash |
4 |
|
|
(1) |
|
|
(10) |
|
|
|
|
|
|
|
| Net increase (decrease) in cash and cash equivalents and restricted cash |
109 |
|
|
(68) |
|
|
(416) |
|
| Cash and cash equivalents and restricted cash at beginning of period |
164 |
|
|
232 |
|
|
648 |
|
| Cash and cash equivalents and restricted cash at end of period |
$ |
273 |
|
|
$ |
164 |
|
|
$ |
232 |
|
|
|
|
|
|
|
| Supplemental cash flow information: |
|
|
|
|
|
| Interest paid, net |
$ |
143 |
|
|
$ |
114 |
|
|
$ |
138 |
|
|
|
|
|
|
|
| Income taxes paid |
$ |
54 |
|
|
$ |
60 |
|
|
$ |
47 |
|
See notes to consolidated financial statements.
TRONOX HOLDINGS PC
CONSOLIDATED STATEMENTS OF CHANGES IN SHAREHOLDERS’ EQUITY
(Millions of U.S. dollars)
|
|
|
|
|
|
|
|
|
|
|
|
|
|
|
|
|
|
|
|
|
|
|
|
|
|
|
|
|
|
|
|
|
|
|
|
|
|
|
|
|
|
|
|
|
|
|
|
|
Tronox Holdings plc
Ordinary
Shares (in thousands) |
|
Tronox
Holdings plc
Ordinary
Shares (amount) |
|
Capital
in
Excess
of par
Value
|
|
(Accumulated
Deficit)
Retained
Earnings
|
|
Accumulated
Other
Comprehensive
Loss
|
|
Total Tronox
Limited
Shareholders’
Equity
|
|
Non-
controlling
Interest
|
|
Total
Equity
|
| Balance at January 1, 2021 |
143,557 |
|
|
$ |
1 |
|
|
$ |
1,873 |
|
|
$ |
434 |
|
|
$ |
(610) |
|
|
$ |
1,698 |
|
|
$ |
173 |
|
|
$ |
1,871 |
|
| Net income |
— |
|
|
— |
|
|
— |
|
|
286 |
|
|
— |
|
|
286 |
|
|
17 |
|
|
303 |
|
| Other comprehensive loss |
— |
|
|
— |
|
|
— |
|
|
— |
|
|
(94) |
|
|
(94) |
|
|
(10) |
|
|
(104) |
|
| Share-based compensation |
2,844 |
|
|
— |
|
|
31 |
|
|
— |
|
|
— |
|
|
31 |
|
|
— |
|
|
31 |
|
| Shares cancelled |
(137) |
|
|
— |
|
|
(3) |
|
|
— |
|
|
— |
|
|
(3) |
|
|
— |
|
|
(3) |
|
| Options exercised |
425 |
|
|
— |
|
|
8 |
|
|
— |
|
|
— |
|
|
8 |
|
|
— |
|
|
8 |
|
| Acquisition of noncontrolling interest |
7,246 |
|
|
1 |
|
|
158 |
|
|
— |
|
|
(34) |
|
|
125 |
|
|
(125) |
|
|
— |
|
Ordinary share dividends ($0.36 per share) |
— |
|
|
— |
|
|
— |
|
|
(57) |
|
|
— |
|
|
(57) |
|
|
(7) |
|
|
(64) |
|
| Balance at December 31, 2021 |
153,935 |
|
|
$ |
2 |
|
|
$ |
2,067 |
|
|
$ |
663 |
|
|
$ |
(738) |
|
|
$ |
1,994 |
|
|
$ |
48 |
|
|
$ |
2,042 |
|
| Net income |
— |
|
|
— |
|
|
— |
|
|
497 |
|
|
— |
|
|
497 |
|
|
3 |
|
|
500 |
|
| Other comprehensive (loss) income |
— |
|
|
— |
|
|
— |
|
|
— |
|
|
(30) |
|
|
(30) |
|
|
3 |
|
|
(27) |
|
| Share-based compensation |
3,420 |
|
|
— |
|
|
26 |
|
|
— |
|
|
— |
|
|
26 |
|
|
— |
|
|
26 |
|
| Shares cancelled |
(28) |
|
|
— |
|
|
— |
|
|
— |
|
|
— |
|
|
— |
|
|
— |
|
|
— |
|
| Options exercised |
14 |
|
|
— |
|
|
— |
|
|
— |
|
|
— |
|
|
— |
|
|
— |
|
|
— |
|
| Shares repurchased and cancelled |
(2,844) |
|
|
— |
|
|
(50) |
|
|
— |
|
|
— |
|
|
(50) |
|
|
— |
|
|
(50) |
|
| Noncontrolling interest dividend |
— |
|
|
— |
|
|
— |
|
|
— |
|
|
— |
|
|
— |
|
|
(8) |
|
|
(8) |
|
Ordinary share dividends ($0.50 per share) |
— |
|
|
— |
|
|
— |
|
|
(80) |
|
|
— |
|
|
(80) |
|
|
— |
|
|
(80) |
|
| Balance at December 31, 2022 |
154,497 |
|
|
$ |
2 |
|
|
$ |
2,043 |
|
|
$ |
1,080 |
|
|
$ |
(768) |
|
|
$ |
2,357 |
|
|
$ |
46 |
|
|
$ |
2,403 |
|
| Net (loss) income |
— |
|
|
— |
|
|
— |
|
|
(316) |
|
|
— |
|
|
(316) |
|
|
2 |
|
|
(314) |
|
| Other comprehensive (loss) income |
— |
|
|
— |
|
|
— |
|
|
— |
|
|
(46) |
|
|
(46) |
|
|
4 |
|
|
(42) |
|
| Share-based compensation |
2,320 |
|
|
— |
|
|
21 |
|
|
— |
|
|
— |
|
|
21 |
|
|
— |
|
|
21 |
|
| Shares cancelled |
(23) |
|
|
— |
|
|
— |
|
|
— |
|
|
— |
|
|
— |
|
|
— |
|
|
— |
|
|
|
|
|
|
|
|
|
|
|
|
|
|
|
|
|
|
|
|
|
|
|
|
|
|
|
|
|
|
|
|
|
| Noncontrolling interest dividend |
— |
|
|
— |
|
|
— |
|
|
— |
|
|
— |
|
|
— |
|
|
(8) |
|
|
(8) |
|
Ordinary share dividends ($0.50 per share) |
— |
|
|
— |
|
|
— |
|
|
(80) |
|
|
— |
|
|
(80) |
|
|
— |
|
|
(80) |
|
| Balance at December 31, 2023 |
156,794 |
|
|
$ |
2 |
|
|
$ |
2,064 |
|
|
$ |
684 |
|
|
$ |
(814) |
|
|
$ |
1,936 |
|
|
$ |
44 |
|
|
$ |
1,980 |
|
See notes to consolidated financial statements.
TRONOX HOLDINGS PLC
NOTES TO CONSOLIDATED FINANCIAL STATEMENTS
(Millions of U.S. dollars, except share, per share and metric tons data or unless otherwise noted)
1. The Company
Tronox Holdings plc (referred to herein as "Tronox", the "Company", "we", "us", or "our") operates titanium-bearing mineral sand mines and beneficiation operations in Australia and South Africa to produce feedstock materials that can be processed into TiO2 for pigment, high purity titanium chemicals, including titanium tetrachloride, and Ultrafine© titanium dioxide used in certain specialty applications. Our strategy is to be vertically integrated and produce enough feedstock materials to be as self-sufficient as possible in the production of TiO2 at our nine pigment facilities located in the United States, Australia, Brazil, UK, France, the Netherlands, China and the Kingdom of Saudi Arabia (“KSA”). We believe that vertical integration is the best way to achieve our ultimate goal of delivering low cost, high-quality pigment to our coatings and other TiO2 customers throughout the world. The mining, beneficiation and smelting of titanium bearing mineral sands creates meaningful quantities of zircon, pig iron and the rare-earth bearing mineral, monazite, which we also supply to customers around the world.
We are a public limited company listed on the New York Stock Exchange and are registered under the laws of England and Wales.
Basis of Presentation
We are considered a domestic company in the United Kingdom and, as such, are required to comply with filing requirements in the United Kingdom. Additionally, we are not considered a “foreign private issuer” in the U.S.; therefore, we are required to comply with the reporting and other requirements imposed by the U.S. securities law on U.S. domestic issuers, which, among other things, requires reporting under accounting principles generally accepted in the United States of America (“U.S. GAAP”). The consolidated financial statements included in this Form 10-K are prepared in conformity with U.S. GAAP.
Our consolidated financial statements include the accounts of all majority-owned subsidiary companies. All intercompany balances and transactions have been eliminated in consolidation. Certain prior period amounts have been reclassified to conform to the manner and presentation in the current period.
Use of Estimates
The preparation of financial statements in conformity with U.S. GAAP requires management to make estimates and assumptions that affect the reported amounts of assets and liabilities, the disclosure of contingent assets and liabilities at the date of the financial statements, and the reported amounts of revenues and expenses during the reporting periods. It is at least reasonably possible that the effect on the financial statements of a change in estimate due to one or more future confirming events could have a material effect on the financial statements.
2. Significant Accounting Policies
Foreign Currency
The U.S. dollar is our reporting currency for our consolidated financial statements in U.S. GAAP. We determine the functional currency of each subsidiary based on a number of factors, including the predominant currency for revenues, expenditures and borrowings. Adjustments from the remeasurement of non-functional currency monetary assets and liabilities are recorded in “Other income (expense), net” in the Consolidated Statements of Operations. When a subsidiary’s functional currency is not the U.S. dollar, translation adjustments resulting from translating the functional currency financial statements into U.S. dollar equivalents are recorded in “Accumulated other comprehensive loss” in the Consolidated Balance Sheets.
Translation adjustments on intercompany foreign currency receivables and payables that are not expected to be settled in the foreseeable future are reported in the same manner as translation adjustments.
Revenue Recognition
We recognize revenue at a point in time when the customer obtains control of the promised products. For most transactions this occurs when products are shipped from our manufacturing facilities or at a later point when control of the products transfers to the customer at a specified destination or time. All amounts billed to a customer in a sales transaction related to shipping and handling represent revenues earned and are reported as “Net sales” in the Consolidated Statements of Operations. Accruals are made for sales returns, rebates and other allowances, which are recorded in “Net sales” in the Consolidated Statements of Operations and are based on our historical experience and current business conditions. Additionally, we have elected the practical expedient to exclude sales taxes and similar taxes that we collect from customers on behalf of government authorities from the revenue transaction price.
See Note 3.
Cost of Goods Sold
Cost of goods sold includes costs for purchasing, receiving, manufacturing, and distributing products, including raw materials, energy, labor, depreciation, depletion, shipping and handling, freight, warehousing, and other production costs.
Research and Development
Research and development costs, included in “Selling, general and administrative expenses” in the Consolidated Statements of Operations comprised of salaries, building costs, utilities, administrative expenses, third party research, and allocations of corporate costs, were $12 million, $12 million, and $13 million during 2023, 2022, and 2021, respectively, and were expensed as incurred.
Selling, General and Administrative Expenses
Selling, general and administrative expenses include costs related to marketing, research and development, agent commissions, and legal and administrative functions such as corporate management, human resources, information technology, investor relations, accounting, treasury, and tax compliance.
Income Taxes
We use the asset and liability method of accounting for income taxes. The estimation of the amounts of income taxes involves the interpretation of complex tax laws and regulations and how foreign taxes affect domestic taxes, as well as the analysis of the realizability of deferred tax assets, tax audit findings, and uncertain tax positions.
Deferred tax assets and liabilities are determined based on temporary differences between the financial reporting and tax bases of assets and liabilities using enacted tax rates expected to apply to taxable income in the years in which those temporary differences are expected to be recovered or settled. A valuation allowance is provided against a deferred tax asset when it is more likely than not that all or some portion of the deferred tax asset will not be realized. We periodically assess the likelihood that we will be able to recover our deferred tax assets and reflect any changes in our estimates in the valuation allowance, with a corresponding adjustment to earnings or other comprehensive income (loss), as appropriate. All available positive and negative evidence is weighed to determine whether a valuation allowance should be recorded.
The amount of income taxes we pay is subject to ongoing audits by federal, state, and foreign tax authorities, which may result in proposed assessments. Our estimate of the potential outcome for any uncertain tax issue is highly judgmental. We assess our income tax positions, and record tax benefits for all years subject to examination based upon our evaluation of the facts, circumstances, and information available at the reporting date. For those tax positions for which it is more likely than not that a tax benefit will be sustained, we record the amount that has a greater than 50% likelihood of being realized upon settlement with a taxing authority that has full knowledge of all relevant information. Interest and penalties are accrued as part of tax expense, where applicable. If we do not believe that it is more likely than not that a tax benefit will be sustained, no tax benefit is recognized. See Note 5.
Fair Value Measurement
We measure fair value on a recurring basis utilizing valuation techniques that maximize the use of observable inputs and minimize the use of unobservable inputs, to the extent possible, and consider counterparty credit risk in our assessment of fair value. The fair value hierarchy is as follows:
•Level 1 – Quoted prices in active markets for identical assets and liabilities;
•Level 2 – Quoted prices for similar assets and liabilities in active markets, quoted prices for identical or similar assets and liabilities in markets that are not active or other inputs that are observable or can be corroborated by observable market data; and,
•Level 3 – Unobservable inputs that are supported by little or no market activity and that are significant to the fair value of the assets and liabilities
See Note 15.
Cash and Cash Equivalents
We consider all investments with original maturities of three months or less to be cash equivalents. We maintain cash and cash equivalents in bank deposit and money market accounts that may exceed federally insured limits. The financial institutions where our cash and cash equivalents are held are generally highly rated and geographically dispersed, and we have a policy to limit the amount of credit exposure with any one institution. We have not experienced any losses in such accounts and believe we are not exposed to significant credit risk.
At both December 31, 2023 and December 31, 2022, we had restricted cash of less than $1 million which was in Australia related to outstanding performance bonds.
Accounts Receivable, net of allowance for credit losses
We perform credit evaluations of our customers, and take actions deemed appropriate to mitigate credit risk. Only in certain specific occasions do we require collateral in the form of bank or parent company guarantees or guarantee payments. We maintain allowances for potential credit losses based on specific customer review and current financial conditions.
Inventories, net
Pigment inventories are stated at the lower of actual cost and net realizable value, net of allowances for obsolete and slow-moving inventory. The cost of inventories is determined using the first-in, first-out method. Carrying values include material costs, labor, and associated indirect manufacturing expenses. Costs for materials and supplies, excluding titanium ore, are determined by average cost to acquire. Feedstock and co-products inventories including titanium ore are stated at the lower of the weighted-average cost of production or market. Inventory costs include those costs directly attributable to products, including all manufacturing overhead but excluding distribution costs. Raw materials are carried at actual cost.
We review the cost of our inventory in comparison to its net realizable value. We also periodically review our inventory for obsolescence. In either case, we record any write-down equal to the difference between the cost of inventory and its estimated net realizable value based on assumptions about alternative uses, market conditions and other factors. Inventories expected to be sold or consumed within twelve months after the balance sheet date are classified as current assets and all other inventories are classified as non-current assets. See Note 8.
Long Lived Assets
Property, plant and equipment, net is stated at cost less accumulated depreciation, and is depreciated over its estimated useful life using the straight-line method as follows:
|
|
|
|
|
|
| Land improvements |
10 — 20 years |
| Buildings |
10 — 40 years |
| Machinery and equipment |
3 — 25 years |
| Furniture and fixtures |
10 years |
Maintenance and repairs are expensed as incurred, except for costs of replacements or renewals that improve or extend the lives of existing properties, which are capitalized. Upon retirement or sale, the cost and related accumulated depreciation are removed from the respective account, and any resulting gain or loss is included in “Cost of goods sold” or “Selling, general, and administrative expenses” in the Consolidated Statements of Operations. See Note 9.
We capitalize costs associated with our asset retirement obligations which are generally included in machinery and equipment. See Note 17.
We capitalize interest costs on major projects that require an extended period of time to complete. See Note 13.
Mineral property acquisition costs are capitalized as tangible assets when management determines that probable future benefits consisting of a contribution to future cash inflows have been identified and adequate financial resources are available or are expected to be available as required to meet the terms of property acquisition and anticipated exploration and development expenditures. Mineral leaseholds are depleted over their useful lives as determined under the units of production method. Mineral property exploration costs are expensed as incurred. When it has been determined that a mineral property can be economically developed as a result of establishing proven and probable reserves, the costs incurred to develop such property through the commencement of production are capitalized. See Note 10.
Intangible assets are stated at cost less accumulated amortization and are amortized on a straight-line basis over their estimated useful lives, which generally range from 3 to 20 years. See Note 11.
We evaluate the recoverability of the carrying value of long-lived assets that are held and used whenever events or changes in circumstances indicate that the carrying value may not be recoverable. Under such circumstances, we assess whether the projected undiscounted cash flows of our long-lived assets are sufficient to recover the carrying amount of the asset group being assessed. If the undiscounted projected cash flows are not sufficient, we calculate the impairment amount by discounting the projected cash flows using our weighted-average cost of capital. For assets that satisfy the criteria to be classified as held for sale, an impairment loss, if any, is recognized to the extent the carrying amount exceeds fair value, less cost to sell. The amount of the impairment of long-lived assets is written off against earnings in the period in which the impairment is determined.
Leases
We determine if a contract is or contains a lease at inception of the contract. Our leases are primarily operating leases. Leased assets primarily include office buildings, rail cars and motor vehicles, forklifts, and other machinery and equipment. Our leases primarily have fixed lease payments, with real estate leases typically requiring additional payments for real estate taxes and occupancy-related costs. Certain of our leases also have variable lease payments. Variable lease payments that depend on an index or a rate (such as the Consumer Price Index) are included in our initial measurement of the lease right of use assets and lease liabilities. Variable lease payments that are not index or rate based (such as variable payments based on our performance or use of the leased assets) are recorded as expenses when incurred and excluded from the measurement of right of use assets and lease liabilities. Our leases typically have initial lease terms ranging from 1 to 25 years. Some of our lease agreements include options to renew, extend or early terminate the leases. Lease term is the non-cancellable period of a lease, adjusted by the period covered by an option to extend or terminate the lease if we are reasonably certain to exercise (or not exercise) that option. Our operating leases typically do not contain purchase options we expect to exercise, residual value guarantees or other material covenants.
Operating leases are recorded under “Lease right of use assets”, “Short-term lease liabilities”, and “Long-term lease liabilities” on the Consolidated Balance Sheets. Finance leases are recorded under “Property, plant and equipment net”, “Long-term debt due within one year”, and “Long-term debt” on the Consolidated Balance Sheets. Operating lease right of use ("ROU") assets and lease liabilities are initially recorded at the present value of the future minimum lease payments over the lease term at the commencement date. As most of our leases do not provide an implicit rate, we use our incremental borrowing rate based on the information available at the lease commencement date in determining the present value of future payments. Lease payments for the initial measurement of lease ROU assets and lease liabilities include fixed payments and variable payments that depend on an index or a rate. Variable lease payments that are not index or rate based are recorded as expenses when incurred. Operating lease ROU assets are amortized on a straight-line basis over the period of the lease. Finance lease assets are amortized on a straight-line basis over the shorter of their estimated useful lives and the lease terms. See Note 16.
Long-term Debt
Long-term debt is stated net of unamortized original issue premium or discount. Premiums or discounts are amortized using the effective interest method with amortization expense recorded in “Interest and debt expense, net” in the Consolidated Statements of Operations. Deferred debt issuance costs related to a recognized debt liability are presented in the Consolidated Balance Sheets as a direct deduction from the carrying amount of that debt liability, consistent with debt discounts and are amortized using the effective interest method with amortization expense recorded in “Interest and debt expense, net” in the Consolidated Statements of Operations. See Note 13.
Asset Retirement Obligations
Asset retirement obligations are recorded at their estimated fair value, and accretion expense is recognized over time as the discounted liability is accreted to its expected settlement value. Fair value is measured using expected future cash outflows discounted at our credit-adjusted risk-free interest rate, which are considered Level 3 inputs. We classify accretion expense related to asset retirement obligations as a production cost, which is included in “Cost of goods sold” in the Consolidated Statements of Operations. See Note 17.
Environmental Remediation and Other Contingencies
We record an undiscounted liability when any of the following occur: 1) a claim or assessment has been asserted, 2) a litigation has commenced, or 3) based on available information, it is probable that a claim or an assessment will be asserted or a litigation will commence; and in addition, the outcome is expected to be unfavorable to us and the associated costs can be reasonably estimated. See Note 18.
Self-Insurance
We are self-insured for certain levels of general and vehicle liability, property, workers’ compensation and health care coverage. The cost of these self-insurance programs is accrued based upon estimated fully developed settlements for known and anticipated claims. Any resulting adjustments to previously recorded reserves are reflected in current operating results. We do not accrue for general or unspecific business risks.
Share-based Compensation
Equity Restricted Share and Restricted Share Unit Awards — The fair value of equity instruments is measured based on the share price on the grant date and is recognized over the vesting period. These awards contain service, market, and/or performance conditions. For awards containing only a service or a market condition, we have elected to recognize compensation costs using the straight-line method over the requisite service period for the entire award. For awards containing a market condition, the fair value of the award is measured using the Monte Carlo simulation under a lattice model approach. For awards containing a performance condition, the fair value is the grant date close price and compensation expense is not recognized until we conclude that it is probable that the performance condition will be met. We reassess the probability at least quarterly. See Note 20.
Defined Benefit Pension and Postretirement Benefit Plans
We recognize the funded status of our defined benefit pension plans and postretirement benefit plans in the Consolidated Balance Sheets. The funded status is measured as the difference between the fair value of plan assets and the benefit obligation at the measurement date. The benefit obligation for the defined benefit plans is the projected benefit obligation (PBO), which represents the actuarial present value of benefits expected to be paid upon retirement based on employee services already rendered and estimated future compensation levels. The benefit obligation for our postretirement benefit plans is the accumulated postretirement benefit obligation (APBO), which represents the actuarial present value of postretirement benefits attributed to employee services already rendered. The fair value of plan assets related to our defined benefit plan represents the current market value of assets held in a trust fund, which is established for the sole benefit of plan participants.
If the fair value of plan assets exceeds the benefit obligation, the plan is overfunded, and the excess is recorded as a prepaid pension asset. On the other hand, if the benefit obligation exceeds the fair value of plan assets, the plan is underfunded, and the deficit is recorded as pension and postretirement healthcare benefits obligation in the Consolidated Balance Sheet. The portion of the pension and postretirement healthcare obligations payable within the next 12 months is recorded in accrued liabilities in the Consolidated Balance Sheet.
Net periodic pension and postretirement benefit cost represents the aggregation of service cost, interest cost, expected return on plan assets, amortization of prior service costs or credits and actuarial gains or losses previously recognized as a component of OCI and it is recorded in the Consolidated Statements of Operations. Net periodic cost is recorded in cost of goods sold and selling, general and administrative expenses in the Consolidated Statements of Operations based on the employees’ respective functions.
Actuarial gains or losses represents the effect of remeasurement on the benefit obligation principally driven by changes in the plan actuarial assumptions. Prior service costs or credits arise from plan amendments. The actuarial gains or losses and prior service costs or credits are initially recognized as a component of Other comprehensive income (loss) in the Consolidated Statement of Comprehensive Income. Those gains or losses and prior service costs or credits are subsequently recognized as a component of net periodic cost.
The measurement of benefit obligations and net periodic cost is based on estimates and assumptions approved by management. These valuations reflect the terms of the plans and use participant-specific information such as compensation, age and years of service, as well as certain assumptions, including estimates of discount rates, expected return on plan assets, rate of compensation increases and mortality rates.
Defined Contribution Plans — We recognize our contribution as expense when they are due. The expense is recorded in cost of goods sold or selling, general and administrative expenses the Consolidated Statements of Operations based on the employees’ respective functions.
Multiemployer Plan — We treat our multiemployer plan like a defined contribution plan. A pension plan to which two or more unrelated employers contribute is generally considered to be a multiemployer plan. As a defined contribution plan, we recognize the contribution for the period as a net benefit cost and any contributions due and unpaid as a liability.
Recently Issued Accounting Pronouncements
In November 2023, the FASB issued ASU 2023-07, "Improvements to Reportable Segment Disclosures". The amendment requires additional disclosures by public entities, including those with a single reportable segment, to disclose significant segment expenses and other segment items for each reportable segment. The guidance applies to fiscal years beginning after December 15, 2023, and interim periods within fiscal years beginning after December 15, 2024. Early adoption is permitted. We are currently evaluating any incremental disclosures required as a result of this standard.
In December 2023, the FASB issued ASU 2023-09, "Income Taxes (Topic 740): Improvements to Income Tax Disclosures". The amendments in this update apply to all entities that are subject to Topic 740, Income Taxes. The standard requires disaggregated information about a reporting entity's effective tax rate reconciliation as well as information on income taxes paid. The amendments in this update are effective for annual periods beginning after December 15, 2024. The guidance will be applied on a prospective basis with the option to apply the standard retrospectively. Early adoption is permitted. We are currently evaluating any incremental disclosures required as a result of this standard.
Recently Adopted Accounting Pronouncements
In March 2020, the FASB issued ASU 2020-04, "Reference Rate Reform (Topic 848): Facilitation of the Effects of Reference Rate Reform Financial Reporting”. This amendment is elective in nature. Amongst other aspects, this standard provides for practical expedients and exceptions to current accounting standards that reference a rate which is expected to be dissolved (e.g., London Interbank Offered Rate “LIBOR”) as it relates to hedge accounting, contract modifications and other transactions that reference this rate, subject to meeting certain criteria. The standard is effective for all entities as of March 12, 2020 through December 31, 2022. In December 2022, the FASB issued ASU 2022-06, which defers the sunset date of ASC 848, Reference Rate Reform, from December 31, 2022 to December 31, 2024. ASU 2022-06 is effective immediately for all entities.
We completed an internal assessment to identify items that were impacted as a result of the dissolution of LIBOR. Based upon this assessment, we determined that this change was most impactful to our intercompany debt agreements and interest rate swap agreements. Upon conversion of these benchmark rates, we elected the practical expedients allowed under this standard which resulted in an immaterial impact to the financial statements. In addition, during the year ended December 31, 2023, we elected to utilize certain exemptions allowed by this pronouncement as it relates to our interest rate swap transactions. Refer to Note 14 for further details.
3. Revenue
Nature of Contracts and Performance Obligations
We primarily generate revenue from selling TiO2 pigment products and related co-products, primarily zircon and pig iron, to our customers. These products are used for the manufacture of paints, coatings, plastics, paper, and a wide range of other applications. We account for a contract with our customer when it has approval and commitment from both parties, the rights of the parties are identified, payment terms are identified, the contract has commercial substance, and collectability of consideration is probable.
Our promise in a contract typically relates to the transferring of a product or multiple distinct products that are substantially the same and that have the same pattern of transfer, representing a single performance obligation within a contract. We have elected to account for shipping and handling activities that occur after control of the products has transferred to the customer as contract fulfillment activities, rather than a separate performance obligation. Amounts billed to a customer in a sales transaction related to shipping and handling activities continue to be reported as “Net sales” and related costs as “Cost of goods sold” in the Consolidated Statements of Operations.
The duration of our contract period is one year or less. As such, we have elected to recognize incremental costs incurred to obtain contracts, which primarily consist of commissions paid to third-party sales agents, as “Selling, general and administrative expenses” in the Consolidated Statements of Operations. Furthermore, we have elected not to disclose the value of unsatisfied performance obligations at each period end, given the original expected duration of our contracts are one year or less.
Transaction Price
Revenue is measured as the amount of consideration that we expect to be entitled in exchange for transferring products to the customer. The transaction price typically consists of fixed cash consideration. We also offer various incentive programs to our customers, such as rebates, discounts, and other price adjustments that represent variable consideration. We estimate variable consideration and include such consideration amounts in the transaction price to the extent it is probable that a significant reversal of cumulative revenue recognized will not occur when the uncertainty associated with the variable consideration is resolved. Our estimates of variable consideration and determination of whether to include estimated amounts in the transaction price are based largely on an assessment of our anticipated performance and all information (historical, current and forecasted) that is reasonably available to us. We adjust our estimate of revenue at the earlier of when the amount of consideration we expect to receive changes or when the consideration becomes fixed.
Sales returns rarely happen in our business; therefore, it is unlikely that a significant reversal of revenue will occur.
Sales and similar taxes we collect on behalf of governmental authorities are excluded from the transaction price for the determination of revenue. The expected costs associated with product warranties continue to be recognized as expense when the products are sold. Customer payment terms and conditions vary by contract and customer, although the timing of revenue recognition typically does not differ from the timing of invoicing. Additionally, as we generally do not grant extended payment terms, we have determined that our contracts generally do not include a significant financing component.
Revenue Recognition
We recognize revenue at a point in time when the customer obtains control of the promised products. For most transactions this occurs when products are shipped from our manufacturing facilities or at a later point when control of the products transfers to the customer at a specified destination or time.
Contract Balances
Contract assets represent our rights to consideration in exchange for products that have transferred to a customer when the right is conditional on situations other than the passage of time. For products that we have transferred to our customers, our rights to the consideration are typically unconditional and only the passage of time is required before payments become due. These unconditional rights are recorded as accounts receivable. As of December 31, 2023, and December 31, 2022, we did not have material contract asset balances.
Contract liabilities represent our obligations to transfer products to a customer for which we have received consideration from the customer. When a customer has poor credit worthiness, we may receive advance payment that is accounted for as deferred revenue. Deferred revenue is earned when control of the product transfers to the customer, which is typically within a short period of time from when we received the advanced payment. Contract liability balances as of both December 31, 2023 and December 31, 2022 were less than $1 million. Contract liability balances were reported as “Accrued liabilities” in the Consolidated Balance Sheets. All material contract liabilities as of December 31, 2022 and 2021 were recognized as revenue in “Net sales” in the Consolidated Statements of Operations during the first quarter of 2023 and first quarter of 2022, respectively.
Disaggregation of Revenue
We operate under one operating and reportable segment, Tronox. See Note 23 for details. We disaggregate our revenue from contracts with customers by product type and geographic area. We believe this level of disaggregation appropriately depicts how the nature, amount, timing and uncertainty of our revenue and cash flows are affected by economic factors and reflects how our business is managed.
Net sales to external customers by geographic areas where our customers are located were as follows:
|
|
|
|
|
|
|
|
|
|
|
|
|
|
|
|
|
|
|
Year Ended December 31, |
| 2023 |
|
2022 |
|
2021 |
| North America |
$ |
754 |
|
|
$ |
790 |
|
|
$ |
743 |
|
| South and Central America |
159 |
|
|
264 |
|
|
252 |
|
| Europe, Middle-East and Africa |
1,131 |
|
|
1,335 |
|
|
1,398 |
|
| Asia Pacific |
806 |
|
|
1,065 |
|
|
1,179 |
|
| Total net sales |
$ |
2,850 |
|
|
$ |
3,454 |
|
|
$ |
3,572 |
|
Net sales from external customers for each similar type of product were as follows:
|
|
|
|
|
|
|
|
|
|
|
|
|
|
|
|
|
|
|
Year Ended December 31, |
| 2023 |
|
2022 |
|
2021 |
TiO2 |
$ |
2,248 |
|
|
$ |
2,693 |
|
|
$ |
2,793 |
|
| Zircon |
257 |
|
|
438 |
|
|
478 |
|
| Other products |
345 |
|
|
323 |
|
|
301 |
|
| Total net sales |
$ |
2,850 |
|
|
$ |
3,454 |
|
|
$ |
3,572 |
|
Other products mainly include pig iron, TiCl4 and other mining products. The nature, amount, timing and uncertainty of revenue and cash flows typically do not differ significantly among different products.
4. Other Income (Expense), Net
Other income (expense), net is comprised of the following:
|
|
|
|
|
|
|
|
|
|
|
|
|
|
|
|
|
|
|
Year Ended December 31, |
|
2023 |
|
2022 |
|
2021 |
| Net realized and unrealized foreign currency gains (losses) |
$ |
6 |
|
|
$ |
(3) |
|
|
$ |
16 |
|
| Pension and postretirement benefit interest cost, expected return on assets and amortization of actuarial losses |
— |
|
|
4 |
|
|
5 |
|
Pension settlement loss(1) |
— |
|
|
(20) |
|
|
— |
|
|
|
|
|
|
|
Breakage fee(2) |
— |
|
|
— |
|
|
(18) |
|
| AMIC technical service support fee (Note 22) |
6 |
|
|
8 |
|
|
8 |
|
| Other, net |
(9) |
|
|
(2) |
|
|
1 |
|
| Total |
$ |
3 |
|
|
$ |
(13) |
|
|
$ |
12 |
|
_____________________
(1) 2022 amount is a settlement loss related to our U.S. Qualified Plan.
(2) 2021 amount represents the breakage fee associated with the termination of the TTI acquisition.
5. Income Taxes
Our operations are conducted through various subsidiaries in a number of countries throughout the world. We have provided for income taxes based upon the tax laws and rates in the countries in which operations are conducted and income is earned.
Income (loss) before income taxes is comprised of the following:
|
|
|
|
|
|
|
|
|
|
|
|
|
|
|
|
|
|
|
Year Ended December 31, |
|
2023 |
|
2022 |
|
2021 |
| United Kingdom |
$ |
(47) |
|
|
$ |
(130) |
|
|
$ |
(16) |
|
| International |
96 |
|
|
438 |
|
|
390 |
|
| Income before income taxes |
$ |
49 |
|
|
$ |
308 |
|
|
$ |
374 |
|
The income tax (provision) benefit is summarized below:
|
|
|
|
|
|
|
|
|
|
|
|
|
|
|
|
|
|
|
Year Ended December 31, |
|
2023 |
|
2022 |
|
2021 |
| United Kingdom: |
|
|
|
|
|
| Current |
$ |
1 |
|
|
$ |
— |
|
|
$ |
(1) |
|
| Deferred |
— |
|
|
— |
|
|
— |
|
| International: |
|
|
|
|
|
| Current |
(34) |
|
|
(69) |
|
|
(55) |
|
| Deferred |
(330) |
|
|
261 |
|
|
(15) |
|
| Income tax (provision) benefit |
$ |
(363) |
|
|
$ |
192 |
|
|
$ |
(71) |
|
The following table reconciles the applicable statutory income tax rates to our effective income tax rates for “Income tax (provision) benefit” as reflected in the Consolidated Statements of Operations.
|
|
|
|
|
|
|
|
|
|
|
|
|
|
|
|
|
|
|
Year Ended December 31, |
|
2023 |
|
2022 |
|
2021 |
| Statutory tax rate |
24 |
% |
|
19 |
% |
|
19 |
% |
| Increases (decreases) resulting from: |
|
|
|
|
|
| Tax rate differences |
(26) |
|
|
9 |
|
|
7 |
|
| Non-taxable income and expenses |
29 |
|
|
8 |
|
|
2 |
|
| Valuation allowances |
670 |
|
|
(100) |
|
|
(27) |
|
| Corporate reorganization |
— |
|
|
— |
|
|
17 |
|
| Tax rate changes |
10 |
|
|
(3) |
|
|
2 |
|
| State and local taxes |
14 |
|
|
1 |
|
|
1 |
|
| Prior year accruals |
9 |
|
|
— |
|
|
(2) |
|
| Branch taxation |
— |
|
|
— |
|
|
— |
|
| Withholding taxes |
— |
|
|
2 |
|
|
2 |
|
| Tax credits |
— |
|
|
— |
|
|
(2) |
|
| Expiration of net operating loss |
11 |
|
|
2 |
|
|
— |
|
| Other, net |
— |
|
|
— |
|
|
— |
|
| Effective tax rate |
741 |
% |
|
(62) |
% |
|
19 |
% |
Tronox Holdings plc is a U.K. public limited company and the parent company for the business group. The statutory tax rate in the U.K. at December 31, 2023 was 25% and at December 31, 2022 and 2021 was 19%. The statutory rate in the U.K. changed to 25% effective April 1, 2023 and a weighted average rate of 23.5% was applied for the full year 2023.
The effective tax rates in 2023, 2022 and 2021 are all influenced by a variety of factors, primarily income and losses in jurisdictions with valuation allowances, changes in tax rates, non-taxable income and expenses, prior year accruals, and rates different than the United Kingdom statutory rate. The valuation allowances in each year were impacted by items other than income and losses as follows: 2023 was impacted by recording valuation allowances in China and Australia, 2022 was impacted by releasing a valuation allowance in Australia, and 2021 was impacted by releasing a valuation allowance in Saudi Arabia. Additional factors of significance in the above table are as follows: 1) the Non-taxable income and expenses amount for 2022 includes the Venator settlement, 2) the Corporate reorganization amount for 2021 includes the liquidation of the inactive Dutch subsidiary and the write-off of its net operating losses, and 3) the Corporate reorganization amounts for 2021 include the restructuring of our Australian entities. Each of these additional factors were fully offset by valuation allowances.
Net deferred tax assets (liabilities) at December 31, 2023 and 2022 were comprised of the following:
|
|
|
|
|
|
|
|
|
|
|
|
|
December 31, |
|
2023 |
|
2022 |
| Deferred tax assets: |
|
|
|
| Net operating loss and other carryforwards |
$ |
1,800 |
|
|
$ |
1,739 |
|
| Property, plant and equipment, net |
182 |
|
|
200 |
|
| Reserves for environmental remediation and restoration |
53 |
|
|
47 |
|
| Obligations for pension and other employee benefits |
50 |
|
|
46 |
|
| Investments |
3 |
|
|
4 |
|
| Grantor trusts |
609 |
|
|
621 |
|
| Inventories, net |
10 |
|
|
6 |
|
| Interest |
161 |
|
|
190 |
|
| Lease liabilities |
46 |
|
|
48 |
|
| Other accrued liabilities |
4 |
|
|
2 |
|
| Foreign exchange |
0 |
|
|
1 |
|
| Other |
4 |
|
|
5 |
|
| Total deferred tax assets |
2,922 |
|
|
2,909 |
|
| Valuation allowance associated with deferred tax assets |
(1,860) |
|
|
(1,527) |
|
| Net deferred tax assets |
1,062 |
|
|
1,382 |
|
|
|
|
|
| Deferred tax liabilities: |
|
|
|
| Inventories, net |
(3) |
|
|
(3) |
|
| Property, plant and equipment, net |
(223) |
|
|
(228) |
|
| Intangible assets, net |
(9) |
|
|
(15) |
|
| Lease assets |
(43) |
|
|
(38) |
|
| Foreign exchange |
(6) |
|
|
(4) |
|
| Interest |
(7) |
|
|
(9) |
|
| Other |
(3) |
|
|
(5) |
|
| Total deferred tax liabilities |
(294) |
|
|
(302) |
|
| Net deferred tax asset |
$ |
768 |
|
|
$ |
1,080 |
|
|
|
|
|
| Balance sheet classifications: |
|
|
|
| Deferred tax assets — long-term |
$ |
917 |
|
|
$ |
1,233 |
|
| Deferred tax liabilities — long-term |
$ |
(149) |
|
|
$ |
(153) |
|
| Net deferred tax asset |
$ |
768 |
|
|
$ |
1,080 |
|
The net deferred tax assets reflected in the above table include deferred tax assets related to grantor trusts, which were established as Tronox Incorporated emerged from bankruptcy during 2011. The balances relate to the assets contributed to such grantor trusts by Tronox Incorporated and the proceeds from the resolution of previous litigation of $5.2 billion during 2014, which resulted in additional deferred tax assets of $2.0 billion. As the grantor trusts continue to spend funds received from the litigation and earn income from the investment of those funds, the U.S. net operating loss will increase or decrease.
There was an increase to our valuation allowance of $333 million during 2023 and a decrease of $314 million in 2022. The table below sets forth the changes, by jurisdiction:
|
|
|
|
|
|
|
|
|
|
|
|
|
December 31, |
|
2023 |
|
2022 |
| United Kingdom |
$ |
11 |
|
|
$ |
13 |
|
| United States |
(18) |
|
|
(5) |
|
| Australia |
346 |
|
|
(314) |
|
|
|
|
|
|
|
|
|
|
|
|
|
| Switzerland |
(7) |
|
|
(8) |
|
| China |
1 |
|
|
— |
|
|
|
|
|
| Total increase (decrease) in valuation allowances |
$ |
333 |
|
|
$ |
(314) |
|
During the year ended December 31, 2023, the Company identified negative evidence concerning our ability to realize the net balance of our Australia group deferred tax assets. This evidence primarily relates to losses generated during the current year and uncertainty regarding the region's ability to generate income in the near term. After weighing all the positive and negative evidence, we determined that it is more likely than not that the Australia deferred tax assets may not be realized. As a result, we recorded a $293 million non-cash charge to tax expense for the year ended December 31, 2023.
The Company has a Swiss entity acquired in the Cristal transaction that had net operating loss carryovers. During the year ended December 31, 2023, a majority of these losses expired unused because the Swiss entity no longer has significant income-generating activities. A valuation allowance was previously carried against these losses and is no longer required.
During the year ended December 31, 2022, the Company had determined that sufficient positive evidence existed to reverse a portion of the valuation allowance in Australia. This reversal resulted in a non-cash deferred tax benefit of $300 million. Our analysis considered all positive and negative evidence, including (i) three years of cumulative income of our Australian subsidiaries, (ii) our continuing and improved profitability over the last twelve months, (iii) estimates of continued profitability based on updated to our latest forecasts, (iv) changes in the factors that drove losses in the past, and (v) an evaluation of specific deferred tax assets for limitations under certain Australian tax provisions. Based on this analysis, we concluded that it is more likely than not that our Australian subsidiaries will be able to utilize all of their deferred tax assets except for those which are classified as Capital Gains Tax (CGT) assets.
At December 31, 2023, we continue to maintain full valuation allowances related to the total net deferred tax assets in the United Kingdom, as we cannot objectively assert that these deferred tax assets are more likely than not to be realized. Future provisions for income taxes in Australia and the United Kingdom will include no tax benefits with respect to losses incurred and tax expense only to the extent of current tax payments until the valuation allowances are eliminated. Additionally, we have valuation allowances against specific tax assets in China, South Africa and the U.S.
These conclusions were reached by the application of ASC 740, Income Taxes, and require that all available positive and negative evidence be weighed to determine whether a valuation allowance should be recorded. The more significant evidential matter in the United Kingdom relates to cumulative book losses. The most significant evidential matter for Australia and South Africa relates to capital losses and assets that cannot be depleted or depreciated for tax purposes.
The deferred tax assets generated by tax loss carryforwards in Australia, China and the United Kingdom have been fully offset by valuation allowances. In the United States, the deferred tax assets generated by tax loss carryforwards are partially offset by a valuation allowance to the extent they are subject to expiration. The expiration of these carryforwards at December 31, 2023 is shown below. The tax loss carryforwards in Australia, Saudi Arabia, France, Brazil and the United Kingdom do not expire.
|
|
|
|
|
|
|
|
|
|
|
|
|
|
|
|
|
|
|
|
|
|
|
|
|
|
|
|
|
|
|
|
|
|
|
|
|
|
|
|
|
|
|
|
|
|
|
|
|
2024 |
|
2025 |
|
2026 |
|
2027 |
|
2028 |
|
2029 - 2040 |
|
Unlimited |
|
Total Tax Loss Carryforwards |
| United Kingdom |
$ |
— |
|
|
$ |
— |
|
|
$ |
— |
|
|
$ |
— |
|
|
$ |
— |
|
|
$ |
— |
|
|
$ |
(135) |
|
|
$ |
(135) |
|
| Australia |
— |
|
|
— |
|
|
— |
|
|
— |
|
|
— |
|
|
— |
|
|
(622) |
|
|
(622) |
|
| The Netherlands |
— |
|
|
— |
|
|
— |
|
|
— |
|
|
— |
|
|
— |
|
|
(122) |
|
|
(122) |
|
| France |
— |
|
|
— |
|
|
— |
|
|
— |
|
|
— |
|
|
— |
|
|
(179) |
|
|
(179) |
|
| Saudi Arabia |
— |
|
|
— |
|
|
— |
|
|
— |
|
|
— |
|
|
— |
|
|
(4) |
|
|
(4) |
|
|
|
|
|
|
|
|
|
|
|
|
|
|
|
|
|
| China |
— |
|
|
— |
|
|
— |
|
|
(3) |
|
|
(6) |
|
|
— |
|
|
— |
|
|
(9) |
|
| Brazil |
— |
|
|
— |
|
|
— |
|
|
— |
|
|
— |
|
|
— |
|
|
(11) |
|
|
(11) |
|
| Other |
— |
|
|
— |
|
|
— |
|
|
— |
|
|
— |
|
|
— |
|
|
(2) |
|
|
(2) |
|
| U.S. Federal |
— |
|
|
— |
|
|
— |
|
|
— |
|
|
— |
|
|
(3,919) |
|
|
(334) |
|
|
(4,253) |
|
| U.S. State |
(12) |
|
|
(39) |
|
|
(66) |
|
|
(27) |
|
|
(12) |
|
|
(3,969) |
|
|
(19) |
|
|
(4,144) |
|
| Total tax loss carryforwards |
$ |
(12) |
|
|
$ |
(39) |
|
|
$ |
(66) |
|
|
$ |
(30) |
|
|
$ |
(18) |
|
|
$ |
(7,888) |
|
|
$ |
(1,428) |
|
|
$ |
(9,481) |
|
At December 31, 2023, Tronox Holdings plc had foreign subsidiaries with undistributed earnings. Although we would not be subject to income tax on these earnings, amounts totaling $535 million are in specific jurisdictions which we assert are indefinitely reinvested outside of the parents' taxing jurisdictions. These amounts could be subject to withholding tax if distributed, but the Company has made no provision for tax related to these undistributed earnings. The Company has removed its assertion that earnings in China are indefinitely reinvested, and the withholding tax accruals for potential repatriations from that jurisdiction are now reflected in the effective tax rate reconciliation above.
The noncurrent liabilities section of our Consolidated Balance Sheet does not reflect any reserves for uncertain tax positions for either 2023 or 2022.
Our France returns are closed through 2020. Our Brazil, China, Netherlands, South Africa, U.K. and U.S. returns are closed through 2019. Our Australia returns are being held open back to 2017 for an on-going risk review.
We believe that we have made adequate provision for income taxes that may be payable with respect to years open for examination; however, the ultimate outcome is not presently known and, accordingly, additional provisions may be necessary and/or reclassifications of noncurrent tax liabilities to current may occur in the future.
During the year ended December 31, 2023, the United Kingdom enacted legislation consistent with guidance from the Organization for Economic Co-operation and Development ("OECD") for the implementation of Pillar Two, effective in 2024. The Company does not believe this will have a significant impact on future financial results.
6. (Loss) Income Per Share
The computation of basic and diluted (loss) income per share for the periods indicated is as follows:
|
|
|
|
|
|
|
|
|
|
|
|
|
|
|
|
|
|
|
Year Ended December 31, |
|
2023 |
|
2022 |
|
2021 |
| Numerator – Basic and Diluted: |
|
|
|
|
|
| Net (loss) income |
$ |
(314) |
|
|
$ |
500 |
|
|
$ |
303 |
|
| Less: Net income attributable to noncontrolling interest |
2 |
|
|
3 |
|
|
17 |
|
| Net (loss) income available to ordinary shares |
$ |
(316) |
|
|
$ |
497 |
|
|
$ |
286 |
|
|
|
|
|
|
|
| Denominator – Basic and Diluted: |
|
|
|
|
|
| Weighted-average ordinary shares, basic (in thousands) |
156,397 |
|
|
154,867 |
|
|
152,056 |
|
| Weighted-average ordinary shares, diluted (in thousands) |
156,397 |
|
|
157,110 |
|
|
157,945 |
|
|
|
|
|
|
|
| Net (loss) income per Ordinary Share: |
|
|
|
|
|
| Basic net (loss) income per ordinary share |
$ |
(2.02) |
|
|
$ |
3.21 |
|
|
$ |
1.88 |
|
| Diluted net (loss) income per ordinary share |
$ |
(2.02) |
|
|
$ |
3.16 |
|
|
$ |
1.81 |
|
Net (loss) income per ordinary share amounts were calculated from exact, unrounded net (loss) income and share information. Anti-dilutive shares not recognized in the diluted net (loss) income per share calculation for the years ended December 31, 2023, 2022 and 2021 were as follows:
|
|
|
|
|
|
|
|
|
|
|
|
|
|
|
|
|
|
|
Shares |
|
2023 |
|
2022 |
|
2021 |
| Options |
217,643 |
|
|
515,092 |
|
|
414,296 |
|
| Restricted share units |
2,475,125 |
|
|
1,590,086 |
|
|
— |
|
7. Accounts Receivable Securitization Program
On March 15, 2022, the Company entered into an accounts receivable securitization program (“Securitization Facility”) with a financial institution ("Purchaser"), through our wholly-owned special purpose bankruptcy-remote subsidiary Tronox Securitization LLC (“ SPE”). The purpose of this program is to enhance the Company's financial flexibility by providing
additional liquidity. The Securitization Facility permitted the SPE to sell accounts receivable up to $75 million (the “Facility
Limit”). Under the Securitization Facility, our wholly-owned U.S. operating subsidiary, Tronox LLC (“Originator”), sells its
entire accounts receivable on a periodic basis to the SPE. The SPE in turn sells undivided interests in the receivables that meet
certain eligibility criteria, pursuant to the terms of a receivable purchase agreement, to the Purchaser in exchange for cash, not to
exceed the Facility Limit. The SPE retains the remaining receivables as unsold receivables which are pledged as a collateral for
the sold receivables to which the purchaser is granted a first priority security interest.
Following the sale of the receivables by the Originator to the SPE, the receivables are legally isolated from Tronox and its affiliated entities, and upon the subsequent sale and transfer of the receivables from the SPE to the administrative agent, effective control of the receivables is passed to the purchaser, which has all rights, including the right to pledge or sell the receivables. Any new receivables that are not sold to the purchaser by the SPE are added to the unsold receivables held as collateral.
In November 2022, the Securitization Facility was amended (the "First Amendment") to include receivables generated by our wholly-owned Australian operating subsidiaries, Tronox Pigment Pty Ltd., Tronox Pigment Bunbury Ltd. and Tronox Mining Australia Ltd. which increased the Facility Limit to $200 million and extended the program term to November 2025. Following this amendment, we sold additional accounts receivable in exchange for net cash proceeds of $72 million, for a total aggregate amount of $147 million for the combined program.
In June 2023, the Company entered into an additional amendment (the “Second Amendment”) to further include receivables generated by our wholly-owned European operating subsidiaries Tronox Pigment Holland BV and Tronox Pigment UK Limited. Neither the facility limit nor the program term were changed as a result of the Second Amendment, which remain at $200 million and November 2025, respectively. As a result of the Second Amendment, during the year ended December 31, 2023, we incurred $1 million of transaction costs, which are recorded in "Other income (expense), net" in our Consolidated Statement of Operations.
As the Company does not maintain effective control over the sold receivables, we derecognize the sold receivables from our
Consolidated Balance Sheet and classify the cash proceeds as source of cash from operating activities in our Consolidated Statement of Cash Flows.
The program is structured on a revolving basis under which cash collections from receivables are used to fund additional
purchases of receivables at 100% face value, not to exceed the facility limit. At December 31, 2023 and 2022, the total value of accounts receivable sold under the Securitization Facility and derecognized from the Company's Consolidated Balance Sheet was $186 million and $123 million, respectively. This resulted in the Company recording $5 million and $24 million within "Accounts payable" on the Consolidated Balance Sheet at December 31, 2023 and 2022, respectively, as this amount is due to the Purchaser as a result of a periodic decrease in accounts receivable sold to the Purchaser, which was paid in January 2024 and January 2023, respectively. Additionally, at December 31, 2023 and 2022, respectively, we retained $129 million and $69 million of unsold receivables that we pledged as collateral for the sold receivables.
The following table sets forth a summary of the receivables sold and fees incurred under the program during the related periods:
|
|
|
|
|
|
|
|
|
|
Year Ended December 31, |
|
2023 |
2022 |
| Cash proceeds from collections reinvested in the program |
$ |
821 |
|
$ |
426 |
|
| Incremental accounts receivables sold |
884 |
|
549 |
|
Fees incurred1 |
11 |
|
2 |
|
1 Fees due to the Purchaser relate to monthly utilization of the Securitization Facility and are recorded in "Other income (expense), net" in our Consolidated Statements of Operations.
8. Inventories, net
Inventories, net consisted of the following:
|
|
|
|
|
|
|
|
|
|
|
|
|
December 31, |
|
2023 |
|
2022 |
| Raw materials |
$ |
352 |
|
|
$ |
261 |
|
| Work-in-process |
141 |
|
|
125 |
|
| Finished goods, net |
688 |
|
|
641 |
|
| Materials and supplies, net |
240 |
|
|
251 |
|
| Inventories, net |
$ |
1,421 |
|
|
$ |
1,278 |
|
Materials and supplies, net consists of processing chemicals, maintenance supplies, and spare parts, which will be consumed directly and indirectly in the production of our products.
At December 31, 2023, there was approximately $57 million of inventory that is not expected to be sold within in one year and as such, has been recorded in "Other long-term assets" on the Consolidated Balance Sheet.
At December 31, 2023 and 2022, inventory obsolescence reserves were $42 million and $42 million, respectively. At December 31, 2023 and December 31, 2022, reserves for lower of cost and net realizable value were $50 million and $27 million, respectively.
9. Property, Plant and Equipment
Property, plant and equipment, net of accumulated depreciation, consisted of the following:
|
|
|
|
|
|
|
|
|
|
|
|
|
December 31, |
|
2023 |
|
2022 |
| Land and land improvements |
$ |
237 |
|
|
$ |
226 |
|
| Buildings |
404 |
|
|
390 |
|
| Machinery and equipment |
2,530 |
|
|
2,330 |
|
| Construction-in-progress |
319 |
|
|
370 |
|
| Other |
60 |
|
|
62 |
|
| Subtotal |
3,550 |
|
|
3,378 |
|
| Less: accumulated depreciation |
(1,715) |
|
|
(1,548) |
|
| Property, plant and equipment, net |
$ |
1,835 |
|
|
$ |
1,830 |
|
Substantially all the Property, plant and equipment, net is pledged as collateral for our debt. See Note 13.
The table below summarizes depreciation expense related to property, plant and equipment for the periods presented, recorded in the specific line items in our Consolidated Statements of Operations:
|
|
|
|
|
|
|
|
|
|
|
|
|
|
|
|
|
|
|
Year Ended December 31, |
|
2023 |
|
2022 |
|
2021 |
| Cost of goods sold |
$ |
210 |
|
|
$ |
205 |
|
|
$ |
222 |
|
| Selling, general and administrative expenses |
4 |
|
|
4 |
|
|
5 |
|
| Total |
$ |
214 |
|
|
$ |
209 |
|
|
$ |
227 |
|
10. Mineral Leaseholds, net
Mineral leaseholds, net of accumulated depletion, consisted of the following:
|
|
|
|
|
|
|
|
|
|
|
|
|
December 31, |
|
2023 |
|
2022 |
| Mineral leaseholds |
$ |
1,260 |
|
|
$ |
1,282 |
|
| Less accumulated depletion |
(606) |
|
|
(581) |
|
| Mineral leaseholds, net |
$ |
654 |
|
|
$ |
701 |
|
Depletion expense related to mineral leaseholds during 2023, 2022, and 2021 was $30 million, $29 million, and $37 million, respectively, and was recorded in “Cost of goods sold” in the Consolidated Statements of Operations.
11. Intangible Assets, net
Intangible Assets, net of accumulated amortization, consisted of the following:
|
|
|
|
|
|
|
|
|
|
|
|
|
|
|
|
|
|
|
|
|
|
|
|
|
|
|
|
|
|
|
|
|
|
|
|
|
December 31, 2023 |
|
December 31, 2022 |
|
Gross Cost |
|
Accumulated Amortization |
|
Net Carrying Amount |
|
Gross Cost |
|
Accumulated Amortization |
|
Net Carrying Amount |
| Customer relationships |
$ |
291 |
|
|
$ |
(250) |
|
|
$ |
41 |
|
|
$ |
291 |
|
|
$ |
(231) |
|
|
$ |
60 |
|
TiO2 technology |
93 |
|
|
(44) |
|
|
49 |
|
|
93 |
|
|
(37) |
|
|
56 |
|
| Internal-use software and other |
201 |
|
|
(48) |
|
|
153 |
|
|
179 |
|
|
(45) |
|
|
134 |
|
| Intangible assets, net |
$ |
585 |
|
|
$ |
(342) |
|
|
$ |
243 |
|
|
$ |
563 |
|
|
$ |
(313) |
|
|
$ |
250 |
|
As of December 31, 2023 and 2022, internal-use software included approximately $125 million and $106 million, respectively, of capitalized software costs which are not being amortized as the software is not ready for its intended use.
The table below summarizes amortization expense related to intangible assets for the periods presented, recorded in the specific line items in our Consolidated Statements of Operations:
|
|
|
|
|
|
|
|
|
|
|
|
|
|
|
|
|
|
|
Year Ended December 31, |
|
2023 |
|
2022 |
|
2021 |
| Cost of goods sold |
$ |
3 |
|
|
$ |
2 |
|
|
$ |
2 |
|
| Selling, general and administrative expenses |
28 |
|
|
29 |
|
|
31 |
|
| Total |
$ |
31 |
|
|
$ |
31 |
|
|
$ |
33 |
|
Estimated future amortization expense related to intangible assets is $32 million for 2024, $39 million for 2025, $26 million for 2026, $24 million for 2027, $24 million for 2028 and $98 million thereafter.
12. Balance Sheet and Cash Flows Supplemental Information
Accrued liabilities consisted of the following:
|
|
|
|
|
|
|
|
|
|
|
|
|
December 31, |
|
2023 |
|
2022 |
| Employee-related costs and benefits |
$ |
111 |
|
|
$ |
107 |
|
| Related party payables |
1 |
|
|
15 |
|
| Interest |
16 |
|
|
15 |
|
| Sales rebates |
36 |
|
|
37 |
|
| Taxes other than income taxes |
6 |
|
|
13 |
|
| Asset retirement obligations |
14 |
|
|
8 |
|
|
|
|
|
| Other accrued liabilities |
46 |
|
|
57 |
|
| Accrued liabilities |
$ |
230 |
|
|
$ |
252 |
|
Additional supplemental cash flow information for the year ended and as of December 31, 2023, 2022 and 2021 is as follows:
|
|
|
|
|
|
|
|
|
|
|
|
|
|
|
|
|
|
|
Year Ended December 31, |
| Supplemental non cash information: |
2023 |
|
2022 |
|
2021 |
| Operating activities - Chloride slag inventory purchases made from AMIC |
$ |
51 |
|
|
$ |
— |
|
|
$ |
— |
|
| Operating activities - reduction of Hawkins Point environmental obligation |
$ |
— |
|
|
$ |
12 |
|
|
$ |
— |
|
| Operating activities - MGT sales made to AMIC |
$ |
6 |
|
|
$ |
3 |
|
|
$ |
4 |
|
| Operating activities - Interest expense on MGT loan |
$ |
2 |
|
|
$ |
1 |
|
|
$ |
1 |
|
| Investing activities - In-kind receipt of AMIC loan repayment |
$ |
51 |
|
|
$ |
— |
|
|
$ |
— |
|
| Investing activities - sale of Hawkins Point land |
$ |
— |
|
|
$ |
12 |
|
|
$ |
— |
|
|
|
|
|
|
|
|
|
|
|
|
|
| Financing activities - Acquisition of noncontrolling interest |
$ |
— |
|
|
$ |
— |
|
|
$ |
125 |
|
| Financing activities - Repayment of MGT loan |
$ |
6 |
|
|
$ |
3 |
|
|
$ |
3 |
|
| Financing activities - Initial commercial insurance premium financing agreement |
$ |
18 |
|
|
$ |
21 |
|
|
$ |
— |
|
|
|
|
|
|
|
|
December 31, |
|
2023 |
|
2022 |
|
2021 |
| Capital expenditures acquired but not yet paid |
$ |
67 |
|
|
$ |
72 |
|
|
$ |
75 |
|
13. Debt
Long-term Debt
Long-term debt, net of an unamortized discount and debt issuance costs, consisted of the following:
|
|
|
|
|
|
|
|
|
|
|
|
|
|
|
|
|
|
|
|
|
|
|
|
|
|
|
|
|
|
|
Original
Principal |
|
Annual
Interest Rate |
|
Maturity
Date |
|
December 31,
2023 |
|
December 31,
2022 |
Term Loan Facility, net of unamortized discount(1) |
$ |
1,300 |
|
|
Variable |
|
3/11/2028 |
|
$ |
898 |
|
|
$ |
898 |
|
2022 Term Loan Facility, net of unamortized discount(1) |
400 |
|
|
Variable |
|
4/4/2029 |
|
390 |
|
|
393 |
|
2023 Term Loan Facility, net of unamortized discount(1) |
350 |
|
|
Variable |
|
8/16/2028 |
|
347 |
|
|
— |
|
| Senior Notes due 2029 |
1,075 |
|
|
4.63 |
% |
|
3/15/2029 |
|
1,075 |
|
|
1,075 |
|
Standard Bank Term Loan Facility(1) |
98 |
|
|
Variable |
|
11/11/2026 |
|
64 |
|
|
77 |
|
| Australian Government Loan, net of unamortized discount |
N/A |
|
N/A |
|
12/31/2036 |
|
1 |
|
|
1 |
|
MGT Loan(2) |
36 |
|
|
Variable |
|
Variable |
|
25 |
|
|
30 |
|
| Finance leases |
|
|
|
|
|
|
43 |
|
|
47 |
|
| Long-term debt |
|
|
|
|
|
|
2,843 |
|
|
2,521 |
|
| Less: Long-term debt due within one year |
|
|
|
|
|
|
(27) |
|
|
(24) |
|
| Debt issuance costs |
|
|
|
|
|
|
(30) |
|
|
(33) |
|
| Long-term debt, net |
|
|
|
|
|
|
$ |
2,786 |
|
|
$ |
2,464 |
|
(1)The average effective interest rate, including impacts of our interest rate swap, for the Term Loan Facility was 6.6% and 4.8% for the year ended December 31, 2023 and 2022, respectively. The average effective interest rate on the 2022 Term Loan Facility was 8.7% and 5.8% for the year ended December 31, 2023 and 2022, respectively. The average effective interest rate on the 2023 Term Loan Facility was 10.1% for the year ended December 31, 2023. The average effective interest rate on the Standard Bank Term Loan Facility was 10.3% and 7.2% for the year ended December 31, 2023 and 2022, respectively.
(2)The MGT loan is a related party debt facility. Average effective interest rate on the MGT loan was 6.0% and 4.4% during the year ended December 31, 2023 and 2022, respectively. Refer below for further details.
At December 31, 2023, the scheduled maturities of our long-term debt were as follows:
|
|
|
|
|
|
|
Total Borrowings |
| 2024 |
27 |
|
| 2025 |
28 |
|
| 2026 |
67 |
|
| 2027 |
16 |
|
| 2028 |
1,247 |
|
| Thereafter |
1,468 |
|
| Total |
2,853 |
|
| Remaining accretion associated with the Term Loan Facility, the 2022 Term Loan Facility and the 2023 Term Loan Facility |
(10) |
|
| Total borrowings |
2,843 |
|
Long-term Debt
Term Loan Facility and Cash Flow Revolver
On March 11, 2021, Tronox Finance LLC (the "Borrower", the Borrower's indirect parent company, Tronox Holdings plc (the "Company"), and certain of the Company's subsidiaries, entered into an amendment and restatement of its then existing senior secured first lien term loan credit facility dated as of September 22, 2017 pursuant to which, among other things, the Borrower amended and restated such existing credit facility with a new amended and restated senior secured first lien credit agreement dated as of September 22, 2017 (as amended through and including March 11, 2021, the "New Credit Agreement") with a syndicate of lenders and HSBC Bank USA, National Association, as administrative agent and collateral agent. The New Credit Agreement provides the Borrower with (a) a new seven-year term loan facility (the "Term Loan Facility") in an aggregate initial principal amount of $1.3 billion and (b) new five-year cash flow revolving facility (the "Cash Flow Revolver") providing initial revolving commitments of $350 million and a sublimit of $125 million for letters of credit.
The maturity date on the Term Loan Facility and the Cash Flow Revolver is March 11, 2028 and March 11, 2026, respectively.
Subject to certain customary and other exceptions, the obligations of the Borrower under the New Credit Agreement are (a) guaranteed on a joint and several basis by the Company and certain of the Company's restricted subsidiaries, and (b) secured by a first priority lien on substantially all of the Borrower's and gurantors' assets, including inventory, receivables and related assets, and equipment, equity interests in subsidiaries, and material real property, in each case subject to certain limitations and principles.
In connection with entering into the New Credit Agreement, the Company terminated all remaining commitments and repaid all obligations under its prior term loan facility and prior revolving credit facility totaling $1.6 billion (of which $313 million of the principal under the prior term loan facility was repaid with cash on hand). As a result of this transaction in accordance with ASC 470, we recognized approximately $4 million in "Loss on Extinguishment of Debt" recorded in the Consolidated Statements of Operations for the year ended December 31, 2021. Additionally, during the year ended December 31, 2021, the Company made several voluntary prepayments totaling $398 million on the Term Loan Facility. As a result, we recognized approximately $9 million in "Loss on Extinguishment of Debt" recorded in the Consolidated Statements of Operations for the year ended December 31, 2021.
In June 2023, in anticipation of Reference Rate Reform, we amended our interest rate terms of the Term Loan Facility and Cash Flow Revolver from LIBOR to SOFR pursuant to the New Credit Agreement (the "Second Amendment"). The Term Loan Facility and Cash Flow Revolver bear interest at either the base rate or the SOFR rate, at the Company's discretion, in each case plus an applicable margin. Based on our first lien net leverage ratio pursuant to the credit agreement, the applicable margin under the Term Loan Facility and Cash Flow Revolver as of December 31, 2023 was 2.50% and 2.25%, respectively.
Commencing June 30, 2021, the Cash Flow Revolver contains a springing financial covenant when a loan amount is drawn exceeding 35% of the Cash Flow Revolver. In this instance, the first lien net leverage ratio shall not exceed 4.75x at quarter end testing period.
During the year ended December 31, 2022, we drew down $133 million on our Cash Flow Revolver and repaid $103 million as of December 31, 2022. As of December 31, 2022, there was $30 million outstanding revolving credit loans (recorded within "Short-term debt" on the Consolidated Balance Sheet) under the Cash Flow Revolver, which was fully repaid during the year ended December 31, 2023. The average effective interest rate on the Cash Flow Revolver for the year ended December 31, 2022 was 5.1%. Additionally, there was $7 million of issued and undrawn letters of credit under the Cash Flow Revolver as of December 31, 2023. Additionally, in connection with the sale of the Hawkins Point Plant (refer to Note 18 - Commitments & Contingencies for further details), in December 2022, a $50 million undrawn letter of credit was issued as a bi-lateral, stand-alone arrangement. Debt issuance costs associated with the Cash Flow Revolver of $1 million and $2 million were included in “Other long-term assets” in the Consolidated Balance Sheets at December 31, 2023 and 2022, respectively, and are being amortized over the life of the Cash Flow Revolver.
2022 Term Loan Facility
On April 4, 2022, the Borrower, the Company, certain of the Company's subsidiaries, the incremental term lender party thereto, and HSBC Bank USA. National Association, as Administrative Agent and Collateral Agent, entered into Amendment No. 1 to the New Credit Agreement (the "First Amendment"). The First Amendment provides the Borrower with a new seven-year incremental term loan facility (the "2022 Term Loan Facility" and, the loans thereunder, the "2022 Incremental Term Loans") under the New Credit Agreement in an aggregate initial principal amount of $400 million.
The obligations of the Borrower under the 2022 Term Loan Facility are guaranteed and secured by the same guarantees and liens under the New Credit Agreement with respect to the Term Loan Facility (as discussed above). The 2022 Incremental Term Loans are a separate class of loans under the credit agreement, and if the Borrower elects to make an optional prepayment under the credit agreement or is required to make a mandatory prepayment under the credit agreement, the Borrower, may, in each case, select which class or classes of loans to prepay.
The 2022 Incremental Term Loans will amortize in equal quarterly installments in an aggregate annual amount equal to 1.0% of the original principal amount of the 2022 Incremental Term Loans commencing with the second full fiscal quarter after the effective date of the 2022 Incremental Term Loan Facility. The final maturity of the 2022 Incremental Term Loans will occur on the seventh anniversary of the effective date of the 2022 Incremental Term Loan Facility. The 2022 Incremental Term Loan Facility permits amendments thereto whereby individual lenders may extend the maturity date of their outstanding loans upon the Borrower's request without the consent of any other lender, so long as certain conditions are met.
The 2022 Incremental Term Loans shall bear interest, at the Borrower's option, at either the base or the SOFR rate, in each case plus an applicable margin. The applicable margin in respect of the 2022 Incremental Loans is 2.25% per annum, for base rate loans, or 3.25% per annum, for SOFR rate loans.
The 2022 Incremental Term Loans have an interest rate floor of 0.50%. As of December 31, 2023, the applicable margin under the 2022 Term Loan Facility was 3.25%.
The 2022 Incremental Term Loan Facility contains the same negative covenants applicable to the term loans outstanding under the New Credit Agreement immediately prior to the effectiveness of the First Amendment, which covenants, subject to certain limitations, thresholds and exceptions, limit the Company and its restricted subsidiaries to (among other restrictions): incur indebtedness; grant liens; pay dividends and make subsidiary and certain other distributions; sell assets; make investments; enter into transactions with affiliates; and make certain modifications to material documents (including organizational documents).
The proceeds of the 2022 Incremental Term Loans were used on April 4, 2022, along with cash on hand, to redeem previous senior notes of $500 million. As a result of this transaction, we recognized approximately $21 million, including a call premium of $18 million, in "Loss on extinguishment of debt" on the Consolidated Statements of Operations for the year ended December 31, 2022.
As of December 31, 2023, the total outstanding principal balance is $393 million, of which $4 million is recorded within "Long-term debt due within one year" on the Consolidated Balance Sheet.
2023 Term Loan Facility
In August 2023, the Borrower, the Company, certain of the Company’s subsidiaries, the incremental term lender party thereto and HSBC Bank USA, National Association, as Administrative Agent and Collateral Agent, entered into Amendment No. 3 to the New Credit Agreement (the "Third Amendment"). The Third Amendment provides the Borrower with a new five-year incremental term loan facility ("the 2023 Term Loan Facility" and, the loans thereunder, the "2023 Incremental Term Loans") under the New Credit Agreement in an aggregate initial principal amount of $350 million. A portion of the proceeds of the 2023 Term Loan Facility were used to repay $159 million of then-outstanding borrowings under the Company's existing revolving credit facilities and to enhance available liquidity for upcoming capital expenditures.
The obligations of the Borrower under the 2023 Term Loan Facility are guaranteed and secured by the same guarantees and liens under the New Credit Agreement with respect to the Term Loan Facility and 2022 Term Loan Facility (as discussed above). The 2023 Incremental Term Loans are a separate class of loans under the credit agreement, and if the Borrower elects to make an optional prepayment under the credit agreement or is required to make a mandatory prepayment under the credit agreement, the Borrower, may, in each case, select which class or classes of loans to prepay.
The 2023 Incremental Term Loans will amortize in equal quarterly installments in an aggregate annual amount equal to 1.0% of the original principal amount of the 2023 Incremental Term Loans commencing with the second full fiscal quarter after the effective date of the 2023 Incremental Term Loan Facility. The final maturity of the 2023 Incremental Term Loans will occur on August 16, 2028. The 2023 Incremental Term Loan Facility permits amendments thereto whereby individual lenders may extend the maturity date of their outstanding loans upon the Borrower’s request without the consent of any other lender, so long as certain conditions are met.
The 2023 Incremental Term Loans bear interest, at the Borrower's option, at either the base or the SOFR rate, in each case plus an applicable margin. The applicable margin in respect of the 2023 Incremental Term Loans is 2.50% per annum for base rate loans, or 3.50% per annum for SOFR rate loans. The 2023 Incremental Term Loans have an interest rate floor of 0.50%. As of December 31, 2023, the applicable margin under the 2023 Term Loan Facility was 3.50%.
The 2023 Incremental Term Loan Facility contains the same negative covenants applicable to the term loans outstanding under the New Credit Agreement immediately prior to the effectiveness of the Third Amendment, which covenants, subject to certain limitations, thresholds and exceptions, limit the Company and its restricted subsidiaries to (among other restrictions): incur indebtedness; grant liens; pay dividends and make subsidiary and certain other distributions; sell assets; make investments; enter into transactions with affiliates; and make certain modifications to material documents (including organizational documents).
As of December 31, 2023, the total outstanding principal balance is $350 million, of which $4 million is recorded within "Long-term debt due within one year" on the Consolidated Balance Sheet.
Senior Notes due 2029
On March 15, 2021, Tronox Incorporated closed an offering of $1,075 million aggregate principal amount of its 4.625% senior notes due 2029 (the "Senior Notes due 2029"). The notes were offered at par and issued under an indenture dated as of March 15, 2021 among the Company and certain of the Company's restricted subsidiaries as guarantors and Wilmington Trust, National Association. The Senior Notes due 2029 provide, among other thing, that the Senior Notes due 2029 are guaranteed by the Company and certain of the Company's restricted subsidiaries, subject to certain exceptions. The Senior Notes due 2029 and related guarantees are the senior obligations of the Company and the guarantors. The Senior Notes due 2029 have not been registered under the Securities Act, or any state securities laws, and may not be offered or sold in the United States absent registration requirements.
The terms of the indenture, among other things, limit, in certain circumstances, the ability of the Company and its restricted subsidiaries to: incur secured indebtedness, incur indebtedness at a non-guarantor subsidiary, engage in certain sale-leaseback transactions and merge, consolidate or sell substantially all of their assets.
During the year ended December 31, 2021, the Company utilized the proceeds of the Senior Notes due 2029 to repay our previous senior notes which had an aggregate outstanding principal balance of $1.1 billion. As a result of this transaction, we recorded $52 million of debt extinguishment costs, including call premiums of $40 million in the aggregate on the previous senior notes, in "Loss on Extinguishment of Debt" on the Consolidated Statement of Operations for the year ended December 31, 2021.
Standard Bank Term Loan Facility and Revolving Credit Facility
During the year ended December 31, 2021, we made several voluntary prepayments totaling R1,040 million (approximately $69 million) on our previous facility with Standard Bank as well as mandatory quarterly repayments totaling approximately $24 million. No prepayment penalties were required as a result of this principal prepayment. Additionally, during the year ended December 31, 2021, we repaid the remaining outstanding balance of R390 million (approximately $26 million) of the previous facility with Standard Bank and entered into an amendment and restatement with Standard Bank as is discussed below.
On October 1, 2021, Tronox Minerals Sands Proprietary Limited, a wholly-owned subsidiary of the Company, entered into an amendment and restatement of a new credit facility with Standard Bank. The new credit facility provides the Company with (a) a new five-year term loan facility in an aggregate principal amount of R1.5 billion (approximately $98 million) (the "Standard Bank Term Loan Facility") and (b) a new three-year revolving credit facility (the "Standard Bank Revolving Credit Facility") providing initial revolving commitments of R1.0 billion (approximately $55 million at the December 31, 2023 exchange rate). The maturity date on the Standard Bank Term Loan Facility and the Standard Bank Revolving Credit Facility is November 11, 2026 and October 1, 2024, respectively. The Standard Bank Term Loan Facility has a delayed draw feature up to thirty business days from the effective date of the executed credit agreement. Mandatory capital repayments of R37.5 million (approximately $2 million at the December 31, 2023 exchange rate) are scheduled quarterly with the first mandatory repayment which started in December 2021.
Both the Standard Bank Term Loan Facility and the Standard Bank Revolving Credit Facility shall bear interest at an adjusted JIBAR rate plus an applicable margin. The applicable margin on the Standard Bank Term Loan Facility is 2.35%. The applicable margin on the Standard Bank Revolving Credit Facility is based upon average credit utilization during any interest period. If the revolving credit facility utilization is less than 33%, less than 66% but greater than 33%, or greater than 66%, the applicable margin is 2.10%, 2.25%, and 2.40%, respectively.
Pursuant to the credit agreement, on November 11, 2021, the Company drew down the total outstanding principal balance of R1.5 billion (approximately $98 million) on the Standard Bank Term Loan Facility. As of December 31, 2023, the total outstanding principal balance is R1.2 billion (approximately $64 million at the December 31, 2023 exchange rate), of which R150 million (approximately $8 million at the December 31, 2023 exchange rate) is recorded within "Long-term debt due within one year" on the Consolidated Balance Sheet. Additionally, during the year ended December 31, 2023, we drew down R650 million (approximately $36 million at the December 31, 2023 exchange rate) under the Standard Bank Revolving Credit Facility for general corporate purposes and fully repaid the outstanding amount during the year.
Australian Government Loan
We maintain an interest-free loan with the Australian government (“Australian Government Loan”) that is subject to renewal every 5 years and is contingent on renewal of our Australind site leases with final maturity in December 2036. The loan balance due upon maturity is AUD 6 million (approximately $4 million at the December 31, 2023 exchange rate). At December 31, 2023, the discounted value on the Australian Government Loan was approximately AUD 2 million (approximately $1 million at the December 31, 2023 exchange rate).
MGT Loan
On December 17, 2020, we completed our agreement with Cristal to acquire certain assets co-located at our Yanbu facility which produce metal grade TiCl4 (“MGT”) in exchange for a $36 million note payable. Repayment of the note payable is based on a fixed U.S. dollar per metric ton quantity of MGT delivered by us to Advanced Metal Industries Cluster and Toho Titanium Metal Co. Ltd (ATTM) over time and therefore the ultimate maturity date is variable in nature. If ATTM fails to purchase MGT from us under certain contractually agreed upon conditions, then at our election we may terminate the MGT supply agreement with ATTM and will no longer owe any amount under the loan agreement with Cristal. We currently estimate the ultimate maturity to be between approximately five to six years, subject to actual future MGT production levels. The interest rate is based on the Saudi Arabian Interbank Offered Rate (“SAIBOR”) plus a premium.
As of December 31, 2023, the outstanding balance of the note payable was $25 million, of which $7 million is expected to be paid within the next twelve months (recorded within "Long-term debt due within one year" on our Consolidated Balance Sheet). Refer to Note 22 for further information on the MGT transaction.
Tikon Loan
We maintained a working capital debt agreement in China (“Tikon Loan”) that matured in May of 2021. The Tikon Loan bore interest based on an official lending basis rate per annum as announced and published by the People’s Bank of China plus a 7% premium. During the year ended December 31, 2021, we repaid the remaining outstanding principal balance of CNY 111 million (approximately $17 million). No prepayment penalties were required as a result of these principal prepayments.
Short-term Debt
Cash Flow Revolver
For a description of the Cash Flow Revolver, see details above under "Term Loan Facility and Cash Flow Revolver".
Standard Bank Revolving Credit Facility
For a description of the Standard Bank Revolving Credit Facility, see details above under "Standard Bank Term Loan Facility and Revolving Credit Facility".
Emirates Revolver
In June 2023, Tronox Pigment UK Limited, as borrower, and Tronox Holdings plc, as guarantor, entered into a new revolving credit facility with Emirates NBD PJSC (“Emirates”) which replaced the existing revolving credit facility with Emirates. The new Emirates revolving credit facility is secured by inventory of Tronox Pigment UK Limited and will mature in June 2024. The facility limit is 50 million Pound Sterling (approximately $64 million at the December 31, 2023 exchange rate) and can be drawn in either Pound Sterling, Euro or US Dollar. Under the terms of the revolver, for U.S. dollar borrowings, the interest rate is SOFR plus 1.75%, for Euro borrowings, the interest rate is Euribor plus 1.75% and for Pound Sterling borrowings, the interest rate is SONIA plus 1.75%. During the year ended December 31, 2023, we drew down 35 million Pound Sterling (approximately $43 million) and fully repaid the outstanding amount as of December 31, 2023.
SABB Credit Facility
On October 16, 2019, our KSA subsidiary entered into a short-term working capital facility with the Saudi British Bank (“SABB Facility”) for an amount up to SAR 70 million (approximately $19 million). The SABB Facility bears interest at the Saudi Inter Bank Offered Rate plus 180 basis points on outstanding balances. In November 2023, the Company amended the agreement which amongst other things, extended the maturity date of the SABB Credit Facility from November 30, 2023 to November 30, 2024 and increased the facility limit to SAR 75 million (approximately $20 million at the December 31, 2023 exchange rate). During the year ended December 31, 2023, we drew down SAR 16 million (approximately $4 million at the December 31, 2023 exchange rate) under the SABB Facility for general corporate purposes and fully repaid the outstanding amount as of December 31, 2023.
Itaù Unibanco S.A. Credit Facility
In November 2022, our Brazilian subsidiary entered into a working capital facility with Itaù Unibanco S.A. in Brazil for an amount up to 30 million BRL (approximately $6 million at the December 31, 2023 exchange rate). There is no maturity date under this facility until written notice is given. The facility bears interest at the Bolsa do Basil reference rate on outstanding balances. There is no borrowings outstanding under this facility at December 31, 2023.
Insurance premium financing
In August 2022, the Company entered into a $21 million insurance premium financing agreement with a third-party financing company. The balance was repaid in monthly installments over 10 months at a 5% fixed annual interest rate. In August 2023, the Company entered into a $27 million insurance premium financing agreement with a third-party financing company. The financing balance required a 33% down payment and will be repaid in monthly installments over 9 months at a 8% fixed annual interest rate. As of December 31, 2023 and 2022, the financing balance of these arrangements was $11 million and $10 million, respectively, and is recorded in "Short-term debt" in the Consolidated Balance Sheet.
Debt Covenants
At December 31, 2023, we are in compliance with all financial covenants in our debt facilities.
Interest and Debt Expense, Net
Interest and debt expense, net in the Consolidated Statements of Operations consisted of the following:
|
|
|
|
|
|
|
|
|
|
|
|
|
|
|
|
|
|
|
Year Ended December 31, |
|
2023 |
|
2022 |
|
2021 |
| Interest on debt |
$ |
157 |
|
|
$ |
132 |
|
|
$ |
148 |
|
| Amortization of deferred debt issuance costs and discounts on debt |
9 |
|
|
8 |
|
|
11 |
|
| Capitalized interest |
(17) |
|
|
(17) |
|
|
(7) |
|
| Interest on capital leases and letters of credit and commitments |
9 |
|
|
2 |
|
|
5 |
|
| Total interest and debt expense, net |
$ |
158 |
|
|
$ |
125 |
|
|
$ |
157 |
|
In connection with obtaining debt, we incurred debt issuance costs, which are being amortized through the respective maturity dates on a straight-line basis for all of our debt facilities. At December 31, 2023 and December 31, 2022, we had deferred debt issuance costs of $1 million and $2 million, respectively, related to the Cash Flow Revolver, which is recorded in “Other long-term assets” in the Consolidated Balance Sheets. At December 31, 2023 and December 31, 2022, we had debt discounts of $10 million and $8 million, respectively, and debt issuance costs of $30 million and $33 million, respectively, primarily related to our term loans and senior notes, which were recorded as a direct reduction of the carrying value of the long-term debt in the Consolidated Balance Sheets.
14. Derivative Financial Instruments
Derivatives recorded on the Consolidated Balance Sheet:
The following table is a summary of the fair value of derivatives outstanding at December 31, 2023 and 2022:
|
|
|
|
|
|
|
|
|
|
|
|
|
|
|
|
|
|
|
|
|
|
|
|
|
Fair Value |
|
December 31, 2023 |
|
December 31, 2022 |
|
Assets(a) |
|
Accrued Liabilities |
|
Assets(a) |
|
Accrued Liabilities |
| Derivatives Designated as Cash Flow Hedges |
|
|
|
|
|
|
|
|
| Interest Rate Swaps |
$ |
18 |
|
|
$ |
— |
|
|
$ |
30 |
|
|
$ |
— |
|
| Natural Gas Hedges |
$ |
— |
|
|
$ |
1 |
|
|
$ |
1 |
|
|
$ |
2 |
|
| Total Hedges |
$ |
18 |
|
|
$ |
1 |
|
|
$ |
31 |
|
|
$ |
2 |
|
| Derivatives Not Designated as Cash Flow Hedges |
| Currency Contracts |
$ |
1 |
|
|
$ |
1 |
|
|
$ |
1 |
|
|
$ |
— |
|
| Total Derivatives |
$ |
19 |
|
|
$ |
2 |
|
|
$ |
32 |
|
|
$ |
2 |
|
(a) At December 31, 2023 and 2022, current assets of $19 million and $32 million, respectively, are recorded in prepaid and other current assets on the Consolidated Balance Sheet.
Derivatives' Impact on the Consolidated Statements of Operations
The following table summarizes the impact of the Company's derivatives on the Consolidated Statements of Operations:
|
|
|
|
|
|
|
|
|
|
|
|
|
|
|
|
|
|
|
|
|
|
|
|
|
|
|
|
|
|
|
|
|
|
|
|
|
|
|
|
|
|
|
|
|
|
|
|
|
|
|
|
|
|
|
Amount of Pre-Tax Gain (Loss) Recognized in Earnings |
|
Revenue |
|
Cost of Goods Sold |
|
Other Income (Expense), net |
|
Revenue |
|
Cost of Goods Sold |
|
Other Income (Expense), net |
|
Revenue |
|
Cost of Goods Sold |
|
Other Income (Expense), net |
|
Year Ended December 31, 2023 |
|
Year Ended December 31, 2022 |
|
Year Ended December 31, 2021 |
| Derivatives Not Designated as Hedging Instruments |
|
|
|
|
|
|
| Currency Contracts |
$ |
— |
|
|
$ |
— |
|
|
$ |
3 |
|
|
$ |
— |
|
|
$ |
— |
|
|
$ |
1 |
|
|
$ |
— |
|
|
$ |
— |
|
|
$ |
1 |
|
| Derivatives Designated as Hedging Instruments |
|
|
|
|
|
|
| Currency Contracts |
$ |
— |
|
|
$ |
(4) |
|
|
$ |
— |
|
|
$ |
4 |
|
|
$ |
13 |
|
|
$ |
— |
|
|
$ |
(3) |
|
|
$ |
35 |
|
|
$ |
— |
|
| Natural Gas |
$ |
— |
|
|
$ |
(5) |
|
|
$ |
— |
|
|
$ |
— |
|
|
$ |
5 |
|
|
$ |
— |
|
|
$ |
— |
|
|
$ |
3 |
|
|
$ |
— |
|
| Total Derivatives |
$ |
— |
|
|
$ |
(9) |
|
|
$ |
3 |
|
|
$ |
4 |
|
|
$ |
18 |
|
|
$ |
1 |
|
|
$ |
(3) |
|
|
$ |
38 |
|
|
$ |
1 |
|
Interest Rate Risk
During the second quarter of 2019, we entered into interest-rate swap agreements with an aggregate notional value of $750 million representing a portion of our Term Loan Facility, which effectively converted the variable rate to a fixed rate for that portion of the loan. The agreements were to expire in September 2024.
On March 27, 2023, the Company entered into amendments to two of our existing interest rate swap agreements with the counterparty banks. As a result of these amendments, the Company terminated two of our existing interest rate swap contracts which were indexed to LIBOR with an aggregate notional value of $500 million which had maturity dates of September 2024. At the time of these amendments, the Company determined that the interest payments hedged are still probable to occur, therefore, the gains accumulated of $11 million on the interest rate swaps prior to the amendments are being amortized into interest expense through September 22, 2024, the original maturity of the interest rate swap agreements.
We simultaneously entered into two SOFR-indexed forward starting interest rate swaps with the same counterparty banks with no change to the aggregate notional value. The forward starting swaps became effective in June 2023 and will mature in March 2028 which is aligned with the maturity date of the Term Loan Facility. Indexing forward starting swaps to SOFR also ensured that the reference rates in our hedge instruments are now aligned with the interest rate terms of the Term Loan Facility which also changed from LIBOR to SOFR in June 2023 in anticipation of Reference Rate Reform and pursuant to the loan agreement. We elected to apply the hedge accounting expedients in ASC Topic 848, Reference Rate Reform on Financial Reporting related to the following: 1) the assertion that the future forecasted transaction is still probable of occurring despite reference rate changes and 2) the assumption that the index of the future hedged transactions will match the index of the corresponding hedge instruments for the assessment of effectiveness.
Additionally, on March 27, 2023, the Company entered into a new interest rate swap with a $200 million notional value which matures in March 2028 and effectively converts the variable rate to a fixed rate for that portion of the 2022 Term Loan Facility.
On May 17, 2023, the Company entered into an agreement with the counterparty bank to amend the remaining $250 million notional of the three original interest rate swap contracts of $750 million aggregate notional value. As a result of this amendment, the Company changed the rate indexed in the contract from LIBOR to SOFR, effective June 30, 2023 in anticipation of the Reference Rate Reform and to align the index rate in this contract to that in the Term Loan Facility, as described above. This amendment did not change the notional value and the expiration date of this contract, which is set to expire in September 2024. We completed a hedge effectiveness test as a result of this amendment and determined that this hedge instrument continues to be highly effective, enabling us to continue to apply hedge accounting over the remaining term of this hedge relationship.
As of December 31, 2023, the Company maintains a total of $950 million of interest rate swaps with the objective in using the interest-rate swap agreements to add stability to interest expense and to manage the Company's exposure to interest rate movements. These interest rate swaps have been designated as cash flow hedges and involve the receipt of variable amounts from a counterparty in exchange for the Company making fixed-rate payments over the life of the agreements without exchange of the underlying notional amount.
Fair value gains or losses on these cash flow hedges are recorded in accumulated other comprehensive loss and are subsequently reclassified into interest expense in the same periods during which the hedged transactions affect earnings. For the year ended December 31, 2023, 2022 and 2021, the amounts recorded in interest expense related to the interest-rate swap agreements were $26 million, $4 million and $16 million, respectively. At December 31, 2023 and December 31, 2022, the net unrealized gain was $18 million and the unrealized gain was $30 million, respectively, and was recorded in "Accumulated other comprehensive loss" on the Consolidated Balance Sheet.
Foreign Currency Risk
From time to time, we enter into foreign currency contracts used to hedge forecasted third party non-functional currency sales for our South African subsidiaries and forecasted non-functional currency cost of goods sold for our Australian subsidiaries. These foreign currency contracts are designated as cash flow hedges. Changes to the fair value of these foreign currency contracts are recorded as a component of other comprehensive (loss) income, if these contracts remain highly effective, and are recognized in net sales or costs of goods sold in the period in which the forecasted transaction affects earnings or are recognized in other income (expense), net when the transactions are no longer probable of occurring.
As of December 31, 2023, we had no outstanding amounts to reduce the exposure of our Australian subsidiaries’ cost of sales to fluctuations in currency rates or to reduce the exposure of our South African subsidiaries' third party sales to fluctuations in currency rates. At December 31, 2022, there was an unrealized net loss of $4 million recorded in "Accumulated other comprehensive loss" on the Consolidated Balance Sheet, which was fully recognized in earnings during the year ended December 31, 2023.
From time to time, we enter into foreign currency contracts for the South African Rand, Australian Dollar, Euro, Pound Sterling and Saudi Riyal to reduce exposure of our subsidiaries’ balance sheet accounts not denominated in our subsidiaries’ functional currency to fluctuations in foreign currency exchange rates. Historically, we have used forward contracts to reduce the exposure.
For accounting purposes, these foreign currency contracts are not considered hedges. The change in fair value associated with these contracts is recorded in “Other income (expense), net” within the Consolidated Statements of Operations and partially offsets the change in value of third party and intercompany-related receivables not denominated in the functional currency of the subsidiary. At December 31, 2023, there was (i) 837 million South African Rand (or approximately $46 million at the December 31, 2023 exchange rate), (ii) 153 million Australian dollars (or approximately $105 million at the December 31, 2023 exchange rate), (iii) 45 million Pound Sterling (or approximately $57 million at the December 31, 2023 exchange rate, (iv) 45 million Euro (or approximately $50 million at the December 31, 2023 exchange rate) and (v) 67 million Saudi Riyal (or approximately $18 million at the December 31, 2023 exchange rate) of notional amount of outstanding foreign currency contracts.
15. Fair Value Measurement
For financial instruments that are subsequently measured at fair value, the fair value measurement is grouped into levels. See Note 2.
Our debt is recorded at historical amounts. The following table presents the fair value of our debt and derivative contracts at both December 31, 2023 and December 31, 2022:
|
|
|
|
|
|
|
|
|
|
|
|
|
|
|
|
|
|
|
December 31,
2023 |
|
December 31,
2022 |
|
Asset |
Liability |
|
Asset |
Liability |
| Term Loan Facility |
$ |
— |
|
$ |
903 |
|
|
$ |
— |
|
$ |
876 |
|
| 2022 Term Loan Facility |
— |
|
394 |
|
|
— |
|
388 |
|
| 2023 Term Loan Facility |
— |
|
351 |
|
|
— |
|
— |
|
| Standard Bank Term Loan Facility |
— |
|
64 |
|
|
— |
|
77 |
|
| Senior Notes due 2029 |
— |
|
956 |
|
|
— |
|
893 |
|
| Australian Government Loan |
— |
|
1 |
|
|
— |
|
1 |
|
| MGT Loan |
— |
|
25 |
|
|
— |
|
30 |
|
| Interest rate swaps |
18 |
|
— |
|
|
30 |
|
— |
|
| Natural gas hedges |
— |
|
1 |
|
|
1 |
|
2 |
|
| Foreign currency contracts |
1 |
|
1 |
|
|
1 |
|
— |
|
We determined the fair value of the Term Loan Facility, the 2022 Term Loan Facility, the 2023 Term Loan Facility, and the Senior Notes due 2029 using quoted market prices, which under the fair value hierarchy is a Level 1 input. We determined the fair value of the Standard Bank Term Loan Facility utilizing transactions in the listed markets for similar liabilities, which under the fair value hierarchy is a Level 2 input. The fair value of the Australian Government Loan and MGT Loan is based on the contracted amount which is a Level 2 input.
We determined the fair value of the foreign currency contracts, natural gas hedges, and the interest rate swaps using inputs other than quoted prices in active markets that are observable either directly or indirectly. The fair value hierarchy for the foreign currency contracts, natural gas hedges, and interest rate swaps is a Level 2 input.
The carrying value of cash and cash equivalents, restricted cash, accounts receivable and accounts payable approximate fair value due to the short-term nature of these items.
16. Leases
Lease expense for the year ended December 31, 2023, 2022 and 2021 was comprised of the following:
|
|
|
|
|
|
|
|
|
|
|
|
|
|
|
|
|
|
|
|
|
|
|
Year Ended December 31, |
|
|
2023 |
|
2022 |
|
2021 |
| Operating lease expense |
|
$ |
37 |
|
|
$ |
39 |
|
|
$ |
47 |
|
|
|
|
|
|
|
|
| Finance lease expense: |
|
|
|
|
|
|
| Amortization of right-of-use assets |
|
6 |
|
|
4 |
|
|
$ |
1 |
|
| Interest on lease liabilities |
|
5 |
|
|
4 |
|
|
$ |
2 |
|
|
|
|
|
|
|
|
| Short term lease expense |
|
36 |
|
|
35 |
|
|
$ |
30 |
|
| Variable lease expense |
|
5 |
|
|
14 |
|
|
$ |
23 |
|
| Total lease expense |
|
$ |
89 |
|
|
$ |
96 |
|
|
$ |
103 |
|
The table below summarizes lease expense for the year ended December 31, 2023, 2022 and 2021 recorded in the specific line items, which are subsequently recorded in our Consolidated Statements of Operations:
|
|
|
|
|
|
|
|
|
|
|
|
|
|
|
|
|
|
|
|
|
|
|
Year Ended December 31, |
|
|
2023 |
|
2022 |
|
2021 |
| Cost of goods sold |
|
$ |
87 |
|
|
$ |
92 |
|
|
$ |
98 |
|
| Selling, general and administrative expenses |
|
2 |
|
|
4 |
|
|
5 |
|
| Total |
|
$ |
89 |
|
|
$ |
96 |
|
|
$ |
103 |
|
The weighted-average remaining lease term in years and weighted-average discount rates at December 31, 2023 and 2022 were as follows:
|
|
|
|
|
|
|
|
|
|
|
|
|
|
|
|
|
December 31, 2023 |
|
December 31, 2022 |
| Weighted-average remaining lease term: |
|
|
|
|
| Operating leases |
|
11.1 |
|
11.6 |
| Finance leases |
|
8.0 |
|
8.8 |
|
|
|
|
|
| Weighted-average discount rate: |
|
|
|
|
| Operating leases |
|
12.1 |
% |
|
10.8 |
% |
| Finance leases |
|
12.1 |
% |
|
12.2 |
% |
The maturity analysis for operating leases and finance leases at December 31, 2023 were as follows:
|
|
|
|
|
|
|
|
|
|
|
|
|
|
|
|
|
Operating Leases |
|
Finance Leases |
| 2024 |
|
36 |
|
|
10 |
|
| 2025 |
|
24 |
|
|
9 |
|
| 2026 |
|
20 |
|
|
8 |
|
| 2027 |
|
16 |
|
|
8 |
|
| 2028 |
|
15 |
|
|
7 |
|
| Thereafter |
|
120 |
|
|
25 |
|
| Total lease payments |
|
231 |
|
|
67 |
|
| Less: imputed interest |
|
(104) |
|
|
(24) |
|
| Present value of lease payments |
|
$ |
127 |
|
|
$ |
43 |
|
Additional information relating to cash flows and ROU assets for the year ended December 31, 2023, 2022 and 2021 is as follows:
|
|
|
|
|
|
|
|
|
|
|
|
|
|
|
|
|
|
|
|
|
|
|
December 31, 2023 |
|
December 31, 2022 |
|
December 31, 2021 |
| Cash paid for amounts included in the measurement of lease liabilities: |
|
|
|
|
|
|
| Operating cash flows used for operating leases |
|
$ |
40 |
|
|
$ |
39 |
|
|
$ |
51 |
|
| Operating cash flows used for finance leases |
|
$ |
5 |
|
|
$ |
4 |
|
|
$ |
2 |
|
| Financing cash flows used for finance leases |
|
$ |
5 |
|
|
$ |
3 |
|
|
$ |
1 |
|
Additional information relating to ROU assets for the year ended December 31, 2023 and 2022 is as follows:
|
|
|
|
|
|
|
|
|
|
|
|
|
|
|
|
|
Year Ended December 31, |
|
|
2023 |
|
2022 |
| ROU assets obtained in exchange for lease obligations: |
|
|
|
|
| Operating leases obtained in the normal course of business |
|
$ |
21 |
|
|
$ |
83 |
|
| Finance leases obtained in the normal course of business |
|
$ |
3 |
|
|
$ |
37 |
|
17. Asset Retirement Obligations
Asset retirement obligations consist primarily of rehabilitation and restoration costs, landfill capping costs, decommissioning costs, and closure and post-closure costs. Activity related to asset retirement obligations was as follows:
|
|
|
|
|
|
|
|
|
|
|
|
|
Year Ended December 31, |
|
2023 |
|
2022 |
| Balance, January 1 |
$ |
161 |
|
|
$ |
149 |
|
| Additions |
11 |
|
|
3 |
|
| Accretion expense |
15 |
|
|
12 |
|
| Remeasurement/translation |
1 |
|
|
(7) |
|
| Changes in estimates, including cost and timing of cash flows |
7 |
|
|
7 |
|
| Settlements/payments |
(9) |
|
|
(3) |
|
| Other acquisition and divestiture related |
— |
|
|
— |
|
| Balance, December 31 |
$ |
186 |
|
|
$ |
161 |
|
|
|
|
|
|
|
|
|
|
|
|
|
|
December 31, |
|
2023 |
|
2022 |
| Asset retirement obligations were classified as follows: |
|
|
|
| Current portion included in “Accrued liabilities” |
$ |
14 |
|
|
$ |
8 |
|
| Noncurrent portion included in “Asset retirement obligations” |
172 |
|
|
153 |
|
| Asset retirement obligations |
$ |
186 |
|
|
$ |
161 |
|
We used the following assumptions in determining asset retirement obligations at December 31, 2023: inflation rates between 1.5% - 5.5% per year; credit adjusted risk-free interest rates between 6.0% -22.0%; the life of mines from less than 1 to 23 years and the useful life of assets between 5-44 years.
Environmental Rehabilitation Scheme
In accordance with applicable regulations, we established an environmental rehabilitation scheme for the prospecting and mining operations in South Africa, which receives, holds, and invests funds for the rehabilitation or management of asset retirement obligations. At December 31, 2023 and 2022, the total value of the assets held in the environmental rehabilitation scheme were $15 million and $12 million, respectively, which were recorded in “Other long-term assets” in the Consolidated Balance Sheets.
18. Commitments and Contingencies
Purchase and Capital Commitments—At December 31, 2023, purchase commitments were $285 million for 2024, $173 million for 2025, $167 million for 2026, $163 million for 2027, $291 million for 2028, and $1,475 million thereafter.
Letters of Credit—At December 31, 2023, we had outstanding letters of credit and bank guarantees of $109 million, of which $70 million were letters of credit (inclusive of $50 million related to the sale of Hawkins Point as discussed below) and $39 million were bank guarantees. Amounts for performance bonds were not material.
Environmental Matters— It is our policy to record appropriate liabilities for environmental matters when remedial efforts are probable and the costs can be reasonably estimated. Such liabilities are based on our best estimate of the undiscounted future costs required to complete the remedial work. The recorded liabilities are adjusted periodically as remediation efforts progress or as additional technical, regulatory or legal information becomes available. Given the uncertainties regarding the status of laws, regulations, enforcement policies, the impact of other potentially responsible parties, technology and information related to individual sites, we do not believe it is possible to develop an estimate of the range of reasonably possible environmental loss in excess of our recorded liabilities. We expect to fund expenditures for these matters from operating cash flows. The timing of cash expenditures depends principally on the timing of remedial investigations and feasibility studies, regulatory approval of cleanup projects, remedial techniques to be utilized and agreements with other parties. Included in these environmental matters are the following:
Hawkins Point Plant. Residual waste mud, known as Batch Attack Mud, and a spent sulfuric waste stream were deposited in an onsite repository (the “Batch Attack Lagoon”) at a former TiO2 manufacturing site, Hawkins Point Plant in Baltimore, Maryland, operated by Cristal USA, Inc. from 1954 until 2011. We assumed responsibility for remediation of the Hawkins Point Plant when we acquired the TiO2 business of Cristal in April 2019. On December 21, 2022, we sold the Hawkins Point Plant to the Maryland Port Administration ("MPA"), a state agency controlled by the Maryland Department of Transportation. Pursuant to the terms of the transaction, MPA became the lead party in developing and implementing appropriate measures to address, treat, control, and mitigate the environmental conditions at the property under the regulatory oversight of the Maryland Department of the Environment ("MPE"). Under MPA ownership, the Hawkins Point Plant will be utilized for storage and beneficial reuse of dredged material from the Port of Baltimore. In exchange for transferring ownership of the site to MPA, Tronox has agreed to make scheduled, annual payments to MPA which together with scheduled, annual contributions from MPA will be used to remediate the property. The sale of the property to MPA did not have a material impact to the Consolidated Statements of Operations. As of December 31, 2023, we have a provision of $42 million included in "Environmental liabilities" in our Consolidated Balance Sheet for the Hawkins Point Plant consistent with the accounting policy described above.
Other Matters— We are subject to a number of other lawsuits, investigations and disputes (some of which involve substantial amounts claimed) arising out of the conduct of our business, including matters relating to commercial transactions, prior acquisitions and divestitures, including our acquisition of Cristal, employee benefit plans, intellectual property, and environmental, health and safety matters. We recognize a liability for any contingency that is probable of occurrence and reasonably estimable. We continually assess the likelihood of adverse judgments of outcomes in these matters, as well as potential ranges of possible losses (taking into consideration any insurance recoveries), based on a careful analysis of each matter with the assistance of outside legal counsel and, if applicable, other experts. Included in these other matters is the following:
UK Health and Safety Matter. In April 2023, we received a summons from the UK Health and Safety Executive (HSE) alleging non-compliance with UK health and safety legislation at the Stallingborough pigment plant resulting from an incident involving a contractor in August 2021. In June 2023, Tronox Pigment UK Limited, the entity which owns the Stallingborough plant, pled guilty to the allegation. The sentencing hearing to determine monetary penalties occurred in September 2023. At such hearing, the judge imposed a monetary penalty in the amount of £207,681, inclusive of costs. We do not believe this matter will have a material adverse effect on our business, financial condition and results of operations. In addition, in February 2024, we received a second summons from the HSE alleging non-compliance with UK health and safety legislation at the Stallingborough pigment plant resulting from a separate incident involving an employee in August 2022. Based upon our current understanding, we do not believe the enforcement action with regards to this second incident will have a material adverse effect on our business, financial condition and results of operations.
Venator Materials plc v. Tronox Limited. In May 2019, Venator Materials plc (“Venator”) filed an action in the Superior Court of the State of Delaware alleging among other things that we owed Venator a $75 million “Break Fee” pursuant to the terms of a preliminary agreement dated July 14, 2018 (the “Exclusivity Agreement”). The Exclusivity Agreement required, among other things, Tronox and Venator to use their respective best efforts to negotiate a definitive agreement to sell the entirety of the National Titanium Dioxide Company Limited’s (“Cristal’s”) North American operations to Venator if a divestiture of all or a substantial part of these operations were required to secure the approval of the Federal Trade Commission for us to complete our acquisition of Cristal’s TiO2 business. In June 2019, we denied Venator's claims and counterclaimed against Venator seeking to recover $400 million in damages from Venator that we suffered as a result of Venator’s breaches of the Exclusivity Agreement. Specifically, we alleged, among other things, that Venator’s failure to use best efforts constituted a material breach of the Exclusivity Agreement and directly resulted in and caused us to sell Cristal’s North American operations to an alternative buyer for $701 million, $400 million less than the price Venator had agreed to in the Exclusivity Agreement. On April 6, 2022, the Judge presiding over the case in the Superior Court of the State of Delaware delivered a directed verdict in favor of Venator without allowing the jury to deliberate. The Company determined not to appeal the Judge's verdict, and as such, on April 18, 2022, the Company and Venator entered into a settlement agreement whereby the Company paid $85 million, inclusive of interest, on April 25, 2022. As a result, we recorded the charge within "Venator settlement" on the Consolidated Statement of Operations for the year ended December 31, 2022.
Western Australia Stamp Duty Matter. In May 2018, we lodged a pre-transaction determination request for a stamp duty exemption with the Western Australia Office of State Revenue (the “WA OSR”) in connection with our re-domicile transaction (the “Re-Domicile Transaction”). The WA OSR subsequently granted our request for an exemption in June 2018 on a preliminary basis. Immediately following the consummation of the Re-Domicile Transaction, we filed a confirmation request for the stamp duty exemption with the WA OSR. Following this confirmation request, we exchanged numerous communications with the WA OSR addressing questions raised and stating our position. In July 2021, the WA OSR informed us that they have reviewed their technical position on the applicability of the stamp duty exemption and have determined that such an exemption is disallowed. On April 8, 2022, the Company lodged an appeal of the WA OSR's decision with the Western Australia State Administrative Tribunal. On March 3, 2023, the WA OSR officially granted us the stamp duty exemption in connection with the Re-Domicile Transaction, and as such, the Tribunal proceeding was withdrawn.
19. Accumulated Other Comprehensive Loss Attributable to Tronox Holdings plc and Other Equity Items
The tables below present changes in accumulated other comprehensive loss by component for 2023, 2022 and 2021.
|
|
|
|
|
|
|
|
|
|
|
|
|
|
|
|
|
|
|
|
|
|
|
|
|
Cumulative
Translation
Adjustment
|
|
Pension
Liability
Adjustment
|
|
Unrealized
Gains (losses)
on Derivatives
|
|
Total |
| Balance, January 1, 2021 |
$ |
(491) |
|
|
$ |
(120) |
|
|
$ |
1 |
|
|
$ |
(610) |
|
| Other comprehensive income (loss) |
(103) |
|
|
16 |
|
|
21 |
|
|
(66) |
|
| Acquisition of noncontrolling interest |
(34) |
|
|
— |
|
|
— |
|
|
(34) |
|
| Amounts reclassified from accumulated other comprehensive loss |
— |
|
|
4 |
|
|
(32) |
|
|
(28) |
|
| Balance, December 31, 2021 |
(628) |
|
|
(100) |
|
|
(10) |
|
|
(738) |
|
| Other comprehensive (loss) income |
(82) |
|
|
5 |
|
|
53 |
|
|
(24) |
|
|
|
|
|
|
|
|
|
| Amounts reclassified from accumulated other comprehensive loss |
— |
|
|
17 |
|
|
(23) |
|
|
(6) |
|
| Balance, December 31, 2022 |
$ |
(710) |
|
|
$ |
(78) |
|
|
$ |
20 |
|
|
$ |
(768) |
|
| Other comprehensive (loss) income |
(19) |
|
|
(14) |
|
|
(15) |
|
|
(48) |
|
| Amounts reclassified from accumulated other comprehensive loss |
— |
|
|
— |
|
|
2 |
|
|
2 |
|
| Balance, December 31, 2023 |
$ |
(729) |
|
|
$ |
(92) |
|
|
$ |
7 |
|
|
$ |
(814) |
|
Repurchase of Common Stock
On November 9, 2021, the Company's Board of Directors authorized the repurchase of up to $300 million of the Company's stock through February 2024. During the year ended December 31, 2023, we made no repurchases of the Company's stock. In connection with the expiration in February 2024 of the Company's existing share repurchase program, on February 21, 2024, the Company's Board of Directors authorized the repurchase of up to $300 million of the Company's stock through February 21, 2027.
20. Share-based Compensation
Share-based compensation expense consisted of the following:
|
|
|
|
|
|
|
|
|
|
|
|
|
|
|
|
|
|
|
Year Ended December 31, |
|
2023 |
|
2022 |
|
2021 |
| Total share-based compensation expense from restricted share units |
$ |
21 |
|
|
$ |
26 |
|
|
$ |
31 |
|
The stock compensation expense for the year ended December 31, 2023 is inclusive of a $4 million reduction of expense due to the 2021 performance grants. The stock compensation expense for the year ended December 31, 2021 is inclusive of a $3 million true up of expense due to the 2020 and 2021 performance grants as well as the acceleration of $2 million of stock compensation expense associated with the retirement agreement entered into with the former CEO on March 18, 2021.
Tronox Holdings plc Amended and Restated Management Equity Incentive Plan
On March 27, 2019, in connection with the Re-domicile Transaction, Tronox Holdings plc assumed the management equity incentive plan previously adopted by Tronox Limited, which plan was renamed the Tronox Holdings plc Amended and Restated Management Equity Incentive Plan. The amendments to the plan were made to provide, among other things, for the appropriate substitution of Tronox Holdings in place of Tronox Limited and to ensure the compliance with the laws of England and Wales law in place of Australian law. The MEIP permits the grant of awards that are comprised of incentive options, nonqualified options, share appreciation rights, restricted shares, restricted share units, performance awards, and other share-based awards, cash payments, and other forms as the compensation committee of the Board of Directors (the “Board”) in its discretion deems appropriate, including any combination of the above. The maximum number of shares which were initially subjected to awards (inclusive of incentive options) was 20,781,225 ordinary shares and was increased by 8,000,000 on the affirmative vote of our shareholders on June 24, 2020.
Restricted Share Units (“RSUs”)
On an annual basis, the Company grants RSUs which have time and/or performance conditions. Both the time-based awards and the performance-based awards are classified as equity awards.
2023 Grants- The Company granted both time-based and performance-based awards to certain members of management. A total of 872,660 of time-based awards were granted to management which will vest ratably over a three-year period ending March 5, 2026. A total of 90,088 of time-based awards were granted to non-employee members of the Board which will vest in May 2024. A total of 872,660 of performance-based awards were granted, of which 436,330 of the awards vest based on a relative Total Shareholder Return ("TSR") calculation and 436,330 of the awards vest based on certain performance metrics of the Company. The non-TSR performance-based awards vest on March 5, 2026 based on the actual 2025 annual return on invested capital (ROIC). Similar to the Company's historical TSR awards granted in prior years, the TSR awards vest based on the Company's three-year TSR versus the peer group performance levels. Given these terms, the TSR metric is considered a market condition for which we used a Monte Carlo simulation to determine the weighted average grant date fair value of $22.42.
Similar TSR awards were granted during 2022 and 2021 with a grant date fair values of $34.41 and $29.07 which was calculated utilizing a Monte Carlo simulation. The following weighted-average assumptions were utilized to value the grants in 2023, 2022 and 2021:
|
|
|
|
|
|
|
|
|
|
|
|
|
|
|
|
|
|
|
2023 |
|
2022 |
|
2021 |
| Dividend yield |
N/A |
|
3.22 |
% |
|
1.56 |
% |
| Expected historical volatility |
67.1 |
% |
|
68.0 |
% |
|
71.1 |
% |
| Risk free interest rate |
4.47 |
% |
|
3.06 |
% |
|
0.17 |
% |
| Expected life (in years) |
3 |
|
3 |
|
3 |
The following table presents a summary of activity for RSUs for 2023:
|
|
|
|
|
|
|
|
|
|
|
|
|
Number
of Shares
|
|
Weighted
Average
Grant Date
Fair Value
|
| Outstanding, January 1, 2023 |
3,790,404 |
|
|
$ |
17.01 |
|
| Granted |
1,958,242 |
|
|
16.33 |
|
| Vested |
(2,326,611) |
|
|
11.72 |
|
| Forfeited |
(103,691) |
|
|
19.92 |
|
| Outstanding, December 31, 2023 |
3,318,344 |
|
|
$ |
20.22 |
|
| Expected to vest, December 31, 2023 |
2,430,837 |
|
|
$ |
19.36 |
|
The 2020 performance-based RSUs vested above target in 2023 and resulted in 122,834 additional RSU shares being granted and vested immediately. At December 31, 2023, there was $29 million of unrecognized compensation expense related to nonvested RSUs, adjusted for estimated forfeitures, which is expected to be recognized over a weighted-average period of 1.8 years. The weighted-average grant-date fair value of RSUs granted during 2023, 2022 and 2021 was $16.33 per unit, $19.47 per unit, and $20.91 per unit, respectively. The total fair value of RSUs that vested during 2023, 2022 and 2021 was $27 million, $44 million and $41 million, respectively.
Options
We did not issue any options during 2023, 2022 and 2021 and all our options outstanding are fully vested at December 31, 2023. The following table presents a summary of option activity for 2023:
|
|
|
|
|
|
|
|
|
|
|
|
|
|
|
|
|
|
|
|
|
|
|
|
|
Number of
Options
|
|
Weighted
Average
Exercise Price
|
|
Weighted
Average
Contractual
Life (years)
|
|
Intrinsic
Value
|
| Outstanding, January 1, 2023 |
515,092 |
|
|
$ |
20.55 |
|
|
0.62 |
|
$ |
— |
|
| Exercised |
— |
|
|
— |
|
|
|
|
|
| Forfeited |
3,842 |
|
|
20.30 |
|
|
|
|
|
| Expired |
(301,291) |
|
|
19.41 |
|
|
|
|
|
| Outstanding and Exercisable, December 31, 2023 |
217,643 |
|
|
$ |
22.13 |
|
|
0.13 |
|
$ |
— |
|
The aggregate intrinsic values in the table represent the total pre-tax intrinsic value (the difference between our share price at the indicated dates and the options’ exercise price, multiplied by the number of in-the-money options) that would have been received by the option holders had all option holders exercised their in-the-money options at the end of the year. The amount will change based on the fair market value of our stock.
During 2022 and 2021, there were 13,881 and 424,832 options exercised, respectively, with a total intrinsic value of less than $1 million and $2 million, respectively. We issue new shares upon the exercise of options. During 2022 and 2021, we received less than $1 million and $8 million, respectively, in cash for the exercise of stock options. There were no options exercised during 2023 and consequently, there was no related intrinsic value. At December 31, 2023, 2022 and 2021, there was no unrecognized compensation expense related to options.
21. Pension and Other Postretirement Healthcare Benefits
The following provides information regarding our U.S. and foreign plans:
U.S. Plans
Pension and Postretirement Healthcare Plans— Tronox has one main U.S. defined benefit plan: the U.S. Qualified Plan. The U.S. Qualified Plan is a funded noncontributory qualified benefit plan which is in accordance with the Employee Retirement Income Security Act of 1974 (“ERISA”) and the Internal Revenue Code. We made contributions into funds managed by a third party, and those funds are held exclusively for the benefit of the plan participants. Benefits under the U.S. Qualified Plan were generally calculated based on years of service and final average pay. The U.S. Qualified Plan was frozen and closed to new participants on June 1, 2009. In October 2022, the Company entered into an irrevocable arrangement with an insurance provider to settle certain lower dollar valued accounts within its frozen U.S Qualified Plan to reduce PBGC premiums. As a result of this arrangement, the Company recorded a non-cash pension settlement charge of approximately $20 million during the fourth quarter of 2022. We also maintain one postretirement healthcare plan - the U.S. retiree welfare plan.
International Plans
Pension Plans — Tronox has international defined benefit commitments primarily in the United Kingdom ("U.K. DB Scheme") and Saudi Arabia. The U.K. DB Scheme is a funded qualified defined benefit plan in the United Kingdom, which is frozen with no additional benefits accruing to the participants. Benefits under the U.K. DB Scheme are generally calculated based on years of credit service and final compensation when benefits ceased to accrue as defined under the plan provisions. We also maintain a Saudi Arabia Cristal End of Service Benefit plan which provides end of service benefits to qualifying participants. End of service benefits are based on years of service and the reasons for which a participant's services to the Company are terminated.
Multiemployer Pension Plan - In prior periods, we maintained a defined benefit plan in the Netherlands (the “Netherlands Plan”) to provide defined pension benefits to qualifying employees of Tronox Pigments (Holland) B.V. and its related companies. During 2014, the Netherlands Plan was replaced with a multiemployer plan, the Netherlands Contribution Plan (the "CDC Plan") effective January 1, 2015. Under the CDC Plan, employees earn benefits based on their pensionable salaries each year determined using a career average benefit formula. The collective bargaining agreement between us and the participants require us to contribute 20.4% of the participants’ pensionable salaries into a pooled fund administered by the industry-wide PGB. The pensionable salary is the annual income of employees subject to a cap, which is adjusted each year to reflect the current requirements of the Netherlands’ Wages and Salaries Tax Act of 1964. Our obligation under this plan is limited to the fixed percentage contribution we make each year. The employees are entitled to any returns generated from the investment activities of the fund.
The following table outlines the details of our participation in the CDC Plan for the year ended December 31, 2023. The CDC disclosures provided herein are based on the fund’s 2022 annual report, which is the most recently available public information. Based on the total plan assets and accumulated benefit obligation information in the plan’s annual report, the zone status was green as of December 31, 2022. A green zone status indicates that the plan was at least 80 percent funded. The “FIP/RP Status Pending/Implemented” column indicates whether a financial improvement plan (FIP) or a rehabilitation plan (RP) is either pending or has been implemented. As of December 31, 2023, we are not aware of any financial improvement or rehabilitation plan being implemented or pending. The last column lists the expiration date of the collective-bargaining agreement to which the plan is subject.
|
|
|
|
|
|
|
|
|
|
|
|
|
|
|
|
|
|
|
|
|
|
|
|
|
|
|
|
|
|
|
|
|
|
|
|
|
|
|
|
|
|
|
|
|
|
|
|
|
|
|
|
|
|
|
Pension Protection Act
Zone Status
|
|
|
|
Tronox Contributions |
|
|
|
|
|
Pension
Fund
|
|
EIN/Pension
Plan
Number
|
|
2023 |
|
2022 |
|
FIP/RP
Pending/
Implemented
|
|
2023 |
|
2022 |
|
Surcharge
Imposed
|
|
Expiration
date of
Collective-
Bargaining
Agreement
|
| PGB |
|
NA |
|
N/A |
|
Green |
|
No |
|
$ |
5 |
|
|
$ |
5 |
|
|
No |
|
12/31/2024 |
On the basis of the information available in the CDC Plan 2022 annual report, our contribution does not constitute more than 5 percent of the total contribution to the plan by all participants. During 2023, the fund did not impose any surcharge on us.
Postretirement Healthcare Plans — We also maintain postretirement healthcare plans in South Africa (the "South African Plan") and Brazil (the "Brazil Medical Plan"). The South African Plan provides medical and dental benefits to certain South African employees, retired employees and their registered dependents. The South African Plan provides benefits as follows: (i) members employed before March 1, 1994 receive 100% post-retirement and death-in-service benefits; (ii) members employed on or after March 1, 1994 but before January 1, 2002 receive 2% per year of completed service subject to a maximum of 50% post-retirement and death-in-service benefits; and, (iii) members employed on or after January 1, 2002 receive no post-retirement and death-in-service benefits. The Brazil Medical Plan provides post-employment medical benefits to employees who contributed to the medical plan while employed. Retirees receiving a benefit under the plan are required to pay a contribution that varies based on the coverage level elected.
Pension and Postretirement Benefit Costs / Obligations
Benefit Obligations and Funded Status — The following provides a reconciliation of beginning and ending benefit obligations, beginning and ending plan assets, funded status, and balance sheet classification of our U.S. and international pension plans and other post-retirement benefit plans ("OPEB") as of and for the years ended December 31, 2023 and 2022. The benefit obligations and plan assets associated with our principal benefit plans are measured on December 31.
|
|
|
|
|
|
|
|
|
|
|
|
|
|
|
|
|
|
|
|
|
|
|
|
|
|
|
|
|
|
|
|
|
|
|
|
|
Pensions |
|
Other Post Retirement Benefit Plans |
|
December 31 |
|
December 31 |
|
2023 |
|
2022 |
|
2023 |
|
2022 |
|
US |
International |
|
US |
International |
|
US |
International |
|
US |
International |
| Change in benefit obligations: |
|
|
|
|
|
|
|
|
|
|
|
| Benefit obligation, beginning of year |
$ |
199 |
|
$ |
154 |
|
|
$ |
369 |
|
$ |
234 |
|
|
$ |
1 |
|
$ |
17 |
|
|
$ |
2 |
|
$ |
16 |
|
| Service cost |
— |
|
3 |
|
|
— |
|
4 |
|
|
— |
|
1 |
|
|
— |
|
1 |
|
| Interest cost |
11 |
|
7 |
|
|
10 |
|
4 |
|
|
— |
|
2 |
|
|
— |
|
2 |
|
| Net actuarial (gains) losses |
13 |
|
5 |
|
|
(77) |
|
(61) |
|
|
— |
|
6 |
|
|
(1) |
|
(1) |
|
| Curtailments |
— |
|
— |
|
|
— |
|
— |
|
|
— |
|
(1) |
|
|
— |
|
— |
|
| Settlements |
— |
|
— |
|
|
(81) |
|
— |
|
|
— |
|
— |
|
|
— |
|
— |
|
Plan amendments(1) |
— |
|
— |
|
|
— |
|
— |
|
|
— |
|
— |
|
|
— |
|
— |
|
| Foreign currency rate changes |
— |
|
5 |
|
|
— |
|
(17) |
|
|
— |
|
— |
|
|
— |
|
— |
|
| Benefits paid |
(24) |
|
(11) |
|
|
(22) |
|
(10) |
|
|
— |
|
(1) |
|
|
— |
|
(1) |
|
Benefit obligation, end of year (2) |
199 |
|
163 |
|
|
199 |
|
154 |
|
|
1 |
|
24 |
|
|
1 |
|
17 |
|
| Change in plan assets: |
|
|
|
|
|
|
|
|
|
|
|
| Fair value of plan assets, beginning of year |
180 |
|
106 |
|
|
337 |
|
183 |
|
|
— |
|
— |
|
|
— |
|
— |
|
| Actual return on plan assets |
20 |
|
3 |
|
|
(63) |
|
(53) |
|
|
— |
|
— |
|
|
— |
|
— |
|
| Employer contributions |
— |
|
5 |
|
|
— |
|
4 |
|
|
— |
|
1 |
|
|
— |
|
1 |
|
| Benefits paid |
(24) |
|
(11) |
|
|
(22) |
|
(10) |
|
|
— |
|
(1) |
|
|
— |
|
(1) |
|
| Foreign currency rate changes |
— |
|
6 |
|
|
— |
|
(18) |
|
|
— |
|
— |
|
|
— |
|
— |
|
| Settlements |
— |
|
— |
|
|
(72) |
|
— |
|
|
— |
|
— |
|
|
— |
|
— |
|
| Fair value of plan assets, end of year |
176 |
|
109 |
|
|
180 |
|
106 |
|
|
— |
|
— |
|
|
— |
|
— |
|
| Net underfunded status of plans |
$ |
(23) |
|
$ |
(54) |
|
|
$ |
(19) |
|
$ |
(48) |
|
|
$ |
(1) |
|
$ |
(24) |
|
|
$ |
(1) |
|
$ |
(17) |
|
| Classification of amounts recognized in the Consolidated Balance Sheets: |
| Other long-term assets |
$ |
— |
|
$ |
10 |
|
|
$ |
— |
|
$ |
10 |
|
|
$ |
— |
|
$ |
— |
|
|
$ |
— |
|
$ |
— |
|
| Accrued liabilities |
— |
|
(7) |
|
|
— |
|
(6) |
|
|
— |
|
(1) |
|
|
— |
|
— |
|
| Pension and postretirement healthcare benefits |
(23) |
|
(57) |
|
|
(19) |
|
(52) |
|
|
(1) |
|
(23) |
|
|
(1) |
|
(17) |
|
| Total liabilities |
(23) |
|
(64) |
|
|
(19) |
|
(58) |
|
|
(1) |
|
(24) |
|
|
(1) |
|
(17) |
|
| Accumulated other comprehensive (income) loss |
64 |
|
11 |
|
|
55 |
|
4 |
|
|
— |
|
8 |
|
|
— |
|
2 |
|
| Total |
$ |
41 |
|
$ |
(43) |
|
|
$ |
36 |
|
$ |
(44) |
|
|
$ |
(1) |
|
$ |
(16) |
|
|
$ |
(1) |
|
$ |
(15) |
|
________________
(1) Relates to a plan amendment entered into during 2021 related to the Brazil Medical Plan.
(2) Since the benefits under the U.S Qualified Plan and the U.K. DB Scheme are frozen, the projected benefit obligation and accumulated benefit obligation are the same.
Contributions
At a minimum, Tronox contributes to its pension plans to comply with local regulatory requirements (e.g., ERISA in the United States). Discretionary contributions in excess of the local minimum requirements are made based on many factors, including long-term projections of the plans' funded status, the economic environment, potential risk of overfunding, pension insurance costs and alternative uses of the cash. Changes to these factors can impact the timing of discretionary contributions from year to year. Pension contributions for its US and international plans were approximately $6 million in 2023 and are currently expected to be approximately $8 million in 2024.
The following table provides information for pension plans where the accumulated benefit obligation exceeds the fair value of the plan assets:
|
|
|
|
|
|
|
|
|
|
|
|
|
Pensions |
|
2023 |
|
US |
|
International |
| Projected benefit obligation (PBO) |
$ |
198 |
|
|
$ |
63 |
|
| Accumulated benefit obligation (ABO) |
$ |
198 |
|
|
$ |
42 |
|
| Fair value of plan assets |
$ |
175 |
|
|
$ |
— |
|
Expected Benefit Payments — The following table shows the expected cash benefit payments for the next five years and in the aggregate for the years 2029 through 2033:
|
|
|
|
|
|
|
|
|
|
|
|
|
|
|
|
|
|
|
|
|
|
|
|
|
|
|
|
|
|
|
|
|
|
|
|
|
2024 |
|
2025 |
|
2026 |
|
2027 |
|
2028 |
|
2029-2032 |
| Pensions - US |
$ |
19 |
|
|
$ |
19 |
|
|
$ |
19 |
|
|
$ |
18 |
|
|
$ |
17 |
|
|
$ |
76 |
|
| Pensions - International |
$ |
13 |
|
|
$ |
9 |
|
|
$ |
10 |
|
|
$ |
10 |
|
|
$ |
11 |
|
|
$ |
51 |
|
| Other Post Retirement Benefit Plans - US |
$ |
— |
|
|
$ |
— |
|
|
$ |
— |
|
|
$ |
— |
|
|
$ |
— |
|
|
$ |
1 |
|
| Other Post Retirement Benefit Plans - International |
$ |
— |
|
|
$ |
1 |
|
|
$ |
1 |
|
|
$ |
1 |
|
|
$ |
1 |
|
|
$ |
10 |
|
Retirement and Postretirement Healthcare Expense — The table below presents the components of net periodic cost associated with the U.S. and foreign plans recognized in the Consolidated Statements of Operations for 2023, 2022, and 2021:
|
|
|
|
|
|
|
|
|
|
|
|
|
|
|
|
|
|
|
|
|
|
|
|
|
|
|
|
|
|
|
|
|
|
|
|
|
Pensions |
|
Other Postretirement Benefit Plans |
|
Year Ended December 31, |
|
Year Ended December 31, |
|
2023 |
|
2022 |
|
2021 |
|
2023 |
|
2022 |
|
2021 |
| Net periodic cost: |
|
|
|
|
|
|
|
|
|
|
|
| Service cost |
$ |
3 |
|
|
$ |
5 |
|
|
$ |
4 |
|
|
$ |
1 |
|
|
$ |
— |
|
|
$ |
1 |
|
Interest cost(1) |
18 |
|
|
14 |
|
|
14 |
|
|
2 |
|
|
2 |
|
|
2 |
|
Expected return on plan assets(1) |
(20) |
|
|
(24) |
|
|
(26) |
|
|
— |
|
|
— |
|
|
— |
|
Net amortization of actuarial loss(1) |
— |
|
|
4 |
|
|
5 |
|
|
— |
|
|
— |
|
|
1 |
|
Settlement losses (gains)(1) |
— |
|
|
20 |
|
|
— |
|
|
— |
|
|
— |
|
|
— |
|
Curtailment (gains)(1) |
— |
|
|
— |
|
|
— |
|
|
— |
|
|
— |
|
|
— |
|
Total net periodic cost |
$ |
1 |
|
|
$ |
19 |
|
|
$ |
(3) |
|
|
$ |
3 |
|
|
$ |
2 |
|
|
$ |
4 |
|
________________
(1) Recorded in Other income (expense), net in the Consolidated Statements of Operations.
Assumptions —
The following weighted average assumptions were used to determine net periodic cost:
|
|
|
|
|
|
|
|
|
|
|
|
|
|
|
|
|
|
|
|
|
|
|
|
|
|
|
|
|
|
|
|
|
|
|
|
|
Pension |
|
|
|
2023 |
|
2022 |
|
2021 |
|
US |
|
International |
|
US |
|
International |
|
US |
|
International |
| Discount rate |
5.70 |
% |
|
4.70 |
% |
|
2.97 |
% |
|
1.91 |
% |
|
2.60 |
% |
|
1.47 |
% |
| Expected return on plan assets |
7.50 |
% |
|
4.00 |
% |
|
6.80 |
% |
|
2.50 |
% |
|
6.70 |
% |
|
2.50 |
% |
|
|
|
|
|
|
|
|
|
|
|
|
|
OPEB |
|
|
|
2023 |
2022 |
|
2021 |
|
US |
|
International |
|
US |
|
International |
|
US |
|
International |
| Discount rate |
5.62 |
% |
|
10.59 |
% |
|
2.83 |
% |
|
10.29 |
% |
|
2.59 |
% |
|
10.19 |
% |
| Expected return on plan assets |
N/A |
|
N/A |
|
N/A |
|
N/A |
|
N/A |
|
N/A |
The following weighted average assumptions were used in estimating the actuarial present value of benefit obligations:
|
|
|
|
|
|
|
|
|
|
|
|
|
|
|
|
|
|
|
|
|
|
|
|
|
|
|
|
|
|
|
|
|
|
|
|
|
Pensions |
|
|
|
2023 |
|
2022 |
|
|
|
2021 |
|
US |
|
International |
|
US |
|
International |
|
US |
|
International |
| Discount rate |
5.42 |
% |
|
4.45 |
% |
|
5.70 |
% |
|
4.70 |
% |
|
2.97 |
% |
|
1.87 |
% |
| Rate of compensation increase |
N/A |
|
4.76 |
% |
|
N/A |
|
4.72 |
% |
|
N/A |
|
4.68 |
% |
|
|
|
|
|
|
|
|
|
|
|
|
|
OPEB |
|
|
|
2023 |
|
2022 |
|
|
|
2021 |
|
US |
|
International |
|
US |
|
International |
|
US |
|
International |
| Discount rate |
5.95 |
% |
|
10.50 |
% |
|
5.62 |
% |
|
11.10 |
% |
|
2.83 |
% |
|
10.33 |
% |
| Rate of compensation increase |
N/A |
|
N/A |
|
N/A |
|
N/A |
|
N/A |
|
N/A |
For the U.S. Qualified Plan, at both December 31, 2023 and December 31, 2022, the mortality assumption was determined using the Society of Actuaries' the generational projection scale (i.e. MP-2021) and base table (i.e. Pri-2012).
Expected Return on Plan Assets — In forming the assumption of the U.S. and international long-term rate of return on plan assets, we considered the expected earnings on funds already invested, earnings on contributions expected to be received in the current year, and earnings on reinvested returns. The long-term rate of return estimation methodology for the Company's pension plans is based on a capital asset pricing model using historical data and a forecasted earnings model. An expected return on plan assets analysis is performed which incorporates the current portfolio allocation, historical asset-class returns, and an assessment of expected future performance using asset-class risk factors.
Discount Rate — The 2023 and 2022 rates were selected based on the results of a cash flow matching analysis, which projected the expected cash flows of the plans using a yield curves model developed from a universe of Aa-graded U.S. currency corporate bonds (obtained from Bloomberg) with BVAL scores of 6 or greater.
Plan Assets — The investments of the U.S. and International pension plans are managed to meet the future expected benefit liabilities of the plan over the long term by investing in diversified portfolios consistent with prudent diversification and historical and expected capital market returns. Tronox's U.S. and international pension plans’ weighted-average asset allocations at December 31, 2023 and 2022, and the target asset allocation ranges, by major asset category, are as follows:
|
|
|
|
|
|
|
|
|
|
|
|
|
|
|
|
|
|
|
|
|
|
|
|
|
|
|
|
|
|
|
|
|
|
|
|
|
|
|
|
|
|
|
|
|
|
|
|
|
December 31, |
|
2023 |
|
2022 |
|
US |
|
International |
|
US |
|
International |
|
Actual |
|
Target |
|
Actual |
|
Target |
|
Actual |
|
Target |
|
Actual |
|
Target |
|
|
|
|
|
|
|
|
|
|
|
|
|
|
|
|
| Equity securities |
49 |
% |
|
50 |
% |
|
— |
% |
|
— |
% |
|
49 |
% |
|
46 |
% |
|
— |
% |
|
— |
% |
| Debt securities |
47 |
|
|
47 |
|
|
38 |
|
|
38 |
|
|
46 |
|
|
46 |
|
|
37 |
|
|
37 |
|
| Real estate |
1 |
|
|
1 |
|
|
— |
|
|
— |
|
|
1 |
|
|
— |
|
|
— |
|
|
— |
|
| Other |
3 |
|
|
2 |
|
|
62 |
|
|
62 |
|
|
4 |
|
|
8 |
|
|
63 |
|
|
63 |
|
| Total |
100 |
% |
|
100 |
% |
|
100 |
% |
|
100 |
% |
|
100 |
% |
|
100 |
% |
|
100 |
% |
|
100 |
% |
The fair values of pension investments as of December 31, 2023 are summarized below:
|
|
|
|
|
|
|
|
|
|
|
|
|
|
|
|
|
|
|
|
|
|
|
|
|
|
|
|
|
|
|
|
|
|
|
|
|
|
|
|
|
|
|
|
|
|
|
|
|
|
|
|
Fair Value Measurement at December 31, 2023 Using: |
|
|
|
Quoted Prices
in Active
Markets for
Identical
Assets
(Level 1) |
|
|
|
Significant Other
Observable Inputs
(Level 2) |
|
|
Significant
Unobservable
Inputs
(Level 3) |
|
|
|
Total |
| Asset category: |
|
|
|
|
|
|
|
|
|
|
|
|
|
|
| Equities securities: |
|
|
|
|
|
|
|
|
|
|
|
|
|
|
| Global equity securities |
|
|
$ |
48 |
|
|
|
(1) |
$ |
— |
|
|
|
$ |
— |
|
|
|
|
$ |
48 |
|
| Global commingled equity funds |
|
|
38 |
|
|
|
(2) |
— |
|
|
|
— |
|
|
|
|
38 |
|
| Debt securities: |
|
|
|
|
|
|
|
|
|
|
|
|
|
|
| US government bonds |
|
|
48 |
|
|
|
(3) |
— |
|
|
|
— |
|
|
|
|
48 |
|
| Foreign government bonds |
|
|
22 |
|
|
|
(3) |
— |
|
|
|
— |
|
|
|
|
22 |
|
| US corporate bonds |
|
|
— |
|
|
|
|
34 |
|
|
(4) |
— |
|
|
|
|
34 |
|
| Foreign corporate bonds |
|
|
— |
|
|
|
|
21 |
|
|
(4) |
— |
|
|
|
|
21 |
|
| Real Estate: |
|
|
|
|
|
|
|
|
|
|
|
|
|
|
| Property/ real estate fund |
|
|
— |
|
|
|
|
1 |
|
|
(5) |
— |
|
|
|
|
1 |
|
| Other: |
|
|
|
|
|
|
|
|
|
|
|
|
|
|
| Insurance contracts |
|
|
— |
|
|
|
|
— |
|
|
|
63 |
|
|
(7) |
|
63 |
|
| Cash & cash equivalents |
|
|
10 |
|
|
|
(6) |
— |
|
|
|
— |
|
|
|
|
10 |
|
| Total at fair value |
|
|
$ |
166 |
|
|
|
|
$ |
56 |
|
|
|
$ |
63 |
|
|
|
|
$ |
285 |
|
________________
(1)For global equity securities, this category is comprised of shares of common stock in both U.S. and international companies from a diverse set of industries and size. Common stock is valuated at the closing market price reported on a U.S. or international exchange where the security is actively traded. Equity securities are classified within level 1 of the fair value hierarchy.
(2)Global commingled equity funds are comprised of managed funds that invest in common stock of both U.S. and international companies shares from a diverse set of industries and size. Common stock are valued at the closing market price reported on a U.S. or international exchange where the security is actively traded. These funds are classified within level 1 of the fair value hierarchy.
(3)For US and foreign government bonds, this category includes U.S. treasuries, U.S. federal agency obligations and international government debt. The fair value of these investments are based on observable quoted prices on active exchanges, which are level 1 inputs.
(4)For US corporate bonds and foreign corporate bonds, this category is comprised of corporate bonds of U.S. and foreign companies from a diverse set of industries and size. The fair values for the U.S. and foreign corporate bonds are determined using quoted prices of similar securities in active markets and observable data or broker or dealer quotations. The fair values for these investments are classified as level 2 within the valuation hierarchy.
(5)For property / real estate funds, this category includes real estate properties, partnership equities and investments in operating companies. The fair value of the assets is determined using discounted cash flows by estimating an income stream for the property plus a reversion into a present value at a risk adjusted rate. Yield rates and growth assumptions utilized are derived from market transactions as well as other financial and industry data. The fair value of these investments are classified as level 2 in the valuation hierarchy.
(6)Cash and cash equivalents include cash and short-interest bearing investments with maturities of three months or less. Investments are valued at cost plus accrued interest. Cash and cash equivalents are classified within level 1 of the valuation hierarchy.
(7)For insurance contracts, the fair value is estimated as the cost of purchasing equivalent annuities on terms consistent with those currently available in the market. The contracts are with highly rated insurance companies and are classified within level 3 of the valuation hierarchy. The following table summarizes changes in fair value of the pension plan assets classified as level 3 for the year ended December 31, 2023:
|
|
|
|
|
|
|
|
|
|
|
Insurance Contracts |
| Balance, December 31, 2022 |
|
$ |
63 |
|
| Actual return on plan assets |
|
2 |
|
| Purchases, sales, settlements |
|
(5) |
|
| Transfers in/out of Level 3 |
|
— |
|
| Foreign currency translation |
|
3 |
|
| Balance, December 31, 2023 |
|
$ |
63 |
|
The fair values of pension investments as of December 31, 2022 are summarized below:
|
|
|
|
|
|
|
|
|
|
|
|
|
|
|
|
|
|
|
|
|
|
|
|
|
Fair Value Measurement at December 31, 2022, Using: |
|
Quoted Prices
in Active
Markets for
Identical
Assets
(Level 1)
|
|
Significant Other
Observable Inputs
(Level 2)
|
|
Significant
Unobservable
Inputs
(Level 3)
|
|
Total |
| Asset category: |
|
|
|
|
|
|
|
| Equities securities: |
|
|
|
|
|
|
|
| Global equity securities |
$ |
53 |
|
(1) |
$ |
— |
|
|
$ |
— |
|
|
$ |
53 |
|
| Global commingled equity funds |
35 |
|
(2) |
— |
|
|
— |
|
|
35 |
|
| Debt securities: |
|
|
|
|
|
|
|
| US government bonds |
48 |
|
(3) |
— |
|
|
— |
|
|
48 |
|
| Foreign government bonds |
19 |
|
(3) |
— |
|
|
— |
|
|
19 |
|
| US corporate bonds |
— |
|
|
34 |
|
(4) |
— |
|
|
34 |
|
| Foreign corporate bonds |
— |
|
|
22 |
|
(4) |
— |
|
|
22 |
|
| Real Estate: |
|
|
|
|
|
|
|
| Property/ real estate fund |
— |
|
|
1 |
|
(5) |
— |
|
|
1 |
|
| Other: |
|
|
|
|
|
|
|
| Insurance contracts |
— |
|
|
— |
|
|
63 |
|
(7) |
63 |
|
| Cash & cash equivalents |
11 |
|
(6) |
— |
|
|
— |
|
|
11 |
|
| Total at fair value |
$ |
166 |
|
|
$ |
57 |
|
|
$ |
63 |
|
|
$ |
286 |
|
________________
(1)For global equity securities, this category is comprised of shares of common stock in both U.S. and international companies from a diverse set of industries and size. Common stock is valuated at the closing market price reported on a U.S. or international exchange where the security is actively traded. Equity securities are classified within level 1 of the fair value hierarchy.
(2)Global commingled equity funds are comprised of managed funds that invest in common stock of both U.S. and international companies shares from a diverse set of industries and size. Common stock are valued at the closing market price reported on a U.S. or international exchange where the security is actively traded. These funds are classified within level 1 of the fair value hierarchy.
(3)For US and foreign government bonds, this category includes U.S. treasuries, U.S. federal agency obligations and international government debt. The fair value of these investments are based on observable quoted prices on active exchanges, which are level 1 inputs.
(4)For US corporate bonds and foreign corporate bonds, this category is comprised of corporate bonds of U.S. and foreign companies from a diverse set of industries and size. The fair values for the U.S. and foreign corporate bonds are determined using quoted prices of similar securities in active markets and observable data or broker or dealer quotations. The fair values for these investments are classified as level 2 within the valuation hierarchy.
(5)For property / real estate funds, this category includes real estate properties, partnership equities and investments in operating companies. The fair value of the assets is determined using discounted cash flows by estimating an income stream for the property plus a reversion into a present value at a risk adjusted rate. Yield rates and growth assumptions utilized are derived from market transactions as well as other financial and industry data. The fair value of these investments are classified as level 2 in the valuation hierarchy.
(6)Cash and cash equivalents include cash and short-interest bearing investments with maturities of three months or less. Investments are valued at cost plus accrued interest. Cash and cash equivalents are classified within level 1 of the valuation hierarchy.
(7)For insurance contracts, the fair value is estimated as the cost of purchasing equivalent annuities on terms consistent with those currently available in the market. The contracts are with highly rated insurance companies and are classified within level 3 of the valuation hierarchy. The following table summarizes changes in fair value of the pension plan assets classified as level 3 for the year ended December 31, 2022:
|
|
|
|
|
|
|
|
|
|
|
Insurance Contracts |
| Balance, December 31, 2021 |
|
$ |
98 |
|
| Actual return on plan assets |
|
(20) |
|
| Purchases, sales, settlements |
|
(5) |
|
| Transfers in/out of Level 3 |
|
— |
|
| Foreign currency translation |
|
(10) |
|
| Balance, December 31, 2022 |
|
$ |
63 |
|
Defined Contribution Plans
U.S. Savings Investment Plan
In 2006, we established the U.S. Savings Investment Plan (the “SIP”), a qualified defined contribution plan under Section 401(k) of the Internal Revenue Code. Under the SIP, our regular full-time and part-time employees contribute a portion of their earnings, and we match these contributions up to a predefined threshold. Our matching contribution is 100% of the first 6% of employee contributions. Effective January 1, 2013, we established a profit sharing contribution at 6% of employees’ pay (“discretionary contribution”). A discretionary contribution of 6% was made for 2023, 2022 and 2021. Our matching contribution to the SIP vests immediately; however, our discretionary contribution is subject to vesting conditions that must be satisfied over a three-year vesting period. Contributions under the SIP, including our match, are invested in accordance with the investment options elected by plan participants. Compensation expenses associated with our matching contribution to the SIP was $4 million, $5 million and $5 million during 2023, 2022 and 2021, respectively, which was included in “Selling, general and administrative expenses” in the Consolidated Statements of Operations. Compensation expense associated with our discretionary contribution was $5 million in 2023, $5 million in 2022 and $5 million in 2021, which was included in “Selling, general and administrative expenses” in the Consolidated Statements of Operations.
U.S. Benefit Restoration Plan
In 2006, we established the U.S. Benefit Restoration Plan (the “BRP”), a nonqualified defined contribution plan, for employees whose eligible compensation is expected to exceed the IRS compensation limits for qualified plans. Under the BRP, participants can contribute up to 20% of their annual compensation and incentive. Our matching contribution under the BRP is the same as the SIP. Our matching contribution under this plan vests immediately to plan participants. Contributions under the BRP, including our match, are invested in accordance with the investment options elected by plan participants. Compensation expense associated with our matching contribution to the BRP was $1 million, $1 million and $1 million during 2023, 2022 and 2021, respectively, which was included in “Selling, general and administrative expenses” in the Consolidated Statements of Operations.
South Africa Defined Contribution Plans
Tronox Mineral Sands Proprietary Limited, a wholly owned subsidiary of the Company, participates in several defined contribution plans which are registered in the Republic of South Africa and are governed by the South African Pension Funds Act of 1956. These plans provide retirement and other benefits to all permanent employees, and where applicable, retired employees and their dependents. The Company contributes a range of 10% to 15% (depending on the plan) of the employees' predefined pre-tax pensionable earnings. Compensation expense associated with these plans was $8 million, $7 million, and $5 million during 2023, 2022 and 2021, respectively, which was included in both "Costs of goods sold" and "Selling, general and administrative expenses" in the Consolidated Statements of Operations.
22. Related Party Transactions
Tasnee / Cristal
At December 31, 2023 Cristal International Holdings B.V. (formerly known as Cristal Inorganic Chemical Netherlands Cooperatief W.A.), a subsidiary of Tasnee, continues to own 37,580,000 shares of Tronox, or a 24% ownership interest.
On May 9, 2018, we entered into an Option Agreement with AMIC which is owned equally by Tasnee and Cristal. Under the terms of the Option Agreement, AMIC granted us an option (the “Option”) to acquire 90% of a special purpose vehicle (the “SPV”), to which AMIC’s ownership in a titanium slag smelter facility (the “Slagger”) in The Jazan City for Primary and Downstream Industries in KSA will be contributed together with $322 million of AMIC indebtedness (the "AMIC Debt"). The AMIC Debt would remain outstanding debt of the SPV upon exercise of the Option. The Option may be exercised if the Slagger achieves certain production criteria related to sustained quality and tonnage of slag produced (the “Option Criteria”). Likewise, AMIC may require us to acquire the Slagger on the same terms if the Option Criteria are satisfied. Furthermore, pursuant to the Option Agreement we lent AMIC $125 million for capital expenditures and operational expenses intended to facilitate the start-up of the Slagger (the “Tronox Loans”).
On May 13, 2020, we amended the Option Agreement (the "First Amendment") with AMIC to address circumstances in which the Option Criteria cannot be satisfied. Pursuant to the First Amendment, Tronox has the right to acquire the SPV in exchange for (i) our forgiveness of the Tronox Loans principal and accrued interest thereon, and (ii) the SPV's assumption of $36 million of indebtedness plus accrued interest thereon lent by AMIC to the SPV. Under the First Amendment, the SPV would not assume any of the AMIC Debt.
On May 10, 2023, AMIC and Tronox further amended the Option Agreement (the “Second Amendment”). In the Second Amendment the parties acknowledged that the Option expired on May 10, 2023 without being exercised but agreed to continue negotiating until September 30, 2023 (the "Renegotiation Period") as to whether, and under what circumstances, Tronox may acquire the Slagger. Subsequent to September 30, 2023, the parties continued to negotiate as to whether, and under what circumstances, Tronox may acquire the Slagger and on February 21, 2024 they again amended the Option Agreement (the “Third Amendment”), which extended the Renegotiation Period until the earlier of the repayment of the Tronox Loans or December 31, 2024, subject to certain early termination rights. The Third Amendment also provided that from the date the parties entered into the Second Amendment and through December 31, 2023, all chloride slag produced by the Slagger was to be delivered to Tronox as repayment in-kind of the Tronox Loans at a price based on a widely published index for feedstock less a nominal discount (the “Slag Price”). Thereafter and until the end of the Renegotiation Period, 65% of all chloride slag produced by the Slagger will be delivered to Tronox as repayment in-kind of the Tronox Loans based on the Slag Price and Tronox will purchase via cash settlements the remaining 35% at the Slag Price. Full repayment of the Tronox Loans is required by January 2025 in either cash or in-kind through chloride slag deliveries. During July 2023, we also entered into an agreement with AMIC to act as their sales agent with regard to sales of slag fines to customers outside of the Kingdom of Saudi Arabia for an agreed upon commission fee to be paid.
The following table shows the outstanding balance of the Tronox Loans, which is recorded in "Other long-term assets" on the Consolidated Balance Sheet:
|
|
|
|
|
|
|
|
|
|
|
|
|
December 31, |
|
2023 |
|
2022 |
| Principal balance |
80 |
|
125 |
| Accrued interest income balance |
12 |
|
13 |
| Total outstanding balance |
92 |
|
138 |
The following table shows the interest income earned on the Tronox Loans, which is recorded in "Interest income" on our Consolidated Statement of Operations:
|
|
|
|
|
|
|
|
|
|
|
|
|
|
|
|
|
|
|
December 31, |
|
2023 |
|
2022 |
|
2021 |
| Interest income |
5 |
|
4 |
|
3 |
The following table shows the amount of feedstock purchased from the Slagger, which is subsequently recorded in "Cost of goods sold" on our Consolidated Statement of Operations:
|
|
|
|
|
|
|
|
|
|
|
|
|
|
|
|
|
|
|
December 31, |
|
2023 |
|
2022 |
|
2021 |
| Settled as in-kind repayment of Tronox Loans |
44 |
|
|
— |
|
|
— |
|
| Settled in cash |
80 |
|
|
60 |
|
|
— |
|
| Total chloride slag purchases |
124 |
|
|
60 |
|
|
— |
|
The following table shows the amounts due to AMIC at period-end regarding the purchase feedstock purchased from the Slagger, which are recorded in "Accrued liabilities" on our Consolidated Balance Sheet:
|
|
|
|
|
|
|
|
|
|
|
|
|
December 31, |
|
2023 |
|
2022 |
| Amount due to AMIC for slag purchases |
— |
|
|
14 |
|
In addition, on March 15, 2018 Tronox and AMIC entered into a Technical Services Agreement (the "Original Technical Services Agreement"), which was subsequently amended on May 13, 2020, May 10, 2023 and February 21, 2024 (the "Restated Technical Services Agreement"). Through September 30, 2023 we provided technical advice and project management services, however AMIC and its consultants were still responsible for engineering and construction of the Slagger. As compensation for these services, Tronox received certain fees, including a management fee. In the Consolidated Statement of Operations and shown in the table below, the management fees per the Original Technical Services Agreement were recorded within "Other income, net" and other technical support fees, including fees per the Restated Technical Services Agreement, are recorded within "Selling, general and administrative" costs. From and after October 1, 2023, we no longer receive a management fee and the scope of services we provide is more limited, for which we receive cost reimbursement plus a nominal margin.
|
|
|
|
|
|
|
|
|
|
|
|
|
|
|
|
|
|
|
December 31, |
|
2023 |
|
2022 |
|
2021 |
| Management fees |
6 |
|
8 |
|
8 |
| Other technical support fees |
2 |
|
2 |
|
— |
|
| Total fees received |
8 |
|
10 |
|
8 |
Outstanding balances for these fees receivable are shown below, which are recorded within “Prepaid and other assets” on the Consolidated Balance Sheet:
|
|
|
|
|
|
|
|
|
|
|
|
|
December 31, |
|
2023 |
|
2022 |
| Management fees and other technical support fees |
1 |
|
2 |
On December 29, 2019, we entered into an agreement with Cristal to acquire certain assets co-located at our Yanbu facility which produce metal grade TiCl4 ("MGT"). Consideration for the acquisition was the assumption by Tronox of a $36 million note payable to Cristal (the "MGT Loan"). MGT is used at a titanium "sponge" plant facility, 65% of the ownership interests of which are held by Advanced Metal Industries Cluster and Toho Titanium Metal Co. Ltd ("ATTM"), a joint venture between AMIC and Toho Titanium Company Ltd. ATTM uses the TiCl4, which we supply by pipeline, for the production of titanium sponge, a precursor material used in the production of titanium metal.
On December 17, 2020 we completed the MGT transaction. Repayment of the $36 million note payable is based on a fixed U.S. dollar per metric ton quantity of MGT delivered by us to ATTM over time and therefore the ultimate maturity date is variable in nature. If ATTM fails to purchase MGT from us under certain contractually agreed upon conditions, then at our election we may terminate the MGT supply agreement with ATTM and will no longer owe any amount under the loan agreement with Cristal. We currently estimate the ultimate maturity to be between approximately four and five years, subject to actual future MGT production levels. The interest rate on the note payable is based on the SAIBOR plus a premium. As shown in the table below, the note payable is recorded within "Long-term debt, net" and "Long-term debt due within one year" on the Consolidated Balance Sheet.
|
|
|
|
|
|
|
|
|
|
|
|
|
December 31, |
|
2023 |
|
2022 |
| Note payable, due within 1 year |
7 |
|
7 |
| Note payable, due longer than 1 year from now |
18 |
|
23 |
| Total outstanding note payable |
25 |
|
30 |
Amounts regarding interest expense and loan repayments for the MGT loan, which are recorded on the Consolidated Statement of Operations within “Interest expense” and “Net sales,” respectively, are shown below:
|
|
|
|
|
|
|
|
|
|
|
|
|
|
|
|
|
|
|
December 31, |
|
2023 |
|
2022 |
|
2021 |
| Interest expense |
2 |
|
1 |
|
1 |
| Loan Repayment via MGT delivered to ATTM |
6 |
|
3 |
|
4 |
As a result of these transactions we have entered into related to the MGT assets, Tronox purchases chlorine gas from ATTM for use in the production of MGT and such transactions are reflected as follows:
|
|
|
|
|
|
|
|
|
|
|
|
|
|
|
|
|
|
|
December 31, |
|
2023 |
|
2022 |
|
2021 |
| Purchases of chlorine gas |
5 |
|
4 |
|
8 |
These purchases are subsequently recorded within “Cost of goods sold” on the Consolidated Statement of Operations. Amounts due at period end, which are presented below, are recorded within “Accrued liabilities” on the Consolidated Balance Sheet.
|
|
|
|
|
|
|
|
|
|
|
|
|
December 31, |
|
2023 |
|
2022 |
| Amount due related to purchases of chlorine gas |
1 |
|
1 |
As Tronox delivers MGT product to ATTM, amounts are recorded within “Net sales” on the Consolidated Statement of Operations, as shown below:
|
|
|
|
|
|
|
|
|
|
|
|
|
|
|
|
|
|
|
December 31, |
|
2023 |
|
2022 |
|
2021 |
| MGT sales made to ATTM as product is delivered |
47 |
|
29 |
|
31 |
Amounts related to MGT deliveries that are outstanding at period end are recorded in “Prepaid and other assets” on the Consolidated Balance Sheet, as shown below:
|
|
|
|
|
|
|
|
|
|
|
|
|
December 31, |
|
2023 |
|
2022 |
| Due from ATTM for MGT deliveries |
9 |
|
6 |
23. Segment Information
We operate our business under one operating segment, Tronox, which is also our reportable segment. The Company's chief operating decision maker, who are its Co-CEOs, reviews financial information presented at the consolidated level for purposes of allocating resources and evaluating financial performance. Since we operate our business under one segment, there is no difference between our consolidated results and segment results.
We disaggregate revenue from contracts with customers by product type and geographic area as well as sales based on country of production. We believe this level of disaggregation appropriately depicts how the nature, amount, timing and uncertainty of our revenue and cash flows are affected by economic factors and reflects how our business is managed.
During 2023, 2022 and 2021 our ten largest third-party customers represented 39%, 30%, and 28%, respectively, of our consolidated net sales. During 2023, 2022, and 2021, no single customer accounted for 10 % of our consolidated net sales.
Net sales to external customers based on country of production, were as follows:
|
|
|
|
|
|
|
|
|
|
|
|
|
|
|
|
|
|
|
Year Ended December 31, |
|
2023 |
|
2022 |
|
2021 |
| U.S. operations |
$ |
686 |
|
|
$ |
733 |
|
|
$ |
716 |
|
| International operations: |
|
|
|
|
|
| United Kingdom |
267 |
|
|
331 |
|
|
396 |
|
| Australia |
659 |
|
|
822 |
|
|
873 |
|
| South Africa |
398 |
|
|
484 |
|
|
441 |
|
| Saudi Arabia |
318 |
|
|
419 |
|
|
420 |
|
| Other - international |
522 |
|
|
665 |
|
|
726 |
|
| Total net sales |
$ |
2,850 |
|
|
$ |
3,454 |
|
|
$ |
3,572 |
|
See Note 3 for further information on revenues.
There is no difference between the total consolidated assets and our segment assets. Property, plant and equipment, net, mineral leaseholds, net, and lease right of use assets, net by geographic region, were as follows:
|
|
|
|
|
|
|
|
|
|
|
|
|
December 31, |
|
2023 |
|
2022 |
| U.S. operations |
$ |
299 |
|
|
$ |
308 |
|
| International operations: |
|
|
|
| United Kingdom |
103 |
|
|
93 |
|
| Saudi Arabia |
222 |
|
|
226 |
|
| South Africa |
701 |
|
|
705 |
|
| Australia |
1,048 |
|
|
1,093 |
|
| Other - international |
248 |
|
|
242 |
|
| Total |
$ |
2,621 |
|
|
$ |
2,667 |
|
Item 9. Changes in and Disagreements with Accountants on Accounting and Financial Disclosure
None.
Item 9A. Controls and Procedures
Evaluation of Disclosure Controls and Procedures
Under the supervision of and with the participation of Tronox's management, including our Co-CEOs and CFO, we evaluated the effectiveness of the design and operation of our disclosure controls and procedures (as such term is defined in Rules 13a-15(e) and 15d-15(e) under the Securities Exchange Act of 1934, as amended) (the "Exchange Act"), as of December 31, 2023, the end of the period covered by this report. Based on that evaluation, our co-CEOs and CFO have concluded that the Company's disclosure controls and procedures were effective as of that date. Tronox's disclosure controls and procedures are designed to ensure that information required to be disclosed by Tronox in the reports that it files or submits under the Exchange Act is recorded, processed, summarized and reported, within the time periods specified in the Commission's rules and forms, and that such information is accumulated and communicated to Tronox's management, including Tronox's co-CEOs and CFO, or other person performing similar functions, as appropriate to allow timely decisions regarding required disclosure.
Management’s Report on Internal Control Over Financial Reporting
Management of Tronox Holdings plc and its subsidiaries is responsible for establishing and maintaining adequate internal control over financial reporting. Internal controls over financial reporting is a process designed under the supervision of our interim principal co-executive officers and principal financial officer to provide reasonable assurance regarding the reliability of financial reporting and the preparation of the Company’s financial statements for external purposes in accordance with U.S. generally accepted accounting principles.
Our internal controls over financial reporting include those policies and procedures that:
•pertain to the maintenance of records that, in reasonable detail, accurately and fairly reflect the transactions and dispositions of the assets of the Company;
•provide reasonable assurance that transactions are recorded as necessary to permit preparation of financial statements in accordance with U.S. generally accepted accounting principles, and that our receipts and expenditures are being made only in accordance with authorizations of the Company’s management and directors; and
•provide reasonable assurance regarding prevention or timely detection of unauthorized acquisition, use or disposition of our assets that could have a material effect on the financial statements.
Management assessed the effectiveness of our internal controls over financial reporting as of December 31, 2023. In making this assessment, management used the criteria in Internal Control-Integrated Framework (2013) set forth by the Committee of Sponsoring Organizations of the Treadway Commission (COSO). Based on our assessment using those criteria, management concluded that our internal control over financial reporting as of December 31, 2023 was effective.
Because of its inherent limitations, internal controls over financial reporting may not prevent or detect misstatements. Projections of any evaluation of effectiveness to future periods are subject to the risk that controls may become inadequate because of changes in conditions, or that the degree of compliance with the policies or procedures may deteriorate.
The effectiveness of the Company’s internal control over financial reporting as of December 31, 2023 has been audited by PricewaterhouseCoopers LLP, an independent registered public accounting firm, as stated in their report, which appears in Item 8 of this Form 10-K.
Changes in Internal Control Over Financial Reporting
We are currently undergoing a multi-year IT-enabled transformation program that includes increased automation of both operational and financial systems, including the global enterprise risk management program, through new and upgraded systems, technology and processes. As part of such transformation program, during the third quarter of 2022, we implemented upgrades to our financial systems and platforms in certain regions. The full implementation is expected to occur in phases over a number of years. As the phased implementation of this system occurs, we expect certain changes to our processes and procedures which, in turn, will result in changes to our internal control over financial reporting.
While we expect this transformation program to strengthen our internal financial controls, management will continue to evaluate and monitor our internal controls as processes and procedures in each of the affected areas evolve.
Other than as discussed above, there have been no changes to our internal control over financial reporting during the quarter ended December 31, 2023 that have materially affected, or are reasonably likely to materially affect, our internal control over financial reporting.
Item 9B. Other Information
During the three months ended December 31, 2023, none of our directors or officers (as defined in Rule 16a-1(f) under the Exchange Act) had any contact, instruction or written plan for the purchase or sale of our securities that was intended to satisfy the affirmative defense conditions of Rule 10b5-1(c) under the Exchange Act for any "non-Rule 10b5-1 trading arrangement" as defined in Item 408(c) of Regulation S-K.
Item 9C. Disclosure Regarding Foreign Jurisdictions that Prevent Inspections
Not applicable.
PART III
Item 10. Directors, Executive Officers and Corporate Governance
Information about our executive officers as of February 21, 2024:
|
|
|
|
|
|
| NAME |
POSITION |
| John D. Romano |
Co-Chief Executive Officer(1) |
| Jean-Francois Turgeon |
Co-Chief Executive Officer(2) |
| D. John Srivisal |
Senior Vice President, Chief Financial Officer |
| Jeff Engle |
Senior Vice President, Commercial and Strategy |
| Russell Austin |
Senior Vice President, Global Operations |
| Jeffrey Neuman |
Senior Vice President, General Counsel and Secretary |
| Melissa Zona |
Senior Vice President, Chief Human Resources Officer and SHEQ |
| Emad AlJunaidi |
Senior Vice President, Integrated Supply Chain and Digital Transformation |
| Jennifer Guenther |
Vice President, Chief Sustainability Officer and Head of Investor Relations |
| Jonathan P. Flood |
Vice President, Controller and Principal Accounting Officer |
(1) As the Company previously announced, Mr. Romano will become sole CEO effective April 1, 2024.
(2) As the Company previously announced, Mr. Turgeon will be retiring from his position as Co-Chief Executive Officer effective April 1, 2024.
Information about members of our Board of Directors as of February 21, 2024:
|
|
|
|
|
|
| NAME |
CURRENT OCCUPATION |
| Ilan Kaufthal |
Chairman of the Board, Tronox Holdings plc;
Eastwind Advisors |
| Mutlaq Al-Morished |
CEO, TASNEE |
| Peter B. Johnston |
Former Interim CEO, Tronox Limited; Former Global Head of Nickel Assets, Glencore |
| Ginger M. Jones |
Former Senior Vice President and CFO, Cooper Tire & Rubber Company |
| Stephen Jones |
Former President and CEO, Covanta Holding Corporation |
| Moazzam Khan |
Managing Director, Cristal International Holdings BV |
| Sipho Nkosi |
Former CEO, Exxaro Resources Limited |
| John Romano |
Co-Chief Executive Officer, Tronox |
| Jean-Francois Turgeon |
Co-Chief Executive Officer, Tronox |
Other information regarding our executive officers, members of the Board of Directors, including its audit committee and audit committee financial experts, as well as information regarding our Code of Ethics and Business Conduct that applies to our co-Chief Executive Officers and senior financial officers, will be presented in Tronox Holding plc’s definitive proxy statement for its 2024 annual general meeting of shareholders, which will be filed not later than 120 days after the end of the fiscal year covered by this Annual Report on Form 10-K, under the headings "Proposal 1 - Election of Directors" and "Code of Ethics and Business Conduct" and is incorporated herein by reference.
Item 11. Executive Compensation
Information regarding executive officer and director compensation will be presented in Tronox Holdings plc's definitive proxy statement for its 2024 annual general meeting of shareholders, filed not later than 120 days after the end of the fiscal year covered by this Annual Report on Form 10-K, under the headings "Human Resources and Compensation Committee Interlocks and Insider Participation", "2023 Non-Employee Director Compensation" and "Compensation Discussion and Analysis" and is incorporated herein by reference, except as to information required pursuant to Item 402(v) of Regulation S-K relating to pay versus performance.
Item 12. Security Ownership of Certain Beneficial Owners and Management and Related Shareholder Matters
Information regarding security ownership of certain beneficial owners and management and related shareholder matters will be presented in Tronox Holdings plc's definitive proxy statement for its 2024 annual general meeting of shareholders, filed not later than 120 days after the end of the fiscal year covered by this Annual Report on Form 10-K, under the heading "Security Ownership of Certain Beneficial Owners" and is incorporated herein by reference.
Equity Compensation Plan Information
The following table provides information as of December 31, 2023 regarding securities issued under the Tronox Holdings plc Amended and Restated Management Equity Incentive Plan (the “Tronox Holdings plc MEIP”).
|
|
|
|
|
|
|
|
|
|
|
|
|
|
|
|
|
|
|
Number of securities
to be issued upon
exercise of
outstanding restricted share
units and options
|
|
Weighted-average
exercise price of
outstanding
options(1)
|
|
Number of securities
remaining available for
future issuance under
equity compensation
plans (excluding
securities reflected in
the second column)(2)
|
Equity compensation plans approved by security holders |
3,535,987 |
|
|
$ |
22.13 |
|
|
4,700,201 |
|
Equity compensation plans not approved by security holders |
— |
|
|
— |
|
|
— |
|
| Total |
3,535,987 |
|
|
$ |
22.13 |
|
|
4,700,201 |
|
_____________________
(1) Because there is no exercise price for restricted share units, such awards are not included in the weighted-average exercise price.
(2) Each restricted share unit awarded under the Tronox Holdings plc MEIP was granted at no cost to the persons receiving them and represents the contingent right to receive the equivalent number of ordinary shares.
Item 13. Certain Relationships and Related Transactions, and Director Independence.
Information regarding certain relationships and related transactions and director independence will be presented in Tronox Holdings plc's definitive proxy statement for its 2024 annual general meeting of shareholders, filed not later than 120 days after the end of the fiscal year covered by this Annual Report on Form 10-K, under the heading "Certain Relationships and Related Transactions" and is incorporated herein by reference.
Item 14. Principal Accounting Fees and Services.
Information regarding principal accounting fees and services will be presented in Tronox Holdings plc's definitive proxy statement for its 2024 annual general meeting of shareholders, filed not later than 120 days after the end of the fiscal year covered by this Annual Report on Form 10-K, under the heading "Fees Paid to Independent Registered Public Accounting Firm" and is incorporated herein by reference.
PART IV
Item 15. Exhibits, Financial Statement Schedules.
(a)The following documents are filed as part of this Annual Report on Form 10-K:
1.Consolidated Financial Statements
Reference is made to the Index to Consolidated Financial Statements and Consolidated Financial Statement Schedules appearing at “Item 8. Financial Statements and Supplementary Data” in this report.
2.Consolidated Financial Statement Schedules
All financial statement schedules are omitted as they are inapplicable, or the required information has been included in the consolidated financial statements or notes thereto.
3. Exhibits
(b) The exhibits listed in the following table have been filed with, or incorporated by reference into, this Annual Report on Form 10-K.
|
|
|
|
|
|
| 2.1 |
|
| 2.2 |
|
| 2.3 |
|
| 3.1 |
|
| 4.1 |
|
| 4.2 |
|
| 4.3 |
|
| 4.4 |
|
| 4.5 |
|
| 10.1* |
|
| 10.2* |
|
| 10.3* |
|
| 10.4* |
|
| 10.5* |
|
| 10.6* |
|
| 10.7* |
|
| 10.8 |
|
|
|
|
|
|
|
| 10.9 |
|
| 10.10 |
Amended and Restated First Lien Credit Agreement dated as of March 1, 2021 (as amended by that certain Amendment No. 1 to Amended and Restated First Lien Credit Agreement, dated as of April 4, 2022, that certain Amendment No. 2 to Amended and Restated First Lien Credit Agreement, dated as of May 19, 2023 and Amendment No. 3 to Amended and Restated First Lien Credit Agreement, dated as of August 16, 2023) by and among Tronox Holdings plc, Tronox Finance LLC, certain of Holding plc's subsidiaries, as Subsidiary Loan Parties (as defined therein), the lenders party thereto from time to time and HSBC Bank USA, National Association, as administrative agent and collateral agent (incorporated by reference to Exhibit 10.1 of the Current Report on Form 8-K filed on August 16, 2023). |
| 10.11* |
|
| 10.12* |
|
| 10.13* |
|
| 14.1 |
|
| 21.1 |
|
| 23.1 |
|
| 24.0 |
|
| 31.1 |
|
| 31.2 |
|
| 31.3 |
|
| 32.1 |
|
| 32.2 |
|
| 32.3 |
|
| 96.1 |
|
| 96.2 |
|
| 96.3 |
|
| 96.4 |
|
| 97.1 |
|
| 101.INS |
Inline XBRL Instance Document (filed herewith) |
| 101.SCH |
Inline XBRL Taxonomy Extension Schema Document (filed herewith) |
| 101.CAL |
Inline XBRL Taxonomy Extension Calculation Linkbase Document (filed herewith) |
| 101.LAB |
Inline XBRL Taxonomy Extension Label Linkbase Document (filed herewith) |
| 101.DEF |
Inline XBRL Taxonomy Extension Definition Linkbase Document (filed herewith) |
| 101.PRE |
Inline XBRL Taxonomy Extension Presentation Linkbase Document (filed herewith) |
| 104 |
The cover page from the Company's Annual Report on Form 10-K for the year ended December 31, 2023, which has been formatted in Inline XBRL, and included with Exhibit 101. |
_______________
*Indicates management contract or compensatory plan or arrangement.
Item 16. Form 10-K Summary.
None.
SIGNATURES
Pursuant to the requirements of Section 13 or 15(d) of the Securities Exchange Act of 1934, the registrant has duly caused this report to be signed on its behalf by the undersigned, thereunto duly authorized, on this 21st day of February 2024.
|
|
|
|
|
|
|
|
|
|
TRONOX HOLDINGS PLC |
|
(Registrant) |
|
|
|
|
By: |
/s/ Jonathan P. Flood |
|
Name: |
Jonathan P. Flood |
|
Title: |
Vice President, Controller and Principal Accounting Officer |
|
|
|
Pursuant to the requirements of the Securities Exchange Act of 1934, this report has been signed by the following persons on behalf of the registrant and in the capacities and on the dates indicated.
|
|
|
|
|
|
|
|
|
|
|
|
|
|
|
Signature |
|
Title |
|
Date |
|
|
|
|
|
| /s/ John Romano |
|
Co-Chief Executive Officer, Director
(Principal Executive Officer) |
|
February 21, 2024 |
| John Romano |
|
|
|
|
|
|
| /s/ Jean-Francois Turgeon |
|
Co-Chief Executive Officer, Director
(Principal Executive Officer) |
|
February 21, 2024 |
| Jean-Francois Turgeon |
|
|
|
|
|
|
| /s/ D. John Srivisal |
|
Senior Vice President and Chief Financial Officer (Principal Financial Officer) |
|
February 21, 2024 |
| D. John Srivisal |
|
|
|
|
|
|
| /s/ Jonathan P. Flood |
|
Vice President and Controller
(Principal Accounting Officer) |
|
February 21, 2024 |
| Jonathan P. Flood |
|
|
|
|
|
|
| * |
|
Chairman of the Board of Directors |
|
February 21, 2024 |
Ilan Kaufthal |
|
|
|
|
|
|
|
|
| * |
|
Director |
|
February 21, 2024 |
| Mutlaq Al-Morished |
|
|
|
|
|
|
|
|
|
| * |
|
Director |
|
February 21, 2024 |
| Stephen Jones |
|
|
|
|
|
|
|
|
|
| * |
|
Director |
|
February 21, 2024 |
| Moazzam Khan |
|
|
|
|
|
|
|
|
|
| * |
|
Director |
|
February 21, 2024 |
| Peter B. Johnston |
|
|
|
|
|
|
|
|
|
| * |
|
Director |
|
February 21, 2024 |
Sipho Nkosi |
|
|
|
|
|
|
|
|
|
| * |
|
Director |
|
February 21, 2024 |
| Ginger M. Jones |
|
|
|
|
|
|
|
|
|
| *By: /s/ Jeffrey Neuman |
|
Senior Vice President, General Counsel and Secretary |
|
February 21, 2024 |
| Jeffrey Neuman, Attorney-in-fact |
|
|
|
|
EX-4.3
2
ex43202310k.htm
EX-4.3
Document
Exhibit 4.3
DESCRIPTION OF THE REGISTRANT’S SECURITIES
REGISTERED PURSUANT TO SECTION 12 OF THE
SECURITIES EXCHANGE ACT OF 1934
As of December 31, 2023, Tronox Holdings plc (“Tronox Holdings” or the “Company”) had one class of securities registered under Section 12 of the Securities Exchange Act of 1934, as amended (the “Exchange Act”): our ordinary shares.
Description of Ordinary Shares
The following description of our ordinary shares, nominal value US$0.01 per share, is a summary and does not purport to be complete. It is subject to and qualified in its entirety by reference to the applicable laws of England and Wales, the applicable provisions of the UK Companies Act 2006 (the “UK Companies Act”) and our Articles of Association (the “Articles of Association”), which is incorporated by reference as an exhibit to the Annual Report on Form 10-K of which this Exhibit 4.3 is a part. We encourage you to read our Articles of Association and the applicable provisions of the UK Companies Act for additional information.
General
As of the date of this filing, we are authorized to issue up to 500 million of our ordinary shares. Computershare Trust Company, N.A. is the transfer agent and registrar for our ordinary shares, which are listed on the New York Stock Exchange under the symbol “TROX.”
Dividends and Distributions
Subject to the UK Companies Act, shareholders may declare dividends by ordinary resolution (but no dividend shall exceed any dividend recommended by the Board). The Board may also pay dividends to shareholders in accordance with their respective rights and interests in the Company. Dividends may be paid only out of “distributable reserves,” defined as “accumulated, realized profits, so far as not previously utilized by distribution or capitalization, less accumulated, realized losses, so far as not previously written off in a reduction or reorganization of capital.” The Company is not permitted to pay dividends out of share capital, which includes share premiums. Realized reserves are determined by reference to qualifying accounts of the Company meeting certain prescribed contents requirements and in accordance with generally accepted accounting principles. The Company will not be permitted to make a distribution if, at the time, the amount of its net assets is less than the aggregate of its issued and paid-up share capital and undistributable reserves or to the extent that the distribution will reduce the net assets below such amount.
There are no fixed dates on which entitlement to dividends arise on any of the ordinary shares.
A general meeting declaring a dividend may, upon the recommendation of the Board, by ordinary resolution direct that it be satisfied wholly or partly by the distribution of assets, including shares or securities in any company. The Articles of Association also permit a scrip dividend scheme under which the Board may allot to holders of ordinary shares who have elected to receive them, further ordinary shares, credited as fully paid, instead of cash in respect of all or part of a dividend. Unclaimed dividends and other amounts payable by the Company can be invested or otherwise used by the Board for the benefit of the Company until they are claimed or disposed of in accordance with any applicable law relating to unclaimed monies.
Conversion, Redemption and Residency
There are no conversion rights or redemption provisions relating to the ordinary shares. Under the laws of England and Wales, persons who are neither residents nor nationals of the UK may freely hold, vote and transfer the ordinary shares in the same manner and under the same terms as UK residents or nationals.
Voting Rights
The Articles of Association provide that, for so long as any shares are held by a Depositary (as defined in the Articles of Association), a resolution put to the vote at a general meeting shall be decided on a poll. Subject to the UK Companies Act and to any rights or restrictions as to voting attached to any class of shares, every shareholder present and entitled to vote on the resolution has one vote for every ordinary share of which he, she or it is the holder. In the case of joint holders of an ordinary share, the vote of the senior holder (determined by the order of the joint holders’ names on the register) who votes (or any proxy duly appointed by the senior holder) shall be accepted to the exclusion of the votes of the other joint holders.
Amendment to the Articles of Association
Under the laws of England and Wales, and subject to a quorum being present, the shareholders may amend the articles of association of the Company by special resolution (i.e., a resolution approved by the holders of at least 75% of the aggregate voting power of the outstanding ordinary shares that, being entitled to vote, vote on the resolution) at a general meeting. The full text of the special resolution must be included in the notice of the meeting.
Winding Up
In the event of a voluntary winding up of the Company, the liquidator may, with the sanction of a special resolution of the Company and any other sanction required by law, divide among the shareholders the whole or any part of the assets of the Company and vest the whole or any part of the assets in trustees upon such trusts for the benefit of the members as the liquidator, with the like sanction, will determine.
Upon any such winding up, after payment or provision for payment of the Company’s debts and liabilities, the holders of ordinary shares (and any other shares in issue at the relevant time which rank equally with such shares) will share equally, on a share for share basis, in the Company’s assets remaining for distribution to the holders of ordinary shares.
Pre-emptive Rights and New Issues of ordinary shares
Under the laws of England and Wales, the Board is, with certain exceptions, unable to allot and issue securities without being authorized by the shareholders in a general meeting. In addition, the laws of England and Wales require that any issuance of equity securities that are to be paid for wholly in cash must be offered first to the existing holders of equity securities in proportion to the respective nominal amounts (i.e., par values) of their holdings on the same or more favorable terms, unless a special resolution (i.e., a resolution approved by the holders of at least 75% of the aggregate voting power of the outstanding ordinary shares that, being entitled to vote, vote on the resolution) excluding this requirement has been passed in a general meeting of shareholders (which authority can be for a maximum of five years, after which a further shareholder approval would be required to renew the exclusion). In this context, equity securities generally means shares other than shares which, with respect to dividends or capital, carry a right to participate only up to a specified amount in a distribution, which, in relation to the Company, will include the ordinary shares and all rights to subscribe for or convert securities into such shares.
The directors of the Company have been authorized by way of a shareholder resolution passed at a general meeting of the Company held on May 3, 2023, for a period from May 3, 2023 through the end of the Company’s next annual general meeting or, if earlier, the close of business on the date that is fifteen (15) months after May 3, 2023, to allot shares in the Company, or to grant rights to subscribe for or to convert or exchange any security into shares in the Company, up to an aggregate nominal amount (i.e., par value) of US$308,993 and pre-emption rights in respect of such allotments have also been excluded.
The laws of England and Wales also prohibit an English company from issuing shares at a discount to nominal amount (i.e., par value) or for no consideration. If the shares are issued upon the lapse of restrictions or the vesting of any restricted stock award or any other share-based grant underlying any ordinary shares, the nominal amount (i.e., par value) of the shares must be paid up in accordance with the laws of England and Wales.
Shareholder Rights Plan
Under the Articles of Association, a shareholder rights plan may be established to prevent an “ownership change” for the purpose of section 382 of the US Internal Revenue Code of 1986, as amended (“section 382”). The purpose of any rights plan will be to preserve the Company’s ability to utilize its net operating loss carry forwards and other tax attributes, which would be substantially limited if the Company experienced an “ownership change” as defined under section 382.
In general, an ownership change would occur under section 382 if the shareholders who are treated as owning 5% or more of ordinary shares for the purposes of section 382 collectively increased their aggregate ownership in ordinary shares by more than 50% over a rolling three-year period.
Effective from the date that a rights plan is introduced, the Board will grant subscription rights to holders of ordinary shares to acquire ordinary shares (or shares of any class as specified in the rights plan) such that, if any person or group acquires 4.5% or more of the ordinary shares, or if a person or group that owns 4.5% or more of ordinary shares acquires additional ordinary shares representing 0.5% or more of the issued ordinary shares, then, subject to certain exceptions, there would be a triggering event under the rights plan. The rights would then separate from the ordinary shares and would be adjusted to become exercisable so that ordinary shares (or shares of any class as specified in the rights plan) could be acquired by all holders of ordinary shares (other than the person or group that caused the trigger event). The shares to be acquired would have a market value equal to twice the exercise price, resulting in significant dilution in the ownership interest of the person or group that caused the trigger event.
If a rights plan is established, the Board will have the discretion to exempt any acquisition of ordinary shares from the provisions of the rights plan if it determines that doing so would not jeopardize or endanger the Company’s use of its net operating losses. The Board will also have the ability to terminate any rights plan prior to a triggering event, including, but not limited to, in connection with a transaction.
Rights issued under a rights plan are expected to expire five years after the date on which any rights plan is established.
Disclosure of Interests in Shares
The laws of England and Wales give the Company the power to serve a notice requiring any person whom it knows has, or whom it has reasonable cause to believe has, or within the previous three years has had, any ownership interest in any ordinary shares to disclose specified information regarding those shares. Failure to provide the information requested within the prescribed period (or knowingly or recklessly providing false information) after the date the notice is sent can result in criminal or civil sanctions being imposed against the person in default.
Under the Articles of Association, if any shareholder, or any other person appearing to be interested in ordinary shares held by such shareholder, fails to give the Company the information required by the notice, the Board may withdraw voting and certain other rights, and place restrictions on the rights to receive dividends and to transfer such ordinary shares.
Alteration of Share Capital; Repurchase of ordinary shares
Subject to the provisions of the UK Companies Act, and without prejudice to any relevant special rights attached to any class of shares, the Company may, from time to time:
•increase its share capital by allotting and issuing new shares in accordance with the Articles of Association and any relevant shareholder resolution;
•consolidate all or any of its share capital into shares of a larger nominal amount (i.e., par value) than the existing shares; or
•redenominate its share capital or any class of share capital.
The laws of England and Wales prohibit the Company from purchasing its own shares unless such purchase has been approved by its shareholders. Shareholders may approve two different types of such share purchases: “on-market” purchases or “off-market” purchases. “On-market” purchases may be made only on a “recognised investment exchange,” which does not include the NYSE, which is the only exchange on which the Company’s Shares are traded. In order to purchase its own shares, the Company must therefore obtain shareholder approval for “off-market” purchases. This requires that the Company’s shareholders pass an ordinary resolution approving the terms of the contract pursuant to which any purchase is to be made. Such approval may be for a specific purchase or constitute a general authority lasting for up to five years after the date of the resolution, and renewal of such approval for additional five-year terms may be sought more frequently. However, shares may be repurchased only out of distributable reserves or, subject to certain exceptions, the proceeds of a fresh issue of shares made for that purpose. At a general meeting of the Company held on May 3, 2023, shareholder resolutions were passed authorizing the Company to repurchase ordinary shares for a period from May 3, 2023 through the end of the Company’s next annual general meeting or, if earlier, the close of business on the date that is fifteen (15) months after May 3, 2023 through (i) an approved form of share repurchase contract, or (ii) an approved form of share repurchase plan established in accordance with Rule 10b5-1 under the Exchange Act.
Transfer of ordinary shares
The Articles of Association allow holders of ordinary shares to transfer all or any of their ordinary shares in the case of ordinary shares held in certificated form by instrument of transfer in writing in any usual form or in any other form which is permitted by the UK Companies Act and is approved by the Board. The instrument of transfer must be executed by or on behalf of the transferor and (in the case of a transfer of a share which is not fully paid) by or on behalf of the transferee.
The Board may, in its absolute discretion, refuse to register a transfer of a certificated ordinary share to any person if it is not fully paid or is an ordinary share on which the Company has a lien. The Board may also refuse to register the transfer of a share in certain other limited circumstances, including if the transfer is not in favor of four or fewer transferees or it is in favor of a minor, bankrupt or person of mental ill health.
If the Board refuses to register the transfer of a share, the instrument of transfer must be returned to the transferee within two months after the date on which the transfer was lodged with the Company with the notice of refusal and reasons for the refusal.
The Company’s share register is maintained by its transfer agent, Computershare Trust Company, N.A. Registration in this share register is determinative of share ownership. A shareholder who holds ordinary shares through the DTC clearance system is not the holder of record of such shares. Instead, the depositary (for example, Cede & Co., as nominee for DTC) or other nominee is the holder of record of such shares. Accordingly, a transfer of shares from a person who holds such shares through the DTC clearance system to a person who also holds such shares through the DTC clearance system will not be registered in the Company’s official share register, as the depositary or other nominee will remain the record holder of such shares.
Anti-Takeover Provisions
The UK City Code on Takeovers and Mergers (the “Takeover Code”) applies, among other things, to an offer for a public company whose registered office is in the UK (or the Channel Islands or the Isle of Man) and whose securities are not admitted to trading on a regulated marked in the UK (or on any stock exchange in the Channel Islands or the Isle of Man) if the company is considered by the UK Panel on Takeovers and Mergers (the “Takeover Panel”), the regulatory body which issues and administers the Takeover Code, to have its place of central management and control in the UK (or the Channel Islands or the Isle of Man). This is known as the “residency test”. Under the Takeover Code, the Takeover Panel will determine whether the Company has its place of central management and control in the UK by looking at various factors, including the structure of the Board, the functions of the directors and where they are resident.
If, at the time of a takeover offer, the Takeover Panel determines that the Company has its place of central management and control in the UK, the Company would be subject to a number of rules and restrictions, including but not limited to the following: (i) the ability of the Company to enter into deal protection arrangements with a bidder would be extremely limited; (ii) the Company might not, without the approval of its shareholders, be able to perform certain actions that could have the effect of frustrating an offer, such as issuing shares or carrying out acquisitions or disposals; and (iii) the Company would be obliged to provide equality of information to all bona fide competing bidders.
It is intended that all of the Company’s directors will reside outside of the UK, the Channel Islands and the Isle of Man. Accordingly, for the purposes of the Takeover Code, the Company is expected to be considered to have its place of central management and control outside the UK, the Channel Islands or the Isle of Man. Therefore, the Takeover Code is not expected to apply to the Company.
It is possible that in the future circumstances could change that may cause the Takeover Code to apply to the Company.
Although the Company is not expected to be subject to the Takeover Code, the Articles of Association incorporate the protections of mandatory offer provisions substantially similar to the Takeover Code. Except with the prior consent of the Board or the prior approval of independent shareholders, a shareholder, together with persons acting in concert with it, would be at risk of certain sanctions including disenfranchisement (as regards voting and entitlement to dividends) if they acquired an interest in ordinary shares carrying 30% or more of the voting rights of the Company without making an offer for all of the other issued ordinary shares in cash or accompanied by a cash alternative. These provisions could have the effect of discouraging the acquisition and holding of interests of 30% or more of the voting rights and encouraging those shareholders who may be acting in concert with respect to the acquisition of shares to consult with the Board before effecting any additional purchases.
The mandatory offer provisions in the Articles of Association only apply while the Takeover Code does not apply to the Company.
EX-10.1
3
ex101202310k.htm
EX-10.1
Document
Exhibit 10.1
TRONOX HOLDINGS PLC
AMENDED AND RESTATED MANAGEMENT EQUITY INCENTIVE PLAN
ARTICLE I
PURPOSE
1.1 Establishment. Tronox Holdings plc (the successor to Tronox Limited), a public limited company incorporated under the laws of England and Wales (the "Company"), established an equity incentive plan known as the "Tronox Limited Management Equity Incentive Plan, as amended (the "Original Plan"). The Original Plan was amended and restated by the Company’s Board effective March 27, 2019 (the “Effective Date”) and became known as the "Tronox Holdings plc Amended and Restated Management Equity Incentive Plan" (the "Plan").
1.2 Purpose of the Plan. The Plan is intended to further the growth and profitability of the Company by increasing incentives and encouraging Share ownership on the part of the Employees, Members of the Board, and Independent Contractors of the Company and its Subsidiaries. The Plan is intended to permit the grant of Awards that constitute Incentive Stock Options, Non-Qualified Share Options, Share Appreciation Rights, Restricted Share, Restricted Share Units, Performance Awards and Other Share-Based Awards, cash payments and such other forms as the Committee in its discretion deems appropriate, including any combination of the above.
ARTICLE II
DEFINITIONS
The following words and phrases shall have the following meanings unless a different meaning is plainly required by the context:
“Affiliate” means (i) any person or entity that directly or indirectly controls or is controlled by the Company and/or (ii) to the extent provided by the Committee, any person or entity in which the Company has a significant interest. The term “control” (including, with correlative meaning, the terms “controlled by” and “under common control with”), as applied to any person or entity, means the possession, directly or indirectly, of the power to direct or cause the direction of the management and policies of such person or entity, whether through the ownership of voting or other securities, by contract or otherwise.
“Award” means, individually or collectively, a grant under the Plan of Incentive Stock Options, Non-Qualified Share Options, Share Appreciation Rights, Restricted Share, Restricted Share Units, Performance Awards and Other Share-Based Awards, cash payments and such other forms as the Committee in its discretion deems appropriate.
“Award Agreement” means the written or electronic agreement setting forth the terms and conditions applicable to an Award.
“Base Price” means the price at which a SAR may be exercised with respect to a Share.
“Board” means the Company’s Board of Directors, as constituted from time to time.
“Cause” means with respect to a Participant’s Termination from and after the date hereof, the following (unless the applicable Award Agreement states otherwise): (a) in the case where there is no employment agreement, consulting agreement, change in control agreement or similar agreement in effect between the Company or an Affiliate and the Participant at the time of the determination (or where there is such an agreement but it does not define “cause” (or words of like import)), termination due to: (i) the Participant’s material breach of any written agreement between the Company or any Affiliate and such Participant or the commission by a Participant of any indictable offense which carries a maximum penalty of imprisonment; (ii) perpetration by a Participant of an illegal act, or fraud which could cause demonstrable economic injury to the Company; (iii) continuing failure by the Participant to perform the Participant’s duties in any material respect, provided that the Participant is given notice and an opportunity to effectuate a cure as determined by the Committee; or (iv) a Participant’s willful misconduct with regard to the Company that could have a material adverse effect on the Company; or (b) in the case where there is an employment agreement, consulting agreement, change in control agreement or similar agreement in effect between the Company or an Affiliate and the Participant at the time of the determination that defines “cause” (or words of like import), “cause” as defined under such agreement; provided, however, that with regard to any agreement under which the definition of “cause” only applies on occurrence of a change in control, such definition of “cause” shall not apply until a change in control actually takes place and then only with regard to a termination thereafter. With respect to a Participant’s Termination of Directorship, “cause” means an act or failure to act that constitutes cause for removal of a director under applicable law.
“Change in Control” means the occurrence, after the Effective Date, of any one or more of the following events; provided that, with respect to any Award that is subject to Section 409A of the Code, an event shall not be treated as a Change in Control hereunder unless such event also constitutes a “change in control event” within the meaning of Section 409A of the Code:
(a) any “person” as such term is used in Sections 13(d) and 14(d) of the Exchange Act (other than the Company, any trustee or other fiduciary holding securities under any employee benefit plan of the Company, or any company owned, directly or indirectly, by the shareholders of the Company in substantially the same proportions as their ownership of common Shares of the Company), becoming the beneficial owner (as defined in Rule 13d-3 under the Exchange Act), directly or indirectly, of securities of the Company representing more than fifty percent (50%) of the combined voting power of the Company’s then outstanding securities;
(b) any “person” as such term is used in Sections 13(d) and 14(d) of the Exchange Act (other than the Company, any trustee or other fiduciary holding securities under any employee benefit plan of the Company, any company owned, directly or indirectly, or by the shareholders of the Company in substantially the same proportions as their ownership of common Shares of the Company), becoming the beneficial owner (as defined in Rule 13d-3 under the Exchange Act) in one or a series of related transactions during any twelve (12)-month period, directly or indirectly, of securities of the Company representing thirty percent (30%) or more of the combined voting power of the Company’s then outstanding securities;
(c) during any one-year period, individuals who at the beginning of such period constitute the Board, and any new director (other than a director whose initial appointment occurs as a result of either an actual or threatened election contest or other actual or threatened solicitation of proxies or consents by or on behalf of a person other than the Board) whose election by the Board or nomination for election by the Company’s shareholders was approved by a vote of such number of directors as required by the Company’s Articles of Association, each of whom were either directors at the beginning of the one year period or whose election or nomination for election was previously so approved, cease for any reason to constitute at least a majority of the Board;
(d) a merger, consolidation, scheme of arrangement, share issue or other similar transaction of the Company or a direct or indirect subsidiary of the Company with any other company, other than a merger, consolidation, scheme of arrangement, share issue or other similar transaction which would result in the voting securities of the Company outstanding immediately prior thereto continuing to represent (either by remaining outstanding or by being converted into voting securities of the surviving entity) more than fifty percent (50%) of the combined voting power of the voting securities of the Company (including any successor to the Company or the ultimate parent company of the Company); provided, however, that a merger, consolidation, scheme of arrangement, share issue or other similar transaction effected to implement a recapitalization of the Company (or similar transaction) in which no person (other than those covered by the exceptions in subparagraphs (b) and (c)) acquires more than fifty percent (50%) of the combined voting power of the Company’s then outstanding securities shall not constitute a Change in Control; or
(e) the consummation of a sale or disposition of assets of the Company and/or its direct and indirect subsidiaries having a value constituting at least forty percent (40%) of the total gross fair market value of all of the assets of the Company and its direct and indirect subsidiaries (on a consolidated basis) immediately prior to such transaction, other than the sale or disposition of all or substantially all of the assets of the Company to a person or persons who beneficially own, directly or indirectly, more than fifty percent (50%) of the combined voting power of the outstanding voting securities of the Company at the time of the sale.
“Code” means the Internal Revenue Code of 1986 (US), as amended. Reference to a specific section of the Code or regulation thereunder shall include such section or regulation, any valid regulation or other guidance promulgated under such section, and any comparable provision of any future legislation or regulation amending, supplementing or superseding such section or regulation.
“Committee” means at least one committee, as described in Article III, appointed by the Board from time to time to administer the Plan and to perform the functions set forth herein; provided that if no such committee exists, the “Committee” means the Board.
“Disability” means with respect to a Participant’s Termination from and after the date hereof, the following (unless the applicable Award Agreement states otherwise): (a) in the case where there is no employment agreement, consulting agreement, change in control agreement or similar agreement in effect between the Company or an Affiliate and the Participant at the time of the grant of the Award (or where there is such an agreement but it does not define “disability” (or words of like import)), termination due to: (i) a permanent and total disability as defined in Section 22(e)(3) of the Code; or (b) in the case where there is an employment agreement, consulting agreement, change in control agreement or similar agreement in effect between the Company or an Affiliate and the Participant at the time of the grant of the Award that defines “disability” (or words of like import), “disability” as defined under such agreement; provided that with respect to Incentive Stock Options “disability” shall mean a permanent and total disability as defined in Section 22(e)(3) of the Code and; provided further, that for Awards that are subject to Section 409A of the Code, Disability shall mean that a Participant is disabled under Section 409A(a)(2)(C)(i) or (ii) of the Code. A Disability shall only be deemed to occur at the time of the determination by the Committee of the Disability.
“Eligible Individual” means any of the following individuals who is designated by the Committee in its discretion as eligible to receive Awards subject to the conditions set forth herein: (a) any Member of the Board, officer or Employee of the Company or a Subsidiary or Affiliate of the Company, (b) any individual to whom the Company, or a Subsidiary of the Company, has extended a formal offer of employment, so long as the grant of any Award shall not become effective until the individual commences employment or (c) any Independent Contractor or advisor of the Company or a Subsidiary or Affiliate.
“Employee” means an employee of the Company or a Subsidiary or Affiliate. Notwithstanding anything to the contrary contained herein, the Committee may grant Awards to an individual who has been extended an offer of employment by the Company or a Subsidiary or Affiliate; provided that any such Award shall be subject to forfeiture if such individual does not commence employment by a date established by the Committee.
“Exchange Act” means the Securities Exchange Act of 1934 (US), as amended. Reference to a specific section of the Exchange Act or regulation thereunder shall include such section or regulation, any valid regulation or interpretation promulgated under such section, and any comparable provision of any future legislation or regulation amending, supplementing or superseding such section or regulation.
“Exercise Price” means the price at which a Share subject to an Option may be purchased upon the exercise of the Option.
“Fair Market Value” means, except as otherwise specified in a particular Award Agreement, (a) while the Shares are readily traded on an established national or regional securities exchange, the closing transaction price of such a Share as reported by the principal exchange on which such Shares are traded on the date as of which such value is being determined or, if there was no reported transaction for such date, the closing transaction price as reported by the exchange for the first trading date following the date by which such value is being determined on the next preceding date for which a transaction was reported, (b) if the Shares are not readily traded on an established national or regional securities exchange, the value as determined by the Board, in its sole discretion, on a good faith basis, taking into account the requirements of Section 409A of the Code.
“Good Reason” means with respect to a Participant’s Termination, the following (unless the applicable Award Agreement states otherwise): (i) the assignment of duties materially inconsistent with the Participant’s position, authority, duties or responsibilities, or a material diminution in such position, authority, duties or responsibilities, (ii) a reduction of the Participant’s aggregate annual compensation opportunity (i.e., base salary and annual bonus and incentive compensation target opportunity), and such reduction is not related to a reduction in either individual or corporate performance, (iii) a change of more than 50 miles in the Participant’s principal place of employment, or (iv) any other action or inaction that constitutes a material breach of the Plan.
“Grant Date” means the date that the Award is granted.
“Immediate Family” means the Participant’s children, stepchildren, grandchildren, parents, stepparents, grandparents, spouse, siblings (including half-brothers and half-sisters), in-laws (including all such relationships arising because of legal adoption) and any other person required under applicable law to be accorded a status identical to any of the foregoing.
“Incentive Stock Option” means an Option that is designated as an Incentive Stock Option and is intended by the Committee to meet the requirements of Section 422 of the Code.
“Independent Contractor” means an independent contractor or consultant of the Company or a Subsidiary. Notwithstanding anything to the contrary contained herein, the Committee may grant Awards to an individual who has been extended an offer to become an independent contractor or consultant by the Company or a Subsidiary; provided that any such Award shall be subject to forfeiture if such individual does not commence his or her duties by a date established by the Committee.
“Member of the Board” means an individual who is a member of the Board or of the board of directors of a Subsidiary or Affiliate.
“Non-Employee Director” means a director or a member of the Board of the Company or any Affiliate who is not an active employee of the Company or any Affiliate.
“Non-Qualified Share Option” means an Option that is not an Incentive Stock Option.
“Option” means an option to purchase Shares granted pursuant to Article VI.
“Other Share-Based Award” means an Award under Article X of this Plan that is valued in whole or in part by reference to, or is payable in or otherwise based on, Shares including, without limitation, an Award valued by reference to an Affiliate.
“Participant” means an Employee, Independent Contractor, or Member of the Board with respect to whom an Award has been granted and remains outstanding.
“Performance Award” means an Award granted to a Participant pursuant to Article IX hereof contingent upon achieving certain Performance Goals.
“Performance Goals” means goals established by the Committee as contingencies for Awards to vest and/or become exercisable or distributable.
“Performance Period” means the designated period during which the Performance Goals must be satisfied with respect to the Award to which the Performance Goals relate.
“Period of Restriction” means the period during which Awards are subject to forfeiture and/or restrictions on transferability.
“Restricted Share” means a Share Award granted pursuant to Article VII under which the Shares are subject to forfeiture upon such terms and conditions as specified in the relevant Award Agreement.
“Restricted Share Unit” or “RSU” means a Share Award granted pursuant to Article VII subject to a period or periods of time after which the Participant will receive Shares (which may be settled in cash at the Company’s discretion) if the conditions contained in such Share Award have been met.
“Securities Act” means the Securities Act of 1933 (US), as amended, and any successor thereto. Reference in the Plan to any section of (or rule promulgated under) the Securities Act shall be deemed to include any rules, regulations or other interpretative guidance under such section or rule, and any amendments or successor provisions to such section, rules, regulations or guidance.
“Share” means the Company’s ordinary shares, or any security issued by the Company or any successor in exchange or in substitution therefore.
“Share Appreciation Right” or “SAR” means an Award granted pursuant to Article VIII, granted alone or in tandem with a related Option which is designated by the Committee as a SAR.
“Share Award” means an Award of Restricted Shares or an RSU pursuant to Article VII.
“Subsidiary” means, with respect to any person, any corporation, limited liability company, partnership, association or other business entity of which (a) if a corporation, a majority of the total voting power of shares entitled (without regard to the occurrence of any contingency) to vote in the election of directors, managers or trustees thereof is at the time owned or controlled, directly or indirectly, by that person or one or more of the other Subsidiaries of that person or a combination thereof, or (b) if a limited liability company, partnership, association or other business entity, a majority of the limited liability company, partnership or other similar ownership interest thereof is at the time owned or controlled, directly or indirectly, by any person or one or more Subsidiaries of that person or a combination thereof.
For purposes hereof, person or persons shall be deemed to have a majority ownership interest in a limited liability company, partnership, association or other business entity if such person or persons shall be allocated a majority of limited liability company, partnership, association or other business entity gains or losses or shall be or control the managing director or general partner of such limited liability company, partnership, association or other business entity.
“Ten Percent Holder” means an Employee (together with persons whose Share ownership is attributed to the Employee pursuant to Section 424(d) of the Code) who, at the time an Option is granted, owns shares representing more than ten percent of the voting power of all classes of securities of the Company.
“Termination” means a Termination of Consultancy, Termination of Directorship or Termination of Employment, as applicable. Notwithstanding the foregoing, for Awards that are subject to Section 409A of the Code and that are settled or distributed upon a “Termination,” the foregoing definition shall only apply to the extent the applicable event would also constitute a “separation from service” under Code Section 409A.
“Termination of Consultancy” means: (a) that the Independent Contractor is no longer acting as a consultant to the Company or an Affiliate; or (b) when an entity which is retaining a Participant as an Independent Contractor ceases to be an Affiliate unless the Participant otherwise is, or thereupon becomes, an Independent Contractor to the Company or another Affiliate at the time the entity ceases to be an Affiliate. In the event that an Independent Contractor becomes an Eligible Employee or a Non-Employee Director upon the termination of his or her consultancy, unless otherwise determined by the Committee, in its sole discretion, no Termination of Consultancy shall be deemed to occur until such time as such Independent Contractor is no longer an Independent Contractor, an Eligible Employee or a Non-Employee Director.
“Termination of Directorship” means that the Non-Employee Director has ceased to be a director of the Company; except that if a Non-Employee Director becomes an Eligible Employee or a Consultant upon the termination of his or her directorship, his or her ceasing to be a director of the Company shall not be treated as a Termination of Directorship unless and until the Participant has a Termination of Employment or Termination of Consultancy, as the case may be.
“Termination of Employment” means: (a) a termination of employment (for reasons other than a military or personal leave of absence granted by the Company) of a Participant from the Company and its Affiliates; or (b) when an entity which is employing a Participant ceases to be an Affiliate, unless the Participant otherwise is, or thereupon becomes, employed by the Company or another Affiliate at the time the entity ceases to be an Affiliate. In the event that an Eligible Employee becomes an independent director upon the termination of his or her employment, unless otherwise determined by the Committee, in its sole discretion, no Termination of Employment shall be deemed to occur until such time as such Eligible Employee is no longer an Eligible Employee or an independent director. Notwithstanding the foregoing, the Committee may otherwise define Termination of Employment in the Award Agreement, provided that any such change to the definition of the term “Termination of Employment” does not subject the applicable Award to adverse consequences under Section 409A of the Code.
“Transfer” means: (a) when used as a noun, any direct or indirect transfer, sale, assignment, pledge, hypothecation, encumbrance or other disposition (including the issuance of equity in a Person), whether for value or no value and whether voluntary or involuntary (including by operation of law), and (b) when used as a verb, to directly or indirectly transfer, sell, assign, pledge, encumber, charge, hypothecate or otherwise dispose of (including the issuance of equity in a Person) whether for value or for no value and whether voluntarily or involuntarily (including by operation of law). “Transferred” and “Transferable” shall have a correlative meaning. A Share is “delivered” by the Company to a person if:
|
|
|
|
|
|
|
|
|
| |
(a) |
the Company issues the Share to the person (or a nominee of the person); or |
|
|
|
|
|
|
|
|
|
| |
(b) |
the Company causes the Share to be transferred to the person (or a nominee of the person). |
ARTICLE III
ADMINISTRATION
3.1 The Committee. The Plan shall be administered by the Committee. The Committee shall consist of three (3) or more Members of the Board (as appointed by the Board) and may consist of the entire Board. Unless otherwise determined by the Board, the Committee shall be the Compensation Committee of the Board.
3.2 Authority and Action of the Committee. It shall be the duty of the Committee to administer the Plan in accordance with the Plan’s provisions. The Committee shall have all powers and discretions necessary or appropriate to administer the Plan and to control its operation, including, but not limited to, the full and final authority in its discretion to (a) determine which Eligible Individuals shall be eligible to receive Awards and to grant Awards, (b) prescribe the form, amount, timing and other terms and conditions of each Award, (c) interpret the Plan and the Award Agreements (and any other instrument relating to the Plan), (d) adopt such procedures as it deems necessary or appropriate to permit participation in the Plan by Eligible Individuals, (e) adopt such rules as it deems necessary or appropriate for the administration, interpretation and application of the Plan, (f) interpret, amend or revoke any such procedures or rules, (g) correct any defect(s) or omission(s), or reconcile any inconsistency(ies), in the Plan and/or any Award Agreement, (h) accelerate the vesting of any Award, (i) subject to Sections 6.4 and 8.4, extend the period during which an Option or SAR may be exercisable, and (j) make all other decisions and determinations that may be required pursuant to the Plan and/or any Award Agreement or as the Committee deems necessary or advisable to administer the Plan.
The acts of the Committee shall be acts approved in writing by all of the members of the Committee or approved by resolution of the Committee. The Committee’s determinations under the Plan need not be uniform and may be made selectively among Participants, whether or not such Participants are similarly situated. Subject to applicable law, each member of the Committee is entitled to rely or act upon any report or other information furnished to that member by any Employee of the Company or any of its Subsidiaries or Affiliates, the Company’s independent certified public accountants or any executive compensation consultant or other professional retained by the Company to assist in the administration of the Plan.
The Company shall effect the granting of Awards under the Plan, in accordance with the determinations made by the Committee, by execution of written agreements and/or other instruments in such form as is approved by the Committee.
3.3 Delegation by the Committee.
3.3.1
The Committee, in its sole discretion and on such terms and conditions as it may provide, may delegate all or any part of its authority and powers under the Plan to one or more Members of the Board of the Company and/or officers of the Company except for grants of Awards to persons (a) who are Non-Employee Directors or otherwise are subject to Section 16 of the Exchange Act or (b) who are, or who are reasonably expected to be, ‘covered employees’ for purposes of Section 162(m) of the Code; provided, however, that the Committee may not delegate its authority or power if prohibited by applicable law or the rules and regulations of the principal U.S. national securities exchange on which the Shares are listed.
3.3.2 The Committee may, in its sole discretion, employ such legal counsel, consultants and agents as it may deem desirable for the administration of this Plan and, subject to applicable law, may rely upon any opinion received from any such counsel or consultant and any computation received from any such consultant or agent. Expenses incurred by the Committee or the Board in the engagement of any such counsel, consultant or agent shall be paid by the Company.
3.4 Indemnification. Each person who is or shall have been a member of the Committee, or of the Board and any person designated pursuant to Section 3.3.1, shall to the maximum extent permitted by applicable law and the Articles of Association of the Company be indemnified and held harmless by the Company against and from (a) any loss, cost, liability, or expense that may be imposed upon or reasonably incurred by him or her in connection with or resulting from any claim, action, suit, or proceeding to which he or she may be a party or in which he or she may be involved by reason of any good faith action taken or good faith failure to act under the Plan or any Award Agreement, and (b) from any and all amounts paid by him or her in settlement thereof, with the Company’s approval, or paid by him or her in satisfaction of any judgment in any such claim, action, suit, or proceeding against him or her, provided he or she shall give the Company an opportunity, at its own expense, to handle and defend the same before he or she undertakes to handle and defend it on his or her own behalf. The foregoing right of indemnification shall not be available to the extent that a final judgment or other final adjudication (in either case not subject to further appeal) binding upon the person otherwise to be indemnified under this Section 3.4 determines that the acts or omissions or determinations of such person giving rise to the indemnification claim resulted from such person’s bad faith, fraud or willful criminal act or omission. This section 3.4 does not create any right of indemnification or exclude any liability to the extent such indemnification or exclusion is prohibited by law or by the Company’s Articles of Association. The foregoing right of indemnification shall not be exclusive of any other rights of indemnification to which such persons may be entitled under the Articles of Association (or other organizational document) of the Company or a Subsidiary or Affiliate, by contract, as a matter of law, or otherwise, or under any power that the Company may have to indemnify them or hold them harmless.
3.5 Decisions Binding. All determinations, decisions and interpretations of the Committee, the Board, and any delegate of the Committee pursuant to the provisions of the Plan or any Award Agreement shall be final, conclusive, and binding on all persons, and shall be given the maximum deference permitted by law.
ARTICLE IV
SHARES SUBJECT TO THE PLAN
4.1 Number of Shares. Subject to adjustment as provided in Section 4.2, the maximum number of Shares which may be the subject of Awards (inclusive of unissued Shares to which outstanding Incentive Stock Options relate) granted under the Plan shall be 28,781,225 Shares in total (the “Share Reserve”). Shares required to be delivered under the Plan may be newly issued Shares or previously issued Shares which the Company has caused to be acquired by or for the benefit of Participants (as the Committee decides from time to time). To the extent permitted by applicable law or exchange rules, Shares issued in assumption of, or in substitution for, any outstanding awards of any entity acquired in any form or combination by the Company or any Subsidiary or Affiliate shall not reduce the Shares available to be issued or transferred for grants of Awards under this Section 4.1. The maximum number of Shares to which Incentive Stock Options relate shall be equal to the Share Reserve. The maximum number of Shares subject to a Performance Award (which includes Options for this purpose) that may be granted to any one person in any one fiscal year is that number of Shares equal to $6,000,000 as determined on the grant date and the maximum amount that can be earned in respect of a performance award denomination in cash or value other than shares on an annualized basis is $7,500,000.
4.2 Lapsed Awards. To the extent that Shares subject to an outstanding Award have ceased to be deliverable to a Participant by reason of (i) expiration, cancellation, forfeiture or other termination of such Award, or (ii) the settlement of all or a portion of such Award in cash, then such Shares which have ceased to be deliverable by the Company shall not be counted toward the Share Reserve and shall again be available under this Plan; provided, however, that Shares surrendered in payment of the exercise price of an Option, Shares withheld or surrendered for payment of taxes with respect to any Award, and Shares repurchased by the Company on the open market with the proceeds of the exercise price of Options, shall be counted toward the Share Reserve and not be available for re-issuance under the Plan. If SARs are exercised and settled in Shares, the full number of Shares subject to the SARs shall be considered issued under the Plan, without regard to the number of Shares issued upon settlement of the SARs.
4.3 Changes in Capital Structure. Unless otherwise provided in the Award Agreement, in the event that any special dividend or other special distribution (whether in the form of cash, Shares, other securities, or other property), Share bonus issue, recapitalization, subdivision, consolidation, reorganization, merger, split-up, spin-off, combination, repurchase, change of control or exchange of Shares or other securities of the Company, or other corporate transaction or event (each a “Corporate Event”) affects the Shares (including, without limitation, a transaction under which a person (either alone or together with associates) acquires control of the Company), subject to applicable law the Board or the Committee shall make any adjustments in such manner as it, in good faith, deems equitable or appropriate, in (i) the number of Shares or other securities of the Company (or number and kind of other securities or property) which may be delivered in respect of Awards or with respect to which Awards may be granted under the Plan (including, without limitation, adjusting any or all of the limitations under this Article IV), (ii) the number of Shares or other securities of the Company (or number and kind of other securities or property) subject to outstanding Awards or to which outstanding Awards relate, and (iii) the Exercise Price or Base Price with respect to any Award, or make provision for an immediate cash payment to the holder of an outstanding Award in consideration for the cancellation of such Award (based on the spread).
4.3.1 If the Company enters into or is involved in any Corporate Event, subject to applicable law, the Board or the Committee shall, prior to such Corporate Event and upon such Corporate Event, take such action as it, in good faith, deems to be equitable or appropriate, which may (but need not) include replacing Awards with substitute awards in respect of the Shares, cash, other securities or other property of the surviving corporation, acquirer, ultimate parent company of the Company or any affiliate of the foregoing on such terms and conditions, as to the number of Shares, pricing and otherwise, to substantially preserve the value, rights and benefits of any affected Awards granted hereunder as of the date of the consummation of the Corporate Event. Notwithstanding anything to the contrary in the Plan, if a Change in Control occurs, the Company shall have the right, but not the obligation, to cancel each Participant’s Awards immediately prior to such Change in Control and to pay to each affected Participant in connection with the cancellation of such Participant’s Awards, an amount that the Committee, in its sole discretion, determines to be the equivalent value of such Award (e.g., in the case of an Option or SAR, the amount of the spread), it being understood that the equivalent value of an Option or SAR with an exercise price greater than or equal to the Fair Market Value of the underlying Shares shall be zero.
4.3.2 Upon receipt by any affected Participant of any such substitute awards (or payment) as a result of any such Corporate Event, such Participant’s affected Awards for which such substitute awards (or payment) were received shall be thereupon cancelled without the need for obtaining the consent of any such affected Participant. Any actions or determinations of the Committee under this Section 4.3 need not be uniform as to all outstanding Awards, nor treat all Participants identically.
4.3.3 Nothing in this Section 4.3 requires the Board or the Committee to do or procure anything which is not within its power or control to do or procure or which would involve the Board or Committee (or any member thereof) breaching a duty owed to the Company.
4.4 Minimum Purchase Price. Notwithstanding any provision of this Plan to the contrary, any Shares which are delivered under this Plan, must not be delivered for consideration that is less than as permitted under applicable law.
ARTICLE V
GENERAL REQUIREMENTS FOR AWARDS
5.1 Awards Under the Plan. Awards under the Plan may be in the form of Incentive Stock Options, Non-Qualified Share Options, Share Appreciation Rights, Restricted Share, Restricted Share Units, Performance Awards and Other Share-Based Awards, cash payments and such other forms as the Committee in its discretion deems appropriate, including any combination of the above. No fractional Shares shall be issued under the Plan nor shall any right be exercised under the Plan with respect to a fractional Share. If (but for this Section) a Participant would become entitled to be delivered a number of Shares that is not a whole number, the number of Shares to which the Participant is entitled to be delivered shall not include the fraction.
5.2 General Eligibility. All Eligible Individuals are eligible to be granted Awards, subject to the terms and conditions of this Plan. Eligibility for the grant of Awards and actual participation in this Plan shall be determined by the Committee in its sole discretion.
5.3 Incentive Stock Options. Notwithstanding anything herein to the contrary, only Employees of the Company, its Subsidiaries and its parent (if any) are eligible to be granted Incentive Stock Options under this Plan. Eligibility for the grant of an Incentive Stock Option and actual participation in this Plan shall be determined by the Committee in its sole discretion.
5.4 Participation. No person shall have the right to be selected to receive an Award under this Plan, or, having been so selected, to be selected to receive a future Award. The Committee’s determination under the Plan (including, without limitation, determination of the eligible Employees who shall be granted Awards, the form, amount and timing of such Awards, the terms and provisions of Awards and the Award Agreements and the establishment of Performance Goals) need not be uniform and may be made by it selectively among eligible Employees who receive or are eligible to receive Awards under the Plan, whether or not such eligible Employees are similarly situated.
5.5 Conditions and Restrictions on Shares. Each Participant to whom an Award is made under the Plan shall (i) enter into an Award Agreement with the Company that shall contain such provisions consistent with the provisions of the Plan, as may be approved by the Committee and (ii) to the extent the Award is made at a time prior to the date Shares are listed for trading on an established securities exchange, enter into a “Stockholder’s Agreement” that is substantially similar in all material respect to any stockholder’s agreement entered into by any other employee of the Company or its Subsidiaries in connection with the Award of any equity-based compensation. Each Award made hereunder shall be subject to the requirement that if at any time the Company determines that the listing, registration or qualification of the Shares subject to such Award upon any securities exchange or under any law, or the consent or approval of any governmental body, or the taking of any other action is necessary or desirable as a condition of, or in connection with, the exercise or settlement of such Award or the delivery of Shares thereunder, such Award shall not be exercised or settled and such Shares shall not be delivered unless such listing, registration, qualification, consent, approval or other action shall have been effected or obtained, free of any conditions not acceptable to the Company. The Company may require that certificates evidencing Shares delivered pursuant to any Award made hereunder bear a legend indicating that the sale, transfer or other disposition thereof by the holder is prohibited except in compliance with the Securities Act. Finally, no Shares shall be delivered under the Plan, unless the delivery of those Shares shall comply with all relevant regulations and any registration, approval or action thereunder and the person to whom they are to be delivered has agreed to become a member of the Company and be bound by its Articles of Association.
5.6 Clawback/Forfeiture. Notwithstanding anything to the contrary contained herein, an Award Agreement may provide that the Committee may in its sole discretion cancel such Award, in whole or in part, if the Participant, without the consent of the Company, while employed by or providing services to the Company or any Affiliate or after termination of such employment or service, violates a non-competition, non-solicitation or non-disclosure covenant or agreement or otherwise engages in activity that is in conflict with or adverse to the interest of the Company or any Affiliate, including fraud or conduct contributing to any financial restatements or irregularities, as determined by the Committee in its sole discretion. The Committee may also provide in an Award Agreement that if the Participant engages in any activity referred to in the preceding sentence, the Participant will forfeit any gain realized on the vesting or exercise of such Award, and must repay the gain to the Company. In the case of an Award of Restricted Shares that is cancelled pursuant to this Section 5.6, the Committee may determine that the Restricted Shares are forfeited, in which case the provisions of Section 7.4 shall apply in respect of such forfeited Shares. Furthermore, to the extent required by applicable law (including, without limitation, Section 304 of the Sarbanes-Oxley Act and Section 954 of the Dodd-Frank Wall Street Reform and Consumer Protection Act) and the rules and regulations of the principal U.S. national securities exchange in which the Shares are listed, or if so required pursuant to a written policy adopted by the Company, and in accordance with the Company’s incentive clawback policy, originally adopted January 25, 2013 as in effect from time to time, Awards are and shall continue to be subject to clawback, forfeiture or similar requirements.
5.7 Restrictions on Transfer. It shall be a condition of every Award that no Participant shall offer (or permit or cause to be offered) any Shares that are delivered to him or her pursuant to the Award for sale within 12 months of their issue, unless the Award Agreement provides otherwise
ARTICLE VI
SHARE OPTIONS
6.1 Grant of Options. Subject to the provisions of the Plan, Options may be granted to Participants at such times, and subject to such terms and conditions, as determined by the Committee in its sole discretion. An Award of Options may include Incentive Stock Options, Non-Qualified Share Options, or a combination thereof; provided, however, that an Incentive Stock
Option may only be granted to an Employee of the Company or a Subsidiary and no Incentive Stock Option shall be granted more than ten years after the earlier of (i) the Effective Date or (ii) the date this Plan is approved by the Company’s shareholders.
6.2 Award Agreement. Each Option shall be evidenced by an Award Agreement that shall specify the Exercise Price, the expiration date of the Option, the number of Shares to which the Option pertains, any conditions to the exercise of all or a portion of the Option, and such other terms and conditions as the Committee, in its discretion, shall determine. The Award Agreement pertaining to an Option shall designate such Option as an Incentive Stock Option or a Non-Qualified Share Option. Notwithstanding any such designation, to the extent that the aggregate Fair Market Value (determined as of the Grant Date) of Shares with respect to which Options designated as Incentive Stock Options are exercisable for the first time by a Participant during any calendar year (under this Plan or any other plan of the Company, or any parent or subsidiary as defined in Section 424 of the Code) exceeds $100,000, such Options shall constitute Non-Qualified Share Options. For purposes of the preceding sentence, Incentive Stock Options shall be taken into account in the order in which they are granted.
6.3 Exercise Price. Subject to the other provisions of this Section, the Exercise Price with respect to Shares subject to an Option shall be determined by the Committee at the time of grant, provided; however; that the Exercise Price of an Option shall not be less than 100% (or, in the case of an Incentive Stock Option granted to a Ten Percent Holder, 110%) of the Fair Market Value of a Share on the Grant Date.
6.4 Expiration Dates. Each Option shall terminate not later than the expiration date specified in the Award Agreement pertaining to such Option; provided, however, that the expiration date with respect to an Option shall not be later than the tenth (10th) anniversary of its Grant Date and the expiration date with respect to an Incentive Stock Option granted to a Ten Percent Holder shall not be later than the fifth (5th) anniversary of its Grant Date.
6.5 Exercisability of Options. Subject to Section 6.4, Options granted under the Plan shall be exercisable at such times, and shall be subject to such restrictions and conditions, as the Committee shall determine in its sole discretion. The exercise of an Option is contingent upon payment by the optionee of the amount sufficient to pay all taxes required to be withheld by any governmental agency. Such payment may be in any form approved by the Committee.
6.6 Method of Exercise. Options shall be exercised in whole or in part by the Participant’s delivery of a written notice of exercise to the General Counsel or Secretary of the Company (or his or her designee) setting forth the number of Shares with respect to which the Option is to be exercised, accompanied by full payment of the Exercise Price with respect to each such Share and an amount sufficient to pay all taxes required to be withheld by any governmental agency. The Exercise Price shall be payable to the Company in full in cash or its equivalent and no Shares resulting from the exercise of an Option shall be issued until full payment therefore has been made. The Committee, in its sole discretion, also may permit exercise by any other means which the Committee, in its sole discretion, determines to both provide legal consideration for the Shares, and to be consistent with the purposes of the Plan (including, without limitation, a cashless exercise whereby the Company does not deliver that number of Shares with a Fair Market Value equal to the aggregate exercise price of the Options being exercised). As soon as practicable after receipt of a written notification of exercise and full payment for the Shares with respect to which the Option is exercised, the Company shall deliver to the Participant Share certificates (or the equivalent if such Shares are held in book entry form) for such Shares with respect to which the Option is exercised.
6.7 Restrictions on Share Transferability. Incentive Stock Options are not transferable, except by will or the laws of descent. The Committee may impose such additional restrictions on any Shares acquired pursuant to the exercise of an Option as it may deem advisable, including, but not limited to, restrictions related to applicable federal securities laws, the requirements of any national securities exchange or system upon which Shares are then listed or traded, or any blue sky or state securities laws.
6.8 RESERVED
6.9 RESERVED
6.10 Incentive Stock Options. Should any Option granted under this Plan be designated an “Incentive Stock Option,” but fail, for any reason, to meet the requirements of the Code for such a designation, then such Option shall be deemed to be a Non-Qualified Share Option and shall be valid as such according to its terms.
6.11 Prohibition on Repricing. Notwithstanding anything in the Plan to the contrary, other than as may be permitted pursuant to Section 4.3, the Committee shall not without the approval of the Company’s shareholders (a) lower the Exercise Price of an Option after it is granted, (b) cancel an Option when the Exercise Price exceeds the Fair Market Value of one Share in exchange for cash or another Award (other than in connection with a Change in Control), or (c) take any other action with respect to an Option that would be treated as a repricing under the rules and regulations of the principal U.S. national securities exchange on which the Shares are listed.
ARTICLE VII
SHARE AWARDS
7.1 Grant of Share Awards. Subject to the provisions of the Plan, Share Awards may be granted to such Participants at such times, and subject to such terms and conditions, as determined by the Committee in its sole discretion. Share Awards may be issued either alone or in addition to other Awards granted under the Plan.
7.2 Share Award Agreement. Each Share Award shall be evidenced by an Award Agreement that shall specify the number of Shares granted, the price, if any, to be paid for the Shares and the Period of Restriction applicable to a Restricted Share Award or RSU Award and such other terms and conditions as the Committee, in its sole discretion, shall determine including, without limitation, that an RSU Award may be settled in cash or a combination of cash and Shares.
7.3 Acceptance. Awards of Restricted Shares must be accepted within a period of thirty (30) days (or such other period as the Committee may specify) after the grant date, by executing a Restricted Share Award Agreement and by paying whatever price (if any) the Committee has designated thereunder.
7.4 Transferability/Share Certificates/Forfeiture.
7.4.1 Restricted Shares may not be sold, Transferred, pledged, assigned, or otherwise alienated or hypothecated during the Period of Restriction. During the Period of Restriction, a Restricted Share Award may bear a legend as described in Section 7.5.2. Unless the Committee determines otherwise, Restricted Shares shall be delivered to and held by the relevant Participant for the applicable Period of Restriction and such Participant shall be and remain the beneficial owner of each such Restricted Share.
7.4.2 The Committee may impose such requirements and implement such arrangements as it considers necessary or desirable for the purpose of securing compliance by the Participant with the terms of an Award of Restricted Shares and the Plan (including this Section 7.4). Such requirements and arrangements may include, without limitation, a requirement that the Participant deliver to the Company (or its nominee) any Share certificate relating to the Restricted Shares and a blank transfer of the Restricted Shares duly executed by the Participant (as transferor).
7.4.3 In the event that an Award of Restricted Shares is forfeited in whole or part, the Company shall be entitled, at its election at any time thereafter, to do any of the following:
(a) to require the Participant to transfer the forfeited Shares to any person nominated by the Company including, without limitation:
(i) an Eligible Individual for or in connection with an Award made to such Eligible Individual; or
(ii) a broker instructed to sell the Shares on a securities exchange at the then prevailing market price for Shares (or any other price acceptable to the Committee);
(b) to require the Participant to sell the forfeited Shares (or cause them to be sold):
(i) to any person nominated by the Company at such price and on such terms and subject to such conditions as the Committee decides; or
(ii) on any securities exchange at the then prevailing market price for Shares (or any other price acceptable to the Committee); (c) (subject to applicable law) to buy-back the forfeited Shares from the Participant for a total purchase price of $1.00 (that is, $1.00 for all the forfeited Shares of the Participant irrespective of the number of Shares that are bought back from the Participant).
7.4.4 The Participant must do any act that Company may reasonably require to give effect to an election made by the Company under Section 7.4.3. Without limiting the generality of the foregoing, the acts may include sign or give any direction, instruction, share transfer or other document to any person.
7.4.5 Where the Company requires the Participant to transfer the Shares or to sell the Shares (or cause them to be sold) under paragraph (a) or paragraph (b) of Section 7.4.3, the Participant shall be obliged to pay to the Company an amount equal to the consideration (if any) received upon such transfer or sale (or, in the case of non-cash consideration, the value of such consideration as reasonably determined by the Company) immediately upon receipt of the consideration. Without limiting Section 7.4.4, the Company may require the Participant to direct that the transferee or purchaser pay or deliver any consideration to which the Participant is entitled under the transfer or sale to the Company (or as the Company directs). If any consideration is received by the Company (in any capacity) upon a transfer or sale of forfeited Shares of a Participant, the Company shall be entitled to retain that consideration for its own benefit and shall not be required to account to the Participant for it.
7.4.6 The Company is authorized under the Plan by each Participant to do, and to appoint any person who is a director, secretary, general counsel or employee of the Company to do, for and on behalf of and in the name of any Participant to whom an Award of Restricted Shares is made, any act which the Committee considers that the Participant is required to do under the Plan (including, without limitation, under Section 7.4.3 or Section 7.4.4) or the terms of an Award of Restricted Shares. Without limiting the generality of the foregoing, the acts may include sign or give any direction, instruction, share transfer or other document to any person for and on behalf of and in the name of the Participant. A Participant may not revoke this authority.
7.5 Other Restrictions. The Committee, in its sole discretion, may impose such other restrictions on Shares subject to an Award of Restricted Shares as it may deem advisable or appropriate.
7.5.1 General Restrictions. The Committee may set restrictions based upon applicable federal or state securities laws, , or any other basis determined by the Committee in its discretion.
7.5.2 Legend on Certificates. The Committee, in its sole discretion, may legend the certificates representing Restricted Shares during the Period of Restriction to give appropriate notice of such restrictions. For example, the Committee may determine that some or all certificates representing Restricted Shares shall bear the following legend: “The sale or other transfer of the shares of Shares represented by this certificate, whether voluntary, involuntary, or by operation of law, is subject to certain restrictions on transfer as set forth in the Tronox Holdings plc Amended and Restated Management Equity Incentive Plan (the “Plan”), and in a Restricted Share Award Agreement (as defined by the Plan). A copy of the Plan and such Restricted Share Award Agreement may be obtained from the General Counsel or Secretary of Tronox Holdings plc.”
7.5.3 Removal of Restrictions. Upon the termination or expiry of the Period of Restriction applicable to Restricted Shares, subject to the Company’s right to require payment of any taxes, the Shares shall cease to be liable to be forfeited by the Participant and the restrictions in Section 7.4 shall cease to apply (“Released Shares”). Upon delivery to the Company of any Share certificate relating to Released Shares bearing a legend as referred to in Section 7.5.2, the Company shall cancel such certificate and deliver to the Participant a new certificate for the Released Shares that does not bear such a legend (unless no such certificate is required to be delivered under applicable law).
7.5.4 Voting Rights. During the Period of Restriction, Participants holding Restricted Shares may exercise full voting rights attaching to the Shares, unless otherwise provided in the Award Agreement. However, if an award of Restricted Shares is forfeited, the Participant must not cast a vote attaching to any of the forfeited Shares (or appoint a proxy or attorney to do so).
7.5.5 Dividends and Other Distributions. Unless otherwise provided in the Award Agreement:
(a) a Participant shall be entitled to receive all dividends and other distributions paid on Restricted Shares held by him or her provided, that any such dividends or other distributions shall be subject to the same vesting requirements as the underlying Share Awards and shall be accumulated and paid only at the time the Share Award becomes vested. In the case of a distribution paid other than in cash, the relevant amount shall be the value of the property distributed as at the date of the distribution, as determined by the Committee;
(b) in the case of an Share Award of RSUs, if and when the RSUs vest and cease to be liable to be forfeited, the Company shall make a Dividend Equivalent Payment to the Participant. For this purpose, a “Dividend Equivalent Payment” is an amount equal to the amount of cash dividends and other distributions that would have been paid to the Participant during the period commencing on the date of grant of the Share Award and ending on the date that is one business day before the date on which Participant is delivered the Shares pursuant to the RSU Award or the RSU Award is settled in cash (as the case may be) as if, for each RSU that has vested, a Share had been delivered to the Participant on the date of grant instead of an RSU; and
(c) for the avoidance of doubt, notwithstanding anything to contrary, cash dividends, stock and any other property (other than cash) distributed as a dividend, Dividend Equivalent Payment or otherwise with respect to any Award that vests based on achievement of performance goals shall either (i) not be paid or credited or (ii) be accumulated, subject to restrictions and risk of forfeiture to the same extent as the Award with respect to which such cash, stock or other property has been distributed and shall be paid at the time such restrictions and risk of forfeiture lapse.
7.5.6 Consolidations/Subdivisions/Bonus Issues. For the avoidance of doubt, subject to the Committee determining otherwise pursuant to Section 4.3 and to the terms of any Award Agreement, if there is a consolidation of Shares or a subdivision of Shares, or a pro rata bonus issue of Shares or other securities by the Company, the Restricted Shares of each Participant shall as from the effective date of such consolidation, subdivision or bonus issue be:
(a) in the case of a consolidation or subdivision, the smaller or greater number of Shares (as the case may be) resulting from the consolidation or subdivision of the Restricted Shares of the Participant held immediately before the effective date of the consolidation or subdivision; and
(b) in the case of a pro rata bonus issue, the Shares comprising the Restricted Shares of the Participant and the bonus Shares or other securities issued to the Participant in relation to the Restricted Shares of the Participant held immediately before the record date for the pro rata bonus issue.
ARTICLE VIII
SHARE APPRECIATION RIGHTS
8.1 Grant of SARs. Subject to the provisions of the Plan, SARs may be granted to such Participants at such times, and subject to such terms and conditions, as shall be determined by the Committee in its sole discretion.
8.2 Base Price and Other Terms. The Committee, subject to the provisions of the Plan, shall have complete discretion to determine the terms and conditions of SARs granted under the Plan. Without limiting the foregoing, the Base Price with respect to Shares subject to a tandem SAR shall be the same as the Exercise Price with respect to the Shares subject to the related Option. The Base Price with respect to Shares subject to a non-tandem SAR shall be determined by the Committee at the time of grant, provided that the Base Price of a non-tandem SAR shall not be less than 100% of the Fair Market Value of a Share on the Grant Date.
8.3 SAR Agreement. Each SAR grant shall be evidenced by an Award Agreement that shall specify the Base Price, the term of the SAR, the conditions of exercise, and such other terms and conditions as the Committee, in its sole discretion, shall determine.
8.4 Expiration Dates. Each SAR shall terminate no later than the tenth (10th) anniversary of its Grant Date; provided, however, that the expiration date with respect to a tandem SAR shall not be later than the expiration date of the related Option.
8.5 Exercisability.
8.5.1 Method of Exercise. Unless otherwise specified in the Award Agreement pertaining to a SAR, a SAR may be exercised (a) by the Participant’s delivery of a written notice of exercise to the General Counsel or Secretary of the Company (or his or her designee) setting forth the number of whole SARs which are being exercised, (b) in the case of a tandem SAR, by surrendering to the Company any Options which are cancelled by reason of the exercise of such SAR, and (c) by executing such documents as the Company may reasonably request.
8.5.2 Tandem SARs. Tandem SARs (i.e., SARs issued in tandem with Options) shall be exercisable only at such time or times and to the extent that the Options to which they relate shall be exercisable in accordance with the provisions of Article VI. The related Options which have been surrendered by the exercise of a tandem SAR, in whole or in part, shall no longer be exercisable to the extent the related tandem SARs have been exercised.
8.5.3 Discretionary Limitations. If the Committee provides, in its discretion, that any such right is exercisable subject to certain limitations (including, without limitation, that it is exercisable only in installments or within certain time periods), the Committee may waive such limitations on the exercisability at any time at or after grant in whole or in part (including, without limitation, waiver of the installment exercise provisions or acceleration of the time at which such right may be exercised), based on such factors, if any, as the Committee shall determine, in its sole discretion.
8.6 Payment. Except as otherwise provided in the relevant Award Agreement, upon exercise of a SAR, the Participant shall be entitled to receive payment from the Company in an amount determined by multiplying: (i) the amount by which the Fair Market Value of a Share on the date of exercise exceeds the Base Price specified in the Award Agreement pertaining to such SAR by (ii) the number of Shares with respect to which the SAR is exercised.
8.7 Payment Upon Exercise of SAR. Payment to a Participant upon the exercise of the SAR shall be made, as determined by the Committee in its sole discretion, either (a) in cash, (b) in newly issued Shares with a Fair Market Value equal to the amount of the payment or (c) in a combination thereof, as set forth in the applicable Award Agreement.
8.8 Prohibition on Repricing. Notwithstanding anything in the Plan to the contrary, other than as may be permitted pursuant to Section 4.3, the Committee shall not without the approval of the Company’s shareholders (a) lower the Base Price of an SAR after it is granted, (b) cancel a SAR when the Base Price exceeds the Fair Market Value of one Share in exchange for cash or another Award (other than in connection with a Change in Control) or (c) take any other action with respect to an SAR that would be treated as a repricing under the rules and regulations of the principal U.S. national securities exchange on which the Shares are listed.
ARTICLE IX
PERFORMANCE AWARDS
9.1 General. The Committee may grant a Performance Award to a Participant, payable in any form described in Section 5.1, upon the attainment of specific Performance Goals. If the Performance Award is payable in Restricted Shares, with the provisions of Article VII shall apply in respect of the Restricted Shares. If the Performance Award is payable in cash, it may be paid upon attainment of the relevant Performance Goals either in cash or in Restricted Shares (based on the then current Fair Market Value of such Shares) to be held in accordance with Article VII, as determined by the Committee, in its sole and absolute discretion. If it is a condition of the Performance Award payable in Restricted Shares that the Restricted Shares shall be forfeited if a Performance Goal is not attained, the provisions of Section 7.4 shall apply in respect of such forfeited Shares and Section 7.5.5 shall apply in respect of forfeited dividends and other distributions. Each Performance Award shall be evidenced by an Award Agreement in such form that is not inconsistent with the Plan and that the Committee may from time to time approve. Performance Awards granted under the Plan shall be subject to the following terms and conditions and such additional terms and conditions, not inconsistent with the terms of the Plan, as the Committee shall deem desirable, which additional terms and conditions shall be reflected in the applicable Award Agreement.
9.2 Performance Goals. Subject to applicable law, the Committee shall have the authority to grant Awards under this Plan that are contingent upon the achievement of Performance Goals. Such Performance Goals are to be specified in the relevant Award Agreement and may be based on such factors including, but not limited to: (a) revenue, (b) earnings per Share (basic and diluted), (c) net income per Share, (d) Share price, (e) pre-tax profits, (f) net earnings, (g) net income, (h) operating income, (i) cash flow (including, without limitation, operating cash flow, free cash flow, discounted cash flow, return on investment and cash flow in excess of cost of capital), (j) earnings before interest, taxes, depreciation and amortization, (k) earnings before interest and taxes, (l) sales, (m) total stockholder return relative to assets, (n) total stockholder return relative to peers, (o) financial returns (including, without limitation, return on assets, return on net assets, return on equity and return on investment), (p) cost reduction targets, (q) customer satisfaction, (r) customer growth, (s) employee satisfaction, (t) gross margin, (u) revenue growth, (v) market share, (w) book value per share, (x) expenses and expense ratio management, (y) system-wide sales or system-wide sales growth, (z) traffic or customer counts, (aa) new product sales, (bb) any combination of the foregoing or (cc) such other criteria as the Committee may determine. Performance Goals may be in respect of the performance of the Company, any of its Subsidiaries or Affiliates or any combination thereof on either a consolidated, business unit or divisional level. Performance Goals may be absolute or relative (to prior performance of the Company or to the performance of one or more other entities or external indices) and may be expressed in terms of a progression within a specified range. Multiple Performance Goals may be established and may have the same or different weighting.
9.3 Additional Criteria. The foregoing criteria shall have any reasonable definitions that the Committee may specify, which may include or exclude any or all of the following items, as the Committee may specify: extraordinary, unusual or non-recurring items; effects of accounting changes; effects of currency fluctuations; effects of financing activities (e.g., effect on earnings per share of issuing convertible debt securities); expenses for restructuring, productivity initiatives or new business initiatives; non-operating items; acquisition expenses; and effects of divestitures. Any such performance criterion or combination of such criteria may apply to the Participant’s award opportunity in its entirety or to any designated portion or portions of the award opportunity, as the Committee may specify.
9.4 Adjustment to Performance Goals. At any time prior to payment of an Award, the Committee may adjust previously established Performance Goals and other terms and conditions of the Award to reflect major unforeseen events, including, without limitation, changes in laws, regulations or accounting policies or procedures, mergers, acquisitions or divestitures or extraordinary, unusual or non-recurring items.
9.5 Value, Form and Payment of Performance Award. The Committee will establish the value or range of value of the Performance Award, the form in which the Award will be paid, and the date(s) and timing of payment of the Award. The Participant will be entitled to receive the Performance Award only upon the attainment of the Performance Goals and such other criteria as may be prescribed by the Committee during the Performance Period.
ARTICLE X
OTHER SHARE-BASED AWARDS
10.1 Grant. Subject to the provisions of the Plan, the Committee may grant Other Share-Based Awards that are payable in, valued in whole or in part by reference to, or otherwise based on or related to Shares, including, but not limited to, Shares issued to a Participant purely as a bonus and not subject to any restrictions or conditions, Shares issued to a Participant in payment of the amounts due under an incentive or performance plan sponsored or maintained by the Company or a Subsidiary, performance units, dividend equivalent units, Share equivalent units, and deferred Share units. To the extent permitted by law, the Committee may, in its sole discretion, permit Eligible Individuals to defer all or a portion of their cash compensation in the form of Other Share-Based Awards granted under this Plan, subject to the terms and conditions of any deferred compensation arrangement established by the Company, which shall be intended to comply with Section 409A of the Code. Other Share-Based Awards may be granted either alone or in addition to or in tandem with other Awards granted under the Plan.
10.2 Non-Transferability. Subject to the applicable provisions of the Award agreement and this Plan, Shares subject to Awards made under this Article X may not be Transferred prior to the date on which the Shares are issued, or, if later, the date on which any applicable restriction, performance or deferral period lapses.
10.3 Dividends. Unless otherwise determined by the Committee at the time of Award, subject to the provisions of the Award Agreement and this Plan, the recipient of an Award under this Article X shall be entitled to receive all dividends and other distributions paid with respect to such Award; provided, that any such dividends or other distributions will be subject to the same vesting requirements as the underlying Award and shall be paid at the time the Award becomes vested. If any dividends or distributions are paid in Shares, such Shares shall be subject to the same restrictions on transferability and forfeitability as the Award with respect to which they were paid and, if such Shares are forfeited under the Award, the provisions of Section 7.4 shall apply in respect of such forfeited Shares and Section 7.5.5 shall apply in respect of any forfeited dividends and other distributions (as if the Shares were forfeited Restricted Shares).
10.4 Vesting. Any Award under this Article X and any Shares covered by any such Award shall vest or be forfeited to the extent so provided in the Award Agreement, as determined by the Committee, in its sole discretion. Unless expressly provided otherwise in an Award Agreement, in the event that a written employment agreement between the Company and a Participant provides for a vesting schedule that is more favorable than the vesting schedule provided in the form of Award agreement, the vesting schedule in such employment agreement shall govern, provided that such agreement is in effect on the date of grant and applicable to the specific Award. Where any Shares covered by an Award under this Article X are forfeited by a Participant, the provisions of Section 7.4 shall apply in respect of such forfeited Shares and Section 7.5.5 shall apply in respect of any forfeited dividends and other distributions (as if the Shares were forfeited Restricted Shares).
10.5 Price. Subject to applicable law, (a) Shares issued on a bonus basis under this Article X may be issued for no cash consideration; and (b) Shares purchased pursuant to a purchase right awarded under this Article X shall be priced, as determined by the Committee in its sole discretion.
10.6 Payment. The form of payment for the Other Share-Based Award shall be specified in the Award Agreement.
ARTICLE XI
PARTICIPANT TERMINATION
11.1 Rules Applicable to Options and SARs. Unless otherwise determined by the Committee or as set forth in the applicable Award Agreement:
11.1.1 Termination by Reason of Death or Disability. If a Participant’s Termination is by reason of death or Disability, all Options or SARs that are held by such Participant that are vested and exercisable at the time of the Participant’s Termination may be exercised by the Participant (or, in the case of death, by the legal representative of the Participant’s estate) at any time within a one-year period from the date of such Termination, but in no event beyond the expiration of the stated term of such Options or SARs.
11.1.2 Termination Without Cause. If a Participant’s Termination is by the Company without Cause, all Options or SARs that are held by such Participant that are vested and exercisable at the time of the Participant’s Termination may be exercised by the Participant at any time within a period of ninety (90) days from the date of such Termination, but in no event beyond the expiration of the stated term of such Options or SARs.
11.1.3 Termination by the Participant. If a Participant terminates his or her service with the Company for any reason, all Options or SARs that are held by such Participant that are vested and exercisable at the time of the Participant’s Termination may be exercised by the Participant at any time within a period of ninety (90) days from the date of such Termination, but in no event beyond the expiration of the stated terms of such Options or SARs.
11.1.4 Termination for Cause. If a Participant’s Termination is for Cause all Options or SARs, whether vested or unvested, that are held by such Participant shall thereupon terminate and expire as of the date of such Termination.
11.1.5 Unvested Options and SARs. Except as set forth in the applicable Award Agreement, Options or SARs that are not vested as of the date of a Participant’s Termination for any reason shall terminate and expire as of the date of such Termination.
11.2 Rules Applicable to Share Awards, Performance Awards and Other Share-Based Awards. Unless otherwise determined by the Committee in the applicable Award Agreement, upon a Participant’s Termination for any reason: (i) during the relevant Period of Restriction, all Share Awards still subject to restriction shall be forfeited; and (ii) any unvested Performance Award or Other Share-Based Awards shall be forfeited. If a Participant forfeits Shares held by him or her, the provisions of Section 7.4 shall apply in respect of such forfeited Shares and Section 7.5.5 shall apply in respect of any forfeited dividends and other distributions (as if the Shares were forfeited Restricted Shares).
11.3 Statutory limitations. Without limiting the generality of Section 14.11, if (but for this Section, the Participant (or legal personal representative or other person) would be entitled to receive a payment or other benefit under this Plan or an Award Agreement in connection with the Participant’s termination of service and payment of such amount or the giving of such benefit would result in the Company, a Subsidiary, then despite any other provision in this Plan or the applicable Award Agreement, the Participant shall be entitled to receive only the maximum amount that may lawfully be paid to the Participant, or the benefit to the extent that it may be lawfully given, in connection with the Participant’s termination of service.
ARTICLE XII
CHANGE IN CONTROL
12.1 Treatment of Awards in connection with a Change in Control. Unless provided otherwise by the Committee (as constituted prior to a Change in Control) in an Award Agreement or otherwise, or as provided in an employment agreement or similar agreement between the Company or any Subsidiary and the Participant, in the event of a Change in Control:
12.1.1. Any Options and Share Appreciation Rights outstanding as of the date such Change in Control is determined to have occurred shall be assumed by the successor (or its parent company) or cancelled in exchange for substitute options or share appreciation rights issued by the successor (or its parent company) in a manner consistent with the requirements of Treas. Reg. § 1.409A-1(b)(5)(v)(D) (or any successor regulation) in the case of a Non-Qualified Share Option, and Treas. Reg. §1.424-1(a) (or any successor regulation) in the case of an Incentive Stock Option and, if, during the 24-month period following the Change in Control date, the Participant’s employment is terminated by such successor (or an affiliate) without Cause or by the Participant for Good Reason, such Awards, to the extent then outstanding, shall fully vest and become exercisable. To the extent Options and Share Appreciation Rights that are outstanding as of the date of such Change in Control are not assumed or substituted, the Award shall, as determined by the Committee, (A) immediately become fully exercisable and vested to the full extent of the original grant, or (B) be cancelled in exchange for cash and/or other substitute consideration (if any) with respect to each Share subject to the Award as of the Change in Control date equal in value to the excess (if any) of (I) the per-Share value, as determined by the Committee in its discretion, of the property (including cash) received by the Company’s shareholders as a result of the transaction over (II) if applicable, the per-Share Exercise Price or Base Price of the applicable Award.
If the value of the property (including cash) received by the holder of a Share as a result of the transaction does not exceed the per-Share Exercise Price or Base Price of the Award, the Award may be cancelled without providing any cash or other consideration to the Participant with respect to such Award.
12.1.2 Any Performance Awards outstanding as of the date such Change in Control is determined to have occurred shall be converted into, as applicable, time-based restricted stock of the successor (or its parent company) or time-based restricted stock units based on stock of the successor (or its parent company) and, if, during the 24-month period following the Change in Control date, the Participant’s employment is terminated by such successor (or an affiliate) without Cause or by the Participant for Good Reason, such Awards, to the extent then outstanding, shall fully vest. With respect to Performance Awards that are outstanding as of the date of such Change in Control and are not converted to a time-based Award, any deferral or other restriction shall lapse and such Performance Awards shall be settled in cash as promptly as is practicable (unless otherwise required by Section 409A of the Code and the applicable terms of the Performance Awards). In either case, unless otherwise determined by the Committee in an Award Agreement or otherwise, the value of the Performance Awards as of the date of the Change in Control shall be determined assuming target performance has been achieved, except that the value shall be determined based on actual performance as of such date if (A) more than half of the performance period has elapsed as of such date and (B) actual performance is determinable as of such date.
12.1.3 Any other Share Awards and cash Awards outstanding as of the date such Change in Control is determined to have occurred shall be assumed by the successor (or its parent company) or cancelled in exchange for comparable awards issued by the successor (or its parent company), and, if, during the 24-month period following the Change in Control date, the Participant’s employment is terminated by such successor (or an affiliate) without Cause or by the Participant for Good Reason, such Awards, to the extent then outstanding, shall fully vest. With respect to such Awards that are outstanding as of the date of such Change in Control and are not assumed or substituted, any deferral or other restriction shall lapse and such Awards shall be settled in cash as promptly as is practicable (unless otherwise required by Section 409A of the Code and the applicable terms of the Awards).
12.1.4 For an Award to be validly assumed or substituted by a successor for purpose of this Section 12, it must (A) provide such Participant with rights and entitlements substantially equivalent to or better than the rights, terms and conditions applicable under such Award, including, but not limited to, an identical or better exercise or vesting schedules; (B) have substantially equivalent value to such Award (determined at the time of the Change in Control); and (C) be based on stock that is listed and traded on an established U.S. securities market or an established securities market outside the United Stated upon which the Participants could readily trade the stock without administrative burdens or complexities.
ARTICLE XIII
AMENDMENT, TERMINATION AND DURATION
13.1 Amendment, Suspension or Termination. The Board, in its sole discretion, may amend, suspend or terminate the Plan, or any part thereof, at any time and for any reason, subject to any requirement of shareholder approval required by applicable law, rule or regulation, including, without limitation, Section 422 of the Code, and the rules of the applicable securities exchange; provided, however, unless prohibited by applicable law, the Board may amend the Plan and any Award Agreement without shareholder approval as necessary to avoid the imposition of any taxes under Section 409A of the Code. Subject to the preceding sentence, the amendment, suspension or termination of the Plan shall not, without the consent of the Participant, materially adversely alter or impair any rights or obligations under any Award theretofore granted to such Participant. Notwithstanding the foregoing, the Committee may, but shall not be required to, amend or modify any Award to the extent necessary to avoid the imposition of taxes under Section 409A of the Code. The Company intends to administer the Plan and all Awards granted thereunder in a manner that complies with Code Section 409A, however, the Company shall not be responsible for any additional tax imposed pursuant to Code Section 409A, nor will the Company indemnify or otherwise reimburse Participant for any liability incurred as a result of Code Section 409A. No Award may be granted during any period of suspension or after termination of the Plan.
13.2 Duration of the Plan. The Plan shall, subject to Section 13.1, terminate ten (10) years after the date that the Plan is approved by a resolution passed at a general meeting of the Company, unless earlier terminated by the Board and no further Awards shall be granted under the Plan. The termination of the Plan shall not affect any Awards granted prior to the termination of the Plan.
ARTICLE XIV
MISCELLANEOUS
14.1 No Effect on Employment or Service. Nothing in the Plan shall interfere with or limit in any way the right of the Company to terminate any Participant’s employment or service at any time, for any reason and with or without cause.
14.2 Unfunded Status. The Plan is intended to constitute an “unfunded” plan for incentive and deferred compensation. With respect to any payments not yet made to a Participant by the Company, nothing set forth herein shall give any Participant any rights that are greater than those of a general creditor of the Company. In its sole and absolute discretion, the Committee may authorize the creation of trusts or other arrangements to meet the obligations created under the Plan to deliver Shares or payments in lieu of or with respect to Awards hereunder; provided, however, that the existence of such trusts or other arrangements is consistent with the unfunded status of the Plan.
14.3 Successors. All obligations of the Company under the Plan, with respect to Awards granted hereunder, shall be binding on any successor to the Company, whether the existence of such successor is the result of a direct or indirect purchase, merger, consolidation or otherwise, of all or substantially all of the business or assets of the Company.
14.4 Beneficiary Designations. Subject to the restrictions in Section 14.5 below, a Participant under the Plan may name a beneficiary or beneficiaries to whom any vested but unpaid Award shall be paid in the event of the Participant’s death. For purposes of this Section, a beneficiary may include a designated trust having as its primary beneficiary a family member of a Participant. Each such designation shall revoke all prior designations by the Participant and shall be effective only if given in a form and manner acceptable to the Committee. In the absence of any such designation or such designation being effective under applicable law, any vested benefits remaining unpaid at the Participant’s death shall be paid to the Participant’s estate and, subject to the terms of the Plan and of the applicable Award Agreement, any unexercised vested Award may be exercised by the administrator or executor of the Participant’s estate.
14.5 Nontransferability of Awards. No Award granted under the Plan may be sold, transferred, pledged, assigned, or otherwise alienated or hypothecated, other than by will, by the laws of descent and distribution; provided, however, that except as provided by in the relevant Award Agreement or as prohibited by applicable law, a Participant may (with the prior approval of the Committee) transfer, without consideration, an Award other than an Incentive Stock Option to one or more members of his or her Immediate Family, to a trust established for the exclusive benefit of one or more members of his or her Immediate Family, to a partnership in which all the partners are members of his or her Immediate Family, or to a limited liability company in which all the members are members of his or her Immediate Family; provided, further, that any such Immediate Family, and any such trust, partnership and limited liability company, shall agree to be and shall be bound by the terms of the Plan, and by the terms and provisions of the applicable Award Agreement and any other agreements covering the transferred Awards. All rights with respect to an Award granted to a Participant shall be available during his or her lifetime only to the Participant and may be exercised only by the Participant or the Participant’s legal representative.
14.6 No Rights as Shareholder. Except to the limited extent provided in Sections 7.5.4 and 7.5.5 or as otherwise provided under applicable law, no Participant (nor any beneficiary) shall have any of the rights or privileges of a shareholder of the Company with respect to any Shares issuable pursuant to an Award (or exercise thereof), unless and until the Shares that are the subject of the Award have actually been delivered to the Participant and certificates representing such Shares, if any, or in the event the Shares are non-certificate, such other method of recording beneficial ownership, shall have been issued, recorded on the records of the Company or its transfer agents or registrars, and delivered to the Participant (or beneficiary).
14.7 Withholding. Subject to the terms of the applicable Award Agreement or any other agreement addressing the withholding obligations of the Company or the Participant in connection with the issuance or settlement of an Award granted hereunder, as a condition to the settlement of any Award hereunder, a Participant shall be required to pay in cash, or to make other arrangements satisfactory to the Company (including, without limitation, if permitted by the Committee, authorizing withholding from payroll, reducing the number of Shares otherwise deliverable, delivering Shares already owned and any other amounts payable to the Participant), an amount sufficient to satisfy any federal, state, local and foreign taxes of any kind (including, but not limited to, the Participant’s FICA and SDI obligations) which the Company, in its sole discretion, deems necessary to comply with the Code and/or any other applicable law, rule or regulation with respect to the Award. Unless the tax withholding obligations of the Company are satisfied, the Company shall have no obligation (except as required under applicable law) to deliver Shares to the Participant or to issue a certificate or book-entry transfer for such Shares. Unless otherwise provided in an Award Agreement or other written agreement with a Participant, the Committee, in its sole discretion and pursuant to such procedures as it may specify from time to time, may permit or require a Participant to satisfy all or part of the tax withholding obligations in connection with an Award by (a) paying cash, (b) not delivering Shares to which the Participant would otherwise be entitled to be delivered, or (c) any combination of the foregoing.
14.8 No Corporate Action Restriction. The existence of the Plan, any Award Agreement and/or the Awards granted hereunder shall not limit, affect or restrict in any way the right or power of the Board or the shareholders of the Company to make or authorize (a) any adjustment, recapitalization, reorganization or other change in the Company’s or any Subsidiary’s or Affiliate’s capital structure or business, (b) any merger, consolidation or change in the ownership of the Company or any Subsidiary or Affiliate, (c) any issue of bonds, debentures, capital, preferred or prior preference stocks ahead of or affecting the Company’s or any Subsidiary’s or Affiliate’s capital Shares or the rights thereof, (d) any dissolution or liquidation of the Company or any Subsidiary or Affiliate, (e) any sale or transfer of all or any part of the Company’s or any Subsidiary’s or Affiliate’s assets or business, or (f) any other corporate act or proceeding by the Company or any Subsidiary or Affiliate. No Participant, beneficiary or any other person shall have any claim against any Member of the Board or the Committee, the Company or any Subsidiary or Affiliate, or any employees, officers, shareholders or agents of the Company or any Subsidiary or Affiliate, as a result of any such action.
14.9 Gender and Number. Except where otherwise indicated by the context, any masculine term used herein also shall include the feminine; the plural shall include the singular and the singular shall include the plural.
14.10 Severability. In the event any provision of the Plan or of any Award Agreement shall be held illegal or invalid for any reason, the illegality or invalidity shall not affect the remaining parts of the Plan or the Award Agreement, and the Plan and/or the Award Agreement shall be construed and enforced as if the illegal or invalid provision had not been included.
14.11 Requirements of Law. The granting of Awards and the delivery of Shares under the Plan shall be subject to all applicable laws, rules and regulations, and to such approvals by any governmental agencies or national securities exchanges as may be required. Nothing under the Plan or an Award Agreement shall require the Company, a Subsidiary or any other person to do any act or thing or refrain from doing any act or thing if to do or not do that act or thing (as the case may be) would contravene applicable law.
14.12 Governing Law. The Plan and all determinations made and actions taken pursuant hereto to the extent not otherwise governed by the Code or the securities laws of the United States, shall be governed by the law of the State of New York and construed accordingly.
14.13 Jurisdiction; Waiver of Jury Trial. Any suit, action or proceeding with respect to this Plan or any Award Agreement, or any judgment entered by any court of competent jurisdiction in respect of any thereof, shall be resolved only in the courts of the State of New York in New York County or the United States District Court for the Southern District of New York and the appellate courts having jurisdiction of appeals in such courts. In that context, and without limiting the generality of the foregoing, the Company and each Participant shall irrevocably and unconditionally (a) submit in any proceeding relating to this Plan or any Award Agreement, or for the recognition and enforcement of any judgment in respect thereof (a “Proceeding”), to the exclusive jurisdiction of the courts of the State of New York in New York County, the court of the United States of America for the Southern District of New York, and appellate courts having jurisdiction of appeals from any of the foregoing, and agree that all claims in respect of any such Proceeding shall be heard and determined in such New York State court or, to the extent permitted by law, in such federal court, (b) consent that any such Proceeding may and shall be brought in such courts and waives any objection that the Company and each Participant may now or thereafter have to the venue or jurisdiction of any such Proceeding in any such court or that such Proceeding was brought in an inconvenient court and agree not to plead or claim the same, (c) waive all right to trial by jury in any Proceeding (whether based on contract, tort or otherwise) arising out of or relating to this Plan or any Award Agreement, (d) agree that service of process in any such Proceeding may be effected by mailing a copy of such process by registered or certified mail (or any substantially similar form of mail), postage prepaid, to such party, in the case of a Participant, at the Participant’s address shown in the books and records of the Company or, in the case of the Company, at the Company’s registered office, attention General Counsel and Secretary, and (e) agree that nothing in this Agreement shall affect the right to effect service of process in any other manner permitted by the laws of the State of New York.
14.14 Notices. Any notice which may be required or permitted under this Plan shall be in writing, and shall be delivered in person or via facsimile transmission, overnight courier service or certified mail, return receipt requested, postage prepaid, properly addressed as follows:
14.14.1 If such notice is to the Company, to the attention of the General Counsel or Secretary of the Company or at such other address as the Company, by notice to the Participant, shall designate in writing from time to time.
14.14.2 If such notice is to the Participant, at his/her address as shown on the Company’s records, or at such other address as the Participant, by notice to the Company, shall designate in writing from time to time.
14.15 Captions. Captions are provided herein for convenience only, and shall not serve as a basis for interpretation or construction of the Plan.
14.16 Payments to Minors. Any benefit payable to or for the benefit of a minor, an incompetent person or other person incapable of receipt thereof shall be deemed paid when paid to such person’s guardian or to the party providing or reasonably appearing to provide for the care of such person, and such payment shall fully discharge the Committee, the Board, the Company, its Affiliates and their employees, agents and representatives with respect thereto.
14.17 Section 409A of the Code. The Plan is intended to comply with the applicable requirements of Section 409A of the Code and shall be limited, construed and interpreted in accordance with such intent. To the extent that any Award is subject to Section 409A of the Code, it shall be paid in a manner that will comply with Section 409A of the Code, including proposed, temporary or final regulations or any other guidance issued by the Secretary of the Treasury and the Internal Revenue Service with respect thereto. Notwithstanding anything herein to the contrary, any provision in the Plan that is inconsistent with Section 409A of the Code shall be deemed to be amended to comply with Section 409A of the Code and to the extent such provision cannot be amended to comply therewith, such provision shall be null and void. The Company shall have no liability to a Participant, or any other party, if an Award that is intended to be exempt from, or compliant with, Code Section 409A is not so exempt or compliant or for any action taken by the Committee or the Company and, in the event that any amount or benefit under the Plan becomes subject to penalties under Section 409A, responsibility for payment of such penalties shall rest solely with the affected Participant(s) and not with the Company.
14.18 Other Benefits. No Award granted or paid out under this Plan shall be deemed compensation for purposes of computing benefits under any retirement plan of the Company or its Affiliates nor affect any benefits under any other benefit plan now or subsequently in effect under which the availability or amount of benefits is related to the level of compensation.
14.19 Costs. The Company shall bear all expenses associated with administering this Plan, including expenses of issuing Shares pursuant to any Awards hereunder.
14.20 Award Agreement. Notwithstanding any other provision of the Plan, to the extent the provisions of any Award Agreement are inconsistent with terms of the Plan and such inconsistency is a result of compliance with laws of the jurisdiction in which the Participant is resident or is related to taxation of such Award in such jurisdiction, the relevant provisions of the particular Award Agreement shall govern.
EX-21.1
4
ex211202310k.htm
EX-21.1
Document
Exhibit 21.1
|
|
|
|
|
|
|
|
|
|
|
|
|
|
|
| LIST OF TRONOX HOLDINGS PLC SUBSIDIARIES |
|
|
|
| Subsidiary |
|
Jurisdiction of Incorporation or Organization |
|
|
|
| Cristal Metals, LLC |
|
Delaware |
|
|
|
| Tronox Finance LLC |
|
Delaware |
|
|
|
| Tronox Incorporated |
|
Delaware |
|
|
|
| Tronox LLC |
|
Delaware |
|
|
|
| Tronox US Holdings Inc. |
|
Delaware |
|
|
|
| Non-U.S. Subsidiaries: |
|
|
|
|
|
| CIC Switzerland |
|
Switzerland |
|
|
|
| Hong Kong Titanium Products Company Limited |
|
Hong Kong |
|
|
|
| Jiangxi Tikon Titanium Products Co. Ltd. |
|
China |
|
|
|
| Millennium Inorganic Chemicals Holdings Brasil Ltda. |
|
Brazil |
|
|
|
| Millennium Inorganic Chemicals Le Havre SAS |
|
France |
|
|
|
| Millennium Inorganic Chemicals Overseas Holdings |
|
United Kingdom |
|
|
|
| Millennium Inorganic Chemicals SAS |
|
France |
|
|
|
| Shanghai Millennium Chemicals Trading Ltd. |
|
China |
|
|
|
| Tronox Belgium BVBA |
|
Belgium |
|
|
|
| Tronox France SaS |
|
France |
|
|
|
| Tronox Global Holdings Pty Limited |
|
Australia |
|
|
|
| Tronox India Private Limited |
|
India |
|
|
|
| Tronox International BV |
|
Netherlands |
|
|
|
|
|
|
|
|
|
|
|
|
|
|
|
|
|
|
| Tronox Investment Holdings Limited |
|
United Kingdom |
|
|
|
| Tronox Investments Netherlands BV |
|
Netherlands |
|
|
|
| Tronox Investments UK Limited |
|
United Kingdom |
|
|
|
| Tronox KZN Sands (Pty) Ltd |
|
South Africa |
|
|
|
| Tronox Limited |
|
Australia |
|
|
|
| Tronox Management Pty Ltd. |
|
Australia |
|
|
|
| Tronox Mineral Sands (Pty) Ltd |
|
South Africa |
|
|
|
| Tronox Mining Australia Limited |
|
Australia |
|
|
|
| Tronox Pigment Bunbury Ltd |
|
Australia |
|
|
|
| Tronox Pigment UK Limited |
|
United Kingdom |
|
|
|
| Tronox Pigmentos do Brasil SA |
|
Brazil |
|
|
|
| Tronox Pigments (Holland) B.V. |
|
Netherlands |
|
|
|
| Tronox Pigments Pty Limited |
|
Australia |
|
|
|
| Tronox Pigments (Singapore) Pte. Ltd. |
|
Singapore |
|
|
|
| Tronox Sands Holdings Pty Limited |
|
Australia |
|
|
|
| Tronox Saudi Industries Company |
|
Kingdom of Saudi Arabia |
|
|
|
| Tronox UK Holdings Limited |
|
United Kingdom |
|
|
|
| Tronox UK Merger Company Limited |
|
United Kingdom |
EX-23.1
5
ex231202310k.htm
EX-23.1
Document
Exhibit 23.1
CONSENT OF INDEPENDENT REGISTERED PUBLIC ACCOUNTING FIRM
We hereby consent to the incorporation by reference in the Registration Statements on Form S-8 (No. 333-240322) and Form S-3 (No. 333-269953) of Tronox Holdings plc of our report dated February 21, 2024 relating to the financial statements and the effectiveness of internal control over financial reporting, which appears in this Form 10-K.
/s/PricewaterhouseCoopers LLP
Stamford, Connecticut
February 21, 2024
EX-24.0
6
ex240202310k.htm
EX-24.0
Document
Exhibit 24.0
POWER OF ATTORNEY
Each of the undersigned, as a director of Tronox Holdings plc (the “Company”), a public limited company registered under the laws of England and Wales, hereby appoints D. John Srivisal, Jeffrey Neuman and Steven Kaye, each with power to act without the other and with power of substitution and resubstitution, as my attorney-in-fact and agent for me and in my name, place and stead in any and all capacities,
(i) to sign the Company’s Annual Report on Form 10-K under the Securities Exchange Act of 1934 for the year ended December 31, 2023,
(ii) to sign any amendment to the Annual Report referred to in (i) above, or to any previously filed Annual Report on Form 10-K for any prior fiscal year, and
(iii) to file the documents described in (i) and (ii) above and all exhibits thereto and any and all other documents in connection therewith,
granting unto each said attorney-in-fact and agent full power and authority to do and perform every act and thing requisite, necessary or desirable to be done in connection therewith, as fully to all intents and purposes as I might or could do in person, hereby ratifying and confirming all that said attorneys-in-fact and agents, or any of them, or their or his or her substitutes or substitute, may lawfully do or cause to be done by virtue hereof.
This Power of Attorney may be signed in any number of counterparts, each of which shall be an original, with the same effect as if the signatures thereto and hereto were upon the same instrument.
Dated: February 21, 2024
[SIGNATURE PAGE TO FOLLOW]
|
|
|
|
|
|
|
|
|
| Signatures |
|
Title |
|
|
|
| /s/ Ilan Kaufthal |
|
Chairman of the Board |
| Ilan Kaufthal |
|
|
|
|
|
/s/ Mutlaq H. Al-Morished |
|
Director |
| Mutlaq H. Al-Morished |
|
|
|
|
|
| /s/ Peter Johnston |
|
Director |
|
Peter Johnston
|
|
|
|
|
|
|
| /s/ Ginger Jones |
|
Director |
|
Ginger Jones
|
|
|
|
|
|
/s/ Stephen Jones |
|
Director |
| Stephen Jones |
|
|
|
|
|
/s/ Moazzam A. Khan |
|
Director |
| Moazzam A. Khan |
|
|
|
|
|
| /s/ Sipho Nkosi |
|
Director |
| Sipho Nkosi |
|
|
EX-31.1
7
ex311202310k.htm
EX-31.1
Document
Exhibit 31.1
CERTIFICATION OF PRINCIPAL EXECUTIVE OFFICER
PURSUANT TO
EXCHANGE ACT RULE 13A-14(A)/15D-14(A)
AS ADOPTED PURSUANT TO
SECTION 302 OF THE SARBANES-OXLEY ACT OF 2002
I, John Romano, certify that:
1.I have reviewed this Annual Report on Form 10-K for the year ended December 31, 2023 of Tronox Holdings plc (the “Registrant”);
2.Based on my knowledge, this report does not contain any untrue statement of a material fact or omit to state a material fact necessary to make the statements made, in light of the circumstances under which such statements were made, not misleading with respect to the period covered by this report;
3.Based on my knowledge, the financial statements, and other financial information included in this report, fairly present in all material respects the financial condition, results of operations and cash flows of the Registrant as of, and for, the periods presented in this report;
4.The Registrant’s other certifying officers and I are responsible for establishing and maintaining disclosure controls and procedures (as defined in Exchange Act Rules 13a-15(e) and 15d-15(e)) and internal control over financial reporting (as defined in Exchange Act Rules 13a-15(f) and 15d-15(f)) for the Registrant and have:
(a)Designed such disclosure controls and procedures, or caused such disclosure controls and procedures to be designed under our supervision, to ensure that material information relating to the Registrant, including its consolidated subsidiaries, is made known to us by others within those entities, particularly during the period in which this report is being prepared;
(b)Designed such internal control over financial reporting, or caused such internal control over financial reporting to be designed under our supervision, to provide reasonable assurance regarding the reliability of financial reporting and the preparation of financial statements for external purposes in accordance with generally accepted accounting principles;
(c)Evaluated the effectiveness of the Registrant’s disclosure controls and procedures and presented in this report our conclusions about the effectiveness of the disclosure controls and procedures, as of the end of the period covered by this report based on such evaluation; and
(d)Disclosed in this report any change in the Registrant’s internal control over financial reporting that occurred during the Registrant’s most recent fiscal quarter (the Registrant’s fourth fiscal quarter in the case of an annual report) that has materially affected, or is reasonably likely to materially affect, the Registrant’s internal control over financial reporting; and
5.The Registrant’s other certifying officers and I have disclosed, based on our most recent evaluation of internal control over financial reporting, to the Registrant’s auditors and the audit committee of the Registrant’s board of directors (or persons performing the equivalent functions):
(a)All significant deficiencies and material weaknesses in the design or operation of internal control over financial reporting which are reasonably likely to adversely affect the Registrant’s ability to record, process, summarize and report financial information; and
(b)Any fraud, whether or not material, that involves management or other employees who have a significant role in the Registrant’s internal control over financial reporting.
Date: February 21, 2024
|
|
|
|
|
|
| /s/ JOHN ROMANO |
|
| John Romano |
|
| Co-Chief Executive Officer |
|
EX-31.2
8
ex312202310k.htm
EX-31.2
Document
Exhibit 31.2
CERTIFICATION OF PRINCIPAL EXECUTIVE OFFICER
PURSUANT TO
EXCHANGE ACT RULE 13A-14(A)/15D-14(A)
AS ADOPTED PURSUANT TO
SECTION 302 OF THE SARBANES-OXLEY ACT OF 2002
I, Jean-Francois Turgeon, certify that:
1.I have reviewed this Annual Report on Form 10-K for the year ended December 31, 2023 of Tronox Holdings plc (the “Registrant”);
2.Based on my knowledge, this report does not contain any untrue statement of a material fact or omit to state a material fact necessary to make the statements made, in light of the circumstances under which such statements were made, not misleading with respect to the period covered by this report;
3.Based on my knowledge, the financial statements, and other financial information included in this report, fairly present in all material respects the financial condition, results of operations and cash flows of the Registrant as of, and for, the periods presented in this report;
4.The Registrant’s other certifying officers and I are responsible for establishing and maintaining disclosure controls and procedures (as defined in Exchange Act Rules 13a-15(e) and 15d-15(e)) and internal control over financial reporting (as defined in Exchange Act Rules 13a-15(f) and 15d-15(f)) for the Registrant and have:
(a)Designed such disclosure controls and procedures, or caused such disclosure controls and procedures to be designed under our supervision, to ensure that material information relating to the Registrant, including its consolidated subsidiaries, is made known to us by others within those entities, particularly during the period in which this report is being prepared;
(b)Designed such internal control over financial reporting, or caused such internal control over financial reporting to be designed under our supervision, to provide reasonable assurance regarding the reliability of financial reporting and the preparation of financial statements for external purposes in accordance with generally accepted accounting principles;
(c)Evaluated the effectiveness of the Registrant’s disclosure controls and procedures and presented in this report our conclusions about the effectiveness of the disclosure controls and procedures, as of the end of the period covered by this report based on such evaluation; and
(d)Disclosed in this report any change in the Registrant’s internal control over financial reporting that occurred during the Registrant’s most recent fiscal quarter (the Registrant’s fourth fiscal quarter in the case of an annual report) that has materially affected, or is reasonably likely to materially affect, the Registrant’s internal control over financial reporting; and
5.The Registrant’s other certifying officers and I have disclosed, based on our most recent evaluation of internal control over financial reporting, to the Registrant’s auditors and the audit committee of the Registrant’s board of directors (or persons performing the equivalent functions):
(a)All significant deficiencies and material weaknesses in the design or operation of internal control over financial reporting which are reasonably likely to adversely affect the Registrant’s ability to record, process, summarize and report financial information; and
(b)Any fraud, whether or not material, that involves management or other employees who have a significant role in the Registrant’s internal control over financial reporting.
Date: February 21, 2024
|
|
|
|
|
|
| /s/ JEAN-FRANCOIS TURGEON |
|
| Jean-Francois Turgeon |
|
| Co-Chief Executive Officer |
|
EX-31.3
9
ex313202310k.htm
EX-31.3
Document
Exhibit 31.3
CERTIFICATION OF PRINCIPAL FINANCIAL OFFICER
PURSUANT TO
EXCHANGE ACT RULE 13A-14(A)/15D-14(A)
AS ADOPTED PURSUANT TO
SECTION 302 OF THE SARBANES-OXLEY ACT OF 2002
I, D. John Srivisal, certify that:
1.I have reviewed this Annual Report on Form 10-K for the year ended December 31, 2023 of Tronox Holdings plc (the “Registrant”);
2.Based on my knowledge, this report does not contain any untrue statement of a material fact or omit to state a material fact necessary to make the statements made, in light of the circumstances under which such statements were made, not misleading with respect to the period covered by this report;
3.Based on my knowledge, the financial statements, and other financial information included in this report, fairly present in all material respects the financial condition, results of operations and cash flows of the Registrant as of, and for, the periods presented in this report;
4.The Registrant’s other certifying officers and I are responsible for establishing and maintaining disclosure controls and procedures (as defined in Exchange Act Rules 13a-15(e) and 15d-15(e)) and internal control over financial reporting (as defined in Exchange Act Rules 13a-15(f) and 15d-15(f)) for the Registrant and have:
(a)Designed such disclosure controls and procedures, or caused such disclosure controls and procedures to be designed under our supervision, to ensure that material information relating to the Registrant, including its consolidated subsidiaries, is made known to us by others within those entities, particularly during the period in which this report is being prepared;
(b)Designed such internal control over financial reporting, or caused such internal control over financial reporting to be designed under our supervision, to provide reasonable assurance regarding the reliability of financial reporting and the preparation of financial statements for external purposes in accordance with generally accepted accounting principles;
(c)Evaluated the effectiveness of the Registrant’s disclosure controls and procedures and presented in this report our conclusions about the effectiveness of the disclosure controls and procedures, as of the end of the period covered by this report based on such evaluation; and
(d)Disclosed in this report any change in the Registrant’s internal control over financial reporting that occurred during the Registrant’s most recent fiscal quarter (the Registrant’s fourth fiscal quarter in the case of an annual report) that has materially affected, or is reasonably likely to materially affect, the Registrant’s internal control over financial reporting; and
5.The Registrant’s other certifying officers and I have disclosed, based on our most recent evaluation of internal control over financial reporting, to the Registrant’s auditors and the audit committee of the Registrant’s board of directors (or persons performing the equivalent functions):
(a)All significant deficiencies and material weaknesses in the design or operation of internal control over financial reporting which are reasonably likely to adversely affect the Registrant’s ability to record, process, summarize and report financial information; and
(b)Any fraud, whether or not material, that involves management or other employees who have a significant role in the Registrant’s internal control over financial reporting.
Date: February 21, 2024
|
|
|
|
|
|
| /s/ D. JOHN SRIVISAL |
|
| D. John Srivisal |
|
| Senior Vice President and Chief Financial Officer |
|
EX-32.1
10
ex321202310k.htm
EX-32.1
Document
Exhibit 32.1
CERTIFICATION OF PRINCIPAL EXECUTIVE OFFICER
PURSUANT TO
18 U.S.C. SECTION 1350,
AS ADOPTED PURSUANT TO
SECTION 906 OF THE SARBANES-OXLEY ACT OF 2002
Pursuant to 18 U.S.C § 1350, the undersigned officer of Tronox Holdings plc (the “Registrant”) hereby certifies that the Registrant’s Annual Report on Form 10-K for the year ended December 31, 2023 (the “Report”) fully complies with the requirements of Section 13(a) or 15(d), as applicable, of the Securities Exchange Act of 1934 and that the information contained in the Report fairly presents, in all material respects, the financial condition and results of operations of the Registrant.
February 21, 2024
|
|
|
|
|
|
| |
/s/ JOHN ROMANO |
| |
John Romano |
| |
Co-Chief Executive Officer |
The foregoing certification is being furnished solely pursuant to 18 U.S.C. § 1350 and is not being filed as part of the Report or as a separate disclosure document.
EX-32.2
11
ex322202310k.htm
EX-32.2
Document
Exhibit 32.2
CERTIFICATION OF PRINCIPAL EXECUTIVE OFFICER
PURSUANT TO
18 U.S.C. SECTION 1350,
AS ADOPTED PURSUANT TO
SECTION 906 OF THE SARBANES-OXLEY ACT OF 2002
Pursuant to 18 U.S.C. § 1350, the undersigned officer of Tronox Holdings plc (the “Registrant”) hereby certifies that the Registrant’s Annual Report on Form 10-K for the year ended December 31, 2023 (the “Report”) fully complies with the requirements of Section 13(a) or 15(d), as applicable, of the Securities Exchange Act of 1934 and that the information contained in the Report fairly presents, in all material respects, the financial condition and results of operations of the Registrant.
February 21, 2024
|
|
|
|
|
|
|
/s/ JEAN-FRANCOIS TURGEON |
|
Jean-Francois Turgeon |
|
Co-Chief Executive Officer |
The foregoing certification is being furnished solely pursuant to 18 U.S.C. § 1350 and is not being filed as part of the Report or as a separate disclosure document.
EX-32.3
12
ex323202310k.htm
EX-32.3
Document
Exhibit 32.3
CERTIFICATION OF PRINCIPAL FINANCIAL OFFICER
PURSUANT TO
18 U.S.C. SECTION 1350,
AS ADOPTED PURSUANT TO
SECTION 906 OF THE SARBANES-OXLEY ACT OF 2002
Pursuant to 18 U.S.C § 1350, the undersigned officer of Tronox Holdings plc (the “Registrant”) hereby certifies that the Registrant’s Annual Report on Form 10-K for the year ended December 31, 2023 (the “Report”) fully complies with the requirements of Section 13(a) or 15(d), as applicable, of the Securities Exchange Act of 1934 and that the information contained in the Report fairly presents, in all material respects, the financial condition and results of operations of the Registrant.
February 21, 2024
|
|
|
|
|
|
| |
/s/ D. JOHN SRIVISAL |
| |
D. John Srivisal |
| |
Senior Vice President and Chief Financial Officer |
The foregoing certification is being furnished solely pursuant to 18 U.S.C. § 1350 and is not being filed as part of the Report or as a separate disclosure document.
EX-96.1
13
ex961202310k.htm
EX-96.1
ex961202310k

ATLAS-CAMPASPE TECHNICAL REPORT SUMMARY 1 Exhibit 96.1 Cooljarloo Technical Report Summary Explanatory Note This Technical Report Summary (TRS), dated February 21, 2024, serves as an amendment to, and restatement of, the TRS filed on February 22, 2022, effective December 31, 2021, following Tronox Holding plc’s receipt of a comment letter from the U.S. Securities and Exchange Commission. While this Amended TRS incorporates changes to the original version, it maintains an effective date of December 31, 2021 with regard to assumptions and the knowledge of the Qualified Persons. Notable revisions and changes to the previously filed TRS were as follows: • Inclusion of the coordinates of the mine (Section 3) • Inclusion of a stratigraphic column (Figure 5) • Inclusion of the Qualified Person opinions regarding sample preparation, security, and analytical procedures; the metallurgical data; the current plans to address any issues related to environmental compliance, permitting, and local individuals or groups; and issues relating to relevant technical and economic factors likely to influence the prospect of economic extraction can be resolved with further work (Sections 8, 14, 17 and 22) • Amended cutoff grade disclosure (Section 11) • Inclusion of saleable product yield (Table 6) • Amended mine closure disclosure, including closing/reclamation costs (Section 17) • Inclusion of operating and capital costs for life of mine (Tables 7-8) • Inclusion of accuracy of capital and operating costs estimates (Section 18) • Inclusion of market price projections (Table 9) • Inclusion of annual life of mine production schedule (Table 10) • Inclusion of historic plant throughput and saleable product yield (Table 11) • Inclusion of a cash flow analysis (Table 12) • Inclusion of a sensitivity analysis (Table 13) 1 Executive Summary The Cooljarloo project was established in 1988. The total project involved a mine, wet concentrator and infrastructure at Cooljarloo, a mineral separation plant and synthetic rutile plant plus infrastructure at Chandala and a titanium dioxide pigment plant at Kwinana. The synthetic rutile plant is fed with ilmenite primarily from the MSP and the pigment plant then fed primarily with feedstock from the SR plant. The ore body is made up of conventional mineral sands strandlines and eminently suited to dredge mining and gravity concentration. The project currently operates within a 21 year mining lease, set from 2020, that is held 100% by Tronox Management Limited, a wholly owned subsidiary of the Company. There are an additional 2 mining leases that cover the Cooljarloo West mine life extension project and Tronox also holds a number of exploration leases nearby to the operations. The current reserves are 361Mt tonnes at 1.8% HM grade, which gives a further 19 years of life. Current resources, additional to the reserve tonnage, are 292Mt tonnes at 1.5% HM grade. 2 Introduction This report has been prepared by Tronox Holdings Plc in compliance with the U.S. Securities and Exchange Commission’s modernization of reporting rules for geological resources and reserves for the Cooljarloo /Cooljarloo West deposits located in Western Australia. Information used to support this technical summary of the geology includes the annual Resources and Reserves report, the original project Definitive Feasibility Study, the current Life of Mine Plan and various other relevant study documents listed in the references section of this technical report. A Qualified Person visits the Cooljarloo mine site on at least a monthly basis. Discussions with site management on resource utilisation and optimisation opportunities are also completed regularly. Visits to the drilling areas are completed, at a minimum, on a quarterly basis. 3 Property Description Tronox Management Pty Ltd is a subsidiary of Tronox Holdings plc and is the operator of Tronox Northern Operations which includes:

ATLAS-CAMPASPE TECHNICAL REPORT SUMMARY 2 • Cooljarloo Mine, 170 kilometres north of Perth, where heavy mineral concentrates are produced from dredge mining operations • Cooljarloo West deposits, which conjoin the Cooljarloo Mine operations • Chandala Processing Plant, 60 kilometres north of Perth, where the heavy mineral concentrates (HMC) are separated into saleable mineral products and also where ilmenite is further upgraded to synthetic rutile. • The laboratory and mineral testing facility is also located at the Chandala site See Figure 1 on next page. Mining tenements in Australia are managed at the State or Territorial level. In Western Australia, Mining Leases, Exploration Licenses and Retention Licenses are granted and administered by the Western Australian Department of Mines, Industry Regulation and Safety. Tronox operates under three (3) mining leases which are 100% held by Tronox Management Pty Ltd., a wholly-owned subsidiary of Tronox Holdings plc, and shown in Table 1 below. Table 1: Mining Tenement Schedule Region Tenement Tenement Type Area (Ha) Grant Date Expiry/ Renewal Date Commitment US$/a Rent U$/a Status of Rights Cooljarloo M70/1398 (Previously MSA 268) Mining Lease 9,744 02-Mar-2020 01-Mar-2041 701,600 138,900 Active Mining Lease Cooljarloo (West) M70/1314 Mining Lease 3,782 18-Mar-2015 17-Mar-2036 272,300 53,915 EPA approval pending Cooljarloo (West) M70/1333 Mining Lease 420 04-Apr-2016 03-Apr-2037 30,310 6,000 EPA approval pending Tronox has one active mine site that was originally controlled by a State Agreement Act with the State of Western Australia. The mining lease (MSA 268) for this area was a State Agreement Act lease which was originally granted in 1989 for a period of 21 years and was extended for a 10 year term which expired in 2020. MSA 268 was replaced by a standard Mining Lease (M70/1398) which will expire in 2041.

ATLAS-CAMPASPE TECHNICAL REPORT SUMMARY 3 Figure 1: Location of Western Australian Operations

ATLAS-CAMPASPE TECHNICAL REPORT SUMMARY 4 The Cooljarloo Mine is located at coordinates latitude 30°39'S and longitude 115°27'E. Cooljarloo West is located within Mining Leases 70/1314, 70/1333 and 70/1398. Granting of rights to mine are pending environmental approval. The minerals in Western Australia belong to the Crown (the State of Western Australia) and Tronox is obligated to pay a 5% revenue- based royalty on saleable mineral products. This is factored into the valuation models and optimisations conducted by Tronox. A private royalty of 10c/t of VHM is paid for a portion of the northern section of the Cooljarloo tenement. Based on the current mine plan, mining in this royalty agreement area will cease by 2025 and the amounts paid are not material to the business. On Mining Lease 70/1333 Tronox agrees to pay the previous holder of the exploration lease a royalty of 1% of a previously agreed price for each tonne of Valuable Heavy Mineral recovered from the Mining Lease. The cost will also be immaterial to the business. 4 Accessibility The project area is approximately 90m above sea level and characterised by low-lying weathered sandplains dominated by Banksia, Tuart and Sheoak, while swamp environments exhibit Paperbark. Maximum temperatures occur during the summer months ranging between 35°C and 18°C. Winter months produce the lowest average temperatures, ranging from a maximum of 18°C and a minimum of 7°C. The area experiences an average of 540 mm of rain per year, with the majority of rainfall occurring in winter. The nett annual evaporation rate is close to 2 metres per annum. Surface soils consist primarily of coarse alluvial material, and generally display very low clay (1%) and silt (1-2%) content. Soil is non-sodic and nutrient deficient with low moisture retention capability. Both Mine and MSP sites are easily accessed. Infrastructure availability is disclosed in Item 14. 5 History Cooljarloo The Cooljarloo tenements were originally pegged in 1972 by Kamilaroi Oil Company following the discovery of the Eneabba Deposits. They were subsequently obtained by Yalgoo Minerals Pty Ltd and Tific Pty Ltd in 1985 which became part of TiO2 Corporation NL (TiO2). In 1988 prior to mining commencing, the Cooljarloo Joint Venture was formed between Kerr-McGee Chemical Corp and Minproc Ltd, subsequent reorganizations of both partners led to 100% ownership under Tronox in 2012. No geological data generated by owners prior to the formation of the Cooljarloo Joint Venture is in use. Cooljarloo West In 1990 drilling by Peko Exploration Ltd delineated a zone of deep low grade mineralisation but further drilling failed to intercept economic mineralisation. The tenements were relinquished in 1992. Image Resources later pegged the area which were acquired by Tronox in 2005. Drilling completed by Tronox in 2007 delineated the deposits named Woolka Road, Harrier and Kestrel and Resources and Reserves are based only on data generated by Tronox.

ATLAS-CAMPASPE TECHNICAL REPORT SUMMARY 5 6 Geological Setting, Mineralisation and Deposit Tronox’s deposits are situated in the North Perth Basin, which forms part of the Swan Coastal Plain and a shown in Figure 2 below. Figure 2: Regional Geology over Elevation The Plain sediments unconformably overlie older Mesozoic sediments deposited in continental and marine environments forming a platform on which the Cainozoic sediments accumulate. The shallow Cainozoic sedimentary sequence which hosts the commercial heavy mineral deposits are a result of a sea incursion and regression which resulted in a sequence of marginal marine and paralic sediments being deposited as far as 30km inland to the sea cut scarp. At the Cooljarloo area this coastal plain is covered by the Bassendean Sands, the Guildford Formation and the Yoganup Formation which are predominantly all unconsolidated sediments. Tronox’s Resources are marine shoreline strands and the location and style of mineralisation is affected by the sedimentary processes which gave rise to them. The base and western (shoreward) margins tend to be discrete as these are a wave cut platform or similar coastal notch. They tend to be elongate shapes with lengths of up to 12km and lateral width of 100-300m and thicknesses of up to 10 metres (Figure 3 and Figure 4). The strands tend to be gently curved and can be interrupted by later erosion by cross- cutting surface water systems.

ATLAS-CAMPASPE TECHNICAL REPORT SUMMARY 6 Figure 3: Interpreted Strandlines Figure 4: Typical Cross Section for Cooljarloo deposits

ATLAS-CAMPASPE TECHNICAL REPORT SUMMARY 7 On a smaller scale, the mineral grades and grain-sizes are controlled by the original beach face energy, with higher zircon and rutile proportions in the HM suite with coarser grain-size as the energy increases. The deposits are all Tertiary/Quaternary and therefore have only slight post-depositional tectonism, such as regional uplift and tilting, meaning that units can be followed with some confidence. Figure 5: Stratigraphic column of the Perth Basin: 7 Exploration There is no relevant exploration work to disclose. 8 Sample Preparation, Analyses and Security Drilling Reverse circulation “aircore” drilling is completed using a small Landcruiser mounted drill. This style of drilling suits the soft sand ground conditions, and the drilling is relatively shallow (20-50m) and very rapid (30-45 minutes per hole). Holes are drilled vertically using three metre NQ size rods, giving a nominal hole diameter at the bit of 83 mm. Drill samples are collected in one metre continuous intervals from surface. The drill sample return is captured through a cyclone to separate the air and reduce sand/slurry velocity which is then passed through a rotary splitter. All samples are sent to the Tronox’s internal laboratory for heavy mineral analysis by Tetrabromoethane (TBE). Figure 6 shows the drilling density over the interpreted strandlines that are part of the future mine plan. Previously mined areas have been excluded. TBE Analyses The total sample supplied from the field is dried, weighed and screened at 1mm. The remaining sample is wet attritioned and washed to remove sub 63 µm clay fines. 100g of the -1 mm +63 µm fraction is stirred into a separating flask containing Tetrabromoethane (TBE) to obtain a heavy mineral (HM) sink. The TBE density is regularly monitored to ensure minerals of less than 2.96 gcm-3 float. The weight of washed HM sinks are then used to calculate the heavy mineral content as a percentage of the original sample weight (HM%). Assay data is returned from Tronox’s laboratory in digital format and merged into a relational database. Mineralogical Analyses Tronox uses a mineralogy-based analysis technique, MA98, which was developed to provide an effective mineralogical estimation and can be completed entirely within the Chandala Assay Laboratory. The process is completed on composited HM sinks derived from TBE Analyses. TBE sinks from similar geological domains and strands are composited together in order to achieve a minimum starting weight of approximately 100g for the mineral assemblage technique.

ATLAS-CAMPASPE TECHNICAL REPORT SUMMARY 8 The MA98 process uses magnetic and electrostatic separation and XRF oxide determinations to reflect the mineral makeup as well as processes within the Mineral Separation Plant. The procedure uses a semi-lift induced roll magnet to separate the sample into three fractions; Mags1, Mags2 and Non-Mags. Each fraction is analysed by XRF in Tronox’s certified laboratory and a Mags1 subsample is further sized and separated by Coronastat with a separate XRF analysis and wet chemistry assay for ilmenite characterisation. These various results are then integrated by a series of mathematical algorithms that estimate the mineral composition of a sample based on the sample’s oxide composition. The sum of squared errors gives a good measure of confidence in the algorithm’s accuracy. Currently the algorithm estimates the concentration of 18 different minerals, based on ten different oxide analyses and the three magnetic response fractions. The MA98 algorithm provides information in addition to mineralogy, including TiO2 and Fe2O3 grades of ilmenite and leucoxene, and concentrations of weakly magnetic zircon and kyanite. Other ore assessment procedures used by Tronox provide for modelling of orebodies by mineral sizings, and FeO and U+Th in ilmenite. The same process is used by the metallurgical teams for daily plant control and for month end plant balances, so the system is robust and calibrated against production. In the Qualified Person’s opinion, Tronox’s sample preparation, security, and analytical procedures are adequate.

ATLAS-CAMPASPE TECHNICAL REPORT SUMMARY 9 Figure 6: Drill Holes over Annual Strips within the Life of Mine

ATLAS-CAMPASPE TECHNICAL REPORT SUMMARY 10 9 Data Verification Duplicates Duplicate samples are collected from a designated depth from each hole drilled on a frequency of 1 in every 40 metres drilled. The duplicates are collected by the drilling offsider from the riffle splitter at the same time the original sample is collected. The samples are set aside and dispatched to an independent external laboratory. The correlation between the Tronox Laboratory assay and the Western Geolabs duplicate is good. Of the 8379 samples checked with HM grades ranging from 0.01% to 42.43% the mean HM difference was 0.05%, the difference in standard deviation was 0.03% and the correlation coefficient between the two sets of data was 0.95. The small offset in mean HM grade is due to known minor differences in assay technique. Standards The drill loggers insert a standard sample at the end of the drill hole for processing at the Chandala Laboratory. The current standard uses Cooljarloo South mine concentrate and externally sourced clean sand with low clay fines and low oversize. The standard samples have been constructed in bulk by an external party. At two standard deviations, the results are within 4.4% relative to the expected HM value Regular internal and external audits of reserve and resource estimation processes are done in a staged manner, where some key steps are evaluated each audit rather than the whole at once. In 2018, an audit of drilling, sampling and assay methodologies was conducted by an independent expert. The results confirmed that practices are consistent with industry standards. Additional verification of drill data is completed regularly based on quarterly and annual reconciliation studies using production data. Reconciled quarterly heavy mineral feed grades from 2017-2020 were 1.9% higher than the estimated in ground grades and is an accurate outcome. Based on the data validation techniques deployed, the Qualified Person confirms that the accuracy of the mineralisation assays is in line with industry standards and is suitable to support estimates of Resources and Reserves. 10 Mineral Processing and Metallurgical Testing Thirty + years of mining and processing mineral from the Cooljarloo field along with production forecast modelling techniques and extensive ore characterization work on domain composites provides substantial and suitable recovery information. As the project has been in the production phase for so long, the original testwork and performance estimates have been superseded by known fact. The current forecasting methods used are industry standard. 11 Mineral Resource Estimates Resources and Reserves at Cooljarloo/Cooljarloo West are modelled using ellipsoid inverse distance cubed weighting. The models contain estimates of all valuable minerals and the deleterious trash minerals, plus key elemental contaminants to major minerals like U+Th in ilmenite and metallurgical recovery factors such as grain sizing. These are then uploaded into the scheduling software, Xpak and finally uploaded into forecasting software, PBCS. Mineral Reserves are subsets of Resources having used the same modelling processes but with a higher financial outcome metric applied. The dates of the Mineral Resource and Reserve estimates for Cooljarloo and Cooljarloo West, and shown in this Technical Summary, are as of December 31, 2021. Geological Modelling A model of the different geological domains is generated using mine planning and modelling software, Vulcan. Geological and assay data collected during logging are displayed on graphical sections and unit boundaries/layers are digitised at 50-200m spaced intervals in a north-south sectional orientation, depending on the location and drill spacing. The digitised strings are then joined together to create wireframe surfaces which are used during the estimation process of the “Background” material, that is, the material not bound by interpreted strandlines (Figure 7). The strand wireframe interpretations are generated in a very similar manner to the geological wireframes. A nominal cut-off grade of 0.8% HM is generally applied in order to create realistic shaped mineralised strands for estimation, which have priority over the background layers. These domains are later used to constrain variograms and block model grades. Variography Variography is completed for all domains to determine anisotropy and to set search ellipsoid parameters. Typical variogram ranges are greater than 80 metres across the strand and several hundred metres along strand strike. Block Model Construction Block models are created in Vulcan using a parent block size that is selected using Neighbourhood Analysis once variography is complete. Sub-celling is employed at domain boundaries to allow adequate representation of the domain geometry and volume. The sub-cell size is typically half the parent block size. .

ATLAS-CAMPASPE TECHNICAL REPORT SUMMARY 11 Figure 7: Geological Layers and Interpreted Orebody Section at Cooljarloo Grade Estimation The estimation of block grades is completed using the estimation codes and applied hard boundaries to all domains. Inverse Distance Cubed (ID3) is undertaken for heavy mineral, clay fines, oversize and mineral assemblage data. A minimum of two passes is undertaken for all domains. Capping Values No high-grade capping is applied to the resource estimation, however other estimation parameters control the influence of extreme high values. Density The bulk density for the reported resources are calculated from core samples recovered from the ore bodies. Density increases with increasing HM content and this is allowed for in a sliding formula which is applied to each ore block; Density = 1.87 + (HM*0.0092). Density is cross-checked via monthly reconciliations against production and has not needed to be altered for many years. Block Model Validation Block grade estimates are validated primarily by statistical analysis and also a visual comparison to the input drill hole data. Optimisation The optimisation process uses mining and revenue parameters to generate a mining outline based on accumulating cash positive subset areas within the block model. A cash positive area is where revenue from dry mill products exceeds the cost of mining that area and processing the resultant concentrate. The optimisation process is repeated using different revenue factors to create a series of nested shells. The top of ore and bottom of ore surfaces are created for each of the revenue factors. These are then run through Vulcan again to generate tonnes and grade, whilst ensuring that mined out and sterilised areas are removed from the tonnes. Mining block sequences are created for each of the shells ore tonnes and mineral assemblage information as well as mining and processing costs. Modifying Factors In the resource optimisation modifying factors including recoveries, ore loss assumptions, operating costs and mineral sales pricing are used to seek the maximum value for a column of mineralization. Cut-off Grade1 The nominal cutoff grade used to estimate resources in Tronox’s Northern Operations is generally 1% HM. This is between the breakeven grade for the minerals production side of the business and the marginal cost grade where certain material needs to be moved and it is cheaper to process and receive revenue than it is to extract it with earth moving equipment and transport it the waste dump. The 1% HM cutoff grade generally follows a natural geological boundary and allows smooth geometric shapes to be modelled. The 1% HM cutoff also captures all material within the deposit which has the potential to be economic. The reserve estimates are calculated during a resource optimization process using a series of complex mathematical routines. Inputs to the optimization process include mineral pricing, saleable product yield (recovery), variable costs and fixed costs. When the optimization process is run over the three-dimensional resource model, which contains variable HM grades, variable mineralogy, variable clay and rock content, variable orebody thickness and variable depth of burial the optimization process determines which parts of the resource should be converted to reserves. As such, it is not possible to quote a single cutoff grade as the reserve at any given location is a combination of HM%, clay%, mineralogy, orebody thickness and depth of burial. 1 Note to Tronox: We have tried to consolidate the this discussion with the existing disclosure – defer to the QPs on whether the remaining portions of the existing disclosure are relevant.

ATLAS-CAMPASPE TECHNICAL REPORT SUMMARY 12 The base assumptions used in this optimization process are: • Saleable product yield (recovery): ilmenite 84.7%, rutile 88%, zircon 83.2% and leucoxene 78.7% • Commodity prices: $235/metric ton for chloride ilmenite, $932/metric ton for rutile, $1,318/metric ton for zircon and $873/metric ton for leucoxene • Operating cost: $2.85 per metric ton ore mined • Mineral prices used are substantially in line with the prices for each of our products published quarterly by third-party independent consultancies. The long term mine plan and reserve estimates are derived from detailed techno-economic models created from geological, mining and analytical databases, and optimized with respect to anticipated revenues, and costs. Cost assumptions are developed from our extensive operating experience and include mining parameters, processing performance, and rehabilitation costs. Predicted mining and processing metrics are reconciled with actual production and recovery data on a monthly basis. Classification of Resources is based on: Drill density Survey method and accuracy Drilling method and sampling interval Continuity of mineralisation and geological units Reliability of assay method and mineralogical information Frequency and results of QA/QC data Initial financial assessment from optimisation Tronox relies on constraining grade variation by drilling on progressively tighter grid patterns. Initial exploration results for Inferred Resources will generally be assessed on a drill hole grid spacing of 400x80m, 400x160m or 600x160m. All holes are sampled at 1m intervals. For the style of mineralisation being investigated (strandlines) this will generally produce 3 or 4 line intercepts which confirms approximate width and strike but may be open ended. Indicated Resources are most commonly reported based on a 100 x 80m grid or 200x80m grid, though depending on the width of strand this may be varied to a 200x20m or 200x40m grid. This will generally constrain the strands limits, confirm strike across several line intercepts and provide good confidence of grade variability. Measured Resources use a 50x40m grid with closer infill near boundaries. Thinner, high grade strands may require closer spaced 50mx20m grid before being considered Measured. This will constrain volumes over many drill sections intercepts, provide confident grade variation control over multiple internal populations and provide adequate lithological information for mining criteria. The mineral assemblage assays are applied on both downhole composites and along section composites within geological domains. Typical variogram ranges are greater than 80m across the strand and several hundred metres along strand strike. The initial financial assessment from optimisation, as well as grade tonnage curves, also aid in the classification of Resources and Reserves. Figure 8 below outlines the physical location of the resources in relation to the reserves. There is little physical reason why some or all of those resources might not be mineable with the existing dredges and concentrator. Additional resource definition is needed. The categorisation of resources is made based on the judgements of the Qualified Person, in consultation with the mining development engineer and resource geologist. Tronox uses breakeven contribution as a guide to cut-off determination rather than just grade. This allows for the polymetallic nature of the resource and the broad mineralization of surrounding areas. As costs change over time and long-term revenue values change, new reviews are conducted which may lead to a different shell becoming optimal. A summary of Mineral Resources as of December 31, 2021 are included in Table 2. Table 2: Summary Mineral Resources at December 31, 2021 Measured mineral resources Indicated mineral resources Measured + Indicated mineral resources Inferred mineral resources Material (Kt) HM% Mineral Assemblage Material (Kt) HM% Mineral Assemblage (% of HM) Material (Kt) HM% Mineral Assemblage (% of HM) Material (Kt) HM% Heavy Mineral Sands Ilmenite Rutile and Leucoxene Zircon Ilmenite Rutile and Leucoxene Zircon Ilmenite Rutile and Leucoxene Zircon Cooljarloo 10,254 1.5 58.7 7.7 9.7 201,517 1.6 61.6 6.2 10.1 211,770 1.6 61.4 6.2 10.1 - - Cooljarloo West 80,293 1.3 60.7 8.5 11.6 80,293 1.3 60.7 8.5 11.6 - - Total 10,254 1.5 58.7 7.7 9.7 281,810 1.5 61.4 6.7 10.5 292,063 1.5 61.3 6.8 10.4 - - *N.B. Resources are Exclusive of Mineral Reserves The Qualified Person considers the data validation and geological modelling processes in addition to monthly and annual

ATLAS-CAMPASPE TECHNICAL REPORT SUMMARY 13 reconciliations between forecast grades and actual mined grades confirms that the mineralisation estimates are in line with industry standards and is entirely suitable to support estimates of Resources. 12 Mineral Reserve Estimates Mineral reserves are essentially subsets of resources having used the same modelling processes but with tighter scrutiny and application of the various modifying factors as well as a higher financial outcome metric being applied. The nominal cut-off grades used to calculate ore reserves are generally 1.3% HM which is close to breakeven. Actual cut-off grades applied in reserve estimates can vary according to a number of factors such as overburden: ore ratios and HM assemblage quality. The reserves as of December 31, 2021 are shown in Table 3 below. Table 3: Summary Mineral Reserves as of December 31, 2021 Proven mineral reserves Probable mineral reserves Total mineral reserves Material (Kt) HM% Mineral Assemblage Material (Kt) HM% Mineral Assemblage Material (Kt) HM% Mineral Assemblage Heavy Mineral Sands Ilmenite Rutile and Leucoxene Zircon Ilmenite Rutile and Leucoxene Zircon Ilmenite Rutile and Leucoxene Zircon Cooljarloo 230,730 1.7 61.1 7.7 10.5 - 2.0 - - - 230,730 1.7 61.1 7.7 10.5 Cooljarloo West 130,492 2.0 60.5 8.3 12.3 130,500 2.0 60.5 8.3 12.3 Total 230,730 1.7 61.2 7.7 10.5 130,492 2.0 60.5 8.3 12.3 361,230 1.8 60.9 7.9 11.2 1) Mineral prices used in Reserve estimation are substantially in line with the prices for each of our products published quarterly by independent consulting companies 2) Conversion of in ground grade to saleable product yield, taking into account all of the losses in mining and processing, is for ilmenite typically 83%, for rutile 94%, for Leucoxene 66% and for zircon 80%

ATLAS-CAMPASPE TECHNICAL REPORT SUMMARY 14 Figure 8: Resource in relation to the Reserve outline

ATLAS-CAMPASPE TECHNICAL REPORT SUMMARY 15 13 Mining Methods Cooljarloo mine commenced operation in 1989 and has operated with 2 dredges in the one pond since 1999 and currently uses (Table 4) • The original Ellicott Cooljarloo1 dredge and, • The smaller capacity Neumann built Pelican which was brought into service in 2012. Table 4: Dredge Parameters Dredge Parameters Cooljarloo I Pelican Length 65 m 50 m Width 15 m 12 m Max Effective Mining Depth 25 m 15 m Total Dredge Power 3Mwh 1.6Mwh Dredge Pump Size 28/24 16/14 Max Mining capacity 3000tph 1000tph The bucket wheel dredges operate in a purpose-built pond which sits within the ore mining limit. They are connected to a floating concentrator via floating pipelines and high voltage (HV) cables for power. The dredge pond typically sits at or slightly below the natural ground water table level so there is a high degree of ground water inflow to maintain the pond. Losses of pond water are associated with clay fines management, concentrate stockpiling and natural evaporation. An extensive network of shallow bores around the site are used to make up for the losses. The pond has an area typically 30Ha. The dredges swing side to side in an arc pivoting around a spud driven into the pond bottom and wire winch rope side anchors buried in the pond walls. After the initial mining of the full face and advance distance, Cooljarloo 1 will retreat back and do a clean-up sweep of the floor where it pumps all the loose ore that was not initially picked up when mining at the face. Typical relationships between the two dredges and the floating concentrator are shown in Figure 9. The Concentrator is connected to land through a pump pontoon via floating pipelines and HV cable. After both dredges and the Wet Concentrator have reached the full extent of their float line length, a ramp move is done. Depending on the width and depth of the dredge pond this relocation is done approximately every eight to twelve weeks as the full dredge face advance is approximately 110 metres per month. The total forward advance distance of the dredge pond since start-up is 40km. Ore mined is pumped as a slurry to a rotating trommel where a small amount of oversize rocks and debris are rejected back into the dredge pond. The sand drains into a surge bin where it is diluted with water and pumped to the wet gravity concentrator circuit. Both dredges pump their feed simultaneously to the wet concentrator. However, depending on the surge bin level the dredges adjust their feed accordingly to keep the bin level stable. Figure 9: Pelican (foreground), Cooljarloo 1 (mid ground) and Concentrator ( background)

ATLAS-CAMPASPE TECHNICAL REPORT SUMMARY 16 To establish where in relation to the mine plan the dredges are mining, there are GPS receivers on both dredges and Wet Concentrator that records location, dredging depths and swing distances. Information such as run time throughput, pumping density along with other production data are also recorded on each dredge and the wet concentrator. Mining plans are established using a grid method known as centrelines, which are loaded into the dredges GPS systems. The plan is visible to the operators as to which centreline they will be mining on each shift. The dr3dx GPS software helps the operator track location and dredging depth in relation to the plan and other performance data. In the planning phase a range of resource shells are generated based on business requirements. These shells are generated using a Tronox in-house Visual C++ optimization script and variations of the revenue factor. The output for each run is a set of point data for the optimised top, bottom and extremities of ore. For the chosen shell, these points are uploaded into the site mine planning design software Vulcan where they are smoothed out for mining practicality as well as adding crest and toe strings to form the pit walls at an angle based on the general ore characteristics. Overburden removal is by truck and shovel and is carried out by contractor. Over the life of mine, overburden quantity averages 5Mbcm/annum. Any high overburden faces are extracted in 4 metre benches. Pit wall slopes are typically 30 degrees but can be up to 45 degrees in areas of higher clay content. Overburden is generally removed 3 months ahead, exposing enough ore to keep apart the dredges and mining face so as not to compromise safety and production risks. Overburden is usually dumped directly onto the sand tailings beach at the back of the pond, or onto dried out clay-fines cells, to create final landform. Truck types commonly used are Caterpillar 785B and 777’s as well as articulated D400E. Capacity varies from 40t to 150t each. Excavator used is typically a Komatsu PC2000. Most deposits mined at Cooljarloo have little issue with digging conditions and therefore geotechnical work is only performed occasionally. Ground water and surface water flow models are maintained but even in the driest conditions water availability has never been a significant issue. The digging method is such that as the face is disturbed at the toe, using the dredge bucket wheel, the whole face tends to collapse. This material is relatively fluid and easy to pump away. The total tonnage of dilution over the past decade has averaged 4%. However, dilution material typically has a grade in the range of 0.8% HM to 1.2% HM and significantly mitigates the impact. The dredging operation uses approximately 1.5Gl of water per month of which 0.5Gl comes from a shallow bore field network across the site. The rest comes from natural ground water inflow to the dredge pond and returns from off path clay fines thickening cells. In slurrying the ore for primary concentration the clay and silt component become liberated. Once suspended, the clay fines tailings are allowed to settle and pumped to clay consolidating ponds where they dry by evaporation. The current LOM plan annual ore blocks and sequence of annual mining is shown in Figure 10. The cross-country distance travelled by the dredges and trailing concentrator is significant, which requires good planning and execution of site infrastructure relocation.

ATLAS-CAMPASPE TECHNICAL REPORT SUMMARY 17 Figure 10: Annual Ore Blocks for the Life of Mine Plan

ATLAS-CAMPASPE TECHNICAL REPORT SUMMARY 18 14 Processing and Recovery Methods Spiral wet gravity concentrators are used for the recovery of VHM at Cooljarloo. The spiral circuit consists of five stages: roughers, middlings, cleaners, recleaners and classifiers. Clay fines are managed by entrapment in sand tailings and natural thickening and removal in the pond. No flocculants are required in the process. The plant spiral circuit layout is set up as two parallel streams as this facilitates steady operation should one dredge be shut down and also facilitates access for unscheduled maintenance events. The dredges and the concentrator are electrically powered, predominantly consumed by the various pumping duties between process stages. The total power consumption is approximately 9Mwhr with the major power consumers being Cooljarloo 1 dredge at 3Mwh, Pelican dredge at 1.6Mwh and the wet concentrator at 4Mwh. The operation runs 24 hours per day, 365 days per year and has shift operators, a day crew, maintainers, and sundry support personnel directly employed. Overburden removal and postmining land forming is done by contractors. Drained HMC at Cooljarloo is loaded by front end loader into 93 tonne triple road trains for haulage to the Chandala Mineral Separation Plant. Haulage of HMC to, and mineral product from, the MSP are managed by a logistics contractor. Both the mine and MSP are based on physical separation processes. There is no need for chemical or physical alteration in order to achieve good product recovery and quality. Attritioning is a critical process step to ensure clean mineral surfaces that are responsive to the electrostatic HT separators. The attritioned HMC is presented by filter belt to a natural gas fired drier that not only removes the moisture but heats the mineral so that it is most responsive to the primary stage electrostatic separation circuit. The unit operations at the MSP are many and varied but the significant ones are as follows: (1) vibrating and reciprocating woven wire screening, (2) mechanical slurry attritioning, (3) gas fired fluid bed drying, reheating and cooling, (4) HT Roll, Coronastat and Plate electrostatic separators, (5) Rare Earth Drum, Rare Earth Roll, Induced Roll and Semi-Lift magnetic separators, (6) Hydrosizing and (7) spiral gravity and centrifugal jig concentrators A simplified schematic flowsheet for the Chandala MSP is shown below in Figure 11. Figure 11: Schematic MSP Flowsheet ( Flowsheet needs updating to reflect the one Leu product)

ATLAS-CAMPASPE TECHNICAL REPORT SUMMARY 19 Typical saleable mineral product qualities are shown in Table 5 below. Table 5: Mineral Product Qualities Ilmenite Rutile Zircon TiO2 % 60.5-63.0 93.0–95.0 0.08-0.15 Fe2O3 % 32-34 0.7-0.9 0.03-0.06 ZrO2 (inc HfO2) % 0.2 0.5-0.8 66.0-67.0 MnO2 % 1.1-1.4 - - SiO2 % 0.6-0.8 0.6-0.85 32.1 – 32.8 Al2O3 % 0.7-1.0 0.25-0.4 0.4-0.6 V2O5 % 0.20-0.25 0.4-0.5 - The MSP processes all the HMC produced at the mine in that year. Power consumption is 1.9Mwh. The plant has shift operators, a day crew, maintainers, and sundry support personnel directly employed. Table 6: Estimated saleable product yield (recovery) for the year ended December 31, 2021: Description Total Recovery % Ilmenite 84.7 Zircon 83.2 Rutile 88.0 Leucoxene 78.7 In the opinion of the QP, the methodology employed in this section was appropriate and the data derived from the testing activities described above are adequate for the purposes of defining a Mineral Resource as of the effective date of this report. 15 Infrastructure The Brand Highway is a major bitumen road running from Muchea, just North of Perth up to Geraldton, a provincial city 450km north of Perth. The road runs just past the Western boundary of the Chandala site and just past the Eastern boundary of the Cooljarloo mine site. It is suitable for all weather and wide loads. There is a 132kV power line that also runs from Perth to Geraldton and passing near the Chandala site and through the mine site. Tronox has a substation on its property in order to draw and reticulate 22kV power from the sub-station connected to the main high voltage distribution line. At the various locations power is ultimately transformed down to 415V. The same situation exists for Chandala and it gets power from the same main line. Two gas pipelines run just a kilometre to the West of the Chandala site. They are referred to as the Dampier to Bunbury Natural Gas pipeline (DBNG) and also the Parmelia line which originates just south of Geraldton. The Chandala Mineral Separation Plant currently gets supply for driers and re-heaters from the Parmelia line. The countryside surrounding both Chandala and Cooljarloo is relatively flat. This made the construction of buildings and fixed plant straightforward. Storage ponds for solid waste from the MSP were able to be made quite shallow only being a few metres above natural ground level. There is a large freshwater aquifer (Yarragadee) immediately to the west of the Brand highway adjacent to the Chandala site. Tronox has a borefield there to supply the licensed 1megalitre/annum of water that the site requires. Even in times of severe drought, supply from this aquifer has never been at risk. Cooljarloo draws from an extensive field of relatively shallow bores and also an extension of the Yarragadee aquifer. To limit pumping distances, it has been preferable to have multiple smaller bores around the site since the dredging operation has travelled more than 40km within the mining lease area since 1989. Tailings disposal at Cooljarloo is all placed behind the dredging operations and incorporated into rehabilitation. There is a registered waste disposal pit where wastes from the MSP, the Synthetic Rutile plant and from the Kwinana pigment plant are licensed to be stored. That pits are constructed above the water table and are clay lined and when full, capped to minimize the ingress and egress of water. The Chandala operation utilizes two port facilities. The Port of Fremantle is used for export of bagged and containerized mineral products and the Port of Bunbury is used for bulk shipments. Tronox rents storage and warehousing facilities at or nearby to those sites. For Cooljarloo there is a new permanent single person’s quarters (SPQ), capable of accommodating the majority of the work force. At Chandala, employees and contractors are primarily sourced from the Perth metropolitan area.

ATLAS-CAMPASPE TECHNICAL REPORT SUMMARY 20 16 Market Studies The principal commodities titanium and zircon are freely traded, at prices and terms that are widely known, so that prospects for sale of any mineral production are virtually assured. Tronox is among the world’s leading producers of TiO2 based pigments and has the specific strategy of being predominantly vertically integrated. This means that its own mining production will provide the bulk of the titanium feedstock to its 9 pigment plants, located around the globe. Tronox Management Pty Ltd now markets all mineral products sold emanating from the Cooljarloo mine. However with the integrated pigment strategy, this predominantly relates to the range of zircon products and a relatively immaterial amount of sandblasting staurolite product. The Cooljarloo zircon products are highly sought for use in tile ceramics and refractories. Tronox routinely uses the services of various industry trade consultants to closely monitor and report on global production of titanium minerals and zircon as well as reporting on the current global supply and demand status, plus projections of new projects to come on stream, both timing and capacity. Export and import data by country is monitored. As noted earlier, zircon, TiO2 feedstock and TiO2 product pricing are internationally traded, specialized commodities. Generally speaking, the prices of our products are substantially in line with the prices for each of these products published quarterly by TZ Minerals International Pty Ltd (TZMI) and other independent consulting companies who track the mineral sands, titanium dioxide and coatings industries. The ilmenite product is of chloride grade and has a micro-porosity/reactivity that makes it ideally suited to the Becher Synthetic Rutile process or direct chlorination. Natural Rutile has been marketed in the past with a TiO2 content of 95+% but is currently blended with leucoxenes and consumed internally by Tronox. The bulk of Cooljarloo zircon is classified as Premium Grade. A couple of slightly higher contaminant grade products called HTZ and ZCM are also produced and generally sell for a price in proportion to the zircon content. Over the past decade Tronox zircon has consistently sold in line with market pricing. 17 Environmental studies, permitting and plans, negotiations, or agreements with local individuals or groups The aim in rehabilitation is to replicate the nature of the original soil profiles within mined out areas. Cooljarloo sand tailings material comprises benign quartz sands with minor clays and heavy minerals and settle to a final dry bulk density of 1.5 t/m3. Tailings and clays are, in the main, handled and stored separately. Clays are commonly pumped at a solids content of 25%, drying to approximately 95% solids (dry bulk density = 1.5 t/m3). Water used in the processing of the mineralized sands is basically fresh with very low salinity levels. Clays liberated from the ore are managed, in the majority, by solar drying. This approach requires dedicated clay drying cells which are usually constructed within previous mine voids or atop backfilled voids. Solar drying cells are constructed using embankments not exceeding a height of 5 metres. Following final drying and consolidation, additional sands and/or overburden are placed to bring the area to the final designed contour and ensure the appropriate subsoil materials are in place for rehabilitation pursuant to the mine closure plan. Environmental approvals are in place subject to implementing rehabilitation and monitoring programmes based on pre-mining research, establishing long term monitoring studies, prevention of dieback, monitoring of ground and surface water conditions and dust control measures at the MSP, annual reporting and that any proposal to extend mining would require the approval of the Environmental Protection Authority Surface water drains in a westward fashion from the scarp, flowing via a number of creek lines. All watercourses in the area are seasonal, and usually terminate in swamps, or dissipate within the local alluvial soil profile. All current and future above ground Cooljarloo Tailings Storage Facilities (TSF) are rated as Low Hazard, Category 3 in accordance with the DMIRS Guidelines on the Safe Design and Operating Standards for Tailings Storages. Prior to accessing overburden or ore, 100 mm of material is collected in a ‘first cut’ which is broadly considered to be topsoil and is stockpiled accordingly. The ‘second cut’ is 200 mm onwards to the overburden, this represents the subsoil which, when appropriate is collected and stockpiled separately to the first cut topsoil for later use in rehabilitation. Cooljarloo is also an approved mineral residue facility (MRF) and receives waste products generated at the Chandala MSP and synthetic rutile plants as well as by the Kwinana pigments plant. Under the DWER administered Licence L5319/1988/12. The nature of the materials disposed of must be solid i.e. ‘spadeable’. Mining and processing operations at Cooljarloo were established in accordance with the Mineral Sands (Cooljarloo) Mining and Processing Agreement Act 1988. An act of the parliament of Western Australia. Annual reporting of compliance with these conditions is undertaken. A further assessment in relation to the Cooljarloo operations - the Cooljarloo West Titanium Minerals Project - is currently underway. Tronox holds two Native Title Agreements under the Commonwealth’s Native Title Act 1993. Both agreements are with the Yued Native Title Claimant group and relate to the Falcon extension area (reached in 2006) and Cooljarloo West (reached in 2015). These agreements include commitments for the protection of heritage, provision of training/education, business opportunities, and the formation of a facilitation committee and the development of a cultural awareness programme for Tronox staff. Costs are modest and immaterial to the business.In the Qualified Person’s opinion, Tronox’s current plans to address any issues related to environmental compliance, permitting, and local individuals or groups are adequate. Mine Closure Cooljarloo future mine path is predominantly situated on Unallocated Crown Land (UCL) comprising native vegetation occasionally

ATLAS-CAMPASPE TECHNICAL REPORT SUMMARY 21 used for bee keeping or flower and seed picking. Tronox has determined, in consultation with key stakeholders that the UCL within the Mining Lease will be rehabilitated back to a state that is broadly representative of native vegetation communities. The 1040 Ha Mullering Farm is owned by Tronox and will rehabilitate this freehold land to mixed agriculture land-use after mining. Tronox proposes to rehabilitate the freehold land to mixed agriculture land-use after mining. Tronox’s overarching closure objectives are to establish safe and stable landforms capable of supporting: • Sustainable native ecosystems on UCL like that which occurs in adjacent UCL areas: and • Productive agricultural land on Mullering Farm. Following the cessation of mining, some activities will continue that will require active management of environmental aspects. The rehabilitation programme will still require some significant earthmoving activities, decommissioning works will require specialist teams to disconnect, modularize and remove equipment. There will continue to be requirements for water and power. The closure works will not be on the scale of the mining operations in terms of amount of machinery or personnel used. Tronox has developed and implemented an EMS to identify and manage environmental aspects at Cooljarloo. The EMS will continue to be applied during the closure phase to ensure management of continuing activities. Adequate resources will be provided during closure to fulfil the requirement of this Plan. The closure provision is established on the basis of estimates, which include the closure and rehabilitation costs to be incurred after mining operations have ceased. The closure provision represents the present value of the future estimated mine closure cost which is reviewed by management each year. The latest cost estimate was completed in 2021. The mine closure cost provision in Tronox’s books is based on the most recent management cost review and is fully provided for. The balance of the provision represents the present value of the future estimated mine closure cost which is reviewed by management each year. The mine closure cost provision is increased each month as the discount is unwound with the time period to mine closure decreasing, thus ensuring the mine closure costs are fully provided for at the end of mine life. Given the progressive nature of rehabilitation, a considerable amount of data is available upon which the cost assumptions for individual closure tasks can be based. This is further supported by an external consultant review which is conducted every five years. Key assumptions relevant to closure cost estimation and provisioning at Cooljarloo are listed below: Disturbed areas will be progressively rehabilitated over the life of mine with a minimum area of around 1,250 ha required for active working and operations (i.e. infrastructure and voids). At the end of mining, it is expected that a 20 ha dredge void will be backfilled using previously constructed overburden dumps on Mullering Farm or other equivalent areas. In total, mining and ancillary activities will have disturbed up to a total of 7800 ha by the time mining is complete in 2040 and final rehabilitation of all disturbed areas is expected by 2045. At closure it is expected that sufficient slime drying cells will be constructed to allow for the storage and drying of any clay fines produced in the last years of production (~100 ha). Land farming and rehabilitation requirements will be aligned with agreed completion criteria for UCL and farm areas. In 2020 when the Cooljarloo Act was replaced with Mining Lease 70/1398 Tronox became required to lodge a sum of approximately US$280 thousand to a Western Australian State based Mining Rehabilitation Fund. This is an annual fee based on open area of the active mine at Cooljarloo and used to fund the rehabilitation of legacy mined out areas around the State. This has nothing to do with Tronox rehabilitation performance, which is in good standing. The total of the mine closure provision is currently estimated to be US$34 million in real terms. 18 Capital and Operating Cost As the operation commenced in 1989 the project capital is no longer a relevant factor in determining the economic viability of the property. However the economic analysis allows for ongoing minor stay in business capital and also a pre-feasibility estimate of a range of US$40 to US$70 million for the Cooljarloo West mine extension project. The operating costs are known and no longer subject to estimate. Costs used in the economic analysis come from Tronox internal cost accounting systems. Our projected average annual operating and capital costs from our Cooljarloo life of mine model at December 31, 2021 were as follows: Table 7: Average Annual Capital Cost Estimate (US$/Mpa, 2021 real terms, rounded) Life of Mine Estimate (2022 – 2040) Category 2022-2026 2027-2031 2032-2036 2037-2040 LOM Total Sustaining Capital 14 14 14 14 248 Major Infrastructure Investment 0 3 13 0 82 Total Capital Expenditure 14 17 27 14 330 Table 8: Average Annual Operating Cost Estimate (US$/Mpa, 2021 real terms, rounded) Life of Mine Estimate (2022 – 2040) Category 2022-2026 2027-2031 2032-2036 2037-2040 LOM Total Mining and Concentration 44 42 49 40 804

ATLAS-CAMPASPE TECHNICAL REPORT SUMMARY 22 Table 8: Average Annual Operating Cost Estimate (US$/Mpa, 2021 real terms, rounded) Life of Mine Estimate (2022 – 2040) Category 2022-2026 2027-2031 2032-2036 2037-2040 LOM Total Dry Mill 14 14 15 15 265 Realization 5 6 8 6 109 Total Operating Expenses 63 62 72 61 1,178 For this report, capital and operating costs for the year ended December 31, 2021 have been estimated to an accuracy of +/-15%. 19 Economic Analysis For the financial modelling that supports the current Reserves, a range of mining block schedules are prepared by the senior mine development engineer. These schedules contain information on ore tonnes and grades, mineral assemblages, predicted product qualities, clay fines levels as well as other information that may impact on throughputs, recoveries and costs. Whilst the resource modelling is done on the basis of approximate potential revenues and costs likely to be incurred, the financial modelling is a more detailed second iteration. Historical performance validated forecasting models have been used to predict a range of physical performance parameters for future ore blocks to be mined over the remaining life that are used as input drivers to the financial modelling and economic validation. Grouped cost drivers, physical and revenue parameters used in the modelling. There are many mineral sands mines operating worldwide. Many as standalone mineral sales operations producing mineral products similar to those emanating from Cooljarloo. With so many operations selling titanium and zircon mineral products on the open market Tronox chooses to value its ore reserves on the basis of what it would have to pay to buy the mineral products, if it didn’t produce and use them itself. Mineral pricing data is readily available through a number of industry sources and from Tronox own marketing team. The current Cooljarloo orebody is expected to be depleted by 2033 at which time the dredge mining operation will progress to Cooljarloo West and spend a further 7 years mining that deposit. Key cost assumptions, macro and mineral price assumptions: To determine the economic viability and cash flows of the Cooljarloo project, the Company utilized management’s best estimates of the following key assumptions for the mining operations: 1) overburden removal cost, 2) plant variable cost, 3) concentrator fixed costs, 4) tailings fixed costs, and 5) maintenance, overhead and support services costs; and for the separation plant, the assumptions are as follows: 1) plant variable costs, 2) MSP fixed costs, 3) HMC haulage rates and 4) maintenance, overhead and support services. Other key assumptions were mineral royalties, distribution costs, mine and concentrator and MSP capital spending, tax rates, and exchange rates. Cash flows are positive for all years in the Life of Mine Plan out to 2040. The physical mining and processing parameters used in the life of mine plan and applicable to exploiting the reserves result in a mine life of 19 years and product yields from in ground mineral to saleable products as follows: • Ilmenite 83% • Rutile 94% • Leucoxene 66% • Zircon 80% Sensitivity analyses were conducted using variants such as commodity price, operating costs, capital costs, ore grade and exchange rates. As a result of these analyses, the project was determined to be economically viable in all scenarios. Table 9: Long term real pricing used in the economic analysis (US$/MT, 2021 real terms, rounded). Product 2016 2017 2018 2019 2020 2021 Forecast 2022 – 2026 (annual average) Forecast 2027 – 2031 (annual average) Forecast 2022 – 2036 (annual average) Forecast 2037 – 2040 (annual average) Chloride Ilmenite 165 158 159 250 230 235 293 312 313 314 Rutile 750 735 819 851 992 932 973 984 960 941 Leucoxene 608 686 690 755 844 873 911 922 900 882 Zircon 1,000 882 1,364 1,587 1,564 1,318 1,378 1,454 1,501 1,524 Consistent with industry standards, Tronox values its mineral reserves based on the prices at which its titanium and zircon mineral products would sell on freely traded markets, as forecasted by third-party industry consultancies.

ATLAS-CAMPASPE TECHNICAL REPORT SUMMARY 23 Table 10: LOM Plan Summary (for the year ended December 31, 2021) Annual Averages(1) 2022-2026 2027-2031 2032-2036 2037-2040 Ore Mined (kt) 21,024 23,143 23,278 23,045 HM (%) 1.9 1.7 2.0 1.6 Ilmenite (in HM%) 58.4 61.5 59.3 61.7 Rutile (in HM%) 5.3 5.5 5.3 5.1 Leucoxene (in HM%) 1.7 2.4 2.9 2.9 Zircon (in HM%) 8.5 11.1 12.2 12.5 (1) Amounts presented are based on weighted averages. Table 11: Historic Plant Throughput and Saleable product yield (recovery) (for each of the three years ended December 31, 2021) Annual Total 2019 2020 2021 Plant Throughput (kt) 23,808 25,104 23,558 Ilmenite saleable product yield (recovery) (%) 75.6 80.2 95.8 Rutile saleable product yield (recovery) (%) 89.6 93.9 92.3 Zircon saleable product yield (recovery) (%) 69.5 75.5 89.7 Leucoxene saleable product yield (recovery) (%) 74.7 90.0 90.9 Table 12: Average Annual Cash Flow Analysis of Cooljarloo (for the year ended December 31, 2021) Cash Flow (US$ million) 2022-2026 2027-2031 2032-2036 2037-2040 LOM Total Chloride Ilmenite 58 63 71 63 1,149 Zircon 38 52 66 58 956 Rutile 20 21 21 17 360 Leucoxene 2 3 10 10 108 Revenue 118 139 168 148 2,573 Operating Costs 63 62 72 61 1,178 EBITDA 55 77 96 87 1,395 Income Tax (-) 0 0 0 6 19 Capital Expenses (-) 14 17 27 14 330 Free Cash Flow 41 60 69 67 1,046 The sole purpose of the operational and related financial data presented is to demonstrate the economic feasibility of the mineral reserves for the purpose of reporting in accordance with subpart 1300 of Regulation S-K, and should not be used for other purposes. The information presented originates from comprehensive techno-economic modelling, which is subject to change as assumptions and inputs are updated, and as a result does not guarantee future operational or financial performance. Consistent with industry standards, Tronox values its mineral reserves based on the prices at which its titanium and zircon mineral products would sell on freely traded markets, as forecasted by third-party industry consultancies. Table 13: Sensitivity Analysis (for the year ended December 31, 2021) Economic sensitivity analysis results are presented below based on variations in significant input parameters and assumptions. Ave Annual Cashflow (US$Mpa) -25% -10% Reference +10% +25% Commodity Price 23 43 55 65 80 Operating Costs 71 61 55 49 40 Capital Costs 60 57 55 53 51 Ore Grade 25 44 55 64 78 Exchange Rate 43 50 55 60 67 20 Adjacent Properties

ATLAS-CAMPASPE TECHNICAL REPORT SUMMARY 24 Not applicable. 21 Other Relevant Data and Information • Glossary of Terms summarised in Table 14.

ATLAS-CAMPASPE TECHNICAL REPORT SUMMARY 25 Table 14: Glossary of Terms Symbol Description AC Air Core drilling DMIRS Department of Mines, Industry Regulation and Safety DTM Digital Terrain Model DWER Department of Water and Environmental Regulation CPI Consumer Price Index a measure of inflation EBITDA Earnings Before Interest, Tax, Depreciation and Amortisation GPS Global Positioning System HMC Heavy Mineral Concentrate HM Heavy Minerals HT Roll A high voltage electric charging mineral separator JORC Code Australasian Code for Reporting of Exploration Results, Mineral Resources and Ore Reserves LOMP Life of Mine Plan MA98 Tronox Method of determining mineral assemblage using XRF and algorithms Mbcm Millions of bank cubic metres ML Mining Lease MSP Mineral Separation Plant Mt Million tonnes MWh Mega Watt Hour, a unit of electricity consumption Neighbourhood Analysis Method of classifying multivariate data according to a given distance, provides optimal parameters for modelling. NYSE New York Stock Exchange DFS Definitive Feasibility study QA/QC Quality Assurance/Quality Control QEMSCAN Quantitative. Evaluation of Materials by Scanning. Electron Microscopy Clay Fines Industry term defined in Tronox as material passing a 63 µm sieve and generically meaning “clay and silt sus- pended in water”. Strandline Line of concentrated heavy minerals usually associated with historical shorelines THM Total Heavy Minerals VHM Valuable Heavy Minerals (total of Ilmenite+Rutile+Leucoxene+Zircon) XRF X-ray fluorescent Analysis Yield The recovered weight of material to a saleable product 22 Interpretation and Conclusions The declaration that the Cooljarloo operations have 361Mt of ore reserve at 1.8% HM grade and resources of 292Mt and 1.5% HM grade is well supported. The mineralization in the deposit varies relatively gently in lateral dimensions. The basement material is often mineralized as well, and the overburden sands also mineralized often only marginally below cut-off grade. Although the deposit is low grade by world standards, parameters like the drill hole spacing generally being much closer than variogram distances, the metre-by- metre downhole analysis, the attention paid to domain composites in which the analysis partially mimics the production process,

ATLAS-CAMPASPE TECHNICAL REPORT SUMMARY 26 the accuracy of analytical checks and the reconciliation between plan grade forecasts and actual grade mined and processed all provide solid support for there being a low margin for error. The minerals in the deposit are relatively clean with limited existence of inclusions and composite grains. This all supports the high recoveries observed in processing. The product qualities are excellent with the high TiO2 ilmenite being suited for synthetic rutile production, the rutile and leucoxene suited to direct use in chloride pigment processes that Tronox predominantly operates and the zircon well regarded for use in ceramics. Cooljarloo has a good record for rehabilitation of past mining areas, groundwater management, control of dust and radiation management. Relationships with key stakeholders and government regulators are also in good standing. The LOMP runs through to 2040, with closure and rehabilitation plans and financial provisions being made. On a mineral only basis, financial modelling shows that future reserves are profitably mineable with the existing equipment and infrastructure. In the Qualified Person’s opinion, all issues relating to relevant technical and economic factors likely to influence the prospect of economic extraction can be resolved with further work. The Cooljarloo operations are a key part of the Tronox vertically integrated pigment production process. 23 Recommendations That geological work continues to better define the economic margins of the resources, looking for inclusion, at least in part, as reserves to further extend mine life. 24 References List of References summarised in Table 15. Table 15: List of References Title Cooljarloo Heavy Mineral Sands Project Definitive Feasibility Study 1988 Tronox Northern Operations 2021 Annual Resources and Reserves Report Cooljarloo Mineral Sands Mining Proposal – February 2020 Tronox Mineral Sands Mine Closure Plan – February 2020 South Mine Step Change Project DFS 2010 25 Reliance on information provided by the registrant The preparation of this Technical Summary Report relies on information provided by Tronox and its employees in the following areas, as they are reasonably outside the expertise of the qualified persons. • Marketing plans and pricing forecasts as key inputs to the economic modelling. • Environmental performance commitments and mine closure costing • Maintenance of licenses and other government approvals required to sustain the LOMP • Capital to progress the mining of the Cooljarloo West deposits At least one of the qualified persons has functional knowledge of current sales prices and has been involved in economic analysis, at a strategic level, of third-party projects. But there has been no direct engagement in the determination of macro forecast parameters. Similarly at least one of the qualified persons has had direct involvement with historical rehabilitation practices but there has been no direct involvement with the mine closure costing estimate nor the post land forming rehabilitation and regulatory commitments Whilst at least one of the qualified persons has been engaged with the plan to relocate to Cooljarloo West and engaged in estimating the financial worth of that mine life extension, it is assumed that funds will be available to enact the plan when the time comes. 26 Date and Signature Page This report titled “Cooljarloo Technical Report Summary” with an effective date of December 31, 2021 was prepared and signed by: /s/ Alan Heptinstall Alan Heptinstall, Manager Minerals Resource Development Dated at Muchea, Western Australia February 21, 2024
EX-96.2
14
ex962202310k.htm
EX-96.2
ex962202310k

1 ATLAS-CAMPASPE TECHNICAL REPORT SUMMARY Exhibit 96.2 Atlas-Campaspe Technical Report Summary Explanatory Note This Technical Report Summary (TRS), dated February 21, 2024, serves as an amendment to, and restatement of, the TRS filed on February 22, 2022, effective December 31, 2021, following Tronox Holding plc’s receipt of a comment letter from the U.S. Securities and Exchange Commission. While this Amended TRS incorporates changes to the original version, it maintains an effective date of December 31, 2021 with regard to assumptions and the knowledge of the Qualified Persons. Notable revisions and changes to the previously filed TRS were as follows: • Inclusion of the coordinates of the mine (Section 3) • Inclusion of a stratigraphic column (Figure 4) • Inclusion of the Qualified Person opinions regarding sample preparation, security, and analytical procedures; the metallurgical data; the current plans to address any issues related to environmental compliance, permitting, and local individuals or groups; and issues relating to relevant technical and economic factors likely to influence the prospect of economic extraction can be resolved with further work (Sections 8, 14, 17 and 22) • Amended cutoff grade disclosure (Section 11) • Inclusion of saleable product yield (Table 5) • Amended mine closure disclosure, including closing/reclamation costs (Section 17) • Inclusion of operating and capital costs for life of mine (Tables 7-8) • Inclusion of accuracy of capital and operating costs estimates (Section 18) • Inclusion of market price projections (Table 9) • Inclusion of annual life of mine production schedule (Table 10) • Inclusion of a cash flow analysis (Table 11) • Inclusion of a sensitivity analysis (Table 12) 1 Executive Summary The Atlas-Campaspe Project is currently under construction and will replace production from the existing Crayfish, Ginkgo and Snapper mining operations in New South Wales. Heavy Mineral Concentrate (HMC) produced at the Atlas and Campaspe mines will be transported by road train and rail to the existing mineral separation plant (MSP) at Broken Hill. As it does now, the Broken Hill MSP will produce a non-magnetic concentrate which is then transported by rail and subsequently shipped to Bunbury in Western Australia for processing at the North Shore MSP into rutile, zircon and leucoxene products. The Broken Hill MSP will also produce a range of ilmenite products. Atlas and Campaspe are situated on an historical coastline and made up of conventional mineral sands strandlines. The deposits are eminently suited to standard dry mining techniques and gravity mineral concentration. There is one Mining Lease and the Atlas Campaspe Mineral Sands Development Consent held 100% by Tronox Mining Australia Ltd., a wholly owned subsidiary of the Company. The current reserves are 107Mt at 6.3% HM giving an 11 year mine life. The resources, additional to the reserve tonnage, are 114Mt at 3.0% HM. 2 Introduction This report has been prepared by Tronox Holdings Plc in compliance with the US Securities and Exchange Commission’s modernisation of reporting rules for geological resources and reserves for the Atlas and Campaspe deposits located in New South Wales, Australia. Information used to support this technical summary of the geology includes the annual Resources and Reserves report, the Definitive Feasibility Study and various other relevant study documents. A Qualified Person visits the operating mine sites on at least a quarterly basis. Discussions with site management on resource utilisation and optimisation opportunities are also completed regularly. Visits to the drilling areas are also completed, at a minimum, on a quarterly basis. 3 Property Description

2 ATLAS-CAMPASPE TECHNICAL REPORT SUMMARY Tronox Mining Australia Ltd is a subsidiary of Tronox Holdings plc and is the operator of Tronox Eastern Operations which includes: • The Crayfish, Ginkgo and Snapper Mines, 110 kilometres north of Wentworth in southwestern New South Wales, where heavy mineral concentrates are currently produced from dredge mining operations; • The Atlas-Campaspe project in southwestern New South Wales, 120 kilometres northeast of Mildura, where site development has commenced for future mining operations and also shown in Figure 1; • Broken Hill Mineral Separation Plant in southwestern New South Wales, where the heavy mineral concentrates (HMC) are separated into mineral products; • Adelaide Port space where bulk mineral sands products from Broken Hill are loaded for export and transhipment is leased. See Figure 1 on next page.

3 ATLAS-CAMPASPE TECHNICAL REPORT SUMMARY Figure 1: Regional location of Atlas/Campaspe Project

4 ATLAS-CAMPASPE TECHNICAL REPORT SUMMARY The Atlas mine is located at coordinates latitude 33°53’S and longitude 143°21’E. The Campaspe mine is located at coordinates latitude 33°49’S and longitude 143°22’E. Mining tenements in Australia are managed at the State or Territorial level. In New South Wales, Mining Leases, Exploration Licenses and Assessment Leases are granted and administered by the New South Wales Department of Primary Industries Mineral Resources Division. The Development Consent for Atlas and Campaspe was granted in June 2014 and construction of the Atlas Project has commenced. The Atlas deposit is secured by Mining Lease 1767. The Campaspe deposit is secured by the Atlas/Campaspe Mineral Sands Project Development Consent SSD_5012 from the Government of New South Wales. The minerals in New South Wales belong to the Crown (the State of NSW) and Tronox is obligated to pay a 4% revenue-based royalty on all saleable minerals produced. All the land encompassing the intended mining area has been purchased by Tronox so no mining compensation payments to landowners will be required as part of the Atlas-Campaspe Project. 4 Accessibility The project area comprises flat to undulating sandplains covered by a combination of grasslands, low woodlands and shrublands. The elevation ranges from approximately 100m Australian Height Datum (AHD) in the west to approximately 70m AHD in the east. The southwestern region of NSW has a semi-arid climate. The project area is located in a persistently dry, arid climatic zone with mostly uniform rainfall distribution throughout the year. The average annual rainfall is 284 mm occurring over an average of 35 days in the year. Mild winters, hot summers and warm spring and autumn weather are typically experienced in the general region. The warmest month of the year is January, with an average maximum temperature of 33 °C. The coldest month is generally July with an average maximum temperature of 15 °C. Soils in the project area are considered stable and calcic with various layers and horizons. The region has a good road network of highways and both bitumen and unsealed local roads. Infrastructure is disclosed in Item 14. 5 History In the Murray Basin fine heavy mineral occurrences were identified from 1982 to 1986 by RioTinto. Subsequently many smaller, coarser and high-grade deposits were also located and these formed the first mineral sands mines to be developed in the region. Bemax Resources discovered the Ginkgo, Snapper and Crayfish deposits in the early to mid-2000’s. Mining commenced at Ginkgo in 2005 and Snapper in 2010. These deposits are still being mined today by Tronox. The Atlas-Campaspe Project is a further development to replace production from the existing Ginkgo and Snapper mining operations, which are expected to be mined until at least 2023. 6 Geological Setting, Mineralisation and Deposit Regional Geology The Murray Basin is a low-lying saucer-shaped basin defined by flat lying Cainozoic sediment, which extends over an area of 320,000 km2 in New South Wales, Victoria and South Australia, surrounding the Murray River. The tertiary Cainozoic sedimentary blanket is generally less than 200m to 300m thick. Only the sediments of the third depositional sequence are of any importance in the present exploration for mineral sand deposits. The third sequence, from Upper Miocene to Pliocene, is 0 to 250 m thick, and formed in an environment of fluvial flood plain to the east, flanking an extensive marine strand plain. Atlas Geology The Atlas resource is a continuous body of mineralisation approximately 15km long and up to 150m wide with an average thickness of 6m. The southern 12km is planned to be mined with HM grade decreasing to the north. A typical cross section is shown in Figure 2 on the next page. The sedimentary package that hosts both the Atlas and Campaspe deposits is typical of most other mineral sands deposits in the Murray Basin, comprising: • Woorinen Formation (recent dunes); • Shepparton Formation (terrigenous fluvio-lacustrine deposits); and • Loxton Parilla Sand (littoral marine sediment) hosting the mineralisation. A consistent high-grade domain, denoted Domain 1, occurs along the length of the deposit which is typically less than 100m wide. The deposit is overlain on average by 26m of overburden which consists of a thin 1- 3 m layer of the Woorinen sandy clay Formation and approximately 20m of Shepparton Formation, which consists of sandy clays and minor sand beds with mildly indurated zones. Geological interpretation splits the high-grade Domain 1, which is defined by a 5% HM grade cut-off, into two sub-domains, 1A and 1B. Domain 1A has an average HM grade of 25.2%, with 17.2% rutile and 11.4% zircon in the HM. Domain 1B typically lies below and to the east of Domain 1A, has an average HM grade of 14.0% and contains 14.6% rutile and 7.7% zircon in the HM. Domain 2 is a lower grade envelope defined by a 1% HM grade cut-off. The orebody dips 39m over 10km, before being faulted up near the northern extent of the ore reserve.

5 ATLAS-CAMPASPE TECHNICAL REPORT SUMMARY Figure 2: Atlas Deposit - Typical Cross Section Campaspe Geology The Campaspe mineralisation is over 20km long and averages 420m wide, defined by 1% HM grade cut-off. The mineralisation averages 12m in thickness. The deposit is shallowest at the south-eastern end, averaging less than 10m of overburden, but deepens to the north with an average overburden depth of 25m. The current plan is to restrict mining to the southern 13.5km of the deposit, up to the fault position at 21500mN. North of this position the mineralisation deepens significantly. Geological interpretation of drill-hole and mineralogical data has delineated five high-grade domains within a broad lower-grade envelope. A typical cross section is shown in Figure 3 below. Figure 3: Campaspe Deposit - Typical Cross Section

6 ATLAS-CAMPASPE TECHNICAL REPORT SUMMARY The resource estimate is in part Measured (100m and 200m spaced drilling) and Indicated (400m spaced drilling) south of the 21500mN fault position, and all Inferred (800m spaced drilling) north of that position, none of which is considered in the current life of mine plans. The overburden consists of a 1m to 6m layer of the Woorinen Formation, consisting of clayey, poorly sorted sands, and an average of 20m of the Shepparton formation consisting of interbedded clays, sands and silts. The thickness of the overburden increases northwards. The Loxton Parilla Sand, hosting the mineralisation, is a fine-to mediumgrained, very well sorted beach sand that averages only 2% clay. The mineralised domains across the deposit are quite variable and represent past beaches and dunes. Domain 1, located on the western side, is the highest-grade beach. Domain 1 is approximately 60m wide and 6m thick, with an average grade of 12.4% HM containing 11.4% rutile and 14.6% zircon. Domains 1 to 4 are broadly based on a 5% HM grade cut-off, whereas Domain 5 is a higher-grade dune with a 3% HM grade cut-off. These high-grade domains can be traced along the length of the deposit. Domain 6 is the halo of low-grade mineralization defined by a 1% HM grade cut-off. The deposit is at surface at the southern end and is predominantly above the water table. The deposit dips northward with the base of deposit dipping below the water table. The most obvious post-depositional structural modification is a significant down-throw of the stratigraphy and mineralisation by approximately 30m at 21500mN. The current mine plan ends at this northern down-throw. Figure 4: Stratigraphic column the Murray Basin: 7 Exploration There is no relevant exploration work to disclose. 8 Sample Preparation, Analyses and Security Drilling and Sampling Reverse circulation “aircore” drilling is completed using a Landcruiser or small truck mounted drill. This style of drilling suits the soft sand ground conditions and the drilling is relatively shallow (40-60m) and very rapid (60 minutes per hole). Holes are drilled vertically using three metre NQ size rods, giving a nominal hole diameter at the bit of 83 mm. Drill samples are collected in one metre continuous intervals from surface. The drill sample return is captured through a cyclone to separate the air and reduce sand/slurry velocity which is then passed through a rotary splitter. All samples are sent to a Tronox internal laboratory for heavy mineral analysis by Lithium Heteropoly Tungstate (LST), SG 2.85. Figure 5 shows the drilling density over the interpreted strandlines at Atlas and Campaspe that form part of the future mine plan. Logging Geological data is collected during the drilling and sampling process to accurately log the different stratigraphic units, and to differentiate the Loxton-Parilla Sands host horizon from the generally un-mineralised Shepparton Sands sequence. The data is also used to help discretise domains. The logging is commenced from surface at 1m intervals until the end of the hole. A measured sub-sample for each metre of the Shepparton Formation Sands/Loxton-Parilla Sands is washed and separated into a mineral concentrate by panning and the amount of HM is visually estimated. Data collected for each metre includes lithology, sample colour, sorting, grainsize, cement type, colour, an estimation of HM, clay fines and hardness; additional comments such as the observation of trash minerals (i.e. garnet) or the water table are also noted.

7 ATLAS-CAMPASPE TECHNICAL REPORT SUMMARY Heavy Mineral Analyses Samples from the field, once dried and crushed, get screened at 2mm to remove oversize, a 70g split is attritioned in water and wet screened at 53 microns to remove silt and clay. The deslimed portion is stirred into a separating funnel of LST solution to split the heavy minerals at 2.85 SG from the floats, mostly quartz. The weight of washed HM sinks are then used to calculate the heavy mineral content as a percentage of the original sample weight (HM%). Assay data is returned from Tronox’s Broken Hill laboratory in digital format and merged into a relational database. Mineralogical Analyses Tronox Eastern Operations uses a mineralogical analysis technique which is a combination of XRF oxide analysis and scanning electron microscopy to identify minerals. The process is undertaken typically on composited HM sinks derived from LST Analyses. Mineralogy from distinct geological domains or strands is generally consistent across an orebody, so retained HM sinks from similar geological domains and strands can be composited together to create mineralogical composites. The XRF analysis requires 3 – 5 grams of material and the electron microscopy scanning process requires 10 grams of material. As such, a minimum of 15 grams is sent off for mineralogical assessment, at SGS in PerthIn the Qualified Person’s opinion, Tronox’s sample preparation, security, and analytical procedures are adequate.

8 ATLAS-CAMPASPE TECHNICAL REPORT SUMMARY Figure 5 : Drill Holes over the Atlas and Campaspe Resource

9 ATLAS-CAMPASPE TECHNICAL REPORT SUMMARY 9 Data Verification Laboratory triplicates are undertaken at a rate of one in every hole drilled. The process involves a triplicate sample being collected during the initial laboratory sample splitting process. A total of 524 triplicate samples were completed in the Murray Basin during 2021. Triplicate samples consist of an original split, a duplicate split for internal analysis and a third for external analysis. Scatterplots are shown below in Figure 6 and Figure 7. Figure 6: Scatterplot Original split HM% compared with internal split HM% The heavy mineral internal comparison shows excellent correlation. No systematic errors or biases were noted during the reporting period. Both the internal and external comparisons show excellent correlation with the original split analysis. The Qualified Person considers the data validation confirms that the accuracy of the mineralisation assays is in line with industry standards and is suitable to support estimates of Resources and Reserves. Figure 7: Scatterplot Original HM% compared with External Laboratory HM%

10 ATLAS-CAMPASPE TECHNICAL REPORT SUMMARY 10 Mineral Processing and Metallurgical Testing Atlas Metallurgical Testing Extensive metallurgical samples have been collected across the entire Atlas deposit from 2011 through to 2016. Forty-five samples based on drilling composites through to 1 tonne bulk samples have been processed at pilot scale to give recovery and mineral quality information. Further test work was also undertaken on 2018 bulk samples to enable plant optimisation work. The results of this work, in combination with the Atlas short term mine grade variability, enabled the operational ranges and control philosophy to be defined and incorporated into the design of the wet concentration plant (WCP). Test work to investigate the option of Dry HMC processing at Broken Hill rather than using current WHIMS separation prior to processing the magnetic fractions separately was undertaken in 2018. This work was conducted at a pilot plant scale and as a plant trial. These studies concluded that dry processing was the preferred option. The benefits of dry processing arise from the improved separation of products at Broken Hill and the reduced transport of lower value product to Bunbury. The metallurgical test programmes were primarily conducted at Tronox North Shore and the Broken Hill metallurgical testing facilities by experienced in house personnel. Campaspe Metallurgical Testing Extensive metallurgical samples have been collected across the entire Campaspe deposit. Six large composites from drilling defined areas were constructed. A further 31 composites from previous drilling on the standard grid were also compiled. Test work was done primarily at the Tronox North Shore metallurgical testing facilities in Bunbury WA. Product quality observations apparent from the test work on both Atlas and Campaspe are: • Elevated Cr2O3 in the ilmenite products, but no higher than that experienced at the current Ginkgo and Snapper ore bodies, the impact of which is easily managed by blending with other feedstocks used in Tronox vertically integrated pigment production facilities. • Elevated Fe2O3 levels in zircon from Atlas are modest and can be managed by mine planning and blending. At Campaspe the levels are somewhat higher and can be substantially eliminated by acid leaching or accepting a modest price penalty. • Elevated levels of SnO2 in rutile produced from Campaspe can be managed by screening the fine cassiterite out and blending with other pigment feedstocks in Tronox pigment plants. 11 Mineral Resource Estimates Resources at Atlas and Campaspe are modelled using ellipsoid inverse distance squared weighting. The models contain estimates of all valuable minerals and all the deleterious trash minerals and metallurgical recovery factors such as grain sizing. These are then uploaded into the scheduling software, Minesched and finally uploaded into forecasting software, SAP. The dates of the Mineral Resource and Reserve estimates for Atlas and Campaspe, and shown in this Technical Summary, are as of December 31, 2021. Geological Modelling A model of the different geological domains is generated using Surpac software. Geological and assay data collected during logging are displayed on graphical sections and unit boundaries/layers are digitised at regularly spaced intervals in a north-south sectional orientation, depending on the location and drill spacing. The digitised strings are then joined together to create Surpac surfaces (DTM). Geological layers are created for any relevant and continuous geological features such as clay layers, basement layers and layers of induration. These layers are used during the estimation process of the “Background” material, that is, the material not bound by interpreted strandlines or mineralised zones. These layers represent major geological changes that occur downhole and ensure that the data used to estimate blocks comes from similar geological domains. See Figure 8 on the next page.

11 ATLAS-CAMPASPE TECHNICAL REPORT SUMMARY Figure 8: Geological Layers and Interpreted Orebody Section at Atlas 4,100mN Interpretations of the mineralised domains are generated in a very similar manner to the geological surfaces and wireframed to created 3-dimensional bodies encompassing mineralisation at designated cut-off grades or representing particular mineralogical characteristics. For the Murray Basin deposits, a nominal cut-off grade of >1% HM is generally applied in order to create realistic shaped mineralised zones for estimation. These domains are later used to constrain block model grades. Block Model Construction Block models are created in Surpac using a parent block size that is generally half of the drill spacing. This is consistent with industry standards. Regular sub-celling for the block model is employed at domain boundaries to allow adequate representation of the domain geometry and volume. The sub-cell size is typically half the parent block size. Grade Estimation and Domain Control Each block within the block model and each composite within the composite database have been assigned a domain code for each of the domains. The estimation of block grades is completed using the domain codes and applied hard boundaries to all domains. Inverse Distance Squared (ID2) was undertaken for heavy mineral, slimes and oversize. Mineral assemblage data is estimated using Nearest Neighbour. Generally, one or two passes were undertaken for all domains however, where drill data is sparse third or fourth estimation passes were undertaken. Occasionally, estimation passes use other data from neighbouring domains where full estimation was difficult. This usually occurs on the third or fourth passes only. Search distances and parameters applied during the nearest neighbour estimation of the mineralogical elements are generally required to be more generous due to the sparser nature of the data. High-grade capping No high-grade capping is applied to resource estimations in the Murray Basin because other estimation parameters are used to manage the influence of extreme high values. Density A bulk density formula of 1.62 + (HM% x 0.01) has been used for the Atlas and Campaspe resource models. This formula is based on 27 in-situ nuclear probe samples and is considered appropriate for deposits of this nature. Further bulk density testing is planned prior to commencement of operations. Block Model Validation Block grade estimates are validated by statistical analysis and visual comparison to the input drillhole data. Visual validation is completed by cutting sections through the block model at distances equal to the drill spacing and comparing the block model estimated grade to the drillhole assay data. Statistical validation is completed by the comparison of the mean estimated grades to the mean grade of the input composite data grouped by domain.

12 ATLAS-CAMPASPE TECHNICAL REPORT SUMMARY Optimisation The optimisation process uses mining and revenue parameters to generate a mining outline based on accumulating cash positive subset areas within the block model. A cash positive area is where revenue from dry mill products exceeds the cost of mining that area and processing the resultant concentrate. The optimisation process is repeated using different revenue factors to create a series of nested shells. The top of ore and bottom of ore surfaces are created for each of the revenue factors. These are then run through Surpac again to generate tonnes and grade, whilst ensuring that mined out and sterilised areas are removed from the tonnes. Mining block sequences are created for each of the shells ore tonnes and mineral assemblage information as well as mining and processing costs. Modifying Factors In the resource optimisation, modifying factors including recoveries, ore loss assumptions, operating costs and mineral sales pricing are used to seek the maximum value for a column of mineralization. Cutoff Grade1 The nominal cutoff grade used to estimate resources in Tronox’s Eastern Operations is generally 1% HM. This is between the breakeven grade for the minerals production side of the business and the marginal cost grade where certain material needs to be moved and it is cheaper to process and receive revenue than it is to extract it with earth moving equipment and transport it the waste dump. The 1% HM cutoff grade generally follows a natural geological boundary and allows smooth geometric shapes to be modelled. The 1% HM cutoff also captures all material within the deposit which has the potential to be economic. The reserve estimates are calculated during a resource optimization process using a series of complex mathematical routines. Inputs to the optimization process include mineral pricing, saleable product yield (recovery), variable costs and fixed costs. When the optimization process is run over the three-dimensional resource model, which contains variable HM grades, variable mineralogy, variable clay and rock content, variable orebody thickness and variable depth of burial the optimization process determines which parts of the resource should be converted to reserves. As such, it is not possible to quote a single cutoff grade as the reserve at any given location is a combination of HM%, clay%, mineralogy, orebody thickness and depth of burial. The base assumptions used in this optimization process are: • Saleable product yield (recovery): ilmenite 96%, rutile 92.2%, zircon 78.8% and leucoxene 87.4% • Commodity prices: $234/metric ton for chloride ilmenite, $162/metric ton for sulfate ilmenite, $1,059/metric ton for rutile, $1,512/metric ton for zircon and $300/metric ton for leucoxene • Operating cost: $14 per metric ton ore mined • Mineral prices used are substantially in line with the prices for each of our products published quarterly by third-party independent consultancies. The long term mine plan and reserve estimates are derived from detailed techno-economic models created from geological, mining and analytical databases, and optimized with respect to anticipated revenues, and costs. Cost assumptions are developed from our extensive operating experience at Ginkgo and Snapper as well as from other Tronox sites and include mining parameters, processing performance, and rehabilitation costs. Predicted mining and processing metrics are reconciled with actual production and recovery data on a monthly basis. Classification of Resources is based on: • Drill density • Survey method and accuracy • Drilling method and sampling interval • Continuity of mineralisation and geological units • Reliability of assay method and mineralogical information • Frequency and results of QA/QC data • Initial financial assessment from optimisation • Tronox relies on constraining grade variation by drilling on progressively tighter grid patterns. Initial exploration results for Inferred resources will generally be reported on a drill hole grid spacing of 1,600m x 80m or as access allows. All holes are sampled at 1m intervals. For the style of mineralisation being investigated (strandlines), this will generally produce three or four line intercepts which confirms approximate width and strike but may be open ended. Indicated Resources will generally be reported based on an 800 x 40m grid or 400 x 20m grid. This will generally constrain the strands limits, confirm strike across several line intercepts and provide good confidence of grade continuity. Measured Resources use a 200 x 20m grid, 100 x 20m grid or a 50m x 20m grid with 10m infill near boundaries. Thinner, high-grade strands may require a closer spaced grid before being considered Measured. This will constrain volumes over many drill section intercepts, provide confident grade variation control over multiple internal populations and provide adequate lithological information to determine mining criteria. XRF and Valuescan mineral assemblage assays are applied on both individual down hole composites and along section composites made up from multiple drillholes within the geological domain. The initial financial assessment from optimisation, as well as grade tonnage curves, also aid in the classification of resources and reserves. 1 Note to Tronox: We have tried to consolidate the this discussion with the existing disclosure – defer to the QPs on whether the remaining portions of the existing disclosure are relevant.

13 ATLAS-CAMPASPE TECHNICAL REPORT SUMMARY The categorisation of resources is made based on the judgements of the Qualified Person, in consultation with the Mining Development Engineer and Resource Geologist. Tronox uses breakeven contribution as a guide to cut-off determination rather than just grade. This allows for the polymetallic nature of the resource and the broad mineralisation of surrounding areas. As costs change over time and long-term revenue values change, new reviews are conducted which may lead to a different shell becoming optimal. A summary of Mineral Resources as of December 31, 2021 are included in Table 2 on the next page. Table 2: Summary Mineral Resources as of December 31, 2021 Deposit Mineral Resource Classification Tonnes of Material (Mt) Grade HM% Tonnes of HM (kt) Clay Fines Content (% of material) Mineral Assemblage Ilmenite +Leucoxene (% of HM) Rutile (% of HM) Zircon (% of HM) Atlas Measured 9 2.7 229 2.7 58 14 8 Campaspe Measured 23 2.6 575 2.1 59 9 13 Inferred 83 3.1 2,599 2.6 60 6 13 Measured 31 2.6 804 2.3 59 11 12 Indicated 0 0.0 0 0.0 0 0 0 Inferred 83 3.1 2,599 2.6 60 6 13 Total Mineral Resources 114 3.0 3,404 2.5 60 7 13 *N.B. Resources are Exclusive of Mineral Reserves The Qualified Person considers the data validation and geological modelling processes in addition to monthly and annual reconciliations between forecast grades and actual mined grades from current operations at Ginkgo and Snapper where the same processes have been used confirms that the mineralisation estimates are in line with industry standards and is entirely suitable to support estimates of resources and reserves. 12 Mineral Reserve Estimates Mineral reserves are subsets of resources having used the same modelling processes for resources, but with a higher financial outcome metric applied and a more rigorous application of modifying factors. Table 3: Summary Mineral Reserves as of the 31st December 2021 Deposit Mineral Reserve Classification Cut-off Grade (HM%) Ore Tonnes (Mt) Grade HM% Tonnes of HM (kt) Clay Fines Content (% of Ore) Mineral Assemblage Ilmenite + Leucoxene (% of HM) Rutile (% of HM) Zircon (% of HM) Atlas Proved 1.0 11.6 15.0 1,742 2.0 60.9 16.3 10.3 Campaspe Proved 1.0 39.0 4.9 1,931 2.3 60.4 11.0 13.1 Probable 1.0 56.5 5.4 3,052 2.3 60.3 10.0 13.1 Proved 1.0 50.6 7.3 3,674 2.3 60.6 13.5 11.8 Probable 1.0 56.5 5.4 3,052 2.3 60.3 10.0 13.1 Total Mineral Reserves 1.0 107.1 6.3 6,725 2.3 60.5 11.9 12.4 1) Mineral prices used in reserve estimation are substantially in line with the prices for each of our products, published quarterly by independent consulting companies 2) Conversion of in ground grade to saleable product yield, taking into account all of the losses in mining and processing, is for ilmenite typically 93%, for rutile 89%, for Leucoxene 109% and for zircon 75% 13 Mining Methods Mining commences at Atlas for approximately 3 years. Mining will then transition to Campaspe, which will be mined for approximately 8 years. Average feed grade to the WCP varies between the Atlas and Campaspe deposits, with Atlas averaging 15.4% HM whilst Campaspe averages 5.2% HM. The nominal mining rate for each mine normalises annual HMC production. The Atlas and Campaspe orebodies will be mined in the sequence shown in Figure 9 on the next page.

14 ATLAS-CAMPASPE TECHNICAL REPORT SUMMARY Figure 9: Atlas-Campaspe Mining Sequence Atlas Mine Plan The Atlas deposit will be dry mined for both overburden and ore extraction. The WCP will be centrally located. Ore is to be trucked from the pit and delivered to the Dry Mining Unit (DMU), which will be periodically relocated along the mine path during the life-of- mine. Ore will be pumped from the DMU to the WCP for processing. Tailings will initially be placed off-path but will subsequently be placed on the mine path into the voids left behind as mining advances. The start-up pit is to be located at the midpoint of the mine path. Selection of the startup pit location has been optimised to minimise the volume of the start-up pit and also to commence mining in higher grade ore in order to maximise initial production. The location of the start-up pit also has the advantage of being in close proximity to the WCP and associated process infrastructure during commissioning and ramp up of operations. From the start-up pit, mining will advance towards the southern end of the mine path as shown in Figure 9 above. Mining to the south will be stopped immediately prior to the area of the deposit exhibiting elevated zircon iron staining at the southern end of the mine. Mining will resume from the start-up pit advancing north before completing the southern end of the mine. Tailings produced during this initial mining stage will be pumped from the WCP to an Off-Path Tailings Dam (OPTD) until tailings can be accommodated in the voids left behind as mining advances along the mine path. Figure 10 below shows that the resources clearly surround the mineable reserves and therefore the impact of ore dilution will be limited because of the significant grades in the resources.

15 ATLAS-CAMPASPE TECHNICAL REPORT SUMMARY Figure 10: Location of Resources relative to Reserves

16 ATLAS-CAMPASPE TECHNICAL REPORT SUMMARY The overburden at Atlas varies in both thickness and material type. The flexibility provided by truck and shovel operation is the best outcome for Atlas. The northern portion of the central Atlas deposit dips into the water table. Dewatering of this area will be undertaken by means of in-pit sumps as mining advances towards this area. Water supply for mining and processing will be derived from the natural water table as per the current arrangements at the Ginkgo and Snapper operations. The WCP will require a water supply of approximately 400L/s. Studies have shown water losses to tailings, evaporation, and mineral concentrate will be in the range of 200L/s to 250L/s. Make-up water requirements will require seven production water bores. For HMC washing and potable water, the highly saline bore water will be treated through a Reverse Osmosis (RO) plant. Campaspe Mine Plan At the conclusion of mining at Atlas, the Atlas WCP will be moved to a central location at Campaspe. A Primary Concentration Plant (PCP) will be added. Of ore fed to the PCP, 80% of material will be rejected to tailings and 20% will be pumped to the WCP as an upgraded (25% HM) concentrate for further processing. The PCP is designed to be relocatable and will be moved periodically to reduce pumping distances as mining progresses along the mine path. It is intended that the PCP will be relocated on three occasions. Based on both grade variation along the deposit, highest at northern and southern extents of the deposit, and lower overburden at the southern end of the orebody, the best mining sequence is south to north. Commencement of mining at the southern end of the Campaspe deposit will reduce mining haul road and associated infrastructure requirements. It is planned to use the southern void at Atlas to reduce offpath overburden placement. Redundant booster pumps and pipes from the Snapper and Ginkgo operations will be utilised at Campaspe. Campaspe Overburden Mining Methodology Removal of overburden to expose the ore will be undertaken using conventional bulk earth moving machinery. At the planned mining rate an average of 1.15 million bcm of overburden will be removed per year by excavators and trucks over an average haul distance of 1400m. The overburden removal will be a 24/7 operation. Campaspe Ore Mining Methodology The wider and higher mining face at Campaspe is more suited to a dozer trap arrangement with in-pit pumping to the PCP located outside of the pit. Although advance rates at Atlas compel the mining unit to be located outside of the pit, at Campaspe the pit is much wider and advance rates are slower. Three moves of the PCP are planned along the length of the Campaspe deposit to optimise pumping costs. The Campaspe ore face will be up to 18m thick, which is more favourable to dozer operation than conventional truck and shovel. The typical advance of the Campaspe ore face is estimated to be 150m per month. The Campaspe deposit dips northward with the base of deposit dipping below the natural water table. Pit dewatering will be done to facilitate mining. 14 Processing and Recovery Methods On Site Mineral Processing For Atlas, the high variability in the ore grade and the narrow width of the mining face will require blending. Three blending stockpiles in combination with direct discharge of fresh ore from the pit will be wet screened at 4mm and undersize pumped as slurry to the WCP. A 3 stage spiral circuit is used to produce a 94% HM heavy mineral concentrate. The predominantly quartz tailings are returned to the pit while the HMC will be washed in a counter current cyclone circuit using RO water to remove salt. The wet HMC will be stockpiled and allowed to drain to minimise the water content before trucking to the Ivanhoe Rail Facility. The spiral circuit will consist of rougher, middlings scavenger and cleaner stages of gravity separation spirals. A Super-concentrate stream from the roughers will be sent directly to the HMC sump as it is sufficiently high grade to by-pass the cleaner stage. There will be mass flow rate in-stream measurement to identify relative variation in ROM grade and be used to adjust plant throughputs accordingly. Allowances have been made in the spiral circuit and overall WCP plant design to cater for a range of feed rates and densities to each stage of spirals based on expected feed grade variations. Final HMC is densified through a cyclone tower. The clay content of the ore is low and when thickened will be co-disposed of with sand tailings Processing of Campaspe ore requires a 4-stage plant. This will be achieved by combining the Atlas WCP with a newly built PCP, which provides the rougher circuit. The thickening capacity will require upgrade. Field booster pumps and piping from Atlas will be re-used to pump between PCP and WCP while redundant boosters and piping from Ginkgo and Snapper will be used for ore and tails pumping. The PCP will be located close to the mining void, at natural surface and will be relocated four times over the life-of-mine, while the WCP is centrally located is only relocated once over the life-of-mine.

17 ATLAS-CAMPASPE TECHNICAL REPORT SUMMARY Downstream Processing HMC is delivered to the existing Broken Hill site where it will be processed to produce ilmenite products and a non-magnetic concentrate. The ilmenite products will be distributed through the Adelaide port while the non-magnetic concentrate will be further processed to reject predominantly quartz before being transported to Bunbury, WA for additional processing to produce rutile, zircon and leucoxene products in the North Shore facilities. Dry HMC Processing at Broken Hill The current ilmenite circuit will be upgraded with new dry magnet technology that will give improved separation of the ilmenite type minerals. It will have the functionality to produce up to three grades of ilmenite products. The non-magnetics produced from the dry HMC processing is further processed in a gravity circuit to reject residual quartz and low density HM trash minerals. North Shore Processing Once the non-magnetic concentrate is received at the existing North Shore plant in Bunbury WA it will be processed to make rutile and zircon products plus recover any altered ilmenite remaining. The plant will be upgraded to allow for the increased rutile percentage in the feed, increased processing depth due to iron staining and to improved zircon recovery. Figure 11 below shows the flowsheet and modifications planned for the North Shore dry processing of Broken Hill non-magnetics. Figure 11: North Shore MSP Dry Processing circuit

18 ATLAS-CAMPASPE TECHNICAL REPORT SUMMARY The typical final mineral product qualities emanating from the Broken Hill and North Shore MSP’s are shown in table 4 below. Table 4: Expected Typical Mineral Product Qualities Ilmenite BHT Ilmenite BHI Leucoxene Rutile Zircon TiO2 % 56.0 60.7 69.6 94.0 0.12 Fe2O3 % 36.0 29.2 19.6 0.93 0.11 ZrO2 (inc HfO2) % 0.10 0.10 0.31 0.93 66.4 MnO2 % 1.06 1.14 0.66 0.01 - Cr2O3% 1.01 0.92 0.36 0.14 - SiO2 % 0.81 1.14 2.21 1.38 32.4 Al2O3 % 0.9 1.17 1.48 0.20 0.26 V2O5 % 0.22 0.23 0.29 0.20 - U+Th ppm 67 100 230 60 470 Table 5: Estimated saleable product yield (recovery) for the year ended December 31, 2021: Description Total Recovery % Ilmenite 96.0 Zircon 78.8 Rutile 92.2 Leucoxene 87.4 In the opinion of the QP, the methodology employed in this section was appropriate and the data derived from the testing activities described above are adequate for the purposes of defining a Mineral Resource as of the effective date of this report. 15 Infrastructure Atlas Site Establishment Works The Project Development Consent provides for an envelope within which vegetation clearing can occur following pre-clearance flora and fauna surveys. Clearing is undertaken by a bulldozer. Waste vegetation is stockpiled in windrows at the edge of clearing areas for reuse during post-mining rehabilitation. Topsoil and subsoil are being stripped and stockpiled separately for later use in rehabilitation. The Atlas mining civils include the construction of a start-up pit, an OPTD and process water dam as shown in Figure 12 below. Figure 12: Atlas Mining Civil Works Layout

19 ATLAS-CAMPASPE TECHNICAL REPORT SUMMARY

20 ATLAS-CAMPASPE TECHNICAL REPORT SUMMARY The start-up pit is located directly west of the central processing area. A volume of 0.6Mbcm of overburden will be excavated and used to construct the OPTD. The Atlas WCP is modular construction to allow for the offsite fabrication and preassembly of all structural elements to the greatest practical and economic extent. The structural design of the WCP caters for future relocation to Campaspe as a single plant, using self-propelled modular transporters. An on-site 200 person accommodation village is to be constructed to house the workforce and the mine will require a number of permanent and demountable buildings and facilities such as: Administration and Office Building; Workshops; Process Area Crib Room and Amenities; and Main Store. Electrical power will be supplied directly from a centralized 5Mwh diesel generation system. Hydrological investigations have identified a bore field location at the Northern end of the mine path that will be developed. Approximately 5km from the central start-up pit location it will supply water for the mining operations and ancillaries. Based on a test bore a total of seven bore pumps are required to supply the required volume. A RO Plant and potable water treatment plant sized to deliver 115m3/hour is required to supply wash water for the HMC and potable water for site buildings, wash pads and accommodation village. A communication building will be located adjacent to the communication tower for telecom and the Local Area Network (LAN). Data and telephone connection between the communications building, process area, administration area and accommodation aillage will be via a buried fibre optic cable. To ensure that haul trucks comply with legal weight limitations when transporting HMC from the mines, a single axle 50t weigh bridge is to be installed at the HMC loading area. A new rail siding and HMC stockpile facility will be constructed just outside at the township of Ivanhoe, approximately 140km northeast of the Atlas Mine, to allow despatch of Atlas HMC to Broken Hill for further processing. The HMC will be transported to Ivanhoe by Road Trains, and will be stockpiled for loading onto trains for rail transport to the Broken Hill MSP. A 1.7km long rail siding will be constructed, connecting to the existing Interstate Rail Freight Network Parkes to Broken Hill line. The siding is sized to accommodate 66 wagons. Campaspe Site The development of the Campaspe site and required plant to operate includes: • fencing of the mine lease (47km); • construction of the access road (11km); • construction of the mine corridor road (5.4km); • construction of the process water dam (210,000m3); • development of the mining pit; • development of the bore field and water reticulation systems; • relocation of workshops and amenities; • expansion of the accommodation village from 200 to 300 beds; • construction of a PCP; • relocation of the Atlas WCP; • relocation of Ginkgo/Snapper field booster pumps and piping; • mobilisation of the Campaspe DMU; • construction of the HMC pad and relocation of the Atlas HMC tower; and • Upgrading of power generation to 7Mwh DMU will be provided by the mining contractor. The wider and thicker ore body, as well as higher throughputs required a dozer trap style unit rather than the receiving hopper for Atlas. It is anticipated that the unit will be fed by two D10 dozers and relocate across and along the mine path. Optimising push distances of the dozers, around three relocations per month are required. 16 Market Studies The principal commodities titanium and zircon are freely traded, at prices and terms that are widely known, so that prospects for sale of any mineral production are virtually assured. Tronox is the world’s second largest producer of TiO2 based pigments and has the specific strategy of being predominantly vertically integrated. This means that its own mining production will provide the bulk of the titanium feedstock to its 9 pigment plants, located around the globe. Tronox Management Pty Ltd now markets all mineral products sold emanating from the Murray Basin mines. However, with the integrated pigment strategy, this predominantly relates to the range of zircon products and a relatively small amount of lower grade ilmenite. Tronox routinely uses the services of various industry trade consultants to closely monitor and report on global production of titanium minerals and zircon as well as reporting on the current global supply and demand status, plus projections of new projects to come on stream, both timing and capacity. Export and import data by country is monitored. As noted earlier, zircon, TiO2 feedstock and TiO2 product pricing are internationally traded, specialized commodities. Generally, speaking, the prices of our products are substantially in line with the prices for each of these products published quarterly by TZ Minerals International Pty Ltd (TZMI) and other independent consulting companies who track the mineral sands, titanium dioxide and coatings industries.

21 ATLAS-CAMPASPE TECHNICAL REPORT SUMMARY The BHI ilmenite is of chloride grade and has a micro-porosity/reactivity that makes it suited to the Becher Synthetic Rutile process or direct chlorination. The lower TiO2 BHT ilmenite can be used for either smelting or as a blend for sulphate pigment processing. Natural Rutile is the highest-grade feedstock for chloride pigment plants and is consumed internally by Tronox. The leucoxene product made at Broken Hill will have a TiO2 content of just under 70% and will be consumed internally at Tronox pigment plants. Zircon from Atlas-Campaspe contains higher Fe2O3 levels than that typically seen in zircon from the Eastern Operations. Current zircon pricing is based on a maximum Fe2O3 level of 0.08%, however the Zircon from the Atlas and Campaspe deposits have average Fe2O3 grades of 0.10% and 0.12%, respectively and when appropriate prices used in modelling are discounted to reflect elevated iron levels. 17 Environmental studies, permitting and plans, negotiations, or agreements with local individuals or groups The status of all required Federal Government, State government and local shire council approvals, licences or permits are detailed in Table 6. Table 6: Atlas and Campaspe - Status of Approvals, Licences and Permits Domain Required Approval Status Atlas Mine Mining Lease ML 1767 under the Mining Act 1992. Granted February 2018. Campaspe Mine Conversion of part of Willandra East Exploration Lease into a Mining Lease under the Mining Act 1992. Not required until 2023. Atlas-Campaspe Project Development Consent under the Environmental Planning and Assessment Act 1979. Granted June 2014. The Development Consent includes the following approved documents: • Construction Transport Management Plan. • Biodiversity Management Plan. • Noise Management Plan. • Air Quality Management Plan. • Water Management Plan. • Heritage Management Plan. • Environmental Management Strategy. All supporting documents approved. The Development Consent requires the following outstanding management plans: • Radiation Waste Management Plan: The existing Radiation Waste Management Plan requires revision to include AtlasCampaspe product prior to commencement of mining. • Rehabilitation Management Plan: Requires approval prior to commencement of mining. • Operations Transport Management Plan: Requires approval prior to commencement of operations. Currently being compiled. Atlas-Campaspe Project Project approval under the Commonwealth Environment Protection and Biodiversity Conservation Act 1999. Granted September 2014. Atlas Gravel Pits Three Extractive Industry Licences under the Crown Land Management Act 2016. Granted October 2018. Ivanhoe Rail Facility Crown Land Licence under the Crown Land Management Act 2016. Granted May 2017. Ivanhoe Rail Facility Agreement with the Australian Rail Track Corporation (ARTC) for parts of siding on ARTC land to accommodate rail switches. Design has been approved by ARTC. Final design approval in progress. Atlas-Campaspe Project Groundwater allocation licence totalling 14,000ML for AtlasCampaspe under the Water Management Act 2000. Granted February 2013. There are also two minor agreements in place for road diversions between the mine and Ivanhoe to facilitate the road train movement of HMC. In the Qualified Person’s opinion, Tronox’s current plans to address any issues related to environmental compliance, permitting, and local individuals or groups are adequate. Mine Closure Rehabilitation will be completed to the satisfaction of the Resource Regulator and be prepared in consultation with the Department, BCD, DRG, DPIE Water, BSC and CDSC. A Rehabilitation Management Plan must be submitted to the Resource Regulator for approval prior to commencing mining operations on the site. Rehabilitation requirements are extensively outlined in the Environmental Impact Statement and associated management plans stipulated in Appendix 5 of the Atlas/Campaspe Mineral Sands Project Development Consent SSD_5012 from the Government of New South Wales. Progressive rehabilitation of disturbed areas will be conducted where applicable, and at the completion of mining all remaining disturbed grounds will be rehabilitated. All reasonable and feasible measures must be taken to minimize the total area exposed for dust generation at any time.

22 ATLAS-CAMPASPE TECHNICAL REPORT SUMMARY Rehabilitation consists of covering all slurried material, such as tailings, with dry overburden which is sourced from the overburden dumps and subsequently capped with subsoil and topsoil sourced from subsoil and topsoil stockpiles which have been established during construction. For Atlas, the total of the mine closure provision is currently estimated to be US$5.8 million in real terms. Final closure provisions for Campaspe will be estimated during the mine construction phase.

23 ATLAS-CAMPASPE TECHNICAL REPORT SUMMARY 18 Capital and Operating Cost Capital cost for the Atlas Campaspe project is estimated to be between US$142 and US$174 million. Operating costs used in the economic analysis comes from Tronox internal cost accounting systems. Our projected average annual operating and capital costs from our Atlas-Campaspe life of mine model at December 31, 2021 were as follows: Table 7: Average Annual Capital Cost Estimate (US$/Mpa, 2021 real terms, rounded) Life of Mine Estimate (2022 – 2032) Category 2022-2026 2027-2031 2032 LOM Total Sustaining Capital 1 2 1 18 Major Infrastructure Investment 30 0 0 151 Total Capital Expenditure 31 2 1 169 Table 8: Average Annual Operating Cost Estimate (US$/Mpa, 2021 real terms, rounded) Life of Mine Estimate (2022 – 2033) Category 2022-2026 2027-2031 2032 LOM Total Mining and Concentration 65 78 76 788 Dry Mill 20 25 31 254 Realization 25 28 34 302 Total Operating Expenses 110 131 141 1,344 For this report, capital and operating costs for the year ended December 31, 2021 have been estimated to an accuracy of +/-15%. 19 Economic Analysis The economic outcomes for the Atlas-Campaspe Project have been calculated on a ‘minerals only’ basis, whereby the minerals are valued as final products with no upgrading into either slag, SR or pigment. The minerals have been valued at purchase price, representing what Tronox could expect to pay to purchase equivalent quality feedstocks for either the slag furnaces, SR kiln or the pigment plants. For the financial modelling that supports the current reserves, a range of mining block schedules are prepared by the senior mine development engineer. These schedules contain information on ore tonnes and grades, mineral assemblages, clay fines levels as well as other information that may impact on throughputs, recoveries and costs. Grouped cost drivers, physical and revenue parameters used in the modelling. There are many mineral sands mines operating worldwide. Many as standalone mineral sales operations producing mineral products similar to those of Atlas Campaspe. With so many operations selling titanium and zircon mineral products on the open market Tronox chooses to value its ore reserves on the basis of what it would have to pay to buy the mineral products, if it didn’t produce and use them itself. Mineral pricing data is readily available through a number of industry sources and from Tronox own marketing team. The Atlas Campaspe orebodies are expected to be depleted by 2033 at which time other resources may well be mined utilizing the same equipment. Key cost assumptions, macro and mineral price assumptions: To determine the economic viability and cash flows of the Atlas Campaspe project, the Company utilized management’s best estimates of the following key assumptions for the mining operations: 1) overburden removal cost, 2) mining plant variable cost, 3) concentrator fixed and variable costs, 4) tailings fixed and variable costs, and 5) maintenance, overhead and support services costs; and for the separation plant, the assumptions are as follows: 1) plant variable costs, 2) MSP fixed costs for Broken Hill and North Shore, 3) HMC haulage rates, Shipping rates to North Shore and 4) maintenance, overhead and support services. Other key assumptions were mineral royalties, distribution costs, mine and concentrator and MSP capital spending, tax rates, and exchange rates. Cash flows are positive for all years in the Life of Mine Plan out to 2033. The physical mining and processing parameters used in the life of mine plan and applicable to exploiting the reserves result in an 11 year mine life with product yields from in ground mineral to saleable products as follows- • Ilmenite 93% • Rutile 89%

24 ATLAS-CAMPASPE TECHNICAL REPORT SUMMARY • Leucoxene 109% • Zircon 75% Sensitivity analyses have been conducted using variants such as commodity price, operating costs, capital costs, ore grade and exchange rates. As a result of these analyses, the project was determined to be economical viable in all scenarios. Table 9: Long term real pricing used in the economic analysis (US$/MT, 2021 real terms, rounded). Product 2021 Forecast 2022- 2026 (annual average) Forecast 2027-2031 (annual average) 2032 Chloride Ilmenite 234 246 254 254 Sulfate Ilmenite 162 162 180 180 Leucoxene (East) 300 314 322 322 Rutile 1,059 1,088 1,008 953 Zircon 1,512 1,495 1,493 1,490 Consistent with industry standards, Tronox values its mineral reserves based on the prices at which its titanium and zircon mineral products would sell on freely traded markets, as forecasted by third-party industry consultancies. Historic prices are not presented because production at Atlas-Campaspe had not yet commenced at the end of 2021. Table 10: LOM Plan Summary (for the year ended December 31, 2021) Annual Averages(1) 2022-2026 2027-2031 2032 Ore Mined (kt) 5,744 11,248 10,867 HM (%) 11.8 4.9 6.8 Ilmenite (in HM%) 55.5 53.9 56.6 Rutile (in HM%) 14.2 11.6 11.9 Leucoxene (in HM%) 4.6 5.7 4.8 Zircon (in HM%) 11.8 13.1 11.3 (1) Amounts presented are based on weighted averages. Production at Atlas-Campaspe had not commenced at the end of 2021, and therefore no production data is available. Table 11: Average Annual Cash Flow Analysis of Atlas-Campaspe (for the year ended December 31, 2021) Cash Flow (US$ million) 2022-2026 2027-2031 2032 LOM Total Chloride Ilmenite 40 30 42 394 Sulfate Ilmenite 23 33 44 323 Zircon 69 88 101 899 Rutile 78 55 61 734 Leucoxene (East) 4 12 18 98 Revenue 214 218 266 2,448 Operating Costs 110 131 141 1,344 EBITDA 104 87 125 1,104 Income Tax (-) 23 18 27 230 Capital Expenses (-) 31 2 1 169 Free Cash Flow 50 67 97 705

25 ATLAS-CAMPASPE TECHNICAL REPORT SUMMARY The sole purpose of the operational and related financial data presented is to demonstrate the economic feasibility of the mineral reserves for the purpose of reporting in accordance with subpart 1300 of Regulation S-K, and should not be used for other purposes. The information presented originates from comprehensive techno-economic modelling, which is subject to change as assumptions and inputs are updated, and as a result does not guarantee future operational or financial performance. Consistent with industry standards, Tronox values its mineral reserves based on the prices at which its titanium and zircon mineral products would sell on freely traded markets, as forecasted by third-party industry consultancies. Table 12: Economic sensitivity analysis results are presented below based on variations in significant input parameters and assumptions. Ave Annual Cashflow (US$Mpa) -25% -10% Reference +10% +25% Commodity Price 18 44 62 79 105 Operating Costs 97 76 62 48 26 Capital Costs 66 63 62 60 58 Ore Grade 26 48 62 73 80 Exchange Rate 34 51 62 73 89 20 Adjacent Properties Not applicable.

26 ATLAS-CAMPASPE TECHNICAL REPORT SUMMARY 21 Other Relevant Data and Information Glossary of Terms summarised in Table 13. Table 13: Glossary of Terms Term Definition AFE Application for Expenditure. AHD Australian Height Datum. The datum to which all vertical control for mapping and geodetic surveys is to be referred. Defined in National Mapping Council Special Publication 10 (NMC SP10). AMDAD Australian Mine Design and Development (Company). ANCOLD Australian National Committee on Large Dams. ARTC Australian Rail Track Corporation. A Statutory corporation, owned by the Government of Australia, which manages rail infrastructure. bcm bank cubic metres. BoD Basis of Design. BOO Build, Own, Operate (Contract). CASA Civil Aviation Safety Authority. CMA Cristal Mining Australia. DB Distribution Board. DFS Definitive Feasibility Study. DMU Dry Mining Unit. DSC (New South Wales) Dam Safety Committee. EBITDA Earnings Before Interest, Taxes, Depreciation and Amortisation. EIS Environmental Impact Study. FPC Feed Preparation Circuit. GDA94 Geocentric Datum of Australia (1994). Geodetic datum covering the Australian continent. The GDA is defined by the coordinates of the Australian Fiducial Network (AFN) geodetic stations, referred to the GRS80 ellipsoid, determined within the International Earth Rotation Service Terrestrial Reference Frame 1992 (ITRF92) at the epoch of 1994. GPS Global Positioning System. Ha hectare (10,000m²). HAL Hot Acid Leach. HAZOP Hazard and Operability Study. HM Heavy Mineral. HMC Heavy Mineral Concentrate. HV High Voltage. IFC Issued for Construction. JORC Joint Ore Reserves Committee. JORC Code Australasian Code for Reporting of Exploration Results, Mineral Results and Ore Reserves. kt thousand tonne. kt/y thousand tonne per year. LAN Local Area Network. LG Local Grid. LIDAR Light Detection and Ranging. Surveying system which measures the distance to a target by means of laser light. LTR Low Temperature Roasting. LV Low Voltage. MCC Motor Control Centre. MLA Mine Lease Application. Mt million tonne. Mt/y million tonne per year.

27 ATLAS-CAMPASPE TECHNICAL REPORT SUMMARY Term Definition NMC Non-Magnetic Concentrate. NPI Non-Process Infrastructure. NPV Net Present Value. NSW New South Wales (State). OPTD Off-Path Tailings Dam. OST On-Stream Time. P&ID Piping and Instrumentation Diagram. PCN Project Change Notice. PCP Pre-Concentrator Plant. PFD Process Flow Diagram. PFS Preliminary Feasibility Study. PLC Programmable Logic Controller. PMP Project Management Plan. POP Procurement Operating Plan. ppm parts per million. ProCom (Tronox) Procurement Committee. Product yield Ratio of mineral product against the grade and ore tonnes to produce RFDS Royal Flying Doctor Service. RMS Roads and Maritime Services. An agency of the Government of New South Wales. RO Reverse Osmosis (Plant). ROM Run-of-Mine. SR Synthetic Rutile. SteerCom (Tronox) Steering Committee. t Metric tonne (1,000kg). t/y tonne per year. TIC Total Installed Cost. VSD Variable Speed Drive. WCP Wet Concentrator Plant. WHIMS Wet High-Intensity Magnetic Separator. XRF X-Ray Fluorescence. 22 Interpretation and Conclusions The declaration that the Atlas and Campaspe Projects have 107Mt of ore reserve at 6.3% HM grade and resources of 114Mt at 3.0% HM grade is well supported. The mineralisation is well understood and is continuous over many kilometres. The basement material is well defined by a sharp drop off in HM grade and the overburden sands are often mineralized but well below cut-off grade. Parameters such as the drill hole spacing, the metre-by-metre downhole analysis, the attention paid to domain composites, the accuracy of analytical checks as well as the known performance characteristics of the existing plant and equipment utilized for this project all provide solid support for there being a low margin for error. The product qualities are varied with the high TiO2 ilmenite being suited for synthetic rutile production or smelting, the rutile and leucoxene suited to direct use chloride pigment processes that Tronox predominantly operates and the zircon easily sold into existing markets. Tronox Mining Australia has a good record for rehabilitation of past mining areas, groundwater management, control of dust and radiation management. Relationships with key stakeholders and government regulators are also in good standing. The LOMP expects to operate through to 2033 with mine closure and rehabilitation plans and provisions made. On a minerals only basis, financial modelling shows that future reserves are profitably mineable. In the Qualified Person’s opinion, all issues relating to relevant technical and economic factors likely to influence the prospect of economic extraction can be resolved with further work.

28 ATLAS-CAMPASPE TECHNICAL REPORT SUMMARY The Atlas and Campaspe operations will form a key part of the Tronox vertically integrated pigment production process.

29 ATLAS-CAMPASPE TECHNICAL REPORT SUMMARY 23 Recommendations That geological work continues to better define the economic margins of the resources, looking for inclusion, at least in part, as reserves to further extend mine life. 24 References A list of References is summarised in Table 14. Table 14: List of References Title Tronox Eastern Operations - Resources and Reserves Annual Report 2021 Atlas Campaspe Project, Definitive Feasibility Study Report, October 2019 25 Reliance on information provided by the registrant The preparation of this Technical Summary Report relies on information provided by Tronox and its employees in the following areas, as they are reasonably outside the expertise of the qualified persons. • Marketing plans and pricing forecasts as key inputs to the economic modelling • Environmental performance commitments and mine closure costing • Maintenance of licenses and other government approvals required to sustain the LOMP • Capital to progress the mining of the Atlas and Campaspe deposits 26 Date and Signature Page This report titled “Atlas-Campaspe Technical Report Summary” with an effective date of December 31, 2021 was prepared and signed by: /s/ Alan Heptinstall Alan Heptinstall, Manager Minerals Resource Development Dated at Muchea, Western Australia February 21, 2024
EX-96.3
15
ex963202310k.htm
EX-96.3
ex963202310k

1 NAMAKWA TECHNICAL REPORT SUMMARY Exhibit 96.3 Namakwa Technical Report Summary Explanatory Note This Technical Report Summary (TRS), dated February 21, 2024, serves as an amendment to, and restatement of, the TRS filed on February 22, 2022, effective December 31, 2021, following Tronox Holding plc’s receipt of a comment letter from the U.S. Securities and Exchange Commission. While this Amended TRS incorporates changes to the original version, it maintains an effective date of December 31, 2021 with regard to assumptions and the knowledge of the Qualified Persons. Notable revisions and changes to the previously filed TRS were as follows: • Amended mine location map (Figure 1) • Inclusion of the coordinates of the mine (Section 3) • Inclusion of a stratigraphic column (Figure 5) • Inclusion of the Qualified Person opinions regarding sample preparation, security, and analytical procedures; the metallurgical data; the current plans to address any issues related to environmental compliance, permitting, and local individuals or groups; and issues relating to relevant technical and economic factors likely to influence the prospect of economic extraction can be resolved with further work (Sections 8, 14, 17 and 22) • Amended cutoff grade disclosure (Section 11) • Inclusion of saleable product yield (Table 5) • Amended mine closure disclosure, including closing/reclamation costs (Section 17) • Inclusion of operating and capital costs for life of mine (Tables 6-7) • Inclusion of accuracy of capital and operating costs estimates (Section 18) • Inclusion of market price projections (Table 8) • Inclusion of annual life of mine production schedule (Table 9) • Inclusion of historic plant throughput and saleable product yield (Table 10) • Inclusion of a cash flow analysis (Table 11) • Inclusion of a sensitivity analysis (Table 12) 1 Executive Summary Tronox acquired the majority stake in the Namakwa project from Exxaro in 2012 and has since attained the complete asset. The operations at Namakwa were originally established by Anglo in 1994 and have operated continuously since. The total project involves two mining operations at Brand-se-Baai, each with an associated wet gravity concentrator and secondary upgrading plant that treats blended HMC from the two operations. The rough ilmenite magnetics and the zircon/rutile non magnetics are trucked 52km south to the MSP operation near Koekenaap where finished mineral products are produced. The ilmenite product is consumed internally and converted to a titanium slag and pig iron co-product in arc furnaces located at Saldanha Bay 200 km further south. Ultimately the titanium slag and rutile products from these operations are consumed as feedstock at Tronox integrated pigment production facilities located around the globe. Being situated on an historical coastline the Graauwduinen West orebody received source sediment via established fluvial-marine courses, whereas the source of the Graauwduinen East orebody is considered to originate from a distinct fluvial-aeolian corridor. Both mines operate with typical earth moving equipment and haulage fleets with shiftable belt conveyors also used to transport mined ore to the concentrators, some kilometers away. There are 3 Mining Rights covering the mining and processing operation and are held 100% by Tronox Mineral Sands Pty Ltd, a wholly owned subsidiary of the Company. The defined Reserves are 703Mt at an in-ground grade of 2.90% ilmenite, and 0.63% zircon. Current Resources in addition to the Reserve tonnage is 306Mt at a grade of 2.05% ilmenite and 0.43% zircon. 2 Introduction This report has been prepared by Tronox Holdings Plc in compliance with the US Federal Commission’s modernization of reporting rules for mineral assets located at Namakwa Sands in the Western Cape, South Africa.

2 NAMAKWA TECHNICAL REPORT SUMMARY Information used to support this technical summary report includes the annual Mineral Resources and Reserves report listed in the references section of this report. Mineral Resources and Mineral Reserves as of 31st December, 2021 are summarised in Table 2 and Table 3 in section 11 and section 12 respectively of this report. A Qualified Person works at the Namakwa Sands site and frequently visits the mining areas. Discussions with site management on resource utilisation and optimisation opportunities are held regularly. During the periodic drilling activities, a qualified person regularly attends site activities. 3 Property Description Tronox Mineral Sands Pty Ltd is a subsidiary of Tronox Holdings Plc and holds 100% of the rights at Namakwa Sands Operations which includes: • The Northern operations consisting of the Brand-se-Baai mining operations and the Mineral Separation Plant at Koekenaap • The Southern operations that consist of the Smelting Operations at Saldanha Bay along with administrative headquarters. See Figure 1 on next page.

3 NAMAKWA TECHNICAL REPORT SUMMARY Figure 1: Location of Western Cape operations The Namakwa Sands Mine is located at coordinates 31°16’S and 17°54’E

4 NAMAKWA TECHNICAL REPORT SUMMARY Production comes from two shallow open pit mines where excavators and front-end loaders extract free running and lightly consolidated/cemented sand. The ore is conveyed to two primary concentrator plants (PCP) that utilize wet spirals to produce a heavy mineral concentrate. These concentrates are pumped to a secondary concentrator plant (SCP) where wet high-intensity magnetic separators (WHIMS) and spirals are used to produce a zircon-rich non-magnetic concentrate, and a magnetic concentrate comprising mainly ilmenite. An ilmenite rich secondary stream from the SCP is reprocessed at a separate plant called the UMM Plant to produce a crude ilmenite. SCP and UMM concentrates are separately trucked to and treated at the mineral separation plant (MSP) near Koekenaap, where a series of magnetic and electrical high-tension separators are employed to produce ilmenite, rutile, and zircon products. These products are transported from the Mineral Separation Plant to the Smelter using the Saldanha-Sishen railway network. The Southern Operations consist of the administrative headquarters and smelter operations and are located 3 km from the Saldanha export harbour. The smelting process comprises the carbonaceous reduction of ilmenite using DC arc furnaces to produce titanium slag and pig iron. The received rutile and zircon products as well as the titanium slag are stored in on-site silos from where it is distributed in bag, container, or bulk shipment format. Mining tenements in South Africa are managed at a national level. In the Western Cape, Mining Rights and Prospecting Rights are granted and administered by the South African Department of Mineral Resources and Energy. The Mining Rights for Namakwa are shown in Table 1 and Figure 2. Table 1: Tronox Mining Rights, west coast of South Africa Area/Farm DMRE Ref. no. Area (ha) Current status Goeraap 140 Portion 17 WC 30/5/1/2/2/114 MR 250 active, expires 17 August 2038 Graauwduinen 152 Portion 1 WC 30/5/1/2/2/114 MR 2,978 active, expires 17 August 2038 Hartebeeste Kom 156 Portion 1 & 2 WC 30/5/1/2/2/114 MR 3,903 active, expires 17 August 2038 Rietfontein Ext 151 Portion 1 & 2 WC 30/5/1/2/2/114 MR 2,084 active, expires 17 August 2038 Hartebeeste Kom 156 Portion 3 WC 30/5/1/2/2/113 MR 1,790 active, expires 17 August 2038 Houtkraal 143 Portion 3 WC 30/5/1/2/2/113 MR 1,780 active, expires 17 August 2038 Graauwduinen 152 Portion 2 WC 30/5/1/2/2/10040 MR 599 active, expires 29 March 2046 Graauwduinen 152 Remaining Extent WC 30/5/1/2/2/10040 MR 1,776 active, expires 29 March 2046 Rietfontein Ext 151 Remaining Extent WC 30/5/1/2/2/10040 MR 2,536 active, expires 29 March 2046 Houtkraal 143 Remainder of Portion 2 WC 30/5/1/2/2/10040 MR 645 active, expires 29 March 2046 Houtkraal 143 Remaining Extent WC 30/5/1/2/2/10040 MR 864 active, expires 29 March 2046

5 NAMAKWA TECHNICAL REPORT SUMMARY Figure 2: Namakwa Sands tenement plans

6 NAMAKWA TECHNICAL REPORT SUMMARY The total area covered by the Mining Rights is 19,205 hectares as shown in Figure 2 above. The minerals in South Africa belong to the Government and Tronox is obligated to pay a royalty to the South African Revenue Services (SARS) based on the sales of final mineral products. The actual royalty payable depends on the EBIT (Earnings before Interest and Tax) adjusted for capex redeemed, generated through the “sales” of mineral products. The royalty percentage ranges between a minimum of 0.5% to a maximum of 7%. Tronox owns all the properties for which it holds Mining Rights. 4 Accessibility The project area is characterised by low-lying weathered sandplains situated in the arid succulent Karoo biome, on the South African West Coast. The region’s climate is characterised by low winter rainfall, 150mm annual average, high summer temperatures, maxima exceeding 40°C and high-water evaporation rates. Wind speeds are periodically sufficient to mobilize fine sands. The Brand-se-Baai site, the MSP and the Saldanha operations are connected by the bituminized roads R362, R363 and R364. The N7 national highway runs from Cape Town to north of Brand-se-Baai approximately parallel to the coastal roads mentioned but slightly further inland (Figure 1). Land that is not mined, and which falls outside of any active mining areas, is leased back to the neighbouring farmers for on-going use as grazing for small stock. The northern boundary of the mine abuts onto a well-established salt works located on the Sout River estuary. The farm to the east of the mine also runs a guesthouse. Employees live in local towns of Koekenaap, Lutzville, Vredendal but spread as far as Klawer, Vanrhynsdorp and surrounding areas. The company runs buses and vans for employees from all local towns to Koekenaap and Brand-se-Baai each shift change. Infrastructure availability is disclosed in section 15. 5 History Exploration for heavy minerals along the coastal strip of southwest Africa led to the discovery and subsequent delineation of the Namakwa Sands deposit near Brand-se-Baai in 1987. In September 1994 Anglo Operations Ltd commenced mining and processing at the West mine ore body. In 2008 Exxaro Resources acquired the Namakwa operations from Anglo and then in 2012 Tronox acquired 74% of Namakwa Mineral Sands Pty Ltd. In 2021 Tronox acquired the whole of Namakwa Mineral Sands Pty Ltd. 6 Geological Setting, Mineralisation and Deposit Heavy mineral sand placer deposits are surface mineral deposits formed by mechanical concentration of resistant heavy minerals derived from weathered material. The formation of heavy mineral sand deposits requires the interaction between a provenance (source), transporting systems (marine, fluvial and/or terrestrial) and a depositional environment, within which certain concentration processes prevail. The Namakwa Sands deposit consists of two adjacent orebodies, referred to as the Graauwduinen West orebody and the Graauwduinen East orebody, which are named after the farm Graauw Duinen, the discovery site. A SE-NW trending depression called Langlaagte Corridor defines the border between the two orebodies (Figure 3).

7 NAMAKWA TECHNICAL REPORT SUMMARY Figure 3: Typical Cross Section for Namakwa deposits. The Graauwduinen West orebody The Graauwduinen West orebody comprises a barren paleodune complex that is overlain by a series of elevated strandline deposits, which in turn have been largely reworked into a dune sequence superimposed with duricrust. Free-flowing cover sands terminate this stratigraphy. Basement in the area comprises mostly the mid-Neoproterozoic Gariep Supergroup metasediments, with lesser contributions from the Mesoproterozoic Namaqualand Metamorphic Province rocks (Figure 4). A collection of barren, unconsolidated, well sorted, fine-grained aeolian sands called the Other Sands cover the bedrock predominantly. The eastward-thickening, shallow-marine succession of Strandline East represents the first major stage of local marine sedimentation. This raised, fossilized strandline deposit lies approximately 2 km inland from the current coastline and displays typical log spiral morphology. In a northerly direction Strandline East is about 5.5 km long, up to 1 km wide, and 5 m thick on average. Eastward it pinches out around 50 m amsl. Northward the Other Sand underlie Strandline East, but to the south downward to 20 m amsl, it covers bedrock directly. Highly mineralized, moderately sorted, medium-grained, dark-brown, olive-green, and black sands occupy the top part of Strandline East. Most parts of Strandline East appear to be reworked and redistributed into the above-lying Orange Feldspathic Sands Mineralized 2. The basal unit of the Orange Feldspathic Sands Waste (OFSW) comprises a 1m to 2m-thick, fairly developed duricrust horizon. Thin, localized mud pans and sandy colluvial lithologies are often interfingered. The following lithology consists of an unconsolidated, distinctly dark-yellow, moderately sorted, medium-grained sand. The aeolian fossil contents peak in this unit, resulting in an anomalous phosphorous signature particular to the 75- to 90-m amsl level and surrounds. Strandline West characterizes the next major marine transgression to a maximum elevation of 30 m amsl. This strandline deposit exhibits similar features to Strandline East but is about half the size. The third mineralized dune succession called Orange Feldspathic Sands Mineralized (OFSM) hosts the bulk of the ore of the Namakwa Sands deposit (Figure 3). Its four lithologies form a relatively massive, seaward-thickening wedge, which can be up to 30 m thick. The basal portion constitutes a yellow, well developed duricrust horizon, referred to as the Hards, which cemented an assortment of terrestrial fossil types. In the western part of the Graauwduinen West orebody the Hards overlie reworked Strandline West, but toward the east it rests on the top of the Orange Feldspathic Sands Waste. Compared to the Subhards, the Hards are also predominantly calcareous but have a higher clay content. The fourth mineralized dune succession, which is distinctly rubified, includes a complex duricrust horizon called Dorbank, which is overlain by free-flowing Red Aeolian Sands. The characteristic red coloration of both these units relates to prolonged oxidation of ferruginous minerals in a hot and arid climate that has marked the area since the Quaternary. The Dorbank occupies the top part of the Orange Feldspathic Sands Mineralized and is mapped across the entire Graauwduinen West orebody. The vertical thickness of cementation is inconsistent, ranging up to 15 m, and laterally it can be extremely discontinuous. On a larger scale, the Dorbank manifests thickest in topographic depressions, thinning to the northeast and southwest flanks, approximating basin-like morphology.

8 NAMAKWA TECHNICAL REPORT SUMMARY Figure 4: Local Geology of the Namakwa Sands area

9 NAMAKWA TECHNICAL REPORT SUMMARY Intensely reddened, fine-grained, moderately sorted, up to 5 m thick, free-flowing sands of the Red Aeolian Sands (RAS) cover the Dorbank unconformably. These aeolian sands are generally structureless with abundant fauna and flora taxa relics (Figure 3). Figure 5: Stratigraphic column of the West Coast Group as of December 31, 2021: The Graauwduinen East orebody The Graauwduinen East orebody represents surficial aeolian sands, overlying a clayeous dune sequence, cast on top of barren sands. Intercalations between mid-Neoproterozoic Gariep Supergroup and Mesoproterozoic Namaqualand Metamorphic Province basement lithologies become more common here (Figure 4). Unlike the generally flat and scoured bedrock profile encountered in the Graauwduinen West orebody, the bedrock in the Graauwduinen East orebody displays extreme undulation and outcrops frequently, noticeably to the southeast. The bulk of the ore in the Graauwduinen East orebody is represented by the above-lying Orange Feldspathic Sands Mineralized, but the two constituting lithologies are much thinner than found in the Graauwduinen West orebody (Figure 3). The average thickness is about 5 m, but in the eastern part of the Graauwduinen East orebody the Orange Feldspathic Sands Mineralized can be up to 20 m thick. In the Graauwduinen East orebody, the base of the Orange Feldspathic Sands Mineralized is cast as a laterally continuous, single layer duricrust horizon, called Hardpan that can reach up to 5 m in thickness. Its streaky, orange-white, rust-like appearance is very different to the Subhards or Hards found in the Graauwduinen West orebody. Instead, it resembles the type of duricrust that underlies much of the Namaqualand coastal plain. The physical competency of the Hardpan is also considerably weaker than the duricrust mapped in the Graauwduinen West orebody and it appears compacted rather than lithified. This is possibly because the cementing agent is a noncalcareous, ferrialuminous clay. The Red Aeolian Sands are also substantially thicker, and it constitutes light-orange, well-sorted, medium-grained, unconsolidated, but well-articulated sands. these particular Red Aeolian Sands are considered incongruous to the Red Aeolian Sands in the Graauwduinen West orebody (Figure 3). Mineralogical Classification Heavy mineral assemblages representing the two orebodies are distinctly different. The Graauwduinen West orebody lithologies are characterized by heavy mineral assemblages that contain high quantities of garnet and pyroxene, and conversely lesser quantities of ilmenite and zircon. By contrast, heavy mineral assemblages of the Graauwduinen East orebody lithologies are appreciably enriched in ilmenite and zircon and host smaller proportions of the other key heavy minerals, particularly pyroxene. On average the Graauwduinen West orebody contains 34% ilmenite, 8% zircon, 8% leucoxene, 3% rutile, 16% garnet, 17% pyroxene, and 14% other heavy minerals in the THM. Heavy mineral assemblages of the Graauwduinen East orebody typically contain 60% ilmenite, 13% zircon, 7% leucoxene, 4% rutile, 6% garnet, 1% pyroxene, and 9% other heavy minerals in THM. The proportion of valuable minerals in the total heavy mineral suite increases upward in the Graauwduinen West orebody stratigraphy, from 34% in Strandline East to 78% in the Red Aeolian Sands. The Graauwduinen East orebody, by comparison,

10 NAMAKWA TECHNICAL REPORT SUMMARY features appreciably better and more consistent valuable heavy mineral proportion of typically around 85%. Ilmenite dominates all the valuable heavy mineral fractions without exception, followed by zircon, leucoxene, and rutile in that order of abundance; however, their proportions also differ for the two orebodies. Upward in both orebodies, the proportion of zircon increases at the expense of ilmenite, whereas the rutile abundance remains relatively uniform. The various geological units differ strikingly in VHM content. East Mine RAS has a high VHM content, which explains its superior processing character in comparison to the lesser-pronounced West Mine RAS. The bulk of the mineralisation (OFSM) typically comprises only 50% VHM due to the presence of nearly equal amounts of garnet and pyriboles. The OFSM2 represents the poorest section of the economic horizon with low VHM values characterising the grade-enriched strandline deposits, whereas the uneconomic units (OFSW and Other Sands) contain garnet, pyroxene and other heavy minerals in appreciable amounts at the expense of the valuable minerals. Mineral components such as apatite, kyanite, monazite, chromite and cassiterite generally occur in trace amounts (<0.2% in total) and their distribution is grade related. Of interest recently is the potential use of monazite, both in contained ore bodies and in stockpiled sources located near the Mineral Separation processes at Namakwa. Monazite has increasing commercial value due to a high concentration of rare earth metals which can be separated by well-established methods. Rare earths are expected to remain in high demand as demand grows for electric vehicles, wind turbines, and consumer goods that require rare earth-containing permanent magnets. We currently do not know the metallurgical recovery potential for the monazite as our processes have historically focused on traditional valuable minerals. Given the increasing importance of monazite, we are evaluating new processes to better understand the grade and recoverability of monazite in our mining tenements. Mineral coatings, defined as non-discrete mineral matter, is prevalent on all minerals. They are extremely variable for all geological units, but on average the OFSM and OFSM2 are more coated than the RAS. A reddish clay-like substance almost exclusively coats the RAS minerals whereas yellowish-white silicate coatings, most likely related to the dorbank event are more characteristic of the OFSM. In summary, the Namakwa Sands Deposit is an elongated ore body confined between two topographic highs and strikes from the Atlantic Coast inland for approximately 14 km into a north-eastern direction (Figure 2, Figure 3). Along its widest part the ore body extends over approximately 4 km. The mineralisation extends from within the sea, but for environmental reasons a setback of 300m from the high-water mark along the beach, has been established. In the western ore body, the mining depth is defined by lithological and/or mineralization parameters. It varies in depth from about 20m in the west, as defined by the bedrock contact, to about 50m in the east where the boundary is defined by barren or poorly mineralised other sand. However, the final mining depths are determined during production scheduling, by the economic mineable material. The eastern ore body consists of a thin veneer of aeolian surface sand, and an underlying deeper resource in the northern parts. The ore body

11 NAMAKWA TECHNICAL REPORT SUMMARY extends over 17,000 hectares, with some possibility of extension. The mineralisation stretches from surface down to basement/other sand and no overburden stripping is required. 7 Exploration Currently all drilling is confined to the Mining Right area. There is no greenfields exploration work to disclose. 8 Sample Preparation, Analyses and Security Drilling Reverse circulation “aircore” drilling is mainly used, other than for the shallow free-flowing mineralised sands, (RAS) where auger sampling methods are employed. Aircore drilling is completed using a small Landcruiser mounted drill. This style of drilling suits the soft sand ground conditions, and the drilling is relatively shallow (5-40m) and very rapid. Holes are drilled vertically using three meter NQ size rods, giving a nominal hole diameter at the bit of 83 mm. Drill samples are collected in one metre continuous intervals from surface. The drill sample return is captured through a cyclone to separate the air and reduce sand velocity which is then captured in plastic sample bags and riffle split to approximately 3 to 5 kg each at the drill site. All samples are sent to the Tronox’s internal lab for clay fines and heavy mineral analysis. Figure 6 and Figure 7 show the auger and aircore drilling density over the mining authorization that is not mined out. Figure 6: Namakwa Sands Aircore Drillholes At the laboratory, approximately 300g drawn from the 8-pot rotary splitter is dry screened at 1mm to remove oversize material.

12 NAMAKWA TECHNICAL REPORT SUMMARY Figure 7: Namakwa Sands Auger Drillholes Clay fines, Oversize and Total Heavy Mineral Analyses At the laboratory, approximately 300g drawn from the 8-pot rotary splitter is dry screened at 1mm to remove oversize material. Another 300g sample is taken and submitted for XRF analyses. A reference sample is also kept and is stored on site. The clay fines are removed by wet screening at 45microns and the intermediate of these two operations is subjected to SG 2.85gcm-3 bromoform to capture the quantity of Heavy Mineral sinks. All masses are converted to percentages based on initial sample mass and the mass of the relevant sub fraction. Fused disc XRF analysis of in situ material is used to determine the main oxide abundances, including TiO2 and ZrO2. Assay data is returned from the laboratory in digital format and merged into a relational database. Mineralogical Analyses QEMSCAN, an adaptation of SEM technology, uses the relatively fast assay scan results to match with results obtained from known minerals in a standard suite of samples. The method is particularly useful for detecting titano-haematite and intergrowths of ilmenite and haematite. Since inception of the mine in 1994, the distribution of the TiO2 and ZrO2 between the ilmenite, rutile, leucoxene and zircon has been estimated from the XRF data. Quantitative electron scanning microscopy (QEMSCAN), development work since 2006, has refined the conversion of the metal analysis into mineral species. In the Qualified Person’s opinion, Tronox’s sample preparation, security, and analytical procedures are adequate.

13 NAMAKWA TECHNICAL REPORT SUMMARY 9 Data Verification XRF standards Practice at Namakwa Sands includes the submission a high- and low-grade matrix-matched Control Reference Material (CRM) from East RAS tailings spiked with known quantities of Namakwa Sands ilmenite and zircon concentrate. The spiked samples were submitted to various laboratories and the certified mean, upper and lower limits determined. Two CRM’s of known different grades (low and high) are submitted with the lab samples on an alternating basis to identify and quantify XRF lab accuracy, precision, and bias. CRM samples are submitted at the rate of one in every ten samples submitted to the labs in batches of fifty. A sequential numbering system is used, rather than separate identifiers for standards and replicates. This maintains sample anonymity within the laboratory. Standard control charts are maintained during the course of the drilling program to highlight and address lab anomalies. A batch should be repeated if 2 values in the batch fall outside of 5%, or 2 standard deviations of the mean. A total 95% of the standards are required to fall within 5% of the mean for the exploration programme. Blanks The blind submission of blanks is required to identify contamination during the XRF lab sample preparation process. The total sample programme contains a minimum of 5% (1 in 20) blank submissions. Two blank numbered samples are added randomly in sample batches. Values are continually monitored on Blank Control Charts. Replicates At least 10% of the total sample programme contain identical coarse replicates obtained by the rotary splitting of selected samples. These are submitted (blindly) to the XRF lab to quantify analytical precision and to detect sample preparation errors. This is monitored by means of replicate control charts and any anomalies validated with the XRF laboratory. Summary of Geochemical Quality Assurance and Quality Control From the recent West Mine drilling campaign, of the 11,320 samples analysed at ALS, Johannesburg, only one duplicate representing one batch of 50 samples was repeated as it had plotted beyond the trigger limits (Figure 8). This is 0.4% of the total samples under consideration Figure 8: Replicate control charts for TiO2 and ZrO2. One batch of control sample low was queried and re-analysed. This represents 0.4% total samples analysed. Two batches of control sample high were queried and re-analysed. This represents 1% total samples analysed. The analyses in total performed beyond 95% target confidence. The Qualified Person considers the data validation confirms that the accuracy of the mineralisation assays is in line with industry standards and is suitable to support estimates of Resources and Reserves. 10 Mineral Processing and Metallurgical Testing More than two decades of mining and processing mineral from the Namakwa field along with production forecast modelling techniques and extensive ore characterization work on zone composites provides substantial and suitable recovery prediction information. The methods used are industry standard. Various studies have quantified the impacts on recovery of poor mineral liberation, anomalously high abundance of garnets and pyroxenes and variations in particle chemistry. The others content is the most significant constraint to ilmenite recovery, whereas zircon chemistry is the most important negative factor in the production of a premium quality zircon product. Results of studies have been used to refine the geometallurgical model and identify opportunities to optimise mineral resources utilisation. The geometallurgical model describes selected relationships between ore characteristics and mineral recoveries and is determined from bulk samples. These ore characteristics manifest as bulk properties, for example oversize contents (+1 mm particle size), fines contents (-45 µm particle size), mineral grade and heavy mineral composition.

14 NAMAKWA TECHNICAL REPORT SUMMARY 11 Mineral Resource Estimates Variography Ordinary Kriging is used for all the estimation processes. Conversion to mineral species from chemical data was done in the block model after the data (ZrO2 and TiO2) were estimated by applying calculations in the block model. The geological resource model was constructed systematically by estimating the relevant grades into the regularised blocks. The various geological horizons were estimated using different methods as discussed below. Prior to ordinary kriging, the appropriate geological horizons (RAS, OFSM, OFSM2, OFSW and two Strandlines) were extracted from the block model using rock type (“material”) selection criteria. The extracted RAS and OFSM were constrained using boundary strings to select (separately), each of the different zones. The geological block model (25m × 25m × 1m blocks) was used as the basis for the construction of the resource model. DTM’s are used as constraints, and all blocks are also assigned a material type in the Surpac block model module. The dorbank is reclassified from within the OFSM layer during the last stage of forming the geological block model based on CaO and MgO ratios. The various geological units are classified into measured, indicated, and inferred resource categories based on: • Drill density • Drilling method and sampling interval • Continuity of mineralisation and geological units • Reliability of assay method and mineralogical information • Frequency and results of QA/QC data Confidence in Estimations Experimental variograms were calculated separately for each variable of all the geological domains, the OFSM2, OFSW and the two strandlines. The Surpac software suite and the appropriate composited borehole data were used for this analysis. The attributes that are modelled are THM, slimes, oversize, ZrO2 and TiO2 content. For OFSM, CaO and MgO estimations were also done. Omni-directional variograms were constructed to determine the Kriging parameters for the estimation process. Variography is completed for all domains to determine anisotropy and to set search ellipsoid parameters. Typical variogram ranges are greater than several hundred meters in any lateral direction. Consistently larger than the drill spacing used to define resources. Block Model Construction Block models are created in Geovia Surpac using a 25m × 25m × 1m block size with one standard level of sub-celling allowed. Grade Estimation The estimation of block grades is completed using the estimation codes and applied hard boundaries to all domains. Estimation is undertaken for heavy mineral, clay fines, oversize and mineral assemblage data. A comparison between the output Block Model THM grade estimate and the input borehole sample THM grades is shown in Figure 9 below.

15 NAMAKWA TECHNICAL REPORT SUMMARY Figure 9: Sectional comparison of block model grade estimates, borehole grades and resultant variances Cutoff grade The estimated breakeven economic cutoff grade of 0.3% zircon is utilized for mineral resource reporting purposes and were applied for conversion to mineral reserves has been calculated using a revenue cost breakeven calculation and are based on the following key assumptions: • Saleable product yield (recovery): ilmenite 68%, rutile 63% and zircon 63% • Commodity prices: $194/metric ton for ilmenite, $925/metric ton for rutile and $1,499/metric ton for zircon • Operating cost: rounded $7 per metric ton ore mined. Mineral prices used are substantially in line with the prices for each of our products published quarterly by third-party independent consultancies. Although a zircon-only cutoff grade is employed, due to the poly metallic nature of the mineralization, the economic contribution from all the economic minerals (ilmenite, zircon and rutile) are used to delineate mineral resources, rather than just zircon grade. This also allows for a broader consideration of mineralization of surrounding areas. As costs change over time and long-term revenue values change, new reviews are conducted which may lead to a modified mining plan becoming optimal. The Qualified Person utilized this information as the basis for determining reasonable prospects for economic extraction, according to the definition for mineral resources in the SK-1300 regulation. To qualify for recognition to mineral resources, there must be a valid existing prospecting or a mining right. Mineral reserves only consider properties with a valid mining right or where a mining right is under application. Subsequently, mineral resources are classified into measured, indicated and inferred categories based on the confidence in the geological analyses, the geological complexity evident in the various stratigraphic units, and the borehole distribution and spacing. The same break-even cutoff grade of 0.3% zircon is maintained for the mineral resources to reserves conversion process. Mineral reserves are subsets of mineral resources, having used the same modelling processes but with a higher grade and financial outcome metric applied, i.e. more stringent practical and economic considerations are applied. The mineral resource block models are constrained into mineral reserve block models discounting the mineral resources (i.e. the exclusive mineral resources) that cannot be mined due to existing infrastructure, geotechnical parameters, geological floor and other mining method limitations. The long term mine plan and reserve estimates are derived from detailed techno-economic models created from geological, mining and analytical databases and optimized with respect to anticipated revenues and costs. Cost assumptions are developed from our extensive operating experience and include mining parameters, processing performance, and rehabilitation costs. Predicted mining and processing metrics are reconciled with actual production and recovery data on a regular basis.

16 NAMAKWA TECHNICAL REPORT SUMMARY First, several life of mine production schedules are produced and run through a techno-economic model. An optimization process is performed using different cutoff grades to create a series of nested shells. Mining block sequences are created for each of the shells tonnages and mineral assemblage information as well as mining costs, processing costs and mineral revenues. In the optimization process, modifying factors including recoveries, ore loss assumptions, operating costs and mineral sales pricing are used to seek the maximum value for a shell. The material scheduled previously classified as measured mineral resources will be converted to proven reserves, material previously classified as indicated mineral resources will be converted to probable reserves whereas inferred mineral resources remain unconverted according to definition as set out in the SK regulation. If any liabilities e.g., legislative, environmental, etc. exists, proven resources will be downgraded to probable reserves, even though geological confidence is high. Density The relative in situ density has previously been determined using the standard box frame method and averaged 1.7t/m3. To compensate for heavy mineral content of the samples, THM is multiplied by 0.01 and added to the RD factor. Later tests were performed by external specialists using the box frame method, on all the geological units, except for dorbank and strandlines. The density for all the units came to a value of 1.91 g/cm3. That value is used for all units, but the calculated unit for RAS, Dorbank and the strandlines is retained. Mineral Resource Classification The various geological units were classified into measured, indicated and inferred resource categories based on the confidence in the geological analyses, the geological complexity evident in the various stratigraphic units, and the borehole distribution and spacing. Due to the poly metallic nature Tronox uses economic contribution as a guide to cut-off determination rather than just zircon grade. This also allows for the broad mineralization of surrounding areas. As costs change over time and long-term revenue values change, new reviews are conducted which may lead to a modified mining plan becoming optimal. The 2021 Mineral Resources Statement for Namakwa Sands is presented in Table 2 on the next page.

17 NAMAKWA TECHNICAL REPORT SUMMARY Table 2: Namakwa Sands Summary of Mineral Resources at the End of the Fiscal Year Ended 2021 Exclusive Mineral Resources – Namakwa Sands 2021 Mineral Resources Category Material Tonnes Mt THM Grade (%) Mineral Assemblage Ilmenite Grade (%) Rutile + Leucoxene Grade (%) Zircon Grade (%) Measured 111 7.3 31.6 5.7 6.9 Indicated 86 6.5 28.3 5.6 6.9 Measured + Indicated 197 6.9 30.1 5.7 6.9 Inferred 110 5.5 35.1 8.1 6.5 TOTAL 307 6.4 31.9 6.5 6.8 (1) Cut-off grade applied is 0.3% zircon (2) Mineral Resources are exclusive of Mineral Reserves 12 Mineral Reserve Estimates Several Life of Mine (LOM) production schedules are produced and run through an economic model. Based on the results of the economic model an optimised schedule is produced. The material scheduled previously classified as measured will be converted to proven reserves and material previously classified as indicated resources will be converted to probable reserves. If any liabilities e.g., legislative, environmental, etc. exists, proven resources will be downgraded to probable reserves. Mineral Reserves are subsets of Resources, having used the same modelling processes but with a higher grade and financial outcome metric applied. The 2021 Mineral Reserves Statement for Namakwa Sands is presented in Table 3 below. Table 3: Namakwa Sands-Summary of Mineral Reserves at the End of the Fiscal Year Ended 2021 Mineral Reserves – Namakwa Sands 2021 Mineral Resources Category Material Tonnes Mt THM Grade (%) Mineral Assemblage Change from 2020 Ilmenite Grade (%) Rutile + Leucoxene Grade (%) Zircon Grade (%) Proven 148 7.8 37.0 8.6 9.0 2.7% Probable 555 5.4 53.7 11.1 11.4 -4.8% TOTAL 703 5.9 49.0 10.4 10.7 -3.3% (1) Mineral prices used in Reserve estimation are substantially in line with the prices for each of our products published quarterly by independent consulting companies (2) Metallurgical recoveries vary by mineral and are discussed in the Economic Analysis Summary 13 Mining Methods Mining takes place in two distinct areas known as the East and West Mines. The East Mine comprises predominantly shallow mineral sands stripping. The West Mine entails shallow stripping of mineral sands followed by a deeper mining operation recovering hardened materials to a depth of about 40m. The shallow mining is done with front-end loaders onto a conveyor system (East Mine) or dump trucks (West Mine). The deeper mining is done with hydraulic excavators loading rigid dump trucks that convey the material to a central tipping area. Material is transported to the plant via a conveyor system from the tipping areas. Beneath the shallow sands of the East mine lies a future ore body called East OFS for which a definitive feasibility study is almost complete. East Mining Currently only the free flowing and lightly consolidated RAS is extracted at the East Mine. At the cessation of East RAS mining in approximately 2025 the underlying more consolidated East OFS mineralization will be extracted. The present mining method entails front-end loaders loading and carrying aeolian sand to moveable grizzly feeders. These feeders discharge onto shiftable branch conveyors that feed onto a semi-permanent trunk conveyor or directly onto the dual carry conveyor

18 NAMAKWA TECHNICAL REPORT SUMMARY (DCC). The trunk conveyor system feeds onto the dual carry conveyor (DCC), which in turn feeds the ore via a stockpile feed conveyor onto the PCP East run of mine (ROM) stockpile. The free-standing grizzly feeders are moved by a track-dozer along the branch conveyors to maintain a maximum haul distance of 100m. A recent layout of the East mining and conveying system is shown in Figure 10 below. Figure 10: Layout of the East RAS mining and conveyors Mechanised strip mining is performed in several areas simultaneously after the top 50 mm of topsoil has been dozed off. Where underfoot conditions allow it, front-end loaders simply scoop up the RAS, and carry it over distances of less than 120 m to the nearest grizzly that discharges onto a branch conveyor system. At greater distances (>120 m), or unsuitable underfoot, a truck and shovel method is used to haul and stack ore within reaching distance of a front-end loader. No benching is needed. The ROM feed to the PCP is transported on the bottom strand of the DCC, while the plant tailings are simultaneously returned on the top strand of that conveyor. The DCC length is currently 6.4 km. The conveyor is powered by four 400kW variable speed drives to discharge bins, from where ADTs collect and haul the plant tails to the backfill areas. The mining sequence is completed by the placement (front-end loader and trucks) and level-dozing of topsoil, after which the rehabilitation process starts along with the placement of windbreak nets. Clearing of vegetation ahead of the mining faces and rehabilitation is carried out concurrently with the mining. The scheduling of the East RAS mining targets a consistent feed grade blend between the mining areas considering the optimization of the conveyor infrastructure and available EMV fleet. The primary production fleet at the East Mine varies with mine pit location and haulage distances but will typically consist of front end loaders, articulated dump trucks, bulldozers and excavators.

19 NAMAKWA TECHNICAL REPORT SUMMARY West Mining The West Primary Concentration Plant (PCP West) receives ore from mining of four pits operating within the West Mine. Mining consists of loading ore into haul trucks that discharge into the ROM tipping bin. By means of an apron feeder ore passes through a vibrating grizzly with the coarse material passing through a primary mineral sizer to -300mm. A secondary mineral sizer, reduces ore down to -150mm and feeds the trunk conveyor to the PCP West stockpile, currently over a distance of 4.3 km. After mineral separation, the remaining 90% is conveyed on the tailings deposition system back to the mined-out areas for rehabilitation purposes or is utilised to build clay residue dam walls. The mining sequence starts with strip-dozing the topsoil (top 50 mm of soil) from the surface Red Aeolian Sands (RAS), which is stacked for rehabilitation at a later stage. The remainder of the RAS is mined with a front-end loader and truck combination. For the deeper ore, mining is accomplished by conventional strip mining, utilising 300-ton excavators, front-end loaders, dozers, and 100 ton and 40-ton dump trucks. Multiple benches, with a height up to 5m, are excavated. It has been established that the double bench mining method increases production and reduces unit cost through less hard padding preparation. Underlying the RAS is the Orange Feldspathic Sands Mineralised (OFSM), also called “dorbank”, is lithified and often requires rip dozing. The bulk of the OFSM is mined with two mass excavators and six haul trucks, in a multiple- 4 m single- or double bench style. Internal sub-economic waste (OFSW) is stripped with a separate excavator-truck fleet and used as backfill. The softer, exposed ore below, which include the OFSM2 and strandline deposits, are also mined with the mass excavator-truck fleet. Figure 11 below shows a schematic cross-section of the West mine. Figure 11: Typical cross-section of the West Mine. The tailings from PCP West are transported on a conveyor system back to the mined-out areas for rehabilitation purposes or is utilised to build clay residue dam walls. The conveyor system consists of a central conveyor, called the Extendable conveyor that runs southwards along the general mining direction, with two perpendicular, shiftable conveyors that can also be extended, resulting in three discharging points for tailings placement. These shiftable conveyors are moved along the Extendable conveyor and discharge the tailings into the mined-out areas. The West Shiftable conveyor is utilised for constructing the residue dams and the East Shiftable conveyor is used for the bulk of the backfill, which covers the greater area of the mined-out areas. Dozers are used to push the tailings beyond the immediate conveyor discharge point, up to 80 m. The mining sequence is completed by the placement (front-end loader and trucks) and level-dozing of topsoil, after which the rehabilitation process starts with the placement of windbreak nets. Aside from reliable tonnage delivery, mining aims to provide an even feed grade as well as a balance of harder material, clay fines content and oversize. The upper layers of the West ore body are generally above average grade but with higher grades of related oversize and clay fines residues, whereas the basal part of the West ore body by comparison, is generally lower grade but with low levels of oversize and clay fines.

20 NAMAKWA TECHNICAL REPORT SUMMARY The relative tonnages between areas are a balance considering the following parameters: • zircon and ilmenite grades, • oversize (LT 35% +20mm) and clay fines content (LT 15%), • waste stripping ahead of the Extendable conveyor and East Shiftable conveyor, • distances to the ROM tip, • position of mining blocks in relation to advancing tailings. • infrastructure location • available EMV fleet Deposits mined at Namakwa have little issue with digging conditions and therefore geotechnical work is rarely required for the mining mechanical equipment. The ore body lies above the surrounding groundwater level, the quality of which is too salty for human or animal consumption. 14 Processing and Recovery Methods East Primary Concentration Plant (PCP East) Aeolian sand is received from the Mine and fed to the plant from the ROM stockpile by means of vibrating feeders. The feed passes through a trommel screen that removes the +6mm material and then to two linear screens, which further removes the +1mm material. The oversize from both the linear and trommel screens is discharged onto the tailings conveyor. Undersize from the two linear screens is de-slimed with the -45µm material going to thickening units. The +45µm is pumped to the spiral section which comprises two parallel streams each containing rougher, middling, cleaner and scavenger spiral gravity separator banks for the recovery of HM. Spiral tailings go to de-watering cyclones then de-watering screens prior to discharge onto the tailings conveyor. The concentrate is pumped to either an emergency stockpile, from where it is trucked to the Secondary Concentration Plant (SCP), or directly into the feed CD-tank of the SCP. West Primary Concentration Plant (PCP West) This plant consists of two parallel processing streams. ROM is fed to the plant from the ROM stockpile by means of vibrating feeders. A trommel screen removes the +6 mm material. The undersize passes over three primary linear screens, which removes the +1mm material. Undersize is pumped to de-sliming cyclones and then to the spiral section. The cyclone overflow is thickened and pumped to a residue dam. The spiral gravity circuits comprise rougher, middling, cleaner and scavenger spiral banks . The concentrate produced is approximately 90% HM. Spiral tailings are pumped to de-watering cyclones then dewatering screens for discharge onto the tailings conveyor, concentrate is pumped to the SCP. Concentrate stock from an emergency stockpile is trucked to the SCP. For processing harder material the PCP also has 7.3m diameter autogenous pancake scrubber which is fed from the trommel (+6mm) and linear screen oversize (+1 mm) from both the North and South steams. The mill discharge is screened, cycloned and fed to the existing spiral feed tank. Secondary Concentration Plant (SCP) This plant receives HMC concentrate from the East and West Primary Concentration Plants (PCPs). The SCP roughly separates the magnetic (ilmenite) from the non-magnetic (zircon, rutile and leucoxene) material. HMC is fed into the plant via two streams and over linear screens to remove oversize (+1mm) . Drum magnets (LIMS) then remove magnetite before it enters the WHIMS magnet circuit. This circuit comprises rougher, magnetic, middling, non-magnetic, cleaner and scavenger 16 pole WHIMS that produce a magnetic fraction (typically 91% ilmenite) which is attritioned, to remove clay cemented coatings, before being filtered and pumped to the magnetic product bays. Excess unattritioned magnetics (UMM) from the WHIMS circuit that cannot be used immediately in the downstream production process is sent to the UMM stockpile for later retreatment. The bulk of the stockpile was accumulated some years ago and contains predominantly ilmenite with some garnet. The stockpile is currently estimated to be 4.5 Mt and is progressively being processed over the next two decades. The non-magnetic fraction, is sent to the wet gravity spiral circuit for further upgrading. The final non-magnetic product concentrate is typically 55% zircon and 10% rutile. This product is also mechanically attritioned to remove surface coatings and then passed over a belt filter, to remove excess moisture. The magnetic concentrate uses a stacker/blending system to deposit in five drying bays, and is allowed to dry for four to five days before being trucked to the MSP. The non-magnetic concentrate is diverted from the non-mags conveyor, using a stacker/blending system, into the bay where it dries before being trucked to the MSP. Mineral Separation Plant (MSP) The SCP crude ilmenite magnetics are first dried in a paraffin fired fluid bed then rougher processed in a bank of drum magnetic separators to remove garnets as non-magnetics and ilmenite magnetics which are further processed on HTR electrostatic separators to make final product smelter grade ilmenite. The circuitry also has a number of middling and scavenging process streams that are further treated on drum magnets and HTR machines with different settings to recover more ilmenite and reject as much garnet as possible.. The unrecovered ilmenite and garnet end up in a rejects stockpile.

21 NAMAKWA TECHNICAL REPORT SUMMARY The SCP zircon rich non magnetics are processed in an entirely separate circuit with no dynamic crossover with the ilmenite circuit. After drying, Induced Roll Magnetic Separators (IRMS) are used to remove iron rich contaminants that would otherwise interfere with the effectiveness of the hot acid leach circuit (HAL) . Dissolution of magnetic monazite and the radio-actives impact on acid effluent is also averted. Of current interest is the development of another circuit to recover monazite from both stockpiled historic reject streams and current HMC production through known separation techniques as monazite has increasing commercial value in the production of rare-earth metals. In the HAL circuit an iron-rich mineral coating that affects electrostatic separation and contributes to iron contamination of zircon products is removed. An upgraded non-magnetic feed from the IRMS circuit is heated in a drier and fed into a rotary reactor where a sulphuric acid solution is added to the hot sand. The heat of the sand bakes the acid on the mineral surface to form iron sulphate. The leached product is quenched, after which the acid effluent is removed. Residual iron coating that remained after the leaching process is removed by attritioners. The acidic effluent is neutralized with lime. Next is a wet gravity circuit, the purpose of which is to remove the less dense minerals like quartz, siliceous leucoxene, kyanite, garnet, pyriboles and other low-density nonvaluable minerals. Up front is a hydrosizer from which the coarser underflow contains the bulk of the zircon and is upgraded through a six stage spiral circuit. The lighter and finer minerals in the hydrosizer overflow are processed over two stages to remove quartz and leucoxenes from the fine zircon. The dry mill is made up of five main circuits: rougher, middlings, zircon, rutile and Zirkwa circuits. The rougher circuit consists of the CoronaStat and MT HTR separators performing the initial separation between zircon and rutile. Conductors from the rougher stage are fed to the rutile plate circuit which includes the tin/cassiterite removal circuit (HTR) and the silica/leucoxene plus ilmenite removal circuit in the process of producing a pigment grade Rutile product. The non-conductors are fed to the zircon plate circuit. The middlings have a separate circuit for scavenging zircon and rutile and also feed the Zirkwa circuit with less amenable mineral. The low TiO2 non-conductors are fed to the zircon plate circuit which consists of a combination of Electrostatic Plate Separators (EPS), Electrostatic Screen Plate Separators (ESPS), High Force Magnets (HFM) and Induced Roll Magnetic Separators (IRMS). This circuit produces a primary grade zircon and rejects, is combined with the middlings and fed to the Zirkwa circuit. The Zirkwa circuit treats the rejects from the middlings circuit, zircon plate circuit and the wet gravity circuit secondary concentrate to produce a secondary zircon product and a final zircon reject stream. The mineralogy, the chemistry and physical characteristics of the Namakwa minerals are quite varied and complex leading to complex interactive MSP circuitry in order to reject trash and sub-specification valuables. The magnetic feed to the MSP comprises ilmenites at a grade of approximately 90% together with 10% of other minerals (predominantly garnet). By contrast the mineral suite of the non-magnetic feed is much more diverse and in addition to the valuable minerals zircon, rutile and leucoxene, hosts a range of other minerals including garnet, ilmenite, pyriboles, staurolite, monazite, kyanite, cassiterite, titanite, and quartz. Typically, a non-magnetic feedstock contains about 55% zircon; 10%-15% rutile and 10% leucoxene with the significant remainder being other minerals. The zircon, leucoxene and ilmenite grains display a broad range in their respective compositions. Generally zircon is distinguished by two types namely pure (clear) and impure (metamict) varieties, and although both types contain ~65% ZrO2 the metamict type hosts undesired Fe, U, and Th of up to 0.05% levels. Silica-rich intergrowths commonly lower the titanium quality of leucoxene (to 85% TiO2 and lower), and similarly, Ti-poor ilmenite degrades the titanium content of the final ilmenite product to approximately 46% TiO2. Fe-Al silicate coatings are present on all mineral grains as surface deposits which impacts the quality of zircon and ilmenite products, but also impairs electrostatic and magnetic separation performance. Apart from having diverse chemical compositions, the various minerals also exhibit different physical properties and mineral separation is accomplished by exploiting these. The SCP magnetics surplus stream gets reprocessed through a small standalone scavenger plant with the crude ilmenite output being blended with SCP crude ilmenite processed through the MSP. The recovery conversion of Mineral Reserve to Saleable Product is based on empirical calculations and historical information retrieved from reconciliations. Metallurgical recoveries are dependent on a variety of factors. These factors that affect recoveries are listed as follows: • Clay fines content • Oversize • Other content and type • Material type • Other geometallurgical parameters such as physical and chemical mineral characteristics • Cementing and staining agents The operation runs 24 hours per day, 365 days per year and personnel cover shift operations, day crew, maintenance and various services. Haulage of HMC to and mineral product from the MSP are managed by contract. Figure 12 shows an abridged Schematic Flowsheet for the Mineral Processing at Namakwa Sands Operations.

22 NAMAKWA TECHNICAL REPORT SUMMARY Figure 12: General Flowsheet of Namakwa Sands Operations Typical mineral product qualities are shown in Table 4 below. Table 4: Expected Typical Mineral Product Qualities Ilmenite Rutile Zircon Zirkwa %TiO2 46.3 93.0 0.11 0.5 %Fe2O3 53.1 0.6 0.06 0.2 %ZrO2 (inc HfO2) - 1.2 66.4 64.3 %SiO2 1.15 2.8 32.8 33.0 %Al2O3 0.5 0.6 0.16 0.5 %Mg 0.4 - - - %MnO2 1.2 - - - %P2O5 0.03 - - - %Sn - 0.07 na na U+Th ppm nd 140 450 850 Table 5: Estimated saleable product yield (recovery) for the year ended December 31, 2021: Description Total Recovery % Ilmenite 68 Rutile 63 Zircon 63 In the opinion of the QP, the methodology employed in this section was appropriate and the data derived from the testing activities described above are adequate for the purposes of defining a Mineral Resource as of the effective date of this report.

23 NAMAKWA TECHNICAL REPORT SUMMARY 15 Infrastructure Potable water is sourced from the Olifants River Irrigation Scheme canal system. Water is distributed to the MSP and Brand-se-Baai (BsB) for process and domestic use. Water is pumped to BsB via a 56 km pipeline at the rate of 280m3/h. This line also provides water to farmers along the line and rehabilitation areas at the Mine. Namakwa Sands holds servitude rights in the area adjacent to the tar sealed road between the Mineral Separation Plant and the Mine. ESCOM supplies the MSP via the 132kV line from the Juno substation. A 132/22kV, 20MVA transformer from ESCOM supplies both

24 NAMAKWA TECHNICAL REPORT SUMMARY the MSP and a local farm. The allocated maximum demand is 7.5MVA for the MSP and the normal operating load is approximately 3.5MVA. For PCP East: Max = 5.2MVA, normal operating = 3MVA, for PCP West: Max = 10.5MVA, normal operating = 9MVA and for SCP: Max = 22MVA, normal operating = 12MVA The minerals are transported with purpose-built trailers and trucks between the Mine and MSP. The trucks travel on a tar seal road constructed for this purpose. A Sishen-Saldanha railway line connects the MSP and Smelter sites. The minerals are transported from the MSP to the Smelter/port storage in closed container trucks, to prevent mineral losses and contamination. Seawater is used in the primary and secondary separation processes and is pumped via the seawater pump station installation close to the Mine. 16 Market Studies The principal commodities titanium and zircon are freely traded, at prices and terms that are widely known, so that prospects for sale of any mineral production are virtually assured. Tronox is the world’s second largest producer of TiO2 based pigments and has the specific strategy of being predominantly vertically integrated. This means that its own mining production will provide the bulk of the titanium feedstock to its 9 pigment plants, located around the globe. Tronox Management Pty Ltd now markets all mineral products sold emanating from the Namakwa mine. However with the integrated pigment strategy, this predominantly relates to the range of zircon products. The Namakwa zircon products are highly sought for use in tile ceramics. Tronox routinely uses the services of various industry trade consultants to closely monitor and report on global production of titanium minerals and zircon as well as reporting on the current global supply and demand status, plus projections of new projects to come on stream, both timing and capacity. Export and import data by country is monitored. As noted earlier, zircon, TiO2 feedstock and TiO2 product pricing are internationally traded, specialized commodities. Generally speaking, the prices of our products are substantially in line with the prices for each of these products published quarterly by TZ Minerals International Pty Ltd (TZMI) and other independent consulting companies who track the mineral sands, titanium dioxide and coatings industries. The ilmenite product is smelter grade and converts well to high grade slag for use in chloride pigment plants. Natural Rutile has been marketed in the past with a TiO2 content of 94+% but is currently blended with leucoxenes and consumed internally by Tronox. The bulk of Namakwa zircon is classified as Premium Grade with a slightly higher contaminant grade product Zirkwa also produced. Namakwa zircon has consistently sold in line with market pricing. 17 Environmental studies, permitting and plans, negotiations, or agreements with local individuals or groups Tronox Namakwa Sands’ mining operations are covered by three Mining Rights issued by DMRE on 18 August 2008 and 30 March 2016. The Mining Rights cover 19,144 ha of land of which ~14,000 ha has been authorised for mining. Namakwa Sands is covered under a number of approved EMP’s, EMP addendums and Environmental Authorisations. These include: • 1990 Environmental Impact Report • 1992 Rehabilitation Plan • 1994 EMP Addendum to include the MSP • 2002 Revised EMP • 2005 EMP Addendum for the Effluent Treatment Plant & Gypsum disposal • 2005 EMP Addendum for the P1000 project • 2006 EMP Amendment pertaining to various issues on the bulk storage of fuel • 2011 Expansion of the Mining Footprint EMP (Applicable to Mine only) • 2011 UMM Plant EMP Addendum (Applicable to Mine only) • 2011 UMM Dryer EMP Addendum (Applicable to Mine only) • 2013 Quartz Reject Plant EMP Addendum (Applicable to MSP only) • 2016 Satellite Expansion (Expansion into Satellite Deposits) (Applicable to Mine only) • 2018 East OFS Infrastructure (Applicable to Mine only) • 2018 RSF6 and associated West Mine Infrastructure (Applicable to Mine only) • Water Use Licenses (Mine and MSP) • Air Emission Licenses (Mine and MSP) In terms of the EMPs and authorisations, various audits (internal and external) are conducted to ensure compliance with the conditions of these authorisations. There are no issues of noncompliance outstanding. The Namakwa operations are situated within the Succulent Karoo, part of the Cape Floristic Region (CFR), which is known for its large diversity of plants. Namakwa Sands propagates indigenous plants in an in-house nursery, transplants indigenous plants from areas to be mined in future and sows indigenous seeds as part of the rehabilitation programme to re-establish the natural biodiversity. Biodiversity audits are undertaken periodically to gain insight into the recovery of the Succulent Karoo veldt. The goal is to achieve sustainable small stock grazing capacity and species counted in rehab are up to 70% of pre-existing baseline audit.

25 NAMAKWA TECHNICAL REPORT SUMMARY Soils are generally poor in nutritional value. Topsoil however plays a significant role in the success of rehabilitation. The top 50mm of the sandy aeolian soils contains 80% of the veld seed resource. A minimum of 50mm topsoil is therefore collected for rehabilitation purposes prior to commencement of mining activities and/or the establishment of any infrastructure. Seed viability deteriorates rapidly during soil storage, necessitating storage periods of three months or shorter. Rehabilitation Programme The EMPR (East Mine and West Mine rehabilitation plans and schedules) requires Namakwa Sands to rehabilitate continuously with mining advance. The first step in rehabilitation is the backfilling of tailings to generate a soft undulating landscape. Topsoil is then placed and levelled on the backfilled tailings. Windbreaks are then installed to minimize the impact of strong winds on topsoil and newly established vegetation. Re-vegetation includes the sowing of indigenous seed, transplantation of propagated plant from an in-house nursery and from undisturbed areas, clay fines dam walls will be sloped to 1:5 gradient and re-vegetated during LOM. Rainfall is not the single most important source of precipitation. Heavy dewfalls and sea fogs occur over approximately 100 days of the year because of the moderating effect the cold Atlantic ocean has on temperatures. The dewfalls and sea fogs supplement the rainfall resulting in a cumulative average annual precipitation of approximately 280 mm per annum. Groundwater Monitoring Groundwater is regularly monitored across all sites. There are elevated levels of some analytes at the MSP seeping from small storage dams. This water is managed through reclaim and recycling back to the process. At the mine there is a certain amount of seepage of process saltwater that escapes from the RSF dams. The natural ground water is quite salty and too high for unacclimatized stock usage. These dams are only a short distance from the coast where the water was originally sourced. The use of seawater during heavy mineral separation also results in salt being returned to the mining excavations in the backfill tailings which, along with the need to be able to easily convey, is why the return material is dewatered to a handleable extent. Dust Monitoring Because of site-specific climatic conditions and the nature of activities associated with mineral sand mining, fugitive dust is managed to reduce impacts outside the site boundaries. The rehabilitation netting works well to reduce windspeed at ground level for the betterment of plant growth and minimizing fugitive dust and sand. A system of monitoring with bucket catchment units around the mine perimeter is in place. Ionising Radiation Namakwa Sands operates under a nuclear authorisation issued under the terms of the National Nuclear Regulatory Act (Act No 47 of 1999). Waste streams at the Mine and the MSP, and product material such as primary and secondary zircon and rutile, are described as NORM (Naturally Occurring Radioactive Material). Low-level radioactive and chemically inert mineral tailings material from the Secondary Concentration Plant (SCP) at the Mine is blended back into the primary sand tailings. Adequate dilution is obtained since primary tailings constitute more than 90% of all tailings. This is returned to the mining voids and the surface areas are rehabilitated as required in the approved EMPR. The bulk of the radioactive waste, which has significantly higher radioactive levels is generated at the MSP. The mineral monazite naturally contains levels of uranium and thorium. This mineral primarily goes into stockpiles at the MSP which because of the much larger concentrations of rutile, zircon and ilmenite remain at site for further reprocessing. The treatment of the non-magnetics stream through the HAL process at the MSP results in some acid solubilized uranium and thorium however this is converted back to an immobile solid by neutralization with lime, filtration and inground disposal at Brand-se-Baai according to the approved EMPR. Mine Closure1 GN R1147 GG 39425 refers to the Regulations Pertaining to the Financial Provision for Prospecting, Exploration, Mining or Production Operations under the National Environmental Management (NEMA) Act. These regulations were published by the Department of Environmental Affairs on 20 November 2015. The purpose of these regulations is to regulate the determination and making of financial provision for the costs associated with the management, rehabilitation and remediation of environmental impacts from prospecting, exploration, mining or production operations throughout their lifespan. This includes potential latent or residual environmental impacts that may become known in the future. The regulations require an applicant or holder of a permit or right to determine and make financial provision to guarantee the availability of sufficient funds for the rehabilitation and remediation of adverse environmental impacts. The financial provision must be determined through a detailed itemization of all the activities and costs, which are calculated by the actual cost of implementing measures required for annual rehabilitation, final rehabilitation, decommissioning, closure, and remediation of latent or residual environmental impacts. The financial provision can be made through a financial guarantee, a deposit into an account administered by the Minister or a contribution to a trust fund established in terms of applicable legislation. NEMA GN R1147 prescribes that mine closure planning should be done over the total scheduled LOM. This requirement necessitates the inclusion and differentiation of the rehabilitation, the decommissioning and finally, the aftercare phase. In agreement with NEMA GN R1147, mine closure provision has been estimated on the basis of functional domains and risks. Closure items and components with relevance and commonality in terms of location and closure objectives are categorised into closure domains. The following closure domains are used; 1: Offices and Infrastructure; 2: Plant Infrastructure; 3: Water Infrastructure; 4: Waste and Product Storage Areas; 5: Conveyors; 6: Linear infrastructure, 7: Residue Storage Facilities (RSF’s) and associated infrastructure and 8: Mining Areas. Domain 9 deals with post-closure monitoring aspects and 10 with cost of Risk and the cost of Regulatory Aspects associated with a closure application. Rehabilitation of mined out areas are planned to be conducted continuously through the life of mine. The concurrent rehabilitation of the mine voids the RSF’s and stockpiles is

26 NAMAKWA TECHNICAL REPORT SUMMARY scheduled to take place in the operational LOM period, whilst the decommissioning of the PCP East, PCP West, the West RSF 6 - 9, the planned East OFS RSF and the MSP with associated infrastructure will be initiated when reserves are depleted. Consultants have estimated mine closure cost, using an internationally accepted closure assessment method. The unscheduled closure cost is calculated as the cost of immediate, unplanned closure of all domains inclusive of decommissioning and restoration. The scheduled closure cost liability is made up of closure costs incurred during the scheduled LOM, followed by final closure, rehabilitation and or aftercare phases. Unscheduled closure cost is estimated at US$14.5 million. Community The local procurement targets as set out in the Mining Charter for capital goods and procurement of services are being met. For employment, the proportion of historically disadvantaged South Africans (HDSA) was 84% in total and well exceeded the required Mining Charter target levels of 40%. In the Qualified Person’s opinion, Tronox’s current plans to address any issues related to environmental compliance, permitting, and local individuals or groups are adequate.

27 NAMAKWA TECHNICAL REPORT SUMMARY 18 Capital and Operating Cost As the operation commenced in 1994 the project capital is no longer a relevant factor in determining the economic viability of the property. However, the economic analysis allows for ongoing minor stay in business capital and also a pre-feasibility estimate of a range of US$150 to US$200 million for the East OFS mine extension project. The operating costs are known and no longer subject to estimate. Costs used in the economic analysis come from Tronox internal cost accounting systems. Our projected average annual operating and capital costs from our Namakwa life of mine model at December 31, 2021 were as follows: Table 6: Average Annual Capital Cost Estimate (US$/Mpa, 2021 real terms, rounded) Life of Mine Estimate (2022 – 2053) Category 2022-2026 2027-2031 2032-2036 2037-2041 2042-2046 2047-2051 2052-2053 LOM Total Sustaining Capital 6 12 7 7 6 10 8 261 Major Infrastructure Investment 35 0 0 0 0 0 0 173 Total Capital Expenditure 41 12 7 7 6 10 8 435 Table 7: Average Annual Operating Cost Estimate (US$/Mpa, 2021 real terms, rounded) Life of Mine Estimate (2022 – 2053) Category 2022-2026 2027-2031 2032-2036 2037-2041 2042-2046 2047-2051 2052-2053 LOM Total Mining and Concentration 92 101 101 101 101 101 88 3,161 Dry Mill 31 31 31 30 30 30 19 952 Realization 22 19 18 17 16 16 15 559 Total Operating Expenses 145 151 149 148 146 147 122 4,672 For this report, capital and operating costs for the year ended December 31, 2021 have been estimated to an accuracy of +/- 15%. 19 Economic Analysis For the financial modelling that supports the current Reserves, a range of mining block schedules are prepared by the senior mine development engineer. These schedules contain information on ore tonnes and grades, mineral assemblages and clay fines levels as well as other information that may impact on throughputs, recoveries and costs. Historical performance validated forecasting models have been used to predict a range of physical performance parameters for future ore blocks to be mined over the remaining life that are used as input drivers to the financial modelling and economic validation. Grouped cost drivers, physical and revenue parameters used in the modelling. There are many mineral sands mines operating worldwide. Many as standalone mineral sales operations producing mineral products similar to those emanating from Namakwa. With so many operations selling titanium and zircon mineral products on the open market Tronox chooses to value its ore reserves on the basis of what it would have to pay to buy the mineral products, if it didn’t produce and use them itself. Mineral pricing data is readily available through a number of industry sources and from Tronox own marketing team. The current Namakwa orebodies are expected to be depleted by approximately 2049. Key cost assumptions, macro and mineral price assumptions To determine the economic viability and cash flows of the Namakwa project, the Company utilized management’s best estimates of the following key assumptions for the mining operations: 1) mining and waste material removal cost, 2) primary plant variable cost, 3) concentrator fixed costs, 4) tailings fixed costs, and 5) maintenance, overhead and support services costs; and for the separation plants, the assumptions are as follows: 1) plant variable costs, 2) SCP and MSP fixed costs, 3) HMC haulage rates and 4) maintenance, overhead and support services. Other key assumptions were mineral royalties, distribution costs, mine and concentrator and MSP capital spending, tax rates, and exchange rates. Cash flows are positive for all years in the Life of Mine Plan. The physical mining and processing parameters used in the life of mine plan and applicable to exploiting the reserves result in a mine life of 25+ years and product yields from in ground mineral to saleable products as follows:

28 NAMAKWA TECHNICAL REPORT SUMMARY • Ilmenite 68% • Zircon 63% • Rutile 63% Sensitivity analyses were conducted using variants such as commodity price, operating costs, capital costs, ore grade and exchange rates. As a result of these analyses, the project was determined to be economical viable in all scenarios. Table 8: Long term real pricing used in the economic analysis (US$/MT, 2021 real terms, rounded). Product 2016 2017 2018 2019 2020 2021 Forecast 2022 – 2026 (annual average) Forecast 2027 – 2031 (annual average) Forecast 2022 – 2036 (annual average) Forecast 2037 – 2041 (annual average) Forecast 2042 – 2046 (annual average) Forecast 2047 – 2051 (annual average) Forecast 2052 – 2053 (annual average) Ilmenite 95 160 175 176 211 261 248 205 205 205 205 205 205 Rutile 725 755 900 1,103 1,211 1,201 1,328 1,183 1,183 1,183 1,183 1,183 1,183 Zircon 900 1,080 1,470 1,520 1,360 1,500 1,840 1,554 1,554 1,554 1,554 1,554 1,554 Consistent with industry standards, Tronox values its mineral reserves based on the prices at which its titanium and zircon mineral products would sell on freely traded markets, as forecasted by third-party industry consultancies. Table 9: LOM Plan Summary (for the year ended December 31, 2021) Annual Averages(1) 2022-2026 2027-2031 2032-2036 2037-2046 2042-2046 2047-2051 2052-2053 Ore Mined (kt) 21,510 22,121 22,173 22,152 22,152 11,840 8,612 HM (%) 8.7 7.0 6.4 5.6 4.6 3.9 4.4 Ilmenite (in HM %) 39.7 42.1 45.3 49.0 56.5 67.9 72.7 Rutile+Leucoxene (in HM %) 8.8 9.7 9.9 10.4 11.8 12.5 12.1 Zircon (in HM %) 9.1 10.2 9.7 10.0 11.1 13.4 14.4 (1) Amounts presented are based on weighted averages. Table 10: Historic Plant Throughput and Saleable product yield (recovery) (for each of the three years ended December 31, 2021) Annual Total 2019 2020 2021 Plant Throughput (kt) 20,008 19,171 21,457 Ilmenite saleable product yield (recovery) (%) 63 72 76 Rutile saleable product yield (recovery) (%) 65 61 60 Zircon saleable product yield (recovery) (%) 63 67 67 Table 11: Cash Flow Analysis of Namakwa Sands (for the year ended December 31, 2021) Cash Flow (US$ million) 2022- 2026 2027- 2031 2032- 2036 2037- 2041 2042- 2046 2047- 2051 2052- 2053 LOM Total Revenue - Ilmenite 118 90 90 87 84 82 75 2,912 Revenue - Rutile 41 35 32 30 27 26 25 1,005 Revenue - Zircon 192 150 130 118 109 121 112 4,324 Revenue 351 275 252 235 221 230 212 8,241 Operating Costs -145 -151 -149 -148 -146 -147 -122 -4,672 EBITDA 206 124 103 88 74 83 90 3,569 Income Tax -54 -30 -24 -20 -16 -19 -21 -861 Capital Expenses -41 -12 -7 -7 -6 -10 -8 -435 Free Cash Flow 111 82 71 60 51 55 61 2,273

29 NAMAKWA TECHNICAL REPORT SUMMARY The sole purpose of the operational and related financial data presented is to demonstrate the economic feasibility of the mineral reserves for the purpose of reporting in accordance with subpart 1300 of Regulation S-K, and should not be used for other purposes. The information presented originates from comprehensive techno-economic modelling, which is subject to change as assumptions and inputs are updated, and as a result does not guarantee future operational or financial performance. Consistent with industry standards, Tronox values its mineral reserves based on the prices at which its titanium and zircon mineral products would sell on freely traded markets, as forecasted by third- party industry consultancies. Table 12: Sensitivity Analysis (for the year ended December 31, 2021) Economic sensitivity analysis results are presented below based on variations in significant input parameters and assumptions. Cashflow (US$Mpa) -25% -10% Reference +10% +25% Commodity Price 827 1,695 2,273 2,852 3,720 Operating Costs 3,441 2,741 2,273 1,806 1,105 Capital Costs 2,382 2,317 2,273 2,230 2,165 Ore Grade 1,672 2,033 2,273 2,511 2,867 Exchange Rate 1,103 1,883 2,273 2,593 2,976 20 Adjacent Properties Not applicable.

30 NAMAKWA TECHNICAL REPORT SUMMARY 21 Other Relevant Data and Information Glossary of Terms summarised in Table 13. Table 13: Glossary of Terms Term Definition AC Air Core drilling amsl Above mean sea level Clay Fines Clay and Fines finer than 45 micron, often suspended in water CPI Consumer Price Index, a measure of inflation CRM Certified reference material DFS Definitive feasibility Study DMRE Department of Mineral Resources and Energy DTM Digital Terrain Model DWAF Department of Water Affairs and Forestry EBIT Earnings before Interest and Tax EBITDA Earnings Before Interest, Tax, Depreciation and Amortisation GPS Global Positioning System GSSA Geological Society of South Africa HM Heavy Minerals HMC Heavy Mineral Concentrate HTR High Tension Rolls, a high voltage electric charging mineral separator IWULA Integrated Water Use License Act JORC Code Australasian Code for Reporting of Exploration Results, Mineral Resources and Ore Reserves LOMP Life of Mine Plan Mbcm Millions of bank cubic metres ML Mining Lease MSP Mineral Separation Plant Mt Million tonnes MWh Mega Watt Hour, a unit of electricity consumption Neighbourhood Analysis Method of classifying multivariate data according to a given distance, provides optimal parameters for modelling. NYSE New York Stock Exchange OFS Orange Felspathic Sands OFSM Orange Felspathic Sands Mineralized OFSM2 Orange Felspathic Sands Second Mineralized layer, beneath waste OFSW Orange Felspathic Sands Waste Ordinary Kriging A statistical method of relating data points based on distance of separation PCP Primary Concentration Plant PFS Pre Feasibility Study QA/QC Quality Assurance/Quality Control QEMSCAN Quantitative. Evaluation of Materials by Scanning. Electron Microscopy RAS Red Aeolian Sands RET Recent Emergent Terrace, often coastal sand dunes ROM Run of Mine RSF Residue Storage Facility, often for clay fines SAMREC South African Code for the Reporting of Exploration Results, Resources and Mineral Reserves SCP Secondary Concentration Plant Strandline Line of concentrated heavy minerals usually associated with historical shorelines

31 NAMAKWA TECHNICAL REPORT SUMMARY Term Definition THM Total Heavy Minerals VHM Valuable Heavy Minerals (total of Ilmenite+Rutile+Leucoxene+Zircon) XRF X-ray fluorescent Analysis Yield The recovered weight of material to a saleable product 22 Interpretation and Conclusions The declaration that the Namakwa operations have 703Mt of ore reserve at 2.90% ilmenite and 0.63 % zircon and resources of 306Mt at 2.05% ilmenite and 0.43% zircon is well supported. The minerals in the deposit show a limited existence of inclusions and composite grains which does impact on mineral recoveries and qualities. There is modest Fe staining of the zircon which responds well to HAL treatment. The ilmenite performs well in making a high TiO2 slag. Namakwa has a good record for rehabilitation of past mining areas, groundwater management, control of dust and radiation management. Relationships with key stakeholders and government regulators are also in good standing. The LOMP runs through to 2049 however, closure and rehabilitation plans and provisions for unplanned closure are appropriately made. On a minerals only basis, financial modelling shows that future reserves are profitably mineable with the existing equipment and infrastructure. In the Qualified Person’s opinion, all issues relating to relevant technical and economic factors likely to influence the prospect of economic extraction can be resolved with further work. The Namakwa operations are a key part of the Tronox vertically integrated pigment production process. 23 Recommendations That geological work continues to better define the economic margins of the resources, looking for inclusion, at least in part, as reserves to further extend mine life. 24 References List of References summarised in Table 14 Table 14: List of References Title Tronox Namakwa East OFS Project Pre-Feasibility Study 2020 Tronox Namakwa Mine Closure Plan 2020 Tronox Namakwa Operations 2021 Annual Resources and Reserves Report 25 Reliance on information provided by the registrant The preparation of this Technical Summary Report relies on information provided by Tronox and its employees in the following areas, as they are reasonably outside the expertise of the qualified persons. • Marketing plans and pricing forecasts as key inputs to the economic modelling • Environmental performance commitments and mine closure costing • Maintenance of licenses and other government approvals required to sustain the LOMP • Capital to progress the mining of the East OFS deposits. 26 Date and Signature Page This report titled “Namakwa Technical Report Summary” with an effective date of December 31, 2021 was prepared and signed by: /s/ Carlo Philander Carlo Philander, Regional Manager Mineral Resource Development Dated at Koekenaap, Western Cape, South Africa February 21, 2024
EX-96.4
16
ex964202310k.htm
EX-96.4
ex964202310k

1 KZN TECHNICAL REPORT SUMMARY Exhibit 96.4 KZN Technical Report Summary Explanatory Note This Technical Report Summary (TRS), dated February 21, 2024, serves as an amendment to, and restatement of, the TRS filed on February 22, 2022, effective December 31, 2021, following Tronox Holding plc’s receipt of a comment letter from the U.S. Securities and Exchange Commission. While this Amended TRS incorporates changes to the original version, it maintains an effective date of December 31, 2021 with regard to assumptions and the knowledge of the Qualified Persons. Notable revisions and changes to the previously filed TRS were as follows: • Inclusion of the coordinates of the mine (Section 3) • Inclusion of a stratigraphic column (Figure 5) • Inclusion of the Qualified Person opinions regarding sample preparation, security, and analytical procedures; the metallurgical data; the current plans to address any issues related to environmental compliance, permitting, and local individuals or groups; and issues relating to relevant technical and economic factors likely to influence the prospect of economic extraction can be resolved with further work (Sections 8, 14, 17 and 22) • Amended cutoff grade disclosure (Section 12) • Inclusion of saleable product yield (Table 7) • Amended mine closure disclosure, including closing/reclamation costs (Section 17) • Inclusion of operating and capital costs for life of mine (Tables 10-11) • Inclusion of accuracy of capital and operating costs estimates (Section 18) • Inclusion of market price projections (Table 12) • Inclusion of annual life of mine production schedule (Table 13) • Inclusion of historic plant throughput and saleable product yield (Table 14) • Inclusion of a cash flow analysis (Table 15) • Inclusion of a sensitivity analysis (Table 16) 1 Executive Summary The KZN mineral sands project commenced operations at Hillendale in 2001 had transferred to the nearby Fairbreeze site in 2015. This utilized the existing infrastructure at Empangeni, being a fully functional mineral separation plant for zircon, ilmenite and rutile products and smelting operations using two DC arc furnaces for the production of TiO2 slag and pig iron, on the same site. The majority of the equipment from Hillendale was also put into service at Fairbreeze. Being situated on an historical coastline the ore body is made up of ancient dunal mineral sands deposits, eminently suited to hydraulic mining and wet gravity concentration. There are 2 Mining Rights covering the mining and processing operation and are held 100% by Tronox KZN Sands, a wholly owned subsidiary of the Company. The current reserves are 217Mt tonnes at an average grade of 5.5% THM. The current resources, additional to the reserves tonnage, are 107Mt tonnes at 3.7% THM and the current Life of Mine Plan extends out 15 years. 2 Introduction This report has been prepared by Tronox Holdings Plc in compliance with the US Federal Commission’s modernization of reporting rules for mineral assets located at Fairbreeze in KwaZulu-Natal, South Africa. Information used to support this technical summary report includes the annual Mineral Resources and Reserves report listed in the references section of this report. Mineral Resources and Mineral Reserves as of 31st December, 2021 are summarised in Table 4 and Table 5 in section 11 and section 12 respectively of this report A Qualified Person works at the Fairbreeze site and frequently visits the mining areas. Discussions with site management on resource utilisation and optimisation opportunities are held regularly. During the periodic drilling activities, a qualified person regularly attends site activities.

2 KZN TECHNICAL REPORT SUMMARY 3 Property Description Tronox KZN Sands operations are wholly owned subsidiaries of Tronox Holdings Plc which include: • Fairbreeze Mine, immediately south of the Mtunzini township with the Primary Wet Plant (PWP) situated a further 8 km south of Mtunzini. A hybrid mining method that utilizes track dozers to break lightly cemented ore layers in combination with high- pressure hydraulic mining using water monitor guns to slurry the ore for gravity recovery of heavy minerals at the Primary Wet Concentrator (PWP). • The Central Processing Complex (CPC), 50 road km north of Mtunzini, just outside the town of Empangeni, is where heavy mineral concentrates are processed into mineral products and ilmenite is further converted to titanium rich slag and pig iron in two direct current (DC) arc furnaces. The laboratory and mineral testing facilities are also located at CPC. See Figure 1 on next page.

3 KZN TECHNICAL REPORT SUMMARY Figure 1: Location Map The Fairbreeze Mine is located at coordinates 29°00’S and 31°42’E Mining tenements in South Africa are managed at a national government level. In KwaZulu-Natal, Mining Rights and Prospecting Rights are granted and administered by the regional office of the South African Department of Mineral Resources and Energy (DMRE). The Mining Rights for Fairbreeze are shown in Table 1 and Figure 2. Table 1: Tronox Mining Rights for Fairbreeze Area/Farm DMRE Ref. no. Area (ha) Current status Fairbreeze A, B, C, D KZN 30/5/1/2/2/123 MR 3,810 expires 24 March 2035 Fairbreeze CX KZN 30/5/1/2/2/164 MR 231 expires 04 August 2039

4 KZN TECHNICAL REPORT SUMMARY Figure 2: Mining Rights and Surface Ownership All deposit areas are largely covered by eucalyptus plantations and sugar cane to a lesser extent (see Figure 3). An agreement to conduct business exists between Mondi Ltd and Tronox KZN Sands for the properties within the Fairbreeze Mining Right area.

5 KZN TECHNICAL REPORT SUMMARY Figure 3: Land Use In Relation to Mineral Resource Outlines The minerals in South Africa belong to the government and Tronox is obligated to pay a royalty to the South African Revenue Services (SARS) based on the sales of final mineral products. The actual royalty payable depends on the Tronox KZN Sand’s EBIT (Earnings before Interest and Tax) adjusted for capex redeemed. The royalty percentage ranges between a minimum of 0.5% to a maximum of 7%. 4 Accessibility, climate, local resources, infrastructure and physiography The Fairbreeze area is characterised by a ridge situated about 2.5 km inland from the present coastline which has been dissected by streams to leave smaller free-standing dunes. The dunes generally slope toward the sea from a maximum height above sea level of 109 meters. The regional climate can be described as sub-tropical receiving an average of about 1 100 mm rain /annum at Mtunzini. On average, rainfall occurs for about 20 days in January down to 10 days in July. January temperatures have an average daily maximum of 27°C down to 22°C minimum. In July the average maximum is 22°C down to minimums of around 17°C. An extensive road network services the greater Richards Bay - Empangeni - Mtunzini area. The national road, N2, serves as the main vehicular access route to the Fairbreeze Mine. Railway networks in and around the region are suitable for the cargo requirements of the harbour and local industry and are directly connected to the national network for import/export purposes. Flights can be accessed from Durban King Shaka Airport or Richards Bay Airport. Electricity supply is drawn from the national ESCOM grid for all operations. Water supplies are drawn from Mhlathuze Water for mining operations and via the local municipality for the CPC operations. Infrastructure availability is further disclosed in section 15.

6 KZN TECHNICAL REPORT SUMMARY 5 History Natal Mineral Sands (NMS), prospected for mineral sands on Hillendale and Fairbreeze in the northern coast of KwaZulu-Natal during the 1980’s. Iscor Limited purchased NMS in 1994 and mining activities commenced in 2001 at the Hillendale Mine. In 2012, Tronox announced the acquisition of 74% of KZN Mineral Sands operations. Production commenced at Fairbreeze in 2015 and in 2021 Tronox acquired the whole of the remaining portion it did not own of the KZN Sands operations. 6 Geological Setting, Mineralisation and Deposit The Fairbreeze deposits consist almost entirely of older (Pliocene parent) Berea-type red sands, which have been exposed to a long period of weathering resulting in the disintegration of the original components to form silt-sized particles and clay. Progressive enrichment in the swash zones of several beaches, which developed along the large coastal beach/dune system, resulted in the concentration of heavy minerals. See Figure 4 for general geology of the area. Heavy minerals, derived from weathering of inland rocks and sediments, were deposited into the ocean by the Tugela River, concentrated because of progressive enrichment in the swash zones of several beaches, which developed along the large coastal beach/dunal system. Ilmenite, zircon and rutile represent the primary valuable heavy minerals (VHM) of this deposit. Figure 4: Geology of Fairbreeze Area Collectively, the Fairbreeze deposits span 526 ha, with a total length of more than 15 km, striking 34°, and reaching 630m in width (Table 2). Generally, the different ore bodies have depths close to 30m, and the elevation drops from around the 100 mamsl in the southwest (A and B ore bodies) to around 70m amsl in the northeast (C, CX and D ore bodies). Heavy minerals are disseminated in the dune systems with general preference of higher concentrations at the ridge of the dunes.

7 KZN TECHNICAL REPORT SUMMARY Table 2: Pre-mining dimensions of the Fairbreeze deposits Orebody Avg. Depth (m) Max. Depth (m) Max. Elevation (mamsl) General strike (°) Width (m) Length (m) Surface Area (ha) FBA 33 63 108 30 535 4,500 250 FBB 30 51 94 33 230 2,409 50 FBC (mined out) 25 51 78 35 280 2,160 55 FBCX 28 50 78 30 630 2,000 110 FBD 23 48 68 40 200 4,030 61 Figure 5: Stratigraphic column of the Maputaland Group as of December 31, 2021: 7 Exploration Drilling activities at Fairbreeze are predominantly focused on better definition of deposit edges and drilling for production purposes. Tronox relies on constraining grade variation by drilling on progressively tighter grid patterns. There is no greenfields exploration work to disclose. 8 Sample Preparation, Analyses and Security Orebodies have been defined by reverse circulation “air core” drilling, with Fairbreeze CX and Fairbreeze B covered on a 50m × 50m grid. Fairbreeze A is largely covered on a 100m × 100m grid with the area targeted for the first two years of mining drilled on a

8 KZN TECHNICAL REPORT SUMMARY 50m x 50m grid. Holes are drilled vertically using three meter NQ size rods, giving a nominal hole diameter at the bit of 83 mm. Drill samples are collected in one meter continuous intervals from surface stopping at underlying hard bedrock. Figure 6 shows the drilling density over the Fairbreeze orebodies. Figure 6: Drilling coverage

9 KZN TECHNICAL REPORT SUMMARY Drill samples are collected from the rig cyclone separator at the drill site and weights recorded over 1m sections. Samples are submitted to the sample preparation facility where they are dried and passed through a rotary splitter to obtain a ± 500g representative laboratory sample and the remaining sample is sent for storage. Samples then progress for laboratory analysis as blind sequential numbers in batches of 66 samples. Included in each batch are 3 duplicates and 3 control samples. Heavy Mineral Analysis Oversize material (>1mm) is removed by screening and the <1mm material is analysed for clay fines content using a wet 45-micron screen. The dried +45μm sand fraction is further analysed for the total heavy mineral content (THM) by dense medium separation using tetrabromoethane (TBE) with a specific gravity of 2.96 g/cm3. The heavy mineral separation aliquots are sent for fused bead XRF element analyses. Mineralogical analysis QEMSCAN, an adaptation of SEM technology, which employs a scanning electron microscope to traverse across polished mineral grain surfaces in a mount is used for composite mineral assemblage determination. Software programs convert the metal analyses into mineral species and calculate areas, volumes and relative percentages of the minerals present. QEMSCAN uses the relatively fast assay scan results to match with assays obtained from locally known minerals in a standard suite of samples. Table 3 shows the average of heavy mineral assemblages for the main ore bodies Table 3: Average major heavy mineral Assemblage of THM fractions Orebody Ilmenite (%) Zircon(%) Rutile(%) Other(%) FBA 64-74 8-12 5-10 14-18 FBB 62-74 8-12 5-8 14-22 FBCX 64-77 8-12 5-7 11-21 FBD 46-57 5-7 3-5 31-46 In the Qualified Person’s opinion, Tronox’s sample preparation, security, and analytical procedures are adequate.

10 KZN TECHNICAL REPORT SUMMARY 9 Data Verification Control samples of varying clay fines and total heavy mineral grades are prepared in advance of a drilling programme. Results from the prepared control subsamples are used to derive parameters for validation of results received from the laboratory. Every batch of drilling samples submitted to the laboratory include control samples of three different grades. During sample preparation every 20th sample is duplicated to monitor repeatability of sample preparation processes and analytical results. In addition, randomly selected samples are sent on an ad-hoc basis to an external independent laboratory to verify analytical results. Figure 7, Figure 8 and Figure 9, below show typical duplicate sample comparisons for key drill section attributes. The half absolute relative difference of paired duplicate results assists to measure the precision of data results. The pairs of half relative differences are expressed as percentage and sorted cumulatively in an increasing order from smallest to largest. The coarse split duplicates should have at least 80% with less than 10% difference. Differences in excess of 10% are investigated. As can be seen in the figures below, the duplicate data exceeds the standard. Figure 7: Half Absolute Relative Difference Plot of Total Heavy Minerals

11 KZN TECHNICAL REPORT SUMMARY Figure 8: Half Absolute Relative Difference Plot TiO2 in THM Figure 9: Half Absolute Relative Difference Plot ZrO2 in THM The Tronox laboratory at the CPC is ISO 9000 certified for chemical analysis and the laboratory is also certified by the country’s National Accreditation Body for Laboratories called SANAS. In the opinion of the Qualified Person the accuracy of duplicates and standard geological samples along with internal chemical assay standards is of industry standard and the data is suitable for geological modelling resource purposes. Mineralogical Analysis Quantitative electron scanning microscopy (QEMSCAN), development work within Tronox since 2006, has refined the conversion of the metal analysis into mineral species. Mineral assemblages are established by domain. Ore hardness Parts of the orebody contain lightly cemented/indurated areas where the high-pressure hydraulic mining method experiences difficulties in maintaining required plant throughput. By mining standards, the ore is still classified as very soft and is easily moved by mechanical equipment such as dozers and front-end-loaders. Mechanically assisted mining is slightly more expensive than solely hydraulic mining and gets costed in when forecasting mining of harder zones. The indurated material at Fairbreeze can be characterized as having SiO2 >5.5% and Al2O3/MgO>2.1. The ore impacted by light cementing was determined to be 5% for C Ext and up to 16% in Fairbreeze A. The Fairbreeze B orebody shows discontinuous hardness near surface within high clay fines zones but tonnage impacted is yet to be determined.

12 KZN TECHNICAL REPORT SUMMARY 10 Mineral Processing and Metallurgical Testing During the feasibility studies phase of the project, 19 bulk samples from different geological units across the Fairbreeze orebodies were collected for metallurgical pilot testing. An area in the orebody was drilled where after samples were composited to form a bulk sample representing the specific geological units. It was aimed that each composite will produce enough heavy mineral concentrate of about 100kg as a starting mass for all downstream test work. Processing of the samples formed part of data input to the Fairbreeze feasibility studies. This work continues with composites produced based on annual ore blocks for geo metallurgical testing to give advance knowledge of minor variables likely to impact processing. More recently a DFS has been completed into the phase 2 expansion of the operation at Fairbreeze in order to maintain HMC production due to lower THM grades in both the B and A orebodies. The expansion involves increasing the mining and PWP processing rate. Mineral recoveries will be maintained following the expansion as will product quality. 11 Mineral Resource Estimates Geological Modelling A model of the different geological domains is generated using geological and mine planning software, Geovia Surpac. Geological and assay data are displayed on graphical sections and unit boundaries/layers are digitised per vertical cross sections, depending on the location and drill spacing. The digitised strings are then joined together to create wireframe surfaces, which are used during the estimation process of the background material, that is, the material not bound by interpreted ore outlines (Figure 10). Figure 10: Vertical cross section through Fairbreeze A orebody

13 KZN TECHNICAL REPORT SUMMARY The orebody outlines, at various ilmenite cut-off grades, are generated in a similar manner as geological wire-frames. A nominal cut- off grade of 1.5% ilmenite is generally applied for defining mineral resources. Variography Variography is completed for all domains to determine geostatistical parameters. Typical variogram ranges for THM are greater than 100 meters across and along strand strike. The drilling at 100m x 100m is adequate for defining measured mineral resources. Block Model Construction Block models are created in Surpac Geovia geological and mine modelling software. Sub-celling is employed at domain boundaries to allow adequate representation of the domain geometry and volume. Grade Estimation Grade estimations was done on the four Fairbreeze deposits from topographic surface to the base of sand at end of boreholes with estimation parameters used for each applicable domain. For Fairbreeze A and C Ext deposits Ordinary kriging was performed for the three iterations whilst adjusting search parameters. The first run is at 65% of the range, second iteration at 100% of range and the third iteration at 150% of the range. The remaining blocks were filled up using the inverse distance squared method and finally the nearest neighbour estimation method. The level of confidence with estimation was allocated in the decreasing order from high in the kriging method and lower in the nearest neighbour. A similar approach of estimation technique was followed for Fairbreeze B, but all estimation runs are currently based on inverse distance squared method. This will be updated as new drilling data becomes available. Fairbreeze D is small and has been estimated using the inverse distance squared method at this stage. Cut-off values Currently resource volumes are established for cut-off grades of 1.5% ilmenite, which is in line with the breakeven grade. Density Consultants carried out the test work on Fairbreeze and recommended the use of dry density of 1.7t/m3 for resource tonnage calculations. Reconciliation of block model tonnages against the primary wet plant show a variance of less than 5%. Block Model validation Block grade estimates are validated primarily by statistical analysis and also a visual comparison to the input drill hole data. The following figures illustrate typical graphical comparison of the raw data (borehole samples) and the block model output. In both figures (Figure 11 and Figure 12), the THM estimates fall within 10% of an average of boreholes samples. Areas falling outside are typically poorly drilled and most likely the resources are of lower category. The model is also broken down into smaller areas, blocks and domains to compare the block values against the input data. Figure 11: Comparison of Bore hole THM grade with Block model THM grade estimates; Northing FBA

14 KZN TECHNICAL REPORT SUMMARY Figure 12: Comparison of Bore hole THM grade with Block model THM grade estimates; Easting FBA Mineral Resources Classification Variography for KZN dune deposits has shown that in general, a measured mineral resource is achieved at a drilling density of 100m x 100m. However, final classification considers: drilling density, analytical techniques, and confidence expressed in estimation. Fairbreeze CX and Fairbreeze B have been drilled on a 50m × 50m grid largely to gather detailed information that is pertinent for mine planning. Fairbreeze A has been drilled on 100m x 100m grid, and larger part of the mineral resources are in the measured mineral resource category. Figure 13 on the next page outlines the physical location of the resources in relation to the reserves.

15 KZN TECHNICAL REPORT SUMMARY Figure 13: Mineral reserves and mineral resource Locations Tronox uses economic contribution as a guide to cut-off determination. This allows for the polymetallic nature of the resource and the broad mineralization of surrounding areas. As costs change over time and long-term revenue values change, new reviews are conducted which may lead to a different grade shell becoming optimal. The 2021 Mineral Resources Statement for Fairbreeze is presented in Table 4 below. Table 4: Fairbreeze Summary of Mineral Resources at the End of the Fiscal Year Ended 2021 Exclusive Mineral Resources – Fairbreeze 2021 Mineral Resources Category Material Tonnes Mt THM Grade (%) Mineral Assemblage Ilmenite Grade (%) Rutile + Leucoxene Grade (%) Zircon Grade (%) Measured 50 4.1 64.1 8.1 7.7 Indicated 1 2.0 53.5 7.0 7.5 Measured + Indicated 51 4.0 63.9 8.1 7.7 Inferred 56 3.4 54.7 6.9 7.1 TOTAL 107 3.7 59.1 7.5 7.4 (1) Cut-off grade applied is 1.5% ilmenite (2) Mineral Resources are exclusive of Mineral Reserves The categorisation of resources is made based on the judgements of the Qualified Person, in consultation with the mining development engineer and resource geologist.

16 KZN TECHNICAL REPORT SUMMARY 12 Mineral Reserve Estimates Mineral Reserves are subsets of Resources having used the same modelling processes but with more stringent practical and economic considerations applied. The Resource block models are constrained into Reserve block models discounting the Resources that cannot be mined due to infrastructure (roads, railways, pipelines), geotechnical parameters, geological floor and any mining method limitation to create final pit DTM’s. The reserve block model is then imported to MineSched module for scheduling run on mining blocks 50m × 50m × 10m. The scheduling results are used to test forecast production plans. The following scheduling criteria is incorporated to ensure a practical mining sequence and accurate forecast: • Optimise flow paths and distance from the mining face to pump stations. • Maintaining a balance between high and low clay fines material. • Mine in sequence so that no sterilisation takes place. • Minimise mining void open area. • Blending between harder and softer ore. • Blending between higher grade and lower grade ore. Optimisation The optimisation process is repeated using different cut-off grades to create a series of nested shells. Mining block sequences are created for each of the shells ore tonnes and mineral assemblage information as well as mining costs, processing costs and mineral revenues. Modifying Factors In the resource optimisation, modifying factors including recoveries, ore loss assumptions, operating costs and mineral sales pricing are used to seek the maximum value for a shell. Cutoff Grades 1 The estimated breakeven economic cutoff grades of 1.5% ilmenite is utilized for mineral resource reporting purposes and were applied for conversion to mineral reserves has been calculated using a revenue cost breakeven calculation and are based on the following key assumptions: • Saleable product yield (recovery): ilmenite 66%, rutile 75% and zircon 80% • Commodity prices: $205/metric ton for ilmenite, $1,183/metric ton for rutile and $1,554/metric ton for zircon • Operating cost: abbreviated $5 per metric ton ore mined Mineral prices used are substantially in line with the prices for each of our products published quarterly by third-party independent consultancies. Although an ilmenite-only cutoff grade is employed, due to the poly metallic nature of the mineralization, the economic contribution from all the economic minerals (ilmenite, zircon and rutile) are used to delineate mineral resources, rather than just zircon grade. This also allows for a broader consideration of mineralization of surrounding areas. As costs change over time and long-term revenue values change, new reviews are conducted which may lead to a modified mining plan becoming optimal. The Qualified Person utilized this information as the basis for determining reasonable prospects for economic extraction, according to the definition for mineral resources in the SK-1300 regulation. To qualify for recognition to mineral resources, there must be a valid existing prospecting or a mining right. Mineral reserves only consider properties with a valid mining right or where a mining right is under application. Subsequently, mineral resources are classified into measured, indicated and inferred categories based on the confidence in the geological analyses, the geological complexity evident in the various stratigraphic units, and the borehole distribution and spacing. The same break-even cutoff grade of 1.5% ilmenite is maintained for the mineral resources to reserves conversion process. Mineral reserves are subsets of mineral resources, having used the same modelling processes but with a higher grade and financial outcome metric applied, i.e., more stringent practical and economic considerations are applied. The mineral resource block models are constrained into mineral reserve block models discounting the mineral resources (i.e. the exclusive mineral resources) that cannot be mined due to existing infrastructure, geotechnical parameters, geological floor and other mining method limitations. The long term mine plan and reserve estimates are derived from detailed techno-economic models created from geological, mining and analytical databases and optimized with respect to anticipated revenues and costs. Cost assumptions are developed from our extensive operating experience and include mining parameters, processing performance, and rehabilitation costs. Predicted mining and processing metrics are reconciled with actual production and recovery data on a regular basis. First, several life of mine production schedules are produced and run through a techno-economic model. An optimisation process is performed using different cutoff grades to create a series of nested shells. Mining block sequences are created for each of the shells tonnages and mineral assemblage information as well as mining costs, processing costs and mineral revenues. In the optimization process, modifying factors including recoveries, ore loss assumptions, operating costs and mineral sales pricing are used to seek the maximum value for a shell. The material scheduled previously classified as measured mineral resources will be converted to proven reserves, material

17 KZN TECHNICAL REPORT SUMMARY previously classified as indicated mineral resources will be converted to probable reserves whereas inferred mineral resources remain unconverted according to definition as set out in the SK regulation. If any liabilities e.g., legislative, environmental, etc. exists, proven resources will be downgraded to probable reserves, even though geological confidence is high. Fairbreeze has few environmentally sensitive areas covering indigenous trees, shrubbery, and grasslands. These areas are protected from mining by creating buffer zones. Berms and trenches are also constructed to ensure that none of the mining activities encroach on to the non-mining areas. Tree barriers have been planted and continue to be planted to protect the neighbouring town of Mtunzini and the N2 national carriage way from dust and other aspects of the mining activities. A 3m high topsoil berm has been constructed along the boundary to the neighbouring town to also reduce noise emission and mining pits are designed to ensure the mining face absorbs noise that would otherwise radiate toward the township. As part of the impact assessment for the Fairbreeze Mine, sites of heritage significance in the area have been identified and management plans are in place to protect these from any possible impacts of mining. The heritage mitigation actions are included in the mine EMPR. The 2021 Mineral Reserves Statement for Fairbreeze is presented in Table 5 below. Table 5: Fairbreeze-Summary of Mineral Reserves at the End of the Fiscal Year Ended 2021 Mineral Reserves – Fairbreeze 2021 Mineral Resources Category Material Tonnes Mt THM Grade (%) Mineral Assemblage Change from 2020 Ilmenite Grade (%) Rutile + Leucoxene Grade (%) Zircon Grade (%) Proven 206 5.6 61.6 7.3 7.7 -3.9% Probable 11 3.7 51.9 5.0 7.0 -0.5% TOTAL 217 5.5 61.3 7.2 7.7 -3.7% (1) Mineral prices used in Reserve estimation are substantially in line with the prices for each of our products published quarterly by independent consulting companies (2) Metallurgical recoveries vary by mineral and are discussed in the Economic Analysis Summary

18 KZN TECHNICAL REPORT SUMMARY 13 Mining Methods The mining method at Fairbreeze is hydraulic monitoring. A jet of high-pressure water (+/-2500kpa) is aimed at a mining face, thereby cutting into and loosening the in-situ sand so that it collapses on to the pit floor. The water also acts as a carrier medium for the sand (ROM), buoyed by the clay fines content of the ROM. The slurry generated by the monitors, flows to a collection sump and is then pumped some kilometers to the PWP through a system of booster pumps. The varying grade and clay content requires the mining of different faces concurrently to manage variation. The pressure and volumetric flow rate at the monitors is controlled through the number of pumps running at the booster pump station, the number of monitors operating and the sizes of the nozzles on these monitors. A monitor is moved towards the mining face once per day. The two ROM pumpstations (sumps), are equipped with 12/10 Warman pumps and 350kW motors. Each pump station also has a monitor that cleans the roots and rocks (oversize) that build up at the pump station screen. Two pump stations are operated at a time. Each pump station has four monitor guns with one of the four on standby. The mining staff compliment comprises of two sections, the day team and the shift team. The shift team is subdivided into four rotational teams. The mining operation works on a 24hour day basis. The day team does the daily monitor gun moves, new pump station installations and any pipeline moves. The day crew also manages the stripping and hauling of topsoil. Ore dilution can occur due to pit floor conditions but is only generally a few % of total tonnage mined and usually contains lower grade mineral sitting in the resource category. The declared resources generally abut the mine plan ore and so minor improvements in operating cost and mineral revenues could see those resources being exploited. There would be little equipment relocation cost required to extract them. The mining operation is currently active in Fairbreeze CX. Fairbreeze C has been depleted. The backfilling operation entails placing of the sand tails fraction into the mining void and for the building of residue facility storage walls. The volume of backfilling is a function of the overall sand balance and the amount that is required to provide a suitable post mining topography such that surface run-off water moves to the same water paths as existed prior to mining. The major strength of the hydraulic mining method lies in the relatively low cost capital layout. The blending capability and throughput control as well as relatively low operating cost. A relatively unskilled workforce can operate the mining equipment. Figure 14 below shows typical mining operation at Fairbreeze Mine. Figure 14: Hydraulic mining operation at Fairbreeze Cx The life of mine plan is shown in Figure 15. The last 2 years of the LOMP consist of material currently in the Inferred Resource category but for which mineral grades encountered are well above cut-off and are sufficiently encouraging and likely to be upgraded following further drilling. The Residue Storage and water return facilities are shown on the West side of the N2.

19 KZN TECHNICAL REPORT SUMMARY Figure 15: Life of Mine Plan 14 Processing and Recovery Methods The ore characteristics and hence the primary processing flowsheet for Fairbreeze is essentially the same as was used at Hillendale. Much of the processing equipment was relocated from Hillendale to Fairbreeze for Phase 1 of the project. Two new 42m diameter Outokumpu high-rate thickeners were installed for the first phase due to substandard performance of the thickeners used at the Hillendale mine, with an additional two thickeners required for the second phase expansion associated with mining the lower grades at FBA and FBB. Phase 2 will mine ore from A and B ore bodies which require upgrades to the upfront desliming circuit, a further upgrade of the clay fines thickening and residue disposal equipment, rougher spiral capacity, increased concentrator building capacity and additional process water pumping capacity. A series of pilot tests to determine the effect of the feed variables, other than clay fines, on spiral performance showed that the Rougher spirals would achieve optimum metallurgical performance under the following feed conditions: • Solids feed rate per spiral start: 1.8 tph - 2.2 tph • Slurry density (Solids by mass): 35% - 45% • Clay fines content < 6.0% as % of feed solids • Feed grade (THM): 5% - 20% • Feed mineralogy (Ilmenite:THM): > 0.5 A 9 500 tonne bulk test of Fairbreeze ore through the Hillendale plant confirmed the need for upfront desliming cyclones. The PWP consists of the following sections and shown in the Figure 16 below: • Feed preparation and desliming circuits equipped with Multotec de-sliming cyclones. • Spiral circuit 720 Roughers, 360 middling scavengers (MG4B and MG4 Mineral technology units respectively) and 216 cleaner spiral starts (HG10 Mineral Technology units). • HMC cleaning circuit: Low Intensity Magnetic Separator (LIMS) • Fines thickening and water recovery circuit - 2× 42m diameter Outotec high rate thickeners - 3× WIRTH positive displacement pumps • Coarse tailings circuit for backfilling and RSF wall building

20 KZN TECHNICAL REPORT SUMMARY Figure 16: General Flowsheet of Fairbreeze PWP The Mineral Separation Plant (MSP) used to convert HMC into saleable mineral products is the same that was used for the KZN project’s original mining at Hillendale. The mined out Hillendale deposits and the yet to be developed Port Durnford deposits are all in close proximity and all stem from the Berea Type Red Sands. They have similar mineralogy, particle size, clay type and mineral assemblages. Processing characteristics are also similar. The MSP at Empangeni consists of configurations of relatively standard equipment positioned in the flowsheet to reflect the valuable mineral separation characteristics as well as the processing characteristics of the trash minerals that must be removed in order to recover key products of ilmenite, rutile/leucoxene and zircon at the required quality. The MSP circuit is shown in Figure 167where the processing blocks contain several or more unit operations within each.

21 KZN TECHNICAL REPORT SUMMARY Figure 17: MSP Circuit Flowsheet The MSP primarily separates the magnetic and electrically conductive ilmenite from the non-magnetic and conductive rutile and leucoxene and also separating rutile and leucoxene from the non-magnetic and non-electrically conductive zircon. The circuitry is also required to remove residual free silica, other silicate minerals, chromite, magnetite and haematite as well as iron stainings and coatings on the minerals which would interfere with efficient mineral separation and quality, particularly for the valuable zircon products. The ilmenite is primarily recovered in the feed prep and Uric circuits where all HMC is subject to various levels of magnetic intensity, both wet and dry to remove chromite, magnetite and haematite to make smelter grade ilmenite product. The primary dry circuit uses electrical conductivity to roughly sort conductive rutiles and leucoxenes from non-conductive zircons. The crude zircon is reacted with sulphuric acid in the hot acid leach (HAL) in order to remove ferrous stainings so that efficient downstream separation in the wet and dry zircon circuits can occur and customer product qualities achieved. The rutile attritioning circuit removes surface staining from the minerals allowing the redirection of misplaced zircons back to the zircon circuit, and a high TiO2 rutile product to be finished in the rutile dry circuit. The chemical quality of the mineral products are shown below in Table 6. Rutile and zircon products are packed in bulk bags as well as in bulk shipping containers and occasionally stockpiled for bulk in ship holds.

22 KZN TECHNICAL REPORT SUMMARY Table 6: Typical Chemical Analysis of Mineral Products Element Ilmenite smelter feed (%) Prime Zircon product (%) Rutile blend product (%) TiO2 47.3 0.13 93.7 Total Fe as Fe2O3 52.7 0.06 0.92 ZrO2 0.19 66.4 0.98 SiO2 0.70 32.5 2.12 Cr2O3 0.19 - 0.11 Al2O3 0.36 0.15 0.46 P2O5 0.04 0.10 0.02 MnO 1.10 - - CaO 0.02 - 0.02 MgO 0.50 - 0.01 V2O5 0.25 - 0.44 Nb2O5 0.07 - 0.22 U+Th (ppm) 50 490 76 d50 (microns) 130 130 140 Table 7: Estimated saleable product yield (recovery) for the year ended December 31, 2021: Description Total Recovery % Ilmenite 76 Rutile 75 Zircon 80 In the opinion of the QP, the methodology employed in this section was appropriate and the data derived from the testing activities described above are adequate for the purposes of defining a Mineral Resource as of the effective date of this report. 15 Infrastructure General Access to the PWP is from off ramps at Bridge 4 on the national highway N2, south of the town of Mtunzini. Road transport for HMC to the MSP at Empangeni, a distance of 50km, is along the N2 highway utilizing side tipping trucks. Gypsum waste and MSP sand tailings are returned on the backhaul. There is another route between Fairbreeze and the MSP along the R102 that can be used in emergencies. The distance is similar but the road condition poorer than the newer multi-lane national highway. Bulk Electricity supply for Fairbreeze is from 88kV and 132kV ESCOM power lines that run adjacent to the residue storage facilities and feeds the Fairbreeze substation. The 132kV line is used to inject into the 88 kV line to ensure there is sufficient power when the Fairbreeze Phase 2 expansion comes online. The maximum absorbed power requirements for Fairbreeze are shown below in Table 8. Table 8: Fairbreeze Maximum Load Requirements Area kW requirement (Phase 1) kW requirement (Phase 2) Primary Wet Plant 9,500 15,000 Mining 3,600 7,000 Bulk water supply Study 2020 250 1,000 Clay residue facilities are currently in place and operational, however with the recent increase in Reserves, mine life and planned mining rate, an adjacent area called the Everglades RSF will be constructed. This had been considered as a possibility in the original Fairbreeze BFS and capital has been allowed for in the Fairbreeze Phase 2 expansion feasibility study. The Everglades residue storage facility abuts the current MegaSebeka residue facility. Figure 18 shows mining and processing operations on the East side of the N2 whilst the residue storage and water return facilities are located on the West side.

23 KZN TECHNICAL REPORT SUMMARY Figure 18: Mining and Processing Facilities with the planned Everglades Residue Facility Water supply Water is sourced from the uMhlatuze River upgraded installation that originally supplied the Hillendale mine. This system was upgraded to a pipeline of 750mm nominal diameter over approximately 33km to FB and discharging into the raw water dam. Site layout infrastructure is shown in the Figure 19 below. Storm water containment, stockpiles, administration buildings and roads along with the wet plant and thickeners can be seen. Very little permanent infrastructure is required for the actual mining activities. The population of the Greater Richards Bay area/ The City of Umhlathuze, is approximately 400 000. The workforce is drawn from these surrounding localities in consideration of community and BEEE principles. All employees source their own living facilities. Rail and Shipping Railway networks in and around the region are suitable for the cargo requirements of the harbour and local industry and are directly connected to the national network for import/export purposes. The harbour at Richards Bay operates a very large coal-handling terminal and controls a wide range of import and export cargos. Durban also has port facilities that Tronox uses to export containerized and bagged product from. Air flights can be accessed from Durban King Shaka Airport or Richards Bay Airport.

24 KZN TECHNICAL REPORT SUMMARY Figure 19: Layout of the Primary Wet Plant Area 16 Market Studies The principal commodities titanium and zircon are freely traded, at prices and terms that are widely known, so that prospects for sale of any mineral production are virtually assured. Tronox is a significant global producer of TiO2 based pigments and has the specific strategy of being predominantly vertically integrated. This means that its own mining production will provide the bulk of the titanium feedstock to its 9 pigment plants, located around the globe. Tronox Management Pty Ltd now markets all mineral products sold emanating from the Fairbreeze Mine. However, with the integrated pigment strategy, this predominantly relates to the range of zircon products. The KZN zircon products are highly sought for use in tile ceramics and refractories. Tronox routinely uses the services of various industry trade consultants to closely monitor and report on global production of titanium minerals and zircon as well as reporting on the current global supply and demand status, plus projections of new projects to come on stream, both timing and capacity. Export and import data by country is monitored. As noted earlier, zircon, TiO2 feedstock and TiO2 product pricing are internationally traded, specialized commodities. Generally speaking, the prices of our products are substantially in line with the prices for each of these products published quarterly by independent consulting companies who track the mineral sands, titanium dioxide and coatings industries. The ilmenite product is of smelter grade and processes well in the Empangeni arc furnaces. Natural Rutile has been marketed in the past with a TiO2 content of 95+% but is currently recovered with leucoxenes and consumed internally by Tronox. The bulk of KZN zircon is classified as Prime Grade and consistently sells in line with market pricing. 17 Environmental studies, permitting and plans, negotiations, or agreements with local individuals or groups All necessary authorisations, licenses, rights, and permits were obtained for Fairbreeze Phase 1 prior to the commencement of mining in 2015/2016 (see Table 9). For the Phase 2 expansion additional applications have been made, mainly to authorise the new Everglades RSF extension. Application for an integrated environmental authorisation has also been lodged with DMRE. This application is for environmental authorisation in terms of the national environmental management act (NEMA) as well as for authorisation under the national environment management waste act (NEMWA). The overarching mitigation objectives remain the same as for the mine original EIA, namely: • To rehabilitate the mine site to the extent where the previous land use is not compromised in terms of value unlocked; • To minimise any residual environmental impacts resulting from the mining operations; and • To minimise the social impacts following mine closure.

25 KZN TECHNICAL REPORT SUMMARY Due to the 170 ha Everglades RSF facility containing wastes with the potential to pollute and due to it impacting on wetlands, several sections of the National Water Act are also triggered requiring application for a further water use license, which has been lodged with the applicable departments. (see Table 9). Additionally, the property earmarked for the Everglades RSF needs to be rezoned and an application to the local municipality has been made in terms of the relevant land use planning legislation. Tronox intends to reduce the impact of Fairbreeze Mine on wetlands by relocating the Phase 2 expansion of the existing Mega Sebeka Residue Storage Facility (MSRSF) from the current approved expansion footprint to a proposed new footprint on the adjacent Everglades sugar cane farm. The project will minimise future destruction of wetlands and is anticipated to significantly reduce the environmental impacts associated with the approved Phase 2 expansion. The Final Basic Assessment Report and Environmental Management Programme conducted by an independent consultant concluded that based on various specialist studies, the project is beneficial. These studies assisted in the assessment of impacts and identification of essential measures that will mitigate the impacts to within tolerable limits. In conclusion the consultant was of the opinion that on purely environmental grounds the application as it is currently articulated, should be approved. Table 9: Licenses and Permits Legislation Permit No. Date of Issue Period of Validity (where applicable) Supporting Studies Geographical Area Mineral & Petroleum Development Act KZN30/5/1/2/2/164 MR 9 Apr 2009 8 Apr 2039 C EXT KZN30/5/1/2/2/123 MR 23 Mar 2010 24 Mar 2035 A, B, C & D Environmental Conservation Act EIA/4187 19 July 2006 Commence within 7 years Complete within 10 years of commencement C EXT National Environmental Management Act EIA/4187/AMND/2013 2 Sept 2013 C EXT DC/28/0033/2013 12 Dec 2014 Commence within 5 years of issue date CX (Siyayi R Bridge & Offset restoration) DC/28/0036/2010 12 July 2012 Commence within 5 years of issue date Soil and Land Use Socio-economic Social Biodiversity Geohydrology Surface water Biomonitoring Air Quality Noise Heritage Visual A, B, C & D DC/28/0036/2010 Appeal Decisions 11 June 2013 EA upheld A, B, C & D National Water Act 06/W13B/CGI/2229 9 Sept 2013 A, B, C & D 21169147 23 July 2007 A, B, C & D 06/ W13B/CI/2603 22 July 2014 20 years from date of issue, subject to 5 yearly review Bulk water pipeline Kwa-Zulu Natal Heritage Act 0011/10 11 Oct 2011 30 June 2014 Heritage Assessment A, B, C & D NEM:BA

26 KZN TECHNICAL REPORT SUMMARY Legislation Application Ref Date Submitted Supporting Studies Geographical Area National Environmental Management Act KZN 30/5/1/2/2/123 MR KZN 30/5/1/2/2/164 MR 2019 Wetlands Terrestrial Habitat Rivers & Estuaries Surface Water Ground Water Dust Noise Visual Heritage Socio-economic Agricultural Traffic & Transport Geotechnical Everglades RSF Greater Fairbreeze Biodiversity Offset NEM: Waste Act KZN 30/5/1/2/2/123 MR KZN 30/5/1/2/2/164 MR 2019 Everglades RSF Greater Fairbreeze Biodiversity Offset National Water Act 2019 Everglades RSF Greater Fairbreeze Biodiversity Offset MPRDA Section 102 Amendment Application 2019 Everglades RSF SPLUMA Land Use planning 2021 EIA studies as required. Motivational report by registered town Planning professional Everglades RSF Compliance with the approved environmental management programme is monitored monthly by an independent environmental control officer and reported to the DMRE. Compliance with water use licence conditions is audited annually by an independent auditor and reported to Department of Water and Sanitation. The water use licence requires 6 monthly updates for water quality monitoring as well as the audit reports to be submitted by Tronox to the authority. Formal agreements are in place with Mondi, the owner of orebody A, for compensation of lost earnings and infrastructure due to use of its land for mining. The agreement caters for different forms of compensation. Direct compensation for timber removal is allowed for, compensation for the 6-year period any area is out of forestry production, as well as for impacted infrastructure. The Fairbreeze B, C and C Ext orebody surface rights are owned by Tronox. Community The local procurement targets as set out in the Mining Charter for capital goods and procurement of services are being met. For employment, the proportion of historically disadvantaged South Africans (HDSA) well exceeded the required Mining Charter target levels of 40%In the Qualified Person’s opinion, Tronox’s current plans to address any issues related to environmental compliance, permitting, and local individuals or groups are adequate. Mine Closure GN R1147 GG 39425 refers to the Regulations Pertaining to the Financial Provision for Prospecting, Exploration, Mining or Production Operations under the National Environmental Management (NEMA) Act. These regulations were published by the Department of Environmental Affairs on 20 November 2015. The purpose of these regulations is to regulate the determination and making of financial provision for the costs associated with the management, rehabilitation, and remediation of environmental impacts from prospecting, exploration, mining or production operations throughout their lifespan. This includes potential latent or residual environmental impacts that may become known in the future. The regulations require an applicant or holder of a permit or right to determine and make financial provision to guarantee the availability of sufficient funds for the rehabilitation and remediation of adverse environmental impacts. The financial provision must be determined through a detailed itemization of all the activities and costs, which are calculated by the actual cost of implementing measures required for annual rehabilitation, final rehabilitation, decommissioning, closure, and remediation of latent or residual environmental impacts. The financial provision can be made through a financial guarantee, a deposit into an account administered by the Minister or a contribution to a trust fund established in terms of applicable legislation. The South African regulated NEMA GN R1147 prescribes that mine closure planning should be done over the total scheduled LOM. This requirement necessitates the inclusion and differentiation of the rehabilitation, the decommissioning and, finally, the aftercare phase. In agreement with NEMA GN R1147, mine closure provision has been estimated on the basis of functional domains and risks. Rehabilitation of mined out areas are planned to be carried out continuously through the life of mine. Consultants have estimated mine closure cost, using internationally accepted closure assessment method. In the event of unscheduled closure a provision of US$12 million inclusive of contingency, preliminary and general, post closure as well as risk based and regulatory costs, have been allowed for. 18 Capital and Operating Cost

27 KZN TECHNICAL REPORT SUMMARY As the operation commenced in 2015 the project capital is no longer a relevant factor in determining the economic viability of the property. However, the economic analysis allows for ongoing minor stay in business capital and also an expansion costing in the feasibility estimate range of US$100 to US$135 million for the Fairbreeze Phase 2 throughput expansion project. The expansion will be done in 2 parts with the first entailing additional processing capacity in the wet concentrator along with additional thickening and residue storage capacity. There will be minor additional capital required for the mining of FBA when a dozer trap will come into use. The first stage is expected to be operational by 2024 with the second stage implemented in H2 of 2025. The operating costs are known and no longer subject to estimate. Costs used in the economic analysis come from Tronox internal cost accounting systems. Our projected average annual operating and capital costs from our KZN life of mine model at December 31, 2021 were as follows: Table 10: Average Annual Capital Cost Estimate (US$/Mpa, 2021 real terms, rounded) Life of Mine Estimate (2022 – 2037) Category 2022-2026 2027-2031 2032-2036 2037 LOM Total Sustaining Capital 2 3 2 0 34 Major Infrastructure Investment 24 0 0 0 118 Total Capital Expenditure 25 3 2 0 152 Table 11: Average Annual Operating Cost Estimate (US$/Mpa, 2021 real terms, rounded) Life of Mine Estimate (2022 – 2037) Category 2022-2026 2027-2031 2032-2036 2037 LOM Total Mining and Concentration 50 48 50 4 743 Dry Mill 20 21 20 17 320 Realization 11 11 11 8 172 Total Operating Expenses 80 80 81 29 1,235 For this report, capital and operating costs for the year ended December 31, 2021 have been estimated to an accuracy of +/-15%.

28 KZN TECHNICAL REPORT SUMMARY 19 Economic Analysis For the financial modelling that supports the current Reserves, a range of mining block schedules are prepared by the senior mine development engineer. These schedules contain information on ore tonnes and grades, mineral assemblages, predicted product qualities, clay fines levels as well as other information that may impact on throughputs, recoveries and costs. There are many mineral sands mines operating worldwide. Many as standalone mineral sales operations producing mineral products similar to those emanating from KZN. With so many operations selling titanium and zircon mineral products on the open market Tronox chooses to value its ore reserves on the basis of what it would have to pay to buy the mineral products, if it didn’t produce and use them itself. Mineral pricing data is readily available through a number of industry sources. The current Fairbreeze orebody is expected to be depleted by 2037 at which time the Operation may possibly be relocated to the nearby Port Durnford deposits following further definition of that resource. Key cost assumptions, macro and mineral price assumptions: To determine the economic viability and cash flows of the Fairbreeze project, the Company utilized management’s best estimates of the following key assumptions for the mining operations: 1) top soil removal and supportive mechanical mining equipment cost, 2) Hydraulic mining costs, 3) plant variable cost, 4) concentrator fixed costs, 5) tailings fixed costs, and 6) maintenance, overhead and support services costs; and for the separation plant, the assumptions are as follows: 1) plant variable costs, 2) MSP fixed costs, 3) HMC haulage rates and 4) maintenance, overhead and support services. Other key assumptions were mineral royalties, distribution costs, mine and concentrator and MSP capital spending, tax rates, and exchange rates. Cash flows are positive for all years in the Life of Mine Plan out to 2037. The physical mining and processing parameters used in the life of mine plan result in a mine life of 15 years and product yields from in ground mineral to saleable products as follows: • Ilmenite 76% • Rutile 75% • Zircon 80% Sensitivity analyses were conducted using variants such as commodity price, operating costs, capital costs, ore grade and exchange rates. As a result of these analyses, the project was determined to be economically viable in all scenarios. After tax nominal cashflows in current day dollar terms are positive for all years in the Life of Mine Plan. The financial evaluation of ore reserves at KZN Sands indicates that the ore can be economically extracted and processed based on the current price assumptions, costs and plant performance and expected mineral characteristics. Table 12: Long term real pricing used in the economic analysis (US$/MT, 2021 real terms, rounded). Product 2016 2017 2018 2019 2020 2021 Forecast 2022 – 2026 (annual average) Forecast 2027 – 2031 (annual average) Forecast 2022 – 2037 (annual average) Ilmenite 95 160 175 176 211 261 248 205 205 Rutile 725 755 900 1,103 1,211 1,201 1,328 1,183 1,183 Zircon 900 1,080 1,470 1,520 1,360 1,500 1,835 1,554 1,554 Consistent with industry standards, Tronox values its mineral reserves based on the prices at which its titanium and zircon mineral products would sell on freely traded markets, as forecasted by third-party industry consultancies. Table 13: LOM Plan Summary (for the year ended December 31, 2021) Annual Averages(1) 2022-2026 2027-2031 2032-2036 2037 Ore Mined (kt) 14,861 16,380 16,344 1,178 HM (%) 5.4 6.2 4.4 3.9 Ilmenite (in HM %) 62.8 61.3 59.3 53.6 Rutile+Leucoxene (in HM %) 6.3 7.4 7.2 6.5 Zircon (in HM %) 8.1 7.3 7.5 5.7 (1) Amounts presented are based on weighted averages. Table 14: Historic Plant Throughput and Saleable product yield (recovery) (for each of the three years ended December 31,

29 KZN TECHNICAL REPORT SUMMARY 2021) Annual Total 2019 2020 2021 Plant Throughput (kt) 9,506 9,882 9,219 Ilmenite saleable product yield (recovery) (%) 83 87 75 Rutile saleable product yield (recovery) (%) 73 81 78 Zircon saleable product yield (recovery) (%) 78 83 78 Table 15: Cash Flow Analysis of KZN Sands (for the year ended December 31, 2021) Cash Flow (US$ million) 2022-2026 2027-2031 2032-2036 2037 LOM Total Revenue - Ilmenite 82 83 80 61 1,288 Revenue - Rutile 31 40 39 31 583 Revenue - Zircon 87 76 78 61 1,266 Revenue 200 199 197 153 3,138 Operating Costs -80 -80 -81 -29 -1,235 EBITDA 120 119 117 124 1,903 Income Tax -27 -27 -23 -21 -407 Capital Expenses -25 -3 -2 0 -152 Free Cash Flow 68 90 91 103 1,344 The sole purpose of the operational and related financial data presented is to demonstrate the economic feasibility of the mineral reserves for the purpose of reporting in accordance with subpart 1300 of Regulation S-K, and should not be used for other purposes. The information presented originates from comprehensive techno-economic modelling, which is subject to change as assumptions and inputs are updated, and as a result does not guarantee future operational or financial performance. Consistent with industry standards, Tronox values its mineral reserves based on the prices at which its titanium and zircon mineral products would sell on freely traded markets, as forecasted by third-party industry consultancies. Table 16: Sensitivity Analysis (for the year ended December 31, 2021) Economic sensitivity analysis results are presented below based on variations in significant input parameters and assumptions. Cashflow (US$Mpa) -25% -10% Reference +10% +25% Commodity Price 808 1,130 1,344 1,559 1,881 Operating Costs 1,647 1,460 1,344 1,211 1,025 Capital Costs 1,374 1,351 1,344 1,321 1,298 Ore Grade 821 1,134 1,344 1,530 1,818 Exchange Rate 1,066 1,246 1,344 1,409 1,498 20 Adjacent Properties Not applicable. 21 Other Relevant Data and Information Glossary of Terms are summarized in the table below.

30 KZN TECHNICAL REPORT SUMMARY Table 17: Glossary of Terms Term Definition AC Air Core drilling Clay Fines Industry term defined in Tronox as material passing a 45/63 μm sieve and generically meaning “clay and silt suspended in water”. For KZN Sands it is 45 μm CPI Consumer Price Index, a measure of inflation DFS Definitive Feasibility study DMRE Department of Mineral Resources and Energy DTM Digital Terrain Model DWER Department of Water and Environmental Regulation EBITDA Earnings Before Interest, Tax, Depreciation and Amortisation FOB Free-On-Board pricing GPS Global Positioning System HMC Heavy Mineral Concentrate HM/THM Heavy Minerals/ Total Heavy Minerals HT Roll A high voltage electric charging mineral separator JORC Code Australasian Code for Reporting of Exploration Results, Mineral Resources and Ore Reserves Kt Kilo tonnes LOMP Life of Mine Plan Mt Million tonnes MWh Mega Watt Hour, a unit of electricity consumption Neighbourhood Analysis Method of classifying multivariate data according to a given distance, provides optimal parameters for modelling. NYSE New York Stock Exchange Ordinary Kriging A statistical method of relating data points based on distance of separation QA/QC Quality Assurance/Quality Control QEMSCAN Quantitative. Evaluation of Materials by Scanning. Electron Microscopy SAMREC South African Code for the Reporting of Exploration Results, Resources and Mineral Reserves Strandline Line of concentrated heavy minerals usually associated with historical shorelines VHM Valuable Heavy Minerals (total of Ilmenite+Rutile+Leucoxene+Zircon) XRF X-ray fluorescent Analysis Yield The recovered weight of material to a saleable product 22 Interpretation and Conclusions The declaration that as at 31st December 2021, the Fairbreeze operations have 217Mt of Mineral Reserves at 5.5% THM grade and in addition Mineral Resources of 107Mt at 3.7% THM grade is well supported. The mineralization in the deposit varies relatively gently in lateral dimensions. Material outside the mine plan is usually mineralized, as is the topsoil, and only marginally below planned grade. The minerals in the deposit are relatively clean with limited existence of inclusions and composite grains. Although there is modest iron staining of the zircon which responds well to HAL treatment and justifies the good recoveries observed in processing. The product qualities are excellent with the ilmenite being ideally suited for TiO2 slag production, the rutile product suited to direct use in chloride pigment processes that Tronox predominantly operates, and the zircon well regarded in the market. Tronox KZN Mineral Sands has a good record for rehabilitation of past mining areas, groundwater management, control of dust and radiation management. Relationships with key stakeholders and government regulators are also in good standing. The LOMP expects to operate through to 2037 with financial provisions made for both scheduled closure and an unexpected closure. On a minerals only basis, financial modelling shows that future reserves are profitably mineable with the existing equipment and infrastructure or as deemed appropriate in the Phase 2 feasibility study. In the Qualified Person’s opinion, all issues relating to relevant technical and economic factors likely to influence the prospect of economic extraction can be resolved with further work. The Fairbreeze operations are a key part of the Tronox vertically integrated pigment production process.

31 KZN TECHNICAL REPORT SUMMARY 23 Recommendations That geological work continues to better define the economic margins of the resources, looking for inclusion, at least in part, as reserves to further extend mine life. 24 References List of References summarized in the table below. Table 18: List of References Title Everglades RSF Pre-Feasibility Study Fairbreeze A&B Definitive Feasibility Study 2020 Fairbreeze Bankable Feasibility Study Updated 2014 Final Basic Assessment Report and Environmental Management Programme - Proposed Everglades Expansion of the Residue Storage Facility and the iSiyaya Plantations Biodiversity Offset at Fairbreeze Mine - Feb 2021 KZN Sands Mineral Resources and Mineral Reserves Report 2021 Tronox KZN Mineral Sands Mine Closure Plan 25 Reliance on information provided by the registrant The preparation of this Technical Summary Report relies on information provided by Tronox and its employees in the following areas, as they are reasonably outside the expertise of the qualified persons. • Marketing plans and pricing forecasts as key inputs to the economic modelling; • Environmental performance commitments and mine closure costing; • Maintenance of licenses and other government approvals required to sustain the LOMP; • Capital to progress the mining of the Fairbreeze A and B deposits. 26 Date and Signature Page This report titled “KZN Technical Report Summary” with an effective date of December 31, 2021 was prepared and signed by: /s/ Carlo Philander Carlo Philander, Regional Manager Mineral Resource Development Dated at Koekenaap, Western Cape, South Africa February 21, 2024
EX-97.1
17
ex971202310k.htm
EX-97.1
Document
TRONOX HOLDINGS PLC DODD-FRANK CLAWBACK POLICY
Tronox Holdings plc (the “Company”) has adopted this clawback policy (the “Policy”) which, subject to applicable law (including the Sarbanes-Oxley Act of 2002), supersedes and replaces in its entirety any other clawback policies currently in effect at the Company. Subject to applicable law, to the extent this Policy applies to compensation payable to a person covered by this Policy, it shall be the only clawback policy applicable to such compensation and, unless otherwise determined by the Company following October 2, 2023 (the “Effective Date”), no other clawback policy shall apply. This Policy shall be interpreted to comply with the clawback rules found in 229 C.F.R. §240.10D and the related listing rules of the national securities exchange or national securities association on which the Company has listed securities (the “Exchange”) and any other applicable laws. To the extent any provision of this Policy is in any manner deemed inconsistent with such rules, this Policy shall be treated as retroactively amended to be compliant with such rules and such provision shall be applied to the maximum extent permitted by applicable law.
1. Definitions. 229 C.F.R. §240.10D-1(d) defines the terms “Executive Officer,” “Financial Reporting Measure,” “Incentive-Based Compensation,” and “Received.” As used herein, these terms shall have the same meaning as defined in that regulation (as may be in effect from time to time).
2. Application of the Policy. This Policy shall only apply in the event that the Company is required to prepare an accounting restatement due to the material noncompliance of the Company with any financial reporting requirement under the securities laws, including any required accounting restatement to correct an error in previously issued financial statements that is material to the previously issued financial statements, or that would result in a material misstatement if the error were corrected in the current period or left uncorrected in the current period. The date that the Company is required to prepare an accounting restatement shall be determined pursuant to 229 C.F.R. §240.10D-1(b)(1)(ii).
3. Recovery Period. The Incentive-Based Compensation subject to clawback under this Policy is, with respect to each individual who served as an Executive Officer at any time during the applicable performance period for any Incentive-Based Compensation, all Incentive-Based Compensation Received by such individual (a) on or after the Effective Date, (b) after beginning service as an Executive Officer, (c) while the Company has a class of securities listed on an Exchange, and (d) during the three completed fiscal years immediately preceding the date that the Company is required to prepare an accounting restatement as described in Section 2 (and any transition period arising due to a change in the Company’s fiscal year as described in 229 C.F.R. §240.10D-1(b)(1)(i)(D)).
4. Erroneously Awarded Compensation. The amount of Incentive-Based Compensation subject to the Policy (“Erroneously Awarded Compensation”) is the amount of Incentive-Based Compensation Received during the applicable recovery period as described in Section 3 that exceeds the amount of Incentive Based-Compensation that otherwise would have been Received had it been determined based on the restated amounts and shall be computed without regard to any taxes paid.
(a) For Incentive-Based Compensation based on stock price or total shareholder return, where the amount of Erroneously Awarded Compensation is not subject to mathematical recalculation directly from the information in an accounting restatement: (1) the amount shall be based on a reasonable estimate of the effect of the accounting restatement on the stock price or total shareholder return upon which the Incentive-Based Compensation was received; and (2) the Company must maintain documentation of the determination of that reasonable estimate and provide such documentation to the Exchange.
5. Recovery of Erroneously Awarded Compensation.
(a) In the event that the Company is required to prepare an accounting restatement as described in Section 2, the Company shall recover reasonably promptly any Erroneously Awarded Compensation except to the extent that the Human Resources and Compensation Committee (the “Committee”), or if the Committee does not consist of independent directors, a majority of the independent directors serving on the Board of Directors of the Company, has made a determination that recovery would be impracticable and the conditions of paragraphs (1), (2), or (3) below apply (in which case, the Erroneously Awarded Compensation need not be recovered).
(1) the direct expense paid to a third party to assist in enforcing the Policy would exceed the amount to be recovered. Before concluding that it would be impracticable to recover any amount of Erroneously Awarded Compensation based on expense of enforcement, the Company shall make a reasonable attempt to recover such Erroneously Awarded Compensation, document such reasonable attempt(s) to recover, and provide that documentation to the Exchange.
(2) recovery would violate the Company’s home country law where that law was adopted prior to November 28, 2022. Before concluding that it would be impracticable to recover any amount of Erroneously Awarded Compensation based on violation of home country law, the Company shall obtain an opinion of the Company’s home country counsel, acceptable to the Exchange, that recovery would result in such a violation and shall provide such opinion to the Exchange.
(3) recovery would likely cause an otherwise tax-qualified retirement plan, under which benefits are broadly available to employees of the registrant, to fail to meet the requirements of 26 U.S.C. 401(a)(13) or 26 U.S.C. 411(a) and regulations thereunder.
(b) In recovering Erroneously Awarded Compensation reasonably promptly pursuant to Section 5(a) of this Policy, the Committee shall determine the appropriate method of recovery it deems reasonable and appropriate in its discretion based on all applicable facts and circumstances and taking into account the time value of money and the cost to shareholders of delaying recovery. Such determination shall be consistent with any applicable legal guidance, by the U.S. Securities and Exchange Commission (“SEC”), judicial opinion, or otherwise. The determination of “reasonably promptly” may vary from case to case based on the applicable facts and circumstances. The method of recovery the Committee may determine is applicable include, but is not limited to: (1) requiring reimbursement of Erroneously Awarded Compensation; (2) seeking recovery of any gain realized on the vesting, exercise, settlement, sale, transfer, or other disposition of any equity-based awards; (3) offsetting the Erroneously Awarded Compensation from any compensation otherwise owed by the Company to the Executive Officer; (4) cancelling outstanding vested or unvested equity awards; and/or (5) taking any other remedial and recovery action permitted by applicable law, as determined by the Committee.
6. Administration; Committee Decisions. This Policy shall be administered by the Committee and the Committee is authorized to interpret and construe this Policy and to make all determinations necessary, appropriate, or advisable for the administration of this Policy. Decisions of the Committee with respect to this Policy shall be final, conclusive and binding on all Executive Officers subject to this policy (unless determined to be an abuse of discretion), and need not be uniform with respect to each individual covered by this Policy. Subject to any limitation under applicable law, the Committee may authorize and empower any officer or employee of the Company to take any and all actions necessary or appropriate to carry out the purpose and intent of this Policy (other than with respect to any recovery under this Policy involving such officer or employee). The Committee may modify or amend this Policy, in whole or in part, from time to time in its discretion and shall amend any or all of the provisions of this Policy as it deems necessary, including as and when it determines that it is legally required by 229 C.F.R. §240.10D or the related listing rules of the Exchange. The Committee may terminate this Policy at any time. Notwithstanding anything in this Section 6 to the contrary, no amendment or termination of this Policy shall be effective if such amendment or termination would (after taking into account any actions taken by the Company contemporaneously with such amendment or termination) cause the Company to violate the 229 C.F.R. §240.10D, the related listing rules of the Exchange, or any federal securities law, SEC rule or Exchange rule.
7. No Indemnification. Notwithstanding anything to the contrary in any other policy of the Company or any agreement between the Company and an Executive Officer, no Executive Officer shall be indemnified by the Company against the loss of any Erroneously Awarded Compensation. Additionally, the Company shall not pay or reimburse any Executive Officer for the cost of third-party insurance purchased by an Executive Officer to cover any such loss under this Policy.
8. Reporting and Disclosure. The Company shall file all disclosures with respect to this Policy in accordance with the requirements of U.S. federal securities laws, including the disclosure required by applicable SEC filings.
9. Agreement to Policy by Executive Officers. The Committee shall take reasonable steps to inform Executive Officers of this Policy and obtain their agreement to this Policy, which steps may constitute the incorporation of this Policy into any award that is accepted by the Executive Officer. Each Executive Officer shall be required to sign and return to the Company the Acknowledgement and Acceptance Form attached hereto as Exhibit A pursuant to which such Executive Officer will acknowledge that he or she is bound by the terms of this Policy; provided, however, that this Policy shall apply to, and be enforceable against, any Executive Officer and his or her successors (as specified in Section 11 of this Policy) regardless of whether or not such Executive Officer properly signs and returns to the Company such Acknowledgement and Acceptance Form and regardless of whether or not such Executive Officer is aware of his or her status as such.
10. Other Recoupment Rights; No Additional Payments. The Committee intends that this Policy will be applied to the fullest extent permitted by applicable law. The Committee may require that any employment agreement, equity award agreement, or any other agreement entered into on or after the Effective Date shall, as a condition to the grant of any benefit thereunder, require an Executive Officer to agree to abide by the terms of this Policy. Executive Officers shall be deemed to have accepted continuing employment on terms that include compliance with the Policy, to the extent of its otherwise applicable provisions, and to be contractually bound by its enforcement provisions. Executive Officers who cease employment or service with the Company shall continue to be bound by the terms of the Policy with respect to Incentive-Based Compensation that is subject to the Policy. Any right of recoupment under this Policy is in addition to, and not in lieu of, any other remedies or rights of recoupment that may be available to the Company under applicable law, regulation or rule or pursuant to the terms of any similar policy in any employment agreement, cash-based bonus plan, equity award agreement or similar agreement and any other legal remedies available to the Company. To the extent that an Executive Officer has already reimbursed the Company for any Erroneously Awarded Compensation Received under any duplicative recovery obligations established by the Company or applicable law, it shall be appropriate for any such reimbursed amount to be credited to the amount of Erroneously Awarded Compensation that is subject to recovery under this Policy, as determined by the Committee in its sole discretion. Nothing in this Policy precludes the Company from implementing any additional clawback or recoupment policies with respect to Executive Officers or any other service provider of the Company. Application of this Policy does not preclude the Company from taking any other action to enforce any Executive Officer’s obligations to the Company, including termination of employment or institution of civil or criminal proceedings or any other remedies that may be available to the Company with respect to any Executive Officer.
11. Successors. This Policy shall be binding and enforceable against all Executive Officers and their beneficiaries, estates, heirs, executors, administrators or other legal representatives to the extent required by 229 C.F.R. §240.10D and the related listing rules of the Exchange or as otherwise determined by the Committee.
* * *
Exhibit A
TRONOX HOLDINGS PLC DODD-FRANK CLAWBACK POLICY
ACKNOWLEDGEMENT AND ACCEPTANCE FORM
Capitalized terms used but not otherwise defined in this Acknowledgement and Acceptance Form shall have the meanings ascribed to such terms in the Tronox Holdings Plc Dodd-Frank Clawback Policy (the “Policy”). By signing below, the undersigned executive officer (the “Executive Officer”) acknowledges and confirms that the Executive Officer has received and reviewed a copy of the Policy and, in addition, the Executive Officer acknowledges and agrees as follows:
(a)the Executive Officer is and will continue to be subject to the Policy and that the Policy will apply both during and after the Executive Officer’s employment with the Company;
(b)to the extent necessary to comply with the Policy, the Policy hereby amends any employment agreement, equity award agreement or similar agreement that the Executive Officer is a party to with the Company and shall apply and govern Incentive-Based Compensation Received by any Executive Officer, notwithstanding any contrary or supplemental term or condition in any document, plan or agreement including without limitation any employment contract, indemnification agreement, equity agreement, or equity plan document;
(c)the Executive Officer shall abide by the terms of the Policy, including, without limitation, by returning any Erroneously Awarded Compensation to the Company to the extent required by, and in a manner permitted by, the Policy;
(d)any amounts payable to the Executive Officer, including any Incentive-Based Compensation, shall be subject to the Policy as may be in effect and modified from time to time in the sole discretion of the Committee or as required by applicable law or the requirements of the Exchange, and that such modification will be deemed to amend this acknowledgment;
(e)the Company may recover compensation paid to the Executive Officer through any method of recovery the Committee deems appropriate, and the Executive Officer agrees to comply with any request or demand for repayment by the Company in order to comply with the Policy;
(f)the recovery of Erroneously Awarded Compensation under this Policy will not give rise to any right to voluntarily terminate employment for “good reason,” or due to a “constructive termination” (or any similar term of like effect) under any plan, program or policy of or agreement with the Company;
(g)the Company may, to the greatest extent permitted by applicable law, reduce any amount that may become payable to the Executive Officer by any amount to be recovered by the Company pursuant to the Policy to the extent such amount has not been returned by the Executive Officer to the Company prior to the date that any subsequent amount becomes payable to the Executive Officer; and
(h)any assertion or application of any rights under federal, state, local or foreign law or in contract or equity that would otherwise conflict with or narrow the Company’s authority to interpret, apply and enforce the Policy to its fullest extent, including but not limited to, the
Company’s authority to withhold or divert wages pursuant to the Policy, is hereby waived by the Executive Officer.
Signature
Print Name
Date
Signature page to Tronox Holdings Plc Dodd-Frank Clawback Policy
Acknowledgement and Acceptance Form