00015219512021FYfalsehttp://fasb.org/us-gaap/2023#OtherNoninterestExpensehttp://fasb.org/us-gaap/2023#OtherNoninterestExpensehttp://fasb.org/us-gaap/2023#OtherNoninterestExpense00015219512023-01-012023-12-3100015219512023-06-30iso4217:USD00015219512024-02-26xbrli:shares00015219512023-12-3100015219512022-12-31iso4217:USDxbrli:shares00015219512022-01-012022-12-31xbrli:pure00015219512021-01-012021-12-310001521951us-gaap:CommonStockMember2020-12-310001521951us-gaap:PreferredStockMember2020-12-310001521951us-gaap:AdditionalPaidInCapitalMember2020-12-310001521951us-gaap:RetainedEarningsMember2020-12-310001521951us-gaap:AccumulatedOtherComprehensiveIncomeMember2020-12-310001521951us-gaap:TreasuryStockCommonMember2020-12-3100015219512020-12-310001521951us-gaap:RetainedEarningsMember2021-01-012021-12-310001521951us-gaap:AccumulatedOtherComprehensiveIncomeMember2021-01-012021-12-310001521951us-gaap:CommonStockMember2021-01-012021-12-310001521951us-gaap:AdditionalPaidInCapitalMember2021-01-012021-12-310001521951us-gaap:TreasuryStockCommonMember2021-01-012021-12-310001521951us-gaap:CommonStockMember2021-12-310001521951us-gaap:PreferredStockMember2021-12-310001521951us-gaap:AdditionalPaidInCapitalMember2021-12-310001521951us-gaap:RetainedEarningsMember2021-12-310001521951us-gaap:AccumulatedOtherComprehensiveIncomeMember2021-12-310001521951us-gaap:TreasuryStockCommonMember2021-12-3100015219512021-12-310001521951us-gaap:RetainedEarningsMember2022-01-012022-12-310001521951us-gaap:AccumulatedOtherComprehensiveIncomeMember2022-01-012022-12-310001521951us-gaap:PreferredStockMember2022-01-012022-12-310001521951us-gaap:CommonStockMember2022-01-012022-12-310001521951us-gaap:AdditionalPaidInCapitalMember2022-01-012022-12-310001521951us-gaap:TreasuryStockCommonMember2022-01-012022-12-310001521951us-gaap:CommonStockMember2022-12-310001521951us-gaap:PreferredStockMember2022-12-310001521951us-gaap:AdditionalPaidInCapitalMember2022-12-310001521951us-gaap:RetainedEarningsMember2022-12-310001521951us-gaap:AccumulatedOtherComprehensiveIncomeMember2022-12-310001521951us-gaap:TreasuryStockCommonMember2022-12-310001521951us-gaap:RetainedEarningsMembersrt:CumulativeEffectPeriodOfAdoptionAdjustmentMember2022-12-310001521951srt:CumulativeEffectPeriodOfAdoptionAdjustmentMember2022-12-310001521951srt:CumulativeEffectPeriodOfAdoptionAdjustedBalanceMemberus-gaap:RetainedEarningsMember2022-12-310001521951srt:CumulativeEffectPeriodOfAdoptionAdjustedBalanceMember2022-12-310001521951us-gaap:RetainedEarningsMember2023-01-012023-12-310001521951us-gaap:AccumulatedOtherComprehensiveIncomeMember2023-01-012023-12-310001521951us-gaap:CommonStockMember2023-01-012023-12-310001521951us-gaap:AdditionalPaidInCapitalMember2023-01-012023-12-310001521951us-gaap:TreasuryStockCommonMember2023-01-012023-12-310001521951us-gaap:CommonStockMember2023-12-310001521951us-gaap:PreferredStockMember2023-12-310001521951us-gaap:AdditionalPaidInCapitalMember2023-12-310001521951us-gaap:RetainedEarningsMember2023-12-310001521951us-gaap:AccumulatedOtherComprehensiveIncomeMember2023-12-310001521951us-gaap:TreasuryStockCommonMember2023-12-310001521951srt:MinimumMember2023-12-310001521951srt:MaximumMember2023-12-310001521951srt:MinimumMember2023-01-012023-12-310001521951srt:MaximumMember2023-01-012023-12-310001521951srt:CumulativeEffectPeriodOfAdoptionAdjustmentMember2023-01-010001521951us-gaap:USTreasurySecuritiesMember2023-12-310001521951fbiz:GovernmentSponsoredEnterprisesMemberfbiz:OtherAgencySecuritiesMember2023-12-310001521951us-gaap:USStatesAndPoliticalSubdivisionsMember2023-12-310001521951fbiz:GNMAMemberus-gaap:ResidentialMortgageBackedSecuritiesMember2023-12-310001521951fbiz:GovernmentSponsoredEnterprisesMemberus-gaap:ResidentialMortgageBackedSecuritiesMember2023-12-310001521951us-gaap:CommercialMortgageBackedSecuritiesMemberfbiz:GNMAMember2023-12-310001521951us-gaap:CommercialMortgageBackedSecuritiesMemberfbiz:GovernmentSponsoredEnterprisesMember2023-12-310001521951us-gaap:USTreasurySecuritiesMember2022-12-310001521951fbiz:GovernmentSponsoredEnterprisesMemberfbiz:OtherAgencySecuritiesMember2022-12-310001521951us-gaap:USStatesAndPoliticalSubdivisionsMember2022-12-310001521951fbiz:GNMAMemberus-gaap:ResidentialMortgageBackedSecuritiesMember2022-12-310001521951fbiz:GovernmentSponsoredEnterprisesMemberus-gaap:ResidentialMortgageBackedSecuritiesMember2022-12-310001521951us-gaap:CommercialMortgageBackedSecuritiesMemberfbiz:GNMAMember2022-12-310001521951us-gaap:CommercialMortgageBackedSecuritiesMemberfbiz:GovernmentSponsoredEnterprisesMember2022-12-31fbiz:securities0001521951fbiz:VariousObligationsMember2023-12-310001521951fbiz:VariousObligationsMember2022-12-310001521951fbiz:CommercialRealEstateLoansReceivableOwnerOccupiedMember2023-12-310001521951fbiz:CommercialRealEstateLoansReceivableOwnerOccupiedMember2022-12-310001521951fbiz:CommercialRealEstateLoansReceivableNonOwnerOccupiedMember2023-12-310001521951fbiz:CommercialRealEstateLoansReceivableNonOwnerOccupiedMember2022-12-310001521951fbiz:CommercialRealEstateLoansReceivableLandDevelopmentMember2023-12-310001521951fbiz:CommercialRealEstateLoansReceivableLandDevelopmentMember2022-12-310001521951fbiz:CommercialRealEstateLoansReceivableMultiFamilyMember2023-12-310001521951fbiz:CommercialRealEstateLoansReceivableMultiFamilyMember2022-12-310001521951fbiz:CommercialRealEstateLoansReceivable14FamilyMember2023-12-310001521951fbiz:CommercialRealEstateLoansReceivable14FamilyMember2022-12-310001521951us-gaap:CommercialRealEstatePortfolioSegmentMember2023-12-310001521951us-gaap:CommercialRealEstatePortfolioSegmentMember2022-12-310001521951fbiz:CommercialandIndustrialLoansandLeasesReceivableMember2023-12-310001521951fbiz:CommercialandIndustrialLoansandLeasesReceivableMember2022-12-310001521951fbiz:ConsumerAndOtherLoansReceivableMember2023-12-310001521951fbiz:ConsumerAndOtherLoansReceivableMember2022-12-310001521951fbiz:CommercialRealEstateLoansReceivableOwnerOccupiedMember2023-01-012023-12-310001521951fbiz:CommercialRealEstateLoansReceivableNonOwnerOccupiedMember2023-01-012023-12-310001521951fbiz:CommercialRealEstateLoansReceivableConstructionMember2023-01-012023-12-310001521951fbiz:CommercialRealEstateLoansReceivableMultiFamilyMember2023-01-012023-12-310001521951fbiz:CommercialRealEstateLoansReceivable14FamilyMember2023-01-012023-12-310001521951fbiz:CommercialandIndustrialLoansandLeasesReceivableMember2023-01-012023-12-310001521951fbiz:ConsumerAndOtherLoansReceivableMember2023-01-012023-12-310001521951fbiz:CommercialRealEstateLoansReceivableOwnerOccupiedMember2022-01-012022-12-310001521951fbiz:CommercialRealEstateLoansReceivableNonOwnerOccupiedMember2022-01-012022-12-310001521951fbiz:CommercialRealEstateLoansReceivableConstructionMember2022-01-012022-12-310001521951fbiz:CommercialRealEstateLoansReceivableMultiFamilyMember2022-01-012022-12-310001521951fbiz:CommercialRealEstateLoansReceivable14FamilyMember2022-01-012022-12-310001521951fbiz:CommercialandIndustrialLoansandLeasesReceivableMember2022-01-012022-12-310001521951fbiz:ConsumerAndOtherLoansReceivableMember2022-01-012022-12-310001521951fbiz:CommercialRealEstateLoansReceivableOwnerOccupiedMemberfbiz:CategoryIMember2023-12-310001521951fbiz:CommercialRealEstateLoansReceivableOwnerOccupiedMemberfbiz:CategoryIiMember2023-12-310001521951fbiz:CommercialRealEstateLoansReceivableOwnerOccupiedMemberfbiz:CategoryIiiMember2023-12-310001521951fbiz:CommercialRealEstateLoansReceivableOwnerOccupiedMemberfbiz:CategoryIvMember2023-12-310001521951fbiz:CommercialRealEstateLoansReceivableNonOwnerOccupiedMemberfbiz:CategoryIMember2023-12-310001521951fbiz:CommercialRealEstateLoansReceivableNonOwnerOccupiedMemberfbiz:CategoryIiMember2023-12-310001521951fbiz:CategoryIiiMemberfbiz:CommercialRealEstateLoansReceivableNonOwnerOccupiedMember2023-12-310001521951fbiz:CommercialRealEstateLoansReceivableNonOwnerOccupiedMemberfbiz:CategoryIvMember2023-12-310001521951fbiz:CommercialRealEstateLoansReceivableConstructionMemberfbiz:CategoryIMember2023-12-310001521951fbiz:CommercialRealEstateLoansReceivableConstructionMemberfbiz:CategoryIiMember2023-12-310001521951fbiz:CommercialRealEstateLoansReceivableConstructionMemberfbiz:CategoryIiiMember2023-12-310001521951fbiz:CommercialRealEstateLoansReceivableConstructionMemberfbiz:CategoryIvMember2023-12-310001521951fbiz:CommercialRealEstateLoansReceivableConstructionMember2023-12-310001521951fbiz:CommercialRealEstateLoansReceivableMultiFamilyMemberfbiz:CategoryIMember2023-12-310001521951fbiz:CategoryIiMemberfbiz:CommercialRealEstateLoansReceivableMultiFamilyMember2023-12-310001521951fbiz:CategoryIiiMemberfbiz:CommercialRealEstateLoansReceivableMultiFamilyMember2023-12-310001521951fbiz:CommercialRealEstateLoansReceivableMultiFamilyMemberfbiz:CategoryIvMember2023-12-310001521951fbiz:CommercialRealEstateLoansReceivable14FamilyMemberfbiz:CategoryIMember2023-12-310001521951fbiz:CategoryIiMemberfbiz:CommercialRealEstateLoansReceivable14FamilyMember2023-12-310001521951fbiz:CategoryIiiMemberfbiz:CommercialRealEstateLoansReceivable14FamilyMember2023-12-310001521951fbiz:CommercialRealEstateLoansReceivable14FamilyMemberfbiz:CategoryIvMember2023-12-310001521951fbiz:CommercialandIndustrialLoansandLeasesReceivableMemberfbiz:CategoryIMember2023-12-310001521951fbiz:CategoryIiMemberfbiz:CommercialandIndustrialLoansandLeasesReceivableMember2023-12-310001521951fbiz:CategoryIiiMemberfbiz:CommercialandIndustrialLoansandLeasesReceivableMember2023-12-310001521951fbiz:CommercialandIndustrialLoansandLeasesReceivableMemberfbiz:CategoryIvMember2023-12-310001521951fbiz:CategoryIMemberfbiz:ConsumerAndOtherLoansReceivableMember2023-12-310001521951fbiz:CategoryIiMemberfbiz:ConsumerAndOtherLoansReceivableMember2023-12-310001521951fbiz:CategoryIiiMemberfbiz:ConsumerAndOtherLoansReceivableMember2023-12-310001521951fbiz:ConsumerAndOtherLoansReceivableMemberfbiz:CategoryIvMember2023-12-310001521951fbiz:CategoryIMember2023-12-310001521951fbiz:CategoryIiMember2023-12-310001521951fbiz:CategoryIiiMember2023-12-310001521951fbiz:CategoryIvMember2023-12-310001521951fbiz:CommercialRealEstateLoansReceivableOwnerOccupiedMemberfbiz:CategoryIMember2022-12-310001521951fbiz:CommercialRealEstateLoansReceivableOwnerOccupiedMemberfbiz:CategoryIiMember2022-12-310001521951fbiz:CommercialRealEstateLoansReceivableOwnerOccupiedMemberfbiz:CategoryIiiMember2022-12-310001521951fbiz:CommercialRealEstateLoansReceivableOwnerOccupiedMemberfbiz:CategoryIvMember2022-12-310001521951fbiz:CommercialRealEstateLoansReceivableNonOwnerOccupiedMemberfbiz:CategoryIMember2022-12-310001521951fbiz:CommercialRealEstateLoansReceivableNonOwnerOccupiedMemberfbiz:CategoryIiMember2022-12-310001521951fbiz:CategoryIiiMemberfbiz:CommercialRealEstateLoansReceivableNonOwnerOccupiedMember2022-12-310001521951fbiz:CommercialRealEstateLoansReceivableNonOwnerOccupiedMemberfbiz:CategoryIvMember2022-12-310001521951fbiz:CommercialRealEstateLoansReceivableConstructionMemberfbiz:CategoryIMember2022-12-310001521951fbiz:CommercialRealEstateLoansReceivableConstructionMemberfbiz:CategoryIiMember2022-12-310001521951fbiz:CommercialRealEstateLoansReceivableConstructionMemberfbiz:CategoryIiiMember2022-12-310001521951fbiz:CommercialRealEstateLoansReceivableConstructionMemberfbiz:CategoryIvMember2022-12-310001521951fbiz:CommercialRealEstateLoansReceivableConstructionMember2022-12-310001521951fbiz:CommercialRealEstateLoansReceivableMultiFamilyMemberfbiz:CategoryIMember2022-12-310001521951fbiz:CategoryIiMemberfbiz:CommercialRealEstateLoansReceivableMultiFamilyMember2022-12-310001521951fbiz:CategoryIiiMemberfbiz:CommercialRealEstateLoansReceivableMultiFamilyMember2022-12-310001521951fbiz:CommercialRealEstateLoansReceivableMultiFamilyMemberfbiz:CategoryIvMember2022-12-310001521951fbiz:CommercialRealEstateLoansReceivable14FamilyMemberfbiz:CategoryIMember2022-12-310001521951fbiz:CategoryIiMemberfbiz:CommercialRealEstateLoansReceivable14FamilyMember2022-12-310001521951fbiz:CategoryIiiMemberfbiz:CommercialRealEstateLoansReceivable14FamilyMember2022-12-310001521951fbiz:CommercialRealEstateLoansReceivable14FamilyMemberfbiz:CategoryIvMember2022-12-310001521951fbiz:CommercialandIndustrialLoansandLeasesReceivableMemberfbiz:CategoryIMember2022-12-310001521951fbiz:CategoryIiMemberfbiz:CommercialandIndustrialLoansandLeasesReceivableMember2022-12-310001521951fbiz:CategoryIiiMemberfbiz:CommercialandIndustrialLoansandLeasesReceivableMember2022-12-310001521951fbiz:CommercialandIndustrialLoansandLeasesReceivableMemberfbiz:CategoryIvMember2022-12-310001521951fbiz:CategoryIMemberfbiz:ConsumerAndOtherLoansReceivableMember2022-12-310001521951fbiz:CategoryIiMemberfbiz:ConsumerAndOtherLoansReceivableMember2022-12-310001521951fbiz:CategoryIiiMemberfbiz:ConsumerAndOtherLoansReceivableMember2022-12-310001521951fbiz:ConsumerAndOtherLoansReceivableMemberfbiz:CategoryIvMember2022-12-310001521951fbiz:CategoryIMember2022-12-310001521951fbiz:CategoryIiMember2022-12-310001521951fbiz:CategoryIiiMember2022-12-310001521951fbiz:CategoryIvMember2022-12-310001521951fbiz:CommercialRealEstateLoansReceivableOwnerOccupiedMemberus-gaap:FinancingReceivables30To59DaysPastDueMemberus-gaap:PerformingFinancingReceivableMember2023-12-310001521951fbiz:CommercialRealEstateLoansReceivableOwnerOccupiedMemberus-gaap:PerformingFinancingReceivableMemberus-gaap:FinancingReceivables60To89DaysPastDueMember2023-12-310001521951fbiz:CommercialRealEstateLoansReceivableOwnerOccupiedMemberus-gaap:FinancingReceivablesEqualToGreaterThan90DaysPastDueMemberus-gaap:PerformingFinancingReceivableMember2023-12-310001521951fbiz:CommercialRealEstateLoansReceivableOwnerOccupiedMemberus-gaap:FinancialAssetPastDueMemberus-gaap:PerformingFinancingReceivableMember2023-12-310001521951fbiz:CommercialRealEstateLoansReceivableOwnerOccupiedMemberus-gaap:FinancialAssetNotPastDueMemberus-gaap:PerformingFinancingReceivableMember2023-12-310001521951fbiz:CommercialRealEstateLoansReceivableOwnerOccupiedMemberus-gaap:PerformingFinancingReceivableMember2023-12-310001521951us-gaap:FinancingReceivables30To59DaysPastDueMemberfbiz:CommercialRealEstateLoansReceivableNonOwnerOccupiedMemberus-gaap:PerformingFinancingReceivableMember2023-12-310001521951fbiz:CommercialRealEstateLoansReceivableNonOwnerOccupiedMemberus-gaap:PerformingFinancingReceivableMemberus-gaap:FinancingReceivables60To89DaysPastDueMember2023-12-310001521951fbiz:CommercialRealEstateLoansReceivableNonOwnerOccupiedMemberus-gaap:FinancingReceivablesEqualToGreaterThan90DaysPastDueMemberus-gaap:PerformingFinancingReceivableMember2023-12-310001521951fbiz:CommercialRealEstateLoansReceivableNonOwnerOccupiedMemberus-gaap:FinancialAssetPastDueMemberus-gaap:PerformingFinancingReceivableMember2023-12-310001521951fbiz:CommercialRealEstateLoansReceivableNonOwnerOccupiedMemberus-gaap:FinancialAssetNotPastDueMemberus-gaap:PerformingFinancingReceivableMember2023-12-310001521951fbiz:CommercialRealEstateLoansReceivableNonOwnerOccupiedMemberus-gaap:PerformingFinancingReceivableMember2023-12-310001521951fbiz:CommercialRealEstateLoansReceivableConstructionMemberus-gaap:FinancingReceivables30To59DaysPastDueMemberus-gaap:PerformingFinancingReceivableMember2023-12-310001521951fbiz:CommercialRealEstateLoansReceivableConstructionMemberus-gaap:PerformingFinancingReceivableMemberus-gaap:FinancingReceivables60To89DaysPastDueMember2023-12-310001521951fbiz:CommercialRealEstateLoansReceivableConstructionMemberus-gaap:FinancingReceivablesEqualToGreaterThan90DaysPastDueMemberus-gaap:PerformingFinancingReceivableMember2023-12-310001521951fbiz:CommercialRealEstateLoansReceivableConstructionMemberus-gaap:FinancialAssetPastDueMemberus-gaap:PerformingFinancingReceivableMember2023-12-310001521951fbiz:CommercialRealEstateLoansReceivableConstructionMemberus-gaap:FinancialAssetNotPastDueMemberus-gaap:PerformingFinancingReceivableMember2023-12-310001521951fbiz:CommercialRealEstateLoansReceivableConstructionMemberus-gaap:PerformingFinancingReceivableMember2023-12-310001521951us-gaap:FinancingReceivables30To59DaysPastDueMemberfbiz:CommercialRealEstateLoansReceivableMultiFamilyMemberus-gaap:PerformingFinancingReceivableMember2023-12-310001521951fbiz:CommercialRealEstateLoansReceivableMultiFamilyMemberus-gaap:PerformingFinancingReceivableMemberus-gaap:FinancingReceivables60To89DaysPastDueMember2023-12-310001521951us-gaap:FinancingReceivablesEqualToGreaterThan90DaysPastDueMemberfbiz:CommercialRealEstateLoansReceivableMultiFamilyMemberus-gaap:PerformingFinancingReceivableMember2023-12-310001521951us-gaap:FinancialAssetPastDueMemberfbiz:CommercialRealEstateLoansReceivableMultiFamilyMemberus-gaap:PerformingFinancingReceivableMember2023-12-310001521951us-gaap:FinancialAssetNotPastDueMemberfbiz:CommercialRealEstateLoansReceivableMultiFamilyMemberus-gaap:PerformingFinancingReceivableMember2023-12-310001521951fbiz:CommercialRealEstateLoansReceivableMultiFamilyMemberus-gaap:PerformingFinancingReceivableMember2023-12-310001521951us-gaap:FinancingReceivables30To59DaysPastDueMemberfbiz:CommercialRealEstateLoansReceivable14FamilyMemberus-gaap:PerformingFinancingReceivableMember2023-12-310001521951fbiz:CommercialRealEstateLoansReceivable14FamilyMemberus-gaap:PerformingFinancingReceivableMemberus-gaap:FinancingReceivables60To89DaysPastDueMember2023-12-310001521951fbiz:CommercialRealEstateLoansReceivable14FamilyMemberus-gaap:FinancingReceivablesEqualToGreaterThan90DaysPastDueMemberus-gaap:PerformingFinancingReceivableMember2023-12-310001521951us-gaap:FinancialAssetPastDueMemberfbiz:CommercialRealEstateLoansReceivable14FamilyMemberus-gaap:PerformingFinancingReceivableMember2023-12-310001521951fbiz:CommercialRealEstateLoansReceivable14FamilyMemberus-gaap:FinancialAssetNotPastDueMemberus-gaap:PerformingFinancingReceivableMember2023-12-310001521951fbiz:CommercialRealEstateLoansReceivable14FamilyMemberus-gaap:PerformingFinancingReceivableMember2023-12-310001521951us-gaap:FinancingReceivables30To59DaysPastDueMemberfbiz:CommercialandIndustrialLoansandLeasesReceivableMemberus-gaap:PerformingFinancingReceivableMember2023-12-310001521951fbiz:CommercialandIndustrialLoansandLeasesReceivableMemberus-gaap:PerformingFinancingReceivableMemberus-gaap:FinancingReceivables60To89DaysPastDueMember2023-12-310001521951us-gaap:FinancingReceivablesEqualToGreaterThan90DaysPastDueMemberfbiz:CommercialandIndustrialLoansandLeasesReceivableMemberus-gaap:PerformingFinancingReceivableMember2023-12-310001521951us-gaap:FinancialAssetPastDueMemberfbiz:CommercialandIndustrialLoansandLeasesReceivableMemberus-gaap:PerformingFinancingReceivableMember2023-12-310001521951us-gaap:FinancialAssetNotPastDueMemberfbiz:CommercialandIndustrialLoansandLeasesReceivableMemberus-gaap:PerformingFinancingReceivableMember2023-12-310001521951fbiz:CommercialandIndustrialLoansandLeasesReceivableMemberus-gaap:PerformingFinancingReceivableMember2023-12-310001521951us-gaap:FinancingReceivables30To59DaysPastDueMemberus-gaap:PerformingFinancingReceivableMemberfbiz:ConsumerAndOtherLoansReceivableMember2023-12-310001521951us-gaap:PerformingFinancingReceivableMemberus-gaap:FinancingReceivables60To89DaysPastDueMemberfbiz:ConsumerAndOtherLoansReceivableMember2023-12-310001521951us-gaap:FinancingReceivablesEqualToGreaterThan90DaysPastDueMemberus-gaap:PerformingFinancingReceivableMemberfbiz:ConsumerAndOtherLoansReceivableMember2023-12-310001521951us-gaap:FinancialAssetPastDueMemberus-gaap:PerformingFinancingReceivableMemberfbiz:ConsumerAndOtherLoansReceivableMember2023-12-310001521951us-gaap:FinancialAssetNotPastDueMemberus-gaap:PerformingFinancingReceivableMemberfbiz:ConsumerAndOtherLoansReceivableMember2023-12-310001521951us-gaap:PerformingFinancingReceivableMemberfbiz:ConsumerAndOtherLoansReceivableMember2023-12-310001521951us-gaap:FinancingReceivables30To59DaysPastDueMemberus-gaap:PerformingFinancingReceivableMember2023-12-310001521951us-gaap:PerformingFinancingReceivableMemberus-gaap:FinancingReceivables60To89DaysPastDueMember2023-12-310001521951us-gaap:FinancingReceivablesEqualToGreaterThan90DaysPastDueMemberus-gaap:PerformingFinancingReceivableMember2023-12-310001521951us-gaap:FinancialAssetPastDueMemberus-gaap:PerformingFinancingReceivableMember2023-12-310001521951us-gaap:FinancialAssetNotPastDueMemberus-gaap:PerformingFinancingReceivableMember2023-12-310001521951us-gaap:PerformingFinancingReceivableMember2023-12-310001521951fbiz:CommercialRealEstateLoansReceivableOwnerOccupiedMemberus-gaap:NonperformingFinancingReceivableMemberus-gaap:FinancingReceivables30To59DaysPastDueMember2023-12-310001521951fbiz:CommercialRealEstateLoansReceivableOwnerOccupiedMemberus-gaap:NonperformingFinancingReceivableMemberus-gaap:FinancingReceivables60To89DaysPastDueMember2023-12-310001521951fbiz:CommercialRealEstateLoansReceivableOwnerOccupiedMemberus-gaap:NonperformingFinancingReceivableMemberus-gaap:FinancingReceivablesEqualToGreaterThan90DaysPastDueMember2023-12-310001521951fbiz:CommercialRealEstateLoansReceivableOwnerOccupiedMemberus-gaap:NonperformingFinancingReceivableMemberus-gaap:FinancialAssetPastDueMember2023-12-310001521951fbiz:CommercialRealEstateLoansReceivableOwnerOccupiedMemberus-gaap:NonperformingFinancingReceivableMemberus-gaap:FinancialAssetNotPastDueMember2023-12-310001521951fbiz:CommercialRealEstateLoansReceivableOwnerOccupiedMemberus-gaap:NonperformingFinancingReceivableMember2023-12-310001521951us-gaap:NonperformingFinancingReceivableMemberus-gaap:FinancingReceivables30To59DaysPastDueMemberfbiz:CommercialRealEstateLoansReceivableNonOwnerOccupiedMember2023-12-310001521951us-gaap:NonperformingFinancingReceivableMemberfbiz:CommercialRealEstateLoansReceivableNonOwnerOccupiedMemberus-gaap:FinancingReceivables60To89DaysPastDueMember2023-12-310001521951us-gaap:NonperformingFinancingReceivableMemberfbiz:CommercialRealEstateLoansReceivableNonOwnerOccupiedMemberus-gaap:FinancingReceivablesEqualToGreaterThan90DaysPastDueMember2023-12-310001521951us-gaap:NonperformingFinancingReceivableMemberfbiz:CommercialRealEstateLoansReceivableNonOwnerOccupiedMemberus-gaap:FinancialAssetPastDueMember2023-12-310001521951us-gaap:NonperformingFinancingReceivableMemberfbiz:CommercialRealEstateLoansReceivableNonOwnerOccupiedMemberus-gaap:FinancialAssetNotPastDueMember2023-12-310001521951us-gaap:NonperformingFinancingReceivableMemberfbiz:CommercialRealEstateLoansReceivableNonOwnerOccupiedMember2023-12-310001521951fbiz:CommercialRealEstateLoansReceivableConstructionMemberus-gaap:NonperformingFinancingReceivableMemberus-gaap:FinancingReceivables30To59DaysPastDueMember2023-12-310001521951fbiz:CommercialRealEstateLoansReceivableConstructionMemberus-gaap:NonperformingFinancingReceivableMemberus-gaap:FinancingReceivables60To89DaysPastDueMember2023-12-310001521951fbiz:CommercialRealEstateLoansReceivableConstructionMemberus-gaap:NonperformingFinancingReceivableMemberus-gaap:FinancingReceivablesEqualToGreaterThan90DaysPastDueMember2023-12-310001521951fbiz:CommercialRealEstateLoansReceivableConstructionMemberus-gaap:NonperformingFinancingReceivableMemberus-gaap:FinancialAssetPastDueMember2023-12-310001521951fbiz:CommercialRealEstateLoansReceivableConstructionMemberus-gaap:NonperformingFinancingReceivableMemberus-gaap:FinancialAssetNotPastDueMember2023-12-310001521951fbiz:CommercialRealEstateLoansReceivableConstructionMemberus-gaap:NonperformingFinancingReceivableMember2023-12-310001521951us-gaap:NonperformingFinancingReceivableMemberus-gaap:FinancingReceivables30To59DaysPastDueMemberfbiz:CommercialRealEstateLoansReceivableMultiFamilyMember2023-12-310001521951us-gaap:NonperformingFinancingReceivableMemberfbiz:CommercialRealEstateLoansReceivableMultiFamilyMemberus-gaap:FinancingReceivables60To89DaysPastDueMember2023-12-310001521951us-gaap:NonperformingFinancingReceivableMemberus-gaap:FinancingReceivablesEqualToGreaterThan90DaysPastDueMemberfbiz:CommercialRealEstateLoansReceivableMultiFamilyMember2023-12-310001521951us-gaap:NonperformingFinancingReceivableMemberus-gaap:FinancialAssetPastDueMemberfbiz:CommercialRealEstateLoansReceivableMultiFamilyMember2023-12-310001521951us-gaap:NonperformingFinancingReceivableMemberus-gaap:FinancialAssetNotPastDueMemberfbiz:CommercialRealEstateLoansReceivableMultiFamilyMember2023-12-310001521951us-gaap:NonperformingFinancingReceivableMemberfbiz:CommercialRealEstateLoansReceivableMultiFamilyMember2023-12-310001521951us-gaap:NonperformingFinancingReceivableMemberus-gaap:FinancingReceivables30To59DaysPastDueMemberfbiz:CommercialRealEstateLoansReceivable14FamilyMember2023-12-310001521951us-gaap:NonperformingFinancingReceivableMemberfbiz:CommercialRealEstateLoansReceivable14FamilyMemberus-gaap:FinancingReceivables60To89DaysPastDueMember2023-12-310001521951us-gaap:NonperformingFinancingReceivableMemberfbiz:CommercialRealEstateLoansReceivable14FamilyMemberus-gaap:FinancingReceivablesEqualToGreaterThan90DaysPastDueMember2023-12-310001521951us-gaap:NonperformingFinancingReceivableMemberus-gaap:FinancialAssetPastDueMemberfbiz:CommercialRealEstateLoansReceivable14FamilyMember2023-12-310001521951us-gaap:NonperformingFinancingReceivableMemberfbiz:CommercialRealEstateLoansReceivable14FamilyMemberus-gaap:FinancialAssetNotPastDueMember2023-12-310001521951us-gaap:NonperformingFinancingReceivableMemberfbiz:CommercialRealEstateLoansReceivable14FamilyMember2023-12-310001521951us-gaap:NonperformingFinancingReceivableMemberus-gaap:FinancingReceivables30To59DaysPastDueMemberfbiz:CommercialandIndustrialLoansandLeasesReceivableMember2023-12-310001521951us-gaap:NonperformingFinancingReceivableMemberfbiz:CommercialandIndustrialLoansandLeasesReceivableMemberus-gaap:FinancingReceivables60To89DaysPastDueMember2023-12-310001521951us-gaap:NonperformingFinancingReceivableMemberus-gaap:FinancingReceivablesEqualToGreaterThan90DaysPastDueMemberfbiz:CommercialandIndustrialLoansandLeasesReceivableMember2023-12-310001521951us-gaap:NonperformingFinancingReceivableMemberus-gaap:FinancialAssetPastDueMemberfbiz:CommercialandIndustrialLoansandLeasesReceivableMember2023-12-310001521951us-gaap:NonperformingFinancingReceivableMemberus-gaap:FinancialAssetNotPastDueMemberfbiz:CommercialandIndustrialLoansandLeasesReceivableMember2023-12-310001521951us-gaap:NonperformingFinancingReceivableMemberfbiz:CommercialandIndustrialLoansandLeasesReceivableMember2023-12-310001521951us-gaap:NonperformingFinancingReceivableMemberus-gaap:FinancingReceivables30To59DaysPastDueMemberfbiz:ConsumerAndOtherLoansReceivableMember2023-12-310001521951us-gaap:NonperformingFinancingReceivableMemberus-gaap:FinancingReceivables60To89DaysPastDueMemberfbiz:ConsumerAndOtherLoansReceivableMember2023-12-310001521951us-gaap:NonperformingFinancingReceivableMemberus-gaap:FinancingReceivablesEqualToGreaterThan90DaysPastDueMemberfbiz:ConsumerAndOtherLoansReceivableMember2023-12-310001521951us-gaap:NonperformingFinancingReceivableMemberus-gaap:FinancialAssetPastDueMemberfbiz:ConsumerAndOtherLoansReceivableMember2023-12-310001521951us-gaap:NonperformingFinancingReceivableMemberus-gaap:FinancialAssetNotPastDueMemberfbiz:ConsumerAndOtherLoansReceivableMember2023-12-310001521951us-gaap:NonperformingFinancingReceivableMemberfbiz:ConsumerAndOtherLoansReceivableMember2023-12-310001521951us-gaap:NonperformingFinancingReceivableMemberus-gaap:FinancingReceivables30To59DaysPastDueMember2023-12-310001521951us-gaap:NonperformingFinancingReceivableMemberus-gaap:FinancingReceivables60To89DaysPastDueMember2023-12-310001521951us-gaap:NonperformingFinancingReceivableMemberus-gaap:FinancingReceivablesEqualToGreaterThan90DaysPastDueMember2023-12-310001521951us-gaap:NonperformingFinancingReceivableMemberus-gaap:FinancialAssetPastDueMember2023-12-310001521951us-gaap:NonperformingFinancingReceivableMemberus-gaap:FinancialAssetNotPastDueMember2023-12-310001521951us-gaap:NonperformingFinancingReceivableMember2023-12-310001521951fbiz:CommercialRealEstateLoansReceivableOwnerOccupiedMemberus-gaap:FinancingReceivables30To59DaysPastDueMember2023-12-310001521951fbiz:CommercialRealEstateLoansReceivableOwnerOccupiedMemberus-gaap:FinancingReceivables60To89DaysPastDueMember2023-12-310001521951fbiz:CommercialRealEstateLoansReceivableOwnerOccupiedMemberus-gaap:FinancingReceivablesEqualToGreaterThan90DaysPastDueMember2023-12-310001521951fbiz:CommercialRealEstateLoansReceivableOwnerOccupiedMemberus-gaap:FinancialAssetPastDueMember2023-12-310001521951fbiz:CommercialRealEstateLoansReceivableOwnerOccupiedMemberus-gaap:FinancialAssetNotPastDueMember2023-12-310001521951fbiz:CommercialRealEstateLoansReceivableNonOwnerOccupiedMemberus-gaap:FinancingReceivables30To59DaysPastDueMember2023-12-310001521951fbiz:CommercialRealEstateLoansReceivableNonOwnerOccupiedMemberus-gaap:FinancingReceivables60To89DaysPastDueMember2023-12-310001521951fbiz:CommercialRealEstateLoansReceivableNonOwnerOccupiedMemberus-gaap:FinancingReceivablesEqualToGreaterThan90DaysPastDueMember2023-12-310001521951fbiz:CommercialRealEstateLoansReceivableNonOwnerOccupiedMemberus-gaap:FinancialAssetPastDueMember2023-12-310001521951fbiz:CommercialRealEstateLoansReceivableNonOwnerOccupiedMemberus-gaap:FinancialAssetNotPastDueMember2023-12-310001521951fbiz:CommercialRealEstateLoansReceivableConstructionMemberus-gaap:FinancingReceivables30To59DaysPastDueMember2023-12-310001521951fbiz:CommercialRealEstateLoansReceivableConstructionMemberus-gaap:FinancingReceivables60To89DaysPastDueMember2023-12-310001521951fbiz:CommercialRealEstateLoansReceivableConstructionMemberus-gaap:FinancingReceivablesEqualToGreaterThan90DaysPastDueMember2023-12-310001521951fbiz:CommercialRealEstateLoansReceivableConstructionMemberus-gaap:FinancialAssetPastDueMember2023-12-310001521951fbiz:CommercialRealEstateLoansReceivableConstructionMemberus-gaap:FinancialAssetNotPastDueMember2023-12-310001521951us-gaap:FinancingReceivables30To59DaysPastDueMemberfbiz:CommercialRealEstateLoansReceivableMultiFamilyMember2023-12-310001521951fbiz:CommercialRealEstateLoansReceivableMultiFamilyMemberus-gaap:FinancingReceivables60To89DaysPastDueMember2023-12-310001521951us-gaap:FinancingReceivablesEqualToGreaterThan90DaysPastDueMemberfbiz:CommercialRealEstateLoansReceivableMultiFamilyMember2023-12-310001521951us-gaap:FinancialAssetPastDueMemberfbiz:CommercialRealEstateLoansReceivableMultiFamilyMember2023-12-310001521951us-gaap:FinancialAssetNotPastDueMemberfbiz:CommercialRealEstateLoansReceivableMultiFamilyMember2023-12-310001521951us-gaap:FinancingReceivables30To59DaysPastDueMemberfbiz:CommercialRealEstateLoansReceivable14FamilyMember2023-12-310001521951fbiz:CommercialRealEstateLoansReceivable14FamilyMemberus-gaap:FinancingReceivables60To89DaysPastDueMember2023-12-310001521951fbiz:CommercialRealEstateLoansReceivable14FamilyMemberus-gaap:FinancingReceivablesEqualToGreaterThan90DaysPastDueMember2023-12-310001521951fbiz:CommercialRealEstateLoansReceivable14FamilyMemberus-gaap:FinancialAssetPastDueMember2023-12-310001521951fbiz:CommercialRealEstateLoansReceivable14FamilyMemberus-gaap:FinancialAssetNotPastDueMember2023-12-310001521951us-gaap:FinancingReceivables30To59DaysPastDueMemberfbiz:CommercialandIndustrialLoansandLeasesReceivableMember2023-12-310001521951fbiz:CommercialandIndustrialLoansandLeasesReceivableMemberus-gaap:FinancingReceivables60To89DaysPastDueMember2023-12-310001521951us-gaap:FinancingReceivablesEqualToGreaterThan90DaysPastDueMemberfbiz:CommercialandIndustrialLoansandLeasesReceivableMember2023-12-310001521951us-gaap:FinancialAssetPastDueMemberfbiz:CommercialandIndustrialLoansandLeasesReceivableMember2023-12-310001521951us-gaap:FinancialAssetNotPastDueMemberfbiz:CommercialandIndustrialLoansandLeasesReceivableMember2023-12-310001521951us-gaap:FinancingReceivables30To59DaysPastDueMemberfbiz:ConsumerAndOtherLoansReceivableMember2023-12-310001521951us-gaap:FinancingReceivables60To89DaysPastDueMemberfbiz:ConsumerAndOtherLoansReceivableMember2023-12-310001521951us-gaap:FinancingReceivablesEqualToGreaterThan90DaysPastDueMemberfbiz:ConsumerAndOtherLoansReceivableMember2023-12-310001521951us-gaap:FinancialAssetPastDueMemberfbiz:ConsumerAndOtherLoansReceivableMember2023-12-310001521951us-gaap:FinancialAssetNotPastDueMemberfbiz:ConsumerAndOtherLoansReceivableMember2023-12-310001521951us-gaap:FinancingReceivables30To59DaysPastDueMember2023-12-310001521951us-gaap:FinancingReceivables60To89DaysPastDueMember2023-12-310001521951us-gaap:FinancingReceivablesEqualToGreaterThan90DaysPastDueMember2023-12-310001521951us-gaap:FinancialAssetPastDueMember2023-12-310001521951us-gaap:FinancialAssetNotPastDueMember2023-12-310001521951fbiz:CommercialRealEstateLoansReceivableOwnerOccupiedMemberus-gaap:FinancingReceivables30To59DaysPastDueMemberus-gaap:PerformingFinancingReceivableMember2022-12-310001521951fbiz:CommercialRealEstateLoansReceivableOwnerOccupiedMemberus-gaap:PerformingFinancingReceivableMemberus-gaap:FinancingReceivables60To89DaysPastDueMember2022-12-310001521951fbiz:CommercialRealEstateLoansReceivableOwnerOccupiedMemberus-gaap:FinancingReceivablesEqualToGreaterThan90DaysPastDueMemberus-gaap:PerformingFinancingReceivableMember2022-12-310001521951fbiz:CommercialRealEstateLoansReceivableOwnerOccupiedMemberus-gaap:FinancialAssetPastDueMemberus-gaap:PerformingFinancingReceivableMember2022-12-310001521951fbiz:CommercialRealEstateLoansReceivableOwnerOccupiedMemberus-gaap:FinancialAssetNotPastDueMemberus-gaap:PerformingFinancingReceivableMember2022-12-310001521951fbiz:CommercialRealEstateLoansReceivableOwnerOccupiedMemberus-gaap:PerformingFinancingReceivableMember2022-12-310001521951us-gaap:FinancingReceivables30To59DaysPastDueMemberfbiz:CommercialRealEstateLoansReceivableNonOwnerOccupiedMemberus-gaap:PerformingFinancingReceivableMember2022-12-310001521951fbiz:CommercialRealEstateLoansReceivableNonOwnerOccupiedMemberus-gaap:PerformingFinancingReceivableMemberus-gaap:FinancingReceivables60To89DaysPastDueMember2022-12-310001521951fbiz:CommercialRealEstateLoansReceivableNonOwnerOccupiedMemberus-gaap:FinancingReceivablesEqualToGreaterThan90DaysPastDueMemberus-gaap:PerformingFinancingReceivableMember2022-12-310001521951fbiz:CommercialRealEstateLoansReceivableNonOwnerOccupiedMemberus-gaap:FinancialAssetPastDueMemberus-gaap:PerformingFinancingReceivableMember2022-12-310001521951fbiz:CommercialRealEstateLoansReceivableNonOwnerOccupiedMemberus-gaap:FinancialAssetNotPastDueMemberus-gaap:PerformingFinancingReceivableMember2022-12-310001521951fbiz:CommercialRealEstateLoansReceivableNonOwnerOccupiedMemberus-gaap:PerformingFinancingReceivableMember2022-12-310001521951fbiz:CommercialRealEstateLoansReceivableConstructionMemberus-gaap:FinancingReceivables30To59DaysPastDueMemberus-gaap:PerformingFinancingReceivableMember2022-12-310001521951fbiz:CommercialRealEstateLoansReceivableConstructionMemberus-gaap:PerformingFinancingReceivableMemberus-gaap:FinancingReceivables60To89DaysPastDueMember2022-12-310001521951fbiz:CommercialRealEstateLoansReceivableConstructionMemberus-gaap:FinancingReceivablesEqualToGreaterThan90DaysPastDueMemberus-gaap:PerformingFinancingReceivableMember2022-12-310001521951fbiz:CommercialRealEstateLoansReceivableConstructionMemberus-gaap:FinancialAssetPastDueMemberus-gaap:PerformingFinancingReceivableMember2022-12-310001521951fbiz:CommercialRealEstateLoansReceivableConstructionMemberus-gaap:FinancialAssetNotPastDueMemberus-gaap:PerformingFinancingReceivableMember2022-12-310001521951fbiz:CommercialRealEstateLoansReceivableConstructionMemberus-gaap:PerformingFinancingReceivableMember2022-12-310001521951us-gaap:FinancingReceivables30To59DaysPastDueMemberfbiz:CommercialRealEstateLoansReceivableMultiFamilyMemberus-gaap:PerformingFinancingReceivableMember2022-12-310001521951fbiz:CommercialRealEstateLoansReceivableMultiFamilyMemberus-gaap:PerformingFinancingReceivableMemberus-gaap:FinancingReceivables60To89DaysPastDueMember2022-12-310001521951us-gaap:FinancingReceivablesEqualToGreaterThan90DaysPastDueMemberfbiz:CommercialRealEstateLoansReceivableMultiFamilyMemberus-gaap:PerformingFinancingReceivableMember2022-12-310001521951us-gaap:FinancialAssetPastDueMemberfbiz:CommercialRealEstateLoansReceivableMultiFamilyMemberus-gaap:PerformingFinancingReceivableMember2022-12-310001521951us-gaap:FinancialAssetNotPastDueMemberfbiz:CommercialRealEstateLoansReceivableMultiFamilyMemberus-gaap:PerformingFinancingReceivableMember2022-12-310001521951fbiz:CommercialRealEstateLoansReceivableMultiFamilyMemberus-gaap:PerformingFinancingReceivableMember2022-12-310001521951us-gaap:FinancingReceivables30To59DaysPastDueMemberfbiz:CommercialRealEstateLoansReceivable14FamilyMemberus-gaap:PerformingFinancingReceivableMember2022-12-310001521951fbiz:CommercialRealEstateLoansReceivable14FamilyMemberus-gaap:PerformingFinancingReceivableMemberus-gaap:FinancingReceivables60To89DaysPastDueMember2022-12-310001521951fbiz:CommercialRealEstateLoansReceivable14FamilyMemberus-gaap:FinancingReceivablesEqualToGreaterThan90DaysPastDueMemberus-gaap:PerformingFinancingReceivableMember2022-12-310001521951us-gaap:FinancialAssetPastDueMemberfbiz:CommercialRealEstateLoansReceivable14FamilyMemberus-gaap:PerformingFinancingReceivableMember2022-12-310001521951fbiz:CommercialRealEstateLoansReceivable14FamilyMemberus-gaap:FinancialAssetNotPastDueMemberus-gaap:PerformingFinancingReceivableMember2022-12-310001521951fbiz:CommercialRealEstateLoansReceivable14FamilyMemberus-gaap:PerformingFinancingReceivableMember2022-12-310001521951us-gaap:FinancingReceivables30To59DaysPastDueMemberfbiz:CommercialandIndustrialLoansandLeasesReceivableMemberus-gaap:PerformingFinancingReceivableMember2022-12-310001521951fbiz:CommercialandIndustrialLoansandLeasesReceivableMemberus-gaap:PerformingFinancingReceivableMemberus-gaap:FinancingReceivables60To89DaysPastDueMember2022-12-310001521951us-gaap:FinancingReceivablesEqualToGreaterThan90DaysPastDueMemberfbiz:CommercialandIndustrialLoansandLeasesReceivableMemberus-gaap:PerformingFinancingReceivableMember2022-12-310001521951us-gaap:FinancialAssetPastDueMemberfbiz:CommercialandIndustrialLoansandLeasesReceivableMemberus-gaap:PerformingFinancingReceivableMember2022-12-310001521951us-gaap:FinancialAssetNotPastDueMemberfbiz:CommercialandIndustrialLoansandLeasesReceivableMemberus-gaap:PerformingFinancingReceivableMember2022-12-310001521951fbiz:CommercialandIndustrialLoansandLeasesReceivableMemberus-gaap:PerformingFinancingReceivableMember2022-12-310001521951us-gaap:FinancingReceivables30To59DaysPastDueMemberus-gaap:PerformingFinancingReceivableMemberfbiz:ConsumerAndOtherLoansReceivableMember2022-12-310001521951us-gaap:PerformingFinancingReceivableMemberus-gaap:FinancingReceivables60To89DaysPastDueMemberfbiz:ConsumerAndOtherLoansReceivableMember2022-12-310001521951us-gaap:FinancingReceivablesEqualToGreaterThan90DaysPastDueMemberus-gaap:PerformingFinancingReceivableMemberfbiz:ConsumerAndOtherLoansReceivableMember2022-12-310001521951us-gaap:FinancialAssetPastDueMemberus-gaap:PerformingFinancingReceivableMemberfbiz:ConsumerAndOtherLoansReceivableMember2022-12-310001521951us-gaap:FinancialAssetNotPastDueMemberus-gaap:PerformingFinancingReceivableMemberfbiz:ConsumerAndOtherLoansReceivableMember2022-12-310001521951us-gaap:PerformingFinancingReceivableMemberfbiz:ConsumerAndOtherLoansReceivableMember2022-12-310001521951us-gaap:FinancingReceivables30To59DaysPastDueMemberus-gaap:PerformingFinancingReceivableMember2022-12-310001521951us-gaap:PerformingFinancingReceivableMemberus-gaap:FinancingReceivables60To89DaysPastDueMember2022-12-310001521951us-gaap:FinancingReceivablesEqualToGreaterThan90DaysPastDueMemberus-gaap:PerformingFinancingReceivableMember2022-12-310001521951us-gaap:FinancialAssetPastDueMemberus-gaap:PerformingFinancingReceivableMember2022-12-310001521951us-gaap:FinancialAssetNotPastDueMemberus-gaap:PerformingFinancingReceivableMember2022-12-310001521951us-gaap:PerformingFinancingReceivableMember2022-12-310001521951fbiz:CommercialRealEstateLoansReceivableOwnerOccupiedMemberus-gaap:NonperformingFinancingReceivableMemberus-gaap:FinancingReceivables30To59DaysPastDueMember2022-12-310001521951fbiz:CommercialRealEstateLoansReceivableOwnerOccupiedMemberus-gaap:NonperformingFinancingReceivableMemberus-gaap:FinancingReceivables60To89DaysPastDueMember2022-12-310001521951fbiz:CommercialRealEstateLoansReceivableOwnerOccupiedMemberus-gaap:NonperformingFinancingReceivableMemberus-gaap:FinancingReceivablesEqualToGreaterThan90DaysPastDueMember2022-12-310001521951fbiz:CommercialRealEstateLoansReceivableOwnerOccupiedMemberus-gaap:NonperformingFinancingReceivableMemberus-gaap:FinancialAssetPastDueMember2022-12-310001521951fbiz:CommercialRealEstateLoansReceivableOwnerOccupiedMemberus-gaap:NonperformingFinancingReceivableMemberus-gaap:FinancialAssetNotPastDueMember2022-12-310001521951fbiz:CommercialRealEstateLoansReceivableOwnerOccupiedMemberus-gaap:NonperformingFinancingReceivableMember2022-12-310001521951us-gaap:NonperformingFinancingReceivableMemberus-gaap:FinancingReceivables30To59DaysPastDueMemberfbiz:CommercialRealEstateLoansReceivableNonOwnerOccupiedMember2022-12-310001521951us-gaap:NonperformingFinancingReceivableMemberfbiz:CommercialRealEstateLoansReceivableNonOwnerOccupiedMemberus-gaap:FinancingReceivables60To89DaysPastDueMember2022-12-310001521951us-gaap:NonperformingFinancingReceivableMemberfbiz:CommercialRealEstateLoansReceivableNonOwnerOccupiedMemberus-gaap:FinancingReceivablesEqualToGreaterThan90DaysPastDueMember2022-12-310001521951us-gaap:NonperformingFinancingReceivableMemberfbiz:CommercialRealEstateLoansReceivableNonOwnerOccupiedMemberus-gaap:FinancialAssetPastDueMember2022-12-310001521951us-gaap:NonperformingFinancingReceivableMemberfbiz:CommercialRealEstateLoansReceivableNonOwnerOccupiedMemberus-gaap:FinancialAssetNotPastDueMember2022-12-310001521951us-gaap:NonperformingFinancingReceivableMemberfbiz:CommercialRealEstateLoansReceivableNonOwnerOccupiedMember2022-12-310001521951fbiz:CommercialRealEstateLoansReceivableConstructionMemberus-gaap:NonperformingFinancingReceivableMemberus-gaap:FinancingReceivables30To59DaysPastDueMember2022-12-310001521951fbiz:CommercialRealEstateLoansReceivableConstructionMemberus-gaap:NonperformingFinancingReceivableMemberus-gaap:FinancingReceivables60To89DaysPastDueMember2022-12-310001521951fbiz:CommercialRealEstateLoansReceivableConstructionMemberus-gaap:NonperformingFinancingReceivableMemberus-gaap:FinancingReceivablesEqualToGreaterThan90DaysPastDueMember2022-12-310001521951fbiz:CommercialRealEstateLoansReceivableConstructionMemberus-gaap:NonperformingFinancingReceivableMemberus-gaap:FinancialAssetPastDueMember2022-12-310001521951fbiz:CommercialRealEstateLoansReceivableConstructionMemberus-gaap:NonperformingFinancingReceivableMemberus-gaap:FinancialAssetNotPastDueMember2022-12-310001521951fbiz:CommercialRealEstateLoansReceivableConstructionMemberus-gaap:NonperformingFinancingReceivableMember2022-12-310001521951us-gaap:NonperformingFinancingReceivableMemberus-gaap:FinancingReceivables30To59DaysPastDueMemberfbiz:CommercialRealEstateLoansReceivableMultiFamilyMember2022-12-310001521951us-gaap:NonperformingFinancingReceivableMemberfbiz:CommercialRealEstateLoansReceivableMultiFamilyMemberus-gaap:FinancingReceivables60To89DaysPastDueMember2022-12-310001521951us-gaap:NonperformingFinancingReceivableMemberus-gaap:FinancingReceivablesEqualToGreaterThan90DaysPastDueMemberfbiz:CommercialRealEstateLoansReceivableMultiFamilyMember2022-12-310001521951us-gaap:NonperformingFinancingReceivableMemberus-gaap:FinancialAssetPastDueMemberfbiz:CommercialRealEstateLoansReceivableMultiFamilyMember2022-12-310001521951us-gaap:NonperformingFinancingReceivableMemberus-gaap:FinancialAssetNotPastDueMemberfbiz:CommercialRealEstateLoansReceivableMultiFamilyMember2022-12-310001521951us-gaap:NonperformingFinancingReceivableMemberfbiz:CommercialRealEstateLoansReceivableMultiFamilyMember2022-12-310001521951us-gaap:NonperformingFinancingReceivableMemberus-gaap:FinancingReceivables30To59DaysPastDueMemberfbiz:CommercialRealEstateLoansReceivable14FamilyMember2022-12-310001521951us-gaap:NonperformingFinancingReceivableMemberfbiz:CommercialRealEstateLoansReceivable14FamilyMemberus-gaap:FinancingReceivables60To89DaysPastDueMember2022-12-310001521951us-gaap:NonperformingFinancingReceivableMemberfbiz:CommercialRealEstateLoansReceivable14FamilyMemberus-gaap:FinancingReceivablesEqualToGreaterThan90DaysPastDueMember2022-12-310001521951us-gaap:NonperformingFinancingReceivableMemberus-gaap:FinancialAssetPastDueMemberfbiz:CommercialRealEstateLoansReceivable14FamilyMember2022-12-310001521951us-gaap:NonperformingFinancingReceivableMemberfbiz:CommercialRealEstateLoansReceivable14FamilyMemberus-gaap:FinancialAssetNotPastDueMember2022-12-310001521951us-gaap:NonperformingFinancingReceivableMemberfbiz:CommercialRealEstateLoansReceivable14FamilyMember2022-12-310001521951us-gaap:NonperformingFinancingReceivableMemberus-gaap:FinancingReceivables30To59DaysPastDueMemberfbiz:CommercialandIndustrialLoansandLeasesReceivableMember2022-12-310001521951us-gaap:NonperformingFinancingReceivableMemberfbiz:CommercialandIndustrialLoansandLeasesReceivableMemberus-gaap:FinancingReceivables60To89DaysPastDueMember2022-12-310001521951us-gaap:NonperformingFinancingReceivableMemberus-gaap:FinancingReceivablesEqualToGreaterThan90DaysPastDueMemberfbiz:CommercialandIndustrialLoansandLeasesReceivableMember2022-12-310001521951us-gaap:NonperformingFinancingReceivableMemberus-gaap:FinancialAssetPastDueMemberfbiz:CommercialandIndustrialLoansandLeasesReceivableMember2022-12-310001521951us-gaap:NonperformingFinancingReceivableMemberus-gaap:FinancialAssetNotPastDueMemberfbiz:CommercialandIndustrialLoansandLeasesReceivableMember2022-12-310001521951us-gaap:NonperformingFinancingReceivableMemberfbiz:CommercialandIndustrialLoansandLeasesReceivableMember2022-12-310001521951us-gaap:NonperformingFinancingReceivableMemberus-gaap:FinancingReceivables30To59DaysPastDueMemberfbiz:ConsumerAndOtherLoansReceivableMember2022-12-310001521951us-gaap:NonperformingFinancingReceivableMemberus-gaap:FinancingReceivables60To89DaysPastDueMemberfbiz:ConsumerAndOtherLoansReceivableMember2022-12-310001521951us-gaap:NonperformingFinancingReceivableMemberus-gaap:FinancingReceivablesEqualToGreaterThan90DaysPastDueMemberfbiz:ConsumerAndOtherLoansReceivableMember2022-12-310001521951us-gaap:NonperformingFinancingReceivableMemberus-gaap:FinancialAssetPastDueMemberfbiz:ConsumerAndOtherLoansReceivableMember2022-12-310001521951us-gaap:NonperformingFinancingReceivableMemberus-gaap:FinancialAssetNotPastDueMemberfbiz:ConsumerAndOtherLoansReceivableMember2022-12-310001521951us-gaap:NonperformingFinancingReceivableMemberfbiz:ConsumerAndOtherLoansReceivableMember2022-12-310001521951us-gaap:NonperformingFinancingReceivableMemberus-gaap:FinancingReceivables30To59DaysPastDueMember2022-12-310001521951us-gaap:NonperformingFinancingReceivableMemberus-gaap:FinancingReceivables60To89DaysPastDueMember2022-12-310001521951us-gaap:NonperformingFinancingReceivableMemberus-gaap:FinancingReceivablesEqualToGreaterThan90DaysPastDueMember2022-12-310001521951us-gaap:NonperformingFinancingReceivableMemberus-gaap:FinancialAssetPastDueMember2022-12-310001521951us-gaap:NonperformingFinancingReceivableMemberus-gaap:FinancialAssetNotPastDueMember2022-12-310001521951us-gaap:NonperformingFinancingReceivableMember2022-12-310001521951fbiz:CommercialRealEstateLoansReceivableOwnerOccupiedMemberus-gaap:FinancingReceivables30To59DaysPastDueMember2022-12-310001521951fbiz:CommercialRealEstateLoansReceivableOwnerOccupiedMemberus-gaap:FinancingReceivables60To89DaysPastDueMember2022-12-310001521951fbiz:CommercialRealEstateLoansReceivableOwnerOccupiedMemberus-gaap:FinancingReceivablesEqualToGreaterThan90DaysPastDueMember2022-12-310001521951fbiz:CommercialRealEstateLoansReceivableOwnerOccupiedMemberus-gaap:FinancialAssetPastDueMember2022-12-310001521951fbiz:CommercialRealEstateLoansReceivableOwnerOccupiedMemberus-gaap:FinancialAssetNotPastDueMember2022-12-310001521951fbiz:CommercialRealEstateLoansReceivableNonOwnerOccupiedMemberus-gaap:FinancingReceivables30To59DaysPastDueMember2022-12-310001521951fbiz:CommercialRealEstateLoansReceivableNonOwnerOccupiedMemberus-gaap:FinancingReceivables60To89DaysPastDueMember2022-12-310001521951fbiz:CommercialRealEstateLoansReceivableNonOwnerOccupiedMemberus-gaap:FinancingReceivablesEqualToGreaterThan90DaysPastDueMember2022-12-310001521951fbiz:CommercialRealEstateLoansReceivableNonOwnerOccupiedMemberus-gaap:FinancialAssetPastDueMember2022-12-310001521951fbiz:CommercialRealEstateLoansReceivableNonOwnerOccupiedMemberus-gaap:FinancialAssetNotPastDueMember2022-12-310001521951fbiz:CommercialRealEstateLoansReceivableConstructionMemberus-gaap:FinancingReceivables30To59DaysPastDueMember2022-12-310001521951fbiz:CommercialRealEstateLoansReceivableConstructionMemberus-gaap:FinancingReceivables60To89DaysPastDueMember2022-12-310001521951fbiz:CommercialRealEstateLoansReceivableConstructionMemberus-gaap:FinancingReceivablesEqualToGreaterThan90DaysPastDueMember2022-12-310001521951fbiz:CommercialRealEstateLoansReceivableConstructionMemberus-gaap:FinancialAssetPastDueMember2022-12-310001521951fbiz:CommercialRealEstateLoansReceivableConstructionMemberus-gaap:FinancialAssetNotPastDueMember2022-12-310001521951us-gaap:FinancingReceivables30To59DaysPastDueMemberfbiz:CommercialRealEstateLoansReceivableMultiFamilyMember2022-12-310001521951fbiz:CommercialRealEstateLoansReceivableMultiFamilyMemberus-gaap:FinancingReceivables60To89DaysPastDueMember2022-12-310001521951us-gaap:FinancingReceivablesEqualToGreaterThan90DaysPastDueMemberfbiz:CommercialRealEstateLoansReceivableMultiFamilyMember2022-12-310001521951us-gaap:FinancialAssetPastDueMemberfbiz:CommercialRealEstateLoansReceivableMultiFamilyMember2022-12-310001521951us-gaap:FinancialAssetNotPastDueMemberfbiz:CommercialRealEstateLoansReceivableMultiFamilyMember2022-12-310001521951us-gaap:FinancingReceivables30To59DaysPastDueMemberfbiz:CommercialRealEstateLoansReceivable14FamilyMember2022-12-310001521951fbiz:CommercialRealEstateLoansReceivable14FamilyMemberus-gaap:FinancingReceivables60To89DaysPastDueMember2022-12-310001521951fbiz:CommercialRealEstateLoansReceivable14FamilyMemberus-gaap:FinancingReceivablesEqualToGreaterThan90DaysPastDueMember2022-12-310001521951fbiz:CommercialRealEstateLoansReceivable14FamilyMemberus-gaap:FinancialAssetPastDueMember2022-12-310001521951fbiz:CommercialRealEstateLoansReceivable14FamilyMemberus-gaap:FinancialAssetNotPastDueMember2022-12-310001521951us-gaap:FinancingReceivables30To59DaysPastDueMemberfbiz:CommercialandIndustrialLoansandLeasesReceivableMember2022-12-310001521951fbiz:CommercialandIndustrialLoansandLeasesReceivableMemberus-gaap:FinancingReceivables60To89DaysPastDueMember2022-12-310001521951us-gaap:FinancingReceivablesEqualToGreaterThan90DaysPastDueMemberfbiz:CommercialandIndustrialLoansandLeasesReceivableMember2022-12-310001521951us-gaap:FinancialAssetPastDueMemberfbiz:CommercialandIndustrialLoansandLeasesReceivableMember2022-12-310001521951us-gaap:FinancialAssetNotPastDueMemberfbiz:CommercialandIndustrialLoansandLeasesReceivableMember2022-12-310001521951us-gaap:FinancingReceivables30To59DaysPastDueMemberfbiz:ConsumerAndOtherLoansReceivableMember2022-12-310001521951us-gaap:FinancingReceivables60To89DaysPastDueMemberfbiz:ConsumerAndOtherLoansReceivableMember2022-12-310001521951us-gaap:FinancingReceivablesEqualToGreaterThan90DaysPastDueMemberfbiz:ConsumerAndOtherLoansReceivableMember2022-12-310001521951us-gaap:FinancialAssetPastDueMemberfbiz:ConsumerAndOtherLoansReceivableMember2022-12-310001521951us-gaap:FinancialAssetNotPastDueMemberfbiz:ConsumerAndOtherLoansReceivableMember2022-12-310001521951us-gaap:FinancingReceivables30To59DaysPastDueMember2022-12-310001521951us-gaap:FinancingReceivables60To89DaysPastDueMember2022-12-310001521951us-gaap:FinancingReceivablesEqualToGreaterThan90DaysPastDueMember2022-12-310001521951us-gaap:FinancialAssetPastDueMember2022-12-310001521951us-gaap:FinancialAssetNotPastDueMember2022-12-310001521951fbiz:InventoryMember2023-12-310001521951us-gaap:EquipmentMember2023-12-310001521951fbiz:AccountsReceivableAndOtherAssetsMember2023-12-31fbiz:loansfbiz:days0001521951fbiz:CommercialRealEstateLoansReceivableOwnerOccupiedMember2021-12-310001521951fbiz:CommercialRealEstateLoansReceivableOwnerOccupiedMember2021-01-012021-12-310001521951fbiz:CommercialRealEstateLoansReceivableNonOwnerOccupiedMember2021-12-310001521951fbiz:CommercialRealEstateLoansReceivableNonOwnerOccupiedMember2021-01-012021-12-310001521951fbiz:CommercialRealEstateLoansReceivableConstructionMember2021-12-310001521951fbiz:CommercialRealEstateLoansReceivableConstructionMember2021-01-012021-12-310001521951fbiz:CommercialRealEstateLoansReceivableMultiFamilyMember2021-12-310001521951fbiz:CommercialRealEstateLoansReceivableMultiFamilyMember2021-01-012021-12-310001521951fbiz:CommercialRealEstateLoansReceivable14FamilyMember2021-12-310001521951fbiz:CommercialRealEstateLoansReceivable14FamilyMember2021-01-012021-12-310001521951fbiz:CommercialandIndustrialLoansandLeasesReceivableMember2021-12-310001521951fbiz:CommercialandIndustrialLoansandLeasesReceivableMember2021-01-012021-12-310001521951fbiz:ConsumerAndOtherLoansReceivableMember2021-12-310001521951fbiz:ConsumerAndOtherLoansReceivableMember2021-01-012021-12-310001521951fbiz:CommercialRealEstateLoansReceivableOwnerOccupiedMembersrt:CumulativeEffectPeriodOfAdoptionAdjustmentMember2023-12-310001521951fbiz:CommercialRealEstateLoansReceivableNonOwnerOccupiedMembersrt:CumulativeEffectPeriodOfAdoptionAdjustmentMember2023-12-310001521951fbiz:CommercialRealEstateLoansReceivableConstructionMembersrt:CumulativeEffectPeriodOfAdoptionAdjustmentMember2023-12-310001521951fbiz:CommercialRealEstateLoansReceivableMultiFamilyMembersrt:CumulativeEffectPeriodOfAdoptionAdjustmentMember2023-12-310001521951fbiz:CommercialRealEstateLoansReceivable14FamilyMembersrt:CumulativeEffectPeriodOfAdoptionAdjustmentMember2023-12-310001521951fbiz:CommercialandIndustrialLoansandLeasesReceivableMembersrt:CumulativeEffectPeriodOfAdoptionAdjustmentMember2023-12-310001521951fbiz:ConsumerAndOtherLoansReceivableMembersrt:CumulativeEffectPeriodOfAdoptionAdjustmentMember2023-12-310001521951srt:CumulativeEffectPeriodOfAdoptionAdjustmentMember2023-12-310001521951us-gaap:CommercialRealEstatePortfolioSegmentMember2021-12-310001521951us-gaap:CommercialRealEstatePortfolioSegmentMember2022-01-012022-12-310001521951us-gaap:CommercialRealEstatePortfolioSegmentMember2020-12-310001521951fbiz:CommercialandIndustrialLoansandLeasesReceivableMember2020-12-310001521951fbiz:ConsumerAndOtherLoansReceivableMember2020-12-310001521951us-gaap:CommercialRealEstatePortfolioSegmentMember2021-01-012021-12-310001521951fbiz:KansasCityMetropolitanMember2023-01-012023-12-310001521951fbiz:KansasCityMetropolitanMember2023-12-310001521951fbiz:LoanservicingrightsMember2023-01-012023-12-310001521951fbiz:LoanservicingrightsMember2022-01-012022-12-310001521951fbiz:LoanservicingrightsMember2021-01-012021-12-310001521951fbiz:AldineCapitalFundsMember2023-12-310001521951fbiz:AldineCapitalFundsMember2022-12-310001521951fbiz:AldineCapitalFundsMember2023-01-012023-12-310001521951fbiz:AldineCapitalFundsMember2022-01-012022-12-310001521951fbiz:AldineCapitalFundsMember2021-01-012021-12-310001521951fbiz:DaneWorkforceHousingFundLLCMember2023-12-310001521951fbiz:DaneWorkforceHousingFundLLCMember2022-12-310001521951fbiz:DaneWorkforceHousingFundLLCMember2023-01-012023-12-310001521951fbiz:DaneWorkforceHousingFundLLCMember2022-01-012022-12-310001521951fbiz:DaneWorkforceHousingFundLLCMember2021-01-012021-12-310001521951fbiz:BankTechVenturesLPMember2023-12-310001521951fbiz:BankTechVenturesLPMember2022-12-310001521951fbiz:BankTechVenturesLPMember2023-01-012023-12-310001521951fbiz:BankTechVenturesLPMember2022-01-012022-12-310001521951fbiz:BankTechVenturesLPMember2021-01-012021-12-310001521951fbiz:NoninterestbearingTransactionAccountsMember2023-12-310001521951fbiz:NoninterestbearingTransactionAccountsMember2023-01-012023-12-310001521951fbiz:NoninterestbearingTransactionAccountsMember2022-12-310001521951fbiz:NoninterestbearingTransactionAccountsMember2022-01-012022-12-310001521951fbiz:InterestbearingTransactionAccountsMember2023-12-310001521951fbiz:InterestbearingTransactionAccountsMember2023-01-012023-12-310001521951fbiz:InterestbearingTransactionAccountsMember2022-12-310001521951fbiz:InterestbearingTransactionAccountsMember2022-01-012022-12-310001521951fbiz:MoneyMarketAccountsMember2023-12-310001521951fbiz:MoneyMarketAccountsMember2023-01-012023-12-310001521951fbiz:MoneyMarketAccountsMember2022-12-310001521951fbiz:MoneyMarketAccountsMember2022-01-012022-12-310001521951fbiz:NonbrokeredCertificatesofDepositMember2023-12-310001521951fbiz:NonbrokeredCertificatesofDepositMember2023-01-012023-12-310001521951fbiz:NonbrokeredCertificatesofDepositMember2022-12-310001521951fbiz:NonbrokeredCertificatesofDepositMember2022-01-012022-12-310001521951fbiz:BrokeredCertificatesofDepositMember2023-12-310001521951fbiz:BrokeredCertificatesofDepositMember2023-01-012023-12-310001521951fbiz:BrokeredCertificatesofDepositMember2022-12-310001521951fbiz:BrokeredCertificatesofDepositMember2022-01-012022-12-310001521951fbiz:WholesaleCertificatesOfDepositMember2023-12-310001521951fbiz:NonReciprocalInterestBearingTransactionAccountsMember2023-12-310001521951fbiz:WholesaleCertificatesOfDepositMember2022-12-310001521951fbiz:NonReciprocalInterestBearingTransactionAccountsMember2022-12-310001521951us-gaap:DesignatedAsHedgingInstrumentMemberfbiz:InterestRateSwapRelatedToCertificateOfDepositsMember2023-12-310001521951us-gaap:DesignatedAsHedgingInstrumentMemberfbiz:InterestRateSwapRelatedToCertificateOfDepositsMember2023-01-012023-12-310001521951fbiz:CertificatesOfDepositsAndWholesaleDepositsMember2023-12-310001521951fbiz:CertificatesOfDepositsAndWholesaleDepositsMember2022-12-310001521951us-gaap:FederalFundsPurchasedMember2023-12-310001521951us-gaap:FederalFundsPurchasedMember2023-01-012023-12-310001521951us-gaap:FederalFundsPurchasedMember2022-12-310001521951us-gaap:FederalFundsPurchasedMember2022-01-012022-12-310001521951fbiz:FHLBadvancesMember2023-12-310001521951fbiz:FHLBadvancesMember2023-01-012023-12-310001521951fbiz:FHLBadvancesMember2022-12-310001521951fbiz:FHLBadvancesMember2022-01-012022-12-310001521951us-gaap:LineOfCreditMember2023-12-310001521951us-gaap:LineOfCreditMember2023-01-012023-12-310001521951us-gaap:LineOfCreditMember2022-12-310001521951us-gaap:LineOfCreditMember2022-01-012022-12-310001521951fbiz:OtherBorrowingsMember2023-12-310001521951fbiz:OtherBorrowingsMember2023-01-012023-12-310001521951fbiz:SecuredBorrowingsMember2022-12-310001521951fbiz:OtherBorrowingsMember2022-01-012022-12-310001521951us-gaap:SubordinatedDebtMember2023-12-310001521951us-gaap:SubordinatedDebtMember2023-01-012023-12-310001521951us-gaap:SubordinatedDebtMember2022-12-310001521951us-gaap:SubordinatedDebtMember2022-01-012022-12-310001521951us-gaap:JuniorSubordinatedDebtMember2023-12-310001521951us-gaap:JuniorSubordinatedDebtMember2023-01-012023-12-310001521951us-gaap:JuniorSubordinatedDebtMember2022-12-310001521951us-gaap:JuniorSubordinatedDebtMember2022-01-012022-12-310001521951us-gaap:FederalHomeLoanBankAdvancesMember2023-12-310001521951srt:MinimumMemberus-gaap:FederalHomeLoanBankAdvancesMember2023-12-310001521951srt:MaximumMemberus-gaap:FederalHomeLoanBankAdvancesMember2023-12-310001521951us-gaap:FederalHomeLoanBankAdvancesMember2022-12-310001521951srt:MinimumMemberus-gaap:FederalHomeLoanBankAdvancesMember2022-12-310001521951srt:MaximumMemberus-gaap:FederalHomeLoanBankAdvancesMember2022-12-310001521951us-gaap:FederalHomeLoanBankAdvancesMember2023-12-310001521951us-gaap:FederalHomeLoanBankAdvancesMember2022-12-310001521951us-gaap:LineOfCreditMemberus-gaap:SecuredOvernightFinancingRateSofrOvernightIndexSwapRateMember2023-01-012023-12-310001521951fbiz:A2023SubordinatedDebtIssuanceMember2023-12-310001521951fbiz:A2023SubordinatedDebtIssuanceMember2023-01-012023-12-310001521951us-gaap:DesignatedAsHedgingInstrumentMemberfbiz:InterestRateSwapRelatedToFHLBBorrowingsMember2023-12-310001521951us-gaap:DesignatedAsHedgingInstrumentMemberfbiz:InterestRateSwapRelatedToFHLBBorrowingsMember2023-01-012023-12-310001521951fbiz:FirstBusinessBankMember2023-12-310001521951fbiz:FirstBusinessBankMember2022-12-310001521951us-gaap:RestrictedStockMember2020-12-310001521951us-gaap:PerformanceSharesMember2020-12-310001521951us-gaap:RestrictedStockUnitsRSUMember2020-12-310001521951us-gaap:RestrictedStockMember2021-01-012021-12-310001521951us-gaap:PerformanceSharesMember2021-01-012021-12-310001521951us-gaap:RestrictedStockUnitsRSUMember2021-01-012021-12-310001521951us-gaap:RestrictedStockMember2021-12-310001521951us-gaap:PerformanceSharesMember2021-12-310001521951us-gaap:RestrictedStockUnitsRSUMember2021-12-310001521951us-gaap:RestrictedStockMember2022-01-012022-12-310001521951us-gaap:PerformanceSharesMember2022-01-012022-12-310001521951us-gaap:RestrictedStockUnitsRSUMember2022-01-012022-12-310001521951us-gaap:RestrictedStockMember2022-12-310001521951us-gaap:PerformanceSharesMember2022-12-310001521951us-gaap:RestrictedStockUnitsRSUMember2022-12-310001521951us-gaap:RestrictedStockMember2023-01-012023-12-310001521951us-gaap:PerformanceSharesMember2023-01-012023-12-310001521951us-gaap:RestrictedStockUnitsRSUMember2023-01-012023-12-310001521951us-gaap:RestrictedStockMember2023-12-310001521951us-gaap:PerformanceSharesMember2023-12-310001521951us-gaap:RestrictedStockUnitsRSUMember2023-12-310001521951fbiz:InsuredExecutiveOfficersWithDeferredCompensationPlansMember2023-12-310001521951fbiz:InsuredExecutiveOfficersWithDeferredCompensationPlansMember2022-12-310001521951fbiz:OtherInsuredIndividualsMember2023-12-310001521951fbiz:OtherInsuredIndividualsMember2022-12-310001521951us-gaap:StateAndLocalJurisdictionMember2023-12-310001521951us-gaap:StateAndLocalJurisdictionMember2022-12-310001521951fbiz:InterestRateSwapAgreementsOnLoansWithThirdPartyCounterPartiesMember2023-12-310001521951us-gaap:DesignatedAsHedgingInstrumentMemberfbiz:InterestRateSwapRelatedToFHLBBorrowingsMember2022-01-012022-12-310001521951us-gaap:DesignatedAsHedgingInstrumentMemberfbiz:InterestRateSwapRelatedToFHLBBorrowingsMember2021-01-012021-12-310001521951us-gaap:DesignatedAsHedgingInstrumentMemberfbiz:InterestRateSwapRelatedToAFSSecuritiesMember2023-01-012023-12-310001521951us-gaap:DesignatedAsHedgingInstrumentMemberfbiz:InterestRateSwapRelatedToAFSSecuritiesMember2022-01-012022-12-310001521951us-gaap:DesignatedAsHedgingInstrumentMemberfbiz:InterestRateSwapRelatedToAFSSecuritiesMember2021-01-012021-12-310001521951fbiz:InterestRateSwapAgreementsOnLoansWithCommercialLoanCustomersMemberus-gaap:NondesignatedMember2023-12-310001521951fbiz:InterestRateSwapAgreementsOnLoansWithCommercialLoanCustomersMemberus-gaap:NondesignatedMember2023-01-012023-12-310001521951fbiz:InterestRateSwapAgreementsOnLoansWithThirdPartyCounterPartiesMemberus-gaap:NondesignatedMember2023-12-310001521951fbiz:InterestRateSwapAgreementsOnLoansWithThirdPartyCounterPartiesMemberus-gaap:NondesignatedMember2023-01-012023-12-310001521951us-gaap:DesignatedAsHedgingInstrumentMemberfbiz:InterestRateSwapRelatedToAFSSecuritiesMember2023-12-310001521951us-gaap:DesignatedAsHedgingInstrumentMemberfbiz:InterestRateSwapRelatedToWholesaleFundingMember2023-12-310001521951us-gaap:DesignatedAsHedgingInstrumentMemberfbiz:InterestRateSwapRelatedToWholesaleFundingMember2023-01-012023-12-310001521951fbiz:InterestRateSwapAgreementsOnLoansWithCommercialLoanCustomersMemberus-gaap:NondesignatedMember2022-12-310001521951fbiz:InterestRateSwapAgreementsOnLoansWithCommercialLoanCustomersMemberus-gaap:NondesignatedMember2022-01-012022-12-310001521951fbiz:InterestRateSwapAgreementsOnLoansWithThirdPartyCounterPartiesMemberus-gaap:NondesignatedMember2022-12-310001521951fbiz:InterestRateSwapAgreementsOnLoansWithThirdPartyCounterPartiesMemberus-gaap:NondesignatedMember2022-01-012022-12-310001521951us-gaap:DesignatedAsHedgingInstrumentMemberfbiz:InterestRateSwapRelatedToAFSSecuritiesMember2022-12-310001521951us-gaap:DesignatedAsHedgingInstrumentMemberfbiz:InterestRateSwapRelatedToWholesaleFundingMember2022-12-310001521951us-gaap:DesignatedAsHedgingInstrumentMemberfbiz:InterestRateSwapRelatedToWholesaleFundingMember2022-01-012022-12-310001521951us-gaap:CommitmentsToExtendCreditMember2023-12-310001521951us-gaap:CommitmentsToExtendCreditMember2022-12-310001521951us-gaap:StandbyLettersOfCreditMember2023-12-310001521951us-gaap:StandbyLettersOfCreditMember2022-12-310001521951us-gaap:USTreasurySecuritiesMemberus-gaap:FairValueInputsLevel1Memberus-gaap:FairValueMeasurementsRecurringMember2023-12-310001521951us-gaap:FairValueInputsLevel2Memberus-gaap:USTreasurySecuritiesMemberus-gaap:FairValueMeasurementsRecurringMember2023-12-310001521951us-gaap:FairValueInputsLevel3Memberus-gaap:USTreasurySecuritiesMemberus-gaap:FairValueMeasurementsRecurringMember2023-12-310001521951us-gaap:USTreasurySecuritiesMemberus-gaap:FairValueMeasurementsRecurringMember2023-12-310001521951us-gaap:USGovernmentSponsoredEnterprisesDebtSecuritiesMemberus-gaap:FairValueInputsLevel1Memberus-gaap:FairValueMeasurementsRecurringMember2023-12-310001521951us-gaap:FairValueInputsLevel2Memberus-gaap:USGovernmentSponsoredEnterprisesDebtSecuritiesMemberus-gaap:FairValueMeasurementsRecurringMember2023-12-310001521951us-gaap:USGovernmentSponsoredEnterprisesDebtSecuritiesMemberus-gaap:FairValueInputsLevel3Memberus-gaap:FairValueMeasurementsRecurringMember2023-12-310001521951us-gaap:USGovernmentSponsoredEnterprisesDebtSecuritiesMemberus-gaap:FairValueMeasurementsRecurringMember2023-12-310001521951us-gaap:FairValueInputsLevel1Memberus-gaap:USStatesAndPoliticalSubdivisionsMemberus-gaap:FairValueMeasurementsRecurringMember2023-12-310001521951us-gaap:FairValueInputsLevel2Memberus-gaap:USStatesAndPoliticalSubdivisionsMemberus-gaap:FairValueMeasurementsRecurringMember2023-12-310001521951us-gaap:FairValueInputsLevel3Memberus-gaap:USStatesAndPoliticalSubdivisionsMemberus-gaap:FairValueMeasurementsRecurringMember2023-12-310001521951us-gaap:USStatesAndPoliticalSubdivisionsMemberus-gaap:FairValueMeasurementsRecurringMember2023-12-310001521951us-gaap:FairValueInputsLevel1Memberfbiz:GNMAMemberus-gaap:ResidentialMortgageBackedSecuritiesMemberus-gaap:FairValueMeasurementsRecurringMember2023-12-310001521951us-gaap:FairValueInputsLevel2Memberfbiz:GNMAMemberus-gaap:ResidentialMortgageBackedSecuritiesMemberus-gaap:FairValueMeasurementsRecurringMember2023-12-310001521951us-gaap:FairValueInputsLevel3Memberfbiz:GNMAMemberus-gaap:ResidentialMortgageBackedSecuritiesMemberus-gaap:FairValueMeasurementsRecurringMember2023-12-310001521951fbiz:GNMAMemberus-gaap:ResidentialMortgageBackedSecuritiesMemberus-gaap:FairValueMeasurementsRecurringMember2023-12-310001521951fbiz:GovernmentSponsoredEnterprisesMemberus-gaap:FairValueInputsLevel1Memberus-gaap:ResidentialMortgageBackedSecuritiesMemberus-gaap:FairValueMeasurementsRecurringMember2023-12-310001521951us-gaap:FairValueInputsLevel2Memberfbiz:GovernmentSponsoredEnterprisesMemberus-gaap:ResidentialMortgageBackedSecuritiesMemberus-gaap:FairValueMeasurementsRecurringMember2023-12-310001521951us-gaap:FairValueInputsLevel3Memberfbiz:GovernmentSponsoredEnterprisesMemberus-gaap:ResidentialMortgageBackedSecuritiesMemberus-gaap:FairValueMeasurementsRecurringMember2023-12-310001521951fbiz:GovernmentSponsoredEnterprisesMemberus-gaap:ResidentialMortgageBackedSecuritiesMemberus-gaap:FairValueMeasurementsRecurringMember2023-12-310001521951us-gaap:CommercialMortgageBackedSecuritiesMemberus-gaap:FairValueInputsLevel1Memberfbiz:GNMAMemberus-gaap:FairValueMeasurementsRecurringMember2023-12-310001521951us-gaap:FairValueInputsLevel2Memberus-gaap:CommercialMortgageBackedSecuritiesMemberfbiz:GNMAMemberus-gaap:FairValueMeasurementsRecurringMember2023-12-310001521951us-gaap:FairValueInputsLevel3Memberus-gaap:CommercialMortgageBackedSecuritiesMemberfbiz:GNMAMemberus-gaap:FairValueMeasurementsRecurringMember2023-12-310001521951us-gaap:CommercialMortgageBackedSecuritiesMemberfbiz:GNMAMemberus-gaap:FairValueMeasurementsRecurringMember2023-12-310001521951fbiz:GovernmentSponsoredEnterprisesMemberus-gaap:CommercialMortgageBackedSecuritiesMemberus-gaap:FairValueInputsLevel1Memberus-gaap:FairValueMeasurementsRecurringMember2023-12-310001521951us-gaap:FairValueInputsLevel2Memberfbiz:GovernmentSponsoredEnterprisesMemberus-gaap:CommercialMortgageBackedSecuritiesMemberus-gaap:FairValueMeasurementsRecurringMember2023-12-310001521951us-gaap:FairValueInputsLevel3Memberfbiz:GovernmentSponsoredEnterprisesMemberus-gaap:CommercialMortgageBackedSecuritiesMemberus-gaap:FairValueMeasurementsRecurringMember2023-12-310001521951fbiz:GovernmentSponsoredEnterprisesMemberus-gaap:CommercialMortgageBackedSecuritiesMemberus-gaap:FairValueMeasurementsRecurringMember2023-12-310001521951us-gaap:InterestRateSwapMemberus-gaap:FairValueInputsLevel1Memberus-gaap:FairValueMeasurementsRecurringMember2023-12-310001521951us-gaap:InterestRateSwapMemberus-gaap:FairValueInputsLevel2Memberus-gaap:FairValueMeasurementsRecurringMember2023-12-310001521951us-gaap:InterestRateSwapMemberus-gaap:FairValueInputsLevel3Memberus-gaap:FairValueMeasurementsRecurringMember2023-12-310001521951us-gaap:InterestRateSwapMemberus-gaap:FairValueMeasurementsRecurringMember2023-12-310001521951us-gaap:InterestRateSwapMemberus-gaap:FairValueInputsLevel1Memberus-gaap:FairValueMeasurementsRecurringMember2023-12-310001521951us-gaap:FairValueInputsLevel2Memberus-gaap:InterestRateSwapMemberus-gaap:FairValueMeasurementsRecurringMember2023-12-310001521951us-gaap:FairValueInputsLevel3Memberus-gaap:InterestRateSwapMemberus-gaap:FairValueMeasurementsRecurringMember2023-12-310001521951us-gaap:InterestRateSwapMemberus-gaap:FairValueMeasurementsRecurringMember2023-12-310001521951us-gaap:USTreasurySecuritiesMemberus-gaap:FairValueInputsLevel1Memberus-gaap:FairValueMeasurementsRecurringMember2022-12-310001521951us-gaap:FairValueInputsLevel2Memberus-gaap:USTreasurySecuritiesMemberus-gaap:FairValueMeasurementsRecurringMember2022-12-310001521951us-gaap:FairValueInputsLevel3Memberus-gaap:USTreasurySecuritiesMemberus-gaap:FairValueMeasurementsRecurringMember2022-12-310001521951us-gaap:USTreasurySecuritiesMemberus-gaap:FairValueMeasurementsRecurringMember2022-12-310001521951us-gaap:USGovernmentSponsoredEnterprisesDebtSecuritiesMemberus-gaap:FairValueInputsLevel1Memberus-gaap:FairValueMeasurementsRecurringMember2022-12-310001521951us-gaap:FairValueInputsLevel2Memberus-gaap:USGovernmentSponsoredEnterprisesDebtSecuritiesMemberus-gaap:FairValueMeasurementsRecurringMember2022-12-310001521951us-gaap:USGovernmentSponsoredEnterprisesDebtSecuritiesMemberus-gaap:FairValueInputsLevel3Memberus-gaap:FairValueMeasurementsRecurringMember2022-12-310001521951us-gaap:USGovernmentSponsoredEnterprisesDebtSecuritiesMemberus-gaap:FairValueMeasurementsRecurringMember2022-12-310001521951us-gaap:FairValueInputsLevel1Memberus-gaap:USStatesAndPoliticalSubdivisionsMemberus-gaap:FairValueMeasurementsRecurringMember2022-12-310001521951us-gaap:FairValueInputsLevel2Memberus-gaap:USStatesAndPoliticalSubdivisionsMemberus-gaap:FairValueMeasurementsRecurringMember2022-12-310001521951us-gaap:FairValueInputsLevel3Memberus-gaap:USStatesAndPoliticalSubdivisionsMemberus-gaap:FairValueMeasurementsRecurringMember2022-12-310001521951us-gaap:USStatesAndPoliticalSubdivisionsMemberus-gaap:FairValueMeasurementsRecurringMember2022-12-310001521951us-gaap:FairValueInputsLevel1Memberfbiz:GNMAMemberus-gaap:ResidentialMortgageBackedSecuritiesMemberus-gaap:FairValueMeasurementsRecurringMember2022-12-310001521951us-gaap:FairValueInputsLevel2Memberfbiz:GNMAMemberus-gaap:ResidentialMortgageBackedSecuritiesMemberus-gaap:FairValueMeasurementsRecurringMember2022-12-310001521951us-gaap:FairValueInputsLevel3Memberfbiz:GNMAMemberus-gaap:ResidentialMortgageBackedSecuritiesMemberus-gaap:FairValueMeasurementsRecurringMember2022-12-310001521951fbiz:GNMAMemberus-gaap:ResidentialMortgageBackedSecuritiesMemberus-gaap:FairValueMeasurementsRecurringMember2022-12-310001521951fbiz:GovernmentSponsoredEnterprisesMemberus-gaap:FairValueInputsLevel1Memberus-gaap:ResidentialMortgageBackedSecuritiesMemberus-gaap:FairValueMeasurementsRecurringMember2022-12-310001521951us-gaap:FairValueInputsLevel2Memberfbiz:GovernmentSponsoredEnterprisesMemberus-gaap:ResidentialMortgageBackedSecuritiesMemberus-gaap:FairValueMeasurementsRecurringMember2022-12-310001521951us-gaap:FairValueInputsLevel3Memberfbiz:GovernmentSponsoredEnterprisesMemberus-gaap:ResidentialMortgageBackedSecuritiesMemberus-gaap:FairValueMeasurementsRecurringMember2022-12-310001521951fbiz:GovernmentSponsoredEnterprisesMemberus-gaap:ResidentialMortgageBackedSecuritiesMemberus-gaap:FairValueMeasurementsRecurringMember2022-12-310001521951us-gaap:CommercialMortgageBackedSecuritiesMemberus-gaap:FairValueInputsLevel1Memberfbiz:GNMAMemberus-gaap:FairValueMeasurementsRecurringMember2022-12-310001521951us-gaap:FairValueInputsLevel2Memberus-gaap:CommercialMortgageBackedSecuritiesMemberfbiz:GNMAMemberus-gaap:FairValueMeasurementsRecurringMember2022-12-310001521951us-gaap:FairValueInputsLevel3Memberus-gaap:CommercialMortgageBackedSecuritiesMemberfbiz:GNMAMemberus-gaap:FairValueMeasurementsRecurringMember2022-12-310001521951us-gaap:CommercialMortgageBackedSecuritiesMemberfbiz:GNMAMemberus-gaap:FairValueMeasurementsRecurringMember2022-12-310001521951fbiz:GovernmentSponsoredEnterprisesMemberus-gaap:CommercialMortgageBackedSecuritiesMemberus-gaap:FairValueInputsLevel1Memberus-gaap:FairValueMeasurementsRecurringMember2022-12-310001521951us-gaap:FairValueInputsLevel2Memberfbiz:GovernmentSponsoredEnterprisesMemberus-gaap:CommercialMortgageBackedSecuritiesMemberus-gaap:FairValueMeasurementsRecurringMember2022-12-310001521951us-gaap:FairValueInputsLevel3Memberfbiz:GovernmentSponsoredEnterprisesMemberus-gaap:CommercialMortgageBackedSecuritiesMemberus-gaap:FairValueMeasurementsRecurringMember2022-12-310001521951fbiz:GovernmentSponsoredEnterprisesMemberus-gaap:CommercialMortgageBackedSecuritiesMemberus-gaap:FairValueMeasurementsRecurringMember2022-12-310001521951us-gaap:InterestRateSwapMemberus-gaap:FairValueInputsLevel1Memberus-gaap:FairValueMeasurementsRecurringMember2022-12-310001521951us-gaap:InterestRateSwapMemberus-gaap:FairValueInputsLevel2Memberus-gaap:FairValueMeasurementsRecurringMember2022-12-310001521951us-gaap:InterestRateSwapMemberus-gaap:FairValueInputsLevel3Memberus-gaap:FairValueMeasurementsRecurringMember2022-12-310001521951us-gaap:InterestRateSwapMemberus-gaap:FairValueMeasurementsRecurringMember2022-12-310001521951us-gaap:InterestRateSwapMemberus-gaap:FairValueInputsLevel1Memberus-gaap:FairValueMeasurementsRecurringMember2022-12-310001521951us-gaap:FairValueInputsLevel2Memberus-gaap:InterestRateSwapMemberus-gaap:FairValueMeasurementsRecurringMember2022-12-310001521951us-gaap:FairValueInputsLevel3Memberus-gaap:InterestRateSwapMemberus-gaap:FairValueMeasurementsRecurringMember2022-12-310001521951us-gaap:InterestRateSwapMemberus-gaap:FairValueMeasurementsRecurringMember2022-12-310001521951us-gaap:FairValueInputsLevel1Memberfbiz:ImpairedLoansMemberus-gaap:FairValueMeasurementsNonrecurringMember2023-12-310001521951us-gaap:FairValueInputsLevel2Memberfbiz:ImpairedLoansMemberus-gaap:FairValueMeasurementsNonrecurringMember2023-12-310001521951us-gaap:FairValueInputsLevel3Memberfbiz:ImpairedLoansMemberus-gaap:FairValueMeasurementsNonrecurringMember2023-12-310001521951fbiz:ImpairedLoansMemberus-gaap:FairValueMeasurementsNonrecurringMember2023-12-310001521951us-gaap:FairValueInputsLevel1Memberfbiz:ForeclosedPropertiesMemberus-gaap:FairValueMeasurementsNonrecurringMember2023-12-310001521951us-gaap:FairValueInputsLevel2Memberfbiz:ForeclosedPropertiesMemberus-gaap:FairValueMeasurementsNonrecurringMember2023-12-310001521951us-gaap:FairValueInputsLevel3Memberfbiz:ForeclosedPropertiesMemberus-gaap:FairValueMeasurementsNonrecurringMember2023-12-310001521951fbiz:ForeclosedPropertiesMemberus-gaap:FairValueMeasurementsNonrecurringMember2023-12-310001521951fbiz:LoanservicingrightsMemberus-gaap:FairValueInputsLevel1Memberus-gaap:FairValueMeasurementsNonrecurringMember2023-12-310001521951us-gaap:FairValueInputsLevel2Memberfbiz:LoanservicingrightsMemberus-gaap:FairValueMeasurementsNonrecurringMember2023-12-310001521951fbiz:LoanservicingrightsMemberus-gaap:FairValueInputsLevel3Memberus-gaap:FairValueMeasurementsNonrecurringMember2023-12-310001521951fbiz:LoanservicingrightsMemberus-gaap:FairValueMeasurementsNonrecurringMember2023-12-310001521951us-gaap:FairValueInputsLevel1Memberfbiz:ImpairedLoansMemberus-gaap:FairValueMeasurementsNonrecurringMember2022-12-310001521951us-gaap:FairValueInputsLevel2Memberfbiz:ImpairedLoansMemberus-gaap:FairValueMeasurementsNonrecurringMember2022-12-310001521951us-gaap:FairValueInputsLevel3Memberfbiz:ImpairedLoansMemberus-gaap:FairValueMeasurementsNonrecurringMember2022-12-310001521951fbiz:ImpairedLoansMemberus-gaap:FairValueMeasurementsNonrecurringMember2022-12-310001521951us-gaap:FairValueInputsLevel1Memberfbiz:ForeclosedPropertiesMemberus-gaap:FairValueMeasurementsNonrecurringMember2022-12-310001521951us-gaap:FairValueInputsLevel2Memberfbiz:ForeclosedPropertiesMemberus-gaap:FairValueMeasurementsNonrecurringMember2022-12-310001521951us-gaap:FairValueInputsLevel3Memberfbiz:ForeclosedPropertiesMemberus-gaap:FairValueMeasurementsNonrecurringMember2022-12-310001521951fbiz:ForeclosedPropertiesMemberus-gaap:FairValueMeasurementsNonrecurringMember2022-12-310001521951fbiz:LoanservicingrightsMemberus-gaap:FairValueInputsLevel1Memberus-gaap:FairValueMeasurementsNonrecurringMember2022-12-310001521951us-gaap:FairValueInputsLevel2Memberfbiz:LoanservicingrightsMemberus-gaap:FairValueMeasurementsNonrecurringMember2022-12-310001521951fbiz:LoanservicingrightsMemberus-gaap:FairValueInputsLevel3Memberus-gaap:FairValueMeasurementsNonrecurringMember2022-12-310001521951fbiz:LoanservicingrightsMemberus-gaap:FairValueMeasurementsNonrecurringMember2022-12-310001521951srt:WeightedAverageMember2023-12-310001521951us-gaap:FairValueInputsLevel1Member2023-12-310001521951us-gaap:FairValueInputsLevel2Member2023-12-310001521951us-gaap:FairValueInputsLevel3Member2023-12-310001521951us-gaap:InterestRateSwapMember2023-12-310001521951us-gaap:InterestRateSwapMemberus-gaap:FairValueInputsLevel1Member2023-12-310001521951us-gaap:InterestRateSwapMemberus-gaap:FairValueInputsLevel2Member2023-12-310001521951us-gaap:InterestRateSwapMemberus-gaap:FairValueInputsLevel3Member2023-12-310001521951us-gaap:InterestRateSwapMember2023-12-310001521951us-gaap:InterestRateSwapMemberus-gaap:FairValueInputsLevel1Member2023-12-310001521951us-gaap:FairValueInputsLevel2Memberus-gaap:InterestRateSwapMember2023-12-310001521951us-gaap:FairValueInputsLevel3Memberus-gaap:InterestRateSwapMember2023-12-310001521951us-gaap:FairValueInputsLevel1Member2022-12-310001521951us-gaap:FairValueInputsLevel2Member2022-12-310001521951us-gaap:FairValueInputsLevel3Member2022-12-310001521951us-gaap:InterestRateSwapMember2022-12-310001521951us-gaap:InterestRateSwapMemberus-gaap:FairValueInputsLevel1Member2022-12-310001521951us-gaap:InterestRateSwapMemberus-gaap:FairValueInputsLevel2Member2022-12-310001521951us-gaap:InterestRateSwapMemberus-gaap:FairValueInputsLevel3Member2022-12-310001521951us-gaap:InterestRateSwapMember2022-12-310001521951us-gaap:InterestRateSwapMemberus-gaap:FairValueInputsLevel1Member2022-12-310001521951us-gaap:FairValueInputsLevel2Memberus-gaap:InterestRateSwapMember2022-12-310001521951us-gaap:FairValueInputsLevel3Memberus-gaap:InterestRateSwapMember2022-12-310001521951srt:ParentCompanyMember2023-12-310001521951srt:ParentCompanyMember2022-12-310001521951srt:ParentCompanyMember2023-01-012023-12-310001521951srt:ParentCompanyMember2022-01-012022-12-310001521951srt:ParentCompanyMember2021-01-012021-12-310001521951srt:ParentCompanyMember2021-12-310001521951srt:ParentCompanyMember2020-12-3100015219512023-10-012023-12-3100015219512023-07-012023-09-3000015219512023-04-012023-06-3000015219512023-01-012023-03-3100015219512022-10-012022-12-3100015219512022-07-012022-09-3000015219512022-04-012022-06-3000015219512022-01-012022-03-31
UNITED STATES SECURITIES AND EXCHANGE COMMISSION
WASHINGTON, D.C. 20549
FORM 10-K
(Mark One)
|
|
|
|
|
|
| ☑ |
ANNUAL REPORT PURSUANT TO SECTION 13 OR 15(d) OF THE SECURITIES EXCHANGE ACT OF 1934 |
|
For the fiscal year ended December 31, 2023 |
| ☐ |
TRANSITION REPORT PURSUANT TO SECTION 13 OR 15(d) OF THE SECURITIES EXCHANGE ACT OF 1934 |
|
For the transition period from to |
Commission file number 001-34095
FIRST BUSINESS FINANCIAL SERVICES, INC.
(Exact name of registrant as specified in its charter)
|
|
|
|
|
|
|
|
|
| Wisconsin |
|
39-1576570 |
| (State or other jurisdiction of incorporation or organization) |
|
(I.R.S. Employer Identification No.) |
|
|
401 Charmany Drive, Madison, WI |
|
53719 |
| (Address of principal executive offices) |
|
(Zip Code) |
Registrant’s telephone number, including area code: (608) 238-8008
Securities registered pursuant to Section 12(b) of the Act:
|
|
|
|
|
|
|
|
|
| Title of each class |
Trading Symbol(s) |
Name of each exchange on which registered |
| Common Stock, $0.01 par value |
FBIZ |
The Nasdaq Stock Market LLC |
Securities registered pursuant to Section 12(g) of the Act
None
Indicate by check mark if the registrant is a well-known seasoned issuer, as defined in Rule 405 of the Securities Act. Yes ¨ No þ
Indicate by check mark if the registrant is not required to file reports pursuant to Section 13 or 15(d) of the Act. Yes ¨ No þ
Indicate by check mark whether the registrant (1) has filed all reports required to be filed by Section 13 or 15(d) of the Securities Exchange Act of 1934 during the preceding 12 months (or for such shorter period that the registrant was required to file such reports), and (2) has been subject to such filing requirements for the past 90 days. Yes þ No ¨
Indicate by check mark whether the registrant has submitted electronically every Interactive Data File required to be submitted pursuant to Rule 405 of Regulation S-T during the preceding 12 months (or for such shorter period that the registrant was required to submit such files.) Yes þ No ¨
Indicate by check mark whether the registrant is a large accelerated filer, an accelerated filer, a non-accelerated filer, a smaller reporting company, or an emerging growth company. See the definitions of “large accelerated filer,” “accelerated filer”, “smaller reporting company” and “emerging growth company” in Rule 12b-2 of the Exchange Act.
|
|
|
|
|
|
|
|
|
|
|
|
|
|
|
|
|
|
|
|
|
|
|
|
|
|
|
|
|
|
| Large accelerated filer |
☐ |
Accelerated filer |
☑ |
Non-accelerated filer |
☐ |
Smaller reporting company |
☑ |
Emerging growth company |
☐ |
If an emerging growth company, indicate by check mark if the registrant has elected not to use the extended transition period for complying with any new or revised financial accounting standards provided pursuant to Section 13(a) of the Exchange Act. ¨
Indicate by check mark whether the registrant has filed a report on and attestation to its management’s assessment of the effectiveness of its internal control over financial reporting under Section 404(b) of the Sarbanes-Oxley Act (15 U.S.C. 7262(b)) by the registered public accounting firm that prepared or issued its audit report. þ
If securities are registered pursuant to Section 12(b) of the Act, indicate by check mark whether the financial statements of the registrant included in the filing reflect the correction of an error to previously issued financial statements. ☐
Indicate by check mark whether any of those error corrections are restatements that required a recovery analysis of incentive-based compensation received by any of the registrant’s executive officers during the relevant recovery period pursuant to §240.10D-1(b). ☐
Indicate by check mark whether the registrant is a shell company (as defined in Rule 12b-2 of the Act). Yes ☐ No ☑
The aggregate market value of the common equity held by non-affiliates computed by reference to the closing price of such common equity, as of the last business day of the registrant’s most recently completed second fiscal quarter, was approximately $245.2 million.
As of February 26, 2024, 8,306,543 shares of common stock were outstanding.
DOCUMENTS INCORPORATED BY REFERENCE
Part III – Portions of the Proxy Statement for the Annual Meeting of Shareholders to be held on April 26, 2024 are incorporated by reference into Part III hereof.
Table of Contents
PART I.
Item 1. Business
BUSINESS
General
First Business Financial Services, Inc. (together with all of its subsidiaries, collectively referred to as the “Corporation,” “FBFS,” “we,” “us,” or “our”) is a registered bank holding company originally incorporated in 1986 under the laws of the State of Wisconsin and is engaged in the commercial banking business through its wholly-owned bank subsidiary, First Business Bank (collectively with its subsidiaries “FBB” or the “Bank”), headquartered in Madison, Wisconsin. All of our operations are conducted through FBB and its wholly-owned subsidiary First Business Specialty Finance, LLC (“FBSF”). The Bank operates as a business bank, delivering a full line of commercial banking products and services tailored to meet the specific needs of small and medium-sized businesses, business owners, executives, professionals, and high net worth individuals. Our products and services are focused on business banking, private wealth, and bank consulting. Within business banking, we offer commercial real estate lending, commercial and industrial lending, asset-based lending, accounts receivable financing, equipment financing, floorplan financing, vendor financing, Small Business Administration (“SBA”) lending and servicing, treasury management solutions, and company retirement services. Our private wealth management services include trust and estate administration, financial planning, investment management, and private banking. Our bank consulting experts provide investment portfolio administrative services, and asset liability management services. We do not utilize a branch network to attract retail clients. Our operating model is predicated on deep client relationships, financial expertise, and an efficient, centralized administration function delivering best in class client satisfaction. Our focused model allows experienced staff to provide the level of financial expertise needed to develop and maintain long-term relationships with our clients. We conduct our commercial banking operations through one operating segment.
As of December 31, 2023, on a consolidated basis, we had total assets of $3.508 billion, total gross loans and leases of $2.850 billion, total deposits of $2.797 billion, and total stockholders’ equity of $289.6 million.
Commercial Banking Products and Services
We strive to meet the specific commercial lending needs of small- to medium-sized companies in our primary markets in Wisconsin, Kansas, and Missouri, predominantly through lines of credit and term loans to businesses with annual sales of up to $150 million. Through FBB, we service South Central Wisconsin, Southeast Wisconsin, Northeast Wisconsin, the greater Kansas City Metro, and other borrowers through products with national channels.
Commercial Real Estate Lending We originate loans secured by commercial real estate, including owner-occupied, non owner-occupied facilities, primarily market-rent multifamily developments, 1-4 family residential developments, and construction loans for these types of buildings. As of December 31, 2023, our commercial real estate portfolio (“CRE”) represented approximately 60% of our total gross loans and leases receivable.
Commercial and Industrial Lending Our commercial loans are typically secured by various types of business assets, including inventory, receivables, and equipment. As of December 31, 2023, our commercial and industrial portfolio (“C&I”) represented approximately 39% of our total gross loans and leases receivable. The C&I portfolio includes conventional commercial and industrial loans as well as asset-based lending, accounts receivable financing, equipment financing, floorplan financing, and SBA lending. These C&I lending niches are described below.
C&I Lending - Asset-Based Lending
We provide asset-based lending to small- to medium-sized companies. Our asset-based lending team serves clients on a nationwide basis through business development officers located in several states. We primarily provide revolving lines of credit and term loans for financial and strategic acquisitions, capital expenditures, working capital to support rapid growth, bank debt refinancing, debt restructuring, and corporate turnaround strategies. As a bank-owned, asset-based lender with strong underwriting standards, our team is positioned to provide cost-effective financing solutions to companies which do not have the established, stable cash flows necessary to qualify for traditional commercial lending products. These borrowing relationships generally range between $2 million and $18 million with terms of 24 to 60 months. Asset-based lending typically generates higher yields than traditional commercial lending. This line of business complements our traditional commercial loan portfolio and provides us with more diverse income opportunities. As of December 31, 2023, asset-based lending represented approximately 8% of our total gross loans and leases receivable.
C&I Lending - Accounts Receivable Financing
Our Accounts Receivable Financing team, with business development officers located in several states, serves clients nationwide by purchasing accounts receivable primarily on a full recourse basis. This offering provides working capital to support client growth and other client cash flow needs. Accounts receivable financing typically generates higher yields than traditional commercial lending and complements our traditional commercial portfolio. As of December 31, 2023, accounts receivable financing represented approximately 3% of our total gross loans and leases receivable.
C&I Lending - Equipment Financing
The Bank finances a broad range of equipment, through loans and leases, to address the financing needs of commercial clients in a variety of industries. Our Equipment Finance team, with business development officers located in several states, provides financing solutions for manufacturing equipment, industrial assets, construction and transportation equipment, agriculture equipment, medical equipment, and a variety of other commercial equipment. These financings generally range between $25,000 and $1 million with terms of 36 to 84 months.
Our Equipment Finance team seeks to position itself as the preferred point of sale financing choice utilized by equipment vendors and their purchasing customers. Our online application and proprietary credit scoring architecture enable us to provide small ticket vendor equipment financings through a nationwide distribution channel. These equipment vendors specialize primarily in healthcare, manufacturing, technology equipment, agriculture, construction, and specialty vehicles. Small ticket vendor equipment financing typically generates higher yields than traditional commercial lending. As of December 31, 2023, equipment financing represented approximately 10% of our total gross loans and leases receivable.
C&I Lending - Floorplan Financing
We offer floorplan financing for independent car dealerships nationwide. These floorplan programs generally range from $500,000 to $10 million for larger, well-established independent car dealers. Floorplan financing typically generates higher yields than traditional commercial lending. As of December 31, 2023, floorplan financing represented approximately 3% of our total gross loans and leases receivable.
C&I Lending - SBA Lending and Servicing
SBA loans are made through programs designed by the federal government to assist the small business community in obtaining financing. We are an approved participant in the SBA’s Preferred Lender Program (“PLP”). The PLP is part of the SBA's effort to streamline the procedures necessary to provide financial assistance to the small business community. Under this program, the SBA delegates the final credit decision, most servicing, liquidation authority and responsibility to PLP lenders. We leverage this program authority and capacity to package, underwrite, process, service, and liquidate, if necessary, SBA loans nationwide.
Our SBA loans fall into three categories: loans originated under the SBA’s 7(a) term loan program; loans originated under the SBA’s 504 program; and SBA Express loans and lines of credit. Specific program guidelines vary based on the SBA loan program; however, all loans must be underwritten, originated, monitored, and serviced according to the SBA’s Standard Operating Procedures in order to maintain the guaranty, if any, under the SBA program. Except for loans originated under the SBA’s 504 program, the SBA generally provides a guaranty to the lender ranging from 50% to 90% of loan the balance as an inducement to the lender to originate the loan.
The majority of our SBA loans are originated using the 7(a) term loan program. This program typically provides a guaranty of 75% of loan the balance. In the event of default on the loan, the lender may request that the SBA purchase the guaranteed portion of the loan for an amount equal to outstanding principal plus accrued interest permissible under SBA guidelines. In addition, the SBA will share on a pro-rata basis in certain costs of collection, subject to SBA rules and limits, as well as the proceeds of liquidation.
SBA lending is designed to generate new business opportunities for the Bank by meeting the needs of clients that cannot be met with conventional bank loans. We earn interest income from these loans, generally at variable rates higher than those of our traditional commercial loans. We have a history of recognizing gains on the sale of the guaranteed portion of the loans. We also regularly earn treasury management fee income from the borrower and servicing income from the owner of the sold portion of these loans. As of December 31, 2023, the on-balance sheet portion of SBA loans represented approximately 2% of our total gross loans and leases receivable.
Treasury Management Services
FBB provides comprehensive treasury management services for commercial banking and specialized lending clients to manage their cash and liquidity, including a variety of deposit accounts, accounts receivable collection services, electronic payment solutions, fraud detection and protection, information reporting, reconciliation, data integration solutions, and account balance optimization solutions.
For our clients involved in international trade, the Bank offers international payment services, foreign exchange, and trade letters of credit.
Company Retirement Plan Services
FBB acts as fiduciary and investment manager for corporate clients, creating and executing asset allocation strategies tailored to each corporation’s unique situation. FBB also acts as a discretionary trustee and investment fiduciary, sharing responsibility for monitoring assets to match the client’s specifications. Offering only non-proprietary funds removes conflict of interest while designing cost-effective company retirement plans which provide a competitive return. As of December 31, 2023, FBB had $395.9 million of company retirement plan assets under management and administration.
Private Wealth Management
FBB acts as fiduciary and investment manager for individual clients, creating and executing asset allocation strategies tailored to each client’s unique situation. FBB has full fiduciary powers and offers trust and estate administration, financial planning, and investment management, acting in a trustee or agent capacity. FBB also provides access to brokerage and custody-only services, for which it administers and safeguards assets. As of December 31, 2023, FBB had $2.726 billion of private wealth assets under management and administration.
The Bank also offers private banking to its Private Wealth Management clients. As of December 31, 2023, private wealth loans represented approximately 2% of total gross loans and leases receivable.
Bank Consulting Services
FBB provides outsourced treasury services to assist banks and other financial institutions with balance sheet management. These services include investment portfolio management and administrative services, and asset liability management services.
Competition
FBB encounters strong competition across all of our commercial banking products and services. Such competition includes banks, savings institutions, mortgage banking companies, credit unions, finance companies, equipment finance companies, mutual funds, insurance companies, brokerage firms, investment banking firms, and FinTech companies. The Bank also competes with regional and national financial institutions, many of which have greater liquidity, higher lending limits, greater access to capital, more established market recognition, and more resources than the Bank. We believe the experience, expertise, and responsiveness of our banking professionals, as well as our focus on fostering long-lasting relationships, sets us apart from our competitors.
Human Capital Management
The Corporation believes achieving strong financial results begins with its employees. In 2023, the workforce grew to 349 employees. While the majority of employees are located in the primary banking markets, the Corporation has employees working onsite, hybrid, and remote in over 20 states.
This geographic expansion allows the Corporation to continue to diversify the workforce, compete in an increasingly challenging talent landscape, and add producers and specialists as business lines and needs grow.
The Corporation’s culture is critical to success and is rooted in a set of founding beliefs and guided by a core cultural competency framework. The clarity of the Corporation’s core values creates a special and committed team atmosphere, which increases productivity, reduces turnover, attracts motivated employees, and cultivates a culture of belonging. The Corporation is in a people-differentiated business and attracting and retaining the best talent possible is critical to our success and financial performance. The strength of our culture and core values was demonstrated as follows throughout 2023:
a.The Corporation was named to the national list of Top Workplaces USA for the second year in a row and to the regional list of Wisconsin State Journal Top Workplaces for the South Central Wisconsin area and Milwaukee Journal Sentinel for the Milwaukee/Southeast Wisconsin area.
b.As part of the Top Workplaces Survey, the Corporation was also awarded the Top Workplaces Culture Excellence recognition across nine categories for a second year.
c.The Corporation achieved an Employee Engagement rating of 90% with an 88% participation rate – both well above the finance and insurance industry norm of 78% and 80%, respectively.
d.Employee Turnover was 9.33% – well below the employee turnover average of 17.7% in the banking industry, as reported in a survey conducted by Aon in 2023.
e.The Career Path Ratio for employees was 14%, above our 10% goal, indicating the prioritization of internal transfers and promotions throughout the organization to fill open positions, recognize strong employee performance and career progression.
f.Managerial Effectiveness, as measured in the engagement survey, was 86%, well above our goal of 80%. Managers and employees meet regularly to set and track progress on goals, have 1:1 conversations, complete check-ins focused on professional development, and track activity related to overall performance management.
g.A Culture Check-In was conducted with all employees to encourage open discussion and feedback between managers and employees. 100% of employees participated in the check-in.
h.A Rising Professionals Development Series was launched providing employee opportunities to grow, connect, and share ideas with peers and leadership within the organization.
i.A Leadership Challenge group was created comprised of emerging leaders and key employees from across the organization. The goal was to provide these emerging leaders with development opportunities and exposure to the strategic planning process to better prepare them to lead future planning cycles.
j.The Corporation provided ongoing diversity, equity, and inclusion education opportunities to all employees. In addition, workplace culture interviews were held with approximately 60% of our employees who identify as racially/ethnically diverse. The continued emphasis on an inclusive culture resulted in a Belonging rating of 90%, well above the 83% benchmark, in the 2023 employee engagement survey.
k.The Corporation is committed to paying an attractive, equitable, and competitive wage based on market rates for the employees' roles, experience, and performance. To ensure pay is competitive, the Corporation regularly benchmarks against other companies both within and outside the banking industry.
l.The Corporation is committed to supporting employees’ and their families’ well-being by offering a comprehensive total rewards package. The Corporation prioritizes supporting an employee’s physical, emotional, and financial wellness.
From the Corporation’s inception, the commitment to and investment in our employees and the communities we serve has been the foundation of the Corporation’s long-term success for the benefit of our shareholders. The Corporation’s commitment is best expressed in the words of our Belief Statement: At First Business Bank, we believe visionary, determined entrepreneurs and investors create a thriving economy and, in turn, social and economic advancement for their employees, investors, families, and communities. Built by driven entrepreneurs, First Business Bank has the experience to create both wealth, and a wealth of good in the world.
Subsidiaries
First Business Bank
FBB is a state bank chartered in 1909 in Wisconsin under the name Kingston State Bank. In 1990, FBB relocated its home office to Madison, Wisconsin, and began focusing on providing high-quality banking services to small- to medium-sized businesses located in Madison and the surrounding area. FBB’s commercial banking products and services include commercial loans, commercial real estate loans, asset-based loans, accounts receivable financing, SBA lending and servicing, floorplan financing, equipment loans and leases, commercial deposit accounts, company retirement solutions, and treasury management services. FBB offers a variety of deposit accounts and personal loans to business owners, executives, professionals, and high net worth individuals. FBB also offers private wealth management services and bank consulting services. FBB has four full-service banking locations in Madison, Brookfield, and Appleton, Wisconsin, and Leawood, Kansas.
As of December 31, 2023, FBB had six wholly-owned subsidiaries and total gross loans and leases receivable of $2.850 billion, total deposits of $2.799 billion, and total stockholders’ equity of $339.9 million.
Corporate Information
Our principal executive offices are located at 401 Charmany Drive, Madison, Wisconsin 53719 and our telephone number is (608) 238-8008. The contents of our website are not incorporated by reference into this Form 10-K. We maintain an Internet website at www.firstbusiness.bank. This Form 10-K and all of our other filings under the Securities Exchange Act of 1934, as amended (the “Exchange Act”), are available free of charge through that website, including copies of our proxy statement, annual reports on Form 10-K, quarterly reports on Form 10-Q, current reports on Form 8-K, and any amendments to those reports, as soon as reasonably practicable after we file those materials with, or furnish them to, the Securities and Exchange Commission (“SEC”).
Markets
Although certain of our commercial banking products and services are marketed throughout the Midwest and beyond, our primary markets lie in Wisconsin, Kansas, and Missouri. Specifically, our three markets in Wisconsin consist of South Central Wisconsin, Southeast Wisconsin, and Northeast Wisconsin. We serve these markets primarily through our offices in Madison, Brookfield, and Appleton, respectively. We serve the greater Kansas City Metro through our Leawood, Kansas office, which is located in the Kansas City metropolitan area. Each of our primary markets provides a unique set of economic and demographic characteristics which provide us with a variety of strategic opportunities. A brief description of each of our primary markets is as follows:
South Central Wisconsin
As the capital of Wisconsin and home of the University of Wisconsin-Madison, the greater Madison area, specifically Dane County and surrounding counties, offers an appealing economic environment populated by a highly educated workforce. While the economy of the South Central Wisconsin is driven in large part by the government and education sectors, there is also a diverse array of industries outside of these segments. South Central Wisconsin is also home to technology and research and development related companies, which benefit from the area’s strong governmental and academic ties, as well as several major health care systems and hospitals, which provides healthcare services to South Central Wisconsin.
Southeast Wisconsin
The Milwaukee metropolitan area has a diverse economic base with a highly skilled labor force and strong manufacturing sector. The most prominent economic sectors include manufacturing, financial services, health care, diversified service companies, and education. The area is home to several major hospitals, providing health services to the greater Southeast Wisconsin market, several large academic institutions including the University of Wisconsin-Milwaukee and Marquette University, and a wide variety of small- to medium-sized firms with representatives in nearly every industrial classification.
Northeast Wisconsin
The cities of Appleton, Green Bay, and Oshkosh, Wisconsin serve as the primary population centers in our Northeast Wisconsin market and provide an attractive market to a variety of industries, including transportation, utilities, packaging, and diversified services, with the most significant economic drivers being the manufacturing, packaging, and paper goods industries.
Kansas City Metro
Geographically located in the center of the U.S., the greater Kansas City Metro includes 15 counties and more than 50 communities in Missouri and Kansas, including a central business district located in Kansas City, Missouri and communities on both sides of the state line. The area is known for the diversity of its economic base, with major employers in manufacturing and distribution, architecture and engineering, technology, telecommunications, financial services, and bioscience, as well as local and federal government.
EXECUTIVE OFFICERS OF THE REGISTRANT
The following contains certain information about the executive officers of FBFS. There are no family relationships between any directors or executive officers of FBFS.
Corey A. Chambas, age 61, has served as a director of FBFS since July 2002, as Chief Executive Officer since December 2006 and as President from February 2005 until January 2023. He served as Chief Operating Officer of FBFS from February 2005 to September 2006 and as Executive Vice President from July 2002 to February 2005. He served as Chief Executive Officer of FBB from July 1999 to September 2006 and as President of FBB from July 1999 to February 2005. Mr. Chambas has over 35 years of commercial banking experience. Prior to joining FBFS in 1993, he was a Vice President of Commercial Lending with M&I Bank, now known as BMO Bank, N.A. , in Madison, Wisconsin.
Brian D. Spielmann, age 41, has served as Chief Financial Officer of FBFS since April 2023. Mr. Spielmann also serves as the Chief Financial Officer of the Bank. He also currently serves as a director of our FBSF subsidiary. Mr. Spielmann had been serving as the Corporation’s Deputy Chief Financial Officer and Chief Accounting Officer since May 2022. Mr.
Spielmann joined FBFS in 2006 and has held various positions including Chief Accounting Officer, Director of Finance, Financial Reporting Manager, and Senior Financial Accountant.
David R. Seiler, age 59, has served as Chief Operating Officer of FBFS since April 2016 and as President of FBFS since January 2023. He also currently serves as a director for our subsidiary FBSF. Mr. Seiler has over 25 years of financial services experience including his previous position as Managing Director (formerly Senior Vice President/Manager) of the Correspondent Banking Division with BMO Bank, N.A. in Milwaukee, Wisconsin which he held from 2007 to 2016. Prior to that, he held the position of Senior Vice President/Team Leader, Correspondent Real Estate Division from 2005 to 2007 and Vice President, Relationship Manager, Commercial Real Estate from 2002 to 2005.
Mark J. Meloy, age 62, has served as Executive Vice President of FBFS since January 2023. Mr. Meloy joined FBFS in 2000 and has held various positions including Chief Executive Officer of FBB, Executive Vice President of FBB, and President and Chief Executive Officer of FBB-Milwaukee. He also currently serves as a director of our FBSF subsidiary. Mr. Meloy has over 35 years of commercial lending experience. Prior to joining FBFS, Mr. Meloy was a Vice President and Senior Relationship Manager with Firstar Bank, NA, in Cedar Rapids, Iowa and Milwaukee, Wisconsin, now known as U.S. Bank, working in their financial institutions group with mergers and acquisition financing.
Bradley A. Quade, age 58, has served as Chief Credit Officer of FBFS since April 2020. Mr. Quade had been serving as the Corporation’s Deputy Chief Credit Officer since October 2019. He also currently serves as a director for our subsidiary FBSF. Mr. Quade has over 35 years of experience in banking at publicly traded and privately-owned institutions and has led successful lending teams in commercial banking, investment real estate, equipment leasing, and treasury management. Prior to joining FBFS, Mr. Quade held the position of Senior Vice President with Johnson Bank in Milwaukee, Wisconsin.
Jodi A. Chandler, age 59, has served as Chief Human Resources Officer of FBFS since January 2010. Prior to that, she held the position of Senior Vice President-Human Resources for several years. She has been an employee of FBFS for over 30 years.
Laura M. Garcia, age 51, has served as Chief Risk Officer for FBFS since March 2022. Prior to joining FBFS, she held the position of Head of North American Risk and Compliance, Managing Director for BMO Bank, N.A. in Chicago, Illinois, from 2018 to 2022. Ms. Garcia has over 30 years of experience in the financial services industry, centered in commercial banking, credit, compliance, and risk management.
James E. Hartlieb, age 53, has served as President of FBB since 2015 and as Chief Executive Officer of FBB and a director of FBB since January 2023. Mr. Hartlieb joined FBB in 2009 as Senior Vice President of Greater Dane County. He also currently serves as a director of our FBSF subsidiary. Mr. Hartlieb has over 25 years of financial services experience. Prior to joining FBB, Mr. Hartlieb held the position of Regional President with AMCORE Bank in Madison, Wisconsin, which he held from 1998 to 2009.
Daniel S. Ovokaitys, age 50, has served as Chief Information Officer since June 2014. Prior to joining FBFS, Mr. Ovokaitys held the position of Head of Corporate IT (North/South America) for Merz Pharmaceuticals, located in Frankfurt, Germany, from 2010 to 2014. He also served as Director of IT for Aurora Health Care from 2006 to 2010 and Manager of IT for the American Transmission Company from 2000 to 2006.
SUPERVISION AND REGULATION
Below is a brief description of certain laws and regulations that relate to us and the Bank. This narrative does not purport to be complete and is qualified in its entirety by reference to applicable laws and regulations.
General
Federal Deposit Insurance Corporation (“FDIC”)-insured institutions, like the Bank, their holding companies, and their affiliates are extensively regulated under federal and state law. As a result, our growth and earnings performance may be affected not only by management decisions and general economic conditions, but also by the requirements of federal and state statutes and by the regulations and policies of various bank regulatory agencies, including our primary regulators, the Board of Governors of the Federal Reserve System (“Federal Reserve”), the Bank’s state regulator, the Wisconsin Department of Financial Institutions (“WDFI”), and its primary federal regulator, the FDIC. Furthermore, taxation laws administered by the Internal Revenue Service (“IRS”) and state taxing authorities, accounting rules developed by the Financial Accounting Standards Board (“FASB”), securities laws administered by the SEC and state securities authorities, and anti-money laundering laws enforced by the U.S. Department of the Treasury (“Treasury”) have an impact on our business. The effect of these statutes, regulations, regulatory policies, and accounting rules are significant to our operations and results.
Federal and state banking laws impose a comprehensive system of supervision, regulation, and enforcement on the operations of FDIC-insured institutions, their holding companies, and affiliates that is intended primarily for the protection of the FDIC-insured deposits and depositors of banks, rather than shareholders. These laws, and the regulations of the bank regulatory agencies issued under them, affect, among other things, the scope of our business, the kinds and amounts of investments the Corporation and the Bank may make, limits on the Bank’s loans to any one borrower, reserve requirements, required capital levels relative to assets, the nature and amount of collateral for loans, the establishment of branches, the ability to merge, consolidate and acquire, dealings with the Corporation’s and the Bank’s insiders and affiliates, and payment of dividends. In reaction to the global financial crisis beginning in 2008 (the “global financial crisis”), and particularly following the passage of the Dodd-Frank Wall Street Reform and Consumer Protection Act of 2010 (“Dodd-Frank Act”), we experienced heightened regulatory requirements and scrutiny. Although the reforms primarily targeted systemically important financial service providers, their influence filtered down in varying degrees to community banks over time and caused our compliance and risk management processes, and the costs thereof, to increase. After the 2016 federal elections, momentum to decrease the regulatory burden on community banks gathered strength. In May 2018, the Economic Growth, Regulatory Relief and Consumer Protection Act (the “Regulatory Relief Act”) was enacted to modify or remove certain financial reform rules and regulations. While the Regulatory Relief Act maintains most of the regulatory structure established by the Dodd-Frank Act, it amends certain aspects of the regulatory framework for small depository institutions with assets of less than $10 billion, like us, and for large banks with assets of more than $50 billion that were considered systemically important under the Dodd-Frank Act solely because of size. Many of these changes were intended to result in meaningful regulatory relief for community banks and their holding companies, including new rules that may make the capital requirements less complex. For a discussion of capital requirements, see The Role of Capital below. The Regulatory Relief Act also eliminated questions about the applicability of certain Dodd-Frank Act reforms to community bank systems, including relieving the Bank of any requirement to engage in mandatory stress tests, name a risk committee, or comply with the Volcker Rule’s complicated prohibitions on proprietary trading and ownership of private funds. The Corporation believes these reforms are generally favorable to its operations.
The supervisory framework for U.S. banking organizations subjects banks and bank holding companies to regular examination by their respective regulatory agencies, which results in examination reports and ratings that are not publicly available and can impact the conduct and growth of their business. These examinations consider not only compliance with applicable laws and regulations, but also capital levels, asset quality and risk, management ability and performance, earnings, liquidity, information technology, and various other factors. The regulatory agencies generally have broad discretion to impose restrictions and limitations on the operations of a regulated entity where the agencies determine, among other things, that such operations are unsafe or unsound, fail to comply with applicable law, or are otherwise inconsistent with laws and regulations.
The following is a summary of the material elements of the supervisory and regulatory framework applicable to the Corporation and the Bank, beginning with a discussion of the continuing regulatory emphasis on our capital levels. It does not describe all of the statutes, regulations, and regulatory policies that apply, nor does it restate all of the requirements of those that are described. The descriptions are qualified in their entirety by reference to the particular statutory and regulatory provision.
The Role of Capital
Regulatory capital represents the net assets of a banking organization available to absorb losses. Because of the risks attendant to their business, FDIC-insured institutions are generally required to hold more capital than other businesses, which directly affects our earnings capabilities. While capital has historically been one of the key measures of the financial health of both bank holding companies and banks, its role became fundamentally more important in the wake of the global financial crisis, as the banking regulators recognized that the amount and quality of capital held by banks prior to the crisis was insufficient to absorb losses during periods of severe stress. Certain provisions of the Dodd-Frank Act and Basel III, discussed below, establish capital standards for banks and bank holding companies that are meaningfully more stringent than those in place previously.
Minimum Required Capital Levels. Banks have been required to hold minimum levels of capital based on guidelines established by the bank regulatory agencies since 1983. The minimums have been expressed in terms of ratios of “capital” divided by “total assets.” As discussed below, bank capital measures have become more sophisticated over the years and have focused more on the quality of capital and the risk of assets. Bank holding companies have historically had to comply with less stringent capital standards than their bank subsidiaries and have been able to raise capital with hybrid instruments such as trust preferred securities. The Dodd-Frank Act mandated the Federal Reserve to establish minimum capital levels for holding companies on a consolidated basis as stringent as those required for FDIC-insured institutions. A result of this change is that the proceeds of hybrid instruments, such as trust preferred securities, were excluded from capital over a phase-out period. However, if such securities were issued prior to May 19, 2010 by bank holding companies with less than $15 billion of assets, they may be retained, subject to certain restrictions.
The Basel III Rule. In July 2013, the U.S. federal banking agencies approved the implementation of the Basel III regulatory capital reforms in pertinent part, and, at the same time, promulgated rules effecting certain changes required by the Dodd-Frank Act (the “Basel III Rule”). In contrast to capital requirements historically, which were in the form of guidelines, Basel III was released in the form of enforceable regulations by each of the regulatory agencies. The Basel III Rule is applicable to all banking organizations that are subject to minimum capital requirements, including federal and state banks and savings and loan associations, as well as to bank and savings and loan holding companies, other than “small bank holding companies” who are relieved from compliance with the Basel III Rule. Historically we have been disqualified from taking advantage of the relief since we have securities registered with the SEC. Moreover, our asset size now exceeds the small bank holding company threshold. Banking organizations became subject to the Basel III Rule on January 1, 2015, and its requirements were fully phased-in as of January 1, 2019.
The Basel III Rule increased the required quantity and quality of capital and, for nearly every class of assets, it requires a more complex, detailed and calibrated assessment of risk and calculation of risk-weight amounts.
Not only did the Basel III Rule increase most of the required minimum capital ratios in effect prior to January 1, 2015, but it introduced the concept of Common Equity Tier 1 Capital, which consists primarily of common stock, related surplus (net of treasury stock), retained earnings, and Common Equity Tier 1 minority interests subject to certain regulatory adjustments. The Basel III Rule also changed the definition of capital by establishing more stringent criteria that instruments must meet to be considered Additional Tier 1 Capital (primarily non-cumulative perpetual preferred stock that meets certain requirements) and Tier 2 Capital (primarily other types of preferred stock and subordinated debt, subject to limitations). A number of instruments that historically qualified as Tier 1 Capital under Basel I do not qualify, or their qualifications changed. For example, noncumulative perpetual preferred stock, which qualified as simple Tier 1 Capital, does not qualify as Common Equity Tier 1 Capital, but qualifies as Additional Tier 1 Capital. The Basel III Rule also constrained the inclusion of minority interests, mortgage-servicing assets, and deferred tax assets in capital and requires deductions from Common Equity Tier 1 Capital in the event that such assets exceed a certain percentage of a banking institution’s Common Equity Tier 1 Capital.
The Basel III Rule required minimum capital ratios beginning as of January 1, 2015, as follows:
•A ratio of minimum Common Equity Tier 1 Capital equal to 4.5% of risk-weighted assets;
•An increase in the minimum required amount of Tier 1 Capital from 4% to 6% of risk-weighted assets;
•A continuation of the minimum required amount of Total Capital (Tier 1 plus Tier 2) at 8% of risk-weighted assets; and
•A minimum leverage ratio of Tier 1 Capital to total quarterly average assets equal to 4% in all circumstances.
In addition, institutions that seek the freedom to make capital distributions (including for dividends and repurchases of stock) and pay discretionary bonuses to executive officers without restriction must also maintain 2.5% in Common Equity Tier 1 Capital attributable to a capital conservation buffer. The purpose of the conservation buffer is to ensure that banking institutions maintain a buffer of capital that can be used to absorb losses during periods of financial and economic stress. Factoring in the conservation buffer increases the minimum ratios depicted above to 7% for Common Equity Tier 1 Capital, 8.5% for Tier 1 Capital and 10.5% for Total Capital.
Through subsequent rulemaking, the federal banking agencies provided certain forms of relief to banking organizations that are not subject to the capital regulation's advanced approaches, such as the Corporation. For instance, non-advanced approaches institutions are subject to simpler regulatory capital requirements for Mortgage Servicing Assets (“MSA”), certain Deferred Tax Assets (“DTA”) arising from temporary differences, investments in the capital of unconsolidated financial institutions, and requirements for the amount of capital issued by a consolidated subsidiary of a banking organization and held by third parties (sometimes referred to as a minority interest) that is includable in regulatory capital. Specifically, such institutions may deduct from Common Equity Tier 1 Capital any amount of MSAs, temporary difference DTAs, and investments in the capital of unconsolidated financial institutions that individually exceeds 25 percent of Common Equity Tier 1 Capital.
On July 27, 2023, the federal banking agencies issued a proposed rule to implement the final components of the Basel III standards set by the Basel Committee on Banking Supervision in 2017. The proposed rule, which would not apply to the Corporation and the Bank as proposed, would substantially revise the existing regulatory capital framework for institutions with $100 billion or more of assets.
Well-Capitalized Requirements. The ratios described above are minimum standards in order for banking organizations to be considered “adequately capitalized.” Bank regulatory agencies uniformly encourage banks to hold more capital and be “well-capitalized” and, to that end, federal law and regulations provide various incentives for banking organizations to maintain regulatory capital at levels in excess of minimum regulatory requirements.
For example, a banking organization that is well-capitalized may: (i) qualify for exemptions from prior notice or application requirements otherwise applicable to certain types of activities; (ii) qualify for expedited processing of other required notices or applications; and (iii) accept, roll-over, or renew brokered deposits. Higher capital levels could also be required if warranted by the particular circumstances or risk profiles of individual banking organizations. For example, the Federal Reserve’s capital guidelines contemplate that additional capital may be required to take adequate account of, among other things, interest rate risk, or the risks posed by concentrations of credit, nontraditional activities, or securities trading activities. Further, any banking organization experiencing or anticipating significant growth would be expected to maintain capital ratios, including tangible capital positions (i.e., Tier 1 Capital less all intangible assets), well above the minimum levels.
Under the capital regulations of the FDIC, in order to be well‑capitalized, a banking organization must maintain:
•A Common Equity Tier 1 Capital ratio to risk-weighted assets of 6.5% or more;
•A ratio of Tier 1 Capital to total risk-weighted assets of 8% or more;
•A ratio of Total Capital to total risk-weighted assets of 10% or more; and
•A leverage ratio of Tier 1 Capital to total adjusted average quarterly assets of 5% or greater.
As of December 31, 2023: (i) the Bank is not subject to a directive from the WDFI or the FDIC to increase its capital; and (ii) the Bank was well-capitalized, as defined by FDIC regulations. Additionally, the Corporation had regulatory capital in excess of the Federal Reserve’s requirements as of December 31, 2023.
Prompt Corrective Action. The concept of an institution being “well-capitalized” is part of a regulatory enforcement regime that provides the federal banking regulators with broad power to take “prompt corrective action” to resolve the problems of institutions based on the capital level of each particular institution. The extent of the regulators’ powers depends on whether the institution in question is “adequately capitalized,” “undercapitalized,” “significantly undercapitalized” or “critically undercapitalized,” in each case as defined by regulation. Depending upon the capital category to which an institution is assigned, the regulators’ corrective powers include: (i) requiring the institution to submit a capital restoration plan; (ii) limiting the institution’s asset growth and restricting its activities; (iii) requiring the institution to issue additional capital stock (including additional voting stock) or to sell itself; (iv) restricting transactions between the institution and its affiliates; (v) restricting the interest rate that the institution may pay on deposits; (vi) ordering a new election of directors of the institution; (vii) requiring that senior executive officers or directors be dismissed; (viii) prohibiting the institution from accepting deposits from correspondent banks; (ix) requiring the institution to divest certain subsidiaries; (x) prohibiting the payment of principal or interest on subordinated debt; and (xi) ultimately, appointing a receiver for the institution.
Community Bank Capital Simplification. Community banks have long raised concerns with bank regulators about the regulatory burden, complexity, and costs associated with certain provisions of the Basel III Rule. In response, Congress provided a potential Basel III “off-ramp” for certain institutions, like us, under Section 201 of the Regulatory Relief Act. Pursuant to authority granted thereunder, on September 17, 2019, the agencies adopted a final rule, effective on January 1, 2020, providing that banks and bank holding companies that have less than $10 billion in total consolidated assets and meet other qualifying criteria, including a “Community Bank Leverage Ratio” (“CBLR”) calculated by dividing Tier 1 capital by average total consolidated assets of greater than 9%, will be eligible to opt into the CBLR framework. By opting into the framework, qualifying banks and bank holding companies maintaining a CBLR greater than 9% will be considered to have satisfied the generally applicable risk-based and leverage capital requirements in the agencies’ capital rules and, if applicable, will be considered to have met the well-capitalized ratio requirements for purposes of section 38 of the Federal Deposit Insurance Act. In addition to the consolidated assets and CBLR requirements described above, a qualifying bank or bank holding company must also have (i) total off-balance sheet exposures (excluding derivatives other than sold credit derivatives and unconditionally cancellable commitments) of 25% or less of total consolidated assets, and (ii) the sum of total trading assets and trading liabilities of 5% or less of total consolidated assets.
The Corporation and the Bank opted out of the CBLR framework for each reporting period in 2023 and has the option to opt into the framework for future reporting periods. The decision to opt into or out of the CBLR framework is monitored on an ongoing basis.
First Business Financial Services, Inc.
General. As the sole shareholder of the Bank, we are a bank holding company. As a bank holding company, we are registered with, and subject to regulation, supervision, and enforcement by, the Federal Reserve under the Bank Holding Company Act of 1956, as amended (“BHCA”). We are legally obligated to act as a source of financial strength to the Bank and to commit resources to support the Bank in circumstances where we might not otherwise do so. Under the BHCA, we are subject to periodic examination by the Federal Reserve. We are required to file with the Federal Reserve periodic reports of our operations and such additional information regarding the Corporation and our subsidiaries as the Federal Reserve may require.
Acquisitions and Activities. The primary purpose of a bank holding company is to control and manage banks. The BHCA generally requires the prior approval of the Federal Reserve for any merger involving a bank holding company or any acquisition by a bank holding company of another bank or bank holding company. Subject to certain conditions (including deposit concentration limits established by the BHCA), the Federal Reserve may allow a bank holding company to acquire banks located in any state of the United States. In approving interstate acquisitions, the Federal Reserve is required to give effect to applicable state law limitations on the aggregate amount of deposits that may be held by the acquiring bank holding company and its FDIC-insured institution affiliates in the state in which the target bank is located (provided that those limits do not discriminate against out-of-state institutions or their holding companies) and state laws that require that the target bank has been in existence for a minimum period of time (not to exceed five years) before being acquired by an out-of-state bank holding company. Furthermore, in accordance with the Dodd-Frank Act, bank holding companies must be well-capitalized and well-managed in order to effect interstate mergers or acquisitions. For a discussion of the capital requirements, see The Role of Capital above.
The BHCA generally prohibits the Corporation from acquiring direct or indirect ownership or control of more than 5% of the voting shares of any company that is not a bank and from engaging in any business other than that of banking, managing and controlling banks or furnishing services to banks and their subsidiaries. This general prohibition is subject to a number of exceptions. The principal exception allows bank holding companies to engage in, and to own shares of companies engaged in, certain businesses found by the Federal Reserve prior to November 11, 1999 to be “so closely related to banking ... as to be a proper incident thereto.” This authority permits the Corporation to engage in a variety of banking-related businesses, including the ownership and operation of a savings association, or any entity engaged in consumer finance, equipment leasing, the operation of a computer service bureau (including software development), and mortgage banking and brokerage services. The BHCA does not place territorial restrictions on the domestic activities of non-bank subsidiaries of bank holding companies.
Additionally, bank holding companies that meet certain eligibility requirements prescribed by the BHCA and elect to operate as financial holding companies may engage in, or own shares in companies engaged in, a wider range of non-banking activities, including securities and insurance underwriting and sales, merchant banking, and any other activity that the Federal Reserve, in consultation with the Secretary of the Treasury, determines by regulation or order is financial in nature or incidental to any such financial activity or that the Federal Reserve determines by order to be complementary to any such financial activity and does not pose a substantial risk to the safety or soundness of FDIC-insured institutions or the financial system generally. The Corporation has not elected to operate as a financial holding company.
Change in Control. Federal law also prohibits any person or company from acquiring “control” of an FDIC-insured depository institution or its holding company without prior notice to the appropriate federal bank regulator. “Control” is conclusively presumed to exist upon the acquisition of 25% or more of the outstanding voting securities of a bank or bank holding company but may arise under certain circumstances between 10% and 24.99% ownership. On January 30, 2020, the Federal Reserve issued a final rule clarifying and expanding upon the Federal Reserve’s position on determinations of whether a company has the ability to exercise a controlling influence over another company. In particular, the final rule is intended to provide a better understanding of the facts and circumstances that the Federal Reserve considers most relevant when assessing whether control exists.
Dividend Payments. Our ability to pay dividends to our shareholders may be affected by both general corporate law considerations and policies of the Federal Reserve applicable to bank holding companies. As a Wisconsin corporation, we are subject to the limitations of Wisconsin law, which allows us to pay dividends unless, after giving effect to a dividend, any of the following would occur: (i) we would not be able to pay our debts as they become due in the usual course of business or (ii) the total assets would be less than the sum of its total liabilities plus any amount that would be needed if we were to be dissolved at the time of the dividend payment, to satisfy the preferential rights upon dissolution of shareholders whose rights are superior to the rights of the shareholders receiving the distribution.
As a general matter, the Federal Reserve has indicated that the board of directors of a bank holding company should eliminate, defer, or significantly reduce dividends to shareholders if: (i) the company’s net income available to shareholders for the past four quarters, net of dividends previously paid during that period, is not sufficient to fully fund the dividends; (ii) the prospective rate of earnings retention is inconsistent with the company’s capital needs and overall current and prospective financial condition; or (iii) the company will not meet, or is in danger of not meeting, its minimum regulatory capital adequacy ratios.
Moreover, under the Dodd-Frank Act and the requirements of the Federal Reserve, the Corporation, as a bank holding company, is required to serve as a source of financial strength to the Bank and to commit resources to support the Bank. In addition, consistent with its “source of strength” policy, the Federal Reserve has stated that, as a matter of prudent banking, a bank holding company should not maintain a level of cash dividends to its shareholders that places undue pressure on the capital of its bank subsidiaries, or that can be funded only through additional borrowings or other arrangements that may undermine the bank holding company’s ability to serve as a source of strength. The appropriate federal regulatory authorities have indicated that paying dividends that deplete a bank’s capital base to an inadequate level would be an unsafe and unsound banking practice and that banking organizations should generally pay dividends only out of current operating earnings.
The Federal Reserve possesses enforcement powers over bank holding companies and their non-bank subsidiaries to prevent or remedy actions that represent unsafe or unsound practices or violations of applicable statutes and regulations. Among these powers is the ability to proscribe the payment of dividends by banks and bank holding companies. In addition, under the Basel III Rule, institutions that seek the freedom to pay dividends have to maintain 2.5% in Common Equity Tier 1 Capital attributable to the capital conservation buffer. See The Role of Capital above for additional information.
Monetary Policy. The monetary policy of the Federal Reserve has a significant effect on the operating results of financial or bank holding companies and their subsidiaries. Among the tools available to the Federal Reserve to affect the money supply are open market transactions in U.S. government securities, changes in the discount rate on bank borrowings, and changes in reserve requirements against bank deposits. These means are used in varying combinations to influence overall growth and distribution of bank loans, investments and deposits, and their use may affect interest rates charged on loans or paid on deposits.
Federal Securities Regulation. The Corporation’s common stock is registered with the SEC under the Securities Act of 1933, as amended, and the Exchange Act. Consequently, we are subject to the information, proxy solicitation, insider trading, and other restrictions and requirements of the SEC under the Exchange Act.
Corporate Governance. The Dodd-Frank Act addressed many investor protection, corporate governance, and executive compensation matters that affect most U.S. publicly traded companies. The Dodd-Frank Act increased shareholder influence over boards of directors by requiring companies to give shareholders a nonbinding vote on executive compensation and so-called “golden parachute” payments, and by authorizing the SEC to promulgate rules that would allow shareholders to nominate and solicit voters for their own candidates using a company’s proxy materials. The legislation also directed the Federal Reserve to promulgate rules prohibiting excessive compensation paid to executives of bank holding companies, regardless of whether such companies are publicly traded.
The Bank
General. The Bank is a Wisconsin state-chartered bank. The deposit accounts of the Bank are insured by the FDIC’s Deposit Insurance Fund (“DIF”) to the maximum extent provided under federal law and FDIC regulations. As a Wisconsin-chartered FDIC-insured bank, the Bank is subject to the examination, supervision, reporting, and enforcement requirements of the WDFI, the chartering authority for Wisconsin banks, and the FDIC, designated by federal law as the primary federal regulator of insured state banks that, like the Bank, are not members of the Federal Reserve System (nonmember banks).
Deposit Insurance. As an FDIC-insured institution, the Bank is required to pay deposit insurance premium assessments to the FDIC. Deposits are insured up to applicable limits by the FDIC and such insurance is backed by the full faith and credit of the United States Government. Under the Dodd-Frank Act, a permanent increase in deposit insurance was authorized to $250,000 per depositor, per insured depository institution for each account ownership category.
The FDIC has adopted a risk-based assessment system whereby FDIC-insured institutions pay insurance premiums at rates based on their risk classification. For institutions like the Bank that are not considered large and highly complex banking organizations, assessments are now based on examination ratings and financial ratios. At least semi-annually, the FDIC updates its loss and income projections for the DIF and, if needed, increases or decreases the assessment rates, following notice and comment on proposed rulemaking. The assessment base against which an FDIC-insured institution’s deposit insurance premiums paid to the DIF has been calculated since effectiveness of the Dodd-Frank Act is based on its average consolidated total assets less its average tangible equity. This method shifted the burden of deposit insurance premiums toward those large depository institutions that rely on funding sources other than U.S. deposits.
The Dodd-Frank Act set the minimum DIF reserve ratio at 1.35% of the estimated amount of total insured deposits, and eliminating the requirement that the FDIC pay dividends to FDIC-insured institutions when the reserve ratio exceeds certain thresholds.
On October 18, 2022, the FDIC adopted a final rule increasing the initial base deposit insurance rate schedules by 2 basis points, beginning with the first quarterly assessment period of 2023. Starting January 1, 2023, the total base assessment rates for small banks, such as the Bank, ranged from 2.5 basis points to 32 basis points. This new assessment rate schedule will remain in effect unless and until the reserve ratio meets or exceeds 2.00%. Progressively lower assessment rate schedules will take effect when the reserve ratio reaches 2.00%, and again when it reaches 2.50%. The Bank’s assessment rate for deposit insurance was approximately 8 basis points for 2023.
The DIF reserve ratio was 1.10% as of June 30, 2023, which is less than the statutory minimum reserve ratio of 1.35%, which is required to be achieved by September 30, 2028. There was a sharp decline in the DIF in 2023 following the failures of Silicon Valley Bank, Signature Bank and First Republic Bank in the first half of 2023, coupled with strong insured deposit growth. On November 16, 2023, the FDIC issued a final rule to implement a special assessment to recover the loss DIF associated with protecting uninsured depositors following these bank failures. Under the final rule, the assessment base for an insured depository institution will be equal to the institution’s estimated uninsured deposits as of December 31, 2022, adjusted to exclude the first $5 billion in estimated uninsured deposits. Under the final rule, the FDIC will collect the special assessment at an annual rate of 13.4 basis points beginning with the first quarterly assessment period of 2024 and will continue to collect special assessments for an anticipated total of eight quarterly assessment periods. At December 31, 2023, our estimated level of uninsured deposits was below this threshold, and therefore, the Bank is not subject to this special assessment.
The FDIC is authorized to conduct examinations of and require reporting by FDIC-insured institutions. It is also authorized to terminate a depository bank’s deposit insurance upon a finding by the FDIC that the bank’s financial condition is unsafe or unsound or that the institution has engaged in unsafe or unsound practices or has violated any applicable rule, regulation, order or condition enacted or imposed by the bank’s regulatory agency. The termination of deposit insurance for the Bank would have a material adverse effect on our earnings, operations and financial condition.
Supervisory Assessments. All Wisconsin banks are required to pay supervisory assessments to the WDFI to fund the operations of that agency. The amount of the assessment is calculated on the basis of the Bank’s total assets.
Liquidity Requirements. Liquidity is a measure of the ability and ease with which bank assets may be converted to cash. Liquid assets are those that can be converted to cash quickly if needed to meet financial obligations. To remain viable, FDIC-insured institutions must have enough liquid assets to meet their near-term obligations, such as withdrawals by depositors. Because the global financial crisis was in part a liquidity crisis, Basel III also includes a liquidity framework that requires FDIC-insured institutions to measure their liquidity against specific liquidity tests. One test, referred to as the Liquidity Coverage Ratio, is designed to ensure that the banking entity has an adequate stock of unencumbered high-quality liquid assets that can be converted easily and immediately in private markets into cash to meet liquidity needs for a 30-calendar day liquidity stress scenario. The other test, known as the Net Stable Funding Ratio, is designed to promote more medium- and long-term funding of the assets and activities of FDIC-insured institutions over a one-year horizon. These tests provide an incentive for banks and holding companies to increase their holdings in Treasury securities and other sovereign debt as a component of assets, increase the use of long-term debt as a funding source, and rely on stable funding like core deposits (in lieu of brokered deposits).
Dividend Payments. The primary source of funds for the Corporation is dividends from the Bank. Under Wisconsin law, the board of directors of a bank may declare and pay a dividend from its undivided profits in an amount it considers expedient. The board of directors must provide for the payment of all expenses, losses, required reserves, taxes, and interest accrued or due from the bank before the declaration of dividends from undivided profits. If dividends declared and paid in either of the two immediately preceding years exceeded net income for either of those two years respectively, the bank may not declare or pay any dividend in the current year that exceeds year-to-date net income except with the written consent of the WDFI. The FDIC and the WDFI may prohibit the payment of dividends by the Bank if either or both determine such payment would constitute an unsafe or unsound practice. In addition, under the Basel III Rule, institutions that seek the freedom to pay dividends will have to maintain 2.5% in Common Equity Tier 1 Capital attributable to the capital conservation buffer. See The Role of Capital above.
State Bank Investments and Activities. The Bank is permitted to make investments and engage in activities directly or through subsidiaries as authorized by Wisconsin law. However, under federal law and FDIC regulations, FDIC-insured state banks are prohibited, subject to certain exceptions, from making or retaining equity investments of a type, or in an amount, which are not permissible for a national bank. Federal law and FDIC regulations also prohibit FDIC-insured state banks and their subsidiaries, subject to certain exceptions, from engaging as principal in any activity that is not permitted for a national bank unless the bank meets, and continues to meet, its minimum regulatory capital requirements and the FDIC determines that the activity would not pose a significant risk to the DIF. These restrictions have not had, and are not currently expected to have, a material impact on the operations of the Bank.
Insider Transactions. The Bank is subject to certain restrictions imposed by federal law on “covered transactions” between the Bank and its “affiliates.” We are an affiliate of the Bank for purposes of these restrictions, and covered transactions subject to the restrictions include extensions of credit to the Corporation, investments in the stock or other securities of the Corporation, and the acceptance of the stock or other securities of the Corporation as collateral for loans made by the Bank. The Dodd-Frank Act enhanced the requirements for certain transactions with affiliates, including an expansion of the definition of “covered transactions” and an increase in the amount of time for which collateral requirements regarding covered transactions must be maintained.
Certain limitations and reporting requirements are also placed on extensions of credit by the Bank to its directors and officers, to directors and officers of the Corporation and its subsidiaries, to principal shareholders of the Corporation, and to “related interests” of such directors, officers, and principal shareholders. In addition, federal law and regulations may affect the terms upon which any person who is a director or officer of the Corporation or the Bank, or a principal shareholder of the Corporation, may obtain credit from banks with which the Bank maintains a correspondent relationship.
Safety and Soundness Standards/Risk Management. The federal banking agencies have adopted operational and managerial standards to promote the safety and soundness of FDIC-insured institutions. The standards apply to internal controls, information systems, internal audit systems, risk mitigation, bank operations, compliance, credit underwriting, interest rate exposure, asset growth, compensation, fiduciary risk, asset quality, and earnings.
In general, the safety and soundness standards prescribe the goals to be achieved in each area, and each institution is responsible for establishing its own procedures to achieve those goals. While regulatory standards do not have the force of law, if an institution operates in an unsafe and unsound manner, the FDIC-insured institution’s primary federal regulator may require the institution to submit a plan for achieving and maintaining compliance. If an FDIC-insured institution fails to submit an acceptable compliance plan or fails in any material respect to implement a compliance plan that has been accepted by its primary federal regulator, the regulator is required to issue an order directing the institution to cure the deficiency. Until the deficiency cited in the regulator’s order is cured, the regulator may restrict the FDIC-insured institution’s rate of growth, require the FDIC-insured institution to increase its capital, restrict the rates the institution pays on deposits, or require the institution to take any action the regulator deems appropriate under the circumstances. Noncompliance with safety and soundness may also constitute grounds for other enforcement action by the federal bank regulatory agencies, including cease and desist orders and civil money penalty assessments.
During the past several years, the bank regulatory agencies have increasingly emphasized the importance of sound risk management processes and strong internal controls when evaluating the activities of the FDIC-insured institutions they supervise. Properly managing risks has been identified as critical to the conduct of safe and sound banking activities and has become even more important as new technologies, product innovation, and the size and speed of financial transactions have changed the nature of banking markets. The agencies have identified a spectrum of risks facing a banking institution including, but not limited to, credit, market, liquidity, operational, compliance, and reputational risk. In particular, recent regulatory pronouncements have focused on operational risk, which arises from the potential that inadequate information systems, operational problems, breaches in internal controls, fraud, or unforeseen catastrophes will result in unexpected losses. New products and services, third-party risk, incentive compensation, and cybersecurity are critical sources of risk that FDIC-insured institutions are expected to address in the current environment. The Bank is expected to have active board and senior management oversight; adequate policies, procedures, and limits; adequate risk measurement, monitoring, and management information systems; and comprehensive internal controls.
Branching Authority. Wisconsin banks, such as the Bank, have the authority under Wisconsin law to establish branches anywhere in the State of Wisconsin, subject to receipt of all required regulatory approvals. The establishment of new interstate branches has historically been permitted only in those states the laws of which expressly authorize such expansion. The Dodd-Frank Act permits well-capitalized and well-managed banks to establish new interstate branches or acquire individual branches of a bank in another state (rather than the acquisition of an out-of-state bank in its entirety) without impediments. Federal law permits state and national banks to merge with banks in other states subject to: (i) regulatory approval; (ii) federal and state deposit concentration limits; and (iii) state law limitations requiring the merging bank to have been in existence for a minimum period of time (not to exceed five years) prior to the merger.
Brokered Deposits. On December 19, 2018, the FDIC adopted a final rule on the treatment of reciprocal deposits pursuant to the Regulatory Relief Act. The final rule, effective March 6, 2019, exempts certain reciprocal deposits from being considered as brokered deposits for certain insured institutions. In particular, well-capitalized and well-rated institutions are not required to treat reciprocal deposits as brokered deposits up to the lesser of 20% of their total liabilities or $5 billion. Institutions that are not both well-capitalized and well-rated may also exclude reciprocal deposits from their brokered deposits under certain circumstances.
On December 15, 2020, the FDIC issued a final rule on brokered deposits. The rule aims to clarify and modernize the FDIC’s existing regulatory framework for brokered deposits. Among other things, the rule establishes bright-line standards for determining whether an entity meets the definition of a “deposit broker,” and identifies a number of business relationships (or “designated exceptions”) that automatically meet the “primary purpose” exception. The rule also establishes a transparent application process for entities that seek a “primary purpose” exception but do not meet one of the “designated exceptions.” The new rule also reflects technological changes across the banking industry and removes regulatory disincentives that limit banks’ ability to serve their customers. Full compliance with the amended brokered deposits regulation was required by January 1, 2022. The FDIC staff continues to implement the final rule through the issuance of interpretative guidance and other administrative actions.
Community Reinvestment Act (“CRA”) Requirements. The CRA requires the Bank to have a continuing and affirmative obligation in a safe and sound manner to help meet the credit needs of the entire community, including low- and moderate-income (“LMI”) neighborhoods. Federal regulators regularly assess the Bank’s record of meeting the credit needs of its communities. An institution’s CRA assessment may be used by its regulators in their evaluation of certain applications, including a merger, acquisition, or the establishment of a branch office. An unsatisfactory rating may be used as a basis for denial of such an application.
On October 24, 2023, the federal banking agencies jointly issued a final rule to strengthen and modernize the existing CRA regulations. Under the final rule, the agencies will evaluate a bank’s CRA performance based upon the varied activities that it conducts and the communities in which it operates. CRA evaluations and data collection requirements will be tailored based on bank size and type. The Bank would be considered a large bank with assets of greater than $2 billion under the final rule and therefore will be evaluated under new lending, retail services and products, community development financing, and community development services tests. The final rule includes CRA assessment areas associated with mobile and online banking, and new metrics and benchmarks to assess retail lending performance. In addition, the final rule emphasizes smaller loans and investments that can have a high impact and be more responsive to the needs of LMI communities. The final rule will take effect on April 1, 2024; however, compliance with the majority of the final rule's provisions will not be required until January 1, 2026, and the data reporting requirements of the final rule will not take effect until January 1, 2027.
Anti-Money Laundering. The Bank is subject to several federal laws that are designed to combat money laundering and terrorist financing, and to restrict transactions with persons, companies, or foreign governments sanctioned by United States authorities. This category of laws includes the Bank Secrecy Act (the “BSA”), the Money Laundering Control Act, the USA PATRIOT Act (collectively, “AML laws”) and implementing regulations as administered by the United States Treasury Department’s Office of Foreign Assets Control (“sanctions laws”).
As implemented by federal banking and securities regulators and the Department of the Treasury, AML laws obligate depository institutions to verify their customers’ identity, conduct customer due diligence, report on suspicious activity, file reports of transactions in currency, and conduct enhanced due diligence on certain accounts. In addition, the Financial Crimes Enforcement Network (“FinCEN”) promulgated customer due diligence and customer identification rules that required banks to identify and verify the identity of beneficial owners of all legal entity customers (with certain exclusions) at the time a new account is opened (subject to certain exemptions). Sanctions laws prohibit persons of the United States from engaging in any transaction with a restricted person or restricted country. Depository institutions are required by their respective federal regulators to maintain policies and procedures in order to ensure compliance with the above obligations. Federal regulators regularly examine BSA/AML and sanctions compliance programs to ensure their adequacy and effectiveness, and the frequency and extent of such examinations and the remedial actions resulting therefrom have been increasing. Non–compliance with sanctions laws and/or AML laws or failure to maintain an adequate BSA/AML compliance program can lead to significant monetary penalties and reputational damage, and federal regulators evaluate the effectiveness of an applicant in combating money laundering when determining whether to approve a proposed bank merger, acquisition, restructuring, or other expansionary activity.
On January 1, 2021, the National Defense Authorization Act (“NDAA”) was enacted by Congress. The new law establishes the most significant overhaul of BSA and AML since the USA PATRIOT Act of 2001, including: (i) new beneficial ownership information and the establishment of a beneficial ownership registry, which requires corporate entities (generally any corporation, limited liability company or similar entity with 20 or fewer employees and annual gross income of $5 million or less) to report beneficial ownership information to FinCEN (which information will be maintained by FinCEN and made available upon request to financial institutions); (ii) whistleblower and penalty enhancements; (iii) improvements to existing information sharing provisions that permit financial institutions to share information relating to suspicious activity reports for purposes of combating illicit finance risks; and (iv) provisions emphasizing the importance of risk-based approaches to AML program requirements. Many of the changes to the BSA and AML require the Department of Treasury and FinCEN to promulgate rules.
On September 29, 2022, FinCEN issued a final regulation implementing the BSA amendments included in the NDAA with respect to beneficial ownership.
Privacy and Cybersecurity. The Bank is subject to many U.S. federal and state laws and regulations governing requirements for maintaining policies and procedures to protect non-public personal information of their consumers. These laws require the Bank to periodically disclose their privacy policies and practices relating to sharing such information and permit consumers to opt out of their ability to share information with unaffiliated third parties under certain circumstances. They also impact the Bank’s ability to share certain information with affiliates and non-affiliates for marketing and/or non-marketing purposes, or to contact clients with marketing offers.
Moreover, given the increased focus on privacy and data security in the United States and internationally, laws and regulations related to the same are evolving. Multiple states and Congress are considering additional laws or regulations that could create or alter individual privacy rights and impose additional obligations on banks and related financial services companies in possession of or with access to personal data.
The Bank is required to implement a comprehensive information security program that includes administrative, technical, and physical safeguards to ensure the security and confidentiality of customer records and information. These security and privacy policies and procedures, for the protection of personal and confidential information, are in effect across the Bank and its subsidiaries. On November 18, 2021, the FDIC, the Federal Reserve System, and the OCC (collectively, the agencies) issued a joint final rule, to establish computer-security incident notification requirements for banking organizations and their bank service providers.
Specifically, the rule requires banking organizations to notify their primary federal regulator as soon as possible and no later than 36 hours after the discovery of a “computer-security incident” that rises to the level of a "notification incident," as those terms are defined under the final rule. Banks’ service providers are required under the rule to notify any affected bank to or on behalf of which the service provider provides services "as soon as possible" after determining that it has experienced an incident that materially disrupts or degrades, or is reasonably likely to materially disrupt or degrade, covered services provided to such bank for as much as four hours.
The federal banking agencies have also adopted guidelines for establishing information security standards and cybersecurity programs for implementing safeguards under the supervision of the board of directors. These guidelines, along with related regulatory materials, increasingly focus on risk management and processes related to information technology and the use of third parties in the provision of financial services. Moreover, recent cyberattacks against banks and other financial institutions that resulted in unauthorized access to confidential customer information have prompted the federal banking regulators to issue more extensive guidance on cybersecurity risk management. Among other things, financial institutions are expected to design multiple layers of security controls to establish lines of defense and ensure that their risk management processes address the risks posed by compromised customer credentials, including security measures to authenticate customers accessing internet-based services. A financial institution also should have a robust business continuity program to recover from a cyberattack and procedures for monitoring the security of third-party service providers that may have access to nonpublic data at the institution.
Concentrations in Commercial Real Estate. Concentration risk exists when FDIC-insured institutions deploy too many assets to any one industry or segment. A concentration in commercial real estate is one example of regulatory concern. The interagency Concentrations in Commercial Real Estate Lending, Sound Risk Management Practices guidance (“CRE Guidance”) provides supervisory criteria, including the following numerical indicators, to assist bank examiners in identifying banks with potentially significant commercial real estate loan concentrations that may warrant greater supervisory scrutiny: (i) commercial real estate loans exceeding 300% of capital and increasing 50% or more in the preceding three years; or (ii) construction and land development loans exceeding 100% of capital. The CRE Guidance does not limit banks’ levels of commercial real estate lending activities, but rather guides institutions in developing risk management practices and levels of capital that are commensurate with the level and nature of their commercial real estate concentrations. On December 18, 2015, the federal banking agencies issued a statement to reinforce prudent risk-management practices related to CRE lending, having observed substantial growth in many CRE asset and lending markets, increased competitive pressures, rising CRE concentrations in banks, and an easing of CRE underwriting standards. The federal bank agencies reminded FDIC-insured institutions to maintain underwriting discipline and exercise prudent risk-management practices to identify, measure, monitor, and manage the risks arising from CRE lending. In addition, FDIC-insured institutions must maintain capital commensurate with the level and nature of their CRE concentration risk.
Consumer Financial Services. The CFPB has broad rulemaking authority for a wide range of consumer protection laws that apply to all providers of consumer products and services, including the Bank, as well as the authority to prohibit “unfair, deceptive or abusive” acts and practices.
The CFPB has examination and enforcement authority over providers with more than $10 billion in assets. FDIC-insured institutions with $10 billion or less in assets, like the Bank, continue to be examined by their applicable bank regulators.
Because abuses in connection with residential mortgages were a significant factor contributing to the financial crisis, many new rules issued by the CFPB and required by the Dodd-Frank Act addressed mortgage and mortgage-related products, their underwriting, origination, servicing, and sales. The Dodd-Frank Act significantly expanded underwriting requirements applicable to loans secured by 1-4 family residential real property and augmented federal law combating predatory lending practices. In addition to numerous disclosure requirements, the Dodd‑Frank Act imposed new standards for mortgage loan originations on all lenders, including banks and savings associations, in an effort to strongly encourage lenders to verify a borrower’s ability to repay, while also establishing a presumption of compliance for certain “qualified mortgages.” The Regulatory Relief Act provided relief in connection with mortgages for banks with assets of less than $10 billion, and, as a result, mortgages the Bank makes are now considered to be qualified mortgages if they are held in portfolio for the life of the loan.
Current Expected Credit Loss (“CECL”) Treatment. In June 2016, the FASB issued an accounting standard update, “Financial Instruments-Credit Losses (Topic 326), Measurement of Credit Losses on Financial Instruments,” which replaces the current “incurred loss” model for recognizing credit losses with an “expected loss” model referred to as the CECL model. Under the CECL model, we are required to present certain financial assets carried at amortized cost, such as loans held for investment and held-to-maturity debt securities, at the net amount expected to be collected. The measurement of expected credit losses is based on information about past events, including historical experience, current conditions, and reasonable and supportable forecasts that affect the collectability of the reported amount.
On December 21, 2018, the federal banking agencies issued a joint final rule revising their regulatory capital rules to (i) address the impending implementation of the CECL accounting standard under GAAP; (ii) provide an optional three-year phase-in period for the day-one adverse regulatory capital effects that banking organizations were expected to experience upon enacting CECL; and (iii) require the use of CECL in stress tests beginning with the 2020 capital planning and stress testing cycle for certain banking organizations. The final rule took effect on April 1, 2019; however, on August 26, 2020, the federal bank regulatory agencies issued a final rule allowing institutions that adopted the CECL accounting standard in 2020 the option to mitigate the estimated capital effects of CECL for two years, followed by the three-year transition period already provided by the joint final rule. We elected to use the 2020 Capital Transition Relief as permitted under the applicable regulations. As a result, the three-year phase-out period described above commenced in 2023.
Digital Asset Regulation. The federal banking agencies have issued interpretive guidance and statements regarding the engagement by banking organizations in certain digital asset activities. On August 16, 2022, the Federal Reserve released supervisory guidance encouraging all banking organizations supervised by the agency to notify its lead supervisory point of contact at the Federal Reserve prior to engaging in any digital asset-related activity. Prior to engaging in any such activities, banking organizations are expected to ensure their proposed activities are legally permissible under relevant state and federal laws, and ensure they have implemented adequate systems, risk management, and internal controls to ensure that the activities are conducted in a safe and sound manner consistent with applicable laws, including consumer protection laws. On April 7, 2022, the FDIC issued a financial institution letter also requiring its supervised institutions to provide notice and obtain supervisory feedback prior to engaging in any crypto-related activities.
On January 3, 2023, the federal banking agencies issued additional guidance in the form of a joint statement addressing digital asset-related risks to banking organizations. That statement noted the recent volatility and exposure of vulnerabilities in the digital asset sector and indicated that the agencies are continuing to assess whether or how the digital asset-related activities of banking organizations can be conducted in a safe and sound manner and in compliance with all applicable laws and regulations. The statement stressed that each agency has developed, and expects banking organizations to follow, supervisory processes for evaluating proposed and existing digital asset activities.
On February 23, 2023, the federal banking agencies issued a joint statement addressing liquidity risks to banking organizations resulting from crypto-asset market vulnerabilities. The joint statement noted that deposits placed by a crypto-asset-related entity and deposits that constitute stablecoin-related reserves may pose heightened liquidity risks to banking organizations due to the unpredictability of the scale and timing of deposit inflows and outflows. The statement stressed that banking organizations should establish and maintain effective risk management and controls commensurate with the level of liquidity risks from such funding sources. Further, on August 8, 2023, the Federal Reserve announced the establishment of a Novel Activities Supervision Program, which is designed in part to enhance the Federal Reserve’s supervision processes in respect of banking organizations’ crypto-asset related activities and use of distributed ledger technologies and other novel technologies in the delivery of financial products and services.
Although the federal banking agencies have not developed formal regulations governing the digital asset activities of banking organizations, the supervisory framework summarized above dictates that, in order to effectively identify and manage digital asset-related risks and obtain supervisory non-objection to the proposed engagement in digital asset activities, banking organizations must implement appropriate risk management practices, including with respect to board and management oversight, policies and procedures, risk assessments, internal controls and monitoring.
Item 1A. Risk Factors
An investment in our common stock is subject to risks inherent to our business. Before making an investment decision, you should carefully read and consider the following risks and uncertainties. We may encounter risks in addition to those described below, including risks and uncertainties not currently known to us or those we currently deem to be immaterial. The risks described below, as well as such additional risks and uncertainties, may impair or materially and adversely affect our business, results of operations, and financial condition. The risks are organized in the following categories:
•Credit Risk
•Liquidity and Interest Rate Risk
•Operational Risk
•Strategic and External Risk
•Regulatory, Compliance, Legal, and Reputational Risk
•Risks Related to Investing in Our Common Stock
•General Risk Factors
Credit Risks
If we do not effectively manage our credit risk, we may experience increased levels of delinquencies, non-performing loans, and charge-offs, which would require increases in our provision for credit losses.
There are risks inherent in making any loan or lease, including risks inherent in dealing with individual borrowers, risks of nonpayment, risks resulting from uncertainties as to the future value of collateral and cash flows available to service debt, and risks resulting from changes in economic and market conditions. Our credit risk approval and monitoring procedures may not have identified or will identify all of these credit risks, and they cannot be expected to completely eliminate our credit risks. If the overall economic climate in the U.S., generally, or in our markets, specifically, deteriorates, or if the financial condition of our borrowers otherwise declines, then our borrowers may experience difficulties in repaying their loans and leases, and the level of non-performing loans and leases, charge-offs, and delinquencies could rise. This would, in turn, require increases in the provision for credit losses, which may adversely affect our business, results of operations, and financial condition.
Our allowance for credit losses may not be adequate to cover actual losses.
We establish our allowance for credit losses (“ACL”) and maintain it at a level considered appropriate by management based on an analysis of our portfolio and market environment. The ACL represents our estimate of probable losses inherent in the portfolio at each balance sheet date and is based upon relevant information available to us. The allowance contains provisions for probable losses that have been identified relating to specific relationships, as well as probable losses inherent in our loan and lease portfolio that are not specifically identified. Additions to the ACL, which are charged to earnings through the provision for credit losses, are determined based on a variety of factors, including an analysis of our loan and lease portfolio by segment, historical loss experience, subjective factors, and an evaluation of current economic conditions in our markets. The actual amount of credit losses is affected by changes in economic, operating, and other conditions within our markets, which may be beyond our control, and such losses may exceed current estimates.
At December 31, 2023, our ACL as a percentage of total loans and leases was 1.16% and as a percentage of total non-performing loans and leases was 160.21%. Although management believes the ACL is appropriate, we may be required to take additional provisions for losses in the future to further supplement the allowance, either due to management’s assessment of credit conditions, or requirements by our banking regulators. In addition, bank regulatory agencies will periodically review our ACL and the value attributed to non-performing loans and leases. Such regulatory agencies may require us to adjust our determination of the value for these items. Any significant increases to the ACL may materially decrease our net income, which may adversely affect our business, results of operations, and financial condition.
A significant portion of our loan and lease portfolio is comprised of commercial real estate loans, which involve risks specific to real estate values and the real estate markets in general.
At December 31, 2023 we had $1.700 billion of commercial real estate loans, which represented 59.6% of our total loan and lease portfolio. Payments on such loans are often dependent on the successful operation or development of the property or business involved; therefore, repayment of such loans is sensitive to conditions in the real estate market or the general economy, which are outside the borrower’s control. In the event that the cash flow from the property is reduced, the borrower’s ability to repay the loan could be negatively impacted. The deterioration of one or a few of these loans could cause a material increase in our level of non-performing loans, which would result in a loss of revenue from these loans and could result in an increase in the provision for credit losses and an increase in charge-offs, all of which could have a material adverse impact on our net income. Many of these loans have real estate as a primary or secondary component of collateral. The market value of real estate can fluctuate significantly in a short period of time as a result of economic conditions. Adverse developments affecting real estate values in one or more of our markets could impact the collateral coverage associated with the commercial real estate segment of our portfolio, possibly leading to increased specific reserves or charge-offs, which may adversely affect our business, results of operations, and financial condition.
Commercial real estate markets have been facing downward pressure since 2022 due in large part to increasing interest rates and declining property values. Accordingly, the federal banking agencies have expressed concerns about weaknesses in the current commercial real estate market and have applied increased regulatory scrutiny to institutions with commercial real estate loan portfolios that are fast growing or large relative to the institutions' total capital. To address supervisory expectations with respect to financial institutions’ handling of commercial real estate borrowers who are experiencing financial difficulty, in June of 2023, the federal banking agencies, including the FDIC, issued an interagency policy statement addressing prudent commercial real estate loan accommodations and workouts. Our failure to adequately implement enhanced risk management policies, procedures and controls could adversely affect our ability to increase this portfolio going forward and could result in an increased rate of delinquencies in, and increased losses from, this portfolio.
Because of the risks associated with commercial real estate loans, we closely monitor the concentration of such loans in our portfolio. If we or our regulators determine that this concentration is approaching or exceeds appropriate limits, we may need to reduce or cease the origination of additional commercial real estate loans, which could adversely affect our growth plans and profitability. We may be required to sell existing loans in our portfolio, but there can be no assurances that we would be able to do so at prices that are acceptable to us.
Real estate construction and land development loans are based upon estimates of costs and values associated with the completed project. These estimates may be inaccurate and we may be exposed to significant losses on loans for these projects.
Real estate construction loans, a subset of commercial real estate loans, comprised approximately $193.1 million, or 6.8%, of our gross loan and lease portfolio, respectively, as of December 31, 2023. Such lending involves additional risks as these loans are underwritten using the as-completed value of the project, which is uncertain prior to its completion, and costs may exceed realizable values in declining real estate markets. Because of the uncertainties inherent in estimating construction costs and the realizable market value of the completed project, it can be relatively difficult to evaluate accurately the total funds required to complete a project and the related loan-to-value ratio. As a result, construction loans often involve the disbursement of substantial funds with repayment dependent, in part, on the success of the ultimate project and the ability of the borrower to sell or lease the property, rather than the ability of the borrower or guarantor to repay principal and interest. If the appraisal of the completed project’s value proves to be overstated or market values decline, we may have inadequate security for the repayment of the loan upon completion of construction of the project. If we are forced to foreclose on a project prior to or at completion due to a default, we may not be able to recover all of the unpaid balance of, and accrued interest on, the loan and may incur related foreclosure and holding costs. In addition, we may be required to fund additional amounts to complete the project and may have to hold the property for an unspecified period of time while we attempt to dispose of it.
A large portion of our loan and lease portfolio is comprised of commercial loans secured by various business assets, the deterioration in value of which could increase our exposure to future probable losses.
At December 31, 2023, approximately $1.106 billion, or 38.8%, of our loan portfolio was comprised of commercial loans to businesses collateralized by general business assets, including accounts receivable, inventory, and equipment. Our commercial loans are typically larger in amount than loans to individual consumers and therefore, have the potential for larger losses on an individual loan basis. Additionally, some of our niche commercial lending clients are highly leveraged and/or have inconsistent historical earnings. Significant adverse changes in various industries could cause rapid declines in values and collectability associated with those business assets resulting in inadequate collateral coverage that may expose us to future losses. An increase in specific reserves and charge-offs may adversely affect our business, results of operations, and financial condition.
The success of our SBA lending program is dependent upon the continued availability of SBA loan programs, our status as a Preferred Lender under the SBA loan programs, our ability to effectively compete and originate new SBA loans, and our ability to comply with applicable SBA lending requirements.
SBA loans, excluding SBA loans made under the Paycheck Protection Program (“PPP Loans”), consisting of both commercial real estate and commercial loans, comprised approximately $53.4 million, or 1.9%, of our gross loan and lease portfolio as of December 31, 2023.
As an SBA Preferred Lender, we enable our clients to obtain SBA loans without being subject to the potentially lengthy SBA approval process necessary for lenders that are not SBA Preferred Lenders. The SBA periodically reviews the lending operations of participating lenders to assess, among other things, whether the lender exhibits prudent risk management. When weaknesses are identified, the SBA may request corrective actions or impose other restrictions, including revocation of the lender’s Preferred Lender status. If we lose our status as a Preferred Lender, we may lose our ability to compete effectively with other SBA Preferred Lenders, and as a result we could experience a material adverse effect to our financial results. Any changes to the SBA program, including changes to the level of guaranty provided by the federal government on SBA loans or changes to the level of funds appropriated by the federal government to the various SBA programs, may also have an adverse effect on our business, results of operations, and financial condition.
We often choose to sell the guaranteed portions of our SBA 7(a) loans in the secondary market. These sales result in earning premium income and create a stream of future servicing income. There can be no assurance that we will be able to continue originating these loans, that a secondary market will exist, or that we will continue to realize premiums upon the sale of the guaranteed portions of these loans. Whether or not we sell the guaranteed portion of an SBA loan, we retain credit risk on the non-guaranteed portion of the loan. We also have credit risk on the guaranteed portion if a determination is made by the SBA that there is a deficiency in the manner in which the loan was originated, funded, or serviced by the Bank. The total outstanding balance of sold SBA loans as of December 31, 2023 was $84.2 million.
In order for a borrower to be eligible to receive an SBA loan, it must be established that the borrower would not be able to secure a bank loan without the credit enhancements provided by a guaranty under the SBA program. Accordingly, the SBA loans in our portfolio generally have weaker credit characteristics than the rest of our portfolio and may be at greater risk of default. In the event of a loss resulting from default and a determination by the SBA that there is a deficiency in the manner in which the loan was originated, funded, or serviced by the Bank, the SBA may require the Bank to repurchase the previously sold portion of the loan, deny its liability under the guaranty, reduce the amount of the guaranty, or, if it has already paid under the guaranty, seek recovery of the principal loss related to the deficiency from the Bank. Management has estimated losses in the outstanding guaranteed portions of SBA loans and recorded an ACL and a SBA recourse reserve at a level determined to be appropriate. Significant increases to the ACL and the recourse reserve may materially decrease our net income, which may adversely affect our business, results of operations, and financial condition.
Non-performing assets take time to resolve, adversely affect our results of operations and financial condition, and could result in losses.
At December 31, 2023, our non-performing loans totaled $20.6 million, or 0.72% of our gross loan and lease portfolio, and our non-performing assets (which include non-performing loans and repossessed assets) totaled $20.8 million, or 0.59% of total assets. Our non-performing assets adversely affect our net income in various ways. We do not record interest income on non-accrual loans, thereby adversely affecting our net income and returns on assets and equity, increasing our loan administration costs, and adversely affecting our efficiency ratio. When we take collateral in repossession and similar proceedings, we are required to mark the collateral to its then net realizable value, less estimated selling costs, which may result in a loss. These non-performing loans and repossessed assets also increase our risk profile and the capital our regulators believe is appropriate in light of such risks. The resolution of non-performing assets requires significant time commitments from management and can be detrimental to the performance of their other responsibilities. If we experience increases in non-performing loans and non-performing assets, our net interest income may be negatively impacted and our loan administration costs could increase, each of which may adversely affect our business, results of operations, and financial condition.
Liquidity and Interest Rate Risks
Liquidity risks could affect operations and jeopardize our business, financial condition, and results of operations.
Our ability to implement our business strategy will depend on our liquidity and ability to obtain funding for loan originations, working capital, and other general purposes. An inability to raise funds through deposits, borrowings, the sale of loans, and other sources could have a substantial negative effect on our liquidity. Our preferred source of funding consists of client deposits, which we supplement with other sources, such as wholesale deposits made up of brokered deposits and deposits gathered through internet listing services. Such account and deposit balances can decrease when clients perceive alternative investments as providing a better risk/return profile. If clients move money out of bank deposits and into other investments, we may increase our utilization of wholesale deposits, FHLB advances, and other wholesale funding sources necessary to fund desired growth levels. In addition, the use of brokered deposits without regulatory approval is limited to banks that are “well capitalized” according to regulation. If the Bank is unable to maintain its capital levels at “well capitalized” minimums, we could lose a significant source of funding, which would force us to utilize different wholesale funding or potentially sell assets at a time when pricing may be unfavorable, increasing our funding costs and reducing our net interest income and net income.
Our access to funding sources could be impaired by factors that affect us directly or the financial services industry or economy in general, such as disruptions in the financial markets, credit quality, capital adequacy, or negative views and expectations about the prospects for the financial services industry. Regional and community banks generally have less access to the capital markets than do national and super-regional banks because of their smaller size and limited analyst coverage. During periods of economic turmoil or decline, the financial services industry and the credit markets generally may be materially and adversely affected by declines in asset values and by diminished liquidity. Under such circumstances, the liquidity issues are often particularly acute for regional and community banks, as larger financial institutions may curtail their lending to regional and community banks to reduce their exposure to the risks of other banks. Correspondent lenders may also reduce or even eliminate federal funds lines for their correspondent clients in difficult economic times.
As a result, we rely on our ability to generate deposits and effectively manage the repayment and maturity schedules of our loans and investment securities to ensure that we have adequate liquidity to fund our operations. Any decline in available funding could adversely impact our ability to originate loans, invest in securities, meet our expenses, pay dividends to our shareholders, or fulfill obligations such as repaying our borrowings or meeting deposit withdrawal demands, any of which could have a material adverse effect on our business, results of operations, and financial condition.
The Corporation is a bank holding company and its sources of funds necessary to meet its obligations are limited.
The Corporation is a bank holding company and its operations are primarily conducted by the Bank, which is subject to significant federal and state regulation. Cash available to pay dividends to our shareholders, pay our obligations, and meet our debt service requirements is derived primarily from our existing cash flow sources, our third party line of credit, dividends received from the Bank, or a combination thereof. Future dividend payments by the Bank will require the generation of future earnings by the Bank and are subject to certain regulatory guidelines. If the Bank is unable to pay dividends, we may not have the resources or cash flow to pay or meet all of our obligations.
Interest rate shifts may reduce net interest income and otherwise negatively impact our financial condition and results of operations.
Shifts in short-term interest rates may reduce net interest income, which is the principal component of our earnings. Net interest income is the difference between the amounts we receive on our interest-bearing assets and the amounts we pay on our interest-bearing liabilities. In certain scenarios, when interest rates rise, the rate of interest we pay on our liabilities may rise more quickly than the rate of interest that we receive on our interest-bearing assets, which could cause our profits to decrease. Similarly, when interest rates fall, the rate of interest we pay on our liabilities may not decrease as quickly as the rate of interest we receive on our interest-bearing assets, which could cause our profits to decrease. The structure of our balance sheet and resultant sensitivity to interest rates in various scenarios may change in the future.
Interest rate increases on variable rate loans often result in larger payment requirements for our borrowers, which increases the potential for default. At the same time, the marketability of underlying collateral may be adversely affected by any reduced demand resulting from higher interest rates. In a declining interest rate environment, there may be an increase in prepayments on certain loans as borrowers refinance at lower rates.
Changes in interest rates also can affect the value of loans. An increase in interest rates that adversely affects the ability of borrowers to pay the principal or interest on loans may lead to an increase in non-performing assets and a reduction of income recognized, which could have an adverse effect on our results of operations and cash flows. Further, when we place a loan on non-accrual status, we reverse any accrued but unpaid interest receivable, which decreases interest income. Subsequently, we continue to have a cost to fund the loan, which is reflected as interest expense, without any interest income to offset the associated funding expense. Thus, an increase in the amount of non-performing assets would have an adverse impact on net interest income.
Rising interest rates may also result in a decline in value of our fixed-rate debt securities. The unrealized losses resulting from holding these securities would be recognized in other comprehensive income and reduce total stockholders’ equity. If debt securities in an unrealized loss position are sold, such losses become realized and will reduce our regulatory capital ratios.
The proportion of the Corporation’s deposit account balances that exceed FDIC insurance limits may expose the Bank to enhanced liquidity risk.
There is growing consensus that the proportion of the deposits that exceeded FDIC insurance limits at Silicon Valley Bank, Signature Bank, and First Republic Bank was a significant factor in the failure of these institutions in the first half of 2023. In response, many large depositors across the industry withdrew deposits in excess of applicable deposit insurance limits and deposited these funds in other financial institutions and low-risk securities accounts in an effort to mitigate the risk of potential further bank failures. While the Bank has not experienced significant withdrawal activity in connection with the recent bank failures, if a significant portion of the Bank’s deposits were to be withdrawn within a short period of time in connection with a similar future crisis, additional sources of funding may be required to meet withdrawal demands. The Corporation may be unable to obtain sufficient funding on favorable terms, which may have an adverse effect on the Corporation’s net interest margin. In addition, funding deposit obligations may be more difficult in a high interest rate environment. Because the Corporation’s available-for-sale investment securities may lose value when interest rates rise, proceeds from the sale of such assets may be diminished during periods of elevated interest rates. Under such circumstances, the Corporation may be required to access funding from sources such as the Federal Reserve Discount Window or other alternative liquidity sources in order to manage our liquidity risk.
Uninsured deposits historically have been viewed by the regulators as less stable than insured deposits. According to statements made by the regulators, clients with larger uninsured deposit account balances often are small- and mid-sized businesses that rely upon deposit funds for payment of operational expenses and, as a result, are more likely to closely monitor the financial condition and performance of their depository institutions. As a result, in the event of financial distress, uninsured depositors historically have been more likely to withdraw their deposits. To that end, the federal banking agencies issued an interagency policy statement in July 2023 to underscore the importance of robust liquidity risk management and contingency funding planning. In the policy statement, the regulators noted that banks should maintain actionable contingency funding plans that take into account a range of possible stress scenarios, assess the stability of their funding and maintain a broad range of funding sources, ensure that collateral is available for borrowing, and review and revise contingency funding plans periodically and more frequently as market conditions and strategic initiatives change.
Operational Risks
Information security risks for financial institutions like us continue to increase in part because of new technologies, the increased use of the internet and telecommunications technologies (including mobile devices and cloud computing) to conduct financial and other business transactions, political activism, and the increased sophistication and activities of organized crime, terrorist, hackers, and perpetrators of fraud. A successful cyber-attack or other breach of our information systems could adversely affect the Corporation’s business, financial condition or results of operations and damage its reputation.
The methods of cyber-attacks change frequently or, in some cases, are not recognized until launch, we are not able to anticipate or implement effective preventive measures against all possible security breaches and the probability of a successful attack cannot be predicted. Although we employ detection and response mechanisms designed to detect and mitigate security incidents, early detection may be thwarted by persistent sophisticated attacks and malware designed to avoid detection. We train employees and our business and consumer clients on fraud risks and mitigation strategies. We face risks related to cyber-attacks and other security breaches that typically involve the transmission of sensitive information regarding our clients and monetary transactions through various third parties. Some of these parties have in the past been the target of security breaches and cyber-attacks. Because the transactions involve third parties and environments that we do not control or secure, future security breaches or cyber-attacks affecting any of these third parties could impact us through no fault of our own, and in some cases, we may suffer losses for breaches or attacks relating to them. We also rely on numerous other third-party service providers to conduct other aspects of our business operations and face similar risks relating to them. While we conduct security assessments on our high risk third party service providers, we cannot be sure that their information security protocols are sufficient to withstand a cyber-attack or other security breach.
The Corporation regularly evaluates its systems and controls and implements upgrades as necessary. The additional cost to the Corporation of our cyber security monitoring and protection systems and controls includes the cost of hardware and software, third party technology providers, consulting and forensic testing firms, and insurance premium costs, in addition to the incremental cost of our personnel who focus a substantial portion of their responsibilities on fraud and cyber security.
Any successful cyber-attack or other security breach involving the misappropriation, loss or other unauthorized disclosure of confidential client information or funds or that compromises our ability to function could erode confidence in the security of our systems, products and services, result in monetary losses, potentially subject us to regulatory investigation with fines and penalties, expose us to litigation and liability, disrupt our operations and have a material adverse effect on our business, financial condition or results of operations and damage our reputation.
We are dependent upon third parties for certain information systems, data management and processing services, and key components of our business infrastructure, which are subject to operational, security, and other risks.
As with many other companies, we outsource certain information systems, data management, and processing functions to third-party providers, including key components of our business infrastructure like internet and network access, and core application processing. While we have selected these third-party vendors carefully, we do not control their actions, nor is any vendor due diligence perfect. These third-party service providers are sources of operational and informational security risk to us, including risks associated with operational errors, information system interruptions or outages, unauthorized access or disclosure of sensitive or confidential information. If our third-party service providers encounter any of these issues, or if we have difficulty exchanging information with or receiving services from them, we could be exposed to disruption of operations, an inability to provide products and services to our clients, a loss of service or connectivity, reputational damage, and litigation risk that could have a material adverse effect on our business, results of operations, and financial condition.
Our business continuity plans could prove to be inadequate, resulting in a material interruption in or disruption to our business and a negative impact on our results of operations.
We rely heavily on communications and information systems to conduct our business and our operations are dependent on our ability to protect our systems against damage from fire, power loss, telecommunication failure, or other emergencies. The computer systems and network infrastructure we use could be vulnerable to unforeseen problems. These problems may arise in both our internally developed systems and the systems of our third-party service providers. Any failure or interruption of these systems could result in failures or disruptions in general ledger, core bank processing systems, client relationship management, and other systems. While we have a business continuity plan and other policies and procedures designed to prevent or limit the impact of a failure, interruption or security breach of our information systems, there can be no assurance that any of those events will not occur or, if they do occur, that they will be adequately remediated. The occurrence of any failure, interruption, or security breach of our information systems could damage our reputation, result in a loss of clients, subject us to additional regulatory scrutiny, or expose us to civil litigation and possible financial liability, any of which could have a material adverse effect on our business, results of operations, and financial condition.
New lines of business, products, and services are essential to our ability to compete but may subject us to additional risks.
Periodically, we implement new lines of business and/or offer new products and services within existing lines of business. There can be substantial risks and uncertainties associated with these efforts, particularly in instances where the markets for such services are still developing or due diligence is not fully vetted. In developing and marketing new lines of business and/or new products or services, we invest significant time and resources. Initial timetables for the introduction and development of new lines of business and/or new products or services may not be achieved, and price and profitability targets may not prove feasible. New technologies needed to support the new line of business or product may result in incremental operating costs and system defects. Compliance with regulations, competitive alternatives, and shifting market preferences, may also impact the successful implementation of a new line of business or a new product or service. In instances of new lines of businesses offering credit services, weaknesses relating to underwriting and operations may impact credit and capital. Delinquency may negatively affect non-performing assets and increase the provision for credit losses.
Any new line of business and/or new product or service could also have a significant impact on the effectiveness of our system of internal controls. Failure to successfully manage these risks in the development and implementation of new lines of business or new products or services could have a material adverse effect on our business, results of operations, and financial condition.
Our framework for managing risks may not be effective in mitigating risk and loss to us.
Our risk management framework seeks to mitigate risk and loss to us. We have established processes and procedures intended to identify, measure, monitor, control, and analyze the types of risk to which we are subject, including liquidity risk, credit risk, market risk, interest rate risk, operational risk, information and cyber security risk, compensation risk, legal and compliance risk, and reputational risk, among others. As with any risk management framework, there are inherent limitations to our risk management strategies as there may exist, or develop in the future, risks that we have not appropriately anticipated or identified. Our ability to successfully identify and manage risks facing us is an important factor that can significantly impact our results. If our risk management framework proves ineffective, we could suffer unexpected losses which could adversely affect our business, results of operations, and financial condition.
We are subject to changes in accounting principles, policies, or guidelines.
Our financial performance is impacted by accounting principles, policies, and guidelines. Some of these policies require the use of estimates and assumptions that may affect the value of our assets or liabilities and financial results. Some of our accounting policies are critical because they require management to make difficult, subjective, and complex judgments about matters that are inherently uncertain and because it is likely that materially different amounts would be reported under different conditions or using different assumptions. If such estimates or assumptions underlying our financial statements are incorrect, we may experience material losses.
From time to time, the FASB and SEC change the financial accounting and reporting standards or the interpretation of those standards that govern the preparation of our financial statements. These changes are beyond our control, can be difficult to predict, and could materially impact how we report our financial condition and results of operations. Changes in these standards are continuously occurring and more changes may occur in the future. The implementation of such changes could have a material adverse effect on our business, results of operations, and financial condition.
Our internal controls may be ineffective.
Management regularly reviews and updates its internal controls, disclosure controls and procedures, and corporate governance policies and procedures. Any system of controls, however well designed and operated, is based in part on certain assumptions and can provide only reasonable, not absolute, assurances that the objectives of the controls are met. In addition, as we continue to grow the Corporation, our controls need to be updated to keep up with such growth. Any failure or circumvention of our controls and procedures or failure to comply with regulations related to controls and procedures could cause us to report a material weakness in internal control over financial reporting and conclude that our controls and procedures are not effective, which could have a material adverse effect on our business, results of operations, and financial condition.
Strategic and External Risks
The Corporation’s business and financial results could be materially and adversely affected by widespread public health events.
The COVID-19 pandemic negatively impacted the global economy, disrupted global supply chains and equity markets and created significant volatility and disruption in financial and labor markets. In addition, the pandemic resulted in temporary closures of many businesses and the institution of social distancing and stay-at-home requirements in many states and communities, including Wisconsin, Kansas, and Missouri. The COVID-19 pandemic, including, in part, supply chain disruption and the effects of the extensive pandemic-related government stimulus, played a significant role in recent inflationary pressure in the U.S. economy.
Future widespread public health epidemics could result in the continued and increased recognition of credit losses in the Corporation’s loan portfolio and increases in the Corporation’s ACL, particularly to the extent that there is a significant negative impact on the global economy. Because of changing economic and market conditions affecting issuers, the Corporation may be required to recognize impairments on the securities it holds. Furthermore, the demand for the Corporation’s products and services may be impacted, which could materially adversely affect the Corporation’s revenue.
We cannot predict how further outbreaks, new variants, the efficacy of vaccines or future widespread public health epidemics, should they occur, might impact our financial condition and results of operation. The extent to which any future pandemic impacts the Corporation’s business, results of operations, and financial condition, as well as the Corporation’s regulatory capital, liquidity ratios, and stock price, will depend on future developments, which are highly uncertain and cannot be predicted, including the scope and duration of the pandemic and any responsive actions taken by governmental authorities and other third parties.
Our business may be adversely affected by conditions in the financial markets and economic conditions generally.
Our operations and profitability are impacted by general business and economic conditions in the U.S. and, to some extent, abroad. These conditions include short-term and long-term interest rates, inflation, money supply, political issues, legislative and regulatory changes, fluctuations in both debt and equity markets, broad trends in industry and finance, the strength of the U.S. economy and uncertainty in financial markets globally, all of which are beyond our control. A deterioration in economic conditions could result in an increase in loan delinquencies and non-performing assets, decreases in loan collateral values, and a decrease in demand for our products and services, among other things, any of which could have a material adverse effect on our business, results of operations, and financial condition.
Our business is concentrated in and largely dependent upon the continued growth and welfare of the general geographical markets in which we operate.
Our operations are heavily concentrated in southern Wisconsin and, to a lesser extent, the Northeast regions of Wisconsin and the greater Kansas City Metro and, as a result, our financial condition, results of operations, and cash flows are significantly impacted by changes in the economic conditions in those areas. Our success depends to a significant extent upon the business activity, population, income levels, deposits, and real estate activity in these markets. Although our clients’ business and financial interests may extend well beyond these markets, adverse economic conditions that affect these markets, including, without limitation, could reduce our growth rate, affect the ability of our clients to repay their loans to us, affect the value of collateral underlying loans, and generally affect our financial condition and results of operations. Because of our geographic concentration, we are less able than other regional or national financial institutions to diversify our credit risks across multiple markets.
Our financial condition and results of operations could be negatively affected if we fail to effectively execute our strategic plan or manage the growth called for in our strategic plan.
While we believe we have the management resources and internal systems in place to successfully execute our strategic plan, we cannot guarantee that opportunities will be available and that the strategic plan will be successful or effectively executed.
Although we do not have any current definitive plans to do so, we may expand into additional communities or attempt to strengthen our position in our current markets through opportunistic acquisitions of similar or complementary financial services organizations. To the extent that we do so, we may experience higher operating expenses relative to operating income from the new operations or certain one-time expenses associated with the closure of offices, all of which may have an adverse effect on our business, results of operations, and financial condition. Other effects of engaging in such strategies may include potential diversion of our management’s time and attention and general disruption to our business. To the extent that we grow through new locations, we cannot ensure that we will be able to adequately and profitably manage this growth. Acquiring other banks and businesses would involve similar risks to those commonly associated with branching, but may also involve additional risks, including potential exposure to unknown or contingent liabilities of banks and businesses we acquire and exposure to potential asset quality issues of the acquired bank or related business.
We could recognize impairment losses on securities held in our securities portfolio, goodwill, or other long-lived assets.
As of December 31, 2023, the fair value of our securities portfolio was approximately $305.3 million. Factors beyond our control can significantly influence the fair value of securities in our portfolio and can cause potential adverse changes to the fair value of these securities. For example, fixed-rate securities acquired by us are generally subject to decreases in market value when interest rates rise. Additional factors include, but are not limited to, rating agency downgrades of the securities, defaults by the issuer or individual mortgagors with respect to the underlying securities, and instability in the credit markets. Any of the foregoing factors could cause credit losses and result in a provision for credit losses. The process for determining whether impairment is other-than-temporary usually requires difficult, subjective judgments about the future financial performance of the issuer and any collateral underlying the security in order to assess the probability of receiving all contractual principal and interest payments on the security. Because of changing economic and market conditions affecting interest rates, the financial condition of issuers of the securities and the performance of the underlying collateral, we may recognize realized and/or unrealized losses in future periods, which could have an adverse effect on our business, results of operations, and financial condition.
As of December 31, 2023, the Corporation had goodwill of $10.7 million. Goodwill is not amortized but, instead, is subject to impairment tests on at least an annual basis, and more frequently if an event occurs or circumstances change that would more likely than not reduce the fair value of a reporting unit below its carrying amount. A decline in our stock price, decline in the performance of our acquired operations, or the occurrence of another triggering event could, under certain circumstances, result in an impairment charge being recorded. During 2023, our annual impairment test conducted July 1, 2023 indicated that the estimated fair value of the reporting unit exceeded the carrying value (including goodwill). Depending on market conditions, economic forecasts, results of operations, additional adverse circumstances or other factors, the goodwill impairment analysis may require additional review of assumptions and outcomes prior to our next annual impairment testing date of July 1, 2024.
In the event that we conclude that all or a portion of our goodwill may be impaired, a non-cash charge for the amount of such impairment would be recorded to earnings. Such a charge would have no impact on tangible capital or regulatory capital.
We could be required to establish a deferred tax asset valuation allowance and a corresponding charge against earnings if we experience a decrease in earnings.
Deferred tax assets are reported as assets on our balance sheet and represent the decrease in taxes expected to be paid in the future in connection with our ACL and other matters. If it becomes more likely than not that some portion or the entire deferred tax asset will not be realized, a valuation allowance must be recognized. As a result of a Wisconsin state tax law change in 2023, the Corporation has recorded a valuation allowance of $2.8 million against related state deferred tax assets. The Corporation believes it will fully realize its Federal and non-Wisconsin deferred tax assets. These determinations were based on the evaluation of several factors, including relevant tax law changes, our recent earnings history, expected future taxable earnings, and appropriate tax planning strategies. A decrease in taxable earnings could adversely impact our ability to fully utilize our remaining deferred tax assets. If we determine that it is more likely than not that some portion or all of the remaining deferred tax assets will not be realized, a valuation allowance will need to be recognized and this would result in a corresponding charge against our earnings.
Competition from other financial services providers could adversely affect our profitability.
We encounter heavy competition in attracting commercial loan, specialty finance, deposit, and private wealth management clients. We believe the principal factors that are used to attract quality clients and distinguish one financial institution from another include value-added relationships, interest rates and rates of return, types of accounts and product offerings, service fees, and quality of service.
Our competition includes banks, savings institutions, mortgage banking companies, credit unions, finance companies, equipment finance companies, mutual funds, insurance companies, brokerage firms, investment banking firms, and financial technology (“FinTech”) companies. We compete with regional and national financial institutions that have a substantial presence in our market areas, many of which have greater liquidity, higher lending limits, greater access to capital, more established market recognition, and more resources and collective experience than we do. Some larger financial institutions that have not historically competed with us directly have substantial excess liquidity and have sought, and may continue to seek, smaller lending relationships in our primary markets. Furthermore, tax-exempt credit unions operate in our market areas and aggressively price their products and services to a large portion of the market. Finally, technology has also lowered the barriers to entry and made it possible for non-bank financial service providers to offer products and services we have traditionally offered, such as automatic funds transfer and automatic payment systems. Our profitability depends, in part, upon our ability to successfully maintain and increase market share.
Consumers and businesses are increasingly using non-banks to complete their financial transactions, which could adversely affect our business and results of operations.
Technology and other changes are allowing consumers and businesses to complete financial transactions that historically have involved financial institutions through alternative methods. The wide acceptance of Internet-based and person-to-person commerce has resulted in a number of alternative payment processing systems and lending platforms in which banks play only minor roles. Businesses and consumers can now maintain funds in social payment applications, prepaid debit cards or digital currencies, and pay bills and transfer funds directly without the direct assistance of financial institutions. The diminishing role of financial institutions as financial intermediaries has resulted, and could continue to result, in the loss of fee income, as well as the loss of client deposits and the related income generated from those deposits. The loss of these revenue streams and the potential loss of lower cost deposits as a source of funds could have a material adverse effect on our business, financial condition, and results of operations.
If we are unable to keep pace with technological advances in our industry, our ability to attract and retain clients could be adversely affected.
The banking industry is constantly subject to technological changes with frequent introductions of new technology-driven products and services. In addition to better serving clients, the effective use of technology increases our efficiency and enables us to reduce costs. Our future success will depend in part on our ability to address the needs of our clients by using technology to provide products and services that will satisfy client demands for convenience as well as create additional efficiencies in our operations. A number of our competitors have substantially greater resources to invest in technological improvements, as well as significant economies of scale. There can be no assurance that we will be able to implement and offer new technology-driven products and services to our clients. If we fail to do so, our ability to attract and retain clients may be adversely affected.
Our private wealth management results of operations may be negatively impacted by changes in economic and market conditions.
Our private wealth management results of operations may be negatively impacted by changes in general economic conditions and the conditions in the financial and securities markets, including the values of assets held under management, which are beyond our control. Our management contracts generally provide for fees payable for services based on the market value of assets under management; therefore, declines in securities prices will generally have an adverse effect on our results of operations from this business. Market declines and reductions in the value of our clients’ private wealth management services accounts could result in us losing private wealth management services clients, including those who are also banking clients, and negatively affect our earnings.
Potential acquisitions may disrupt our business and dilute shareholder value.
While we remain committed to organic growth, we also may consider additional acquisition opportunities involving complementary financial service organizations if the right situation were to arise. Various risks commonly associated with acquisitions include, among other things:
•Potential exposure to unknown or contingent liabilities of the target company.
•Exposure to potential asset quality issues of the target company.
•Potential diversion of our management’s time and attention.
•Possible loss of key employees and clients of the target company.
•Difficulty in estimating the value of the target company.
•Potential changes in banking or tax laws or regulations that may affect the target company.
•Difficulty in integrating operations, personnel, technologies, services, and products of acquired companies.
Acquisitions may involve the payment of a premium over book and market values, and, therefore, some dilution of our tangible book value and net income per common share may occur in connection with any future transaction. Furthermore, failure to realize the expected revenue increases, cost savings, increases in geographic or product presence, and/or other projected benefits from an acquisition could have a material adverse effect on our business, financial condition, and results of operations.
The investments we make in certain tax-advantaged projects may not generate returns as anticipated and may have an adverse impact on the Corporation’s financial results.
We invest in certain tax-advantaged projects promoting community development. Investments in these projects are designed to generate a return primarily through the realization of federal and state income tax credits, and other tax benefits, over specified time periods. The Corporation is subject to the risk that previously recorded tax credits, which remain subject to recapture by taxing authorities based on compliance features required to be met at the project level, will fail to meet certain government compliance requirements and will not be able to be realized. The possible inability to realize these tax credit and other tax benefits could have a negative impact on the Corporation’s financial results. The risk of not being able to realize the tax credits and other tax benefits depends on many factors outside of the Corporation’s control, including changes in the applicable tax code and the ability of the projects to be completed.
A prolonged U.S. government shutdown or default by the U.S. on government obligations would harm our results of operations.
Our results of operations, including revenue, non-interest income, expenses and net interest income, would be adversely affected in the event of widespread financial and business disruption due to a default by the United States on U.S. government obligations or a prolonged failure to maintain significant U.S. government operations. Of particular impact to the Corporation are the operations regulated by the SBA. Any failure to maintain such U.S. government operations, and the after-effects of such shutdown, could impede our ability to originate SBA loans and sell such loans in the secondary market, and would materially adversely affect our business, results of operations, and financial condition.
In addition, many of our investment securities are issued by, and some of our loans are made to, the U.S. government and government agencies and sponsored entities. Uncertain domestic political conditions, including prior federal government shutdowns and potential future federal government shutdowns or other unresolved political issues, may pose credit default and liquidity risks with respect to investments in financial instruments issued or guaranteed by the federal government and loans to the federal government. Any further downgrade in the sovereign credit rating of the United States, as well as sovereign debt issues facing the governments of other countries, could have a material adverse impact on financial markets and economic conditions in the United States and worldwide. Any such adverse impact could have a material adverse effect on our liquidity, financial condition, and results of operations.
Regulatory, Compliance, Legal and Reputational Risks
We operate in multiple states and in a highly regulated industry and the federal and state laws and regulations that govern our operations, corporate governance, executive compensation, and accounting principles. Changes in them or our failure to comply with them, may adversely affect us.
We are subject to extensive regulation and supervision that govern almost all aspects of our operations. These laws and regulations, among other matters, prescribe minimum capital requirements, expose us to legal penalties, financial forfeiture and material loss if we fail to act in accordance with bank laws and regulations, impose limitations on our business activities and compensation practices, limit the dividends or distributions that we can pay, restrict the ability to guarantee our debt, and impose certain specific accounting requirements that may be more restrictive and may result in greater or earlier charges to earnings or reductions in our capital than generally accepted accounting principles. These regulations affect our lending practices, employment practices, compliance management system, operational controls, tax structure, and growth, among other things. Changes to federal and state laws, income and property tax regulations, or regulatory guidance, could affect us in substantial and unpredictable ways. Such changes could subject us to additional costs, tax filing requirements, employment practices, and limit the types of financial services and products we may offer, among other things. Compliance with laws and regulations can be difficult and costly, and changes to laws and regulations often impose additional costs. Further, our failure to comply with these laws and regulations, even if the failure was inadvertent or reflects a difference in interpretation, could subject us to restrictions on our business activities, fines, and other penalties, any of which could adversely affect our business, results of operations, and financial condition.
The financial services industry, as well as the broader economy, may be subject to new legislation, regulation, and government policy.
From time to time, federal and state governments and bank regulatory agencies modify the laws and regulations that govern financial institutions and the financial system generally. These modifications often, but not always, occur in response to crises or significant events, such as the several bank failures in early 2023, the COVID-19 pandemic, or political transitions. Such laws and regulations can affect our operating environment in substantial and unpredictable ways. Among other effects, such laws and regulations can increase or decrease the cost of doing business, limit or expand the scope of permissible activities, or affect the competitive balance among banks and other financial institutions. In addition, any changes in monetary policy, fiscal policy, tax laws, and other policies can affect the broader economic environment, interest rates, and patterns of trade. Any of these changes could affect our company and the banking industry as a whole in ways that are difficult to predict, and could adversely impact our business, financial condition, or results of operations.
We face a risk of noncompliance and enforcement action with the Bank Secrecy Act (“BSA”) and other anti-money laundering (“AML”) statutes and regulations.
AML laws and regulations require financial institutions, among other duties, to institute and maintain effective anti-money laundering programs and file suspicious activity and currency transaction reports as appropriate. The Financial Crimes Enforcement Network (“FinCEN”), established by Treasury to administer the BSA, is authorized to impose significant civil money penalties for violations of those requirements and has recently engaged in coordinated enforcement efforts with the individual federal banking regulators, as well as the U.S. Department of Justice, Drug Enforcement Administration and IRS. There is also increased scrutiny of compliance with the rules enforced by the FinCEN, Federal, and State regulators. Federal and state bank regulators also focus on compliance with AML laws.
If our policies, procedures, and systems are deemed deficient or the policies, procedures, and systems of the financial institutions that we may acquire in the future are deficient, we would be subject to liability, including fines and regulatory actions, such as restrictions on our ability to pay dividends and the necessity to obtain regulatory approvals to proceed with certain aspects of our business plan which would adversely affect our business, results of operations, and financial condition. Failure to maintain and implement adequate programs to combat money laundering and terrorist financing could also have serious reputational consequences for us.
We are periodically subject to examination and scrutiny by a number of banking agencies and, depending upon the findings and determinations of these agencies, we may be required to make adjustments to our business that could adversely affect us.
Federal and state banking agencies periodically conduct examinations of our business, including compliance with applicable laws and regulations. If, as a result of an examination, a federal banking agency was to determine that the financial condition, capital resources, asset quality, asset concentration, earnings prospects, management, liquidity, sensitivity to market risk, or other aspects of any of our operations has become unsatisfactory, or that we or our management is in violation of any law or regulation, it could take a number of different remedial actions as it deems appropriate. These actions include the power to enjoin “unsafe or unsound” practices, to require affirmative actions to correct any conditions resulting from any violation or practice, to issue an administrative order that can be judicially enforced, to direct an increase in our capital, to restrict our growth, to change the asset composition of our portfolio or balance sheet, to assess civil monetary penalties against our officers or directors, to remove officers and directors and, if it is concluded that such conditions cannot be corrected or there is an imminent risk of loss to depositors, to terminate our deposit insurance.
If we become subject to such regulatory actions, our business, results of operations, and financial condition may be adversely affected.
We are subject to claims and litigation pertaining to our fiduciary responsibilities.
Some of the services we provide, such as private wealth management services, require us to act as fiduciaries for our clients and others. From time to time, third parties could make claims and take legal action against us pertaining to the performance of our fiduciary responsibilities. If fiduciary investment decisions are not appropriately documented to justify action taken or trades are placed incorrectly, among other possible claims, and if these claims and legal actions are not resolved in a manner favorable to us, we may be exposed to significant financial liability and/or our reputation could be damaged. These results may adversely impact demand for our products and services or otherwise have an adverse effect on our business, results of operations, and financial condition.
Risks Related to Investing in Our Common Stock
Our stock is thinly traded and our stock price can fluctuate.
Although our common stock is listed for trading on the Nasdaq Global Select Market, low volume of trading activity and volatility in the price of our common stock may make it difficult for our shareholders to sell common stock when desired and at prices they find attractive. Our stock price can fluctuate significantly in response to a variety of factors including, among other things:
•actual or anticipated variations in our quarterly results of operations;
•recommendations by securities analysts;
•operating and stock price performance of other companies that investors deem comparable to us;
•news reports relating to trends, concerns, and other issues in the financial services industry;
•perceptions in the marketplace regarding us or our competitors and other financial services companies;
•new technology used, or services offered, by competitors; and
•changes in government regulations.
General market fluctuations, industry factors, and general economic and political conditions and events, such as economic slowdowns or recessions, interest rate changes, or credit loss trends, could also cause our stock price to decrease regardless of our operating results.
To maintain adequate capital levels, we may be required to raise additional capital in the future, but that capital may not be available when it is needed and/or could be dilutive to our existing shareholders.
We are required by regulatory authorities to maintain adequate levels of capital to support our operations. In order to ensure our ability to support the operations of the Bank, we may need to limit or terminate cash dividends that can be paid to our shareholders. In addition, we may need to raise capital in the future. Our ability to raise capital, if needed, will depend in part on our financial performance and conditions in the capital markets at that time, and accordingly, we cannot guarantee our ability to raise capital on terms acceptable to us. If we decide to raise equity capital in the future, the interests of our shareholders could be diluted. Any issuance of common stock would dilute the ownership percentage of our current shareholders and any issuance of common stock at prices below tangible book value would dilute the tangible book value of each existing share of our common stock held by our current shareholders. The market price of our common stock could also decrease as a result of the sale of a large number of shares or similar securities, or the perception that such sales could occur. If we cannot raise capital when needed, our ability to serve as a source of strength to the Bank, pay dividends, maintain adequate capital levels and liquidity, or further expand our operations could be materially impaired.
If equity research analysts publish research or reports about our business with unfavorable commentary or downgrade our common stock, the price and trading volume of our common stock could decline.
The trading market for our common stock could be affected by whether equity research analysts publish research or reports about us and our business and what is included in such research or reports. If equity analysts publish research reports about us containing unfavorable commentary, downgrade our stock, or cease publishing reports about our business, the price of our stock could decline. If any analyst electing to cover us downgrades our stock, our stock price could decline rapidly. If any analyst electing to cover us ceases coverage of us, we could lose visibility in the market, which in turn could cause our common stock price or trading volume to decline and our common stock to be less liquid.
Volatility or events impacting a subset of the banking industry, such as larger banks or institutions that serve to specific markets, can impact the entire sector, including the Corporation, which could affect the confidence of our clients and investors and result in a material adverse effect on our performance and a decline in our stock price for reasons outside of our control.
The industry in which we compete is diverse, with participants ranging from community-based banks to global financial institutions with assets in the trillions of dollars. In addition, some financial institutions have exposure of an extremely broad range of risks, or outsized exposure to specific industries such as startup and early-stage, pharmaceutical, or oil & gas companies. When volatility, market events or similar issues affect a subset of financial institutions, or when there are news reports or high-profile incidents relating to trends, concerns, and other issues in the banking industry, the ramifications can affect the sector as a whole, regardless of the effect, or lack thereof, on any specific institution. For example, the recent failures of Silicon Valley Bank, Signature Bank and First Republic Bank, which were caused by specific risk management and industry issues, negatively impacted customer, investor and media perception of the entire sector, resulting in declines in depositor confidence and stock prices throughout the industry. Future events of this nature could result in a material adverse effect on our performance and a decline in our stock priced for reasons that would not otherwise affect the Bank or which are outside of our control.
General Risk Factors
Our ability to attract and retain talented employees is critical to our success.
Our success depends on our ability to continue to recruit and retain talented employees. Competition for such employees is intense, which has led to an increase in compensation throughout the labor market, and accordingly, an increase in payroll costs for employers. Prospective employees are also placing an emphasis on flexible, including remote, work arrangements and other considerations, and such arrangements can provide employees with more employment options and mobility, making them more difficult to retain. If we are unable to meet the expectations of employees and prospective employees, and thus, retain or attract employees, it could have a substantial adverse effect on our business.
We rely on our management and the loss of one or more of those managers may harm our business.
Our success has been and will be greatly influenced by our continuing ability to retain the services of our existing senior management and to attract and retain additional qualified senior and middle management. The unexpected loss of key management personnel or the inability to recruit and retain qualified personnel in the future could have an adverse effect on our business and financial results. In addition, our failure to develop and/or maintain an effective succession plan will impede our ability to quickly and effectively react to unexpected loss of key management, and in turn, may have an adverse effect on our business, results of operations, and financial condition.
Negative publicity could damage our reputation and adversely impact our business and financial results.
Reputation risk, or the risk to our earnings and capital due to negative publicity, is inherent in our business. Negative publicity can result from our actual or alleged conduct in a number of activities, including lending practices, fraud, information security, management actions, corporate governance, and actions taken by government regulators and community organizations in response to those activities. Negative publicity can adversely affect our ability to keep and attract clients, employees, and shareholders and can expose us to litigation and regulatory action, all of which could have a material adverse effect on our business, financial condition, and results of operations.
Item 1B. Unresolved Staff Comments
None.
Item 1C. Cybersecurity
Cybersecurity is an important component of our overall approach to Enterprise Risk Management (“ERM”). Our cybersecurity policies, standards, processes and practices are fully integrated in our ERM program which are based on recognized frameworks established by the National Institute of Standards and Technology, the International Organization for Standardization and other applicable industry standards. We seek to address cybersecurity risks through a comprehensive approach that is focused on preserving the confidentiality, security and availability of the information that we collect and store by identifying, preventing and mitigating cybersecurity threats and effectively responding to cybersecurity incidents when they occur.
Our cybersecurity program is focused on the following key areas:
Governance: The Board of Director’s (the “Board”) oversight of cybersecurity risk management is delegated to the Operational Risk Committee of the Board (the "ORC"), which regularly interacts with our ERM function, the Chief Information Officer ("CIO"), other members of management and relevant management committees. The ORC chair regularly reports material developments on cybersecurity to the Board.
Collaborative Approach: We have implemented a comprehensive approach to identifying, preventing and mitigating cybersecurity threats and incidents, while also implementing controls and procedures that provide for the prompt escalation of certain cybersecurity incidents so that decisions regarding the public disclosure and reporting of such incidents can be made by management in a timely manner.
Technical Safeguards: We deploy technical safeguards that are designed to continuously protect our information systems from cybersecurity threats, including firewalls, intrusion prevention and detection systems, anti-malware functionality and access controls. These safeguards are evaluated and improved through vulnerability assessments, penetration testing, and cybersecurity threat intelligence.
Incident Response and Recovery Planning: We have established and maintain a comprehensive incident response and recovery plan that fully addresses our response to a potential cybersecurity incident, and such plans are tested and evaluated on a regular basis.
Third-Party Risk Management: We maintain a comprehensive, risk-based approach to identifying and monitoring cybersecurity risks presented by third parties, including vendors, service providers and other external users of our systems, as well as the systems of third parties that could adversely impact our business in the event of a cybersecurity incident affecting those third-party systems. Our third-party risk management program includes robust upfront and ongoing risk assessments for all critical and high-risk vendors.
Education and Awareness: We provide regular, mandatory training for personnel regarding cybersecurity threats as a means to equip our personnel with effective tools to address cybersecurity threats, and to communicate our evolving information security policies, standards, processes and practices. The Board receives periodic education and on a regular basis is informed about industry trends and how the Bank is responding to evolving threats.
We engage an independent third party to conduct periodic testing and assessment of our policies, standards, processes, controls and practices that are designed to address cybersecurity threats and incidents. These efforts include audits, assessments, vulnerability and penetration testing and other exercises focused on evaluating the effectiveness of our cybersecurity measures. We also engage independent third parties to complete periodic testing and assessments of our cybersecurity measures. The results of such assessments are reported to the ORC and the Board and we adjust our policies and practices as necessary based on the information provided by these assessments.
The Board and the ORC oversee our ERM process, including regular presentations and reports. The Board and the ORC also receive prompt and timely information regarding any cybersecurity incident that meets established reporting thresholds. The Board and the ORC coordinate the approach to cybersecurity management with the Chief Risk Officer and the Chief Information Officer, as well as our CFO and CEO.
Our Chief Risk and Chief Information Officers have 30 and 24 years of experience, respectively. Their background is summarized in Item 1, Executive Officers of the Registrant.
To date, we have not been materially affected by cybersecurity threats, including our business strategy, results of operations or financial condition. Please refer to Risk Factors in Item 1A for discussion of possible impacts from future cybersecurity events.
Item 2. Properties
The following table provides certain summary information with respect to the principal properties in which we conduct our operations, all of which were leased, as of December 31, 2023:
|
|
|
|
|
|
|
|
|
|
|
|
|
|
|
| Location |
|
Function |
|
Expiration
Date |
| 401 Charmany Drive, Madison, WI |
|
Full-service banking location of FBB - South Central Region and office of FBFS |
|
2028 |
| 17335 Golf Parkway, Brookfield, WI |
|
Full-service banking location of FBB - Southeast Region |
|
2032 |
| 11141 Overbrook Road, Leawood, KS |
|
Full-service banking location of FBB - Kansas City Region |
|
2033 |
| 3913 West Prospect Avenue, Appleton, WI |
|
Full-service banking location of FBB - Northeast Region |
|
2025 |
For the purpose of generating business development opportunities in our specialized lending and consulting businesses, as of December 31, 2023, office space was also leased in several states nationwide under shorter-term lease agreements, which generally have terms of one year or less.
Item 3. Legal Proceedings
We believe no litigation is threatened or pending in which we face potential loss or exposure which could materially affect our consolidated financial position, consolidated results of operations, or consolidated cash flows. Since our subsidiaries act as depositories of funds, lenders, and fiduciaries, they are occasionally named as defendants in lawsuits involving a variety of claims. This and other litigation is ordinary, routine litigation incidental to our business.
Item 4. Mine Safety Disclosures
Not applicable.
PART II.
Item 5. Market for Registrant’s Common Equity, Related Shareholder Matters and Issuer Purchases of Equity Securities
Holders
The common stock of the Corporation is traded on the Nasdaq Global Select Market under the symbol “FBIZ.” As of February 15, 2024, there were 361 registered shareholders of record of the Corporation’s common stock.
Dividend Policy
It has been our practice to pay a dividend to common shareholders. Dividends historically have been declared in the month following the end of each calendar quarter. However, the timing and amount of future dividends are at the discretion of the Board of Directors of the Corporation (the “Board”) and will depend upon the consolidated earnings, financial condition, liquidity, and capital requirements of the Corporation and the Bank, the amount of cash dividends paid to the Corporation by the Bank, applicable government regulations and policies, supervisory actions, and other factors considered relevant by the Board. Refer to Item 1 - Business - Supervision and Regulation - Regulation and Supervision of the Bank - Dividend Payments for additional discussion regarding the limitations on dividends and other capital contributions by the Bank to the Corporation. The Board anticipates it will continue to declare dividends as appropriate based on the above factors.
Stock Performance Graph
The chart shown below depicts total return to shareholders during the period beginning December 31, 2018 and ending December 31, 2023. The total return includes appreciation or depreciation in market value of the Corporation’s common stock as well as actual cash and stock dividends paid to common stockholders. Indices shown below, for comparison purposes only, are the Total Return Index for the Nasdaq Composite, which is a broad nationally recognized index of stock performance by publicly traded companies, and the SNL Bank Nasdaq, which is an index that contains securities of Nasdaq-listed companies classified according to the Industry Classification Benchmark as banks. The chart assumes that the value of the investment in FBIZ common stock and each of the three indices was $100 on December 31, 2018 and that all dividends were reinvested in FBIZ common stock.
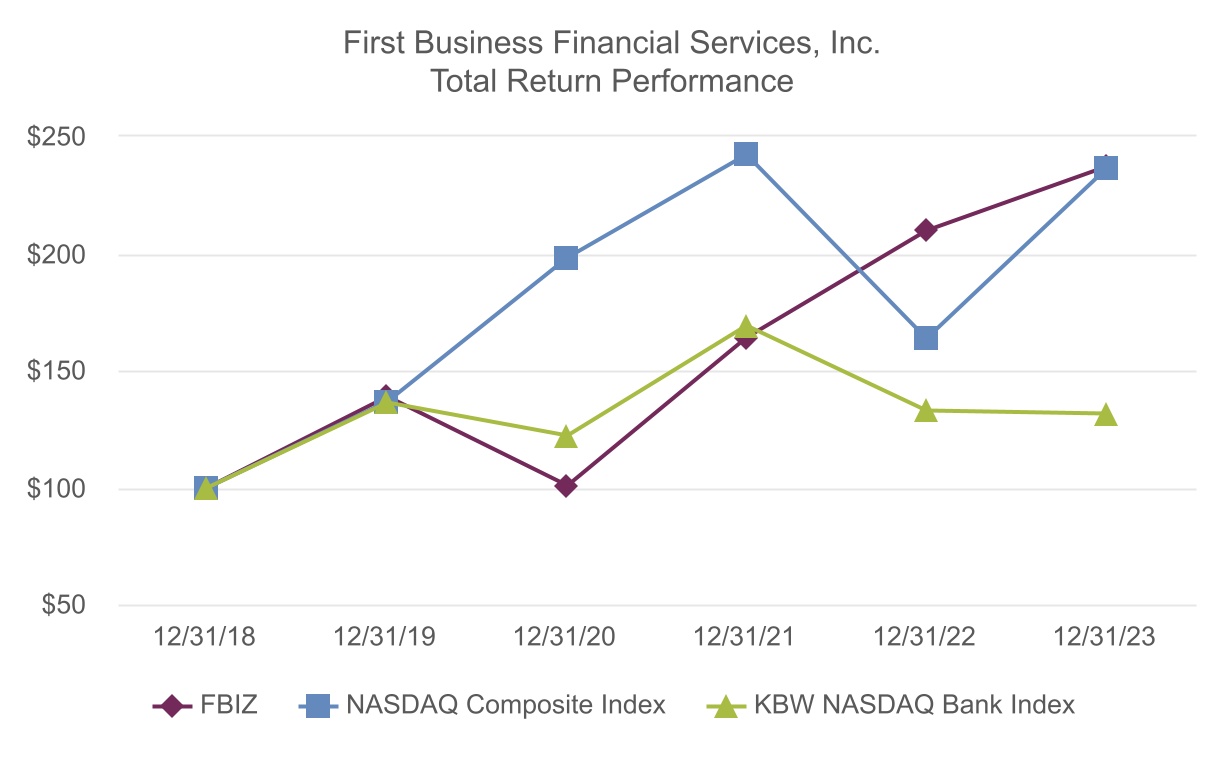
|
|
|
|
|
|
|
|
|
|
|
|
|
|
|
|
|
|
|
|
|
|
|
|
|
|
|
|
|
|
|
|
|
|
|
|
|
|
|
|
|
As of December 31, |
| Index |
|
2018 |
|
2019 |
|
2020 |
|
2021 |
|
2022 |
|
2023 |
| First Business Financial Services, Inc. |
|
$ |
100.00 |
|
|
$ |
138.56 |
|
|
$ |
100.53 |
|
|
$ |
163.69 |
|
|
$ |
209.82 |
|
|
$ |
236.96 |
|
| NASDAQ Composite Index |
|
100.00 |
|
136.69 |
|
198.10 |
|
242.03 |
|
163.28 |
|
236.17 |
| KBW NASDAQ Bank Index |
|
100.00 |
|
136.13 |
|
122.09 |
|
168.88 |
|
132.75 |
|
131.57 |
Issuer Purchases of Securities
As previously announced, effective January 27, 2023, the Corporation’s Board of Directors authorized the repurchase by the Corporation of shares of its common stock with a maximum aggregate purchase price of $5.0 million, effective January 31, 2023 through January 31, 2024. As of December 31, 2023, the Corporation had repurchased a total of 65,112 shares for approximately $2.0 million at an average cost of $30.72 per share. At this time, the Corporation does not expect to adopt a new plan upon its expiration to replace the recently expired plan due to strong balance sheet growth.
Under the recently expired share repurchase program, the Corporation was authorized to repurchase shares from time to time in the open market or negotiated transactions at prevailing market rates, or by other means in accordance with federal securities laws.
The following table sets forth information about the Corporation's purchases of its common stock during the three months ended December 31, 2023.
|
|
|
|
|
|
|
|
|
|
|
|
|
|
|
|
|
|
|
|
|
|
|
|
|
|
|
| Period |
|
Total Number of Shares Purchased(1) |
|
Average Price Paid Per Share |
|
Total Number of Shares Purchased as Part of Publicly Announced Plans or Programs |
|
Total Number of Shares that May Yet Be Purchased Under the Plans or Programs |
| October 1, 2023 - October 31, 2023 |
|
— |
|
|
$ |
— |
|
|
— |
|
|
|
| November 1, 2023 - November 30, 2023 |
|
458 |
|
|
34.30 |
|
|
— |
|
|
|
| December 1, 2023 - December 31, 2023 |
|
— |
|
|
— |
|
|
— |
|
|
|
| Total |
|
458 |
|
|
|
|
— |
|
|
74,813 |
|
(1)During the fourth quarter of 2023, the Corporation repurchased an aggregate 458 shares of the Corporation’s common stock in open-market transactions, of which no shares were purchased pursuant to the repurchase program publicly announced on January 27, 2023, and of which 458 shares were surrendered to us to satisfy income tax withholding obligations in connection with the vesting of restricted awards. The Corporation did not repurchase any shares pursuant to the publicly announced program described above during the quarter.
Item 6. [Reserved]
Item 7. Management’s Discussion and Analysis of Financial Condition and Results of Operations
Forward-Looking Statements
When used in this report the words or phrases “may,” “could,” “should,” “hope,” “might,” “believe,” “expect,” “plan,” “assume,” “intend,” “estimate,” “anticipate,” “project,” “likely,” or similar expressions are intended to identify “forward-looking statements.” Such statements are subject to risks and uncertainties, including among other things:
•Adverse changes in the economy or business conditions, either nationally or in our markets, including, without limitation, inflation, supply chain issues, economic downturn, labor shortages, wage pressures, and the adverse effects of public health events on the global, national, and local economy.
•Competitive pressures among depository and other financial institutions nationally and in our markets.
•Increases in defaults by borrowers and other delinquencies.
•Our ability to manage growth effectively, including the successful expansion of our client support, administrative infrastructure, and internal management systems.
•Fluctuations in interest rates and market prices.
•Changes in legislative or regulatory requirements applicable to us and our subsidiaries.
•Changes in tax requirements, including tax rate changes, new tax laws, and revised tax law interpretations.
•Fraud, including client and system failure or breaches of our network security, including our internet banking activities.
•Failure to comply with the applicable SBA regulations in order to maintain the eligibility of the guaranteed portions of SBA loans.
These risks, together with the risks identified in Item 1A — Risk Factors, could cause actual results to differ materially from what we have anticipated or projected. These risk factors and uncertainties should be carefully considered by our stockholders and potential investors. Investors should not place undue reliance on any such forward-looking statements, which speak only as of the date made.
Where any such forward-looking statement includes a statement of the assumptions or bases underlying such forward-looking statement, we caution that, while our management believes such assumptions or bases are reasonable and are made in good faith, assumed facts or bases can vary from actual results, and the differences between assumed facts or bases and actual results can be material, depending on the circumstances. Where, in any forward-looking statement, an expectation or belief is expressed as to future results, such expectation or belief is expressed in good faith and believed to have a reasonable basis, but there can be no assurance that the statement of expectation or belief will be achieved or accomplished.
We do not intend to, and specifically disclaim any obligation to, update any forward-looking statements.
The following discussion and analysis is intended as a review of significant events and factors affecting our financial condition and results of operations for the periods indicated. The discussion should be read in conjunction with the Consolidated Financial Statements and the Notes thereto.
Overview
We are a registered bank holding company incorporated under the laws of the State of Wisconsin and are engaged in the commercial banking business through our wholly-owned banking subsidiary, FBB. All of our operations are conducted through FBB and First Business Specialty Finance, LLC (“FBSF”), a wholly-owned subsidiary of FBB. FBB operates as a business bank, delivering a full line of commercial banking products and services tailored to meet the specific needs of small and medium-sized businesses, business owners, executives, professionals, and high net worth individuals. Our products and services are focused on business banking, private wealth, and bank consulting. Within business banking, we offer commercial lending, asset-based lending, accounts receivable financing, equipment financing, floorplan financing, vendor financing, Small Business Administration (“SBA”) lending and servicing, treasury management solutions, and company retirement services. Our private wealth management services include trust and estate administration, financial planning, investment management, and private banking for executives and owners of our business banking clients and others. Our bank consulting experts provide investment portfolio administrative services, asset liability management services, and asset liability management process validation for other financial institutions. We do not utilize a branch network to attract retail clients. Our operating model is predicated on deep client relationships, financial expertise, and an efficient, centralized administration function delivering best in class client satisfaction. Our focused model allows experienced staff to provide the level of financial expertise needed to develop and maintain long-term relationships with our clients.
Long-Term Strategic Plan
In early 2019, management finalized the development of its five year strategic plan and began the implementation of strategies and initiatives that drive successful execution. Management’s objective over this five year period was to excel by building an expert team with diverse experiences who work together to impact client success more than any other financial partner. To meet this objective, we identified four key strategies which are linked to corporate financial goals, all business lines, and centralized administration functions to ensure communication and execution are consistent at all levels of the Corporation.
These four strategies are described below:
•We will identify, attract, develop, and retain a diverse, high performing team to positively impact the overall performance and efficiency of the Corporation.
•We will increase internal efficiencies, deliver a differentiated client experience, and drive client experience utilizing technology where possible.
•We will diversify and grow our deposit base.
•We will optimize our business lines for diversification and performance.
The table below shows the Corporation’s performance for the years ended December 31, 2023, 2022, and 2021 in comparison to the key performance indicators included in the Corporation’s 2019 strategic plan.
|
|
|
|
|
|
|
|
|
|
|
|
|
|
|
|
As of December 31, |
|
| Key Performance Indicators |
2021 |
2022 |
2023 |
Strategic Plan |
| Return on average equity (“ROAE”) |
16.21% |
16.79% |
13.79% |
13.50% |
| Return on average assets (“ROAA”) |
1.37% |
1.46% |
1.13% |
1.15% |
| Top line revenue growth |
8.4% |
13.4% |
12.6% |
≥ 10% per year |
| In-market deposits to total bank funding |
82.9% |
76.1% |
76.0% |
≥ 75% |
Employee engagement (1) |
87% |
87% |
90% |
≥ 80% |
Client satisfaction (1) |
93% |
95% |
93% |
≥ 90% |
|
|
|
|
|
| (1) Anonymous surveys conducted annually |
|
|
|
|
Throughout 2023, the last year of the existing plan, management undertook an extensive process to reassess its key strategies and performance indicators to create a new long-term strategic plan. The Corporation intends to disclose information about the key terms of the new strategic plan later in 2024 after it is finalized.
Financial Performance Summary
Results as of and for the year ended December 31, 2023 include:
•Net income available to common shareholders for the year ended December 31, 2023 was $36.2 million, decreasing 10.0% compared to $40.2 million for the year ended December 31, 2022.
•Diluted earnings per common share were $4.33 for the year ended December 31, 2023, decreasing 8.8% compared to $4.75 in the prior year.
•Return on average assets (“ROAA”) for the year ended December 31, 2023 was 1.13%, compared to 1.46% for 2022.
•Return on average common equity (“ROACE”), which is defined as net income available to common shareholders divided by average equity reduced by average preferred stock, if any. ROACE was 13.79% for the year ended December 31, 2023, compared to 16.79% for the year ended December 31, 2022.
•Pre-tax, pre-provision (“PTPP”) adjusted earnings, which excludes certain one-time and discrete items, and PTPP ROAA were $56.2 million and 1.75%, respectively, for the year ended December 31, 2023, increasing $8.3 million, or 17.3%, and 1 bp, from year ended December 31, 2022.
•Fees in lieu of interest, defined as prepayment fees, asset-based loan fees, non-accrual interest, and loan fee amortization, totaled $3.2 million for the year ended December 31, 2023, decreasing 38.6% compared to $5.3 million for the year ended December 31, 2022.
•Net interest margin was 3.78% for the year ended December 31, 2023, declining 4 bps from 3.82% for the year ended December 31, 2022. Adjusted net interest margin, which excludes certain one-time and discrete items, was 3.63% for the year ended December 31, 2023 and December 31, 2022.
•Top line revenue, defined as net interest income plus non-interest income, grew 12.6% to $143.9 million for the year ended December 31, 2023, compared to $127.9 million for the year ended December 31, 2022.
•Effective tax rate was 21.45% for the year ended December 31, 2023 compared to 21.79% for the year ended December 31, 2022.
•Provision for credit losses was $8.2 million for the year ended December 31, 2023, compared to a net provision benefit of $3.9 million for the year ended December 31, 2022. Net charge-offs as a percentage of average loans and leases were 0.05% for the year ended December 31, 2023, compared to net recoveries of 0.16% for the year ended December 31, 2022.
•Total assets at December 31, 2023 increased $531.2 million, or 17.8%, to $3.508 billion from $2.977 billion at December 31, 2022.
•Period-end gross loans and leases receivable at December 31, 2023 increased $407.2 million, or 16.7%, to $2.850 billion from $2.443 billion as of December 31, 2022. Average gross loans and leases of $2.648 billion increased $342.9 million, or 14.9% for the year ended December 31, 2023, compared to $2.305 billion for the same period in 2022.
•Non-performing assets increased to $20.8 million as of December 31, 2023, compared to $3.8 million as of December 31, 2022. Non-performing assets to total assets increased to 0.59% as of December 31, 2023, from 0.13% as of December 31, 2022.
•The allowance for credit losses as of December 31, 2023 increased $7.0 million, or 29.1%, to $31.3 million, compared to $24.2 million as of December 31, 2022. The allowance for credit losses was 1.16% of total loans as of December 31, 2023, compared to 0.99% as of December 31, 2022.
•Period-end in-market deposits at December 31, 2023 increased $373.1 million, or 19.0%, to $2.339 billion from $1.966 billion as of December 31, 2022. Average in-market deposits of $2.098 billion increased $169.3 million, or 8.8%, for the year ended December 31, 2023, compared to $1.929 billion for the same period in 2022.
•Private wealth and trust assets under management and administration increased by $461.5 million, or 17.3%, to $3.122 billion at December 31, 2023, compared to $2.660 billion at December 31, 2022. Private wealth management service fees increased $544,000, or 5.00%, for the year ended December 31, 2023, compared to the year ended December 31, 2022.
The detailed financial discussion that follows focuses on 2023 results compared to 2022. Information pertaining to 2022 in comparison to 2021 was included in the Corporation’s Annual Report on Form 10-K for the year ended December 31, 2022 on page 33 under Part II, Item 7, “Management’s Discussion and Analysis of Financial and Results of Operations,” which was filed with the SEC on February 22, 2023.
Results of Operations
Top Line Revenue
Top line revenue, comprised of net interest income and non-interest income, increased 12.6% for the year ended December 31, 2023 compared to the year ended December 31, 2022 primarily due to a $14.2 million, or 14.4%, increase in net interest income and a $1.9 million, or 6.4%, increase in non-interest income. The increase in net interest income was driven by an increase in average loans and leases outstanding and related interest income, partially offset by net interest margin compression and a decrease in fees in lieu of interest. The increase in non-interest income was primarily due to a $1.8 million increase in other fee income, a $1.2 million increase in swap fee income, a $544,000 increase in trust fee income, and a $353,000 increase in loan fee income. These favorable variances were partially offset by a $733,000 decrease in bank owned life insurance income, a $718,000 decrease in service charge income on deposits, and a $482,000 decrease in gains on the sale of SBA loans during the year ended December 31, 2023.
The components of top line revenue were as follows:
|
|
|
|
|
|
|
|
|
|
|
|
|
|
|
|
|
|
|
|
|
|
|
|
|
|
|
|
|
|
|
|
|
|
|
|
|
|
|
|
|
|
|
|
|
| |
|
For the Year Ended December 31, |
|
Change From Prior Year |
| |
|
2023 |
|
2022 |
|
2021 |
|
$ Change 2023 |
|
% Change 2023 |
|
$ Change 2022 |
|
% Change 2022 |
| |
|
(Dollars in Thousands) |
| Net interest income |
|
$ |
112,588 |
|
|
$ |
98,422 |
|
|
$ |
84,662 |
|
|
$ |
14,166 |
|
|
14.4 |
% |
|
$ |
13,760 |
|
|
16.3 |
% |
| Non-interest income |
|
31,308 |
|
|
29,428 |
|
|
28,100 |
|
|
1,880 |
|
|
6.4 |
|
|
1,328 |
|
|
4.7 |
% |
| Top line revenue |
|
$ |
143,896 |
|
|
$ |
127,850 |
|
|
$ |
112,762 |
|
|
$ |
16,046 |
|
|
12.6 |
|
|
$ |
15,088 |
|
|
13.4 |
% |
Return on Average Assets and Return on Average Common Equity
ROAA was 1.13% for the year ended December 31, 2023, compared to 1.46% for the year ended December 31, 2022 principally due to a $12.1 million increase in provision for credit losses and an $8.6 million increase in operating expenses, partially offset by a $14.2 million increase in net interest income. We consider ROAA a critical metric to measure the profitability of our organization and how efficiently our assets are deployed. ROAA also allows us to better benchmark our profitability to our peers without the need to consider different degrees of leverage which can ultimately influence return on equity measures.
ROACE for the year ended December 31, 2023 was 13.79% compared to 16.79% for the year ended December 31, 2022. The primary reason for the change in ROACE is consistent with the change in ROAA discussed above. We view ROACE as an important measurement for monitoring profitability and continue to focus on improving our return to our shareholders by enhancing the overall profitability of our client relationships, controlling our expenses, and minimizing our costs of credit.
Efficiency Ratio and Pre-Tax, Pre-Provision Adjusted Earnings
Efficiency ratio measured 60.99% and 62.31% for the years ended December 31, 2023 and 2022, respectively. Efficiency ratio is a non-GAAP measure representing operating expense divided by operating revenue. Operating expense is defined as non-interest expense excluding the effects of the SBA recourse benefit or provision, impairment of tax credit investments, net gains or losses on repossessed assets, amortization of other intangible assets, and other discrete items, if any. Operating revenue is defined as net interest income plus non-interest income less realized net gains or losses on securities, if any, and other discrete items.
PTPP adjusted earnings for the year ended December 31, 2023 was $56.2 million, compared to $47.9 million for the year ended December 31, 2022. PTPP adjusted earnings is a non-GAAP measure defined as operating revenue less operating expense. In the judgment of the Corporation’s management, the adjustments made to non-interest expense and non-interest income allow investors and analysts to better assess the Corporation’s operating expenses in relation to its core operating revenue by removing the volatility associated with certain one-time items and other discrete items. PTPP adjusted earnings allows management to benchmark performance of our model to our peers without the influence of the loan loss provision and tax considerations, which will ultimately influence other traditional financial measurements, including ROA and ROAE. The information provided below reconciles the efficiency ratio to its most comparable GAAP measure.
Please refer to the Non-Interest Income and Non-Interest Expense sections below for discussion on additional drivers of the year-over-year change in the efficiency ratio and PTPP adjusted earnings.
|
|
|
|
|
|
|
|
|
|
|
|
|
|
|
|
|
|
|
|
|
|
|
|
|
|
|
|
|
|
|
|
|
|
|
|
|
|
|
|
|
|
|
|
|
|
|
For the Year Ended December 31, |
|
Change From Prior Year |
|
|
2023 |
|
2022 |
|
2021 |
|
$ Change 2023 |
|
% Change 2023 |
|
$ Change 2022 |
|
% Change 2022 |
|
|
(Dollars in Thousands) |
|
|
|
|
| Total non-interest expense |
|
$ |
88,575 |
|
|
$ |
79,474 |
|
|
$ |
71,535 |
|
|
$ |
9,101 |
|
|
11.5 |
% |
|
$ |
7,939 |
|
|
11.1 |
% |
| Less: |
|
|
|
|
|
|
|
|
|
|
|
|
|
|
| Net loss on repossessed assets |
|
12 |
|
|
49 |
|
|
15 |
|
|
(37) |
|
|
(75.5) |
|
|
34 |
|
|
226.7 |
|
| Amortization of other intangible assets |
|
— |
|
|
— |
|
|
25 |
|
|
— |
|
|
NM |
|
(25) |
|
|
NM |
SBA recourse expense (benefit) |
|
775 |
|
|
(188) |
|
|
(76) |
|
|
963 |
|
|
(512.2) |
|
|
(112) |
|
|
147.4 |
|
Contribution to First Business Charitable Foundation |
|
— |
|
|
809 |
|
|
— |
|
|
(809) |
|
|
NM |
|
809 |
|
|
NM |
| Impairment of tax credit investments |
|
— |
|
|
(351) |
|
|
— |
|
|
351 |
|
|
NM |
|
(351) |
|
|
NM |
|
|
|
|
|
|
|
|
|
|
|
|
|
|
|
| Total operating expense (a) |
|
$ |
87,788 |
|
|
$ |
79,155 |
|
|
$ |
71,571 |
|
|
$ |
8,633 |
|
|
10.9 |
|
|
$ |
7,584 |
|
|
10.6 |
|
| Net interest income |
|
$ |
112,588 |
|
|
$ |
98,422 |
|
|
$ |
84,662 |
|
|
$ |
14,166 |
|
|
14.4 |
|
|
13,760 |
|
|
16.3 |
|
| Total non-interest income |
|
31,308 |
|
|
29,428 |
|
|
28,100 |
|
|
1,880 |
|
|
6.4 |
|
|
1,328 |
|
|
4.7 |
|
| Less: |
|
|
|
|
|
|
|
|
|
|
|
|
|
|
| Bank-owned life insurance claim |
|
— |
|
|
809 |
|
|
— |
|
|
(809) |
|
|
NM |
|
809 |
|
|
NM |
| Net gain (loss) on sale of securities |
|
(45) |
|
|
— |
|
|
29 |
|
|
(45) |
|
|
NM |
|
(29) |
|
|
NM |
| Adjusted non-interest income |
|
31,353 |
|
|
28,619 |
|
|
28,071 |
|
|
2,734 |
|
|
9.6 |
|
|
548 |
|
|
2.0 |
|
| Total operating revenue (b) |
|
$ |
143,941 |
|
|
$ |
127,041 |
|
|
$ |
112,733 |
|
|
$ |
16,900 |
|
|
13.3 |
|
|
$ |
14,308 |
|
|
12.7 |
|
Efficiency ratio |
|
60.99 |
% |
|
62.31 |
% |
|
63.49 |
% |
|
|
|
|
|
|
|
|
|
|
|
|
|
|
|
|
|
|
|
|
|
|
|
| Pre-tax, pre-provision adjusted earnings (b-a) |
|
$ |
56,153 |
|
|
$ |
47,886 |
|
|
$ |
41,162 |
|
|
$ |
8,267 |
|
|
17.3 |
|
|
$ |
6,724 |
|
|
16.3 |
|
| Average total assets |
|
3,212,149 |
|
|
2,752,916 |
|
|
2,605,008 |
|
|
459,233 |
|
|
16.7 |
|
|
147,908 |
|
|
5.7 |
|
| Pre-tax, pre-provision adjusted return on average assets |
|
1.75 |
% |
|
1.74 |
% |
|
1.58 |
% |
|
|
|
|
|
|
|
|
NM = Not meaningful
Net Interest Income
Net interest income levels depend on the amount of and yield on interest-earning assets as compared to the amount of and rate paid on interest-bearing liabilities. Net interest income is sensitive to changes in market rates of interest and the asset/liability management processes to prepare for and respond to such changes.
The table below shows average balances, interest, average rates, net interest margin and the spread between combined average rates earned on our interest-earning assets and cost of interest-bearing liabilities for the periods indicated. The average balances are derived from average daily balances.
|
|
|
|
|
|
|
|
|
|
|
|
|
|
|
|
|
|
|
|
|
|
|
|
|
|
|
|
|
|
|
|
|
|
|
|
|
|
|
|
|
|
|
|
|
|
|
|
|
|
|
|
|
|
|
|
|
| |
|
For the Year Ended December 31, |
| |
|
2023 |
|
2022 |
|
2021 |
| |
|
Average
Balance |
|
Interest |
|
Average
Yield/
Rate |
|
Average
Balance |
|
Interest |
|
Average
Yield/
Rate |
|
Average
Balance |
|
Interest |
|
Average
Yield/
Rate |
| |
|
(Dollars in Thousands) |
| Interest-earning assets |
|
|
|
|
|
|
|
|
|
|
|
|
|
|
|
|
|
|
Commercial real estate and other mortgage loans(1) |
|
$ |
1,586,967 |
|
|
$ |
98,370 |
|
|
6.20 |
% |
|
$ |
1,484,239 |
|
|
$ |
66,917 |
|
|
4.51 |
% |
|
$ |
1,387,434 |
|
|
$ |
51,930 |
|
|
3.74 |
% |
Commercial and industrial loans(1) |
|
1,013,866 |
|
|
81,963 |
|
|
8.08 |
% |
|
771,056 |
|
|
46,575 |
|
|
6.04 |
% |
|
747,514 |
|
|
38,342 |
|
|
5.13 |
% |
Consumer and other loans(1) |
|
47,018 |
|
|
2,316 |
|
|
4.93 |
% |
|
49,695 |
|
|
1,876 |
|
|
3.78 |
% |
|
44,206 |
|
|
1,572 |
|
|
3.56 |
% |
Total loans and leases receivable(1) |
|
2,647,851 |
|
|
182,649 |
|
|
6.90 |
% |
|
2,304,990 |
|
|
115,368 |
|
|
5.01 |
% |
|
2,179,154 |
|
|
91,844 |
|
|
4.21 |
% |
Mortgage-related securities(2) |
|
200,383 |
|
|
6,433 |
|
|
3.21 |
% |
|
173,495 |
|
|
3,486 |
|
|
2.01 |
% |
|
159,242 |
|
|
2,633 |
|
|
1.65 |
% |
Other investment securities(3) |
|
62,921 |
|
|
1,770 |
|
|
2.81 |
% |
|
51,700 |
|
|
986 |
|
|
1.91 |
% |
|
44,739 |
|
|
777 |
|
|
1.74 |
% |
| FHLB stock |
|
15,162 |
|
|
1,231 |
|
|
8.12 |
% |
|
16,462 |
|
|
989 |
|
|
6.01 |
% |
|
13,066 |
|
|
651 |
|
|
4.98 |
% |
| Short-term investments |
|
54,311 |
|
|
2,845 |
|
|
5.24 |
% |
|
30,845 |
|
|
542 |
|
|
1.76 |
% |
|
64,308 |
|
|
90 |
|
|
0.14 |
% |
| Total interest-earning assets |
|
2,980,628 |
|
|
194,928 |
|
|
6.54 |
% |
|
2,577,492 |
|
|
121,371 |
|
|
4.71 |
% |
|
2,460,509 |
|
|
95,995 |
|
|
3.90 |
% |
| Non-interest-earning assets |
|
231,521 |
|
|
|
|
|
|
175,424 |
|
|
|
|
|
|
144,499 |
|
|
|
|
|
| Total assets |
|
$ |
3,212,149 |
|
|
|
|
|
|
$ |
2,752,916 |
|
|
|
|
|
|
$ |
2,605,008 |
|
|
|
|
|
| Interest-bearing liabilities |
|
|
|
|
|
|
|
|
|
|
|
|
|
|
|
|
|
|
Transaction accounts |
|
$ |
689,500 |
|
|
23,727 |
|
|
3.44 |
% |
|
$ |
503,668 |
|
|
3,963 |
|
|
0.79 |
% |
|
$ |
506,693 |
|
|
988 |
|
|
0.19 |
% |
| Money market accounts |
|
681,336 |
|
|
22,129 |
|
|
3.25 |
% |
|
761,469 |
|
|
6,241 |
|
|
0.82 |
% |
|
693,608 |
|
|
1,183 |
|
|
0.17 |
% |
| Certificates of deposit |
|
273,387 |
|
|
11,209 |
|
|
4.10 |
% |
|
97,448 |
|
|
1,358 |
|
|
1.39 |
% |
|
47,020 |
|
|
396 |
|
|
0.84 |
% |
| Wholesale deposits |
|
346,285 |
|
|
14,353 |
|
|
4.14 |
% |
|
48,825 |
|
|
1,616 |
|
|
3.31 |
% |
|
119,831 |
|
|
986 |
|
|
0.82 |
% |
| Total interest-bearing deposits |
|
1,990,508 |
|
|
71,418 |
|
|
3.59 |
% |
|
1,411,410 |
|
|
13,178 |
|
|
0.93 |
% |
|
1,367,152 |
|
|
3,553 |
|
|
0.26 |
% |
FHLB advances |
|
351,990 |
|
|
8,881 |
|
|
2.52 |
% |
|
414,191 |
|
|
7,024 |
|
|
1.70 |
% |
|
376,781 |
|
|
4,908 |
|
|
1.30 |
% |
| Other borrowings |
|
38,891 |
|
|
2,041 |
|
|
5.25 |
% |
|
43,818 |
|
|
2,243 |
|
|
5.12 |
% |
|
31,935 |
|
|
1,759 |
|
|
5.51 |
% |
Junior subordinated notes (4) |
|
— |
|
|
— |
|
|
— |
% |
|
2,429 |
|
|
504 |
|
|
20.75 |
% |
|
10,068 |
|
|
1,113 |
|
|
11.05 |
% |
| Total interest-bearing liabilities |
|
2,381,389 |
|
|
82,340 |
|
|
3.46 |
% |
|
1,871,848 |
|
|
22,949 |
|
|
1.23 |
% |
|
1,785,936 |
|
|
11,333 |
|
|
0.63 |
% |
Non-interest-bearing demand deposit accounts |
|
453,930 |
|
|
|
|
|
|
566,230 |
|
|
|
|
|
|
536,981 |
|
|
|
|
|
Other non-interest-bearing liabilities |
|
102,668 |
|
|
|
|
|
|
65,611 |
|
|
|
|
|
|
61,580 |
|
|
|
|
|
| Total liabilities |
|
2,937,987 |
|
|
|
|
|
|
2,503,689 |
|
|
|
|
|
|
2,384,497 |
|
|
|
|
|
| Stockholders’ equity |
|
274,162 |
|
|
|
|
|
|
249,227 |
|
|
|
|
|
|
220,511 |
|
|
|
|
|
Total liabilities and stockholders’ equity |
|
$ |
3,212,149 |
|
|
|
|
|
|
$ |
2,752,916 |
|
|
|
|
|
|
$ |
2,605,008 |
|
|
|
|
|
| Net interest income |
|
|
|
$ |
112,588 |
|
|
|
|
|
|
$ |
98,422 |
|
|
|
|
|
|
$ |
84,662 |
|
|
|
| Net interest spread |
|
|
|
|
|
3.08 |
% |
|
|
|
|
|
3.48 |
% |
|
|
|
|
|
3.27 |
% |
| Net interest-earning assets |
|
$ |
599,239 |
|
|
|
|
|
|
$ |
705,644 |
|
|
|
|
|
|
$ |
674,573 |
|
|
|
|
|
| Net interest margin |
|
|
|
|
|
3.78 |
% |
|
|
|
|
|
3.82 |
% |
|
|
|
|
|
3.44 |
% |
Average interest-earning assets to average interest-bearing liabilities |
|
125.16 |
% |
|
|
|
|
|
137.70 |
% |
|
|
|
|
|
137.77 |
% |
|
|
|
|
| Return on average assets |
|
1.13 |
% |
|
|
|
|
|
1.46 |
% |
|
|
|
|
|
1.37 |
% |
|
|
|
|
| Return on average equity |
|
13.79 |
% |
|
|
|
|
|
16.79 |
% |
|
|
|
|
|
16.21 |
% |
|
|
|
|
| Average equity to average assets |
|
8.54 |
% |
|
|
|
|
|
9.05 |
% |
|
|
|
|
|
8.46 |
% |
|
|
|
|
Non-interest expense to average assets |
|
2.76 |
% |
|
|
|
|
|
2.89 |
% |
|
|
|
|
|
2.75 |
% |
|
|
|
|
|
|
|
|
|
|
|
|
|
|
|
|
|
|
|
|
|
|
|
(1)The average balances of loans and leases include non-accrual loans and leases and loans held for sale. Interest income related to non-accrual loans and leases is recognized when collected. Interest income includes net loan fees in lieu of interest.
(2)Includes amortized cost basis of assets available-for-sale and held-to-maturity.
(3)Yields on tax-exempt municipal securities are not presented on a tax-equivalent basis in this table.
(4)Weighted average rate of junior subordinated notes and debentures reflects the accelerated amortization of subordinated debt issuance costs as a result of the early redemption of the junior subordinated notes during the first quarter of 2022.
The following table provides information with respect to: (1) the change in net interest income attributable to changes in rate (changes in rate multiplied by prior volume); and (2) the change in net interest income attributable to changes in volume (changes in volume multiplied by prior rate) for the year ended December 31, 2023 compared to the year ended December 31, 2022. The change in net interest income attributable to changes in rate and volume (changes in rate multiplied by changes in volume) has been allocated to the rate and volume changes in proportion to the relationship of the absolute dollar amounts of the change in each.
Rate/Volume Analysis
|
|
|
|
|
|
|
|
|
|
|
|
|
|
|
|
|
|
|
|
|
|
|
|
|
|
|
|
|
|
|
|
|
|
|
|
|
|
|
| |
|
Increase (Decrease) for the Year Ended December 31, |
| |
|
2023 Compared to 2022 |
|
2022 Compared to 2021 |
| |
|
Rate |
|
Volume |
|
Net |
|
Rate |
|
Volume |
|
Net |
| |
|
(In Thousands) |
| Interest-earning assets |
|
|
|
|
|
|
|
|
|
|
|
|
Commercial real estate and other mortgage loans(1) |
|
$ |
26,551 |
|
|
$ |
4,902 |
|
|
$ |
31,453 |
|
|
$ |
11,176 |
|
|
$ |
3,811 |
|
|
$ |
14,987 |
|
Commercial and industrial loans(1) |
|
18,329 |
|
|
17,059 |
|
|
35,388 |
|
|
6,993 |
|
|
1,240 |
|
|
8,233 |
|
Consumer and other loans(1) |
|
546 |
|
|
(106) |
|
|
440 |
|
|
101 |
|
|
203 |
|
|
304 |
|
Total loans and leases receivable(1) |
|
45,426 |
|
|
21,855 |
|
|
67,281 |
|
|
18,270 |
|
|
5,254 |
|
|
23,524 |
|
Mortgage-related securities(2) |
|
2,341 |
|
|
606 |
|
|
2,947 |
|
|
602 |
|
|
251 |
|
|
853 |
|
| Other investment securities |
|
538 |
|
|
246 |
|
|
784 |
|
|
81 |
|
|
128 |
|
|
209 |
|
| FHLB Stock |
|
325 |
|
|
(83) |
|
|
242 |
|
|
149 |
|
|
189 |
|
|
338 |
|
| Short-term investments |
|
1,664 |
|
|
639 |
|
|
2,303 |
|
|
522 |
|
|
(70) |
|
|
452 |
|
| Total net change in income on interest-earning assets |
|
50,294 |
|
|
23,263 |
|
|
73,557 |
|
|
19,625 |
|
|
5,752 |
|
|
25,376 |
|
| Interest-bearing liabilities |
|
|
|
|
|
|
|
|
|
|
|
|
| Transaction accounts |
|
17,816 |
|
|
1,948 |
|
|
19,764 |
|
|
2,981 |
|
|
(6) |
|
|
2,975 |
|
| Money market |
|
16,612 |
|
|
(724) |
|
|
15,888 |
|
|
4,931 |
|
|
127 |
|
|
5,058 |
|
| Certificates of deposit |
|
5,105 |
|
|
4,746 |
|
|
9,851 |
|
|
364 |
|
|
598 |
|
|
962 |
|
| Wholesale deposits |
|
507 |
|
|
12,230 |
|
|
12,737 |
|
|
1,503 |
|
|
(873) |
|
|
630 |
|
| Total deposits |
|
40,040 |
|
|
18,200 |
|
|
58,240 |
|
|
9,779 |
|
|
(154) |
|
|
9,625 |
|
| FHLB advances |
|
3,033 |
|
|
(1,176) |
|
|
1,857 |
|
|
1,593 |
|
|
523 |
|
|
2,116 |
|
| Other borrowings |
|
56 |
|
|
(258) |
|
|
(202) |
|
|
(131) |
|
|
615 |
|
|
484 |
|
| Junior subordinated notes |
|
— |
|
|
(504) |
|
|
(504) |
|
|
579 |
|
|
(1,188) |
|
|
(609) |
|
| Total net change in expense on interest-bearing liabilities |
|
43,129 |
|
|
16,262 |
|
|
59,391 |
|
|
11,820 |
|
|
(204) |
|
|
11,616 |
|
| Net change in net interest income |
|
$ |
7,165 |
|
|
$ |
7,001 |
|
|
$ |
14,166 |
|
|
$ |
7,805 |
|
|
$ |
5,956 |
|
|
$ |
13,760 |
|
(1)The average balances of loans and leases include non-accrual loans and leases and loans held for sale. Interest income related to non-accrual loans and leases is recognized when collected. Interest income includes net loan fees collected in lieu of interest.
(2)Includes amortized cost basis of assets available-for-sale and held-to-maturity.
The change in yield of the respective interest-earning asset or the rate paid on interest-bearing liability compared to the change in short-term market rates is commonly referred to as a beta. The table below displays the beta calculations for loans and leases, total interest earning assets, in-market deposits, interest-bearing deposits and total interest-bearing liabilities for the year ended December 31, 2023 and 2022. Additionally, adjusted total loans and leases and total interest-earning assets excludes the volatile impact of fees in lieu of interest.
Asset and Liability Beta Analysis
|
|
|
|
|
|
|
|
|
|
|
|
|
|
|
|
|
|
|
|
|
|
|
|
|
|
|
|
|
|
|
For the Year Ended December 31, |
|
|
|
|
|
2023 |
|
2022 |
|
2021 |
|
2023 Compared to 2022 |
|
2022 Compared to 2021 |
|
Average Yield/Rate (3) |
|
Increase (Decrease) |
Total loans and leases receivable (a) |
6.90 |
% |
|
5.01 |
% |
|
4.21 |
% |
|
1.89 |
% |
|
0.80 |
% |
Total interest-earning assets(b) |
6.54 |
% |
|
4.71 |
% |
|
3.90 |
% |
|
1.83 |
% |
|
0.81 |
% |
Adjusted total loans and leases receivable (1)(c) |
6.78 |
% |
|
4.78 |
% |
|
3.91 |
% |
|
2.00 |
% |
|
0.87 |
% |
Adjusted total interest-earning assets (1)(d) |
6.43 |
% |
|
4.50 |
% |
|
3.61 |
% |
|
1.93 |
% |
|
0.89 |
% |
Total in-market deposits(e) |
2.72 |
% |
|
0.60 |
% |
|
0.14 |
% |
|
2.12 |
% |
|
0.46 |
% |
Total bank funding(f) |
2.87 |
% |
|
0.84 |
% |
|
0.37 |
% |
|
2.03 |
% |
|
0.47 |
% |
Net interest margin(g) |
3.78 |
% |
|
3.82 |
% |
|
3.44 |
% |
|
(0.04) |
% |
|
0.38 |
% |
Adjusted net interest margin(h) |
3.63 |
% |
|
3.63 |
% |
|
3.21 |
% |
|
— |
% |
|
0.42 |
% |
|
|
|
|
|
|
|
|
|
|
Effective fed funds rate (2)(i) |
5.02 |
% |
|
1.69 |
% |
|
0.08 |
% |
|
3.33 |
% |
|
1.61 |
% |
|
|
|
|
|
|
|
|
|
|
| Beta Calculations: |
|
|
|
|
|
|
|
|
|
Total loans and leases receivable(a)/(i) |
|
|
|
|
|
|
56.76 |
% |
|
49.69 |
% |
Total interest-earning assets(b)/(i) |
|
|
|
|
|
|
54.98 |
% |
|
50.31 |
% |
Adjusted total loans and leases receivable (1)(c)/(i) |
|
|
|
|
|
|
60.06 |
% |
|
54.04 |
% |
Adjusted total interest-earning assets (1)(d)/(i) |
|
|
|
|
|
|
57.87 |
% |
|
55.28 |
% |
Total in-market deposits(e)/(i) |
|
|
|
|
|
|
63.66 |
% |
|
28.57 |
% |
Total bank funding(f)/(i) |
|
|
|
|
|
|
60.96 |
% |
|
29.19 |
% |
Net interest margin(g)/(i) |
|
|
|
|
|
|
(1.20) |
% |
|
23.60 |
% |
Adjusted net interest margin(h)/(i) |
|
|
|
|
|
|
— |
% |
|
26.09 |
% |
(1)Excluding average net PPP loans, PPP loan interest income, and fees in lieu of interest.
(2)Board of Governors of the Federal Reserve System (US), Effective Federal Funds Rates [DFF]. retrieved from FRED, Federal Reserve Bank of St. Louis.
(3)Represents annualized yields/rates.
Net interest income increased by $14.2 million, or 14.4%, for the year ended December 31, 2023, compared to the year ended December 31, 2022. The increase was principally due to an increase in average loans and leases outstanding, partially offset by net interest margin compression and a decrease in fees in lieu of interest. Average gross loans and leases of $2.648 billion increased by $342.9 million, or 14.9% for the year ended December 31, 2023, compared to $2.305 billion for the same period in 2022. Loan fees collected in lieu of interest decreased 38.6% to $3.2 million, compared to $5.3 million during the same period of comparison.
The yield on average earning assets for the year ended December 31, 2023 was 6.54%, an increase of 183 basis points compared to 4.71% for the year ended December 31, 2022. This increase was principally due to the rising interest rates on variable-rate loans and investment in securities at higher interest rates. Excluding the impact of recurring loan fees in lieu of interest in both 2023 and 2022, the yield on average earning assets for the year ended December 31, 2023 was 6.43%, an increase of 193 basis points compared to 4.50% for the year ended December 31, 2022.
The average rate paid on interest-bearing liabilities was 3.46% for the year ended December 31, 2023, an increase of 223 basis points from 1.23% for the year ended December 31, 2022. The average rate paid increased as the Corporation increased deposit rates and secured wholesale funding, which consists of wholesale deposits and FHLB advances, at elevated fixed rates.
Net interest margin decreased four basis points to 3.78% for the year ended December 31, 2023, compared to 3.82% for the year ended December 31, 2022. Adjusted net interest margin measured 3.63% for the years ended December 31, 2023 and December 31, 2022. Adjusted net interest margin is a non-GAAP measure representing net interest income excluding the fees in lieu of interest and other recurring, but volatile, components of net interest margin divided by average interest-earning assets less other recurring, but volatile, components of average interest-earning assets.
Management believes its success in growing in-market deposits, disciplined loan pricing, and increased production in existing higher-yielding commercial lending products will allow the Corporation to achieve a net interest margin that supports our long-term profitability goals. The collection of loan fees in lieu of interest is an expected source of volatility to quarterly net interest income and net interest margin.
Net interest margin may also experience volatility due to events such as the collection of interest on loans previously in non-accrual status or the accumulation of significant short-term deposit inflows.
Provision for Credit Losses
We determined our provision for credit losses pursuant to our allowance for credit loss methodology, which is based on the magnitude of current and historical net charge-offs recorded throughout the established look-back period, the evaluation of several qualitative factors for each portfolio category, and the amount of specific reserves established for non-performing loans that present collateral shortfall positions. Refer to Allowance for Credit Losses in the Critical Accounting Policy section, for further information regarding our allowance for credit loss methodology.
The following table shows the components of the provision for credit losses.
|
|
|
|
|
|
|
|
|
|
|
|
|
|
|
|
|
|
|
|
|
|
|
For the Year Ended December 31, |
| (Dollars in thousands) |
|
2023 |
|
2022 |
|
2021 |
| Change in general reserve due to subjective factor changes |
|
$ |
33 |
|
|
$ |
(384) |
|
|
$ |
(426) |
|
| Change in general reserve due to quantitative factor changes |
|
(1,453) |
|
|
(2,012) |
|
|
(4,456) |
|
| Charge-offs |
|
1,781 |
|
|
979 |
|
|
3,508 |
|
| Recoveries |
|
(548) |
|
|
(4,741) |
|
|
(5,126) |
|
| Change in specific reserves on individually evaluated loans, net |
|
4,330 |
|
|
146 |
|
|
(2,175) |
|
| Change due to loan growth, net |
|
3,652 |
|
|
2,144 |
|
|
2,872 |
|
Change in unfunded credit commitment reserve |
|
387 |
|
|
— |
|
|
— |
|
Total provision for credit losses (a) |
|
$ |
8,182 |
|
|
$ |
(3,868) |
|
|
$ |
(5,803) |
|
(a) - Management adopted ASC 326 on January 1, 2023. Prior periods are presented under the incurred loss model.
The Corporation recognized $8.2 million of provision expense for the year ended December 31, 2023, compared to a $3.9 million provision benefit for the year ended December 31, 2022. The provision expense for the year ended December 31, 2023 was primarily due to a $4.3 million increase in the specific reserves on individually evaluated loans and a $3.7 million increase in the general reserve due to loan growth. These increases were partially offset by a $1.5 million reduction in the general reserve from quantitative factors, mainly due to an improving economic forecast. Specific reserves were higher on loans in Equipment Finance and, to a lesser extent SBA, within the Commercial and Industrial portfolio. Equipment Finance had higher defaults from borrowers in the transportation and logistics industry which management believes is consistent with the cyclical nature of this industry. Given current economic conditions, the Corporation expects continued stress within this group of borrowers in 2024.
Refer to Asset Quality, below, for further information regarding the overall credit quality of our loan and lease portfolio.
Non-Interest Income
Non-interest income increased by $1.9 million, or 6.4%, to $31.3 million for the year ended December 31, 2023, from $29.4 million for the year ended December 31, 2022. Management continues to focus on revenue growth from multiple non-interest income sources in order to maintain a diversified revenue stream through greater contributions from fee-based revenues. Total non-interest income accounted for 21.8% of our total revenues in 2023 compared to 23.0% in 2022. The increase in total non-interest income for the year ended December 31, 2023 primarily reflected an increase in other non-interest income, led by mezzanine fund investment income, commercial loan swap fee income, and higher private wealth management services income. These increases were partially offset by a decrease bank owned life insurance income and lower service charge income.
The components of non-interest income were as follows:
|
|
|
|
|
|
|
|
|
|
|
|
|
|
|
|
|
|
|
|
|
|
|
|
|
|
|
|
|
|
|
|
|
|
|
|
|
|
|
|
|
|
|
For the Year Ended December 31, |
|
Change From Prior Year |
|
2023 |
|
2022 |
|
2021 |
|
$ Change 2023 |
|
% Change 2023 |
|
$ Change 2022 |
|
% Change 2022 |
|
(Dollars in Thousands) |
Private wealth management services fee income |
$ |
11,425 |
|
|
$ |
10,881 |
|
|
$ |
10,784 |
|
|
$ |
544 |
|
|
5.0 |
% |
|
$ |
97 |
|
|
0.9 |
|
| Gain on sale of SBA loans |
2,055 |
|
|
2,537 |
|
|
4,044 |
|
|
(482) |
|
|
(19.0) |
|
|
(1,507) |
|
|
(37.3) |
|
| Service charges on deposits |
3,131 |
|
|
3,849 |
|
|
3,837 |
|
|
(718) |
|
|
(18.7) |
|
|
12 |
|
|
0.3 |
|
| Loan fees |
3,363 |
|
|
3,010 |
|
|
2,506 |
|
|
353 |
|
|
11.7 |
|
|
504 |
|
|
20.1 |
|
| Bank-owned life insurance income |
1,494 |
|
|
2,227 |
|
|
1,413 |
|
|
(733) |
|
|
(32.9) |
|
|
814 |
|
|
57.6 |
|
| Net (loss) gain on sale of securities |
(45) |
|
|
— |
|
|
29 |
|
|
(45) |
|
|
NM |
|
(29) |
|
|
(100.0) |
|
| Swap fees |
2,964 |
|
|
1,793 |
|
|
1,368 |
|
|
1,171 |
|
|
65.3 |
|
|
425 |
|
|
31.1 |
|
| Other non-interest income |
6,921 |
|
|
5,131 |
|
|
4,119 |
|
|
1,790 |
|
|
34.9 |
|
|
1,012 |
|
|
24.6 |
|
| Total non-interest income |
$ |
31,308 |
|
|
$ |
29,428 |
|
|
$ |
28,100 |
|
|
$ |
1,880 |
|
|
6.4 |
|
|
$ |
1,328 |
|
|
4.7 |
|
Fee income ratio(1) |
21.8 |
% |
|
23.0 |
% |
|
24.9 |
% |
|
|
|
|
|
|
|
|
(1)Fee income ratio is fee income, per the above table, divided by top line revenue (defined as net interest income plus non-interest income).
Private wealth management services fee income increased by $544,000, or 5.0%, to a record $11.4 million for the year ended December 31, 2023 compared to the previous record of $10.9 million for the year ended December 31, 2022. Private wealth management services fee income is primarily driven by the amount of trust assets under management and administration, as well as the mix of business at different fee structures, and can be positively or negatively influenced by the timing and magnitude of volatility within the equity and fixed income markets. This increase was driven by an increase in average assets under management and administration, which is attributable to market appreciation, new client relationships, and new money from existing client relationships. At December 31, 2023, our trust assets under management and administration were $3.122 billion, or 17.3% more than trust assets under management and administration of $2.660 billion at December 31, 2022.
Other non-interest income increased by $1.8 million to $6.9 million for the year ended December 31, 2023, compared to $5.1 million for the year ended December 31, 2022. The increase was primarily due to strong returns from the Corporation’s investments in mezzanine funds.
Commercial loan interest rate swap fee income was $3.0 million for the year ended December 31, 2023, compared to $1.8 million for the year ended December 31, 2022. We originate commercial real estate loans in which we offer clients a floating rate and an interest rate swap. The client’s swap is then offset with a counter-party dealer. The execution of these transactions generates swap fee income. The aggregate amortizing notional value of interest rate swaps with various borrowers was $939.2 million as of December 31, 2023, compared to $744.2 million as of December 31, 2022. Interest rate swaps can be an attractive product for our commercial borrowers, although associated fee income can be variable from period to period based on client demand and the interest rate environment in any given quarter.
Loan fees increased $353,000, or 11.7%, to $3.4 million for the year ended December 31, 2023, compared to $3.0 million for the same period in 2022. The increase was driven by an increase in equipment finance and floorplan finance lending activity generating additional service fee income.
Bank-owned life insurance income decreased by $733,000, or 32.9%, to $1.5 million for the year ended December 31, 2023, compared to $2.2 million for the year ended December 31, 2022. The decrease was due to the recognition of a $809,000 insurance claim in the year ended December 31, 2022.
Service charges on deposits for the year ended December 31, 2023 totaled $3.1 million, a decrease of $718,000, or 18.7%, from the same period in 2022. The decrease was due to higher earnings credit rates commensurate with the higher interest rate environment partially offset by an increase in additional product sales to new and existing clients.
Gain on sale of SBA loans for the year ended December 31, 2023 totaled $2.1 million, a decrease of $482,000, or 19.0%, from the same period in 2022. The decrease is mainly due to a reduction in total loans sold resulting from lighter production in the first half of 2023.
Non-Interest Expense
Non-interest expense increased by $9.1 million, or 11.5%, to $88.6 million for the year ended December 31, 2023 from $79.5 million for the year ended December 31, 2022. Operating expense, which excludes certain one-time and discrete items as defined in the Efficiency Ratio table above, increased $8.6 million, or 10.9%, to $87.8 million for the year ended December 31, 2023 compared to $79.2 million for the year ended December 31, 2022. The increase in operating expense was due to an increase in all expense categories, led by compensation, FDIC insurance, and other non-interest expense.
The components of non-interest expense were as follows:
|
|
|
|
|
|
|
|
|
|
|
|
|
|
|
|
|
|
|
|
|
|
|
|
|
|
|
|
|
|
|
|
|
|
|
|
|
|
|
|
|
|
|
For the Year Ended December 31, |
|
Change From Prior Year |
|
2023 |
|
2022 |
|
2021 |
|
$ Change 2023 |
|
% Change 2023 |
|
$ Change 2022 |
|
% Change 2022 |
|
(Dollars in Thousands) |
| Compensation |
$ |
61,059 |
|
|
$ |
57,742 |
|
|
$ |
51,710 |
|
|
$ |
3,317 |
|
|
5.7 |
% |
|
$ |
6,032 |
|
|
11.7 |
|
| Occupancy |
2,381 |
|
|
2,358 |
|
|
2,180 |
|
|
23 |
|
|
1.0 |
|
|
178 |
|
|
8.2 |
|
| Professional fees |
5,325 |
|
|
4,881 |
|
|
3,736 |
|
|
444 |
|
|
9.1 |
|
|
1,145 |
|
|
30.6 |
|
| Data processing |
3,826 |
|
|
3,197 |
|
|
3,087 |
|
|
629 |
|
|
19.7 |
|
|
110 |
|
|
3.6 |
|
| Marketing |
2,889 |
|
|
2,354 |
|
|
2,022 |
|
|
535 |
|
|
22.7 |
|
|
332 |
|
|
16.4 |
|
| Equipment |
1,340 |
|
|
1,091 |
|
|
990 |
|
|
249 |
|
|
22.8 |
|
|
101 |
|
|
10.2 |
|
| Computer software |
4,985 |
|
|
4,416 |
|
|
4,260 |
|
|
569 |
|
|
12.9 |
|
|
156 |
|
|
3.7 |
|
| FDIC insurance |
2,238 |
|
|
1,042 |
|
|
1,143 |
|
|
1,196 |
|
|
114.8 |
|
|
(101) |
|
|
(8.8) |
|
|
|
|
|
|
|
|
|
|
|
|
|
|
|
|
|
|
|
|
|
|
|
|
|
|
|
|
|
|
|
|
|
|
|
|
|
|
|
|
|
|
|
|
|
|
|
|
|
|
|
|
|
|
|
|
|
|
|
|
|
|
|
|
|
|
|
|
|
|
|
| Other non-interest expense |
4,532 |
|
|
2,393 |
|
|
2,407 |
|
|
2,139 |
|
|
89.4 |
|
|
(14) |
|
|
(0.6) |
|
| Total non-interest expense |
$ |
88,575 |
|
|
$ |
79,474 |
|
|
$ |
71,535 |
|
|
$ |
9,101 |
|
|
11.5 |
|
|
$ |
7,939 |
|
|
11.1 |
|
Total operating expense(1) |
$ |
87,788 |
|
|
$ |
79,155 |
|
|
$ |
71,571 |
|
|
$ |
8,633 |
|
|
10.9 |
|
|
$ |
7,584 |
|
|
10.6 |
|
| Full-time equivalent employees |
343 |
|
|
337 |
|
|
304 |
|
|
6 |
|
|
1.8 |
|
|
33 |
|
|
10.9 |
|
NM = Not meaningful
(1)Total operating expense represents total non-interest expense, adjusted to exclude the impact of discrete items as previously defined in the non-GAAP efficiency ratio calculation above.
Compensation expense increased by $3.3 million, or 5.7%, to $61.1 million for the year ended December 31, 2023 from $57.7 million for the year ended December 31, 2022 principally due to an increase in average FTEs, annual merit increases, growth in employee benefit costs, and increase in incentive compensation. The increase reflects a $2.5 million, or 7.1%, increase in employee salaries and a $908,000, or 25.6% increase in incentive compensation due to exceptional loan and deposit growth. These increases were partially offset by a $1.5 million, or 22.6% decrease in estimated annual cash bonuses compared to a record year for 2022. The Bank’s compensation philosophy is to provide base salaries competitive with the market. Given the competitive job market and the critical importance to the Corporation of retaining employees, annual base salaries were increased an additional $1.5 million, or approximately 4.1%, in the aggregate for 2024. Average FTEs were 343 for the year ended December 31, 2023, increased by 18, or 5.5%, from 325 for the year ended December 31, 2022.
Other non-interest expense increased $2.1 million, or 89.4%, for the year ended December 31, 2023 compared to the year ended December 31, 2022. The increase was primarily due to a $985,000 increase in liquidation expense related to an Asset-Based Lending client, a $963,000 increase in SBA recourse provision, a $232,000 increase in expense from swap credit valuation changes, increase in travel expense, and an increase in loan related expenses. These increases were partially offset by a decrease in charitable donations due to a non-recurring contribution to First Business Charitable foundation totaling $809,000 in the prior year.
FDIC Insurance increased $1.2 million, or 114.8%, for the year ended December 31, 2023 compared to the year ended December 31, 2022. The increase was primarily due to an increase in the assessment rate and the Corporation’s assessable base.
Data processing fees increased $629,000, or 19.7%, for the year ended December 31, 2023 compared to the year ended December 31, 2022. The increase was primarily due to an increase in core processing costs commensurate with loan and deposit account growth, as well as various project implementations.
Computer software expense increased by $569,000, or 12.9%, for the year ended December 31, 2023 compared to the year ended December 31, 2022. The increase was primarily due to continued investment in technology to support the Corporation’s growth.
Marketing expense increased by $535,000, or 22.7%, for the year ended December 31, 2023 compared to the year ended December 31, 2022. The increase was primarily due to an increase in business development efforts and advertising projects commensurate with our expanding sales force.
Professional fees increased $444,000, or 9.1%, for the year ended December 31, 2023 compared to the year ended December 31, 2022. The increase was primarily due to an increase in recruiting expense and a general increase in other professional consulting services for various projects.
Income Taxes
Income tax expense was $10.1 million for the year ended December 31, 2023, compared to $11.4 million for the year ended December 31, 2022. The income tax expense included a $1.2 million and $635,000 net benefit from tax credit investments in 2023 and 2022, respectively. The effective tax rate for the year ended December 31, 2023 was 21.5% compared to 21.8% for the year ended December 31, 2022. Management completed its analysis of the Wisconsin State Budget 2023, which included language that provides an exemption for state tax on certain loan income for loans to Wisconsin small businesses. Management estimates this law will eliminate the Bank’s Wisconsin state income tax in 2023 and the foreseeable future. This conclusion results in a 2023 state income tax benefit of $2.8 million offset by a one-time $2.8 million charge to state income tax expense to recognize a valuation allowance on deferred state income taxes. Based on expected earnings, reduction in state tax, and future tax credit investments, the Corporation expects to report an effective tax rate between 18% and 19% for 2024.
FINANCIAL CONDITION
General
Total assets increased by $531.2 million, or 17.8%, to $3.508 billion as of December 31, 2023 compared to $2.977 billion at December 31, 2022. The increase in total assets was primarily driven by an increase in loans and leases receivable, cash and cash equivalents, securities, and other assets. Total liabilities increased by $502.3 million, or 18.5%, to $3.218 billion as of December 31, 2023 compared to $2.716 billion at December 31, 2022. The increase in total liabilities was principally due to an increase in deposits.
Cash and cash equivalents
Cash and cash equivalents include short-term investments and cash and due from banks. Short-term investments increased by $30.3 million to $107.2 million at December 31, 2023 from $76.9 million at December 31, 2022. Both short-term investments and cash and due from banks increased during 2023. Short-term investments primarily consist of interest-bearing deposits held at the Federal Reserve Bank (“FRB”). We value the safety and soundness provided by the FRB, and therefore, we incorporate short-term investments in our on-balance sheet liquidity program. As of December 31, 2023 and 2022, interest-bearing deposits held at the FRB were $76.5 million and $47.0 million, respectively. In general, the level of our cash and short-term investments will be influenced by the timing of deposit gathering, scheduled maturities of wholesale deposits, funding of loan and lease growth when opportunities are presented, and the level of our securities portfolio. Please refer to the section entitled Liquidity and Capital Resources for further discussion.
Securities
Total securities, including available-for-sale and held-to-maturity, increased by $80.9 million to $305.5 million at December 31, 2023 from $224.7 million at December 31, 2022. As of December 31, 2023 and 2022, our total securities portfolio had a weighted average estimated remaining maturity of approximately 5.6 years and 6.3 years, respectively. The investment portfolio primarily consists of mortgage-backed securities and is used to provide a source of liquidity, including the ability to pledge securities for possible future cash advances, while contributing to the earnings potential of the Bank. The overall duration of the securities portfolio is established and maintained to further mitigate interest rate risk present within our balance sheet as identified through asset/liability simulations. We purchase investment securities intended to protect net interest margin while maintaining an acceptable risk profile. In addition, we will purchase investment securities to utilize our cash position effectively within appropriate policy guidelines and estimates of future cash demands. While mortgage-backed securities present prepayment risk and extension risk, we believe the overall credit risk associated with these investments is minimal, as all of the securities we hold are guaranteed by the United States Treasury, the Federal National Mortgage Association (“FNMA”), the Federal Home Loan Mortgage Corporation (“FHLMC”), or the Government National Mortgage Association (“GNMA”), a U.S. government agency. The estimated repayment streams associated with this portfolio also allow us to better match short-term liabilities.
The Bank’s investment policies allow for various types of investments, including tax-exempt municipal securities. The ability to invest in tax-exempt municipal securities provides for further opportunity to improve our overall yield on the securities portfolio. We evaluate the credit risk of the municipal securities prior to purchase and generally limit exposure to general obligation issuances from municipalities, primarily in Wisconsin.
The majority of the securities we hold have active trading markets; therefore, we have not experienced difficulties in pricing our securities. We use a third-party pricing service as our primary source of market prices for the securities portfolio. On a quarterly basis, we validate the reasonableness of prices received from this source through independent verification of the portfolio, data integrity validation through comparison of current price to prior period prices, and an expectation-based analysis of movement in prices based upon the changes in the related yield curves and other market factors. On a periodic basis, we review the third-party pricing vendor’s methodology for pricing relevant securities and the results of its internal control assessments. Our securities portfolio is sensitive to fluctuations in the interest rate environment and has limited sensitivity to credit risk due to the nature of the issuers and guarantors of the securities as previously discussed. If interest rates decline and the credit quality of the securities remains constant or improves, the fair value of our debt securities portfolio would likely improve, thereby increasing total comprehensive income. If interest rates increase and the credit quality of the securities remains constant or deteriorates, the fair value of our debt securities portfolio would likely decline and therefore decrease total comprehensive income. The magnitude of the fair value change will be based upon the duration of the portfolio. A securities portfolio with a longer average duration will exhibit greater market price volatility than a securities portfolio with a shorter average duration in a changing rate environment. During the year ended December 31, 2023, we recognized unrealized holding gains of $5.6 million before income taxes through other comprehensive income. These gains were the result of an increase in interest rates. No securities within our portfolio were deemed to require an allowance for credit losses as of December 31, 2023. We sold approximately $5.1 million of securities during the year ended December 31, 2023 to proactively manage our securities portfolio and meet our long-term investment objectives. As of December 31, 2023 no securities were classified as trading securities. At December 31, 2023, $45.4 million of our securities were pledged to secure various obligations, including interest rate swap contracts and municipal deposits.
The tables below set forth information regarding the amortized cost and fair values of our securities.
|
|
|
|
|
|
|
|
|
|
|
|
|
|
|
|
|
|
|
|
|
|
|
|
|
|
|
|
|
|
|
| |
|
As of December 31, |
| |
|
2023 |
|
2022 |
|
|
| |
|
Amortized Cost |
|
Fair Value |
|
Amortized Cost |
|
Fair Value |
|
|
|
|
| |
|
(In Thousands) |
| Available-for-sale: |
|
|
|
|
|
|
|
|
|
|
|
|
| U.S. Treasuries |
|
$ |
14,158 |
|
|
$ |
13,776 |
|
|
$ |
4,977 |
|
|
$ |
4,445 |
|
|
|
|
|
| U.S. government agency securities - government-sponsored enterprises |
|
27,986 |
|
|
27,566 |
|
|
13,666 |
|
|
13,205 |
|
|
|
|
|
| Municipal securities |
|
40,407 |
|
|
35,881 |
|
|
45,088 |
|
|
39,311 |
|
|
|
|
|
| Residential mortgage-backed securities - government issued |
|
69,441 |
|
|
68,056 |
|
|
21,790 |
|
|
19,431 |
|
|
|
|
|
| Residential mortgage-backed securities - government-sponsored enterprises |
|
131,321 |
|
|
120,833 |
|
|
119,265 |
|
|
106,323 |
|
|
|
|
|
| Commercial mortgage-backed securities - government issued |
|
2,995 |
|
|
2,525 |
|
|
3,450 |
|
|
2,932 |
|
|
|
|
|
| Commercial mortgage-backed securities - government-sponsored enterprises |
|
32,774 |
|
|
28,369 |
|
|
31,515 |
|
|
26,377 |
|
|
|
|
|
|
|
|
|
|
|
|
|
|
|
|
|
|
|
|
$ |
319,082 |
|
|
$ |
297,006 |
|
|
$ |
239,751 |
|
|
$ |
212,024 |
|
|
|
|
|
|
|
|
|
|
|
|
|
|
|
|
|
|
|
|
|
|
|
|
|
|
|
|
|
|
|
|
|
|
|
|
| |
|
As of December 31, |
| |
|
2023 |
|
2022 |
|
|
| |
|
Amortized Cost |
|
Fair Value |
|
Amortized Cost |
|
Fair Value |
|
|
|
|
| |
|
(In Thousands) |
| Held-to-maturity: |
|
|
|
|
|
|
|
|
|
|
|
|
| Municipal securities |
|
$ |
4,210 |
|
|
$ |
4,173 |
|
|
$ |
7,467 |
|
|
$ |
7,404 |
|
|
|
|
|
| Residential mortgage-backed securities - government issued |
|
1,211 |
|
|
1,135 |
|
|
1,625 |
|
|
1,518 |
|
|
|
|
|
| Residential mortgage-backed securities - government-sponsored issued |
|
1,078 |
|
|
1,025 |
|
|
1,537 |
|
|
1,444 |
|
|
|
|
|
| Commercial mortgage-backed securities - government-sponsored enterprises |
|
2,004 |
|
|
1,922 |
|
|
2,006 |
|
|
1,904 |
|
|
|
|
|
|
|
$ |
8,503 |
|
|
$ |
8,255 |
|
|
$ |
12,635 |
|
|
$ |
12,270 |
|
|
|
|
|
U.S. Treasuries represent treasury bonds issued by the United States Treasury. U.S. government agency securities - government-sponsored enterprises represent securities issued by FNMA and the SBA. Municipal securities include securities issued by various municipalities located primarily within Wisconsin and are primarily general obligation bonds that are tax-exempt in nature. Residential and commercial mortgage-backed securities - government issued represent securities guaranteed by GNMA. Residential and commercial mortgage-backed securities - government-sponsored enterprises include securities guaranteed by FHLMC, FNMA, and the FHLB. Other securities represent certificates of deposit of insured banks and savings institutions with an original maturity greater than three months. As of December 31, 2023, no issuer's securities exceeded 10% of our total stockholders' equity.
The following table sets forth the contractual maturity and weighted average yield characteristics of the fair value of our available-for-sale securities and the amortized cost of our held-to-maturity securities at December 31, 2023, classified by remaining contractual maturity. Actual maturities may differ from contractual maturities because issuers have the right to call or prepay securities without call or prepayment penalties. Yields on tax-exempt securities have not been computed on a tax equivalent basis.
|
|
|
|
|
|
|
|
|
|
|
|
|
|
|
|
|
|
|
|
|
|
|
|
|
|
|
|
|
|
|
|
|
|
|
|
|
|
|
|
|
|
|
|
|
|
|
|
|
|
|
|
|
|
|
|
|
|
|
Less than One Year |
|
One to Five Years |
|
Five to Ten Years |
|
Over Ten Years |
|
|
|
|
Fair Value |
|
Weighted
Average
Yield |
|
Fair Value |
|
Weighted
Average
Yield |
|
Fair Value |
|
Weighted
Average
Yield |
|
Fair Value |
|
Weighted
Average
Yield |
|
Total |
| |
|
(Dollars in Thousands) |
| Available-for-sale: |
|
|
|
|
|
|
|
|
|
|
|
|
|
|
|
|
|
|
| U.S. treasuries |
|
$ |
9,182 |
|
|
5.19 |
% |
|
$ |
4,594 |
|
|
1.00 |
% |
|
$ |
— |
|
|
— |
% |
|
$ |
— |
|
|
— |
% |
|
$ |
13,776 |
|
U.S. government agency securities - government-sponsored enterprises |
|
13,387 |
|
|
4.12 |
|
|
6,060 |
|
|
2.76 |
|
|
1,345 |
|
|
6.19 |
|
|
6,774 |
|
|
6.04 |
|
|
27,566 |
|
| Municipal securities |
|
— |
|
|
— |
|
|
6,992 |
|
|
1.42 |
|
|
10,570 |
|
|
1.86 |
|
|
18,319 |
|
|
2.05 |
|
|
35,881 |
|
|
|
|
|
|
|
|
|
|
|
|
|
|
|
|
|
|
|
|
|
|
22,569 |
|
|
|
|
17,646 |
|
|
|
|
11,915 |
|
|
|
|
25,093 |
|
|
|
|
77,223 |
|
| Residential mortgage-backed securities |
|
|
|
|
|
|
|
|
|
|
|
|
|
|
|
|
|
188,889 |
|
| Commercial mortgage-backed securities |
|
|
|
|
|
|
|
|
|
|
|
|
|
|
|
|
|
30,894 |
|
|
|
$ |
22,569 |
|
|
|
|
$ |
17,646 |
|
|
|
|
$ |
11,915 |
|
|
|
|
$ |
25,093 |
|
|
|
|
$ |
297,006 |
|
|
|
|
|
|
|
|
|
|
|
|
|
|
|
|
|
|
|
|
|
|
|
|
|
|
|
|
|
|
|
|
|
|
|
|
|
|
|
|
|
|
|
|
|
|
|
|
|
|
|
|
|
|
|
|
|
|
|
|
Less than One Year |
|
One to Five Years |
|
Five to Ten Years |
|
Over Ten Years |
|
|
|
|
Amortized Cost |
|
Weighted
Average
Yield |
|
Amortized Cost |
|
Weighted
Average
Yield |
|
Amortized Cost |
|
Weighted
Average
Yield |
|
Amortized Cost |
|
Weighted
Average
Yield |
|
Total |
| |
|
(Dollars in Thousands) |
| Held-to-maturity: |
|
|
|
|
|
|
|
|
|
|
|
|
|
|
|
|
|
|
| Municipal securities |
|
$ |
1,060 |
|
|
2.40 |
% |
|
$ |
3,150 |
|
|
2.76 |
% |
|
$ |
— |
|
|
— |
% |
|
$ |
— |
|
|
— |
% |
|
$ |
4,210 |
|
|
|
1,060 |
|
|
|
|
3,150 |
|
|
|
|
— |
|
|
|
|
— |
|
|
|
|
4,210 |
|
| Residential mortgage-backed securities |
|
|
|
|
|
|
|
|
|
|
|
|
|
|
|
|
|
2,289 |
|
| Commercial mortgage-backed securities |
|
|
|
|
|
|
|
|
|
|
|
|
|
|
|
|
|
2,004 |
|
|
|
$ |
1,060 |
|
|
|
|
$ |
3,150 |
|
|
|
|
$ |
— |
|
|
|
|
$ |
— |
|
|
|
|
$ |
8,503 |
|
Derivatives
The Board-approved Bank policies allow the Bank to participate in hedging strategies or to use financial futures, options, forward commitments, or interest rate swaps. The Bank utilizes, from time to time, derivative instruments in the course of its asset/liability management. The Corporation’s derivative financial instruments, under which the Corporation is required to either receive cash from or pay cash to counterparties depending on changes in interest rates applied to notional amounts, are carried at fair value on the consolidated balance sheets.
As of December 31, 2023, the aggregate amortizing notional value of interest rate swaps with various commercial borrowers was approximately $939.2 million, compared to $744.2 million as of December 31, 2022. We receive fixed rates and pay floating rates based upon designated benchmark interest rates on the swaps with commercial borrowers. These swaps mature between May 2024 and July 2040. Commercial borrower swaps are completed independently with each borrower and are not subject to master netting arrangements. As of December 31, 2023, the commercial borrower swaps were reported on the Consolidated Balance Sheet as a derivative liability and asset of $51.1 million and $7.9 million, respectively, compared to a derivative liability and asset of $61.4 million and $1.0 million, respectively, as of December 31, 2022. On the offsetting swap contracts with dealer counterparties, we pay fixed rates and receive floating rates based upon designated benchmark interest rates. These interest rate swaps also have maturity dates between May 2024 and July 2040. Dealer counterparty swaps are subject to master netting agreements among the contracts within our Bank and were reported on the Consolidated Balance Sheet as a net derivative asset of $43.2 million as of December 31, 2023, compared to a net derivative asset of $60.4 million as of December 31, 2022. The gross amount of dealer counterparty swaps as of December 31, 2023, without regard to the enforceable master netting agreement, was a gross derivative asset and liability of $51.1 million and $7.9 million, respectively, compared to a gross derivative asset and liability of $61.4 million and $1.0 million, respectively, as of December 31, 2022.
The Corporation also enters into interest rate swaps to manage interest rate risk and reduce the cost of match-funding certain long-term fixed rate loans. These derivative contracts involve the receipt of floating rate interest from a counterparty in exchange for the Corporation making fixed-rate payments over the life of the agreement, without the exchange of the underlying notional value. The instruments are designated as cash flow hedges as the receipt of floating rate interest from the counterparty is used to manage interest rate risk associated with forecasted issuances of short-term FHLB advances. The change in the fair value of these hedging instruments is recorded in accumulated other comprehensive income and is subsequently reclassified into earnings in the period that the hedged transactions affect earnings. As of December 31, 2023, the aggregate notional value of interest rate swaps designated as cash flow hedges was $402.7 million. These interest rate swaps mature between December 2023 and March 2034. A pre-tax unrealized loss of $3.5 million was recognized in other comprehensive income for the year ended December 31, 2023, while a pre-tax unrealized gain of $8.5 million and $3.6 million were recognized in other comprehensive income for the years ended December 31, 2022 and 2021, respectively, and there were no ineffective portion of these hedges.
The Corporation also enters into interest rate swaps to mitigate market value volatility on certain long-term fixed-rate securities. The objective of the hedge is to protect the Corporation against changes in fair value due to changes in benchmark interest rates. The instruments are designated as fair value hedges as the changes in the fair value of the interest rate swap are expected to offset changes in the fair value of the hedged item attributable to changes in the SOFR swap rate, the designated benchmark interest rate. These derivative contracts involve the receipt of floating rate interest from a counterparty in exchange for the Corporation making fixed-rate payments over the life of the agreement, without the exchange of the underlying notional value. The change in the fair value of these hedging instruments is recorded in accumulated other comprehensive income and is subsequently reclassified into earnings in the period that the hedged transactions affect earnings. As of December 31, 2023, the aggregate notional value of interest rate swaps designated as fair value hedges was $12.5 million. These interest rate swaps mature between February 2031 and October 2034. A pre-tax unrealized gain of $22,000 and $602,000 was recognized in other comprehensive income for the year ended December 31, 2023 and 2022, respectively, and there was no ineffective portion of these hedges. No pre-tax unrealized gain or loss was recognized in other comprehensive income for the year ended December 31, 2021.
For further information and discussion of our derivatives, see Note 17 — Derivative Financial Instruments of the Consolidated Financial Statements.
Loans and Leases Receivable
Loans and leases receivable, net of allowance for credit losses, increased by $400.2 million, or 16.5%, to $2.819 billion at December 31, 2023 from $2.419 billion at December 31, 2022.
There continues to be a concentration in CRE loans which represented 59.6% and 63.1% of our total loans, as of December 31, 2023 and December 31, 2022, respectively. As of December 31, 2023, approximately 15.1% of the CRE loans were owner-occupied CRE, compared to 17.4% as of December 31, 2022.
We consider owner-occupied CRE more characteristic of the Corporation’s C&I portfolio as, in general, the client’s primary source of repayment is the cash flow from the operating entity occupying the commercial real estate property.
Our C&I portfolio increased $252.5 million, or 29.6%, to $1.106 billion at December 31, 2023 from $853.3 million at December 31, 2022. The Corporation experienced significant C&I loan growth in 2023, due to growth across products and geographies. Management believes the investment in the Corporation’s C&I product lines has positioned the Corporation for strong and sustainable growth in 2024 and beyond.
We continue to actively pursue C&I loans across the Corporation as this segment of our loan and lease portfolio provides an attractive yield commensurate with an appropriate level of credit risk and creates opportunities for in-market deposit, treasury management, and private wealth management relationships which generate additional fee revenue. Underwriting of new credit is primarily through approval from a serial sign-off or committee process and is a key component of our operating philosophy. Business development officers have no individual lending authority limits, and thus, a significant portion of our new credit extensions require approval from a loan approval committee regardless of the type of loan or lease, or the related complexities of each proposal. To monitor the ongoing credit quality of our loans and leases, each credit is evaluated for proper risk rating using a nine grade risk rating system at the time of origination, subsequent renewal, evaluation of updated financial information from our borrowers, or as other circumstances dictate.
While we continue to experience significant competition from banks operating in our primary geographic areas, we remain committed to our underwriting standards and will not deviate from those standards for the sole purpose of growing our loan and lease portfolio. We continue to expect our new loan and lease activity to be adequate to replace normal amortization, allowing us to continue growing in future years.
The following table presents information concerning the composition of the Bank’s consolidated loans and leases receivable.
|
|
|
|
|
|
|
|
|
|
|
|
|
|
|
|
|
|
|
|
|
|
|
|
|
|
|
|
|
|
|
|
|
|
|
|
|
|
|
|
|
As of December 31, |
|
|
2023 |
|
2022 |
|
|
|
|
|
|
|
|
Amount Outstanding |
|
% of Total Loans and Leases |
|
Amount Outstanding |
|
% of Total Loans and Leases |
|
|
|
|
|
|
|
|
|
|
|
|
|
|
(Dollars in Thousands) |
Commercial real estate: |
|
|
|
|
|
|
|
|
|
|
|
|
|
|
|
|
|
|
|
|
Commercial real estate — owner occupied |
|
$ |
256,479 |
|
|
9.0 |
% |
|
$ |
268,354 |
|
|
11.0 |
% |
|
|
|
|
|
|
|
|
|
|
|
|
Commercial real estate — non-owner occupied |
|
773,494 |
|
|
27.1 |
|
|
687,091 |
|
|
28.1 |
|
|
|
|
|
|
|
|
|
|
|
|
|
| Construction |
|
193,080 |
|
|
6.8 |
|
|
218,751 |
|
|
9.0 |
|
|
|
|
|
|
|
|
|
|
|
|
|
Multi-family |
|
450,529 |
|
|
15.8 |
|
|
350,026 |
|
|
14.3 |
|
|
|
|
|
|
|
|
|
|
|
|
|
1-4 family |
|
26,289 |
|
|
0.9 |
|
|
17,728 |
|
|
0.7 |
|
|
|
|
|
|
|
|
|
|
|
|
|
Total commercial real estate |
|
1,699,871 |
|
|
59.6 |
|
|
1,541,950 |
|
|
63.1 |
|
|
|
|
|
|
|
|
|
|
|
|
|
Commercial and industrial |
|
1,105,835 |
|
|
38.8 |
|
|
853,327 |
|
|
34.9 |
|
|
|
|
|
|
|
|
|
|
|
|
|
| Consumer and other |
|
44,312 |
|
|
1.6 |
|
|
47,938 |
|
|
2.0 |
|
|
|
|
|
|
|
|
|
|
|
|
|
Total gross loans and leases receivable |
|
2,850,018 |
|
|
100.0 |
% |
|
2,443,215 |
|
|
100.0 |
% |
|
|
|
|
|
|
|
|
|
|
|
|
| Less: |
|
|
|
|
|
|
|
|
|
|
|
|
|
|
|
|
|
|
|
|
| Allowance for credit losses |
|
31,275 |
|
|
|
|
24,230 |
|
|
|
|
|
|
|
|
|
|
|
|
|
|
|
| Deferred loan fees and costs, net |
|
(243) |
|
|
|
|
149 |
|
|
|
|
|
|
|
|
|
|
|
|
|
|
|
Loans and leases receivable, net |
|
$ |
2,818,986 |
|
|
|
|
$ |
2,418,836 |
|
|
|
|
|
|
|
|
|
|
|
|
|
|
|
Below is a view of selected loan portfolios disaggregated by North American Industry Classification (“NAICs”) code as of December 31, 2023:
|
|
|
|
|
|
|
|
|
|
|
|
|
|
|
|
|
|
|
|
|
|
Real Estate |
Wholesale and Manufacturing |
Retail and Hospitality |
Transportation and Warehousing |
Other |
Total |
| Commercial real estate — owner occupied |
4% |
27% |
18% |
17% |
34% |
100% |
| Commercial real estate — non-owner occupied |
75% (1) |
1% |
10% |
2% |
12% |
100% |
Commercial and industrial |
4% |
26% |
21% |
12% |
37% |
100% |
(1) Includes approximately $252.9 million of office real estate, or 10% of gross loans.
See Asset Quality for further discussion of industry-specific risks.
The following table shows the scheduled contractual maturities of the Bank’s consolidated gross loans and leases receivable, as well as the dollar amount of such loans and leases which are scheduled to mature after one year and have fixed or adjustable interest rates, as of December 31, 2023.
|
|
|
|
|
|
|
|
|
|
|
|
|
|
|
|
|
|
|
|
|
|
|
|
|
|
|
|
|
|
|
|
|
|
|
|
|
|
|
|
|
Amounts Due |
|
Interest Terms On Amounts Due after One Year |
| |
|
In One Year
or Less |
|
After One
Year through
Five Years |
|
After Five
Years |
|
Total |
|
Fixed Rate |
|
Variable
Rate |
| |
|
(In Thousands) |
| Commercial real estate: |
|
|
|
|
|
|
|
|
|
|
|
|
| Owner-occupied |
|
$ |
20,274 |
|
|
$ |
137,966 |
|
|
$ |
98,239 |
|
|
$ |
256,479 |
|
|
$ |
191,383 |
|
|
$ |
44,822 |
|
| Non-owner occupied |
|
96,300 |
|
|
364,249 |
|
|
312,945 |
|
|
773,494 |
|
|
325,712 |
|
|
351,483 |
|
| Construction |
|
48,652 |
|
|
77,203 |
|
|
67,225 |
|
|
193,080 |
|
|
22,604 |
|
|
121,825 |
|
| Multi-family |
|
25,669 |
|
|
162,554 |
|
|
262,306 |
|
|
450,529 |
|
|
102,604 |
|
|
322,256 |
|
| 1-4 family |
|
1,140 |
|
|
11,514 |
|
|
13,635 |
|
|
26,289 |
|
|
18,708 |
|
|
6,440 |
|
| Commercial and industrial |
|
306,864 |
|
|
665,954 |
|
|
133,017 |
|
|
1,105,835 |
|
|
241,606 |
|
|
557,364 |
|
| Consumer and other |
|
9,992 |
|
|
33,886 |
|
|
434 |
|
|
44,312 |
|
|
28,452 |
|
|
5,868 |
|
|
|
$ |
508,891 |
|
|
$ |
1,453,326 |
|
|
$ |
887,801 |
|
|
$ |
2,850,018 |
|
|
$ |
931,069 |
|
|
$ |
1,410,058 |
|
Commercial Real Estate. The Bank originates owner-occupied and non-owner-occupied commercial real estate loans which have fixed or adjustable rates and generally terms of three to 10 years and amortizations of up to 30 years on existing commercial real estate. The Bank also originates loans to construct commercial properties and complete land development projects. The Bank’s construction loans generally have terms of six to 24 months with fixed or adjustable interest rates and fees that are due at the time of origination. Loan proceeds are disbursed in increments as construction progresses and as project inspections warrant.
The repayment of commercial real estate loans generally is dependent on sufficient income from the occupants of properties securing the loans to cover operating expenses and debt service. Payments on commercial real estate loans are often dependent on external market conditions impacting the successful operation or development of the property or business involved. Therefore, repayment of such loans is often sensitive to conditions in the real estate market or the general economy, which are outside the borrower’s control. In the event that the cash flow from the property is reduced, the borrower’s ability to repay the loan could be negatively impacted. The deterioration of one or a few of these loans could cause a material increase in our level of nonperforming loans, which would result in a loss of revenue from these loans and could result in an increase in the provision for credit losses and an increase in charge-offs, all of which could have a material adverse impact on our net income. Additionally, many of these loans have real estate as a primary or secondary component of collateral. The market value of real estate can fluctuate significantly in a short period of time as a result of economic conditions. Adverse developments affecting real estate values in one or more of our markets could impact collateral coverage associated with the commercial real estate segment of our portfolio, possibly leading to increased specific reserves or charge-offs, which would adversely affect profitability.
Commercial and Industrial. The Bank’s commercial and industrial loan portfolio is comprised of loans for a variety of purposes which principally are secured by inventory, accounts receivable, equipment, machinery, and other corporate assets and are advanced within limits prescribed by our loan policy. The majority of such loans are secured and typically backed by personal guarantees of the owners of the borrowing business. Of the $1.106 billion of C&I loans outstanding as of December 31, 2023, $464.3 million were conventional C&I loans and $728.0 million were originated by the FBSF subsidiary. FBSF products consists of equipment financing, asset-based lending, accounts receivable financing, and floorplan financing.
Consumer and Other. The Bank originates a small amount of consumer loans consisting of home equity, first and second mortgages, and other personal loans for professional and executive clients of the Bank.
Asset Quality
Non-performing loans and leases increased $16.9 million, or 462.9%, to $20.6 million at December 31, 2023 compared to $3.7 million at December 31, 2022. Our total non-performing assets consisted of the following:
|
|
|
|
|
|
|
|
|
|
|
|
|
|
|
|
|
|
|
|
|
| |
|
As of December 31, |
| |
|
2023 |
|
2022 |
|
|
|
|
|
|
| |
|
(Dollars in Thousands) |
Non-performing loans and leases |
|
|
|
|
|
|
|
|
|
|
| Commercial real estate: |
|
|
|
|
|
|
|
|
|
|
| Commercial real estate – owner occupied |
|
$ |
— |
|
|
$ |
— |
|
|
|
|
|
|
|
| Commercial real estate – non-owner occupied |
|
— |
|
|
— |
|
|
|
|
|
|
|
| Construction |
|
— |
|
|
— |
|
|
|
|
|
|
|
| Multi-family |
|
— |
|
|
— |
|
|
|
|
|
|
|
| 1-4 family |
|
22 |
|
|
30 |
|
|
|
|
|
|
|
Total non-performing commercial real estate |
|
22 |
|
|
30 |
|
|
|
|
|
|
|
| Commercial and industrial |
|
20,575 |
|
|
3,629 |
|
|
|
|
|
|
|
| Consumer and other |
|
— |
|
|
— |
|
|
|
|
|
|
|
| Total non-accrual loans and leases |
|
20,597 |
|
|
3,659 |
|
|
|
|
|
|
|
| Repossessed assets, net |
|
247 |
|
|
95 |
|
|
|
|
|
|
|
| Total non-performing assets |
|
$ |
20,844 |
|
|
$ |
3,754 |
|
|
|
|
|
|
|
|
|
|
|
|
|
|
|
|
|
|
|
|
|
|
|
|
|
|
|
|
|
|
|
|
|
|
|
|
|
|
|
|
Total non-performing loans and leases to gross loans and leases |
|
0.72 |
% |
|
0.15 |
% |
|
|
|
|
|
|
| Total non-performing assets to gross loans and leases plus repossessed assets, net |
|
0.73 |
% |
|
0.15 |
% |
|
|
|
|
|
|
| Total non-performing assets to total assets |
|
0.59 |
% |
|
0.13 |
% |
|
|
|
|
|
|
| Allowance for credit losses to gross loans and leases |
|
1.16 |
% |
|
0.99 |
% |
|
|
|
|
|
|
Allowance for credit losses to non-performing loans and leases |
|
160.21 |
% |
|
662.20 |
% |
|
|
|
|
|
|
As noted in the table above, non-performing assets consisted of non-performing loans and leases and repossessed assets totaling $20.8 million, or 0.59% of total assets, as of December 31, 2023, an increase in non-performing assets of $17.1 million, or 455.2%, from December 31, 2022. As of December 31, 2023 and 2022, our allowance for credit losses to total non-performing loans and leases was 160.21% and 662.20%, respectively. The increase in non-performing assets was primarily due to one fully-collateralized, $8.8 million ABL loan which defaulted in the second quarter 2023. Excluding the ABL loan, non-performing assets totaled $12.0 million, or 0.34% of total assets. The liquidation process has transitioned into Chapter 7 bankruptcy, likely delaying final resolution until the second half of 2024. The Corporation’s ABL loans are rigorously underwritten and fully collateralized, historically resulting in no losses in the event of a default. Another driver in non-performing assets, is an increase in defaults in Equipment Finance driven by transportation and logistics borrowers, which management believes is consistent with the cyclical nature of this industry.
We use a wide variety of available metrics to assess the overall asset quality of the portfolio and no one metric is used independently to make a final conclusion as to the asset quality of the portfolio. Non-performing assets as a percentage of total assets increased to 0.59% at December 31, 2023 from 0.13% at December 31, 2022. As of December 31, 2023, 99.20% of loans were current compared to 99.8% as of December 31, 2022. The decrease in current status is primarily driven by higher past-due Equipment Finance borrowers.
We reviewed loans and leases with exposure to certain industries:
•Transportation and Logistics, Equipment Finance - 2% of total loans - Management considered the following: 7% of Equipment Finance Transportation loans are rated Category IV and defaults from these borrowers are driving an increase in charge-offs and new reserves. Based on our reserve methodology for individually and collectively evaluated loans, we believe our reserves related to this industry to be appropriate
•Transportation and Logistics, other than Equipment Finance - 4% of total loans - Management considered the following: Less than 1% of the Transportation loans outside of Equipment Finance are rated Category IV. Collateral on these loans includes commercial real estate, business assets, and equipment. Based on these and other borrower-specific considerations, no additional reserve requirements were identified.
•Office, Commercial Real Estate - 10% of total loans - Management considered the following: office exposure is concentrated in the Wisconsin markets where local market vacancy rates are below national rates, a majority of the loan maturity dates are beyond 2031 with the borrower paying a fixed rate, either directly or through an interest rate swap, and there are no non-performing loans in the portfolio. Based on these and other borrower-specific considerations, no additional reserve requirements were identified.
•Multifamily, Commercial Real Estate - 16% of total loans - Management considered the following: multifamily exposure is concentrated in the Wisconsin markets where local market vacancy rates are below national rates, a majority of the loan maturity dates are beyond 2029 with the borrower paying a fixed rate, either directly or through an interest rate swap, and there are no non-performing loans in the portfolio. Based on these and other borrower-specific considerations, no additional reserve requirements were identified.
We also monitor asset quality through our established categories as defined in Note 4 – Loans, Leases Receivable, and Allowance for Credit Losses of the Consolidated Financial Statements. As we continue to actively monitor the credit quality of our loan and lease portfolios, we may identify additional loans and leases for which the borrowers or lessees are having difficulties making the required principal and interest payments based upon factors including, but not limited to, the inability to sell the underlying collateral, inadequate cash flow from the operations of the underlying businesses, liquidation events, or bankruptcy filings. We are proactively working with our non-performing loan borrowers to find meaningful solutions to difficult situations that are in the best interests of the Bank.
Additional information about non-performing loans is as follows:
|
|
|
|
|
|
|
|
|
|
|
|
|
|
|
|
|
|
|
|
|
| |
|
As of December 31, |
| |
|
2023 |
|
2022 |
|
|
|
|
|
|
| |
|
(In Thousands) |
| Individually evaluated loans and leases with no specific reserves required |
|
$ |
9,691 |
|
|
$ |
1,067 |
|
|
|
|
|
|
|
| Individually evaluated loans and leases with specific reserves required |
|
10,906 |
|
|
2,592 |
|
|
|
|
|
|
|
| Total individually evaluated loans and leases |
|
20,597 |
|
|
3,659 |
|
|
|
|
|
|
|
| Less: Specific reserve (included in allowance for credit losses) |
|
5,990 |
|
|
1,650 |
|
|
|
|
|
|
|
| Net non-performing loans and leases |
|
$ |
14,607 |
|
|
$ |
2,009 |
|
|
|
|
|
|
|
| Average non-performing loans and leases |
|
$ |
10,450 |
|
|
$ |
4,899 |
|
|
|
|
|
|
|
|
|
|
|
|
|
|
|
|
|
|
| |
|
For the years ended December 31, |
| |
|
2023 |
|
2022 |
|
|
|
|
|
|
| |
|
(In Thousands) |
| Foregone interest income attributable to non-performing loans and leases |
|
$ |
1,431 |
|
|
$ |
400 |
|
|
|
|
|
|
|
Less: Interest income recognized on non-performing loans and leases |
|
266 |
|
|
1,436 |
|
|
|
|
|
|
|
| Net foregone interest income on non-performing loans and leases |
|
$ |
1,165 |
|
|
$ |
(1,036) |
|
|
|
|
|
|
|
Loans and leases with no specific reserves represent non-performing loans where the collateral, less cost to sell, equals or exceeds the net realizable value of the loan. As part of the underwriting process, as well as our ongoing monitoring efforts, we evaluate sufficiency of collateral to protect our interest in the related loan or lease. As a result of this practice, a significant portion of our outstanding balance of non-performing loans or leases may not require additional specific reserves or require only a minimal amount of required specific reserve. Management is proactive in recording charge-offs to bring loans to their net realizable value in situations where it is determined with certainty that we will not recover the entire amount of our principal. This practice may lead to a lower allowance for credit loss to non-performing loans and leases ratio as compared to our peers or industry expectations.
In 2023, as well as in all previous reporting periods, there were no loans over 90 days past due and still accruing interest. Loans and leases greater than 90 days past due are considered non-performing and are placed on non-accrual status. Cash received while a loan or a lease is on non-accrual status is generally applied solely against the outstanding principal. If collectability of the contractual principal and interest is not in doubt, payments received may be applied to both interest due on a cash basis and principal.
Allowance for Credit Losses
The allowance for credit losses (“ACL”) increased $7.0 million, or 29.1%, to $31.3 million as of December 31, 2023 from $24.2 million as of December 31, 2022. A summary of the activity in the ACL, inclusive of reserves for unfunded credit commitments, follows:
|
|
|
|
|
|
|
|
|
|
|
|
|
|
|
|
|
|
|
|
|
| |
|
Year Ended December 31, |
| |
|
2023 |
|
2022 |
|
|
|
|
|
|
| |
|
(Dollars in Thousands) |
| Allowance at beginning of period |
|
$ |
24,230 |
|
|
$ |
24,336 |
|
|
|
|
|
|
|
Impact of adoption of ASC 326 |
|
1,818 |
|
|
— |
|
|
|
|
|
|
|
| Charge-offs: |
|
|
|
|
|
|
|
|
|
|
| Commercial real estate |
|
|
|
|
|
|
|
|
|
|
| Commercial real estate — owner occupied |
|
— |
|
|
— |
|
|
|
|
|
|
|
| Commercial real estate — non-owner occupied |
|
— |
|
|
— |
|
|
|
|
|
|
|
| Construction |
|
— |
|
|
— |
|
|
|
|
|
|
|
| Multi-family |
|
— |
|
|
— |
|
|
|
|
|
|
|
| 1-4 family |
|
— |
|
|
— |
|
|
|
|
|
|
|
| Commercial and industrial |
|
(1,781) |
|
|
(909) |
|
|
|
|
|
|
|
| Consumer and other |
|
— |
|
|
(70) |
|
|
|
|
|
|
|
| Total charge-offs |
|
(1,781) |
|
|
(979) |
|
|
|
|
|
|
|
| Recoveries: |
|
|
|
|
|
|
|
|
|
|
| Commercial real estate |
|
|
|
|
|
|
|
|
|
|
| Commercial real estate — owner occupied |
|
8 |
|
|
4,260 |
|
|
|
|
|
|
|
| Commercial real estate — non-owner occupied |
|
1 |
|
|
2 |
|
|
|
|
|
|
|
| Construction |
|
— |
|
|
— |
|
|
|
|
|
|
|
| Multi-family |
|
— |
|
|
— |
|
|
|
|
|
|
|
| 1-4 family |
|
40 |
|
|
— |
|
|
|
|
|
|
|
| Commercial and industrial |
|
479 |
|
|
437 |
|
|
|
|
|
|
|
| Consumer and other |
|
20 |
|
|
42 |
|
|
|
|
|
|
|
| Total recoveries |
|
548 |
|
|
4,741 |
|
|
|
|
|
|
|
| Net charge-offs |
|
(1,233) |
|
|
3,762 |
|
|
|
|
|
|
|
| Provision for credit losses |
|
8,182 |
|
|
(3,868) |
|
|
|
|
|
|
|
| Allowance at end of period |
|
$ |
32,997 |
|
|
$ |
24,230 |
|
|
|
|
|
|
|
| Net charge-offs as a percent of average gross loans and leases |
|
0.05 |
% |
|
(0.16) |
% |
|
|
|
|
|
|
During the first quarter of 2023, the Corporation adopted ASU 2016-13, including the CECL methodology for estimating the ACL. This standard was adopted using a modified retrospective approach on January 1, 2023, resulting in a $484,000 increase to the ACL and a $1.3 million increase to the unfunded credit commitments reserve. In addition to the adoption of ASU 2016-13, the increase in ACL as a percent of gross loans and leases was principally due to increase in specific reserves and changes to quantitative and qualitative model factors.
During the year ended December 31, 2023, the Corporation recorded net charge-offs on non-performing loans and leases of approximately $1.2 million, which included $1.8 million of charge-offs and $548,000 of recoveries. During the year ended December 31, 2022, we recorded net recoveries on non-performing loans and leases of approximately $3.8 million, which included $979,000 of charge-offs and $4.7 million of recoveries.
The Corporation recognized $8.2 million provision expense for the year ended December 31, 2023, compared to $3.9 million provision benefit for the year ended December 31, 2022. The provision expense for the year ended December 31, 2023 was primarily due to a $4.3 million increase in the specific reserves on individually evaluated loans and a $3.7 million increase in the general reserve due to loan growth. These increases were partially offset by a $1.5 million reduction in the general reserve from improving historical loss rates.
The increase in ACL was primarily driven by loan growth and net increase in specific reserves on loans in Equipment Finance and SBA within the Commercial and Industrial portfolio. Equipment Finance had higher defaults from borrowers in the transportation and logistics industry which management believes is consistent with the cyclical nature of this industry.
Given current economic conditions, the Corporation expects continued stress within this group of borrowers in 2024.
As a result of our review process, we have concluded an appropriate ACL for the loan and lease portfolio is $33.0 million, or 1.16% of gross loans and leases, at December 31, 2023. However, given ongoing complexities with current workout situations and the uncertainty surrounding future economic conditions, further charge-offs, and increased provisions for credit losses may be recorded if additional facts and circumstances lead us to a different conclusion.
The table below shows our allocation of the allowance for loan losses by loan portfolio segments. The allocation of the allowance by segment is management’s best estimate of the inherent risk in the respective loan portfolio as described in Allowance for Credit Losses in the Critical Accounting Policies and Estimates section. Despite the specific allocation noted in the table below, the entire allowance is available to cover any loss.
|
|
|
|
|
|
|
|
|
|
|
|
|
|
|
|
|
|
|
|
|
|
|
|
|
|
|
|
|
|
|
|
|
|
|
|
|
|
|
| |
|
As of December 31, |
| |
|
2023 |
|
2022 |
|
|
|
|
|
|
|
|
Balance |
|
(a) |
|
Balance |
|
(a) |
|
|
|
|
|
|
|
|
|
|
|
|
| |
|
(Dollars in Thousands) |
Loan and lease portfolios: |
|
|
|
|
|
|
|
|
|
|
|
|
|
|
|
|
|
|
|
|
| Commercial real estate |
|
$ |
12,170 |
|
|
0.72 |
% |
|
$ |
12,560 |
|
|
0.81 |
% |
|
|
|
|
|
|
|
|
|
|
|
|
Commercial and industrial |
|
18,710 |
|
|
1.69 |
|
|
11,128 |
|
|
1.30 |
|
|
|
|
|
|
|
|
|
|
|
|
|
| Consumer and other |
|
395 |
|
|
0.89 |
|
|
542 |
|
|
1.13 |
|
|
|
|
|
|
|
|
|
|
|
|
|
Total allowance for loan losses |
|
$ |
31,275 |
|
|
1.10 |
% |
|
$ |
24,230 |
|
|
0.99 |
% |
|
|
|
|
|
|
|
|
|
|
|
|
Reserve for unfunded credit commitments (b) |
|
$ |
1,722 |
|
|
|
|
$ |
— |
|
|
|
|
|
|
|
|
|
|
|
|
|
|
|
Total allowance for credit losses |
|
$ |
32,997 |
|
|
1.16 |
% |
|
$ |
24,230 |
|
|
0.99 |
% |
|
|
|
|
|
|
|
|
|
|
|
|
(a)Allowance for credit losses category as a percentage of total loans by category.
(b)Not required prior to adoption of ASC 326 on January 1, 2023
The change in ACL as a percentage of gross loans and leases for the portfolios was due to additional specific reserves in Commercial and industrial and change in quantitative factors in all portfolios in the adoption of ASC 326. Although we believe the ACL was appropriate based on the current level of loan and lease delinquencies, non-accrual loans and leases, trends in charge-offs, economic conditions, and other factors as of December 31, 2023, there can be no assurance that future adjustments to the allowance will not be necessary.
Deposits
As of December 31, 2023, deposits increased by $628.6 million to $2.797 billion from $2.168 billion at December 31, 2022. The increase in deposits was primarily due to increases in wholesale deposits and transaction accounts of $255.5 million and $227.0 million, respectively. The large increase in wholesale deposits is primarily driven by a shift from FHLB advances to wholesale deposits to manage interest rate risk and liquidity by utilizing the most efficient and cost-effective source of wholesale funds to match-fund our fixed-rate loan portfolio. In addition, certificates of deposit and money market accounts increased by $133.4 million and $12.7 million, respectively. Both transaction and money market accounts increased due to the successful execution of client deposits initiatives and change in client preferences. Additionally, certificate of deposit accounts saw an increase primarily due to a change in client interest rate expectations.
The following table presents the composition of the Bank’s consolidated deposits.
|
|
|
|
|
|
|
|
|
|
|
|
|
|
|
|
|
|
|
|
|
|
|
|
|
|
|
|
|
|
|
|
|
|
|
|
|
|
|
|
|
As of December 31, |
|
|
2023 |
|
2022 |
|
|
|
|
|
|
|
|
Balance |
|
% of Total Deposits |
|
Balance |
|
% of Total Deposits |
|
|
|
|
|
|
|
|
|
|
|
|
|
|
(Dollars in Thousands) |
Non-interest-bearing transaction accounts |
|
$ |
445,376 |
|
|
15.9 |
% |
|
$ |
537,107 |
|
|
24.8 |
% |
|
|
|
|
|
|
|
|
|
|
|
|
Interest-bearing transaction accounts |
|
895,319 |
|
|
32.0 |
|
|
576,601 |
|
|
26.6 |
|
|
|
|
|
|
|
|
|
|
|
|
|
Money market accounts |
|
711,245 |
|
|
25.4 |
|
|
698,505 |
|
|
32.2 |
|
|
|
|
|
|
|
|
|
|
|
|
|
Certificates of deposit |
|
287,131 |
|
|
10.3 |
|
|
153,757 |
|
|
7.1 |
|
|
|
|
|
|
|
|
|
|
|
|
|
| Wholesale deposits |
|
457,708 |
|
|
16.4 |
|
|
202,236 |
|
|
9.3 |
|
|
|
|
|
|
|
|
|
|
|
|
|
Total deposits |
|
$ |
2,796,779 |
|
|
100.0 |
% |
|
$ |
2,168,206 |
|
|
100.0 |
% |
|
|
|
|
|
|
|
|
|
|
|
|
|
|
|
|
|
|
|
|
|
|
|
|
|
|
|
|
|
|
|
|
|
| Uninsured deposits |
|
994,687 |
|
|
|
|
967,465 |
|
|
|
|
|
|
|
|
|
|
|
|
|
|
|
| Less: uninsured deposits collateralized by pledged assets |
|
17,051 |
|
|
|
|
14,326 |
|
|
|
|
|
|
|
|
|
|
|
|
|
|
|
Total uninsured, net of collateralized deposits |
|
$ |
977,636 |
|
|
35.0 |
% |
|
$ |
953,139 |
|
|
44.0 |
% |
|
|
|
|
|
|
|
|
|
|
|
|
Period-end deposit balances associated with in-market relationships will fluctuate based upon maturity of time deposits, client demands for the use of their cash, and our ability to service and maintain existing and new client relationships. Deposits continue to be the primary source of the Bank’s funding for lending and other investment activities. A variety of accounts are designed to attract both short- and long-term deposits. These accounts include non-interest-bearing transaction accounts, interest-bearing transaction accounts, money market accounts, and certificates of deposit. Deposit terms offered by the Bank vary according to the minimum balance required, the time period the funds must remain on deposit, the rates and products offered by competitors, and the interest rates charged on other sources of funds, among other factors. Our Bank’s in-market deposits are obtained primarily from the South Central, Northeast and Southeast regions of Wisconsin and the greater Kansas City Metro.
We measure the success of in-market deposit gathering efforts based on the average balances of our deposit accounts rather than ending balances due to the volatility of some of our larger relationships. Average in-market deposits for the year ended December 31, 2023 were approximately $2.098 billion, or 75.0% of total bank funding. Total bank funding is defined as total deposits plus FHLB advances. This compares to average in-market deposits of $1.929 billion, or 80.6% of total bank funding, for 2022. Refer to Note 9 - Deposits in the Consolidated Financial Statements for additional information regarding our deposit composition.
The following table sets forth the amount and maturities of the Bank’s certificates of deposit and term wholesale deposits at December 31, 2023.
|
|
|
|
|
|
|
|
|
|
|
|
|
|
|
|
|
|
|
|
|
|
|
|
|
|
|
|
|
|
|
|
|
| Interest Rate |
|
Three Months and Less |
|
Over Three Months Through Six Months |
|
Over Six Months Through Twelve Months |
|
Over Twelve Months |
|
Total |
|
|
(In Thousands) |
| 0.00% to 0.99% |
|
$ |
712 |
|
|
$ |
— |
|
|
$ |
233 |
|
|
$ |
408 |
|
|
$ |
1,353 |
|
| 1.00% to 1.99% |
|
— |
|
|
176 |
|
|
2,084 |
|
|
— |
|
|
2,260 |
|
| 2.00% to 2.99% |
|
2,332 |
|
|
— |
|
|
5,195 |
|
|
2,552 |
|
|
10,079 |
|
| 3.00% to 3.99% |
|
10,185 |
|
|
2,507 |
|
|
484 |
|
|
39,103 |
|
|
52,279 |
|
| 4.00% to 4.99% |
|
110,400 |
|
|
17,120 |
|
|
13,181 |
|
|
116,131 |
|
|
256,832 |
|
| 5.00% and greater |
|
317,805 |
|
|
21,005 |
|
|
33,226 |
|
|
— |
|
|
372,036 |
|
|
|
$ |
441,434 |
|
|
$ |
40,808 |
|
|
$ |
54,403 |
|
|
$ |
158,194 |
|
|
$ |
694,839 |
|
At December 31, 2023, time deposits included $120.2 million of certificates of deposit and wholesale deposits in denominations greater than or equal to $250,000. Of these certificates, $87.7 million are scheduled to mature in three months or less, $5.5 million in greater than three through six months, $24.5 million in greater than six through twelve months and $2.5 million in greater than twelve months.
Of the total time deposits outstanding as of December 31, 2023, $536.6 million are scheduled to mature in 2024, $19.1 million in 2025, $50.4 million in 2026, $73.8 million in 2027, and $12.8 million in 2028. As of December 31, 2023, we have no wholesale certificates of deposit which the Bank has the right to call prior to the scheduled maturity.
Borrowings
We had total borrowings of $330.9 million as of December 31, 2023, a decrease of $125.9 million, or 27.6%, from $456.8 million at December 31, 2022. The Bank utilized more wholesale deposits in lieu of FHLB advances to manage interest rate risk and liquidity by utilizing the most efficient and cost-effective source of wholesale funds to match-fund our fixed-rate loan portfolio. Total wholesale funding as a percentage of total bank funding was 25.2% as of December 31, 2023 compared to 25.1% as of December 31, 2022. Total bank funding is defined as total deposits plus FHLB advances.
As of December 31, 2023, the Corporation had $20,000 of other borrowings, which consisted of sold tax credit investments accounted for as secured borrowings because they did not qualify for true sale accounting. As of December 31, 2022, the Corporation had other borrowings of $6.1 million which consisted of sold loans accounted for as secured borrowings because they did not qualify for true sale accounting.
Consistent with our funding philosophy to manage interest rate risk, we will use the most efficient and cost effective source of wholesale funds. We utilize FHLB advances to the extent we maintain an adequate level of excess borrowing capacity for liquidity and contingency funding purposes and pricing remains favorable in comparison to the wholesale deposit alternative. We will use FHLB advances and/or brokered certificates of deposit in specific maturity periods needed, typically three to five years, to match-fund fixed rate loans and effectively mitigate the interest rate risk measured through our asset/liability management process and to support asset growth initiatives while taking into consideration our operating goals and desired level of usage of wholesale funds. Please refer to the section titled Liquidity and Capital Resources, below, for further information regarding our use and monitoring of wholesale funds.
The following table sets forth the outstanding balances, weighted average balances, and weighted average interest rates for our borrowings (short-term and long-term) as indicated.
|
|
|
|
|
|
|
|
|
|
|
|
|
|
|
|
|
|
|
|
|
|
|
|
|
|
|
|
|
|
|
|
|
|
|
|
|
|
|
|
|
|
|
|
|
| |
|
December 31, 2023 |
|
December 31, 2022 |
|
|
|
|
Balance |
|
Weighted
Average
Balance |
|
Weighted
Average
Rate |
|
Balance |
|
Weighted
Average
Balance |
|
Weighted
Average
Rate |
|
|
|
|
|
|
| |
|
(Dollars in Thousands) |
| Federal funds purchased |
|
$ |
— |
|
|
$ |
3 |
|
|
5.37 |
% |
|
$ |
— |
|
|
$ |
14 |
|
|
7.42 |
% |
|
|
|
|
|
|
FHLB advances |
|
281,500 |
|
|
351,990 |
|
|
2.52 |
|
|
416,380 |
|
|
414,191 |
|
|
1.70 |
|
|
|
|
|
|
|
| Line of credit |
|
— |
|
|
38 |
|
|
7.26 |
|
|
— |
|
|
85 |
|
|
2.78 |
|
|
|
|
|
|
|
| Other borrowings |
|
20 |
|
|
600 |
|
|
8.33 |
|
|
6,088 |
|
|
8,624 |
|
|
5.23 |
|
|
|
|
|
|
|
| Subordinated notes payable |
|
49,396 |
|
|
38,250 |
|
|
5.16 |
|
|
34,340 |
|
|
35,095 |
|
|
5.06 |
|
|
|
|
|
|
|
Junior subordinated notes(1) |
|
— |
|
|
— |
|
|
— |
|
|
— |
|
|
2,429 |
|
|
20.75 |
|
|
|
|
|
|
|
| |
|
$ |
330,916 |
|
|
$ |
390,881 |
|
|
2.79 |
|
|
$ |
456,808 |
|
|
$ |
460,438 |
|
|
2.12 |
|
|
|
|
|
|
|
(1) Weighted average rate of junior subordinated notes reflects the accelerated amortization of subordinated debt issuance costs as a result of the early redemption of the junior subordinated notes during the first quarter of 2022.
A summary of annual maturities of borrowings at December 31, 2023 is as follows:
|
|
|
|
|
|
|
|
|
| (In Thousands) |
|
|
| Maturities during the year ended December 31, |
|
|
| 2024 |
|
$ |
120,520 |
|
| 2025 |
|
48,000 |
|
| 2026 |
|
65,000 |
|
| 2027 |
|
28,000 |
|
| 2028 |
|
— |
|
| Thereafter |
|
69,396 |
|
|
|
$ |
330,916 |
|
The Corporation issued new subordinated debentures as of September 29, 2023. The aggregate principal amount of the newly issued subordinated debentures was $15.0 million which qualified as Tier 2 capital. The subordinated debentures bear a fixed interest rate of 8.0% with a maturity date of September 29, 2033. The Corporation may, at its option, redeem the debentures, in whole or part, at any time after the fifth anniversary of issuance.
Refer to Note 10 – FHLB Advances, Other Borrowings and Subordinated Notes and Debentures in the Consolidated Financial Statements for additional information on the terms of Corporation’s current debt instruments.
Stockholders’ Equity
As of December 31, 2023, stockholders’ equity was $289.6 million, or 8.26% of total assets, compared to stockholders’ equity of $260.6 million, or 8.76% of total assets, as of December 31, 2022. Stockholders’ equity increased by $28.9 million during the year ended December 31, 2023 attributable to net income of $37.0 million for the year ended December 31, 2023, partially offset by preferred and common stock dividend declarations of $875,000 and $7.6 million, respectively, and stock repurchases of $2.0 million of the $5.0 million authorized under the repurchase program discussed below.
On March 4, 2022, the Corporation issued 12,500 shares, or $12.5 million in aggregate liquidation preference, of 7.0% Fixed-to-Floating Rate Non-Cumulative Perpetual Preferred Stock, Series A, par value $0.01 per share, with a liquidation preference of $1,000 per share (the “Series A Preferred Stock”) in a private placement to institutional investors. The net proceeds received from the issuance of the Series A Preferred Stock were $12.0 million.
The Corporation expects to pay dividends on the Series A Preferred Stock when and if declared by its Board, at a fixed rate of 7.0% per annum, payable quarterly, in arrears, on March 15, June 15, September 15 and December 15 of each year up to, but excluding, March 15, 2027. For each dividend period from and including March 15, 2027, dividends will be paid at a floating rate of Three-Month Term SOFR plus a spread of 539 basis points per annum. During the year ended December 31, 2023, the Corporation paid $875,000 in preferred cash dividends. The Series A Preferred Stock is perpetual and has no stated maturity. The Corporation may redeem the Series A Preferred Stock at its option at a redemption price equal to $1,000 per share, plus any declared and unpaid dividends (without regard to any undeclared dividends), subject to regulatory approval, on or after March 15, 2027 or within 90 days following a regulatory capital treatment event, in accordance with the terms of the Series A Preferred Stock.
On January 27, 2023, the Board of Directors of the Corporation approved a share repurchase program. The program authorized the repurchase by the Corporation of up to $5 million of its total outstanding shares of common stock over a period of approximately twelve months, ending January 31, 2024. As of December 31, 2023, the Corporation had repurchased a total of 65,112 shares for approximately $2.0 million at an average cost of $30.72 per share. At this time, the Corporation does not expect to adopt a new plan to replace the recently expired plan due to strong balance sheet growth.
Under the recently expired share repurchase program, authorized the repurchase of shares from time to time in the open market or negotiated transactions at prevailing market rates, or by other means in accordance with federal securities laws.
LIQUIDITY AND CAPITAL RESOURCES
The Corporation expects to meet its liquidity needs through existing cash on hand, established cash flow sources, its third party senior line of credit, and dividends received from the Bank. While the Bank is subject to certain generally applicable regulatory limitations regarding its ability to pay dividends to the Corporation, we do not believe that the Corporation will be adversely affected by these dividend limitations. The Corporation’s principal liquidity requirements at December 31, 2023 were the interest payments due on subordinated notes and cash dividends payable to both common and preferred stockholders. During 2023 and 2022, FBB declared and paid dividends totaling $12.1 million and $2.0 million, respectively. The capital ratios of the Bank met all applicable regulatory capital adequacy requirements in effect on December 31, 2023, and continue to meet the heightened requirements imposed by Basel III, including the capital conservation buffer. The Corporation’s Board and management teams adhere to the appropriate regulatory guidelines on decisions which affect their capital positions, including but not limited to, decisions relating to the payment of dividends and increasing indebtedness.
The Bank maintains liquidity by obtaining funds from several sources. The Bank’s primary source of funds are principal and interest payments on loans receivable and mortgage-related securities, deposits, and other borrowings, such as federal funds and FHLB advances. The scheduled payments of loans and mortgage-related securities are generally a predictable source of funds. Deposit flows and loan prepayments, however, are greatly influenced by general interest rates, economic conditions, and competition.
We view readily accessible liquidity as a critical element to meet our cash and collateral obligations. We define our readily accessible liquidity as the total of our short-term investments, our unencumbered securities available-for-sale, and our unencumbered pledged loans. As of December 31, 2023 and 2022, our readily accessible liquidity was $734.4 million and $449.6 million, respectively. At December 31, 2023 and 2022, the Bank had $106.8 million and $76.5 million on deposit with the FRB recorded in short-term investments, respectively. Any excess funds not used for loan funding or satisfying other cash obligations were maintained as part of our readily accessible liquidity in our interest-bearing accounts with the FRB, as we value the safety and soundness provided by the FRB. We plan to utilize excess liquidity to fund loan and lease portfolio growth, pay down maturing debt, pay down FHLB advances, allow run off of maturing wholesale certificates of deposit or to invest in securities to maintain adequate liquidity at an improved margin.
We had $739.2 million of outstanding wholesale funds at December 31, 2023, compared to $618.6 million of wholesale funds as of December 31, 2022, which represented 24.0% and 23.9%, respectively, of period end total bank funding. Wholesale funds include FHLB advances, brokered certificates of deposit, and deposits gathered from internet listing services. Total bank funding is defined as total deposits plus FHLB advances. We are committed to raising in-market deposits while utilizing wholesale funds to match-fund our loan portfolio and mitigate interest rate risk. Wholesale funds continue to be an efficient and cost effective source of funding for the Bank and allows it to gather funds across a larger geographic base at price levels and maturities that are more attractive than local time deposits when required to raise a similar level of in-market deposits within a short time period. Access to such deposits and borrowings allows us the flexibility to refrain from pursuing less desirable deposit relationships. In addition, the administrative costs associated with wholesale funds are considerably lower than those that would be incurred to administer a similar level of local deposits with a similar maturity structure. During the time frames necessary to accumulate wholesale funds in an orderly manner, we will use short-term FHLB advances to meet our temporary funding needs. The short-term FHLB advances will typically have terms of one week to one month to cover the overall expected funding demands.
Period-end in-market deposits increased $373.1 million, or 19.0%, to $2.339 billion at December 31, 2023 from $1.966 billion at December 31, 2022 as in-market deposit balances increased due to successful business development efforts, partially offset by deposit movement from money market accounts to, alternative investment options, and clients funding their normal course of business. Our in-market relationships continue to grow; however, deposit balances associated with those relationships will fluctuate. We expect to establish new client relationships and continue marketing efforts aimed at increasing the balances in existing clients’ deposit accounts. Nonetheless, we will continue to use wholesale funds in specific maturity periods, typically three to five years, needed to effectively mitigate the interest rate risk measured through our asset/liability management process or in shorter time periods if in-market deposit balances decline. In order to provide for ongoing liquidity and funding, substantially all of our wholesale funds are certificates of deposit which do not allow for withdrawal at the option of the depositor before the stated maturity (with the exception of deposits accumulated through the internet listing service which have the same early withdrawal privileges and fees as do our other in-market deposits) and FHLB advances with contractual maturity terms and no call provisions. The Bank limits the percentage of wholesale funds to total bank funds in accordance with liquidity policies approved by its Board. The Bank was in compliance with its policy limits as of December 31, 2023.
The Bank was able to access the wholesale funding market as needed at rates and terms comparable to market standards during the year ended December 31, 2023. In the event that there is a disruption in the availability of wholesale funds at maturity, the Bank has managed the maturity structure, in compliance with our approved liquidity policy, so at least one year of maturities could be funded through readily available liquidity. These potential funding sources include deposits maintained at the FRB or Federal Reserve Discount Window utilizing currently unencumbered securities and acceptable loans as collateral.
As of December 31, 2023, the available liquidity was in excess of the stated policy minimum. We believe the Bank will also have access to the unused federal funds lines, cash flows from borrower repayments, and cash flows from security maturities. The Bank also has the ability to raise local market deposits by offering attractive rates to generate the level required to fulfill its liquidity needs.
The Corporation maintains a shelf registration with the Securities and Exchange Commission that would allow the Corporation to offer and sell, from time to time and in one or more offerings, up to $75.0 million in aggregate initial offering price of common and preferred stock, debt securities, warrants, subscription rights, units, or depository shares, or any combination thereof.
The Bank is required by federal regulation to maintain sufficient liquidity to ensure safe and sound operations. We believe that the Bank has sufficient liquidity to match the balance of net withdrawable deposits and short-term borrowings in light of present economic conditions and deposit flows.
During the year ended December 31, 2023, operating activities resulted in a net cash inflow of $52.3 million driven by net income of $37.0 million. Net cash used in investing activities for the year ended December 31, 2023 was $506.8 million which consisted of $408.6 million in cash outflows to fund net loan growth and $75.7 million in net cash outflows to purchase available-for-sale securities. Net cash provided by financing activities for the year ended December 31, 2023 was $491.4 million. Financing cash flows included a $628.6 million net increase in deposits and a $134.9 million net increase in FHLB advances, partially offset by cash dividends paid of $7.6 million, and share repurchases of $3.0 million, respectively.
Refer to Note 12 - Regulatory Capital for additional information regarding the Corporation’s and the Bank’s capital ratios and the ratios required by their federal regulators at December 31, 2023 and 2022.
CRITICAL ACCOUNTING POLICIES AND ESTIMATES
The preparation of financial statements in conformity with GAAP requires management to make estimates and assumptions that affect the reported amounts of assets and liabilities and disclosure of contingent assets and liabilities at the date of the financial statements and the reported amounts of revenues and expenses during the reporting period. By their nature, changes in these assumptions and estimates could significantly affect the Corporation’s financial position or results of operations. Actual results could differ from those estimates. Discussed below are certain policies that are critical to the Corporation. We view critical accounting policies to be those which are highly dependent on subjective or complex judgments, estimates and assumptions, and where changes in those estimates and assumptions could have a significant impact on the financial statements.
Allowance for Credit Losses. Management believes the determination of the ACL involves a high degree of judgment and complexity than its other significant accounting policies. The ACL is calculated with the objective of maintaining a reserve level believed by management to be sufficient to absorb estimated credit losses over the life of an asset or an off-balance sheet credit exposure. Management’s determination of the adequacy of the ACL is based on periodic evaluations of past events, including historical credit loss experience on financial assets with similar risk characteristics, current conditions, and reasonable and supportable forecasts that affect the collectability of the remaining cash flows over the contractual term of the financial assets. However, this evaluation has subjective components requiring material estimates, including expected default probabilities, the expected loss given default, the amounts and timing of expected future cash flows, and estimated losses based on historical loss experience and forecasted economic conditions. All of these factors may be susceptible to significant change. To the extent that actual results differ from management estimates, additional provisions for credit losses may be required that would adversely impact earnings in future periods. The ACL represents our recognition of the risks of extending credit and our evaluation of the quality of the loan and lease portfolio and as such, requires the use of judgment as well as other systematic objective and quantitative methods which may include additional assumptions and estimates.
One of the most significant judgments impacting the ACL estimate is the economic forecast for United States national unemployment and United States national GDP. Changes in the economic forecast could significantly affect the estimated credit losses which could potentially lead to materially different allowance levels from one reporting period to the next.
Loans that no longer conform to the risk characteristics of any pool are evaluated individually. This includes all non-performing loans and may also include other loans that management identifies as non-conforming. Reserves on individually-evaluated loans are estimated based on one or a combination of estimates of fair value of the underlying collateral less cost to sell, seniority of the Bank’s claim, and borrower repayment forecasts. For loans and leases less than $1,000,000 in the Equipment Finance pool, the recovery value is based on historical experience rather than specific asset appraisals.
Management also evaluates debt securities for credit losses when a default or decline in fair value is identified.
See Note 1 – Nature of Operations and Summary of Significant Accounting Policies, Note 3 Securities, and Note 4 – Loans, Leases Receivable, and Allowance for Credit Losses in the Consolidated Financial Statements for further discussion of the ACL.
We also continue to exercise our legal rights and remedies as appropriate in the collection and disposal of non-performing assets, and adhere to rigorous underwriting standards in our origination process in order to achieve strong asset quality. Although we believe that the ACL was appropriate as of December 31, 2023 based upon the evaluation of loan and lease delinquencies, non-performing assets, charge-off trends, economic conditions, and other factors, there can be no assurance that future adjustments to the allowance will not be necessary.
Goodwill Impairment Assessment. Goodwill is not amortized but, instead, is subject to impairment tests on at least an annual basis, and more frequently if an event occurs or circumstances change that would more likely than not reduce the fair value of a reporting unit below its carrying amount, including goodwill. The Corporation conducted its annual impairment test as of July 1, 2023, utilizing a qualitative assessment, and concluded that it was more likely than not the estimated fair value of the reporting unit exceeded its carrying value, resulting in no impairment. Although no goodwill impairment was noted, there can be no assurances that future goodwill impairment will not occur. See Note 1 – Nature of Operations and Summary of Significant Accounting Policies for the Corporation's accounting policy on goodwill and see Note 7 – Goodwill and Intangible Assets in the Consolidated Financial Statements for a detailed discussion of the factors considered by management in the assessment.
Income Taxes. The Corporation and its wholly owned subsidiaries file a consolidated federal income tax return and a combined Wisconsin state tax return. Deferred income taxes are recognized for the future tax consequences attributable to differences between the financial statement carrying amounts of existing assets and liabilities and their respective tax bases. The determination of current and deferred income taxes is based on complex analysis of many factors, including the interpretation of federal and state income tax laws, the difference between the tax and financial reporting basis of assets and liabilities (temporary differences), estimates of amounts currently due or owed, such as the timing of reversals of temporary differences, and current accounting standards. We apply a more likely than not approach to each of our tax positions when determining the amount of tax benefit to record in our Consolidated Financial Statements. Deferred tax assets and liabilities are measured using enacted tax rates expected to apply to taxable income in the years in which those temporary differences are expected to be recovered or settled.
We have made our best estimate of valuation allowances utilizing available evidence and evaluation of sources of taxable income including tax planning strategies and expected reversals of timing differences to determine if valuation allowances were needed for deferred tax assets. Realization of deferred tax assets over time is dependent on our ability to generate sufficient taxable earnings in future periods and a valuation allowance may be necessary if management determines that it is more likely than not that the deferred asset will not be utilized. These estimates and assumptions are subject to change. Changes in these estimates and assumptions could adversely affect future consolidated results of operations. The Corporation believes the tax assets and liabilities are properly recorded in the Consolidated Financial Statements. See also Note 16 – Income Taxes in the Consolidated Financial Statements.
The Corporation also invests in certain development entities that generate federal and state historic and low income housing tax credits. The tax benefits associated with these investments are accounted for either under the flow-through method, equity method, or proportional amortization method and are recognized when the respective project is placed in service or over the investment term.
The federal and state taxing authorities who make assessments based on their determination of tax laws may periodically review our interpretation of federal and state income tax laws. Tax liabilities could differ significantly from the estimates and interpretations used in determining the current and deferred income tax liabilities based on the completion of examinations by taxing authorities.
Item 7A. Quantitative and Qualitative Disclosures about Market Risk
Our primary market risk is interest rate risk, which arises from exposure of our financial position to changes in interest rates. It is our strategy to reduce the impact of interest rate risk on net interest margin by maintaining a match-funded position between the maturities and repricing dates of interest-earning assets and interest-bearing liabilities. This strategy is monitored by the Bank’s Asset/Liability Management Committee, in accordance with policies approved by the Bank’s Board. The committee meets regularly to review the sensitivity of the Bank’s assets and liabilities to changes in interest rates, liquidity needs and sources, and pricing and funding strategies.
The primary technique we use to measure interest rate risk is simulation of earnings. In this measurement technique the balance sheet is modeled as an ongoing entity whereby future growth, pricing, and funding assumptions are implemented. These assumptions are modeled under different rate scenarios that include a simultaneous, instant and sustained change in interest rates.
The following table illustrates the potential impact of changes in market rates on our net interest income for the next twelve months.
|
|
|
|
|
|
|
|
|
|
|
|
|
|
|
|
|
Impact on Net Interest Income as of December 31, |
| Instantaneous Rate Change in Basis Points |
|
2023 |
|
2022 |
| Down 300 |
|
(0.20) |
% |
|
(9.90) |
% |
| Down 200 |
|
1.54 |
|
|
(0.88) |
|
| Down 100 |
|
1.92 |
|
|
0.79 |
|
| No Change |
|
— |
|
|
— |
|
| Up 100 |
|
2.11 |
|
|
2.26 |
|
| Up 200 |
|
2.24 |
|
|
4.48 |
|
| Up 300 |
|
2.36 |
|
|
6.65 |
|
We manage the structure of interest-earning assets and interest-bearing liabilities by adjusting their mix, yield, maturity and/or repricing characteristics based on market conditions. FHLB advances and, to a lesser extent, wholesale certificates of deposit are a significant source of funds. We use a variety of maturities to augment our management of interest rate exposure. Currently, we do not employ any derivatives to assist in managing our interest rate risk exposure; however, management has the authorization, as permitted within applicable approved policies, and ability to utilize such instruments should they be appropriate to manage interest rate exposure. We maintained our historically neutral balance sheet throughout 2023 and believe we ended the year appropriately positioned.
Item 8. Financial Statements and Supplementary Data
INDEX TO CONSOLIDATED FINANCIAL STATEMENTS OF FIRST BUSINESS FINANCIAL SERVICES
|
|
|
|
|
|
|
|
|
|
|
|
| Consolidated Financial Statements |
|
Page No. |
|
|
|
|
|
|
|
|
|
|
|
|
|
|
|
|
|
|
|
|
|
|
|
|
|
|
|
|
|
|
|
|
|
|
|
|
|
|
|
|
|
|
First Business Financial Services, Inc.
Consolidated Balance Sheets
|
|
|
|
|
|
|
|
|
|
|
|
|
|
|
|
|
December 31,
2023 |
|
December 31,
2022 |
| |
(In Thousands, Except Share Data) |
| Assets |
|
|
|
|
| Cash and due from banks |
|
$ |
32,348 |
|
|
$ |
25,811 |
|
| Short-term investments |
|
107,162 |
|
|
76,871 |
|
Cash and cash equivalents |
|
139,510 |
|
|
102,682 |
|
| Securities available-for-sale, at fair value |
|
297,006 |
|
|
212,024 |
|
Securities held-to-maturity, at amortized cost |
|
8,503 |
|
|
12,635 |
|
Loans held for sale |
|
4,589 |
|
|
2,632 |
|
Loans and leases receivable, net of allowance for credit losses of $31,275 and $24,230, respectively |
|
2,818,986 |
|
|
2,418,836 |
|
| Premises and equipment, net |
|
6,190 |
|
|
4,340 |
|
| Repossessed assets |
|
247 |
|
|
95 |
|
| Right-of-use assets, net |
|
6,559 |
|
|
7,690 |
|
| Bank-owned life insurance |
|
55,536 |
|
|
54,018 |
|
| Federal Home Loan Bank stock, at cost |
|
12,042 |
|
|
17,812 |
|
| Goodwill and other intangible assets |
|
12,023 |
|
|
12,159 |
|
| Derivatives |
|
55,597 |
|
|
68,581 |
|
| Accrued interest receivable and other assets |
|
91,058 |
|
|
63,107 |
|
Total assets |
|
$ |
3,507,846 |
|
|
$ |
2,976,611 |
|
| Liabilities and Stockholders’ Equity |
|
|
|
|
| Deposits |
|
$ |
2,796,779 |
|
|
$ |
2,168,206 |
|
| Federal Home Loan Bank advances and other borrowings |
|
330,916 |
|
|
456,808 |
|
| Lease liabilities |
|
8,954 |
|
|
10,175 |
|
| Derivatives |
|
51,949 |
|
|
61,419 |
|
| Accrued interest payable and other liabilities |
|
29,660 |
|
|
19,363 |
|
Total liabilities |
|
3,218,258 |
|
|
2,715,971 |
|
| Stockholders’ equity: |
|
|
|
|
Preferred stock, $0.01 par value, 2,500,000 shares authorized, 12,500 shares of 7% non-cumulative perpetual preferred stock, Series A, outstanding at December 31, 2023 and 2022, respectively |
|
11,992 |
|
|
11,992 |
|
Common stock, $0.01 par value, 25,000,000 shares authorized, 9,418,463 and 9,371,078 shares issued, 8,314,778 and 8,362,085 shares outstanding at December 31, 2023 and 2022, respectively |
|
95 |
|
|
94 |
|
| Additional paid-in capital |
|
90,616 |
|
|
87,512 |
|
| Retained earnings |
|
230,728 |
|
|
203,507 |
|
| Accumulated other comprehensive loss |
|
(13,717) |
|
|
(15,310) |
|
Treasury stock, 1,103,685 and 1,008,993 shares at December 31, 2023 and 2022, respectively, at cost |
|
(30,126) |
|
|
(27,155) |
|
Total stockholders’ equity |
|
289,588 |
|
|
260,640 |
|
Total liabilities and stockholders’ equity |
|
$ |
3,507,846 |
|
|
$ |
2,976,611 |
|
See accompanying Notes to Consolidated Financial Statements.
First Business Financial Services, Inc.
Consolidated Statements of Income
|
|
|
|
|
|
|
|
|
|
|
|
|
|
|
|
|
|
|
|
|
|
|
For the Year Ended December 31, |
| |
|
2023 |
|
2022 |
|
2021 |
| |
|
(In Thousands, Except Share Data) |
| Interest income |
|
|
|
|
|
|
| Loans and leases |
|
$ |
182,650 |
|
|
$ |
115,368 |
|
|
$ |
91,844 |
|
| Securities |
|
8,203 |
|
|
4,472 |
|
|
3,410 |
|
| Short-term investments |
|
4,075 |
|
|
1,531 |
|
|
741 |
|
| Total interest income |
|
194,928 |
|
|
121,371 |
|
|
95,995 |
|
| Interest expense |
|
|
|
|
|
|
| Deposits |
|
71,418 |
|
|
13,178 |
|
|
3,553 |
|
| Federal Home Loan Bank advances and other borrowings |
|
10,922 |
|
|
9,267 |
|
|
6,667 |
|
| Junior subordinated notes |
|
— |
|
|
504 |
|
|
1,113 |
|
| Total interest expense |
|
82,340 |
|
|
22,949 |
|
|
11,333 |
|
| Net interest income |
|
112,588 |
|
|
98,422 |
|
|
84,662 |
|
| Provision for credit losses |
|
8,182 |
|
|
(3,868) |
|
|
(5,803) |
|
| Net interest income after provision for credit losses |
|
104,406 |
|
|
102,290 |
|
|
90,465 |
|
| Non-interest income |
|
|
|
|
|
|
| Private wealth management service fees |
|
11,425 |
|
|
10,881 |
|
|
10,784 |
|
| Gain on sale of Small Business Administration loans |
|
2,055 |
|
|
2,537 |
|
|
4,044 |
|
|
|
|
|
|
|
|
| Service charges on deposits |
|
3,131 |
|
|
3,849 |
|
|
3,837 |
|
| Loan fees |
|
3,363 |
|
|
3,010 |
|
|
2,506 |
|
| Bank-owned life insurance income |
|
1,494 |
|
|
2,227 |
|
|
1,413 |
|
| Net (loss) gain on sale of securities |
|
(45) |
|
|
— |
|
|
29 |
|
| Swap fees |
|
2,964 |
|
|
1,793 |
|
|
1,368 |
|
| Other non-interest income |
|
6,921 |
|
|
5,131 |
|
|
4,119 |
|
| Total non-interest income |
|
31,308 |
|
|
29,428 |
|
|
28,100 |
|
| Non-interest expense |
|
|
|
|
|
|
| Compensation |
|
61,059 |
|
|
57,742 |
|
|
51,710 |
|
| Occupancy |
|
2,381 |
|
|
2,358 |
|
|
2,180 |
|
| Professional fees |
|
5,325 |
|
|
4,881 |
|
|
3,736 |
|
| Data processing |
|
3,826 |
|
|
3,197 |
|
|
3,087 |
|
| Marketing |
|
2,889 |
|
|
2,354 |
|
|
2,022 |
|
| Equipment |
|
1,340 |
|
|
1,091 |
|
|
990 |
|
| Computer software |
|
4,985 |
|
|
4,416 |
|
|
4,260 |
|
| FDIC insurance |
|
2,238 |
|
|
1,042 |
|
|
1,143 |
|
| Other non-interest expense |
|
4,532 |
|
|
2,393 |
|
|
2,407 |
|
| Total non-interest expense |
|
88,575 |
|
|
79,474 |
|
|
71,535 |
|
| Income before income tax expense |
|
47,139 |
|
|
52,244 |
|
|
47,030 |
|
| Income tax expense |
|
10,112 |
|
|
11,386 |
|
|
11,275 |
|
| Net income |
|
$ |
37,027 |
|
|
$ |
40,858 |
|
|
$ |
35,755 |
|
| Preferred stock dividend |
|
875 |
|
|
683 |
|
|
— |
|
| Income available to common shareholders |
|
$ |
36,152 |
|
|
$ |
40,175 |
|
|
$ |
35,755 |
|
| Earnings per common share: |
|
|
|
|
|
|
| Basic |
|
$ |
4.33 |
|
|
$ |
4.75 |
|
|
$ |
4.17 |
|
| Diluted |
|
4.33 |
|
|
4.75 |
|
|
4.17 |
|
| Dividends declared per share |
|
0.91 |
|
|
0.79 |
|
|
0.72 |
|
See accompanying Notes to Consolidated Financial Statements.
First Business Financial Services, Inc.
Consolidated Statements of Comprehensive Income
|
|
|
|
|
|
|
|
|
|
|
|
|
|
|
|
|
|
|
|
|
|
|
For the Year Ended December 31, |
|
|
2023 |
|
2022 |
|
2021 |
|
|
(In Thousands) |
| Net income |
|
$ |
37,027 |
|
|
$ |
40,858 |
|
|
$ |
35,755 |
|
| Other comprehensive income (loss) |
|
|
|
|
|
|
| Securities available-for-sale: |
|
|
|
|
|
|
| Unrealized securities gains (losses) arising during the period |
|
5,606 |
|
|
(27,730) |
|
|
(4,312) |
|
| Reclassification adjustment for net losses (gains) realized in net income |
|
45 |
|
|
— |
|
|
(29) |
|
| Securities held-to-maturity: |
|
|
|
|
|
|
|
|
|
|
|
|
|
| Amortization of net unrealized losses transferred from available-for-sale |
|
4 |
|
|
14 |
|
|
26 |
|
| Interest rate swaps: |
|
|
|
|
|
|
| Unrealized (losses) gains on interest rate swaps arising during the period |
|
(3,514) |
|
|
9,102 |
|
|
3,610 |
|
| Income tax (expense) benefit |
|
(548) |
|
|
4,761 |
|
|
181 |
|
| Total other comprehensive income (loss) |
|
1,593 |
|
|
(13,853) |
|
|
(524) |
|
Comprehensive income |
|
$ |
38,620 |
|
|
$ |
27,005 |
|
|
$ |
35,231 |
|
See accompanying Notes to Consolidated Financial Statements.
First Business Financial Services, Inc.
Consolidated Statements of Changes in Stockholders’ Equity
|
|
|
|
|
|
|
|
|
|
|
|
|
|
|
|
|
|
|
|
|
|
|
|
|
|
|
|
|
|
|
|
|
|
|
|
|
|
|
|
|
|
|
|
|
|
|
|
|
|
|
|
|
Common Shares Outstanding |
|
Preferred Stock |
|
Common
Stock |
|
Additional
Paid-in
Capital |
|
Retained
Earnings |
|
Accumulated
Other
Comprehensive
Loss |
|
Treasury
Stock |
|
Total |
| |
|
(In Thousands, Except Share Data) |
| Balance at January 1, 2021 |
|
8,566,960 |
|
|
$ |
— |
|
|
$ |
92 |
|
|
$ |
83,125 |
|
|
$ |
140,431 |
|
|
$ |
(933) |
|
|
$ |
(16,553) |
|
|
$ |
206,162 |
|
| Net income |
|
— |
|
|
— |
|
|
— |
|
|
— |
|
|
35,755 |
|
|
— |
|
|
— |
|
|
35,755 |
|
Other comprehensive loss |
|
— |
|
|
— |
|
|
— |
|
|
— |
|
|
— |
|
|
(524) |
|
|
— |
|
|
(524) |
|
|
|
|
|
|
|
|
|
|
|
|
|
|
|
|
|
|
|
|
|
|
|
|
|
|
|
|
|
|
|
|
|
|
|
|
|
|
|
|
|
|
|
|
|
|
|
|
|
|
|
|
|
|
|
|
|
|
|
|
|
|
|
|
|
|
|
|
|
| Share-based compensation - restricted shares and employee stock purchase plan |
|
85,370 |
|
|
— |
|
|
1 |
|
|
2,512 |
|
|
— |
|
|
— |
|
|
— |
|
|
2,513 |
|
| Issuance of common stock under the employee stock purchase plan |
|
6,531 |
|
|
— |
|
|
— |
|
|
160 |
|
|
— |
|
|
— |
|
|
— |
|
|
160 |
|
|
|
|
|
|
|
|
|
|
|
|
|
|
|
|
|
|
|
|
|
|
|
|
|
|
|
|
|
|
|
|
|
|
|
Cash dividends ($0.72 per share) |
|
— |
|
|
— |
|
|
— |
|
|
— |
|
|
(6,166) |
|
|
— |
|
|
— |
|
|
(6,166) |
|
| Treasury stock purchased |
|
(201,297) |
|
|
— |
|
|
— |
|
|
— |
|
|
— |
|
|
— |
|
|
(5,478) |
|
|
(5,478) |
|
| Balance at December 31, 2021 |
|
8,457,564 |
|
|
— |
|
|
93 |
|
|
85,797 |
|
|
170,020 |
|
|
(1,457) |
|
|
(22,031) |
|
|
232,422 |
|
| Net income |
|
— |
|
|
— |
|
|
— |
|
|
— |
|
|
40,858 |
|
|
— |
|
|
— |
|
|
40,858 |
|
| Other comprehensive loss |
|
— |
|
|
— |
|
|
— |
|
|
— |
|
|
— |
|
|
(13,853) |
|
|
— |
|
|
(13,853) |
|
| Issuance of preferred stock, net of issuance costs |
|
— |
|
|
11,992 |
|
|
— |
|
|
— |
|
|
— |
|
|
— |
|
|
— |
|
|
11,992 |
|
|
|
|
|
|
|
|
|
|
|
|
|
|
|
|
|
|
|
|
|
|
|
|
|
|
|
|
|
|
|
|
|
|
|
|
|
|
|
|
|
|
|
|
|
|
|
|
|
|
|
|
| Share-based compensation - restricted shares and employee stock purchase plan |
|
75,564 |
|
|
— |
|
|
1 |
|
|
2,583 |
|
|
— |
|
|
— |
|
|
— |
|
|
2,584 |
|
| Issuance of common stock under the employee stock purchase plan |
|
4,535 |
|
|
— |
|
|
— |
|
|
134 |
|
|
— |
|
|
— |
|
|
— |
|
|
134 |
|
| Treasury stock re-issued |
|
— |
|
|
— |
|
|
— |
|
|
(1,002) |
|
|
— |
|
|
— |
|
|
1,002 |
|
|
— |
|
| Preferred stock dividends |
|
— |
|
|
— |
|
|
— |
|
|
— |
|
|
(683) |
|
|
— |
|
|
— |
|
|
(683) |
|
Cash dividends ($0.79 per share) |
|
— |
|
|
— |
|
|
— |
|
|
— |
|
|
(6,688) |
|
|
— |
|
|
— |
|
|
(6,688) |
|
| Treasury stock purchased |
|
(175,578) |
|
|
— |
|
|
— |
|
|
— |
|
|
— |
|
|
— |
|
|
(6,126) |
|
|
(6,126) |
|
| Balance at December 31, 2022 |
|
8,362,085 |
|
|
11,992 |
|
|
94 |
|
|
87,512 |
|
|
203,507 |
|
|
(15,310) |
|
|
(27,155) |
|
|
260,640 |
|
| Cumulative change in accounting principle |
|
— |
|
|
— |
|
|
— |
|
|
— |
|
|
(1,353) |
|
|
— |
|
|
— |
|
|
(1,353) |
|
| Balance at January 1, 2023 |
|
8,362,085 |
|
|
11,992 |
|
|
94 |
|
|
87,512 |
|
|
202,154 |
|
|
(15,310) |
|
|
(27,155) |
|
|
259,287 |
|
| Net income |
|
— |
|
|
— |
|
|
— |
|
|
— |
|
|
37,027 |
|
|
— |
|
|
— |
|
|
37,027 |
|
Other comprehensive income |
|
— |
|
|
— |
|
|
— |
|
|
— |
|
|
— |
|
|
1,593 |
|
|
— |
|
|
1,593 |
|
|
|
|
|
|
|
|
|
|
|
|
|
|
|
|
|
|
|
|
|
|
|
|
|
|
|
|
|
|
|
|
|
|
|
|
|
|
|
|
|
|
|
|
|
|
|
|
|
|
|
|
|
|
|
|
|
|
|
|
|
|
|
|
|
|
|
|
|
| Share-based compensation - restricted shares and employee stock purchase plan |
|
43,057 |
|
|
— |
|
|
1 |
|
|
2,976 |
|
|
— |
|
|
— |
|
|
— |
|
|
2,977 |
|
| Issuance of common stock under the employee stock purchase plan |
|
4,328 |
|
|
— |
|
|
— |
|
|
128 |
|
|
— |
|
|
— |
|
|
— |
|
|
128 |
|
|
|
|
|
|
|
|
|
|
|
|
|
|
|
|
|
|
| Preferred stock dividends |
|
— |
|
|
— |
|
|
— |
|
|
— |
|
|
(875) |
|
|
— |
|
|
— |
|
|
(875) |
|
Cash dividends ($0.91 per share) |
|
— |
|
|
— |
|
|
— |
|
|
— |
|
|
(7,578) |
|
|
— |
|
|
— |
|
|
(7,578) |
|
| Treasury stock purchased |
|
(94,692) |
|
|
— |
|
|
— |
|
|
|
|
— |
|
|
— |
|
|
(2,971) |
|
|
(2,971) |
|
| Balance at December 31, 2023 |
|
8,314,778 |
|
|
$ |
11,992 |
|
|
$ |
95 |
|
|
$ |
90,616 |
|
|
$ |
230,728 |
|
|
$ |
(13,717) |
|
|
$ |
(30,126) |
|
|
$ |
289,588 |
|
See accompanying Notes to Consolidated Financial Statements.
First Business Financial Services, Inc.
Consolidated Statements of Cash Flows
|
|
|
|
|
|
|
|
|
|
|
|
|
|
|
|
|
|
|
|
|
|
|
For the Year Ended December 31, |
| |
|
2023 |
|
2022 |
|
2021 |
| |
|
(In Thousands) |
| Operating activities |
|
|
|
|
|
|
| Net income |
|
$ |
37,027 |
|
|
$ |
40,858 |
|
|
$ |
35,755 |
|
| Adjustments to reconcile net income to net cash provided by operating activities: |
|
|
|
|
|
|
| Deferred income taxes, net |
|
2,120 |
|
|
(775) |
|
|
1,223 |
|
| Tax credit investments recovery |
|
— |
|
|
(351) |
|
|
— |
|
| Provision for credit losses |
|
8,182 |
|
|
(3,868) |
|
|
(5,803) |
|
|
|
|
|
|
|
|
| Depreciation, amortization and accretion, net |
|
3,636 |
|
|
4,066 |
|
|
3,554 |
|
| Share-based compensation |
|
2,977 |
|
|
2,584 |
|
|
2,513 |
|
| Net loss on disposal of fixed assets |
|
73 |
|
|
— |
|
|
78 |
|
|
|
|
|
|
|
|
| Amortization of tax credit investments |
|
4,053 |
|
|
1,035 |
|
|
— |
|
|
|
|
|
|
|
|
| Bank-owned life insurance policy income |
|
(1,494) |
|
|
(2,227) |
|
|
(1,413) |
|
| Origination of loans for sale |
|
(149,669) |
|
|
(124,915) |
|
|
(99,266) |
|
| Sale of loans originated for sale |
|
149,767 |
|
|
128,391 |
|
|
108,435 |
|
| Gain on sale of loans originated for sale |
|
(2,055) |
|
|
(2,537) |
|
|
(4,044) |
|
| Net loss (gain) on repossessed assets |
|
13 |
|
|
(429) |
|
|
15 |
|
| Return on investment in limited partnerships |
|
4,922 |
|
|
721 |
|
|
371 |
|
| Excess tax benefit from share-based compensation |
|
194 |
|
|
264 |
|
|
48 |
|
| Net payments on operating lease liabilities |
|
(1,425) |
|
|
(1,470) |
|
|
(1,431) |
|
| Net increase in accrued interest receivable and other assets |
|
(21,497) |
|
|
(7,728) |
|
|
(6,774) |
|
| Net increase in accrued interest payable and other liabilities |
|
15,468 |
|
|
5,026 |
|
|
2,731 |
|
| Net cash provided by operating activities |
|
52,292 |
|
|
38,645 |
|
|
35,992 |
|
| Investing activities |
|
|
|
|
|
|
| Proceeds from maturities, redemptions and paydowns of available-for-sale securities |
|
22,114 |
|
|
40,835 |
|
|
51,166 |
|
| Proceeds from maturities, redemptions and paydowns of held-to-maturity securities |
|
4,115 |
|
|
7,080 |
|
|
6,586 |
|
| Proceeds from sale of available-for-sale securities |
|
5,085 |
|
|
— |
|
|
14,955 |
|
| Purchases of available-for-sale securities |
|
(106,967) |
|
|
(75,740) |
|
|
(93,019) |
|
|
|
|
|
|
|
|
| Proceeds from sale of repossessed assets |
|
25 |
|
|
71 |
|
|
— |
|
|
|
|
|
|
|
|
| Net increase in loans and leases |
|
(408,618) |
|
|
(199,467) |
|
|
(86,660) |
|
| Investments in limited partnerships |
|
(1,413) |
|
|
(1,508) |
|
|
(1,059) |
|
| Returns of investments in limited partnerships |
|
7 |
|
|
17 |
|
|
32 |
|
|
|
|
|
|
|
|
| Investment in tax credit investments |
|
(24,160) |
|
|
(11,454) |
|
|
(2,964) |
|
| Distribution from tax credit investments |
|
101 |
|
|
474 |
|
|
57 |
|
|
|
|
|
|
|
|
| Investment in Federal Home Loan Bank and Federal Reserve Bank Stock |
|
(32,069) |
|
|
(45,660) |
|
|
(7,439) |
|
| Proceeds from the sale of Federal Home Loan Bank Stock |
|
37,839 |
|
|
41,184 |
|
|
7,680 |
|
| Purchases of leasehold improvements and equipment, net |
|
(2,884) |
|
|
(3,223) |
|
|
(391) |
|
| Proceeds from sale of leasehold improvements and equipment, net |
|
— |
|
|
— |
|
|
44 |
|
|
|
|
|
|
|
|
| Premium payment on bank owned life insurance policies |
|
(24) |
|
|
(50) |
|
|
— |
|
|
|
|
|
|
|
|
| Proceeds from bank owned life insurance claim |
|
— |
|
|
1,859 |
|
|
— |
|
| Proceeds from redemption of Trust II stock |
|
— |
|
|
315 |
|
|
— |
|
| Net cash used in investing activities |
|
(506,849) |
|
|
(245,267) |
|
|
(111,012) |
|
| Financing activities |
|
|
|
|
|
|
| Net increase in deposits |
|
628,573 |
|
|
210,283 |
|
|
102,407 |
|
| Repayment of Federal Home Loan Bank advances |
|
(1,698,730) |
|
|
(2,374,849) |
|
|
(814,000) |
|
| Proceeds from Federal Home Loan Bank advances |
|
1,563,851 |
|
|
2,422,429 |
|
|
788,300 |
|
|
|
|
|
|
|
|
| Proceeds from issuance of subordinated notes payable |
|
15,000 |
|
|
20,000 |
|
|
— |
|
| Repayment of subordinated notes payable |
|
— |
|
|
(9,090) |
|
|
— |
|
| Repayment of junior subordinated debt |
|
— |
|
|
(10,076) |
|
|
— |
|
|
|
|
|
|
|
|
|
|
|
|
|
|
|
| Net (decrease) increase in long-term borrowed funds |
|
(6,013) |
|
|
(5,132) |
|
|
9,998 |
|
|
|
|
|
|
|
|
|
|
|
|
|
|
|
| Cash dividends paid |
|
(7,578) |
|
|
(6,688) |
|
|
(6,166) |
|
|
|
|
|
|
|
|
|
|
|
|
|
|
|
|
|
|
|
|
|
|
|
|
For the Year Ended December 31, |
| |
|
2023 |
|
2022 |
|
2021 |
| |
|
(In Thousands) |
| Preferred stock dividends paid |
|
(875) |
|
|
(683) |
|
|
— |
|
| Proceeds from issuance of common stock under ESPP |
|
128 |
|
|
134 |
|
|
160 |
|
| Proceeds from issuance of preferred stock |
|
— |
|
|
11,992 |
|
|
— |
|
|
|
|
|
|
|
|
| Purchase of treasury stock |
|
(2,971) |
|
|
(6,126) |
|
|
(5,478) |
|
| Net cash provided by financing activities |
|
491,385 |
|
|
252,194 |
|
|
75,221 |
|
| Net increase in cash and cash equivalents |
|
36,828 |
|
|
45,572 |
|
|
201 |
|
| Cash and cash equivalents at the beginning of the period |
|
102,682 |
|
|
57,110 |
|
|
56,909 |
|
| Cash and cash equivalents at the end of the period |
|
$ |
139,510 |
|
|
$ |
102,682 |
|
|
$ |
57,110 |
|
| Supplementary cash flow information |
|
|
|
|
|
|
| Cash paid during the period for: |
|
|
|
|
|
|
| Interest paid on deposits and borrowings |
|
$ |
75,533 |
|
|
$ |
20,110 |
|
|
$ |
13,206 |
|
| Net income taxes paid |
|
7,456 |
|
|
8,038 |
|
|
14,519 |
|
| Non-cash investing and financing activities: |
|
|
|
|
|
|
|
|
|
|
|
|
|
|
|
|
|
|
|
|
| Transfer of loans to repossessed assets |
|
190 |
|
|
50 |
|
|
146 |
|
|
|
|
|
|
|
|
|
|
|
|
|
|
|
|
|
|
|
|
|
|
|
|
|
|
|
|
|
|
|
|
|
|
|
|
| Lease liability in exchange for right-of-use-asset |
|
— |
|
|
6,265 |
|
|
316 |
|
See accompanying Notes to Consolidated Financial Statements.
First Business Financial Services, Inc.
NOTES TO CONSOLIDATED FINANCIAL STATEMENTS
Note 1 – Nature of Operations and Summary of Significant Accounting Policies
Nature of Operations. The accounting and reporting practices of First Business Financial Services, Inc. (“FBFS” or the “Corporation”), through our wholly-owned subsidiary, First Business Bank (“FBB” or the “Bank”), have been prepared in accordance with U.S. generally accepted accounting principles (“GAAP”). FBB operates as a commercial banking institution primarily in Wisconsin and the greater Kansas City metropolitan area. The Bank provides a full range of financial services to businesses, business owners, executives, professionals, and high net worth individuals. FBB also offers bank consulting services to community financial institutions. The Bank is subject to competition from other financial institutions and service providers, and is also subject to state and federal regulations. As of December 31, 2023, FBB had the following wholly-owned subsidiaries: First Business Specialty Finance, LLC (“FBSF”), First Madison Investment Corp. (“FMIC”), ABKC Real Estate, LLC (“ABKC”), FBB Real Estate 2, LLC (“FBB RE 2”), Mitchell Street Apartments Investment, LLC (“Mitchell Street”), and FBB Tax Credit Investment LLC (“FBB Tax Credit”).
Basis of Presentation. The Consolidated Financial Statements include the accounts of the Corporation and its wholly-owned subsidiaries. All significant intercompany balances and transactions have been eliminated in consolidation.
Use of Estimates. Management of the Corporation is required to make estimates and assumptions which affect the reported amounts of assets and liabilities and disclosure of contingent assets and liabilities at the date of the financial statements as well as reported amounts of revenues and expenses during the reporting period. Actual results could differ significantly from those estimates. Material estimates that could significantly change in the near-term include the value of securities and interest rate swaps, level of the allowance for credit losses, lease residuals, property under operating leases, goodwill, and income taxes.
Subsequent Events. Subsequent events have been evaluated through the date of the issuance of the Consolidated Financial Statements. No significant subsequent events have occurred through this date requiring adjustment to the financial statements or disclosures.
Cash and Cash Equivalents. The Corporation considers federal funds sold, interest-bearing deposits, and short-term investments that have original maturities of three months or less to be cash equivalents.
Securities. The Corporation classifies its investment and mortgage-related securities as available-for-sale, held-to-maturity, and trading. Debt securities that the Corporation has the positive intent and ability to hold to maturity are classified as held-to-maturity and are stated at amortized cost. Debt securities bought expressly for the purpose of selling in the near term are classified as trading securities and are measured at fair value with unrealized gains and losses reported in earnings. Debt securities not classified as held-to-maturity or as trading are classified as available-for-sale. Available-for-sale securities are measured at fair value with unrealized gains and losses reported as a separate component of stockholders’ equity, net of tax. Realized gains and losses are included in the Consolidated Statements of Income as a component of non-interest income. Credit losses for securities are recorded as an allowance for credit losses through the provision for credit losses. The cost of securities sold is based on the specific identification method. The Corporation did not hold any trading securities at December 31, 2023 or 2022.
Discounts and premiums on securities are accreted and amortized into interest income using the effective yield method over the estimated life (based on maturity date, call date, or weighted average life) of the related security.
Allowance for Credit Loss (“ACL”) - Available For Sale (“AFS”) Debt Securities. For AFS debt securities in an unrealized loss position, the Corporation first assesses whether it intends to sell, or it is more likely than not that it will be required to sell, the security before recovery of its amortized cost basis. If either of the criteria regarding intent or requirement to sell is met, the security's amortized cost basis is written down to fair value through income. For AFS debt securities that do not meet the aforementioned criteria, the Corporation evaluates whether the decline in fair value has resulted from credit losses or other factors. In making this assessment, management considers the extent to which fair value is less than amortized cost, any changes to the rating of the security by a rating agency, and adverse conditions specifically related to the security, among other factors. If this assessment indicates that a credit loss exists, the present value of cash flows expected to be collected from the security are compared to the amortized cost basis of the security. If the present value of cash flows expected to be collected is less than the amortized cost basis, a credit loss exists and an allowance for credit losses is recorded for the credit loss, limited by the amount that the fair value is less than the amortized cost basis. Any decline in fair value that has not been recorded through an allowance for credit losses is recognized in other comprehensive income, net of applicable taxes.
Changes in the ACL are recorded as a provision for (or recovery of) credit loss expense. Losses are charged against allowance when management believes that uncollectibility of an AFS debt security is confirmed or when either of the criteria regarding intent or requirement to sell is met.
Accrued interest receivable on AFS debt securities totaled $1.3 million at December 31, 2023 and is excluded from the estimate of credit losses.
ACL - Held To Maturity (“HTM”) Debt Securities. Management measures expected credit losses on HTM debt securities on a collective basis by major security type. Accrued interest receivable on HTM debt securities totaled $38,000 at December 31, 2023 and is excluded from the estimate of credit losses. The HTM securities portfolio includes residential mortgage backed securities (“MBS”) commercial MBS, and municipal securities. All residential and commercial MBS are U.S. government issued or U.S. government sponsored and substantially all municipal bonds are rated A or above.
Loans Held for Sale. The guaranteed portions of SBA loans which are originated and intended for sale in the secondary market are classified as held for sale. These loans are carried at the lower of cost or fair value in the aggregate. Unrealized losses on such loans are recognized through a valuation allowance by a charge to other non-interest income. Gains and losses on the sale of loans are also included in other non-interest income. As assets specifically originated for sale, the origination of, disposition of, and gain/loss on these loans are classified as operating activities in the Consolidated Statement of Cash Flows. Fees received from the borrower and direct costs to originate the loans are deferred and recognized as part of the gain or loss on sale. There were $4.6 million and $2.6 million in loans held for sale outstanding at December 31, 2023 and 2022, respectively.
Loans and Leases. Loans and leases which management has the intent and ability to hold for the foreseeable future or until maturity are reported at their outstanding principal balance with adjustments for partial charge-offs, the allowance for credit losses, deferred fees or costs on originated loans and leases, and unamortized premiums or discounts on any purchased loans.
Occasionally, the Corporation modifies loans or leases to borrowers in financial distress by providing principal forgiveness, term extension, an other-than-significant payment delay or interest rate reduction. When principal forgiveness is provided, the amount of forgiveness is charged-off against the allowance for credit loss.
Interest on non-performing loans and leases is accrued and credited to income on a daily basis based on the unpaid principal balance and is calculated using the effective interest method. Per policy, a loan or a lease is considered non-performing and placed on non-accrual status when it becomes 90 days past due or it is doubtful that contractual principal and interest will be collected in accordance with the terms of the contract. A loan or lease is determined to be past due if the borrower fails to meet a contractual payment and will continue to be considered past due until all contractual payments are received. When a loan or leases is placed on non-accrual, the interest accrual is discontinued and previously accrued but uncollected interest is deducted from interest income. If collectability of the contractual principal and interest is in doubt, payments received are first applied to reduce the loan principal. If collectability of the contractual payments is not in doubt, payments may be applied to interest for interest amounts due on a cash basis. As soon as it is determined with certainty that the principal of a non-performing loan or lease is uncollectible, either through collections from the borrower or disposition of the underlying collateral, the portion of the carrying balance that exceeds the estimated measurement value of the loan or lease is charged off. Loans or leases are returned to accrual status when they are brought current in terms of both principal and accrued interest due, have performed in accordance with contractual terms for a reasonable period of time, and when the ultimate collectability of total contractual principal and interest is no longer doubtful.
Transfers of assets, including but not limited to the guaranteed portions of SBA loans and participation interests in other, non-SBA originated loans, that upon completion of the transfer satisfy the conditions to be reported as a sale, including legal isolation, are derecognized from the Consolidated Financial Statements. Transfers of assets that upon completion of the transfer do not meet the conditions of a sale are recorded on a gross basis with a secured borrowing identified to reflect the amount of the transferred interest.
Loan and lease origination fees as well as certain direct origination costs are deferred and amortized as an adjustment to loan yields over the stated term of the loan. Loans or leases that result from a refinance or restructuring, other than modified loans or leases to borrowers in financial distress, where terms are at least as favorable to the Corporation as the terms for comparable loans to other borrowers with similar collection risks and result in an essentially new loan, are accounted for as a new loan. Any unamortized net fees, costs, or penalties are recognized when the new loan or lease is originated. Unamortized net loan or lease fees or costs for loans and leases that result from a refinance or restructure with only minor modifications to the original loan or lease contract are carried forward as a part of the net investment in the new loan. For modified loans or leases to borrowers in financial distress, all fees received in connection with a modification of terms are applied as a reduction of the loan or lease and any related costs, including direct loan origination costs, are charged to expense as incurred.
ACL - Loans. The ACL is a valuation account that is deducted from the loans' amortized cost basis to present the net amounts expected to be collected on the loans. Loans are charged off against the allowance when management believes that the uncollectibility of a loan balance is confirmed. Expected recoveries do not exceed the aggregate of amounts previously charged-off and expected to be charged-off.
Management estimates the allowance balance using relevant available information, from internal and external sources, relating to past events, current conditions, and reasonable and supportable forecasts. Historical credit loss experience provides the basis for the estimation of expected credit losses. Adjustments to historical loss information are made for differences in current loan-specific risk characteristics such as differences in underwriting standards, portfolio mix, delinquency level, or term as well as changes in external conditions, such as changes in unemployment rates, property values, or other relevant factors.
Accrued interest receivable on loans totaled $11.1 million at December 31, 2023 and is excluded from the estimate of credit losses.
ACL - Loans - Collectively Evaluated. The ACL is measured on a collective pool basis when similar risk characteristics exist. The Corporation has identified the following portfolio segments:
Commercial Real Estate: Commercial real estate portfolio segments utilize substantially similar processes and controls. Due to the collateral types, availability of data, and results of the Loss Driver Analysis (“LDA”), management utilizes a unique forecast model for each portfolio segment along with a separate analysis of subjective factors.
•Construction - Loans secured by real estate used to finance land development or construction.
•1-4 Family - Loans secured by 1-4 family residential property
•Multi-family - Loans secured by multi-family residential property
•Owner Occupied - Loans secured by nonfarm, nonresidential owner-occupied property
•Non-owner Occupied - Loans secured by other nonfarm, nonresidential property
Commercial and Industrial Lending: Commercial and industrial lending is a portfolio segment where management uses a common forecast due to common risk management, similarity in collateral types, availability of data, and results of the LDA. Management has distinct processes, controls, and procedures which enable more precise development of subjective factors at the pool level.
•Commercial - Loans to small- to medium-sized companies in our primary markets in Wisconsin, Kansas, and Missouri, predominantly through lines of credit and term loans to businesses with annual sales of up to $150 million.
•Asset Based Lending - Products include revolving lines of credit and term loans for strategic acquisitions, capital expenditures, working capital, bank debt refinancing, debt restructuring, and corporate turnaround strategies.
•Floorplan - Floor plan financing for independent auto dealerships nationwide.
•SBA - Loans originated in accordance with the guidelines of the Small Business Administration (“SBA”). As the Corporation prefers to sell the guaranteed portion, the on-balance sheet loans are primarily unguaranteed.
•Equipment finance - Loans and leases secured by a broad range of equipment to commercial clients in a variety of industries.
Consumer and other: Consumer loans consisted of marketable security loans and other personal loans for executives and high net-worth individuals. The Corporation uses a unique forecast model and subjective factors for this portfolio segment due to the client type and data availability.
Measures of the ACL are as follows:
|
|
|
|
|
|
|
|
|
|
|
|
|
|
|
|
|
|
|
|
|
| Portfolio Segment |
|
Pool |
|
Measurement Method |
|
Loss Driver |
| Commercial real estate |
|
|
|
|
|
|
| Owner occupied |
|
|
|
Discounted Cash Flow |
|
National unemployment, National GDP |
| Non-owner occupied |
|
|
|
Discounted Cash Flow |
|
National unemployment, National GDP |
| Construction |
|
|
|
Discounted Cash Flow |
|
National unemployment, National GDP |
| Multi-family |
|
|
|
Discounted Cash Flow |
|
National unemployment, National GDP |
| 1-4 Family |
|
|
|
Discounted Cash Flow |
|
National unemployment, National GDP |
| Commercial and industrial |
|
|
|
|
|
|
|
|
Commercial |
|
Discounted Cash Flow |
|
National unemployment, National GDP |
|
|
ABL |
|
Discounted Cash Flow |
|
National unemployment, National GDP |
|
|
Floorplan |
|
Discounted Cash Flow |
|
National unemployment, National GDP |
|
|
SBA |
|
Weighted Average Remaining Maturity |
|
N/A |
|
|
Equipment Finance |
|
Discounted Cash Flow |
|
National unemployment, National GDP |
| Consumer and other |
|
|
|
Discounted Cash Flow |
|
National unemployment, National GDP |
The Corporation utilized a discounted cash flow (DCF) or Weighted Average Remaining Maturity (WARM) method to estimate the quantitative portion of the allowance for credit losses for loans evaluated on a collective pooled basis. For each segment, a LDA was performed in order to identify loss drivers and create a regression model for use in forecasting cash flows. For all DCF-based pools, the LDA analyses utilized the Corporation’s and peer data from the Federal Financial Institutions Examination Council's (“FFIEC”) Call Report filings.
In creating the DCF model, the Corporation has established a one-year reasonable and supportable forecast period with a one-year straight line reversion to the long-term historical average. Due to the infrequency of losses, the Corporation elected to use peer data for a more statistically sound calculation.
Key inputs into the DCF model include loan-level detail, including the amortized cost basis of individual loans, payment structure, loss history, and forecasted loss drivers. The Corporation utilizes a third party to provide economic forecasts under various scenarios, which are assessed quarterly considering the scenarios in the context of the current economic environment and presumed risk of loss.
Expected credit losses are estimated over the contractual term of the loans, adjusted for prepayments when appropriate. The contractual term excludes extensions, renewals, and modifications unless the extension or renewal options are included in the original or modified contract at the reporting date and are not unconditionally cancellable by the Corporation.
Additional key assumptions in the DCF model include the probability of default (“PD”), loss given default (“LGD”), and prepayment/curtailment rates. The Corporation utilizes the model-driven PD and a LGD derived using a method referred to as Frye Jacobs. The Frye Jacobs method is a mathematical formula that traces the relationship between LGD and PD over time and projects the LGD based on the level of PD forecasted. In all cases, the Frye Jacobs method is utilized to calculate LGDs during the forecast period, reversion period and long-term historical average. Prepayment and curtailment rates were calculated through third party studies of the Corporation’s own data.
When the DCF method is used to determine the allowance for credit losses, management adjusts the effective interest rate used to discount expected cash flows to incorporate expected prepayments.
For the WARM-based SBA pool, Corporation-specific data was used to develop the model assumptions. The Corporation developed a reasonable and supportable estimate for the remaining maturity and estimated loss through analysis of historical data. The remaining maturity calculation excludes loans originated under the Paycheck Protection Program as such loans are inconsistent with the current portfolio composition. The quarterly loss rate data includes 2017 to current as the SBA lending policies and procedures were realigned in 2016 following the acquisition of Alterra Bank. Only the unguaranteed portion of the SBA loans are assessed via WARM. The risk of a failed guarantee claim is captured under ASC 450 contingency accounting.
Qualitative factors for DCF and WARM methodologies include the following:
•The Corporation’s lending policies and procedures, including changes in lending strategies, underwriting standards and practices for collections, write-offs, and recoveries;
•Actual and expected changes in international, national, regional, and local economic and business conditions and developments in which the Corporation operates that affect the collectability of financial assets;
•The experience, ability, and depth of the Corporation’s lending, investment, collection, and other relevant management and staff;
•The volume of past due financial assets, the volume of non-performing assets, and the volume and severity of adversely classified or graded assets;
•The existence and effect of industry concentrations of credit;
•The nature and volume of the portfolio segment or class;
•The quality of the Corporation’s credit review function and;
•The effect of other external factors such as the regulatory, legal and technological environments, competition, and events such as natural disasters or pandemics
ACL - Loans - Individually Evaluated. Loans that do not share risk characteristics are evaluated on an individual basis and are excluded from the collective evaluation. The Corporation has determined that all loans which have been placed on non-performing status and other performing loans that have been identified due to non-conforming characteristics will be individually evaluated. Individual analysis will evaluate the required specific reserve for loans in scope. Specific reserves on non-performing loans are typically based on management’s best estimate of the fair value of collateral securing these loans, adjusted for selling costs as appropriate.
ACL - Off-Balance Sheet Credit Exposures. The Corporation estimates expected credit losses over the contractual period in which the Corporation is exposed to credit risk via a contractual obligation to extend credit, unless that obligation is unconditionally cancellable by the Corporation. The allowance for credit losses on off-balance sheet credit exposure is adjusted as a provision for credit loss expense. The estimate includes consideration of the likelihood that funding will occur and an estimate of expected credit losses on commitments expected to be funded over its estimated life. Funding rates are based on a historical analysis of the Corporation’s portfolio, while estimates of credit losses are determined using the same loss rates as funded loans.
Premises and Equipment, net. The cost of capitalized leasehold improvements is amortized on the straight-line method over the lesser of the term of the respective lease or estimated economic life. Equipment is stated at cost less accumulated depreciation and amortization which is calculated by the straight-line method over the estimated useful lives of 3 to 10 years. Maintenance and repair costs are charged to expense as incurred. Improvements which extend the useful life are capitalized and depreciated over the remaining useful life of the assets.
Repossessed Assets. Property acquired by repossession, foreclosure, or by deed in lieu of foreclosure is recorded at the fair value of the underlying property, less costs to sell. This fair value becomes the new cost basis for the repossessed asset. Any write-down in the carrying value of a loan or lease at the time of acquisition is charged to the allowance for credit losses. Any subsequent write-downs to reflect current fair value, as well as gains and losses on disposition and revenues are recorded in non-interest expense. Any required or prudent costs incurred relating to the development and improvement of the property are capitalized while holding period costs are charged to other non-interest expense.
Leases. At contract inception, the Corporation determines whether the arrangement is or contains a lease and determines the lease classification. The lease term is determined based on the non-cancellable term of the lease adjusted to the extent optional renewal terms and termination rights are reasonably certain. Lease expense is recognized evenly over the lease term. Variable lease payments are recognized as period costs. The present value of remaining lease payments is recognized as a liability on the balance sheet with a corresponding right-of-use asset adjusted for prepaid or accrued lease payments. The Corporation uses the Federal Home Loan Bank fixed advance rate as of the lease inception date that most closely resembles the remaining term of the lease as the incremental borrowing rate, unless the interest rate implicit in the lease contract is readily determinable. The Corporation has elected to exclude short-term leases as well as all non-lease items, such as common area maintenance, from being included in the lease liability on the Consolidated Balance Sheets.
Bank-Owned Life Insurance. Bank-owned life insurance (“BOLI”) is reported at the amount that would be realized if the life insurance policies were surrendered on the balance sheet date. BOLI policies owned by the Bank are purchased with the objective to fund certain future employee benefit costs with the death benefit proceeds. The cash surrender value of such policies is recorded in bank-owned life insurance on the Consolidated Balance Sheets and changes in the value are recorded in non-interest income. The total death benefit of all BOLI policies was $133.7 million and $133.8 million as of December 31, 2023 and 2022, respectively. There are no restrictions on the use of BOLI proceeds nor are there any contractual restrictions on the ability to surrender the policy. As of December 31, 2023 and 2022, there were no borrowings against the cash surrender value of the BOLI policies.
Federal Home Loan Bank Stock. The Bank is required to maintain Federal Home Loan Bank (“FHLB”) stock as members of the FHLB, and in amounts as required by the FHLB. This equity security is “restricted” in that it can only be sold back to the FHLB or another member institution at par. Therefore, it is less liquid than other marketable equity securities and the fair value is equal to cost. The Corporation periodically evaluates its holding in FHLB stock for impairment. Should the stock be impaired, it would be written down to its estimated fair value. There were no impairments recorded on FHLB stock during the years ended December 31, 2023 or 2022.
Goodwill and Other Intangible Assets. Goodwill and other intangible assets consist primarily of goodwill and loan servicing rights. Core deposit intangibles have estimated finite lives and are amortized on an accelerated basis to expense over a period of seven years. Loan servicing rights, when originated, are initially recorded at fair value and subsequently amortized in proportion to and over the period of estimated net servicing income. The Corporation reviews other intangible assets for impairment at least annually, or whenever events or changes in circumstances indicate that the carrying amount of an asset may not be recoverable, in which case an impairment charge would be recorded.
Goodwill is not amortized but is subject to impairment tests on at least an annual basis, and more frequently if an event occurs or circumstances change that would more likely than not reduce the fair value of the reporting unit below its carrying amount (including goodwill). An initial qualitative evaluation is made to assess the likelihood of impairment and determine whether further quantitative testing to calculate the fair value is necessary. When the qualitative evaluation indicates that impairment is more likely than not, quantitative testing is required whereby the fair value of each reporting unit is calculated and compared to the recorded book value. If the calculated fair value of the reporting unit exceeds its carrying value, goodwill is not considered impaired. If the carrying value of a reporting unit exceeds its calculated fair value, an impairment charge is recognized in earnings in an amount equal to the difference.
Other Investments. The Corporation owns certain equity investments in other corporate organizations which are not consolidated because the Corporation does not own more than a 50% interest or exercise control over the organization. Investments in corporations representing at least a 20% interest are generally accounted for using the equity method and investments in corporations representing less than 20% interest are generally accounted for at cost. Investments in limited partnerships representing from at least a 3% up to a 50% interest in the entity are generally accounted for using the equity method and investments in limited partnerships representing less than 3% are generally accounted for at cost. All of these investments are periodically evaluated for impairment. Should an investment be impaired, it would be written down to its estimated fair value. The equity investments are reported in other assets and the income and expense from such investments, if any, is reported in non-interest income and non-interest expense.
Derivative Instruments. The Corporation uses derivative instruments to protect against the risk of adverse price or interest rate movements on the value of certain assets, liabilities, future cash flows, and economic hedges for written client derivative contracts. Derivative instruments represent contracts between parties that usually require little or no initial net investment and result in one party delivering cash to the other party based on a notional amount and an underlying variable, as specified in the contract, and may be subject to master netting agreements.
Market risk is the risk of loss arising from an adverse change in interest rates, exchange rates, or equity prices. The Corporation’s primary market risk is interest rate risk. Instruments designed to manage interest rate risk include interest rate swaps, interest rate options, and interest rate caps and floors with indices that relate to the pricing of specific assets and liabilities. The nature and volume of the derivative instruments used to manage interest rate risk depend on the level and type of assets and liabilities on the balance sheet and the risk management strategies for the current and anticipated rate environments. Counterparty risk with respect to derivative instruments occurs when a counterparty to a derivative contract with an unrealized gain fails to perform according to the terms of the agreement. Counterparty risk is managed by limiting the counterparties to highly rated dealers, requiring collateral postings when values are in deficit positions, applying uniform credit standards to all activities with credit risk, and monitoring the size and the maturity structure of the derivative portfolio.
All derivative instruments are to be carried at fair value on the Consolidated Balance Sheets. The accounting for the gain or loss due to changes in the fair value of a derivative instrument depends on whether the derivative instrument qualifies as a hedge. If the derivative instrument does not qualify as a hedge, the gains or losses are reported in earnings when they occur. However, if the derivative instrument qualifies as a hedge, the accounting varies based on the type of risk being hedged. The Corporation utilizes interest rate swaps offered directly to qualified commercial borrowers, which do not qualify for hedge accounting, and therefore, all changes in fair value and gains and losses on these instruments are reported in earnings as they occur. The effects of netting arrangements are disclosed within the Notes of the Consolidated Financial Statements. The Corporation offers interest rate swap products directly to qualified commercial borrowers. The Corporation economically hedges client derivative transactions by entering into offsetting interest rate swap contracts executed with a third party. Derivative transactions executed as part of this program are not considered hedging instruments and are marked-to-market through earnings each period. The derivative contracts have mirror-image terms, which results in the positions’ changes in fair value offsetting through earnings each period. The credit risk and risk of non-performance embedded in the fair value calculations is different between the dealer counterparties and the commercial borrowers which may result in a difference in the changes in the fair value of the mirror-image swaps.
The Corporation incorporates credit valuation adjustments to appropriately reflect both its own non-performance risk and the counterparty’s risk in the fair value measurements. When evaluating the fair value of its derivative contracts for the effects of non-performance and credit risk, the Corporation considers the impact of netting and any applicable credit enhancements such as collateral postings, thresholds and guarantees.
The Corporation also enters into interest rate swaps to manage interest rate risk and reduce the cost of match-funding certain long-term fixed rate loans. These derivative contracts are designated as a cash flow hedge as the receipt of floating interest from the counterparty is used to manage interest rate risk associated with forecasted issuances of short-term FHLB advances. The change in fair value of the hedging instrument is recorded in accumulated other comprehensive income.
SBA Recourse Reserve. The Corporation establishes SBA recourse reserves on the guaranteed portions of sold SBA loans. The recourse reserve is reported in accrued interest payable and other liabilities on the Consolidated Balance Sheets. A reserve is established for loans that present a collateral shortfall and it is probable that the guaranty associated with the sold portion of the SBA loan is ineligible.
In the ordinary course of business, the Corporation sells the guaranteed portions of SBA loans to third parties. The Corporation has a continuing involvement in each of the transferred lending arrangements by way of relationship management, servicing the loans, as well as being subject to normal and customary requirements of the SBA loan program; however, there are no further obligations to the third-party participant required of the Corporation, other than standard representations and warranties related to sold amounts. In the event of a loss resulting from default and a determination by the SBA that there is a deficiency in the manner in which the loan was originated, funded, or serviced by the Corporation, the SBA may require the Corporation to repurchase the loan, deny its liability under the guaranty, reduce the amount of the guaranty, or, if it has already paid under the guaranty, seek recovery of the principal loss related to the deficiency from the Corporation. The Corporation must comply with applicable SBA regulations in order to maintain the guaranty. In addition, the Corporation retains the option to repurchase the sold guaranteed portion of an SBA loan if the loan defaults.
Income Taxes. Deferred income tax assets and liabilities are computed for temporary differences in timing between the financial statement and tax basis of assets and liabilities that result in taxable or deductible amounts in the future based on enacted tax law and rates applicable to periods in which the differences are expected to affect taxable income. The effect of a change in tax rates on deferred taxes is recognized in income in the period that includes the enactment date. The ultimate realization of deferred tax assets is dependent upon the generation of future taxable income during the periods in which those temporary differences become deductible. Management considers the scheduled reversals of deferred tax liabilities, appropriate tax planning strategies, and projections for future taxable income over the period which the deferred tax assets are deductible. When necessary, valuation allowances are established to reduce deferred tax assets to the realizable amount. In July 2023, the state of Wisconsin incorporated a Commercial loan interest exemption (2023 Wis. Act. 19 - Section 71.26(1)(i)) into its tax law. The exemption applies to the income of a financial institution including interest, fees ,and penalties, derived from a commercial loan of $5 million or less provided to borrowers residing or located in the state and used primarily for a business or agricultural purposes. The addition of the new state commercial income exclusion is expected to result in a taxable loss at the state level considering pre-tax book income and expected permanent adjustments to state income. This state taxable loss is expected to produce state net operating losses that will not be realizable in the future barring any further state tax law change, or a change in the Corporation’s mix of products. The Corporation also does not expect its deferred tax liabilities to be a substantial source of taxable income at the state level. The Corporation does not currently have a tax planning technique in process to generate Wisconsin taxable income to overcome the losses. Therefore, management recorded a valuation allowance against the Corporation’s Wisconsin deferred tax assets as of December 31, 2023.
Income tax expense or benefit represents the tax payable or tax refundable for a period, adjusted by the applicable change in deferred tax assets and liabilities for that period. The Corporation also invests in certain development entities that generate federal and state historic tax credits. The tax benefits associated with these investments are accounted for under the flow-through method and are recognized when the respective project is placed in service. The Corporation and its subsidiaries file a consolidated federal income tax return and separate state income tax returns. Tax sharing agreements allocate taxes to each legal entity for the settlement of intercompany taxes. The Corporation applies a more likely than not standard to each of its tax positions when determining the amount of tax expense or benefit to record in its financial statements. Unrecognized tax benefits are recorded in other liabilities. The Corporation recognizes accrued interest relating to unrecognized tax benefits in income tax expense and penalties in other non-interest expense.
Other Comprehensive Income or Loss. Comprehensive income or loss, shown as a separate financial statement, includes net income or loss, changes in unrealized gains and losses on available-for-sale securities, changes in deferred gains and losses on investment securities transferred from available-for-sale to held-to-maturity, if any, changes in unrealized gains and losses associated with cash flow hedging instruments, if any, and the amortization of deferred gains and losses associated with terminated cash flow hedges, if any. For the year ended December 31, 2023, $45,000 of realized securities losses were recognized and reclassified out of accumulated other comprehensive loss.
For the year ended December 31, 2022, no realized securities gains or losses were recognized.
Earnings Per Common Share. Earnings per common share (“EPS”) is computed using the two-class method. Basic EPS is computed by dividing net income allocated to common shares by the weighted average number of common shares outstanding for the period, excluding any participating securities. Participating securities include unvested restricted shares. Unvested restricted shares are considered participating securities because holders of these securities receive non-forfeitable dividends at the same rate as the holders of the Corporation’s common stock. Diluted EPS is computed by dividing net income allocated to common shares adjusted for reallocation of undistributed earnings of unvested restricted shares by the weighted average number of common shares determined for the basic EPS plus the dilutive effect of common stock equivalents using the treasury stock method based on the average market price for the period.
Segments and Related Information. The Corporation is required to report each operating segment based on materiality thresholds of ten percent or more of certain amounts, such as revenue. Additionally, the Corporation is required to report separate operating segments until the revenue attributable to such segments is at least 75 percent of total consolidated revenue. The Corporation provides a broad range of financial services to individuals and companies. These services include demand, time, and savings products, the sale of certain non-deposit financial products, and commercial and retail lending, leasing and private wealth management services. While the Corporation’s chief decision-maker monitors the revenue streams of the various products, services, and locations, operations are managed and financial performance is evaluated on a corporate-wide basis. The Corporation’s business units have similar basic characteristics in the nature of the products, production processes and type or class of client for products or services; therefore, these business units are considered one operating segment.
Share-Based Compensation. The Corporation may grant restricted stock awards, restricted stock units, and other stock based awards to plan participants, subject to forfeiture upon the occurrence of certain events until the dates specified in the participant’s award agreement. The Corporation accounts for forfeitures as they occur. While restricted stock is subject to forfeiture, restricted stock award participants may exercise full voting rights and will receive all dividends and other distributions paid with respect to the restricted shares. Dividend equivalent units with respect to restricted stock grants made after January 2023 will be deferred and paid at the time of vesting. Restricted stock units do not have voting rights and are provided dividend equivalents. The restricted stock granted under the 2019 Equity Incentive Plan (the “Plan”) is typically subject to a three or four year vesting period. Compensation expense for restricted stock is recognized over the requisite service period of three or four years for the entire award on a straight-line basis. Upon vesting of restricted stock, the benefit of tax deductions in excess of recognized compensation expense is reflected as an income tax benefit in the Consolidated Statements of Income.
The Corporation issues a combination of performance-based restricted stock units and restricted stock awards to plan participants. Vesting of the performance-based restricted stock units will be measured on Total Shareholder Return (“TSR”) and Return on Average Equity (“ROAE”) prior to 2023 or Return on Average Common Equity (“ROACE”) for issuances after 2022, and will cliff-vest after a three-year measurement period based on the Corporation’s performance relative to a custom peer group. At the end of the performance period, the number of actual shares to be awarded varies between 0% and 200% of target amounts. Compensation expense is recognized for performance-based restricted stock units over the requisite service and performance period of generally three years for the entire expected award on a straight-line basis. The compensation expense for the awards expected to vest for the percentage of performance-based restricted stock units subject to the metric will be adjusted if there is a change in the expectation of metric. The compensation expense for the awards expected to vest for the percentage of performance-based restricted stock units subject to the TSR metric are never adjusted, and are amortized utilizing the accounting fair value provided using a Monte Carlo pricing model.
The Corporation offers an Employee Stock Purchase Plan (“ESPP”) to all qualifying employees. The plan qualifies as an ESPP under section 423 of the Internal Revenue Code of 1986. Under the ESPP, eligible employees may enroll in a three month offer period that begins January, April, July, and October of each year. Employees may purchase a limited number of shares of the Corporation’s common stock at 90% of the fair market value on the last day of the offering period. The ESPP is treated as a compensatory plan for purposes of share-based compensation expense.
Recent Accounting Pronouncements. In June 2016, the FASB issued ASU No. 2016-13, “Financial Instruments- Credit Losses (Topic 326),” which is often referred to as CECL. The ASU replaces the incurred loss impairment methodology for recognizing credit losses with a methodology that reflects all expected credit losses. Entities will apply the amendments in the ASU through a cumulative-effect adjustment to retained earnings as of the beginning of the first reporting period in which the guidance is effective. In November 2019, the FASB issued ASU No. 2019-10, “Financial Instruments—Credit Losses (Topic 326), Derivatives and Hedging (Topic 815), and Leases (Topic 842).” The ASU delays the effective date for the credit losses standard from January 1, 2020 to January 1, 2023 for certain entities, including certain Securities and Exchange Commission filers, public business entities, and private companies. As a smaller reporting company, the Corporation elected to defer adoption.
The Corporation has established a cross-functional committee and has implemented a third-party software solution to assist with the adoption of the standard. During the fourth quarter of 2022 and first quarter of 2023, management had the model validated by a third party, performed a full parallel run, and finalized the methodology, processes and internal controls. Management’s model utilizes national GDP and unemployment as inputs to the reasonable and supportable forecast. On January 1,2023, the Corporation adopted ASC 326 using the modified retrospective method for all financial assets measuring at amortized cost and off-balance sheet credit exposures. Results for reporting periods beginning after January 1, 2023 are presented under ASC 326 while prior period amounts continue to be reported in accordance with previously applicable U.S. GAAP. The Corporation recorded a net decrease to retained earnings of $1.4 million as of January 1, 2023 for the cumulative effect of adopting ASC 326. The transition adjustment to allowance for credit losses (“ACL”) includes $1.3 million related to off-balance sheet credit exposures and $484,000 related to loans.
In March 2020, the FASB issued ASU No. 2020-04 “Reference Rate Reform (Topic 848): Facilitation of the Effects of Reference Rate Reform on Financial Reporting.” These amendments provide temporary, optional guidance to ease the potential burden in accounting for reference rate reform. The ASU provides optional expedients and exceptions for applying generally accepted accounting principles to contract modifications and hedging relationships, subject to meeting certain criteria, that reference LIBOR or another reference rate expected to be discontinued. It is intended to help stakeholders during the global market-wide reference rate transition period. In January 2021, the FASB issued ASU 2021-01 which clarifies that certain optional expedients and exceptions in Topic 848 for contract modifications and hedge accounting apply to derivatives that are affected by the discounting transition. The Corporation adopted this standard in the fourth quarter 2022. The Corporation utilized available optional expedients to simplify accounting analyses for contract modifications and allow hedging relationships to continue without de-designation where there are qualifying changes in the critical terms. The adoption of this standard did not have a material effect on the Corporation’s operating results or financial condition.
In March 2022, the FASB issued ASU No. 2022-02 "Financial Instruments-Credit Losses (Topic 326): Troubled Debt Restructurings and Vintage Disclosures." The amendments in this update eliminate the accounting guidance for TDRs by creditors in Subtopic 310-40, Receivables-Troubled Debt Restructurings by Creditors, while enhancing disclosure requirements for certain loan refinancings and restructurings by creditors when a borrower is experiencing financial difficulty. Specifically, rather than applying the recognition and measurement guidance for TDRs, an entity must apply the loan refinancing and restructuring guidance in paragraphs 310-20-35-9 through 35-11 to determine whether a modification results in a new loan or a continuation of an existing loan. Additionally, for public business entities, the amendments in this update require that an entity disclose current-period gross write-offs by year of origination for financing receivables and net investments in leases within the scope of Subtopic 326-20, Financial Instruments-Credit Losses-Measured at Amortized Cost in the vintage disclosures required by paragraph 326-20-50-6. The Corporation adopted this standard in the first quarter 2023. The adoption did not have a material impact on the consolidated financial statements.
In March 2023, the FASB issued ASU No. 2023-02 “Investments-Equity Method and Joint Ventures (Topic 323): Accounting for Investments in Tax Credit Structures Using the Proportional Amortization Method (a consensus of the Emerging Issues Task Force).” The amendments in this Update permit reporting entities to elect to account for their tax equity investments, regardless of the program from which the income tax credits are received, using the proportional amortization method if certain conditions are met. A reporting entity may make an accounting policy election to apply the proportional amortization method on a tax-credit-program-by-tax-credit-program basis rather than electing to apply the proportional amortization method at the reporting entity level or to individual investments. This update is effective for fiscal years beginning after December 15, 2023. We are currently assessing the impact of the standard.
In December 2023, the FASB issued ASU No. 2023-09, “Income Taxes (Topic 740): Improvements to Income Tax Disclosures.” This update enhances the transparency and decision usefulness of income tax disclosures by providing better information regarding exposure to potential changes in jurisdictional tax legislation and related forecasting and cash flow opportunities. This update is effective for fiscal years beginning after December 15, 2024. We are currently assessing the impact of the standard.
In October 2023, the FASB issued ASU No. 2023-06, “Disclosure Improvements: Codification Amendments in Response to the SEC’s Disclosure Update and Simplification Initiative.” This update is intended to improve the relevance and usefulness of financial information for investors and other users by incorporating certain SEC disclosure requirements into the FASB Accounting Standards Codification. This update is effective for fiscal years, and interim periods within those fiscal years, beginning after December 15, 2023. We are currently assessing the impact of the standard.
In November 2023 the FASB issued ASU No. 2023-07, “Segment Reporting (Topic 820): Improvements to Reportable Segment Disclosures.” This update is intended to improve reportable segment disclosure requirements, primarily through enhanced disclosures about significant segment expenses. This update is effective for fiscal years, and interim periods within those fiscal years, beginning after December 15, 2024. We are currently assessing the impact of the standard.
Reclassifications. Certain amounts in the 2022 consolidated financial statements have been reclassified to conform to the 2023 presentation. These reclassifications were not material and did not impact previously reported net income or comprehensive income.
Note 2 – Cash and Cash Equivalents
Cash and due from banks was approximately $32.3 million and $25.8 million at December 31, 2023 and 2022, respectively. As of March 26, 2020, the Federal Reserve Bank (“FRB”) reduced reserve requirement ratios to zero percent for all depository institutions. FRB balances were $106.8 million and $76.5 million at December 31, 2023 and 2022, respectively, and are included in short-term investments on the Consolidated Balance Sheets. Short-term investments, considered cash equivalents, were $107.2 million and $76.9 million at December 31, 2023 and 2022, respectively.
Note 3 – Securities
The amortized cost and fair value of securities available-for-sale and the corresponding amounts of gross unrealized gains and losses recognized in accumulated other comprehensive income were as follows:
|
|
|
|
|
|
|
|
|
|
|
|
|
|
|
|
|
|
|
|
|
|
|
|
|
|
|
| |
|
As of December 31, 2023 |
|
|
Amortized Cost |
|
Gross
Unrealized
Gains |
|
Gross
Unrealized
Losses |
|
Fair Value |
| |
|
(In Thousands) |
Available-for-sale: |
|
|
|
|
|
|
|
|
| U.S. treasuries |
|
$ |
14,158 |
|
|
$ |
7 |
|
|
$ |
(389) |
|
|
$ |
13,776 |
|
U.S. government agency securities - government-sponsored enterprises |
|
27,986 |
|
|
35 |
|
|
(455) |
|
|
27,566 |
|
| Municipal securities |
|
40,407 |
|
|
— |
|
|
(4,526) |
|
|
35,881 |
|
|
|
|
|
|
|
|
|
|
| Residential mortgage-backed securities - government issued |
|
69,441 |
|
|
1,000 |
|
|
(2,385) |
|
|
68,056 |
|
Residential mortgage-backed securities - government-sponsored enterprises |
|
131,321 |
|
|
281 |
|
|
(10,769) |
|
|
120,833 |
|
| Commercial mortgage-backed securities - government issued |
|
2,995 |
|
|
— |
|
|
(470) |
|
|
2,525 |
|
| Commercial mortgage-backed securities - government-sponsored enterprises |
|
32,774 |
|
|
65 |
|
|
(4,470) |
|
|
28,369 |
|
|
|
|
|
|
|
|
|
|
| |
|
$ |
319,082 |
|
|
$ |
1,388 |
|
|
$ |
(23,464) |
|
|
$ |
297,006 |
|
|
|
|
|
|
|
|
|
|
|
|
|
|
|
|
|
|
|
|
|
|
|
|
|
|
|
|
| |
|
As of December 31, 2022 |
|
|
Amortized Cost |
|
Gross
Unrealized
Gains |
|
Gross
Unrealized
Losses |
|
Fair Value |
| |
|
(In Thousands) |
Available-for-sale: |
|
|
|
|
|
|
|
|
| U.S. treasuries |
|
$ |
4,977 |
|
|
$ |
— |
|
|
$ |
(532) |
|
|
$ |
4,445 |
|
U.S. government agency securities - government-sponsored enterprises |
|
13,666 |
|
|
70 |
|
|
(531) |
|
|
13,205 |
|
| Municipal securities |
|
45,088 |
|
|
90 |
|
|
(5,867) |
|
|
39,311 |
|
|
|
|
|
|
|
|
|
|
| Residential mortgage-backed securities - government issued |
|
21,790 |
|
|
— |
|
|
(2,359) |
|
|
19,431 |
|
Residential mortgage-backed securities - government-sponsored enterprises |
|
119,265 |
|
|
— |
|
|
(12,942) |
|
|
106,323 |
|
| Commercial mortgage-backed securities - government issued |
|
3,450 |
|
|
— |
|
|
(518) |
|
|
2,932 |
|
| Commercial mortgage-backed securities - government-sponsored enterprises |
|
31,515 |
|
|
— |
|
|
(5,138) |
|
|
26,377 |
|
|
|
|
|
|
|
|
|
|
| |
|
$ |
239,751 |
|
|
$ |
160 |
|
|
$ |
(27,887) |
|
|
$ |
212,024 |
|
The amortized cost and fair value of securities held-to-maturity and the corresponding amounts of gross unrecognized gains and losses were as follows:
|
|
|
|
|
|
|
|
|
|
|
|
|
|
|
|
|
|
|
|
|
|
|
|
|
|
|
| |
|
As of December 31, 2023 |
|
|
Amortized Cost |
|
Gross
Unrecognized
Gains |
|
Gross
Unrecognized
Losses |
|
Fair Value |
| |
|
(In Thousands) |
Held-to-maturity: |
|
|
|
|
|
|
|
|
|
|
|
|
|
|
|
|
|
| Municipal securities |
|
$ |
4,210 |
|
|
$ |
4 |
|
|
$ |
(41) |
|
|
$ |
4,173 |
|
|
|
|
|
|
|
|
|
|
| Residential mortgage-backed securities - government issued |
|
1,211 |
|
|
— |
|
|
(76) |
|
|
1,135 |
|
Residential mortgage-backed securities - government-sponsored enterprises |
|
1,078 |
|
|
— |
|
|
(53) |
|
|
1,025 |
|
Commercial mortgage-backed securities - government-sponsored enterprises |
|
2,004 |
|
|
— |
|
|
(82) |
|
|
1,922 |
|
| |
|
$ |
8,503 |
|
|
$ |
4 |
|
|
$ |
(252) |
|
|
$ |
8,255 |
|
|
|
|
|
|
|
|
|
|
|
|
|
|
|
|
|
|
|
|
|
|
|
|
|
|
|
|
| |
|
As of December 31, 2022 |
|
|
Amortized Cost |
|
Gross
Unrecognized
Gains |
|
Gross
Unrecognized
Losses |
|
Fair Value |
| |
|
(In Thousands) |
Held-to-maturity: |
|
|
|
|
|
|
|
|
|
|
|
|
|
|
|
|
|
| Municipal securities |
|
$ |
7,467 |
|
|
$ |
7 |
|
|
$ |
(70) |
|
|
$ |
7,404 |
|
|
|
|
|
|
|
|
|
|
| Residential mortgage-backed securities - government issued |
|
1,625 |
|
|
— |
|
|
(107) |
|
|
1,518 |
|
Residential mortgage-backed securities - government-sponsored enterprises |
|
1,537 |
|
|
— |
|
|
(93) |
|
|
1,444 |
|
Commercial mortgage-backed securities - government-sponsored enterprises |
|
2,006 |
|
|
— |
|
|
(102) |
|
|
1,904 |
|
| |
|
$ |
12,635 |
|
|
$ |
7 |
|
|
$ |
(372) |
|
|
$ |
12,270 |
|
U.S. Treasuries contain treasury bonds issued by the United States Treasury. U.S. government agency securities - government-sponsored enterprises represent securities issued by Federal National Mortgage Association (“FNMA”) and the SBA. Municipal securities include securities issued by various municipalities located primarily within Wisconsin and are primarily general obligation bonds that are tax-exempt in nature. Residential and commercial mortgage-backed securities - government issued represent securities guaranteed by the Government National Mortgage Association. Residential and commercial mortgage-backed securities - government-sponsored enterprises include securities guaranteed by the Federal Home Loan Mortgage Corporation, FNMA, and the FHLB. There were 16 and seven sales of available-for-sale securities that occurred during the years ended December 31, 2023 and 2021, respectively. There were no sales of available-for-sale securities that occurred during the year ended December 31, 2022.
Total proceeds and gross realized gains and losses from sales of securities available-for-sale were as follows:
|
|
|
|
|
|
|
|
|
|
|
|
|
|
|
|
|
|
|
|
|
| |
|
For the Year Ended December 31, |
|
|
2023 |
|
2022 |
|
2021 |
| |
|
(In Thousands) |
| Gross gains |
|
$ |
68 |
|
|
$ |
— |
|
|
$ |
92 |
|
| Gross losses |
|
(113) |
|
|
— |
|
|
(63) |
|
| Net (losses) gains on sale of available-for-sale securities |
|
$ |
(45) |
|
|
$ |
— |
|
|
$ |
29 |
|
| Proceeds from sale of available-for-sale securities |
|
$ |
5,085 |
|
|
$ |
— |
|
|
$ |
14,955 |
|
At December 31, 2023 and 2022, securities with a fair value of $45.4 million and $35.9 million, respectively, were pledged to secure various obligations, including interest rate swap contracts and municipal deposits.
The amortized cost and fair value of securities by contractual maturity at December 31, 2023 are shown below. Actual maturities may differ from contractual maturities because issuers have the right to call or prepay certain obligations with or without call or prepayment penalties.
|
|
|
|
|
|
|
|
|
|
|
|
|
|
|
|
|
|
|
|
|
|
|
|
|
|
|
|
|
Available-for-Sale |
|
Held-to-Maturity |
|
|
Amortized Cost |
|
Fair Value |
|
Amortized Cost |
|
Fair Value |
| |
|
(In Thousands) |
| Due in one year or less |
|
$ |
22,576 |
|
|
$ |
22,569 |
|
|
$ |
1,060 |
|
|
$ |
1,057 |
|
| Due in one year through five years |
|
18,970 |
|
|
17,646 |
|
|
3,150 |
|
|
3,116 |
|
| Due in five through ten years |
|
12,653 |
|
|
11,915 |
|
|
— |
|
|
— |
|
| Due in over ten years |
|
28,352 |
|
|
25,093 |
|
|
— |
|
|
— |
|
| |
|
82,551 |
|
|
77,223 |
|
|
4,210 |
|
|
4,173 |
|
| Residential mortgage-backed securities |
|
200,762 |
|
|
188,889 |
|
|
2,289 |
|
|
2,160 |
|
| Commercial mortgage-backed securities |
|
35,769 |
|
|
30,894 |
|
|
2,004 |
|
|
1,922 |
|
|
|
$ |
319,082 |
|
|
$ |
297,006 |
|
|
$ |
8,503 |
|
|
$ |
8,255 |
|
The tables below show the Corporation’s gross unrealized losses and fair value of available-for-sale investments, aggregated by investment category and length of time that individual investments were in a continuous loss position at December 31, 2023 and 2022.
The Corporation also has not specifically identified available-for-sale securities in a loss position that it intends to sell in the near term and does not believe that it will be required to sell any such securities. The Corporation reviews its securities on a quarterly basis to assess declines in fair value for credit losses. Consideration is given to such factors as the credit rating of the borrower, market conditions such as current interest rates, any adverse conditions specific to the security and delinquency status on contractual payments. For the years ended December 31, 2023 and 2022, management concluded that in all instances securities with fair value less than carrying value was due to market and other factors; thus no credit loss provision was required.
A summary of unrealized loss information for securities available-for-sale, categorized by security type and length of time for which the security has been in a continuous unrealized loss position, follows:
|
|
|
|
|
|
|
|
|
|
|
|
|
|
|
|
|
|
|
|
|
|
|
|
|
|
|
|
|
|
|
|
|
|
|
|
|
|
|
| |
|
December 31, 2023 |
| |
|
Less than 12 Months |
|
12 Months or Longer |
|
Total |
|
|
Fair Value |
|
Unrealized
Losses |
|
Fair Value |
|
Unrealized
Losses |
|
Fair Value |
|
Unrealized
Losses |
| |
|
(In Thousands) |
Available-for-sale: |
|
|
|
|
|
|
|
|
|
|
|
|
| U.S. treasuries |
|
$ |
— |
|
|
$ |
— |
|
|
$ |
4,595 |
|
|
$ |
389 |
|
|
$ |
4,595 |
|
|
$ |
389 |
|
| U.S. government agency securities - government-sponsored enterprises |
|
13,370 |
|
|
30 |
|
|
3,076 |
|
|
425 |
|
|
16,446 |
|
|
455 |
|
Municipal securities |
|
— |
|
|
— |
|
|
35,881 |
|
|
4,526 |
|
|
35,881 |
|
|
4,526 |
|
|
|
|
|
|
|
|
|
|
|
|
|
|
| Residential mortgage-backed securities - government issued |
|
13,178 |
|
|
160 |
|
|
13,819 |
|
|
2,225 |
|
|
26,997 |
|
|
2,385 |
|
Residential mortgage-backed securities - government-sponsored enterprises |
|
19,925 |
|
|
285 |
|
|
78,086 |
|
|
10,484 |
|
|
98,011 |
|
|
10,769 |
|
| Commercial mortgage-backed securities - government issued |
|
— |
|
|
— |
|
|
2,525 |
|
|
470 |
|
|
2,525 |
|
|
470 |
|
| Commercial mortgage-backed securities - government-sponsored enterprises |
|
893 |
|
|
20 |
|
|
26,465 |
|
|
4,450 |
|
|
27,358 |
|
|
4,470 |
|
|
|
|
|
|
|
|
|
|
|
|
|
|
| |
|
$ |
47,366 |
|
|
$ |
495 |
|
|
$ |
164,447 |
|
|
$ |
22,969 |
|
|
$ |
211,813 |
|
|
$ |
23,464 |
|
|
|
|
|
|
|
|
|
|
|
|
|
|
|
|
|
|
|
|
|
|
|
|
|
|
|
|
|
|
|
|
|
|
|
|
|
|
|
|
| |
|
December 31, 2022 |
| |
|
Less than 12 Months |
|
12 Months or Longer |
|
Total |
|
|
Fair Value |
|
Unrealized
Losses |
|
Fair Value |
|
Unrealized
Losses |
|
Fair Value |
|
Unrealized
Losses |
| |
|
(In Thousands) |
Available-for-sale: |
|
|
|
|
|
|
|
|
|
|
|
|
| U.S. treasuries |
|
$ |
— |
|
|
$ |
— |
|
|
$ |
4,446 |
|
|
$ |
532 |
|
|
$ |
4,446 |
|
|
$ |
532 |
|
U.S. government agency obligations - government-sponsored enterprises |
|
— |
|
|
— |
|
|
2,969 |
|
|
531 |
|
|
2,969 |
|
|
531 |
|
Municipal securities |
|
26,759 |
|
|
3,132 |
|
|
10,133 |
|
|
2,735 |
|
|
36,892 |
|
|
5,867 |
|
|
|
|
|
|
|
|
|
|
|
|
|
|
| Residential mortgage-backed securities - government issued |
|
9,624 |
|
|
436 |
|
|
9,807 |
|
|
1,923 |
|
|
19,431 |
|
|
2,359 |
|
Residential mortgage-backed securities - government-sponsored enterprises |
|
71,474 |
|
|
6,433 |
|
|
34,849 |
|
|
6,509 |
|
|
106,323 |
|
|
12,942 |
|
| Commercial mortgage-backed securities - government issued |
|
1,236 |
|
|
112 |
|
|
1,696 |
|
|
406 |
|
|
2,932 |
|
|
518 |
|
| Commercial mortgage-backed securities - government-sponsored enterprises |
|
7,758 |
|
|
984 |
|
|
18,619 |
|
|
4,154 |
|
|
26,377 |
|
|
5,138 |
|
|
|
|
|
|
|
|
|
|
|
|
|
|
| |
|
$ |
116,851 |
|
|
$ |
11,097 |
|
|
$ |
82,519 |
|
|
$ |
16,790 |
|
|
$ |
199,370 |
|
|
$ |
27,887 |
|
The tables below show the Corporation’s gross unrealized losses and fair value of held-to-maturity investments, aggregated by investment category and length of time that individual investments were in a continuous loss position at December 31, 2023 and 2022. At December 31, 2023, the Corporation held 29 held-to-maturity securities that were in an unrealized loss position, 24 of which have been in a continuous loss position for twelve months or greater. Management assesses held-to-maturity securities for credit losses on a quarterly basis. The assessment includes review of credit ratings, identification of delinquency and evaluation of market factors. Based on this analysis, management concludes the decline in fair value is due to market factors, specifically changes in interest rates. Accordingly, no credit loss provision was recorded in the Consolidated Statements of Income for the years ended December 31, 2023, 2022, and 2021.
A summary of unrecognized loss information for securities held-to-maturity, categorized by security type and length of time for which the security has been in a continuous unrealized loss position, follows:
|
|
|
|
|
|
|
|
|
|
|
|
|
|
|
|
|
|
|
|
|
|
|
|
|
|
|
|
|
|
|
|
|
|
|
|
|
|
|
| |
|
December 31, 2023 |
| |
|
Less than 12 Months |
|
12 Months or Longer |
|
Total |
|
|
Fair Value |
|
Unrealized
Losses |
|
Fair Value |
|
Unrealized
Losses |
|
Fair Value |
|
Unrealized
Losses |
| |
|
(In Thousands) |
Held-to-maturity: |
|
|
|
|
|
|
|
|
|
|
|
|
|
|
|
|
|
|
|
|
|
|
|
|
|
Municipal securities |
|
$ |
1,424 |
|
|
$ |
4 |
|
|
$ |
2,234 |
|
|
$ |
37 |
|
|
$ |
3,658 |
|
|
$ |
41 |
|
|
|
|
|
|
|
|
|
|
|
|
|
|
Residential mortgage-backed securities - government issued |
|
— |
|
|
— |
|
|
1,135 |
|
|
76 |
|
|
1,135 |
|
|
76 |
|
Residential mortgage-backed securities - government-sponsored enterprises |
|
— |
|
|
— |
|
|
1,025 |
|
|
53 |
|
|
1,025 |
|
|
53 |
|
| Commercial mortgage backed securities - government-sponsored enterprises |
|
— |
|
|
— |
|
|
1,922 |
|
|
82 |
|
|
1,922 |
|
|
82 |
|
| |
|
$ |
1,424 |
|
|
$ |
4 |
|
|
$ |
6,316 |
|
|
$ |
248 |
|
|
$ |
7,740 |
|
|
$ |
252 |
|
|
|
|
|
|
|
|
|
|
|
|
|
|
|
|
|
|
|
|
|
|
|
|
|
|
|
|
|
|
|
|
|
|
|
|
|
|
|
|
| |
|
December 31, 2022 |
| |
|
Less than 12 Months |
|
12 Months or Longer |
|
Total |
|
|
Fair Value |
|
Unrealized
Losses |
|
Fair Value |
|
Unrealized
Losses |
|
Fair Value |
|
Unrealized
Losses |
| |
|
(In Thousands) |
Held-to-maturity: |
|
|
|
|
|
|
|
|
|
|
|
|
|
|
|
|
|
|
|
|
|
|
|
|
|
Municipal securities |
|
$ |
6,035 |
|
|
$ |
52 |
|
|
$ |
267 |
|
|
$ |
18 |
|
|
$ |
6,302 |
|
|
$ |
70 |
|
|
|
|
|
|
|
|
|
|
|
|
|
|
Residential mortgage-backed securities - government issued |
|
1,518 |
|
|
107 |
|
|
— |
|
|
— |
|
|
1,518 |
|
|
107 |
|
Residential mortgage-backed securities - government-sponsored enterprises |
|
1,444 |
|
|
93 |
|
|
— |
|
|
— |
|
|
1,444 |
|
|
93 |
|
| Commercial mortgage-backed securities - government-sponsored enterprises |
|
1,904 |
|
|
102 |
|
|
— |
|
|
— |
|
|
1,904 |
|
|
102 |
|
| |
|
$ |
10,901 |
|
|
$ |
354 |
|
|
$ |
267 |
|
|
$ |
18 |
|
|
$ |
11,168 |
|
|
$ |
372 |
|
On January 1, 2023, the Corporation adopted ASU 2016-13, which replaced the legacy GAAP other-than-temporary impairment (“OTTI”) model with a credit loss model. ASU 2016-13 requires an allowance on lifetime expected credit losses on held to maturity debt securities. As of January 1, 2023 and December 31, 2023, the Corporation estimated the expected credit losses to be immaterial based on the composition of the securities portfolio.
Note 4 – Loans, Leases Receivable, and Allowance for Credit Losses
Loan and leases receivable consist of the following:
|
|
|
|
|
|
|
|
|
|
|
|
|
|
|
|
|
December 31,
2023 |
|
December 31,
2022 |
| |
|
(In Thousands) |
| Commercial real estate: |
|
|
|
|
Commercial real estate — owner occupied |
|
$ |
256,479 |
|
|
$ |
268,354 |
|
Commercial real estate — non-owner occupied |
|
773,494 |
|
|
687,091 |
|
| Construction |
|
193,080 |
|
|
218,751 |
|
Multi-family |
|
450,529 |
|
|
350,026 |
|
1-4 family |
|
26,289 |
|
|
17,728 |
|
| Total commercial real estate |
|
1,699,871 |
|
|
1,541,950 |
|
| Commercial and industrial |
|
1,105,835 |
|
|
853,327 |
|
| Consumer and other |
|
44,312 |
|
|
47,938 |
|
Total gross loans and leases receivable |
|
2,850,018 |
|
|
2,443,215 |
|
| Less: |
|
|
|
|
Allowance for loan losses |
|
31,275 |
|
|
24,230 |
|
| Deferred loan fees and costs, net |
|
(243) |
|
|
149 |
|
| Loans and leases receivable, net |
|
$ |
2,818,986 |
|
|
$ |
2,418,836 |
|
Loans transferred to third parties consist of the guaranteed portions of SBA loans which the Corporation sold in the secondary market and participation interests in other, non-SBA originated loans. The total principal amount of the guaranteed portions of SBA loans sold during the year ended December 31, 2023 and 2022 was $23.6 million and $29.9 million, respectively. Each of the transfers of these financial assets met the qualifications for sale accounting, and therefore, all of the loans transferred during the year ended December 31, 2023 and 2022 have been derecognized in the Consolidated Financial Statements. The guaranteed portions of SBA loans were transferred at their fair value and the related gain was recognized upon the transfer as non-interest income in the Consolidated Financial Statements. The total outstanding balance of sold SBA loans at December 31, 2023 and 2022 was $84.2 million and $88.5 million, respectively.
The total principal amount of transferred participation interests in other, non-SBA originated loans during the year ended December 31, 2023 and 2022 was $120.0 million and $96.0 million, respectively, all of which were treated as sales and derecognized under the applicable accounting guidance at the time of transfer.
No gain or loss was recognized on participation interests in other, non-SBA originated loans as they were transferred at or near the date of loan origination and the payments received for servicing the portion of the loans participated represents adequate compensation. The total outstanding balance of these transferred loans at December 31, 2023 and 2022 was $279.5 million and $222.9 million, respectively. As of December 31, 2023 and 2022, the total amount of the Corporation’s partial ownership of these transferred loans on the Consolidated Balance Sheets was $367.4 million and $339.0 million, respectively. As of December 31, 2023 and 2022, the non-SBA originated participation portfolio contained no non-performing loans. The Corporation does not share in the participant’s portion of any potential charge-offs. There were no loans purchased on the Consolidated Balance Sheets as of December 31, 2023 and 2022.
The following table presents loans and loan participations sold during the year by portfolio segment:
|
|
|
|
|
|
|
|
|
|
|
|
|
|
|
|
|
|
|
|
|
|
|
|
|
|
|
|
|
|
|
|
|
|
|
|
|
|
|
|
|
|
|
|
|
|
|
|
|
|
|
| December 31, 2023 |
|
Owner Occupied |
|
Non-Owner Occupied |
|
Construction |
|
Multi-Family |
|
1-4 Family |
|
Commercial and Industrial |
|
Consumer and Other |
|
Total |
|
|
(In Thousands) |
Sales |
|
$ |
17,390 |
|
|
$ |
— |
|
|
$ |
75,532 |
|
|
$ |
11,382 |
|
|
$ |
— |
|
|
$ |
39,290 |
|
|
$ |
— |
|
|
$ |
143,594 |
|
|
|
|
|
|
|
|
|
|
|
|
|
|
|
|
|
|
|
|
|
|
|
|
|
|
|
|
|
|
|
|
|
|
|
|
|
|
|
|
|
|
|
|
|
|
|
|
|
|
|
|
| December 31, 2022 |
|
Owner Occupied |
|
Non-Owner Occupied |
|
Construction |
|
Multi-Family |
|
1-4 Family |
|
Commercial and Industrial |
|
Consumer and Other |
|
Total |
|
|
(In Thousands) |
Sales |
|
$ |
— |
|
|
$ |
5,000 |
|
|
$ |
58,586 |
|
|
$ |
3,184 |
|
|
$ |
— |
|
|
$ |
59,085 |
|
|
$ |
— |
|
|
$ |
125,855 |
|
Certain of the Corporation’s executive officers, directors, and their related interests are loan clients of the Bank. These loans to related parties are summarized below:
|
|
|
|
|
|
|
|
|
|
|
|
|
|
|
|
|
December 31, 2023 |
|
December 31, 2022 |
|
|
(In Thousands) |
| Balance at beginning of year |
|
$ |
224 |
|
|
$ |
1,288 |
|
| New loans |
|
349 |
|
|
656 |
|
| Repayments |
|
(310) |
|
|
(1,560) |
|
| Change due to status of executive officers and directors |
|
— |
|
|
(160) |
|
| Balance at end of year |
|
$ |
263 |
|
|
$ |
224 |
|
The Corporation’s net investment in direct financing leases consists of the following:
|
|
|
|
|
|
|
|
|
|
|
|
|
|
|
| |
|
December 31,
2023 |
|
December 31,
2022 |
| |
|
(In Thousands) |
| Minimum lease payments receivable |
|
$ |
9,660 |
|
|
$ |
10,673 |
|
| Estimated unguaranteed residual values in leased property |
|
1,468 |
|
|
2,776 |
|
| Unearned lease and residual income |
|
(1,362) |
|
|
(1,300) |
|
| Investment in commercial direct financing leases |
|
$ |
9,766 |
|
|
$ |
12,149 |
|
The Corporation leases equipment under direct financing leases expiring in future years. Some of these leases provide for additional rents and generally allow the lessees to purchase the equipment for fair value at the end of the lease term.
Future aggregate maturities of minimum lease payments to be received are as follows:
|
|
|
|
|
|
|
|
|
| (In Thousands) |
|
|
| Maturities during year ended December 31, |
|
|
| 2024 |
|
$ |
3,268 |
|
| 2025 |
|
2,425 |
|
| 2026 |
|
1,788 |
|
| 2027 |
|
1,301 |
|
| 2028 |
|
626 |
|
| Thereafter |
|
252 |
|
|
|
$ |
9,660 |
|
The following tables illustrate ending balances of the Corporation’s loan and lease portfolio, including non-performing loans by class of receivable, and considering certain credit quality indicators:
|
|
|
|
|
|
|
|
|
|
|
|
|
|
|
|
|
|
|
|
|
|
|
|
|
|
|
|
|
|
|
|
|
|
|
|
|
|
|
|
|
|
|
|
|
|
|
|
|
|
|
| December 31, 2023 |
|
Term Loans Amortized Cost Basis by Origination Year |
|
|
|
|
| (In Thousands) |
|
2023 |
|
2022 |
|
2021 |
|
2020 |
|
2019 |
|
Prior |
|
Revolving Loans Amortized Cost Basis |
|
Total |
| Commercial real estate — owner occupied |
|
|
|
|
|
|
|
|
|
|
|
|
| Category |
|
|
|
|
|
|
|
|
|
|
|
|
|
|
|
|
| I |
|
$ |
31,637 |
|
|
$ |
43,156 |
|
|
$ |
38,803 |
|
|
$ |
44,704 |
|
|
$ |
22,078 |
|
|
$ |
72,774 |
|
|
$ |
451 |
|
|
$ |
253,603 |
|
| II |
|
— |
|
|
— |
|
|
— |
|
|
260 |
|
|
— |
|
|
— |
|
|
— |
|
|
260 |
|
| III |
|
— |
|
|
— |
|
|
— |
|
|
— |
|
|
— |
|
|
2,616 |
|
|
— |
|
|
2,616 |
|
| IV |
|
— |
|
|
— |
|
|
— |
|
|
— |
|
|
— |
|
|
— |
|
|
— |
|
|
— |
|
| Total |
|
$ |
31,637 |
|
|
$ |
43,156 |
|
|
$ |
38,803 |
|
|
$ |
44,964 |
|
|
$ |
22,078 |
|
|
$ |
75,390 |
|
|
$ |
451 |
|
|
$ |
256,479 |
|
|
|
|
|
|
|
|
|
|
|
|
|
|
|
|
|
|
| Commercial real estate — non-owner occupied |
|
|
|
|
|
|
|
|
|
|
|
|
| Category |
|
|
|
|
|
|
|
|
|
|
|
|
|
|
|
|
| I |
|
$ |
71,857 |
|
|
$ |
76,689 |
|
|
$ |
72,660 |
|
|
$ |
78,212 |
|
|
$ |
66,262 |
|
|
$ |
314,970 |
|
|
$ |
32,478 |
|
|
$ |
713,128 |
|
| II |
|
— |
|
|
— |
|
|
2,302 |
|
|
2,252 |
|
|
19,838 |
|
|
16,274 |
|
|
— |
|
|
40,666 |
|
| III |
|
— |
|
|
— |
|
|
— |
|
|
— |
|
|
— |
|
|
19,700 |
|
|
— |
|
|
19,700 |
|
| IV |
|
— |
|
|
— |
|
|
— |
|
|
— |
|
|
— |
|
|
— |
|
|
— |
|
|
— |
|
| Total |
|
$ |
71,857 |
|
|
$ |
76,689 |
|
|
$ |
74,962 |
|
|
$ |
80,464 |
|
|
$ |
86,100 |
|
|
$ |
350,944 |
|
|
$ |
32,478 |
|
|
$ |
773,494 |
|
|
|
|
|
|
|
|
|
|
|
|
|
|
|
|
|
|
| Construction |
|
|
|
|
|
|
|
|
|
|
|
|
|
|
|
|
| Category |
|
|
|
|
|
|
|
|
|
|
|
|
|
|
|
|
| I |
|
$ |
63,660 |
|
|
$ |
83,161 |
|
|
$ |
8,542 |
|
|
$ |
744 |
|
|
$ |
433 |
|
|
$ |
6,528 |
|
|
$ |
15,011 |
|
|
$ |
178,079 |
|
| II |
|
— |
|
|
— |
|
|
9,289 |
|
|
5,712 |
|
|
— |
|
|
— |
|
|
— |
|
|
15,001 |
|
| III |
|
— |
|
|
— |
|
|
— |
|
|
— |
|
|
— |
|
|
— |
|
|
— |
|
|
— |
|
| IV |
|
— |
|
|
— |
|
|
— |
|
|
— |
|
|
— |
|
|
— |
|
|
— |
|
|
— |
|
| Total |
|
$ |
63,660 |
|
|
$ |
83,161 |
|
|
$ |
17,831 |
|
|
$ |
6,456 |
|
|
$ |
433 |
|
|
$ |
6,528 |
|
|
$ |
15,011 |
|
|
$ |
193,080 |
|
|
|
|
|
|
|
|
|
|
|
|
|
|
|
|
|
|
|
|
|
|
|
|
|
|
|
|
|
|
|
|
|
|
|
|
|
|
|
|
|
|
|
|
|
|
|
|
|
|
|
|
|
|
|
|
|
|
|
|
|
|
|
|
|
|
|
|
|
| December 31, 2023 |
|
Term Loans Amortized Cost Basis by Origination Year |
|
|
|
|
| (In Thousands) |
|
2023 |
|
2022 |
|
2021 |
|
2020 |
|
2019 |
|
Prior |
|
Revolving Loans Amortized Cost Basis |
|
Total |
| Multi-family |
|
|
|
|
|
|
|
|
|
|
|
|
|
|
|
|
| Category |
|
|
|
|
|
|
|
|
|
|
|
|
|
|
|
|
| I |
|
$ |
84,932 |
|
|
$ |
41,068 |
|
|
$ |
70,054 |
|
|
$ |
113,294 |
|
|
$ |
22,925 |
|
|
$ |
115,243 |
|
|
$ |
3,013 |
|
|
$ |
450,529 |
|
| II |
|
— |
|
|
— |
|
|
— |
|
|
— |
|
|
— |
|
|
— |
|
|
— |
|
|
— |
|
| III |
|
— |
|
|
— |
|
|
— |
|
|
— |
|
|
— |
|
|
— |
|
|
— |
|
|
— |
|
| IV |
|
— |
|
|
— |
|
|
— |
|
|
— |
|
|
— |
|
|
— |
|
|
— |
|
|
— |
|
| Total |
|
$ |
84,932 |
|
|
$ |
41,068 |
|
|
$ |
70,054 |
|
|
$ |
113,294 |
|
|
$ |
22,925 |
|
|
$ |
115,243 |
|
|
$ |
3,013 |
|
|
$ |
450,529 |
|
|
|
|
|
|
|
|
|
|
|
|
|
|
|
|
|
|
| 1-4 family |
|
|
|
|
|
|
|
|
|
|
|
|
|
|
|
|
| Category |
|
|
|
|
|
|
|
|
|
|
|
|
|
|
|
|
| I |
|
$ |
4,242 |
|
|
$ |
7,684 |
|
|
$ |
2,672 |
|
|
$ |
2,359 |
|
|
$ |
443 |
|
|
$ |
2,805 |
|
|
$ |
6,062 |
|
|
$ |
26,267 |
|
| II |
|
— |
|
|
— |
|
|
— |
|
|
— |
|
|
— |
|
|
— |
|
|
— |
|
|
— |
|
| III |
|
— |
|
|
— |
|
|
— |
|
|
— |
|
|
— |
|
|
— |
|
|
— |
|
|
— |
|
| IV |
|
— |
|
|
— |
|
|
— |
|
|
— |
|
|
— |
|
|
22 |
|
|
— |
|
|
22 |
|
| Total |
|
$ |
4,242 |
|
|
$ |
7,684 |
|
|
$ |
2,672 |
|
|
$ |
2,359 |
|
|
$ |
443 |
|
|
$ |
2,827 |
|
|
$ |
6,062 |
|
|
$ |
26,289 |
|
|
|
|
|
|
|
|
|
|
|
|
|
|
|
|
|
|
| Commercial and industrial |
|
|
|
|
|
|
|
|
|
|
|
|
|
|
| Category |
|
|
|
|
|
|
|
|
|
|
|
|
|
|
|
|
| I |
|
$ |
302,612 |
|
|
$ |
144,167 |
|
|
$ |
85,504 |
|
|
$ |
38,164 |
|
|
$ |
20,151 |
|
|
$ |
26,490 |
|
|
$ |
415,301 |
|
|
$ |
1,032,389 |
|
| II |
|
1,496 |
|
|
5,280 |
|
|
785 |
|
|
353 |
|
|
94 |
|
|
219 |
|
|
5,706 |
|
|
13,933 |
|
| III |
|
1,093 |
|
|
7,168 |
|
|
1,882 |
|
|
5,919 |
|
|
3,861 |
|
|
3,957 |
|
|
15,058 |
|
|
38,938 |
|
| IV |
|
1,482 |
|
|
6,519 |
|
|
1,319 |
|
|
321 |
|
|
133 |
|
|
1,644 |
|
|
9,157 |
|
|
20,575 |
|
| Total |
|
$ |
306,683 |
|
|
$ |
163,134 |
|
|
$ |
89,490 |
|
|
$ |
44,757 |
|
|
$ |
24,239 |
|
|
$ |
32,310 |
|
|
$ |
445,222 |
|
|
$ |
1,105,835 |
|
|
|
|
|
|
|
|
|
|
|
|
|
|
|
|
|
|
| Consumer and other |
|
|
|
|
|
|
|
|
|
|
|
|
|
|
|
|
| Category |
|
|
|
|
|
|
|
|
|
|
|
|
|
|
|
|
| I |
|
$ |
5,920 |
|
|
$ |
8,786 |
|
|
$ |
3,167 |
|
|
$ |
12,193 |
|
|
$ |
2,049 |
|
|
$ |
3,485 |
|
|
$ |
8,712 |
|
|
$ |
44,312 |
|
| II |
|
— |
|
|
— |
|
|
— |
|
|
— |
|
|
— |
|
|
— |
|
|
— |
|
|
— |
|
| III |
|
— |
|
|
— |
|
|
— |
|
|
— |
|
|
— |
|
|
— |
|
|
— |
|
|
— |
|
| IV |
|
— |
|
|
— |
|
|
— |
|
|
— |
|
|
— |
|
|
— |
|
|
— |
|
|
— |
|
| Total |
|
$ |
5,920 |
|
|
$ |
8,786 |
|
|
$ |
3,167 |
|
|
$ |
12,193 |
|
|
$ |
2,049 |
|
|
$ |
3,485 |
|
|
$ |
8,712 |
|
|
$ |
44,312 |
|
|
|
|
|
|
|
|
|
|
|
|
|
|
|
|
|
|
Total Loans |
|
|
|
|
|
|
|
|
|
|
|
|
|
|
|
|
| Category |
|
|
|
|
|
|
|
|
|
|
|
|
|
|
|
|
| I |
|
$ |
564,860 |
|
|
$ |
404,711 |
|
|
$ |
281,402 |
|
|
$ |
289,670 |
|
|
$ |
134,341 |
|
|
$ |
542,295 |
|
|
$ |
481,028 |
|
|
$ |
2,698,307 |
|
| II |
|
1,496 |
|
|
5,280 |
|
|
12,376 |
|
|
8,577 |
|
|
19,932 |
|
|
16,493 |
|
|
5,706 |
|
|
69,860 |
|
| III |
|
1,093 |
|
|
7,168 |
|
|
1,882 |
|
|
5,919 |
|
|
3,861 |
|
|
26,273 |
|
|
15,058 |
|
|
61,254 |
|
| IV |
|
1,482 |
|
|
6,519 |
|
|
1,319 |
|
|
321 |
|
|
133 |
|
|
1,666 |
|
|
9,157 |
|
|
$ |
20,597 |
|
| Total |
|
$ |
568,931 |
|
|
$ |
423,678 |
|
|
$ |
296,979 |
|
|
$ |
304,487 |
|
|
$ |
158,267 |
|
|
$ |
586,727 |
|
|
$ |
510,949 |
|
|
$ |
2,850,018 |
|
|
|
|
|
|
|
|
|
|
|
|
|
|
|
|
|
|
|
|
|
|
|
|
|
|
|
|
|
|
|
|
|
|
|
|
|
|
|
|
|
|
|
|
|
|
|
|
|
|
|
|
| December 31, 2022 |
|
Term Loans Amortized Cost Basis by Origination Year |
|
|
|
|
| (In Thousands) |
|
2022 |
|
2021 |
|
2020 |
|
2019 |
|
2018 |
|
Prior |
|
Revolving Loans Amortized Cost Basis |
|
Total |
| Commercial real estate — owner occupied |
|
|
|
|
|
|
|
|
|
|
|
|
| Category |
|
|
|
|
|
|
|
|
|
|
|
|
|
|
|
|
| I |
|
$ |
50,705 |
|
|
$ |
34,896 |
|
|
$ |
55,096 |
|
|
$ |
25,583 |
|
|
$ |
15,583 |
|
|
$ |
72,091 |
|
|
$ |
2,287 |
|
|
$ |
256,241 |
|
| II |
|
— |
|
|
560 |
|
|
300 |
|
|
— |
|
|
399 |
|
|
1,344 |
|
|
— |
|
|
2,603 |
|
| III |
|
— |
|
|
494 |
|
|
5,489 |
|
|
299 |
|
|
417 |
|
|
2,811 |
|
|
— |
|
|
9,510 |
|
| IV |
|
— |
|
|
— |
|
|
— |
|
|
— |
|
|
— |
|
|
— |
|
|
— |
|
|
— |
|
| Total |
|
$ |
50,705 |
|
|
$ |
35,950 |
|
|
$ |
60,885 |
|
|
$ |
25,882 |
|
|
$ |
16,399 |
|
|
$ |
76,246 |
|
|
$ |
2,287 |
|
|
$ |
268,354 |
|
|
|
|
|
|
|
|
|
|
|
|
|
|
|
|
|
|
| Commercial real estate — non-owner occupied |
|
|
|
|
|
|
|
|
|
|
|
|
| Category |
|
|
|
|
|
|
|
|
|
|
|
|
|
|
|
|
| I |
|
$ |
88,752 |
|
|
$ |
74,615 |
|
|
$ |
60,216 |
|
|
$ |
64,847 |
|
|
$ |
84,053 |
|
|
$ |
232,405 |
|
|
$ |
25,508 |
|
|
$ |
630,396 |
|
| II |
|
— |
|
|
— |
|
|
— |
|
|
15,099 |
|
|
11,390 |
|
|
7,534 |
|
|
— |
|
|
34,023 |
|
| III |
|
— |
|
|
— |
|
|
3,891 |
|
|
— |
|
|
— |
|
|
18,566 |
|
|
215 |
|
|
22,672 |
|
| IV |
|
— |
|
|
— |
|
|
— |
|
|
— |
|
|
— |
|
|
— |
|
|
— |
|
|
— |
|
| Total |
|
$ |
88,752 |
|
|
$ |
74,615 |
|
|
$ |
64,107 |
|
|
$ |
79,946 |
|
|
$ |
95,443 |
|
|
$ |
258,505 |
|
|
$ |
25,723 |
|
|
$ |
687,091 |
|
|
|
|
|
|
|
|
|
|
|
|
|
|
|
|
|
|
| Construction |
|
|
|
|
|
|
|
|
|
|
|
|
|
|
|
|
| Category |
|
|
|
|
|
|
|
|
|
|
|
|
|
|
|
|
| I |
|
$ |
39,942 |
|
|
$ |
70,257 |
|
|
$ |
39,048 |
|
|
$ |
457 |
|
|
$ |
8,052 |
|
|
$ |
22,603 |
|
|
$ |
27,601 |
|
|
$ |
207,960 |
|
| II |
|
— |
|
|
— |
|
|
— |
|
|
— |
|
|
— |
|
|
— |
|
|
— |
|
|
— |
|
| III |
|
— |
|
|
— |
|
|
— |
|
|
10,791 |
|
|
— |
|
|
— |
|
|
— |
|
|
10,791 |
|
| IV |
|
— |
|
|
— |
|
|
— |
|
|
— |
|
|
— |
|
|
— |
|
|
— |
|
|
— |
|
| Total |
|
$ |
39,942 |
|
|
$ |
70,257 |
|
|
$ |
39,048 |
|
|
$ |
11,248 |
|
|
$ |
8,052 |
|
|
$ |
22,603 |
|
|
$ |
27,601 |
|
|
$ |
218,751 |
|
|
|
|
|
|
|
|
|
|
|
|
|
|
|
|
|
|
| Multi-family |
|
|
|
|
|
|
|
|
|
|
|
|
|
|
|
|
| Category |
|
|
|
|
|
|
|
|
|
|
|
|
|
|
|
|
| I |
|
$ |
21,698 |
|
|
$ |
46,894 |
|
|
$ |
121,199 |
|
|
$ |
23,293 |
|
|
$ |
32,611 |
|
|
$ |
93,723 |
|
|
$ |
2,612 |
|
|
$ |
342,030 |
|
| II |
|
— |
|
|
— |
|
|
— |
|
|
— |
|
|
— |
|
|
7,996 |
|
|
— |
|
|
7,996 |
|
| III |
|
— |
|
|
— |
|
|
— |
|
|
— |
|
|
— |
|
|
— |
|
|
— |
|
|
— |
|
| IV |
|
— |
|
|
— |
|
|
— |
|
|
— |
|
|
— |
|
|
— |
|
|
— |
|
|
— |
|
| Total |
|
$ |
21,698 |
|
|
$ |
46,894 |
|
|
$ |
121,199 |
|
|
$ |
23,293 |
|
|
$ |
32,611 |
|
|
$ |
101,719 |
|
|
$ |
2,612 |
|
|
$ |
350,026 |
|
|
|
|
|
|
|
|
|
|
|
|
|
|
|
|
|
|
| 1-4 family |
|
|
|
|
|
|
|
|
|
|
|
|
|
|
|
|
| Category |
|
|
|
|
|
|
|
|
|
|
|
|
|
|
|
|
| I |
|
$ |
7,659 |
|
|
$ |
3,087 |
|
|
$ |
2,525 |
|
|
$ |
632 |
|
|
$ |
98 |
|
|
$ |
2,250 |
|
|
$ |
1,447 |
|
|
$ |
17,698 |
|
| II |
|
— |
|
|
— |
|
|
— |
|
|
— |
|
|
— |
|
|
— |
|
|
— |
|
|
— |
|
| III |
|
— |
|
|
— |
|
|
— |
|
|
— |
|
|
— |
|
|
— |
|
|
— |
|
|
— |
|
| IV |
|
— |
|
|
— |
|
|
— |
|
|
— |
|
|
— |
|
|
30 |
|
|
— |
|
|
30 |
|
| Total |
|
$ |
7,659 |
|
|
$ |
3,087 |
|
|
$ |
2,525 |
|
|
$ |
632 |
|
|
$ |
98 |
|
|
$ |
2,280 |
|
|
$ |
1,447 |
|
|
$ |
17,728 |
|
|
|
|
|
|
|
|
|
|
|
|
|
|
|
|
|
|
|
|
|
|
|
|
|
|
|
|
|
|
|
|
|
|
|
|
|
|
|
|
|
|
|
|
|
|
|
|
|
|
|
|
|
|
|
|
|
|
|
|
|
|
|
|
|
|
|
|
|
| December 31, 2022 |
|
Term Loans Amortized Cost Basis by Origination Year |
|
|
|
|
| (In Thousands) |
|
2022 |
|
2021 |
|
2020 |
|
2019 |
|
2018 |
|
Prior |
|
Revolving Loans Amortized Cost Basis |
|
Total |
| Commercial and industrial |
|
|
|
|
|
|
|
|
|
|
|
|
|
|
| Category |
|
|
|
|
|
|
|
|
|
|
|
|
|
|
|
|
| I |
|
$ |
199,293 |
|
|
$ |
109,901 |
|
|
$ |
56,590 |
|
|
$ |
30,000 |
|
|
$ |
13,838 |
|
|
$ |
19,367 |
|
|
$ |
364,817 |
|
|
$ |
793,806 |
|
| II |
|
5,499 |
|
|
801 |
|
|
3,021 |
|
|
1,108 |
|
|
92 |
|
|
239 |
|
|
9,846 |
|
|
20,606 |
|
| III |
|
1,809 |
|
|
5,607 |
|
|
6,691 |
|
|
6,699 |
|
|
133 |
|
|
5,451 |
|
|
8,896 |
|
|
35,286 |
|
| IV |
|
601 |
|
|
1,015 |
|
|
589 |
|
|
446 |
|
|
102 |
|
|
876 |
|
|
— |
|
|
3,629 |
|
| Total |
|
$ |
207,202 |
|
|
$ |
117,324 |
|
|
$ |
66,891 |
|
|
$ |
38,253 |
|
|
$ |
14,165 |
|
|
$ |
25,933 |
|
|
$ |
383,559 |
|
|
$ |
853,327 |
|
|
|
|
|
|
|
|
|
|
|
|
|
|
|
|
|
|
| Consumer and other |
|
|
|
|
|
|
|
|
|
|
|
|
|
|
|
|
| Category |
|
|
|
|
|
|
|
|
|
|
|
|
|
|
|
|
| I |
|
$ |
11,086 |
|
|
$ |
3,556 |
|
|
$ |
13,870 |
|
|
$ |
2,433 |
|
|
$ |
2,600 |
|
|
$ |
4,193 |
|
|
$ |
10,200 |
|
|
$ |
47,938 |
|
| II |
|
— |
|
|
— |
|
|
— |
|
|
— |
|
|
— |
|
|
— |
|
|
— |
|
|
— |
|
| III |
|
— |
|
|
— |
|
|
— |
|
|
— |
|
|
— |
|
|
— |
|
|
— |
|
|
— |
|
| IV |
|
— |
|
|
— |
|
|
— |
|
|
— |
|
|
— |
|
|
— |
|
|
— |
|
|
— |
|
| Total |
|
$ |
11,086 |
|
|
$ |
3,556 |
|
|
$ |
13,870 |
|
|
$ |
2,433 |
|
|
$ |
2,600 |
|
|
$ |
4,193 |
|
|
$ |
10,200 |
|
|
$ |
47,938 |
|
|
|
|
|
|
|
|
|
|
|
|
|
|
|
|
|
|
Total Loans |
|
|
|
|
|
|
|
|
|
|
|
|
|
|
|
|
| Category |
|
|
|
|
|
|
|
|
|
|
|
|
|
|
|
|
| I |
|
$ |
419,135 |
|
|
$ |
343,206 |
|
|
$ |
348,544 |
|
|
$ |
147,245 |
|
|
$ |
156,835 |
|
|
$ |
446,632 |
|
|
$ |
434,472 |
|
|
$ |
2,296,069 |
|
| II |
|
5,499 |
|
|
1,361 |
|
|
3,321 |
|
|
16,207 |
|
|
11,881 |
|
|
17,113 |
|
|
9,846 |
|
|
65,228 |
|
| III |
|
1,809 |
|
|
6,101 |
|
|
16,071 |
|
|
17,789 |
|
|
550 |
|
|
26,828 |
|
|
9,111 |
|
|
78,259 |
|
| IV |
|
601 |
|
|
1,015 |
|
|
589 |
|
|
446 |
|
|
102 |
|
|
906 |
|
|
— |
|
|
3,659 |
|
| Total |
|
$ |
427,044 |
|
|
$ |
351,683 |
|
|
$ |
368,525 |
|
|
$ |
181,687 |
|
|
$ |
169,368 |
|
|
$ |
491,479 |
|
|
$ |
453,429 |
|
|
$ |
2,443,215 |
|
Each credit is evaluated for proper risk rating upon origination, at the time of each subsequent renewal, upon receipt and evaluation of updated financial information from the Corporation’s borrowers or as other circumstances dictate. The Corporation primarily uses a nine grade risk rating system to monitor the ongoing credit quality of its loans and leases. The risk rating grades follow a consistent definition and are then applied to specific loan types based on the nature of the loan. Each risk rating is subjective and, depending on the size and nature of the credit, subject to various levels of review and concurrence on the stated risk rating. In addition to its nine grade risk rating system, the Corporation groups loans into four loan and related risk categories which determine the level and nature of review by management.
Category I — Loans and leases in this category are performing in accordance with the terms of the contract and generally exhibit no immediate concerns regarding the security and viability of the underlying collateral, financial stability of the borrower, integrity or strength of the borrowers’ management team or the industry in which the borrower operates. The Corporation monitors Category I loans and leases through payment performance, continued maintenance of its personal relationships with such borrowers and continued review of such borrowers’ compliance with the terms of their respective agreements.
Category II — Loans and leases in this category are beginning to show signs of deterioration in one or more of the Corporation’s core underwriting criteria such as financial stability, management strength, industry trends or collateral values. Management will place credits in this category to allow for proactive monitoring and resolution with the borrower to possibly mitigate the area of concern and prevent further deterioration or risk of loss to the Corporation. Category II loans are considered performing but are monitored frequently by the assigned business development officer and by asset quality review committees.
Category III — Loans and leases in this category are identified by management as warranting special attention. However, the balance in this category is not intended to represent the amount of adversely classified assets held by the Bank.
Category III loans and leases generally exhibit undesirable characteristics, such as evidence of adverse financial trends and conditions, managerial problems, deteriorating economic conditions within the related industry or evidence of adverse public filings and may exhibit collateral shortfall positions. Management continues to believe that it will collect all contractual principal and interest in accordance with the original terms of the contracts relating to the loans and leases in this category, and therefore Category III loans are considered performing with no specific reserves established for this category. Category III loans are monitored by management and asset quality review committees on a monthly basis.
Category IV — Loans and leases in this category are non-performing loans. Management has determined that it is unlikely that the Bank will receive the contractual principal and interest in accordance with the original terms of the agreement. Non-performing loans are individually evaluated to assess the need for the establishment of specific reserves or charge-offs. When analyzing the adequacy of collateral, the Corporation obtains external appraisals at least annually. External appraisals are obtained from the Corporation’s approved appraiser listing and are independently reviewed to monitor the quality of such appraisals. To the extent a collateral shortfall position is present, a specific reserve or charge-off will be recorded. Loans and leases in this category are monitored by management and asset quality review committees on a monthly basis.
The delinquency aging of the loan and lease portfolio by class of receivable was as follows:
|
|
|
|
|
|
|
|
|
|
|
|
|
|
|
|
|
|
|
|
|
|
|
|
|
|
|
|
|
|
|
|
|
|
|
|
|
|
|
|
|
December 31, 2023 |
|
|
30-59
Days Past Due |
|
60-89
Days Past Due |
|
Greater
Than 90
Days Past Due |
|
Total Past Due |
|
Current |
|
Total Loans and Leases |
| |
|
(Dollars in Thousands) |
| Performing loans and leases |
|
|
|
|
|
|
|
|
|
|
|
|
| Commercial real estate: |
|
|
|
|
|
|
|
|
|
|
|
|
| Owner occupied |
|
$ |
— |
|
|
$ |
— |
|
|
$ |
— |
|
|
$ |
— |
|
|
$ |
256,479 |
|
|
$ |
256,479 |
|
| Non-owner occupied |
|
— |
|
|
— |
|
|
— |
|
|
— |
|
|
773,494 |
|
|
773,494 |
|
| Construction |
|
— |
|
|
— |
|
|
— |
|
|
— |
|
|
193,080 |
|
|
193,080 |
|
| Multi-family |
|
— |
|
|
— |
|
|
— |
|
|
— |
|
|
450,529 |
|
|
450,529 |
|
| 1-4 family |
|
— |
|
|
— |
|
|
— |
|
|
— |
|
|
26,267 |
|
|
26,267 |
|
| Commercial and industrial |
|
3,026 |
|
|
491 |
|
|
— |
|
|
3,517 |
|
|
1,081,743 |
|
|
1,085,260 |
|
| Consumer and other |
|
— |
|
|
— |
|
|
— |
|
|
— |
|
|
44,312 |
|
|
44,312 |
|
| Total |
|
3,026 |
|
|
491 |
|
|
— |
|
|
3,517 |
|
|
2,825,904 |
|
|
2,829,421 |
|
| Non-performing loans and leases |
|
|
|
|
|
|
|
|
|
|
|
|
| Commercial real estate: |
|
|
|
|
|
|
|
|
|
|
|
|
| Owner occupied |
|
— |
|
|
— |
|
|
— |
|
|
— |
|
|
— |
|
|
— |
|
| Non-owner occupied |
|
— |
|
|
— |
|
|
— |
|
|
— |
|
|
— |
|
|
— |
|
| Construction |
|
— |
|
|
— |
|
|
— |
|
|
— |
|
|
— |
|
|
— |
|
| Multi-family |
|
— |
|
|
— |
|
|
— |
|
|
— |
|
|
— |
|
|
— |
|
| 1-4 family |
|
— |
|
|
— |
|
|
— |
|
|
— |
|
|
22 |
|
|
22 |
|
| Commercial and industrial |
|
404 |
|
|
550 |
|
|
18,347 |
|
|
19,301 |
|
|
1,274 |
|
|
20,575 |
|
| Consumer and other |
|
— |
|
|
— |
|
|
— |
|
|
— |
|
|
— |
|
|
— |
|
| Total |
|
404 |
|
|
550 |
|
|
18,347 |
|
|
19,301 |
|
|
1,296 |
|
|
20,597 |
|
| Total loans and leases |
|
|
|
|
|
|
|
|
|
|
|
|
| Commercial real estate: |
|
|
|
|
|
|
|
|
|
|
|
|
| Owner occupied |
|
— |
|
|
— |
|
|
— |
|
|
— |
|
|
256,479 |
|
|
256,479 |
|
| Non-owner occupied |
|
— |
|
|
— |
|
|
— |
|
|
— |
|
|
773,494 |
|
|
773,494 |
|
| Construction |
|
— |
|
|
— |
|
|
— |
|
|
— |
|
|
193,080 |
|
|
193,080 |
|
| Multi-family |
|
— |
|
|
— |
|
|
— |
|
|
— |
|
|
450,529 |
|
|
450,529 |
|
| 1-4 family |
|
— |
|
|
— |
|
|
— |
|
|
— |
|
|
26,289 |
|
|
26,289 |
|
| Commercial and industrial |
|
3,430 |
|
|
1,041 |
|
|
18,347 |
|
|
22,818 |
|
|
1,083,017 |
|
|
1,105,835 |
|
| Consumer and other |
|
— |
|
|
— |
|
|
— |
|
|
— |
|
|
44,312 |
|
|
44,312 |
|
| Total |
|
$ |
3,430 |
|
|
$ |
1,041 |
|
|
$ |
18,347 |
|
|
$ |
22,818 |
|
|
$ |
2,827,200 |
|
|
$ |
2,850,018 |
|
| Percent of portfolio |
|
0.12 |
% |
|
0.04 |
% |
|
0.64 |
% |
|
0.80 |
% |
|
99.20 |
% |
|
100.00 |
% |
|
|
|
|
|
|
|
|
|
|
|
|
|
|
|
|
|
|
|
|
|
|
|
|
|
|
|
|
|
|
|
|
|
|
|
|
|
|
|
|
|
December 31, 2022 |
|
|
30-59
Days Past Due |
|
60-89
Days Past Due |
|
Greater
Than 90
Days Past Due |
|
Total Past Due |
|
Current |
|
Total Loans and Leases |
| |
|
(Dollars in Thousands) |
| Performing loans and leases |
|
|
|
|
|
|
|
|
|
|
|
|
| Commercial real estate: |
|
|
|
|
|
|
|
|
|
|
|
|
| Owner occupied |
|
$ |
— |
|
|
$ |
— |
|
|
$ |
— |
|
|
$ |
— |
|
|
$ |
268,354 |
|
|
$ |
268,354 |
|
| Non-owner occupied |
|
215 |
|
|
— |
|
|
— |
|
|
215 |
|
|
686,876 |
|
|
687,091 |
|
| Construction |
|
— |
|
|
— |
|
|
— |
|
|
— |
|
|
218,751 |
|
|
218,751 |
|
| Multi-family |
|
— |
|
|
— |
|
|
— |
|
|
— |
|
|
350,026 |
|
|
350,026 |
|
| 1-4 family |
|
— |
|
|
— |
|
|
— |
|
|
— |
|
|
17,698 |
|
|
17,698 |
|
| Commercial and industrial |
|
1,437 |
|
|
403 |
|
|
— |
|
|
1,840 |
|
|
847,858 |
|
|
849,698 |
|
| Consumer and other |
|
— |
|
|
— |
|
|
— |
|
|
— |
|
|
47,938 |
|
|
47,938 |
|
| Total |
|
1,652 |
|
|
403 |
|
|
— |
|
|
2,055 |
|
|
2,437,501 |
|
|
2,439,556 |
|
| Non-performing loans and leases |
|
|
|
|
|
|
|
|
|
|
|
|
| Commercial real estate: |
|
|
|
|
|
|
|
|
|
|
|
|
| Owner occupied |
|
— |
|
|
— |
|
|
— |
|
|
— |
|
|
— |
|
|
— |
|
| Non-owner occupied |
|
— |
|
|
— |
|
|
— |
|
|
— |
|
|
— |
|
|
— |
|
| Construction |
|
— |
|
|
— |
|
|
— |
|
|
— |
|
|
— |
|
|
— |
|
| Multi-family |
|
— |
|
|
— |
|
|
— |
|
|
— |
|
|
— |
|
|
— |
|
| 1-4 family |
|
— |
|
|
— |
|
|
— |
|
|
— |
|
|
30 |
|
|
30 |
|
| Commercial and industrial |
|
439 |
|
|
126 |
|
|
2,464 |
|
|
3,029 |
|
|
600 |
|
|
3,629 |
|
| Consumer and other |
|
— |
|
|
— |
|
|
— |
|
|
— |
|
|
— |
|
|
— |
|
| Total |
|
439 |
|
|
126 |
|
|
2,464 |
|
|
3,029 |
|
|
630 |
|
|
3,659 |
|
| Total loans and leases |
|
|
|
|
|
|
|
|
|
|
|
|
| Commercial real estate: |
|
|
|
|
|
|
|
|
|
|
|
|
| Owner occupied |
|
— |
|
|
— |
|
|
— |
|
|
— |
|
|
268,354 |
|
|
268,354 |
|
| Non-owner occupied |
|
215 |
|
|
— |
|
|
— |
|
|
215 |
|
|
686,876 |
|
|
687,091 |
|
| Construction |
|
— |
|
|
— |
|
|
— |
|
|
— |
|
|
218,751 |
|
|
218,751 |
|
| Multi-family |
|
— |
|
|
— |
|
|
— |
|
|
— |
|
|
350,026 |
|
|
350,026 |
|
| 1-4 family |
|
— |
|
|
— |
|
|
— |
|
|
— |
|
|
17,728 |
|
|
17,728 |
|
| Commercial and industrial |
|
1,876 |
|
|
529 |
|
|
2,464 |
|
|
4,869 |
|
|
848,458 |
|
|
853,327 |
|
| Consumer and other |
|
— |
|
|
— |
|
|
— |
|
|
— |
|
|
47,938 |
|
|
47,938 |
|
| Total |
|
$ |
2,091 |
|
|
$ |
529 |
|
|
$ |
2,464 |
|
|
$ |
5,084 |
|
|
$ |
2,438,131 |
|
|
$ |
2,443,215 |
|
| Percent of portfolio |
|
0.09 |
% |
|
0.02 |
% |
|
0.10 |
% |
|
0.21 |
% |
|
99.79 |
% |
|
100.00 |
% |
The Corporation’s total non-performing assets consisted of the following:
|
|
|
|
|
|
|
|
|
|
|
|
|
|
|
|
|
December 31,
2023 |
|
December 31,
2022 |
| |
|
(In Thousands) |
| Non-performing loans and leases |
|
|
|
|
| Commercial real estate: |
|
|
|
|
| Commercial real estate — owner occupied |
|
$ |
— |
|
|
$ |
— |
|
| Commercial real estate — non-owner occupied |
|
— |
|
|
— |
|
| Construction |
|
— |
|
|
— |
|
| Multi-family |
|
— |
|
|
— |
|
| 1-4 family |
|
22 |
|
|
30 |
|
| Total non-performing commercial real estate |
|
22 |
|
|
30 |
|
| Commercial and industrial |
|
20,575 |
|
|
3,629 |
|
| Consumer and other |
|
— |
|
|
— |
|
| Total non-performing loans and leases |
|
20,597 |
|
|
3,659 |
|
| Repossessed assets, net |
|
247 |
|
|
95 |
|
| Total non-performing assets |
|
$ |
20,844 |
|
|
$ |
3,754 |
|
|
|
|
|
|
|
|
|
|
|
|
|
|
|
|
|
|
December 31,
2023 |
|
December 31,
2022 |
| Total non-performing loans and leases to gross loans and leases |
|
0.72 |
% |
|
0.15 |
% |
| Total non-performing assets to total gross loans and leases plus repossessed assets, net |
|
0.73 |
|
|
0.15 |
|
| Total non-performing assets to total assets |
|
0.59 |
|
|
0.13 |
|
| Allowance for credit losses to gross loans and leases |
|
1.16 |
|
|
0.99 |
|
| Allowance for credit losses to non-performing loans and leases |
|
160.21 |
|
|
662.20 |
|
Non-performing loans, which are collateral dependent, are primarily secured by inventory $8.9 million, equipment $3.7 million, and accounts receivable and other assets $1.7 million. Occasionally, the Corporation modifies loans to borrowers in financial distress. There were three commercial and industrial loans for a total of $882,000 modified during the year ended December 31, 2023. The modifications consisted of payment deferrals. These loans are included in total non-performing loans and are currently between zero and 209 days past due as of December 31, 2023. No loans were modified during the year ended December 31, 2022. There was one commercial and industrial loan to a borrower experiencing financial distress for a total of $382,000 that was modified during the previous 12 months and which subsequently defaulted during the year ended December 31, 2023. There were no loans to borrowers experiencing financial distress that were modified during the previous 12 months and which subsequently defaulted during the year ended December 31, 2022. There were no unfunded commitments associated with loans modified for borrowers experiencing financial distress as of December 31, 2023.
The following represents additional information regarding the Corporation’s non-accrual loans and leases, by portfolio segment:
|
|
|
|
|
|
|
|
|
|
|
|
|
|
|
|
|
|
|
|
|
|
|
|
|
|
|
|
|
|
|
|
|
|
|
|
|
|
|
|
|
|
|
|
|
|
|
As of and for the Year Ended December 31, 2023 |
|
|
Amortized Cost(1) |
|
Unpaid
Principal
Balance |
|
Individual
Reserve |
|
Average
Recorded
Investment(2)
|
|
Foregone
Interest
Income |
|
Interest
Income
Recognized |
|
Net Foregone
Interest
Income |
| |
|
(In Thousands) |
| With no individual reserve recorded: |
|
|
|
|
|
|
|
|
|
|
|
|
|
|
| Commercial real estate: |
|
|
|
|
|
|
|
|
|
|
|
|
|
|
| Owner occupied |
|
$ |
— |
|
|
$ |
— |
|
|
$ |
— |
|
|
$ |
— |
|
|
$ |
— |
|
|
$ |
— |
|
|
$ |
— |
|
| Non-owner occupied |
|
— |
|
|
— |
|
|
— |
|
|
— |
|
|
— |
|
|
— |
|
|
— |
|
| Construction |
|
— |
|
|
— |
|
|
— |
|
|
— |
|
|
— |
|
|
— |
|
|
— |
|
| Multi-family |
|
— |
|
|
— |
|
|
— |
|
|
— |
|
|
— |
|
|
— |
|
|
— |
|
| 1-4 family |
|
— |
|
|
— |
|
|
— |
|
|
4 |
|
|
— |
|
|
23 |
|
|
(23) |
|
| Commercial and industrial |
|
9,691 |
|
|
9,695 |
|
|
— |
|
|
4,989 |
|
|
786 |
|
|
214 |
|
|
572 |
|
| Consumer and other |
|
— |
|
|
— |
|
|
— |
|
|
— |
|
|
— |
|
|
— |
|
|
— |
|
| Total |
|
9,691 |
|
|
9,695 |
|
|
— |
|
|
4,993 |
|
|
786 |
|
|
237 |
|
|
549 |
|
| With individual reserve recorded: |
|
|
|
|
|
|
|
|
|
|
|
|
|
|
| Commercial real estate: |
|
|
|
|
|
|
|
|
|
|
|
|
|
|
| Owner occupied |
|
— |
|
|
— |
|
|
— |
|
|
— |
|
|
— |
|
|
— |
|
|
— |
|
| Non-owner occupied |
|
— |
|
|
— |
|
|
— |
|
|
— |
|
|
— |
|
|
— |
|
|
— |
|
| Construction |
|
— |
|
|
— |
|
|
— |
|
|
— |
|
|
— |
|
|
— |
|
|
— |
|
| Multi-family |
|
— |
|
|
— |
|
|
— |
|
|
— |
|
|
— |
|
|
— |
|
|
— |
|
| 1-4 family |
|
22 |
|
|
27 |
|
|
22 |
|
|
22 |
|
|
4 |
|
|
— |
|
|
4 |
|
| Commercial and industrial |
|
10,884 |
|
|
10,890 |
|
|
5,968 |
|
|
5,435 |
|
|
641 |
|
|
29 |
|
|
612 |
|
| Consumer and other |
|
— |
|
|
— |
|
|
— |
|
|
— |
|
|
— |
|
|
— |
|
|
— |
|
| Total |
|
10,906 |
|
|
10,917 |
|
|
5,990 |
|
|
5,457 |
|
|
645 |
|
|
29 |
|
|
616 |
|
| Total: |
|
|
|
|
|
|
|
|
|
|
|
|
|
|
| Commercial real estate: |
|
|
|
|
|
|
|
|
|
|
|
|
|
|
| Owner occupied |
|
— |
|
|
— |
|
|
— |
|
|
— |
|
|
— |
|
|
— |
|
|
— |
|
| Non-owner occupied |
|
— |
|
|
— |
|
|
— |
|
|
— |
|
|
— |
|
|
— |
|
|
— |
|
| Construction |
|
— |
|
|
— |
|
|
— |
|
|
— |
|
|
— |
|
|
— |
|
|
— |
|
| Multi-family |
|
— |
|
|
— |
|
|
— |
|
|
— |
|
|
— |
|
|
— |
|
|
— |
|
| 1-4 family |
|
22 |
|
|
27 |
|
|
22 |
|
|
26 |
|
|
4 |
|
|
23 |
|
|
(19) |
|
| Commercial and industrial |
|
20,575 |
|
|
20,585 |
|
|
5,968 |
|
|
10,424 |
|
|
1,427 |
|
|
243 |
|
|
1,184 |
|
| Consumer and other |
|
— |
|
|
— |
|
|
— |
|
|
— |
|
|
— |
|
|
— |
|
|
— |
|
| Grand total |
|
$ |
20,597 |
|
|
$ |
20,612 |
|
|
$ |
5,990 |
|
|
$ |
10,450 |
|
|
$ |
1,431 |
|
|
$ |
266 |
|
|
$ |
1,165 |
|
(1)The amortized cost represents the unpaid principal balance net of any partial charge-offs.
(2)Average recorded investment is calculated primarily using daily average balances.
|
|
|
|
|
|
|
|
|
|
|
|
|
|
|
|
|
|
|
|
|
|
|
|
|
|
|
|
|
|
|
|
|
|
|
|
|
|
|
|
|
|
|
|
|
|
|
As of and for the Year Ended December 31, 2022 |
|
|
Recorded
Investment(1)
|
|
Unpaid
Principal
Balance |
|
Individual
Reserve |
|
Average
Recorded
Investment(2)
|
|
Foregone
Interest
Income |
|
Interest
Income
Recognized |
|
Net Foregone
Interest
Income |
| |
|
(In Thousands) |
| With no individual reserve recorded: |
|
|
|
|
|
|
|
|
|
|
|
|
|
|
| Commercial real estate: |
|
|
|
|
|
|
|
|
|
|
|
|
|
|
| Owner occupied |
|
$ |
— |
|
|
$ |
— |
|
|
$ |
— |
|
|
$ |
180 |
|
|
$ |
14 |
|
|
$ |
759 |
|
|
$ |
(745) |
|
| Non-owner occupied |
|
— |
|
|
— |
|
|
— |
|
|
— |
|
|
— |
|
|
1 |
|
|
(1) |
|
| Construction |
|
— |
|
|
— |
|
|
— |
|
|
— |
|
|
— |
|
|
47 |
|
|
(47) |
|
| Multi-family |
|
— |
|
|
— |
|
|
— |
|
|
— |
|
|
— |
|
|
— |
|
|
— |
|
| 1-4 family |
|
30 |
|
|
35 |
|
|
— |
|
|
112 |
|
|
8 |
|
|
41 |
|
|
(33) |
|
| Commercial and industrial |
|
1,037 |
|
|
1,037 |
|
|
— |
|
|
3,153 |
|
|
277 |
|
|
587 |
|
|
(310) |
|
| Consumer and other |
|
— |
|
|
— |
|
|
— |
|
|
— |
|
|
— |
|
|
— |
|
|
— |
|
| Total |
|
1,067 |
|
|
1,072 |
|
|
— |
|
|
3,445 |
|
|
299 |
|
|
1,435 |
|
|
(1,136) |
|
| With individual reserve recorded: |
|
|
|
|
|
|
|
|
|
|
|
|
|
|
| Commercial real estate: |
|
|
|
|
|
|
|
|
|
|
|
|
|
|
| Owner occupied |
|
— |
|
|
— |
|
|
— |
|
|
— |
|
|
— |
|
|
— |
|
|
— |
|
| Non-owner occupied |
|
— |
|
|
— |
|
|
— |
|
|
— |
|
|
— |
|
|
— |
|
|
— |
|
| Construction |
|
— |
|
|
— |
|
|
— |
|
|
— |
|
|
— |
|
|
— |
|
|
— |
|
| Multi-family |
|
— |
|
|
— |
|
|
— |
|
|
— |
|
|
— |
|
|
— |
|
|
— |
|
| 1-4 family |
|
— |
|
|
— |
|
|
— |
|
|
— |
|
|
— |
|
|
— |
|
|
— |
|
| Commercial and industrial |
|
2,592 |
|
|
2,612 |
|
|
1,650 |
|
|
1,454 |
|
|
101 |
|
|
1 |
|
|
100 |
|
| Consumer and other |
|
— |
|
|
— |
|
|
— |
|
|
— |
|
|
— |
|
|
— |
|
|
— |
|
| Total |
|
2,592 |
|
|
2,612 |
|
|
1,650 |
|
|
1,454 |
|
|
101 |
|
|
1 |
|
|
100 |
|
| Total: |
|
|
|
|
|
|
|
|
|
|
|
|
|
|
| Commercial real estate: |
|
|
|
|
|
|
|
|
|
|
|
|
|
|
| Owner occupied |
|
— |
|
|
— |
|
|
— |
|
|
180 |
|
|
14 |
|
|
759 |
|
|
(745) |
|
| Non-owner occupied |
|
— |
|
|
— |
|
|
— |
|
|
— |
|
|
— |
|
|
1 |
|
|
(1) |
|
| Construction |
|
— |
|
|
— |
|
|
— |
|
|
— |
|
|
— |
|
|
47 |
|
|
(47) |
|
| Multi-family |
|
— |
|
|
— |
|
|
— |
|
|
— |
|
|
— |
|
|
— |
|
|
— |
|
| 1-4 family |
|
30 |
|
|
35 |
|
|
— |
|
|
112 |
|
|
8 |
|
|
41 |
|
|
(33) |
|
| Commercial and industrial |
|
3,629 |
|
|
3,649 |
|
|
1,650 |
|
|
4,607 |
|
|
378 |
|
|
588 |
|
|
(210) |
|
| Consumer and other |
|
— |
|
|
— |
|
|
— |
|
|
— |
|
|
— |
|
|
— |
|
|
— |
|
| Grand total |
|
$ |
3,659 |
|
|
$ |
3,684 |
|
|
$ |
1,650 |
|
|
$ |
4,899 |
|
|
$ |
400 |
|
|
$ |
1,436 |
|
|
$ |
(1,036) |
|
(1)The recorded investment represents the unpaid principal balance net of any partial charge-offs.
(2)Average recorded investment is calculated primarily using daily average balances.
|
|
|
|
|
|
|
|
|
|
|
|
|
|
|
|
|
|
|
|
|
|
|
|
|
|
|
|
|
|
|
|
|
|
|
|
|
|
|
|
|
|
|
|
|
|
|
As of and for the Year Ended December 31, 2021 |
|
|
Recorded
Investment(1)
|
|
Unpaid
Principal
Balance |
|
Individual
Reserve |
|
Average
Recorded
Investment(2)
|
|
Foregone
Interest
Income |
|
Interest
Income
Recognized |
|
Net Foregone
Interest
Income |
| |
|
(In Thousands) |
| With no individual reserve recorded: |
|
|
|
|
|
|
|
|
|
|
|
|
|
|
| Commercial real estate: |
|
|
|
|
|
|
|
|
|
|
|
|
|
|
| Owner occupied |
|
$ |
348 |
|
|
$ |
386 |
|
|
$ |
— |
|
|
$ |
2,217 |
|
|
$ |
145 |
|
|
$ |
218 |
|
|
$ |
(73) |
|
| Non-owner occupied |
|
— |
|
|
— |
|
|
— |
|
|
2,281 |
|
|
233 |
|
|
16 |
|
|
217 |
|
| Construction |
|
— |
|
|
— |
|
|
— |
|
|
7 |
|
|
— |
|
|
— |
|
|
— |
|
| Multi-family |
|
— |
|
|
— |
|
|
— |
|
|
— |
|
|
— |
|
|
— |
|
|
— |
|
| 1-4 family |
|
339 |
|
|
344 |
|
|
— |
|
|
285 |
|
|
60 |
|
|
24 |
|
|
36 |
|
| Commercial and industrial |
|
3,732 |
|
|
3,834 |
|
|
— |
|
|
7,916 |
|
|
523 |
|
|
179 |
|
|
344 |
|
| Consumer and other |
|
— |
|
|
— |
|
|
— |
|
|
48 |
|
|
30 |
|
|
9 |
|
|
21 |
|
| Total |
|
4,419 |
|
|
4,564 |
|
|
— |
|
|
12,754 |
|
|
991 |
|
|
446 |
|
|
545 |
|
| With individual reserve recorded: |
|
|
|
|
|
|
|
|
|
|
|
|
|
|
| Commercial real estate: |
|
|
|
|
|
|
|
|
|
|
|
|
|
|
| Owner occupied |
|
— |
|
|
— |
|
|
— |
|
|
— |
|
|
— |
|
|
— |
|
|
— |
|
| Non-owner occupied |
|
— |
|
|
— |
|
|
— |
|
|
— |
|
|
— |
|
|
— |
|
|
— |
|
| Construction |
|
— |
|
|
— |
|
|
— |
|
|
— |
|
|
— |
|
|
— |
|
|
— |
|
| Multi-family |
|
— |
|
|
— |
|
|
— |
|
|
— |
|
|
— |
|
|
— |
|
|
— |
|
| 1-4 family |
|
— |
|
|
— |
|
|
— |
|
|
— |
|
|
— |
|
|
— |
|
|
— |
|
| Commercial and industrial |
|
2,156 |
|
|
2,156 |
|
|
1,505 |
|
|
1,506 |
|
|
113 |
|
|
8 |
|
|
105 |
|
| Consumer and other |
|
— |
|
|
— |
|
|
— |
|
|
— |
|
|
— |
|
|
— |
|
|
— |
|
| Total |
|
2,156 |
|
|
2,156 |
|
|
1,505 |
|
|
1,506 |
|
|
113 |
|
|
8 |
|
|
105 |
|
| Total: |
|
|
|
|
|
|
|
|
|
|
|
|
|
|
| Commercial real estate: |
|
|
|
|
|
|
|
|
|
|
|
|
|
|
| Owner occupied |
|
348 |
|
|
386 |
|
|
— |
|
|
2,217 |
|
|
145 |
|
|
218 |
|
|
(73) |
|
| Non-owner occupied |
|
— |
|
|
— |
|
|
— |
|
|
2,281 |
|
|
233 |
|
|
16 |
|
|
217 |
|
| Construction |
|
— |
|
|
— |
|
|
— |
|
|
7 |
|
|
— |
|
|
— |
|
|
— |
|
| Multi-family |
|
— |
|
|
— |
|
|
— |
|
|
— |
|
|
— |
|
|
— |
|
|
— |
|
| 1-4 family |
|
339 |
|
|
344 |
|
|
— |
|
|
285 |
|
|
60 |
|
|
24 |
|
|
36 |
|
| Commercial and industrial |
|
5,888 |
|
|
5,990 |
|
|
1,505 |
|
|
9,422 |
|
|
636 |
|
|
187 |
|
|
449 |
|
| Consumer and other |
|
— |
|
|
— |
|
|
— |
|
|
48 |
|
|
30 |
|
|
9 |
|
|
21 |
|
| Grand total |
|
$ |
6,575 |
|
|
$ |
6,720 |
|
|
$ |
1,505 |
|
|
$ |
14,260 |
|
|
$ |
1,104 |
|
|
$ |
454 |
|
|
$ |
650 |
|
(1)The recorded investment represents the unpaid principal balance net of any partial charge-offs.
(2)Average recorded investment is calculated primarily using daily average balances.
The difference between the recorded investment of loans and leases and the unpaid principal balance of $15,000 and $26,000 as of December 31, 2023 and 2022, respectively, represents partial charge-offs of loans and leases resulting from losses due to the value of the collateral securing the loans and leases being below the carrying values of the loans and leases. When a loan is placed on non-accrual, interest accrual is discontinued and previously accrued but uncollected interest is deducted from interest income. Cash payments collected on non-accrual loans are first applied to such loan’s principal. Foregone interest represents the interest that was contractually due on the loan but not received or recorded. No principal has been forgiven on modified loans during the years ended December 31, 2023 and 2022. To the extent the amount of principal on a non-accrual loan is fully collected and additional cash is received, the Corporation will recognize interest income.
Allowance for Credit Losses
The ACL is an estimate of the expected credit losses on financial assets measured at amortized cost, which is measured using relevant information about past events, including historical credit loss experience on financial assets with similar risk characteristics, current conditions, and reasonable and supportable forecasts that affect the collectability of the remaining cash flows over the contractual term of the financial assets.
During the first quarter of 2023, the Corporation adopted ASU 2016-13, including the CECL methodology for estimating the ACL. This standard was adopted using a modified retrospective approach on January 1, 2023, resulting in a $484,000 increase to the ACL and a $1.3 million increase to the unfunded credit commitments reserve. A cumulative effect adjustment resulting in an $1.4 million decrease to retained earnings and a $465,000 increase to deferred tax assets was also recorded as of the adoption of ASU 2016-13.
Quantitative Considerations
The ACL is primarily calculated utilizing a discounted cash flow (“DCF”) model. Key inputs and assumptions used in this model are discussed below:
•Forecast model - For each portfolio segment, a loss driver analysis (“LDA”) was performed in order to identify appropriate loss drivers and create a regression model for use in forecasting cash flows. The LDA analysis utilized peer FFIEC Call Report data for all pools. The Corporation plans to update the LDA annually.
•Probability of default – PD is the probability that an asset will be in default within a given time frame. The Corporation has defined default as when a charge-off has occurred, a loan goes to non-accrual status, or a loan is greater than 90 days past due. The forecast model is utilized to estimate PDs.
•Loss given default – LGD is the percentage of the asset not expected to be collected due to default. The LGD is derived from using a method referred to as Frye Jacobs which uses industry data.
•Prepayments and curtailments – Prepayments and curtailments are calculated based on the Corporation’s own data. This analysis is updated annually.
•Forecast and reversion – the Corporation has established a one-year reasonable and supportable forecast period with a one-year straight line reversion to the long-term historical average.
•Economic forecast – the Corporation utilizes a third party to provide economic forecasts under various scenarios, which are assessed against economic indicators and management’s observations in the market. As of December 31, 2023, the Corporation selected a forecast which forecasts unemployment between 3.89% and 4.04% and GDP growth change between 1.29% and 2.32% over the next four quarters. Following the forecast period, the model reverts to long-term averages over four quarters. Management believes that the resulting quantitative reserve appropriately balances economic indicators with identified risks.
Qualitative Considerations
In addition to the quantitative model, management considers the need for qualitative adjustment for risks not considered in the DCF. Factors that are considered by management in determining loan collectability and the appropriate level of the ACL are listed below:
•The Corporation’s lending policies and procedures, including changes in lending strategies, underwriting standards and practices for collections, write-offs, and recoveries;
•Actual and expected changes in international, national, regional, and local economic and business conditions and developments in which the Corporation operates that affect the collectability of financial assets;
•The experience, ability, and depth of the Corporation’s lending, investment, collection, and other relevant management and staff;
•The volume of past due financial assets, the volume of non-performing assets, and the volume and severity of adversely classified or graded assets;
•The existence and effect of industry concentrations of credit;
•The nature and volume of the portfolio segment or class;
•The quality of the Corporation’s credit review function;
•The effect of other external factors such as the regulatory, legal and technological environments, competition, and events such as natural disasters or pandemics.
ACL Activity
A summary of the activity in the allowance for credit losses by portfolio segment is as follows:
|
|
|
|
|
|
|
|
|
|
|
|
|
|
|
|
|
|
|
|
|
|
|
|
|
|
|
|
|
|
|
|
|
|
|
|
|
|
|
|
|
|
|
|
|
|
|
|
|
|
|
| |
|
As of and for the Year Ended December 31, 2023 |
|
|
Owner Occupied |
|
Non-Owner Occupied |
|
Construction |
|
Multi-Family |
|
1-4 Family |
|
Commercial
and
Industrial |
|
Consumer
and Other |
|
Total |
| |
|
(In Thousands) |
| Beginning balance |
|
$ |
1,766 |
|
|
$ |
5,108 |
|
|
$ |
1,646 |
|
|
$ |
2,634 |
|
|
$ |
207 |
|
|
$ |
12,403 |
|
|
$ |
466 |
|
|
$ |
24,230 |
|
| Impact of adopting ASC 326 |
|
(204) |
|
|
(242) |
|
|
796 |
|
|
(386) |
|
|
(45) |
|
|
1,873 |
|
|
26 |
|
|
1,818 |
|
| Charge-offs |
|
— |
|
|
— |
|
|
— |
|
|
— |
|
|
— |
|
|
(1,781) |
|
|
— |
|
|
(1,781) |
|
| Recoveries |
|
9 |
|
|
1 |
|
|
— |
|
|
— |
|
|
40 |
|
|
478 |
|
|
20 |
|
|
548 |
|
| Net recoveries (charge-offs) |
|
9 |
|
|
1 |
|
|
— |
|
|
— |
|
|
40 |
|
|
(1,303) |
|
|
20 |
|
|
(1,233) |
|
| Provision for credit losses |
|
(31) |
|
|
769 |
|
|
(317) |
|
|
1,323 |
|
|
64 |
|
|
6,435 |
|
|
(61) |
|
|
8,182 |
|
| Ending balance |
|
$ |
1,540 |
|
|
$ |
5,636 |
|
|
$ |
2,125 |
|
|
$ |
3,571 |
|
|
$ |
266 |
|
|
$ |
19,408 |
|
|
$ |
451 |
|
|
$ |
32,997 |
|
| Components: |
|
|
|
|
|
|
|
|
|
|
|
|
|
|
|
|
| Allowance for loan losses |
|
1,525 |
|
|
5,596 |
|
|
1,244 |
|
|
3,562 |
|
|
243 |
|
|
18,710 |
|
|
395 |
|
|
31,275 |
|
| Allowance for unfunded credit commitments |
|
15 |
|
|
40 |
|
|
881 |
|
|
9 |
|
|
23 |
|
|
698 |
|
|
56 |
|
|
1,722 |
|
| Total ACL |
|
$ |
1,540 |
|
|
$ |
5,636 |
|
|
$ |
2,125 |
|
|
$ |
3,571 |
|
|
$ |
266 |
|
|
$ |
19,408 |
|
|
$ |
451 |
|
|
$ |
32,997 |
|
|
|
|
|
|
|
|
|
|
|
|
|
|
|
|
|
|
|
|
|
|
|
|
|
|
|
|
| |
|
As of and for the Year Ended December 31, 2022 |
|
|
Commercial
Real Estate |
|
Commercial
and
Industrial |
|
Consumer
and Other |
|
Total |
| |
|
(In Thousands) |
| Beginning balance |
|
$ |
15,110 |
|
|
$ |
8,413 |
|
|
$ |
813 |
|
|
$ |
24,336 |
|
| Charge-offs |
|
— |
|
|
(958) |
|
|
(21) |
|
|
(979) |
|
| Recoveries |
|
4,262 |
|
|
437 |
|
|
42 |
|
|
4,741 |
|
| Net recoveries (charge-offs) |
|
4,262 |
|
|
(521) |
|
|
21 |
|
|
3,762 |
|
| Provision for credit losses |
|
(6,812) |
|
|
3,236 |
|
|
(292) |
|
|
(3,868) |
|
|
|
|
|
|
|
|
|
|
| Ending balance |
|
$ |
12,560 |
|
|
$ |
11,128 |
|
|
$ |
542 |
|
|
$ |
24,230 |
|
|
|
|
|
|
|
|
|
|
|
|
|
|
|
|
|
|
|
|
|
|
|
|
|
|
|
|
| |
|
As of and for the Year Ended December 31, 2021 |
|
|
Commercial
Real Estate |
|
Commercial
and
Industrial |
|
Consumer
and Other |
|
Total |
| |
|
(In Thousands) |
| Beginning balance |
|
$ |
17,157 |
|
|
$ |
10,593 |
|
|
$ |
771 |
|
|
$ |
28,521 |
|
| Charge-offs |
|
(256) |
|
|
(3,227) |
|
|
(25) |
|
|
(3,508) |
|
| Recoveries |
|
3,935 |
|
|
1,168 |
|
|
23 |
|
|
5,126 |
|
| Net recoveries (charge-offs) |
|
3,679 |
|
|
(2,059) |
|
|
(2) |
|
|
1,618 |
|
| Provision for credit losses |
|
(5,726) |
|
|
(121) |
|
|
44 |
|
|
(5,803) |
|
|
|
|
|
|
|
|
|
|
| Ending balance |
|
$ |
15,110 |
|
|
$ |
8,413 |
|
|
$ |
813 |
|
|
$ |
24,336 |
|
ACL Summary
Loans collectively evaluated for credit losses in the following tables include all performing loans at December 31, 2023 and 2022. Loans individually evaluated for credit losses include all non-performing loans.
The following tables provide information regarding the allowance for credit losses and balances by type of allowance methodology:
|
|
|
|
|
|
|
|
|
|
|
|
|
|
|
|
|
|
|
|
|
|
|
|
|
|
|
|
|
|
|
|
|
|
|
|
|
|
|
|
|
|
|
|
|
|
|
|
|
|
|
| |
|
December 31, 2023 |
|
|
Owner Occupied |
|
Non-Owner Occupied |
|
Construction |
|
Multi-Family |
|
1-4 Family |
|
Commercial
and
Industrial |
|
Consumer
and Other |
|
Total |
| |
|
(In Thousands) |
| Allowance for credit losses: |
|
|
|
|
|
|
|
|
|
|
|
|
|
|
|
|
| Collectively evaluated for credit losses |
|
$ |
1,525 |
|
|
$ |
5,596 |
|
|
$ |
1,244 |
|
|
$ |
3,562 |
|
|
$ |
221 |
|
|
$ |
12,743 |
|
|
$ |
395 |
|
|
$ |
25,286 |
|
| Individually evaluated for credit loss |
|
— |
|
|
— |
|
|
— |
|
|
— |
|
|
22 |
|
|
5,967 |
|
|
— |
|
|
5,989 |
|
| Total |
|
$ |
1,525 |
|
|
$ |
5,596 |
|
|
$ |
1,244 |
|
|
$ |
3,562 |
|
|
$ |
243 |
|
|
$ |
18,710 |
|
|
$ |
395 |
|
|
$ |
31,275 |
|
| Loans and lease receivables: |
|
|
|
|
|
|
|
|
|
|
|
|
|
|
|
|
| Collectively evaluated for credit losses |
|
$ |
256,479 |
|
|
$ |
773,494 |
|
|
$ |
193,080 |
|
|
$ |
450,529 |
|
|
$ |
26,267 |
|
|
$ |
1,085,260 |
|
|
$ |
44,312 |
|
|
$ |
2,829,421 |
|
| Individually evaluated for credit loss |
|
— |
|
|
— |
|
|
— |
|
|
— |
|
|
22 |
|
|
20,575 |
|
|
— |
|
|
20,597 |
|
| Total |
|
$ |
256,479 |
|
|
$ |
773,494 |
|
|
$ |
193,080 |
|
|
$ |
450,529 |
|
|
$ |
26,289 |
|
|
$ |
1,105,835 |
|
|
$ |
44,312 |
|
|
$ |
2,850,018 |
|
|
|
|
|
|
|
|
|
|
|
|
|
|
|
|
|
|
|
|
|
|
|
|
|
|
|
|
| |
|
December 31, 2022 |
|
|
Commercial
Real Estate |
|
Commercial
and
Industrial |
|
Consumer
and Other |
|
Total |
| |
|
(In Thousands) |
| Allowance for credit losses: |
|
|
|
|
|
|
|
|
| Collectively evaluated for credit losses |
|
$ |
12,560 |
|
|
$ |
9,478 |
|
|
$ |
542 |
|
|
$ |
22,580 |
|
| Individually evaluated for credit loss |
|
— |
|
|
1,650 |
|
|
— |
|
|
1,650 |
|
|
|
|
|
|
|
|
|
|
| Total |
|
$ |
12,560 |
|
|
$ |
11,128 |
|
|
$ |
542 |
|
|
$ |
24,230 |
|
| Loans and lease receivables: |
|
|
|
|
|
|
|
|
| Collectively evaluated for credit losses |
|
$ |
1,541,920 |
|
|
$ |
849,542 |
|
|
$ |
47,938 |
|
|
$ |
2,439,400 |
|
| Individually evaluated for credit loss |
|
30 |
|
|
3,785 |
|
|
— |
|
|
3,815 |
|
|
|
|
|
|
|
|
|
|
| Total |
|
$ |
1,541,950 |
|
|
$ |
853,327 |
|
|
$ |
47,938 |
|
|
$ |
2,443,215 |
|
Note 5 – Premises and Equipment
A summary of premises and equipment was as follows:
|
|
|
|
|
|
|
|
|
|
|
|
|
|
|
| |
|
As of December 31, |
| |
|
2023 |
|
2022 |
| |
|
(In Thousands) |
|
|
|
|
|
| Leasehold improvements |
|
$ |
5,557 |
|
|
$ |
4,525 |
|
| Furniture and equipment |
|
9,361 |
|
|
8,250 |
|
| Total premises and equipment |
|
14,918 |
|
|
12,775 |
|
| Less: accumulated depreciation |
|
(8,728) |
|
|
(8,435) |
|
| Total premises and equipment, net |
|
$ |
6,190 |
|
|
$ |
4,340 |
|
Depreciation expense was $961,000, $578,000, and $585,000 for the years ended December 31, 2023, 2022, and 2021, respectively. During 2023, the Corporation relocated its Kansas City metropolitan office. This resulted in additional leasehold improvements and equipment of $1.3 million and $606,000, respectively.
Note 6 – Leases
The Corporation leases various office spaces and specialized lending production offices under non-cancellable operating leases which expire on various dates through 2033. The Corporation also leases office equipment. The Corporation recognizes a right-of-use asset and an operating lease liability for all leases, with the exception of short-term leases. Right-of-use assets represent the right to use an underlying asset for the lease term and lease liabilities are recognized at the lease commencement date based on the estimated present value of lease payments over the lease term. Lease expense for operating leases and short-term leases is recognized on a straight-line basis over the lease term.
In June 2023, the Corporation relocated its Kansas City metropolitan area office. This resulted in a $2.6 million right-of-use asset and $3.7 million lease liability, which was recorded in October 2022. The Corporation received a $1.1 million tenant improvement allowance related to this lease, which was recognized as a lease incentive and deducted from the right-of-use asset.
The components of total lease expense were as follows:
|
|
|
|
|
|
|
|
|
|
|
|
|
|
|
|
|
|
|
|
|
|
|
For the Year Ended December 31, |
|
|
2023 |
|
2022 |
|
2021 |
|
|
(In Thousands) |
Operating lease cost |
|
$ |
1,411 |
|
|
$ |
1,544 |
|
|
$ |
1,513 |
|
Short-term lease cost |
|
200 |
|
|
148 |
|
|
158 |
|
Variable lease cost |
|
576 |
|
|
604 |
|
|
492 |
|
Less: sublease income |
|
(75) |
|
|
(179) |
|
|
(170) |
|
Total lease cost, net |
|
$ |
2,112 |
|
|
$ |
2,117 |
|
|
$ |
1,993 |
|
Quantitative information regarding the Corporation’s operating leases was as follows:
|
|
|
|
|
|
|
|
|
|
|
|
|
|
|
|
|
|
|
|
|
|
|
December 31, 2023 |
|
December 31, 2022 |
|
December 31, 2021 |
Weighted-average remaining lease term (in years) |
|
7.70 |
|
8.06 |
|
5.05 |
Weighted-average discount rate |
|
3.61 |
% |
|
3.40 |
% |
|
2.51 |
% |
The following maturity analysis shows the undiscounted cash flows due on the Corporation’s operating lease liabilities:
|
|
|
|
|
|
| (In Thousands) |
|
| 2024 |
$ |
1,514 |
|
| 2025 |
1,408 |
|
| 2026 |
1,400 |
|
| 2027 |
1,427 |
|
| 2028 |
1,113 |
|
| Thereafter |
3,600 |
|
| Total undiscounted cash flows |
10,462 |
|
| Discount on cash flows |
(1,508) |
|
| Total lease liability |
$ |
8,954 |
|
Note 7 – Goodwill and Other Intangible Assets
Goodwill
Goodwill is not amortized, but is subject to impairment tests on an annual basis and more frequently if an event occurs or circumstances change that would more likely than not reduce the fair value of a reporting unit below its carrying amount (including goodwill).
At December 31, 2023 and 2022, the Corporation had goodwill of $10.7 million, which was related to the acquisition of Alterra Bank in 2014.
The Corporation conducted its annual impairment test on July 1, 2023, utilizing a qualitative assessment, and concluded that it was more likely than not the estimated fair value of the reporting unit exceeded its carrying value, resulting in no impairment.
Other Intangible Assets
The Corporation has intangible assets that are amortized consisting of loan servicing rights.
Loan servicing rights are recognized upon sale of the guaranteed portions of SBA loans with servicing rights retained. When SBA loans are sold, servicing rights are initially recorded at fair value with the income statement effect recorded in gains on sales of loans. Loan servicing assets are subsequently measured using the amortization method, which requires servicing rights to be amortized into interest income in proportion to, and over the period of, the estimated future net servicing income of the underlying loans. For the years ended December 31, 2023, 2022, and 2021, loan servicing asset amortization totaled $500,000, $634,000, and $412,000, respectively.
The estimated fair value of the Corporation’s loan servicing asset was $1.4 million and $1.5 million as of December 31, 2023 and 2022, respectively. The Corporation periodically reviews this portfolio for impairment and engages a third-party valuation firm to assess the fair value of the overall servicing rights portfolio. During the years ended December 31, 2023 and 2022, the Corporation recognized $73,000 and $1,000 of impairment expense, respectively. During the year ended December 31, 2021, the Corporation recognized an impairment recovery of $63,000.
Note 8 – Other Assets
The Corporation is a limited partner in several limited partnership investments. The Corporation is not the general partner, does not have controlling ownership, and is not the primary beneficiary in any of these limited partnerships and the limited partnerships have not been consolidated. These investments are accounted for using the equity and proportional amortization method of accounting and are evaluated for impairment at the end of each reporting period.
Historic Rehabilitation Tax Credits
The Corporation invests in development entities through Mitchell Street and FBB Tax Credit, wholly-owned subsidiaries of FBB, to rehabilitate historic buildings. At December 31, 2023 and 2022, the net carrying value of the investments was $2.4 million and $2.2 million, respectively. During 2023, the Corporation invested $285,000 in these partnerships. During 2022 and 2021, the Corporation had no activity related to these investments.
Low-Income Housing Tax Credits
The Corporation invests in development entities through FBB Tax Credit, a wholly-owned subsidiary of FBB, to develop buildings that offer low-income housing. These investments are accounted for using the proportional amortization method of accounting. At December 31, 2023 and 2022, the net carrying value of the investments were $33.3 million and $13.5 million, respectively. During 2023, 2022, and 2021, the Corporation invested $24.0 million, $11.5 million, and $3.0 million in these partnerships, respectively. During 2023 and 2022, the Corporation recognized $5.3 million and $1.4 million in tax benefit, respectively, and $4.1 million and $1.0 million in amortization, respectively, related to these partnerships. Amortization is included in income tax expense in the accompanying Consolidated Statements of Income. During 2021, the Corporation did not recognize any tax benefit or amortization related to these partnerships.
Other Investments
The Corporation’s equity investment in mezzanine funds, consisting of Aldine Capital Fund II, LP, Aldine Capital Fund III, LP, and Aldine Capital Fund IV, LP, totaled $13.5 million and $12.8 million as of December 31, 2023 and 2022, respectively. As of December 31, 2023, the Corporation has $5.3 million remaining of the original $15.0 million commitment to these partnerships. The Corporation’s share of these partnerships’ income included in other non-interest income in the Consolidated Statements of Income for the years ended December 31, 2023, 2022, and 2021 was $4.8 million, $3.0 million, and $2.5 million, respectively. The Corporation’s share of these partnerships’ losses included in other non-interest expense in the Consolidated Statements of Income for the years ended December 31, 2023, 2022 and 2021 was $101,000, $0, and $24,000, respectively.
The Corporation’s equity investment in Dane Workforce Housing Fund LLC, a Wisconsin limited liability company focused on community development by providing affordable workforce housing units in Dane County, Wisconsin, totaled $916,000 and $653,000 as of December 31, 2023 and 2022, respectively. The Corporation had a $63,000 commitment remaining of the original $1.0 million as of December 31, 2023. The Corporation’s share of the investment fund’s income included in other non-interest income in the Consolidated Statements of Income for the years ended December 31, 2023, 2022, and 2021 was $13,000, $8,000, and $2,000, respectively. The Corporation’s share of this partnerships’ losses included in other non-interest expense in the Consolidated Statements of Income for the year ended December 31, 2021 was $19,000. There were no losses related to this investment during the years ended December 31, 2023 and 2022.
The Corporation’s equity investment in BankTech Ventures, LP, a venture capital fund, focused on the community banking industry through strategic investments in growth-stage startups that directly support community banking needs, totaled $569,000 and $154,000 as of December 31, 2023 and 2022, respectively. The Corporation had a $530,000 commitment remaining of the original $1.0 million as of December 31, 2023. The Corporation’s share of the investment fund’s income included in other non-interest income in the Consolidated Statements of Income for the year ended December 31, 2023 was $211,000. There was no income related to this investment during the years ended December 31, 2022 and 2021. The Corporation’s share of this partnerships’ losses included in other non-interest expense in the Consolidated Statements of Income for the years ended December 31, 2023 and 2022 was $2,000 and $21,000, respectively. There were no losses related to this investment during the year ended December 31, 2021.
A summary of accrued interest receivable and other assets was as follows:
|
|
|
|
|
|
|
|
|
|
|
|
|
|
|
| |
|
December 31, 2023 |
|
December 31, 2022 |
| |
|
(In Thousands) |
| Accrued interest receivable |
|
$ |
13,275 |
|
|
$ |
9,403 |
|
| Net deferred tax asset |
|
9,508 |
|
|
11,711 |
|
| Investment in historic development entities |
|
2,393 |
|
|
2,176 |
|
| Investment in low-income housing development entity |
|
33,303 |
|
|
13,514 |
|
|
|
|
|
|
| Investment in limited partnerships |
|
15,027 |
|
|
13,599 |
|
| Prepaid expenses |
|
4,269 |
|
|
3,821 |
|
| Other assets |
|
13,283 |
|
|
8,883 |
|
| Total accrued interest receivable and other assets |
|
$ |
91,058 |
|
|
$ |
63,107 |
|
Note 9 – Deposits
The composition of deposits is shown below.
|
|
|
|
|
|
|
|
|
|
|
|
|
|
|
|
|
|
|
|
|
|
|
|
|
|
|
|
|
|
|
|
|
|
|
|
|
|
|
| |
|
December 31, 2023 |
|
December 31, 2022 |
|
|
Balance |
|
Average Balance |
|
Average Rate |
|
Balance |
|
Average Balance |
|
Average Rate |
| |
|
(Dollars in Thousands) |
Non-interest-bearing transaction accounts |
|
$ |
445,376 |
|
|
$ |
453,930 |
|
|
— |
% |
|
$ |
537,107 |
|
|
$ |
566,230 |
|
|
— |
% |
Interest-bearing transaction accounts |
|
895,319 |
|
|
689,500 |
|
|
3.44 |
|
|
576,601 |
|
|
503,668 |
|
|
0.79 |
|
| Money market accounts |
|
711,245 |
|
|
681,336 |
|
|
3.25 |
|
|
698,505 |
|
|
761,469 |
|
|
0.82 |
|
| Certificates of deposit |
|
287,131 |
|
|
273,387 |
|
|
4.10 |
|
|
153,757 |
|
|
97,448 |
|
|
1.39 |
|
| Wholesale deposits |
|
457,708 |
|
|
346,285 |
|
|
4.14 |
|
|
202,236 |
|
|
48,825 |
|
|
3.31 |
|
| Total deposits |
|
$ |
2,796,779 |
|
|
$ |
2,444,438 |
|
|
2.92 |
|
|
$ |
2,168,206 |
|
|
$ |
1,977,640 |
|
|
0.67 |
|
A summary of annual maturities of in-market and wholesale certificates of deposit at December 31, 2023 is as follows:
|
|
|
|
|
|
|
|
|
| (In Thousands) |
|
|
| Maturities during the year ended December 31, |
|
|
| 2024 |
|
$ |
536,645 |
|
| 2025 |
|
19,081 |
|
| 2026 |
|
50,416 |
|
| 2027 |
|
73,804 |
|
| 2028 |
|
12,821 |
|
| Thereafter |
|
2,072 |
|
|
|
$ |
694,839 |
|
Wholesale deposits include $407.7 million and $50.0 million of wholesale certificates of deposit and non-reciprocal interest-bearing transaction accounts, respectively, at December 31, 2023, compared to $187.2 million and $15.0 million of wholesale certificates of deposit and non-reciprocal interest-bearing transaction accounts at December 31, 2022. The Corporation has entered into derivative contracts hedging a portion of the certificates of deposit included in the 2024 maturities above. As of December 31, 2023, the notional amount of derivatives designated as cash flow hedges totaled $306.3 million with a weighted average remaining maturity of 3.9 years and a weighted average rate of 3.95%.
Certificates of deposit and wholesale deposits denominated in amounts greater than $250,000 were $120.2 million and $81.6 million at December 31, 2023 and 2022, respectively.
Note 10 – FHLB Advances, Other Borrowings and Subordinated Notes and Debentures
The composition of borrowed funds is shown below.
|
|
|
|
|
|
|
|
|
|
|
|
|
|
|
|
|
|
|
|
|
|
|
|
|
|
|
|
|
|
|
|
|
|
|
|
|
|
|
| |
|
December 31, 2023 |
|
December 31, 2022 |
|
|
Balance |
|
Weighted
Average
Balance |
|
Weighted
Average
Rate |
|
Balance |
|
Weighted
Average
Balance |
|
Weighted
Average
Rate |
| |
|
(Dollars in Thousands) |
| Federal funds purchased |
|
$ |
— |
|
|
$ |
3 |
|
|
5.37 |
% |
|
$ |
— |
|
|
$ |
14 |
|
|
7.42 |
% |
|
|
|
|
|
|
|
|
|
|
|
|
|
FHLB advances |
|
281,500 |
|
|
351,990 |
|
|
2.52 |
|
|
416,380 |
|
|
414,191 |
|
|
1.70 |
|
Line of credit |
|
— |
|
|
38 |
|
|
7.26 |
|
|
— |
|
|
85 |
|
|
2.78 |
|
| Other borrowings |
|
20 |
|
|
600 |
|
|
8.33 |
|
|
6,088 |
|
|
8,624 |
|
|
5.23 |
|
|
|
|
|
|
|
|
|
|
|
|
|
|
| Subordinated notes and debentures |
|
49,396 |
|
|
38,250 |
|
|
5.16 |
|
|
34,340 |
|
|
35,095 |
|
|
5.06 |
|
Junior subordinated notes(1) |
|
— |
|
|
— |
|
|
— |
|
|
— |
|
|
2,429 |
|
|
20.75 |
|
| |
|
$ |
330,916 |
|
|
$ |
390,881 |
|
|
2.79 |
|
|
$ |
456,808 |
|
|
$ |
460,438 |
|
|
2.12 |
|
(1) Weighted average rate of junior subordinated notes and debentures reflects the accelerated amortization of subordinated debt issuance costs as a result of the early redemption of the junior subordinated notes during the first quarter of 2022.
A summary of annual maturities of borrowings at December 31, 2023 is as follows:
|
|
|
|
|
|
|
|
|
| (In Thousands) |
|
|
| Maturities during the year ended December 31, |
|
|
| 2024 |
|
$ |
120,520 |
|
| 2025 |
|
48,000 |
|
| 2026 |
|
65,000 |
|
| 2027 |
|
28,000 |
|
| 2028 |
|
— |
|
| Thereafter |
|
69,396 |
|
|
|
$ |
330,916 |
|
The Corporation has a $649.0 million FHLB line of credit available for advances which is collateralized as noted below. At December 31, 2023, $367.5 million of this line remained unused. There were $281.5 million of term FHLB advances outstanding at December 31, 2023 with stated fixed interest rates ranging from 0.50% to 5.58% compared to $416.4 million of term FHLB advances outstanding at December 31, 2022 with stated fixed interest rates ranging from 0.31% to 4.69%. The term FHLB advances outstanding at December 31, 2023 are due at various dates through May 2030.
The Corporation is required to maintain as collateral mortgage-related securities, unencumbered first mortgage loans and secured small business loans in its portfolio aggregating at least the amount of outstanding advances from the FHLB. Loans totaling approximately $1.172 billion and $1.059 billion were pledged as collateral at December 31, 2023 and 2022, respectively.
The Corporation has a senior line of credit with a third-party financial institution of $10.5 million. As of December 31, 2023, the line of credit carried an interest rate of SOFR + 2.36% that matured on February 19, 2024 and had certain performance debt covenants of which the Corporation was in compliance. The Corporation pays a commitment fee on this senior line of credit. For the years ended December 31, 2023, 2022, and 2021 the Corporation incurred $13,000 additional interest expense due to this fee. There was no outstanding balance on the line of credit as of December 31, 2023. On February 20, 2024, the credit line was renewed for one additional year with pricing terms of 1-month term SOFR + 2.36% and a maturity date of February 19, 2025.
The Corporation issued new subordinated debentures as of September 29, 2023. The aggregate principal amount of the newly issued subordinated debentures was $15.0 million which qualified as Tier 2 capital. The subordinated debentures bear a fixed interest rate of 8.0% with a maturity date of September 29, 2033. The Corporation may, at its option, redeem the debentures, in whole or part, at any time after the fifth anniversary of issuance. As of December 31, 2023, $573,000 of debt issuance costs remain in the subordinated note and debenture payable balance, of which $48,000 was related to the recently issued subordinated debentures.
As of December 31, 2023, the Corporation had other borrowings of $20,000, which consisted of sold tax credit investments accounted for as secured borrowings because they did not qualify for true sale accounting. As of December 31, 2022, the Corporation had other borrowings of $6.1 million, which consisted of sold loans accounted for as secured borrowings because they did not qualify for true sale accounting.
The Corporation has entered into derivative contracts hedging a portion of the borrowings included in the 2024 maturities above. As of December 31, 2023, the notional amount of derivatives designated as cash flow hedges totaled $96.4 million with a weighted average remaining maturity of 2.5 years and a weighted average rate of 1.78%.
Note 11 – Preferred Stock
On March 4, 2022, the Corporation issued 12,500 shares, or $12.5 million in aggregate liquidation preference, of 7.0% Fixed-to-Floating Rate Non-Cumulative Perpetual Preferred Stock, Series A, par value $0.01 per share, with a liquidation preference of $1,000 per share (the “Series A Preferred Stock”) in a private placement to institutional investors. The net proceeds received from the issuance of the Series A Preferred Stock were $12.0 million.
The Corporation expects to pay dividends on the Series A Preferred Stock when and if declared by the Board, at a fixed rate of 7.0% per annum, payable quarterly, in arrears, on March 15, June 15, September 15 and December 15 of each year up to, but excluding, March 15, 2027. For each dividend period from and including March 15, 2027, dividends will be paid at a floating rate of Three-Month Term SOFR plus a spread of 539 basis points per annum. During the years ended December 31, 2023 and 2022, the Board of Directors declared aggregate preferred stock dividends of $875,000 and $683,000, respectively. The Series A Preferred Stock is perpetual and has no stated maturity. The Corporation may redeem the Series A Preferred Stock at its option at a redemption price equal to $1,000 per share, plus any declared and unpaid dividends (without regard to any undeclared dividends), subject to regulatory approval, on or after March 15, 2027 or within 90 days following a regulatory capital treatment event, in accordance with the terms of the Series A Preferred Stock.
Note 12 – Regulatory Capital
The Corporation and the Bank are subject to various regulatory capital requirements administered by Federal and Wisconsin banking agencies. Failure to meet minimum capital requirements can result in certain mandatory, and possibly additional discretionary actions on the part of regulators, that if undertaken, could have a direct material effect on the Bank’s assets, liabilities, and certain off-balance sheet items as calculated under regulatory practices. The Corporation’s and the Bank’s capital amounts and classifications are also subject to qualitative judgments by the regulators about components, risk weightings, and other factors. The Corporation regularly reviews and updates, when appropriate, its Capital and Liquidity Action Plans, which is designed to help ensure appropriate capital adequacy, to plan for future capital needs, and to ensure that the Corporation serves as a source of financial strength to the Bank. The Corporation’s and the Bank’s Board and management teams adhere to the appropriate regulatory guidelines on decisions which affect their respective capital positions, including but not limited to, decisions relating to the payment of dividends and increasing indebtedness.
As a bank holding company, the Corporation’s ability to pay dividends is affected by the policies and enforcement powers of the Board of Governors of the Federal Reserve system (the “Federal Reserve”). Federal Reserve guidance urges financial institutions to strongly consider eliminating, deferring, or significantly reducing dividends if: (i) net income available to common shareholders for the past four quarters, net of dividends previously paid during that period, is not sufficient to fully fund the dividend; (ii) the prospective rate of earnings retention is not consistent with the bank holding company’s capital needs and overall current and prospective financial condition; or (iii) the bank holding company will not meet, or is in danger of not meeting, its minimum regulatory capital ratios. Management intends, when appropriate under regulatory guidelines, to consult with the FRB of Chicago and provide it with information on the Corporation’s then-current and prospective earnings and capital position in advance of declaring any cash dividends. As a Wisconsin corporation, the Corporation is subject to the limitations of the Wisconsin Business Corporation Law, which prohibit the Corporation from paying dividends if such payment would: (i) render the Corporation unable to pay its debts as they become due in the usual course of business, or (ii) result in the Corporation’s assets being less than the sum of its total liabilities plus the amount needed to satisfy the preferential rights upon dissolution of any shareholders with preferential rights superior to those shareholders receiving the dividend.
The Bank is also subject to certain legal, regulatory, and other restrictions on their ability to pay dividends to the Corporation. As a bank holding company, the payment of dividends by the Bank to the Corporation is one of the sources of funds the Corporation could use to pay dividends, if any, in the future and to make other payments. Future dividend decisions by the Bank and the Corporation will continue to be subject to compliance with various legal, regulatory, and other restrictions as defined from time to time.
Quantitative measures established by regulation to ensure capital adequacy require the Corporation and the Bank to maintain minimum amounts and ratios of Total Common Equity Tier 1 and Tier 1 capital to risk-weighted assets and of Tier 1 capital to adjusted total assets.
These risk-based capital requirements presently address credit risk related to both recorded and off-balance sheet commitments and obligations.
In July 2013, the FRB and the FDIC approved the final rules implementing the Basel Committee on Banking Supervision’s capital guidelines for U.S. banks. These rules are applicable to all financial institutions that are subject to minimum capital requirements, including federal and state banks and savings and loan associations, as well as bank and savings and loan holding companies other than “small bank holding companies” (generally non-publicly traded bank holding companies with consolidated assets of less than $1 billion). Under the final rules, minimum requirements increased for both the quantity and quality of capital held by the Corporation. The rules include a new Common Equity Tier 1 capital to risk-weighted assets minimum ratio of 4.5%, raise the minimum ratio of Tier 1 capital to risk-weighted assets from 4.0% to 6.0%, require a minimum ratio of Total Capital to risk-weighted assets of 8.0%, and require a minimum Tier 1 leverage ratio of 4.0%. The rules also permit banking organizations with less than $15 billion in assets to retain, through a one-time election, the past treatment for accumulated other comprehensive income, which did not affect regulatory capital. The Corporation elected to retain this treatment, which reduces the volatility of regulatory capital ratios. The Corporation also must comply with the 2.5% conservation buffer, which the Corporation met as of December 31, 2023.
As of December 31, 2023, the Corporation’s capital levels exceeded the regulatory minimums and the Bank’s capital levels remained characterized as well capitalized under the regulatory framework. The following tables summarize both the Corporation’s and the Bank’s capital ratios and the ratios required by their federal regulators:
|
|
|
|
|
|
|
|
|
|
|
|
|
|
|
|
|
|
|
|
|
|
|
|
|
|
|
|
|
|
|
|
|
|
|
|
|
|
|
|
|
|
|
|
|
|
|
|
|
|
|
|
|
As of December 31, 2023 |
| |
|
Actual(1) |
|
Minimum Required for Capital Adequacy Purposes |
|
For Capital Adequacy Purposes Plus Capital Conservation Buffer |
|
Minimum Required to Be Well Capitalized Under Prompt Corrective Action
Requirements |
| |
|
Amount |
|
Ratio |
|
Amount |
|
Ratio |
|
Amount |
|
Ratio |
|
Amount |
|
Ratio |
| |
|
(Dollars in Thousands) |
Total capital
(to risk-weighted assets) |
|
|
|
|
|
|
|
|
|
|
|
|
|
|
|
|
| Consolidated |
|
$ |
375,440 |
|
|
11.19 |
% |
|
$ |
268,500 |
|
|
8.00 |
% |
|
$ |
352,406 |
|
|
10.50 |
% |
|
N/A |
|
N/A |
| First Business Bank |
|
376,310 |
|
|
11.21 |
|
|
268,595 |
|
|
8.00 |
|
|
352,531 |
|
|
10.50 |
|
|
$ |
335,744 |
|
|
10.00 |
% |
Tier 1 capital
(to risk-weighted assets) |
|
|
|
|
|
|
|
|
|
|
|
|
|
|
|
|
| Consolidated |
|
$ |
293,338 |
|
|
8.74 |
% |
|
$ |
201,375 |
|
|
6.00 |
% |
|
$ |
285,281 |
|
|
8.50 |
% |
|
N/A |
|
N/A |
| First Business Bank |
|
343,604 |
|
|
10.23 |
|
|
201,446 |
|
|
6.00 |
|
|
285,382 |
|
|
8.50 |
|
|
$ |
268,595 |
|
|
8.00 |
% |
Common equity tier 1 capital
(to risk-weighted assets) |
|
|
|
|
|
|
|
|
|
|
|
|
|
|
|
|
| Consolidated |
|
$ |
281,346 |
|
|
8.38 |
% |
|
$ |
151,031 |
|
|
4.50 |
% |
|
$ |
234,937 |
|
|
7.00 |
% |
|
N/A |
|
N/A |
| First Business Bank |
|
343,604 |
|
|
10.23 |
|
|
151,085 |
|
|
4.50 |
|
|
235,021 |
|
|
7.00 |
|
|
$ |
218,233 |
|
|
6.50 |
% |
Tier 1 leverage capital
(to adjusted assets) |
|
|
|
|
|
|
|
|
|
|
|
|
|
|
|
|
| Consolidated |
|
$ |
293,338 |
|
|
8.43 |
% |
|
$ |
139,145 |
|
|
4.00 |
% |
|
$ |
139,145 |
|
|
4.00 |
% |
|
N/A |
|
N/A |
| First Business Bank |
|
343,604 |
|
|
9.87 |
|
|
139,262 |
|
|
4.00 |
|
|
139,262 |
|
|
4.00 |
|
|
$ |
174,077 |
|
|
5.00 |
% |
(1) 2023 capital amounts include $1.0 million of additional stockholders’ equity as elected by the Corporation and permitted by federal banking regulatory agencies. Risk-weighted assets were also adjusted accordingly.
|
|
|
|
|
|
|
|
|
|
|
|
|
|
|
|
|
|
|
|
|
|
|
|
|
|
|
|
|
|
|
|
|
|
|
|
|
|
|
|
|
|
|
|
|
|
|
|
|
|
|
|
|
As of December 31, 2022 |
| |
|
Actual |
|
Minimum Required for Capital Adequacy Purposes |
|
For Capital Adequacy Purposes Plus Capital Conservation Buffer |
|
Minimum Required to Be Well Capitalized Under Prompt Corrective Action
Requirements |
| |
|
Amount |
|
Ratio |
|
Amount |
|
Ratio |
|
Amount |
|
Ratio |
|
Amount |
|
Ratio |
| |
|
(Dollars in Thousands) |
Total capital
(to risk-weighted assets) |
|
|
|
|
|
|
|
|
|
|
|
|
|
|
|
|
| Consolidated |
|
$ |
323,893 |
|
|
11.26 |
% |
|
$ |
230,180 |
|
|
8.00 |
% |
|
$ |
302,111 |
|
|
10.50 |
% |
|
N/A |
|
N/A |
| First Business Bank |
|
323,021 |
|
|
11.22 |
|
|
230,367 |
|
|
8.00 |
|
|
302,357 |
|
|
10.50 |
|
|
$ |
287,959 |
|
|
10.00 |
% |
Tier 1 capital
(to risk-weighted assets) |
|
|
|
|
|
|
|
|
|
|
|
|
|
|
|
|
| Consolidated |
|
$ |
264,843 |
|
|
9.20 |
% |
|
$ |
172,635 |
|
|
6.00 |
% |
|
$ |
244,566 |
|
|
8.50 |
% |
|
N/A |
|
N/A |
| First Business Bank |
|
298,312 |
|
|
10.36 |
|
|
172,775 |
|
|
6.00 |
|
|
244,765 |
|
|
8.50 |
|
|
$ |
230,367 |
|
|
8.00 |
% |
Common equity tier 1 capital
(to risk-weighted assets) |
|
|
|
|
|
|
|
|
|
|
|
|
|
|
|
|
| Consolidated |
|
$ |
252,851 |
|
|
8.79 |
% |
|
$ |
129,476 |
|
|
4.50 |
% |
|
$ |
201,407 |
|
|
7.00 |
% |
|
N/A |
|
N/A |
| First Business Bank |
|
298,312 |
|
|
10.36 |
|
|
129,581 |
|
|
4.50 |
|
|
201,571 |
|
|
7.00 |
|
|
$ |
187,173 |
|
|
6.50 |
% |
Tier 1 leverage capital
(to adjusted assets) |
|
|
|
|
|
|
|
|
|
|
|
|
|
|
|
|
| Consolidated |
|
$ |
264,843 |
|
|
9.17 |
% |
|
$ |
115,464 |
|
|
4.00 |
% |
|
$ |
115,464 |
|
|
4.00 |
% |
|
N/A |
|
N/A |
| First Business Bank |
|
298,312 |
|
|
10.34 |
|
|
115,402 |
|
|
4.00 |
|
|
115,402 |
|
|
4.00 |
|
|
$ |
144,252 |
|
|
5.00 |
% |
The following table reconciles stockholders’ equity to federal regulatory capital at December 31, 2023 and 2022, respectively:
|
|
|
|
|
|
|
|
|
|
|
|
|
|
|
| |
|
As of December 31, |
| |
|
2023 |
|
2022 |
| |
|
(In Thousands) |
| Stockholders’ equity of the Corporation |
|
$ |
289,588 |
|
|
$ |
260,640 |
|
Net unrealized and accumulated losses on specific items |
|
13,717 |
|
|
15,310 |
|
| Disallowed servicing assets |
|
(614) |
|
|
(706) |
|
| Disallowed goodwill and other intangibles |
|
(10,368) |
|
|
(10,401) |
|
| ASC 326 Phase-in |
|
1,015 |
|
|
— |
|
| Tier 1 capital |
|
293,338 |
|
|
264,843 |
|
| Allowable general valuation allowances and subordinated debt |
|
82,102 |
|
|
59,050 |
|
| Total capital |
|
$ |
375,440 |
|
|
$ |
323,893 |
|
Note 13 – Earnings per Common Share
Earnings per common share are computed using the two-class method. Basic earnings per common share are computed by dividing net income allocated to common shares by the weighted average number of shares outstanding during the applicable period, excluding outstanding participating securities. Participating securities include unvested restricted shares. Unvested restricted shares are considered participating securities because holders of these securities receive non-forfeitable dividends, or dividend equivalents, at the same rate as holders of the Corporation’s common stock. Diluted earnings per share are computed by dividing net income allocated to common shares adjusted for reallocation of undistributed earnings of unvested restricted shares by the weighted average number of shares determined for the basic earnings per common share computation plus the dilutive effect of common stock equivalents using the treasury stock method.
|
|
|
|
|
|
|
|
|
|
|
|
|
|
|
|
|
|
|
|
|
|
|
For the Year Ended December 31, |
| |
|
2023 |
|
2022 |
|
2021 |
|
(Dollars in Thousands, Except Share Data) |
| Basic earnings per common share |
|
|
|
|
|
|
| Net income |
|
$ |
37,027 |
|
|
$ |
40,858 |
|
|
$ |
35,755 |
|
| Less: preferred stock dividends |
|
875 |
|
|
683 |
|
|
— |
|
| Less: earnings allocated to participating securities |
|
938 |
|
|
1,106 |
|
|
1,053 |
|
| Basic earnings allocated to common shareholders |
|
$ |
35,214 |
|
|
$ |
39,069 |
|
|
$ |
34,702 |
|
|
|
|
|
|
|
|
Weighted-average common shares outstanding, excluding participating securities |
|
8,131,251 |
|
|
8,226,943 |
|
|
8,314,921 |
|
|
|
|
|
|
|
|
| Basic earnings per common share |
|
$ |
4.33 |
|
|
$ |
4.75 |
|
|
$ |
4.17 |
|
|
|
|
|
|
|
|
| Diluted earnings per common share |
|
|
|
|
|
|
| Earnings allocated to common shareholders, diluted |
|
$ |
35,214 |
|
|
$ |
39,069 |
|
|
$ |
34,702 |
|
|
|
|
|
|
|
|
|
|
|
|
|
|
|
|
|
|
|
|
|
|
|
|
|
|
|
|
|
|
|
|
|
|
|
|
Weighted-average diluted common shares outstanding, excluding participating securities |
|
8,131,251 |
|
|
8,226,943 |
|
|
8,314,921 |
|
|
|
|
|
|
|
|
| Diluted earnings per common share |
|
$ |
4.33 |
|
|
$ |
4.75 |
|
|
$ |
4.17 |
|
Note 14 – Share-Based Compensation
The Corporation initially adopted the 2019 Equity Incentive Plan (the “Plan”) during the quarter ended June 30, 2019. The Plan is administered by the Compensation Committee of the Board of Directors (the “Board”) of the Corporation and provides for the grant of equity ownership opportunities through incentive stock options and nonqualified stock options, restricted stock, restricted stock units, dividend equivalent units, and any other type of award permitted by the Plan. As of December 31, 2023, 328,332 shares were available for future grants under the Plan, as amended. Shares covered by awards that expire, terminate, or lapse will again be available for the grant of awards under the Plan.
Restricted Stock
Under the Plan, the Corporation may grant restricted stock awards (“RSA”), restricted stock units (“RSU”), and other stock-based awards to plan participants, subject to forfeiture upon the occurrence of certain events until the dates specified in the participant’s award agreement. While restricted stock is subject to forfeiture, RSA participants may exercise full voting rights and will receive all dividends and other distributions paid with respect to the restricted shares. RSUs do not have voting rights. RSUs granted prior to 2023 are provided dividend equivalents concurrent with dividends paid to shareholders while RSUs granted in 2023 and after will accrue dividend equivalents payable upon vesting. The restricted stock granted under the Plan is typically subject to a vesting period. Compensation expense for restricted stock is recognized over the requisite service period of generally three or four years for the entire award on a straight-line basis. Upon vesting of restricted stock, the benefit of tax deductions in excess of recognized compensation expense is reflected as an income tax benefit in the Consolidated Statements of Income.
The Corporation may also issue performance-based restricted stock units (“PRSU”). Vesting of the PRSU will be measured on the relative Total Shareholder Return (“TSR”) and relative Return on Average Equity (“ROAE”) for issuances prior to 2023 or Return on Average Common Equity (“ROACE”) for issuances after 2022, and will cliff-vest after a three-year measurement period based on the Corporation’s TSR performance and ROAE or ROACE performance compared to a broad peer group of over 100 banks. At the end of the performance period, the number of actual shares to be awarded varies between 0% and 200% of target amounts. The restricted stock awards and units issued to executive officers will vest ratably over a three-year period. Compensation expense is recognized for PRSU over the requisite service and performance period of generally three years for the entire expected award on a straight-line basis. The compensation expense for the awards expected to vest for the percentage of performance-based restricted stock units subject to the ROAE or ROACE metric will be adjusted if there is a change in the expectation of ROAE or ROACE. The compensation expense for the awards expected to vest for the percentage of PRSU subject to the TSR metric are never adjusted and are amortized utilizing the accounting fair value provided using a Monte Carlo pricing model.
Restricted stock activity for the year ended December 31, 2023, 2022, and 2021 was as follows:
|
|
|
|
|
|
|
|
|
|
|
|
|
|
|
|
|
|
|
|
|
|
|
|
|
|
|
|
|
|
|
|
|
|
|
|
|
|
|
|
|
|
|
|
|
|
|
|
|
|
|
|
|
RSA |
|
Weighted Average Grant Price |
|
PRSU |
|
Weighted Average Grant Price |
|
RSU |
|
Weighted Average Grant Price |
|
Total |
|
Weighted Average Grant Price |
| Nonvested balance as of January 1, 2021 |
|
143,246 |
|
|
$ |
23.04 |
|
|
39,570 |
|
|
$ |
28.85 |
|
|
4,988 |
|
|
$ |
24.08 |
|
|
187,804 |
|
|
$ |
24.29 |
|
Granted (1) |
|
67,515 |
|
|
22.39 |
|
|
23,550 |
|
|
27.12 |
|
|
2,065 |
|
|
21.68 |
|
|
93,130 |
|
|
23.57 |
|
| Vested |
|
(61,384) |
|
|
22.26 |
|
|
— |
|
|
— |
|
|
(2,001) |
|
|
22.91 |
|
|
(63,385) |
|
|
22.28 |
|
| Forfeited |
|
(7,760) |
|
|
23.24 |
|
|
— |
|
|
— |
|
|
— |
|
|
— |
|
|
(7,760) |
|
|
23.24 |
|
| Nonvested balance as of December 31, 2021 |
|
141,617 |
|
|
23.06 |
|
|
63,120 |
|
|
28.20 |
|
|
5,052 |
|
|
23.56 |
|
|
209,789 |
|
|
24.62 |
|
Granted (1) |
|
62,560 |
|
|
34.04 |
|
|
37,335 |
|
|
24.71 |
|
|
3,115 |
|
|
27.95 |
|
|
103,010 |
|
|
30.47 |
|
| Vested |
|
(62,353) |
|
|
23.21 |
|
|
(43,020) |
|
|
18.91 |
|
|
(2,062) |
|
|
23.20 |
|
|
(107,435) |
|
|
21.49 |
|
| Forfeited |
|
(8,507) |
|
|
26.15 |
|
|
— |
|
|
— |
|
|
— |
|
|
— |
|
|
(8,507) |
|
|
26.15 |
|
| Nonvested balance as of December 31, 2022 |
|
133,317 |
|
|
27.95 |
|
|
57,435 |
|
|
32.89 |
|
|
6,105 |
|
|
25.92 |
|
|
196,857 |
|
|
29.32 |
|
Granted (1) |
|
— |
|
|
— |
|
|
34,840 |
|
|
35.79 |
|
|
54,955 |
|
|
34.43 |
|
|
89,795 |
|
|
34.96 |
|
| Vested |
|
(56,931) |
|
|
27.03 |
|
|
(36,120) |
|
|
31.31 |
|
|
(3,253) |
|
|
26.06 |
|
|
(96,304) |
|
|
28.60 |
|
| Forfeited |
|
(4,435) |
|
|
30.20 |
|
|
— |
|
|
— |
|
|
(820) |
|
|
36.42 |
|
|
(5,255) |
|
|
31.17 |
|
| Nonvested balance as of December 31, 2023 |
|
71,951 |
|
|
$ |
28.53 |
|
|
56,155 |
|
|
$ |
35.70 |
|
|
56,987 |
|
|
$ |
33.97 |
|
|
185,093 |
|
|
$ |
32.38 |
|
| Unrecognized compensation cost (in thousands) |
|
$ |
1,229 |
|
|
|
|
$ |
879 |
|
|
|
|
$ |
1,393 |
|
|
|
|
$ |
3,501 |
|
|
|
| Weighted average remaining recognition period (in years) |
|
1.80 |
|
|
|
1.64 |
|
|
|
2.79 |
|
|
|
2.15 |
|
|
(1)The number of restricted shares/units shown includes the shares that would be granted if the target level of performance is achieved related to the PRSU. The number of shares actually issued may vary. During the year ended December 31, 2023, an additional 18,060 were issued related to actual performance results of previously granted awards.
Employee Stock Purchase Plan
The Corporation is authorized to issue up to 250,000 shares of common stock under the ESPP. The plan qualifies as an employee stock purchase plan under section 423 of the Internal Revenue Code of 1986. Under the ESPP, eligible employees may enroll in a three month offer period that begins January, April, July, and October of each year. Employees may elect to purchase a limited number of shares of the Corporation's common stock at 90% of the fair market value on the last day of the offering period. The ESPP is treated as a compensatory item for purposes of share-based compensation expense.
During the year ended December 31, 2023, the Corporation issued 4,328 shares of common stock under the ESPP. At December 31, 2023, 230,638 shares remained available for issuance under the ESPP.
Share-based compensation expense related to restricted stock and ESPP included in the Consolidated Statements of Income was as follows:
|
|
|
|
|
|
|
|
|
|
|
|
|
|
|
|
|
|
|
|
|
|
|
For the Year Ended December 31, |
|
|
2023 |
|
2022 |
|
2021 |
|
|
(In Thousands) |
| Share-based compensation expense |
|
$ |
2,977 |
|
|
$ |
2,584 |
|
|
$ |
2,513 |
|
Note 15 – Employee Benefit Plans
The Corporation maintains a contributory 401(k) defined contribution plan covering substantially all employees. The Corporation matches 100% of amounts contributed by each participating employee, up to 3% of the employee’s compensation. The Corporation may also make discretionary profit sharing contributions up to an additional 6% of salary. Contributions are expensed in the period incurred and recorded in compensation expense in the Consolidated Statements of Income. The Corporation made a matching contribution of 3% to all eligible employees which totaled $1.2 million, $1.1 million, and $987,000 for the years ended December 31, 2023, 2022, and 2021, respectively. Discretionary profit sharing contributions for substantially all employees of 5.9%, or $2.1 million, 5.2%, or $1.6 million, and 4.7%, or $1.3 million, were made in 2023, 2022, and 2021, respectively.
As of December 31, 2023, 2022, and 2021, the Corporation had a deferred compensation plan under which it provided contributions to supplement the retirement income of one executive. Under the terms of the plan, benefits to be received are generally payable within six months of the date of the termination of employment with the Corporation. The expense associated with the deferred compensation plan for the years ended December 31, 2023, 2022, and 2021 was $493,000, $382,000, and $237,000, respectively. The deferred compensation liability under the remaining plan of $2.8 million and $2.3 million at December 31, 2023 and 2022, respectively, is included in accrued interest payable and other liabilities on the Consolidated Balance Sheets.
The Corporation owned life insurance policies on the life of the executive covered by the deferred compensation plan, which had cash surrender values and death benefits of approximately $3.1 million and $6.2 million, respectively, at December 31, 2023 and cash surrender values and death benefits of approximately $2.9 million and $6.1 million, respectively, at December 31, 2022. The remaining balance of the cash surrender value of bank-owned life insurance of $52.4 million and $51.0 million as of December 31, 2023 and 2022, respectively, is related to policies on a number of then-qualified individuals affiliated with the Bank.
Note 16 – Income Taxes
Income tax expense consists of the following:
|
|
|
|
|
|
|
|
|
|
|
|
|
|
|
|
|
|
|
|
|
| |
|
For the Year Ended December 31, |
| |
|
2023 |
|
2022 |
|
2021 |
| |
|
(In Thousands) |
Current: |
|
|
|
|
|
|
| Federal |
|
$ |
7,759 |
|
|
$ |
9,174 |
|
|
$ |
6,965 |
|
| State |
|
233 |
|
|
2,987 |
|
|
3,087 |
|
| Current tax expense |
|
7,992 |
|
|
12,161 |
|
|
10,052 |
|
| Deferred: |
|
|
|
|
|
|
| Federal |
|
(716) |
|
|
(733) |
|
|
1,333 |
|
| State |
|
2,836 |
|
|
(42) |
|
|
(110) |
|
| Deferred tax expense (benefit) |
|
2,120 |
|
|
(775) |
|
|
1,223 |
|
| Total income tax expense |
|
$ |
10,112 |
|
|
$ |
11,386 |
|
|
$ |
11,275 |
|
Deferred income tax assets and liabilities reflect the net tax effects of temporary differences between the carrying amounts of assets and liabilities for financial reporting purposes and their tax basis. Deferred tax assets and liabilities are measured using enacted tax rates to apply to taxable income in the period in which the temporary differences are expected to be recovered or settled. Net deferred tax assets are included in accrued interest receivable and other assets in the Consolidated Balance Sheets.
The significant components of the Corporation’s deferred tax assets and liabilities were as follows:
|
|
|
|
|
|
|
|
|
|
|
|
|
|
|
| |
|
December 31, 2023 |
|
December 31, 2022 |
| |
|
(In Thousands) |
| Deferred tax assets: |
|
|
|
|
| Allowance for credit losses |
|
$ |
8,730 |
|
|
$ |
6,267 |
|
|
|
|
|
|
| Deferred compensation |
|
2,094 |
|
|
2,342 |
|
| State net operating loss carryforwards |
|
875 |
|
|
265 |
|
| Write-down of repossessed assets |
|
10 |
|
|
11 |
|
|
|
|
|
|
| Non-accrual loan interest |
|
95 |
|
|
47 |
|
| Capital loss carryforwards |
|
22 |
|
|
21 |
|
| Unrealized losses on securities |
|
4,715 |
|
|
5,263 |
|
| Share-based compensation |
|
788 |
|
|
725 |
|
| Other |
|
284 |
|
|
125 |
|
| Total deferred tax assets before valuation allowance |
|
17,613 |
|
|
15,066 |
|
| Valuation allowance |
|
(3,339) |
|
|
— |
|
| Total deferred tax assets |
|
14,274 |
|
|
15,066 |
|
| Deferred tax liabilities: |
|
|
|
|
| Leasing and fixed asset activities |
|
1,854 |
|
|
2,197 |
|
| Loan servicing asset |
|
381 |
|
|
393 |
|
|
|
|
|
|
| Other |
|
2,531 |
|
|
765 |
|
| Total deferred tax liabilities |
|
4,766 |
|
|
3,355 |
|
| Net deferred tax asset |
|
$ |
9,508 |
|
|
$ |
11,711 |
|
The tax effects of unrealized gains and losses on securities are components of other comprehensive income. A reconciliation of the change in net deferred tax assets to deferred tax expense is as follows:
|
|
|
|
|
|
|
|
|
|
|
|
|
|
|
|
|
|
|
|
|
| |
|
December 31, 2023 |
|
December 31, 2022 |
|
December 31, 2021 |
| |
|
(In Thousands) |
|
|
| Change in net deferred tax assets |
|
$ |
(2,203) |
|
|
$ |
5,536 |
|
|
$ |
(1,042) |
|
| Deferred taxes allocated to other comprehensive income |
|
548 |
|
|
(4,761) |
|
|
(181) |
|
Cumulative change in accounting principle |
|
(465) |
|
|
— |
|
|
— |
|
| Deferred income tax benefit (expense) |
|
$ |
(2,120) |
|
|
$ |
775 |
|
|
$ |
(1,223) |
|
Realization of the deferred tax asset over time is dependent upon the Corporation generating sufficient taxable earnings in future periods. In making the determination that the realization of the deferred tax was more likely than not, the Corporation considered several factors including its recent earnings history, its expected earnings in the future, appropriate tax planning strategies, and expiration dates associated with operating loss carryforwards.
On July 5, 2023, the Wisconsin legislature enacted 2023 Wisconsin Act 19 (the “Act”). The Act contains a provision that provides financial institutions with a state tax-exemption for interest, fees, and penalties earned on qualifying loans. For the exemption to apply, the loan must be $5 million or less, for primarily a business or agricultural purpose, and made to borrowers residing or located in Wisconsin. The exemption first applies to taxable years beginning after December 31, 2022 and applies to loans on the books as of January 1, 2023 and to new loans made after that meet the qualifications. The Corporation currently projects that its Wisconsin state taxable income will be significantly reduced and/or eliminated in the future as a result of this provision. The Corporation reversed $2.8 million in income tax expense which had been recorded during 2023 and recognized a date of enactment valuation allowance for Wisconsin deferred tax assets of $2.8 million, resulting in a one-time $2.8 million increase in tax expense.
Deferred tax assets are deferred tax consequences attributable to deductible temporary differences and carryforwards. After the deferred tax asset has been measured using the applicable enacted tax rate and provisions of the enacted tax law, it is then necessary to assess the need for a valuation allowance. A valuation allowance is needed when, based on the weight of the available evidence, it is more likely than not that some portion of the deferred asset will not be realized.
The realization of deferred tax assets is dependent on the existence of taxable income of the appropriate character (e.g., ordinary or capital) within the carry-back and carry-forward periods available under tax law, which would consider future reversals of existing taxable temporary differences and available tax planning strategies. As of December 31, 2023, the state deferred tax valuation allowance was $3.3 million, reducing our Wisconsin deferred tax assets to $0. The Corporation had state net operating loss carryforwards of approximately $16.4 million and $6.3 million at December 31, 2023 and 2022, respectively, which it does not expect to offset due to having no expected future state taxable income. The Corporation fully utilized its established deferred tax assets and Wisconsin state net operating losses and therefore no valuation allowance established as of December 31, 2022.
The provision for income taxes differs from that computed at the federal statutory corporate tax rate as follows:
|
|
|
|
|
|
|
|
|
|
|
|
|
|
|
|
|
|
|
|
|
| |
|
Year Ended December 31, |
| |
|
2023 |
|
2022 |
|
2021 |
| |
|
(Dollars in Thousands) |
| Income before income tax expense |
|
$ |
47,139 |
|
|
$ |
52,244 |
|
|
$ |
47,030 |
|
Tax expense at statutory federal rate of 21% applied to income before income tax expense |
|
$ |
9,899 |
|
|
$ |
10,971 |
|
|
$ |
9,876 |
|
| State income tax, net of federal effect |
|
(52) |
|
|
2,337 |
|
|
2,351 |
|
| Tax-exempt security and loan income, net of TEFRA adjustments |
|
(856) |
|
|
(704) |
|
|
(710) |
|
|
|
|
|
|
|
|
| Change in valuation allowance |
|
3,349 |
|
|
— |
|
|
— |
|
| Bank-owned life insurance |
|
(313) |
|
|
(468) |
|
|
(297) |
|
|
|
|
|
|
|
|
|
|
|
|
|
|
|
|
|
|
|
|
|
|
| Tax credits, net |
|
(1,045) |
|
|
(338) |
|
|
— |
|
|
|
|
|
|
|
|
| Share-based compensation |
|
(159) |
|
|
(392) |
|
|
— |
|
| Section 162(m) limitation |
|
123 |
|
|
118 |
|
|
— |
|
| Other |
|
(834) |
|
|
(138) |
|
|
55 |
|
| Total income tax expense |
|
$ |
10,112 |
|
|
$ |
11,386 |
|
|
$ |
11,275 |
|
| Effective tax rate |
|
21.45 |
% |
|
21.79 |
% |
|
23.97 |
% |
There were no uncertain tax positions outstanding as of December 31, 2023 and 2022. As of December 31, 2023, tax years remaining open for the State of Wisconsin tax were 2019 through 2022. Federal tax years that remained open were 2020 through 2022. As of December 31, 2023, there were also no unrecognized tax benefits that are expected to significantly increase or decrease within the next twelve months.
Note 17 – Derivative Financial Instruments
The Corporation offers interest rate swap products directly to qualified commercial borrowers. The Corporation economically hedges client derivative transactions by entering into offsetting interest rate swap contracts executed with a third party. Derivative transactions executed as part of this program are not considered hedging instruments and are marked-to-market through earnings each period. The derivative contracts have mirror-image terms, which results in the positions’ changes in fair value offsetting through earnings each period. The credit risk and risk of non-performance embedded in the fair value calculations is different between the dealer counterparties and the commercial borrowers which may result in a difference in the changes in the fair value of the mirror-image swaps. The Corporation incorporates credit valuation adjustments to appropriately reflect both its own non-performance risk and the counterparty’s risk in the fair value measurements. When evaluating the fair value of its derivative contracts for the effects of non-performance and credit risk, the Corporation considered the impact of netting and any applicable credit enhancements such as collateral postings, thresholds and guarantees. As of December 31, 2023 and 2022 the credit valuation allowance was $117,000 and $38,000, respectively.
The Corporation receives fixed rates and pays floating rates based upon designated benchmark interest rates used on the swaps with commercial borrowers. Commercial borrower swaps are completed independently with each borrower and are not subject to master netting arrangements. The Corporation pays fixed rates and receives floating rates based upon designated benchmark interest rates used on the swaps with dealer counterparties. Dealer counterparty swaps are subject to master netting agreements among the contracts within our Bank and are reported on the Consolidated Balance Sheet. The gross amount of dealer counterparty swaps, without regard to the enforceable master netting agreement, was a gross derivative asset of $51.1 million and gross derivative liability of $7.9 million. No right of offset existed with the dealer counterparty swaps as of December 31, 2023.
All changes in fair value of these instruments are recorded in other non-interest income. Given the mirror-image terms of the outstanding derivative portfolio, the change in fair value for the years ended December 31, 2023, 2022, and 2021 had an insignificant impact on the Consolidated Statements of Income.
The Corporation also enters into interest rate swaps to manage interest rate risk and reduce the cost of match-funding certain long-term fixed rate loans. These derivative contracts involve the receipt of floating rate interest from a counterparty in exchange for the Corporation making fixed-rate payments over the life of the agreement, without the exchange of the underlying notional value. The instruments are designated as cash flow hedges as the receipt of floating rate interest from the counterparty is used to manage interest rate risk related to cash outflows attributable to future wholesale deposit or short-term FHLB advance borrowings. The change in the fair value of these hedging instruments is recorded in accumulated other comprehensive income and is subsequently reclassified into earnings in the period that the hedged transactions affect earnings. A pre-tax unrealized loss of $3.5 million was recognized in other comprehensive income for the year ended December 31, 2023, while a pre-tax unrealized gain of $8.5 million and $3.6 million was recognized in other comprehensive income for the years ended December 31, 2022 and 2021, respectively, and there were no ineffective portions of these hedges.
The Corporation also enters into interest rate swaps to mitigate market value volatility on certain long-term fixed securities. The objective of the hedge is to protect the Corporation against changes in fair value due to changes in benchmark interest rates. The instruments are designated as fair value hedges as the changes in the fair value of the interest rate swap are expected to offset changes in the fair value of the hedged item attributable to changes in the SOFR swap rate, the designated benchmark interest rate. These derivative contracts involve the receipt of floating rate interest from a counterparty in exchange for the Corporation making fixed-rate payments over the life of the agreement, without the exchange of the underlying notional value. The change in the fair value of these hedging instruments is recorded in accumulated other comprehensive income and is subsequently reclassified into earnings in the period that the hedged transactions affect earnings. Pre-tax unrealized gains of $22,000 and $602,000 were recognized in other comprehensive income for the years ended December 31, 2023 and 2022, and there were no ineffective portions of these hedges. No pre-tax unrealized gain or loss was recognized in other comprehensive income for the year ended December 31, 2021.
|
|
|
|
|
|
|
|
|
|
|
|
|
|
|
|
|
|
|
|
|
|
|
|
|
|
|
|
|
As of December 31, 2023 |
|
|
Number of Instruments |
|
Notional Amount |
|
Weighted Average Maturity (In Years) |
|
Fair Value |
|
|
(Dollars in Thousands) |
| Included in Derivative assets |
|
|
|
|
|
|
|
|
| Derivatives not designated as hedging instruments |
|
|
|
|
|
|
|
|
| Interest rate swap agreements on loans with commercial loan clients |
|
25 |
|
|
$ |
249,454 |
|
|
6.33 |
|
$ |
7,904 |
|
| Interest rate swap agreements on loans with third-party counter parties |
|
106 |
|
|
939,156 |
|
|
6.06 |
|
43,234 |
|
| Derivatives designated as hedging instruments |
|
|
|
|
|
|
|
|
| Interest rate swap related to AFS securities |
|
11 |
|
|
$ |
12,500 |
|
|
8.28 |
|
$ |
624 |
|
| Interest rate swap related to wholesale funding |
|
9 |
|
|
96,400 |
|
|
2.47 |
|
3,835 |
|
| Included in Derivative liabilities |
|
|
|
|
|
|
|
|
| Derivatives not designated as hedging instruments |
|
|
|
|
|
|
|
|
| Interest rate swap agreements on loans with commercial loan clients |
|
81 |
|
|
$ |
689,702 |
|
|
5.96 |
|
$ |
51,138 |
|
|
|
|
|
|
|
|
|
|
| Derivatives designated as hedging instruments |
|
|
|
|
|
|
|
|
|
|
|
|
|
|
|
|
|
| Interest rate swap related to wholesale funding |
|
29 |
|
|
$ |
306,255 |
|
|
3.89 |
|
$ |
811 |
|
|
|
|
|
|
|
|
|
|
|
|
|
|
|
|
|
|
|
|
|
|
|
|
|
|
|
|
|
|
As of December 31, 2022 |
|
|
Number of Instruments |
|
Notional Amount |
|
Weighted Average Maturity (In Years) |
|
Fair Value |
|
|
(Dollars in Thousands) |
| Included in Derivative assets |
|
|
|
|
|
|
|
|
| Derivatives not designated as hedging instruments |
|
|
|
|
|
|
|
|
| Interest rate swap agreements on loans with commercial loan clients |
|
2 |
|
|
$ |
65,352 |
|
|
4.83 |
|
$ |
1,010 |
|
| Interest rate swap agreements on loans with third-party counter parties |
|
84 |
|
|
744,233 |
|
|
7.37 |
|
60,409 |
|
| Derivatives designated as hedging instruments |
|
|
|
|
|
|
|
|
| Interest rate swap related to AFS securities |
|
11 |
|
|
$ |
12,500 |
|
|
9.28 |
|
$ |
602 |
|
| Interest rate swap related to wholesale funding |
|
11 |
|
|
116,400 |
|
|
2.88 |
|
6,560 |
|
| Included in Derivative liabilities |
|
|
|
|
|
|
|
|
| Derivatives not designated as hedging instruments |
|
|
|
|
|
|
|
|
| Interest rate swap agreements on loans with commercial loan clients |
|
82 |
|
|
$ |
678,881 |
|
|
7.61 |
|
$ |
61,419 |
|
|
|
|
|
|
|
|
|
|
|
|
|
|
|
|
|
|
|
|
|
|
|
|
|
|
|
|
|
|
|
|
|
|
|
|
|
Note 18 – Commitments and Contingencies
The Bank is party to financial instruments with off-balance sheet risk in the normal course of business to meet the financing needs of clients. These financial instruments include commitments to extend credit and standby letters of credit and involve, to varying degrees, elements of credit and interest rate risk in excess of the amounts recognized in the Consolidated Financial Statements. The contract amounts reflect the extent of involvement the Bank has in these particular classes of financial instruments.
In the event of non-performance, the Bank’s exposure to credit loss for commitments to extend credit and standby letters of credit is represented by the contractual amount of these instruments. The Bank uses the same credit policies in making commitments and conditional obligations as they do for instruments reflected in the Consolidated Financial Statements. An accrual for credit losses on financial instruments with off-balance sheet risk would be recorded separate from any valuation account related to any such recognized financial instrument. As of December 31, 2023 and 2022, there were no accrued credit losses for financial instruments with off-balance sheet risk.
Financial instruments whose contract amounts represent potential credit risk were as follows:
|
|
|
|
|
|
|
|
|
|
|
|
|
|
|
| |
|
At December 31, |
| |
|
2023 |
|
2022 |
| |
|
(In Thousands) |
| Commitments to extend credit, primarily commercial loans |
|
$ |
1,198,031 |
|
|
$ |
913,042 |
|
| Standby letters of credit |
|
17,938 |
|
|
15,013 |
|
Commitments to extend credit are agreements to lend to a client as long as there is no violation of any condition in the contract. Commitments generally have fixed expiration dates or other termination clauses and may have a fixed interest rate or a rate which varies with the prime rate or other market indices and may require payment of a fee. Since some commitments expire without being drawn upon, the total commitment amounts do not necessarily represent future cash requirements of the Bank. The Bank evaluates the creditworthiness of each client on a case-by-case basis and generally extends credit only on a secured basis. Collateral obtained varies but consists primarily of commercial real estate, accounts receivable, inventory, equipment, and securities. There is generally no market for commercial loan commitments, the fair value of which would approximate the present value of any fees expected to be received as a result of the commitment. These are not considered to be material to the financial statements.
Standby letters of credit are conditional commitments issued by the Bank to guarantee the performance of a client to a third party. Generally, standby letters of credit expire within one year and are collateralized by accounts receivable, equipment, inventory, and commercial properties.
The credit risk involved in issuing letters of credit is essentially the same as that involved in extending loan facilities to clients. The fair value of standby letters of credit is recorded as a liability when the standby letter of credit is issued. The fair value has been estimated to approximate the fees received by the Bank for issuance. The fees are recorded into income and the fair value of the guarantee is decreased ratably over the term of the standby letter of credit.
The Corporation sells the guaranteed portions of SBA 7(a) and 504 loans, as well as participation interests in other, non-SBA originated, loans to third parties. The Corporation has a continuing involvement in each of the transferred lending arrangements by way of relationship management and servicing the loans, as well as being subject to normal and customary requirements of the SBA loan program and standard representations and warranties related to sold amounts. In the event of a loss resulting from default and a determination by the SBA that there is a deficiency in the manner in which the loan was originated, funded, or serviced by the Corporation, the SBA may require the Corporation to repurchase the loan, deny its liability under the guaranty, reduce the amount of the guaranty, or, if it has already paid under the guaranty, seek recovery of the principal loss related to the deficiency from the Corporation. The Corporation must comply with applicable SBA regulations in order to maintain the guaranty. In addition, the Corporation retains the option to repurchase the sold guaranteed portion of an SBA loan if the loan defaults.
Management has assessed estimated losses inherent in the outstanding guaranteed portions of SBA loans sold in accordance with ASC 450, Contingencies, and determined a recourse reserve based on the probability of future losses for these loans to be $955,000 and $441,000 at December 31, 2023 and 2022, respectively, which is reported in accrued interest payable and other liabilities on the Consolidated Balance Sheets.
The summary of the activity in the SBA recourse reserve is as follows:
|
|
|
|
|
|
|
|
|
|
|
|
|
|
|
|
|
As of and For the Year Ended December 31, |
| |
|
2023 |
|
2022 |
| |
|
(In Thousands) |
| Balance at the beginning of the period |
|
$ |
441 |
|
|
$ |
635 |
|
| SBA recourse provision (benefit) |
|
775 |
|
|
(188) |
|
| Charge-offs, net |
|
(261) |
|
|
(6) |
|
| Balance at the end of the period |
|
$ |
955 |
|
|
$ |
441 |
|
In the normal course of business, various legal proceedings involving the Corporation are pending. Management, based upon advice from legal counsel, does not anticipate any significant losses as a result of these actions. Management believes that any liability arising from any such proceedings currently existing or threatened will not have a material adverse effect on the Corporation’s financial position, results of operations, and cash flows.
Note 19 – Fair Value Disclosures
The Corporation determines the fair values of its financial instruments based on the fair value hierarchy established in ASC Topic 820, which requires an entity to maximize the use of observable inputs and minimize the use of unobservable inputs when measuring fair value. Fair value is defined as the price that would be received in an orderly transaction that is not a forced liquidation or distressed sale at the measurement date and is based on exit prices. Fair value includes assumptions about risk, such as nonperformance risk in liability fair values, and is a market-based measurement, not an entity-specific measurement. The standard describes three levels of inputs that may be used to measure fair value.
Level 1 — Level 1 inputs are unadjusted quoted prices in active markets for identical assets or liabilities that the Corporation has the ability to access at the measurement date.
Level 2 — Level 2 inputs are inputs, other than quoted prices included with Level 1, that are observable for the asset or liability either directly or indirectly, such as quoted prices for similar assets or liabilities; quoted prices in markets that are not active; or other inputs that are observable or can be corroborated by observable market data for substantially the full term of the assets or liabilities.
Level 3 — Level 3 inputs are supported by little or no market activity and are significant to the fair value of the assets or liabilities.
In instances where the determination of the fair value measurement is based on inputs from different levels of the fair value hierarchy, the level in the fair value hierarchy within which the entire fair value measurement falls is based on the lowest level input that is significant to the fair value measurement in its entirety. The Corporation’s assessment of the significance of a particular input to the fair value measurement in its entirety requires judgment and considers factors specific to the asset or liability.
Assets and liabilities measured at fair value on a recurring basis, segregated by fair value hierarchy level, are summarized below:
|
|
|
|
|
|
|
|
|
|
|
|
|
|
|
|
|
|
|
|
|
|
|
|
|
|
|
|
|
December 31, 2023 |
|
|
Fair Value Measurements Using |
|
|
|
|
Level 1 |
|
Level 2 |
|
Level 3 |
|
Total |
| |
|
(In Thousands) |
| Assets: |
|
|
|
|
|
|
|
|
| Securities available-for-sale: |
|
|
|
|
|
|
|
|
| U.S. treasuries |
|
$ |
— |
|
|
$ |
13,776 |
|
|
$ |
— |
|
|
$ |
13,776 |
|
| U.S. government agency securities - government-sponsored enterprises |
|
— |
|
|
27,566 |
|
|
— |
|
|
27,566 |
|
| Municipal securities |
|
— |
|
|
35,881 |
|
|
— |
|
|
35,881 |
|
| Residential mortgage-backed securities - government issued |
|
— |
|
|
68,056 |
|
|
— |
|
|
68,056 |
|
| Residential mortgage-backed securities - government-sponsored enterprises |
|
— |
|
|
120,833 |
|
|
— |
|
|
120,833 |
|
| Commercial mortgage-backed securities - government issued |
|
— |
|
|
2,525 |
|
|
— |
|
|
2,525 |
|
| Commercial mortgage-backed securities - government-sponsored enterprises |
|
— |
|
|
28,369 |
|
|
— |
|
|
28,369 |
|
|
|
|
|
|
|
|
|
|
| Interest rate swaps |
|
— |
|
|
55,597 |
|
|
— |
|
|
55,597 |
|
| Liabilities: |
|
|
|
|
|
|
|
|
| Interest rate swaps |
|
— |
|
|
51,949 |
|
|
— |
|
|
51,949 |
|
|
|
|
|
|
|
|
|
|
|
|
|
|
|
|
|
|
|
|
|
|
|
|
|
|
|
|
|
|
December 31, 2022 |
| |
|
Fair Value Measurements Using |
|
|
|
|
Level 1 |
|
Level 2 |
|
Level 3 |
|
Total |
| |
|
(In Thousands) |
| Assets: |
|
|
|
|
|
|
|
|
| Securities available-for-sale: |
|
|
|
|
|
|
|
|
| U.S. treasuries |
|
$ |
— |
|
|
$ |
4,445 |
|
|
$ |
— |
|
|
$ |
4,445 |
|
| U.S. government agency securities - government-sponsored enterprises |
|
— |
|
|
13,205 |
|
|
— |
|
|
13,205 |
|
| Municipal securities |
|
— |
|
|
39,311 |
|
|
— |
|
|
39,311 |
|
| Residential mortgage-backed securities - government issued |
|
— |
|
|
19,431 |
|
|
— |
|
|
19,431 |
|
| Residential mortgage-backed securities - government-sponsored enterprises |
|
— |
|
|
106,323 |
|
|
— |
|
|
106,323 |
|
| Commercial mortgage-backed securities - government issued |
|
— |
|
|
2,932 |
|
|
— |
|
|
2,932 |
|
| Commercial mortgage-backed securities - government-sponsored enterprises |
|
— |
|
|
26,377 |
|
|
— |
|
|
26,377 |
|
|
|
|
|
|
|
|
|
|
| Interest rate swaps |
|
— |
|
|
68,581 |
|
|
— |
|
|
68,581 |
|
| Liabilities: |
|
|
|
|
|
|
|
|
| Interest rate swaps |
|
— |
|
|
61,419 |
|
|
— |
|
|
61,419 |
|
For assets and liabilities measured at fair value on a recurring basis, there were no transfers between the levels during the year ended December 31, 2023 or 2022 related to the above measurements.
Assets and liabilities measured at fair value on a non-recurring basis, segregated by fair value hierarchy, are summarized below:
|
|
|
|
|
|
|
|
|
|
|
|
|
|
|
|
|
|
|
|
|
|
|
|
|
|
|
| |
|
December 31, 2023 |
| |
|
Fair Value Measurements Using |
|
|
| |
|
Level 1 |
|
Level 2 |
|
Level 3 |
|
Total |
| |
|
(In Thousands) |
| Collateral-dependent loans |
|
$ |
— |
|
|
$ |
— |
|
|
$ |
4,917 |
|
|
$ |
4,917 |
|
| Repossessed assets |
|
— |
|
|
— |
|
|
247 |
|
|
247 |
|
| Loan servicing rights |
|
— |
|
|
— |
|
|
1,356 |
|
|
1,356 |
|
|
|
|
|
|
|
|
|
|
|
|
|
|
|
|
|
|
|
|
|
|
|
|
|
|
|
|
| |
|
December 31, 2022 |
| |
|
Fair Value Measurements Using |
|
|
| |
|
Level 1 |
|
Level 2 |
|
Level 3 |
|
Total |
| |
|
(In Thousands) |
| Impaired loans |
|
$ |
— |
|
|
$ |
— |
|
|
$ |
1,022 |
|
|
$ |
1,022 |
|
| Repossessed assets |
|
— |
|
|
— |
|
|
95 |
|
|
95 |
|
| Loan servicing rights |
|
— |
|
|
— |
|
|
1,491 |
|
|
1,491 |
|
Collateral-dependent loans were written down to the fair value of their underlying collateral less costs to sell of $4.9 million and $1.0 million at December 31, 2023 and 2022, respectively, through the establishment of specific reserves or by recording charge-offs when the carrying value exceeded the fair value of the underlying collateral of impaired loans. Valuation techniques consistent with the market approach, income approach, or cost approach were used to measure fair value. These techniques included observable inputs for the individual impaired loans being evaluated such as current appraisals, recent sales of similar assets, or other observable market data, and unobservable inputs, typically when discounts are applied to appraisal values to adjust such values to current market conditions or to reflect net realizable values. The quantification of unobservable inputs for Level 3 impaired loan values range from 10% - 100% as of the measurement date of December 31, 2023. The weighted average of those unobservable inputs was 57%. The majority of the impaired loans are considered collateral dependent loans or are supported by an SBA guaranty.
Repossessed assets, upon initial recognition, are remeasured and reported at fair value through a charge-off to the allowance for credit losses, if deemed necessary, based upon the fair value of the repossessed asset. The fair value of a repossessed asset, upon initial recognition, is estimated using a market approach or based on observable market data, such as a current appraisal, recent sale price of similar assets, or based upon assumptions specific to the individual property or equipment, such as management applied discounts used to further reduce values to a net realizable value when observable inputs become stale.
Loan servicing rights represent the asset retained upon sale of the guaranteed portion of certain SBA loans. When SBA loans are sold, servicing rights are initially recorded at fair value with the income statement effect recorded in gains on sales of loans. The servicing rights are subsequently measured using the amortization method, which requires amortization into interest income in proportion to, and over the period of, the estimated future net servicing income of the underlying loans.
The Corporation periodically reviews this portfolio for impairment and engages a third-party valuation firm to assess the fair value of the overall servicing rights portfolio. Loan servicing rights do not trade in an active, open market with readily observable prices. While sales of loan servicing rights do occur, the precise terms and conditions typically are not readily available to allow for a “quoted price for similar assets” comparison. Accordingly, the Corporation utilizes an independent valuation from a third party which uses a discounted cash flow model to estimate the fair value of its loan servicing rights. The valuation model incorporates prepayment assumptions to project loan servicing rights cash flows based on the current interest rate scenario, which is then discounted to estimate an expected fair value of the loan servicing rights. The valuation model considers portfolio characteristics of the underlying serviced portion of the SBA loans and uses the following significant unobservable inputs: (1) constant prepayment rate (“CPR”) assumptions based on the SBA sold pools historical CPR as quoted in Bloomberg and (2) a discount rate. Due to the nature of the valuation inputs, loan servicing rights are classified in Level 3 of the fair value hierarchy.
Fair Value of Financial Instruments
The Corporation is required to disclose estimated fair values for its financial instruments. Fair value estimates, methods and assumptions, consistent with exit price concepts for fair value measurements, are set forth below:
|
|
|
|
|
|
|
|
|
|
|
|
|
|
|
|
|
|
|
|
|
|
|
|
|
|
|
|
|
|
|
|
|
|
|
December 31, 2023 |
|
|
Carrying
Amount |
|
Fair Value |
|
|
|
|
Total |
|
Level 1 |
|
Level 2 |
|
Level 3 |
| |
|
(In Thousands) |
| Financial assets: |
|
|
|
|
|
|
|
|
|
|
| Cash and cash equivalents |
|
$ |
139,510 |
|
|
$ |
139,510 |
|
|
$ |
139,510 |
|
|
$ |
— |
|
|
$ |
— |
|
| Securities available-for-sale |
|
297,006 |
|
|
297,006 |
|
|
— |
|
|
297,006 |
|
|
— |
|
| Securities held-to-maturity |
|
8,503 |
|
|
8,255 |
|
|
— |
|
|
8,255 |
|
|
— |
|
| Loans held for sale |
|
4,589 |
|
|
4,956 |
|
|
— |
|
|
4,956 |
|
|
— |
|
| Loans and lease receivables, net |
|
2,818,986 |
|
|
2,789,731 |
|
|
— |
|
|
— |
|
|
2,789,731 |
|
|
|
|
|
|
|
|
|
|
|
|
| Federal Home Loan Bank stock |
|
12,042 |
|
|
N/A |
|
N/A |
|
N/A |
|
N/A |
| Accrued interest receivable |
|
13,275 |
|
|
13,275 |
|
|
13,275 |
|
|
— |
|
|
— |
|
| Interest rate swaps |
|
55,597 |
|
|
55,597 |
|
|
— |
|
|
55,597 |
|
|
— |
|
| Financial liabilities: |
|
|
|
|
|
|
|
|
|
|
| Deposits |
|
2,796,779 |
|
|
2,795,463 |
|
|
2,101,939 |
|
|
693,524 |
|
|
— |
|
| Federal Home Loan Bank advances and other borrowings |
|
330,916 |
|
|
320,287 |
|
|
— |
|
|
320,287 |
|
|
— |
|
|
|
|
|
|
|
|
|
|
|
|
| Accrued interest payable |
|
10,860 |
|
|
10,860 |
|
|
10,860 |
|
|
— |
|
|
— |
|
| Interest rate swaps |
|
51,949 |
|
|
51,949 |
|
|
— |
|
|
51,949 |
|
|
— |
|
| Off-balance sheet items: |
|
|
|
|
|
|
|
|
|
|
| Standby letters of credit |
|
190 |
|
|
190 |
|
|
— |
|
|
— |
|
|
190 |
|
|
|
|
|
|
|
|
|
|
|
|
N/A = The fair value is not applicable due to restrictions placed on transferability
|
|
|
|
|
|
|
|
|
|
|
|
|
|
|
|
|
|
|
|
|
|
|
|
|
|
|
|
|
|
|
|
|
| |
|
December 31, 2022 |
|
|
Carrying
Amount |
|
Fair Value |
|
|
|
|
Total |
|
Level 1 |
|
Level 2 |
|
Level 3 |
| |
|
(In Thousands) |
| Financial assets: |
|
|
|
|
|
|
|
|
|
|
| Cash and cash equivalents |
|
$ |
102,682 |
|
|
$ |
102,682 |
|
|
$ |
102,682 |
|
|
$ |
— |
|
|
$ |
— |
|
| Securities available-for-sale |
|
212,024 |
|
|
212,024 |
|
|
— |
|
|
212,024 |
|
|
— |
|
| Securities held-to-maturity |
|
12,635 |
|
|
12,270 |
|
|
— |
|
|
12,270 |
|
|
— |
|
| Loans held for sale |
|
2,632 |
|
|
2,829 |
|
|
— |
|
|
2,829 |
|
|
— |
|
| Loans and lease receivables, net |
|
2,418,836 |
|
|
2,394,702 |
|
|
— |
|
|
— |
|
|
2,394,702 |
|
|
|
|
|
|
|
|
|
|
|
|
| Federal Home Loan Bank stock |
|
17,812 |
|
|
N/A |
|
N/A |
|
N/A |
|
N/A |
| Accrued interest receivable |
|
9,403 |
|
|
9,403 |
|
|
9,403 |
|
|
— |
|
|
— |
|
| Interest rate swaps |
|
68,581 |
|
|
68,543 |
|
|
— |
|
|
68,543 |
|
|
— |
|
| Financial liabilities: |
|
|
|
|
|
|
|
|
|
|
| Deposits |
|
2,168,206 |
|
|
2,167,444 |
|
|
1,827,215 |
|
|
340,229 |
|
|
— |
|
| Federal Home Loan Bank advances and other borrowings |
|
456,808 |
|
|
440,242 |
|
|
— |
|
|
440,242 |
|
|
— |
|
|
|
|
|
|
|
|
|
|
|
|
| Accrued interest payable |
|
4,053 |
|
|
4,053 |
|
|
4,053 |
|
|
— |
|
|
— |
|
| Interest rate swaps |
|
61,419 |
|
|
61,419 |
|
|
— |
|
|
61,419 |
|
|
— |
|
| Off-balance sheet items: |
|
|
|
|
|
|
|
|
|
|
| Standby letters of credit |
|
184 |
|
|
184 |
|
|
— |
|
|
— |
|
|
184 |
|
|
|
|
|
|
|
|
|
|
|
|
N/A = The fair value is not applicable due to restrictions placed on transferability
Disclosure of fair value information about financial instruments, for which it is practicable to estimate that value, is required whether or not recognized in the Consolidated Balance Sheets. In cases where quoted market prices are not available, fair values are based on estimates using present value or other valuation techniques. Those techniques are significantly affected by the assumptions used, including the discount rate and estimates of future cash flows. In that regard, the derived fair value estimates cannot be substantiated by comparison to independent markets and, in many cases, could not be realized in immediate settlement of the instruments. Certain financial instruments and all non-financial instruments are excluded from the disclosure requirements. Accordingly, the aggregate fair value amounts presented do not necessarily represent the underlying value of the Corporation.
Securities: The fair value measurements of investment securities are determined by a third-party pricing service which considers observable data that may include dealer quotes, market spreads, cash flows, the U.S. Treasury yield curve, trade execution data, market consensus prepayment speeds, credit information and the securities’ terms and conditions, among other things. The fair value measurements are subject to independent verification by another pricing source on a quarterly basis to review for reasonableness. Any significant differences in pricing are reviewed with appropriate members of management who have the relevant technical expertise to assess the results. The Corporation has determined that these valuations are classified in Level 2 of the fair value hierarchy. When the independent pricing service does not provide a fair value measurement for a particular security, the Corporation will estimate the fair value based on specific information about each security. Fair values derived in this manner are classified in Level 3 of the fair value hierarchy.
Loans Held for Sale: Loans held for sale, which consist of the guaranteed portions of SBA 7(a) loans, are carried at the lower of cost or estimated fair value. The estimated fair value is based on what secondary markets are currently offering for portfolios with similar characteristics.
Interest Rate Swaps: The carrying amount and fair value of existing derivative financial instruments are based upon independent valuation models, which use widely accepted valuation techniques, including discounted cash flow analysis on the expected cash flows of each derivative contract. This analysis reflects the contractual terms of the derivatives, including the period to maturity, and uses observable market-based inputs, including interest rate curves and implied volatilities. The Corporation incorporates credit valuation adjustments to appropriately reflect both its own nonperformance risk and the respective counterparty’s nonperformance risk in the fair value measurements. In adjusting the fair value of its derivative contracts for the effect of nonperformance risk, the Corporation considers the impact of netting and any applicable credit enhancements, such as collateral postings, thresholds, mutual puts and guarantees.
Limitations: Fair value estimates are made at a discrete point in time, based on relevant market information and information about the financial instrument. These estimates do not reflect any premium or discount that could result from offering for sale at one time the Corporation’s entire holding of a particular financial instrument. Because no market exists for a significant portion of the Corporation’s financial instruments, fair value estimates are based on judgments regarding future expected loss experience, current economic conditions, risk characteristics of various financial instruments and other factors. These estimates are subjective in nature and involve uncertainties and matters of significant judgment and, therefore, cannot be determined with precision. Changes in assumptions could significantly affect the estimates.
Fair value estimates are based on existing balance sheet financial instruments without attempting to estimate the value of anticipated future business and the value of assets and liabilities that are not considered financial instruments. In addition, the tax ramifications related to the realization of the unrealized gains and losses can have a significant effect on fair value estimates and are not considered in the estimates.
Note 20 – Condensed Parent Only Financial Information
The following represents the condensed financial information of the Corporation only:
Condensed Balance Sheets
|
|
|
|
|
|
|
|
|
|
|
|
|
|
|
| |
|
December 31,
2023 |
|
December 31,
2022 |
| |
|
(In Thousands) |
| Assets |
|
|
|
|
| Cash and cash equivalents |
|
$ |
2,027 |
|
|
$ |
3,129 |
|
| Investments in subsidiaries, at equity |
|
339,854 |
|
|
294,109 |
|
| Premises and equipment, net |
|
51 |
|
|
66 |
|
|
|
|
|
|
| Other assets |
|
697 |
|
|
1,239 |
|
| Total assets |
|
$ |
342,629 |
|
|
$ |
298,543 |
|
| Liabilities and Stockholders’ Equity |
|
|
|
|
| Junior subordinated notes and other borrowings |
|
$ |
49,396 |
|
|
$ |
34,341 |
|
|
|
|
|
|
| Accrued interest payable and other liabilities |
|
3,645 |
|
|
3,562 |
|
| Total liabilities |
|
53,041 |
|
|
37,903 |
|
| Stockholders’ equity |
|
289,588 |
|
|
260,640 |
|
| Total liabilities and stockholders’ equity |
|
$ |
342,629 |
|
|
$ |
298,543 |
|
Condensed Statements of Income
|
|
|
|
|
|
|
|
|
|
|
|
|
|
|
|
|
|
|
|
|
| |
|
For the Year Ended December 31, |
| |
|
2023 |
|
2022 |
|
2021 |
| |
|
(In Thousands) |
| Net interest expense |
|
$ |
1,989 |
|
|
$ |
2,295 |
|
|
$ |
2,539 |
|
| Non-interest income |
|
|
|
|
|
|
| Consulting and rental income from consolidated subsidiaries |
|
5,644 |
|
|
5,794 |
|
|
2,417 |
|
| Other non-interest income |
|
43 |
|
|
69 |
|
|
34 |
|
| Total non-interest income |
|
5,687 |
|
|
5,863 |
|
|
2,451 |
|
| Non-interest expense |
|
8,234 |
|
|
7,633 |
|
|
5,747 |
|
Loss before income tax benefit and equity in undistributed net income of consolidated subsidiaries |
|
4,536 |
|
|
4,065 |
|
|
5,835 |
|
| Income tax benefit |
|
337 |
|
|
1,387 |
|
|
1,483 |
|
| Loss before equity in undistributed net income of consolidated subsidiaries |
|
4,199 |
|
|
2,678 |
|
|
4,352 |
|
| Equity in undistributed net income of consolidated subsidiaries |
|
41,226 |
|
|
43,536 |
|
|
40,107 |
|
| Net income |
|
$ |
37,027 |
|
|
$ |
40,858 |
|
|
$ |
35,755 |
|
Condensed Statements of Cash Flows
|
|
|
|
|
|
|
|
|
|
|
|
|
|
|
|
|
|
|
|
|
| |
|
For the Year Ended December 31, |
| |
|
2023 |
|
2022 |
|
2021 |
| |
|
(In Thousands) |
| Operating activities |
|
|
|
|
|
|
| Net income |
|
$ |
37,027 |
|
|
$ |
40,858 |
|
|
$ |
35,755 |
|
| Adjustments to reconcile net income to net cash used in operating activities: |
|
|
|
|
|
|
| Equity in undistributed earnings of consolidated subsidiaries |
|
(41,226) |
|
|
(43,536) |
|
|
(40,107) |
|
| Share-based compensation |
|
2,977 |
|
|
2,584 |
|
|
2,513 |
|
| Excess tax benefit from share-based compensation |
|
(91) |
|
|
(91) |
|
|
(27) |
|
|
|
|
|
|
|
|
Net (decrease) increase in other liabilities |
|
(1,854) |
|
|
2,592 |
|
|
(2,090) |
|
| Other, net |
|
1,207 |
|
|
(538) |
|
|
3,413 |
|
Net cash (used in) provided by operating activities |
|
(1,960) |
|
|
1,869 |
|
|
(543) |
|
| Investing activities |
|
|
|
|
|
|
| Dividends received from subsidiaries |
|
12,100 |
|
|
2,008 |
|
|
8,534 |
|
| Proceeds from redemption of Trust II stock |
|
— |
|
|
315 |
|
|
— |
|
| Capital contributions to subsidiaries |
|
(15,000) |
|
|
— |
|
|
— |
|
Net cash (used in) provided by investing activities |
|
(2,900) |
|
|
2,323 |
|
|
8,534 |
|
| Financing activities |
|
|
|
|
|
|
Net increase (decreases) in long-term borrowed funds |
|
54 |
|
|
(357) |
|
|
55 |
|
| Proceeds from issuance of subordinated notes payable |
|
15,000 |
|
|
20,000 |
|
|
— |
|
| Repayment of subordinated notes payable |
|
— |
|
|
(9,090) |
|
|
— |
|
| Repayment of junior subordinated debentures |
|
— |
|
|
(10,076) |
|
|
— |
|
| Proceeds from issuance of preferred stock |
|
— |
|
|
11,992 |
|
|
— |
|
|
|
|
|
|
|
|
|
|
|
|
|
|
|
| Proceeds from purchased funds and other short-term debt |
|
— |
|
|
(500) |
|
|
500 |
|
| Purchase of treasury stock |
|
(2,971) |
|
|
(6,126) |
|
|
(5,477) |
|
|
|
|
|
|
|
|
| Preferred stock dividends paid |
|
(875) |
|
|
(683) |
|
|
— |
|
| Cash dividends paid |
|
(7,578) |
|
|
(6,688) |
|
|
(6,166) |
|
| Net proceeds from purchases of ESPP shares |
|
128 |
|
|
134 |
|
|
160 |
|
Net cash provided by (used in) financing activities |
|
3,758 |
|
|
(1,394) |
|
|
(10,928) |
|
| Net (decrease) increase in cash and due from banks |
|
(1,102) |
|
|
2,798 |
|
|
(2,937) |
|
| Cash and cash equivalents at the beginning of the period |
|
3,129 |
|
|
331 |
|
|
3,268 |
|
| Cash and cash equivalents at the end of the period |
|
$ |
2,027 |
|
|
$ |
3,129 |
|
|
$ |
331 |
|
Note 21 – Condensed Quarterly Earnings (unaudited)
|
|
|
|
|
|
|
|
|
|
|
|
|
|
|
|
|
|
|
|
|
|
|
|
|
|
|
|
|
|
|
|
|
|
|
|
|
|
|
|
|
|
|
|
|
|
|
|
| |
2023 |
|
2022 |
| |
Fourth
Quarter |
|
Third
Quarter |
|
Second
Quarter |
|
First
Quarter |
|
Fourth
Quarter |
|
Third
Quarter |
|
Second
Quarter |
|
First
Quarter |
| |
(Dollars in Thousands, Except Per Share Data) |
| Interest income |
$ |
54,762 |
|
|
$ |
50,941 |
|
|
$ |
47,161 |
|
|
$ |
42,064 |
|
|
$ |
38,319 |
|
|
$ |
31,786 |
|
|
$ |
27,031 |
|
|
$ |
24,235 |
|
| Interest expense |
25,222 |
|
|
22,345 |
|
|
19,414 |
|
|
15,359 |
|
|
10,867 |
|
|
5,902 |
|
|
3,371 |
|
|
2,809 |
|
| Net interest income |
29,540 |
|
|
28,596 |
|
|
27,747 |
|
|
26,705 |
|
|
27,452 |
|
|
25,884 |
|
|
23,660 |
|
|
21,426 |
|
| Provision for credit losses |
2,573 |
|
|
1,817 |
|
|
2,231 |
|
|
1,561 |
|
|
702 |
|
|
12 |
|
|
(3,727) |
|
|
(855) |
|
| Non-interest income |
7,094 |
|
|
8,430 |
|
|
7,374 |
|
|
8,410 |
|
|
6,973 |
|
|
8,197 |
|
|
6,872 |
|
|
7,386 |
|
| Non-interest expense |
21,588 |
|
|
23,189 |
|
|
22,031 |
|
|
21,767 |
|
|
21,167 |
|
|
20,028 |
|
|
19,456 |
|
|
18,823 |
|
Income before income tax expense |
12,473 |
|
|
12,020 |
|
|
10,859 |
|
|
11,787 |
|
|
12,556 |
|
|
14,041 |
|
|
14,803 |
|
|
10,844 |
|
| Income tax expense |
2,703 |
|
|
2,079 |
|
|
2,522 |
|
|
2,808 |
|
|
2,400 |
|
|
3,215 |
|
|
3,599 |
|
|
2,172 |
|
| Net income |
9,770 |
|
|
9,941 |
|
|
8,337 |
|
|
8,979 |
|
|
10,156 |
|
|
10,826 |
|
|
11,204 |
|
|
8,672 |
|
| Preferred stock dividend |
219 |
|
|
218 |
|
|
219 |
|
|
219 |
|
|
219 |
|
|
219 |
|
|
245 |
|
|
— |
|
| Income available to common shareholders |
$ |
9,551 |
|
|
$ |
9,723 |
|
|
$ |
8,118 |
|
|
$ |
8,760 |
|
|
$ |
9,937 |
|
|
$ |
10,607 |
|
|
$ |
10,959 |
|
|
$ |
8,672 |
|
| Per common share: |
|
|
|
|
|
|
|
|
|
|
|
|
|
|
|
| Basic earnings |
$ |
1.15 |
|
|
$ |
1.17 |
|
|
$ |
0.98 |
|
|
$ |
1.05 |
|
|
$ |
1.18 |
|
|
$ |
1.25 |
|
|
$ |
1.29 |
|
|
$ |
1.02 |
|
Diluted earnings |
1.15 |
|
|
1.17 |
|
|
0.98 |
|
|
1.05 |
|
|
1.18 |
|
|
1.25 |
|
|
1.29 |
|
|
1.02 |
|
| Dividends declared |
0.2275 |
|
|
0.2275 |
|
|
0.2275 |
|
|
0.2275 |
|
|
0.1975 |
|
|
0.1975 |
|
|
0.1975 |
|
|
0.1975 |
|
REPORT OF INDEPENDENT REGISTERED PUBLIC ACCOUNTING FIRM
Shareholders and the Board of Directors
First Business Financial Services, Inc.
Madison, Wisconsin
Opinions on the Financial Statements and Internal Control over Financial Reporting
We have audited the accompanying consolidated balance sheets of First Business Financial Services, Inc. (the "Corporation") as of December 31, 2023 and 2022, the related consolidated statements of income, comprehensive income, changes in stockholders’ equity, and cash flows for each of the years in the three-year period ended December 31, 2023, and the related notes (collectively referred to as the "financial statements"). We also have audited the Corporation’s internal control over financial reporting as of December 31, 2023, based on criteria established in Internal Control – Integrated Framework: (2013) issued by the Committee of Sponsoring Organizations of the Treadway Commission (COSO).
In our opinion, the financial statements referred to above present fairly, in all material respects, the financial position of the Corporation as of December 31, 2023 and 2022, and the results of its operations and its cash flows for each of the years in the three-year period ended December 31, 2023 in conformity with accounting principles generally accepted in the United States of America. Also in our opinion, the Corporation maintained, in all material respects, effective internal control over financial reporting as of December 31, 2023, based on criteria established in Internal Control – Integrated Framework: (2013) issued by COSO.
Change in Accounting Principle
As discussed in Note 1 to the consolidated financial statements, the Corporation has changed its method of accounting for credit losses effective January 1, 2023 due to the adoption of Financial Accounting Standards Board (“FASB”) Accounting Standards Codification No. 326, Financial Instruments – Credit Losses (“ASC 326”). The Corporation adopted the new credit loss standard using the modified retrospective method such that prior period amounts are not adjusted and continue to be reported in accordance with previously applicable generally accepted accounting principles.
Basis for Opinions
The Corporation’s management is responsible for these financial statements, for maintaining effective internal control over financial reporting, and for its assessment of the effectiveness of internal control over financial reporting, included in the accompanying Management’s Annual Report on Internal Control over Financial Reporting. Our responsibility is to express an opinion on the Corporation’s financial statements and an opinion on the Corporation’s internal control over financial reporting based on our audits. We are a public accounting firm registered with the Public Company Accounting Oversight Board (United States) ("PCAOB") and are required to be independent with respect to the Corporation in accordance with the U.S. federal securities laws and the applicable rules and regulations of the Securities and Exchange Commission and the PCAOB.
We conducted our audits in accordance with the standards of the PCAOB. Those standards require that we plan and perform the audits to obtain reasonable assurance about whether the financial statements are free of material misstatement, whether due to error or fraud, and whether effective internal control over financial reporting was maintained in all material respects.
Our audits of the financial statements included performing procedures to assess the risks of material misstatement of the financial statements, whether due to error or fraud, and performing procedures that respond to those risks. Such procedures included examining, on a test basis, evidence regarding the amounts and disclosures in the financial statements. Our audits also included evaluating the accounting principles used and significant estimates made by management, as well as evaluating the overall presentation of the financial statements. Our audit of internal control over financial reporting included obtaining an understanding of internal control over financial reporting, assessing the risk that a material weakness exists, and testing and evaluating the design and operating effectiveness of internal control based on the assessed risk. Our audits also included performing such other procedures as we considered necessary in the circumstances. We believe that our audits provide a reasonable basis for our opinions.
Definition and Limitations of Internal Control Over Financial Reporting
A company’s internal control over financial reporting is a process designed to provide reasonable assurance regarding the reliability of financial reporting and the preparation of financial statements for external purposes in accordance with generally accepted accounting principles. A company’s internal control over financial reporting includes those policies and procedures that (1) pertain to the maintenance of records that, in reasonable detail, accurately and fairly reflect the transactions and dispositions of the assets of the company; (2) provide reasonable assurance that transactions are recorded as necessary to permit preparation of financial statements in accordance with generally accepted accounting principles, and that receipts and expenditures of the company are being made only in accordance with authorizations of management and directors of the company; and (3) provide reasonable assurance regarding prevention or timely detection of unauthorized acquisition, use, or disposition of the company’s assets that could have a material effect on the financial statements.
Because of its inherent limitations, internal control over financial reporting may not prevent or detect misstatements. Also, projections of any evaluation of effectiveness to future periods are subject to the risk that controls may become inadequate because of changes in conditions, or that the degree of compliance with the policies or procedures may deteriorate.
Critical Audit Matter
The critical audit matter communicated below is a matter arising from the current period audit of the financial statements that was communicated or required to be communicated to the audit committee and that: (1) relates to accounts or disclosures that are material to the financial statements and (2) involved our especially challenging, subjective, or complex judgments. The communication of the critical audit matter does not alter in any way our opinion on the financial statements, taken as a whole, and we are not, by communicating the critical audit matter below, providing a separate opinion on the critical audit matter or on the accounts or disclosures to which it relates.
Allowance and Provision for Credit Losses – Qualitative Factors
The Corporation adopted ASC 326 (“CECL”) as of January 1, 2023 as described in Note 1 of the consolidated financial statements using the modified retrospective method. ASC 326 requires the Corporation’s loan portfolio, measured at amortized cost, to be presented at the net amount expected to be collected. The estimates of expected credit losses on loans are based on relevant information about past events, current conditions, and reasonable and supportable forecasts regarding the collectability of the remaining cash flows over the contractual term of the loans. The Corporation utilized a discounted cash flow model to estimate the quantitative component of the allowance for credit losses for loans using key inputs and assumptions such as probability of default, loss given default, prepayment and curtailment rates, and forecast model. The quantitative model was adjusted with qualitative factors, including but not limited to: management’s ongoing review and grading of the loan and lease portfolios, consideration of delinquency experience, changes in the size of the loan and lease portfolios, existing economic conditions, level of loans and leases subject to more frequent review by management, changes in underlying collateral, concentrations of loans to specific industries, and other qualitative factors that could affect credit losses. The determination of qualitative factors involves significant management judgment and the use of subjective assumptions.
We identified auditing the qualitative factors as a critical audit matter because of the high degree of auditor judgment and auditor effort required to evaluate management's judgments in their determination of the qualitative factors.
The primary procedures we performed to address this critical audit matter included:
Testing the effectiveness of controls over the evaluation of the qualitative factors, including controls addressing:
a.The reliability and relevance of data used as the basis for the adjustments relating to qualitative factors;
b.The reasonableness of management’s judgments and assumptions related to the assessed level of risk and the ending allocation of the qualitative factors;
c.The mathematical accuracy of the dollar amount applied to the qualitative factors;
Substantively testing management’s process, including evaluating their judgments and assumptions, for developing the qualitative factors, which included:
a.Evaluation of the reliability and relevance of data used as a basis for the adjustments relating to qualitative factors;
b.Evaluation of the reasonableness of management’s judgments and assumptions related to the assessed level of risk for the qualitative factors and the resulting allocation;
c.Evaluation of the mathematical accuracy of the adjustment factors for the qualitative component and the dollar amount of the reserve derived from the qualitative factor assessment;
d.Tracing the allowance allocation from the qualitative factor analysis to the overall allowance calculation.
/s/Crowe LLP
We have served as the Corporation's auditor since 2017, which is the year the engagement was signed for the audit of the 2018 financial statements.
Oak Brook, Illinois
February 28, 2024
Item 9. Changes in and Disagreements with Accountants on Accounting and Financial Disclosure
None.
Item 9A. Controls and Procedures
Disclosure Controls and Procedures
The Corporation’s management, with the participation of the Corporation’s Chief Executive Officer and Chief Financial Officer, has evaluated the Corporation’s disclosure controls and procedures (as defined in Rules 13a-15(e) and 15d-15(e) under the Securities Exchange Act of 1934, as amended). Based upon that evaluation, the Corporation’s Chief Executive Officer and Chief Financial Officer have concluded that the Corporation’s disclosure controls and procedures were effective as of December 31, 2023.
Changes in Internal Control over Financial Reporting
There was no change in the Corporation’s internal control over financial reporting (as such term is defined in Rules 13a-15(f) and 15d-15(f) under the Securities and Exchange Act of 1934, as amended) that occurred during the quarter ended December 31, 2023 that has materially affected, or is reasonably likely to materially affect, the Corporation’s internal control over financial reporting.
Management’s Annual Report on Internal Control over Financial Reporting
The Corporation’s management is responsible for establishing and maintaining adequate internal control over financial reporting, as such term is defined in Rules 13a-15(f) and 15d-15(f) under the Securities Exchange Act of 1934, as amended. The Corporation’s internal control over financial reporting is a process designed to provide reasonable assurance regarding the reliability of financial reporting and the preparation of the Corporation’s financial statements for external purposes in accordance with generally accepted accounting principles.
Management, under the supervision of the Chief Executive Officer and the Chief Financial Officer, assessed the effectiveness of the Corporation’s internal control over financial reporting based on criteria for effective internal control over financial reporting established in Internal Control – Integrated Framework (2013), issued by the Committee of Sponsoring Organization of the Treadway Commission (COSO). Based on this assessment, management has determined that the Corporation’s internal control over financial reporting was effective as of December 31, 2023.
Crowe LLP, the independent registered public accounting firm that audited the Consolidated Financial Statements of the Corporation included in this Annual Report on Form 10-K, has issued an attestation report on the effectiveness of the Corporation’s internal control over financial reporting as of December 31, 2023. The report, which expresses an unqualified opinion on the effectiveness of the Corporation’s internal control over financial reporting as of December 31, 2023, is included under the heading “Report of Independent Registered Public Accounting Firm.”
Item 9B. Other Information
(a) None.
(b) During the three months ended December 31, 2023, no director or "officer" of the Corporation adopted or terminated a "Rule 10b5-1 Trading Arrangement" or "non-Rule 10b5-1 trading arrangement," as each term is defined in Item 408(a) of Regulation S-K.
Item 9C. Disclosure Regarding Foreign Jurisdictions that Prevent Inspections
Not applicable.
PART III.
Item 10. Directors, Executive Officers and Corporate Governance
(a)Directors of the Registrant. The information included in the definitive Proxy Statement for the Annual Meeting of the Shareholders to be held on April 26, 2024 under the caption “Item 1 - Election of Directors” is incorporated herein by reference.
(b)Executive Officers of the Registrant. The information presented in Item 1 of this document is incorporated herein by reference.
(c)Code of Ethics. The Corporation has adopted a code of ethics applicable to all employees, including the principal executive officer, principal financial officer and principal accounting officer of the Corporation. The FBFS Code of Business Conduct and Ethics is posted on the Corporation’s website at ir.firstbusiness.bank/govdocs. The Corporation intends to satisfy the disclosure requirements under Item 5.05(c) of Form 8-K regarding any amendment to or waiver of the code with respect to its Chief Executive Officer, Chief Financial Officer, principal accounting officer, and persons performing similar functions, by posting such information to the Corporation’s website.
(d)Audit Committee. The information included in the definitive Proxy Statement for the Annual Meeting of the Shareholders to be held on April 26, 2024 under the caption “Item 1 - Election of Directors” is incorporated herein by reference.
(e)Delinquent Section 16(a) Reports. The information included in the definitive Proxy Statement for the Annual Meeting of the Shareholders to be held on April 26, 2024 under the caption “Delinquent Section 16(a) Reports” is incorporated herein by reference.
Item 11. Executive Compensation
Information with respect to compensation for our directors and officers included in the definitive Proxy Statement for the Annual Meeting of the Shareholders to be held on April 26, 2024 under the captions “Executive Compensation”, “Director Compensation,” “Compensation Committee Report,” and “Compensation Committee Interlocks and Insider Participation” is incorporated herein by reference.
Item 12. Security Ownership of Certain Beneficial Owners and Management and Related Shareholder Matters
Information with respect to security ownership of certain beneficial owners and management included in the definitive Proxy Statement for the Annual Meeting of the Shareholders to be held on April 26, 2024 under the caption “Principal Shareholders” is incorporated herein by reference.
The following table provides information as of December 31, 2023 regarding shares outstanding and available for issuance under our existing compensation plans.
|
|
|
|
|
|
|
|
|
|
|
|
|
|
|
|
|
|
|
|
|
|
|
|
|
|
|
Plan Category |
|
(a) Number of securities to be issued upon exercise of outstanding options, warrants and rights(1) |
|
(b) Weighted-average exercise price of outstanding options, warrants and rights(2) |
|
(c) Weighted-average contractual term outstanding options, warrants and rights (years) |
|
(d) Number of securities remaining available for future issuance under equity compensation plans (excluding securities reflected in column (a))(3) |
Equity compensation plans approved by shareholders |
|
152,517 |
|
|
35.05 |
|
|
2.94 |
|
|
558,970 |
|
Equity compensation plans not approved by shareholders |
|
— |
|
|
— |
|
|
— |
|
|
— |
|
(1) Includes the following type of awards: options - 0 shares; RSUs - 56,987 shares; PRSUs prior to 2023 assuming maximum performance - 78,750; PRSUs in 2023 assuming target performance - 16,780 shares. All shares subject to RSUs issued under the 2019 Equity Incentive Plan.
(2) The weighted average exercise price does not take into account awards of RSUs or PRSUs which do not have an exercise price.
(3) Includes the number of shares remaining available for future issuance under the following plans: Employee Stock Purchase Plan - 230,638 shares: and Equity Incentive Plan - 328,332 shares (assuming maximum performance is achieved under PRSU awards).
Item 13. Certain Relationships and Related Transactions, and Director Independence
Information with respect to certain relationships and related transactions included in the definitive Proxy Statement for the Annual Meeting of the Shareholders to be held on April 26, 2024 under the captions “Related Party Transactions” and “Item 1 - Election of Directors” is incorporated herein by reference.
Item 14. Principal Accountant Fees and Services
Information with respect to principal accounting fees and services included in the definitive Proxy Statement for the Annual Meeting of the Shareholders to be held on April 26, 2024 under the caption “Miscellaneous” is incorporated herein by reference.
PART IV.
Item 15. Exhibits and Financial Statement Schedules
The Consolidated Financial Statements listed on the Index included under “Item 8. Financial Statements and Supplementary Data” are filed as a part of this Form 10-K. All financial statement schedules have been included in the Consolidated Financial Statements or are either not applicable or not significant.
Exhibit Index
|
|
|
|
|
|
| Exhibit No. |
Exhibit Name |
|
|
| 3.1 |
|
|
|
| 3.2 |
|
|
|
| 3.3 |
|
|
|
|
Pursuant to Item 601(b)(4)(iii) of Regulation S-K, the Registrant agrees to furnish to the Securities and Exchange Commission, upon request, any instrument defining the rights of holders of long-term debt not being registered that is not filed as an exhibit to this Annual Report on Form 10-K. No such instrument authorizes securities in excess of 10% of the total assets of the Registrant. |
|
|
| 4.1 |
|
|
|
| 4.2 |
|
|
|
10.1* |
|
|
|
10.2* |
|
|
|
10.3* |
|
|
|
10.4* |
|
|
|
10.5* |
|
|
|
10.6* |
|
|
|
10.7* |
|
|
|
10.8* |
|
|
|
10.9* |
|
|
|
10.10* |
|
|
|
|
|
|
|
|
|
10.11* |
|
|
|
10.12* |
|
|
|
10.13* |
|
|
|
| 10.14* |
|
|
|
| 10.15* |
|
|
|
| 10.16* |
|
|
|
| 10.17* |
|
|
|
| 10.18 |
|
|
|
| 10.19 |
|
|
|
| 21 |
|
|
|
| 23 |
|
|
|
| 31.1 |
|
|
|
| 31.2 |
|
|
|
| 32 |
|
|
|
| 97 |
|
|
|
| 101 |
The following financial information from First Business Financial Services, Inc.’s Annual Report on Form 10-K for the year ended December 31, 2023, formatted in XBRL (eXtensible Business Reporting Language): (i) Consolidated Balance Sheets as of December 31, 2023 and December 31, 2022, (ii) Consolidated Statements of Income for the years ended December 31, 2023, 2022, and 2021, (iii) Consolidated Statements of Comprehensive Income for the years ended December 31, 2023, 2022, and 2021, (iv) Consolidated Statements of Changes in Stockholders’ Equity for the years ended December 31, 2023, 2022, and 2021, (v) Consolidated Statements of Cash Flows for the years ended December 31, 2023, 2022, and 2021, and (vi) the Notes to Consolidated Financial Statements |
| 104 |
Cover page interactive data file (formatted as inline XBRL and contained in Exhibit 101) |
|
|
| * |
Management contract or compensatory plan. |
Item 16. Form 10-K Summary
None.
Signatures
Pursuant to the requirements of Section 13 or 15(d) of the Securities Exchange Act of 1934, the registrant has duly caused this report to be signed on its behalf by the undersigned, thereunto duly authorized.
|
|
|
|
|
|
|
|
|
|
|
|
|
|
|
FIRST BUSINESS FINANCIAL SERVICES, INC. |
|
|
|
|
| February 28, 2024 |
|
|
/s/ Corey A. Chambas |
|
|
|
Corey A. Chambas |
|
|
|
Chief Executive Officer |
Pursuant to the requirements of the Securities Exchange Act of 1934, this report has been signed below by the following persons on behalf of the registrant and in the capacities and on the dates indicated.
|
|
|
|
|
|
|
|
|
|
|
|
|
|
|
| Signature |
|
Title |
|
Date |
|
|
|
|
|
| /s/ Corey A. Chambas |
|
Chief Executive Officer and Director |
|
February 28, 2024 |
| Corey A. Chambas |
|
(principal executive officer) |
|
|
|
|
|
|
|
| /s/ Brian D. Spielmann |
|
Chief Financial Officer |
|
February 28, 2024 |
| Brian D. Spielmann |
|
(principal financial officer) |
|
|
|
|
|
|
|
| /s/ Kevin D. Crampton |
|
Chief Accounting Officer |
|
February 28, 2024 |
Kevin D. Crampton |
|
(principal accounting officer) |
|
|
|
|
|
|
|
| /s/ Gerald L. Kilcoyne |
|
Chair of the Board of Directors |
|
February 28, 2024 |
| Gerald L. Kilcoyne |
|
|
|
|
|
|
|
|
|
| /s/ Laurie S. Benson |
|
Director |
|
February 28, 2024 |
| Laurie S. Benson |
|
|
|
|
|
|
|
|
|
| /s/ Mark D. Bugher |
|
Director |
|
February 28, 2024 |
| Mark D. Bugher |
|
|
|
|
|
|
|
|
|
| /s/ Carla C. Chavarria |
|
Director |
|
February 28, 2024 |
| Carla C. Chavarria |
|
|
|
|
|
|
|
|
|
| /s/ John J. Harris |
|
Director |
|
February 28, 2024 |
| John J. Harris |
|
|
|
|
|
|
|
|
|
| /s/ Ralph R. Kauten |
|
Director |
|
February 28, 2024 |
| Ralph R. Kauten |
|
|
|
|
|
|
|
|
|
| /s/ W. Kent Lorenz |
|
Director |
|
February 28, 2024 |
| W. Kent Lorenz |
|
|
|
|
|
|
|
|
|
| /s/ Daniel P. Olszewski |
|
Director |
|
February 28, 2024 |
| Daniel P. Olszewski |
|
|
|
|
|
|
|
|
|
| /s/ Carol P. Sanders |
|
Director |
|
February 28, 2024 |
| Carol P. Sanders |
|
|
|
|
|
|
|
|
|
EX-4.2
2
fbiz20231231exhibit42.htm
EX-4.2
Document
FIRST BUSINESS FINANCIAL SERVICES, INC.
Description of Securities Registered Pursuant to
Section 12 of the Securities Exchange Act of 1934
General
As of December 31, 2023, First Business Financial Services, Inc. (“First Business,” “we,” “our,” “us”) has one class of securities registered under Section 12 of the Securities Exchange Act of 1934, as amended: common stock, $0.01 par value. The following is a summary of the material terms and rights of our common stock and the provisions of our Amended and Restated Articles of Incorporation (the “Articles”) and our Amended and Restated Bylaws (the “Bylaws”), each of which is incorporated by reference as an exhibit to our Annual Report on Form 10-K for the year ended December 31, 2023, of which this exhibit is a part. The summary is not complete and you should refer to the applicable provisions of our Articles and Bylaws. As of December 31, 2023, we had 9,418,463 shares of common stock issued and 8,314,778 shares of common stock outstanding. Additionally, we have reserved 328,332 shares of our common stock for future issuance under our equity incentive plan.
Our Articles also authorize us to issue up to 2,500,000 shares of preferred stock, $0.01 par value. As of December 31, 2023, we had 12,500 shares of our 7.0% Fixed-to-Floating Rate Non-Cumulative Perpetual Preferred Stock, Series A, par value $0.01 per share, issued and outstanding.
Listing
Our common stock is listed for trading on the NASDAQ Global Select Market under the symbol “FBIZ.”
Voting Rights
Each outstanding share of our common stock is entitled to one vote on all matters submitted to a vote of shareholders. There is no cumulative voting in the election of directors, which means that a plurality of the shares voted shall elect all of the directors then standing for election at a meeting of shareholders at which a quorum is present. Our board of directors is divided into three classes of directors, each serving a staggered three-year term. At each annual meeting, the successors to the class of directors whose terms expire at that meeting are elected for a term of office to expire at the third succeeding annual meeting after their election and until their successors have been duly elected and qualified.
Liquidation Rights
Upon our liquidation, dissolution or winding up, the holders of our common stock are entitled to receive, pro rata, our assets which are legally available for distribution, after payment of all debts and other liabilities and subject to the prior rights of any holders of preferred stock then outstanding.
Dividends Payable on Shares of Common Stock
In general, the holders of outstanding shares of our common stock are entitled to receive dividends out of assets legally available therefor at such times and in such amounts as our board of directors may from time to time determine. The ability of our board of directors to declare and pay dividends on our common stock may be affected by both general corporate law considerations and policies of the Board of Governors of the Federal Reserve System, which we refer to herein as the Federal Reserve, applicable to bank holding companies.
As a Wisconsin corporation, we are subject to the limitations of Wisconsin law, which allows us to pay a dividend unless, after such dividend, we would not be able to pay our debts as they become due in the usual course of business or our total assets would be less than the sum of our total liabilities plus any amount that would be needed if we were to be dissolved at the time of the dividend payment to satisfy the preferential rights upon dissolution of shareholders whose preferential rights are superior to those receiving the dividend. As a bank holding company, our ability to declare and pay dividends is also subject to the guidelines of the Federal Reserve regarding capital adequacy and dividends. The Federal Reserve guidelines generally require us to review the effects of the cash payment of dividends on our common stock and other Tier 1 capital instruments in light of our earnings, capital adequacy and financial condition. As a general matter, the Federal Reserve indicates that the board of directors of a bank holding company should eliminate, defer or significantly reduce the dividends if: (i) the company’s net income available to shareholders for the past four quarters, net of dividends previously paid during that period, is not sufficient to fully fund the dividends; (ii) the prospective rate of earnings retention is inconsistent with the company’s capital needs and overall current and prospective financial condition; or (iii) the company will not meet, or is in danger of not meeting, its minimum regulatory capital adequacy ratios. The Federal Reserve also possesses enforcement powers over bank holding companies and their nonbank subsidiaries to prevent or remedy actions that represent unsafe or unsound practices or violations of applicable statutes and regulations. Among these powers is the ability to proscribe the payment of dividends by banks and bank holding companies.
Most of our revenues available for the payment of dividends derive from amounts paid to us by First Business Bank (the “Bank”). There are various statutory limitations that limit the ability of the Bank to pay dividends to us. The Bank is a Wisconsin state-chartered bank and is subject to the laws and regulations of the Wisconsin Department of Financial Institutions and to the regulations of the Federal Deposit Insurance Corporation, which we refer to herein as the FDIC. If a bank’s primary banking regulator determines that the bank is engaged or is about to engage in an unsafe or unsound banking practice, the regulator may require, after notice and hearing, that the bank cease and desist from such practice. Depending on the financial condition of the bank, an unsafe or unsound practice could include the payment of dividends. In particular, the federal banking agencies have indicated that paying dividends that deplete a bank’s capital base to an inadequate level would be an unsafe and unsound banking practice.
Under Wisconsin banking law, the Bank generally may not pay dividends in excess of its undivided profits, and if dividends declared and paid in either of the two immediately preceding years exceeded net income for either of those two years respectively, the Bank may not declare or pay any dividend in the current year that exceeds year-to-date net income. Further, the payment of dividends by any financial institution is also affected by the requirement to maintain adequate capital pursuant to applicable capital adequacy guidelines and regulations, and a financial institution generally is prohibited from paying any dividends if, following payment thereof, the institution would be undercapitalized. Even notwithstanding the availability of funds for dividends, the FDIC may prohibit the payment of any dividends by an insured bank, such as the Bank, if the FDIC determines such payment would constitute an unsafe or unsound practice.
Furthermore, as of December 31, 2023, we had outstanding approximately $49.4 million of subordinated notes. As of December 31, 2023, we were current on the interest payable pursuant to such subordinated notes. However, if we default on our obligation to pay interest on such instruments in the future, our ability to pay dividends on our common stock also will be subject to the prior payment of all accrued but unpaid interest on such subordinated notes.
Anti-Takeover Provisions
General.
Our Articles and Bylaws may have the effect of discouraging, delaying or preventing a change in control or an unsolicited acquisition proposal that a shareholder might consider favorable, including a proposal that might result in the payment of a premium over the market price for the shares held by shareholders. These provisions are summarized in the following paragraphs.
Authorized Shares of Capital Stock.
Authorized but unissued shares of our common stock and preferred stock under our Articles could (within the limits imposed by applicable law and the rules of The NASDAQ Stock Market LLC) be issued in one or more transactions that could make a change of control of us more difficult, and therefore more unlikely. The additional authorized shares could be used to discourage persons from attempting to gain control of us by diluting the voting power of shares then outstanding or increasing the voting power of persons who would support the board of directors in a potential takeover situation, including by preventing or delaying a proposed business combination that is opposed by the board of directors although perceived to be desirable by some shareholders.
Limitations on Right to Call Special Meetings; Stockholder Proposal Notice Requirements; Unanimous Consent without Meeting.
Under our Bylaws, a special meeting of our shareholders may be called only by: (i) the Chairperson of the board of directors; (ii) the President; (iii) resolution adopted by a majority of the board of directors; or (iv) the holders of at least 10% of all the votes entitled to be cast on any issue proposed to be considered at the proposed special meeting who sign, date and deliver to First Business one or more written demands for the meeting describing one or more purposes for which it is to be held. Additionally, our Bylaws require that shareholder proposals meet certain advanced notice and minimum informational requirements. Further, under our Bylaws, shareholders may only take action without a meeting if such action receives the unanimous written consent of all shareholders entitled to vote thereon. These provisions could have the effect of delaying until the next annual shareholders meeting shareholder actions which are favored by the holders of a majority of our outstanding voting securities.
Classified Board of Directors; Noncumulative Voting for Directors.
Our Bylaws provide that our board of directors is classified into three classes of directors, with the members of one class to be elected each year, which prevents a majority of our directors from being removed at a single annual meeting. Our shareholders are also not permitted to cumulate votes for directors, which may make it more difficult for a noncompany nominee to be elected to our board of directors.
Director Removal; Filling of Board Vacancies.
Our Bylaws specify that directors may be removed during their three-year terms only for one of the following reasons: (i) a willful failure to deal fairly with us or our shareholders in connection with a matter in which the director has a material conflict of interest; (ii) a violation of criminal law, unless the director had reasonable cause to believe that his or her conduct was lawful or no reasonable cause to believe that his or her conduct was unlawful; (iii) a transaction from which the director derived an improper personal profit; or (iv) willful misconduct. Further, our Bylaws provide that any vacancy occurring in the board of directors may be filled by a vote of a majority of the remaining directors, unless such vacancy was created by shareholder action.
A person elected to fill a vacancy on the board of directors will serve for the unexpired term of the director whose seat became vacant. These provisions make it more difficult for shareholders to remove directors and/or fill vacancies.
State Anti-Takeover Laws.
Provisions of the Wisconsin Business Corporation Law prevent “interested shareholders” and an applicable Wisconsin corporation from entering into a “business combination” unless certain conditions are met. A business combination means: (i) any merger or share exchange with an interested shareholder; (ii) any sale, lease, exchange, mortgage, pledge, transfer or other disposition, in one transaction or a series of transactions, with an interested shareholder having (a) an aggregate market value equal to 5% or more of the aggregate market value of the assets of the corporation, (b) an aggregate market value equal to 5% or more of the aggregate market value of all outstanding shares of the corporation, or (c) representing 10% or more of the earning power or income of the corporation; (iii) the issuance of stock with a market value equal to 5% or more of the outstanding stock of the corporation to an interested shareholder; (iv) the adoption of a plan or proposal for the liquidation or dissolution which is proposed by, on behalf of, or pursuant to a written or unwritten agreement, arrangement or understanding with, an interested shareholder; and (v) certain other transactions involving an interested shareholder.
An “interested shareholder” is defined to mean a person who beneficially owns, directly or indirectly, 10% or more of the voting power of the outstanding voting stock of a Wisconsin corporation or who is an affiliate or associate of the corporation and beneficially owned 10% or more of the voting power of its then-outstanding voting stock within the last three years. Under Wisconsin law, a corporation cannot engage in a business combination with an interested shareholder for a period of three years following the date such person becomes an interested shareholder, unless the board of directors approved the business combination or the acquisition of the stock that resulted in the person becoming an interested shareholder before such acquisition. A corporation may engage in a business combination with an interested shareholder after the three-year period with respect to that shareholder expires only if one or more of the following conditions is satisfied: (i) the board of directors approved the acquisition of the stock that resulted in the person becoming an interested shareholder before such acquisition; (ii) the business combination is approved by a majority of the outstanding voting stock not beneficially owned by the interested shareholder; or (iii) the consideration to be received by shareholders meets certain fair price requirements of the statute with respect to form and amount.
Other provisions of the Wisconsin Business Corporation Law prohibit an acquiror, under certain circumstances, from voting shares of a target corporation’s stock after crossing certain threshold ownership percentages, unless the acquiror obtains the approval of the target corporation’s shareholders. Once an acquiror obtains voting securities representing in excess of 20% of the outstanding voting power of the corporation, such shareholder’s voting power shall be limited to 10% of the voting power of those shares until disinterested shareholders restore the right.
The Wisconsin Business Corporation Law also prohibits a Wisconsin corporation from taking certain actions while it is subject to a take-over offer, which is generally defined as an offer to acquire the equity securities of the corporation which would result in the acquiror beneficially owning more than 5% of the equity securities of the corporation. While subject to a take-over offer, a Wisconsin corporation may not take either of the following actions unless approved by a majority of its shareholders: (i) acquire more than 5% of its voting shares from a shareholder who holds more than 3% of the voting shares and has held those shares for less than two years at a price above market price, unless the corporation has made the same offer to all of its shareholders; or (ii) sell assets of the corporation which amount to at least 10% of the market value of the corporation.
Finally, Wisconsin law also provides that certain mergers, share exchanges or sales, leases, exchanges or other dispositions of assets in a transaction involving a significant shareholder and a Wisconsin corporation require a supermajority vote of shareholders in addition to any approval otherwise required, unless shareholders receive a fair price for their shares that satisfies a statutory formula. A “significant shareholder” for this purpose is defined as a person or group who beneficially owns, directly or indirectly, 10% or more of the voting stock of the corporation, or is an affiliate of the corporation and beneficially owned, directly or indirectly, 10% or more of the voting stock of the corporation within the last two years. Any such business combination must be approved by 80% of the voting power of the corporation’s stock and at least two-thirds of the voting power of its stock not beneficially owned by the significant shareholder who is party to the relevant transaction or any of its affiliates or associates, in each case voting together as a single group, unless the following fair price standards have been met:
•the aggregate value of the per share consideration is at least equal to the highest of:
o the highest price paid for any common shares of the corporation by the significant shareholder in the transaction in which it became a significant shareholder or within two years before the date of the business combination;
o the market value of the corporation’s shares on the date of commencement of any tender offer by the significant shareholder, the date on which the person became a significant shareholder or the date of the first public announcement of the proposed business combination, whichever is highest; or
o the highest preferential liquidation or dissolution distribution to which holders of the shares would be entitled; and
•the consideration to be received by shareholders is either cash or the form of consideration used by the significant shareholder to acquire its shares, or, if it paid for its shares with varying forms of consideration, the form of consideration shall be either cash or the form used to acquire the largest number of the significant shareholder’s shares.
Miscellaneous
Our shares of common stock are neither redeemable nor convertible, and the holders thereof have no preemptive, subscription or other rights to purchase any of our securities.
EX-21
3
fbiz20231231exhibit21.htm
EX-21
Document
Exhibit 21
Subsidiaries of the Registrant
|
|
|
|
|
|
| Subsidiary |
State of Incorporation or Organization |
| First Business Bank |
Wisconsin |
| First Business Specialty Finance, LLC |
Wisconsin |
|
|
| Mitchell Street Apartments Investment, LLC |
Wisconsin |
| ABKC Real Estate, LLC |
Kansas |
| FBB Real Estate 2, LLC |
Kansas |
| FBB Tax Credit Investment, LLC |
Wisconsin |
First Madison Investment Corp. |
Nevada |
|
|
|
|
EX-23
4
fbiz20231231exhibit23.htm
EX-23
Document
Consent of Independent Registered Public Accounting Firm
The Board of Directors
First Business Financial Services, Inc.:
We consent to the incorporation by reference in Registration Statement Nos. 333-183274, 333-231418, 333-248131, 333-256132, and 333-272174 on Form S-8 of First Business Financial Services, Inc. of our report dated February 28, 2024 relating to the financial statements and effectiveness of internal control over financial reporting, appearing in this Annual Report on Form 10-K.
/s/ Crowe LLP
Oak Brook, Illinois
February 28, 2024
EX-31.1
5
fbiz20231231exhibit311.htm
EX-31.1
Document
Exhibit 31.1
Certifications
I, Corey A. Chambas, certify that:
1.I have reviewed this Annual Report on Form 10-K of First Business Financial Services, Inc.;
2.Based on my knowledge, this report does not contain any untrue statement of a material fact or omit to state a material fact necessary to make the statements made, in light of the circumstances under which such statements were made, not misleading with respect to the period covered by this report;
3.Based on my knowledge, the financial statements, and other financial information included in this report, fairly present in all material respects the financial condition, results of operations and cash flows of the registrant as of, and for, the periods presented in this report;
4.The registrant’s other certifying officer and I are responsible for establishing and maintaining disclosure controls and procedures (as defined in Exchange Act Rules 13a-15(e) and 15d-15(e)) and internal control over financial reporting (as defined in Exchange Act Rules 13a-15(f) and 15d-15(f)) for the registrant and have:
a.Designed such disclosure controls and procedures, or caused such disclosure controls and procedures to be designed under our supervision, to ensure that material information relating to the registrant, including its consolidated subsidiaries, is made known to us by others within those entities, particularly during the period in which this report is being prepared;
b.Designed such internal control over financial reporting, or caused such internal control over financial reporting to be designed under our supervision, to provide reasonable assurance regarding the reliability of financial reporting and the preparation of financial statements for external purposes in accordance with generally accepted accounting principles;
c.Evaluated the effectiveness of the registrant’s disclosure controls and procedures and presented in this report our conclusions about the effectiveness of the disclosure controls and procedures, as of the end of the period covered by this report based on such evaluation; and
d.Disclosed in this report any change in the registrant’s internal control over financial reporting that occurred during the registrant’s most recent fiscal quarter (the registrant’s fourth fiscal quarter in the case of an annual report) that has materially affected, or is reasonably likely to materially affect, the registrant’s internal control over financial reporting; and
5.The registrant’s other certifying officer and I have disclosed, based on our most recent evaluation of internal control over financial reporting, to the registrant’s auditors and the audit committee of the registrant’s board of directors (or persons performing the equivalent functions):
a.Any significant deficiencies and material weaknesses in the design or operation of internal control over financial reporting which are reasonably likely to adversely affect the registrant’s ability to record, process, summarize and report financial information; and
b.Any fraud, whether or not material, that involves management or other employees who have a significant role in the registrant’s internal control over financial reporting.
|
|
|
|
|
|
| |
/s/ Corey A. Chambas |
| |
Corey A. Chambas |
|
Chief Executive Officer |
|
February 28, 2024 |
EX-31.2
6
fbiz20231231exhibit312.htm
EX-31.2
Document
Exhibit 31.2
Certifications
I, Brian D. Spielmann, certify that:
1.I have reviewed this Annual Report on Form 10-K of First Business Financial Services, Inc.;
2.Based on my knowledge, this report does not contain any untrue statement of a material fact or omit to state a material fact necessary to make the statements made, in light of the circumstances under which such statements were made, not misleading with respect to the period covered by this report;
3.Based on my knowledge, the financial statements, and other financial information included in this report, fairly present in all material respects the financial condition, results of operations and cash flows of the registrant as of, and for, the periods presented in this report;
4.The registrant’s other certifying officer and I are responsible for establishing and maintaining disclosure controls and procedures (as defined in Exchange Act Rules 13a-15(e) and 15d-15(e)) and internal control over financial reporting (as defined in Exchange Act Rules 13a-15(f) and 15d-15(f)) for the registrant and have:
a.Designed such disclosure controls and procedures, or caused such disclosure controls and procedures to be designed under our supervision, to ensure that material information relating to the registrant, including its consolidated subsidiaries, is made known to us by others within those entities, particularly during the period in which this report is being prepared;
b.Designed such internal control over financial reporting, or caused such internal control over financial reporting to be designed under our supervision, to provide reasonable assurance regarding the reliability of financial reporting and the preparation of financial statements for external purposes in accordance with generally accepted accounting principles;
c.Evaluated the effectiveness of the registrant’s disclosure controls and procedures and presented in this report our conclusions about the effectiveness of the disclosure controls and procedures, as of the end of the period covered by this report based on such evaluation; and
d.Disclosed in this report any change in the registrant’s internal control over financial reporting that occurred during the registrant’s most recent fiscal quarter (the registrant’s fourth fiscal quarter in the case of an annual report) that has materially affected, or is reasonably likely to materially affect, the registrant’s internal control over financial reporting; and
5.The registrant’s other certifying officer and I have disclosed, based on our most recent evaluation of internal control over financial reporting, to the registrant’s auditors and the audit committee of the registrant’s board of directors (or persons performing the equivalent functions):
a.Any significant deficiencies and material weaknesses in the design or operation of internal control over financial reporting which are reasonably likely to adversely affect the registrant’s ability to record, process, summarize and report financial information; and
b.Any fraud, whether or not material, that involves management or other employees who have a significant role in the registrant’s internal control over financial reporting.
|
|
|
|
|
|
| |
/s/ Brian D. Spielmann |
| |
Brian D. Spielmann |
|
Chief Financial Officer |
|
February 28, 2024 |
EX-32
7
fbiz20231231exhibit32.htm
EX-32
Document
Exhibit 32
Certification of the Chief Executive Officer and the Chief Financial Officer Pursuant to 18 U.S.C. Section 1350
Solely for the purposes of complying with 18 U.S.C. Section 1350, as adopted pursuant to Section 906 of the Sarbanes-Oxley Act of 2002, we, the undersigned Chief Executive Officer and Chief Financial Officer, of First Business Financial Services, Inc., a Wisconsin Corporation (the “Corporation”), hereby certify, based on our knowledge that the Annual Report on Form 10-K of the Corporation for the quarter ended December 31, 2023 (the “Report”) fully complies with the requirements of Section 13(a) or Section 15(d) of the Securities Exchange Act of 1934, as amended, and that information contained in the Report fairly presents, in all material respects, the financial condition and results of operations of the Corporation.
|
|
|
|
|
|
| |
/s/ Corey A. Chambas |
| |
Corey A. Chambas |
|
Chief Executive Officer |
|
February 28, 2024 |
| |
|
| |
/s/ Brian D. Spielmann |
| |
Brian D. Spielmann |
|
Chief Financial Officer |
|
February 28, 2024 |
EX-97
8
fbiz20231231exhibit97.htm
EX-97
Document
First Business Financial Services, Inc.
Executive Officer Compensation Recovery Policy
October 2023
A.PURPOSE.
The purpose of this Policy is to describe the circumstances in which Executive Officers will be required to repay or return Erroneously Awarded Compensation to members of the Company Group in the event of an Accounting Restatement. Each Executive Officer shall be required to sign and return to the Company the Acknowledgement Form attached hereto as Exhibit A. This Policy is designed to comply with, and shall be interpreted to be consistent with, Section 10D of the Exchange Act, Rule 10D-1 promulgated under the Exchange Act and Rule 5608 of the Nasdaq listing rules.
A.ADMINISTRATION.
This Policy shall be administered by the Committee. Any determinations made by the Committee shall be final and binding on all affected individuals.
A.DEFINITIONS.
For purposes of this Policy, the following capitalized terms shall have the meanings set forth below.
“Accounting Restatement” shall mean an accounting restatement (i) due to the material noncompliance of the Company with any financial reporting requirement under the securities laws, including any required accounting restatement to correct an error in previously issued financial statements that is material to the previously issued financial statements (a “Big R” restatement), or (ii) that corrects an error that is not material to previously issued financial statements, but would result in a material misstatement if the error were corrected in the current period or left uncorrected in the current period (a “little r” restatement).
“Clawback Eligible Incentive Compensation” shall mean, in connection with an Accounting Restatement and with respect to each individual who served as an Executive Officer at any time during the applicable performance period for any Incentive-Based Compensation (whether or not such Executive Officer is serving at the time the Erroneously Awarded Compensation is required to be repaid to the Company Group), all Incentive-Based Compensation Received by such Executive Officer (i) on or after the Effective Date, (ii) after beginning service as an Executive Officer, (iii) while the Company has a class of securities listed on a national securities exchange or a national securities association, and (iv) during the applicable Clawback Period.
“Clawback Period” shall mean, with respect to any Accounting Restatement, the three (3) completed fiscal years of the Company immediately preceding the Restatement Date and any transition period (that results from a change in the Company’s fiscal year) within or immediately following those three (3) completed fiscal years. However, a transition period between the last day of the Company’s previous fiscal year end and the first day of its new fiscal year that comprises a period of nine (9) to twelve (12) months shall be deemed a completed fiscal year.
“Committee” shall mean the Compensation Committee of the Board of Directors of the Company.
“Company” shall mean First Business Financial Services, Inc., a Wisconsin corporation.
“Company Group” shall mean the Company, together with each of its direct and indirect subsidiaries.
“Effective Date” shall mean October 2, 2023.
“Erroneously Awarded Compensation” shall mean, with respect to each Executive Officer in connection with an Accounting Restatement, the amount of Clawback Eligible Incentive Compensation that is Received by such Executive Officer that exceeds the amount of Incentive-Based Compensation that otherwise would have been Received by such Executive Officer had it been determined based on the restated amounts, computed without regard to any taxes paid. With respect to any compensation plans or programs that take into account Incentive-Based Compensation, the amount of Erroneously Awarded Compensation subject to recovery hereunder includes, but is not limited to, the amount contributed to any notional account based on Erroneously Awarded Compensation and any earnings accrued to date on that notional amount.
“Executive Officer” shall mean each individual who is or was designated as an “officer” of the Company in accordance with 17 C.F.R. 240.16a-1(f). Identification of an executive officer for purposes of this Policy shall include at a minimum executive officers identified pursuant to 17 C.F.R. 229.401(b).
“Exchange Act” shall mean the Securities Exchange Act of 1934, as amended.
“Financial Reporting Measures” shall mean measures that are determined and presented in accordance with the accounting principles used in preparing the Company’s financial statements, and any measures that are derived wholly or in part from such measures. Stock price and total shareholder return (and any measures that are derived wholly or in part from stock price or total shareholder return) shall for purposes of this Policy be considered Financial Reporting Measures. For the avoidance of doubt, a Financial Reporting Measure need not be presented in the Company’s financial statements or included in a filing with the SEC.
“Incentive-Based Compensation” shall mean any compensation that is granted, earned, or vested based wholly or in part upon the attainment of a Financial Reporting Measure for any fiscal period ending on or after the Effective Date.
“Nasdaq” shall mean The Nasdaq Stock Market.
“Policy” shall mean this Executive Officer Compensation Recovery Policy, as the same may be amended or restated from time to time.
“Received” shall, with respect to any Incentive-Based Compensation, mean actual or deemed receipt by the Executive Officer. Incentive-Based Compensation shall be deemed received in the Company’s fiscal period during which the Financial Reporting Measure specified in the Incentive-Based Compensation award or applicable granting policy is attained, even if payment or grant of the Incentive-Based Compensation occurs after the end of that period.
“Restatement Date” shall mean the earlier to occur of (i) the date the Board of Directors, a committee of the Board of Directors, or the officers of the Company authorized to take such action if Board of Directors’ action is not required, concludes, or reasonably should have concluded, that the Company is required to prepare an Accounting Restatement, or (ii) the date a court, regulator, or other legally authorized body directs the Company to prepare an Accounting Restatement.
“SEC” shall mean the U.S. Securities and Exchange Commission.
A.Repayment of Erroneously Awarded Compensation.
a.In the event of an Accounting Restatement, the Committee shall promptly (and in all events within ninety (90) days after the Restatement Date) determine the amount of any Erroneously Awarded Compensation for each Executive Officer in connection with such Accounting Restatement and shall promptly thereafter provide each Executive Officer with a written notice containing the amount of Erroneously Awarded Compensation and a demand for repayment or return, as applicable. For Incentive-Based Compensation based on (or derived from) stock price or total shareholder return where the amount of Erroneously Awarded Compensation is not subject to mathematical recalculation directly from the information in the applicable Accounting Restatement, the amount shall be determined by the Committee based on a reasonable estimate of the effect of the Accounting Restatement on the stock price or total shareholder return upon which the Incentive-Based Compensation was Received (in which case, the Company shall maintain documentation of such determination of that reasonable estimate and provide such documentation to the Nasdaq).
a.The Committee shall have broad discretion to determine the appropriate means of recovery of Erroneously Awarded Compensation based on all applicable facts and circumstances and taking into account the time value of money and the cost to shareholders of delaying recovery. To the extent that the Committee determines that any method of recovery other than repayment by the Executive Officer in a lump sum in cash or property is appropriate, the Company shall offer to enter into a repayment agreement (in a form reasonably acceptable to the Committee) with the Executive Officer. If the Executive Officer accepts such offer and signs the repayment agreement within thirty (30) days after such offer is extended, the Company shall countersign such repayment agreement. If the Executive Officer fails to sign the repayment agreement within thirty (30) days after such offer is extended, the Executive Officer will be required to repay the Erroneously Awarded Compensation in a lump sum in cash (or such property as the Committee agrees to accept with a value equal to such Erroneously Awarded Compensation) on or prior to the date that is one hundred twenty (120) days following the Restatement Date. For the avoidance of doubt, except as set forth in paragraph IV(d) below, in no event may the Company accept an amount that is less than the amount of Erroneously Awarded Compensation in satisfaction of an Executive Officer’s obligations hereunder.
a.To the extent that an Executive Officer fails to repay all Erroneously Awarded Compensation to the Company Group when due (as determined in accordance with paragraph IV(b) above), the Company shall, or shall cause one or more other members of the Company Group to, take all actions reasonable and appropriate to recover such Erroneously Awarded Compensation from the applicable Executive Officer. The applicable Executive Officer shall be required to reimburse the Company Group for any and all expenses reasonably incurred (including legal fees) by the Company Group in recovering such Erroneously Awarded Compensation in accordance with the immediately preceding sentence.
a.Notwithstanding anything herein to the contrary, the Company shall not be required to take the actions contemplated by paragraph IV(b) above if any of the following conditions are met and the Committee determines that recovery would be impracticable:
i.The direct expenses paid to a third party to assist in enforcing the Policy against an Executive Officer would exceed the amount to be recovered, after the Company has made a reasonable attempt to recover the applicable Erroneously Awarded Compensation, documented such attempts and provided such documentation to the Nasdaq;
i.Recovery would violate home country law where that law was adopted prior to November 28, 2022, provided that, before determining that it would be impracticable to recover any amount of Erroneously Awarded Compensation based on violation of home country law, the Company has obtained an opinion of home country counsel, acceptable to the Nasdaq, that recovery would result in such a violation and a copy of the opinion is provided to the Nasdaq; or
i.Recovery would likely cause an otherwise tax-qualified retirement plan, under which benefits are broadly available to employees of the Company, to fail to meet the requirements of 26 U.S.C. 401(a)(13) or 26 U.S.C. 411(a) and regulations thereunder.
A.Reporting and Disclosure.
The Company shall file all disclosures with respect to this Policy in accordance with the requirements of the federal securities laws, including the disclosure required by the applicable SEC filings.
A.ACKNOWLEDGEMENT.
Each Executive Officer shall sign and return to the Company the Acknowledgement Form attached hereto as Exhibit A, within 30 calendar days following the later of (i) the date of adoption of this Policy or (ii) the date the individual becomes an Executive Officer, pursuant to which the Executive Officer agrees to be bound by, and to comply with, the terms and conditions of this Policy.
A.Indemnification Prohibition.
The Company Group shall not be permitted to indemnify any Executive Officer against (i) the loss of any Erroneously Awarded Compensation that is repaid, returned, or recovered pursuant to the terms of this Policy, or (ii) any claims relating to the Company Group’s enforcement of its rights under this Policy. Further, the Company Group shall not enter into any agreement that exempts any Incentive-Based Compensation from the application of this Policy or that waives the Company Group’s right to recovery of any Erroneously Awarded Compensation and this Policy shall supersede any such agreement (whether entered into before, on, or after the date this Policy was adopted).
A.Interpretation.
The Committee is authorized to interpret and construe this Policy and to make all determinations necessary, appropriate, or advisable for the administration of this Policy.
A.Amendment; Termination.
The Committee may amend this Policy from time to time in its discretion and shall amend this Policy as it deems necessary, including as and when it determines that it is legally required by any federal securities laws, SEC rule or the rules of any national securities exchange or national securities association on which the Company’s securities are listed. The Committee may terminate this Policy at any time. Notwithstanding anything in this paragraph to the contrary, no amendment or termination of this Policy shall be effective if such amendment or termination would (after taking into account any actions taken by the Company contemporaneously with such amendment or termination) cause the Company to violate any federal securities laws, SEC rule or the rules of any national securities exchange or national securities association on which the Company’s securities are listed.
A.Other Recoupment Rights; No Additional Payments.
The Committee intends that this Policy will be applied to the fullest extent of the law. The Committee may require that any employment agreement, equity award agreement, or any other agreement entered into on or after the date of adoption of this Policy shall, as a condition to the grant of any benefit thereunder, require an Executive Officer to agree to abide by the terms of this Policy. Any right of recoupment under this Policy is in addition to, and not in lieu of, any other remedies or rights of recoupment that may be available to the Company Group under applicable law, regulation, or rule or pursuant to the terms of any similar policy in any employment agreement, equity award agreement, or similar agreement and any other legal remedies available to the Company.
A.Successors.
This Policy shall be binding and enforceable against all Executive Officers and their beneficiaries, heirs, executors, administrators, or other legal representatives.
* * * * *
Adopted by the First Business Financial Services, Inc. Board of Directors: October 27, 2023
Exhibit A
EXECUTIVE OFFICER COMPENSATION RECOVERY POLICY
ACKNOWLEDGEMENT FORM
By signing below, the undersigned acknowledges and confirms that the undersigned has received and reviewed a copy of First Business Financial Services, Inc.’s Executive Officer Compensation Recovery Policy (the “Policy”). Capitalized terms used but not otherwise defined in this Acknowledgement Form (this “Acknowledgement Form”) shall have the meanings ascribed to such terms in the Policy.
By signing this Acknowledgement Form, the undersigned acknowledges and agrees that the undersigned is and will continue to be subject to the Policy and that the Policy will apply both during and after the undersigned’s employment with First Business Financial Services, Inc. Further, by signing below, the undersigned agrees to abide by the terms of the Policy, including, without limitation, by returning any Erroneously Awarded Compensation (as defined in the Policy) to First Business Financial Services, Inc. to the extent required by, and in a manner permitted by, the Policy, and hereby further waives any rights to indemnification that would be prohibited by paragraph VII.
|
|
|
|
|
|
|
Signature: _______________________________
Printed Name: ____________________________
Title: ___________________________________
Date: ___________________________________
|
|
29972324.5