
Nasdaq: HMST 1st Quarter 2024 April 30, 2024

Important Disclosures Forward-Looking Statements This presentation includes forward-looking statements, as that term is defined for purposes of applicable securities laws, about our proposed merger (the “Merger”) with FirstSun Capital Bancorp, Inc. (“FirstSun”), our industry, our future financial performance, business plans and expectations. These statements are, in essence, attempts to anticipate or forecast future events, and thus subject to many risks and uncertainties. These forward-looking statements are based on our management's current expectations, beliefs, projections, and related to future plans and strategies, anticipated events, outcomes, or trends, as well as a number of assumptions concerning future events, are not historical facts and are identified by words such as “anticipate,” “believe,” “could,” “estimate,” “expect,” “intend,” “may,” “plan,” “potential,” “should,” “will,” “would” and similar expressions. Forward-looking statements in this presentation include, among other matters, statements regarding anticipated timing to complete the proposed Merger, anticipated expenses of the Merger, our business plans and strategies, general economic trends, strategic initiatives we have announced, growth scenarios and performance targets and key drivers guidance with respect to loans held for investment, average deposits, net interest margin, noninterest income and noninterest expense. Readers should note, however, that all statements in this presentation other than assertions of historical fact are forward-looking in nature. These statements are subject to risks, uncertainties, assumptions and other important factors set forth in our SEC filings, including but not limited to our Annual Report on Form 10-K for the year ended December 31, 2023 and any amendments there to filed on Form10-K/A, and in our subsequent quarterly reports on Forms 10-Q and Forms 8-K. Many of these factors and events and their impact on the volatility in our stock price and shareholders’ response to those events and factors are beyond our control. Such factors could cause actual results to differ materially from the results discussed or implied in the forward-looking statements. These risks include, without limitation, our ability to successfully consummate the Merger with FirstSun, the ability of HomeStreet to obtain the necessary approval by shareholders with respect to the Merger, the ability of HomeStreet and FirstSun to obtain required governmental approvals of the Merger, the failure to satisfy the closing conditions in the definitive Agreement and Plan of Merger (the “Merger Agreement”), dated as of January 16, 2024, by and between HomeStreet and FirstSun, or any unexpected delay in closing the Merger, the ability to achieve expected cost savings, synergies and other financial benefits from the Merger within the expected time frames and costs or difficulties relating to integration matters being greater than expected, the diversion of management time from core banking functions due to Merger-related issues; potential difficulty in maintaining relationships with customers, associates or business partners as a result of the announced Merger, changes in the U.S. and global economies, including business disruptions, reductions in employment, inflationary pressures and an increase in business failures, specifically among our customers; changes in the interest rate environment may reduce interest margins; changes in deposit flows, loan demand or real estate values may adversely affect the business of the Bank, through which substantially all of our operations are carried out; there may be increases in competitive pressure among financial institutions or from non-financial institutions; our ability to attract and retain key members of our senior management team; the timing and occurrence or non- occurrence of events may be subject to circumstances beyond our control; our ability to control operating costs and expenses; our credit quality and the effect of credit quality on our credit losses expense and allowance for credit losses; the adequacy of our allowance for credit losses; changes in accounting principles, policies or guidelines may cause our financial condition to be perceived or interpreted differently; legislative or regulatory changes that may adversely affect our business or financial condition, including, without limitation, changes in corporate and/or individual income tax laws and policies, changes in privacy laws, and changes in regulatory capital or other rules, and the availability of resources to address or respond to such changes; general economic conditions, either nationally or locally in some or all areas in which we conduct business, or conditions in the securities markets or banking industry, may be less favorable than what we currently anticipate; challenges our customers may face in meeting current underwriting standards may adversely impact all or a substantial portion of the value of our rate-lock loan activity we recognize; technological changes may be more difficult or expensive than what we anticipate; a failure in or breach of our operational or security systems or information technology infrastructure, or those of our third-party providers and vendors, including due to cyber-attacks; success or consummation of new business initiatives may be more difficult or expensive than what we anticipate; our ability to grow efficiently both organically and through acquisitions and to manage our growth and integration costs; staffing fluctuations in response to product demand or the implementation of corporate strategies that affect our work force and potential associated charges; litigation, investigations or other matters before regulatory agencies, whether currently existing or commencing in the future, may delay the occurrence or non-occurrence of events longer than what we anticipate; and our ability to obtain regulatory approvals or non-objection to take various capital actions, including the payment of dividends by us or the Bank, or repurchases of our common stock. Actual results may fall materially short of our expectations and projections, and we may be unable to execute on our strategic initiatives, or we may change our plans or take additional actions that differ in material ways from our current intentions. Accordingly, we can give no assurance of future performance, and you should not rely unduly on forward-looking statements. All forward-looking statements are based on information available to us as of the date hereof, and we do not undertake to update or revise any forward-looking statements for any reason. As used in this presentation, "HMST," "HomeStreet," the "Company," "we," "us," "our," or similar references refer to HomeStreet, Inc., a Washington corporation, and its consolidated subsidiary, HomeStreet Bank (the "Bank"). Non-GAAP Financial Measures This presentation contains supplemental financial information determined by methods other than in accordance with U.S. generally accepted accounting principles ("GAAP"). Information on any non-GAAP financial measures such as core measures or tangible measures referenced in this presentation, including a reconciliation of those measures to GAAP measures, may also be found in the appendix, our SEC filings, and in the earnings release available on our web site. p. 1

Highlights and Developments p. 2 Quarterly Results • Net loss of $7.5 million, or $0.40 per share • Net interest margin of 1.44% • Loans held for investment remained stable • Excluding broker deposits, total deposits increased $25 million to $5.6 billion • Uninsured deposits were $494 million as of March 31, 2024 (8% of total deposits) • Nonperforming assets to total assets 0.56% on March 31, 2024 • Book value per share of $27.96 and tangible book value per share of $27.49(1) on March 31, 2024 Other Results • Announced a Merger Agreement with FirstSun Bank, estimated to close 2024, pending shareholder and regulatory approvals • Two branches closed and consolidated into other branches during the first quarter of 2024 HomeStreet’s results reflect the challenges of rising interest rates and competition for deposits. (1) See appendix for reconciliation of non-GAAP financial measures.

Seattle Metro Washington Oregon Idaho Utah California Hawaii Southern California Retail deposit branches (56) Primary stand-alone insurance office (1) Primary stand-alone lending centers (4)HomeStreet p. 3 The number of offices depicted does not include satellite offices that have a limited number of staff which report to a manager located in a separate primary office. • Seattle-based diversified commercial & consumer bank – company founded in 1921 • Serving customers throughout the western United States • Total assets $9.5 billion Market Focus: • Seattle / Puget Sound • Southern California • Portland, OR • Hawaiian Islands • Idaho/Utah(Single Family Construction Lending)

p. 4 Strategy • Long term strategy to replace borrowings and certificates of deposit with transaction accounts through organic growth • Demonstrated ability to attract deposits at interest rates meaningfully below wholesale borrowing rates • Hedged borrowings to mitigate risk of continued increases in interest rates Current loan production strategy • Substantially reduced production levels in 2023 and first quarter of 2024 • Focus on variable rate loan production Higher Interest Rate Environment
p. 5 • Low level of uninsured deposits • Diversified deposit base • Continuing ability to attract new deposit clients • Strong on balance sheet and contingent Liquidity • New loan originations focus is on variable rate products Funding Overview

p. 6 Diversified Deposit Base: • The average balance of our noninterest-bearing consumer deposit accounts as of March 31, 2024, was $7,000 and overall average consumer deposit account balance was $28,000. • The average balance of our noninterest-bearing business deposit accounts as of March 31, 2024, was $64,000 and overall average business deposit account balance was $93,000. • As a percentage of our deposit portfolio, our top ten customers make up only 4.7% of our total deposit balances. • Uninsured deposits of $494 million as of March 31, 2024 (8% of total deposits) Continuing ability to attract new deposit clients • Our branch system added 123 new business customers in Q1 2024. • Commercial banking added 25 new customers in Q1 2024. Liquidity: • Our on-balance sheet liquidity as of March 31, 2024, was 14%. • Our available contingent liquidity borrowing sources ($5.1 billion) equal to 78% of the total amount of deposits outstanding as of March 31, 2024. • Optimizing funding costs by utilizing least cost option (borrowings / brokered deposits) Liquidity Considerations

$9.05 $9.11 $9.01 $8.92 $9.09 4.35% 4.45% 4.46% 4.52% 4.54% 3.0% 3.5% 4.0% 4.5% 5.0% $0 $1 $2 $3 $4 $5 $6 $7 $8 $9 $10 1Q23 2Q23 3Q23 4Q23 1Q24 Investment Securities Loans Average Yield Interest-Earning Assets p. 7 Average Balances $ Billions Average Rate Percent $49.4 $43.5 $38.9 $35.0 $32.2 2.23% 1.93% 1.74% 1.59% 1.44% 0 10 20 30 40 50 60 1Q23 2Q23 3Q23 4Q23 1Q24 Net Interest Income Net Interest Margin Net Interest Income & Margin $ Millions $7.27 $7.44 $7.37 $7.39 $7.53 2.64% 3.08% 3.33% 3.55% 3.74% 1.79% 2.01% 2.25% 2.58% 2.59% 0.0% 0.5% 1.0% 1.5% 2.0% 2.5% 3.0% 3.5% 4.0% $0 $1 $2 $3 $4 $5 $6 $7 $8 1Q23 2Q23 3Q23 4Q23 1Q24 Total Borrowings Interest Bearing Deposits Average Rate Period End Cost of Deposits Interest-Bearing Liabilities Average Balances $ Billions 21% 21% 21% 19% 20% 41% 38% 35% 33% 33% 38% 41% 44% 48% 47% 10% 20% 30% 40% 50% 60% 70% 80% 90% 100% $- $1 $2 $3 $4 $5 $6 $7 $8 1Q23 2Q23 3Q23 4Q23 1Q24 Time Deposits Interest-Bearing Transaction & Savings Deposits Noninterest-Bearing Transaction & Savings Deposits Consumer Deposits Deposits Period End Balances $ Billions $7.06 $6.67 $6.75 $6.76 $6.49

$10.2 $10.3 $10.5 $11.0 $9.5 $0 $10 $20 1Q23 2Q23 3Q23 4Q23 1Q24 Net Gain on Single Family Loan Sales Net Gain on Commercial & CRE Loan Sales Loan Servicing Income Deposit Fees Other Noninterest Income p. 8 $ Millions Other consists of insurance agency commissions, swap income, gain (loss) on sale of securities, and other miscellaneous income
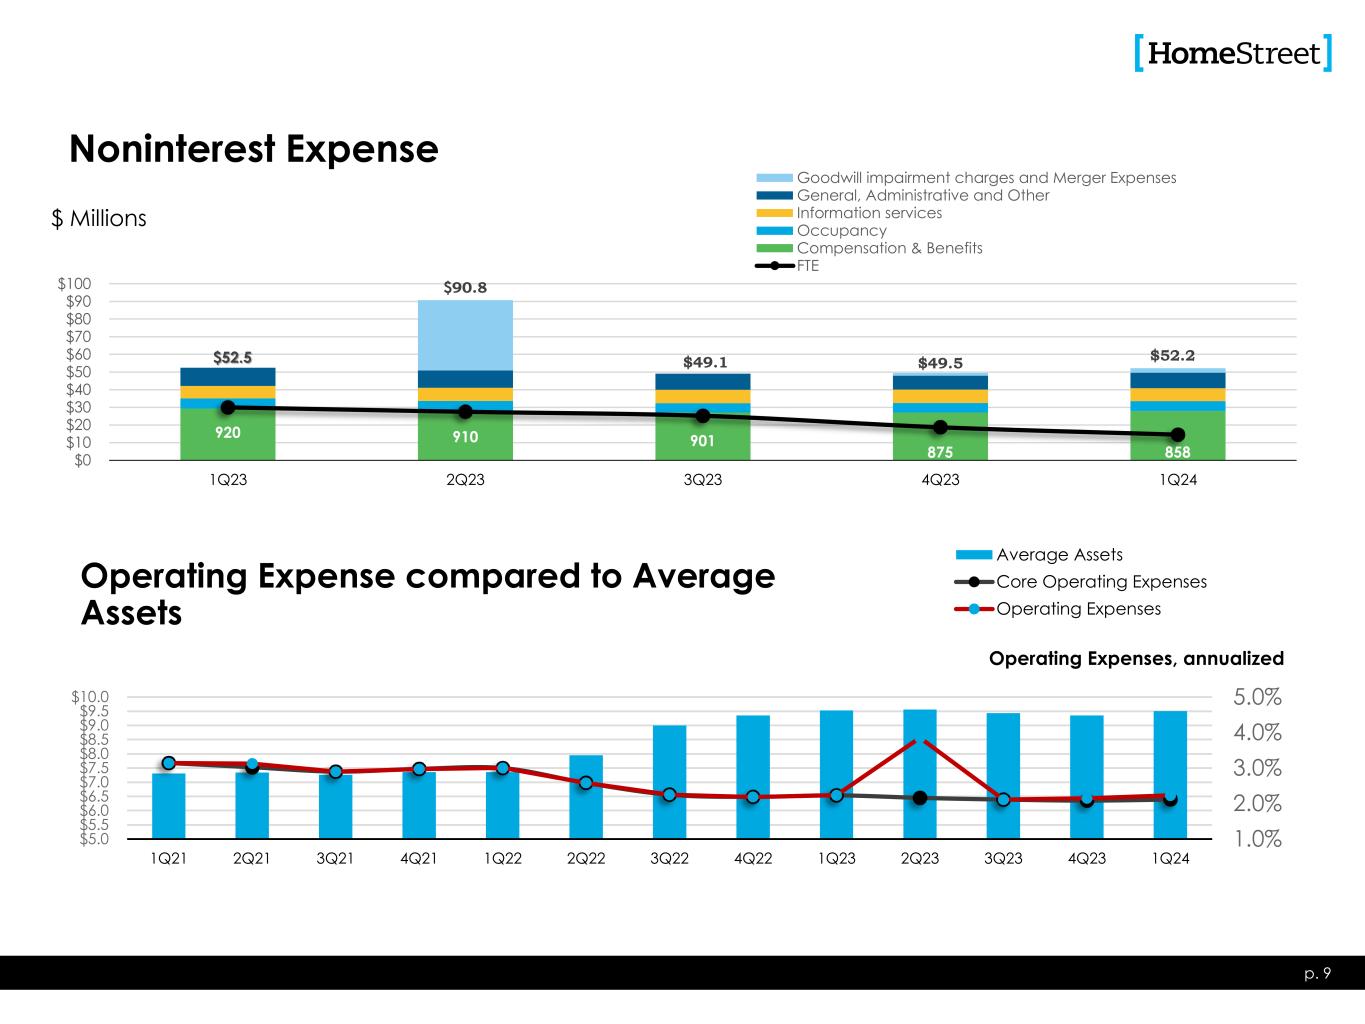
Noninterest Expense p. 9 $ Millions 1.0% 2.0% 3.0% 4.0% 5.0% $5.0 $5.5 $6.0 $6.5 $7.0 $7.5 $8.0 $8.5 $9.0 $9.5 $10.0 1Q21 2Q21 3Q21 4Q21 1Q22 2Q22 3Q22 4Q22 1Q23 2Q23 3Q23 4Q23 1Q24 Average Assets Core Operating Expenses Operating Expenses Operating Expense compared to Average Assets Operating Expenses, annualized $52.5 $90.8 $49.1 $49.5 $52.2 920 910 901 875 858$0 $10 $20 $30 $40 $50 $60 $70 $80 $90 $100 1Q23 2Q23 3Q23 4Q23 1Q24 Goodwill impairment charges and Merger Expenses General, Administrative and Other Information services Occupancy Compensation & Benefits FTE
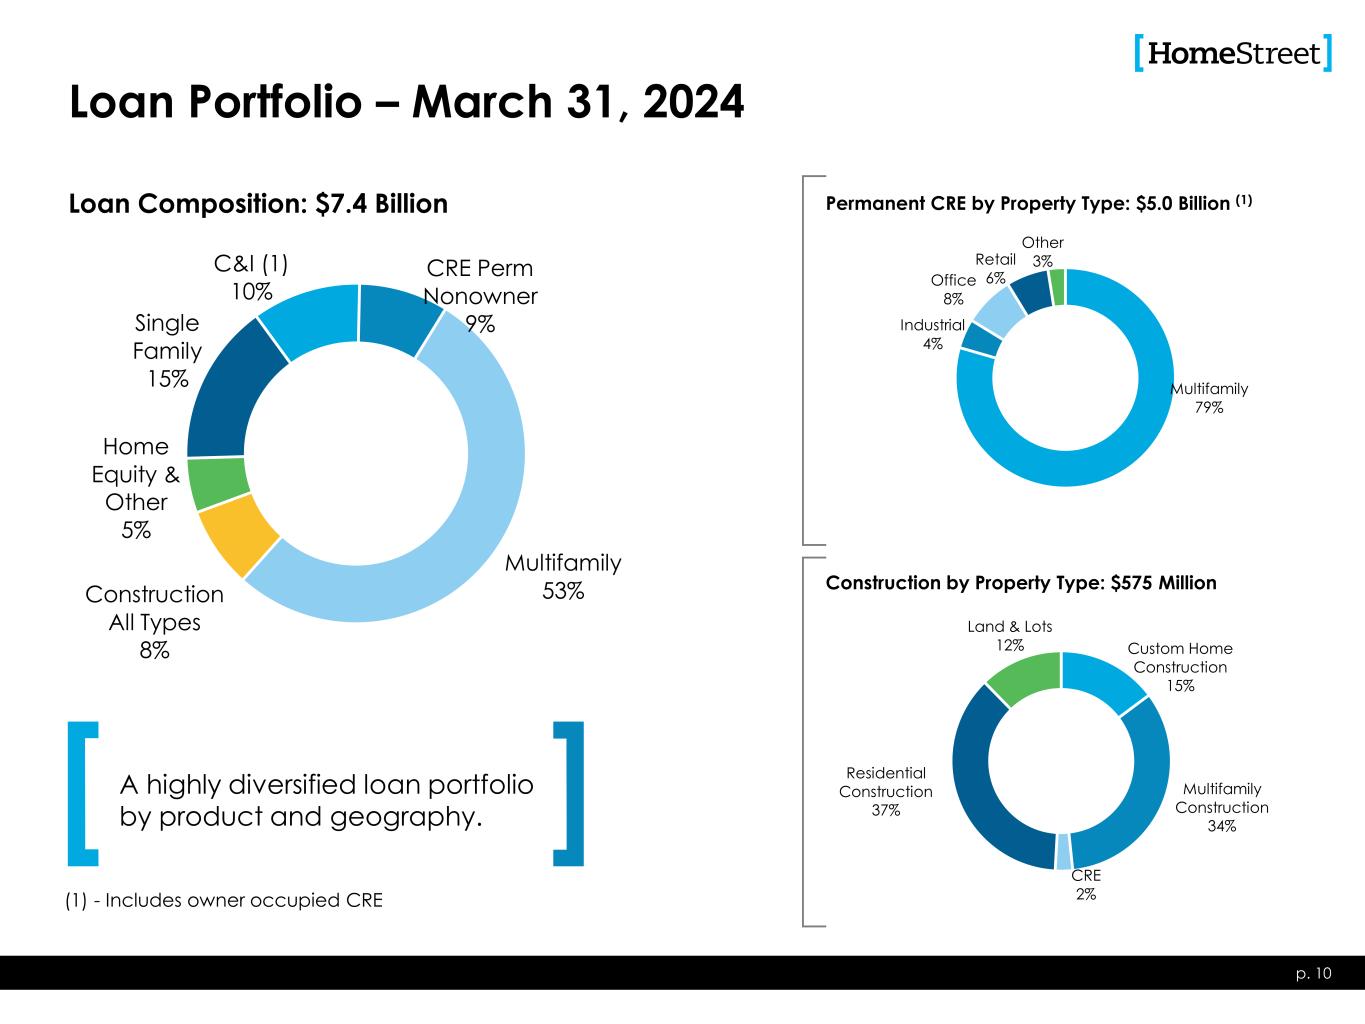
C&I (1) 10% CRE Perm Nonowner 9% Multifamily 53%Construction All Types 8% Home Equity & Other 5% Single Family 15% Loan Portfolio – March 31, 2024 p. 10 A highly diversified loan portfolio by product and geography. Multifamily 79% Industrial 4% Office 8% Retail 6% Other 3% Permanent CRE by Property Type: $5.0 Billion (1) Custom Home Construction 15% Multifamily Construction 34% CRE 2% Residential Construction 37% Land & Lots 12% Construction by Property Type: $575 Million Loan Composition: $7.4 Billion (1) - Includes owner occupied CRE

Permanent Commercial Real Estate Lending Overview March 31, 2024 • Up To 30 Year Term • $30MM Loan Amt. Max • ≥ 1.15 DSCR • Avg. LTV @ Orig. ~ 60% p. 11 Loan Characteristics • Up To 15 Year Term • $30MM Loan Amt. Max • ≥ 1.25 DSCR • Avg. LTV @ Orig. ~ 59% • Up To 15 Year Term • $30MM Loan Amt. Max • ≥ 1.25 DSCR • Avg. LTV @ Orig. ~ 65% • Up To 15 Year Term • $30MM Loan Amt. Max • ≥ 1.25 DSCR • Avg. LTV @ Orig. ~ 54% • Additional property types are reviewed on a case by case basis • Includes acquired loan types • Examples include: hotels, schools, churches, marinas • Balance: $3.9B • % of Balances: 79% • Portfolio Avg. LTV ~ 57%(1) • Portfolio Avg. DSCR ~ 1.51x • Avg. Loan Size: $5.4M • Largest Dollar Loan: $48.0M 03/31/2024 Balances Outstanding Totaling $5.0 Billion • Balance: $214M • % of Balances: 4% • % Owner Occupied: 51% • Portfolio LTV ~ 47%(1) • Portfolio Avg. DSCR ~ 2.18x • Avg. Loan Size: $2.5M • Largest Dollar Loan: $21.3M • Balance: $369M • % of Balances: 8% • % Owner Occupied: 29% • Portfolio LTV ~ 53%(1) • Portfolio Avg. DSCR ~ 1.61x • Avg. Loan Size: $2.4M • Largest Dollar Loan: $23.4M • Balance: $307M • % of Balances: 6% • % Owner Occupied: 24% • Portfolio LTV ~ 45%(1) • Portfolio Avg. DSCR ~ 1.70x • Avg. Loan Size: $2.9M • Largest Dollar Loan: $15.4M • Balance: $126M • % of Balances: 3% • % of Owner Occupied: 72% • Portfolio LTV ~ 38%(1) • Portfolio Avg. DSCR ~ 1.93x • Avg. Loan Size: $3.0M • Largest Dollar Loan: $20.0M 46% 22% 8% 15% 6% 3% Geographical Distribution (Balances) Multifamily 15% 29% 2%2% 44% 8% Industrial / Warehouse 16% 14% 4% 6% 47% 13% Office 18% 24%8% 7% 41% 2% Retail 8% 7% 1% 70% 14% Other CA Los Angeles County CA Other Oregon Other WA King/Pierce/Snohomish WA Other (1) Property values as of origination date. • HomeStreet lends across the full spectrum of commercial real estate lending types, but is deliberate in its effort to achieve diversification among property types and geographic areas to mitigate concentration risk. • “Other” category includes loans secured by Schools ($55.5 million), Hotels ($12.6 million), and Churches ($10.1 million).
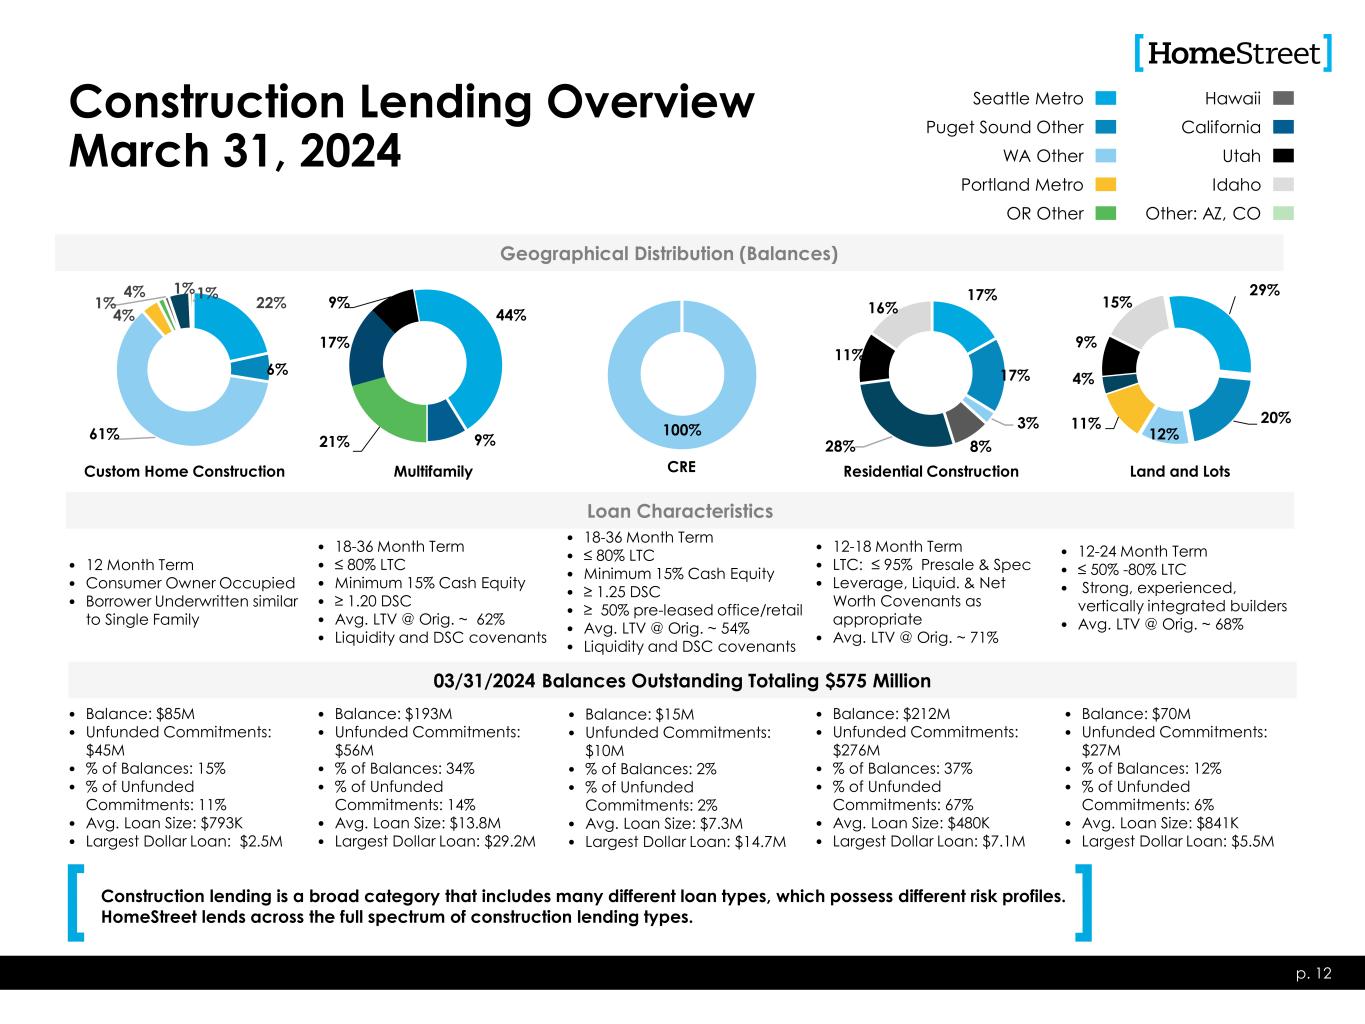
Construction Lending Overview March 31, 2024 • 12 Month Term • Consumer Owner Occupied • Borrower Underwritten similar to Single Family p. 12 Loan Characteristics • 18-36 Month Term • ≤ 80% LTC • Minimum 15% Cash Equity • ≥ 1.20 DSC • Avg. LTV @ Orig. ~ 62% • Liquidity and DSC covenants • 18-36 Month Term • ≤ 80% LTC • Minimum 15% Cash Equity • ≥ 1.25 DSC • ≥ 50% pre-leased office/retail • Avg. LTV @ Orig. ~ 54% • Liquidity and DSC covenants • 12-18 Month Term • LTC: ≤ 95% Presale & Spec • Leverage, Liquid. & Net Worth Covenants as appropriate • Avg. LTV @ Orig. ~ 71% • 12-24 Month Term • ≤ 50% -80% LTC • Strong, experienced, vertically integrated builders • Avg. LTV @ Orig. ~ 68% • Balance: $85M • Unfunded Commitments: $45M • % of Balances: 15% • % of Unfunded Commitments: 11% • Avg. Loan Size: $793K • Largest Dollar Loan: $2.5M 03/31/2024 Balances Outstanding Totaling $575 Million • Balance: $193M • Unfunded Commitments: $56M • % of Balances: 34% • % of Unfunded Commitments: 14% • Avg. Loan Size: $13.8M • Largest Dollar Loan: $29.2M • Balance: $15M • Unfunded Commitments: $10M • % of Balances: 2% • % of Unfunded Commitments: 2% • Avg. Loan Size: $7.3M • Largest Dollar Loan: $14.7M • Balance: $212M • Unfunded Commitments: $276M • % of Balances: 37% • % of Unfunded Commitments: 67% • Avg. Loan Size: $480K • Largest Dollar Loan: $7.1M • Balance: $70M • Unfunded Commitments: $27M • % of Balances: 12% • % of Unfunded Commitments: 6% • Avg. Loan Size: $841K • Largest Dollar Loan: $5.5M 22% 6% 61% 4% 1% 1% 4% 1% Geographical Distribution (Balances) Custom Home Construction 44% 9%21% 17% 9% Multifamily 100% CRE 17% 17% 3% 8%28% 11% 16% Residential Construction 29% 20% 12%11% 4% 9% 15% Land and Lots Seattle Metro Puget Sound Other WA Other Portland Metro OR Other Hawaii California Utah Idaho Other: AZ, CO Construction lending is a broad category that includes many different loan types, which possess different risk profiles. HomeStreet lends across the full spectrum of construction lending types.

Single Family Lending and Home Equity Line of Credit (HELOC) Overview March 31, 2024 p. 13 Single family Loan Characteristics • Balance: $1.15B • $92.4M Gov't Guaranteed • $319.0M Conventional Fixed Rate • $738.0M Conventional Variable Rate • Average Term Remaining: 296 Months • Average Term Remaining Conventional Variable Rate: 311 Months • Average Current LTV: 64.26% • DTI Initial: 31.35% • Average Loan Size: $535 thousand • Largest Dollar Loan: $4.0M • Average Current Interest Rate 4.125% • Balance: $378.7M • Available Line: $592.9M • Average Loan Size: $68K • Largest Loan Size: $1M • Average FICO: 770 • Portfolio CLTV: 63.17% • Average Current Interest Rate: 9.38% 31% 14%29%5% 2% 4% 12%1% 2% Single Family Geographical Distribution (Balances) Single Family Lending 29% 20% 10%7% 3% 2% 27% 1%1% Home Equity Line of Credit Seattle Metro Puget Sound Other WA Other Portland Metro OR Other Hawaii California Utah Idaho Other: AZ, CO HELOC Geographical Distribution (Balances) HELOC Loan Characteristics
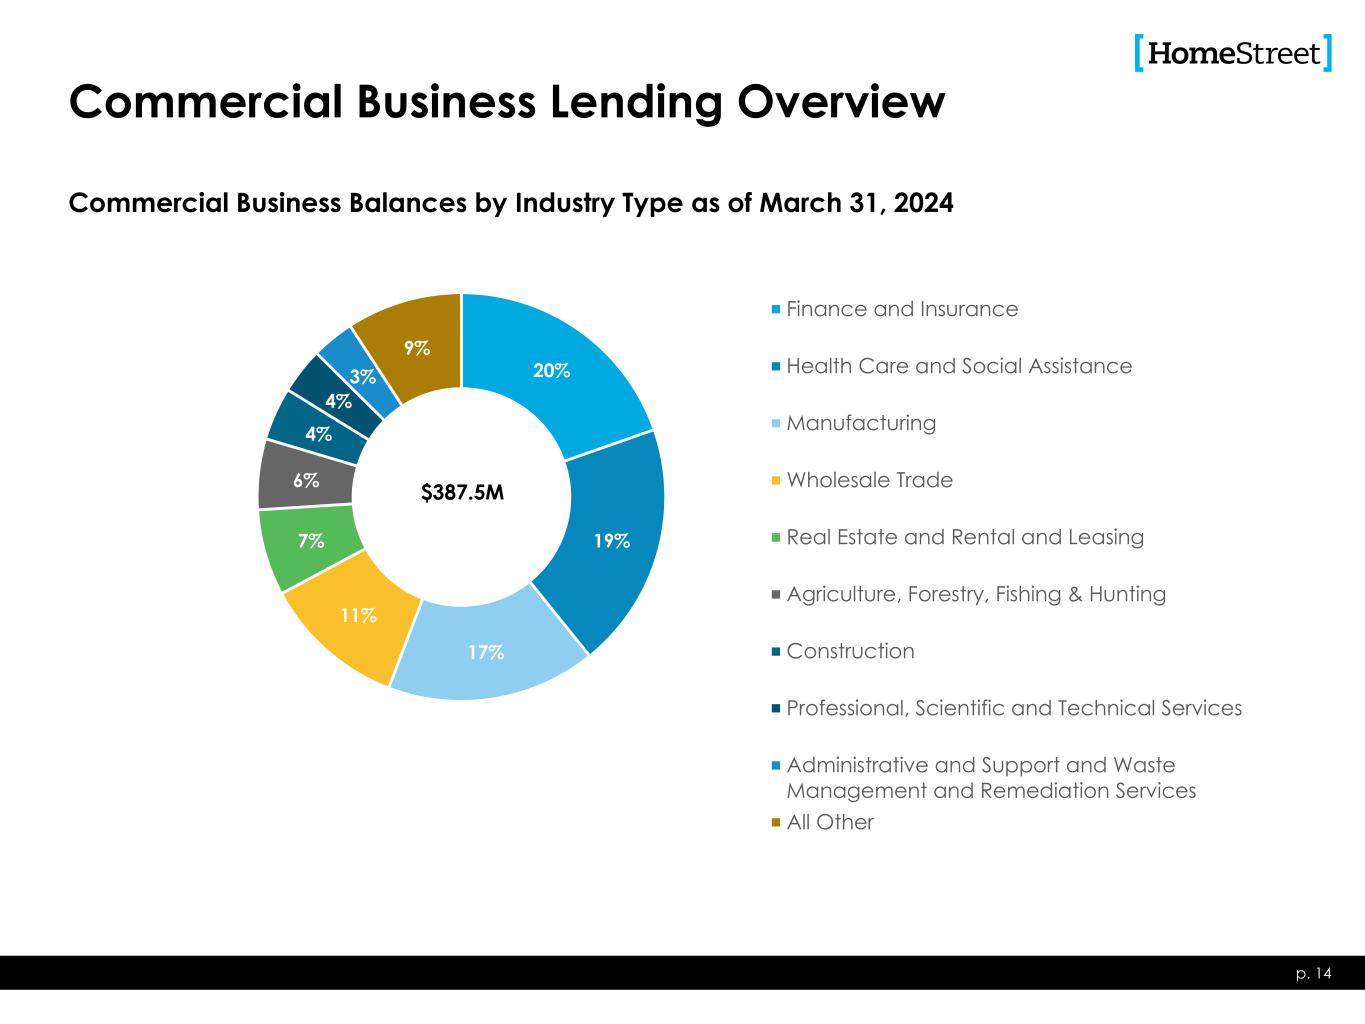
Commercial Business Lending Overview Commercial Business Balances by Industry Type as of March 31, 2024 p. 14 20% 19% 17% 11% 7% 6% 4% 4% 3% 9% Finance and Insurance Health Care and Social Assistance Manufacturing Wholesale Trade Real Estate and Rental and Leasing Agriculture, Forestry, Fishing & Hunting Construction Professional, Scientific and Technical Services Administrative and Support and Waste Management and Remediation Services All Other $387.5M
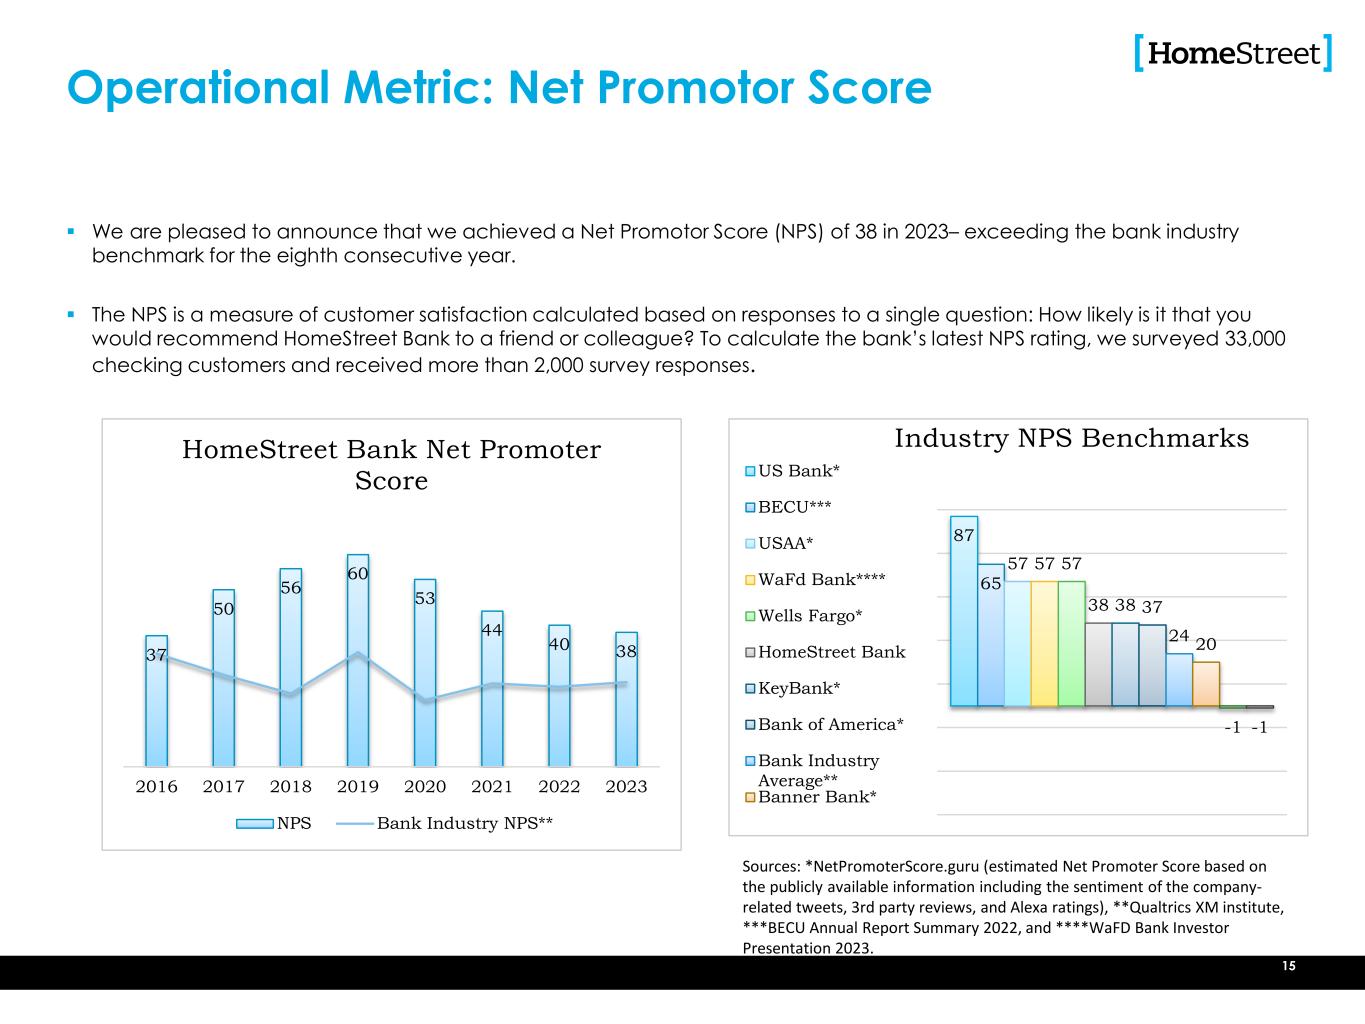
The content Operational Metric: Net Promotor Score We are pleased to announce that we achieved a Net Promotor Score (NPS) of 38 in 2023– exceeding the bank industry benchmark for the eighth consecutive year. The NPS is a measure of customer satisfaction calculated based on responses to a single question: How likely is it that you would recommend HomeStreet Bank to a friend or colleague? To calculate the bank’s latest NPS rating, we surveyed 33,000 checking customers and received more than 2,000 survey responses. 15 37 50 56 60 53 44 40 38 2016 2017 2018 2019 2020 2021 2022 2023 HomeStreet Bank Net Promoter Score NPS Bank Industry NPS** 87 65 57 57 57 38 38 37 24 20 -1 -1 Industry NPS Benchmarks US Bank* BECU*** USAA* WaFd Bank**** Wells Fargo* HomeStreet Bank KeyBank* Bank of America* Bank Industry Average** Banner Bank* Sources: *NetPromoterScore.guru (estimated Net Promoter Score based on the publicly available information including the sentiment of the company- related tweets, 3rd party reviews, and Alexa ratings), **Qualtrics XM institute, ***BECU Annual Report Summary 2022, and ****WaFD Bank Investor Presentation 2023.
Appendix
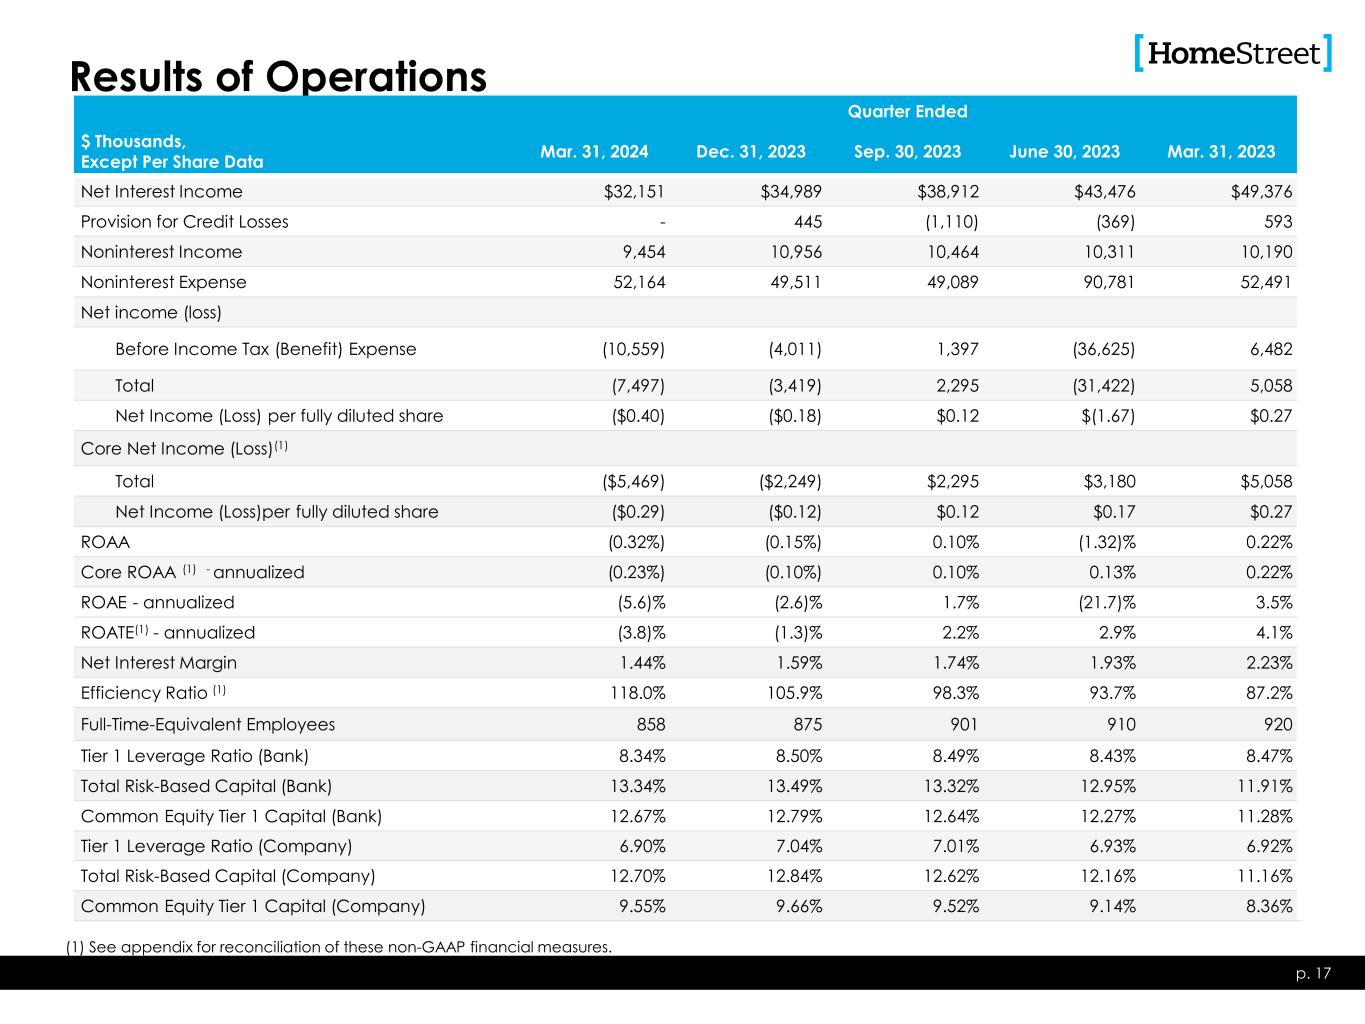
Results of Operations Quarter Ended $ Thousands, Except Per Share Data Mar. 31, 2024 Dec. 31, 2023 Sep. 30, 2023 June 30, 2023 Mar. 31, 2023 Net Interest Income $32,151 $34,989 $38,912 $43,476 $49,376 Provision for Credit Losses - 445 (1,110) (369) 593 Noninterest Income 9,454 10,956 10,464 10,311 10,190 Noninterest Expense 52,164 49,511 49,089 90,781 52,491 Net income (loss) Before Income Tax (Benefit) Expense (10,559) (4,011) 1,397 (36,625) 6,482 Total (7,497) (3,419) 2,295 (31,422) 5,058 Net Income (Loss) per fully diluted share ($0.40) ($0.18) $0.12 $(1.67) $0.27 Core Net Income (Loss)(1) Total ($5,469) ($2,249) $2,295 $3,180 $5,058 Net Income (Loss)per fully diluted share ($0.29) ($0.12) $0.12 $0.17 $0.27 ROAA (0.32%) (0.15%) 0.10% (1.32)% 0.22% Core ROAA (1) - annualized (0.23%) (0.10%) 0.10% 0.13% 0.22% ROAE - annualized (5.6)% (2.6)% 1.7% (21.7)% 3.5% ROATE(1) - annualized (3.8)% (1.3)% 2.2% 2.9% 4.1% Net Interest Margin 1.44% 1.59% 1.74% 1.93% 2.23% Efficiency Ratio (1) 118.0% 105.9% 98.3% 93.7% 87.2% Full-Time-Equivalent Employees 858 875 901 910 920 Tier 1 Leverage Ratio (Bank) 8.34% 8.50% 8.49% 8.43% 8.47% Total Risk-Based Capital (Bank) 13.34% 13.49% 13.32% 12.95% 11.91% Common Equity Tier 1 Capital (Bank) 12.67% 12.79% 12.64% 12.27% 11.28% Tier 1 Leverage Ratio (Company) 6.90% 7.04% 7.01% 6.93% 6.92% Total Risk-Based Capital (Company) 12.70% 12.84% 12.62% 12.16% 11.16% Common Equity Tier 1 Capital (Company) 9.55% 9.66% 9.52% 9.14% 8.36% p. 17 (1) See appendix for reconciliation of these non-GAAP financial measures.

Selected Balance Sheet and Other Data As of: $ Thousands, except per share data Mar. 31, 2024 Dec. 31, 2023 Sep. 30, 2023 June 30, 2023 Mar. 31, 2023 Loans Held For Sale $21,102 $19,637 $33,879 $31,873 $24,253 Loans Held for Investment, net 7,405,052 7,382,404 7,400,501 7,395,151 7,444,882 Allowance for Credit Losses 39,677 40,500 40,000 41,500 41,500 Investment Securities 1,191,108 1,278,268 1,294,634 1,397,051 1,477,004 Total Assets 9,455,182 9,392,450 9,458,751 9,501,475 9,858,889 Deposits 6,491,102 6,763,378 6,745,551 6,670,033 7,056,603 Borrowings 2,094,000 1,745,000 1,873,000 1,972,000 1,878,000 Long-Term Debt 224,857 224,766 224,671 224,583 224,492 Total Shareholders’ Equity 527,333 538,387 502,487 527,623 574,994 Other Data: Book Value per Share $27.96 $28.62 $26.74 $28.10 $30.64 Tangible Book Value per Share(1) $27.49 $28.11 $26.18 $27.50 $27.87 Shares Outstanding 18,857,566 18,810,055 18,794,030 18,776,597 18,767,811 Loans to Deposit Ratio (Bank) 114.3% 109.4% 110.0% 111.3% 105.9% Asset Quality: ACL to Total Loans(2) 0.54% 0.55% 0.55% 0.57% 0.56% ACL to Nonaccrual Loans 80.2% 103.9% 103.2% 104.3% 318.1% Nonaccrual Loans to Total Loans 0.66% 0.53% 0.52% 0.54% 0.17% Nonperforming Assets to Total Assets 0.56% 0.45% 0.42% 0.44% 0.15% Nonperforming Assets $52,584 $42,643 $39,749 $41,469 $14,886 p. 18 (1) See appendix for reconciliation of this non-GAAP financial measure. (2) This ratio excludes balances insured by the FHA or guaranteed by the VA or SBA.

Loans Held for Investment Balance Trend p. 19 $ Millions Mar. 31, 2024 Dec. 31, 2023 Sep. 30, 2023 June 30, 2023 Mar. 31, 2023 Non-owner Occupied CRE $633 9% $642 9% $633 9% $651 9% $652 9% Multifamily 3,930 53% 3,940 53% 3,957 52% 3,967 53% 3,976 53% Construction / Land Development 575 8% 566 8% 567 8% 576 8% 607 8% Total CRE Loans $5,138 70% $5,148 70% $5,157 69% $5,194 70% $5,235 70% Owner Occupied CRE $382 5% $391 5% $428 6% $434 6% $438 6% Commercial Business 388 5% 359 5% 385 5% 372 5% 393 5% Total C&I Loans $770 10% $750 10% $813 11% $806 11% $831 11% Single Family $1,150 15% $1,140 15% $1,100 15% $1,068 14% $1,058 14% Home Equity and Other 387 5% 385 5% 371 5% 368 5% 362 5% Total Consumer Loans $1,537 20% $1,525 20% $1,471 20% $1,436 19% $1,420 19% Total Loans Held for Investment $7,445 100% $7,423 100% $7,441 100% $7,437 100% $7,486 100%
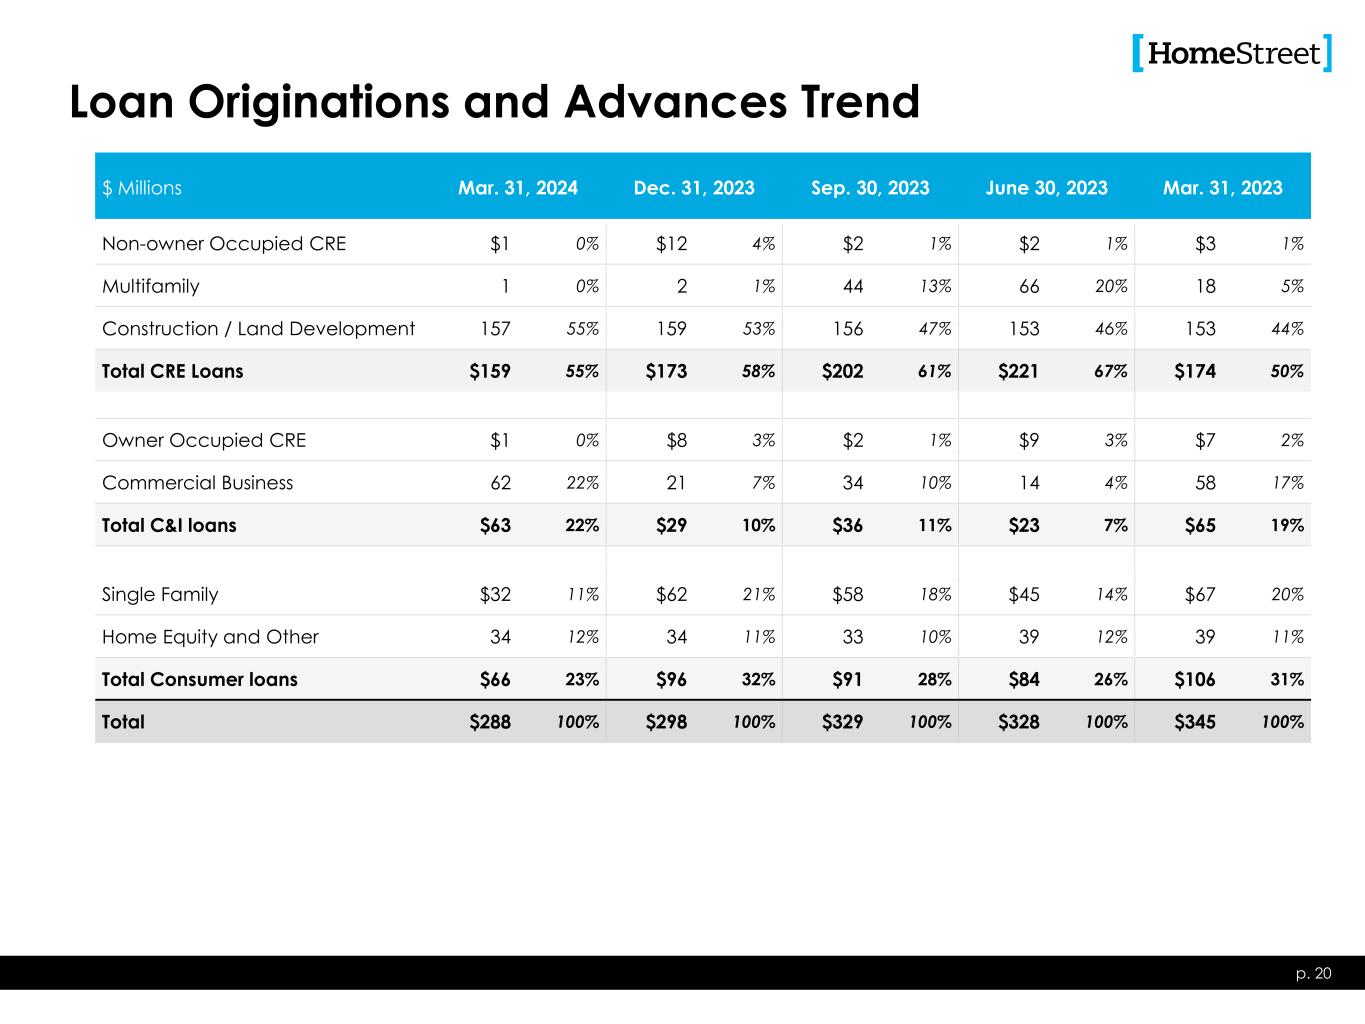
Loan Originations and Advances Trend p. 20 $ Millions Mar. 31, 2024 Dec. 31, 2023 Sep. 30, 2023 June 30, 2023 Mar. 31, 2023 Non-owner Occupied CRE $1 0% $12 4% $2 1% $2 1% $3 1% Multifamily 1 0% 2 1% 44 13% 66 20% 18 5% Construction / Land Development 157 55% 159 53% 156 47% 153 46% 153 44% Total CRE Loans $159 55% $173 58% $202 61% $221 67% $174 50% Owner Occupied CRE $1 0% $8 3% $2 1% $9 3% $7 2% Commercial Business 62 22% 21 7% 34 10% 14 4% 58 17% Total C&I loans $63 22% $29 10% $36 11% $23 7% $65 19% Single Family $32 11% $62 21% $58 18% $45 14% $67 20% Home Equity and Other 34 12% 34 11% 33 10% 39 12% 39 11% Total Consumer loans $66 23% $96 32% $91 28% $84 26% $106 31% Total $288 100% $298 100% $329 100% $328 100% $345 100%

Allowance for Credit Losses by Product Type p. 21 $ Thousands Mar. 31, 2024 Dec. 31, 2023 Reserve Amount Reserve Rate Reserve Amount Reserve Rate Non-owner Occupied CRE $2,131 0.34% $2,610 0.41% Multifamily 18,947 0.48% 13,093 0.33% Construction/Land Development Multifamily Construction 1,621 0.84% 3,983 2.37% CRE Construction 188 1.02% 189 1.02% Single Family Construction 5,578 2.00% 7,365 2.69% Single Family Construction to Permanent 435 0.51% 672 0.64% Total CRE Loans 28,900 0.56% 27,912 0.54% Owner Occupied CRE 836 0.22% 899 0.23% Commercial Business 2,646 0.69% 2,950 0.83% Total C&I 3,482 0.46% 3,849 0.52% Single Family 4,273 0.40% 5,287 0.51% Home Equity and Other 3,022 0.78% 3,452 0.90% Total Consumer Loans 7,295 0.51% 8,739 0.61% Total Allowance for Credit Losses $39,677 0.54% $40,500 0.55% The reserve rate is calculated excluding balances related to loans that are insured by the FHA or guaranteed by the VA or SBA.

Non-GAAP Financial Measures $ Thousands, Except Per Share Data Quarter Ended Mar. 31, 2024 Dec. 31, 2023 Sep. 30, 2023 June 30, 2023 Mar. 31, 2023 Tangible Book Value per Share Shareholders’ Equity $527,333 $538,387 $502,487 $527,623 $574,994 Less: Goodwill and Other Intangibles (9,016) (9,641) (10,429) (11,217) (51,862) Tangible Shareholders’ Equity $518,317 $528,746 $492,508 $516,406 $523,132 Common Shares Outstanding 18,857,566 18,810,055 18,794,030 18,776,597 18,767,811 Computed Amount $27.49 $28.11 $26.18 $27.50 $27.87 Tangible Common Equity to Tangible Assets Tangible Shareholders’ Equity $518,317 $528,746 $492,058 $516,406 $523,132 Tangible Assets Total Assets $9,455,182 $9,392,450 $9,458,751 $9,501,475 $9,858,889 Less: Goodwill and other intangibles (9,016) (9,641) (10,429) (11,217) (51,862) Net $9,446,166 $9,382,809 $9,448,322 $9,490,258 $9,807,027 Ratio 5.5% 5.6% 5.2% 5.4% 5.3% Core net income (loss) Net income (loss) $(7,497) $(3,419) $2,295 $(31,422) $5,058 Adjustments (tax effected) Merger related expenses 2,028 1,170 Goodwill impairment - - - 34,622 - Total $(5,469) $(2,249) $2,295 $3,180 $5,058 Fully diluted shares 18,856,870 18,807,965 18,792,893 18,775,022 18,771,899 Computed amount ($0.29) ($0.12) $0.12 $0.17 $0.27 p. 22

Non-GAAP Financial Measures (continued) $ Thousands, Except Per Share Data Quarter Ended Mar. 31, 2024 Dec. 31, 2023 Sep. 30, 2023 June 30, 2023 Mar. 31, 2023 Return on Average Tangible Equity Average Shareholders’ Equity $537,627 $513,758 $535,369 $582,172 $578,533 Less: Average Goodwill and Other Intangibles (9,403) (10,149) (10,917) (51,138) (30,969) Average Tangible Equity $528,224 $503,609 $524,452 $531,034 $547,564 Core Net Income (Loss) (per above) ($5,469) ($2,249) $2,295 $3,180 $5,058 Amortization of Core Deposit Intangibles (net of tax) 488 615 614 614 459 Tangible Income (Loss) Applicable to Shareholders ($4,981) ($1,634) $2,909 $3,794 $5,517 Ratio (3.8%) (1.3%) 2.2% 2.9% 4.1% Return on Average Assets - Annualized core Average Assets $9,502,189 $9,351,866 $9,433,648 $9,562,817 $9,530,705 Core Net Income (per above) ($5,469) ($2,249) $2,295 $3,180 $5,058 Ratio (0.23%) (0.10%) 0.10% 0.13% 0.22% Effective Tax Rate Used in Computations Above (1) 22.0% 22.0% 22.0% 22.0% 22.0% (1) Effective tax rate indicated is used for all adjustment except the goodwill impairment charge as a portion of this charge was not deductible for tax purposes. Instead a computed effective rate of 13.1% was used for the goodwill impairment charge. p. 23
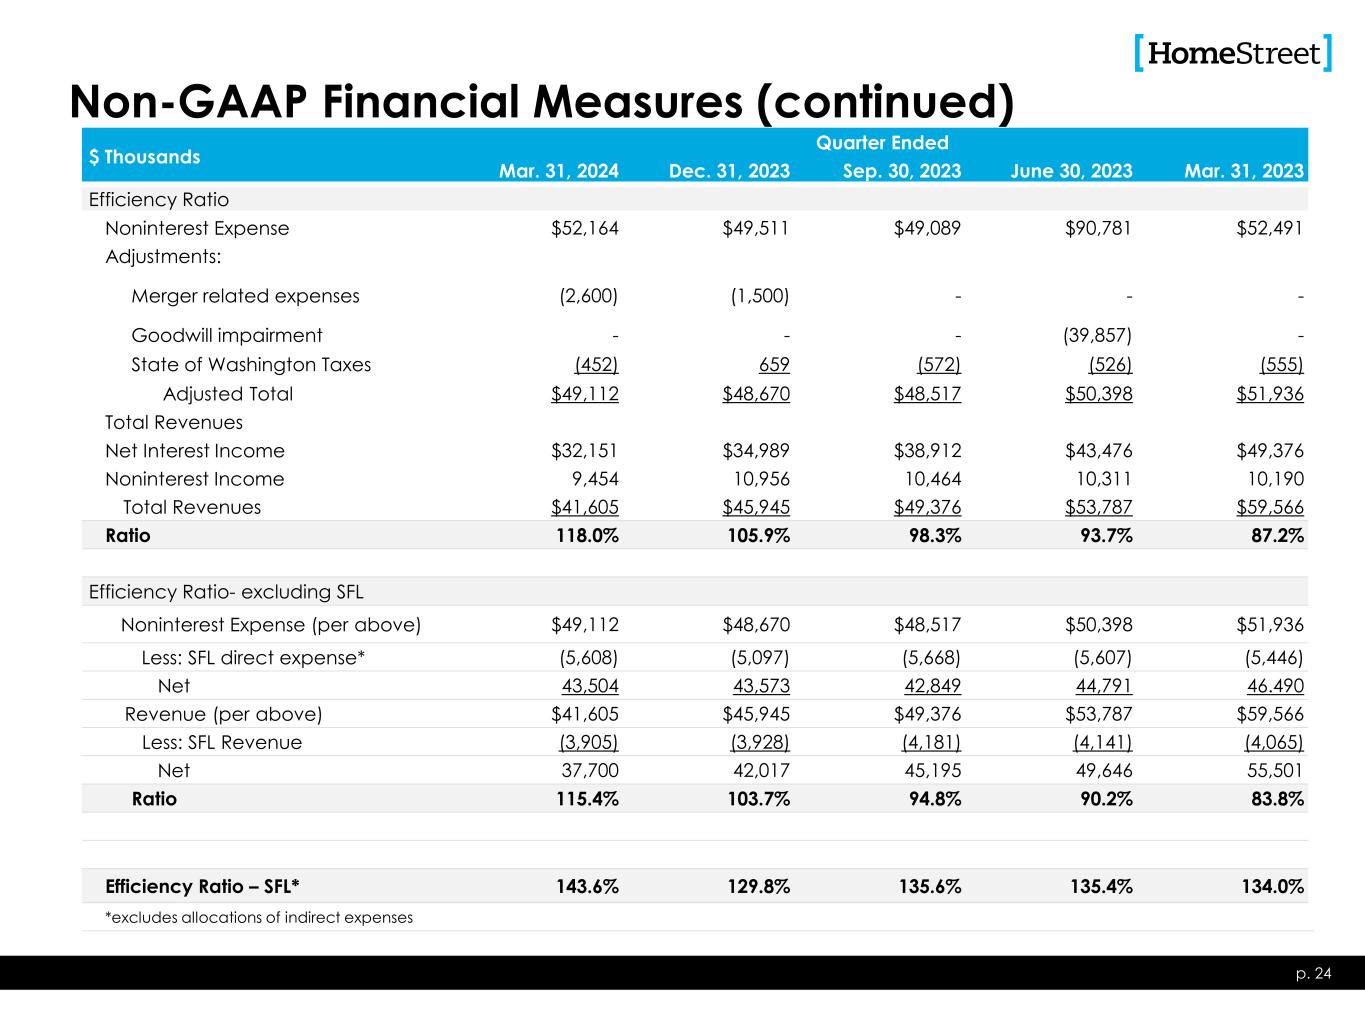
Non-GAAP Financial Measures (continued) $ Thousands Quarter Ended Mar. 31, 2024 Dec. 31, 2023 Sep. 30, 2023 June 30, 2023 Mar. 31, 2023 Efficiency Ratio Noninterest Expense $52,164 $49,511 $49,089 $90,781 $52,491 Adjustments: Merger related expenses (2,600) (1,500) - - - Goodwill impairment - - - (39,857) - State of Washington Taxes (452) 659 (572) (526) (555) Adjusted Total $49,112 $48,670 $48,517 $50,398 $51,936 Total Revenues Net Interest Income $32,151 $34,989 $38,912 $43,476 $49,376 Noninterest Income 9,454 10,956 10,464 10,311 10,190 Total Revenues $41,605 $45,945 $49,376 $53,787 $59,566 Ratio 118.0% 105.9% 98.3% 93.7% 87.2% Efficiency Ratio- excluding SFL Noninterest Expense (per above) $49,112 $48,670 $48,517 $50,398 $51,936 Less: SFL direct expense* (5,608) (5,097) (5,668) (5,607) (5,446) Net 43,504 43,573 42,849 44,791 46.490 Revenue (per above) $41,605 $45,945 $49,376 $53,787 $59,566 Less: SFL Revenue (3,905) (3,928) (4,181) (4,141) (4,065) Net 37,700 42,017 45,195 49,646 55,501 Ratio 115.4% 103.7% 94.8% 90.2% 83.8% Efficiency Ratio – SFL* 143.6% 129.8% 135.6% 135.4% 134.0% *excludes allocations of indirect expenses p. 24

Non-GAAP Financial Measures (continued) p. 25 To supplement our unaudited condensed consolidated financial statements presented in accordance with GAAP, we use certain non- GAAP measures of financial performance. In this presentation, we use the following non-GAAP measures: (i) tangible common equity and tangible assets as we believe this information is consistent with the treatment by bank regulatory agencies, which exclude intangible assets from the calculation of capital ratios; (ii) core income which excludes goodwill impairment charges and merger related expenses as we believe this is a better comparison to be used in projecting future results and (iii)an efficiency ratio, which is the ratio of noninterest expense to the sum of net interest income and noninterest income, excluding certain items of income or expense and excluding taxes incurred and payable to the state of Washington as such taxes are not classified as income taxes, and we believe including them in noninterest expense impacts the comparability of our results to those companies whose operations are in states where assessed taxes on business are classified as income taxes. These supplemental performance measures may vary from, and may not be comparable to, similarly titled measures provided by other companies in our industry. Non-GAAP financial measures are not in accordance with, or an alternative for, GAAP. Generally, a non- GAAP financial measure is a numerical measure of a company’s performance that either excludes or includes amounts that are not normally excluded or included in the most directly comparable measure calculated and presented in accordance with GAAP. A non- GAAP financial measure may also be a financial metric that is not required by GAAP or other applicable requirements. We believe that these non-GAAP financial measures, when taken together with the corresponding GAAP financial measures, provide meaningful supplemental information regarding our performance by providing additional information used by management that is not otherwise required by GAAP or other applicable requirements. Our management uses, and believes that investors benefit from referring to, these non-GAAP financial measures in assessing our operating results and when planning, forecasting and analyzing future periods. These non-GAAP financial measures also facilitate a comparison of our performance to prior periods. We believe these measures are frequently used by securities analysts, investors and other parties in the evaluation of companies in our industry. Rather, these non-GAAP financial measures should be considered in addition to, not as a substitute for or superior to, financial measures prepared in accordance with GAAP. We have provided reconciliations of, where applicable, the most comparable GAAP financial measures to the non-GAAP measures used in this presentation, or a reconciliation of the non-GAAP calculation of the financial measure.


