0001509589false2024--12-31Q3P1YP2Yxbrli:sharesiso4217:USDiso4217:USDxbrli:sharesxbrli:pureutr:bbliso4217:USDutr:bblutr:MMBTUiso4217:USDutr:MMBTU00015095892024-01-012024-09-3000015095892024-11-0600015095892024-09-3000015095892023-12-310001509589civi:CrudeOilNaturalGasAndNaturalGasLiquidsMember2024-07-012024-09-300001509589civi:CrudeOilNaturalGasAndNaturalGasLiquidsMember2023-07-012023-09-300001509589civi:CrudeOilNaturalGasAndNaturalGasLiquidsMember2024-01-012024-09-300001509589civi:CrudeOilNaturalGasAndNaturalGasLiquidsMember2023-01-012023-09-300001509589us-gaap:OilAndGasOperationAndMaintenanceMember2024-07-012024-09-300001509589us-gaap:OilAndGasOperationAndMaintenanceMember2023-07-012023-09-300001509589us-gaap:OilAndGasOperationAndMaintenanceMember2024-01-012024-09-300001509589us-gaap:OilAndGasOperationAndMaintenanceMember2023-01-012023-09-3000015095892024-07-012024-09-3000015095892023-07-012023-09-3000015095892023-01-012023-09-300001509589us-gaap:NaturalGasGatheringTransportationMarketingAndProcessingMember2024-07-012024-09-300001509589us-gaap:NaturalGasGatheringTransportationMarketingAndProcessingMember2023-07-012023-09-300001509589us-gaap:NaturalGasGatheringTransportationMarketingAndProcessingMember2024-01-012024-09-300001509589us-gaap:NaturalGasGatheringTransportationMarketingAndProcessingMember2023-01-012023-09-300001509589us-gaap:CommonStockMember2023-12-310001509589us-gaap:AdditionalPaidInCapitalMember2023-12-310001509589us-gaap:RetainedEarningsMember2023-12-310001509589us-gaap:CommonStockMember2024-01-012024-03-310001509589us-gaap:AdditionalPaidInCapitalMember2024-01-012024-03-3100015095892024-01-012024-03-310001509589us-gaap:RetainedEarningsMember2024-01-012024-03-310001509589us-gaap:CommonStockMember2024-03-310001509589us-gaap:AdditionalPaidInCapitalMember2024-03-310001509589us-gaap:RetainedEarningsMember2024-03-3100015095892024-03-310001509589us-gaap:CommonStockMember2024-04-012024-06-3000015095892024-04-012024-06-300001509589us-gaap:AdditionalPaidInCapitalMember2024-04-012024-06-300001509589us-gaap:RetainedEarningsMember2024-04-012024-06-300001509589us-gaap:CommonStockMember2024-06-300001509589us-gaap:AdditionalPaidInCapitalMember2024-06-300001509589us-gaap:RetainedEarningsMember2024-06-3000015095892024-06-300001509589us-gaap:CommonStockMember2024-07-012024-09-300001509589us-gaap:AdditionalPaidInCapitalMember2024-07-012024-09-300001509589us-gaap:RetainedEarningsMember2024-07-012024-09-300001509589us-gaap:CommonStockMember2024-09-300001509589us-gaap:AdditionalPaidInCapitalMember2024-09-300001509589us-gaap:RetainedEarningsMember2024-09-300001509589us-gaap:CommonStockMember2022-12-310001509589us-gaap:AdditionalPaidInCapitalMember2022-12-310001509589us-gaap:RetainedEarningsMember2022-12-3100015095892022-12-310001509589us-gaap:CommonStockMember2023-01-012023-03-310001509589us-gaap:AdditionalPaidInCapitalMember2023-01-012023-03-3100015095892023-01-012023-03-310001509589us-gaap:RetainedEarningsMember2023-01-012023-03-310001509589us-gaap:CommonStockMember2023-03-310001509589us-gaap:AdditionalPaidInCapitalMember2023-03-310001509589us-gaap:RetainedEarningsMember2023-03-3100015095892023-03-310001509589us-gaap:CommonStockMember2023-04-012023-06-3000015095892023-04-012023-06-300001509589us-gaap:AdditionalPaidInCapitalMember2023-04-012023-06-300001509589us-gaap:RetainedEarningsMember2023-04-012023-06-300001509589us-gaap:CommonStockMember2023-06-300001509589us-gaap:AdditionalPaidInCapitalMember2023-06-300001509589us-gaap:RetainedEarningsMember2023-06-3000015095892023-06-300001509589us-gaap:CommonStockMember2023-07-012023-09-300001509589us-gaap:AdditionalPaidInCapitalMember2023-07-012023-09-300001509589us-gaap:RetainedEarningsMember2023-07-012023-09-300001509589us-gaap:CommonStockMember2023-09-300001509589us-gaap:AdditionalPaidInCapitalMember2023-09-300001509589us-gaap:RetainedEarningsMember2023-09-3000015095892023-09-300001509589civi:VencerAcquisitionMember2024-01-022024-01-020001509589civi:VencerAcquisitionMember2024-01-020001509589civi:VencerAcquisitionMemberus-gaap:CommonStockMember2024-01-022024-01-020001509589civi:HiberniaAcquisitionMember2023-08-022023-08-020001509589civi:HiberniaAcquisitionMember2023-08-020001509589civi:TapRockAcquisitionMember2023-08-022023-08-020001509589civi:TapRockAcquisitionMemberus-gaap:CommonStockMember2023-08-022023-08-020001509589civi:TapRockAcquisitionMember2023-08-020001509589civi:VencerAcquisitionMember2024-07-012024-09-300001509589civi:VencerAcquisitionMember2024-01-012024-09-300001509589civi:VencerAcquisitionHiberniaAcquisitionAndTapRockAcquisitionMember2023-07-012023-09-300001509589civi:HiberniaAcquisitionAndTapRockAcquisitionMember2023-01-012023-09-300001509589civi:DenverJulesburgBasinMembersrt:CrudeOilMember2024-07-012024-09-300001509589civi:DenverJulesburgBasinMembersrt:CrudeOilMember2023-07-012023-09-300001509589civi:DenverJulesburgBasinMembersrt:CrudeOilMember2024-01-012024-09-300001509589civi:DenverJulesburgBasinMembersrt:CrudeOilMember2023-01-012023-09-300001509589civi:PermianBasinMembersrt:CrudeOilMember2024-07-012024-09-300001509589civi:PermianBasinMembersrt:CrudeOilMember2023-07-012023-09-300001509589civi:PermianBasinMembersrt:CrudeOilMember2024-01-012024-09-300001509589civi:PermianBasinMembersrt:CrudeOilMember2023-01-012023-09-300001509589srt:CrudeOilMember2024-07-012024-09-300001509589srt:CrudeOilMember2023-07-012023-09-300001509589srt:CrudeOilMember2024-01-012024-09-300001509589srt:CrudeOilMember2023-01-012023-09-300001509589civi:DenverJulesburgBasinMembersrt:NaturalGasReservesMember2024-07-012024-09-300001509589civi:DenverJulesburgBasinMembersrt:NaturalGasReservesMember2023-07-012023-09-300001509589civi:DenverJulesburgBasinMembersrt:NaturalGasReservesMember2024-01-012024-09-300001509589civi:DenverJulesburgBasinMembersrt:NaturalGasReservesMember2023-01-012023-09-300001509589civi:PermianBasinMembersrt:NaturalGasReservesMember2024-07-012024-09-300001509589civi:PermianBasinMembersrt:NaturalGasReservesMember2023-07-012023-09-300001509589civi:PermianBasinMembersrt:NaturalGasReservesMember2024-01-012024-09-300001509589civi:PermianBasinMembersrt:NaturalGasReservesMember2023-01-012023-09-300001509589srt:NaturalGasReservesMember2024-07-012024-09-300001509589srt:NaturalGasReservesMember2023-07-012023-09-300001509589srt:NaturalGasReservesMember2024-01-012024-09-300001509589srt:NaturalGasReservesMember2023-01-012023-09-300001509589civi:DenverJulesburgBasinMembersrt:NaturalGasLiquidsReservesMember2024-07-012024-09-300001509589civi:DenverJulesburgBasinMembersrt:NaturalGasLiquidsReservesMember2023-07-012023-09-300001509589civi:DenverJulesburgBasinMembersrt:NaturalGasLiquidsReservesMember2024-01-012024-09-300001509589civi:DenverJulesburgBasinMembersrt:NaturalGasLiquidsReservesMember2023-01-012023-09-300001509589civi:PermianBasinMembersrt:NaturalGasLiquidsReservesMember2024-07-012024-09-300001509589civi:PermianBasinMembersrt:NaturalGasLiquidsReservesMember2023-07-012023-09-300001509589civi:PermianBasinMembersrt:NaturalGasLiquidsReservesMember2024-01-012024-09-300001509589civi:PermianBasinMembersrt:NaturalGasLiquidsReservesMember2023-01-012023-09-300001509589srt:NaturalGasLiquidsReservesMember2024-07-012024-09-300001509589srt:NaturalGasLiquidsReservesMember2023-07-012023-09-300001509589srt:NaturalGasLiquidsReservesMember2024-01-012024-09-300001509589srt:NaturalGasLiquidsReservesMember2023-01-012023-09-300001509589civi:DenverJulesburgBasinMembercivi:CrudeOilNaturalGasAndNaturalGasLiquidsMember2024-07-012024-09-300001509589civi:DenverJulesburgBasinMembercivi:CrudeOilNaturalGasAndNaturalGasLiquidsMember2023-07-012023-09-300001509589civi:DenverJulesburgBasinMembercivi:CrudeOilNaturalGasAndNaturalGasLiquidsMember2024-01-012024-09-300001509589civi:DenverJulesburgBasinMembercivi:CrudeOilNaturalGasAndNaturalGasLiquidsMember2023-01-012023-09-300001509589civi:PermianBasinMembercivi:CrudeOilNaturalGasAndNaturalGasLiquidsMember2024-07-012024-09-300001509589civi:PermianBasinMembercivi:CrudeOilNaturalGasAndNaturalGasLiquidsMember2023-07-012023-09-300001509589civi:PermianBasinMembercivi:CrudeOilNaturalGasAndNaturalGasLiquidsMember2024-01-012024-09-300001509589civi:PermianBasinMembercivi:CrudeOilNaturalGasAndNaturalGasLiquidsMember2023-01-012023-09-300001509589civi:SeniorNotesDue202650Memberus-gaap:SeniorNotesMember2024-09-300001509589civi:SeniorNotesDue202650Memberus-gaap:SeniorNotesMember2023-12-310001509589civi:SeniorNotesDue20288375Memberus-gaap:SeniorNotesMember2024-09-300001509589civi:SeniorNotesDue20288375Memberus-gaap:SeniorNotesMember2023-12-310001509589civi:SeniorNotesDue20308625Memberus-gaap:SeniorNotesMember2024-09-300001509589civi:SeniorNotesDue20308625Memberus-gaap:SeniorNotesMember2023-12-310001509589civi:SeniorNotesDue20318750Memberus-gaap:SeniorNotesMember2024-09-300001509589civi:SeniorNotesDue20318750Memberus-gaap:SeniorNotesMember2023-12-310001509589us-gaap:SeniorNotesMember2024-09-300001509589us-gaap:SeniorNotesMember2023-12-310001509589us-gaap:RevolvingCreditFacilityMember2024-09-300001509589us-gaap:RevolvingCreditFacilityMember2023-12-310001509589civi:AmendedCreditAgreementMemberus-gaap:RevolvingCreditFacilityMember2024-09-300001509589civi:AmendedCreditAgreementMemberus-gaap:RevolvingCreditFacilityMember2024-06-120001509589civi:AmendedCreditAgreementMemberus-gaap:RevolvingCreditFacilityMemberus-gaap:FederalFundsEffectiveSwapRateMember2024-01-012024-09-300001509589civi:AmendedCreditAgreementMemberus-gaap:RevolvingCreditFacilityMemberus-gaap:SecuredOvernightFinancingRateSofrMember2024-01-012024-09-300001509589civi:AmendedCreditAgreementMemberus-gaap:RevolvingCreditFacilityMembercivi:SecuredOvernightFinancingRateSOFRPlusBasisSpreadOneMember2024-01-012024-09-300001509589civi:AmendedCreditAgreementMemberus-gaap:RevolvingCreditFacilityMembercivi:SecuredOvernightFinancingRateSOFRPlusBasisSpreadOneMembersrt:MinimumMember2024-01-012024-09-300001509589civi:AmendedCreditAgreementMemberus-gaap:RevolvingCreditFacilityMembercivi:SecuredOvernightFinancingRateSOFRPlusBasisSpreadOneMembersrt:MaximumMember2024-01-012024-09-300001509589civi:AmendedCreditAgreementMemberus-gaap:RevolvingCreditFacilityMemberus-gaap:SecuredOvernightFinancingRateSofrMembersrt:MinimumMember2024-01-012024-09-300001509589civi:AmendedCreditAgreementMemberus-gaap:RevolvingCreditFacilityMemberus-gaap:SecuredOvernightFinancingRateSofrMembersrt:MaximumMember2024-01-012024-09-300001509589us-gaap:RevolvingCreditFacilityMember2024-01-012024-09-300001509589us-gaap:RevolvingCreditFacilityMemberus-gaap:LineOfCreditMemberus-gaap:SubsequentEventMember2024-11-060001509589us-gaap:RevolvingCreditFacilityMemberus-gaap:LineOfCreditMember2024-09-300001509589us-gaap:RevolvingCreditFacilityMemberus-gaap:LineOfCreditMember2023-12-310001509589us-gaap:LetterOfCreditMemberus-gaap:LineOfCreditMemberus-gaap:SubsequentEventMember2024-11-060001509589us-gaap:LetterOfCreditMemberus-gaap:LineOfCreditMember2024-09-300001509589us-gaap:LetterOfCreditMemberus-gaap:LineOfCreditMember2023-12-310001509589civi:RevolvingCreditFacilityAndLetterOfCreditMemberus-gaap:LineOfCreditMemberus-gaap:SubsequentEventMember2024-11-060001509589civi:RevolvingCreditFacilityAndLetterOfCreditMemberus-gaap:LineOfCreditMember2024-09-300001509589civi:RevolvingCreditFacilityAndLetterOfCreditMemberus-gaap:LineOfCreditMember2023-12-310001509589civi:HighPointMergerMembercivi:AmendedCreditAgreementMemberus-gaap:RevolvingCreditFacilityMember2024-09-300001509589civi:HighPointMergerMembercivi:AmendedCreditAgreementMemberus-gaap:RevolvingCreditFacilityMember2023-12-310001509589civi:VencerAcquisitionMember2024-04-012024-09-300001509589civi:VencerAcquisitionMember2024-09-300001509589civi:LongTermIncentivePlan2024Member2024-06-040001509589civi:RestrictedStockUnitsRSUsAndDeferredStockUnitsDSUsMembercivi:LTIPMember2024-07-012024-09-300001509589civi:RestrictedStockUnitsRSUsAndDeferredStockUnitsDSUsMembercivi:LTIPMember2023-07-012023-09-300001509589civi:RestrictedStockUnitsRSUsAndDeferredStockUnitsDSUsMembercivi:LTIPMember2024-01-012024-09-300001509589civi:RestrictedStockUnitsRSUsAndDeferredStockUnitsDSUsMembercivi:LTIPMember2023-01-012023-09-300001509589us-gaap:PerformanceSharesMembercivi:LTIPMember2024-07-012024-09-300001509589us-gaap:PerformanceSharesMembercivi:LTIPMember2023-07-012023-09-300001509589us-gaap:PerformanceSharesMembercivi:LTIPMember2024-01-012024-09-300001509589us-gaap:PerformanceSharesMembercivi:LTIPMember2023-01-012023-09-300001509589civi:LTIPMember2024-07-012024-09-300001509589civi:LTIPMember2023-07-012023-09-300001509589civi:LTIPMember2024-01-012024-09-300001509589civi:LTIPMember2023-01-012023-09-300001509589civi:RestrictedStockUnitsRSUsAndDeferredStockUnitsDSUsMembercivi:LTIPMember2024-09-300001509589us-gaap:PerformanceSharesMembercivi:LTIPMember2024-09-300001509589civi:LTIPMember2024-09-300001509589civi:DeferredStockUnitsDSUsMembercivi:LTIPMember2024-01-012024-09-300001509589us-gaap:RestrictedStockUnitsRSUMembercivi:LTIPMember2024-01-012024-09-300001509589civi:LTIPMemberus-gaap:RestrictedStockUnitsRSUMembercivi:ShareBasedPaymentArrangementVestingPeriodOneMember2024-01-012024-09-300001509589civi:LTIPMemberus-gaap:RestrictedStockUnitsRSUMembercivi:ShareBasedPaymentArrangementVestingPeriodTwoMember2024-01-012024-09-300001509589civi:LTIPMemberus-gaap:RestrictedStockUnitsRSUMembercivi:ShareBasedPaymentArrangementVestingPeriodThreeMember2024-01-012024-09-300001509589civi:LTIPMembercivi:DeferredStockUnitsDSUsMembercivi:ShareBasedPaymentArrangementVestingPeriodOneMember2024-01-012024-09-300001509589civi:RestrictedStockUnitsRSUsAndDeferredStockUnitsDSUsMembercivi:LTIPMember2023-12-310001509589civi:LTIPMembercivi:RestrictedStockUnitsRSUsAndDeferredStockUnitsDSUsMembercivi:NonexecutiveBoardMembersMember2024-01-012024-09-300001509589civi:LTIPMemberus-gaap:PerformanceSharesMembersrt:OfficerMembersrt:MinimumMember2024-01-012024-09-300001509589civi:LTIPMemberus-gaap:PerformanceSharesMembersrt:OfficerMembersrt:MaximumMember2024-01-012024-09-300001509589civi:LTIPMembercivi:PerformanceSharesGrantedPriorToFiscal2023Membersrt:OfficerMember2024-01-012024-09-300001509589civi:LTIPMemberus-gaap:PerformanceSharesMembersrt:OfficerMember2024-01-012024-09-300001509589civi:LTIPMemberus-gaap:PerformanceSharesMembersrt:OfficerMember2023-12-310001509589civi:LTIPMemberus-gaap:PerformanceSharesMembersrt:OfficerMember2024-09-300001509589civi:ExtractionEquityPlanMembercivi:PerformanceSharesGrantedInFiscal2021Membersrt:OfficerMember2024-01-012024-09-300001509589civi:LTIPMembercivi:PerformanceSharesGrantedInFiscal2021Membersrt:OfficerMember2024-01-012024-09-300001509589us-gaap:FairValueInputsLevel2Memberus-gaap:EstimateOfFairValueFairValueDisclosureMember2024-09-300001509589us-gaap:FairValueInputsLevel2Memberus-gaap:EstimateOfFairValueFairValueDisclosureMember2023-12-310001509589us-gaap:FairValueInputsLevel1Membercivi:SeniorNotesDue202650Memberus-gaap:SeniorNotesMember2024-09-300001509589us-gaap:FairValueInputsLevel1Membercivi:SeniorNotesDue202650Memberus-gaap:SeniorNotesMember2023-12-310001509589us-gaap:FairValueInputsLevel1Membercivi:SeniorNotesDue20288375Memberus-gaap:SeniorNotesMember2024-09-300001509589us-gaap:FairValueInputsLevel1Membercivi:SeniorNotesDue20288375Memberus-gaap:SeniorNotesMember2023-12-310001509589us-gaap:FairValueInputsLevel1Membercivi:SeniorNotesDue20308625Memberus-gaap:SeniorNotesMember2024-09-300001509589us-gaap:FairValueInputsLevel1Membercivi:SeniorNotesDue20308625Memberus-gaap:SeniorNotesMember2023-12-310001509589us-gaap:FairValueInputsLevel1Membercivi:SeniorNotesDue20318750Memberus-gaap:SeniorNotesMember2024-09-300001509589us-gaap:FairValueInputsLevel1Membercivi:SeniorNotesDue20318750Memberus-gaap:SeniorNotesMember2023-12-310001509589us-gaap:CommodityContractMembersrt:CrudeOilMember2024-07-012024-09-300001509589us-gaap:CommodityContractMembersrt:CrudeOilMember2023-07-012023-09-300001509589us-gaap:CommodityContractMembersrt:CrudeOilMember2024-01-012024-09-300001509589us-gaap:CommodityContractMembersrt:CrudeOilMember2023-01-012023-09-300001509589us-gaap:CommodityContractMembersrt:NaturalGasReservesMember2024-07-012024-09-300001509589us-gaap:CommodityContractMembersrt:NaturalGasReservesMember2023-07-012023-09-300001509589us-gaap:CommodityContractMembersrt:NaturalGasReservesMember2024-01-012024-09-300001509589us-gaap:CommodityContractMembersrt:NaturalGasReservesMember2023-01-012023-09-300001509589us-gaap:CommodityContractMember2024-07-012024-09-300001509589us-gaap:CommodityContractMember2023-07-012023-09-300001509589us-gaap:CommodityContractMember2024-01-012024-09-300001509589us-gaap:CommodityContractMember2023-01-012023-09-300001509589us-gaap:SwapMembersrt:CrudeOilMembersrt:ScenarioForecastMember2024-10-012024-12-310001509589us-gaap:SwapMembersrt:CrudeOilMembersrt:ScenarioForecastMember2025-01-012025-03-310001509589us-gaap:SwapMembersrt:CrudeOilMembersrt:ScenarioForecastMember2025-04-012025-06-300001509589us-gaap:SwapMembersrt:CrudeOilMembersrt:ScenarioForecastMember2025-07-012025-09-300001509589us-gaap:SwapMembersrt:CrudeOilMembersrt:ScenarioForecastMember2024-12-310001509589us-gaap:SwapMembersrt:CrudeOilMembersrt:ScenarioForecastMember2025-03-310001509589us-gaap:SwapMembersrt:CrudeOilMembersrt:ScenarioForecastMember2025-06-300001509589us-gaap:SwapMembersrt:CrudeOilMembersrt:ScenarioForecastMember2025-09-300001509589civi:TwoWayCollarMembersrt:CrudeOilMembersrt:ScenarioForecastMember2024-10-012024-12-310001509589civi:TwoWayCollarMembersrt:CrudeOilMembersrt:ScenarioForecastMember2025-01-012025-03-310001509589civi:TwoWayCollarMembersrt:CrudeOilMembersrt:ScenarioForecastMember2025-04-012025-06-300001509589civi:TwoWayCollarMembersrt:CrudeOilMembersrt:ScenarioForecastMember2025-07-012025-09-300001509589civi:TwoWayCollarMembersrt:CrudeOilMembersrt:ScenarioForecastMember2025-10-012025-12-310001509589civi:TwoWayCollarMembersrt:CrudeOilMembersrt:ScenarioForecastMember2024-12-310001509589civi:TwoWayCollarMembersrt:CrudeOilMembersrt:ScenarioForecastMember2025-03-310001509589civi:TwoWayCollarMembersrt:CrudeOilMembersrt:ScenarioForecastMember2025-06-300001509589civi:TwoWayCollarMembersrt:CrudeOilMembersrt:ScenarioForecastMember2025-09-300001509589civi:TwoWayCollarMembersrt:CrudeOilMembersrt:ScenarioForecastMember2025-12-310001509589civi:BoughtPutOptionMembersrt:CrudeOilMembersrt:ScenarioForecastMember2024-10-012024-12-310001509589civi:BoughtPutOptionMembersrt:CrudeOilMembersrt:ScenarioForecastMember2024-12-310001509589us-gaap:SwapMembersrt:NaturalGasReservesMembersrt:ScenarioForecastMember2024-10-012024-12-310001509589us-gaap:SwapMembersrt:NaturalGasReservesMembersrt:ScenarioForecastMember2025-01-012025-03-310001509589us-gaap:SwapMembersrt:NaturalGasReservesMembersrt:ScenarioForecastMember2025-04-012025-06-300001509589us-gaap:SwapMembersrt:NaturalGasReservesMembersrt:ScenarioForecastMember2025-07-012025-09-300001509589us-gaap:SwapMembersrt:NaturalGasReservesMembersrt:ScenarioForecastMember2025-10-012025-12-310001509589us-gaap:SwapMembersrt:NaturalGasReservesMembersrt:ScenarioForecastMember2024-12-310001509589us-gaap:SwapMembersrt:NaturalGasReservesMembersrt:ScenarioForecastMember2025-03-310001509589us-gaap:SwapMembersrt:NaturalGasReservesMembersrt:ScenarioForecastMember2025-06-300001509589us-gaap:SwapMembersrt:NaturalGasReservesMembersrt:ScenarioForecastMember2025-09-300001509589us-gaap:SwapMembersrt:NaturalGasReservesMembersrt:ScenarioForecastMember2025-12-310001509589civi:TwoWayCollarMembersrt:NaturalGasReservesMembersrt:ScenarioForecastMember2025-01-012025-03-310001509589civi:TwoWayCollarMembersrt:NaturalGasReservesMembersrt:ScenarioForecastMember2025-04-012025-06-300001509589civi:TwoWayCollarMembersrt:NaturalGasReservesMembersrt:ScenarioForecastMember2025-07-012025-09-300001509589civi:TwoWayCollarMembersrt:NaturalGasReservesMembersrt:ScenarioForecastMember2025-10-012025-12-310001509589civi:TwoWayCollarMembersrt:NaturalGasReservesMembersrt:ScenarioForecastMember2026-01-012026-12-310001509589civi:TwoWayCollarMembersrt:NaturalGasReservesMembersrt:ScenarioForecastMember2025-03-310001509589civi:TwoWayCollarMembersrt:NaturalGasReservesMembersrt:ScenarioForecastMember2025-06-300001509589civi:TwoWayCollarMembersrt:NaturalGasReservesMembersrt:ScenarioForecastMember2025-09-300001509589civi:TwoWayCollarMembersrt:NaturalGasReservesMembersrt:ScenarioForecastMember2025-12-310001509589civi:TwoWayCollarMembersrt:NaturalGasReservesMembersrt:ScenarioForecastMember2026-12-310001509589us-gaap:BasisSwapMembercivi:NaturalGasPermianBasinBasisMembersrt:ScenarioForecastMember2024-10-012024-12-310001509589us-gaap:BasisSwapMembercivi:NaturalGasPermianBasinBasisMembersrt:ScenarioForecastMember2025-01-012025-03-310001509589us-gaap:BasisSwapMembercivi:NaturalGasPermianBasinBasisMembersrt:ScenarioForecastMember2025-04-012025-06-300001509589us-gaap:BasisSwapMembercivi:NaturalGasPermianBasinBasisMembersrt:ScenarioForecastMember2025-07-012025-09-300001509589us-gaap:BasisSwapMembercivi:NaturalGasPermianBasinBasisMembersrt:ScenarioForecastMember2025-10-012025-12-310001509589us-gaap:BasisSwapMembercivi:NaturalGasPermianBasinBasisMembersrt:ScenarioForecastMember2026-01-012026-12-310001509589us-gaap:BasisSwapMembercivi:NaturalGasPermianBasinBasisMembersrt:ScenarioForecastMember2024-12-310001509589us-gaap:BasisSwapMembercivi:NaturalGasPermianBasinBasisMembersrt:ScenarioForecastMember2025-03-310001509589us-gaap:BasisSwapMembercivi:NaturalGasPermianBasinBasisMembersrt:ScenarioForecastMember2025-06-300001509589us-gaap:BasisSwapMembercivi:NaturalGasPermianBasinBasisMembersrt:ScenarioForecastMember2025-09-300001509589us-gaap:BasisSwapMembercivi:NaturalGasPermianBasinBasisMembersrt:ScenarioForecastMember2025-12-310001509589us-gaap:BasisSwapMembercivi:NaturalGasPermianBasinBasisMembersrt:ScenarioForecastMember2026-12-310001509589us-gaap:BasisSwapMembercivi:NaturalGasPermianBasinIndexMembersrt:ScenarioForecastMember2024-10-012024-12-310001509589us-gaap:BasisSwapMembercivi:NaturalGasPermianBasinIndexMembersrt:ScenarioForecastMember2025-01-012025-03-310001509589us-gaap:BasisSwapMembercivi:NaturalGasPermianBasinIndexMembersrt:ScenarioForecastMember2024-12-310001509589us-gaap:BasisSwapMembercivi:NaturalGasPermianBasinIndexMembersrt:ScenarioForecastMember2025-03-310001509589us-gaap:SwapMemberus-gaap:SubsequentEventMembersrt:CrudeOilMembersrt:ScenarioForecastMember2025-10-012025-12-310001509589us-gaap:SwapMemberus-gaap:SubsequentEventMembersrt:CrudeOilMembersrt:ScenarioForecastMember2025-12-310001509589civi:TwoWayCollarMemberus-gaap:SubsequentEventMembersrt:CrudeOilMembersrt:ScenarioForecastMember2025-10-012025-12-310001509589civi:TwoWayCollarMemberus-gaap:SubsequentEventMembersrt:CrudeOilMembersrt:ScenarioForecastMember2025-12-310001509589us-gaap:BasisSwapMemberus-gaap:SubsequentEventMembercivi:NaturalGasPermianBasinIndexMembersrt:ScenarioForecastMember2024-10-012024-12-310001509589us-gaap:BasisSwapMemberus-gaap:SubsequentEventMembercivi:NaturalGasPermianBasinIndexMembersrt:ScenarioForecastMember2024-12-310001509589civi:CurrentDerivativeAssetsMemberus-gaap:CommodityMember2024-09-300001509589civi:CurrentDerivativeAssetsMemberus-gaap:CommodityMember2023-12-310001509589civi:LongTermDerivativeAssetsMemberus-gaap:CommodityMember2024-09-300001509589civi:LongTermDerivativeAssetsMemberus-gaap:CommodityMember2023-12-310001509589us-gaap:CommodityMember2024-09-300001509589us-gaap:CommodityMember2023-12-310001509589us-gaap:OtherCurrentLiabilitiesMemberus-gaap:CommodityMember2024-09-300001509589us-gaap:OtherCurrentLiabilitiesMemberus-gaap:CommodityMember2023-12-310001509589us-gaap:OtherNoncurrentLiabilitiesMemberus-gaap:CommodityMember2024-09-300001509589us-gaap:OtherNoncurrentLiabilitiesMemberus-gaap:CommodityMember2023-12-310001509589civi:A2024ShareRepurchasePlanMemberus-gaap:CommonStockMember2024-07-310001509589civi:NGPTapRockHoldingsLLCAndCertainAffiliatesMember2024-01-012024-09-300001509589civi:VencerEnergyLLCMember2024-01-012024-09-300001509589civi:OtherTransactionsMember2024-01-012024-09-300001509589civi:CPPIBCrestonePeakResourcesCanadaIncMember2023-01-012023-09-300001509589civi:OtherTransactionsMember2023-01-012023-09-300001509589civi:A2024ShareRepurchasePlanMemberus-gaap:CommonStockMember2024-09-300001509589civi:O2024Q1DividendsMember2024-01-012024-03-310001509589civi:S2024Q1DividendsMember2024-01-012024-03-310001509589civi:O2024Q2DividendsMember2024-04-012024-06-300001509589civi:S2024Q2DividendsMember2024-04-012024-06-300001509589civi:O2024Q3DividendsMember2024-07-012024-09-300001509589civi:S2024Q3DividendsMember2024-07-012024-09-300001509589civi:O2023Q1DividendsMember2023-01-012023-03-310001509589civi:S2023Q1DividendsMember2023-01-012023-03-310001509589civi:O2023Q2DividendsMember2023-04-012023-06-300001509589civi:S2023Q2DividendsMember2023-04-012023-06-300001509589civi:O2023Q3DividendsMember2023-07-012023-09-300001509589civi:S2023Q3DividendsMember2023-07-012023-09-30
UNITED STATES
SECURITIES AND EXCHANGE COMMISSION
Washington, D.C. 20549
FORM 10-Q
☒ QUARTERLY REPORT PURSUANT TO SECTION 13 OR 15(d) OF THE SECURITIES
EXCHANGE ACT OF 1934
For the quarterly period ended September 30, 2024
or
☐ TRANSITION REPORT PURSUANT TO SECTION 13 OR 15(d) OF THE SECURITIES EXCHANGE ACT OF 1934
For the transition period from _________ to _________
Commission File Number: 001-35371
Civitas Resources, Inc.
(Exact name of registrant as specified in its charter)
|
|
|
|
|
|
|
|
|
| Delaware |
|
61-1630631 |
| (State or other jurisdiction of incorporation or organization) |
|
(I.R.S. Employer Identification No.) |
|
|
|
|
|
|
|
|
|
|
|
|
|
|
|
| 555 17th Street, |
Suite 3700 |
|
|
| Denver, |
Colorado |
|
80202 |
| (Address of principal executive offices) |
|
(Zip Code) |
(303) 293-9100
(Registrant’s telephone number, including area code)
|
|
|
|
|
|
|
|
|
| Securities registered pursuant to Section 12(b) of the Act: |
| Title of each class |
Trading Symbol |
Name of exchange on which registered |
| Common Stock, par value $0.01 per share |
CIVI |
New York Stock Exchange |
Indicate by check mark whether the registrant (1) has filed all reports required to be filed by Section 13 or 15(d) of the Securities Exchange Act of 1934 during the preceding 12 months (or for such shorter period that the registrant was required to file such reports), and (2) has been subject to such filing requirements for the past 90 days. ☒ Yes ☐ No
Indicate by check mark whether the registrant has submitted electronically every Interactive Data File required to be submitted pursuant to Rule 405 of Regulation S-T (§232.405 of this chapter) during the preceding 12 months (or for such shorter period that the registrant was required to submit such files). ☒ Yes ☐ No
Indicate by check mark whether the registrant is a large accelerated filer, an accelerated filer, a non-accelerated filer, smaller reporting company, or an emerging growth company. See the definitions of “large accelerated filer,” “accelerated filer”, “smaller reporting company,” and “emerging growth company” in Rule 12b-2 of the Exchange Act.
|
|
|
|
|
|
|
|
|
|
|
|
|
|
|
|
|
|
| Large Accelerated Filer |
☒ |
Accelerated Filer |
☐ |
|
| Non-accelerated Filer |
☐ |
Smaller reporting company |
☐ |
|
|
|
Emerging growth company |
☐ |
|
If an emerging growth company, indicate by check mark if the registrant has elected not to use the extended transition period for complying with any new or revised financial accounting standards provided pursuant to Section 13(a) of the Exchange Act. ☐
Indicate by check mark whether the registrant is a shell company (as defined in Rule 12b-2 of the Exchange Act). ☐ Yes ☒ No
As of November 6, 2024, the registrant had 96,514,065 shares of common stock outstanding.
CIVITAS RESOURCES, INC.
FORM 10-Q
FOR THE QUARTER ENDED SEPTEMBER 30, 2024
TABLE OF CONTENTS
Information Regarding Forward-Looking Statements
This Quarterly Report on Form 10-Q contains various statements, including those that express belief, expectation or intention, as well as those that are not statements of historic fact, that are forward-looking statements within the meaning of Section 27A of the Securities Act of 1933, as amended (the “Securities Act”), and Section 21E of the Securities and Exchange Act of 1934, as amended (the “Exchange Act”). When used in this Quarterly Report on Form 10-Q, the words “could,” “believe,” “anticipate,” “intend,” “estimate,” “expect,” “may,” “continue,” “predict,” “potential,” “project,” “plan,” “will,” and similar expressions are intended to identify forward-looking statements, although not all forward-looking statements contain such identifying words. These forward-looking statements are based on management’s current belief, based on currently available information, as to the outcome and timing of future events.
Forward-looking statements include statements related to, among other things:
•our business strategies;
•reserves estimates;
•estimated sales volumes;
•the amount and allocation of forecasted capital expenditures and plans for funding capital expenditures and operating expenses;
•our ability to modify future capital expenditures;
•anticipated costs;
•compliance with debt covenants;
•our ability to fund and satisfy obligations related to ongoing operations;
•compliance with government regulations, including those related to climate change as well as environmental, health, and safety regulations and liabilities thereunder;
•our ability to achieve, reach, or otherwise meet initiatives, plans, or ambitions with respect to environmental, social, and governance matters;
•the adequacy of gathering systems and continuous improvement of such gathering systems;
•the impact from the lack of available gathering systems and processing facilities in certain areas;
•crude oil, natural gas, and natural gas liquids (“NGL”) prices and factors affecting the volatility of such prices;
•the ability to use derivative instruments to manage commodity price risk and ability to use such instruments in the future;
•our drilling inventory and drilling intentions;
•the impact of potentially disruptive technologies;
•the timing and success of specific projects;
•our implementation of standard and long reach laterals;
•our intention to continue to optimize enhanced completion techniques and well design changes;
•stated working interest percentages;
•our management and technical team;
•outcomes and effects of litigation, claims, and disputes;
•our ability to replace crude oil and natural gas reserves;
•our ability to convert proved undeveloped reserves to producing properties within five years of their initial proved booking;
•our ability to pursue potential future capital management activities such as stock repurchases, paying dividends on our common stock at their current level or at all, or additional mechanisms to return excess capital to our stockholders;
•the impact of the loss of a single customer or any purchaser of our products;
•the timing and ability to meet certain volume commitments related to purchase and transportation agreements;
•the impact of customary royalty interests, overriding royalty interests, obligations incident to operating agreements, liens for current taxes, and other industry-related constraints;
•our anticipated financial position, including our cash flow and liquidity;
•the adequacy of our insurance;
•plans and expectations with respect to our recent acquisitions and the anticipated impact of the recent acquisitions on our results of operations, financial position, future growth opportunities, reserve estimates, and competitive position;
•the results, effects, benefits, and synergies of other mergers and acquisitions; and
•other statements concerning our anticipated operations, economic performance, and financial condition.
We have based these forward-looking statements on certain assumptions and analyses we have made in light of our experience and our perception of historical trends, current conditions, and expected future developments as well as other factors we believe are appropriate under the circumstances. They can be affected by inaccurate assumptions or by known or unknown risks and uncertainties. Many such factors will be important in determining actual future results. The actual results or developments anticipated by these forward-looking statements are subject to a number of risks and uncertainties, many of which are beyond our control, and may not be realized or, even if substantially realized, may not have the expected consequences. Actual results could differ materially from those expressed or implied in the forward-looking statements.
Factors that could cause actual results to differ materially include, but are not limited to, the following:
•the risk factors discussed in Part I, Item 1A of our Annual Report on Form 10-K for the year ended December 31, 2023 (“
2023 Form 10-K”);
•declines or volatility in the prices we receive for our crude oil, natural gas, and NGL;
•general economic conditions, whether internationally, nationally, or in the regional and local market areas in which we do business, including any future economic downturn, the impact of continued or further inflation, disruption in the financial markets, and the availability of credit on acceptable terms;
•our ability to identify and select possible additional acquisition and disposition opportunities;
•the effects of disruption of our operations or excess supply of crude oil and natural gas and other effects of world health events, and the actions by certain crude oil and natural gas producing countries;
•the ability of our customers to meet their obligations to us;
•our access to capital on acceptable terms;
•our ability to generate sufficient cash flow from operations, borrowings, or other sources to enable us to fully develop our undeveloped acreage positions;
•the presence or recoverability of estimated crude oil and natural gas reserves and the actual future sales volume rates and associated costs;
•uncertainties associated with estimates of proved crude oil and natural gas reserves;
•the possibility that the industry may be subject to future local, state, and federal regulatory or legislative actions (including additional taxes and changes in environmental, health, and safety regulation and regulations addressing climate change);
•environmental, health, and safety risks;
•seasonal weather conditions as well as severe weather and other natural events caused by climate change;
•lease stipulations;
•drilling and operating risks, including the risks associated with the employment of horizontal drilling and completion techniques;
•our ability to acquire adequate supplies of water for drilling and completion operations;
•availability of oilfield equipment, services, and personnel;
•exploration and development risks;
•operational interruption of centralized crude oil and natural gas processing facilities;
•competition in the crude oil and natural gas industry;
•management’s ability to execute our plans to meet our goals;
•unforeseen difficulties encountered in operating in new geographic areas;
•our ability to attract and retain key members of our senior management and key technical employees;
•our ability to maintain effective internal controls;
•access to adequate gathering systems and pipeline take-away capacity;
•our ability to secure adequate processing capacity for natural gas we produce, to secure adequate transportation for crude oil, natural gas, and NGL we produce, and to sell the crude oil, natural gas, and NGL at market prices;
•costs and other risks associated with perfecting title for mineral rights in some of our properties;
•pandemics and other public health epidemics;
•potential impacts following the result of the presidential election in the United States, including volatility in the political, legal, and regulatory environments;
•political conditions in or affecting other producing countries, including conflicts or hostilities in or relating to the Middle East (including the current events related to the Israel-Palestine conflict), South America, and Russia (including the current events involving Russia and Ukraine), and other sustained military campaigns or acts of terrorism or sabotage and the effects therefrom; and
•other economic, competitive, governmental, legislative, regulatory, geopolitical, and technological factors that may negatively impact our businesses, operations, or pricing.
All forward-looking statements speak only as of the date of this Quarterly Report on Form 10-Q. We disclaim any obligation to update or revise these statements unless required by law, and you should not place undue reliance on these forward-looking statements. Although we believe that our plans, intentions, and expectations reflected in or suggested by the forward-looking statements we make in this Quarterly Report on Form 10-Q are reasonable, we can give no assurance that these plans, intentions, or expectations will be achieved. We disclose other important factors that could cause our actual results to differ materially from our expectations under “Part I, Item 1A. Risk Factors” and elsewhere in our
2023 Form 10-K, which may be updated by in subsequent Quarterly Reports on Form 10-Q and other documents we file with the Securities and Exchange Commission (the “SEC”). These cautionary statements qualify all forward-looking statements attributable to us or persons acting on our behalf.
PART I. FINANCIAL INFORMATION
Item 1. Financial Statements.
CIVITAS RESOURCES, INC. AND SUBSIDIARIES
CONDENSED CONSOLIDATED BALANCE SHEETS (UNAUDITED)
(in thousands, except per share amounts)
|
|
|
|
|
|
|
|
|
|
|
|
|
September 30, 2024 |
|
December 31, 2023 |
| ASSETS |
|
|
|
| Current assets: |
|
|
|
| Cash and cash equivalents |
$ |
47,075 |
|
|
$ |
1,124,797 |
|
| Accounts receivable, net: |
|
|
|
| Crude oil and natural gas sales |
549,074 |
|
|
505,961 |
|
| Joint interest and other |
201,202 |
|
|
247,228 |
|
| Derivative assets |
94,312 |
|
|
35,192 |
|
| Deposits for acquisitions |
— |
|
|
163,164 |
|
| Prepaid expenses and other |
67,955 |
|
|
68,070 |
|
| Total current assets |
959,618 |
|
|
2,144,412 |
|
| Property and equipment (successful efforts method): |
|
|
|
| Proved properties |
16,310,966 |
|
|
12,738,568 |
|
| Less: accumulated depreciation, depletion, and amortization |
(3,751,613) |
|
|
(2,339,541) |
|
| Total proved properties, net |
12,559,353 |
|
|
10,399,027 |
|
| Unproved properties |
782,027 |
|
|
821,939 |
|
| Wells in progress |
514,590 |
|
|
536,858 |
|
Other property and equipment, net of accumulated depreciation of $11,522 in 2024 and $9,808 in 2023 |
55,297 |
|
|
62,392 |
|
| Total property and equipment, net |
13,911,267 |
|
|
11,820,216 |
|
| Derivative assets |
4,492 |
|
|
8,233 |
|
|
|
|
|
|
|
|
|
| Other noncurrent assets |
132,416 |
|
|
124,458 |
|
| Total assets |
$ |
15,007,793 |
|
|
$ |
14,097,319 |
|
| LIABILITIES AND STOCKHOLDERS’ EQUITY |
|
|
|
| Current liabilities: |
|
|
|
| Accounts payable and accrued expenses |
$ |
586,329 |
|
|
$ |
565,708 |
|
| Production taxes payable |
320,523 |
|
|
421,045 |
|
| Crude oil and natural gas revenue distribution payable |
635,512 |
|
|
766,123 |
|
| Derivative liability |
14,168 |
|
|
18,096 |
|
| Deferred acquisition consideration |
469,183 |
|
|
— |
|
| Other liabilities |
88,394 |
|
|
80,915 |
|
| Total current liabilities |
2,114,109 |
|
|
1,851,887 |
|
| Long-term liabilities: |
|
|
|
|
|
|
|
|
|
|
|
Debt, net |
4,841,523 |
|
|
4,785,732 |
|
| Ad valorem taxes |
203,471 |
|
|
307,924 |
|
| Derivative liability |
10,890 |
|
|
— |
|
| Deferred income tax liabilities, net |
752,175 |
|
|
564,781 |
|
| Asset retirement obligations |
310,417 |
|
|
305,716 |
|
| Other long-term liabilities |
106,731 |
|
|
99,958 |
|
| Total liabilities |
8,339,316 |
|
|
7,915,998 |
|
| Commitments and contingencies (Note 6) |
|
|
|
| Stockholders’ equity: |
|
|
|
Preferred stock, $.01 par value, 25,000,000 shares authorized, none outstanding |
— |
|
|
— |
|
Common stock, $.01 par value, 225,000,000 shares authorized, 97,091,021 and 93,774,901 issued and outstanding as of September 30, 2024 and December 31, 2023, respectively |
5,037 |
|
|
5,004 |
|
| Additional paid-in capital |
5,255,278 |
|
|
4,964,450 |
|
| Retained earnings |
1,408,162 |
|
|
1,211,867 |
|
| Total stockholders’ equity |
6,668,477 |
|
|
6,181,321 |
|
| Total liabilities and stockholders’ equity |
$ |
15,007,793 |
|
|
$ |
14,097,319 |
|
The accompanying notes are an integral part of these unaudited condensed consolidated financial statements.
CIVITAS RESOURCES, INC. AND SUBSIDIARIES
CONDENSED CONSOLIDATED STATEMENTS OF OPERATIONS (UNAUDITED)
(in thousands, except per share amounts)
|
|
|
|
|
|
|
|
|
|
|
|
|
|
|
|
|
|
|
|
|
|
|
|
|
Three Months Ended September 30, |
|
Nine Months Ended September 30, |
| |
2024 |
|
2023 |
|
2024 |
|
2023 |
| Operating net revenues: |
|
|
|
|
|
|
|
| Crude oil, natural gas, and NGL sales |
$ |
1,271,375 |
|
|
$ |
1,034,410 |
|
|
$ |
3,910,663 |
|
|
$ |
2,348,090 |
|
| Other operating income |
670 |
|
|
1,506 |
|
|
3,279 |
|
|
4,374 |
|
| Total operating net revenues |
1,272,045 |
|
|
1,035,916 |
|
|
3,913,942 |
|
|
2,352,464 |
|
| Operating expenses: |
|
|
|
|
|
|
|
| Lease operating expense |
146,761 |
|
|
94,660 |
|
|
404,832 |
|
|
191,728 |
|
| Midstream operating expense |
11,225 |
|
|
11,661 |
|
|
36,725 |
|
|
35,041 |
|
| Gathering, transportation, and processing |
96,414 |
|
|
77,540 |
|
|
279,784 |
|
|
209,765 |
|
| Severance and ad valorem taxes |
87,262 |
|
|
83,437 |
|
|
291,081 |
|
|
188,242 |
|
| Exploration |
861 |
|
|
429 |
|
|
13,735 |
|
|
1,546 |
|
| Depreciation, depletion, and amortization |
523,929 |
|
|
320,469 |
|
|
1,511,859 |
|
|
754,558 |
|
|
|
|
|
|
|
|
|
| Transaction costs |
140 |
|
|
28,450 |
|
|
30,737 |
|
|
60,077 |
|
General and administrative expense |
56,729 |
|
|
36,154 |
|
|
173,742 |
|
|
106,553 |
|
Other operating expense |
2,114 |
|
|
3,918 |
|
|
11,138 |
|
|
5,255 |
|
| Total operating expenses |
925,435 |
|
|
656,718 |
|
|
2,753,633 |
|
|
1,552,765 |
|
| Other income (expense): |
|
|
|
|
|
|
|
| Derivative gain (loss), net |
151,029 |
|
|
(150,661) |
|
|
48,927 |
|
|
(120,574) |
|
| Interest expense |
(117,760) |
|
|
(76,467) |
|
|
(342,443) |
|
|
(92,669) |
|
Loss on property transactions, net |
— |
|
|
— |
|
|
(1,430) |
|
|
(254) |
|
Other income |
9,233 |
|
|
17,288 |
|
|
17,571 |
|
|
34,356 |
|
Total other income (expense) |
42,502 |
|
|
(209,840) |
|
|
(277,375) |
|
|
(179,141) |
|
| Income from operations before income taxes |
389,112 |
|
|
169,358 |
|
|
882,934 |
|
|
620,558 |
|
| Income tax expense |
(93,309) |
|
|
(29,686) |
|
|
(195,321) |
|
|
(139,138) |
|
| Net income |
$ |
295,803 |
|
|
$ |
139,672 |
|
|
$ |
687,613 |
|
|
$ |
481,420 |
|
|
|
|
|
|
|
|
|
|
|
|
|
|
|
|
|
|
|
|
|
|
|
|
|
| Earnings per common share: |
|
|
|
|
|
|
|
| Basic |
$ |
3.02 |
|
|
$ |
1.57 |
|
|
$ |
6.91 |
|
|
$ |
5.75 |
|
| Diluted |
$ |
3.01 |
|
|
$ |
1.56 |
|
|
$ |
6.88 |
|
|
$ |
5.70 |
|
| Weighted-average common shares outstanding: |
|
|
|
|
|
|
|
| Basic |
97,905 |
|
|
88,911 |
|
|
99,540 |
|
|
83,700 |
|
| Diluted |
98,224 |
|
|
89,631 |
|
|
99,951 |
|
|
84,468 |
|
The accompanying notes are an integral part of these unaudited condensed consolidated financial statements.
CIVITAS RESOURCES, INC. AND SUBSIDIARIES
CONDENSED CONSOLIDATED STATEMENTS OF STOCKHOLDERS’ EQUITY (UNAUDITED)
(in thousands, except per share amounts)
|
|
|
|
|
|
|
|
|
|
|
|
|
|
|
|
|
|
|
|
|
|
|
|
|
|
|
|
|
|
|
|
|
|
|
Additional |
|
|
|
|
|
Common Stock |
|
Paid-In |
|
Retained |
|
|
|
Shares |
|
Amount |
|
Capital |
|
Earnings |
|
Total |
Balances, December 31, 2023 |
93,774,901 |
|
|
$ |
5,004 |
|
|
$ |
4,964,450 |
|
|
$ |
1,211,867 |
|
|
$ |
6,181,321 |
|
| Issuance pursuant to acquisition |
7,181,527 |
|
|
72 |
|
|
488,846 |
|
|
— |
|
|
488,918 |
|
| Restricted common stock issued |
255,442 |
|
|
2 |
|
|
— |
|
|
— |
|
|
2 |
|
| Stock used for tax withholdings |
(99,307) |
|
|
(1) |
|
|
(7,069) |
|
|
— |
|
|
(7,070) |
|
|
|
|
|
|
|
|
|
|
|
| Common stock repurchased and retired |
(1,028,468) |
|
|
(10) |
|
|
(54,447) |
|
|
(12,479) |
|
|
(66,936) |
|
| Stock-based compensation |
— |
|
|
— |
|
|
11,199 |
|
|
— |
|
|
11,199 |
|
Dividends declared, $1.45 per share |
— |
|
|
— |
|
|
— |
|
|
(148,327) |
|
|
(148,327) |
|
| Net income |
— |
|
|
— |
|
|
— |
|
|
175,821 |
|
|
175,821 |
|
Balances, March 31, 2024 |
100,084,095 |
|
|
5,067 |
|
|
5,402,979 |
|
|
1,226,882 |
|
|
6,634,928 |
|
|
|
|
|
|
|
|
|
|
|
| Restricted common stock issued |
48,999 |
|
|
1 |
|
|
— |
|
|
— |
|
|
1 |
|
| Stock used for tax withholdings |
(18,571) |
|
|
— |
|
|
(1,436) |
|
|
— |
|
|
(1,436) |
|
| Exercise of stock options |
222 |
|
|
— |
|
|
6 |
|
|
— |
|
|
6 |
|
| Common stock repurchased and retired |
(1,766,808) |
|
|
(18) |
|
|
(95,380) |
|
|
(29,538) |
|
|
(124,936) |
|
| Stock-based compensation |
— |
|
|
— |
|
|
12,262 |
|
|
— |
|
|
12,262 |
|
Dividends declared, $1.50 per share |
— |
|
|
— |
|
|
— |
|
|
(150,797) |
|
|
(150,797) |
|
| Net income |
— |
|
|
— |
|
|
— |
|
|
215,989 |
|
|
215,989 |
|
Balances, June 30, 2024 |
98,347,937 |
|
|
5,050 |
|
|
5,318,431 |
|
|
1,262,536 |
|
|
6,586,017 |
|
|
|
|
|
|
|
|
|
|
|
| Restricted common stock issued |
129,371 |
|
|
— |
|
|
— |
|
|
— |
|
|
— |
|
| Stock used for tax withholdings |
(42,354) |
|
|
— |
|
|
(3,135) |
|
|
— |
|
|
(3,135) |
|
| Exercise of stock options |
111 |
|
|
— |
|
|
4 |
|
|
— |
|
|
4 |
|
| Common stock repurchased and retired |
(1,344,044) |
|
|
(13) |
|
|
(72,683) |
|
|
(5,293) |
|
|
(77,989) |
|
| Stock-based compensation |
— |
|
|
— |
|
|
12,661 |
|
|
— |
|
|
12,661 |
|
Dividends declared, $1.52 per share |
— |
|
|
— |
|
|
— |
|
|
(144,884) |
|
|
(144,884) |
|
| Net income |
— |
|
|
— |
|
|
— |
|
|
295,803 |
|
|
295,803 |
|
Balances, September 30, 2024 |
97,091,021 |
|
|
$ |
5,037 |
|
|
$ |
5,255,278 |
|
|
$ |
1,408,162 |
|
|
$ |
6,668,477 |
|
|
|
|
|
|
|
|
|
|
|
|
|
|
|
|
|
|
|
|
|
|
|
|
|
|
|
|
|
|
|
|
|
|
|
|
|
|
|
|
|
|
|
|
|
|
|
|
|
|
|
|
|
|
|
|
|
|
|
|
|
|
|
|
|
|
|
|
|
|
|
|
|
|
|
|
|
|
|
|
|
|
|
|
|
|
|
|
|
|
|
|
|
|
|
|
|
|
|
|
|
Balances, December 31, 2022 |
85,120,287 |
|
|
$ |
4,918 |
|
|
$ |
4,211,197 |
|
|
$ |
1,157,804 |
|
|
$ |
5,373,919 |
|
|
|
|
|
|
|
|
|
|
|
| Restricted common stock issued |
112,052 |
|
|
— |
|
|
— |
|
|
— |
|
|
— |
|
| Stock used for tax withholdings |
(30,111) |
|
|
— |
|
|
(2,118) |
|
|
— |
|
|
(2,118) |
|
| Exercise of stock options |
13,352 |
|
|
— |
|
|
440 |
|
|
— |
|
|
440 |
|
| Common stock repurchased and retired |
(4,918,032) |
|
|
(49) |
|
|
(243,312) |
|
|
(60,094) |
|
|
(303,455) |
|
| Stock-based compensation |
— |
|
|
— |
|
|
7,380 |
|
|
— |
|
|
7,380 |
|
Dividends declared, $2.15 per share |
— |
|
|
— |
|
|
— |
|
|
(176,878) |
|
|
(176,878) |
|
| Net income |
— |
|
|
— |
|
|
— |
|
|
202,461 |
|
|
202,461 |
|
Balances, March 31, 2023 |
80,297,548 |
|
|
4,869 |
|
|
3,973,587 |
|
|
1,123,293 |
|
|
5,101,749 |
|
|
|
|
|
|
|
|
|
|
|
| Restricted common stock issued |
375,615 |
|
|
4 |
|
|
— |
|
|
— |
|
|
4 |
|
| Stock used for tax withholdings |
(139,895) |
|
|
(1) |
|
|
(10,495) |
|
|
— |
|
|
(10,496) |
|
| Exercise of stock options |
111 |
|
|
— |
|
|
4 |
|
|
— |
|
|
4 |
|
| Common stock repurchased and retired |
(312,766) |
|
|
(3) |
|
|
(15,478) |
|
|
(4,917) |
|
|
(20,398) |
|
| Stock-based compensation |
— |
|
|
— |
|
|
9,895 |
|
|
— |
|
|
9,895 |
|
Dividends declared, $2.12 per share |
— |
|
|
— |
|
|
— |
|
|
(173,358) |
|
|
(173,358) |
|
| Net income |
— |
|
|
— |
|
|
— |
|
|
139,287 |
|
|
139,287 |
|
| Balances, June 30, 2023 |
80,220,613 |
|
|
4,869 |
|
|
3,957,513 |
|
|
1,084,305 |
|
|
5,046,687 |
|
| Issuance pursuant to acquisition |
13,538,472 |
|
|
135 |
|
|
990,069 |
|
|
— |
|
|
990,204 |
|
| Restricted common stock issued |
21,596 |
|
|
— |
|
|
— |
|
|
— |
|
|
— |
|
| Stock used for tax withholdings |
(8,783) |
|
|
— |
|
|
(693) |
|
|
— |
|
|
(693) |
|
| Exercise of stock options |
465 |
|
|
— |
|
|
15 |
|
|
— |
|
|
15 |
|
| Common stock repurchased and retired |
— |
|
|
— |
|
|
— |
|
|
3,456 |
|
|
3,456 |
|
| Stock-based compensation |
— |
|
|
— |
|
|
8,302 |
|
|
— |
|
|
8,302 |
|
Dividends declared, $1.74 per share |
— |
|
|
— |
|
|
— |
|
|
(167,010) |
|
|
(167,010) |
|
| Net income |
— |
|
|
— |
|
|
— |
|
|
139,672 |
|
|
139,672 |
|
Balances, September 30, 2023 |
93,772,363 |
|
|
$ |
5,004 |
|
|
$ |
4,955,206 |
|
|
$ |
1,060,423 |
|
|
$ |
6,020,633 |
|
The accompanying notes are an integral part of these unaudited condensed consolidated financial statements.
CIVITAS RESOURCES, INC. AND SUBSIDIARIES
CONDENSED CONSOLIDATED STATEMENTS OF CASH FLOWS (UNAUDITED)
(in thousands)
|
|
|
|
|
|
|
|
|
|
|
|
| |
Nine Months Ended September 30, |
| |
2024 |
|
2023 |
| Cash flows from operating activities: |
|
|
|
| Net income |
$ |
687,613 |
|
|
$ |
481,420 |
|
| Adjustments to reconcile net income to net cash provided by operating activities: |
|
|
|
| Depreciation, depletion, and amortization |
1,511,859 |
|
|
754,558 |
|
|
|
|
|
| Stock-based compensation |
36,122 |
|
|
25,577 |
|
| Derivative (gain) loss, net |
(48,927) |
|
|
120,574 |
|
| Derivative cash settlement loss, net |
(5,712) |
|
|
(44,907) |
|
Amortization of deferred financing costs and deferred acquisition consideration |
38,927 |
|
|
5,706 |
|
| Loss on property transactions, net |
1,430 |
|
|
254 |
|
| Deferred income tax expense |
187,395 |
|
|
138,972 |
|
| Other, net |
(3,000) |
|
|
(409) |
|
| Changes in operating assets and liabilities, net |
(398,549) |
|
|
(86,173) |
|
|
|
|
|
|
|
|
|
|
|
|
|
|
|
|
|
| Net cash provided by operating activities |
2,007,158 |
|
|
1,395,572 |
|
| Cash flows from investing activities: |
|
|
|
| Acquisitions of businesses, net of cash acquired |
(905,096) |
|
|
(3,650,491) |
|
| Acquisitions of crude oil and natural gas properties |
(24,344) |
|
|
(60,975) |
|
|
|
|
|
Capital expenditures for drilling and completion activities and other fixed assets |
(1,632,107) |
|
|
(782,119) |
|
Proceeds from property transactions |
163,280 |
|
|
5,764 |
|
| Purchases of carbon credits and renewable energy credits |
(3,918) |
|
|
(5,864) |
|
| Other, net |
2,000 |
|
|
(3,178) |
|
| Net cash used in investing activities |
(2,400,185) |
|
|
(4,496,863) |
|
| Cash flows from financing activities: |
|
|
|
| Proceeds from credit facility |
1,650,000 |
|
|
1,120,000 |
|
| Payments to credit facility |
(1,600,000) |
|
|
(470,000) |
|
| Proceeds from issuance of senior notes |
— |
|
|
2,666,250 |
|
Payment of deferred financing costs and other |
(6,509) |
|
|
(42,909) |
|
|
|
|
|
| Dividends paid |
(446,213) |
|
|
(511,031) |
|
| Common stock repurchased and retired |
(269,861) |
|
|
(320,398) |
|
| Proceeds from exercise of stock options |
10 |
|
|
458 |
|
| Payment of employee tax withholdings in exchange for the return of common stock |
(11,641) |
|
|
(13,302) |
|
| Principal payments on finance lease obligations |
(2,499) |
|
|
(483) |
|
Net cash provided by (used in) financing activities |
(686,713) |
|
|
2,428,585 |
|
| Net change in cash, cash equivalents, and restricted cash |
(1,079,740) |
|
|
(672,706) |
|
| Cash, cash equivalents, and restricted cash: |
|
|
|
Beginning of period(1)(2) |
1,126,815 |
|
|
768,134 |
|
End of period(2) |
$ |
47,075 |
|
|
$ |
95,428 |
|
(1) Includes $2.0 million of restricted cash consisting of $1.9 million of interest earned on cash held in escrow that is presented in deposits for acquisitions and $0.1 million of funds for road maintenance and repairs that is presented in other noncurrent assets within the accompanying unaudited condensed consolidated balance sheets (“balance sheets”) for the period ended December 31, 2023. |
(2) Includes $0.1 million of restricted cash consisting of funds for road maintenance and repairs that is presented in other noncurrent assets within the balance sheets for the periods ended December 31, 2022 and September 30, 2023. |
Refer to Note 2 - Acquisitions and Divestitures and Note 13 - Supplemental Disclosures of Cash Flow Information for additional information. |
The accompanying notes are an integral part of these unaudited condensed consolidated financial statements.
CIVITAS RESOURCES, INC. AND SUBSIDIARIES
NOTES TO THE CONDENSED CONSOLIDATED FINANCIAL STATEMENTS (UNAUDITED)
NOTE 1 - SUMMARY OF SIGNIFICANT ACCOUNTING POLICIES
Description of Operations
When we use the terms “Civitas,” the “Company,” “we,” “us,” or “our,” we are referring to Civitas Resources, Inc. and its consolidated subsidiaries unless the context otherwise requires. Civitas is an independent exploration and production company focused on the acquisition, development, and production of crude oil and associated liquids-rich natural gas in the DJ Basin in Colorado and the Permian Basin in Texas and New Mexico.
Basis of Presentation
The accompanying unaudited condensed consolidated financial statements include the accounts of Civitas and have been prepared in accordance with accounting principles generally accepted in the United States (“GAAP”) for interim financial information, the instructions to Quarterly Report on Form 10-Q, and Regulation S-X. Accordingly, pursuant to such rules and regulations, certain notes and other financial information included in audited financial statements have been condensed or omitted. In the opinion of management, all adjustments, consisting of normal recurring adjustments considered necessary for a fair presentation of interim financial information, have been included. All significant intercompany balances and transactions have been eliminated in consolidation.
The December 31, 2023 unaudited condensed consolidated balance sheet data has been derived from the audited consolidated financial statements contained in our
2023 Form 10-K, but does not include all disclosures, including notes required by GAAP. As such, this Quarterly Report on Form 10-Q should be read in conjunction with the audited consolidated financial statements and related notes included in our
2023 Form 10-K. In connection with the preparation of the unaudited condensed consolidated financial statements, we evaluated events subsequent to the balance sheet date of September 30, 2024 through the filing date of this Quarterly Report on Form 10-Q. The results of operations for the three and nine months ended September 30, 2024 are not necessarily indicative of the results that may be expected for the full year or any other future period. Additionally, certain insignificant prior period amounts have been reclassified to conform to current period presentation in the accompanying unaudited condensed consolidated financial statements. Such reclassifications did not have a material impact on prior period consolidated financial statements.
Significant Accounting Policies
The significant accounting policies followed by us are set forth in Note 1 - Summary of Significant Accounting Policies in the
2023 Form 10-K and are supplemented by the notes to the unaudited condensed consolidated financial statements included in this Quarterly Report on Form 10-Q.
Recently Issued and Adopted Accounting Standards
In November 2023, the FASB issued ASU No. 2023-07, Segment Reporting (Topic 280): Improvements to Reportable Segment Disclosures (“ASU 2023-07”). ASU 2023-07 was issued to improve the disclosures about a public entity’s reportable segments and to provide additional, more detailed information about a reportable segment’s expenses. ASU 2023-07 is effective for fiscal years beginning after December 15, 2023, and interim periods within fiscal years beginning after December 15, 2024, with early adoption permitted. The guidance is to be applied on a retrospective basis to all prior periods presented in the financial statements. We are within the scope of this ASU and are evaluating the impact of this ASU on our consolidated financial statement disclosures.
In December 2023, the FASB issued ASU No. 2023-09, Improvements to Income Tax Disclosures (“ASU 2023-09”). ASU 2023-09 is intended to enhance income tax disclosures by requiring disclosure of items such as the disaggregation of the income tax rate reconciliation as well as information regarding income taxes paid. This ASU is effective for annual reporting periods beginning after December 15, 2024, and early adoption is permitted. ASU 2023-07 should be applied on a prospective basis, and retrospective application is permitted. We are evaluating the impact that ASC 2023-09 will have on the consolidated financial statements and our plan for adoption, including the adoption date and transition method.
In March 2024, the SEC adopted rules intended to enhance and standardize climate-related disclosures in registration statements and annual reports. The new rules will require disclosure of material climate-related risks, including disclosure of boards of directors’ oversight and risk management activities, the material impacts of these risks to us and the quantification of material impacts to us as a result of severe weather events and other natural conditions. The rules also require disclosure of material greenhouse gas emissions and any material climate-related targets and goals.
The new rules were to be effective for annual reporting periods beginning in fiscal year 2025, except for the greenhouse gas emissions disclosures which were to be effective for annual reporting periods beginning in fiscal year 2026, though the new rules were voluntarily stayed by the SEC on April 4, 2024 pending completion of the judicial review of consolidated challenges to the new rules by the Court of Appeals for the Eighth Circuit. We are currently evaluating the impact of these new rules.
As of the filing of this Quarterly Report, we have not elected to early adopt ASU 2023-07 or ASU 2023-09. There are no other accounting standards applicable that would have a material effect on our financial statements and disclosures that have been issued but not yet adopted as of September 30, 2024, and through the filing date of this Quarterly Report on Form 10-Q.
NOTE 2 - ACQUISITIONS AND DIVESTITURES
All mergers and acquisitions disclosed below are accounted for under the acquisition method of accounting for business combinations under ASC Topic 805, Business Combinations. Accordingly, we conducted assessments of the net assets acquired and recognized amounts for identifiable assets acquired and liabilities assumed at their estimated acquisition date fair values, while transaction and integration costs associated with the acquisition were expensed as incurred. The fair value measurements of assets acquired, and liabilities assumed were based on inputs that are not observable in the market, and therefore represent Level 3 inputs. The fair values of crude oil and natural gas properties were measured using valuation techniques that converted future cash flows to a single discounted amount. Significant inputs to the valuation of the crude oil and natural gas properties included estimates of reserves, future operating and development costs, future commodity prices, estimated future cash flows, reserve adjustment factors, and a market-based weighted-average cost of capital. These inputs required significant judgments and estimates by management at the time of the valuation.
Vencer Acquisition
On January 2, 2024, we completed the acquisition of certain crude oil and natural gas assets from Vencer Energy, LLC (“Vencer”) for adjusted aggregate consideration of approximately $2.0 billion, inclusive of customary post-closing adjustments and $550 million in cash to be paid on or before January 3, 2025 (the “Vencer Acquisition”). In connection with and upon execution of the Vencer purchase and sale agreement, we deposited cash of $161.3 million with an escrow agent. This deposit, along with interest accrued thereon, was credited against the cash payable at closing. The following tables present the consideration transferred and preliminary purchase price allocation of the assets acquired and the liabilities assumed in the Vencer Acquisition:
|
|
|
|
|
|
Consideration (in thousands, except shares and per share amount) |
|
| Cash consideration |
$ |
996,420 |
|
Deferred acquisition consideration(1)(3) |
$ |
532,284 |
|
|
|
| Shares of common stock issued |
7,181,527 |
|
Closing price per share(2) |
$ |
68.08 |
|
Equity consideration(4) |
$ |
488,918 |
|
|
|
| Total consideration |
$ |
2,017,622 |
|
_______________________
(1)Based on discounted fixed and determinable future payments of cash.
(2)Based on the closing stock price of Civitas common stock on January 2, 2024.
(3)Amounts represent non-cash investing activities until such time payments are made, as applicable. Refer to Note 5 - Debt for additional information.
(4)Amounts represent non-cash financing activities.
|
|
|
|
|
|
| Preliminary Purchase Price Allocation (in thousands) |
|
| Assets Acquired |
|
| Proved properties |
$ |
1,855,909 |
|
| Unproved properties |
231,627 |
|
| Other property and equipment |
666 |
|
| Right-of-use assets |
4,049 |
|
| Total assets acquired |
$ |
2,092,251 |
|
|
|
| Liabilities Assumed |
|
| Accounts payable and accrued expenses |
$ |
2,000 |
|
| Crude oil and natural gas revenue distribution payable |
28,423 |
|
| Asset retirement obligations |
40,157 |
|
| Lease liability |
4,049 |
|
| Total liabilities assumed |
74,629 |
|
| Net assets acquired |
$ |
2,017,622 |
|
Through September 30, 2024, there have been immaterial adjustments made to the allocation presented in the Quarterly Report on Form 10-Q for the quarter ended March 31, 2024, filed with the SEC on May 2, 2024. The purchase price allocation for the Vencer Acquisition is preliminary, and we continue to assess the fair values of certain of the Vencer assets acquired and liabilities assumed. We expect to finalize the purchase price allocation as soon as practicable, which will not extend beyond the one-year measurement period.
Hibernia Acquisition
On August 2, 2023, we acquired all of the issued and outstanding equity ownership interests of Hibernia Energy III, LLC (“HE3”) and Hibernia Energy III-B, LLC (“HE3-B”, and together with HE3, “Hibernia”) for aggregate consideration of approximately $2.2 billion in cash, inclusive of customary post-closing adjustments (the “Hibernia Acquisition”). The following table presents the final purchase price allocation of the assets acquired and the liabilities assumed in the Hibernia Acquisition:
|
|
|
|
|
|
Final Purchase Price Allocation (in thousands) |
|
| Assets Acquired |
|
| Cash and cash equivalents |
$ |
30,671 |
|
| Accounts receivable - crude oil and natural gas sales |
86,262 |
|
| Accounts receivable - joint interest and other |
4,463 |
|
| Proved properties |
2,150,872 |
|
| Unproved properties |
115,802 |
|
| Other property and equipment |
520 |
|
| Right-of-use assets |
30,393 |
|
| Total assets acquired |
$ |
2,418,983 |
|
|
|
| Liabilities Assumed |
|
| Accounts payable and accrued expenses |
$ |
110,022 |
|
| Production taxes payable |
10,320 |
|
| Crude oil and natural gas revenue distribution payable |
75,267 |
|
| Asset retirement obligations |
8,299 |
|
| Lease liability |
30,393 |
|
| Total liabilities assumed |
234,301 |
|
| Net assets acquired |
$ |
2,184,682 |
|
The purchase price allocation for the Hibernia Acquisition was finalized as of the third quarter of 2024 with immaterial adjustments made to the allocation presented in the Quarterly Report on Form 10-Q for the quarter ended September 30, 2023, filed with the SEC on November 7, 2023.
Tap Rock Acquisition
On August 2, 2023, we acquired all of the issued and outstanding equity ownership interests of Tap Rock AcquisitionCo, LLC (“Tap Rock AcquisitionCo”), Tap Rock Resources II, LLC (“Tap Rock Resources II”), and Tap Rock NM10 Holdings, LLC (“Tap Rock NM10” and, together with Tap Rock AcquisitionCo and Tap Rock NM10, “Tap Rock”) for aggregate consideration of approximately $2.5 billion, inclusive of customary post-closing adjustments (the “Tap Rock Acquisition”). The following tables present the consideration transferred and final purchase price allocation of the assets acquired and the liabilities assumed in the Tap Rock Acquisition:
|
|
|
|
|
|
Consideration (in thousands, except shares and per share amount) |
|
| Cash consideration |
$ |
1,502,880 |
|
|
|
| Shares of common stock issued |
13,538,472 |
|
Closing price per share(1) |
$ |
73.14 |
|
| Equity consideration |
$ |
990,204 |
|
|
|
| Total consideration |
$ |
2,493,084 |
|
_______________________
(1)Based on the closing stock price of Civitas common stock on August 2, 2023.
|
|
|
|
|
|
Final Purchase Price Allocation (in thousands) |
|
| Assets Acquired |
|
| Cash and cash equivalents |
$ |
6,543 |
|
| Accounts receivable - crude oil and natural gas sales |
105,509 |
|
| Accounts receivable - joint interest and other |
30,415 |
|
| Prepaid expenses and other |
17,930 |
|
| Proved properties |
2,334,678 |
|
| Unproved properties |
300,859 |
|
| Other property and equipment |
12,827 |
|
| Right-of-use assets |
626 |
|
| Total assets acquired |
$ |
2,809,387 |
|
|
|
| Liabilities Assumed |
|
| Accounts payable and accrued expenses |
$ |
157,606 |
|
| Production taxes payable |
9,692 |
|
| Crude oil and natural gas revenue distribution payable |
68,094 |
|
| Ad valorem taxes |
1,407 |
|
| Asset retirement obligations |
28,612 |
|
| Lease liability |
626 |
|
| Deferred revenue |
50,266 |
|
| Total liabilities assumed |
316,303 |
|
| Net assets acquired |
$ |
2,493,084 |
|
The purchase price allocation for the Tap Rock Acquisition was finalized as of the third quarter of 2024 with immaterial adjustments made to the allocation presented in the Quarterly Report on Form 10-Q for the quarter ended September 30, 2023, filed with the SEC on November 7, 2023.
Revenue and earnings of the acquiree
The results of operations for the Vencer Acquisition since the closing date have been included on our unaudited condensed consolidated financial statements for the three and nine months ended September 30, 2024. The amount of revenue of Vencer included in our accompanying unaudited condensed consolidated statements of operations (“statements of operations”) was approximately $186.9 million and $584.9 million during the three and nine months ended September 30, 2024, respectively. We determined that disclosing the amount of Vencer-related net income included in the accompanying statements of operations is impracticable as the operations from the acquisition were integrated into our operations from the date of the acquisition.
Supplemental pro forma financial information
The results of operations for the Vencer, Hibernia, and Tap Rock acquisitions since their respective closing dates have been included in our unaudited condensed consolidated financial statements and therefore do not require pro forma disclosure for the three and nine months ended September 30, 2024. The following unaudited pro forma financial information (in thousands, except per share amounts) represents a summary of the consolidated results of operations for the three and nine months ended September 30, 2023, assuming the Vencer Acquisition had been completed as of January 1, 2023 and the Hibernia and Tap Rock acquisitions had been completed as of January 1, 2022. The pro forma financial information is not necessarily indicative of the results of operations that would have been achieved if the Vencer, Hibernia, and Tap Rock acquisitions had been effective as of those dates, or of future results, and includes certain nonrecurring pro forma adjustments that were directly related to these business combinations.
|
|
|
|
|
|
|
|
|
|
|
|
|
|
|
|
|
|
|
Three Months Ended September 30, 2023 |
|
|
|
Nine Months Ended September 30, 2023 |
| Total revenue |
|
$ |
1,448,735 |
|
|
|
|
$ |
3,886,210 |
|
| Net income |
|
278,564 |
|
|
|
|
843,161 |
|
| Earnings per common share - basic |
|
$ |
2.74 |
|
|
|
|
$ |
8.35 |
|
| Earnings per common share - diluted |
|
2.72 |
|
|
|
|
8.29 |
|
Transaction costs
Transaction costs related to the aforementioned acquisitions are accounted for separately from the assets acquired and liabilities assumed and are included in transaction costs in the accompanying statements of operations. Transaction costs also include costs associated with our efforts to divest of certain non-core assets in the DJ Basin, completed in early 2024. We incurred transaction costs of $0.1 million and $28.5 million during the three months ended September 30, 2024 and 2023, respectively, and $30.7 million and $60.1 million during the nine months ended September 30, 2024 and 2023, respectively.
NOTE 3 - REVENUE RECOGNITION
Crude oil, natural gas, and NGL sales revenue presented within the accompanying statements of operations is reflective of the revenue generated from contracts with customers. Revenue attributable to each identified revenue stream and operating region is disaggregated below (in thousands):
|
|
|
|
|
|
|
|
|
|
|
|
|
|
|
|
|
|
|
|
|
|
|
|
|
Three Months Ended September 30, |
|
Nine Months Ended September 30, |
| Sales by Commodity and Operating Region |
2024 |
|
2023 |
|
2024 |
|
2023 |
| Crude oil |
|
|
|
|
|
|
|
| DJ Basin |
$ |
487,311 |
|
|
$ |
582,798 |
|
|
$ |
1,467,376 |
|
|
$ |
1,583,605 |
|
| Permian Basin |
616,563 |
|
|
258,595 |
|
|
1,846,813 |
|
|
258,595 |
|
| Total |
1,103,874 |
|
|
841,393 |
|
|
3,314,189 |
|
|
1,842,200 |
|
| Natural gas |
|
|
|
|
|
|
|
| DJ Basin |
45,009 |
|
|
67,418 |
|
|
159,860 |
|
|
214,079 |
|
| Permian Basin |
(35,522) |
|
|
12,694 |
|
|
(53,995) |
|
|
12,694 |
|
| Total |
9,487 |
|
|
80,112 |
|
|
105,865 |
|
|
226,773 |
|
| NGL |
|
|
|
|
|
|
|
| DJ Basin |
79,970 |
|
|
77,502 |
|
|
248,357 |
|
|
243,714 |
|
| Permian Basin |
78,044 |
|
|
35,403 |
|
|
242,252 |
|
|
35,403 |
|
| Total |
158,014 |
|
|
112,905 |
|
|
490,609 |
|
|
279,117 |
|
| Crude oil, natural gas, and NGL |
|
|
|
|
|
|
|
| DJ Basin |
612,290 |
|
|
727,718 |
|
|
1,875,593 |
|
|
2,041,398 |
|
| Permian Basin |
659,085 |
|
|
306,692 |
|
|
2,035,070 |
|
|
306,692 |
|
| Total |
$ |
1,271,375 |
|
|
$ |
1,034,410 |
|
|
$ |
3,910,663 |
|
|
$ |
2,348,090 |
|
For the three and nine months ended September 30, 2024 and 2023, revenue recognized in the reporting period related to performance obligations satisfied in prior reporting periods was insignificant. As of September 30, 2024 and December 31, 2023, our receivables from contracts with customers were $549.1 million and $506.0 million, respectively.
NOTE 4 - ACCOUNTS PAYABLE AND ACCRUED EXPENSES
Accounts payable and accrued expenses contain the following (in thousands):
|
|
|
|
|
|
|
|
|
|
|
|
| |
September 30, 2024 |
|
December 31, 2023 |
| Accounts payable trade |
$ |
76,824 |
|
|
$ |
55,750 |
|
| Accrued drilling and completion costs |
171,843 |
|
|
149,520 |
|
| Accrued crude oil and natural gas operating expense |
156,730 |
|
|
149,483 |
|
| Accrued general and administrative expense |
33,344 |
|
|
30,095 |
|
| Accrued transaction costs |
63 |
|
|
8,796 |
|
| Accrued interest expense |
109,324 |
|
|
141,401 |
|
| Other accrued expenses |
38,201 |
|
|
30,663 |
|
| Total accounts payable and accrued expenses |
$ |
586,329 |
|
|
$ |
565,708 |
|
NOTE 5 - DEBT
Debt, net of unamortized discounts and deferred financing costs, consists of the following (in thousands):
|
|
|
|
|
|
|
|
|
|
|
|
|
September 30, 2024 |
|
December 31, 2023 |
Outstanding principal balances on Senior Notes: |
|
|
|
2026 Senior Notes (5.000%) |
$ |
400,000 |
|
|
$ |
400,000 |
|
2028 Senior Notes (8.375%) |
1,350,000 |
|
|
1,350,000 |
|
2030 Senior Notes (8.625%) |
1,000,000 |
|
|
1,000,000 |
|
2031 Senior Notes (8.750%) |
1,350,000 |
|
|
1,350,000 |
|
Outstanding principal balances on Senior Notes, gross |
4,100,000 |
|
|
4,100,000 |
|
| Less: unamortized discount and deferred financing costs |
(58,477) |
|
|
(64,268) |
|
Outstanding principal balances on Senior Notes, net |
4,041,523 |
|
|
4,035,732 |
|
Outstanding balance on Credit Facility |
800,000 |
|
|
750,000 |
|
| Long-term debt |
4,841,523 |
|
4,785,732 |
| Deferred acquisition consideration |
469,183 |
|
|
— |
|
Total debt |
$ |
5,310,706 |
|
|
$ |
4,785,732 |
|
Senior Notes
The table below summarizes the face values, interest rates, maturity dates, and semi-annual interest payment dates related to our outstanding senior note obligations as of September 30, 2024 (in thousands):
|
|
|
|
|
|
|
|
|
|
|
|
|
|
|
|
|
|
|
|
|
|
|
|
|
Interest Rate |
|
Interest Payment Dates |
|
Principal Amount |
|
Maturity Date |
| 2026 Senior Notes |
5.000% |
|
April 15, October 15 |
|
$ |
400,000 |
|
|
October 15, 2026 |
| 2028 Senior Notes |
8.375% |
|
January 1, July 1 |
|
1,350,000 |
|
|
July 1, 2028 |
| 2030 Senior Notes |
8.625% |
|
May 1, November 1 |
|
1,000,000 |
|
|
November 1, 2030 |
| 2031 Senior Notes |
8.750% |
|
January 1, July 1 |
|
1,350,000 |
|
|
July 1, 2031 |
The 2026 Senior Notes, 2028 Senior Notes, 2030 Senior Notes, and 2031 Senior Notes (collectively, the “Senior Notes”) are unsecured senior obligations and rank equal in right of payment with all of the Company’s existing and any future unsecured senior debt and are senior in right of payment to any future subordinated debt. The Company may redeem some or all of its Senior Notes prior to their maturity at redemption prices that may include a premium, plus accrued and unpaid interest as described in the indentures governing the Senior Notes. The Senior Notes are fully and unconditionally guaranteed on a senior unsecured basis by all of our existing subsidiaries and are expected to be guaranteed by certain other future subsidiaries that may be required to guarantee the Senior Notes.
The indentures governing the Senior Notes contain covenants that limit, among other things, our ability and the ability of our subsidiaries to: (i) incur or guarantee additional indebtedness; (ii) create liens securing indebtedness; (iii) pay dividends on or redeem or repurchase stock or subordinated debt; (iv) make specified types of investments and acquisitions; (v) enter into or permit to exist contractual limits on the ability of our subsidiaries to pay dividends to us; (vi) enter into transactions with affiliates; and (vii) sell assets or merge with other companies. These covenants are subject to a number of important limitations and exceptions. We were in compliance with all covenants and all restricted payment provisions related to our Senior Notes through the filing of this Quarterly Report on Form 10-Q. The indentures governing the Senior Notes also contain customary events of default.
For additional details on our Senior Notes, refer to Note 5 - Long-Term Debt in Item 8. Financial Statements and Supplementary Data included in our
2023 Form 10-K.
Credit Facility
We are party to a reserve-based revolving facility, as the borrower, with JPMorgan Chase Bank, N.A. (“JPMorgan”), as the administrative agent, and a syndicate of financial institutions, as lenders, that has an aggregate maximum commitment amount of $4.0 billion and is set to mature on August 2, 2028 (together with all amendments thereto, the “Credit Facility” or the “Credit Agreement”).
On June 12, 2024, we entered into a Sixth Amendment to our Credit Agreement (the “Sixth Amendment”), which, among other things, amended certain terms of the Credit Agreement to: (i) increase the borrowing base by $400.0 million for a new borrowing base of $3.4 billion, (ii) increase the aggregate elected commitments by $350.0 million for a new aggregate elected commitment of $2.2 billion, (iii) lower the interest rate margins applicable to loans under the Credit Agreement, (iv) add provisions to lower the interest rate margins and modify certain covenants in the Credit Agreement, as well as to make the Credit Facility unsecured, upon the achievement of investment grade credit ratings, (v) modify certain definitions in the Credit Agreement in connection with the transactions contemplated by the Sixth Amendment, and (vi) provide for the addition of certain new lenders under the Credit Agreement.
As of September 30, 2024, the borrowing base and aggregate elected commitments under the Credit Agreement were $3.4 billion and $2.2 billion, respectively. The next scheduled borrowing base redetermination date is in November 2024.
Interest and commitment fees associated with the Credit Facility are accrued based on a revolving loan commitment utilization grid set forth in the Credit Agreement. Borrowings under the Credit Facility bear interest at a per annum rate equal to, at our option, either (i) the Alternate Base Rate (“ABR”) plus the applicable margin, or (ii) the term-specific Secured Overnight Financing Rate (“SOFR”) plus the applicable margin. ABR is established as a rate per annum equal to the greatest of (a) the rate of interest publicly announced by JPMorgan as its prime rate, (b) the applicable rate of interest published by the Federal Reserve Bank of New York plus 0.5%, or (c) the term-specific SOFR for an interest period of one month plus 1.0%, in each case, subject to a 1.5% floor, plus an applicable margin of 0.75% to 1.75% based on the utilization of the Credit Facility. Term-specific SOFR is based on one-, three-, or six-month terms as selected by us and is subject to a 0.5% floor, plus an applicable margin of 1.75% to 2.75%, based on the utilization of the Credit Facility. Interest on borrowings that bear interest at the SOFR are payable on the last day of the applicable interest period selected by us, and interest on borrowings that bear interest at the ABR are payable quarterly in arrears.
The Credit Facility is guaranteed by all our restricted domestic subsidiaries and is secured by first priority security interests on substantially all assets, including a mortgage on at least 90% of the total value of the proved properties evaluated in the most recently delivered reserve reports, including any engineering reports relating to the crude oil and natural gas properties of our restricted domestic subsidiaries, subject to customary exceptions.
The Credit Facility contains customary representations and affirmative covenants. The Credit Facility also contains customary negative covenants, which, among other things, and subject to certain exceptions, including the suspension and/or modification of certain covenants in the event that we receive investment grade credit ratings, include restrictions on (i) liens, (ii) indebtedness, guarantees and other obligations, (iii) restrictions in agreements on liens and distributions, (iv) mergers or consolidations, (v) asset sales, (vi) restricted payments, (vii) investments, (viii) affiliate transactions, (ix) change of business, (x) foreign operations or subsidiaries, (xi) changes to organizational documents, (xii) use of proceeds from loans and letters of credit, (xiii) hedging transactions, (xiv) additional subsidiaries, (xv) changes in fiscal year or fiscal quarter, (xvi) prepayments of certain debt and other obligations, (xvii) sales or discounts of receivables, and (xviii) dividend payment thresholds.
In addition, we are subject to certain financial covenants under the Credit Facility, as tested on the last day of each fiscal quarter, including, without limitation, (a) a maximum ratio of our consolidated net indebtedness to earnings before interest, income taxes, depreciation, depletion, and amortization, exploration expense, and other non-cash charges (“permitted net leverage ratio”) of 3.00 to 1.00, (b) a current ratio, inclusive of the unused commitments under the Credit Facility then available to be borrowed, to not be less than 1.00 to 1.00, and (c) upon the achievement of investment grade credit ratings, a PV-9 coverage ratio of the net present value, discounted at 9% per annum, of the estimated future net revenues expected in the proved reserves to our total net indebtedness of not less than 1.50 to 1.00 (“PV-9 Coverage Ratio”). We were in compliance with all covenants under the Credit Facility as of September 30, 2024 and through the filing of this Quarterly Report on Form 10-Q.
The following table presents the outstanding balance, letters of credit outstanding, and available borrowing capacity under the Credit Facility as of the dates indicated (in thousands):
|
|
|
|
|
|
|
|
|
|
|
|
|
|
|
|
|
|
|
November 6, 2024 |
|
September 30, 2024 |
|
December 31, 2023 |
Outstanding balance |
$ |
850,000 |
|
|
$ |
800,000 |
|
|
$ |
750,000 |
|
| Letters of credit |
2,100 |
|
|
2,100 |
|
|
2,100 |
|
| Available borrowing capacity |
1,347,900 |
|
|
1,397,900 |
|
|
1,097,900 |
|
Total aggregate elected commitments |
$ |
2,200,000 |
|
|
$ |
2,200,000 |
|
|
$ |
1,850,000 |
|
As of September 30, 2024 and December 31, 2023, the unamortized deferred financing costs associated with amendments to the Credit Facility were $31.4 million and $34.4 million, respectively. Of the unamortized deferred financing costs, (i) $23.2 million and $26.9 million are presented within other noncurrent assets on the accompanying balance sheets as of September 30, 2024 and December 31, 2023, respectively, and (ii) $8.2 million and $7.5 million are presented within prepaid expenses and other on the accompanying balance sheets as of September 30, 2024 and December 31, 2023, respectively.
Deferred Acquisition Consideration
The Vencer Acquisition included deferred consideration of $550.0 million to be paid in cash on or before January 3, 2025. We discounted this obligation and recorded $532.3 million as deferred acquisition consideration upon closing and are amortizing the discount to interest expense in the accompanying statements of operations until the payment is made. During the nine months ended September 30, 2024, we paid $75.0 million of this deferred consideration, which is recorded as a cash outflow within the acquisitions of businesses, net of cash acquired in the accompanying unaudited condensed consolidated statements of cash flows (“statements of cash flows”). $475.0 million of deferred consideration remains to be paid on or before January 3, 2025.
Interest Expense
For the three months ended September 30, 2024 and 2023, we incurred interest expense of $117.8 million and $76.5 million, respectively. Interest expense for the three months ended September 30, 2024 includes $9.5 million related to the amortization of deferred acquisition consideration associated with the Vencer Acquisition. For the nine months ended September 30, 2024 and 2023, we incurred interest expense of $342.4 million and $92.7 million, respectively. Interest expense for the nine months ended September 30, 2024 includes $27.4 million related to the amortization of deferred acquisition consideration associated with the Vencer Acquisition.
NOTE 6 - COMMITMENTS AND CONTINGENCIES
Commitments. We routinely enter into, extend, or amend operating agreements in the ordinary course of business. We have long-term transportation, sales, processing, and water delivery commitments. There were no significant commitments entered into during the nine months ended September 30, 2024. For details of our existing commitments, refer to Note 6 - Commitments and Contingencies in Item 8. Financial Statements and Supplementary Data included in our
2023 Form 10-K.
Litigation and Legal Items. We are involved in various legal proceedings. We review the status of these proceedings on an ongoing basis and, from time to time, may settle or otherwise resolve these matters on terms and conditions that management believes are in our best interests. We have provided the necessary estimated accruals in the accompanying balance sheets where deemed appropriate for litigation and legal related items that are ongoing and not yet concluded. Although the results cannot be known with certainty, we currently believe that the ultimate results of such proceedings will not have a material adverse effect on our financial position, results of operations, or liquidity.
NOTE 7 - STOCK-BASED COMPENSATION
Long Term Incentive Plans
In June 2024, in connection with our stockholders’ approval at our 2024 annual meeting of stockholders, we adopted the 2024 Long Term Incentive Plan (the “2024 LTIP”), which provides for the issuance of restricted stock units, performance stock units, stock options, and various other forms of awards, and reserved 3,100,000 shares of common stock for issuance under the 2024 LTIP. The 2024 LTIP supersedes and replaces all of our previous long-term incentive plans (the “Prior Plans”), such that awards may not be granted under the Prior Plans subsequent to the adoption of the 2024 LTIP. Awards granted under the Prior Plans will remain subject to the terms and conditions set forth in the applicable Prior Plan. The Prior Plans and 2024 LTIP are collectively referred to herein as the “LTIP.”
We record compensation expense associated with the issuance of awards under the LTIP on a straight-line basis over the vesting period based on the fair value of the awards as of the date of grant within general and administrative expense in the accompanying statements of operations. The following table outlines the compensation expense recorded by type of award (in thousands):
|
|
|
|
|
|
|
|
|
|
|
|
|
|
|
|
|
|
|
|
|
|
|
|
|
Three Months Ended September 30, |
|
Nine Months Ended September 30, |
|
2024 |
|
2023 |
|
2024 |
|
2023 |
| Restricted and deferred stock units |
$ |
7,535 |
|
|
$ |
4,711 |
|
|
$ |
21,333 |
|
|
$ |
13,905 |
|
| Performance stock units |
5,126 |
|
|
3,591 |
|
|
14,789 |
|
|
11,672 |
|
|
|
|
|
|
|
|
|
| Total stock-based compensation |
$ |
12,661 |
|
|
$ |
8,302 |
|
|
$ |
36,122 |
|
|
$ |
25,577 |
|
As of September 30, 2024, unrecognized compensation expense related to the awards granted under the LTIP will be amortized through the relevant periods as follows (in thousands):
|
|
|
|
|
|
|
|
|
|
|
|
|
Unrecognized Compensation Expense |
|
Final Year of Recognition |
| Restricted and deferred stock units |
$ |
42,611 |
|
|
2027 |
| Performance stock units |
27,966 |
|
|
2026 |
| Total unrecognized stock-based compensation |
$ |
70,577 |
|
|
|
Restricted Stock Units and Deferred Stock Units
We grant time-based restricted stock units (“RSUs”) to our officers, executives, and employees and time-based deferred stock units (“DSUs”) to our non-employee directors under the LTIP. Each RSU and DSU represents a right to receive one share of our common stock after the RSU or DSU vests and is settled. RSUs generally vest ratably either over a one, two, or three-year service period on each anniversary following the grant date. RSUs are settled in shares of our common stock shortly after vesting. DSUs generally vest over a one-year period following the grant date. DSUs are settled in shares of our common stock upon the non-employee director’s separation of service from our Board of Directors (our “Board”). The grant-date fair value of RSUs and DSUs is equal to the closing price of our common stock on the date of the grant.
The following table presents the changes in non-vested RSUs and DSUs for the nine months ended September 30, 2024:
|
|
|
|
|
|
|
|
|
|
|
|
| |
RSUs and DSUs |
|
Weighted-Average Grant-Date Fair Value |
| Non-vested, beginning of year |
855,627 |
|
|
$ |
66.31 |
|
| Granted |
472,485 |
|
|
64.45 |
|
| Vested |
(294,594) |
|
|
64.65 |
|
| Forfeited |
(58,841) |
|
|
67.18 |
|
| Non-vested, end of period |
974,677 |
|
|
$ |
65.86 |
|
The aggregate grant-date fair value of the RSUs and DSUs granted under the LTIP during the nine months ended September 30, 2024 was $30.5 million.
Performance Stock Units
We grant market-based performance stock units (“PSUs”) to our officers and certain executives under the LTIP. The number of shares of our common stock issued to settle PSUs ranges from zero to 225% (or, for PSUs granted prior to fiscal year 2023, 200%) of the number of PSUs granted and is determined based on performance achievement against certain market-based criteria over a three-year performance period. PSUs generally vest on December 31 of the year preceding the third anniversary of the date of grant and settle by March 15 of the following year upon the determination and approval of performance achievement by the Compensation Committee of our Board.
Performance achievement is determined based on either, or a combination of, (1) our annualized absolute total stockholder return (“TSR”) or (2) for certain PSUs granted prior to fiscal year 2023, our absolute TSR relative to that of a defined peer group. Absolute TSR is determined based upon the change in our stock price over the performance period plus dividends paid. For awards with a relative TSR component, our absolute TSR is compared with the absolute TSRs of a group of peer companies over the performance period.
The grant-date fair value of the PSUs was estimated using a Monte Carlo valuation model. The Monte Carlo valuation model is based on random projections of stock price paths and repeated numerous times to achieve a probabilistic assessment. Significant assumptions used in this valuation include our expected volatility as well as the volatilities for each of our peers and an interpolated risk-free interest rate based on U.S. Treasury yields with maturities consistent with the performance period.
The following table presents the change of non-vested PSUs for the nine months ended September 30, 2024:
|
|
|
|
|
|
|
|
|
|
|
|
| |
PSUs |
|
Weighted-Average Grant-Date Fair Value |
| Non-vested, beginning of year |
472,593 |
|
|
$ |
92.08 |
|
Granted(1) |
270,509 |
|
|
74.55 |
|
Additional shares based on performance(2) |
59,504 |
|
|
97.45 |
|
Vested(2) |
(139,218) |
|
|
91.59 |
|
| Forfeited |
(13,342) |
|
|
99.71 |
|
|
|
|
|
Non-vested, end of period(1) |
650,046 |
|
|
$ |
85.23 |
|
___________________________
(1)The number of awards assumes that the associated performance condition is met at the target amount (multiplier of one). The final number of shares of our common stock issued may vary depending on the performance multiplier, which ranges from zero to 225% (or, for PSUs granted prior to fiscal year 2023, 200%), depending on the level of satisfaction of the performance condition.
(2)Upon completion of the performance period for the PSUs granted in 2021, a performance achievement of 200% or 141%, as applicable, was applied to each of the grants, resulting in a number of shares greater than the target amount of such PSUs vesting and being settled during the nine months ended September 30, 2024.
The aggregate grant-date fair value of the PSUs granted under the LTIP during the nine months ended September 30, 2024 was $20.2 million.
NOTE 8 - FAIR VALUE MEASUREMENTS
We follow authoritative accounting guidance for measuring the fair value of assets and liabilities. This guidance defines fair value as the price that would be received to sell an asset or paid to transfer a liability in an orderly transaction between market participants at the measurement date. Further, this guidance establishes a hierarchy for inputs used in measuring fair value that maximizes the use of observable inputs and minimizes the use of unobservable inputs by requiring that the most observable inputs be used when available.
The fair value hierarchy is broken down into three levels based on the reliability of the inputs as follows:
Level 1: Quoted prices in active markets for identical assets or liabilities
Level 2: Quoted prices in active markets for similar assets and liabilities, quoted prices for identical or similar instruments in markets that are not active, and model-derived valuations whose inputs are observable or whose significant value drivers are observable
Level 3: Significant inputs to the valuation model are unobservable
We classify financial and non-financial assets and liabilities based on the lowest level of input that is significant to the fair value measurement. Our assessment of the significance of a particular input to the fair value measurement requires judgment and may affect the valuation of the fair value of assets and liabilities and their placement within the fair value hierarchy.
Derivatives
We use Level 2 inputs to measure the fair value of crude oil and natural gas commodity price derivatives. The fair value of our commodity price derivatives is estimated using industry-standard models that contemplate various inputs including, but not limited to, the contractual price of the underlying position, current market prices, forward commodity price curves, volatility factors, time value of money, and the credit risk of both us and our counterparties. We validate our fair value estimate by corroborating the original source of inputs, monitoring changes in valuation methods and assumptions, and reviewing counterparty mark-to-market statements and other supporting documentation. Refer to Note 9 - Derivatives for more information regarding our derivative instruments.
The following table presents our financial assets and liabilities that were accounted for at fair value on a recurring basis as of September 30, 2024 and December 31, 2023 and their classification within the fair value hierarchy (in thousands):
|
|
|
|
|
|
|
|
|
|
|
|
| |
As of September 30, 2024 |
|
As of December 31, 2023 |
|
Level 2 |
|
Level 2 |
| Derivative assets |
$ |
98,804 |
|
|
$ |
43,425 |
|
| Derivative liabilities |
$ |
25,058 |
|
|
$ |
18,096 |
|
Long-Term Debt
The portion of our long-term debt related to our Credit Facility, if any, approximates its fair value as it bears interest at a floating rate that approximates a current market rate. The portion of our long-term debt related to our Senior Notes is recorded at cost, net of any unamortized discount and deferred financing costs. The fair value of our Senior Notes is based on quoted market prices, and as such, is designated as Level 1 within the fair value hierarchy. The following table presents the fair value our Senior Notes as of the dates indicated (in thousands):
|
|
|
|
|
|
|
|
|
|
|
|
|
|
|
|
|
|
|
|
|
|
|
|
|
|
|
|
|
|
|
|
|
As of September 30, 2024 |
|
As of December 31, 2023 |
| |
Nominal Interest |
|
Fair Value |
|
Percent of Par |
|
Fair Value |
|
Percent of Par |
| 2026 Senior Notes |
5.000% |
|
$ |
395,616 |
|
|
98.9% |
|
$ |
389,020 |
|
|
97.3% |
| 2028 Senior Notes |
8.375% |
|
1,408,266 |
|
|
104.3% |
|
1,412,559 |
|
|
104.6% |
| 2030 Senior Notes |
8.625% |
|
1,060,660 |
|
|
106.1% |
|
1,063,050 |
|
|
106.3% |
| 2031 Senior Notes |
8.750% |
|
1,430,676 |
|
|
106.0% |
|
1,433,363 |
|
|
106.2% |
Our deferred acquisition consideration was recorded in connection with the Vencer Acquisition using an estimated fair value discount at the time of the transaction based on quoted market prices from our debt as well as other inputs classified as Level 2 within the fair value hierarchy. As of September 30, 2024, the carrying value of the deferred acquisition consideration approximated fair value. Refer to Note 5 - Debt for additional information.
Acquisitions and Impairments of Proved and Unproved Properties
We measure acquired assets or businesses at fair value on a nonrecurring basis and review our proved and unproved crude oil and natural gas properties for impairment using inputs that are not observable in the market and are therefore designated as Level 3 within the valuation hierarchy. The most significant fair value determinations for non-financial assets and liabilities are related to crude oil and natural gas properties acquired. Refer to Note 2 - Acquisitions and Divestitures for additional information. During the three and nine months ended September 30, 2024 and 2023, we recorded no impairments of proved or unproved properties. Refer to Note 1 – Summary of Significant Accounting Policies in Item 8. Financial Statements and Supplementary Data included in our
2023 Form 10-K for information on our policies for determining fair value of proved and unproved properties and related impairment expense.
NOTE 9 - DERIVATIVES
We periodically enter into commodity derivative contracts to mitigate a portion of our exposure to potentially adverse market changes in commodity prices for our expected future crude oil and natural gas production and the associated impact on cash flows. Our commodity derivative contracts consist of swaps, collars, basis protection swaps, and puts. As of September 30, 2024, all derivative counterparties were members of the Credit Facility lender group, and all commodity derivative contracts are entered into for other-than-trading purposes. We do not designate our commodity derivative contracts as hedging instruments.
A typical swap arrangement guarantees a fixed price on contracted volumes. If the agreed upon published third-party index price (“index price”) is lower than the fixed contract price at the time of settlement, we receive the difference between the index price and the fixed contract price. If the index price is higher than the fixed contact price at the time of settlement, we pay the difference between the index price and the fixed contract price.
A typical collar arrangement establishes a floor and ceiling price on contracted volumes through the use of a short call and a long put. When the index price is above the ceiling price at the time of settlement, we pay the difference between the index price and the ceiling price. When the index price is below the floor price at the time of settlement, we receive the difference between the index price and floor price. When the index price is between the floor price and ceiling price, no payment or receipt occurs.
Basis protection swaps are arrangements that guarantee a price differential from a specified delivery point. For basis protection swaps, we receive a payment from the counterparty if the price differential is greater than the stated terms of the contract and pay the counterparty if the price differential is less than the stated terms of the contract.
A put arrangement gives us the right to sell the underlying commodity at a strike price over the term of the contract. If the index price is higher than the strike price, no payment or receipt occurs. If the index price is lower than the strike price, we receive the difference between the index price and the strike price.
The following table summarizes the components of the derivative gain (loss), net presented on the accompanying statements of operations for the periods below (in thousands):
|
|
|
|
|
|
|
|
|
|
|
|
|
|
|
|
|
|
|
|
|
|
|
|
| |
Three Months Ended September 30, |
|
Nine Months Ended September 30, |
|
2024 |
|
2023 |
|
2024 |
|
2023 |
Derivative cash settlement gain (loss), net |
|
|
|
|
|
|
|
| Crude oil contracts |
$ |
(11,145) |
|
|
$ |
(32,397) |
|
|
$ |
(41,412) |
|
|
$ |
(38,010) |
|
| Natural gas contracts |
29,340 |
|
|
(625) |
|
|
35,700 |
|
|
(6,897) |
|
|
|
|
|
|
|
|
|
Total derivative cash settlement gain (loss), net |
18,195 |
|
|
(33,022) |
|
|
(5,712) |
|
|
(44,907) |
|
| Change in fair value gain (loss) |
132,834 |
|
|
(117,639) |
|
|
54,639 |
|
|
(75,667) |
|
Total derivative gain (loss), net |
$ |
151,029 |
|
|
$ |
(150,661) |
|
|
$ |
48,927 |
|
|
$ |
(120,574) |
|
As of September 30, 2024, we had entered into the following commodity price derivative contracts:
|
|
|
|
|
|
|
|
|
|
|
|
|
|
|
|
|
|
|
|
|
|
|
|
|
|
|
|
|
|
|
|
|
|
|
|
|
|
|
|
|
Contract Period |
|
|
Q4 2024 |
|
Q1 2025 |
|
Q2 2025 |
|
Q3 2025 |
|
Q4 2025 |
|
2026 |
| Crude Oil Derivatives (volumes in Bbl/day and prices in $/Bbl) |
|
|
| Swaps |
|
|
|
|
|
|
|
|
|
|
|
|
| NYMEX WTI Volumes |
|
25,997 |
|
19,000 |
|
19,000 |
|
22,000 |
|
— |
|
— |
| Weighted-Average Contract Price |
|
$ |
70.77 |
|
|
$ |
72.74 |
|
|
$ |
71.89 |
|
|
$ |
74.34 |
|
|
$ |
— |
|
|
$ |
— |
|
|
|
|
|
|
|
|
|
|
|
|
|
|
|
|
|
|
|
|
|
|
|
|
|
|
|
|
|
|
|
|
|
|
|
|
|
|
|
|
| Collars |
|
|
|
|
|
|
|
|
|
|
|
|
| NYMEX WTI Volumes |
|
23,504 |
|
28,000 |
|
32,000 |
|
28,000 |
|
6,000 |
|
— |
| Weighted-Average Ceiling Price |
|
$ |
80.99 |
|
|
$ |
79.87 |
|
|
$ |
77.78 |
|
|
$ |
77.65 |
|
|
$ |
75.53 |
|
|
$ |
— |
|
| Weighted-Average Floor Price |
|
$ |
65.66 |
|
|
$ |
70.00 |
|
|
$ |
69.88 |
|
|
$ |
69.31 |
|
|
$ |
55.00 |
|
|
$ |
— |
|
|
|
|
|
|
|
|
|
|
|
|
|
|
|
|
|
|
|
|
|
|
|
|
|
|
|
|
|
|
|
|
|
|
|
|
|
|
|
|
|
|
|
|
|
|
|
|
|
|
|
|
|
|
|
|
|
|
|
|
|
|
|
|
|
|
| Puts |
|
|
|
|
|
|
|
|
|
|
|
|
| NYMEX WTI Volumes |
|
5,669 |
|
— |
|
— |
|
— |
|
— |
|
— |
| Weighted-Average Contract Price |
|
$ |
55.00 |
|
|
$ |
— |
|
|
$ |
— |
|
|
$ |
— |
|
|
$ |
— |
|
|
$ |
— |
|
|
|
|
|
|
|
|
|
|
|
|
|
|
|
|
|
|
|
|
|
|
|
|
|
|
|
|
|
|
|
|
|
|
|
|
|
|
|
|
| Natural Gas Derivatives (volumes in MMBtu/day and prices in $/MMBtu) |
|
|
| Swaps |
|
|
|
|
|
|
|
|
|
|
|
|
| NYMEX HH Volumes |
|
131,701 |
|
110,000 |
|
110,000 |
|
110,000 |
|
110,000 |
|
— |
| Weighted-Average Contract Price |
|
$ |
2.71 |
|
|
$ |
3.20 |
|
|
$ |
3.20 |
|
|
$ |
3.20 |
|
|
$ |
3.20 |
|
|
$ |
— |
|
|
|
|
|
|
|
|
|
|
|
|
|
|
|
|
|
|
|
|
|
|
|
|
|
|
|
| Collars |
|
|
|
|
|
|
|
|
|
|
|
|
| NYMEX HH Volumes |
|
— |
|
20,000 |
|
20,000 |
|
20,000 |
|
20,000 |
|
130,000 |
| Weighted-Average Ceiling Price |
|
$ |
— |
|
|
$ |
3.76 |
|
|
$ |
3.76 |
|
|
$ |
3.76 |
|
|
$ |
3.76 |
|
|
$ |
4.02 |
|
| Weighted-Average Floor Price |
|
$ |
— |
|
|
$ |
3.03 |
|
|
$ |
3.03 |
|
|
$ |
3.03 |
|
|
$ |
3.03 |
|
|
$ |
3.24 |
|
|
|
|
|
|
|
|
|
|
|
|
|
|
|
|
|
|
|
|
|
|
|
|
|
|
|
|
|
|
|
|
|
|
|
|
|
|
|
|
|
|
|
|
|
|
|
|
|
|
|
|
|
|
|
|
|
|
|
|
|
|
|
|
|
|
|
|
|
|
|
|
|
|
|
|
|
|
|
|
|
|
|
|
|
|
|
|
|
|
|
|
|
|
|
|
|
|
|
|
|
|
|
|
|
| Basis Protection Swaps |
|
|
|
|
|
|
|
|
|
|
|
|
|
|
|
|
|
|
|
|
|
|
|
|
|
|
|
|
|
|
|
|
|
|
|
|
|
|
| WAHA Basis Volumes |
|
130,000 |
|
130,000 |
|
130,000 |
|
130,000 |
|
130,000 |
|
130,000 |
| Weighted-Average Contract Price |
|
$ |
(0.97) |
|
|
$ |
(1.17) |
|
|
$ |
(1.17) |
|
|
$ |
(1.17) |
|
|
$ |
(1.17) |
|
|
$ |
(1.31) |
|
| WAHA Index Volumes |
|
96,522 |
|
90,000 |
|
— |
|
— |
|
— |
|
— |
| Weighted-Average Contract Price |
|
$ |
0.02 |
|
|
$ |
0.07 |
|
|
$ |
— |
|
|
$ |
— |
|
|
$ |
— |
|
|
$ |
— |
|
|
|
|
|
|
|
|
|
|
|
|
|
|
|
|
|
|
|
|
|
|
|
|
|
|
|
|
|
|
|
|
|
|
|
|
|
|
|
|
|
|
|
|
|
|
|
|
|
|
|
|
|
Subsequent to September 30, 2024 and as of November 1, 2024, we had entered into the following commodity price derivative contracts:
|
|
|
|
|
|
|
|
|
|
|
|
|
|
|
|
|
|
|
|
|
|
|
|
|
|
|
|
|
|
|
|
|
|
|
|
|
|
|
|
|
|
|
|
|
Contract Period |
|
|
|
|
Q4 2024 |
|
Q1 2025 |
|
Q2 2025 |
|
Q3 2025 |
|
Q4 2025 |
|
2026 |
| Crude Oil Derivatives (volumes in Bbl/day and prices in $/Bbl) |
|
|
|
|
| Swaps |
|
|
|
|
|
|
|
|
|
|
|
|
|
|
| NYMEX WTI Volumes |
|
|
|
— |
|
— |
|
— |
|
— |
|
5,000 |
|
— |
| Weighted-Average Contract Price |
|
|
|
$ |
— |
|
|
$ |
— |
|
|
$ |
— |
|
|
$ |
— |
|
|
$ |
69.68 |
|
|
$ |
— |
|
|
|
|
|
|
|
|
|
|
|
|
|
|
|
|
|
|
|
|
|
|
|
|
|
|
|
|
|
|
|
|
|
|
|
|
|
|
|
|
|
|
|
|
|
|
Collars |
|
|
|
|
|
|
|
|
|
|
|
|
|
|
| NYMEX WTI Volumes |
|
|
|
— |
|
— |
|
— |
|
— |
|
39,000 |
|
— |
| Weighted-Average Ceiling Price |
|
|
|
$ |
— |
|
|
$ |
— |
|
|
$ |
— |
|
|
$ |
— |
|
|
$ |
75.85 |
|
|
$ |
— |
|
| Weighted-Average Floor Price |
|
|
|
$ |
— |
|
|
$ |
— |
|
|
$ |
— |
|
|
$ |
— |
|
|
$ |
59.28 |
|
|
$ |
— |
|
|
|
|
|
|
|
|
|
|
|
|
|
|
|
|
|
|
|
|
|
|
|
|
|
|
|
|
|
|
|
|
|
|
|
|
|
|
|
|
|
|
|
|
|
|
|
|
|
|
|
|
|
|
|
|
|
|
|
|
|
|
|
|
|
|
|
|
|
|
|
|
|
|
|
|
|
|
|
|
|
|
|
|
|
|
|
|
|
|
|
|
|
|
|
|
|
|
|
|
|
|
|
|
|
|
|
|
|
|
|
|
|
|
|
|
|
|
|
|
|
| Natural Gas Derivatives (volumes in MMBtu/day and prices in $/MMBtu) |
|
|
|
|
|
|
|
|
|
|
|
|
|
|
|
|
|
|
|
|
|
|
|
|
|
|
|
|
|
|
|
|
|
|
|
|
|
|
|
|
|
|
|
|
|
|
|
|
|
|
|
|
|
|
|
|
|
|
|
|
|
|
|
|
|
|
|
|
|
|
|
|
|
|
|
|
|
|
|
|
|
|
|
|
|
|
|
|
|
|
|
|
|
|
|
|
|
|
|
|
|
|
|
|
|
|
|
|
|
|
|
|
|
|
|
|
|
|
|
|
|
|
|
|
|
|
|
|
|
|
|
|
|
|
|
|
|
|
|
|
|
|
|
|
|
|
|
|
|
|
|
|
|
|
|
|
|
|
|
|
|
|
|
|
|
|
|
|
|
|
|
|
|
|
|
|
|
|
|
|
|
|
|
|
|
|
|
|
|
|
|
|
|
|
|
|
|
|
|
|
|
|
|
|
|
|
|
|
|
|
|
|
|
|
| Basis Protection Swaps |
|
|
|
|
|
|
|
|
|
|
|
|
|
|
|
|
|
|
|
|
|
|
|
|
|
|
|
|
|
|
|
|
|
|
|
|
|
|
|
|
|
|
|
|
|
|
|
|
|
|
|
|
|
|
|
|
|
|
|
|
|
|
|
|
|
|
|
|
|
|
|
|
|
|
WAHA Index Volumes |
|
|
|
6,739 |
|
— |
|
— |
|
— |
|
— |
|
— |
| Weighted-Average Contract Price |
|
|
|
$ |
(0.03) |
|
|
$ |
— |
|
|
$ |
— |
|
|
$ |
— |
|
|
$ |
— |
|
|
$ |
— |
|
|
|
|
|
|
|
|
|
|
|
|
|
|
|
|
|
|
|
|
|
|
|
|
|
|
|
|
|
|
|
|
|
|
|
|
|
|
|
|
|
|
|
|
|
|
|
|
|
|
|
|
|
|
|
|
|
|
|
|
|
|
|
|
|
|
|
|
|
|
|
|
|
|
|
|
|
|
|
|
|
|
|
|
|
|
|
|
|
|
|
Derivative Assets and Liabilities Fair Value
Our commodity price derivatives are measured at fair value and are included in the accompanying balance sheets as derivative assets and liabilities. The following table contains a summary of all our derivative positions reported on the accompanying balance sheets as well as a reconciliation between the gross assets and liabilities and the potential effects of master netting arrangements on the fair value of our commodity derivative contracts as of September 30, 2024, and December 31, 2023 (in thousands):
|
|
|
|
|
|
|
|
|
|
|
|
|
September 30, 2024 |
|
December 31, 2023 |
| Derivative Assets: |
|
|
|
| Commodity contracts - current |
$ |
94,312 |
|
|
$ |
35,192 |
|
| Commodity contracts - noncurrent |
4,492 |
|
|
8,233 |
|
| Total derivative assets |
98,804 |
|
|
43,425 |
|
| Amounts not offset in the accompanying balance sheets |
(25,058) |
|
|
(11,859) |
|
| Total derivative assets, net |
$ |
73,746 |
|
|
$ |
31,566 |
|
|
|
|
|
| Derivative Liabilities: |
|
|
|
| Commodity contracts - current |
$ |
(14,168) |
|
|
$ |
(18,096) |
|
| Commodity contracts - long-term |
(10,890) |
|
|
— |
|
| Total derivative liabilities |
(25,058) |
|
|
(18,096) |
|
| Amounts not offset in the accompanying balance sheets |
25,058 |
|
|
11,859 |
|
| Total derivative liabilities, net |
$ |
— |
|
|
$ |
(6,237) |
|
NOTE 10 - ASSET RETIREMENT OBLIGATIONS
We recognize an estimated liability for future costs associated with the abandonment of our crude oil and natural gas properties, including facilities requiring decommissioning. A liability for the fair value of an asset retirement obligation and corresponding increase to the carrying value of the related long-lived asset are recorded at the time a well is drilled or acquired, or a facility is constructed. The increase in carrying value is included in proved properties in the accompanying balance sheets. We deplete the amount added to proved properties and recognize expense in connection with the accretion of the discounted liability over the remaining estimated economic lives of the respective long-lived assets. Cash paid to settle asset retirement obligations is included in the cash flows from operating activities section of our accompanying statements of cash flows.
Our estimated asset retirement obligation liability is based on historical experience plugging and abandoning wells, estimated plugging and abandonment cost, estimated economic lives, and regulatory requirements. The liability is discounted using the credit-adjusted risk-free rate estimated at the time the liability is incurred or revised.
A roll-forward of our asset retirement obligation is as follows (in thousands):
|
|
|
|
|
|
|
Amount |
Balance as of December 31, 2023 |
$ |
336,832 |
|
| Additional liabilities incurred with development activities and other |
7,359 |
|
| Additional liabilities incurred with acquisitions |
37,251 |
|
| Liabilities settled |
(29,303) |
|
| Accretion expense |
17,370 |
|
|
|
Obligations discharged with divestitures |
(27,976) |
|
Balance as of September 30, 2024 |
$ |
341,533 |
|
Current portion(1) |
$ |
31,116 |
|
| Long-term portion |
$ |
310,417 |
|
___________________________
(1)The current portion of the asset retirement obligation is included in other liabilities on the accompanying balance sheets.
NOTE 11 - EARNINGS PER SHARE
Earnings per basic and diluted share are calculated under the treasury stock method. Basic net income per common share is calculated by dividing net income by the basic weighted-average common shares outstanding for the respective period. Diluted net income per common share is calculated by dividing net income by the diluted weighted-average common shares outstanding, which includes the effect of potentially dilutive securities. Potentially dilutive securities consist of unvested RSUs, DSUs, PSUs as well as outstanding in-the-money stock options and warrants. When we recognize a loss from continuing operations, all potentially dilutive shares are anti-dilutive and are consequently excluded from the calculation of diluted earnings per share.
As discussed in Note 7 - Stock-Based Compensation, PSUs represent the right to receive a number of shares of the Company’s common stock ranging from zero to 225% (or, for PSUs granted prior to fiscal year 2023, 200%) of PSUs granted based on the performance achievement over the applicable performance period. The number of potentially dilutive shares related to PSUs is based on the number of shares, if any, that would be issuable at the end of the respective reporting period, assuming that date was the end of the performance period applicable to such awards.
We have also issued warrants, which represent the right to purchase our common stock at a specified exercise price. The number of potentially dilutive shares related to the warrants is based on the number of shares, if any, that would be exercisable at the end of the respective reporting period, assuming that date was the end of such warrants’ term. Warrants are only dilutive when the average price of the common stock during the period exceeds the exercise price. The exercise price of our warrants was in excess of our stock price during the three and nine months ended September 30, 2024 and 2023; therefore, they were excluded from the earnings per share calculation.
The following table sets forth the calculations of basic and diluted net earnings per common share (in thousands, except per share amounts):
|
|
|
|
|
|
|
|
|
|
|
|
|
|
|
|
|
|
|
|
|
|
|
|
|
Three Months Ended September 30, |
|
Nine Months Ended September 30, |
|
2024 |
|
2023 |
|
2024 |
|
2023 |
| Net income |
$ |
295,803 |
|
|
$ |
139,672 |
|
|
$ |
687,613 |
|
|
$ |
481,420 |
|
|
|
|
|
|
|
|
|
| Basic earnings per common share |
$ |
3.02 |
|
|
$ |
1.57 |
|
|
$ |
6.91 |
|
|
$ |
5.75 |
|
| Diluted earnings per common share |
$ |
3.01 |
|
|
$ |
1.56 |
|
|
$ |
6.88 |
|
|
$ |
5.70 |
|
|
|
|
|
|
|
|
|
| Weighted-average shares outstanding - basic |
97,905 |
|
|
88,911 |
|
|
99,540 |
|
|
83,700 |
|
| Add: dilutive effect of stock awards |
319 |
|
|
720 |
|
|
411 |
|
|
768 |
|
| Weighted-average shares outstanding - diluted |
98,224 |
|
|
89,631 |
|
|
99,951 |
|
|
84,468 |
|
There were 160,611 and 10,103 shares that were anti-dilutive for the three months ended September 30, 2024 and 2023, respectively. There were 144,300 and 7,437 shares that were anti-dilutive for the nine months ended September 30, 2024 and 2023, respectively.
NOTE 12 - INCOME TAXES
Deferred tax assets and liabilities are measured by applying the provisions of enacted tax laws to determine the amount of taxes payable or refundable currently or in future years related to cumulative temporary differences between the tax basis of assets and liabilities and amounts reported in the accompanying balance sheets. The tax effect of the net change in the cumulative temporary differences during each period in the deferred tax assets and liabilities determines the periodic provision for deferred taxes.
We assess the recoverability of our deferred tax assets each period by considering whether it is more likely than not that all or a portion of the deferred tax assets will be realized. In making such a determination, we consider all available evidence (both positive and negative), including future reversals of temporary differences, tax-planning strategies, projected future taxable income, and results of operations. As a result of merger activity in 2021, we recorded a valuation allowance of $25.4 million, which continued to be recorded as of September 30, 2024 and December 31, 2023, against certain acquired net operating losses and other tax attributes due to the limitation on realizability caused by the change of ownership provisions of Section 382 of the Internal Revenue Code. We will continue to monitor facts and circumstances in the reassessment of the likelihood that the deferred tax assets will be realized.
The net deferred tax liability as of September 30, 2024 and December 31, 2023 was $752.2 million and $564.8 million, respectively. Additionally, income tax payable of $1.3 million is included in other liabilities on the accompanying balance sheets as of September 30, 2024, and prepaid income taxes of $9.6 million is included in prepaid expenses and other on the accompanying balance sheets as of December 31, 2023.
During the three months ended September 30, 2024 and 2023, we recorded income tax expense of $93.3 million and $29.7 million, respectively. During the nine months ended September 30, 2024 and 2023, we recorded income tax expense of $195.3 million and $139.1 million, respectively. Income tax expense differs from the amount that would be provided by applying the statutory United States federal income tax rate of 21% to income from operations before income taxes due to the effect of state income taxes, excess tax benefits and deficiencies on stock-based compensation awards, tax limitations on compensation of covered individuals, tax credits, and other permanent differences. During the nine months ended September 30, 2024, income tax expense was additionally impacted by deferred tax benefits from state apportionment changes as a result of the Vencer Acquisition. During the three and nine months ended September 30, 2023, income tax expense was additionally impacted by deferred tax benefits from state apportionment changes as a result of the Hibernia and Tap Rock acquisitions.
We had no unrecognized tax benefits as of September 30, 2024 and December 31, 2023. We do not believe that there are any new items or changes in facts or judgments that would impact our tax position taken thus far in 2024.
In 2022, the Inflation Reduction Act (“IRA”) was signed into law. Among other provisions, the IRA imposes a 15% corporate alternative minimum tax (“Corporate AMT”) for tax years beginning after December 31, 2022, imposes a 1% excise tax on corporate stock repurchases after December 31, 2022, and provides tax incentives to promote various energy efficient initiatives. We are evaluating the potential impact of the Corporate AMT on our current income tax expense and income taxes payable; however, we currently do not believe this will materially affect our income taxes paid for the 2024 tax year.
NOTE 13 - SUPPLEMENTAL DISCLOSURES OF CASH FLOW INFORMATION
Supplemental cash flow disclosures are presented below (in thousands):
|
|
|
|
|
|
|
|
|
|
|
|
| |
Nine Months Ended September 30, |
| |
2024 |
|
2023 |
| Supplemental cash flow information: |
|
|
|
| Cash refunded for income taxes, net |
$ |
2,925 |
|
|
$ |
7,861 |
|
| Cash paid for interest |
(334,858) |
|
|
(17,110) |
|
| Supplemental non-cash investing and financing activities: |
|
|
|
| Changes in working capital related to capital expenditures |
(22,323) |
|
|
(112,454) |
|
NOTE 14 - STOCKHOLDERS’ EQUITY
Stock Repurchases
In July 2024, our Board authorized a new stock repurchase program authorizing repurchases of up to $500 million of our outstanding shares of common stock, in the open market, in privately negotiated transactions, or through block trades, derivative transactions, or purchases made in accordance with Rule 10b-18 and Rule 10b5-1 of the Exchange Act. The new stock repurchase program replaced our prior stock repurchase program, which was terminated in connection with the adoption of the new stock repurchase program. The stock repurchase program does not have a termination date, does not require any specific number of shares to be acquired, and can be modified or discontinued by our Board at any time.
We record stock repurchases at cost, which includes transaction costs that are direct and incremental to the repurchase, as a reduction to stockholders’ equity. As part of the transaction costs that are direct and incremental to the repurchase and, subject to netting against the fair value of stock issuances, we record a 1% excise tax with the corresponding liability recorded within accounts payable and accrued expenses on the accompanying balance sheets. Any excess of cost over the par value is charged to additional paid-in-capital on a pro-rata basis, with any remaining cost charged to retained earnings.
The table below summarizes stock repurchases pursuant to the stock repurchase program during the nine months ended September 30, 2024 and 2023:
|
|
|
|
|
|
|
|
|
|
|
|
|
|
|
|
|
|
|
Number of Shares (in thousands) |
|
Weighted-Average Price |
|
Total Purchase Price (in thousands)(1) |
| 2024 |
|
|
|
|
|
Privately negotiated transactions |
|
|
|
|
|
NGP Tap Rock Holdings, LLC and certain of its affiliates |
876.2 |
|
$ |
64.54 |
|
|
$ |
56,549 |
|
| Vencer |
1,041.7 |
|
71.99 |
|
|
75,000 |
|
Other transactions |
2,221.4 |
|
62.24 |
|
|
138,267 |
|
| Total stock repurchases |
4,139.3 |
|
$ |
65.18 |
|
|
$ |
269,816 |
|
| 2023 |
|
|
|
|
|
Privately negotiated transactions |
|
|
|
|
|
CPPIB Crestone Peak Resources Canada Inc. |
4,918.0 |
|
$ |
61.00 |
|
|
$ |
300,000 |
|
Other transactions |
312.8 |
|
64.55 |
|
|
20,190 |
|
| Total stock repurchases |
5,230.8 |
|
$ |
61.21 |
|
|
$ |
320,190 |
|
_________________________
(1)Excludes commissions paid and excise taxes accrued related to stock repurchases.
These stock repurchases were funded from our cash on hand, and the shares were immediately retired. As of September 30, 2024, $422.0 million remained available under the program for repurchase of our outstanding common stock.
Dividends
As approved by our Board, cash dividends are paid quarterly and consist of a base and variable component. Beginning in the third quarter of 2024, variable cash dividends are equal to 50% of Adjusted Free Cash Flow for the preceding twelve-month period and pro forma for all acquisition and divestiture activity, after the base cash dividend, less any stock repurchases allocated to the quarter for which the dividend is declared, assuming pro forma compliance with certain leverage targets under our debt agreements. Future dividend payments must be approved by our Board and will depend on our liquidity, financial requirements, and other factors considered relevant by our Board.
The following table summarizes the dividends declared in the nine months ended September 30, 2024 and 2023:
|
|
|
|
|
|
|
|
|
|
|
|
|
|
|
|
|
|
|
|
|
|
|
|
|
Base |
|
Variable |
|
Total |
|
Total |
|
(per share) |
|
(per share) |
|
(per share) |
|
(in thousands) |
| 2024 |
|
|
|
|
|
|
|
| First quarter |
$ |
0.50 |
|
|
$ |
0.95 |
|
|
$ |
1.45 |
|
|
$ |
148,327 |
|
| Second quarter |
$ |
0.50 |
|
|
$ |
1.00 |
|
|
$ |
1.50 |
|
|
$ |
150,797 |
|
Third quarter |
$ |
0.50 |
|
|
$ |
1.02 |
|
|
$ |
1.52 |
|
|
$ |
144,884 |
|
| 2023 |
|
|
|
|
|
|
|
| First quarter |
$ |
0.50 |
|
|
$ |
1.65 |
|
|
$ |
2.15 |
|
|
$ |
176,878 |
|
| Second quarter |
$ |
0.50 |
|
|
$ |
1.62 |
|
|
$ |
2.12 |
|
|
$ |
173,358 |
|
Third quarter |
$ |
0.50 |
|
|
$ |
1.24 |
|
|
$ |
1.74 |
|
|
$ |
167,010 |
|
All RSUs, DSUs, and PSUs receive a dividend equivalent per unit, recognized as a liability included in other liabilities and other long-term liabilities on the accompanying balance sheets until the recipients receive the dividend equivalents. Refer to Note 7 - Stock-Based Compensation for further discussion around our LTIP.
Item 2. Management’s Discussion and Analysis of Financial Condition and Results of Operations.
The following discussion and analysis of our financial condition and results of operations should be read in conjunction with “Management’s Discussion and Analysis of Financial Condition and Results of Operations” contained in our
2023 Form 10-K, as well as with our unaudited condensed consolidated financial statements and notes thereto included in this Quarterly Report on Form 10-Q. Further, we encourage you to review the Information Regarding Forward-Looking Statements.
Executive Summary
We are an independent exploration and production company focused on the acquisition, development, and production of crude oil and liquids-rich natural gas from our premier assets in the DJ Basin in Colorado and the Permian Basin in Texas and New Mexico. Our proven business model to maximize stockholder returns is focused on four key strategic pillars: generating significant free cash flow, maintaining a premier balance sheet, returning capital to our stockholders, and demonstrating ESG leadership.
Financial and Operating Results
Our financial and operational results for the three months ended September 30, 2024:
•Total sales volumes increased 3% when compared to the second quarter of 2024; average sales volumes per day increased to 348 MBoe/d compared to 343 MBoe/d during the second quarter of 2024;
•Cash dividends declared of $144.9 million, or $1.52 per share;
•Repurchased approximately 1.3 million shares of our common stock totaling $78.0 million at a weighted average price of $58.01;
•Net income of $295.8 million, or $3.01 per diluted share;
•Cash flows provided by operating activities were $835.0 million compared to $359.6 million during the second quarter of 2024. Adjusted Free Cash Flow(1) was $366.3 million compared to $235.4 million in the second quarter of 2024; and
•Capital expenditures in drilling, completions, facilities, land, midstream assets, and other were $438.4 million.
Our financial and operational results for the nine months ended September 30, 2024:
•Total sales volumes increased 81% for the first nine months of 2024 when compared to the first nine months of 2023; average sales volumes per day increased to 342 MBoe/d compared to 190 MBoe/d during the first nine months of 2023, in each case, primarily as a result of the Hibernia, Tap Rock, and Vencer acquisitions;
•Cash dividends declared of $444.0 million, or $4.47 per share;
•Repurchased approximately 4.1 million shares of our common stock totaling $269.9 million at a weighted average price of $65.18;
•Net income of $687.6 million or $6.88 per diluted share;
•Cash flows provided by operating activities were $2.0 billion compared to $1.4 billion during the first nine months of 2023. Adjusted Free Cash Flow(1) was $747.4 million compared to $581.3 million during the first nine months of 2023; and
•Capital expenditures in drilling, completions, facilities, land, midstream assets, and other were $1.7 billion.
(1) Adjusted Free Cash Flow is a non-GAAP financial measure. Refer to the “Non-GAAP Financial Measures - Reconciliation of Adjusted Free Cash Flow to Cash Provided by Operating Activities” and “Liquidity and Capital Resources” below for additional discussion.
2024 Transaction
On January 2, 2024, we closed the Vencer Acquisition. The Vencer Acquisition included approximately 44,000 net acres in the Midland Basin and certain related crude oil and natural gas assets with average production of approximately 49 MBoe/d in exchange for aggregate consideration of approximately $1.0 billion in cash, 7.2 million shares of our common stock paid at the closing of the Vencer Acquisition, and $550.0 million in cash to be paid on or before January 3, 2025, inclusive of, customary post-closing adjustments. In May and July 2024, we made two early payments totaling $75.0 million towards the deferred consideration, leaving a remaining balance of $475.0 million. The initial cash portion of the acquisition was funded by cash on hand and the issuance of our 2030 Senior Notes for an aggregate principal amount of $1.0 billion. Refer to Note 2 - Acquisitions and Divestitures under Part I, Item 1 of this Quarterly Report on Form 10-Q for additional discussion.
Commodity Prices and Certain Other Market Conditions
The crude oil and natural gas industry is cyclical and commodity prices are inherently volatile. Commodity prices in 2024 continue to be impacted by various macro-economic factors influencing the balance of supply and demand. From January through April 2024, pricing for crude oil rebounded when compared to declining pricing in the fourth quarter of 2023. The rebound was a result of concerns over lower oil supply driven by uncertainties around political conditions in or affecting other crude oil producing countries, including the Israel-Palestine conflict. Additionally, in the first half of 2024, OPEC+ continued production cuts to seek to stabilize the crude oil market. Despite OPEC+’s efforts of reducing production, non-OPEC+ countries continue to have an impact on pricing by increasing overall output in the second and third quarter of 2024, including the U.S., albeit at a slower pace. Further, production increases are also anticipated from Saudi Arabia and Libya, signaling a possible end to OPEC+’s recent efforts to reduce production. These factors have led to declining monthly average crude oil prices to end the third quarter of 2024 at the lowest level seen in more than a year.
U.S. inflation rates during the first nine months of 2024 remained stable when compared to the last half of 2023, yet remain slightly higher than historical averages. Inflationary pressures can create economic slowdown and/or lead to a recession. A slowdown or recession can cause a decrease in short-term or longer-term demand for commodities, resulting in oversupply and potential for lower commodity prices. Lower prices and inflationary costs could impact our drilling program. The foregoing destabilizing factors have caused dramatic fluctuations in global financial markets and uncertainty about world-wide crude oil and natural gas supply and demand, which in turn has increased the volatility of crude oil and natural gas prices.
The below graph depicts monthly average NYMEX WTI crude oil and NYMEX HH natural gas price over the nine months ended September 30, 2024 and 2023.
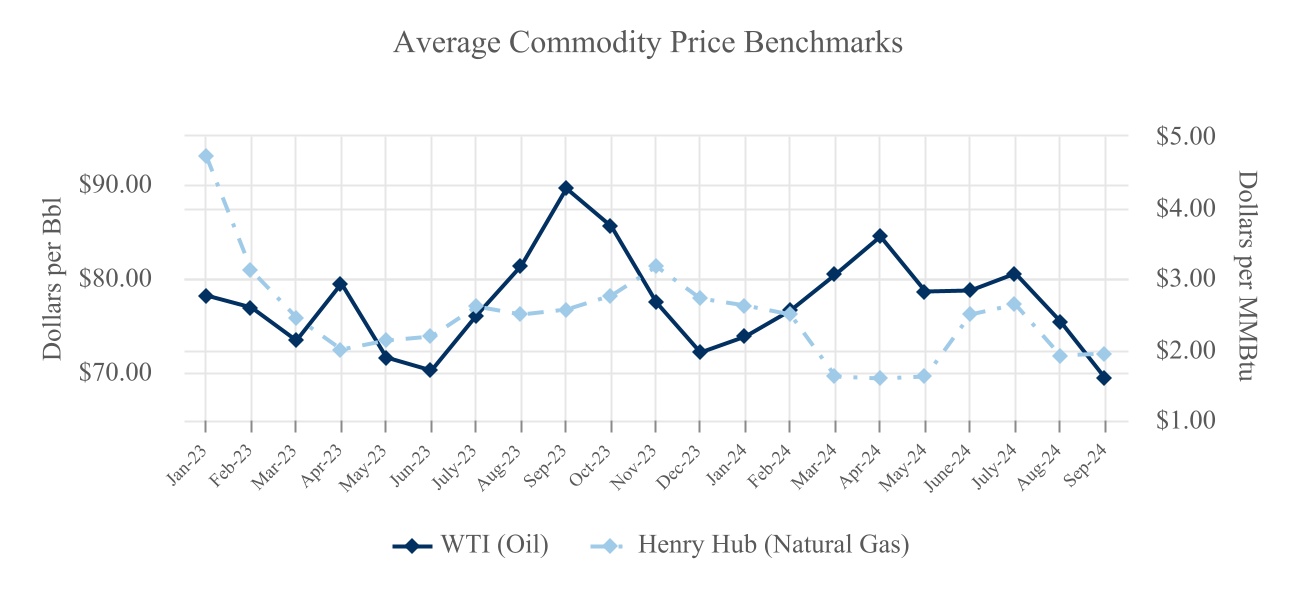
____________________________
(1) The average NYMEX WTI crude oil price for the three months ended September 30, 2024 and June 30, 2024 was $75.09 and $80.57, respectively. The average NYMEX WTI crude oil price for the nine months ended September 30, 2024 and 2023 was $77.54 and $77.39, respectively.
(2) The average NYMEX natural gas HH price for the three months ended three months ended September 30, 2024 and June 30, 2024 was $2.16 and $1.89, respectively. The average NYMEX natural gas HH price for the nine months ended September 30, 2024 and 2023 was $2.10 and $2.69, respectively.
In light of uncertainty associated with crude oil and natural gas demand, future monetary policy relating to inflationary pressures, and governmental policies aimed at transitioning toward lower carbon energy, we cannot predict any future volatility in or levels of commodity prices or demand for crude oil and natural gas.
We receive a premium or discount to the benchmark WTI price for our crude oil production. The differential between the benchmark price and the price we receive can reflect adjustments for quality, location, and transportation. Our DJ Basin crude oil price includes a higher-grade quality differential and a transportation differential for delivery to Cushing, Oklahoma. Our Permian Basin crude oil price includes a transportation differential for delivery to Cushing, Oklahoma. During the first nine months of 2024, this differential was a premium to WTI. However, basis differentials can be volatile and can change at various times given their high correlation with market dynamics, supply and demand, and overall production.
Our natural gas production is typically sold at a discount to the benchmark NYMEX Henry Hub price. Our DJ Basin natural gas production is sold based on prices established for Colorado Interstate Gas (“CIG”), and our Permian Basin natural gas production is based on the Waha Hub in West Texas. Pricing we receive for our natural gas in both basins is correlated with the capacity of in-field gathering systems, compression, and processing facilities, as well as transportation pipelines out of the basins, of which are majority owned and operated by third parties. During the first nine months of 2024, the Waha Hub has experienced six months of negative pricing due to oversupply, seasonal maintenance, and limited pipeline capacity. We periodically enter into natural gas basis protection swaps to mitigate a portion of our exposure to adverse market changes. As a result of our natural gas derivative contracts, we recorded cash settlement gains of $29.3 million and $35.7 million during the three and nine months ended September 30, 2024, respectively. Refer to Note 9 - Derivatives under Part I, Item 1 of this Quarterly Report on Form 10-Q for further discussion on our derivative contracts.
Results of Operations
The following table summarizes our product revenues, sales volumes, and average sales prices for the periods indicated:
|
|
|
|
|
|
|
|
|
|
|
|
|
|
|
|
|
|
|
|
|
|
|
|
|
|
|
|
|
|
|
|
|
|
|
|
|
Three Months Ended |
|
|
|
Nine Months Ended |
|
|
| |
September 30, 2024 |
|
June 30, 2024 |
|
Percent Change |
|
September 30, 2024 |
|
September 30, 2023 |
|
Percent Change |
| Revenues (in thousands): |
|
|
|
|
|
|
|
|
|
|
|
| Crude oil sales |
$ |
1,103,874 |
|
|
$ |
1,134,720 |
|
|
(3) |
% |
|
$ |
3,314,189 |
|
|
$ |
1,842,200 |
|
|
80 |
% |
| Natural gas sales |
9,487 |
|
|
9,386 |
|
|
1 |
% |
|
105,865 |
|
|
226,773 |
|
|
(53) |
% |
| NGL sales |
158,014 |
|
|
167,426 |
|
|
(6) |
% |
|
490,609 |
|
|
279,117 |
|
|
76 |
% |
Product revenue |
$ |
1,271,375 |
|
|
$ |
1,311,532 |
|
|
(3) |
% |
|
$ |
3,910,663 |
|
|
$ |
2,348,090 |
|
|
67 |
% |
|
|
|
|
|
|
|
|
|
|
|
|
| Sales Volumes: |
|
|
|
|
|
|
|
|
|
|
|
| Crude oil (MBbls) |
14,628 |
|
|
14,136 |
|
|
3 |
% |
|
42,974 |
|
|
24,613 |
|
|
75 |
% |
| Natural gas (MMcf) |
55,476 |
|
|
54,415 |
|
|
2 |
% |
|
164,205 |
|
|
90,635 |
|
|
81 |
% |
| NGL (MBbls) |
8,153 |
|
|
7,996 |
|
|
2 |
% |
|
23,416 |
|
|
12,062 |
|
|
94 |
% |
| Total sales volumes (MBoe) |
32,027 |
|
|
31,201 |
|
|
3 |
% |
|
93,758 |
|
|
51,781 |
|
|
81 |
% |
|
|
|
|
|
|
|
|
|
|
|
|
| Average Sales Prices (before derivatives): |
|
|
|
|
|
|
|
|
|
|
|
| Crude oil (per Bbl) |
$ |
75.46 |
|
|
$ |
80.27 |
|
|
(6) |
% |
|
$ |
77.12 |
|
|
$ |
74.85 |
|
|
3 |
% |
| Natural gas (per Mcf) |
$ |
0.17 |
|
|
$ |
0.17 |
|
|
— |
% |
|
$ |
0.64 |
|
|
$ |
2.50 |
|
|
(74) |
% |
| NGL (per Bbl) |
$ |
19.38 |
|
|
$ |
20.94 |
|
|
(7) |
% |
|
$ |
20.95 |
|
|
$ |
23.14 |
|
|
(9) |
% |
| Total (per Boe) |
$ |
39.70 |
|
|
$ |
42.03 |
|
|
(6) |
% |
|
$ |
41.71 |
|
|
$ |
45.35 |
|
|
(8) |
% |
|
|
|
|
|
|
|
|
|
|
|
|
Average Sales Prices (after derivatives)(1): |
|
|
|
|
|
|
|
|
|
|
|
| Crude oil (per Bbl) |
$ |
74.70 |
|
|
$ |
78.92 |
|
|
(5) |
% |
|
$ |
76.16 |
|
|
$ |
73.30 |
|
|
4 |
% |
| Natural gas (per Mcf) |
$ |
0.70 |
|
|
$ |
0.29 |
|
|
141 |
% |
|
$ |
0.86 |
|
|
$ |
2.43 |
|
|
(65) |
% |
| NGL (per Bbl) |
$ |
19.38 |
|
|
$ |
20.94 |
|
|
(7) |
% |
|
$ |
20.95 |
|
|
$ |
23.14 |
|
|
(9) |
% |
| Total (per Boe) |
$ |
40.27 |
|
|
$ |
41.63 |
|
|
(3) |
% |
|
$ |
41.65 |
|
|
$ |
44.48 |
|
|
(6) |
% |
_____________________________
(1)Average sale prices, after derivatives is a non-GAAP financial measure. For a reconciliation of average sales price, before derivatives to average sales price, after derivatives, see Non-GAAP Financial Measures below.
The following table presents crude oil, natural gas, and NGL sales volumes by operating region for the periods presented:
|
|
|
|
|
|
|
|
|
|
|
|
|
|
|
|
|
|
|
|
|
|
|
|
|
|
|
|
|
|
|
|
|
|
|
|
|
Three Months Ended |
|
|
|
Nine Months Ended |
|
|
|
September 30, 2024 |
|
June 30, 2024 |
|
Percent Change |
|
September 30, 2024 |
|
September 30, 2023 |
|
Percent Change |
| Crude oil (MBbls) |
|
|
|
|
|
|
|
|
|
|
|
| DJ Basin |
6,502 |
|
|
6,174 |
|
|
5 |
% |
|
19,330 |
|
|
21,578 |
|
|
(10) |
% |
| Permian Basin |
8,126 |
|
|
7,962 |
|
|
2 |
% |
|
23,644 |
|
|
3,035 |
|
|
** |
| Total |
14,628 |
|
|
14,136 |
|
|
3 |
% |
|
42,974 |
|
|
24,613 |
|
|
75 |
% |
| Natural gas (MMcf) |
|
|
|
|
|
|
|
|
|
|
|
| DJ Basin |
28,646 |
|
|
28,693 |
|
|
— |
% |
|
88,620 |
|
|
81,349 |
|
|
9 |
% |
| Permian Basin |
26,830 |
|
|
25,722 |
|
|
4 |
% |
|
75,585 |
|
|
9,286 |
|
|
** |
| Total |
55,476 |
|
|
54,415 |
|
|
2 |
% |
|
164,205 |
|
|
90,635 |
|
|
81 |
% |
| NGL (MBbls) |
|
|
|
|
|
|
|
|
|
|
|
| DJ Basin |
3,386 |
|
|
3,335 |
|
|
2 |
% |
|
10,222 |
|
|
10,481 |
|
|
(2) |
% |
| Permian Basin |
4,767 |
|
|
4,661 |
|
|
2 |
% |
|
13,194 |
|
|
1,581 |
|
|
** |
| Total |
8,153 |
|
|
7,996 |
|
|
2 |
% |
|
23,416 |
|
|
12,062 |
|
|
94 |
% |
| Total sales volumes (MBoe) |
|
|
|
|
|
|
|
|
|
|
|
| DJ Basin |
14,662 |
|
|
14,291 |
|
|
3 |
% |
|
44,322 |
|
|
45,617 |
|
|
(3) |
% |
| Permian Basin |
17,365 |
|
|
16,910 |
|
|
3 |
% |
|
49,436 |
|
|
6,164 |
|
|
** |
| Total |
32,027 |
|
|
31,201 |
|
|
3 |
% |
|
93,758 |
|
|
51,781 |
|
|
81 |
% |
| Average sales volumes per day (MBoe/d) |
|
|
|
|
|
|
|
|
|
|
|
| DJ Basin |
159 |
|
|
157 |
|
|
1 |
% |
|
162 |
|
|
167 |
|
|
(3) |
% |
| Permian Basin |
189 |
|
|
186 |
|
|
2 |
% |
|
180 |
|
|
23 |
|
|
** |
| Total |
348 |
|
|
343 |
|
|
1 |
% |
|
342 |
|
|
190 |
|
|
80 |
% |
_____________________________
** Percent not meaningful
Product revenues remained relatively flat at $1.3 billion for the three months ended September 30, 2024 and June 30, 2024. However, there was an underlying 6% decrease in crude oil equivalent pricing, excluding the impact of derivatives, partially offset by a 3% increase in total sales volumes.
Product revenues increased by 67% to $3.9 billion for the nine months ended September 30, 2024 compared to $2.3 billion for the nine months ended September 30, 2023. The increase was primarily due to an 81% increase in total sales volumes driven by the Hibernia, Tap Rock, and Vencer acquisitions. The increase was partially offset by an 8% decrease in crude oil equivalent pricing, excluding the impact of derivatives.
The following tables set forth information regarding crude oil, natural gas, and NGL sales prices, excluding the impact of commodity derivatives and production costs for the periods presented.
|
|
|
|
|
|
|
|
|
|
|
|
|
|
|
|
|
|
|
|
|
|
|
|
|
|
|
|
|
|
|
|
|
|
|
|
|
Three Months Ended |
|
|
|
Nine Months Ended |
|
|
| Average Sales Price |
September 30, 2024 |
|
June 30, 2024 |
|
Percent Change |
|
September 30, 2024 |
|
September 30, 2023 |
|
Percent Change |
| Crude Oil (Per Bbl) |
|
|
|
|
|
|
|
|
|
|
|
| DJ Basin |
$ |
74.95 |
|
|
$ |
79.24 |
|
|
(5) |
% |
|
$ |
75.91 |
|
|
$ |
73.39 |
|
|
3 |
% |
| Permian Basin |
$ |
75.88 |
|
|
$ |
81.07 |
|
|
(6) |
% |
|
$ |
78.11 |
|
|
$ |
85.20 |
|
|
(8) |
% |
| Total |
$ |
75.46 |
|
|
$ |
80.27 |
|
|
(6) |
% |
|
$ |
77.12 |
|
|
$ |
74.85 |
|
|
3 |
% |
| Natural Gas (Per Mcf) |
|
|
|
|
|
|
|
|
|
|
|
| DJ Basin |
$ |
1.57 |
|
|
$ |
1.42 |
|
|
11 |
% |
|
$ |
1.80 |
|
|
$ |
2.63 |
|
|
(32) |
% |
| Permian Basin |
$ |
(1.32) |
|
|
$ |
(1.22) |
|
|
(8) |
% |
|
$ |
(0.71) |
|
|
$ |
1.37 |
|
|
(152) |
% |
| Total |
$ |
0.17 |
|
|
$ |
0.17 |
|
|
— |
% |
|
$ |
0.64 |
|
|
$ |
2.50 |
|
|
(74) |
% |
| NGL (Per Bbl) |
|
|
|
|
|
|
|
|
|
|
|
| DJ Basin |
$ |
23.62 |
|
|
$ |
25.82 |
|
|
(9) |
% |
|
$ |
24.30 |
|
|
$ |
23.25 |
|
|
5 |
% |
| Permian Basin |
$ |
16.37 |
|
|
$ |
17.45 |
|
|
(6) |
% |
|
$ |
18.36 |
|
|
$ |
22.39 |
|
|
(18) |
% |
| Total |
$ |
19.38 |
|
|
$ |
20.94 |
|
|
(7) |
% |
|
$ |
20.95 |
|
|
$ |
23.14 |
|
|
(9) |
% |
Production Cost (Per Boe)(1) |
|
|
|
|
|
|
|
|
|
|
|
| DJ Basin |
$ |
4.33 |
|
|
$ |
3.96 |
|
|
9 |
% |
|
$ |
4.10 |
|
|
$ |
4.04 |
|
|
1 |
% |
| Permian Basin |
$ |
5.44 |
|
|
$ |
4.85 |
|
|
12 |
% |
|
$ |
5.26 |
|
|
$ |
6.95 |
|
|
(24) |
% |
| Total |
$ |
4.93 |
|
|
$ |
4.44 |
|
|
11 |
% |
|
$ |
4.71 |
|
|
$ |
4.38 |
|
|
8 |
% |
_____________________________
(1)Represents lease operating expense and midstream operating expense per Boe using total sales volumes and excludes ad valorem and severance taxes.
The following table summarizes our operating expenses for the periods indicated (in thousands, except per Boe amounts):
|
|
|
|
|
|
|
|
|
|
|
|
|
|
|
|
|
|
|
|
|
|
|
|
|
|
|
|
|
|
|
|
|
|
|
|
|
Three Months Ended |
|
|
|
Nine Months Ended |
|
|
| |
September 30, 2024 |
|
June 30, 2024 |
|
Percent Change |
|
September 30, 2024 |
|
September 30, 2023 |
|
Percent Change |
| Operating Expenses: |
|
|
|
|
|
|
|
|
|
|
|
| Lease operating expense |
$ |
146,761 |
|
|
$ |
126,606 |
|
|
16 |
% |
|
$ |
404,832 |
|
|
$ |
191,728 |
|
|
111 |
% |
| Midstream operating expense |
11,225 |
|
|
11,939 |
|
|
(6) |
% |
|
36,725 |
|
|
35,041 |
|
|
5 |
% |
| Gathering, transportation, and processing |
96,414 |
|
|
94,469 |
|
|
2 |
% |
|
279,784 |
|
|
209,765 |
|
|
33 |
% |
| Severance and ad valorem taxes |
87,262 |
|
|
101,913 |
|
|
(14) |
% |
|
291,081 |
|
|
188,242 |
|
|
55 |
% |
| Exploration |
861 |
|
|
1,340 |
|
|
(36) |
% |
|
13,735 |
|
|
1,546 |
|
|
** |
| Depreciation, depletion, and amortization |
523,929 |
|
|
521,090 |
|
|
1 |
% |
|
1,511,859 |
|
|
754,558 |
|
|
100 |
% |
| Transaction costs |
140 |
|
|
7,877 |
|
|
(98) |
% |
|
30,737 |
|
|
60,077 |
|
|
(49) |
% |
| General and administrative expense |
56,729 |
|
|
59,135 |
|
|
(4) |
% |
|
173,742 |
|
|
106,553 |
|
|
63 |
% |
| Other operating expense |
2,114 |
|
|
1,458 |
|
|
45 |
% |
|
11,138 |
|
|
5,255 |
|
|
112 |
% |
| Total operating expenses |
$ |
925,435 |
|
|
$ |
925,827 |
|
|
— |
% |
|
$ |
2,753,633 |
|
|
$ |
1,552,765 |
|
|
77 |
% |
| Selected Costs ($ per Boe): |
|
|
|
|
|
|
|
|
|
|
|
| Lease operating expense |
$ |
4.58 |
|
|
$ |
4.06 |
|
|
13 |
% |
|
$ |
4.32 |
|
|
$ |
3.70 |
|
|
17 |
% |
Midstream operating expense(1) |
0.35 |
|
|
0.38 |
|
|
(8) |
% |
|
0.39 |
|
|
0.68 |
|
|
(43) |
% |
| Gathering, transportation, and processing |
3.01 |
|
|
3.03 |
|
|
(1) |
% |
|
2.98 |
|
|
4.05 |
|
|
(26) |
% |
| Severance and ad valorem taxes |
2.72 |
|
|
3.27 |
|
|
(17) |
% |
|
3.10 |
|
|
3.64 |
|
|
(15) |
% |
| Depreciation, depletion, and amortization |
16.36 |
|
|
16.70 |
|
|
(2) |
% |
|
16.13 |
|
|
14.57 |
|
|
11 |
% |
| Transaction costs |
— |
|
|
0.25 |
|
|
(100) |
% |
|
0.33 |
|
|
1.16 |
|
|
(72) |
% |
| General and administrative expense |
1.77 |
|
|
1.90 |
|
|
(7) |
% |
|
1.85 |
|
|
2.06 |
|
|
(10) |
% |
| Total selected operating expenses (per Boe) |
$ |
28.79 |
|
|
$ |
29.59 |
|
|
(3) |
% |
|
$ |
29.10 |
|
|
$ |
29.86 |
|
|
(3) |
% |
|
|
|
|
|
|
|
|
|
|
|
|
|
|
|
|
|
|
|
|
|
|
|
|
_____________________________
** Percent not meaningful
(1)Our midstream assets relate primarily to our DJ Basin operations. If we were to exclude the production of our Permian Basin assets from this calculation, it would result in $0.07 per Boe, or a 8% decrease between the three months ended September 30, 2024 and June 30, 2024 and $0.06 per Boe, or a 8% increase between the nine months ended September 30, 2024 and September 30, 2023.
Lease operating expense. Our lease operating expense increased 16%, to $146.8 million for the three months ended September 30, 2024, from $126.6 million for the three months ended June 30, 2024, and increased 13% on an equivalent basis per Boe. The increase in lease operating expense, in total and on an equivalent basis per Boe, was mainly driven by increased (i) reclamation and remediation work in the DJ Basin, (ii) water disposal costs resulting from higher water volumes in the Permian Basin, and (iii) maintenance and workover optimizations in the Permian Basin.
Our lease operating expense increased 111%, to $404.8 million for the nine months ended September 30, 2024, from $191.7 million for the nine months ended September 30, 2023, and increased 17% on an equivalent basis per Boe. The increase in lease operating expense was primarily the result of the Tap Rock, Hibernia, and Vencer acquisitions in the Permian Basin. The increase in lease operating expense per Boe was a result of the increased cost of operatorship in the Permian Basin relative to the DJ Basin.
Gathering, transportation, and processing. Gathering, transportation, and processing expense remained relatively flat at $96.4 million for the three months ended September 30, 2024, compared to $94.5 million for the three months ended June 30, 2024, and similarly flat on an equivalent basis per Boe.
Gathering, transportation, and processing expense increased 33%, to $279.8 million for the nine months ended September 30, 2024, from $209.8 million for the nine months ended September 30, 2023, and decreased 26% on an equivalent basis per Boe. All gathering, transportation, and processing contracts contain annual price escalations, which have contributed to the aggregate increase. For a significant portion of the midstream contracts assumed in the Hibernia, Tap Rock, and Vencer acquisitions, gathering, transportation, and processing costs are incurred subsequent to the transfer of control; thereby, these costs are recorded net within crude oil, natural gas, and NGL sales. As a result, gathering, transportation, and processing expense per Boe decreased period over period.
Severance and ad valorem taxes. Severance taxes represent taxes imposed by the states in which we operate based on the value of the crude oil, natural gas, and NGL we produce. Ad valorem taxes represent taxes imposed by specific jurisdictions in which we operate based on the assessed value of our properties in that region. For our operations in Texas, the assessed value of our properties is determined using a discounted cash flow methodology. For our operations in Colorado and New Mexico, assessed value is determined by the value of the crude oil, natural gas, and NGL sold less various costs incurred for transportation and processing.
Our severance and ad valorem taxes decreased 14%, to $87.3 million for the three months ended September 30, 2024, from $101.9 million for the three months ended June 30, 2024, and decreased 17% on an equivalent basis per Boe. Crude oil, natural gas, and NGL sales decreased by 3% three months ended September 30, 2024 when compared to the three months ended June 30, 2024, thereby contributing to lower severance and ad valorem taxes on an absolute basis. Additional decreases in both total and on an equivalent basis per Boe resulted from a refinement of estimated severance and ad valorem taxes based upon updated mill levies in the taxing districts in which we operate.
Our severance and ad valorem taxes increased 55%, to $291.1 million for the nine months ended September 30, 2024, from $188.2 million for the nine months ended September 30, 2023, and decreased 15% on an equivalent basis per Boe. Crude oil, natural gas, and NGL sales increased by 67% for the nine months ended September 30, 2024 when compared to the nine months ended September 30, 2023, resulting in higher severance and ad valorem taxes on an absolute basis. The decrease in severance and ad valorem taxes per Boe was primarily due to an increase in crude oil, natural gas, and NGL sales generated through the Hibernia and Vencer acquisitions in the state of Texas, which generally levies lower severance and ad valorem tax rates relative to the states of Colorado and New Mexico.
Depreciation, depletion, and amortization. Our depreciation, depletion, and amortization expense (“DD&A”) remained flat at $523.9 million for the three months ended September 30, 2024, compared to $521.1 million for the three months ended June 30, 2024, and similarly flat on an equivalent basis per Boe.
Our DD&A increased 100%, to $1.5 billion for the nine months ended September 30, 2024, from $754.6 million for the nine months ended September 30, 2023, and increased 11% on an equivalent basis per Boe. Subsequent to September 30, 2023, we invested approximately $3.9 billion in the development and acquisition of crude oil and natural gas properties. The increase in total DD&A expense was primarily due to an 81% increase in sales volumes between periods driven by the Hibernia, Tap Rock, and Vencer acquisitions. The increase in DD&A expense per Boe was due to an increase in the depletion rate driven by a greater increase in the depletable property base in proportion to proved reserves.
Transaction costs. During the three months ended September 30, 2024 and three months ended June 30, 2024, we incurred nominal transaction costs due to a lack of acquisition or divestiture activity.
During the nine months ended September 30, 2024, we incurred $30.7 million in legal, advisor, and other costs associated with the Vencer Acquisition and subsequent integration, in addition to our efforts to divest of certain non-core assets in the DJ Basin. During the nine months ended September 30, 2023, we incurred $60.1 million in short-term financing fees as well as legal, advisor, and other costs associated with the Hibernia and Tap Rock acquisitions.
Refer to Note 2 - Acquisitions and Divestitures under Part I, Item 1 of this Quarterly Report on Form 10-Q for additional discussion over our acquisitions.
General and administrative expense. Our general and administrative expense remained relatively flat at $56.7 million for the three months ended September 30, 2024, compared to $59.1 million for the three months ended June 30, 2024.
Our general and administrative expense increased 63%, to $173.7 million for the nine months ended September 30, 2024, from $106.6 million for the nine months ended September 30, 2023, and decreased 10% on an equivalent basis per Boe. The increase in general and administrative expense was primarily due to the addition of operations in the Permian Basin, significantly driven by an increase in headcount. General and administrative expense per Boe decreased due to an 81% increase in sales volumes.
Derivative gain (loss). Our derivative gain for the three months ended September 30, 2024 was $151.0 million, as compared to a gain of $7.6 million for the three months ended June 30, 2024. Our derivative gain for the three months ended September 30, 2024 was due to fair market value adjustments resulting from lower market prices relative to our open positions and cash settlement gains. Our derivative gain for the three months ended June 30, 2024 was due to fair market value adjustments resulting from lower market prices relative to our open positions, partially offset by cash settlement losses.
Our derivative gain for the nine months ended September 30, 2024 was $48.9 million, and our derivative loss for the nine months ended September 30, 2023 was $120.6 million. Our derivative gain for the nine months ended September 30, 2024 was due to fair market value adjustments resulting from lower market prices relative to our open positions, partially offset by cash settlement losses. Our derivative loss for the nine months ended September 30, 2023 was due to fair market value adjustments resulting from higher market prices relative to our open positions and cash settlement losses.
Refer to Note 9 - Derivatives under Part I, Item 1 of this Quarterly Report on Form 10-Q for additional discussion.
Interest expense. Our interest expense for the three months ended September 30, 2024 and June 30, 2024 was $117.8 million and $114.9 million, respectively. Average debt outstanding for the three months ended September 30, 2024 and June 30, 2024 was $5.1 billion and $4.9 billion, respectively.
Our interest expense for the nine months ended September 30, 2024 and 2023 was $342.4 million and $92.7 million, respectively. The increase in interest expense was attributable to the debt issued in conjunction with the financing of the Hibernia, Tap Rock, and Vencer acquisitions. Average debt outstanding for the nine months ended September 30, 2024 and 2023 was $4.8 billion and $2.3 billion, respectively. The components of interest expense for the periods presented are as follows (in thousands):
|
|
|
|
|
|
|
|
|
|
|
|
|
|
|
|
|
|
|
|
|
|
|
|
|
Three Months Ended |
|
Nine Months Ended |
|
September 30, 2024 |
|
June 30, 2024 |
|
September 30, 2024 |
|
September 30, 2023 |
| Senior Notes |
$ |
84,376 |
|
|
$ |
84,360 |
|
|
$ |
253,095 |
|
|
$ |
74,081 |
|
| Credit Facility |
17,983 |
|
|
15,654 |
|
|
44,853 |
|
|
8,613 |
|
| Commitment and letter of credit fees under the Credit Facility |
1,208 |
|
|
1,335 |
|
|
4,156 |
|
|
4,086 |
|
Amortization of deferred financing costs and deferred acquisition consideration |
13,538 |
|
|
13,044 |
|
|
38,927 |
|
|
5,706 |
|
Finance lease and other |
655 |
|
|
504 |
|
|
1,412 |
|
|
183 |
|
| Total interest expense |
$ |
117,760 |
|
|
$ |
114,897 |
|
|
$ |
342,443 |
|
|
$ |
92,669 |
|
Income tax expense. Our effective tax rate differs from the amount that would be provided by applying the statutory United States federal income tax rate of 21% to income before income taxes due to the effect of state income taxes, excess tax benefits and deficiencies on stock-based compensation awards, tax limitations on compensation of covered individuals, tax credits, and other permanent differences. Refer to Note 12 - Income Taxes under Part I, Item 1 of this Quarterly Report on Form 10-Q for additional discussion.
Our income tax expense for the three months ended September 30, 2024 and June 30, 2024 was $93.3 million and $67.0 million, resulting in an effective tax rate of 24.0% and 23.7% on pre-tax income, respectively.
Our income tax expense for the nine months ended September 30, 2024 and 2023 was $195.3 million and $139.1 million, resulting in an effective tax rate of 22.1% and 22.4% on pre-tax income, respectively. During the nine months ended September 30, 2024, income tax expense was additionally impacted by deferred tax benefits from the state apportionment changes as a result of the Vencer Acquisition. During the nine months ended September 30, 2023, income tax expense was additionally impacted by deferred tax benefits from state apportionment changes as a result of the Hibernia and Tap Rock acquisitions.
Liquidity and Capital Resources
Our primary sources of liquidity include cash flows from operating activities, available borrowing capacity under the Credit Facility, potential proceeds from equity and/or debt capital markets transactions, potential proceeds from sales of assets, and other sources. We may use our available liquidity for operating activities, working capital requirements, capital expenditures, acquisitions, debt reduction, the return of capital to stockholders, and for general corporate purposes.
Our primary source of cash flows from operating activities is the sale of crude oil, natural gas, and NGL. As such, our cash flows are subject to significant volatility due to changes in commodity prices, as well as variations in our sales volumes. The prices for these commodities are driven by a number of factors beyond our control, including global and regional product supply and demand, the impact of inflation and monetary policy, weather, product distribution, transportation, processing, and refining capacity, regulatory constraints, and other supply chain dynamics, among other factors.
As of September 30, 2024, our liquidity was $1.44 billion, consisting of cash on hand of $47.1 million and $1.40 billion of available borrowing capacity on our Credit Facility. Borrowing capacity under the Credit Facility is primarily based on the value assigned to the proved reserves attributable to our crude oil and natural gas interests. As of November 6, 2024, the available borrowing capacity on our Credit Facility was $1.35 billion. Our Credit Facility is set to mature in August 2028, with the next scheduled borrowing base redetermination date to occur in November 2024, subsequent to the filing of this Quarterly Report on Form 10-Q.
The Credit Facility contains customary representations and various affirmative and negative covenants as well as certain financial covenants, including (a) a permitted net leverage ratio of not greater than 3.00 to 1.00, (b) a current ratio, inclusive of the unused commitments under the Credit Facility then available to be borrowed, of not less than 1.00 to 1.00, and (c) upon the achievement of investment grade credit ratings, a PV-9 Coverage Ratio of not less than 1.50 to 1.00. We were in compliance with all covenants under the Credit Facility as of September 30, 2024, and through the filing of this Quarterly Report on Form 10-Q. Refer to Note 5 - Debt in Part I, Item 1 for additional information.
Our material short-term cash requirements include: operating activities, working capital requirements, capital expenditures, dividends, and payments of contractual obligations, including the payment of the remaining portion of the deferred consideration due with respect to the Vencer Acquisition. Our material long-term cash requirements from various contractual and other obligations include: debt obligations and related interest payments, firm transportation and minimum volume agreements, taxes, asset retirement obligations, and leases. Refer to Part I, Item 1 for additional information. Our future capital requirements, both near-term and long-term, will depend on many factors, including, but not limited to, commodity prices, market conditions, our available liquidity and financing, acquisitions and divestitures of crude oil and natural gas properties, the availability of drilling rigs and completion crews, the cost of completion services, success of drilling programs, land and industry partner issues, weather delays, the acquisition of leases with drilling commitments, and other factors. We regularly consider which resources, including debt and equity financing, are available to meet our future financial obligations, planned capital expenditures, and liquidity requirements.
Funding for these requirements may be provided by any combination of the sources of liquidity outlined above. We expect our 2024 capital program to be funded by cash flows from operations. Although we cannot provide any assurance, based on our projected cash flows from operations, our cash on hand, and available borrowing capacity on our Credit Facility, we believe that we will have sufficient capital available to fund these requirements through the 12-month period following the filing of this Quarterly Report on Form 10-Q, and based on current expectations, the long-term.
The following table summarizes our cash flows and other financial measures for the periods indicated (in thousands):
|
|
|
|
|
|
|
|
|
|
|
|
|
Nine Months Ended |
| |
September 30, 2024 |
|
September 30, 2023 |
| Net cash provided by operating activities |
$ |
2,007,158 |
|
|
$ |
1,395,572 |
|
| Net cash used in investing activities |
(2,400,185) |
|
|
(4,496,863) |
|
| Net cash provided by (used in) financing activities |
(686,713) |
|
|
2,428,585 |
|
| Cash, cash equivalents, and restricted cash |
47,075 |
|
|
95,428 |
|
| Acquisitions of businesses, net of cash acquired |
(905,096) |
|
|
(3,650,491) |
|
| Acquisitions of crude oil and natural gas properties |
(24,344) |
|
|
(60,975) |
|
| Capital expenditures for drilling and completion activities and other fixed assets |
(1,632,107) |
|
|
(782,119) |
|
Operating Activities
Our net cash flows from operating activities are primarily impacted by commodity prices, sales volumes, net settlements from our commodity derivative positions, operating costs, and general and administrative expenses. Net cash provided by operating activities increased by $611.6 million to $2.0 billion during the nine months ended September 30, 2024, compared to $1.4 billion during the nine months ended September 30, 2023. The increase between periods was primarily due to higher net operating cash flows from the Hibernia, Tap Rock, and Vencer acquisitions. This increase was partially offset by a $317.7 million increase in cash paid for interest and a $312.4 million decrease in changes in operating assets and liabilities primarily due to the reduction of ad valorem tax liability and the timing of oil and natural gas revenue distributions payable. See “Results of Operations” above for more information on other factors driving these changes.
Investing Activities
Net cash used in investing activities of $2.4 billion for the nine months ended September 30, 2024 was primarily the result of (i) capital expenditures for drilling and completion activities and other fixed assets of $1.6 billion in the DJ Basin and Permian Basin, (ii) acquisitions of businesses, net of cash acquired of $905.1 million, and (iii) acquisitions of crude oil and natural gas properties of $24.3 million, partially offset by proceeds from property transactions of $163.3 million in the DJ Basin.
Net cash used in investing activities of $4.5 billion for the nine months ended September 30, 2023 was primarily the result of (i) acquisitions of businesses, net of cash acquired of $3.7 billion, (ii) capital expenditures for drilling and completion activities and other fixed assets of $782.1 million, and (iii) acquisitions of crude oil and natural gas properties of $61.0 million.
Financing Activities
Net cash used in financing activities of $686.7 million for the nine months ended September 30, 2024 was primarily the result of (i) dividends paid of $446.2 million; (ii) the repurchase and retirement of common stock of $269.9 million; and (iii) the payment of employee tax withholdings in exchange for the return of common stock of $11.6 million, partially offset by net draws on the Credit Facility of $50.0 million.
Net cash provided by financing activities of $2.4 billion for the nine months ended September 30, 2023 was primarily due to the issuance of an aggregate principal amount of $2.7 billion from our 2028 Senior Notes and our 2031 Senior Notes, net draws on the Credit Facility of $650.0 million, partially offset by (i) dividends paid of $511.0 million, (ii) the repurchase and retirement of common stock of $320.4 million, (iii) the payment of deferred financing costs of $42.9 million, and (iv) the payment of employee tax withholdings in exchange for the return of common stock of $13.3 million.
Material Commitments
There have been no significant changes from our
2023 Form 10-K in our obligations and commitments, other than what is disclosed within Note 6 - Commitments and Contingencies under Part I, Item 1 of this Quarterly Report on Form 10-Q.
Non-GAAP Financial Measures
Reconciliation of Net Income to Adjusted EBITDAX
Adjusted EBITDAX is a supplemental non-GAAP financial measure that represents earnings before interest, income taxes, depreciation, depletion, and amortization, exploration expense, and other non-cash and non-recurring charges. Adjusted EBITDAX excludes certain items that we believe affect the comparability of operating results and can exclude items that are generally non-recurring in nature or whose timing and/or amount cannot be reasonably estimated. We present Adjusted EBITDAX because we believe it provides useful additional information to investors and analysts, as a performance measure, for analysis of our ability to internally generate funds for exploration, development, acquisitions, and to service debt. We are also subject to financial covenants under our Credit Facility based on Adjusted EBITDAX ratios. In addition, Adjusted EBITDAX is widely used by professional research analysts and others in the valuation, comparison, and investment recommendations of companies in the crude oil and natural gas exploration and production industry. Adjusted EBITDAX should not be considered in isolation or as a substitute for net income, net cash provided by operating activities, or other profitability or liquidity measures prepared under GAAP. Because Adjusted EBITDAX excludes some, but not all items that affect net income and may vary among companies, the Adjusted EBITDAX amounts presented may not be comparable to similar metrics of other companies.
The following table presents a reconciliation of the GAAP financial measure of net income to the non-GAAP financial measure of Adjusted EBITDAX (in thousands):
|
|
|
|
|
|
|
|
|
|
|
|
|
|
|
|
|
|
|
|
|
|
|
|
|
Three Months Ended |
|
Nine Months Ended |
|
September 30, 2024 |
|
June 30,
2024
|
|
September 30, 2024 |
|
September 30, 2023 |
| Net income |
$ |
295,803 |
|
|
$ |
215,989 |
|
|
$ |
687,613 |
|
|
$ |
481,420 |
|
| Exploration |
861 |
|
|
1,340 |
|
|
13,735 |
|
|
1,546 |
|
| Depreciation, depletion, and amortization |
523,929 |
|
|
521,090 |
|
|
1,511,859 |
|
|
754,558 |
|
Unused commitments(1) |
1,117 |
|
|
608 |
|
|
498 |
|
|
3,946 |
|
| Transaction costs |
140 |
|
|
7,877 |
|
|
30,737 |
|
|
60,077 |
|
Stock-based compensation(2) |
12,661 |
|
|
12,262 |
|
|
36,122 |
|
|
25,577 |
|
| Derivative (gain) loss, net |
(151,029) |
|
|
(7,578) |
|
|
(48,927) |
|
|
120,574 |
|
Derivative cash settlements gain (loss), net |
18,195 |
|
|
(12,752) |
|
|
(5,712) |
|
|
(44,907) |
|
| Interest expense |
117,760 |
|
|
114,897 |
|
|
342,443 |
|
|
92,669 |
|
Interest income(3) |
(2,650) |
|
|
(2,650) |
|
|
(8,724) |
|
|
(28,172) |
|
| Loss on property transactions, net |
— |
|
|
— |
|
|
1,430 |
|
|
254 |
|
| Income tax expense |
93,309 |
|
|
66,993 |
|
|
195,321 |
|
|
139,138 |
|
| Adjusted EBITDAX |
$ |
910,096 |
|
|
$ |
918,076 |
|
|
$ |
2,756,395 |
|
|
$ |
1,606,680 |
|
_________________________
(1)Included as a portion of other operating expense in the accompanying statements of operations.
(2)Included as a portion of general and administrative expense in the accompanying statements of operations.
(3)Included as a portion of other income in the accompanying statements of operations.
Reconciliation of Cash Provided by Operating Activities to Adjusted Free Cash Flow
Adjusted Free Cash Flow is a supplemental non-GAAP financial measure that is calculated as net cash provided by operating activities before changes in operating assets and liabilities and less exploration and development of crude oil and natural gas properties, changes in working capital related to capital expenditures, and purchases of carbon credits. We believe that Adjusted Free Cash Flow provides additional information that may be useful to investors and analysts in evaluating our ability to generate cash from our existing crude oil and natural gas assets to fund future exploration and development activities and to return cash to stockholders. Adjusted Free Cash Flow is a supplemental measure of liquidity and should not be viewed as a substitute for cash flows from operations because it excludes certain required cash expenditures.
The following table presents a reconciliation of the GAAP financial measure of net cash provided by operating activities to the non-GAAP financial measure of Adjusted Free Cash Flow (in thousands):
|
|
|
|
|
|
|
|
|
|
|
|
|
|
|
|
|
|
|
|
|
|
|
|
|
Three Months Ended |
|
Nine Months Ended |
|
September 30, 2024 |
|
June 30, 2024 |
|
September 30, 2024 |
|
September 30, 2023 |
| Net cash provided by operating activities |
$ |
835,038 |
|
|
$ |
359,568 |
|
|
$ |
2,007,158 |
|
|
$ |
1,395,572 |
|
| Add back: Changes in operating assets and liabilities, net |
(28,270) |
|
|
444,252 |
|
|
398,549 |
|
|
86,173 |
|
| Cash flow from operations before changes in operating assets and liabilities |
806,768 |
|
|
803,820 |
|
|
2,405,707 |
|
|
1,481,745 |
|
Less: Cash paid for capital expenditures for drilling and completion activities and other fixed assets |
(541,410) |
|
|
(519,120) |
|
|
(1,632,107) |
|
|
(782,119) |
|
| Less: Changes in working capital related to capital expenditures |
103,021 |
|
|
(47,389) |
|
|
(22,323) |
|
|
(112,454) |
|
Capital expenditures |
(438,389) |
|
|
(566,509) |
|
|
(1,654,430) |
|
|
(894,573) |
|
| Less: Purchases of carbon credits and renewable energy credits |
(2,032) |
|
|
(1,886) |
|
|
(3,918) |
|
|
(5,864) |
|
Adjusted Free Cash Flow |
$ |
366,347 |
|
|
$ |
235,425 |
|
|
$ |
747,359 |
|
|
$ |
581,308 |
|
Reconciliation of average sales price, after derivatives
Average sales price, after derivatives is a non-GAAP financial measure that incorporates the net effect of derivative cash receipts from or payments on commodity derivatives that are presented in our accompanying statements of cash flows, netted into the average sales price, before derivatives, the most directly comparable GAAP financial measure. We believe that the presentation of average sales price, after derivatives is a useful means to reflect the actual cash performance of our commodity derivatives for the respective periods and is useful to management and our stockholders in determining the effectiveness of our price risk management program.
The following table provides a reconciliation of the GAAP financial measure of average sales price, before derivatives to the non-GAAP financial measure of average sales prices, after derivatives for the periods presented:
|
|
|
|
|
|
|
|
|
|
|
|
|
|
|
|
|
|
|
|
|
|
|
|
|
Three Months Ended |
|
Nine Months Ended |
|
September 30, 2024 |
|
June 30, 2024 |
|
September 30, 2024 |
|
September 30, 2023 |
Average crude oil sales price (per Bbl) |
$ |
75.46 |
|
|
$ |
80.27 |
|
|
$ |
77.12 |
|
|
$ |
74.85 |
|
Effects of derivatives, net (per Bbl) (1) |
(0.76) |
|
|
(1.35) |
|
|
(0.96) |
|
|
(1.55) |
|
Average crude oil sales price (after derivatives) (per Bbl) |
$ |
74.70 |
|
|
$ |
78.92 |
|
|
$ |
76.16 |
|
|
$ |
73.30 |
|
|
|
|
|
|
|
|
|
Average natural gas sales price (per Mcf) |
$ |
0.17 |
|
|
$ |
0.17 |
|
|
$ |
0.64 |
|
|
$ |
2.50 |
|
Effects of derivatives, net (per Mcf) (1) |
0.53 |
|
|
0.12 |
|
|
0.22 |
|
|
(0.07) |
|
Average natural gas sales price (after derivatives) (per Mcf) |
$ |
0.70 |
|
|
$ |
0.29 |
|
|
$ |
0.86 |
|
|
$ |
2.43 |
|
|
|
|
|
|
|
|
|
Average NGL sales price (per Bbl) |
$ |
19.38 |
|
|
$ |
20.94 |
|
|
$ |
20.95 |
|
|
$ |
23.14 |
|
Effects of derivatives, net (per Bbl) (1) |
— |
|
|
— |
|
|
— |
|
|
— |
|
Average NGL sales price (after derivatives) (per Bbl) |
$ |
19.38 |
|
|
$ |
20.94 |
|
|
$ |
20.95 |
|
|
$ |
23.14 |
|
_________________________
(1)Derivatives economically hedge the price we receive for crude oil, natural gas, and NGL. For the three months ended September 30, 2024, the derivative cash settlement loss for crude oil was $11.1 million, and the derivative cash settlement gain for natural gas was $29.3 million. For the three months ended June 30, 2024, the derivative cash settlement loss for crude oil was $19.2 million, and the derivative cash settlement gain for natural gas was $6.4 million. For the nine months ended September 30, 2024, the derivative cash settlement loss for crude oil was $41.4 million, and the derivative cash settlement gain for natural gas was $35.7 million. For the nine months ended September 30, 2023, the derivative cash settlement loss for crude oil and natural gas was $38.0 million and $6.9 million, respectively. We did not hedge the price we receive for NGL during the periods presented. Refer to Note 9 - Derivatives under Part I, Item 1 of this Quarterly Report on Form 10-Q for additional disclosures.
New Accounting Pronouncements
Refer to Note 1 - Summary of Significant Accounting Policies under Part I, Item 1 of this Quarterly Report on Form 10-Q and Note 1 - Summary of Significant Accounting Policies in the
2023 Form 10-K for any recently issued or adopted accounting standards.
Critical Accounting Estimates
Information regarding our critical accounting estimates is contained in Part II, Item 7 of our
2023 Form 10-K. During the three months ended September 30, 2024, there were no significant changes in the application of critical accounting policies.
Item 3. Quantitative and Qualitative Disclosures About Market Risk.
Crude Oil and Natural Gas Price Risk
Our financial condition, results of operations, and capital resources are highly dependent upon the prevailing market prices of crude oil and natural gas. These commodity prices are subject to wide fluctuations and market uncertainties due to a variety of factors that are beyond our control. Factors influencing crude oil and natural gas prices include the level of global demand for crude oil and natural gas, the global supply of crude oil and natural gas, the establishment of and compliance with production quotas by crude oil exporting countries, weather conditions which impact the supply and demand for crude oil and natural gas, the price and availability of alternative fuels, local and global politics, and overall economic conditions. It is impossible to predict future crude oil and natural gas prices with any degree of certainty. Sustained weakness in crude oil and natural gas prices may adversely affect our financial condition and results of operations and may also reduce the amount of crude oil and natural gas reserves that we can produce economically. Any reduction in our crude oil and natural gas reserves, including reductions due to price fluctuations, can have an adverse effect on our ability to obtain capital for our exploration and development activities. Similarly, any improvements in crude oil and natural gas prices can have a favorable impact on our financial condition, results of operations, and capital resources.
Commodity Price Derivative Contracts
Our primary commodity risk management objective is to protect our balance sheet. We periodically enter into commodity derivative contracts to mitigate a portion of our exposure to potentially adverse market changes in commodity prices for our expected future crude oil and natural gas production and the associated impact on cash flows. Our commodity derivative contracts consist of swaps, collars, basis protection swaps, and puts. Upon settlement of the contract(s), if the relevant market commodity price exceeds our contracted swap price, or the collar’s ceiling strike price, we are required to pay our counterparty the difference for the volume of production associated with the contract. Generally, this payment is made up to 15 business days prior to the receipt of cash payments from our customers. This could have an adverse impact on our cash flows for the period between derivative settlements and payments for revenue earned. While we may reduce the potential negative impact of lower commodity prices, we may also be prevented from realizing the benefits of favorable price changes in the physical market. Refer to Note 9 - Derivatives under Part I, Item 1 of this Quarterly Report on Form 10-Q for summary derivative activity tables.
Interest Rates
As of September 30, 2024 and November 6, 2024, we had $800.0 million and $850.0 million, respectively, outstanding under our Credit Facility. Borrowings under our Credit Facility bear interest at a fluctuating rate that is tied to the ABR or SOFR, plus the applicable margin, at our option. Any increases in these interest rates can have an adverse impact on our results of operations and cash flows. As of September 30, 2024, and through the filing date of this Quarterly Report on Form 10-Q, we were in compliance with all financial and non-financial covenants under the Credit Facility.
Counterparty and Customer Credit Risk
We are exposed to counterparty credit risk associated with our derivative activities. As of September 30, 2024 and November 1, 2024, our derivative contracts have been executed with 15 counterparties, all of which are members of the Credit Facility lender group and have investment grade credit ratings. However, if our counterparties fail to perform their obligations under the contracts, we could suffer financial loss.
We are also subject to credit risk due to the concentration of our crude oil and natural gas receivables with certain significant customers. The inability or failure of our significant customers to meet their obligations to us or their insolvency or liquidation may adversely affect our financial results. We review the credit rating, payment history, and financial resources of our customers, but we do not require our customers to post collateral.
Marketability of Our Production
The marketability of our production depends in part upon the availability, proximity, and capacity of third-party refineries, access to regional trucking, pipeline and rail infrastructure, natural gas gathering systems, and processing facilities. We deliver crude oil and natural gas produced through trucking services, pipelines, and rail facilities that we do not own. The lack of availability or capacity on these systems and facilities could reduce the price offered for our production or result in the shut-in of producing wells or the delay or discontinuance of development plans for properties.
A portion of our production may also be interrupted, or shut in, from time to time for numerous other reasons, including as a result of accidents, weather, field labor issues or strikes, or we might voluntarily curtail production in response to market conditions. If a substantial amount of our production is interrupted at the same time, it could adversely affect our cash flow.
Item 4. Controls and Procedures.
Evaluation of Disclosure Controls and Procedures
Our management, with the participation of our principal executive officer and principal financial officer, evaluated the effectiveness of our disclosure controls and procedures as of September 30, 2024. The term “disclosure controls and procedures,” as defined in Rules 13a-15(e) and 15d-15(e) under the Exchange Act, means controls and other procedures of a company that are designed to ensure that information required to be disclosed by a company in the reports that it files or submits under the Exchange Act (15 U.S.C. 78a et seq.) is recorded, processed, summarized, and reported, within the time periods specified in SEC rules and forms. Disclosure controls and procedures include, without limitation, controls and procedures designed to ensure that information required to be disclosed by a company in the reports that it files or submits under the Exchange Act is accumulated and communicated to the company’s management, including its principal executive and principal financial officers and internal audit function, as appropriate, to allow timely decisions regarding required disclosure. Based on the evaluation of our disclosure controls and procedures as of September 30, 2024, our principal executive officer and principal financial officer concluded that, as of such date, our disclosure controls and procedures were effective at the reasonable assurance level.
Management recognizes that any controls and procedures, no matter how well designed and operated, can provide only reasonable assurance of achieving their objectives, and management necessarily applies its judgment in evaluating the cost-benefit relationship of possible controls and procedures. To assist management, we have established an internal audit function to verify and monitor our internal controls and procedures. Our internal control system is supported by written policies and procedures, contains self-monitoring mechanisms, and is audited by the internal audit function. Appropriate actions are taken by management to correct deficiencies as they are identified.
Changes in Internal Control over Financial Reporting
There were no changes in our internal control over financial reporting identified in management’s evaluation pursuant to Rules 13a-15(d) or 15d-15(d) of the Exchange Act during the quarter ended September 30, 2024 that materially affected, or are reasonably likely to materially affect, our internal control over financial reporting.
PART II. OTHER INFORMATION
Item 1. Legal Proceedings.
Information regarding our legal proceedings can be found in Note 6 - Commitments and Contingencies under Part I, Item 1 of this Quarterly Report on Form 10-Q.
Disclosure of certain environmental matters is required when a governmental authority is a party to the proceedings and the proceedings involve potential monetary sanctions that we reasonably believe could exceed a specified threshold. Pursuant to Item 103 of Regulation S-K, we have elected to apply a threshold of $1.0 million for purposes of determining whether disclosure of any such proceedings is required. Applying this threshold, we are not aware of any such proceedings required to be disclosed for the quarter ended September 30, 2024.
Item 1A. Risk Factors.
Our business faces many risks. Any of the risk factors discussed in this Quarterly Report on Form 10-Q or our other SEC filings could have a material impact on our business, financial position, or results of operations. Additional risks and uncertainties not presently known to us or that we currently believe to be immaterial may also impair our business operation. For a discussion of our potential risks and uncertainties, see the risk factors identified in Part I, Item 1A in our
2023 Form 10-K, together with other information in this Quarterly Report on Form 10-Q and other reports and materials we may subsequently file with the SEC. We have identified these risk factors as important factors that could cause our actual results to differ materially from those contained in any written or oral forward-looking statements made by us or on our behalf.
Item 2. Unregistered Sales of Equity Securities, Use of Proceeds, and Issuer Purchases of Equity Securities.
The following table provides information about our purchases of our common stock during the three months ended September 30, 2024:
|
|
|
|
|
|
|
|
|
|
|
|
|
|
|
|
|
|
|
|
|
|
|
|
|
Total Number of Shares Purchased(1) |
|
Average Price Paid per Share(2) |
|
Total Number of
Shares Purchased as Part of Publicly Announced Plans or Programs(3)
|
|
Maximum Dollar Value that May Yet be Purchased as Part of Publicly Announced Plans or Programs (in thousands)(3) |
| July 1, 2024 – July 29, 2024 |
805 |
|
|
$ |
69.63 |
|
|
— |
|
|
$ |
287,956 |
|
| July 30, 2024 – July 31, 2024 |
— |
|
|
— |
|
|
— |
|
|
500,000 |
|
| August 1, 2024 – August 31, 2024 |
923,733 |
|
|
60.14 |
|
|
884,542 |
|
|
447,038 |
|
| September 1, 2024 – September 30, 2024 |
461,860 |
|
|
54.39 |
|
|
459,502 |
|
|
422,038 |
|
| Total |
1,386,398 |
|
|
$ |
58.23 |
|
|
1,344,044 |
|
|
$ |
422,038 |
|
_________________________
(1)Purchases outside of the stock repurchase program represent shares withheld from officers, former officers, executives, and employees for the payment of personal income tax withholding obligations upon the vesting of restricted stock awards. The withheld shares are not considered common stock repurchased under the stock repurchase program.
(2)Excludes commissions paid and excise taxes accrued related to stock repurchases.
(3)In February 2023, our Board authorized the stock repurchase program pursuant to which we were authorized, from time to time, to acquire shares of our common stock in the open market, in privately negotiated transactions, or through block trades, derivative transactions, or purchases made in accordance with Rule 10b-18 and Rule 10b5-1 of the Exchange Act. On July 30, 2024, our Board authorized a new stock repurchase program authorizing repurchases of up to $500 million of our outstanding shares of common stock, replacing our prior stock repurchase program. The stock repurchase program does not have a termination date, does not require any specific number of shares to be acquired, and can be modified or discontinued by our Board at any time.
Item 3. Defaults Upon Senior Securities.
None.
Item 4. Mine Safety Disclosures.
Not applicable.
Item 5. Other Information.
During the three months ended September 30, 2024, no director or officer of the Company adopted or terminated a “Rule 10b5-1 trading arrangement” or “non-Rule 10b5-1 trading arrangement,” as each term is defined in Item 408 of Regulation S-K.
Item 6. Exhibits.
|
|
|
|
|
|
|
Exhibit
Number
|
Description |
|
Purchase and Sale Agreement, dated as of October 3, 2023, by and among Vencer Energy, LLC, as seller, and Civitas Resources, Inc., as buyer (incorporated by reference to Exhibit 2.1 to Civitas Resources, Inc.’s Current Report on Form 8-K, File No. 001-35371, filed on October 4, 2023) |
|
|
|
|
|
|
|
|
|
|
|
|
| 101.INS† |
XBRL Instance Document |
101.SCH† |
XBRL Taxonomy Extension Schema |
101.CAL† |
XBRL Taxonomy Extension Calculation Linkbase |
101.DEF† |
XBRL Taxonomy Extension Definition Linkbase |
101.LAB† |
XBRL Taxonomy Extension Label Linkbase |
101.PRE† |
XBRL Taxonomy Extension Presentation Linkbase |
| 104 |
Cover Page Interactive Data File (formatted as Inline XBRL and contained in Exhibit 101) |
_________________________
* Certain of the schedules and exhibits to the agreement have been omitted pursuant to Item 601(a)(5) of Regulation
S-K. A copy of any omitted schedule or exhibit will be furnished to the SEC upon request.
† Filed or furnished herewith Pursuant to the requirements of the Securities Exchange Act of 1934, the registrant has duly caused this report to be signed on its behalf by the undersigned thereunto duly authorized.
SIGNATURES
CIVITAS RESOURCES, INC. Date: November 7, 2024 By: /s/ Chris Doyle Chris Doyle President and Chief Executive Officer (principal executive officer) By: /s/ Marianella Foschi Marianella Foschi Chief Financial Officer and Treasurer (principal financial officer) By: /s/ Kayla D. Baird Kayla D. Baird Senior Vice President and Chief Accounting Officer (principal accounting officer)
EX-31.1
2
ex31120240930-doyle.htm
EX-31.1
Document
Exhibit 31.1
CERTIFICATION OF THE CHIEF EXECUTIVE OFFICER PURSUANT TO RULE 13a‑ 14(a)
I, Chris Doyle, certify that:
1.I have reviewed this Quarterly Report on Form 10-Q for the period ended September 30, 2024 of Civitas Resources, Inc.;
2.Based on my knowledge, this report does not contain any untrue statement of a material fact or omit to state a material fact necessary to make the statements made, in light of the circumstances under which such statements were made, not misleading with respect to the period covered by this report;
3.Based on my knowledge, the financial statements, and other financial information included in this report, fairly present in all material respects the financial condition, results of operations and cash flows of the registrant as of, and for, the periods presented in this report;
4.The registrant’s other certifying officer and I are responsible for establishing and maintaining disclosure controls and procedures (as defined in Exchange Act Rules 13a-15(e) and 15d-15(e)) and internal control over financial reporting (as defined in Exchange Act Rules 13a-15(f) and 15d-15(f)) for the registrant and have:
a)Designed such disclosure controls and procedures, or caused such disclosure controls and procedures to be designed under our supervision, to ensure that material information relating to the registrant, including its consolidated subsidiaries, is made known to us by others within those entities, particularly during the period in which this report is being prepared;
b)Designed such internal control over financial reporting, or caused such internal control over financial reporting to be designed under our supervision, to provide reasonable assurance regarding the reliability of financial reporting and the preparation of financial statements for external purposes in accordance with generally accepted accounting principles;
c)Evaluated the effectiveness of the registrant’s disclosure controls and procedures and presented in this report our conclusions about the effectiveness of the disclosure controls and procedures, as of the end of the period covered by this report based on such evaluation; and
d)Disclosed in this report any change in the registrant’s internal control over financial reporting that occurred during the registrant’s most recent fiscal quarter (the registrant’s fourth fiscal quarter in the case of an annual report) that has materially affected, or is reasonably likely to materially affect, the registrant’s internal control over financial reporting; and
5.The registrant’s other certifying officer and I have disclosed, based on our most recent evaluation of internal control over financial reporting, to the registrant’s auditors and the audit committee of the registrant’s board of directors (or persons performing the equivalent functions):
a)All significant deficiencies and material weaknesses in the design or operation of internal control over financial reporting which are reasonably likely to adversely affect the registrant’s ability to record, process, summarize and report financial information; and
b)Any fraud, whether or not material, that involves management or other employees who have a significant role in the registrant’s internal control over financial reporting.
Date: November 7, 2024
|
|
|
|
|
|
| |
/s/ Chris Doyle |
|
Chris Doyle |
|
President and Chief Executive Officer
(principal executive officer)
|
EX-31.2
3
ex31220240930-foschi.htm
EX-31.2
Document
Exhibit 31.2
CERTIFICATION OF THE PRINCIPAL FINANCIAL OFFICER PURSUANT TO RULE 13a‑ 14(a)
I, Marianella Foschi, certify that:
1.I have reviewed this Quarterly Report on Form 10-Q for the period ended September 30, 2024 of Civitas Resources, Inc.;
2.Based on my knowledge, this report does not contain any untrue statement of a material fact or omit to state a material fact necessary to make the statements made, in light of the circumstances under which such statements were made, not misleading with respect to the period covered by this report;
3.Based on my knowledge, the financial statements, and other financial information included in this report, fairly present in all material respects the financial condition, results of operations and cash flows of the registrant as of, and for, the periods presented in this report;
4.The registrant’s other certifying officer and I are responsible for establishing and maintaining disclosure controls and procedures (as defined in Exchange Act Rules 13a-15(e) and 15d-15(e)) and internal control over financial reporting (as defined in Exchange Act Rules 13a-15(f) and 15d-15(f)) for the registrant and have:
a)Designed such disclosure controls and procedures, or caused such disclosure controls and procedures to be designed under our supervision, to ensure that material information relating to the registrant, including its consolidated subsidiaries, is made known to us by others within those entities, particularly during the period in which this report is being prepared;
b)Designed such internal control over financial reporting, or caused such internal control over financial reporting to be designed under our supervision, to provide reasonable assurance regarding the reliability of financial reporting and the preparation of financial statements for external purposes in accordance with generally accepted accounting principles;
c)Evaluated the effectiveness of the registrant’s disclosure controls and procedures and presented in this report our conclusions about the effectiveness of the disclosure controls and procedures, as of the end of the period covered by this report based on such evaluation; and
d)Disclosed in this report any change in the registrant’s internal control over financial reporting that occurred during the registrant’s most recent fiscal quarter (the registrant’s fourth fiscal quarter in the case of an annual report) that has materially affected, or is reasonably likely to materially affect, the registrant’s internal control over financial reporting; and
5.The registrant’s other certifying officer and I have disclosed, based on our most recent evaluation of internal control over financial reporting, to the registrant’s auditors and the audit committee of the registrant’s board of directors (or persons performing the equivalent functions):
a)All significant deficiencies and material weaknesses in the design or operation of internal control over financial reporting which are reasonably likely to adversely affect the registrant’s ability to record, process, summarize and report financial information; and
b)Any fraud, whether or not material, that involves management or other employees who have a significant role in the registrant’s internal control over financial reporting.
Date: November 7, 2024
|
|
|
|
|
|
| |
/s/ Marianella Foschi |
|
Marianella Foschi |
|
Chief Financial Officer and Treasurer (principal financial officer) |
EX-32.1
4
ex32120240930-doyle.htm
EX-32.1
Document
Exhibit 32.1
Certification of the Chief Executive Officer
Pursuant to 18 U.S.C. Section 1350,
As Adopted Pursuant to Section 906 of the Sarbanes-Oxley Act of 2002
In connection with the Quarterly Report of Civitas Resources, Inc. (the “Company”) on Form 10-Q for the period ended September 30, 2024 as filed with the Securities and Exchange Commission on the date hereof (the “Report”), I, Chris Doyle, President and Chief Executive Officer of the Company, certify, pursuant to 18 U.S.C. § 1350, as adopted pursuant to Section 906 of the Sarbanes-Oxley Act of 2002, that, to my knowledge:
(1) The Report fully complies with the requirements of Section 13(a) or 15(d) of the Securities Exchange Act of 1934; and
(2) The information contained in the Report fairly presents, in all material respects, the financial condition and results of operations of the Company.
Date: November 7, 2024
|
|
|
|
|
|
|
/s/ Chris Doyle |
|
Chris Doyle |
| |
President and Chief Executive Officer
(principal executive officer)
|
EX-32.2
5
ex32220240930-foschi.htm
EX-32.2
Document
Exhibit 32.2
Certification of the Principle Financial Officer
Pursuant to 18 U.S.C. Section 1350,
As Adopted Pursuant to Section 906 of the Sarbanes-Oxley Act of 2002
In connection with the Quarterly Report of Civitas Resources, Inc. (the “Company”) on Form 10-Q for the period ended September 30, 2024 as filed with the Securities and Exchange Commission on the date hereof (the “Report”), I, Marianella Foschi, Chief Financial Officer, certify, pursuant to 18 U.S.C. § 1350, as adopted pursuant to Section 906 of the Sarbanes-Oxley Act of 2002, that to my knowledge:
(1) The Report fully complies with the requirements of Section 13(a) or 15(d) of the Securities Exchange Act of 1934; and
(2) The information contained in the Report fairly presents, in all material respects, the financial condition and results of operations of the Company.
Date: November 7, 2024
|
|
|
|
|
|
| |
/s/ Marianella Foschi |
|
Marianella Foschi |
|
Chief Financial Officer and Treasurer (principal financial officer) |