000150400812/312024Q1falsehttp://fasb.org/us-gaap/2023#InterestExpenseBorrowingshttp://fasb.org/us-gaap/2023#InterestExpenseBorrowingshttp://fasb.org/us-gaap/2023#InterestExpenseDepositshttp://fasb.org/us-gaap/2023#InterestExpenseDepositshttp://fasb.org/us-gaap/2023#InterestAndFeeIncomeLoansAndLeaseshttp://fasb.org/us-gaap/2023#InterestAndFeeIncomeLoansAndLeaseshttp://fasb.org/us-gaap/2023#LoansAndLeasesReceivableNetOfDeferredIncomehttp://fasb.org/us-gaap/2023#LoansAndLeasesReceivableNetOfDeferredIncomehttp://fasb.org/us-gaap/2023#OtherAssetshttp://fasb.org/us-gaap/2023#OtherAssetshttp://fasb.org/us-gaap/2023#OtherAssetshttp://fasb.org/us-gaap/2023#OtherAssetshttp://fasb.org/us-gaap/2023#OtherLiabilitieshttp://fasb.org/us-gaap/2023#OtherLiabilitieshttp://fasb.org/us-gaap/2023#OtherLiabilitieshttp://fasb.org/us-gaap/2023#OtherLiabilities00015040082024-01-012024-03-310001504008exch:XNYS2024-01-012024-03-3100015040082024-04-23xbrli:shares00015040082024-03-31iso4217:USD00015040082023-12-310001504008us-gaap:LoansMember2024-03-310001504008us-gaap:LoansMember2023-12-31iso4217:USDxbrli:shares00015040082023-01-012023-03-3100015040082022-12-3100015040082023-03-310001504008us-gaap:CommonStockMember2023-12-310001504008us-gaap:AdditionalPaidInCapitalMember2023-12-310001504008us-gaap:RetainedEarningsMember2023-12-310001504008us-gaap:AccumulatedOtherComprehensiveIncomeMember2023-12-310001504008us-gaap:CommonStockMember2024-01-012024-03-310001504008us-gaap:AdditionalPaidInCapitalMember2024-01-012024-03-310001504008us-gaap:RetainedEarningsMember2024-01-012024-03-310001504008us-gaap:AccumulatedOtherComprehensiveIncomeMember2024-01-012024-03-310001504008us-gaap:CommonStockMember2024-03-310001504008us-gaap:AdditionalPaidInCapitalMember2024-03-310001504008us-gaap:RetainedEarningsMember2024-03-310001504008us-gaap:AccumulatedOtherComprehensiveIncomeMember2024-03-310001504008us-gaap:CommonStockMember2022-12-310001504008us-gaap:AdditionalPaidInCapitalMember2022-12-310001504008us-gaap:RetainedEarningsMember2022-12-310001504008us-gaap:AccumulatedOtherComprehensiveIncomeMember2022-12-310001504008srt:CumulativeEffectPeriodOfAdoptionAdjustmentMemberus-gaap:RetainedEarningsMember2023-01-010001504008srt:CumulativeEffectPeriodOfAdoptionAdjustmentMember2023-01-010001504008us-gaap:CommonStockMembersrt:CumulativeEffectPeriodOfAdoptionAdjustedBalanceMember2022-12-310001504008us-gaap:AdditionalPaidInCapitalMembersrt:CumulativeEffectPeriodOfAdoptionAdjustedBalanceMember2022-12-310001504008srt:CumulativeEffectPeriodOfAdoptionAdjustedBalanceMemberus-gaap:RetainedEarningsMember2022-12-310001504008srt:CumulativeEffectPeriodOfAdoptionAdjustedBalanceMemberus-gaap:AccumulatedOtherComprehensiveIncomeMember2022-12-310001504008srt:CumulativeEffectPeriodOfAdoptionAdjustedBalanceMember2022-12-310001504008us-gaap:CommonStockMember2023-01-012023-03-310001504008us-gaap:AdditionalPaidInCapitalMember2023-01-012023-03-310001504008us-gaap:RetainedEarningsMember2023-01-012023-03-310001504008us-gaap:AccumulatedOtherComprehensiveIncomeMember2023-01-012023-03-310001504008us-gaap:CommonStockMember2023-03-310001504008us-gaap:AdditionalPaidInCapitalMember2023-03-310001504008us-gaap:RetainedEarningsMember2023-03-310001504008us-gaap:AccumulatedOtherComprehensiveIncomeMember2023-03-310001504008us-gaap:USTreasurySecuritiesMember2024-03-310001504008bku:USGovernmentagencyandsponsoredenterpriseresidentialmortgagebackedsecuritiesMember2024-03-310001504008bku:UsGovernmentSponsoredEnterprisesDebtSecuritiesCommercialMember2024-03-310001504008us-gaap:ResidentialMortgageBackedSecuritiesMember2024-03-310001504008us-gaap:CommercialMortgageBackedSecuritiesMember2024-03-310001504008bku:SinglefamilyrentalrealestatebackedsecuritiesMember2024-03-310001504008us-gaap:CollateralizedLoanObligationsMember2024-03-310001504008bku:NonMortgageAssetBackedSecuritiesMember2024-03-310001504008us-gaap:USStatesAndPoliticalSubdivisionsMember2024-03-310001504008bku:SmallBusinessAdministrationSecuritiesMember2024-03-310001504008us-gaap:DebtSecuritiesMember2024-03-310001504008us-gaap:EquitySecuritiesMember2024-03-310001504008us-gaap:USTreasurySecuritiesMember2023-12-310001504008bku:USGovernmentagencyandsponsoredenterpriseresidentialmortgagebackedsecuritiesMember2023-12-310001504008bku:UsGovernmentSponsoredEnterprisesDebtSecuritiesCommercialMember2023-12-310001504008us-gaap:ResidentialMortgageBackedSecuritiesMember2023-12-310001504008us-gaap:CommercialMortgageBackedSecuritiesMember2023-12-310001504008bku:SinglefamilyrentalrealestatebackedsecuritiesMember2023-12-310001504008us-gaap:CollateralizedLoanObligationsMember2023-12-310001504008bku:NonMortgageAssetBackedSecuritiesMember2023-12-310001504008us-gaap:USStatesAndPoliticalSubdivisionsMember2023-12-310001504008bku:SmallBusinessAdministrationSecuritiesMember2023-12-310001504008us-gaap:DebtSecuritiesMember2023-12-310001504008us-gaap:EquitySecuritiesMember2023-12-31bku:bond0001504008us-gaap:AvailableforsaleSecuritiesMember2024-03-310001504008us-gaap:AvailableforsaleSecuritiesMember2023-12-31bku:securitybku:rental0001504008us-gaap:ResidentialMortgageBackedSecuritiesMember2024-01-012024-03-31xbrli:pure0001504008us-gaap:CommercialMortgageBackedSecuritiesMember2024-01-012024-03-310001504008bku:SinglefamilyrentalrealestatebackedsecuritiesMember2024-01-012024-03-310001504008us-gaap:CollateralizedLoanObligationsMember2024-01-012024-03-310001504008bku:NonMortgageAssetBackedSecuritiesMember2024-01-012024-03-310001504008us-gaap:USStatesAndPoliticalSubdivisionsMember2024-01-012024-03-310001504008bku:CommercialRealEstateNonOwnerOccupiedMember2024-03-310001504008bku:CommercialRealEstateNonOwnerOccupiedMember2023-12-310001504008bku:ConstructionLandMember2024-03-310001504008bku:ConstructionLandMember2023-12-310001504008bku:CommercialRealEstateOwnerOccupiedMember2024-03-310001504008bku:CommercialRealEstateOwnerOccupiedMember2023-12-310001504008bku:CommercialAndIndustrialMember2024-03-310001504008bku:CommercialAndIndustrialMember2023-12-310001504008bku:PinnaclePublicFinanceMember2024-03-310001504008bku:PinnaclePublicFinanceMember2023-12-310001504008bku:BridgeFranchiseAndEquipmentFinanceMember2024-03-310001504008bku:BridgeFranchiseAndEquipmentFinanceMember2023-12-310001504008bku:MortgagewarehouselendingMember2024-03-310001504008bku:MortgagewarehouselendingMember2023-12-310001504008us-gaap:CommercialPortfolioSegmentMember2024-03-310001504008us-gaap:CommercialPortfolioSegmentMember2023-12-310001504008bku:OneToFourSingleFamilyResidentialMember2024-03-310001504008bku:OneToFourSingleFamilyResidentialMember2023-12-310001504008bku:GovernmentInsuredResidentialMember2024-03-310001504008bku:GovernmentInsuredResidentialMember2023-12-310001504008us-gaap:ResidentialPortfolioSegmentMember2024-03-310001504008us-gaap:ResidentialPortfolioSegmentMember2023-12-310001504008us-gaap:FinancialAssetAcquiredWithCreditDeteriorationMember2024-03-310001504008us-gaap:FinancialAssetAcquiredWithCreditDeteriorationMember2023-12-310001504008us-gaap:FinancialAssetAcquiredWithCreditDeteriorationMember2024-01-012024-03-310001504008us-gaap:FinancialAssetAcquiredWithCreditDeteriorationMember2023-01-012023-12-310001504008bku:OneToFourSingleFamilyResidentialMemberbku:InterestAndFeeIncomeLoansAndLeasesMember2024-01-012024-03-310001504008bku:OneToFourSingleFamilyResidentialMemberbku:InterestAndFeeIncomeLoansAndLeasesMember2023-01-012023-03-310001504008bku:OneToFourSingleFamilyResidentialMember2024-01-012024-03-310001504008bku:OneToFourSingleFamilyResidentialMember2023-01-012023-03-310001504008srt:CumulativeEffectPeriodOfAdoptionAdjustedBalanceMemberus-gaap:CommercialPortfolioSegmentMember2023-12-310001504008srt:CumulativeEffectPeriodOfAdoptionAdjustedBalanceMemberus-gaap:ResidentialPortfolioSegmentMember2023-12-310001504008srt:CumulativeEffectPeriodOfAdoptionAdjustedBalanceMember2023-12-310001504008us-gaap:CommercialPortfolioSegmentMember2022-12-310001504008us-gaap:ResidentialPortfolioSegmentMember2022-12-310001504008us-gaap:CommercialPortfolioSegmentMembersrt:CumulativeEffectPeriodOfAdoptionAdjustmentMember2023-01-010001504008us-gaap:ResidentialPortfolioSegmentMembersrt:CumulativeEffectPeriodOfAdoptionAdjustmentMember2023-01-010001504008srt:CumulativeEffectPeriodOfAdoptionAdjustedBalanceMemberus-gaap:CommercialPortfolioSegmentMember2023-01-010001504008srt:CumulativeEffectPeriodOfAdoptionAdjustedBalanceMemberus-gaap:ResidentialPortfolioSegmentMember2023-01-010001504008srt:CumulativeEffectPeriodOfAdoptionAdjustedBalanceMember2023-01-010001504008bku:FundedLoansMemberus-gaap:CommercialPortfolioSegmentMember2024-01-012024-03-310001504008us-gaap:ResidentialPortfolioSegmentMemberbku:FundedLoansMember2024-01-012024-03-310001504008bku:FundedLoansMember2024-01-012024-03-310001504008bku:FundedLoansMemberus-gaap:CommercialPortfolioSegmentMember2023-01-012023-03-310001504008us-gaap:ResidentialPortfolioSegmentMemberbku:FundedLoansMember2023-01-012023-03-310001504008bku:FundedLoansMember2023-01-012023-03-310001504008us-gaap:CommercialPortfolioSegmentMember2024-01-012024-03-310001504008us-gaap:ResidentialPortfolioSegmentMember2024-01-012024-03-310001504008us-gaap:CommercialPortfolioSegmentMember2023-01-012023-03-310001504008us-gaap:ResidentialPortfolioSegmentMember2023-01-012023-03-310001504008us-gaap:ResidentialPortfolioSegmentMember2024-03-310001504008us-gaap:CommercialPortfolioSegmentMember2023-03-310001504008us-gaap:ResidentialPortfolioSegmentMember2023-03-310001504008us-gaap:CommercialRealEstatePortfolioSegmentMember2024-01-012024-03-310001504008bku:CommercialAndIndustrialPortfolioSegmentMember2024-01-012024-03-310001504008bku:BridgeFranchiseAndEquipmentFinanceMember2024-01-012024-03-310001504008srt:MinimumMemberus-gaap:CommercialPortfolioSegmentMember2024-03-310001504008srt:MaximumMemberus-gaap:CommercialPortfolioSegmentMember2024-03-310001504008us-gaap:PassMemberus-gaap:CommercialRealEstatePortfolioSegmentMember2024-03-310001504008us-gaap:CommercialRealEstatePortfolioSegmentMemberus-gaap:SpecialMentionMember2024-03-310001504008us-gaap:CommercialRealEstatePortfolioSegmentMemberus-gaap:SubstandardMember2024-03-310001504008us-gaap:CommercialRealEstatePortfolioSegmentMember2024-03-310001504008us-gaap:PassMemberbku:CommercialAndIndustrialPortfolioSegmentMember2024-03-310001504008bku:CommercialAndIndustrialPortfolioSegmentMemberus-gaap:SpecialMentionMember2024-03-310001504008bku:CommercialAndIndustrialPortfolioSegmentMemberus-gaap:SubstandardMember2024-03-310001504008us-gaap:DoubtfulMemberbku:CommercialAndIndustrialPortfolioSegmentMember2024-03-310001504008bku:CommercialAndIndustrialPortfolioSegmentMember2024-03-310001504008us-gaap:PassMemberbku:PinnaclePublicFinanceMember2024-03-310001504008bku:BridgeFranchiseAndEquipmentFinanceMemberus-gaap:PassMember2024-03-310001504008bku:BridgeFranchiseAndEquipmentFinanceMemberus-gaap:SubstandardMember2024-03-310001504008bku:BridgeFranchiseAndEquipmentFinanceMemberus-gaap:DoubtfulMember2024-03-310001504008us-gaap:PassMemberbku:MortgagewarehouselendingMember2024-03-310001504008bku:MortgagewarehouselendingMemberus-gaap:SpecialMentionMember2024-03-310001504008us-gaap:PassMemberus-gaap:CommercialRealEstatePortfolioSegmentMember2023-12-310001504008us-gaap:CommercialRealEstatePortfolioSegmentMemberus-gaap:SpecialMentionMember2023-12-310001504008us-gaap:CommercialRealEstatePortfolioSegmentMemberus-gaap:SubstandardMember2023-12-310001504008us-gaap:CommercialRealEstatePortfolioSegmentMember2023-12-310001504008us-gaap:PassMemberbku:CommercialAndIndustrialPortfolioSegmentMember2023-12-310001504008bku:CommercialAndIndustrialPortfolioSegmentMemberus-gaap:SpecialMentionMember2023-12-310001504008bku:CommercialAndIndustrialPortfolioSegmentMemberus-gaap:SubstandardMember2023-12-310001504008us-gaap:DoubtfulMemberbku:CommercialAndIndustrialPortfolioSegmentMember2023-12-310001504008bku:CommercialAndIndustrialPortfolioSegmentMember2023-12-310001504008us-gaap:PassMemberbku:PinnaclePublicFinanceMember2023-12-310001504008bku:BridgeFranchiseAndEquipmentFinanceMemberus-gaap:PassMember2023-12-310001504008bku:BridgeFranchiseAndEquipmentFinanceMemberus-gaap:SpecialMentionMember2023-12-310001504008bku:BridgeFranchiseAndEquipmentFinanceMemberus-gaap:SubstandardMember2023-12-310001504008bku:BridgeFranchiseAndEquipmentFinanceMemberus-gaap:DoubtfulMember2023-12-310001504008us-gaap:PassMemberbku:MortgagewarehouselendingMember2023-12-310001504008bku:CriticizedCommercialPortfolioSegmentMemberus-gaap:SpecialMentionMember2024-03-310001504008bku:CriticizedCommercialPortfolioSegmentMemberus-gaap:SpecialMentionMember2023-12-310001504008bku:CriticizedCommercialPortfolioSegmentMemberbku:SubstandardAccruingMember2024-03-310001504008bku:CriticizedCommercialPortfolioSegmentMemberbku:SubstandardAccruingMember2023-12-310001504008bku:CriticizedCommercialPortfolioSegmentMemberbku:SubstandardNonAccruingMember2024-03-310001504008bku:CriticizedCommercialPortfolioSegmentMemberbku:SubstandardNonAccruingMember2023-12-310001504008us-gaap:DoubtfulMemberbku:CriticizedCommercialPortfolioSegmentMember2024-03-310001504008us-gaap:DoubtfulMemberbku:CriticizedCommercialPortfolioSegmentMember2023-12-310001504008bku:CriticizedCommercialPortfolioSegmentMember2024-03-310001504008bku:CriticizedCommercialPortfolioSegmentMember2023-12-310001504008bku:OneToFourSingleFamilyResidentialMemberus-gaap:FinancialAssetNotPastDueMember2024-03-310001504008bku:OneToFourSingleFamilyResidentialMemberus-gaap:FinancingReceivables30To59DaysPastDueMember2024-03-310001504008bku:OneToFourSingleFamilyResidentialMemberus-gaap:FinancingReceivables60To89DaysPastDueMember2024-03-310001504008bku:OneToFourSingleFamilyResidentialMemberus-gaap:FinancingReceivablesEqualToGreaterThan90DaysPastDueMember2024-03-310001504008bku:OneToFourSingleFamilyResidentialMemberus-gaap:FinancialAssetNotPastDueMember2023-12-310001504008bku:OneToFourSingleFamilyResidentialMemberus-gaap:FinancingReceivables30To59DaysPastDueMember2023-12-310001504008bku:OneToFourSingleFamilyResidentialMemberus-gaap:FinancingReceivables60To89DaysPastDueMember2023-12-310001504008bku:OneToFourSingleFamilyResidentialMemberus-gaap:FinancingReceivablesEqualToGreaterThan90DaysPastDueMember2023-12-310001504008bku:LoantoValueSixtyPercentOneorLessMemberbku:OneToFourSingleFamilyResidentialMember2024-03-310001504008bku:OneToFourSingleFamilyResidentialMemberbku:LoantoValueSixtyPercentonetoSeventyPercentMemberMember2024-03-310001504008bku:OneToFourSingleFamilyResidentialMemberbku:A7180Member2024-03-310001504008bku:LoanToValueEightyPercentOrMoreMemberbku:OneToFourSingleFamilyResidentialMember2024-03-310001504008bku:LoantoValueSixtyPercentOneorLessMemberbku:OneToFourSingleFamilyResidentialMember2023-12-310001504008bku:OneToFourSingleFamilyResidentialMemberbku:LoantoValueSixtyPercentonetoSeventyPercentMemberMember2023-12-310001504008bku:OneToFourSingleFamilyResidentialMemberbku:A7180Member2023-12-310001504008bku:LoanToValueEightyPercentOrMoreMemberbku:OneToFourSingleFamilyResidentialMember2023-12-310001504008bku:OneToFourSingleFamilyResidentialMemberbku:FICOScore760orGreaterMember2024-03-310001504008bku:OneToFourSingleFamilyResidentialMemberbku:FICOScore720to759Member2024-03-310001504008bku:OneToFourSingleFamilyResidentialMemberbku:FICOScore719orLessMember2024-03-310001504008bku:OneToFourSingleFamilyResidentialMemberbku:FICOScore760orGreaterMember2023-12-310001504008bku:OneToFourSingleFamilyResidentialMemberbku:FICOScore720to759Member2023-12-310001504008bku:OneToFourSingleFamilyResidentialMemberbku:FICOScore719orLessMember2023-12-310001504008us-gaap:CommercialRealEstatePortfolioSegmentMemberus-gaap:FinancialAssetNotPastDueMember2024-03-310001504008us-gaap:FinancingReceivables30To59DaysPastDueMemberus-gaap:CommercialRealEstatePortfolioSegmentMember2024-03-310001504008us-gaap:CommercialRealEstatePortfolioSegmentMemberus-gaap:FinancingReceivables60To89DaysPastDueMember2024-03-310001504008us-gaap:CommercialRealEstatePortfolioSegmentMemberus-gaap:FinancingReceivablesEqualToGreaterThan90DaysPastDueMember2024-03-310001504008us-gaap:CommercialRealEstatePortfolioSegmentMemberus-gaap:FinancialAssetNotPastDueMember2023-12-310001504008us-gaap:FinancingReceivables30To59DaysPastDueMemberus-gaap:CommercialRealEstatePortfolioSegmentMember2023-12-310001504008us-gaap:CommercialRealEstatePortfolioSegmentMemberus-gaap:FinancingReceivables60To89DaysPastDueMember2023-12-310001504008us-gaap:CommercialRealEstatePortfolioSegmentMemberus-gaap:FinancingReceivablesEqualToGreaterThan90DaysPastDueMember2023-12-310001504008bku:CommercialAndIndustrialPortfolioSegmentMemberus-gaap:FinancialAssetNotPastDueMember2024-03-310001504008us-gaap:FinancingReceivables30To59DaysPastDueMemberbku:CommercialAndIndustrialPortfolioSegmentMember2024-03-310001504008us-gaap:FinancingReceivables60To89DaysPastDueMemberbku:CommercialAndIndustrialPortfolioSegmentMember2024-03-310001504008bku:CommercialAndIndustrialPortfolioSegmentMemberus-gaap:FinancingReceivablesEqualToGreaterThan90DaysPastDueMember2024-03-310001504008bku:CommercialAndIndustrialPortfolioSegmentMemberus-gaap:FinancialAssetNotPastDueMember2023-12-310001504008us-gaap:FinancingReceivables30To59DaysPastDueMemberbku:CommercialAndIndustrialPortfolioSegmentMember2023-12-310001504008us-gaap:FinancingReceivables60To89DaysPastDueMemberbku:CommercialAndIndustrialPortfolioSegmentMember2023-12-310001504008bku:CommercialAndIndustrialPortfolioSegmentMemberus-gaap:FinancingReceivablesEqualToGreaterThan90DaysPastDueMember2023-12-310001504008bku:PinnaclePublicFinanceMemberus-gaap:FinancialAssetNotPastDueMember2024-03-310001504008us-gaap:FinancingReceivables30To59DaysPastDueMemberbku:PinnaclePublicFinanceMember2024-03-310001504008bku:PinnaclePublicFinanceMemberus-gaap:FinancingReceivables60To89DaysPastDueMember2024-03-310001504008bku:PinnaclePublicFinanceMemberus-gaap:FinancingReceivablesEqualToGreaterThan90DaysPastDueMember2024-03-310001504008bku:PinnaclePublicFinanceMemberus-gaap:FinancialAssetNotPastDueMember2023-12-310001504008us-gaap:FinancingReceivables30To59DaysPastDueMemberbku:PinnaclePublicFinanceMember2023-12-310001504008bku:PinnaclePublicFinanceMemberus-gaap:FinancingReceivables60To89DaysPastDueMember2023-12-310001504008bku:PinnaclePublicFinanceMemberus-gaap:FinancingReceivablesEqualToGreaterThan90DaysPastDueMember2023-12-310001504008bku:BridgeFranchiseAndEquipmentFinanceMemberus-gaap:FinancialAssetNotPastDueMember2024-03-310001504008bku:BridgeFranchiseAndEquipmentFinanceMemberus-gaap:FinancingReceivables30To59DaysPastDueMember2024-03-310001504008bku:BridgeFranchiseAndEquipmentFinanceMemberus-gaap:FinancingReceivables60To89DaysPastDueMember2024-03-310001504008bku:BridgeFranchiseAndEquipmentFinanceMemberus-gaap:FinancingReceivablesEqualToGreaterThan90DaysPastDueMember2024-03-310001504008bku:BridgeFranchiseAndEquipmentFinanceMemberus-gaap:FinancialAssetNotPastDueMember2023-12-310001504008bku:BridgeFranchiseAndEquipmentFinanceMemberus-gaap:FinancingReceivables30To59DaysPastDueMember2023-12-310001504008bku:BridgeFranchiseAndEquipmentFinanceMemberus-gaap:FinancingReceivables60To89DaysPastDueMember2023-12-310001504008bku:BridgeFranchiseAndEquipmentFinanceMemberus-gaap:FinancingReceivablesEqualToGreaterThan90DaysPastDueMember2023-12-310001504008bku:MortgagewarehouselendingMemberus-gaap:FinancialAssetNotPastDueMember2024-03-310001504008us-gaap:FinancingReceivables30To59DaysPastDueMemberbku:MortgagewarehouselendingMember2024-03-310001504008bku:MortgagewarehouselendingMemberus-gaap:FinancingReceivables60To89DaysPastDueMember2024-03-310001504008bku:MortgagewarehouselendingMemberus-gaap:FinancingReceivablesEqualToGreaterThan90DaysPastDueMember2024-03-310001504008bku:MortgagewarehouselendingMemberus-gaap:FinancialAssetNotPastDueMember2023-12-310001504008us-gaap:FinancingReceivables30To59DaysPastDueMemberbku:MortgagewarehouselendingMember2023-12-310001504008bku:MortgagewarehouselendingMemberus-gaap:FinancingReceivables60To89DaysPastDueMember2023-12-310001504008bku:MortgagewarehouselendingMemberus-gaap:FinancingReceivablesEqualToGreaterThan90DaysPastDueMember2023-12-310001504008us-gaap:FinancialAssetNotPastDueMemberus-gaap:UsGovernmentAgencyInsuredLoansMember2024-03-310001504008us-gaap:FinancingReceivables30To59DaysPastDueMemberus-gaap:UsGovernmentAgencyInsuredLoansMember2024-03-310001504008us-gaap:FinancingReceivables60To89DaysPastDueMemberus-gaap:UsGovernmentAgencyInsuredLoansMember2024-03-310001504008us-gaap:FinancingReceivablesEqualToGreaterThan90DaysPastDueMemberus-gaap:UsGovernmentAgencyInsuredLoansMember2024-03-310001504008us-gaap:UsGovernmentAgencyInsuredLoansMember2024-03-310001504008us-gaap:FinancialAssetNotPastDueMemberus-gaap:UsGovernmentAgencyInsuredLoansMember2023-12-310001504008us-gaap:FinancingReceivables30To59DaysPastDueMemberus-gaap:UsGovernmentAgencyInsuredLoansMember2023-12-310001504008us-gaap:FinancingReceivables60To89DaysPastDueMemberus-gaap:UsGovernmentAgencyInsuredLoansMember2023-12-310001504008us-gaap:FinancingReceivablesEqualToGreaterThan90DaysPastDueMemberus-gaap:UsGovernmentAgencyInsuredLoansMember2023-12-310001504008us-gaap:UsGovernmentAgencyInsuredLoansMember2023-12-310001504008us-gaap:FinancialAssetNotPastDueMember2024-03-310001504008us-gaap:FinancingReceivables30To59DaysPastDueMember2024-03-310001504008us-gaap:FinancingReceivables60To89DaysPastDueMember2024-03-310001504008us-gaap:FinancingReceivablesEqualToGreaterThan90DaysPastDueMember2024-03-310001504008us-gaap:FinancialAssetNotPastDueMember2023-12-310001504008us-gaap:FinancingReceivables30To59DaysPastDueMember2023-12-310001504008us-gaap:FinancingReceivables60To89DaysPastDueMember2023-12-310001504008us-gaap:FinancingReceivablesEqualToGreaterThan90DaysPastDueMember2023-12-310001504008bku:SmallbusinessfinanceMember2024-03-310001504008bku:SmallbusinessfinanceMemberbku:CommercialAndIndustrialPortfolioSegmentMember2024-03-310001504008bku:SmallbusinessfinanceMemberus-gaap:CommercialRealEstatePortfolioSegmentMember2024-03-310001504008bku:SmallbusinessfinanceMember2023-12-310001504008us-gaap:CommercialRealEstatePortfolioSegmentMember2024-03-310001504008us-gaap:CommercialRealEstatePortfolioSegmentMember2023-12-310001504008us-gaap:CommercialRealEstateMemberus-gaap:CommercialRealEstatePortfolioSegmentMember2024-03-310001504008us-gaap:CommercialRealEstateMemberus-gaap:CommercialRealEstatePortfolioSegmentMember2023-12-310001504008bku:CommercialAndIndustrialMemberbku:CommercialAndIndustrialPortfolioSegmentMember2024-03-310001504008bku:CommercialAndIndustrialMemberbku:CommercialAndIndustrialPortfolioSegmentMember2023-12-310001504008bku:BridgeFranchiseAndEquipmentFinanceMemberbku:BridgeFranchiseAndEquipmentFinanceMember2024-03-310001504008bku:BridgeFranchiseAndEquipmentFinanceMemberbku:BridgeFranchiseAndEquipmentFinanceMember2023-12-310001504008us-gaap:SecuredDebtMember2024-03-310001504008us-gaap:SecuredDebtMember2023-12-310001504008us-gaap:CommercialRealEstatePortfolioSegmentMemberus-gaap:ContractualInterestRateReductionMember2024-01-012024-03-310001504008us-gaap:ExtendedMaturityMemberus-gaap:CommercialRealEstatePortfolioSegmentMember2024-01-012024-03-310001504008bku:ContractualInterestRateReductionAndExtendedMaturityMemberus-gaap:CommercialRealEstatePortfolioSegmentMember2024-01-012024-03-310001504008us-gaap:ContractualInterestRateReductionMemberbku:CommercialAndIndustrialPortfolioSegmentMember2024-01-012024-03-310001504008us-gaap:ExtendedMaturityMemberbku:CommercialAndIndustrialPortfolioSegmentMember2024-01-012024-03-310001504008bku:ContractualInterestRateReductionAndExtendedMaturityMemberbku:CommercialAndIndustrialPortfolioSegmentMember2024-01-012024-03-310001504008us-gaap:ContractualInterestRateReductionMemberus-gaap:UsGovernmentAgencyInsuredLoansMember2024-01-012024-03-310001504008us-gaap:ExtendedMaturityMemberus-gaap:UsGovernmentAgencyInsuredLoansMember2024-01-012024-03-310001504008bku:ContractualInterestRateReductionAndExtendedMaturityMemberus-gaap:UsGovernmentAgencyInsuredLoansMember2024-01-012024-03-310001504008us-gaap:UsGovernmentAgencyInsuredLoansMember2024-01-012024-03-310001504008us-gaap:ContractualInterestRateReductionMember2024-01-012024-03-310001504008us-gaap:ExtendedMaturityMember2024-01-012024-03-310001504008bku:ContractualInterestRateReductionAndExtendedMaturityMember2024-01-012024-03-310001504008us-gaap:ContractualInterestRateReductionMemberbku:CommercialAndIndustrialPortfolioSegmentMember2023-01-012023-03-310001504008us-gaap:ExtendedMaturityMemberbku:CommercialAndIndustrialPortfolioSegmentMember2023-01-012023-03-310001504008bku:ContractualInterestRateReductionAndExtendedMaturityMemberbku:CommercialAndIndustrialPortfolioSegmentMember2023-01-012023-03-310001504008bku:CommercialAndIndustrialPortfolioSegmentMember2023-01-012023-03-310001504008bku:OneToFourSingleFamilyResidentialMemberus-gaap:ContractualInterestRateReductionMember2023-01-012023-03-310001504008bku:OneToFourSingleFamilyResidentialMemberus-gaap:ExtendedMaturityMember2023-01-012023-03-310001504008bku:ContractualInterestRateReductionAndExtendedMaturityMemberbku:OneToFourSingleFamilyResidentialMember2023-01-012023-03-310001504008us-gaap:ContractualInterestRateReductionMemberus-gaap:UsGovernmentAgencyInsuredLoansMember2023-01-012023-03-310001504008us-gaap:ExtendedMaturityMemberus-gaap:UsGovernmentAgencyInsuredLoansMember2023-01-012023-03-310001504008bku:ContractualInterestRateReductionAndExtendedMaturityMemberus-gaap:UsGovernmentAgencyInsuredLoansMember2023-01-012023-03-310001504008us-gaap:UsGovernmentAgencyInsuredLoansMember2023-01-012023-03-310001504008us-gaap:ContractualInterestRateReductionMember2023-01-012023-03-310001504008us-gaap:ExtendedMaturityMember2023-01-012023-03-310001504008bku:ContractualInterestRateReductionAndExtendedMaturityMember2023-01-012023-03-310001504008bku:GovernmentInsuredResidentialMemberus-gaap:ExtendedMaturityMember2024-01-012024-03-310001504008bku:ContractualInterestRateReductionAndExtendedMaturityMembersrt:MaximumMemberbku:CommercialAndIndustrialPortfolioSegmentMember2024-01-012024-03-310001504008bku:ContractualInterestRateReductionAndExtendedMaturityMembersrt:MinimumMemberbku:CommercialAndIndustrialPortfolioSegmentMember2024-01-012024-03-310001504008bku:ContractualInterestRateReductionAndExtendedMaturityMembersrt:MaximumMemberbku:GovernmentInsuredResidentialMember2024-01-012024-03-310001504008bku:ContractualInterestRateReductionAndExtendedMaturityMemberbku:GovernmentInsuredResidentialMembersrt:MinimumMember2024-01-012024-03-310001504008bku:ContractualInterestRateReductionAndExtendedMaturityMemberbku:GovernmentInsuredResidentialMember2024-01-012024-03-310001504008srt:MaximumMemberbku:OneToFourSingleFamilyResidentialMemberus-gaap:ContractualInterestRateReductionMember2023-01-012023-03-310001504008bku:OneToFourSingleFamilyResidentialMembersrt:MinimumMemberus-gaap:ContractualInterestRateReductionMember2023-01-012023-03-310001504008srt:MaximumMemberbku:GovernmentInsuredResidentialMemberus-gaap:ContractualInterestRateReductionMember2023-01-012023-03-310001504008bku:GovernmentInsuredResidentialMembersrt:MinimumMemberus-gaap:ContractualInterestRateReductionMember2023-01-012023-03-310001504008bku:GovernmentInsuredResidentialMemberus-gaap:ExtendedMaturityMember2023-01-012023-03-310001504008bku:ContractualInterestRateReductionAndExtendedMaturityMembersrt:MaximumMemberbku:GovernmentInsuredResidentialMember2023-01-012023-03-310001504008bku:ContractualInterestRateReductionAndExtendedMaturityMemberbku:GovernmentInsuredResidentialMembersrt:MinimumMember2023-01-012023-03-310001504008bku:ContractualInterestRateReductionAndExtendedMaturityMemberbku:GovernmentInsuredResidentialMember2023-01-012023-03-310001504008bku:CommercialAndIndustrialPortfolioSegmentMemberus-gaap:FinancialAssetNotPastDueMember2023-03-310001504008us-gaap:FinancingReceivables30To59DaysPastDueMemberbku:CommercialAndIndustrialPortfolioSegmentMember2023-03-310001504008us-gaap:FinancingReceivables60To89DaysPastDueMemberbku:CommercialAndIndustrialPortfolioSegmentMember2023-03-310001504008bku:CommercialAndIndustrialPortfolioSegmentMemberus-gaap:FinancingReceivablesEqualToGreaterThan90DaysPastDueMember2023-03-310001504008bku:CommercialAndIndustrialPortfolioSegmentMember2023-03-310001504008bku:OneToFourSingleFamilyResidentialMemberus-gaap:FinancialAssetNotPastDueMember2023-03-310001504008bku:OneToFourSingleFamilyResidentialMemberus-gaap:FinancingReceivables30To59DaysPastDueMember2023-03-310001504008bku:OneToFourSingleFamilyResidentialMemberus-gaap:FinancingReceivables60To89DaysPastDueMember2023-03-310001504008bku:OneToFourSingleFamilyResidentialMemberus-gaap:FinancingReceivablesEqualToGreaterThan90DaysPastDueMember2023-03-310001504008bku:OneToFourSingleFamilyResidentialMember2023-03-310001504008us-gaap:FinancialAssetNotPastDueMemberus-gaap:UsGovernmentAgencyInsuredLoansMember2023-03-310001504008us-gaap:FinancingReceivables30To59DaysPastDueMemberus-gaap:UsGovernmentAgencyInsuredLoansMember2023-03-310001504008us-gaap:FinancingReceivables60To89DaysPastDueMemberus-gaap:UsGovernmentAgencyInsuredLoansMember2023-03-310001504008us-gaap:FinancingReceivablesEqualToGreaterThan90DaysPastDueMemberus-gaap:UsGovernmentAgencyInsuredLoansMember2023-03-310001504008us-gaap:UsGovernmentAgencyInsuredLoansMember2023-03-310001504008us-gaap:FinancialAssetNotPastDueMember2023-03-310001504008us-gaap:FinancingReceivables30To59DaysPastDueMember2023-03-310001504008us-gaap:FinancingReceivables60To89DaysPastDueMember2023-03-310001504008us-gaap:FinancingReceivablesEqualToGreaterThan90DaysPastDueMember2023-03-310001504008us-gaap:InterestRateSwapMemberus-gaap:CashFlowHedgingMemberus-gaap:DesignatedAsHedgingInstrumentMember2024-03-310001504008us-gaap:InterestRateSwapMemberus-gaap:CashFlowHedgingMemberus-gaap:DesignatedAsHedgingInstrumentMember2023-12-310001504008us-gaap:CashFlowHedgingMemberbku:InterestRateCapsPurchasedIndexedToFedFundsEffectiveRateMemberus-gaap:DesignatedAsHedgingInstrumentMember2024-03-310001504008us-gaap:CashFlowHedgingMemberbku:InterestRateCapsPurchasedIndexedToFedFundsEffectiveRateMemberus-gaap:DesignatedAsHedgingInstrumentMember2023-12-310001504008us-gaap:CashFlowHedgingMemberbku:InterestRateCollarMemberus-gaap:DesignatedAsHedgingInstrumentMember2024-03-310001504008us-gaap:CashFlowHedgingMemberbku:InterestRateCollarMemberus-gaap:DesignatedAsHedgingInstrumentMember2023-12-310001504008us-gaap:FairValueHedgingMemberus-gaap:DesignatedAsHedgingInstrumentMemberbku:PayfixedinterestrateswapsMember2024-03-310001504008us-gaap:FairValueHedgingMemberus-gaap:DesignatedAsHedgingInstrumentMemberbku:PayfixedinterestrateswapsMember2023-12-310001504008us-gaap:DesignatedAsHedgingInstrumentMember2024-03-310001504008us-gaap:DesignatedAsHedgingInstrumentMember2023-12-310001504008us-gaap:BorrowingsMember2023-01-012023-03-310001504008us-gaap:BorrowingsMember2024-01-012024-03-310001504008us-gaap:DepositsMember2024-01-012024-03-310001504008us-gaap:DepositsMember2023-01-012023-03-310001504008us-gaap:LoansMember2024-01-012024-03-310001504008us-gaap:LoansMember2023-01-012023-03-310001504008bku:PayFixedForwardStartingInterestRateSwapsMemberus-gaap:NondesignatedMember2024-03-310001504008bku:PayFixedForwardStartingInterestRateSwapsMemberus-gaap:NondesignatedMember2023-12-310001504008us-gaap:NondesignatedMemberbku:PayvariableinterestrateswapsMember2024-03-310001504008us-gaap:NondesignatedMemberbku:PayvariableinterestrateswapsMember2023-12-310001504008us-gaap:InterestRateCapMemberus-gaap:NondesignatedMember2024-03-310001504008us-gaap:InterestRateCapMemberus-gaap:NondesignatedMember2023-12-310001504008us-gaap:NondesignatedMemberbku:InterestRateCapsSoldMember2024-03-310001504008us-gaap:NondesignatedMemberbku:InterestRateCapsSoldMember2023-12-310001504008us-gaap:NondesignatedMember2024-03-310001504008us-gaap:NondesignatedMember2023-12-310001504008us-gaap:AccumulatedNetUnrealizedInvestmentGainLossMember2023-12-310001504008us-gaap:AccumulatedGainLossNetCashFlowHedgeParentMember2023-12-310001504008us-gaap:AccumulatedNetUnrealizedInvestmentGainLossMember2024-01-012024-03-310001504008us-gaap:AccumulatedGainLossNetCashFlowHedgeParentMember2024-01-012024-03-310001504008us-gaap:AccumulatedNetUnrealizedInvestmentGainLossMember2024-03-310001504008us-gaap:AccumulatedGainLossNetCashFlowHedgeParentMember2024-03-310001504008us-gaap:AccumulatedNetUnrealizedInvestmentGainLossMember2022-12-310001504008us-gaap:AccumulatedGainLossNetCashFlowHedgeParentMember2022-12-310001504008us-gaap:AccumulatedNetUnrealizedInvestmentGainLossMember2023-01-012023-03-310001504008us-gaap:AccumulatedGainLossNetCashFlowHedgeParentMember2023-01-012023-03-310001504008us-gaap:AccumulatedNetUnrealizedInvestmentGainLossMember2023-03-310001504008us-gaap:AccumulatedGainLossNetCashFlowHedgeParentMember2023-03-310001504008us-gaap:USTreasurySecuritiesMemberus-gaap:FairValueInputsLevel1Member2024-03-310001504008us-gaap:USTreasurySecuritiesMemberus-gaap:FairValueInputsLevel2Member2024-03-310001504008us-gaap:USTreasurySecuritiesMember2024-03-310001504008us-gaap:FairValueInputsLevel1Memberbku:USGovernmentagencyandsponsoredenterpriseresidentialmortgagebackedsecuritiesMember2024-03-310001504008us-gaap:FairValueInputsLevel2Memberbku:USGovernmentagencyandsponsoredenterpriseresidentialmortgagebackedsecuritiesMember2024-03-310001504008bku:USGovernmentagencyandsponsoredenterpriseresidentialmortgagebackedsecuritiesMember2024-03-310001504008us-gaap:FairValueInputsLevel1Memberbku:UsGovernmentSponsoredEnterprisesDebtSecuritiesCommercialMember2024-03-310001504008bku:UsGovernmentSponsoredEnterprisesDebtSecuritiesCommercialMemberus-gaap:FairValueInputsLevel2Member2024-03-310001504008bku:UsGovernmentSponsoredEnterprisesDebtSecuritiesCommercialMember2024-03-310001504008us-gaap:FairValueInputsLevel1Memberus-gaap:ResidentialMortgageBackedSecuritiesMember2024-03-310001504008us-gaap:ResidentialMortgageBackedSecuritiesMemberus-gaap:FairValueInputsLevel2Member2024-03-310001504008us-gaap:ResidentialMortgageBackedSecuritiesMember2024-03-310001504008us-gaap:FairValueInputsLevel1Memberus-gaap:CommercialMortgageBackedSecuritiesMember2024-03-310001504008us-gaap:FairValueInputsLevel2Memberus-gaap:CommercialMortgageBackedSecuritiesMember2024-03-310001504008us-gaap:CommercialMortgageBackedSecuritiesMember2024-03-310001504008us-gaap:FairValueInputsLevel1Memberbku:SinglefamilyrentalrealestatebackedsecuritiesMember2024-03-310001504008bku:SinglefamilyrentalrealestatebackedsecuritiesMemberus-gaap:FairValueInputsLevel2Member2024-03-310001504008bku:SinglefamilyrentalrealestatebackedsecuritiesMember2024-03-310001504008us-gaap:FairValueInputsLevel1Memberus-gaap:CollateralizedLoanObligationsMember2024-03-310001504008us-gaap:FairValueInputsLevel2Memberus-gaap:CollateralizedLoanObligationsMember2024-03-310001504008us-gaap:CollateralizedLoanObligationsMember2024-03-310001504008us-gaap:FairValueInputsLevel1Memberbku:NonMortgageAssetBackedSecuritiesMember2024-03-310001504008us-gaap:FairValueInputsLevel2Memberbku:NonMortgageAssetBackedSecuritiesMember2024-03-310001504008bku:NonMortgageAssetBackedSecuritiesMember2024-03-310001504008us-gaap:FairValueInputsLevel1Memberus-gaap:USStatesAndPoliticalSubdivisionsMember2024-03-310001504008us-gaap:FairValueInputsLevel2Memberus-gaap:USStatesAndPoliticalSubdivisionsMember2024-03-310001504008us-gaap:USStatesAndPoliticalSubdivisionsMember2024-03-310001504008us-gaap:FairValueInputsLevel1Memberbku:SmallBusinessAdministrationSecuritiesMember2024-03-310001504008bku:SmallBusinessAdministrationSecuritiesMemberus-gaap:FairValueInputsLevel2Member2024-03-310001504008bku:SmallBusinessAdministrationSecuritiesMember2024-03-310001504008us-gaap:FairValueInputsLevel1Memberus-gaap:EquitySecuritiesMember2024-03-310001504008us-gaap:FairValueInputsLevel2Memberus-gaap:EquitySecuritiesMember2024-03-310001504008us-gaap:EquitySecuritiesMember2024-03-310001504008us-gaap:DerivativeFinancialInstrumentsAssetsMemberus-gaap:FairValueInputsLevel1Member2024-03-310001504008us-gaap:DerivativeFinancialInstrumentsAssetsMemberus-gaap:FairValueInputsLevel2Member2024-03-310001504008us-gaap:DerivativeFinancialInstrumentsAssetsMember2024-03-310001504008us-gaap:FairValueInputsLevel1Member2024-03-310001504008us-gaap:FairValueInputsLevel2Member2024-03-310001504008us-gaap:DerivativeFinancialInstrumentsLiabilitiesMemberus-gaap:FairValueInputsLevel1Member2024-03-310001504008us-gaap:DerivativeFinancialInstrumentsLiabilitiesMemberus-gaap:FairValueInputsLevel2Member2024-03-310001504008us-gaap:DerivativeFinancialInstrumentsLiabilitiesMember2024-03-310001504008us-gaap:USTreasurySecuritiesMemberus-gaap:FairValueInputsLevel1Member2023-12-310001504008us-gaap:USTreasurySecuritiesMemberus-gaap:FairValueInputsLevel2Member2023-12-310001504008us-gaap:USTreasurySecuritiesMember2023-12-310001504008us-gaap:FairValueInputsLevel1Memberbku:USGovernmentagencyandsponsoredenterpriseresidentialmortgagebackedsecuritiesMember2023-12-310001504008us-gaap:FairValueInputsLevel2Memberbku:USGovernmentagencyandsponsoredenterpriseresidentialmortgagebackedsecuritiesMember2023-12-310001504008bku:USGovernmentagencyandsponsoredenterpriseresidentialmortgagebackedsecuritiesMember2023-12-310001504008us-gaap:FairValueInputsLevel1Memberbku:UsGovernmentSponsoredEnterprisesDebtSecuritiesCommercialMember2023-12-310001504008bku:UsGovernmentSponsoredEnterprisesDebtSecuritiesCommercialMemberus-gaap:FairValueInputsLevel2Member2023-12-310001504008bku:UsGovernmentSponsoredEnterprisesDebtSecuritiesCommercialMember2023-12-310001504008us-gaap:FairValueInputsLevel1Memberus-gaap:ResidentialMortgageBackedSecuritiesMember2023-12-310001504008us-gaap:ResidentialMortgageBackedSecuritiesMemberus-gaap:FairValueInputsLevel2Member2023-12-310001504008us-gaap:ResidentialMortgageBackedSecuritiesMember2023-12-310001504008us-gaap:FairValueInputsLevel1Memberus-gaap:CommercialMortgageBackedSecuritiesMember2023-12-310001504008us-gaap:FairValueInputsLevel2Memberus-gaap:CommercialMortgageBackedSecuritiesMember2023-12-310001504008us-gaap:CommercialMortgageBackedSecuritiesMember2023-12-310001504008us-gaap:FairValueInputsLevel1Memberbku:SinglefamilyrentalrealestatebackedsecuritiesMember2023-12-310001504008bku:SinglefamilyrentalrealestatebackedsecuritiesMemberus-gaap:FairValueInputsLevel2Member2023-12-310001504008bku:SinglefamilyrentalrealestatebackedsecuritiesMember2023-12-310001504008us-gaap:FairValueInputsLevel1Memberus-gaap:CollateralizedLoanObligationsMember2023-12-310001504008us-gaap:FairValueInputsLevel2Memberus-gaap:CollateralizedLoanObligationsMember2023-12-310001504008us-gaap:CollateralizedLoanObligationsMember2023-12-310001504008us-gaap:FairValueInputsLevel1Memberbku:NonMortgageAssetBackedSecuritiesMember2023-12-310001504008us-gaap:FairValueInputsLevel2Memberbku:NonMortgageAssetBackedSecuritiesMember2023-12-310001504008bku:NonMortgageAssetBackedSecuritiesMember2023-12-310001504008us-gaap:FairValueInputsLevel1Memberus-gaap:USStatesAndPoliticalSubdivisionsMember2023-12-310001504008us-gaap:FairValueInputsLevel2Memberus-gaap:USStatesAndPoliticalSubdivisionsMember2023-12-310001504008us-gaap:USStatesAndPoliticalSubdivisionsMember2023-12-310001504008us-gaap:FairValueInputsLevel1Memberbku:SmallBusinessAdministrationSecuritiesMember2023-12-310001504008bku:SmallBusinessAdministrationSecuritiesMemberus-gaap:FairValueInputsLevel2Member2023-12-310001504008bku:SmallBusinessAdministrationSecuritiesMember2023-12-310001504008us-gaap:FairValueInputsLevel1Memberus-gaap:EquitySecuritiesMember2023-12-310001504008us-gaap:FairValueInputsLevel2Memberus-gaap:EquitySecuritiesMember2023-12-310001504008us-gaap:EquitySecuritiesMember2023-12-310001504008us-gaap:DerivativeFinancialInstrumentsAssetsMemberus-gaap:FairValueInputsLevel1Member2023-12-310001504008us-gaap:DerivativeFinancialInstrumentsAssetsMemberus-gaap:FairValueInputsLevel2Member2023-12-310001504008us-gaap:DerivativeFinancialInstrumentsAssetsMember2023-12-310001504008us-gaap:FairValueInputsLevel1Member2023-12-310001504008us-gaap:FairValueInputsLevel2Member2023-12-310001504008us-gaap:DerivativeFinancialInstrumentsLiabilitiesMemberus-gaap:FairValueInputsLevel1Member2023-12-310001504008us-gaap:DerivativeFinancialInstrumentsLiabilitiesMemberus-gaap:FairValueInputsLevel2Member2023-12-310001504008us-gaap:DerivativeFinancialInstrumentsLiabilitiesMember2023-12-310001504008us-gaap:FairValueInputsLevel3Memberbku:ImpairedLoansMember2024-03-310001504008us-gaap:FairValueInputsLevel3Memberbku:ImpairedLoansMember2023-12-310001504008bku:OREOandRepossessedAssetsMemberus-gaap:FairValueInputsLevel3Member2024-03-310001504008bku:OREOandRepossessedAssetsMemberus-gaap:FairValueInputsLevel3Member2023-12-310001504008us-gaap:FairValueInputsLevel3Member2024-03-310001504008us-gaap:FairValueInputsLevel3Member2023-12-310001504008us-gaap:CarryingReportedAmountFairValueDisclosureMember2024-03-310001504008us-gaap:CarryingReportedAmountFairValueDisclosureMember2023-12-310001504008us-gaap:LoanOriginationCommitmentsMember2024-03-310001504008us-gaap:UnusedLinesOfCreditMember2024-03-310001504008us-gaap:StandbyLettersOfCreditMember2024-03-31
UNITED STATES
SECURITIES AND EXCHANGE COMMISSION
Washington, D.C. 20549
FORM 10-Q
|
|
|
|
|
|
| ☒ |
QUARTERLY REPORT PURSUANT TO SECTION 13 OR 15(d) OF THE SECURITIES EXCHANGE ACT OF 1934 |
OR
|
|
|
|
|
|
| ☐ |
TRANSITION REPORT PURSUANT TO SECTION 13 OR 15(d) OF THE SECURITIES EXCHANGE ACT OF 1934 |
For the quarterly period ended March 31, 2024
Commission File Number: 001-35039
BankUnited, Inc.
(Exact name of registrant as specified in its charter)
|
|
|
|
|
|
|
|
|
| Delaware |
|
27-0162450 |
| (State or other jurisdiction of incorporation or organization) |
(I.R.S. Employer Identification No.) |
|
|
|
|
|
|
|
|
|
|
|
|
| 14817 Oak Lane |
Miami Lakes |
FL |
33016 |
| (Address of principal executive offices) |
|
|
(Zip Code) |
Registrant’s telephone number, including area code: (305) 569-2000
Securities registered pursuant to Section 12(b) of the Act:
|
|
|
|
|
|
|
|
|
|
|
|
|
|
|
| Class |
|
Trading Symbol |
|
Name of Exchange on Which Registered |
| Common Stock, $0.01 Par Value |
|
BKU |
|
New York Stock Exchange |
Indicate by check mark whether the registrant (1) has filed all reports required to be filed by Section 13 or 15(d) of the Securities Exchange Act of 1934 during the preceding 12 months (or for such shorter period that the registrant was required to file such reports), and (2) has been subject to such filing requirements for the past 90 days. Yes ý No o
Indicate by check mark whether the registrant has submitted electronically every Interactive Data File required to be submitted pursuant to Rule 405 of Regulation S-T (§232.405 of this chapter) during the preceding 12 months (or for such shorter period that the registrant was required to submit and post such files). Yes ý No o
Indicate by check mark whether the registrant is a large accelerated filer, an accelerated filer, a non-accelerated filer, a smaller reporting company, or an emerging growth company. See the definitions of “large accelerated filer,” “accelerated filer,” “smaller reporting company,” and "emerging growth company" in Rule 12b-2 of the Exchange Act.
|
|
|
|
|
|
|
|
|
|
|
|
|
|
|
|
|
|
| Large accelerated filer |
☒ |
Accelerated filer |
☐ |
Emerging growth company |
☐ |
| Non-accelerated filer |
☐ |
Smaller reporting company |
☐ |
|
|
If an emerging growth company, indicate by check mark if the registrant has elected not to use the extended transition period for complying with any new or revised financial accounting standards provided pursuant to Section 13(a) of the Exchange Act o
Indicate by check mark whether the registrant is a shell company (as defined in Rule 12b-2 of the Exchange Act). Yes o No ☒
Indicate the number of shares outstanding of each of the issuer’s classes of common stock, as of the latest practicable date.
The number of outstanding shares of the registrant common stock, $0.01 par value, as of April 23, 2024 was 74,756,756.
BANKUNITED, INC.
Form 10-Q
For the Quarter Ended March 31, 2024
TABLE OF CONTENTS
|
|
|
|
|
|
|
|
|
| |
|
Page |
|
|
|
|
|
|
|
|
|
| PART I. |
|
|
| |
|
|
| ITEM 1. |
|
|
| |
|
|
| |
|
|
| |
|
|
| |
|
|
| |
|
|
| |
|
|
| |
|
|
| ITEM 2. |
|
|
| |
|
|
| ITEM 3. |
|
|
| |
|
|
| ITEM 4. |
|
|
| |
|
|
| PART II. |
|
|
| |
|
|
| ITEM 1. |
|
|
| |
|
|
| ITEM 1A. |
|
|
|
|
|
| ITEM 2. |
|
|
|
|
|
ITEM 5. |
|
|
| |
|
|
| ITEM 6. |
|
|
| |
|
|
|
|
|
|
|
GLOSSARY OF DEFINED TERMS
The following acronyms and terms may be used throughout this Form 10-Q, including the consolidated financial statements and related notes.
|
|
|
|
|
|
|
|
|
|
|
|
| ACL |
|
Allowance for credit losses |
| AFS |
|
Available for sale |
| ALCO |
|
Asset Liability Committee |
| ALM |
|
Asset Liability Management |
| AOCI |
|
Accumulated other comprehensive income |
|
|
|
| ARM |
|
Adjustable rate mortgage |
|
|
|
| ASU |
|
Accounting Standards Update |
|
|
|
|
|
|
|
|
|
|
|
|
|
|
|
|
|
|
| BKU |
|
BankUnited, Inc. |
| BOLI |
|
Bank Owned Life Insurance |
| BankUnited |
|
BankUnited, National Association |
| The Bank |
|
BankUnited, National Association |
| Bridge |
|
Bridge Funding Group, Inc. |
|
|
|
| Buyout loans |
|
FHA and VA insured mortgages from third party servicers who have exercised their right to purchase these loans out of GNMA securitizations |
|
|
|
|
|
|
|
|
|
|
|
|
|
|
|
|
|
|
| CD |
|
Certificate of Deposit |
| CECL |
|
Current expected credit losses |
| CET1 |
|
Common Equity Tier 1 capital |
|
|
|
| C&I |
|
Commercial and Industrial loans, including owner-occupied commercial real estate |
|
|
|
CIO |
|
Chief Information Officer |
|
|
|
| CLO |
|
Collateralized loan obligations |
| CMBS |
|
Commercial mortgage-backed securities |
| CME |
|
Chicago Mercantile Exchange |
| CMOs |
|
Collateralized mortgage obligations |
|
|
|
|
|
|
|
|
|
| CRE |
|
Commercial real estate loans, including non-owner occupied commercial real estate and construction and land |
|
|
|
|
|
|
|
|
|
|
|
|
|
|
|
|
|
|
| DSCR |
|
Debt Service Coverage Ratio |
| ESG |
|
Environmental, social and governance |
|
|
|
| EVE |
|
Economic value of equity |
|
|
|
|
|
|
|
|
|
|
|
|
| FDIA |
|
Federal Deposit Insurance Act |
| FDIC |
|
Federal Deposit Insurance Corporation |
|
|
|
| FHA |
|
Federal Housing Administration |
FHFA |
|
Federal Housing Finance Agency |
| FHLB |
|
Federal Home Loan Bank |
| FICO |
|
Fair Isaac Corporation (credit score) |
FinTech |
|
Financial Technology |
|
|
|
| FRB |
|
Federal Reserve Bank |
| GAAP |
|
U.S. generally accepted accounting principles |
| GDP |
|
Gross Domestic Product |
|
|
|
| GNMA |
|
Government National Mortgage Association |
|
|
|
| HPI |
|
Home price indices |
| HTM |
|
Held to maturity |
|
|
|
|
|
|
|
|
|
|
|
|
| ISDA |
|
International Swaps and Derivatives Association |
|
|
|
| LGD |
|
Loss Given Default |
|
|
|
| LIHTC |
|
Low Income Housing Tax Credits |
| LTV |
|
Loan-to-value |
|
|
|
|
|
|
|
|
|
MAT |
|
Materiality Assessment Team |
| MBS |
|
Mortgage-backed securities |
| MSA |
|
Metropolitan Statistical Area |
|
|
|
|
|
|
| MWL |
|
Mortgage warehouse lending |
|
|
|
| NRSRO |
|
Nationally recognized statistical rating organization |
|
|
|
|
|
|
|
|
|
|
|
|
|
|
|
|
|
|
|
|
|
| OREO |
|
Other real estate owned |
|
|
|
| PCAOB |
|
Public Company Accounting Oversight Board |
| PCD |
|
Purchased credit-deteriorated |
| PD |
|
Probability of default |
| Pinnacle |
|
Pinnacle Public Finance, Inc. |
|
|
|
|
|
|
|
|
|
|
|
|
|
|
|
|
|
|
| REIT |
|
Real Estate Investment Trust |
|
|
|
|
|
|
RPA |
|
Risk Participation Agreement |
|
|
|
|
|
|
|
|
|
| SAR |
|
Share Appreciation Right |
| SBA |
|
U.S. Small Business Administration |
|
|
|
| SEC |
|
Securities and Exchange Commission |
|
|
|
| SOFR |
|
Secured Overnight Financing Rate |
|
|
|
|
|
|
|
|
|
| Tri-State |
|
New York, New Jersey and Connecticut |
| UPB |
|
Unpaid principal balance |
|
|
|
| VA loan |
|
Loan guaranteed by the U.S. Department of Veterans Affairs |
|
|
|
|
|
|
|
|
|
|
|
|
|
|
|
|
|
|
|
|
|
PART I
Item 1. Financial Statements and Supplementary Data
BANKUNITED, INC. AND SUBSIDIARIES
CONSOLIDATED BALANCE SHEETS - UNAUDITED
(In thousands, except share and per share data)
|
|
|
|
|
|
|
|
|
|
|
|
|
March 31,
2024 |
|
December 31,
2023 |
| ASSETS |
|
|
|
| Cash and due from banks: |
|
|
|
| Non-interest bearing |
$ |
13,773 |
|
|
$ |
14,945 |
|
| Interest bearing |
407,443 |
|
|
573,338 |
|
| Cash and cash equivalents |
421,216 |
|
|
588,283 |
|
Investment securities (including securities reported at fair value of $8,914,959 and $8,867,354) |
8,924,959 |
|
|
8,877,354 |
|
| Non-marketable equity securities |
252,609 |
|
|
310,084 |
|
|
|
|
|
| Loans |
24,226,300 |
|
|
24,633,684 |
|
| Allowance for credit losses |
(217,556) |
|
|
(202,689) |
|
| Loans, net |
24,008,744 |
|
|
24,430,995 |
|
| Bank owned life insurance |
295,970 |
|
|
318,459 |
|
| Operating lease equipment, net |
329,025 |
|
|
371,909 |
|
|
|
|
|
| Goodwill |
77,637 |
|
|
77,637 |
|
| Other assets |
795,494 |
|
|
786,886 |
|
| Total assets |
$ |
35,105,654 |
|
|
$ |
35,761,607 |
|
|
|
|
|
| LIABILITIES AND STOCKHOLDERS’ EQUITY |
|
|
|
| Liabilities: |
|
|
|
| Demand deposits: |
|
|
|
| Non-interest bearing |
$ |
7,239,604 |
|
|
$ |
6,835,236 |
|
| Interest bearing |
3,549,141 |
|
|
3,403,539 |
|
| Savings and money market |
11,122,916 |
|
|
11,135,708 |
|
| Time |
5,115,703 |
|
|
5,163,995 |
|
| Total deposits |
27,027,364 |
|
|
26,538,478 |
|
|
|
|
|
| FHLB advances |
3,905,000 |
|
|
5,115,000 |
|
| Notes and other borrowings |
708,978 |
|
|
708,973 |
|
| Other liabilities |
823,920 |
|
|
821,235 |
|
| Total liabilities |
32,465,262 |
|
|
33,183,686 |
|
|
|
|
|
| Commitments and contingencies |
|
|
|
|
|
|
|
| Stockholders' equity: |
|
|
|
Common stock, par value $0.01 per share, 400,000,000 shares authorized; 74,772,706 and 74,372,505 shares issued and outstanding |
748 |
|
|
744 |
|
| Paid-in capital |
286,169 |
|
|
283,642 |
|
| Retained earnings |
2,677,403 |
|
|
2,650,956 |
|
| Accumulated other comprehensive loss |
(323,928) |
|
|
(357,421) |
|
| Total stockholders' equity |
2,640,392 |
|
|
2,577,921 |
|
| Total liabilities and stockholders' equity |
$ |
35,105,654 |
|
|
$ |
35,761,607 |
|
1
The accompanying notes are an integral part of these consolidated financial statements
BANKUNITED, INC. AND SUBSIDIARIES
CONSOLIDATED STATEMENTS OF INCOME - UNAUDITED
(In thousands, except per share data)
|
|
|
|
|
|
|
|
|
|
|
|
|
|
|
|
|
|
| |
Three Months Ended March 31, |
|
|
| |
2024 |
|
2023 |
|
|
|
|
|
|
| Interest income: |
|
|
|
|
|
|
|
|
|
| Loans |
$ |
347,257 |
|
|
$ |
308,795 |
|
|
|
|
|
|
|
| Investment securities |
124,179 |
|
|
118,758 |
|
|
|
|
|
|
|
| Other |
10,038 |
|
|
12,863 |
|
|
|
|
|
|
|
| Total interest income |
481,474 |
|
|
440,416 |
|
|
|
|
|
|
|
| Interest expense: |
|
|
|
|
|
|
|
|
|
| Deposits |
209,998 |
|
|
133,630 |
|
|
|
|
|
|
|
| Borrowings |
56,619 |
|
|
78,912 |
|
|
|
|
|
|
|
| Total interest expense |
266,617 |
|
|
212,542 |
|
|
|
|
|
|
|
| Net interest income before provision for credit losses |
214,857 |
|
|
227,874 |
|
|
|
|
|
|
|
Provision for credit losses |
15,285 |
|
|
19,788 |
|
|
|
|
|
|
|
| Net interest income after provision for credit losses |
199,572 |
|
|
208,086 |
|
|
|
|
|
|
|
| Non-interest income: |
|
|
|
|
|
|
|
|
|
| Deposit service charges and fees |
5,499 |
|
|
5,545 |
|
|
|
|
|
|
|
|
|
|
|
|
|
|
|
|
|
Gain (loss) on investment securities, net |
775 |
|
|
(12,549) |
|
|
|
|
|
|
|
| Lease financing |
11,440 |
|
|
13,109 |
|
|
|
|
|
|
|
| Other non-interest income |
9,163 |
|
|
10,430 |
|
|
|
|
|
|
|
| Total non-interest income |
26,877 |
|
|
16,535 |
|
|
|
|
|
|
|
| Non-interest expense: |
|
|
|
|
|
|
|
|
|
| Employee compensation and benefits |
75,920 |
|
|
71,051 |
|
|
|
|
|
|
|
| Occupancy and equipment |
10,569 |
|
|
10,802 |
|
|
|
|
|
|
|
| Deposit insurance expense |
13,530 |
|
|
7,907 |
|
|
|
|
|
|
|
| Professional fees |
2,510 |
|
|
2,918 |
|
|
|
|
|
|
|
| Technology |
20,315 |
|
|
21,726 |
|
|
|
|
|
|
|
|
|
|
|
|
|
|
|
|
|
Depreciation of operating lease equipment |
9,213 |
|
|
11,521 |
|
|
|
|
|
|
|
|
|
|
|
|
|
|
|
|
|
| Other non-interest expense |
27,183 |
|
|
26,855 |
|
|
|
|
|
|
|
| Total non-interest expense |
159,240 |
|
|
152,780 |
|
|
|
|
|
|
|
Income before income taxes |
67,209 |
|
|
71,841 |
|
|
|
|
|
|
|
| Provision for income taxes |
19,229 |
|
|
18,959 |
|
|
|
|
|
|
|
Net income |
$ |
47,980 |
|
|
$ |
52,882 |
|
|
|
|
|
|
|
| Earnings per common share, basic |
$ |
0.64 |
|
|
$ |
0.71 |
|
|
|
|
|
|
|
| Earnings per common share, diluted |
$ |
0.64 |
|
|
$ |
0.70 |
|
|
|
|
|
|
|
2
The accompanying notes are an integral part of these consolidated financial statements
BANKUNITED, INC. AND SUBSIDIARIES
CONSOLIDATED STATEMENTS OF COMPREHENSIVE INCOME - UNAUDITED
(In thousands)
|
|
|
|
|
|
|
|
|
|
|
|
|
|
|
|
|
|
|
Three Months Ended March 31, |
|
|
| |
2024 |
|
2023 |
|
|
|
|
|
|
Net income |
$ |
47,980 |
|
|
$ |
52,882 |
|
|
|
|
|
|
|
Other comprehensive income, net of tax: |
|
|
|
|
|
|
|
|
|
| Unrealized gains (losses) on investment securities available for sale: |
|
|
|
|
|
|
|
|
|
Net unrealized holding gains arising during the period |
26,936 |
|
|
74,936 |
|
|
|
|
|
|
|
Reclassification adjustment for net securities (gains) losses realized in income |
21 |
|
|
(556) |
|
|
|
|
|
|
|
Net change in unrealized gains (losses) on securities available for sale |
26,957 |
|
|
74,380 |
|
|
|
|
|
|
|
| Unrealized gains (losses) on derivative instruments: |
|
|
|
|
|
|
|
|
|
Net unrealized holding gains (losses) arising during the period |
21,204 |
|
|
(2,165) |
|
|
|
|
|
|
|
Reclassification adjustment for net gains realized in income |
(14,668) |
|
|
(8,994) |
|
|
|
|
|
|
|
|
|
|
|
|
|
|
|
|
|
| Net change in unrealized gains (losses) on derivative instruments |
6,536 |
|
|
(11,159) |
|
|
|
|
|
|
|
Other comprehensive income |
33,493 |
|
|
63,221 |
|
|
|
|
|
|
|
Comprehensive income |
$ |
81,473 |
|
|
$ |
116,103 |
|
|
|
|
|
|
|
3
The accompanying notes are an integral part of these consolidated financial statements
BANKUNITED, INC. AND SUBSIDIARIES
CONSOLIDATED STATEMENTS OF CASH FLOWS - UNAUDITED
(In thousands)
|
|
|
|
|
|
|
|
|
|
|
|
|
|
| |
Three Months Ended March 31, |
| |
2024 |
|
2023 |
|
|
| Cash flows from operating activities: |
|
|
|
|
|
Net income |
$ |
47,980 |
|
|
$ |
52,882 |
|
|
|
| Adjustments to reconcile net income to net cash provided by operating activities: |
|
|
|
|
|
| Amortization and accretion, net |
(3,690) |
|
|
(2,078) |
|
|
|
Provision for credit losses |
15,285 |
|
|
19,788 |
|
|
|
|
|
|
|
|
|
|
|
|
|
|
|
|
|
|
|
|
|
(Gain) loss on investment securities, net |
(775) |
|
|
12,549 |
|
|
|
Share based compensation |
5,883 |
|
|
5,280 |
|
|
|
| Depreciation and amortization |
17,213 |
|
|
19,430 |
|
|
|
| Deferred income taxes |
(5,865) |
|
|
9,391 |
|
|
|
|
|
|
|
|
|
| Proceeds from sale of loans held for sale, net |
37,431 |
|
|
103,679 |
|
|
|
|
|
|
|
|
|
|
|
|
|
|
|
| Other: |
|
|
|
|
|
Increase in other assets |
(17,523) |
|
|
(53,771) |
|
|
|
Decrease in other liabilities |
(29,443) |
|
|
(25,782) |
|
|
|
Net cash provided by operating activities |
66,496 |
|
|
141,368 |
|
|
|
|
|
|
|
|
|
| Cash flows from investing activities: |
|
|
|
|
|
|
|
|
|
|
|
| Purchases of investment securities |
(309,549) |
|
|
(74,185) |
|
|
|
| Proceeds from repayments and calls of investment securities |
266,878 |
|
|
251,512 |
|
|
|
| Proceeds from sale of investment securities |
32,067 |
|
|
131,879 |
|
|
|
| Purchases of non-marketable equity securities |
(108,063) |
|
|
(263,500) |
|
|
|
| Proceeds from redemption of non-marketable equity securities |
165,538 |
|
|
172,975 |
|
|
|
| Purchases of loans |
(66,570) |
|
|
(186,792) |
|
|
|
| Loan originations and repayments, net |
440,699 |
|
|
73,367 |
|
|
|
|
|
|
|
|
|
Proceeds from surrender of BOLI |
32,144 |
|
|
— |
|
|
|
|
|
|
|
|
|
|
|
|
|
|
|
Disposition of operating lease equipment |
46,418 |
|
|
2,073 |
|
|
|
| Other investing activities |
(12,072) |
|
|
(11,105) |
|
|
|
Net cash provided by investing activities |
487,490 |
|
|
96,224 |
|
|
|
|
|
|
|
|
|
|
|
|
|
|
|
|
|
|
|
|
|
|
|
|
|
|
|
|
|
|
|
|
|
|
|
|
|
|
|
|
|
|
|
|
|
|
|
|
|
|
|
|
|
|
|
|
|
|
|
|
|
|
|
|
|
|
|
|
|
|
|
|
|
|
|
|
|
|
|
|
|
|
|
|
|
|
|
|
|
|
|
|
|
|
|
|
|
|
|
|
|
|
|
|
|
|
|
|
|
|
|
|
|
|
|
|
|
|
|
|
|
|
|
4
The accompanying notes are an integral part of these consolidated financial statements
BANKUNITED, INC. AND SUBSIDIARIES
CONSOLIDATED STATEMENTS OF CASH FLOWS - UNAUDITED (Continued)
(In thousands)
|
|
|
|
|
|
|
|
|
|
|
|
|
|
| |
Three Months Ended March 31, |
| |
2024 |
|
2023 |
|
|
| Cash flows from financing activities: |
|
|
|
|
|
Net increase (decrease) in deposits |
488,886 |
|
|
(1,786,436) |
|
|
|
Net decrease in federal funds purchased |
— |
|
|
(190,000) |
|
|
|
| Additions to FHLB borrowings |
285,000 |
|
|
2,455,000 |
|
|
|
| Repayments of FHLB borrowings |
(1,495,000) |
|
|
(325,000) |
|
|
|
|
|
|
|
|
|
|
|
|
|
|
|
| Dividends paid |
(20,706) |
|
|
(19,346) |
|
|
|
|
|
|
|
|
|
| Repurchase of common stock |
— |
|
|
(55,022) |
|
|
|
| Other financing activities |
20,767 |
|
|
14,563 |
|
|
|
Net cash provided by (used in) financing activities |
(721,053) |
|
|
93,759 |
|
|
|
Net increase (decrease) in cash and cash equivalents |
(167,067) |
|
|
331,351 |
|
|
|
| Cash and cash equivalents, beginning of period |
588,283 |
|
|
572,647 |
|
|
|
| Cash and cash equivalents, end of period |
$ |
421,216 |
|
|
$ |
903,998 |
|
|
|
|
|
|
|
|
|
| Supplemental disclosure of cash flow information: |
|
|
|
|
|
| Interest paid |
$ |
261,376 |
|
|
$ |
184,657 |
|
|
|
Income taxes paid |
$ |
36,907 |
|
|
$ |
8,947 |
|
|
|
|
|
|
|
|
|
| Supplemental schedule of non-cash investing and financing activities: |
|
|
|
|
|
|
|
|
|
|
|
|
|
|
|
|
|
| Transfers from loans to loans held for sale |
$ |
37,576 |
|
|
$ |
103,398 |
|
|
|
|
|
|
|
|
|
|
|
|
|
|
|
| Dividends declared, not paid |
$ |
21,533 |
|
|
$ |
19,637 |
|
|
|
|
|
|
|
|
|
|
|
|
|
|
|
|
|
|
|
|
|
|
|
|
|
|
|
|
|
|
|
|
|
5
The accompanying notes are an integral part of these consolidated financial statements
BANKUNITED, INC. AND SUBSIDIARIES
CONSOLIDATED STATEMENTS OF STOCKHOLDERS’ EQUITY - UNAUDITED
(In thousands, except share data)
|
|
|
|
|
|
|
|
|
|
|
|
|
|
|
|
|
|
|
|
|
|
|
|
|
|
|
|
|
|
|
|
|
|
|
|
|
|
| |
Common
Shares
Outstanding |
|
Common
Stock |
|
Paid-in
Capital |
|
Retained
Earnings |
|
Accumulated
Other
Comprehensive
Loss |
|
Total
Stockholders’
Equity |
|
|
| Balance at December 31, 2023 |
74,372,505 |
|
|
$ |
744 |
|
|
$ |
283,642 |
|
|
$ |
2,650,956 |
|
|
$ |
(357,421) |
|
|
$ |
2,577,921 |
|
|
|
| Comprehensive income |
— |
|
|
— |
|
|
— |
|
|
47,980 |
|
|
33,493 |
|
|
81,473 |
|
|
|
Dividends ($0.29 per common share) |
— |
|
|
— |
|
|
— |
|
|
(21,533) |
|
|
— |
|
|
(21,533) |
|
|
|
Equity based compensation, net of shares forfeited and surrendered |
400,201 |
|
|
4 |
|
|
2,527 |
|
|
— |
|
|
— |
|
|
2,531 |
|
|
|
|
|
|
|
|
|
|
|
|
|
|
|
|
|
| Balance at March 31, 2024 |
74,772,706 |
|
|
$ |
748 |
|
|
$ |
286,169 |
|
|
$ |
2,677,403 |
|
|
$ |
(323,928) |
|
|
$ |
2,640,392 |
|
|
|
|
|
|
|
|
|
|
|
|
|
|
|
|
|
| Balance at December 31, 2022 |
75,674,587 |
|
|
$ |
757 |
|
|
$ |
321,729 |
|
|
$ |
2,551,400 |
|
|
$ |
(437,905) |
|
|
$ |
2,435,981 |
|
|
|
| Impact of adoption of ASU 2022-02 |
— |
|
|
— |
|
|
— |
|
|
1,336 |
|
|
— |
|
|
1,336 |
|
|
|
Balance at January 1, 2023 |
75,674,587 |
|
|
757 |
|
|
321,729 |
|
|
2,552,736 |
|
|
(437,905) |
|
|
2,437,317 |
|
|
|
| Comprehensive income |
— |
|
|
— |
|
|
— |
|
|
52,882 |
|
|
63,221 |
|
|
116,103 |
|
|
|
Dividends ($0.27 per common share) |
— |
|
|
— |
|
|
— |
|
|
(19,637) |
|
|
— |
|
|
(19,637) |
|
|
|
Equity based compensation, net of shares forfeited and surrendered |
383,023 |
|
|
3 |
|
|
2,630 |
|
|
— |
|
|
— |
|
|
2,633 |
|
|
|
|
|
|
|
|
|
|
|
|
|
|
|
|
|
| Repurchase of common stock |
(1,634,245) |
|
|
(16) |
|
|
(55,006) |
|
|
— |
|
|
— |
|
|
(55,022) |
|
|
|
| Balance at March 31, 2023 |
74,423,365 |
|
|
$ |
744 |
|
|
$ |
269,353 |
|
|
$ |
2,585,981 |
|
|
$ |
(374,684) |
|
|
$ |
2,481,394 |
|
|
|
6
The accompanying notes are an integral part of these consolidated financial statements
Table of Contents
BANKUNITED, INC. AND SUBSIDIARIES
NOTES TO CONSOLIDATED FINANCIAL STATEMENTS - UNAUDITED
March 31, 2024
Note 1 Basis of Presentation and Summary of Significant Accounting Policies
BankUnited, Inc. is a national bank holding company with one wholly-owned subsidiary, BankUnited, collectively, the Company. BankUnited, a national banking association headquartered in Miami Lakes, Florida, provides a full range of banking services to individual and corporate customers through banking centers in Florida, the New York metropolitan area and Dallas, Texas. The Bank also offers certain commercial lending and deposit products through national platforms and regional wholesale banking offices.
The accompanying unaudited consolidated financial statements have been prepared in accordance with generally accepted accounting principles for interim financial information and the instructions to Form 10-Q and Article 10 of Regulation S-X of the SEC. Accordingly, these financial statements do not include all of the information and footnotes required for a fair presentation of financial position, results of operations and cash flows in conformity with GAAP and should be read in conjunction with the Company’s consolidated financial statements and the notes thereto appearing in BKU’s Annual Report on Form 10-K for the year ended December 31, 2023, filed with the SEC. In the opinion of management, all adjustments, consisting of normal recurring adjustments, considered necessary for a fair presentation have been included. Operating results for the three months ended March 31, 2024, are not necessarily indicative of the results that may be expected in future periods.
The Company has a single operating segment and thus a single reportable segment. While management monitors the revenue streams of its various business units, the business units serve a similar base of primarily commercial clients, providing a similar range of products and services, managed through similar processes and platforms. The Company’s chief operating decision maker makes company-wide resource allocation decisions and assessments of performance based on a collective assessment of the Company’s operations.
Accounting Estimates
In preparing the consolidated financial statements, management is required to make estimates and assumptions that affect the reported amounts of assets, liabilities, revenues, and expenses and disclosures of contingent assets and liabilities. Actual results could differ significantly from these estimates.
The most significant estimate impacting the Company's consolidated financial statements is the ACL.
New Accounting Pronouncements Adopted During the Three Months Ended March 31, 2024
ASU No. 2023-02—Investments - Equity Method and Joint Ventures (Topic 323): Accounting for Investments in Tax Credit Structures using the Proportional Amortization Method (A Consensus of the Emerging Issues Task Force). This ASU was issued to expand the use of the proportional amortization method of accounting for equity investments in tax credit programs beyond those in LIHTC programs. The ASU allows entities to elect the proportional amortization method, on a tax-credit-program-by-tax-credit-program basis, for all equity investments in tax credit programs meeting the eligibility criteria established. The Company adopted this ASU in the first quarter of 2024. There was no impact upon adoption. Currently, all of the Company's equity investments in tax credit programs are in LIHTC programs already accounted for using the proportional amortization method.
Accounting Pronouncements Not Yet Adopted
ASU No. 2023-07—Segment Reporting (Topic 280): Improvements to Reportable Segment Disclosures. This ASU augments reportable segment disclosure requirements, primarily through enhanced disclosures about significant segment expenses. In addition, the amendments enhance interim disclosure requirements, clarify circumstances in which an entity can disclose multiple segment measures of profit or loss, provide new segment disclosure requirements for entities with a single reportable segment, and contain other disclosure requirements. This ASU is effective for the Company for fiscal years beginning after December 15, 2023, and interim periods within fiscal years beginning after December 15, 2024. This ASU will have no impact on the Company's consolidated financial position, results of operations, and cash flows. Adoption may lead to additional and revised disclosures in the Company's financial statements starting with the 2024 Annual Report on Form 10-K.
Table of Contents
BANKUNITED, INC. AND SUBSIDIARIES
NOTES TO CONSOLIDATED FINANCIAL STATEMENTS - UNAUDITED
March 31, 2024
ASU No. 2023-09—Income Taxes (Topic 740): Improvements to Income Tax Disclosures. This ASU requires entities to provide additional disclosures, primarily related to the income tax rate reconciliation and income taxes paid. The guidance also eliminates certain existing disclosure requirements related to uncertain tax positions among others. This ASU is effective for the Company for fiscal years beginning after December 15, 2024, and interim periods within fiscal years beginning after December 15, 2025. The adoption of this ASU will have no impact on the Company's consolidated financial position, results of operations, and cash flows. Adoption will lead to additional and revised disclosures in the Company's financial statements.
Note 2 Earnings Per Common Share
The computation of basic and diluted earnings per common share is presented below for the periods indicated (in thousands, except share and per share data):
|
|
|
|
|
|
|
|
|
|
|
|
|
|
|
|
|
|
|
Three Months Ended March 31, |
|
|
| c |
2024 |
|
2023 |
|
|
|
|
|
|
| Basic earnings per common share: |
|
|
|
|
|
|
|
|
|
| Numerator: |
|
|
|
|
|
|
|
|
|
Net income |
$ |
47,980 |
|
|
$ |
52,882 |
|
|
|
|
|
|
|
Distributed and undistributed earnings allocated to participating securities |
(680) |
|
|
(798) |
|
|
|
|
|
|
|
| Income allocated to common stockholders for basic earnings per common share |
$ |
47,300 |
|
|
$ |
52,084 |
|
|
|
|
|
|
|
| Denominator: |
|
|
|
|
|
|
|
|
|
| Weighted average common shares outstanding |
74,509,107 |
|
|
74,755,002 |
|
|
|
|
|
|
|
| Less average unvested stock awards |
(1,127,838) |
|
|
(1,193,881) |
|
|
|
|
|
|
|
| Weighted average shares for basic earnings per common share |
73,381,269 |
|
|
73,561,121 |
|
|
|
|
|
|
|
| Basic earnings per common share |
$ |
0.64 |
|
|
$ |
0.71 |
|
|
|
|
|
|
|
| Diluted earnings per common share: |
|
|
|
|
|
|
|
|
|
| Numerator: |
|
|
|
|
|
|
|
|
|
| Income allocated to common stockholders for basic earnings per common share |
$ |
47,300 |
|
|
$ |
52,084 |
|
|
|
|
|
|
|
Adjustment for earnings reallocated from participating securities |
1 |
|
|
3 |
|
|
|
|
|
|
|
| Income used in calculating diluted earnings per common share |
$ |
47,301 |
|
|
$ |
52,087 |
|
|
|
|
|
|
|
| Denominator: |
|
|
|
|
|
|
|
|
|
| Weighted average shares for basic earnings per common share |
73,381,269 |
|
|
73,561,121 |
|
|
|
|
|
|
|
| Dilutive effect of certain share-based awards |
255,824 |
|
|
447,581 |
|
|
|
|
|
|
|
Weighted average shares for diluted earnings per common share |
73,637,093 |
|
|
74,008,702 |
|
|
|
|
|
|
|
| Diluted earnings per common share |
$ |
0.64 |
|
|
$ |
0.70 |
|
|
|
|
|
|
|
Potentially dilutive unvested shares totaling 1,142,702 and 1,190,511 were outstanding at March 31, 2024 and 2023, respectively, but excluded from the calculation of diluted earnings per common share because their inclusion would have been anti-dilutive.
Table of Contents
BANKUNITED, INC. AND SUBSIDIARIES
NOTES TO CONSOLIDATED FINANCIAL STATEMENTS - UNAUDITED
March 31, 2024
Note 3 Investment Securities
Investment securities include investment securities available for sale, marketable equity securities, and investment securities held to maturity. The investment securities portfolio consisted of the following at the dates indicated (in thousands):
|
|
|
|
|
|
|
|
|
|
|
|
|
|
|
|
|
|
|
|
|
|
|
|
|
|
|
March 31, 2024 |
| |
Amortized Cost |
|
Gross Unrealized |
|
Carrying Value (1) |
| |
|
Gains |
|
Losses |
|
| Investment securities available for sale: |
|
|
|
|
|
|
|
| U.S. Treasury securities |
$ |
139,868 |
|
|
$ |
176 |
|
|
$ |
(9,754) |
|
|
$ |
130,290 |
|
U.S. Government agency and sponsored enterprise residential MBS |
2,193,543 |
|
|
2,549 |
|
|
(34,800) |
|
|
2,161,292 |
|
U.S. Government agency and sponsored enterprise commercial MBS |
559,069 |
|
|
116 |
|
|
(64,978) |
|
|
494,207 |
|
|
|
|
|
|
|
|
|
Private label residential MBS and CMOs |
2,543,764 |
|
|
361 |
|
|
(293,906) |
|
|
2,250,219 |
|
Private label commercial MBS |
2,191,733 |
|
|
1,029 |
|
|
(70,491) |
|
|
2,122,271 |
|
| Single family real estate-backed securities |
356,205 |
|
|
— |
|
|
(14,843) |
|
|
341,362 |
|
| Collateralized loan obligations |
1,077,232 |
|
|
1,653 |
|
|
(2,393) |
|
|
1,076,492 |
|
| Non-mortgage asset-backed securities |
103,594 |
|
|
164 |
|
|
(3,634) |
|
|
100,124 |
|
| State and municipal obligations |
113,280 |
|
|
315 |
|
|
(6,882) |
|
|
106,713 |
|
| SBA securities |
101,515 |
|
|
41 |
|
|
(3,091) |
|
|
98,465 |
|
|
|
|
|
|
|
|
|
|
9,379,803 |
|
|
$ |
6,404 |
|
|
$ |
(504,772) |
|
|
8,881,435 |
|
| Investment securities held to maturity |
10,000 |
|
|
|
|
|
|
10,000 |
|
|
$ |
9,389,803 |
|
|
|
|
|
|
8,891,435 |
|
| Marketable equity securities |
|
|
|
|
|
|
33,524 |
|
|
|
|
|
|
|
|
$ |
8,924,959 |
|
Table of Contents
BANKUNITED, INC. AND SUBSIDIARIES
NOTES TO CONSOLIDATED FINANCIAL STATEMENTS - UNAUDITED
March 31, 2024
|
|
|
|
|
|
|
|
|
|
|
|
|
|
|
|
|
|
|
|
|
|
|
|
|
|
|
December 31, 2023 |
| |
Amortized Cost |
|
Gross Unrealized |
|
Carrying Value (1) |
| |
|
Gains |
|
Losses |
|
| Investment securities available for sale: |
|
|
|
|
|
|
|
| U.S. Treasury securities |
$ |
139,858 |
|
|
$ |
532 |
|
|
$ |
(9,798) |
|
|
$ |
130,592 |
|
U.S. Government agency and sponsored enterprise residential MBS |
1,962,658 |
|
|
1,810 |
|
|
(40,261) |
|
|
1,924,207 |
|
U.S. Government agency and sponsored enterprise commercial MBS |
561,557 |
|
|
107 |
|
|
(63,805) |
|
|
497,859 |
|
|
|
|
|
|
|
|
|
Private label residential MBS and CMOs |
2,596,231 |
|
|
268 |
|
|
(300,769) |
|
|
2,295,730 |
|
Private label commercial MBS |
2,282,833 |
|
|
678 |
|
|
(84,768) |
|
|
2,198,743 |
|
| Single family real estate-backed securities |
383,984 |
|
|
— |
|
|
(17,729) |
|
|
366,255 |
|
| Collateralized loan obligations |
1,122,799 |
|
|
735 |
|
|
(10,710) |
|
|
1,112,824 |
|
| Non-mortgage asset-backed securities |
106,095 |
|
|
156 |
|
|
(3,471) |
|
|
102,780 |
|
| State and municipal obligations |
107,176 |
|
|
715 |
|
|
(5,273) |
|
|
102,618 |
|
| SBA securities |
106,237 |
|
|
41 |
|
|
(3,254) |
|
|
103,024 |
|
|
9,369,428 |
|
|
$ |
5,042 |
|
|
$ |
(539,838) |
|
|
8,834,632 |
|
| Investment securities held to maturity |
10,000 |
|
|
|
|
|
|
10,000 |
|
|
$ |
9,379,428 |
|
|
|
|
|
|
8,844,632 |
|
| Marketable equity securities |
|
|
|
|
|
|
32,722 |
|
|
|
|
|
|
|
|
$ |
8,877,354 |
|
(1)At fair value except for securities held to maturity.
Investment securities held to maturity at March 31, 2024 and December 31, 2023, consisted of one State of Israel bond maturing in October 2024. Accrued interest receivable on investments totaled $38 million and $37 million at March 31, 2024 and December 31, 2023, respectively, and is included in other assets in the accompanying consolidated balance sheets.
At March 31, 2024, contractual maturities of investment securities available for sale, adjusted for anticipated prepayments when applicable, were as follows (in thousands):
|
|
|
|
|
|
|
|
|
|
|
|
|
Amortized Cost |
|
Fair Value |
| Due in one year or less |
$ |
964,667 |
|
|
$ |
933,002 |
|
| Due after one year through five years |
5,211,147 |
|
|
5,061,309 |
|
| Due after five years through ten years |
1,952,118 |
|
|
1,774,119 |
|
| Due after ten years |
1,251,871 |
|
|
1,113,005 |
|
| |
$ |
9,379,803 |
|
|
$ |
8,881,435 |
|
The carrying value of securities pledged as collateral for FHLB advances, public deposits, interest rate swaps and to secure borrowing capacity at the FRB totaled $7.7 billion at both March 31, 2024 and December 31, 2023, respectively.
Table of Contents
BANKUNITED, INC. AND SUBSIDIARIES
NOTES TO CONSOLIDATED FINANCIAL STATEMENTS - UNAUDITED
March 31, 2024
The following table provides information about gains (losses) on investment securities for the periods indicated (in thousands):
|
|
|
|
|
|
|
|
|
|
|
|
|
|
|
|
|
|
|
|
|
Three Months Ended March 31, |
| |
|
|
|
|
2024 |
|
2023 |
|
|
|
|
|
|
|
|
|
|
|
|
| Gross realized gains on investment securities AFS |
|
|
|
|
$ |
27 |
|
|
$ |
772 |
|
|
|
| Gross realized losses on investment securities AFS |
|
|
|
|
(55) |
|
|
(20) |
|
|
|
Net realized gain (loss) |
|
|
|
|
(28) |
|
|
752 |
|
|
|
|
|
|
|
|
|
|
|
|
|
Net gain (loss) on marketable equity securities recognized in earnings |
|
|
|
|
803 |
|
|
(13,301) |
|
|
|
|
|
|
|
|
|
|
|
|
|
| Gain (loss) on investment securities, net |
|
|
|
|
$ |
775 |
|
|
$ |
(12,549) |
|
|
|
The following tables present the aggregate fair value and the aggregate amount by which amortized cost exceeded fair value for investment securities available for sale in unrealized loss positions aggregated by investment category and length of time that individual securities had been in continuous unrealized loss positions at the dates indicated (in thousands):
|
|
|
|
|
|
|
|
|
|
|
|
|
|
|
|
|
|
|
|
|
|
|
|
|
|
|
|
|
|
|
|
|
|
|
|
| |
March 31, 2024 |
|
|
| |
Less than 12 Months |
|
12 Months or Greater |
|
Total |
| |
Fair Value |
|
Unrealized Losses |
|
Fair Value |
|
Unrealized Losses |
|
Fair Value |
|
Unrealized Losses |
U.S. Treasury securities |
$ |
9,921 |
|
|
$ |
(54) |
|
|
$ |
99,859 |
|
|
$ |
(9,700) |
|
|
$ |
109,780 |
|
|
$ |
(9,754) |
|
U.S. Government agency and sponsored enterprise residential MBS |
149,058 |
|
|
(370) |
|
|
1,515,872 |
|
|
(34,430) |
|
|
1,664,930 |
|
|
(34,800) |
|
U.S. Government agency and sponsored enterprise commercial MBS |
15,969 |
|
|
(84) |
|
|
465,373 |
|
|
(64,894) |
|
|
481,342 |
|
|
(64,978) |
|
|
|
|
|
|
|
|
|
|
|
|
|
Private label residential MBS and CMOs |
6,393 |
|
|
(26) |
|
|
2,219,341 |
|
|
(293,880) |
|
|
2,225,734 |
|
|
(293,906) |
|
Private label commercial MBS |
15,825 |
|
|
(42) |
|
|
1,985,746 |
|
|
(70,449) |
|
|
2,001,571 |
|
|
(70,491) |
|
| Single family real estate-backed securities |
— |
|
|
— |
|
|
341,362 |
|
|
(14,843) |
|
|
341,362 |
|
|
(14,843) |
|
| Collateralized loan obligations |
— |
|
|
— |
|
|
679,257 |
|
|
(2,393) |
|
|
679,257 |
|
|
(2,393) |
|
Non-mortgage asset-backed securities |
— |
|
|
— |
|
|
77,192 |
|
|
(3,634) |
|
|
77,192 |
|
|
(3,634) |
|
| State and municipal obligations |
6,309 |
|
|
(65) |
|
|
55,353 |
|
|
(6,817) |
|
|
61,662 |
|
|
(6,882) |
|
| SBA securities |
7,777 |
|
|
(35) |
|
|
85,680 |
|
|
(3,056) |
|
|
93,457 |
|
|
(3,091) |
|
|
|
|
|
|
|
|
|
|
|
|
|
| |
$ |
211,252 |
|
|
$ |
(676) |
|
|
$ |
7,525,035 |
|
|
$ |
(504,096) |
|
|
$ |
7,736,287 |
|
|
$ |
(504,772) |
|
Table of Contents
BANKUNITED, INC. AND SUBSIDIARIES
NOTES TO CONSOLIDATED FINANCIAL STATEMENTS - UNAUDITED
March 31, 2024
|
|
|
|
|
|
|
|
|
|
|
|
|
|
|
|
|
|
|
|
|
|
|
|
|
|
|
|
|
|
|
|
|
|
|
|
| |
December 31, 2023 |
| |
Less than 12 Months |
|
12 Months or Greater |
|
Total |
| |
Fair Value |
|
Unrealized Losses |
|
Fair Value |
|
Unrealized Losses |
|
Fair Value |
|
Unrealized Losses |
U.S. Treasury securities |
$ |
9,941 |
|
|
$ |
(27) |
|
|
$ |
99,769 |
|
|
$ |
(9,771) |
|
|
$ |
109,710 |
|
|
$ |
(9,798) |
|
U.S. Government agency and sponsored enterprise residential MBS |
82,382 |
|
|
(430) |
|
|
1,646,081 |
|
|
(39,831) |
|
|
1,728,463 |
|
|
(40,261) |
|
U.S. Government agency and sponsored enterprise commercial MBS |
3,332 |
|
|
(6) |
|
|
481,651 |
|
|
(63,799) |
|
|
484,983 |
|
|
(63,805) |
|
|
|
|
|
|
|
|
|
|
|
|
|
Private label residential MBS and CMOs |
— |
|
|
— |
|
|
2,255,461 |
|
|
(300,769) |
|
|
2,255,461 |
|
|
(300,769) |
|
Private label commercial MBS |
51,434 |
|
|
(323) |
|
|
2,054,378 |
|
|
(84,445) |
|
|
2,105,812 |
|
|
(84,768) |
|
| Single family real estate-backed securities |
— |
|
|
— |
|
|
366,255 |
|
|
(17,729) |
|
|
366,255 |
|
|
(17,729) |
|
| Collateralized loan obligations |
184,652 |
|
|
(348) |
|
|
880,609 |
|
|
(10,362) |
|
|
1,065,261 |
|
|
(10,710) |
|
Non-mortgage asset-backed securities |
— |
|
|
— |
|
|
79,697 |
|
|
(3,471) |
|
|
79,697 |
|
|
(3,471) |
|
| State and municipal obligations |
24,765 |
|
|
(1,049) |
|
|
32,380 |
|
|
(4,224) |
|
|
57,145 |
|
|
(5,273) |
|
| SBA securities |
8,194 |
|
|
(46) |
|
|
89,763 |
|
|
(3,208) |
|
|
97,957 |
|
|
(3,254) |
|
|
|
|
|
|
|
|
|
|
|
|
|
| |
$ |
364,700 |
|
|
$ |
(2,229) |
|
|
$ |
7,986,044 |
|
|
$ |
(537,609) |
|
|
$ |
8,350,744 |
|
|
$ |
(539,838) |
|
The Company monitors its investment securities available for sale for credit loss impairment on an individual security basis. No securities were determined to be credit loss impaired during the three months ended March 31, 2024 and 2023. At March 31, 2024, the Company did not have an intent to sell securities that were in significant unrealized loss positions, and it was not more likely than not that the Company would be required to sell these securities before recovery of the amortized cost basis, which may be at maturity. In making this determination, the Company considered its current and projected liquidity position including its ability to pledge securities to generate liquidity, its investment policy as to permissible holdings and concentration limits, regulatory requirements and other relevant factors. We have not sold, and do not anticipate the need to sell, securities in unrealized loss positions to generate liquidity.
At March 31, 2024, 540 securities available for sale were in unrealized loss positions. The amount of impairment related to 138 of these securities was considered insignificant both individually and in the aggregate, totaling approximately $1.3 million and no further analysis with respect to these securities was considered necessary.
The basis for concluding that AFS securities were not credit loss impaired and no ACL was considered necessary at March 31, 2024, is further discussed below.
Unrealized losses were primarily attributable to a sustained higher interest rate environment. In some cases, wider spreads compared to levels at which securities were purchased. market volatility and yield curve dislocations also contributed to unrealized losses. The investment securities AFS portfolio was in a net unrealized loss position of $498.4 million at March 31, 2024, compared to $534.8 million at December 31, 2023, improving by $36.4 million during the three months ended March 31, 2024. While the majority of securities in the portfolio were floating rate at March 31, 2024, fixed rate securities accounted for the majority of unrealized losses.
U.S. Government, U.S. Government Agency and Government Sponsored Enterprise Securities
At March 31, 2024, six U.S. treasury, 104 U.S. Government agency and sponsored enterprise residential MBS, 27 U.S. Government agency and sponsored enterprise commercial MBS, and 22 SBA securities were in unrealized loss positions. The timely payment of principal and interest on these securities is explicitly or implicitly guaranteed by the U.S. Government. As such, there is an assumption of zero credit loss and the Company expects to recover the amortized cost basis of these securities.
Table of Contents
BANKUNITED, INC. AND SUBSIDIARIES
NOTES TO CONSOLIDATED FINANCIAL STATEMENTS - UNAUDITED
March 31, 2024
Private Label Securities:
None of the impaired private label securities had missed principal or interest payments or had been downgraded by a NRSRO at March 31, 2024. The Company performed an analysis comparing the present value of cash flows expected to be collected to the amortized cost basis of impaired securities. This analysis was based on a scenario that we believe to be generally more conservative than our reasonable and supportable economic forecast at March 31, 2024, and incorporated assumptions about voluntary prepayment rates, collateral defaults, delinquencies, severity and other relevant factors as described further below. Our analysis also considered the structural characteristics of each security and the level of credit enhancement provided by that structure.
Private label residential MBS and CMOs
At March 31, 2024, 115 private label residential MBS and CMOs were in unrealized loss positions. Our analysis of cash flows expected to be collected on these securities incorporated assumptions about collateral default rates, voluntary prepayment rates, loss severity, delinquencies and recovery lag. In developing those assumptions, we took into account collateral quality measures such as FICO, LTV, documentation, loan type, property type, agency availability criteria and performing status. We also regularly monitor sector data including home price appreciation, forbearance, delinquency, special servicing and prepay trends as well as other economic data that could be indicative of stress in the sector. Underlying delinquencies in this sector remain low. Our March 31, 2024 analysis projected weighted average collateral losses for impaired securities in this category of 2% compared to weighted average credit support of 18%. As of March 31, 2024, 95% of impaired securities in this category, based on carrying value, were externally rated AAA, 4% were rated AA and 1% were rated A.
Private label commercial MBS
At March 31, 2024, 88 private label commercial MBS were in unrealized loss positions. Our analysis of cash flows expected to be collected on these securities incorporated assumptions about collateral default rates, voluntary prepayment rates, loss severity, delinquencies and recovery lag. In developing those assumptions, we took into account collateral quality and type, loan size, loan purpose and other qualitative factors. We also regularly monitor collateral concentrations, collateral watch lists, bankruptcy data, defeasance data, special servicing trends, delinquency and other economic data that could be indicative of stress in the sector. We consider collateral, deal, sector and tranche level performance as well as maturity and refinance risk. While we have observed some deterioration in collateral performance in this segment, particularly in the office, retail and hospitality sectors, the high credit quality of these securities and adequacy of subordination to cover projected collateral losses supports the conclusion that there is no credit loss impairment. Our March 31, 2024 analysis projected weighted average collateral losses for impaired securities in this category of 6% compared to weighted average credit support of 43%. As of March 31, 2024, 84% of impaired securities in this category, based on carrying value, were externally rated AAA, 12% were rated AA and 4% were rated A.
Single family real estate-backed securities
At March 31, 2024, 11 single family rental real estate-backed securities were in unrealized loss positions. Our analysis of cash flows expected to be collected on these securities incorporated assumptions about collateral default rates, loss severity, delinquencies and recovery lag. We regularly monitor sector data including home price appreciation, forbearance, delinquency and prepay trends as well as other economic data that could be indicative of stress in the sector. We consider collateral, deal, sector and tranche level performance as well as maturity and refinance risk. Our March 31, 2024 analysis projected weighted average collateral losses for this category of 7% compared to weighted average credit support of 55%. As of March 31, 2024, 54% of impaired securities in this category, based on carrying value, were externally rated AAA, 18% were rated AA and one security was not externally rated.
Table of Contents
BANKUNITED, INC. AND SUBSIDIARIES
NOTES TO CONSOLIDATED FINANCIAL STATEMENTS - UNAUDITED
March 31, 2024
Collateralized loan obligations
At March 31, 2024, 15 collateralized loan obligations were in unrealized loss positions. Unrealized losses totaled less than 1% of total amortized cost of this segment at March 31, 2024. Our analysis of cash flows expected to be collected on these securities incorporated assumptions about collateral default rates, loss severity, and delinquencies, calibrated to take into account idiosyncratic risks associated with the underlying collateral. In developing those assumptions, we took into account each sector’s performance pre-, during and post the 2008 financial crisis. We regularly engage with bond managers to monitor trends in underlying collateral including potential downgrades and subsequent cash flow diversions, liquidity, ratings migration, and any other relevant developments. While we have observed some deterioration in underlying collateral performance due in large part to rising costs, the high credit quality of these securities and adequacy of subordination to cover projected collateral losses supports the conclusion that there is no credit loss impairment. Our March 31, 2024 analysis projected weighted average collateral losses for impaired securities in this category of 11% compared to weighted average credit support of 42%. As of March 31, 2024, 80% of the impaired securities in this category, based on carrying value, were externally rated AAA, 12% were rated AA and 8% were rated A.
Non-mortgage asset-backed securities
At March 31, 2024, six non-mortgage asset-backed securities were in unrealized loss positions. These securities are backed by student loan collateral. Our analysis of cash flows expected to be collected on these securities incorporated assumptions about collateral default rates, loss severity, delinquencies, voluntary prepayment rates and recovery lag. In developing assumptions, we took into account collateral type, delineated by whether collateral consisted of loans to borrowers in school, refinancing, or a mixture. Our March 31, 2024 analysis projected weighted average collateral losses for impaired securities in this category of 4% compared to weighted average credit support of 26%. As of March 31, 2024, 36% of the impaired securities in this category, based on carrying value, were externally rated AAA, and 64% were rated AA.
State and Municipal Obligations
At March 31, 2024, eight state and municipal obligations were in unrealized loss positions. Our analysis of potential credit loss impairment for these securities incorporates a quantitative measure of the underlying obligor's credit worthiness provided by a third-party vendor as well as other relevant qualitative considerations. As of March 31, 2024, 87% of the impaired securities in this category, based on carrying value, were externally rated AAA and 13% were rated AA.
Table of Contents
BANKUNITED, INC. AND SUBSIDIARIES
NOTES TO CONSOLIDATED FINANCIAL STATEMENTS - UNAUDITED
March 31, 2024
Note 4 Loans and Allowance for Credit Losses
Loans consisted of the following at the dates indicated (dollars in thousands):
|
|
|
|
|
|
|
|
|
|
|
|
|
|
|
|
|
|
|
|
|
|
|
|
| |
March 31, 2024 |
|
December 31, 2023 |
|
|
|
|
| |
Total |
|
Percent of Total |
|
Total |
|
Percent of Total |
| Commercial: |
|
|
|
|
|
|
|
| Non-owner occupied commercial real estate |
$ |
5,309,126 |
|
|
21.9 |
% |
|
$ |
5,323,241 |
|
|
21.6 |
% |
| Construction and land |
529,645 |
|
|
2.2 |
% |
|
495,992 |
|
|
2.0 |
% |
| Owner occupied commercial real estate |
1,916,651 |
|
|
7.9 |
% |
|
1,935,743 |
|
|
7.9 |
% |
| Commercial and industrial |
6,745,622 |
|
|
27.9 |
% |
|
6,971,981 |
|
|
28.3 |
% |
|
|
|
|
|
|
|
|
| Pinnacle - municipal finance |
864,796 |
|
|
3.6 |
% |
|
884,690 |
|
|
3.6 |
% |
Franchise and equipment finance |
347,103 |
|
|
1.4 |
% |
|
380,347 |
|
|
1.5 |
% |
|
|
|
|
|
|
|
|
| Mortgage warehouse lending |
456,385 |
|
|
1.9 |
% |
|
432,663 |
|
|
1.8 |
% |
| |
16,169,328 |
|
|
66.8 |
% |
|
16,424,657 |
|
|
66.7 |
% |
| Residential: |
|
|
|
|
|
|
|
| 1-4 single family residential |
6,814,865 |
|
|
28.1 |
% |
|
6,903,013 |
|
|
28.0 |
% |
| Government insured residential |
1,242,107 |
|
|
5.1 |
% |
|
1,306,014 |
|
|
5.3 |
% |
|
8,056,972 |
|
|
33.2 |
% |
|
8,209,027 |
|
|
33.3 |
% |
| Total loans |
24,226,300 |
|
|
100.0 |
% |
|
24,633,684 |
|
|
100.0 |
% |
| Allowance for credit losses |
(217,556) |
|
|
|
|
(202,689) |
|
|
|
| Loans, net |
$ |
24,008,744 |
|
|
|
|
$ |
24,430,995 |
|
|
|
Premiums, discounts and deferred fees and costs, excluding the non-credit related discount on PCD loans, totaled $41 million and $45 million at March 31, 2024 and December 31, 2023, respectively.
The following table presents the amortized cost basis of residential PCD loans and the related amount of non-credit discount, net of the related ACL, at the dates indicated (in thousands):
|
|
|
|
|
|
|
|
|
|
|
|
|
March 31, 2024 |
|
December 31, 2023 |
| UPB |
$ |
76,342 |
|
|
$ |
80,123 |
|
| Non-credit discount |
(33,171) |
|
|
(35,249) |
|
| Total amortized cost of PCD loans |
43,171 |
|
|
44,874 |
|
| ACL related to PCD loans |
(134) |
|
|
(161) |
|
| PCD loans, net |
$ |
43,037 |
|
|
$ |
44,713 |
|
Included in loans, net are direct or sales type finance leases totaling $583 million and $602 million at March 31, 2024 and December 31, 2023, respectively. The amount of income recognized from direct or sales type finance leases for the three months ended March 31, 2024 and 2023 totaled $4.0 million and $4.3 million, respectively, and is included in interest income on loans in the consolidated statements of income.
During the three months ended March 31, 2024 and 2023, the Company purchased residential loans totaling $67 million and $187 million, respectively.
At March 31, 2024 and December 31, 2023, the Company had pledged loans with a carrying value of approximately $16.2 billion and $16.5 billion, respectively, as security for FHLB advances and Federal Reserve discount window capacity.
Accrued interest receivable on loans totaled $138 million at both March 31, 2024 and December 31, 2023, and is included in other assets in the accompanying consolidated balance sheets. The amount of interest income reversed on non-accrual loans was not material for the three months ended March 31, 2024 and 2023.
Table of Contents
BANKUNITED, INC. AND SUBSIDIARIES
NOTES TO CONSOLIDATED FINANCIAL STATEMENTS - UNAUDITED
March 31, 2024
Allowance for credit losses
Activity in the ACL is summarized below for the periods indicated (in thousands):
|
|
|
|
|
|
|
|
|
|
|
|
|
|
|
|
|
|
|
|
|
|
|
|
|
|
|
|
|
|
|
|
|
|
|
|
|
|
|
|
|
|
|
Three Months Ended March 31, |
| |
2024 |
|
2023 |
|
|
| |
Commercial |
|
Residential |
|
Total |
|
Commercial |
|
Residential |
|
Total |
|
|
|
|
|
|
| Beginning balance |
$ |
195,058 |
|
|
$ |
7,631 |
|
|
$ |
202,689 |
|
|
$ |
136,205 |
|
|
$ |
11,741 |
|
|
$ |
147,946 |
|
|
|
|
|
|
|
| Impact of adoption of ASU 2022-02 |
N/A |
|
N/A |
|
N/A |
|
(1,677) |
|
|
(117) |
|
|
(1,794) |
|
|
|
|
|
|
|
| Balance after adoption of ASU 2022-02 |
195,058 |
|
|
7,631 |
|
|
202,689 |
|
|
134,528 |
|
|
11,624 |
|
|
146,152 |
|
|
|
|
|
|
|
| Provision (recovery) |
16,779 |
|
|
(974) |
|
|
15,805 |
|
|
17,425 |
|
|
170 |
|
|
17,595 |
|
|
|
|
|
|
|
| Charge-offs |
(5,352) |
|
|
(34) |
|
|
(5,386) |
|
|
(7,899) |
|
|
— |
|
|
(7,899) |
|
|
|
|
|
|
|
| Recoveries |
4,444 |
|
|
4 |
|
|
4,448 |
|
|
2,941 |
|
|
3 |
|
|
2,944 |
|
|
|
|
|
|
|
| Ending balance |
$ |
210,929 |
|
|
$ |
6,627 |
|
|
$ |
217,556 |
|
|
$ |
146,995 |
|
|
$ |
11,797 |
|
|
$ |
158,792 |
|
|
|
|
|
|
|
|
|
|
|
|
|
|
|
|
|
|
|
|
|
|
|
|
|
|
|
|
|
|
|
|
|
|
|
|
|
|
|
|
|
|
|
|
|
|
|
|
|
|
|
|
|
|
|
|
|
|
|
|
|
|
|
|
|
|
|
|
|
|
|
|
|
|
|
|
|
|
|
|
|
|
|
|
|
|
|
|
|
|
|
|
|
|
|
|
|
|
|
|
|
|
|
|
|
|
|
|
|
|
|
|
|
|
|
|
|
|
|
|
|
|
|
|
|
|
|
|
|
|
|
|
|
|
|
|
|
|
|
|
|
|
|
|
|
|
|
|
|
|
|
|
|
|
|
|
|
|
|
|
|
|
|
|
|
|
|
|
|
|
|
|
|
|
|
|
|
The ACL was determined utilizing a 2-year reasonable and supportable forecast period. The quantitative portion of the ACL was determined using three weighted third-party provided economic scenarios.
The ACL increased by $14.9 million, from 0.82% to 0.90% of total loans, at March 31, 2024, compared to December 31, 2023. The more significant factors impacting the provision for credit losses and increase in the ACL for the three months ended March 31, 2024, were an increase in qualitative loss factors and risk rating migration, partially offset by an improved economic forecast.
The following table presents gross charge-offs during the three months ended March 31, 2024, by year of origination (in thousands):
|
|
|
|
|
|
|
|
|
|
|
|
|
|
|
|
|
|
|
|
|
|
|
|
|
|
|
|
|
|
|
|
|
|
|
|
|
|
|
|
|
|
|
|
|
|
|
|
|
|
| |
2024 |
|
2023 |
|
2022 |
|
2021 |
|
2020 |
|
Prior to 2020 |
|
Revolving Loans |
|
Total |
| CRE |
$ |
— |
|
|
$ |
— |
|
|
$ |
— |
|
|
$ |
— |
|
|
$ |
— |
|
|
$ |
486 |
|
|
$ |
— |
|
|
$ |
486 |
|
| C&I |
— |
|
|
191 |
|
|
3,186 |
|
|
29 |
|
|
— |
|
|
591 |
|
|
79 |
|
|
4,076 |
|
|
|
|
|
|
|
|
|
|
|
|
|
|
|
|
|
Franchise and equipment finance |
— |
|
|
— |
|
|
— |
|
|
— |
|
|
— |
|
|
790 |
|
|
— |
|
|
790 |
|
Residential |
— |
|
|
— |
|
|
— |
|
|
— |
|
|
— |
|
|
34 |
|
|
— |
|
|
34 |
|
|
$ |
— |
|
|
$ |
191 |
|
|
$ |
3,186 |
|
|
$ |
29 |
|
|
$ |
— |
|
|
$ |
1,901 |
|
|
$ |
79 |
|
|
$ |
5,386 |
|
The following table presents the components of the provision for credit losses for the periods indicated (in thousands):
|
|
|
|
|
|
|
|
|
|
|
|
|
|
|
|
|
|
|
Three Months Ended March 31, |
|
|
|
2024 |
|
2023 |
|
|
|
|
|
|
| Amount related to funded portion of loans |
$ |
15,805 |
|
|
$ |
17,595 |
|
|
|
|
|
|
|
| Amount related to off-balance sheet credit exposures |
(520) |
|
|
2,193 |
|
|
|
|
|
|
|
|
|
|
|
|
|
|
|
|
|
|
|
|
|
|
|
|
|
|
|
| Total provision for credit losses |
$ |
15,285 |
|
|
$ |
19,788 |
|
|
|
|
|
|
|
Credit quality information
Credit quality of loans held for investment is continuously monitored by dedicated residential credit risk management and commercial portfolio management functions. The Company also has a workout and recovery department that monitors the credit quality of criticized and classified loans and an independent internal credit review function.
Table of Contents
BANKUNITED, INC. AND SUBSIDIARIES
NOTES TO CONSOLIDATED FINANCIAL STATEMENTS - UNAUDITED
March 31, 2024
Credit quality indicators for commercial loans
Factors that impact risk inherent in commercial portfolio segments include but are not limited to levels of economic activity or potential disruptions in economic activity, health of the national, regional and to a lesser extent global economy, interest rates, industry trends, demographic trends, inflationary trends, including particularly for commercial real estate loans the cost of insurance, patterns of and trends in customer behavior that influence demand for our borrowers' products and services, and commercial real estate values and related market dynamics. Particularly for the office sector, the evolving impact of hybrid and remote work on vacancies and valuations is a factor. Internal risk ratings are considered the most meaningful indicator of credit quality for commercial loans. Internal risk ratings are one indicator of the likelihood that a borrower will default, are a key factor influencing the level and nature of ongoing monitoring of loans and may impact the estimation of the ACL. Internal risk ratings are updated on a continuous basis. Generally, relationships with balances in excess of defined thresholds, ranging from $1 million to $3 million, are re-evaluated at least annually and more frequently if circumstances indicate that a change in risk rating may be warranted. The special mention rating is considered a transitional rating for loans exhibiting potential credit weaknesses that could result in deterioration of repayment prospects at some future date if not checked or corrected and that deserve management’s close attention. These borrowers may exhibit declining cash flows or revenues or increasing leverage. Loans with well-defined credit weaknesses that may result in a loss if the deficiencies are not corrected are assigned a risk rating of substandard. These borrowers may exhibit payment defaults, inadequate cash flows from current operations, operating losses, increasing balance sheet leverage, project cost overruns, unreasonable construction delays, exhausted interest reserves, declining collateral values, frequent overdrafts or past due real estate taxes. Loans with weaknesses so severe that collection in full is highly questionable or improbable, but because of certain reasonably specific pending factors have not been charged off, are assigned an internal risk rating of doubtful.
Commercial credit exposure based on internal risk rating (in thousands):
|
|
|
|
|
|
|
|
|
|
|
|
|
|
|
|
|
|
|
|
|
|
|
|
|
|
|
|
|
|
|
|
|
|
|
|
|
|
|
|
|
|
|
|
|
|
|
|
|
March 31, 2024 |
|
Amortized Cost By Origination Year |
|
Revolving Loans |
|
|
|
2024 |
|
2023 |
|
2022 |
|
2021 |
|
2020 |
|
Prior |
|
|
Total |
| CRE |
|
|
|
|
|
|
|
|
|
|
|
|
|
|
|
| Pass |
$ |
138,654 |
|
|
$ |
674,780 |
|
|
$ |
1,191,170 |
|
|
$ |
616,671 |
|
|
$ |
458,186 |
|
|
$ |
1,795,375 |
|
|
$ |
234,279 |
|
|
$ |
5,109,115 |
|
| Special mention |
— |
|
|
19,073 |
|
|
38,869 |
|
|
— |
|
|
33,037 |
|
|
45,521 |
|
|
3,480 |
|
|
139,980 |
|
| Substandard |
— |
|
|
26,871 |
|
|
63,866 |
|
|
89,228 |
|
|
28,994 |
|
|
357,845 |
|
|
22,872 |
|
|
589,676 |
|
|
|
|
|
|
|
|
|
|
|
|
|
|
|
|
|
| Total CRE |
$ |
138,654 |
|
|
$ |
720,724 |
|
|
$ |
1,293,905 |
|
|
$ |
705,899 |
|
|
$ |
520,217 |
|
|
$ |
2,198,741 |
|
|
$ |
260,631 |
|
|
$ |
5,838,771 |
|
C&I |
|
|
|
|
|
|
|
|
|
|
|
|
|
|
|
| Pass |
$ |
359,240 |
|
|
$ |
1,361,500 |
|
|
$ |
1,295,020 |
|
|
$ |
598,858 |
|
|
$ |
339,439 |
|
|
$ |
1,383,135 |
|
|
$ |
2,707,719 |
|
|
$ |
8,044,911 |
|
| Special mention |
— |
|
|
— |
|
|
57,796 |
|
|
22,851 |
|
|
— |
|
|
55,134 |
|
|
77,741 |
|
|
213,522 |
|
| Substandard |
— |
|
|
8,265 |
|
|
148,115 |
|
|
54,142 |
|
|
17,887 |
|
|
118,475 |
|
|
46,325 |
|
|
393,209 |
|
| Doubtful |
— |
|
|
— |
|
|
7,256 |
|
|
— |
|
|
— |
|
|
3,375 |
|
|
— |
|
|
10,631 |
|
| Total C&I |
$ |
359,240 |
|
|
$ |
1,369,765 |
|
|
$ |
1,508,187 |
|
|
$ |
675,851 |
|
|
$ |
357,326 |
|
|
$ |
1,560,119 |
|
|
$ |
2,831,785 |
|
|
$ |
8,662,273 |
|
| Pinnacle - municipal finance |
|
|
|
|
|
|
|
|
|
|
|
|
|
|
|
| Pass |
$ |
16,152 |
|
|
$ |
158,857 |
|
|
$ |
131,399 |
|
|
$ |
72,274 |
|
|
$ |
29,215 |
|
|
$ |
456,899 |
|
|
$ |
— |
|
|
$ |
864,796 |
|
|
|
|
|
|
|
|
|
|
|
|
|
|
|
|
|
| Total Pinnacle - municipal finance |
$ |
16,152 |
|
|
$ |
158,857 |
|
|
$ |
131,399 |
|
|
$ |
72,274 |
|
|
$ |
29,215 |
|
|
$ |
456,899 |
|
|
$ |
— |
|
|
$ |
864,796 |
|
Franchise and equipment finance |
|
|
|
|
|
|
|
|
|
|
|
|
|
|
|
| Pass |
$ |
— |
|
|
$ |
6,374 |
|
|
$ |
31,690 |
|
|
$ |
70,206 |
|
|
$ |
43,233 |
|
|
$ |
125,526 |
|
|
$ |
128 |
|
|
$ |
277,157 |
|
|
|
|
|
|
|
|
|
|
|
|
|
|
|
|
|
| Substandard |
— |
|
|
— |
|
|
14,654 |
|
|
2,777 |
|
|
3,152 |
|
|
46,172 |
|
|
— |
|
|
66,755 |
|
| Doubtful |
— |
|
|
— |
|
|
— |
|
|
— |
|
|
— |
|
|
3,191 |
|
|
— |
|
|
3,191 |
|
| Total Franchise finance |
$ |
— |
|
|
$ |
6,374 |
|
|
$ |
46,344 |
|
|
$ |
72,983 |
|
|
$ |
46,385 |
|
|
$ |
174,889 |
|
|
$ |
128 |
|
|
$ |
347,103 |
|
|
|
|
|
|
|
|
|
|
|
|
|
|
|
|
|
|
|
|
|
|
|
|
|
|
|
|
|
|
|
|
|
|
|
|
|
|
|
|
|
|
|
|
|
|
|
|
|
|
|
|
|
|
|
|
|
|
|
|
|
|
|
|
|
|
|
|
|
|
|
|
|
|
|
|
|
|
|
|
|
|
|
|
|
|
|
|
|
|
|
|
|
|
|
|
|
| Mortgage warehouse lending |
|
|
|
|
|
|
|
|
|
|
|
|
|
|
|
| Pass |
$ |
— |
|
|
$ |
— |
|
|
$ |
— |
|
|
$ |
— |
|
|
$ |
— |
|
|
$ |
— |
|
|
$ |
452,087 |
|
|
$ |
452,087 |
|
| Special mention |
— |
|
|
— |
|
|
— |
|
|
— |
|
|
— |
|
|
— |
|
|
4,298 |
|
|
4,298 |
|
|
|
|
|
|
|
|
|
|
|
|
|
|
|
|
|
|
|
|
|
|
|
|
|
|
|
|
|
|
|
|
|
| Total Mortgage warehouse lending |
$ |
— |
|
|
$ |
— |
|
|
$ |
— |
|
|
$ |
— |
|
|
$ |
— |
|
|
$ |
— |
|
|
$ |
456,385 |
|
|
$ |
456,385 |
|
Table of Contents
BANKUNITED, INC. AND SUBSIDIARIES
NOTES TO CONSOLIDATED FINANCIAL STATEMENTS - UNAUDITED
March 31, 2024
|
|
|
|
|
|
|
|
|
|
|
|
|
|
|
|
|
|
|
|
|
|
|
|
|
|
|
|
|
|
|
|
|
|
|
|
|
|
|
|
|
|
|
|
|
|
|
|
|
December 31, 2023 |
|
Amortized Cost By Origination Year |
|
Revolving Loans |
|
|
|
2023 |
|
2022 |
|
2021 |
|
2020 |
|
2019 |
|
Prior |
|
|
Total |
| CRE |
|
|
|
|
|
|
|
|
|
|
|
|
|
|
|
| Pass |
$ |
668,669 |
|
|
$ |
1,268,313 |
|
|
$ |
662,340 |
|
|
$ |
493,675 |
|
|
$ |
878,048 |
|
|
$ |
1,064,601 |
|
|
$ |
281,584 |
|
|
$ |
5,317,230 |
|
| Special mention |
19,127 |
|
|
13,377 |
|
|
— |
|
|
— |
|
|
57,984 |
|
|
4,912 |
|
|
2,152 |
|
|
97,552 |
|
| Substandard |
— |
|
|
42,997 |
|
|
2,103 |
|
|
29,180 |
|
|
186,368 |
|
|
142,049 |
|
|
1,754 |
|
|
404,451 |
|
|
|
|
|
|
|
|
|
|
|
|
|
|
|
|
|
| Total CRE |
$ |
687,796 |
|
|
$ |
1,324,687 |
|
|
$ |
664,443 |
|
|
$ |
522,855 |
|
|
$ |
1,122,400 |
|
|
$ |
1,211,562 |
|
|
$ |
285,490 |
|
|
$ |
5,819,233 |
|
| C&I |
|
|
|
|
|
|
|
|
|
|
|
|
|
|
|
| Pass |
$ |
1,382,939 |
|
|
$ |
1,423,581 |
|
|
$ |
653,730 |
|
|
$ |
337,322 |
|
|
$ |
431,257 |
|
|
$ |
1,040,101 |
|
|
$ |
3,069,295 |
|
|
$ |
8,338,225 |
|
| Special mention |
— |
|
|
85,306 |
|
|
1,215 |
|
|
13,949 |
|
|
49,526 |
|
|
22,398 |
|
|
47,680 |
|
|
220,074 |
|
| Substandard |
3,841 |
|
|
70,731 |
|
|
86,747 |
|
|
16,063 |
|
|
20,757 |
|
|
91,844 |
|
|
44,633 |
|
|
334,616 |
|
| Doubtful |
— |
|
|
10,580 |
|
|
— |
|
|
— |
|
|
4,229 |
|
|
— |
|
|
— |
|
|
14,809 |
|
| Total C&I |
$ |
1,386,780 |
|
|
$ |
1,590,198 |
|
|
$ |
741,692 |
|
|
$ |
367,334 |
|
|
$ |
505,769 |
|
|
$ |
1,154,343 |
|
|
$ |
3,161,608 |
|
|
$ |
8,907,724 |
|
| Pinnacle - municipal finance |
|
|
|
|
|
|
|
|
|
|
|
|
|
|
|
| Pass |
$ |
170,919 |
|
|
$ |
133,988 |
|
|
$ |
74,895 |
|
|
$ |
31,771 |
|
|
$ |
55,338 |
|
|
$ |
417,779 |
|
|
$ |
— |
|
|
$ |
884,690 |
|
|
|
|
|
|
|
|
|
|
|
|
|
|
|
|
|
|
|
|
|
|
|
|
|
|
|
|
|
|
|
|
|
|
|
|
|
|
|
|
|
|
|
|
|
|
|
|
|
| Total Pinnacle - municipal finance |
$ |
170,919 |
|
|
$ |
133,988 |
|
|
$ |
74,895 |
|
|
$ |
31,771 |
|
|
$ |
55,338 |
|
|
$ |
417,779 |
|
|
$ |
— |
|
|
$ |
884,690 |
|
Franchise and equipment finance |
|
|
|
|
|
|
|
|
|
|
|
|
|
|
|
| Pass |
$ |
6,569 |
|
|
$ |
32,656 |
|
|
$ |
74,170 |
|
|
$ |
44,698 |
|
|
$ |
76,144 |
|
|
$ |
80,302 |
|
|
$ |
201 |
|
|
$ |
314,740 |
|
| Special mention |
— |
|
|
— |
|
|
— |
|
|
2,279 |
|
|
— |
|
|
— |
|
|
— |
|
|
2,279 |
|
| Substandard |
— |
|
|
14,959 |
|
|
3,019 |
|
|
1,003 |
|
|
23,574 |
|
|
16,547 |
|
|
— |
|
|
59,102 |
|
| Doubtful |
— |
|
|
— |
|
|
— |
|
|
— |
|
|
4,226 |
|
|
— |
|
|
— |
|
|
4,226 |
|
| Total franchise finance |
$ |
6,569 |
|
|
$ |
47,615 |
|
|
$ |
77,189 |
|
|
$ |
47,980 |
|
|
$ |
103,944 |
|
|
$ |
96,849 |
|
|
$ |
201 |
|
|
$ |
380,347 |
|
|
|
|
|
|
|
|
|
|
|
|
|
|
|
|
|
|
|
|
|
|
|
|
|
|
|
|
|
|
|
|
|
|
|
|
|
|
|
|
|
|
|
|
|
|
|
|
|
|
|
|
|
|
|
|
|
|
|
|
|
|
|
|
|
|
|
|
|
|
|
|
|
|
|
|
|
|
|
|
|
|
|
|
|
|
|
|
|
|
|
|
|
|
|
|
|
| Mortgage warehouse lending |
|
|
|
|
|
|
|
|
|
|
|
|
|
|
|
| Pass |
$ |
— |
|
|
$ |
— |
|
|
$ |
— |
|
|
$ |
— |
|
|
$ |
— |
|
|
$ |
— |
|
|
$ |
432,663 |
|
|
$ |
432,663 |
|
|
|
|
|
|
|
|
|
|
|
|
|
|
|
|
|
|
|
|
|
|
|
|
|
|
|
|
|
|
|
|
|
|
|
|
|
|
|
|
|
|
|
|
|
|
|
|
|
| Total Mortgage warehouse lending |
$ |
— |
|
|
$ |
— |
|
|
$ |
— |
|
|
$ |
— |
|
|
$ |
— |
|
|
$ |
— |
|
|
$ |
432,663 |
|
|
$ |
432,663 |
|
At March 31, 2024 and December 31, 2023, the balance of revolving loans converted to term loans was immaterial.
The following table presents criticized and classified commercial loans, in aggregate by risk rating category, at the dates indicated (in thousands):
|
|
|
|
|
|
|
|
|
|
|
|
|
|
|
|
|
|
|
March 31, 2024 |
|
|
|
December 31, 2023 |
|
|
|
|
| Special mention |
$ |
357,800 |
|
|
|
|
$ |
319,905 |
|
|
|
|
|
| Substandard - accruing |
966,129 |
|
|
|
|
711,266 |
|
|
|
|
|
| Substandard - non-accruing |
83,511 |
|
|
|
|
86,903 |
|
|
|
|
|
| Doubtful |
13,822 |
|
|
|
|
19,035 |
|
|
|
|
|
| Total |
$ |
1,421,262 |
|
|
|
|
$ |
1,137,109 |
|
|
|
|
|
Credit quality indicators for residential loans
Management considers delinquency status to be the most meaningful indicator of the credit quality of residential loans, other than government insured residential loans. Delinquency status is updated at least monthly. LTV and FICO scores are also important indicators of credit quality for 1-4 single family residential loans other than government insured loans. FICO scores are generally updated semi-annually, and were most recently updated in the first quarter of 2024. LTVs are typically at origination since we do not routinely update residential appraisals. Substantially all of the government insured residential loans are government insured buyout loans, which the Company buys out of GNMA securitizations upon default. For these loans, traditional measures of credit quality are not particularly relevant considering the guaranteed nature of the loans and the underlying business model. Factors that impact risk inherent in the residential portfolio segment include national and regional economic conditions such as levels of unemployment, wages and interest rates, as well as residential property values.
Table of Contents
BANKUNITED, INC. AND SUBSIDIARIES
NOTES TO CONSOLIDATED FINANCIAL STATEMENTS - UNAUDITED
March 31, 2024
1-4 Single Family Residential credit exposure, excluding government insured residential loans, based on delinquency status (in thousands):
|
|
|
|
|
|
|
|
|
|
|
|
|
|
|
|
|
|
|
|
|
|
|
|
|
|
|
|
|
|
|
|
|
|
|
|
|
|
|
|
|
|
|
March 31, 2024 |
|
Amortized Cost By Origination Year |
|
|
|
2024 |
|
2023 |
|
2022 |
|
2021 |
|
2020 |
|
Prior |
|
Total |
| Current |
$ |
45,089 |
|
|
$ |
363,306 |
|
|
$ |
1,093,852 |
|
|
$ |
2,923,477 |
|
|
$ |
839,473 |
|
|
$ |
1,495,593 |
|
|
$ |
6,760,790 |
|
| 30 - 59 Days Past Due |
— |
|
|
2,033 |
|
|
5,986 |
|
|
5,444 |
|
|
5,651 |
|
|
17,067 |
|
|
36,181 |
|
| 60 - 89 Days Past Due |
— |
|
|
— |
|
|
1,058 |
|
|
— |
|
|
— |
|
|
221 |
|
|
1,279 |
|
| 90 Days or More Past Due |
— |
|
|
— |
|
|
4,505 |
|
|
897 |
|
|
— |
|
|
11,213 |
|
|
16,615 |
|
|
$ |
45,089 |
|
|
$ |
365,339 |
|
|
$ |
1,105,401 |
|
|
$ |
2,929,818 |
|
|
$ |
845,124 |
|
|
$ |
1,524,094 |
|
|
$ |
6,814,865 |
|
|
|
|
|
|
|
|
|
|
|
|
|
|
|
|
|
|
|
|
|
|
|
|
|
|
|
|
|
|
|
|
|
|
|
|
|
|
|
|
|
|
|
|
December 31, 2023 |
|
Amortized Cost By Origination Year |
|
|
|
2023 |
|
2022 |
|
2021 |
|
2020 |
|
2019 |
|
Prior |
|
Total |
| Current |
$ |
363,123 |
|
|
$ |
1,117,039 |
|
|
$ |
2,965,840 |
|
|
$ |
854,376 |
|
|
$ |
296,146 |
|
|
$ |
1,255,688 |
|
|
$ |
6,852,212 |
|
| 30 - 59 Days Past Due |
2,200 |
|
|
1,785 |
|
|
7,201 |
|
|
5,745 |
|
|
— |
|
|
14,527 |
|
|
31,458 |
|
| 60 - 89 Days Past Due |
— |
|
|
2,116 |
|
|
1,465 |
|
|
— |
|
|
143 |
|
|
2,728 |
|
|
6,452 |
|
| 90 Days or More Past Due |
— |
|
|
5,872 |
|
|
— |
|
|
— |
|
|
1,439 |
|
|
5,580 |
|
|
12,891 |
|
|
$ |
365,323 |
|
|
$ |
1,126,812 |
|
|
$ |
2,974,506 |
|
|
$ |
860,121 |
|
|
$ |
297,728 |
|
|
$ |
1,278,523 |
|
|
$ |
6,903,013 |
|
1-4 Single Family Residential credit exposure, excluding government insured residential loans, based on LTV (in thousands):
|
|
|
|
|
|
|
|
|
|
|
|
|
|
|
|
|
|
|
|
|
|
|
|
|
|
|
|
|
|
|
|
|
|
|
|
|
|
|
|
|
|
|
March 31, 2024 |
|
Amortized Cost By Origination Year |
|
|
| LTV |
2024 |
|
2023 |
|
2022 |
|
2021 |
|
2020 |
|
Prior |
|
Total |
| Less than 61% |
$ |
3,734 |
|
|
$ |
63,498 |
|
|
$ |
256,645 |
|
|
$ |
1,190,472 |
|
|
$ |
321,803 |
|
|
$ |
484,128 |
|
|
$ |
2,320,280 |
|
| 61% - 70% |
8,295 |
|
|
67,262 |
|
|
276,274 |
|
|
804,309 |
|
|
216,282 |
|
|
351,977 |
|
|
1,724,399 |
|
| 71% - 80% |
32,772 |
|
|
234,579 |
|
|
570,411 |
|
|
900,665 |
|
|
306,968 |
|
|
646,898 |
|
|
2,692,293 |
|
| More than 80% |
288 |
|
|
— |
|
|
2,071 |
|
|
34,372 |
|
|
71 |
|
|
41,091 |
|
|
77,893 |
|
|
$ |
45,089 |
|
|
$ |
365,339 |
|
|
$ |
1,105,401 |
|
|
$ |
2,929,818 |
|
|
$ |
845,124 |
|
|
$ |
1,524,094 |
|
|
$ |
6,814,865 |
|
|
|
|
|
|
|
|
|
|
|
|
|
|
|
|
|
|
|
|
|
|
|
|
|
|
|
|
|
|
|
|
|
|
|
|
|
|
|
|
|
|
|
|
December 31, 2023 |
|
Amortized Cost By Origination Year |
|
|
| LTV |
2023 |
|
2022 |
|
2021 |
|
2020 |
|
2019 |
|
Prior |
|
Total |
| Less than 61% |
$ |
63,117 |
|
|
$ |
260,403 |
|
|
$ |
1,211,101 |
|
|
$ |
326,771 |
|
|
$ |
72,219 |
|
|
$ |
428,451 |
|
|
$ |
2,362,062 |
|
| 61% - 70% |
67,146 |
|
|
280,602 |
|
|
813,682 |
|
|
221,091 |
|
|
71,652 |
|
|
293,784 |
|
|
1,747,957 |
|
| 71% - 80% |
235,060 |
|
|
583,724 |
|
|
915,166 |
|
|
312,188 |
|
|
148,483 |
|
|
519,699 |
|
|
2,714,320 |
|
| More than 80% |
— |
|
|
2,083 |
|
|
34,557 |
|
|
71 |
|
|
5,374 |
|
|
36,589 |
|
|
78,674 |
|
|
$ |
365,323 |
|
|
$ |
1,126,812 |
|
|
$ |
2,974,506 |
|
|
$ |
860,121 |
|
|
$ |
297,728 |
|
|
$ |
1,278,523 |
|
|
$ |
6,903,013 |
|
Table of Contents
BANKUNITED, INC. AND SUBSIDIARIES
NOTES TO CONSOLIDATED FINANCIAL STATEMENTS - UNAUDITED
March 31, 2024
1-4 Single Family Residential credit exposure, excluding government insured residential loans, based on FICO score (in thousands):
|
|
|
|
|
|
|
|
|
|
|
|
|
|
|
|
|
|
|
|
|
|
|
|
|
|
|
|
|
|
|
|
|
|
|
|
|
|
|
|
|
|
|
March 31, 2024 |
|
Amortized Cost By Origination Year |
|
|
| FICO |
2024 |
|
2023 |
|
2022 |
|
2021 |
|
2020 |
|
Prior |
|
Total |
| 760 or greater |
$ |
32,918 |
|
|
$ |
262,572 |
|
|
$ |
799,670 |
|
|
$ |
2,340,757 |
|
|
$ |
671,972 |
|
|
$ |
1,071,738 |
|
|
$ |
5,179,627 |
|
| 720 - 759 |
9,389 |
|
|
70,612 |
|
|
188,024 |
|
|
375,750 |
|
|
105,189 |
|
|
207,386 |
|
|
956,350 |
|
719 or less or not available |
2,782 |
|
|
32,155 |
|
|
117,707 |
|
|
213,311 |
|
|
67,963 |
|
|
244,970 |
|
|
678,888 |
|
|
$ |
45,089 |
|
|
$ |
365,339 |
|
|
$ |
1,105,401 |
|
|
$ |
2,929,818 |
|
|
$ |
845,124 |
|
|
$ |
1,524,094 |
|
|
$ |
6,814,865 |
|
|
|
|
|
|
|
|
|
|
|
|
|
|
|
|
|
|
|
|
|
|
|
|
|
|
|
|
|
|
|
|
|
|
|
|
|
|
|
|
|
|
|
|
December 31, 2023 |
|
Amortized Cost By Origination Year |
|
|
| FICO |
2023 |
|
2022 |
|
2021 |
|
2020 |
|
2019 |
|
Prior |
|
Total |
| 760 or greater |
$ |
253,774 |
|
|
$ |
810,150 |
|
|
$ |
2,378,572 |
|
|
$ |
696,363 |
|
|
$ |
203,966 |
|
|
$ |
893,290 |
|
|
$ |
5,236,115 |
|
| 720 - 759 |
78,882 |
|
|
194,135 |
|
|
392,179 |
|
|
99,412 |
|
|
50,984 |
|
|
210,663 |
|
|
1,026,255 |
|
719 or less or not available |
32,667 |
|
|
122,527 |
|
|
203,755 |
|
|
64,346 |
|
|
42,778 |
|
|
174,570 |
|
|
640,643 |
|
|
$ |
365,323 |
|
|
$ |
1,126,812 |
|
|
$ |
2,974,506 |
|
|
$ |
860,121 |
|
|
$ |
297,728 |
|
|
$ |
1,278,523 |
|
|
$ |
6,903,013 |
|
Past Due and Non-Accrual Loans:
The following table presents an aging of loans at the dates indicated (in thousands):
|
|
|
|
|
|
|
|
|
|
|
|
|
|
|
|
|
|
|
|
|
|
|
|
|
|
|
|
|
|
|
|
|
|
|
|
|
|
|
|
|
|
|
|
|
|
|
|
|
|
|
|
|
|
|
|
|
|
|
|
| |
March 31, 2024 |
|
December 31, 2023 |
|
|
|
|
| |
Current |
|
30 - 59
Days Past
Due |
|
60 - 89
Days Past
Due |
|
90 Days or
More Past
Due |
|
Total |
|
Current |
|
30 - 59
Days Past
Due |
|
60 - 89
Days Past
Due |
|
90 Days or
More Past
Due |
|
Total |
| CRE |
$ |
5,827,723 |
|
|
$ |
2,332 |
|
|
$ |
— |
|
|
$ |
8,716 |
|
|
$ |
5,838,771 |
|
|
$ |
5,779,309 |
|
|
$ |
27,918 |
|
|
$ |
1,947 |
|
|
$ |
10,059 |
|
|
$ |
5,819,233 |
|
| C&I |
8,603,178 |
|
|
13,084 |
|
|
160 |
|
|
45,851 |
|
|
8,662,273 |
|
|
8,851,585 |
|
|
16,228 |
|
|
5,536 |
|
|
34,375 |
|
|
8,907,724 |
|
| Pinnacle - municipal finance |
864,796 |
|
|
— |
|
|
— |
|
|
— |
|
|
864,796 |
|
|
884,690 |
|
|
— |
|
|
— |
|
|
— |
|
|
884,690 |
|
Franchise and equipment finance |
345,090 |
|
|
1,593 |
|
|
— |
|
|
420 |
|
|
347,103 |
|
|
380,347 |
|
|
— |
|
|
— |
|
|
— |
|
|
380,347 |
|
| Mortgage warehouse lending |
456,385 |
|
|
— |
|
|
— |
|
|
— |
|
|
456,385 |
|
|
432,663 |
|
|
— |
|
|
— |
|
|
— |
|
|
432,663 |
|
| 1-4 single family residential |
6,760,790 |
|
|
36,181 |
|
|
1,279 |
|
|
16,615 |
|
|
6,814,865 |
|
|
6,852,212 |
|
|
31,458 |
|
|
6,452 |
|
|
12,891 |
|
|
6,903,013 |
|
| Government insured residential |
805,859 |
|
|
127,661 |
|
|
53,216 |
|
|
255,371 |
|
|
1,242,107 |
|
|
835,282 |
|
|
131,652 |
|
|
61,942 |
|
|
277,138 |
|
|
1,306,014 |
|
| |
$ |
23,663,821 |
|
|
$ |
180,851 |
|
|
$ |
54,655 |
|
|
$ |
326,973 |
|
|
$ |
24,226,300 |
|
|
$ |
24,016,088 |
|
|
$ |
207,256 |
|
|
$ |
75,877 |
|
|
$ |
334,463 |
|
|
$ |
24,633,684 |
|
Included in the table above is the guaranteed portion of SBA loans past due by 90 days or more totaling $37.8 million ($29.5 million of C&I and $8.3 million of CRE) and $39.7 million at March 31, 2024 and December 31, 2023, respectively.
Loans contractually delinquent by 90 days or more and still accruing totaled $256 million and $278 million at March 31, 2024 and December 31, 2023, respectively, substantially all of which were government insured residential loans. These loans are government insured pool buyout loans, which the Company buys out of GNMA securitizations upon default.
Table of Contents
BANKUNITED, INC. AND SUBSIDIARIES
NOTES TO CONSOLIDATED FINANCIAL STATEMENTS - UNAUDITED
March 31, 2024
The following table presents information about loans on non-accrual status at the dates indicated (in thousands):
|
|
|
|
|
|
|
|
|
|
|
|
|
|
|
|
|
|
|
|
|
|
|
|
|
March 31, 2024 |
|
December 31, 2023 |
|
|
|
|
|
Amortized Cost |
|
Amortized Cost With No Related Allowance |
|
Amortized Cost |
|
Amortized Cost With No Related Allowance |
| CRE |
$ |
12,258 |
|
|
$ |
1,891 |
|
|
$ |
13,727 |
|
|
$ |
1,947 |
|
| C&I |
62,445 |
|
|
9,303 |
|
|
68,533 |
|
|
14,078 |
|
|
|
|
|
|
|
|
|
Franchise and equipment finance |
22,630 |
|
|
7,305 |
|
|
23,678 |
|
|
7,796 |
|
| 1-4 single family residential |
17,847 |
|
|
— |
|
|
20,513 |
|
|
— |
|
|
$ |
115,180 |
|
|
$ |
18,499 |
|
|
$ |
126,451 |
|
|
$ |
23,821 |
|
Included in the table above is the guaranteed portion of non-accrual SBA loans totaling $40.0 million and $41.8 million at March 31, 2024 and December 31, 2023, respectively. The amount of interest income recognized on non-accrual loans was insignificant for the three months ended March 31, 2024 and 2023. The amount of additional interest income that would have been recognized on non-accrual loans had they performed in accordance with their contractual terms was approximately $2.5 million and $1.9 million for the three months ended March 31, 2024 and 2023, respectively.
Collateral dependent loans:
The following table presents the amortized cost basis of collateral dependent loans at the dates indicated (in thousands):
|
|
|
|
|
|
|
|
|
|
|
|
|
|
|
|
|
|
|
|
|
|
|
|
|
March 31, 2024 |
|
December 31, 2023 |
|
Amortized Cost |
|
Extent to Which Secured by Collateral |
|
Amortized Cost |
|
Extent to Which Secured by Collateral |
|
|
|
|
|
|
|
|
| CRE |
$ |
10,995 |
|
|
$ |
10,995 |
|
|
$ |
11,574 |
|
|
$ |
11,574 |
|
| C&I |
45,379 |
|
|
34,711 |
|
|
36,401 |
|
|
25,821 |
|
|
|
|
|
|
|
|
|
Franchise and equipment finance |
22,210 |
|
|
18,330 |
|
|
23,488 |
|
|
18,678 |
|
|
|
|
|
|
|
|
|
|
|
|
|
|
|
|
|
| |
$ |
78,584 |
|
|
$ |
64,036 |
|
|
$ |
71,463 |
|
|
$ |
56,073 |
|
Collateral for the CRE loan class generally consists of commercial real estate, or for certain construction loans, residential real estate. Collateral for C&I loans generally consists of equipment, accounts receivable, inventory and other business assets and for owner-occupied commercial real estate loans, may also include commercial real estate. Franchise and equipment finance loans may be collateralized by franchise value or by equipment. Residential loans are collateralized by residential real estate. There were no significant changes to the extent to which collateral secured collateral dependent loans during the three months ended March 31, 2024.
Foreclosure of residential real estate
The recorded investment in residential loans in the process of foreclosure was $238 million, of which $225 million was government insured at March 31, 2024, and $262 million, of which $250 million was government insured at December 31, 2023. The carrying amount of foreclosed residential real estate included in other assets in the accompanying consolidated balance sheet was insignificant at March 31, 2024 and December 31, 2023.
Table of Contents
BANKUNITED, INC. AND SUBSIDIARIES
NOTES TO CONSOLIDATED FINANCIAL STATEMENTS - UNAUDITED
March 31, 2024
Loan Modifications
The following tables summarize loans that were modified for borrowers experiencing financial difficulty, by type of modification, during the periods indicated (dollars in thousands):
|
|
|
|
|
|
|
|
|
|
|
|
|
|
|
|
|
|
|
|
|
|
|
|
|
|
|
|
|
|
|
|
|
|
|
|
|
|
|
|
|
|
|
|
|
|
|
|
|
|
|
|
|
|
|
Three Months Ended March 31, 2024 |
|
Interest Rate Reduction |
|
Term Extension |
|
|
|
Combination - Interest Rate Reduction and Term Extension |
|
|
|
|
|
|
|
Total |
|
% (1) |
|
Total |
|
% (1) |
|
|
|
|
|
Total |
|
% (1) |
|
|
|
|
|
|
|
|
|
Total |
| CRE |
$ |
— |
|
|
— |
% |
|
$ |
8,486 |
|
|
— |
% |
|
|
|
|
|
$ |
— |
|
|
— |
% |
|
|
|
|
|
|
|
|
|
$ |
8,486 |
|
| C&I |
— |
|
|
— |
% |
|
1,743 |
|
|
— |
% |
|
|
|
|
|
29 |
|
|
— |
% |
|
|
|
|
|
|
|
|
|
1,772 |
|
|
|
|
|
|
|
|
|
|
|
|
|
|
|
|
|
|
|
|
|
|
|
|
|
|
|
|
|
|
|
|
|
|
|
|
|
|
|
|
|
|
|
|
|
|
|
|
|
|
|
|
|
| Government insured residential |
— |
|
|
— |
% |
|
14,422 |
|
|
1 |
% |
|
|
|
|
|
2,623 |
|
|
— |
% |
|
|
|
|
|
|
|
|
|
17,045 |
|
|
$ |
— |
|
|
|
|
$ |
24,651 |
|
|
|
|
|
|
|
|
$ |
2,652 |
|
|
|
|
|
|
|
|
|
|
|
|
$ |
27,303 |
|
|
|
|
|
|
|
|
|
|
|
|
|
|
|
|
|
|
|
|
|
|
|
|
|
|
|
|
|
|
|
|
|
|
|
|
|
|
|
|
|
|
|
|
|
|
|
|
|
|
|
|
|
|
|
|
|
|
|
|
|
|
|
|
|
|
|
|
|
|
|
|
|
|
|
|
|
|
|
|
|
|
|
|
|
|
|
|
|
|
|
|
|
|
|
|
|
|
|
|
|
|
|
|
|
|
|
|
|
|
|
|
|
|
|
|
|
|
|
|
|
|
|
|
|
|
|
|
|
|
|
|
|
|
|
|
|
|
|
|
|
|
|
|
|
|
|
|
|
|
|
|
|
|
|
|
|
|
|
|
|
|
|
|
|
|
|
|
|
|
|
|
|
|
|
|
|
|
|
|
|
|
|
|
|
|
|
|
|
|
|
|
|
|
|
|
|
|
|
|
|
|
|
|
|
|
|
|
|
|
|
|
|
|
|
|
|
|
|
|
|
|
|
|
|
|
|
|
|
|
|
|
|
|
|
|
|
|
|
|
|
|
|
|
|
|
|
|
|
|
|
|
|
|
|
|
|
|
|
|
|
|
|
|
|
|
|
|
|
|
|
|
|
|
|
|
|
|
|
|
|
|
|
|
|
|
|
|
|
|
|
|
|
|
|
|
|
|
|
|
|
|
|
|
|
|
Three Months Ended March 31, 2023 |
|
Interest Rate Reduction |
|
Term Extension |
|
|
|
Combination - Interest Rate Reduction and Term Extension |
|
|
|
|
|
|
|
Total |
|
% (1) |
|
Total |
|
% (1) |
|
|
|
|
|
Total |
|
% (1) |
|
|
|
|
|
|
|
|
|
Total |
|
|
|
|
|
|
|
|
|
|
|
|
|
|
|
|
|
|
|
|
|
|
|
|
|
|
| C&I |
$ |
— |
|
|
— |
% |
|
$ |
4,918 |
|
|
— |
% |
|
|
|
|
|
$ |
— |
|
|
— |
% |
|
|
|
|
|
|
|
|
|
$ |
4,918 |
|
|
|
|
|
|
|
|
|
|
|
|
|
|
|
|
|
|
|
|
|
|
|
|
|
|
|
| 1-4 single family residential |
766 |
|
|
— |
% |
|
— |
|
|
— |
% |
|
|
|
|
|
— |
|
|
— |
% |
|
|
|
|
|
|
|
|
|
766 |
|
| Government insured residential |
109 |
|
|
— |
% |
|
36,920 |
|
|
2 |
% |
|
|
|
|
|
2,312 |
|
|
— |
% |
|
|
|
|
|
|
|
|
|
39,341 |
|
|
$ |
875 |
|
|
|
|
$ |
41,838 |
|
|
|
|
|
|
|
|
$ |
2,312 |
|
|
|
|
|
|
|
|
|
|
|
|
$ |
45,025 |
|
|
|
|
|
|
|
|
|
|
|
|
|
|
|
|
|
|
|
|
|
|
|
|
|
|
|
|
|
|
|
|
|
|
|
|
|
|
|
|
|
|
|
|
|
|
|
|
|
|
|
|
|
|
|
|
|
|
|
|
|
|
|
|
|
|
|
|
|
|
|
|
|
|
|
|
|
|
|
|
|
|
|
|
|
|
|
|
|
|
|
|
|
|
|
|
|
|
|
|
|
|
|
|
|
|
|
|
|
|
|
|
|
|
|
|
|
|
|
|
|
|
|
|
|
|
|
|
|
|
|
|
|
|
|
|
|
|
|
|
|
|
|
|
|
|
|
|
|
|
|
|
|
|
|
|
|
|
|
|
|
|
|
|
|
|
|
|
|
|
|
|
|
|
|
|
|
|
|
|
|
|
|
|
|
|
|
|
|
|
|
|
|
|
|
|
|
|
|
|
|
|
|
|
|
|
|
|
|
|
|
|
|
|
|
|
|
|
|
|
|
|
|
|
|
|
|
|
|
|
|
|
|
|
|
|
|
|
|
|
|
|
|
|
|
|
|
|
|
|
|
(1)Represents percentage of loans receivable in each category.
The following tables summarize the financial effect of the modifications made to borrowers experiencing difficulty, during the periods indicated:
|
|
|
|
|
|
|
|
|
|
|
|
|
|
|
|
|
|
|
|
|
|
|
Three Months Ended March 31, 2024 |
|
|
|
|
|
|
|
|
|
|
|
|
|
|
Financial Effect |
|
|
|
|
|
|
|
|
|
|
|
|
|
|
|
|
|
|
|
|
|
|
|
|
|
|
|
|
|
|
|
|
|
|
|
|
|
|
|
|
|
|
|
|
|
|
|
|
|
|
|
|
|
|
|
|
|
|
|
|
|
|
|
|
|
|
|
|
|
|
|
|
|
|
|
|
|
|
|
|
|
|
|
|
|
|
|
|
|
|
|
|
|
|
|
|
|
|
|
|
|
|
|
|
|
|
|
|
|
|
|
|
|
|
|
|
|
| Term Extension: |
|
|
|
|
|
|
|
|
|
|
|
|
|
|
| CRE |
|
Added a weighted average 0.2 years to the term of the modified loans. |
|
|
|
|
|
|
|
|
|
|
|
|
| C&I |
|
Added a weighted average 0.3 years to the term of the modified loans. |
|
|
|
|
|
|
|
|
|
|
|
|
|
|
|
|
|
|
|
|
|
|
|
|
|
|
|
| Government insured residential |
|
Added a weighted average 11.2 years to the term of the modified loans. |
|
|
|
|
|
|
|
|
|
|
|
|
|
|
|
|
|
|
|
|
|
|
|
|
|
|
|
| Combination - Interest Rate Reduction and Term Extension: |
|
|
|
|
|
|
|
|
|
|
|
|
|
|
|
|
|
|
|
|
|
|
|
|
|
|
|
|
|
|
|
|
|
|
|
|
|
|
|
|
|
|
|
|
| C&I |
|
Reduced weighted average contractual interest rate from 21.2% to 5.0% and added a weighted average 2.2 years to the term of the modified loans. |
|
|
|
|
|
|
|
|
|
|
|
|
|
|
|
|
|
|
|
|
|
|
|
|
|
|
|
| Government insured residential |
|
Reduced weighted average contractual interest rate from 6.8% to 6.4% and added a weighted average 3.7 years to the term of the modified loans. |
|
|
|
|
|
|
|
|
|
|
|
|
|
|
|
|
|
|
|
|
|
|
|
|
|
|
|
|
|
|
|
|
|
|
|
|
|
|
|
|
|
|
|
|
|
|
|
|
|
|
|
|
|
|
|
|
|
|
|
|
|
|
|
|
|
|
|
|
|
|
|
|
|
|
|
|
|
|
|
|
|
|
|
|
|
|
|
|
|
|
|
|
|
|
|
|
|
|
|
|
|
|
|
|
|
|
|
|
|
|
|
|
|
|
|
|
|
|
|
|
|
|
|
|
|
|
|
|
|
|
|
|
|
|
|
|
|
|
|
|
|
|
|
|
|
|
|
|
|
|
|
|
|
|
|
|
|
|
|
|
|
|
|
|
|
|
|
|
|
|
|
|
|
|
|
|
|
|
|
|
|
|
|
|
|
|
|
|
|
|
|
|
|
|
|
|
|
|
|
|
|
|
|
|
|
|
|
|
|
|
|
|
|
|
|
|
|
|
|
|
|
|
|
|
|
|
|
|
|
|
|
|
|
|
|
|
|
|
|
|
|
|
|
|
|
|
|
|
|
|
|
|
|
|
|
|
|
|
|
|
|
|
|
|
|
|
|
|
|
|
|
|
|
|
|
|
|
|
|
|
|
|
|
|
|
|
|
|
|
|
|
|
|
|
|
|
|
|
|
|
|
|
|
|
|
|
|
|
|
|
|
|
|
|
|
|
|
|
|
|
|
|
|
|
|
|
|
|
|
|
|
|
|
|
|
|
|
|
|
|
|
|
|
|
|
|
|
|
|
|
|
|
|
|
|
|
|
|
|
|
|
|
|
|
|
|
|
|
|
|
|
|
|
|
|
|
|
|
|
|
|
|
|
|
|
|
|
|
|
|
|
|
|
|
|
|
|
|
|
|
|
|
Table of Contents
BANKUNITED, INC. AND SUBSIDIARIES
NOTES TO CONSOLIDATED FINANCIAL STATEMENTS - UNAUDITED
March 31, 2024
|
|
|
|
|
|
|
|
|
|
|
Three Months Ended March 31, 2023 |
|
|
Financial Effect |
| Interest Rate Reduction: |
|
|
| 1-4 single family residential |
|
Reduced weighted average contractual interest rate from 3.8% to 3.1%. |
| Government insured residential |
|
Reduced weighted average contractual interest rate from 4.8% to 3.8%. |
|
|
|
|
|
|
|
|
|
|
|
|
| Term Extension: |
|
|
|
|
|
|
|
|
| C&I |
|
Added a weighted average 0.7 years to the term of the modified loans. |
|
|
|
| Government insured residential |
|
Added a weighted average 9.6 years to the term of the modified loans. |
| Combination - Interest Rate Reduction and Term Extension: |
|
|
|
|
|
| Government insured residential |
|
Reduced weighted average contractual interest rate from 5.8% to 4.9% and added a weighted average 6.9 years to the term of the modified loans. |
|
|
|
|
|
|
|
|
|
|
|
|
|
|
|
|
|
|
|
|
|
|
|
|
|
|
|
|
|
|
|
|
|
|
|
|
|
|
|
|
|
|
|
|
|
|
|
|
|
|
|
|
|
|
|
|
|
|
|
|
|
|
|
|
|
|
|
|
|
|
|
|
|
|
|
|
|
|
|
|
|
|
|
|
|
|
|
The following tables present the aging at March 31, 2024, of loans that were modified within the previous 12 months, and at March 31, 2023, of loans that were modified since January 1, 2023, the date of adoption of ASU 2022-02 (in thousands):
|
|
|
|
|
|
|
|
|
|
|
|
|
|
|
|
|
|
|
|
|
|
|
|
|
|
|
|
|
|
|
|
|
|
|
|
|
|
|
|
|
|
|
March 31, 2024 |
|
|
|
|
|
|
|
|
|
Current |
|
30-59 Days Past Due |
|
60-89 Days Past Due |
|
90 Days or More Past Due |
|
Total |
|
|
|
|
|
|
|
|
|
|
|
|
|
|
|
|
|
|
|
|
|
|
|
|
|
|
|
|
|
|
|
|
|
|
|
|
|
|
|
|
|
|
|
|
|
|
|
|
|
|
|
|
|
|
|
|
| CRE |
$ |
8,486 |
|
|
$ |
— |
|
|
$ |
— |
|
|
$ |
— |
|
|
$ |
8,486 |
|
|
|
|
|
|
|
|
|
|
|
|
|
| C&I |
3,953 |
|
|
— |
|
|
— |
|
|
— |
|
|
3,953 |
|
|
|
|
|
|
|
|
|
|
|
|
|
| Franchise and equipment finance |
10,425 |
|
|
— |
|
|
— |
|
|
— |
|
|
10,425 |
|
|
|
|
|
|
|
|
|
|
|
|
|
| 1-4 single family residential |
74 |
|
|
— |
|
|
— |
|
|
— |
|
|
74 |
|
|
|
|
|
|
|
|
|
|
|
|
|
| Government insured residential |
17,123 |
|
|
9,001 |
|
|
4,439 |
|
|
20,974 |
|
|
51,537 |
|
|
|
|
|
|
|
|
|
|
|
|
|
|
$ |
40,061 |
|
|
$ |
9,001 |
|
|
$ |
4,439 |
|
|
$ |
20,974 |
|
|
$ |
74,475 |
|
|
|
|
|
|
|
|
|
|
|
|
|
|
|
|
|
|
|
|
|
|
|
|
|
|
|
|
|
|
|
|
|
|
|
|
|
|
|
|
|
|
|
|
|
|
|
|
|
|
|
|
|
|
|
|
March 31, 2023 |
|
|
|
|
|
|
|
|
|
Current |
|
30-59 Days Past Due |
|
60-89 Days Past Due |
|
90 Days or More Past Due |
|
Total |
|
|
|
|
|
|
|
|
|
|
|
|
|
|
|
|
|
|
|
|
|
|
|
|
|
|
|
|
|
|
|
|
|
|
|
|
|
|
|
|
|
|
|
|
|
|
|
|
|
|
|
|
|
|
|
|
|
|
|
|
|
|
|
|
|
|
|
|
|
|
|
|
|
|
|
|
|
|
| C&I |
$ |
4,918 |
|
|
$ |
— |
|
|
$ |
— |
|
|
$ |
— |
|
|
$ |
4,918 |
|
|
|
|
|
|
|
|
|
|
|
|
|
|
|
|
|
|
|
|
|
|
|
|
|
|
|
|
|
|
|
|
|
|
|
| 1-4 single family residential |
766 |
|
|
— |
|
|
— |
|
|
— |
|
|
766 |
|
|
|
|
|
|
|
|
|
|
|
|
|
| Government insured residential |
22,346 |
|
|
11,083 |
|
|
4,683 |
|
|
1,229 |
|
|
39,341 |
|
|
|
|
|
|
|
|
|
|
|
|
|
|
$ |
28,030 |
|
|
$ |
11,083 |
|
|
$ |
4,683 |
|
|
$ |
1,229 |
|
|
$ |
45,025 |
|
|
|
|
|
|
|
|
|
|
|
|
|
The following tables summarize loans that were modified within the previous 12 months and defaulted during the periods indicated (in thousands):
|
|
|
|
|
|
|
|
|
|
|
|
|
|
|
|
|
|
|
|
|
|
|
|
|
|
|
|
|
|
|
Three Months Ended March 31, 2024 |
|
Interest Rate Reduction |
|
Term Extension |
|
|
|
Combination - Interest Rate Reduction and Term Extension |
|
|
|
|
|
Total |
|
|
|
|
|
|
|
|
|
|
|
|
|
|
| Government insured residential |
$ |
— |
|
|
$ |
10,262 |
|
|
|
|
$ |
— |
|
|
|
|
|
|
$ |
10,262 |
|
|
|
|
|
|
|
|
|
|
|
|
|
|
|
|
|
|
|
|
|
|
|
|
|
|
|
|
|
|
|
|
|
|
|
|
|
|
|
|
|
|
|
|
|
|
|
|
|
|
|
|
|
|
|
|
|
|
|
|
|
|
|
|
|
|
|
|
|
|
|
|
|
|
|
|
|
|
|
|
|
|
|
|
|
|
|
|
|
|
|
|
|
|
|
|
|
|
|
|
|
|
|
|
|
|
|
|
|
|
|
|
|
|
|
|
|
|
|
|
|
|
|
|
|
|
|
|
|
|
|
|
|
|
|
|
|
|
|
|
|
|
|
|
|
|
|
|
|
|
|
|
|
|
|
|
|
|
|
|
|
|
|
|
|
|
|
|
|
|
|
|
|
|
Three Months Ended March 31, 2023 |
|
Interest Rate Reduction |
|
Term Extension |
|
|
|
Combination - Interest Rate Reduction and Term Extension |
|
|
|
|
|
Total |
|
|
|
|
|
|
|
|
|
|
|
|
|
|
| Government insured residential |
$ |
109 |
|
|
$ |
5,070 |
|
|
|
|
$ |
733 |
|
|
|
|
|
|
$ |
5,912 |
|
|
|
|
|
|
|
|
|
|
|
|
|
|
|
|
|
|
|
|
|
|
|
|
|
|
|
|
|
|
|
|
|
|
|
|
|
|
|
|
|
|
|
|
|
|
|
|
|
|
|
|
|
|
|
|
|
|
|
|
|
|
|
|
|
|
|
|
|
|
|
|
|
|
|
|
|
|
|
|
|
|
|
|
|
|
|
|
|
|
|
|
|
|
|
|
|
|
|
|
|
|
|
|
|
|
|
|
|
|
|
|
|
|
|
|
|
|
|
|
|
|
|
|
|
|
|
|
|
|
|
|
|
|
|
|
|
|
|
|
|
|
|
|
|
|
|
|
|
|
|
|
|
|
|
|
|
|
|
|
|
|
|
|
|
|
|
|
|
|
|
|
|
|
|
|
|
|
|
|
|
|
|
|
|
|
|
|
|
|
|
|
|
|
|
|
|
|
|
Table of Contents
BANKUNITED, INC. AND SUBSIDIARIES
NOTES TO CONSOLIDATED FINANCIAL STATEMENTS - UNAUDITED
March 31, 2024
Note 5 Income Taxes
The Company’s effective income tax rate was 28.6% and 26.4% for the three months ended March 31, 2024 and 2023, respectively. The effective income tax rates differed from the statutory federal income tax rate of 21% for the three months ended March 31, 2024 and 2023 primarily due to the impact of state income taxes, partially offset by the benefit of income not subject to federal tax. The effective income tax rate for the three months ended March 31, 2024, also included the impact of a discrete item related to equity based compensation.
Note 6 Derivative Financial Instruments
Derivatives designated as hedging instruments
The Company has entered into interest rate derivatives designated as (i) cash flow hedges with the objective of limiting the variability of interest payment cash flows and (ii) fair value hedges designed to hedge changes in the fair value of outstanding fixed rate instruments caused by fluctuations in the benchmark interest rate. Changes in fair value of derivative instruments designated as cash flow hedges are reported in accumulated other comprehensive income. Changes in the fair value of derivative instruments designated as fair value hedges are recognized in earnings, as is the offsetting gain or loss on the hedged item.
The following table summarizes the Company's derivatives designated as hedging instruments as of the dates indicated (in thousands):
|
|
|
|
|
|
|
|
|
|
|
|
|
|
|
|
|
|
|
|
|
|
|
|
|
|
|
|
|
|
|
|
|
|
|
|
| |
March 31, 2024 |
|
December 31, 2023 |
|
|
|
|
| |
Notional Amount |
|
Fair Value(1) |
|
Notional Amount |
|
Fair Value(1) |
| |
|
Asset |
|
Liability |
|
|
Asset |
|
Liability |
| Derivatives designated as cash flow hedges: |
|
|
|
|
|
|
|
|
|
|
|
| Interest rate swaps |
$ |
2,855,000 |
|
|
$ |
— |
|
|
$ |
(3,051) |
|
|
$ |
3,215,000 |
|
|
$ |
— |
|
|
$ |
(1,048) |
|
| Interest rate caps purchased |
200,000 |
|
|
9,647 |
|
|
— |
|
|
200,000 |
|
|
10,157 |
|
|
— |
|
Interest rate collar |
125,000 |
|
|
— |
|
|
(139) |
|
|
125,000 |
|
|
84 |
|
|
— |
|
| Derivatives designated as fair value hedges: |
|
|
|
|
|
|
|
|
|
|
|
Interest rate swaps |
100,000 |
|
|
— |
|
|
— |
|
|
100,000 |
|
|
— |
|
|
— |
|
| |
$ |
3,280,000 |
|
|
$ |
9,647 |
|
|
$ |
(3,190) |
|
|
$ |
3,640,000 |
|
|
$ |
10,241 |
|
|
$ |
(1,048) |
|
(1)The fair values of derivatives are included in other assets or other liabilities in the consolidated balance sheets.
Derivatives designated as cash flow hedges
The following table provides information about the amount of gain (loss) related to derivatives designated as cash flow hedges reclassified from AOCI into interest income or expense for the periods indicated (in thousands):
|
|
|
|
|
|
|
|
|
|
|
|
|
|
|
|
|
|
|
|
|
|
|
|
|
|
|
|
|
Three Months Ended March 31, |
|
|
|
|
|
|
|
|
|
2024 |
|
2023 |
|
|
| Location of gain (loss) reclassified from AOCI into income: |
|
|
|
|
|
|
|
|
|
|
|
|
|
|
| Interest expense on borrowings |
|
|
|
|
|
|
|
|
|
$ |
15,712 |
|
|
$ |
7,497 |
|
|
|
| Interest expense on deposits |
|
|
|
|
|
|
|
|
|
4,926 |
|
|
5,049 |
|
|
|
| Interest income on loans |
|
|
|
|
|
|
|
|
|
(816) |
|
|
(392) |
|
|
|
|
|
|
|
|
|
|
|
|
|
$ |
19,822 |
|
|
$ |
12,154 |
|
|
|
During the three months ended March 31, 2024 and 2023, no derivative positions designated as cash flow hedges were discontinued and none of the gains and losses reported in AOCI were reclassified into earnings as a result of the discontinuance of cash flow hedges or because of the early extinguishment of debt.
As of March 31, 2024, the amount of net gain expected to be reclassified from AOCI into earnings during the next twelve months was $39.4 million, based on the forward curve. See Note 7 to the consolidated financial statements for additional information about the reclassification adjustments from AOCI into earnings.
Table of Contents
BANKUNITED, INC. AND SUBSIDIARIES
NOTES TO CONSOLIDATED FINANCIAL STATEMENTS - UNAUDITED
March 31, 2024
Derivatives designated as fair value hedges
The amount of gain (loss) related to derivatives designated as fair value hedges recognized in earnings was insignificant for all applicable periods. The following table provides information about the hedged items related to derivatives designated as fair value hedges at the date indicated (in thousands):
|
|
|
|
|
|
|
|
|
|
|
|
|
|
|
|
|
|
|
March 31, 2024 |
|
December 31, 2023 |
|
Location in Consolidated Balance Sheets |
Contractual balance outstanding of hedged item (1) |
$ |
100,000 |
|
|
$ |
100,000 |
|
|
Loans |
| Cumulative fair value hedging adjustments |
$ |
(1,022) |
|
|
$ |
(1,656) |
|
|
Loans |
(1)This amount is included in the amortized cost basis of a closed portfolio of loans used to designate hedging relationships in a portfolio layer method hedge in which the hedged item is anticipated to be outstanding for the designated hedge period. The amortized cost basis of the closed portfolio used in this hedging relationship was $976 million and $992 million, respectively, at March 31, 2024 and December 31, 2023.
Derivatives not designated as hedging instruments
The Company enters into interest rate derivative contracts with certain of its commercial borrowers to enable those borrowers to manage their exposure to interest rate fluctuations. To mitigate interest rate risk associated with these derivative contracts, the Company enters into offsetting derivative contract positions with primary dealers. The Company also purchases and sells credit protection under RPAs with the objective of sharing with financial institution counterparties some of the credit exposure related to interest rate derivative contracts entered into with commercial borrowers related to participations purchased or sold. The Company will make or receive payments under these agreements if a customer defaults on an obligation to perform under certain interest rate derivative contracts. These interest rate derivative contracts are not designated as hedging instruments; therefore, changes in the fair value of these derivatives are recognized immediately in earnings. The impact on earnings related to changes in fair value of these derivatives was not material for the three months ended March 31, 2024 and 2023.
The Company may be exposed to credit risk in the event of non-performance by the counterparties to its interest rate derivative agreements. The Company assesses the credit risk of its financial institution counterparties by monitoring publicly available credit rating and financial information. The Company manages dealer credit risk by entering into interest rate derivatives only with primary and highly rated counterparties, the use of ISDA master agreements, central clearing mechanisms and counterparty limits. The agreements contain bilateral collateral arrangements with the amount of collateral to be posted generally governed by the settlement value of outstanding swaps. The Company manages the risk of default by its commercial borrower counterparties through its normal loan underwriting and credit monitoring policies and procedures. The Company does not currently anticipate any significant losses from failure of interest rate derivative counterparties to honor their obligations.
The following table summarizes the Company's derivatives not designated as hedging instruments as of the dates indicated (in thousands):
|
|
|
|
|
|
|
|
|
|
|
|
|
|
|
|
|
|
|
|
|
|
|
|
|
|
|
|
|
|
|
|
|
|
|
|
| |
March 31, 2024 |
|
December 31, 2023 |
|
|
|
|
| |
Notional Amount |
|
Fair Value(1) |
|
Notional Amount |
|
Fair Value(1) |
| |
|
Asset |
|
Liability |
|
|
Asset |
|
Liability |
|
|
|
|
|
|
|
|
|
|
|
|
| Pay-fixed interest rate swaps |
$ |
2,227,542 |
|
|
$ |
93,495 |
|
|
$ |
(6,958) |
|
|
$ |
2,166,813 |
|
|
$ |
76,793 |
|
|
$ |
(16,702) |
|
| Pay-variable interest rate swaps |
2,227,542 |
|
|
6,958 |
|
|
(93,495) |
|
|
2,166,813 |
|
|
16,702 |
|
|
(77,257) |
|
| Interest rate caps purchased |
65,610 |
|
|
2,110 |
|
|
— |
|
|
65,610 |
|
|
1,922 |
|
|
— |
|
| Interest rate caps sold |
65,610 |
|
|
— |
|
|
(2,110) |
|
|
65,610 |
|
|
— |
|
|
(1,922) |
|
RPAs purchased |
78,838 |
|
|
24 |
|
|
— |
|
|
77,846 |
|
|
20 |
|
|
— |
|
RPAs sold |
335,868 |
|
|
— |
|
|
(292) |
|
|
284,910 |
|
|
— |
|
|
(237) |
|
| |
$ |
5,001,010 |
|
|
$ |
102,587 |
|
|
$ |
(102,855) |
|
|
$ |
4,827,602 |
|
|
$ |
95,437 |
|
|
$ |
(96,118) |
|
(1)Fair values of these derivatives are included in other assets and other liabilities in the consolidated balance sheets.
Table of Contents
BANKUNITED, INC. AND SUBSIDIARIES
NOTES TO CONSOLIDATED FINANCIAL STATEMENTS - UNAUDITED
March 31, 2024
Some of the Company’s ISDA master agreements with financial institution counterparties contain provisions that permit either counterparty to terminate the agreements and require settlement in the event that regulatory capital ratios fall below certain designated thresholds, upon the initiation of other defined regulatory actions or upon suspension or withdrawal of the Bank’s credit rating. Currently, there are no circumstances that would trigger these provisions of the agreements.
Master netting agreements
The Company does not offset assets and liabilities under master netting agreements for financial reporting purposes. Information on interest rate swaps and caps subject to these agreements is as follows at the dates indicated (in thousands):
|
|
|
|
|
|
|
|
|
|
|
|
|
|
|
|
|
|
|
|
|
|
|
|
|
|
|
|
|
|
|
|
|
|
|
|
| |
March 31, 2024 |
|
|
| |
|
|
Gross Amounts Offset in Balance
Sheet |
|
Net Amounts Presented in
Balance Sheet |
|
Gross Amounts Not Offset in
Balance Sheet |
|
|
| |
Gross Amounts
Recognized |
|
|
|
Derivative
Instruments |
|
Collateral
Pledged |
|
Net Amount |
| Derivative assets |
$ |
105,252 |
|
|
$ |
— |
|
|
$ |
105,252 |
|
|
$ |
(10,148) |
|
|
$ |
(94,946) |
|
|
$ |
158 |
|
| Derivative liabilities |
(10,148) |
|
|
— |
|
|
(10,148) |
|
|
10,148 |
|
|
— |
|
|
— |
|
| |
$ |
95,104 |
|
|
$ |
— |
|
|
$ |
95,104 |
|
|
$ |
— |
|
|
$ |
(94,946) |
|
|
$ |
158 |
|
|
|
|
|
|
|
|
|
|
|
|
|
|
|
|
|
|
|
|
|
|
|
|
|
|
|
|
|
|
|
|
|
|
|
|
|
| |
December 31, 2023 |
|
|
| |
|
|
Gross Amounts Offset in Balance
Sheet |
|
Net Amounts Presented in
Balance Sheet |
|
Gross Amounts Not Offset in
Balance Sheet |
|
|
| |
Gross Amounts
Recognized |
|
|
|
Derivative
Instruments |
|
Collateral
Pledged |
|
Net Amount |
| Derivative assets |
$ |
88,956 |
|
|
$ |
— |
|
|
$ |
88,956 |
|
|
$ |
(15,154) |
|
|
$ |
(73,730) |
|
|
$ |
72 |
|
| Derivative liabilities |
(17,750) |
|
|
— |
|
|
(17,750) |
|
|
15,154 |
|
|
2,596 |
|
|
— |
|
|
$ |
71,206 |
|
|
$ |
— |
|
|
$ |
71,206 |
|
|
$ |
— |
|
|
$ |
(71,134) |
|
|
$ |
72 |
|
The difference between the amounts reported for interest rate swaps subject to master netting agreements and the total fair value of interest rate contract derivative financial instruments reported in the consolidated balance sheets is related to interest rate derivative contracts not subject to master netting agreements.
Table of Contents
BANKUNITED, INC. AND SUBSIDIARIES
NOTES TO CONSOLIDATED FINANCIAL STATEMENTS - UNAUDITED
March 31, 2024
Note 7 Stockholders’ Equity
Accumulated Other Comprehensive Income
Changes in other comprehensive income are summarized as follows for the periods indicated (in thousands):
|
|
|
|
|
|
|
|
|
|
|
|
|
|
|
|
|
|
|
|
|
|
|
|
|
|
|
|
|
|
|
|
|
|
|
|
|
Three Months Ended March 31, |
| |
2024 |
|
2023 |
| |
Before Tax |
|
Tax Effect |
|
Net of Tax |
|
Before Tax |
|
Tax Effect |
|
Net of Tax |
Unrealized gains (losses) on investment securities available for sale: |
|
|
|
|
|
|
|
|
|
|
|
Net unrealized holding gains arising during the period |
$ |
36,400 |
|
|
$ |
(9,464) |
|
|
$ |
26,936 |
|
|
$ |
101,265 |
|
|
$ |
(26,329) |
|
|
$ |
74,936 |
|
Amounts reclassified to (gain) loss on investment securities available for sale, net |
28 |
|
|
(7) |
|
|
21 |
|
|
(752) |
|
|
196 |
|
|
(556) |
|
Net change in unrealized gains (losses) on investment securities available for sale |
36,428 |
|
|
(9,471) |
|
|
26,957 |
|
|
100,513 |
|
|
(26,133) |
|
|
74,380 |
|
| Unrealized gains (losses) on derivative instruments: |
|
|
|
|
|
|
|
|
|
|
|
Net unrealized holding gains (losses) arising during the period |
28,654 |
|
|
(7,450) |
|
|
21,204 |
|
|
(2,926) |
|
|
761 |
|
|
(2,165) |
|
| Amounts reclassified to interest expense on deposits |
(4,926) |
|
|
1,281 |
|
|
(3,645) |
|
|
(5,049) |
|
|
1,313 |
|
|
(3,736) |
|
Amounts reclassified to interest expense on borrowings |
(15,712) |
|
|
4,085 |
|
|
(11,627) |
|
|
(7,497) |
|
|
1,949 |
|
|
(5,548) |
|
| Amounts reclassified to interest income on loans |
816 |
|
|
(212) |
|
|
604 |
|
|
392 |
|
|
(102) |
|
|
290 |
|
|
|
|
|
|
|
|
|
|
|
|
|
| Net change in unrealized gains (losses) on derivative instruments |
8,832 |
|
|
(2,296) |
|
|
6,536 |
|
|
(15,080) |
|
|
3,921 |
|
|
(11,159) |
|
Other comprehensive income |
$ |
45,260 |
|
|
$ |
(11,767) |
|
|
$ |
33,493 |
|
|
$ |
85,433 |
|
|
$ |
(22,212) |
|
|
$ |
63,221 |
|
The categories of AOCI and changes therein are presented below for the periods indicated (in thousands):
|
|
|
|
|
|
|
|
|
|
|
|
|
|
|
|
|
|
|
|
|
Unrealized Loss on
Investment Securities
Available for Sale
|
|
Unrealized Gain
on Derivative
Instruments
|
|
Total |
|
|
|
|
|
|
|
|
|
|
|
|
|
|
|
|
|
|
|
|
|
|
|
|
|
|
|
|
|
|
Balance at December 31, 2023 |
$ |
(395,746) |
|
|
$ |
38,325 |
|
|
$ |
(357,421) |
|
Other comprehensive income |
26,957 |
|
|
6,536 |
|
|
33,493 |
|
| Balance at March 31, 2024 |
$ |
(368,789) |
|
|
$ |
44,861 |
|
|
$ |
(323,928) |
|
|
|
|
|
|
|
Balance at December 31, 2022 |
$ |
(498,911) |
|
|
$ |
61,006 |
|
|
$ |
(437,905) |
|
| Other comprehensive income (loss) |
74,380 |
|
|
(11,159) |
|
|
63,221 |
|
| Balance at March 31, 2023 |
$ |
(424,531) |
|
|
$ |
49,847 |
|
|
$ |
(374,684) |
|
Table of Contents
BANKUNITED, INC. AND SUBSIDIARIES
NOTES TO CONSOLIDATED FINANCIAL STATEMENTS - UNAUDITED
March 31, 2024
Note 8 Fair Value Measurements
Assets and liabilities measured at fair value on a recurring basis
The following is a description of the methodologies used to estimate the fair values of assets and liabilities measured at fair value on a recurring basis and the level within the fair value hierarchy in which those measurements are typically classified.
Investment securities available for sale and marketable equity securities—Fair value measurements are based on quoted prices in active markets when available; these measurements are classified within level 1 of the fair value hierarchy. These securities typically include U.S. Treasury securities and certain preferred stocks. If quoted prices in active markets are not available, fair values are estimated using quoted prices of securities with similar characteristics, quoted prices of identical securities in less active markets, discounted cash flow techniques, or matrix pricing models. These securities are generally classified within level 2 of the fair value hierarchy and include U.S. Government agency securities, U.S. Government agency and sponsored enterprise MBS, preferred stock investments for which level 1 valuations are not available, non-mortgage asset-backed securities, single family real estate-backed securities, private label residential MBS and CMOs, private label commercial MBS, collateralized loan obligations and state and municipal obligations. Pricing of these securities is generally primarily spread driven. Observable inputs that may impact the valuation of these securities include benchmark yield curves, credit spreads, reported trades, dealer quotes, bids, issuer spreads, current rating, historical constant prepayment rates, historical voluntary prepayment rates, structural and waterfall features of individual securities, published collateral data, and for certain securities, historical constant default rates and default severities.
The Company uses third-party pricing services in determining fair value measurements for investment securities. To obtain an understanding of the methodologies and assumptions used, management reviews written documentation provided by the pricing services, conducts interviews with valuation desk personnel and reviews model results and detailed assumptions used to value selected securities as considered necessary. Management has established a robust price challenge process that includes a review by the treasury front office of all prices provided on a quarterly basis. Any price evidencing unexpected quarter over quarter fluctuations or deviations from expectations is challenged. If considered necessary to resolve any discrepancies, a price will be obtained from an additional independent valuation source. The Company does not typically adjust the prices provided, other than through this established challenge process. The results of price challenges are subject to review by executive management. Any price discrepancies are resolved based on careful consideration of the assumptions and inputs employed by each of the pricing sources.
Derivative financial instruments—Fair values of interest rate derivatives are determined using widely accepted discounted cash flow modeling techniques. These discounted cash flow models use projections of future cash payments and receipts that are discounted at mid-market rates. Observable inputs that may impact the valuation of these instruments include benchmark swap rates and benchmark forward yield curves. These fair value measurements are generally classified within level 2 of the fair value hierarchy.
Table of Contents
BANKUNITED, INC. AND SUBSIDIARIES
NOTES TO CONSOLIDATED FINANCIAL STATEMENTS - UNAUDITED
March 31, 2024
The following tables present assets and liabilities measured at fair value on a recurring basis at the dates indicated (in thousands):
|
|
|
|
|
|
|
|
|
|
|
|
|
|
|
|
|
|
| |
March 31, 2024 |
| |
Level 1 |
|
Level 2 |
|
Total |
| Investment securities available for sale: |
|
|
|
|
|
| U.S. Treasury securities |
$ |
130,290 |
|
|
$ |
— |
|
|
$ |
130,290 |
|
| U.S. Government agency and sponsored enterprise residential MBS |
— |
|
|
2,161,292 |
|
|
2,161,292 |
|
| U.S. Government agency and sponsored enterprise commercial MBS |
— |
|
|
494,207 |
|
|
494,207 |
|
|
|
|
|
|
|
| Private label residential MBS and CMOs |
— |
|
|
2,250,219 |
|
|
2,250,219 |
|
| Private label commercial MBS |
— |
|
|
2,122,271 |
|
|
2,122,271 |
|
| Single family real estate-backed securities |
— |
|
|
341,362 |
|
|
341,362 |
|
| Collateralized loan obligations |
— |
|
|
1,076,492 |
|
|
1,076,492 |
|
| Non-mortgage asset-backed securities |
— |
|
|
100,124 |
|
|
100,124 |
|
| State and municipal obligations |
— |
|
|
106,713 |
|
|
106,713 |
|
| SBA securities |
— |
|
|
98,465 |
|
|
98,465 |
|
|
|
|
|
|
|
| Marketable equity securities |
33,524 |
|
|
— |
|
|
33,524 |
|
|
|
|
|
|
|
| Derivative assets |
— |
|
|
112,234 |
|
|
112,234 |
|
| Total assets at fair value |
$ |
163,814 |
|
|
$ |
8,863,379 |
|
|
$ |
9,027,193 |
|
| Derivative liabilities |
$ |
— |
|
|
$ |
(106,045) |
|
|
$ |
(106,045) |
|
| Total liabilities at fair value |
$ |
— |
|
|
$ |
(106,045) |
|
|
$ |
(106,045) |
|
|
|
|
|
|
|
|
|
|
|
|
|
|
|
|
|
|
|
| |
December 31, 2023 |
|
|
| |
Level 1 |
|
Level 2 |
|
Total |
| Investment securities available for sale: |
|
|
|
|
|
U.S. Treasury securities |
$ |
130,592 |
|
|
$ |
— |
|
|
$ |
130,592 |
|
| U.S. Government agency and sponsored enterprise residential MBS |
— |
|
|
1,924,207 |
|
|
1,924,207 |
|
| U.S. Government agency and sponsored enterprise commercial MBS |
— |
|
|
497,859 |
|
|
497,859 |
|
|
|
|
|
|
|
| Private label residential MBS and CMOs |
— |
|
|
2,295,730 |
|
|
2,295,730 |
|
| Private label commercial MBS |
— |
|
|
2,198,743 |
|
|
2,198,743 |
|
| Single family real estate-backed securities |
— |
|
|
366,255 |
|
|
366,255 |
|
| Collateralized loan obligations |
— |
|
|
1,112,824 |
|
|
1,112,824 |
|
| Non-mortgage asset-backed securities |
— |
|
|
102,780 |
|
|
102,780 |
|
| State and municipal obligations |
— |
|
|
102,618 |
|
|
102,618 |
|
| SBA securities |
— |
|
|
103,024 |
|
|
103,024 |
|
|
|
|
|
|
|
| Marketable equity securities |
32,722 |
|
|
— |
|
|
32,722 |
|
|
|
|
|
|
|
| Derivative assets |
— |
|
|
105,678 |
|
|
105,678 |
|
| Total assets at fair value |
$ |
163,314 |
|
|
$ |
8,809,718 |
|
|
$ |
8,973,032 |
|
| Derivative liabilities |
$ |
— |
|
|
$ |
(97,166) |
|
|
$ |
(97,166) |
|
| Total liabilities at fair value |
$ |
— |
|
|
$ |
(97,166) |
|
|
$ |
(97,166) |
|
Table of Contents
BANKUNITED, INC. AND SUBSIDIARIES
NOTES TO CONSOLIDATED FINANCIAL STATEMENTS - UNAUDITED
March 31, 2024
Assets and liabilities measured at fair value on a non-recurring basis
Following is a description of the methodologies used to estimate the fair values of assets and liabilities that may be measured at fair value on a non-recurring basis, and the level within the fair value hierarchy in which those measurements are typically classified:
Collateral dependent loans and OREO—The carrying amount of collateral dependent loans is typically based on the fair value of the underlying collateral, which may be real estate, enterprise value or other business assets, less estimated costs to sell when repayment is expected to come from the sale of the collateral. The carrying value of OREO is initially measured based on the fair value of the real estate acquired in foreclosure and subsequently adjusted to the lower of cost or estimated fair value, less estimated cost to sell. Fair values of real estate collateral and OREO are typically based on third-party real estate appraisals which utilize market and income approaches to valuation incorporating both observable and unobservable inputs.
Fair value measurements related to collateral dependent loans and OREO are generally classified within level 3 of the fair value hierarchy.
The following table presents the net carrying value of assets classified within level 3 of the fair value hierarchy at the dates indicated, for which non-recurring changes in fair value were recorded during the period then ended (in thousands):
|
|
|
|
|
|
|
|
|
|
|
|
|
March 31, 2024 |
|
December 31, 2023 |
|
|
|
|
| Collateral dependent loans |
$ |
52,020 |
|
|
$ |
50,885 |
|
|
|
|
|
| OREO |
1,260 |
|
|
29 |
|
|
|
|
|
|
$ |
53,280 |
|
|
$ |
50,914 |
|
The following table presents the carrying value and fair value of financial instruments and the level within the fair value hierarchy in which those measurements are classified at the dates indicated (dollars in thousands):
|
|
|
|
|
|
|
|
|
|
|
|
|
|
|
|
|
|
|
|
|
|
|
|
|
|
|
|
|
|
| |
|
|
March 31, 2024 |
|
December 31, 2023 |
|
|
|
|
|
|
| |
Level |
|
Carrying Value |
|
Fair Value |
|
Carrying Value |
|
Fair Value |
| Assets: |
|
|
|
|
|
|
|
|
|
| Cash and cash equivalents |
1 |
|
$ |
421,216 |
|
|
$ |
421,216 |
|
|
$ |
588,283 |
|
|
$ |
588,283 |
|
| Investment securities |
1/2 |
|
$ |
8,924,959 |
|
|
$ |
8,924,912 |
|
|
$ |
8,877,354 |
|
|
$ |
8,877,281 |
|
| Non-marketable equity securities |
2 |
|
$ |
252,609 |
|
|
$ |
252,609 |
|
|
$ |
310,084 |
|
|
$ |
310,084 |
|
|
|
|
|
|
|
|
|
|
|
| Loans, net |
3 |
|
$ |
24,008,744 |
|
|
$ |
22,696,690 |
|
|
$ |
24,430,995 |
|
|
$ |
23,075,192 |
|
| Derivative assets |
2 |
|
$ |
112,234 |
|
|
$ |
112,234 |
|
|
$ |
105,678 |
|
|
$ |
105,678 |
|
| Liabilities: |
|
|
|
|
|
|
|
|
|
| Demand, savings and money market deposits |
2 |
|
$ |
21,911,661 |
|
|
$ |
21,911,661 |
|
|
$ |
21,374,483 |
|
|
$ |
21,374,483 |
|
| Time deposits |
2 |
|
$ |
5,115,703 |
|
|
$ |
5,079,472 |
|
|
$ |
5,163,995 |
|
|
$ |
5,133,119 |
|
|
|
|
|
|
|
|
|
|
|
| FHLB advances |
2 |
|
$ |
3,905,000 |
|
|
$ |
3,904,870 |
|
|
$ |
5,115,000 |
|
|
$ |
5,115,637 |
|
| Notes and other borrowings |
2 |
|
$ |
708,978 |
|
|
$ |
677,947 |
|
|
$ |
708,973 |
|
|
$ |
676,077 |
|
| Derivative liabilities |
2 |
|
$ |
106,045 |
|
|
$ |
106,045 |
|
|
$ |
97,166 |
|
|
$ |
97,166 |
|
Note 9 Commitments and Contingencies
The Company issues off-balance sheet financial instruments to meet the financing needs of its customers. These financial instruments include commitments to fund loans, unfunded commitments under existing lines of credit, and commercial and standby letters of credit. These commitments expose the Company to varying degrees of credit and market risk which are essentially the same as those involved in extending loans to customers, and are subject to the same credit policies used in underwriting loans. Collateral may be obtained based on the Company’s credit evaluation of the counterparty. The Company’s maximum exposure to credit loss is represented by the contractual amount of these commitments.
Table of Contents
BANKUNITED, INC. AND SUBSIDIARIES
NOTES TO CONSOLIDATED FINANCIAL STATEMENTS - UNAUDITED
March 31, 2024
Commitments to fund loans
These are agreements to lend funds to customers as long as there is no violation of any condition established in the contract. Commitments to fund loans generally have fixed expiration dates or other termination clauses and may require payment of a fee. Many of these commitments are expected to expire without being funded and, therefore, the total commitment amounts do not necessarily represent future liquidity requirements.
Unfunded commitments under lines of credit
Unfunded commitments under lines of credit include commercial and commercial real estate lines of credit to existing customers, for many of which additional extensions of credit are subject to borrowing base requirements. Some of these commitments may mature without being fully funded, so may not necessarily represent future liquidity requirements.
Commercial and standby letters of credit
Letters of credit are conditional commitments issued by the Company to guarantee the performance of a customer to a third party. These letters of credit are primarily issued to support trade transactions or guarantee arrangements. The credit risk involved in issuing letters of credit is essentially the same as that involved in extending loan facilities to customers.
Total lending related commitments outstanding at March 31, 2024 were as follows (in thousands):
|
|
|
|
|
|
| Commitments to fund loans |
$ |
200,034 |
|
|
|
| Unfunded commitments under lines of credit |
5,068,914 |
|
| Commercial and standby letters of credit |
142,032 |
|
|
$ |
5,410,980 |
|
Legal Proceedings
The Company is involved in various legal actions arising in the normal course of business. In the opinion of management, based upon advice of legal counsel, the likelihood is remote that the adverse impact of these proceedings, either individually or in the aggregate, would be material to the Company’s consolidated financial position, results of operations or cash flows.
Note 10 Deposits
The following table presents average balances and weighted average rates paid on deposits for the periods indicated (dollars in thousands):
|
|
|
|
|
|
|
|
|
|
|
|
|
|
|
|
|
|
|
|
|
|
|
|
|
|
|
|
|
|
|
|
|
Three Months Ended March 31, |
|
|
| |
2024 |
|
2023 |
|
|
|
|
| |
Average
Balance |
|
Average
Rate Paid(1)
|
|
Average
Balance |
|
Average
Rate Paid(1)
|
|
|
|
|
|
|
|
|
| Demand deposits: |
|
|
|
|
|
|
|
|
|
|
|
|
|
|
|
| Non-interest bearing |
$ |
6,560,926 |
|
|
— |
% |
|
$ |
7,458,221 |
|
|
— |
% |
|
|
|
|
|
|
|
|
| Interest bearing |
3,584,363 |
|
|
3.76 |
% |
|
2,283,505 |
|
|
1.87 |
% |
|
|
|
|
|
|
|
|
| Savings and money market |
11,234,259 |
|
|
4.25 |
% |
|
12,145,922 |
|
|
3.06 |
% |
|
|
|
|
|
|
|
|
| Time |
5,231,178 |
|
|
4.45 |
% |
|
4,526,480 |
|
|
2.81 |
% |
|
|
|
|
|
|
|
|
|
$ |
26,610,726 |
|
|
3.18 |
% |
|
$ |
26,414,128 |
|
|
2.05 |
% |
|
|
|
|
|
|
|
|
(1)Annualized.
Table of Contents
BANKUNITED, INC. AND SUBSIDIARIES
NOTES TO CONSOLIDATED FINANCIAL STATEMENTS - UNAUDITED
March 31, 2024
The following table presents maturities of time deposits as of March 31, 2024 (in thousands):
|
|
|
|
|
|
| Maturing in: |
|
2024 |
$ |
4,325,792 |
|
2025 |
466,368 |
|
2026 |
322,827 |
|
2027 |
547 |
|
2028 |
164 |
|
| Thereafter |
5 |
|
|
$ |
5,115,703 |
|
Included in deposits at March 31, 2024, are public funds deposits of $3.1 billion and brokered deposits of $5.2 billion.
Interest expense on deposits for the periods indicated was as follows (in thousands):
|
|
|
|
|
|
|
|
|
|
|
|
|
|
|
|
|
Three Months Ended March 31, |
|
|
| |
2024 |
|
2023 |
|
|
|
|
| Interest bearing demand |
$ |
33,507 |
|
|
$ |
10,545 |
|
|
|
|
|
| Savings and money market |
118,639 |
|
|
91,724 |
|
|
|
|
|
| Time |
57,852 |
|
|
31,361 |
|
|
|
|
|
|
$ |
209,998 |
|
|
$ |
133,630 |
|
|
|
|
|
Certain of our depositors participate in various customer rebate programs. During the three months ended March 31, 2024 and 2023, costs related to those programs totaled $14.0 million and $8.5 million, respectively. These expenses are included in "other non-interest expense" in the accompanying consolidated statements of income.
Item 2. Management's Discussion and Analysis of Financial Condition and Results of Operations
The following discussion and analysis is intended to focus on significant matters impacting and changes in the financial condition and results of operations of the Company during the three months ended March 31, 2024 and should be read in conjunction with the consolidated financial statements and notes hereto included in this Quarterly Report on Form 10-Q and BKU's 2023 Annual Report on Form 10-K for the year ended December 31, 2023 (the "2023 Annual Report on Form 10-K").
Forward-Looking Statements
This Quarterly Report on Form 10-Q contains forward-looking statements within the meaning of the Private Securities Litigation Reform Act of 1995 that reflect the Company’s current views with respect to, among other things, future events and financial performance. Words such as “anticipates,” “expects,” “intends,” “plans,” “believes,” “seeks,” “estimates,” "future" and similar expressions identify forward-looking statements. These forward-looking statements are based on the historical performance of the Company or on the Company’s current plans, estimates and expectations. The inclusion of this forward-looking information should not be regarded as a representation by the Company that the future plans, estimates or expectations so contemplated will be achieved. Such forward-looking statements are subject to various risks and uncertainties and assumptions relating to the Company’s operations, financial results, financial condition, business prospects, growth strategy and liquidity, including as impacted by external circumstances outside the Company's direct control, such as adverse events impacting the financial services industry. If one or more of these or other risks or uncertainties materialize, or if the Company’s underlying assumptions prove to be incorrect, the Company’s actual results may vary materially from those indicated in these statements. A number of important factors could cause actual results to differ materially from those indicated by the forward-looking statements, including, but not limited to, the risk factors described in Part I, Item 1A of the 2023 Annual Report on Form 10-K and any subsequent Quarterly Report on Form 10-Q or Current Report on Form 8-K. The Company does not undertake any obligation to publicly update or review any forward looking statement, whether as a result of new information, future developments or otherwise.
Overview
Net income for the three months ended March 31, 2024, was $48.0 million, or $0.64 per diluted share, compared to $52.9 million, or $0.70 per diluted share for the three months ended March 31, 2023. For the three months ended March 31, 2024, the annualized return on average stockholders' equity was 7.31% and the annualized return on average assets was 0.54%.
In evaluating our financial performance, we consider the level of and trends in net interest income, the net interest margin, the cost of deposits, trends in non-interest income and non-interest expense, performance ratios such as the return on average equity and return on average assets and asset quality ratios, including the ratio of non-performing loans to total loans, non-performing assets to total assets, trends in criticized and classified assets and portfolio delinquency and charge-off trends. We consider the composition of earning assets and the funding mix, the composition and level of available liquidity and our interest rate risk profile. We analyze these ratios and trends against our own historical performance, our expected performance, our risk appetite and the financial condition and performance of comparable financial institutions.
In response to evolving macro-environmental factors, we have established the following near-term strategic priorities for our Company:
•Improve the Bank's funding profile by growing core deposits and paying down higher cost wholesale funding;
•Improve the asset mix by re-positioning the balance sheet away from typically lower yielding transactional business such as residential mortgages and organically growing core commercial loans;
•Improve the net interest margin, largely a function of more profitable balance sheet composition;
•Maintain robust liquidity and capital;
•Continue to manage credit;
•Manage the rate of growth in operating expenses.
The three months ended March 31, 2024 embodied strong execution on these key strategic priorities:
◦The funding mix continued to improve as non-interest bearing demand deposits grew by $404 million for the three months ended March 31, 2024. Non-brokered deposits grew by $644 million and total deposits grew by $489 million. Non-interest bearing demand deposits represented 27% of total deposits at March 31, 2024, up from 26% at December 31, 2023.
◦Wholesale funding, including FHLB advances and brokered deposits, declined by $1.4 billion for the three months ended March 31, 2024.
◦Total loans declined by $407 million for the three months ended March 31, 2024. Strategically, the residential loan portfolio declined by $152 million. The C&I and commercial real estate portfolios declined by $226 million. This decline was related to expected seasonality as well as some notable unexpected paydowns and the decision to exit some non-relationship shared national credits.
◦The net interest margin, calculated on a tax-equivalent basis was relatively stable at 2.57% compared to 2.60% for the three months ended December 31, 2023. The net interest margin was 2.62% for the three months ended March 31, 2023.
◦Credit is favorable. The annualized net charge-off ratio for the three months ended March 31, 2024, was 0.02%. The NPA ratio at March 31, 2024 declined to 0.34%, including 0.11% related to the guaranteed portion of non-performing SBA loans, from 0.37%, including 0.12% related to the guaranteed portion of non-performing SBA loans at December 31, 2023.
◦Liquidity is ample. Total same day available liquidity was $14.8 billion, the available liquidity to uninsured, uncollateralized deposits ratio was 156% and an estimated 65% of our deposits were insured or collateralized at March 31, 2024.
◦Our capital position is robust. At March 31, 2024, CET1 was 11.6% and pro-forma CET1, including accumulated other comprehensive income, was 10.3%. The ratio of tangible common equity/tangible assets increased to 7.3%.
Quarterly Highlights:
•The average cost of total deposits increased to 3.18% for the three months ended March 31, 2024, from 2.96% for the immediately preceding three months ended December 31, 2023, and 2.05% for the three months ended March 31, 2023. The cost of deposits is showing signs of stabilizing. On a spot basis, the cost of total deposits was 3.17% at March 31, 2024 compared to 3.18% at December 31, 2023.
•Commercial real estate exposure is modest. Commercial real estate loans totaled 24% of loans at March 31, 2024, representing 166% of the Bank's total risk-based capital. By comparison, based on call report data as of December 31, 2023, (the most recent date available) for banks with between $10 billion and $100 billion in assets, the median level of CRE to total loans was 35% and the median level of CRE to total risk based capital was 225%.
•At March 31, 2024, the ratio of the ACL to total loans was 0.90% compared to 0.82% at December 31, 2023. The ACL to loans ratio for commercial portfolio sub-segments including C&I, CRE, franchise finance and equipment finance was 1.42% at March 31, 2024 and the ACL to loans ratio for CRE office loans was 2.26%.
•Non-interest expense for the three months ended March 31, 2024 included an additional $5.2 million related to the FDIC special assessment announced in the fourth quarter of 2023.
•The net unrealized pre-tax loss on the AFS securities portfolio continued to improve, declining by $36 million for the three months ended March 31, 2024, now representing 5% of amortized cost. The duration of our AFS securities portfolio remained short at 1.85 at March 31, 2024. HTM securities were not significant.
•Book value and tangible book value per common share grew to $35.31 and $34.27, respectively, at March 31, 2024, from $34.66 and $33.62, respectively, at December 31, 2023.
•The Company increased its quarterly cash dividend by $0.02, to $0.29 per share, reflecting a 7% increase from the previous quarterly cash dividend of $0.27 per share.
Results of Operations
Net Interest Income
Net interest income is the difference between interest earned on interest earning assets and interest incurred on interest bearing liabilities and is the primary driver of core earnings. Net interest income is impacted by the mix of interest earning assets and interest bearing liabilities, the ratio of interest earning assets to total assets and of interest bearing liabilities to total funding sources, movements in market interest rates and monetary policy, the shape of the yield curve, levels of non-performing assets and pricing pressure from competitors.
The mix of interest earning assets is influenced by loan demand, market and competitive conditions in our primary lending markets, by management's continual assessment of the rate of return and relative risk associated with various classes of earning assets and liquidity considerations. The mix of funding sources is influenced by the Company's liquidity profile, management's assessment of the desire for lower cost funding sources weighed against relationships with customers, our ability to attract and retain core deposit relationships, competition for deposits in the Company's markets and the availability and pricing of other sources of funds.
The following table presents, for the periods indicated, information about (i) average balances, the total dollar amount of taxable equivalent interest income from earning assets and the resultant average yields; (ii) average balances, the total dollar amount of interest expense on interest bearing liabilities and the resultant average rates; (iii) net interest income; (iv) the interest rate spread; and (v) the net interest margin. Non-accrual loans are included in the average balances presented in this table; however, interest income foregone on non-accrual loans is not included. Interest income, yields, spread and margin have been calculated on a tax-equivalent basis for loans and investment securities that are exempt from federal income taxes, at a federal tax rate of 21% (dollars in thousands):
|
|
|
|
|
|
|
|
|
|
|
|
|
|
|
|
|
|
|
|
|
|
|
|
|
|
|
|
|
|
|
|
|
|
|
|
|
|
|
|
|
|
|
|
|
|
|
|
|
|
|
|
|
|
|
|
|
|
|
|
|
|
|
Three Months Ended March 31, 2024 |
|
Three Months Ended December 31, 2023 |
|
Three Months Ended March 31, 2023 |
|
|
|
Average
Balance |
|
Interest (1) |
|
Yield/
Rate (1)(2)
|
|
Average
Balance |
|
Interest (1) |
|
Yield/
Rate (1)(2)
|
|
Average
Balance |
|
Interest (1) |
|
Yield/
Rate (1)(2)
|
|
|
|
|
|
|
| Assets: |
|
|
|
|
|
|
|
|
|
|
|
|
|
|
|
|
|
|
|
|
|
|
|
| Interest earning assets: |
|
|
|
|
|
|
|
|
|
|
|
|
|
|
|
|
|
|
|
|
|
|
|
| Loans |
$ |
24,337,440 |
|
|
$ |
350,441 |
|
|
5.78 |
% |
|
$ |
24,416,013 |
|
|
$ |
349,603 |
|
|
5.69 |
% |
|
$ |
24,724,296 |
|
|
$ |
312,125 |
|
|
5.10 |
% |
|
|
|
|
|
|
Investment securities (3) |
8,952,453 |
|
|
125,025 |
|
|
5.59 |
% |
|
8,850,397 |
|
|
126,870 |
|
|
5.73 |
% |
|
9,672,514 |
|
|
119,666 |
|
|
4.95 |
% |
|
|
|
|
|
|
| Other interest earning assets |
763,460 |
|
|
10,038 |
|
|
5.29 |
% |
|
801,833 |
|
|
10,957 |
|
|
5.42 |
% |
|
1,039,563 |
|
|
12,863 |
|
|
5.02 |
% |
|
|
|
|
|
|
| Total interest earning assets |
34,053,353 |
|
|
485,504 |
|
|
5.72 |
% |
|
34,068,243 |
|
|
487,430 |
|
|
5.70 |
% |
|
35,436,373 |
|
|
444,654 |
|
|
5.05 |
% |
|
|
|
|
|
|
| Allowance for credit losses |
(206,747) |
|
|
|
|
|
|
(198,984) |
|
|
|
|
|
|
(151,071) |
|
|
|
|
|
|
|
|
|
|
|
| Non-interest earning assets |
1,589,333 |
|
|
|
|
|
|
1,715,795 |
|
|
|
|
|
|
1,793,000 |
|
|
|
|
|
|
|
|
|
|
|
| Total assets |
$ |
35,435,939 |
|
|
|
|
|
|
$ |
35,585,054 |
|
|
|
|
|
|
$ |
37,078,302 |
|
|
|
|
|
|
|
|
|
|
|
| Liabilities and Stockholders' Equity: |
|
|
|
|
|
|
|
|
|
|
|
|
|
|
|
|
|
|
|
|
|
|
|
| Interest bearing liabilities: |
|
|
|
|
|
|
|
|
|
|
|
|
|
|
|
|
|
|
|
|
|
|
|
| Interest bearing demand deposits |
$ |
3,584,363 |
|
|
$ |
33,507 |
|
|
3.76 |
% |
|
$ |
3,433,216 |
|
|
$ |
31,978 |
|
|
3.70 |
% |
|
$ |
2,283,505 |
|
|
$ |
10,545 |
|
|
1.87 |
% |
|
|
|
|
|
|
| Savings and money market deposits |
11,234,259 |
|
|
118,639 |
|
|
4.25 |
% |
|
10,287,945 |
|
|
104,188 |
|
|
4.02 |
% |
|
12,145,922 |
|
|
91,724 |
|
|
3.06 |
% |
|
|
|
|
|
|
| Time deposits |
5,231,178 |
|
|
57,852 |
|
|
4.45 |
% |
|
5,225,756 |
|
|
56,667 |
|
|
4.30 |
% |
|
4,526,480 |
|
|
31,361 |
|
|
2.81 |
% |
|
|
|
|
|
|
| Total interest bearing deposits |
20,049,800 |
|
|
209,998 |
|
|
4.21 |
% |
|
18,946,917 |
|
|
192,833 |
|
|
4.04 |
% |
|
18,955,907 |
|
|
133,630 |
|
|
2.86 |
% |
|
|
|
|
|
|
| Federal funds purchased |
— |
|
|
— |
|
|
— |
% |
|
— |
|
|
— |
|
|
— |
% |
|
143,580 |
|
|
1,611 |
|
|
4.49 |
% |
|
|
|
|
|
|
| FHLB advances |
4,570,220 |
|
|
47,496 |
|
|
4.18 |
% |
|
5,545,978 |
|
|
64,034 |
|
|
4.58 |
% |
|
6,465,000 |
|
|
68,039 |
|
|
4.27 |
% |
|
|
|
|
|
|
| Notes and other borrowings |
709,017 |
|
|
9,123 |
|
|
5.15 |
% |
|
711,073 |
|
|
9,128 |
|
|
5.13 |
% |
|
720,906 |
|
|
9,262 |
|
|
5.14 |
% |
|
|
|
|
|
|
| Total interest bearing liabilities |
25,329,037 |
|
|
266,617 |
|
|
4.23 |
% |
|
25,203,968 |
|
|
265,995 |
|
|
4.19 |
% |
|
26,285,393 |
|
|
212,542 |
|
|
3.28 |
% |
|
|
|
|
|
|
| Non-interest bearing demand deposits |
6,560,926 |
|
|
|
|
|
|
6,909,027 |
|
|
|
|
|
|
7,458,221 |
|
|
|
|
|
|
|
|
|
|
|
| Other non-interest bearing liabilities |
906,266 |
|
|
|
|
|
|
903,099 |
|
|
|
|
|
|
821,419 |
|
|
|
|
|
|
|
|
|
|
|
| Total liabilities |
32,796,229 |
|
|
|
|
|
|
33,016,094 |
|
|
|
|
|
|
34,565,033 |
|
|
|
|
|
|
|
|
|
|
|
| Stockholders' equity |
2,639,710 |
|
|
|
|
|
|
2,568,960 |
|
|
|
|
|
|
2,513,269 |
|
|
|
|
|
|
|
|
|
|
|
| Total liabilities and stockholders' equity |
$ |
35,435,939 |
|
|
|
|
|
|
$ |
35,585,054 |
|
|
|
|
|
|
$ |
37,078,302 |
|
|
|
|
|
|
|
|
|
|
|
| Net interest income |
|
|
$ |
218,887 |
|
|
|
|
|
|
$ |
221,435 |
|
|
|
|
|
|
$ |
232,112 |
|
|
|
|
|
|
|
|
|
| Interest rate spread |
|
|
|
|
1.49 |
% |
|
|
|
|
|
1.51 |
% |
|
|
|
|
|
1.77 |
% |
|
|
|
|
|
|
| Net interest margin |
|
|
|
|
2.57 |
% |
|
|
|
|
|
2.60 |
% |
|
|
|
|
|
2.62 |
% |
|
|
|
|
|
|
|
|
|
|
|
|
|
|
|
|
|
|
|
|
|
|
|
|
|
|
|
|
|
|
|
|
|
|
|
|
|
|
|
|
|
|
|
|
|
|
|
|
|
|
|
|
|
|
(1)On a tax-equivalent basis where applicable. The tax-equivalent adjustment for tax-exempt loans was $3.2 million for the three months ended March 31, 2024 and $3.3 million for both the three months ended December 31, 2023, and March 31, 2023. The tax-equivalent adjustment for tax-exempt investment securities was $0.8 million for the three months ended March 31, 2024, and $0.9 million for both the three months ended December 31, 2023 and March 31, 2023.
(2)Annualized.
(3)At fair value except for securities held to maturity.
Three months ended March 31, 2024 compared to the three months ended December 31, 2023
Net interest income, calculated on a tax-equivalent basis, was $218.9 million for the three months ended March 31, 2024, compared to $221.4 million for the three months ended December 31, 2023, a decrease of $2.5 million. The decrease in net interest income was comprised of decreases in tax-equivalent interest income of $1.9 million and increases in interest expense totaling $0.6 million, for the three months ended March 31, 2024, compared to the three months ended December 31, 2023. The net interest margin, calculated on a tax-equivalent basis, was 2.57% for the three months ended March 31, 2024, compared to 2.60% for the three months ended December 31, 2023.
Factors impacting the net interest margin for the three months ended March 31, 2024, compared to the three months ended December 31, 2023, included:
•The tax-equivalent yield on loans increased to 5.78% for the three months ended March 31, 2024, from 5.69% for the three months ended December 31, 2023. This increase reflects the originations of new loans at higher rates, paydowns of lower rate loans and balance sheet repositioning.
•The tax-equivalent yield on investment securities decreased to 5.59% for the three months ended March 31, 2024, from 5.73% for the three months ended December 31, 2023. The primary driver of this decrease was routine accounting adjustments recorded in the three months ended December 31, 2023 related to prepayment speeds on certain securities; these adjustments positively impacted the yield for the three months ended December 31, 2023.
•The average rate paid on interest bearing deposits increased to 4.21% for the three months ended March 31, 2024, from 4.04% for the three months ended December 31, 2023. An increase in municipal money market deposits late in the fourth quarter of 2023 and CD repricing were contributing factors.
•The average rate paid on FHLB advances decreased to 4.18% for the three months ended March 31, 2024 from 4.58% for the three months ended December 31, 2023, primarily due to repayment of higher rate advances.
Three months ended March 31, 2024 compared to the three months ended March 31, 2023
Net interest income, calculated on a tax-equivalent basis, was $218.9 million for the three months ended March 31, 2024, compared to $232.1 million for the three months ended March 31, 2023, a decrease of $13.2 million, comprised of increases in tax-equivalent interest income and interest expense of $40.9 million and $54.1 million, respectively. The increase in interest income for the three months ended March 31, 2024 compared to the three months ended March 31, 2023, reflected rising yields on interest earning assets that more than offset the decline in average interest earning assets. Similarly, the increase in interest expense for the three months ended March 31, 2024 compared to the three months ended March 31, 2023, resulted from an increase in the cost of interest bearing liabilities that more than offset the decline in average interest bearing liabilities.
The net interest margin, calculated on a tax-equivalent basis, was 2.57% for the three months ended March 31, 2024, compared to 2.62% for the three months ended March 31, 2023. The increase in cost of deposits outpaced the increase in the yield on interest earning assets for the comparative periods. Increased yields on average interest earning assets as well as the increase in the cost of deposits reflected increasing market interest rates.
Further discussion of factors impacting the net interest margin for the three months ended March 31, 2024 compared to the three months ended March 31, 2023 follows:
•The tax-equivalent yield on loans expanded to 5.78% for the three months ended March 31, 2024, from 5.10% for the three months ended March 31, 2023. Factors contributing to this increase were the resetting of variable rate loans at higher coupon rates, runoff of lower rate loans including residential mortgages and originations of new loans at higher prevailing rates and wider spreads. Average residential loans, which are generally lower-yielding, declined by $709 million while average commercial loans increased by $322 million for the quarter ended March 31, 2024 compared to the quarter ended March 31, 2023.
•The tax-equivalent yield on investment securities increased to 5.59% for the three months ended March 31, 2024, from 4.95% for the three months ended March 31, 2023. This increase resulted primarily from the reset of coupon rates on variable rate securities and to a lesser extent, purchases of higher-yielding securities and paydowns and sales of lower-yielding securities.
•The average cost of total deposits increased to 3.18% for the three months ended March 31, 2024, from 2.05% for the three months ended March 31, 2023. This increase resulted from increases in market interest rates and a shift from non-interest bearing deposits to interest bearing deposits.
•The average rate paid on FHLB advances decreased to 4.18% for the three months ended March 31, 2024, from 4.27% for the three months ended March 31, 2023, primarily due to repayment of higher rate advances.
Provision for Credit Losses
The provision for credit losses is a charge or credit to earnings required to maintain the ACL at a level consistent with management’s estimate of expected credit losses on financial assets carried at amortized cost at the balance sheet date. The amount of the provision is impacted by changes in current economic conditions as well as in management's reasonable and supportable economic forecast, loan originations and runoff, changes in portfolio mix, risk rating migration and portfolio seasoning, changes in specific reserves, changes in expected prepayment speeds and other assumptions. The provision for credit losses also includes amounts related to off-balance sheet credit exposures and may include amounts related to accrued interest receivable and AFS debt securities.
The following table presents the components of the provision for (recovery of) credit losses for the periods indicated (in thousands):
|
|
|
|
|
|
|
|
|
|
|
|
|
|
|
|
|
|
|
|
|
Three Months Ended March 31, |
|
|
|
|
|
2024 |
|
2023 |
|
|
| Amount related to funded portion of loans |
|
|
|
|
$ |
15,805 |
|
|
$ |
17,595 |
|
|
|
| Amount related to off-balance sheet credit exposures |
|
|
|
|
(520) |
|
|
2,193 |
|
|
|
|
|
|
|
|
|
|
|
|
|
|
|
|
|
|
|
|
|
|
|
|
|
|
|
|
|
|
|
|
|
Total provision for credit losses |
|
|
|
|
$ |
15,285 |
|
|
$ |
19,788 |
|
|
|
The most significant factors impacting the provision for credit losses for the three months ended March 31, 2024, were an increase in qualitative loss factors, particularly related to the office CRE portfolio sub-segment, and risk rating migration, partially offset by an improved economic forecast.
The provision for credit losses may be volatile and the level of the ACL may change materially from current levels. Future levels of the ACL could be significantly impacted, in either direction, by changes in factors such as, but not limited to, economic conditions or the economic outlook, the composition of the loan portfolio, the financial condition of our borrowers and collateral values.
The determination of the amount of the ACL is complex and involves a high degree of judgment and subjectivity. See “Analysis of the Allowance for Credit Losses” below for more information about how we determine the appropriate level of the ACL and about factors that impacted the ACL and provision for credit losses.
Non-Interest Income
The following table presents a comparison of the categories of non-interest income for the periods indicated (in thousands):
|
|
|
|
|
|
|
|
|
|
|
|
|
|
|
|
|
|
|
Three Months Ended March 31, |
|
|
| |
2024 |
|
2023 |
|
|
|
|
|
|
| Deposit service charges and fees |
$ |
5,499 |
|
|
$ |
5,545 |
|
|
|
|
|
|
|
|
|
|
|
|
|
|
|
|
|
| Gain (loss) on investment securities: |
|
|
|
|
|
|
|
|
|
Net realized gain (loss) on sale of securities AFS |
(28) |
|
|
752 |
|
|
|
|
|
|
|
Net gain (loss) on marketable equity securities recognized in earnings |
803 |
|
|
(13,301) |
|
|
|
|
|
|
|
| Gain (loss) on investment securities, net |
775 |
|
|
(12,549) |
|
|
|
|
|
|
|
| Lease financing |
11,440 |
|
|
13,109 |
|
|
|
|
|
|
|
| Other non-interest income |
9,163 |
|
|
10,430 |
|
|
|
|
|
|
|
|
$ |
26,877 |
|
|
$ |
16,535 |
|
|
|
|
|
|
|
The losses on marketable equity securities during the three months ended March 31, 2023, were attributable to losses related to certain preferred equity investments.
The decrease in lease financing revenue for the three months ended March 31, 2024, compared to the three months ended March 31, 2023, was attributable to the impact of the sale of some operating lease equipment, reducing the size of the portfolio.
Non-Interest Expense
The following table presents the components of non-interest expense for the periods indicated (in thousands):
|
|
|
|
|
|
|
|
|
|
|
|
|
|
|
|
|
|
|
|
|
Three Months Ended March 31, |
| |
|
|
|
|
2024 |
|
2023 |
|
|
| Employee compensation and benefits |
|
|
|
|
$ |
75,920 |
|
|
$ |
71,051 |
|
|
|
| Occupancy and equipment |
|
|
|
|
10,569 |
|
|
10,802 |
|
|
|
| Deposit insurance expense |
|
|
|
|
13,530 |
|
|
7,907 |
|
|
|
| Professional fees |
|
|
|
|
2,510 |
|
|
2,918 |
|
|
|
| Technology |
|
|
|
|
20,315 |
|
|
21,726 |
|
|
|
|
|
|
|
|
|
|
|
|
|
Depreciation of operating lease equipment |
|
|
|
|
9,213 |
|
|
11,521 |
|
|
|
|
|
|
|
|
|
|
|
|
|
| Other non-interest expense |
|
|
|
|
27,183 |
|
|
26,855 |
|
|
|
| Total non-interest expense |
|
|
|
|
$ |
159,240 |
|
|
$ |
152,780 |
|
|
|
The increases in deposit insurance expense was primarily attributable to an additional $5.2 million related to an FDIC special assessment during the three months ended March 31, 2024.
The decline in depreciation of operating lease equipment for the three months ended March 31, 2024, compared to the three months ended March 31, 2023, is primarily attributed to the reduction in operating lease equipment, corresponding to the decline in lease financing revenue.
Income Taxes
See Note 5 to the consolidated financial statements for information about income taxes.
Analysis of Financial Condition
Our funding profile has continued to improve. Total deposits grew by $489 million during the three months ended March 31, 2024, to $27.0 billion; non-brokered deposits grew by $644 million. Most of the increase in total deposits was in non-interest bearing demand deposits, which grew by $404 million, to 27% of total deposits. During the three months ended March 31, 2024, FHLB advances declined by $1.2 billion, as we paid down higher rate advances.
Total loans declined by $407 million during the three months ended March 31, 2024. As we continue to reposition the left side of the balance sheet, residential loans declined by $152 million; franchise, equipment, and municipal finance declined by an aggregate $53 million. The C&I and CRE portfolios declined by $226 million; while production was in line with expectations, seasonality, some unexpected paydowns and exits of some shared national credits contributed to this decline.
Investment Securities
The following table shows the amortized cost and carrying value, which, with the exception of investment securities held to maturity, is fair value, of investment securities at the dates indicated (in thousands):
|
|
|
|
|
|
|
|
|
|
|
|
|
|
|
|
|
|
|
|
|
|
|
|
|
|
|
|
|
|
|
|
|
|
|
March 31, 2024 |
|
December 31, 2023 |
|
|
| |
Amortized
Cost |
|
Carrying Value |
|
Amortized
Cost |
|
Carrying Value |
|
|
|
|
| U.S. Treasury securities |
$ |
139,868 |
|
|
$ |
130,290 |
|
|
$ |
139,858 |
|
|
$ |
130,592 |
|
|
|
|
|
| U.S. Government agency and sponsored enterprise residential MBS |
2,193,543 |
|
|
2,161,292 |
|
|
1,962,658 |
|
|
1,924,207 |
|
|
|
|
|
| U.S. Government agency and sponsored enterprise commercial MBS |
559,069 |
|
|
494,207 |
|
|
561,557 |
|
|
497,859 |
|
|
|
|
|
|
|
|
|
|
|
|
|
|
|
|
|
Private label residential MBS and CMOs |
2,543,764 |
|
|
2,250,219 |
|
|
2,596,231 |
|
|
2,295,730 |
|
|
|
|
|
Private label commercial MBS |
2,191,733 |
|
|
2,122,271 |
|
|
2,282,833 |
|
|
2,198,743 |
|
|
|
|
|
| Single family real estate-backed securities |
356,205 |
|
|
341,362 |
|
|
383,984 |
|
|
366,255 |
|
|
|
|
|
| Collateralized loan obligations |
1,077,232 |
|
|
1,076,492 |
|
|
1,122,799 |
|
|
1,112,824 |
|
|
|
|
|
| Non-mortgage asset-backed securities |
103,594 |
|
|
100,124 |
|
|
106,095 |
|
|
102,780 |
|
|
|
|
|
| State and municipal obligations |
113,280 |
|
|
106,713 |
|
|
107,176 |
|
|
102,618 |
|
|
|
|
|
| SBA securities |
101,515 |
|
|
98,465 |
|
|
106,237 |
|
|
103,024 |
|
|
|
|
|
|
|
|
|
|
|
|
|
|
|
|
|
| Investment securities held to maturity |
10,000 |
|
|
10,000 |
|
|
10,000 |
|
|
10,000 |
|
|
|
|
|
|
$ |
9,389,803 |
|
|
8,891,435 |
|
|
$ |
9,379,428 |
|
|
8,844,632 |
|
|
|
|
|
| Marketable equity securities |
|
|
33,524 |
|
|
|
|
32,722 |
|
|
|
|
|
|
|
|
$ |
8,924,959 |
|
|
|
|
$ |
8,877,354 |
|
|
|
|
|
Our investment strategy is focused on ensuring adequate liquidity, maintaining a suitable balance of high credit quality, diverse assets, managing interest rate risk, and generating acceptable returns given our established risk parameters. We have sought to maintain liquidity by investing a significant portion of the portfolio in high quality liquid securities including U.S. Treasury and U.S. Government Agency and sponsored enterprise securities. We have also invested in highly-rated structured products, including private-label commercial and residential MBS, collateralized loan obligations, single family real estate-backed securities and non-mortgage asset-backed securities that, while somewhat less liquid, are generally pledgeable at either the FHLB or the FRB and provide us with attractive yields. Investment grade municipal securities provide liquidity and attractive tax-equivalent yields. We remain committed to keeping the duration of our securities portfolio short; relatively short effective portfolio duration helps mitigate interest rate risk. Based on the Company’s assumptions, the effective duration of the investment portfolio was 1.86 years and the estimated weighted average life of the portfolio was 5.5 years as of March 31, 2024.
The investment securities AFS portfolio was in a net unrealized loss position of $498.4 million at March 31, 2024, compared to a net unrealized loss position of $534.8 million at December 31, 2023, improving by $36.4 million during the three months ended March 31, 2024. Net unrealized losses at March 31, 2024 included $6.4 million of gross unrealized gains and $504.8 million of gross unrealized losses. Investment securities available for sale in unrealized loss positions at March 31, 2024 had an aggregate fair value of $7.7 billion. The unrealized losses resulted primarily from a sustained period of higher interest rates, and in some cases, wider spreads compared to the levels at which securities were purchased. Market volatility and yield curve dislocations have also contributed to unrealized losses. None of the unrealized losses were attributable to credit loss impairments.
The ratings distribution of our AFS securities portfolio at the dates indicated is depicted in the charts below:
|
|
|
|
|
|
|
|
|
| March 31, 2024 |
|
December 31, 2023 |
We evaluate the credit quality of individual securities in the portfolio quarterly to determine whether we expect to recover the amortized cost basis of the investments in unrealized loss positions. This evaluation considers, but is not necessarily limited to, the following factors, the relative significance of which varies depending on the circumstances pertinent to each individual security:
•Whether we intend to sell the security prior to recovery of its amortized cost basis;
•Whether it is more likely than not that we will be required to sell the security prior to recovery of its amortized cost basis;
•The extent to which fair value is less than amortized cost;
•Adverse conditions specifically related to the security, a sector, an industry or geographic area;
•Changes in the financial condition of the issuer or underlying loan obligors;
•The payment structure and remaining payment terms of the security, including levels of subordination or over-collateralization;
•Failure of the issuer to make scheduled payments;
•Changes in external credit ratings;
•Relevant market data; and
•Estimated prepayments, defaults, and the value and performance of underlying collateral at the individual security level.
We regularly engage with bond managers to monitor trends in underlying collateral, including potential downgrades and subsequent cash flow diversions, liquidity, ratings migration, and any other relevant developments.
We do not intend to sell securities in significant unrealized loss positions at March 31, 2024. Based on an assessment of our liquidity position and internal and regulatory guidelines for permissible investments and concentrations, it is not more likely than not that we will be required to sell securities in significant unrealized loss positions prior to recovery of amortized cost basis, which may be at maturity. The substantial majority of our investment securities are able to be pledged at either the FHLB or FRB. We have not sold, and do not anticipate the need to sell, securities in unrealized loss positions to generate liquidity.
We have implemented a robust credit stress testing framework with respect to our non-agency securities. The following table presents subordination levels and average internal stress scenario losses for select non-agency portfolio segments at March 31, 2024:
|
|
|
|
|
|
|
|
|
|
|
|
|
|
|
|
|
|
|
|
|
|
|
|
|
|
|
|
|
|
|
|
|
|
|
|
|
|
|
|
|
Subordination |
|
Weighted Average Stress Scenario Loss |
|
Rating |
|
Percent of Total |
|
Minimum |
|
Maximum |
|
Average |
|
| Private label CMBS |
AAA |
|
85.4 |
% |
|
30.3 |
|
97.9 |
|
44.8 |
|
6.1 |
|
AA |
|
11.0 |
% |
|
30.5 |
|
74.3 |
|
37.8 |
|
6.7 |
|
A |
|
3.6 |
% |
|
25.1 |
|
51.6 |
|
38.0 |
|
8.6 |
| Weighted average |
|
|
100.0 |
% |
|
30.1 |
|
93.7 |
|
43.8 |
|
6.3 |
|
|
|
|
|
|
|
|
|
|
|
|
| CLOs |
AAA |
|
82.8 |
% |
|
41.3 |
|
89.3 |
|
47.7 |
|
10.9 |
|
AA |
|
13.4 |
% |
|
30.8 |
|
42.8 |
|
35.8 |
|
8.4 |
|
A |
|
3.8 |
% |
|
34.0 |
|
34.3 |
|
34.1 |
|
9.7 |
| Weighted average |
|
|
100.0 |
% |
|
39.6 |
|
81.0 |
|
45.6 |
|
10.5 |
|
|
|
|
|
|
|
|
|
|
|
|
Private label residential MBS and CMOs |
AAA |
|
94.4 |
% |
|
1.2 |
|
92.2 |
|
17.8 |
|
2.2 |
|
AA |
|
4.1 |
% |
|
20.4 |
|
34.5 |
|
25.3 |
|
5.3 |
|
A |
|
1.5 |
% |
|
28.5 |
|
30.5 |
|
29.2 |
|
5.4 |
| Weighted average |
|
|
100.0 |
% |
|
2.4 |
|
88.9 |
|
18.3 |
|
2.4 |
|
|
|
|
|
|
|
|
|
|
|
|
|
|
|
|
|
|
|
|
|
|
|
|
|
|
|
|
|
|
|
|
|
|
|
|
|
|
|
|
|
|
|
|
|
|
|
|
|
|
|
|
|
|
|
|
|
|
|
|
While for some securities, we have seen an increase in stress scenario losses over the last year, the level of subordination continues to provide more than sufficient coverage of stress scenario collateral losses, further supporting our determination that none of our securities are credit loss impaired. The scenario used to project stress scenario losses is generally calibrated to the level of stress experienced in the Great Financial Crisis. For further discussion of our analysis of impaired investment securities AFS for credit loss impairment, see Note 3 to the consolidated financial statements.
We use third-party pricing services to assist us in estimating the fair value of investment securities. We perform a variety of procedures to ensure that we have a thorough understanding of the methodologies and assumptions used by the pricing services including obtaining and reviewing written documentation of the methods and assumptions employed, conducting interviews with valuation desk personnel, and reviewing model results and detailed assumptions used to value selected securities as considered necessary. Our classification of prices within the fair value hierarchy is based on an evaluation of the nature of the significant assumptions impacting the valuation of each type of security in the portfolio. We have established a robust price challenge process that includes a review by our treasury front office of all prices provided on a quarterly basis. Any price evidencing unexpected quarter over quarter fluctuations or deviations from our expectations based on recent observed trading activity and other information available in the marketplace that would impact the value of the security is challenged. Responses to the price challenges, which generally include specific information about inputs and assumptions incorporated in the valuation and their sources, are reviewed in detail. If considered necessary to resolve any discrepancies, a price will be obtained from additional independent valuation sources. We do not typically adjust the prices provided, other than through this established challenge process. Our primary pricing services utilize observable inputs when available, and employ unobservable inputs and proprietary models only when observable inputs are not available. As a matter of course, the services validate prices by comparison to recent trading activity whenever such activity exists. Quotes obtained from the pricing services are typically non-binding.
The majority of our investment securities are classified within level 2 of the fair value hierarchy. U.S. Treasury securities and marketable equity securities are classified within level 1 of the hierarchy.
For additional disclosure related to the fair values of investment securities, see Note 8 to the consolidated financial statements.
The following table shows the weighted average prospective yields, categorized by scheduled maturity, for AFS investment securities as of March 31, 2024. Scheduled maturities have been adjusted for anticipated prepayments when applicable. Yields on tax-exempt securities have been calculated on a tax-equivalent basis, based on a federal income tax rate of 21%:
|
|
|
|
|
|
|
|
|
|
|
|
|
|
|
|
|
|
|
|
|
|
|
|
|
|
|
|
|
|
|
|
|
|
|
|
|
|
|
|
| |
|
|
Within One Year |
|
|
|
After One Year
Through Five Years |
|
|
|
After Five Years
Through Ten Years |
|
|
|
After Ten Years |
|
|
|
Total |
|
|
|
|
|
|
|
|
|
|
|
|
|
|
|
|
|
|
|
|
| U.S. Treasury securities |
|
|
1.08 |
% |
|
|
|
4.47 |
% |
|
|
|
0.89 |
% |
|
|
|
— |
% |
|
|
|
1.55 |
% |
| U.S. Government agency and sponsored enterprise residential MBS |
|
|
5.65 |
% |
|
|
|
5.90 |
% |
|
|
|
6.00 |
% |
|
|
|
5.89 |
% |
|
|
|
5.89 |
% |
| U.S. Government agency and sponsored enterprise commercial MBS |
|
|
2.86 |
% |
|
|
|
5.97 |
% |
|
|
|
3.30 |
% |
|
|
|
2.86 |
% |
|
|
|
3.83 |
% |
| Private label residential MBS and CMOs |
|
|
3.93 |
% |
|
|
|
3.88 |
% |
|
|
|
3.77 |
% |
|
|
|
3.98 |
% |
|
|
|
3.90 |
% |
| Private label commercial MBS |
|
|
6.46 |
% |
|
|
|
6.99 |
% |
|
|
|
1.90 |
% |
|
|
|
3.30 |
% |
|
|
|
6.64 |
% |
| Single family real estate-backed securities |
|
|
1.88 |
% |
|
|
|
3.85 |
% |
|
|
|
— |
% |
|
|
|
— |
% |
|
|
|
3.84 |
% |
| Collateralized loan obligations |
|
|
7.24 |
% |
|
|
|
7.47 |
% |
|
|
|
7.88 |
% |
|
|
|
— |
% |
|
|
|
7.47 |
% |
| Non-mortgage asset-backed securities |
|
|
3.05 |
% |
|
|
|
6.08 |
% |
|
|
|
2.70 |
% |
|
|
|
— |
% |
|
|
|
5.74 |
% |
| State and municipal obligations |
|
|
2.59 |
% |
|
|
|
4.20 |
% |
|
|
|
4.28 |
% |
|
|
|
— |
% |
|
|
|
4.22 |
% |
| SBA securities |
|
|
6.20 |
% |
|
|
|
6.19 |
% |
|
|
|
6.13 |
% |
|
|
|
5.93 |
% |
|
|
|
6.17 |
% |
|
|
|
|
|
|
|
|
|
|
|
|
|
|
|
|
|
|
|
|
|
|
|
5.27 |
% |
|
|
|
6.13 |
% |
|
|
|
4.34 |
% |
|
|
|
4.15 |
% |
|
|
|
5.48 |
% |
|
|
|
|
|
|
|
|
|
|
|
|
|
|
|
|
|
|
|
|
|
|
|
|
|
|
|
|
|
|
|
|
|
|
|
|
|
|
|
|
Loans
The loan portfolio comprises the Company’s primary interest-earning asset. The following table shows the composition of the loan portfolio at the dates indicated (dollars in thousands):
|
|
|
|
|
|
|
|
|
|
|
|
|
|
|
|
|
|
|
|
|
|
|
|
|
|
|
|
|
March 31, 2024 |
|
December 31, 2023 |
|
|
|
|
|
Total |
|
Percent of Total |
|
Total |
|
Percent of Total |
|
|
|
|
| Non-owner occupied commercial real estate |
$ |
5,309,126 |
|
|
21.9 |
% |
|
$ |
5,323,241 |
|
|
21.6 |
% |
|
|
|
|
| Construction and land |
529,645 |
|
|
2.2 |
% |
|
495,992 |
|
|
2.0 |
% |
|
|
|
|
| Owner occupied commercial real estate |
1,916,651 |
|
|
7.9 |
% |
|
1,935,743 |
|
|
7.9 |
% |
|
|
|
|
| Commercial and industrial |
6,745,622 |
|
|
27.9 |
% |
|
6,971,981 |
|
|
28.3 |
% |
|
|
|
|
Total C&I and CRE |
14,501,044 |
|
|
59.9 |
% |
|
14,726,957 |
|
|
59.8 |
% |
|
|
|
|
| Pinnacle - municipal finance |
864,796 |
|
|
3.6 |
% |
|
884,690 |
|
|
3.6 |
% |
|
|
|
|
Franchise and equipment finance |
347,103 |
|
|
1.4 |
% |
|
380,347 |
|
|
1.5 |
% |
|
|
|
|
| Mortgage warehouse lending |
456,385 |
|
|
1.9 |
% |
|
432,663 |
|
|
1.8 |
% |
|
|
|
|
Total commercial |
16,169,328 |
|
|
66.8 |
% |
|
16,424,657 |
|
|
66.7 |
% |
|
|
|
|
|
|
|
|
|
|
|
|
|
|
|
|
| 1-4 single family residential |
6,814,865 |
|
|
28.1 |
% |
|
6,903,013 |
|
|
28.0 |
% |
|
|
|
|
| Government insured residential |
1,242,107 |
|
|
5.1 |
% |
|
1,306,014 |
|
|
5.3 |
% |
|
|
|
|
Total residential |
8,056,972 |
|
|
33.2 |
% |
|
8,209,027 |
|
|
33.3 |
% |
|
|
|
|
| Total loans |
24,226,300 |
|
|
100.0 |
% |
|
24,633,684 |
|
|
100.0 |
% |
|
|
|
|
| Allowance for credit losses |
(217,556) |
|
|
|
|
(202,689) |
|
|
|
|
|
|
|
| Loans, net |
$ |
24,008,744 |
|
|
|
|
$ |
24,430,995 |
|
|
|
|
|
|
|
Commercial loans and leases
Commercial loans include a diverse portfolio of commercial and industrial loans and lines of credit, loans secured by owner-occupied commercial real-estate, income-producing non-owner occupied commercial real estate, a smaller amount of construction loans, SBA loans, mortgage warehouse lines of credit, municipal loans and leases originated by Pinnacle and franchise and equipment finance loans and leases originated by Bridge.
The following charts present the distribution of the commercial loan portfolio at the dates indicated (dollars in millions):
|
|
|
|
|
|
|
|
|
| March 31, 2024 |
|
December 31, 2023 |
Commercial Real Estate:
Commercial real estate loans include term loans secured by non-owner occupied income producing properties including rental apartments, industrial properties, retail shopping centers, free-standing single-tenant buildings, medical and other office buildings, warehouse facilities, hotels and real estate secured lines of credit. The Company’s commercial real estate underwriting standards most often provide for loan terms of five to seven years, with amortization schedules of no more than thirty years.
The following tables present the distribution of commercial real estate loans by property type, along with weighted average DSCRs and LTVs at March 31, 2024 (dollars in thousands):
|
|
|
|
|
|
|
|
|
|
|
|
|
|
|
|
|
|
|
|
|
|
|
|
|
|
|
|
|
|
|
|
|
|
|
|
|
|
|
|
|
|
|
|
|
Amortized Cost |
|
Percent of Total CRE |
|
FL |
|
New York Tri-State |
|
Other |
|
Weighted Average DSCR |
|
Weighted Average LTV |
| Office |
$ |
1,790,541 |
|
|
31 |
% |
|
59 |
% |
|
24 |
% |
|
17 |
% |
|
1.66 |
|
65.3 |
% |
| Warehouse/Industrial |
1,287,570 |
|
|
23 |
% |
|
60 |
% |
|
9 |
% |
|
31 |
% |
|
2.03 |
|
51.7 |
% |
| Multifamily |
839,950 |
|
|
14 |
% |
|
48 |
% |
|
52 |
% |
|
— |
% |
|
1.89 |
|
48.1 |
% |
| Retail |
820,983 |
|
|
14 |
% |
|
52 |
% |
|
31 |
% |
|
17 |
% |
|
1.66 |
|
59.5 |
% |
| Hotel |
488,263 |
|
|
8 |
% |
|
79 |
% |
|
3 |
% |
|
18 |
% |
|
2.12 |
|
46.9 |
% |
| Construction and Land |
529,645 |
|
|
9 |
% |
|
46 |
% |
|
49 |
% |
|
5 |
% |
|
N/A |
|
N/A |
| Other |
81,819 |
|
|
1 |
% |
|
71 |
% |
|
12 |
% |
|
17 |
% |
|
1.76 |
|
49.2 |
% |
|
$ |
5,838,771 |
|
|
100 |
% |
|
57 |
% |
|
26 |
% |
|
17 |
% |
|
1.83 |
|
56.5 |
% |
|
|
|
|
|
|
|
|
|
|
|
|
|
|
|
|
|
|
|
|
|
|
|
|
|
Florida |
|
NY Tri-State |
|
Weighted Average DSCR |
|
Weighted Average LTV |
|
Weighted Average DSCR |
|
Weighted Average LTV |
| Office |
1.68 |
|
|
64.5 |
% |
|
1.61 |
|
|
61.6 |
% |
| Warehouse/Industrial |
2.13 |
|
|
50.0 |
% |
|
1.83 |
|
|
37.2 |
% |
| Multifamily |
2.46 |
|
|
45.3 |
% |
|
1.35 |
|
|
50.8 |
% |
| Retail |
1.82 |
|
|
58.6 |
% |
|
1.38 |
|
|
61.0 |
% |
| Hotel |
2.22 |
|
|
44.7 |
% |
|
2.37 |
|
|
21.4 |
% |
| Other |
1.94 |
|
|
47.3 |
% |
|
1.22 |
|
|
67.3 |
% |
|
1.99 |
|
|
54.7 |
% |
|
1.50 |
|
|
55.4 |
% |
Geographic distribution in the tables above is based on location of the underlying collateral property. LTVs and DSCRs are based on the most recent available information; if current appraisals are not available, LTVs are adjusted by our models based on current and forecasted sub-market dynamics. DSCRs are calculated based on current contractually required payments, which in some cases may be interest only and on current levels of operating cash flows. DSCR calculations do not include pro-forma rental payments on in-place leases that are currently in initial rent abatement periods.
Included in New York tri-state multifamily loans in the tables above is approximately $121 million of rent regulated exposure as of March 31, 2024.
The following table presents the maturity profile of the CRE portfolio over the next 12 months by property type at March 31, 2024 (dollars in thousands):
|
|
|
|
|
|
|
|
|
|
|
|
|
|
|
|
|
|
|
|
|
|
|
|
|
|
|
|
|
Maturing in the Next 12 Months |
|
% Maturing in the Next 12 Months |
|
Fixed Rate or Swapped Maturing Next 12 Months |
|
|
|
Fixed Rate to Borrower as a % of Total Portfolio |
|
|
| Office |
$ |
341,925 |
|
|
19 |
% |
|
$ |
120,952 |
|
|
|
|
7 |
% |
|
|
| Warehouse/Industrial |
87,580 |
|
|
7 |
% |
|
77,292 |
|
|
|
|
6 |
% |
|
|
| Multifamily |
105,983 |
|
|
13 |
% |
|
26,041 |
|
|
|
|
3 |
% |
|
|
| Retail |
106,151 |
|
|
13 |
% |
|
65,665 |
|
|
|
|
8 |
% |
|
|
| Hotel |
41,726 |
|
|
9 |
% |
|
17,244 |
|
|
|
|
4 |
% |
|
|
| Construction and Land |
205,050 |
|
|
39 |
% |
|
3,544 |
|
|
|
|
1 |
% |
|
|
| Other |
12,626 |
|
|
15 |
% |
|
12,626 |
|
|
|
|
15 |
% |
|
|
|
$ |
901,041 |
|
|
15 |
% |
|
$ |
323,364 |
|
|
|
|
6 |
% |
|
|
The following table present scheduled maturities of the CRE portfolio by property type at March 31, 2024 (in thousands):
|
|
|
|
|
|
|
|
|
|
|
|
|
|
|
|
|
|
|
|
|
|
|
|
|
|
|
|
|
|
|
|
|
|
|
|
|
|
|
|
|
|
|
2024 |
|
2025 |
|
2026 |
|
2027 |
|
2028 |
|
Thereafter |
|
Total |
| Office |
$ |
285,124 |
|
|
$ |
398,862 |
|
|
$ |
424,338 |
|
|
$ |
223,952 |
|
|
$ |
144,670 |
|
|
$ |
313,595 |
|
|
$ |
1,790,541 |
|
| Warehouse/Industrial |
77,331 |
|
|
164,897 |
|
|
383,656 |
|
|
294,282 |
|
|
144,975 |
|
|
222,429 |
|
|
1,287,570 |
|
| Multifamily |
59,582 |
|
|
125,327 |
|
|
164,167 |
|
|
159,249 |
|
|
107,955 |
|
|
223,670 |
|
|
839,950 |
|
| Retail |
95,458 |
|
|
149,292 |
|
|
231,254 |
|
|
72,613 |
|
|
186,213 |
|
|
86,153 |
|
|
820,983 |
|
| Hotel |
41,726 |
|
|
43,986 |
|
|
215,979 |
|
|
31,270 |
|
|
55,979 |
|
|
99,323 |
|
|
488,263 |
|
| Construction and Land |
182,801 |
|
|
149,004 |
|
|
82,014 |
|
|
42,578 |
|
|
— |
|
|
73,248 |
|
|
529,645 |
|
| Other |
12,627 |
|
|
6,959 |
|
|
27,037 |
|
|
9,542 |
|
|
1,411 |
|
|
24,243 |
|
|
81,819 |
|
|
$ |
754,649 |
|
|
$ |
1,038,327 |
|
|
$ |
1,528,445 |
|
|
$ |
833,486 |
|
|
$ |
641,203 |
|
|
$ |
1,042,661 |
|
|
$ |
5,838,771 |
|
The office segment totaled $1.8 billion at March 31, 2024. Medical office comprised $309 million or 17% of the total office portfolio. The following charts present the sub-market geographic distribution of the Florida and NY tri-state office portfolios at March 31, 2024:
|
|
|
|
|
|
|
|
|
| NY Tri-State by Sub-Market |
|
Florida by Sub-Market |
The New York tri-state market encompasses approximately 24% of the office segment, with $181 million of exposure in Manhattan. As of March 31, 2024, the Manhattan office portfolio was approximately 96% occupied with 4% rent rollover expected in the next twelve months. Substantially all of the Florida office portfolio is suburban.
Office loans not secured by properties in Florida or the New York tri-state area comprised 17%, or $313 million of the segment, and exhibited no particular geographic concentration. Estimated rent rollover of the total office portfolio in the next 12 months is approximately 10%. Non-performing office loans were insignificant at March 31, 2024, totaling approximately $300 thousand. Also see the section entitled "Asset Quality" below.
Commercial and Industrial
Commercial and industrial loans are typically made to small, middle market and larger corporate businesses and not-for-profit entities and include equipment loans, secured and unsecured working capital facilities, formula-based loans, subscription finance lines of credit, trade finance, SBA product offerings, business acquisition finance credit facilities, credit facilities to institutional real estate entities such as REITs and commercial real estate investment funds, and a small amount of commercial credit cards. These loans may be structured as term loans, typically with maturities of five to seven years, or revolving lines of credit which may have multi-year maturities. In addition to financing provided by Pinnacle, the Bank provides financing to state and local governmental entities generally within our primary geographic markets. The Bank makes loans secured by owner-occupied commercial real estate that typically have risk profiles more closely aligned with that of commercial and industrial loans than with other types of commercial real estate loans.
The following table presents the exposure in the C&I portfolio by industry, at March 31, 2024 (dollars in thousands):
|
|
|
|
|
|
|
|
|
|
|
|
|
|
|
|
|
|
|
|
|
|
|
Amortized Cost(1) |
|
Percent of Total |
|
|
|
|
| Finance and Insurance |
$ |
1,423,871 |
|
|
16.4 |
% |
|
|
|
|
| Manufacturing |
848,997 |
|
|
9.8 |
% |
|
|
|
|
| Educational Services |
742,564 |
|
|
8.6 |
% |
|
|
|
|
| Utilities |
676,705 |
|
|
7.8 |
% |
|
|
|
|
| Wholesale Trade |
662,536 |
|
|
7.6 |
% |
|
|
|
|
| Health Care and Social Assistance |
630,548 |
|
|
7.3 |
% |
|
|
|
|
| Information |
618,358 |
|
|
7.1 |
% |
|
|
|
|
| Real Estate and Rental and Leasing |
465,504 |
|
|
5.4 |
% |
|
|
|
|
| Construction |
433,161 |
|
|
5.0 |
% |
|
|
|
|
| Transportation and Warehousing |
426,863 |
|
|
4.9 |
% |
|
|
|
|
| Retail Trade |
335,443 |
|
|
3.9 |
% |
|
|
|
|
| Professional, Scientific, and Technical Services |
252,752 |
|
|
2.9 |
% |
|
|
|
|
| Other Services (except Public Administration) |
250,096 |
|
|
2.9 |
% |
|
|
|
|
| Public Administration |
245,234 |
|
|
2.8 |
% |
|
|
|
|
| Arts, Entertainment, and Recreation |
226,423 |
|
|
2.6 |
% |
|
|
|
|
| Administrative and Support and Waste Management |
196,804 |
|
|
2.3 |
% |
|
|
|
|
| Accommodation and Food Services |
158,260 |
|
|
1.8 |
% |
|
|
|
|
| Other |
68,154 |
|
|
0.9 |
% |
|
|
|
|
|
$ |
8,662,273 |
|
|
100.0 |
% |
|
|
|
|
(1) Includes $1.9 billion of owner occupied real estate.
Through its commercial lending subsidiaries, Pinnacle and Bridge, the Bank provides franchise and equipment financing on a national basis using both loan and lease structures. Pinnacle provides essential-use equipment financing to state and local governmental entities directly and through vendor programs and alliances. Pinnacle offers a full array of financing structures including equipment lease purchase agreements and direct (private placement) bond re-fundings and loan agreements. Bridge has two divisions. The franchise finance division portfolio includes franchise acquisition, expansion and equipment financing facilities, typically extended to experienced operators in well-established concepts. The franchise finance portfolio is made up primarily of quick service restaurant and fitness concepts comprising 43% and 52% of the portfolio, respectively, at March 31, 2024. The equipment finance division portfolio includes primarily transportation equipment finance facilities utilizing a variety of loan and lease structures. Franchise and equipment finance have been strategically de-emphasized due to their current risk/return profile, including the lack of significant deposit business with these customers. We do not expect significant new loan originations in these segments.
Residential mortgages
The following table shows the composition of residential loans at the dates indicated (in thousands):
|
|
|
|
|
|
|
|
|
|
|
|
|
March 31, 2024 |
|
December 31, 2023 |
|
|
|
|
| 1-4 single family residential |
$ |
6,814,865 |
|
|
$ |
6,903,013 |
|
| Government insured residential |
1,242,107 |
|
|
1,306,014 |
|
|
|
|
|
|
$ |
8,056,972 |
|
|
$ |
8,209,027 |
|
The 1-4 single family residential loan portfolio, excluding government insured residential loans, is primarily comprised of prime jumbo loans purchased through established correspondent channels. 1-4 single family residential mortgage loans are primarily closed-end, first lien jumbo mortgages for the purchase or re-finance of owner occupied property. The loans have terms ranging from 10 to 30 years, with either fixed or adjustable interest rates. At March 31, 2024, $1.0 billion or 15% were secured by investor-owned properties.
The Company acquires non-performing FHA and VA insured mortgages from third party servicers who have exercised their right to purchase these loans out of GNMA securitizations upon default (collectively, "government insured pool buyout loans" or "buyout loans"). Buyout loans that re-perform, either through modification or self-cure, may be eligible for re-securitization. The Company and the servicer share in the economics of the sale of these loans into new securitizations. The balance of buyout loans totaled $1.2 billion at March 31, 2024. The Company is not the servicer of these loans.
The following charts present the distribution of the 1-4 single family residential mortgage portfolio by product type at the dates indicated:
|
|
|
|
|
|
|
|
|
| March 31, 2024 |
|
December 31, 2023 |
The following table presents the five states with the largest geographic concentrations of 1-4 single family residential loans, excluding government insured residential loans, at the dates indicated (dollars in thousands):
|
|
|
|
|
|
|
|
|
|
|
|
|
|
|
|
|
|
|
|
|
|
|
|
|
March 31, 2024 |
|
December 31, 2023 |
|
|
|
|
|
Total |
|
Percent of Total |
|
Total |
|
Percent of Total |
| California |
$ |
2,128,701 |
|
|
31.2 |
% |
|
$ |
2,171,802 |
|
|
31.5 |
% |
| New York |
1,335,323 |
|
|
19.6 |
% |
|
1,344,205 |
|
|
19.5 |
% |
| Florida |
490,354 |
|
|
7.2 |
% |
|
501,744 |
|
|
7.3 |
% |
| Illinois |
354,915 |
|
|
5.2 |
% |
|
358,512 |
|
|
5.2 |
% |
| Virginia |
319,126 |
|
|
4.7 |
% |
|
312,384 |
|
|
4.5 |
% |
| Others |
2,186,446 |
|
|
32.1 |
% |
|
2,214,366 |
|
|
32.0 |
% |
|
$ |
6,814,865 |
|
|
100.0 |
% |
|
$ |
6,903,013 |
|
|
100.0 |
% |
Operating lease equipment, net
Operating lease equipment, net declined by $43 million during the three months ended March 31, 2024 to $329 million as a result of disposals. We expect the balance of operating lease equipment to continue to decline as this product offering is no longer considered core to our business strategy.
The charts below present operating lease equipment by type at the dates indicated:
|
|
|
|
|
|
|
|
|
| March 31, 2024 |
|
December 31, 2023 |
Bridge had exposure to the energy industry of $147 million at March 31, 2024. The majority of the energy exposure was in the operating lease equipment portfolio where energy exposure totaled $139 million, consisting primarily of railcars serving the petroleum industry.
Asset Quality
Commercial Loans
We have a robust credit risk management framework, an experienced team to lead the workout and recovery process for the commercial and commercial real estate portfolios and a dedicated internal credit review function. Loan performance is monitored by our credit administration, portfolio management and workout and recovery departments. Risk ratings are updated continuously; generally, commercial relationships with balances in excess of defined thresholds are re-evaluated at least annually and more frequently if circumstances indicate that a change in risk rating may be warranted. The defined thresholds range from $1 million to $3 million. Homogenous groups of smaller balance commercial loans may be monitored collectively. The credit quality and risk rating of commercial loans as well as our underwriting and portfolio management practices are regularly reviewed by our internal independent credit review department.
We believe internal risk rating is the best indicator of the credit quality of commercial loans. The Company utilizes a 16-grade internal asset risk classification system as part of its efforts to monitor and maintain commercial asset quality. The special mention rating is considered a transitional rating for loans exhibiting potential credit weaknesses that could result in deterioration of repayment prospects at some future date if not checked or corrected and that deserve management’s close attention. These borrowers may exhibit declining cash flows or revenues or increasing leverage. Loans with well-defined credit weaknesses that may result in a loss if the deficiencies are not corrected are assigned a risk rating of substandard. These borrowers may exhibit payment defaults, inadequate cash flows from current operations, operating losses, increasing balance sheet leverage, project cost overruns, unreasonable construction delays, exhausted interest reserves, declining collateral values, frequent overdrafts or past due real estate taxes. Loans with weaknesses so severe that collection in full is highly questionable or improbable, but because of certain reasonably specific pending factors have not been charged off, are assigned an internal risk rating of doubtful.
The following table summarizes the Company's commercial credit exposure, based on internal risk rating, at the dates indicated (dollars in thousands):
|
|
|
|
|
|
|
|
|
|
|
|
|
|
|
|
|
|
|
|
|
|
|
|
|
|
|
|
|
|
|
|
|
|
|
|
|
|
|
|
|
|
|
|
|
|
|
|
|
|
|
|
|
|
|
|
|
March 31, 2024 |
|
|
|
December 31, 2023 |
|
|
|
|
|
|
|
|
|
|
|
|
|
|
|
|
|
|
|
|
|
CRE |
|
Percent of CRE Loans |
|
Total Commercial |
|
Percent of Commercial Loans |
|
|
|
|
|
CRE |
|
Percent of CRE Loans |
|
Total Commercial |
|
Percent of Commercial Loans |
|
|
|
|
| Pass |
$ |
5,109,115 |
|
|
87.5 |
% |
|
$ |
14,748,066 |
|
|
91.2 |
% |
|
|
|
|
|
$ |
5,317,230 |
|
|
91.4 |
% |
|
$ |
15,287,548 |
|
|
93.2 |
% |
|
|
|
|
| Special mention |
139,980 |
|
|
2.4 |
% |
|
357,800 |
|
|
2.2 |
% |
|
|
|
|
|
97,552 |
|
|
1.7 |
% |
|
319,905 |
|
|
1.9 |
% |
|
|
|
|
| Substandard accruing |
577,418 |
|
|
9.9 |
% |
|
966,129 |
|
|
6.0 |
% |
|
|
|
|
|
390,724 |
|
|
6.7 |
% |
|
711,266 |
|
|
4.3 |
% |
|
|
|
|
| Substandard non-accruing |
12,258 |
|
|
0.2 |
% |
|
83,511 |
|
|
0.5 |
% |
|
|
|
|
|
13,727 |
|
|
0.2 |
% |
|
86,903 |
|
|
0.5 |
% |
|
|
|
|
| Doubtful |
— |
|
|
— |
% |
|
13,822 |
|
|
0.1 |
% |
|
|
|
|
|
— |
|
|
— |
% |
|
19,035 |
|
|
0.1 |
% |
|
|
|
|
|
$ |
5,838,771 |
|
|
100.0 |
% |
|
$ |
16,169,328 |
|
|
100.0 |
% |
|
|
|
|
|
$ |
5,819,233 |
|
|
100.0 |
% |
|
$ |
16,424,657 |
|
|
100.0 |
% |
|
|
|
|
The $255 million increase in the substandard accruing category for the quarter ended March 31, 2024 included $187 million of CRE, $115 million of which was office exposure (including construction loans). All of these loans continue to perform. Factors contributing to risk rating migration in the office portfolio included rent abatement periods, delays in completing build-out of leased space and in some cases what we expect to be temporarily lower occupancy levels. In the current market, when office space is leased to new tenants, landlords frequently provide initial rent abatement periods. During these rent abatement periods, we do not include pro-forma rental payments to be made in the future under the terms of new leases, in operating cash flows for the purposes of determining risk ratings.
The following table provides additional information about special mention and substandard accruing loans at the dates indicated (dollars in thousands). All of these loans are performing. Non-performing loans are discussed further in the section entitled "Non-performing Assets" below.
|
|
|
|
|
|
|
|
|
|
|
|
|
|
|
|
|
|
|
|
|
|
|
|
|
|
|
|
|
|
|
|
|
|
|
|
|
|
|
|
|
|
|
|
|
|
|
|
|
|
|
|
|
|
|
|
|
March 31, 2024 |
|
|
|
|
|
|
|
|
|
December 31, 2023 |
|
Amortized Cost |
|
% of Loan Segment |
|
|
|
|
|
|
|
|
|
|
|
|
|
|
|
|
|
Amortized Cost |
|
% of Loan Segment |
| Special mention: |
|
|
|
|
|
|
|
|
|
|
|
|
|
|
|
|
|
|
|
|
|
|
|
| CRE |
|
|
|
|
|
|
|
|
|
|
|
|
|
|
|
|
|
|
|
|
|
|
|
| Hotel |
$ |
18,809 |
|
|
3.9 |
% |
|
|
|
|
|
|
|
|
|
|
|
|
|
|
|
|
|
$ |
15,712 |
|
|
3.2 |
% |
| Retail |
— |
|
|
— |
% |
|
|
|
|
|
|
|
|
|
|
|
|
|
|
|
|
|
36,000 |
|
|
4.4 |
% |
|
|
|
|
|
|
|
|
|
|
|
|
|
|
|
|
|
|
|
|
|
|
|
|
| Office |
95,595 |
|
|
5.3 |
% |
|
|
|
|
|
|
|
|
|
|
|
|
|
|
|
|
|
45,840 |
|
|
2.6 |
% |
|
|
|
|
|
|
|
|
|
|
|
|
|
|
|
|
|
|
|
|
|
|
|
|
Construction and land |
25,576 |
|
|
4.8 |
% |
|
|
|
|
|
|
|
|
|
|
|
|
|
|
|
|
|
— |
|
|
— |
% |
|
|
|
|
|
|
|
|
|
|
|
|
|
|
|
|
|
|
|
|
|
|
|
|
|
139,980 |
|
|
|
|
|
|
|
|
|
|
|
|
|
|
|
|
|
|
|
|
97,552 |
|
|
|
| Owner occupied commercial real estate |
6,691 |
|
|
0.3 |
% |
|
|
|
|
|
|
|
|
|
|
|
|
|
|
|
|
|
22,150 |
|
|
1.1 |
% |
| Commercial and industrial |
206,831 |
|
|
3.1 |
% |
|
|
|
|
|
|
|
|
|
|
|
|
|
|
|
|
|
197,924 |
|
|
2.8 |
% |
|
|
|
|
|
|
|
|
|
|
|
|
|
|
|
|
|
|
|
|
|
|
|
|
Franchise and equipment finance |
— |
|
|
— |
% |
|
|
|
|
|
|
|
|
|
|
|
|
|
|
|
|
|
2,279 |
|
|
1.2 |
% |
Mortgage warehouse lending |
4,298 |
|
|
0.9 |
% |
|
|
|
|
|
|
|
|
|
|
|
|
|
|
|
|
|
— |
|
|
— |
% |
|
$ |
357,800 |
|
|
|
|
|
|
|
|
|
|
|
|
|
|
|
|
|
|
|
|
$ |
319,905 |
|
|
|
|
|
|
|
|
|
|
|
|
|
|
|
|
|
|
|
|
|
|
|
|
|
|
|
| Substandard accruing: |
|
|
|
|
|
|
|
|
|
|
|
|
|
|
|
|
|
|
|
|
|
|
|
| CRE |
|
|
|
|
|
|
|
|
|
|
|
|
|
|
|
|
|
|
|
|
|
|
|
| Hotel |
$ |
40,529 |
|
|
8.3 |
% |
|
|
|
|
|
|
|
|
|
|
|
|
|
|
|
|
|
$ |
41,805 |
|
|
8.5 |
% |
| Retail |
95,717 |
|
|
11.7 |
% |
|
|
|
|
|
|
|
|
|
|
|
|
|
|
|
|
|
53,205 |
|
|
6.5 |
% |
| Multi-family |
123,681 |
|
|
14.7 |
% |
|
|
|
|
|
|
|
|
|
|
|
|
|
|
|
|
|
115,755 |
|
|
13.8 |
% |
| Office |
196,317 |
|
|
11.0 |
% |
|
|
|
|
|
|
|
|
|
|
|
|
|
|
|
|
|
100,307 |
|
|
5.7 |
% |
|
|
|
|
|
|
|
|
|
|
|
|
|
|
|
|
|
|
|
|
|
|
|
|
Construction and land |
118,434 |
|
|
22.4 |
% |
|
|
|
|
|
|
|
|
|
|
|
|
|
|
|
|
|
76,883 |
|
|
15.5 |
% |
| Other |
2,740 |
|
|
3.3 |
% |
|
|
|
|
|
|
|
|
|
|
|
|
|
|
|
|
|
2,769 |
|
|
3.4 |
% |
|
577,418 |
|
|
|
|
|
|
|
|
|
|
|
|
|
|
|
|
|
|
|
|
390,724 |
|
|
|
| Owner occupied commercial real estate |
97,072 |
|
|
5.1 |
% |
|
|
|
|
|
|
|
|
|
|
|
|
|
|
|
|
|
71,908 |
|
|
3.7 |
% |
| Commercial and industrial |
244,323 |
|
|
3.6 |
% |
|
|
|
|
|
|
|
|
|
|
|
|
|
|
|
|
|
208,984 |
|
|
3.0 |
% |
|
|
|
|
|
|
|
|
|
|
|
|
|
|
|
|
|
|
|
|
|
|
|
|
Franchise and equipment finance |
47,316 |
|
|
13.6 |
% |
|
|
|
|
|
|
|
|
|
|
|
|
|
|
|
|
|
39,650 |
|
|
10.4 |
% |
|
|
|
|
|
|
|
|
|
|
|
|
|
|
|
|
|
|
|
|
|
|
|
|
|
|
|
|
|
|
|
|
|
|
|
|
|
|
|
|
|
|
|
|
|
|
|
|
|
$ |
966,129 |
|
|
|
|
|
|
|
|
|
|
|
|
|
|
|
|
|
|
|
|
$ |
711,266 |
|
|
|
|
|
|
|
|
|
|
|
|
|
|
|
|
|
|
|
|
|
|
|
|
|
|
|
|
|
|
|
|
|
|
|
|
|
|
|
|
|
|
|
|
|
|
|
|
|
|
|
|
|
|
|
|
|
|
|
|
|
|
|
|
|
|
|
|
|
|
|
|
|
|
|
|
|
|
|
|
|
|
|
|
|
|
|
|
|
|
|
|
|
|
|
|
|
|
|
|
|
|
|
|
|
|
|
|
|
|
|
|
|
|
|
|
|
|
|
|
|
|
|
The following graphs present trends in criticized and classified loans by segment over the periods indicated (in millions):
|
|
|
|
|
|
|
|
|
Commercial Real Estate(1) |
|
Commercial(1)(2) |
(1)Excludes SBA
(2)Includes Pinnacle and franchise and equipment finance
The following charts present criticized and classified CRE loans by property type at the dates indicated (in millions):
|
|
|
|
|
|
|
|
|
| March 31, 2024 |
|
December 31, 2023 |
The following graphs present delinquency trends by segment over the periods indicated (in millions):
|
|
|
|
|
|
|
|
|
| Commercial Real Estate |
|
Commercial(1) |
(1)Includes Pinnacle and franchise and equipment finance
Residential Loans
Excluding government insured loans, our residential portfolio consists largely of performing jumbo mortgage loans with FICO scores above 700, primarily owner-occupied and full documentation, with current LTV's of 80% or less. Loans with LTVs higher than 80% may be extended to selected credit-worthy borrowers. We perform due diligence on the purchased loans for credit, compliance, counterparty, payment history and property valuation.
We have a dedicated residential credit risk management function, and the residential portfolio is monitored by our internal credit review function. Residential mortgage loans are not individually risk rated. Delinquency status is the primary measure we use to monitor the credit quality of these loans. We also consider original LTV and most recently available FICO score to be significant indicators of credit quality for the 1-4 single family residential portfolio, excluding government insured residential loans.
The following charts present information about the 1-4 single family residential portfolio, excluding government insured loans, by FICO distribution, LTV distribution and vintage at March 31, 2024:
|
|
|
|
|
|
|
|
|
|
|
|
|
|
|
| FICO Distribution |
|
LTV Distribution |
|
Vintage |
The following graph present delinquency trends for residential loans, excluding government insured residential loans, over the periods indicated (in millions):
FICO scores are generally updated semi-annually and were most recently updated in the first quarter of 2024. LTVs are typically based on valuation at origination since we do not routinely update residential appraisals.
At March 31, 2024, the majority of the 1-4 single family residential loan portfolio, excluding government insured residential loans, was owner-occupied, with 80% primary residence, 5% second homes and 15% investment properties.
Note 4 to the consolidated financial statements presents additional information about key credit quality indicators and delinquency status of the loan portfolio.
Operating Lease Equipment, net
Operating leases with a carrying value of assets under lease totaling $24 million were internally risk rated substandard at March 31, 2024. On a quarterly basis, management performs an impairment analysis on assets with indicators of potential impairment. Potential impairment indicators include evidence of changes in residual value, macro-economic conditions, an extended period of time off-lease, criticized or classified status, or management's intention to sell the asset at an amount potentially below its carrying value. There were no impairment charges recognized during the three months ended March 31, 2024 and 2023.
Non-Performing Assets
Non-performing assets generally consist of (i) non-accrual loans, (ii) accruing loans that are more than 90 days contractually past due as to interest or principal, excluding PCD loans for which management has a reasonable basis for an expectation about future cash flows and government insured residential loans, and (iii) OREO and other non-performing assets.
The following table presents information about the Company's non-performing loans and non-performing assets at the dates indicated (dollars in thousands):
|
|
|
|
|
|
|
|
|
|
|
|
|
|
|
March 31, 2024 |
|
|
|
December 31, 2023 |
| Non-accrual loans: |
|
|
|
|
|
| Commercial: |
|
|
|
|
|
| Non-owner occupied commercial real estate |
$ |
12,258 |
|
|
|
|
$ |
13,727 |
|
|
|
|
|
|
|
| Owner occupied commercial real estate |
12,519 |
|
|
|
|
13,626 |
|
| Commercial and industrial |
49,926 |
|
|
|
|
54,907 |
|
|
|
|
|
|
|
Franchise and equipment finance |
22,630 |
|
|
|
|
23,678 |
|
| Total commercial loans |
97,333 |
|
|
|
|
105,938 |
|
| Residential |
17,847 |
|
|
|
|
20,513 |
|
| Total non-accrual loans |
115,180 |
|
|
|
|
126,451 |
|
Loans past due 90 days and still accruing |
593 |
|
|
|
|
593 |
|
| Total non-performing loans |
115,773 |
|
|
|
|
127,044 |
|
| OREO and other non-performing assets |
3,168 |
|
|
|
|
3,536 |
|
| Total non-performing assets |
$ |
118,941 |
|
|
|
|
$ |
130,580 |
|
|
|
|
|
|
|
Non-performing loans to total loans (1) |
0.48 |
% |
|
|
|
0.52 |
% |
Non-performing assets to total assets (1) |
0.34 |
% |
|
|
|
0.37 |
% |
| ACL to total loans |
0.90 |
% |
|
|
|
0.82 |
% |
Commercial ACL to commercial loans (2) |
1.42 |
% |
|
|
|
1.29 |
% |
| ACL to non-performing loans |
187.92 |
% |
|
|
|
159.54 |
% |
Net charge-offs to average loans (3) |
0.02 |
% |
|
|
|
0.09 |
% |
(1) Non-performing loans and assets include the guaranteed portion of non-accrual SBA loans totaling $40.0 million or 0.16% of total loans and 0.11% of total assets, at March 31, 2024, and $41.8 million or 0.17% of total loans and 0.12% of total assets, at December 31, 2023.
(2) For purposes of this ratio, commercial loans includes the C&I and CRE sub-segments, as well as franchise and equipment finance. Due to their unique risk profiles, MWL and municipal finance are excluded from this ratio.
(3) Annualized for the three months ended March 31, 2024.
Contractually delinquent government insured residential loans are typically GNMA early buyout loans and are excluded from non-performing loans as defined in the table above due to their government guarantee. The carrying value of such loans contractually delinquent by 90 days or more was $255 million and $277 million at March 31, 2024 and December 31, 2023, respectively.
The following graphs present trends in non-performing loans to total loans and non-performing assets to total assets over the periods indicated, as well as trends in net charge-offs. Levels of non-performing loans to total loans and non-performing assets to total assets remain below pre-pandemic levels.
|
|
|
|
|
|
|
|
|
| Non-Performing Loans to Total Loans |
|
Non-Performing Assets to Total Assets |
|
|
|
| Net Charges-Offs to Average Loans |
The following graph presents the trend in non-performing loans by portfolio segment over the periods indicated (in millions):
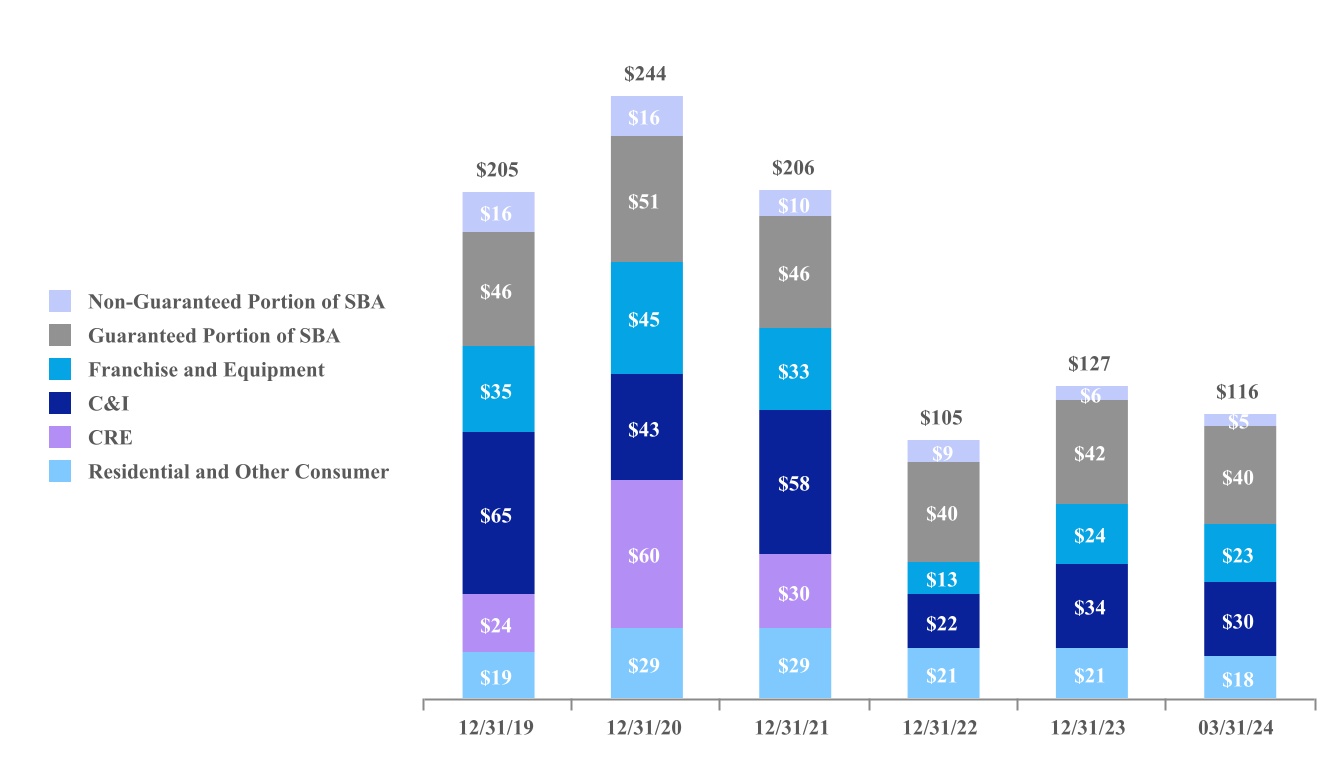
Commercial loans are placed on non-accrual status when (i) management has determined that full repayment of all contractual principal and interest is in doubt, or (ii) the loan is past due 90 days or more as to principal or interest unless the loan is well secured and in the process of collection. Residential loans, other than government insured pool buyout loans, are generally placed on non-accrual status when they are 60 days past due. Additionally, certain residential loans not contractually delinquent but in forbearance may be placed on non-accrual status at management's discretion. When a loan is placed on non-accrual status, uncollected interest accrued is reversed and charged to interest income. Commercial loans are returned to accrual status only after all past due principal and interest has been collected and full repayment of remaining contractual principal and interest is reasonably assured. Residential loans are generally returned to accrual status when less than 60 days past due. Past due status of loans is determined based on the contractual next payment due date. Loans less than 30 days past due are reported as current.
Loss Mitigation Strategies
Criticized or classified commercial loans in excess of certain thresholds are reviewed quarterly by the Criticized Asset Committee, which evaluates the appropriate strategy for collection to mitigate the amount of credit losses and considers the appropriate risk rating for these loans. Criticized asset reports for each relationship are presented by the assigned relationship manager and credit officer to the Criticized Asset Committee until such time as the relationships are returned to a satisfactory credit risk rating or otherwise resolved. The Criticized Asset Committee may require the transfer of a loan to our workout and recovery department, which is tasked to effectively manage the loan with the goal of minimizing losses and expenses associated with restructure, collection and/or liquidation of collateral. Commercial loans with a risk rating of substandard, loans on non-accrual status, and assets classified as OREO or repossessed assets are usually transferred to workout and recovery. Oversight of the workout and recovery department is provided by the Criticized Asset Committee.
Our servicers evaluate each residential loan in default to determine the most effective loss mitigation strategy, which may be modification, short sale, or foreclosure, and pursue the alternative most suitable to the consumer and to mitigate losses to the Bank.
Analysis of the Allowance for Credit Losses
The ACL is management's estimate of the amount of expected credit losses over the life of the loan portfolio, or the amount of amortized cost basis not expected to be collected, at the balance sheet date. This estimate encompasses information about historical events, current conditions and reasonable and supportable economic forecasts. Determining the amount of the ACL is complex and requires extensive judgment by management about matters that are inherently uncertain. Given a level of continued uncertainty about the general economy, evolving dynamics in some segments of the commercial real estate market, particularly the office sector, the complexity of the ACL estimate and level of management judgment required, we believe it is possible that the ACL estimate could change, potentially materially, in future periods. If commercial real estate market dynamics in our primary markets worsen beyond our current expectations, the ACL and the provision for credit losses will increase in the future. Changes in the ACL may result from changes in current economic conditions including but not limited to unanticipated changes in interest rates or inflationary pressures, changes in our economic forecast, loan portfolio composition, commercial and residential real estate market dynamics and other circumstances not currently known to us that may impact the financial condition and operations of our borrowers, among other factors.
Expected credit losses are estimated on a collective basis for groups of loans that share similar risk characteristics. For loans that do not share similar risk characteristics with other loans such as collateral dependent loans, expected credit losses are estimated on an individual basis. Expected credit losses are estimated over the contractual terms of the loans, adjusted for expected prepayments, generally excluding expected extensions, renewals, and modifications.
For the substantial majority of portfolio segments and subsegments, including residential loans other than government insured loans, and most commercial and commercial real estate loans, expected losses are estimated using econometric models. The models employ a factor based methodology, leveraging data sets containing extensive historical loss and recovery information by industry, geography, product type, collateral type and obligor characteristics, to estimate PD and LGD. Measures of PD for commercial loans incorporate current conditions through market cycle or credit cycle adjustments. For residential loans, the models consider FICO and adjusted LTVs. PDs and LGDs are then conditioned on the reasonable and supportable economic forecast. Projected PDs and LGDs, determined based on pool level characteristics, are applied to estimated exposure at default, considering the contractual term and payment structure of loans, adjusted for expected prepayments, to generate estimates of expected loss. For criticized or classified loans, PDs are adjusted to benchmark PDs established for each risk rating. The ACL estimate incorporates a reasonable and supportable economic forecast through the use of externally developed macroeconomic scenarios applied in the models.
A single economic scenario or a probability weighted blend of economic scenarios may be used. The models ingest numerous national, regional and MSA level variables and data points. At March 31, 2024 and December 31, 2023, we used a combination of weighted third-party provided economic scenarios in calculating the quantitative portion of the ACL. Each of these externally provided scenarios in fact represents the result of a probability weighting of thousands of individual scenario paths.
See Note 1 to the consolidated financial statements of the Company's 2023 Annual Report on Form 10-K for more detailed information about our ACL methodology and related accounting policies.
The following table provides an analysis of the ACL, provision for (recovery of) credit losses related to the funded portion of loans and net charge-offs by loan segment for the periods indicated (dollars in thousands):
|
|
|
|
|
|
|
|
|
|
|
|
|
|
|
|
|
|
|
|
|
|
|
|
|
|
|
|
|
|
|
|
|
|
|
|
|
|
|
|
|
|
|
|
|
|
| |
|
|
CRE |
|
|
|
C&I(2) |
|
|
|
Pinnacle - municipal Finance |
|
Franchise and Equipment Finance |
|
Residential |
|
|
|
Total |
|
|
|
|
|
|
|
|
|
|
|
|
|
|
|
|
|
|
|
|
|
|
|
|
|
|
|
|
|
|
|
|
|
|
|
|
|
|
|
|
|
|
|
|
|
|
|
|
|
|
|
|
|
|
|
|
|
|
|
|
|
|
|
|
|
|
|
|
|
|
|
|
|
|
|
|
|
|
|
|
|
|
|
|
|
|
|
|
|
|
|
|
|
|
|
|
|
|
|
|
|
|
|
|
|
|
|
|
|
|
|
|
|
|
|
|
|
|
|
|
|
|
|
|
|
|
|
|
|
|
|
|
|
|
|
|
|
|
|
|
|
|
|
|
|
|
|
|
|
|
|
|
|
|
|
|
|
|
|
|
|
|
|
|
|
|
|
|
|
|
|
|
|
|
|
|
|
|
|
|
|
|
|
|
|
|
|
|
|
|
|
|
|
|
|
|
|
|
|
|
|
|
|
|
|
|
|
|
|
|
|
|
|
|
|
|
|
|
|
|
|
|
|
|
|
|
|
|
|
|
|
|
|
|
|
|
|
|
|
|
|
|
|
|
|
|
|
|
|
|
|
|
|
|
|
|
|
|
|
|
|
|
|
|
|
|
|
|
|
|
|
|
|
|
|
|
|
|
|
|
|
|
|
|
|
|
|
|
|
|
|
|
|
|
|
|
|
|
|
|
|
|
|
|
|
|
|
|
|
|
|
|
|
|
|
|
|
|
|
|
|
|
|
|
|
|
|
|
|
|
|
|
|
|
|
|
|
|
|
|
|
|
|
|
|
|
|
|
|
|
|
|
|
|
Balance at December 31, 2022 |
|
|
$ |
24,751 |
|
|
|
|
$ |
97,190 |
|
|
|
|
$ |
173 |
|
|
$ |
14,091 |
|
|
$ |
11,741 |
|
|
|
|
$ |
147,946 |
|
|
|
| Impact of adoption of ASU 2022-02 |
|
|
— |
|
|
|
|
(1,671) |
|
|
|
|
— |
|
|
(6) |
|
|
(117) |
|
|
|
|
(1,794) |
|
|
|
| Balance at January 1, 2023 |
|
|
24,751 |
|
|
|
|
95,519 |
|
|
|
|
173 |
|
|
14,085 |
|
|
11,624 |
|
|
|
|
146,152 |
|
|
|
| Provision for (recovery of) credit losses |
|
|
1,298 |
|
|
|
|
16,174 |
|
|
|
|
5 |
|
|
(52) |
|
|
170 |
|
|
|
|
17,595 |
|
|
|
| Charge-offs |
|
|
(35) |
|
|
|
|
(1,597) |
|
|
|
|
— |
|
|
(6,267) |
|
|
— |
|
|
|
|
(7,899) |
|
|
|
| Recoveries |
|
|
31 |
|
|
|
|
2,886 |
|
|
|
|
— |
|
|
24 |
|
|
3 |
|
|
|
|
2,944 |
|
|
|
| Balance at March 31, 2023 |
|
|
$ |
26,045 |
|
|
|
|
$ |
112,982 |
|
|
|
|
$ |
178 |
|
|
$ |
7,790 |
|
|
$ |
11,797 |
|
|
|
|
$ |
158,792 |
|
|
|
|
|
|
|
|
|
|
|
|
|
|
|
|
|
|
|
|
|
|
|
|
|
Balance at December 31, 2023 |
|
|
$ |
41,338 |
|
|
|
|
$ |
142,622 |
|
|
|
|
$ |
243 |
|
|
$ |
10,855 |
|
|
$ |
7,631 |
|
|
|
|
$ |
202,689 |
|
|
|
| Provision for (recovery of) credit losses |
|
|
20,176 |
|
|
|
|
(2,725) |
|
|
|
|
(23) |
|
|
(649) |
|
|
(974) |
|
|
|
|
15,805 |
|
|
|
| Charge-offs |
|
|
(486) |
|
|
|
|
(4,076) |
|
|
|
|
— |
|
|
(790) |
|
|
(34) |
|
|
|
|
(5,386) |
|
|
|
| Recoveries |
|
|
50 |
|
|
|
|
4,394 |
|
|
|
|
— |
|
|
— |
|
|
4 |
|
|
|
|
4,448 |
|
|
|
| Balance at March 31, 2024 |
|
|
$ |
61,078 |
|
|
|
|
$ |
140,215 |
|
|
|
|
$ |
220 |
|
|
$ |
9,416 |
|
|
$ |
6,627 |
|
|
|
|
$ |
217,556 |
|
|
|
|
|
|
|
|
|
|
|
|
|
|
|
|
|
|
|
|
|
|
|
|
|
Net Charge-offs to Average Loans (1) |
|
|
|
|
|
|
|
|
|
|
|
|
|
|
|
|
|
|
|
|
|
|
|
|
|
|
|
|
|
|
|
|
|
|
|
|
|
|
|
|
|
|
|
Three Months Ended
March 31, 2023 |
|
|
— |
% |
|
|
|
(0.06) |
% |
|
|
|
— |
% |
|
5.81 |
% |
|
— |
% |
|
|
|
0.08 |
% |
|
|
Three Months Ended
March 31, 2024 |
|
|
0.03 |
% |
|
|
|
(0.01) |
% |
|
|
|
— |
% |
|
0.87 |
% |
|
— |
% |
|
|
|
0.02 |
% |
|
|
(1)Annualized.
(2)Includes mortgage warehouse lending.
The following table shows the distribution of the ACL at the dates indicated (dollars in thousands):
|
|
|
|
|
|
|
|
|
|
|
|
|
|
|
|
|
|
|
|
|
|
|
|
|
|
|
|
|
|
|
|
|
|
|
|
|
March 31, 2024 |
|
|
|
|
|
December 31, 2023 |
|
|
| |
Total |
|
%(1) |
|
|
|
|
|
|
|
|
|
Total |
|
%(1) |
|
|
|
|
|
|
|
|
|
|
|
|
|
|
|
|
|
|
|
|
|
|
|
|
| Non-owner occupied commercial real estate |
$ |
48,551 |
|
|
21.9 |
% |
|
|
|
|
|
|
|
|
|
$ |
32,810 |
|
|
21.6 |
% |
|
|
|
|
| Construction and land |
12,527 |
|
|
2.2 |
% |
|
|
|
|
|
|
|
|
|
8,528 |
|
|
2.0 |
% |
|
|
|
|
| CRE |
61,078 |
|
|
|
|
|
|
|
|
|
|
|
|
41,338 |
|
|
|
|
|
|
|
|
|
|
|
|
|
|
|
|
|
|
|
|
|
|
|
|
|
|
|
| Owner occupied commercial real estate |
17,369 |
|
|
7.9 |
% |
|
|
|
|
|
|
|
|
|
17,642 |
|
|
7.9 |
% |
|
|
|
|
Commercial and industrial(2) |
122,846 |
|
|
29.8 |
% |
|
|
|
|
|
|
|
|
|
124,980 |
|
|
30.1 |
% |
|
|
|
|
| Pinnacle - municipal finance |
220 |
|
|
3.6 |
% |
|
|
|
|
|
|
|
|
|
243 |
|
|
3.6 |
% |
|
|
|
|
Franchise and equipment finance |
9,416 |
|
|
1.4 |
% |
|
|
|
|
|
|
|
|
|
10,855 |
|
|
1.5 |
% |
|
|
|
|
|
149,851 |
|
|
|
|
|
|
|
|
|
|
|
|
153,720 |
|
|
|
|
|
|
|
| Residential |
6,627 |
|
|
33.2 |
% |
|
|
|
|
|
|
|
|
|
7,631 |
|
|
33.3 |
% |
|
|
|
|
|
$ |
217,556 |
|
|
100.0 |
% |
|
|
|
|
|
|
|
|
|
$ |
202,689 |
|
|
100.0 |
% |
|
|
|
|
(1)Represents percentage of loans receivable in each category to total loans receivable.
(2)Includes mortgage warehouse lending.
The following table presents the ACL as a percentage of loans at the dates indicated, by portfolio sub-segment:
|
|
|
|
|
|
|
|
|
|
|
|
|
|
|
|
|
|
|
|
March 31, 2024 |
|
|
|
December 31, 2023 |
|
|
|
|
|
|
|
|
|
|
|
|
|
|
|
|
| Commercial: |
|
|
|
|
|
|
|
|
|
|
| CRE |
1.05 |
% |
|
|
|
0.71 |
% |
|
|
|
|
|
C&I |
1.62 |
% |
|
|
|
1.60 |
% |
|
|
|
|
|
Franchise and equipment finance |
2.71 |
% |
|
|
|
2.85 |
% |
|
|
|
|
|
Total commercial (1) |
1.42 |
% |
|
|
|
1.29 |
% |
|
|
|
|
|
| Pinnacle - municipal finance |
0.03 |
% |
|
|
|
0.03 |
% |
|
|
|
|
|
Residential and MWL |
0.08 |
% |
|
|
|
0.09 |
% |
|
|
|
|
|
|
0.90 |
% |
|
|
|
0.82 |
% |
|
|
|
|
|
|
|
|
|
|
|
|
|
|
|
|
| ACL to non-performing loans |
187.92 |
% |
|
|
|
159.54 |
% |
|
|
|
|
|
(1)For purposes of this ratio, commercial loans includes the C&I and CRE sub-segments, as well as franchise and equipment finance. Due to their unique risk profiles, MWL and municipal finance are excluded from this ratio.
Factors contributing to the change in the ACL during the three months ended March 31, 2024, are depicted in the chart below (dollars in millions):
Changes in the ACL during the three months ended March 31, 2024
As depicted in the chart above, the most significant drivers of the increase in the ACL from December 31, 2023, to March 31, 2024, were (i) an increase in qualitative loss factors, with the majority related to office CRE and (ii) risk rating migration, partially offset by (iii) an overall improvement in current economic conditions and the economic forecast. At March 31, 2024, the ratio of the ACL to loans was 0.90% compared to 0.82% at December 31, 2023. The ACL to loans ratio for commercial portfolio sub-segments including C&I, CRE, and franchise and equipment finance was 1.42% at March 31, 2024 and the ACL to loans ratio for CRE office loans was 2.26%. Further discussion of changes in the ACL for select portfolio sub-segments follows:
•The ACL for the CRE portfolio sub-segment increased by $19.7 million during the three months ended March 31, 2024, from 0.71% to 1.05% of loans. The most significant reasons for the increase in the ACL for this segment were an increase in qualitative loss factors, related primarily to office CRE, and risk rating migration.
•For the commercial and industrial sub-segment, including owner-occupied commercial real estate, the ACL coverage ratio increased from 1.60% to 1.62% of loans. This increase was primarily driven by risk rating migration and qualitative loss factors, partially offset by an improved economic forecast.
•The ACL for the residential segment decreased by $1.0 million during the three months ended March 31, 2024, from 0.09% to 0.08% of loans primarily due to the improved economic forecast.
The estimate of the ACL at March 31, 2024, was informed by forecasted economic scenarios published in March 2024, a wide variety of additional economic data, information about borrower financial condition and collateral values and other relevant information. The quantitative portion of the ACL at March 31, 2024, was modeled using a weighting of baseline, downside and upside third-party economic scenarios, with the highest weighting ascribed to the baseline scenario and lower weightings ascribed equally to the downside and upside scenarios. The economic variables that impacted the ACL for the three months ended March 31, 2024, included assumptions about interest rates and spreads, commercial property forecasts, the forecasted trajectory of regional unemployment and performance of the stock market.
Some of the high level data points informing the baseline scenario, which was the scenario most heavily weighted, used in estimating the quantitative portion of the ACL at March 31, 2024, included:
•Labor market assumptions, which reflected national unemployment peaking at 4.1% and
•Annualized growth in national GDP troughing at 1.3% in the baseline.
The above unemployment and GDP growth assumptions are provided to give a high level overview of the nature and severity of the baseline economic forecast scenario used in estimating the ACL. Numerous additional variables and assumptions not explicitly stated, including but not limited to detailed commercial property forecasts, projected stock market volatility indices and a variety of assumptions about market interest rates and spreads also contributed to the overall impact economic conditions and the economic forecast had on the ACL estimate. Furthermore, while the variables presented above are at the national level, most of the economic variables are regionalized at the market and submarket level in the models.
For additional information about the ACL, see Note 4 to the consolidated financial statements.
Deposits
The Company has a diverse deposit book by industry sector. Our largest industry vertical at March 31, 2024, was the title insurance vertical, with approximately $3.1 billion in total deposits. Approximately 62% of our total deposits were commercial or municipal deposits at March 31, 2024.
The following table presents information about the Company's insured and collateralized deposits as of March 31, 2024 (dollars in thousands):
|
|
|
|
|
|
|
|
|
| Total deposits |
|
$ |
27,027,364 |
|
|
|
|
Estimated amount of uninsured deposits |
|
$ |
12,777,304 |
|
| Less: collateralized deposits |
|
(3,047,517) |
|
| Less: affiliate deposits |
|
(285,930) |
|
| Adjusted uninsured deposits |
|
$ |
9,443,857 |
|
| Estimated insured and collateralized deposits |
|
$ |
17,583,507 |
|
|
|
|
| Insured and collateralized deposits to total deposits |
|
65 |
% |
The estimated amount of uninsured deposits at March 31, 2024 and 2023, was $12.8 billion and $12.4 billion, respectively. Collateralized and affiliate deposits are included in these amounts. Time deposit accounts with balances of $250,000 or more totaled $900 million and $941 million at March 31, 2024 and December 31, 2023, respectively. The following table shows scheduled maturities of uninsured time deposits as of March 31, 2024 (in thousands):
|
|
|
|
|
|
| Three months or less |
$ |
143,984 |
|
| Over three through six months |
211,281 |
|
| Over six through twelve months |
457,653 |
|
| Over twelve months |
4,907 |
|
|
$ |
817,825 |
|
For additional information about Deposits, see Note 10 to the consolidated financial statements.
Borrowings
In addition to deposits, we utilize FHLB advances as a funding source; the advances provide us with additional flexibility in managing both term and cost of funding and in managing interest rate risk. FHLB advances are secured by qualifying residential first mortgage and commercial real estate loans and MBS. The following table presents information about the contractual balance of outstanding FHLB advances, as of March 31, 2024 (dollars in thousands):
|
|
|
|
|
|
|
|
|
|
|
|
|
Amount |
|
Weighted Average Rate |
| Maturing in: |
|
|
|
2024 - One month or less |
$ |
3,170,000 |
|
|
5.47 |
% |
2024 - Over one month |
735,000 |
|
|
5.50 |
% |
|
|
|
|
|
|
|
|
|
|
|
|
|
|
|
|
| Total contractual balance outstanding |
$ |
3,905,000 |
|
|
|
|
|
|
|
|
|
|
|
The table above reflects contractual maturities of outstanding advances and does not incorporate the impact that interest rate swaps designated as cash flow hedges have on the duration or cost of borrowings.
The table below presents information about outstanding interest rate swaps hedging the variability of interest cash flows on the FHLB advances included in the table above, as of March 31, 2024 (dollars in thousands):
|
|
|
|
|
|
|
|
|
|
|
|
|
Notional Amount |
|
Weighted Average Rate |
| Cash flow hedges maturing in: |
|
|
|
|
|
|
|
| 2024 |
$ |
325,000 |
|
|
2.74 |
% |
| 2025 |
625,000 |
|
|
2.74 |
% |
| 2026 |
1,430,000 |
|
|
3.50 |
% |
| Thereafter |
25,000 |
|
|
2.50 |
% |
|
$ |
2,405,000 |
|
|
3.19 |
% |
|
|
|
|
|
|
|
|
See Note 6 to the consolidated financial statements and "Interest Rate Risk" below for more information about derivative instruments.
Outstanding notes payable and other borrowings consisted of the following at the dates indicated (in thousands):
|
|
|
|
|
|
|
|
|
|
|
|
|
|
March 31, 2024 |
|
December 31, 2023 |
|
| Senior notes: |
|
|
|
|
Principal amount of 4.875% senior notes maturing on November 17, 2025 |
$ |
388,479 |
|
|
$ |
388,479 |
|
|
| Unamortized discount and debt issuance costs |
(1,462) |
|
|
(1,676) |
|
|
|
387,017 |
|
|
386,803 |
|
|
| Subordinated notes: |
|
|
|
|
Principal amount of 5.125% subordinated notes maturing on June 11, 2030 |
300,000 |
|
|
300,000 |
|
|
| Unamortized discount and debt issuance costs |
(4,189) |
|
|
(4,331) |
|
|
|
295,811 |
|
|
295,669 |
|
|
| Total notes |
682,828 |
|
|
682,472 |
|
|
| Finance leases |
26,150 |
|
|
26,501 |
|
|
| Notes and other borrowings |
$ |
708,978 |
|
|
$ |
708,973 |
|
|
|
|
|
|
|
|
|
|
|
|
|
|
|
|
|
|
|
|
|
|
Liquidity and Capital Resources
Liquidity
Liquidity involves our ability to generate adequate funds to support planned interest earning asset growth, meet deposit withdrawal and credit line usage requests in both normal operating and stressed environments, maintain reserve requirements, conduct routine operations, pay dividends, service outstanding debt and meet other contractual obligations.
BankUnited's ongoing liquidity needs have historically been met primarily by cash flows from operations, deposit growth, the investment portfolio, its amortizing loan portfolio and FHLB advances. FRB discount window borrowings, repurchase agreement capacity and a letter of credit with the FHLB provide additional sources of contingent liquidity. For the three months ended March 31, 2024 and 2023, net cash provided by operating activities was $66 million and $141 million, respectively.
Same day available liquidity includes cash, secured funding such as borrowing capacity at the Federal Home Loan Bank of Atlanta and the Federal Reserve, and unencumbered securities. Additional sources of liquidity include cash flows from operations, wholesale deposits, cash flow from the Bank's amortizing securities and loan portfolios, and the sale of investment securities. Management also has the ability to exert substantial control over the rate and timing of loan production, and resultant requirements for liquidity to fund new loans.
The following chart presents the components of same day available liquidity at March 31, 2024 and December 31, 2023 (in millions):
|
|
|
| Same Day Available Liquidity |
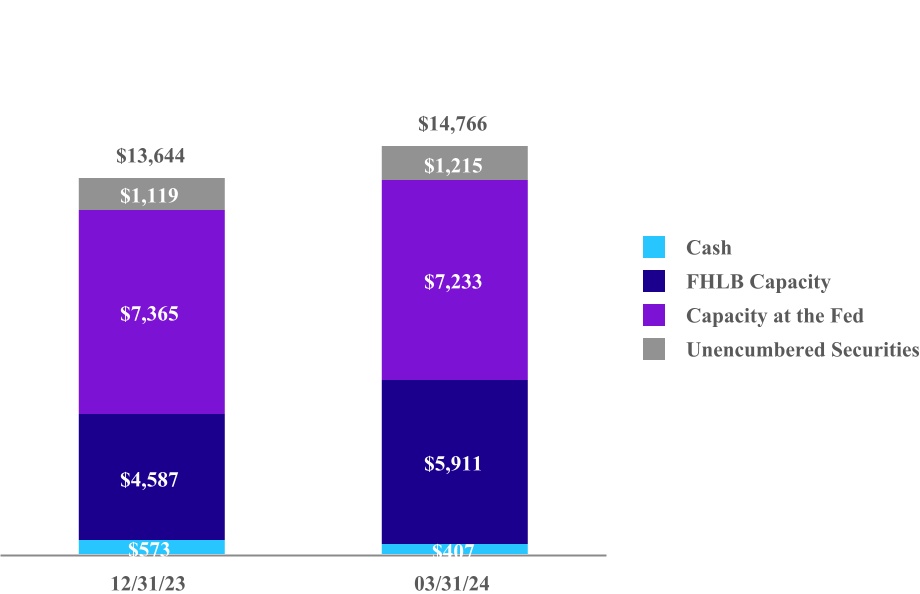
At March 31, 2024, the Bank had total same day available liquidity of approximately $14.8 billion, consisting of cash of $407 million, borrowing capacity at the Federal Home Loan Bank of $5.9 billion, borrowing capacity at the FRB of $7.2 billion and unencumbered securities of $1.2 billion. The increase in same day available liquidity as compared to December 31, 2023 reflected the decline in outstanding FHLB advances, increasing FHLB capacity. At March 31, 2024, the ratio of estimated insured and collateralized deposits to total deposits was 65%, compared to 66% at December 31, 2023, and the ratio of available liquidity to estimated uninsured, uncollateralized deposits was 156% compared to 152% at December 31, 2023. As a commercially focused bank, due to the inherent nature of commercial deposits, a significant portion of our deposits are uninsured. We continue to market and educate our customers about products that enable them to obtain FDIC insurance on certain deposits exceeding the standard single depositor insurance limit, have implemented single depositor concentration limits and reduced or eliminated exposure to sectors or depositors that evidenced higher volatility following the events of early 2023.
Our ALM policy establishes limits or operating risk thresholds for a number of measures of liquidity which are monitored at least monthly by the ALCO and quarterly by the Board of Directors. Some of the measures currently used to dimension liquidity risk and manage liquidity are the ratio of available liquidity to uninsured/non-collateralized deposits, the ratio of wholesale funding to total assets, the ratio of available operational liquidity (which excludes availability at the FRB) to volatile liabilities, a liquidity stress test coverage ratio, the loan to deposit ratio, a one-year liquidity ratio, a measure of available on-balance sheet liquidity, the ratio of FHLB advances to total assets, large depositor concentrations and the ratio of non-interest bearing deposits to total deposits, which is reflective of the quality and cost, rather than the quantity, of available liquidity. We also have single depositor relationship limits.
The following tables present some of the Company's liquidity measures, where applicable, their related policy limits and operating risk thresholds at the dates indicated:
|
|
|
|
|
|
|
|
|
|
|
|
|
|
|
|
|
|
|
|
|
|
|
|
|
March 31, 2024 |
|
|
|
Policy Limit |
|
Available liquidity to uninsured/non-collateralized deposits |
|
156% |
|
|
|
<100% |
|
Wholesale funding/total assets |
|
28.4% |
|
|
|
<37.5% |
|
|
|
|
|
|
|
|
|
|
|
|
|
|
|
|
|
|
|
|
|
|
|
|
|
|
|
|
|
|
|
|
|
|
|
|
|
March 31, 2024 |
|
|
|
Operating Threshold |
|
Available operational liquidity/volatile liabilities |
|
|
|
|
2.29x |
|
|
|
≥1.30x |
|
Liquidity stress test coverage ratio |
|
|
|
|
1.69x |
|
|
|
≥1.50x |
|
FHLB advances/total assets |
|
|
|
|
13.7% |
|
|
|
≤20% |
|
|
|
|
|
|
|
|
|
|
|
|
One year liquidity ratio |
|
|
|
|
2.11x |
|
|
|
≥1.00x |
|
Loan to deposit ratio |
|
|
|
|
89.6% |
|
|
|
≤100% |
|
|
|
|
|
|
|
|
|
|
|
|
Top 20 uninsured depositors to total deposits (excluding brokered & municipal deposits) |
|
|
|
|
13.4% |
|
|
|
≤15% |
|
Non interest-bearing demand deposits/total deposits |
|
|
|
|
26.8% |
|
|
|
≥20% |
|
Available on-balance sheet liquidity |
|
|
|
|
7.1% |
|
|
|
≥5% |
|
As a holding company, BankUnited, Inc. is a corporation separate and apart from its banking subsidiary, and therefore, provides for its own liquidity. BankUnited, Inc.’s main sources of funds include management fees and dividends from the Bank, access to capital markets and, to a lesser extent, its own securities portfolio. There are regulatory limitations that may affect the ability of the Bank to pay dividends to BankUnited, Inc. Management believes that such limitations will not impact our ability to meet our ongoing near-term cash obligations.
Capital
Pursuant to the FDIA, the federal banking agencies have adopted regulations setting forth a five-tier system for measuring the capital adequacy of the financial institutions they supervise. At March 31, 2024 and December 31, 2023, the Company and the Bank had capital levels that exceeded both the regulatory well-capitalized guidelines and all internal capital ratio targets. Upon adoption of ASU 2016-13 on January 1, 2020, the Company elected the option to temporarily delay the effects of CECL on regulatory capital for two years, followed by a three-year transition period.
We have an active shelf registration statement on file with the SEC that allows the Company to periodically offer and sell in one or more offerings, individually or in any combination, our common stock, preferred stock and other non-equity securities. The shelf registration provides us with flexibility in issuing capital instruments and enables us to more readily access the capital markets as needed to pursue future growth opportunities and to ensure continued compliance with regulatory capital requirements. Our ability to issue securities pursuant to the shelf registration is subject to market conditions.
The following table provides information regarding regulatory capital for the Company and the Bank as of March 31, 2024 (dollars in thousands):
|
|
|
|
|
|
|
|
|
|
|
|
|
|
|
|
|
|
|
|
|
|
|
|
|
|
|
|
|
|
|
|
|
|
|
|
|
|
|
|
|
|
|
|
|
|
|
|
| |
March 31, 2024 |
| |
Actual |
|
Required to be
Considered Well
Capitalized |
|
Required to be
Considered
Adequately
Capitalized |
|
Required to be Considered
Adequately
Capitalized Including Capital Conservation Buffer |
| |
Amount |
|
Ratio |
|
Amount |
|
Ratio |
|
Amount |
|
Ratio |
|
Amount |
|
Ratio |
| BankUnited, Inc.: |
|
|
|
|
|
|
|
|
|
|
|
|
|
|
|
| Tier 1 leverage |
$ |
2,889,807 |
|
|
8.05 |
% |
|
N/A (1) |
|
N/A (1) |
|
$ |
1,435,445 |
|
|
4.00 |
% |
|
N/A (1) |
|
N/A (1) |
| CET1 risk-based capital |
$ |
2,889,807 |
|
|
11.58 |
% |
|
$ |
1,622,379 |
|
|
6.50 |
% |
|
$ |
1,123,186 |
|
|
4.50 |
% |
|
$ |
1,747,178 |
|
|
7.00 |
% |
| Tier 1 risk-based capital |
$ |
2,889,807 |
|
|
11.58 |
% |
|
$ |
1,996,774 |
|
|
8.00 |
% |
|
$ |
1,497,581 |
|
|
6.00 |
% |
|
$ |
2,121,573 |
|
|
8.50 |
% |
| Total risk-based capital |
$ |
3,412,100 |
|
|
13.67 |
% |
|
$ |
2,495,968 |
|
|
10.00 |
% |
|
$ |
1,996,774 |
|
|
8.00 |
% |
|
$ |
2,620,766 |
|
|
10.50 |
% |
| BankUnited: |
|
|
|
|
|
|
|
|
|
|
|
|
|
|
|
| Tier 1 leverage |
$ |
3,341,838 |
|
|
9.32 |
% |
|
$ |
1,792,209 |
|
|
5.00 |
% |
|
$ |
1,433,767 |
|
|
4.00 |
% |
|
N/A |
|
N/A |
| CET1 risk-based capital |
$ |
3,341,838 |
|
|
13.41 |
% |
|
$ |
1,619,570 |
|
|
6.50 |
% |
|
$ |
1,121,241 |
|
|
4.50 |
% |
|
$ |
1,744,153 |
|
|
7.00 |
% |
| Tier 1 risk-based capital |
$ |
3,341,838 |
|
|
13.41 |
% |
|
$ |
1,993,317 |
|
|
8.00 |
% |
|
$ |
1,494,988 |
|
|
6.00 |
% |
|
$ |
2,117,900 |
|
|
8.50 |
% |
| Total risk-based capital |
$ |
3,564,131 |
|
|
14.30 |
% |
|
$ |
2,491,647 |
|
|
10.00 |
% |
|
$ |
1,993,317 |
|
|
8.00 |
% |
|
$ |
2,616,229 |
|
|
10.50 |
% |
(1)There is no Tier 1 leverage ratio component in the definition of a well-capitalized bank holding company.
Interest Rate Risk
A principal component of the Company’s risk of loss arising from adverse changes in the fair value of financial instruments, or market risk, is interest rate risk, including the risk that assets and liabilities with similar re-pricing characteristics may not reprice at the same time or to the same degree. A primary objective of the Company’s asset/liability management activities is to maximize net interest income, while maintaining acceptable levels of interest rate risk. The ALCO is responsible for establishing policies to manage exposure to interest rate risk, and to ensure procedures are established to monitor compliance with these policies. The policies established by the ALCO are approved at least annually by the Board of Directors or its Risk Committee.
Management believes that the simulation of net interest income in different interest rate environments provides the most meaningful measure of interest rate risk. Income simulation analysis is designed to capture not only the potential of all assets and liabilities to mature or reprice, but also the probability that they will do so. Income simulation also attends to the relative interest rate sensitivities of these items, and projects their behavior over an extended period of time. Finally, income simulation permits management to assess the probable effects on the balance sheet not only of changes in interest rates, but also of proposed strategies for responding to them. Simulation of changes in EVE in various interest rate environments is also a meaningful measure of interest rate risk.
The income simulation model analyzes interest rate sensitivity by projecting net interest income over twelve and twenty-four month periods in a most likely rate scenario based on a consensus forward curve versus net interest income in alternative rate scenarios. Management continually reviews and refines its interest rate risk management process in response to changes in the interest rate environment, the economic climate and observed customer behavior. Currently, our interest rate risk management policy framework is based on modeling instantaneous rate shocks to a static balance sheet, assuming that maturing instruments are replaced with like instruments at forward rates, of plus and minus 100, 200, 300 and 400 basis point parallel shifts. In lower interest rate environments, we may not model more extreme declining rate scenarios and in certain macro-environments, we may model shocks of more than 400 basis points. Our ALM policy has established limits for the plus and minus 100 and 200 basis points shock scenarios. We also model a variety of dynamic balance sheet scenarios, various yield curve slopes, non-parallel shifts and alternative depositor behavior, beta and decay assumptions. We continually evaluate the scenarios being modeled with a view toward adapting them to changing economic conditions, expectations and trends.
The following table presents the impact on forecasted net interest income compared to a "most likely" scenario, based on the consensus forward curve, in static balance sheet, parallel rate shock scenarios of plus and minus 100 and 200 basis points at March 31, 2024 and December 31, 2023:
|
|
|
|
|
|
|
|
|
|
|
|
|
|
|
|
|
|
|
|
|
|
|
|
|
|
|
|
|
|
|
|
|
Down 200 |
|
Down 100 |
|
Plus 100 |
|
Plus 200 |
|
|
|
|
Policy Limits: |
|
|
|
|
|
|
|
|
|
|
|
|
|
| In year 1 |
|
|
(12) |
% |
|
(8) |
% |
|
(8) |
% |
|
(12) |
% |
|
|
|
|
| In year 2 |
|
|
(15) |
% |
|
(11) |
% |
|
(11) |
% |
|
(15) |
% |
|
|
|
|
Model Results at March 31, 2024 - increase (decrease) |
|
|
|
|
|
|
|
|
|
|
|
|
|
| In year 1 |
|
|
(5.2) |
% |
|
(1.8) |
% |
|
1.5 |
% |
|
2.7 |
% |
|
|
|
|
| In year 2 |
|
|
(5.3) |
% |
|
(2.0) |
% |
|
0.6 |
% |
|
1.0 |
% |
|
|
|
|
Model Results at December 31, 2023 - increase (decrease) |
|
|
|
|
|
|
|
|
|
|
|
|
|
| In year 1 |
|
|
(4.7) |
% |
|
(1.6) |
% |
|
1.0 |
% |
|
2.1 |
% |
|
|
|
|
| In year 2 |
|
|
(6.0) |
% |
|
(2.3) |
% |
|
1.5 |
% |
|
2.0 |
% |
|
|
|
|
The following table illustrates the modeled change in EVE in the indicated scenarios at March 31, 2024 and December 31, 2023:
|
|
|
|
|
|
|
|
|
|
|
|
|
|
|
|
|
|
|
|
|
|
|
|
|
|
|
|
|
|
|
|
|
Down 200 |
|
Down 100 |
|
Plus 100 |
|
Plus 200 |
|
|
|
|
Policy Limits |
|
|
(20.0) |
% |
|
(10.0) |
% |
|
(10.0) |
% |
|
(20.0) |
% |
|
|
|
|
Model Results at March 31, 2024 - increase (decrease): |
|
|
19.3 |
% |
|
11.8 |
% |
|
(8.7) |
% |
|
(17.8) |
% |
|
|
|
|
Model Results at December 31, 2023 - increase (decrease): |
|
|
15.2 |
% |
|
9.5 |
% |
|
(8.8) |
% |
|
(17.4) |
% |
|
|
|
|
All of the modeled results at March 31, 2024, are within ALM policy limits. Many assumptions were used by the Company to calculate the impact of changes in interest rates on forecasted net interest income and EVE, including the change in rates. Actual results may not be similar to the Company’s projections due to several factors including the timing and frequency of rate changes, market conditions, unanticipated changes in depositor behavior and loan prepayment speeds and the shape of the yield curve. Actual results may also differ due to the Company’s actions, if any, in response to changing rates and conditions or changes in balance sheet composition.
Derivative Financial Instruments and Hedging Activities
Management continually evaluates a variety of hedging strategies that are available to manage interest rate risk. In the current environment, we continue to evaluate potential hedging strategies to mitigate risk from a period of rapid or extreme declines in rates.
Interest rate derivatives designated as cash flow or fair value hedging instruments are tools we use to manage interest rate risk. These derivative instruments are used to mitigate exposure to changes in interest cash flows on variable rate liabilities and to changes in the fair value of fixed rate financial instruments, in each case caused by fluctuations in benchmark interest rates, as well as to manage duration of liabilities.
The following table provides information about the Company's derivatives designated as hedging instruments as of March 31, 2024 (dollars in thousands):
|
|
|
|
|
|
|
|
|
|
|
|
|
|
|
|
|
|
|
|
|
|
|
|
|
|
|
|
|
|
|
|
|
|
|
Weighted
Average Pay Rate / Strike Price |
|
Weighted
Average Receive Rate / Strike Price |
|
Weighted
Average
Remaining
Life in Years |
| |
|
|
Notional Amount |
|
|
|
| |
Hedged Item |
|
|
|
|
| Derivatives designated as cash flow hedges: |
|
|
|
|
|
|
|
|
|
| Pay-fixed interest rate swaps |
Variability of interest cash flows on variable rate borrowings |
|
$ |
2,405,000 |
|
|
3.19% |
|
Daily SOFR |
|
1.8 |
| Pay-fixed interest rate swaps |
Variability of interest cash flows on variable rate liabilities |
|
250,000 |
|
|
1.38% |
|
Fed Funds Effective Rate |
|
0.8 |
| Pay-variable interest rate swaps |
Variability of interest cash flows on variable rate loans |
|
200,000 |
|
|
Term SOFR |
|
3.72% |
|
2.1 |
| Interest rate caps purchased, indexed to Fed Funds effective rate |
Variability of interest cash flows on variable rate liabilities |
|
200,000 |
|
|
0.88% |
|
|
|
1.2 |
Interest rate collar, indexed to 1-month SOFR(1) |
Variability of interest cash flows on variable rate loans |
|
125,000 |
|
|
5.58% |
|
1.50% |
|
2.4 |
| Derivatives designated as fair value hedges: |
|
|
|
|
|
|
|
|
|
| Pay-fixed interest rate swaps |
Variability of fair value of fixed rate loans |
|
100,000 |
|
|
1.94% |
|
Daily SOFR |
|
0.3 |
| |
|
|
$ |
3,280,000 |
|
|
|
|
|
|
|
(1) The interest rate collar consists of a combination of zero-premium interest rate options. The Company sold a pay-variable cap with a strike price of 5.58%; sold a 0% floor; and purchased a receive-variable floor with a strike price of 1.50%.
In addition to derivative instruments, the Company has issued callable CDs to hedge interest rate risk in a falling rate environment; the amount of such instruments outstanding at March 31, 2024, was $672 million. The short duration of our AFS investment portfolio (1.85 at March 31, 2024) also provides a natural offset from an interest rate risk perspective to the longer duration of the residential mortgage portfolio.
See Note 6 to the consolidated financial statements for additional information about derivative financial instruments.
Non-GAAP Financial Measures
Tangible book value per common share is a non-GAAP financial measure. Management believes this measure is relevant to understanding the capital position and performance of the Company. Disclosure of this non-GAAP financial measure also provides a meaningful basis for comparison to other financial institutions as it is a metric commonly used in the banking industry. The following table reconciles the non-GAAP financial measurement of tangible book value per common share to the comparable GAAP financial measurement of book value per common share at the dates indicated (in thousands, except share and per share data):
|
|
|
|
|
|
|
|
|
|
|
|
|
|
|
|
|
|
|
|
|
|
|
|
|
|
|
March 31, 2024 |
|
|
|
December 31, 2023 |
|
|
|
|
|
|
|
|
|
|
|
|
| Total stockholders’ equity |
$ |
2,640,392 |
|
|
|
|
$ |
2,577,921 |
|
|
|
|
|
|
|
|
|
|
|
|
|
| Less: goodwill and other intangible assets |
77,637 |
|
|
|
|
77,637 |
|
|
|
|
|
|
|
|
|
|
|
|
|
| Tangible stockholders’ equity |
$ |
2,562,755 |
|
|
|
|
$ |
2,500,284 |
|
|
|
|
|
|
|
|
|
|
|
|
|
| |
|
|
|
|
|
|
|
|
|
|
|
|
|
|
|
|
|
| Common shares issued and outstanding |
74,772,706 |
|
|
|
|
74,372,505 |
|
|
|
|
|
|
|
|
|
|
|
|
|
| |
|
|
|
|
|
|
|
|
|
|
|
|
|
|
|
|
|
| Book value per common share |
$ |
35.31 |
|
|
|
|
$ |
34.66 |
|
|
|
|
|
|
|
|
|
|
|
|
|
| |
|
|
|
|
|
|
|
|
|
|
|
|
|
|
|
|
|
| Tangible book value per common share |
$ |
34.27 |
|
|
|
|
$ |
33.62 |
|
|
|
|
|
|
|
|
|
|
|
|
|
|
|
|
|
|
|
|
|
|
|
|
|
|
|
|
|
|
|
|
|
|
|
|
|
|
|
|
|
|
|
|
|
|
|
|
|
|
|
|
|
|
|
|
|
|
|
|
|
|
|
|
|
|
|
|
|
|
|
|
|
|
|
|
|
|
|
|
|
|
|
|
|
|
|
|
|
|
|
|
|
|
|
|
|
|
|
|
|
|
|
|
|
|
|
|
|
|
|
|
|
|
|
|
|
|
|
|
|
|
|
|
|
|
|
|
|
|
|
|
|
|
|
|
|
|
|
|
|
|
|
|
|
|
|
|
|
|
|
|
|
|
|
|
|
Item 3. Quantitative and Qualitative Disclosures About Market Risk
See the section entitled “Interest Rate Risk” included in Item 2. “Management’s Discussion and Analysis of Financial Condition and Results of Operations.”
Item 4. Controls and Procedures
Evaluation of Disclosure Controls and Procedures
As of the end of the period covered by this Form 10-Q, we carried out an evaluation under the supervision and with the participation of our management, including the Chief Executive Officer and Chief Financial Officer, of the effectiveness of the design and operation of our disclosure controls and procedures as defined in Exchange Act Rules 13a-15(e) and 15d-15(e). Based upon that evaluation, the Chief Executive Officer and the Chief Financial Officer concluded that our disclosure controls and procedures were effective.
During the quarter ended March 31, 2024, there were no changes in the Company's internal control over financial reporting that materially affected, or are reasonably likely to materially affect, the Company's internal control over financial reporting.
PART II. OTHER INFORMATION
Item 1. Legal Proceedings
The Company is involved as plaintiff or defendant in various legal actions arising in the normal course of business. In the opinion of management, based upon currently available information and the advice of legal counsel, the likelihood is remote that any adverse impact of these proceedings, either individually or in the aggregate, would be material to the Company’s consolidated financial position, results of operations or cash flows.
Item 1A. Risk Factors
There have been no material changes in the risk factors disclosed by the Company in its 2023 Annual Report on Form 10-K filed with the Securities and Exchange Commission on February 20, 2024.
Item 2. Unregistered Sales of Equity Securities and Use of Proceeds
None.
Item 5. Other Information
During the three months ended March 31, 2024, no director or officer (as defined in Exchange Act Rule 16a-1(f)) of the Company adopted or terminated a “Rule 10b5-1 trading arrangement” or “non-Rule 10b5-1 trading arrangement,” as each term is defined in Item 408 of Regulation S-K.
Item 6.
Exhibits
|
|
|
|
|
|
|
|
|
|
|
|
|
|
|
Exhibit
Number |
|
Description |
|
Location |
| |
|
|
|
|
|
|
|
|
Filed herewith |
|
|
|
|
|
|
|
|
|
Filed herewith |
|
|
|
|
|
|
|
|
|
Filed herewith |
|
|
|
|
|
|
|
|
|
Filed herewith |
|
|
|
|
|
| 101.INS |
|
The instance document does not appear in the interactive data file because its XBRL tags are embedded within the inline XBRL document |
|
Filed herewith |
|
|
|
|
|
| 101.SCH |
|
XBRL Taxonomy Extension Schema |
|
Filed herewith |
|
|
|
|
|
| 101.CAL |
|
XBRL Taxonomy Extension Calculation Linkbase |
|
Filed herewith |
|
|
|
|
|
| 101.DEF |
|
XBRL Taxonomy Extension Definition Linkbase |
|
Filed herewith |
|
|
|
|
|
| 101.LAB |
|
XBRL Taxonomy Extension Label Linkbase |
|
Filed herewith |
|
|
|
|
|
| 101.PRE |
|
XBRL Taxonomy Extension Presentation Linkbase |
|
Filed herewith |
SIGNATURE
Pursuant to the requirements of the Securities Exchange Act of 1934, the registrant has duly caused this report to be signed on its behalf by the undersigned thereunto duly authorized this 25th day of April 2024.
|
|
|
|
|
|
|
/s/ Rajinder P. Singh |
|
Rajinder P. Singh |
|
Chairman, President and Chief Executive Officer |
|
|
|
|
|
/s/ Leslie N. Lunak |
|
Leslie N. Lunak |
|
Chief Financial Officer |
EX-31.1
2
a20240331ex311.htm
EX-31.1
Document
Exhibit 31.1
Certification of Chief Executive Officer
Pursuant to Section 302 of the Sarbanes-Oxley Act of 2002
I, Rajinder P. Singh, certify that:
1. I have reviewed this quarterly report on Form 10-Q of BankUnited, Inc.;
2. Based on my knowledge, this report does not contain any untrue statement of a material fact or omit to state a material fact necessary to make the statements made, in light of the circumstances under which such statements were made, not misleading with respect to the period covered by this report;
3. Based on my knowledge, the financial statements, and other financial information included in this report, fairly present in all material respects the financial condition, results of operations and cash flows of the registrant as of, and for, the periods presented in this report;
4. The registrant’s other certifying officer and I are responsible for establishing and maintaining disclosure controls and procedures (as defined in Exchange Act Rules 13a-15(e) and 15d-15(e)) and internal control over financial reporting (as defined in Exchange Act Rules 13a-15(f) and 15d-15(f)) for the registrant and have:
a) designed such disclosure controls and procedures, or caused such disclosure controls and procedures to be designed under our supervision, to ensure that material information relating to the registrant, including its consolidated subsidiaries, is made known to us by others within those entities, particularly during the period in which this report is being prepared;
b) designed such internal control over financial reporting, or caused such internal control over financial reporting to be designed under our supervision, to provide reasonable assurance regarding the reliability of financial reporting and the preparation of financial statements for external purposes in accordance with generally accepted accounting principles;
c) evaluated the effectiveness of the registrant’s disclosure controls and procedures and presented in this report our conclusions about the effectiveness of the disclosure controls and procedures, as of the end of the period covered by this report based on such evaluation; and
d) disclosed in this report any change in the registrant’s internal control over financial reporting that occurred during the registrant’s most recent fiscal quarter (the registrant’s fourth fiscal quarter in the case of an annual report) that has materially affected, or is reasonably likely to materially affect, the registrant’s internal control over financial reporting; and
5. The registrant’s other certifying officer and I have disclosed, based on our most recent evaluation of internal control over financial reporting, to the registrant’s auditors and the audit committee of the registrant’s board of directors (or persons performing the equivalent functions):
a) All significant deficiencies and material weaknesses in the design or operation of internal control over financial reporting which are reasonably likely to adversely affect the registrant’s ability to record, process, summarize and report financial information; and
b) Any fraud, whether or not material, that involves management or other employees who have a significant role in the registrant’s internal control over financial reporting.
|
|
|
|
|
|
| /s/ Rajinder P. Singh |
|
| Rajinder P. Singh |
|
| Chairman, President and Chief Executive Officer |
|
| Date: April 25, 2024 |
|
EX-31.2
3
a20240331ex312.htm
EX-31.2
Document
Exhibit 31.2
Certification of Chief Financial Officer
Pursuant to Section 302 of the Sarbanes-Oxley Act of 2002
I, Leslie N. Lunak, certify that:
1. I have reviewed this quarterly report on Form 10-Q of BankUnited, Inc.;
2. Based on my knowledge, this report does not contain any untrue statement of a material fact or omit to state a material fact necessary to make the statements made, in light of the circumstances under which such statements were made, not misleading with respect to the period covered by this report;
3. Based on my knowledge, the financial statements, and other financial information included in this report, fairly present in all material respects the financial condition, results of operations and cash flows of the registrant as of, and for, the periods presented in this report;
4. The registrant’s other certifying officer and I are responsible for establishing and maintaining disclosure controls and procedures (as defined in Exchange Act Rules 13a-15(e) and 15d-15(e)) and internal control over financial reporting (as defined in Exchange Act Rules 13a-15(f) and 15d-15(f)) for the registrant and have:
a) designed such disclosure controls and procedures, or caused such disclosure controls and procedures to be designed under our supervision, to ensure that material information relating to the registrant, including its consolidated subsidiaries, is made known to us by others within those entities, particularly during the period in which this report is being prepared;
b) designed such internal control over financial reporting, or caused such internal control over financial reporting to be designed under our supervision, to provide reasonable assurance regarding the reliability of financial reporting and the preparation of financial statements for external purposes in accordance with generally accepted accounting principles;
c) evaluated the effectiveness of the registrant’s disclosure controls and procedures and presented in this report our conclusions about the effectiveness of the disclosure controls and procedures, as of the end of the period covered by this report based on such evaluation; and
d) disclosed in this report any change in the registrant’s internal control over financial reporting that occurred during the registrant’s most recent fiscal quarter (the registrant’s fourth fiscal quarter in the case of an annual report) that has materially affected, or is reasonably likely to materially affect, the registrant’s internal control over financial reporting; and
5. The registrant’s other certifying officer and I have disclosed, based on our most recent evaluation of internal control over financial reporting, to the registrant’s auditors and the audit committee of the registrant’s board of directors (or persons performing the equivalent functions):
a) All significant deficiencies and material weaknesses in the design or operation of internal control over financial reporting which are reasonably likely to adversely affect the registrant’s ability to record, process, summarize and report financial information; and
b) Any fraud, whether or not material, that involves management or other employees who have a significant role in the registrant’s internal control over financial reporting.
|
|
|
|
|
|
| /s/ Leslie N. Lunak |
|
| Leslie N. Lunak |
|
| Chief Financial Officer |
|
| Date: April 25, 2024 |
|
EX-32.1
4
a20240331ex321.htm
EX-32.1
Document
Exhibit 32.1
Certification of Chief Executive Officer Pursuant to 18 U.S.C. Section 1350
as Adopted Pursuant to Section 906 of the Sarbanes-Oxley Act of 2002
In connection with the Quarterly Report of BankUnited, Inc. (the “Company”) on Form 10-Q for the quarter ended March 31, 2024, as filed with the Securities and Exchange Commission on the date hereof (the “Report”), I, Rajinder P. Singh, as Chief Executive Officer of the Company, certify, to the best of my knowledge, pursuant to 18 U.S.C. §1350, as adopted pursuant to Section 906 of the Sarbanes-Oxley Act of 2002, that:
1) The Report fully complies with the requirements of Section 13(a) or 15(d), as applicable, of the Securities Exchange Act of 1934; and
2) the information contained in the Report fairly presents, in all material respects, the financial condition and results of operations of the Company.
|
|
|
|
|
|
| /s/ Rajinder P. Singh |
|
| Rajinder P. Singh |
|
| Chairman, President and Chief Executive Officer |
|
Date: April 25, 2024
EX-32.2
5
a20240331ex322.htm
EX-32.2
Document
Exhibit 32.2
Certification of Chief Financial Officer Pursuant to 18 U.S.C. Section 1350
as Adopted Pursuant to Section 906 of the Sarbanes-Oxley Act of 2002
In connection with the Quarterly Report of BankUnited, Inc. (the “Company”) on Form 10-Q for the quarter ended March 31, 2024, as filed with the Securities and Exchange Commission on the date hereof (the “Report”), I, Leslie N. Lunak, as Chief Financial Officer of the Company, certify, to the best of my knowledge, pursuant to 18 U.S.C. §1350, as adopted pursuant to Section 906 of the Sarbanes-Oxley Act of 2002, that:
1) The Report fully complies with the requirements of Section 13(a) or 15(d), as applicable, of the Securities Exchange Act of 1934; and
2) the information contained in the Report fairly presents, in all material respects, the financial condition and results of operations of the Company.
|
|
|
|
|
|
| /s/ Leslie N. Lunak |
|
| Leslie N. Lunak |
|
| Chief Financial Officer |
|
Date: April 25, 2024