Document
MANAGEMENT’S DISCUSSION AND ANALYSIS OF FINANCIAL CONDITION AND RESULTS OF OPERATIONS
The following discussion of our financial condition and results of operations should be read in conjunction with our Unaudited Condensed Consolidated Interim Financial Statements as of September 30, 2025. The preparation of the Consolidated Financial Statements required the use of assumptions and estimates that affect the amounts recorded as assets, liabilities, revenue and expenses in the years and periods addressed and are subject to certain risks and uncertainties. Our Unaudited Interim Consolidated Financial Statements have been prepared in accordance with International Accounting Standard 34 (“IAS 34”).
Recent development - Acquisition of Profertil S.A.
On September 5, 2025, we entered into an agreement to acquire Nutrien Ltd.’s (“Nutrien”) 50% equity interests in Profertil S.A. (“Profertil”), the leading producer of granular urea in South America. The remaining 50% stake of Profertil is held by YPF S.A. (“YPF”), the largest oil and gas producer of Argentina. This acquisition is part of our strategy to expand our agro-industrial platform and further diversify our revenue base. Profertil is one of the most cost-efficient producers of urea and ammonia globally, with access to competitively priced natural gas and located in a net importing region.
The acquisition will be executed through Avaldi S.A. (“Avaldi”), an Argentine holding company created by a partnership between the Company and Asociación de Cooperativas Argentinas (“ACA”), with an 80%-20% ownership structure, respectively.
The total purchase price for Nutrien’s shares in Profertil, after certain price adjustments, is approximately $600 million, subject to a price adjustment linked to the working capital on the closing date. Of this amount, $480 million is for the Company´s stake. An initial down payment of $120 million has already been made proportionally by affiliated companies of the Company and ACA, with the Company contributing $96 million and ACA contributing $24 million, in accordance with their ownership structure.
Under the terms of the Profertil shareholders’ agreement, YPF holds a 90-day right of first refusal to acquire Nutrien’s equity interests in Profertil under the same terms and conditions. On December 1, 2025, YPF informed us that they would not exercise their right of first refusal to acquire Nutrien’s equity interest in Profertil.
The acquisition remains subject to other customary closing conditions and is expected to be completed by December 31, 2025.
In addition, on December 1, 2025, the Company presented a binding offer to acquire YPF’s 50% equity interests in Profertil under the same terms and conditions agreed for the 50% equity interests in Profertil to be acquired from Nutrien. The total purchase price for YPF’s shares in Profertil, after certain price adjustments, is approximately $600 million. We will use existing cash to pay a down payment of $120 million upon acceptance of our offer. The balance of the purchase price would be paid in installments due in 2026, which we intend to finance through a combination of equity offerings and additional borrowing. The acceptance of this offer is subject to approval by YPF’s Board of Directors, which is expected to occur on or about December 11, 2025. If approved, this additional acquisition will remain subject to other customary closing conditions, with completion expected by December 31, 2025. While no assurances can be given, we believe that this additional acquisition is probable and that YPF is likely to accept the offer.
Trends and Factors Affecting Our Results of Operations
Our results of operations have been influenced and will continue to be influenced by the following factors:
(i) Effects of Yield Fluctuations
The occurrence of severe adverse weather conditions, especially droughts, hail, floods or frost, is unpredictable and may have a potentially devastating impact on agricultural production and may otherwise adversely affect the supply and prices of the agricultural commodities that we sell and use in our business. The effects of severe adverse weather conditions may also reduce yields at our farms. Yields may also be affected by plague, disease or weed infection and operational problems, such as Spiroplasma disease, which affected our corn yield during the 2023/2024 harvest season.
The following table sets forth our average crop, rice and sugarcane yields per hectare for the periods indicated:
|
|
|
|
|
|
|
|
|
|
|
|
|
|
|
|
|
|
|
2024/2025 |
|
2023/2024 |
|
% Change |
|
Harvest Year (1) |
|
Harvest Year (2) |
|
2024/2025-2023/2024 |
Corn (3) |
5.7 |
|
5.2 |
|
8.7% |
| Soybean |
2.5 |
|
2.6 |
|
(5.6)% |
Wheat (4) |
2.5 |
|
3.1 |
|
(21.0)% |
| Peanut |
3.3 |
|
3.6 |
|
(8.8)% |
| Sunflower |
2.1 |
|
1.7 |
|
23.0% |
| Rice |
8.0 |
|
6.1 |
|
30.2% |
| Sugarcane (5) |
64.2 |
|
72.1 |
|
(11.0)% |
|
|
|
|
|
|
|
|
|
|
|
|
|
|
|
|
|
|
(1) Sets forth current yields as of end of September, 2025. The portion of harvested area completed was 100% for corn, 100% for soybean, 100% for wheat, 100% for sunflower, 100% for peanut and 100% for rice. Yields of crops with harvesting activities <50% progress are not representative.
(2) Sets forth current yields as of end of September, 2024. The portion of harvested area completed was 100% for corn, 100% for soybean, 100% for wheat, 100% for sunflower, 100% for peanut and 100% for rice. Yields of crops with harvesting activities <50% progress are not representative.
(3) Includes sorghum.
(4) Includes barley and peas.
(5) Includes chia, sesame, potatoes and beans.
(ii) Effects of Fluctuations in Production Costs
We experience fluctuations in our production costs due to the fluctuation in the costs of fertilizers, agrochemicals, seeds, fuel, farm leases and labor. The use of advanced technology, however, allows us to increase our efficiency, in large part mitigating the fluctuations in production costs. Some examples of how the implementation of production technology has allowed us to increase our efficiency and reduce our costs include the use of no-till technology (also known as “direct sowing,” which involves farming without the use of tillage, leaving plant residues on the soil to form a protective cover which positively impacts costs, yields and the soil), crop rotation, second harvest in one year, integrated pest management, and balanced fertilization techniques to increase the productive efficiency in our farmland. Increased mechanization of harvesting and planting operations in our sugarcane plantations and utilization of modern, high-pressure boilers in our sugar and ethanol mills has also yielded higher rates of energy production per ton of sugarcane milled. In addition, we reuse all the waste from our sugar cane processing, which together with the ashes from the boilers, and the filter cake, undergo a composting process and are used as organic fertilizer to grow sugarcane, allowing us to reduce chemical fertilizer consumption, while contributing to the environment. We also use manure in our dairy farms to generate electricity with biodigesters.
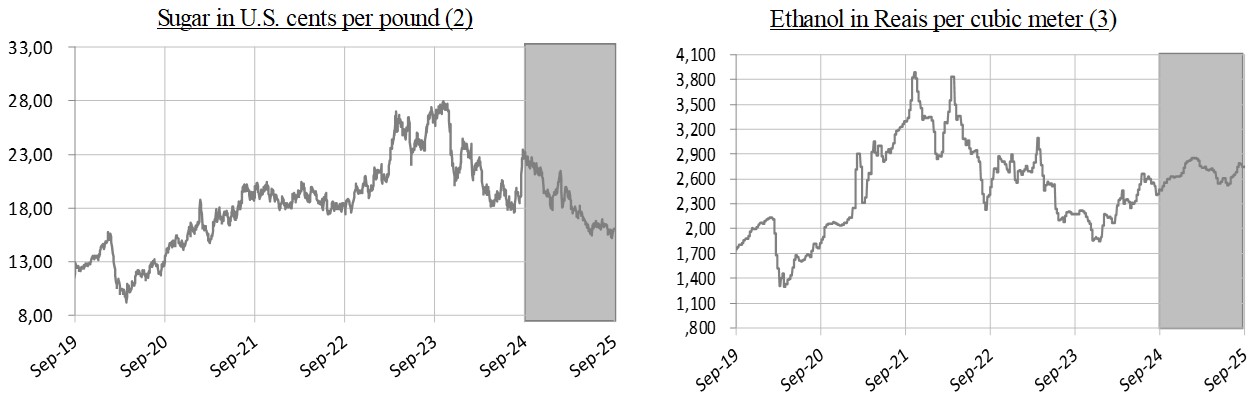
(iii) Effects of Fluctuations in Commodities Prices
Commodity prices have historically experienced substantial fluctuation. For example, between September 30, 2025 and September 30, 2024, sugar prices decreased by 29.0%, according to Intercontinental Exchange of New York (“ICE-NY”) data, and ethanol prices increased by 10.8%, according to Escola Superior de Agricultura “Luiz de Queiroz” (“ESALQ”) data.
Also, based on Chicago Board of Trade (“CBOT”) data, from September 30, 2024 to September 30, 2025, soybean prices decreased 5.2% and corn prices decreased by 2.2%. Commodity price fluctuations affect our consolidated statements of income, as they have an effect over:
• Initial recognition and changes in the fair value of biological assets and agricultural produce in respect of unharvested biological assets undergoing biological transformation;
• Changes in net realizable value of agricultural produce for inventory carried at its net realizable value; and
• Sales of manufactured products and agricultural produce to third parties.
The following graphs show the spot market price of some of our products since September 30, 2019 to September 30, 2025, highlighting the periods September 30, 2024 to September 30, 2025:
(iv) Fiscal Year and Harvest Year
Our fiscal year begins on January 1 and ends on December 31 of each year. However, our production is based on the harvest-year for each of our crops and rice. A harvest-year varies according to the crop or rice plant and the climate in which it is grown. Due to the geographic diversity of our farms, the planting period for a given crop or rice may start earlier on one farm than on another, causing differences for their respective harvesting periods. The presentation of production volume (tons) and production area (hectares) in this report in respect of the harvest-years for each of our crops and rice starts with the first day of the planting period at the first farm to start planting in that harvest-year to the last day of the harvesting period of the crop or rice planting on the last farm to finish harvesting that harvest-year.
On the other hand, production volumes for dairy, processed rice and production volume and production area for sugar, ethanol and energy business, along with the financial results in respect of our products are presented on a fiscal-year basis.
(v) Effects of Fluctuations of the Production Area
Our results of operations also depend on the size of the production area. The size of our owned and leased area devoted to crop, rice and sugarcane production fluctuates from period to period in connection with the purchase and development of new farmland, the sale of developed farmland, the lease of new farmland and the termination of existing farmland lease agreements. Lease agreements are usually settled following the harvest season, from July to September for crops and rice, and from May to April for sugarcane. The length of the lease agreements is usually one year for crops, one to five years for rice and seven years for one-cycle sugarcane or 14 years for a two-cycle of sugarcane. Regarding crops, the production area can be planted and harvested once or twice per year. For example, wheat can be planted in July and harvested in December. Once harvested, soybean can be planted in the same area and harvested in April. As a result, planted and harvested areas can maximize their production in any given year. The production area for sugarcane can exceed the harvested area in one year. Grown sugarcane can be left in the fields and then harvested the following year.
The following table sets forth the production area for the periods indicated:
|
|
|
|
|
|
|
|
|
|
|
|
|
|
|
|
|
|
|
Nine-month period ended September 30, |
|
|
2025 |
|
2024 |
|
Chg (%) 2025-2024 |
|
Hectares |
|
Crops (1) |
196,564 |
|
193,949 |
|
1.3% |
| Rice |
64,438 |
|
58,452 |
|
10.2% |
| Sugar, Ethanol and Energy |
227,833 |
|
208,241 |
|
9.4% |
(1) Does not include second crop area or forage.
The increase in sugar, ethanol and energy production area in the nine-month period ended September 30, 2025, is explained by an increase in the leased space given return on invested capital to ensure the sufficiency of our sugarcane and rice supply during the entire year.
(vi) Macroeconomic Developments in Emerging Markets
We generate nearly all of our revenue from the production of food and renewable energy in emerging markets. Therefore, our operating results and financial condition are directly impacted by macroeconomic and fiscal developments, including fluctuations in currency exchange rates, inflation and interest rate fluctuations, in those markets. The emerging markets where we conduct our business (including Argentina, Brazil and Uruguay) remain subject to such fluctuations.
Moreover, economic conditions of the countries in which we operate may be impacted by inflation over domestic prices, which may result in higher costs and affect our revenues. High inflation rates may undermine the conditions that allow us to grow in those countries and induce to macroeconomic volatility, affecting overall competitiveness, increasing social and economic inequality, reducing employment, consumption and the level of economic activity and undermining confidence in the banking system, which could further limit domestic and international credit availability. For the nine-month period ended September 30, 2025, inflation in local currency in Argentina, Brazil and Uruguay was 22.0%, 3.7% and 3.2%, respectively. We present our results of operations adjusted by the effect of hyperinflationary accounting policies and translation for our Argentine operations according to IAS 29.
In addition, government policies enacted in the countries in which we operate may have a material impact, or could materially affect, the Company’s operations.
(vii) Effects of Export Taxes on Our Products
The following table shows the export taxes applicable to our products for the year ended September 30, 2025:
|
|
|
|
|
|
|
|
|
| Product |
Export tax |
Cap per dollar exported |
| Soybean and derivatives |
26% |
— |
|
| Corn |
9.5% |
— |
|
| Wheat |
9.5% |
— |
|
| Peanut |
—% |
— |
|
| Sunflower |
—% |
— |
|
| Cotton |
—% |
— |
|
| Rice |
—% |
— |
|
| UHT Milk |
—% |
— |
|
| Powdered Milk |
—% |
— |
|
| Cheese |
—% |
— |
|
(viii) Effects of Foreign Currency Fluctuations
Each of our Argentine and Brazilian subsidiaries use local currency as its functional currency. A significant portion of our operating costs in Argentina are denominated in Argentine Pesos and most of our operating costs in Brazil are denominated in Brazilian Reais. For each of our subsidiaries’ statements of income, foreign currency transactions are translated to local currency, as such subsidiaries’ functional currency, using the exchange rates prevailing as of the dates of the relevant specific transactions. Exchange differences resulting from the settlement of such transactions and from the translation at year-end exchange rates of monetary assets and liabilities denominated in foreign currencies are recognized in the statement of income under “finance income” or “finance costs,” as applicable. Our Consolidated Financial Statements are presented in U.S. dollars, and foreign exchange differences that arise in the translation process are disclosed in the consolidated statement of comprehensive income.
As of September 30, 2025, the Argentine Peso-U.S. dollar exchange rate was Ps. 1,379.7 per U.S. dollar as compared to Ps. 968.7 per U.S. dollar as of September 30, 2024. As of September 30, 2025, the Real-U.S. dollar exchange rate was R$5.32 per U.S. dollar as compared to R$5.45 per U.S. dollar as of September 30, 2024.
The following graph shows the Argentine Peso-U.S. dollar rate and the real-U.S. dollar rate of exchange between September 30, 2019 and September 30, 2025, highlighting the period between September 30, 2024, and September 30, 2025:
Source: Bloomberg
Our principal foreign currency fluctuation risk involves changes in the value of the Brazilian Reais and the Argentine Peso relative to the U.S. dollar. Periodically, we evaluate our exposure and consider opportunities to mitigate the effects of currency fluctuations by entering into currency forward contracts and other hedging instruments.
(ix) Seasonality
Our business activities are inherently seasonal. We generally harvest and sell corn, soybean, rice, peanut and sunflower between February and August, and wheat from December to January. With the implementation of the "continuous harvest method,” sugarcane production is more stable during the year; however, the typical harvesting period in Brazil begins between April and May and ends between November and December. Sales of ethanol are generally concentrated during off-season to capture higher seasonal prices. Sales in other business segments, such as in our Dairy segment, tend to be more stable. However, milk sales are generally higher during the fourth quarter, when weather conditions are more favorable for production. As a result of the above factors, there may be significant variations in our results of operations from one quarter to another, since planting activities may be more concentrated in one quarter compared to another. In addition, our quarterly results may vary as a result of the effects of fluctuations in commodity prices and production yields and costs related to the “Initial recognition and changes in fair value of biological assets and agricultural produce” line item.
(x) Capital Expenditures and Other Investments
Our capital expenditures during the last three years consisted mainly of expenses related to (i) transforming and increasing the productivity of our land, (ii) planting sugarcane and (iii) expanding and upgrading our production facilities, such as our biogas project in Brazil and the expansion of our renewable energy generation capacity in that country; along with capital investments aimed at enhancing processing capacity in our dairy facilities in Argentina. Capital expenditures (including both maintenance and expansion) totaled US$289.8 million for the nine-month period ended September 30, 2025, in comparison with US$216.1 million in the same period of 2024. This increase is primarily attributable to an advance payment of US$96.0 million made upon the execution of the agreement to acquire Nutrien’s 50% stake in Profertil.
(xi) Effects of Corporate Taxes on Our Income
We are subject to a variety of taxes on our results of operations. The following table shows the income tax rates in effect for 2025 in each of the countries in which we operate:
Tax Rate (%)
|
|
|
|
|
|
Argentina |
35 |
Brazil(1) |
34 |
Uruguay |
25 |
| Spain |
25 |
| Luxembourg |
23.87 |
| Chile |
27 |
(1) Includes the Social Contribution on Net Profit (Contribuição Social Sobre o Lucro Líquido).
Operating Segments
The Company is engaged in agricultural, manufacturing and land transformation activities. Our agricultural activities consist of harvesting certain agricultural products, including crops, rough rice, and sugarcane, for sale to third parties and for internal use as inputs in our various manufacturing processes, and producing fluid milk. The manufacturing activities consist of (i) selling manufactured products, including processed peanuts, sunflower, rice, sugar, ethanol and energy, among others, (ii) in producing UHT milk, powder milk and semi-hard cheese, among other dairy products; and (iii) providing services, such as grain warehousing and conditioning and handling and drying services, among others. The land transformation activities consist of the acquisition of farmlands or businesses with underdeveloped or underutilized agricultural land and implementing production technology and agricultural best practices on the Group’s farmlands to enhance yields and increase their value for potential realization through sale.
According to IFRS 8, operating segments are identified based on the ‘management approach’. Operating segments are components of an entity about which separate financial information is available that is evaluated regularly by the Company’s chief operating decision maker (“CODM”) in deciding how to allocate resources and in assessing performance. The Company’s CODM is the Management Committee. IFRS 8 stipulates external segment reporting based on the Company’s internal organizational and management structure and on internal financial reporting to the CODM.
Based on the foregoing, the Company operates in two major lines of business, Farming and Sugar, Ethanol and Energy.
The “Farming” is further comprised of three reportable segments:
•“Crops” segment, which consists of the planting, harvesting and sale of grains, oilseeds and fibers (including wheat, corn, soybeans, peanuts, cotton and sunflowers, among others), and to a lesser extent the provision of grain warehousing/conditioning and handling and drying services to third parties. Each underlying crop in this segment does not represent a separate operating segment. Management seeks to maximize the use of the land through the cultivation of one or more type of crops. Types and surface amount of crops cultivated may vary from harvest-year to harvest-year depending on several factors, some of them out of our control. Management is focused on the long-term performance of productive land, and to that extent, our performance is assessed considering the aggregated combination, if any, of crops planted in the land. A single manager is responsible for the management of operating activity of all crops rather than for each individual crop.
•“Rice” segment, which consists of the planting, harvesting, processing and marketing of rice, and the genetic development of seeds; and
•“Dairy” segment, which consists of the production and sale of raw milk and industrialized products, including UHT milk, cheese and powder milk among others.
The “Sugar, Ethanol and Energy” business is also a segment which consists of cultivating sugarcane which is processed in owned sugar mills, transformed into ethanol, sugar and electricity, in addition to biomethane and then marketed;
To evaluate the economic performance of our businesses on a monthly basis, the results of operations of our Argentine subsidiaries are based on monthly data adjusted for inflation and converted into the average exchange rate of the U.S. dollar for each month. These converted figures are not readjusted and reconverted subsequently. We also employ this methodology to translate the results of operations of our subsidiaries in countries without hyperinflationary economies, as it allows for a more accurate analysis of the integral economic performance of their businesses.
Key Financial and Operating Data
The following table presents selected historical financial and operating data solely for the periods indicated below. In respect of production data only as of September 30, 2025, we have not yet completed the 2024/2025 harvest year crops. The harvested tons presented corresponds to the harvest completed as of end of April 2025.
|
|
|
|
|
|
|
|
|
|
|
|
|
|
|
|
|
|
|
|
|
| |
|
Nine-month period ended September 30, |
|
| |
|
2025 |
|
2024 |
|
Chg (%) 2025-2024 |
| Sales |
|
(In thousands of $) |
|
| Farming Business |
|
551,906 |
|
|
620,036 |
|
|
(11.0) |
% |
| Crops |
|
171,566 |
|
|
186,115 |
|
|
(7.8) |
% |
Soybean (1)(2) |
|
50,857 |
|
|
58,585 |
|
|
(13.2) |
% |
| Corn |
|
38,359 |
|
|
42,685 |
|
|
(10.1) |
% |
| Wheat |
|
9,955 |
|
|
14,299 |
|
|
(30.4) |
% |
| Peanut |
|
45,094 |
|
|
39,965 |
|
|
12.8 |
% |
| Sunflower |
|
9,152 |
|
|
8,498 |
|
|
7.7 |
% |
| Cotton Lint |
|
2,775 |
|
|
3,455 |
|
|
(19.7) |
% |
Other crops (3) |
|
15,374 |
|
|
18,628 |
|
|
(17.5) |
% |
Rice (4) |
|
170,594 |
|
|
209,939 |
|
|
(18.7) |
% |
Dairy (5) |
|
209,746 |
|
|
223,982 |
|
|
(6.4) |
% |
| Sugar, Ethanol and Energy Business |
|
459,892 |
|
|
524,651 |
|
|
(12.3) |
% |
| Sugar |
|
209,907 |
|
|
291,891 |
|
|
(28.1) |
% |
| Ethanol |
|
209,600 |
|
|
195,820 |
|
|
7.0 |
% |
| Energy |
|
25,054 |
|
|
22,630 |
|
|
10.7 |
% |
Other (6) |
|
15,331 |
|
|
14,310 |
|
|
7.1 |
% |
| Total |
|
1,011,798 |
|
|
1,144,687 |
|
|
(11.6) |
% |
(1) Includes soybean, soybean oil and soybean meal.
(2) Does not include soybean planted in Brazil as cover crop during the implementation of the agricultural technique known as meiosis. Revenues corresponding to the sale of this product are booked in the Sugar, Ethanol and Energy business.
(3) Includes seeds and farming services, as well as other crops such as sorghum, barley, among others.
(4) Includes sales of processed rice including rough rice purchased from third parties and processed in our own facilities, rice seeds and services.
(5) Includes sales of energy from our biodigester, which produces biogas from effluents of our cows.
(6) Includes operating leases and other services.
|
|
|
|
|
|
|
|
|
|
|
|
|
|
|
|
|
|
|
|
|
|
|
|
|
|
|
2024/2025 |
|
2023/2024 |
|
|
|
|
|
|
Harvest |
|
Harvest |
|
Chg (%) 2024/2025-2023/2024 |
| Production |
|
|
|
Year (1) |
|
Year (1) |
|
| Farming Business |
|
|
|
|
|
|
|
|
| Crops (tons) |
|
|
|
732,340 |
|
|
743,514 |
|
|
(1.5) |
% |
Soybean (tons) (2) |
|
|
|
230,439 |
|
|
234,064 |
|
|
(1.5) |
% |
Corn (tons) (3) |
|
|
|
265,511 |
|
|
310,497 |
|
|
(14.5) |
% |
Wheat (tons) (4) |
|
|
|
118,371 |
|
|
88,207 |
|
|
34.2 |
% |
| Peanut (tons) |
|
|
|
83,406 |
|
|
87,586 |
|
|
(4.8) |
% |
| Sunflower (tons) |
|
|
|
26,480 |
|
|
18,500 |
|
|
43.1 |
% |
| Cotton Lint (tons) |
|
|
|
2,238 |
|
|
2,207 |
|
|
1.4 |
% |
| Others |
|
|
|
5,895 |
|
|
2,452 |
|
|
140.4 |
% |
Rice (tons) (5) |
|
|
|
513,885 |
|
|
357,980 |
|
|
43.6 |
% |
(1) The table reflects the production in respect of harvest-years as of end of April.
(2) 2024/2025, 2023/2024 and 2022/2023 harvest years do not include soybean planted in Brazil as cover crop during the implementation of the agricultural technique known as meiosis.
(3) Includes sorghum.
(4) Includes barley, rye, oats, chickpea and vetch.
(5) Expressed in tons of long grain rough rice equivalent produced on owned and leased farms. The rough rice equivalent we produce, along with additional rough rice we purchase from third parties, is ultimately processed and constitutes the product sold in respect of the rice business.
|
|
|
|
|
|
|
|
|
|
|
|
|
|
|
|
|
|
|
|
|
| |
|
Nine-month period ended September 30, |
|
| |
|
2025 |
|
2024 |
|
Chg (%) 2025-2024 |
Processed rice (1) (tons) |
|
234,801 |
|
|
214,341 |
|
|
9.5 |
% |
Dairy(2) (thousand liters) |
|
145,490 |
|
|
148,651 |
|
|
(2.1) |
% |
Processed Milk (3) (thousand liters) |
|
297,362 |
|
|
260,279 |
|
|
14.2 |
% |
| Sugar, Ethanol and Energy Business |
|
|
|
|
|
|
| Sugar (tons) |
|
518,381 |
|
|
656,479 |
|
|
(21.0) |
% |
| Ethanol (cubic meters) |
|
445,553 |
|
|
433,760 |
|
|
2.7 |
% |
Energy (4) (MWh) |
|
508,451 |
|
|
563,947 |
|
|
(9.8) |
% |
(1) Includes rough rice purchased from third parties and processed in our own facilities. Expressed in tons of rough rice (one ton of processed rice is approximately equivalent to 1.6 tons of rough rice).
(2) Raw milk produced at our dairy farms.
(3) Consists of our and third parties` raw milk processed in our industrial facilities of Morteros and Chivilcoy.
(4) Energy exported to grid.
|
|
|
|
|
|
|
|
|
|
|
|
|
|
|
|
|
|
|
|
|
|
|
|
2024/2025 |
|
2023/2024 |
|
|
Chg (%) 2024/2025-2023/2024 |
|
|
Harvest |
|
Harvest |
|
|
| Planted Area |
|
Year |
|
Year |
|
|
| |
|
(Hectares) |
|
|
| Farming Business |
|
|
|
|
|
|
|
| Crops |
|
240,542 |
|
|
220,425 |
|
|
|
9.1 |
% |
Soybean (1) |
|
92,446 |
|
|
88,681 |
|
|
|
4.2 |
% |
Corn (1)(2) |
|
46,883 |
|
|
59,591 |
|
|
|
(21.3) |
% |
Wheat (3) |
|
47,820 |
|
|
28,142 |
|
|
|
69.9 |
% |
| Peanut |
|
25,352 |
|
|
24,282 |
|
|
|
4.4 |
% |
| Sunflower |
|
12,609 |
|
|
10,832 |
|
|
|
16.4 |
% |
| Cotton |
|
4,890 |
|
|
5,199 |
|
|
|
(5.9) |
% |
| Others |
|
10,542 |
|
|
3,698 |
|
|
|
185.1 |
% |
|
|
|
|
|
|
|
|
| Rice |
|
64,438 |
|
|
58,452 |
|
|
|
10.2 |
% |
| Total Planted Area |
|
304,980 |
|
|
278,877 |
|
|
|
9.4 |
% |
| Second Harvest Area |
|
43,978 |
|
|
26,476 |
|
|
|
66.1 |
% |
| Leased Area |
|
161,945 |
|
|
153,044 |
|
|
|
5.8 |
% |
| Owned Croppable Area |
|
99,056 |
|
|
99,357 |
|
|
|
(0.3) |
% |
(1) Includes first and second crop.
(2) Includes sorghum.
(3) Includes barley, rye, oats, chickpea and vetch.
|
|
|
|
|
|
|
|
|
|
|
|
|
|
|
|
|
|
|
|
|
|
|
|
| |
|
Nine-month period ended September 30, |
|
For the year ended December 31, |
|
|
|
|
|
| |
|
2025 |
|
2024 |
|
|
Chg (%) 2025-2024 |
|
|
| Sugar, Ethanol and Energy Business |
|
|
|
|
|
|
|
|
|
| Sugarcane plantation |
|
227,833 |
|
|
212,996 |
|
|
|
7.0 |
% |
|
|
| Owned land |
|
12,951 |
|
|
12,951 |
|
|
|
— |
% |
|
|
| Leased land |
|
214,882 |
|
|
200,045 |
|
|
|
7.4 |
% |
|
|
Nine-month period ended September 30, 2025 as compared to nine-month period ended September 30, 2024
The following table sets forth certain financial information with respect to our consolidated results of operations for the periods indicated.
|
|
|
|
|
|
|
|
|
|
|
|
|
|
|
|
|
|
|
|
|
|
|
Nine Months Ended, September 30 |
|
|
|
|
2025 (Unaudited) |
|
2024 (Unaudited) |
|
Chg (%) |
|
|
(In thousands of $) |
|
|
| Statements of Income Data: |
|
|
|
|
|
|
| Revenue |
|
1,011,798 |
|
|
1,144,687 |
|
|
(11.6)% |
| Cost of revenue |
|
(841,418) |
|
|
(900,810) |
|
|
(6.6)% |
| Initial recognition and changes in fair value of biological assets and agricultural produce |
|
77,479 |
|
|
121,302 |
|
|
(36.1)% |
| Changes in net realizable value of agricultural produce after harvest |
|
7,594 |
|
|
(19,453) |
|
|
(139.0)% |
| Margin on manufacturing and agricultural activities before operating expenses |
|
255,453 |
|
|
345,726 |
|
|
(26.1)% |
| General and administrative expenses |
|
(90,014) |
|
|
(78,958) |
|
|
14.0% |
| Selling expenses |
|
(111,316) |
|
|
(115,511) |
|
|
(3.6)% |
| Other operating income, net |
|
12,063 |
|
|
(16,505) |
|
|
(173.1)% |
|
|
|
|
|
|
|
| Profit from operations |
|
66,186 |
|
|
134,752 |
|
|
(50.9)% |
| Finance income |
|
25,036 |
|
|
9,164 |
|
|
173.2% |
| Finance costs |
|
(79,104) |
|
|
(106,062) |
|
|
(25.4)% |
| Other financial results - Net loss of inflation effects on monetary items |
|
(6,029) |
|
|
(1,911) |
|
|
215.5% |
| Financial results, net |
|
(60,097) |
|
|
(98,809) |
|
|
(39.2)% |
| Profit before income tax |
|
6,089 |
|
|
35,943 |
|
|
(83.1)% |
| Income tax benefit |
|
2,002 |
|
|
39,980 |
|
|
(95.0)% |
| Profit for the period |
|
8,091 |
|
|
75,923 |
|
|
(89.3)% |
Revenue
|
|
|
|
|
|
|
|
|
|
|
|
|
|
|
|
|
|
|
|
|
|
|
|
|
|
|
|
|
|
| Nine-month period ended September 30, |
Crops |
|
Rice |
|
Dairy |
|
Sugar, Ethanol and Energy |
|
Total |
|
(In thousands of $) |
| 2025 |
171,566 |
|
170,594 |
|
209,746 |
|
459,892 |
|
1,011,798 |
| 2024 |
186,115 |
|
209,939 |
|
223,982 |
|
524,651 |
|
1,144,687 |
|
|
|
|
|
|
|
|
|
|
|
|
|
|
|
|
|
|
|
|
Revenue decreased 11.6%, from US$1.1 billion for the nine-month period ended September 30, 2024, to US$1.0 billion for the same period in 2025, primarily as a result of:
•a US$64.8 million decrease in our Sugar, Ethanol and Energy segment, mainly due to: (i) a 23.3% and 5.0% decrease in volumes of sugar and energy sold, from 631.7 thousand tons and 608.7 Mwh for the nine-month period ended September 30, 2024 to 484.7 thousand tons and 578.3 Mwh during the same period in 2025, respectively; (ii) a 6.3% decrease in sugar prices, from US$462 per ton for the nine-month period ended September 30, 2024 to US$433 per ton for the same period in 2025, partially offset by a 5.0% increase in average ethanol prices, from US$486 per m3 for the nine-month period ended September 30, 2024 to US$ 510 per m3 for the same period in 2025;
•a US$39.3 million decrease in our Rice segment, mainly driven by: (i) a 25.4% decrease in white rice prices, from US$841 per ton for the nine-month period ended September 30, 2024, to US$627 per ton for the same period in 2025; and (ii) a positive impact of US$10.9 million due to the application of hyperinflation accounting and translation to our Argentine operations during the nine-month period ended September 30, 2024, compared to a negative impact of US$4.1 million during the same period in 2025; partially offset by (iii) a 13.9% increase in white rice volumes sold, from 205 thousand tons for the nine-month period ended September 30, 2024, to 234 thousand ton for the same period in 2025.
•a US$14.2 million decrease in our Dairy segment mainly due to a positive impact of US$14.7 million driven by the application of hyperinflation accounting and translation to our Argentine operations during the nine-month period ended September 30, 2024, compared to a negative impact of US$13.8 million during the same period in 2025. This effect was partially offset by higher Total Milk Processed for value-added products, from 260.3 million liters during the nine-month period ended September 30, 2024 to 297.4 million liters for the same period in 2025.
•a US$14.5 million decrease in our Crops segment mainly driven by: (i) a general decrease in commodity prices for the nine-month period ended September 30, 2025; partially offset by higher volumes sold for Peanut, Sunflower and Soybean for the nine-month period ended September 30, 2025.
The following table sets forth the breakdown of sales for the periods indicated.
|
|
|
|
|
|
|
|
|
|
|
|
|
|
|
|
|
|
|
|
|
|
|
|
|
|
|
|
|
|
|
|
|
|
|
|
|
|
|
|
|
|
|
|
|
|
|
|
|
|
|
|
|
|
| |
Nine-month period ended September 30, |
|
Nine-month period ended September 30, |
|
Nine-month period ended September 30, |
| |
2025 |
|
2024 |
|
% Chg |
|
2025 |
|
2024 |
|
% Chg |
|
2025 |
|
2024 |
|
% Chg |
| |
(In millions of $) |
|
(In thousands of tons) |
|
(In $ per ton) |
| Soybean |
50.9 |
|
|
58.6 |
|
|
(13.2) |
% |
|
187.4 |
|
|
178.0 |
|
|
5.3 |
% |
|
271.3 |
|
|
329.1 |
|
|
(17.6) |
% |
Corn (1) |
38.4 |
|
|
42.7 |
|
|
(10.1) |
% |
|
232.3 |
|
|
232.8 |
|
|
(0.2) |
% |
|
165.1 |
|
|
183.4 |
|
|
(9.9) |
% |
Wheat (2) |
10.0 |
|
|
14.3 |
|
|
(30.4) |
% |
|
64.6 |
|
|
64.2 |
|
|
0.6 |
% |
|
154.1 |
|
|
222.6 |
|
|
(30.8) |
% |
| Peanut |
45.1 |
|
|
40.0 |
|
|
12.8 |
% |
|
32.4 |
|
|
22.5 |
|
|
43.5 |
% |
|
1,393.1 |
|
|
1,772.3 |
|
|
(21.4) |
% |
| Sunflower |
9.2 |
|
|
8.5 |
|
|
7.7 |
% |
|
16.2 |
|
13.4 |
|
21.1 |
% |
|
564.3 |
|
|
634.4 |
|
|
(11.1) |
% |
Others (3) |
18.1 |
|
|
22.1 |
|
|
(17.8) |
% |
|
|
|
|
|
|
|
|
|
|
|
|
|
|
|
|
|
|
|
|
|
|
|
|
|
|
|
|
|
|
| Total |
171.6 |
|
|
186.1 |
|
|
(7.8) |
% |
|
|
|
|
|
|
|
|
|
|
|
|
(1) Includes sorghum.
(2) Includes barley.
(3) Includes sale of certifications related to RTRS soybean (Round Table on Responsible Soy Association) and sales related to our cattle activities.
|
|
|
|
|
|
|
|
|
|
|
|
|
|
|
|
|
|
|
|
|
|
|
|
|
|
|
|
|
|
|
|
|
|
|
|
|
|
|
|
|
|
|
|
|
|
|
|
|
|
|
|
|
|
| |
Nine-month period ended September 30, |
|
Nine-month period ended September 30, |
|
Nine-month period ended September 30, |
| |
2025 |
|
2024 |
|
% Chg |
|
2025 |
|
2024 |
|
% Chg |
|
2025 |
|
2024 |
|
% Chg |
| |
(in millions of $) |
|
(in thousand units) |
|
(in dollars per unit) |
| Ethanol (cubic meters) |
209.6 |
|
|
195.8 |
|
|
7.0 |
% |
|
411.3 |
|
|
403.3 |
|
|
2.0 |
% |
|
509.6 |
|
|
485.5 |
|
|
5.0 |
% |
| Sugar (tons) |
209.9 |
|
|
291.9 |
|
|
(28.1) |
% |
|
484.7 |
|
|
631.7 |
|
|
(23.3) |
% |
|
433.0 |
|
|
462.1 |
|
|
(6.3) |
% |
| Energy (MWh) |
25.1 |
|
|
22.6 |
|
|
10.7 |
% |
|
578.3 |
|
|
608.7 |
|
|
(5.0) |
% |
|
43.3 |
|
|
37.2 |
|
|
16.5 |
% |
| Others |
15.3 |
|
|
14.3 |
|
|
7.1 |
% |
|
|
|
|
|
|
|
|
|
|
|
|
| Total |
459.9 |
|
|
524.7 |
|
|
(12.3) |
% |
|
|
|
|
|
|
|
|
|
|
|
|
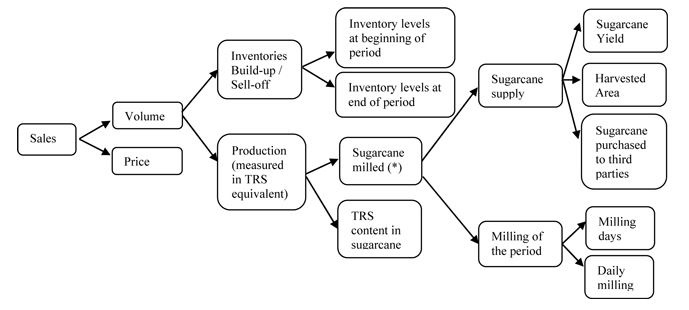
The following chart sets forth the variables that impact our Sugar and Ethanol sales:
The following chart sets forth the variables that impact our Energy sales:
(*) On average, one metric ton of sugarcane contains 140 kilograms of TRS. While a mill can produce either sugar or ethanol, the TRS input requirements differ between these two products. On average, 1.045 kilograms of TRS are required to produce 1.0 kilogram of sugar, while 1.691 kilograms of TRS are required to produce one liter of ethanol.
Cost of Revenue
|
|
|
|
|
|
|
|
|
|
|
|
|
|
|
|
|
|
|
|
|
|
|
|
|
|
|
|
|
|
| Nine-month period ended September 30, |
Crops |
|
Rice |
|
Dairy |
|
Sugar, Ethanol and Energy |
|
Total |
|
(In thousands of $) |
| 2025 |
(166,511) |
|
(146,453) |
|
(182,077) |
|
(346,377) |
|
(841,418) |
| 2024 |
(169,790) |
|
(166,516) |
|
(186,360) |
|
(378,144) |
|
(900,810) |
Agricultural produce sold to third parties (i.e., soybean, corn, wheat and fluid milk), the value of Cost of Revenue is equal to the value of Revenues. The profit of these products is fully recognized under the line items “Initial recognition and changes in fair value of biological assets and agricultural produce” and “Changes in net realizable value of agricultural produce after harvest.” When the agricultural produce is sold to third parties, we do not record any additional profit as the gain or loss has already been recognized.
The profit of our manufactured products sold to third parties (i.e., sugar, ethanol, energy, white rice, processed milk and peanut) is recognized when products are sold. The Cost of Revenue of these products includes, among others, the cost of the agricultural produce (i.e., harvested sugarcane and rough rice), which is the raw material used in the industrial process and is transferred internally from the farm to the industry at fair market value.
Cost of revenue decreased 6.6%, from US$900.8 million during the nine-month period ended September 30, 2024, to US$841.4 million for the same period in 2025. This decrease was primarily due to:
•a US$31.8 million decrease in our Sugar, Ethanol and Energy segment, mainly driven by a 23.3% and 5.0% decrease in volumes of sugar and energy sold, from 631.7 thousand tons and 608.7 Mwh for the nine-month period ended September 30, 2024 to 484.7 thousand tons and 578.3 Mwh during the same period in 2025, respectively; coupled with (i) a 7.5% reduction in the cost of production before D&A, benefited by higher tax credits driven by higher ethanol sales; and (ii) a 6.3% decrease in sugar prices, from US$462.1 per ton for the nine-month period ended September 30, 2024 to US$433.0 per ton for the same period in 2025.
•a US$20.1 million decrease in our Rice segment, mainly driven by a 18.7% decrease in sales, coupled with a negative impact of US$9.0 million due to the application of hyperinflation accounting and translation to our Argentina operations for the nine-month period ended September 30, 2024, compared to a positive impact of US$3.4 million for the same period in 2025.
•a US$4.3 million decrease in our Dairy segment, mainly driven by a general decline in production costs in our operations and mixed price performances; coupled with a negative impact of US$11.5 million due to the application of hyperinflation accounting and translation to our Argentine operations for the nine-month period ended September 30, 2024, compared to a positive impact of US$12.1 million for the same period in 2025;
•a US$3.3 million decrease in our Crops segment, mainly driven by (i) a general decline in prices; (ii) a negative impact of US$10.6 million due to the application of hyperinflation accounting and translation to our Argentine operations for the nine-month period ended September 30, 2024, compared to a positive impact of US$9.3 million for the same period in 2025;
Initial Recognition and Changes in Fair Value of Biological Assets and Agricultural Produce
|
|
|
|
|
|
|
|
|
|
|
|
|
|
|
|
|
|
|
|
|
|
|
|
|
|
|
|
|
|
| Nine-month period ended September 30, |
Crops |
|
Rice |
|
Dairy |
|
Sugar, Ethanol and Energy |
|
Total |
|
(In thousands of $) |
| 2025 |
(6,277) |
|
14,577 |
|
19,563 |
|
49,616 |
|
77,479 |
| 2024 |
33,184 |
|
39,114 |
|
7,473 |
|
41,531 |
|
121,302 |
Initial recognition and changes in fair value of biological assets and agricultural produce decreased 36.1%, from US$121.3 million for the nine-month period ended September 30, 2024, to US$77.5 million for the same period in 2025. This decrease was mainly due to:
•a US$39.5 million decrease in our Crops segment from a gain of US$33.2 million for the nine-month period ended September 30, 2024 (US$10.4 million of which were realized gains) to a loss of US$6.3 million for the same period in 2025 (US$5.0 million of which were realized losses). This decrease was in turn primarily due to:
◦the recognition at fair value of harvested crops, as adjusted for sales costs, which decreased US$35.4 million, from a gain of US$26.9 million for the nine-month period ended September 30, 2024, to a loss of US$8.5 million for the same period in 2025, which was mainly driven by a general decline in crop prices at harvest;
•a US$24.5 million decrease in our Rice segment, from a gain of US$39.1 million for the nine-month period ended September 30, 2024 (US20.0 million of which were realized gains) to a gain of US$14.6 million for the same period in 2025 (US$7.7 million of which were realized gains). This decrease was in turn due to:
◦a US$16.3 million decrease in the recognition at fair value of harvested rice at the point of harvest, as adjusted for sales costs, from US$31.9 million for the nine-month period ended September 30, 2024, to a gain of US$15.6 million for the same period in 2025, mainly driven by a 25.4% decrease in white rice prices; partially offset by (i) an increase in total processed rough rice, from 214 thousand tons for the nine-month period ended September 30, 2024 to 235 thousand tons for the same period in 2025; and (ii) efficiencies gained across all the value chain.
These effects were partially offset by:
•a US$12.1 million increase in our Dairy segment, from US$7.5 million for the nine-month period ended September 30, 2024 (from US$30.1 million of realized gains) to US$19.6 million for the same period in 2025 (from US$35.9 million of realized gains). This increase was mainly driven by a decline in cow nutrition and health costs in dollar terms..
•a US$8.1 million increase in our Sugar, Ethanol and Energy segment from US$41.5 million for the nine-month period ended September 30, 2024 (US$5.4 million of which were unrealized losses) to US$49.6 million for the same period in 2025 (including US$25.9 million of unrealized gains). This increase was mainly due to:
◦a US$31.4 million increase in the recognition at fair value of non-harvested sugarcane, from a loss of US$5.5 million for the nine-month period ended September 30, 2024, to a gain of US$25.9 million in the same period in 2025, mainly driven by higher TCH; partially offset by a US$22.9 million decrease in the recognition at fair value of harvested sugarcane, from US$48.2 million for the nine-month period ended September 30, 2024, to US$25.3 million for the same period in 2025.
Changes in Net Realizable Value of Agricultural Produce after Harvest
|
|
|
|
|
|
|
|
|
|
|
|
|
|
|
|
|
|
|
|
|
|
|
|
|
|
|
|
|
|
| Nine-month period ended September 30, |
Crops |
|
Rice |
|
Dairy |
|
Sugar, Ethanol and Energy |
|
Total |
|
(In thousands of $) |
| 2025 |
8,203 |
|
— |
|
— |
|
(609) |
|
7,594 |
| 2024 |
(19,993) |
|
— |
|
— |
|
540 |
|
(19,453) |
|
|
|
|
|
|
|
|
|
|
|
|
|
|
|
|
|
|
|
|
Changes in net realizable value of agricultural produce after harvest is mainly comprised of: (i) profit or loss from commodity price fluctuations during the period the agricultural produce is in inventory, which has an impact over its fair value; (ii) profit or loss from the valuation of forwards contracts related to agricultural produce in inventory; and (iii) profit from direct exports.
Changes in net realizable value of agricultural produce after harvest increased US$27.0 million, from a loss of US$19.5 million for the nine-month period ended September 30, 2024, to a gain of US$7.6 million for the same period in 2025, as a result of an increase in crop prices after harvest, mainly soybean, which resulted in a higher fair value of our crops held in inventories, adjusted by local inflation in Argentina, for the nine-month period ended September 30, 2025.
General and Administrative Expenses
|
|
|
|
|
|
|
|
|
|
|
|
|
|
|
|
|
|
|
|
|
|
|
|
|
|
|
|
|
|
|
|
|
|
|
|
| Nine-month period ended September 30, |
Crops |
|
Rice |
|
Dairy |
|
Sugar, Ethanol and Energy |
|
Corporate |
|
Total |
|
(In thousands of $) |
| 2025 |
(14,893) |
|
(13,382) |
|
(10,516) |
|
(21,355) |
|
(29,868) |
|
(90,014) |
| 2024 |
(17,380) |
|
(12,574) |
|
(9,055) |
|
(18,364) |
|
(21,585) |
|
(78,958) |
Our general and administrative expenses increased 14.0%, from US$79.0 million during the nine-month period ended September 30, 2024, to US$90.0 million during the same period in 2025. This increase was primarily driven by higher corporate mainly related to one-off expenses on financial and legal advisory due to Tether´s acquisition and Liability Management operations held during 2025, which includes the issuance of US$500 million regarding the 2032 notes, as well as the tender offer carried out to partially cancel the 2027 notes.
Selling Expenses
|
|
|
|
|
|
|
|
|
|
|
|
|
|
|
|
|
|
|
|
|
|
|
|
|
|
|
|
|
|
|
|
|
|
|
|
| Nine-month period ended September 30, |
Crops |
|
Rice |
|
Dairy |
|
Sugar, Ethanol and Energy |
|
Corporate |
|
Total |
|
(In thousands of $) |
| 2025 |
(13,479) |
|
(24,174) |
|
(24,341) |
|
(48,978) |
|
(344) |
|
(111,316) |
| 2024 |
(14,077) |
|
(25,999) |
|
(20,834) |
|
(55,884) |
|
1,283 |
|
(115,511) |
|
|
|
|
|
|
|
|
|
|
|
|
|
|
|
|
|
|
|
|
|
|
|
|
Selling expenses decreased 3.6%, from US$115.5 million for the nine-month period ended September 30, 2024, to US$111.3 million for the same period in 2025. This decrease is mainly explained by a proportional decline in our Sugar, Ethanol & Energy sales, due to lower sugar volumes sold.
Other Operating Income, Net
|
|
|
|
|
|
|
|
|
|
|
|
|
|
|
|
|
|
|
|
|
|
|
|
|
|
|
|
|
|
|
|
|
|
|
|
| Nine-month period ended September 30, |
Crops |
|
Rice |
|
Dairy |
|
Sugar, Ethanol and Energy |
|
Corporate |
|
Total |
|
(In thousands of $) |
| 2025 |
1,070 |
|
5,049 |
|
(53) |
|
6,228 |
|
(231) |
|
12,063 |
| 2024 |
(4,972) |
|
(18,290) |
|
3,919 |
|
2,560 |
|
278 |
|
(16,505) |
|
|
|
|
|
|
|
|
|
|
|
|
Other operating income increased from a loss of US$16.5 million for the nine-month period ended September 30, 2024, to a gain of US$12.1 million for the same period in 2025, primarily due to:
•a US$23.3 million increase in our Rice segment mainly driven by a lower fair value loss on Investment Properties, which was mainly due to lower inflation levels during the nine-month period ended September 30, 2025 compared to the same period during 2024.
•a US$6.0 million increase in our Crops segment, driven by the loss recorded in 2024 for a fire in one of the cells at our peanut facility in the province of Córdoba.
•a US$3.7 million increase in our Sugar, Ethanol and Energy segment mainly driven by the recognition of tax credits of PS COFINS.
Financial Results, Net
Our financial results, net totaled a loss of USD 60.1 million for the nine-month period ended September,30 2025, compared to a loss of US$98.8 million for the nine-month period ended September 30, 2024. This variation was primarily driven by: (i) gains related with the exchange difference in 2025 (US$12.3 million), compared to a loss of US$33.3 million in 2024 (Foreign exchange gain/(losses), net US$5.1 millions, and Cash flow hedge – transfer from equity, US$28.2 millions), which reflects the variations of the functional currencies against the US dollar.
These results were partially offset by the line net gain of inflation effects on the monetary items, from a loss of US$1.9 million for the nine-month period ended September 30, 2024 to a loss of US$6.0 million for the same period in 2025, which was in turn due to impact of inflation on our net monetary position in Pesos coupled with an increase in interest expense mainly driven by the issuance of our 7-Year US$500 million bond with a 7.50% coupon as well as higher needs to finance working capital due to lower revenues than projected.
The following table sets forth the breakdown of financial results for the periods indicated.
|
|
|
|
|
|
|
|
|
|
|
|
|
|
|
|
|
|
| |
Nine-month period ended September 30, |
| |
2025 |
|
2024 |
|
|
| |
(In thousand of $) |
|
% Change |
| Interest income |
9,238 |
|
|
8,610 |
|
|
7.3 |
% |
| Interest expense |
(37,251) |
|
|
(28,581) |
|
|
30.3 |
% |
| Finance cost related to lease liabilities |
(33,459) |
|
|
(29,317) |
|
|
14.1 |
% |
| Foreign exchange gain/(losses), net |
12,323 |
|
|
(5,051) |
|
|
(344.0) |
% |
| Cash flow hedge – transfer from equity |
— |
|
|
(28,224) |
|
|
(100.0) |
% |
| Gain from interest rate /foreign exchange rate derivative financial instruments |
2,459 |
|
|
(871) |
|
|
(382.3) |
% |
| Taxes |
(4,458) |
|
|
(5,860) |
|
|
(23.9) |
% |
| Other expense finance |
(2,920) |
|
|
(7,604) |
|
|
(61.6) |
% |
| Other financial results - Net gain of inflation effects on the monetary items |
(6,029) |
|
|
(1,911) |
|
|
215.5 |
% |
| Total Financial Results |
(60,097) |
|
|
(98,809) |
|
|
(39.2) |
% |
Income Tax expense
Current income tax totaled a benefit of US$2.0 million during the nine-month period ended September 30, 2025, compared to an expense of US$40.0 million for the same period in 2024.
In the nine-month period ended September 30, 2025, income tax calculated at the tax rates applicable in the countries where we operate amounted to an expense of US$1.1 million. Income tax expense has been adjusted for (i) non-taxable income of US$6.7 million related to a supplementary law in Brazil (Lei Complementar or “Supplementary Law”) which provides for ICMS tax benefits granted by the Brazilian Government with the objective of subsidizing investments by excluding such grants from the calculation of tax benefits; (ii) the recognition of unused tax losses for US$6.0 million, mainly by our Argentine subsidiaries resulting from tax inflation adjustments and (iii) a US$11.2 million losses related to the application of IAS 29 to the shareholders’ equity of our Argentine Subsidiaries (See Note 10 to our Unaudited Condensed Consolidated Interim Financial Statements).
In the nine-month period ended September 30, 2024, income tax calculated at the tax rates applicable in the countries where we operate amounted to an expense of US$8.9 million. Income tax expense has been adjusted for (i)
non-taxable income for US$10.4 million mainly related to our operations in Uruguay, (ii) the recognition of unused tax losses for US$9.3 million, mainly by our Argentine subsidiaries resulting from tax inflation adjustments; and (iii) a US$32.1 million gain related to the application of IAS 29 to the shareholders’ equity of our Argentine Subsidiaries (See Note 10 to our Unaudited Condensed Consolidated Interim Financial Statements).
Profit for the period
As a result of the foregoing, our net income during the nine-month period ended September 30, 2025 decreased US$67.8 million, from a gain of US$75.9 million during the same period in 2024 to a gain of US$8.1 million in 2025.
Liquidity and Capital Resources
Our liquidity and capital resources are and will be influenced by a variety of factors, including:
• our ability to generate cash flows from our operations;
• the amount of our outstanding indebtedness and the interest that we are obligated to pay on such outstanding indebtedness;
• our capital expenditure requirements, which consist primarily of investments in new farmland, in our operations, in equipment and plant facilities and maintenance costs; and
• our working capital requirements.
Our principal sources of liquidity have traditionally consisted of cash flows from operations, shareholders’ contributions, short and long term borrowings and proceeds received from the disposition of transformed farmland or subsidiaries.
Nine-month period ended September 30, 2025 and 2024
The table below reflects our statements of Cash Flow for the nine-month period ended September 30, 2025 and 2024.
|
|
|
|
|
|
|
|
|
|
|
|
|
|
|
|
|
| |
|
For the nine months period ended September 30, |
| |
|
2025 |
|
2024 |
|
|
|
|
(Unaudited) |
|
(Unaudited) |
|
|
| |
|
(in thousands of $) |
| Cash and cash equivalents at the beginning of the period |
|
211,244 |
|
|
339,781 |
|
|
|
| Net cash used in operating activities |
(1) |
138,691 |
|
|
164,867 |
|
|
|
| Net cash used in investing activities |
(2) |
(262,529) |
|
|
(147,055) |
|
|
|
| Net cash generated / (used) from / in financing activities |
(3) |
252,740 |
|
|
(210,315) |
|
|
|
| Effect of exchange rate changes and inflation on cash and cash equivalents |
(4) |
(148) |
|
|
50,977 |
|
|
|
| Cash and cash equivalents at the end of the year |
|
339,998 |
|
|
198,255 |
|
|
|
The table below reflects the combined effect of IAS 29 and IAS 21 of our Argentine subsidiaries on each of the following line items for the nine-month period ended September 30, 2025 and 2024; numbered with relevant footnotes:
|
|
|
|
|
|
|
|
|
|
|
|
|
|
|
|
|
For the nine months period ended September 30, |
|
|
2025 |
|
2024 |
|
|
(Unaudited) |
|
(Unaudited) |
|
|
(in thousands of $) |
| (1) |
Operating activities |
10,969 |
|
|
(67,244) |
|
|
|
|
|
|
| (2) |
Investing activities |
(212) |
|
|
(7,889) |
|
|
|
|
|
|
| (3) |
Financing activities (a) |
(8,389) |
|
|
42,457 |
|
| (4) |
Effects of exchange rate changes and inflation on cash and cash equivalents |
(2,368) |
|
|
32,676 |
|
|
|
|
|
|
(a) |
Include the combine effect over Interest paid for: |
(6,386) |
|
|
7,429 |
|
|
|
|
|
|
Operating Activities
Nine-month period ended September 30, 2025
Net cash provided by operating activities was US$138.7 million for the nine-month period ended September 30, 2025. During this period, we generated a net profit of US$8.1 million that included non-cash charges relating primarily to depreciation of property, plant and equipment and right of use assets and amortization of intangible assets for US$204.6 million, and losses from interest, finance cost related to lease liabilities and other financial expenses, net of US$64.6 million. All these effects were partially offset by a gain from foreign exchange, net of US$12.3 millio and initial recognition and changes in fair value of non-harvested biological assets unrealized of US$21.6 million.
In addition, other changes in operating assets and liability balances resulted in a net decrease in cash of US$94.6 million, primarily due to an increase of US$75.9 million in trade and other receivables and an increase of US$103.7 million inventories. All these effects were partially offset by a decrease of US$70.3 million in biological assets.
The net cash provided by operating activities during this period includes a US$11.0 million positive combined effect resulting from the application of IAS 29 and IAS 21 by our Argentine subsidiaries.
Nine-month period ended September 30, 2024
Net cash provided by operating activities was US$164.9 million for the nine-month period ended September 30, 2024. During this period, we generated a net profit of US$75.9 million that included non-cash charges relating primarily to depreciation of property, plant and equipment and right of use assets and amortization for US$234.7 million, losses from interest, finance cost related to lease liabilities and other financial expenses, net of US$58.9 million and US$28.2 million loss as a result of the reclassification from Equity to Financial results, net in connection with the cash flow hedge accounting. All of these effects were partially offset by a benefit of US$40.0 million in our income tax position.
In addition, other changes in operating assets and liability balances resulted in a net decrease in cash of $220.8 million, primarily due to an increase of US$151.0 million in trade and other receivables, an increase of US$111.1 million in inventories and an increase of US$49.1 million in trade and other payables. All of these effects were partially offset by a decrease of US$64.3 million in biological assets.
The net cash provided by operating activities during this period includes a US$67.2 million negative combined effect resulting from the application of IAS 29 and IAS 21 by our Argentine subsidiaries.
Investing Activities
Nine-month period ended September 30, 2025
Net cash used in investing activities totaled US$262.5 million for the nine-month period ended September 30, 2025, mainly due to capital expenditures of US$287.3 million, which included (i) US$96.0 million as an advance payment for the acquisition of a joint venture, (ii) US$96.5 million related to the renewal and expansion of our sugarcane plantation, and (iii) US$94.8 million for the purchase of agricultural and industrial equipment, primarily to expand our harvesting fleet with two-row harvesters and grunner trucks. These investments aim to reduce soil compaction and diesel consumption, strengthening our sustainable footprint while lowering costs. These outflows were partially offset by the net disposition of short-term investments, which totaled US$7.2 million. During this period, interest received amounted to US$12.9 million.
The net cash used in investing activities during this period includes a US$0.2 million negative combined effect resulting from the application of IAS 29 and IAS 21 by our Argentine subsidiaries.
Nine-month period ended September 30, 2024
Net cash used in investing activities totaled US$147.1 million for the nine-month period ended September 30, 2024, mainly driven by capital expenditures of US$221.5 million, which included: (i) US$101.2 million related to the renewal and expansion of our sugarcane plantation; and (ii) US$104.3 million invested in the purchase of agricultural and industrial equipment, primarily harvesting machinery for our Sugar, Ethanol and Energy business, the payment of the final installment of our acquisition of Viterra’s mills in Argentina and Uruguay, and the construction of a new warehouse for dairy products at our Chivilcoy facility.
Net inflows from investing activities mainly reflected proceeds from the disposal of short-term investments, net of acquisitions, totaling US$43.8 million.
The net cash used in investing activities during this period includes a US$7.9 million negative combined effect resulting from the application of IAS 29 and IAS 21 by our Argentine subsidiaries.
Financing Activities
Nine-month period ended September 30, 2025
Net cash generated by financing activities was US$252.7 million for the nine-month period ended September 30, 2025. This amount was mainly driven by the issuance of senior notes due 2032 (1) for US$500.0 million and the incurrence of new long- and short-term borrowings of US$268.8 million. These inflows were partially offset by net repayments of long- and short-term borrowings totaling US$355.0 million, which include US$150.9 million of notes due 2027 validly tendered, while interest paid during the period amounted to US$44.9 million. In addition, US$27.7 million was returned to shareholders through the repurchase of 1.1 million shares (US$10.2 million) and the payment of cash dividends (US$17.5 million). Lease payments totaled US$85.1 million.
(1) Notes 2032:
On July 29, 2025, the Company issued senior notes (the “Notes”) for US$500 million, at an annual nominal rate of 7.5%. The Notes will mature on July 29, 2032. Interest on the Notes are payable semi-annually in arrears on January 29 and July 29 of each year. The total proceeds nets of expenses was US$496.8 million.
Net cash generated in financing activities includes a US$8.4 million negative combined effect resulting from the application of IAS 29 and IAS 21 by our Argentine subsidiaries, of which US$6.4 million is over interest paid.
Nine-month period ended September 30, 2024
Net cash used in financing activities was US$210.3 million for the nine-month period ended September 30, 2024, primarily due to payments of long- and short-term loans totaling US$218.4 million. These outflows were partially offset by net proceeds from long- and short-term borrowings of US$94.6 million and US$89.9 million, respectively. Interest paid during the period amounted to US$19.1 million. Additionally, US$75.8 million was distributed to shareholders through the repurchase of 5.8 million shares (US$58.3 million) and the payment of cash dividends (US$17.5 million). Lease payments totaled US$80.8 million.
Net cash used in financing activities includes a US$42.5 million positive combined effect resulting from the application of IAS 29 and IAS 21 by our Argentine subsidiaries, of which US$7.4 million is over interest paid.
Cash and Cash Equivalents
Historically, since our cash flows from operations were insufficient to fund our working capital needs and investment plans, we funded our operations with proceeds from short-term and long-term indebtedness and capital contributions from existing and new private investors. In 2011, we raised US$421.8 million from an Initial Public Offering (“IPO”) and simultaneous private placement. Subsequently, on September, 2017, the Company issued senior notes (the “Notes 2027”) for US$ 500 million, and more recently, on July, 2025, issued additional senior notes (the “Notes 2023”) for US$ 500 million. As of September 30, 2025, our cash and cash equivalents amounted to US$340.0 million.
However, we may need additional cash resources in the future to continue our investment plans. Also, we may need additional cash if we experience a change in business conditions or other developments. We also might need additional cash resources in the future if we find and wish to pursue opportunities for investment, acquisitions, strategic alliances or other similar investments, such as our potential acquisition of Profertil S.A. If we ever determine that our cash requirements exceed our amounts of cash and cash equivalents on hand, we might seek to issue debt or additional equity securities or obtain additional credit facilities or realize the disposition of transformed farmland and/or subsidiaries. Any issuance of equity securities could cause dilution for our shareholders. Any incurrence of additional indebtedness could increase our debt service obligations and cause us to become subject to additional restrictive operating and financial covenants, and could require that we pledge collateral to secure those borrowings, if permitted to do so. It is possible that, when we need additional cash resources, financing will not be available to us in amounts or on terms that would be acceptable to us or at all.
Projected Sources and Uses of Cash
We anticipate that we will generate cash from the following sources:
•operating cash flow;
•debt financing;
•the dispositions of transformed farmland and/or subsidiaries; and
•debt or equity offerings.
We anticipate that we will use our cash:
•for other working capital purposes;
•to meet our budgeted capital expenditures;
•to make investment in new projects related to our business; and
•to refinance our current debts.
•pay dividends
Indebtedness and Financial Instruments
The table below illustrates the maturity of our indebtedness (excluding obligations under finance leases) and our exposure to fixed and variable interest rates:
|
|
|
|
|
|
|
|
|
|
|
|
|
September 30,
2025 |
|
December 31,
2024 |
|
(unaudited) |
|
|
| Fixed rate: |
|
|
|
Less than 1 year |
151,252 |
|
|
69,178 |
|
Between 1 and 2 years |
287,574 |
|
|
55,952 |
|
Between 2 and 3 years |
6,814 |
|
|
414,994 |
|
Between 3 and 4 years |
991 |
|
|
356 |
|
Between 4 and 5 years |
1,435 |
|
|
356 |
|
More than 5 years |
547,230 |
|
|
35,936 |
|
|
995,296 |
|
|
576,772 |
|
Variable rate: |
|
|
|
Less than 1 year |
31,527 |
|
|
30,373 |
|
Between 1 and 2 years |
121,113 |
|
|
83,142 |
|
Between 2 and 3 years |
51,525 |
|
|
46,593 |
|
Between 3 and 4 years |
— |
|
|
2,932 |
|
Between 4 and 5 years |
— |
|
|
441 |
|
More than 5 years |
37,510 |
|
|
39,303 |
|
|
241,675 |
|
|
202,784 |
|
|
1,236,971 |
|
|
779,556 |
|
(1) The Company plans to partially rollover its short term debt using new available lines of credit, or on using operating cash flow to cancel such debt.
During the nine-month period ended September 30, 2025, the Company was in compliance with all financial covenants.
Short-term Debt
As of September 30, 2025, our short term debt totaled US$182.8 million.
We maintain lines of credit with several banks in order to finance our working capital requirements. We believe that we will continue to be able to obtain additional credit to finance our working capital needs in the future based on our past track record and current market conditions.
Brazilian Subsidiary Guarantors
The main loans of the Brazilian Subsidiary Guarantors are:
|
|
|
|
|
|
|
|
|
|
|
|
|
|
|
|
|
|
|
|
|
|
|
|
|
|
|
|
|
|
| Bank |
Grant date |
Nominal
amount
|
Capital outstanding as of |
Maturity date |
Annual interest rate |
September 30,
2025 |
December 31,
2024 |
| (In millions) |
Millions of
Brazilian Real
|
Millions of
equivalent
Dollars
|
Millions of
equivalent
Dollars
|
Certificados Recebíveis do Agronegócio (CRA) (2) |
December, 2019 |
R$ |
400.0 |
|
R$ |
400.0 |
|
75.2 |
|
64.6 |
|
November-27 |
3.80% + IPCA |
Debênture (1) |
December, 2020 |
R$ |
400.0 |
|
R$ |
266.7 |
|
50.1 |
|
64.6 |
|
December-26 |
4.24% + IPCA |
Certificados Recebíveis do Agronegócio (CRA) (2) |
July, 2024 |
R$ |
400.0 |
|
R$ |
400.0 |
|
75.2 |
|
64.6 |
|
Jul-31 / Jul-34 |
IPCA + 6.80% /12.65% |
(1) Collateralized by long term power purchase agreement (PPA).
(2) This debt was issued with no guarantee.
Uruguayan Subsidiary Guarantors
The principal loans of the Uruguayan Subsidiary Guarantors are:
|
|
|
|
|
|
|
|
|
|
|
|
|
|
|
|
|
|
|
|
|
| Bank |
Grant date |
Nominal
amount
|
Capital outstanding as of |
Maturity date |
Annual interest rate |
| September 30, 2025 |
December 31, 2024 |
| (In millions) |
(In millions) |
(In millions) |
| Rabobank |
July, 2025 |
US$29.1 |
29.10 |
— |
July, 2027 |
4.1% |
Legal and Administrative Proceedings
We are subject to several laws, regulations and business practices of the countries in which we operate. In the ordinary course of business, we are subject to certain contingent liabilities with respect to existing or potential claims, lawsuits and other proceedings, including those involving tax, social security, labor lawsuits and other matters. We accrue liabilities when it is probable that future costs will be incurred and such costs can be reasonably estimated.