Document
MANAGEMENT’S DISCUSSION AND ANALYSIS OF FINANCIAL CONDITION AND RESULTS OF OPERATIONS
The following discussion of our financial condition and results of operations should be read in conjunction with our unaudited interim consolidated financial statements, included in Exhibit 99.2 of our report on Form 6-K which was furnished to the SEC on May 12, 2025 and our audited consolidated financial statements included in our annual report on Form 20-F for the year ended December 31, 2024, which was filed with the SEC on April 25, 2025 (the “Annual Report”). The preparation of the consolidated financial statements required the use of assumptions and estimates that affect the amounts recorded as assets, liabilities, revenue and expenses in the years and periods addressed and are subject to certain risks and uncertainties. Our future results may vary substantially from those indicated because of various factors that affect our business, including, among others, those identified under “Forward Looking Statements” and “Risk Factors” in our Annual Report. Our audited consolidated financial statements have been prepared in accordance with IFRS Accounting Standards issued by the International Accounting Standards Board and our unaudited interim consolidated financial statements have been prepared in accordance with IAS 34 “Interim Financial Reporting” as issued by the IASB.
Overview
We are a leading agro-industrial company in South America, with operations in Argentina, Brazil and Uruguay. We produce a wide range of agricultural products, including various crops, rice, dairy, sugar and ethanol, and are also involved in energy production and commercialization. Our sustainable business model is focused on (i) a low-cost production strategy that leverages growing or producing each of our agricultural products in regions where we believe we have competitive advantages, (ii) reducing the volatility of our returns through product and geographic diversification and use of advanced technology, (iii) benefiting from vertical integration in key segments of the agro-industrial chain, (iv) acquiring and transforming land to improve its productivity and realizing land appreciation through strategic dispositions, and (v) implementing sustainable production practices and technologies focused on long-term profitability.
As of March 31, 2025, we managed 598,928 hectares, of which we owned a total of 210,371 hectares through 17 farms in Argentina and 7 farms in Brazil. In terms of hectares, as of March 31, 2025, Argentina accounts for 94% of our own land portfolio and Brazil accounts for 6%. In addition, we own and operate several processing and manufacturing facilities including four rice mills and one rice snack facility in Argentina, two rice mills in Uruguay, four dairy free-stall facilities and two milk processing facilities in Argentina, one peanut processing facility and one sunflower processing facility in Argentina, two grain handling and conditioning plants in Argentina, and three sugar and ethanol mills in Brazil.
For the three-month period ended March 31, 2025, we had U.S.$325.5 million in revenue compared to U.S.$261.8 million in the same period of 2024 and profit for the period of U.S.$18.7 million compared to a profit of U.S.$47.3 million in the same period of 2024. For the three-month period ended March 31, 2025, we had Adjusted EBITDA of U.S.$35.9 million compared to Adjusted EBITDA of U.S.$90.1 million in the same period of 2024. As of March 31, 2025, we had U.S.$3.4 billion in total assets.
Trends and Factors Affecting Our Results of Operations
Our results of operations have been influenced and will continue to be influenced by the following factors:
(i) Effects of Yield Fluctuations
The occurrence of severe adverse weather conditions, especially droughts, hail, floods or frost, are unpredictable and may have a potentially devastating impact on agricultural production and may otherwise adversely affect the supply and prices of the agricultural commodities that we sell and use in our business. The effects of severe adverse weather conditions may also reduce yields at our farms. Yields may also be affected by plague, disease or weed infection and operational problems, such as Spiroplasma disease, which affected corn yield during the 2023/2024 harvest season.
See “Item 3. Key Information—D. Risk Factors—Risks Related to Our Business and Industries—Unpredictable weather conditions, including as a result of climate change, pest infestations and diseases may have an adverse impact on agricultural production” in our Annual Report.
The following table sets forth our average crop, rice and sugarcane yields per hectare for the periods indicated:
|
|
|
|
|
|
|
|
|
|
|
|
|
|
|
|
|
|
|
2024/2025 |
|
2023/2024 |
|
% Change |
|
Harvest Year (1) |
|
Harvest Year (2) |
|
2024/2025-2023/2024 |
Corn (3) |
6.4 |
|
7.8 |
|
(17.9)% |
| Soybean |
3.0 |
|
3.3 |
|
(9.1)% |
Wheat (4) |
2.5 |
|
3.1 |
|
(19.4)% |
| Peanut |
3.2 |
|
3.7 |
|
(13.5)% |
| Sunflower |
2.2 |
|
1.7 |
|
29.4% |
| Rice |
8.0 |
|
6.5 |
|
23.1% |
| Sugarcane (5) |
53.0 |
|
70.0 |
|
(24.3)% |
(1) Sets forth current yields as of the end of April 2025. The portion of harvested area completed was 23% for corn, 23% for soybean, 100% for wheat, 89% for sunflower, 5% for peanut and 99% for rice. Yields of crops with harvesting activities with less than 50% progress are not representative.
(2) Sets forth current yields as of the end of April 2024. The portion of harvested area completed was 24% for corn, 28% for soybean, 100% for wheat, 100% for sunflower, 5% for peanut and 88% for rice. Yields of crops with harvesting activities with less than 50% progress are not representative.
(3) Includes sorghum. Early Corn was not affected by Spiroplasma desease.
(4) Includes barley and peas.
(5) Only lower quality cane was harvested due to adverse weather conditions.
(ii) Effects of Fluctuations in Production Costs
We experience fluctuations in our production costs due to the fluctuation in the costs of fertilizers, agrochemicals, seeds, fuel, farm leases and labor. The use of advanced technology, however, allows us to increase our efficiency, in large part mitigating the fluctuations in production costs. Some examples of how the implementation of production technology has allowed us to increase our efficiency and reduce our costs include the use of no-till technology (also known as “direct sowing,” which involves farming without the use of tillage, leaving plant residues on the soil to form a protective cover which positively impacts costs, yields and the soil), crop rotation, second harvest in one year, integrated pest management, and balanced fertilization techniques to increase the productive efficiency in our farmland. Increased mechanization of harvesting and planting operations in our sugarcane plantations and utilization of modern, high-pressure boilers in our sugar and ethanol mills has also yielded higher rates of energy production per ton of sugarcane milled. In addition, we reuse all the waste from our sugar cane processing, which together with the ashes from the boilers, and the filter cake, undergo a composting process and are used as organic fertilizer to grow sugarcane, allowing us to reduce chemical fertilizer consumption, while positively contributing to the environment. We also use manure in our dairy farms to generate electricity with biodigesters.
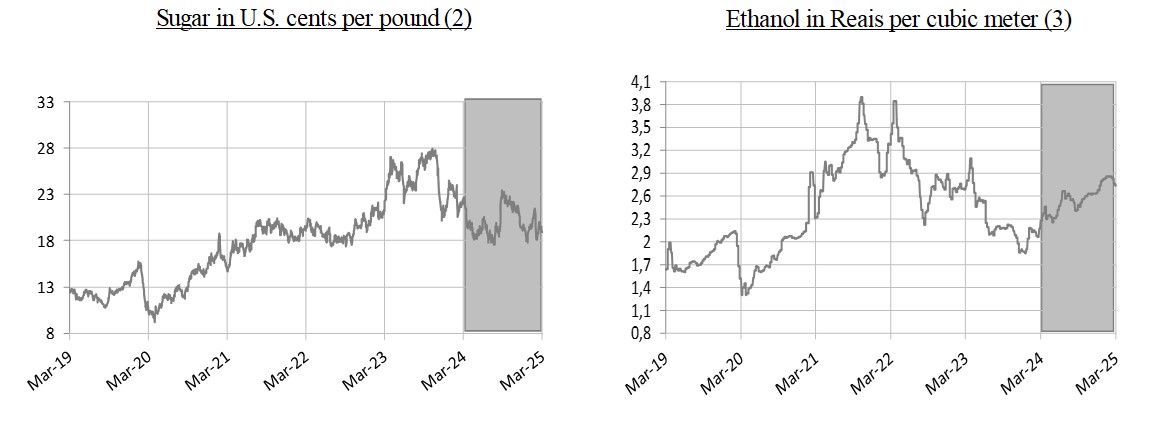
(iii) Effects of Fluctuations in Commodities Prices
Commodity prices have historically experienced substantial fluctuation. For example, between March 31, 2024 and March 31, 2025, sugar prices decreased by 15.6%, according to Intercontinental Exchange of New York (“ICE-NY”) data, and ethanol prices increased by 19.9%, according to Escola Superior de Agricultura “Luiz de Queiroz” (“ESALQ”) data. Also, based on Chicago Board of Trade (“CBOT”) data, from March 31, 2024 to March 31, 2025, soybean prices decreased 13.8% and corn prices increased by 2.3%. Commodity price fluctuations affect our consolidated statements of income, as they have an effect over:
• Initial recognition and changes in the fair value of biological assets and agricultural produce in respect of unharvested biological assets undergoing biological transformation;
• Changes in net realizable value of agricultural produce for inventory carried at its net realizable value; and
• Sales of manufactured products and agricultural produce to third parties.
The following graphs show the spot market price of some of our products since March 31, 2019 to March 31, 2025, highlighting the periods March 31, 2024 to March 31, 2025:
(iv) Fiscal Year and Harvest Year
Our fiscal year begins on January 1 and ends on December 31 of each year. However, our production is based on the harvest-year for each of our crops and rice. A harvest-year varies according to the crop or rice plant and the climate in which it is grown. Due to the geographic diversity of our farms, the planting period for a given crop or rice may start earlier on one farm than on another, causing differences for their respective harvesting periods. The presentation of production volume (tons) and production area (hectares) in this report in respect of the harvest-years for each of our crops and rice starts with the first day of the planting period at the first farm to start planting in that harvest-year to the last day of the harvesting period of the crop or rice planting on the last farm to finish harvesting that harvest-year.
On the other hand, production volumes for dairy, processed rice and production volume and production area for sugar, ethanol and energy business, along with the financial results in respect of our products are presented on a fiscal-year basis.
(v) Effects of Fluctuations of the Production Area
Our results of operations also depend on the size of the production area. The size of our owned and leased area devoted to crop, rice and sugarcane production fluctuates from period to period in connection with the purchase and development of new farmland, the sale of developed farmland, the lease of new farmland and the termination of existing farmland lease agreements. Lease agreements are usually settled following the harvest season, from July to September for crops and rice, and from May to April for sugarcane. The length of the lease agreements is usually one year for crops, one to five years for rice and seven years for one-cycle sugarcane or 14 years for a two-cycle of sugarcane. Regarding crops, the production area can be planted and harvested once or twice per year. For example, wheat can be planted in July and harvested in December. Once harvested, soybean can be planted in the same area and harvested in April. As a result, planted and harvested areas can maximize their production in any given year. The production area for sugarcane can exceed the harvested area in one year. Grown sugarcane can be left in the fields and then harvested the following year.
The following table sets forth the production area for the periods indicated:
|
|
|
|
|
|
|
|
|
|
|
|
|
|
|
|
|
|
|
Three-month period ended March 31, |
|
2025 |
|
2024 |
|
Chg (%) 2025-2024 |
|
Hectares |
|
Crops (1) |
196,603 |
|
193,949 |
|
1.4% |
| Rice |
64,441 |
|
58,452 |
|
10.2% |
| Sugar, Ethanol and Energy |
219,127 |
|
201,442 |
|
8.8% |
(1) Does not include second crop area or forage.
The increase in sugar, ethanol and energy production area in the three-month period ended March 31, 2025, is explained by an increase in the leased space to ensure the sufficiency of our sugarcane supply during the entire year in accordance with our long-term growth plan. It is also explained by growth in our rice operations, in which we continue allocating investments towards area expansion and increasing our leased space to support our growth strategy.
(vi) Macroeconomic Developments in Emerging Markets
We generate nearly all of our revenue from the production of food and renewable energy in emerging markets. Therefore, our operating results and financial condition are directly impacted by macroeconomic and fiscal developments, including fluctuations in currency exchange rates, inflation and interest rate fluctuations, in those markets. The emerging markets where we conduct our business (including Argentina, Brazil and Uruguay) remain subject to such fluctuations.
Moreover, economic conditions of the countries in which we operate may be impacted by inflation over domestic prices, which may result in higher costs and affect our revenues. High inflation rates may undermine the conditions that allow us to grow in those countries and induce to macroeconomic volatility, affecting overall competitiveness, increasing social and economic inequality, reducing employment, consumption and the level of economic activity and undermining confidence in the banking system, which could further limit domestic and international credit availability. For the three-month period ended March 31, 2025, inflation in local currency in Argentina, Brazil and Uruguay was 8.6%, 2.0% and 2.4%, respectively. We present our results of operations adjusted by the effect of hyperinflationary accounting policies and translation for our Argentine operations according to IAS 29.
In addition, government policies enacted in the countries in which we operate may have a material impact, or could materially affect, the Company’s operations.
(vii) Effects of Export Taxes on Our Products
The following table shows the export taxes applicable to our products for the three-month period ended March 31, 2025:
|
|
|
|
|
|
|
|
|
| Product |
Export tax |
Cap per dollar exported |
| Soybean and derivatives |
33% |
— |
|
| Corn |
12% |
— |
|
| Wheat |
12% |
— |
|
| Peanut |
—% |
— |
|
| Sunflower |
—% |
— |
|
| Cotton |
5% |
— |
|
| Rice |
—% |
— |
|
| UHT Milk |
—% |
— |
|
| Powdered Milk |
—% |
— |
|
| Cheese |
—% |
— |
|
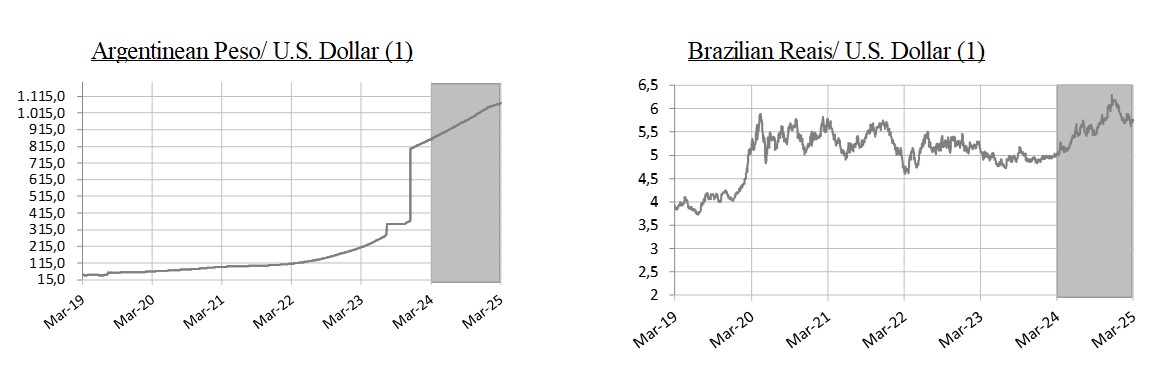
(viii) Effects of Foreign Currency Fluctuations
Each of our Argentine, Brazilian and Uruguayan subsidiaries use local currency as its functional currency. A significant portion of our operating costs in Argentina are denominated in Argentine Pesos and most of our operating costs in Brazil are denominated in Brazilian Real. For each of our subsidiaries’ statements of income, foreign currency transactions are translated to local currency, as such subsidiaries’ functional currency, using the exchange rates prevailing as of the dates of the relevant specific transactions. Exchange differences resulting from the settlement of such transactions and from the translation at year-end exchange rates of monetary assets and liabilities denominated in foreign currencies are recognized in the statement of income under “finance income” or “finance costs,” as applicable. Our Consolidated Financial Statements are presented in U.S. dollars, and foreign exchange differences that arise in the translation process are disclosed in the consolidated statement of comprehensive income.
As of March 31, 2025, the Argentine Peso-U.S. dollar exchange rate was Ps.1,074.0 per U.S. dollar as compared to Ps.858.0 per U.S. dollar as of March 31, 2024. As of March 31, 2025, the Real-U.S. dollar exchange rate was R$5.74 per U.S. dollar as compared to R$5.00 per U.S. dollar as of March 31, 2024.
The following graph shows the Argentine Peso-U.S. dollar rate and the Real-U.S. dollar rate of exchange between March 31, 2019 and March 31, 2025, highlighting the period between March 31, 2024 and March 31, 2025:
Source: Bloomberg
Our principal foreign currency fluctuation risk involves changes in the value of the Brazilian Real and the Argentine Peso relative to the U.S. dollar. Periodically, we evaluate our exposure and consider opportunities to mitigate the effects of currency fluctuations by entering into currency forward contracts and other hedging instruments.
(ix) Seasonality
Our business activities are inherently seasonal. We generally harvest and sell corn, soybean, rice, peanut and sunflower between February and August, and wheat from December to January. With the implementation of the “continuous harvest method,” sugarcane production is more stable during the year; however, the typical harvesting period in Brazil begins between April and May and ends between November and December. Sales of ethanol are generally concentrated during off-season to capture higher seasonal prices. Sales in other business segments, such as in our Dairy segment, tend to be more stable. However, milk sales are generally higher during the fourth quarter, when weather conditions are more favorable for production. As a result of the above factors, there may be significant variations in our results of operations from one quarter to another, since planting activities may be more concentrated in one quarter compared to another. In addition, our quarterly results may vary as a result of the effects of fluctuations in commodity prices and production yields and costs related to the “Initial recognition and changes in fair value of biological assets and agricultural produce” line item.
(x) Capital Expenditures and Other Investments
Our capital expenditures during the last three years consisted mainly of expenses related to (i) transforming and increasing the productivity of our land, (ii) planting sugarcane and (iii) expanding and upgrading our production facilities, such as our biogas project in Brazil and the expansion of our renewable energy generation capacity in that country; along with capital investments aimed at enhancing processing capacity in our dairy facilities in Argentina. Capital expenditures (including both maintenance and expansion) totaled U.S.$84.6 million for the three-month period ended March 31, 2025, in comparison with U.S.$107.1 million in the same period of 2024. This increase is primarily due to (i) a more equal distribution of the maintenance activities at the mills throughout the year, coupled with lower hectares of renewal planting; and (ii) an uneven year-over-year comparison since expansion capital expenditures in the first quarter of 2024 were mostly related to the payment of the third (and final) installment of Viterra’s rice mills in Argentina and Uruguay (approximately U.S.$13 million).
(xi) Effects of Corporate Taxes on Our Income
We are subject to a variety of taxes on our results of operations. The following table shows the income tax rates in effect for 2025 in each of the countries in which we operate:
Tax Rate (%)
|
|
|
|
|
|
Argentina |
35 |
Brazil (1) |
34 |
Uruguay |
25 |
| Spain |
25 |
| Luxembourg |
23.87 |
| Chile |
27 |
(1) Includes the Social Contribution on Net Profit (Contribuição Social Sobre o Lucro Líquido).
Operating Segments
The Company is engaged in agricultural, manufacturing and land transformation activities. Our agricultural activities consist of harvesting certain agricultural products, including crops, rough rice, and sugarcane, for sale to third parties and for internal use as inputs in our various manufacturing processes, and producing fluid milk.
The manufacturing activities consist of (i) selling manufactured products, including processed peanuts, sunflower, rice, sugar, ethanol and energy, among others, (ii) in producing UHT milk, powder milk and semi-hard cheese, among other dairy products; and (iii) providing services, such as grain warehousing and conditioning and handling and drying services, among others. The land transformation activities consist of the acquisition of farmlands or businesses with underdeveloped or underutilized agricultural land and implementing production technology and agricultural best practices on the Group’s farmlands to enhance yields and increase their value for potential realization through sale.
According to IFRS 8, operating segments are identified based on the “management approach.” Operating segments are components of an entity about which separate financial information is available that is evaluated regularly by the Company’s chief operating decision maker (“CODM”) in deciding how to allocate resources and in assessing performance. The Company’s CODM is the Management Committee. IFRS 8 stipulates external segment reporting based on the Company’s internal organizational and management structure and on internal financial reporting to the CODM.
Based on the foregoing, the Company operates in two major lines of business, Farming and Sugar, Ethanol and Energy.
The “Farming” business is further comprised of three reportable segments:
•“Crops” segment, which consists of the planting, harvesting and sale of grains, oilseeds and fibers (including wheat, corn, soybeans, peanuts, cotton and sunflowers, among others), and to a lesser extent the provision of grain warehousing/conditioning and handling and drying services to third parties. Each underlying crop in this segment does not represent a separate operating segment. Management seeks to maximize the use of the land through the cultivation of one or more type of crops. Types and surface amount of crops cultivated may vary from harvest-year to harvest-year depending on several factors, some of them out of our control. Management is focused on the long-term performance of productive land, and to that extent, our performance is assessed considering the aggregated combination, if any, of crops planted in the land. A single manager is responsible for the management of operating activity of all crops rather than for each individual crop.
•“Rice” segment, which consists of the planting, harvesting, processing and marketing of rice, and the genetic development of seeds; and
•“Dairy” segment, which consists of the production and sale of raw milk and industrialized products, including UHT milk, cheese and powder milk among others.
The “Sugar, Ethanol and Energy” business is also a segment which consists of cultivating sugarcane which is processed in owned sugar mills, transformed into ethanol, sugar and electricity, in addition to biomethane and then marketed;
To evaluate the economic performance of our businesses on a monthly basis, the results of operations of our Argentine subsidiaries are based on monthly data adjusted for inflation and converted into the average exchange rate of the U.S. dollar for each month. These converted figures are not readjusted and reconverted subsequently. We also employ this methodology to translate the results of operations of our subsidiaries in countries without hyperinflationary economies, as it allows for a more accurate analysis of the integral economic performance of their businesses.
Key Financial and Operating Data
The following table presents selected historical financial and operating data solely for the periods indicated below. In respect of production data only as of March 31, 2025, we have not yet completed the 2024/2025 harvest year crops. The harvested tons presented corresponds to the harvest completed as of end of April, 2025.
|
|
|
|
|
|
|
|
|
|
|
|
|
|
|
|
|
|
|
|
|
| |
|
Three-month period ended March 31, |
|
| |
|
2025 |
|
2024 |
|
Chg (%)
2025-2024 |
| Sales |
|
(In thousands of $) |
|
| Farming Business |
|
199,919 |
|
|
154,568 |
|
|
29.3 |
% |
| Crops |
|
44,522 |
|
|
34,227 |
|
|
30.1 |
% |
Soybean (1)(2) |
|
1,797 |
|
|
2,396 |
|
|
(25.0) |
% |
| Corn |
|
7,610 |
|
|
3,740 |
|
|
103.5 |
% |
| Wheat |
|
5,008 |
|
|
7,960 |
|
|
(37.1) |
% |
| Peanut |
|
21,072 |
|
|
9,397 |
|
|
124.2 |
% |
| Sunflower |
|
2,976 |
|
|
2,895 |
|
|
2.8 |
% |
| Cotton Lint |
|
1,863 |
|
|
1,111 |
|
|
67.7 |
% |
Other crops (3) |
|
4,196 |
|
|
6,728 |
|
|
(37.6) |
% |
Rice (4) |
|
77,968 |
|
|
60,618 |
|
|
28.6 |
% |
Dairy (5) |
|
77,429 |
|
|
59,723 |
|
|
29.6 |
% |
| Sugar, Ethanol and Energy Business |
|
125,587 |
|
|
107,207 |
|
|
17.1 |
% |
| Sugar |
|
36,252 |
|
|
63,042 |
|
|
(42.5) |
% |
| Ethanol |
|
80,866 |
|
|
36,079 |
|
|
124.1 |
% |
| Energy |
|
2,436 |
|
|
2,509 |
|
|
(2.9) |
% |
Other (6) |
|
6,033 |
|
|
5,577 |
|
|
8.2 |
% |
| Total |
|
325,506 |
|
|
261,775 |
|
|
24.3 |
% |
(1) Includes soybean, soybean oil and soybean meal.
(2) Does not include soybean planted in Brazil as cover crop during the implementation of the agricultural technique known as meiosis. Revenues corresponding to the sale of this product are booked in the Sugar, Ethanol and Energy business.
(3) Includes seeds and farming services, as well as other crops such as sorghum, barley, among others.
(4) Includes sales of processed rice including rough rice purchased from third parties and processed in our own facilities, rice seeds and services.
(5) Includes sales of energy from our biodigester, which produces biogas from effluents of our cows.
(6) Includes operating leases and other services.
|
|
|
|
|
|
|
|
|
|
|
|
|
|
|
|
|
|
|
|
|
|
|
2024/2025 |
|
2023/2024 |
|
|
| Production |
|
Harvest Year (1) |
|
Harvest Year (1) |
|
Chg (%) 2024/2025-2023/2024 |
| Farming Business |
|
|
|
|
|
|
| Crops (tons) |
|
284,685 |
|
|
303,273 |
|
|
(6.1) |
% |
Soybean (tons) (2) |
|
64,513 |
|
|
81,548 |
|
|
(20.9) |
% |
Corn (tons) (3) |
|
70,837 |
|
|
110,252 |
|
|
(35.7) |
% |
Wheat (tons) (4) |
|
118,717 |
|
|
88,235 |
|
|
34.5 |
% |
| Peanut (tons) |
|
4,354 |
|
|
4,099 |
|
|
6.2 |
% |
| Sunflower (tons) |
|
24,466 |
|
|
18,671 |
|
|
31.0 |
% |
|
|
|
|
|
|
|
| Others |
|
1,798 |
|
|
468 |
|
|
284.5 |
% |
Rice (tons) (5) |
|
510,979 |
|
|
354,128 |
|
|
44.3 |
% |
(1) The table reflects the production in respect of harvest-years as of end of April.
(2) 2024/2025 and 2023/2024 harvest years do not include soybean planted in Brazil as cover crop during the implementation of the agricultural technique known as meiosis.
(3) Includes sorghum.
(4) Includes barley, rye, oats, chickpea and vetch.
(5) Expressed in tons of long grain rough rice equivalent produced on owned and leased farms. The rough rice equivalent we produce, along with additional rough rice we purchase from third parties, is ultimately processed and constitutes the product sold in respect of the rice business.
|
|
|
|
|
|
|
|
|
|
|
|
|
|
|
|
|
|
|
|
|
| |
|
Three-month period ended March 31, |
| |
|
2025 |
|
2024 |
|
Chg (%) 2025-2024 |
Processed rice (1) (tons) |
|
97,285 |
|
|
66,380 |
|
|
46.6 |
% |
Dairy(2) (thousand liters) |
|
46,094 |
|
|
48,906 |
|
|
(5.7) |
% |
Processed Milk (3) (thousand liters) |
|
85,817 |
|
|
81,264 |
|
|
5.6 |
% |
| Sugar, Ethanol and Energy Business |
|
|
|
|
|
|
| Sugar (tons) |
|
63,644 |
|
|
119,431 |
|
|
(46.7) |
% |
| Ethanol (cubic meters) |
|
61,060 |
|
|
87,296 |
|
|
(30.1) |
% |
Energy (4) (MWh) |
|
56,248 |
|
|
72,114 |
|
|
(22.0) |
% |
(1) Includes rough rice purchased from third parties and processed in our own facilities. Expressed in tons of white rice.
(2) Raw milk produced at our dairy farms.
(3) Consists of our and third parties’ raw milk processed in our industrial facilities of Morteros and Chivilcoy.
(4) Energy exported to grid.
|
|
|
|
|
|
|
|
|
|
|
|
|
|
|
|
|
|
|
|
|
|
|
2024/2025 |
|
2023/2024 |
|
|
| Planted Area |
|
Harvest Year |
|
Harvest Year |
|
Chg (%) 2024/2025-2023/2024 |
| |
|
(Hectares) |
|
| Farming Business |
|
|
|
|
|
|
| Crops |
|
240,614 |
|
|
220,425 |
|
|
9.2 |
% |
Soybean (1) |
|
92,504 |
|
|
88,681 |
|
|
4.3 |
% |
Corn (1)(2) |
|
46,897 |
|
|
59,591 |
|
|
(21.3) |
% |
Wheat (3) |
|
47,820 |
|
|
28,142 |
|
|
69.9 |
% |
| Peanut |
|
25,352 |
|
|
24,282 |
|
|
4.4 |
% |
| Sunflower |
|
12,609 |
|
|
10,832 |
|
|
16.4 |
% |
| Cotton |
|
4,890 |
|
|
5,199 |
|
|
(5.9) |
% |
| Others |
|
10,542 |
|
|
3,698 |
|
|
185.1 |
% |
|
|
|
|
|
|
|
| Rice |
|
64,441 |
|
|
58,452 |
|
|
10.2 |
% |
| Total Planted Area |
|
305,055 |
|
|
278,877 |
|
|
9.4 |
% |
| Second Harvest Area |
|
44,012 |
|
|
26,476 |
|
|
66.2 |
% |
| Leased Area |
|
161,987 |
|
|
153,044 |
|
|
5.8 |
% |
| Owned Croppable Area |
|
99,056 |
|
|
99,357 |
|
|
(0.3) |
% |
(1) Includes first and second crop.
(2) Includes sorghum.
(3) Includes barley, rye, oats, chickpea and vetch.
|
|
|
|
|
|
|
|
|
|
|
|
|
|
|
|
|
|
|
|
|
| |
|
Three-month period ended March 31, 2025 |
|
For the year ended December 31, 2024 |
|
Chg (%) 2025-2024 |
| Sugar, Ethanol and Energy Business |
|
|
|
|
|
|
| Sugarcane plantation |
|
219,127 |
|
|
212,996 |
|
|
2.9 |
% |
| Owned land |
|
12,951 |
|
|
12,951 |
|
|
— |
% |
| Leased land |
|
206,176 |
|
|
200,045 |
|
|
3.1 |
% |
Three-month period ended March 31, 2025 as compared to three-month period ended March 31, 2024
The following table sets forth certain financial information with respect to our consolidated results of operations for the periods indicated.
|
|
|
|
|
|
|
|
|
|
|
|
|
|
|
|
|
|
|
|
|
|
|
Three Months Ended, March 31 |
|
|
2025 (Unaudited) |
|
2024 (Unaudited) |
|
Chg (%) |
| Statements of Income Data: |
|
(In thousands of $) |
|
|
| Revenue |
|
325,506 |
|
|
261,775 |
|
|
24.3 |
% |
| Cost of revenue |
|
(276,236) |
|
|
(205,341) |
|
|
34.5 |
% |
| Initial recognition and changes in fair value of biological assets and agricultural produce |
|
23,562 |
|
|
63,105 |
|
|
(62.7) |
% |
| Changes in net realizable value of agricultural produce after harvest |
|
1,223 |
|
|
(9,018) |
|
|
(113.6) |
% |
| Margin on manufacturing and agricultural activities before operating expenses |
|
74,055 |
|
|
110,521 |
|
|
(33.0) |
% |
| General and administrative expenses |
|
(32,281) |
|
|
(21,684) |
|
|
48.9 |
% |
| Selling expenses |
|
(37,146) |
|
|
(28,585) |
|
|
29.9 |
% |
| Other operating income, net |
|
(990) |
|
|
(20,474) |
|
|
(95.2) |
% |
|
|
|
|
|
|
|
| Profit from operations |
|
3,638 |
|
|
39,778 |
|
|
(90.9) |
% |
| Finance income |
|
36,400 |
|
|
9,504 |
|
|
283.0 |
% |
| Finance costs |
|
(24,974) |
|
|
(21,734) |
|
|
14.9 |
% |
| Other financial results - Net gain of inflation effects on monetary items |
|
410 |
|
|
32,717 |
|
|
(98.7) |
% |
| Financial results, net |
|
11,836 |
|
|
20,487 |
|
|
(42.2) |
% |
| Profit before income tax |
|
15,474 |
|
|
60,265 |
|
|
(74.3) |
% |
| Income tax benefit / (expense) |
|
3,233 |
|
|
(12,921) |
|
|
(125.0) |
% |
| Profit for the period |
|
18,707 |
|
|
47,344 |
|
|
(60.5) |
% |
Revenue
|
|
|
|
|
|
|
|
|
|
|
|
|
|
|
|
|
|
|
|
|
|
|
|
|
|
|
|
|
|
|
|
| Three-month period ended March 31, |
Crops |
|
Rice |
|
Dairy |
|
|
|
Sugar, Ethanol and Energy |
|
Total |
|
(In thousands of $) |
| 2025 |
44,522 |
|
77,968 |
|
77,429 |
|
|
|
125,587 |
|
325,506 |
| 2024 |
34,227 |
|
60,618 |
|
59,723 |
|
|
|
107,207 |
|
261,775 |
Revenue increased 24.3%, from U.S.$261.8 million for the three-month period ended March 31, 2024, to U.S.$325.5 million for the same period in 2025, primarily as a result of:
•a U.S.$18.4 million increase in our Sugar, Ethanol and Energy segment, mainly due to: (i) a 37.0% increase in TRS sold, from 258 thousand tons for the three-month period ended March 31, 2024 to 354 thousand tons during the same period in 2025; (ii) a 8.9% increase in Ethanol prices, from U.S.$459.5 per m3 for the three-month period ended March 31, 2024 to U.S.$500.4 per m3 for the same period in 2025, partially offset by a 10.3% decrease in average sugar prices, from U.S.$524.8 per ton for the three-month period ended March 31, 2024 to U.S.$470.8 per ton for the same period in 2025;
•a U.S.$17.7 million increase in our Dairy segment mainly due to (i) an increase in total milk processed in the industry, from 81.3 million liters for the three-month period ended March 31, 2024 to 85.8 million liters during the same period in 2025; supported by our growth strategy in domestic markets, aiming to enhance our value added-products and supply chain efficiency; (ii) a 21.9% increase in Cheese and UHT prices, from U.S.$3,824 per ton and U.S.$0.75 per liter, respectively, for the three-month period ended March 31, 2024 to U.S.$4,663 per ton and U.S.$0.77 per liter during the same period in 2025; (iii) a positive impact of U.S.$3.0 million due to the application of hyperinflation accounting and translation to our Argentine operations during the period ended March 31, 2024, compared to a positive impact of U.S.$1.1 million during the same period in 2025.
•a U.S.$17.4 million increase in our Rice segment, mainly driven by: (i) a 103.7% increase in the volume of white rice sold, from 52,311 tons for the three-month period ended March 31, 2024, to 106,550 tons for the same period in 2025, mainly driven by a 22.2% increase in rice yields; (ii) a 10.2% increase in planted area, from 58.4 thousand hectares during the period ended March 31, 2024 to 64.4 thousand hectares during the same period in 2025; and (iii) a 9.3% sell-off of white rice inventories, carried out to accelerate sales ahead of further price declines, reflecting a tactical decision to preserve value and enhance cash conversion. These results were partially offset by a 32.2% decrease in white rice prices, from U.S.$953 per ton for the three-month period ended March 31, 2024, to U.S.$646 per ton for the same period in 2025.
•a U.S.$10.3 million increase in our Crops segment driven by: (i) a 109.7% increase in the volume of corn, from 18,973 tons for the three-month period ended March 31, 2024, to 39,794 tons during the same period in 2025; a 112.3% increase in the volume of peanut sold, from 5,667 tons during the period ended March 31, 2024, to 12,053 tons during the same period in 2025, principally due to better harvested yields during 2025; partially offset by a 20.1% decrease in wheat volumes sold.
The following table sets forth the breakdown of sales for the periods indicated.
|
|
|
|
|
|
|
|
|
|
|
|
|
|
|
|
|
|
|
|
|
|
|
|
|
|
|
|
|
|
|
|
|
|
|
|
|
|
|
|
|
|
|
|
|
|
|
|
|
|
|
|
|
|
| |
Three-month period ended March 31, |
|
Three-month period ended March 31, |
|
Three-month period ended March 31, |
| |
2025 |
|
2024 |
|
% Chg |
|
2025 |
|
2024 |
|
% Chg |
|
2025 |
|
2025 |
|
% Chg |
| |
(In millions of $) |
|
(In thousands of tons) |
|
(In $ per ton) |
| Soybean |
1.8 |
|
|
2.4 |
|
|
(25.0) |
% |
|
6.5 |
|
|
7.0 |
|
|
(6.6) |
% |
|
275.8 |
|
|
343.4 |
|
|
(19.7) |
% |
Corn (1) |
7.6 |
|
|
3.7 |
|
|
103.5 |
% |
|
39.8 |
|
|
19.0 |
|
|
109.7 |
% |
|
191.2 |
|
|
197.1 |
|
|
(3.0) |
% |
Wheat (2) |
5.0 |
|
|
8.0 |
|
|
(37.1) |
% |
|
32.1 |
|
|
40.2 |
|
|
(20.1) |
% |
|
155.9 |
|
|
197.9 |
|
|
(21.2) |
% |
| Peanut |
21.1 |
|
|
9.4 |
|
|
124.2 |
% |
|
12.1 |
|
|
5.7 |
|
|
112.7 |
% |
|
1,748.3 |
|
|
1,658.1 |
|
|
5.4 |
% |
| Sunflower |
3.0 |
|
|
2.9 |
|
|
2.8 |
% |
|
4.5 |
|
5.3 |
|
(14.8) |
% |
|
661.1 |
|
|
547.9 |
|
|
20.7 |
% |
Others (3) |
6.1 |
|
|
7.8 |
|
|
(22.7) |
% |
|
|
|
|
|
|
|
|
|
|
|
|
|
|
|
|
|
|
|
|
|
|
|
|
|
|
|
|
|
|
| Total |
44.5 |
|
|
34.2 |
|
|
30.1 |
% |
|
|
|
|
|
|
|
|
|
|
|
|
(1) Includes sorghum.
(2) Includes barley.
(3) Includes sale of certifications related to RTRS soybean (Round Table on Responsible Soy Association) and sales related to our cattle activities.
|
|
|
|
|
|
|
|
|
|
|
|
|
|
|
|
|
|
|
|
|
|
|
|
|
|
|
|
|
|
|
|
|
|
|
|
|
|
|
|
|
|
|
|
|
|
|
|
|
|
|
|
|
|
| |
Three-month period ended March 31, |
|
Three-month period ended March 31, |
|
Three-month period ended March 31, |
| |
2025 |
|
2024 |
|
% Chg |
|
2025 |
|
2024 |
|
% Chg |
|
2025 |
|
2024 |
|
% Chg |
| |
(in millions of $) |
|
(in thousand units) |
|
(in dollars per unit) |
| Ethanol (cubic meters) |
80.9 |
|
|
36.1 |
|
|
124.1 |
% |
|
161.6 |
|
|
78.5 |
|
|
105.8 |
% |
|
500.4 |
|
|
459.5 |
|
|
8.9 |
% |
| Sugar (tons) |
36.3 |
|
|
63.0 |
|
|
(42.5) |
% |
|
77.0 |
|
|
120.1 |
|
|
(35.9) |
% |
|
470.8 |
|
|
524.8 |
|
|
(10.3) |
% |
| Energy (MWh) |
2.4 |
|
|
2.5 |
|
|
(2.9) |
% |
|
73.7 |
|
|
90.9 |
|
|
(18.9) |
% |
|
33.0 |
|
|
27.6 |
|
|
19.8 |
% |
| Others |
6.0 |
|
|
5.6 |
|
|
8.2 |
% |
|
|
|
|
|
|
|
|
|
|
|
|
| Total |
125.6 |
|
|
107.2 |
|
|
17.1 |
% |
|
|
|
|
|
|
|
|
|
|
|
|
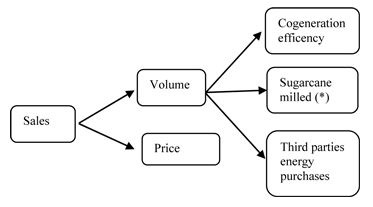
The following chart sets forth the variables that impact our Sugar and Ethanol sales:
The following chart sets forth the variables that impact our Energy sales:
(*) On average, one metric ton of sugarcane contains 140 kilograms of TRS. While a mill can produce either sugar or ethanol, the TRS input requirements differ between these two products. On average, 1.045 kilograms of TRS are required to produce 1.0 kilogram of sugar, while 1.691 kilograms of TRS are required to produce one liter of ethanol.
Cost of Revenue
|
|
|
|
|
|
|
|
|
|
|
|
|
|
|
|
|
|
|
|
|
|
|
|
|
|
|
|
|
|
| Three-month period ended March 31, |
Crops |
|
Rice |
|
Dairy |
|
Sugar, Ethanol and Energy |
|
Total |
|
(In thousands of $) |
| 2025 |
(38,780) |
|
(59,145) |
|
(71,128) |
|
(107,183) |
|
(276,236) |
| 2024 |
(32,368) |
|
(41,654) |
|
(49,146) |
|
(82,173) |
|
(205,341) |
For the agricultural produce sold to third parties (i.e., soybean, corn, wheat and fluid milk), the value of cost of revenue is equal to the value of revenues. The profit of these products is fully recognized under the line items “Initial recognition and changes in fair value of biological assets and agricultural produce” and “Changes in net realizable value of agricultural produce after harvest.” When the agricultural produce is sold to third parties, we do not record any additional profit as the gain or loss has already been recognized.
The profit of our manufactured products sold to third parties (i.e., sugar, ethanol, energy, white rice, processed milk and peanut) is recognized when products are sold. The cost of revenue of these products includes, among others, the cost of the agricultural produce (i.e., harvested sugarcane and rough rice), which is the raw material used in the industrial process and is transferred internally from the farm to the industry at fair market value.
Cost of revenue increased 34.5%, from U.S.$205.3 million during the three-month period ended March 31, 2024, to U.S.$276.2 million for the same period in 2025. This increase was primarily due to:
•a U.S.$22.0 million increase in our Dairy segment, mainly driven by a 20.0% increase in raw milk prices purchases from U.S.$0.35 per liter during the three-month period ended March 31, 2024 to U.S.$0.42 per liter during the same period in 2025; coupled with a negative impact of U.S.$1.0 million due to the application of hyperinflation accounting and translation to our Argentine operations for the three-month period ended March 31, 2025, compared to a negative impact of U.S.$2.2 million for the same period in 2024;
•a U.S.$6.4 million increase in our Crops segment, mainly driven by a 30.1% increase in sales;
•a U.S.$17.5 million increase in our Rice segment, mainly driven by a 103.7% increase in rough rice volume sold, from 106.5 thousand tons during the three-month period ended March 31,2025 to 52.3 thousand tons during the same period in 2024; partially offset by a 32.2% decrease in rough rice costs, from U.S.$646.3 per ton during the three-month period ended March 31,2025 to U.S.$952.8 per ton during the same period in 2024, mainly due to improved operational efficiencies and lower unit production costs achieved through better yields and optimized resource utilization.
•a U.S.$25.0 million increase in our Sugar, Ethanol and Energy segment, driven by 37.0% higher volume of TRS sold; coupled with the impact of a 8% appreciation of the Brazilian real, from 6.2 BRL per USD at the beginning of the period to 5.7 BRL per USD at the end of the period in March 31, 2025.
Initial Recognition and Changes in Fair Value of Biological Assets and Agricultural Produce
|
|
|
|
|
|
|
|
|
|
|
|
|
|
|
|
|
|
|
|
|
|
|
|
|
|
|
|
|
|
| Three-month period ended March 31, |
Crops |
|
Rice |
|
Dairy |
|
Sugar, Ethanol and Energy |
|
Total |
|
(In thousands of $) |
| 2025 |
2,164 |
|
4,976 |
|
8,845 |
|
7,577 |
|
23,562 |
| 2024 |
15,394 |
|
23,799 |
|
760 |
|
23,152 |
|
63,105 |
Initial recognition and changes in fair value of biological assets and agricultural produce decreased 62.7%, from U.S.$63.1 million for the three-month period ended March 31, 2024, to U.S.$23.6 million for the same period in 2025. This decrease was mainly due to:
•a U.S.$18.8 million decrease in our Rice segment, from a gain of U.S.$23.8 million for the three-month period ended March 31, 2024 (U.S.$2.8 million of which were realized gains) to a gain of U.S.$5.0 million for the same period in 2025 (U.S.$1.8 million of which were realized gains). This decrease was in turn due to:
▪a U.S.$21.1 million decrease in the recognition at fair value of harvested rice at the point of harvest, as adjusted for sales costs, from U.S.$26.3 million for the three-month period ended March 31, 2024, to a gain of U.S.$5.2 million for the same period in 2025, mainly driven by a 32.2% decrease in white rice prices; partially offset by a U.S.$4.4 million increase in our non-harvested rice, from a U.S.$4.6 million loss for the three-month period ended March 31, 2024, to a loss of U.S.$0.2 million for the same period in 2025.
•a U.S.$15.6 million decrease in our Sugar, Ethanol and Energy segment from U.S.$23.2 million for the three-month period ended March 31, 2024 (U.S.$14.3 million of which were unrealized gains) to U.S.$7.6 million for the same period in 2025 (including U.S.$11.9 million of unrealized gains). This decrease was mainly due to:
▪a U.S.$1.9 million decrease in the recognition at fair value of non-harvested sugarcane, from a gain of U.S.$13.8 million for the three-month period ended March 31, 2024, to a gain of U.S.$11.9 million in the same period in 2025, coupled with a U.S.$13.2 million decrease in the recognition at fair value of harvested sugarcane, from U.S.$10.7 million for the three-month period ended March 31, 2024, to a loss of U.S.$2.5 million for the same period in 2025, mainly driven by a 31.3% decline in sugarcane crushing volumes.
•a U.S.$13.2 million decrease in our Crops segment from a gain of U.S.$15.4 million for the three-month period ended March 31, 2024 (U.S.$0.1 million of which were realized losses) to a gain of U.S.$2.2 million for the same period in 2025 (U.S.$2.2 million of which were realized losses). This decrease was in turn primarily due to:
▪a negative impact of U.S.$0.1 million resulting from the application of hyperinflation accounting and translation to our Argentine operations for the three-month period ended March 31, 2025, compared to a positive impact of U.S.$1.3 million for the same period in 2024, coupled with the recognition at fair value of harvested crops, as adjusted for sales costs, which decreased U.S.$10.2 million, from a gain of U.S.$6.0 million for the three-month period ended March 31, 2024, to a loss of U.S.$4.2 million for the same period in 2025, which was mainly driven by a general decline in crop prices at harvest.
These effects were partially offset by:
•a U.S.$8.1 million increase in our Dairy segment, from U.S.$0.8 million for the three-month period ended March 31, 2024 (from U.S.$6.0 million of realized gains) to U.S.$8.8 million for the same period in 2025 (from U.S.$16.0 million of realized gains). This increase was due to:
•(i) an increase in fluid milk prices coupled with a decrease in cow nutrition costs, reflecting an improvement in market conditions and operational efficiency; and (ii) lower impact from inflation during the three-month period ended March 31, 2025 compared to the same period during 2024.
Changes in Net Realizable Value of Agricultural Produce after Harvest
|
|
|
|
|
|
|
|
|
|
|
|
|
|
|
|
|
|
|
|
|
|
|
|
|
|
|
|
|
|
| Three-month period ended March 31, |
Crops |
|
Rice |
|
Dairy |
|
Sugar, Ethanol and Energy |
|
Total |
|
(In thousands of $) |
| 2025 |
1,468 |
|
(66) |
|
— |
|
(179) |
|
1,223 |
| 2024 |
(9,385) |
|
12 |
|
— |
|
355 |
|
(9,018) |
Changes in net realizable value of agricultural produce after harvest is mainly comprised of: (i) profit or loss from commodity price fluctuations during the period the agricultural produce is in inventory, which has an impact over its fair value; (ii) profit or loss from the valuation of forwards contracts related to agricultural produce in inventory; and (iii) profit from direct exports.
Changes in net realizable value of agricultural produce after harvest increased U.S.$10.2 million, from a loss of U.S.$9.0 million for the three-month period ended March 31, 2024, to a gain of U.S.$1.2 million for the same period in 2025, as a result of an increase in crop prices after harvest, which resulted in a higher fair value of our crops held in inventories, adjusted by local inflation in Argentina, for the three-month period ended March 31, 2025.
General and Administrative Expenses
|
|
|
|
|
|
|
|
|
|
|
|
|
|
|
|
|
|
|
|
|
|
|
|
|
|
|
|
|
|
|
|
|
|
|
|
| Three-month period ended March 31, |
Crops |
|
Rice |
|
Dairy |
|
Sugar, Ethanol and Energy |
|
Corporate |
|
Total |
|
(In thousands of $) |
| 2025 |
(3,856) |
|
(7,384) |
|
(3,686) |
|
(6,820) |
|
(10,535) |
|
(32,281) |
| 2024 |
(2,491) |
|
(3,923) |
|
(2.533) |
|
(5,903) |
|
(6,834) |
|
(21,684) |
Our general and administrative expenses increased 48.9%, from U.S.$21.7 million during the period ended March 31, 2024, to U.S.$32.3 million during the same period in 2025. This increase was primarily driven by (i) higher one-off corporate expenses associated with Tether’s acquisition of our common stock; and (ii) higher costs in dollar terms in our operations in Argentina, impacted by higher inflation rates which outpaced the local currency devaluation throughout 2024 and the first quarter of 2025.
Selling Expenses
|
|
|
|
|
|
|
|
|
|
|
|
|
|
|
|
|
|
|
|
|
|
|
|
|
|
|
|
|
|
|
|
|
|
|
|
| Three-month period March 31, |
Crops |
|
Rice |
|
Dairy |
|
Sugar, Ethanol and Energy |
|
Corporate |
|
Total |
|
(In thousands of $) |
| 2025 |
(5,100) |
|
(11,652) |
|
(8,384) |
|
(11,816) |
|
(194) |
|
(37,146) |
| 2024 |
(2,703) |
|
(6,974) |
|
(5,533) |
|
(13,285) |
|
(90) |
|
(28,585) |
Selling expenses increased 29.9%, from U.S.$28.6 million for the three-month period ended March 31, 2024, to U.S.$37.1 million for the same period in 2025. This increase is mainly explained by a proportional increase in our Farming sales, coupled with higher costs in dollar terms in our operations in Argentina.
Other Operating Expense, Net
|
|
|
|
|
|
|
|
|
|
|
|
|
|
|
|
|
|
|
|
|
|
|
|
|
|
|
|
|
|
|
|
|
|
|
|
| Three-month period March 31, |
Crops |
|
Rice |
|
Dairy |
|
Sugar, Ethanol and Energy |
|
Corporate |
|
Total |
|
(In thousands of $) |
| 2025 |
(1,844) |
|
(585) |
|
211 |
|
1,596 |
|
(368) |
|
(990) |
| 2024 |
(11,902) |
|
(723) |
|
1,423 |
|
(9,813) |
|
541 |
|
(20,474) |
Other operating expense decreased from U.S.$20.5 million for the three-month period ended March 31, 2024, to U.S.$1.0 million for the same period in 2025, primarily due to:
•a U.S.$11.4 million decrease in our Sugar, Ethanol and Energy segment mainly driven by the recognition of tax credits, coupled with the mark-to-market effect of our sugar hedge positions; and
•a U.S.$10.1 million decrease in our Crops segment mainly driven by a lower fair value loss on Investment Properties, which was mainly due to lower inflation levels during the three-month period ended March 31, 2025 compared to the same period during 2024.
Financial Results, Net
Our financial results, net decreased from a gain of U.S.$20.5 million for the three-month period ended March 31, 2024, to a gain of U.S.$11.8 million for the same period in 2025. This decrease was primarily driven by: (i) an increase in interest expense mainly driven by a higher level of debt in the first quarter of 2025 compared to the first quarter of 2024, due to an 83.7% increase in short-term borrowings. This increase was driven by the company’s strategy to take advantage of market distortions in Argentina, where short-term debt instruments offered favorable conditions. Moreover, the line of Net gain of inflation effects on the monetary items decreased from a gain of U.S.$32.7 million for the three-month period ended March 31, 2024, to a gain of U.S.$0.4 million for the same period in 2025. These reflects the results derived from the exposure of our net monetary position to inflation in Argentina. Monetary assets generate a loss when exposed to inflation while monetary liabilities generate a gain when inflation reduces their outstanding balances in real terms. This is primarily explained by the lower inflation rate observed in Argentina during the first quarter of 2025. While inflation reached approximately 51.6% in the first quarter of 2024, it dropped to around 8.6% in the first quarter of 2025. As a result, the positive impact of inflation on our net monetary position was substantially reduced.
These results were partially offset by the net foreign exchange gains, which reflects the appreciation of functional currencies—such as the Argentine Peso and the Brazilian Real—against the U.S. dollar, which decreased the value of our foreign currency-denominated liabilities in local currency terms, thereby positively impacting our financial results. Additionally, the gain may also reflect the revaluation of foreign currency-denominated assets that increased in value due to exchange rate fluctuations.
The following table sets forth the breakdown of financial results for the periods indicated.
|
|
|
|
|
|
|
|
|
|
|
|
|
|
|
|
|
|
| |
Three-month period ended March 31, |
| |
2025 |
|
2024 |
|
|
| |
(In thousand of $) |
|
% Change |
| Interest income |
337 |
|
|
2,798 |
|
|
(88.0) |
% |
| Interest expense |
(12,608) |
|
|
(6,244) |
|
|
101.9 |
% |
| Finance Cost - Right-of-use Assets |
(8,863) |
|
|
(10,760) |
|
|
(17.6) |
% |
| Foreign exchange gain/(losses), net |
33,226 |
|
|
5,624 |
|
|
490.8 |
% |
|
|
|
|
|
|
| Gain from interest rate /foreign exchange rate derivative financial instruments |
2,618 |
|
|
748 |
|
|
250.0 |
% |
| Taxes |
(1,565) |
|
|
(2,056) |
|
|
(23.9) |
% |
| Other expense, net |
(1,719) |
|
|
(2,340) |
|
|
(26.5) |
% |
| Other financial results - Net gain of inflation effects on the monetary items |
410 |
|
|
32,717 |
|
|
(98.7) |
% |
| Total Financial Results |
11,836 |
|
|
20,487 |
|
|
(42.2) |
% |
Income Tax expense
Current income tax totaled a benefit of U.S.$3.2 million during the three-month period ended March 31, 2025, compared to an expense of U.S.$12.9 million for the same period in 2024.
In the three-month period ended March 31, 2025, income tax calculated at the tax rates applicable in the countries where we operate amounted to an expense of U.S.$5.1 million. Income tax expense has been adjusted for (i) the recognition of unused tax losses for U.S.$11.0 million, mainly by our Argentine subsidiaries resulting from tax inflation adjustments; (ii) non-taxable income of U.S.$3.3 million related to a supplementary law in Brazil (Lei Complementar or “Supplementary Law”) which provides for ICMS tax benefits granted by the Brazilian Government with the objective of subsidizing investments by excluding such grants from the calculation of tax benefits; and (iii) a U.S.$6.6 million losses related to the application of IAS 29 to the shareholders’ equity of our Argentine Subsidiaries (See Note 10 to our Unaudited Interim Consolidated Financial Statements).
In the three-month period ended March 31, 2024, income tax calculated at the tax rates applicable in the countries where we operate amounted to an expense of U.S.$21.0 million. Income tax expense has been adjusted for (i) the recognition of unused tax losses for U.S.$4.9 million, mainly by our Argentine subsidiaries resulting from tax inflation adjustments; and (ii) a U.S.$4.1 million gain related to the application of IAS 29 to the shareholders’ equity of our Argentine Subsidiaries (See Note 10 to our Unaudited Interim Consolidated Financial Statements).
Profit for the period
As a result of the foregoing, our net income during the three-month period ended March 31, 2025 decreased U.S.$28.6 million, from a gain of U.S.$47.3 million during the same period in 2024 to a gain of U.S.$18.7 million in 2025.
Liquidity and Capital Resources
Our liquidity and capital resources are and will be influenced by a variety of factors, including:
• our ability to generate cash flows from our operations;
• the amount of our outstanding indebtedness and the interest that we are obligated to pay on such outstanding indebtedness;
• our capital expenditure requirements, which consist primarily of investments in new farmland, in our operations, in equipment and plant facilities and maintenance costs; and
• our working capital requirements.
Our principal sources of liquidity have traditionally consisted of cash flows from operations, shareholders’ contributions, short and long term borrowings and proceeds received from the disposition of transformed farmland or subsidiaries.
Three-month period ended March 31, 2025 and 2024
The table below reflects our statements of Cash Flow for the three-month period ended March 31, 2025 and 2024.
|
|
|
|
|
|
|
|
|
|
|
|
|
|
|
|
|
| |
|
For the three months period ended March 31, |
| |
|
2025 |
|
2024 |
|
|
|
|
(Unaudited) |
|
(Unaudited) |
|
|
| |
|
(in thousands of $) |
| Cash and cash equivalents at the beginning of the period |
|
211,244 |
|
|
339,781 |
|
|
|
| Net cash used in operating activities |
(1) |
(19,070) |
|
|
(38,701) |
|
|
|
| Net cash used in investing activities |
(2) |
(98,898) |
|
|
(87,444) |
|
|
|
| Net cash generated / (used) from / in financing activities |
(3) |
78,537 |
|
|
(109,286) |
|
|
|
| Effect of exchange rate changes and inflation on cash and cash equivalents |
(4) |
7,717 |
|
|
31,161 |
|
|
|
| Cash and cash equivalents at the end of the period |
|
179,530 |
|
|
135,511 |
|
|
|
The table below reflects the combined effect of IAS 29 and IAS 21 of our Argentine subsidiaries on each of the following line items for the three-month period ended March 31, 2025 and 2024; numbered with relevant footnotes:
|
|
|
|
|
|
|
|
|
|
|
|
|
|
|
|
|
For the three months period ended March 31, |
|
|
2025 |
|
2024 |
|
|
(Unaudited) |
|
(Unaudited) |
|
|
(in thousands of $) |
| (1) |
Operating activities |
(17,342) |
|
|
(53,103) |
|
| (2) |
Investing activities |
15,155 |
|
|
331 |
|
| (3) |
Financing activities |
2,820 |
|
|
43,878 |
|
| (4) |
Effects of exchange rate changes and inflation on cash and cash equivalents |
(633) |
|
|
8,894 |
|
Operating Activities
Period ended March 31, 2025
Net cash used in operating activities was U.S.$19.1 million for the three-month period ended March 31, 2025. During this period, we generated a net profit of U.S.$18.7 million that included non-cash charges relating primarily to depreciation and amortization of U.S.$30.8 million, losses from interest, finance cost related to lease liabilities and other financial expenses, net of U.S.$22.8 million and depreciation of right of use assets for U.S.$15.8 million. All these effects were partially offset by a gain from foreign exchange, net of U.S.$33.2 million and initial recognition and changes in fair value of non-harvested biological assets unrealized of U.S.$13.4 million.
In addition, other changes in operating assets and liability balances resulted in a net decrease in cash of U.S.$59.3 million, primarily due to an increase of U.S.$119.6 million in trade and other receivables and an increase of U.S.$14.5 million in inventories. All these effects were partially offset by a decrease of U.S.$72.8 million in biological assets.
The net cash used in operating activities during this period includes a U.S.$17.3 million negative combined effect resulting from the application of IAS 29 and IAS 21 by our Argentine subsidiaries.
Period ended March 31, 2024
Net cash used in operating activities was U.S.$38.7 million for the three-month period ended March 31, 2024. During this period, we generated a net profit of U.S.$47.3 million that included non-cash charges relating primarily to depreciation and amortization of U.S.$40.5 million, losses from from interest, finance cost related to lease liabilities and other financial expenses, net of U.S.$16.8 million, and depreciation of right of use assets for U.S.$16.5 million. All of these effects were partially offset by a gain from initial recognition and changes in fair value of unrealized non-harvested biological assets of U.S.$41.8 million.
In addition, other changes in operating assets and liability balances resulted in a net decrease in cash of U.S.$119.6 million, primarily due to an increase of U.S.$64.2 million in inventories, an increase of U.S.$51.6 million in trade and other payables and an increase of U.S.$32.4 million in trade and other receivables. All of these effects were partially offset by a decrease of U.S.$31.3 million in biological assets.
The net cash used in operating activities during this period includes a U.S.$53.1 million negative combined effect resulting from the application of IAS 29 and IAS 21 by our Argentine subsidiaries.
Investing Activities
Period ended March 31, 2025
Net cash used in investing activities totaled U.S.$98.9 million in the three-month period ended March 31, 2025, mainly due to capital expenditures which totaled U.S.$84.8 million and included (i) U.S.$28.9 million related to the renewal and expansion of our sugarcane plantation and (ii) U.S.$55.8 million related to the purchase of agricultural and industrial equipment, mainly related to expand our harvesting equipment with the acquisition of two-row harvesters and grunner trucks, which reduce soil compaction and diesel consumption, thus strengthening our sustainable footprint while reducing costs and acquisition of short term investment, net of disposition that totaled U.S.$16.1 million. During this period interest received totaled U.S.$1.8 million.
The net cash used in investing activities during this period includes a U.S.$15.2 million positive combined effect resulting from the application of IAS 29 and IAS 21 by our Argentine subsidiaries.
Period ended March 31, 2024
Net cash used in investing activities totaled U.S.$87.4 million in the three-month period ended March 31, 2024, mainly due to capital expenditures which totaled U.S.$107.5 million and included (i) U.S.$30.6 million related to the renewal and expansion of our sugarcane plantation, (ii) U.S.$64.1 million related to the purchase of agricultural and industrial equipment, mainly related to small projects in our Farming and Sugar, Ethanol and Energy business; and (iii) payment of the last installment of our acquisition of Viterra’s mill in Argentina and Uruguay. Net inflows from investing activities were related to proceeds from the disposals of short term investment, net of acquisition for U.S.$17.4 million.
The net cash used in investing activities during this period includes a U.S.$0.3 million positive combined effect resulting from the application of IAS 29 and IAS 21 by our Argentine subsidiaries.
Financing Activities
Period ended March 31, 2025
Net cash generated by financing activities was U.S.$78.5 million in the three-month period ended March 31, 2025, primarily derived from the incurrence in new short term borrowings to finance our working capital requirements for our farming business, in the amount of U.S.$142.0 million. This effect was primarily offset by net payments of long term borrowings in the amounts of U.S.$21.4 million, U.S.$19.9 million of lease payments, U.S.$15.7 million interest paid and U.S.$10.2 million of shares repurchased.
Net cash generated in financing activities includes a U.S.$2.8 million positive combined effect resulting from the application of IAS 29 and IAS 21 by our Argentine subsidiaries, U.S.$1.2 million of which is over interest paid.
Period ended March 31, 2024
Net cash used in financing activities was U.S.$109.3 million in the three-month period ended March 31, 2024, primarily derived from payments of short term loans in the amounts of U.S.$70.2 million, U.S.$18.3 million of lease payments; and also there was a distribution of U.S.$21.3 million to our shareholders via the repurchase of 2.1 million shares. This effect was partially offset by net proceeds of short- and long-term borrowings in the amounts of U.S.$9.7 million and U.S.$3.0 million, respectively. During this period, interest paid totaled U.S.$12.1 million.
Net cash used in financing activities included a U.S.$43.9 million positive combined effect resulting from the application of IAS 29 and IAS 21 by our Argentine subsidiaries, and a U.S.$0.5 million negative combined effect of which is over interest paid.
Cash and Cash Equivalents
Historically, since our cash flows from operations were insufficient to fund our working capital needs and investment plans, we funded our operations with proceeds from short-term and long-term indebtedness and capital contributions from existing and new private investors. In 2011, we raised U.S.$421.8 million from an initial public offering and simultaneous private placement. As of March 31, 2025, our cash and cash equivalents amounted to U.S.$179.5 million.
However, we may need additional cash resources in the future to continue our investment plans. Also, we may need additional cash if we experience a change in business conditions or other developments. We also might need additional cash resources in the future if we find and wish to pursue opportunities for investment, acquisitions, strategic alliances or other similar investments. If we ever determine that our cash requirements exceed our amounts of cash and cash equivalents on hand, we might seek to issue debt or additional equity securities or obtain additional credit facilities or realize the disposition of transformed farmland and/or subsidiaries. Any issuance of equity securities could cause dilution for our shareholders. Any incurrence of additional indebtedness could increase our debt service obligations and cause us to become subject to additional restrictive operating and financial covenants, and could require that we pledge collateral to secure those borrowings, if permitted to do so. It is possible that, when we need additional cash resources, financing will not be available to us in amounts or on terms that would be acceptable to us or at all.
Projected Sources and Uses of Cash
We anticipate that we will generate cash from the following sources:
•operating cash flow;
•debt financing;
•the dispositions of transformed farmland and/or subsidiaries; and
•debt or equity offerings.
We anticipate that we will use our cash:
•for other working capital purposes;
•to meet our budgeted capital expenditures;
•to make investment in new projects related to our business; and
•to refinance our current debts.
•pay dividends
Indebtedness and Financial Instruments
The table below illustrates the maturity of our indebtedness (excluding obligations under finance leases) and our exposure to fixed and variable interest rates:
|
|
|
|
|
|
|
|
|
|
|
|
|
March 31,
2025 |
|
December 31,
2024 |
|
(unaudited) |
|
|
| Fixed rate: |
(In thousands of $) |
Less than 1 year |
202,920 |
|
|
69,178 |
|
Between 1 and 2 years |
45,619 |
|
|
55,952 |
|
Between 2 and 3 years |
415,236 |
|
|
414,994 |
|
Between 3 and 4 years |
918 |
|
|
356 |
|
Between 4 and 5 years |
1,329 |
|
|
356 |
|
More than 5 years |
47,454 |
|
|
35,936 |
|
|
713,476 |
|
|
576,772 |
|
Variable rate: |
|
|
|
Less than 1 year |
29,948 |
|
|
30,373 |
|
Between 1 and 2 years |
87,343 |
|
|
83,142 |
|
Between 2 and 3 years |
50,257 |
|
|
46,593 |
|
Between 3 and 4 years |
3,400 |
|
|
2,932 |
|
Between 4 and 5 years |
— |
|
|
441 |
|
More than 5 years |
34,025 |
|
|
39,303 |
|
|
204,973 |
|
|
202,784 |
|
|
918,449 |
|
|
779,556 |
|
The Company plans to partially rollover its short term debt using new available lines of credit, or on using operating cash flow to cancel such debt.
During the three-month period ended March 31, 2025, the Company was in compliance with all financial covenants.
Short-term Debt
As of March 31, 2025, our short term debt totaled U.S.$232.9 million.
We maintain lines of credit with several banks in order to finance our working capital requirements. We believe that we will continue to be able to obtain additional credit to finance our working capital needs in the future based on our past track record and current market conditions.
Brazilian Subsidiary Guarantor
The main loans of the Brazilian Subsidiary Guarantor are:
|
|
|
|
|
|
|
|
|
|
|
|
|
|
|
|
|
|
|
|
|
|
|
|
|
|
|
|
|
|
| Bank |
Grant date |
Nominal
amount
|
Capital outstanding as of |
Maturity date |
Annual interest rate |
March 31,
2025 |
December 31,
2024 |
| (In millions) |
Millions of
Brazilian Real
|
Millions of
equivalent
Dollars
|
Millions of
equivalent
Dollars
|
Certificados Recebíveis do Agronegócio (CRA) (2) |
December, 2019 |
R$ |
400.0 |
|
R$ |
400.0 |
|
69.7 |
|
64.6 |
|
November-27 |
3.80% + IPCA |
Debênture (1) |
December, 2020 |
R$ |
400.0 |
|
R$ |
266.7 |
|
46.4 |
|
64.6 |
|
December-26 |
4.24% + IPCA |
Certificados Recebíveis do Agronegócio (CRA) (2) |
July, 2024 |
R$ |
400.0 |
|
R$ |
400.0 |
|
69.7 |
|
64.6 |
|
Jul-31 / Jul-34 |
IPCA + 6.80% /12.65% |
(1) Collateralized by long term power purchase agreement (PPA).
(2) This debt was issued with no guarantee.
Argentine Subsidiary Guarantors
The principal loans of the Argentine Subsidiary Guarantors are:
|
|
|
|
|
|
|
|
|
|
|
|
|
|
|
|
|
|
|
|
|
| Bank |
Grant date |
Nominal
amount
|
Capital outstanding as of |
Maturity date |
Annual interest rate |
| March 31, 2025 |
December 31, 2024 |
| (In millions) |
(In millions) |
(In millions) |
| Rabobank (1) |
June, 2024 |
US$13.6 |
13.60 |
13.60 |
December, 2028 |
3.1% + SOFR |
(1) Fully repaid in June 2025.