 エドガーで原本を確認する
UNITED STATES
SECURITIES AND EXCHANGE COMMISSION
Washington, D.C. 20549
FORM
REPORT OF FOREIGN PRIVATE ISSUER
PURSUANT TO RULE 13a-16 OR 15d-16
UNDER THE SECURITIES EXCHANGE ACT OF 1934
For the month of September 2026
Commission File Number: 001-42445
103 Huizhong Li, B Building, Peking Times Square, Unit 15B10
Chaoyang District, Beijing, China
(Address of principal executive offices)
Indicate by check mark whether the registrant files or will file annual reports under cover of Form 20-F or Form 40-F:
Form 20-F ☒ Form 40-F ☐
Interim Results for the Six Months Ended March 31, 2026
The unaudited consolidated financial statements as of March 31, 2026 and for the six months period then ended (the “Interim Results”) of Leishen Energy Holding Co., Ltd., an exempted company incorporated in the Cayman Islands (“Leishen Cayman”) and its subsidiaries (collectively, the “Company”) is furnished as Exhibit 99.1 to this current report on Form 6-K (this “Report”).
Management’s Discussion and Analysis of Financial Condition and Results of Operations
The management’s discussion and analysis of financial condition and results of operations for the Company’s Interim Results is furnished as Exhibit 99.2 to this Report.
Forward-Looking Statements
Statements in this Report with respect to the Company’s current plans, estimates, strategies and beliefs and other statements that are not historical facts are forward-looking statements about the future performance of the Company. These forward-looking statements are made under the “safe-harbor” provisions of the U.S. Private Securities Litigation Reform Act of 1995. These statements involve known and unknown risks, uncertainties and other factors that may cause our actual results, performance or achievements to be materially different from those expressed or implied by these forward-looking statements. Forward-looking statements include, but are not limited to, those statements using words such as “believe,” “expect,” “plans,” “strategy,” “prospects,” “forecast,” “estimate,” “project,” “anticipate,” “aim,” “intend,” “seek,” “may,” “might,” “could” or “should,” and words of similar meaning in connection with a discussion of future operations, financial performance, events or conditions. From time to time, oral or written forward-looking statements may also be included in other materials released to the public. These statements are based on management’s assumptions, judgments and beliefs in light of the information currently available to it. The Company cautions investors that a number of important risks and uncertainties could cause actual results to differ materially from those discussed in the forward-looking statements, including but not limited to, product and service demand and acceptance, changes in technology, economic conditions, the impact of competition and pricing, government regulation, and other risks contained in reports filed by Leishen Cayman with the U.S. Securities and Exchange Commission. Therefore, investors should not place undue reliance on such forward-looking statements. Actual results may differ significantly from those set forth in the forward-looking statements.
All such forward-looking statements, whether written or oral, and whether made by or on behalf of the Company, are expressly qualified by the cautionary statements and any other cautionary statements which may accompany the forward-looking statements. In addition, the Company disclaims any obligation to update any forward-looking statements to reflect events or circumstances after the date hereof.
Incorporation By Reference
This Report is hereby incorporated by reference into the registration statement of Leishen Cayman on Form F-3 (File No. 333-296613), to be a part thereof from the date on which this Report is submitted and to the extent not superseded by documents or reports subsequently filed or furnished.
| 2 |
SIGNATURES
Pursuant to the requirements of the Securities Exchange Act of 1934, the registrant has duly caused this report to be signed on its behalf by the undersigned, thereunto duly authorized.
| Leishen Energy Holding Co., Ltd. | ||
| Date: September 14, 2026 | By: | /s/ Zhiping Yu |
| Name: | Zhiping Yu | |
| Title: | Chief Financial Officer | |
| 3 |
Exhibit Index
| Exhibit No. | Description | |
| 99.1 | Unaudited Interim Condensed Consolidated Financial Statements for the Six Months Ended March 31, 2026 | |
| 99.2 | Management’s Discussion and Analysis of Financial Condition and Results of Operations for the Six Months Ended March 31, 2026 | |
| 101. INS | Inline XBRL Instance Document. | |
| 101. SCH | Inline XBRL Taxonomy Extension Schema Document. | |
| 101. CAL | Inline XBRL Taxonomy Extension Calculation Linkbase Document. | |
| 101. DEF | Inline XBRL Taxonomy Extension Definition Linkbase Document. | |
| 101. LAB | Inline XBRL Taxonomy Extension Label Linkbase Document. | |
| 101. PRE | Inline XBRL Taxonomy Extension Presentation Linkbase Document. | |
| 104 | Cover Page Interactive Data File (formatted as Inline XBRL and contained in Exhibit 101). |
| 4 |
Exhibit 99.1
LEISHEN ENERGY HOLDING CO., LTD. AND SUBSIDIARIES
INDEX TO UNAUDITED CONDENSED CONSOLIDATED FINANCIAL STATEMENTS
| F-1 |
LEISHEN ENERGY HOLDING CO., LTD. AND SUBSIDIARIES
CONDENSED CONSOLIDATED BALANCE SHEETS
| March 31, 2026 |
September 30, 2025 |
|||||||
| (Unaudited) | ||||||||
| ASSETS | ||||||||
| Current Assets: | ||||||||
| Cash | $ | $ | ||||||
| Restricted cash | ||||||||
| Short-term investments | ||||||||
| Accounts receivable, net | ||||||||
| Notes receivable | ||||||||
| Advance to suppliers, net | ||||||||
| Inventories | ||||||||
| Loans receivable | ||||||||
| Loan receivable - related party | ||||||||
| Prepaid expenses and other current assets, net | ||||||||
| Total current assets | ||||||||
| Non-current assets: | ||||||||
| Long-term investment | ||||||||
| Accounts receivable, non-current | ||||||||
| Property and equipment, net | ||||||||
| Construction in process | ||||||||
| Intangible assets | ||||||||
| Operating lease right-of-use assets, net | ||||||||
| Loans receivable, non-current | ||||||||
| Deferred tax assets, net | ||||||||
| Other non-current assets | ||||||||
| Total non-current assets | ||||||||
| Total Assets | $ | $ | ||||||
| LIABILITIES AND EQUITY | ||||||||
| Current Liabilities: | ||||||||
| Short-term loans | $ | $ | ||||||
| Accounts payable | ||||||||
| Advance from customers | ||||||||
| Taxes payable | ||||||||
| Due to related parties | ||||||||
| Operating lease liabilities | ||||||||
| Other payables and other current liabilities | ||||||||
| Total current liabilities | ||||||||
| Non-current Liabilities: | ||||||||
| Operating lease liabilities, non-current | ||||||||
| Total non-current liabilities | ||||||||
| Total Liabilities | ||||||||
| Commitments and Contingencies | ||||||||
| Equity: | ||||||||
| Ordinary shares (par value $ per share, shares authorized; and shares issued and outstanding as of September 30, 2025) | ||||||||
| Class A Ordinary Shares (par value $ per share, shares authorized, shares issued and outstanding as of March 31, 2026) | ||||||||
| Class B Ordinary Shares (par value $ per share, shares authorized, shares issued and outstanding as of March 31, 2026) | ||||||||
| Subscription receivable | ( |
) | ( |
) | ||||
| Additional paid-in capital | ||||||||
| Statutory reserves | ||||||||
| Retained earnings | ||||||||
| Accumulated other comprehensive loss | ( |
) | ( |
) | ||||
| Total equity attributable to Leishen Energy Holding Co., Ltd | ||||||||
| Non-controlling interests | ||||||||
| Total Equity | ||||||||
| Total Liabilities and Equity | $ | $ | ||||||
| F-2 |
LEISHEN ENERGY HOLDING CO., LTD. AND SUBSIDIARIES
UNAUDITED CONDENSED CONSOLIDATED STATEMENTS OF OPERATIONS AND COMPREHENSIVE LOSS
| Six Months Ended March 31, | ||||||||
| 2026 | 2025 | |||||||
| (Unaudited) | (Unaudited) | |||||||
| Revenues: | ||||||||
| Revenues - third parties | $ | $ | ||||||
| Revenues - related parties | ||||||||
| Total revenues | ||||||||
| Cost of revenues | ( |
) | ( |
) | ||||
| Gross profit | ||||||||
| Operating expenses: | ||||||||
| Selling and marketing | ||||||||
| General and administrative | ||||||||
| Provision for expected credit losses | ||||||||
| Research and development | ||||||||
| Total operating expenses | ||||||||
| Loss from operations | ( |
) | ( |
) | ||||
| Other (expenses) income: | ||||||||
| Interest expense | ( |
) | ( |
) | ||||
| Exchange (loss) gains | ( |
) | ||||||
| Income from equity investment | ||||||||
| Net investment (loss) gain from short-term investments | ( |
) | ||||||
| Interest income from loans receivable | ||||||||
| (Loss) gain from disposal of property and equipment | ( |
) | ||||||
| Other income, net | ||||||||
| Total other (expenses) income, net | ( |
) | ||||||
| Loss before income taxes | ( |
) | ( |
) | ||||
| Income tax (benefit) expense | ( |
) | ||||||
| Net loss | ( |
) | ( |
) | ||||
| Less: net loss attributable to non-controlling interests | ( |
) | ||||||
| Net loss attributable to Leishen Energy Holding Co., Ltd | $ | ( |
) | $ | ( |
) | ||
| Comprehensive loss | ||||||||
| Net loss | $ | ( |
) | $ | ( |
) | ||
| Foreign currency translation gain (loss) | ( |
) | ||||||
| Total comprehensive loss | ( |
) | ( |
) | ||||
| Less: comprehensive loss attributable to non-controlling interests | ( |
) | ||||||
| Comprehensive loss attributable to Leishen Energy Holding Co., Ltd | $ | ( |
) | $ | ( |
) | ||
| Loss per ordinary share | ||||||||
| – Basic and diluted | $ | ) | $ | ) | ||||
| Weighted average number of ordinary shares outstanding | ||||||||
| – Basic and diluted | ||||||||
The accompanying notes are an integral part of these unaudited condensed consolidated financial statements.
| F-3 |
LEISHEN ENERGY HOLDING CO., LTD. AND SUBSIDIARIES
UNAUDITED CONDENSED CONSOLIDATED STATEMENTS OF CHANGES IN EQUITY
SIX MONTHS ENDED MARCH 31, 2026 AND 2025
| Ordinary shares | Subscription |
Additional paid-in |
Statutory | Retained | Accumulated other comprehensive | Total equity attributable to Leishen Energy Holding | Non-controlling | Total | ||||||||||||||||||||||||||||||||
| Shares | Amount | receivable | capital | reserves | earnings | loss | Co., Ltd | interests | equity | |||||||||||||||||||||||||||||||
| Balance as of September 30, 2024 | $ | $ | ( |
) | $ | $ | $ | $ | ( |
) | $ | $ | $ | |||||||||||||||||||||||||||
| Shares issued in initial public offering | ||||||||||||||||||||||||||||||||||||||||
| Net loss | - | ( |
) | ( |
) | ( |
) | ( |
||||||||||||||||||||||||||||||||
| Appropriation to statutory reserve | - | ( |
) | |||||||||||||||||||||||||||||||||||||
| Foreign currency translation adjustment | - | ( |
) | ( |
) | ( |
) | ( |
||||||||||||||||||||||||||||||||
| Balance as of March 31, 2025 (Unaudited) | $ | $ | ( |
) | $ | $ | $ | $ | ( |
) | $ | $ | $ | |||||||||||||||||||||||||||
| Total equity | ||||||||||||||||||||||||||||||||||||||||||||||||||||||||
| attributable | ||||||||||||||||||||||||||||||||||||||||||||||||||||||||
| Accumulated | to Leishen | |||||||||||||||||||||||||||||||||||||||||||||||||||||||
| Ordinary | Class A Ordinary | Class B Ordinary | Additional | other | Energy | Non- | ||||||||||||||||||||||||||||||||||||||||||||||||||
| Shares | Shares* | Shares* | Subscription | paid-in | Statutory | Retained | comprehensive | Holding | controlling | Total | ||||||||||||||||||||||||||||||||||||||||||||||
| shares | Amount | shares | Amount | shares | Amount | receivable | capital | reserves | earnings | loss | Co., Ltd | interests | equity | |||||||||||||||||||||||||||||||||||||||||||
| Balance as of September 30, 2025 | $ | $ | $ | $ | ( |
) | $ | $ | $ | $ | ( |
) | $ | $ | $ | |||||||||||||||||||||||||||||||||||||||||
| Shares re-designated and re-classified | ( |
) | ( |
) | ||||||||||||||||||||||||||||||||||||||||||||||||||||
| Purchase of non-controlling interests | - | - | - | ( |
) | ( |
) | ( |
) | ( |
) | |||||||||||||||||||||||||||||||||||||||||||||
| Net loss | - | - | - | ( |
) | ( |
) | ( |
) | |||||||||||||||||||||||||||||||||||||||||||||||
| Appropriation to statutory reserve | - | - | - | ( |
) | |||||||||||||||||||||||||||||||||||||||||||||||||||
| Cash dividends paid | - | - | - | ( |
) | ( |
) | ( |
) | |||||||||||||||||||||||||||||||||||||||||||||||
| Foreign currency translation adjustment | - | - | - | |||||||||||||||||||||||||||||||||||||||||||||||||||||
| Balance as of March 31, 2026 (Unaudited) | $ | $ | $ | ( |
) | $ | $ | $ | $ | ( |
) | $ | $ | $ | ||||||||||||||||||||||||||||||||||||||||||
The accompanying notes are an integral part of these unaudited condensed consolidated financial statements.
| F-4 |
LEISHEN ENERGY HOLDING CO., LTD. AND SUBSIDIARIES
UNAUDITED CONDENSED CONSOLIDATED STATEMENTS OF CASH FLOWS
| Six Months Ended March 31, | ||||||||
| 2026 | 2025 | |||||||
| (Unaudited) | (Unaudited) | |||||||
| Cash flows from operating activities: | ||||||||
| Net loss | $ | ( |
) | $ | ( |
) | ||
| Adjustments to reconcile net loss to net cash provided by (used in) operating activities: | ||||||||
| Depreciation and amortization | ||||||||
| Loss (gain) from disposal of property and equipment | ( |
) | ||||||
| Unrealized net investment loss (gain) from short-term investments | ( |
) | ||||||
| Provision for credit losses of receivables and advances to suppliers | ||||||||
| Income from equity investment | ( |
) | ||||||
| Non-cash lease expense | ||||||||
| Deferred income tax | ( |
) | ||||||
| Changes in operating assets and liabilities: | ||||||||
| Accounts receivable | ( |
) | ( |
) | ||||
| Notes receivable | ( |
) | ||||||
| Advance to suppliers | ( |
) | ( |
) | ||||
| Inventories | ||||||||
| Due from related parties | ( |
) | ||||||
| Prepaid expenses and other current assets | ( |
) | ||||||
| Accounts payable | ( |
) | ||||||
| Advance from customers | ( |
) | ( |
) | ||||
| Taxes payable | ( |
) | ||||||
| Due to related parties | ( |
) | ||||||
| Other payables and other current liabilities | ( |
) | ||||||
| Lease liabilities | ( |
) | ( |
) | ||||
| Net cash provided by (used in) operating activities | ( |
) | ||||||
| Cash flows from investing activities: | ||||||||
| Purchase of property and equipment | ( |
) | ( |
) | ||||
| Proceeds from disposal of property and equipment | ||||||||
| Payments related to construction in progress | ( |
) | ||||||
| Loan repayment from a related party | ||||||||
| Loan to a related party | ( |
) | ||||||
| Loans repayment from third parties | ||||||||
| Loans to third parties | ( |
) | ( |
) | ||||
| Purchase of short-term investments | ( |
) | ( |
) | ||||
| Maturity of short-term investments | ||||||||
| Purchase of long-term investment | ( |
) | ||||||
| Net cash (used in) provided by investing activities | ( |
) | ||||||
| Cash flows from financing activities: | ||||||||
| Proceeds from short-term loans | ||||||||
| Repayments of short-term loans | ( |
) | ( |
) | ||||
| Repayments of long-term loans | ( |
) | ||||||
| Net proceeds from initial public offering | ||||||||
| Payment of offering expenses | ( |
) | ||||||
| Purchase of non-controlling interests | ( |
) | ||||||
| Dividend to shareholders | ( |
) | ||||||
| Net cash (used in) provided by financing activities | ( |
) | ||||||
| Effect of foreign exchange rate on cash | ( |
) | ||||||
| Net increase in cash and restricted cash | ||||||||
| Cash and restricted cash at the beginning of the period | ||||||||
| Cash and restricted cash at the end of the period | $ | $ | ||||||
| Reconciliation of cash and restricted cash | ||||||||
| Cash | $ | $ | ||||||
| Restricted cash | ||||||||
| Total cash and restricted cash shown in the statements of cash flows | $ | $ | ||||||
| Supplemental disclosures of cash flow information: | ||||||||
| Income taxes paid | $ | $ | ||||||
| Interest paid | $ | $ | ||||||
| Non-cash transactions: | ||||||||
| Operating right-of-use assets recognized for related operating lease liabilities | $ | $ | ( |
) | ||||
| Reclassification of deferred offering cost | $ | $ | ||||||
| Transfer of self-produced products from inventories to property and equipment | $ | $ | ||||||
The accompanying notes are an integral part of these unaudited condensed consolidated financial statements.
| F-5 |
LEISHEN ENERGY HOLDING CO., LTD. AND SUBSIDIARIES
NOTES TO THE CONDENSED CONSOLIDATED FINANCIAL STATEMENTS
March 31, 2026 and September 30, 2025
NOTE 1 – ORGANIZATION AND BUSINESS DESCRIPTION
Leishen
Energy Holding Co., Ltd. (“Leishen Cayman”) was incorporated under the laws of Cayman Islands as an exempted company with
limited liability on
Business Reorganization
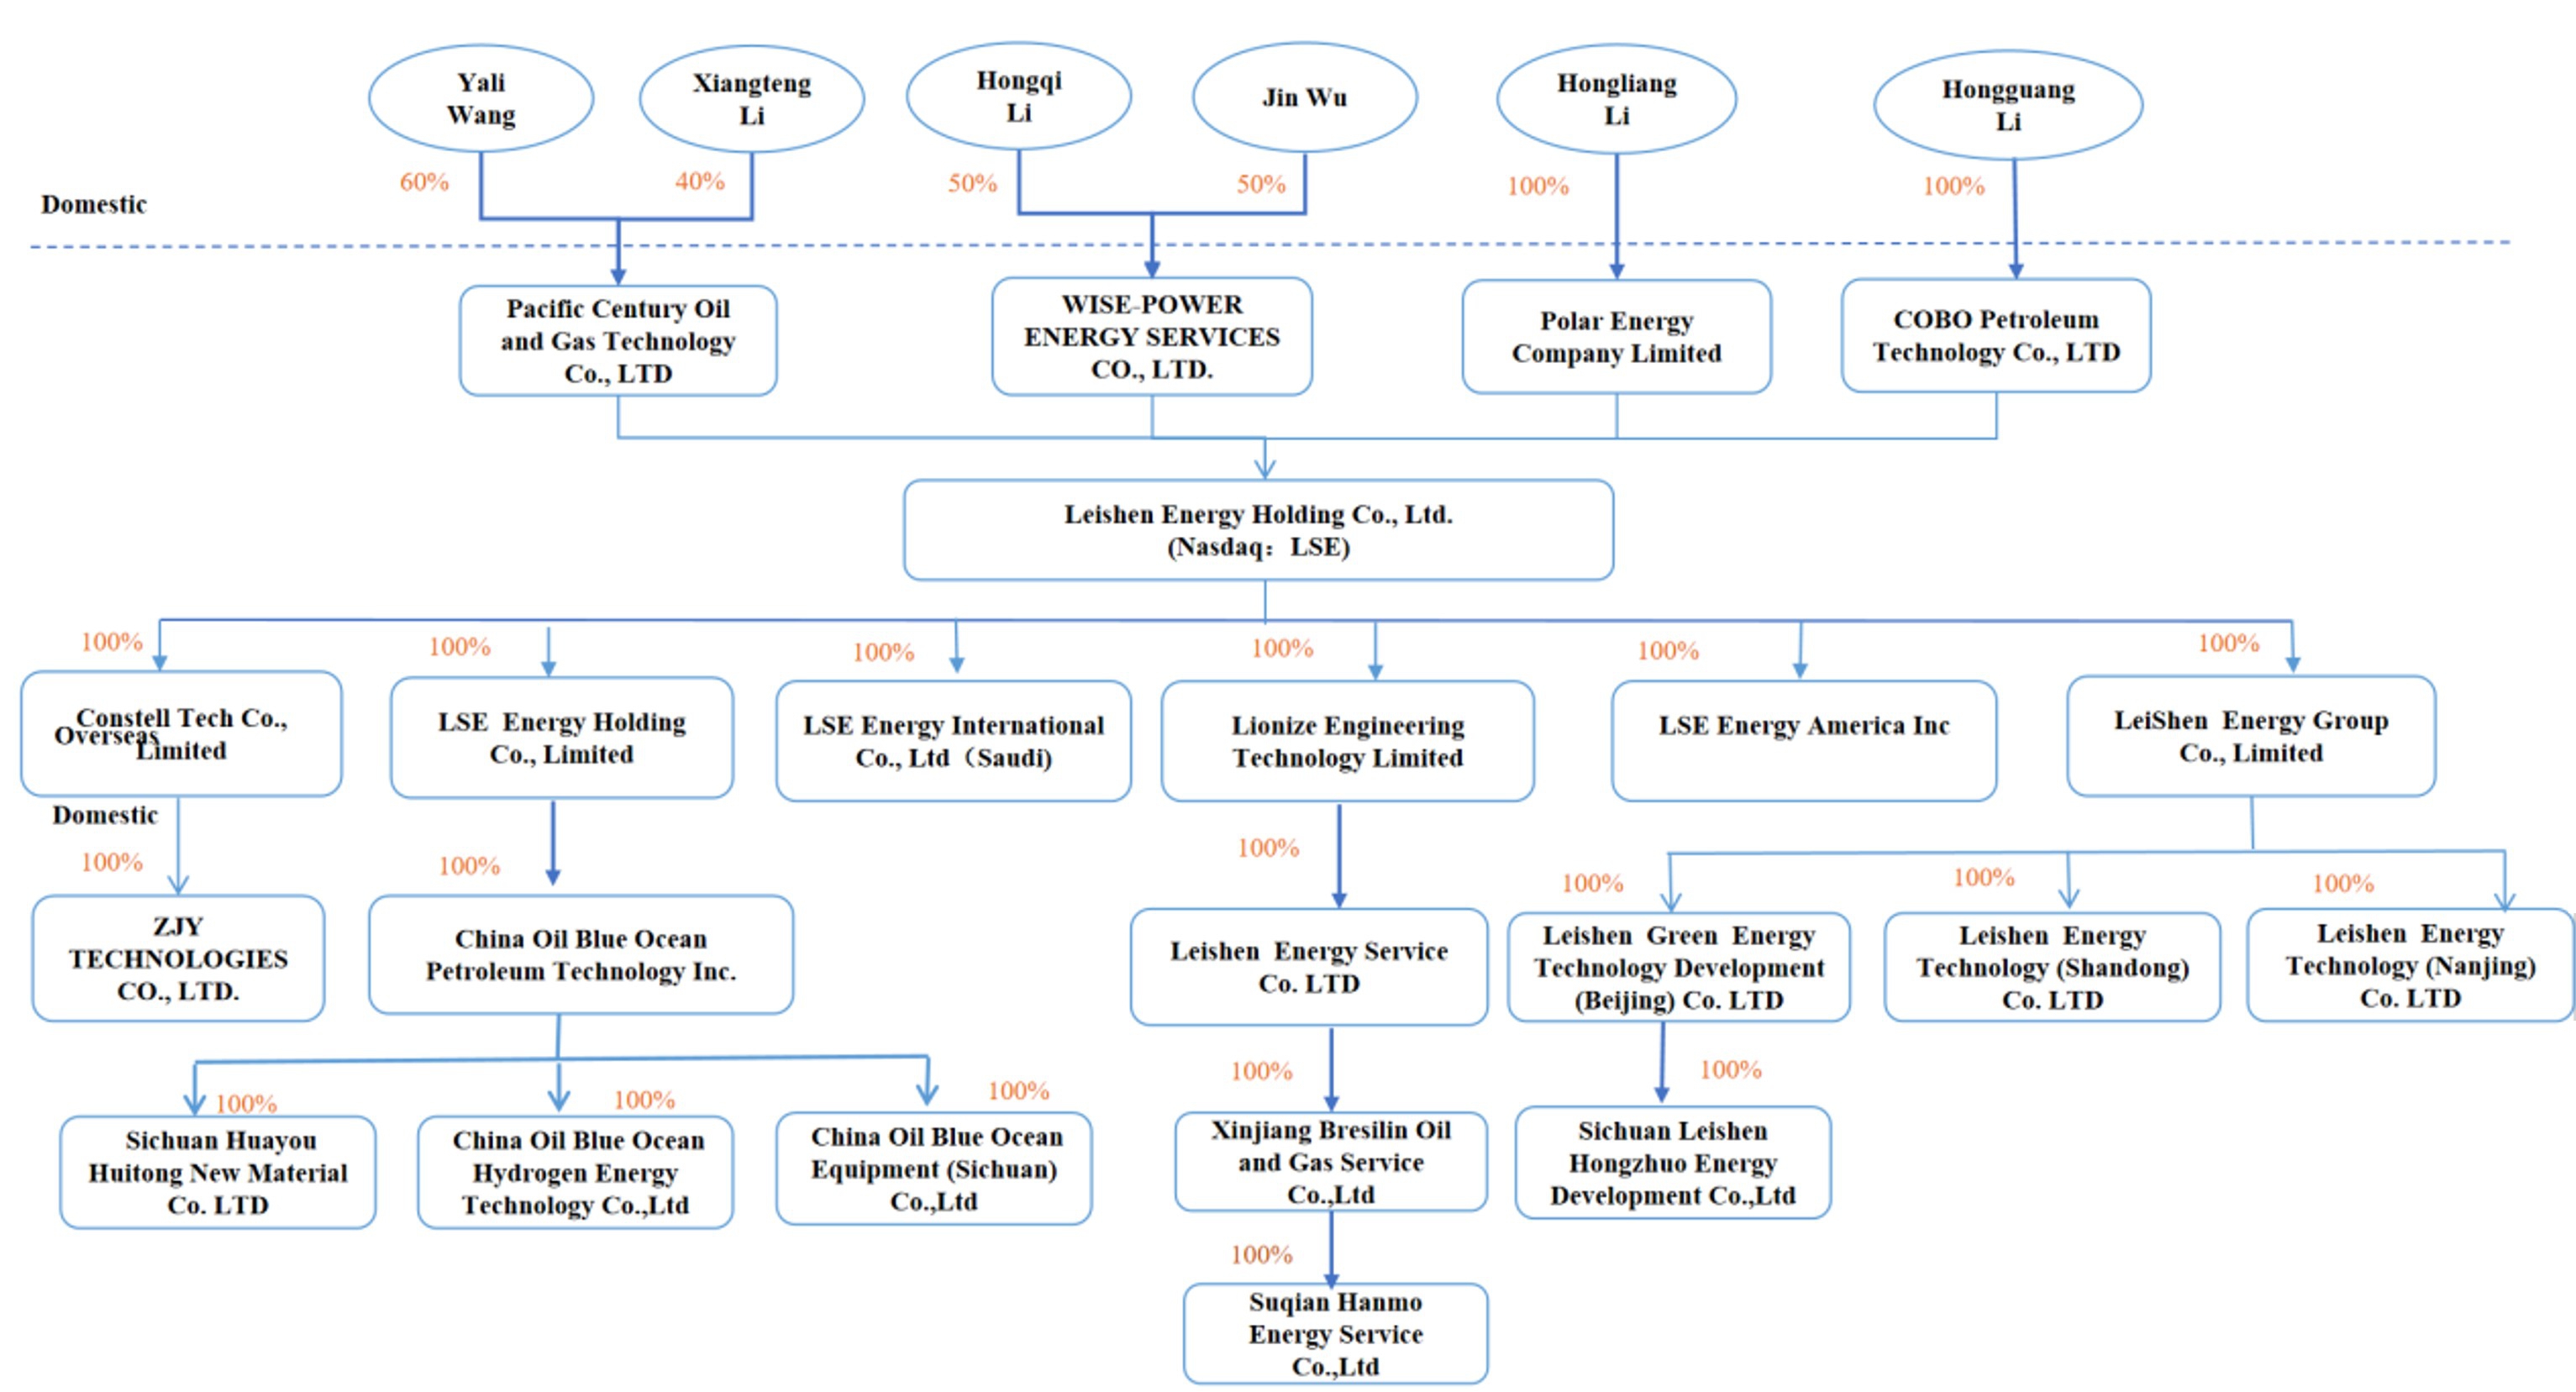
A reorganization of legal structure (“Reorganization”) was completed on March 24, 2023. The reorganization involved the incorporation of Leishen Energy Group Holding Co., Ltd. (“Leishen (Holding) Hong Kong”), and the transfer of the 100% equity interest of Leishen Energy Group Co., Limited (“Leishen Hong Kong”). Consequently, Leishen Cayman, through its subsidiaries Leishen (Holding) Hong Kong and Leishen Hong Kong, directly controls ZJY Technologies Co., Ltd. (“ZJY Technologies”), China Oil Blue Ocean Petroleum Technology Inc. (“China Oil Blue Ocean”), Leishen Energy Technology (Nanjing) Co., Ltd. (“Leishen Nanjing”), Leishen Green Energy Technology Development Co., Ltd. (“Beijing Leishen Green Energy”), Leishen Energy Technology (Shandong) Co., Ltd. (“Leishen Shandong”) and Leishen Energy Services Co., Ltd. (“Leishen Services”), and became the ultimate holding company of all other entities mentioned above.
The Reorganization was accounted for as a reorganization among entities under common control since the same shareholders, controlled all these entities before and after the Reorganization. The consolidation of the Company and its subsidiaries was accounted for at historical cost and prepared on the basis as if the aforementioned transaction became effective as of the beginning of the first period presented in the accompanying consolidated financial statements. Results of operations for the periods presented comprise those of the previously separate entities combined from the beginning to the end of the period, eliminating the effects of intra-entity transactions.
The Company’s corporate structure as of March 31, 2026 was as follows:
| F-6 |
Below is an overview of the Company’s principal subsidiaries as of March 31, 2026:
| Legal Entity | Place
of Incorporation |
Date
of Incorporation |
Percentage
of beneficial ownership |
Principal activities | ||||
| Leishen Energy Holding Co., Ltd (“Leishen Cayman”) | Cayman Islands | |||||||
| Leishen Energy Group Holding Co., Ltd. (“Leishen (Holding) Hong Kong”) | Hongkong, China | |||||||
| Leishen Energy Group Co., Ltd. (“Leishen Hong Kong”) | Hongkong, China | |||||||
| ZJY Technologies Co., Ltd. (“ZJY Technologies”) | Beijing, China | |||||||
| China Oil Blue Ocean Petroleum Technology Inc. (“China Oil Blue Ocean”) | Beijing, China | |||||||
| Leishen Energy Technology (Nanjing) Co., Ltd. (“Leishen Nanjing”) | Nanjing, China | |||||||
| Leishen Green Energy Technology Development Co., Ltd. (“Beijing Leishen Green Energy”) | Beijing, China | |||||||
| Leishen Energy Technology (Shandong) Co., Ltd. (“Leishen Shandong”) | Shandong, China | |||||||
| Leishen Energy Services Co., Ltd. (“Leishen Services”) | Shandong, China | |||||||
| Sichuan Leishen Hongzhuo Energy Development Co., Ltd. (“Sichuan Leishen Hongzhuo”) | Chengdu, China | |||||||
| Sichuan Huayou Huitong New Material Co. Ltd. (“Huayou Huitong”) | Chengdu, China | |||||||
| Xinjiang Breslin Oil and Gas Service Co., Ltd. (“Xinjiang Breslin”) | Xinjiang, China |
| F-7 |
| Legal Entity | Place
of Incorporation |
Date
of Incorporation |
Percentage
of beneficial ownership |
Principal activities | ||||
| Lionize Engineering Technology Limited | Hongkong, China | |||||||
| Suqian Hanmo Energy Service Co., Ltd. (“Suqian Hanmo”) | Jiangsu, China | |||||||
| LSE Energy International Co., Ltd (“LSE Energy International”) | Saudi Aribia | |||||||
| LSE Energy America Inc (“LSE Energy America”) | United States | |||||||
| China Oil Blue Ocean Hydrogen Energy Technology Co., Ltd. (“China Oil Hydrogen Energy”) | Beijing, China | |||||||
| China Oil Blue Ocean Equipment (Sichuan) Co., Ltd. | Chengdu, China |
Initial Public Offering (the “IPO”)
On
December 20, 2024, Leishen Cayman (Nasdaq: LSE) consummated its initial public offering (the “IPO”) of ordinary
shares, par value $ at $ per share (each, an “Ordinary Share”), with gross proceeds of $
Adoption of Dual-Class Share Structure
On
November 27, 2025, the Company’s shareholders approved an amendment to the memorandum and articles of association to adopt a dual-class
share structure. The authorized share capital of the Company is US$
| F-8 |
NOTE 2 – SUMMARY OF SIGNIFICANT ACCOUNTING POLICIES
Basis of presentation
The accompanying unaudited condensed consolidated financial statements were prepared in accordance with accounting principles generally accepted in the U.S. of America (“U.S. GAAP”) and the rules and regulations of the Securities Exchange Commission (“SEC”). All adjustments necessary to present fairly in all material respects the financial position, results of operations and cash flows for all periods presented were made. While these condensed consolidated financial statements are prepared in accordance with US GAAP, they do not include all the information required for annual financial statements and should be read in conjunction with the audited condensed consolidated financial statements and accompanying notes included in the Company’s Form 20-F for the year ended September 30, 2025, as amended.
Principles of consolidation
The condensed consolidated financial statements include the financial statements of the Company and its majority-owned subsidiaries. All transactions and balances between the Company and its subsidiaries were eliminated upon consolidation.
Non-controlling interests
Non-controlling interests are recognized to reflect the portion of subsidiary’s equity that is not attributable, directly or indirectly, to the Company as the controlling shareholder. Non-controlling interests are presented as a separate line item in the equity section of the Company’s consolidated balance sheets and are separately disclosed in the Company’s consolidated statements of operations and comprehensive (loss) income to distinguish the interests from that of the Company.
Use of estimates
In preparing the consolidated financial statements in conformity with U.S. GAAP, management makes estimates and assumptions that affect the reported amounts of assets and liabilities and disclosures of contingent assets and liabilities at the dates of the consolidated financial statements, as well as the reported amounts of revenue and expenses during the reporting periods. Significant items subject to such estimates and assumptions include, but are not limited to, the assessment of the allowance for credit losses, the valuation of inventories, useful lives of property and equipment and intangible assets, uncertain tax positions and realization of deferred tax assets. Actual results could differ from those estimates.
Foreign Currency Translation
The results of operations and the consolidated statements of cash flows are translated at the average rate of exchange during the reporting period. Assets and liabilities at the balance sheet date are translated at the applicable rates of exchange in effect at that date. The equity is translated at the historical rate of exchange at the time of capital contribution. Because cash flows are translated based on the average translation rate, amounts related to assets and liabilities reported on the consolidated statements of cash flows will not necessarily agree with changes in the corresponding balances on the consolidated balance sheets. Translation adjustments arising from the use of different exchange rates from period to period are included as a separate component of accumulated other comprehensive income (loss) included in consolidated statements of changes in equity. Gains and losses from foreign currency transactions are included in the Company’s consolidated statements of operations and comprehensive income.
| F-9 |
The value of RMB against USD and other currencies fluctuates and is affected by, among other things, changes in the PRC’s political and economic conditions. Any significant revaluation of RMB may materially affect the Company’s financial condition in terms of USD reporting. The following table outlines the currency exchange rates used in preparing the condensed consolidated financial statements:
| March 31, | September 30, | Six Months Ended March 31, | ||||||||||||||
| 2026 | 2025 | 2026 | 2025 | |||||||||||||
| Foreign currency | Balance Sheet | Balance Sheet | Profits/Loss | Profits/Loss | ||||||||||||
| RMB:1USD | ||||||||||||||||
Cash
Cash
includes cash on hand and demand deposits in accounts maintained with commercial banks. The Company maintains its bank accounts in mainland
China and Hong Kong. In accordance with China’s Deposit Insurance Regulation that became effective in May 2015, pursuant to which
banking financial institutions, such as commercial banks, established in the PRC are required to purchase deposit insurance for deposits
in RMB and in foreign currency placed with them. The insurance limit is RMB
Restricted Cash
Cash that is legally restricted as to withdrawal or for use or pledged as security is reported separately on the face of the Company’s consolidated balance sheets. The Company’s restricted cash consisted of cash pledged as security for banker’s letter of guarantee. The Company follows Financial Accounting Standards Board (“FASB”) Accounting Standards Update (“ASU”) No. 2016-18, Statement of Cash Flows (Topic 230): Restricted Cash and presented restricted cash within the ending cash and restricted cash balances on the Company’s consolidated statements of cash flows for the periods presented.
Short-term investments
The Company’s short-term investments mainly consist of investment in trading securities and held-to-maturity securities. Trading securities include common stocks listed in public market and wealth management products issued by commercial banks that can be redeemed at any time. Held-to-maturity securities primarily consist of wealth management products issued by commercial banks with maturities of less than one year.
The Company accounts for its short-term investments in accordance with FASB ASC Topic 320 “Investments — Debt and Equity Securities.” Dividend and interest income, including amortization of the premium and discount arising at acquisition, for all categories of investments in securities is included in consolidated statements of operations. Net realized and unrealized holding gains and losses for short-term investments are included in net investment income in the consolidated statements of operations. The Company elected the fair value method to measure its short-term investments.
Accounts Receivable, net
Accounts receivable are presented net of an allowance for credit losses. The Company follows ASC 326, Credit Losses (“ASC 326”) to account for the related expected credit losses.
In accordance with ASC 326, the Company maintains an allowance for credit losses and records the allowance for credit losses as an offset to assets such as accounts receivable, and the estimated credit losses charged to the allowance are presented in the consolidated statements of operations and comprehensive loss. The Company assesses collectability by reviewing receivables on a collective basis where similar characteristics exist, primarily based on the size and nature of specific customer’s receivables (the “CECL model”). In determining the amount of the allowance for credit losses, the Company considers not only the input from its CECL model but also historical collectability based on past due status, the age of the receivable balances, credit quality of customers based on ongoing credit evaluations, current economic conditions, reasonable and supportable forecasts of future economic conditions, and other factors that may affect the Company’s ability to collect from customers. Actual credit losses and related allowance are written off as incurred.
| F-10 |
Notes Receivable
Notes receivable are trade accounts receivable due from various customers where the customers’ banks guaranteed the payments, which are non-interest bearing and generally range from three to six months from the date of issuance. The Company has the ability to submit request for payment to the customer’s bank earlier than the scheduled payment date but will incur an interest charge and a processing fee.
Advance to Suppliers, net
Advance to suppliers are balances paid to suppliers for inventories or services not provided or received. The Company reviews its advance to suppliers on a periodic basis and set up an allowance for credit losses in accordance with ASC 326.
Inventories
Inventories consist of raw materials, self-produced products, purchased products and compressed natural gas, and are stated at the lower of cost or net realizable value. Raw materials are primarily used to manufacture cleaning equipment which is the Company’s self-produced products, primarily including high-end cleaning equipment accessories. Cost is determined using the weighted average method. The Company periodically evaluates its inventories and will record an allowance for inventories that are either obsolete, slow-moving, may not be saleable or whose cost exceeds its net realizable value.
From time to time, the Company produces certain machinery and equipment (e.g., compressors) in anticipation of customer demand. Upon completion of such equipment and receipt of customer orders, the corresponding inventories will be transferred to machinery and equipment in fixed assets.
Loans receivable
Loans
receivable primarily refers to loans provided by the Company to third parties and related parties. As of March 31, 2026, loans receivable
consists of ten loans provided to seven third parties and one loan to a related party. As of September 30, 2025, loans receivable consists
of ten loans provided to six third parties. The average annual interest rate on all loans provided by the Company was approximately
Property and Equipment, net
Property and equipment are carried at cost and are depreciated on the straight-line basis over the estimated useful lives of the underlying assets. The cost of repairs and maintenance is expensed as incurred; major replacements and improvements are capitalized. When assets are retired or disposed of, the cost and accumulated depreciation and amortization are removed from the accounts, and any resulting gains or losses are included in income in the year of disposition. The Company examines the possibility of decreases in the value of its property and equipment, when events or changes in circumstances reflect the fact that their recorded value may not be recoverable.
Estimated useful lives are as follows:
| Category | Estimated
useful lives |
|
| Office equipment | ||
| Vehicle | ||
| Machine and equipment |
| F-11 |
Intangible Assets, net
Intangible assets consist primarily of accounting software that is carried at acquisition cost less accumulated amortization and impairment, if any. It is tested for impairment if triggering events occurred that could affect their carrying value. There were no asset impairment charges incurred during the six months ended March 31, 2026 and 2025. Amortization of intangible assets with finite lives is computed using the straight-line method over the estimated useful lives as below:
| Category | Estimated useful lives |
|
| Software |
Fair value of financial instruments
FASB ASC 820, “Fair Value Measurement,” requires certain disclosures regarding the fair value of financial instruments. fair value is defined as the price that would be received to sell an asset or paid to transfer a liability in an orderly transaction between market participants at the measurement date. A three-level fair value hierarchy prioritizes the inputs used to measure fair value. The hierarchy requires entities to maximize the use of observable inputs and minimize the use of unobservable inputs. The three levels of inputs used to measure fair value are as follows:
| ● | Level 1 - inputs to the valuation methodology are quoted prices (unadjusted) for identical assets or liabilities in active markets. | |
| ● | Level 2 - inputs to the valuation methodology include quoted prices for similar assets and liabilities in active markets, quoted market prices for identical or similar assets in markets that are not active, inputs other than quoted prices that are observable and inputs derived from or corroborated by observable market data. | |
| ● | Level 3 - inputs to the valuation methodology that are unobservable. |
Unless otherwise disclosed, the fair value of the Company’s financial instruments including cash, short-term investments, accounts receivable, notes receivable, advance to suppliers, inventories, due from related parties, prepaid expenses and other current assets, short-term loans, accounts payable, advance from customers, taxes payable, due to related parties, and other payables and other current liabilities approximate their recorded values due to their short-term maturities. The fair value of longer-term leases approximates their recorded values as their stated interest rates approximate the rates currently available.
The Company’s non-financial assets, such as property and equipment would be measured at fair value only if they were determined to be impaired.
The Company measured its short-term investments at fair value. As of March 31, 2026 and September 30, 2025, the Company held investments in common stocks that were publicly traded on the Hong Kong Stock Exchange and bank wealth management products. The common stocks investments were classified as trading securities measured using Level 1 inputs. Among the wealth management products, those redeemable on demand were classified as trading securities measured using Level 2 inputs, and those with a fixed maturity were classified as a held-to-maturity security measured using Level 2 inputs.
The following table presents information about short-term investments that are measured at fair value as of March 31, 2026 and September 30, 2025 and indicates the fair value hierarchy of the valuation techniques we utilized to determine such fair value. The valuation techniques are based on the fair value measurement on a recurring basis of trading securities and held-to-maturity securities.
| Quoted | Significant | Significant | ||||||||||||||
| Prices in | Other | Other | ||||||||||||||
| As of | Active | Observable | Unobservable | |||||||||||||
| March 31 | Markets | Inputs | Inputs | |||||||||||||
| 2026 | (Level 1) | (Level 2) | (Level 3) | |||||||||||||
| (Unaudited) | ||||||||||||||||
| Trading securities | $ | $ | $ | $ | ||||||||||||
| Held-to-maturity securities | ||||||||||||||||
| Total | $ | $ | $ | $ | ||||||||||||
| Quoted | Significant | Significant | ||||||||||||||
| Prices in | Other | Other | ||||||||||||||
| As of | Active | Observable | Unobservable | |||||||||||||
| September 30 | Markets | Inputs | Inputs | |||||||||||||
| 2025 | (Level 1) | (Level 2) | (Level 3) | |||||||||||||
| Trading securities | $ | $ | $ | $ | ||||||||||||
| Held-to-maturity securities | ||||||||||||||||
| Total | $ | $ | $ | $ | ||||||||||||
| F-12 |
Long-term Investment
The Company measures its long-term equity investment using the equity method or the measurement alternative, as applicable. Equity method investments are the Company’s investment in privately-held companies, over which it has significant influence but does not own a majority equity interest or otherwise control. The Company applies the equity method to account for an equity investment, in common stock or in-substance common stock, according to ASC 323 “Investment — Equity Method and Joint Ventures”.
An investment in in-substance common stock is an investment in an entity that has risk and reward characteristics that are substantially similar to that entity’s common stock. The Company considers subordination, risks and rewards of ownership and obligation to transfer value when determining whether an investment in an entity is substantially similar to an investment in that entity’s common stock.
Under the equity method, the Company’s share of the post-acquisition profits or losses of the equity investee is recognized in the consolidated income statements and its share of post-acquisition movements in accumulated other comprehensive income is recognized in shareholders’ equity. When the Company’s share of losses in the equity investee equals or exceeds its interest in the equity investee, the Company does not recognize further losses, unless the Company has incurred obligations or made payments or guarantees on behalf of the equity investee.
The Company continually reviews its investment in equity investees under equity method to determine whether a decline in FV to below the carrying value is other-than-temporary. The primary factors the Company considers in its determination are the duration and severity of the decline in FV, the financial condition, operating performance and the prospects of the equity investee, and other company specific information such as recent financing rounds. If the decline in FV is deemed to be other-than-temporary, the carrying value of the equity investee is written down to FV.
Under the measurement alternative, investment is initially measured at cost, less any impairment, and is adjusted for observable price changes from orderly transactions for identical or similar investments of the same issuer. The Company assesses the need for impairment at each reporting period by considering factors such as the investee’s financial condition, operating performance, and business outlook. Any impairment, if identified, is recognized in the consolidated statements of operations.
There
was
Leases
ASC 842 requires lessees to recognize a right-of-use (“ROU”) asset and corresponding lease liability on the Consolidated Balance Sheets for all leases. The Company determines if an arrangement is a lease at inception of the arrangement and if such lease will be classified as an operating lease or a finance lease. As of March 31, 2026 and September 30, 2025, all of the Company’s leases are accounted for as operating leases.
ROU assets are the Company’s right to use an underlying asset for the lease term and lease liabilities are the Company’s obligation to make lease payments arising from the leases. ROU assets and lease liabilities are recognized at the lease commencement date based on the present value of lease payments over the lease term. Most leases do not provide an implicit interest rate; therefore, the Company used its incremental borrowing rate based on the information available at the inception date to determine the present value of the lease payments. Lease terms include options to extend the lease when it is reasonably certain that the Company will exercise that option. Lease cost for lease payments is recognized on a straight-line basis over the lease term. All ROU assets are reviewed for impairment annually. There was no impairment of the Company’s ROU assets during the six months period ended March 31, 2026 and 2025.
| F-13 |
Restricted net assets
Foreign exchange and other regulations in the PRC may further restrict the Company’s subsidiaries from transferring funds to the Company in the form of dividends, loans and advances. Amounts restricted include paid-in capital and statutory reserves of the Company’s PRC subsidiaries as determined pursuant to PRC generally accepted accounting principles.
Revenue recognition
In accordance with FASB ASC 606, Revenue from Contracts with Customers, the Company recognizes revenue for the transfer of products or services to customers in an amount that reflects the consideration to which the Company expects to be entitled in such exchange. This requires the Company identify contractual performance obligations and determine whether revenue should be recognized at a point in time or over time, based on when control of the product or the benefit of the services transfers to the customer. Under the guidance of ASC 606, the Company is required to (a) identify the contract with a customer, (b) identify the performance obligations in the contract, (c) determine the transaction price, (d) allocate the transaction price to the performance obligations in the contract and (e) recognize revenue when (or as) the Company satisfies its performance obligations.
In accordance with ASC 606-10-55-89 through 55-91, the Company selected the type of good or service for presentation of disaggregated revenue. The Company’s presentation of its disaggregated revenues is aligned with information that can be reviewed by the Company’s chief operating decision maker for evaluating the financial performance of operating segments. The Company derives its revenues mainly from: sales of clean-energy equipment, sales of digitalization and integration equipment, sales of new energy and delivery of oil and gas engineering technical services. Revenues are the amount of consideration the Company is entitled to in exchange for the transfer of promised goods or services in the ordinary course of the Company’s activities and is recorded net of value-added tax (“VAT”). Consistent with the criteria of ASC 606, the Company recognizes revenue when the performance obligation in a contract is satisfied by transferring the control of promised goods or services to the customer. The Company also evaluates whether it is appropriate to record the gross amount of goods and services sold and the related costs.
The following table sets forth the breakdown of the Company’s revenues for the six months ended March 31, 2026 and 2025:
| 2026 | 2025 | |||||||||||||||
| Amount | % | Amount | % | |||||||||||||
| (Unaudited) | (Unaudited) | |||||||||||||||
| Sales of clean-energy equipment | $ | $ | ||||||||||||||
| Sales of digitalization and integration equipment | ||||||||||||||||
| Sales of new energy | ||||||||||||||||
| Delivery of oil and gas engineering technical services | ||||||||||||||||
| Total | $ | $ | ||||||||||||||
| F-14 |
Sale of clean-energy equipment
The Company signs contracts with customers and delivers clean-energy equipment according to the sales contract or sales list. The customer issues an acceptance document after checking the quantity and quality of equipment received. Revenue is recognized when the Company receives confirmation of equipment acceptance. Revenues are recorded net of value-added tax, discounts, and surcharges and allowance for returns. And in accordance with ASC 606, the Company evaluates whether it is appropriate to record the gross amount of goods sales and related costs or the net amount earned as commissions. The Company concludes it is the principal as the control of the specified equipment remains with the Company before it is transferred to the customers. Revenue is recognized as the gross amount of consideration to which the Company expects to be entitled in exchange for the specified equipment transferred.
Sale of digitalization and integration equipment
The Company signs contracts with customers and provides digitalization and integration equipment according to the sales contract or sales list. The customer issues an acceptance document after checking the quantity and quality of the equipment received and installed. Revenue is recognized when the Company receives confirmation of equipment acceptance. Revenues are recorded net of value-added tax, discounts, and surcharges and allowance for returns. In accordance with ASC 606, the Company evaluates whether it is appropriate to record the gross amount of goods sales and related costs or the net amount earned as commissions. The Company concludes it is the principal as the control of the specified equipment remains with the Company before it is transferred to the customers. Revenue is recognized as the gross amount of consideration to which the Company expects to be entitled in exchange for the specified equipment transferred.
Sales of new energy
The Company signs contracts with customers and sells new energy, such as liquefied natural gas (“LNG”) and compressed natural gas (“CNG”), purchased from third parties to the customers. The customer issues an acceptance document after acquiring the new energy. Revenue is recognized when the Company receives confirmation of natural gas acceptance. Revenues are recorded net of value-added tax, discounts, and surcharges and allowance for returns. In accordance with ASC 606, the Company evaluates whether it is appropriate to record the gross amount of new energy sales and related costs or the net amount earned as commissions. The Company concludes it is the principal as the control of the new energy remains with the Company before it is transferred to the customer. Revenue is recognized as the gross amount of consideration to which it expects to be entitled in exchange for the new energy transferred.
Delivery of oil and gas engineering technical services
The Company signs contracts with customers and delivers compressor booster service to them during their shale gas production process. An evaluation is performed to determine whether the Company is a principal or agent in these transactions. Under the terms of these compressor booster service contracts, the Company concludes it is the agent as title to the shale gas production remains with a third-party producer. Revenue is recognized on a net basis since the Company is providing a service. The Company concludes the services provided each month are substantially similar and result in the transfer of substantially similar services to the third-party each month. That is, the benefit consumed by the third-party is substantially similar for each month, even though the exact volume of services may vary. Therefore, the Company concludes the monthly compressor booster service revenue satisfies the requirements of ASC 606-10-25-14(b) to be accounted for as a single performance obligation. Accordingly, based on the output method, the Company recognizes revenues over time when it satisfies its performance obligations throughout the contract terms.
Cost of revenues
Cost of revenues (“COR”) for sales of clean-energy equipment includes purchased cost of equipment and accessories from third parties, labor cost and handling costs.
COR for sales of digitalization and integration equipment includes labor costs, purchased cost of equipment and accessories from third parties, and handling costs.
COR for sales of new energy primarily includes gas cost purchased from third parties.
COR for delivery of oil and gas engineering technical service includes labor costs, and depreciation expenses
| F-15 |
General and administrative expenses
General and administrative expenses consist mainly of payroll and related costs for employees involved in general corporate functions, including accounting, finance, tax, legal and human resources, professional fees and other general corporate expenses as well as costs associated with the use by these functions of facilities and equipment, such as depreciation and rental expenses.
Selling and Marketing expenses
Selling expenses consist mainly of payroll and benefits for employees involved in the sales and distribution functions, and marketing expense.
Research and development expenses
Research and development expenses consist primarily of payroll and related costs for employees involved in research functions and other general corporate expenses as well as costs associated with the use by these functions of facilities and equipment, such as depreciation and rental expenses.
Interest expenses
Interest expense is for interest on short-term borrowings.
Other (expenses) income, net
Other (expenses) income, net primarily consist of rent revenue, bank charges and other miscellaneous expenses, net of interest income from banks and other miscellaneous income.
Mainland China employee contribution plans
As
stipulated by the regulations of the PRC, full-time employees of the Company are entitled to various government statutory employee benefit
plans, including medical insurance, maternity insurance, workplace injury insurance, unemployment insurance and pension benefits through
a PRC government-mandated multi-employer defined contribution plan. The Company is required to make contributions to the plan based on
certain percentages of employees’ salaries. These expenses are recorded in general and administrative and selling expenses. The
expenses the Company incurred for the plans were $
Income taxes
The Company’s subsidiaries in the PRC and Hong Kong are subject to the income tax laws of the PRC and Hong Kong, respectively. No taxable income was generated outside the PRC for the six months ended March 31, 2026 and 2025. The Company accounts for income taxes in accordance with ASC 740, Income Taxes. ASC 740 requires an asset and liability approach for financial accounting and reporting for income taxes and allows recognition and measurement of deferred tax assets based upon the likelihood of realization of tax benefits in future years. Under the asset and liability approach, deferred taxes are provided for the net tax effects of temporary differences between the carrying amounts of assets and liabilities for financial reporting purposes and the amounts used for income tax purposes. A valuation allowance is provided for deferred tax assets if it is more likely than not these items will either expire before the Company is able to realize their benefits, or future deductibility is uncertain.
ASC 740-10-25 prescribes a more-likely-than-not threshold for financial statement recognition and measurement of a tax position taken (or expected to be taken) in a tax return. It also provides guidance on the recognition of income tax assets and liabilities, classification accounting for interest and penalties associated with tax positions, years open for tax examination, accounting for income taxes in interim periods and income tax disclosures. There were no uncertain tax positions as of March 31, 2026 and September 30, 2025.
| F-16 |
Value Added Tax (“VAT”)
The VAT rate for revenue generated from providing products is 13%. VAT is reported as a reduction of revenue when incurred. Entities that are VAT general taxpayers are allowed to offset qualified input VAT paid to suppliers against their output VAT liabilities. The net VAT balance between input VAT and output VAT is recorded in taxes payable. The Company records a VAT payable or receivable net of payments in the accompanying consolidated financial statements. All of the VAT returns filed by the Company’s subsidiaries in the PRC, have been and remain subject to examination by the tax authorities for five years from the date of filing.
The Company computes earnings (loss) per share (“EPS”) in accordance with ASC 260, “Earnings per Share” (“ASC 260”). ASC 260 requires companies with complex capital structures to present basic and diluted EPS. Basic EPS is computed by dividing net income (loss) available to ordinary shareholders of the Company by the weighted average ordinary shares outstanding during the period. Diluted EPS takes into account the potential dilution that could occur if securities or other contracts to issue ordinary shares were exercised and converted into ordinary shares. When the Company has a net (loss), diluted securities are not included as they would be anti-dilutive. For the six months ended March 31, 2026 and 2025, there were no dilutive securities.
Comprehensive income (loss)
Comprehensive income (loss) consists of two components, net income (loss) and other comprehensive income (loss). Net income (loss) refers to revenue, expenses, gains, and losses that under U.S. GAAP are recorded as an element of equity. Other comprehensive income (loss) consists of foreign currency translation adjustments from the Company not using the U.S. dollar as its functional currency.
Segment reporting
ASC Topic 280, “Segment Reporting,” requires use of the management approach model for segment reporting. The Company identifies operating segments as components of the consolidated operations for which discrete financial information is available and is regularly reviewed by the chief operating decision maker (“CODM”), in making decisions regarding resource allocation and evaluating financial performance. The Company defines the term CODM to be its Chief Executive Officer. The Company has determined it operates in one operating and reportable segment. The CODM reviews operating income (loss) presented only on a consolidated basis and uses this information for purposes of allocating resources and evaluating financial performance. There are no reconciling items between segment information and consolidated financial information.
The significant segment expenses and other segment items that are provided to the CODM align with expense information that is included in the Company’s consolidated statements of operations and notes thereto.
Based on management’s assessment, the Company determined it has four operating segments: (i) clean-energy equipment; (ii) oil and gas engineering technical services; (iii) new energy production and operation; and (iv) digitalization and integration equipment.
Significant risks
Concentration of credit risk
Currently, all of the Company’s operations are in the PRC. Accordingly, the Company’s business, financial condition and results of operations may be influenced by the political, economic and legal environment in the PRC, and by the general state of the PRC’s economy. The Company’s results may be adversely affected by changes in governmental policies with respect to laws and regulations, anti-inflationary measures, currency conversion and remittance abroad, and rates and methods of taxation, among other things.
Financial instruments which potentially subject the Company to concentrations of credit risk consist principally of cash, restricted cash, accounts receivable, notes receivable, advances to suppliers and due from related parties. A portion of the Company’s sales are credit sales which are to the customers whose ability to pay is dependent upon industry economics prevailing in these areas; however, concentrations of credit risk with respect to trade accounts receivable is limited due to most clients of the Company are state-owned enterprises. The Company also performs ongoing credit evaluations of its customers to help further reduce credit risk.
| F-17 |
Concentration of customers and suppliers
Details of the customers accounting for 10% or more of the Company’s total revenues are as follows:
| Six Months Ended March 31, | ||||||||||||||||
| 2026 | 2025 | |||||||||||||||
| (Unaudited) | (Unaudited) | |||||||||||||||
| Customer A | $ | % | $ | % | ||||||||||||
| Customer B | % | % | ||||||||||||||
| Total | $ | % | $ | % | ||||||||||||
Details of the customers which accounted for 10% or more of the Company’s accounts receivable are as follows:
| As of March 31, | As of September 30, | |||||||||||||||
| 2026 | 2025 | |||||||||||||||
| (Unaudited) | ||||||||||||||||
| Customer B | $ | % | $ | % | ||||||||||||
| Customer C | % | % | ||||||||||||||
| Total | $ | % | $ | % | ||||||||||||
Details of the vendors which accounted for 10% or more of the Company’s purchases are as follows:
| Six Months Ended March 31, | ||||||||||||||||
| 2026 | 2025 | |||||||||||||||
| (Unaudited) | (Unaudited) | |||||||||||||||
| Vendor A | $ | % | $ | % | ||||||||||||
| Vendor B | % | % | ||||||||||||||
| Vendor C | % | % | ||||||||||||||
| Total | $ | % | $ | % | ||||||||||||
Details of the vendors which accounted for 10% or more of the Company’s accounts payable are as follows:
| As of March 31, | As of September 30, | |||||||||||||||
| 2026 | 2025 | |||||||||||||||
| (Unaudited) | ||||||||||||||||
| Vendor B | $ | % | $ | % | ||||||||||||
| Vendor D | % | % | ||||||||||||||
| Total | $ | % | $ | % | ||||||||||||
Related parties
A party is considered related to the Company if it directly or indirectly or through one or more intermediaries, controls, is controlled by, or is under common control with the Company. Related parties also include principal owners of the Company, its management, members of their immediate families and other parties with which the Company may deal if one party controls or can significantly influence the management or operating policies of the other to an extent that one of the transacting parties might be prevented from fully pursuing its own separate interests. A party which can significantly influence the management or operating policies of the transacting parties or if it has an ownership interest in one of the transacting parties and can significantly influence the other to an extent that one or more of the transacting parties might be prevented from fully pursuing its own separate interests is also a related party.
| F-18 |
Recent accounting pronouncements
In December 2023, the FASB issued ASU 2023-09, Improvements to Income Tax Disclosures, which requires disaggregated information about an entity’s effective tax rate reconciliation and additional discloses on income taxes paid. The new requirements are effective for annual periods beginning after December 15, 2024. The guidance is to be applied prospectively, with an option for retrospective application. The Company adopted this ASU on January 1, 2026. The adoption did not have a material impact on the consolidated financial statements.
In November 2024, the FASB issued ASU 2024-03 on Disaggregation of Income Statement Expenses that enhances disclosure of certain costs and expenses to provide enhanced transparency into the expenses presented in the income statement. The updates are effective for annual periods beginning after December 15, 2026. The Company is still assessing the impact of the related disclosure requirements.
The Company does not believe other recently issued but not yet effective accounting standards, if currently adopted, would have a material effect on its unaudited condensed consolidated financial statements.
NOTE 3 – SHORT-TERM INVESTMENTS
Short-term investments consisted of the following:
|
March 31, 2026 |
September 30, 2025 |
|||||||
| (Unaudited) | ||||||||
| Trading securities | $ | $ | ||||||
| Held-to-maturity securities | ||||||||
| Total short-term investments | $ | $ | ||||||
As
of March 31, 2026, the Company held investments in three common stocks of $
Net investment (loss) gain for the six months ended March 31, 2026 and 2025 consists of the following:
| 2026 | 2025 | |||||||
| (Unaudited) | (Unaudited) | |||||||
| Gain from redemption of wealth management products investments | $ | $ | ||||||
| Unrealized gain from wealth management products investments | ||||||||
| Unrealized (loss) gain from common stocks | ( |
) | ||||||
| Net investment (loss) gain | $ | ( |
) | $ | ||||
NOTE 4 – ACCOUNTS RECEIVABLE, NET
Accounts receivable, net consisted of the following:
|
March 31, 2026 |
September 30, 2025 |
|||||||
| (Unaudited) | ||||||||
| Trade accounts receivable | $ | $ | ||||||
| Less: allowance for expected credit losses | ( |
) | ( |
) | ||||
| Accounts receivable, net | $ | $ | ||||||
| Current portion | $ | $ | ||||||
| Non-current portion | $ | $ | ||||||
The non-current portion represents trade receivables to be collected beyond one year due to the payment terms negotiated between the Company and its customers.
The movement of allowance of for expected credit losses for the six months ended March 31, 2026 and 2025 was as follows:
| 2026 | 2025 | |||||||
| (Unaudited) | (Unaudited) | |||||||
| Balance at beginning of the period | $ | $ | ||||||
| Addition during the six-month period | ||||||||
| Exchange differences | ( |
) | ||||||
| Balance at end of the period | $ | $ | ||||||
| F-19 |
NOTE 5 –NOTES RECEIVABLE
Notes
receivable are trade accounts receivable due from customers where the customers’ banks guaranteed the payments, which are non-interest
bearing and generally range from three to six months from the date of issuance. As of March 31, 2026 and September 30, 2025, no notes
were guaranteed or collateralized. The balance of $
NOTE 6 – ADVANCE TO SUPPLIERS, NET
Advance to suppliers, net consisted of the following:
|
March 31, 2026 |
September 30, 2025 |
|||||||
| (Unaudited) | ||||||||
| Advance for products and services from third parties | $ | $ | ||||||
| Less: allowance for expected credit losses | ( |
) | ( |
) | ||||
| Advance to suppliers, net | $ | $ | ||||||
The movement of allowance for credit losses for the six months ended March 31, 2026 and 2025 was as follows:
| 2026 | 2025 | |||||||
| (Unaudited) | (Unaudited) | |||||||
| Balance at beginning of the period | $ | $ | ||||||
| Addition during the six-month period | ||||||||
| Exchange differences | ( |
) | ||||||
| Balance at end of the period | $ | $ | ||||||
NOTE 7 – INVENTORIES
Inventories consist of the following:
|
March 31, 2026 |
September 30, 2025 |
|||||||
| (Unaudited) | ||||||||
| Raw materials | $ | $ | ||||||
| Work in progress | ||||||||
| Self-produced products | ||||||||
| Purchased products - clean-energy equipment | ||||||||
| Purchased products - digitalization and integration equipment | ||||||||
| Total inventories | $ | $ | ||||||
Self-produced products include compressors, water injection pump skids and wellhead control panels.
The
Company entered into service contracts with separate customers during the period from October 2024 to September 2025. To fulfill these
contracts, five self-produced compressors with a total carrying value of $
The Company reviews its inventories periodically to determine if any reserves are necessary for slow-moving inventory or if a write-down is necessary when the carrying value exceeds net realizable value. There was no allowance for its inventories as of March 31, 2026 and September 30, 2025.
| F-20 |
NOTE 8 – PREPAID EXPENSES AND OTHER CURRENT ASSETS, NET
Prepaid expenses and other current assets consisted of the following:
|
March 31, 2026 |
September 30, 2025 |
|||||||
| (Unaudited) | ||||||||
| Deposits (1) | $ | $ | ||||||
| Staff advances (2) | ||||||||
| VAT Credit to be deducted (3) | ||||||||
| Advanced service fee (4) | ||||||||
| Equity transaction (5) | ||||||||
| Other (6) | ||||||||
| Less: allowance for expected credit losses | ( |
) | ( |
) | ||||
| Prepaid expenses and other current assets, net | $ | $ | ||||||
| (1) | |
| (2) | |
| (3) |
Since fiscal year 2025, revenues generated by Leishen Nanjing, Leishen Shandong, ZJY Technologies and Sichuan Leishen Hongzhuo were lower than their costs and expenses, resulting in a larger amount of input VAT invoices received compared to output VAT invoices issued. The excess portion could not be deducted in the current period and thus classified as other current assets, to be carried forward for deduction in future periods. |
| (4) | |
| (5) | |
| (6) |
The movement of allowance for credit losses for the six months ended March 31, 2026 and 2025 was as follows:
| 2026 | 2025 | |||||||
| (Unaudited) | (Unaudited) | |||||||
| Balance at beginning of the period | $ | $ | ||||||
| Reversal of allowance during the period | ( |
) | ( |
) | ||||
| Exchange differences | ( |
) | ||||||
| Balance at end of the period | $ | $ | ||||||
| F-21 |
NOTE 9 – LONG-TERM INVESTMENT
Long-term investment consisted of the following:
|
March 31, 2026 |
September 30, 2025 |
|||||||
| (Unaudited) | ||||||||
| Equity investment using the measurement alternative | $ | $ | ||||||
| Long-term investment | $ | $ | ||||||
As of March 31, 2026, the Company’s long-term investment is consisted of an investment in Suzhou Kerun New Materials Co., Ltd. (“Suzhou Kerun”), which is accounted for using the measurement alternative.
Suzhou
Kerun is a limited liability company incorporated on April 10, 2019, under the laws of PRC, engaged in new material technology services.
On September 25, 2025, China Oil Hydrogen Energy acquired
The
Company recognized net investment income of and $
During the six months ended March 31, 2025, the investment income realized was attributable to long-term investments in Shuifu Yongcheng Technology Co., Ltd. (“Shuifu Yongcheng”) and Sichuan Hongzhuo Shuya Energy Co., Ltd. (“Hongzhuo Shuya), which were accounted for using the equity method. As of September 30, 2025, both investments were fully disposed and carried no balance on the books.
NOTE 10 – PROPERTY AND EQUIPMENT, NET
Property and equipment, at cost less accumulated depreciation, consisted of the following:
|
March 31, 2026 |
September 30, 2025 |
|||||||
| (Unaudited) | ||||||||
| Machinery and equipment | $ | $ | ||||||
| Office equipment | ||||||||
| Vehicles | ||||||||
| Subtotal | ||||||||
| Less: accumulated depreciation | ( |
) | ( |
) | ||||
| Property and equipment, net | $ | $ | ||||||
The movement of machinery and equipment was presented in the following table:
|
March 31, 2026 |
September 30, 2025 |
|||||||
| (Unaudited) | ||||||||
| Balance at the beginning of the period | $ | $ | ||||||
| Purchases | ||||||||
| Equipment transferred from inventories | ||||||||
| Disposals | ( |
) | ( |
) | ||||
| Exchange differences | ( |
) | ||||||
| Balance at the end of the period | $ | $ | ||||||
For
the six months ended March 31, 2026 and 2025, depreciation was $
| F-22 |
NOTE 11 – INTANGIBLE ASSETS, NET
Intangible assets, net consisted of the following:
|
March 31, 2026 |
September 30, 2025 |
|||||||
| (Unaudited) | ||||||||
| Software | $ | $ | ||||||
| Less: accumulated amortization | ( |
) | ( |
) | ||||
| Intangible assets, net | $ | $ | ||||||
For
the six months ended March 31, 2026 and 2025, amortization was $
NOTE 12 – LOANS RECEIVABLE
Loans receivable consisted of the following:
|
March 31, 2026 |
September 30, 2025 |
|||||||
| (Unaudited) | ||||||||
| Polar Petroleum Equipment (Shandong) Co., Ltd (“Polar”) (1) | $ | $ | ||||||
| Sichuan TIBO Fluid Technology Co., Ltd. (“Sichuan TIBO”) (2) | ||||||||
| Jining Eni Energy Technology Co., Ltd (“Eni Energy”) (3) | ||||||||
| Xianlong Technology (Beijing) Co., Ltd. (“Xianlong”) (4) | ||||||||
| Beijing Youyi Natural Technology Co., Ltd. (“Beijing Youyi”) (5) | ||||||||
| Joseph Petroleum Technology (Beijing) Co., Ltd. (“Joseph Petroleum”) (6) | ||||||||
| Beijing Chenghui Shengsi Technology Co., Ltd. (“Beiiing Chenghui”) (7) | ||||||||
| Accrued Interest Receivable | ||||||||
| Total loans | $ | $ | ||||||
| Less: current portion | $ | $ | ||||||
| Loans receivable, non-current | $ | $ | ||||||
| (1) |
In
May 2025, China Oil Blue Ocean lent RMB |
| (2) |
On
April 20, 2025, China Oil Blue Ocean provided an additional loan of RMB
As
of March 31, 2026 and September 30, 2025, the outstanding loan receivable from TIBO amounted to $ |
| F-23 |
| (3) |
| (4) |
Interest
accrued on these loans were RMB |
| (5) |
Sichuan
TIBO and PetroChina Information Technology Co., Ltd. (“PetroChina Information”) are both procurement suppliers of ZJY Technologies.
Pursuant to a tripartite assignment of debt agreement executed on October 10, 2025, ZJY Technologies assigned its RMB
As
of March 31, 2026 and September 30, 2025, the outstanding loan receivable from Beijing Youyi amounted to RMB |
| (6) |
| (7) |
As
of March 31, 2026 and September 30, 2025, the outstanding loan receivable from Beijing Chenghui amounted to RMB
On May 29, 2026, Beijing Chenghui, ZJY Technologies, Leishen Shandong, and Sichuan TIBO executed a debt offset agreement, under which Beijing Chenghui directly repays to Sichuan TIBO all principal and interest owed to ZJY Technologies, and all chain debts among the four parties are simultaneously settled in full. |
Interest
accrued on all the above-mentioned loans receivable was RMB
| F-24 |
NOTE 13 –BANK LOANS
The loans of the Company consisted of the following:
| March 31, 2026 | ||||||||||
Principal Amount |
Annual Interest Rate |
Contract term | ||||||||
| (Unaudited) | ||||||||||
| Industrial and Commercial Bank (1) | $ | % |
|
|||||||
| Industrial and Commercial Bank (2) | % |
|
||||||||
| Total loans | $ | |||||||||
| Less: current portion | $ | |||||||||
| Long-term loans | $ | |||||||||
| September 30, 2025 | ||||||||||
Principal Amount |
Annual Interest Rate |
Contract term | ||||||||
| Bank of China (3) | $ | % |
|
|||||||
| Industrial and Commercial Bank (4) | % |
|
||||||||
| Industrial and Commercial Bank (5) | % |
|
||||||||
| Total loans | ||||||||||
| Less: current portion | ||||||||||
| Long-term loans | $ | |||||||||
| (1) |
| (2) |
| (3) |
| (4) |
| (5) |
| F-25 |
NOTE 14 – OTHER PAYABLES AND OTHER CURRENT LIABILITIES
Other payables and other current liabilities consisted of the following:
|
March 31, 2026 |
September 30, 2025 |
|||||||
| (Unaudited) | ||||||||
| Payroll payable | $ | $ | ||||||
| Deposits | ||||||||
| Other | ||||||||
| Other payables and other current liabilities | $ | $ | ||||||
Other payable is for employee business expense reimbursement and freight.
NOTE 15– LEASES
The Company’s lease agreements do not contain any material residual value guarantees or material restrictive covenants.
The table below presents the operating lease related assets and liabilities recorded on the balance sheets:
|
March 31, 2026 |
September 30, 2025 |
|||||||
| (Unaudited) | ||||||||
| Operating lease ROU assets | $ | $ | ||||||
| Operating lease liabilities - current | $ | $ | ||||||
| Operating lease liabilities - non-current | ||||||||
| Total operating lease liabilities | $ | $ | ||||||
On
January 22, 2022, Sichuan Leishen Hongzhuo leased a vacant land from Chengdu Longxing Natural Gas Co., Ltd. for the construction of a
natural gas recovery station, which complies with national land-use standards. The lease term is
| F-26 |
On
April 1, 2023, Sichuan TIBO Fluid Technology Co., Ltd. leased the factory at Shiliba Industrial Park, Xinshi Town, Jianyang City, Sichuan
Province to China Oil Blue Ocean. The term is
|
March 31, 2026 |
||||
| Weighted-average remaining lease term (Unaudited) | ||||
| Weighted-average discount rate (Unaudited) | % | |||
A summary of lease cost recognized in Company’s unaudited condensed consolidated financial statements and supplemental cash flow information for operating leases is as follows for the six months ended March 31, 2026 and 2025:
| 2026 | 2025 | |||||||
| (Unaudited) | (Unaudited) | |||||||
| Operating lease cost | $ | $ | ||||||
| Cash paid for operating leases | $ | $ | ||||||
A summary of maturity of operating lease liabilities under the Company’s non-cancelable operating leases as of March 31, 2026 is as follows:
| Six months ending March 31, | ||||
| 2027 | $ | |||
| 2028 | ||||
| 2029 | ||||
| 2030 | ||||
| After 2031 | ||||
| Total lease payments | ||||
| Less: Imputed Interest | ( |
) | ||
| Present value of operating lease liabilities | $ | |||
NOTE 16 – RELATED PARTY BALANCES AND TRANSACTIONS
The table below sets forth the major related parties and their relationships with the Company as of March 31, 2026:
| Name of related parties | Relationship with the Group | |
| Li Hongqi | Chairman of the Board | |
| Li Hongliang | Chief Executive Officer, brother of Li Hongqi | |
| Li Hongguang | A shareholder of the Company, brother of Li Hongqi | |
| Sichuan Hongzhuo Shuya Energy Co., Ltd. (“Sichuan Hongzhuo”) | An equity investee of the Company. On September 12, 2025, the Company sold its equity interest in Sichuan Hongzhuo to a third party. | |
| Beijing Happiness Star No.1 Enterprise Management Center (Limited Partnership) (“Beijing Happiness Star”) | Li Hongqi and Li Hongliang each holds 42.98% of the equity interest but Beijing Happiness Star is controlled by Li Hongliang. | |
| Sichuan TIBO Fluid Technology Co., Ltd. (“Sichuan TIBO”) | An equity investee of the Company. On February 8, 2025, the Company sold its equity interest in Sichuan TIBO to a third party. |
| F-27 |
The following related party balances are non-interest bearing as of March 31, 2026 and September 30, 2025:
|
March 31, 2026 |
September 30, 2025 |
|||||||
| (Unaudited) | ||||||||
| Amounts due to related parties: | ||||||||
| Li Hongqi (1) | $ | $ | ||||||
| Li Hongliang (1) | ||||||||
| $ | $ | |||||||
| Loan receivable - related party: | ||||||||
| Beijing Happiness Star (2) | $ | $ | ||||||
| $ | $ | |||||||
| (1) |
| (2) |
The following are related party transactions for the six months ended March 31, 2026 and 2025:
| 2026 | 2025 | |||||||
| (Unaudited) | (Unaudited) | |||||||
| Revenues: | ||||||||
| Equipment sales to Sichuan TIBO Fluid Technology Co., Ltd. | $ | $ | ||||||
| LNG/CNG sales to Sichuan Hongzhuo Shuya Energy Co., Ltd. | ||||||||
| $ | $ | |||||||
| 2026 | 2025 | |||||||
| (Unaudited) | (Unaudited) | |||||||
| Leases | ||||||||
| Sichuan TIBO Fluid Technology Co., Ltd. (Lessor) | $ | $ | ||||||
| Li Hongliang | ||||||||
| Li Hongqi | ||||||||
| $ | $ | |||||||
| 2026 | 2025 | |||||||
| (Unaudited) | (Unaudited) | |||||||
| Purchase of equipment: | ||||||||
| Sichuan TIBO Fluid Technology Co., Ltd. | $ | $ | ||||||
| $ | $ | |||||||
| F-28 |
NOTE 17 – EQUITY
Cash dividends declared and paid
On
September 30, 2025, the shareholders of Huayou Huitong approved a dividend distribution of RMB
Non-controlling interests
Non-controlling interests consist of the following:
|
March 31, 2026 |
September 30, 2025 |
|||||||
| (Unaudited) |
Huayou Huitong |
|||||||
| Paid-in capital | $ | $ | ||||||
| Deficit | ( |
) | ||||||
| Accumulated other comprehensive loss | ( |
) | ||||||
| Total non-controlling interests | $ | $ | ||||||
Huayou
Huitong is a limited liability company incorporated on May 29, 2020, under the laws of China; China Oil Blue Ocean holds a
Restricted net assets
The
Company’s ability to pay dividends is primarily dependent on the Company receiving distributions of funds from its PRC operating
subsidiaries. Relevant PRC statutory laws and regulations permit payments of dividends by the Company’s PRC subsidiaries only out
of their retained earnings, if any, as determined in accordance with PRC accounting standards and regulations. The results of operations
reflected in the consolidated financial statements prepared in accordance with GAAP differ from those reflected in the statutory financial
statements of the Company’s subsidiaries. As of March 31, 2026 and September 30, 2025, restricted net assets of the Company’s
PRC subsidiaries were $
NOTE 18 – TAXES
Enterprise income taxes (“EIT”)
The Company is subject to income taxes on an entity basis on income derived from the location in which each entity is domiciled.
Leishen Energy Holding Co., Ltd. is incorporated in Cayman Islands as an offshore holding company and is not subject to tax on income or capital gains under the laws of Cayman Islands.
Leishen Energy Group Holding Co., Limited is incorporated in Hong Kong as a holding company with no activities. Under the Hong Kong tax laws, an entity is not subject to income tax if no revenue is generated in Hong Kong.
Leishen Energy Group Co., Limited is incorporated in Hong Kong, exempted from profit tax on its foreign-sourced income, and there are no withholding taxes in Hong Kong on remittance of dividends.
Under
the
| F-29 |
ASC 740-10-25 prescribes a more-likely-than-not threshold for financial statement recognition and measurement of a tax position taken (or expected to be taken) in a tax return. It also provides guidance on the recognition of income tax assets and liabilities, classification accounting for interest and penalties associated with tax positions, years open for tax examination, accounting for income taxes in interim periods and income tax disclosures. Deferred tax assets and liabilities are determined based on the difference between the financial reporting and tax bases of assets and liabilities using enacted tax rates that will be in effect in the period in which the differences are expected to reverse. The Company records a valuation allowance to offset deferred tax assets if, based on the weight of available evidence, it is more-likely-than-not that some portion, or all, of the deferred tax assets will not be realized. There were no material uncertain tax positions as of March 31, 2026 and September 30, 2025. As of the date of which the condensed consolidated financial statements is released, the tax years ended December 31, 2021 through December 31, 2025 for the Company’s PRC subsidiaries remain open for statutory examination for PRC tax.
(Loss) income before income taxes consisted of:
|
Six Months Ended March 31, |
||||||||
| 2026 | 2025 | |||||||
| (Unaudited) | (Unaudited) | |||||||
| China | $ | ( |
) | $ | ( |
) | ||
| Loss before income taxes | $ | ( |
) | $ | ( |
) | ||
The income tax (benefit) expense is consisted of the following:
|
Six Months Ended March 31, |
||||||||
| 2026 | 2025 | |||||||
| (Unaudited) | (Unaudited) | |||||||
| Current | ||||||||
| China | $ | $ | ( |
) | ||||
| Deferred | ||||||||
| China | ( |
) | ||||||
| Income tax (benefit) expense | $ | ( |
) | $ | ||||
The following table reconciles the statutory rate to the Company’s effective tax rate:
|
Six Months Ended March 31, |
||||||||||||||||
| 2026 | 2025 | |||||||||||||||
| (Unaudited) | (Unaudited) | |||||||||||||||
| Income tax at expected tax rates | $ | ( |
) | % | $ | ( |
) | % | ||||||||
| Additional deduction of research and development expenses | ( |
) | % | ( |
) | % | ||||||||||
| Non-deductible expenses | ( |
)% | ( |
)% | ||||||||||||
| Effect of PRC preferential tax rates (1) | ( |
) | % | ( |
)% | |||||||||||
| Non-PRC entities not subject to PRC tax (2) | ( |
)% | ( |
)% | ||||||||||||
| Change of valuation allowance (3) | ( |
)% | - | |||||||||||||
| Other | - | ( |
)% | |||||||||||||
| Effective tax rate | $ | ( |
) | % | $ | ( |
)% | |||||||||
| (1) |
For the six months ended March 31,2026, net income generated by Xinjiang Breslin was offset by the losses of other subsidiaries of the Company, therefore the preferential tax rate of Xinjiang Breslin increased the overall effective tax rate of the Company. |
| (2) | |
| (3) |
| F-30 |
Deferred tax assets and liabilities
Components of deferred tax assets and liabilities were as follows:
|
March 31, 2026 |
September 30, 2025 |
|||||||
| (Unaudited) | ||||||||
| Deferred tax assets | ||||||||
| Allowance for doubtful accounts | $ | $ | ||||||
| Impairment of a long-term investment | ||||||||
| Unbilled cost | ||||||||
| Net operating loss carryforwards | ||||||||
| Total deferred tax assets | ||||||||
| Less: valuation allowance | ( |
) | ||||||
| Deferred tax assets, net | ||||||||
| Deferred tax liabilities | ||||||||
| Unbilled revenue | ( |
) | ( |
) | ||||
| Other | ( |
) | ( |
) | ||||
| Total deferred tax liabilities | ( |
) | ( |
) | ||||
| Net deferred tax assets | $ | $ | ||||||
Taxes Payable
Taxes payable consisted of the following:
|
March 31, 2026 |
September 30, 2025 |
|||||||
| (Unaudited) | ||||||||
| VAT payable | $ | $ | ||||||
| Income taxes payable | ||||||||
| Other | ||||||||
| Total | $ | $ | ||||||
Uncertain tax positions
There were no uncertain tax positions as of March 31, 2026 and September 30, 2025 and management does not anticipate any potential future adjustments which would result in a material change to its tax positions.
NOTE 19 – COMMITMENTS AND CONTINGENCIES
Contingencies
From time to time, the Company may be subject to legal proceedings, claims and disputes that arise in the ordinary course of business. Amounts accrued, as well as the total amount of possible losses with respect to such matters, individually and in the aggregate, are not deemed to be material to the unaudited condensed consolidated financial statements.
| F-31 |
NOTE 20 – SEGMENT INFORMATION
The
Company follows the guidance of ASC 280, “Segment Reporting,” which establishes standards for reporting information about
operating segments on a basis consistent with the Company’s internal organizational structure. The Company uses the management
approach to determine reportable operating segments. The Company has determined that it has
Chief Operating Decision Maker (“CODM”)
The Company’s Chief Executive Officer (“CEO”) has been identified as the CODM. The CEO reviews segment operating results, including segment revenues, total cost of revenues and gross profit on a quarterly and annual basis to evaluate the performance of each operating segment and make decisions about the allocation of resources to individual segments. The CODM uses gross profit as the primary measure of segment profit or loss for all four reportable segments.
Significant Expense Categories Reviewed by the CODM
For each reportable segment, on a quarterly basis, the CODM reviews the main reasons for period-to-period (and actual vs. prior) fluctuations in total cost of revenues and evaluates their impact on gross margin.
The CODM does not allocate any of the following corporate expenses: selling and marketing expenses, general and administrative expenses, provision for expected credit losses, research and development expenses, interest expense, and income taxes in his evaluation of the quarterly and annual segment operating results as such expenses are managed and reviewed at the consolidated level.
Segment Information
The tables below summarize the Company’s segment operating results for the six months ended March 31, 2026 and 2025:
| Six Months Ended March 31, 2026 | ||||||||||||||||||||
| Clean-energy equipment |
Digitalization and integration equipment |
New energy production and operation |
Oil and gas engineering technical services |
Total | ||||||||||||||||
| (Unaudited) | (Unaudited) | (Unaudited) | (Unaudited) | (Unaudited) | ||||||||||||||||
| Revenues | $ | $ | $ | $ | $ | |||||||||||||||
| Cost of revenues | ||||||||||||||||||||
| Gross profit | $ | $ | $ | $ | $ | |||||||||||||||
| Six Months Ended March 31, 2025 | ||||||||||||||||||||
| Clean-energy equipment |
Digitalization and integration equipment |
New energy production and operation |
Oil and gas engineering technical services |
Total | ||||||||||||||||
| (Unaudited) | (Unaudited) | (Unaudited) | (Unaudited) | (Unaudited) | ||||||||||||||||
| Revenues | $ | $ | $ | $ | $ | |||||||||||||||
| Cost of revenues | ||||||||||||||||||||
| Gross profit | $ | $ | $ | $ | $ | |||||||||||||||
| F-32 |
Reconciliation of Segment Profit (Gross Profit) to Consolidated Income Before Income Taxes
| Six Months Ended March 31, | ||||||||
| 2026 | 2025 | |||||||
| (Unaudited) | (Unaudited) | |||||||
| Total segment profit (gross profit) | $ | $ | ||||||
| Corporate expenses: | ||||||||
| Selling and marketing expenses | ( |
) | ( |
) | ||||
| General and administrative expenses | ( |
) | ( |
) | ||||
| Provision for expected credit losses | ( |
) | ( |
) | ||||
| Research and development expenses | ( |
) | ( |
) | ||||
| Total operating expenses | ( |
) | ( |
) | ||||
| Loss from operations | ( |
) | ( |
) | ||||
| Other (expense) income, net | ( |
) | ||||||
| Income before income taxes | $ | ( |
) | ( |
) | |||
Reconciliation of Segments’ assets to the Consolidated assets.
|
March 31, 2026 |
September 30, 2025 |
|||||||
| (Unaudited) | ||||||||
| Clean-energy equipment | $ | $ | ||||||
| Digitalization and integration equipment | ||||||||
| New energy production and operation | ||||||||
| Oil and gas engineering technical services | ||||||||
| Other corporate assets | ||||||||
| Total assets | $ | $ | ||||||
|
March 31, 2026 |
September 30, 2025 |
|||||||
| (Unaudited) | ||||||||
| Total assets related to reportable segments | $ | $ | ||||||
| Other corporate assets | ||||||||
| Elimination of intercompany balances | ( |
) | ( |
) | ||||
| Total consolidated assets | $ | $ | ||||||
NOTE 21 – SUBSEQUENT EVENTS
On May 29, 2026, Beijing Chenghui, ZJY Technologies, Leishen Shandong, and Sichuan TIBO (which is a supplier of the Company) executed a debt offset agreement, under which Beijing Chenghui directly repays to Sichuan TIBO all principal and interest owed to ZJY Technologies, and all chain debts among the four parties are simultaneously settled in full.
In June 2026, the Company filed a registration statement on Form F-3 with the SEC that was declared effective on June 18, 2026. In accordance with the F-3, the Company may offer issue and sell its registered securities from time to time up to $, or its equivalent in any other currency, currency units, or composite currency or currencies, of its Class A ordinary shares of par value $ each, warrants to purchase Class A Ordinary Shares, debt securities, rights and a combination of such securities, separately or as units, in one or more offerings. The Company has not sold any securities under the Form F-3. Any such offering would be made pursuant to a prospectus supplement filed with the SEC.
In
August 2026, Suqian Asgard Energy Service Co., Ltd (“Suqian Asgard”) was incorporated in Suqian Jiangsu Province, China.
Suqian Asgard is
| F-33 |
NOTE 22 – PARENT COMPANY INFORMATION
Pursuant to the requirements of Rule 12-04(a), 5-04(c) and 4-08(e)(3) of Regulation S-X, the condensed financial information of the parent company shall be filed when the restricted net assets of consolidated subsidiaries exceed 25% of consolidated net assets as of the end of the most recently completed fiscal year. The Company performed a test on the restricted net assets of consolidated subsidiaries in accordance with such requirement and concluded that it was applicable to the Company as the restricted net assets of the Company’s PRC subsidiary exceeded 25% of the consolidated net assets of the Company. Therefore, the condensed financial statements for the parent company are included herein.
For purposes of the above test, restricted net assets of consolidated subsidiaries shall mean that amount of the Company’s proportionate share of net assets of consolidated subsidiaries (after intercompany eliminations) which as of the end of the most recent fiscal year may not be transferred to the parent company by subsidiaries in the form of loans, advances or cash dividends without the consent of a third party.
The condensed financial information of the parent company was prepared using the same accounting policies as set out in the Company’s condensed consolidated financial statements except that the parent company used the equity method to account for investment in its subsidiaries. Such investment is presented on the condensed balance sheets as “Investment in subsidiaries” and the respective profit or loss as “Equity in earnings of subsidiaries” on the condensed statements of operations.
As of March 31, 2026 and September 30, 2025, and six months ended March 31, 2026 and 2025, there were no material contingencies, significant provisions for long-term obligations, or guarantees of the Company, except for those which have been separately disclosed in the condensed consolidated financial statements, if any.
| F-34 |
PARENT COMPANY BALANCE SHEETS
|
March 31, 2026 |
September 30, 2025 |
|||||||
| (Unaudited) | ||||||||
| ASSETS | ||||||||
| Current assets: | ||||||||
| Cash and cash equivalents | $ | $ | ||||||
| Amounts due from a subsidiary | ||||||||
| Total current assets | ||||||||
| Non-current assets: | ||||||||
| Investment in subsidiaries | ||||||||
| Total non-current assets | ||||||||
| Total Assets | $ | $ | ||||||
| LIABILITIES AND EQUITY | ||||||||
| LIABILITIES | $ | $ | ||||||
| COMMITMENTS AND CONTINGENCIES | ||||||||
| EQUITY | ||||||||
| Ordinary shares Ordinary shares (par value $ per share, shares authorized; and shares issued and outstanding as of September 30, 2025.) | ||||||||
| Class A Ordinary Shares (par value $ per share, shares authorized, shares issued and outstanding as of March 31, 2026) | ||||||||
| Class B Ordinary Shares (par value $ per share, shares authorized, shares issued and outstanding as of March 31, 2026) | ||||||||
| Subscription receivable | ( |
) | ( |
) | ||||
| Additional paid-in capital | ||||||||
| Statutory reserves | ||||||||
| Retained earnings | ||||||||
| Accumulated other comprehensive loss | ( |
) | ( |
) | ||||
| Total Equity | ||||||||
| Total Liabilities and Equity | $ | $ | ||||||
| F-35 |
PARENT COMPANY STATEMENTS OF OPERATIONS AND COMPREHENSIVE LOSS
|
Six Months Ended March 31, |
||||||||
| 2026 | 2025 | |||||||
| (Unaudited) | (Unaudited) | |||||||
| Equity in loss of subsidiaries | $ | ( |
) | $ | ( |
) | ||
| Operating expenses: | ||||||||
| Selling and marketing | ( |
) | ||||||
| General and administrative | ( |
) | ( |
) | ||||
| Total Operating expenses | ( |
) | ( |
) | ||||
| Other (expenses) income: | ||||||||
| Other (expenses) income, net | ( |
) | ||||||
| Total other (expenses) income, net | ( |
) | ||||||
| Net loss | $ | ( |
) | $ | ( |
) | ||
| Foreign currency translation gain (loss) | ( |
) | ||||||
| Comprehensive loss | $ | ( |
) | $ | ( |
) | ||
| F-36 |
PARENT COMPANY STATEMENTS OF CASH FLOWS
|
Six Months Ended March 31, |
||||||||
| 2026 | 2025 | |||||||
| (Unaudited) | (Unaudited) | |||||||
| Cash flows from operating activities | ||||||||
| Net loss | $ | ( |
) | $ | ( |
) | ||
| Adjustments to reconcile net loss to net cash used in operating activities: | ||||||||
| Equity in loss of subsidiaries | ||||||||
| Changes in other current assets | ( |
) | ||||||
| Changes in due from a subsidiary | ( |
) | ||||||
| Net cash used in operating activities | ( |
) | ( |
) | ||||
| Cash flows from financing activities: | ||||||||
| Net proceeds from initial public offering | ||||||||
| Net cash provided by financing activities | ||||||||
| Net change in cash | ( |
) | ||||||
| Cash at the beginning of the period | ||||||||
| Cash at the end of the period | $ | $ | ||||||
| F-37 |
Exhibit 99.2
MANAGEMENT’S DISCUSSION AND ANALYSIS OF
FINANCIAL CONDITION AND RESULTS OF OPERATIONS
The following discussion and analysis of our financial condition and results of operations should be read in conjunction with our unaudited condensed consolidated financial statements and related notes that appear in this interim report. In addition to historical consolidated financial information, the following discussion contains forward-looking statements that reflect our plans, estimates, and beliefs. Our actual results could differ materially from those discussed in the forward-looking statements.
Overview
Leishen Energy Holding Co., Ltd. (“Leishen Cayman”) was incorporated under the laws of Cayman Islands as an exempted company with limited liability on October 19, 2022. As a holding company with no material operations, Leishen Cayman conducts substantially all of its operations through its operating subsidiaries (collectively, the “Company”) in the PRC. The Company is a provider of clean-energy equipment and integrated solutions to the oil and gas industry, with a commitment to providing customers with high-performance, safe and cost-effective energy solutions. The Company’s major businesses segments include (i) clean-energy equipment; (ii) oil and gas engineering technical services; (iii) new energy production and operation; and (iv) digitalization and integration equipment. At present, the Company holds 102 invention and utility model patents, 3 trademarks and 8 software copyrights.
On December 20, 2024, Leishen Cayman (Nasdaq: LSE) consummated its initial public offering (the “IPO”) of 1,375,000 ordinary shares, par value $0.001 at $4.00 per share (each, an “Ordinary Share”), with gross proceeds of $5.5 million. On January 8, 2025, Leishen Cayman issued and sold 150,000 additional Ordinary Shares at $4.00 per share, pursuant to the partial exercise of the Over-Allotment Option, resulting in additional gross proceeds of $600,000. As a result, Leishen Cayman raised aggregate gross proceeds of $6.1 million in the IPO. After deducting underwriting discounts and commissions, the Company received total net proceeds of $5.4 million.
On November 27, 2025, the Company’s shareholders approved an amendment to the memorandum and articles of association to adopt a dual-class share structure. The authorized share capital of the Company is US$50,000 divided into 467,290,000 Class A Ordinary Shares of a nominal or par value of US$0.001 each and 32,710,000 Class B Ordinary Shares of a nominal or par value of US$0.001 each. All of the issued and outstanding ordinary shares (except the 6,355,000 and 6,355,000 held by Polar Energy Company Limited and WISE-POWER ENERGY SERVICES CO., LTD., respectively, were re-designated into Class A ordinary shares of par value US$0.001 each; the 6,355,000 and 6,355,000 Ordinary Shares held by Polar Energy Company Limited and WISEPOWER ENERGY SERVICES CO., LTD., respectively, were re-designated into class B ordinary shares of a par value of US$0.001 each; 20,000,000 of the authorized but unissued ordinary shares were re-designated into Class B ordinary shares of par value US$0.001 each; and all of the remaining authorized but unissued ordinary shares were re-designated into Class A ordinary shares of par value US$0.001 each. Under the new structure, the Company’s share capital consists of Class A Ordinary Shares and Class B Ordinary Shares. Each Class A Ordinary Share carries one (1) vote per share, and each Class B Ordinary Share carries twenty-five (25) votes per share and the other rights attached to it as set out in the Company’s amended and restated memorandum and articles.
The Company’s corporate structure as of March 31, 2026 was as follows:
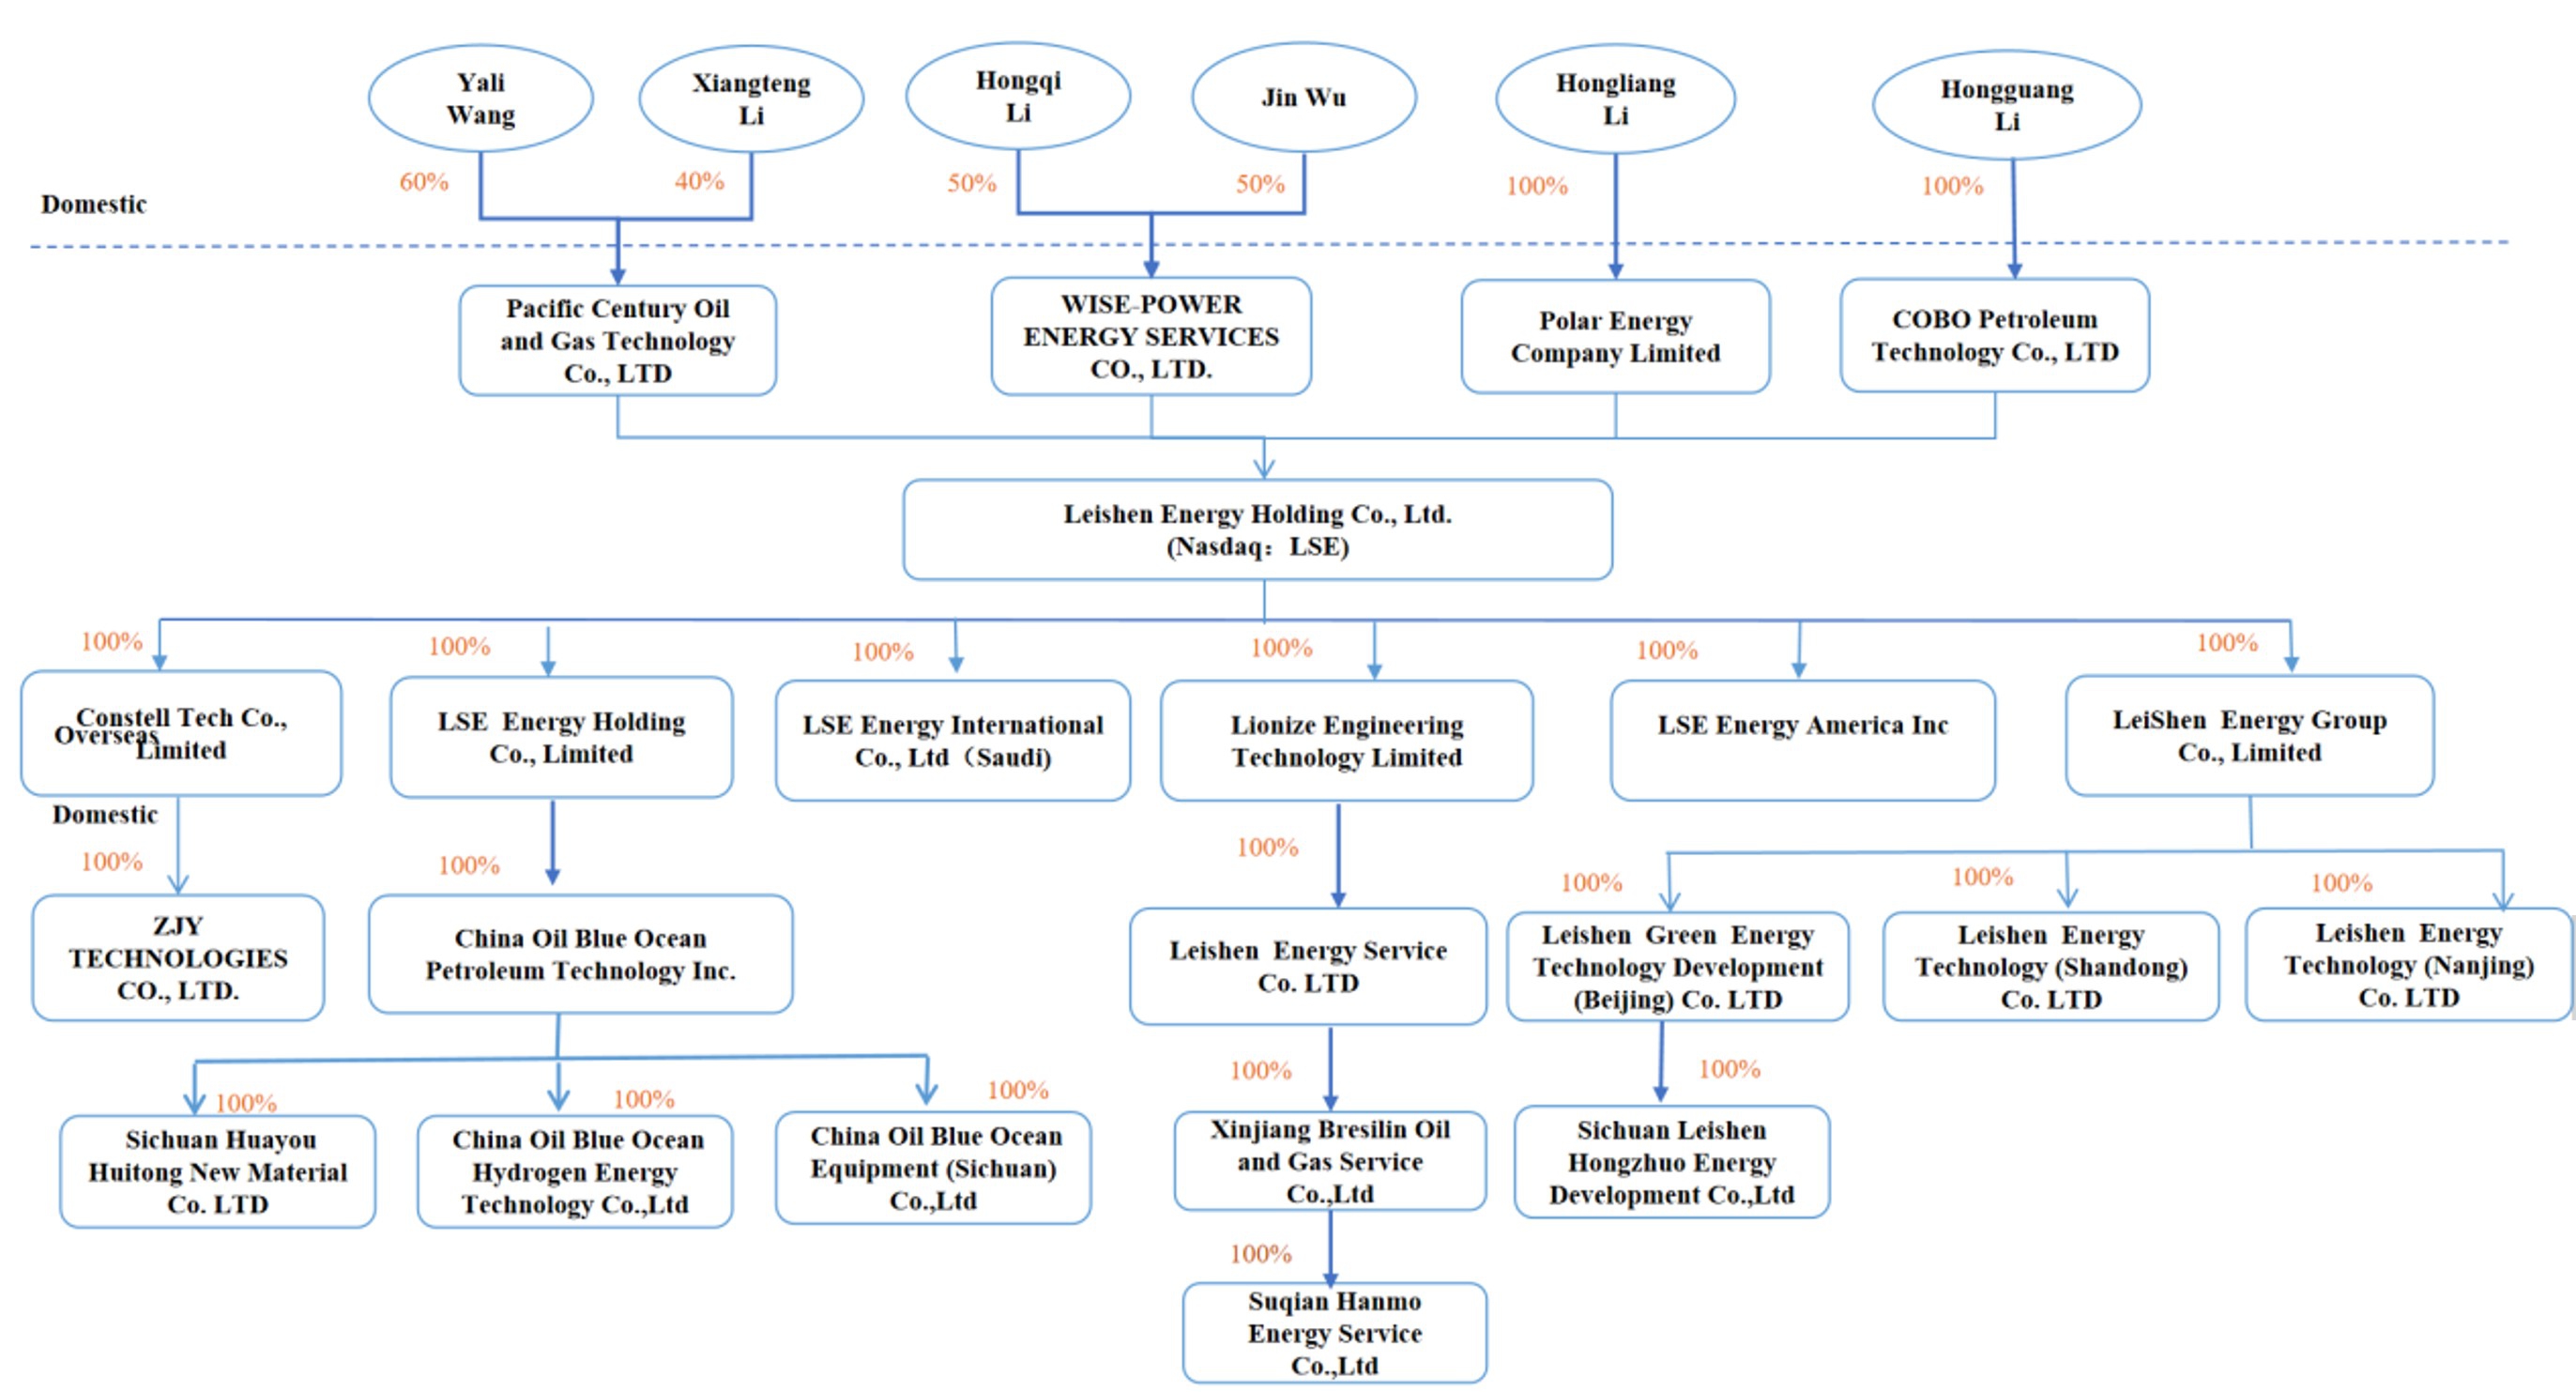
The Company’s principal subsidiaries are as follows:
| Legal Entity | Place
of Incorporation |
Date
of Incorporation |
Percentage
of beneficial ownership |
Principal activities | ||||
| Leishen Energy Holding Co., Ltd (“Leishen Cayman”) | Cayman Islands | October 19, 2022 | — | Holding company | ||||
| Leishen Energy Group Holding Co.,Ltd. (“Leishen (Holding) Hong Kong”) | Hongkong, China | November 25, 2022 | 100% | Holding company | ||||
| Leishen Energy Group Co., Ltd. (“Leishen Hong Kong”) | Hongkong, China | February 11, 2010 | 100% | Purchase and sale of oil and gas professional equipment and instruments | ||||
| ZJY Technologies Co., Ltd. (“ZJY Technologies”) | Beijing, China | March 2, 2007 | 100% | Design and sale of oil and gas professional equipment and after-sales support, and oilfield digitalization and integration service | ||||
| China Oil Blue Ocean Petroleum Technology Inc. (“China Oil Blue Ocean”) | Beijing, China | October 19, 2007 | 100% | Design and sale of oil and gas equipment and instruments, and engineering technology services | ||||
| Leishen Energy Technology (Nanjing) Co.,Ltd. (“Leishen Nanjing”) | Nanjing, China | September 27, 2022 | 100% | Purchase and sale of oil and gas professional equipment and instruments | ||||
| Leishen Green Energy Technology Development Co., Ltd. (“Beijing Leishen Green Energy”) | Beijing, China | January 29, 2018 | 100% | No business operations | ||||
| Leishen Energy Technology (Shandong) Co., Ltd. (“Leishen Shandong”) | Shandong, China | September 14, 2010 | 100% | Sales of oil and gas professional equipment and instruments | ||||
| Leishen Energy Services Co., Ltd. (“Leishen Services”) | Shandong, China | January 23, 2019 | 100% | No business operations | ||||
| Sichuan Leishen Hongzhuo Energy Development Co., Ltd. (“Sichuan Leishen Hongzhuo”) | Chengdu, China | January 16, 2019 | 100% | Production, storage and transportation of natural gas (LNG/CNG) | ||||
| Sichuan Huayou Huitong New Material Co. Ltd. (“Huayou Huitong”) | Chengdu, China | May 29, 2020 | 100% | Production and sales of bonded composite pipes | ||||
| Xinjiang Breslin Oil and Gas Service Co., Ltd. (“Xinjiang Breslin”) | Xinjiang, China | August 22, 2024 | 100% | Purchase and sale of oil and gas professional equipment and instruments, and sales of oil and gas engineering technical service | ||||
| Lionize Engineering Technology Limited | Hongkong, China | February 21, 2025 | 100% | No business operations | ||||
| Suqian Hanmo Energy Service Co., Ltd. (“Suqian Hanmo”) | Jiangsu, China | April 21, 2025 | 100% | Purchase and sale of oil and gas professional equipment and instruments, and sales of oil and gas engineering technical service | ||||
| LSE Energy International Co., Ltd (“LSE Energy International”) | Saudi Aribia | June 29, 2025 | 100% | No business operations | ||||
| LSE Energy America Inc (“LSE Energy America”) | United States | August 14, 2025 | 100% | No business operations | ||||
| China Oil Blue Ocean Hydrogen Energy Technology Co., Ltd (“China Oil Hydrogen Energy”) | Beijing, China | August 5, 2025 | 100% | No business operations | ||||
China Oil Blue Ocean Equipment (Sichuan) Co., Ltd |
Chengdu, China | December 11, 2025 | 100% | Purchase and sale of oil and gas professional equipment and instruments, and sales of oil and gas engineering technical service |
Results of Operations
Comparison of Results of Operations for the Six Months Ended March 31, 2026 and 2025
The following table summarizes our results of operations for the six months ended March 31, 2026 and 2025, and provides information regarding the dollar and percentage change during the six months.
| Six Months Ended March 31, | ||||||||||||||||||||||||
| 2026 | 2025 | Variance | ||||||||||||||||||||||
| Amount | %
of revenue |
Amount | %
of revenue |
Amount | % | |||||||||||||||||||
| (Unaudited) | (Unaudited) | |||||||||||||||||||||||
| Revenues | $ | 20,978,428 | 100.0 | % | $ | 28,195,284 | 100.0 | % | $ | (7,216,856 | ) | (25.6 | )% | |||||||||||
| Cost of revenues | (15,753,600 | ) | (75.1 | )% | (23,256,253 | ) | (82.5 | )% | 7,502,653 | (32.3 | )% | |||||||||||||
| Gross profit | 5,224,828 | 24.9 | % | 4,939,031 | 17.5 | % | 285,797 | 5.8 | % | |||||||||||||||
| Operating expenses: | ||||||||||||||||||||||||
| Selling and marketing | 1,535,890 | 7.3 | % | 635,306 | 2.3 | % | 900,584 | 141.8 | % | |||||||||||||||
| General and administrative | 2,133,900 | 10.2 | % | 3,045,282 | 10.8 | % | (911,382 | ) | (29.9 | )% | ||||||||||||||
| Provision for expected credit losses | 2,145,919 | 10.2 | % | 3,317,683 | 11.8 | % | (1,171,764 | ) | (35.3 | )% | ||||||||||||||
| Research and development | 97,448 | 0.5 | % | 163,008 | 0.6 | % | (65,560 | ) | (40.2 | )% | ||||||||||||||
| Total operating expenses | 5,913,157 | 28.2 | % | 7,161,279 | 25.5 | % | (1,248,122 | ) | (17.4 | )% | ||||||||||||||
| Loss from operations | (688,329 | ) | (3.3 | )% | (2,222,248 | ) | (8.0 | )% | 1,533,919 | (69.0 | )% | |||||||||||||
| Other (expenses) income: | ||||||||||||||||||||||||
| Interest expense | (36,080 | ) | (0.2 | )% | (20,035 | ) | (0.1 | )% | (16,045 | ) | 80.1 | % | ||||||||||||
| Exchange (loss) gains | (167,571 | ) | (0.8 | )% | 45,795 | 0.2 | % | (213,366 | ) | (465.9 | )% | |||||||||||||
| Income from equity investment | - | - | % | 171,368 | 0.6 | % | (171,368 | ) | (100.0 | )% | ||||||||||||||
| Net investment (loss) gain from short-term investments | (1,064,172 | ) | (5.1 | )% | 826,153 | 2.9 | % | (1,890,325 | ) | (228.8 | )% | |||||||||||||
| Interest income from loans receivable | 93,183 | 0.4 | % | 50,805 | 0.2 | % | 42,378 | 83.4 | % | |||||||||||||||
| (Loss) gain from disposal of property and equipment | (288,176 | ) | (1.4 | )% | 116,311 | 0.4 | % | (404,487 | ) | (347.8 | )% | |||||||||||||
| Other income, net | 197,232 | 0.9 | % | 77,831 | 0.3 | % | 119,401 | 153.4 | % | |||||||||||||||
| Total other (expenses) income, net | (1,265,584 | ) | (6.2 | )% | 1,268,228 | 4.5 | % | (2,533,812 | ) | (199.8 | )% | |||||||||||||
| Loss before income taxes | (1,953,913 | ) | (9.5 | )% | (954,020 | ) | (3.5 | )% | (999,893 | ) | 104.8 | % | ||||||||||||
| Income tax (benefit) expense | (117,174 | ) | (0.6 | )% | 14,635 | 0.1 | % | (131,809 | ) | (900.6 | )% | |||||||||||||
| Net loss | (1,836,739 | ) | (8.9 | )% | (968,655 | ) | (3.6 | )% | (868,084 | ) | 89.6 | % | ||||||||||||
| Less: net loss attributable to non-controlling interests | - | - | % | (344,240 | ) | (1.2 | )% | 344,240 | (100.0 | )% | ||||||||||||||
| Net loss attributable to Leishen Energy Holding Co., Ltd. | $ | (1,836,739 | ) | (8.9 | )% | $ | (624,415 | ) | (2.4 | )% | $ | (1,212,324 | ) | 194.2 | % | |||||||||
Revenues
Currently,
we have four revenue streams: clean-energy equipment sales, digitalization and integration equipment sales, new energy sales and
delivery of oil and gas field engineering technical services. Revenues decreased by $7,216,856, or 25.6%, to $20,978,428 for the six
months ended March 31, 2026 from $28,195,284 for the six months ended March 31, 2025. The decrease in our total revenues was
primarily attributable to ongoing initiative to scale-back our lower-margin businesses within our new energy and digitalization and
integration equipment segments, which objective is to enhance our overall gross profit.
The following table sets forth the breakdown of our revenues for the six months ended March 31, 2026 and 2025:
| Six Months Ended March 31, | ||||||||||||||||||||||||
| 2026 | 2025 | Variance | ||||||||||||||||||||||
| Amount | % | Amount | % | Amount | % | |||||||||||||||||||
| (Unaudited) | (Unaudited) | |||||||||||||||||||||||
| Clean-energy equipment | $ | 10,412,332 | 49.6 | % | $ | 13,196,043 | 46.8 | % | $ | (2,783,711 | ) | (21.1 | )% | |||||||||||
| Digitalization and integration equipment | 2,226,141 | 10.6 | % | 2,629,399 | 9.3 | % | (403,258 | ) | (15.3 | )% | ||||||||||||||
| New energy sales | 6,454,584 | 30.8 | % | 10,337,148 | 36.7 | % | (3,882,564 | ) | (37.6 | )% | ||||||||||||||
| Oil and gas engineering technical services | 1,885,371 | 9.0 | % | 2,032,694 | 7.2 | % | (147,323 | ) | (7.2 | )% | ||||||||||||||
| Total | $ | 20,978,428 | 100.0 | % | $ | 28,195,284 | 100.0 | % | $ | (7,216,856 | ) | (25.6 | )% | |||||||||||
Revenues
from clean-energy equipment sales. Revenues from clean-energy equipment sales accounted for 49.6% and 46.8% of our revenues for the
six months ended March 31, 2026 and 2025, respectively. Revenue from clean-energy equipment sales decreased by $2,783,711 or 21.1% to
$10,412,332 for the six months ended March 31, 2026 from $13,196,043 in
Revenues from digitalization and integration equipment sales. Revenues from digitalization and integration equipment sales accounted for 10.6% and 9.3% of our revenues for the six months ended March 31, 2026 and 2025, respectively. Revenue from digitalization and integration equipment sales decreased by $403,258 or 15.3% to $2,226,141 for the six months ended March 31, 2026 from $2,629,399 in 2025. The decrease was mainly due to our plan to scale-back the extent of low-margin businesses.
Revenues from new energy sales. Revenues from new energy sales accounted for 30.8% and 36.7% of our revenues for the six months ended March 31, 2026 and 2025, respectively. Revenue from new energy production and operation sales decreased by $3,882,564 or 37.6% to $6,454,584 for the six months ended March 31, 2026 from $10,337,148 in 2025. The decrease was mainly due to the Middle East geopolitical conflict, which drove volatility in international natural gas prices, alongside weak domestic demand and intense market competition. We have strategically reduced and will continue to scale back low-margin trading volumes in order to manage our exposure to pricing volatility.
Revenues from oil and gas engineering technical services. Revenues from oil and gas engineering technical services accounted for 9.0% and 7.2% of our revenues for the six months ended March 31, 2026 and 2025, respectively. Revenues from oil and gas field engineering technical services decreased by $147,323 or 7.2% to $1,885,371 for the six months ended March 31, 2026 from $2,032,694 in 2025. The decrease was due mainly to the decrease in volumes of our compressor rental service.
Cost of Revenues
The following table sets forth the breakdown of our cost of revenue for the six months ended March 31, 2026 and 2025:
| Six Months Ended March 31, | ||||||||||||||||||||||||
| 2026 | 2025 | Variance | ||||||||||||||||||||||
| Amount | % | Amount | % | Amount | % | |||||||||||||||||||
| (Unaudited) | (Unaudited) | |||||||||||||||||||||||
| Clean-energy equipment | $ | 6,842,781 | 43.4 | % | $ | 10,528,452 | 45.3 | % | $ | (3,685,671 | ) | (35.0 | )% | |||||||||||
| Digitalization and integration equipment | 2,064,862 | 13.1 | % | 2,032,358 | 8.7 | % | 32,504 | 1.6 | % | |||||||||||||||
| New energy sales | 6,276,614 | 39.8 | % | 10,178,056 | 43.7 | % | (3,901,442 | ) | (38.3 | )% | ||||||||||||||
| Oil and gas engineering technical services | 569,343 | 3.7 | % | 517,387 | 2.3 | % | 51,956 | 10.0 | % | |||||||||||||||
| Total | $ | 15,753,600 | 100.0 | % | $ | 23,256,253 | 100.0 | % | $ | (7,502,653 | ) | (32.3 | )% | |||||||||||
Cost of clean-energy equipment sales decreased by $3,685,671 or 35.0%, to $6,842,781 for the six months ended March 31, 2026 from $10,528,452 in 2025, which was mainly due to the 21.1% decrease in related sales revenue.
Cost of digitalization and integration equipment sales increased by $32,504 or 1.6%, to $2,064,862 for the six months ended March 31, 2026 from $2,032,358 in 2025.
Cost of new energy sales decreased by $3,901,442 or 38.3% to $6,276,614 for the six months ended March 31, 2026 from $10,178,056 in 2025, which was mainly due to the decrease of sales of new energy.
Cost of oil and gas engineering technical services increased by $51,956 or 10.0% to $569,343 for the six months ended March 31, 2026 from $517,387 in 2025. The increase was mainly due to the increase in customer requirements for technical expertise and equipment standards in leasing and technical services.
Gross Profit
Gross
profit was $5,224,828 for the six months ended March 31, 2026, an increase of $285,797 compared to $4,939,031 in 2025. Gross margin increased
to 24.9%, representing a 7.4% increase compared to 2025. The increase was mainly due to the Company’s deliberate scale-back of
low-margin businesses, which reduced the dilutive effect of low-margin activities and enhance our ability to enhance the overall gross
margin.
Our gross profit and gross margin by revenue stream were as follows:
| Six Months Ended March 31, | ||||||||||||||||||||||||
| 2026 | 2025 | Variance | ||||||||||||||||||||||
|
Gross Profit |
Gross % |
Gross Profit |
Gross % |
Gross Profit |
Gross % |
|||||||||||||||||||
| Clean-energy equipment | $ | 3,569,551 | 34.3 | % | $ | 2,667,591 | 20.2 | % | $ | 901,960 | 14.1 | % | ||||||||||||
| Digitalization and integration equipment | 161,279 | 7.2 | % | 597,041 | 22.7 | % | (435,762 | ) | (15.5 | )% | ||||||||||||||
| New energy sales | 177,970 | 2.8 | % | 159,092 | 1.5 | % | 18,878 | 1.3 | % | |||||||||||||||
| Oil and gas engineering technical services | 1,316,028 | 69.8 | % | 1,515,307 | 74.5 | % | (199,279 | ) | (4.7 | )% | ||||||||||||||
| Total | $ | 5,224,828 | 24.9 | % | $ | 4,939,031 | 17.5 | % | $ | 285,797 | 7.4 | % | ||||||||||||
Gross profit for clean-energy equipment sales increased by $901,960 to $3,569,551 for the six months ended March 31, 2026, compared to $2,667,591 in 2025. Gross margin increased by 14.1% to 34.3%, primarily attributable to favorable product mix, as we sold more high-margin products in the six months ended March 31, 2026 than in the comparable period of 2025, as well as ongoing cost-control initiatives.
Gross profit for digitalization and integration equipment sales decreased by $435,762 to $161,279 for the six months ended March 31, 2026, compared to $597,041 in 2025. Gross margin decreased by 15.5%, to 7.2% for the six months ended March 31, 2026, from 22.7% in 2025. The decrease in gross margin was mainly attributable to the scale-back of low-margin trading volumes and higher cost in product trading.
Gross profit for new energy sales increased by $18,878 to $177,970 for the six months ended March 31, 2026, compared to $159,092 for the comparable period in 2025. Gross margin increased by 1.3%, to 2.8% for the six months ended March 31, 2026, from 1.5% in 2025. The increase in gross profit was mainly due to the Company’s strategic scale-back of low-margin trading volumes to mitigate our exposure to pricing volatility.
Gross profit for oil and gas engineering technical services decreased to $1,316,028 for the six months ended March 31, 2026 from $1,515,307 in 2025. Gross margin decreased by 4.7%, to 69.8% for the six months ended March 31, 2026, from 74.5% in 2025. The decrease in gross margin was attributable to the increase in customer requirements for technical expertise and equipment standards in leasing and technical services.
Operating Expenses
Operating expenses were as following:
| Six Months Ended March 31, | ||||||||||||||||||||||||
| 2026 | 2025 | Variance | ||||||||||||||||||||||
| Amount | % | Amount | % | Amount | % | |||||||||||||||||||
| (Unaudited) | (Unaudited) | |||||||||||||||||||||||
| Selling and marketing | $ | 1,535,890 | 26.0 | % | $ | 635,306 | 8.9 | % | $ | 900,584 | 141.8 | % | ||||||||||||
| General and administrative | 2,133,900 | 36.1 | % | 3,045,282 | 42.5 | % | (911,382 | ) | (29.9 | )% | ||||||||||||||
| Provision for expected credit losses | 2,145,919 | 36.3 | % | 3,317,683 | 46.3 | % | (1,171,764 | ) | (35.3 | )% | ||||||||||||||
| Research and development | 97,448 | 1.6 | % | 163,008 | 2.3 | % | (65,560 | ) | (40.2 | )% | ||||||||||||||
| Total operating expenses | $ | 5,913,157 | 100.0 | % | $ | 7,161,279 | 100.0 | % | $ | (1,248,122 | ) | (17.4 | )% | |||||||||||
Selling and marketing Expenses
Selling
and marketing expenses consist primarily of shipping fees, consulting fees, bidding fees and payroll and benefits for employees involved
in the sales and distribution functions. Selling and marketing expenses were
General and Administrative Expenses
General
and administrative (“G&A”) expenses consist primarily of payroll and related costs for employees involved in general
corporate functions, including accounting, finance, tax, legal and human resources, professional fees and other general corporate expenses
as well as costs associated with the use by these functions of facilities and equipment, such as depreciation and rental expenses. Our
G&A expenses were $2,133,900 for the six months ended March 31, 2026, a decrease of $911,382, or 29.9%, from $3,045,282 in 2025.
The decrease was due mainly to 1) decrease of
Provision for expected credit losses
Provision for expected credit losses was $2,145,919 for the six months ended March 31, 2026, a decrease of $1,171,764 or 35.3%, from $3,317,683 for 2025. The decrease was mainly due to improvement in our collection of trade receivables.
Research and development expenses
Research and development (“R&D”) expenses consist primarily of payroll and related costs for employees involved in research functions and other general corporate expenses as well as costs associated with the use by these functions of facilities and equipment, such as depreciation and rental expenses. Our R&D expenses were $97,448 for the six months ended March 31, 2026, a decrease of $65,560 from $163,008 in 2025 due primarily due to reduction in R&D activities during the six months ended March 31, 2026.
Other (expenses) income, net
Other (expenses) income was as follows:
| Six Months Ended March 31, | ||||||||||||||||||||||||
| 2026 | 2025 | Variance | ||||||||||||||||||||||
| Amount | % | Amount | % | Amount | % | |||||||||||||||||||
| (Unaudited) | (Unaudited) | |||||||||||||||||||||||
| Interest expense | $ | (36,080 | ) | 2.9 | % | $ | (20,035 | ) | (1.6 | )% | $ | (16,045 | ) | 80.1 | % | |||||||||
| Exchange (loss) gains | (167,571 | ) | 13.2 | % | 45,795 | 3.6 | % | (213,366 | ) | (465.9 | )% | |||||||||||||
| Income from equity investment | - | - | % | 171,368 | 13.5 | % | (171,368 | ) | (100.0 | )% | ||||||||||||||
| Net investment (loss) gain from short-term investments | (1,064,172 | ) | 84.1 | % | 826,153 | 65.1 | % | (1,890,325 | ) | (228.8 | )% | |||||||||||||
| Interest income from loans receivable | 93,183 | (7.4 | )% | 50,805 | 4.0 | % | 42,378 | 83.4 | % | |||||||||||||||
| (Loss) gain from disposal of property and equipment | (288,176 | ) | 22.8 | % | 116,311 | 9.3 | % | (404,487 | ) | (347.8 | )% | |||||||||||||
| Other income, net | 197,232 | (15.6 | )% | 77,831 | 6.1 | % | 119,401 | 153.4 | % | |||||||||||||||
| Total (expenses) income, net | $ | (1,265,584 | ) | 100.0 | % | $ | 1,268,228 | 100.0 | % | $ | (2,533,812 | ) | (199.8 | )% | ||||||||||
Income from equity investment
Income from equity investment decreased by $171,368, or 100.0%, to nil for the six months ended March 31, 2026, from $171,368 for the six months ended March 31, 2025. The decrease was mainly due to the disposal of equity method investments prior to September 30, 2025.
Net investment (loss) gain from short-term investments
For
the six months ended March 31, 2026, we reported a net investment loss of $1,064,172, as opposed to a net investment gain of $826,153
for the six months ended March 31, 2025. The change was mainly due to the decrease in the fair value of common stocks that were publicly
traded on the Hong Kong Stock Exchange
(Loss) gain from disposal of property and equipment
For the six months ended March 31, 2026, the Company disposed of production equipment with net book value of RMB 2,066,784 ($294,590), received RMB 45,000 ($6,414) in cash and recognized a loss on disposal of RMB 2,021,784 ($288,176)
For the six months ended March 31, 2025, the Company disposed of production equipment with net book value of RMB 4,846,387 ($676,199), received RMB 5,680,000 ($792,510) in cash, and recognized a gain on disposal of RMB 833,613 ($116,311).
Other income, net
Other income, net increased by $119,401, or 153.4%, to $197,232 for the six months ended March 31, 2026, from $77,831 for the six months ended March 31, 2025. The increase was mainly due to the increase in government subsidies in the six months period ended March 31, 2026.
Income Taxes
Under the Enterprise Income Tax (“EIT”) Law of the PRC, domestic enterprises and Foreign Investment Enterprises (the “FIE”) are usually subject to a unified 25% EIT rate while preferential tax rates, tax holidays, and even tax exemptions may be granted on case-by-case basis. The PRC tax authorities grant preferential tax treatment to High and New Technology Enterprises (“HNTEs”). Under this preferential tax treatment, HNTEs are entitled to an income tax rate of 15%, subject to a requirement that they re-apply for HNTE status every three years. Since China Oil Blue Ocean was approved as an HNTE in December 2022, China Oil Blue Ocean is entitled to a reduced income tax rate of 15% beginning October 2022 and is able to enjoy the reduced income tax rate through October 2025. In October 2025, China Oil Blue Ocean renewed its HNTE certification for another three years. Since ZJY Technologies was approved as an HNTE in December 2022, ZJY Technologies is entitled to a reduced income tax rate of 15% beginning October 2022 and is able to enjoy the reduced income tax rate through October 2025. In December 2025, ZJY Technologies renewed its HNTE certification for another three years.
For the six months ended March 31, 2026 and 2025, our effective tax rates were 6.0% and (1.5)%, respectively. The increase in the effective tax rate was mainly due to the decrease in taxable income.
For the six months ended March 31, 2026, we reported an income tax benefit of $117,174 as opposed to an income tax expense of $14,635 in the comparable period of 2025. The variance is due mainly to higher net loss in the six months ended March 31, 2026.
Net Loss
As a result of the foregoing, our net loss for the six months ended March 31, 2026 and 2025 was $1,836,739 and $968,655, respectively. The Company is of the view that a continued net loss may pose pressure on its liquidity, but the Company has sufficient cash resources and has implemented measures to improve profitability and control costs. The Company will continue to monitor its liquidity and take necessary actions to ensure it can meet its obligations as they fall due.
Net loss attributable to non-controlling interests
Non-controlling interests are recognized to reflect the portion of net income that is not attributable, directly or indirectly, to the Company as the controlling shareholder.
For the six months ended March 31, 2025, non-controlling interests were $344,240, attributable to the minority shareholder’s 49% ownership interests in Sichuan Leishen Hongzhuo Energy Development Co., Ltd. (“Leishen Hongzhuo”), and Sichuan Huayou Huitong New Material Co., Ltd. (“Huayou Huitong”). The Company purchased non-controlling interests in Leishen Hongzhuo and Huayou Huitong in September and November 2025, respectively. For the six months ended March 31, 2026, the Company had no non-controlling interests.
Net loss attributable to Leishen Energy Holding Co., Ltd.
Net
loss attributable to Leishen Energy decreased by $1,212,324, or 194.2% from
Liquidity and Capital Resources
Presently, our principal sources of liquidity are generated from funds from our operations, bank loans and initial public offering. As of March 31, 2026 and September 30, 2025, we had cash of $10,249,822 and $10,159,656, respectively. Our current assets were $60,094,455 and $59,129,558 as of March 31, 2026 and September 30, 2025, respectively. Our current liabilities were $25,097,406 and $23,248,841 as of March 31, 2026 and September 30, 2025, respectively. Our current ratios as of March 31, 2026 and September 30, 2025 were 239.4% and 254.3%, respectively. Total equity as of March 31, 2026 and September 30, 2025 was $44,576,145 and $45,457,500 respectively.
As of March 31, 2026, we had outstanding bank loans of approximately $2.9 million. We also entered into operating leases for our factory. The following table sets forth our contractual obligations as of March 31, 2026:
| Payment Due by Period | ||||||||||||||||||||
| Less than | More than | |||||||||||||||||||
| Contractual Obligations | Total | 1 year | 1 – 3 years | 3 – 5 years | 5 years | |||||||||||||||
| Operating lease obligations | $ | 777,332 | $ | 111,486 | $ | 222,972 | $ | 222,972 | $ | 219,902 | ||||||||||
| Loan principal obligations | 2,890,424 | 2,890,424 | - | - | - | |||||||||||||||
| Total | $ | 3,667,756 | $ | 3,001,910 | $ | 222,972 | $ | 222,972 | $ | 219,902 | ||||||||||
On
December 20, 2024, we consummated our IPO and raised net proceeds of $5.4 million after deducting underwriting commission. In June 2026,
we filed a
With the uncertainty of the current market and macroeconomic conditions, our management believes it is necessary to enhance collection of outstanding accounts receivable and other receivables, and to be cautious on operational decisions and project selection. The Company reviews the accounts receivable on a periodic basis and makes general and specific allowances when there is doubt as to the collectability of individual balances. Our management is confident that the Company’s accounts receivable and other receivables are collectable.
Cash Flows Analysis
Six Months Ended March 31, 2026 Compared to Six Months Ended March 31, 2025
The following table sets forth a summary of our cash flows for the periods indicated:
| Six Months Ended March 31, | ||||||||
| 2026 | 2025 | |||||||
| (Unaudited) | (Unaudited) | |||||||
| Net cash provided by (used in) operating activities | $ | 730,075 | $ | (1,981,527 | ) | |||
| Net cash (used in) provided by investing activities | (391,698 | ) | 5,664,522 | |||||
| Net cash |
(369,265 | ) | 7,987,112 | |||||
| Effect of foreign exchange rate on cash and restricted cash | 187,225 | (176,524 | ) | |||||
| Net increase in cash and restricted cash | 156,337 | 11,493,583 | ||||||
| Cash at the beginning of the period | 10,160,587 | 7,301,014 | ||||||
| Cash at the end of the period | $ | 10,316,924 | $ | 18,794,597 | ||||
Operating Activities
Net cash provided by operating activities was $730,075 for the six months ended March 31, 2026. It was primarily due to the following:
| a) | Net loss of $1,836,739 for the six months; | |
| b) | Adjusted by loss on disposal of property and equipment of $288,176, fair value change of financial instruments of $1,121,746 and provision for expected credit losses of $2,145,919; | |
| c) | Accounts receivable and notes receivable increased by $2,516,543, due to customers deferring their payments in response to the challenging economic environment; | |
| d) | An increase in accounts payable of $1,412,546 due to our delayed payments to suppliers amid the economic downturn. | |
| e) | An increase in advance to suppliers of $660,631; | |
| f) | A decrease in inventory of $627,921 due to the goods in transit was accepted by our customers; | |
| g) | An increase in taxes payable of $735,390; | |
| h) | An increase in other assets of $523,355 due to an increase in VAT Credit to be deducted. |
Net cash used in operating activities was $1,981,527 for the six months ended March 31, 2025. It was primarily due to the following:
| a) | Net loss of $968,655 for the six months; | |
| b) | Adjusted by fair value change of financial instruments of $826,153, provision for expected credit losses of $3,317,683; | |
| c) | Accounts receivable and notes receivable increased by $1,064,864, due to customers deferring their payments in response to the challenging economic environment; | |
| d) | An increase in advance to suppliers of $2,176,850 due to more suppliers requiring payments in advance; | |
| e) | A decrease in inventory of $1,609,405 due to the goods in transit was accepted by our customers. | |
| f) | A decrease in accounts payable of $2,417,661 due to payment to our vendors; | |
| g) | A decrease in advance from customers of $937,625 due to fewer new orders in this period | |
| h) | A decrease in due to related parties of $1,620,234. |
Investing Activities
Net cash used in investing activities was $391,689 for the six months ended March 31, 2026. It was primarily due to: a) purchase of short-term investments of $16,921,805; b) purchase of long-term investments of $712,677; c) loan to a related party of $622,364; d) purchases of property and equipment of $157,843; and e) loans to third parties of $1,514,666. These were partially offset by: f) maturities of short-term investments of $18,052,936; and g) collection of $1,562,188 in loans receivable from third parties.
Net cash provided by investing activities was $5,664,522 for the six months ended March 31, 2025. It was primarily due to: a) maturities of short-term investments of $24,563,110; b) proceeds on disposal of property and equipment of $701,336; partially offset by: c) purchase of short-term investments of $17,231,516; d) loans to third parties of $2,299,751.
Financing Activities
Net cash used in financing activities was $369,265 for the six months ended March 31, 2026. We obtained borrowings of $2,850,708 via bank loans as working capital, which were offset by the repayment of approximately 3,107,272. In addition, we paid dividends of $70,142 and purchase non-controlling interest of $42,559.
Net
cash provided by financing activities was $7,987,112 for the six months ended March 31, 2025. We obtained net borrowings of $2,733,921
via bank loans as working capital, and
Loan Facilities
(1) On March 16, 2026, the Company obtained a loan of RMB 10 million ($1,445,212) from Industrial and Commercial Bank of China Beijing Yayuncun Sub-branch. The loan carries an annual interest of 2.35% and is due on March 15, 2027.
(2) On March 25, 2026, the Company obtained a loan of RMB 10 million ($1,445,212) from Industrial and Commercial Bank of China Beijing Yayuncun Sub-branch. The loan carries an annual interest of 2.35% and it is due on March 19, 2027.
Contingencies
From time to time, the Company may be subject to legal proceedings, claims and disputes that arise in the ordinary course of business. Amounts accrued, as well as the total amount of possible losses with respect to such matters, individually and in the aggregate, are not deemed to be material to the consolidated financial statements.
Contractual Obligations
The Company leases office spaces and factories under non-cancellable operating leases, with terms from 24 to 120 months.
On January 22, 2022, Sichuan Leishen Hongzhuo leased a vacant land from Chengdu Longxing Natural Gas Co., Ltd. for the construction of a natural gas recovery station, which complies with national land-use standards. The lease term is eleven years and the annual rent is RMB 133,745($19,329). On April 1, 2023, Sichuan TIBO Fluid Technology Co., Ltd. leased the factory at Shiliba Industrial Park, Xinshi Town, Jianyang City, Sichuan Province to China Oil Blue Ocean. The term is ten years and the rent is RMB6,440,367 ($930,770) in total. Future minimum lease payments are $111,486 for the 12 months ending March 31, 2027.
Off-Balance Sheet Arrangements
We have not entered into any financial guarantees or other commitments to guarantee the payment obligations of any third parties. In addition, we have not entered into any derivative contracts that are indexed to our own shares and classified as shareholders’ equity, or that are not reflected in our consolidated financial statements. Furthermore, we do not have any retained or contingent interest in assets transferred to an unconsolidated entity that serves as credit, liquidity, or market risk support to such entity. Moreover, we do not have any variable interest in an unconsolidated entity that provides financing, liquidity, market risk, or credit support to us or engages in leasing, hedging, or research and development services with us.
Critical Accounting Estimates
Our consolidated financial statements are prepared in accordance with accounting principles generally accepted in the U.S., which require us to make estimates and assumptions that affect the reported amounts of assets and liabilities. On an ongoing basis, we evaluate our estimates, including those estimates that may have a significant effect on our financial condition and results of operations. Our significant accounting policies are disclosed in Note 2 to our consolidated financial statements. We base our estimates and judgment on historical experience and on various other factors that are believed to be reasonable under the circumstances. Actual results may differ from these estimates under different assumptions or conditions.
We consider an accounting estimate to be critical if:
| (a) | the nature of the estimate is material due to the levels of subjectivity and judgment necessary to account for highly uncertain matters or the susceptibility of such matters to change; and |
| (b) | the impact of the estimate on financial condition or operating performance is material. |
Expected Credit Losses
The Company follows Accounting Standards Update 326, Credit Losses (“ASC 326”) to account for the related expected credit losses. In accordance with ASC 326, the Company maintains an allowance for credit losses and records the allowance for credit losses as an offset to assets such as accounts receivable, and the estimated credit losses charged to the allowance are presented in the consolidated statements of operations and comprehensive loss.
The Company assesses collectability by reviewing receivables on a collective basis where similar characteristics exist, primarily based on the size and nature of specific customer’s receivables (the “CECL model”). In determining the amount of the allowance for credit losses, the Company considers not only the input from its CECL model but also historical collectability based on past due status, the age of the receivable balances, credit quality of customers based on ongoing credit evaluations, current economic conditions, reasonable and supportable forecasts of future economic conditions, and other factors that may affect the Company’s ability to collect from customers. Actual credit losses and related allowance are written off as incurred.
There were no significant changes in the key assumptions of our CECL model throughout the periods presented.