UNITED STATES
SECURITIES AND EXCHANGE COMMISSION
Washington, D.C. 20549
FORM 8-K
CURRENT REPORT
PURSUANT TO SECTION 13 OR 15(d) OF THE
SECURITIES EXCHANGE ACT OF 1934
Date of Report (Date of earliest event reported): June 15, 2026
POWERFLEET, INC.
(Exact Name of Registrant as Specified in its Charter)
| Delaware | 001-39080 | 83-4366463 | ||
| (State or Other Jurisdiction
of Incorporation) |
(Commission File Number) |
(IRS Employer Identification No.) |
| 123 Tice Boulevard, Woodcliff Lake, New Jersey | 07677 | |
| (Address of Principal Executive Offices) | (Zip Code) |
Registrant’s telephone number, including area code (201) 996-9000
(Former name or former address, if changed since last report)
Check the appropriate box below if the Form 8-K filing is intended to simultaneously satisfy the filing obligation of the registrant under any of the following provisions (see General Instruction A.2. below):
| ☐ | Written communications pursuant to Rule 425 under the Securities Act (17 CFR 230.425) |
| ☐ | Soliciting material pursuant to Rule 14a-12 under the Exchange Act (17 CFR 240.14a-12) |
| ☐ | Pre-commencement communications pursuant to Rule 14d-2(b) under the Exchange Act (17 CFR 240.14d-2(b)) |
| ☐ | Pre-commencement communications pursuant to Rule 13e-4(c) under the Exchange Act (17 CFR 240.13e-4(c)) |
Securities registered pursuant to Section 12(b) of the Act:
| Title of each class | Trading Symbol(s) | Name of each exchange on which registered | ||
| Common Stock, par value $0.01 per share | AIOT | The Nasdaq Global Market |
Indicate by check mark whether the registrant is an emerging growth company as defined in Rule 405 of the Securities Act of 1933 (17 CFR §230.405) or Rule 12b-2 of the Securities Exchange Act of 1934 (17 CFR §240.12b-2).
Emerging growth company ☐
If an emerging growth company, indicate by check mark if the registrant has elected not to use the extended transition period for complying with any new or revised financial accounting standards provided pursuant to Section 13(a) of the Exchange Act. ☐
Item 2.02. Results of Operations and Financial Condition.
On June 15, 2026, Powerfleet, Inc. (the “Company”) issued a press release regarding financial results for the fourth quarter and fiscal year ended March 31, 2026. A copy of the press release is being furnished as Exhibit 99.1 to this Current Report on Form 8-K.
Item 7.01. Regulation FD Disclosure.
As previously announced, the Company will hold a conference call on June 15, 2026 at 8:30 a.m. Eastern time (5:30 a.m. Pacific time) to discuss the financial results for the fourth quarter and fiscal year ended March 31, 2026 and provide a business update. The slide presentation that will accompany the conference call is being furnished as Exhibit 99.2 to this Current Report on Form 8-K.
The information in this report is being furnished pursuant to Items 2.02 and 7.01 of Form 8-K. In accordance with General Instruction B.2. of Form 8-K, the information in this report, including Exhibits 99.1 and 99.2, shall not be deemed “filed” for the purposes of Section 18 of the Securities Exchange Act of 1934, as amended, or otherwise subject to the liability of that section, nor shall it be deemed incorporated by reference in any filing under the Securities Act of 1933, as amended, except as may be expressly set forth by specific reference in such a filing.
Cautionary Note Regarding Forward-Looking Statements
This report, including Exhibits 99.1 and 99.2, contains forward-looking statements within the meaning of federal securities laws. The Company’s actual results may differ from its expectations, estimates and projections and consequently, you should not rely on these forward-looking statements as predictions of future events. Forward-looking statements may be identified by words such as “expect,” “estimate,” “project,” “budget,” “forecast,” “anticipate,” “intend,” “plan,” “may,” “will,” “could,” “should,” “believes,” “predicts,” “potential,” “continue,” and similar expressions. These forward-looking statements include, without limitation, the Company’s expectations with respect to its beliefs, plans, goals, objectives, expectations, anticipations, assumptions, estimates, intentions and future performance, as well as the Company’s financial outlook and guidance for fiscal 2027 and the anticipated financial impacts of recent business combinations and acquisitions. Forward-looking statements involve significant known and unknown risks, uncertainties and other factors, which may cause their actual results, performance or achievements to be materially different from the future results, performance or achievements expressed or implied by such forward-looking statements. All statements other than statements of historical fact are statements that could be forward-looking statements. Most of these factors are outside the Company’s control and are difficult to predict. The risks and uncertainties referred to above include, but are not limited to, risks related to: (i) the possibility that the Company may not fully realize the anticipated benefits of its acquisitions and ongoing business transformation initiatives; (ii) significant losses, accumulated deficits and an inability to achieve or sustain profitability; (iii) future global economic, political and business conditions, including inflation, interest rate increases, foreign exchange instability, geopolitical conflicts, sanctions, export controls and the potential imposition of tariffs; (iv) the commercial, financial, reputational and regulatory risks to the Company’s business associated with operating across multiple geographies, including exposure to foreign exchange fluctuations and economic instability in certain emerging markets; (v) disruptions in the Company’s global supply chain, performance issues or failures by subcontractors, and reliance on a limited number of suppliers for critical components and services; (vi) the loss of any of the Company’s key customers, reductions in customer demand or purchasing levels, and reliance on third-party channel partner relationships, including telecommunication companies and regional distributors; (vii) changes in technology, products and customer expectations, which may be more rapid, costly or difficult to address, or less effective, than anticipated; (viii) risks associated with the deployment and use of artificial intelligence and machine learning technologies, including operational, legal, regulatory and reputational risks arising from their development, use or outputs; (ix) potential breaches, disruptions or failures of the Company’s information technology systems, including risks that could impair operations, customer access to services, or vendor and customer relationships; (x) our inability to adequately protect the Company’s intellectual property rights or defend against third-party intellectual property claims; (xi) the Company’s ability to obtain additional capital to fund its operations; and (xii) such other factors as are set forth in the periodic reports filed by the Company with the Securities and Exchange Commission (“SEC”), including but not limited to those described under the heading “Risk Factors” in its annual reports on Form 10-K, quarterly reports on Form 10-Q and any other filings made with the SEC from time to time, which are available via the SEC’s website at http://www.sec.gov. Should one or more of these risks or uncertainties materialize, or should underlying assumptions prove to be incorrect, actual results may vary materially from those indicated or anticipated by these forward-looking statements. Therefore, you should not rely on any of these forward-looking statements.
The forward-looking statements included in this report are made only as of the date of this report, and except as otherwise required by applicable securities law, the Company assumes no obligation, nor does the Company intend to publicly update or revise any forward-looking statements to reflect subsequent events or circumstances.
Item 9.01. Financial Statements and Exhibits.
(d) Exhibits.
| Exhibit No. | Description | |
| 99.1 | Press release, dated June 15, 2026. | |
| 99.2 | Slide presentation, dated June 15, 2026. | |
| 104 | Cover Page Interactive Data File (embedded within the Inline XBRL document). |
SIGNATURE
Pursuant to the requirements of the Securities Exchange Act of 1934, the registrant has duly caused this report to be signed on its behalf by the undersigned hereunto duly authorized.
| POWERFLEET, INC. | ||
| By: | /s/ David Wilson | |
| Name: | David Wilson | |
| Title: | Chief Financial Officer | |
Date: June 15, 2026
Exhibit 99.1
Powerfleet Reports Results for Fourth Quarter and Full-Year Fiscal 2026
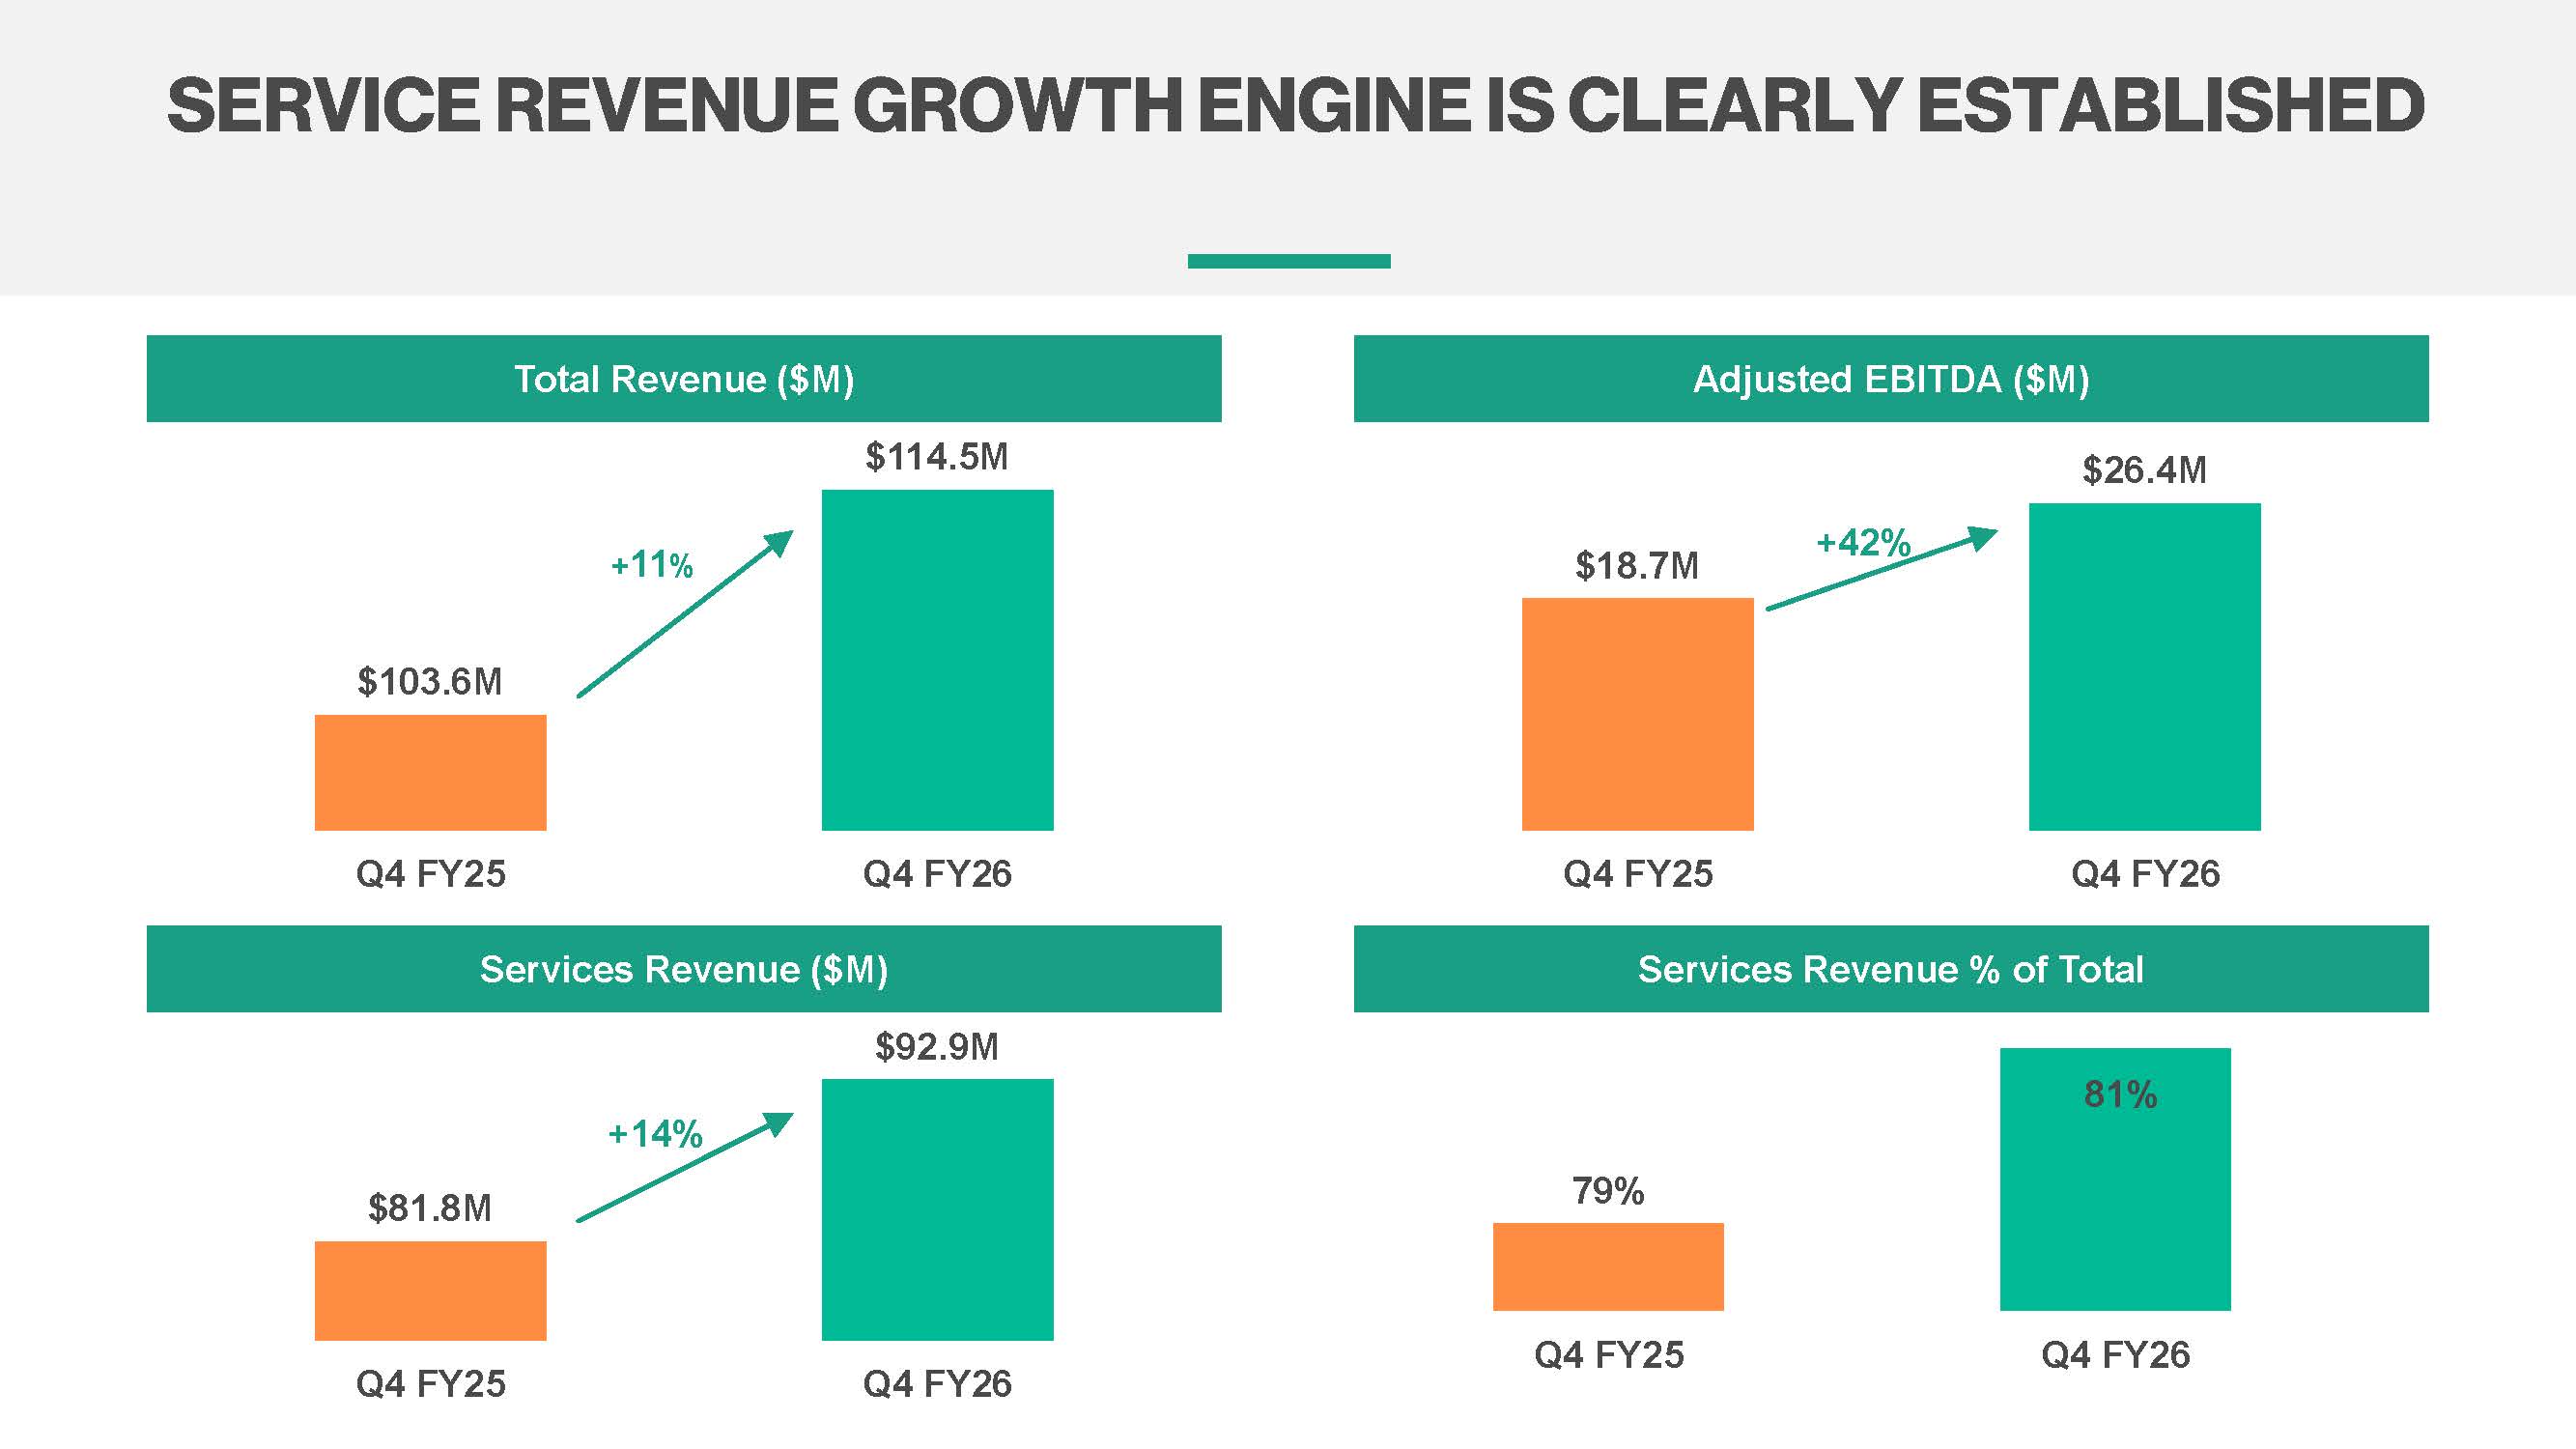
| ● | Revenue of $114.5 million for the fourth quarter, increased 11% year-over-year, driven by services revenue of $92.9 million, up 14% |
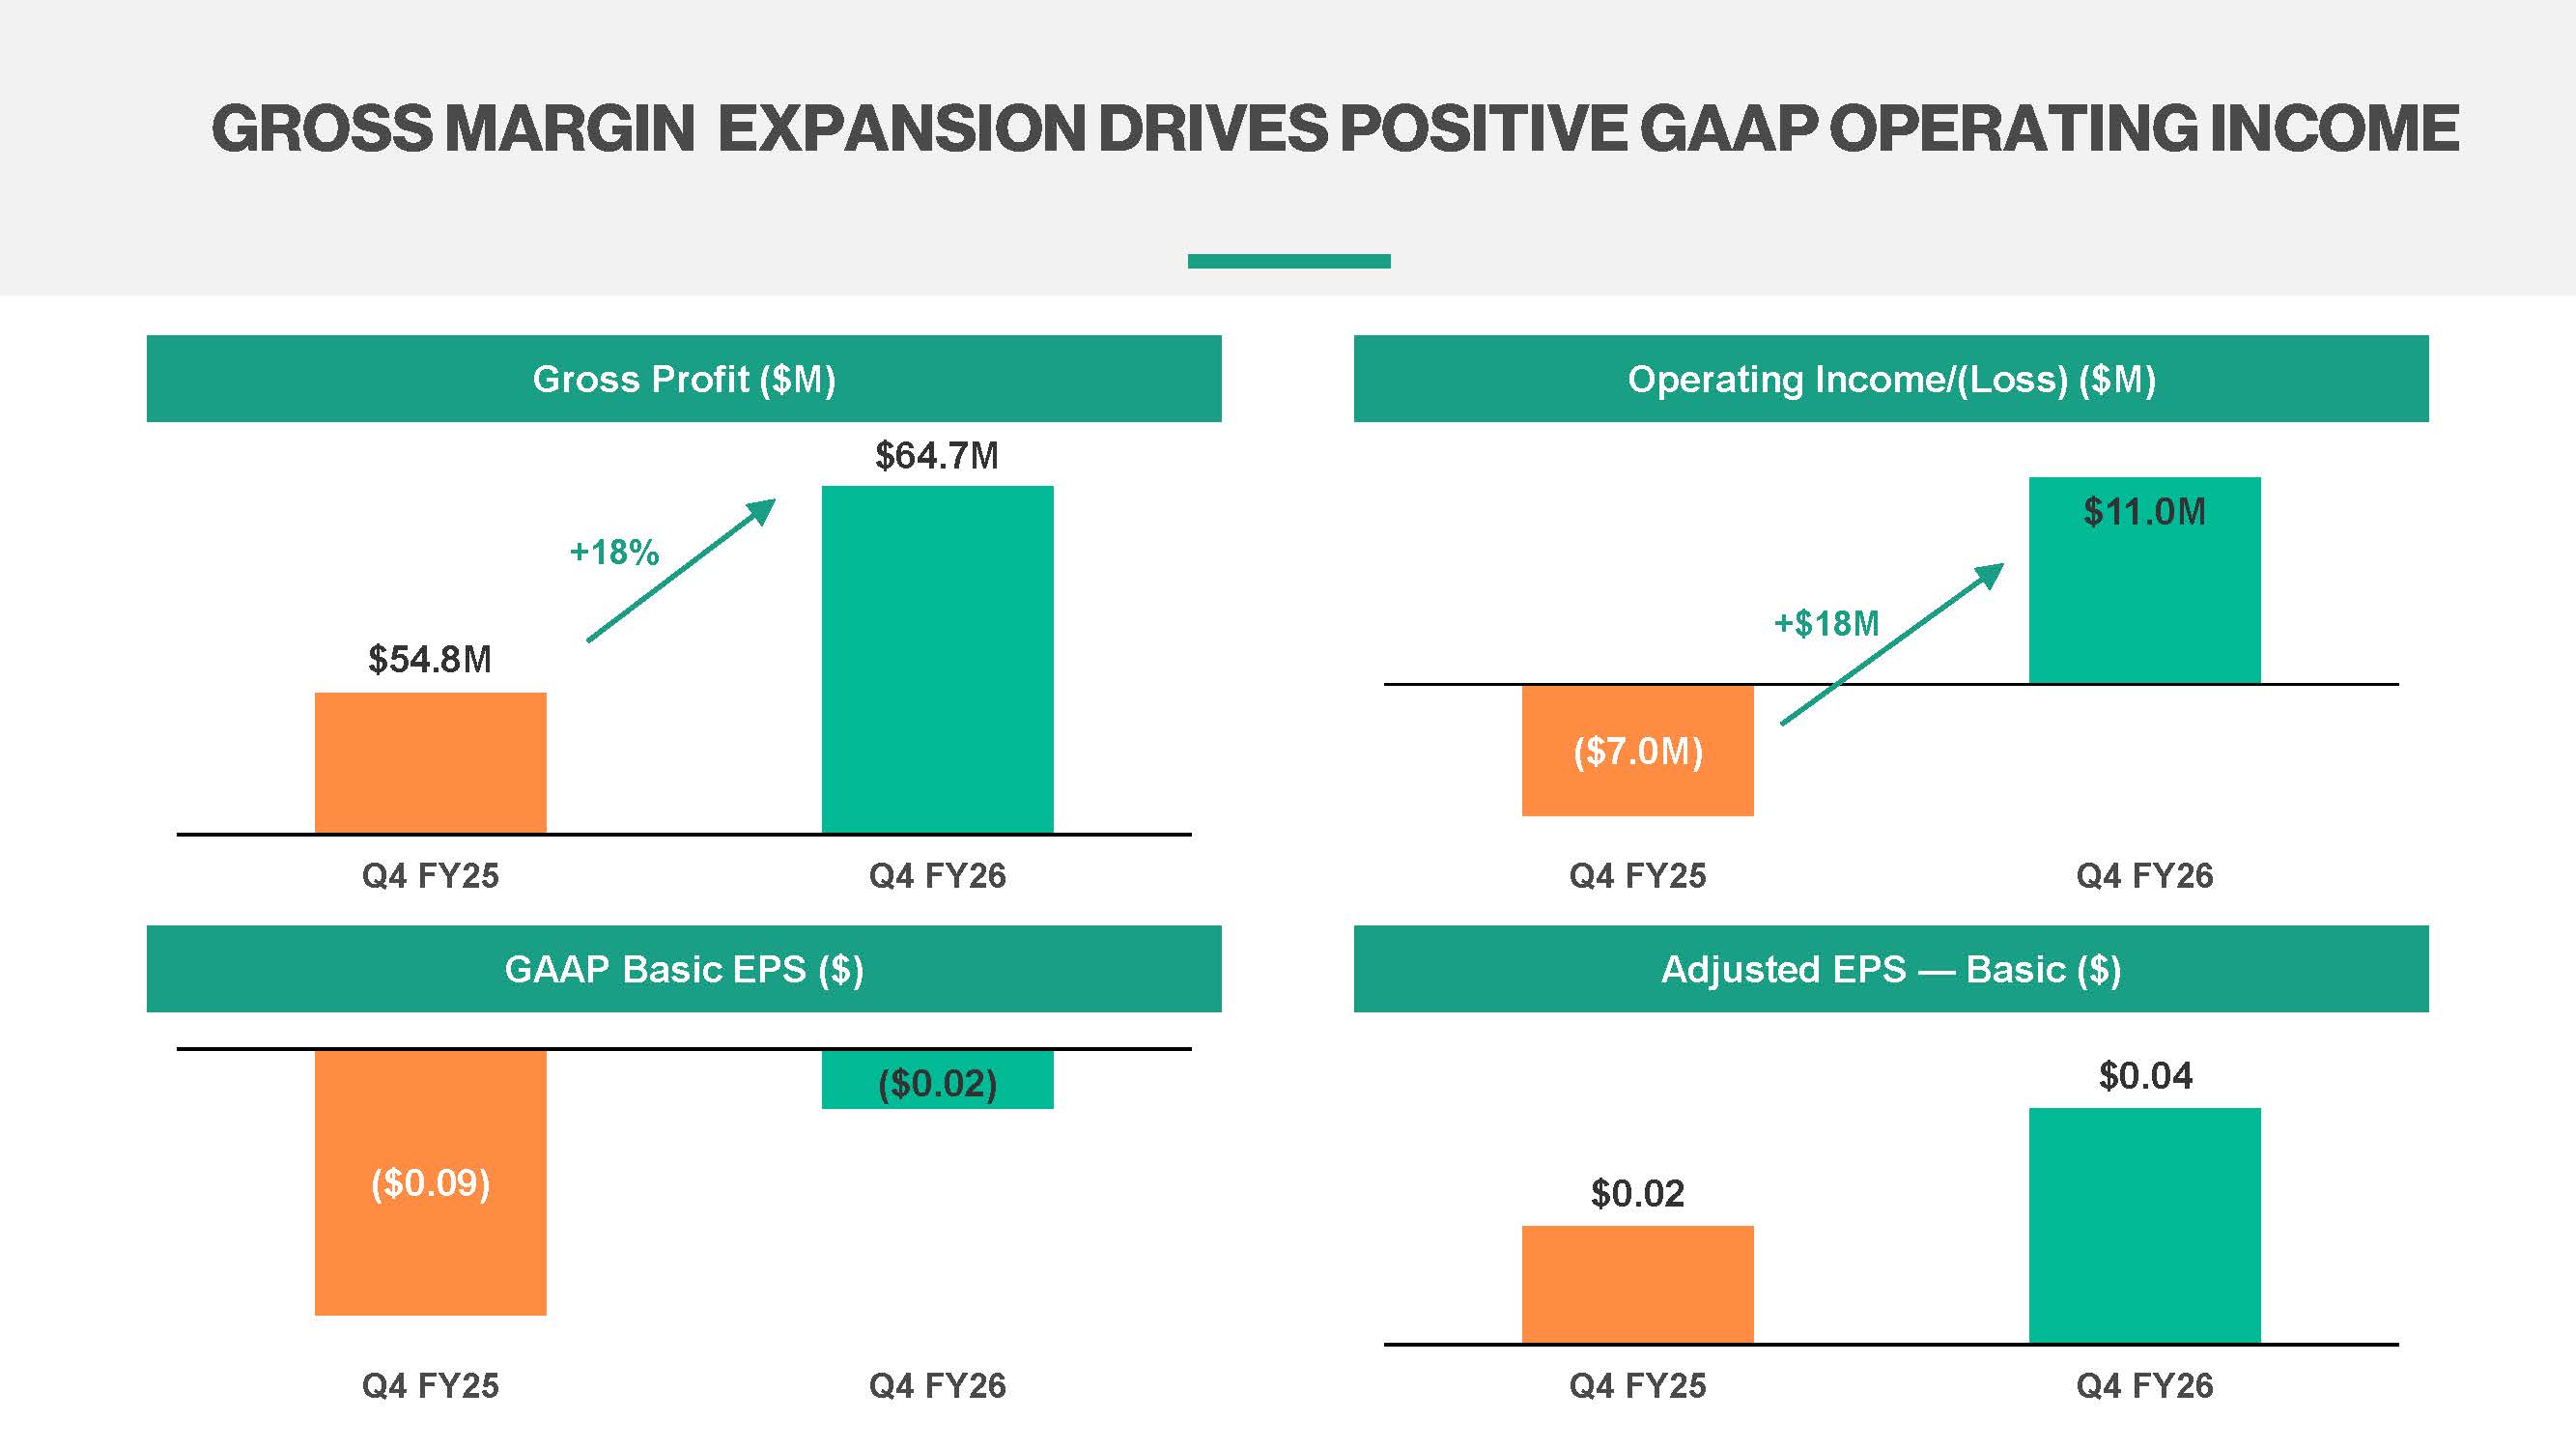
| ● | Fourth quarter income from operations improved to $11.0 million from a $7.0 million loss in the prior-year quarter, while net loss improved 78% to $2.7 million |
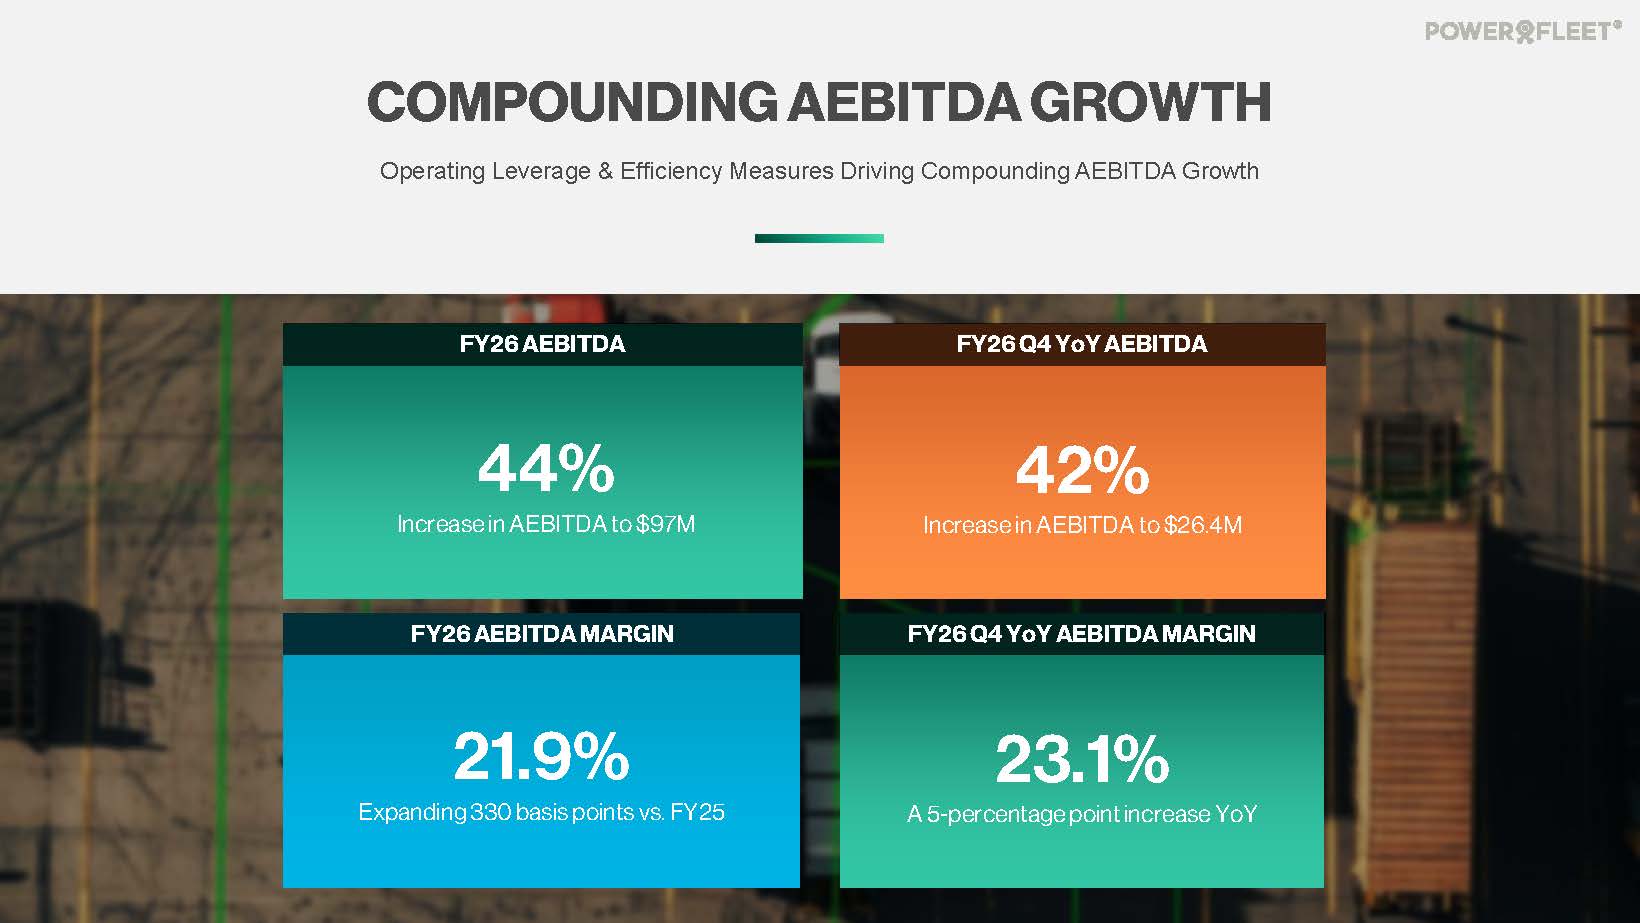
| ● | Adjusted EBITDA of $26.4 million for the fourth quarter, up 42% year-over-year, with a margin of 23% |
| ● | Signed a landmark South African National Treasury five-year agreement anticipated to deliver $100 million to $120 million in total contract value |
WOODCLIFF LAKE, N.J., June 15, 2026 /PRNewswire/ — Powerfleet, Inc. (“Powerfleet” or the “Company”) (Nasdaq: AIOT), a global leader in the artificial intelligence of things (AIoT) software-as-a-service (SaaS) mobile asset industry, today reported its financial results for the fourth quarter and fiscal year ended March 31, 2026.
“Fiscal 2026 was a defining year for the business. We delivered on our objectives to accelerate growth, compound profitability, and establish a consistent, growing cash flow profile—driving 14% growth in high margin services revenue in the fourth quarter of fiscal 2026, increasing adjusted EBITDA by 42% in the same period, and generating positive free cash flow in the second half of the year,” said Powerfleet CEO Steve Towe. “We are entering fiscal 2027 as a stronger, more focused company with clear visibility into the next phase of our growth. With second-half fiscal 2026 free cash flow improving by $17.8 million, we expect to generate more than $30 million of free cash flow in fiscal 2027, with continued expansion expected in fiscal 2028 as revenue growth, margin improvement, and organic operating leverage compounds.”
Results for Fourth Quarter Fiscal 2026 Compared to Fourth Quarter Fiscal 2025
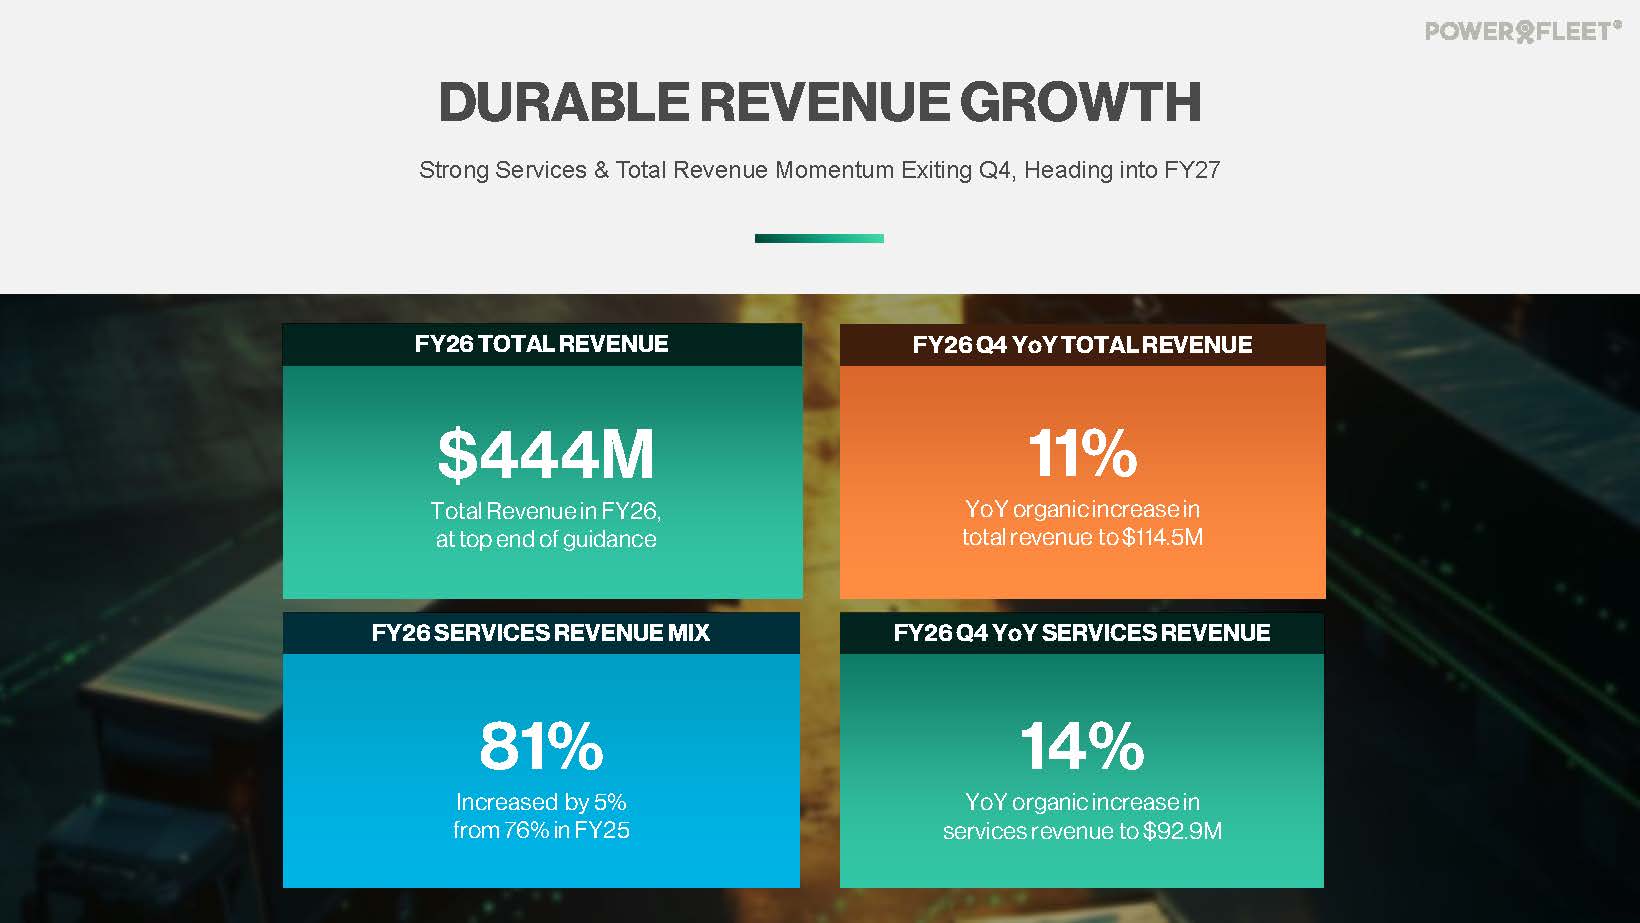
| ● | Revenue increased 11% to $114.5 million |
| ● | Services revenue increased 14% to $92.9 million |
| ● | Gross margin increased to 56.5% from 52.8% in the prior-year quarter |
| ● | Net loss improved 78% to $2.7 million, and loss per share improved by 7 cents to $(0.02) from $(0.09) in the prior-year quarter |
Non-GAAP Results for Fourth Quarter Fiscal 2026 Compared to Fourth Quarter Fiscal 2025
| ● | Adjusted EBITDA increased 42% to $26.4 million, with margins expanding by 5% to 23% |
| ● | Adjusted net income increased 102% to $5.6 million and, on a per share basis, doubled to $0.04 per share |
|
|
Results for Fiscal 2026 Compared to Fiscal 2025
| ● | Revenue increased 22% to $443.8 million, at the top of the guidance range |
| ● | Services revenue increased 30% to $359.8 million |
| ● | Gross margin increased 180 basis points to 55.5% |
| ● | Net loss improved 60% to $20.6 million, or $(0.15) per share, compared to $(0.43) |
| ● | Operating cash flow increased to $30.5 million from $(3.3) million in fiscal 2025, while continuing to invest in growth through capitalized software development costs of $18.5 million and capital expenditures of $21.6 million. |
| ● | Total outstanding debt was $280.0 million and cash, cash equivalents, and restricted cash was $40.8 million |
Non-GAAP Results for Fiscal 2026 Compared to Fiscal 2025
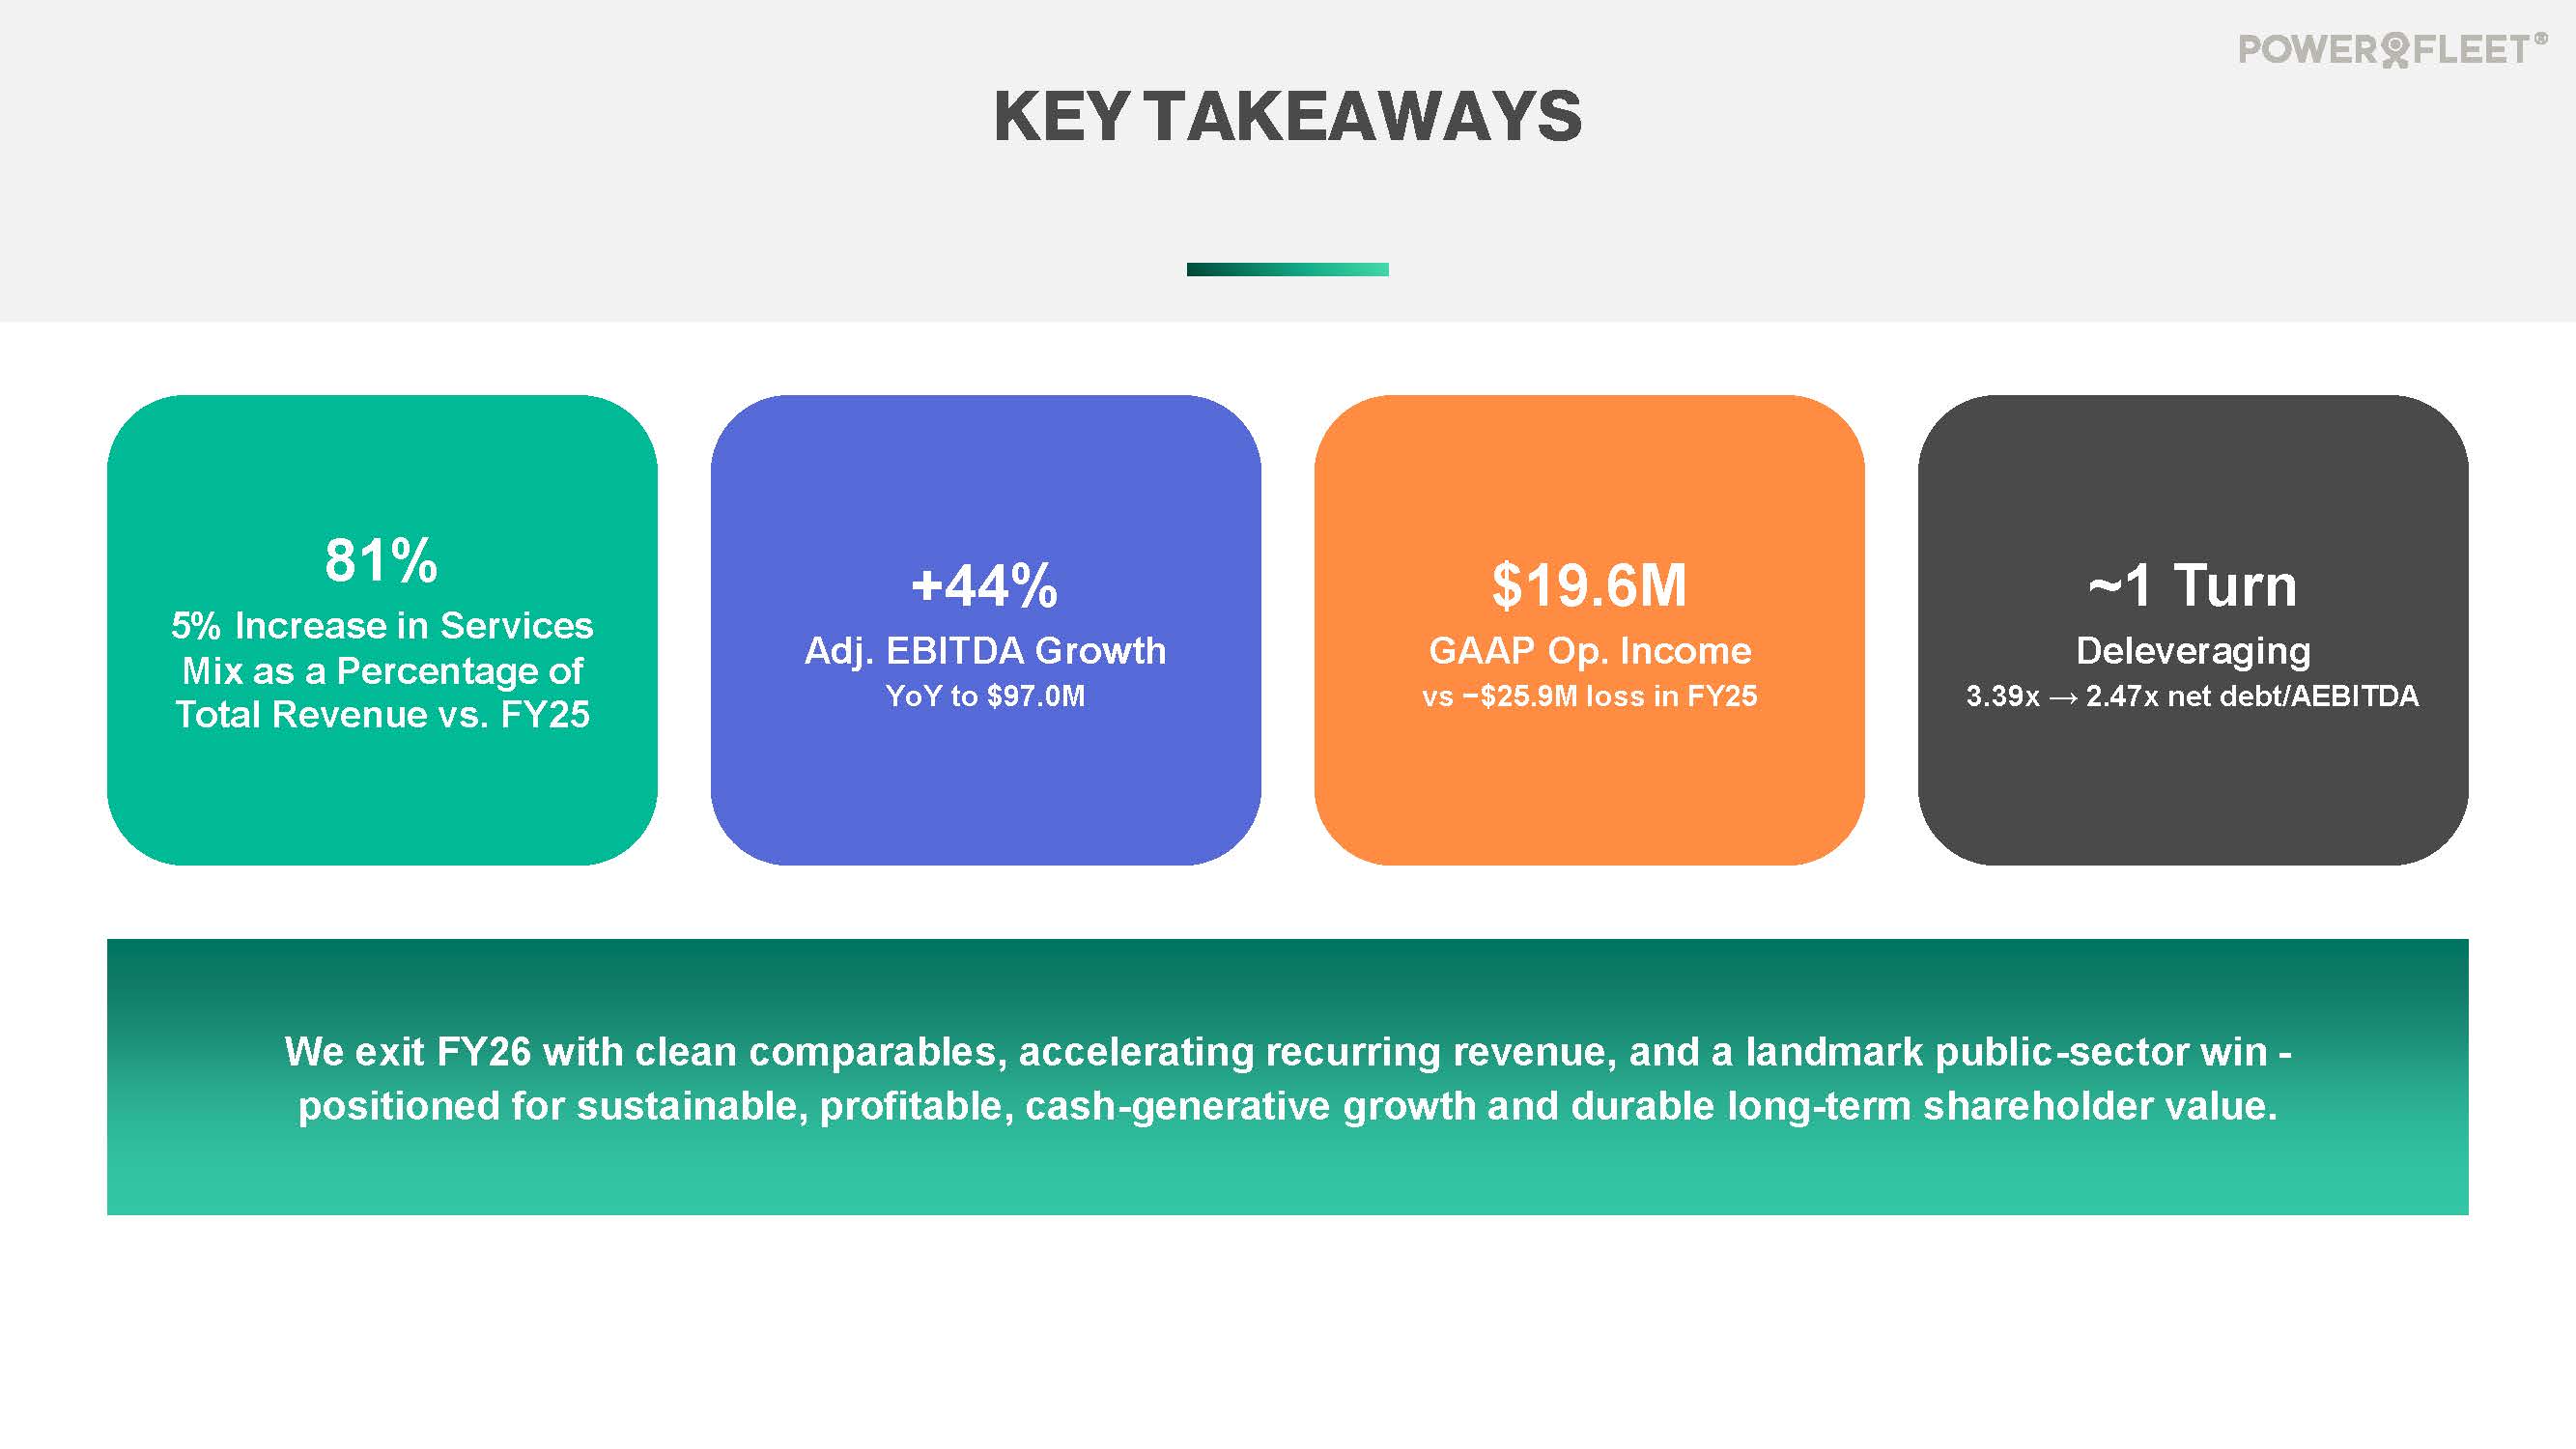
| ● | Adjusted EBITDA increased 44% to $97.0 million, with margin expanding to 22% |
| ● | Adjusted net income increased 118% to $11.3 million and, on a per share basis, doubled to $0.08 |
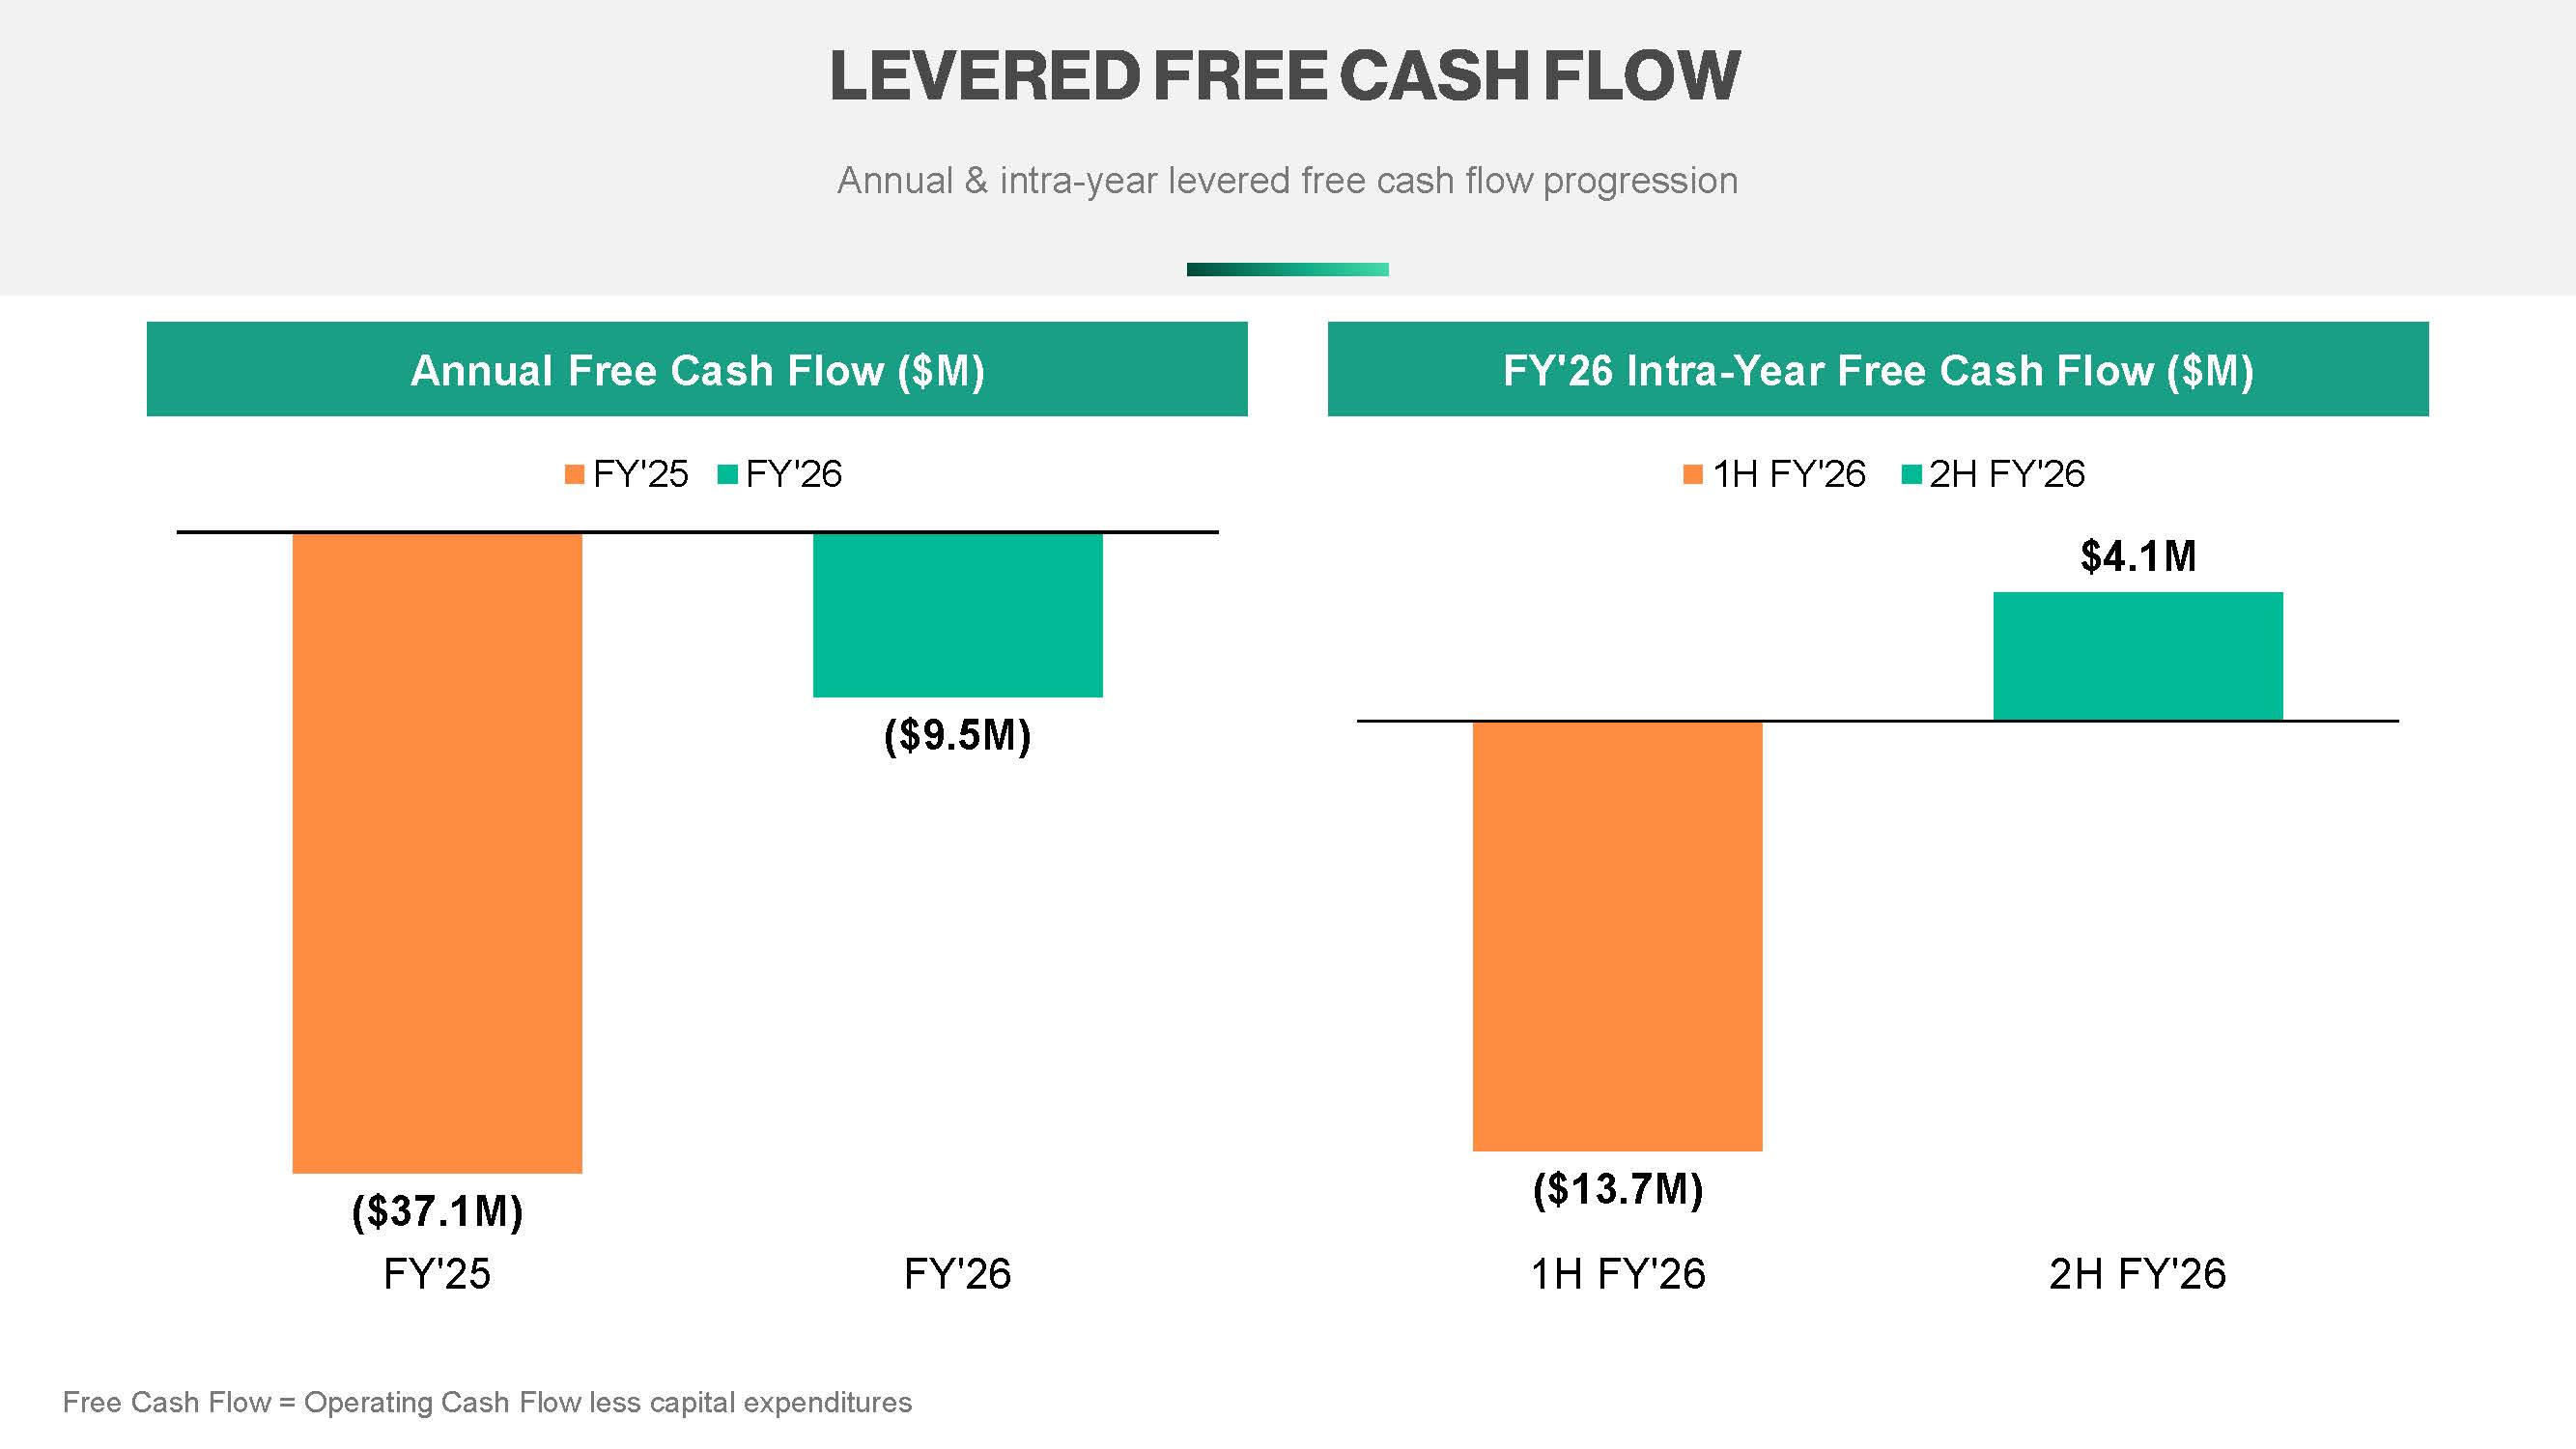
| ● | Free cash flow improved $17.8 million in the second half of fiscal 2026, from a use of cash of $13.7 million in the first half to cash generation of $4.1 million in the second half. |
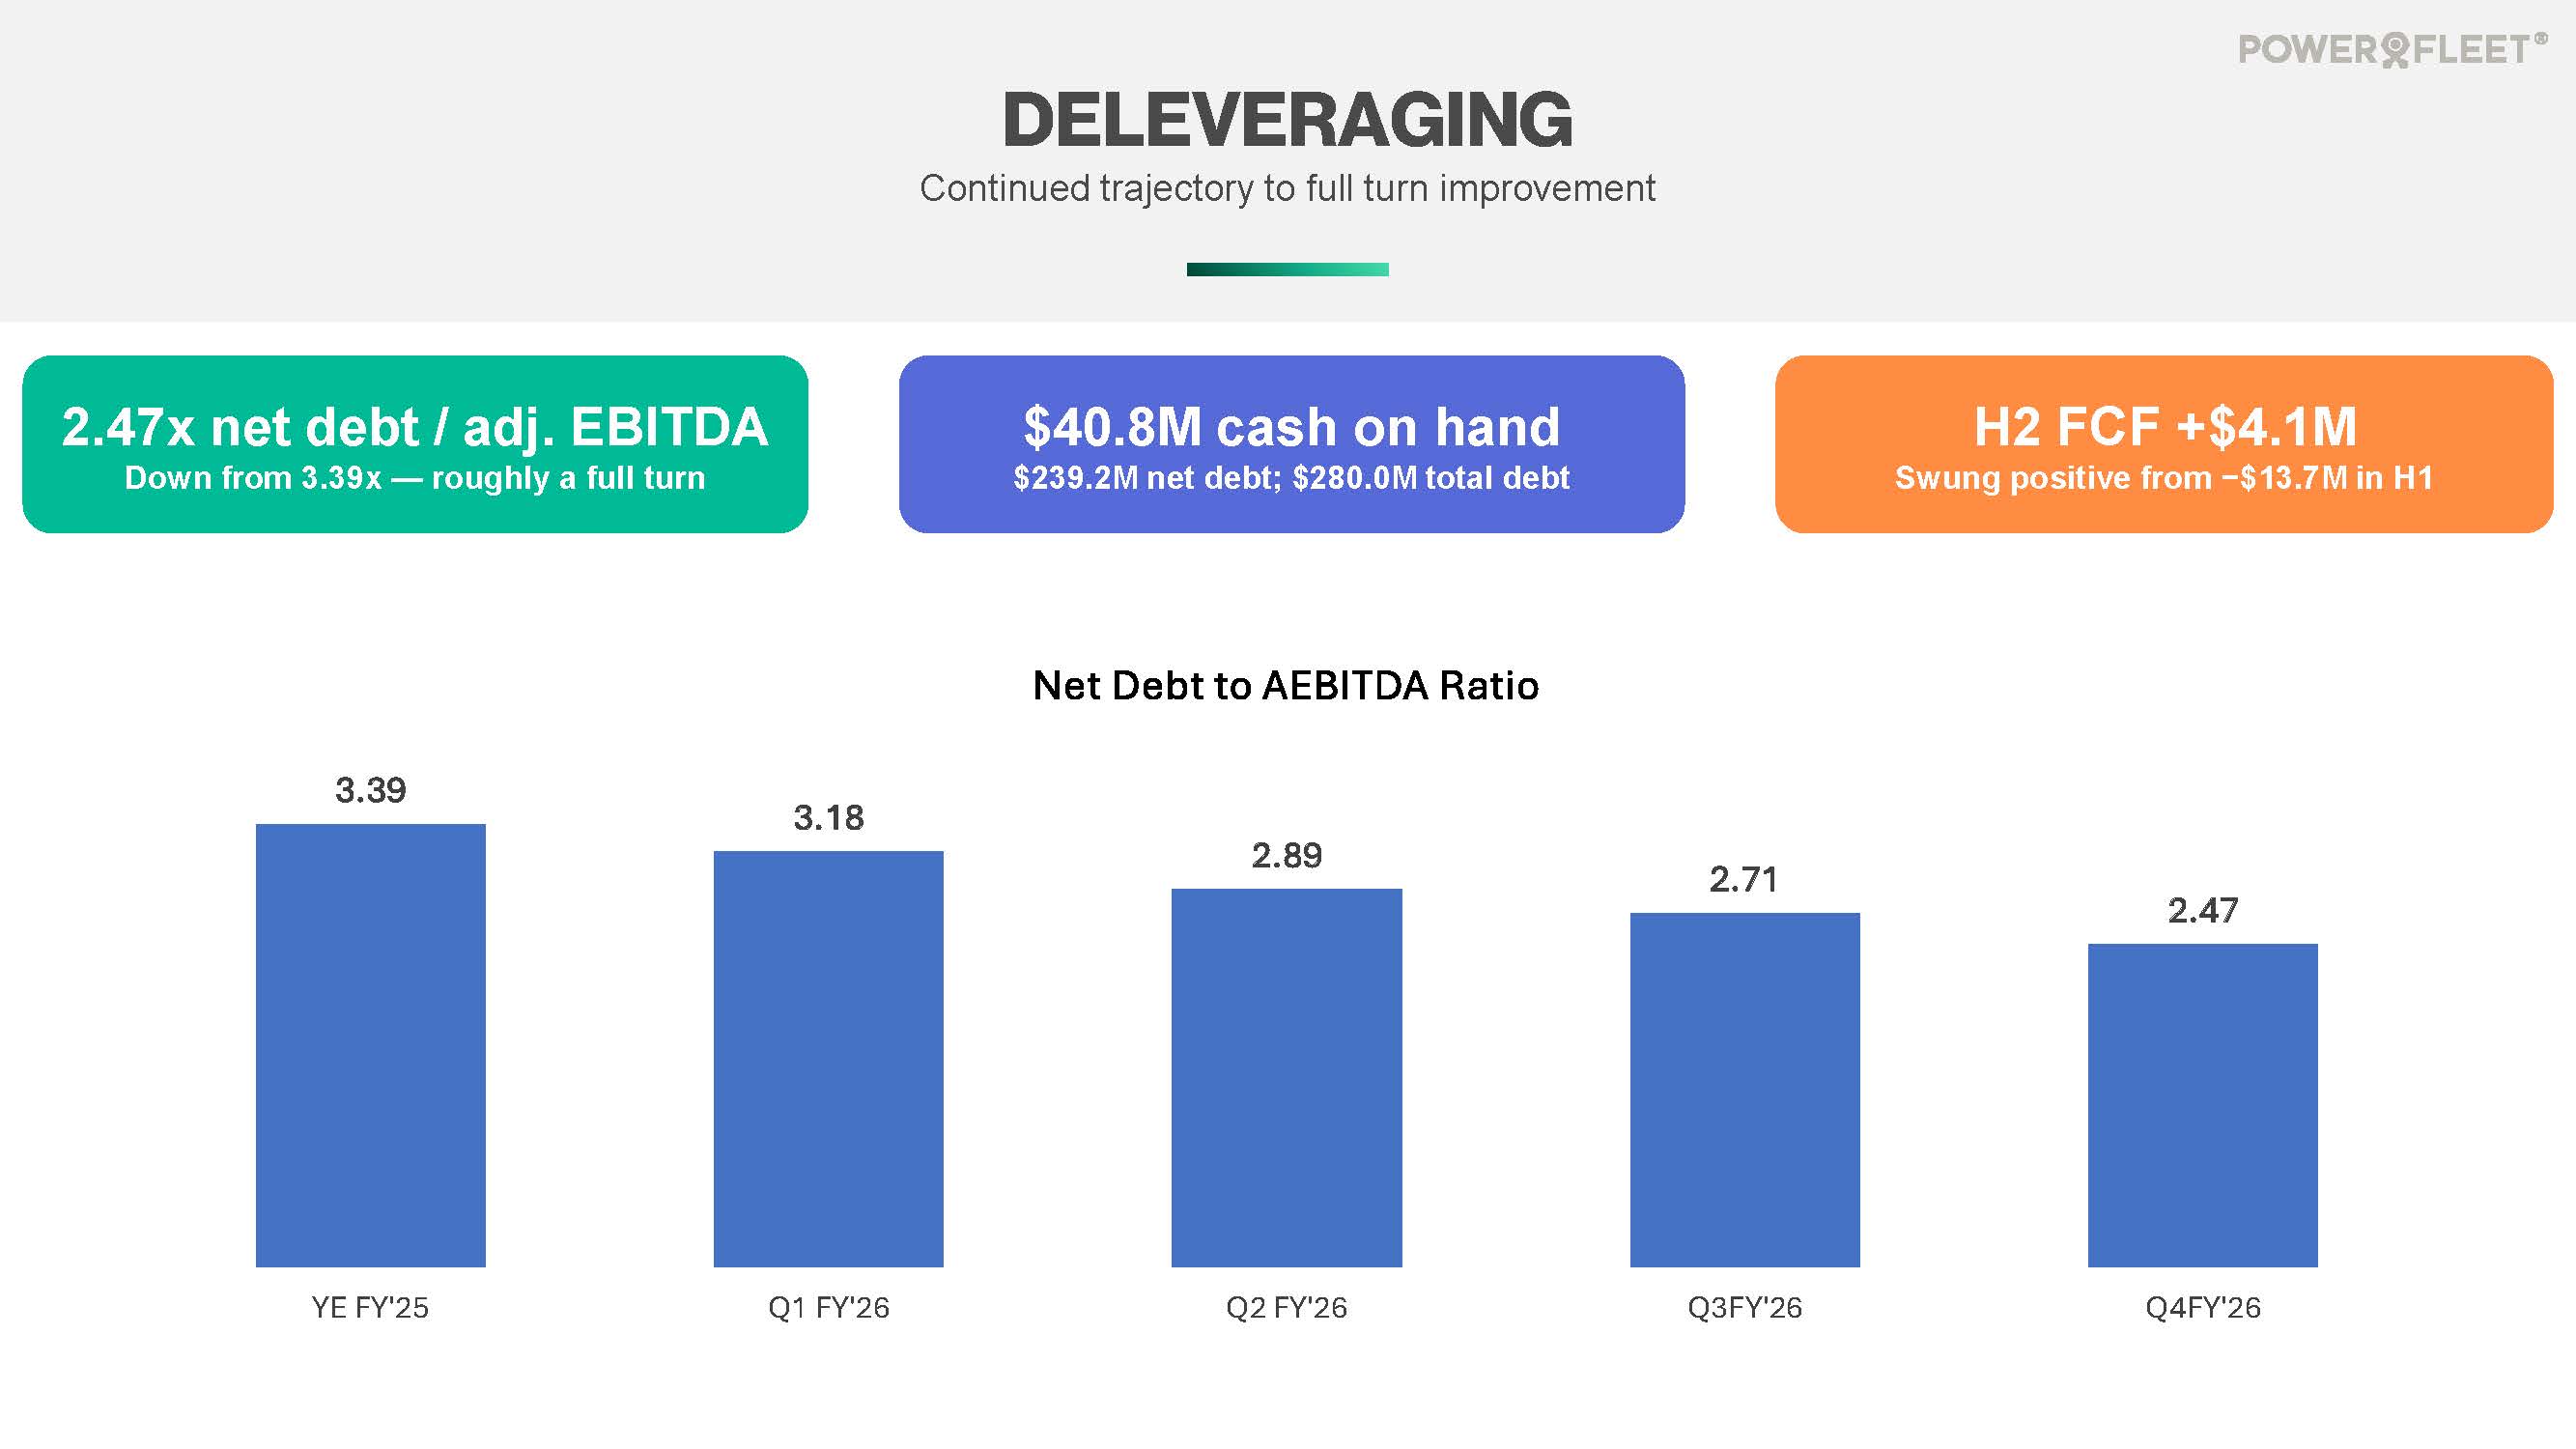
| ● | Total debt, net of cash, cash equivalents, and restricted cash, was $239.2 million. Adjusted net debt to trailing 12-month adjusted EBITDA was 2.47x, representing nearly one turn of improvement from the prior year. |
Discussion of Fourth Quarter Results
Revenue for the quarter totaled $114.5 million, an 11% increase from $103.6 million in the fourth quarter of fiscal 2025, driven primarily by 14% growth in high-margin services revenue, which represented more than 81% of total revenue. Gross profit was $64.7 million, and gross margin expanded 370 basis points to 56.5% from 52.8% in the prior-year quarter, reflecting the increasing mix of higher-margin services revenue and improving services gross margins.
Income from operations was $11.0 million, an approximately 10% operating margin, compared with an operating loss of $7.0 million in the prior-year quarter. GAAP net loss improved to $2.7 million, or $(0.02) per basic share, from a net loss of $12.4 million, or $(0.09) per basic share, in the prior-year quarter.
Adjusted EBITDA, a non-GAAP measure, was $26.4 million in the fourth quarter, a 42% increase from $18.7 million in the prior-year quarter, with adjusted EBITDA margin expanding to 23.1% from 18.0%. The improvement reflects the increasing contribution of high-margin services revenue, realized cost synergies, and disciplined operating expense management. A reconciliation of adjusted EBITDA to GAAP net loss, the most directly comparable GAAP measure, is provided in the tables below.
|
|
Balance Sheet and Capital Resources
As of March 31, 2026, the Company’s total available liquidity was $63.6 million, comprising cash and cash equivalents of $36.5 million, and available borrowing capacity of $27.1 million under the Company’s existing revolving credit facilities. Total outstanding debt was $280.0 million, and net debt (net of cash, cash equivalents, and restricted cash) was $239.2 million. Net debt to trailing 12-month adjusted EBITDA ratio was 2.47x, an improvement from 3.39x as of March 31, 2025.
Business Highlights
| ● | Secured the three largest individual contracts in the Company’s history, including individual $10 million+ TCV contracts with a top three global food & beverage and a global manufacturing enterprise. |
| ● | Signed a landmark agreement with the South African National Treasury to deploy Unity safety solutions, with an anticipated total contract value of $100 million to $120 million over a minimum five-year term and with revenue expected to ramp over the next 18 months. |
| ● | Grew high-quality strategic revenue segments, led by enterprise-grade Unity safety solutions for onsite and AI video on-road applications, with the onsite segment growing 39% in the fourth quarter driven by strong North America sales execution and serving as a key land-and-expand entry point into enterprise mobile operations. |
| ● | Delivered on the adjusted EBITDA expansion cost synergy targets related to business combinations and acquisitions, achieving more than $18 million of annual savings in fiscal 2026 and exiting the year with total realized synergy savings of $34 million over the past two years. |
| ● | Scaled the Unity platform to nearly three million subscribers across 50,000 customers, supported by a differentiated distribution network of more than 350 partners, including AT&T, TELUS, MTN, Telstra, and Accenture, reinforcing the Company’s competitive moat. |
Financial Outlook
The Company’s outlook reflects increased momentum exiting the fourth quarter of fiscal 2026 and implies continued double-digit revenue growth at the midpoint of the guidance range, along with further Adjusted EBITDA margin expansion.
|
|
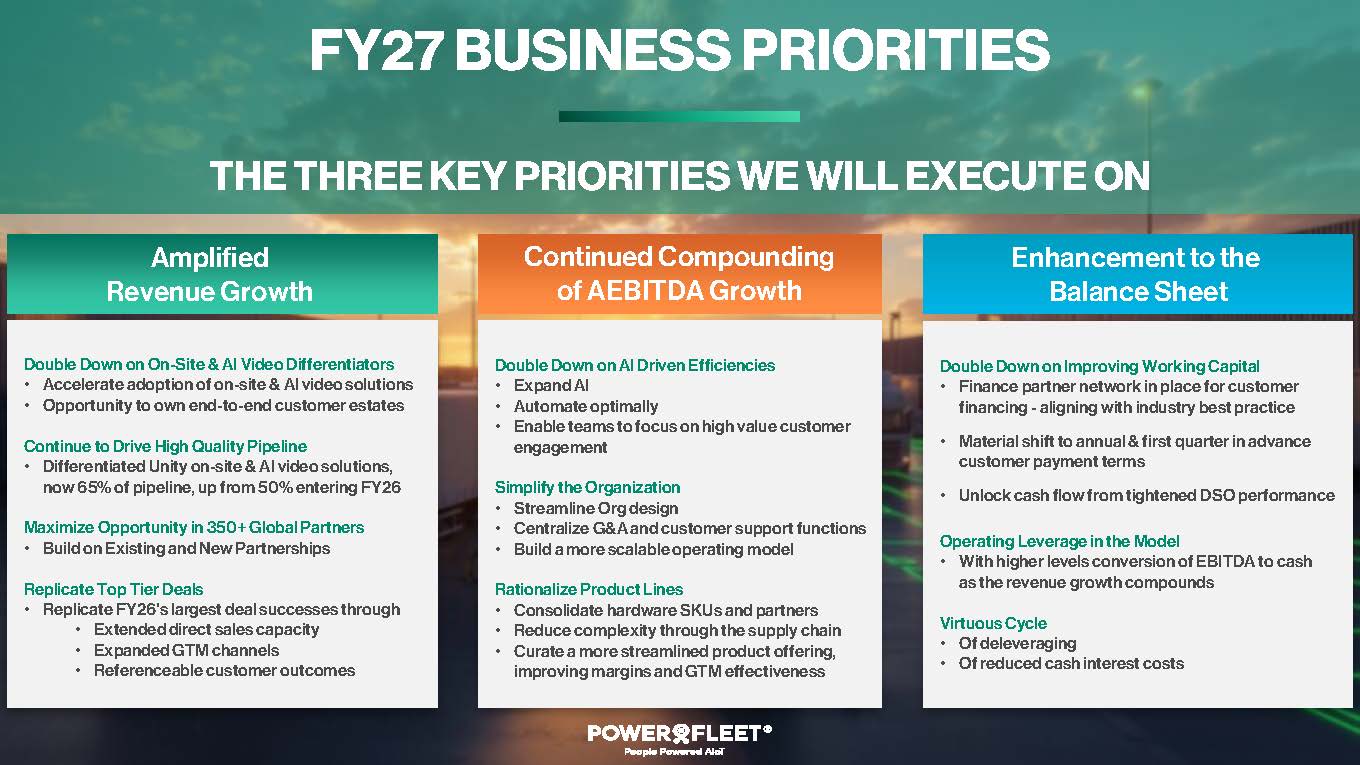
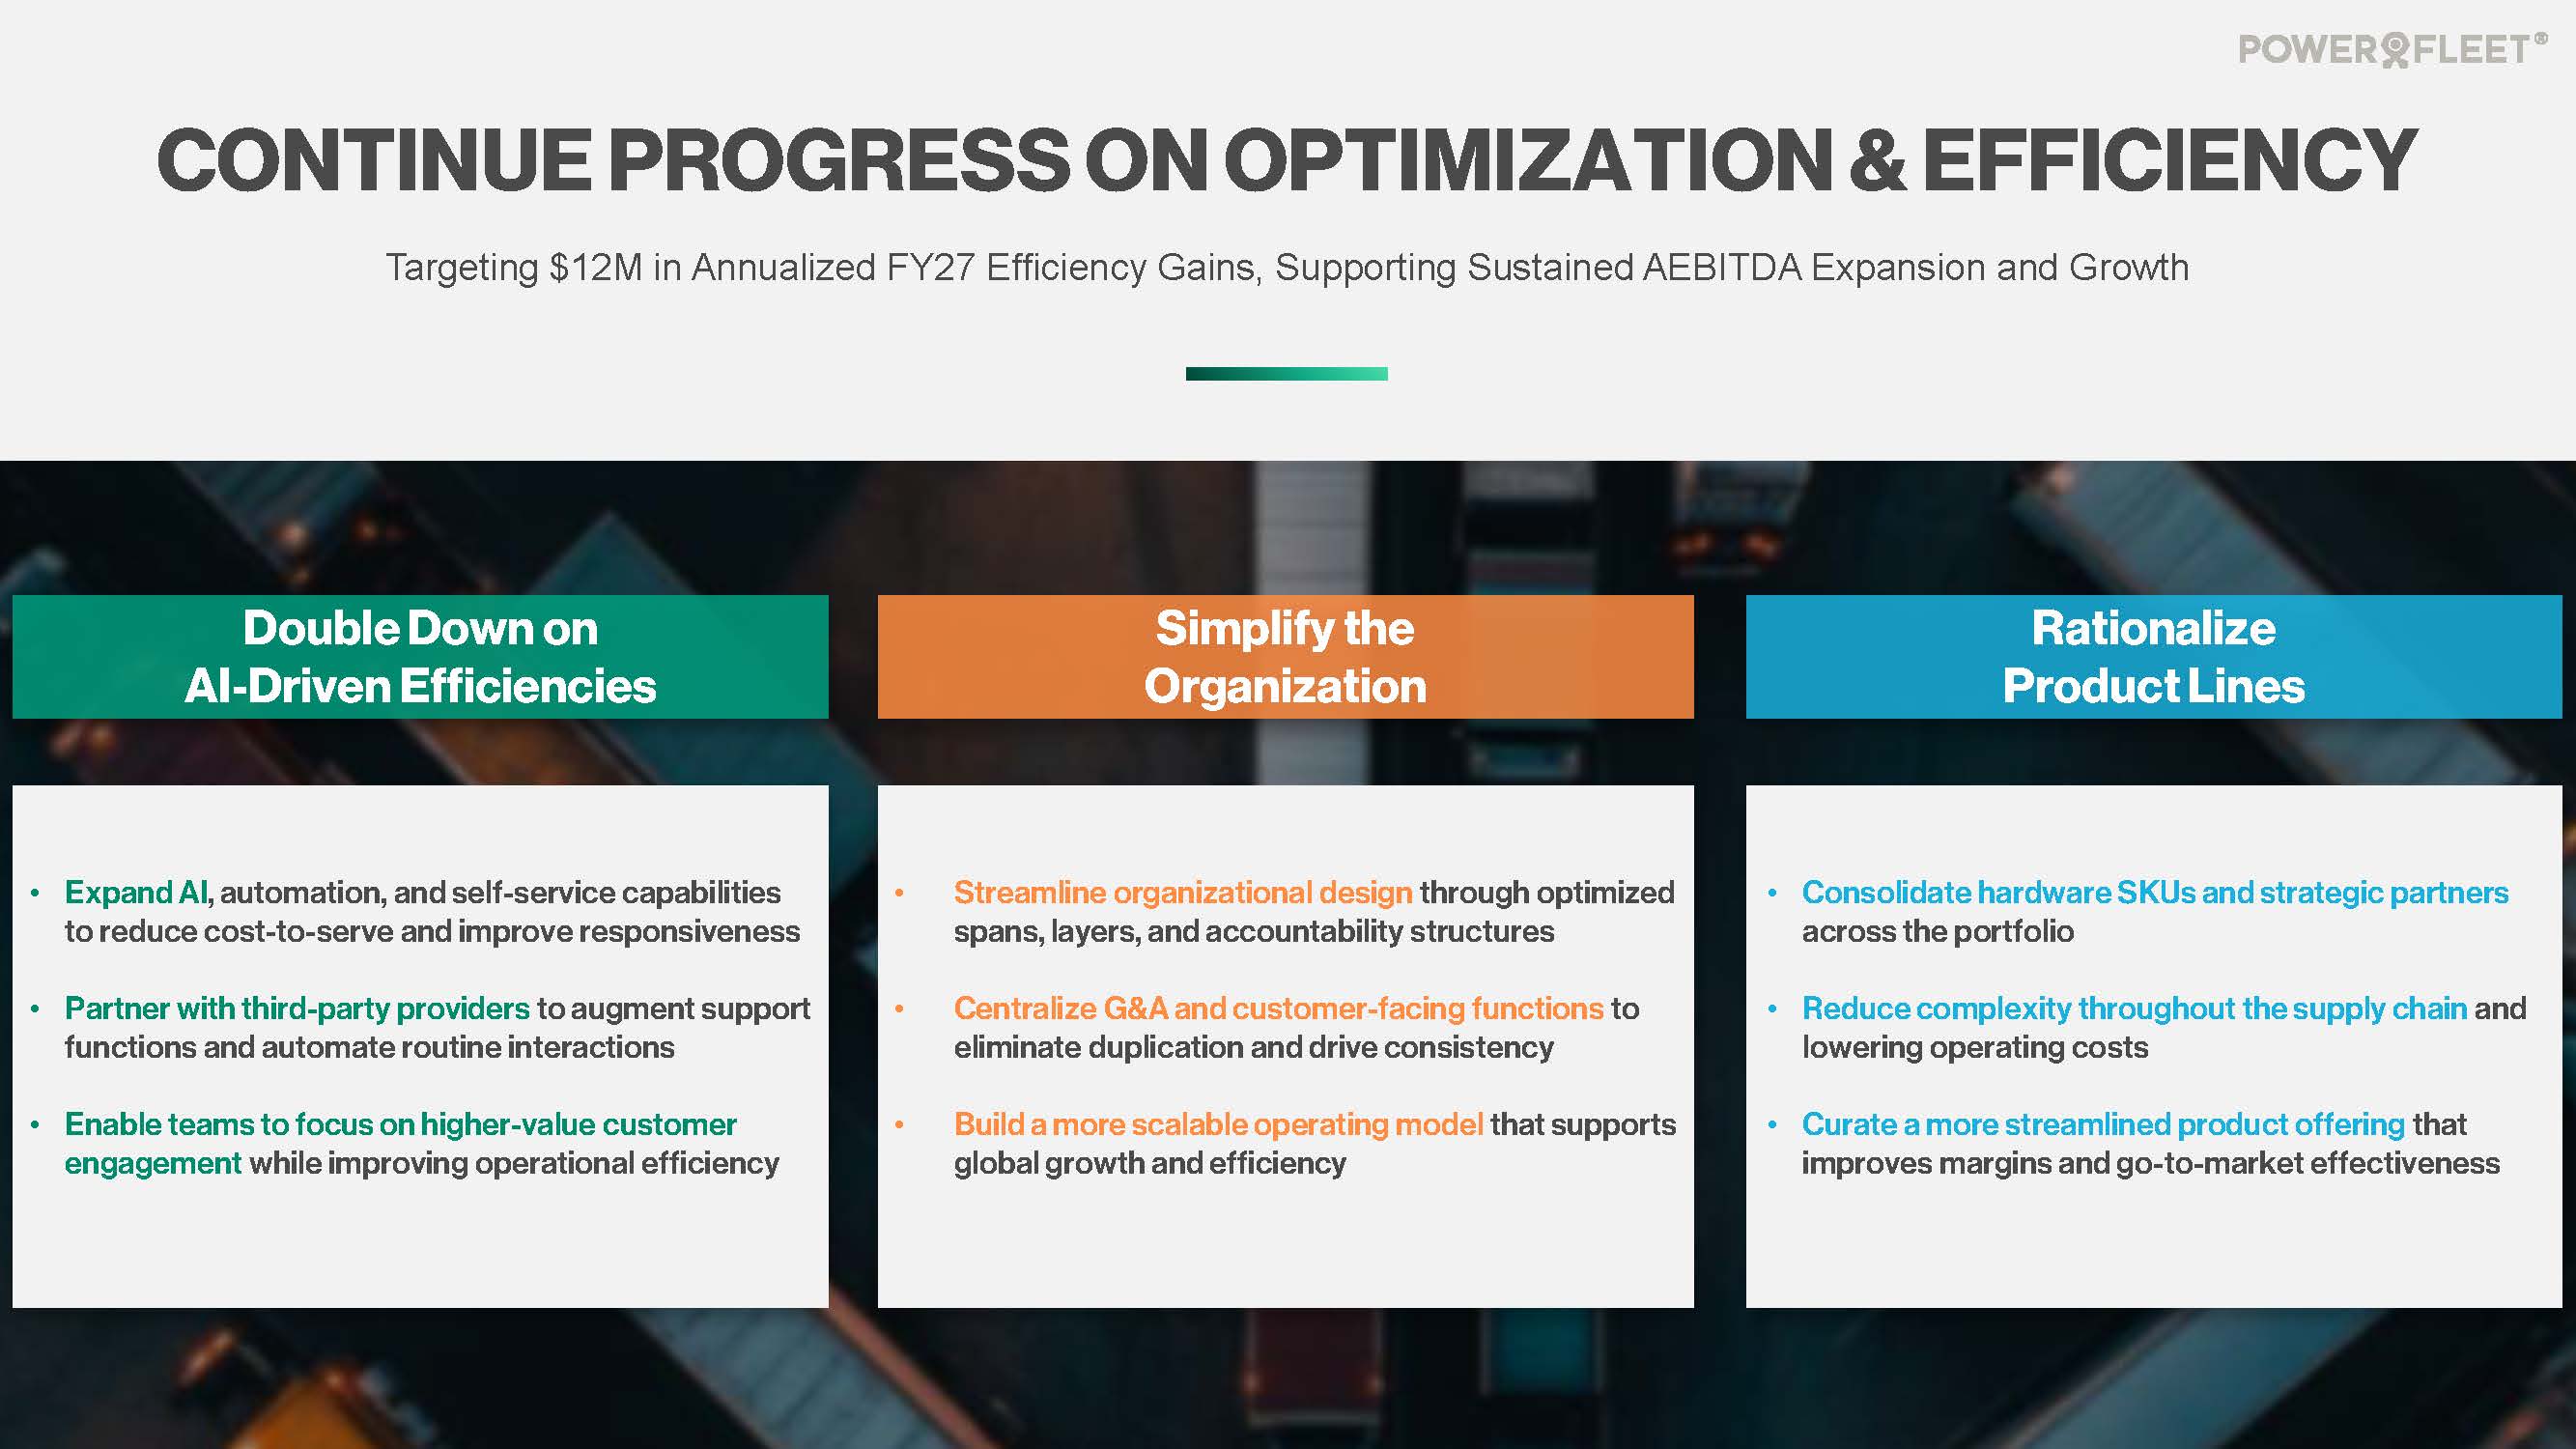
Revenue guidance is supported by a larger, higher-quality pipeline and performance is expected to build sequentially throughout fiscal 2027. This progression is expected to be driven by improved pipeline conversion from increased go-to-market investment and the commencement of the South African National Treasury contract in the second quarter. Revenue and margin contribution from the South Africa deployment are expected to accelerate through year-end. Adjusted EBITDA growth is expected to compound further and outpace revenue growth, reflecting the organic operating leverage in the business. This growth is expected to be driven by a higher mix of services revenue, continued cost discipline, and the benefits of ongoing productivity and cost optimization initiatives. The Company has realized more than $34 million in cost synergies over the past two years and expects to continue investing in centralization, simplification, automation, and AI initiatives during the first half of fiscal 2027. These initiatives require upfront investment in the first half and are expected to yield meaningful savings beginning in the second half. Together with the ramp of the South Africa deployment, these dynamics are expected to drive sequential margin improvement in each quarter of fiscal 2027.
The Company provided guidance for fiscal year 2027 for the following metrics:
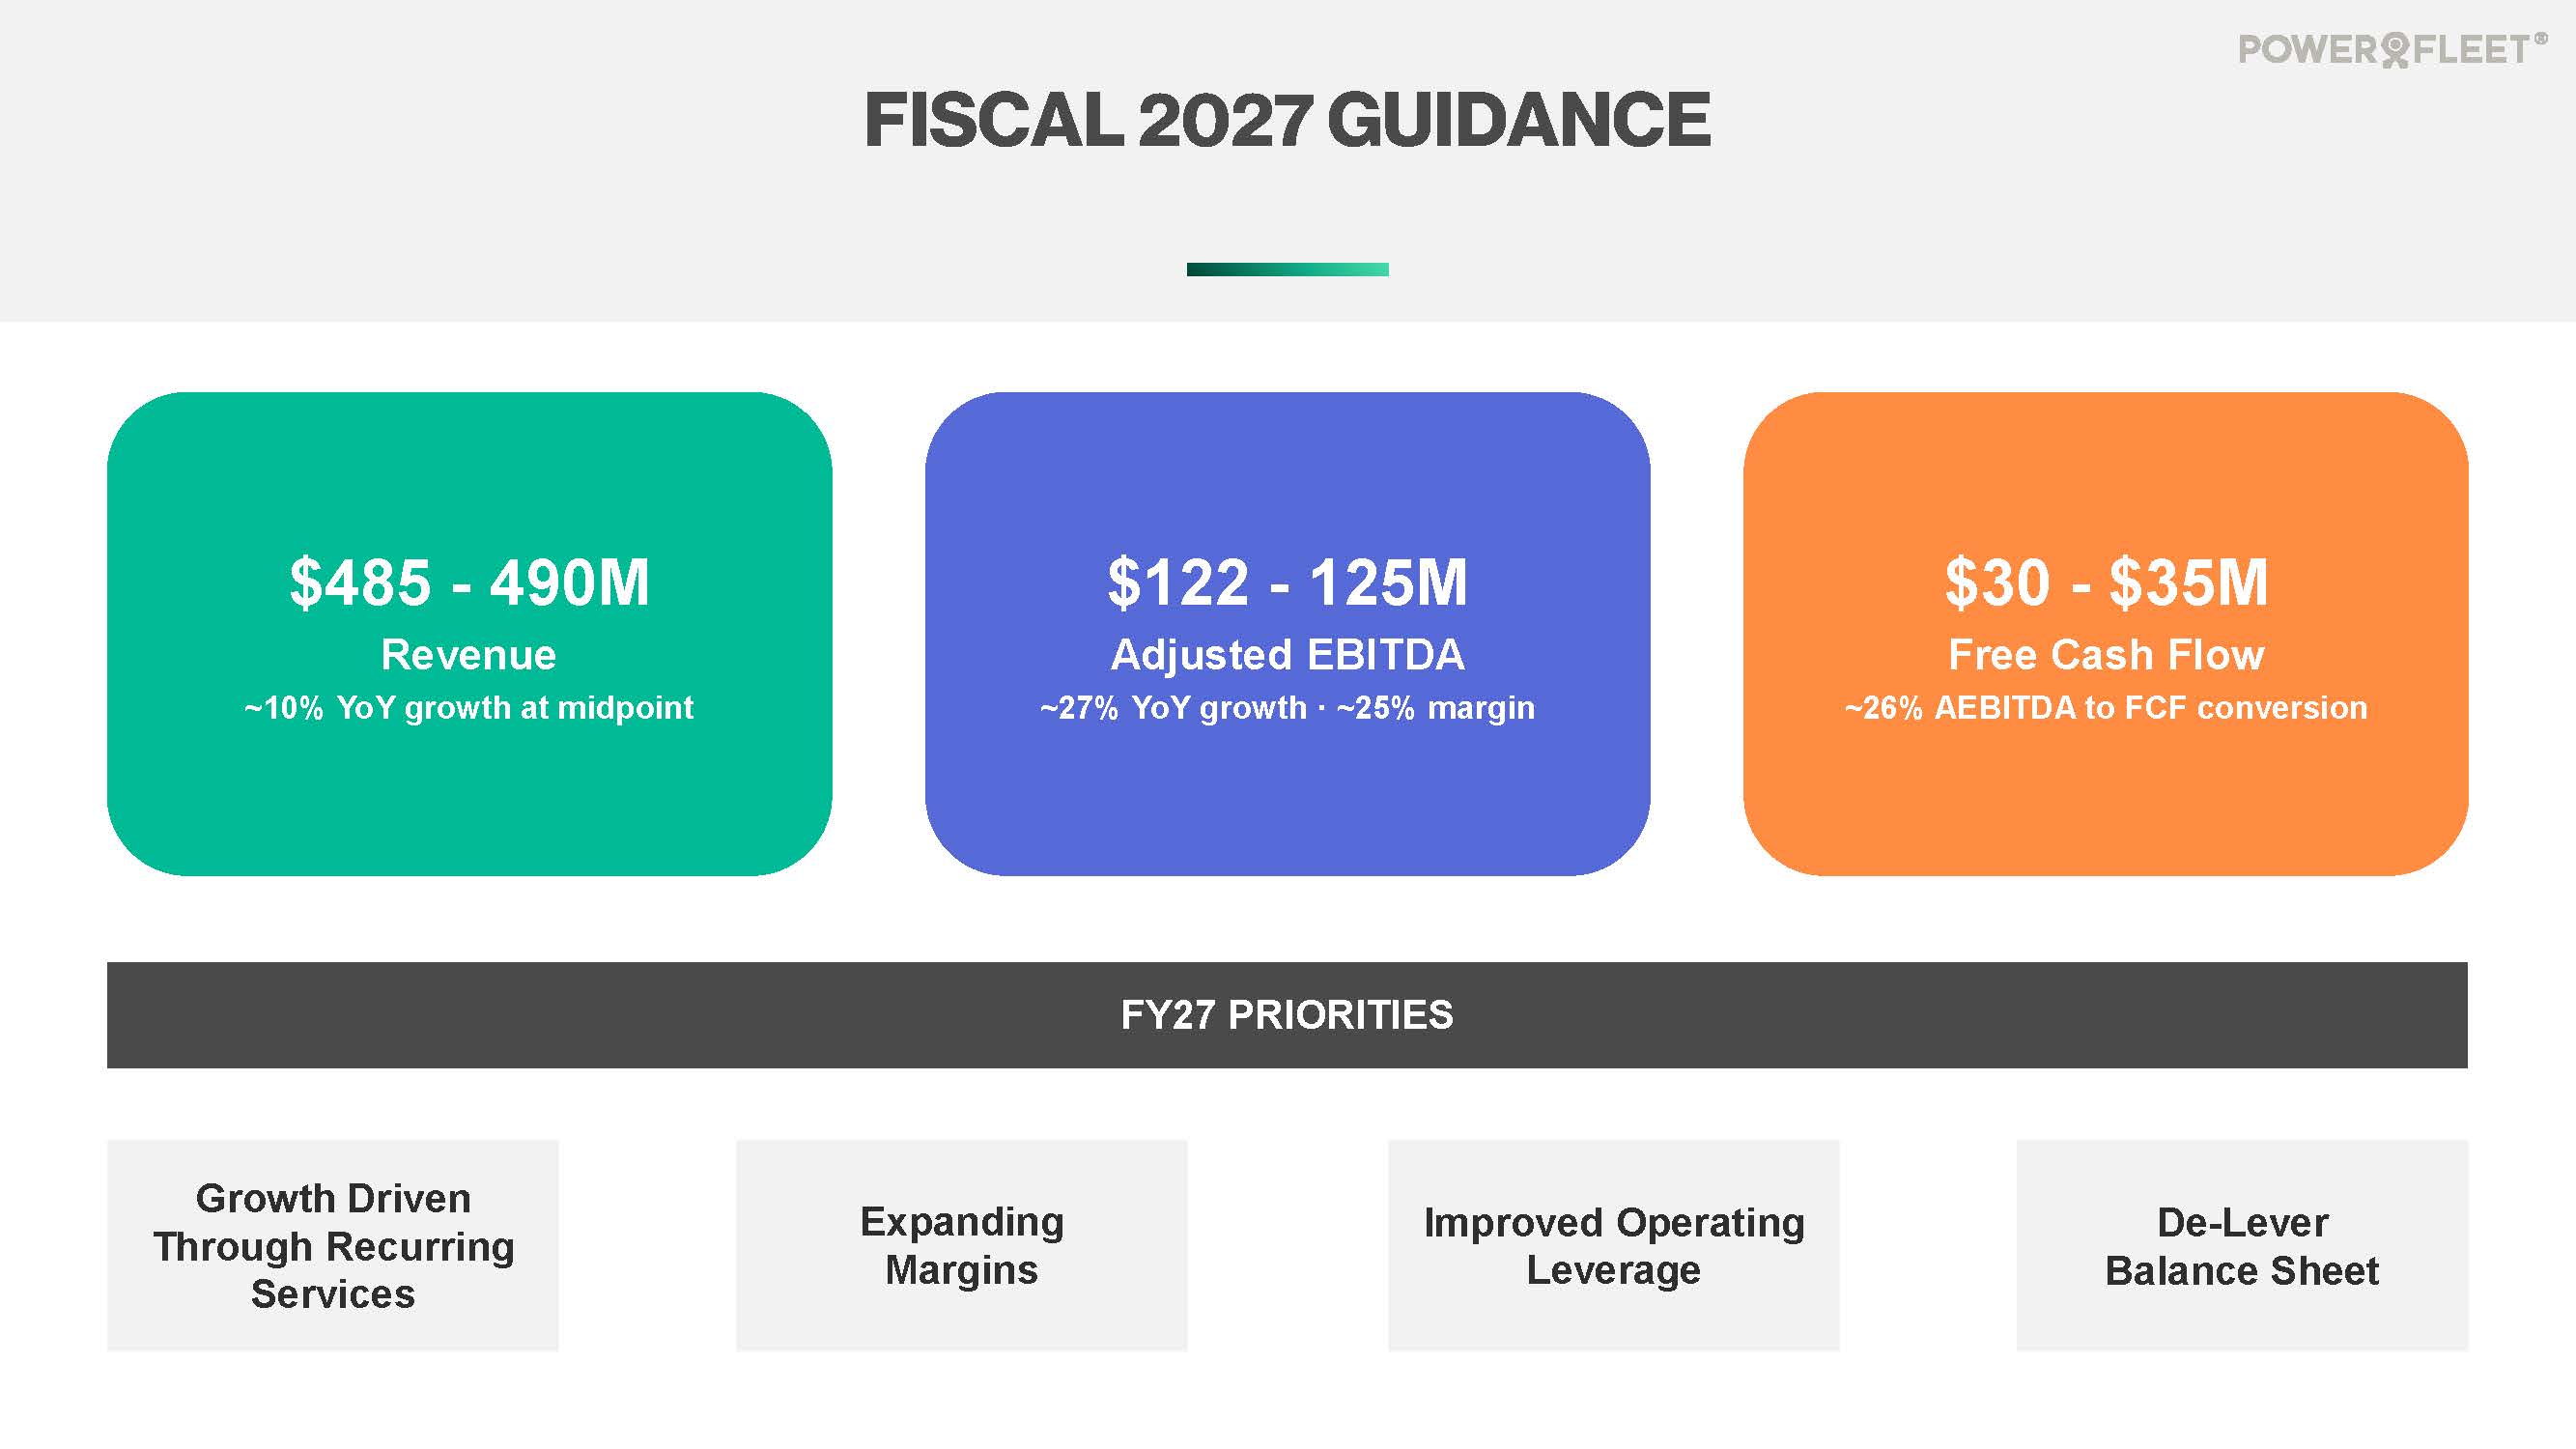
● Revenue is expected to range from $485 million to $490 million, representing growth of approximately 10% year-over-year at the midpoint of the range. Services revenue is expected to exceed $400 million.
● Net income is expected to range from $4 million to $8 million, with weighted-average fully diluted shares outstanding of 136 million.
● Adjusted EBITDA is expected to range from $122 million to $125 million, representing growth of approximately 27% year-over-year at the midpoint of the range, with a margin of approximately 25% at the midpoints of the revenue and Adjusted EBITDA guidance ranges.
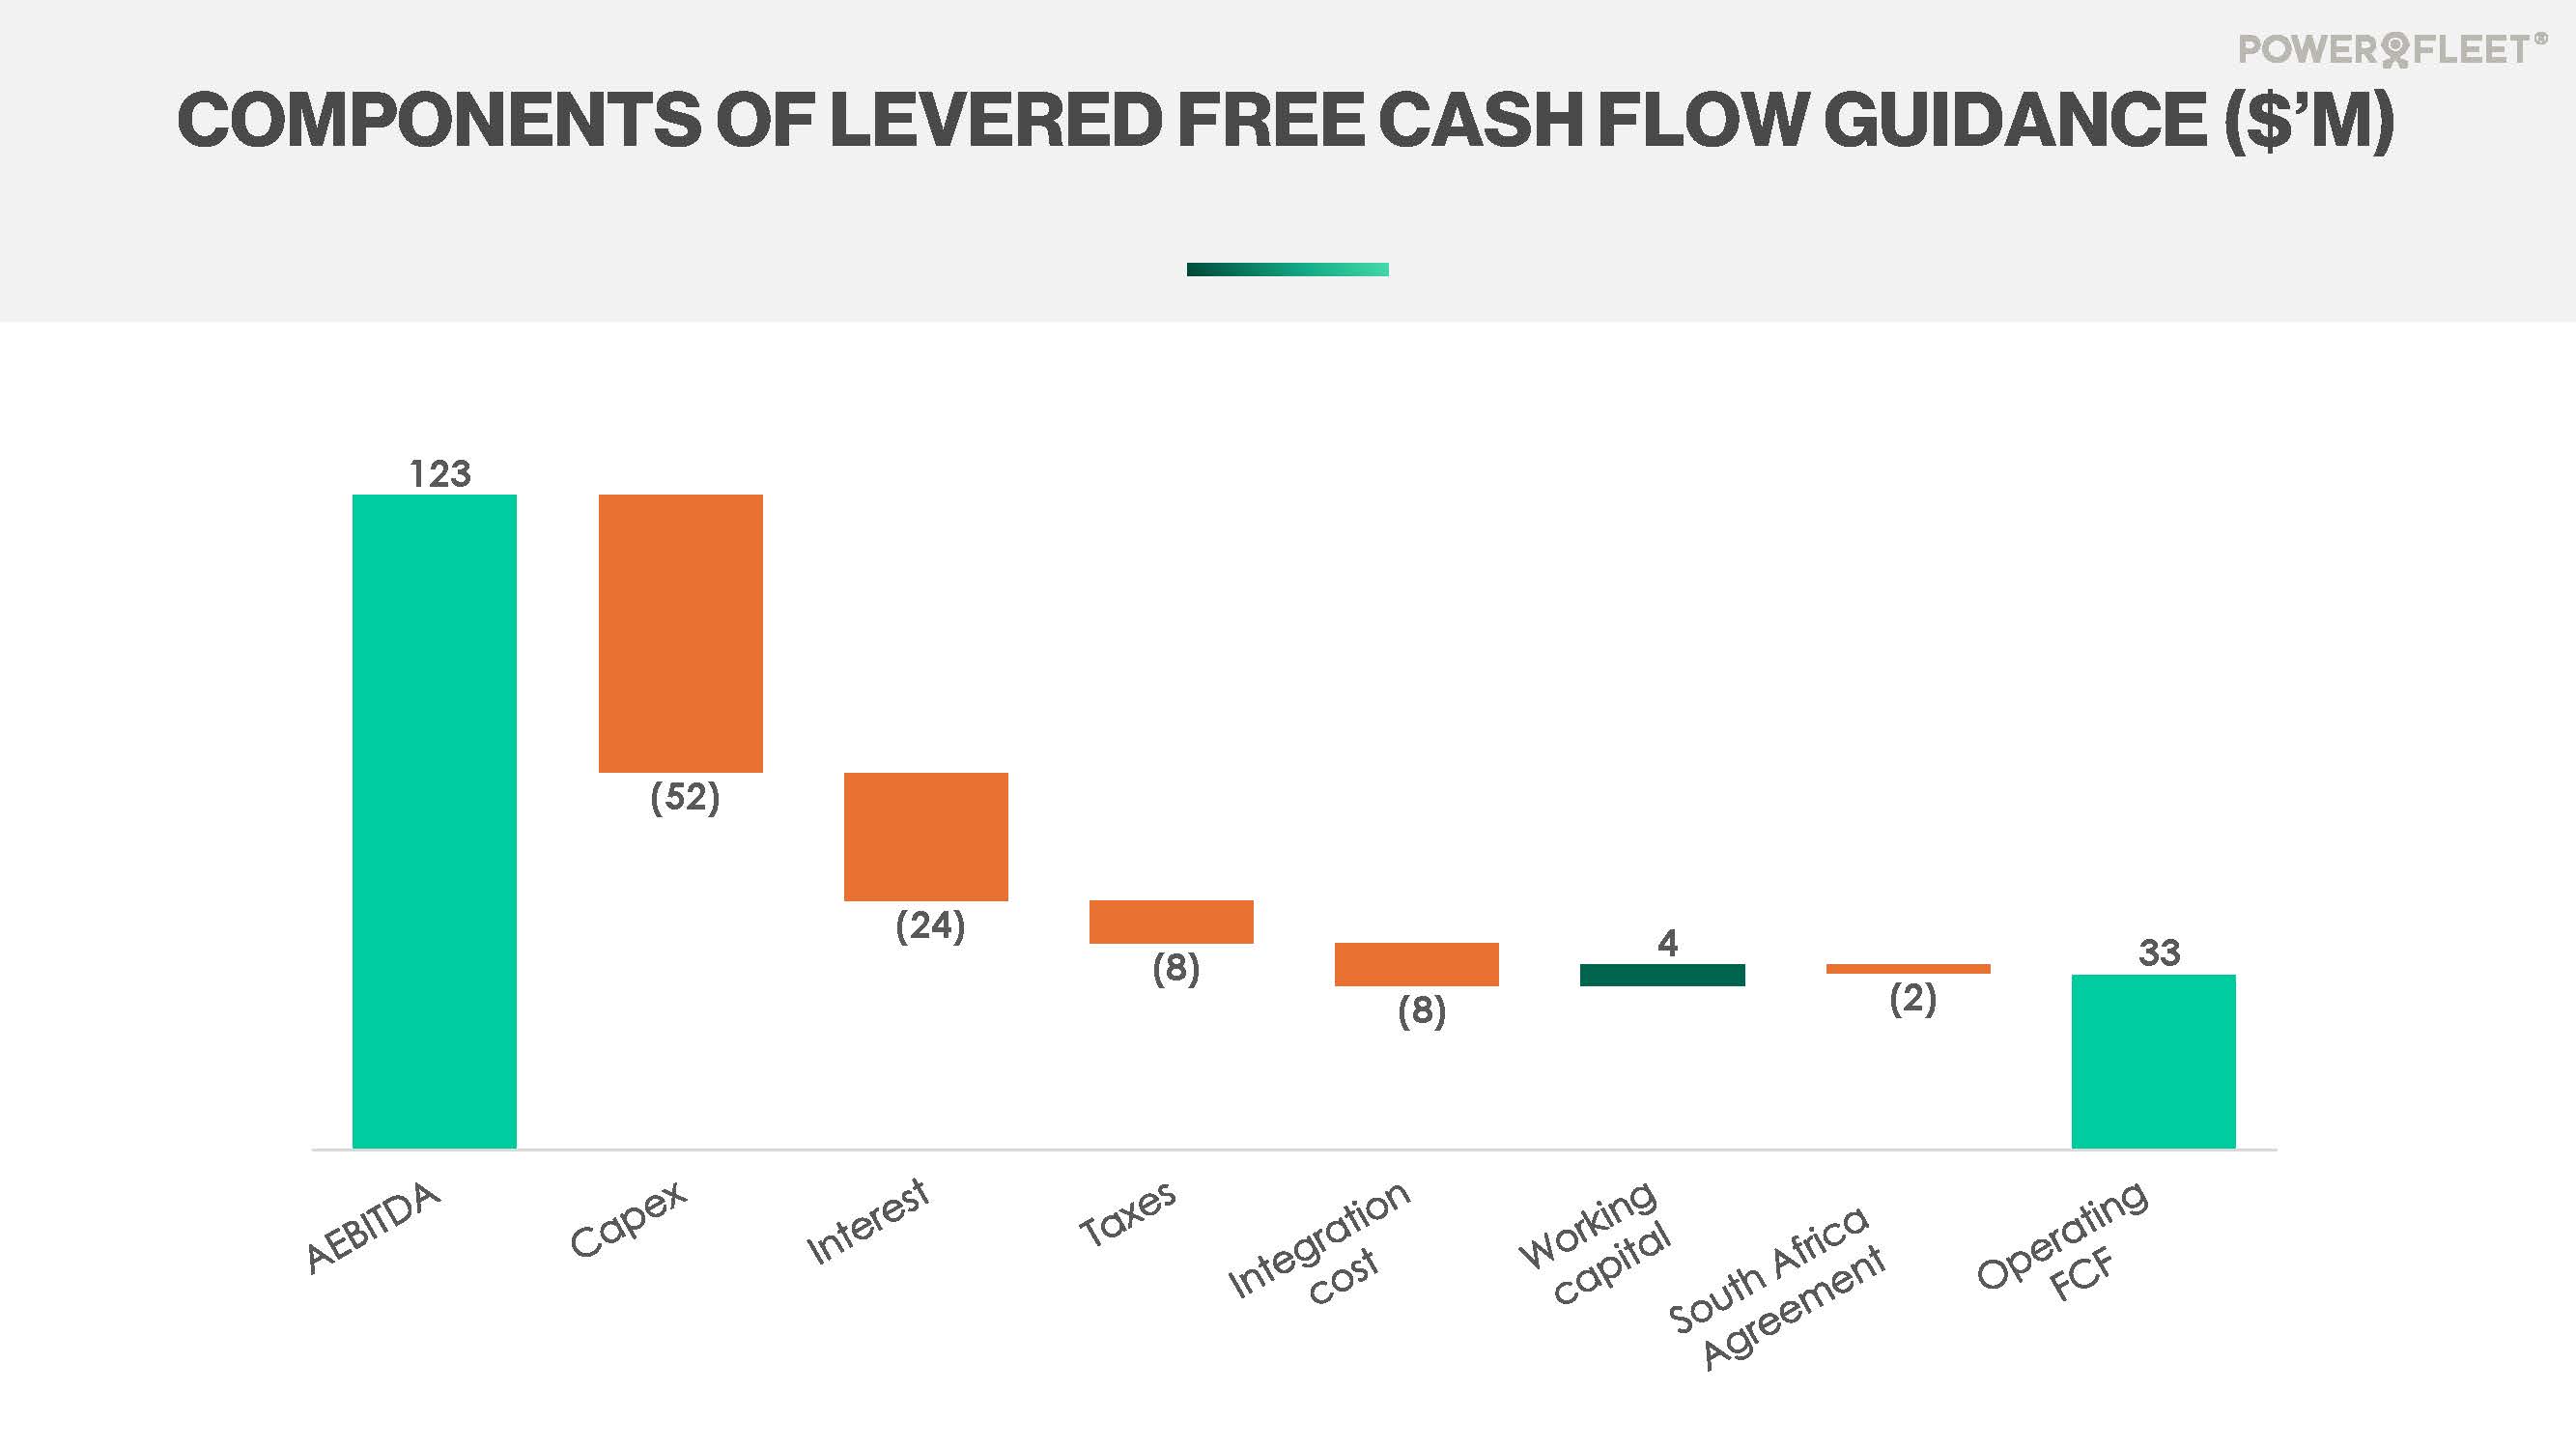
● Free cash flow is expected to range from $30 million to $35 million.
Powerfleet provides guidance for adjusted EBITDA and free cash flow, which are non-GAAP financial measures. Powerfleet does not provide guidance for the most directly comparable GAAP financial measures or a reconciliation of each of these forward-looking non-GAAP financial measures to the most directly comparable GAAP financial measure because it is unable to predict, without unreasonable effort, the timing or amount of certain items that are included in the applicable GAAP financial measure but excluded from adjusted EBITDA and/or free cash flow. These items may include, among others, stock-based compensation, acquisition-related expenses, fair-value adjustments, restructuring charges and other non-recurring items. The variability of these items could have a significant impact on Powerfleet’s future GAAP financial results, and therefore, Powerfleet is unable to provide a reconciliation at this time.
|
|
INVESTOR CONFERENCE CALL AND BUSINESS UPDATE
Powerfleet management will hold a conference call on Monday, June 15, 2026, at 8:30 a.m. Eastern time (5:30 a.m. Pacific time) to discuss results for the fourth quarter and fiscal year 2026 ended March 31, 2026, and provide a business update.
Date: Monday, June 15, 2026
Time: 8:30 a.m. Eastern time (5:30 a.m. Pacific time)
Toll Free: 888-506-0062
International: 973-528-0011
Participant Access Code: 931158
The conference call will be broadcast simultaneously and available for replay here. Additionally, both the webcast and accompanying slide presentation will be available via the investor section of Powerfleet’s website at ir.powerfleet.com.
USE OF NON-GAAP FINANCIAL MEASURES
Management evaluates the financial performance of our business on a variety of key indicators, including non-GAAP measures of adjusted EBITDA, adjusted EBITDA margin, adjusted EBITDA gross margin, adjusted net income per share, adjusted EBITDA leverage ratio, free cash flow, net debt and adjusted net debt. Reference to these non-GAAP measures should be considered in addition to results prepared under current accounting standards, but are not a substitute for, or superior to, GAAP results. These non-GAAP measures are provided to enhance investors’ overall understanding of Powerfleet’s current financial performance. Specifically, Powerfleet believes the non-GAAP measures provide useful information to both management and investors by excluding certain expenses, gains and losses and fluctuations in currency rates that may not be indicative of its core operating results and business outlook. These non-GAAP measures are not measures of financial performance or liquidity under GAAP and, accordingly, should not be considered as an alternative to total revenues, net income, net income margin, gross margin, net income per share, net cash provided by operating activities or total debt as an indicator of operating performance or liquidity. Because Powerfleet’s method for calculating the non-GAAP measures may differ from other companies’ methods, the non-GAAP measures may not be comparable to similarly titled measures reported by other companies. A reconciliation of all non-GAAP financial measures included in this press release to the most directly comparable GAAP financial measures is provided in Annex A titled “Non-GAAP Financial Measures,” including a description of these non-GAAP financial measures and the reasons why management uses these measures.
ABOUT POWERFLEET
Powerfleet (Nasdaq: AIOT; JSE: PWR) is a global leader in the artificial intelligence of things (AIoT) software-as-a-service (SaaS) mobile asset industry. With more than 30 years of experience, Powerfleet unifies business operations through the ingestion, harmonization, and integration of data, irrespective of source, and delivers actionable insights to help companies save lives, time, and money. Powerfleet’s ethos transcends our data ecosystem and commitment to innovation; our people-centric approach empowers our customers to realize impactful and sustained business improvement. The Company is headquartered in New Jersey, United States, with offices around the globe. Explore more at www.powerfleet.com. Powerfleet has a primary listing on The Nasdaq Global Market and a secondary listing on the Main Board of the Johannesburg Stock Exchange (JSE).
|
|
CAUTIONARY NOTE REGARDING FORWARD-LOOKING STATEMENTS
This press release contains forward-looking statements within the meaning of federal securities laws. Powerfleet’s actual results may differ from its expectations, estimates and projections and consequently, you should not rely on these forward-looking statements as predictions of future events. Forward-looking statements may be identified by words such as “expect,” “estimate,” “project,” “budget,” “forecast,” “anticipate,” “intend,” “plan,” “may,” “will,” “could,” “should,” “believes,” “predicts,” “potential,” “continue,” and similar expressions.
These forward-looking statements include, without limitation, our expectations with respect to our beliefs, plans, goals, objectives, expectations, anticipations, assumptions, estimates, intentions and future performance, as well as including our financial outlook and guidance for fiscal 2027 and the anticipated financial impacts of recent business combinations and acquisitions. Forward-looking statements involve significant known and unknown risks, uncertainties and other factors, which may cause our actual results, performance or achievements to be materially different from the future results, performance or achievements expressed or implied by such forward-looking statements. All statements other than statements of historical fact are statements that could be forward-looking statements. Most of these factors are outside our control and are difficult to predict. The risks and uncertainties referred to above include, but are not limited to, risks related to: (i) the possibility that we may not fully realize the anticipated benefits of our acquisitions and ongoing business transformation initiatives; (ii) significant losses, accumulated deficits and an inability to achieve or sustain profitability; (iii) future global economic, political and business conditions, including inflation, interest rate increases, foreign exchange instability, geopolitical conflicts, sanctions, export controls and the potential imposition of tariffs; (iv) the commercial, financial, reputational and regulatory risks to our business associated with operating across multiple geographies, including exposure to foreign exchange fluctuations and economic instability in certain emerging markets; (v) disruptions in our global supply chain, performance issues or failures by subcontractors, and reliance on a limited number of suppliers for critical components and services; (vi) the loss of any of our key customers, reductions in customer demand or purchasing levels, and reliance on third-party channel partner relationships, including telecommunication companies and regional distributors; (vii) changes in technology, products and customer expectations, which may be more rapid, costly or difficult to address, or less effective, than anticipated; (viii) risks associated with the deployment and use of artificial intelligence and machine learning technologies, including operational, legal, regulatory and reputational risks arising from their development, use or outputs; (ix) potential breaches, disruptions or failures of our information technology systems, including risks that could impair operations, customer access to services, or vendor and customer relationships; (x) our inability to adequately protect our intellectual property rights or defend against third-party intellectual property claims; (xi) our ability to obtain additional capital to fund our operations; and (xii) such other factors as are set forth in the periodic reports filed by us with the Securities and Exchange Commission (SEC), including but not limited to those described under the heading “Risk Factors” in our annual reports on Form 10-K, quarterly reports on Form 10-Q and any other filings made with the SEC from time to time, which are available via the SEC’s website at http://www.sec.gov. Should one or more of these risks or uncertainties materialize, or should underlying assumptions prove to be incorrect, actual results may vary materially from those indicated or anticipated by these forward-looking statements. Therefore, you should not rely on any of these forward-looking statements.
The forward-looking statements included in this press release are made only as of the date of this press release, and except as otherwise required by applicable securities law, we assume no obligation, nor do we intend to publicly update or revise any forward-looking statements to reflect subsequent events or circumstances.
Powerfleet Investor Contacts
Carolyn Capaccio and Jody Burfening
Alliance Advisors IR
AIOTIRTeam@allianceadvisors.com
Powerfleet Media Contact
Jonathan Bates
jonathan.bates@powerfleet.com
+44 121 717-5360
|
|
POWERFLEET, INC. AND SUBSIDIARIES
CONDENSED CONSOLIDATED STATEMENTS OF OPERATIONS
(In thousands, except per share data)
|
Three Months Ended March 31, |
Year Ended March 31, |
|||||||||||||||
| 2025 | 2026 | 2025 | 2026 | |||||||||||||
| Revenues: | ||||||||||||||||
| Products | $ | 21,866 | $ | 21,546 | $ | 85,584 | $ | 83,975 | ||||||||
| Services | 81,772 | 92,944 | 276,931 | 359,802 | ||||||||||||
| Total revenues | 103,638 | 114,490 | 362,515 | 443,777 | ||||||||||||
| Cost of revenues: | ||||||||||||||||
| Cost of products | 18,152 | 15,295 | 61,961 | 59,153 | ||||||||||||
| Cost of services | 30,723 | 34,531 | 106,017 | 138,202 | ||||||||||||
| Total cost of revenues | 48,875 | 49,826 | 167,978 | 197,355 | ||||||||||||
| Gross profit | 54,763 | 64,664 | 194,537 | 246,422 | ||||||||||||
| Operating expenses: | ||||||||||||||||
| Selling, general and administrative expenses | 56,839 | 48,903 | 204,361 | 208,487 | ||||||||||||
| Research and development expenses | 4,904 | 4,736 | 16,061 | 18,359 | ||||||||||||
| Total operating expenses | 61,743 | 53,639 | 220,422 | 226,846 | ||||||||||||
| (Loss) income from operations | (6,980 | ) | 11,025 | (25,885 | ) | 19,576 | ||||||||||
| Interest income | 95 | 211 | 926 | 780 | ||||||||||||
| Interest expense | (5,655 | ) | (6,919 | ) | (20,330 | ) | (27,526 | ) | ||||||||
| Other expense, net | (202 | ) | (2,311 | ) | (1,163 | ) | (4,086 | ) | ||||||||
| Net (loss) income before income taxes | (12,742 | ) | 2,006 | (46,452 | ) | (11,256 | ) | |||||||||
| Income tax benefit (expense) | 304 | (4,064 | ) | (4,517 | ) | (8,688 | ) | |||||||||
| Net loss before non-controlling interest | (12,438 | ) | (2,058 | ) | (50,969 | ) | (19,944 | ) | ||||||||
| Non-controlling interest | (1 | ) | (608 | ) | (18 | ) | (608 | ) | ||||||||
| Net loss | (12,439 | ) | (2,666 | ) | (50,987 | ) | (20,552 | ) | ||||||||
| Preferred stock dividend | — | — | (25 | ) | — | |||||||||||
| Net loss attributable to common stockholders | $ | (12,439 | ) | $ | (2,666 | ) | $ | (51,012 | ) | $ | (20,552 | ) | ||||
| Net loss per share attributable to common stockholders - basic and diluted | $ | (0.09 | ) | $ | (0.02 | ) | $ | (0.43 | ) | $ | (0.15 | ) | ||||
| Weighted-average common shares outstanding - basic and diluted | 132,793 | 134,153 | 119,877 | 133,761 | ||||||||||||
|
|
POWERFLEET, INC. AND SUBSIDIARIES
CONDENSED CONSOLIDATED BALANCE SHEETS
(In thousands, except per share data)
| March 31, 2025 | March 31, 2026 | |||||||
| ASSETS | ||||||||
| Current assets: | ||||||||
| Cash and cash equivalents | $ | 44,392 | $ | 36,496 | ||||
| Restricted cash | 4,396 | 4,322 | ||||||
| Accounts receivables, net | 78,623 | 93,820 | ||||||
| Inventory, net | 18,350 | 22,448 | ||||||
| Prepaid expenses and other current assets | 23,319 | 22,094 | ||||||
| Total current assets | 169,080 | 179,180 | ||||||
| Fixed assets, net | 58,011 | 62,398 | ||||||
| Goodwill | 383,146 | 411,995 | ||||||
| Intangible assets, net | 258,582 | 255,518 | ||||||
| Right-of-use asset | 12,339 | 15,893 | ||||||
| Severance payable fund | 3,796 | 4,445 | ||||||
| Deferred tax asset | 3,934 | 4,537 | ||||||
| Other assets | 21,183 | 21,599 | ||||||
| Total assets | $ | 910,071 | $ | 955,565 | ||||
| LIABILITIES | ||||||||
| Current liabilities: | ||||||||
| Short-term bank debt and current maturities of long-term debt | $ | 41,632 | $ | 50,355 | ||||
| Accounts payable | 41,599 | 46,353 | ||||||
| Accrued expenses and other current liabilities | 45,327 | 37,699 | ||||||
| Deferred revenue - current | 17,375 | 20,159 | ||||||
| Lease liability - current | 5,076 | 3,386 | ||||||
| Total current liabilities | 151,009 | 157,952 | ||||||
| Long-term debt - less current maturities | 232,160 | 229,669 | ||||||
| Deferred revenue - less current portion | 5,197 | 4,005 | ||||||
| Lease liability - less current portion | 8,191 | 13,505 | ||||||
| Accrued severance payable | 6,039 | 5,666 | ||||||
| Deferred tax liability | 57,712 | 60,063 | ||||||
| Other long-term liabilities | 3,021 | 3,090 | ||||||
| Total liabilities | 463,329 | 473,950 | ||||||
| REDEEMABLE NON-CONTROLLING INTERESTS | ||||||||
| Redeemable non-controlling interests | — | 6,009 | ||||||
| STOCKHOLDERS’ EQUITY | ||||||||
| Preferred stock | — | — | ||||||
| Common stock | 1,343 | 1,343 | ||||||
| Additional paid-in capital | 671,400 | 682,344 | ||||||
| Accumulated deficit | (205,783 | ) | (226,335 | ) | ||||
| Accumulated other comprehensive (loss) income | (8,850 | ) | 29,660 | |||||
| Treasury stock | (11,518 | ) | (11,518 | ) | ||||
| Total stockholders’ equity | 446,592 | 475,494 | ||||||
| Non-controlling interest | 150 | 112 | ||||||
| Total equity | 446,742 | 475,606 | ||||||
| Total liabilities, redeemable interests and stockholders’ equity | $ | 910,071 | $ | 955,565 | ||||
|
|
POWERFLEET, INC. AND SUBSIDIARIES
CONDENSED CONSOLIDATED STATEMENTS OF CASH FLOWS
(In thousands)
| Year Ended March 31, | ||||||||
| 2025 | 2026 | |||||||
| Cash flows from operating activities | ||||||||
| Net loss | $ | (50,987 | ) | $ | (20,552 | ) | ||
| Adjustments to reconcile net loss to cash (used in) provided by operating activities: | ||||||||
| Non-controlling interest | 18 | 608 | ||||||
| Inventory reserve | 4,480 | 2,339 | ||||||
| Stock-based compensation expense | 9,362 | 7,541 | ||||||
| Depreciation and amortization | 47,494 | 60,280 | ||||||
| Right-of-use assets, non-cash lease expense | 5,007 | 4,056 | ||||||
| Derivative mark-to-market adjustment | (504 | ) | (775 | ) | ||||
| Bad debts expense | 9,418 | 10,988 | ||||||
| Deferred income taxes | (4,872 | ) | (1,737 | ) | ||||
| Shares issued for transaction bonuses | 889 | — | ||||||
| Lease termination and modification losses | 295 | (233 | ) | |||||
| Other non-cash items | 1,061 | (2,159 | ) | |||||
| Changes in operating assets and liabilities: | ||||||||
| Accounts receivables | (14,048 | ) | (21,232 | ) | ||||
| Inventories | 5,729 | (4,464 | ) | |||||
| Prepaid expenses and other current assets | 5,474 | 2,201 | ||||||
| Deferred costs | (8,437 | ) | (8,545 | ) | ||||
| Deferred revenue | 1,748 | 1,623 | ||||||
| Accounts payable, accrued expenses and other current liabilities | (12,162 | ) | 5,228 | |||||
| Lease liabilities | (4,558 | ) | (3,685 | ) | ||||
| Accrued severance payable, net | 1,248 | (1,021 | ) | |||||
| Net cash (used in) provided by operating activities | (3,345 | ) | 30,461 | |||||
| Cash flows from investing activities: | ||||||||
| Acquisition, net of cash assumed | (137,112 | ) | 55 | |||||
| Proceeds from sale of fixed assets | 12 | 140 | ||||||
| Capitalized software development costs | (13,782 | ) | (18,532 | ) | ||||
| Capital expenditures | (20,008 | ) | (21,618 | ) | ||||
| Repayment of loan advanced to external parties | 294 | 207 | ||||||
| Net cash used in investing activities | (170,596 | ) | (39,748 | ) | ||||
| Cash flows from financing activities: | ||||||||
| Repayment of long-term debt | (2,642 | ) | (5,604 | ) | ||||
| Short-term bank debt, net | 19,551 | 5,716 | ||||||
| Purchase of treasury stock upon vesting of restricted stock | (2,836 | ) | — | |||||
| Payment of preferred stock dividend and redemption of preferred stock | (90,298 | ) | — | |||||
| Proceeds from private placement, net | 66,459 | — | ||||||
| Proceeds from long-term debt | 125,000 | — | ||||||
| Payment of long-term debt costs | (1,410 | ) | — | |||||
| Proceeds from exercise of stock options, net | 1,898 | 39 | ||||||
| Net cash provided by financing activities | 115,722 | 151 | ||||||
| Effect of foreign exchange rate changes on cash and cash equivalents | (2,657 | ) | 1,166 | |||||
| Net decrease in cash and cash equivalents, and restricted cash | (60,876 | ) | (7,970 | ) | ||||
| Cash and cash equivalents, and restricted cash at beginning of the period | 109,664 | 48,788 | ||||||
| Cash and cash equivalents, and restricted cash at end of the period | $ | 48,788 | $ | 40,818 | ||||
| Reconciliation of cash, cash equivalents, and restricted cash, beginning of the period | ||||||||
| Cash and cash equivalents | 24,354 | 44,392 | ||||||
| Restricted cash | 85,310 | 4,396 | ||||||
| Cash, cash equivalents, and restricted cash, beginning of the period | $ | 109,664 | $ | 48,788 | ||||
| Reconciliation of cash, cash equivalents, and restricted cash, end of the period | ||||||||
| Cash and cash equivalents | 44,392 | 36,496 | ||||||
| Restricted cash | 4,396 | 4,322 | ||||||
| Cash, cash equivalents, and restricted cash, end of the period | $ | 48,788 | $ | 40,818 | ||||
| Supplemental disclosure of cash flow information: | ||||||||
| Cash paid for: | ||||||||
| Taxes | $ | 4,283 | $ | 7,250 | ||||
| Interest | $ | 15,335 | $ | 24,490 | ||||
| Noncash investing and financing activities: | ||||||||
| Common stock issued for transaction bonus | $ | 9 | $ | — | ||||
| Shares issued in connection with MiX Combination | $ | 362,005 | $ | — | ||||
| Shares issued in connection with Fleet Complete acquisition | $ | 21,343 | $ | — | ||||
| Issuance of redeemable non-controlling interest | $ | — | $ | 8,765 | ||||
| Rebalancing of ownership percentage between parent and subsidiaries | $ | — | $ | (3,364 | ) | |||
|
|
Annex A: Non-GAAP Financial Measures
In order to assist readers of our consolidated financial statements in understanding the operating results that management uses to evaluate the business and for financial planning purposes, we present non-GAAP measures of organic revenue growth, adjusted EBITDA, adjusted EBITDA margin, adjusted net income per share, adjusted EBITDA gross profit margin, adjusted EBITDA products gross profit margin, adjusted EBITDA services gross profit margin, non-GAAP selling, general and administrative expense ratios, adjusted operating expenses, free cash flow, net debt and adjusted net debt, and adjusted net debt to adjusted EBITDA ratio as supplemental measures of our operating performance. We believe they provide useful information to our investors as they eliminate the impact of certain items that we do not consider indicative of our cash operations and ongoing operating performance. In addition, we use them as an integral part of our internal reporting to measure the performance and operating strength of our business.
We believe organic revenue growth, adjusted EBITDA, adjusted EBITDA margin, adjusted net income per share, adjusted EBITDA gross profit margin, adjusted EBITDA products gross profit margin, adjusted EBITDA services gross profit margin, non-GAAP selling, general and administrative expense ratios, adjusted operating expenses, free cash flow, net debt and adjusted net debt, and adjusted net debt to adjusted EBITDA ratio, are relevant and provide useful information frequently used by securities analysts, investors and other interested parties in their evaluation of the operating performance of companies similar to ours and are indicators of the operational strength of our business.
Organic revenue growth represents the year-over-year percentage change in revenue, excluding the impact of acquisitions. We believe organic revenue growth provides insight into the underlying performance of the Company’s existing operations by removing the effects of changes in the scope of consolidation. Adjusted EBITDA is equal to net loss attributable to common stockholders, excluding non-controlling interest, preferred stock dividend, interest expense (net), other expense (net), income tax benefit/expense, depreciation and amortization, stock-based compensation, foreign currency losses, restructuring-related expenses, derivative mark-to-market adjustment, acquisition-related expenses and integration-related expenses. Following a detailed review of relevant SEC guidance on disclosure of non-GAAP financial measures, we refined our definition of adjusted EBITDA by removing recognition of pre-October 1, 2024 contract assets (Fleet Complete). Comparative information has been adjusted to conform with the updated presentation. We believe adjusted EBITDA eliminates the uneven effect of considerable amounts of non-cash depreciation and amortization, stock-based compensation and other items that might otherwise make comparisons of our ongoing business with prior periods more difficult and obscure trends in ongoing operations. We define adjusted EBITDA margin as adjusted EBITDA as a percentage of revenue. Adjusted net income is equal to net loss excluding incremental intangible assets amortization expense as a result of business combinations, stock-based compensation (non-recurring/accelerated cost), foreign currency losses, restructuring-related expenses, derivative mark-to-market adjustment, acquisition-related expenses, integration-related expenses and inventory rationalization and other, net of tax. We define adjusted net income per share as adjusted net income divided by the weighted-average number of shares outstanding during the period. We believe adjusted net income provides additional means of evaluating period-over-period operating performance by eliminating certain non-cash expenses and other items that might otherwise make comparisons of our ongoing business with prior periods more difficult and obscure trends in ongoing operations. We define adjusted EBITDA gross profit as gross profit excluding inventory rationalization and other and depreciation and amortization, and adjusted EBITDA gross profit margin as adjusted EBITDA gross profit as a percentage of revenues. Our adjusted EBITDA gross profit is a measure used by management in evaluating the business’s current operating performance by excluding the impact of prior historical costs of assets that are expensed systematically and allocated over the estimated useful lives of the assets, which may not be indicative of the current operating activity. We define non-GAAP selling, general and administrative expense ratios as selling, general and administrative expenses adjusted for restructuring-related expenses, acquisition-related expenses, integration-related expenses, depreciation and amortization, and stock-based compensation, and expressed as a percentage of total revenues. We define adjusted operating expenses as total operating expenses adjusted for acquisition-related expenses, integration-related expenses, stock-based compensation (non-recurring/accelerated cost) and restructuring-related expenses. We present non-GAAP selling, general and administrative expense ratios and adjusted operating expenses to provide a clearer view of our operating cost structure by excluding items that are not directly tied to ongoing business operations. Free cash flow is equal to net cash provided by operating activities, excluding proceeds from the sale of fixed assets, capitalized software development costs and capital expenditures. We present free cash flow because we believe it provides useful information to investors and others in understanding and evaluating the Company’s cash flows by providing detail of the amount of cash the Company generates or utilizes after accounting for all capital expenditures as well as costs that do not relate to our core business operations. We define adjusted net debt as total debt less cash, cash equivalents, and restricted cash, resulting in net debt less unsettled transaction costs. Adjusted net debt to adjusted EBITDA ratio is calculated as adjusted net debt divided by adjusted EBITDA for the trailing 12-month period. We present adjusted net debt and adjusted net debt to adjusted EBITDA ratio to help investors and others better understand our true leverage position and financial flexibility. Unsettled transaction costs – often related to acquisitions, integrations, or financing activities – can temporarily inflate net debt figures and obscure comparability across periods.
Adjusted EBITDA, adjusted EBITDA margin, adjusted net income per share, adjusted EBITDA gross profit margin, adjusted EBITDA products gross profit margin, adjusted EBITDA services gross profit margin, non-GAAP selling, general and administrative expense ratios, adjusted operating expenses, free cash flow, net debt and adjusted net debt, and adjusted net debt to adjusted EBITDA ratio are not intended to be performance measures that should be regarded as an alternative to, or more meaningful than, financial measures presented in accordance with U.S. GAAP. The way we measure adjusted EBITDA, adjusted EBITDA margin, adjusted net income per share, adjusted EBITDA gross profit margin, adjusted EBITDA products gross profit margin, adjusted EBITDA services gross profit margin, non-GAAP selling, general and administrative expense ratios, adjusted operating expenses, free cash flow, net debt and adjusted net debt, and adjusted net debt to adjusted EBITDA ratio, may not be comparable to similarly titled measures presented by other companies.
|
|
A reconciliation of net loss attributable to common stockholders (the most directly comparable financial measure presented in accordance with GAAP) to adjusted EBITDA for the periods shown is presented below (in thousands and unaudited):
|
Three Months Ended March 31, |
Year Ended March 31, |
|||||||||||||||
| 2025 (1) | 2026 | 2025 (1) | 2026 | |||||||||||||
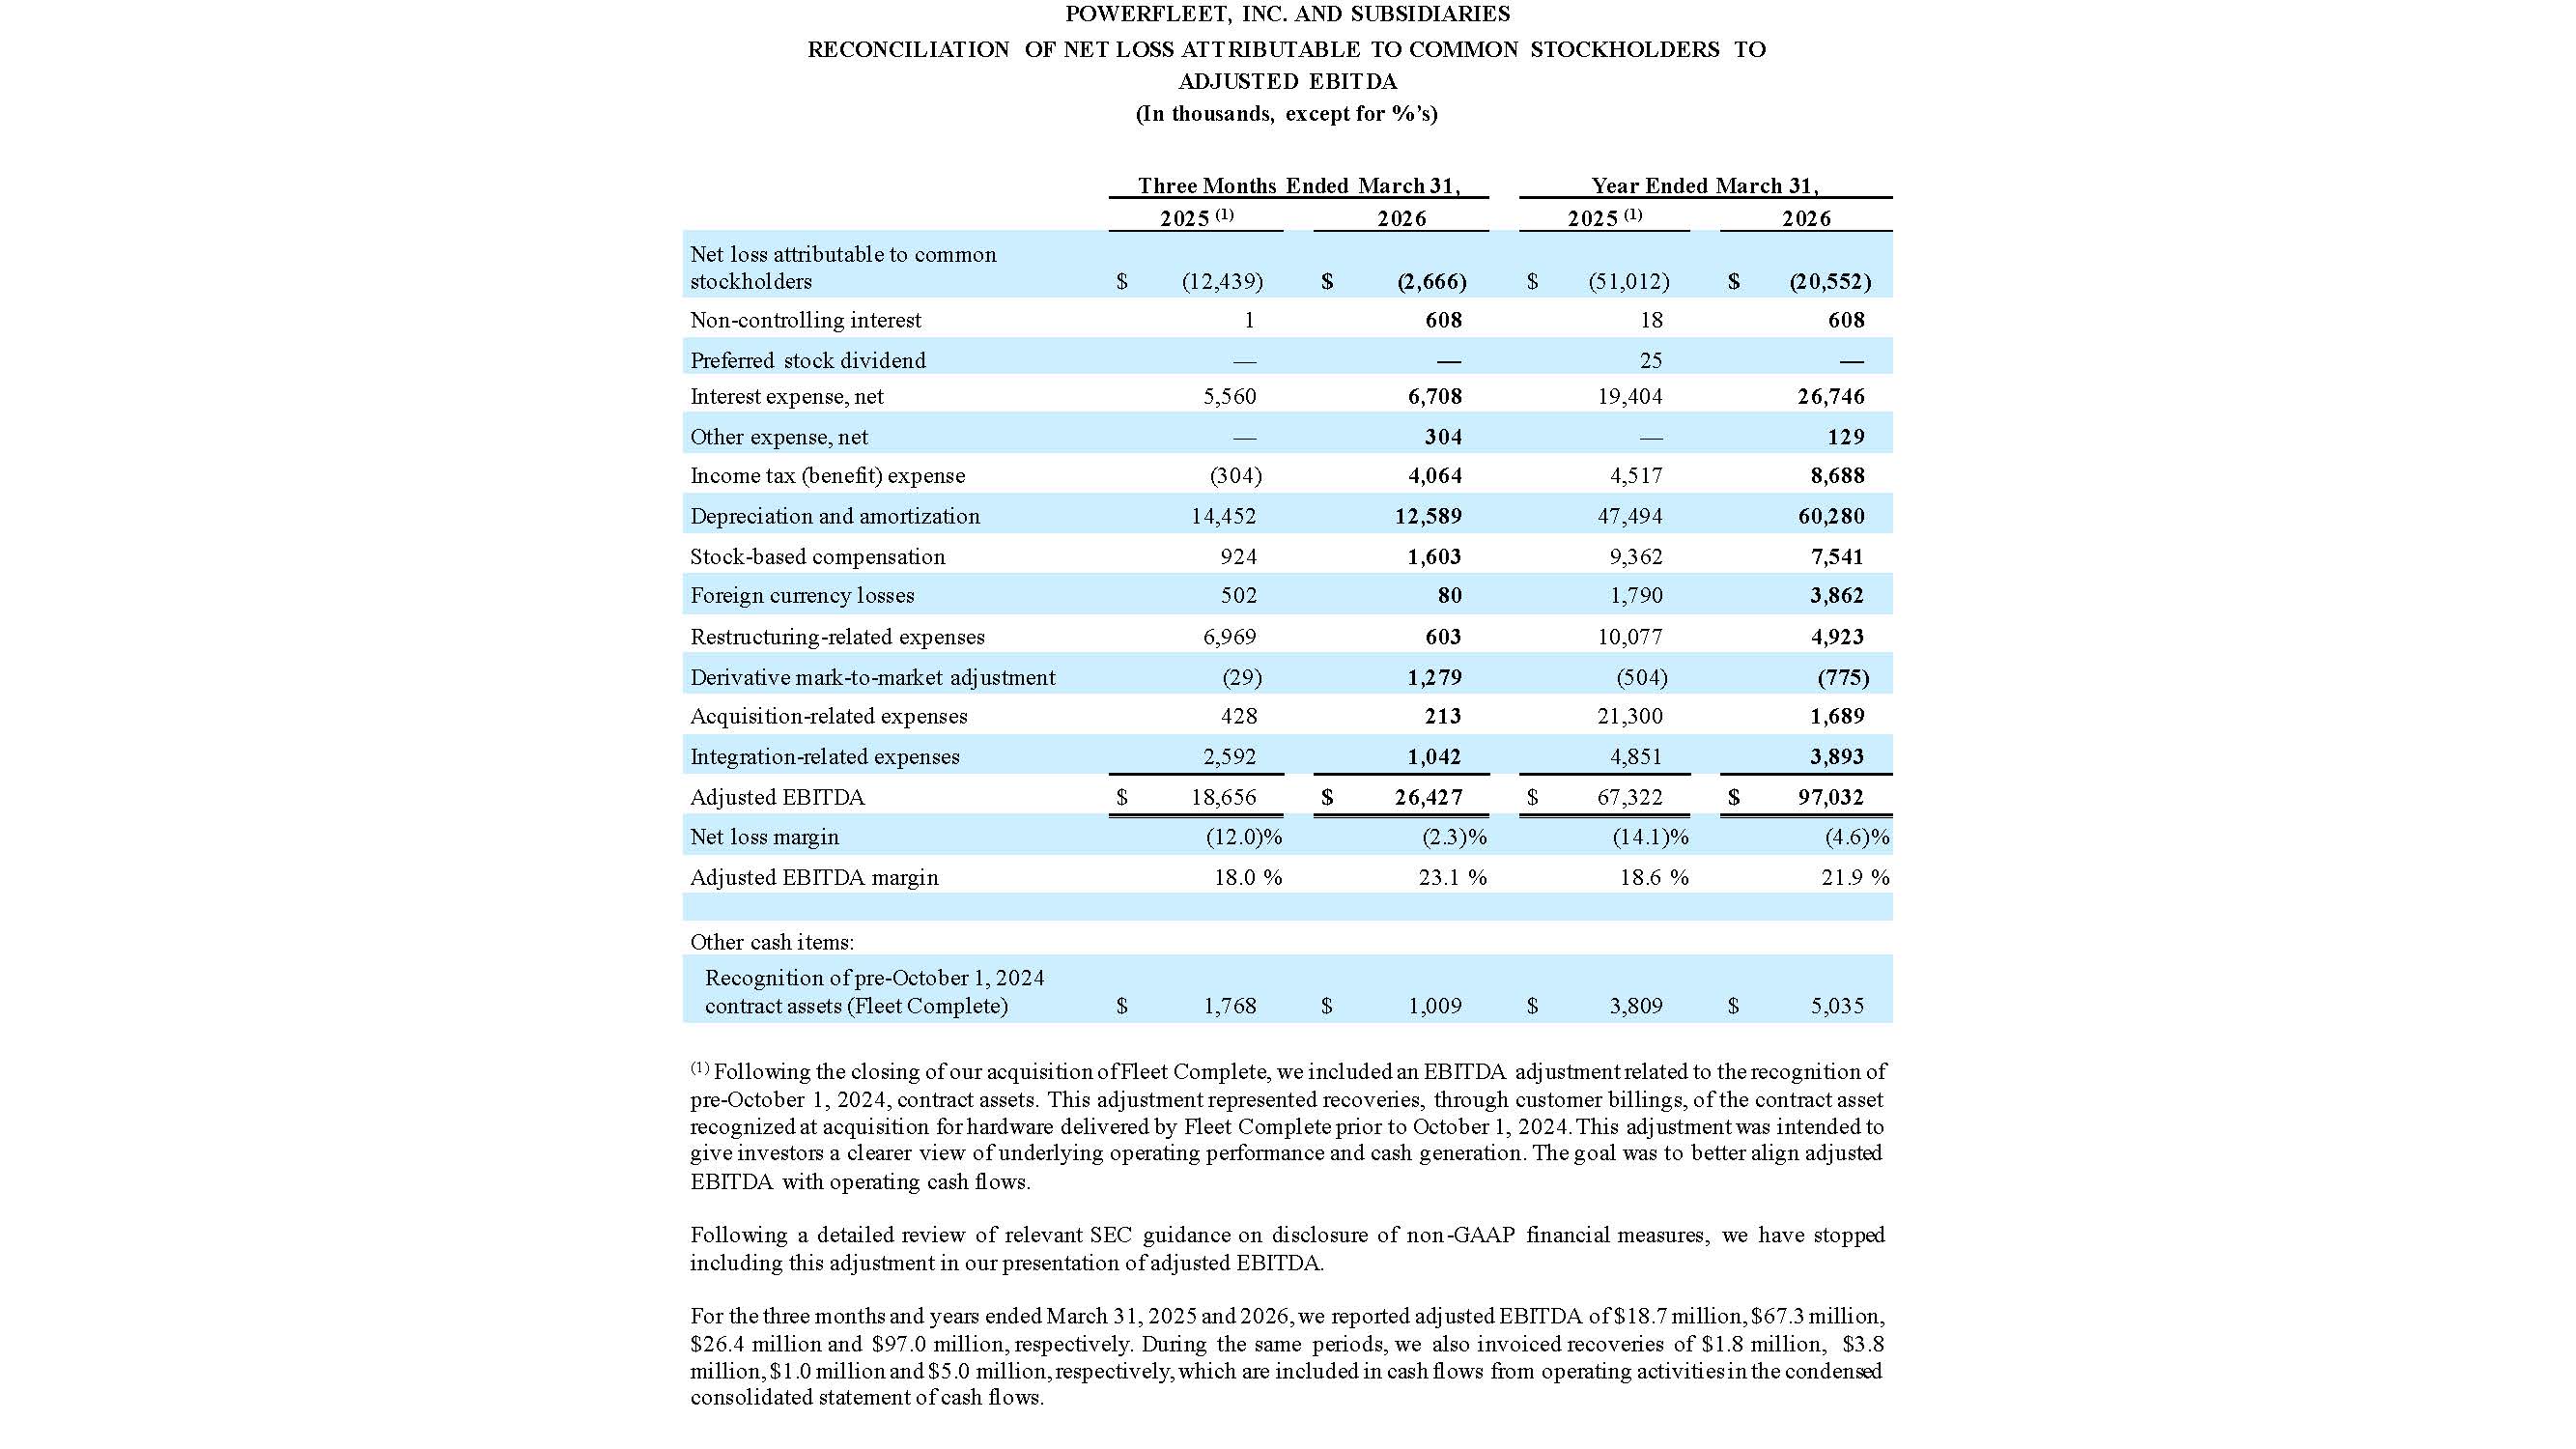
| Net loss attributable to common stockholders | $ | (12,439 | ) | $ | (2,666 | ) | $ | (51,012 | ) | $ | (20,552 | ) | ||||
| Non-controlling interest | 1 | 608 | 18 | 608 | ||||||||||||
| Preferred stock dividend | — | — | 25 | — | ||||||||||||
| Interest expense, net | 5,560 | 6,708 | 19,404 | 26,746 | ||||||||||||
| Other expense, net | — | 304 | — | 129 | ||||||||||||
| Income tax (benefit) expense | (304 | ) | 4,064 | 4,517 | 8,688 | |||||||||||
| Depreciation and amortization | 14,452 | 12,589 | 47,494 | 60,280 | ||||||||||||
| Stock-based compensation | 924 | 1,603 | 9,362 | 7,541 | ||||||||||||
| Foreign currency losses | 502 | 80 | 1,790 | 3,862 | ||||||||||||
| Restructuring-related expenses | 6,969 | 603 | 10,077 | 4,923 | ||||||||||||
| Derivative mark-to-market adjustment | (29 | ) | 1,279 | (504 | ) | (775 | ) | |||||||||
| Acquisition-related expenses | 428 | 213 | 21,300 | 1,689 | ||||||||||||
| Integration-related expenses | 2,592 | 1,042 | 4,851 | 3,893 | ||||||||||||
| Adjusted EBITDA | $ | 18,656 | $ | 26,427 | $ | 67,322 | $ | 97,032 | ||||||||
| Net loss margin | (12.0 | )% | (2.3 | )% | (14.1 | )% | (4.6 | )% | ||||||||
| Adjusted EBITDA margin | 18.0 | % | 23.1 | % | 18.6 | % | 21.9 | % | ||||||||
| Other cash items: | ||||||||||||||||
| Recognition of pre-October 1, 2024 contract assets (Fleet Complete) | $ | 1,768 | $ | 1,009 | $ | 3,809 | $ | 5,035 | ||||||||
(1) Following the closing of our acquisition of Fleet Complete, we included an EBITDA adjustment related to the recognition of pre-October 1, 2024, contract assets. This adjustment represented recoveries, through customer billings, of the contract asset recognized at acquisition for hardware delivered by Fleet Complete prior to October 1, 2024. This adjustment was intended to give investors a clearer view of underlying operating performance and cash generation. The goal was to better align adjusted EBITDA with operating cash flows.
|
|
Following a detailed review of relevant SEC guidance on disclosure of non-GAAP financial measures,
we have stopped including this adjustment in our presentation of adjusted EBITDA.
For the three months and years ended
March 31, 2025 and 2026, we reported adjusted EBITDA of $18.7 million, $67.3 million, $26.4 million and $97.0 million, respectively.
During the same periods, we also invoiced recoveries of $1.8 million, $3.8 million, $1.0 million and $5.0 million, respectively, which
are included in cash flows from operating activities in the condensed consolidated statement of cash flows.
The following table (in thousands, except per share data, and unaudited) reconciles net loss to adjusted net income for the periods shown:
|
Three Months Ended March 31, |
Year Ended March 31, |
|||||||||||||||
| 2025 | 2026 | 2025 | 2026 | |||||||||||||
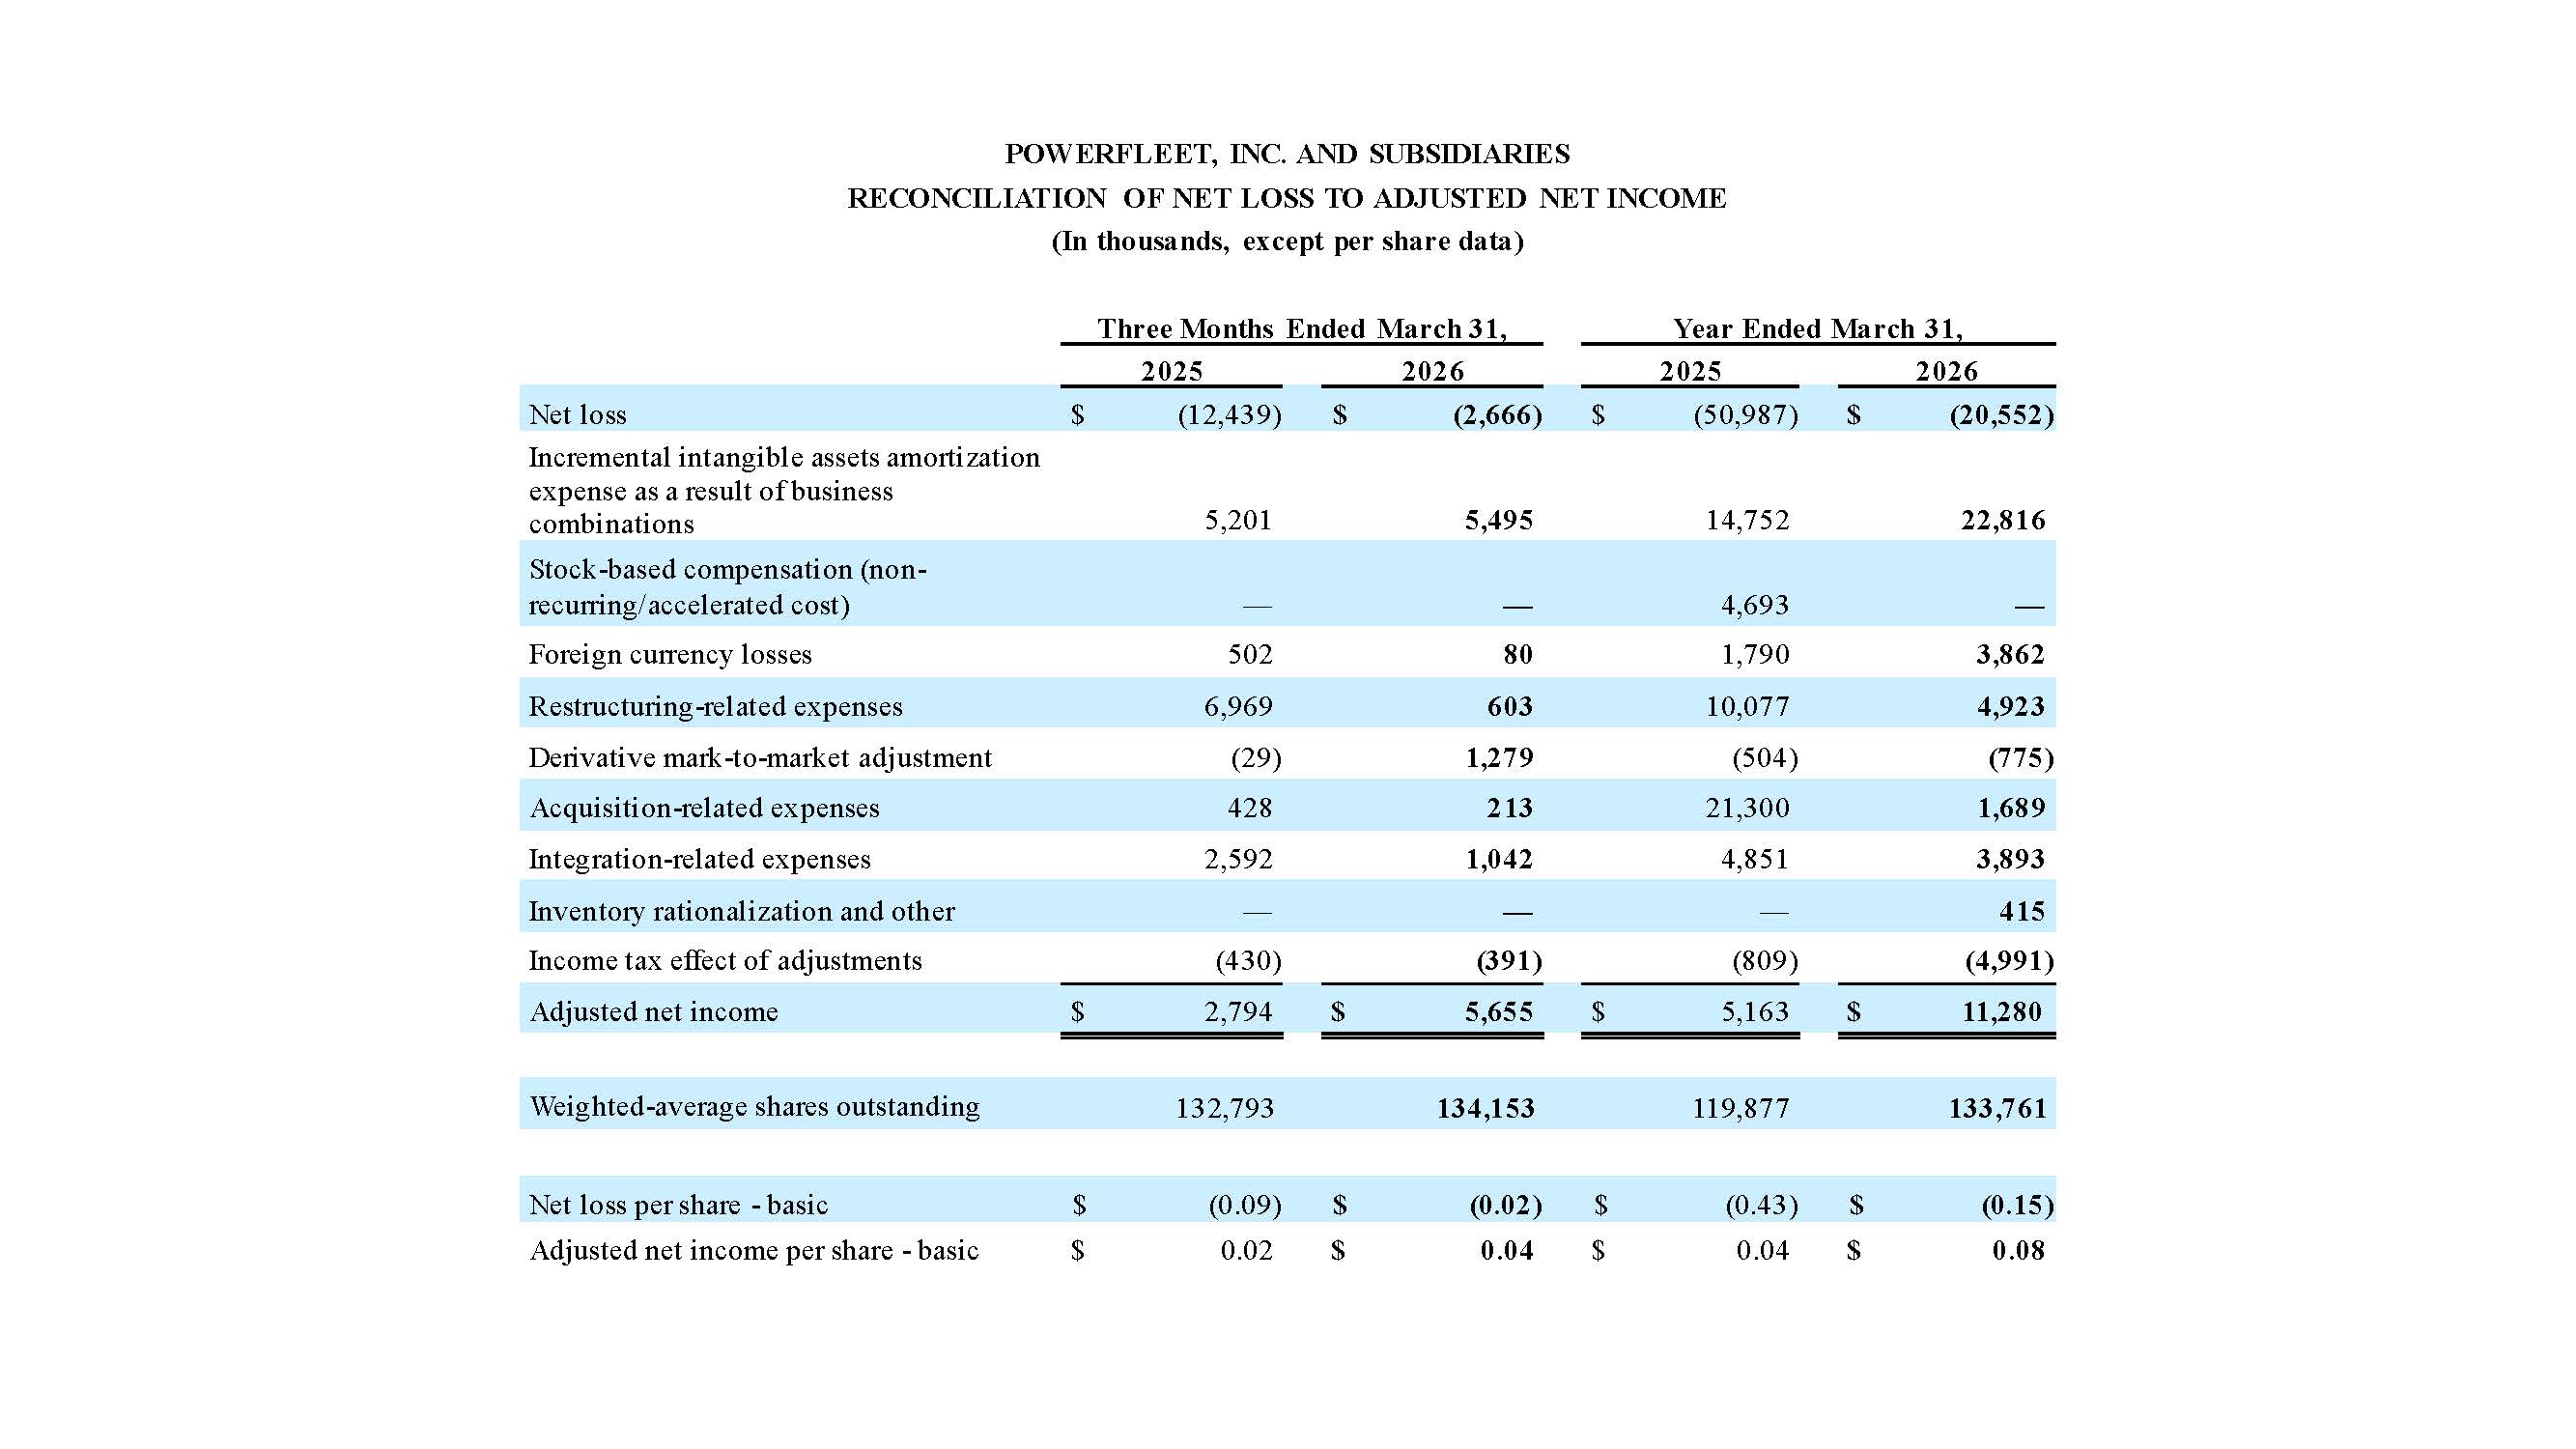
| Net loss | $ | (12,439 | ) | $ | (2,666 | ) | $ | (50,987 | ) | $ | (20,552 | ) | ||||
| Incremental intangible assets amortization expense as a result of business combinations | 5,201 | 5,495 | 14,752 | 22,816 | ||||||||||||
| Stock-based compensation (non-recurring/accelerated cost) | — | — | 4,693 | — | ||||||||||||
| Foreign currency losses | 502 | 80 | 1,790 | 3,862 | ||||||||||||
| Restructuring-related expenses | 6,969 | 603 | 10,077 | 4,923 | ||||||||||||
| Derivative mark-to-market adjustment | (29 | ) | 1,279 | (504 | ) | (775 | ) | |||||||||
| Acquisition-related expenses | 428 | 213 | 21,300 | 1,689 | ||||||||||||
| Integration-related expenses | 2,592 | 1,042 | 4,851 | 3,893 | ||||||||||||
| Inventory rationalization and other | — | — | — | 415 | ||||||||||||
| Income tax effect of adjustments | (430 | ) | (391 | ) | (809 | ) | (4,991 | ) | ||||||||
| Adjusted net income | $ | 2,794 | $ | 5,655 | $ | 5,163 | $ | 11,280 | ||||||||
| Weighted-average shares outstanding | 132,793 | 134,153 | 119,877 | 133,761 | ||||||||||||
| Net loss per share - basic | $ | (0.09 | ) | $ | (0.02 | ) | $ | (0.43 | ) | $ | (0.15 | ) | ||||
| Adjusted net income per share - basic | $ | 0.02 | $ | 0.04 | $ | 0.04 | $ | 0.08 | ||||||||
|
|
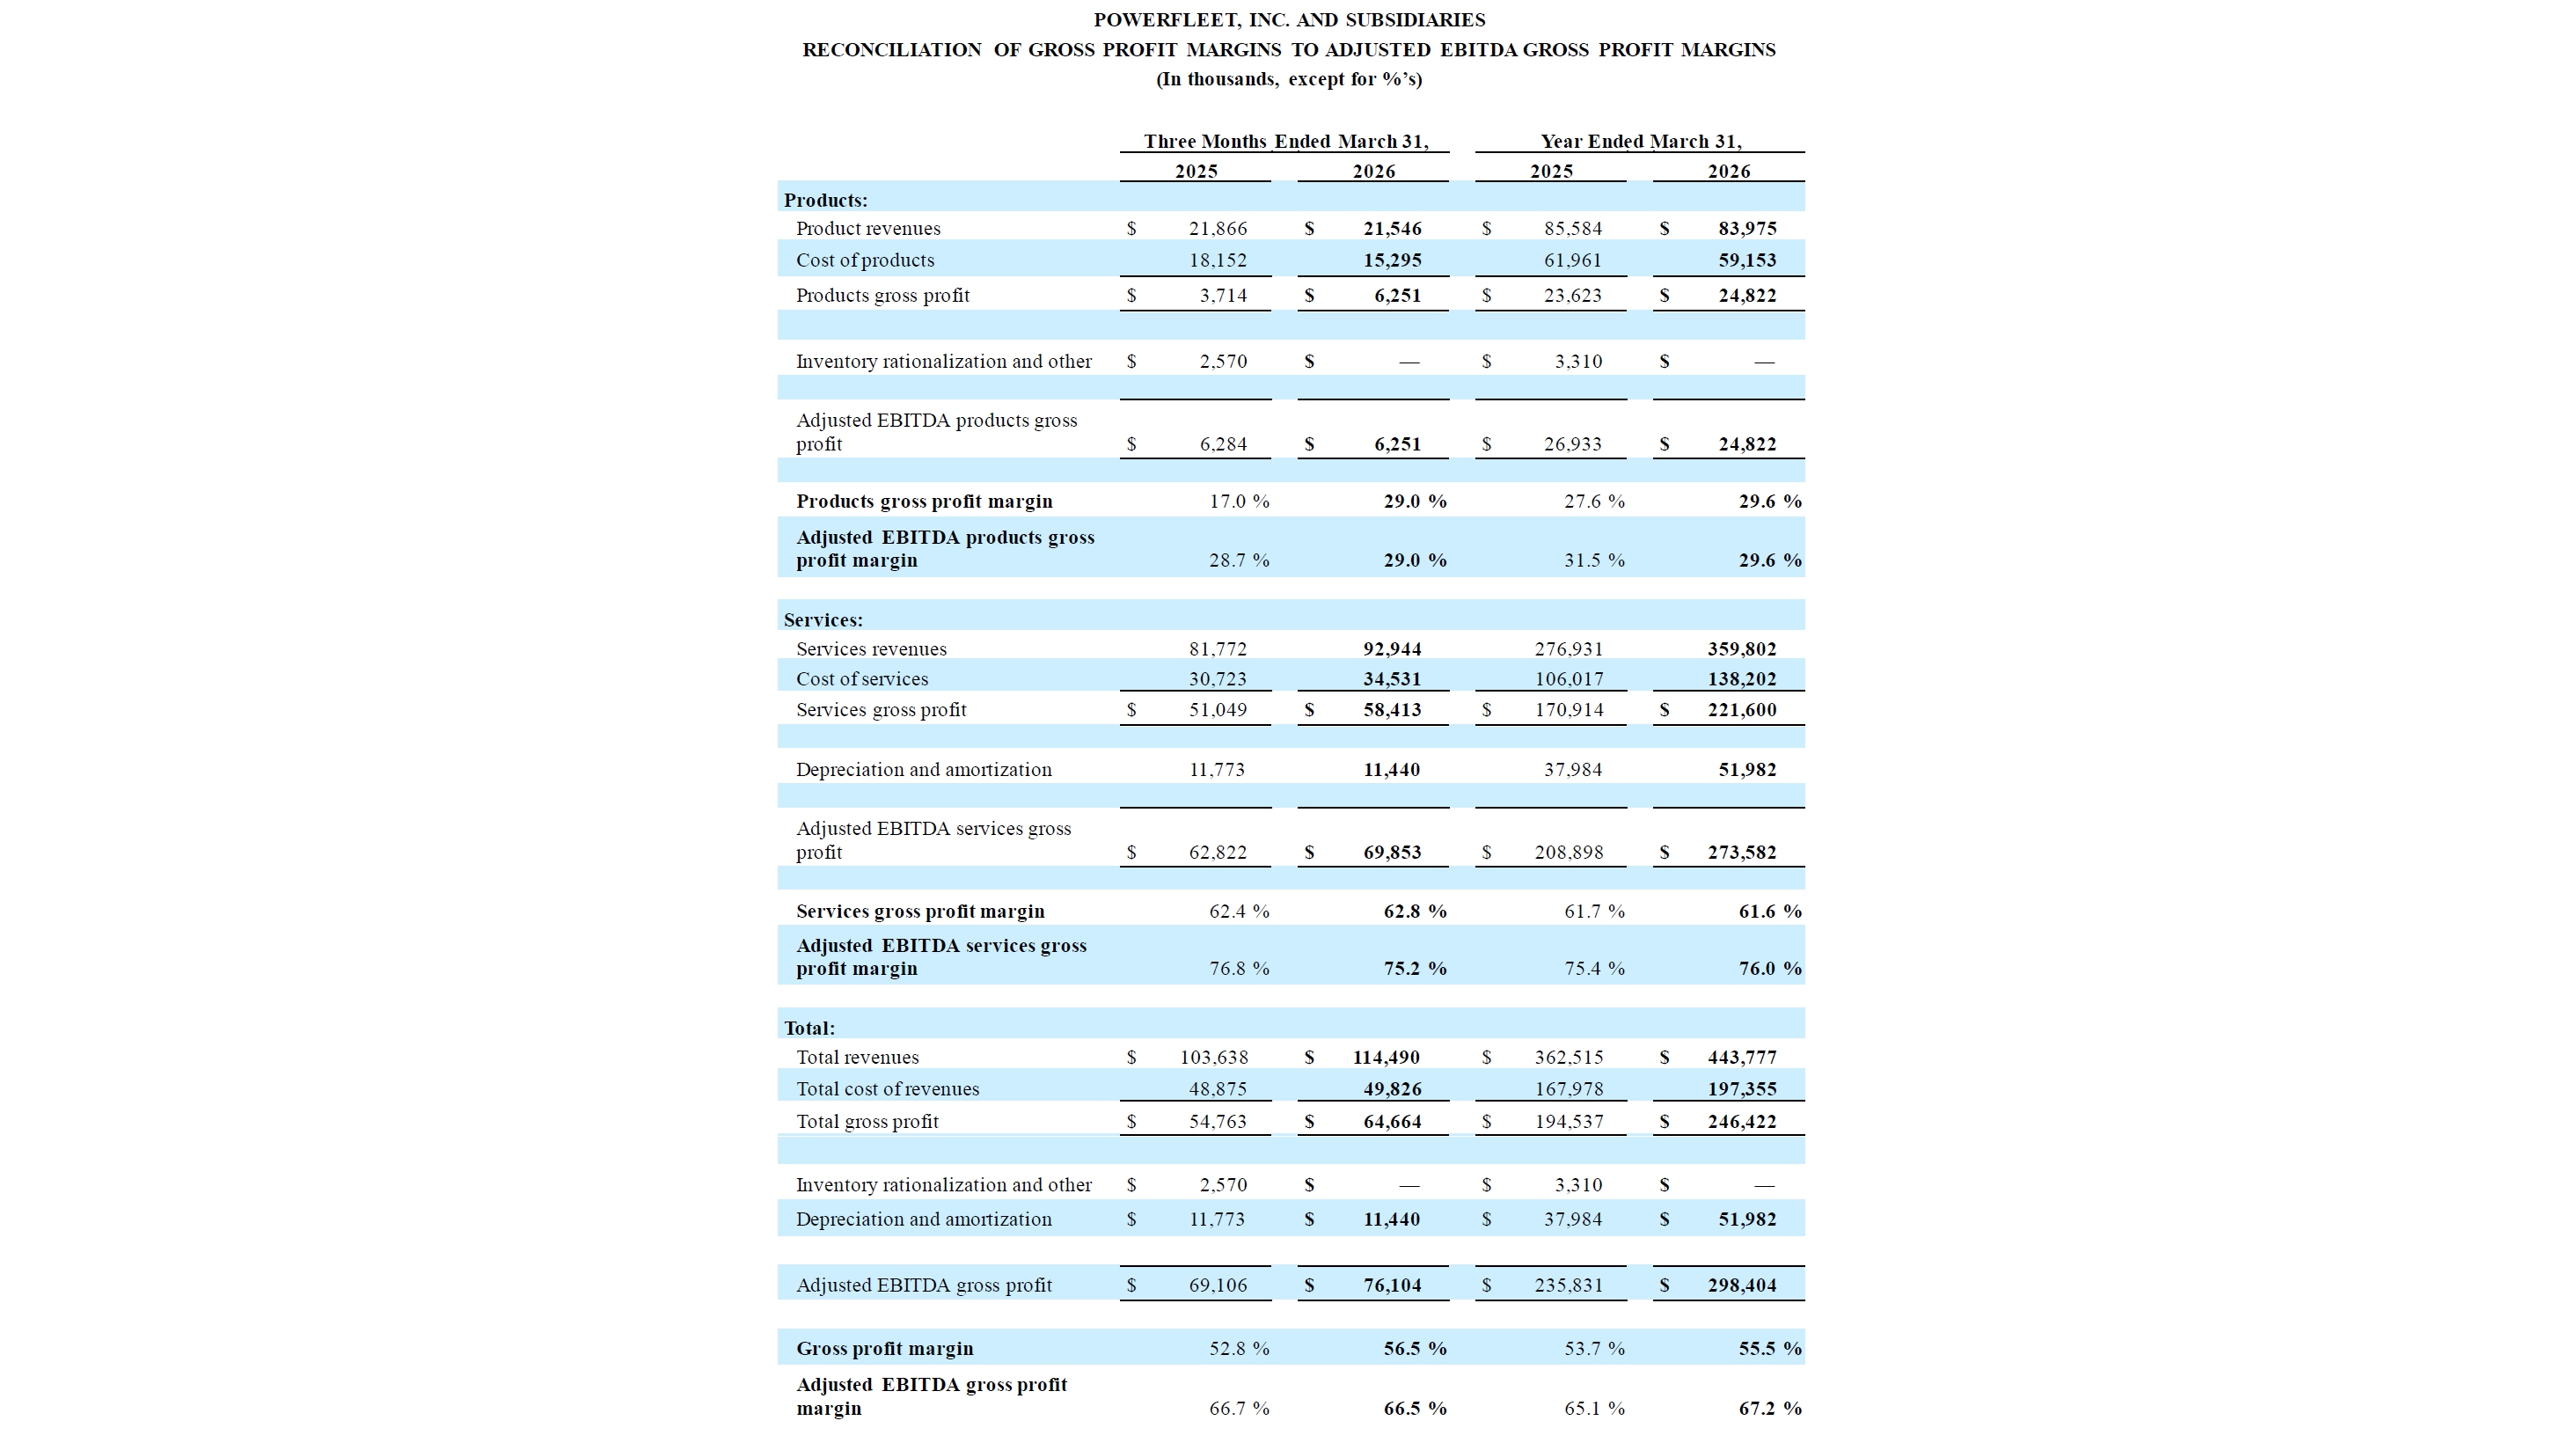
The following table (in thousands and unaudited) reconciles gross profit margins to adjusted EBITDA gross profit margins for the periods shown:
|
Three Months Ended March 31, |
Year Ended March 31, |
|||||||||||||||
| 2025 | 2026 | 2025 | 2026 | |||||||||||||
| Products: | ||||||||||||||||
| Product revenues | $ | 21,866 | $ | 21,546 | $ | 85,584 | $ | 83,975 | ||||||||
| Cost of products | 18,152 | 15,295 | 61,961 | 59,153 | ||||||||||||
| Products gross profit | $ | 3,714 | $ | 6,251 | $ | 23,623 | $ | 24,822 | ||||||||
| Inventory rationalization and other | $ | 2,570 | $ | — | $ | 3,310 | $ | — | ||||||||
| Adjusted EBITDA products gross profit | $ | 6,284 | $ | 6,251 | $ | 26,933 | $ | 24,822 | ||||||||
| Products gross profit margin | 17.0 | % | 29.0 | % | 27.6 | % | 29.6 | % | ||||||||
| Adjusted EBITDA products gross profit margin | 28.7 | % | 29.0 | % | 31.5 | % | 29.6 | % | ||||||||
| Services: | ||||||||||||||||
| Services revenues | 81,772 | 92,944 | 276,931 | 359,802 | ||||||||||||
| Cost of services | 30,723 | 34,531 | 106,017 | 138,202 | ||||||||||||
| Services gross profit | $ | 51,049 | $ | 58,413 | $ | 170,914 | $ | 221,600 | ||||||||
| Depreciation and amortization | 11,773 | 11,440 | 37,984 | 51,982 | ||||||||||||
| Adjusted EBITDA services gross profit | $ | 62,822 | $ | 69,853 | $ | 208,898 | $ | 273,582 | ||||||||
| Services gross profit margin | 62.4 | % | 62.8 | % | 61.7 | % | 61.6 | % | ||||||||
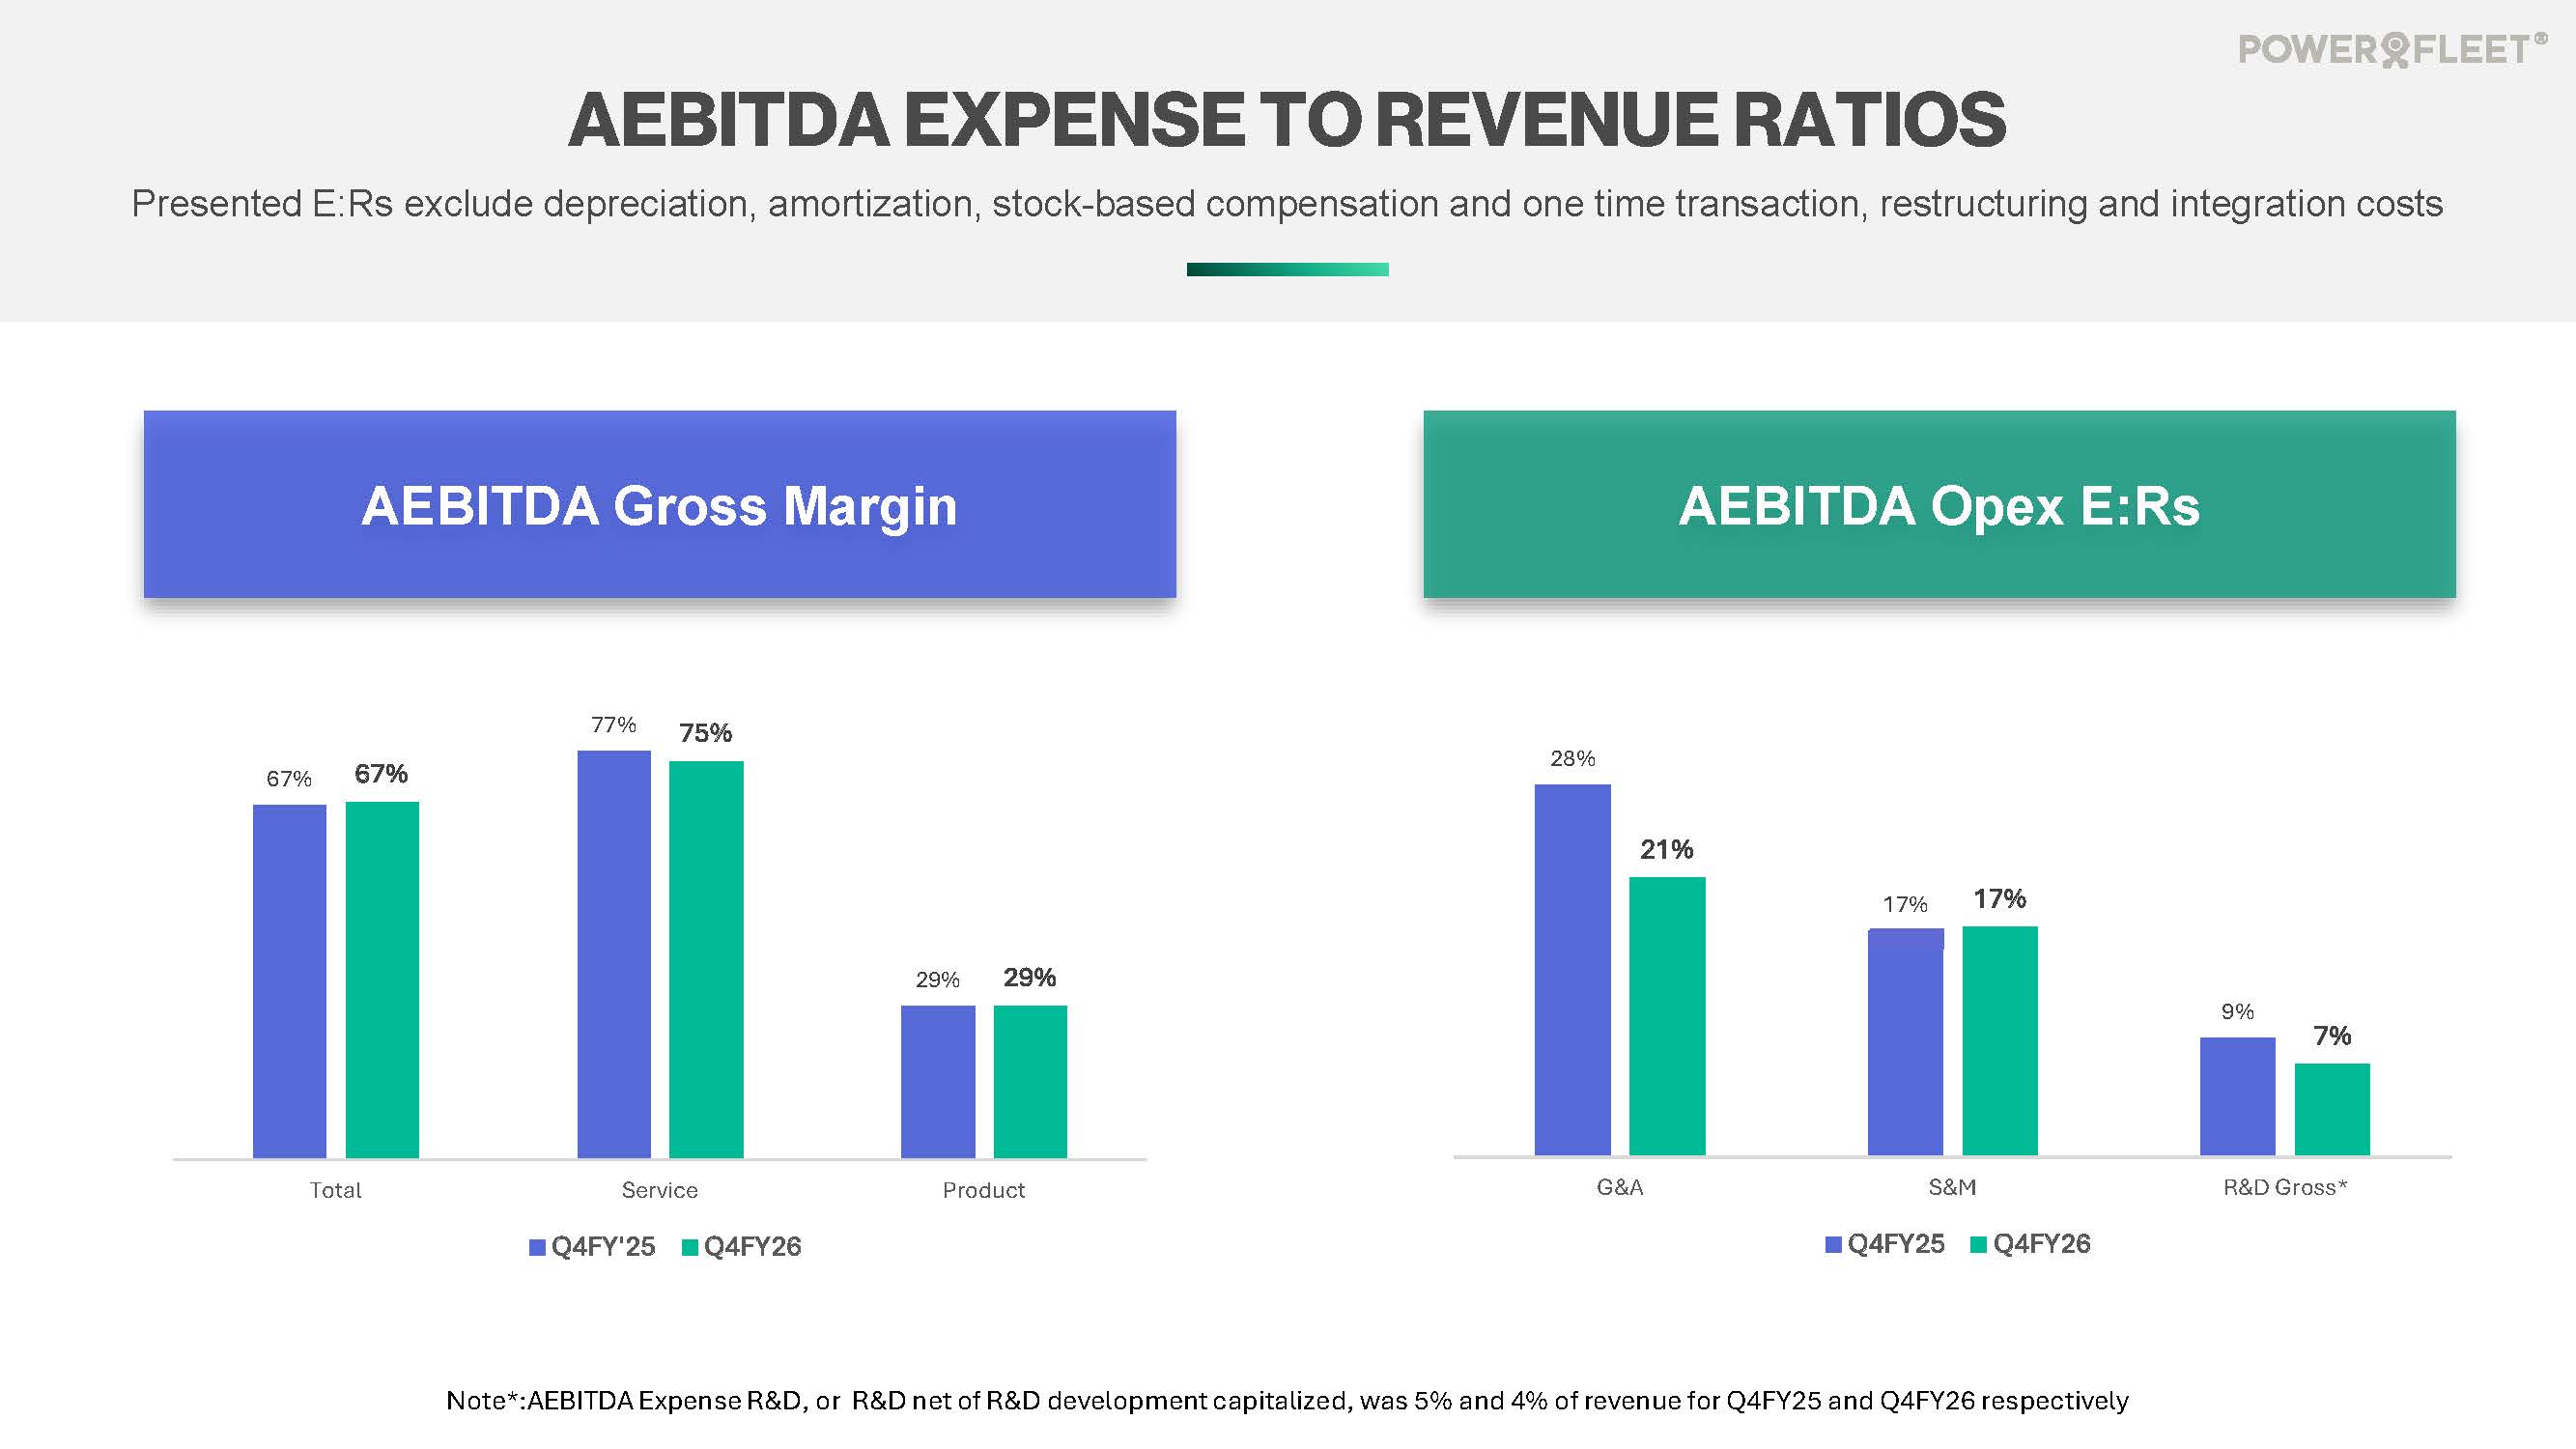
| Adjusted EBITDA services gross profit margin | 76.8 | % | 75.2 | % | 75.4 | % | 76.0 | % | ||||||||
| Total: | ||||||||||||||||
| Total revenues | $ | 103,638 | $ | 114,490 | $ | 362,515 | $ | 443,777 | ||||||||
| Total cost of revenues | 48,875 | 49,826 | 167,978 | 197,355 | ||||||||||||
| Total gross profit | $ | 54,763 | $ | 64,664 | $ | 194,537 | $ | 246,422 | ||||||||
| Inventory rationalization and other | $ | 2,570 | $ | — | $ | 3,310 | $ | — | ||||||||
| Depreciation and amortization | $ | 11,773 | $ | 11,440 | $ | 37,984 | $ | 51,982 | ||||||||
| Adjusted EBITDA gross profit | $ | 69,106 | $ | 76,104 | $ | 235,831 | $ | 298,404 | ||||||||
| Gross profit margin | 52.8 | % | 56.5 | % | 53.7 | % | 55.5 | % | ||||||||
| Adjusted EBITDA gross profit margin | 66.7 | % | 66.5 | % | 65.1 | % | 67.2 | % | ||||||||
|
|
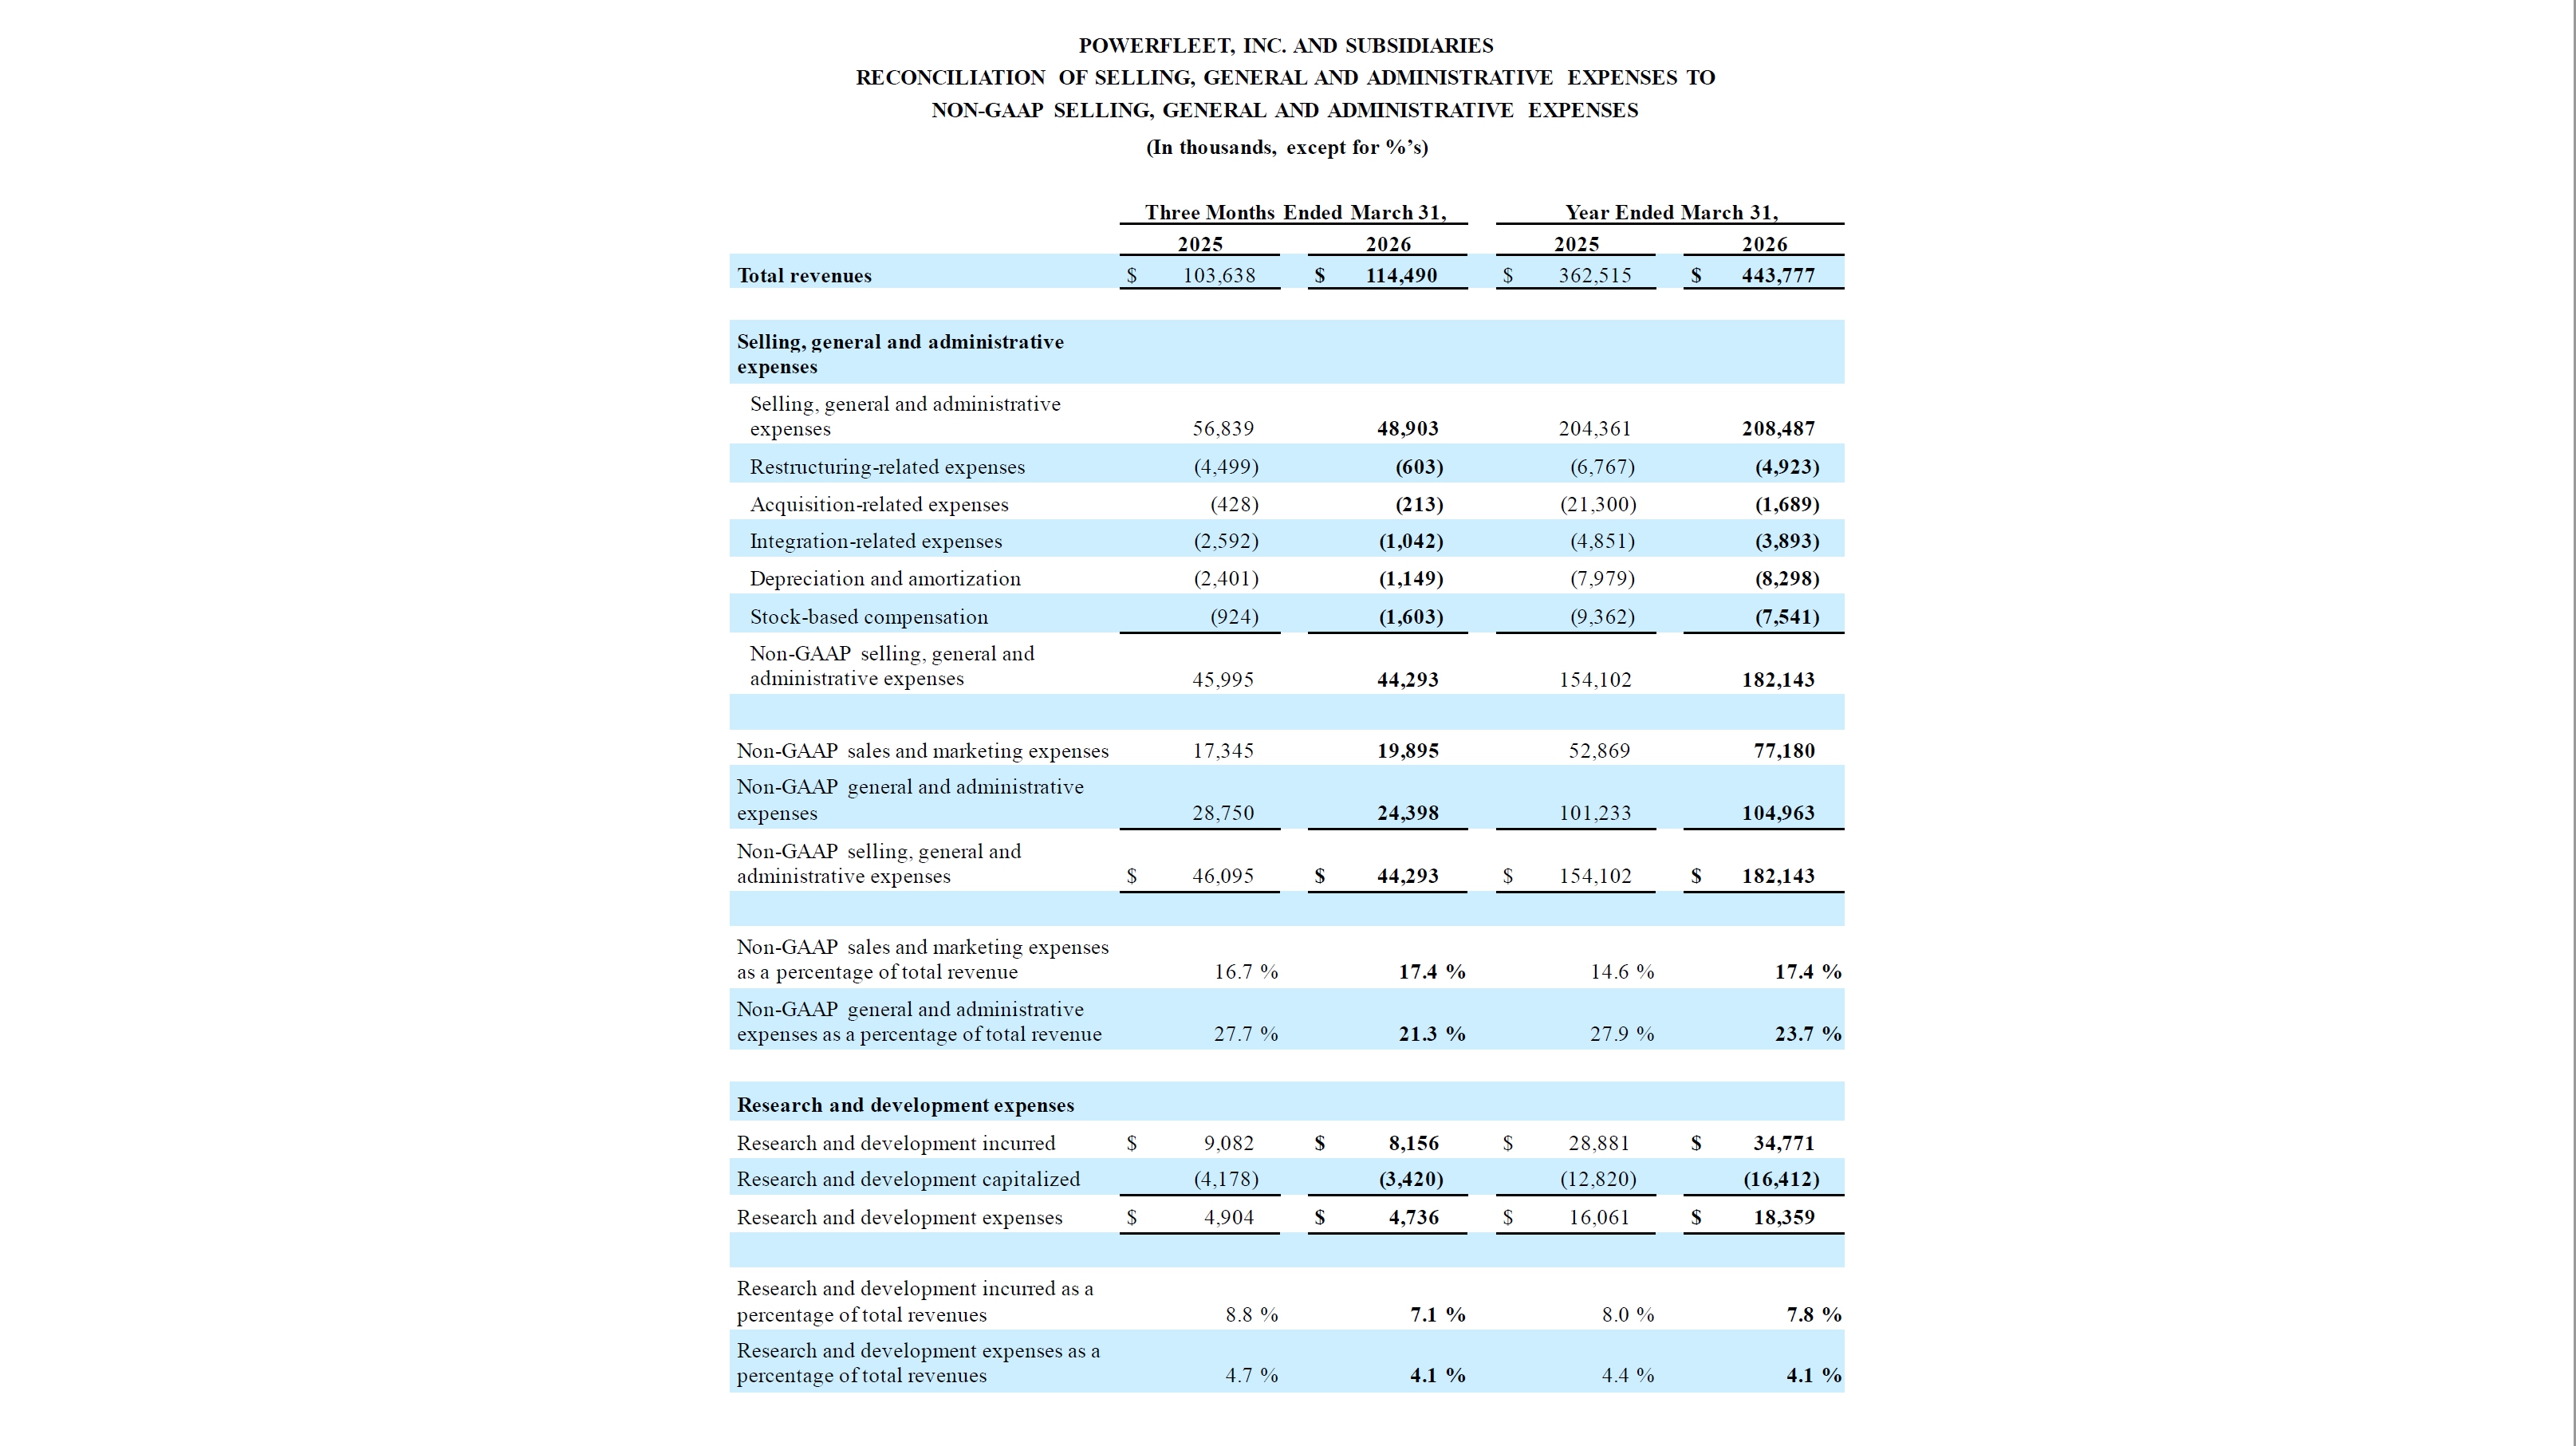
The following table (in thousands and unaudited) reconciles selling, general and administrative (“SG&A”) expenses to non-GAAP SG&A expenses for the periods shown:
|
Three Months Ended March 31, |
Year Ended March 31, |
|||||||||||||||
| 2025 | 2026 | 2025 | 2026 | |||||||||||||
| Total revenues | $ | 103,638 | $ | 114,490 | $ | 362,515 | $ | 443,777 | ||||||||
| Selling, general and administrative expenses | ||||||||||||||||
| Selling, general and administrative expenses | 56,839 | 48,903 | 204,361 | 208,487 | ||||||||||||
| Restructuring-related expenses | (4,499 | ) | (603 | ) | (6,767 | ) | (4,923 | ) | ||||||||
| Acquisition-related expenses | (428 | ) | (213 | ) | (21,300 | ) | (1,689 | ) | ||||||||
| Integration-related expenses | (2,592 | ) | (1,042 | ) | (4,851 | ) | (3,893 | ) | ||||||||
| Depreciation and amortization | (2,401 | ) | (1,149 | ) | (7,979 | ) | (8,298 | ) | ||||||||
| Stock-based compensation | (924 | ) | (1,603 | ) | (9,362 | ) | (7,541 | ) | ||||||||
| Non-GAAP selling, general and administrative expenses | 45,995 | 44,293 | 154,102 | 182,143 | ||||||||||||
| Non-GAAP sales and marketing expenses | 17,345 | 19,895 | 52,869 | 77,180 | ||||||||||||
| Non-GAAP general and administrative expenses | 28,750 | 24,398 | 101,233 | 104,963 | ||||||||||||
| Non-GAAP selling, general and administrative expenses | $ | 46,095 | $ | 44,293 | $ | 154,102 | $ | 182,143 | ||||||||
| Non-GAAP sales and marketing expenses as a percentage of total revenue | 16.7 | % | 17.4 | % | 14.6 | % | 17.4 | % | ||||||||
| Non-GAAP general and administrative expenses as a percentage of total revenue | 27.7 | % | 21.3 | % | 27.9 | % | 23.7 | % | ||||||||
| Research and development expenses | ||||||||||||||||
| Research and development incurred | $ | 9,082 | $ | 8,156 | $ | 28,881 | $ | 34,771 | ||||||||
| Research and development capitalized | (4,178 | ) | (3,420 | ) | (12,820 | ) | (16,412 | ) | ||||||||
| Research and development expenses | $ | 4,904 | $ | 4,736 | $ | 16,061 | $ | 18,359 | ||||||||
| Research and development incurred as a percentage of total revenues | 8.8 | % | 7.1 | % | 8.0 | % | 7.8 | % | ||||||||
| Research and development expenses as a percentage of total revenues | 4.7 | % | 4.1 | % | 4.4 | % | 4.1 | % | ||||||||
|
|
The following table (in thousands and unaudited) reconciles total operating expenses to adjusted operating expenses for the periods shown:
|
Three Months Ended March 31, |
Year Ended March 31, |
|||||||||||||||
| 2025 | 2026 | 2025 | 2026 | |||||||||||||
| Total operating expenses | $ | 61,743 | $ | 53,639 | $ | 220,422 | $ | 226,846 | ||||||||
| Adjusted for: | ||||||||||||||||
| Acquisition-related expenses | 428 | 213 | 21,300 | 1,689 | ||||||||||||
| Integration-related expenses | 2,592 | 1,042 | 4,851 | 3,893 | ||||||||||||
| Stock-based compensation (non-recurring/accelerated cost) | — | — | 4,693 | — | ||||||||||||
| Restructuring-related expenses | 4,499 | 603 | 6,767 | 4,923 | ||||||||||||
| 7,519 | 1,858 | 37,611 | 10,505 | |||||||||||||
| Adjusted operating expenses | $ | 54,224 | $ | 51,781 | $ | 182,811 | $ | 216,341 | ||||||||
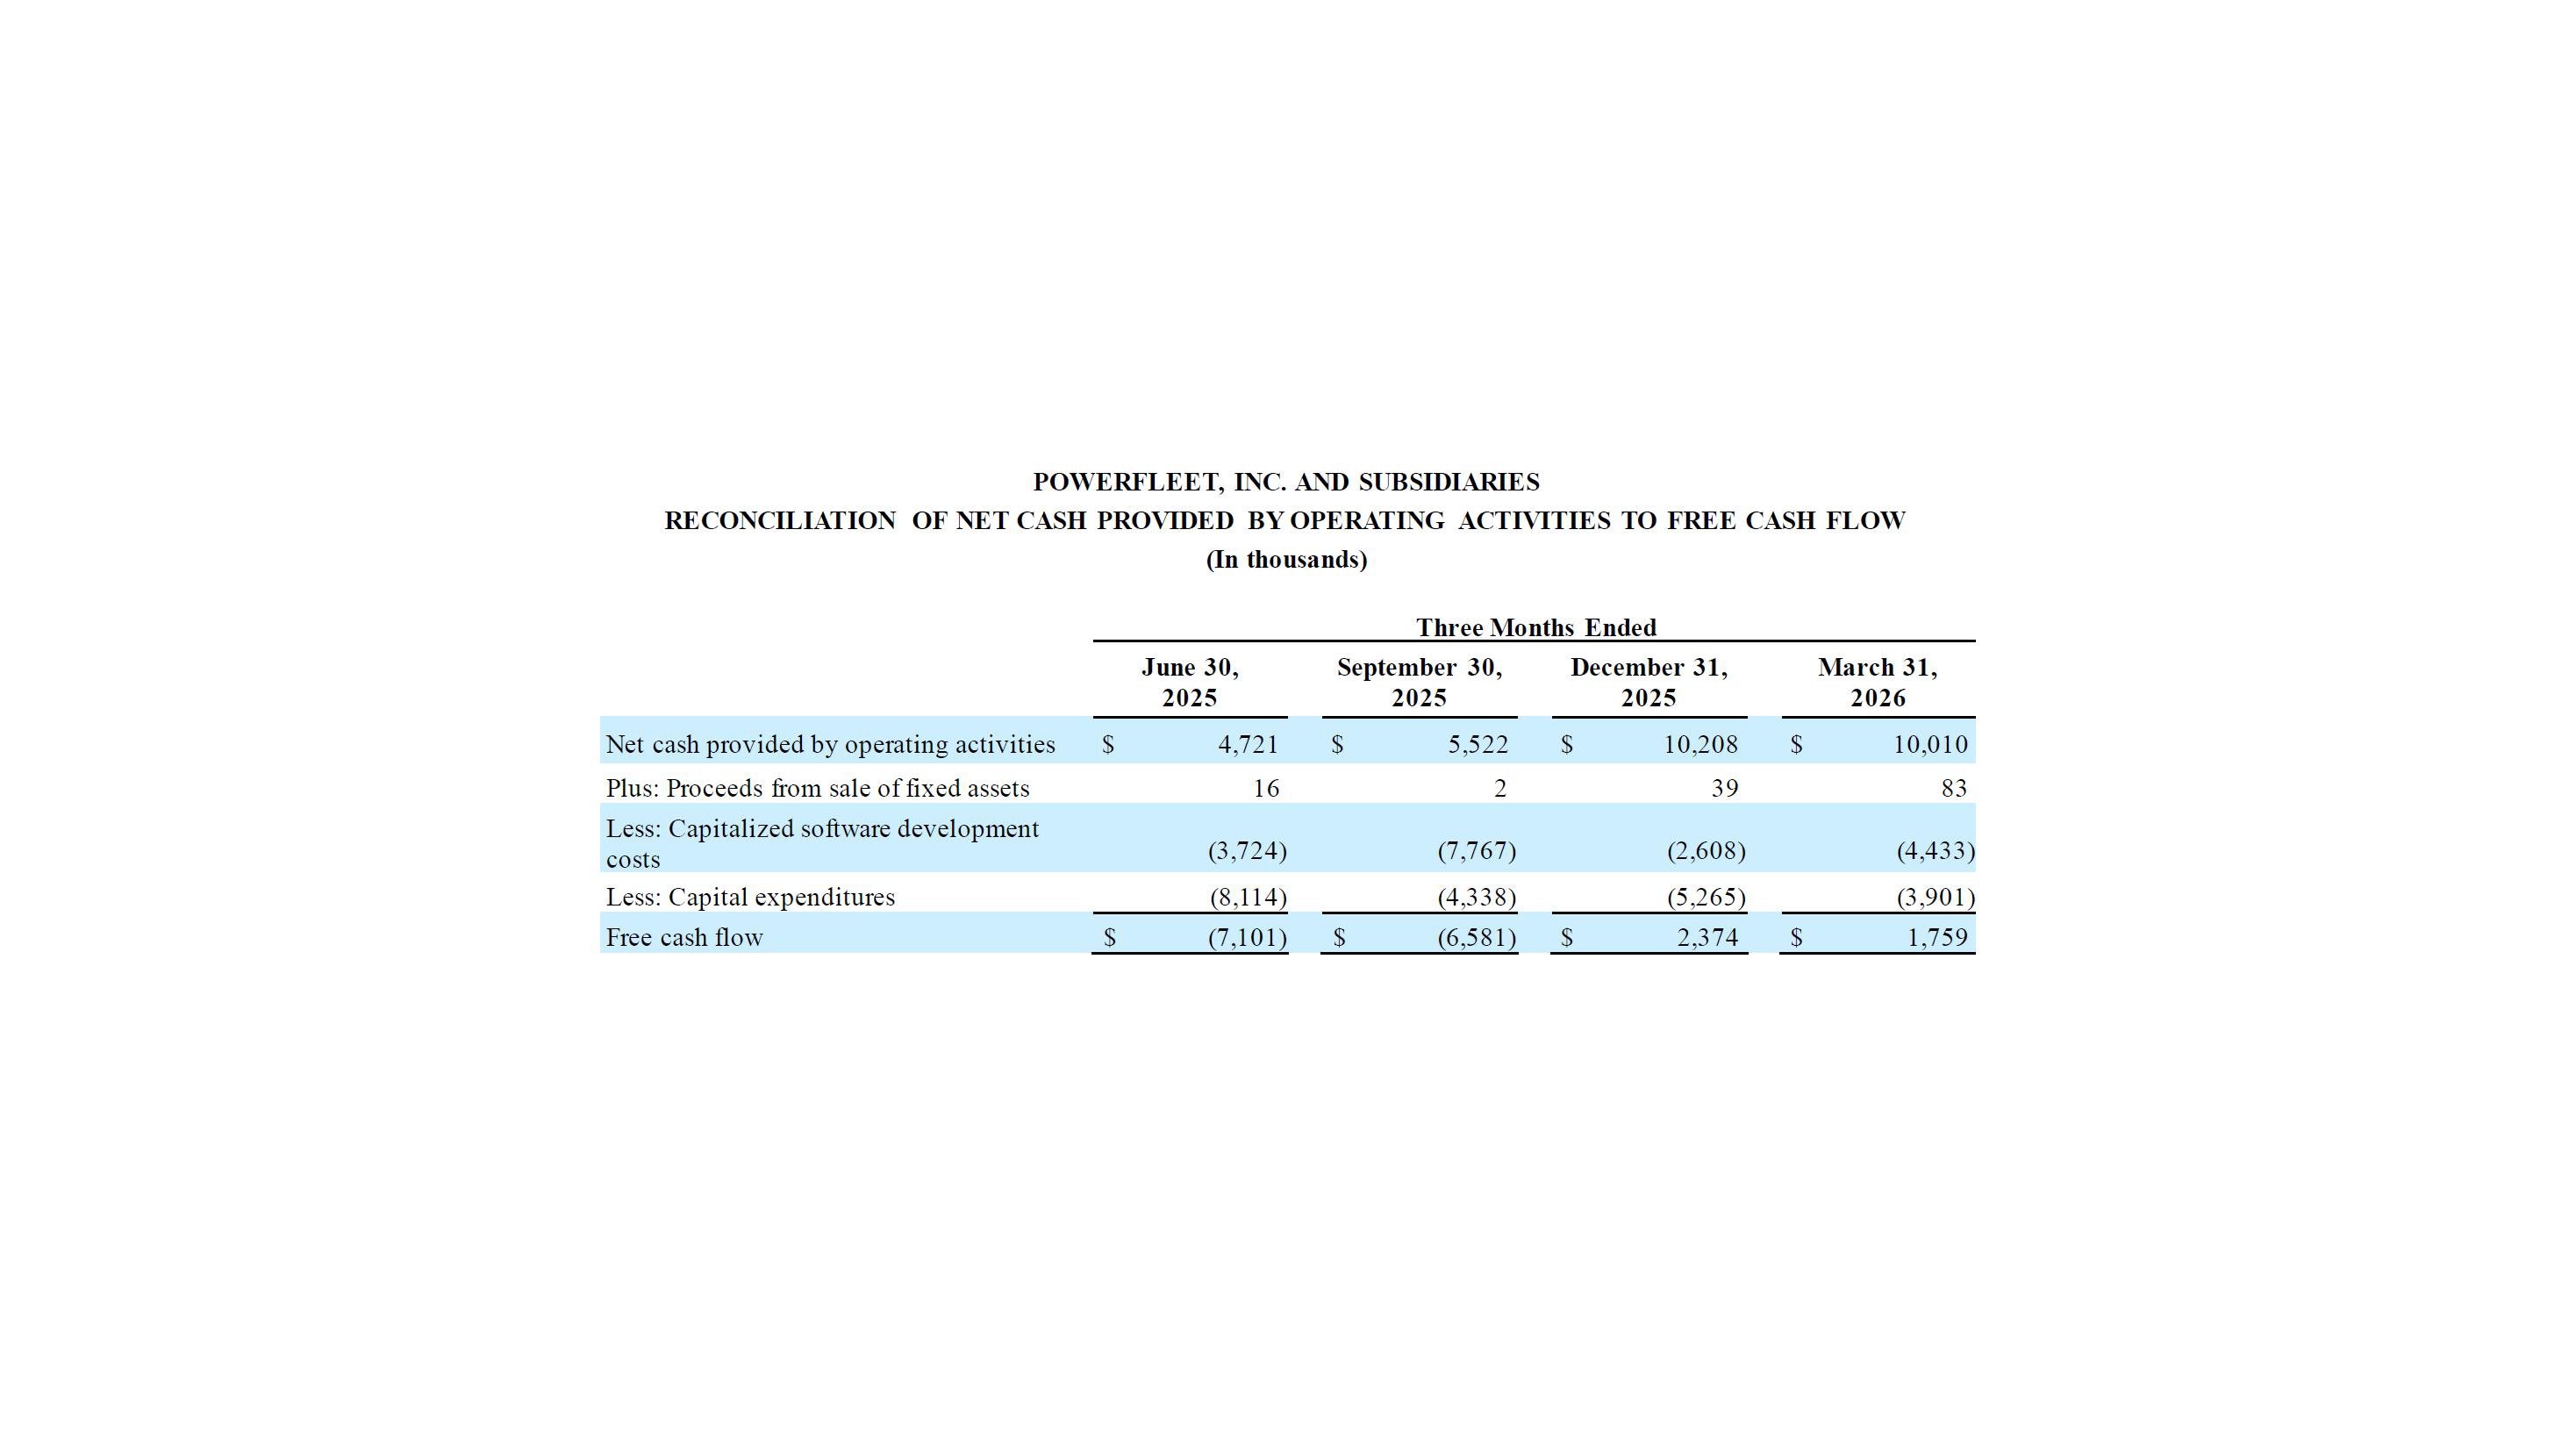
The following table (in thousands and unaudited) reconciles net cash provided by operating activities to free cash flow for the periods shown:
| Three Months Ended | ||||||||||||||||
|
June 30, 2025 |
September 30, 2025 | December 31, 2025 |
March 31, 2026 |
|||||||||||||
| Net cash provided by operating activities | $ | 4,721 | $ | 5,522 | $ | 10,208 | $ | 10,010 | ||||||||
| Plus: Proceeds from sale of fixed assets | 16 | 2 | 39 | 83 | ||||||||||||
| Less: Capitalized software development costs | (3,724 | ) | (7,767 | ) | (2,608 | ) | (4,433 | ) | ||||||||
| Less: Capital expenditures | (8,114 | ) | (4,338 | ) | (5,265 | ) | (3,901 | ) | ||||||||
| Free cash flow | $ | (7,101 | ) | $ | (6,581 | ) | $ | 2,374 | $ | 1,759 | ||||||
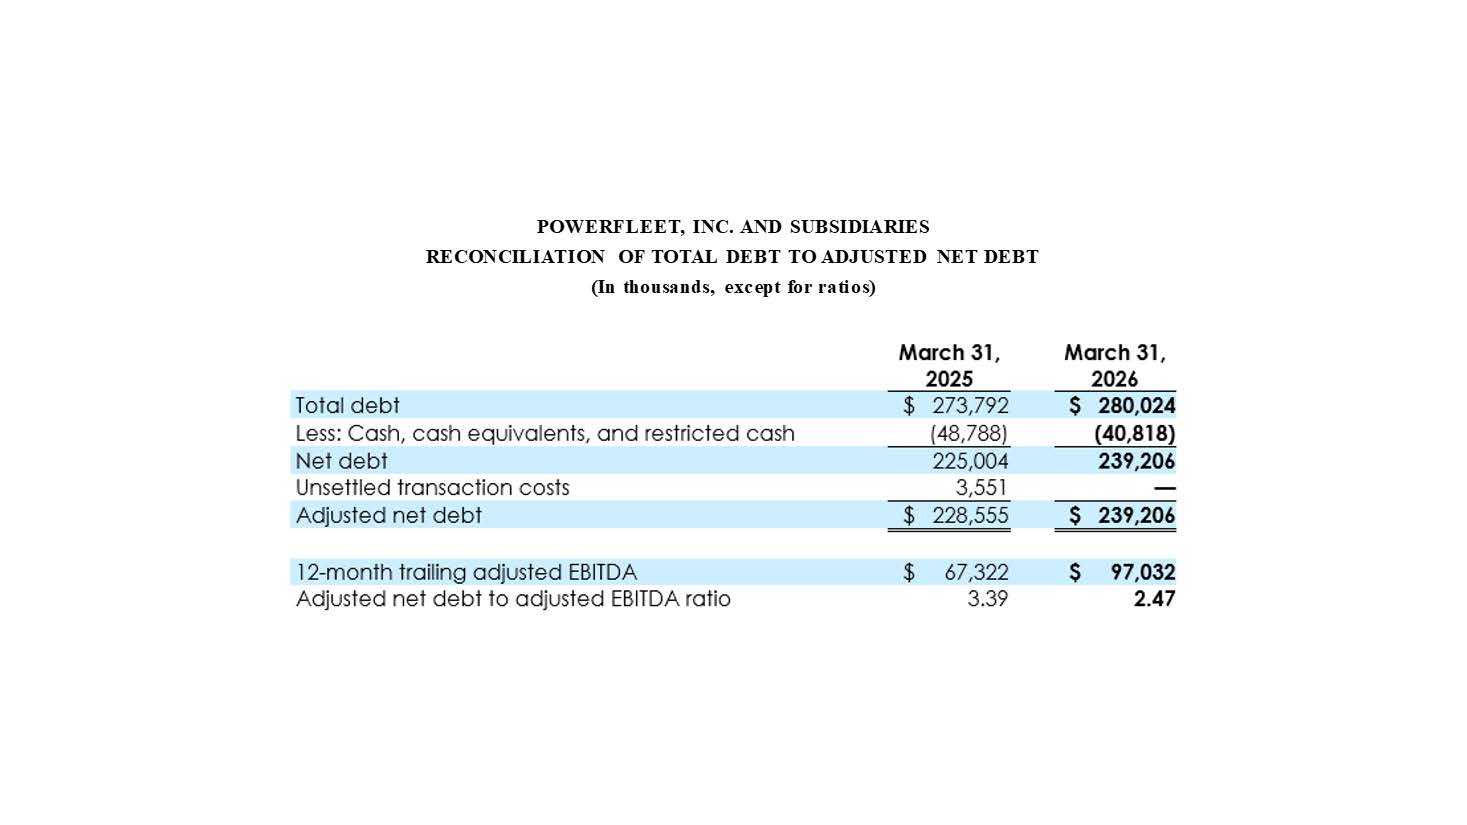
The following table (in thousands and unaudited) reconciles total debt to adjusted net debt for the periods shown:
|
March 31, 2025 |
March 31, 2026 |
|||||||
| Total debt | $ | 273,792 | $ | 280,024 | ||||
| Less: Cash, cash equivalents, and restricted cash | (48,788 | ) | (40,818 | ) | ||||
| Net debt | 225,004 | 239,206 | ||||||
| Unsettled transaction costs | 3,551 | — | ||||||
| Adjusted net debt | $ | 228,555 | $ | 239,206 | ||||
| 12-month trailing adjusted EBITDA | $ | 67,322 | $ | 97,032 | ||||
| Adjusted net debt to adjusted EBITDA ratio | 3.39 | 2.47 | ||||||
|
|
Exhibit 99.2