UNITED STATES
SECURITIES AND EXCHANGE COMMISSION
Washington, D.C. 20549
FORM 8-K
CURRENT REPORT
Pursuant to Section 13 or Section 15(d) of the Securities Exchange Act of 1934
Date of Report (Date of earliest event reported): March 10, 2026
Inspired Entertainment, Inc.
(Exact name of registrant as specified in its charter)
| Delaware | 001-36689 | 47-1025534 | ||
| (State
or other jurisdiction of incorporation) |
(Commission File Number) |
(IRS
Employer Identification No.) |
|
250 West 57th Street, Suite 415 New York, New York |
10107 | |
| (Address of principal executive offices) | (Zip Code) |
Registrant’s telephone number, including area code: (646) 565-3861
Not Applicable
(Former name or former address, if changed since last report)
Check the appropriate box below if the Form 8-K filing is intended to simultaneously satisfy the filing obligation to the registrant under any of the following provisions:
| ☐ | Written communications pursuant to Rule 425 under the Securities Act (17 CFR 230.425) |
| ☐ | Soliciting material pursuant to Rule 14a-12 under the Exchange Act (17 CFR 240.14a-12) |
| ☐ | Pre-commencement communications pursuant to Rule 14d-2(b) under the Exchange Act (17 CFR 240.14d-2(b)) |
| ☐ | Pre-commencement communications pursuant to Rule 13e-4(c) under the Exchange Act (17 CFR 240.13e-4(c)) |
Securities registered pursuant to Section 12(b) of the Act:
| Title of each class | Trading Symbol(s) | Name of each exchange on which registered | ||
| Common stock, par value $0.0001 per share | INSE | The NASDAQ Stock Market LLC |
Indicate by check mark whether the registrant is an emerging growth company as defined in as defined in Rule 405 of the Securities Act of 1933 (§230.405 of this chapter) or Rule 12b-2 of the Securities Exchange Act of 1934 (§240.12b-2 of this chapter).
Emerging growth company ☐
If an emerging growth company, indicate by check mark if the registrant has elected not to use the extended transition period for complying with any new or revised financial accounting standards provided pursuant to Section 13(a) of the Exchange Act. ☐
| Item 2.02 | Results of Operations and Financial Condition. |
On March 10, 2026, Inspired Entertainment, Inc. (the “Company”) issued a press release announcing results for the fiscal year ended December 31, 2025 and the three-month period ended December 31, 2025. A copy of the press release is attached hereto as Exhibit 99.1.
Also on March 10, 2026, the Company distributed an investor presentation relating to its results of operations and financial condition, which may be used at meetings with investors, analysts or others, in whole or in part and possibly with modifications from time to time. A copy of the investor presentation is attached hereto as Exhibit 99.2.
The information contained in this Current Report on Form 8-K, including the exhibits hereto, shall not be deemed “filed” for purposes of Section 18 of the Securities Exchange Act of 1934, as amended (the “Exchange Act”), or incorporated by reference in any filing under the Securities Act of 1933, as amended, or the Exchange Act, except as shall be expressly set forth by specific reference in such a filing.
| Item 9.01. | Financial Statements and Exhibits. |
| Exhibit Number | Exhibit Description | |
| 99.1 | Press Release issued by Inspired Entertainment, Inc. on March 10, 2026 | |
| 99.2 | Investor Presentation issued by Inspired Entertainment, Inc. on March 10, 2026 | |
| 104 | Cover Page Interactive Data File (embedded within the Inline XBRL document). |
SIGNATURES
Pursuant to the requirements of the Securities Exchange Act of 1934, the registrant has caused this report to be signed on its behalf by the undersigned hereunto duly authorized.
| March 10, 2026 | Inspired Entertainment, Inc. | |
| By: | /s/ Simona Camilleri | |
| Name: | Simona Camilleri | |
| Title: | General Counsel | |
Exhibit 99.1

INSPIRED REPORTS FOURTH QUARTER AND FULL YEAR 2025 RESULTS
Transition Underway to More Digital, Scalable, Higher Margin Business
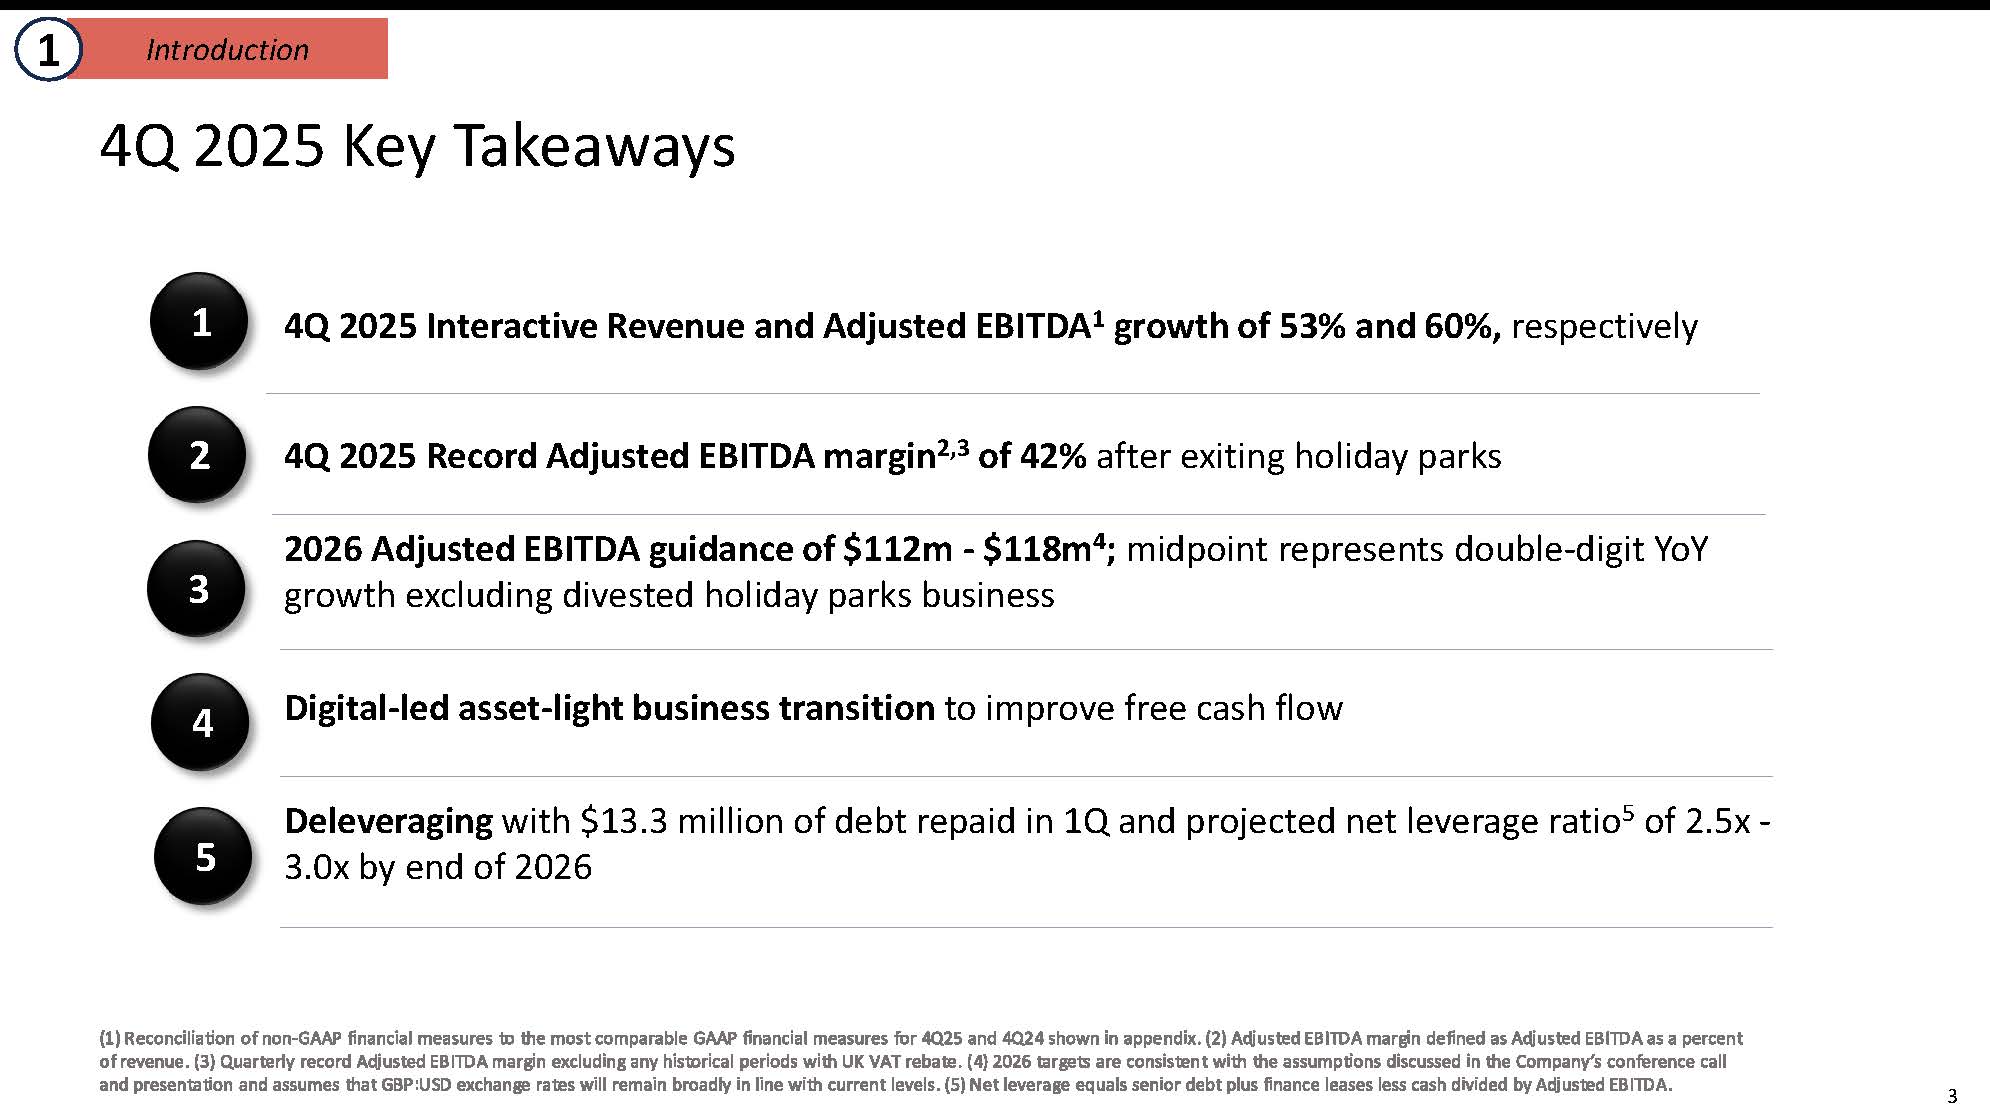
| ● | Fourth quarter Revenue of $77.2 million driven primarily by record Interactive revenue, up 53% year-over-year |
| ● | Fourth quarter Net Operating Income of $11.2 million, Net Loss of $7.2 million and Adjusted Net Loss of $5.1 million |
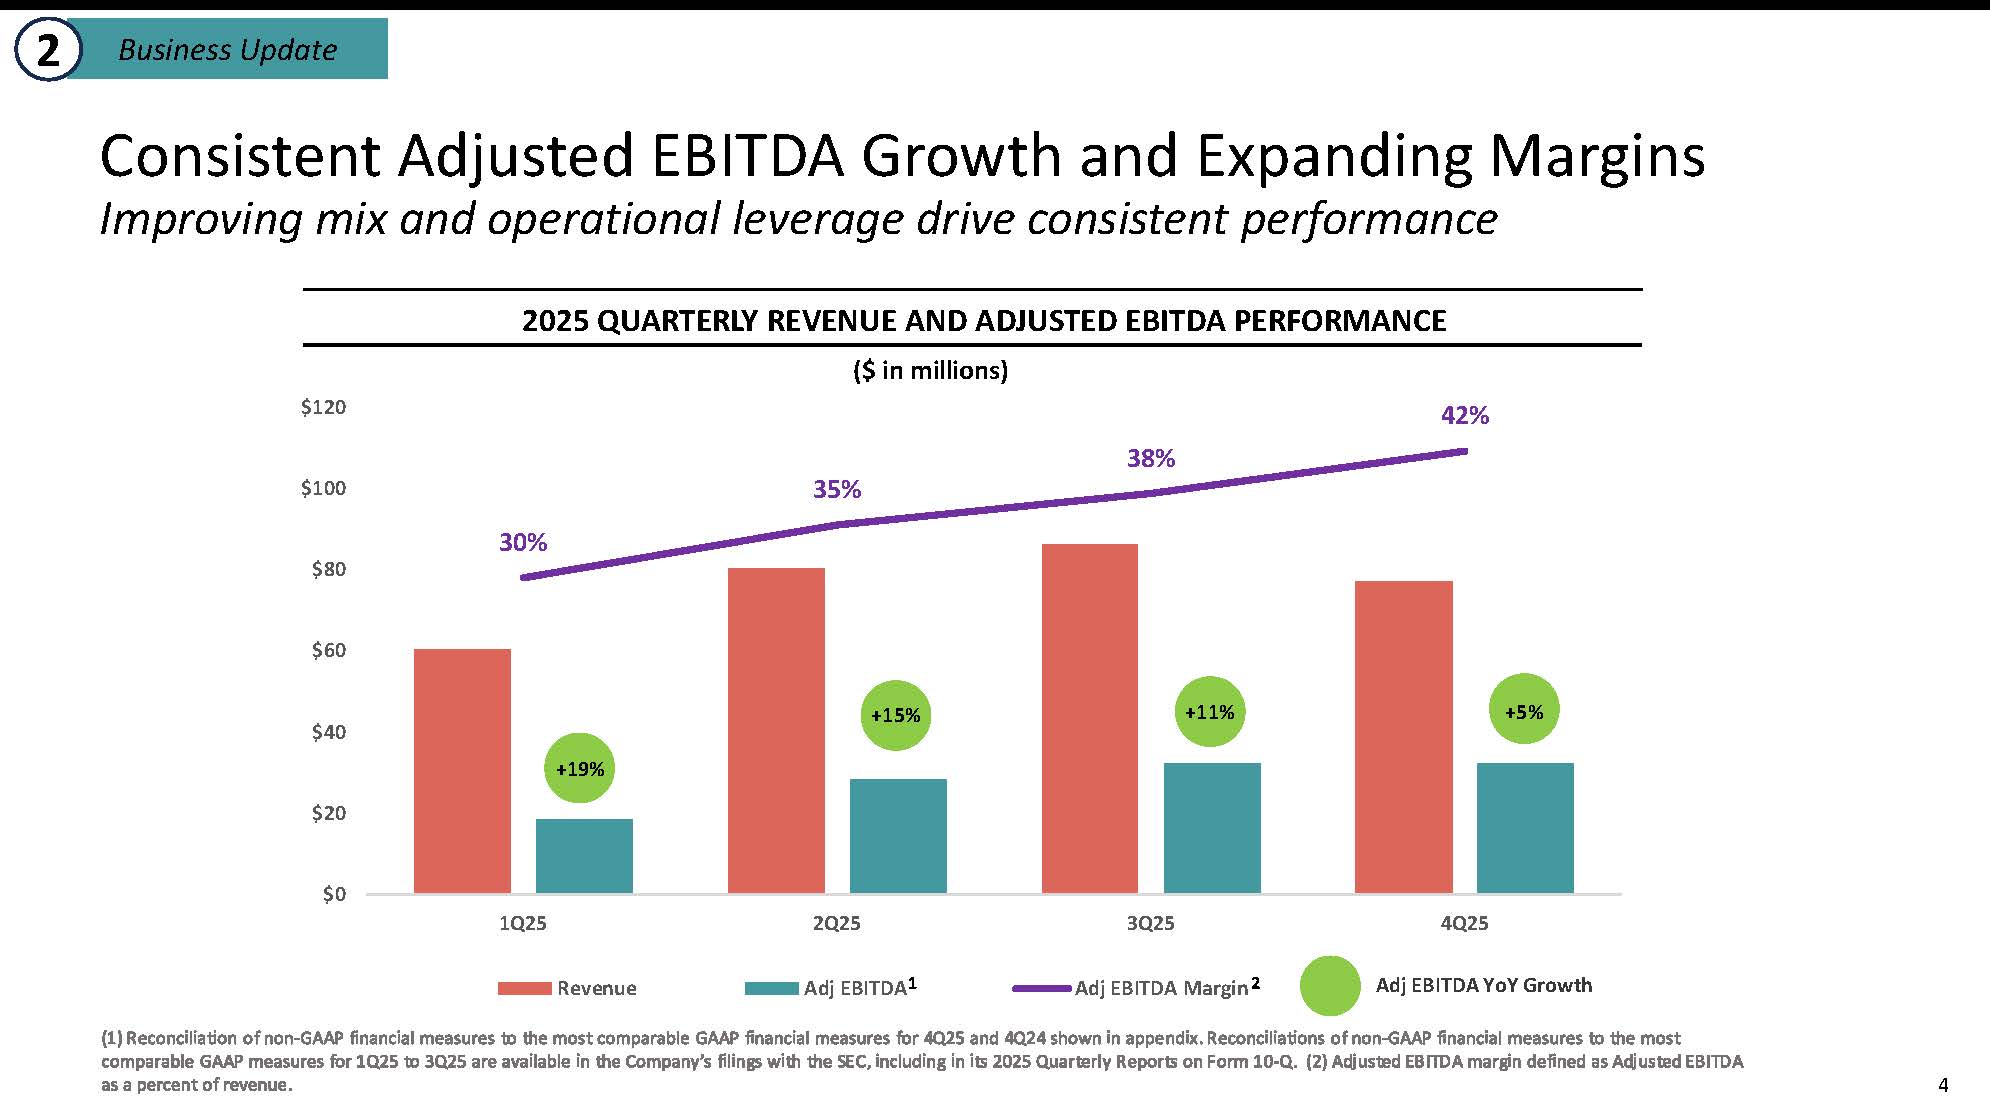
| ● | Adjusted EBITDA of $32.3 million, up 5% from prior year, generating a record 42% Adjusted EBITDA Margin, driven by all-time-high Interactive Adjusted EBITDA, up 60% year-over-year |
| ● | First quarter 2026 Adjusted EBITDA expected to increase by at least 20% year over year, with full year 2026 Adjusted EBITDA expected to be in the range of $112 million to $118 million1 |
New York, New York, March 10, 2026 - Inspired Entertainment, Inc. (“Inspired” or the “Company”) (NASDAQ: INSE), a leading B2B provider of gaming content, technology, hardware and services, today reported financial results for the fourth quarter and fiscal year ended December 31, 2025.
“Our fourth quarter results reflect the strength of our underlying business and the progress we are making in advancing our strategic priorities,” said Brooks Pierce, President and CEO of Inspired. “We delivered record Interactive revenue (+53% YoY) and Adjusted EBITDA (+60% YoY), underscoring the scalability and operating leverage of our digital core growth engine. With digital representing 52% of Adjusted EBITDA2 following the November divestiture of our holiday parks business, we achieved a record Adjusted EBITDA margin for the quarter3.
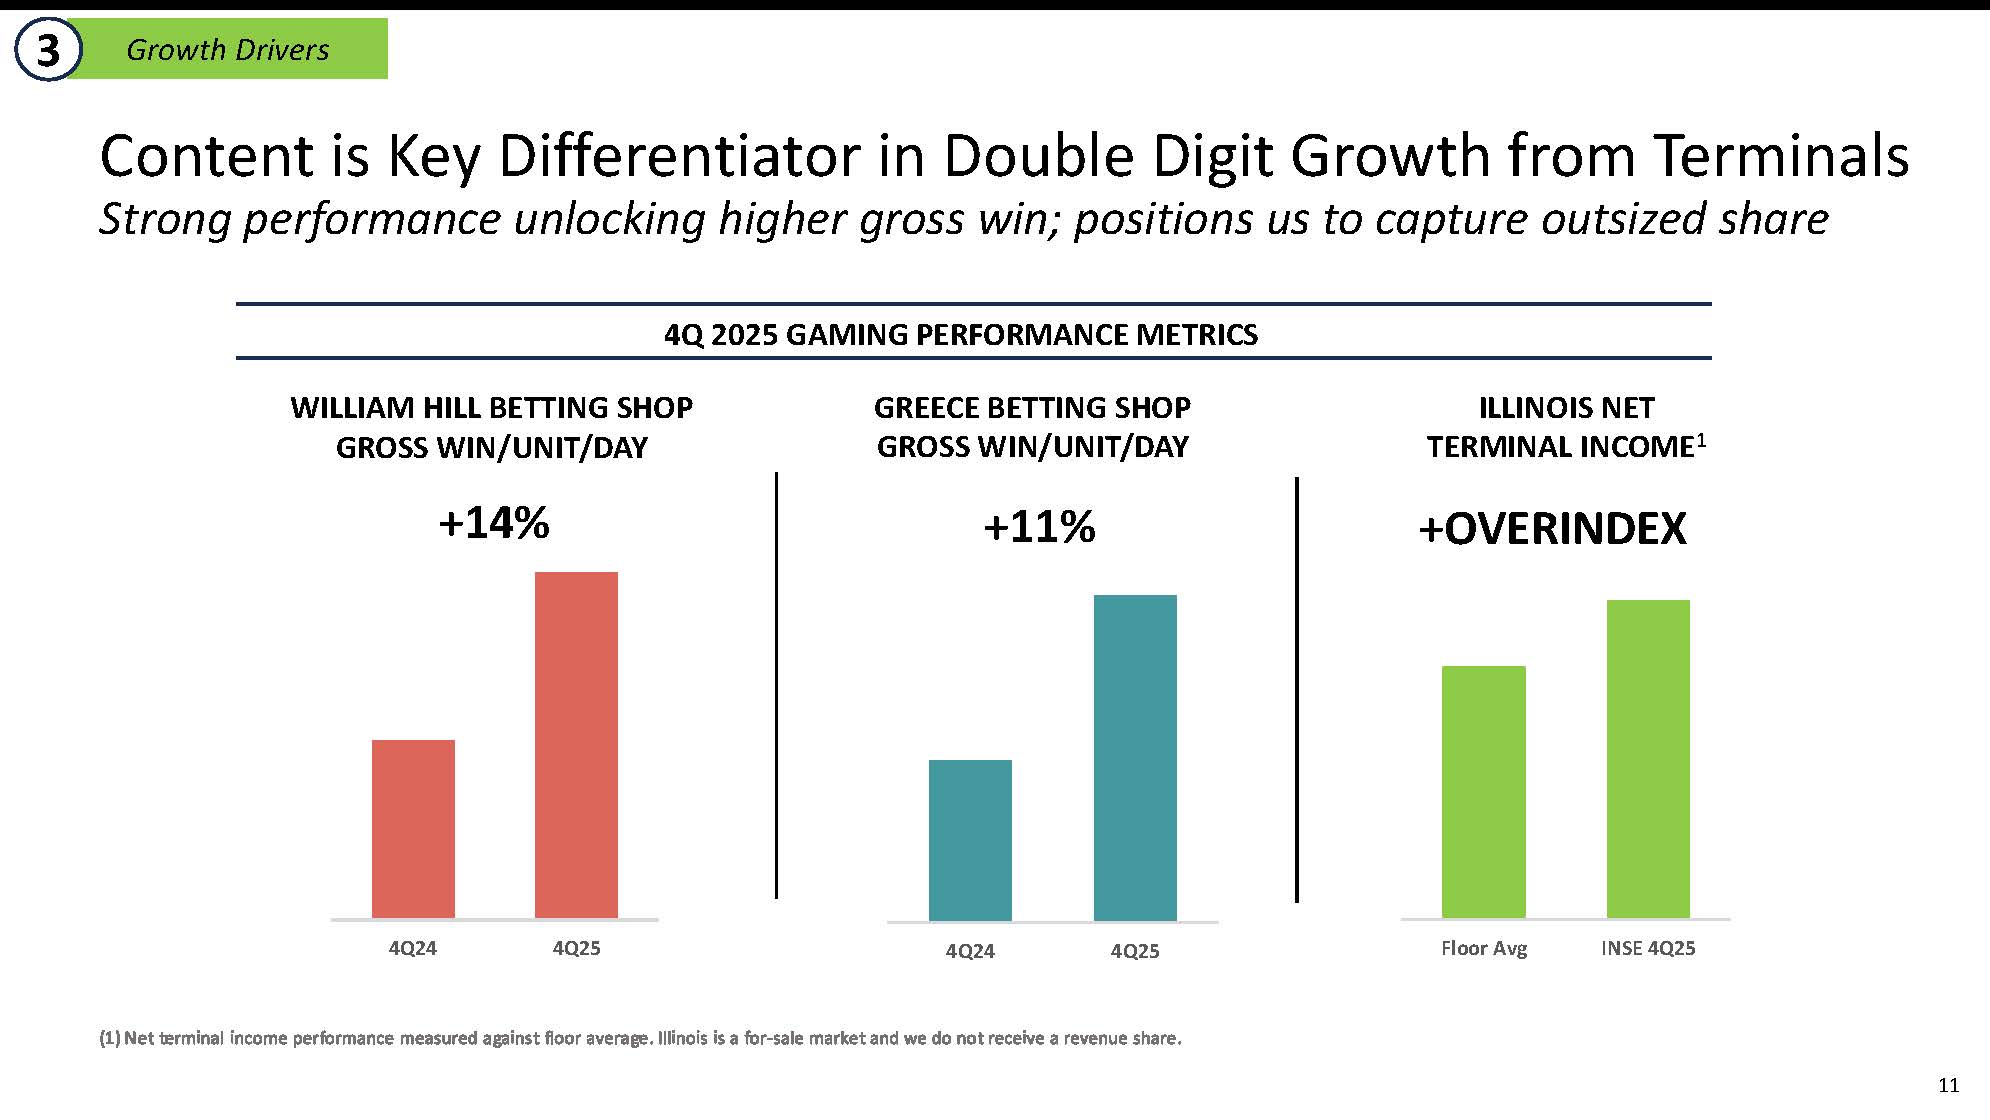
Content continues to be a key differentiator across the portfolio. In Gaming, customers with new terminal deployments in our UK and Greece estates delivered double-digit gross win growth, supporting further share gains. In Virtual Sports, our new Virtual Soccer BetBuilder™ product in Greece is still in its early stages but is already driving increases in total bet volume and gross win, positioning us well for a broader rollout ahead of this summer’s World Cup. We remain focused on investing in product innovation and new content studios to build on this momentum and further strengthen our competitive position.”
Pierce added, “We have also strengthened our balance sheet, repaying approximately $13 million of debt4 and opportunistically repurchasing shares. We will continue to allocate capital thoughtfully while maintaining our focus on consistent performance, improved cash conversion, and long-term shareholder value.”
1 2026 target is consistent with the assumptions discussed in the Company’s conference call and presentation and assumes that GBP:USD exchange rates will remain broadly in line with current levels.
2 Segment level Adjusted EBITDA including pro-rated corporate allocation. Corporate allocation pro-rated by segment % of total revenue contribution.
3 Quarterly record Adjusted EBITDA margin excluding any periods with UK VAT rebate.
4 Repaid £10 million of principal of senior secured notes in 1Q 2026.
Summary of Fourth Quarter ended December 31, 2025 - Segment Financial Results
(unaudited)
|
Three Months Ended December 31, |
Reported Variance | Currency Movement 20252 | Functional Currency Variance | |||||||||||||||||
| (In $ millions, except per share amounts) | 2025 | 2024 | % | $ | % | |||||||||||||||
| Total Revenue | ||||||||||||||||||||
| Gaming | $ | 36.3 | $ | 38.8 | (6 | )% | $ | 1.5 | (10 | )% | ||||||||||
| Virtual Sports | 9.4 | 10.1 | (7 | )% | 0.4 | (11 | )% | |||||||||||||
| Interactive | 17.8 | 11.6 | 53 | % | 0.7 | 47 | % | |||||||||||||
| Leisure | 13.7 | 22.5 | (39 | )% | 0.5 | (41 | )% | |||||||||||||
| Total Revenue | $ | 77.2 | $ | 83.0 | (7 | )% | $ | 3.1 | (11 | )% | ||||||||||
| Net operating income | 11.2 | 13.0 | (14 | )% | (0.1 | ) | (15 | )% | ||||||||||||
| Net (loss) income | (7.2 | ) | 67.0 | NM3 | NM3 | NM3 | ||||||||||||||
| Net (loss) income per basic share | $ | (0.25 | ) | $ | 2.35 | NM3 | NM3 | NM3 | ||||||||||||
| Net (loss) income per diluted share | $ | (0.25 | ) | $ | 2.29 | NM3 | NM3 | NM3 | ||||||||||||
| Non-GAAP Financial Measures | ||||||||||||||||||||
| Adjusted EBITDA1 | ||||||||||||||||||||
| Gaming | $ | 19.8 | $ | 19.5 | 2 | % | $ | 0.9 | (3 | )% | ||||||||||
| Virtual Sports | 7.3 | 7.2 | 1 | % | 0.5 | (5 | )% | |||||||||||||
| Interactive | 13.1 | 8.2 | 60 | % | 0.4 | 55 | % | |||||||||||||
| Leisure | 2.3 | 5.2 | (56 | )% | 0.2 | (59 | )% | |||||||||||||
| Corporate | (10.2 | ) | (9.2 | ) | (11 | )% | (0.6 | ) | (4 | )% | ||||||||||
| Total Company Adjusted EBITDA1 | $ | 32.3 | $ | 30.9 | 5 | % | $ | 1.4 | 0 | % | ||||||||||
| Adjusted EBITDA Margin1 | 42 | % | 37 | % | ||||||||||||||||
| Adjusted net (loss) income1 | $ | (5.1 | ) | $ | 3.8 | NM3 | NM3 | NM3 | ||||||||||||
| Adjusted net (loss) income per diluted share | $ | (0.18 | ) | $ | 0.13 | NM3 | NM3 | NM3 | ||||||||||||
| 1 | Reconciliation to US GAAP shown below. |
| 2 | Currency movement calculated by translating 2025 and 2024 performances at 2024 exchange rates. |
| 3 | Percentage/dollar change is not meaningful. |
“Looking ahead, we see substantial opportunity across our portfolio,” Lorne Weil, Executive Chairman of Inspired, continued. “Our confidence is grounded in the expanding scale of our Interactive platform, a robust pipeline of innovative content, and continued geographic expansion. These growth drivers are compounding and position us to deliver sustainable, scalable performance over the long term.
We have been deliberate in reshaping the business toward a more digital, higher-margin model, and our fourth quarter results validate that strategy. We are gaining share, improving profitability, and increasing financial flexibility; creating greater optionality as we deploy capital to the highest-return opportunities.
We expect 2026 Adjusted EBITDA to be in the range of $112 million to $118 million1. At the midpoint, this represents double-digit growth versus 2025 excluding the divested holiday parks business. We expect earnings to build progressively through the year, with our focus on converting earnings into stronger free cash flow generation and further enhancing long-term shareholder value.”
Recent Highlights
Corporate & Capital Allocation
| ● | Sold UK Holiday Parks and certain associated leisure assets for £18.6 million on November 7th; continuing transitional services and recurring game/content platform support (4Q 2025). | |
| ● | Repaid approximately $13.3 million (£10.0 million) of debt principal (1Q 2026). |
Interactive
| ● | Record performance in December with five games in Eilers & Fantini’s Top 505, including Bigger Piggy Christmas Bank™ at #6 among new online slots (4Q 2025). | |
| ● | U.S. iGaming GGR market share5 increased 50 basis points quarter-over-quarter in 4Q 2025, driven by a step change in the number of top performing game themes. | |
| ● | Expanded into South Africa (4Q 2025). |
Gaming
| ● | Launched new customer Jenningsbet with 470 terminals installed in 4Q 2025 and 120 in 1Q 2026. | |
| ● | Successfully deployed our first cloud-native lottery platform with LEIDSA in the Dominican Republic, powering 2,500 terminals and integrated digital channels (4Q 2025). |
Virtual Sports
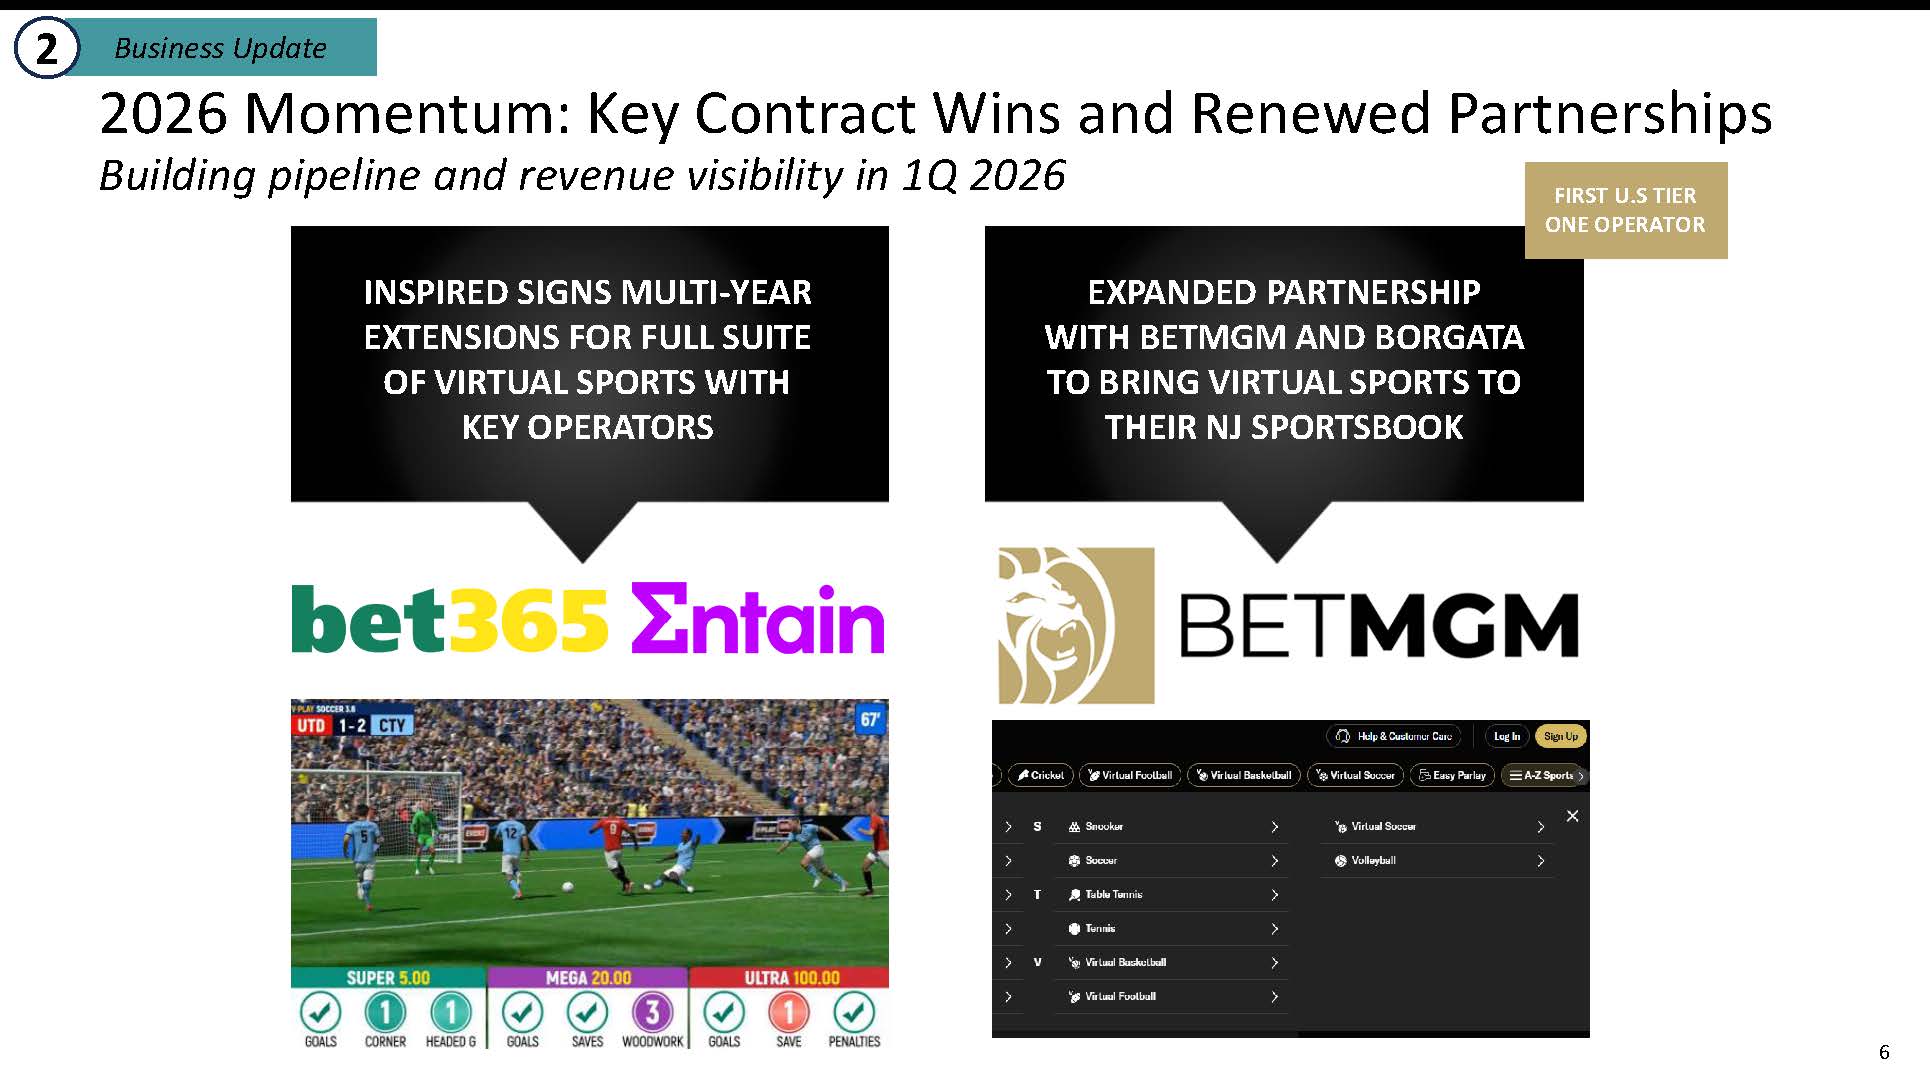
| ● | Expanded partnership with BetMGM and Borgata to bring Virtual Sports to their New Jersey sportsbook; the first US Tier O operator to integrate Virtual Sports into their sportsbook tab (1Q 2026). | |
| ● | Secured multi-year extensions with key operators, bet365 and Entain (1Q 2026). | |
| ● | Launched new Virtual Soccer BetBuilder product in Greece with OPAP with strong early results showing increased bet volume and gross win (4Q 2025); expected to rollout across the estate ahead of the 2026 World Cup. | |
| ● | Expanded content in Turkey to include Horse and Greyhound Racing, first racing products in the market (1Q 2026). |
Outlook
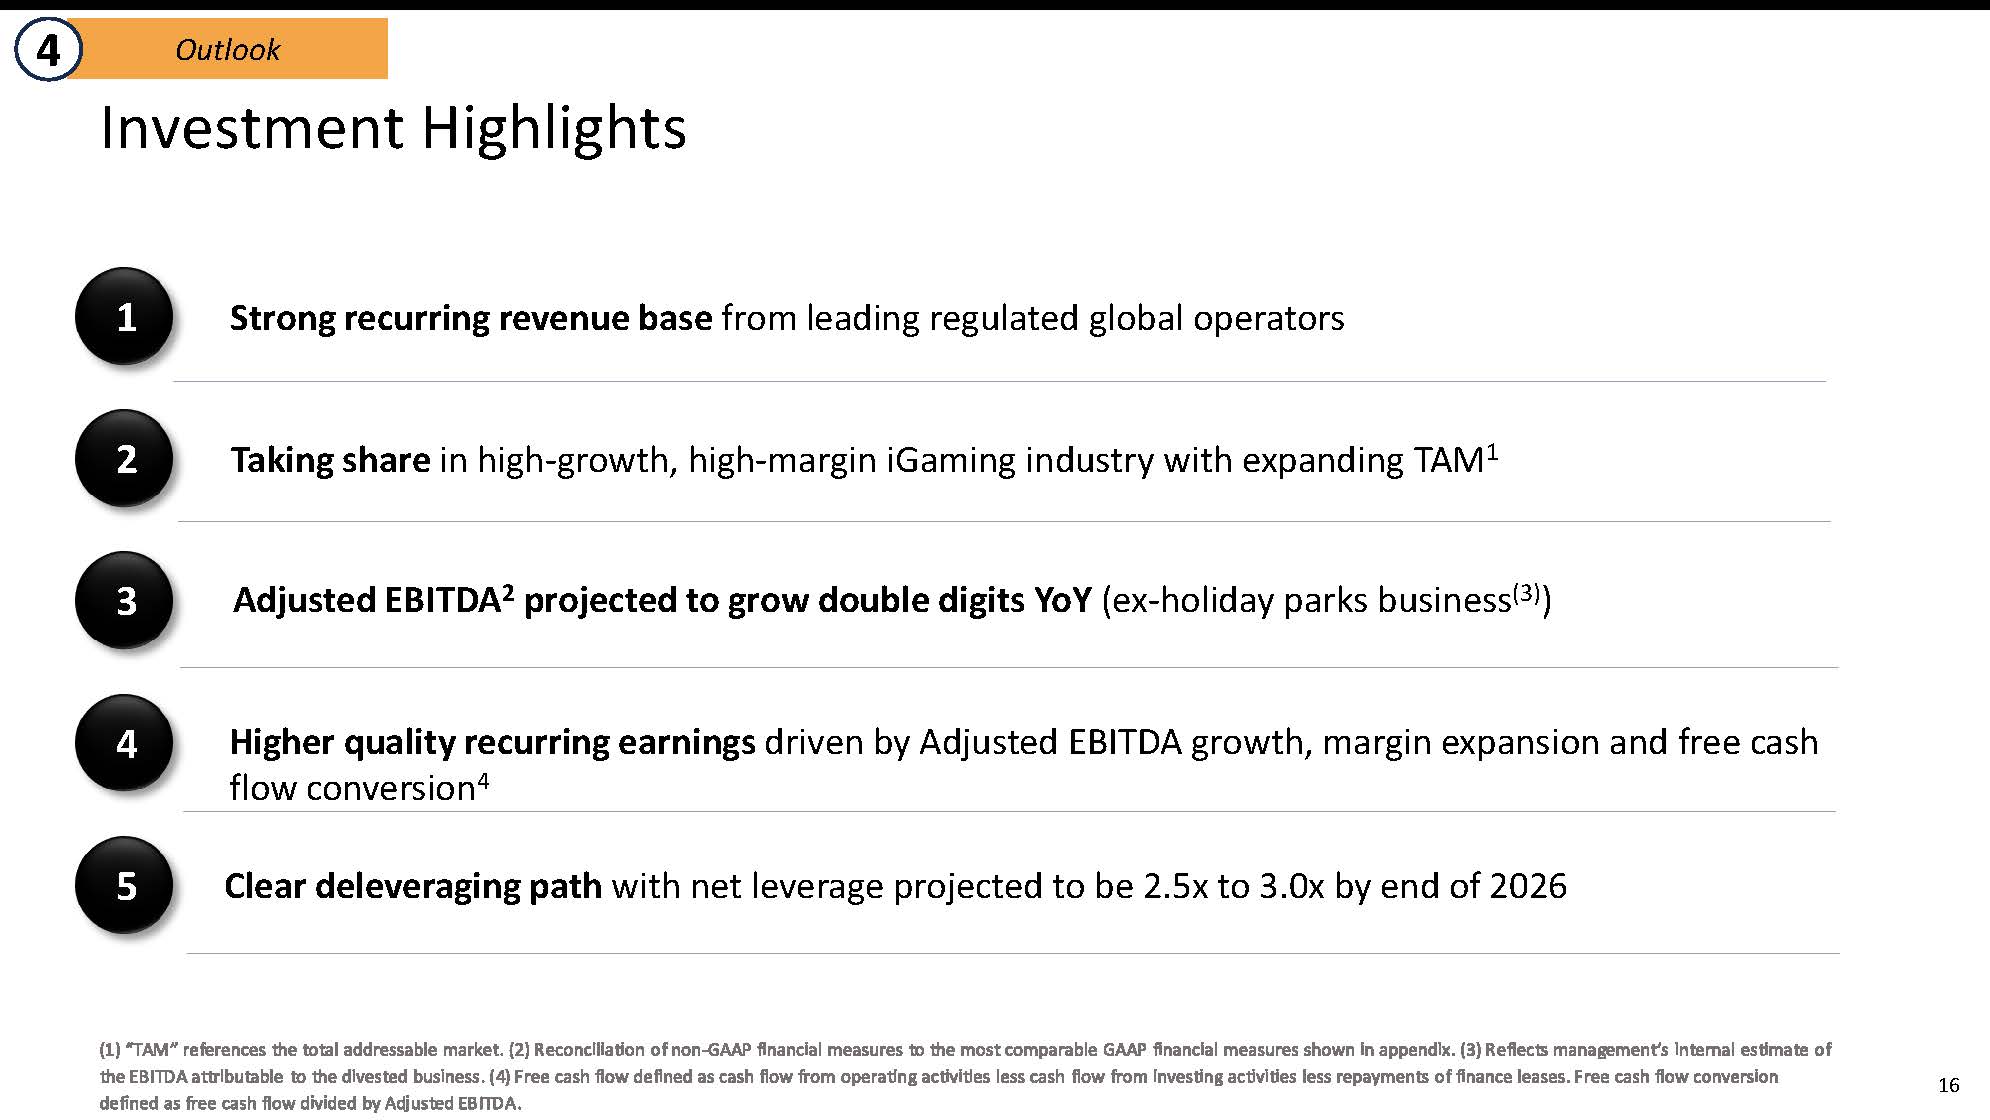
| ● | Management remains confident in its strategic direction and ability to deliver profitable growth in 2026. The continued expansion of our higher-margin digital businesses and increasing operating leverage support improved earnings quality and stronger free cash flow generation, driving long-term shareholder value. | |
| ● | Management expects first quarter 2026 Adjusted EBITDA to increase by at least 20% year over year and expects full year 2026 Adjusted EBITDA to be in the range of $112 million to $118 million1. This includes the expected impact of the UK online gaming tax changes5 set out in the November 2025 UK Budget and effective from April 2026. | |
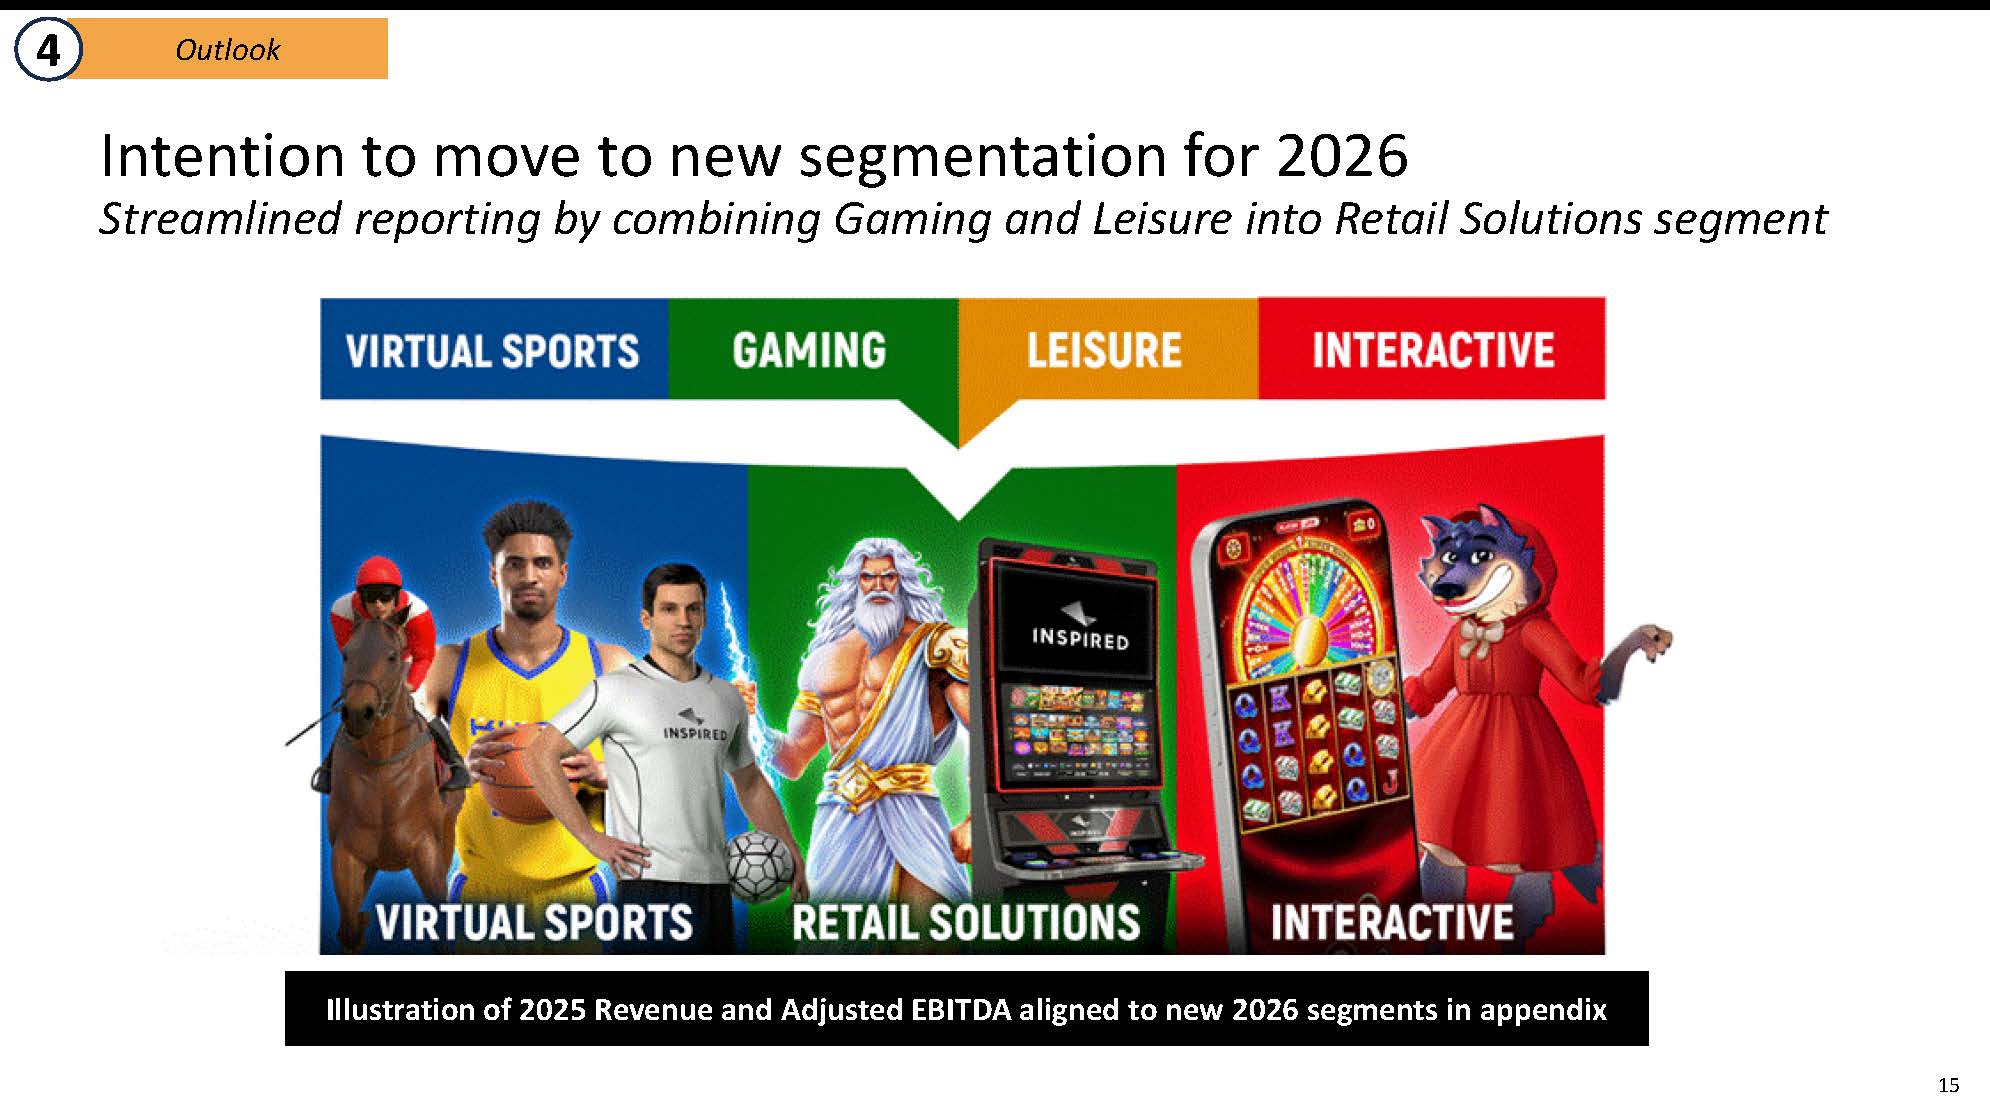
| ● | Starting in 1Q 2026, we intend to streamline our reporting structure by merging Gaming and Leisure into a single “Retail Solutions” segment; Virtual Sports and Interactive will continue to be reported separately. |
5 Eilers-Fantini U.S. Online Game Performance Report February 2026 Edition
Summary of Full Year ended December 31, 2025 - Segment Financial Results
(unaudited)
|
Twelve Months Ended December 31, |
Reported Variance | Currency Movement 20252 | Functional Currency Variance | |||||||||||||||||
| (In $ millions, except per share amounts) | 2025 | 2024 | % | $ | % | |||||||||||||||
| Total Revenue | ||||||||||||||||||||
| Gaming | $ | 112.3 | $ | 110.6 | 2 | % | $ | 3.8 | (2 | )% | ||||||||||
| Virtual Sports | 36.6 | 45.4 | (19 | )% | 1.1 | (22 | % | |||||||||||||
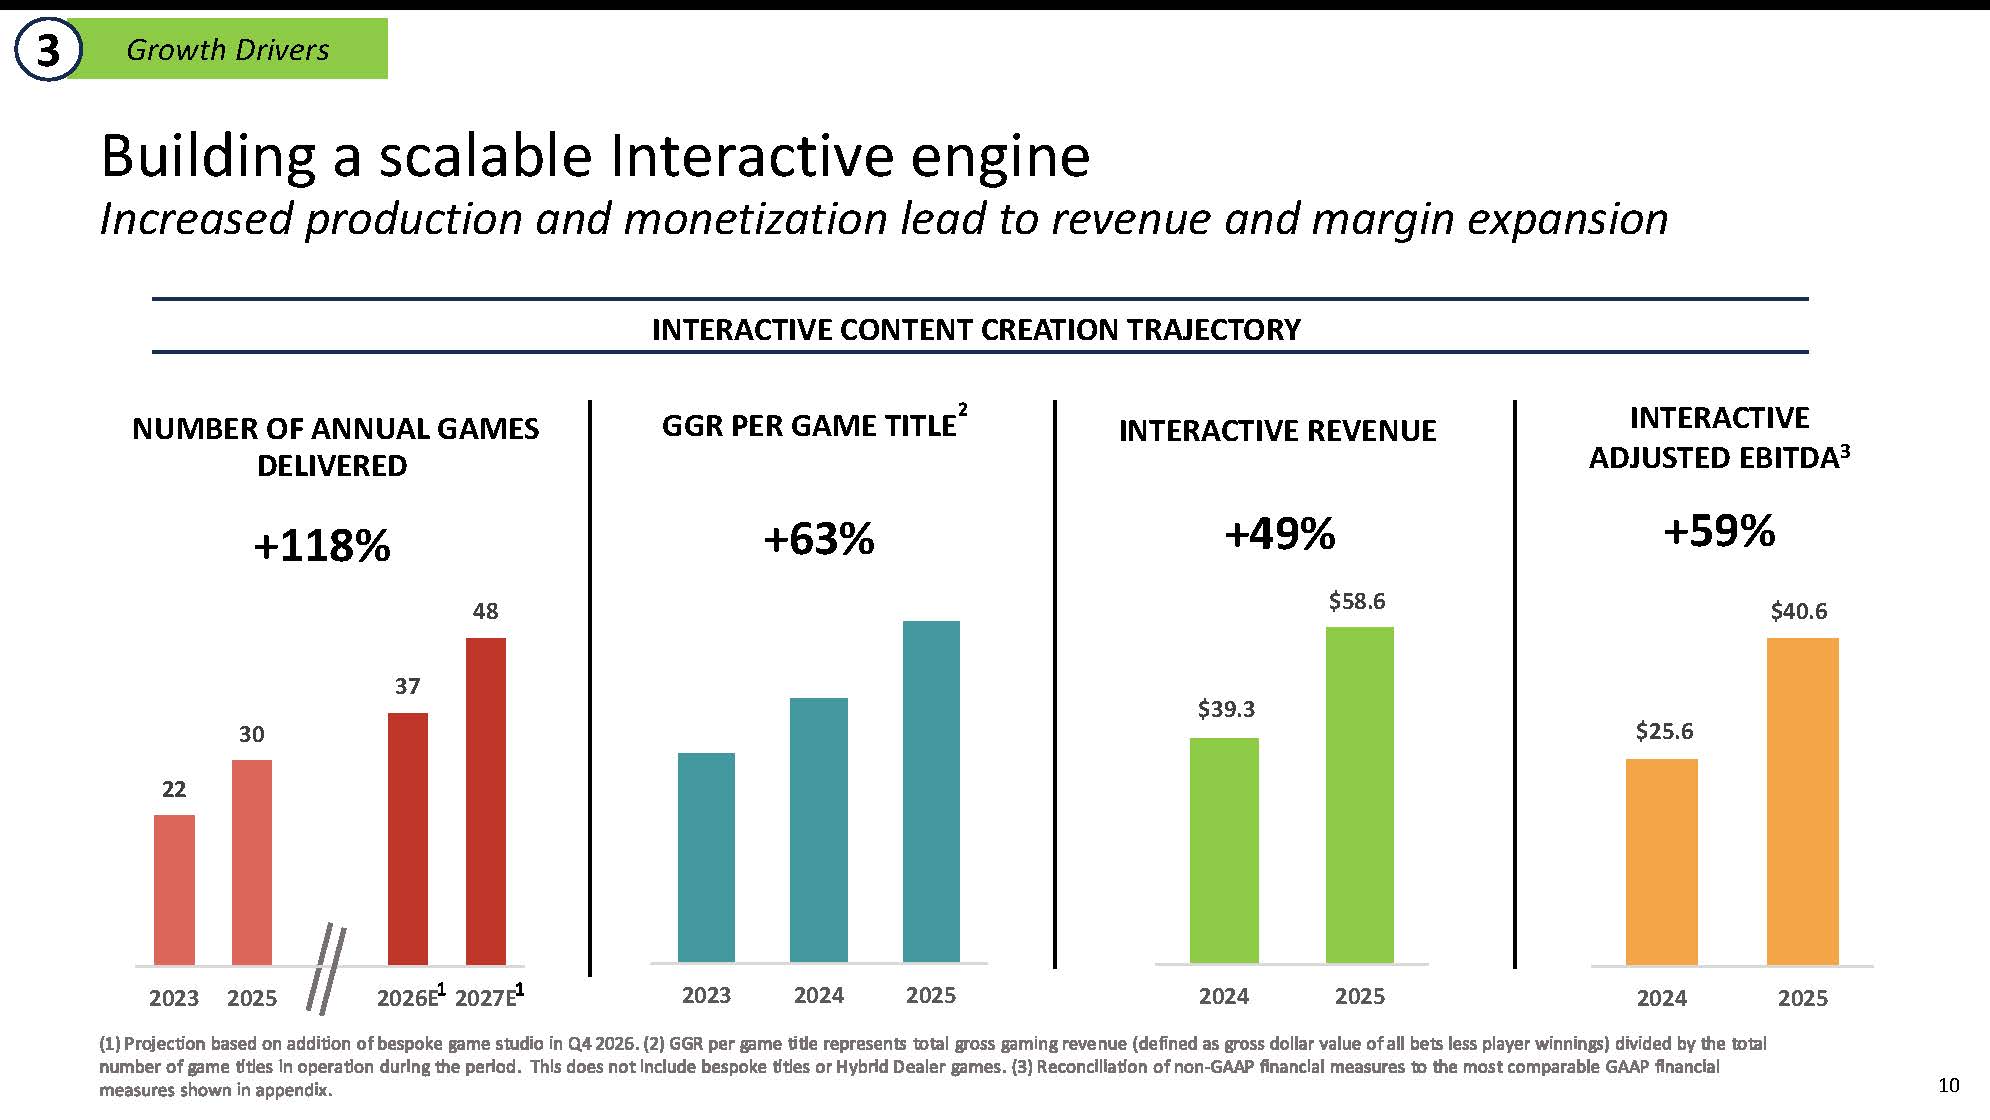
| Interactive | 58.6 | 39.3 | 49 | % | 1.9 | 44 | % | |||||||||||||
| Leisure | 96.6 | 101.8 | (5 | )% | 3.3 | (8 | )% | |||||||||||||
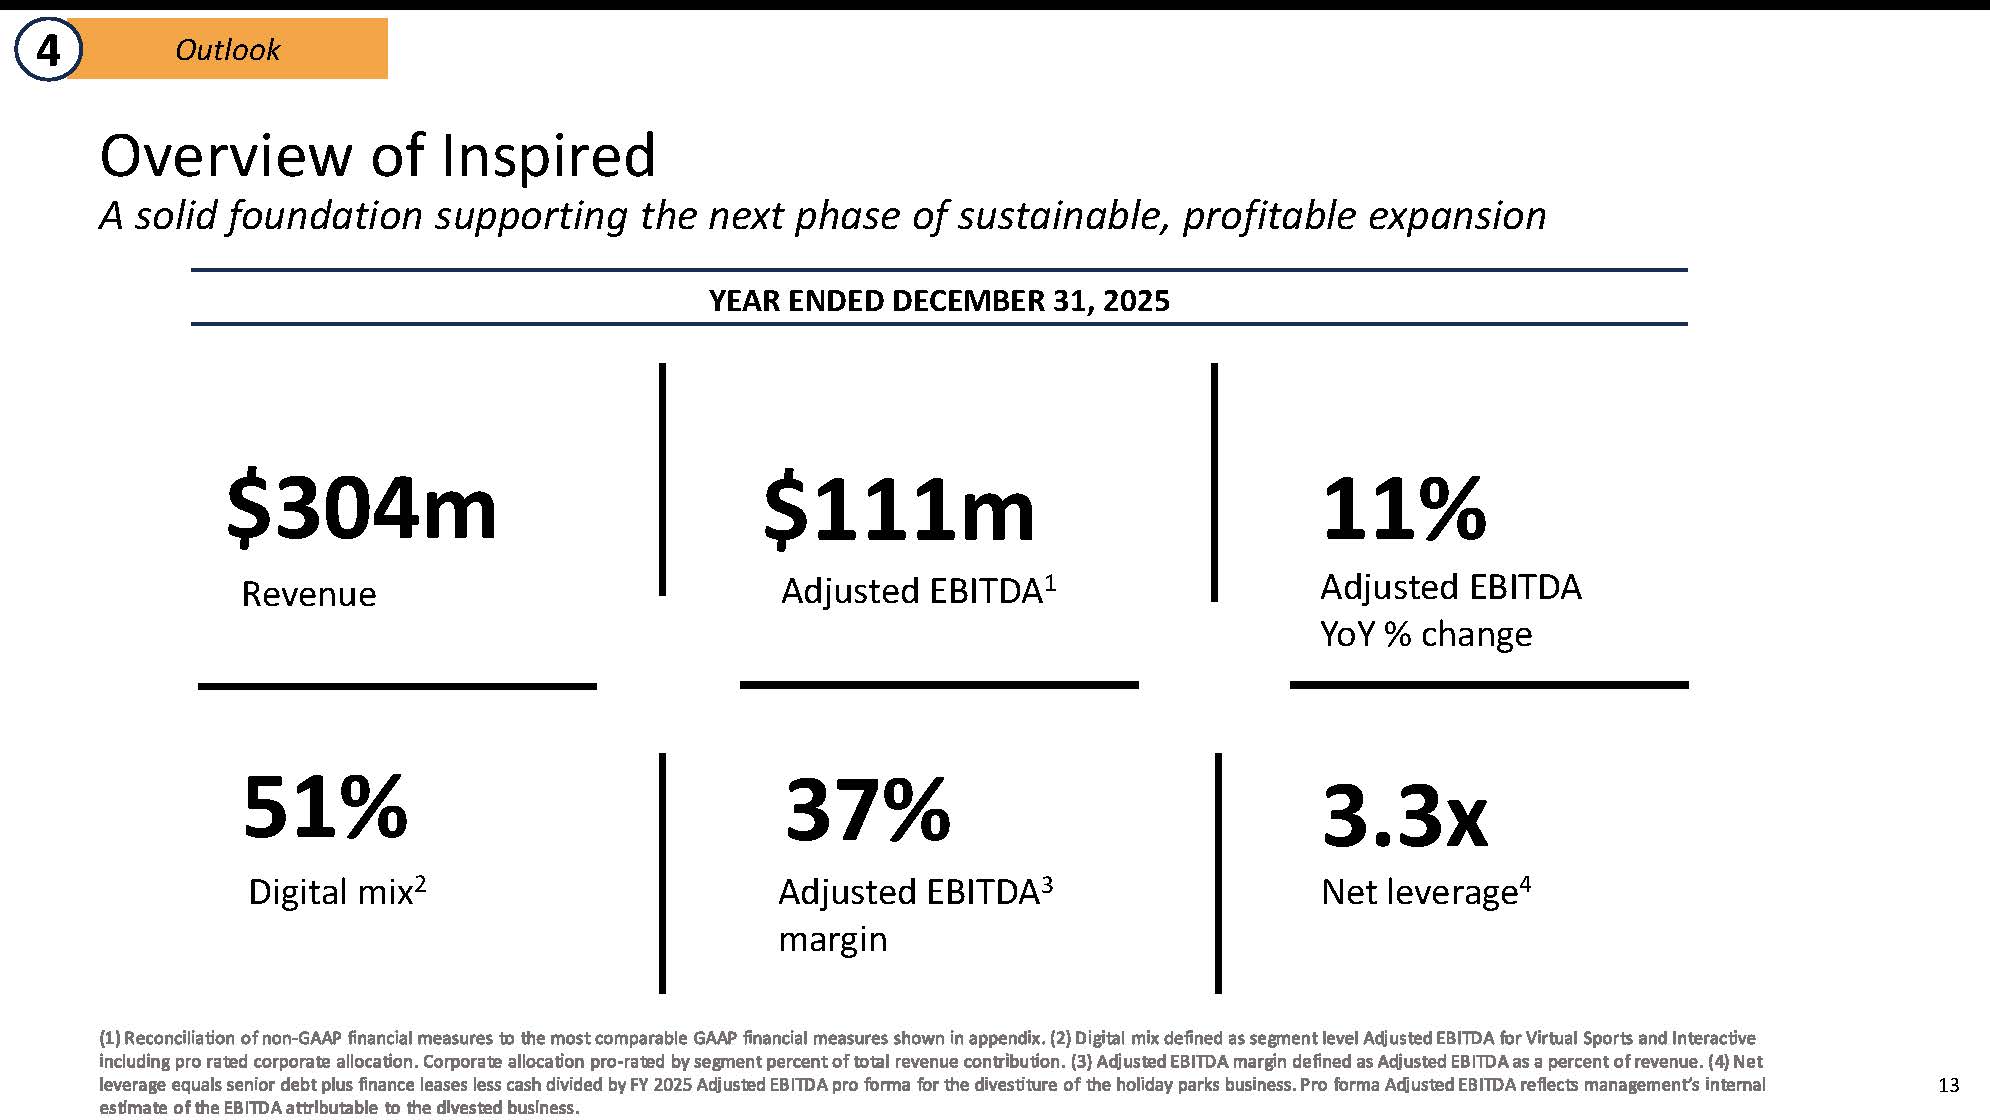
| Total Revenue | $ | 304.1 | $ | 297.1 | 2 | % | $ | 10.1 | (1 | )% | ||||||||||
| Net operating income | 30.5 | 30.7 | (1 | )% | 0.2 | (1 | )% | |||||||||||||
| Net (loss) income | (17.0 | ) | 64.8 | NM3 | (1.1 | ) | NM3 | |||||||||||||
| Net (loss) income per basic share | $ | (0.58 | ) | $ | 2.27 | NM3 | NM3 | NM3 | ||||||||||||
| Net (loss) income per diluted share | $ | (0.58 | ) | $ | 2.22 | NM3 | NM3 | NM3 | ||||||||||||
| Non-GAAP Financial Measures | ||||||||||||||||||||
| Adjusted EBITDA1 | ||||||||||||||||||||
| Gaming | $ | 55.0 | $ | 45.3 | 21 | % | $ | 2.2 | 17 | % | ||||||||||
| Virtual Sports | 26.8 | 36.1 | (26 | )% | 0.3 | (28 | )% | |||||||||||||
| Interactive | 40.6 | 25.6 | 59 | % | 1.6 | 54 | % | |||||||||||||
| Leisure | 21.2 | 23.3 | (9 | )% | 0.8 | (13 | )% | |||||||||||||
| Corporate | (32.2 | ) | (30.2 | ) | (7 | )% | (0.6 | ) | (5 | )% | ||||||||||
| Total Company Adjusted EBITDA1 | $ | 111.4 | $ | 100.1 | 11 | % | $ | 4.3 | 7 | % | ||||||||||
| Adjusted EBITDA Margin1 | 37 | % | 34 | % | ||||||||||||||||
| Adjusted net (loss) income1 | $ | 1.4 | $ | 13.0 | (89 | %) | 0.0 | (89 | %) | |||||||||||
| Adjusted net (loss) income per diluted share | $ | 0.05 | $ | 0.45 | (89 | %) | NM3 | (89 | %) | |||||||||||
| 1 | Reconciliation to US GAAP shown below. |
| 2 | Currency movement calculated by translating 2025 and 2024 performances at 2024 exchange rates. |
| 3 | Percentage/dollar change is not meaningful. |
Non-GAAP Financial Measures
We use non-GAAP financial measures, including Adjusted EBITDA, to analyze our operating performance. We use these financial measures to manage our business on a day-to-day basis. We believe that these measures are also commonly used in our industry to measure performance. For these reasons, we believe that these non-GAAP financial measures provide expanded insight into our business, in addition to standard U.S. GAAP financial measures. There are no uniform rules for defining and using non-GAAP financial measures, and as a result the measures we use may not be comparable to measures used by other companies, even if they have similar labels. The presentation of non-GAAP financial information should not be considered in isolation from, as a substitute for, or superior to, financial information prepared and presented in accordance with U.S. GAAP. You should consider our non-GAAP financial measures in conjunction with our U.S. GAAP financial statements.
We define our non-GAAP financial measures as follows:
EBITDA is defined as net income (loss) excluding depreciation and amortization, interest expense, interest income and income tax expense.
Adjusted EBITDA is defined as net income (loss) excluding depreciation and amortization, interest expense, interest income and income tax expense, and other additional exclusions and adjustments (see Adjusted EBITDA reconciliation table). Such additional excluded amounts include stock-based compensation U.S. GAAP charges where the associated liability is expected to be settled in stock, and changes in the value of earnout liabilities and income and expenditure in relation to legacy portions of the business (being those portions where trading no longer occurs) including closed defined benefit pension plans. Additional adjustments are made for items considered outside the normal course of business, including (1) restructuring costs, which include charges attributable to employee severance, management changes, restructuring, dual running costs, costs related to facility closures and integration costs, (2) merger and acquisition costs, (3) gains or losses not in the ordinary course of business and (4) the costs of the restatement of previously issued financial statements.
We believe Adjusted EBITDA, when considered along with other performance measures, is a particularly useful performance measure, because it focuses on certain operating drivers of the business, including sales growth, operating costs, selling and administrative expense and other operating income and expense. We believe Adjusted EBITDA can provide a more complete understanding of our operating results and the trends to which we are subject, and an enhanced overall understanding of our financial performance and prospects for the future. Adjusted EBITDA is not intended to be a measure of liquidity or cash flows from operations or a measure comparable to net income or loss, because it does not take into account certain aspects of our operating performance (for example, it excludes non-recurring gains and losses which are not deemed to be a normal part of underlying business activities). Our use of Adjusted EBITDA may not be comparable to the use by other companies of similarly termed measures. Management compensates for these limitations by using Adjusted EBITDA as only one of several measures for evaluating our operating performance. In addition, capital expenditures, which affect depreciation and amortization, interest expense, and income tax benefit (expense), are evaluated separately by management.
Adjusted Net Income is defined as net income (loss) excluding the effects of certain exclusions and adjustments. Such excluded amounts include income and expenditure in relation to legacy portions of the business (being those portions where trading no longer occurs) including closed defined benefit pension plans. Additional adjustments are made for items considered outside the normal course of business, including (1) restructuring costs, which include charges attributable to employee severance, management changes, restructuring, dual running costs, costs related to facility closures and integration costs, (2) merger and acquisition costs and (3) gains or losses not in the ordinary course of business. These items have been adjusted to reflect the tax impact from excluding them from net income (loss).
Adjusted Net Income per diluted share is computed by dividing the Adjusted Net Income by the weighted-average number of common shares outstanding during the period, including the effects of any potentially dilutive securities, including RSUs, using the treasury stock method, and convertible debt or convertible preferred stock, using the if-converted method, unless the inclusion would be anti-dilutive.
Functional Currency at Constant rate. Currency impacts shown have been calculated as the current-period average GBP:USD rate less the equivalent average rate in the prior year quarter, multiplied by the current period amount in our functional currency (GBP). The remaining difference, referred to as functional currency at constant rate, is calculated as the difference in our functional currency, multiplied by the prior year quarter average GBP: USD rate, as a proxy for functional currency at constant rate movement.
Currency Movement represents the difference between the results in our reporting currency (USD) and the results on a functional currency at constant rate basis.
Reconciliations from net income (loss), as shown in our Consolidated Statements of Operations and Comprehensive Loss, to Adjusted EBITDA are shown below.
Conference Call and Webcast
Inspired management will host a conference call and simultaneous webcast at 8:30 a.m. ET / 12:30 p.m. in the UK on Tuesday, March 10, 2026 to discuss the financial results and general business trends.
Telephone: The dial-in number to access the call live is 1-800-715-9871 (US) or 1-646-307-1963 (International). Participants should ask to be joined into the Inspired Entertainment call.
Webcast: A live audio-only webcast of the call can be accessed through the “Events and Presentations” page of the Company’s website at www.inseinc.com under the Investors link. Please follow the registration prompts.
Replay: A replay of the webcast will be available on the Company’s website at www.inseinc.com, along with a copy of this press release and an investor slide presentation.
About Inspired Entertainment, Inc.
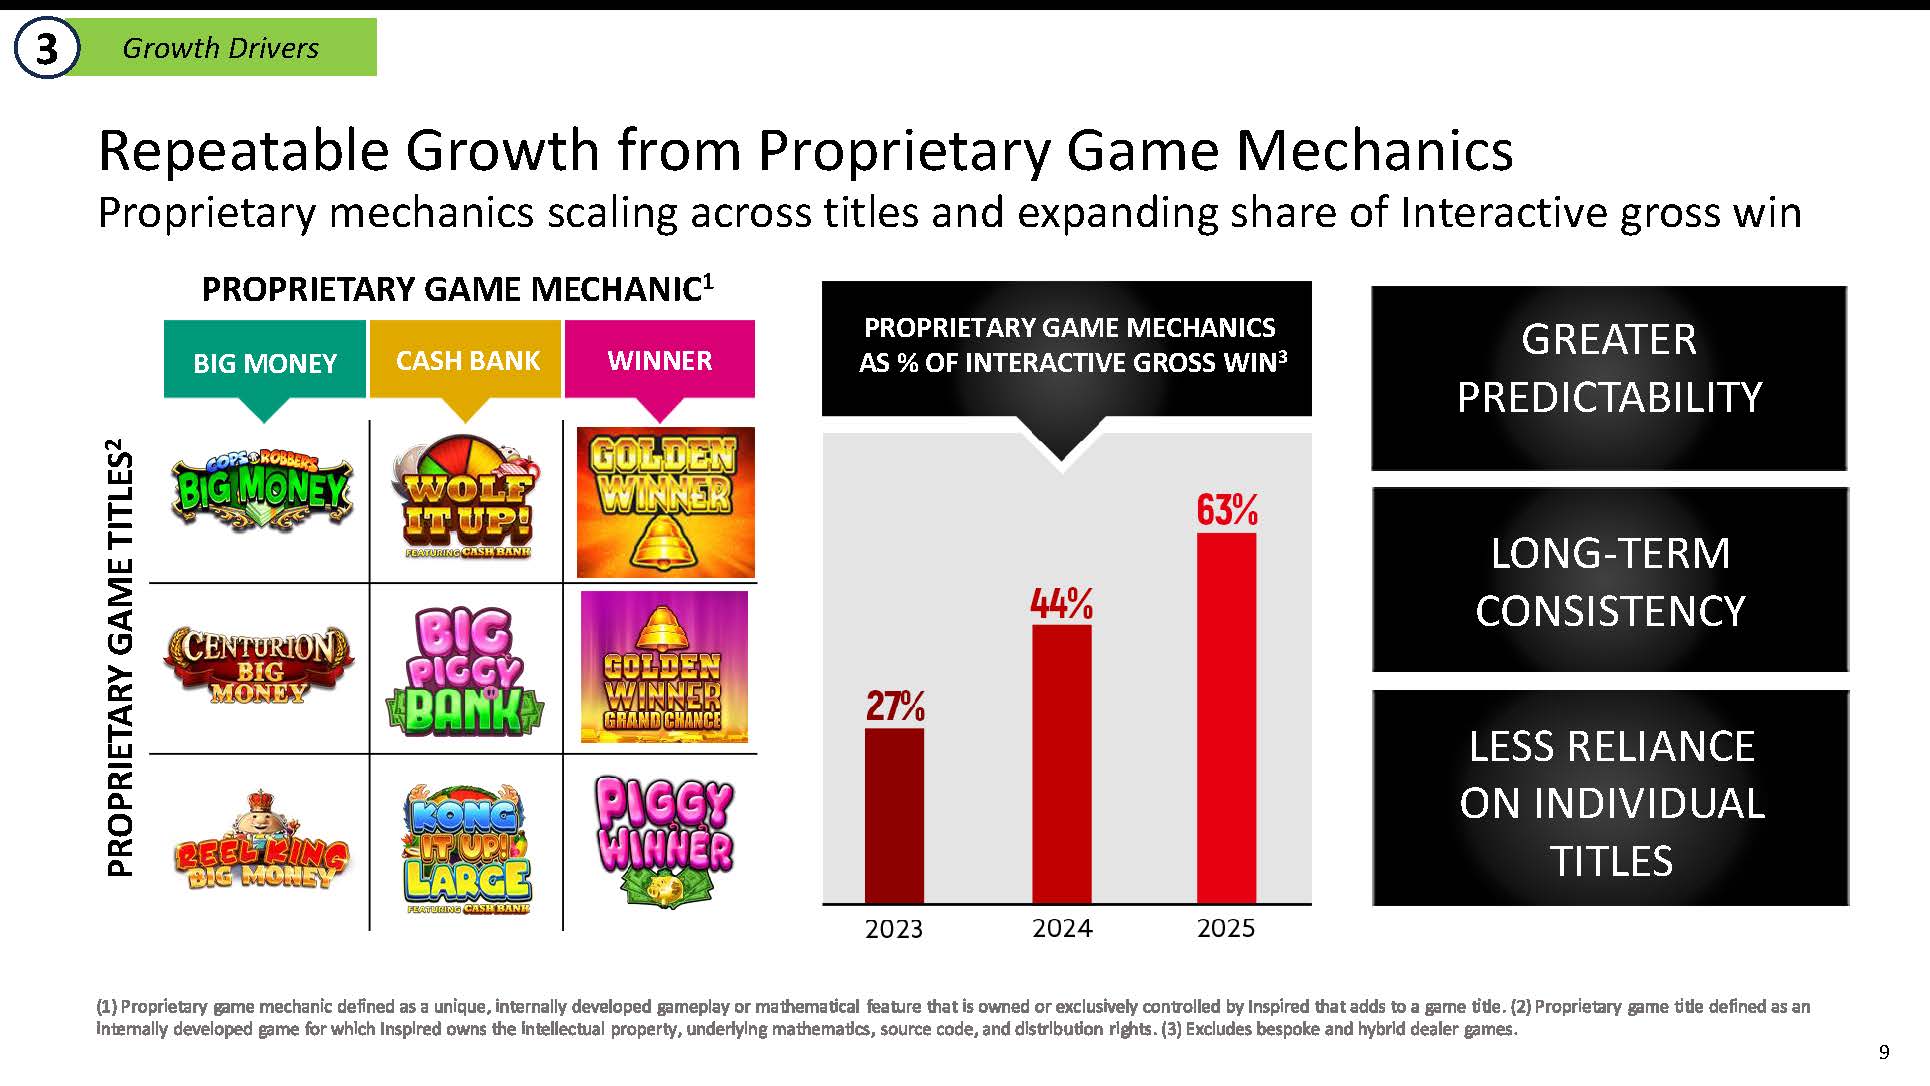
With a proven track record of innovation, Inspired is a leading provider of content, technology, hardware and services for licensed gaming, betting and lottery operators around the world. Inspired’s proprietary games resonate with players and deliver consistent performance for gaming operators across interactive, virtual sports, and retail gaming environments. Inspired’s content and gaming systems are designed to work together across digital and retail channels, enabling scalable deployment and a consistent player experience. Through this integrated content-led approach, Inspired helps operators strengthen their offerings, drive engagement, and deliver compelling player experiences.
Additional information can be found at www.inseinc.com.
Forward-Looking Statements
This press release contains “forward-looking statements” within the meaning of the “safe harbor” provisions of the U.S. Private Securities Litigation Reform Act of 1995, including, but not limited to, statements regarding our ability to bring certain of our products to customers in the various markets in which we operate and execute on our strategic plan, statements regarding expectations with respect to potential new customers and statements regarding our anticipated financial performance. Forward-looking statements may be identified by the use of words such as “anticipate,” “believe,” “continue,” “expect,” “estimate,” “plan,” “will,” “would” and “project” and other similar expressions that indicate future events or trends or are not statements of historical matters. These statements are based on Inspired management’s current expectations and beliefs, as well as a number of assumptions concerning future events.
Forward-looking statements are subject to known and unknown risks, uncertainties, assumptions and other important factors, many of which are outside of Inspired’s control and all of which could cause actual results to differ materially from the results discussed in the forward-looking statements. Accordingly, forward-looking statements should not be relied upon as representing Inspired’s views as of any subsequent date. We cannot guarantee that the results anticipated by management, as set forth herein, will be realized or, even if realized, will have the expected effects on our results of operations or financial performance. Such results may be affected by, among other things, the “Risk Factors” section of Inspired’s annual report on Form 10-K for the fiscal year ended December 31, 2024, and subsequent quarterly reports on Form 10-Q, which are available, free of charge, on the U.S. Securities and Exchange Commission’s website at www.sec.gov. Inspired does not undertake any obligation to update forward-looking statements to reflect events or circumstances after the date they were made, whether as a result of new information, future events or otherwise, except as required by law.
Contact:
For Investors
IR@inseinc.com
For Press and Sales
inspiredsales@inseinc.com
INSPIRED ENTERTAINMENT, INC. AND SUBSIDIARIES
CONDENSED CONSOLIDATED STATEMENTS OF OPERATIONS AND COMPREHENSIVE (LOSS) INCOME
(in millions, except share and per share data) (Unaudited)
|
Three Months Ended December 31, |
Twelve Months Ended December 31, |
|||||||||||||||
| 2025 | 2024 | 2025 | 2024 | |||||||||||||
| Revenue: | ||||||||||||||||
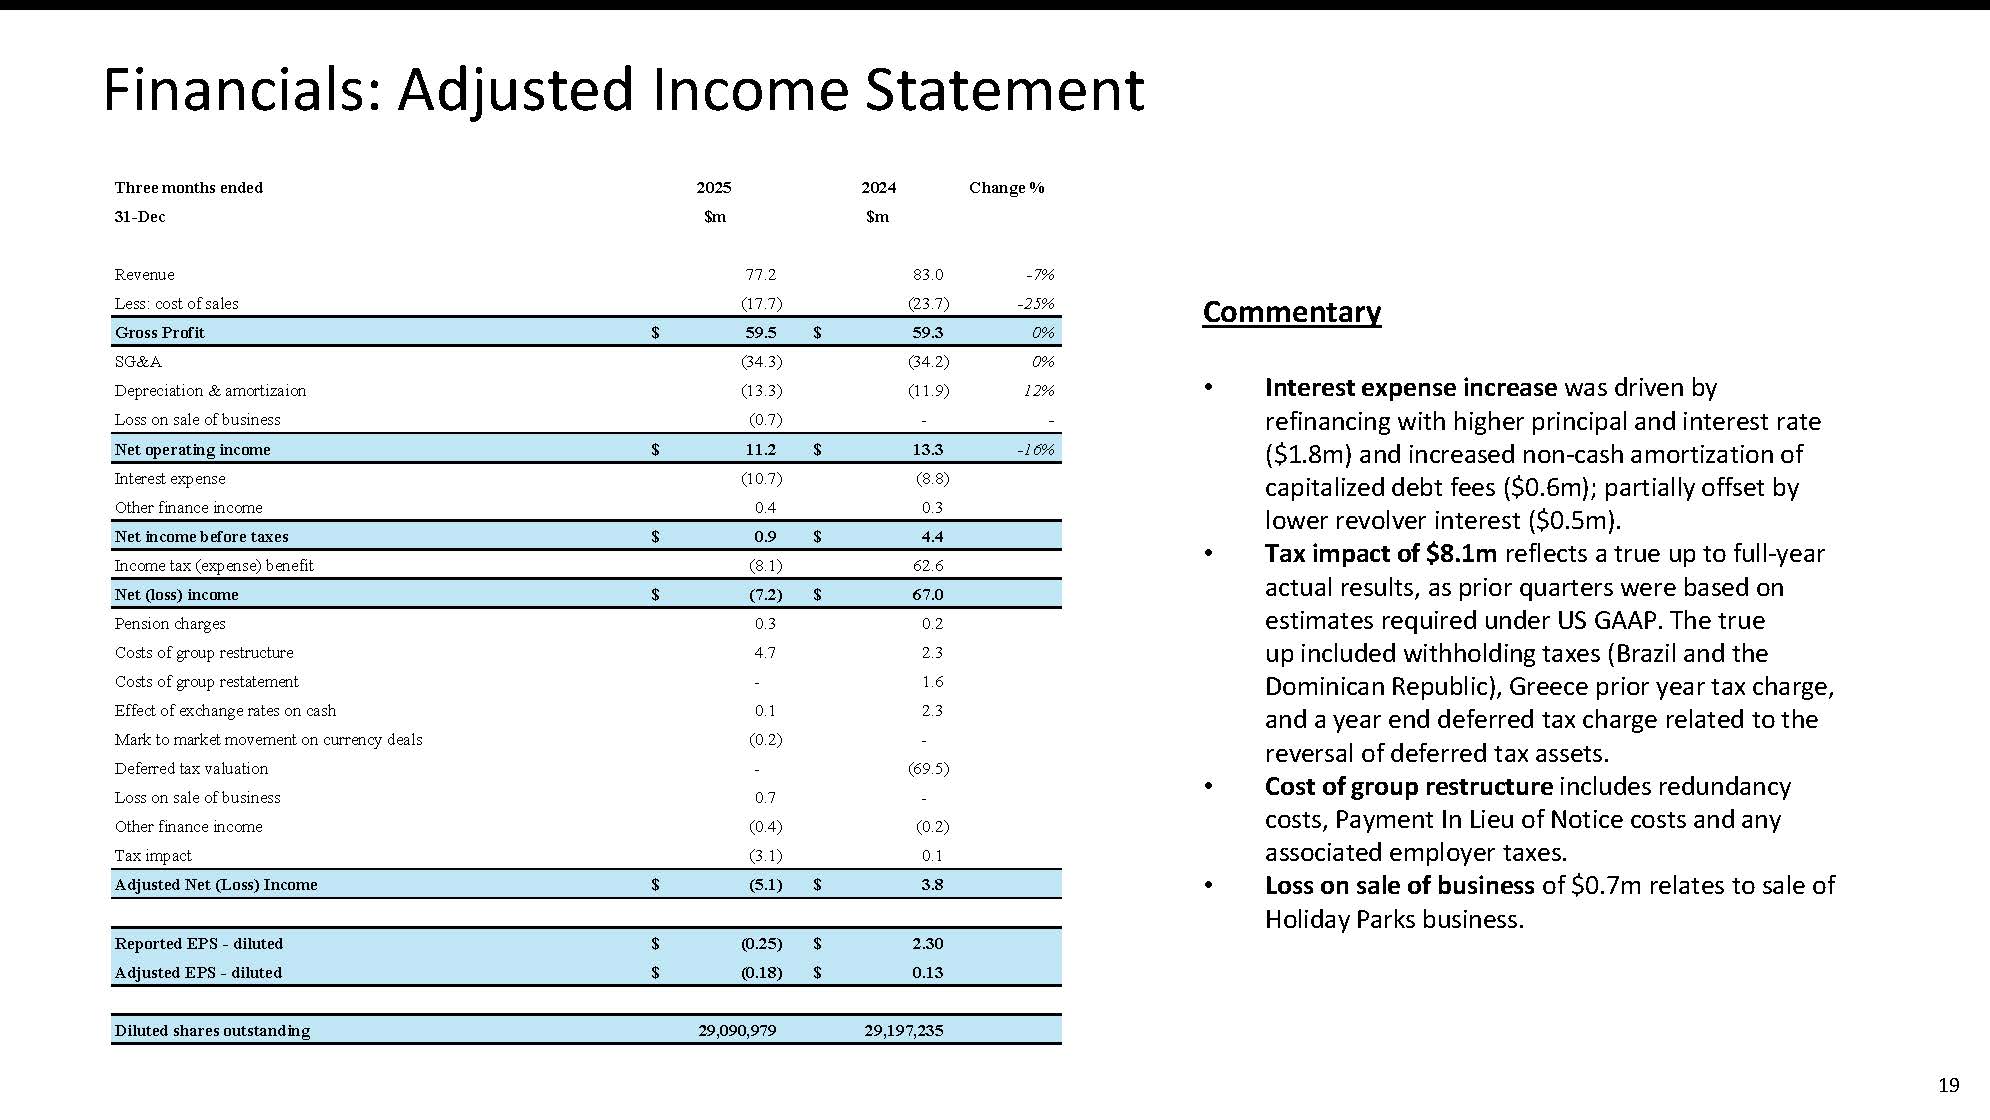
| Service | $ | 68.4 | $ | 64.7 | $ | 278.6 | $ | 258.6 | ||||||||
| Product sales | 8.8 | 18.3 | 25.5 | 38.5 | ||||||||||||
| Total revenue | 77.2 | 83.0 | 304.1 | 297.1 | ||||||||||||
| Cost of sales: | ||||||||||||||||
| Cost of service (1) | (12.0 | ) | (14.7 | ) | (70.2 | ) | (70.3 | ) | ||||||||
| Cost of product sales (1) | (5.7 | ) | (9.0 | ) | (16.3 | ) | (22.0 | ) | ||||||||
| Selling, general and administrative expenses | (34.3 | ) | (34.4 | ) | (128.1 | ) | (130.8 | ) | ||||||||
| Depreciation and amortization | (13.3 | ) | (11.9 | ) | (52.4 | ) | (43.3 | ) | ||||||||
| Loss on sale of business | (0.7 | ) | — | (6.6 | ) | — | ||||||||||
| Net operating income | 11.2 | 13.0 | 30.5 | 30.7 | ||||||||||||
| Other expense | ||||||||||||||||
| Interest expense, net | (10.7 | ) | (8.8 | ) | (37.3 | ) | (29.4 | ) | ||||||||
| Other finance income | 0.4 | 0.2 | 0.9 | 0.5 | ||||||||||||
| Total other expense, net | (10.3 | ) | (8.6 | ) | (36.4 | ) | (28.9 | ) | ||||||||
| Net (loss) income before income taxes | 0.9 | 4.4 | (5.9 | ) | 1.8 | |||||||||||
| Income tax benefit (expense) | (8.1 | ) | 62.6 | (11.1 | ) | 63.0 | ||||||||||
| Net (loss) income | (7.2 | ) | 67.0 | (17.0 | ) | 64.8 | ||||||||||
| Other comprehensive (loss)/income: | ||||||||||||||||
| Foreign currency translation gain (loss) | 0.6 | 6.1 | (0.7 | ) | 1.4 | |||||||||||
| Deferred tax on foreign currency translation (loss) gain | 0.1 | (1.0 | ) | 0.1 | (1.0 | ) | ||||||||||
| Change in fair value of hedging instrument | (0.5 | ) | — | (0.5 | ) | — | ||||||||||
| Reclassification of gain on hedging instrument to comprehensive income | (0.1 | ) | — | (0.1 | ) | — | ||||||||||
| Deferred tax on movement of hedging instrument | 0.1 | — | 0.1 | — | ||||||||||||
| Actuarial gains on pension plan | — | 3.8 | 0.8 | 4.7 | ||||||||||||
| Deferred tax on actuarial gains on pension plan | (0.2 | ) | (1.1 | ) | (0.2 | ) | (1.1 | ) | ||||||||
| Other comprehensive income (loss) | — | 7.8 | (0.5 | ) | 4.0 | |||||||||||
| Comprehensive (loss) income | $ | (7.2 | ) | $ | 74.8 | $ | (17.5 | ) | $ | 68.8 | ||||||
| Net (loss) income per common share – basic | $ | (0.25 | ) | $ | 2.35 | $ | (0.58 | ) | $ | 2.27 | ||||||
| Net (loss) income per common share – diluted | $ | (0.25 | ) | $ | 2.29 | $ | (0.58 | ) | $ | 2.22 | ||||||
| Weighted average number of shares outstanding during the period – basic | 29,090,979 | 28,509,904 | 29,060,055 | 28,521,027 | ||||||||||||
| Weighted average number of shares outstanding during the period – diluted | 29,090,979 | 29,197,235 | 29,060,055 | 29,199,375 | ||||||||||||
| Supplemental disclosure of stock-based compensation expense | ||||||||||||||||
| Stock-based compensation included in: | ||||||||||||||||
| Selling, general and administrative expenses | $ | (2.1 | ) | $ | (1.9 | ) | $ | (6.7 | ) | $ | (7.6 | ) | ||||
| (1) | Excluding depreciation and amortization |
INSPIRED ENTERTAINMENT, INC. AND SUBSIDIARIES
CONDENSED CONSOLIDATED BALANCE SHEETS
(in millions, except share data)
| December 31, 2025 | December 31, 2024 | |||||||
| Assets | ||||||||
| Current assets | ||||||||
| Cash | $ | 42.0 | $ | 29.3 | ||||
| Restricted cash | 1.3 | — | ||||||
| Accounts receivable, net | 43.9 | 65.4 | ||||||
| Inventory | 18.5 | 28.0 | ||||||
| Prepaid expenses and other current assets | 46.8 | 36.0 | ||||||
| Corporate tax and other current taxes receivable | 5.5 | 1.2 | ||||||
| Total current assets | 158.0 | 159.9 | ||||||
| Property and equipment, net | 60.5 | 56.4 | ||||||
| Software development costs, net | 22.7 | 22.4 | ||||||
| Other acquired intangible assets subject to amortization, net | 14.0 | 16.1 | ||||||
| Goodwill | 62.1 | 57.8 | ||||||
| Finance lease right of use asset | 21.7 | 18.7 | ||||||
| Operating lease right of use asset | 7.8 | 16.2 | ||||||
| Costs of obtaining and fulfilling customer contracts, net | 12.1 | 11.0 | ||||||
| Deferred tax | 65.3 | 67.4 | ||||||
| Other assets | 15.7 | 12.5 | ||||||
| Total assets | $ | 439.9 | $ | 438.4 | ||||
| Liabilities and Stockholders’ Deficit | ||||||||
| Current liabilities | ||||||||
| Accounts payable and accrued expenses | $ | 42.7 | $ | 53.7 | ||||
| Corporate tax and other current taxes payable | 9.1 | 12.3 | ||||||
| Deferred revenue, current | 7.1 | 5.8 | ||||||
| Operating lease liabilities | 2.9 | 5.1 | ||||||
| Current portion of long-term debt | — | 18.8 | ||||||
| Current portion of finance lease liabilities | 4.3 | 4.4 | ||||||
| Other current liabilities | 4.7 | 3.9 | ||||||
| Total current liabilities | 70.8 | 104.0 | ||||||
| Long-term debt | 345.2 | 292.2 | ||||||
| Finance lease liabilities, net of current portion | 13.8 | 18.6 | ||||||
| Deferred revenue, net of current portion | 19.1 | 12.8 | ||||||
| Operating lease liabilities | 6.1 | 11.7 | ||||||
| Other long-term liabilities | 1.1 | 2.4 | ||||||
| Total liabilities | 456.1 | 441.7 | ||||||
| Commitments and contingencies | — | — | ||||||
| Stockholders’ deficit | ||||||||
| Preferred stock; $0.0001 par value; 1,000,000 shares authorized, no shares issued and outstanding at December 31, 2025 and December 31, 2024, respectively | — | — | ||||||
| Common stock; $0.0001 par value; 49,000,000 shares authorized; 26,873,509 shares and 26,581,972 shares issued and outstanding at December 31, 2025 and December 31, 2024, respectively | — | — | ||||||
| Additional paid in capital | 394.9 | 389.9 | ||||||
| Accumulated other comprehensive income | 47.8 | 48.3 | ||||||
| Accumulated deficit | (458.9 | ) | (441.5 | ) | ||||
| Total stockholders’ deficit | (16.2 | ) | (3.3 | ) | ||||
| Total liabilities and stockholders’ deficit | $ | 439.9 | $ | 438.4 | ||||
INSPIRED ENTERTAINMENT, INC. AND SUBSIDIARIES
CONDENSED CONSOLIDATED STATEMENTS OF CASH FLOWS
(in millions) (Unaudited)
| Year
Ended December 31, 2025 |
Year
Ended December 31, 2024 |
|||||||
| Cash flows from operating activities: | ||||||||
| Net (loss) income | $ | (17.0 | ) | $ | 64.8 | |||
| Adjustments to reconcile net loss to net cash provided by operating activities: | ||||||||
| Depreciation and amortization | 46.5 | 43.3 | ||||||
| Amortization of finance lease right of use asset | 5.9 | — | ||||||
| Amortization of operating lease right of use asset | 4.7 | 4.4 | ||||||
| Loss on sale of business | 6.6 | — | ||||||
| Stock-based compensation expense | 6.7 | 7.6 | ||||||
| Amortization of deferred financing fees relating to senior debt | 3.0 | 1.1 | ||||||
| Deferred tax | 2.9 | (69.4 | ) | |||||
| Changes in assets and liabilities: | ||||||||
| Accounts receivable | 24.2 | (22.8 | ) | |||||
| Inventory | 7.3 | 3.8 | ||||||
| Prepaid expenses and other assets | (18.0 | ) | 5.8 | |||||
| Corporate tax and other current taxes payable | (8.9 | ) | 1.1 | |||||
| Accounts payable and accrued expenses | (10.7 | ) | (10.6 | ) | ||||
| Deferred revenue and customer prepayment | 6.7 | 7.2 | ||||||
| Operating lease liabilities | (4.1 | ) | (4.0 | ) | ||||
| Pension contributions | (1.2 | ) | (1.5 | ) | ||||
| Other long-term liabilities | (2.6 | ) | 0.9 | |||||
| Net cash provided by operating activities | 52.0 | 31.7 | ||||||
| Cash flows from investing activities: | ||||||||
| Purchases of property and equipment | (35.7 | ) | (17.0 | ) | ||||
| Purchases of capital software and internally developed costs | (9.9 | ) | (11.8 | ) | ||||
| Net cash on deconsolidation of subsidiary | 18.1 | — | ||||||
| Contract cost expenditures | (13.0 | ) | (11.3 | ) | ||||
| Net cash used in investing activities | (40.5 | ) | (40.1 | ) | ||||
| Cash flows from financing activities: | ||||||||
| Proceeds from long-term debt | 365.7 | — | ||||||
| Repayments of long-term debt and short-term debt | (338.6 | ) | — | |||||
| Debt fees incurred | (18.8 | ) | — | |||||
| Repurchase of common stock | (0.4 | ) | — | |||||
| Repayments of finance leases | (7.9 | ) | (1.6 | ) | ||||
| Net cash provided by (used in) financing activities | — | (1.6 | ) | |||||
| Effect of exchange rate changes on cash | 2.5 | (0.7 | ) | |||||
| Net increase (decrease) in cash | 14.0 | (10.7 | ) | |||||
| Cash, beginning of period | 29.3 | 40.0 | ||||||
| Cash and restricted cash, end of period | $ | 43.3 | $ | 29.3 | ||||
| Components of cash and restricted cash | ||||||||
| Cash | 42.0 | 29.3 | ||||||
| Restricted cash | 1.3 | — | ||||||
| Total cash and restricted cash, end of period | $ | 43.3 | $ | 29.3 | ||||
| Supplemental cash flow disclosures | ||||||||
| Cash paid during the period for interest | $ | 36.6 | $ | 26.6 | ||||
| Cash paid during the period for operating leases | $ | 7.5 | $ | 9.2 | ||||
| Supplemental disclosure of noncash investing and financing activities | ||||||||
| Right of use property and equipment acquired through finance lease | $ | 11.1 | $ | 21.9 | ||||
| Lease liabilities arising from obtaining finance lease right of use assets | $ | (1.3 | ) | $ | (18.7 | ) | ||
| Lease liabilities arising from obtaining operating lease right of use assets | $ | (1.1 | ) | $ | (6.5 | ) | ||
| Additional paid in capital from net settlement of RSUs | $ | (1.3 | ) | $ | (3.0 | ) | ||
INSPIRED ENTERTAINMENT, INC. AND SUBSIDIARIES
RECONCILIATION OF NON-GAAP FINANCIAL MEASURES
ADJUSTED EBITDA RECONCILIATION BY SEGMENT
(in millions)
(Unaudited)
Three Months Ended December 31, 2025
| Gaming |
Virtual Sports |
Interactive | Leisure | Corporate | Total | |||||||||||||||||||
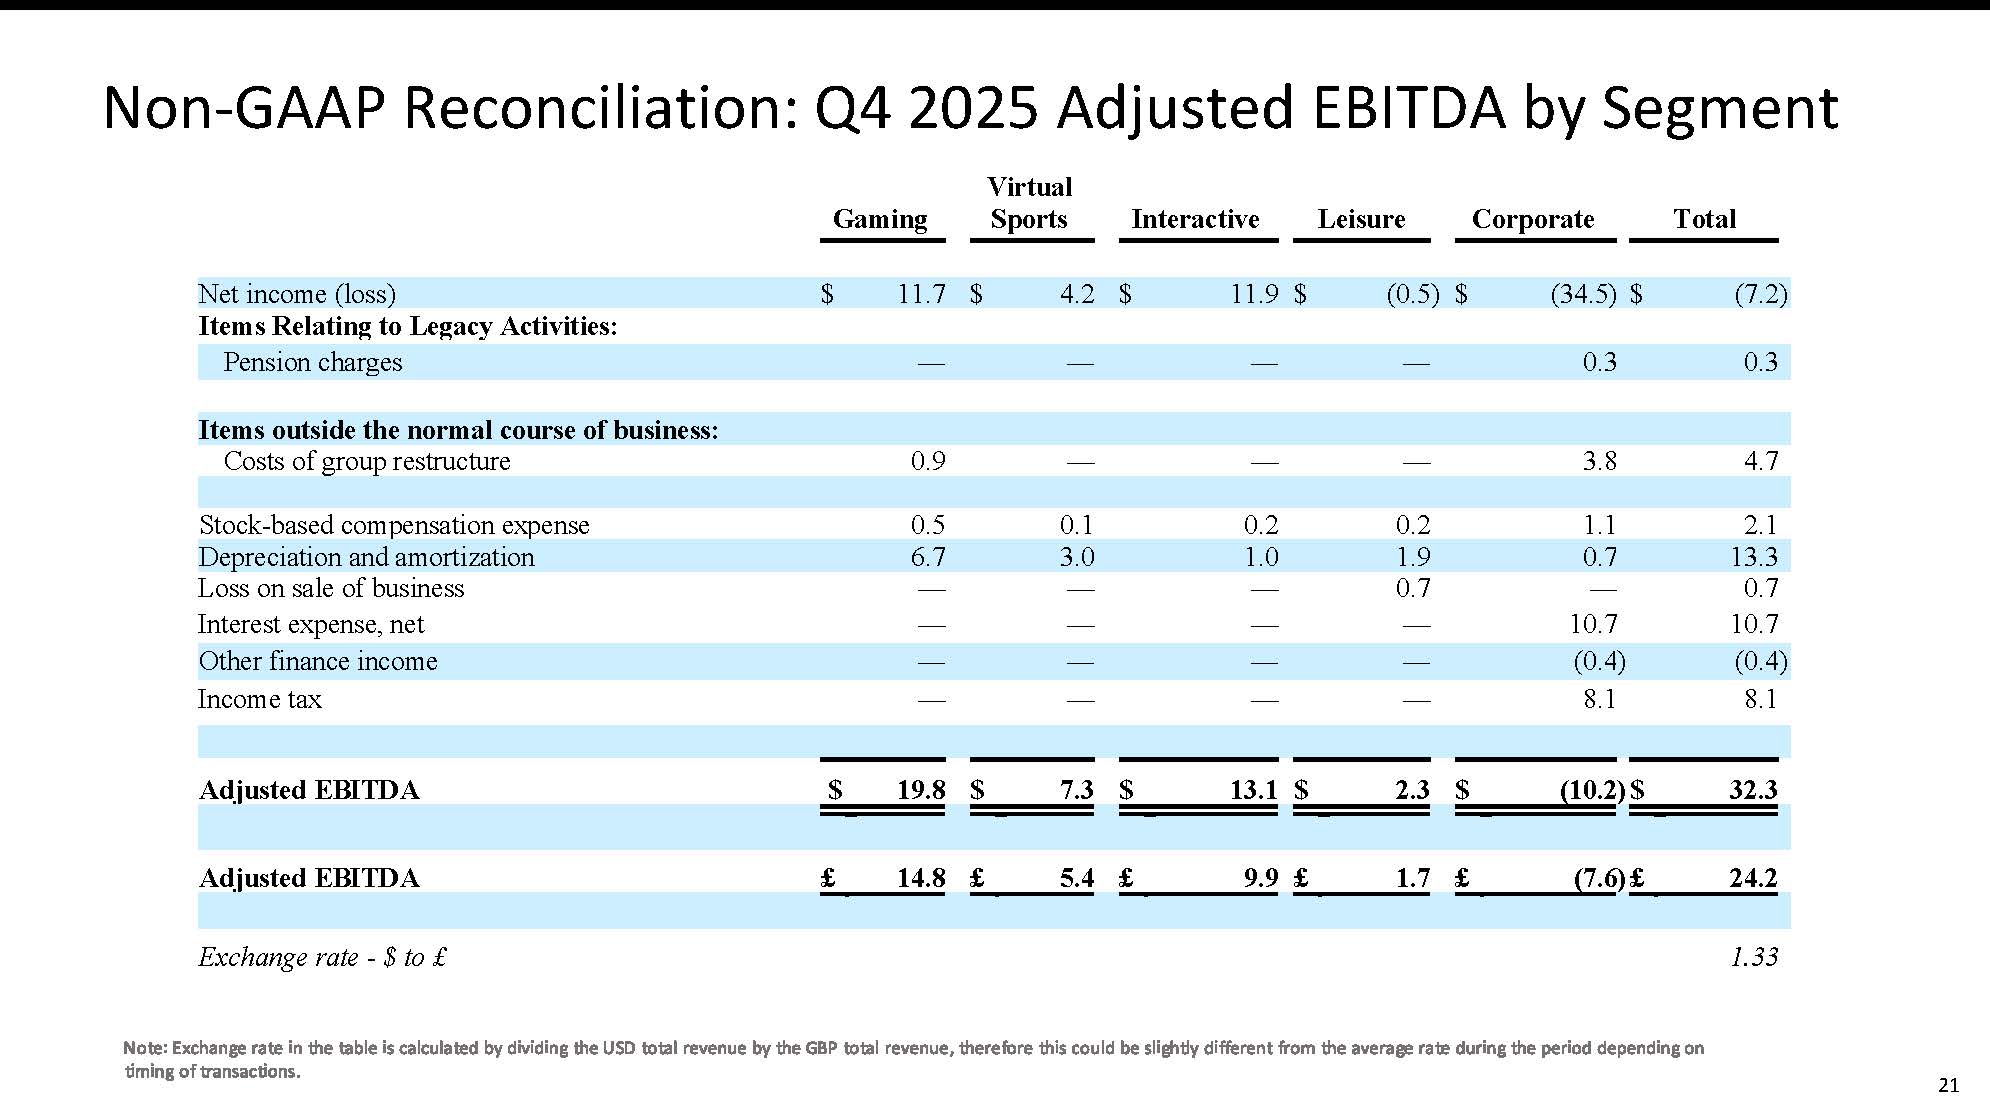
| Net income (loss) | $ | 11.7 | $ | 4.2 | $ | 11.9 | $ | (0.5 | ) | $ | (34.5 | ) | $ | (7.2 | ) | |||||||||
| Items Relating to Legacy Activities: | ||||||||||||||||||||||||
| Pension charges | — | — | — | — | 0.3 | 0.3 | ||||||||||||||||||
| Items outside the normal course of business: | ||||||||||||||||||||||||
| Costs of group restructure | 0.9 | — | — | — | 3.8 | 4.7 | ||||||||||||||||||
| Stock-based compensation expense | 0.5 | 0.1 | 0.2 | 0.2 | 1.1 | 2.1 | ||||||||||||||||||
| Depreciation and amortization | 6.7 | 3.0 | 1.0 | 1.9 | 0.7 | 13.3 | ||||||||||||||||||
| Loss on sale of business | — | — | — | 0.7 | — | 0.7 | ||||||||||||||||||
| Interest expense, net | — | — | — | — | 10.7 | 10.7 | ||||||||||||||||||
| Other finance income | — | — | — | — | (0.4 | ) | (0.4 | ) | ||||||||||||||||
| Income tax | — | — | — | — | 8.1 | 8.1 | ||||||||||||||||||
| Adjusted EBITDA | $ | 19.8 | $ | 7.3 | $ | 13.1 | $ | 2.3 | $ | (10.2 | ) | $ | 32.3 | |||||||||||
| Adjusted EBITDA | £ | 14.8 | £ | 5.4 | £ | 9.9 | £ | 1.7 | £ | (7.6 | ) | £ | 24.2 | |||||||||||
| Exchange rate - $ to £ | 1.33 | |||||||||||||||||||||||
Three Months Ended December 31, 2024
| Gaming |
Virtual Sports |
Interactive | Leisure | Corporate | Total | |||||||||||||||||||
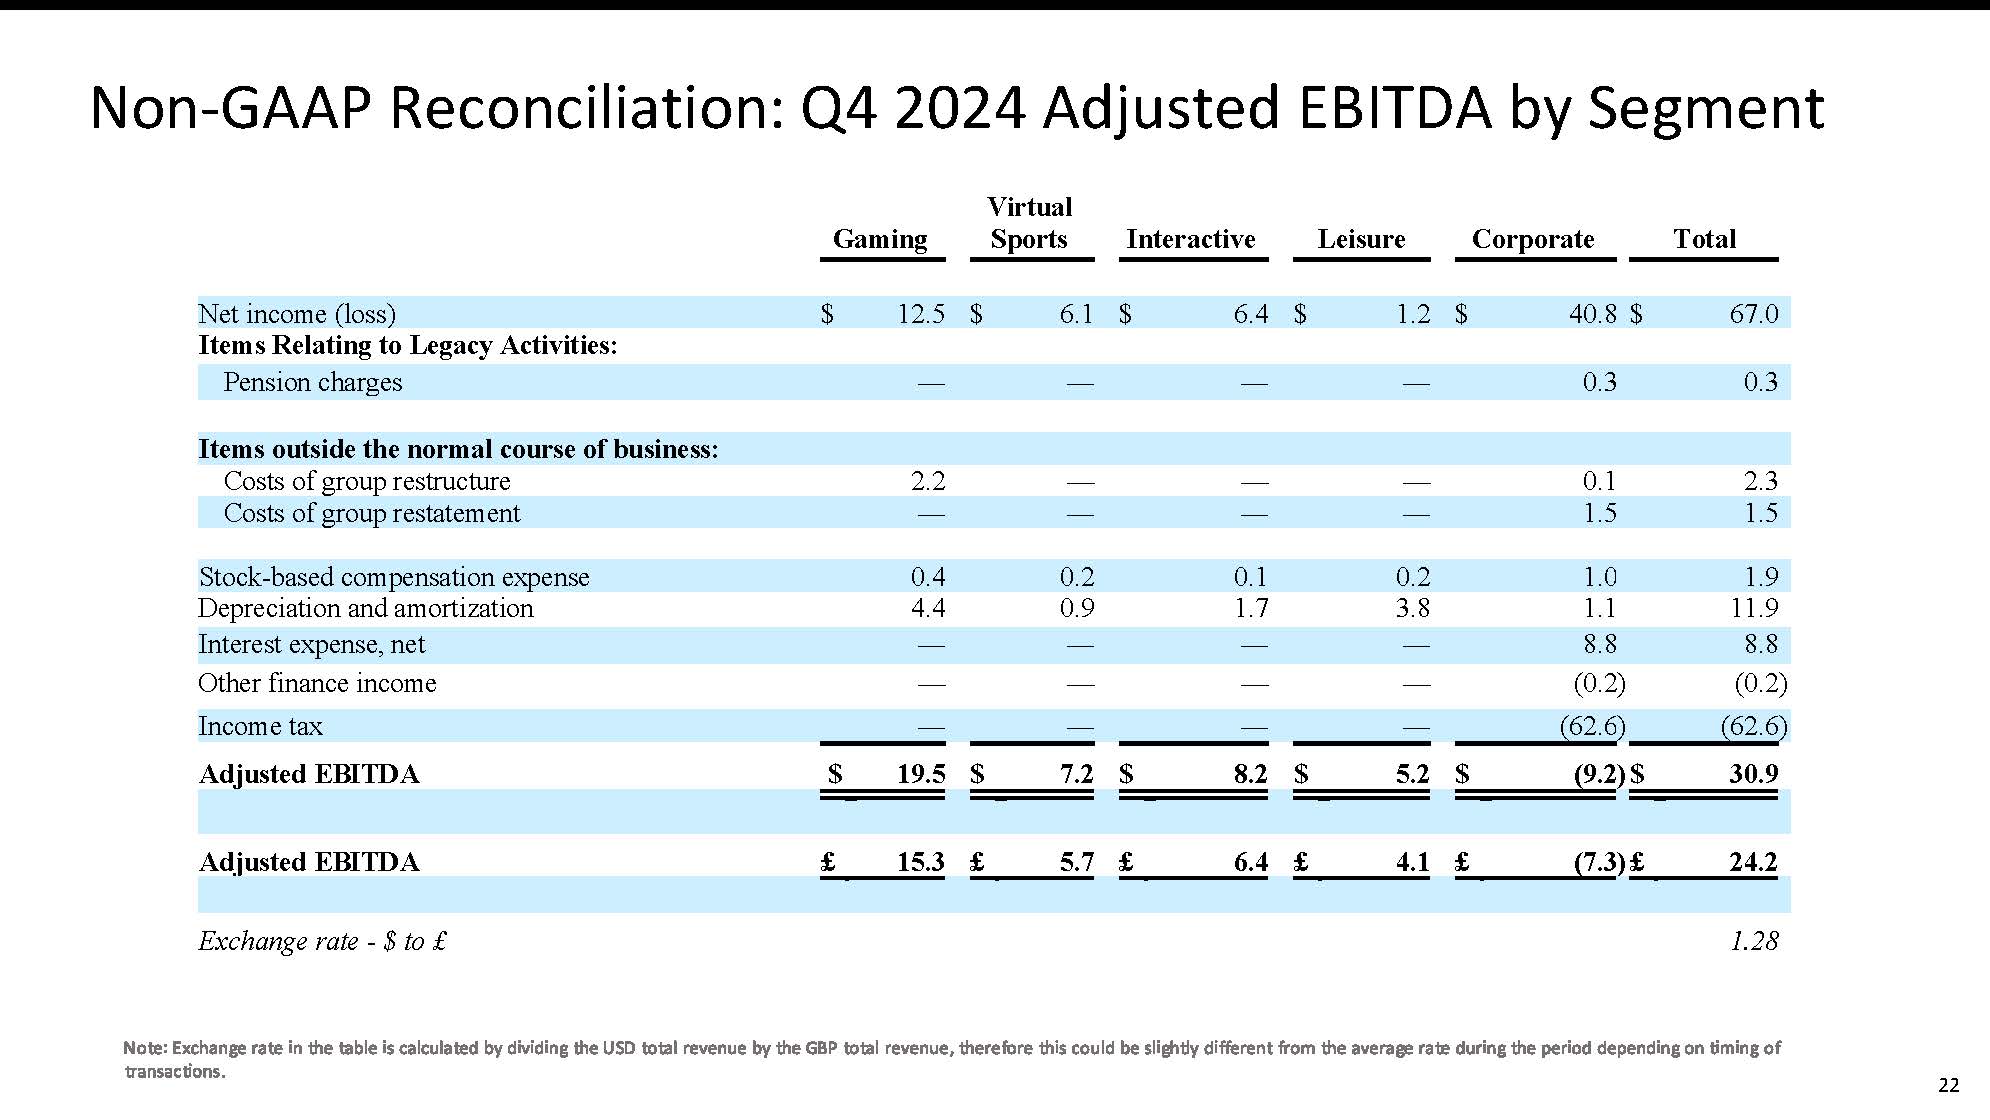
| Net income (loss) | $ | 12.5 | $ | 6.1 | $ | 6.4 | $ | 1.2 | $ | 40.8 | $ | 67.0 | ||||||||||||
| Items Relating to Legacy Activities: | ||||||||||||||||||||||||
| Pension charges | — | — | — | — | 0.3 | 0.3 | ||||||||||||||||||
| Items outside the normal course of business: | ||||||||||||||||||||||||
| Costs of group restructure | 2.2 | — | — | — | 0.1 | 2.3 | ||||||||||||||||||
| Costs of group restatement | — | — | — | — | 1.5 | 1.5 | ||||||||||||||||||
| Stock-based compensation expense | 0.4 | 0.2 | 0.1 | 0.2 | 1.0 | 1.9 | ||||||||||||||||||
| Depreciation and amortization | 4.4 | 0.9 | 1.7 | 3.8 | 1.1 | 11.9 | ||||||||||||||||||
| Interest expense, net | — | — | — | — | 8.8 | 8.8 | ||||||||||||||||||
| Other finance income | — | — | — | — | (0.2 | ) | (0.2 | ) | ||||||||||||||||
| Income tax | — | — | — | — | (62.6 | ) | (62.6 | ) | ||||||||||||||||
| Adjusted EBITDA | $ | 19.5 | $ | 7.2 | $ | 8.2 | $ | 5.2 | $ | (9.2 | ) | $ | 30.9 | |||||||||||
| Adjusted EBITDA | £ | 15.3 | £ | 5.7 | £ | 6.4 | £ | 4.1 | £ | (7.3 | ) | £ | 24.2 | |||||||||||
| Exchange rate - $ to £ | 1.28 | |||||||||||||||||||||||
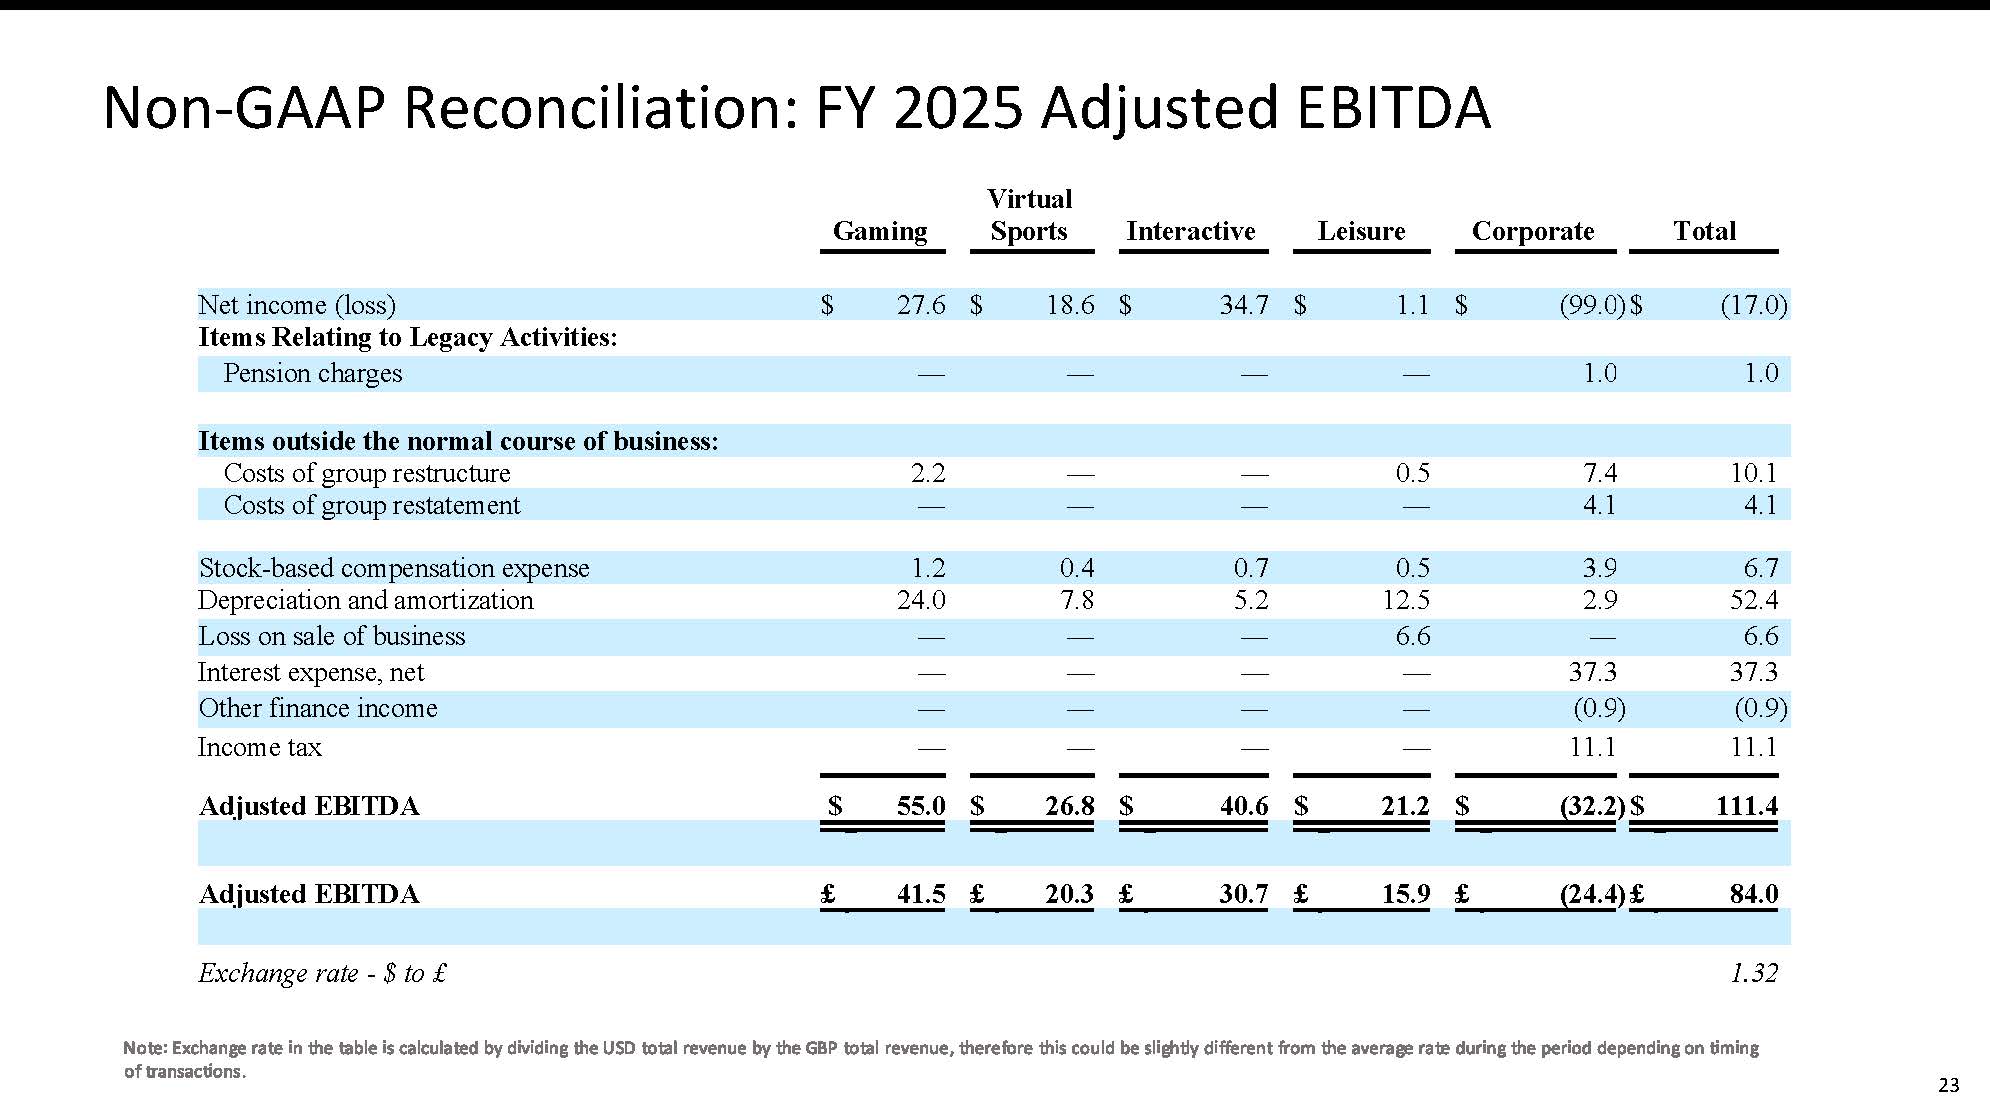
Twelve Months Ended December 31, 2025
| Gaming |
Virtual Sports |
Interactive | Leisure | Corporate | Total | |||||||||||||||||||
| Net income (loss) | $ | 27.6 | $ | 18.6 | $ | 34.7 | $ | 1.1 | $ | (99.0 | ) | $ | (17.0 | ) | ||||||||||
| Items Relating to Legacy Activities: | ||||||||||||||||||||||||
| Pension charges | — | — | — | — | 1.0 | 1.0 | ||||||||||||||||||
| Items outside the normal course of business: | ||||||||||||||||||||||||
| Costs of group restructure | 2.2 | — | — | 0.5 | 7.4 | 10.1 | ||||||||||||||||||
| Costs of group restatement | — | — | — | — | 4.1 | 4.1 | ||||||||||||||||||
| Stock-based compensation expense | 1.2 | 0.4 | 0.7 | 0.5 | 3.9 | 6.7 | ||||||||||||||||||
| Depreciation and amortization | 24.0 | 7.8 | 5.2 | 12.5 | 2.9 | 52.4 | ||||||||||||||||||
| Loss on sale of business | — | — | — | 6.6 | — | 6.6 | ||||||||||||||||||
| Interest expense, net | — | — | — | — | 37.3 | 37.3 | ||||||||||||||||||
| Other finance income | — | — | — | — | (0.9 | ) | (0.9 | ) | ||||||||||||||||
| Income tax | — | — | — | — | 11.1 | 11.1 | ||||||||||||||||||
| Adjusted EBITDA | $ | 55.0 | $ | 26.8 | $ | 40.6 | $ | 21.2 | $ | (32.2 | ) | $ | 111.4 | |||||||||||
| Adjusted EBITDA | £ | 41.5 | £ | 20.3 | £ | 30.7 | £ | 15.9 | £ | (24.4 | ) | £ | 84.0 | |||||||||||
| Exchange rate - $ to £ | 1.32 | |||||||||||||||||||||||
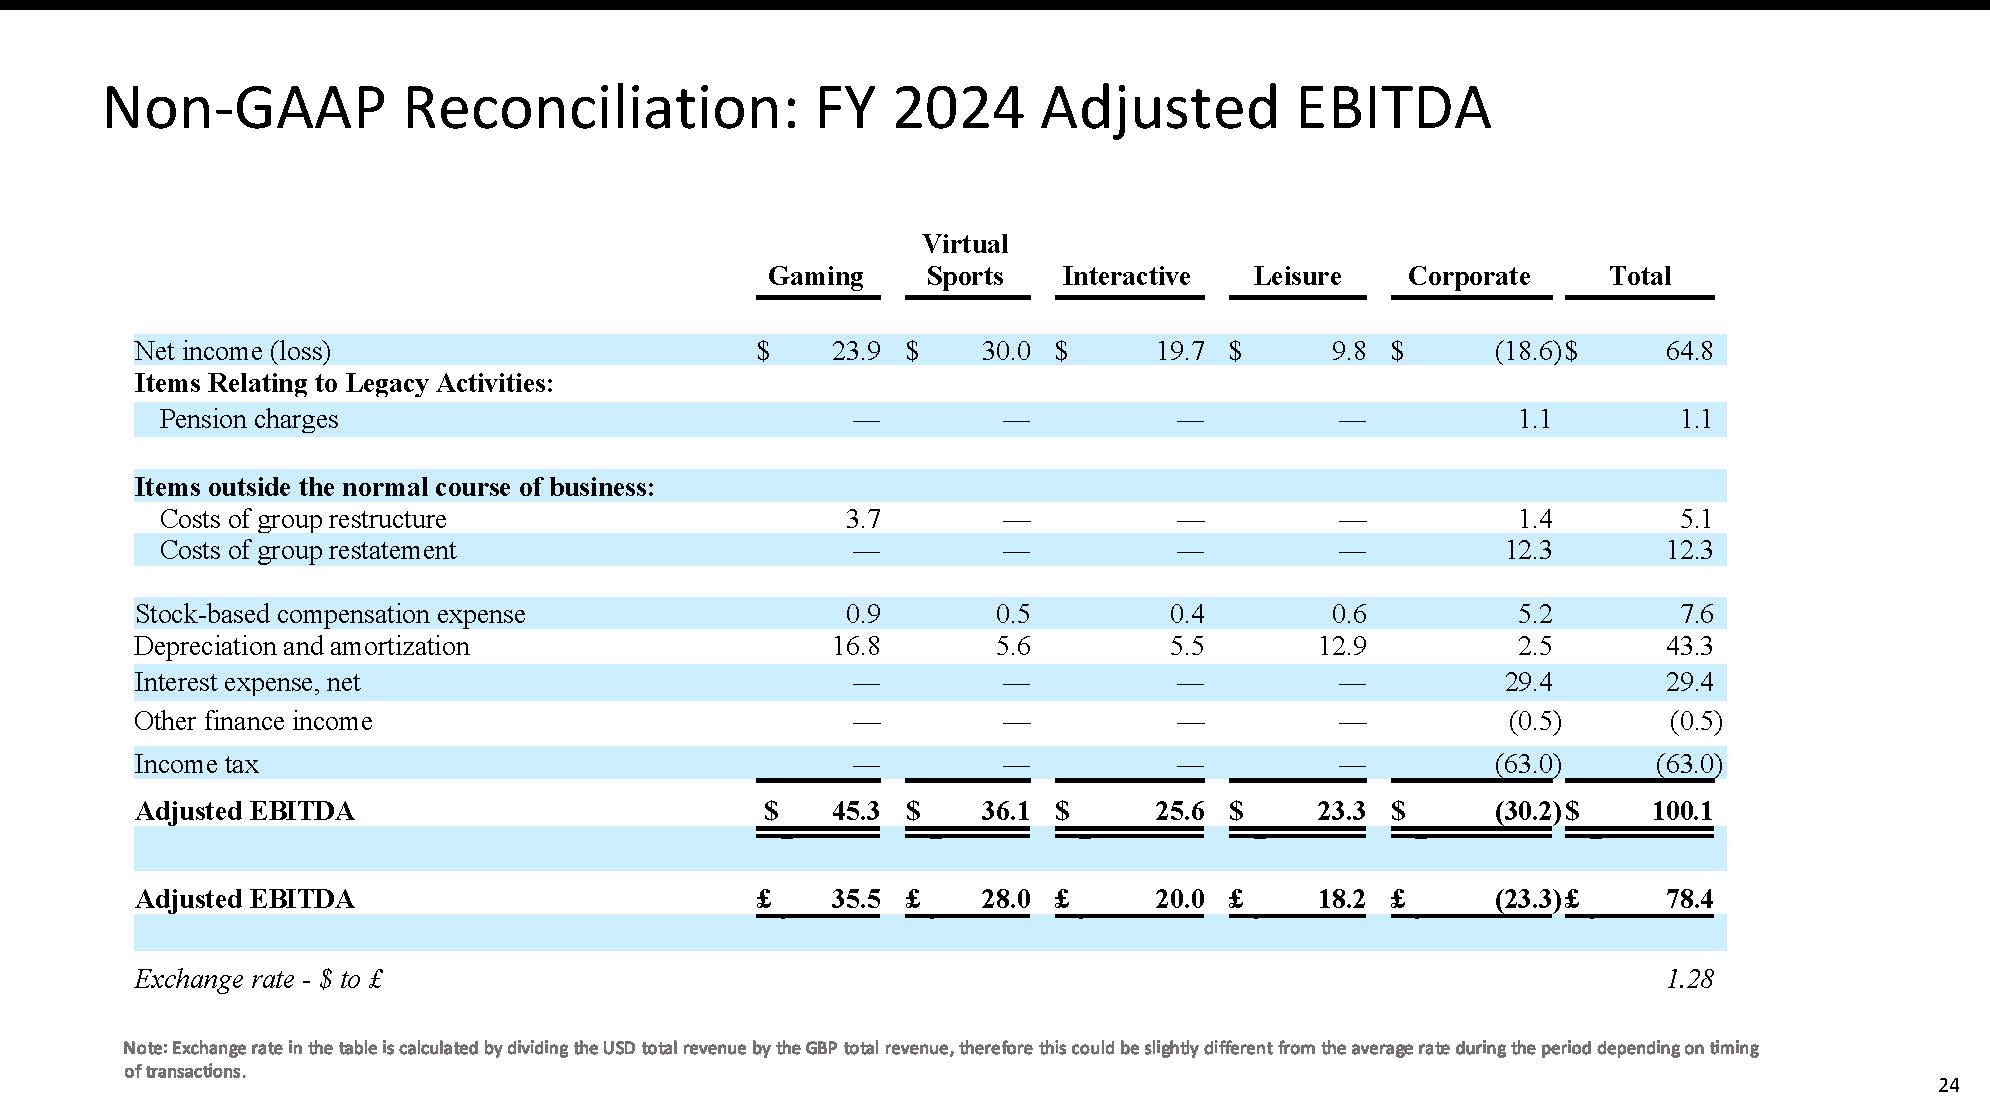
Twelve Months Ended December 31, 2024
| Gaming |
Virtual Sports |
Interactive | Leisure | Corporate | Total | |||||||||||||||||||
| Net income (loss) | $ | 23.9 | $ | 30.0 | $ | 19.7 | $ | 9.8 | $ | (18.6 | ) | $ | 64.8 | |||||||||||
| Items Relating to Legacy Activities: | ||||||||||||||||||||||||
| Pension charges | — | — | — | — | 1.1 | 1.1 | ||||||||||||||||||
| Items outside the normal course of business: | ||||||||||||||||||||||||
| Costs of group restructure | 3.7 | — | — | — | 1.4 | 5.1 | ||||||||||||||||||
| Costs of group restatement | — | — | — | — | 12.3 | 12.3 | ||||||||||||||||||
| Stock-based compensation expense | 0.9 | 0.5 | 0.4 | 0.6 | 5.2 | 7.6 | ||||||||||||||||||
| Depreciation and amortization | 16.8 | 5.6 | 5.5 | 12.9 | 2.5 | 43.3 | ||||||||||||||||||
| Interest expense, net | — | — | — | — | 29.4 | 29.4 | ||||||||||||||||||
| Other finance income | — | — | — | — | (0.5 | ) | (0.5 | ) | ||||||||||||||||
| Income tax | — | — | — | — | (63.0 | ) | (63.0 | ) | ||||||||||||||||
| Adjusted EBITDA | $ | 45.3 | $ | 36.1 | $ | 25.6 | $ | 23.3 | $ | (30.2 | ) | $ | 100.1 | |||||||||||
| Adjusted EBITDA | £ | 35.5 | £ | 28.0 | £ | 20.0 | £ | 18.2 | £ | (23.3 | ) | £ | 78.4 | |||||||||||
| Exchange rate - $ to £ | 1.28 | |||||||||||||||||||||||
ADJUSTED NET INCOME RECONCILIATION
(in millions, except share data)
(Unaudited)
| For the Three-Month Period ended | For the Twelve-Month Period ended | |||||||||||||||
| December 31, | December 31, | December 31, | December 31, | |||||||||||||
| (In millions) | 2025 | 2024 | 2025 | 2024 | ||||||||||||
| Net (loss) income | $ | (7.2 | ) | $ | 67.0 | $ | (17.0 | ) | $ | 64.8 | ||||||
| Items Relating to Legacy Activities: | ||||||||||||||||
| Pension charges | 0.3 | 0.2 | 1.0 | 1.1 | ||||||||||||
| Items outside the normal course of business: | ||||||||||||||||
| Cost of group restructure | 4.7 | 2.3 | 10.1 | 5.1 | ||||||||||||
| Cost of group restatement | — | 1.6 | 4.1 | 12.3 | ||||||||||||
| Effect of exchange rates on cash | 0.1 | 2.3 | (2.4 | ) | 0.7 | |||||||||||
| Mark to market movement on currency deals | (0.2 | ) | — | — | (0.5 | ) | ||||||||||
| Deferred tax valuation | — | (69.5 | ) | — | (69.5 | ) | ||||||||||
| Loss on sale of business | 0.7 | — | 6.6 | — | ||||||||||||
| Other finance income | (0.4 | ) | (0.2 | ) | (1.0 | ) | (0.5 | ) | ||||||||
| Tax Impact | (3.1 | ) | 0.1 | — | (0.5 | ) | ||||||||||
| Adjusted Net (Loss) Income | $ | (5.1 | ) | $ | 3.8 | $ | 1.4 | $ | 13.0 | |||||||
| Adjusted Net (Loss) Income | £ | (3.8 | ) | £ | 3.0 | £ | 1.1 | £ | 10.3 | |||||||
| Exchange Rate - $ to £ | 1.33 | 1.28 | 1.32 | 1.28 | ||||||||||||
| Weighted average number of shares outstanding– diluted | 29,090,979 | 29,197,235 | 29,354,861 | 29,199,375 | ||||||||||||
| Adjusted Net (Loss) Income per diluted share | $ | (0.18 | ) | $ | 0.13 | $ | 0.05 | $ | 0.45 | |||||||
PRO-RATED SEGMENT ADJUSTED EBITDA CONTRIBUTION
(in millions)
(Unaudited)
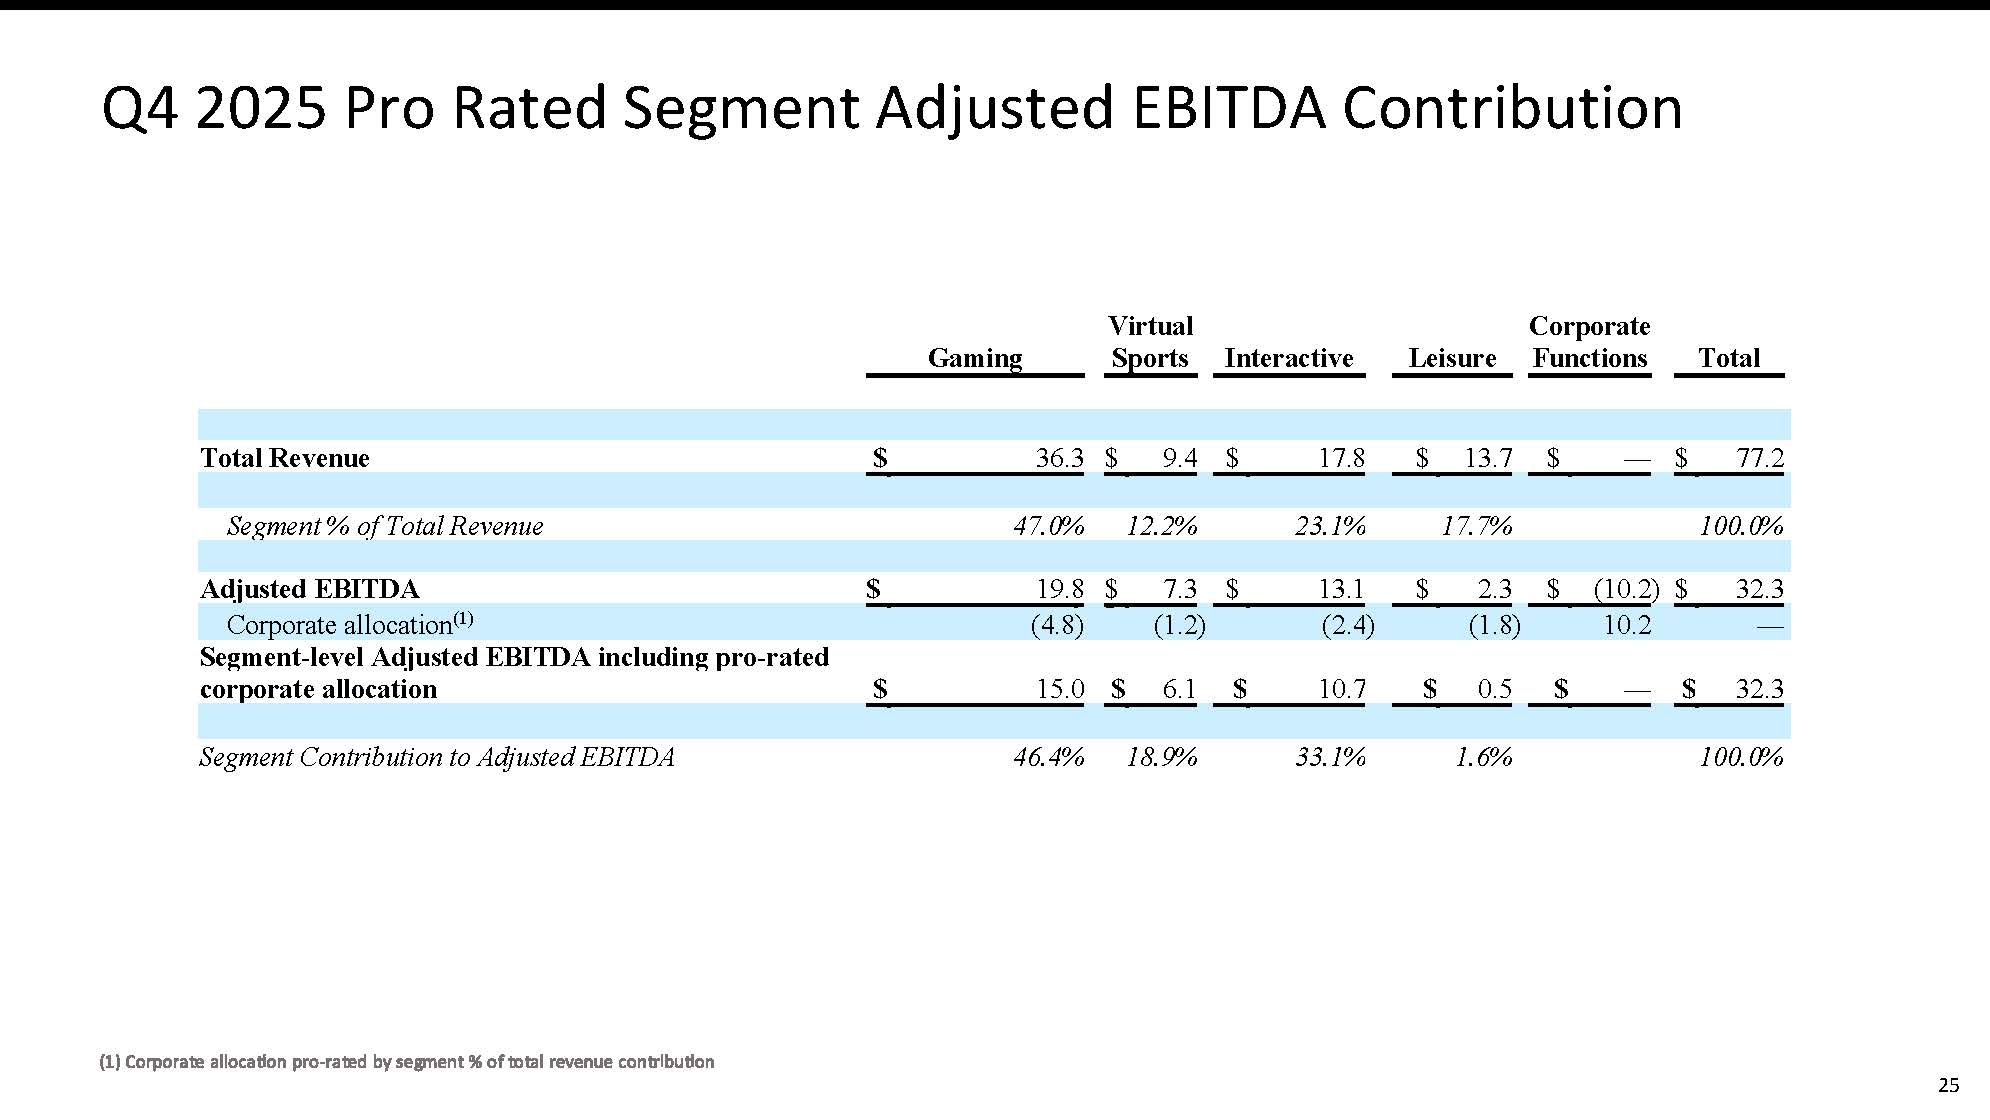
Three Months Ended December 31, 2025
| Gaming |
Virtual Sports |
Interactive | Leisure |
Corporate Functions |
Total | |||||||||||||||||||
| Total Revenue | $ | 36.3 | $ | 9.4 | $ | 17.8 | $ | 13.7 | $ | — | $ | 77.2 | ||||||||||||
| Segment % of Total Revenue | 47.0 | % | 12.2 | % | 23.1 | % | 17.7 | % | 100.0 | % | ||||||||||||||
| Adjusted EBITDA | $ | 19.8 | $ | 7.3 | $ | 13.1 | $ | 2.3 | $ | (10.2 | ) | $ | 32.3 | |||||||||||
| Corporate allocation(1) | (4.8 | ) | (1.2 | ) | (2.4 | ) | (1.8 | ) | 10.2 | — | ||||||||||||||
| Segment-level Adjusted EBITDA including pro-rated corporate allocation | $ | 15.0 | $ | 6.1 | $ | 10.7 | $ | 0.5 | $ | — | $ | 32.3 | ||||||||||||
| Segment Contribution to Adjusted EBITDA | 46.4 | % | 18.9 | % | 33.1 | % | 1.6 | % | 100.0 | % | ||||||||||||||
| (1) | Corporate allocation pro-rated by segment % of total revenue contribution |
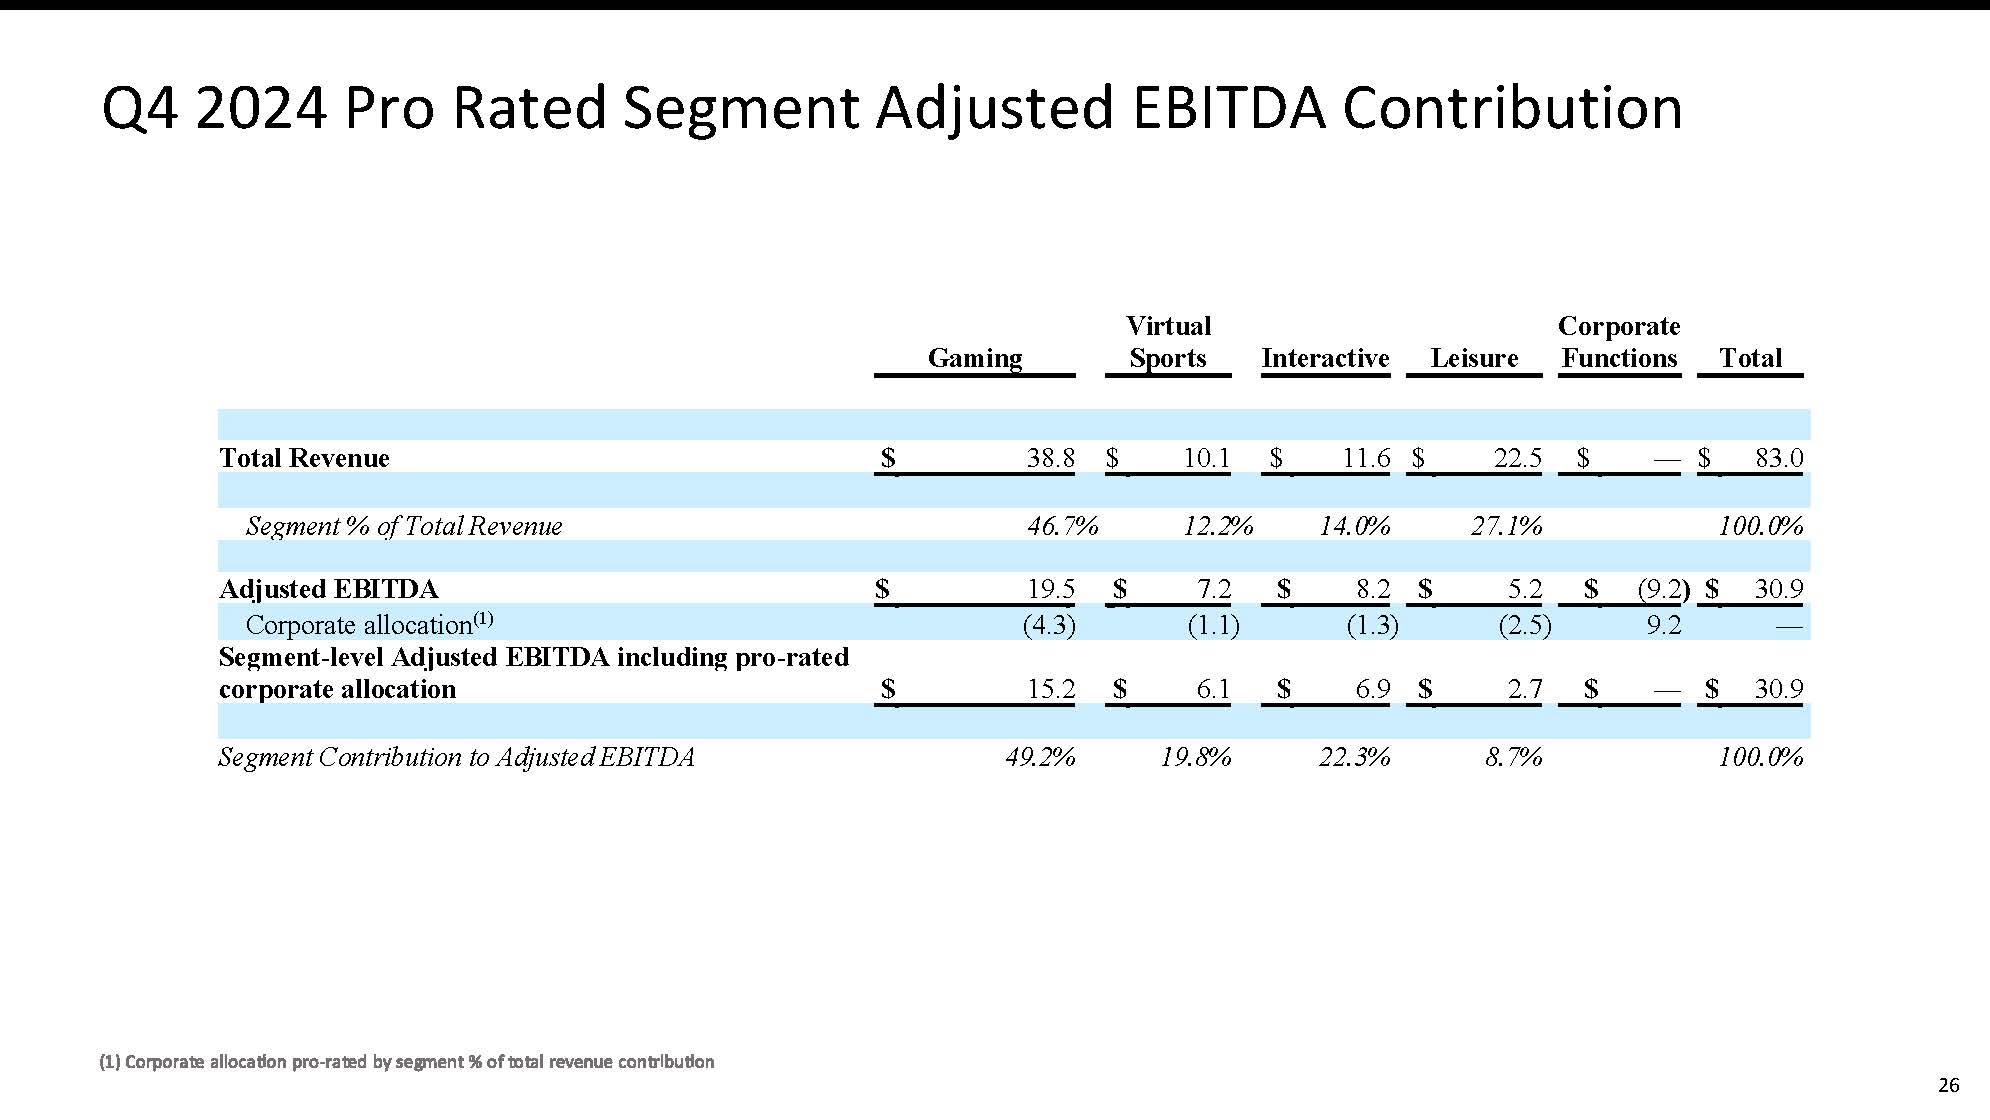
Three Months Ended December 31, 2024
| Gaming |
Virtual Sports |
Interactive | Leisure |
Corporate Functions |
Total | |||||||||||||||||||
| Total Revenue | $ | 38.8 | $ | 10.1 | $ | 11.6 | $ | 22.5 | $ | — | $ | 83.0 | ||||||||||||
| Segment % of Total Revenue | 46.7 | % | 12.2 | % | 14.0 | % | 27.1 | % | 100.0 | % | ||||||||||||||
| Adjusted EBITDA | $ | 19.5 | $ | 7.2 | $ | 8.2 | $ | 5.2 | $ | (9.2 | ) | $ | 30.9 | |||||||||||
| Corporate allocation(1) | (4.3 | ) | (1.1 | ) | (1.3 | ) | (2.5 | ) | 9.2 | — | ||||||||||||||
| Segment-level Adjusted EBITDA including pro-rated corporate allocation | $ | 15.2 | $ | 6.1 | $ | 6.9 | $ | 2.7 | $ | — | $ | 30.9 | ||||||||||||
| Segment Contribution to Adjusted EBITDA | 49.2 | % | 19.8 | % | 22.3 | % | 8.7 | % | 100.0 | % | ||||||||||||||
| (1) | Corporate allocation pro-rated by segment % of total revenue contribution |
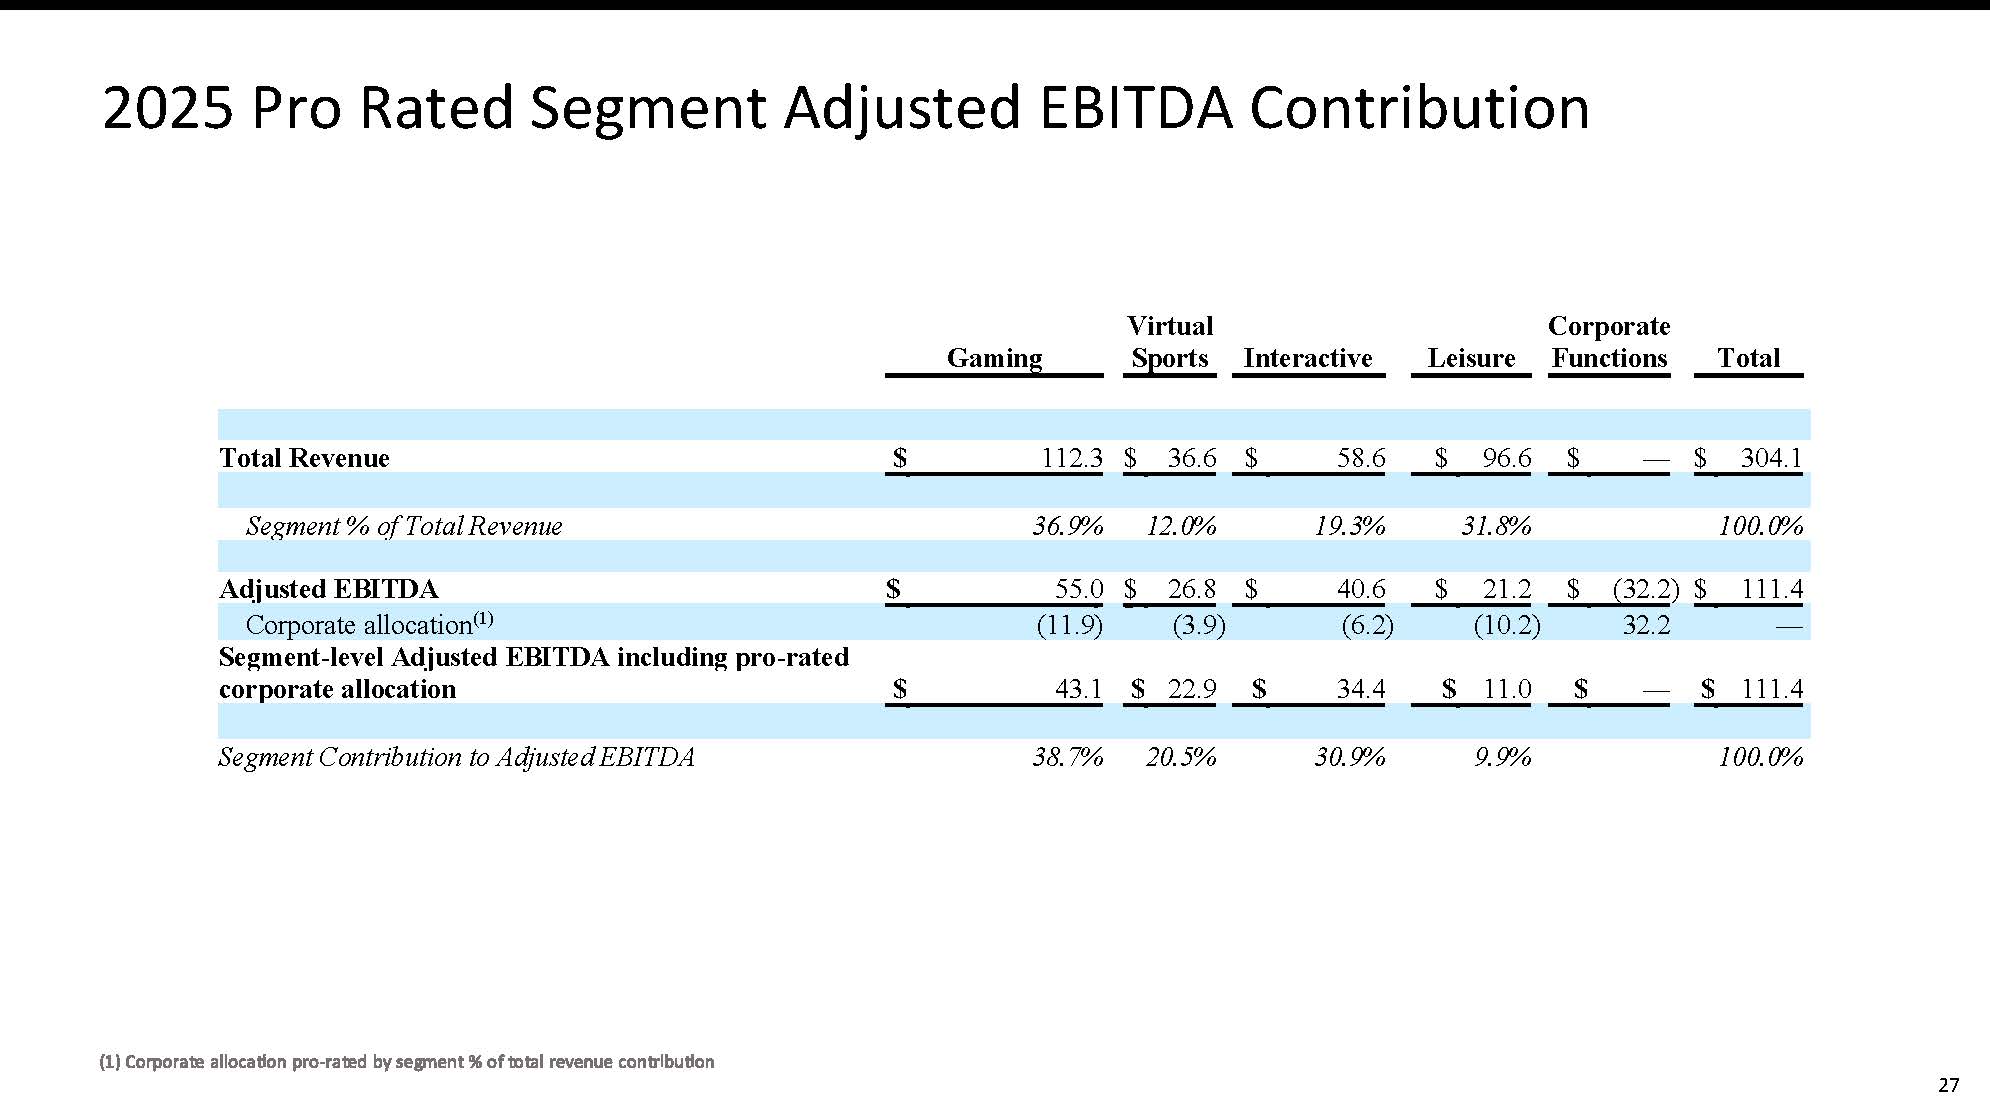
Twelve Months Ended December 31, 2025
| Gaming |
Virtual Sports |
Interactive | Leisure |
Corporate Functions |
Total | |||||||||||||||||||
| Total Revenue | $ | 112.3 | $ | 36.6 | $ | 58.6 | $ | 96.6 | $ | — | $ | 304.1 | ||||||||||||
| Segment % of Total Revenue | 36.9 | % | 12.0 | % | 19.3 | % | 31.8 | % | 100.0 | % | ||||||||||||||
| Adjusted EBITDA | $ | 55.0 | $ | 26.8 | $ | 40.6 | $ | 21.2 | $ | (32.2 | ) | $ | 111.4 | |||||||||||
| Corporate allocation(1) | (11.9 | ) | (3.9 | ) | (6.2 | ) | (10.2 | ) | 32.2 | — | ||||||||||||||
| Segment-level Adjusted EBITDA including pro-rated corporate allocation | $ | 43.1 | $ | 22.9 | $ | 34.4 | $ | 11.0 | $ | — | $ | 111.4 | ||||||||||||
| Segment Contribution to Adjusted EBITDA | 38.7 | % | 20.5 | % | 30.9 | % | 9.9 | % | 100.0 | % | ||||||||||||||
| (1) | Corporate allocation pro-rated by segment % of total revenue contribution |
Twelve Months Ended December 31, 2024
| Gaming |
Virtual Sports |
Interactive | Leisure |
Corporate Functions |
Total | |||||||||||||||||||
| Total Revenue | $ | 110.6 | $ | 45.4 | $ | 39.3 | $ | 101.8 | $ | — | $ | 297.1 | ||||||||||||
| Segment % of Total Revenue | 37.2 | % | 15.3 | % | 13.2 | % | 34.3 | % | 100.0 | % | ||||||||||||||
| Adjusted EBITDA | $ | 45.3 | $ | 36.1 | $ | 25.6 | $ | 23.3 | $ | (30.2 | ) | $ | 100.1 | |||||||||||
| Corporate allocation(1) | (11.3 | ) | (4.6 | ) | (4.0 | ) | (10.3 | ) | 30.2 | — | ||||||||||||||
| Segment-level Adjusted EBITDA including pro-rated corporate allocation | $ | 34.0 | $ | 31.5 | $ | 21.6 | $ | 13.0 | $ | — | $ | 100.1 | ||||||||||||
| Segment Contribution to Adjusted EBITDA | 34.0 | % | 31.5 | % | 21.6 | % | 12.9 | % | 100.0 | % | ||||||||||||||
| (1) | Corporate allocation pro-rated by segment % of total revenue contribution |
Exhibit 99.2