UNITED STATES
SECURITIES AND EXCHANGE COMMISSION
Washington, D.C. 20549
FORM 8-K
CURRENT REPORT
Pursuant to Section 13 OR 15(d) of The Securities Exchange Act of 1934
Date of Report (Date of earliest event reported): August 11, 2025
HARROW, INC.
(Exact name of registrant as specified in its charter)
| Delaware | 001-35814 | 45-0567010 | ||
|
(State or other jurisdiction of incorporation) |
(Commission File Number) |
(IRS Employer Identification No.) |
| 1A Burton Hills Blvd., Suite 200 | ||
| Nashville, Tennessee | 37215 | |
| (Address of principal executive offices) | (Zip Code) |
Registrant’s telephone number, including area code: (615) 733-4730
| Not Applicable | ||
| (Former Name or Former Address, if Changed Since Last Report) |
Securities registered pursuant to Section 12(b) of the Act:
| Title of each class | Trading Symbol(s) | Name on exchange on which registered | ||
| Common Stock, $0.001 par value per share | HROW | The Nasdaq Stock Market LLC |
Check the appropriate box below if the Form 8-K filing is intended to simultaneously satisfy the filing obligation of the registrant under any of the following provisions:
| ☐ | Written communications pursuant to Rule 425 under the Securities Act (17 CFR 230.425) |
| ☐ | Soliciting material pursuant to Rule 14a-12 under the Exchange Act (17 CFR 240.14a-12) |
| ☐ | Pre-commencement communications pursuant to Rule 14d-2(b) under the Exchange Act (17 CFR 240.14d-2(b)) |
| ☐ | Pre-commencement communications pursuant to Rule 13e-4(c) under the Exchange Act (17 CFR 240.13e-4(c)) |
Indicate by check mark whether the registrant is an emerging growth company as defined in Rule 405 of the Securities Act of 1933 or Rule 12b-2 of the Securities Act of 1934: Emerging growth company ☐
If any emerging growth company, indicate by check mark if the registrant has elected not to use the extended transition period for complying with any new or revised financial accounting standards provided pursuant to Section 13(a) of the Exchange Act. ☐
Item 2.02 Results of Operations and Financial Condition.
On November 10, 2025, Harrow, Inc. (the “Company”) issued a press release and a letter to stockholders announcing its financial results for the period ended September 30, 2025, and an update on recent corporate events. The press release and letter to stockholders are being furnished as Exhibits 99.1 and 99.2, respectively, to this Current Report on Form 8-K.
Item 7.01. Regulation FD Disclosure
Attached as Exhibit 99.3 to this Current Report on Form 8-K is a presentation of the Company that may be used by the management of the Company at investor conferences and at meetings describing the Company.
The information furnished under Items 2.02 and 7.01 of this Current Report on Form 8-K, including Exhibits 99.1, 99.2 and 99.3, shall not be deemed to be “filed” for the purposes of Section 18 of the Securities Exchange Act of 1934, as amended (the “Exchange Act”), or otherwise subject to the liabilities of that Section. The information in Items 2.02 and 7.01, including Exhibits 99.1, 99.2 and 99.3, shall not be deemed incorporated by reference into any filing under the Securities Act of 1933, as amended, or the Exchange Act, except to the extent it is specifically incorporated by reference but regardless of any general incorporation language in such filing.
The information furnished under Items 2.02 and 7.01 of this Current Report on Form 8-K, including Exhibits 99.1, 99.2 and 99.3, shall not be deemed to constitute an admission that such information or exhibit is required to be furnished pursuant to Regulation FD or that such information or exhibit contains material information that is not otherwise publicly available. In addition, the Company does not assume any obligation to update such information or exhibit in the future.
Item 9.01. Financial Statements and Exhibits
| (d) | Exhibits | |
| 99.1 | Press Release issued by Harrow, Inc. on November 10, 2025 | |
| 99.2 | Letter to Stockholders by Harrow, Inc. dated November 10, 2025 | |
| 99.3 | Harrow Corporate Presentation dated November 2025 | |
| 104 | Cover Page Interactive Data File (embedded within the Inline XBRL document) |
SIGNATURES
Pursuant to the requirements of the Securities Exchange Act of 1934, the registrant has duly caused this report to be signed on its behalf by the undersigned hereunto duly authorized.
| HARROW, INC. | ||
| Dated: November 10, 2025 | By: | /s/ Andrew R. Boll |
| Name: | Andrew R. Boll | |
| Title: | President & Chief Financial Officer | |
Exhibit 99.1

Harrow Announces Third Quarter 2025 Financial Results
Third-Quarter 2025 and Recent Selected Highlights:
| ● | Total revenues of $71.6 million, a 45% increase over $49.3 million recorded in the prior-year period | |
| ● | GAAP net income of $1.0 million | |
| ● | Adjusted EBITDA of $22.7 million | |
| ● | Cash and cash equivalents of $74.3 million as of September 30, 2025 |
NASHVILLE, Tenn., November 10, 2025 – Harrow (Nasdaq: HROW), a leading provider of ophthalmic disease management solutions in North America, announced results for the third quarter ended September 30, 2025. The Company also posted its third quarter Letter to Stockholders and corporate presentation to the “Investors” section of its website, harrow.com. The Company encourages all Harrow stockholders to review these documents, which provide additional details concerning the historical quarterly period and future expectations for the business.
“The third quarter represented another period of meaningful progress for Harrow. We continued to execute across our portfolio, driving strong performance from VEVYE® and IHEEZO®, while advancing several strategic initiatives that strengthen our foundation for future growth,” said Mark L. Baum, Chief Executive Officer of Harrow. “With the launch of TRIESENCE® into its largest market opportunity, the upcoming rollout of our Harrow Access for All (HAFA) program, the expansion of our commercial leadership team, and new major coverage wins for VEVYE, we are well-positioned for a terrific close to the year and sustained growth for many years to come.
Business Highlights:
| ● | Coverage Expansion for VEVYE |
| ○ | Harrow recently entered into coverage agreements with several leading national payers, including the largest US pharmacy benefit manager of commercial lives. As a result of these coverage wins, VEVYE is expected to be included on multiple new formulary listings with a preferred product status effective January 1, 2026. |
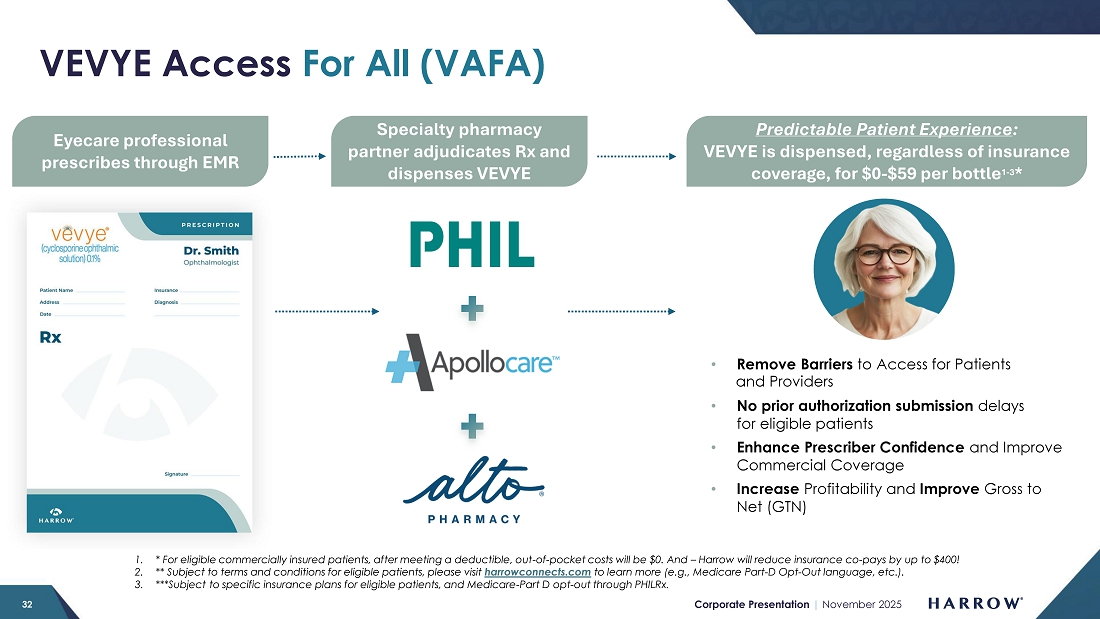
| ● | Expands VEVYE Access For All (VAFA) Program Capacity Through Partnership with Alto Pharmacy Powered by Fuze Health |
| ○ | Harrow has entered into a partnership with Alto Pharmacy Powered by Fuze Health, a full-service, digitally powered pharmacy, marking the addition of Harrow’s third specialty pharmacy partner supporting the VAFA program. This strategic expansion significantly expands its national distribution footprint via Alto’s comprehensive pharmacy network. Alto’s coverage model, ability to communicate in over 250 languages, and retail infrastructure, should enable broader insurance coverage, improve affordability, and expand patient access. |
Harrow Announces Third Quarter 2025 Financial Results
Page 2
November 10, 2025
| ● | Melt Acquisition |
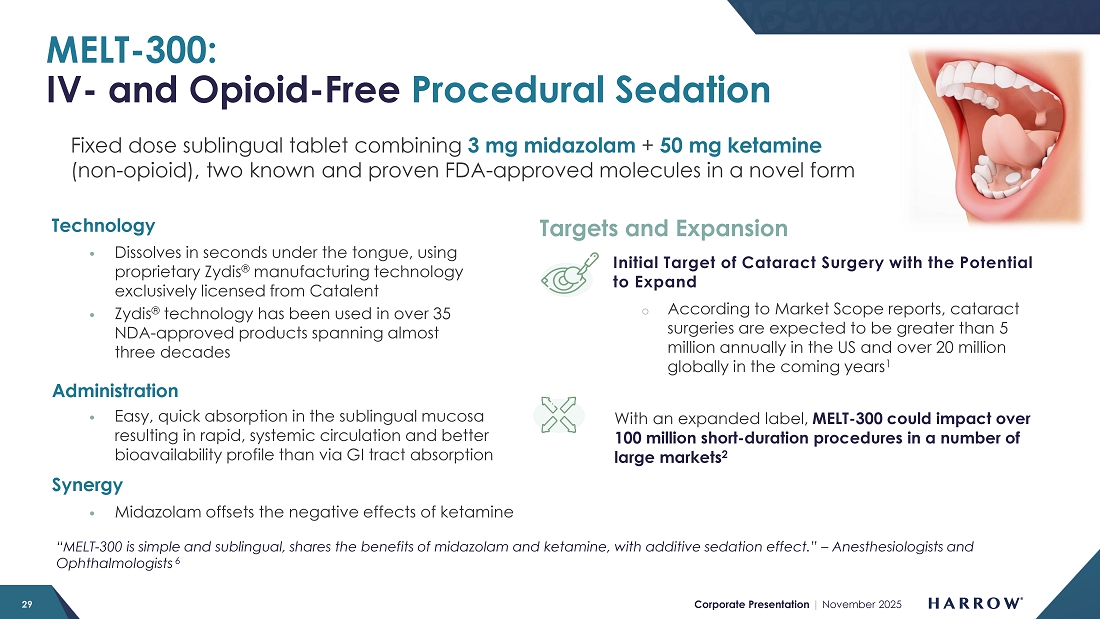
| ○ | In September 2025, Harrow announced that it had entered into an agreement to acquire Melt Pharmaceuticals, Inc., a clinical-stage pharmaceutical company pioneering non-opioid, non-IV therapies for sedation for medical procedures in the hospital, outpatient, and in-office settings. Melt’s lead investigational therapy, MELT-300, is a patented, sublingually delivered formulation of a fixed dose of midazolam (3mg) and ketamine (50mg) designed to provide rapid, predictable sedation and analgesia without the need for intravenous administration. This innovative approach has the potential to transform patient experiences across a wide range of office-based and outpatient procedures and address the healthcare system’s growing demand to reduce exposure to opioids. |
| ● | Harrow Access for All |
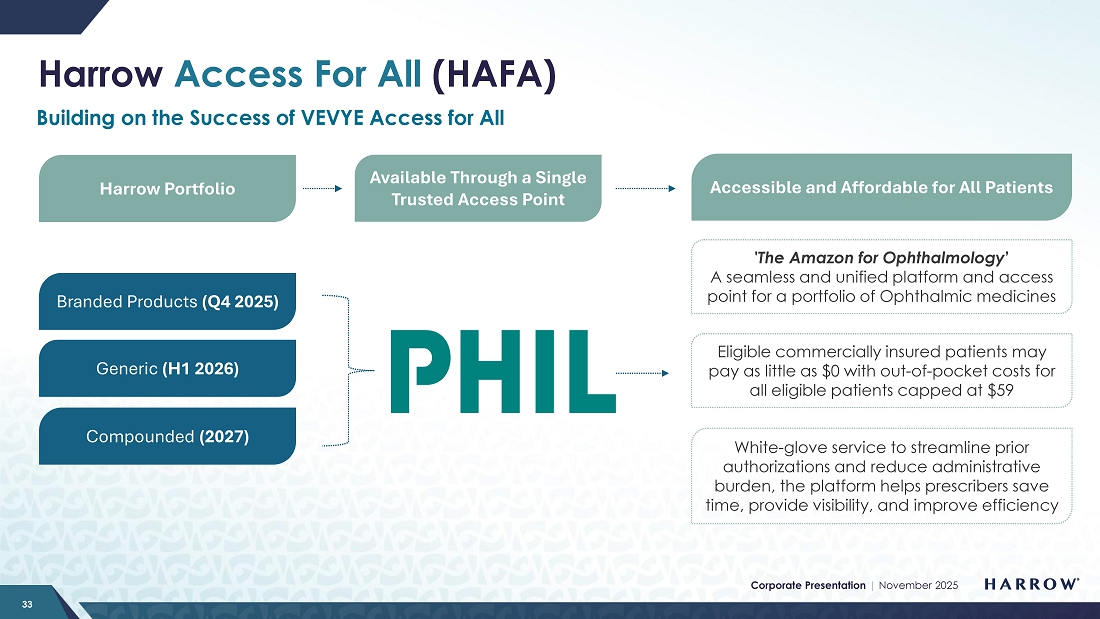
| ○ | In September 2025, Harrow announced the launch of Harrow Access for All (HAFA), expanding Harrow’s commitment to make it easier and more affordable for patients to access Harrow’s full range of branded, generic, and compounded ophthalmic medications. HAFA builds on the success of the VEVYE® Access for All initiative, which launched in March 2025 with a strong reception from both physicians and patients. |
Third Quarter 2025 Financial Results:
|
For the Three Months Ended September 30, |
For the Nine Months Ended September 30, |
|||||||||||||||
| 2025 | 2024 | 2025 | 2024 | |||||||||||||
| Total revenues | $ | 71,638,000 | $ | 49,257,000 | $ | 183,211,000 | $ | 132,783,000 | ||||||||
| Gross margin | 75 | % | 76 | % | 73 | % | 74 | % | ||||||||
| Core gross margin(1) | 81 | % | 80 | % | 79 | % | 78 | % | ||||||||
| Net income (loss) | 1,020,000 | (4,220,000 | ) | (11,765,000 | ) | (24,258,000 | ) | |||||||||
| Core net income (loss)(1) | 12,933,000 | (1,619,000 | ) | 8,606,000 | (13,455,000 | ) | ||||||||||
| Adjusted EBITDA(1) | 22,732,000 | 8,808,000 | 37,753,000 | 17,838,000 | ||||||||||||
| Net income (loss) per share: | ||||||||||||||||
| Basic | 0.03 | (0.12 | ) | (0.32 | ) | (0.68 | ) | |||||||||
| Diluted | 0.03 | (0.12 | ) | (0.32 | ) | (0.68 | ) | |||||||||
| Core net income (loss) per share:(1) | ||||||||||||||||
| Basic | 0.35 | (0.05 | ) | 0.24 | (0.38 | ) | ||||||||||
| Diluted | 0.33 | (0.05 | ) | 0.24 | (0.38 | ) | ||||||||||
| (1) | Core gross margin, core net income (loss), core basic and diluted net income (loss) per share (collectively, “Core Results”), and Adjusted EBITDA are non-GAAP measures. For additional information, including a reconciliation of such Core Results and Adjusted EBITDA to the most directly comparable measures presented in accordance with GAAP, see the explanation of non-GAAP measures and reconciliation tables at the end of this release. |
Conference Call and Webcast
Participants can access the live webcast of Harrow’s presentation on the “Investors” page of Harrow’s website. A replay of the webcast will be available on the Company’s website for one year.
To participate via telephone, please register in advance using this link. Upon registration, all telephone participants will receive a confirmation email with detailed instructions, including a unique dial-in number and PIN, for accessing the call.
| -MORE- |
Harrow Announces Third Quarter 2025 Financial Results
Page 3
November 10, 2025
About Harrow
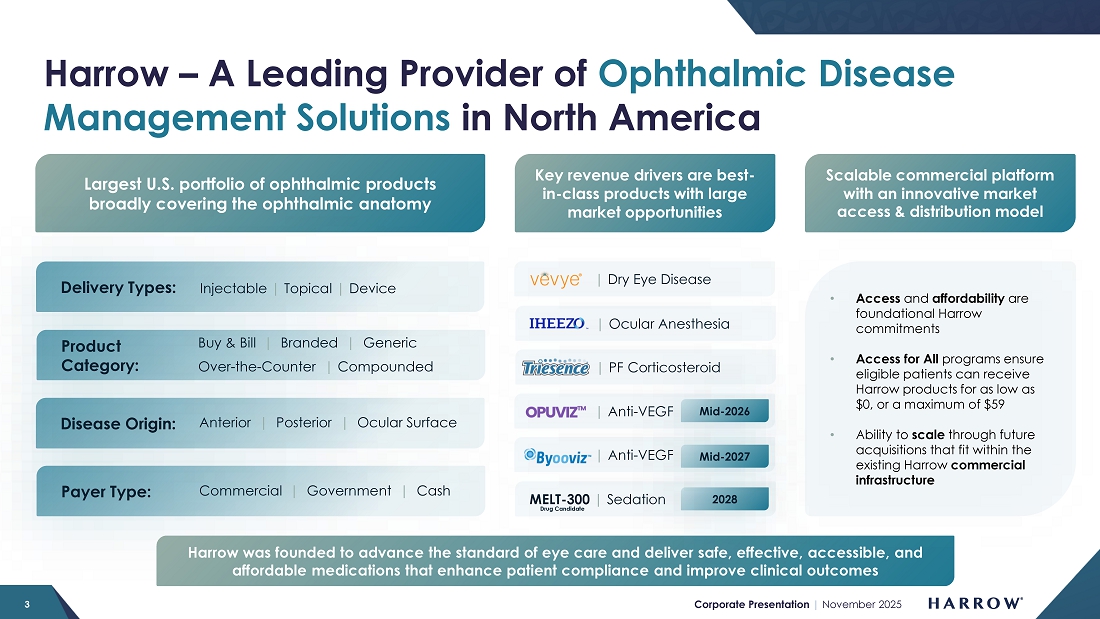
Harrow, Inc. (Nasdaq: HROW) is a leading provider of ophthalmic disease management solutions in North America, offering a comprehensive portfolio of products that address conditions affecting both the front and back of the eye, such as dry eye disease, wet (or neovascular) age-related macular degeneration, cataracts, refractive errors, glaucoma and a range of other ocular surface conditions and retina diseases. Harrow was founded with a commitment to deliver safe, effective, accessible, and affordable medications that enhance patient compliance and improve clinical outcomes. For more information about Harrow, please visit harrow.com.
Forward-Looking Statements
This press release contains “forward-looking statements” within the meaning of the U.S. Private Securities Litigation Reform Act of 1995. Any statements in this release that are not historical facts may be considered such “forward—looking statements.” Forward-looking statements are based on management’s current expectations and are subject to risks and uncertainties which may cause results to differ materially and adversely from the statements contained herein. Some of the potential risks and uncertainties that could cause actual results to differ from those predicted include, among others, risks related to: liquidity or results of operations; our ability to successfully implement our business plan, develop and commercialize our products, product candidates and proprietary formulations in a timely manner or at all, identify and acquire additional products, manage our pharmacy operations, refinance and otherwise service our debt, obtain financing necessary to operate our business, recruit and retain qualified personnel, manage any growth we may experience and successfully realize the benefits of our previous acquisitions and any other acquisitions and collaborative arrangements we may pursue; competition from pharmaceutical companies, outsourcing facilities and pharmacies; general economic and business conditions, including inflation and supply chain challenges; regulatory and legal risks and uncertainties related to our pharmacy operations and the pharmacy and pharmaceutical business in general, including the ongoing communications with the U.S. Food and Drug Administration relating to compliance and quality plans at our outsourcing facility in New Jersey; physician interest in and market acceptance of our current and any future formulations and compounding pharmacies generally. These and additional risks and uncertainties are more fully described in Harrow’s filings with the Securities and Exchange Commission (SEC), including its Annual Report on Form 10-K for the year ended December 31, 2024, subsequent Quarterly Reports on Form 10-Q, and other filings with the SEC. Such documents may be read free of charge on the SEC’s web site at sec.gov. Undue reliance should not be placed on forward-looking- statements, which speak only as of the date they are made. Except as required by law, Harrow undertakes no obligation to update any forward-looking- statements to reflect new information, events, or circumstances after the date they are made, or to reflect the occurrence of unanticipated events.
Contact:
Mike Biega, VP of Investor Relations and Communications
mbiega@harrowinc.com
617-913-8890
| -MORE- |
Harrow Announces Third Quarter 2025 Financial Results
Page 4
November 10, 2025
HARROW, INC.
CONDENSED CONSOLIDATED BALANCE SHEETS
|
September 30, 2025 |
December 31, 2024 |
|||||||
| (unaudited) | ||||||||
| ASSETS | ||||||||
| Cash and cash equivalents | $ | 74,290,000 | $ | 47,247,000 | ||||
| All other current assets | 103,314,000 | 142,404,000 | ||||||
| Total current assets | 177,604,000 | 189,651,000 | ||||||
| All other assets | 185,470,000 | 199,320,000 | ||||||
| TOTAL ASSETS | $ | 363,074,000 | $ | 388,971,000 | ||||
| LIABILITIES AND STOCKHOLDERS’ EQUITY | ||||||||
| Current liabilities | $ | 65,400,000 | $ | 91,343,000 | ||||
| Loans payable, net of unamortized debt discount | 242,874,000 | 219,539,000 | ||||||
| All other liabilities | 8,139,000 | 8,792,000 | ||||||
| TOTAL LIABILITIES | 316,413,000 | 319,674,000 | ||||||
| TOTAL STOCKHOLDERS’ EQUITY | 46,661,000 | 69,297,000 | ||||||
| TOTAL LIABILITIES AND STOCKHOLDERS’ EQUITY | $ | 363,074,000 | $ | 388,971,000 | ||||
HARROW, INC.
UNAUDITED CONDENSED CONSOLIDATED STATEMENTS OF OPERATIONS
|
For the Three Months Ended September 30, |
For the Nine Months Ended September 30, |
|||||||||||||||
| 2025 | 2024 | 2025 | 2024 | |||||||||||||
| Total revenues | $ | 71,638,000 | $ | 49,257,000 | $ | 183,211,000 | $ | 132,783,000 | ||||||||
| Cost of sales | 17,712,000 | 12,018,000 | 49,466,000 | 35,110,000 | ||||||||||||
| Gross profit | 53,926,000 | 37,239,000 | 133,745,000 | 97,673,000 | ||||||||||||
| Selling, general and administrative | 35,856,000 | 33,645,000 | 109,604,000 | 94,275,000 | ||||||||||||
| Research and development | 3,323,000 | 2,273,000 | 9,217,000 | 7,475,000 | ||||||||||||
| Total operating expenses | 39,179,000 | 35,918,000 | 118,821,000 | 101,750,000 | ||||||||||||
| Income (loss) from operations | 14,747,000 | 1,321,000 | 14,924,000 | (4,077,000 | ) | |||||||||||
| Total other expense, net | (13,727,000 | ) | (5,521,000 | ) | (26,689,000 | ) | (19,506,000 | ) | ||||||||
| Income tax expense | - | 20,000 | - | 675,000 | ||||||||||||
| Net income (loss) | $ | 1,020,000 | $ | (4,220,000 | ) | $ | (11,765,000 | ) | $ | (24,258,000 | ) | |||||
| Net income (loss) per share: | ||||||||||||||||
| Basic | $ | 0.03 | $ | (0.12 | ) | $ | (0.32 | ) | $ | (0.68 | ) | |||||
| Diluted | $ | 0.03 | $ | (0.12 | ) | $ | (0.32 | ) | $ | (0.68 | ) | |||||
HARROW, INC.
UNAUDITED CONDENSED CONSOLIDATED STATEMENTS OF CASH FLOWS
| For the Nine Months Ended September 30, | ||||||||
| 2025 | 2024 | |||||||
| Net cash provided by (used in): | ||||||||
| Operating activities | $ | 35,453,000 | $ | (4,423,000 | ) | |||
| Investing activities | (730,000 | ) | 4,396,000 | |||||
| Financing activities | (7,680,000 | ) | (1,457,000 | |||||
| Net change in cash and cash equivalents | 27,043,000 | (1,484,000 | ) | |||||
| Cash and cash equivalents at beginning of the period | 47,247,000 | 74,085,000 | ||||||
| Cash and cash equivalents at end of the period | $ | 74,290,000 | $ | 72,601,000 | ||||
| -MORE- |
Harrow Announces Third Quarter 2025 Financial Results
Page 5
November 10, 2025
Non-GAAP Financial Measures
In addition to the Company’s results of operations determined in accordance with U.S. generally accepted accounting principles (GAAP), which are presented and discussed above, management also utilizes Adjusted EBITDA and Core Results, unaudited financial measures that are not calculated in accordance with GAAP, to evaluate the Company’s financial results and performance and to plan and forecast future periods. Adjusted EBITDA and Core Results are considered “non-GAAP” financial measures within the meaning of Regulation G promulgated by the SEC. Management believes that these non-GAAP financial measures reflect an additional way of viewing aspects of the Company’s operations that, when viewed with GAAP results, provide a more complete understanding of the Company’s results of operations and the factors and trends affecting its business. Management believes Adjusted EBITDA and Core Results provide meaningful supplemental information regarding the Company’s performance because (i) they allow for greater transparency with respect to key metrics used by management in its financial and operational decision-making; (ii) they exclude the impact of non-cash or, when specified, non-recurring items that are not directly attributable to the Company’s core operating performance and that may obscure trends in the Company’s core operating performance; and (iii) they are used by institutional investors and the analyst community to help analyze the Company’s results. However, Adjusted EBITDA, Core Results, and any other non-GAAP financial measures should be considered as a supplement to, and not as a substitute for, or superior to, the corresponding measures calculated in accordance with GAAP. Further, non-GAAP financial measures used by the Company and the way they are calculated may differ from the non-GAAP financial measures or the calculations of the same non-GAAP financial measures used by other companies, including the Company’s competitors.
Adjusted EBITDA
The Company defines Adjusted EBITDA as net income (loss), excluding the effects of stock-based compensation and expenses, interest, taxes, depreciation, amortization, investment loss, net, and, if any and when specified, other non-recurring income or expense items. Management believes that the most directly comparable GAAP financial measure to Adjusted EBITDA is net income (loss). Adjusted EBITDA has limitations and should not be considered as an alternative to gross profit or net income (loss) as a measure of operating performance or to net cash provided by (used in) operating, investing, or financing activities as a measure of ability to meet cash needs.
The following is a reconciliation of Adjusted EBITDA, a non-GAAP measure, to the most comparable GAAP measure, net income (loss), for the three months and nine months ended September 30, 2025 and for the same period in 2024:
HARROW, INC.
RECONCILIATION OF NET LOSS TO ADJUSTED EBITDA
|
For the Three Months Ended September 30, |
For the Nine Months Ended September 30, |
|||||||||||||||
| 2025 | 2024 | 2025 | 2024 | |||||||||||||
| GAAP net income (loss) | $ | 1,020,000 | $ | (4,220,000 | ) | $ | (11,765,000 | ) | $ | (24,258,000 | ) | |||||
| Stock-based compensation and expenses | 3,271,000 | 4,385,000 | 8,702,000 | 12,825,000 | ||||||||||||
| Interest expense, net | 6,038,000 | 5,525,000 | 18,994,000 | 16,411,000 | ||||||||||||
| Income tax expense | - | 20,000 | - | 675,000 | ||||||||||||
| Depreciation | 490,000 | 497,000 | 1,451,000 | 1,382,000 | ||||||||||||
| Amortization of intangible assets | 4,224,000 | 2,605,000 | 12,676,000 | 7,708,000 | ||||||||||||
| Investment loss, net | - | - | - | 3,171,000 | ||||||||||||
| Other expense (income), net | 7,689,000 | (4,000 | ) | 7,695,000 | (76,000 | ) | ||||||||||
| Adjusted EBITDA | $ | 22,732,000 | $ | 8,808,000 | $ | 37,753,000 | $ | 17,838,000 | ||||||||
| -MORE- |
Harrow Announces Third Quarter 2025 Financial Results
Page 6
November 10, 2025
Core Results
Harrow Core Results, including core gross margin, core net income (loss), and core basic and diluted income (loss) per share exclude (1) all amortization and impairment charges of intangible assets, excluding software development costs, (2) net gains and losses on investments and equity securities, including equity method gains and losses and equity valued at fair value through profit and loss (FVPL), and preferred stock dividends, and (3) gains/losses on forgiveness of debt. In certain periods, Core Results may also exclude fair value adjustments of financial assets in the form of options to acquire a company carried at FVPL, obligations related to product recalls, certain acquisition-related items, restructuring charges/releases and associated items, related legal items, gains/losses on early extinguishment of debt or debt modifications, impairments of property, plant and equipment and software, as well as income and expense items that management deems exceptional and that are or are expected to accumulate within the year to be over a $100,000 threshold.
The following is a reconciliation of Core Results, non-GAAP measures, to the most comparable GAAP measures for the three months and nine months ended September 30, 2025 and 2024:
| For the Three Months Ended September 30, 2025 | ||||||||||||||||||||
| GAAP Results |
Amortization Intangible Assets |
Investment Gains (Losses) |
Other Items |
Core Results |
||||||||||||||||
| Gross profit | $ | 53,926,000 | $ | 3,780,000 | $ | - | $ | - | $ | 57,706,000 | ||||||||||
| Gross margin | 75 | % | 81 | % | ||||||||||||||||
| Operating income | 14,747,000 | 4,224,000 | - | - | 18,971,000 | |||||||||||||||
| Income before taxes | 1,020,000 | 4,224,000 | - | 7,689,000 | 12,933,000 | |||||||||||||||
| Taxes | - | - | - | - | - | |||||||||||||||
| Net income | 1,020,000 | 4,224,000 | - | 7,689,000 | 12,933,000 | |||||||||||||||
| Income per share ($)(1): | ||||||||||||||||||||
| Basic | 0.13 | 0.35 | ||||||||||||||||||
| Diluted | 0.13 | 0.33 | ||||||||||||||||||
| Weighted average number of shares of common stock outstanding: |
||||||||||||||||||||
| Basic | 37,145,440 | 37,145,440 | ||||||||||||||||||
| Diluted | 38,875,005 | 38,875,005 | ||||||||||||||||||
| For the Nine Months Ended September 30, 2025 | ||||||||||||||||||||
|
GAAP Results |
Amortization of Certain Intangible Assets |
Investment Gains (Losses) |
Other Items |
Core Results |
||||||||||||||||
| Gross profit | $ | 133,745,000 | $ | 11,340,000 | $ | - | $ | - | $ | 145,085,000 | ||||||||||
| Gross margin | 73 | % | 79 | % | ||||||||||||||||
| Operating income | 14,924,000 | 12,676,000 | - | - | 27,600,000 | |||||||||||||||
| Loss before taxes | (11,765,000 | ) | 12,676,000 | 7,695,000 | 8,606,000 | |||||||||||||||
| Taxes | - | - | - | - | - | |||||||||||||||
| Net loss | (11,765,000 | ) | 12,676,000 | - | 7,695,000 | 8,606,000 | ||||||||||||||
| Basic and diluted loss per share ($)(1) |
(0.32 | ) | (0.24 | ) | ||||||||||||||||
| Weighted average number of shares of common stock outstanding, basic and diluted |
36,588,163 | 36,588,163 | ||||||||||||||||||
| -MORE- |
Harrow Announces Second Quarter 2025 Financial Results
Page 7
August 11, 2025
| For the Three Months Ended September 30, 2024 | ||||||||||||||||||||
|
GAAP Results |
Amortization of Certain Intangible Assets |
Investment Gains (Losses) |
Other Items |
Core Results |
||||||||||||||||
| Gross profit | $ | 37,239,000 | $ | 2,191,000 | $ | - | $ | - | $ | 39,430,000 | ||||||||||
| Gross margin | 76 | % | 80 | % | ||||||||||||||||
| Operating income | 1,321,000 | 2,605,000 | - | - | 3,926,000 | |||||||||||||||
| (Loss) income before taxes | (4,200,000 | ) | 2,605,000 | - | (4,000 | ) | (1,599,000 | ) | ||||||||||||
| Taxes | (20,000 | ) | - | - | - | (20,000 | ) | |||||||||||||
| Net (loss) income | (4,220,000 | ) | 2,605,000 | - | (4,000 | ) | (1,619,000 | ) | ||||||||||||
| Basic and diluted loss per share ($)(1) | (0.12 | ) | (0.05 | ) | ||||||||||||||||
| Weighted average number of shares of common stock outstanding, basic and diluted | 35,702,200 | 35,702,200 | ||||||||||||||||||
| For the Nine Months Ended September 30, 2024 | ||||||||||||||||||||
|
GAAP Results |
Amortization Intangible Assets |
Investment Gains (Losses) |
Other Items |
Core Results |
||||||||||||||||
| Gross profit | $ | 97,673,000 | $ | 6,471,000 | $ | - | $ | - | $ | 104,144,000 | ||||||||||
| Gross margin | 74 | % | 78 | % | ||||||||||||||||
| Operating loss | (4,077,000 | ) | 7,708,000 | - | - | 3,631,000 | ||||||||||||||
| (Loss) income before taxes | (23,583,000 | ) | 7,708,000 | 3,171,000 | (76,000 | ) | (12,780,000 | ) | ||||||||||||
| Taxes | (675,000 | ) | - | - | - | (675,000 | ) | |||||||||||||
| Net (loss) income | (24,258,000 | ) | 7,708,000 | 3,171,000 | (76,000 | ) | (13,455,000 | ) | ||||||||||||
| Basic and diluted loss per share ($)(1) | (0.68 | ) | (0.38 | ) | ||||||||||||||||
| Weighted average number of shares of common stock outstanding, basic and diluted | 35,597,409 | 35,597,409 | ||||||||||||||||||
| (1) | Core basic and diluted loss per share is calculated using the weighted-average number of shares of common stock outstanding during the period. Core basic and diluted loss per share also contemplates dilutive shares associated with equity based awards as described in Note 2 and elsewhere in the Consolidated Financial Statements included in the Company’s Quarterly Report on Form 10-Q for the quarter ended June 30, 2025. |
| -END- |
Exhibit 99.2
25th Quarterly Letter to Stockholders
November 10, 2025
Dear Harrow Stockholders:
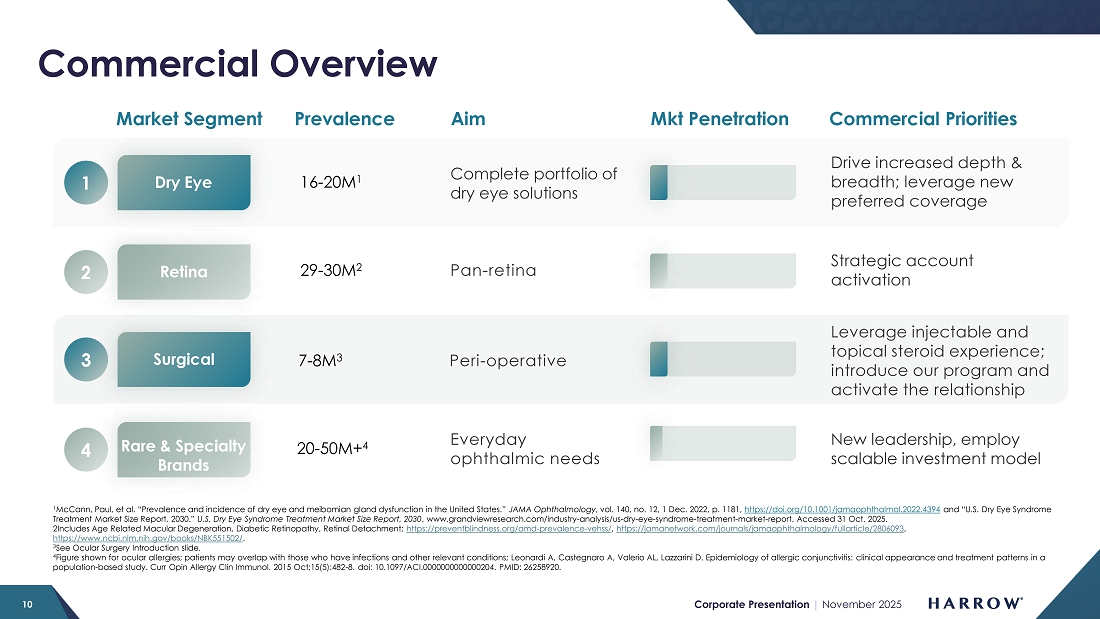
During the third quarter of 2025, Harrow continued to emerge as a leader in providing ophthalmic disease management solutions in North America. We’re making progress, but much work remains to be done as we advance the standard of care in key markets such as dry eye disease (DED) and seek to improve clinical outcomes and patient experiences in ophthalmic surgery and other office-based ophthalmic procedures. We remain grateful for the support of our stockholders as we ensure every patient in need has access to our products, an ideal that remains a motivating force for every member of the Harrow Family.
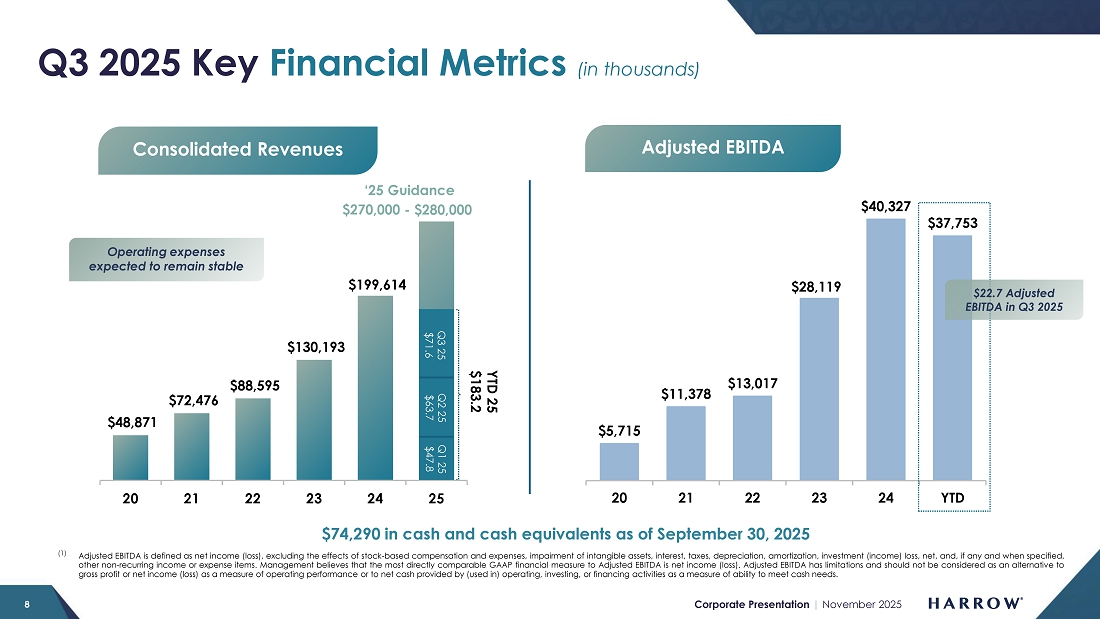
Today, we reported record third quarter 2025 revenues of $71.6 million, a 45% increase over the prior year’s third quarter revenues of $49.3 million, and a sequential increase of 12% from the second quarter 2025 revenues. In addition, during the third quarter of 2025, we continued to demonstrate the operating leverage in our business, reporting $1.0 million of net income and $22.7 million of Adjusted EBITDA (a non-GAAP measure1).
While it is our responsibility to maximize the impact of every one of our products within our platform, I have been candid that, from period to period, we expect some areas of our business will overperform, while others will underperform. Seasonality also affects revenues for certain products from quarter to quarter. The third quarter is a period of seasonality for surgical and in-office procedural products. That said, I am encouraged by the continued strong momentum we’re seeing with VEVYE® and IHEEZO®. Both products are on track for a record year, performing above expectations and steadily gaining market share. On the other hand, TRIESENCE® and our Rare & Specialty Products (RSP) portfolio have not met my expectations this year — including in the third quarter.
It’s way too early to despair about TRIESENCE. There are facts on the ground that I see, especially recently, which support my ongoing conviction that this important product, in due course, will meet my high expectations.
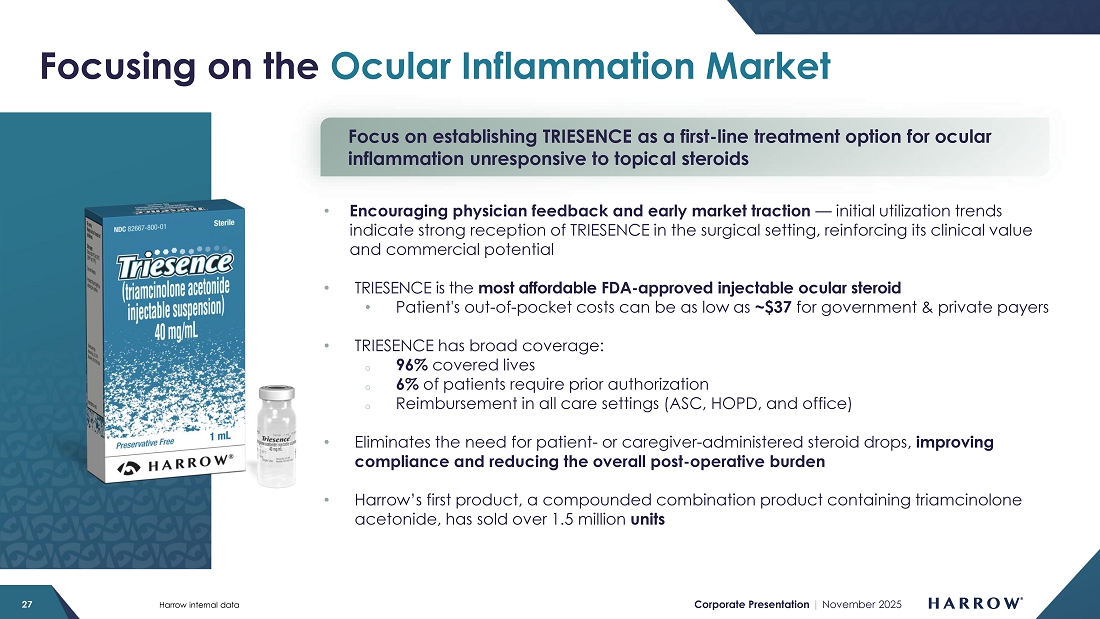
On October 1, 2025, we significantly lowered the price of TRIESENCE and launched it into its largest market opportunity — ocular inflammation. Early commercial indicators are positive, including outstanding clinical outcomes, strong coverage, low prior authorization rates, and lowest-in-class patient out-of-pocket costs.
At this point in my tenure at Harrow, I have been involved in many ophthalmic surgical product launches, which gives me insight into when we are on the right track and when we will need to navigate rough waters. A few weeks back, at the American Academy of Ophthalmology (AAO) meeting in Orlando, I gave a talk on TRIESENCE to the Outpatient Ophthalmic Surgery Society (OOSS). From the feedback we received at OOSS and initial orders coming from physician-owned ambulatory surgery centers (ASCs) and large private equity owned ophthalmic groups, I strongly believe we are on the “right track” with TRIESENCE.
1 A reconciliation of all non-GAAP measures can be found starting on page 12 of this letter.
I am also not shedding any tears over the recent performance of our Rare & Specialty Product portfolio. Harrow stockholders should expect things to turn around, as the need for and interest in these products is far from waning. I take responsibility for the fact that we have not allocated the right resources to this part of our business, and I recognize that over the past few quarters, we have not met the mark. I, too, am tired of excuses, and we are taking action. With the upcoming launch of Harrow Access for All (HAFA) this quarter and the appointment of new, dedicated RSP leadership, we anticipate a turnaround in the RSP portfolio, positioning us well for growth in both areas starting in Q4 and continuing into 2026 and beyond.
The third quarter also marked the introduction of several initiatives that I believe establish a stronger foundation for our business and set the stage for sustained long-term value creation:
| ● | Commercial Leadership: Throughout the second and third quarters, we have made several key commercial hires that have strengthened our leadership and enhanced our ability to execute. These new leaders bring deep industry expertise and a proven track record in driving growth. With these additions, the Harrow commercial leadership team is positioned to support the growth of all aspects of our portfolio and help our respective teams execute effectively. |
| ○ | Our recent hires include Patrick Sullivan, Head of Commercial; Vince Mair, Senior Vice President, Commercial Operations; Chad Brines, Vice President, Surgical Portfolio; and, most recently, Tom Curatolo, Vice President, Rare & Specialty Portfolio. We have also made National Sales Director hires and anticipate enhancing our marketing capabilities by the end of the year. Collectively, this team will play a critical role in advancing our commercial strategy and accelerating revenue growth across all key product lines in 2026 and beyond. |
| ● | Harrow Access For All: Building on the success of our VEVYE Access For All (VAFA) program, we are launching Harrow Access for All this quarter, expanding our proven, patient-centric access model across our entire portfolio of medications. Designed to remove barriers to access and streamline the patient and prescriber experience, HAFA will leverage the same efficient framework that drove a rapid increase in prescriptions and strong per-script profitability for VEVYE under VAFA. I expect this initiative will deliver similar results, particularly for the RSP portfolio, driving volume growth and profitability while strengthening our competitive position and supporting our long-term goal of sustained revenue growth and shareholder value creation. |
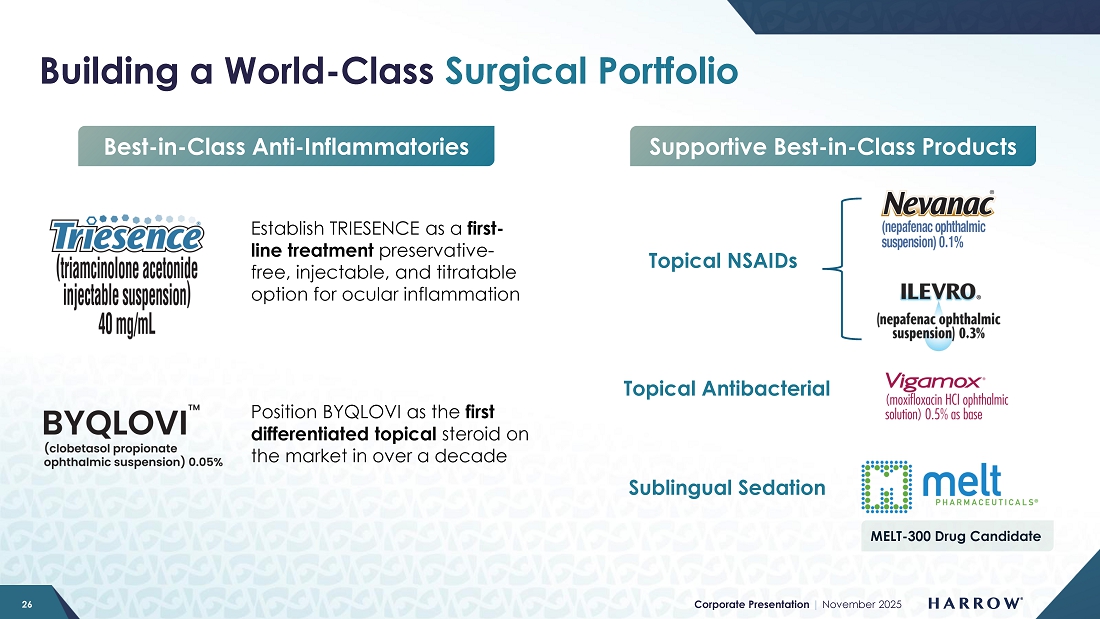
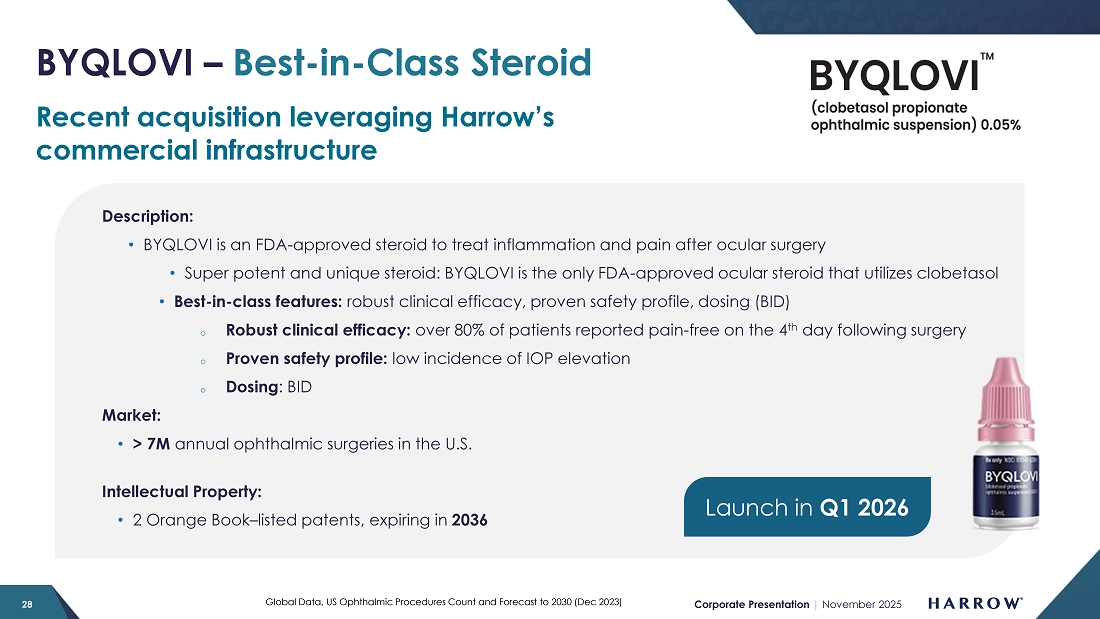
| ● | Surgical Portfolio: I’m excited about our expanding Surgical Portfolio. With the launch of TRIESENCE in ocular inflammation, the upcoming BYQLOVI™ launch in early 2026, and an upcoming launch of a direct-to-medical-doctor (DTMD) program for customers preferring branded topical eyedrops, we’re building a differentiated portfolio of solutions, with multiple points of engagement, that leverages the breadth of our product line, serving the full surgical continuum, and further cementing Harrow as a trusted partner to ophthalmic surgeons. |
| ● | MELT Acquisition: The pending acquisition of MELT Pharmaceuticals and its lead candidate, MELT-300, represents a transformational long-term growth opportunity for Harrow. MELT-300, a non-opioid, non-IV drug candidate for procedural sedation, would help fulfill our vision for ophthalmic surgery: no opioids, IVs, or eyedrops. If FDA-approved, MELT-300 has the potential to redefine patient care by offering a safer, more efficient, and more convenient alternative to current IV and opioid-based sedation protocols. |
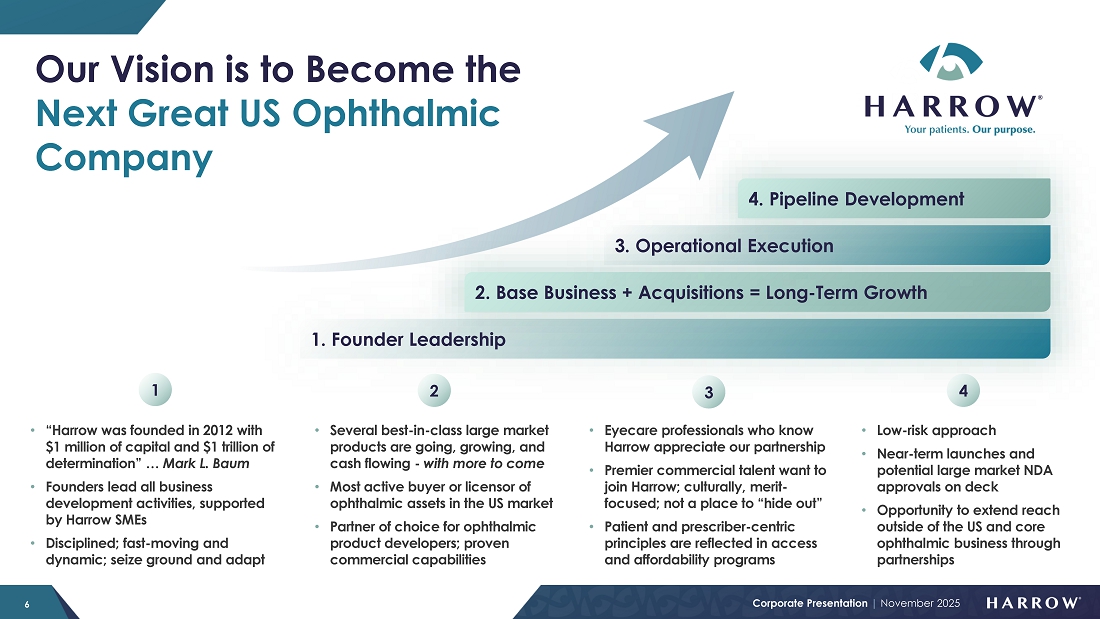
As I shared during our Investor & Analyst Day in September, our vision is to make Harrow the next great U.S. ophthalmic company. Everything we have accomplished thus far in 2025 — particularly the progress made in the third quarter — has strengthened our foundation and positioned Harrow for sustained growth and value creation in the years ahead. With the right strategy, leadership, allocation of resources, and executional discipline in place, I am more confident than ever in our operational trajectory and ability to achieve the promise of our vision.
Capital Structure: Hitting all Three Objectives
In September, as promised, we successfully completed a refinancing that meaningfully strengthens our balance sheet and positions us for our next phase of growth. By refinancing on more favorable terms, we significantly reduced our cost of capital, lowering annual interest expenses and improving cash flow, while extending our debt maturities to enhance financial stability.
This transaction achieved all three of our previously stated objectives:
| ● | Lower cost of capital – reducing interest expense by approximately $3 million per year. | |
| ● | Greater financial flexibility – extending maturities and reducing near-term obligations. | |
| ● | Enhanced ability to pursue growth – increased liquidity to support business development opportunities. |
Between our new revolving credit facility and the incremental cash proceeds from our refinancing, we added $50 million in new liquidity. Looking ahead, we remain disciplined in managing leverage. Our goal is to operate with gross leverage of under 3x and net leverage of under 2x, and we expect to achieve these levels in the near term as we execute our growth plans.
Taken together, these steps improve our capital efficiency, reduce financial risk, and ensure we are well-positioned to reinvest in growth and pursue attractive business development opportunities.
I must add that I am encouraged to see our bonds trading above par, reflecting the market’s confidence in our financial strength and our ability to successfully execute our growth strategy.
VEVYE: Double-Digit National Market Share and Growing; New Coverage Wins; Sales Expansion
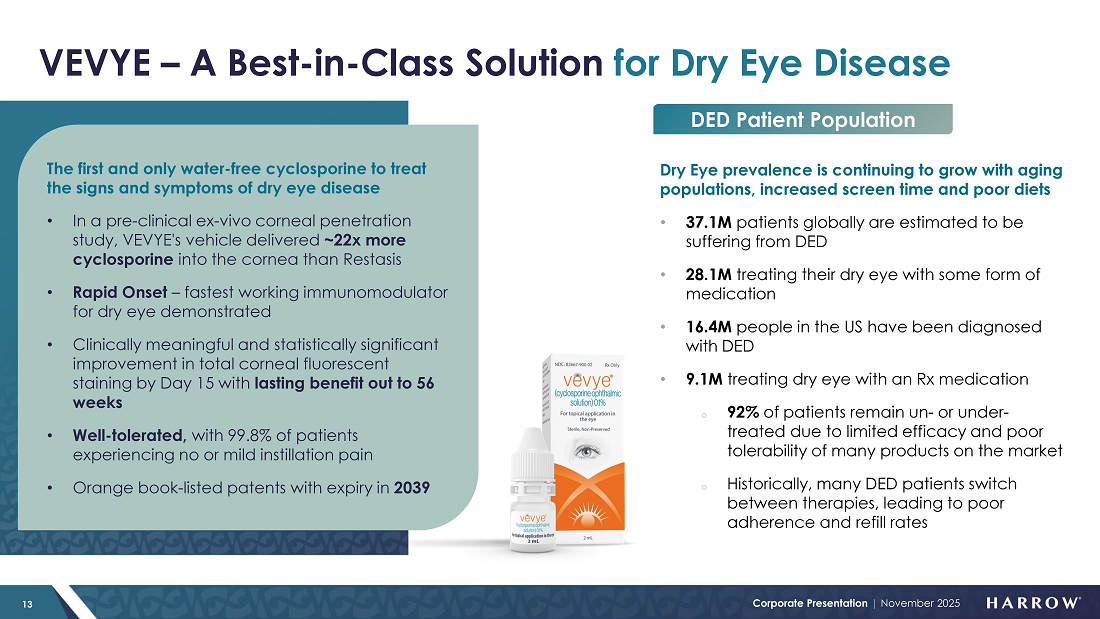
Our flagship dry eye therapy, VEVYE, continued to build momentum in the third quarter of 2025, capturing additional market share and reinforcing its growing reputation as a best-in-class treatment for dry eye disease. This performance reflects VEVYE’s compelling clinical profile, strong patient outcomes, and the success of our innovative access model, which continues to make VEVYE more affordable and accessible.
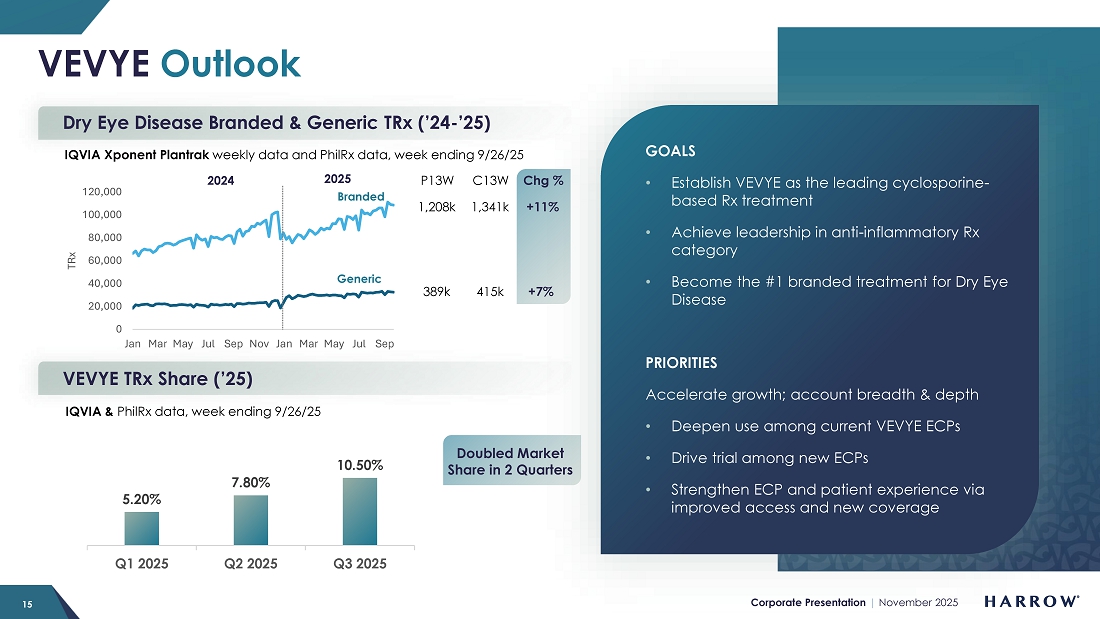
Our commercial goals for VEVYE are, first, to make VEVYE the leading cyclosporine-based DED prescription product in the U.S. market. Then, we believe VEVYE can become the number one anti-inflammatory prescription product in the U.S. And finally, we believe VEVYE can become the leading DED prescription product in the U.S. market.
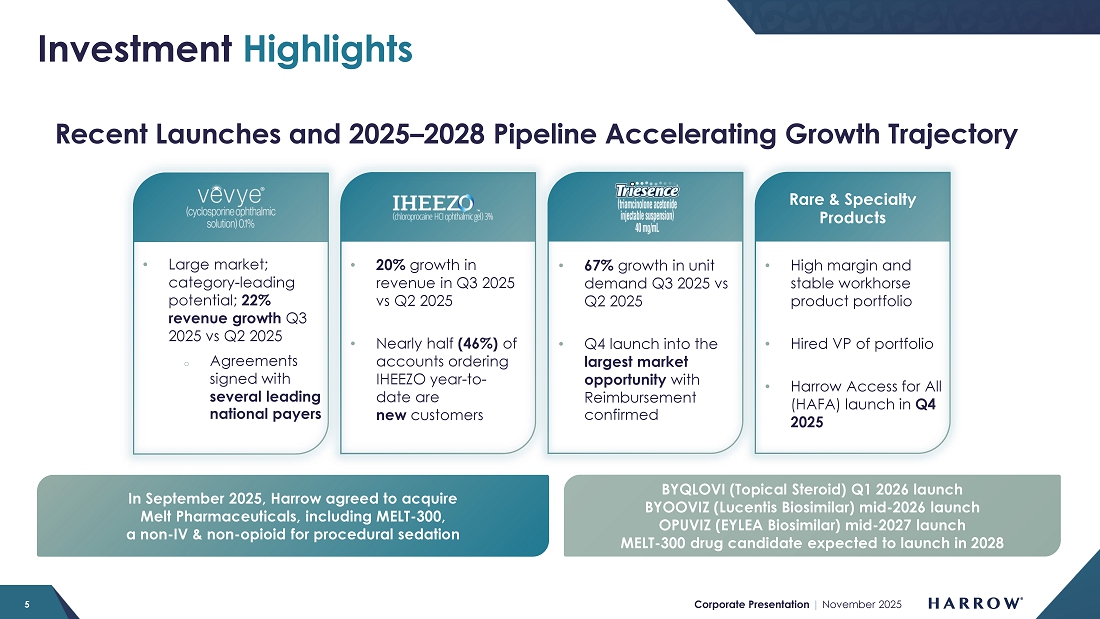
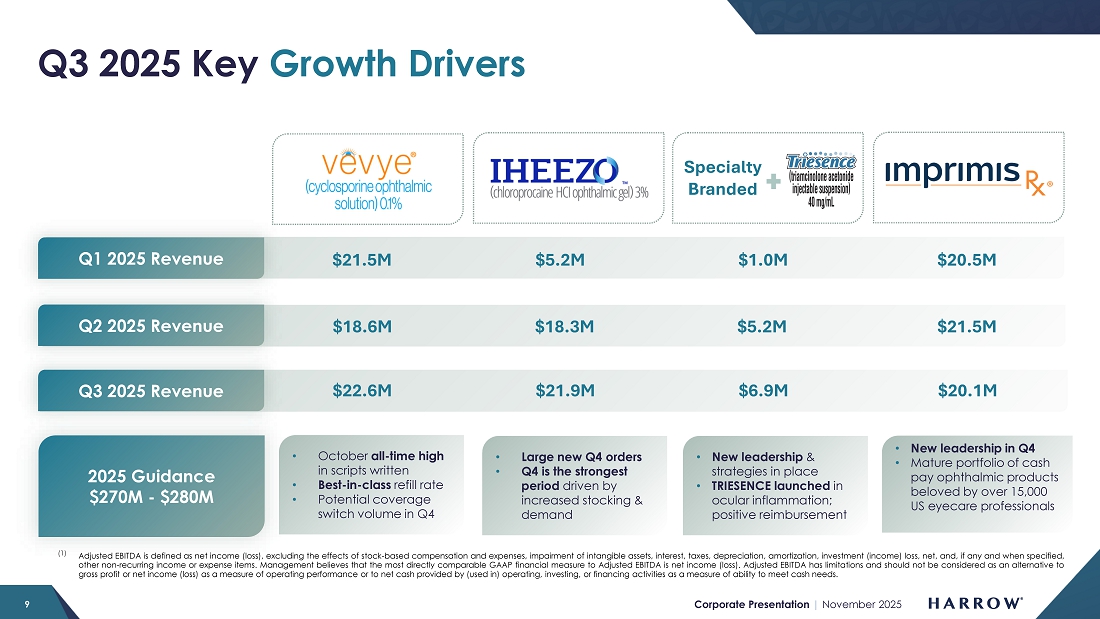
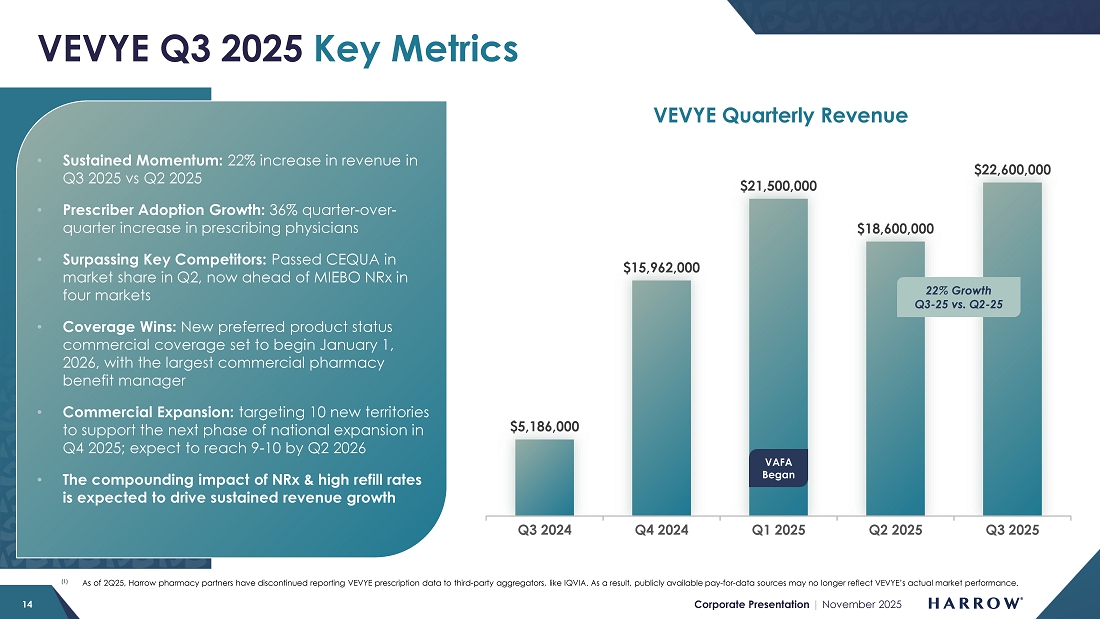
Despite a conservative launch and investment in our sales force, VEVYE’s momentum is growing. VEVYE revenue increased 22% quarter-over-quarter to $22.6 million in the third quarter, reflecting strong and sustained demand for the product. Based on IQVIA and PhilRx data, VEVYE achieved a 10.5% share of the national dry eye disease market by the end of the quarter, representing a 2.7% quarter-over-quarter gain, marking steady progress toward our goal of leading the cyclosporine category in dry eye disease. VEVYE’s market share has doubled in two quarters, and we expect that trend of market share growth to continue.
Our VEVYE Access For All initiative is delivering strong and measurable results. The program is reducing barriers to patient access, expanding access, and driving consistent growth in demand. As a direct result of VAFA, supported by both robust market demand and compelling clinical outcomes that patients are experiencing with VEVYE, we are now seeing steady improvements in coverage across major payers.
Of importance to our stockholders and VEVYE patients alike are recently signed agreements with several leading national payers. Beginning in January 2026, VEVYE will be listed on multiple new formularies with a preferred product status. I am proud to announce that VEVYE was recently chosen by the largest US pharmacy benefit manager of commercial lives, as one of two preferred products. These key coverage wins will further strengthen our commercial position, enhance patient access, and solidify VEVYE’s role as a leading therapy in the dry eye disease market.
In the third quarter, our specialty pharmacy partner, PhilRx, served as the primary specialty pharmacy for VEVYE. In early Q4, Apollo Care officially came online, and Alto Rx, our third specialty pharmacy partner, is expected to follow later in the fourth quarter. I expect the additions of Apollo Care and Alto Rx will further enhance patient access and increase the proportion of patients receiving insurance coverage.
VEVYE’s net price per unit (NPP) remains within our modeled range. While there was a modest sequential decline, based on our internal modeling, we do expect NPP to firm in the near term. With expanded coverage taking effect on January 1, 2026, and both Apollo Care and Alto coming online in the fourth quarter, we anticipate a higher proportion of patients accessing and receiving insurance coverage.
For 2026, we are excited about the leverage we expect (1) as VEVYE prescriptions continue to grow, and (2) as current cash-paying patients take advantage of VEVYE’s expanded coverage in their plans. The combination of NRx/TRx growth, improved coverage, and a lower percentage of cash pay prescriptions makes 2026 particularly exciting for VEVYE.
I am also pleased that the investments we made in the VEVYE supply chain are bearing fruit. We are now comfortable with our current safety stock levels and ability to ensure product availability to meet rising demand. With increased manufacturing volumes scheduled to come online in 2026, we’ve initially targeted the opening of 10 new VEVYE territories and plan to invest further in VEVYE’s commercial infrastructure to fuel the next phase of expansion and the sustained growth we expect through the remainder of the decade. We expect to open more territories during the first half of 2026, focusing on market clusters served by the new plans that will cover VEVYE.
In terms of what we are seeing for the balance of this year, VEVYE is on pace for a record fourth quarter. October was the strongest month since launch, with the highest number of prescriptions written to date. Given this robust start — and the fact that the fourth quarter has historically been VEVYE’s best-performing period — we expect the product to finish the year strong, coming in at or near our full-year revenue target for 2025.
With a best-in-class clinical profile, expanding coverage, an exceptionally high refill rate, and the addition of new commercial resources, the future remains bright for VEVYE. We are still in the early stages of its growth trajectory, and as awareness builds, access broadens, and commercial efforts intensify, we believe VEVYE will continue to deliver strong, durable growth, profitability, and long-term value for shareholders.
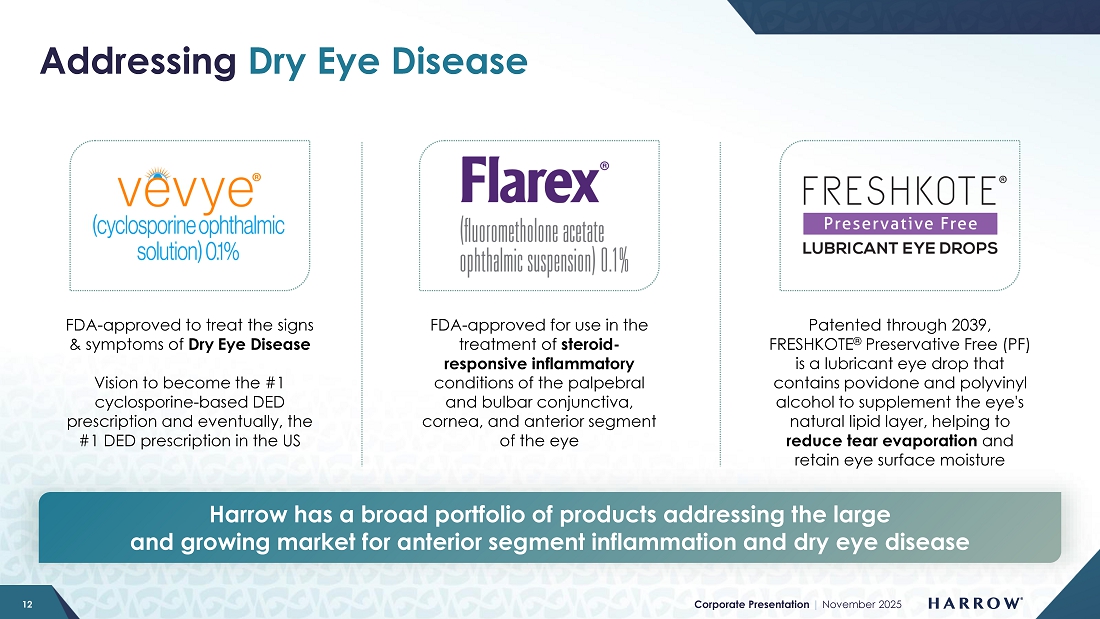
One final related item is that we have added both FLAREX® and FRESHKOTE® to the bag of our DED team. These additions strengthen our clinical offering, providing ophthalmologists and optometrists with a comprehensive suite of therapies to manage ocular surface disease across the full spectrum of inflammation and dryness. For patients with chronic inflammatory DED requiring long-term management, VEVYE offers a targeted, non-steroidal therapy with sustained efficacy and excellent tolerability. Anterior segment inflammation is frequently associated with DED, and short-term anti-inflammatory intervention is often necessary to break the inflammatory cycle. FLAREX, a corticosteroid formulated for ocular inflammation, provides an effective option for these acute phases. Complementing both is FRESHKOTE, a preservative-free lubricating drop, which protects the corneal surface and stabilizes the tear film to reduce evaporation. Together, these products create a synergistic, unified portfolio that empowers eye care professionals to personalize treatment and optimize outcomes for patients with ocular inflammation and dry eye disease, including challenges related to tear evaporation.
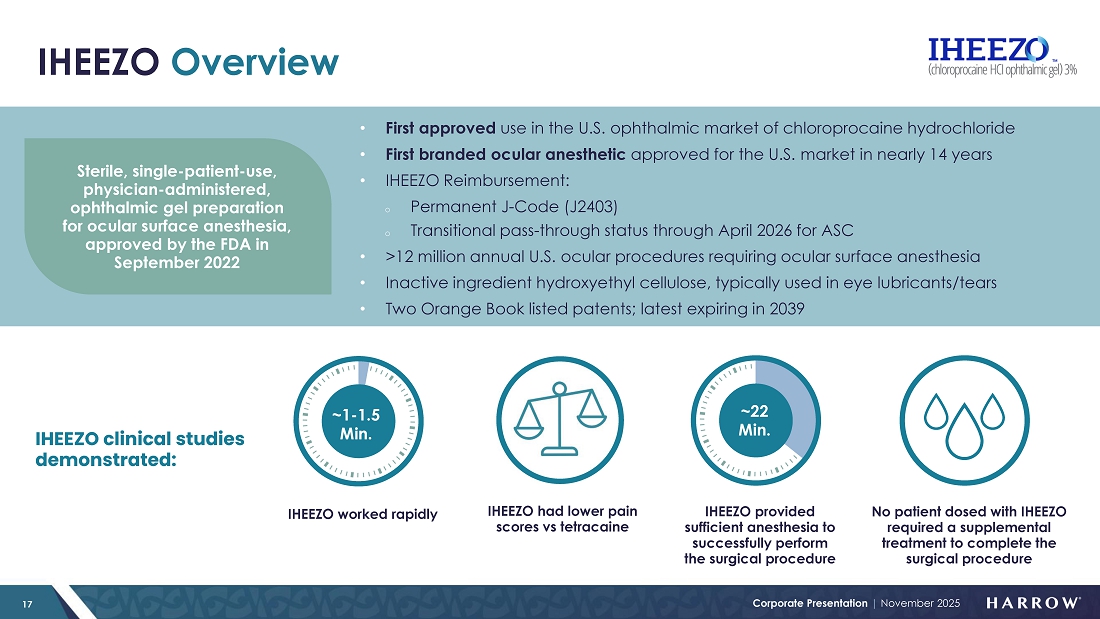
IHEEZO: Tracking Towards Record Year and Growing
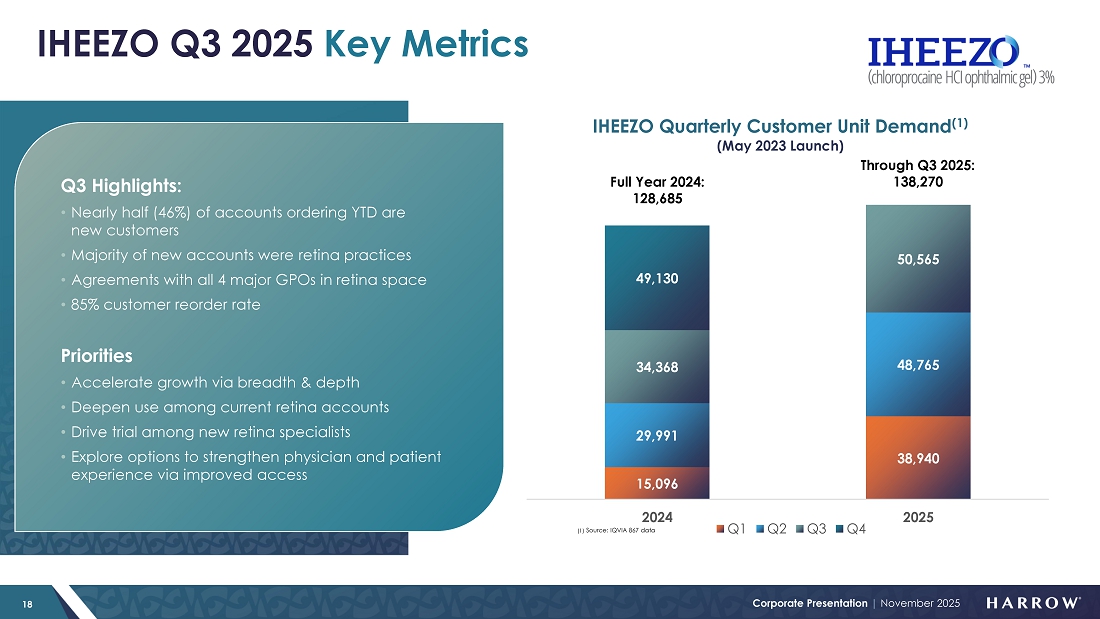
IHEEZO revenue increased to $21.9 million in the third quarter of 2025, representing a 70% increase from the third quarter of 2024 and a 20% sequential increase from the second quarter of 2025. Third quarter unit demand of 50,565 represents a 47% increase over the third quarter of 2024, and a 4% sequential increase.
As we’ve seen in prior years, the third quarter tends to be seasonally slower for IHEEZO, given the July and August slowdown as patients and physicians take time off. However, demand rebounded sharply in September, and that momentum carried into October, which included notably large new orders placed during the month. These trends position IHEEZO for a strong finish to 2025 and continued growth heading into 2026.
I am very pleased with the progress our team is making with IHEEZO. Growth is being driven by several strategic initiatives, including our retina pivot in 2024 and the launch of our “IHEEZO For All” educational strategy. Together, these efforts are expanding awareness, deepening customer engagement, and reinforcing IHEEZO’s differentiated clinical and operational value. Notably, 46% of the total accounts that have ordered IHEEZO in 2025 are new to the product, underscoring the success of our initiatives to attract new users and broaden adoption.
With robust payer coverage, a best-in-class safety and efficacy profile, and a rapid, predictable onset of action, IHEEZO delivers both clinical and operational advantages that resonate strongly with physicians. For high-volume retina specialists, customers continue to relay that IHEEZO offers meaningful efficiency gains and workflow improvements, saving time while maintaining patient comfort and safety. From our perspective, there is no reason not to use IHEEZO given its clinical benefits and robust coverage.
IHEEZO continues to outperform our expectations and is easily on track to surpass $50 million in annual revenue by year-end 2025. With large orders already placed in October and the potential for additional seasonal stocking activity typically seen in the fourth quarter, IHEEZO is positioned for a very strong finish to the year and is expected to exceed our full-year revenue target. The future remains exceptionally bright for IHEEZO, as awareness and adoption continue to grow across the ophthalmic community.
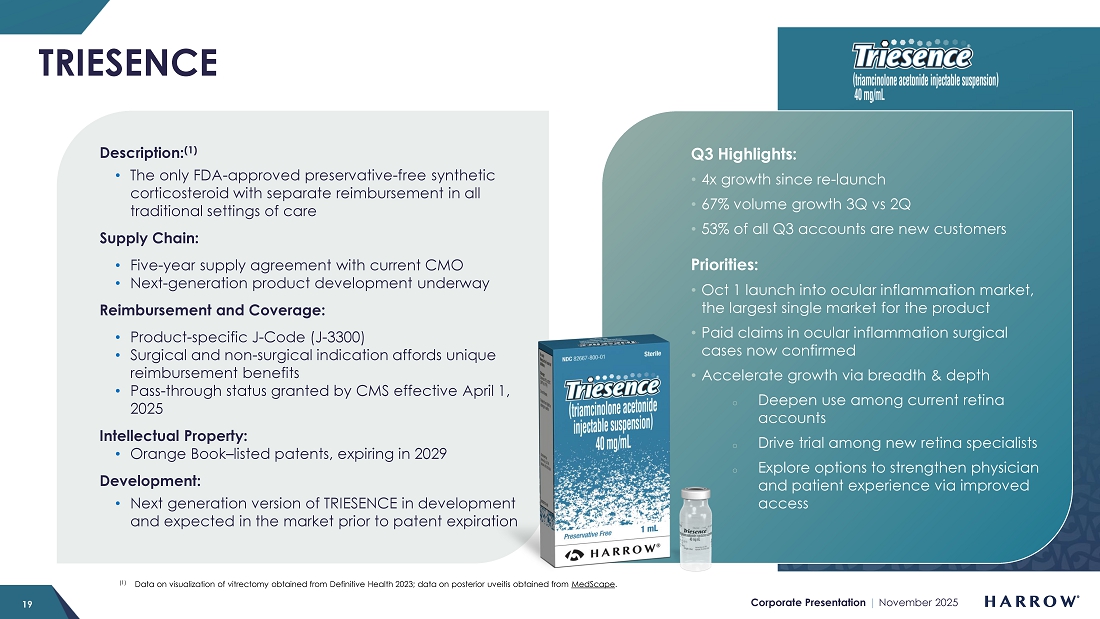
TRIESENCE: I remain a bull!
I believe that when your goal is to achieve something that benefits everyone involved, success is an inevitable outcome. This is in part why I am an unabashed TRIESENCE bull. Due to its proven safety, exceptional efficacy, flexibility (e.g., ability to be titrated), low patient out-of-pocket costs, and broad payer coverage, I believe TRIESENCE should become the leading ophthalmic injectable steroid in the U.S. market, and I am beginning to see evidence of growing traction within the retinal community. But the major opportunity for this product is in the ocular inflammation market, particularly for use in the ASC. As unit volumes and reorders increase within that market segment, everyone benefits – patients, physicians, ASCs, and, of course, Harrow and our stockholders.
In the third quarter, TRIESENCE achieved 67% quarter-over-quarter unit growth, reflecting increasing utilization across key practices. Of all accounts ordering TRIESENCE during the quarter, 53% were new customers — a powerful indicator that our reach is expanding and that physicians are recognizing the product’s differentiated clinical value and strong reimbursement profile.
As I mentioned, my bullishness on TRIESENCE is tied to our October 1, 2025, launch into the ocular inflammation market. Surgical market launches follow a predictable pattern, with accounts first dipping their toes into the water by ordering a few trade units to ensure safety, efficacy, and a positive experience for both physicians and patients. Critically, they must ensure coverage before they make a financial commitment to purchasing larger volumes. Then, once these issues are resolved, they will be more broadly or completely adopted. Failure in any of these elements can cause delays or completely undermine commercial success. My favorite aspect of ophthalmic surgical products is that once adopted, if the clinical outcomes are strong, physicians are reluctant to switch away from what works. Then they tell their friends, and they teach younger doctors, and you can enter what I call a “positive snowball cycle” for many years. While still in the early stages of launch, initial clinical feedback from physicians has been encouraging, and we are beginning to see positive indicators of market traction. Early utilization trends suggest TRIESENCE has been well received in the surgical setting, validating our belief in its strong clinical value. And I am pleased to report that we have now validated coverage with paid claims data in hand. The elements are now there to expand usage and bring the benefits of TRIESENCE to more US surgical patients.
Over the past 30 years in business, I’ve seen that it’s not how you start, but how you finish. I believe this will be the case for TRIESENCE in 2025. Real signs of progress in the ocular inflammation market in the fourth quarter, along with the work the retina team is doing to drive new and existing account development, give me confidence that TRIESENCE is on its way to becoming a meaningful and growing contributor to Harrow’s top-line performance, driving both near-term revenue acceleration and long-term market leadership in ophthalmic steroids.
Rare & Specialty Products: Taking Action to Reestablish Market Positioning
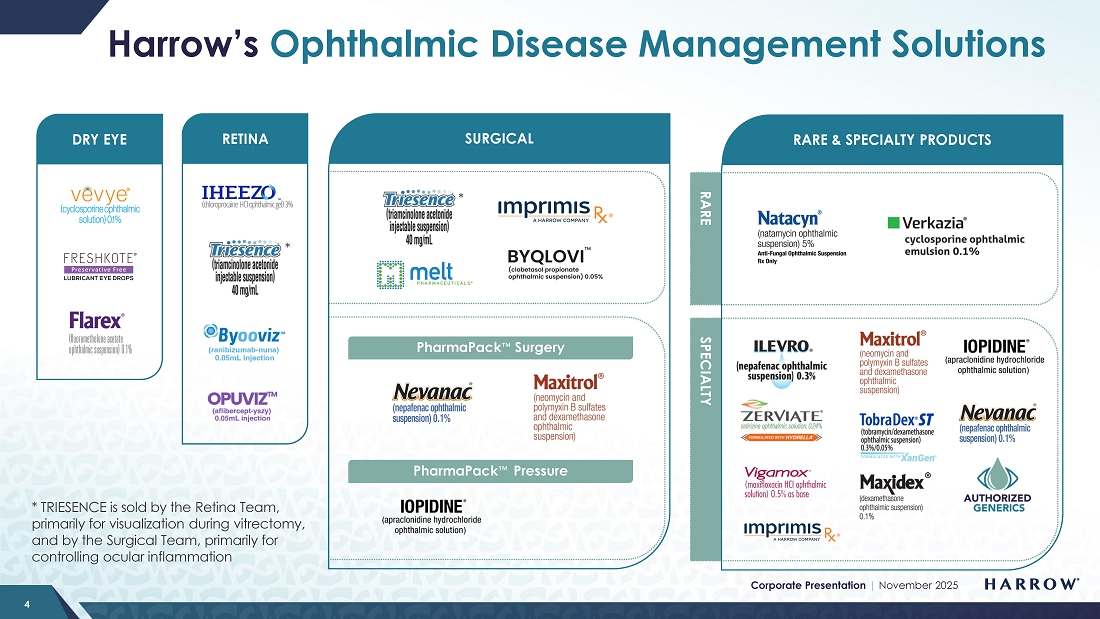
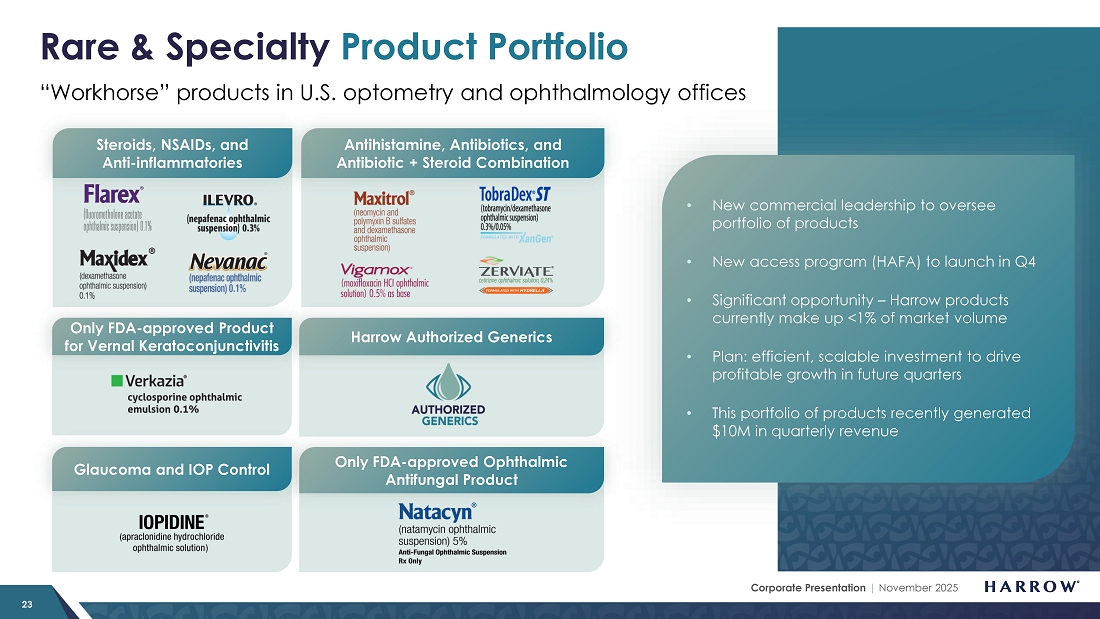
Our Rare & Specialty Product portfolio consists of well-known brands that eyecare professionals (ECPs) depend on to manage a wide array of ophthalmic diseases, including ILEVRO®, NEVANAC®, VIGAMOX®, MAXITROL®, MAXIDEX®, IOPIDINE®, NATACYN™, FLAREX, TOBRADEX® ST, VERKAZIA®, FRESHKOTE, ZERVIATE®, and BYQLOVI.
As mentioned earlier, we recently welcomed Tom Curatolo as Vice President of our Rare & Specialty Portfolio. Tom brings extensive experience in specialty pharmaceuticals and a proven track record of driving commercial performance. His leadership will be instrumental in optimizing this diverse portfolio, ensuring these products achieve their full potential and make a meaningful contribution to Harrow’s growth and long-term success.
With a dedicated and focused leader now overseeing this portfolio, as well as a focused and supportive team, we are internally aligned and committed to increasing the market impact of these products. Our efforts, which will be made at a marginal cost, include optimizing commercial infrastructure, refining go-to-market strategies, and ensuring that each product receives the right mix of resources, leadership attention, and executional support needed to drive both near-term performance and long-term growth.
In addition, the upcoming launch of our Harrow Access for All initiative in the fourth quarter of 2025 marks a significant step forward in improving patient access, affordability, and adherence across this portfolio. The HAFA program is designed to streamline the prescription fulfillment process, enhance payer engagement, and reduce barriers for both physicians and patients — key factors in driving sustainable growth and market penetration.
With Tom’s leadership and the rollout of HAFA, after several quarters of underperformance, I am confident that we now have the right strategies, talent, and infrastructure in place to get this group of products firmly back on track. We expect to see steady improvements in prescription volumes, access to coverage, and brand awareness, laying the groundwork for consistent and profitable growth across the Rare & Specialty Product portfolio.
I always tell people who get focused on problems and negatives that something is bad until it isn’t. Sounds simple, but it takes humility, action, and initiative to stop going down the wrong road so that one can have a chance to get things right. I really feel like that is the case with the RSP portfolio. This group of products previously delivered a quarterly high of $10 million in 2024, and there is no reason – now that we have, with humility, taken action – to return to, and ultimately exceed, those levels as our initiatives take hold.
MELT-300
With the acquisition of MELT Pharmaceuticals progressing, our team is planning to accelerate the development of MELT-300 — a market-changing product candidate designed to transform the way patients experience sedation for ophthalmic procedures and potentially beyond. The reintegration of MELT Pharmaceuticals into Harrow’s operations is expected to be straightforward, allowing us to immediately shift our focus toward generating and compiling the final data sets so we can engage with our regulators and make a filing as soon as possible.
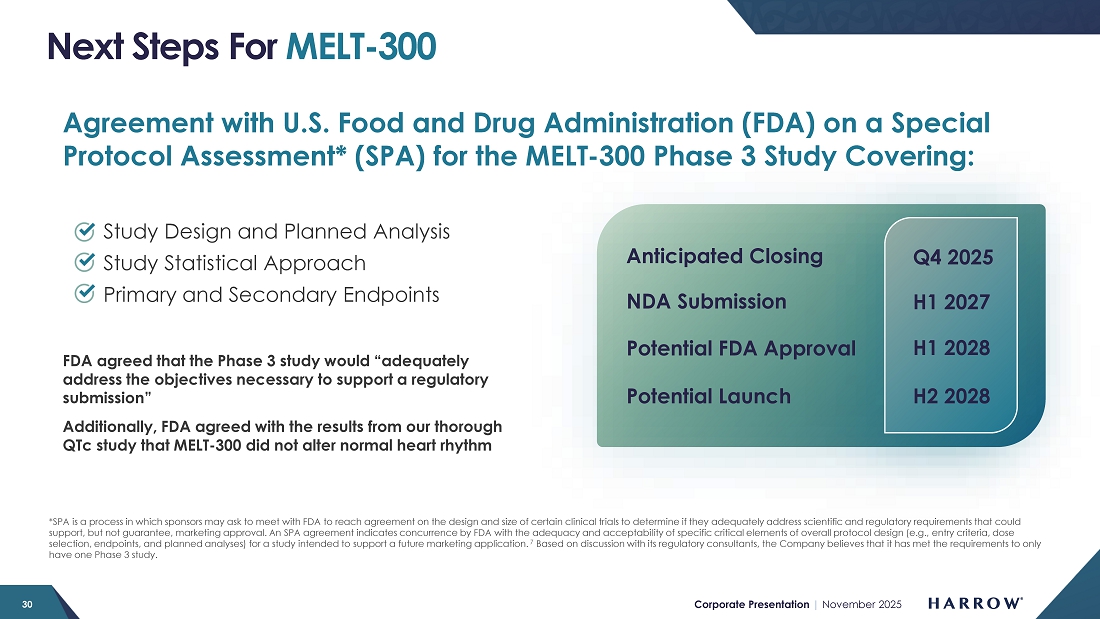
Our regulatory and clinical teams will be laser-focused on advancing MELT-300 toward a New Drug Application (NDA) submission to the U.S. Food and Drug Administration. In support of this goal, we are preparing to initiate one non-clinical animal study and three pharmacokinetic (PK) studies, each designed to generate the data necessary for a robust NDA package. The results of these studies will be instrumental in defining product labeling, including which patient populations are eligible for treatment.
We currently anticipate submitting the NDA in the first half of 2027, positioning us for a potential commercial launch in 2028. However, our internal teams are working diligently to accelerate that timeline, and we will continue to update stockholders as key milestones are achieved.
From a strategic standpoint, I view MELT-300 as a transformative long-term growth opportunity for Harrow. Its clinical profile, potential procedural applications, and non-IV and non-opioid delivery could represent a paradigm shift in procedural sedation. Moreover, the product’s broad potential beyond ophthalmology, combined with our global commercialization rights and global patent portfolio, makes MELT-300 one of the most compelling assets in our pipeline.
I am very excited about what MELT-300 represents for both patients and Harrow. With the combination of a world-class development team, a clear regulatory pathway, and a large addressable market, and our first product to generate significant non-US value, we believe MELT-300 could become one of the largest products in our portfolio and a key driver of sustainable, long-term value creation for our shareholders.
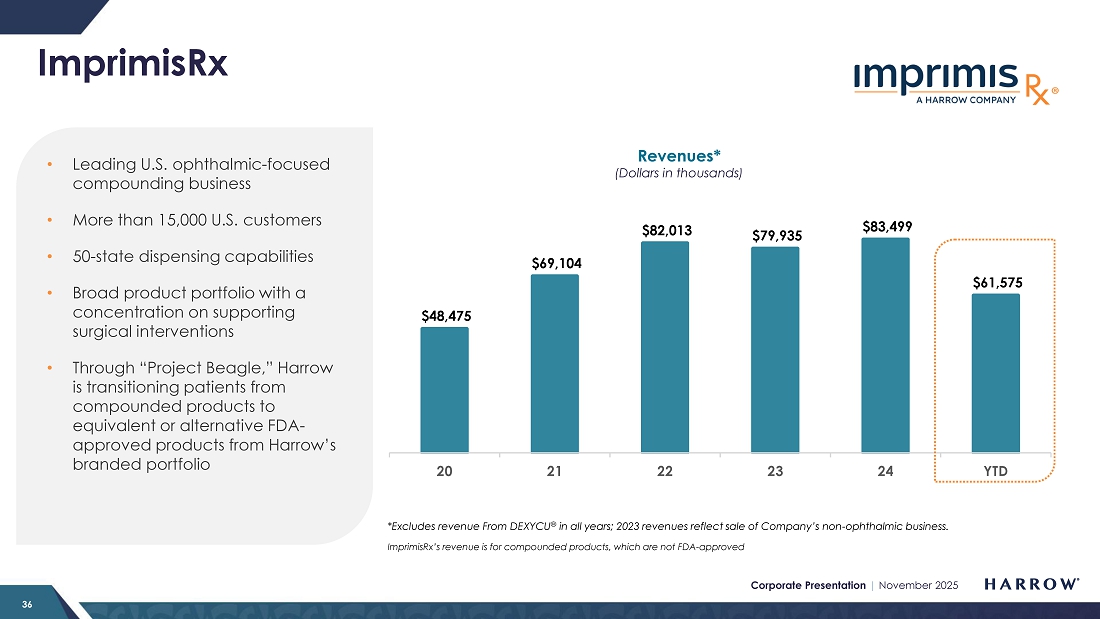
ImprimisRx Compounded Products
ImprimisRx compounded products continue to provide attractive revenue stability, generating approximately $20.1 million in the third quarter of 2025 and underscoring the demand for these high-quality ophthalmic formulations. In October, however, we experienced an inventory shortage and will likely not be able to make up for it this year. Mainly due to this one-time revenue loss, we are slightly reducing our overall guidance for the year, as discussed later in this Letter to Stockholders. We are now selling everything we make and rebuilding inventory to an appropriate safety stock level.
Last month, we announced the appointment of Frank Mullery as Chief Executive Officer of ImprimisRx. Frank brings deep experience in pharmaceutical operations, strategic execution, and commercial optimization, and he is exceptionally well-positioned to drive operational excellence and maintain the highest standards of quality, compliance, and patient safety — core principles that define the ImprimisRx portfolio and brand.
Outlook
We are on track for another year of strong growth and continued progress toward our long-term financial objectives. However, while there is a path to achieving our third consecutive year of 40%+ revenue growth, it may be challenging to fully compensate for the unexpected underperformance of certain products. Therefore, we are taking a slightly more conservative approach and updating our guidance to reflect what we believe we can deliver – updating our full-year revenue outlook to a range of $270 million to $280 million.
VEVYE remains in good shape. With a record month in prescription volume in October and as we enter VEVYE’s strongest seasonal period in Q4, the product is on pace for a record year, tracking toward our full-year 2025 revenue target. As coverage expands in 2026 and we invest further in VEVYE’s commercial platform to drive its next stage of growth, VEVYE is set up for a powerful 2026 and beyond.
IHEEZO is also performing exceptionally well and is on track to significantly exceed expectations. With large orders already placed in October and the potential for additional stocking activity in the fourth quarter, we expect IHEEZO to deliver a record Q4 and finish the year with strong momentum.
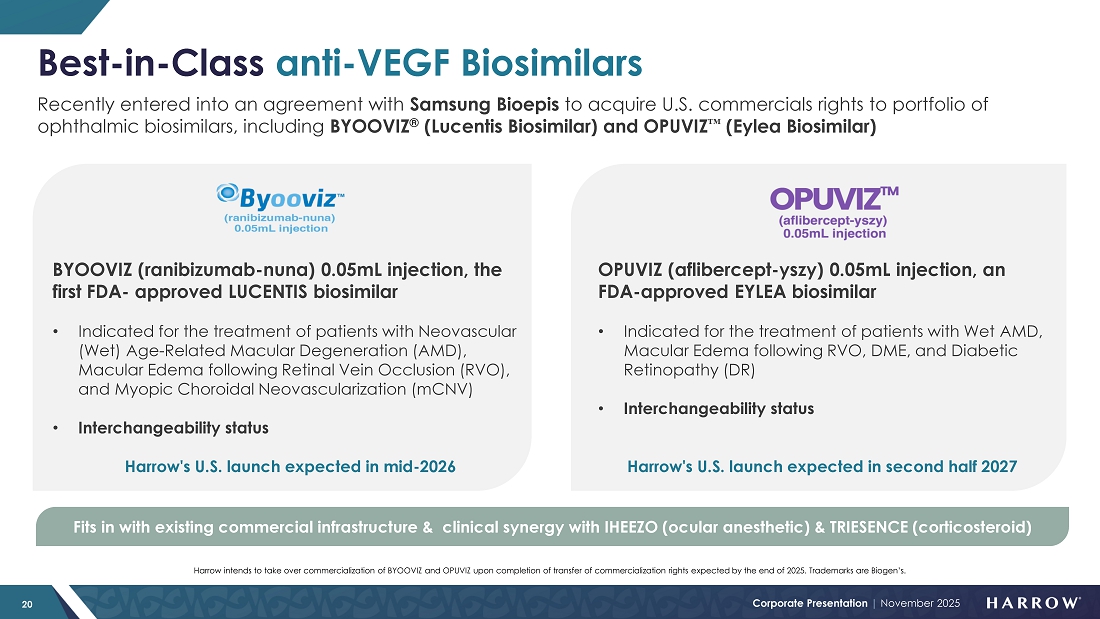
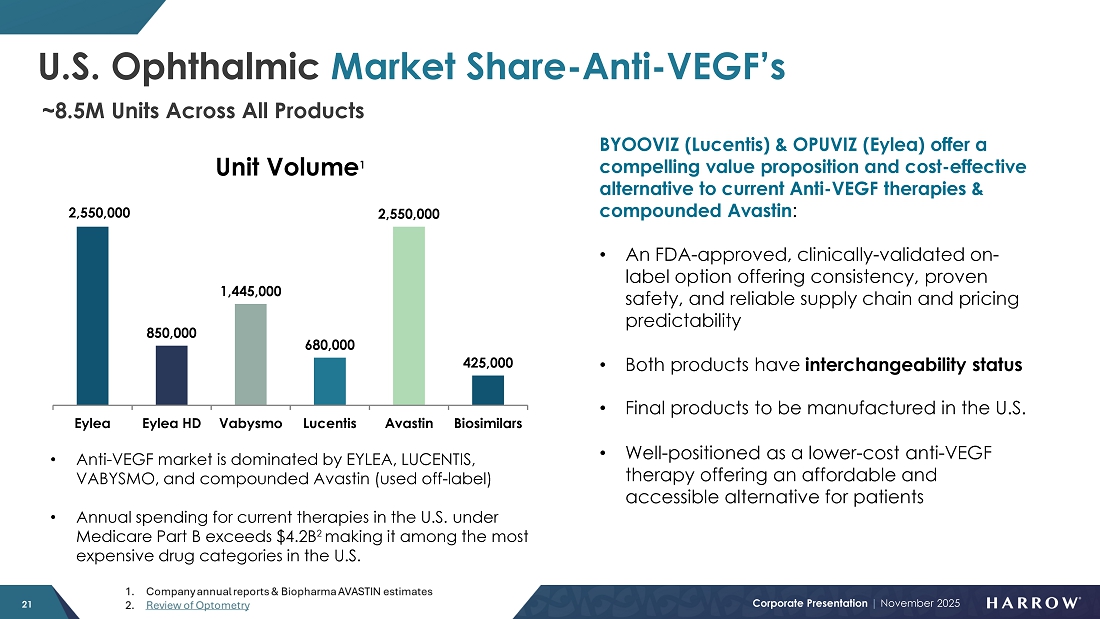
We are excited about the new ways we will soon be able to serve our customers. Initial BYQLOVI inventories are a few months away. And as we prepare to introduce BYOOVIZ™ in mid-2026 and OPUVIZ™ in mid-2027, Harrow will be uniquely positioned as the only company offering both an anesthetic and multiple therapeutic options in the retinal space — a potentially powerful combination that further strengthens our competitive advantage and expands our opportunity for increased growth.
While TRIESENCE and our Rare & Specialty Portfolio have underperformed this year, we believe that we have the right leadership team and commercial strategies in place to reignite growth. We anticipate a meaningful rebound in the fourth quarter and continued progress into 2026, positioning this group of products for sustained improvement and long-term contribution to our top line.
Following an expected strong fourth quarter, we anticipate a typical seasonal decline from Q4 2025 to Q1 2026, like the pattern we experienced earlier this year. That said, we also expect stocking activity from new products we anticipate launching in 2026. I plan to provide additional commentary on this dynamic when we report our full-year 2025 results, including the expected magnitude of the impact from fourth-quarter stocking activity.
Looking ahead, I am confident that we have the right strategies, leadership, and commercial infrastructure in place to position Harrow for sustained growth and margin expansion. As a result of the diligence of our team, today, we are a stronger, more resilient business—one that is well aligned for long-term value creation and continued shareholder success.
Closing
As we look ahead, I remain extremely confident about Harrow’s future. We have built a strong foundation, assembled an exceptional team of leaders, and established a clear growth strategy across every part of our business. With best-in-class products, expanding market access, and a culture defined by focus and execution, we are poised to deliver sustained growth and long-term value for our shareholders, our customers, and the patients we serve. The opportunities before us are significant — and we are ready to seize them.
Sincerely,
Mark L. Baum
Founder, Chairman of the Board, and Chief Executive Officer
Nashville, Tennessee
Index to Previous Letters to Stockholders
| 2025 | 2024 | 2023 | 2022 | 2021 | 2020 | 2019 | ||||||
| 4Q 2025 | 4Q 2023 | 4Q 2022 | 4Q 2021 | 4Q 2020 | 4Q 2019 | |||||||
| 3Q 2024 | 3Q 2023 | 3Q 2022 | 3Q 2021 | 3Q 2020 | 3Q
2019 |
|||||||
| 2Q25 | 2Q 2024 | 2Q 2023 | 2Q 2022 | 2Q 2021 | 2Q 2020 | |||||||
| 1Q25 | 1Q 2024 | 1Q 2023 | 1Q 2022 | 1Q 2021 | 1Q 2020 |
Commentary on Third Quarter 2025 Financials
Revenues of $71.6 million for the third quarter of 2025 represent a 45% increase over the prior-year third quarter revenues of $49.3 million and an increase of 12% over second-quarter 2025 revenues.
Selling, general and administrative (“SG&A”) costs for the third quarter of 2025 were $35.9 million compared with $33.6 million during the same period last year.
GAAP net income for the third quarter of 2025 was $1.0 million compared with a GAAP net loss of $(4.2) million during the same period last year. Core net income (a non-GAAP measure) for the third quarter of 2025 was $12.9 million compared with a core net loss of $(1.6) million in the prior year’s third quarter.
Adjusted EBITDA (a non-GAAP measure) for the third quarter of 2025 was $22.7 million compared with Adjusted EBITDA of $8.8 million during the same quarter last year.
As of September 30, 2025, cash and cash equivalents totaled $74.3 million while accounts receivable stood at $77.6 million.
GAAP gross margins were 75% for the third quarter of 2025 compared to 76% in the same quarter in 2024. Core gross margins (a non-GAAP measure) were 81% in the third quarter of 2025 compared with 80% in the same period in 2024.
IHEEZO and VEVYE both surpassed the threshold of contributing 10% or more to total Harrow revenues. As a result, we reported individual revenues for these products in the Form 10-Q filing, as reflected in the table below:
| For
the Three Months Ended September 30, |
For
the Nine Months Ended September 30, |
|||||||||||||||||||||||||||||||
| 2025 | 2024 | 2025 | 2024 | |||||||||||||||||||||||||||||
| IHEEZO | $ | 21,907,000 | 31 | % | $ | 12,882,000 | 26 | % | $ | 45,465,000 | 25 | % | $ | 26,498,000 | 20 | % | ||||||||||||||||
| VEVYE | 22,626,000 | 32 | % | 5,186,000 | 11 | % | 62,783,000 | 34 | % | 12,099,000 | 9 | % | ||||||||||||||||||||
| Other branded products | 6,908,000 | 10 | % | 10,256,000 | 21 | % | 13,076,000 | 7 | % | 30,808,000 | 23 | % | ||||||||||||||||||||
| Other revenues | 141,000 | 0 | % | 228,000 | -% | 312,000 | 0 | % | 375,000 | -% | ||||||||||||||||||||||
| Branded revenue, net | 51,582,000 | 72 | % | 28,552,000 | 58 | % | 121,636,000 | 66 | % | 69,780,000 | 53 | % | ||||||||||||||||||||
| ImprimisRx revenue, net | 20,056,000 | 28 | % | 20,705,000 | 42 | % | 61,575,000 | 34 | % | 63,003,000 | 47 | % | ||||||||||||||||||||
| Total revenues, net | $ | 71,638,000 | 100 | % | $ | 49,257,000 | 100 | % | $ | 183,211,000 | 100 | % | $ | 132,783,000 | 100 | % | ||||||||||||||||
As we move deeper into 2025, we expect continued growth across our branded portfolio and continue to expect traditional quarter-to-quarter revenue build, enhancing profitability through operational efficiencies and strategically positioning Harrow for continued leadership in the North American ophthalmic pharmaceutical sector.
Third Quarter 2025 Financial Overview
GAAP Operating Results
Selected financial highlights regarding GAAP operating results for the three months and nine months ended September 30, 2025 and 2024 are as follows:
|
For the Three Months Ended September 30, |
For
the Nine Months Ended September 30, |
|||||||||||||||
| 2025 | 2024 | 2025 | 2024 | |||||||||||||
| Total revenues | $ | 71,638,000 | $ | 49,257,000 | $ | 183,211,000 | $ | 132,783,000 | ||||||||
| Cost of sales | 17,712,000 | 12,018,000 | 49,466,000 | 35,110,000 | ||||||||||||
| Gross profit | 53,926,000 | 37,239,000 | 133,745,000 | 97,673,000 | ||||||||||||
| Selling, general and administrative | 35,856,000 | 33,645,000 | 109,604,000 | 94,275,000 | ||||||||||||
| Research and development | 3,323,000 | 2,273,000 | 9,217,000 | 7,475,000 | ||||||||||||
| Total operating expenses | 39,179,000 | 35,918,000 | 118,821,000 | 101,750,000 | ||||||||||||
| Income (loss) from operations | 14,747,000 | 1,321,000 | 14,924,000 | (4,077,000 | ) | |||||||||||
| Total other expense, net | (13,727,000 | ) | 5,521,000 | (26,689,000 | ) | 19,506,000 | ||||||||||
| Income tax expense | - | (20,000 | ) | - | (675,000 | ) | ||||||||||
| Net income (loss) attributable to Harrow, Inc. | $ | 1,020,000 | $ | (4,220,000 | ) | $ | (11,765,000 | ) | $ | (24,258,000 | ) | |||||
| Net income (loss) per share: | ||||||||||||||||
| Basic | $ | 0.03 | $ | (0.12 | ) | $ | (0.32 | ) | $ | (0.68 | ) | |||||
| Diluted | $ | 0.03 | $ | (0.12 | ) | $ | (0.32 | ) | $ | (0.68 | ) | |||||
Core Results (Non-GAAP Measures)
Core Results (non-GAAP measures), which we define as the after-tax earnings and other operational and financial metrics generated from our principal business, for the three months and nine months ended September 30, 2025 and 2024 are as follows:
|
For the Three Months Ended September 30, |
For
the Nine Months Ended September 30, |
|||||||||||||||
| 2025 | 2024 | 2025 | 2024 | |||||||||||||
| Total revenues | $ | 71,638,000 | $ | 49,257,000 | $ | 183,211,000 | $ | 132,783,000 | ||||||||
| Gross margin | 75 | % | 76 | % | 73 | % | 74 | % | ||||||||
| Core gross margin(1) | 81 | % | 80 | % | 79 | % | 78 | % | ||||||||
| Net income (loss) | 1,020,000 | (4,220,000 | ) | (11,765,000 | ) | (24,258,000 | ) | |||||||||
| Core net income (loss)(1) | 12,933,000 | (1,619,000 | ) | 8,606,000 | (13,455,000 | ) | ||||||||||
| Adjusted EBITDA(1) | 22,732,000 | 8,808,000 | 37,753,000 | 17,838,000 | ||||||||||||
| Net income (loss) per share: | ||||||||||||||||
| Basic | 0.03 | (0.12 | ) | (0.32 | ) | (0.68 | ) | |||||||||
| Diluted | 0.03 | (0.12 | ) | (0.32 | ) | (0.68 | ) | |||||||||
| Core net income (loss) per share:(1) | ||||||||||||||||
| Basic | 0.35 | (0.05 | ) | 0.24 | (0.38 | ) | ||||||||||
| Diluted | 0.33 | (0.05 | ) | 0.24 | (0.38 | ) | ||||||||||
| (1) | Core gross margin, core net income (loss), core basic and diluted net income (loss) per share (collectively, “Core Results”), and Adjusted EBITDA are non-GAAP measures. For additional information, including a reconciliation of such Core Results and Adjusted EBITDA to the most directly comparable measures presented in accordance with GAAP, see the explanation of non-GAAP measures and reconciliation tables at the end of this Letter to Stockholders. |
FORWARD-LOOKING STATEMENTS
Management’s remarks in this stockholder letter include forward-looking statements within the meaning of federal securities laws. Forward-looking statements are subject to numerous risks and uncertainties, many of which are beyond Harrow’s control, including risks and uncertainties described from time to time in its Securities and Exchange Commission (SEC) filings, such as the risks and uncertainties related to the Company’s ability to make commercially available its FDA-approved products and compounded formulations and technologies, and FDA approval of certain drug candidates in a timely manner or at all.
For a list and description of those risks and uncertainties, please see the “Risk Factors” section of the Company’s Annual Report on Form 10-K for the year ended December 31, 2024, subsequent Quarterly Reports on Form 10-Q, and other filings with the SEC.
Harrow’s results may differ materially from those projected. Harrow disclaims any intention or obligation to update or revise any financial projections or forward-looking statements whether because of new information, future events or otherwise. This stockholder letter contains time-sensitive information and is accurate only as of today.
Additionally, Harrow refers to non-GAAP financial measures, specifically Adjusted EBITDA, adjusted earnings, core gross margin, core net income (loss), and core basic and diluted net income (loss) per share. A reconciliation of non-GAAP measures with the most directly comparable GAAP measures is included in this letter.
No compounded formulation is FDA-approved. All compounded formulations are customizable. Other than drugs compounded at a registered outsourcing facility, all compounded formulations require a prescription for an individually identified patient consistent with federal and state laws.
All trademarks, service marks, and trade names included or referenced in this publication are the property of their respective owners.
Non-GAAP Financial Measures
In addition to the Company’s results of operations determined in accordance with U.S. generally accepted accounting principles (GAAP), which are presented and discussed above, management also utilizes Adjusted EBITDA and Core Results, unaudited financial measures that are not calculated in accordance with GAAP, to evaluate the Company’s financial results and performance and to plan and forecast future periods. Adjusted EBITDA and Core Results are considered “non-GAAP” financial measures within the meaning of Regulation G promulgated by the SEC. Management believes that these non-GAAP financial measures reflect an additional way of viewing aspects of the Company’s operations that, when viewed with GAAP results, provide a more complete understanding of the Company’s results of operations and the factors and trends affecting its business. Management believes Adjusted EBITDA and Core Results provide meaningful supplemental information regarding the Company’s performance because (i) they allow for greater transparency with respect to key metrics used by management in its financial and operational decision-making; (ii) they exclude the impact of non-cash or, when specified, non-recurring items that are not directly attributable to the Company’s core operating performance and that may obscure trends in the Company’s core operating performance; and (iii) they are used by institutional investors and the analyst community to help analyze the Company’s results. However, Adjusted EBITDA, Core Results, and any other non-GAAP financial measures should be considered as a supplement to, and not as a substitute for, or superior to, the corresponding measures calculated in accordance with GAAP. Further, non-GAAP financial measures used by the Company and the way they are calculated may differ from the non-GAAP financial measures or the calculations of the same non-GAAP financial measures used by other companies, including the Company’s competitors.
Adjusted EBITDA
The Company defines Adjusted EBITDA as net income (loss), excluding the effects of stock-based compensation and expenses, interest, taxes, depreciation, amortization, investment loss, net, and, if any and when specified, other non-recurring income or expense items. Management believes that the most directly comparable GAAP financial measure to Adjusted EBITDA is net income (loss). Adjusted EBITDA has limitations and should not be considered as an alternative to gross profit or net income (loss) as a measure of operating performance or to net cash provided by (used in) operating, investing, or financing activities as a measure of ability to meet cash needs.
The following is a reconciliation of Adjusted EBITDA, a non-GAAP measure, to the most comparable GAAP measure, net income (loss), for the three months and nine months ended September, 2025 and for the same period in 2024:
|
For the Three Months Ended September 30, |
For
the Nine Months Ended September 30, |
|||||||||||||||
| 2025 | 2024 | 2025 | 2024 | |||||||||||||
| GAAP net income (loss) | $ | 1,020,000 | $ | (4,220,000 | ) | $ | (11,765,000 | ) | $ | (24,258,000 | ) | |||||
| Stock-based compensation and expenses | 3,271,000 | 4,385,000 | 8,702,000 | 12,825,000 | ||||||||||||
| Interest expense, net | 6,038,000 | 5,525,000 | 18,994,000 | 16,411,000 | ||||||||||||
| Income tax expense | - | 20,000 | - | 675,000 | ||||||||||||
| Depreciation | 490,000 | 497,000 | 1,451,000 | 1,382,000 | ||||||||||||
| Amortization of intangible assets | 4,224,000 | 2,605,000 | 12,676,000 | 7,708,000 | ||||||||||||
| Investment loss, net | - | - | - | 3,171,000 | ||||||||||||
| Other expense (income), net | 7,689,000 | (4,000 | ) | 7,695,000 | (76,000 | ) | ||||||||||
| Adjusted EBITDA | $ | 22,732,000 | $ | 8,808,000 | $ | 37,753,000 | $ | 17,838,000 | ||||||||
Core Results
Harrow Core Results, including core gross margin, core net income (loss), and core basic and diluted income (loss) per share exclude (1) all amortization and impairment charges of intangible assets, excluding software development costs, (2) net gains and losses on investments and equity securities, including equity method gains and losses and equity valued at fair value through profit and loss (FVPL), and preferred stock dividends, and (3) gains/losses on forgiveness of debt. In certain periods, Core Results may also exclude fair value adjustments of financial assets in the form of options to acquire a company carried at FVPL, obligations related to product recalls, certain acquisition-related items, restructuring charges/releases and associated items, related legal items, gains/losses on early extinguishment of debt or debt modifications, impairments of property, plant and equipment and software, as well as income and expense items that management deems exceptional and that are or are expected to accumulate within the year to be over a $100,000 threshold.
The following is a reconciliation of Core Results, non-GAAP measures, to the most comparable GAAP measures for the three months and nine months ended September 30, 2025 and 2024:
| For the Three Months Ended September 30, 2025 | ||||||||||||||||||||
|
GAAP Results |
Amortization of Certain Intangible Assets |
Investment Gains (Losses) |
Other Items |
Core Results |
||||||||||||||||
| Gross profit | $ | 53,926,000 | $ | 3,780,000 | $ | - | $ | - | $ | 57,706,000 | ||||||||||
| Gross margin | 75 | % | 81 | % | ||||||||||||||||
| Operating income | 14,747,000 | 4,224,000 | - | - | 18,971,000 | |||||||||||||||
| Income before taxes | 1,020,000 | 4,224,000 | - | 7,689,000 | 12,933,000 | |||||||||||||||
| Taxes | - | - | - | - | - | |||||||||||||||
| Net income | 1,020,000 | 4,224,000 | - | 7,689,000 | 12,933,000 | |||||||||||||||
| Income per share ($)(1): | ||||||||||||||||||||
| Basic | 0.13 | 0.35 | ||||||||||||||||||
| Diluted | 0.13 | 0.33 | ||||||||||||||||||
| Weighted average number of shares of common stock outstanding: | ||||||||||||||||||||
| Basic | 37,145,440 | 37,145,440 | ||||||||||||||||||
| Diluted | 38,875,005 | 38,875,005 | ||||||||||||||||||
| For the Nine Months Ended September 30, 2025 | ||||||||||||||||||||
|
GAAP Results |
Amortization of Certain Intangible Assets |
Investment Gains (Losses) |
Other Items |
Core Results |
||||||||||||||||
| Gross profit | $ | 133,745,000 | $ | 11,340,000 | $ | - | $ | - | $ | 145,085,000 | ||||||||||
| Gross margin | 73 | % | 79 | % | ||||||||||||||||
| Operating income | 14,924,000 | 12,676,000 | - | - | 27,600,000 | |||||||||||||||
| Loss before taxes | (11,765,000 | ) | 12,676,000 | 7,695,000 | 8,606,000 | |||||||||||||||
| Taxes | - | - | - | - | - | |||||||||||||||
| Net Income (loss) | (11,765,000 | ) | 12,676,000 | - | 7,695,000 | 8,606,000 | ||||||||||||||
| Basic and diluted loss per share ($)(1) | (0.32 | ) | (0.24 | ) | ||||||||||||||||
| Weighted
average number of shares of common stock outstanding, basic and diluted |
36,588,163 | 36,588,163 | ||||||||||||||||||
| For the Three Months Ended September 30, 2024 | ||||||||||||||||||||
|
GAAP Results |
Amortization of Certain Intangible Assets |
Investment Gains (Losses) |
Other Items |
Core Results |
||||||||||||||||
| Gross profit | $ | 37,239,000 | $ | 2,191,000 | $ | - | $ | - | $ | 39,430,000 | ||||||||||
| Gross margin | 76 | % | 80 | % | ||||||||||||||||
| Operating income | 1,321,000 | 2,605,000 | - | - | 3,926,000 | |||||||||||||||
| (Loss) income before taxes | (4,200,000 | ) | 2,605,000 | - | (4,000 | ) | (1,599,000 | ) | ||||||||||||
| Taxes | (20,000 | ) | - | - | - | (20,000 | ) | |||||||||||||
| Net (loss) income | (4,220,000 | ) | 2,605,000 | - | (4,000 | ) | (1,619,000 | ) | ||||||||||||
| Basic and diluted loss per share ($)(1) | (0.12 | ) | (0.05 | ) | ||||||||||||||||
| Weighted average number of shares of common stock outstanding, basic and diluted | 35,702,200 | 35,702,200 | ||||||||||||||||||
| For the Nine Months Ended September 30, 2024 | ||||||||||||||||||||
|
GAAP Results |
Amortization of Certain Intangible Assets |
Investment Gains (Losses) |
Other Items |
Core Results |
||||||||||||||||
| Gross profit | $ | 97,673,000 | $ | 6,471,000 | $ | - | $ | - | $ | 104,144,000 | ||||||||||
| Gross margin | 74 | % | 78 | % | ||||||||||||||||
| Operating Income (loss) | (4,077,000 | ) | 7,708,000 | - | - | 3,631,000 | ||||||||||||||
| (Loss) income before taxes | (23,583,000 | ) | 7,708,000 | 3,171,000 | (76,000 | ) | (12,780,000 | ) | ||||||||||||
| Taxes | (675,000 | ) | - | - | - | (675,000 | ) | |||||||||||||
| Net (loss) income | (24,258,000 | ) | 7,708,000 | 3,171,000 | (76,000 | ) | (13,455,000 | ) | ||||||||||||
| Basic and diluted loss per share ($)(1) | (0.68 | ) | (0.38 | ) | ||||||||||||||||
| Weighted average number of shares of common stock outstanding, basic and diluted | 35,597,409 | 35,597,409 | ||||||||||||||||||
| (1) | Core basic and diluted loss per share is calculated using the weighted-average number of shares of common stock outstanding during the period. Core basic and diluted loss per share also contemplates dilutive shares associated with equity based awards as described in Note 2 and elsewhere in the Consolidated Financial Statements included in the Company’s Quarterly Report on Form 10-Q for the quarter ended September 30, 2025. |
Exhibit 99.3