UNITED STATES
SECURITIES AND EXCHANGE COMMISSION
Washington, D.C. 20549
FORM 8-K
CURRENT REPORT
Pursuant to Section 13 or Section 15(d) of the Securities Exchange Act of 1934
Date of Report (Date of earliest event reported): November 5, 2025
Inspired Entertainment, Inc.
(Exact name of registrant as specified in its charter)
| Delaware | 001-36689 | 47-1025534 | ||
| (State
or other jurisdiction of incorporation) |
(Commission File Number) |
(IRS
Employer Identification No.) |
|
250 West 57th Street, Suite 415 New York, New York |
10107 | |
| (Address of principal executive offices) | (Zip Code) |
Registrant’s telephone number, including area code: (646) 565-3861
Not Applicable
(Former name or former address, if changed since last report)
Check the appropriate box below if the Form 8-K filing is intended to simultaneously satisfy the filing obligation to the registrant under any of the following provisions:
| ☐ | Written communications pursuant to Rule 425 under the Securities Act (17 CFR 230.425) |
| ☐ | Soliciting material pursuant to Rule 14a-12 under the Exchange Act (17 CFR 240.14a-12) |
| ☐ | Pre-commencement communications pursuant to Rule 14d-2(b) under the Exchange Act (17 CFR 240.14d-2(b)) |
| ☐ | Pre-commencement communications pursuant to Rule 13e-4(c) under the Exchange Act (17 CFR 240.13e-4(c)) |
Securities registered pursuant to Section 12(b) of the Act:
| Title of each class | Trading Symbol(s) | Name of each exchange on which registered | ||
| Common stock, par value $0.0001 per share | INSE | The NASDAQ Stock Market LLC |
Indicate by check mark whether the registrant is an emerging growth company as defined in as defined in Rule 405 of the Securities Act of 1933 (§230.405 of this chapter) or Rule 12b-2 of the Securities Exchange Act of 1934 (§240.12b-2 of this chapter).
Emerging growth company ☐
If an emerging growth company, indicate by check mark if the registrant has elected not to use the extended transition period for complying with any new or revised financial accounting standards provided pursuant to Section 13(a) of the Exchange Act. ☐
| Item 2.02 | Results of Operations and Financial Condition. |
On November 5, 2025, Inspired Entertainment, Inc. (the “Company”) issued a press release announcing results for the three-month period ended September 30, 2025. A copy of the press release is attached hereto as Exhibit 99.1 and is incorporated herein by reference.
Also on November 5, 2025, the Company distributed an investor presentation relating to its results of operations and financial condition, which may be used at meetings with investors, analysts or others, in whole or in part and possibly with modifications from time to time.
| Item 8.01. | Other Events. |
Effective as of November 1, 2025, the Company’s board of directors authorized the Company to repurchase up to $25.0 million of shares of the Company’s common stock, par value $0.0001 per share (the “Common Stock”), on or before November 30, 2028.
The information contained in this Current Report on Form 8-K, including the exhibits hereto, shall not be deemed “filed” for purposes of Section 18 of the Securities Exchange Act of 1934, as amended (the “Exchange Act”), or incorporated by reference in any filing under the Securities Act of 1933, as amended, or the Exchange Act, except as shall be expressly set forth by specific reference in such a filing.
The information contained in this Current Report on Form 8-K is neither an offer to sell nor a solicitation of an offer to purchase the Common Stock or any other securities.
| Item 9.01. | Financial Statements and Exhibits. |
| Exhibit Number | Exhibit Description | |
| 99.1 | Press Release issued by Inspired Entertainment, Inc. on November 5, 2025 | |
| 99.2 | Investor Presentation issued on November 5, 2025. | |
| 104 | Cover Page Interactive Data File (embedded within the Inline XBRL document). |
SIGNATURES
Pursuant to the requirements of the Securities Exchange Act of 1934, the registrant has caused this report to be signed on its behalf by the undersigned hereunto duly authorized.
| November 5, 2025 | Inspired Entertainment, Inc. | |
| By: | /s/ Simona Camilleri | |
| Name: | Simona Camilleri | |
| Title: | General Counsel | |
Exhibit 99.1

INSPIRED REPORTS THIRD QUARTER 2025 RESULTS
Strong Interactive Momentum and Strategic Evolution Position Inspired for Growth and Margin Expansion
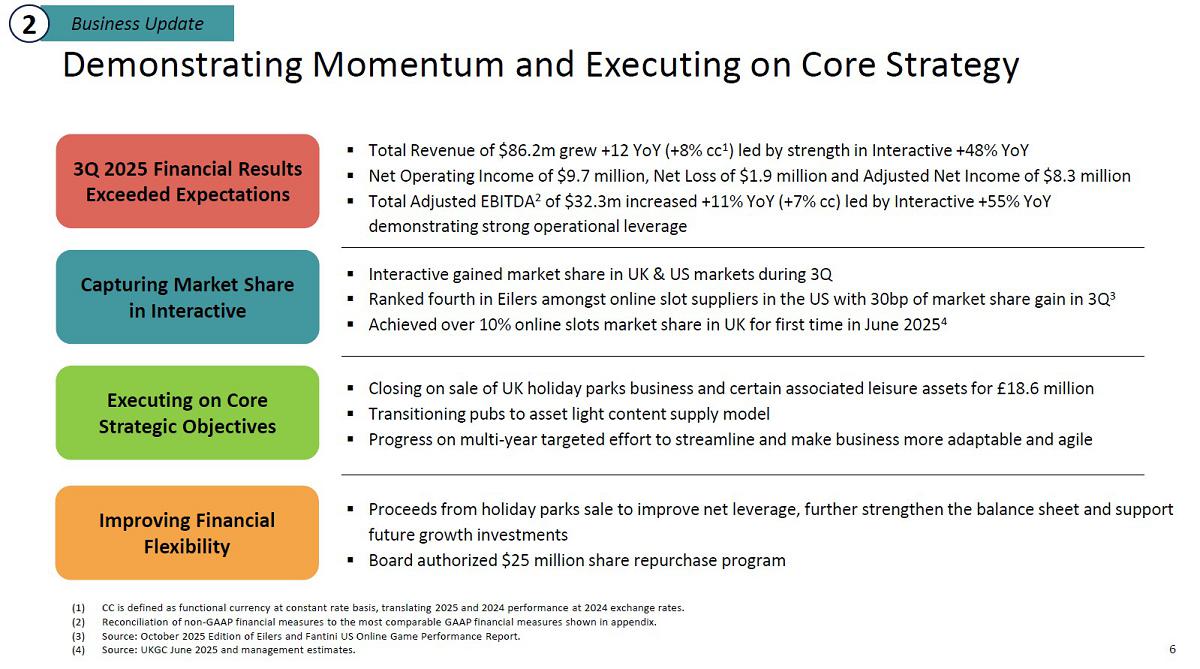
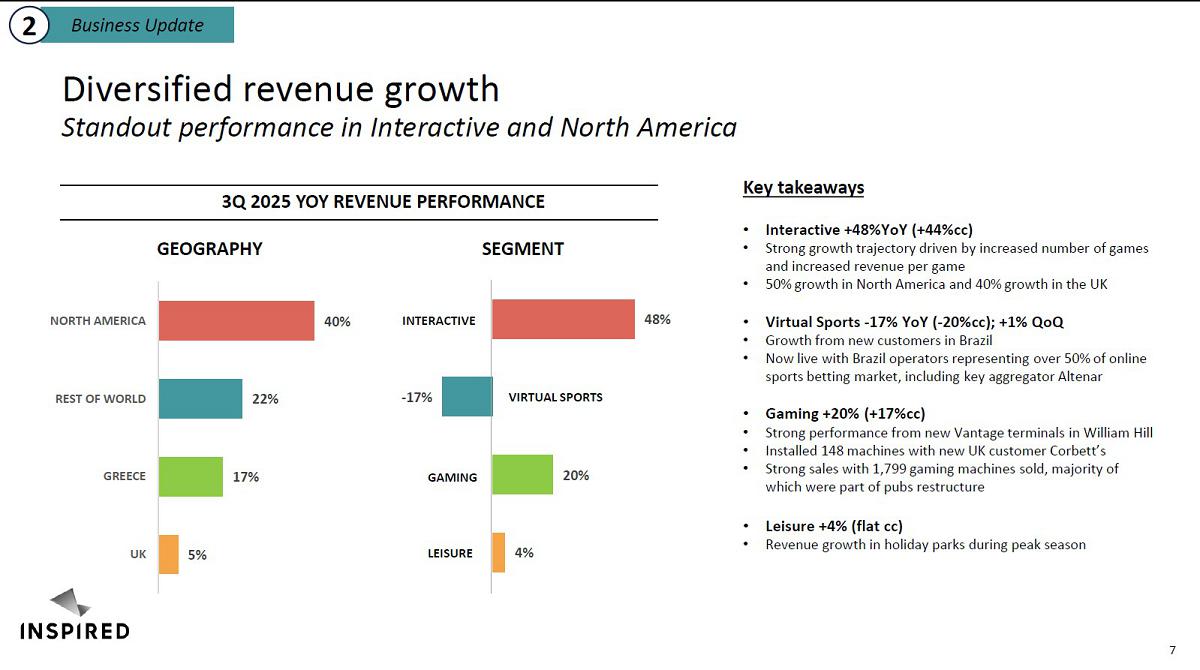
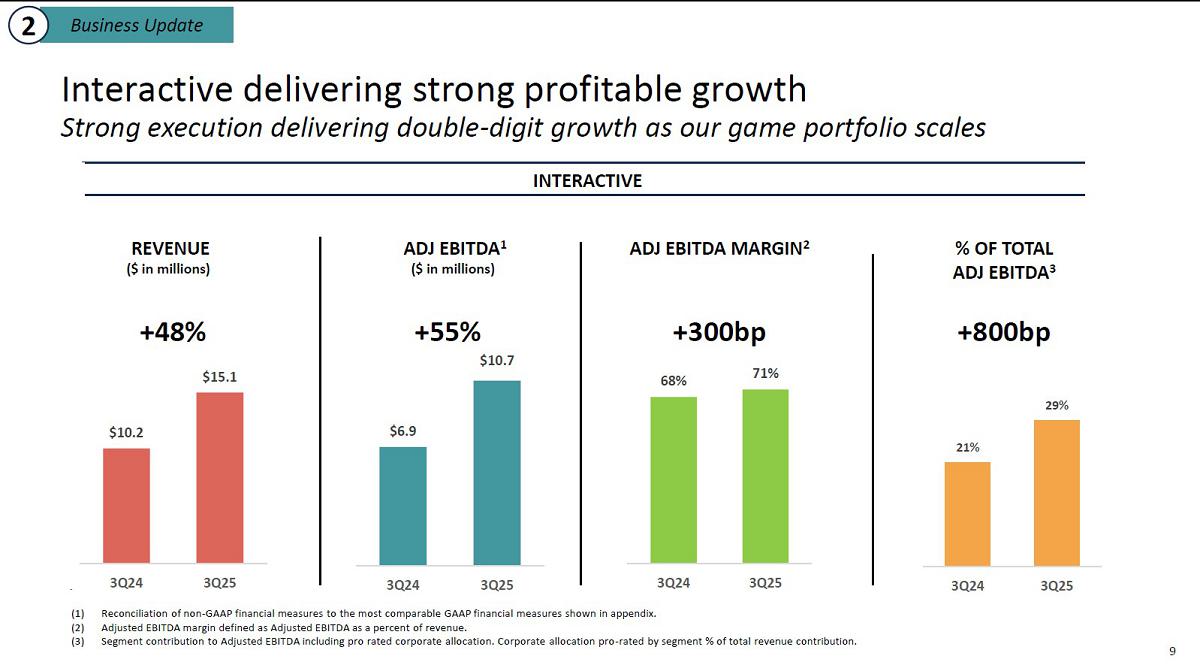
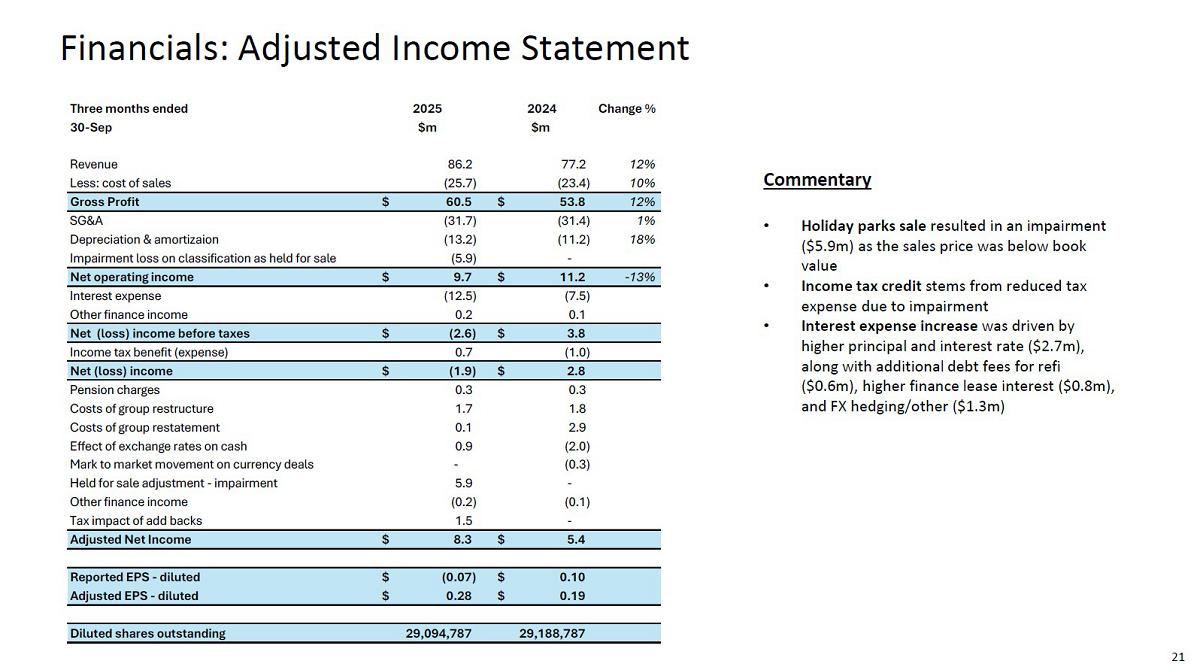
| ● | Revenue of $86.2 million, up 12% over prior year, driven primarily by record Interactive revenue, up 48% year-over-year |
| ● | Net Operating Income of $9.7 million, Net Loss of $1.9 million and Adjusted Net Income of $8.3 million |
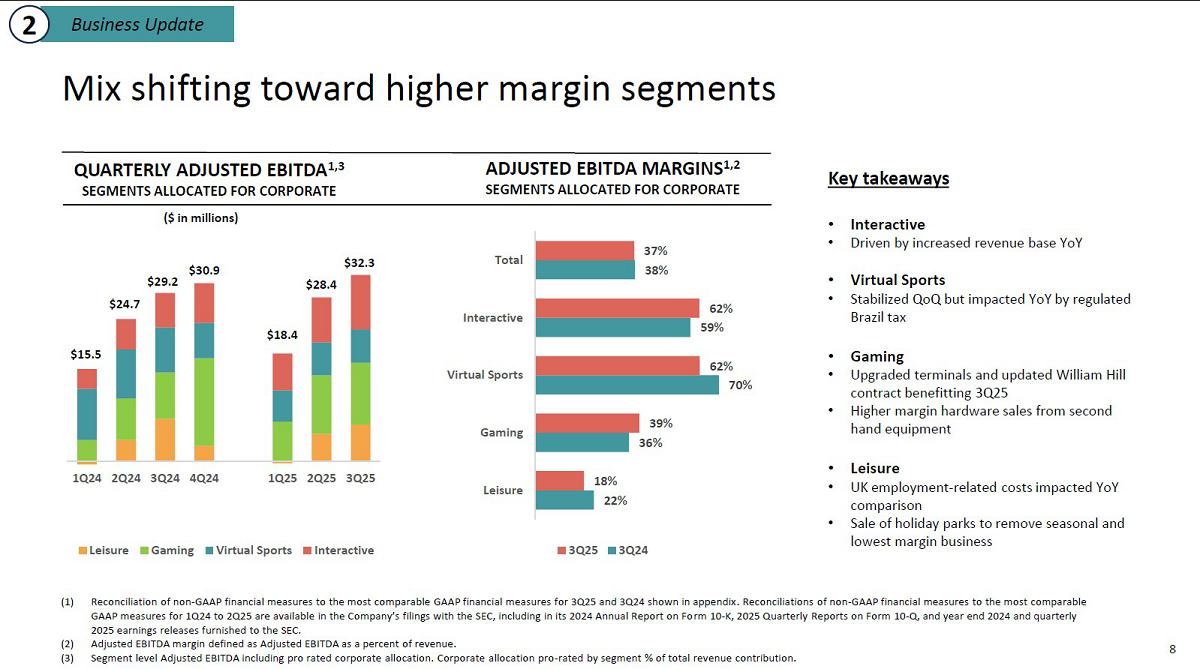
| ● | Adjusted EBITDA of $32.3 million, up 11% from prior year, driven by all-time-high Interactive Adjusted EBITDA, up 55% year-over-year |
| ● | Sale of UK holiday parks business and certain associated leisure assets for total cash consideration of £18.6 million to close on November 7th, further supporting transition to higher margin digital-led business model |
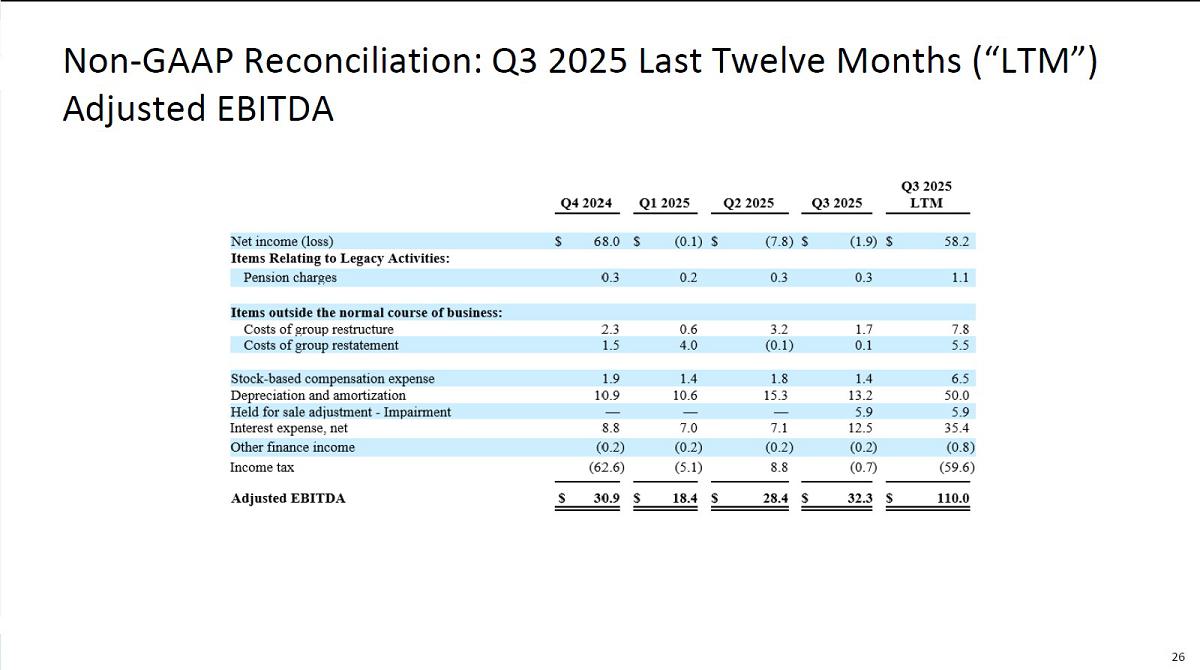
| ● | Fourth quarter 2025 Adjusted EBITDA expected to increase year over year, with full year 2025 Adjusted EBITDA expected to exceed $110 million1 |
| ● | Board authorizes $25 million share buyback program |
New York, New York, November 5, 2025 - Inspired Entertainment, Inc. (“Inspired” or the “Company”) (NASDAQ: INSE), a leading B2B provider of gaming content, technology, hardware and services, today reported financial results for the three-month period ended September 30, 2025 and provided an update on accelerating the Company’s operational strategy.
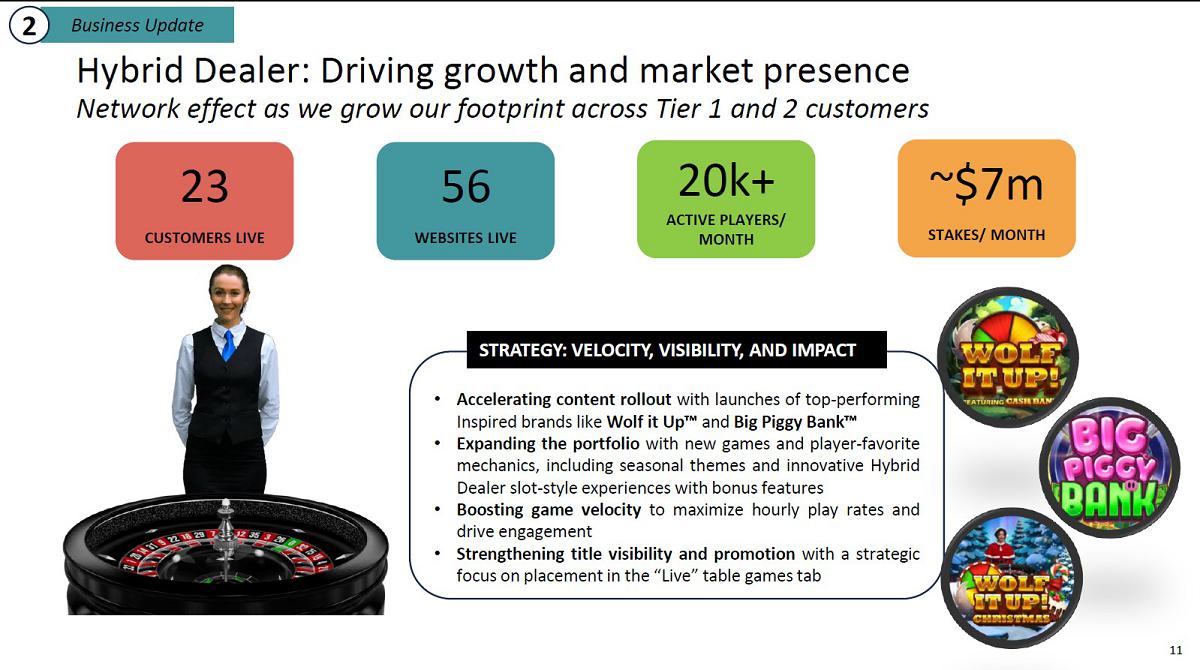
“Inspired delivered a strong quarter driven by strategic execution, digital expansion, and product innovation,” said Brooks Pierce, President and CEO of Inspired. “Our sustained momentum in Interactive continues to build, delivering another record quarter. We’ve built a powerful distribution network and brand franchises that players love, and now we’re scaling that success. We’re gaining market share in our largest markets, and we expect further gains as we roll out key titles within our leading brand franchises and introduce industry-first new multiplayer experiences. Our strong presence at G2E reinforced this momentum, highlighted by Hybrid Dealer winning the Global Gaming Award for Innovative Product of the Year, an amazing achievement for a company of our size.
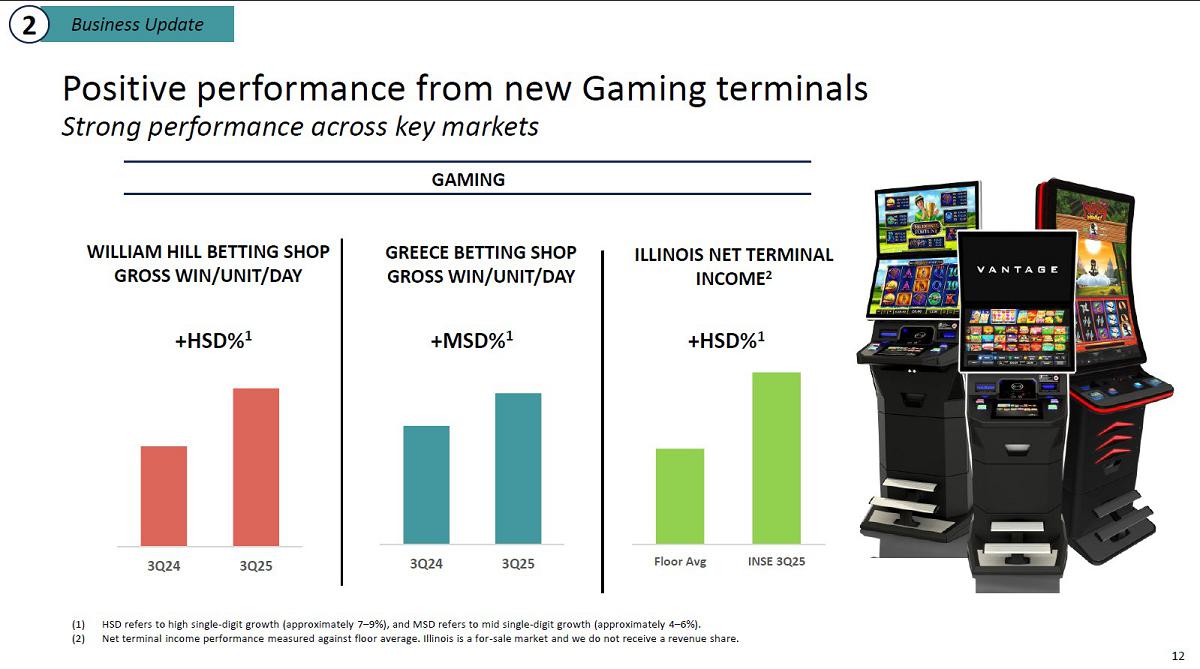
Our Gaming business continues to perform well and gain share, including installations of our terminals with new customers, while Virtual Sports has stabilized and is positioned for year-over-year growth in 2026 with several new customers and more localized content.”
1 Assumes that GBP:USD exchange rates will remain broadly in line with current levels
Summary of Third Quarter ended September 30, 2025 - Segment Financial Results
(unaudited)
|
Three Months Ended September 30, |
Reported Variance | Currency Movement 20252 | Functional Currency Variance | |||||||||||||||||
| (In $ millions, except per share amounts) | 2025 | 2024 | % | $ | % | |||||||||||||||
| Total Revenue | ||||||||||||||||||||
| Gaming | $ | 27.1 | $ | 22.5 | 20 | % | $ | 0.9 | 17 | % | ||||||||||
| Virtual Sports | 9.3 | 11.2 | (17 | )% | 0.3 | (20 | )% | |||||||||||||
| Interactive | 15.1 | 10.2 | 48 | % | 0.4 | 44 | % | |||||||||||||
| Leisure | 34.7 | 33.3 | 4 | % | 1.2 | — | ||||||||||||||
| Total Revenue | $ | 86.2 | $ | 77.2 | 12 | % | $ | 2.9 | 8 | % | ||||||||||
| Net operating income | 9.7 | 11.2 | (13 | )% | 0.1 | (14 | )% | |||||||||||||
| Net (loss) income | (1.9 | ) | 2.8 | NM3 | (0.3 | ) | NM3 | |||||||||||||
| Net (loss) income per basic share | $ | (0.07 | ) | $ | 0.10 | NM3 | NM3 | NM3 | ||||||||||||
| Net (loss) income per diluted share | $ | (0.07 | ) | $ | 0.10 | NM3 | NM3 | NM3 | ||||||||||||
| Non-GAAP Financial Measures | ||||||||||||||||||||
| Adjusted EBITDA1 | ||||||||||||||||||||
| Gaming | $ | 13.1 | $ | 9.9 | 33 | % | $ | 0.1 | 33 | % | ||||||||||
| Virtual Sports | 6.6 | 8.8 | (25 | )% | 0.4 | (29 | )% | |||||||||||||
| Interactive | 10.7 | 6.9 | 55 | % | 0.1 | 55 | % | |||||||||||||
| Leisure | 9.5 | 10.2 | (7 | )% | 0.1 | (8 | )% | |||||||||||||
| Corporate | (7.6 | ) | (6.6 | ) | (15 | )% | 0.3 | (21 | )% | |||||||||||
| Total Company Adjusted EBITDA1 | $ | 32.3 | $ | 29.2 | 11 | % | $ | 1.0 | 7 | % | ||||||||||
| Adjusted EBITDA Margin1 | 37 | % | 38 | % | ||||||||||||||||
| Adjusted net income1 | $ | 8.3 | $ | 5.4 | 53 | % | $ | 0.3 | 47 | % | ||||||||||
| Adjusted net income per diluted share | $ | 0.28 | $ | 0.19 | 47 | % | NM3 | 40 | % | |||||||||||
1 Reconciliation to US GAAP shown below.
2 Currency movement calculated by translating 2025 and 2024 performances at 2024 exchange rates.
3 Percentage/dollar change is not meaningful.
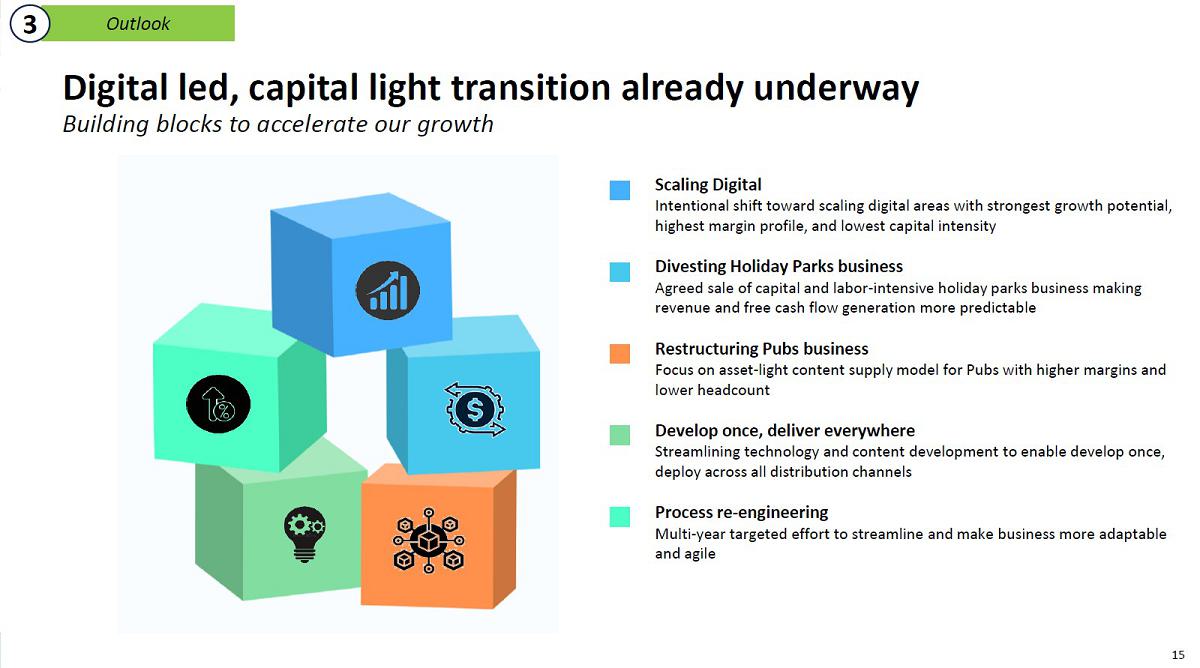
Lorne Weil, Executive Chairman of Inspired, continued, “The divestiture of our holiday parks business marks the next step in our strategic evolution, further supporting our transition toward a more digital, scalable, and higher-margin business. With strong momentum across Interactive and Gaming and the benefits of a more agile, capital-light structure in 2026, we expect digital mix to increase and Adjusted EBITDA margins to expand, more than offsetting the Adjusted EBITDA reduction from the divestiture.
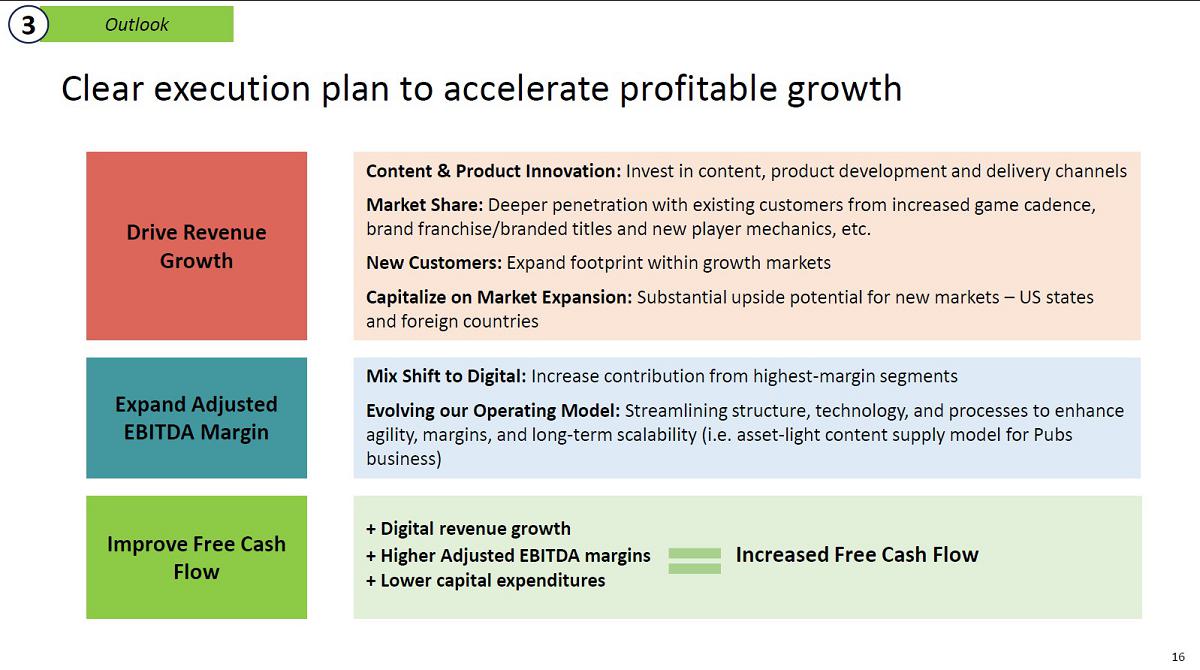
We have a strong foundation and a clear plan to drive revenue growth, strengthen operational leverage, and drive free cash flow generation—positioning us to deliver sustainable, long-term value for our shareholders. Our new share repurchase program is further evidence of the Board’s confidence in our strategy, growth prospects, and ability to generate significant free cash flow, underscoring our commitment to disciplined capital allocation and strong shareholder returns.”
Recent Highlights
| ● | Closing Sale of UK Holiday Parks Business and Certain Associated Leisure Assets for £18.6 million on November 7th: As part of the agreement, after completion Inspired will provide Indigo NewCo Ltd with a number of transitional services, and further provide game and content platform services on a recurring revenue basis. |
| ● | Board Approved a $25 million Share Repurchase Program: Allows the company to buy back shares on or before November 30, 2028, unless the Board determines to extend such period. |
| ● | Advanced Digital-led Growth Strategy: Formed a strategic partnership with Gaming Arts LLC in the third quarter to adapt Inspired’s top-performing online slot titles for land-based markets across North and South America, expanding our reach and reinforcing our digital-led growth strategy. |
| ● | Recognized for Industry-Leading Innovation: Hybrid Dealer™ received Product Innovation of the Year at the 2025 Global Gaming Awards, underscoring Inspired’s ground-breaking game development. |
| ● | Expanded Global Lottery Platform Capabilities: Successfully launched the first cloud-native lottery platform with LEIDSA in the Dominican Republic during the fourth quarter, powering 2,500 retail terminals and digital channels. Built and optimized entirely in the cloud, the platform delivers unmatched scalability, security, and flexibility, enhancing performance across retail and online channels and enabling seamless, cutting-edge lottery experiences for players. |
| ● | Expanded Presence in Brazil: Launched Virtual Sports with six new operators during the third quarter including Estrelabet, powered by Altenar, and KTO Group. |
| ● | Launched New Customer in Gaming: Completed installation of 148 terminals for Corbett’s on schedule, with encouraging early performance contributing to fourth-quarter momentum. |
| ● | Interactive Segment Continues its Momentum into the Fourth Quarter: |
| ○ | Delivered record performance in October |
| ○ | Ranked with three games in Eilers Fantini’s Top 30 and one in the Top 10, with Bigger Piggy Bank™ debuting at #4 among new online slot titles2 |
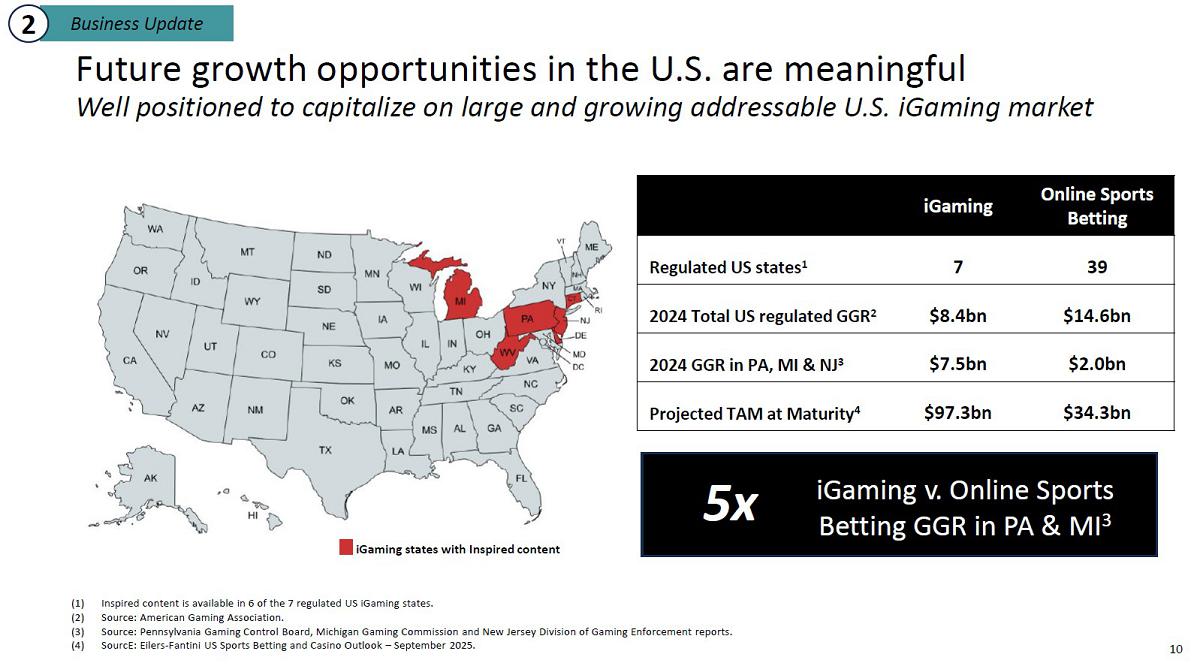
| ○ | Entered West Virginia, our sixth regulated iGaming market in the U.S. |
| ○ | Introduced new industry-first multiplayer persistence mechanic Player Link™ which allows players to share a single Super Wheel across all games |
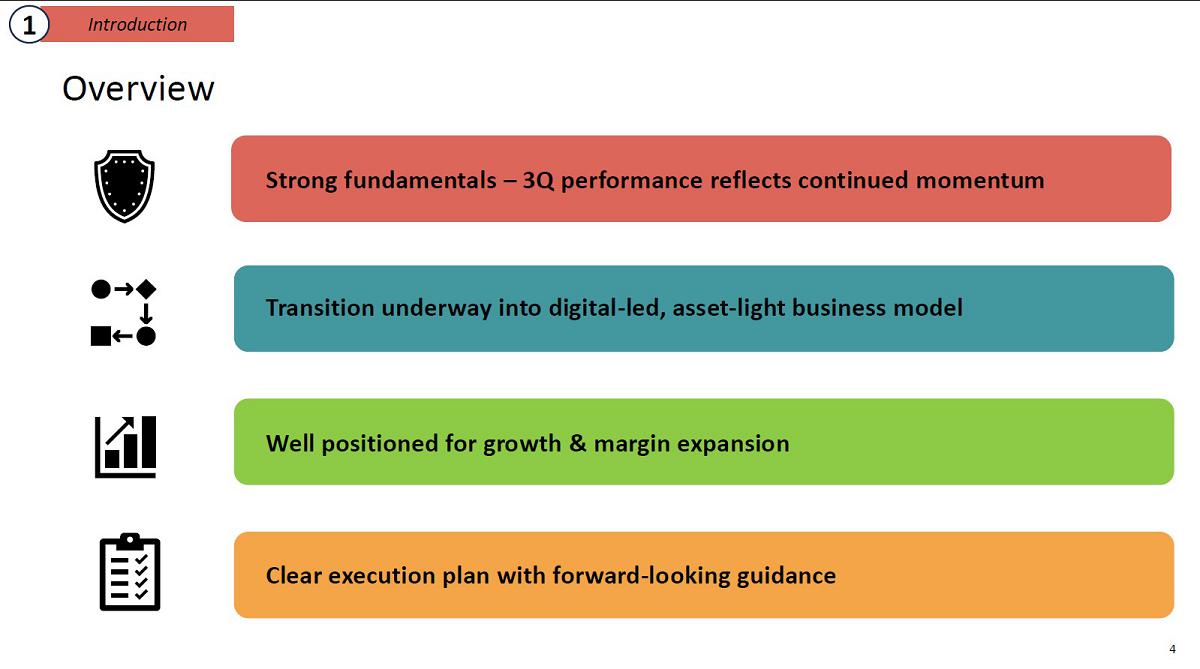
Advancing our Strategic Evolution
Inspired has been undergoing a significant strategic evolution, improving the quality of earnings, strengthening operations, and aligning organizational structures to best position the Company to capitalize on future growth opportunities and deliver shareholder value. In the presentation today, management will outline key initiatives to deliver on this transformation, including:
| ● | Prioritizing Higher Growth, Higher Return Digital Content; Maximizing Omnichannel Game Development |
| ○ | Drive market share gains in Interactive across U.K. and North America through targeted investments in content, account management and omnichannel integration |
| ○ | Deepen engagement with existing customers and expand our presence in high-growth markets, including North America and Brazil |
| ○ | Leverage our strong Interactive roadmap to inform Retail content development, reducing time to market and maximizing cross-channel opportunities |
| ● | Streamlining Operations to Drive Higher Adjusted EBITDA Margins |
| ○ | Divestiture of lower margin holiday parks business will reduce capital intensity and exposure to seasonal and cost-driven volatility, positioning Inspired for faster, more scalable growth across our established network |
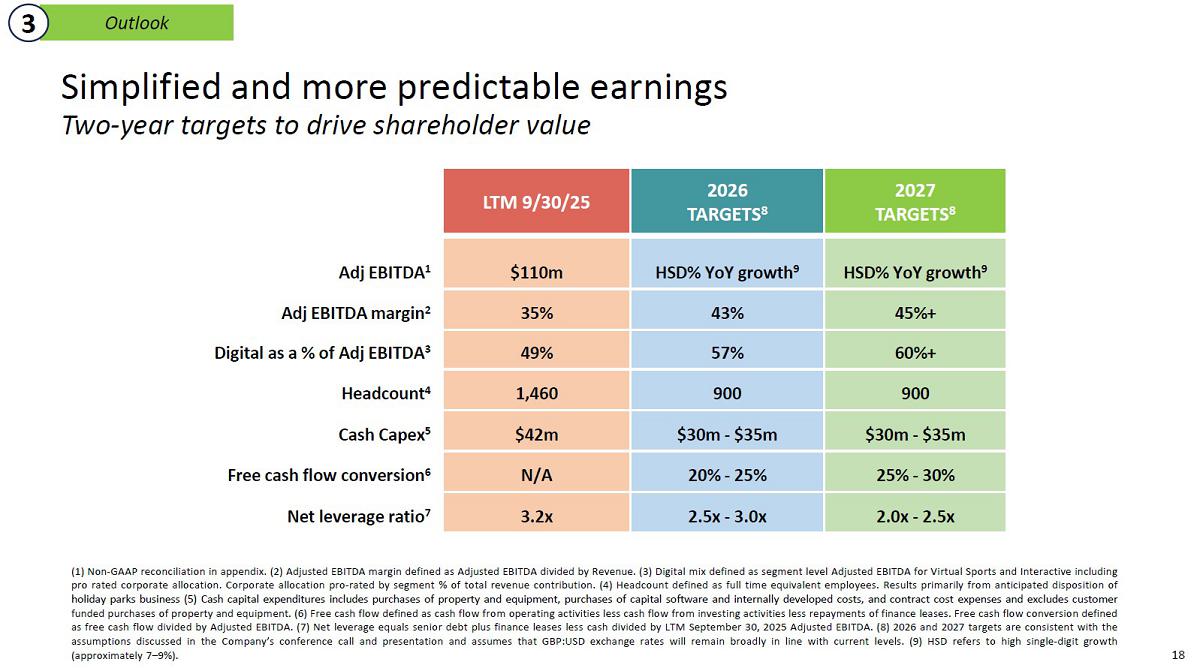
| ○ | Optimizing workforce efficiency, reducing headcount3 from 1,460 to 975 employees by year end 2025 |
| ○ | Investing in new game development framework to deliver retail derivatives from top online titles in an effort to streamline content delivery across all channels, enhance operational leverage and drive sustainable efficiencies |
2 Source: October 2025 Edition of Eilers and Fantini US Online Game Performance Report
3 Full-time equivalent employees including those subject to holiday parks sale
| ● | Enhancing Capital Flexibility to Deleverage and Invest in Growth |
| ○ | Sale of holiday parks and restructuring the Pubs business model expected to reduce annual cash capital expenditures4 to a range of $30 million to $35 million in 2026 |
| ○ | Proceeds from holiday parks sale expected to improve net leverage, further strengthen the balance sheet and support future growth investments |
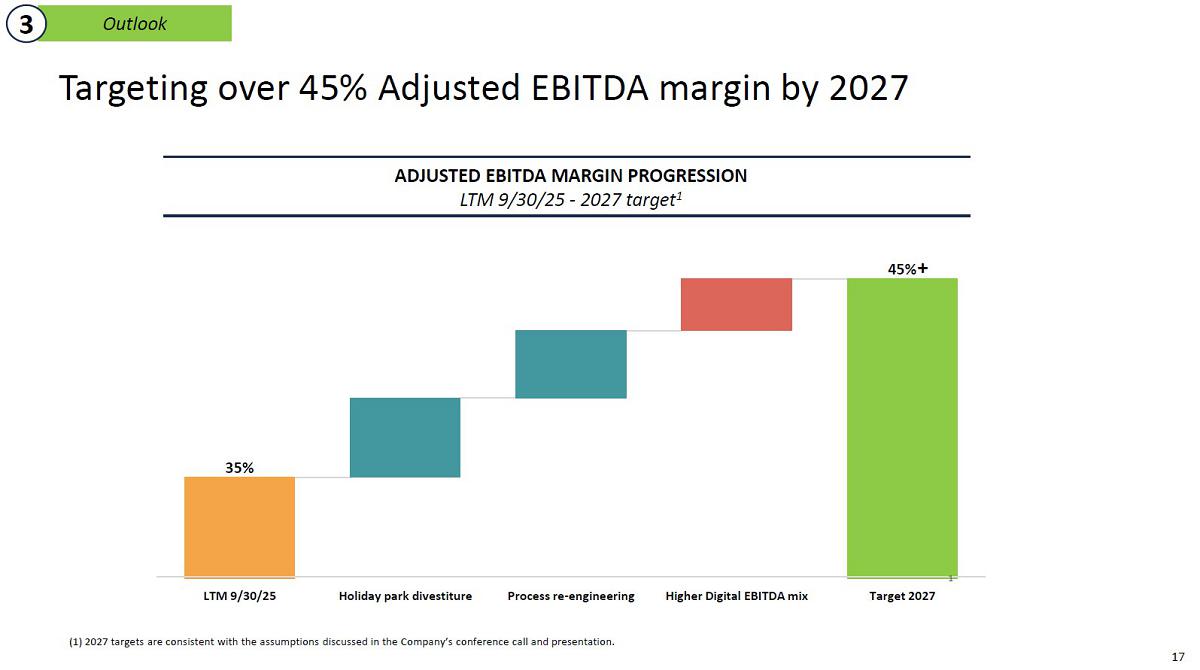
Outlook
| ● | 2025 Outlook: Positive momentum continues into the fourth quarter driven by strength in Interactive, organizational integration efforts, and operational execution across the portfolio. |
Management expects fourth quarter 2025 Adjusted EBITDA to increase year over year and full year 2025 Adjusted EBITDA to exceed $110 million5.
| ● | 2026 and Beyond: Management remains confident in its strategic direction and its ability to drive long-term shareholder value, supported by a resilient business model, diversified revenue streams, and a strong foundation for continued digital growth. |
The divestiture of the lower-margin holiday parks business, coupled with continued Interactive growth and a more agile, capital-light operating model, is expected to support Adjusted EBITDA margin expansion, strengthen free cash flow conversion, and reduce net leverage.
Detailed 2026 outlook will be provided with fourth quarter 2025 results.
Summary of Nine Months ended September 30, 2025 - Segment Financial Results
(unaudited)
|
Nine Months Ended September 30, |
Reported Variance | Currency Movement 20252 | Functional Currency Variance | |||||||||||||||||
| (In $ millions) | 2025 | 2024 | % | $ | % | |||||||||||||||
| Total Revenue | ||||||||||||||||||||
| Gaming | $ | 76.0 | $ | 71.8 | 6 | % | $ | 2.4 | 3 | % | ||||||||||
| Virtual Sports | 27.2 | 35.3 | (23 | )% | 0.8 | (25 | )% | |||||||||||||
| Interactive | 40.8 | 27.7 | 47 | % | 1.1 | 43 | % | |||||||||||||
| Leisure | 82.9 | 79.3 | 5 | % | 2.8 | 1 | % | |||||||||||||
| Total Revenue | $ | 226.9 | $ | 214.1 | 6 | % | $ | 7.1 | 3 | % | ||||||||||
| Net operating income | 19.2 | 17.8 | 8 | % | 0.2 | 7 | % | |||||||||||||
| Net loss | (9.8 | ) | (2.2 | ) | NM3 | (1.1 | ) | NM3 | ||||||||||||
| Net loss per basic share | $ | (0.34 | ) | $ | (0.08 | ) | NM3 | NM3 | NM3 | |||||||||||
| Net loss per diluted share | $ | (0.33 | ) | $ | (0.08 | ) | NM3 | NM3 | NM3 | |||||||||||
| Non-GAAP Financial Measures | ||||||||||||||||||||
| Adjusted EBITDA1 | ||||||||||||||||||||
| Gaming | $ | 35.2 | $ | 25.7 | 37 | % | $ | 1.2 | 33 | % | ||||||||||
| Virtual Sports | 19.5 | 28.8 | (32 | )% | 0.5 | (35 | )% | |||||||||||||
| Interactive | 27.5 | 17.4 | 58 | % | 1.0 | 54 | % | |||||||||||||
| Leisure | 18.9 | 18.1 | 4 | % | 0.7 | 1 | % | |||||||||||||
| Corporate | (22.0 | ) | (20.9 | ) | (5 | )% | (0.6 | ) | (2 | )% | ||||||||||
| Total Company Adjusted EBITDA1 | $ | 79.1 | $ | 69.1 | 14 | % | $ | 2.8 | 11 | % | ||||||||||
| Adjusted EBITDA Margin1 | 35 | % | 32 | % | ||||||||||||||||
| Adjusted net income1 | $ | 0.7 | $ | 9.8 | (92 | )% | $ | 0.0 | (93 | )% | ||||||||||
| Adjusted net income per diluted share | $ | 0.03 | $ | 0.34 | (91 | )% | NM3 | (93 | )% | |||||||||||
1 Reconciliation to US GAAP shown below.
2 Currency movement calculated by translating 2025 and 2024 performances at 2024 exchange rates.
3 Percentage/dollar change is not meaningful.
4 Cash capital expenditures includes purchases of property and equipment, purchases of capital software and internally developed costs, and contract cost expenses and excludes customer funded purchases of property and equipment
5 Assumes that GBP:USD exchange rates will remain broadly in line with current levels We use non-GAAP financial measures, including Adjusted EBITDA, to analyze our operating performance.
Non-GAAP Financial Measures
We use these financial measures to manage our business on a day-to-day basis. We believe that these measures are also commonly used in our industry to measure performance. For these reasons, we believe that these non-GAAP financial measures provide expanded insight into our business, in addition to standard U.S. GAAP financial measures. There are no uniform rules for defining and using non-GAAP financial measures, and as a result the measures we use may not be comparable to measures used by other companies, even if they have similar labels. The presentation of non-GAAP financial information should not be considered in isolation from, as a substitute for, or superior to, financial information prepared and presented in accordance with U.S. GAAP. You should consider our non-GAAP financial measures in conjunction with our U.S. GAAP financial statements.
We define our non-GAAP financial measures as follows:
EBITDA is defined as net income (loss) excluding depreciation and amortization, interest expense, interest income and income tax expense.
Adjusted EBITDA is defined as net income (loss) excluding depreciation and amortization, interest expense, interest income and income tax expense, and other additional exclusions and adjustments (see Adjusted EBITDA reconciliation table). Such additional excluded amounts include stock-based compensation U.S. GAAP charges where the associated liability is expected to be settled in stock, and changes in the value of earnout liabilities and income and expenditure in relation to legacy portions of the business (being those portions where trading no longer occurs) including closed defined benefit pension schemes. Additional adjustments are made for items considered outside the normal course of business, including (1) restructuring costs, which include charges attributable to employee severance, management changes, restructuring, dual running costs, costs related to facility closures and integration costs, (2) merger and acquisition costs, (3) gains or losses not in the ordinary course of business and (4) the costs of the restatement of previously issued financial statements.
We believe Adjusted EBITDA, when considered along with other performance measures, is a particularly useful performance measure, because it focuses on certain operating drivers of the business, including sales growth, operating costs, selling and administrative expense and other operating income and expense. We believe Adjusted EBITDA can provide a more complete understanding of our operating results and the trends to which we are subject, and an enhanced overall understanding of our financial performance and prospects for the future. Adjusted EBITDA is not intended to be a measure of liquidity or cash flows from operations or a measure comparable to net income or loss, because it does not take into account certain aspects of our operating performance (for example, it excludes non-recurring gains and losses which are not deemed to be a normal part of underlying business activities). Our use of Adjusted EBITDA may not be comparable to the use by other companies of similarly termed measures. Management compensates for these limitations by using Adjusted EBITDA as only one of several measures for evaluating our operating performance. In addition, capital expenditures, which affect depreciation and amortization, interest expense, and income tax benefit (expense), are evaluated separately by management.
Adjusted Net Income is defined as net income (loss) excluding the effects of certain exclusions and adjustments. Such excluded amounts include income and expenditure in relation to legacy portions of the business (being those portions where trading no longer occurs) including closed defined benefit pension schemes. Additional adjustments are made for items considered outside the normal course of business, including (1) restructuring costs, which include charges attributable to employee severance, management changes, restructuring, dual running costs, costs related to facility closures and integration costs, (2) merger and acquisition costs and (3) gains or losses not in the ordinary course of business. These items have been adjusted to reflect the tax impact from excluding them from net income (loss).
Adjusted Net Income per diluted share is computed by dividing the Adjusted Net Income by the weighted-average number of common shares outstanding during the period, including the effects of any potentially dilutive securities, including RSUs, using the treasury stock method, and convertible debt or convertible preferred stock, using the if-converted method, unless the inclusion would be anti-dilutive.
Functional Currency at Constant rate. Currency impacts shown have been calculated as the current-period average GBP:USD rate less the equivalent average rate in the prior year quarter, multiplied by the current period amount in our functional currency (GBP). The remaining difference, referred to as functional currency at constant rate, is calculated as the difference in our functional currency, multiplied by the prior year quarter average GBP: USD rate, as a proxy for functional currency at constant rate movement.
Currency Movement represents the difference between the results in our reporting currency (USD) and the results on a functional currency at constant rate basis.
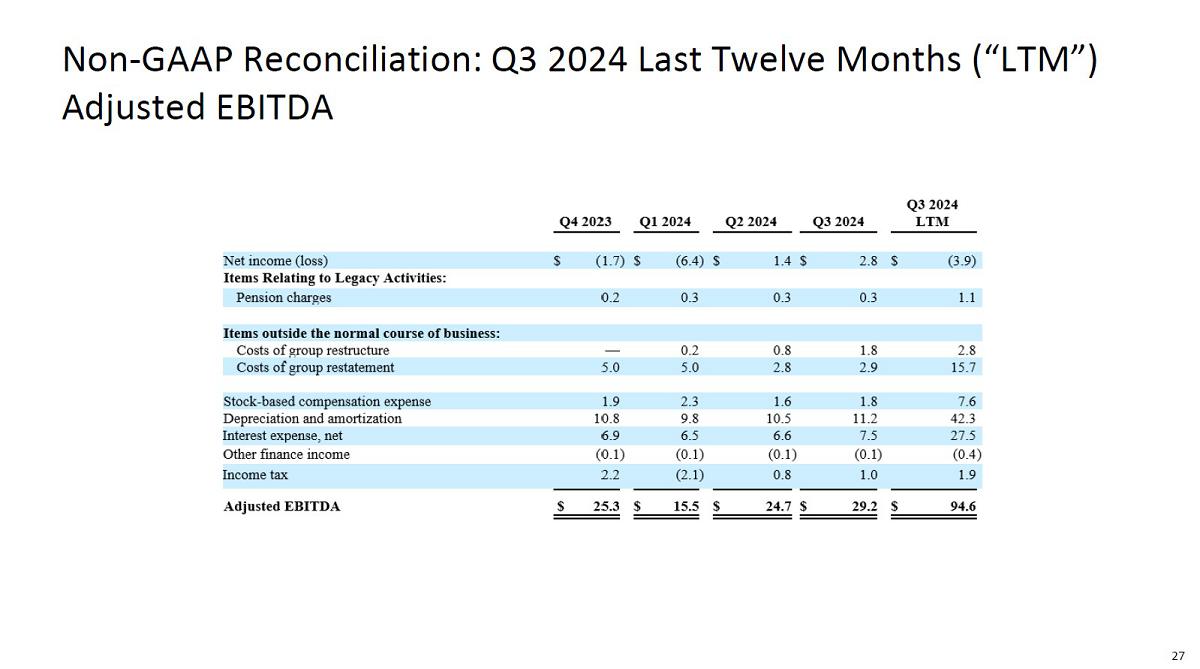
Reconciliations from net income (loss), as shown in our Consolidated Statements of Operations and Comprehensive Loss, to Adjusted EBITDA are shown below.
Conference Call and Webcast
Inspired management will host a conference call and simultaneous webcast at 8:00 a.m. ET / 1:00 p.m. in the UK on Wednesday, November 5, 2025 to discuss the financial results and general business trends.
Telephone: The dial-in number to access the call live is 1-800-715-9871 (US) or 1-646-307-1963 (International). Participants should ask to be joined into the Inspired Entertainment call.
Webcast: A live audio-only webcast of the call can be accessed through the “Events and Presentations” page of the Company’s website at www.inseinc.com under the Investors link. Please follow the registration prompts.
Replay: A replay of the webcast will be available on the Company’s website at www.inseinc.com, along with a copy of this press release and an investor slide presentation.
About Inspired Entertainment, Inc.
Inspired offers an expanding portfolio of content, technology, hardware and services for regulated gaming, betting and lottery operators across land-based, online, and mobile channels around the world. Inspired’s gaming, virtual sports, and interactive products appeal to a wide variety of players, creating new opportunities for operators to grow their revenue. The Company operates in approximately 35 jurisdictions worldwide, supplying gaming systems with associated terminals and content for approximately 75,000 gaming machines located in betting shops, pubs, gaming halls and other route operations; virtual sports products through approximately 25,000 retail venues and various online websites; and interactive games for over 500 websites. Additional information can be found at www.inseinc.com.
Forward-Looking Statements
This press release contains “forward-looking statements” within the meaning of the “safe harbor” provisions of the U.S. Private Securities Litigation Reform Act of 1995, including, but not limited to, statements regarding our ability to bring certain of our products to customers in the various markets in which we operate and execute on our strategic plan, statements regarding expectations with respect to potential new customers and statements regarding our anticipated financial performance. Forward-looking statements may be identified by the use of words such as “anticipate,” “believe,” “continue,” “expect,” “estimate,” “plan,” “will,” “would” and “project” and other similar expressions that indicate future events or trends or are not statements of historical matters. These statements are based on Inspired management’s current expectations and beliefs, as well as a number of assumptions concerning future events.
Forward-looking statements are subject to known and unknown risks, uncertainties, assumptions and other important factors, many of which are outside of Inspired’s control and all of which could cause actual results to differ materially from the results discussed in the forward-looking statements. Accordingly, forward-looking statements should not be relied upon as representing Inspired’s views as of any subsequent date. We cannot guarantee that the results anticipated by management, as set forth herein, will be realized or, even if realized, will have the expected effects on our results of operations or financial performance. Such results may be affected by, among other things, the “Risk Factors” section of Inspired’s annual report on Form 10-K for the fiscal year ended December 31, 2024, and subsequent quarterly reports on Form 10-Q, which are available, free of charge, on the U.S. Securities and Exchange Commission’s website at www.sec.gov. Inspired does not undertake any obligation to update forward-looking statements to reflect events or circumstances after the date they were made, whether as a result of new information, future events or otherwise, except as required by law.
Contact:
For Investors
IR@inseinc.com
For Press and Sales
inspiredsales@inseinc.com
INSPIRED ENTERTAINMENT, INC. AND SUBSIDIARIES
CONDENSED CONSOLIDATED STATEMENTS OF OPERATIONS AND COMPREHENSIVE (LOSS) INCOME
(in millions, except share and per share data)
(Unaudited)
|
Three Months Ended September 30, |
Nine Months Ended September 30, |
|||||||||||||||
| 2025 | 2024 | 2025 | 2024 | |||||||||||||
| Revenue: | ||||||||||||||||
| Service | $ | 79.4 | $ | 72.9 | $ | 210.2 | $ | 193.9 | ||||||||
| Product sales | 6.8 | 4.3 | 16.7 | 20.2 | ||||||||||||
| Total revenue | 86.2 | 77.2 | 226.9 | 214.1 | ||||||||||||
| Cost of sales: | ||||||||||||||||
| Cost of service (1) | (22.0 | ) | (20.7 | ) | (58.2 | ) | (55.6 | ) | ||||||||
| Cost of product sales (1) | (3.7 | ) | (2.7 | ) | (10.6 | ) | (13.0 | ) | ||||||||
| Selling, general and administrative expenses | (31.7 | ) | (31.4 | ) | (93.9 | ) | (96.4 | ) | ||||||||
| Depreciation and amortization | (13.2 | ) | (11.2 | ) | (39.1 | ) | (31.3 | ) | ||||||||
| Impairment loss on classification as held-for-sale | (5.9 | ) | — | (5.9 | ) | — | ||||||||||
| Net operating income | 9.7 | 11.2 | 19.2 | 17.8 | ||||||||||||
| Other expense | ||||||||||||||||
| Interest expense, net | (12.5 | ) | (7.5 | ) | (26.6 | ) | (20.7 | ) | ||||||||
| Other finance income | 0.2 | 0.1 | 0.6 | 0.3 | ||||||||||||
| Total other expense, net | (12.3 | ) | (7.4 | ) | (26.0 | ) | (20.4 | ) | ||||||||
| Net (loss) income before income taxes | (2.6 | ) | 3.8 | (6.8 | ) | (2.6 | ) | |||||||||
| Income tax benefit (expense) | 0.7 | (1.0 | ) | (3.0 | ) | 0.4 | ||||||||||
| Net (loss) income | (1.9 | ) | 2.8 | (9.8 | ) | (2.2 | ) | |||||||||
| Other comprehensive (loss)/income: | ||||||||||||||||
| Foreign currency translation gain (loss) | 0.6 | (5.9 | ) | (1.3 | ) | (5.6 | ) | |||||||||
| Reclassification of loss on pension plan to comprehensive income | 0.3 | 0.3 | 0.8 | 0.9 | ||||||||||||
| Other comprehensive income (loss) | 0.9 | (5.6 | ) | (0.5 | ) | (4.7 | ) | |||||||||
| Comprehensive (loss) income | $ | (1.0 | ) | $ | (2.8 | ) | $ | (10.3 | ) | $ | (6.9 | ) | ||||
| Net (loss) income per common share – basic | $ | (0.07 | ) | $ | 0.10 | $ | (0.34 | ) | $ | (0.08 | ) | |||||
| Net (loss) income per common share – diluted | $ | (0.07 | ) | $ | 0.10 | $ | (0.34 | ) | $ | (0.08 | ) | |||||
| Weighted average number of shares outstanding during the period – basic | 29,094,787 | 28,496,801 | 29,049,634 | 28,524,762 | ||||||||||||
| Weighted average number of shares outstanding during the period – diluted | 29,094,787 | 29,188,787 | 29,049,634 | 28,524,762 | ||||||||||||
| Supplemental disclosure of stock-based compensation expense | ||||||||||||||||
| Stock-based compensation included in: | ||||||||||||||||
| Selling, general and administrative expenses | $ | (1.4 | ) | $ | (1.8 | ) | $ | (4.6 | ) | $ | (5.7 | ) | ||||
| (1) | Excluding depreciation and amortization |
INSPIRED ENTERTAINMENT, INC. AND SUBSIDIARIES
CONDENSED CONSOLIDATED BALANCE SHEETS
(in millions, except share data)
|
September 30, 2025 |
December 31, 2024 |
|||||||
| (Unaudited) | ||||||||
| Assets | ||||||||
| Current assets | ||||||||
| Cash | $ | 36.3 | $ | 29.3 | ||||
| Accounts receivable, net | 43.3 | 65.4 | ||||||
| Inventory | 26.7 | 28.0 | ||||||
| Prepaid expenses and other current assets | 46.0 | 36.0 | ||||||
| Corporate tax and other current taxes receivable | 5.2 | 1.2 | ||||||
| Current assets held-for-sale | 40.9 | — | ||||||
| Total current assets | 198.4 | 159.9 | ||||||
| Property and equipment, net | 53.6 | 56.4 | ||||||
| Software development costs, net | 21.1 | 22.4 | ||||||
| Other acquired intangible assets subject to amortization, net | 15.6 | 16.1 | ||||||
| Goodwill | 62.1 | 57.8 | ||||||
| Finance lease right of use asset | 23.4 | 18.7 | ||||||
| Operating lease right of use asset | 9.3 | 16.2 | ||||||
| Costs of obtaining and fulfilling customer contracts, net | 15.2 | 11.0 | ||||||
| Deferred tax | 71.8 | 67.4 | ||||||
| Other assets | 15.3 | 12.5 | ||||||
| Total assets | $ | 485.8 | $ | 438.4 | ||||
| Liabilities and Stockholders’ Deficit | ||||||||
| Current liabilities | ||||||||
| Accounts payable and accrued expenses | $ | 70.9 | $ | 53.7 | ||||
| Corporate tax and other current taxes payable | 8.9 | 12.3 | ||||||
| Deferred revenue, current | 6.5 | 5.8 | ||||||
| Operating lease liabilities | 3.3 | 5.1 | ||||||
| Current portion of long-term debt | — | 18.8 | ||||||
| Current portion of finance lease liabilities | 4.9 | 4.4 | ||||||
| Current liabilities held-for-sale | 10.9 | — | ||||||
| Other current liabilities | 3.7 | 3.9 | ||||||
| Total current liabilities | 109.1 | 104.0 | ||||||
| Long-term debt | 344.4 | 292.2 | ||||||
| Finance lease liabilities, net of current portion | 16.2 | 18.6 | ||||||
| Deferred revenue, net of current portion | 16.6 | 12.8 | ||||||
| Operating lease liabilities | 7.0 | 11.7 | ||||||
| Other long-term liabilities | 1.5 | 2.4 | ||||||
| Total liabilities | 494.8 | 441.7 | ||||||
| Commitments and contingencies | — | — | ||||||
| Stockholders’ deficit | ||||||||
| Preferred stock; $0.0001 par value; 1,000,000 shares authorized, no shares issued and outstanding at September 30, 2025 and December 31, 2024, respectively. | — | — | ||||||
| Common stock; $0.0001 par value; 49,000,000 shares authorized; 26,920,506 shares and 26,581,972 shares issued and outstanding at September 30, 2025 and December 31, 2024, respectively | — | — | ||||||
| Additional paid in capital | 394.5 | 389.9 | ||||||
| Accumulated other comprehensive income | 47.8 | 48.3 | ||||||
| Accumulated deficit | (451.3 | ) | (441.5 | ) | ||||
| Total stockholders’ deficit | (9.0 | ) | (3.3 | ) | ||||
| Total liabilities and stockholders’ deficit | $ | 485.8 | $ | 438.4 | ||||
INSPIRED ENTERTAINMENT, INC. AND SUBSIDIARIES
CONDENSED CONSOLIDATED STATEMENTS OF CASH FLOWS
(in millions)
(Unaudited)
|
Nine Months Ended September 30, |
||||||||
| 2025 | 2024 | |||||||
| Cash flows from operating activities: | ||||||||
| Net loss | $ | (9.8 | ) | $ | (2.2 | ) | ||
| Adjustments to reconcile net loss to net cash provided by operating activities: | ||||||||
| Depreciation and amortization | 32.3 | 31.3 | ||||||
| Amortization of finance lease right of use asset | 6.8 | — | ||||||
| Amortization of operating lease right of use asset | 3.2 | 3.3 | ||||||
| Impairment loss on classification as held-for-sale | 5.9 | — | ||||||
| Stock-based compensation expense | 4.6 | 5.7 | ||||||
| Amortization of deferred financing fees relating to senior debt | 2.3 | 0.7 | ||||||
| Deferred tax | (2.8 | ) | — | |||||
| Changes in assets and liabilities: | ||||||||
| Accounts receivable | 24.3 | (4.0 | ) | |||||
| Inventory | (0.9 | ) | 2.3 | |||||
| Prepaid expenses and other assets | (20.1 | ) | (1.1 | ) | ||||
| Corporate tax and other current taxes payable | (7.6 | ) | (4.0 | ) | ||||
| Accounts payable and accrued expenses | 15.9 | (7.8 | ) | |||||
| Deferred revenue and customer prepayment | 2.6 | 3.9 | ||||||
| Operating lease liabilities | (2.9 | ) | (3.1 | ) | ||||
| Pension contributions | (0.9 | ) | (1.1 | ) | ||||
| Other long-term liabilities | (2.1 | ) | 0.9 | |||||
| Net cash provided by operating activities | 50.8 | 24.8 | ||||||
| Cash flows from investing activities: | ||||||||
| Purchases of property and equipment | (24.6 | ) | (11.7 | ) | ||||
| Purchases of capital software and internally developed costs | (7.6 | ) | (9.2 | ) | ||||
| Contract cost expense | (10.0 | ) | (8.6 | ) | ||||
| Net cash used in investing activities | (42.2 | ) | (29.5 | ) | ||||
| Cash flows from financing activities: | ||||||||
| Debt introduced | 365.7 | — | ||||||
| Repayments of long-term debt | (318.3 | ) | — | |||||
| Repayments of short-term debt | (20.3 | ) | — | |||||
| Debt fees incurred | (18.8 | ) | — | |||||
| Repayments of finance leases | (4.9 | ) | (0.4 | ) | ||||
| Net cash provided by (used in) financing activities | 3.4 | (0.4 | ) | |||||
| Net increase in cash classified within assets held-for-sale | (7.6 | ) | — | |||||
| Effect of exchange rate changes on cash | 2.6 | 1.6 | ||||||
| Net increase (decrease) in cash | 7.0 | (3.5 | ) | |||||
| Cash, beginning of period | 29.3 | 40.0 | ||||||
| Cash, end of period | $ | 36.3 | $ | 36.5 | ||||
| Components of cash and restricted cash | ||||||||
| Cash | 36.3 | 35.7 | ||||||
| Restricted cash | — | 0.8 | ||||||
| Total cash and restricted cash, end of period | $ | 36.3 | $ | 36.5 | ||||
| Supplemental cash flow disclosures | ||||||||
| Cash paid during the period for interest | $ | 17.3 | $ | 12.8 | ||||
| Cash paid during the period for income taxes | $ | 9.4 | $ | 2.5 | ||||
| Cash paid during the period for operating leases | $ | 6.1 | $ | 7.2 | ||||
| Supplemental disclosure of non-cash investing and financing activities | ||||||||
| Lease liabilities arising from obtaining finance lease right of use assets | $ | (1.3 | ) | $ | — | |||
| Lease liabilities arising from obtaining operating lease right of use assets | $ | (1.1 | ) | $ | (6.4 | ) | ||
| Right of use property and equipment acquired through finance lease | $ | 10.4 | $ | 21.9 | ||||
| Additional paid in capital from net settlement of RSUs | $ | — | $ | (0.8 | ) | |||
INSPIRED ENTERTAINMENT, INC. AND SUBSIDIARIES
RECONCILIATION OF NON-GAAP FINANCIAL MEASURES
ADJUSTED EBITDA RECONCILIATION BY SEGMENT
(in millions)
(Unaudited)
Three Months Ended September 30, 2025
| Gaming |
Virtual Sports |
Interactive | Leisure | Corporate | Total | |||||||||||||||||||
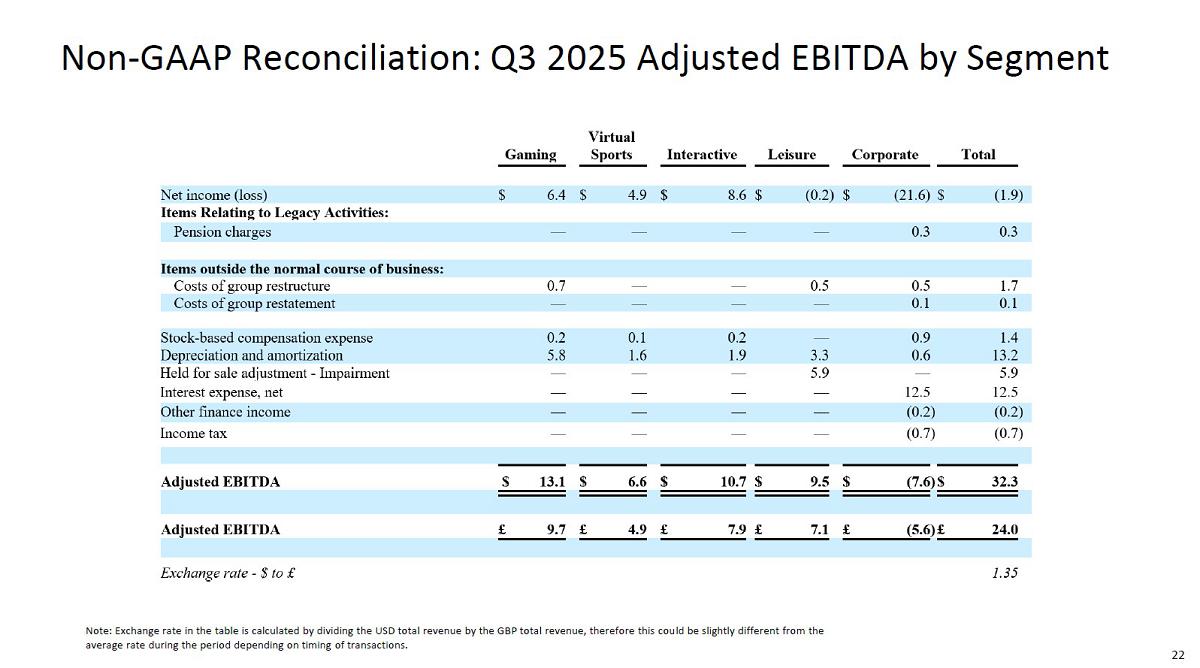
| Net income (loss) | $ | 6.4 | $ | 4.9 | $ | 8.6 | $ | (0.2 | ) | $ | (21.6 | ) | $ | (1.9 | ) | |||||||||
| Items Relating to Legacy Activities: | ||||||||||||||||||||||||
| Pension charges | — | — | — | — | 0.3 | 0.3 | ||||||||||||||||||
| Items outside the normal course of business: | ||||||||||||||||||||||||
| Costs of group restructure | 0.7 | — | — | 0.5 | 0.5 | 1.7 | ||||||||||||||||||
| Costs of group restatement | — | — | — | — | 0.1 | 0.1 | ||||||||||||||||||
| Stock-based compensation expense | 0.2 | 0.1 | 0.2 | — | 0.9 | 1.4 | ||||||||||||||||||
| Depreciation and amortization | 5.8 | 1.6 | 1.9 | 3.3 | 0.6 | 13.2 | ||||||||||||||||||
| Held for sale adjustment - Impairment | — | — | — | 5.9 | — | 5.9 | ||||||||||||||||||
| Interest expense, net | — | — | — | — | 12.5 | 12.5 | ||||||||||||||||||
| Other finance income | — | — | — | — | (0.2 | ) | (0.2 | ) | ||||||||||||||||
| Income tax | — | — | — | — | (0.7 | ) | (0.7 | ) | ||||||||||||||||
| Adjusted EBITDA | $ | 13.1 | $ | 6.6 | $ | 10.7 | $ | 9.5 | $ | (7.6 | ) | $ | 32.3 | |||||||||||
| Adjusted EBITDA | £ | 9.7 | £ | 4.9 | £ | 7.9 | £ | 7.1 | £ | (5.6 | ) | £ | 24.0 | |||||||||||
| Exchange rate - $ to £ | 1.35 | |||||||||||||||||||||||
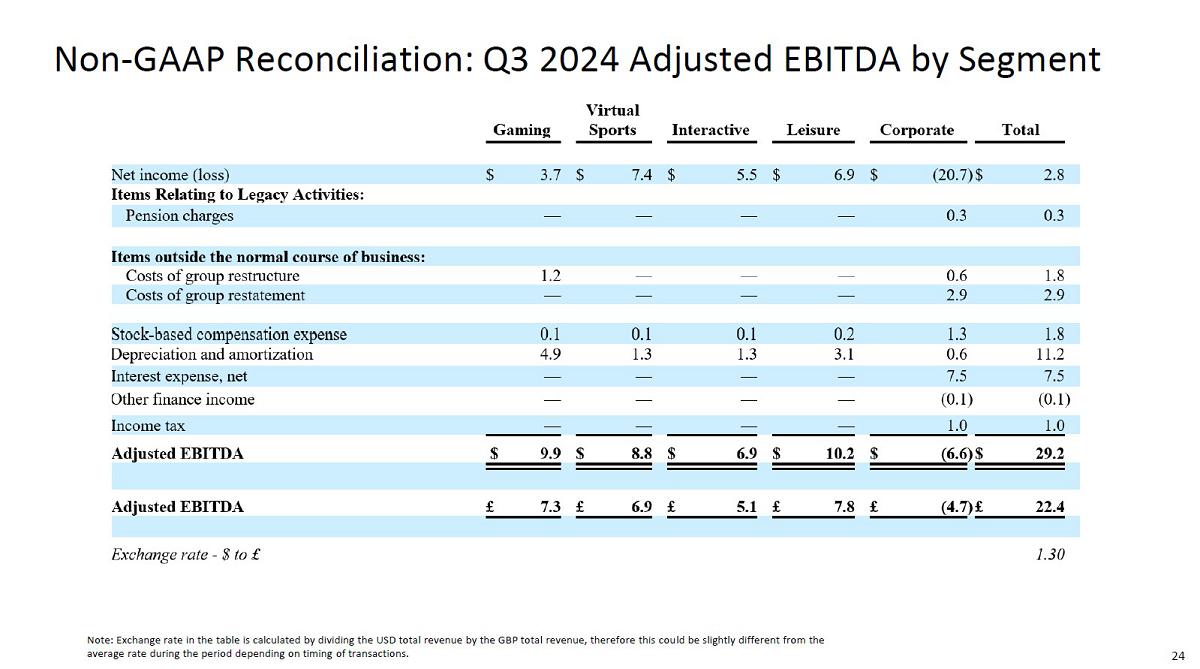
Three Months Ended September 30, 2024
| Gaming |
Virtual Sports |
Interactive | Leisure | Corporate | Total | |||||||||||||||||||
| Net income (loss) | $ | 3.7 | $ | 7.4 | $ | 5.5 | $ | 6.9 | $ | (20.7 | ) | $ | 2.8 | |||||||||||
| Items Relating to Legacy Activities: | ||||||||||||||||||||||||
| Pension charges | — | — | — | — | 0.3 | 0.3 | ||||||||||||||||||
| Items outside the normal course of business: | ||||||||||||||||||||||||
| Costs of group restructure | 1.2 | — | — | — | 0.6 | 1.8 | ||||||||||||||||||
| Costs of group restatement | — | — | — | — | 2.9 | 2.9 | ||||||||||||||||||
| Stock-based compensation expense | 0.1 | 0.1 | 0.1 | 0.2 | 1.3 | 1.8 | ||||||||||||||||||
| Depreciation and amortization | 4.9 | 1.3 | 1.3 | 3.1 | 0.6 | 11.2 | ||||||||||||||||||
| Interest expense, net | — | — | — | — | 7.5 | 7.5 | ||||||||||||||||||
| Other finance income | — | — | — | — | (0.1 | ) | (0.1 | ) | ||||||||||||||||
| Income tax | — | — | — | — | 1.0 | 1.0 | ||||||||||||||||||
| Adjusted EBITDA | $ | 9.9 | $ | 8.8 | $ | 6.9 | $ | 10.2 | $ | (6.6 | ) | $ | 29.2 | |||||||||||
| Adjusted EBITDA | £ | 7.3 | £ | 6.9 | £ | 5.1 | £ | 7.8 | £ | (4.7 | ) | £ | 22.4 | |||||||||||
| Exchange rate - $ to £ | 1.30 | |||||||||||||||||||||||
Nine Months Ended September 30, 2025
| Gaming |
Virtual Sports |
Interactive | Leisure | Corporate | Total | |||||||||||||||||||
| Net income (loss) | $ | 15.9 | $ | 14.4 | $ | 22.8 | $ | 1.6 | $ | (64.5 | ) | $ | (9.8 | ) | ||||||||||
| Items Relating to Legacy Activities: | ||||||||||||||||||||||||
| Pension charges | — | — | — | — | 0.8 | 0.8 | ||||||||||||||||||
| Items outside the normal course of business: | ||||||||||||||||||||||||
| Costs of group restructure | 1.3 | — | — | 0.5 | 3.6 | 5.4 | ||||||||||||||||||
| Costs of group restatement | — | — | — | — | 4.1 | 4.1 | ||||||||||||||||||
| Stock-based compensation expense | 0.7 | 0.3 | 0.5 | 0.3 | 2.8 | 4.6 | ||||||||||||||||||
| Depreciation and amortization | 17.3 | 4.8 | 4.2 | 10.6 | 2.2 | 39.1 | ||||||||||||||||||
| Held for sale adjustment - Impairment | — | — | — | 5.9 | — | 5.9 | ||||||||||||||||||
| Interest expense, net | — | — | — | — | 26.6 | 26.6 | ||||||||||||||||||
| Other finance income | — | — | — | — | (0.6 | ) | (0.6 | ) | ||||||||||||||||
| Income tax | — | — | — | — | 3.0 | 3.0 | ||||||||||||||||||
| Adjusted EBITDA | $ | 35.2 | $ | 19.5 | $ | 27.5 | $ | 18.9 | $ | (22.0 | ) | $ | 79.1 | |||||||||||
| Adjusted EBITDA | £ | 26.7 | £ | 14.8 | £ | 20.8 | £ | 14.2 | £ | (16.7 | ) | £ | 59.8 | |||||||||||
| Exchange rate - $ to £ | 1.32 | |||||||||||||||||||||||
Nine Months Ended September 30, 2024
| Gaming |
Virtual Sports |
Interactive | Leisure | Corporate | Total | |||||||||||||||||||
| Net income (loss) | $ | 11.5 | $ | 23.8 | $ | 13.4 | $ | 8.6 | $ | (59.5 | ) | $ | (2.2 | ) | ||||||||||
| Items Relating to Legacy Activities: | ||||||||||||||||||||||||
| Pension charges | — | — | — | — | 0.9 | 0.9 | ||||||||||||||||||
| Items outside the normal course of business: | ||||||||||||||||||||||||
| Costs of group restructure | 1.5 | — | — | — | 1.3 | 2.8 | ||||||||||||||||||
| Costs of group restatement | — | — | — | — | 10.6 | 10.6 | ||||||||||||||||||
| Stock-based compensation expense | 0.5 | 0.3 | 0.3 | 0.4 | 4.2 | 5.7 | ||||||||||||||||||
| Depreciation and amortization | 12.2 | 4.7 | 3.7 | 9.1 | 1.6 | 31.3 | ||||||||||||||||||
| Interest expense, net | — | — | — | — | 20.7 | 20.7 | ||||||||||||||||||
| Other finance income | — | — | — | — | (0.3 | ) | (0.3 | ) | ||||||||||||||||
| Income tax | — | — | — | — | (0.4 | ) | (0.4 | ) | ||||||||||||||||
| Adjusted EBITDA | $ | 25.7 | $ | 28.8 | $ | 17.4 | $ | 18.1 | $ | (20.9 | ) | $ | 69.1 | |||||||||||
| Adjusted EBITDA | £ | 20.1 | £ | 22.6 | £ | 13.5 | £ | 14.1 | £ | (16.3 | ) | £ | 54.0 | |||||||||||
| Exchange rate - $ to £ | 1.28 | |||||||||||||||||||||||
ADJUSTED NET INCOME RECONCILIATION
(in millions, except share data)
(Unaudited)
(in millions, except share data)
(Unaudited)
| For the Three-Month Period ended | For the Nine-Month Period ended | |||||||||||||||
| September30, | September 30, | September 30, | September 30, | |||||||||||||
| (In millions) | 2025 | 2024 | 2025 | 2024 | ||||||||||||
| Net (loss) income | $ | (1.9 | ) | $ | 2.8 | $ | (9.8 | ) | $ | (2.2 | ) | |||||
| Items Relating to Legacy Activities: | ||||||||||||||||
| Pension charges | 0.3 | 0.3 | 0.8 | 0.9 | ||||||||||||
| Items outside the normal course of business: | ||||||||||||||||
| Cost of group restructure | 1.7 | 1.8 | 5.4 | 2.8 | ||||||||||||
| Cost of group restatement | 0.1 | 2.9 | 4.1 | 10.6 | ||||||||||||
| Effect of exchange rates on cash | 0.9 | (2.0 | ) | (2.6 | ) | (1.6 | ) | |||||||||
| Mark to market movement on currency deals | — | (0.3 | ) | 0.2 | (0.5 | ) | ||||||||||
| Hold for sale adjustment - impairment | 5.9 | — | 5.9 | — | ||||||||||||
| Other finance income | (0.2 | ) | (0.1 | ) | (0.6 | ) | (0.3 | ) | ||||||||
| Tax Impact | 1.5 | — | (2.7 | ) | 0.1 | |||||||||||
| Adjusted Net Income | $ | 8.3 | $ | 5.4 | $ | 0.7 | $ | 9.8 | ||||||||
| Adjusted Net Income | £ | 6.1 | £ | 4.2 | £ | 0.6 | £ | 7.7 | ||||||||
| Exchange Rate - $ to £ | 1.35 | 1.30 | 1.32 | 1.28 | ||||||||||||
| Weighted average number of shares outstanding– diluted | 29,278,253 | 29,188,787 | 29,205,035 | 29,172,000 | ||||||||||||
| Adjusted Net (Loss) Income per diluted share | $ | 0.28 | $ | 0.19 | $ | 0.03 | $ | 0.34 | ||||||||
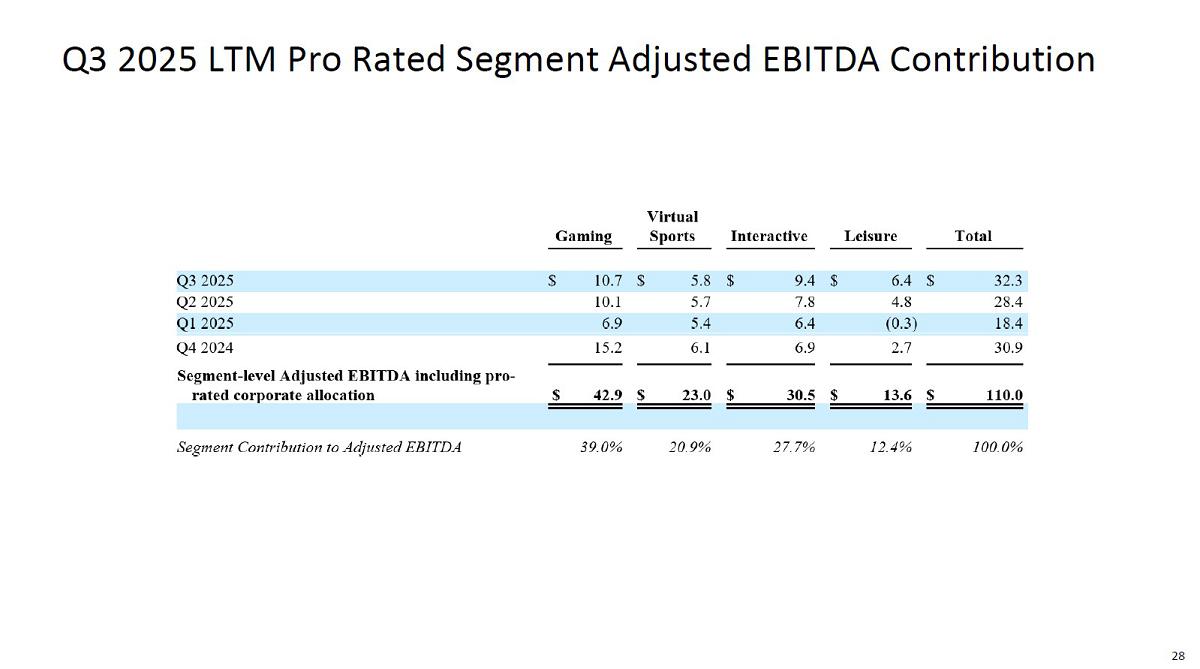
PRO-RATED SEGMENT ADJUSTED EBITDA CONTRIBUTION
(in millions)
(Unaudited)
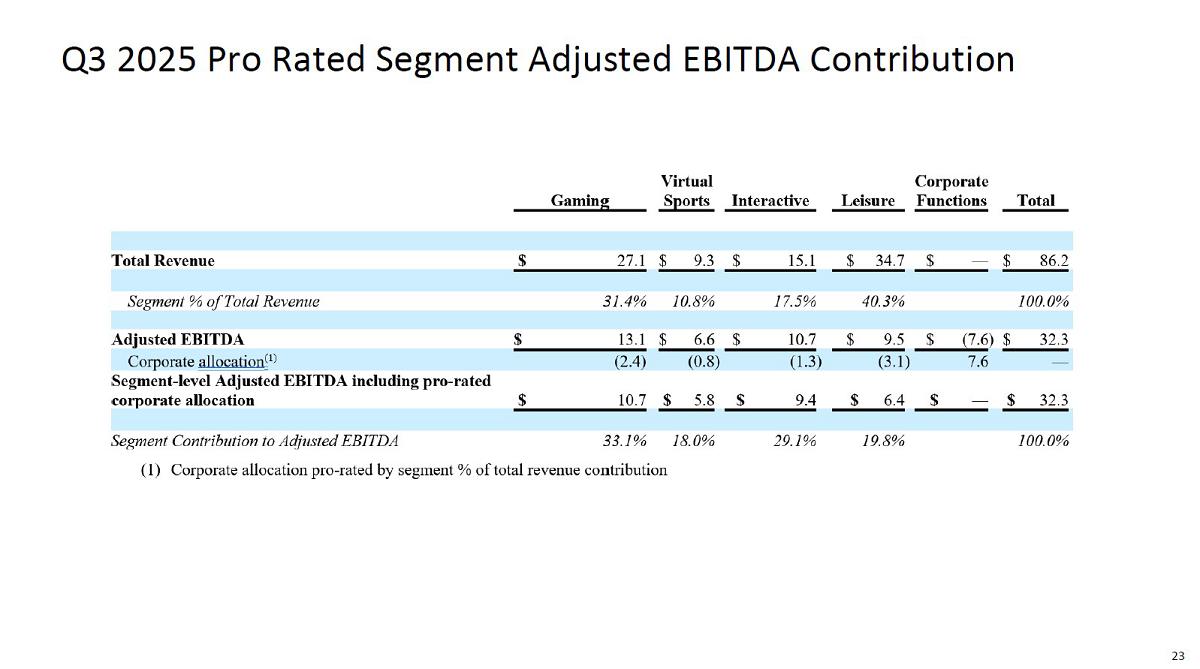
Three Months Ended September 30, 2025
| Gaming |
Virtual Sports |
Interactive | Leisure |
Corporate Functions |
Total | |||||||||||||||||||
| Total Revenue | $ | 27.1 | $ | 9.3 | $ | 15.1 | $ | 34.7 | $ | — | $ | 86.2 | ||||||||||||
| Segment % of Total Revenue | 31.4 | % | 10.8 | % | 17.5 | % | 40.3 | % | 100.0 | % | ||||||||||||||
| Adjusted EBITDA | $ | 13.1 | $ | 6.6 | $ | 10.7 | $ | 9.5 | $ | (7.6 | ) | $ | 32.3 | |||||||||||
| Corporate allocation(1) | (2.4 | ) | (0.8 | ) | (1.3 | ) | (3.1 | ) | 7.6 | — | ||||||||||||||
| Segment-level Adjusted EBITDA including pro-rated corporate allocation | $ | 10.7 | $ | 5.8 | $ | 9.4 | $ | 6.4 | $ | — | $ | 32.3 | ||||||||||||
| Segment Contribution to Adjusted EBITDA | 33.1 | % | 18.0 | % | 29.1 | % | 19.8 | % | 100.0 | % | ||||||||||||||
| (1) | Corporate allocation pro-rated by segment % of total revenue contribution |
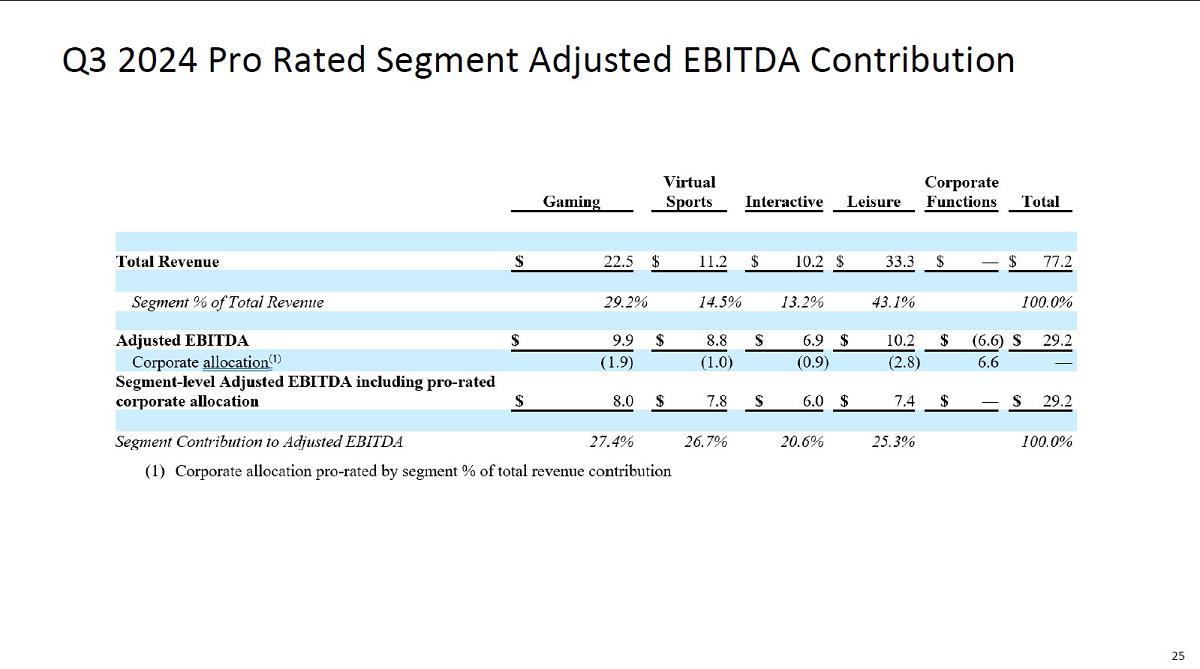
Three Months Ended September 30, 2024
| Gaming |
Virtual Sports |
Interactive | Leisure |
Corporate Functions |
Total | |||||||||||||||||||
| Total Revenue | $ | 22.5 | $ | 11.2 | $ | 10.2 | $ | 33.3 | $ | — | $ | 77.2 | ||||||||||||
| Segment % of Total Revenue | 29.2 | % | 14.5 | % | 13.2 | % | 43.1 | % | 100.0 | % | ||||||||||||||
| Adjusted EBITDA | $ | 9.9 | $ | 8.8 | $ | 6.9 | $ | 10.2 | $ | (6.6 | ) | $ | 29.2 | |||||||||||
| Corporate allocation(1) | (1.9 | ) | (1.0 | ) | (0.9 | ) | (2.8 | ) | 6.6 | — | ||||||||||||||
| Segment-level Adjusted EBITDA including pro-rated corporate allocation | $ | 8.0 | $ | 7.8 | $ | 6.0 | $ | 7.4 | $ | — | $ | 29.2 | ||||||||||||
| Segment Contribution to Adjusted EBITDA | 27.4 | % | 26.7 | % | 20.6 | % | 25.3 | % | 100.0 | % | ||||||||||||||
| (1) | Corporate allocation pro-rated by segment % of total revenue contribution |
Nine Months Ended September 30, 2025
| Gaming |
Virtual Sports |
Interactive | Leisure |
Corporate Functions |
Total | |||||||||||||||||||
| Total Revenue | $ | 76.0 | $ | 27.2 | $ | 40.8 | $ | 82.9 | $ | — | $ | 226.9 | ||||||||||||
| Segment % of Total Revenue | 33.5 | % | 12.0 | % | 18.0 | % | 36.5 | % | 100.0 | % | ||||||||||||||
| Adjusted EBITDA | $ | 35.2 | $ | 19.5 | $ | 27.5 | $ | 18.9 | $ | (22.0 | ) | $ | 79.1 | |||||||||||
| Corporate allocation(1) | (7.4 | ) | (2.6 | ) | (4.0 | ) | (8.0 | ) | 22.0 | — | ||||||||||||||
| Segment-level Adjusted EBITDA including pro-rated corporate allocation | $ | 27.8 | $ | 16.9 | $ | 23.5 | $ | 10.9 | $ | — | $ | 79.1 | ||||||||||||
| Segment Contribution to Adjusted EBITDA | 35.1 | % | 21.4 | % | 29.7 | % | 13.8 | % | 100.0 | % | ||||||||||||||
| (1) | Corporate allocation pro-rated by segment % of total revenue contribution |
Nine Months Ended September 30, 2024
| Gaming |
Virtual Sports |
Interactive | Leisure |
Corporate Functions |
Total | |||||||||||||||||||
| Total Revenue | $ | 71.8 | $ | 35.3 | $ | 27.7 | $ | 79.3 | $ | — | $ | 214.1 | ||||||||||||
| Segment % of Total Revenue | 33.5 | % | 16.5 | % | 13.0 | % | 37.0 | % | 100.0 | % | ||||||||||||||
| Adjusted EBITDA | $ | 25.7 | $ | 28.8 | $ | 17.4 | $ | 18.1 | $ | (20.9 | ) | $ | 69.1 | |||||||||||
| Corporate allocation(1) | (7.0 | ) | (3.5 | ) | (2.7 | ) | (7.7 | ) | 20.9 | — | ||||||||||||||
| Segment-level Adjusted EBITDA including pro-rated corporate allocation | $ | 18.7 | $ | 25.3 | $ | 14.7 | $ | 10.4 | $ | — | $ | 69.1 | ||||||||||||
| Segment Contribution to Adjusted EBITDA | 27.1 | % | 36.6 | % | 21.3 | % | 15.0 | % | 100.0 | % | ||||||||||||||
| (1) | Corporate allocation pro-rated by segment % of total revenue contribution |
Exhibit 99.2