UNITED STATES
SECURITIES AND EXCHANGE COMMISSION
Washington, D.C. 20549
FORM 8-K
CURRENT REPORT
PURSUANT TO SECTION 13 OR 15(d) OF THE SECURITIES EXCHANGE ACT OF 1934
Date of Report (Date of earliest event reported): October 16, 2025
| AMERICAN BATTERY TECHNOLOGY COMPANY |
| (Exact name of registrant as specified in its charter) |
| Nevada | 001-41811 | 33-1227980 | ||
| (State or other jurisdiction of | (Commission | (IRS Employer | ||
| incorporation or organization) | File No.) | Identification Number) |
|
100 Washington Street, Suite 100 Reno, NV |
89503 |
|
| (Address of principal executive offices) | (Zip Code) |
(775) 473-4744
(Registrant’s telephone number including area code)
N/A
(Former name or former address, if changed since last report)
Check the appropriate box below if the Form 8-K filing is intended to simultaneously satisfy the filing obligation of the registrant under any of the following provisions (see General Instruction A.2. below):
| ☐ | Written communications pursuant to Rule 425 under the Securities Act (17 CFR 230.425) |
| ☐ | Soliciting material pursuant to Rule 14a-12 under the Exchange Act (17 CFR 240.14a-12) |
| ☐ | Pre-commencement communications pursuant to Rule 14d-2(b) under the Exchange Act (17 CFR 240.14d-2(b)) |
| ☐ | Pre-commencement communications pursuant to Rule 13e-4(c) under the Exchange Act (17 CFR 240.13e-4(c)) |
Securities registered pursuant to Section 12(b) of the Act:
| Title of Each Class | Trading Symbol(s) | Name of Each Exchange on Which Registered | ||
| Common Stock, $0.001 par value | ABAT | The Nasdaq Stock Market LLC |
Indicate by check mark whether the registrant is an emerging growth company as defined in Rule 405 of the Securities Act of 1933 (§230.405 of this chapter) or Rule 12b-2 of the Securities Exchange Act of 1934 (§240.12b-2 of this chapter).
Emerging growth company ☐
If an emerging growth company, indicate by check mark if the registrant has elected not to use the extended transition period for complying with any new or revised financial accounting standards provided pursuant to Section 13(a) of the Exchange Act. ☐
Item 8.01 Other Events.
On October 16, 2025, the Company issued a press release announcing the completion of the S-K 1300 Technical Report and Preliminary Feasibility Study (the “PFS”) disclosing mineral reserves and mineral resources, including economic assessment, for the Tonopah Flats Lithium Project. The PFS was completed by Daniel R. Palo, qualified person on behalf of Barr Engineering Co., Jeffrey Woods, qualified person on behalf of Woods Process Services, LLC, and Jacob Anderson, qualified person on behalf of Dahrouge Geologic Consulting Ltd., in compliance with Item 1300 of Regulation S-K and with an effective date of September 4, 2025.
A copy of the press release is attached as Exhibit 99.1 to this Form 8-K and is incorporated herein by reference. The PFS is filed as Exhibit 96.1 and the qualified person consents are filed as Exhibits 23.1 through 23.3 to this Form 8-K, each of which are incorporated herein by reference.
Item 9.01. Financial Statements and Exhibits.
(d) Exhibits
| Exhibit No. | Description | |
| 23.1 | Consent of Daniel R. Palo. | |
| 23.2 | Consent of Jeffrey Woods. | |
| 23.3 | Consent of Jacob Anderson. | |
| 96.1 | S-K 1300 Technical Report and Preliminary Feasibility Study, effective as of September 4, 2025. | |
| 99.1 | Press Release, dated October 16, 2025. | |
| 104 | Cover Page Interactive Data File (embedded within the Inline XBRL document) |
SIGNATURES
Pursuant to the requirements of the Securities Exchange Act of 1934, as amended, the registrant has duly caused this report to be signed on its behalf by the undersigned hereunto duly authorized.
| AMERICAN BATTERY TECHNOLOGY COMPANY | ||
| Date: October 16, 2025 | By: | /s/ Ryan Melsert |
| Ryan Melsert | ||
| Chief Executive Officer | ||
Exhibit 23.1

|
 |
Consent of Qualified Person
I, Daniel R. Palo , PE on behalf of Barr Engineering Co., hereby consent to:
| 1. | The inclusion of Barr Engineering Co., and associated Qualified Persons in connection with American Battery Technology Company’s anticipated filing of the technical report and preliminary feasibility study titled “Tonopah Flats Lithium Project S-K 1300 Technical Report and Preliminary Feasibility Study, Esmeralda and Nye Counties, Nevada, USA” dated September 4, 2025, as an exhibit to and referenced in Form 10-K/Form 8-K/or other filing, prepared in accordance with Item 601(b)(96) of Regulation S-K (17 CFR §229.601 (b)(96)) and Subpart 1300 of Regulation S-K. |
| 2. | The incorporation, by reference, of the Report, in the above filing, or any other periodic reports filed by the company, and to the extent practicable in the Registration Statements on any of the associated forms prepared in relation to the filing mentioned above. |
| 3. | The information derived, summarized, quoted, or referenced from the Report, or portions thereof, that was prepared by us, that we supervised in the preparation of, and/or that was reviewed and approved by us, that is included or incorporated by reference in any of the forms associated with the above mentioned filing, other periodic reports, or the Registration Statements. |
Barr Engineering Co. is responsible for authoring, and this consent pertains to, all chapters of the Report, except for chapters 6, 7, 8, 9, 10, 11, 14, and subsections 18.2.2 and 18.3.2.
Report Effective Date: September 04, 2025.
| By: | /s/ Daniel R. Palo | |
| Name: | Daniel R. Palo | |
| Title: | Vice President | |
| Company: | Barr Engineering Co. |
Exhibit 23.2
 |
Consent of Qualified Person |
I, Jeffrey Woods , License (i.e., PE) or QP Designation on behalf of Woods Process Services, LLC., hereby consent to:
| 1. | The inclusion of Woods Process Services, LLC., and associated Qualified Persons in connection with American Battery Technology Company’s anticipated filing of the technical report and preliminary feasibility study titled “Tonopah Flats Lithium Project S-K 1300 Technical Report and Preliminary Feasibility Study, Esmeralda and Nye Counties, Nevada, USA” dated September 4, 2025, as an exhibit to and referenced in Form 10-K/Form 8-K/or other filing, prepared in accordance with Item 601(b)(96) of Regulation S-K (17 CFR §229.601 (b)(96)) and Subpart 1300 of Regulation S-K. |
| 2. | The incorporation, by reference, of the Report, in the above filing, or any other periodic reports filed by the company, and to the extent practicable in the Registration Statements on any of the associated forms prepared in relation to the filing mentioned above. |
| 3. | The information derived, summarized, quoted, or referenced from the Report, or portions thereof, that was prepared by us, that we supervised in the preparation of, and/or that was reviewed and approved by us, that is included or incorporated by reference in any of the forms associated with the above mentioned filing, other periodic reports, or the Registration Statements. |
Woods Process Services, LLC., is responsible for authoring, and this consent pertains to, the following Chapters of the Report: Only Chapters 10 and 14 and sections 18.2.2 and 18.3.2.
Report Effective Date: September 04, 2025.
| By: | /s/ Jeffrey Woods | |
| Name: | Jeffrey Woods | |
| Title: | Owner/President | |
| Company: | WPS |
Exhibit 23.3
 |
Consent of Qualified Person |
I, Jacob Anderson , CPG, MAusIMM on behalf of Dahrouge Geologic Consulting Ltd., hereby consent to:
| 1. | The inclusion of Dahrouge Geologic Consulting Ltd., and associated Qualified Persons in connection with American Battery Technology Company’s anticipated filing of the technical report and preliminary feasibility study titled “Tonopah Flats Lithium Project S-K 1300 Technical Report and Preliminary Feasibility Study, Esmeralda and Nye Counties, Nevada, USA” dated September 4, 2025, as an exhibit to and referenced in Form 10-K/Form 8-K/or other filing, prepared in accordance with Item 601(b)(96) of Regulation S-K (17 CFR §229.601 (b)(96)) and Subpart 1300 of Regulation S-K. |
| 2. | The incorporation, by reference, of the Report, in the above filing, or any other periodic reports filed by the company, and to the extent practicable in the Registration Statements on any of the associated forms prepared in relation to the filing mentioned above. |
| 3. | The information derived, summarized, quoted, or referenced from the Report, or portions thereof, that was prepared by us, that we supervised in the preparation of, and/or that was reviewed and approved by us, that is included or incorporated by reference in any of the forms associated with the above mentioned filing, other periodic reports, or the Registration Statements. |
Dahrouge Geologic Consulting Ltd. is responsible for authoring, and this consent pertains to, the following Chapters of the Report: Only chapters 6, 7, 8, 9, and 11.
Report Effective Date: September 04, 2025.
| By: | /s/ Jacob Anderson | |
| Name: | Jacob Anderson | |
| Title: | Resource Geologist | |
| Company: | Dahrouge Geological Consulting Ltd. |
Exhibit 96.1
 |
 |
Important Notice
This Report was prepared for American Battery Technology Company by the qualified persons (QPs) identified in the Report’s Date and Signature Page.
This Report contains estimates, projections, and conclusions that are forward-looking information within the meaning of applicable securities laws. Forward-looking statements are based upon the responsible QPs opinions at the time that they are made but, in most cases, involve significant risk and uncertainty.
Although each of the responsible QPs has attempted to identify factors that could cause actual events or results to differ materially from those described in this Report, there may be other factors that cause events or results to not be as anticipated, estimated, or projected. None of the QPs undertake any obligation to update the forward-looking information.
This Report is intended to be used by American Battery Technology Company subject to the terms and conditions of its contracts with each of the QPs. Except for the purposes legislated under United States securities law, any use of, or reliance on, this Report by any third party is at that party’s sole risk.
| barr.com |
Date and Signature Page
| This technical report and pre-feasibility study is effective as of the 4th day of September, 2025. | ||
| Original signed and sealed on file | September 4, 2025 | |
|
Daniel R. Palo, PE On behalf of Barr Engineering Co. Chapters 1-5, 12-13, and 15-25 (excluding sections 18.2.2 and 18.3.2) |
Date | |
| Original signed and sealed on file | September 4, 2025 | |
| Jacob
Anderson, CPG On behalf of Dahrouge Geologic Consulting Ltd. |
Date | |
| Chapters 6-9 and 11 | ||
| Original signed and sealed on file | September 4, 2025 | |
| Jeffrey
Woods, RM-SME, QP-MMSA Woods Process Services, LLC. |
Date | |
| Chapters 10, 14, and sections 18.2.2, and 18.3.2 | ||
| barr.com |
Tonopah
Flats Lithium Project
Pre-Feasibility Study
September 2025

Contents
| 1 Executive Summary | 1 |
| 1.1 Property Description and Ownership | 1 |
| 1.2 Geology and Mineralization | 1 |
| 1.3 Status of Exploration, Development, and Operations | 2 |
| 1.4 Metallurgical Testing and Mineral Processing | 2 |
| 1.5 Mineral Resource Estimate | 2 |
| 1.6 Mineral Reserves | 3 |
| 1.7 Mining Methods | 4 |
| 1.8 Processing and Recovery Methods | 5 |
| 1.9 Infrastructure | 5 |
| 1.10 Capital and Operating Costs | 6 |
| 1.11 Economic Analysis | 8 |
| 1.12 Economic Sensitivities | 8 |
| 1.13 Conclusions and Recommendations | 9 |
| 1.13.1 Project Risks | 10 |
| 1.13.2 Recommendations | 11 |
| 2 Introduction | 12 |
| 2.1 Sources of Information | 12 |
| 2.2 Personal Inspections | 12 |
| 2.3 Effective Date | 13 |
| 3 Property Description and Location | 14 |
| 3.1 Property Location | 14 |
| 3.2 Property Area and Claim Type | 15 |
| 3.3 Mineral Rights | 16 |
| 3.4 Significant Encumbrances and Permitting | 16 |
| 3.5 Royalties | 16 |
| 3.6 Significant Factors and Risks | 16 |
| barr.com |
|
|
| 4 Accessibility, Climate, Local Resources, Infrastructure and Physiography | 17 |
| 4.1 Property Access | 17 |
| 4.2 Climate and Length of Operating Season | 17 |
| 4.3 Infrastructure | 17 |
| 5 History | 19 |
| 6 Geologic Setting, Deposit Type, and Mineralization | 20 |
| 6.1 Regional Geologic Setting | 20 |
| 6.2 Regional Geology | 20 |
| 6.3 District and Local Geology | 20 |
| 6.4 Mineralization | 27 |
| 6.5 Deposit Type | 27 |
| 6.5.1 Lithium Deposit Model | 27 |
| 6.5.2 Sources of and Concentration of Lithium in Clays | 28 |
| 7 Exploration | 30 |
| 7.1 ABTC 2021 Surface Sampling | 30 |
| 7.2 ABTC 2021 and 2022 Exploration Drilling | 32 |
| 7.3 ABTC 2023 Exploration Drilling | 35 |
| 7.4 ABTC 2025 Exploration and Geotechnical Drilling | 35 |
| 7.5 Interpretation of Drilling Results and Adequacy of Sample Quality | 38 |
| 8 Sample Preparation, Analysis, and Security | 41 |
| 8.1 Historical Sample Preparation, Analysis, Quality Assurance/ Quality Control Procedures, and Historical Sample Security | 41 |
| 8.2 Sample Preparation, Analyses, Sample Security, and Quality Assurance/Quality Control Procedures by ABTC | 41 |
| 8.2.1 ABTC 2021 Surface Sampling | 41 |
| 8.2.2 ABTC 2021-2022 Air Core and RC Drill Sampling | 41 |
| 8.2.3 ABTC 2023 Core Drill Sampling | 42 |
| 8.2.4 ABTC 2025 Core Drill Sampling | 43 |
| 8.3 ABTC Quality Assurance/Quality Control Results | 43 |
| 8.3.1 Standards | 44 |
| 8.3.2 Lithium CRM Results in the 2021-2022 Drill Programs | 45 |
| 8.3.3 Lithium CRM Results in the 2023 Drill Programs | 47 |
| 8.3.4 Lithium CRM Results in the 2025 Drill Programs | 48 |
| 8.4 Duplicates | 49 |
| 8.5 Blanks | 56 |
| 8.5.1 Results for Blanks in the 2021 to 2022 Drill Program | 56 |
| 8.5.2 Results for Blanks in the 2023 Drill Program | 57 |
| 8.5.3 Results for Blanks in the 2025 Drill Program | 58 |
| 8.6 Adequacy of Sample Preparation, Analyses, and Security | 58 |
| barr.com |
|
|
| 9 Data Verification | 60 |
| 9.1 Site Visit | 60 |
| 9.2 Drilling Database Verification | 60 |
| 9.2.1 Assays | 61 |
| 9.3 Adequacy of Data | 61 |
| 9.4 Metallurgical Test Work and Pilot Plant Adequacy of Data | 62 |
| 10 Mineral Processing and Metallurgical Testing | 64 |
| 10.1 Mineral Processing and Metallurgical Testing Summary | 64 |
| 10.2 Sample Information | 65 |
| 10.3 Sample Analysis Methods and Validation | 66 |
| 10.4 Mineralogy and Particle Properties | 68 |
| 10.4.1 Particle Size and Mineralogy | 69 |
| 10.4.2 QEMSCAN Field Imaging | 72 |
| 10.4.3 Specific Gravity Analysis | 73 |
| 10.4.4 Thermogravimetric Analysis | 73 |
| 10.5 Mineral Processing | 74 |
| 10.5.1 Bond Ball Work Index | 74 |
| 10.5.2 Beneficiation | 75 |
| 10.5.3 Mineral Processing – Dewatering | 76 |
| 10.5.4 Pulp Rheology | 78 |
| 10.6 Lithium Extraction – Pretreatment and Water Leaching of Beneficiated Claystone | 78 |
| 10.6.1 Counter Current Decantation Leaching | 78 |
| 10.7 PLS Purification and Polishing | 79 |
| 10.7.1 Alkaline-Earth Metal Removal by Precipitation | 79 |
| 10.7.2 Ion-Exchange Screening | 79 |
| 10.8 Sulfate to Hydroxide Conversion | 80 |
| 10.9 Crystallization of Lithium Hydroxide Monohydrate | 80 |
| 10.10 Pilot Plant | 81 |
| 10.11 Conclusions | 82 |
| 11 Mineral Resource Estimate | 83 |
| 11.1 Summary | 83 |
| 11.2 Key Assumptions and Methods | 83 |
| 11.3 Database | 84 |
| 11.4 Interpretation and Modeling | 88 |
| 11.5 Density | 89 |
| 11.6 Compositing | 90 |
| 11.7 Outlier and Capping | 90 |
| barr.com |
|
|
| 11.8 Variography | 91 |
| 11.9 Lithium Block Modeling and Estimation | 93 |
| 11.9.1 Estimation Domains | 93 |
| 11.9.2 Grade Simulation | 98 |
| 11.9.3 Block Model Validation | 98 |
| 11.10 Reasonable Prospects of Economic Extraction for Mineral Resources | 101 |
| 11.11 Mineral Resource Estimate | 103 |
| 11.12 Qualified Person Statement | 104 |
| 11.13 Mineral Resource Uncertainty | 104 |
| 12 Mineral Reserves Estimates | 106 |
| 12.1 Approach | 106 |
| 12.2 Design Pit Selection | 107 |
| 12.3 Open-Pit Design | 109 |
| 12.4 Mining Dilution and Ore Loss | 112 |
| 12.5 Mineral Reserve Estimate | 112 |
| 13 Mining Methods | 113 |
| 13.1 Economic Parameters and Cut-Off Grades | 113 |
| 13.2 Pit Optimization | 114 |
| 13.3 Road and Ramp Design | 114 |
| 13.4 Open Pit Design | 115 |
| 13.4.1 Open Pit Geotechnical Considerations | 115 |
| 13.4.2 Rock and Soils Strength Assessment | 123 |
| 13.4.3 Stability Analysis | 124 |
| 13.4.4 Open-Pit Slope Design Recommendations | 126 |
| 13.5 Pit, Tailings, Coarse Gangue, Waste Dump, and Backfill Designs | 127 |
| 13.6 Phase Design | 128 |
| 13.7 Production Schedule | 130 |
| 13.8 Mine Equipment | 142 |
| 13.8.1 Drilling and Blasting | 143 |
| 13.8.2 Loading and Hauling | 145 |
| 13.8.3 ROM Ore Handling | 148 |
| 13.8.4 Tailings And Coarse Gangues Handling | 148 |
| 13.8.5 Support and Service Equipment | 149 |
| 13.9 Mine Personnel | 150 |
| 13.10 Reclamation and Closure | 152 |
| 14 Processing and Recovery Methods | 154 |
| 14.1 Introduction | 154 |
| barr.com |
|
|
| 14.2 ABTC’s Pilot-Scale Plant | 155 |
| 14.2.1 Pertinent Results | 155 |
| 14.2.2 Key Findings and Scale-Up Differences | 155 |
| 14.3 High Level Design Criteria | 157 |
| 14.4 Comminution and Screening | 158 |
| 14.5 Beneficiation | 159 |
| 14.6 Extraction | 160 |
| 14.7 Impurity Removal and Concentration | 162 |
| 14.8 Impurity Crystallization | 163 |
| 14.9 Sulfate Crystallization | 163 |
| 14.10 Hydroxide Conversion and Crystallization | 164 |
| 14.11 Tailings | 165 |
| 14.12 Utilities | 165 |
| 14.12.1 Off-Gas Handling | 165 |
| 14.12.2 Water | 165 |
| 14.12.3 Chilled Water | 165 |
| 14.12.4 Cooling Water | 165 |
| 14.12.5 Reagents | 166 |
| 15 Infrastructure | 167 |
| 15.1 Site General Arrangement | 167 |
| 15.1.1 Access Roads | 167 |
| 15.1.2 Process Plant General Arrangement | 167 |
| 15.1.3 Reagents, Consumables, and Shipping | 169 |
| 15.1.4 Ancillary Buildings | 169 |
| 15.2 Mine Infrastructure and Tailings Facility | 170 |
| 15.2.1 Mine Workshop and Truck Maintenance | 170 |
| 15.2.2 Fuel Storage and Distribution | 170 |
| 15.2.3 Tailings Storage Facility | 170 |
| 15.3 Power Infrastructure | 173 |
| 15.3.1 Site Power Distribution | 173 |
| 15.3.2 Onsite Power Generation | 174 |
| 15.3.3 Financial Incentives and Revenue Opportunities | 175 |
| 15.4 Water Infrastructure | 176 |
| 15.4.1 Water Supply | 176 |
| 15.4.2 Process Water Treatment and Recovery | 176 |
| 15.4.3 Water Discharge | 176 |
| 15.4.4 Storm Water Handling | 176 |
| 15.5 Waste Management | 176 |
| barr.com |
|
|
| 15.6 Communications | 176 |
| 15.7 Mobile Equipment | 177 |
| 15.8 Rail | 177 |
| 15.9 Fossil Fuels | 177 |
| 16 Market Studies | 178 |
| 16.1 Demand | 180 |
| 16.2 Comparable Pricing | 181 |
| 17 Environmental Studies, Permitting, and Plans; Negotiations or Agreements with Local Individuals or Groups | 182 |
| 17.1 Introduction | 182 |
| 17.2 Environmental Baseline Studies | 182 |
| 17.2.1 Visual | 183 |
| 17.2.2 Environmental Justice | 183 |
| 17.2.3 Human Noise | 183 |
| 17.2.4 Paleontology | 184 |
| 17.2.5 Grazing | 184 |
| 17.2.6 Lands and Realty | 184 |
| 17.2.7 Socioeconomics | 184 |
| 17.2.8 Floodplains | 184 |
| 17.2.9 Cultural Resources | 185 |
| 17.2.10 Biological | 185 |
| 17.2.11 Raptors | 185 |
| 17.2.12 Geochemistry | 185 |
| 17.2.13 Hydrology | 186 |
| 17.2.14 Air Quality | 187 |
| 17.3 Permitting | 187 |
| 18 Capital and Operating Costs | 192 |
| 18.1 Introduction | 192 |
| 18.2 Capital Cost Estimate | 192 |
| 18.2.1 Mining Capital Cost Estimates | 193 |
| 18.2.2 Refinery CAPEX | 195 |
| 18.3 OPEX Estimate | 196 |
| 18.3.1 Mining OPEX Estimates | 197 |
| 18.3.2 Refining OPEX | 200 |
| 18.3.3 Energy Cost | 202 |
| 18.3.4 General and Administrative OPEX | 203 |
| 19 Economic Analysis | 205 |
| 19.1 Sensitivity Analysis | 210 |
| barr.com |
|
|
| 20 Adjacent Properties | 212 |
| 21 Other Relevant Data and Information | 215 |
| 22 Interpretations and Conclusions | 216 |
| 22.1 Conclusions | 216 |
| 22.2 Tonopah Flats Expansion Potential | 217 |
| 22.3 Project Risks | 217 |
| 23 Recommendations | 219 |
| 23.1 Mining, Ore Handling, and Tailings Handling | 219 |
| 23.2 Metallurgy and Processing | 219 |
| 23.2.1 Recommended Metallurgical Test Work | 219 |
| 23.3 Passive Seismic Study | 220 |
| 23.4 Geotechnical | 220 |
| 23.5 Baseline Environmental Studies and NEPA Documentation | 221 |
| 23.6 Feasibility Study | 222 |
| 24 References | 223 |
| 25 Reliance on Information Provided by the Registrant | 226 |
| barr.com |
|
|
Tables
| Table 1-1 | Tonopah Flats Mineral Resources | 3 |
| Table 1-2 | Tonopah Flats Mineral Reserves Estimate Effective as of the Date of this PFS | 4 |
| Table 1-3 | Total Capital Cost Summary | 7 |
| Table 1-4 | Operating Cost Summary | 8 |
| Table 1-5 | ABTC Estimated Costs for Tonopah Flats Recommended Work Program | 11 |
| Table 3-1 | Summary of Annual Property Holding Costs | 16 |
| Table 4-1 | Average Climate Data for Tonopah, Nevada | 17 |
| Table 7-1 | ABTC Drilling 2021 - 2023 | 32 |
| Table 7-2 | ABTC 2025 Drilling Program | 35 |
| Table 7-3 | Drill Intervals of Interest | 38 |
| Table 8-1 | Summary Counts of Tonopah Flats QA/QC Analyses | 44 |
| Table 8-2 | CRMs Used by ABTC | 45 |
| Table 8-3 | Summary of Lithium Results for Certified Reference Materials, 2021-2022 | 45 |
| Table 8-4 | Lithium CRM Failures in the 2022 Drill Program | 46 |
| Table 8-5 | Explanation for Figure 8-1 | 47 |
| Table 8-6 | Summary of Tonopah Flats Lithium Results for Certified Reference Materials, 2023 | 47 |
| Table 8-7 | Lithium Failures in the 2023 Drill Program | 48 |
| Table 8-8 | Summary of Tonopah Flats Lithium Results for Certified Reference Materials, 2025 | 49 |
| Table 8-9 | Summary of Results for Field Duplicates and Laboratory Preparation Duplicates | 51 |
| Table 8-10 | Summary of Results for Blanks | 56 |
| Table 8-11 | Blank Failures and Preceding Samples 2021-2022 | 56 |
| Table 9-1 | Limits of Detection for Analytical Methods | 63 |
| Table 10-1 | Materials Used for Mineral Processing and Metallurgical Test Work | 66 |
| Table 10-2 | Limits of Detection for Analytical Methods | 67 |
| Table 10-3 | Particle Size Distribution for BS-TF-2219 | 69 |
| Table 10-4 | Semi-Quantitative Mineralogical Composition of DC-TF-2218 (Head Material) and DC-TF-2218-BC2 (Beneficiated Clay) (SGS Canada, Inc., 2025) | 72 |
| Table 10-5 | Bond Ball Work for Two Closing Screen Sizes | 75 |
| Table 11-1 | Descriptive Statistics of Sample Assays in Tonopah Flats Drillhole Database | 84 |
| Table 11-2 | Drillhole Sample Statistics | 84 |
| Table 11-3 | Lithium Statistics by Geologic Unit | 86 |
| Table 11-4 | Tonopah Flats Deposit Average Specific Gravity Measurements by Lithology | 89 |
| Table 11-5 | Approximate Grade Ranges of Lithium Domains for Fault Block 3 | 94 |
| Table 11-6 | Approximate Grade Ranges of Lithium Domains for Fault Block 4 | 95 |
| Table 11-7 | Tonopah Flats Sequential Gaussian Simulation Parameters | 98 |
| Table 11-8 | Pit Optimization Parameters | 101 |
| Table 11-9 | Tonopah Flats Inferred Mineral Resources at Various Cut-Offs (Exclusive of Measured and Indicated) | 103 |
| Table 11-10 | Classified Lithium Mineralization Exclusive of the Mineral Reserve with a Cut-Off of 300 ppm Li | 104 |
| Table 11-11 | Lithium Mineral Resources Inclusive of the Mineral Reserve with a Cut-Off of 300 ppm Li | 104 |
| Table 12-1 | Primary Pit Optimization Parameters | 107 |
| Table 12-2 | Overall Results of the Tonopah Flats Open Pit Optimization | 108 |
| Table 12-3 | Tonopah Flats Mineral Reserves Estimate as of PFS Date | 112 |
| barr.com |
|
|
| Table 13-1 | Economic Parameters for Calculation of the Cut-Off Grade | 114 |
| Table 13-2 | Geotechnical Borings Drilled for South Lobe of the Open Pit | 116 |
| Table 13-3 | Atterberg Limits Summary | 119 |
| Table 13-4 | Results of Uniaxial Compressive Strength Tests | 120 |
| Table 13-5 | Summary of Uniaxial Compressive Strength Tests | 120 |
| Table 13-6 | Results of Splitting Tensile Strength Tests | 121 |
| Table 13-7 | Summary of Splitting Tensile Strength Tests | 121 |
| Table 13-8 | Summary of Triaxial Compressive Strength Tests | 122 |
| Table 13-9 | Results of Direct Shear Strength Tests | 122 |
| Table 13-10 | Summary of Unconsolidated-Undrained Triaxial Compression Test | 123 |
| Table 13-11 | Results of Consolidated-Undrained Triaxial Compression Tests | 123 |
| Table 13-12 | Typical FOS and POF Acceptance Criteria Values (Read & Stacey, 2009) | 125 |
| Table 13-13 | Recommended Open-Pit Design Slope Configuration | 126 |
| Table 13-14 | Tonopah Flats Phase Design Report | 129 |
| Table 13-15 | 45-Year Production Schedule | 132 |
| Table 13-16 | 45-Year Mining Quantities (tonnes) | 133 |
| Table 13-17 | Major Mining Equipment – Maximum Units Required | 143 |
| Table 13-18 | Drilling Productivity | 143 |
| Table 13-19 | Drilling Productivity by Period | 144 |
| Table 13-20 | Blasting Patterns and Powder Factors | 144 |
| Table 13-21 | Blasting and Explosives by Period | 145 |
| Table 13-22 | Loading and Hauling Productivity | 145 |
| Table 13-23 | Truck Speed Limits and Grade-Speed Bin | 147 |
| Table 13-24 | Average Load-Haul Units and Productivity by Period | 147 |
| Table 13-25 | Feed Handling Equipment By Period | 148 |
| Table 13-26 | Tailings Handling Equipment By Period | 149 |
| Table 13-27 | Support and Service Equipment-Maximum Units Required | 150 |
| Table 13-28 | Mining Labor Requirements | 151 |
| Table 14-1 | Differences Between Pilot and Commercial Scale | 156 |
| Table 14-2 | Design Requirements Not Previously Identified | 156 |
| Table 14-3 | High Level Process Design Criteria | 157 |
| Table 15-1 | Tailings Index Properties | 171 |
| Table 15-2 | Direct Shear Test Results for Tailings | 171 |
| Table 15-3 | Geotechnical Model Parameters | 171 |
| Table 15-4 | Tailings Storage Facility Stability Modeling Results | 172 |
| Table 15-5 | Seismic Sensitivity Results | 173 |
| Table 15-6 | Water Sensitivity Analysis | 173 |
| Table 16-1 | Historic 3-Year LHM Pricing FOB North America (S&P Global Market Intelligence, n.d.) | 179 |
| Table 16-2 | Industry LiOH Pricing Data | 181 |
| Table 16-3 | Average LiOH Prices Using a Five-Year Pricing Window | 181 |
| Table 17-1 | Required Baseline Studies for TFLP | 183 |
| Table 17-2 | Federal Environmental Permits, Reviews, and Approvals | 188 |
| Table 17-3 | State of Nevada Environmental Permits, Reviews, and Approvals | 189 |
| Table 18-1 | Project Capital Estimates | 193 |
| Table 18-2 | Mining Capital Estimates | 194 |
| Table 18-3 | Overview of Refinery Direct Capital Costs ($000) | 196 |
| barr.com |
|
|
| Table 18-4 | Refinery Capital Cost Timeline ($ 000s) | 196 |
| Table 18-5 | Operating Cost Summary | 197 |
| Table 18-6 | Mining Operating Costs Summary | 198 |
| Table 18-7 | Mining Operating Costs By Period | 199 |
| Table 18-8 | Energy Usage By Mining Activity | 200 |
| Table 18-9 | Refinery OPEX Cost Summary | 200 |
| Table 18-10 | Estimated Refinery Labor | 201 |
| Table 18-11 | G&A Operating Costs – Personnel ($000s) | 203 |
| Table 18-12 | G&A Operating Costs – General ($000s) | 203 |
| Table 19-1 | PFS Production Schedule | 206 |
| Table 19-2 | Project Cash Flow | 207 |
| Table 19-3 | After Tax Cash Flow Lithium Price Sensitivity | 210 |
| Table 19-4 | After Tax Cash Flow Capital Cost Sensitivity (US$ Billion) | 210 |
| Table 19-5 | After Tax Cash Flow Energy Cost Sensitivity (US$ Billion) | 211 |
Figures
| Figure 1-1 | After-Tax Cash Flow Sensitivity - NPV (8%) US$ Billion | 9 |
| Figure 3-1 | Location Map for the Tonopah Flats Property | 14 |
| Figure 3-2 | Tonopah Flats Property Map | 15 |
| Figure 6-1 | Property Geologic Map of the Tonopah Flats Lithium Project - Modified from Bonham & Garside, 1979 | 22 |
| Figure 6-2 | Generalized North-South Cross Section Through the Central Portion of the Tonopah flats Property (provided by ABTC, 2023) | 24 |
| Figure 6-3 | Generalized East-West Cross Section through the Central Portion of the Tonopah Flats Property (provided by ABTC, 2023) | 25 |
| Figure 6-4 | Detailed Stratigraphic Column of the Tonopah Flats Lithologic Units from Drilling | 26 |
| Figure 6-5 | Modified Schematic Model of Sedimentary or Clay Lithium Deposits (modified after Helvaci (2015), from Vardar Minerals Ltd, Viti Li-B Project, Kosovo) | 29 |
| Figure 7-1 | Map of Tonopah Flats Surface Sample Locations | 31 |
| Figure 7-2 | Map of Tonopah Flats Drillhole Collars | 33 |
| Figure 7-3 | ABTC 2025 Sonic Drillhole Locations | 36 |
| Figure 7-4 | ABTC 2025 Diamond Drilled Core Hole Locations | 37 |
| Figure 8-1 | Lithium Control Chart for MEG Li.10.14 | 46 |
| Figure 8-2 | Lithium Control Chart for MEG Li.10.11, 2023 Drill Program | 48 |
| Figure 8-3 | Li CRM MEG Li 10.12 Used for the 2025 Drill Program | 49 |
| Figure 8-4 | Lithium AAL vs. Paragon Scatterplot, 2021-2022 | 52 |
| Figure 8-5 | Lithium Relative Percent Difference, AAL vs. Paragon, 2021-2022 | 52 |
| Figure 8-6 | AAL Preparation Duplicate vs. Original for Lithium, 2021-2022 | 53 |
| Figure 8-7 | Lithium Field Duplicates Scatterplot, 2023 | 54 |
| Figure 8-8 | Field Duplicates for 2025 Program (Li ppm) | 55 |
| Figure 8-9 | Relative Percentage Difference Between Duplicates for the 2025 Drilling Program | 55 |
| Figure 8-10 | Lithium in "MEG Silica Blank 21.03" and Preceding Samples 2021-2022 | 57 |
| Figure 8-11 | Lithium in "MEG Silica Blank 21.03" and Preceding Samples 2023 | 57 |
| Figure 8-12 | Blank Analysis Completed on the 2025 Drilling Program | 58 |
| barr.com |
|
|
| Figure 9-1 | Lithium Concentration Control Chart for Certified Reference Materials from Moment Exploration Geochemistry LLC, MEG Li.10.14 | 62 |
| Figure 9-2 | Lithium Concentration Control Chart for Certified Reference Material from Moment Exploration Geochemistry LLC, MEG Li.10.15 | 63 |
| Figure 10-1 | Lithium Concentration Control Charts for Certified Reference Materials from Moment Exploration Geochemistry LLC., MEG Li.10.14 and MEG Li.10.15. | 68 |
| Figure 10-2 | Particle Size Distribution of -20 µm Fraction Showing a Bimodal Distribution of the Head Material For BS-TF-2219 | 70 |
| Figure 10-3 | Cumulative Elemental Distribution of Clay Materials Shows That 90% of Li Mass is Reported in Less Than 20 µm Size Fraction for BS-TF-2219 (Hazen Research Inc., 2024) | 70 |
| Figure 10-4 | Cumulative Distributions of Lithium, Magnesium, and Silicon of Sample DC-TF-2218 (SGS Canada, Inc., 2025) | 71 |
| Figure 10-5 | Detailed QEMSCAN Field Image Of 100% -600 µm Sample. Calcite is Present as Discrete Finer Grains and Pervasively Penetrates the Surrounding Illite-Smectite Clay Minerals (Hazen Research Inc., 2024) | 73 |
| Figure 10-6 | Thermogravimetric Analysis of DC-TF-2218 (Homogenized Clay) and DC-TF-2218-BC2 (Beneficiated Clay) | 74 |
| Figure 10-7 | Lithium Recovery vs. Grade for Bench Scale Trials Carried Out by SGS (SGS Canada, Inc., 2025). HC-3 Gives a Highest Grade of Lithium in the Beneficiated Clay | 75 |
| Figure 10-8 | Particle Size Distribution of DC-TF-2218-BC2. The D80, D50, and D10 of the Beneficiated Clay is 1.680 µm, 0.932 µm, 0.455 µm Respectively | 76 |
| Figure 10-9 | Process Flow Sheet for Lithium Extraction from Claystone by Pretreated Selective Extraction | 78 |
| Figure 10-10 | Lithium Hydroxide Monohydrate Battery-Grade Sample Certificate of Analysis Manufactured from ABTC Claystone Material | 81 |
| Figure 10-11 | Photograph of ABTC’s Lithium Hydroxide Pilot Plant Processing Materials from the Tonopah Flats Sedimentary Claystone Deposit with a Nominal Plant Capacity of Multi-Kilograms of Products/Day. | 82 |
| Figure 11-1 | Lithium PPM Histogram for the Upper Unit – Tcsu | 86 |
| Figure 11-2 | Lithium (ppm) Histogram for the Middle Unit – Tcsm | 87 |
| Figure 11-3 | Box Plot of the Tcsu, Tcsm, and Tcsl Geologic Units | 87 |
| Figure 11-4 | Fault Traces Interpreted from Drilling (Left); Corresponding Fault Blocks Used to Constrain the Conditional Simulations (Right) | 89 |
| Figure 11-5 | Perspective View Looking Down Towards the East Showing the Relative Positions of Qal (Yellow), Tcsu (Green), Tcsm (Brown) and Tcsl (Dk Green) Lithologies in Fault Block 3 | 90 |
| Figure 11-6 | Variogram for Tcsu with Ranges to Sill Included | 91 |
| Figure 11-7 | Variogram for Tcsm with Ranges to Sill Included | 92 |
| Figure 11-8 | Variogram for Tcsl with Ranges to Sill Included | 92 |
| Figure 11-9 | Lithium Drillhole Sample Variography in Fault Block 3 | 93 |
| Figure 11-10 | Lithium Population Probability Distribution Graph | 94 |
| Figure 11-11 | Cross Section Looking North Showing Lithium Domains | 96 |
| Figure 11-12 | Cross Section Looking East Showing Lithium Domains | 97 |
| Figure 11-13 | Comparison Of Drillhole Composite Lithium Grades (Bars) to Conditionally Simulated Block Grades (Red Line) | 99 |
| barr.com |
|
|
| Figure 11-14 | Swath Plots Comparing Drillhole Composite Lithium Grades (Black Lines) to Simulated Grades In 5 m by 5 m by 1 m Model (Red Lines) | 100 |
| Figure 11-15 | Resource Classification | 101 |
| Figure 12-1 | Tonopah Flats Open Pit Optimization - Overall Pit Shell Results | 109 |
| Figure 12-2 | Final Pit Design | 110 |
| Figure 12-3 | Measured and Indicated Resources Relative to the Final Pit Design | 111 |
| Figure 12-4 | E470300 Cross Section of the Final Pit Showing Measured and Indicated Resources (Li ppm) | 111 |
| Figure 12-5 | N4215200 Cross Section of the Final Pit Showing Measured and Indicated Resources (Li ppm) | 112 |
| Figure 13-1 | Open Pit Geotechnical Boring Locations | 116 |
| Figure 13-2 | Poles of Features Picked by IDS as Sealed (Type 0), Partial Open (Type 1), and Continuous Open (Type 2) Structures from TF25-GT1 and TF25-GT3 | 118 |
| Figure 13-3 | Density Concentrations and Mean Set Planes for Structures Picked by IDS As Type 1 and Type 2 (i.e., Potentially Structures Other Than Bedding Planes) | 118 |
| Figure 13-4 | Shear Strength Data from Laboratory Testing | 124 |
| Figure 13-5 | Tonopah Flats Ultimate Pit Design and Facilities | 127 |
| Figure 13-6 | Tonopah Flats Ultimate Pit Design, Facilities, and In-Pit Backfill (Year 45) | 128 |
| Figure 13-7 | Tonopah Flats Phase Design | 129 |
| Figure 13-8 | Total Tonnage Scheduled by Phase | 130 |
| Figure 13-9 | Process Feed and Li Grade | 131 |
| Figure 13-10 | Process Feed and LHM Production | 131 |
| Figure 13-11 | Production Schedule and Strip Ratio | 131 |
| Figure 13-12 | LOM Material Movements | 135 |
| Figure 13-13 | LOM Truck Hours | 135 |
| Figure 13-14 | Tonopah Flats Phase 1 Mining (Year 5) | 136 |
| Figure 13-15 | Tonopah Flats Phase 2 Mining and Backfill (Year 7) | 137 |
| Figure 13-16 | Tonopah Flats Phase 3 Mining and Backfill (Year 13) | 138 |
| Figure 13-17 | Tonopah Flats Phase 4 Mining and Backfill (Year 17) | 139 |
| Figure 13-18 | Tonopah Flats Phase 5 Mining and Backfill (Year 21) | 140 |
| Figure 13-19 | Tonopah Flats Phase 6 Mining and Backfill (Year 28) | 141 |
| Figure 13-20 | Tonopah Flats Phase 7 Mining and Backfill (Year 37) | 142 |
| Figure 14-1 | ABTC’s Process Block Flow Diagram | 154 |
| Figure 14-2 | Comminution and Screening Flow Diagram | 158 |
| Figure 14-3 | Beneficiation Flow Diagram | 159 |
| Figure 14-4 | Filter Press Flow Diagram | 160 |
| Figure 14-5 | Extraction Flow Diagram | 160 |
| Figure 14-6 | Thickener and Leaching Flow Diagram | 161 |
| Figure 14-7 | Precipitation Flow Diagram | 162 |
| Figure 14-8 | Osmosis Flow Diagram | 162 |
| Figure 14-9 | Crystallizer Flow Diagram | 163 |
| Figure 14-10 | Ion Exchange Flow Diagram | 164 |
| Figure 14-11 | Electrochemical Conversion Process Flow Diagram | 164 |
| Figure 15-1 | Refinery Block Layout | 168 |
| Figure 16-1 | Industry Price Chart from S&P Global Market Intelligence (accessed July 31, 2025) Showing Historic 5-Year LHM Pricing | 179 |
| Figure 18-1 | Mining Operating Costs (weighted $/t moved) | 198 |
| barr.com |
|
|
| Figure 19-1 | After Tax Cash Flow Sensitivity - NPV (8%) (US$ Billion) | 211 |
| Figure 20-1 | Adjacent Properties | 212 |
Appendices
| Appendix A | List of Unpatented Lode Claims of the Tonopah Flats Property |
| barr.com |
|
|
Abbreviations, Acronyms, and Units
| °C | degrees Celsius |
| µg/g | micrograms per gram |
| μm | micrometer (micron) |
| 45X MPTC | Advanced Manufacturing Production Tax Credit |
| AACE | Association for the Advancement of Cost Engineering (AACE International) |
| AAL | American Assay Laboratory |
| ABA | acid-base accounting |
| ABI | acoustic borehole imagers |
| ABTC | American Battery Technology Company |
| ac | acres |
| AC | air core (drilling) |
| ACOE | U.S. Army Corps of Engineers |
| AGP | acid generation potential |
| ALS | ALS Limited - Geochemistry |
| AMSL | above mean sea level |
| ANP | acid neutralization potential |
| ARPD | absolute relative percent difference |
| ATF | U.S. Bureau of Alcohol, Tobacco, Firearms and Explosives |
| avg | average |
| B | billion |
| B&V | Black & Veatch Corporation |
| BAPC | NDEP Bureau of Air Pollution Control |
| BESS | battery energy storage system |
| bgs | below ground surface |
| BLM | U.S. Bureau of Land Management |
| BMRR | NDEP Bureau of Mining Regulation and Reclamation |
| BSDW | NDEP Bureau of Safe Drinking Water |
| BWM | NDEP Bureau of Waste Management |
| BWPC | NDEP Bureau of Water Pollution Control |
| CAA | U.S. Clean Air Act |
| CAPEX | capital expenditures |
| CCD | countercurrent decantation |
| CFR | Code of Federal Regulations |
| barr.com |
|
|
| CG | coarse gangues |
| CH | high-plasticity clay |
| CI | confidence interval |
| cm | centimeter |
| cm/s | centimeters per second |
| cm3 | cubic centimeters |
| COA | Certificate of Analysis |
| COG | cut-off grade |
| CRM | Certified Reference Material |
| CU | consolidated-undrained (triaxial test) |
| Dahrouge | Dahrouge Geological Consulting Ltd. |
| DC | direct current |
| DDS | NDWR Dams & Dam Safety |
| dm | decimeters |
| DSFM | NDPS Division of State Fire Marshal |
| EDX | energy dispersive X-ray spectroscopy |
| EIS | environmental impact statement |
| EMS | Energy Management System |
| EPA | U.S. Environmental Protection Agency |
| EPC | engineering, procurement, and construction |
| EV | electric vehicle |
| FCC | U.S. Federal Communications Commission |
| FOB | free on board |
| FOS | factor of safety |
| FS | feasibility study |
| FSS | fully softened strength |
| ft | foot/feet |
| ft/s | feet per second |
| g | gram |
| G&A | general and administrative |
| g/cm3 | grams per cubic centimeter |
| g/t | grams per tonne |
| GPS | global positioning system |
| h | hour |
| barr.com |
|
|
| ha | hectares |
| Hazen | Hazen Research, Inc. |
| IA | Initial Assessment Report (April 2024) |
| IC | ion chromatograph |
| ICP | inductively coupled plasma |
| ICP-MS | inductively coupled plasma mass spectrometry |
| ICP-OES | inductively coupled plasma optical emission spectrometry |
| ID | Identification |
| IRA | Inflation Reduction Act |
| IRR | internal rate of return |
| IT | information technology |
| ITC | Investment Tax Credit |
| IX | ion exchange |
| kg | kilogram |
| kh | seismic loading coefficient |
| km | kilometer |
| kN/m3 | kilonewtons per cubic meter |
| KOP | Key Observation Points |
| kPa | kilopascals |
| kph | kilometers per hour |
| ktonnes | kilotonnes |
| kV | kilovolt |
| kWh | kilowatt-hour |
| LCL | Lower Control Limit |
| LHM | lithium hydroxide monohydrate |
| Li | lithium |
| Li-ion | lithium ion |
| LNG | liquefied natural gas |
| LOM | life of mine |
| LSL | lower specification limit |
| m | meter |
| m2 | square meter |
| m3 | cubic meter |
| Ma | mega-annum |
| barr.com |
|
|
| MEG | Moment Exploration Geochemistry, LLC. |
| mg/kg | milligrams per kilogram |
| mg/L | milligrams per liter |
| mi | mile |
| min | minimum |
| MLRS | BLM Mineral and Land Records System |
| mm | millimeter |
| MPa | megapascals |
| MPO | mine plan of operations |
| MSHA | U.S. Mine Safety and Health Administration |
| MST | NDBI Mine Safety and Training |
| Mt | million tonnes |
| Mtpa | million tonnes per annum |
| MV | medium voltage |
| MVR | mechanical vapor recompression |
| MWdc | megawatts direct current |
| MWMP | Meteoric Water Mobility Procedure |
| NAAQS | National Ambient Air Quality Standards |
| NAD | North American Datum |
| NAMC | Nevada Alaska Mining Company |
| NDBI | Nevada Division of Industrial Relations |
| NDEP | Nevada Division of Environmental Protection |
| NDOM | Nevada Division of Minerals |
| NDOT | Nevada Department of Transportation |
| NDOW | Nevada Department of Wildlife |
| NDPS | Nevada Department of Public Safety |
| NDWR | Nevada Division of Water Resources |
| NEPA | National Environmental Policy Act |
| Nexus | Nexus Environmental Consultants |
| NOH | net operating hours |
| NPDES | National Pollutant Discharge Elimination System |
| NPV | net present value |
| NREL | National Renewable Energy Laboratory |
| O&M | operations and maintenance |
| barr.com |
|
|
| OBI | optical borehole imagers |
| OPEX | operating expenditure |
| OSHA | Occupational Safety and Health Administration |
| PAM | polyacrylamide |
| Paragon | Paragon Geochemical |
| pcf | pounds per cubic foot |
| PFS | Pre-Feasibility Study |
| PGA | peak ground acceleration |
| PLS | pregnant leach solution |
| Pocock | Pocock Industrial Inc. |
| POF | probability of failure |
| ppm | parts per million |
| PSD | particle size distribution |
| psf | pounds per square foot |
| psi | pounds per square inch |
| PTC | Production Tax Credit |
| PV | photovoltaic |
| PVSCM | NREL PV System Cost Model |
| PVWatts | NREL Photovoltaic Watts Calculator |
| QA/QC | quality assurance / quality control |
| Qal | Quaternary alluvium (unconsolidated silt, sand, and gravel deposited by modern streams) |
| QEMSCAN® | Quantitative Evaluation of Minerals by Scanning Electron Microscopy |
| QP | Qualified Person |
| qty | quantity |
| R&D | research and development |
| RC | reverse circulation |
| REC | Renewable Energy Certificate |
| REF | refinery |
| RMA | reduced major axis |
| RO | reverse osmosis |
| ROM | run of mine |
| ROW | right-of-way |
| RPD | relative percent difference |
| RQD | rock quality designation |
| barr.com |
|
|
| s | seconds |
| SAM | NREL System Advisor Model |
| SCADA | supervisory control and data acquisition |
| SEC | U.S. Securities and Exchange Commission |
| SEM | scanning electron microscopy |
| sg | specific gravity |
| SGS | SGS Canada, Inc. |
| SGSim | Sequential Gaussian Simulation |
| SHPO | Nevada State Historic Preservation Office |
| SI | International System of Units |
| S-K 1300 | SEC Regulation S-K, Subpart 1300 (S-K 1300) |
| SR | stripping ratio |
| SWPPP | Stormwater Pollution Prevention Plan |
| t | metric tonne |
| TC | total carbon |
| Tcsl | Lower Siebert Formation (Tertiary tuffaceous sedimentary unit) |
| Tcsm | Middle Siebert Formation (Tertiary tuffaceous sedimentary unit) |
| Tcsu | Upper Siebert Formation (Tertiary tuffaceous sedimentary unit) |
| TFLP | ABTC’s Tonopah Flats Lithium Project |
| TGA-DSC | thermogravimetric analysis coupled with differential scanning calorimetry |
| TOC | total organic carbon |
| tpa | tonnes per annum |
| tpd | tonnes per day |
| tph | tonnes per hour |
| TRS | Technical Report Summary |
| TSF | tailings storage facility |
| TWh | terawatt hour |
| UCL | upper control limit |
| UCS | uniaxial compressive strength |
| UPS | uninterruptible power supply |
| US 6/95 | US Highways 6 and 95 |
| US/U.S. | United States |
| USCS | Unified Soil Classification System |
| USFWS | U.S. Fish and Wildlife Service |
| barr.com |
|
|
| USGS | U.S. Geological Survey |
| USL | upper specification limit |
| UTM | Universal Transverse Mercator |
| UU | unconsolidated-undrained |
| V | volt |
| VFD | variable frequency drive |
| VOC | volatile organic compounds |
| Wi-Fi | wireless fidelity |
| WMS | Aquaveo’s Watershed Modeling System |
| Woods | Woods Process Services, LLC |
| WRF | waste rock facility |
| WRSF | waste rock storage facility |
| XRD | x-ray diffraction |
| yr | year |
| barr.com |
|
|
1 Executive Summary
Barr Engineering Co. has prepared this Technical Report Summary (TRS) for the Tonopah Flats Lithium Project (TFLP), Esmeralda and Nye Counties, Nevada, USA, at the request of American Battery Technology Company (ABTC), a Nevada Corporation and a United States (U.S.) listed company (NASDAQ: ABAT) based in Reno, Nevada, USA. The purpose of this TRS is to disclose the results of a Pre-Feasibility Study (PFS) for the project. The Tonopah Flats property is considered a material property as defined under U.S. Securities and Exchange Commission (SEC) Regulation S-K, Subpart 1300 (S-K 1300).
ABTC is an integrated battery-critical material manufacturing company focused on the supply of low-cost, low-environmental impact, and domestically-sourced critical materials through its three core operations to support a sustainable closed-loop battery critical material economy. These core operations include the recycling of lithium-ion (Li-ion) batteries, the development of domestic critical mineral mines, and the refining of these primary critical materials into refined products. ABTC’s development of its lithium (Li) claystone resource and its associated claystone to lithium hydroxide refinery near Tonopah, Nevada, namely the Tonopah Flats Lithium Project, is a key project to achieving the company’s mission.
| 1.1 | Property Description and Ownership |
The Tonopah Flats property consists of 517 unpatented federal lode mining claims covering approximately 4,322 hectares (ha) (10,680 acres [ac]) and is centered at 469500.9 E, and 4218056.0 N (NAD 83 UTM Meters Zone 11N). ABTC owns 100% of the claims comprising the Tonopah Flats property. Ownership of the unpatented mining lode claims is in the name of the holder (locator), subject to the paramount title of the United States of America. Under the Mining Law of 1872, the locator has the right to explore, develop, and mine minerals on unpatented mining lode claims without payments of production royalties to the U.S. government. The 517 unpatented lode claims include rights to all locatable subsurface minerals.
| 1.2 | Geology and Mineralization |
The Tonopah Flats property is in a broad alluvial basin of subdued topography between the San Antonio Mountains to the east and the Monte Cristo Mountains to the west, approximately 11 kilometers (km) (seven miles) northwest of the town of Tonopah, Nevada. Quaternary alluvial fan and pediment sedimentary deposits cover most of the property and are generally composed of silt, sand, and gravel from local sources. The alluvial cover has an average thickness of less than 15 meters (m) (50 feet [ft]) over much of the property and overlies a thick sequence of fluvial and lacustrine epiclastic claystone, volcanic conglomerate, sandstone, siltstone, and tuff of the Miocene age Siebert Formation. The overall sedimentary package within the project area is flat lying to gently dipping.
Lithium mineralization occurs predominantly in the claystone of the Siebert Formation. Drilling by ABTC has so far defined an area of generally continuous lithium mineralization 7,925 m (26,000 ft) north to south by 1,524 m to 4,572 m (5,000 ft to 15,000 ft) east to west, with thicknesses ranging from 122 m to 436 m (400 ft to 1,430 ft).
| barr.com |
|
|
| 1.3 | Status of Exploration, Development, and Operations |
In addition to the 5,704 m from 30 drill holes already reported, ABTC has conducted additional exploration through May 2025 consisting of 2,856 m from eight boreholes. From January 2025 to February 2025, eight core holes were drilled and from April 2025 to May 2025 an additional six sonic holes were drilled to collect geotechnical data on the alluvial gravels and assay data. Lithium mineralization was encountered in the majority of the boreholes drilled.
| 1.4 | Metallurgical Testing and Mineral Processing |
ABTC has conducted material characterization, mineral processing, and metallurgical testing on sample cuttings from its drill programs and cuttings collected from bulk samples. Two processing routes were employed to empirically evaluate this material: i) conventional mineral acid leaching, and ii) internally-developed pretreatment and selective lithium leaching. Subsequent purification and conversion processes of the extracted lithium to battery grade lithium hydroxide monohydrate (LHM) were performed and evaluated for each processing route.
The conclusions from the conventional mineral acid leaching efforts were generally aligned with commercially reported observations. These trials demonstrated high lithium extraction efficiencies (>90%), however low selectivity for lithium extraction relative to other elements. This low selectivity resulted in the need for extensive purification and conversion processes that require high reagent and water consumption and result in significant operating expenses.
When implementing ABTC’s internally-developed pretreatment and selective lithium leaching processes, moderate lithium extraction (>65%) was demonstrated, however with very high selectivity of lithium to other elements. This resulted in the use of simplified purification and conversion processes with very low consumption of chemical reagents and water, and very low processing lithium losses.
ABTC has constructed and is operating a multi-tonne per day integrated demonstration scale facility that utilizes lithium-bearing claystone feedstock specifically from the Tonopah Flats deposit as feedstock and processing this material through each of the refining operations of ABTC’s internally-developed pretreatment, selective lithium leaching, and refining operations. This facility is demonstrating the attributes of the internally-developed pretreatment and selective lithium leaching technology and generating large quantities of battery grade lithium hydroxide for evaluation by customers and stakeholders.
In addition to this selective leaching technique, it has been observed that the lithium within the claystone is not uniformly distributed throughout the various mineralizations. Initial test work has been performed that has allowed for the beneficiation of this claystone material, where the non- and low-lithium bearing minerals are separated from the bulk material, and the high-lithium bearing minerals are concentrated. These initial trials have demonstrated an increase in the grade of approximately 2.85x to over 2,000 parts per million (ppm) lithium. These beneficiation processes have the potential to substantially increase overall lithium extraction efficiencies and further reduce reagent and energy consumption.
| 1.5 | Mineral Resource Estimate |
The mineral resources for Tonopah Flats described and tabulated in this report are classified as Measured, Indicated, and Inferred in accordance with the SEC S-K 1300 New Mining Disclosure Rule and were estimated to reflect potential open-pit extraction. These resources were constrained with an optimization and cut-off grade satisfactorily to meet the requirement of reasonable prospects for economic extraction using a cut-off of 300 ppm within the mineralized units.
| barr.com |
|
|
Sequential Gaussian Simulation (SGSim) was used to generate the mineral resource estimate for Li (ppm), which reduced uncertainty from the previous results. The Measured mineral resource blocks were classified within approximately 300 m of multiple drill holes and where the simulation variance did not exceed ±15% at the 90% confidence interval (CI). The Indicated mineral resource blocks were classified within approximately 600 m of multiple drill holes and where the variance was within ±15% at the 70% CI. The Inferred mineral resource blocks comprise the remaining blocks that fell outside of those criteria or are located more than 600 m from multiple drill holes.
The mineral resource for 2025 reported below is inclusive of the mineral reserve based on a 300 ppm cut-off.
| Table 1-1 | Tonopah Flats Mineral Resources |
| Classification | ktonnes | Grade Li (ppm) | Li (ktonnes) | LHM (ktonnes) |
| Measured | 1,126,772 | 876 | 987 | 5,968 |
| Indicated | 2,534,419 | 640 | 1,621 | 9,800 |
| Measured and Indicated | 3,661,191 | 712 | 2,608 | 15,767 |
| Inferred | 2,151,227 | 424 | 911 | 5,508 |
| a) | The estimate of mineral resources was completed by ABTC and Dahrouge. |
| b) | Tonopah Flats resources are classified as Measured, Indicated, and Inferred. |
| c) | Mineral resources comprised all model blocks at a 300 ppm tonne Li cut-off that lie within an optimized pit. |
| d) | Lithium hydroxide monohydrate (LHM) tonnes were calculated using a factor of 6.0459. |
| e) | Mineral resources that are not mineral reserves do not have demonstrated economic viability. |
| f) | Mineral resources potentially amenable to open pit mining methods are reported using a LHM price of US$23,000/tonne, assumed metallurgical recoveries of 48% for Li, mining costs of US$2.70/tonne mined, processing costs of US$7.50/tonne processed, minimum grade of 300 ppm lithium within claystone, and general and administrative costs of $0.83/tonne processed, and a 45,000-tpd processing rate. |
| g) | The effective date of the estimate is as of the date of this PFS. |
| h) | Rounding may result in apparent discrepancies between tonnes, grade, and contained metal content. |
ktonnes = kilotonnes
ppm = parts per million
tonnes = metric tonnes
There is some risk that a significant commodity price drop would change the economic inputs to the pit constraints used to report this resource. As a result, a conservative cut-off concentration of 300 ppm Li within the optimized pit is used in this analysis. It should be noted that without this grade constraint, the resulting pit shell using these parameters would be larger than has been used for the resources reported herein.
| 1.6 | Mineral Reserves |
To convert a mineral resource into a mineral reserve, estimates of commodity prices, mining dilution, process recovery, refining/transport costs, royalties, mining costs, processing, and general and administration costs were used to estimate cut-off grades (COGs). These input parameters, along with geotechnical slope recommendations, formed the basis for the selection of economic mining blocks.
The economic mining blocks were identified using the Lerchs-Grossmann Pit Optimization Algorithm in the Maptek Vulcan software package, which produced a series of optimized open-pit shapes. The Qualified Person (QP) has selected one of the pit shells for detailed design and quantified the mineral reserves at the determined COG within the final pit design.
| barr.com |
|
|
The lithium resources at Tonopah Flats are not subject to royalty. A mill recovery of 48% was utilized for the pit optimization. The mineral resources and reserves were reported undiluted, as the strip ratio is very low and the deposit shows little variability at the 300 ppm COG. No additional tonnage adjustment was necessary.
A summary of the mineral reserves for the TFLP is shown in Table 1-2 within the designed final pit for the Tonopah Flats deposit. In the detailed mine production schedule, the COG has been held constant at 300 ppm Li. The QPs have not identified any known legal, political, environmental, or other risks that would materially affect the potential development of the mineral reserves, except for the risk of not being able to secure the necessary permits from the government for the development and operation of the project; however, the QPs are not aware of any unique characteristics of the project that would prevent permitting.
| Table 1-2 | Tonopah Flats Mineral Reserves Estimate Effective as of the Date of this PFS |
| Classification | Tonnes (ktonnes) |
Grade
Li (ppm) |
Contained
Li (ktonnes) |
LHM
Equivalent Mined (ktonnes) |
| Proven | 175,515 | 920 | 161 | 979 |
| Probable | 384,333 | 753 | 289 | 1,754 |
| Total Proven and Probable | 559,848 | 805 | 451 | 2,733 |
ktonnes = kilotonnes
LHM = lithium hydroxide monohydrate
ppm = parts per million
tonnes = metric tonnes
| 1.7 | Mining Methods |
The mine will be developed using conventional open-pit mining, selected based on the resources and reserves defined in the previous section, and its relatively low cost. This method encompasses drilling, blasting, loading and hauling, and related support activities. Due to the predominantly soft rock conditions within the project area, drilling and blasting requirements are expected to be minimal, accounting for only approximately 5% of the clay material.
A pit optimization process was utilized to generate the ultimate pit shell, along with eight intermediate pit shells representing the phases (pushbacks). These pit shells served as the basis for the final pit and phase designs, which were subsequently used to develop the life of mine (LOM) production schedule. These phases are designed to optimize production rates, facilitate construction activities, and support backfill operations.
The pit designs utilize 10-m-high benches with a 9.65-m-wide catch bench installed on every other bench (double-benching), or 20 vertical meters apart. The bench face angle used is 45º. The resulting inter-ramp slope is 34º. The design road width of 30 m is used resulting in the overall stope angle of 33º.
| barr.com |
|
|
Ore production rate was established in alignment with the refinery’s throughput of 30,000 tonnes (t) of LHM per year, necessitating an approximate feed rate of 12,400,000 tonnes per annum (tpa) over the LOM. The mine is planned to operate continuously, with two 12-hour shifts per day, 365 days per year. Key milestones within the LOM production schedule are summarized as follows:
| ● | Pre-mining site development and earthworks: approximately six months |
| ● | Pre-production mining (non-processing phase): approximately one year |
| ● | Initial ramp-up production phase (5,000 tpa of LHM): 1-2 years |
| ● | Full ramp-up phase achieving and sustaining 30,000 tpa: 1-3 years |
| ● | Loading and transporting dry-stack tailings to the backfill dumps: year-6 to LOM |
The waste management infrastructure comprises a waste rock facility (WRF), dry-stack tailings storage facility (TSF), a coarse gangues (CG) dump, and one backfill dump split into eight phases. These facilities were designed in accordance with geotechnical guidelines to ensure slope stability and overall structural integrity. The waste rock from the pit, along with waste generated from refinery, will be sent to these destinated waste management facilities.
As part of the comprehensive mine planning process, detailed plans have been developed for equipment selection, drilling, blasting, staffing, reclamation, ROM ore handling, tailings and coarse gangue handling, and overall costing. The primary mining fleet for this project will include hydraulic shovels, wheel loaders, haul trucks, dozers, graders, water trucks, etc. This primary equipment will be supplemented by ancillary equipment as required. Both routine and preventive maintenance will be conducted in-house, while the owner and equipment vendors will collaboratively manage major repairs and equipment overhauls.
| 1.8 | Processing and Recovery Methods |
The initial process design is scaled to produce 30,000 tpa of battery grade LHM, and the process plant is based on achieving a nameplate feed tonnage of 11.9 million tpa (Mtpa) of claystone. Refinery installation is planned in three phases of 5,000 tpa, 12,500 tpa, and 12,500 tpa, in Phases 1-3, respectively. The process flow sheet consists of six process areas, namely: Feed Comminution and Screening, Extraction, Impurity Removal and Concentration, Impurity Crystallization, Sulfate Crystallization, and Lithium Hydroxide Conversion.
The refinery will receive lithium claystone from the open pit mine via mine haul trucks. Claystone will be processed through the comminution circuit where it will be sized, processed, and pretreated as part of the extraction. Lithium will be extracted into an aqueous phase from the pretreated claystone. Impurities are to be removed from the aqueous phase using precipitation, membrane technology, and crystallization. LHM will be produced using a combination of electrochemical conversion and crystallization. The filtered tailings from the extraction and impurity removal process, along with solids generated from off-gas handling, are planned to be combined and placed in a temporary dry-stack tailing impoundment. As areas of the pit are mined out, tailings will be placed as backfill.
| 1.9 | Infrastructure |
A TSF is planned to be located between the proposed pit and the refinery facility. This TSF, storing both the CG and the tailings in two separate facilities, will be used until the tailings can be returned back into the open pit. A stability analysis was performed for both static and earthquake conditions, indicating that the TSF can be safely built using 2.5-horizontal to 1-vertical slopes (2.5H:1V) with a 9-m-high perimeter berm encapsulating both tailing facilities. Surface water from outside the mining site will be diverted to a series of ponds on the southern portion of the site. Runoff from within the mining site will be diverted to a pond located on the western edge of the facility.
| barr.com |
|
|
| 1.10 | Capital and Operating Costs |
The capital and operating cost estimates for this project were based on the costs associated with mining, processing/refining, safety and training, infrastructure, site reclamation and closure, and all other relevant direct and indirect expenditures necessary to ensure the successful execution of this project. These cost estimates were developed using data collected from in-house databases, vendor quotations, contractors, reliable publicly available sources, benchmarking from similar lithium projects, operational experiences, and other industry-standard estimating factors.
These costs in this report are presented in 2025 USD on a calendar year basis. No escalation or inflation is included.
The capital cost projections were defined and developed based on expected quantities of materials, labor, and equipment. The expected quantities were derived from engineering drawings, early-stage 3D models, and preliminary facility layout. The capital costs in this report have an expected accuracy of +/-25% based on AACE International guidance related to Class 4 capital cost estimates.
Process capital costs were estimated by ABTC and Woods Process Services, LLC. (Woods), while mining, infrastructure, and other capital expenses were estimated by ABTC and Barr. The total estimated capital cost for the design, construction, installation, and commissioning of project facilities includes approximately $2.0 billion in pre-production and initial capital expenditures through year 5, and $205.6 million in new and sustaining capital costs over the remaining LOM, as reflected in Table 1-3, bringing the total capital requirement over the 45-year mine life considered in this PFS to an estimated $2.2 billion.
| barr.com |
|
|
| Table 1-3 | Total Capital Cost Summary |
| Capital Costs ($000) | YR -2 | YR -1 | YR 1-2 | YR 3-5 | YR 6-10 | YR 11-20 | YR 21-30 | YR 31-40 | YR 41-45 | Total |
| Pre-Mining Cost | $- | $10,170 | $- | $- | $- | $- | $- | $- | $- | $10,170 |
| Mining Capital | $- | $86,648 | $53,360 | $3,355 | $37,252 | $34 | $10,099 | $15,099 | $34 | $205,881 |
| Mining Sustaining Capital | $- | $- | $76 | $2,141 | $8,423 | $19,374 | $68,995 | $21,371 | $1,253 | $121,632 |
| Process/ Milling | $91,234 | $373,462 | $746,924 | $282,228 | $- | $- | $- | $- | $- | $1,493,848 |
| Owner's Costs | $778 | $3,723 | $7,446 | $11,169 | $14,114 | $- | $- | $- | $- | $37,230 |
| Closure Provisions | $- | $- | $- | $- | $- | $- | $- | $- | $150 | $150 |
| Subtotal | $92,012 | $474,003 | $807,806 | $298,894 | $59,789 | $19,408 | $79,094 | $36,470 | $1,437 | $1,868,912 |
| Contingency | $18,247 | $89,215 | $157,389 | $56,949 | $5,588 | $5 | $1,515 | $2,265 | $5 | $331,177 |
| Total Capital | $110,259 | $563,219 | $965,195 | $355,843 | $65,377 | $19,413 | $80,609 | $38,735 | $1,442 | $2,200,090 |
yr = year
| barr.com |
|
|
The average LOM operating cost equates to $6,994/t of LHM produced. The project average annual operating cost is approximately $199.5 million, supporting a refinery’s throughput of 30,000 tpa of LHM, along with an average refinery feed rate of 12.4 Mtpa, and an average mining rate of 15.6 Mtpa. Table 1-4 presents a summary of the operating cost.
| Table 1-4 | Operating Cost Summary |
| Cost Area Description | LOM Total Cost | LOM Average | Unit Operating Expenditure Cost | Operating Expenditure Percent |
| ($000s) | ($000s/Year) | ($/t LHM) | (%) | |
| Total Mining Cost | 3,247,358 | 70,595 | 2,476 | 35.4% |
| Process/Refining | 5,649,008 | 122,805 | 4,307 | 61.6% |
| General & Administrative | 171,953 | 3,738 | 131 | 1.9% |
| Reclamation Cost | 105,331 | 2,290 | 80 | 1.1% |
| Operating Cost | 9,173,699 | 199,428 | 6,994 | 100.0% |
LOM = life of mine
t = metric tonne
LHM = lithium hydroxide monohydrate
| 1.11 | Economic Analysis |
ABTC and Barr created a cash-flow model based on the production schedule and resulting revenue stream in accordance with the costs presented. Only Measured and Indicated mineral resources were used to create the revenue stream. The PFS limits the TFLP to a mine life of 45 years for approximately 599.8 Mt with an average of 805 ppm Li grade processed and a total recovery including beneficiation, extraction, and refining of 48%. With $2.0 billion in initial capital costs, processing costs of $4,307/t of LHM, overall operating costs of $6,994/t of LHM produced, and average production of 30,000 tpa of LHM, this project is estimated to have a $2.57 billion after-tax net present value (NPV) at an 8% discount rate. At a discount rate of 10%, the after-tax net NPV is $1.75 billion. The project has a 21.8% Internal Rate of Return (IRR) and 7.5-year payback of initial capital. Mineral resources that are not categorized as reserves do not have demonstrated economic viability.
| 1.12 | Economic Sensitivities |
Revenues, operating costs, and capital costs were evaluated from +/-30% of the values in 10% increments, using the PFS cash flow model. Figure 1-1 shows the cash flow sensitivity in NPV (8%) graphically. The steeper slope of the revenue line shows that the project is most sensitive to the price of lithium and less sensitive to the operating and capital costs.
| barr.com |
|
|

| Figure 1-1 | After-Tax Cash Flow Sensitivity - NPV (8%) US$ Billion |
| 1.13 | Conclusions and Recommendations |
This PFS has integrated drilling, testing, design, and economic evaluation data, as described in the various sections of this report. This PFS represents a significant step forward from the previously published IA, providing an updated resource estimate, reserve estimate, viable mining plan, technically feasible processing scenario, tailings and mine waste management approach, update on permitting considerations, and a resultant economic evaluation.
The Mineral Resource estimate has been updated with additional drilling conducted in 2025. This resulted in the updating of the geologic and mineralization domains. The Mineral Resource exclusive of the Mineral Reserve within Measured and Indicated categories consists of 2,333,767 ktonnes at 712 ppm Li.
The drilling has thus far defined an area of generally continuous mineralization 7,925 m (26,000 ft) north to south by 1,524 m to 4,572 m (5,000 ft to 15,000 ft) east to west, with known thicknesses up to 436 m (1,430 ft). Clay beds with higher concentrations of lithium are localized to semi-continuous, and the lithium-bearing beds are generally contained in a 1,219- to 3,048-m wide (4,000- to 10,000-ft wide) corridor in multiple stratigraphic horizons from 6.1 m to 35 m (20 ft to 115 ft) in thickness, running north to south through the central portion of the property.
ABTC, in partnership with Hazen Research, Inc. (Hazen), Pocock Industrial Inc. (Pocock), and SGS Canada, Inc. (SGS), has been conducting a comprehensive mineral processing and metallurgical testing program since Spring 2022 to produce high-purity lithium hydroxide from lithium-bearing claystone. Initial efforts using conventional acid leaching (HCl and H₂SO₄) achieved high lithium extraction rates (>80%) but also extracted unwanted gangue minerals and deleterious elements, increasing reagent consumption and complicating purification. To address this, ABTC developed pretreatment methods that improved selectivity by converting lithium into more leachable forms while minimizing impurity extraction. These methods maintained strong lithium recovery (70–85%) and significantly reduced impurities in the pregnant leach solution (PLS), streamlining downstream purification and improving economic viability.
| barr.com |
|
|
Building on successful bench-scale results, ABTC constructed and operated a 5-tpd pilot plant, validating the feasibility of producing battery-grade LHM. The team also explored beneficiation techniques to concentrate lithium-bearing minerals, achieving a 2.85x upgrade ratio from run-of-mine ore, which reduced processing costs and improved efficiency. Process simulations using METSIM and Aspen were employed to optimize operational parameters and economics. The report highlights bench-scale and pilot plant results, beneficiation and pretreatment studies, and ongoing efforts to refine reagent use and enhance final product purity. Further testing and pilot runs are planned to support the upcoming feasibility study (FS).
It should be noted that this PFS was limited to a mine life of 45 years and only a portion of the South Pit was included in the mine life and economic analysis. A 45-year mine life will not exhaust the known mineral reserves and resources.
The QPs believe that the data provided by ABTC, and the geological interpretations Dahrouge Geological Consulting Ltd. (Dahrouge) has derived from the data, are an accurate and reasonable representation of the project, subject to those concerns written elsewhere in this report.
The current lithium resources remain open to the south, southwest, and at depth. It is reasonable to assume that there is the potential to significantly expand the resources with further drilling extending to the south and southwest property boundaries, and at greater depths.
| 1.13.1 | Project Risks |
Processing lithium-clay deposits is an uncommon practice in lithium production worldwide, currently. The work to date has demonstrated the likely economic extraction of the resources reported herein, based on the test work described in this report. To address this risk, ABTC has constructed and continues to operate a multi-tonne per day pilot plant that operates on representative bulk samples from the deposit and these operations will continue to derisk the processing approach.
The operating expenditure (OPEX) for this project are heavily weighted to the power consumption of the refinery. As a result, the power supply to the TFLP is a major risk factor. ABTC has addressed this through a combination of power sources, namely solar power production, with battery energy storage, combined with grid power supplied by NV Energy. Furthermore, ABTC has an operational plan that prorates production during times of high and low power availability or constraint. Further refinement of this approach through power system modeling and process design modifications will help reduce the risk in this area.
The price of LHM can vary widely. This represents a major risk to project economics. Expected reasonable near-term lithium price variations are addressed in the sensitivity analysis of this report.
| barr.com |
|
|
| 1.13.2 | Recommendations |
While the PFS indicates positive cash flow, additional studies are needed to advance to the FS, as described below.
| ● | Additional study of mining, ore handling, and tailings handling to improve approaches and reduce risk. |
| ● | Additional metallurgy and processing test work, supported by metallurgical drilling to provide composites for testing |
| ● | Additional test campaigns in the pilot plant, incorporate ore beneficiation, stress test the operations, and provide longer-duration test campaign data |
| ● | Develop a geometallurgical model, unified metallurgical dataset, and ore control methodology |
| ● | A passive seismic study for the southern portion of the property south of US 6/95 to improve the understanding of the subsurface geologic structure and depth to basement rock in areas that have not yet been tested by exploration drilling |
| ● | Additional geotechnical drilling and testing related to slope stability and deformation analysis |
| ● | Additional baseline environmental studies, including raptor surveys, geochemistry, hydrology, and air quality to support the NEPA process |
| ● | Completion of a FS to further reduce risk and further refine the economics of the project, including additional resource drilling, process recovery improvements, energy efficiency improvements, further detailed refinery design work, further tailings design work, environmental study advancement, and updated detailed economic evaluations |
| Table 1-5 | ABTC Estimated Costs for Tonopah Flats Recommended Work Program |
| Category | Estimated Cost USD |
| Mining, Ore Handling, and Tailings Handling | $250,000 |
| Metallurgy and Processing | $550,000 |
| Passive Seismic Study | $30,000 |
| Geotechnical Drilling | $300,000 |
| Baseline Environmental Studies including NEPA Documentation | $1,000,000 |
| Feasibility Study | $3,000,000 to $4,000,000 |
| Total | $5,130,000 to $6,130,000 |
NEPA = National Environmental Policy Act
| barr.com |
|
|
2 Introduction
Barr Engineering Co. (Barr). has prepared this Technical Report Summary (TRS) for the Tonopah Flats Lithium Project (TFLP), Esmeralda and Nye Counties, Nevada, USA, at the request of American Battery Technology Company (ABTC), a Nevada Corporation and a United States (U.S.) listed company (NASDAQ: ABAT) based in Reno, Nevada, USA. The purpose of this TRS is to disclose the results of a Pre-Feasibility Study (PFS) for the Project. The Tonopah Flats property is considered a material property under S-K 1300.
ABTC is an integrated battery critical material manufacturing company focused on the supply of low-cost, low-environmental impact, and domestically sourced critical materials through its three core operations to support a sustainable closed-loop battery critical material economy. These core operations include the recycling of lithium-ion (Li) batteries, the development of domestic critical mineral mines, and the refining of these primary critical materials into refined critical material products. ABTC’s development of its primary lithium claystone resource and its associated claystone-to-lithium-hydroxide refinery near Tonopah, Nevada, namely the TFLP, is a key project to achieving the company’s mission.
In this report, measurements are generally reported in metric (SI) units. However, some test work was originally conducted with U.S. customary units of measure and may not have been converted to metric units within the chapters and sections of this report.
Unless otherwise indicated, all references to dollars ($) in this report refer to 2025 United States Dollars.
| 2.1 | Sources of Information |
The scope of this updated PFS includes a review of pertinent technical reports and data provided to Barr, Dahrouge Geological Consulting Ltd. (Dahrouge), and Woods Process Services, LLC (Woods) by ABTC relative to the general setting, geology, project history, exploration activities and results, methodology, quality assurance, interpretations, drilling programs, and metallurgy and mineral processing. Chapters 6 through 9 and chapter 11 were contributed by Dahrouge and chapters 10 and 14 were contributed by Woods.
Barr, Dahrouge, and Woods, as applicable, have relied on data and information provided by ABTC for the completion of this report as well as other sources of information cited specifically in portions of this PFS and listed in chapter 24, such as third-party laboratory test work and the associated reports. Additionally, information has been relied upon as previously disclosed in the initial assessment (IA) report for the Tonopah Flats Lithium Project, by Respec Company, LLC, and Woods Process Services (2024). The QPs have reviewed much of the available data and have made judgments about the general reliability of the underlying data. Where deemed either inadequate or unreliable, the data were either eliminated from use or procedures were modified to account for lack of confidence in that specific information. The QPs have made such investigations as deemed necessary in their professional judgment to be able to reasonably present the conclusions discussed herein.
| 2.2 | Personal Inspections |
Barr’s QP conducted a site visit of the TFLP on September 27, 2024. The visit included a tour of the core storage shed and multiple stops throughout the Tonopah Flats property. A selection of core and bulk samples were reviewed at the core shed. The visit to the mine site included stops at some of the drill hole collars, test pits, lithium resource outcrops, powerline corridors, and general viewing of the property topography.
| barr.com |
|
|
On June 26, 2025, Barr QPs visited the ABTC pilot plant in Sparks, Nevada. The visit included a thorough tour of the pilot plant operation and viewing of the bulk feed materials being used for the pilot testing. Barr’s QPs also viewed bulk samples (supersacks) of combined tailings material from the pilot plant operations.
Mr. Jeff Woods, of Woods, the QP for chapters 10 and 14 of this report, has visited the pilot plant multiple times during the course of the project, including observing the pilot plant in operation.
| 2.3 | Effective Date |
The effective date of the current mineral resources and of this TRS is the date of this report.
| barr.com |
|
|
3 Property Description and Location
Barr has relied fully on ABTC for the information in Section 3.1 through Section 3.5 as summarized in Section 25.
| 3.1 | Property Location |
The Tonopah Flats property is in the southeastern portion of Big Smoky Valley approximately 11 km northwest of Tonopah in Esmeralda and Nye Counties, Nevada, USA. (Figure 3-1).

| Figure 3-1 | Location Map for the Tonopah Flats Property |
| barr.com |
|
|
| 3.2 | Property Area and Claim Type |
The Tonopah Flats property (Figure 3-2) is centered at 469500.9E, and 4218065.9N (NAD 83 UTM Meters Zone 11N). The property consists of 517 unpatented federal lode mining claims covering approximately 4,322 hectares. Appendix A provides a list of the individual lode claims that comprise the Tonopah Flats property.
In 2021, ABTC acquired an exploration license with an option to purchase lode claims 1 through 305 from 1317038 Nevada Ltd. Inc. The option was exercised by ABTC after a due diligence period and the agreement closed escrow in October 2022. ABTC staked additional lode claims in December 2021 (lode claims 306 through 427) and February 2022 (lode claims 428 through 517).

| Figure 3-2 | Tonopah Flats Property Map |
| barr.com |
|
|
| 3.3 | Mineral Rights |
Ownership of the unpatented mining lode claims is in the name of the holder (locator), subject to the paramount title of the United States of America, under the administration of the U.S. Bureau of Land Management (BLM). Under the Mining Law of 1872, which governs the location of unpatented mining lode claims on federal lands, the locator has the right to explore, develop, and mine minerals on unpatented mining lode claims without payments of production royalties to the U.S. government, and subject to the surface management regulation of the BLM. The 517 unpatented lode claims include rights to all locatable subsurface minerals. Currently, annual claim-maintenance fees of $200 per claim are the only federal payments related to unpatented mining lode claims. As of the effective date of this report, these fees have been paid in full. The annual Nevada Division of Mineral Claim Notice of Intent to Hold fee is currently $12 per claim and due on or before November 1st of each year. The annual claim holding costs a total of $109,604 (Table 3-1).
Surface rights sufficient to explore, develop, and mine minerals on the unpatented mining lode claims are inherent to the claims as long as the claims are maintained in good standing. The surface rights are subject to all applicable state and federal environmental regulations.
| Table 3-1 | Summary of Annual Property Holding Costs |
| Type | Annual Federal Claim Fees | Annual State Claim Fees | Total Annual Costs |
| Unpatented Lode Claims | $103,400 | $6,204 | $109,604 |
| 3.4 | Significant Encumbrances and Permitting |
The Tonopah Flats property is owned 100% by ABTC with no significant encumbrances or agreements such as leases, options, or purchase payments known to Barr. Tonopah Flats is currently operated as a mid-stage project with studies advancing for mineral resources, metallurgy and processing, engineering and economics, and environmental permitting. Key BLM permits and bonding for these activities are in place as of the effective date of this report and include:
| ● | BLM Notice of Operations NVN-100850 |
| ● | The reclamation bond associated with the above activity is: |
| ○ | Exploration Bond #4969389; current obligation $59,646 |
| 3.5 | Royalties |
There are no royalties associated with the Tonopah Flats property.
| 3.6 | Significant Factors and Risks |
Barr is not aware of any significant factors and risks that may affect access, title, or the right or ability to perform work on the property other than those described in Sections 3.1 through 3.5.
| barr.com |
|
|
4 Accessibility, Climate, Local Resources, Infrastructure and Physiography
The Tonopah Flats lithium property is located approximately 11 kilometers (km) northwest of Tonopah, Nevada and 129 km east of Bishop, California in the southeastern portion of the Big Smoky Valley. The property covers flat to gently sloping, shrub-covered high desert. Vegetation includes sage brush, rabbit brush, and other hardy desert plant communities. Elevations range from approximately 1,500 m in the northwestern portion of property to 1,640 m in the southeastern portion of the property.
| 4.1 | Property Access |
Access to the Tonopah Flats lithium property is via U.S. Highways 6 and 95, (US 6/95) which bisects the central portion of the property from southeast to northwest. The Gabbs Pole Line Road parallels the eastern boundary of the property. Numerous unpaved roads extend through the property allowing for easy access throughout. The nearest commercial airport and railroads are in Reno, Nevada, approximately 266 km northwest of the property.
| 4.2 | Climate and Length of Operating Season |
The climate at the Tonopah Flats property area is semi-arid. As shown in Table 4-1 January is the coldest month of the year, with an average high temperature of 6 °C and average low temperature of -7 °C. July is the hottest month with an average high temperature of about 33 °C and average low temperature of 14 °C. Average annual precipitation includes approximately 127 millimeters (mm) of rainfall and 406 mm of snow (Weather Averages Tonopah, Nevada, n.d.). In general, the area is dry, with monsoonal rains during the summer and cold, snowy storms in the winter. Exploration and mining activities can be conducted year-round.
| Table 4-1 | Average Climate Data for Tonopah, Nevada |
| Jan | Feb | Mar | Apr | May | Jun | Jul | Aug | Sep | Oct | Nov | Dec | |
| Average High in °C | 6 | 9 | 13 | 17 | 23 | 29 | 33 | 32 | 27 | 20 | 12 | 7 |
| Average Low in °C | -7 | -4 | -2 | 2 | 6 | 11 | 14 | 13 | 9 | 3 | -3 | -7 |
| Average Precipitation in mm | 13 | 13 | 14 | 11 | 13 | 7 | 11 | 13 | 10 | 9 | 11 | 8 |
| Average Snowfall in mm | 101 | 76 | 76 | 25 | 0 | 0 | 0 | 0 | 0 | 0 | 50 | 76 |
| °C = degrees Celsius | Source: (Weather Averages Tonopah, Nevada, n.d.) |
mm = millimeters
| 4.3 | Infrastructure |
Power is available to the site from high-voltage powerlines that extend along the Gabbs Pole Line Road immediately east of the property and from lines that run along US 6/95 through the central portion of the property. ABTC has used metered municipal water from the city of Tonopah during their exploration drilling programs and will continue to do so for future drilling. ABTC has identified a suitable water source for the project through water exploration drilling. An exploration well and a water production well have been drilled on the project site. Current hydrologic studies by ABTC indicate sufficient water is available for the project. Anticipated future water usage for development of the property will require an application to the State of Nevada, Division of Water Resources for a temporary (25 years or less) mining and milling water usage permit.
| barr.com |
|
|
Tonopah is situated roughly equidistant from Reno and Las Vegas, Nevada. Necessary supplies, equipment, and services to carry out full sequence exploration and mining development projects are available in Tonopah and the larger Nevada communities. Additionally, a trained mining-industrial workforce is available in Tonopah and much of Nevada. The Tonopah Flats property area is uninhabited. The overall subdued topography that characterizes much of the property provides ample ground for the siting of mine facilities, tailings, and waste dumps. It is anticipated that a right-of-way (ROW) along US 6/95 corridor will be developed with appropriate federal, state, and local agencies as the project progresses.
ABTC currently has an office with storage and laboratory space located on South Main Street in Tonopah, approximately 11 km southeast of the subject property. An additional 139 square meters (m2) of warehouse and office space and fenced outdoor storage area for exploration equipment and sample storage bins are located on Ketten Road in Tonopah. The Ketten Road property also houses ABTC’s core logging and cutting facility.
| barr.com |
|
|
5 History
Exploration on the subject property, as an extension of the Tonopah mining district, dates to the early 20th century. At least two shallow, hand-dug vertical shafts for precious metal exploration are present in the southern and northwestern portions of the property. The shafts are caved but likely did not exceed 30 m in depth and did not reach bedrock. They were later used as water sources, as one has the remains of an old windmill.
Past exploration, estimated to date from the 1970s, consists of numerous shallow bulldozer excavations, likely completed as required annual assessment work for historical maintenance of BLM lode claims. Several historical drill holes have also been located on the property and are presumed to be part of the assessment. No further information is known about the historical exploration program or project owners at the time of this work.
In 2020, Nevada Alaska Mining Company (NAMC) staked 305 unpatented lode claims for lithium claystone similar to that found on the adjacent American Lithium TLC deposit. Forty-four surface samples were collected by hand-digging small pits to depths ranging from approximately 0.46 m to 0.9 m or more and placing representative material into labeled sample bags. The samples were collected at locations where tuff, sandstone, and clay crop out at the surface. Each sample location was recorded on paper maps at the time of collection. The samples were assayed at ALS Limited – Geochemistry (ALS) in Reno, Nevada and returned an average of 780 parts per million (ppm) lithium over an area of approximately 4 km by 3 km. The highest reported lithium value was 1,530 ppm.
NAMC’s claims were acquired by 1317038 Nevada Ltd. in 2020. In 2021, ABTC secured an exploration license with an option to purchase from 1317038 Nevada Ltd. Following a due diligence period, the option was exercised and ABTC gained 100% ownership of the claims in October 2022. ABTC subsequently staked 212 additional lode claims in December 2021 and February 2022.
A discussion of ABTC’s exploration activities is presented in Chapter 7 of this report.
| barr.com |
|
|
6 Geologic Setting, Deposit Type, and Mineralization
| 6.1 | Regional Geologic Setting |
The TFLP is situated in a broad alluvial basin of subdued topography between the San Antonio Mountains to the east and the Monte Cristo Mountains to the west. The project area is along the eastern margin of the Walker Lane tectonic belt, an approximately 80 km wide, northwest- trending zone in western Nevada and eastern California (Stewart, 1988). Prominent northwest-trending strike-slip faults and related north-south to northeast trending normal faults characterize much of the Walker Lane tectonic belt and accommodate part of the motion between the Pacific Plate and the North American Plate. The belt separates the Sierra Nevada and Basin and Range physiographic provinces.
The regional geologic setting is characterized by late Miocene to Quaternary alluvial basins surrounded by uplifted ranges generally exposing Cretaceous intrusive cores which are structurally overlain by Paleozoic and Mesozoic sedimentary rocks and Cenozoic volcanic rocks. The Cenozoic volcanic rocks in the San Antonio Mountains are of Oligocene and Miocene ages that vary in composition from rhyolite to trachyandesite (Bonham & Garside, 1979). The Oligocene volcanic rocks include thick units of felsic ash-flow tuff erupted from the Central Nevada Caldera Complex north of the San Antonio Mountains. The Miocene units were interpreted to have been erupted from volcanic centers within the San Antonio Mountains (Bonham & Garside, 1979), including the Fraction caldera and the Heller caldera of the Tonopah volcanic center (John & Henry, 2022). Miocene volcanism near Tonopah has been linked to ancestral Cascade arc magmatism (du Bray et al., 2019; John & Henry, 2022).
| 6.2 | Regional Geology |
The Tonopah Mining District lies on the eastern portion of a zone of NW-SE trending disrupted structure, known as the Walker Lane tectonic belt that separates the Sierra Nevada batholith from the Basin and Range province in the Great Basin of Nevada. The Basin and Range is a tectonic province west of the Rocky Mountains and Colorado Plateau, which underwent crustal extension and elevated thermal activity in the mid-Tertiary that developed the characteristic basin and range physiography. The ranges are comprised of fault-bounded mountain ranges that are dominantly composed of Proterozoic and Paleozoic sedimentary rocks, while the basins were filled with volcanic deposits and erosional detritus shed from the ranges (Bonham & Garside, 1979).
The Miocene-aged Siebert Formation is composed of epiclastic fluviatile and lacustrine conglomerates, sandstone, siltstone, and subordinate quantities of both subaerially and subaqueously deposited ashfall and lithic tuffs. Northerly-trending faults in the area are believed to be contemporaneous with Basin and Range faulting (Bonham & Garside, 1979). There is evidence of later plutonism as the Siebert Formation is locally intruded by intermediate to felsic plutons and dikes. Outcrops of the Siebert Formation are shown on Figure 7-1 and Figure 7-2 as “Ts.”
| 6.3 | District and Local Geology |
Much of the geologic information presented in this section is from Bonham and Garside (1979), which included a geologic map of the Tonopah, Lone Mountain, Klondike, and Northern Mud Lake Quadrangles, Nevada, with accompanying text.
| barr.com |
|
|
The TFLP is entirely within a low-lying portion of the Big Smoky Valley. Quaternary fan and pediment deposits cover most of the property and are generally composed of silt, sand, and gravel from local sources. Ephemeral stream deposits are located along the southwestern edge of the property. The stream deposits are transitional between upland fans and pediments and lower relief areas and are distinguished from other alluvial fans by their position near valley floors (Bonham & Garside, 1979). The alluvial cover averages less than 12 to 15 m over much of the property and overlies a thick sequence of claystone interbedded with tuff and sandstone of the Miocene-age Siebert Formation. The Siebert Formation has been dated at 13 to 17 Ma and contains a wide range of sedimentary and pyroclastic rocks. The bulk of the formation includes fluvial and lacustrine epiclastic volcanic conglomerate, sandstone, siltstone, and lesser subaerial and subaqueous tuff (Bonham & Garside, 1979). The thickness of the formation varies from 183 to 450 m but may be as much as 914 m in the center of Montezuma Valley, approximately 24 km south of the property. The Siebert Formation was derived from local sources in the San Antonio Mountains and Lone Mountain, which bounds the southern part of the valley. Much of the formation was deposited under alternating fluvial and lacustrine conditions. Fossil mammals, fish, and invertebrates have been identified within the formation and fossil bird tracks have been identified approximately 5 m west of Tonopah.
In the project area, claystone and tuff beds of the Siebert Formation crop out in several locations. Bonham and Garside (1979) mapped a high-angle fault extending across the property from the southwest to the northeast (Figure 6-1). This structure is interpreted to be related to Basin and Range extensional faulting.
Precambrian rocks of the Wyman Formation, Deep Springs Formation, and Reed Dolomite are present along the flanks of Lone Mountain. These units are intruded by Mesozoic rocks of the Lone Mountain Pluton which range in composition from gabbro through quartz monzonite and granite. A silicic porphyry dike swarm of Tertiary age intrudes the plutonic units.
To the east of the Tonopah Flats property is the San Antonio Mountains and the center of the Tonopah mining district. The volcanic units east of the property generally consist of silicic flow-domes, intrusions, ash-flow tuffs, breccias, and tuffaceous sedimentary rocks of the Tonopah Formation, Mizpah Formation, and the Tonopah Summit Member of the Fraction Tuff.
| barr.com |
|
|

Source: RESPEC Company, LLC, and Woods Process Services, 2024
| Figure 6-1 | Property Geologic Map of the Tonopah Flats Lithium Project - Modified from Bonham & Garside, 1979 |
| barr.com |
|
|
ABTC’s drilling, as summarized in Section 7.2 and 7.3 of this report, has intersected a thick sequence of massive to finely bedded, poorly lithified to unlithified, calcareous claystone below approximately 6 to 12 m of alluvium. The claystone appears to have been deposited in a reduced or anoxic environment. Thin (generally 3 m or less) interbeds of siltstone, tuffaceous sandstone, conglomerate, and tuffs are present to depths of up to approximately 436 m or more. A semi-continuous, one- to three-meter-thick crystal tuff “marker” bed has been intersected in many of the drill holes at depths ranging from 122 m to 159 m. Opal sinter and fault breccias have been locally intersected in drilling. ABTC geologists have divided the claystone into three separate units based on the observed depositional environments (upper, middle, and lower units) identified during core logging from the most recent drilling campaign (discussed in Section 7.3). The crystal tuff “marker” bed separates the lower and middle claystone units. Cross-sections through the Tonopah Flats property are presented in Figure 6-2 and Figure 6-3. A detailed stratigraphic column is shown in Figure 6-4.
| barr.com |
|
|

Alluvial gravel (light yellow), gray-green (upper lithium clay unit), brown-green (middle lithium clay unit), green (lower lithium clay unit), red dashed line (crystal tuff marker bed), blue dashed line (faults).
| Figure 6-2 | Generalized North-South Cross Section Through the Central Portion of the Tonopah flats Property (provided by ABTC, 2023) |
| barr.com |
|
|

Alluvial gravel (light yellow), gray-green (upper lithium clay unit), brown-green (middle lithium clay unit), green (lower lithium clay unit), red dashed line (crystal tuff marker bed), blue dashed line (faults).
| Figure 6-3 | Generalized East-West Cross Section through the Central Portion of the Tonopah Flats Property (provided by ABTC, 2023) |
| barr.com |
|
|
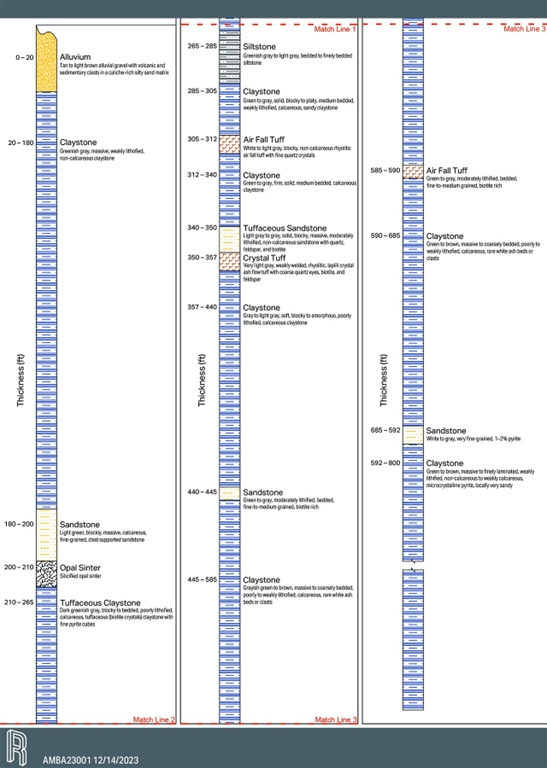
Source: RESPEC Company, LLC, and Woods Process Services, 2024
| Figure 6-4 | Detailed Stratigraphic Column of the Tonopah Flats Lithologic Units from Drilling |
| barr.com |
|
|
| 6.4 | Mineralization |
Lithium mineralization has been identified within the Miocene Siebert Formation in the southeastern portion of Big Smoky Valley. Lithium mineralization occurs within a thick sequence of lacustrine claystones with thin (3 m or less) interbeds of silt, tuffaceous sandstone, and crystal tuffs. The identified claystone thickness in the project area exceeds 436 m and appears to thicken toward the sedimentary basin to the west. The overall sedimentary package within the project area is flat lying to gently dipping as indicated by a tuffaceous marker bed identified in drill hole chips and core.
A drill hole on the western edge of the drilled area encountered 160 m of alluvial cover and did not reach the claystone unit. However, the hole was collared adjacent to a fault mapped by Bonham and Garside (1979) that bounds thicker Quaternary fill to the west. Drilling on an adjacent property to the west of the Tonopah Flats property has also confirmed a thick sequence of alluvial material west of the fault. Oligocene and older Miocene volcanic rocks below the Siebert Formation have not been encountered at the maximum depth of present drilling (436 m).
Drilling by ABTC has so far defined an area of generally continuous lithium mineralization 7,925 m north to south by 1,524 m to 4,572 m east to west, with thicknesses up to 436 m. Clay beds with higher concentrations of lithium are localized to semi-continuous, and the lithium-bearing beds are generally contained in a 1,219 m- to 3,048 m-wide corridor in multiple stratigraphic horizons.
Elevated lithium mineralization from 6 m to 67 m in thickness and grading up to 1000 ppm trends north to south through the central portion of the property. Interbeds of tuffaceous sandstone, crystal tuff, and siltstone less than 3 m thick show a general decrease in lithium with values of 200 ppm or less
The lithium deposit, defined as of the effective date of this PFS, underlies and extends continuously, both north and south of US 6/95. For this reason, the lithium mineral resources estimated in Section 11.8 have been defined within two areas, the “North Pit” and the “South Pit”, which are located north and south of the highway, respectively. For the purpose of this PFS only the South Pit is being evaluated.
| 6.5 | Deposit Type |
| 6.5.1 | Lithium Deposit Model |
The TFLP is a sedimentary- or clay-hosted lithium deposit. The U.S. Geological Survey (USGS) presented a descriptive model of lithium in smectites of closed basins in the 2011 Open File Report 91-11A (Asher-Bolinder, 1991). These deposits are commonly tuffaceous, lacustrine rocks that contain swelling smectite clays. It has been suggested that the smectite clays may also be altered to illite during or post diagenesis.
This model proposed three forms of genesis for clay-hosted lithium deposits:
| ● | Alteration of volcanic glass to lithium-rich smectite |
| ● | Precipitation from lacustrine water |
| ● | Incorporation of lithium from groundwater or brines into existing smectites |
Tectonic settings that typically accommodate sedimentary- or clay-hosted lithium deposits are characterized by crustal or rift extension and bimodal volcanism with a depositional environment consisting of high rates of sedimentation within a closed or semi-closed basin. Controlling factors for these types of deposits can include the extent of lacustrine beds and the source or availability of lithium from silicic volcanic rocks (Asher-Bolinder, 1991).
| barr.com |
|
|
| 6.5.2 | Sources of and Concentration of Lithium in Clays |
During crystallization of lithium-enriched magma, lithium is incorporated into pyroxenes, amphiboles, and micas. If the magma then erupts, the lithium is deposited within phenocrysts contained in volcanic lavas and tuffs. Over thousands to millions of years, weathering and erosion of the volcanic rocks will preferentially leach lithium that can be redeposited in sediments in nearby basins. If the basin is a hydrologically closed or semi-closed system, such as were present during the Neogene and Quaternary in Nevada, the volcanic sediments can form clays by diagenetic processes.
Hydrothermal systems may also play an important role in deposition or remobilization of lithium. These systems can pick up lithium from downward percolating surface water, in-situ clays, or from leaching of lithium-bearing volcanic rocks and redeposit it into pre-existing clays (Starkey, 1982), particularly those of the montmorillonite (smectite) group.
Recent work by Dr. Thomas Benson and researchers at the University of Nevada, Reno, on the origin of the Thacker Pass lithium deposit in north-central Nevada, has suggested that in addition to leaching of lithium enriched tuffs by meteoric water, degassing and devitrification of tuffs underlying the McDermitt Caldera lake sediments resulted in the release of lithium and other metals. The lithium mobilized from the degassing was then incorporated into authigenic clays forming at the bottom of the caldera lake. The caldera served as a closed basin during degassing, sediment deposition, diagenesis, alteration, and weathering. The lithium captured within the caldera has resulted in one of the largest known lithium resources in the United States (Benson, 2022).
Additional work is required to better understand the origins of clay-type lithium enrichment. Figure 6-5 shows a recent schematic geologic model for sedimentary and clay-hosted lithium deposits.
| barr.com |
|
|

| Figure 6-5 | Modified Schematic Model of Sedimentary or Clay Lithium Deposits (modified after Helvaci (2015), from Vardar Minerals Ltd, Viti Li-B Project, Kosovo) |
Clay lithium deposits that formed in closed or semi-closed basins are located in a broad area of southwestern Nevada and adjacent to the TFLP, including the American Lithium TLC project, located immediately to the northeast and the Pan American Horizon project, located immediately to the south. These projects, including Tonopah Flats, may be part of a semi-continuous zone of enriched lithium-bearing sediments within the southeastern portion of Big Smoky Valley.
| barr.com |
|
|
7 Exploration
Exploration conducted by ABTC commenced in the summer of 2021 and has included surface sampling and drilling as summarized below.
| 7.1 | ABTC 2021 Surface Sampling |
ABTC collected 29 surface samples in June 2021 prior to entering the agreement with 1317038 Nevada Ltd. The purpose of the sampling was to confirm elevated lithium values found in samples collected by NAMC and to conduct an initial survey of lithium mineralization present in alluvium and sedimentary units that are exposed at various locations throughout the property. Sample chips were generated utilizing a three-horsepower, two-cycle auger to depths ranging from 0.15 to 1.12 m. Samples were placed in 480 mm by 330 mm cloth sample bags and labeled with a unique identification number. The samples generally ranged in weight from 5 to 7 kilograms (kg). All samples were collected within the initial group of the 305 lode claims. Each sample location was recorded with a hand-held global positioning system (GPS) unit. All samples were collected under the supervision of Mr. Greg Kuzma, consulting geologist, or Mr. Ross Leisinger of ABTC. The NAMC and ABTC surface sample locations coded by lithium assay values are shown in Figure 7-1.
The ABTC 2021 samples were assayed at American Assay Laboratory (AAL) in Sparks, Nevada and returned an average of 314 ppm lithium over an area of approximately 5 km by 1.6 km. The highest reported lithium value for the surface samples was 882 ppm.
| barr.com |
|
|

| Figure 7-1 | Map of Tonopah Flats Surface Sample Locations |
| barr.com |
|
|
| 7.2 | ABTC 2021 and 2022 Exploration Drilling |
ABTC commenced drilling at the Tonopah Flats property in December 2021. A total of 3,658 m were drilled in 10 reverse circulation (RC) holes and 12 air core (AC) holes during 2021 and 2022 as summarized in Table 7-1. The drill hole locations were laid out in a rough grid within the initial 305 lode claims (Figure 7-2). Drillholes were spaced approximately 549 m to 1,067 m feet apart and were collared on easily accessible jeep roads that extend across the property. The purpose of the drilling program was early-stage exploration to determine the general depth, thickness, continuity, and tenor of the clay lithium mineralization at the property and to obtain samples to begin metallurgical testing. All holes were drilled vertically and ranged from 122 m to 270 m in depth.
| Table 7-1 | ABTC Drilling 2021 - 2023 |
| Phase of Drilling | Reverse Circulation Holes | Air Core Holes | Core Holes | Meters |
| December 2021 – March 2022 | 6 | 10 | 0 | 2,404.9 |
| July – September 2022 | 4 | 2 | 0 | 1,252.7 |
| August – September 2023 | 0 | 0 | 8 | 2,046.0 |
| Totals | 10 | 12 | 8 | 5,703.6 |
| barr.com |
|
|

| Figure 7-2 | Map of Tonopah Flats Drillhole Collars |
| barr.com |
|
|
The first six holes (TF-2101 through TF-2106) were drilled by Harris Exploration of Fallon, Nevada with a T-685 Schram track-mounted RC rig. The equipment included a 5 3/8-inch (136 mm) hammer bit and rotary splitter. The sample interval was 1.5 m with water injection. Each sample was collected in a cloth bag inside a 19-liter (L) bucket to assure that representative coarse and fine material was collected. Sample bags were numbered, labeled with pertinent information, and laid out sequentially. A separate line of bags was designated for duplicate samples which were collected for every 30 m of drilling. The samples were allowed to air dry at the drill site (weather permitting) prior to transportation to ABTC’s secure facility in Tonopah, Nevada. Chip samples from each 1.5 m interval were collected for geologic logging from a screen below the main outlet of the rotary sample splitter and placed in plastic chip trays. Separate geological samples were collected for each sample interval in labeled plastic bags for reference. Each drill hole collar location was recorded with a survey-grade GPS RTK unit accurate to 10 mm.
Drillholes TF-2207 through TF-2216 were drilled by Drill Rite NV, Inc. of Dayton, Nevada. The holes were advanced with a truck-mounted AC rig. The rig utilized a 5 3/8-inch (136 mm) AC bit, reduced to 3 7/8-inch (98.4 mm) as necessary and a rotary splitter. Samples were collected every 1.5 m in a cloth bag inside a 19-L bucket to assure that representative coarse and fine material was collected. Sample bags were numbered, labeled with pertinent information, and laid out sequentially. A separate line of bags was designated for duplicate samples which were collected every for every 30 m of drilling. The samples were allowed to air dry at the drill site (weather permitting) prior to removal to ABTC’s secure facility in Tonopah, Nevada. Chip samples for logging purposes were collected on a screen below the splitter and placed in plastic chip trays. Separate geological samples were collected for each sample interval in labeled plastic bags for reference. Each drill hole collar location was recorded with a survey grade GPS RTK unit accurate to 10 mm.
A second round of exploration drilling was conducted between July and September 2022. A total of 1,253 m were drilled in two AC and four RC holes (Table 7-1). Most of the holes for this phase of drilling stepped out from the initial holes or infilled the most widely spaced holes to test the continuity of lithium mineralization. Hole TF-2218 was collared approximately 61 m from hole TF-2208 to confirm continuation of a zone of higher-grade lithium mineralization. All the phase two exploration holes were drilled vertically and were collared within the original 305 claims.
Drillholes TF-2217 and TF-2218 were also drilled by Drill Rite NV, Inc. of Dayton, Nevada with an AC truck- mounted rig as described above for holes TF-2207 through TF-2216. Midway through hole TF-2218, the AC bit was exchanged for a rock bit to decrease plugging issues. Holes TF-2219 through TF-2222 were drilled with a track-mounted RC rig. The equipment included a 5 1/2-inch (139.7 mm) center pipe and a 5 3/8-inch (126 mm) rock bit. The drill rig was equipped with a Y-splitter set beneath a cyclone and rotary sample splitter. Samples were collected every 1.5 m in a cloth bag inside a 19-L bucket to assure that representative coarse and fine material was collected. Sample bags were numbered, labeled with pertinent information, and laid out sequentially. A separate line of bags was designated for duplicate samples which were collected every for every 15 m of drilling. The samples were allowed to air dry at the drill site (weather permitting) prior to removal to ABTC’s secure facility in Tonopah, Nevada. Chip samples for logging were collected on a screen below the main outlet of the rotary Y-splitter and placed in plastic chip trays. Separate geological samples were collected for each sample interval in labeled plastic bags for reference. Each drill hole collar location was recorded with a survey grade GPS RTK unit accurate to 10 mm.
Drillhole TF-2217 was drilled to 160 m at a location west of the fault shown in Figure 7-2 and only intersected alluvial gravels. No sample intervals from hole TF-2217 were submitted for laboratory analysis. Lithium mineralization was encountered in all the other 21 drill holes.
| barr.com |
|
|
| 7.3 | ABTC 2023 Exploration Drilling |
ABTC commenced a core drilling program at the Tonopah Flats property in July 2023. A total of 2,046 m were drilled in eight core holes (Table 7-1). The purpose of the program was to infill drill an area of higher-grade mineralization in the southern portion of the property, “twin” one RC drill hole (TF-2219) to confirm assays and lithologic units from earlier drilling and extend exploration to the southern property boundary. All holes were drilled south of US 6/95. Drillhole spacing was generally decreased to less than 610 m for the area south of the highway, except for one hole drilled adjacent to the southern property boundary, which is approximately 838 m from the nearest drill hole. The holes were collared on easily accessible jeep roads that extend across the property to minimize surface disturbance from drilling activities (Figure 7-2).
Drillholes TF-2323 through TF-2330 were drilled by KB Drilling of Mound House, Nevada. The holes were advanced with an Atlas Copco CS-14 truck-mounted rig by conventional wireline core drilling methods. When difficult ground conditions were encountered in drill hole TF-2323, KB Drilling reduced the tooling from PQ to HQ diameter for the remainder of the drilling program. Water was injected continuously during drilling. Each drill hole collar location was recorded with a survey grade GPS RTK unit accurate to 10 mm. All holes were drilled vertically and ranged from 216 m to 436 m in depth. No downhole surveys were collected during this program.
KB Drilling recovered core on 3 m runs unless broken ground or difficult drilling conditions made shorter runs necessary. The drillers stored all recovered core in wax-coated core boxes. The drillers recorded drill-run lengths and recoveries on wooden blocks placed between runs in the core boxes. Redrilled or reamed core was identified by the drillers and that information relayed to the onsite geologists.
Each day, core boxes were transported by the drillers or ABTC staff to the secure core logging facility in Tonopah. ABTC geologists logged the core, recording core recovery, rock quality designation (RQD), lithology, rock alteration, veining, and geological structures. After logging but before splitting, geologists or technicians sprayed the whole core with water and photographed it.
ABTC geologists or technicians saw-split the drill core at a workstation at the core logging facility. One half-core was retained for reference. The other half-core was bagged and labeled for analysis and was prepared for transport to the laboratory.
| 7.4 | ABTC 2025 Exploration and Geotechnical Drilling |
The 2025 drilling program was initiated to further inform the Mine Plan of Operations and provide geotechnical data for pit slope stability and waste rock storage facilities (WRSF) (Table 7-2). Drillholes TF25-GT1 through TF25-GT8 were drilled by True North Drilling of San Tan Valley, Arizona between January 19 and February 16, 2025. Total footage for this program was 2,056.5 m in eight holes. Additionally, shallow sonic drilling was done on six sites to provide geotechnical data on the alluvial gravels. A map of the sonic drill holes is shown below as Figure 7-3.
| Table 7-2 | ABTC 2025 Drilling Program |
| Phase of Drilling | Core Holes | Sonic Holes | Meters |
| January 19 – February 16, 2025 | 8 | 2,056.5 | |
| April 30 – May 3, 2025 | 6 | 86.6 |
| barr.com |
|
|

| Figure 7-3 | ABTC 2025 Sonic Drillhole Locations |
| barr.com |
|
|

| Figure 7-4 | ABTC 2025 Diamond Drilled Core Hole Locations |
| barr.com |
|
|
The holes were advanced utilizing a Torque Drill TD9000D track-mounted rig by conventional wireline core drilling methods using 3 m, HQ diameter equipment. Water was injected continuously during drilling. Each drill hole collar location was recorded with a survey grade GPS RTK unit accurate to 10 mm. Holes were drilled at angles ranging from –80 to –60 degrees and ranged from 233 m to 300 m in depth. Various downhole surveys were collected during this program. A map of the eight drill holes is shown as Figure 7-4.
True North recovered core on 3 m runs unless broken ground or difficult drilling conditions made shorter runs necessary. The drillers stored all recovered core in wax-coated core boxes. The drillers recorded drill-run lengths and recoveries on wooden blocks placed between runs in the core boxes. Redrilled or reamed core was identified by the drillers and that information relayed to the onsite geologists.
Core boxes were transported daily by the drillers or ABTC staff to the secure core logging facility in Tonopah. ABTC geologists logged the core, recording core recovery, RQD, lithology, rock alteration, veining, and geological structures. The core was also logged by Barr engineers for geotechnical analysis and select samples taken for laboratory analysis, after logging but before splitting, geologists or technicians sprayed the whole core with water and photographed it.
ABTC geologists or technicians saw-split the drill core at a workstation at the core logging facility. One half-core was retained for reference. The other half-core was bagged and labeled for analysis and was prepared for transport to the laboratory.
| 7.5 | Interpretation of Drilling Results and Adequacy of Sample Quality |
Lithium mineralization has been encountered in 37 out of 38 holes drilled by ABTC at the Tonopah Flats property. One hole (TF-2217), drilled west of the fault identified by Bonham and Garside (1979) (Figure 6-1) intersected alluvial material to the total depth drilled of 160 m. No samples from this hole were submitted to the analytical laboratory for analysis. As presented in Section 6.3, drilling by ABTC has so far defined an area of generally continuous lithium mineralization 7,925 m north to south by 1,524 m to 4,572 m east to west, with thicknesses up to 436 m at the property. Assays have ranged from 27.6 ppm Li to 1,940 ppm Li in the drilling with an average of just over 584 ppm Li. Notable lithium assay intervals from the drilling programs are presented in Table 7-3 below.
| Table 7-3 | Drill Intervals of Interest |
| Hole ID | From (m) | To (m) | Length (m) | Li (ppm) |
| TF-2104 | 53 | 79 | 11 | 1,029.9 |
| TF-2105 | 108 | 119 | 15 | 1,018.5 |
| and | 133 | 148 | 11 | 1,008.5 |
| TF-2207 | 108 | 119 | 34 | 982.7 |
| TF-2208 | 50 | 84 | 6 | 922.9 |
| and | 146 | 152 | 12 | 1,072.8 |
| TF-2209 | 61 | 73 | 3 | 936.8 |
| TF-2213 | 47 | 50 | 5 | 1,460.0 |
| and | 56 | 61 | 3 | 1,440.0 |
| barr.com |
|
|
| TF-2214 | 43 | 46 | 9 | 1,395.0 |
| TF-2218 | 49 | 58 | 6 | 1,015.3 |
| and | 72 | 78 | 14 | 1,085.0 |
| and | 157 | 171 | 35 | 1,017.2 |
| and | 175 | 210 | 15 | 1,043.0 |
| TF-2219 | 5 | 20 | 17 | 1,040.9 |
| and | 96 | 113 | 29 | 1,039.2 |
| and | 120 | 149 | 24 | 1,203.1 |
| TF-2222 | 27 | 52 | 3 | 1,110.2 |
| TF-2323 | 105 | 108 | 6 | 1,410 |
| and | 148 | 154 | 18 | 1,035 |
| and | 184 | 203 | 15 | 1,100.2 |
| and | 38 | 53 | 27 | 1,055.2 |
| TF-2324 | 46 | 73 | 27 | 1,170.8 |
| and | 79 | 107 | 21 | 1,280.6 |
| TF-2325 | 66 | 87 | 24 | 1,246.9 |
| and | 94 | 119 | 14 | 1,177.0 |
| TF-2326 | 113 | 126 | 9 | 1,028.5 |
| and | 137 | 146 | 6 | 1,116.7 |
| TF-2327 | 114 | 120 | 17 | 1,097.5 |
| and | 131 | 148 | 15 | 1,086.3 |
| TF-2328 | 38 | 53 | 18 | 1,055.2 |
| and | 58 | 76 | 6 | 1,141.9 |
| and | 131 | 137 | 11 | 1,122.8 |
| TF-2329 | 23 | 34 | 17 | 1,014.9 |
| and | 46 | 62 | 17 | 1,125.5 |
| TF-2330 | 12 | 29 | 15 | 1,132.5 |
| and | 38 | 53 | 17 | 1,086.8 |
| and | 102 | 119 | 29 | 1,097.8 |
| and | 126 | 155 | 35 | 1,165.8 |
| TF25-GT1 | 76 | 111 | 35 | 988.1 |
| and | 178 | 221 | 43 | 1,023.40 |
| TF25-GT2 | 37 | 102 | 65 | 896.4 |
| and | 221 | 236 | 15 | 933.3 |
| TF25-GT3 | 43 | 108 | 65 | 951.7 |
| and | 117 | 148 | 30 | 1,118.90 |
| TF25-GT4 | 67 | 134 | 67 | 984.5 |
| barr.com |
|
|
| TF25-GT5 | 9 | 46 | 37 | 880.3 |
| and | 69 | 134 | 65 | 991.30 |
| TF25-GT6 | 18 | 67 | 49 | 851.6 |
| and | 87 | 125 | 38 | 1065.4 |
| and | 178 | 241 | 63 | 1,017.50 |
| TF25-GT7 | 101 | 133 | 32 | 903.6 |
| and | 181 | 233 | 52 | 934.8 |
| TF25-GT8 | 38 | 75 | 37 | 776.5 |
| and | 148 | 189 | 41 | 975 |
ID = identification
m = meter
ppm = parts per million
The ABTC procedures pertaining to the handling, logging, and security of RC, AC, and core samples generated during ABTC’s drilling programs have been reviewed and found suitable to industry practices. In the opinion of the QP, the samples are representative of the mineralized material at the site and are reliable for use in the estimation of a mineral resource.
Barr’s QP conducted a site visit of the TFLP on September 27, 2024. The visit included stops at the core storage shed and multiple stops at the Tonopah Flats property. A selection of core and bulk samples were reviewed at the core shed. The visit to the mine site included stops at some of the drill hole collars, test pits, lithium resource outcrops, powerline corridors, and general viewing of the property topography.
| barr.com |
|
|
8 Sample Preparation, Analysis, and Security
This section summarizes the data relating to sample preparation, analysis, and security, and the quality assurance/quality control (QA/QC) procedures that pertain to the TFLP. The information has been provided by ABTC. The QP has reviewed this information and believes it is materially accurate. Section 8.1 pertains to procedures carried out for historical surface sampling by NAMC, a previous owner of the original land holdings. Section 8.2 discusses sample preparation, analysis, and security procedures for ABTC’s exploration program. A summary statement regarding the adequacy of the samples for use in resource estimation is presented in Section 8.6.
| 8.1 | Historical Sample Preparation, Analysis, Quality Assurance/ Quality Control Procedures, and Historical Sample Security |
NAMC submitted 59 surface samples to ALS, an independent, commercial laboratory in Reno, Nevada, between March and June 2020. The samples were crushed in their entirety to at least 70% at minus 19 mm and riffle-split to obtain 250 gram (g) subsamples. The subsamples were then pulverized to at least 85% at <75 microns. The samples were analyzed for 51 major, minor, trace, and rare-earth elements by inductively coupled plasma mass spectrometry (ICP-MS) following a laboratory-preferred 4-acid digestion for lithium analysis. QA/QC samples, such as field duplicates, blanks, and certified reference materials (CRMs), were not included in the surface sample program conducted by NAMC.
| 8.2 | Sample Preparation, Analyses, Sample Security, and Quality Assurance/Quality Control Procedures by ABTC |
The following sections summarize sample preparation, analysis, sample security, and QA/QC procedures by ABTC.
| 8.2.1 | ABTC 2021 Surface Sampling |
ABTC personnel collected 29 surface samples in June 2021. The samples were placed in cloth bags and labeled with unique numbers. Two QA/QC samples were inserted by ABTC into the sample stream, including one blank pulp and one CRM (MEG Li.10.11) pulp. The samples were transported by ABTC personnel to AAL in Sparks, Nevada, an independent geochemical analytical laboratory that retains ISO/IEC 17025:2017 Laboratory Accreditation.
The samples were dried, weighed, and then jaw-crushed to 85% at <6 mesh (3.4 mm). The crushed samples were then roll-crushed to 90% at <10 mesh (1.7 mm) and riffle split in a Jones splitter to obtain approximately 1.0001-kg subsamples, which were then ring-pulverized to 90% at <150 mesh (0.104 mm). The samples were analyzed for 48 major, minor, trace, and rare-earth elements by ICP-MS following a laboratory-preferred 4-acid digestion for lithium analysis.
| 8.2.2 | ABTC 2021-2022 Air Core and RC Drill Sampling |
ABTC utilized AAL for all samples generated from drill holes TF-2101 through TF-2208 and Paragon Geochemical (Paragon) for all samples generated from drill holes TF-2209 through TF-2222. Both laboratories, located in Sparks, Nevada, are independent of ABTC and hold ISO/IEC 17025:2017 accreditation.
| barr.com |
|
|
All drill sample bags were labeled with a unique sample number prior to transportation to ABTC’s office in Tonopah. The samples were organized, QA/QC samples were inserted into the sample stream, and a log of drill hole samples, duplicates, blanks, and CRMs was prepared by ABTC personnel. The samples were then transported to ABTC’s secure, fenced yard, approximately 1 km from their office, and placed in storage bins. The bins were picked up by arrangement from the secure yard by AAL or Paragon personnel, and the date and the number of samples transported were recorded on a sample chain-of-custody form.
RC rig-duplicate samples were collected at the drill rig every 15 to 30 m (every 10th to 20th sample). Control blanks or CRMs accompanied each sample batch to the laboratory and were inserted every 20th sample. On average, one coarse blank, one CRM, and one field duplicate were inserted for every 20 drill samples.
The drill samples submitted to AAL were dried, weighed, and then jaw-crushed to 85% at <6 mesh (3.4 mm). The crushed samples were then roll-crushed to 90% at <10 mesh (1.7 mm) and riffle split in a Jones splitter to obtain approximately 1.0001-kg subsamples, which were then ring pulverized to 90% at <150 mesh (0.104 mm). The samples were analyzed for 48 major, minor, trace, and rare-earth elements by ICP-MS following a laboratory-preferred 4-acid digestion for lithium analysis. Two QA/QC samples were inserted by AAL into the sample stream, including one blank and one CRM (MEG Li.10.11).
The drill samples submitted to Paragon were oven dried at 110 °C and then single-stage crushed to a nominal 0.203-cm particle size. Each crushed sample was riffle split and pulverized to >85% at <200 mesh (<75 microns). The samples were analyzed for 48 major, minor, trace, and rare-earth elements by ICP-MS following an aqua-regia digestion process. Two QA/QC samples were inserted by Paragon into the sample stream, including one blank and one CRM (MEG-Li.10.11).
| 8.2.3 | ABTC 2023 Core Drill Sampling |
ABTC utilized Paragon for all samples generated from drill holes TF-2323 through TF-2330. After completing core logging, an ABTC geologist or technician photographed each core box with relevant identifying information, including the hole number, core box number, and from–to footages.
Prior to sampling the core, the ABTC technician or geologist labeled cloth sample bags with the sample number and the from–to footages on the tag outside of each sample bag and added in-sequence QA/QC sample bags into the sample stream. Section 8.3 of this report addresses the QA/QC procedures employed by ABTC.
When the sequence of cloth sample bags was prepared, an ABTC technician or geologist then sampled the core. Competent core was cut in half lengthwise with a diamond-bladed core saw. The highly broken core was split by hand directly from the core box using a putty knife and/or chisel. The technician placed half of the split core into its pre-labeled cloth sample bag for analysis, and the other half back into the core box.
When collecting field duplicate samples, one-half of the split core was cut again lengthwise to make a quarter-core. The half core was used as the analytical sample, and one of the quarter cores was used as the field duplicate sample.
The samples were organized, QA/QC samples were inserted into the sample stream, and a log of drill hole samples, duplicates, blanks, and CRMs was prepared by ABTC personnel. The samples were then placed in storage bins. The bins were picked up by arrangement from the secure yard by Paragon personnel and the date and the number of samples transported were recorded on a sample chain-of-custody form.
| barr.com |
|
|
The drill hole samples submitted to Paragon were oven dried at 110 °C and then single-stage crushed to a nominal 0.203-cm particle size. Each crushed sample was riffle split and pulverized to >85% at <200 mesh (<75 microns). The samples were analyzed for 48 major, minor, trace, and rare-earth elements by ICP-MS following an aqua-regia digestion process. Two QA/QC samples were inserted by Paragon into the sample stream, including one blank and one CRM (MEG Li.10.11). A complete library of all drill core is stored at ABTC’s secured core storage facility in Tonopah.
| 8.2.4 | ABTC 2025 Core Drill Sampling |
For the 2025 program, ABTC continued to utilize the Paragon Geochemical Laboratory in Reno, Nevada, for the analysis.
An ABTC geologist or technician photographed each core box with relevant identifying information, including the hole number, core box number, and from–to footages. Core was split and sampled in 1.5 m intervals.
Core was logged and prior to sampling the core, the ABTC technician or geologist labeled cloth sample bags with the sample number and the from–to footages on the tag outside of each sample bag and added in-sequence QA/QC sample bags into the sample stream.
The complete library of all drill core is stored at ABTC’s secured core storage facility in Tonopah.
| 8.3 | ABTC Quality Assurance/Quality Control Results |
The analytical portion of the QA/QC program employed by ABTC aimed to provide a means by which the accuracy and precision of the assaying that was performed on the RC drilling samples can be assessed to ensure the highest possible data quality. To achieve this goal, ABTC personnel inserted samples of CRMs (standards), which are commercially available pulverized materials certified to contain a known concentration of an element - in this case, lithium. The ABTC protocol was to use several CRMs of varying lithium concentrations during the drilling campaign and to randomly insert one CRM sample pulp into the stream of actual drill samples at a rate of up to two in fifty, depending on the phase of the drill program. The analytical QA/QC measures employed by ABTC during the latter part of the 2021-2022 drill program and the entire 2023 drill program are sufficient to properly monitor analytical accuracy and precision, and possible in-laboratory contamination. For the 2022 drilling program, ABTC used three CRMs obtained from Moment Exploration Geochemical Laboratory (MEG) of Lamoille, Nevada. An additional CRM obtained from MEG was used in 2023, bringing the total count to four CRMs used in that program.
A typical criterion for accepting the analyses of CRMs in the mineral industry is that they should fall within a range determined by the certified average or expected value ± three standard deviations.
Blanks are samples known or thought to contain little or no values of the target element, lithium. They are inserted into the sample stream, and the results are monitored to be sure that the laboratory does not report significant values when little or no lithium should be present. ABTC used two blanks for their 2021-2022 drilling: two fine (pulp) blanks, both obtained from MEG. The pulp blank does not go through the sample preparation circuit and monitors only potential analytical contamination, which is extremely rare in commercial laboratories. For the drill programs, ABTC inserted blanks at a rate of about one blank for every two CRM samples.
| barr.com |
|
|
In the 2023 and 2025 drill programs, a single coarse blank from MEG Laboratory was used. For both drill programs, ABTC inserted blanks at a rate of about one blank for every two CRM samples. Normally, a blank would be considered evaluated for results greater than five times the detection limit. With an average crustal abundance of around 20 ppm, it may be difficult to find suitable commercial blanks for lithium, and ABTC may need to develop a custom blank for the TFLP. ABTC deliberately chose commercial blanks designed for use with gold and silver that would allow for immediate identification of laboratory contamination during ICP analysis.
Field (rig) duplicates were also inserted into the sample stream at rate of about one duplicate for every drill hole 15 to 20 m of drilling. During the 2023 and 2025 drill programs, field duplicates were used at a regular interval of around one field duplicate per 60 samples. In 2022, over 60 field duplicates were analyzed by Paragon. These cross-laboratory duplicates were used to validate the analytical results from the two laboratories. Table 8-1 summarizes the quantities of QA/QC sample insertions by ABTC.
| Table 8-1 | Summary Counts of Tonopah Flats QA/QC Analyses |
| QA/QC Samples | 2021 - 2022 | 2023 | 2025 |
| QA/QC Type | Li | Li | Li |
| CRMs | |||
| Number in Use | 3 | 4 | 3 |
| Number of Analyses | 66 | 95 | 148 |
| Number of Failures | 9 | 8 | 7 |
| Duplicates | |||
| Field Duplicate | 6 | 24 | 26 |
| Coarse (Prep) Duplicate | 64 | 0 | 0 |
| Pulp Duplicate or Replicate | 0 | 0 | 0 |
| Laboratory Prep Duplicate | 97 | 0 | 0 |
| Laboratory Pulp Duplicate | 0 | 0 | 0 |
| Blanks | |||
| Pulp Blank | 21 | 0 | 0 |
| Coarse Blank | 8 | 27 | 30 |
| Drillhole Samples | 2,240 | 1,306 | 1,290 |
| Total Insertion Percent* | 4.42 | 10.06 | 13.8 |
*Does not include Coarse/Pulp blanks as those were not inserted into the sample stream.
CRM = certified reference material
| 8.3.1 | Standards |
Three CRMs were used during the 2021-2022 drill program, all from MEG. All three CRMs were certified for lithium. One additional CRM was inserted during the 2023 program, also from MEG. The standard insertion rates for the 2022 and 2023 drill programs were 2.86% and 6.54%, respectively. Table 8-2 describes the CRMs used during the 2022 and 2023 drill programs:
| barr.com |
|
|
| Table 8-2 | CRMs Used by ABTC |
| CRM ID | Drill Year(s) | Insertion Count | Certified Li (ppm) | Li Standard Deviation (ppm) |
| MEG Li.10.11 | 2022 | 21 | 723.1 | 29.0 |
| 2023 | 29 | 723.1 | 29.0 | |
| MEG Li.10.12 | 2023 | 29 | 1171.9 | 99.5 |
| MEG Li.10.14 | 2022 | 27 | 813.9 | 72.3 |
| 2023 | 12 | 813.9 | 72.3 | |
| MEG Li.10.15 | 2022 | 18 | 1,606.4 | 104.8 |
| 2023 | 25 | 1,606.4 | 104.8 |
CRM = certified reference material
ID = identification
ppm = parts per million
| 8.3.2 | Lithium CRM Results in the 2021-2022 Drill Programs |
Analyses of the three CRMs used in the 2021-2022 programs had three high failures and six low failures for lithium. Two of the three CRMs had a slight positive bias, with the third CRM having a slight negative bias. ABTC used AAL as the initial laboratory for the 2021-2022 drill programs and finished the programs with Paragon for over half of the final drill hole analyses. AAL also reported in-house laboratory standards, and these were evaluated with no failures, but are not shown or detailed in this document. Both laboratories used a 0.25 g sample aliquot with a 4-acid digestion for all ICP-MS analyses. Detection limits were <0.2 ppm for lithium for both laboratories. Results for the CRM lithium analyses are summarized in Table 8-3. Table 8-4 details the nine lithium failures in the 2021-2022 drilling.
| Table 8-3 | Summary of Lithium Results for Certified Reference Materials, 2021-2022 |
| CRM ID | Grades Li (ppm) | Counts | Dates Used | Failure Counts | Bias Percent | |||||
| Target | Average | Maximum | Minimum | First | Last | High | Low | |||
| MEG Li.10.11 | 723.1 | 740.752 | 883.0 | 599.0 | 21 | 02/08/2022 | 10/14/2022 | 2 | 1 | 2.4 |
| MEG Li.10.14 | 813.9 | 773.100 | 996.0 | 336.0 | 25 | 02/08/2022 | 10/28/2022 | 0 | 5 | -5.0 |
| MEG Li.10.15 | 1,606.4 | 1,695.372 | 1,990.0 | 1,530.0 | 18 | 02/28/2022 | 10/28/2022 | 1 | 0 | 5.5 |
CRM = certified reference material
ID = identification
ppm = parts per million
| barr.com |
|
|
| Table 8-4 | Lithium CRM Failures in the 2022 Drill Program |
| CRM ID | Hole ID | Values Li (ppm) | Sample Designation | Certificate | |||
| Target | Fail Type High/Low | Fail Limit | Failed Value | ||||
| MEG Li.10.11 | TF-2213 | 723.1 | High | 810.1 | 883.0 | TF-2213 245-250S | B22-0232 |
| MEG Li.10.11 | TF-2214 | 723.1 | High | 810.1 | 849.0 | TF-2214 145-150S | B22-0233 |
| MEG Li.10.11 | TF-2220 | 723.1 | Low | 636.1 | 599.0 | TF-2220 245-250S | B22-1141 |
| MEG Li.10.14 | TF-2211 | 813.9 | Low | 597.0 | 423.0 | TF-2211 345-350S | B22-0230 |
| MEG Li.10.14 | TF-2213 | 813.9 | Low | 597.0 | 576.0 | TF-2213 145-150S | B22-0232 |
| MEG Li.10.14 | TF-2215 | 813.9 | Low | 597.0 | 489.0 | TF-2215 345-350S | B22-0234 |
| MEG Li.10.14 | TF-2216 | 813.9 | Low | 597.0 | 336.0 | TF-2216 445-450S | B22-0235 |
| MEG Li.10.14 | TF-2222 | 813.9 | Low | 597.0 | 529.0 | TF-2222 545-550S | B22-1142 |
| MEG Li.10.15 | TF-2222 | 1,606.4 | High | 1,920.8 | 1,990.0 | TF-2222 145-150S | B22-1142 |
CRM = certified reference material
ID = identification
ppm = parts per million
All nine failures were analyses performed by Paragon, spanning seven certificates. The five low failures in the MEG Li.10.14 undoubtedly caused the slight negative bias. While two or three of the failures were very close to the failure limit, none of these could be mislabeled samples, as the values do not match another CRM in use at the time. The two laboratories were charted separately for each of the three CRMs. While the number of samples for both laboratories is low, it does appear that Paragon was failing more consistently for evaluating the CRM for lithium. Note that both laboratories used the same analytical method with the same detection limits. Figure 8-1 presents the control chart for the CRM MEG Li.10.14 and clearly illustrates the five low-side failures associated with Paragon’s certificates. Table 8-5 provides an explanation for Figure 8-1.

| Figure 8-1 | Lithium Control Chart for MEG Li.10.14 |
| barr.com |
|
|
| Table 8-5 | Explanation for Figure 8-1 |
| Items Obtained from Certificate for CRM | ||
| USL | Upper Specification Limit | Target + 3 Standard Deviations (CRM) |
| Target | Expected Value (CRM) | |
| LSL | Lower Specification Limit | Target - 3 Standard Deviations (CRM) |
| Items Calculated using ABTC Data | ||
| UCL | Upper Control Limit | Avg + 3 Standard Deviations (Population) |
| Average | Mean Value (Population) | |
| LCL | Lower Control Limit | Avg - 3 Standard Deviations (Population) |
avg = average
CRM = certified reference material
| 8.3.3 | Lithium CRM Results in the 2023 Drill Programs |
The four standards used in this program had three high failures and five low failures for lithium. Two of the four CRMs had a slight positive bias, with a third CRM having a slight negative bias. ABTC used Paragon Laboratory of Sparks, Nevada, for all of the 2023 drill hole analyses. Paragon did not report in-house laboratory standards. The laboratory used a 0.25 gram ICP-MS with a multi-acid digestion for all analyses. Detection limits were <0.2 ppm for lithium. Results for the CRM lithium analyses for 2023 are summarized in Table 8-6. Table 8-7 details the eight lithium failures in the 2023 drilling.
| Table 8-6 | Summary of Tonopah Flats Lithium Results for Certified Reference Materials, 2023 |
| Standard ID | Grades Li (ppm) | Counts | Dates Used | Failure Counts | Bias Percent | |||||
| Target | Average | Maximum | Minimum | First | Last | High | Low | |||
| MEG Li.10.11 | 723.1 | 780.793 | 1,770.000 | 623.000 | 29 | 09/13/2023 | 11/09/2023 | 3 | 2 | 8.0 |
| MEG Li.10.12 | 1,171.9 | 1,169.897 | 1,430.000 | 669.000 | 29 | 09/13/2023 | 11/09/2023 | 0 | 1 | -0.2 |
| MEG Li.10.14 | 813.9 | 825.833 | 9,30.000 | 704.000 | 12 | 09/13/2023 | 10/12/2023 | 0 | 0 | 1.5 |
| MEG Li.10.15 | 1,606.4 | 1,551.720 | 1,750.000 | 684.000 | 25 | 09/13/2023 | 11/09/2023 | 0 | 2 | -3.4 |
ID = identification
ppm = parts per million
| barr.com |
|
|
| Table 8-7 | Lithium Failures in the 2023 Drill Program |
| Standard ID | Hole ID | Values Li (ppm) | Sample Designation | Certificate | |||
| Target for Standard | Fail Type High/Low | Fail Limit | Failed Value | ||||
| MEG Li.10.11 | TF-2324 | 723.1 | High | 810.1 | 851.0 | TF-2324 695-700S | B23-0390 |
| MEG Li.10.11 | TF-2323 | 723.1 | High | 810.1 | 1,770.0 | TF-2323 505-510S | B23-0390 |
| MEG Li.10.11 | TF-2323 | 723.1 | High | 810.1 | 1,590.0 | TF-2323 58-61.5S | B23-0390 |
| MEG Li.10.11 | TF-2329 | 723.1 | Low | 636.1 | 623.0 | TF-2329 500-505 S | B23-0523 |
| MEG Li.10.11 | TF-2330 | 723.1 | Low | 636.1 | 634.0 | TF-2330 750-755 S | B23-0538 |
| MEG Li.10.12 | TF-2323 | 1,171.9 | Low | 873.4 | 669.0 | TF-2323 190-195S | B23-0380 |
| MEG Li.10.15 | TF-2323 | 1,606.4 | Low | 1,292.0 | 684.0 | TF-2323 325-330S | B23-0380 |
| MEG Li.10.15 | TF-2323 | 1,606.4 | Low | 1,292.0 | 729.0 | TF-2323 555-560S | B23-0380 |
ID = identification
ppm = parts per million
All eight failures are from the same laboratory (Paragon) across four certificates. The three high failures in the MEG Li.10.11 CRM could be mislabeled samples, as the values match other CRMs in use at the time. Of the five low failures, three may also have been mislabeled samples. However, as the cut sheets clearly detail the CRM used, it is hard to prove the mislabeling of samples.
Figure 8-2 shows the control chart for the standard MEG Li.10.11, and clearly shows the three high-side failures associated with the Paragon Laboratory certificates. It is not known what actions ABTC took, if any.

| Figure 8-2 | Lithium Control Chart for MEG Li.10.11, 2023 Drill Program |
| 8.3.4 | Lithium CRM Results in the 2025 Drill Programs |
Three standards were utilized throughout the sampling process. There were seven failures from the results returned from the laboratory. Failures have been determined to be a result of mislabeling of the CRM at the time of submission; no further action was taken in those batches.
| barr.com |
|
|
There was a negative bias on one of the CRM and a positive bias on the other two. Similar trends were observed during previous sampling campaigns where these CRMS have been utilized. In Figure 8-3, the majority of assay results fell within the three standard deviation limits.
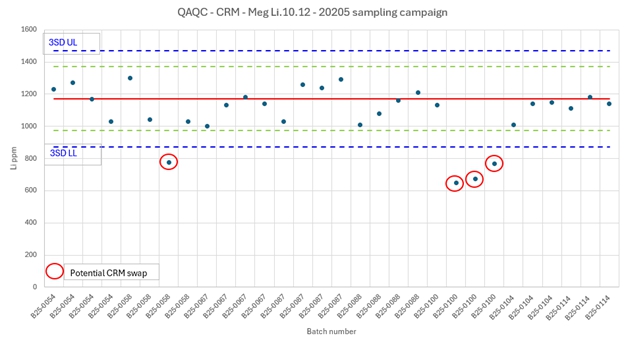
| Figure 8-3 | Li CRM MEG Li 10.12 Used for the 2025 Drill Program |
| Table 8-8 | Summary of Tonopah Flats Lithium Results for Certified Reference Materials, 2025 |
| CRM | Mean
Value Li (ppm) |
Upper
Limit Li (ppm) |
Lower
Limit Li (ppm) |
Results
Average Li (ppm) |
Failures | Bias |
| MEG Li.10.11 | 723.1 | 810.1 | 636.1 | 785.2 | 2 | -9% |
| MEG Li.10.12 | 1,171.9 | 1,470.4 | 873.4 | 1,084.1 | 4 | 7% |
| MEG Li.10.15 | 1,606.4 | 1,920.8 | 1,292 | 1,578.8 | 1 | 2% |
CRM = certified reference material
ppm = parts per million
| 8.4 | Duplicates |
Field duplicates were inserted into the sample stream at an insertion rate of 0.3% for the 2021-2022 drill program. For the 2023 drill program, a much more concerted effort was made with respect to duplicates, and field duplicates were inserted with an insertion rate of 1.65%. Duplicate pairs were evaluated by the charting in three distinct methods: a scatterplot showing an reduced major axis (RMA) regression, a quantile/quantile plot, and relative percent and absolute relative percent difference (ARPD) plots using both the maximum of the pair and the mean of the pair. The relative percent difference (RPD) of the maximum of the pair is expressed as follows:
| barr.com |
|
|
| Equation 8-1 | RPD Maximum |

The RPD of the mean of the pair is expressed as follows:
| Equation 8-2 | RPD Mean |

Two types of duplicates were evaluated for the 2021-2022 drill program including field (rig) duplicates and laboratory preparation duplicates.
Before changing analytical laboratories from AAL to Paragon, 63 rig duplicates from AAL were sent to Paragon for analyses. These duplicates were evaluated in total and by the two drill types, AC and RC. In addition, AAL did report laboratory preparation duplicates for 2021 and the first part of 2022. These laboratory preparation duplicates were evaluated both in total and by the two drill types. Although the data is insufficient to be statistically certain, it appears that the AC rig did not gather as good a sample as the RC rig. This is apparent in the field duplicates but is less so in the laboratory preparation duplicates. This may be a function of the sampling methodology used rather than the drilling method. There is also a slight negative bias between the AAL and Paragon coarse duplicate pairs.
All duplicate pairs were analyzed, with some issues found. Outliers were discarded as either a visual outlier on the scatterplot or an outlier with an ARPD of greater than 2,000. Outliers were removed for the purpose of calculating statistics, but they are important. They indicate that pairs of analyses that are expected to be similar are not. Efforts should be made to understand the reasons for outliers, and many outliers with unknown causes would be a concern.
The duplicate pairs were plotted for quality control for lithium only. Table 8-9 shows summary data for these duplicate pairs.
| barr.com |
|
|
| Table 8-9 | Summary of Results for Field Duplicates and Laboratory Preparation Duplicates |
| Laboratory | Type | Element | Drill Type | Counts | RMA Regression | Averages as Percent | |||
| All | Used | Outliers |
y = Duplicate x = Original |
RPD | ARPD | ||||
| Paragon | Field Duplicate | Li | All | 7 | 7 | 0 | y = 1.0819x – 129.27 | -12.49 | 50.86 |
| AAL vs. Paragon | Field Duplicate | Li | All | 63 | 62 | 1 | y = 1.2396x – 137.94 | -11.25 | 43.50 |
| AAL vs. Paragon | Field Duplicate | Li | AC | 13 | 13 | 0 | y = 2.1279x – 961.52 | -88.59 | 122.73 |
| AAL vs. Paragon | Field Duplicate | Li | RC | 50 | 50 | 0 | y = 1.1091x - 61.369 | -7.37 | 38.48 |
| AAL | Laboratory Preparation | Li | All | 97 | 97 | 0 | y = 1.0014x - 0.5458 | -0.05 | 1.65 |
| AAL | Laboratory Preparation | Li | AC | 23 | 23 | 0 | y = 0.9972x + 5.9706 | 0.6 | 1.58 |
| AAL | Laboratory Preparation | Li | RC | 74 | 74 | 0 | y = 1.0001x - 0.9142 | -0.26 | 1.68 |
AC = air core
ARPD = absolute relative percent difference
RC = reverse circulation
RPD = relative percent difference
After removing the one outlier found on the scatterplot for the lithium field duplicates, the duplicate pairs showed less correlation between grades of about 400 and 1,200 ppm. An overall negative bias (-11.25) was found, showing that the original AAL values tended towards higher grades than the duplicate Paragon value. Charting only the RC samples removed some of the variation, but a slight negative bias was still observed. The following scatterplot shows some correlation across all grades, with higher variance at the mid-range lithium grades (Figure 8-4).
| barr.com |
|
|

| Figure 8-4 | Lithium AAL vs. Paragon Scatterplot, 2021-2022 |

| Figure 8-5 | Lithium Relative Percent Difference, AAL vs. Paragon, 2021-2022 |
The relative percent difference chart (based on the mean of the pair) for the duplicates shows all relative differences under 120%, with higher variance between the mid-range grades of 300 to 800 ppm lithium (Figure 8-4). A relative difference based on the mean pair of less than 200% is considered acceptable.
| barr.com |
|
|
Charting the laboratory preparation duplicates shows a well-behaved distribution of duplicate pairs, with almost no bias and a near-perfect regression line (Figure 8-5).
These laboratory preparation duplicates, while not ideal for evaluation, do show that the duplicate pairs taken are at least capable of a high degree of correlation.
For the 2023 drill program, field (rig) duplicates were inserted at a regular insertion rate of about one in sixty samples. No outliers were found, and all 24 rig duplicate pairs were used with a near-perfect scatterplot as shown below. Note the regression equation with an x-coefficient very near unity. Withstanding the small sample size of only 24 pairs, there appears to be good correlation across all grades. This gives confidence in both the rig sampling and analytical methods used.

| Figure 8-6 | AAL Preparation Duplicate vs. Original for Lithium, 2021-2022 |
| barr.com |
|
|

| Figure 8-7 | Lithium Field Duplicates Scatterplot, 2023 |
For the 2025 drilling program, field duplicates were taken similar to the 2023 program. The duplicates were taken at approximately one in sixty, together with the rest of the QA/QC.
The results showed a good correlation between duplicate pairs, with a total of three samples plotting outside of a 10% difference. One result returned only an 11% bias. The duplicates showed a correlation coefficient of 0.9 (R2= 0.8127), as shown in Figure 8-8. This results in high confidence in the analytical method used for the 2025 drilling program.
| barr.com |
|
|

| Figure 8-8 | Field Duplicates for 2025 Program (Li ppm) |

| Figure 8-9 | Relative Percentage Difference Between Duplicates for the 2025 Drilling Program |
| barr.com |
|
|
| 8.5 | Blanks |
Pulp blanks were used throughout the ABTC 2021-2022 drill program for the TFLP. A second pulp blank was also added during the last few holes drilled in the summer of 2022. Both blanks were obtained from MEG. Neither of the two blanks used had lithium values below the detection limit of 0.2 ppm, so they were evaluated as a low-grade CRM would be. Normally, a blank would be evaluated by setting the warning limit to five times the detection limit. The blanks are both derived from barren silica sand with the average lithium value for the initial pulp blank (MEG Blank 17.11) of 3.42 ppm Li, with a median value of 2.35 ppm and an average lithium value of the second pulp blank (MEG Silica Blank.21.03) of 4.81 ppm Li, with a median value of 4.05 ppm. Table 8-10 shows a summary of the blanks in use during the 2021-2022 and 2023 drill programs.
| Table 8-10 | Summary of Results for Blanks |
| Blank ID | Drill Year(s) | Element | Type | Counts | Maximum | Dates of Analyses | ||
| All | Above Warning | (ppm) | Start | End | ||||
| MEG Silica Blank 21.03 | 2022 | Li | Pulp | 7 | 0 | 7.9 | 10/12/2022 | 10/28/2022 |
| 2023 | Li | Pulp | 27 | 0 | 10.8 | 09/13/2023 | 11/09/2023 | |
| MEG Blank 17.11 | 2022 | Li | Pulp | 20 | 1 | 15.1 | 02/08/2022 | 10/07/2022 |
ID = identification
ppm = parts per million
| 8.5.1 | Results for Blanks in the 2021 to 2022 Drill Program |
For the 2021-2022 drill program, seven pulp blanks from MEG Blank 21.03 were submitted with no lithium failure. ABTC also submitted 20 pulp blanks from MEG Blank 17.11 with one lithium failure. The single failure was based on a warning limit of the population average plus three times the standard deviation, after removing any outliers. The single failure for this drill program is shown in Table 8-11.
| Table 8-11 | Blank Failures and Preceding Samples 2021-2022 |
| Blank | Certificate | Element | Method | Preceding | Blank |
Warning Limit (ppm) |
||
| Sample | Value (ppm) | Sample | Value (ppm) | |||||
| MEG Blank 17.11 | B22-0951 | Li | ICP-MS | TF-2219 245-250 | 544.0 | TF-2219 245-250 S | 15.1 | 13.76 |
ppm = parts per million
Figure 8-10 shows the lithium values of the MEG Silica Blank 21.03 pulp blanks plotted with the preceding sample values.
| barr.com |
|
|

| Figure 8-10 | Lithium in "MEG Silica Blank 21.03" and Preceding Samples 2021-2022 |
| 8.5.2 | Results for Blanks in the 2023 Drill Program |
In the 2023 drill program, 27 coarse blanks were submitted with no failures. Of these 27 blanks, six were “first blanks”, so they are the first sample in the sample stream. Since the previous value is unknown in the case of a “first blank”, these are plotted without reference to a previous value.
The chart in Figure 8-11 shows the 21 single coarse blanks used in 2023 and are plotted with the preceding sample grades for lithium.

| Figure 8-11 | Lithium in "MEG Silica Blank 21.03" and Preceding Samples 2023 |
Although low-grade lithium values are inherent in the coarse blank in use, no failures were observed when applying a warning limit of the average blank value plus three times the population standard deviation.
| barr.com |
|
|
| 8.5.3 | Results for Blanks in the 2025 Drill Program |
Utilizing a suitable Li blank for the project has been challenging. The silica blank utilized contains unknown quantities of Li (ppm), but it is utilized extensively in the gold mining industry.
It was determined that low-grade lithium values are inherent in the coarse blank in use; failure of the blank material results seemed not applicable since the content of the blank material used was unknown and did not appear on the silica blank certificate.
The results for the blanks were reviewed and determined to be non-indicative of any contamination within the lab. The results show that 53% of the samples returned values less than the previously utilized warning limit (Figure 8-12). This was determined as acceptable for this type of deposit.
The results of the blank material do not skew the results of the rest of the QA/QC program.
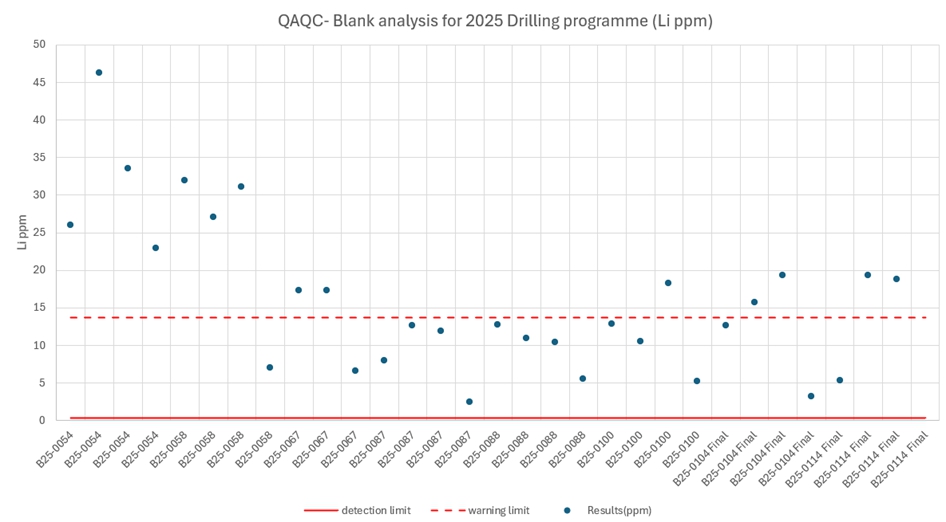
| Figure 8-12 | Blank Analysis Completed on the 2025 Drilling Program |
| 8.6 | Adequacy of Sample Preparation, Analyses, and Security |
For all drilling programs from 2022-2025, the QA/QC measures applied have been sufficient to monitor accuracy and precision, as well as identify any external contamination that may occur during analysis. ABTC’s QA/QC program involved the use of field duplicates, pulp blanks, and CRMs at an overall insertion rate of 5% - 10% during the programs from 2022-2025.
For the 2023 - 2025 drill program, the overall insertion rates were above 10%, with the use of field duplicates, coarse blanks, and CRMs all within accepted industry recommendations.
| ● | The 2021-2022 drill program had nine lithium CRM failures across three out of three CRMs used, which were not addressed. One of the CRMs had five low failures, all from Paragon. While more of the CRMs (67%) were submitted to Paragon, it should be noted that all failures were with that laboratory, and no failures were associated with AAL, who was used earlier in the drill program. |
| barr.com |
|
|
| ● | The 2023 drill program had eight lithium CRM failures. Five of these failures may have been the result of mislabeled samples, although this cannot be proven at this point. |
| ● | The 2025 drill program had seven lithium CRM failures. The majority are considered mislabeling errors on the side of the ABTC geologists. Any other discrepancies were immediately reported to the assay lab and rectified. |
| ● | Field duplicate analysis shows considerable variation across all lithium grades but is within accepted industry standards (<200% RDP with an average RDP of less than 20%). The cross-laboratory field duplicates showed considerable variability with a low correlation coefficient and a negative bias. Removal of the AC samples helped the RMA regression to a small extent. Laboratory preparation duplicates show an extremely well-behaved distribution. |
| ● | Field duplicates were inserted with regularity in the 2023 and 2025 programs and showed an extremely well-behaved distribution. This lends confidence to the drill sampling and analytical methods used. |
| ● | The blanks used were not low enough in lithium values to be used as conventional blanks, so they were treated as low-grade CRMs. Two of the three failures may well have been due to mislabeled samples. An effort should be made to find more suitable lithium blank material if it is available, which may be difficult because of the low detection limit (0.2 ppm) of the analytical method and the natural abundance of lithium in the Earth’s crust. |
| ● | Overall, there are some indications in the data that occasional mix-ups of QA/QC samples occurred, particularly in the earlier drill campaigns, as some of the CRM failures matched the values of other CRMs in use at the time. However, as the cut sheets clearly detail the CRM used, it is hard to prove the mislabeling of samples. |
Any issues observed during this assessment of the QA/QC process done by ABTC are not sufficient to preclude the use of the lithium assays in a mineral resource estimate. It is the QP’s opinion that the data are adequate to use for the resource estimate described herein.
| barr.com |
|
|
9 Data Verification
The current Tonopah Flats drill hole database, which forms the basis for the Tonopah Flats resource estimation, is comprised of information derived from 38 drill holes. Information from the 2025 diamond core drilling program is included in the current resource estimation. This database, inclusive of the 2025 core holes, was subjected to the data verification procedures discussed in Section 9.2 and below.
| 9.1 | Site Visit |
Barr’s QP conducted a site visit of the TFLP on September 27, 2024. The visit included a tour of the core storage shed and multiple stops throughout the Tonopah Flats property. A selection of core and bulk samples were reviewed at the core shed. The visit to the mine site included stops at some of the drill hole collars, test pits, lithium resource outcrops, powerline corridors, and general viewing of the property topography.
On June 26, 2025, Barr QPs visited the ABTC pilot plant in Sparks, Nevada. The visit included a thorough tour of the pilot plant operation and viewing of the bulk feed materials being used for the pilot testing. Barr QPs also viewed bulk samples (supersacks) of combined tailings material from the pilot plant operations.
Mr. Jeff Woods, of Woods, the QP for chapters 10 and 14 of this report, has visited the pilot plant multiple times during the course of the project, including observing the pilot plant in operation, as well as ABTC’s research and development (R&D) and analytical laboratories located at the Nevada Center for Applied Research on the University of Nevada’s Reno campus.
| 9.2 | Drilling Database Verification |
Data verification, as defined in Regulation S-K, is the process of confirming that data have been generated with proper procedures, have been accurately transcribed from the original sources, and are suitable to be used. Additional confirmation of the drill data’s reliability is based on the authors’ evaluations of the Tonopah Flats drill project QA/QC procedures and results, as described in Section 8.2, and in general working with the data.
Verification of ABTC’s TFLP Microsoft Excel database was conducted during the geological modeling and mineral resource estimate update phases. A review of the data was conducted to evaluate data integrity.
The initial phase of tests included performing a series of queries, listed below, to validate the database:
| ● | Drill collars were reviewed |
| ● | Collars with missing depths |
| ● | Collars with missing coordinates |
| ● | Coordinates that might be swapped |
| ● | Drillholes without assay intervals |
| ● | Drillholes without collar survey information |
| ● | Drillholes with nearly duplicate coordinates |
| barr.com |
|
|
| ● | Drillholes without assays |
| ● | Assay data was reviewed: |
| ○ | Excessively large or small sample intervals |
| ○ | Assay intervals that are greater than collar total depth |
| ○ | Gaps and overlaps in sample intervals |
The verification process found no significant issues with the dataset, and it was determined to be valid for the estimation process. The database was then used as supplied by ABTC. Comments recorded by previous reviewers of the property were taken into account when conducting the 2025 update of the mineral resource estimate.
| 9.2.1 | Assays |
The second phase of the data validation was the most comprehensive, comparing raw assay certificates to the database provided by ABTC. Any discrepancies were reported to ABTC and corrected in the database.
In 2025, all assay data was imported directly from Paragon Laboratory certificates with no data integrity issues found in the modeling database.
| 9.3 | Adequacy of Data |
The QPs have reviewed the QA/QC data supplied by the client and verified the drilling for the previous drilling programs at the Tonopah Flats property. The QP agrees that the data are reliable.
Further verification of the drilling data was also accomplished through the generation of a substantive geological domain model generated from the lithological controls and the lithium assays, in the context of those variables as summarized in Section 11.5 through Section 11.7.
Explicit modeling of the lithium mineralization domains on cross-section was the most critical component to the estimation of the project mineral resources. Modeling of the continuity of geological controls, and the assays in the context of the variables, were carefully evaluated and considered.
No downhole surveys were collected during each of the three previous drill phases. In 2025, ABTC conducted downhole surveys on three geotechnical drill holes. Downhole televiewer surveys were conducted on TF25-GT1 and TF25-GT3, as well as a downhole deviation survey conducted on TF25-GT4 and the results were found to be within industry standards.
The QPs have found no limitations with respect to data verification for the TFLP.
| barr.com |
|
|
| 9.4 | Metallurgical Test Work and Pilot Plant Adequacy of Data |
ABTC conducted in-house analytical chemistry to determine the elemental composition of claystone samples. The process involved several steps:
| ● | Elemental Analysis: Claystone samples were first ground and then digested using a 3-acid microwave digestion process. The resulting solution was analyzed with an Agilent 5800 inductively coupled plasma optical emission spectrometry (ICP-OES) instrument to measure the concentration of 25 different elements. This method was based on EPA 200.7 Rev. 4.4 and was validated with CRMs from MEG. |
| ● | Two CRMs, MEG Li.10.14 and MEG Li.10.15 from MEG. These CRMs were lithium and boron containing claystone material from Central Nevada, USA. MEG Li.10.14 had a certified lithium value of 814 ppm and boron value of 0.17% while MEG Li.10.15 had a certified lithium value of 1606.4 ppm and boron value of 1.6 ppm. Control charts for reference materials MEG Li.10.14 and MEG Li.10.15 are shown in Figure 9-1 and Figure 9-2. |
| ● | Inorganic Anion Analysis: A Thermo Scientific Dionex ICS-6000 ion chromatograph was used to measure inorganic anions such as fluoride, sulfate, and chloride, following a method similar to EPA 300.0. |
| ● | Carbon Analysis: A Shimadzu TOC-L CSH system was used to determine total carbon, inorganic carbon, and organic carbon, using a method based on SM 5310B. |

| Figure 9-1 | Lithium Concentration Control Chart for Certified Reference Materials from Moment Exploration Geochemistry LLC, MEG Li.10.14 |
| barr.com |
|
|

| Figure 9-2 | Lithium Concentration Control Chart for Certified Reference Material from Moment Exploration Geochemistry LLC, MEG Li.10.15 |
Detection limits for the methods run by analytical instruments are found in Table 9-1.
| Table 9-1 | Limits of Detection for Analytical Methods |
| Instrument (Method) | Limit of Detection (µg/g) |
| ICP-OES (EPA 200.7 Rev 4.4) | 0.012 – 0.687 |
| Ion Chromatograph (EPA 300.0) | 0.001 – 0.013 |
| Carbon Analyzer (SM 5310B) | 0.086 |
ICP-OES = inductively coupled plasma optical emission spectrometry
µg/g = micrograms per gram
ABTC used several QA/QC procedures to ensure the accuracy and reliability of its analytical results.
| ● | Calibration Standards: ABTC used certified calibration standards to create multi-point calibration curves with an r² value of 0.995 or higher. |
| ● | Checks and Blanks: Calibration checks from both primary and secondary sources were used to confirm accuracy. If a check deviated by more than 15%, the calibration standards were rerun. Blanks were also used to detect and account for any contamination. |
| ● | Duplication: For ICP-OES analysis, most samples were digested and analyzed in duplicate to ensure precision and accuracy. CRMs were also periodically digested to further validate the results. |
All these procedures were carried out using specific chemical reagents and documented in ABTC's internal standard operating procedures. In the QP’s opinion, the analytical methods and QA/QC procedures follow industry practices and are adequate for the purpose of this report and of the use of plant design, metallurgical performance and accounting, and recovery forecast.
| barr.com |
|
|
10 Mineral Processing and Metallurgical Testing
| 10.1 | Mineral Processing and Metallurgical Testing Summary |
The mineral processing and metallurgical testing program has been managed by ABTC and supported by third-party institutions (Hazen Research, Inc. [Hazen], Pocock Industrial Inc. [Pocock], and SGS Canada, Inc. [SGS]). As of the effective date of this report, mineral processing, metallurgical testing, and processing optimization remain on-going for continued process enhancements. ABTC and Woods have prepared this section of the report based on the results of these programs.
The mineral processing and metallurgical testing campaign for the manufacturing of high purity lithium hydroxide product from this lithium bearing claystone material initiated in Spring 2022, where conventional mineral acid leaching of run of mine (ROM) materials was first explored.
In this initial program it was demonstrated that high lithium extractions could be achieved (>80%) with conventional processing when using mineral acids, such as HCl or H2SO4. In these trials leaching times greater than two hours were required at temperatures greater than 60 °C and with acid compositions of 450-1,000 kg acid per tonne of claystone. However, while high extraction efficiencies were achieved, this type of conventional mineral acid leaching was non-selective and resulted in a pregnant leach solution (PLS) with high concentrations of deleterious elemental species compared to the lithium content (Deleterious: Li > 500 mol/mol), thus requiring chemical intensive downstream purification. Due to the presence of carbonate minerals in the claystone feed, much of the acid consumption is due to carbonates and not efficiently utilized in leaching lithium within the claystone.
To improve the selectivity of the leaching (reduce the amount of non-lithium elements leached into the PLS), trials were next performed with various types of pretreatments on the claystone prior to leaching. Several of these pretreatment operations were able to selectively convert lithium to forms that could be readily leached, while deleterious elements (i.e., Mg, Fe, Al) were unaffected and remained within the solid claystone matrix during subsequent leaching. Also, the generated PLS was demonstrated to have a basic pH (i.e., pH ≥ 9), thus reducing the need for process pH adjustment for a final lithium product (i.e., hydroxide).
Initial pretreatment trials were carried out with claystone feed materials in batch using bench scale systems. A wide range of conditions were examined, and it was demonstrated that with pretreatment and subsequent leaching lithium extraction of 70% to 85% was achieved, with significant improvements in selectivity to lithium extraction observed (Deleterious: Li < 20 mol/mol).
With these significant reductions in deleterious elements leached into the PLS with the implementation of these pretreatment operations and improved lithium selectivity, simplified downstream purification methods and operations were tested and evaluated using conventional lithium processing techniques. Demonstration of a battery grade LHM product, as defined in the specifications shown in Figure 10-10, was demonstrated at the bench scale.
After demonstration of these processes at the bench scale, a pilot-scale processing plant (~5 t claystone per day capacity) was designed, constructed, commissioned, and operated demonstrating the extraction, purification, and conversion of lithium from the claystone resource to a battery-grade LHM product. Large scale samples of products from this system have been analyzed internally by ABTC, and also provided to prospective customers for their evaluation.
| barr.com |
|
|
While the pilot-scale processing plant confirmed that battery-grade lithium hydroxide could be produced with the existing process flow sheet, additional mineral deportment studies along with laboratory trials carried out using various beneficiation methods showed that the lithium clay minerals consist of fine particles compared to most gangue minerals and can be concentrated. Beneficiation was examined as a method to upgrade and concentrate the lithium bearing constituents of the claystone while rejecting the low or non-lithium bearing constituents.
This beneficiated material could then exhibit significantly increased grade at the entrance of the conversion plant, allowing for the same amount of product to be manufactured from significantly smaller equipment and with lower energy, chemical agent, and labor costs. Bench and pilot-scale beneficiation trials were carried out on the claystone material and demonstrated an initial upgrading ratio of the non-beneficiated to beneficiated material of 2.85x, and the subsequently produced beneficiated products were subjected to similar pretreatment and lithium extraction trials.
Generated laboratory process data was analyzed with process simulations (METSIM and Aspen) used to optimize and improve process parameters and associated economics.
The focus of the experimental campaigns in this report is on the ABTC pilot plant demonstration trials, and associated studies regarding beneficiation of the claystone feed materials, interim product dewatering, pretreatment studies of beneficiated materials, and subsequent downstream lithium processing and purification. At the time of writing, work continues on optimization of the process to improve reagent utilization, lithium product purity, and process economics.
| 10.2 | Sample Information |
The samples used for this test campaign were obtained from two sample sets collected from ABTC’s Tonopah Flats claystone deposit and prepared for mineral processing and metallurgical testing. The first sample consisted of reverse circulation drill cuttings from the 2021-2022 drill hole program that were collected from TF-2218 (316 kg, referred to as sample DC-TF-2218). This sample was pulverized (Bico Braun Type UA disk pulverizer) to 100 mesh (75% passing) and homogenized to obtain a statistically representative sample of the entire drill hole depth (30 m to 213 m). Mineral processing of these materials was carried out at the University of Nevada, Reno’s Ore Dressing Laboratory. The homogenized bulk sample was analyzed in-house at ABTC’s analytical laboratories. The head grade data was compared with third-party assay data (Paragon) for validation and found to be statistically consistent and representative. This material, DC-TF-2218, was used for beneficiation test work as well as downstream extraction test work. The head grade of the beneficiated materials used for further downstream testing is referred to as sample DC-TF-2218-BC2 and was compared with third-party assay data (SGS Canada, Inc., 2025) for validation and found to be statistically consistent and representative.
A second bulk sample, consisting of approximately 100 t was excavated from the TF-2219 site and used for pilot plant campaigns, characterization, and mineral processing and metallurgical test work. This bulk sample was used in parallel to determine the characteristics of ROM material and can be considered part of the “upper zone” of the deposit. This sample is referred to as BS-TF-2219. This material was then crushed using a jaw crusher attachment on a skid steer (MB-HDS214) and is referred to as sample JC-BS-TF-2219. Samples BS-TF-2219 and JC-BS-TF-2219 were subject to deportment analysis. The head grade of each sieve size was averaged to obtain the overall composition. Assaying was determined by methods outlined in Section 10.2 and the average values are reported as shown in Table 10-1.
| barr.com |
|
|
Table 10-1 outlines the feed materials used for mineral processing and metallurgical test work and is based on ABTC’s in-house head grade assay data for samples used in this test work campaign. Units are in milligrams per kilogram (mg/kg) or ppm and are on a dry basis. “NQ” denotes elements not quantified and “ND” denotes a non-detect or below the detection limit of the machine.
| Table 10-1 | Materials Used for Mineral Processing and Metallurgical Test Work |
| Element (ppm) |
Sample ID | |||
| DC-TF-2218 | DC-TF-2218-BC2 | BS-TF-2219 | JC-BS-TF-2219 | |
| Li | 797 | 1,982 | 622 | 690 |
| Al | 65,240 | 54,773 | 60,684 | 57,038 |
| As | 87 | 41 | 36 | 33 |
| Ba | 742 | 363 | 457 | 634 |
| Ca | 56,214 | 16,119 | 52,624 | 51,156 |
| Co | 13 | 18 | 7 | 9 |
| Cr | 30 | 38 | 23 | 17 |
| Cu | 28 | 30 | 85 | 71 |
| Fe | 25,954 | 39,881 | 24,104 | 23,432 |
| K | 42,118 | 46,315 | 50,384 | 40,454 |
| Mg | 19,933 | 43,906 | 18,040 | 18,246 |
| Mn | 611 | 719 | 534 | 529 |
| Mo | 16 | 4 | “ND” | “ND” |
| Na | 18,482 | 16,819 | 11,861 | 10,454 |
| Ni | 17 | 29 | 14 | 12 |
| P | 641 | 555 | 575 | 540 |
| Si | 230,233 | 175,215 | 199,791 | 191,681 |
| Sr | 2,047 | 1231 | 766 | 780 |
| Ti | 2,670 | 3,910 | 2,491 | 2,492 |
| V | 91 | 163 | 86 | 104 |
| Zn | 103 | 113 | 65 | 58 |
ID = identification
ppm = parts per million
| 10.3 | Sample Analysis Methods and Validation |
All analytical chemistry was carried out in-house by ABTC unless otherwise stated or studies carried out by third-party laboratories. Analysis of the elemental composition of claystone samples was carried out by an internally developed process which consisted of microwave digestion (three acids) and analysis of the leachate solution by ICP-OES multi-element analysis with the use of an Agilent 5800 ICP-OES instrument. The foundational method used for analysis was EPA 200.7 Rev. 4.4 for both total and dissolved metals. The digestion method was validated with the use of two CRMs, MEG Li.10.14 and MEG Li.10.15 from MEG. These CRMs were lithium and boron containing claystone material from Central Nevada, USA. MEG Li.10.14 had a certified lithium value of 814 ppm and boron value of 0.17% while MEG Li.10.15 had a certified lithium value of 1,606.4 ppm and boron value of 1.6 ppm. The instrument used for digestion was an Anton Parr Multiwave 5000 Microwave Reaction System. All claystone samples were ground with mortar and pestle prior to microwave digestion. The digestion method entailed a 10-minute ramp up to 180 °C followed by a 20-minute hold time. Analysis of the leachate by ICP-OES was subject to 25-element analysis, with both single and multi-element standards purchased from Sigma-Aldrich, Agilent, and Inorganic Ventures.
| barr.com |
|
|
In addition to elemental analysis, a Thermo Scientific Dionex ICS-6000 ion chromatograph (IC) system was used to determine inorganic anions, namely fluoride, sulfate, and chloride, by an analysis method similar to EPA 300.0. Total carbon, inorganic carbon, and organic carbon by high-temperature combustion oxidation was also employed by operation of a Shimadzu TOC-L CSH system. Method SM 5310B was used for the determination of total carbon, inorganic carbon, and organic carbon. Detection limits for the methods run by analytical instruments are found in Table 10-2.
| Table 10-2 | Limits of Detection for Analytical Methods |
| Instrument (Method) | Limit of Detection (µg/g) |
| ICP-OES (EPA 200.7 Rev 4.4) | 0.012 – 0.687 |
| Ion Chromatograph (EPA 300.0) | 0.001 – 0.013 |
| Carbon Analyzer (SM 5310B) | 0.086 |
ICP-OES = inductively coupled plasma optical emission spectrometry
µg/g = micrograms per gram
QA/QC procedures for all analyses entailed the use of certified calibration standards, chemical reagents, calibration checks, duplicates, and CRMs which are described in the individual standard operating procedures for each method used (internal ABTC documentation). Calibration standards and reagents include, but are not limited to, Multielement Standard Solution 6 for ICP (Sigma Aldrich; P/N 43843-100ML), sodium carbonate 99.99% (Chem-Impex; P/N 15134), sodium bicarbonate 99.5-100.5% (Sigma-Aldrich; S6297-250G), potassium hydrogen phthalate >99.95% (Sigma-Aldrich;P1088-100G) for total carbon, inorganic carbon, and organic carbon, multi-element anion standard (Inorganic Ventures; P/N IC-FAS-1A), and Dionex seven anion standard (Thermo Scientific Dionex; P/N 056933) for IC.
For all major analytical methods, calibration standards were prepared to generate multi-point calibration curves across the analytical range, with r2 value ≥ 0.995. Blanks were used to monitor and account for contamination, and calibration check standards from first and second sources were prepared to ensure accuracy and validity. If calibration checks deviated ± 15% from known value, troubleshooting/rerunning of calibration standards was performed until deviation was within the acceptable limit. For ICP-OES analysis, most digestions and total metals analysis were performed in duplicate and CRMs digested periodically to ensure accuracy and precision throughout the analysis. Control charts for MEG Li.10.14 and MEG Li.10.15 reference materials are shown in Figure 10-2.
| barr.com |
|
|


| Figure 10-1 | Lithium Concentration Control Charts for Certified Reference Materials from Moment Exploration Geochemistry LLC., MEG Li.10.14 and MEG Li.10.15. |
In the QP’s opinion, the analytical methods and QA/QC procedures follow industry practices and is adequate for the purpose of this report and of the use of plant design, metallurgical performance, and recovery forecast.
| 10.4 | Mineralogy and Particle Properties |
A series of advanced mineral characterization campaigns were conducted by ABTC, Hazen, and SGS to understand the minerology, particle properties, and thermal behavior of claystone materials. The mineral phases were identified using powder X-ray diffraction (XRD) and quantitative evaluation of minerals by scanning electron microscopy (QEMSCAN), while particle morphology and elemental mapping were carried out by scanning electron microscopy (SEM) coupled with energy dispersive X-ray spectroscopy (EDX). Particle size distribution (PSD) measurements (laser scattering) were carried out along with sieve analysis (wet and dry) for size and mass deportment. Hazen conducted mineralogy and size deportment analysis on “upper zone” materials (BS-TF-2219), whereas SGS conducted PSD and minerology of homogenized samples DC-TF-2218 and DC-TF-2218-BC2.
| barr.com |
|
|
| 10.4.1 | Particle Size and Mineralogy |
A detailed particle size and mineralogy of BS-TF-2219 was conducted by Hazen Research, Inc. (2024). The size deportation of BS-TF-2219 (“upper zone” material) was conducted via wet screening (shown in Table 10-3). The wet screening studies showed that the majority of the upper zone material is smaller than 20 μm (~60 wt%). Figure 10-2 shows a bimodal particle size distribution of BS-TF-2219 clay material smaller than 20 μm. A bimodal distribution indicates that the finer material is associated with lithium enriched clay, whereas, the relatively coarse fraction is associated with the gangue. The mean size of the -20 μm particles is approximately 5 μm, with a D90 of 10 μm and a D20 <1 μm in size. In the overall head material, approximately 50% of the sample is <10 μm, with approximately 10% of the sample <1 μm. Assay analysis showed that about 90% of total lithium reports to the -20 μm size fraction, whereas, 50% of Si is rejected in the coarser size fractions indicating that the lithium enriched clay is concentrated in the finer size fraction (Figure 10-3). The head sample (BS-TF-2219) is mainly characterized by K-feldspar (orthoclase, approximately 38 wt%), plagioclase (approximately 19 wt%), mica (illite) (approximately 17 wt%), and calcite (approximately 11 wt%). Minor amounts of quartz (approximately 6 wt%), analcime zeolite (approximately 3 wt%), goethite (approximately 3 wt%), clinoamphibole (approximately 1 wt%), and smectite clay (approximately 1 wt%) make up the rest. The mica (illite) and calcite are concentrated in the - 20 μm fraction (approximately 22 wt% and 15 wt%, respectively), while the quartz is concentrated in the +75 μm fractions (≥8 up to 22 wt%).
Table 10-3 reflects the PSD determined by wet screening of BS-TF-2219 shows that about 59% of the upper zone material is smaller than 20 µm and about 90% of lithium mass reports to the -20 μm size fraction.
| Table 10-3 | Particle Size Distribution for BS-TF-2219 |
| Fraction (µm) | Cumulative Passing % | Li Cumulative Passing % |
| +600 | 100.0 | 100.0 |
| 300-600 | 90.2 | 98.2 |
| 150-300 | 81.2 | 95.0 |
| 75-150 | 75.3 | 93.7 |
| 38-75 | 68.2 | 92.0 |
| 20-38 | 61.8 | 90.0 |
| -20 | 59.2 | 89.6 |
% = percent
µm = micron
Particle size distribution of -20 µm fraction, as shown in Figure 10-2, reflects a bimodal distribution of the head material BS-TF-2219. Bi-modal particle size distribution indicates that the upper material contains finer fraction concentrated in clays and coarser size fraction rich in gangue (Hazen Research, Inc., 2024).
| barr.com |
|
|

| Figure 10-2 | Particle Size Distribution of -20 µm Fraction Showing a Bimodal Distribution of the Head Material For BS-TF-2219 |

| Figure 10-3 | Cumulative Elemental Distribution of Clay Materials Shows That 90% of Li Mass is Reported in Less Than 20 µm Size Fraction for BS-TF-2219 (Hazen Research Inc., 2024) |
| barr.com |
|
|
The size deportation of the homogenized DC-TF-2218 is shown in Figure 10-4. Similar to the “upper zone” materials, about 90% of the total lithium mass reports into <10 µm fraction whereas only 60% of the total silicon reported into <10 µm size fraction. This observation is consistent with the BS-TF-2219 sample. Internal results corroborate with the findings of third-party analysis carried out by SGS Canada, Inc. (2025).

| Figure 10-4 | Cumulative Distributions of Lithium, Magnesium, and Silicon of Sample DC-TF-2218 (SGS Canada, Inc., 2025) |
Figure 10-4 shows that most of the lithium is present in the finer size fractions of the head material, whereas silicon is present in the coarser size fractions of the head material (SGS Canada, Inc., 2025). Several mineral phases were identified in the homogenized samples (DC-TF-2218) using XRD analysis such as, quartz, calcite, orthoclase (feldspar), and clay fractions such as illite (mica) and montmorillonite (smectite). A semi-quantitative mineral composition for DC-TF-2218 homogenized clay is shown in Table 10-4 where an estimate amount of 4.5 wt% can be attributed to the clay fractions. To determine the average stoichiometry of the illite/smectite clay fraction, a procedure developed by the USGS was followed (U.S. Geological Survey Open-File Report 01-041). In short, the clay fraction was isolated from the silt fraction followed by a series of XRD measurements and elemental balances to determine the average stoichiometry. An average illite/smectite formulation was found to be K0.83Na0.47Ca0.29Li0.38Ti0.10[Al0.73Mg2.50Fe0.99][Si6.65P0.27Al1.08]O20(OH,F)4.nH2O. These findings are consistent with other illite/smectite clays found in Nevada (Morissette, 2012).
| barr.com |
|
|
| Table 10-4 | Semi-Quantitative Mineralogical Composition of DC-TF-2218 (Head Material) and DC-TF-2218-BC2 (Beneficiated Clay) (SGS Canada, Inc., 2025) |
| Mineral | DC-TF-2218 (Head Material) | DC-TF-2218-BC2 (Beneficiated Clay) |
| (wt %) | (wt%) | |
| Orthoclase (Feldspar) | 27.9 | 22.2 |
| Albite | 17.9 | ND |
| Calcite | 13.0 | 6.3 |
| Quartz | 11.4 | 4.0 |
| Clinoptilolite | 7.7 | ND |
| Clinochlore | 6.7 | 3.0 |
| Actinolite | 5.7 | ND |
| Muscovite | 2.3 | ND |
| Clay fraction | ||
| Illite | 2.3 | 6.4 |
| Montmorillonite | 2.2 | 32.7 |
ND=Not Detected
| 10.4.2 | QEMSCAN Field Imaging |
A detailed QEMSCAN® analysis conducted by Hazen showed that the quartz and granitoid particles in the 80% -600 µm head sample are the coarsest grained, with a D50 of 40 µm and 50 µm respectively and approximately 21% and 27% greater than 190 µm in size (Figure 10-5). However, approximately 21% and 33% of quartz and granitoid particles are less than 10 µm in size. This reflects a bimodal size distribution. The distinct K-feldspar-volcanic glass and plagioclase-analcime grains are substantially finer grained than the quartz and granitoid particles, with a D50 of 15 µm and 20 µm respectively. The K-feldspar-volcanic glass and plagioclase-analcime also exhibit a bimodal size distribution. The calcite and calcite-illite intergrowths exhibit a much finer PSD than the silicate gangue, with a 65% and 44% respectively, less than 10 µm size distribution. QEMSCAN of the -300 µm fraction exhibited similar mineralogical characteristics.
| barr.com |
|
|

| Figure 10-5 | Detailed QEMSCAN Field Image Of 100% -600 µm Sample. Calcite is Present as Discrete Finer Grains and Pervasively Penetrates the Surrounding Illite-Smectite Clay Minerals (Hazen Research Inc., 2024) |
| 10.4.3 | Specific Gravity Analysis |
The specific gravity of claystone rocks in the range of 12.7 mm to 25.4 mm (BS-TF-2219 and JC-BS-TF- 2219 samples) was estimated using water displacement with parafilm coated samples (Scorgins, 2015) and found to be 1.81 ± 0.10. The specific gravity was also measured on various sized fractions using helium gas pycnometery (BELPYCNO manufactured by Microtrac MRB, USA). The specific gravity was measured on size fractions from 38.1 mm down to -400 mesh. The range observed was from 1.80-2.34, with an average of 2.13 ± 0.18. Helium gas pycnometery of larger, single rock samples (i.e., 25.4 mm to 38.1 mm claystone rocks, seven samples in total) yielded an average specific gravity of 1.83 ± 0.03, similar to water displacement method results. Bulk density of the claystone was estimated to be 1.026 g/mL for 106 µm particle size and 1.023 g/mL for 75 µm particle size.
| 10.4.4 | Thermogravimetric Analysis |
Thermogravimetric analysis coupled with differential scanning calorimetry (TGA-DSC) was performed on DC-TF-2218 samples and the beneficiated clay DC-TF-2218-BC2, scanning from 25 °C to 1,000 °C at a rate of 20 °C per minute under air atmosphere (Figure 10-6). The overall mass loss in the DC-TF-2218 and DC-TF-2218-BC2 is about 10-12 wt%. An initial sharp mass loss of about 3-4% below 150 °C takes place due to moisture removal and loss of freely bound water. This is evident in the endothermic peak observed at low temperatures associated with moisture evaporation. Between 150 and 550 °C with little mass loss (~2%) takes place due to exothermic events such as phase changes in some of the minerals and/or the oxidation of iron sulfide and/or iron-oxyhydroxide minerals in DC-TF-2218 and DC-TF-2218-BC2. A sharp exothermic event at 500 °C can be associated with the structural collapse of layered structures present in the DC-TF-2218 clay. However, no such sharp exothermic event is observed in the beneficiated clay DC-TF-2218-BC2. A significant mass loss occurs at around 600 to 800 °C which corresponds to a very strong endothermic peak. This event is due to the thermal decomposition of carbonate minerals (calcite) and the dehydroxylation of clay minerals (i.e., loss of structurally bound water). Thermal decomposition of calcite generally takes place between 650 and 800 °C (Karunadasa, Manoratne, Pitawala, & Rajapakse, 2019). It should be noted that mass loss in this region for DC-TF-2218 (~5 wt%) is significantly higher than DC-TF-2218-BC2 (~3 wt%). This is due to the removal of calcite phases after the beneficiation of the clay. From about 800 °C mass loss remains stable; however, a continuous endotherm is observed. This is likely a result of mineral phase changes.
| barr.com |
|
|

| Figure 10-6 | Thermogravimetric Analysis of DC-TF-2218 (Homogenized Clay) and DC-TF-2218-BC2 (Beneficiated Clay) |
Figure 10-6 demonstrates thermogravimetric analysis of DC-TF-2218 homogenized clay and DC-TF-2218-BC2 beneficiated clay and shows a significant mass loss due to the decomposition of calcite in the region of 600 to 850 °C. The dashed lines correspond to the DSC profile which represents the heat flow during the endothermic and exothermic events.
| 10.5 | Mineral Processing |
| 10.5.1 | Bond Ball Work Index |
Bond ball work index experiments were conducted (sample BS-TF-2219) to ascertain the hardness of the claystone material to closing screen sizes of 106 µm and 75 µm. Five cycles of milling test were conducted on a constant feed mass of 718.3 g using 106 µm test screen, and 715.9 g using the 75 µm test screen. A summary of the data is given in Table 10-5. These initial studies show that the material under investigation is relatively soft.
| barr.com |
|
|
| Table 10-5 | Bond Ball Work for Two Closing Screen Sizes |
| Closing Screen Size | Bond Ball Work Index (kWh/t) |
| 75 µm | 6.51 |
| 106 µm | 7.18 |
µm = micrometer
kWh = kilowatt-hour
t = tonne
| 10.5.2 | Beneficiation |
Sedimentary lithium-bearing claystone can contain several gangue minerals (e.g., calcite, quartz, gypsum, feldspars). These gangue minerals can be separated from the lithium bearing clay minerals by either particle size, gravitational methods, or a combination thereof (RESPEC Company, LLC, & Woods Process Services, 2024; Tita, Mends, Hussaini, Thella, Smith, & Chu, 2024; Arthur, Mends, Tita, & Chu, 2025). Various beneficiation strategies/flowsheet configurations utilizing well established technologies and unit operations have been examined with the objective to i) decrease the deportment of gangue minerals in downstream processing and, ii) increase the lithium grade and lithium mass pull in the system. Beneficiation unit operations examined included attrition scrubbing, wet screening, Falcon concentrators, hydrocyclone circuits, and various combinations and configurations of these unit operations.
Of the systems tested, a combination of attrition scrubbing and screening, followed by a series of hydrocyclones demonstrates the highest rejection of gangue materials and achieves the highest lithium grade. A test program was developed and carried out by SGS. Five bench-scale beneficiation tests (HC1-HC5) were conducted to determine the most efficient beneficiation configuration using DC-TF-2218 material. The results of these tests indicated the HC3 configuration to produce the highest lithium grade with the most satisfactory weight percentage and lithium distribution (Figure 10-7).

| Figure 10-7 | Lithium Recovery vs. Grade for Bench Scale Trials Carried Out by SGS (SGS Canada, Inc., 2025). HC-3 Gives a Highest Grade of Lithium in the Beneficiated Clay |
| barr.com |
|
|
Two bulk beneficiation tests campaigns (BC1 and BC2) were conducted, with the system configuration of HC3 being taken into consideration and using DC-TF-2218 materials. The products of the initial bulk test (BC1) were utilized for assaying and solid-liquid separation tests. The primary objectives of the second bulk test (BC2) were twofold: firstly, to obtain the requisite data for process mass balances, and secondly, to produce materials (~20 kg) further testing and validation work. The BC2 test produced a concentrate stream with a lithium grade of 2090 mg/kg, a lithium distribution of 80.2%, a weight percentage of 28.2%, and an enrichment ratio of 2.85 (SGS Canada, Inc., 2025). Bilmat software was utilized for data reconciliation to minimize mass balance error.
The beneficiation studies show that significant gangue materials can be rejected and a resulting high lithium grade (>1600 ppm), fine particle size distribution concentrate is obtained. Analysis of the fine fraction, i.e., -20 micron, for DC-TF-2218 and DC-TF-2218-BC2 shows to be similar in PSD and geochemically (Figure 10-8). Therefore, the application of a beneficiation circuit can be used to reduce the variability in the geochemistry and mineralogy of feed into the plant, thereby making the “upper, middle, lower zones” of the deposit geochemically and mineralogically similar.

| Figure 10-8 | Particle Size Distribution of DC-TF-2218-BC2. The D80, D50, and D10 of the Beneficiated Clay is 1.680 µm, 0.932 µm, 0.455 µm Respectively |
| 10.5.3 | Mineral Processing – Dewatering |
Dewatering flocculation trials were carried out by Pocock, SGS, and ABTC on the gangue tailings from beneficiation, the beneficiated concentrate, and the post-leach concentrate tailings. A variety of tests were performed to evaluate their capacity for flocculation, dewatering, and the slurry rheology evaluated. The following parameters were evaluated for the flocculation of gangue tailings from beneficiation, the beneficiated concentrate, and the post-leach concentrate tailings:
| ● | Flocculant type (Anionic/Cationic Polyacrylamide [PAM]) |
| ● | pH |
| barr.com |
|
|
| ● | Solids % |
| ● | Flocculant dosage |
| ● | Underflow density |
| 10.5.3.1 | Beneficiated Concentrate Flocculation and Dewatering Performance |
Two third-party laboratories were consulted by ABTC to develop flocculation, filtration, and dewatering strategies. Initial testing found that significant dosages of cationic and anionic polyacrylamide (PAM) flocculants in excess of 1,000 g/t were necessary for the concentrate to respond to flocculation. The best responses were to be dosing the concentrate slurry with 200 mg/L of Al2(SO4)3 and 1,000 g/t Magnafloc 1011 flocculant when sample was diluted to 0.5% w/w solids (from 2% w/w solids). Overall, even with the help of salt/pH adjustment, the concentrate failed to achieve a good settling response with reagents at a practical range of dosages.
Further testing had success but still observed challenges with flocculation with cationic/anionic PAM dosages ranging from 200 to 800 g/t, outside of practical addition values. In addition to PAM flocculation, the addition of a PolyDADMAC coagulant dosed at 500 g/t was found to have positive responses during pressure filtration. The addition of Ca(OH)2 to adjust the pH up to 11.8, was found to help form a more robust floccule structure with some flocculants, but not all. At pH 11.8, the concentrate material flocculated and settled well at approximately 1-2% solids. Settling performance was observed to decrease in conditions tested at higher solids concentrations. During dynamic thickening tests, underflow density reached a maximum of 10%, provided 400 g/t of anionic PAM flocculant were dosed into the feed (solids at 1.5-2.5%) with pH of 11.8.
In-house trials by ABTC observed a positive effect with the addition of Ca(OH)2 to the concentrate slurry. Although no significant settling occurred, coagulation did occur which allowed filtration of the slurry to be feasible by both vacuum filtration and pressure filtration. While pressure filtration was observed to be feasible, the filter cake moisture content remained high (~70% moisture). To reduce the capillary action formed between fine particle filter cakes, the addition of a recoverable filter agent was explored. Preliminary testing has shown that the use of a recoverable filter agent, filter cake moisture contents of ~40 wt% are achievable. Further studies are currently underway.
| 10.5.3.2 | Gangue Tailings Flocculation and Dewatering Performance |
It was observed by ABTC and Pocock that the gangue tailings responded well to flocculation when feed solids were 10% (w/w). ABTC used a cationic PAM flocculant dosage of 150 g/t and after flocculation, thickened to an underflow density of 60% prior to pressure filtration. No pH adjustment was necessary. Pressure filtration carried out at 4.86 bar (70 psi) yielded a filter cake with an average moisture content of 25%.
| 10.5.3.3 | Post-Leach Concentrate Tailings Flocculation and Dewatering Performance |
Studies carried out by ABTC and Pocock were consistent in observation. In a single batch leaching system, filter cake moisture contents between 17 and 25% with a clear filtrate and a fast filtration time, less than one minute were observed. In this scenario, no flocculant is used, and the average filter size was 11 µm.
| barr.com |
|
|
In a counter current decantation system, flocculation studies and dewatering results were investigated by Pocock. Here it was observed that with the use of SNF 920 SH flocculant at a dose of 40-45 g/t with a high-rate thickener, an underflow density in the range of 57 to 65% can be achieved. Pressure filtration of this slurry yields a filter cake with a moisture content of 16 to 17 wt%.
| 10.5.4 | Pulp Rheology |
Rheology testing was carried out by Pocock. In all cases of materials (i.e., gangue tailings, concentrate, and post-leach concentrate tailings), a decrease in apparent viscosity with an increasing shear rate was observed (i.e., shear thinning). This behavior is an example of the pseudoplastic class of non-Newtonian fluids. This data demonstrates the need to maintain a specific velocity gradient or shear rate to initiate and maintain flow.
| 10.6 | Lithium Extraction – Pretreatment and Water Leaching of Beneficiated Claystone |
Previous studies on lithium extraction from claystone using mineral acids have shown relatively high acid consumption (450-1000 kg acid/tonne of clay) namely due to the presence of acid consuming minerals such as carbonates. Removal of these gangue minerals by beneficiation processes did show some improvement in acid utilization, i.e., down to 250-400 kg acid/tonne of clay; however, selectivity remained poor compared to pretreated material and would result in more downstream processing equipment (increased CAPEX) and reagent use (increased OPEX). Therefore, testing campaigns continued with the pretreated extraction methods using beneficiated materials as the use of beneficiated materials would decrease the OPEX while increasing the mass pull of lithium in the system. Figure 10-9 shows a block flow diagram of the process of study.

| Figure 10-9 | Process Flow Sheet for Lithium Extraction from Claystone by Pretreated Selective Extraction |
| 10.6.1 | Counter Current Decantation Leaching |
Countercurrent decantation (CCD) leach testing was performed by Pocock to determine the soluble value recovery in the leached claystone material. The CCD testing utilized an eight-stage system to determine optimal parameters for the recovery of soluble values. A solute removal efficiency above 99.5% can be achieved in three stages with an initial solid/liquid wash ratio above three and an underflow wash ratio above 4.5. The feed parameters for the CCD system are an underflow density of 60% in CCD stage 1 with a feed solids concentration of 10%. The initial solid to liquid wash ratio can be defined as the ratio of wash solution relative to the dry weight of solids entering the CCD at stage 1. The underflow wash ratio is defined as the ratio of wash solution relative to the weight of underflow liquor exiting each CCD stage.
| barr.com |
|
|
| 10.7 | PLS Purification and Polishing |
| 10.7.1 | Alkaline-Earth Metal Removal by Precipitation |
Bench-scale precipitation trials were performed in batch-reactor mode to identify operational conditions for the removal of alkaline-earth-metal removal applied to the PLS using carbonate minerals.
The primary goal was to optimize conditions for maximum removal of alkaline earth metals (i.e., Ca, Mg, and Sr) and minimize loss of Li. Trials were performed with both unfiltered leach slurry (slurry PLS) and filtered PLS (clear PLS). Various operational parameters and modes were tested, including type of PLS (slurry, clear, process-derived, mimic), types of pH-adjustors (NaOH and LiOH), PLS pre-precipitation pH, mode of precipitant addition (solid or in aqueous form, one-batch or stepwise), time of PLS/precipitant mixing, and precipitate settling time.
Conditions to remove over 95% of Ca (400-700 mg/L) were identified, although less Ca removal (~75%) was found to be beneficial in downstream pilot-scale processing (e.g., to avoid reverse osmosis [RO] fouling and to minimize acid consumption in carbonate removal). The feed concentration of Mg (0-150 mg/L) and Sr (0-50 mg/L) is significantly lower than the Ca concentration. Removal of Mg decreases from 33% to 23% while decreasing the feed pH from 11.5 to 9.5. Removal of Sr is independent of the basic feed pH and shows a removal of 81%. Under optimized conditions, lithium loss was negligible, <5% or below detection.
In pilot plant operations, ~90% removal of calcium is obtainable and satisfactorily avoids complications with ion transfer downstream, especially in the RO process. Lithium loss was observed to be negligible, <5% or below detection.
| 10.7.2 | Ion-Exchange Screening |
Ion exchange (IX) resins are used commercially to remove multi-valent metal cations and oxo-metal anions from solutions. Batch and continuous metal stripping applications were tested with multiple process feeds. In resin screening campaigns, multiple resins with excellent operating capacities were identified. Their efficiency of removing targeted metals (i.e., multivalent cations) to a combined value below 5 ppm was demonstrated.
Laboratory bench-scale column breakthrough testing was carried out using selected resins. It was shown that divalent metal cations (Mg2+ and Ca2+) and oxo-anions of Mo, V, and Si can be removed from aqueous brines down to concentrations well below 5 ppm. An optimal feed pH between 5 and 6 was established.
In pilot plant testing campaigns, IX optimization was based on bench trial results. Engineering work was done on resin preconditioning as well as testing different solution feed flow rates and residence times.
Pilot plant studies confirmed laboratory-scale findings and were able to remove Mo/V/Si/Ca/Mg down to manageable levels (i.e., single digit ppm) to move forward to downstream processing. A >95% removal of Si, Mo, V, Ca, Mg was observed depending on the performance of resin and flowrates. Lithium loss was negligible at <5%. Numerous IX resins were used to remove multivalent metals ions down to a total sum of multivalent species to 5 ppm or less.
| barr.com |
|
|
| 10.8 | Sulfate to Hydroxide Conversion |
The lithium sulfate solution generated from the PLS and subsequent purification processes was used as feed into a membrane electrodialysis unit. The lithium sulfate solution was converted to lithium hydroxide with sulfuric acid formed as a by-product. Laboratory-scale testing, as well as pilot plant testing using this technology have been carried out by ABTC, demonstrating its efficacy. Parameters such as sulfate carryover, feed composition, operating temperature, current, and voltage have been examined. Current efficiencies in the range of 69-85% have been demonstrated. Continued efforts for further optimization of these parameters are currently underway at laboratory and pilot scale.
| 10.9 | Crystallization of Lithium Hydroxide Monohydrate |
A lithium hydroxide solution product from electrodialysis conversion process was used as feed for crystallization to produce a battery grade LHM product. Two crystallization steps were used with a washing step after each crystallization. With this method, the remaining impurities (i.e., Na, K, Ca) were reduced to below 50-100 ppm. After the second crystallization and washing step, the crystals were dried to obtain a LiOH concentration of ≥56% resulting in a battery-grade LHM product (Figure 10-10). This process has been demonstrated on both laboratory-scale and pilot-scale, being some of the first reports on the extraction and production of battery grade LHM from a domestic lithium claystone resource.
| barr.com |
|
|

| Figure 10-10 | Lithium Hydroxide Monohydrate Battery-Grade Sample Certificate of Analysis Manufactured from ABTC Claystone Material |
| 10.10 | Pilot Plant |
Recent work includes a pilot plant demonstration (Figure 10-11) with a nominal capacity of producing multiple kg/day of LHM product was designed, installed, commissioned, and operated under several testing campaigns. Results from these pilot runs were used to inform the design of the commercial refinery process. The pilot plant was designed in the first half of 2023, installed during the fourth quarter of 2023 and the first quarter of 2024, then commissioned and initially operated throughout the remaining year of 2024. In early 2025, the pilot line was operated during a continuous two week demonstration to prove the robustness of the process/equipment, and repeatability of the individual processing steps. Materials used for the pilot plant were from a bulk excavated sample, BS-TF-2219. Continuous improvement and process optimization campaigns remain ongoing.
| barr.com |
|
|

Located at the ABTC Processing Facility in Reno, Nevada.
| Figure 10-11 | Photograph of ABTC’s Lithium Hydroxide Pilot Plant Processing Materials from the Tonopah Flats Sedimentary Claystone Deposit with a Nominal Plant Capacity of Multi-Kilograms of Products/Day. |
| 10.11 | Conclusions |
Pilot plant operations have proven that downstream purification and hydroxide conversion, as well as crystallization, are achievable with claystone materials from ABTC’s resource.
During laboratory-based studies in this campaign, processing efficiencies and improvements were realized through the beneficiation of claystone materials. The lithium content in a homogenized sample representing the whole depth of a drill hole (DC-TF-2218) can be enriched by a factor > 2.85x. The beneficiated material demonstrated improvements in operational parameters for lithium extraction to non-beneficiated materials (i.e., kinetics, selectivity, and lithium mass pull). Although high lithium extraction (>80%) with excellent selectivity (Deleterious: Li < 20 mol/mol) have been demonstrated through various conditions, OPEX optimization of these parameters is gated by side stream recovery/recycling, energy use, and reagent consumption. Continued efforts on the optimization of the pretreatment, beneficiation, dewatering circuits, and downstream processing remain ongoing.
In the QP’s opinion, the metallurgical test work follows industry practices and is adequate for the purpose of this report and suitable for the use for plant design, metallurgical performance, and production forecasting.
| barr.com |
|
|
11 Mineral Resource Estimate
| 11.1 | Summary |
The mineral resource estimate for the TFLP was prepared by ABTC in coordination with Dahrouge Geological Consulting (Dahrouge), in accordance with the U.S. Securities and Exchange Commission’s Regulation S-K 1300 guidelines. The estimate has been validated and supported by a quality-assured drill hole database containing 38 drill holes, of which 37 contain analytical analysis which was incorporated within this mineral resource estimate.
The mineral resource model utilizes domain boundaries that were defined by integrated geological and structural interpretations derived from core logging and assay data. Wireframe solids representing lithium grade shells were constructed to help estimate the various populations of lithium mineralization within the geological controls. Variography helped to inform the Sequential Gaussian Simulation (SGSim) to capture the grade variability within each geological domain.
Classification of resources was conducted on a block-by-block basis within the 25 m by 25 m by 10 m regular block model. The classification considered factors such as the local density of drill data, spatial continuity of lithium mineralization, and simulation confidence intervals.
The mineral resource estimate is based on drilling data collected through March 2025, with an effective date as of the date of this report.
| 11.2 | Key Assumptions and Methods |
The mineral resource estimate for the TFLP is based on 38 drill holes completed through March 2025, with 37 containing lithium assay data used in the model. All data was compiled, validated, and audited prior to resources modeling.
A block model with the dimensions of 25 m by 25 m by 10 m was constructed using Maptek Vulcan software. The model is oriented due north, and lithium mineralization was estimated using SGSim constrained by interpreted geological and structural domains. The domains were defined using lithologic logging and fault block modeling to ensure the spatial continuity and geometry of mineralized zones were properly captured.
Experimental variograms were calculated and modeled for each of the primary lithological units. Variogram ranges and orientations were used to inform simulation parameters, which honored the observed spatial variability within each domain.
Resources were classified into Measured, Indicated, and Inferred based on the following criteria:
| ● | Drilling spacing and data density |
| ● | Continuity of mineralization |
| ● | Simulation variance and confidence intervals |
| ● | Proximity to geological contacts and data clustering |
| barr.com |
|
|
A pit optimization was conducted to demonstrate reasonable prospects for economic extraction. This included assumptions for:
| ● | Mining methods (open pit) |
| ● | Lithium processing recoveries |
| ● | Cost estimates for mining and processing |
| ● | Market pricing appropriate for the context and reporting date |
COGs were derived from pit optimization and applied during resource tabulation.
| 11.3 | Database |
The mineral resource estimate is supported by a validated drill hole database provided by ABTC. The database includes 38 drill holes, of which 37 contain analytical analysis which was incorporated within this mineral resource estimate. One drill hole was excluded from estimation due to being entirely contained within the alluvium which contains no grade.
The drill hole data is stored in UTM Zone 11 NAD83 (meters) coordinate system, and includes collar locations, downhole surveys, lithology logs, and analytical results. ABTC maintained and updated the database throughout the drilling program, and the final quality control and verification of data was completed by 15 March 2025.
Descriptive statistics are shown in Table 11-1 and Table 11-2.
| Table 11-1 | Descriptive Statistics of Sample Assays in Tonopah Flats Drillhole Database |
| Count | Mean | Median | Standard Deviation | Coefficient of Variation | Minimum | Maximum | Units | |
| Li ppm | 4971 | 625 | 627 | 336 | 0.54 | 0.001 | 1,940 | ppm |
ppm = parts per million
| Table 11-2 | Drillhole Sample Statistics |
| Drillhole ID | Number of Composites | Total Drilled Length (m) |
| TF-2101 | 80 | 121.9 |
| TF-2102 | 111 | 167.6 |
| TF-2103 | 97 | 146.3 |
| TF-2104 | 112 | 167.6 |
| TF-2105 | 113 | 167.6 |
| TF-2106 | 90 | 134.1 |
| TF-2207 | 83 | 126.5 |
| TF-2208 | 102 | 155.4 |
| TF-2209 | 101 | 152.4 |
| TF-2210 | 101 | 152.4 |
| barr.com |
|
|
| Drillhole ID | Number of Composites | Total Drilled Length (m) |
| TF-2211 | 102 | 152.4 |
| TF-2212 | 102 | 152.4 |
| TF-2213 | 101 | 150.9 |
| TF-2214 | 101 | 152.4 |
| TF-2215 | 101 | 152.4 |
| TF-2216 | 100 | 152.4 |
| TF-2218 | 143 | 216.4 |
| TF-2219 | 139 | 208.8 |
| TF-2220 | 179 | 271.3 |
| TF-2221 | 145 | 219.5 |
| TF-2222 | 118 | 176.8 |
| TF-2323 | 158 | 237.1 |
| TF-2324 | 139 | 205.8 |
| TF-2325 | 288 | 434.4 |
| TF-2326 | 142 | 213.4 |
| TF-2327 | 152 | 225.5 |
| TF-2328 | 147 | 218.9 |
| TF-2329 | 151 | 226.4 |
| TF-2330 | 149 | 221.1 |
| TF25-GT01 | 200 | 297.18 |
| TF25-GT02 | 174 | 259.08 |
| TF25-GT03 | 167 | 245.822 |
| TF25-GT04 | 166 | 245.822 |
| TF25-GT05 | 163 | 240.487 |
| TF25-GT06 | 156 | 231.495 |
| TF25-GT07 | 143 | 215.646 |
| TF25-GT08 | 155 | 235.763 |
ID = identification
m = meter
Based on a comparison of capped and uncapped statistics, no capping was applied. The dataset shows stable central tendency and dispersion, with minimal influence from high-grade outliers.
The following table (Table 11-3) summarizes Li concentration statistics (in ppm) by geologic unit.
| barr.com |
|
|
| Table 11-3 | Lithium Statistics by Geologic Unit |
| Geologic Unit | Count | Mean (ppm) | Median | Standard Deviation | Coefficient of Variation | Minimum | Maximum |
| Qal | 138 | 103.07 | 41.05 | 206.14 | 2.00 | 0.001 | 1,190.0 |
| Tcsu | 2,042 | 731.92 | 751.00 | 295.91 | 0.40 | 0.001 | 1,870.0 |
| Tcsm | 1,525 | 676.79 | 679.70 | 330.09 | 0.49 | 0.001 | 1,940.0 |
| Tcsl | 1,189 | 460.50 | 398.00 | 289.68 | 0.63 | 0.001 | 1,920.0 |
ppm = parts per million
Qal = Quaternary Alluvium
Tcsl = Lower Siebert Formation (Tertiary tuffaceous sedimentary unit)
Tcsm = Middle Siebert Formation (Tertiary tuffaceous sedimentary unit)
Tcsu = Upper Siebert Formation (Tertiary tuffaceous sedimentary unit)
The figures below present histograms of Li ppm for each geologic unit, illustrating their grade distribution characteristics.

Tcsu = Upper Siebert Formation (Tertiary tuffaceous sedimentary unit)
| Figure 11-1 | Lithium PPM Histogram for the Upper Unit – Tcsu |
| barr.com |
|
|

Tcsm = Middle Siebert Formation (Tertiary tuffaceous sedimentary unit)
| Figure 11-2 | Lithium (ppm) Histogram for the Middle Unit – Tcsm |
The upper (Tcsu), middle (Tcsm), and lower (Tcsl) Siebert Formation units are all Tertiary tuffaceous sedimentary rocks that support stratigraphic and geochemical zonation within their respective intervals. Tcsu and Tcsm exhibit normal distributions while Tcsl is semi-right skewed which could be a result of more complex heterogeneous mixing of the lithium concentrations.

| Figure 11-3 | Box Plot of the Tcsu, Tcsm, and Tcsl Geologic Units |
| barr.com |
|
|
| 11.4 | Interpretation and Modeling |
The geological interpretation for the Tonopah Flats lithium deposit was developed using core logging, stratigraphic relationships, and structural analysis from the 2023 and 2024 / 2025 drilling programs. The deposit is hosted in a sequence of claystone-rich volcanic tuff units that are regionally continuous and have been subdivided into distinct lithologic domains based on composition, color, and textural features observed in core.
A structural model was constructed to account for faulting within the basin. This included interpretation of range-front faulting and internal fault blocks, which were critical for segmenting the deposit into geostatistically independent zones. Fault block boundaries were used to constrain variogram modeling and simulations, ensuring that grade continuity was modeled within, rather than across, structural domains. Based on the integrated geological and structural interpretations, three-dimensional wireframe solids were created to represent the boundaries of mineralized domains. These wireframes were used to code the block model by domain, allowing for grade estimation and simulation to be performed within geologically consistent volumes.
Lithium mineralization shows strong lithologic control, with higher grades associated with specific subunits of the claystone package. These domains were supported by statistical analysis of lithium assays by geologic unit, confirming the basis for geologic modeling. Histograms and box plots were also used to identify internal population changes. The resulting geological and domain models formed the foundation for all subsequent variography, estimation, and classification work. The domains were honored explicitly in the block model and during SGSim, ensuring that spatial continuity was modeled appropriately within each lithologic-fault block domain.
ABTC produced a three-dimensional digital geologic model based on downhole lithologic data and the historical regional surface geology map. A combination of large-scale range-front faulting with a general north-south orientation and local smaller-scale cross faulting aligned more southwest to northeast has been interpreted from the drilling. A district fault from Bonham and Garside (1979) was incorporated into the geologic interpretation and modified to account for 160 m of gravel intersected in TF-2217 on the west side of the deposit. Claystone units were interpreted to be dropped down to the west on this northeast fault (Figure 11-4) and no mineralization was projected west of the fault, though it may be present at depths of greater than 160 m.
| barr.com |
|
|

|
 |
| Figure 11-4 | Fault Traces Interpreted from Drilling (Left); Corresponding Fault Blocks Used to Constrain the Conditional Simulations (Right) |
| 11.5 | Density |
Density measurements were collected from drill hole samples within the property during the 2023 core drilling program. Fifty samples were collected from core and were analyzed by Paragon. Density values were evaluated in geologic context and by lithium grade. Density values were then grouped into two groups: claystone and all other lithologies categories. The Tonopah Flats density values applied by lithology types are summarized in Table 11-4. Density data should be collected from future core drill programs to continue to refine the density values in the block model. The current density dataset is adequate to support the Measured and Indicated resources in this report.
| Table 11-4 | Tonopah Flats Deposit Average Specific Gravity Measurements by Lithology |
| Lithology | g/cm3 |
| Alluvium | 1.51 |
| Claystone - Tcsu | 1.57 |
| Claystone - Tcsm | 1.49 |
| Claystone - Tcsl | 1.61 |
g/cm3 = grams per cubic centimeter
Tcsl = Lower Siebert Formation (Tertiary tuffaceous sedimentary unit)
Tcsm = Middle Siebert Formation (Tertiary tuffaceous sedimentary unit)
Tcsu = Upper Siebert Formation (Tertiary tuffaceous sedimentary unit)
In the block model, the bulk density values were either estimated on a nearest neighbor basis or assigned to model blocks on a unit average basis, so that all blocks below topography have a density value.
| barr.com |
|
|

| Figure 11-5 | Perspective View Looking Down Towards the East Showing the Relative Positions of Qal (Yellow), Tcsu (Green), Tcsm (Brown) and Tcsl (Dk Green) Lithologies in Fault Block 3 |
| 11.6 | Compositing |
Drillhole assay data for the Tonopah Flats lithium deposit were composited prior to resource estimation to standardize sample lengths and reduce bias related to variable sample intervals. The compositing process was conducted in Maptek Vulcan using downhole assay intervals, honoring lithological and domain boundaries to preserve geologic control during estimation. All valid lithium assays were composited to a fixed length of 1.5 m, which was selected based on the prevailing raw sample lengths and the desired resolution for modeling. This length represents a balance between maintaining resolution and minimizing variability due to extreme short intervals.
Compositing was restricted within lithologic units and estimation domains, meaning that composite intervals did not cross interpreted geological boundaries. This preserves the internal integrity of modeled domains and ensures that grade continuity reflects real geologic controls. Assay intervals that could not accommodate a full composite length at the end of a domain were either adjusted proportionally or excluded based on best practices to avoid introducing partial length bias. No capping or grade adjustment was performed during compositing; statistical treatment of high values was handled during exploratory data analysis and later simulation stages.
The composite database was then used for variography, estimation, and simulation. Compositing ensured equal sample support and mitigated the impact of clustered short intervals on spatial continuity models and grade interpolation.
| 11.7 | Outlier and Capping |
Histograms, log probability plots, and boxplots were used to evaluate the lithium grade distribution both globally and within each interpreted lithologic domain. The dataset exhibited moderately skewed grade distributions, typical of lithium-bearing claystone deposits, but no extreme outliers were identified that warranted hard capping at this stage. Furthermore, domain-specific statistical analyses demonstrated that high-grade values were geologically reasonable and spatially clustered within the upper portions of certain claystone units. These zones were captured explicitly through wireframing and simulation domain coding, reducing the risk of isolated outliers influencing broader model estimates.
| barr.com |
|
|
While no numeric top cuts were applied during compositing or estimation, the data was monitored throughout the modeling workflow for local conditional bias or excessive smoothing. Future updates to the resource model may revisit grade capping based on additional drilling, metallurgical constraints, or reconciliation data.
| 11.8 | Variography |
Experimental variograms were calculated for each geologic domain within the Tonopah Flats deposit to quantify spatial continuity of lithium grades and to inform simulation and classification parameters. Variogram modeling was completed using composited lithium assay (1.5 m intervals), with directional variograms evaluated in horizontal and vertical orientations.
Separate variograms were modeled for the primary claystone units Tcsu, Tcsm, and Tcsl and were further constrained within fault blocks to account for structural segmentation of the deposit. Variogram calculation included omnidirectional and directional analyses, with key directions defined based on deposit geometry, drilling orientation, and domain extents.
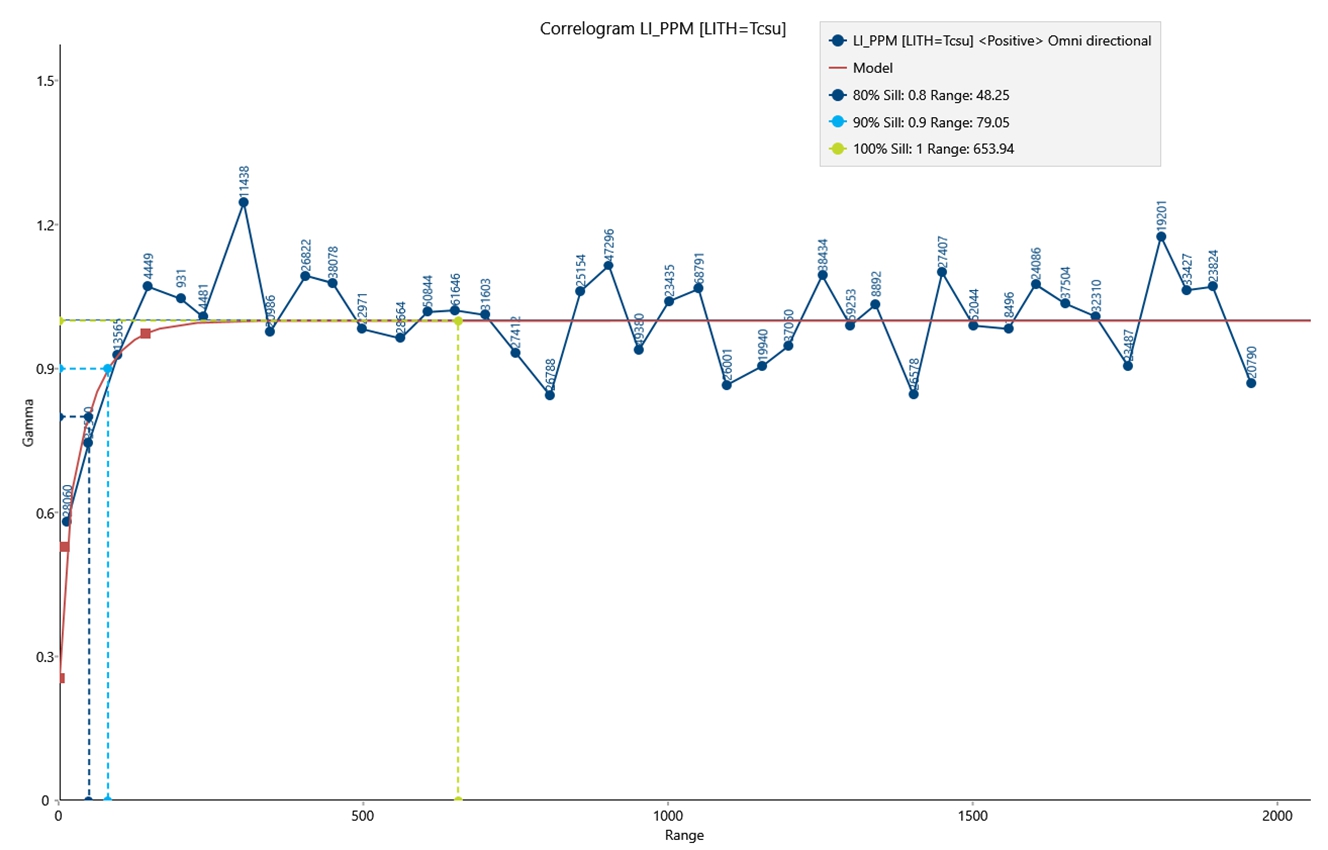
| Figure 11-6 | Variogram for Tcsu with Ranges to Sill Included |
| barr.com |
|
|

| Figure 11-7 | Variogram for Tcsm with Ranges to Sill Included |

| Figure 11-8 | Variogram for Tcsl with Ranges to Sill Included |
| barr.com |
|
|
ABTC examined the combined Tcsu and Tcsm lithium grades directionally in Fault Block 3 (Figure 11-9).

| Figure 11-9 | Lithium Drillhole Sample Variography in Fault Block 3 |
Modeled variogram parameters were used directly in the SGSim process and influenced classification criteria by defining the search neighborhood and simulation variance confidence intervals.
Variogram reproduction was validated by comparing model fits to experimental data and ensuring consistency with known geologic structures. Cross-validation and swath plot analyses also confirmed that the modeled spatial continuity was appropriate for lithium grade interpolation within each domain.
| 11.9 | Lithium Block Modeling and Estimation |
| 11.9.1 | Estimation Domains |
A mineral domain encompasses a volume of rock that ideally is characterized by a single, natural, grade population of a metal or metals that occurs within a specific geologic environment or unit. To define the mineral domains at Tonopah Flats, the natural lithium population was first identified on population-distribution graphs that plot the lithium-grade distribution of all the drill hole assays (Figure 11-10). Breaks in slope on the graph delineate different grade populations. This analysis led to the identification of three grade populations for lithium. Ideally, each of these populations can be correlated with specific geologic characteristics that are captured in the project database. These characteristics can be used in conjunction with the grade populations to interpret the bounds of the lithium mineral domains. The Fault Block 3 approximate grade ranges of the lower-grade (domain 180), moderate-grade (domain 550), and higher- grade (domain 800) domains that were modeled for lithium are listed in Table 11-5.
| barr.com |
|
|

| Figure 11-10 | Lithium Population Probability Distribution Graph |
| Table 11-5 | Approximate Grade Ranges of Lithium Domains for Fault Block 3 |
| Domain | Li Range (ppm) | Li Mean (ppm) |
| 180 | 0 to 1560 | 409 |
| 550 | 0 to 1700 | 659 |
| 800 | 0 to 1940 | 867 |
ppm = parts per million
| barr.com |
|
|
| Table 11-6 | Approximate Grade Ranges of Lithium Domains for Fault Block 4 |
| Domain | Li (ppm) | Li Mean (ppm) |
| 150 | ~30 to ~1400 | 320 |
| 550 | ~360 to ~970 | 747 |
ppm = parts per million
The Fault Block 4 approximate grade ranges of the lower-grade (domain 150) and moderate-grade (domain 550) domains that were modeled for lithium are listed in Table 11-6.
The lithium mineral domains were interpreted in the Vulcan modeling software package using the lithium drill hole assay data creating nested 3D solids. This information was used to discern the stratigraphic controls of the mineralization discussed in Section 11.4 and to model the domains accordingly in the block models. Domains were treated as hard boundaries outward only.
Cross-sections showing examples of the lithium mineral domains in the central portion of the Tonopah Flats deposit are shown in Figure 11-11 and Figure 11-12.
| barr.com |
|
|

| Figure 11-11 | Cross Section Looking North Showing Lithium Domains |
| barr.com |
|
|

| Figure 11-12 | Cross Section Looking East Showing Lithium Domains |
| barr.com |
|
|
| 11.9.2 | Grade Simulation |
The parameters applied to the lithium grade estimations at TFLP are summarized in Table 11-7. Grade simulation was completed in three passes in Fault Block 3 and two passes in Fault Block 4 using length-weighted composites.
Due to the uniform nature of the sub-horizontal lithological controls, the modeled mineralization has one orientation of mineralization that covers most of the deposit with local areas of gently east dipping mineralization. The block model was therefore coded into two estimation areas. Fault Block 3 encompasses the majority of the Tonopah Flats deposit and is characterized by shallow dips of the stratigraphic host rocks of up to about 1-2° to the northwest. Fault Block 4 encompasses local areas of uplifted Tcsl.
| Table 11-7 | Tonopah Flats Sequential Gaussian Simulation Parameters |
| All Simulation Passes | |
| Description | Parameter |
| Samples: Minimum/Maximum/Maximum Per Hole | 1 / 12 / none |
| Search Distances (m): Major/Semimajor/Minor (Vertical) | 850 / 850 / 15 |
| Search Orientation: Bearing/Plunge/Dip | 30 / 0 / 0 |
| Maximum Block Samples Used in Simulation | 10 |
| High-Grade Restrictions (Grade in ppm Li/t, Distance in m) | none |
| Low-Grade Restrictions (Grade in ppm Li/t, Distance in m) | none |
| Number of Realizations Per Block | 20 |
m = meter
ppm = parts per million
t = metric tonne
The Tonopah Flats lithium mineral resources were simulated using conditional SGSim. OK and NN estimations were completed only as statistical checks on the conditional simulation results.
The simulation passes were performed sequentially for each of the mineral domains, so that more lower grade samples were progressively added to the simulations as the grade shells expanded. Simulations were run on a block model with 5 m by 5 m by 1 m block size. The final resource grades, and their associated resource tonnages are from a 25 m by 25 m by 10 m block size model.
| 11.9.3 | Block Model Validation |
The Tonopah Flats lithium block model underwent a comprehensive validation process to ensure it accurately represents the input data and underlying geology. Visual checks were performed by comparing estimated block grades with drill hole composite values in plan and section views, confirming that the model honors spatial trends and domain boundaries. Statistical comparisons between the block model and declustered composites showed strong agreement in mean grades and distribution shapes, indicating minimal global bias. Swath plots along easting, northing, and elevation directions further confirmed that the model preserves local grade trends without introducing significant smoothing. Variogram reproduction tests using multiple simulation realizations demonstrated that spatial continuity was appropriately modeled within each geologic and grade domain. In addition, simple kriging cross-validation was performed using both full and reduced sample sets, and the results showed low error, high correlation, and consistent performance across fault blocks. Collectively, these validation steps confirm that the block model is robust, geologically sound, and suitable for public reporting under S-K 1300 guidelines.
| barr.com |
|
|

| Figure 11-13 | Comparison Of Drillhole Composite Lithium Grades (Bars) to Conditionally Simulated Block Grades (Red Line) |
| barr.com |
|
|

| Figure 11-14 | Swath Plots Comparing Drillhole Composite Lithium Grades (Black Lines) to Simulated Grades In 5 m by 5 m by 1 m Model (Red Lines) |
| barr.com |
|
|

| Figure 11-15 | Resource Classification |
| 11.10 | Reasonable Prospects of Economic Extraction for Mineral Resources |
To meet the requirement of reasonable prospects for economic extraction for the portion of mineral resources potentially amenable to open pit mining methods, pit optimizations were run using the parameters summarized in Table 11-8.
| Table 11-8 | Pit Optimization Parameters |
| Item | Value | Unit |
| Mining Cost | 2.70 | $/tonne claystone |
| Processing Cost | 7.50 | $/tonne processed |
| Processing Rate | 17.0 | Mtpa processed |
| General & Administrative Cost | 15,000,000 | $/year |
| LHM Price | 22,000 | $/tonne |
| Li Recovery | 48 | percent |
| Minimum Li Grade | 300 | ppm |
LHM = lithium hydroxide monohydrate
Mtpa = million tonnes per year
ppm = parts per million
| barr.com |
|
|
The two pit shells created by this optimization were used to constrain the mineral resources potentially amenable to open-pit mining methods. While the break-even COG is lower, the QP utilized an elevated COG of 300 ppm for material inside of the optimized pit shells to ensure a conservative approach. The lithium COG was calculated using the processing and general & administrative costs, as well as the lithium price, and recovery provided in Table 11-8. The mining cost is not included in the determination of the COG, as all material in the conceptual pits is potentially to be mined and the COG determines whether the mined materials are sent to be processed or to the WRSF. The reference point at which the mineral resources are defined is therefore at the top rim of the pits, where material having lithium equal to or greater than the COG would be processed. Also, a linear zone containing US 6/95 and powerlines, which crosses through the central portion of the project, and a buffer around it, were excluded from the optimization.
The metal prices used in pit optimization and the determination of the lithium COG are derived from a lithium hydroxide monohydrate (LHM) price of US$22,000/t. The reader is referred to sections 11.9 and 16 for a summary of ABTC’s reasoning for the selected commodity price. The open-pit resource estimates are based on a 46,575 tonne per day (tpd) processing rate, with processing assumed to consist of pretreatment followed by water leaching and LHM recovery.
The calculated lithium COG for Tonopah Flats is as follows:
| Equation 11-1 | Calculated Lithium Cut-Off Grade |

Where:
ProcCst = Processing cost in $/tonne
G&ACst = General & Administrative cost in $/tonne
SellPrice = Selling price of lithium in $/tonne LHM
SellCst = Selling cost of product in $/tonne
Roy = Royalty in NSR % Rec = Recovery in %
Using the input parameters outlined in this report, the lithium COG is:
(7.50+0.83) / (22,000*6.045-0)*(1-0)*48%)*1,000,000 = 130 ppm.
The pit shells created using these optimization parameters were further constrained to limit the project resources to a grade of 300 ppm within claystone only, which was done as a conservative measure to avoid extremely low COGs despite economics. It should be noted that without the grade constraint, the resulting pit shell using these parameters would be larger than has been used for the resources reported herein.
All mineral resources are contained within the ABTC property boundary. Results from the pit optimization define a resource of over 1.3 billion tonnes of Measured and Indicated material at an average grade of 755 ppm Li. This resource is estimated using a 300 ppm Li COG.
Table 11-9 presents the Tonopah Flats mineral resources compared to subsets of mineralized material tabulated with increasing COGs. This is presented to provide grade-distribution data that allows for detailed assessment of the project resources. All the tabulations are constrained as lying within the same optimized pit shells used to constrain the current mineral resources, which means the tabulations at cut-offs higher than the resource COG of 300 ppm Li represent subsets of the current resources.
| barr.com |
|
|
| Table 11-9 | Tonopah Flats Inferred Mineral Resources at Various Cut-Offs (Exclusive of Measured and Indicated) |
| Cut-Off Li (ppm) | ktonnes | Li (ppm) | Li (ktonnes) | LHM (ktonnes) |
| 300 | 3,661,191 | 712 | 2,607 | 15,767 |
| 400 | 3,284,290 | 752 | 2,471 | 14,941 |
| 500 | 3,037,226 | 780 | 2,367 | 14,314 |
| 600 | 2,665,845 | 808 | 2,146 | 12,977 |
| 700 | 1,721,274 | 905 | 1,558 | 9,420 |
| 800 | 1,602,392 | 917 | 1,468 | 8,880 |
| 900 | 1,248,344 | 929 | 1,159 | 7,009 |
| 1,000 | 38,230 | 1,021 | 3.9 | 235 |
| 1,100 | 515 | 1,127 | .580 | 3.50 |
| a) | The project mineral resources are comprised of all model blocks at a 300 ppm Li cut-off | |
| b) | Tabulations at higher cut-offs than used to define the mineral resources represent subsets of the mineral resource | |
| c) | Mineral resources that are not mineral reserves do not have demonstrated economic viability | |
| d) | Rounding as required by reporting guidelines may result in apparent discrepancies between tonnes, grade, and contained metal content |
ktonnes = kilotonnes
LHM = lithium hydroxide monohydrate
ppm = parts per million
| 11.11 | Mineral Resource Estimate |
The mineral resources at Tonopah Flats have been classified and reported in accordance with the requirements of SEC Regulation S-K 1300. The resource model incorporates 38 drill holes completed through March 2025, of which 37 contain valid lithium assay data. The resource estimate is effective as of the date of this PFS and is based on geologically constrained modeling and geostatistical simulation within a fully validated block model. Lithium grades were estimated using SGSim, constrained by interpreted lithological and structural domains, and classification was assigned based on drill hole spacing, geological continuity, and simulation variance.
The current Tonopah Flats mineral resources are estimated in consideration of potential mining by open pit with 25 m by 25 m by 10 m blocks to accommodate open-pit engineering requirements. All other modeling steps and inputs that were used to estimate the lithium resources, including the mineral domain modeling, grade zoning, grade simulation, density assignment, and classification, were completed independent of potential mining methods.
Potential mining by open pit uses LHM prices that reflect current trends. The current resources are pit constrained based on a US $22,000/t LHM price. This price was determined by evaluating the three-year average of historical prices rounded to US $22,000/t. A more thorough discussion of pricing for both the mineral resources and economic analysis is presented in Chapter 16 of this PFS. Based on the current market conditions and demand for lithium, Barr believes that this price projection is reasonable. There is some risk that a significant commodity price drop could change the economics input to the pit constraints used to report this resource. Such a change could increase the COG and reduce the tonnage compared to the reported resources.
| barr.com |
|
|
| Table 11-10 | Classified Lithium Mineralization Exclusive of the Mineral Reserve with a Cut-Off of 300 ppm Li |
| Classification | ktonnes | Grade Li (ppm) | Li (ktonnes) | LHM (ktonnes) |
| Measured | 893,803 | 876 | 773 | 4,670 |
| Indicated | 1,439,965 | 639 | 832 | 5,022 |
| Measured and Indicated | 2,333,767 | 712 | 1,605 | 9,692 |
| Inferred | 532,343 | 423 | 75 | 444 |
ktonnes = kilotonnes
LHM = lithium hydroxide monohydrate
ppm = parts per million
| Table 11-11 | Lithium Mineral Resources Inclusive of the Mineral Reserve with a Cut-Off of 300 ppm Li |
| Classification | ktonnes | Grade Li (ppm) | Li (ktonnes) | LHM (ktonnes) |
| Measured | 1,126,772 | 876 | 978 | 5,976 |
| Indicated | 2,534,419 | 639 | 1,620 | 9,799 |
| Measured and Indicated | 3,661,191 | 712 | 2,607 | 15,767 |
| Inferred | 2,151,226 | 423 | 911 | 5,508 |
| a) | The estimate of mineral resources was completed by ABTC and Dahrouge | |
| b) | Tonopah Flats resources are classified as Measured, Indicated, and Inferred | |
| c) | Mineral resources comprised all model blocks at a 300 parts per million (ppm) tonne Li cut-off that lie within an optimized pit | |
| d) | Lithium hydroxide monohydrate (LHM) tonnes were calculated using a factor of 6.0459 | |
| e) | Mineral resources that are not mineral reserves do not have demonstrated economic viability | |
| f) | Mineral resources potentially amenable to open pit mining methods are reported using a lithium hydroxide monohydrate price of US$22,000/t, assumed metallurgical recoveries of 48% for Li, mining costs of US$2.70/t mined, processing costs of US$7.50/t processed, minimum grade of 300 ppm lithium within claystone, and general & administrative costs of US$0.83/t processed, and a 45,000-tpd processing rate. | |
| g) | Rounding may result in apparent discrepancies between tons, grade, and contained metal content |
ktonnes = kilotonnes
LHM = lithium hydroxide monohydrate
ppm = parts per million
| 11.12 | Qualified Person Statement |
The confidence classification of the mineral resource estimate has been classified as a Measured, Indicated and Inferred Mineral Resource.
The mineral resource estimate will be influenced by further exploration and infill drill drilling and may increase or decrease as the data dictates.
| 11.13 | Mineral Resource Uncertainty |
The economic viability of the TFLP is not necessarily demonstrated by the mineral resources estimate. The certainty that all or any part of the estimate can be converted into a viable economic plan cannot be guaranteed and depends heavily on key assumptions relevant for the conversion of mineral resources into mineral reserves. Uncertainty was decreased by the use of SGSim which was incorporated into the estimation and mineral resource classification.
As of the effective date of this PFS, Barr, and Dahrouge are not aware of any environmental, permitting, legal, title, taxation, socio-economic, marketing, or political factors that may materially affect the Tonopah Flats mineral resources and that are not otherwise discussed in this report. Barr and Dahrouge believe that any factors that would likely influence the prospect of economic extraction have either been addressed or could be resolved by further work.
| barr.com |
|
|
12 Mineral Reserves Estimates
| 12.1 | Approach |
A mineral reserve is the economically mineable part of a Measured and/or Indicated mineral resource and is defined by studies at a pre-feasibility or feasibility level that include the application of modifying factors. This PFS includes adequate information and considerations regarding mining, processing, metallurgical, infrastructure, economic, marketing, environmental, and other relevant factors that demonstrate at the time of reporting that economic extraction can be reasonably justified.
The QP is responsible for reviewing all mining factors and costs to verify that the mineral reserve estimates are correct. The estimation of mineral reserves is the basis of an economically viable project. Mineral reserves are inclusive of diluting material that will be mined in conjunction with the mineral reserves and delivered to the treatment plant or equivalent facility. The term “mineral reserve” need not necessarily signify that extraction facilities are in place, operative, or that all governmental approvals have been received. It does signify that there are reasonable expectations of such approvals.
Mineral reserves are subdivided in order of increasing confidence into Probable mineral reserves and Proven mineral reserves. The reserve classifications used in this report conform to the definitions and guidelines set forth in U.S. SEC Regulation S-K 1300. These classifications are listed below.
A Probable mineral reserve is the economically mineable part of an Indicated mineral resource, and in some circumstances, a Measured mineral resource. The confidence in the modifying factors applying to a Probable mineral reserve is lower than that applying to a Proven mineral reserve. The QPs may elect to convert Measured mineral resources to Probable mineral reserves if confidence in the modifying factors is lower than that applied to a Proven mineral reserve.
A Proven (or Proved) mineral reserve is the economically mineable part of a Measured mineral resource and can only result from conversion of a measured mineral resource. Application of the Proven mineral reserve category implies that the QPs have the highest degree of confidence in the estimate and the consequent expectation in the minds of the readers of the report. The term should be restricted to that part of the deposit where production planning is taking place and for which any variation in the estimate would not significantly affect the potential economic viability of the deposit.
To convert a mineral resource into a mineral reserve, estimates of commodity prices, mining dilution, process recovery, refining/transport costs, royalties, mining costs, processing, and general and administration costs were used to estimate COGs. These input parameters, along with geotechnical slope recommendations, formed the basis for the selection of economic mining blocks.
The economic mining blocks were identified using the Lerchs-Grossmann Pit Optimization Algorithm in the Maptek Vulcan software package, which produced a series of optimized open-pit shapes. The QP has selected one of these shapes for detailed design and quantified the mineral reserves at the determined COG within the final pit design.
The lithium resources at Tonopah Flats are not subject to royalty.
A conventional truck/shovel open-pit mining method was selected for the deposit. Mining costs used in the pit optimization were based on first principles build-ups using a preliminary production schedule as guidance.
| barr.com |
|
|
Processing and general and administrative (G&A) operating costs were developed for the treatment of mineralized material. The battery limits for determining the process operating costs commence from the sizing and crushing facilities and continue through to the surface stacking of tailings. G&A costs cover items such as site services, transportation, and camp costs. The operating costs are based on a refinery production rate of 30,000 tpa LHM.
A mill recovery of 48% was utilized for the pit optimization. This information was sourced from both historical and current test work performed by SGS at its Lakefield laboratory in 2020, 2021, 2023, and 2024.
| 12.2 | Design Pit Selection |
The pit shell that defines the ultimate pit limit was derived in Vulcan using the pit-optimization algorithm. The optimization procedure uses the block value and pit slopes to determine a group of blocks representing pits of valid slopes that yield the maximum profit. The block value is calculated using information stored in the geological block model, commodity prices, mining and processing costs, process recovery, and the sales pricing for the metals produced. The pit shell chosen for design was selected to limit mine life to approximately 40 years. Table 12-1 provides a summary of the primary optimization inputs and Table 12-2 provides the overall results.
| Table 12-1 | Primary Pit Optimization Parameters |
| Parameter | Value | Unit |
| Mining Cost | 2.70 | $/tonne |
| Process Cost | 10.70 | $/tonne processed |
| G&A | 0.90 | $/tonne processed |
| LHM Price | 22,000 | $/tonne |
| Recovery | 48 | percent |
| Li Content In LiOH | 0.165 | |
| Li Price | 133,333 | $/tonne |
| Minimum Li Grade | 300 | ppm |
| Overall Pit Slope | 33 | degree |
G&A = general and administrative
LHM = lithium hydroxide monohydrate
ppm = parts per million
| barr.com |
|
|
| Table 12-2 | Overall Results of the Tonopah Flats Open Pit Optimization |
| Pit | LHM Price | Total | Ore | Waste | SR | Li | Li | LHM | Rec LHM | NPV Best | NPV Lag | NPV Worst |
| (US$/t) | (Mt) | (Mt) | (Mt) | w:o | (ppm) | (ktonnes) | (ktonnes) | (ktonnes) | (US$M) | (US$M) | (US$M) | |
| 1 | 6,000 | 254 | 217 | 37 | 0.17 | 869 | 189 | 1,144 | 549 | $3,996 | $3,996 | $3,996 |
| 2 | 6,200 | 335 | 288 | 47 | 0.16 | 861 | 248 | 1,503 | 722 | $4,507 | $4,487 | $4,415 |
| 3 | 6,400 | 386 | 332 | 54 | 0.16 | 855 | 284 | 1,720 | 825 | $4,722 | $4,698 | $4,566 |
| 4 | 6,600 | 451 | 386 | 65 | 0.17 | 848 | 328 | 1,987 | 954 | $4,914 | $4,888 | $4,688 |
| 5 | 6,800 | 516 | 439 | 77 | 0.18 | 842 | 370 | 2,240 | 1,075 | $5,047 | $5,020 | $4,752 |
| 6 | 7,000 | 602 | 511 | 91 | 0.18 | 830 | 425 | 2,574 | 1,236 | $5,165 | $5,136 | $4,787 |
| 7 | 7,200 | 656 | 552 | 104 | 0.19 | 827 | 457 | 2,767 | 1,328 | $5,215 | $5,186 | $4,776 |
| 8 | 7,400 | 913 | 744 | 169 | 0.23 | 811 | 603 | 3,657 | 1,755 | $5,335 | $5,301 | $4,575 |
| 9 | 7,600 | 960 | 782 | 178 | 0.23 | 806 | 630 | 3,821 | 1,834 | $5,346 | $5,311 | $4,540 |
| 10 | 7,800 | 987 | 804 | 183 | 0.23 | 803 | 645 | 3,911 | 1,877 | $5,351 | $5,316 | $4,534 |
| 11 | 8,000 | 1,234 | 1,000 | 234 | 0.23 | 778 | 778 | 4,715 | 2,263 | $5,376 | $5,341 | $4,459 |
| 12 | 8,500 | 1,269 | 1,025 | 244 | 0.24 | 776 | 795 | 4,817 | 2,312 | $5,377 | $5,342 | $4,448 |
| 13 | 9,000 | 1,299 | 1,041 | 257 | 0.25 | 775 | 807 | 4,891 | 2,348 | $5,378 | $5,343 | $4,436 |
| 14 | 9,500 | 1,332 | 1,058 | 274 | 0.26 | 775 | 819 | 4,966 | 2,384 | $5,379 | $5,344 | $4,425 |
| 15 | 10,000 | 1,372 | 1,075 | 297 | 0.28 | 774 | 833 | 5,047 | 2,422 | $5,380 | $5,345 | $4,411 |
| 16 | 11,000 | 1,396 | 1,085 | 311 | 0.29 | 774 | 840 | 5,091 | 2,443 | $5,380 | $5,345 | $4,401 |
| 17 | 12,000 | 1,415 | 1,092 | 324 | 0.30 | 774 | 845 | 5,121 | 2,458 | $5,381 | $5,345 | $4,394 |
| 18 | 13,000 | 1,432 | 1,097 | 335 | 0.31 | 774 | 849 | 5,145 | 2,470 | $5,381 | $5,346 | $4,388 |
| 19 | 14,000 | 1,444 | 1,100 | 343 | 0.31 | 774 | 851 | 5,160 | 2,477 | $5,381 | $5,346 | $4,383 |
| 20 | 15,000 | 1,454 | 1,103 | 351 | 0.32 | 774 | 853 | 5,172 | 2,483 | $5,381 | $5,346 | $4,379 |
| 21 | 16,000 | 1,472 | 1,107 | 364 | 0.33 | 774 | 857 | 5,192 | 2,492 | $5,381 | $5,346 | $4,372 |
| 22 | 18,000 | 1,490 | 1,112 | 379 | 0.34 | 773 | 860 | 5,210 | 2,501 | $5,381 | $5,346 | $4,364 |
| 23 | 20,000 | 1,505 | 1,114 | 391 | 0.35 | 773 | 862 | 5,222 | 2,507 | $5,381 | $5,346 | $4,359 |
| 24 | 22,000 | 1,505 | 1,114 | 391 | 0.35 | 773 | 862 | 5,222 | 2,507 | $5,381 | $5,346 | $4,359 |
Best = NPV outcome calculated under the most optimistic set of assumptions
ktonne = kilotonne
Lag = delay between when project costs are incurred and when cash inflows are realized
LHM = lithium hydroxide monohydrate
Mt = million tonnes
NPV = net present value
ppm = parts per million
Rec = recovery
SR = stripping ratio
t = tonne
US$M = USD in millions
Worst = NPV outcome calculated under the most conservative set of assumptions
| barr.com |
|
|

| Figure 12-1 | Tonopah Flats Open Pit Optimization - Overall Pit Shell Results |
| 12.3 | Open-Pit Design |
The selected optimized pit shell was converted into a detailed open-pit mine design that formed the basis of the mineral reserve estimate and production schedule. The pit wall slope angles, bench heights, and access ramp parameters are discussed in further detail below. The final pit design, located approximately 11 km west of Tonopah, Nevada, is approximately 1,900 m long with a maximum elevation of 1,625 m above mean sea level (AMSL) and a pit bottom elevation of 1,380 m AMSL. Ramp access varies through the mine life and progression of the back-fill plan. The final pit design is shown in Figure 12-2. Measured and Indicated resources above the economic COG of 300 ppm Li are shown relative to the final pit design in Figure 12-3, Figure 12-4, and Figure 12-5.
| barr.com |
|
|

| Figure 12-2 | Final Pit Design |
| barr.com |
|
|

| Figure 12-3 | Measured and Indicated Resources Relative to the Final Pit Design |

| Figure 12-4 | E470300 Cross Section of the Final Pit Showing Measured and Indicated Resources (Li ppm) |
| barr.com |
|
|

| Figure 12-5 | N4215200 Cross Section of the Final Pit Showing Measured and Indicated Resources (Li ppm) |
| 12.4 | Mining Dilution and Ore Loss |
The mineral resources and reserves were reported undiluted, as the strip ratio is very low and the deposit shows little variability at the 300 ppm COG. No additional tonnage adjustment was necessary.
| 12.5 | Mineral Reserve Estimate |
A summary of the mineral reserves for the project is shown in Table 12-3 within the designed final pit for the Tonopah Flats deposit. In the detailed mine production schedule, the COG has been held constant at 300 ppm Li. Any resources below the COG have been wasted. The effective date of the mineral reserve stated in this report is 15 March 2025. The QPs have not identified any known legal, political, environmental, or other risks that would materially affect the potential development of the mineral reserves, except for the risk of not being able to secure the necessary permits from the government for the development and operation of the project; however, the QPs are not aware of any unique characteristics of the project that would prevent permitting.
| Table 12-3 | Tonopah Flats Mineral Reserves Estimate as of PFS Date |
| Classification | Tonnes (ktonnes) |
Grade
Li (ppm) |
Contained
Li (ktonnes) |
LHM
Equivalent Mined (ktonnes) |
| Proven | 175,515 | 920 | 161 | 979 |
| Probable | 384,333 | 753 | 289 | 1,754 |
| Total Proven and Probable | 559,848 | 805 | 451 | 2,733 |
ktonnes = kilotonnes
LHM = lithium hydroxide monohydrate
ppm = parts per million
| barr.com |
|
|
13 Mining Methods
The TFLP will be mined using conventional open-pit mining techniques, including drilling, blasting, loading, and hauling. Due to the relatively soft nature of the host rock, drilling and blasting is expected to be minimal, accounting for approximately 5% of the clay material. Overlying alluvium will be stripped and stockpiled for future use in site reclamation activities. The mine production rate has been optimized to support the refinery’s production goal of 30,000 tpa of LHM, resulting in an average ore feed rate of approximately 12.4 Mtpa.
The mine, waste dump, and backfill dump and stockpile designs have been developed in accordance with geotechnical guidelines. Both ore and waste materials will be mined in 10 m high benches using hydraulic shovels and front-end loaders. A fleet of 141-tonne haul trucks will transport the excavated materials to either the ROM stockpile or designated dumps. In alignment with the mine plan, the loading units and haul trucks will also be used to transport dry-stack tailings and coarse gangues from the refinery and the beneficiation circuits to the designated backfill dumps. In addition, the mine will conduct various mine and site development activities that are essential for the success of this project.
The mine is scheduled to operate continuously, 24 hours a day, 365 days per year, utilizing three rotating crews working two 12-hour shifts daily. This operating schedule accounts for non-productive time related to employee breaks, weather delays, blasting activities, equipment downtimes, etc.
Comprehensive details regarding mine designs and mining methods are discussed in this chapter. Mining cost estimates and economic analysis are addressed separately in chapters 18 and 19, respectively.
| 13.1 | Economic Parameters and Cut-Off Grades |
The economic parameters used for mine design and production schedules in this PFS have been developed between ABTC and Barr. Table 13-1 presents the economic parameters used for mining, processing and general and administrative (G&A) costs. Mining costs assume contractor pre-stripping moving to owner-operator mining activities as the project has a significantly long mine life. Processing costs were provided by ABTC and Woods. G&A costs were based on a fixed cost of US$ 4.5 million per year for site management, environmental, general site maintenance, insurance, human resources, and other administrative costs. There are no royalties associated with the Tonopah Flats property.
Due to a highway running through the middle of the deposit, a constraint around the highway and the power line was used with a 200-m right-of-way (ROW). This ROW divided the deposit evenly into north and south portions (North Pit and South Pit) used for the resource pits. Only the South Pit was included in the mine life and pit designs of this PFS.
| barr.com |
|
|
| Table 13-1 | Economic Parameters for Calculation of the Cut-Off Grade |
| Parameter | Value | Units |
| Mining Cost | 2.70 | $/tonne |
| Process Cost | 10.70 | $/tonne processed |
| G&A | 0.90 | $/tonne processed |
| LHM Price | 22,000 | $/tonne |
| Recovery | 48 | percent |
| Li Content in LiOH | 0.165 | |
| Li Price | 133,333 | $/tonne |
| Minimum Li Grade | 300 | ppm |
G&A = general and administrative
LHM = lithium hydroxide monohydrate
ppm = parts per million
COGs were used to distinguish material that would be processed from waste material. A COG of 94 ppm Li is calculated when using the inputs in Table 13-1. However, an elevated COG of 300 ppm Li was used to determine in-pit material to be processed. This elevated COG advances the processing of higher-grade material and improves the project economics.
| 13.2 | Pit Optimization |
Production constraints were considered when specifying mine parameters for pit optimization and subsequent pit design and production scheduling. Pit optimizations for the TFLP used a Vulcan pit-optimization algorithm to create three-dimensional pit shells. The metal selling price used for this analysis is US$22,000/t of LHM. Pit optimizations were generated using ranges of LHM prices from US$6,000/t to US$22,000/t. Only Measured and Indicated material above the elevated COG was allowed to be processed for the optimization. The pit optimization results at various prices are shown in Table 12-2 in Chapter 12.
| 13.3 | Road and Ramp Design |
Detailed roads and ramp designs were not created for this study since the roads will be dynamic and move during the life of mine, but conceptual haul routes were used to develop haulage profiles and estimate truck requirements.
The ramps that will be utilized for production will be designed for the use of 150-t haul trucks with an operating width of 7.5 m. For two-way access, the goal of road design is to allow a running width of nearly 3.5 times the width of the trucks. Mine Safety and Health Administration (MSHA) regulations specify that safety berms are to be maintained at least the axle height of the haul trucks that will travel on the roads. The axle height of the 150-t truck is approximately 1.5 m. An extra 10% was added to the berm height design to ensure that all berms are sufficient in height, resulting in a total berm height of 1.7 m.
Safety berms assume a slope of 1.5 horizontal to 1.0 vertical. Considering that ramps in the pit only require one berm, the design road width of 30 m was determined for two-way traffic. Haul roads grades will be designed at a maximum of 10%.
| barr.com |
|
|
| 13.4 | Open Pit Design |
Barr reviewed the previous geotechnical information, which was limited to the RQD measurements from eight boreholes within the 2023 exploration core drilling program. From this information, in addition to the project’s geologic setting, the 2025 geotechnical field and laboratory testing programs were carried out to build and/or update the structural, geotechnical, and hydrogeologic models to support the PFS. The 2025 field program was based on the permitted and accessible locations at the time of this study.
Detailed engineering analyses were completed using information collected from the 2025 work to update the open-pit design recommendations for the TFLP PFS.
| 13.4.1 | Open Pit Geotechnical Considerations |
| 13.4.1.1 | Geology and Structure |
The Tonopah Flats property, including the proposed open pit, is located in a broad alluvial basin of subdued topography between the San Antonio Mountains to the east and the Monte Cristo Mountains to the west, approximately 11 km northwest of the town of Tonopah, Nevada. Quaternary alluvial fan and pediment sedimentary deposits cover most of the property and are generally composed of silt, sand, and gravel from the nearby mountains. The alluvial cover has an average thickness of less than 15 m from east of the fault over much of the property. It also overlies a thick sequence of fluvial and lacustrine epiclastic claystone, volcanic conglomerate, sandstone, siltstone, and tuff of the Miocene age Siebert Formation. The overall sedimentary package within the project area is flat lying to gently dipping.
The project area is along the eastern margin of the Walker Lane tectonic belt, an approximately 15-m-wide, northwest-trending zone in western Nevada and eastern California (Stewart, 1988). Prominent northwest-trending strike-slip faults and related north- to northeast-trending normal faults characterize much of the Walker Lane tectonic belt and accommodate part of the motion between the Pacific plate and the North American plate. The belt separates the Sierra Nevada and the Basin and Range physiographic provinces.
| 13.4.1.2 | Open Pit Subsurface Investigations |
Barr was contracted to oversee a geotechnical field investigation in support of an S-K 1300-compliant PFS for the open pit at the project site. The investigation consisted of three geotechnical borings along the east side of the south lobe of the open pit as per the project priorities and available permitted locations for drilling in early 2025.
The three borings were performed by advancing an HQ-size (85.7 mm [3 3/8 inch]) diamond core drill bit. The drill rig was operated by True North Drilling, based out of Gilbert, Arizona, on a 24/7 continuous basis. Continuous wireline coring was carried out with core runs ranging from 3 dm to 3 m. The boring locations are provided in Figure 13-1. The coordinates, azimuth, inclination, and completed total drill depth for the borings are presented in Table 13-2.
| barr.com |
|
|
| Table 13-2 | Geotechnical Borings Drilled for South Lobe of the Open Pit |
| Borehole | Easting 1 | Northing 1 | Ground Surface Elevation (m) | Target Inclined Depth 2 | Azimuth (degree) | Plunge (degree) | |
| (m) | (ft) | ||||||
| TF25-GT1 | 470348 | 4214322 | 1,613 | 300 | 985.0 | 190 | 80 |
| TF25-GT2 | 470762 | 4214689 | 1,605 | 275 | 893.5 | 95 | 60 |
| TF25-GT3 | 470784 | 4215492 | 1,600 | 250 | 820.0 | 80 | 60 |
1 Coordinates and datum are NAD83 UTM Zone 11, in meters.
2 Borehole target inclined depths and orientations were adjusted by ABTC for exploration purposes that are still aligned with geotechnical purposes.
ft = feet
m = meter

| Figure 13-1 | Open Pit Geotechnical Boring Locations |
| barr.com |
|
|
The subsurface geology identified and described by ABTC geologists during the geotechnical drilling program generally coincided with the expected geology from the existing subsurface model provided to Barr by ABTC. Notable lithology present in the borings included alluvium, claystone, sandstone, and tuff. A summary description of lithology is provided below.
| ● | Alluvial sediments were present to an inclined depth of 13.25 m in hole TF25-GT2. They were present to inclined depths of 1.8 m and 5.0 m in holes TF25-GT1 and TF25-GT3, respectively. |
| ● | Claystone was the thickest lithologic unit encountered at all three locations, as expected. The upper marker that separates the upper claystone unit from the mid claystone unit was noted at inclined depths of about 207.8 m, 219.4 m, and 115.2 m in holes TF25-GT1, TF25-GT2, and TF25-GT3, respectively. The lower marker that separates the mid claystone unit from the lower claystone unit was noted at about 288 m and 214.3 m in holes TF25-GT1 and TF25-GT3, respectively. |
| ● | Sandstone layers exhibiting thicknesses from 7.6 dm to 3 m were interbedded at multiple depths within the claystone units in all three borings. |
The drillers did not observe groundwater during drilling.
Televiewer surveys were performed by IDS, who was contracted directly by ABTC, immediately after the completion of drilling. The work was carried out in boreholes TF25-GT1 and TF25-GT3 to measure the true orientation of rock mass features such as bedding, joints, and faults. The surveys were carried out using optical borehole imagers (OBI) and acoustic borehole imagers (ABI). A total of 2,869 structures, including sealed (Type 0), partial open (Type 1), and continuous open (Type 2) structures from two boreholes, were picked by IDS on downhole images, and the pole plot by structure type is presented on the stereonet in Figure 13-2.
Figure 13-3 illustrates the density concentrations of picked structures (i.e., joints) other than Type 0 (i.e., bedding) without showing the poles, and the dip and dip direction values of mean sets, which was determined from the set boundaries drawn using the density concentration contours having concentrations greater than approximately 4% and 7% for TF25-GT1 and TF25-GT3, respectively.
| barr.com |
|
|

| Figure 13-2 | Poles of Features Picked by IDS as Sealed (Type 0), Partial Open (Type 1), and Continuous Open (Type 2) Structures from TF25-GT1 and TF25-GT3 |

| Figure 13-3 | Density Concentrations and Mean Set Planes for Structures Picked by IDS As Type 1 and Type 2 (i.e., Potentially Structures Other Than Bedding Planes) |
| barr.com |
|
|
| 13.4.1.3 | Laboratory Testing |
Barr selected core samples for laboratory testing to focus on soil characterization, strength of intact rock, and strength of and rock discontinuities, including faults, joints, and bedding. Barr prepared a laboratory testing program that included rock samples for unconfined compressive strength (ASTM D7012 Method C), Brazilian indirect tensile strength (ASTM D3967), triaxial compressive strength (ASTM D7012 Method A), and direct shear strength (ASTM D5607) on natural discontinuities with sampling depths determined primarily based on rock type and relevant structures. For claystone rock cores comprising fine-grained materials, unconsolidated-undrained (UU) triaxial compression (D2850), consolidated-undrained (CU) triaxial compression (ASTM D4767), and Atterberg limits (ASTM D4318) were performed. This was to characterize the fully softened shear strength and possibly the residual shear strength, which could be relevant shear strengths for excavations such as open pits in these materials. The complete test results are provided in Barr’s report (Greenwood & Sopaci, 2025).
The Atterberg limits results are summarized in Table 13-3. The liquid limit ranged from 55 to 101, with an average of 70, while the plasticity index ranged from 31 to 77, with an average of 45. All samples were classified as high-plasticity clay (CH) based on their index properties.
| Table 13-3 | Atterberg Limits Summary |
| Hole ID | Inclined Depth | Lithology | Liquid Limit | Plastic Limit | Plasticity Index | USCS Classification | |
| (m) | (ft) | ||||||
| TF25-GT1 | 125 | 410 | Claystone | 101 | 24 | 77 | CH |
| TF25-GT1 | 140 | 459 | Claystone | 65 | 23 | 42 | CH |
| TF25-GT1 | 151 | 495 | Claystone | 55 | 23 | 32 | CH |
| TF25-GT1 | 201 | 659 | Claystone | 64 | 33 | 31 | CH |
| TF25-GT2 | 107 | 351 | Claystone | 87 | 23 | 64 | CH |
| TF25-GT2 | 144 | 472 | Claystone | 55 | 22 | 33 | CH |
| TF25-GT2 | 208 | 682 | Claystone | 70 | 23 | 47 | CH |
| TF25-GT2 | 241 | 791 | Claystone | 65 | 20 | 45 | CH |
| TF25-GT3 | 50 | 164 | Claystone | 58 | 21 | 37 | CH |
| TF25-GT3 | 73 | 240 | Claystone | 71 | 30 | 41 | CH |
| TF25-GT3 | 111 | 364 | Claystone | 74 | 27 | 47 | CH |
| TF25-GT3 | 138 | 453 | Claystone | 69 | 20 | 49 | CH |
| Average | 70 | 24 | 45 | ||||
CH = high-plasticity clay
ft = feet
ID = identification
m = meter
USCS = Unified Soil Classification System
The results and summary of the uniaxial compressive strength tests are provided in Table 13-4 and Table 13-5, and the splitting tensile strength test results and summary are provided in Table 13-6 and Table 13-7. The triaxial compression test results for Crystal-Lithic Tuff are provided in Table 13-8.
| barr.com |
|
|
| Table 13-4 | Results of Uniaxial Compressive Strength Tests |
| Hole ID | Inclined Depth Range | Lithology | UCS | ||
| (m) | (ft) | (kPa) | (psi) | ||
| TF25-GT1 | 110.58 –110.73 | 362.8 – 363.3 | Claystone | 2,020 | 293 |
| TF25-GT1 | 142.98 – 143.10 | 469.1 – 469.5 | Claystone | 2,730 | 396 |
| TF25-GT1 | 161.57 – 161.69 | 530.1 – 530.5 | Claystone | 4,378 | 635 |
| TF25-GT1 | 222.38 – 222.50 | 729.6 – 730.0 | Claystone | 7,012 | 1,017 |
| TF25-GT1 | 237.28 – 237.43 | 778.5 – 779.0 | Claystone | 4,888 | 709 |
| TF25-GT2 | 29.62 – 29.77 | 97.2 – 97.7 | Claystone | 193 | 28 |
| TF25-GT2 | 51.02 – 51.17 | 167.4 – 167.9 | Claystone | 3,951 | 573 |
| TF25-GT2 | 82.38 – 82.53 | 270.3 – 270.8 | Claystone | 1,392 | 202 |
| TF25-GT2 | 96.37 – 96.53 | 316.2 – 316.7 | Claystone | 2,613 | 379 |
| TF25-GT2 | 115.85 – 115.97 | 380.1 – 380.5 | Claystone | 586 | 85 |
| TF25-GT2 | 258.92 – 259.08 | 849.5 – 850.0 | Claystone | 5,640 | 818 |
| TF25-GT2 | 220.30 – 220.43 | 722.8 – 723.2 | Tuffaceous Sandstone | 2,758 | 400 |
| TF25-GT3 | 131.73 – 131.85 | 432.2 – 432.6 | Claystone | 4,716 | 684 |
| TF25-GT3 | 142.28 – 142.40 | 466.8 – 467.2 | Claystone | 3,303 | 479 |
| TF25-GT3 | 155.81 – 155.96 | 511.2 – 511.7 | Claystone | 3,613 | 524 |
| TF25-GT3 | 175.74 – 175.90 | 576.6 – 577.1 | Claystone | 4,233 | 614 |
| TF25-GT3 | 219.39 – 219.51 | 719.8 – 720.2 | Crystal-Lithic Tuff | 8,081 | 1,172 |
ft = feet
ID = identification
kPa = kilopascals
m = meter
psi = pounds per square inch
UCS = Uniaxial compressive strength
| Table 13-5 | Summary of Uniaxial Compressive Strength Tests |
| Lithology | Number of Samples Tested | Minimum UCS | Average UCS | Maximum UCS | |||
| (kPa) | (psi) | (kPa) | (psi) | (kPa) | (psi) | ||
| Claystone | 16 | 193 | 28 | 3,330 | 483 | 7,012 | 1,017 |
| Tuffaceous Sandstone | 1 | 2,758 | 400 | 2,758 | 400 | 2,758 | 400 |
| Crystal-Lithic Tuff | 1 | 8,081 | 1,172 | 8,081 | 1,172 | 8,081 | 1,172 |
kPa = kilopascals
psi = pounds per square inch
UCS = Uniaxial compressive strength
| barr.com |
|
|
| Table 13-6 | Results of Splitting Tensile Strength Tests |
| Hole ID | Inclined Depth Range | Lithology | Splitting Tensile Strength | ||
| (m) | (ft) | (kPa) | (psi) | ||
| TF25-GT1 | 80.49-80.52 | 264.1-264.2 | Claystone | 228 | 33 |
| TF25-GT1 | 107.04-107.7 | 351.2-351.3 | Claystone | 145 | 21 |
| TF25-GT1 | 119.48-119.51 | 392.0-392.1 | Claystone | 317 | 46 |
| TF25-GT1 | 166.66-166.69 | 546.8-546.9 | Claystone | 317 | 46 |
| TF25-GT1 | 185.34-185.37 | 608.1-608.2 | Claystone | 600 | 87 |
| TF25-GT1 | 228.32-288.35 | 749.1-749.2 | Claystone | 565 | 82 |
| TF25-GT2 | 42.51-42.55 | 139.5-139.6 | Claystone | 228 | 33 |
| TF25-GT2 | 69.70-69.73 | 228.7-228.8 | Claystone | 296 | 43 |
| TF25-GT2 | 90.09-90.12 | 295.6-295.7 | Claystone | 186 | 27 |
| TF25-GT2 | 125.82-125.85 | 412.8-412.9 | Claystone | 228 | 33 |
| TF25-GT2 | 154.22-154.25 | 506.0-506.1 | Claystone | 331 | 48 |
| TF25-GT2 | 183.09-183.12 | 600.7-600.8 | Claystone | 510 | 74 |
| TF25-GT2 | 221.34-221.37 | 726.2-726.3 | Claystone | 427 | 62 |
| TF25-GT2 | 232.04-232.04 | 761.3-761.3 | Claystone | 331 | 48 |
| TF25-GT3 | 83.14-83.17 | 272.8-272.9 | Claystone | 469 | 68 |
| TF25-GT3 | 95.70-95.73 | 314.0-314.1 | Claystone | 228 | 33 |
| TF25-GT3 | 149.99-150.02 | 492.1-492.2 | Claystone | 490 | 71 |
| TF25-GT3 | 188.82-188.85 | 619.5-619.6 | Claystone | 338 | 49 |
| TF25-GT3 | 227.90-227.93 | 747.7-747.8 | Claystone | 552 | 80 |
| TF25-GT3 | 249.63-249.66 | 819.0-819.1 | Claystone | 565 | 82 |
ft = feet
ID = identification
kPa - kilopascals
m = meter
psi = pounds per square inch
| Table 13-7 | Summary of Splitting Tensile Strength Tests |
| Lithology | Number of Samples Tested | Minimum Splitting Tensile Strength | Average Splitting Tensile Strength | Maximum Splitting Tensile Strength | |||
| (kPa) | (psi) | (kPa) | (psi) | (kPa) | (psi) | ||
| Claystone | 20 | 144.8 | 21 | 365.4 | 53 | 599.8 | 87 |
kPa - kilopascals
psi = pounds per square inch
| barr.com |
|
|
| Table 13-8 | Summary of Triaxial Compressive Strength Tests |
| Hole ID | Inclined Depth Range | Lithology | Confining Pressure (kPa) | Deviator Stress (σd) at Failure | Failure Type | ||
| (m) | (ft) | (kPa) | (psi) | ||||
| TF25-GT3 | 217.93-218.21 | 715-715.9 | Crystal-Lithic Tuff | 2,000 | 13,000 | 1,940 | Fracture / Bedding |
ft = feet
ID = identification
kPa - kilopascals
m = meter
psi = pounds per square inch
The shear strength of rock discontinuities was evaluated by the direct shear test following ASTM D5607. The results of the direct shear strength tests are provided in Table 13-9.
| Table 13-9 | Results of Direct Shear Strength Tests |
| Hole ID | Inclined Depth | Lithology | Peak | Post-Peak | |||||
| (m) | (ft) | Friction Angle (degree) | Cohesion | Friction Angle (degree) | Cohesion | ||||
| (kPa) | (psi) | (kPa) | (psi) | ||||||
| TF25-GT1 | 172 | 565 | Claystone | 38 | 0 | 0 | 37 | 0 | 0 |
| TF25-GT2 | 103 | 337 | Claystone & Sandstone | 17 | 310.3 | 45 | 16 | 248.2 | 36 |
| TF25-GT2 | 236 | 774 | Claystone | 19 | 310.3 | 45 | 23 | 0 | 0 |
| TF25-GT2 | 235 | 771 | Claystone | 30 | 131.0 | 19 | 30 | 0 | 0 |
| TF25-GT2 | 156 | 511 | Claystone | 25 | 158.6 | 23 | 27 | 62.1 | 9 |
| TF25-GT3 | 216 | 709 | Claystone | 28 | 337.8 | 49 | 31 | 62.1 | 9 |
| TF25-GT3 | 215 | 707 | Claystone | 30 | 448.2 | 65 | 30 | 337.8 | 49 |
| TF25-GT3 | 66 | 216 | Tuffaceous Claystone | 42 | 75.8 | 11 | 40 | 82.7 | 12 |
| TF25-GT3 | 79 | 259 | Sandstone | 27 | 441.3 | 64 | 38 | 62.1 | 9 |
ft = feet
ID = identification
kPa - kilopascals
m = meter
psi = pounds per square inch
The UU triaxial compression tests on rock samples followed ASTM D2850. The results of those tests are provided in Table 13-10.
| barr.com |
|
|
| Table 13-10 | Summary of Unconsolidated-Undrained Triaxial Compression Test |
| Hole ID | Inclined Depth | Lithology | Confining Pressure | Deviator Stress (σd) at Failure | Undrained Shear Strength | ||||
| (m) | (ft) | σ3 (kPa) | σ3 (psi) | σ1-σ3 (kPa) | σ1-σ3 (psi) | q
(kPa) (σ1-σ3)/2 |
q
(psi) (σ1-σ3)/2 |
||
| TF25-GT3 | 50 | 164 | Claystone | 108.2 | 15.7 | 3,093.7 | 448.7 | 1,547.2 | 224.4 |
| TF25-GT3 | 73 | 240 | Claystone | 108.2 | 15.7 | 3,177.6 | 460.8 | 1,588.6 | 230.4 |
| TF25-GT2 | 107 | 351 | Claystone | 108.2 | 15.7 | 2,511.1 | 364.2 | 1,255.5 | 182.1 |
| TF25-GT3 | 111 | 364 | Claystone | 215.1 | 31.2 | 2,553.8 | 370.4 | 1,276.9 | 185.2 |
| TF25-GT3 | 138 | 453 | Claystone | 215.1 | 31.2 | 3,335.7 | 483.8 | 1,667.8 | 241.9 |
| TF25-GT2 | 144 | 472 | Claystone | 526.8 | 76.4 | 4,800.8 | 696.3 | 1,711.3 | 348.2 |
| TF25-GT1 | 260 | 853 | Claystone | 526.8 | 76.4 | 7,518.0 | 1,090.4 | 3,759.0 | 545.2 |
| TF25-GT2 | 208 | 682 | Claystone | 1,052.8 | 152.7 | 3,141.3 | 455.6 | 1,570.6 | 227.8 |
| TF25-GT3 | 241 | 791 | Claystone | 1,052.8 | 152.7 | 5,413.1 | 785.1 | 2,706.2 | 392.5 |
ft = feet
ID = identification
kPa - kilopascals
m = meter
psi = pounds per square inch
The CU triaxial compression tests, with pore pressure measurements, on rock samples followed ASTM D4767. The results of the tests are provided in Table 13-11.
| Table 13-11 | Results of Consolidated-Undrained Triaxial Compression Tests |
| Hole ID | Inclined Depth | Lithology | Consolidation Stress | Deviator Stress (σd) at Failure | Mean Effective Stress at Failure | Shear Strength | |||||
| (m) | (ft) | σ’3c (kPa) | σ’3c (psi) | σ’1-σ’3 (kPa) | σ’1-σ’3 (psi) | p'
(kPa) (σ'1+σ'3)/2 |
p'
(psi) (σ'1+σ'3)/2 |
q
(kPa) (σ'1-σ'3)/2 |
q
(psi) (σ'1-σ'3)/2 |
||
| TF25-GT3 | 125 | 410 | Claystone | 1,482.4 | 215 | 6,556.9 | 951 | 550.2 | 79.8 | 475.0 | 68.9 |
| TF25-GT3 | 140 | 459 | Claystone | 3,633.5 | 527 | 23,021.6 | 3,339 | 1,949.8 | 282.8 | 1,700.2 | 246.6 |
| TF25-GT2 | 200 | 656 | Claystone | 5,281.4 | 766 | 39,369.1 | 5,710 | 3,099.9 | 449.6 | 1,658.9 | 420.6 |
ft = feet
ID = identification
kPa - kilopascals
m = meter
psi = pounds per square inch
| 13.4.2 | Rock and Soils Strength Assessment |
Claystone was the primary lithologic unit encountered at all three borehole locations, as expected. From a geotechnical perspective, claystone was generally described as weak sedimentary rocks that represent a stage in the transition from soil to rock based on the degree of induration. It was generally distinctively bedded.
To account for potentially varying strength and behavior of the claystone due to effects such as stress relaxation from excavation and/or softening as a result of opened fissures with an accompanying increase in water content, the fully softened strength (FSS) envelope was assessed for the intact rock and along the bedding.
| barr.com |
|
|
The shear strength of claystones and discontinuities (i.e., bedding planes) were assessed using the shear strength test results presented in Figure 13-4.

| Figure 13-4 | Shear Strength Data from Laboratory Testing |
| 13.4.3 | Stability Analysis |
The acceptable factor of safety (FOS) and probability of failure (POF) for the planned TFLP open pit varies depending on the pit slope component and the likely consequences of failure. Based upon current plans, there is no major infrastructure set to be constructed proximally to any pit walls. If this were to change, it would be necessary to examine the selected acceptance criteria. Table 13-12 presents the selected acceptance criteria in bold for the TFLP pit slope design.
| barr.com |
|
|
| Table 13-12 | Typical FOS and POF Acceptance Criteria Values (Read & Stacey, 2009) |
| Slope Scale | Consequences of Failure | Factor of Safety (Min) (Static) | Factor of Safety (Min) (Dynamic) | Probability of Failure (Max) P(FOS≤1) |
| Bench | Low-High | 1.1 | NA | 25-50% |
| Inter-Ramp | Low | 1.15-1.2 | 1.0 | 25% |
| Moderate | 1.2 | 1.0 | 20% | |
| High | 1.2-1.3 | 1.1 | 10% | |
| Overall | Low | 1.2-1.3 | 1.0 | 15-20% |
| Moderate | 1.3 | 1.05 | 10% | |
| High | 1.3-1.5 | 1.1 | 5% |
FOS = factor of safety
Max = maximum
Min = minimum
The pit slope design recommendations presented in the next section were supported by the following slope stability analyses.
| ● | Kinematic analysis of rock slopes to evaluate the potential for development of bench-scale and inter-ramp-scale planar and wedge failures. |
| ● | Two-dimensional limit equilibrium analysis of pit slopes to evaluate the potential for the development of deep-seated pit slope instability, including the phreatic surface estimated at 189 m below existing ground surface based on available data obtained from exploration drilling records within the pit shell (M. Dusenbury, personal communication, April 10, 2025). |
Bench-face and inter-ramp scale kinematic stability was evaluated by reviewing the stereonets, including dip and dip-direction of logged geologic structures, such as bedding and joints from the televiewer data. The most significant geologic structure controlling the pit slope angles along the east side of the south lobe of the open pit is horizontal bedding planes. Analysis results indicated a POF less than the design acceptance criteria for bench, inter-ramp, and overall slope scales.
The two-dimensional limit equilibrium analyses of rock slopes at inter-ramp and overall slope scales along the east side of the south lobe of the open pit were performed using the SEEP/W and SLOPE/W modules within the GeoStudio 2024 software suite. To estimate groundwater pressures and evaluate their impact on pit slope stability, finite-element seepage analyses were performed for two cross-sections using hydraulic conductivity values typical for claystone from the literature and the groundwater table at 189 m below existing ground surface. Additionally, to assess the effect of fully saturated conditions on rock mass strength, an anisotropic rock mass strength model was used, which assigned different shear strengths depending on the location of the slip surface passing through the rock mass with the estimated groundwater table. Results of the analysis indicated a FOS greater than the minimum FOS criteria (Table 13-12) for both the static (non-earthquake) and pseudo-static (dynamic or earthquake) analysis scenarios. In other words, the pit slope configuration provided in Table 13-13 meets the minimum FOS regarding slope stability for both cases.
| barr.com |
|
|
| 13.4.4 | Open-Pit Slope Design Recommendations |
The slope recommendations for use in the PFS pit design for the TFLP are given in Table 13-13 below. The stability assessment of the pit slopes first started with the overall highwall (formed by claystone) stability checks, and then the bench configuration was fitted to the overall and/or inter-ramp-scale slopes by using currently available geotechnical and hydrogeological information via a 2D limit equilibrium analysis and rockfall analysis. This was based on an overall slope maximum vertical height of 240 m. The alluvium is thin and not yet well characterized, so it did not enter into the analysis at this stage. It was noted by others that there will not be any groundwater shallower than 189 m below existing ground surface in the proposed pit area (M. Dusenbury, personal communication, April 10, 2025). No mining facility (e.g., waste dump, refinery, tailings, etc.) near the pit crest would create a surcharge/loading for the highwalls or infrastructure, such as US 6/95, was included in the analysis. It was not needed to have separate slope sectors within the proposed pit shape as there were no major rock structures or geotechnically different materials identified to impact the stability of highwalls.
| Table 13-13 | Recommended Open-Pit Design Slope Configuration |
| Parameter | Recommendation | Notes |
| Bench Height (m) | 20 | Stacking of two 10-m-high bench slopes (i.e., double-benching). |
| Bench Face Angle (degrees) | 45 | Slopes in claystone. Alluvial sediments above claystone were present to an inclined maximum depth of 13.3 m in drilled boreholes and were not separately analyzed for slope stability. |
| Bench Width (m) | 9.65 | Providing containment of approximately 85% of rockfall from the bench face that is performed in the rockfall analysis. |
| Inter-Ramp Angle (degrees) | 34 | This is for a sequence of benches separated by a haul road or a geotechnical ramp. |
| Ramp Width (m) | 30 | This is the same as an approximate road width for two-way traffic. |
| Typical Max. Slope Height Without a Ramp (m) | 120 | The typical slope height may locally be adjusted depending on the pit design optimization needs. |
| Overall Highwall Angle (degrees) | 33 | Incorporating a haul road or a geotechnical ramp. |
m= meter
The following geologic, hydrogeologic, and operating recommendations related to pit design slopes and pit development should be considered in further project stages.
| ● | Additional geotechnical investigations in locations other than along the east side of the south lobe of the open pit |
| ● | Groundwater and hydrogeology subsurface investigations |
| ● | Infrastructure designed in close vicinity of pit crest |
| ● | Mining method |
| ● | Bench slope configuration |
| ● | Horizontal bedding and subvertical rock joints and faults |
| barr.com |
|
|
| 13.5 | Pit, Tailings, Coarse Gangue, Waste Dump, and Backfill Designs |
Pit, tailings (tails), coarse gangue, waste dump, and in-pit backfill designs were completed for the TFLP using Vulcan software (Version 2025). The pit designs utilize benches that are 10 m high, with a 9.65 m wide catch bench installed on every other bench (double-benching), or 20 m vertical spacing. The bench face angle used is 45º. The resulting inter-ramp slope is 34º. The design road width of 30 m is used resulting in the overall stope angle of 33º. The minimum mining width for the design is 100 m and the mining width of 200 m is recommended. The final pit is located on the south side of US 6/95 and 200 m from the power line.
The tailings and coarse gangue designs utilize 10 m high benches with a 13 m wide catch bench. The bench face angle used is 40º. The slope requirement is 2.5:1 with 10 m high perimeter berms constructed with waste material during the pre-mining period.
The waste dump and in-pit backfill designs utilize 10 m high benches with a 5 m wide catch bench. The bench face angle used is 40º. In-pit backfill starts after Year 5 as mining allows.
The pit, tailings, coarse gangue, waste dump, and in-pit backfill designs are shown in the figures below.

| Figure 13-5 | Tonopah Flats Ultimate Pit Design and Facilities |
| barr.com |
|
|

| Figure 13-6 | Tonopah Flats Ultimate Pit Design, Facilities, and In-Pit Backfill (Year 45) |
| 13.6 | Phase Design |
The ultimate pit design was split into eight phases to aid construction activities and help smooth production rates during operations. The approximate phase shapes were selected from the generated pit shells as part of the pit optimization process, which provides a sequence based on overall value. The design also considers an in-pit backfill schedule. The design parameters include a ramp width of 30 m, road grades of 10%, bench height of 10 m, and a minimum mining width of 100 m. The phase design and details are shown in the figure and table below.
| barr.com |
|
|

| Figure 13-7 | Tonopah Flats Phase Design |
| Table 13-14 | Tonopah Flats Phase Design Report |
| Phase | Quantity (t) | Ore (t) | Li (ppm) | Waste (t) | Stripping Ratio | LHM Contained (t) | LHM Recoverable (t) |
| Phase1 | 66,196,885 | 36,179,850 | 747.34 | 30,017,035 | 0.83 | 163,870 | 78,658 |
| Phase2 | 64,135,974 | 40,831,653 | 729.58 | 23,304,321 | 0.57 | 180,545 | 86,662 |
| Phase3 | 90,710,174 | 73,192,080 | 815.46 | 17,518,094 | 0.24 | 361,728 | 173,629 |
| Phase4 | 60,774,371 | 52,303,914 | 800.74 | 8,470,458 | 0.16 | 253,830 | 121,838 |
| Phase5 | 60,525,324 | 53,583,098 | 815.04 | 6,942,226 | 0.13 | 264,680 | 127,046 |
| Phase6 | 99,065,746 | 84,380,447 | 841.55 | 14,685,300 | 0.17 | 430,366 | 206,576 |
| Phase7 | 134,097,883 | 105,627,543 | 820.33 | 28,470,340 | 0.27 | 525,145 | 252,070 |
| Phase8 | 141,213,657 | 113,749,789 | 801.22 | 27,463,868 | 0.24 | 552,354 | 265,130 |
| Total | 716,720,014 | 559,848,373 | 805.34 | 156,871,641 | 0.28 | 2,732,519 | 1,311,609 |
LHM = lithium hydroxide monohydrate
ppm = parts per million
t = tonne
| barr.com |
|
|
| 13.7 | Production Schedule |
Production scheduling was completed using Datamine Minemax Scheduler software (Version 7.7). The production schedule was primarily driven by targeting the product produced to approximately 30,000 tpa of LHM after a two-year ramp up (Figure 13-10). Mining starts with initial pre-stripping and sustains the productivity required to feed the processing facility thereafter.
The production schedule is presented on a quarterly basis for the first five-years, and on an annual basis from Year 6 through Year 45.
The resulting production schedule requires approximately 12 months of preproduction to strip waste above the deposit. Production will be ramped up through the first two years of production, reaching full capacity at the beginning of Year 3 (Figure 13-11). Table 13-15 summarizes the 45-year production schedule.
The pit will be mined starting in Year -1 and will continue as the sole pit through Year 45. The mining has been planned in eight phases with Phase 1 mined first ending in year 5. Phase 8 will be mined last starting in year 36 and ending in year 45 as shown in Figure 13-8.

| Figure 13-8 | Total Tonnage Scheduled by Phase |
Processing starts at the beginning of production Year 1 and continues throughout the mine life, until mining ceases in Year 45 as shown in Figure 13-20. The average Li grade is 805 ppm and it increases slowly during the two-year ramp up then it is consistent (±10%) throughout LOM (Figure 13-9).
| barr.com |
|
|

| Figure 13-9 | Process Feed and Li Grade |

| Figure 13-10 | Process Feed and LHM Production |

| Figure 13-11 | Production Schedule and Strip Ratio |
| barr.com |
|
|
| Table 13-15 | 45-Year Production Schedule |
| Period | Ore (t) | Li (ppm) | Li Contained (t) | LHM Recoverable (t) | Waste (t) | Stripping Ratio | Total Mined (t) |
| YR-1 | - | 0.00 | - | - | 6,597,966 | - | 6,597,966 |
| YR1 | 3,293,071 | 521.93 | 1,719 | 5,000 | 10,325,073 | 3.14 | 13,618,144 |
| YR2 | 9,567,801 | 595.04 | 5,693 | 16,562 | 12,432,199 | 1.30 | 22,000,000 |
| YR3 | 15,207,636 | 678.11 | 10,312 | 30,000 | 6,746,826 | 0.44 | 21,954,462 |
| YR4 | 11,405,428 | 904.17 | 10,312 | 30,000 | 5,954,140 | 0.52 | 17,359,569 |
| YR5 | 15,644,817 | 659.16 | 10,312 | 30,000 | 6,355,183 | 0.41 | 22,000,000 |
| YR6 | 12,894,492 | 799.76 | 10,312 | 30,000 | 4,799,913 | 0.37 | 17,694,404 |
| YR7 | 12,637,505 | 816.02 | 10,312 | 30,000 | 7,545,446 | 0.60 | 20,182,950 |
| YR8 | 15,490,359 | 665.74 | 10,312 | 30,000 | 6,509,641 | 0.42 | 22,000,000 |
| YR9 | 12,399,746 | 831.67 | 10,312 | 30,000 | 1,040,440 | 0.08 | 13,440,187 |
| YR10 | 12,002,996 | 859.16 | 10,312 | 30,000 | 1,970,448 | 0.16 | 13,973,444 |
| YR11 | 11,700,833 | 881.35 | 10,312 | 30,000 | 562,175 | 0.05 | 12,263,008 |
| YR12 | 11,108,284 | 928.36 | 10,312 | 30,000 | - | - | 11,108,284 |
| YR13 | 14,046,014 | 734.19 | 10,312 | 30,000 | 6,033,753 | 0.43 | 20,079,767 |
| YR14 | 14,608,718 | 705.91 | 10,312 | 30,000 | 172,133 | 0.01 | 14,780,851 |
| YR15 | 11,835,947 | 871.29 | 10,312 | 30,000 | 2,253,696 | 0.19 | 14,089,643 |
| YR16 | 11,421,775 | 902.88 | 10,312 | 30,000 | 10,875 | 0.00 | 11,432,650 |
| YR17 | 13,317,946 | 774.33 | 10,312 | 30,000 | 5,632,473 | 0.42 | 18,950,419 |
| YR18 | 14,424,246 | 714.94 | 10,312 | 30,000 | 933,724 | 0.06 | 15,357,971 |
| YR19 | 12,189,414 | 846.02 | 10,312 | 30,000 | 376,029 | 0.03 | 12,565,443 |
| YR20 | 11,138,068 | 925.88 | 10,312 | 30,000 | - | - | 11,138,068 |
| YR21 | 11,669,781 | 883.69 | 10,312 | 30,000 | 7,229,523 | 0.62 | 18,899,304 |
| YR22 | 14,948,467 | 689.87 | 10,312 | 30,000 | 4,453,927 | 0.30 | 19,402,394 |
| YR23 | 12,440,417 | 828.95 | 10,312 | 30,000 | 393,117 | 0.03 | 12,833,534 |
| YR24 | 11,671,126 | 883.59 | 10,312 | 30,000 | 913,183 | 0.08 | 12,584,309 |
| YR25 | 11,415,746 | 903.36 | 10,312 | 30,000 | 1,409,399 | 0.12 | 12,825,145 |
| YR26 | 11,328,610 | 910.31 | 10,312 | 30,000 | 132,740 | 0.01 | 11,461,350 |
| YR27 | 11,768,638 | 876.27 | 10,312 | 30,000 | 109,993 | 0.01 | 11,878,631 |
| YR28 | 11,882,628 | 867.86 | 10,312 | 30,000 | 7,569,231 | 0.64 | 19,451,859 |
| YR29 | 14,174,632 | 727.53 | 10,312 | 30,000 | 5,076,473 | 0.36 | 19,251,105 |
| YR30 | 12,429,614 | 829.67 | 10,312 | 30,000 | 8,887,781 | 0.72 | 21,317,395 |
| YR31 | 11,978,720 | 860.90 | 10,312 | 30,000 | 4,989,846 | 0.42 | 16,968,566 |
| YR32 | 12,241,867 | 842.40 | 10,312 | 30,000 | 418,871 | 0.03 | 12,660,738 |
| YR33 | 14,877,679 | 693.15 | 10,312 | 30,000 | 113,519 | 0.01 | 14,991,198 |
| YR34 | 12,530,835 | 822.97 | 10,312 | 30,000 | - | - | 12,530,835 |
| YR35 | 11,237,767 | 917.66 | 10,312 | 30,000 | 82,666 | 0.01 | 11,320,433 |
| barr.com |
|
|
| Period | Ore (t) | Li (ppm) | Li Contained (t) | LHM Recoverable (t) | Waste (t) | Stripping Ratio | Total Mined (t) |
| YR36 | 11,195,052 | 921.17 | 10,312 | 30,000 | 9,973,322 | 0.89 | 21,168,374 |
| YR37 | 11,920,177 | 865.13 | 10,312 | 30,000 | 10,079,823 | 0.85 | 22,000,000 |
| YR38 | 12,516,442 | 823.92 | 10,312 | 30,000 | 3,971,541 | 0.32 | 16,487,983 |
| YR39 | 12,468,694 | 827.07 | 10,312 | 30,000 | 3,295,221 | 0.26 | 15,763,915 |
| YR40 | 11,805,773 | 873.51 | 10,312 | 30,000 | 882,558 | 0.07 | 12,688,331 |
| YR41 | 12,009,248 | 858.71 | 10,312 | 30,000 | 291,100 | 0.02 | 12,300,348 |
| YR42 | 12,267,691 | 840.62 | 10,312 | 30,000 | 13,278 | 0.00 | 12,280,969 |
| YR43 | 13,769,132 | 748.96 | 10,312 | 30,000 | 59,448 | 0.00 | 13,828,580 |
| YR44 | 16,261,498 | 634.17 | 10,312 | 30,000 | 149,905 | 0.01 | 16,411,403 |
| YR45 | 12,703,043 | 813.09 | 10,329 | 30,047 | 123,040 | 0.01 | 12,826,083 |
| Total | 559,848,373 | 805.34 | 450,866 | 1,311,609 | 156,871,641 | 0.28 | 716,720,014 |
LHM = lithium hydroxide monohydrate
ppm = parts per million
t = tonne
yr = year
| Table 13-16 | 45-Year Mining Quantities (tonnes) |
| Period | Pit to Process | Process to Tailings | Process to Coarse Gangue | Process to Backfill | Waste to Backfill | Waste to Waste Dump | Total Material Moved |
| YR-1 | - | - | - | - | - | 6,597,966 | 6,597,966 |
| YR1 | 3,293,071 | 987,921 | 2,305,150 | - | - | 10,325,073 | 13,618,144 |
| YR2 | 9,567,801 | 2,870,340 | 6,697,461 | - | - | 12,432,199 | 22,000,000 |
| YR3 | 15,207,636 | 4,562,291 | 10,645,345 | - | - | 6,746,826 | 21,954,462 |
| YR4 | 11,405,428 | 3,421,629 | 7,983,800 | - | - | 5,954,140 | 17,359,569 |
| YR5 | 15,644,817 | 4,693,445 | 10,951,372 | - | - | 6,355,183 | 22,000,000 |
| YR6 | 12,894,492 | 2,528,882 | 5,900,724 | 4,464,885 | 1,627,315 | 3,172,598 | 22,159,290 |
| YR7 | 12,637,505 | 2,274,751 | 5,307,752 | 5,055,002 | 3,479,633 | 4,065,813 | 25,237,952 |
| YR8 | 15,490,359 | 2,788,265 | 6,505,951 | 6,196,144 | 2,603,856 | 3,905,785 | 28,196,144 |
| YR9 | 12,399,746 | 2,086,242 | 4,867,898 | 5,445,606 | 416,176 | 624,264 | 18,885,793 |
| YR10 | 12,002,996 | 1,800,449 | 4,201,049 | 6,001,498 | 985,224 | 985,224 | 19,974,942 |
| YR11 | 11,700,833 | 1,549,736 | 3,616,051 | 6,535,046 | 282,203 | 279,972 | 18,798,054 |
| YR12 | 11,108,284 | 1,332,994 | 3,110,320 | 6,664,971 | - | - | 17,773,255 |
| YR13 | 14,046,014 | 2,188,329 | 5,106,101 | 6,751,584 | 2,456,037 | 3,577,716 | 26,831,351 |
| YR14 | 14,608,718 | 1,008,002 | 2,352,004 | 11,248,713 | 132,543 | 39,591 | 26,029,564 |
| YR15 | 11,835,947 | 634,306 | 1,480,048 | 9,721,592 | 1,839,374 | 414,322 | 23,811,235 |
| YR16 | 11,421,775 | 513,980 | 1,199,286 | 9,708,508 | 9,244 | 1,631 | 21,141,158 |
| YR17 | 13,317,946 | 1,200,819 | 2,801,911 | 9,315,217 | 2,928,886 | 2,703,587 | 28,265,636 |
| YR18 | 14,424,246 | 2,077,091 | 4,846,547 | 7,500,608 | 485,537 | 448,188 | 22,858,579 |
| barr.com |
|
|
| Period | Pit to Process | Process to Tailings | Process to Coarse Gangue | Process to Backfill | Waste to Backfill | Waste to Waste Dump | Total Material Moved |
| YR19 | 12,189,414 | 1,755,276 | 4,095,643 | 6,338,495 | 195,535 | 180,494 | 18,903,938 |
| YR20 | 11,138,068 | 1,603,882 | 3,742,391 | 5,791,795 | - | - | 16,929,864 |
| YR21 | 11,669,781 | 1,818,277 | 4,242,646 | 5,608,858 | 2,024,266 | 5,205,257 | 24,508,162 |
| YR22 | 14,948,467 | 3,228,869 | 7,534,028 | 4,185,571 | 1,247,100 | 3,206,828 | 23,587,965 |
| YR23 | 12,440,417 | 2,687,130 | 6,269,970 | 3,483,317 | 110,073 | 283,044 | 16,316,850 |
| YR24 | 11,671,126 | 2,520,963 | 5,882,248 | 3,267,915 | 255,691 | 657,492 | 15,852,225 |
| YR25 | 11,415,746 | 2,465,801 | 5,753,536 | 3,196,409 | 394,632 | 1,014,768 | 16,021,554 |
| YR26 | 11,328,610 | 2,446,980 | 5,709,620 | 3,172,011 | 37,167 | 95,573 | 14,633,361 |
| YR27 | 11,768,638 | 2,542,026 | 5,931,393 | 3,295,219 | 30,798 | 79,195 | 15,173,850 |
| YR28 | 11,882,628 | 2,369,343 | 5,528,466 | 3,984,819 | 3,775,064 | 3,794,167 | 23,436,678 |
| YR29 | 14,174,632 | 2,126,195 | 4,961,121 | 7,087,316 | 2,538,236 | 2,538,236 | 26,338,421 |
| YR30 | 12,429,614 | 1,255,440 | 2,929,359 | 8,244,815 | 5,571,357 | 3,316,425 | 29,562,210 |
| YR31 | 11,978,720 | 718,723 | 1,677,021 | 9,582,976 | 3,991,877 | 997,969 | 26,551,542 |
| YR32 | 12,241,867 | 863,400 | 2,014,601 | 9,363,866 | 335,097 | 83,774 | 22,024,603 |
| YR33 | 14,877,679 | 2,149,539 | 5,015,591 | 7,712,550 | 64,285 | 49,234 | 22,703,748 |
| YR34 | 12,530,835 | 1,313,670 | 3,065,230 | 8,151,935 | - | - | 20,682,770 |
| YR35 | 11,237,767 | 1,000,005 | 2,333,345 | 7,904,418 | 66,133 | 16,533 | 19,224,851 |
| YR36 | 11,195,052 | 2,955,269 | 6,895,628 | 1,344,154 | 1,015,048 | 8,958,274 | 22,512,528 |
| YR37 | 11,920,177 | 2,797,771 | 6,528,132 | 2,594,274 | 1,300,789 | 8,779,034 | 24,594,274 |
| YR38 | 12,516,442 | 2,337,600 | 5,454,399 | 4,724,443 | 1,359,317 | 2,612,224 | 21,212,426 |
| YR39 | 12,468,694 | 2,232,847 | 5,209,976 | 5,025,870 | 1,318,089 | 1,977,133 | 20,789,785 |
| YR40 | 11,805,773 | 1,770,866 | 4,132,021 | 5,902,887 | 441,279 | 441,279 | 18,591,218 |
| YR41 | 12,009,248 | 1,528,402 | 3,566,271 | 6,914,575 | 145,550 | 145,550 | 19,214,923 |
| YR42 | 12,267,691 | 743,212 | 1,734,162 | 9,790,317 | 7,967 | 5,311 | 22,071,287 |
| YR43 | 13,769,132 | 826,148 | 1,927,678 | 11,015,306 | 47,558 | 11,890 | 24,843,886 |
| YR44 | 16,261,498 | 975,690 | 2,276,610 | 13,009,198 | 119,924 | 29,981 | 29,420,601 |
| YR45 | 12,703,043 | 762,183 | 1,778,426 | 10,162,435 | 98,432 | 24,608 | 22,988,518 |
| Total | 559,848,373 | 88,314,976 | 206,068,278 | 265,465,118 | 43,737,291 | 113,134,351 | 982,185,133 |
yr = year
The mining operation is responsible for moving ore, waste, tailings, and coarse gangue materials to different locations. There are six material movements that occur throughout the LOM. They are pit to process (stockpile), process to tailings, process to coarse gangue, process to in-pit backfill, waste to in-pit backfill, and waste to dump. A conveyor system is used to convey materials to tailings and coarse gangue. A conventional truck and loader is used to move materials for the rest. A truck cycle time study was conducted based on haulage profiles created using Vulcan software as shown in Figure 13-12 and Figure 13-13. The truck fleet size is based on the total truck hours from the LOM plan.
| barr.com |
|
|

| Figure 13-12 | LOM Material Movements |

| Figure 13-13 | LOM Truck Hours |
The ultimate pit design (Year 45) is shown in Figure 13-6, while additional pit progressions are shown as Figure 13-14 through Figure 13-19, starting with Phase 1. The pit will be backfilled as space allows throughout the mine life, while tailings, coarse gangue, and waste dump will be built as mining progresses.
| barr.com |
|
|

| Figure 13-14 | Tonopah Flats Phase 1 Mining (Year 5) |
| barr.com |
|
|

| Figure 13-15 | Tonopah Flats Phase 2 Mining and Backfill (Year 7) |
| barr.com |
|
|

| Figure 13-16 | Tonopah Flats Phase 3 Mining and Backfill (Year 13) |
| barr.com |
|
|

| Figure 13-17 | Tonopah Flats Phase 4 Mining and Backfill (Year 17) |
| barr.com |
|
|

| Figure 13-18 | Tonopah Flats Phase 5 Mining and Backfill (Year 21) |
| barr.com |
|
|

| Figure 13-19 | Tonopah Flats Phase 6 Mining and Backfill (Year 28) |
| barr.com |
|
|

| Figure 13-20 | Tonopah Flats Phase 7 Mining and Backfill (Year 37) |
| 13.8 | Mine Equipment |
Mine production will utilize conventional open-pit mining methods, including drilling, blasting, loading, and hauling. Mining will be conducted on 10 m benches, with well-designed phases or pushbacks to enhance mining efficiency. The equipment selected for this project will support mine production, site developments, ore handling, and tailings handling. Equipment selection and requirements are based on the mine design, planned production rates, and site development activities. While the following subsections provide details of the LOM mining equipment, the information related to ore and tailings handling equipment is presented separately in the ROM and tailings section of this report. Pre-stripping activities include a small portable crusher and a screening plant, which has been accounted for in the capital expenditure (CAPEX) estimates.
| barr.com |
|
|
| Table 13-17 | Major Mining Equipment – Maximum Units Required |
| Major Equipment | YR -1 | YR 1-2 |
YR
3-5 |
YR 6-10 |
YR 11-20 |
YR 21-30 |
YR 31-40 |
YR 41-45 |
Maximum |
| Hydraulic Face Shovel – 20 m3 | 1 | 2 | 2 | 2 | 2 | 2 | 2 | 2 | 2 |
| Frontend Loader – 20 m3 | 1 | 2 | 2 | 2 | 2 | 2 | 2 | 2 | 2 |
| Haul Truck – 141-t / 99 m3 | 6 | 12 | 13 | 20 | 20 | 23 | 26 | 24 | 26 |
| Production Drill - 115 mm | 1 | 1 | 1 | 1 | 1 | 1 | 1 | 1 | 1 |
| Motor Grader – 32 t / 216 kW | 1 | 2 | 2 | 3 | 3 | 3 | 3 | 3 | 3 |
| Water Truck - 75,000 liters | 1 | 2 | 2 | 3 | 3 | 3 | 3 | 3 | 3 |
| Wheel Dozer (RTD) – 46 t / 336 kW | 1 | 2 | 2 | 2 | 2 | 2 | 2 | 2 | 2 |
| Track Dozer – 70 t / 462 kW | 2 | 3 | 3 | 5 | 5 | 5 | 5 | 5 | 5 |
| Hydraulic Excavator - 4.6 m3 | 1 | 1 | 1 | 1 | 1 | 1 | 1 | 1 | 1 |
| Fuel/Lube Truck – 5,675 liters | 1 | 1 | 1 | 1 | 1 | 1 | 1 | 1 | 1 |
| Dewatering Pumps – 152 m head | 1 | 1 | 1 | 1 | 1 | 1 | 1 | 1 | 1 |
| Total Major Equipment | 17 | 29 | 30 | 41 | 41 | 44 | 47 | 45 | 47 |
kW = kilowatt
m = meter
m3 = cubic meters
mm = millimeter
RTD = rear tow device
t = tonne
yr = year
| 13.8.1 | Drilling and Blasting |
Given the soft nature of the rock in the project area, drilling and blasting requirements are expected to be minimal, accounting for approximately 5% of the clay material. Drilling will be self-performed by the owner while blasting and explosives handling will be managed by a specialized explosives contractor. Blasting is neither planned nor required for the overburden, as it is made of alluvial material.
Production drilling will be conducted using a 115 mm diameter drill on 10 m benches. Table 13-18 and Table 13-19 show drilling productivity by material type, the number of drills required, the average and total drill output.
| Table 13-18 | Drilling Productivity |
| Parameter | Unit | Ore | Waste Rock | Wall Control |
| Hole Diameter | millimeter | 115.0 | 115.0 | 115.0 |
| Penetration Rate | meter / hour | 38.2 | 37.4 | 37.4 |
| Hole Length | meter | 11.2 | 11.2 | 20.0 |
| Drilling Time per Hole | minute / hole | 17.6 | 17.9 | 32.1 |
| Non-Drilling Time per Hole | minute / hole | 2.0 | 2.0 | 3.6 |
| Total Time per Hole | minute / hole | 19.6 | 19.9 | 35.6 |
| Drilling Productivity | meter / hour | 34.3 | 33.7 | 33.7 |
| barr.com |
|
|
| Table 13-19 | Drilling Productivity by Period |
| Description / Period | YR -1 | YR 1-2 |
YR 3-5 |
YR 6-10 |
YR 11-20 |
YR 21-30 |
YR 31-40 |
YR 41-45 |
Average / Total |
| Production Drills | 1 | 1 | 1 | 1 | 1 | 1 | 1 | 1 | 1 |
| Pioneering Drills | - | - | - | - | - | - | - | - | - |
| Average Feet Drilled | 3,470 | 32,611 | 57,672 | 43,706 | 37,939 | 38,784 | 39,315 | 38,271 | 39,391 |
| Average Meters Drilled | 1,058 | 9,940 | 17,578 | 13,322 | 11,564 | 11,821 | 11,983 | 11,665 | 12,006 |
| Average Hours - NOH | 93 | 906 | 1,640 | 1,248 | 1,095 | 1,110 | 1,127 | 1,113 | 1,129 |
| Total Feet Drilled | 3,470 | 65,221 | 173,015 | 218,532 | 379,392 | 387,836 | 393,147 | 191,353 | 1,811,968 |
| Total Meters Drilled | 1,058 | 19,880 | 52,735 | 66,609 | 115,639 | 118,212 | 119,831 | 58,324 | 552,288 |
| Total Hours - NOH | 93 | 1,811 | 4,919 | 6,238 | 10,954 | 11,099 | 11,273 | 5,567 | 51,953 |
NOH = Net Operating Hours
yr = year
Blasting at this mine will primarily be done with a mixed explosive consisting of a 70/30 blend of emulsion and ANFO (ammonium nitrate fuel oil). The selected explosives contractor will be responsible for the manufacturing and delivery of explosives and blasting accessories. Blastholes loading and blasting will be a joint effort performed by both the owner and the explosives contractor. Table 13-20 and Table 13-21 present the blasting parameters (burden, spacing, etc.,) by material type, the targeted tonnages to be blasted, and the estimated quantities of explosives and blasting accessories required to meet those targets.
| Table 13-20 | Blasting Patterns and Powder Factors |
| Parameter | Unit | Ore | Waste-Rock | Wall Control |
| Bench Height | meter | 10.0 | 10.0 | 20.0 |
| Sub Drill | meter | 1.2 | 1.2 | 0.0 |
| Hole Length | meter | 11.2 | 11.2 | 20.0 |
| Hole Diameter | millimeter | 115.0 | 115.0 | 115.0 |
| Burden | meter | 3.2 | 3.2 | 3.2 |
| Spacing | meter | 4.0 | 4.0 | 4.0 |
| Powder / Hole | kilogram / hole | 116.8 | 116.8 | 234.7 |
| Powder Factor | kilogram / tonne | 0.58 | 0.59 | 0.59 |
| barr.com |
|
|
| Table 13-21 | Blasting and Explosives by Period |
| Description / Period | YR -1 | YR
1-2 |
YR
3-5 |
YR
6-10 |
YR
11-20 |
YR
21-30 |
YR
31-40 |
YR
41-45 |
Average / Total |
| Average Blasted, t | 60,401 | 562,587 | 1,021,887 | 769,105 | 668,125 | 707,251 | 702,644 | 676,474 | 701,290 |
| Average ANFO, t | 9 | 39 | 151 | 118 | 103 | 105 | 106 | 104 | 107 |
| Average Emulsion, t | 22 | 91 | 353 | 276 | 240 | 245 | 248 | 242 | 249 |
| Average Boasters 0.45 kg | 310 | 1,287 | 4,996 | 3,902 | 3,387 | 3,463 | 3,510 | 3,417 | 3,517 |
| Average Detonators, No. | 310 | 1,287 | 4,996 | 3,902 | 3,387 | 3,463 | 3,510 | 3,417 | 3,517 |
| Total Blasted, t | 60,401 | 252,641 | 3,938,195 | 3,845,523 | 6,681,251 | 7,072,513 | 7,026,437 | 3,382,369 | 32,259,331 |
| Total ANFO, t | 9 | 39 | 606 | 591 | 1,027 | 1,050 | 1,064 | 518 | 4,903 |
| Total Emulsion, t | 22 | 91 | 1,413 | 1,380 | 2,396 | 2,449 | 2,482 | 1,208 | 11,441 |
| Total Boasters 0.45 kg | 310 | 1,287 | 19,985 | 19,512 | 33,874 | 34,628 | 35,102 | 17,085 | 161,783 |
| Total Detonators, No. | 310 | 1,287 | 19,985 | 19,512 | 33,874 | 34,628 | 35,102 | 17,085 | 161,783 |
ANFO = Ammonium Nitrate Fuel Oil
t = tonne
yr = year
| 13.8.2 | Loading and Hauling |
A fleet of 20 m3 hydraulic shovels and 20 m3 front-end loaders, along with 141-t haul trucks were selected for loading and hauling operations based on the results of an equipment trade-off study. This fleet will be used for handling ore and waste, transporting backfill tailings from the refinery to the backfill dumps, and moving reclamation materials. Table 13-22 summarizes the productivity and other key parameters of both the loading units and haul trucks. The required fleet size, hourly productivity, and operating hours for each loading and hauling unit are provided in Table 13-24. This project will incorporate the services of a mine dispatch system for real-time production optimizations.
| Table 13-22 | Loading and Hauling Productivity |
| Parameters | Shovel-Truck | Loader-Truck |
| Material Bank Specific Gravity (sg) | 1.510 | 1.510 |
| Estimated Bucket Fill Factor (%) | 95.0% | 95.0% |
| Estimated Bucket Payload (t) | 29 | 29 |
| Rated Truck Payload (t) | 142 | 142 |
| Number of Passes/Truck (decimal) | 5.5 | 5.5 |
| Effective Passes Per Truck (No.) | 6.0 | 6.0 |
| Effective Truck Payload - Wet (t) | 135 | 135 |
| Loading Cycle Time (minutes) | 3.5 | 4.5 |
| Travel Time - Loaded (minutes) | 12.1 | 12.1 |
| barr.com |
|
|
| Parameters | Shovel-Truck | Loader-Truck |
| Travel Time - Empty (minutes) | 8.1 | 8.1 |
| Total Cycle Time (minutes) | 25.2 | 26.2 |
| Available Hours Per Day (h/day) | 17.8 | 17.8 |
| Shovel-Loader Availability (%) | 85% | 85% |
| Shovel-Loader Utilizations (%) | 85% | 85% |
| Shovel-Loader NOH Per Year (h/yr) | 4,067 | 4,067 |
| Maximum Production - Shovel-Loader (tph) | 2,320 | 1,804 |
| Shovel-Loader Operating Efficiency (%) | 90% | 90% |
| Effective Production - Shovel-Loader (tph) | 2,088 | 1,624 |
| Effective Production - Shovel-Loader (tpa) | 8,490,515 | 6,603,734 |
| Truck Availability (%) | 85% | 85% |
| Truck Utilizations (%) | 85% | 85% |
| Truck NOH Per Year (h/yr) | 4,067 | 4,067 |
| Maximum Production - Truck (tph) | 322 | 310 |
| Truck Operating Efficiency (%) | 90% | 90% |
| Effective Production - Truck (tph) | 290 | 279 |
| Effective Production - Truck (tpa) | 1,179,238 | 1,134,229 |
% = percent
h = hours
sg = specific gravity
t = tonne
tpa = tonnes per year/annum
tph = tonnes per hour
yr = year
In addition to loading time, the productivity of the loading units and trucks includes waiting, maneuvering, and unproductive time. Although the shovel has a faster loading time and higher productivity, the front-end loader offers greater mobility and flexibility, thereby enabling it to move easily between the active mining areas, which is essential for selective mining to maintain consistent ore grades. The loading fleet will also be used to strip waste (when possible), load overburden and topsoil, pit clean up, feed ROM, and support road construction.
| barr.com |
|
|
| Table 13-23 | Truck Speed Limits and Grade-Speed Bin |
| Road Segment and Grade | Loaded Uphill (kph) | Empty Uphill (kph) | Loaded Downhill (kph) | Empty Downhill (kph) |
| Max Speed | 40.0 | 40.0 | 40.0 | 40.0 |
| Flat | 30.0 | 30.0 | 30.0 | 30.0 |
| 2% | 15.0 | 15.0 | 20.0 | 20.0 |
| 4% | 15.0 | 15.0 | 20.0 | 20.0 |
| 6% | 15.0 | 15.0 | 20.0 | 20.0 |
| 8% | 11.5 | 15.0 | 20.0 | 20.0 |
| 10% | 10.0 | 15.0 | 20.0 | 20.0 |
| 12% | 6.0 | 15.0 | 14.9 | 20.0 |
kph = kilometers per hour
As previously mentioned, haul truck productivity is influenced by travel times, among other factors. To estimate travel times for hauling ore, waste, and tailings, various haulage profiles were developed for the 141-t truck. These profiles were created for each mining bench, by phase, to all the potential destinations. Table 13-23 outlines the grade-speed bin, and the haul truck speed limits used to reflect actual operating conditions within the haul profiles. These profiles were integrated into haulage-simulation software and a route-estimation model to calculate individual travel times for each bench in every pushback. These travel times combined with loading times, were used to determine total cycle times, which were subsequently incorporated into the mine's production estimates.
| Table 13-24 | Average Load-Haul Units and Productivity by Period |
| Description / Period | YR -1 | YR
1-2 |
YR
3-5 |
YR
6-10 |
YR
11-20 |
YR
21-30 |
YR
31-40 |
YR
41-45 |
Average |
| Shovel - 20 m3: Average Quantity | 1 | 2 | 2 | 2 | 2 | 2 | 2 | 2 | 2 |
| Shovel - 20 m3: t/NOH | 2,088 | 2,124 | 2,243 | 2,168 | 2,211 | 2,223 | 2,198 | 2,168 | 2,197 |
| Shovel - 20 m3: NOH/yr | 1,376 | 4,421 | 4,693 | 5,387 | 5,160 | 4,676 | 4,996 | 5,665 | 4,954 |
| Loader - 20 m3: Average Quantity | 1 | 2 | 2 | 2 | 2 | 2 | 2 | 2 | 2 |
| Loader - 20 m3: t/NOH | 1,624 | 1,680 | 1,694 | 1,712 | 1,713 | 1,732 | 1,721 | 1,688 | 1,711 |
| Loader - 20 m3: NOH/yr | 2,294 | 5,038 | 5,886 | 6,520 | 6,267 | 5,904 | 6,341 | 6,829 | 6,128 |
| Truck – 141-t: Average Quantity | 6 | 11 | 13 | 16 | 17 | 17 | 23 | 21 | 18 |
| Truck – 141-t: t/NOH | 330 | 515 | 455 | 371 | 334 | 313 | 241 | 277 | 323 |
| Truck – 141-t: NOH/yr | 19,851 | 34,743 | 44,913 | 62,128 | 66,208 | 65,474 | 90,987 | 85,454 | 69,319 |
m3 = cubic meter
NOH = Net Operating Hours
t = tonne
yr = Year
| barr.com |
|
|
| 13.8.3 | ROM Ore Handling |
Ore extracted from the mine will be transported to the ROM pile located on the east side of the processing mill/refinery. This lithium-bearing ore will be fed into the ROM hopper by loading units and conveyed to the feeder-sizer, which will reduce the material to the target size for beneficiation and further refining processes. Table 13-25 shows the required ROM ore handling equipment for this project.
| Table 13-25 | Feed Handling Equipment By Period |
| ROM Ore Handling Equipment | YR -1 | YR 1-2 |
YR 3-5 |
YR 6-10 |
YR 11-20 |
YR 21-30 |
YR 31-40 |
YR 41-45 |
Maximum |
| Front-end Loader - 20 m3 | - | 2 | 2 | 2 | 2 | 2 | 2 | 2 | 2 |
| Feeder-Sizer Assembly | - | 1 | 1 | 1 | 1 | 1 | 1 | 1 | 1 |
| ROM Ore Handling Equipment | - | 3 | 3 | 3 | 3 | 3 | 3 | 3 | 3 |
m3 = cubic meters
| 13.8.4 | Tailings And Coarse Gangues Handling |
As detailed in chapter 14, the oversized barren lithium material generated from the attrition scrubbing process is removed and conveyed to the coarse gangue dump, where it is combined with other tailings streams. The coarse gangue dump will be enclosed by a perimeter berm constructed to a height of 10 m with side slopes of 2.5:1 (horizontal:vertical) to ensure operational safety and containment. Table 13-25 shows the estimated for feed handling while the estimated equipment for coarse gangues handling is shown in Table 13-26.
Additionally, dry-stack tailings produced from the refining process will be transported via conveyors to the TSF. The tailings will be placed within the TSF using grasshopper conveyors that feed a stacking conveyor for efficient placement. The TSF will be contained by a perimeter berm constructed to a height of 10 m with side slopes of 2.5:1 (horizontal:vertical) to ensure or maintain structural stability and safe containment.
A bulldozer is used for compaction and final contouring of both the coarse gangue and tailings dumps. As sections of the open-pit are mined out, the tailings and coarse gangue material will be redirected to the pit for in-pit backfilling. Table 13-26 presents the equipment required for both the coarse gangue and tailings handling operations.
| barr.com |
|
|
| Table 13-26 | Tailings Handling Equipment By Period |
| Tailings Handling Equipment | YR -1 | YR 1-2 |
YR 3-5 |
YR 6-10 |
YR 11-20 |
YR 21-30 |
YR 31-40 |
YR 41-45 |
Maximum |
| CG
Conveyor 1: size =1.2 m x 35 m |
- | 1 | 1 | 1 | 1 | 1 | 1 | 1 | 1 |
| CG
Conveyor 2: size = 1.2 m x 414 m |
- | 1 | 1 | 1 | 1 | 1 | 1 | 1 | 1 |
| CG
Conveyor 3: size = 1.2 m x 670 m |
- | 1 | 1 | 1 | 1 | 1 | 1 | 1 | 1 |
| CG
Conveyor 4: size = 1.2 m x 1400 m |
- | - | 1 | 1 | 1 | 1 | 1 | 1 | 1 |
| REF
Conveyor 1R: size = 1.2 m x 35 m |
- | 1 | 1 | 1 | 1 | 1 | 1 | 1 | 1 |
| REF
Conveyor 2R: size = 1.2 m x 414 m |
- | 1 | 1 | 1 | 1 | 1 | 1 | 1 | 1 |
| REF
Conveyor 3R: size = 1.2 m x 519 m |
- | 1 | 1 | 1 | 1 | 1 | 1 | 1 | 1 |
| CG
Conveyor: size = 1.0 m x 35 m |
- | 28 | 57 | 57 | 57 | 57 | 57 | 57 | 57 |
| CG Stacker | - | 2 | 2 | 2 | 2 | 2 | 2 | 2 | 2 |
| Total Tailings Handling Equipment | - | 36 | 66 | 66 | 66 | 66 | 66 | 66 | 66 |
CG = coarse gangue
m = meter
REF = Refinery
| 13.8.4.1 | Tailings Storage Facility |
The TSF will be enclosed by a perimeter berm constructed to a height of 10 m with side slopes of 2.5:1 (horizontal:vertical) to ensure operational safety and containment.
| 13.8.5 | Support and Service Equipment |
The support and service equipment play a vital role in the effective execution of daily mining, processes, and site development activities. This equipment includes graders, water trucks, rubber-tire dozers, track dozers, excavators, fuel/lube trucks, dewatering pumps, mechanic service trucks, backhoes, snow sand truck, light plants, skid-steers, and other units. A detailed list of this equipment, along with the required quantities, is provided in Table 13-27. Key tasks performed by this support fleet include:
| ● | Construction and maintenance of roads |
| ● | Bench prep and build safety berms |
| ● | Shovel and loader support/cleanup |
| ● | Building waste management facility |
| ● | Support tailings management facility |
| barr.com |
|
|
| ● | Build and support coarse gangue dump |
| ● | Stockpile construction/maintenance |
| ● | Backfill construction/maintenance |
| ● | Blasting support and cleanup work |
| ● | Support and service field equipment |
| ● | Pioneering and phase development |
| ● | Dust control and water for drills, etc. |
| ● | Ditch construction and maintenance |
| ● | Build sediment ponds and ROM pad |
| ● | Reclamation and closure activities |
| Table 13-27 | Support and Service Equipment-Maximum Units Required |
| Support Equipment | YR -1 | YR 1-2 |
YR 3-5 |
YR 6-10 |
YR 11-20 |
YR 21-30 |
YR 31-40 |
YR 41-45 |
Maximum |
| Sand Truck – 37-t | 1 | 1 | 1 | 1 | 1 | 1 | 1 | 1 | 1 |
| Light Plant - PL80 | 4 | 7 | 7 | 10 | 10 | 10 | 10 | 10 | 10 |
| Small Backhoe/Loader | 1 | 1 | 1 | 1 | 1 | 1 | 1 | 1 | 1 |
| Lowboy – 91-t | 1 | 1 | 1 | 1 | 1 | 1 | 1 | 1 | 1 |
| Oper Skid Steer - S510 | 1 | 1 | 1 | 1 | 1 | 1 | 1 | 1 | 1 |
| Mechanic Service Truck | 1 | 2 | 2 | 2 | 2 | 2 | 2 | 2 | 2 |
| Tire Handler Truck | 1 | 1 | 1 | 1 | 1 | 1 | 1 | 1 | 1 |
| Crane – 100-t | 1 | 1 | 1 | 1 | 1 | 1 | 1 | 1 | 1 |
| Telehandler – 13-t | 1 | 1 | 1 | 1 | 1 | 1 | 1 | 1 | 1 |
| Forklift – 10-t | 1 | 1 | 1 | 1 | 1 | 1 | 1 | 1 | 1 |
| Maintenance Fuel/Lube Truck | 1 | 1 | 1 | 1 | 1 | 1 | 1 | 1 | 1 |
| Maintenance Flatbed Trailer | 1 | 1 | 1 | 1 | 1 | 1 | 1 | 1 | 1 |
| Maintenance Skid Steer - S510 | 1 | 1 | 1 | 1 | 1 | 1 | 1 | 1 | 1 |
| Total Support Equipment | 16 | 20 | 20 | 23 | 23 | 23 | 23 | 23 | 23 |
t = tonne
| 13.9 | Mine Personnel |
The staffing plan for the mine is designed to support continuous, year-round operations, 24 hours per day, and 7 days per week, including salaried and hourly personnel. A total of 196 employees are planned for a typical full production year—comprising of 25 salaried and 171 hourly—distributed across key mining functioning areas including mine operations, maintenance, technical services, and administration. Both mine operations and maintenance staff will work rotating shifts to ensure full coverage, while the technical services team will provide specialized support. Details of the mining staffing requirements are outlined in Table 13-28. In addition, contract personnel will provide supplementary services such as blasting, major equipment repairs or overhaul, consulting, environmental services, and other specialized tasks.
| barr.com |
|
|
| Table 13-28 | Mining Labor Requirements |
| Job Title / Designation | Staff Non-Crew |
Prod Crew A | Prod Crew B | Prod Crew C | Total Staff |
| Mine Manager | 1 | - | - | - | 1 |
| Mine Clerk | 1 | - | - | - | 1 |
| Mine Clerk Assistant | 1 | - | - | - | 1 |
| Subtotal - Mine Administration | 3 | - | - | - | 3 |
| Mine Operations Superintendent/Manager | 1 | - | - | - | 1 |
| Mine/Plant Supervisor | - | 1 | 1 | 1 | 3 |
| Mine/Plant Assistant Supervisor | - | 2 | 2 | 2 | 6 |
| Superintendent/Utility Supervisor | - | 2 | 2 | 2 | 6 |
| Driller | - | 1 | 1 | 1 | 3 |
| Shovel Operator | - | 2 | 2 | 2 | 6 |
| Loader Operator | - | 2 | 2 | 2 | 6 |
| Truck Driver | - | 26 | 26 | 26 | 78 |
| Support/Utility Operator | - | 1 | 1 | 1 | 3 |
| Loader Operator - Run-of-Mine | - | 2 | 2 | 2 | 6 |
| Crusher/Feeder/Sizer Operator | - | 1 | 1 | 1 | 3 |
| Utility Operator – Run-of-Mine/Tailings | - | 1 | 1 | 1 | 3 |
| Ore/Tailings Handling Assistant Supervisor | - | 1 | 1 | 1 | 3 |
| Subtotal - Mine Operations | 1 | 42 | 42 | 42 | 127 |
| Mine Maintenance Superintendent/Manager | 1 | - | - | - | 1 |
| Mine Maintenance Senior Planner | 2 | - | - | - | 2 |
| Maintenance/Electrical Supervisor | - | 1 | 1 | 1 | 3 |
| Field Mechanic | - | 3 | 3 | 3 | 9 |
| Oiler/Fuel Truck | - | 2 | 2 | 2 | 6 |
| Shop Mechanic | - | 5 | 5 | 5 | 15 |
| Mine Maintenance Clerk | - | 1 | 1 | 1 | 3 |
| Mine Electrician | - | 1 | 1 | 1 | 3 |
| Heavy Equipment Mechanic | 1 | 2 | 2 | 2 | 7 |
| Subtotal - Mine Maintenance | 4 | 15 | 15 | 15 | 49 |
| barr.com |
|
|
| Job Title / Designation | Staff Non-Crew |
Prod Crew A | Prod Crew B | Prod Crew C | Total Staff |
| Technical Services Superintendent/Manager | 1 | - | - | - | 1 |
| Senior Mine Engineer | 1 | - | - | - | 1 |
| Senior Geotechnical Engineer | 1 | - | - | - | 1 |
| Dispatch Engineer | 3 | - | - | - | 3 |
| Mining Engineer | 2 | - | - | - | 2 |
| Chief Geologist | 1 | - | - | - | 1 |
| Senior Geologist | 1 | - | - | - | 1 |
| Mine Geologist | 1 | - | - | - | 1 |
| Senior Surveyor | 1 | - | - | - | 1 |
| Surveyor/Survey Technician | 4 | - | - | - | 4 |
| Technical Service Technicians | 1 | - | - | - | 1 |
| Subtotal - Technical Services | 17 | - | - | - | 17 |
| Grand Total – Life-Of-Mine Mining | 25 | 57 | 57 | 57 | 196 |
| 13.10 | Reclamation and Closure |
This project will include both concurrent reclamation during the LOM and final reclamation following the completion of mining operations. Upon the cessation of mining activities, the site will transition into final reclamation and closure activities. It is assumed that final reclamation will be completed using the existing equipment fleet that supported the mining operation. Based upon the implementation of concurrent reclamation throughout the LOM, it is assumed that the demolition and most of final reclamation activities will be completed in approximately one year.
The refinery, all facilities, foundations, etc., will be demolished and removed, or broken up and buried in place as applicable. The debris will be disposed of in the final pit and covered in accordance with the State of Nevada mining regulations. Haul roads, access roads, and facility pads will be ripped and regraded to approximate original contours. The WRSF, TSF, coarse gangues dump, and backfilled dumps will be built to design, and reclaimed in accordance with an agency-approved reclamation plan that complies with federal and state regulations for closure and reclamation.
Results of a Meteoric Water Mobility Procedure (MWMP) analyses indicate some potential for constituent leaching from material sampled. Aluminum, arsenic, beryllium, fluoride, iron, lead, manganese, pH, sulfate, total dissolved solids, and uranium were observed in concentrations greater than the Nevada Division of Environmental Protection (NDEP) reference values for drinking water in one or more samples. The concentrations of elements observed are not unusual for the alkaline, high-clay content soils in the project area and Nevada in general. Arsenic, in particular, is endemic and pervasive in Nevada soils.
Results of an Acid-Base Accounting (ABA) analyses on ore and alluvium are universally good with high ratios of Acid Neutralization Potential to Acid Generation Potential (ANP:AGP). The probability of acid generation from ore and alluvium is very low. Special handling of tuffaceous marker bed material may be warranted due to lower pH (5.83) and potentially marginal ratio of 1.3:1 ANP:AGP. Geochemical analyses are ongoing with additional ore samples currently undergoing MWMP and ABA analyses. Tailings analyses are planned as the proposed humidity cell testing may be undertaken pending evaluation of comprehensive results by the NDEP Bureau of Mining Regulation and Reclamation (BMRR) and the BLM.
Topsoil or alluvium growth medium material salvaged during operations will be spread on the regraded areas where additional growth medium is required to establish vegetation. All areas will be reseeded with an agency approved seed mix in accordance with reclamation permit requirements. Final reclamation monitoring and maintenance are assumed to be required and have been incorporated into the mine’s operating cost estimate, for a ten-year period following the completion of reclamation activities.
| barr.com |
|
|
14 Processing and Recovery Methods
| 14.1 | Introduction |
ABTC and third-party consultant Woods have prepared this PFS chapter. Test work discussed in Chapter 10 of this report developed the basis for the process block flow diagram as shown in Figure 14-1 and defined in the high-level process design criteria (Table 14-3) used for the beneficiation and refining plant development.
The refining process presented here has been developed using industry-standard, commercially proven unit operations. The block flow diagram provides the basis for operating costs presented in this report. ABTC has designed and is currently piloting its own internally developed proprietary process for producing battery-grade LHM from claystone feed material and intends to detail the performance of this system in future reports.
The commercial processing plant will produce battery-grade LHM from lithium claystone supplied by ABTC’s Tonopah Flats mine. The beneficiation and refining facility is designed to process 11.9 Mtpa of claystone and have an overall production capacity of 30,000 tpa of LHM. The refinery will be constructed in three phases. The first phase is designed to produce 5,000 tpa of battery-grade LHM. The second and third phase refinery expansions are each designed to produce 12,500 tpa of battery grade LHM. Figure 14-1 illustrates the block flow diagram highlighting the major processing steps.

| Figure 14-1 | ABTC’s Process Block Flow Diagram |
| barr.com |
|
|
The Tonopah Flats plant is designed to include:
| ● | Comminution and Screening |
| ● | Beneficiation |
| ● | Pretreatment and Extraction |
| ● | Impurity Removal and Concentration |
| ● | Impurity Crystallization |
| ● | Sulfate Crystallization |
| ● | Lithium Hydroxide Conversion |
| ● | Tailings Management |
| ● | Utilities |
| 14.2 | ABTC’s Pilot-Scale Plant |
ABTC has successfully designed, installed, commissioned, and operated a pilot plant (approximately 5 tpd claystone capacity) to inform the design of the commercial refinery process. The pilot was designed in the first half of calendar year 2023, installed during the fourth quarter of 2023 and into the first quarter of 2024, then commissioned and operated throughout 2024. In early 2025, the pilot line was operated continuously for two weeks to demonstrate the robustness of the process, selection of equipment, reliability, and consistency of the individual process unit operations.
| 14.2.1 | Pertinent Results |
ABTC’s lithium pilot-scale plant was designed, built, and commissioned by its in-house engineering team. The design includes both manual and continuous processes to demonstrate process conditions as well as cost metrics at this scale. The pilot plant is controlled by an in-house supervisory control and data acquisition (SCADA) system, including process monitoring/control, data collection, and analysis tools. Validation of the process was achieved in collaboration of ABTC’s analytical lab team, who performed regular quality analysis of in-process samples.
To date, the pilot plant has processed over 50 t of claystone and generated kilogram-level samples of LHM product that meet battery grade specifications, as shown in Figure 10-9. Feedstock for these pilot scale trials was provided directly from ABTC’s Tonopah Flats resource and is representative of the expected feed to the commercial scale process facilities in Li composition, deleterious element content, as well as physical condition (moisture, debris, particle size). It is the QP’s opinion that the pilot plant feed utilized in runs is an adequate representation of the deposit.
| 14.2.2 | Key Findings and Scale-Up Differences |
Various learnings applied to the commercial scale-up effort are detailed below.
| barr.com |
|
|
| 14.2.2.1 | Differences Between Pilot and Commercial Scale |
Due to various design considerations, some process steps were operated at conditions different than what would be expected on a commercial scale. These are detailed below:
| Table 14-1 | Differences Between Pilot and Commercial Scale |
| Step | Pilot | Commercial | Comment |
| Centrifuges | Manual/Batch | Continuous | Continuous centrifuges are not suitable for pilot-scale throughputs. Manual basket centrifuges are typical for characterizing the process and solid product for scale-up. |
| Precipitation | Batch | Continuous | In-line quality analysis to enable continuous precipitation intended at pilot scale but not yet validated. Batch-wise operation of single filter press upstream at pilot scale limits continuous operation of precipitation. |
| Evaporation | Steam-Driven + Vacuum | MVR | MVRs are not cost- or timeline-effective at pilot scale. Evaporation at pilot scale occurs at a lower temperature and vacuum than MVR conditions. |
| Ion Exchange (IX) Regeneration | Offline | Online | IX beds regenerated with offline reagent system, at commercial scale will be managed with automated carousel operation. |
| LHM Product Crystallization | 1-step w/ manual reprocessing | 2-Step (Crude, Pure) | To achieve product quality, the pilot system utilized a single-stage crystallization system with manual redissolution/washing and reprocessing for any subsequent stages. |
MVR = Mechanical vapor recompression
| 14.2.2.2 | Key Findings |
Pilot scale operations have resulted in observation of multiple available design enhancements, some of these are detailed below:
| Table 14-2 | Design Requirements Not Previously Identified |
| Step | Process Parameter | Comment |
| Monovalent Impurity Removal | pH Control | pH control of PLS in the recirculation loop is critical to ensure proper removal of impurities |
| Ion Exchange | Resin Type | Impurity buildup identified at levels that could affect downstream processes – additional resins specified to keep these below problematic levels. |
| Distillate Recovery | Quality | Evaporator operation has a large impact on distillate quality. Poor distillate quality is unsuitable for re-use in high-purity applications (e.g., product washing). Continuous quality monitoring and evaporator equipment improvements should be added upon diagnosis of poor distillate quality; polishing bed recommended for commercial scale. |
| Water Imbalance | Tank Size/Level Control | Arrangement/size of leach, precipitation, and recycle water tanks may lead to an imbalance. Recommend commercial sizing increase to prevent blockage/bottleneck due to provisional location of water volume in the process. |
PLS = pregnant leach solution
| barr.com |
|
|
| 14.3 | High Level Design Criteria |
The Process Design Criteria is presented in Table 14-3. Although much of the following portions of Chapter 14 are written in the present tense, the text herein refers to the proposed or planned process, of the future, rather than any existing infrastructure or process arrangement as of the effective date of this report.
| Table 14-3 | High Level Process Design Criteria |
| Parameter | Unit | Nominal |
| General | ||
| Life of Mine | year (yr) | 45 |
| Plant Design Lithium Hydroxide Production (Total) | tonnes per annum (tpa) | 30,000 |
| Phase 1 Lithium Hydroxide Production | tonnes per annum (tpa) | 5,000 |
| Phase 2 Lithium Hydroxide Production | tonnes per annum (tpa) | 12,500 |
| Phase 3 Lithium Hydroxide Production | tonnes per annum (tpa) | 12,500 |
| Crushing Plant | ||
| Run of Mine (ROM) | ||
| Feed Specific Gravity | - | 2.69 |
| Bond Abrasion Index | grams (g) | 0.5 |
| Bond Ball Work Index | kilowatt-hour per tonne (kWh/t) | 7.18 |
| Unconfined Compressive Strength (UCS) | megapascal (MPa) | 21 |
| ROM Moisture | percent (%) | 15 |
| Design ROM Lithium Grade | parts per million (ppm) | 742 |
| Throughput – Phase 1 | ||
| Annual Crushing Throughput | tonnes per annum (tpa) | 2,300,000 |
| Crushed Material Size P100 | millimeter (mm) | 25 |
| Beneficiation | ||
| Throughput – Phase 1 | ||
| Annual Beneficiation Throughput | tonnes per annum (tpa) | 2,300,000 |
| Hourly Throughput | tonnes per hour (tph) | 290 |
| Planned Beneficiation Effective Utilization | percent (%) | 90.3 |
| Planned Beneficiation Operating Hours, Annual | hours (h) | 7,906 |
| Beneficiation Concentrate – Phase 1 | ||
| Claystone Concentrate Produced Hourly | tonnes per hour (tph) | 90 |
| Lithium grade | parts per million (ppm) | 2090 |
| Lithium recovery | percent (%) | 79.30 |
| Lithium Extraction and Purification | ||
| Nominal Lithium Extraction | percent (%) | 67.4 |
| Nominal Lithium Recovery-Purification/Conversion | percent (%) | 93.3 |
| barr.com |
|
|
| 14.4 | Comminution and Screening |

| Figure 14-2 | Comminution and Screening Flow Diagram |
The mine will deliver lithium claystone feed mined by a hydraulic shovel and transported by haul truck to the ROM hopper. The apron feeder conveys the mineralized material out of the ROM hopper to the vibrating grizzly for preliminary sizing. The oversized material discharges to the sizer while the undersize discharges to the beneficiation transfer conveyor. The sizer reduces the mineralized material and discharges it to the beneficiation transfer conveyor for deagglomeration in the attrition scrubber at the refinery.
The beneficiation transfer conveyor deposits sized material into a ROM hopper at the feed to the refinery. This ROM hopper feeds material into the attrition scrubber, where recycled process water is added. Overflow from the attrition scrubber is discharged to the scalping screen, where the oversized barren lithium material is removed and conveyed to a coarse gangue dump, which will be combined with other tailings streams.
| barr.com |
|
|
| 14.5 | Beneficiation |

| Figure 14-3 | Beneficiation Flow Diagram |
The underflow slurry from the scalping screen is collected in a pump box where additional process water is added to adjust the slurry pulp density to its optimal condition for classification using hydrocyclones. The classification circuit consists of two hydrocyclone clusters fed in series. Overflow from the first hydrocyclone cluster (hydrocyclone #1) is discharged into the hydrocyclone overflow collection tank. The underflow is discharged to a pump box that feeds the second hydrocyclone cluster (hydrocyclone #2). Additional recycled process water is added to the pump box to adjust the slurry pulp density. Overflow from hydrocyclone #2 is combined with the overflow from hydrocyclone #1 in the hydrocyclone overflow collection tank. Underflow from hydrocyclone #2 is pumped to the beneficiation tailings filter feed tank. The hydrocyclone overflow collection tank gravity feeds the hydroclassifier. In the hydroclassifier, the coarse feed settles to the bottom, and the lithium-rich fine solids stay suspended and report to the hydroclassifier overflow. Underflow from the hydroclassifier is pumped to the beneficiation tailings filter feed tank, where it combines with the hydrocyclone underflows. This slurry is filtered in a set of filter presses, and the cake is sent to the tailings backfill pile. Filtrate is recycled back to the beneficiation process.
| barr.com |
|
|

| Figure 14-4 | Filter Press Flow Diagram |
The hydroclassifier overflow is sent to the concentrated claystone filter feed tank, which is then pumped to a set of filter presses. The solid cake is collected and conveyed to the agglomeration hopper, and the filtrate is recycled back to the beneficiation process.
| 14.6 | Extraction |

| Figure 14-5 | Extraction Flow Diagram |
The beneficiated claystone is stored in the agglomeration hopper and transferred to the briquetter via the briquetter feed conveyor. Recycled and fresh reagents are also added to the briquetter feed conveyor where they are combined with the beneficiated claystone.
| barr.com |
|
|
Due to variable onsite electrical generation, transmission capacity constraints, and the requirements for this step, the feed rate of claystone will be modulated to reduce demand whenever electricity supply is constrained. Feed rate during periods of high-power constraints may be as low as a quarter of the continuous design rate, while the “surge” rate during minimal power constraints may exceed nominal plant design rates to achieve the net daily production rate. The opportunity to optimize equipment operation during the daily power cycles will be investigated in the next phase of design.
The pretreated beneficiated claystone is discharged, where it is converted to a slurry by adding process water. The slurry is then pumped to the leach circuit, and during surge production, excess converted claystone will be stored locally in order to maintain a constant feed rate to the downstream refinery. Pretreated claystone storage logistics and arrangement will be investigated in the next phase of design.

| Figure 14-6 | Thickener and Leaching Flow Diagram |
The leach circuit consists of three agitated tanks (TNK-3125-01/2/3) operating in a cascading overflow fashion. The retention time in each tank is fifteen minutes. This slurry is then sent to a countercurrent decantation (CCD) circuit of three thickeners in series (TNK-3130-01/2/3), the underflow of each, feeding into the next.
The leached slurry from the 3rd CCD underflow is pumped to the leach filter feed tank (TNK-3130-04) for processing to recover the PLS. The leach filter feed tank feeds a recessed plate filter (FP-3130-01) to separate the solid phase from the aqueous phase. The PLS is advanced to the precipitation circuit for impurity removal. Once the filter is full, the slurry feed to the filter is stopped and wash water is added to the filter to recover interstitial fluid remaining in the filter cake to recover additional lithium. The wash water is recovered and recycled to the leach/CCD circuit to lower water consumption and reduce lithium losses.
| barr.com |
|
|
| 14.7 | Impurity Removal and Concentration |

| Figure 14-7 | Precipitation Flow Diagram |
Following the leach circuit, the PLS is fed to a series of three cascading tanks (TNK-3140-01/2/3) where metal impurities are precipitated out through a series of reagent additions by the addition of a recycled hydroxide solution from the LiOH crystallizer, soda ash, and ferrous sulfate. The discharge from the last precipitation tank is pumped to the precipitation filter for processing.
The precipitation filter feed tank (TNK-3140-04) feeds a candle filter (FLT-3140-01) to remove the fine precipitates and recover the PLS. Filtrate is collected in the PLS reverse osmosis feed tank (TNK-3140-05) prior to concentration in the reverse osmosis (RO) circuit. The filter cake, comprised of carbonates and hydroxides of calcium, strontium, magnesium, etc., is washed with process water to recover entrained PLS and the wash water is recycled to the quench tank to minimize lithium losses.

| Figure 14-8 | Osmosis Flow Diagram |
The pH of the PLS is adjusted prior to pumping it through a RO membrane (RO-3140-01) to concentrate the dissolved salts and lower the energy requirement on the downstream crystallizer. The permeate from the reverse osmosis unit is collected and recycled as process water to reduce net water consumption and recover any lithium that may report to the permeate stream. The concentrate is collected in the monovalent crystallizer feed tank (TNK-3150-01).
| barr.com |
|
|
| 14.8 | Impurity Crystallization |

| Figure 14-9 | Crystallizer Flow Diagram |
The concentrated PLS is then further processed in the impurity crystallizer circuit (CRY-3150-01) to remove the bulk of impurities by mechanical vapor recompression crystallization. The evaporative crystallizer and cooling crystallizer series are operated at conditions to minimize the loss of lithium to the crystal phase. Discharged slurry from the evaporative crystallizer is then filtered through a pusher style centrifuge, where the salt mixture is recovered and recycled back to supplement the upstream reagent requirements and recycle any entrained lithium. The filtrate stream after cold-crystallization is lithium-rich, and advances to the lithium sulfate crystallizer system (CRY-3155-01).
| 14.9 | Sulfate Crystallization |
The filtrate from the crystallizer is processed in a second mechanical vapor recompression crystallizer (the lithium sulfate crystallizer, CRY-3155-01) to precipitate lithium as lithium sulfate monohydrate to reduce the amount of monovalent and divalent impurities. Discharged slurry from the crystallizer is filtered through a pusher style centrifuge, similar to the previous unit operation. The filtrate stream is recycled back to the impurity crystallizer to remove excess impurities. The lithium sulfate crystals from the centrifuge are transferred to an agitated tank where they are mixed with process water and dissolved to form a lithium sulfate solution.
| barr.com |
|
|
| 14.10 | Hydroxide Conversion and Crystallization |

| Figure 14-10 | Ion Exchange Flow Diagram |
The lithium sulfate solution is then pumped through a series of IX columns (IX-3160-01) to remove any remaining impurities that precipitated upstream with the lithium sulfate and carried over to redissolution. The IX resin will be periodically stripped with sulfuric acid and regenerated with sodium/lithium hydroxide produced from downstream operations.
Concentrated lithium sulfate solution is converted to lithium hydroxide solution by an electrochemical conversion process system (MED-3160-01). The dilute sulfuric acid by-product is collected in TNK-4040-01, and recycled in the process to strip the IX resin, adjust the pH prior to RO, as well as any other minor pH adjustments upstream. The lithium hydroxide stream produced by the electrochemical system is collected in the lithium hydroxide crystallizer feed tank (TNK-3170-01).

| barr.com |
|
|
| Figure 14-11 | Electrochemical Conversion Process Flow Diagram |
This final crystallizer train (CRY-3170-01) precipitates LHM crystals from the caustic solution of lithium, potassium, and sodium. The LHM crystals are washed, dried in DRY-3170-01, and bagged for shipping in BAG-3170-01. The excess liquor from crystallization is collected in TNK-3170-02, and recycled back to precipitation for pH adjustment, and to IX for pre-loading of the resin.
| 14.11 | Tailings |
The filtered and washed residue from the extraction and impurity removal process, along with gypsum generated from off-gas handling, are combined and placed in a dry-stack. As areas of the pit are mined out, the tailings will be directed to the pit for backfill and not to the TSF. The tailings will be transported via conveyor to the TSF and placed via grasshopper conveyors to a stacking conveyor for placement. A bulldozer is used for compaction and final contouring.
| 14.12 | Utilities |
| 14.12.1 | Off-Gas Handling |
If required, the off gas from the sulfate conversion step is scrubbed using a lime system and the solids generated will be disposed to the TSF.
| 14.12.2 | Water |
Process water for comminution and beneficiation is delivered via pipeline from a well field, stored in a process water tank, and distributed as required. The overall process recovers and recycles roughly 93% of the process water required for operation, and between 300 to 700 m3/h of freshwater makeup is required for the full plant buildout. Grinding water is stored proximally at each refinery train, and distributed to the lime scrubber, attrition scrubber, and beneficiation circuit.
Process water for refining is collected from RO steps and excess distillate, with some feed-forward from the beneficiation filtrate water. It is stored in a tank proximal to each refinery train. It is pumped to various unit operations as needed, including leach, quench, and various reagent dosing systems. A minimum operating level is reserved in the tank for fire water, which can be pumped to the sprinklers in the case of a fire.
High-purity water users are supplied by recovered distillate from the mechanical vapor recompression (MVR) evaporators that is sent to a secondary purification step (similar to typical condensate polishing). The distillate from the MVRs is collected into the distillate tank, where it is pumped through a resin bed or other polishing system prior to being sent to the pure water users. Excess distillate is repurposed and added to the process water supply tank.
| 14.12.3 | Chilled Water |
Chilled water is fed to the cooling crystallization step in the monovalent crystallization circuit to precipitate impurities. This water/glycol mixture is recirculated locally through chillers that can operate down to sub-freezing temperatures if required.
| 14.12.4 | Cooling Water |
Cooling water is required for electrodialysis cooling and the cooling screws. This is provided via cooling towers, which are installed proximally for each refinery train.
| barr.com |
|
|
| 14.12.5 | Reagents |
| 14.12.5.1 | Flux |
Flux for processing is recycled from the process at approximately 75%, with the additional amount being made up with fresh supply. The makeup quantity is brought in via tractor trailer, where it is unloaded into covered stockpiles and mixed with recycled flux prior to agglomeration in the briquetter.
| 14.12.5.2 | Soda Ash |
Soda ash is received in bulk bags and stored proximally at each precipitation train, where it is fed into the process. The bulk bags are loaded into a silo/hopper via standard bulk bag unloading system(s), then fed into the refinery via a screw conveyor and loss-in-weight feeder. Solids are dropped directly into the precipitation tank(s) where they are consumed.
| 14.12.5.3 | Ferrous Sulfate |
Ferrous sulfate is received in bulk bags and stored proximally at each precipitation train, where it is fed into the process. The bulk bags are loaded into a silo/hopper via standard bulk bag unloading system(s), then fed into the refinery via a screw conveyor and loss-in-weight feeder. Solids are dropped directly into the leach and precipitation tank(s) where they are consumed.
| 14.12.5.4 | Hydroxide Solution |
Hydroxide solution is liquor (a blend of sodium, potassium and lithium hydroxide) produced in the lithium hydroxide crystallization step. Composition may vary depending on how the final product crystallization steps are operated. It is collected in a proximally located storage tank where it is recycled to various upstream users, including precipitation, IX regeneration, and lithium crystallization feed. The storage tank and associated lines are heated and insulated to prevent precipitation. A startup quantity may be required for initial commissioning and operation of precipitation and IX regeneration, which will be trucked in as a 50% sodium hydroxide solution.
| 14.12.5.5 | Sulfuric Acid |
Dilute sulfuric acid is produced in the lithium hydroxide conversion step and is stored in a tank local to each refinery train. The process is a net producer of sulfuric acid, so excess acid will be concentrated and sold to customers off-site.
| 14.12.5.6 | Lime |
Lime (CaO), if needed, is trucked in and pneumatically conveyed into a silo with baghouse at the scrubber system. The silo feeds a slaking system, producing milk of lime, which feeds into the scrubber recirculation line. Spent reagent is collected in another silo and trucked off as waste.
| barr.com |
|
|
15 Infrastructure
| 15.1 | Site General Arrangement |
The TFLP location is approximately 11 km west of Tonopah, Nevada, along US 6/95. The primary entrance will be south of the highway, providing access to the Tonopah Flats Lithium Claystone Refinery. The refinery will be constructed on condemned claims approximately one kilometer west of the initial pit phases (see Figure 13-7).
| 15.1.1 | Access Roads |
From the primary site entrance, service roads will be built to access areas throughout the property, including the Tonopah Flats Lithium Claystone Refinery as well as the mine office and truck shop.
Mining roads will be developed for haulage of claystone and tailings material between the pit, refinery, TSF, and other infrastructure located within the property boundary.
| 15.1.2 | Process Plant General Arrangement |
The refinery is set within an 81-hectare (200-acre) boundary constructed adjacent to the NV Energy power line easement to the south along the west boundary of the Tonopah Flats Property (Figure 15-1). Refinery process equipment for Phase 1 is to be constructed in scheduled equipment “trains” to meet the production target of 30,000 tpa of product. The initial process train to be constructed will produce 5,000 tpa of product. Subsequent train construction will be staggered after the start of the initial train’s production to complete Phase 1 of the Tonopah Flats Lithium Claystone Refinery. Subsequent trains are planned at a capacity larger than the initial train to capture economies of scale and further system efficiency improvements.
| barr.com |
|
|

| Figure 15-1 | Refinery Block Layout |
| barr.com |
|
|
| 15.1.3 | Reagents, Consumables, and Shipping |
| 15.1.3.1 | Reagents |
The stockpile of primary reagents will be located in a covered facility and filled via truck offload. Reagents are also recovered and recycled within the process. Fresh reagent makeup will be added to the recycled feed lines to supplement consumption from the refinery process.
| 15.1.3.2 | Consumables |
Other bulk solid consumables including lime and soda ash are delivered to the facility via truck and offloaded into silos. Material consumables (e.g., cubic meter bags) are delivered via truck to the material warehouse and distributed to facility use areas.
| 15.1.3.3 | Shipping |
The primary site warehouse is developed for LHM product storage and outbound shipping. This facility will be constructed in a secure space between the administrative offices and the refinery and will also house the logistics office.
| 15.1.4 | Ancillary Buildings |
| 15.1.4.1 | Administration |
Administrative functions supporting the mine and refinery will be housed directly south of US 6/95, outside the main gate to the plant. This administrative office will provide offices, meeting space, and related facilities without need for site access beyond the gatehouse.
| 15.1.4.2 | Gatehouse |
A gatehouse, located just south of the administration building, will provide security, controlled personnel access to the site, and delivery management. A weigh scale will be installed near the gatehouse to coordinate with logistics and shipping.
| 15.1.4.3 | Warehouses and Workshops |
Separate from reagent handling and product storage, additional outbuildings installed around the facility will contain spare parts and material storage. The refinery maintenance workshop will include maintenance offices, some storage, and shop space with tooling for refinery equipment repairs.
| 15.1.4.4 | Laboratory |
Onsite analytical laboratory space and equipment will be installed within the building containing the refinery’s final purification processes. This laboratory will provide quality control testing for the process and will be used to produce Certificates of Analysis (COA) of refinery products.
| barr.com |
|
|
| 15.2 | Mine Infrastructure and Tailings Facility |
| 15.2.1 | Mine Workshop and Truck Maintenance |
A mine office with a mobile maintenance shop and fueling stations will be situated further east of the main entrance, also directly south of the highway. This provides a separate service entrance for mine fleet operations, maintenance, and refueling.
The truck shop will be developed for maintenance on the mining haul fleet and other rubber-tired equipment. The shop will feature cranes, hydraulic lifts, tire changing equipment, diagnostic and calibration systems, and other fleet repair tooling.
| 15.2.2 | Fuel Storage and Distribution |
Fuel will be delivered to the fuel depot situated near to the mining office and truck shop. Fuel trucks will deliver fuel to the mobile pit fleet at designated locations along the haul roads.
| 15.2.3 | Tailings Storage Facility |
The TSF is to be located along the west boundaries of the mine pit south of the refinery. Tailings will be conveyed from the refinery to the TSF by use of a conveyor system. The tailings will be spread by bulldozers or loaders and compacted by the wheel loads of the associated equipment. The TSF will be utilized until tailings backfilling into the pit begins. The location of the TSF is shown on Figure 13-16 and shows tailings, backfill, and pit layout.
| 15.2.3.1 | Tailings Storage Facility Geotechnical Parameters |
The geotechnical parameters for the TSF design were established from data collected during the alluvium investigation in March 2025 and tailings samples collected and tested as part of site visits conducted in June 2025.
Lab testing was performed as part of the alluvium investigation to assess geotechnical parameters for the in place alluvial soils and to establish strength parameters for recompacted alluvium to be used in construction of the starter dam. Detailed lab results are included the technical memorandum regarding the Tonopah Flats PFS Study – Alluvium GDR (Barr Engineering Co., 2025).
Lab testing in conjunction with the tailings facility visit was performed to assess the strength of the placed tailings material. The lab testing included particle size distribution, Atterberg Limits, Standard Proctor compaction, and direct shear testing. A summary of the tailings lab test results is provided in Table 15-1 and Table 15-2.
| barr.com |
|
|
| Table 15-1 | Tailings Index Properties |
| Material | PSD Results | Atterberg Limits | Proctor | |||||||
| Gravel (%) | Sand (%) | Silt (%) | Clay (%) | Liquid Limit | Plastic Limit | Plasticity Index | Dry Density | Optimum Water Content (%) | ||
| (pcf) | (kg/m3) | |||||||||
| Tailings | 1.0 | 38.7 | 44.3 | 16.0 | NP | NP | NP | 80.8 | 1,294 | 34.4 |
| % | = percent |
kg/m3 = kilograms per cubic meter
NP = Non-Plastic
pcf = pounds per cubic foot
| Table 15-2 | Direct Shear Test Results for Tailings |
| Material | Drained Shear Strength | ||
| Apparent Cohesion | Friction Angle, ϕ (degree) | ||
| c (psf) | c (kPa) | ||
| Tailings at 20.1% Moisture | 42 | 2.01 | 36.9 |
| Tailings at 25.1% Moisture | 4 | 0.19 | 36.8 |
| Tailings at 30.1% Moisture | 282 | 13.50 | 35.6 |
kPa = kilopascals
psf = pounds per square foot
A summary of the geotechnical parameters used in the stability analysis is provided in Table 15-3.
| Table 15-3 | Geotechnical Model Parameters |
| Material | Conductivity, k | Moist Unit Weight | Mohr-Coulomb Parameters | Shear-Normal Points | ||||
| (ft/s) | (cm/s) | (pcf) | (kN/m3) | Cohesion c’ (psf) | Friction
Angle ϕ’ (deg.) |
(psf) | (kPa) | |
| Tailings1 | 1x10⁻⁵ – 1x10⁻⁸ | 3x10⁻⁴ – 3x10⁻⁷ | 94.6 | 14.8 | 0 | 37 | (2000, 1593), (4000, 3053), (8000, 6027) |
(114.9, 76.3), (191.5, 146.2), (383.0, 288.6) |
| Fill (Alluvium)2 | 4.59x10⁻⁸ | 1.40x10⁻⁷ | 129.6 | 20.4 | 0 | 30 | (3168, 3510), (6336, 5292), (12672, 10306) | (151.7, 168.1), (303.4, 253.4), (606.7, 493.5) |
| Native Alluvium3 | 8.20x10⁻⁶ | 2.50x10⁻⁴ | 94.3 | 14.8 | 0 | 36 | (7845, 4675), (13132, 9797), (31541, 18868) | (375.6, 223.8), (628.8, 469.1), (1510.2, 903.4) |
| Claystone4 | 1x10-12 | 3x10-11 | - | Impenetrable (Infinite Strength) | ||||
1 Derived from 30.1% MC testing
2 Derived from alluvium triaxial testing at 98% of Standard Proctor Compaction
3 Derived from alluvium direct shear testing at 80% of Standard Proctor Compaction
4 Claystone modeled as Impenetrable (Infinite Strength) with low conductivity
deg = degree
ft = feet
kN/m3 = kilonewtons per cubic meter
kPa = kilopascals
pcf = pounds per cubic foot
psf = pounds per square foot
s = second
| barr.com |
|
|
| 15.2.3.2 | Tailings Storage Facility Stability Analysis |
A series of stability analyses were performed to assess the stability of the TSF throughout the deposition process. A simplified geometry of the TSF was used in the model. Two sections were checked, one on the north side of the TSF and the other on the west side where a proposed ramp will be located (Table 15-4). The TSF was modeled with a 2.25H:1V slope angle to a maximum height of 140 m. A 9 m high perimeter berm was included to act as a buttress and provide containment for the initial tailings placement. The downstream slope of the buttress was modeled at 3H:1V. A 0.69-m-deep ditch was also included in the model as a flow pathway for any runoff from the TSF stack.
Model scenarios were performed to assess the stability of the TSF under planned operating conditions throughout the life of the stack under static conditions. The target FOS under static conditions is 1.50. Models were run at ~40 m, 75 m, 100 m, 125 m, and 140 m heights.
In addition, a seismic factor was applied to the models to assess stability under seismic loading. A seismic loading coefficient (kh) of 1/2 the horizontal peak ground acceleration (PGA) is typically used in seismic analysis. The PGA for the site was determined to be 0.32 based on the ASCE/SEI 7-22 Hazards Report (ASCE, 2025). Based on a PGA of 0.32, a kh of 0.16 was chosen for the analysis. The target FOS for seismic conditions is 1.10.
| Table 15-4 | Tailings Storage Facility Stability Modeling Results |
| Model Number/Location | Height | Strength Parameter | Seismic Factor | Factor Of Safety | |
| (m) | (ft) | ||||
| 2.0.2 – North | 40.7 | 133.52 | Mohr-Coulomb | N/A | 1.71 |
| 3.0.1 – West | 40. | 133.52 | Mohr-Coulomb | N/A | 1.52 |
| 4.0.1 - North | 41. | 135.3 | Shear-Normal | N/A | 2.04 |
| 4.0.2 - North | 41.2 | 135.3 | Shear-Normal | 0.16 | 1.37 |
| 5.0.1 - North | 75 | 246.1 | Shear-Normal | N/A | 1.96 |
| 5.0.2 - North | 75 | 246.1 | Shear-Normal | 0.16 | 1.28 |
| 6.0.1 - North | 100 | 328.1 | Shear-Normal | N/A | 1.89 |
| 6.0.2 - North | 100 | 328.1 | Shear-Normal | 0.16 | 1.24 |
| 7.0.1 - North | 125 | 410.1 | Shear-Normal | N/A | 1.85 |
| 7.0.2 - North | 125 | 410.1 | Shear-Normal | 0.16 | 1.20 |
| 8.0.1 - North | 140 | 459.3 | Shear-Normal | N/A | 1.82 |
| 8.0.2 - North | 140 | 459.3 | Shear-Normal | 0.16 | 1.18 |
ft = feet
m = meters
In addition to the overall stability analysis, two sensitivity analyses were conducted. The first was to assess the effects of variable horizontal seismic coefficients. The second was to assess the influence of free water within the stack on overall stability. The results of the sensitivity analyses are provided in Table 15-5 and Table 15-6.
| barr.com |
|
|
| Table 15-5 | Seismic Sensitivity Results |
| Model Number/Location | Height | Strength Parameter | Seismic Factor | Factor of Safety | |
| (m) | (ft) | ||||
| 2.0.4 – North | 40.7 | 133.52 | Mohr-Coulomb | 0.05 | 1.50 |
| 2.0.4 – North | 40.7 | 133.52 | Mohr-Coulomb | 0.1 | 1.32 |
| 2.0.4 – North | 40.7 | 133.52 | Mohr-Coulomb | 0.15 | 1.15 |
| 2.0.4 – North | 40.7 | 133.52 | Mohr-Coulomb | 0.16 | 1.12 |
ft = feet
m = meters
| Table 15-6 | Water Sensitivity Analysis |
| Model Number/Location | Height | Strength Parameter | Seismic Factor | Factor Of Safety | |
| (m) | (ft) | ||||
| 2.1.1 – 20% Free Water | 40.7 | 133.52 | Mohr-Coulomb | N/A | 1.71 |
| 2.2.1 – 30% Free Water | 40.7 | 133.52 | Mohr-Coulomb | N/A | 1.62 |
| 2.3.1 – K = 1e-5 cm/s | 40.7 | 133.52 | Mohr-Coulomb | N/A | 1.67 |
| 2.3.2 – K = 1e-6 cm/s | 40.7 | 133.52 | Mohr-Coulomb | N/A | 1.71 |
| 2.3.3 – K = 1e-8 cm/s | 40.7 | 133.52 | Mohr-Coulomb | N/A | 1.71 |
cm = centimeter
ft = feet
m = meters
s = second
The models and results are provided in the Technical Memorandum (Barr Engineering Co., 2025).
| 15.3 | Power Infrastructure |
Electrical power for the processing facility and mine will be supplied through a hybrid model that combines on-site generation with utility-provided power. A 120 kV and 55 kV transmission corridor runs west to east across the project site, interconnecting with NV Energy’s Miller’s Substation. ABTC has completed an initial load transmission study in collaboration with NV Energy, confirming that the existing infrastructure has sufficient capacity to support initial operational needs and support approximately 1/3 of final operating load. ABTC is actively engaged with NV Energy to continue studying the import and export system capacity abilities of the site.
To integrate both utility power and on-site renewable generation, ABTC will construct a new 120 kV high-voltage substation onsite. This substation will function as the central hub for electrical distribution across the entire project, including the processing facility, mine, and auxiliary loads.
| 15.3.1 | Site Power Distribution |
ABTC will construct a 120 kV high-voltage substation to serve as the primary utility interconnection point. This substation will manage high-voltage transmission power and step the voltage down to 34.5 kV for distribution across the site. Power will be supplied through a blended model, combining utility imports with onsite solar generation and battery storage connected behind the meter. This approach reduces reliance on grid power, lowers energy costs, and improves operational flexibility, while also enabling potential export of surplus energy.
| barr.com |
|
|
The 34.5 kV medium-voltage (MV) distribution loop will serve as the electrical backbone for the site, supplying power to both the processing plant and mining infrastructure. Power from this loop will be routed to multiple MV switchgear lineups and strategically located power distribution centers, which will further step-down voltage for local use. To enhance reliability and maintainability, the 34.5 kV loop will be configured as a normally open ring, enabling sectional isolation and back feeding capabilities. Critical loads will be backed by uninterruptible power supply (UPS) systems or directly supported by the direct current (DC) bus.
A 4.16 kV distribution network will support large process and mining equipment, including high-horsepower motors, crushers, pumps, compressors, and electrochemical systems. General plant and auxiliary systems will be powered through 480 V low-voltage distribution boards, while lighting, controls, and small equipment will be served via 208/120 V transformers and panels.
In selected areas of the processing facility, ABTC will implement a DC system to serve DC-native loads such as variable frequency drives (VFDs), electrochemical systems, and other process and building systems designed for DC operation. The DC architecture is intended to reduce conversion losses, enhance efficiency in high-duty-cycle applications, and enable direct integration with distributed DC generation and energy storage resources across the site.
| 15.3.2 | Onsite Power Generation |
ABTC intends to construct an 800 megawatts direct current (MWdc) solar photovoltaic generation facility integrated with a utility-scale battery energy storage system (BESS) on the northern section of the project site. The system may employ a DC-coupled architecture, enabling solar power to be fed directly into the batteries without intermediate inversion to AC, thereby improving round-trip efficiency and overall system responsiveness.
Tonopah’s unique geographic characteristics make it ideally suited for solar energy production. The site benefits from some of the highest solar irradiance levels in the U.S., with extended sunlight hours, minimal cloud cover, and low humidity. These conditions maximize photovoltaic energy yield and strengthen the business case for on-site renewable generation.
The onsite solar and battery system is targeted to produce more than 1.5 terawatt-hours (TWh) of energy per year, a quantity that is expected to substantially offset both the facility’s operating load and contribute surplus energy for potential grid exports and service. ABTC’s strategy to co-locate onsite solar generation with battery storage and an integrated energy management system allows the project to produce low-cost power while improving operational flexibility and grid responsiveness. This approach enables real-time control over energy dispatch, demand shifting, and time-of-use optimization, allowing the facility to minimize peak demand charges and reduce reliance on grid imports during high-cost periods. It also enhances ABTC’s ability to align production with grid constraints, respond to utility signals, and potentially participate in ancillary service markets. By managing both generation and load in a unified system, ABTC positions itself to reduce energy-related operating costs while increasing system resiliency and long-term energy autonomy.
An energy management system (EMS) will monitor, control, and forecast energy flows across the solar array, battery storage, processing plant, mine, and utility interconnection. The EMS will manage dispatch between on-site generation, storage, and the utility grid to maximize power delivery to the facility while minimizing utility charges during periods of high electricity prices. Additionally, the EMS will enable export control and support participation in load demand response programs in coordination with the utility and wholesale energy markets.
| barr.com |
|
|
ABTC has designated the 120 kV substation as an integral component of the solar and battery project, and has included all associated costs, such as substation infrastructure, protection systems, metering, and interconnection equipment, within the solar and battery financial model. This approach reflects the substation’s core role in enabling utility interconnection, managing bidirectional power flow, and supporting import/export metering for the solar facility.
ABTC has engaged NV Energy to perform a combined system impact study evaluating both the import and export capabilities of the facility. This analysis is essential to confirm the site’s ability to draw power during high-demand periods while also exporting surplus solar generation back to the grid.
| 15.3.3 | Financial Incentives and Revenue Opportunities |
ABTC is currently evaluating eligibility under several incentive programs, including the Investment Tax Credit (ITC) and Production Tax Credit (PTC) programs as enabled by the Inflation Reduction Act (IRA). Depending on final system configuration, ownership structure, and grid interconnection parameters, the project may elect the ITC for upfront capital cost recovery or the PTC to monetize ongoing renewable energy production over time. Both programs offer potential enhancements for domestic content, energy community location, and prevailing wage compliance, further increasing their value to the project. While certain eligibility factors such as final design, milestone timing, and regulatory interpretation are still being evaluated, ABTC is proactively working to align the project to capture the full benefit of these incentives wherever possible.
In addition to federal tax incentives, ABTC will generate Renewable Energy Certificates (REC) for each megawatt-hour of solar energy produced. These RECs represent a marketable environmental attribute and can be sold into voluntary or compliance markets. ABTC plans to register its solar generation with compliance organizations to track and monetize these credits. The RECs may either be retired to support ABTC’s own emissions reduction goals or sold to third parties, creating a recurring revenue stream independent of electricity sales.
Furthermore, ABTC is exploring opportunities to participate in grid services markets through its battery energy storage system. Services under consideration include frequency regulation, voltage support, and processing plant demand response participation managed by the site EMS. These ancillary services provide potential for monetization while supporting regional grid stability and reliability in coordination with NV Energy.
The combination of federal tax incentives, environmental credit revenues, and energy market participation supports a positive financial evaluation of the proposed power system. These mechanisms not only reduce the project’s effective capital and operating costs but also demonstrate alignment with long-term sustainability and decarbonization goals.
| barr.com |
|
|
| 15.4 | Water Infrastructure |
| 15.4.1 | Water Supply |
Onsite well water will support site fire water, refinery, and mine loads. This is accomplished via multiple site wells and pump houses at locations near to primary water consumers’ buffer tanks.
ABTC is in the process of changing the point of diversion on 40.52 acres of water rights it owns in Basin 137a Permit No. 31053 to the well and acquiring additional water rights. Water usage associated with mining and processing may additionally require an application to the State of Nevada, Division of Water Resources for a water use permit as the project progresses.
The Tonopah Flats Property currently has one production well and one exploration well.
| 15.4.2 | Process Water Treatment and Recovery |
The majority of water in the refining system is recycled within the process. Process water from beneficiation is purged to the downstream extraction processes, and high purity waters from evaporation distillate and RO operations are fed into refinery processes requiring high purity water.
| 15.4.3 | Water Discharge |
Process water is designed to be recycled within the system, with some losses to tailings. The beneficiation and refinery trains have water purification steps local to the operations. The process does not require an on-site water treatment plant due to integrated process recycle loops. A less than one-acre lined evaporation pond has been included in the design for intermediate holding maintenance drains for refinery processes.
Site sanitary wastewater is designed with localized haul-off or site septic systems.
| 15.4.4 | Storm Water Handling |
Storm water runoff through the property primarily occurs via slime wash travelling west-northwest. A diversion trench provides stormwater re-direction into retention basins along the south boundary of the property. Local runoff from the tailing facilities will be directed into a collection pond on the west side of the facilities.
Refinery process sections will have containment in accordance with a National Pollutant Discharge Elimination System (NPDES) and site Stormwater Pollution Prevention Plans (SWPPP) requirements. Rainwater collected via any secondary containment will be pumped off as needed.
| 15.5 | Waste Management |
The commercial and light industrial site waste disposal will be contracted through the Nye County Class II Landfill in Tonopah, Nevada.
| 15.6 | Communications |
The site information technology (IT) internet service is expected to be fulfilled by Starlink or hardwired methods.
| barr.com |
|
|
Refinery facility operations connections will be provided on an ethernet network with firewalled subnets and wireless fidelity (Wi-Fi) for operator interaction.
Mine operations will be controlled via a GPS, radar, and node networked dispatch system controlled via the mine office. This system will provide automated scheduling and haulage traffic controlling for the fleet moving between the mine pit and refinery stockpiles.
| 15.7 | Mobile Equipment |
Site operations, supervisors, and maintenance staff will travel within the secure refinery area roads via truck or utility vehicles.
The refinery product warehouse will be equipped with three electric forklifts for pallet management and truck loading. The product finishing building will also feature forklifts for local staging of product. Autonomous guided vehicles and/or outdoor rated forklifts will be used to transport sealed product bags to the product warehouse.
| 15.8 | Rail |
The area around Tonopah, Nevada is not currently served by an active rail line or depot. The TFLP does not assume rail as a primary means of transportation for reagents or other materials.
| 15.9 | Fossil Fuels |
The area around Tonopah, Nevada is not currently served by a natural gas pipeline or liquefied natural gas (LNG) terminal. The refinery is designed around this constraint and the process equipment planned does not directly rely on liquid or gas fuels for production.
Provision for liquid fuels for the mobile fleet is accounted for in the mine infrastructure design.
| barr.com |
|
|
16 Market Studies
According to the U.S. Department of the Interior and U.S. Geological Survey’s Mineral Commodity Summary (2025), although lithium uses vary by location, global end uses were estimated as follows: batteries, 87%; ceramics and glass, 5%; lubricating greases, 2%; air treatment, 1%; continuous casting mold flux powders, 1%; medical, 1%; and other uses, 3%. Lithium consumption for batteries increased significantly due to the growing use of rechargeable lithium batteries in the growing market for electric vehicles (EVs), portable electronic devices, electric tools, and energy grid storage applications. Lithium minerals were also used directly, as mineral concentrates, in ceramics and glass applications.
Commercial-scale lithium production in the U.S. is currently from a single continental brine operation in Nevada. Owing to lower lithium prices in 2024, commercial production from the brine-sourced waste tailings of a Utah-based magnesium producer was idled. Two companies produced a wide range of downstream lithium compounds in the U.S. from domestic or imported lithium carbonate, lithium chloride, and lithium hydroxide.
Excluding U.S. production, worldwide lithium production in 2024 increased by 18% to approximately 240,000 t from 204,000 t in 2023. This was in response to strong demand from the lithium-ion battery market, high lithium prices from 2021 to early 2023, and an increase in global lithium production capacity. Global consumption of lithium in 2024 was estimated to be 220,000 t, a 29% increase from revised consumption of 170,000 t in 2023. Concern about a short-term lithium oversupply and weaker-than-expected EV sales worldwide during the first half of 2024 caused the price for lithium to decrease considerably throughout the year. Owing in part to incentives and discounts, EV sales in the third quarter of 2024 saw considerable growth in Canada, China, and the U.S.
A 5-year Lithium price graph (Figure 16-1) from S&P Global Market Intelligence (n.d.) shows the rise in lithium pricing from 2021 through 2023, with lithium pricing returning closer to historic levels in 2024.
S&P Capital IQ shows the historic 3-year LHM pricing FOB North America in Table 16-1.
| barr.com |
|
|
 Source:
S&P Capital IQ
Source:
S&P Capital IQ
| Figure 16-1 | Industry Price Chart from S&P Global Market Intelligence (accessed July 31, 2025) Showing Historic 5-Year LHM Pricing |
| Table 16-1 | Historic 3-Year LHM Pricing FOB North America (S&P Global Market Intelligence, n.d.) |
| Date | Lithium Hydroxide - FOB North America (US$/tonne) |
| 7/1/2022 | $ 54,500 |
| 8/1/2022 | $ 54,000 |
| 9/1/2022 | $ 54,000 |
| 10/1/2022 | $ 60,250 |
| 11/1/2022 | $ 60,250 |
| 12/1/2022 | $ 61,500 |
| 1/1/2023 | $ 71,500 |
| 2/1/2023 | $ 71,500 |
| 3/1/2023 | $ 71,500 |
| 4/1/2023 | $ 59,750 |
| 5/1/2023 | $ 52,375 |
| 6/1/2023 | $ 49,750 |
| barr.com |
|
|
| Date | Lithium Hydroxide - FOB North America (US$/tonne) |
| 7/1/2023 | $ 48,750 |
| 8/1/2023 | $ 40,000 |
| 9/1/2023 | $ 39,750 |
| 10/1/2023 | $ 31,500 |
| 11/1/2023 | $ 25,000 |
| 12/1/2023 | $ 22,500 |
| 1/1/2024 | $ 16,000 |
| 2/1/2024 | $ 15,000 |
| 3/1/2024 | $ 13,750 |
| 4/1/2024 | $ 14,400 |
| 5/1/2024 | $ 14,250 |
| 6/1/2024 | $ 12,750 |
| 7/1/2024 | $ 11,700 |
| 8/1/2024 | $ 10,950 |
| 9/1/2024 | $ 10,950 |
| 10/1/2024 | $ 11,550 |
| 11/1/2024 | $ 11,550 |
| 12/1/2024 | $ 11,550 |
| 1/1/2025 | $ 10,450 |
| 2/1/2025 | $ 10,600 |
| 3/1/2025 | $ 10,700 |
| 4/1/2025 | $ 10,590 |
| 5/1/2025 | $ 9,950 |
| 6/1/2025 | $ 9,500 |
| 7/1/2025 | $ 9,250 |
| 3-Year Average | $ 31,184 |
FOB = Free on Board
Using monthly price data from above, a three year (July 2022 to July 2025) average price for LHM is $31,184/t.
| 16.1 | Demand |
A Benchmark Mineral Intelligence (2024) report states that in 2034, the lithium and nickel markets are expected to be in deficits of 572,000 t and 839,000 t, respectively. These shortfalls are around seven times larger than the current surpluses for each material. Benchmark analysis found that of the US$514 billion investment needed to meet battery demand in 2030, upstream projects require US$220 billion. Nickel and lithium require the largest investment of any of the materials, at US$66 billion and US$51 billion, respectively. It is Benchmark’s view that lithium will be the bottleneck for the growth of the battery industry more than any other part of the supply chain. Though more than one million tonnes of mined lithium carbonate equivalent is expected to be produced in 2024, the mined supply will need to reach 2.7 Mt to meet demand in 2030, the majority of which is driven by the EV and grid scale energy storage markets.
| barr.com |
|
|
| 16.2 | Comparable Pricing |
Barr reviewed several lithium-related technical reports published in the past two years. The table below shows the LHM pricing data (or equivalent) used for each of the reports (some were converted from lithium carbonate pricing, depending on the project):
| Table 16-2 | Industry LiOH Pricing Data |
| Company | Study | Effective Date | Battery Quality LiOH US$/tonne |
| Frontier Lithium | NI 43-101 PFS | May-23 | $ 22,000 |
| Piedmont Lithium | SK-1300/NI 43-101 PFS | May-23 | $ 26,000 |
| Standard Lithium | SK-1300/NI 43-101 PFS | Jul-23 | $ 30,000 |
| E3 Lithium | NI 43-101 PFS | Jul-24 | $ 31,000 |
| Zinnwald Lithium | JORC PFS | Mar-25 | $ 23,800 |
| European Lithium | JORC PFS | Mar-23 | $ 29,600 |
| Lithium Americas | NI 43-101 FS | Jan-23 | $ 26,000 |
The research by Barr indicates that the historically high prices in 2022 and early 2023 are unsustainable. Because of the oversupply of LHM in the current market, prices are expected to be somewhat stable through 2030. Due to the significant market deficits in the 2030s and beyond, the consensus is that prices should increase based on market pressure. Using information on past pricing, projected future estimates, and prices used in comparable recent technical reports, a conservative long term average price of $23,000/tonne for LHM FOB USA was used for this PFS. This also corresponds with a three-year look back plus a two-year look forward pricing approach:
| Table 16-3 | Average LiOH Prices Using a Five-Year Pricing Window |
| Price | Year(s) |
| $ 31,184 | Average - Prior 3 Years |
| $ 9,300 | 2026 Pricing |
| $ 11,025 | 2027 Pricing |
| $ 22,775 | 5-Year Average |
Sources: Macquarie Group Limited (2025), S&P Global Market Intelligence (n.d.)
| barr.com |
|
|
17 Environmental Studies, Permitting, and Plans; Negotiations or Agreements with Local Individuals or Groups
| 17.1 | Introduction |
The TFLP is located primarily on federal lands managed by the BLM. Consequently, federal law governs operations and environmental compliance, with the State of Nevada and local governments having concurrent authority over certain aspects of the TFLP, such as permitting and water rights.
The anticipated environmental permits and social impacts of the TFLP are summarized based on the conceptual design presented in this PFS, environmental baselines, and current regulatory requirements. If changes to the scope, area, or design of the TFLP occur as planning and designs advance, this information may require review and reassessment.
Initial results of previous exploration drilling campaigns from the summer of 2021 through the summer of 2023 on ABTC’s BLM-administered Lode Claims under Notice-level permit (NVN-100850) established feasibility for the expansion of the TFLP operations to greater than five acres of surface disturbance. Proposed operations exceeding five acres of surface disturbance on federal lands require a Mine Plan of Operations (MPO) to be prepared and submitted along with a conceptual approach to closure and reclamation and the associated estimated costs based on the anticipated development for the TFLP. Potential impacts of the MPO must be analyzed, and alternatives assessed, pursuant to the National Environmental Policy Act (NEPA).
ABTC submitted documentation in December 2022 describing the proposed surface disturbance, schedule of operations, and conceptual site plans for a proposed mine and mineral processing operation within a defined plan area boundary to the BLM Battle Mountain District Office.
A Baseline Needs Assessment meeting was conducted on March 9, 2023, to review the TFLP and discuss the requisite environmental analyses and baseline resource inventories. The meeting detailed the initial requirements to initiate the NEPA process. Baseline analyses were determined based on feedback from the BLM resource specialists and related government stakeholders, including the U.S. Environmental Protection Agency (EPA), Nye and Esmeralda County government representatives, the Nevada Division of Environmental Protection (NDEP), and the Nevada Department of Wildlife (NDOW). Of a total of 29 categories of baseline studies, 21 were identified as required for the TFLP based on several factors, ranging from location to forecasted area of disturbance. Categories of studies required are indicated in Table 17-1; multiple studies are indicated under super categories (general wildlife, soils, vegetation, among others for biology, wetlands, seeps and springs under hydrology, etc.).
| 17.2 | Environmental Baseline Studies |
ABTC has retained multiple third-party specialists to conduct the necessary baseline analyses and provide reporting for BLM review. ABTC has initiated required baseline evaluations, many of which have concluded fieldwork and are either submitted to the BLM for review or nearing final submission.
Table 17-1 provides the status of environmental baseline studies that have been completed, are in progress, or are pending to support project permitting and EIS preparation.
| barr.com |
|
|
| Table 17-1 | Required Baseline Studies for TFLP |
| Baseline Study | Status |
| Visual | Completed |
| Environmental Justice | Completed |
| Human Noise | Completed |
| Paleontology | Completed |
| Grazing | Completed |
| Lands and Realty | Completed |
| Socioeconomics | Completed |
| Floodplains | Completed |
| Cultural Resources | Completed |
| Biological | Completed |
| Raptors | Ongoing |
| Geochemistry | Ongoing |
| Hydrology | Ongoing |
| Air Quality | Ongoing |
| 17.2.1 | Visual |
A visual resources baseline survey was conducted by a third-party consultant in January and June 2024. Photographs were taken at four Key Observation Points (KOP). A KOP is a specific place on a public travel route or in an existing or potential use area where the view of a management activity or project would be most revealing for purposes of the contrast rating. The BLM Form 8400-4 (Visual Contrast Rating Worksheet) was used to record the various design elements that characterize the land and water features, vegetation cover, and structures that comprise each KOP landscape.
The TFLP area is fully located within the Visual Resource Management Class 4 Objective, the Objective with the fewest restrictions on development indicating level of change to the characteristic landscape can be high (BLM, 1997).
| 17.2.2 | Environmental Justice |
An Environmental Justice analysis was conducted by a third-party consultant in June 2024. The Environmental Justice analysis screens populations that are in the analysis area to identify communities that are present and may be disproportionately and adversely impacted by the TFLP.
| 17.2.3 | Human Noise |
Potential impact to human receptors from proposed activities was assessed by a third-party consultant in January 2024. Protocol for potential impacts extends analyses to a 4.83 km buffer around the TFLP area. One residential building was located 4.67 km away and one municipal building was located 4.51 km away at the eastern extremity of the area of analysis.
| barr.com |
|
|
| 17.2.4 | Paleontology |
A third-party consultant was retained to provide the paleontological baseline analysis in June 2024. The analysis provided the results of the literature review, museum, and records search for the TFLP area. The analysis determined that no fossils are known from the TFLP area. The third-party consultant concluded that the TFLP will not have an adverse effect to paleontological resources, and no further mitigation was recommended.
| 17.2.5 | Grazing |
A grazing analysis was conducted by a third-party consultant in February 2024. The analysis provided baseline information to analyze the TFLP’s effects to grazing resources. The area of analysis for project-related grazing impacts encompassed the project boundary and an 8.05 km buffer around the TFLP. The analysis area is contained within the Monte Cristo, Montezuma (buffer only), and San Antone Grazing Allotments. The entire project area (4,320.03 ha) covers 2.2% of the Monte Cristo and 0.004% of the San Antone Grazing Allotments.
| 17.2.6 | Lands and Realty |
A land status analysis was conducted by a third-party consultant in January 2024. Public land records were compiled from the BLM Mineral and Land Records System (MLRS). Land records were queried for all Townships, Ranges, and Sections that overlap the TFLP area. Land use authorizations other than those associated with ABTC include power and telephone transmission line ROW, roads and material borrow sites for roads, and a fiber optic facility.
| 17.2.7 | Socioeconomics |
A socioeconomic analysis was conducted by a third-party consultant in July 2024. The analysis estimated workforce needs and provided baseline information for the BLM to analyze project effects on socioeconomic resources. Analysis included review of housing, education, employment, wages, poverty, commuting patterns, community services, public finance, and fiscal conditions impacts. The analysis area included Esmeralda, Mineral, and Nye counties in Nevada and Inyo County in California. Populations and communities within these counties could be a workforce source to the TFLP and impacts on social and community services and housing may occur in these counties because of worker relocation.
Significant strain on analysis area infrastructure and services is not anticipated.
| 17.2.8 | Floodplains |
An analysis of floodplains within and adjacent to the TFLP area was completed by a third-party consultant in October 2023. The floodplain analysis was completed for the proposed TFLP and potential impacts from 100-year (53.34 mm) and 500-year (73.41 mm) events and 24-hour magnitude storm events. Analyses used Aquaveo’s Watershed Modeling System (WMS) version 11.2, and its HEC-1 and HEC-HMS sub-modules.
Operational stormwater flow control facilities will need to be engineered and sized to withstand the 100-year event pursuant to State of Nevada regulations. Closure stormwater flow control facilities will need to be engineered and sized to withstand the 500-year event.
| barr.com |
|
|
| 17.2.9 | Cultural Resources |
An archeological evaluation of the property was completed by a third-party consultant in 2024. The consultant completed a Class III pedestrian investigation over the entire project area with additional minor considerations adjacent to the claim block (4,320.03 ha). Although the investigation identified two sites eligible for listing in the National Park Service’s National Register of Historic Places, the TFLP will avoid them throughout the life of the project. Avoidance is the preferred method compared to disturbance and mitigation which results in additional time and costs. Should avoidance become impossible, ABTC will engage BLM to develop a mitigation plan.
ABTC has participated in BLM-coordinated government-to-government engagement with interested tribal communities and one site tour. Additional tours are planned. ABTC is committed to working directly with descendant communities to help preserve and protect places of important cultural value.
| 17.2.10 | Biological |
Biological analyses were conducted by a third-party consultant in November 2024. Analyses were conducted over the entirety of the claim block (4,320.03 ha). Field survey protocol was developed in coordination with the Tonopah BLM biologists. Field surveys conducted included soils, vegetation, noxious weeds/non-native invasive species, plant and wildlife special status species, general wildlife, migratory birds, raptors and eagles, monarch butterfly, burrowing owl, pale and dark kangaroo mouse, and bat (passive acoustic).
No species listed on the Nevada Department of Agriculture’s Noxious Weed List were located within the TFLP area during field surveys. No special status plant species and no milkweed was observed in the project area.
ABTC understands its obligation to comply with the Migratory Bird Treaty Act, Endangered Species Act, BLM, and State of Nevada regulations regarding the need to avoid disturbing special status species during the conduct of the proposed exploration operations. Applicant-committed environmental protection measures will be developed and customized in coordination with the BLM for each species of concern within the project area as needed.
| 17.2.11 | Raptors |
Raptor and eagle surveys were included as part of the biological analyses that were conducted by a third-party consultant in November 2024. Analyses were conducted over the entirety of the claim block (4,320.03 ha) and included the 16.09 km buffer zone recommended by the U.S. Fish and Wildlife Service (USFWS) for initial surveys. The survey identified the Golden Eagle as a special status species within the TFLP area.
A final report on two years of raptor surveys is expected in August 2025.
| 17.2.12 | Geochemistry |
ABTC is undertaking geochemical evaluation of its ore, overburden, and tailings, and submitted analyses to the BLM in September of 2024. ABTC has analyzed seven separate samples for materials characterization (Meteoric Water Mobility Procedure [MWMP] for Profile I constituents and ABA) to date. These include:
| barr.com |
|
|
| ● | Two alluvial (cover) quaternary gravel composite samples. |
| ● | One sample of the claystone ore from the near-surface horizon (oxidized claystone) excavated from a shallow pit. |
| ● | Three composite claystone ore samples from a drill hole specifically drilled for metallurgical process testing (composites of the upper, middle, and lower claystone units) There is not an operational or handling difference between the near-surface and composite ore. They are undifferentiated and will be handled as ore in the same stream and processed without special routing. |
| ● | One composite sample of tuffaceous sandstone that contains sub-economic lithium values, which is being characterized as waste rock for the purpose of this report. |
| 17.2.13 | Hydrology |
ABTC contracted a third-party consultant to perform an analysis of hydrologic resource baseline conditions in September of 2023. The TFLP is located within hydrographic basin 137A, Lower Smoky Valley. Hydrologic analyses included review of seeps and springs, Waters of the U.S., groundwater inventory and characterization, and groundwater drawdown modeling.
No seeps, springs, or Waters of the U.S. are within an 8-km radius of the TFLP area.
Well drillers’ logs downloaded from the Nevada State Engineer’s office and the Nevada Bureau of Mines and Geology Bulletin’s 92 and 99A, State of Nevada Water Resources Bulletin No. 41, and USGS Water-Supply Paper 243 were reviewed. Due to the limited number of extant wells and well logs within an 8 km radius of the TFLP area, the inventory and model boundary was extended north to capture the center of basin 137A, where production and monitoring wells in support of the Liberty Mine and solar facility were located, and to the west to capture the Miller’s facility and associated wells. Historical water levels have been relatively stable. A monitoring well near the center of the basin has had its water level decline measured at 1.12 m during the past 54 years (2 cm/year).
In February 2024, ABTC drilled and installed two wells about 610 m west of the down-drop fault: EW-01 and MW-01. Each well was drilled to a depth of about 213 m below ground surface (bgs). Wells EW-01 and MW-01 are about 51.8 m apart. Groundwater is measured at depths of about 79.6 m bgs in each well.
To calculate aquifer parameters and develop a conceptual numerical model of groundwater dynamics in the basin, a conceptual numerical model was prepared. The Aquaveo groundwater modeling system and MODFLOW were used. Available data used in the model included a digital elevation map of the land surface, area geologic map, pumping test data (EW-01 included), well drillers’ logs, NDWR well log database, Water Resources Bulletin 41, precipitation data, and groundwater level measurements. The groundwater model was calibrated by comparing water levels at six observation wells and pilot points placed throughout the basin.
The model demonstrated up to four production wells (35.56 cm) spaced about 762 m apart will provide the proposed 7,570.82 liters per minute process demand for the 45-year project life. Recovery of pre-mining groundwater elevations occurred after 70 years (year 2137). From literature review, a rough transmissivity value was estimated at less than 121,133.12 liters per 0.3 m/day.
| barr.com |
|
|
| 17.2.14 | Air Quality |
Air quality baseline analysis is underway by a third-party contractor. The contractor is conducting air dispersion modeling and providing an air quality impact analysis for the TFLP. The purpose of this air dispersion modeling protocol is to outline the proposed modeling procedures that will be used to determine the impacts on ambient air quality from the air pollutant emissions emanating from facility operations. The modeling analysis will utilize the AERMOD modeling system, the EPA-approved near-field air dispersion modeling package. Predicted impacts from the modeling analysis, including background concentrations, will be compared against the National Ambient Air Quality Standards. Air dispersion modeling will be performed for criteria pollutants under the maximum potential to emit scenario for the facility. Pollutants to be modeled include carbon monoxide (CO), nitrogen dioxide (NO2), sulfur dioxide (SO2), particulate matter with an aerodynamic diameter less than 10 micrometers (PM10), particulate matter with an aerodynamic diameter less than 2.5 micrometers (PM2.5), and ozone (O3), which will use a screening analysis of the photochemical reaction of volatile organic compounds (VOC) and NO2. Modeling will conform with Appendix W of 40 CFR Part 51 and the General Air Dispersion Modeling Guidelines from the Nevada Bureau of Air Pollution Control.
The model will use the maximum hourly emission rates, with the exception of annualized hourly emission rates where applicable, which will be calculated using the maximum throughputs, projected hours of operation, manufacturers data, EPA AP-42 emission factors, and/or other credible sources as needed, all of which will be documented in the final evaluation report.
Pursuant to the Clean Air Act (CAA), as amended [42 U.S.C. §§ 7401 et seq.], the EPA has developed classifications for distinct geographic regions known as air basins. Under these classifications, for each federal criteria pollutant, each air basin (or portion of an air basin [or “planning area”]) is classified as in “attainment” if the air basin (or planning area) has “attained” compliance with (i.e. not exceeded) the adopted National Ambient Air Quality Standards (NAAQS) for that pollutant; is classified as “non-attainment” if the levels of ambient air pollution exceed the NAAQS for that pollutant; or is classified as “maintenance” if the monitored pollutants have improved from non-attainment levels to attainment levels. Air basins for which sufficient ambient monitoring data are not available or are designated as “unclassified” for those particular pollutants until actual monitoring data supports formal “attainment” or “non-attainment” classification. The proposed TFLP is within Hydrographic Basin 137A, which is unclassified and therefore, presumed to be in attainment.
| 17.3 | Permitting |
The environmental studies, permitting, and social aspects of the TFLP are being managed, and planned to support the proposed mine and mineral processing operation on ABTC’s lode claims. As the MPO is in the process of being drafted, the project mine closure plans, remediation plans, and reclamation plans have not been fully developed and approved. ABTC will continue to work with federal, state, and local agencies to ensure that all permitting will be reviewed and approved in accordance with all applicable regulations (Table 17-2, Table 17-3)
Additionally, ABTC intends to develop community engagement plans to identify and ensure an understanding of the needs of the surrounding communities, including Native American communities, and to determine appropriate programs for addressing those needs.
| barr.com |
|
|
| Table 17-2 | Federal Environmental Permits, Reviews, and Approvals |
| Permit/Approval | Agency | Requirement | Project Phase | Status |
| Exploration Permit | BLM and BMRR | Required in order to perform any exploration activities on publicly managed federal land. |
Preconstruction Active permit issued |
Ongoing |
| Exploration Reclamation Permit & Bond | BLM and BMRR | Prior to the initiation of certain exploration projects |
Preconstruction Active permit issued |
In Process |
| Right of Way for Road Access, SF-299 | BLM and NDOT | Required to establish roadway development for access. Requires public notice & environmental analysis. | Preconstruction | In Process |
| Right of Way for Electric Transmission | BLM, BMRR, and NDOT | Required to establish a Powerline corridor for construction. Requires public notice & Environmental analysis. | Preconstruction | In Process |
| Mine Plan of Operations (MPO) & Notice of National Environmental Policy Act (NEPA) Action | BLM | Notice of NEPA action request submitted with MPO. BLM will determine the level of NEPA action and associated requirements, i.e., Environmental Assessment (EA), Environmental Impact Statement (EIS), etc. | Preconstruction | In Process |
| NEPA Compliance | BLM | For projects that need federal authorizations, permits, or approvals (such as SF-299 issuance for right-of-way). | Preconstruction | In Process |
| Section 7 Concurrence | USFWS | Required as part of NEPA to review projects for compliance with Section 7 of the Endangered Species Act and issue a determination of affect for federally listed threatened or endangered species and any designated critical habitat. | Preconstruction Concurrent with NEPA process | Not Initiated |
| Section 106 Concurrence | SHPO | Required as part of NEPA to review projects for compliance with Section 106 of the National Historic Preservation Act and issue a determination of affect for resources that are either listed or eligible for listing in the National Register of Historic Places. | Preconstruction Concurrent with NEPA process | Not Initiated |
| Federal Mine ID Number | MSHA | Obtained from the MSHA district office where the mine is located | Exploration or, Preconstruction | Not Initiated |
| FCC License(s) | FCC | Required to register through the FCC's Commission Registration System (CORES) to be assigned an FCC Registration Number (FRN). Licenses will be issued for mine radio communication systems. |
Construction Prior to the installation and use of mine radio communications |
Not Initiated |
| Explosives License & Permit | ATF | Required for blasting on-site |
Operation Prior to active blasting and storage of explosives on site |
Not Initiated |
| barr.com |
|
|
| Permit/Approval | Agency | Requirement | Project Phase | Status |
| Eagle Incidental Take Permit | USFWS | Required if eagle nesting pairs are identified within the project boundary during EIS baseline surveys | Construction Submit permit application following issuance of ROD |
In Process |
| Water of U.S. Designation | ACOE | Activities in wetlands and/or Waters of the U.S. (includes dry washes, creeks, lakes, etc.) | Preconstruction Concurrent to NEPA process | In Process |
ACOE = U.S. Army Corps of Engineers
ATF = U.S. Bureau of Alcohol, Tobacco, Firearms and Explosives
BLM = Bureau of Land Management
BMRR = NDEP Bureau of Mining, Reclamation and Regulation
FCC = U.S. Federal Communications Commission
ID = identification
MSHA = U.S. Mine Safety and Health Administration
NDEP = Nevada Division of Environmental Protection
NDOT = Nevada Department of Transportation
SHPO = Nevada State Historic Preservation Office
USFWS = U.S. Fish and Wildlife Service
| Table 17-3 | State of Nevada Environmental Permits, Reviews, and Approvals |
| Permit/Approval | Agency | Requirement | Project Phase | Status |
| Permit to Mine | BMRR | Required to license and permit all hard rock metal/non-metal mines in Nevada | Preconstruction | In Preparation |
| Reclamation Permit | BMRR | This includes the Bond estimate (SRCE), prior to initiation of mining operations | Preconstruction | In Preparation |
| Opening & Closing Mines | MST | Operators shall notify the Administrator before opening and upon the closing of mine operations |
Pre-operation Minimum of 30 days prior to startup. |
In Preparation |
| Nevada Mine Registration | NDOM | Operators shall submit a completed form for registration within 30 days after a mine operation begins | Operation | In Preparation |
| NDOT ROW Occupancy/ Encroachment Permit | NDOT | An encroachment permit and an NDOT-approved traffic control plan must be secured before performing the construction of the turn-off connection within the NDOT ROW | Preconstruction | In Preparation |
| State General Groundwater Permit | BWPC | Required prior to construction | Preconstruction | In Preparation |
| Air Quality Permit(s) | BAPC | Required due to air emissions associated with the Project. May have multiple air permits dependent upon applicability (MOPTC, Class I, II, etc.) | Preconstruction | In Preparation |
| Dam Permit(s) | DDS | Permit to Construct Dam; (J-) for ponds & tailings impoundment | Preconstruction | In Preparation |
| Water Pollution Control Permit | BWPC | Process water permit for Operations, prior to the initiation of construction of a process component, or any mining | Preconstruction | In Preparation |
| barr.com |
|
|
| Permit/Approval | Agency | Requirement | Project Phase | Status |
| National Pollutant Discharge Elimination System (NPDES) Permit | BWPC | Prior to construction | Preconstruction | In Preparation |
| Stormwater Discharge Permit | BWPC | Existing Facilities: Within 90 days of issuance of a new General Groundwater Permit. New Facilities: No later than 2 days prior to discharge; Notice of Intent (NOI), Stormwater Pollution Prevention Plan |
Preconstruction Submittal following issuance of General Permit |
In Preparation |
| IAP | BWPC | Industrial Artificial Pond Permit | Preconstruction | In Preparation |
| Class III Landfill Permit | BWM | Site landfill construction or operation | Preconstruction | In Preparation |
| Onsite Sewage Disposal Systems (OSDS) | BWPC | Septic discharge is regulated under NV General Permit: GNEVOSDS09; depending on volume other agency approval may be required | Preconstruction | In Preparation |
| Hazardous Waste Management Permit | BWM | Prior to the construction of a facility for management or recycling of hazardous waste as identified by NAC 444.8850 | Preconstruction | In Preparation |
| State Fire Marshal | DSFM | Permit to Store Hazardous Material on site | Preconstruction | In Preparation |
| Water of the State Appropriations Permits | NDWR | Required to procure water rights from within the basin to facilitate start-up and operations | Preconstruction | In Preparation |
| PWS Operating Permit | BSDW | Potable water supply system | Preconstruction | In Preparation |
| Temporary water use waivers for mineral exploration | NDWR | Obtain a permit or waiver for temporary use of water for mineral exploration prior to drilling | Preconstruction Active - Issued Permit(s) | Ongoing |
| Utilities Permit | NDOT and NV Energy | Required to locate a utility within a highway ROW or for a utility to cross a highway ROW. | Preconstruction | In Preparation |
BAPC = NDEP Bureau of Air Pollution Control
BMRR = NDEP Bureau of Mining, Reclamation and Regulation
BSDW = NDEP Bureau of Safe Drinking Water
BWM = NDEP Bureau of Waste Management
BWPC = NDEP Bureau of Water Pollution Control
DDS = NDWR Dams & Dam Safety
DSFM = NDPS Division of State Fire Marshal
MST = NDBI Mine Safety and Training
NDBI = Nevada Division of Industrial Relations
NDEP = Nevada Division of Environmental Protection
NDOM = Nevada Division of Minerals
NDOT = Nevada Department of Transportation
NDOW = Nevada Department of Wildlife
NDPS = Nevada Department of Public Safety
NDWR = Nevada Division of Water Resources
ROW = Right of way
| barr.com |
|
|
It should be noted that ABTC holds three claims in Nye county and the current plan considers no operations on those claims.
Considering the current regulatory framework, it is reasonable to expect that all required permits and authorizations can likely be obtained for the TFLP due to:
| ● | The project plans, which optimize the use of site and infrastructure design to limit surface disturbance and include environmental design features to promote environmental protection; |
| ● | The ongoing collaboration between ABTC and the regulatory and administrative agencies at the federal, state, and local levels; and |
| ● | The continued stakeholder engagement actions by ABTC in the local communities as well as at the regional level. |
Development of the TFLP is likely to have positive impacts on the local communities by providing direct employment in the mining industry and secondary employment in the support industries, income generated from wages and by secondary job employers, and local and state revenues generated through taxes paid by ABTC.
| barr.com |
|
|
18 Capital and Operating Costs
| 18.1 | Introduction |
This chapter provides an outline of the estimated capital expenditure (CAPEX) and operating expenditure (OPEX) for the development of the TFLP. The CAPEX and OPEX estimates are based on an ultimate targeted production capacity of 30,000 tpa of LHM.
The overall project cost is categorized into two major components within the project boundary:
| ● | Mining: Inclusive of the ore extraction equipment and infrastructure, as well as the systems required to transport the ore to the refinery |
| ● | Refinery: Inclusive of the processing plant equipment and infrastructure required to convert ore into lithium products |
Some capital components within the mine scope will be phased in alignment with the refinery’s production scale-up from an initial capacity of 5,000 tpa LHM in year 1, to full production of 30,000 tpa LHM in year 3 along with the commencement of tailings backfill into the mine in year 6.
Electrical power for the mining operations and processing facility will be supplied through a hybrid energy model that combines both on-site generation and utility-grid power supply. The capital and operating expenditure associated with this hybrid model have been incorporated into the overall OPEX figures within the mine and processing cost estimates. For further details on this component of the project cost, refer to Section 18.3.3.
The costs in this report are presented in 2025 USD on a calendar year basis. No escalation or inflation is included.
| 18.2 | Capital Cost Estimate |
The capital cost projections were defined and developed based on the expected quantities of materials, labor, and equipment. The expected quantities were estimated by using engineering drawings, early-stage 3D models, and preliminary facility layouts. The cost data was compiled from vendor quotes, benchmarking from similar lithium projects, and industry-standard estimating factors. All cost values are presented in U.S. dollars and reflect a Class 4 cost estimate classification, as defined within the AACE International Recommended Practice No. 47R-11. This classification typically carries an expected accuracy range of -15% to -30% on the low side, and +20% to +50% on the high side.
| ● | Mining CAPEX was developed in collaboration with Barr |
| ● | Refining CAPEX was developed by engineering, procurement, and construction (EPC) partner Black & Veatch Corporation (B&V) and validated by Woods |
Table 18-1 presents the project capital cost estimates, which includes approximately $2.0 billion in initial and pre-production capital expenditures through year 5, and $205.6 million in new and sustaining capital over the remaining mine life. Bringing the total capital requirement over the 45-year mine life considered in this PFS to an estimated $2.2 billion.
| barr.com |
|
|
| Table 18-1 | Project Capital Estimates |
| Capital Costs ($000) | YR -2 |
YR
-1 |
YR 1-2 |
YR 3-5 |
YR 6-10 |
YR 11-20 |
YR 21-30 |
YR 31-40 |
YR 41-45 |
Total |
| Pre-Mining Cost | $- | $10,170 | $- | $- | $- | $- | $- | $- | $- | $10,170 |
| Mining Capital | $- | $86,648 | $53,360 | $3,355 | $37,252 | $34 | $10,099 | $15,099 | $34 | $205,881 |
| Mining Sustaining Capital | $- | $- | $76 | $2,141 | $8,423 | $19,374 | $68,995 | $21,371 | $1,253 | $121,632 |
| Process/ Milling | $91,234 | $373,462 | $746,924 | $282,228 | $- | $- | $- | $- | $- | $1,493,848 |
| Owner's Costs | $778 | $3,723 | $7,446 | $11,169 | $14,114 | $- | $- | $- | $- | $37,230 |
| Closure Provisions | $- | $- | $- | $- | $- | $- | $- | $- | $150 | $150 |
| Subtotal | $92,012 | $474,003 | $807,806 | $298,894 | $59,789 | $19,408 | $79,094 | $36,470 | $1,437 | $1,868,912 |
| Contingency | $18,247 | $89,215 | $157,389 | $56,949 | $5,588 | $5 | $1,515 | $2,265 | $5 | $331,177 |
| Total Capital ($000) | $110,259 | $563,219 | $965,195 | $355,843 | $65,377 | $19,413 | $80,609 | $38,735 | $1,442 | $2,200,090 |
yr = year
Process capital was estimated by ABTC and Woods, while mining, infrastructure, and other capital were estimated by ABTC and Barr.
Preproduction capital was estimated based on mining, processing, owner’s, and contingency costs required in the preproduction period in Year -1 and -2. The mining capital cost estimates assume the owner will procure and own the mining equipment and hire the personnel needed to achieve the proposed production targets. It is worth mentioning that most of the cost for site closure is included in the mine OPEX because most of the mine reclamation and closure activities will be self-performed.
The infrastructure costs for the project are allocated across the mining and refining CAPEX as presented in Table 18-2 and Table 18-3. Additional details on infrastructure costs will be developed through subsequent studies. Contingencies were individually added to the areas of the project at an average of approximately 18% of the estimated capital costs for the project. Capital costs in this report have an expected accuracy of +/-25% based on AACE International guidance related to Class 4 capital cost estimates.
| 18.2.1 | Mining Capital Cost Estimates |
The capital cost for mining is based on mine design, mine plan, production schedules, and planned mine development activities. The mining fleet is comprised of primary loading and hauling equipment as well as road maintenance and dump support units. A significant expansion of the fleet occurs prior to the refinery capacity increase to 30,000 tpa of LHM production, and when in-pit backfilling operations commence following the completion of mining Phase 1.
| barr.com |
|
|
Ther truck shop facility is a service center designed to support heavy equipment operations. It includes areas for equipment maintenance, spare parts warehousing, mine and maintenance offices, logistics coordination, and wash bays equipped with water recycling systems. The facility is designed to service a fleet of up to thirty 240 t haul trucks, with four full-size service bays. The service bays are equipped with 50 t capacity overhead cranes, mobile hydraulic column lifts, tire handling systems, diagnostic and calibration systems, welding and fabrication tools, and specialized tooling for servicing both electric and autonomous trucks.
General shop tools include heavy-duty tool sets, hydraulic and pneumatic tools, shop floor equipment, workbenches with integrated storage, as well as portable lighting and power tools to support a wide range of maintenance tasks.
| Table 18-2 | Mining Capital Estimates |
| Mine Capital Costs ($000) | YR
-2 |
YR
-1 |
YR
1-2 |
YR
3-5 |
YR
6-10 |
YR
11-20 |
YR
21-30 |
YR
31-40 |
YR
41-45 |
Total |
| Mine Development | $- | $10,170 | $- | $- | $- | $- | $- | $- | $- | $10,170 |
| Mine Equipment | $- | $46,240 | $35,593 | $3,355 | $30,307 | $- | $10,065 | $10,065 | $- | $135,625 |
| Mine Infrastructure | $- | $16,436 | $7,311 | $- | $6,082 | $- | $- | $- | $- | $29,829 |
| Mine Communications | $- | $384 | $1,031 | $- | $829 | $- | $- | $- | $- | $2,244 |
| Mine Contingency Cost | $- | $14,544 | $8,004 | $503 | $5,588 | $5 | $1,515 | $2,265 | $5 | $32,429 |
| Initial Mine Capital ($000) | $- | $111,501 | $61,364 | $3,858 | $42,840 | $39 | $11,614 | $17,364 | $39 | $248,619 |
| Mine Sustaining Capital | $- | $- | $76 | $2,141 | $8,423 | $19,374 | $68,995 | $21,371 | $1,253 | $121,632 |
| Total Mine Capital ($000) | $- | $111,501 | $61,440 | $6,000 | $51,262 | $19,413 | $80,609 | $38,735 | $1,292 | $370,252 |
yr = year
The initial stock and spare parts inventory will cover haul truck tires, engine and transmission components, hydraulic and electrical components, and wear parts sufficient for the initial year of production. Other supporting infrastructure will cover power supply equipment, HVAC and ventilation systems, water and waste systems, IT and communications systems, and safety and environmental equipment.
NDEP and MSHA regulations mandate proper management of wash water to prevent contamination (e.g., oil, grease, heavy metals). A dedicated truck wash with water recycling and waste treatment is standard for large mining fleets. The wash bay facility is steel framed and enclosed with drainage and waterproofing. An automated high-pressure wash system will employ gantry or robotic arms for 360-degree cleaning. The water recycling system treats sludge to meet NDEP standards.
It is assumed that the initial mining fleet is diesel powered. The fuel farm facility requires diesel storage tanks for up to two weeks of capacity, as well as pumps, dispensers, secondary containment, and fire suppression and monitoring systems. The facility must be constructed to meet MSHA, Nevada Occupational Safety and Health Administration (OSHA), and NDEP compliance regulations.
| barr.com |
|
|
Ultimate capacity of the fuel farm is scaled at 1,200,000 liters. The facility will be constructed in phases with three 400,000-liter capacity above-ground, double-walled steel tanks.
Beneficiation and refinery tailings will be conveyed away from the refinery and stacked at storage and transfer facilities via 1.2 m (48-inch) wide conveyors.
The mine is designed to reach depths exceeding 200 m from the surface, with concurrent mining and backfilling activities taking place in adjacent mining phases. To ensure the safety of personnel and equipment, highwalls will be continuously monitored using a radar-based slope stability monitoring system.
The mine will require a communications mesh to facilitate equipment dispatching, fleet monitoring, and production reporting.
Pre-stripping and site capital includes approximately six months of pre-mining site development projects such as access and haul roads construction, slime wash diversion with water retention ponds, and the ROM pad base construction.
| 18.2.2 | Refinery CAPEX |
Refinery direct capital cost estimates were developed in coordination with B&V estimating. Engineering and project management staff are based on FEL2 design work conducted in 2024-2025. The refinery CAPEX was detailed in a Class 4 estimate inclusive of Work Breakdown Structure (WBS) coding. Refinery Phase 1 CAPEX cost is inclusive of all the sitework, supporting buildings, and the initial processing equipment installation for a 5,000 tpa product output. Phase 2 and Phase 3 CAPEX are inclusive of expansion of processing capacity of 12,500 tpa each, to meet the 30,000 tpa product output (Table 18-4). During the Class 4 estimate, primary equipment costs were obtained through vendor quotations, while secondary equipment costs were derived from industry-standard cost database(s). Preliminary G&A and 3D modeling were completed as part of this phase. Bulk material quantities and cost estimates were benchmarked against recent, comparable projects in the region. For non-modeled areas, costs were generated using an industry-standard Lang Factor-Based Approach to calculate the installation cost.
Refinery indirect capital cost was estimated with the industry-standard estimating factor of 5% over direct cost, and contingency cost was estimated with the industry-standard estimating factor of 20%.
| barr.com |
|
|
| Table 18-3 | Overview of Refinery Direct Capital Costs ($000) |
| Refinery Area | ($ 000) |
| Comminution & Screening | $15,069 |
| Beneficiation | $97,231 |
| Extraction | $270,813 |
| Impurity Removal | $252,700 |
| Sulfate Crystallization | $27,746 |
| Hydroxide Conversion | $229,296 |
| Site Infrastructure | $642,158 |
| Total Direct Capital Cost | $1,422,713 |
| Table 18-4 | Refinery Capital Cost Timeline ($ 000s) |
| Description | YR -2 | YR -1 | YR 1-2 | YR 3-5 | Total |
| Phase 1 (5,000 tpa) | $86,890 | $86,890 | $173,779 | $- | $347,558 |
| Phase 2 (12,500 tpa) | $- | $134,808 | $269,617 | $134,808 | $539,234 |
| Phase 3 (12,500 tpa) | $- | $133,980 | $267,960 | $133,980 | $535,921 |
| Subtotal - Direct | $86,890 | $355,678 | $711,356 | $28,789 | $1,422,713 |
| Indirect | $4,344 | $17,784 | $35,568 | $13,439 | $71,136 |
| Contingency | $18,247 | $74,692 | $149,385 | $56,446 | $298,770 |
| Total Capital Cost | $109,481 | $448,155 | $ 896,309 | $338,674 | $1,792,618 |
tpa = tons per annum
yr = year
| 18.3 | OPEX Estimate |
The LOM operating cost estimates for the project are presented in Table 18-5. These estimates include costs associated with mining, processing and refining, G&A expenses, ore handling, tailings handling, coarse gangue handling, tailings backfill, energy consumption, reclamation and closure, maintenance, and other operational support services. The data used to estimate these costs was derived from a combination of vendor quotes, current equipment performance, operational experience, and historic data with appropriate escalation.
| barr.com |
|
|
| Table 18-5 | Operating Cost Summary |
| Cost Area Description | LOM Total Cost | LOM Average | Unit OPEX Cost | OPEX Percent |
| ($ 000s) | ($ 000s/Year) | ($/t LHM) | (%) | |
| Total Mining Cost | $3,247,358 | $70,595 | $2,476 | 35.4% |
| Process/Refining | $5,649,008 | $122,805 | $4,307 | 61.6% |
| General & Administrative | $171,953 | $3,738 | $131 | 1.9% |
| Reclamation Cost | $105,331 | $2,290 | $80 | 1.1% |
| Operating Cost | $9,173,650 | $199,428 | $6,994 | 100.0% |
| % | = percent |
LHM – lithium hydroxide monohydrate
LOM = life of mine
OPEX = operating expenditure
t = tonne
The operating costs are based on the LOM production schedule and mine plan, which were developed to support the refinery’s ore feed rate of approximately 12.4 Mtpa and LHM production rate of 30,000 tpa.
| 18.3.1 | Mining OPEX Estimates |
Mine operating cost estimates were developed based on key functional areas, including mine production (drill, blast, load, haul), mine maintenance, labor and staffing, ROM ore handling, tailings handling, tailings backfilling, mine support services, and other direct mining-related overhead costs. As previously noted, the cost data were sourced from vendors, current equipment performance, operational experience, and historical data. Primary cost drivers include consumables (fuels, parts, blasting supplies, tires, power, etc.), tailings handling, equipment maintenance, labor, and overhead costs associated with mining operations and mobile equipment support.
As shown in Table 18-6, the mine operating costs are organized into the following major categories:
| ● | Mining Cost: Include direct pre-production and LOM costs associated with the extraction of both for ore and waste materials |
| ● | Stockpile Rehandling: No costs are allocated under this category, as the project mine plan does not include any stockpile rehandling activities |
| ● | Ore Handling: Represents the operating cost of sizing and transporting ore or mill feed from the ROM pad to the ROM hopper or bin |
| ● | Tailings Handling: Covers the cost of transporting tailings and coarse gangues materials from the refinery to the designated tailings and coarse gangue dumps using conveyors and stackers |
| ● | Tailings Backfill: Encompasses the costs of loading and transporting tailings and coarse gangues from the mill area (or other designated locations) to the backfill dumps |
| barr.com |
|
|
| Table 18-6 | Mining Operating Costs Summary |
| Cost Activity | Material Moved | OPEX Total Cost | OPEX Unit Cost | Weighted Moved |
| (ktonnes) | ($000) | ($/t) | ($/t moved) | |
| Total Mining | 716,720 | $2,328,377 | $3.25 | $1.27 |
| Stockpile Rehandle | - | $- | $- | $- |
| Ore Handling | 559,848 | $281,320 | $0.50 | $0.15 |
| Tailings Handling | 294,383 | $260,758 | $0.89 | $0.14 |
| Tailings Backfill | 265,465 | $376,902 | $1.42 | $0.21 |
| Mining OPEX | 1,836,417 | $3,247,358 | N/A | $1.77 |
ktonnes = kilotonnes
OPEX = operating expenditure
t = tonne
The weighted average mining costs, as presented in Table 18-6 and Figure 18-1, provide a consistent basis for comparing the key cost categories. While mining accounts for the largest cost component, it also includes the costs for supporting activities such as dozer and grade operations, water truck usage, fuel and lube truck usage, and other ancillary services.

| Figure 18-1 | Mining Operating Costs (weighted $/t moved) |
| barr.com |
|
|
Table 18-7 shows mine production tonnages, operating costs, and unit operating costs, categorized by the key components and specific production intervals throughout the LOM.
| Table 18-7 | Mining Operating Costs By Period |
| Description / Period | YR -1 |
YR
1-2 |
YR
3-5 |
YR
6-10 |
YR 11-20 |
YR 21-30 |
YR 31-40 |
YR 41-45 |
Total/ Average |
| Total Mining Quantity, ktonne | 6,598 | 35,618 | 61,314 | 87,291 | 141,766 | 159,905 | 156,580 | 67,647 | 716,720 |
| Ore Handling Quantity, ktonne | - | 12,861 | 42,258 | 65,425 | 125,791 | 123,730 | 122,773 | 67,011 | 559,848 |
| Tailings Handling Quantity, ktonne | - | 12,861 | 42,258 | 38,262 | 46,215 | 78,203 | 60,466 | 16,119 | 294,383 |
| Tailings Backfill Quantity, ktonne | - | - | - | 27,163 | 79,577 | 45,526 | 62,307 | 50,892 | 265,465 |
| Total Mining Cost, $000 | $17,449 | $65,886 | $130,108 | $254,842 | $548,412 | $492,669 | $565,465 | $253,546 | $2,328,377 |
| Ore Handling Cost, $000 | $- | $12,509 | $18,757 | $31,254 | $62,508 | $62,520 | $62,508 | $31,266 | $281,320 |
| Tailings Handling Cost, $000 | $- | $6,886 | $17,715 | $29,516 | $59,032 | $59,047 | $59,032 | $29,531 | $260,758 |
| Tailings Backfill Cost, $000 | $- | $- | $- | $32,366 | $103,757 | $61,337 | $104,194 | $75,248 | $376,902 |
| Total
Mining $/t-mined |
$2.64 | $1.85 | $2.12 | $2.92 | $3.87 | $3.08 | $3.61 | $3.75 | $3.25 |
| Ore Handling $/t-ore | $- | $0.97 | $0.44 | $0.48 | $0.50 | $0.51 | $0.51 | $0.47 | $0.50 |
| Tailings
Handling $/t-tailings |
$- | $0.54 | $0.42 | $0.77 | $1.28 | $0.76 | $0.98 | $1.83 | $0.89 |
| Tailings Backfill $/t-backfill | $- | $- | $- | $1.19 | $1.30 | $1.35 | $1.67 | $1.48 | $1.42 |
ktonnes = kilotonnes
t = tonne
yr = year
The mine operating cost breakdown provided above includes the costs of diesel and power. Table 18-8 summarizes the diesel and power consumption, with local supply price rate estimated at $0.69 per liter and $0.035 per kWh, respectively. Over the LOM, total consumption will be approximately 813 million liters of diesel and 8 million kWh of power to support mining and closure activities.
| barr.com |
|
|
| Table 18-8 | Energy Usage By Mining Activity |
| Mining Category | Diesel Usage | Power Usage | OPEX Cost |
| (liters) | (kWh) | (US$) | |
| Mining/Tailings-Backfill | 548,138,913 | - | $378,659,976 |
| Stockpile Rehandling | - | - | - |
| ROM Ore Handling | 73,515,739 | 1,138,047 | $50,825,257 |
| Tailings/Coarse Gangue Handling | - | 7,076,482 | $247,677 |
| Reclamation/Closure | 192,243,656 | - | $132,803,887 |
| Total Mining Energy | 813,898,308 | 8,214,528 | $562,536,796 |
kWh = kilowatt
| 18.3.2 | Refining OPEX |
Refinery process operating costs were developed by ABTC and validated by Woods.
Reagent and energy consumption are the key drivers of refining OPEX (Table 18-9). Both reagent and energy consumption rates were developed and modeled in both METSIM and Aspen software and validated at ABTC’s lithium pilot plant facility, including a two-week continuous run.
| Table 18-9 | Refinery OPEX Cost Summary |
| OPEX | $/t LHM |
| Energy | $2,877 |
| Reagents | $913 |
| Labor | $517 |
| Total | $4,307 |
LHM = lithium hydroxide monohydrate
OPEX = operating expenditure
t = tonne
| 18.3.2.1 | Refining Reagents |
The primary reagent cost is from flux added during pretreatment. This reagent is locally recycled within the process, with a recovery rate expected above 80%. The net reagent consumption rate is therefore used in OPEX calculations. Other produced intermediate products are internally recycled. The process is expected to produce a surplus of sulfuric acid, though at this time no revenue offsets are considered within the OPEX calculations. Reagent costs per tonne were determined through a mix of vendor quotes and industrial database or market study references.
The primary waste from the process consists of leach tailings and precipitation solids, but no OPEX is attributed to these within the refinery as they are handled by backfilling operations under the mining and infrastructure areas. Insignificant quantities of impurity purge waste are expected from concentrated IX regeneration and purge streams, which will be handled at the site’s small local collection basin to concentrate before offsite disposal. This disposal is included in the reagent OPEX estimate.
| barr.com |
|
|
| 18.3.2.2 | Refining Energy |
Energy is the primary cost driver for lithium production from the facility. A blended energy rate was developed for pass-through from the solar facility and grid to satisfy the plant energy demands. Primary energy uses were specifically modeled where accessory energy uses were factored. Overall plant demand factors were also used to develop an overall annual and per-product-tonne energy consumption.
The project infrastructure includes a shared 120 kV interconnection substation, facilitating efficient use of equipment and streamlined distribution between the solar and battery system and the plant’s electrical network. This co-location and system integration strategy minimizes redundancy costs, reduces capital and operational costs, and improves reliability. ABTC has designated the 120 kV substation as an integral component of the solar and battery project, and has included all associated costs, such as substation infrastructure, protection systems, metering, and interconnection equipment, within the solar and battery financial model. This approach reflects the substation’s core role in enabling utility interconnection, managing bidirectional power flow, and supporting import/export metering for the solar facility. Critically, this approach also insulates the project from long-term utility electricity price inflation. By securing a majority of the facility’s energy needs through fixed-cost, on-site generation, ABTC has de-risked and optimized a major input cost over the life of the project. While grid power may still be used during periods of low solar output, the dependence on volatile wholesale and retail electricity markets is significantly reduced.
The resulting blended electricity rate of $0.035/kWh reflects the effective cost of delivering both utility-sourced and self-generated electricity to the processing plant and mine. This internal rate is used directly in the project’s energy cost model and is not tracked as a separate OPEX item, as the energy infrastructure is fully integrated into the facility’s overall capital and operating structure. The approach to providing onsite power generation and storage is described further below.
| 18.3.2.3 | Refining Labor |
The refinery process operation is expected to require a staff of approximately 125 personnel separate from mining and G&A labor. An organizational structure was developed including salaried and hourly staff counts along with shift teams and shift schedule. Fully burdened labor rates were developed using Nevada and mining industry reference data. Table 18-10 shows the staff count by job type for the refinery.
| Table 18-10 | Estimated Refinery Labor |
| Job Type | Staff Count |
| Plant Management | 4 |
| Plant Operations | 72 |
| Maintenance Personnel | 29 |
| Metallurgy and Laboratory | 13 |
| Warehouse and Support | 5 |
| barr.com |
|
|
| 18.3.3 | Energy Cost |
The project’s electrical energy supply will be sourced from a combination of NV Energy grid power and an on-site solar and battery storage system. The solar and battery storage system is structured as an internal power provider, functioning as a cost-neutral entity that delivers electricity directly to the mine and refinery.
To evaluate the cost of energy supply for the facility, a capital cost model was developed for the co-located solar photovoltaic and battery storage system using industry-standard tools and benchmarks. System sizing was informed by real-world solar irradiance profiles specific to Tonopah, Nevada, based on modeled daily production curves for both summer and winter conditions. These profiles informed system capacity sizing to align with seasonal energy production to match generation to the plant demand. The model was developed by the ABTC’s engineering team and reviewed by Barr.
System performance and output were analyzed using the National Renewable Energy Laboratory’s (NREL) Photovoltaic (PV) Watts, PV System Cost Model (PVSCM), and System Advisor Model (SAM) calculation modules, which provided detailed hourly energy generation forecasts and system loss modeling. The capital cost estimate was developed using NREL utility-scale cost benchmarks and reflects a full EPC deployment consistent with current industry norms for similar projects.
The capital cost model also includes the construction of a 120 kV substation, which serves as the primary interconnection point between the facility and the utility grid. ABTC has designed the solar, battery, and substation systems holistically to optimize infrastructure between the plant substation and the energy substation. Which enabled shared transformers, switchgear, and protection systems where practical. This approach minimizes redundant equipment, reduces capital costs, and supports system resilience and operational flexibility.
The site’s estimated electric utility bill was determined by calculating grid import requirements during periods of low on-site generation and applying NV Energy’s LGS-3 (Large General Service) rate structure. The utility billing analysis consolidates demand charges, energy charges, and facility charges into a simplified $/kWh rate for modeling costs in a financial model. The seasonal effective rates are summer at $0.067/kWh and winter at $0.065/kWh.
Solar operations and maintenance (O&M) costs were estimated based on ongoing operational, maintenance, and financial support requirements, using published cost benchmarks from NREL. These values were adjusted to reflect the project’s scale, configuration, and regional labor and service conditions.
The implied blended electricity rate of $0.0350/kWh represents a levelized cost of energy from a hybrid model, including delivery from the on-site solar generation and battery storage facility and the estimated cost of grid electricity supplied by NV Energy under LGS-3 tariff. The blended rate was derived from a discounted cash flow model that solved for the minimum rate needed to achieve financial breakeven (NPV = $0) after accounting for all solar generation and battery storage system capital and operating costs (including escalation), the estimated utility bill for purchased power from the grid, taxes, and debt service. Debt financing was assumed within the financial model using market comparable debt terms.
As this internal rate fully accounts for lifecycle system costs, ABTC has not presented a separate solar financial model; all solar-related expenses are embedded within the blended electricity rate and treated as part of the facility’s electricity cost included in the project’s OPEX, effectively structured as an internal power provider.
| barr.com |
|
|
| 18.3.4 | General and Administrative OPEX |
The G&A operating costs have been estimated based on personnel, supplies, and expenses. G&A costs are shown in Table 18-11 and Table 18-12, with a total 45-year cost of $172 million.
| Table 18-11 | G&A Operating Costs – Personnel ($000s) |
| Personnel Costs | YR -1 |
YR
1-2 |
YR
3-5 |
YR
6-10 |
YR
11-20 |
YR
21-30 |
YR
31-40 |
YR
41-45 |
Total |
| Construction Management Personnel | $458 | $170 | $- | $- | $- | $- | $- | $- | $628 |
| Admin Personnel | $648 | $2,436 | $3,654 | $6,090 | $12,181 | $12,181 | $12,181 | $6,090 | $55,461 |
| Safety & Security Personnel | $313 | $1,213 | $2,225 | $3,757 | $8,036 | $7,514 | $7,891 | $4,047 | $34,997 |
| Environmental Personnel | $329 | $659 | $988 | $1,647 | $3,295 | $3,295 | $3,295 | $1,647 | $15,156 |
| Total Personnel Costs | $1,748 | $4,479 | $6,868 | $11,495 | $23,511 | $22,990 | $23,366 | $11,785 | $106,242 |
yr = year
| Table 18-12 | G&A Operating Costs – General ($000s) |
| General Costs | YR -1 |
YR
1-2 |
YR 3-5 |
YR 6-10 |
YR 11-20 |
YR 21-30 |
YR 31-40 |
YR 41-45 |
Total |
| Construction Management Expenses | $200 | $100 | $- | $- | $- | $- | $- | $- | $300 |
| Supplies & General Maintenance | $144 | $288 | $432 | $720 | $1,440 | $1,440 | $1,440 | $720 | $6,624 |
| Land Holdings | $115 | $230 | $345 | $575 | $1,150 | $1,150 | $1,150 | $575 | $5,290 |
| Off Site Overhead | $18 | $36 | $54 | $90 | $180 | $180 | $180 | $90 | $828 |
| Legal, Audits, Consulting, MSHA | $49 | $98 | $147 | $245 | $490 | $490 | $490 | $245 | $2,254 |
| Computers, IT, Internet, Software, Hardware | $66 | $132 | $198 | $330 | $660 | $660 | $660 | $330 | $3,036 |
| Environmental, Monitoring Wells, Reporting | $200 | $400 | $600 | $1,000 | $2,000 | $2,000 | $2,000 | $1,000 | $9,200 |
| Expense Exploration Drilling | $100 | $200 | $300 | $500 | $1,000 | $1,000 | $1,000 | $500 | $4,600 |
| Donations, Dues, Public Relations | $30 | $60 | $90 | $150 | $300 | $300 | $300 | $150 | $1,380 |
| barr.com |
|
|
| General Costs | YR -1 |
YR
1-2 |
YR 3-5 |
YR 6-10 |
YR 11-20 |
YR 21-30 |
YR 31-40 |
YR 41-45 |
Total |
| Fees, Licenses, Misc Taxes, Insurance | $240 | $480 | $720 | $1,200 | $2,400 | $2,400 | $2,400 | $1,200 | $11,040 |
| Travel, Lodging, Meals, Entertainment | $54 | $108 | $162 | $270 | $540 | $540 | $540 | $270 | $2,484 |
| Telephones, Computers, Cell Phones | $78 | $156 | $234 | $390 | $780 | $780 | $780 | $390 | $3,588 |
| Light Vehicle Maintenance, Fuel | $121 | $295 | $448 | $747 | $1,493 | $1,493 | $1,493 | $747 | $6,837 |
| Small Tools, Janitorial, Safety Supplies | $66 | $132 | $198 | $330 | $660 | $660 | $660 | $330 | $3,036 |
| Equipment Rentals | $60 | $120 | $180 | $300 | $600 | $600 | $600 | $300 | $2,760 |
| Access Road Maintenance | $48 | $96 | $144 | $240 | $480 | $480 | $480 | $240 | $2,208 |
| Office Power | $- | $11 | $16 | $27 | $55 | $55 | $55 | $27 | $247 |
| Total General G&A Costs | $1,589 | $2,942 | $4,268 | $7,114 | $14,228 | $14,228 | $14,228 | $7,114 | $65,711 |
G&A = general and administrative
IT = information technology
MSHA = U.S. Mine Safety and Health Administration
yr = year
| barr.com |
|
|
19 Economic Analysis
The economic analysis is based on the sale of the lithium product at $23,000/t LHM and nominal 2025 dollars. Capital costs are expressed in U.S. dollars with no escalation or inflation unless stated otherwise.
The PFS results are as follows:
| ● | The economic analysis presented in this report limits the project to a mine life of approximately 45 years without exhausting the known mineral resources |
| ● | Approximately 559.8 Mt processed over the 45-year LOM |
| ● | Average head grade of 805 ppm Li, and beneficiated grade of approximately 2,100 ppm |
| ● | $2.0 billion in total facility initial capital costs |
| ● | Processing costs of $4,307/t LHM |
| ● | Overall mining, processing, and G&A operating costs of $6,994/t produced LHM |
| ● | Average production of 30,000 tpa of LHM |
| ● | $4.70 billion After-Tax NPV (5%) |
| ● | $2.57 billion After-Tax NPV (8%) |
| ● | $1.75 billion After-Tax NPV (10%) |
| ● | 21.8% IRR |
| ● | 7.5-year payback of initial investment |
| ● | The economic assumptions include the costs as summarized in Section 18.0, with other assumptions as follows: |
| ○ | Selling price of $23,000/t LHM |
| ○ | Federal tax rate of 21% |
| ○ | Nevada net proceeds tax of 5% |
The mining and process physicals used for the economic analysis were summarized based on the mine and process production schedules and are presented in Table 19-1. Total LHM produced is 1,311,609 tonnes over the 45-year course of the mine life.
| barr.com |
|
|
| Table 19-1 | PFS Production Schedule |
| Mine Production | Units | YR -1 |
YR 1 |
YR 2 |
YR 3 |
YR 4 |
YR 5 |
YR 6-10 |
YR 11-20 |
YR 21-30 |
YR 31-40 |
YR 41-45 |
Total |
| Total Above Cut-Off | ktonnes | - | 3,293 | 9,568 | 15,208 | 11,405 | 15,645 | 65,425 | 125,791 | 123,730 | 122,773 | 67,011 | 559,848 |
| ppm Li | - | 522 | 595 | 678 | 904 | 659 | 788 | 820 | 833 | 840 | 770 | 805 | |
| Li Tonnes | - | 1,719 | 5,693 | 10,312 | 10,312 | 10,312 | 51,562 | 103,125 | 103,125 | 103,125 | 51,579 | 450,866 | |
| ppm LHM | - | 3,163 | 3,606 | 4,110 | 5,480 | 3,995 | 4,776 | 4,969 | 5,051 | 5,091 | 4,665 | 4,881 | |
| LHM Tonnes | - | 10,417 | 34,504 | 62,500 | 62,500 | 62,500 | 312,500 | 625,000 | 625,000 | 625,000 | 312,598 | 2,732,519 | |
| Total Waste | ktonnes | 6,598 | 10,325 | 12,432 | 6,747 | 5,954 | 6,355 | 21,866 | 15,975 | 36,175 | 33,807 | 637 | 156,872 |
| Total Mined | ktonnes | 6,598 | 13,618 | 22,000 | 21,954 | 17,360 | 22,000 | 87,291 | 141,766 | 159,905 | 156,580 | 67,647 | 716,720 |
| Strip Ratio | W:O | NA | 3.14 | 1.30 | 0.44 | 0.52 | 0.41 | 0.33 | 0.13 | 0.29 | 0.28 | 0.01 | 0.28 |
| Material Processed | Units | YR -1 |
YR 1 |
YR 2 |
YR 3 |
YR 4 |
YR 5 |
YR 6-10 |
YR 11-20 |
YR 21-30 |
YR 31-40 |
YR 41-45 |
Total |
| ktonnes | - | 3,293 | 9,568 | 15,208 | 11,405 | 15,645 | 65,425 | 125,791 | 123,730 | 122,773 | 67,011 | 559,848 | |
| ppm Li | - | 522 | 595 | 678 | 904 | 659 | 788 | 820 | 833 | 840 | 770 | 805 | |
| Li Tonnes | - | 1,719 | 5,693 | 10,312 | 10,312 | 10,312 | 51,562 | 103,125 | 103,125 | 103,125 | 51,579 | 450,866 | |
| ppm LHM | - | 3,163 | 3,606 | 4,110 | 5,480 | 3,995 | 4,776 | 4,969 | 5,051 | 5,091 | 4,665 | 4,881 | |
| LHM Tonnes | - | 10,417 | 34,504 | 62,500 | 62,500 | 62,500 | 312,500 | 625,000 | 625,000 | 625,000 | 312,598 | 2,732,519 | |
| LHM Tonnes Recovered | - | 5,000 | 16,562 | 30,000 | 30,000 | 30,000 | 150,000 | 300,000 | 300,000 | 300,000 | 150,047 | 1,311,609 |
ktonnes = kilotonnes
ppm = parts per million
LHM = Lithium hydroxide monohydrate
W:O = Waste-to-Ore ratio
yr = year
| barr.com |
|
|
| Table 19-2 | Project Cash Flow |
| Cash Inflows ($000) | YR - 2 |
YR - 1 |
YR 1 |
YR 2 |
YR 3 |
YR 4 |
YR 5 |
YR 6 |
YR 7 |
YR 8 |
YR 9 |
YR 10 |
YR 11 |
YR 12 |
YR 13 |
YR 14 |
YR 15 |
| LHM Sales | $- | $- | $115,000 | $380,926 | $690,000 | $690,000 | $690,000 | $690,000 | $690,000 | $690,000 | $690,000 | $690,000 | $690,000 | $690,000 | $690,000 | $690,000 | $690,000 |
| Total Revenue | $- | $- | $115,000 | $380,926 | $690,000 | $690,000 | $690,000 | $690,000 | $690,000 | $690,000 | $690,000 | $690,000 | $690,000 | $690,000 | $690,000 | $690,000 | $690,000 |
| Cash Outflows ($000s) | YR - 2 |
YR - 1 |
YR 1 |
YR 2 |
YR 3 |
YR 4 |
YR 5 |
YR 6 |
YR 7 |
YR 8 |
YR 9 |
YR 10 |
YR 11 |
YR 12 |
YR 13 |
YR 14 |
YR 15 |
| Operating Cost ($000) | |||||||||||||||||
| Mining | $- | $(17,449) | $(37,309) | $(47,971) | $(56,021) | $(53,687) | $(56,872) | $(62,413) | $(66,876) | $(74,614) | $(71,454) | $(72,621) | $(71,479) | $(76,482) | $(82,387) | $(76,082) | $(75,570) |
| Processing | $- | $- | $(20,693) | $(70,893) | $(129,238) | $(129,238) | $(129,238) | $(129,238) | $(129,238) | $(129,238) | $(129,238) | $(129,238) | $(129,238) | $(129,238) | $(129,238) | $(129,238) | $(129,238) |
| G&A | $- | $(3,337) | $(3,814) | $(3,606) | $(3,693) | $(3,722) | $(3,722) | $(3,722) | $(3,722) | $(3,722) | $(3,722) | $(3,722) | $(3,722) | $(3,722) | $(3,722) | $(3,722) | $(3,751) |
| Total Operating Cost | $(20,786) | $(61,817) | $(122,470) | $(188,952) | $(186,646) | $(189,832) | $(195,373) | $(199,835) | $(207,573) | $(204,413) | $(205,581) | $(204,438) | $(209,442) | $(215,346) | $(209,041) | $(208,558) | |
| Taxes ($000) | |||||||||||||||||
| NV Net Proceeds Tax (5%) | $- | $- | $(1,541) | $(10,324) | $(20,614) | $(20,659) | $(20,505) | $(20,171) | $(19,904) | $(19,450) | $(19,587) | $(24,909) | $(24,954) | $(24,720) | $(24,448) | $(24,701) | $(24,727) |
| Federal Income Tax (21%) | $- | $- | $- | $- | $- | $(13,717) | $(13,614) | $(12,925) | $(12,748) | $(27,664) | $(65,472) | $(64,043) | $(64,852) | $(63,957) | $(62,419) | $(63,310) | $(64,141) |
| 45X
MPTC Tax Credit (-10%) |
$- | $- | $- | $- | $- | $13,717 | $10,779 | $5,685 | $- | $- | $- | $- | $- | $- | $- | $- | $- |
| Total Income Taxes | $- | $- | $(1,541) | $(10,324) | $(20,614) | $(20,659) | $(23,339) | $(27,412) | $(32,652) | $(47,113) | $(85,059) | $(88,951) | $(89,806) | $(88,676) | $(86,867) | $(88,011) | $(88,867) |
| Capital Expenditures ($000) | |||||||||||||||||
| G&A Capital | $(778) | $(3,723) | $(3,723) | $(3,723) | $(3,723) | $(3,723) | $(3,723) | $(3,723) | $(3,723) | $(3,723) | $(2,945) | $- | $- | $- | $- | $- | $- |
| Mining Capital | $- | $(111,341) | $(16,192) | $(45,248) | $(3,943) | $(1,057) | $(1,000) | $(12,721) | $(12,733) | $(20,544) | $(1,000) | $(4,264) | $(1,505) | $(1,000) | $(2,689) | $(4,500) | $(1,000) |
| Process Capital | $(109,481) | $(448,155) | $(448,155) | $(448,155) | $(338,674) | $- | $- | $- | $- | $- | $- | $- | $- | $- | $- | $- | $- |
| Sitework and Reclamation | $- | $- | $- | $- | $- | $- | $- | $- | $- | $- | $- | $- | $- | $- | $- | $- | $- |
| Total Capital Expenditures | $(110,259) | $(563,219) | $(468,070) | $(497,125) | $(346,340) | $(4,780) | $(4,723) | $(16,444) | $(16,456) | $(24,267) | $(3,945) | $(4,264) | $(1,505) | $(1,000) | $(2,689) | $(4,500) | $(1,000) |
| Grants ($000) | |||||||||||||||||
| Government Grant Payments | $- | $54,740 | $3,002 | $- | $- | $- | $- | $- | $- | $- | $- | $- | $- | $- | $- | $- | $- |
| Total Grants | $- | $54,740 | $3,002 | $- | $- | $- | $- | $- | $- | $- | $- | $- | $- | $- | $- | $- | $- |
| Cash Flow ($000) | YR - 2 |
YR - 1 |
YR 1 |
YR 2 |
YR 3 |
YR 4 |
YR 5 |
YR 6 |
YR 7 |
YR 8 |
YR 9 |
YR 10 |
YR 11 |
YR 12 |
YR 13 |
YR 14 |
YR 15 |
| After Tax Cash Flow Analysis (Unlevered) | |||||||||||||||||
| Revenue | $- | $- | $115,000 | $380,926 | $690,000 | $690,000 | $690,000 | $690,000 | $690,000 | $690,000 | $690,000 | $690,000 | $690,000 | $690,000 | $690,000 | $690,000 | $690,000 |
| Operating Costs | $- | $(20,786) | $(61,817) | $(122,470) | $(188,952) | $(186,646) | $(189,832) | $(195,373) | $(199,835) | $(207,573) | $(204,413) | $(205,581) | $(204,438) | $(209,442) | $(215,346) | $(209,041) | $(208,558) |
| Tax Payables | $- | $- | $(1,541) | $(10,324) | $(20,614) | $(20,659) | $(23,339) | $(27,412) | $(32,652) | $(47,113) | $(85,059) | $(88,951) | $(89,806) | $(88,676) | $(86,867) | $(88,011) | $(88,867) |
| Capital Expenditures | $(110,259) | $(563,219) | $(468,070) | $(497,125) | $(346,340) | $(4,780) | $(4,723) | $(16,444) | $(16,456) | $(24,267) | $(3,945) | $(4,264) | $(1,505) | $(1,000) | $(2,689) | $(4,500) | $(1,000) |
| Grants Reimbursement | $- | $54,740 | $3,002 | $- | $- | $- | $- | $- | $- | $- | $- | $- | $- | $- | $- | $- | $- |
| Net Cash Flow (unlevered) | $(110,259) | $(529,264) | $(413,425) | $(248,993) | $134,095 | $477,915 | $472,106 | $450,772 | $441,056 | $411,046 | $396,583 | $391,204 | $394,250 | $390,882 | $385,097 | $388,449 | $391,574 |
| Cumulative Net Cash Flow | $(110,259) | $(639,523) | $(1,052,948) | $(1,301,941) | $(1,167,846) | $(689,931) | $(217,825) | $232,947 | $674,003 | $1,085,050 | $1,481,632 | $1,872,837 | $2,267,087 | $2,657,968 | $3,043,066 | $3,431,514 | $3,823,088 |
| barr.com |
|
|
| Cash Inflows ($000) | YR 16 |
YR 17 |
YR 18 |
YR 19 |
YR 20 |
YR 21 |
YR 22 |
YR 23 |
YR 24 |
YR 25 |
YR 26 |
YR 27 |
YR 28 |
YR 29 |
YR 30 |
YR 31 |
| LHM Sales | $690,000 | $690,000 | $690,000 | $690,000 | $690,000 | $690,000 | $690,000 | $690,000 | $690,000 | $690,000 | $690,000 | $690,000 | $690,000 | $690,000 | $690,000 | $690,000 |
| Total Revenue | $690,000 | $690,000 | $690,000 | $690,000 | $690,000 | $690,000 | $690,000 | $690,000 | $690,000 | $690,000 | $690,000 | $690,000 | $690,000 | $690,000 | $690,000 | $690,000 |
| Cash Outflows ($000) | YR 16 |
YR 17 |
YR 18 |
YR 19 |
YR 20 |
YR 21 |
YR 22 |
YR 23 |
YR 24 |
YR 25 |
YR 26 |
YR 27 |
YR 28 |
YR 29 |
YR 30 |
YR 31 |
| Operating Cost ($000) | ||||||||||||||||
| Mining | $(74,354) | $(84,671) | $(79,787) | $(76,189) | $(76,707) | $(75,562) | $(70,806) | $(73,597) | $(73,385) | $(73,075) | $(70,974) | $(72,156) | $(69,238) | $(77,202) | $(82,349) | $(83,267) |
| Processing | $(129,238) | $(129,238) | $(129,238) | $(129,238) | $(129,238) | $(129,238) | $(129,238) | $(129,238) | $(129,238) | $(129,238) | $(129,238) | $(129,238) | $(129,238) | $(129,238) | $(129,238) | $(129,238) |
| G&A | $(3,838) | $(3,838) | $(3,838) | $(3,838) | $(3,751) | $(3,722) | $(3,722) | $(3,722) | $(3,722) | $(3,722) | $(3,722) | $(3,722) | $(3,722) | $(3,722) | $(3,722) | $(3,722) |
| Total Operating Cost | $(207,430) | $(217,747) | $(212,862) | $(209,264) | $(209,696) | $(208,522) | $(203,765) | $(206,556) | $(206,345) | $(206,035) | $(203,933) | $(205,115) | $(202,198) | $(210,162) | $(215,308) | $(216,227) |
| Taxes ($000) | ||||||||||||||||
| NV Net Proceeds Tax (5%) | $(24,779) | $(24,342) | $(24,657) | $(24,825) | $(24,820) | $(24,883) | $(25,109) | $(24,938) | $(24,966) | $(24,981) | $(25,077) | $(25,042) | $(25,228) | $(24,844) | $(24,602) | $(24,534) |
| Federal Income Tax (21%) | $(64,355) | $(61,523) | $(63,252) | $(63,972) | $(63,883) | $(60,841) | $(62,953) | $(64,002) | $(64,555) | $(62,590) | $(64,334) | $(64,798) | $(63,529) | $(61,666) | $(60,832) | $(60,851) |
| 45X
MPTC Tax Credit (-10%) |
$- | $- | $- | $- | $- | $- | $- | $- | $- | $- | $- | $- | $- | $- | $- | $- |
| Total Income Taxes | $(89,134) | $(85,865) | $(87,908) | $(88,797) | $(88,702) | $(85,724) | $(88,063) | $(88,940) | $(89,522) | $(87,570) | $(89,411) | $(89,840) | $(88,757) | $(86,510) | $(85,434) | $(85,385) |
| Capital Expenditures ($000) | ||||||||||||||||
| G&A Capital | $- | $- | $- | $- | $- | $- | $- | $- | $- | $- | $- | $- | $- | $- | $- | $- |
| Mining Capital | $(1,057) | $(4,662) | $(1,000) | $(1,000) | $(1,000) | $(17,097) | $(11,065) | $(3,459) | $(1,000) | $(10,657) | $(4,355) | $(1,000) | $(9,774) | $(11,065) | $(11,137) | $(9,940) |
| Process Capital | $- | $- | $- | $- | $- | $- | $- | $- | $- | $- | $- | $- | $- | $- | $- | $- |
| Sitework and Reclamation | $- | $- | $- | $- | $- | $- | $- | $- | $- | $- | $- | $- | $- | $- | $- | $- |
| Total Capital Expenditures | $(1,057) | $(4,662) | $(1,000) | $(1,000) | $(1,000) | $(17,097) | $(11,065) | $(3,459) | $(1,000) | $(10,657) | $(4,355) | $(1,000) | $(9,774) | $(11,065) | $(11,137) | $(9,940) |
| Grants ($000) | ||||||||||||||||
| Government Grant Payments | $- | $- | $- | $- | $- | $- | $- | $- | $- | $- | $- | $- | $- | $- | $- | $- |
| Total Grants | $- | $- | $- | $- | $- | $- | $- | $- | $- | $- | $- | $- | $- | $- | $- | $- |
| Cash Flow ($000) | YR 16 |
YR 17 |
YR 18 |
YR 19 |
YR 20 |
YR 21 |
YR 22 |
YR 23 |
YR 24 |
YR 25 |
YR 26 |
YR 27 |
YR 28 |
YR 29 |
YR 30 |
YR 31 |
| After Tax Cash Flow Analysis (Unlevered) | ||||||||||||||||
| Revenue | $690,000 | $690,000 | $690,000 | $690,000 | $690,000 | $690,000 | $690,000 | $690,000 | $690,000 | $690,000 | $690,000 | $690,000 | $690,000 | $690,000 | $690,000 | $690,000 |
| Operating Costs | $(207,430) | $(217,747) | $(212,862) | $(209,264) | $(209,696) | $(208,522) | $(203,765) | $(206,556) | $(206,345) | $(206,035) | $(203,933) | $(205,115) | $(202,198) | $(210,162) | $(215,308) | $(216,227) |
| Tax Payables | $(89,134) | $(85,865) | $(87,908) | $(88,797) | $(88,702) | $(85,724) | $(88,063) | $(88,940) | $(89,522) | $(87,570) | $(89,411) | $(89,840) | $(88,757) | $(86,510) | $(85,434) | $(85,385) |
| Capital Expenditures | $(1,057) | $(4,662) | $(1,000) | $(1,000) | $(1,000) | $(17,097) | $(11,065) | $(3,459) | $(1,000) | $(10,657) | $(4,355) | $(1,000) | $(9,774) | $(11,065) | $(11,137) | $(9,940) |
| Grants Reimbursement | $- | $- | $- | $- | $- | $- | $- | $- | $- | $- | $- | $- | $- | $- | $- | $- |
| Net Cash Flow (unlevered) | $392,379 | $381,726 | $388,229 | $390,939 | $390,602 | $378,657 | $387,107 | $391,045 | $393,133 | $385,738 | $392,301 | $394,045 | $389,271 | $382,263 | $378,121 | $378,448 |
| Cumulative Net Cash Flow | $4,215,468 | $4,597,194 | $4,985,423 | $5,376,363 | $5,766,965 | $6,145,728 | $6,532,835 | $6,923,880 | $7,317,014 | $7,702,752 | $8,095,053 | $8,489,098 | $8,878,370 | $9,260,633 | $9,638,965 | $10,017,571 |
| barr.com |
|
|
| Cash Inflows ($000) | YR 32 |
YR 33 |
YR 34 |
YR 35 |
YR 36 |
YR 37 |
YR 38 |
YR 39 |
YR 40 |
YR 41 |
YR 42 |
YR 43 |
YR 44 |
YR 45 |
Total |
| LHM Sales | $690,000 | $690,000 | $690,000 | $690,000 | $690,000 | $690,000 | $690,000 | $690,000 | $690,000 | $690,000 | $690,000 | $690,000 | $690,000 | $691,081 | 30,167,007 |
| Total Revenue | $690,000 | $690,000 | $690,000 | $690,000 | $690,000 | $690,000 | $690,000 | $690,000 | $690,000 | $690,000 | $690,000 | $690,000 | $690,000 | $691,081 | 30,167,007 |
| Cash Outflows ($000) | YR 32 |
YR 33 |
YR 34 |
YR 35 |
YR 36 |
YR 37 |
YR 38 |
YR 39 |
YR 40 |
YR 41 |
YR 42 |
YR 43 |
YR 44 |
YR 45 |
Total |
| Operating Cost ($000) | |||||||||||||||
| Mining | $(80,503) | $(79,761) | $(87,020) | $(76,925) | $(78,348) | $(80,426) | $(77,010) | $(86,270) | $(77,392) | $(74,185) | $(77,395) | $(83,104) | $(89,091) | $(92,650) | $(3,352,688) |
| Processing | $(129,238) | $(129,238) | $(129,238) | $(129,238) | $(129,238) | $(129,238) | $(129,238) | $(129,238) | $(129,238) | $(129,238) | $(129,238) | $(129,238) | $(129,238) | $(129,442) | $(5,649,008) |
| G&A | $(3,722) | $(3,722) | $(3,809) | $(3,751) | $(3,722) | $(3,838) | $(3,838) | $(3,751) | $(3,722) | $(3,722) | $(3,722) | $(3,780) | $(3,838) | $(3,838) | $(171,953) |
| Total Operating Cost | $(213,463) | $(212,720) | $(220,066) | $(209,913) | $(211,307) | $(213,501) | $(210,086) | $(219,258) | $(210,351) | $(207,144) | $(210,355) | $(216,122) | $(222,167) | $(225,929) | $(9,173,650) |
| Taxes ($000) | |||||||||||||||
| NV Net Proceeds Tax (5%) | $(24,654) | $(24,712) | $(24,370) | $(24,833) | $(24,875) | $(24,767) | $(24,894) | $(24,478) | $(24,863) | $(25,015) | $(24,856) | $(24,559) | $(24,313) | $(24,133) | (1,044,161) |
| Federal Income Tax (21%) | $(61,867) | $(62,504) | $(61,799) | $(63,834) | $(61,987) | $(62,600) | $(63,995) | $(62,156) | $(63,542) | $(64,587) | $(63,683) | $(62,791) | $(61,580) | $(61,005) | (2,413,933) |
| 45X MPTC Tax Credit (-10%) | $- | $- | $- | $- | $- | $- | $- | $- | $- | $- | $- | $- | $- | $- | 30,019 |
| Total Income Taxes | $(86,521) | $(87,217) | $(86,170) | $(88,667) | $(86,862) | $(87,367) | $(88,889) | $(86,635) | $(88,405) | $(89,603) | $(88,539) | $(87,350) | $(85,893) | $(85,138) | $(3,439,408) |
| Capital Expenditures ($000) | |||||||||||||||
| G&A Capital | $- | $- | $- | $- | $- | $- | $- | $- | $- | $- | $- | $- | $- | $- | (37,230) |
| Mining Capital | $(6,995) | $(5,154) | $(1,000) | $(1,000) | $(8,863) | $(3,858) | $- | $- | $(1,925) | $- | $(1,253) | $(39) | $- | $- | (370,091) |
| Process Capital | $- | $- | $- | $- | $- | $- | $- | $- | $- | $- | $- | $- | $- | $- | (1,792,618) |
| Sitework and Reclamation | $- | $- | $- | $- | $- | $- | $- | $- | $- | $- | $- | $- | $- | $(150) | (150) |
| Total Capital Expenditures | $(6,995) | $(5,154) | $(1,000) | $(1,000) | $(8,863) | $(3,858) | $- | $- | $(1,925) | $- | $(1,253) | $(39) | $- | $(150) | $(2,200,090) |
| Grants ($000) | |||||||||||||||
| Government Grant Payments | $- | $- | $- | $- | $- | $- | $- | $- | $- | $- | $- | $- | $- | $- | $57,743 |
| Total Grants | $- | $- | $- | $- | $- | $- | $- | $- | $- | $- | $- | $- | $- | $- | $57,743 |
| Cash Flow ($000) | YR 32 |
YR 33 |
YR 34 |
YR 35 |
YR 36 |
YR 37 |
YR 38 |
YR 39 |
YR 40 |
YR 41 |
YR 42 |
YR 43 |
YR 44 |
YR 45 |
Total |
| After Tax Cash Flow Analysis (Unlevered) | |||||||||||||||
| Revenue | $690,000 | $690,000 | $690,000 | $690,000 | $690,000 | $690,000 | $690,000 | $690,000 | $690,000 | $690,000 | $690,000 | $690,000 | $690,000 | $691,081 | 30,167,007 |
| Operating Costs | $(213,463) | $(212,720) | $(220,066) | $(209,913) | $(211,307) | $(213,501) | $(210,086) | $(219,258) | $(210,351) | $(207,144) | $(210,355) | $(216,122) | $(222,167) | $(225,929) | (9,173,650) |
| Tax Payables | $(86,521) | $(87,217) | $(86,170) | $(88,667) | $(86,862) | $(87,367) | $(88,889) | $(86,635) | $(88,405) | $(89,603) | $(88,539) | $(87,350) | $(85,893) | $(85,138) | (3,427,914) |
| Capital Expenditures | $(6,995) | $(5,154) | $(1,000) | $(1,000) | $(8,863) | $(3,858) | $- | $- | $(1,925) | $- | $(1,253) | $(39) | $- | $(150) | (2,200,090) |
| Grants Reimbursement | $- | $- | $- | $- | $- | $- | $- | $- | $- | $- | $- | $- | $- | $- | 57,743 |
| Net Cash Flow (unlevered) | $383,021 | $384,909 | $382,764 | $390,420 | $382,968 | $385,274 | $391,025 | $384,107 | $389,319 | $393,253 | $389,853 | $386,489 | $381,940 | $379,864 | $15,423,097 |
| Cumulative Net Cash Flow | $10,400,592 | $10,785,608 | $11,168,372 | $11,558,792 | $11,941,865 | $12,327,245 | $12,718,270 | $13,102,377 | $13,491,696 | $13,884,949 | $14,274,802 | $14,661,292 | $15,043,233 | $15,423,097 | |
45X MPTC = Advanced Manufacturing Production Tax Credit
G&A = general and administrative
LHM = lithium hydroxide monohydrate
NV = Nevada
yr = year
| barr.com |
|
|
| 19.1 | Sensitivity Analysis |
After-tax cash flow sensitivity to lithium prices was evaluated at LHM sales prices from $13,000/t to $43,000/t LHM and are shown in Table 19-3. Note the sensitivities have been done in the PFS cash flow model, thus there is no change in the pit designs or production schedules.
| Table 19-3 | After Tax Cash Flow Lithium Price Sensitivity |
| Lithium Price | Net Cash Flow | NPV at 8% | Internal Rate of Return | Payback (years) |
| $13,000 | $5.0B | $0.0B | 8.2% | 14.7 yr |
| $15,500 | $7.6B | $0.7B | 11.8% | 11.3 yr |
| $18,000 | $10.2B | $1.3B | 15.3% | 9.4 yr |
| $20,500 | $12.8B | $2.0B | 18.6% | 8.3 yr |
| $23,000 | $15.4B | $2.6B | 21.8% | 7.5 yr |
| $25,500 | $18.0B | $3.8B | 25.0% | 6.9 yr |
| $28,000 | $20.6B | $3.8B | 28.0% | 6.5 yr |
| $30,500 | $23.2B | $4.4B | 31.1% | 6.2 yr |
| $33,000 | $25.8B | $5.0B | 34.0% | 5.9 yr |
| $38,000 | $31.1B | $6.2B | 39.6% | 5.5 yr |
| $43,000 | $36.3B | $7.4B | 45.4% | 5.2 yr |
B = billion
NPV = net present value
yr = year
Revenue, operating cost, and capital cost were evaluated from +/-30% of the values in 10% increments, using the PFS cash flow model. Table 19-4 and Table 19-5 shows the cash flow sensitivity results in tabular form for revenue, operating, and capital cost adjustments, respectively. Figure 19-1 shows the cash flow sensitivity graphically to the NPV (8%). Economic viability is positive for revenue and operating cost as well as positive under market value and capital cost.
| Table 19-4 | After Tax Cash Flow Capital Cost Sensitivity (US$ Billion) |
| Capital Cost | Net Cash Flow | NPV at 8% | Internal Rate of Return | Payback (years) |
| 70% | $16.1B | $3.1B | 31.4% | 6.2 yr |
| 80% | $15.9B | $2.9B | 27.5% | 6.6 yr |
| 90% | $15.6B | $2.7B | 24.3% | 7.1 yr |
| 100% | $15.4B | $2.6B | 21.8% | 7.5 yr |
| 110% | $15.2B | $2.4B | 19.7% | 8.0 yr |
| 120% | $15.0B | $2.2B | 18.0% | 8.4 yr |
| 130% | $14.8B | $2.0B | 16.5% | 8.9 yr |
B = billion
NPV = net present value
yr = year
| barr.com |
|
|

| Figure 19-1 | After Tax Cash Flow Sensitivity - NPV (8%) (US$ Billion) |
After-tax cash flow sensitivity to energy cost was evaluated at $0.005 per kWh increments, using the PFS cash flow model given that energy is the primary cost driver for lithium production from the facility, and results are shown in Table 19-5.
| Table 19-5 | After Tax Cash Flow Energy Cost Sensitivity (US$ Billion) |
| Energy Cost ($/kWh) | Net Cash Flow | NPV at 8% | Internal Rate of Return | Payback (years) |
| $0.0050 | $17.9B | $3.1B | 24.8% | 6.9 yr |
| $0.0150 | $17.0B | $2.9B | 23.8% | 7.1 yr |
| $0.0250 | $16.2B | $2.8B | 22.8% | 7.3 yr |
| $0.0350 | $15.4B | $2.6B | 21.8% | 7.5 yr |
| $0.0450 | $14.6B | $2.4B | 20.8% | 7.7 yr |
| $0.0550 | $13.8B | $2.2B | 19.8% | 8.0 yr |
| $0.0650 | $13.0B | $2.0B | 18.7% | 8.2 yr |
B = billion
kWh = kilowatt hour
NPV = net present value
yr = year
| barr.com |
|
|
20 Adjacent Properties
The paragraphs below briefly describe projects adjacent to the Tonopah Flats property. The descriptions of the projects and ownership are current as of May 30, 2025. Figure 20-1 presents the locations of the projects in the immediate vicinity of Tonopah Flats.

| Figure 20-1 | Adjacent Properties |
| barr.com |
|
|
American Lithium’s TLC project is located about 10 km northwest of Tonopah, Nevada, about 1.6 km to the northeast of the Tonopah Flats property and includes two continuous claim packages. The TLC project is a lithium claystone deposit analogous to the Tonopah Flats lithium deposit. A PEA was completed for the project by DRA Global and Stantec Consulting Ltd. in early 2023. DRA Global has been engaged as the lead engineering firm for an upcoming PFS. Barr has not been able to verify this information, and this information is not necessarily indicative of the mineralization at the Tonopah Flats property.
Enertopia’s 712 ha West Tonopah Lithium project is located approximately 6 km west of Tonopah, Nevada and borders the Tonopah Flats property to the east, straddling US 6/95. Enertopia completed exploration drill programs in 2022 and 2023 for a total of 1,497 m of drilling (Shaas, 2023). They released the maiden resource for the project On November 21, 2023. The company reports that two distinct horizons of mineralized claystone were intersected in the drill holes to a depth of 61 m. Barr has not been able to verify this information, and this information is not necessarily indicative of the mineralization at the Tonopah Flats property.
POWR Lithium’s Halo project (formerly Clear Sky Lithium Corporation) is immediately east of the Tonopah Flats property, to the north of US 6/95 (Power Lithium, 2024). The property is comprised of 98 claims totaling 819 ha. The company completed their Phase I exploration drilling program consisting of four core holes for a total of 884 m in November 2023. Drilling was completed to a maximum depth of 245.4 m. According to Chariot Corporation’s website POWR also released the Halo claims back to Chariot Corporation/Mustang Lithium LLC. Barr has not been able to verify this information, and this information is not necessarily indicative of the mineralization at the Tonopah Flats property.
Pan American Energy’s Horizon project is located immediately south of the Tonopah Flats property and includes 839 claims totaling more than 6,880 ha. Pan American completed an initial 21-core hole exploration program in the spring of 2023 for a total of 4,399 m drilled. Lithium bearing claystone was intercepted to the maximum depth of exploration of 304 m. The company released their maiden resource estimate for the property in November 2023 (Murray, 2023). The mineral resource estimate was completed by RESPEC. The mineralization on the Horizon property may be continuous with that of the Tonopah Flats property. Pan American Energy released the property back to the underlying claim owner Chariot Corporation/Mustang Lithium LLC in a public announcement dated August 29, 2024.
Future Battery Mineral’s early-stage Nevada Lithium Project consists of five prospects near Tonopah, Nevada. The Lone Mountain and Western Flats prospects are early-stage exploration projects located to the north, west, and southwest of the Tonopah Flats property. An initial 9-hole RC exploration drill program on the Western Flats prospect completed in March 2023 intersected lithium-bearing claystones of the Siebert Formation. Results include intersections of thick sequences (up to 182 m or more) of lithium mineralization. A follow up drill program is currently undergoing permitting (Mulholland, 2023). The property changed ownership to Austroid Corporation and announced acquiring 80% of the project from Future Battery Minerals November 4th, 2024 (Austroid Corporation, 2024). Barr has not been able to verify this information, and this information is not necessarily indicative of the mineralization at the Tonopah Flats property.
Tearlach Resources (through its subsidiary Pan Am Lithium) and Blackrock Silver own the joint venture Gabriel project east of the Tonopah Flats property. The property consists of approximately 1,586 ha of unpatented mining claims. Previous exploration drilling on the property by Blackrock Silver intersected lithium-bearing claystone of the Seibert Formation. Tearlach began an additional 19-hole drill program at the project in March 2023 to confirm previous drill results by Blackrock Silver, collect material for
metallurgical testing, and explore other prospective areas of the land package (Tearlach Resources Ltd., 2025). ABTC contacted BlackRock Silver in June of 2025, and BlackRock confirmed that Tearlach had released the Gabriel Project Claims back to BlackRock. Barr has not been able to verify this information, and this information is not necessarily indicative of the mineralization at the Tonopah Flats property.
Blackrock Silver’s Tonopah West project is located on the west side of Tonopah. The Tonopah West project is centered on several low sulfidation epithermal silver-gold veins (Lindholm and Bickel, 2022). Lithium mineralization has also been identified in the Siebert Formation at this project. Barr has not been able to verify this information, and this information is not necessarily indicative of the mineralization at the Tonopah Flats property.
| barr.com |
|
|
21 Other Relevant Data and Information
The QPs have no other relevant data and information to report that would be necessary to provide a complete and balanced preliminary feasibility of the Project.
| barr.com |
|
|
22 Interpretations and Conclusions
This PFS has integrated drilling, testing, design, and economic evaluation data provided by ABTC or developed by the QPs or third parties, as described in the various sections of this report. This PFS represents a significant step forward from the IA published for this project in 2023, providing an updated resource estimate, reserve estimate, viable mining plan, technically feasible processing scenario, tailings and mine waste management approach, update on permitting considerations, and a resultant economic evaluation.
| 22.1 | Conclusions |
The Mineral Resource estimate has been updated with the additional drilling conducted in 2025. This resulted in the updating of the geologic and mineralization domains. The model was estimated with SGSim to effectively estimate grade and reduce the uncertainty of the Mineral Resource. The resulting Measured and Indicated Mineral Resource is of sufficient quality and confidence for conversion into a Mineral Reserve. The Mineral Resource exclusive of the Mineral Reserve within Measured and Indicated categories consists of 2,333,767 ktonnes, at 712 ppm Li.
The drilling has so far defined an area of generally continuous mineralization 7925 m (26,000 ft) north to south by 1,524 m to 4,572 m (5,000 ft to 15,000 ft) east to west, with known thicknesses up to 436 m (1,430 ft). Clay beds with higher concentrations of lithium are localized to semi-continuous, and the lithium-bearing beds are generally contained in a 1,219- to 3,048-m wide (4,000- to 10,000-ft wide) corridor in multiple stratigraphic horizons from 6.1 m to 35 m (20 ft to 115 ft) in thickness, running north to south through the central portion of the property.
ABTC, in collaboration with Hazen, Pocock, and SGS, has been conducting an ongoing mineral processing and metallurgical testing program to produce high-purity LHM from lithium-bearing claystone. Initiated in Spring 2022, the program began with conventional acid leaching methods (using HCl and H₂SO₄), which achieved high lithium extraction rates (>80%) but also leached gangue minerals increasing reagent consumption as well as deleterious element extractions, complicating purification.
To improve selectivity, pretreatment methods were developed that converted lithium into more easily leachable forms while minimizing both reagent consumption and extraction of deleterious elements from the solid matrix. These methods improved lithium extraction (70–85%) and significantly reduced impurities in the PLS, simplifying downstream purification and improving economics.
Following successful bench-scale trials, a pilot plant with a feed capacity of 5 tpd was built and operated, confirming the feasibility of producing battery-grade LHM. Beneficiation techniques were also explored to concentrate lithium-bearing minerals, reducing processing costs, and improving efficiency. These trials showed a 2.85x upgrade ratio from run of mine ore to beneficiated material.
Process simulations using METSIM and Aspen were employed to optimize parameters and economics. The report focuses on bench scaled data as well as the pilot plant demonstration results, beneficiation studies, pretreatment of beneficiated materials, and ongoing efforts to enhance reagent use regarding final product purity, and overall process economics. Additional test work and pilot plant runs are scheduled to be conducted to further optimize the process design for the FS.
| barr.com |
|
|
Based on these results, there are sufficient Measured and Indicated resources as well as Proven and Probable reserves to advance the project to a FS. The Mineral Reserves are also supported by the 2024 IA Study for this project. Reserves are based on lithium price of $133,333/t, LHM price of $22,000/t, mining cost of $2.70/t, processing/milling cost of $10.7/t-processed, G&A cost of $0.90/t-processed, lithium content in LHM of 0.165, flat recovery of 48%, and with minimum lithium COG of 300 ppm. Furthermore, based on this PFS, and building on previous work to date, Tonopah Flats has been shown to be a robust lithium clay resource which is a strong candidate for advanced project development and economic studies.
The evaluations described in this report define approximately 559.8 Mt of Proven and Probable reserves at an average grade of 805 ppm Li for a planned average production of 30,000 tpa of LHM, resulting in a 45-years mine life. The overall operating cost is expected to be $6,994/t of LHM produced. The project has a positive after-tax NPV of $2.57 billion at an 8% discount rate and an IRR of 21.8%, or $4.70 billion NPV at a 5% discount rate. These values indicate a 7.5-year payback from the initial capital investment of $1.6 billion. With sustaining capital of $561 million, the total capital for the 45-year mine life is expected to be $2.2 billion.
It should be noted that this PFS was limited to a mine life of 45 years and only a portion of the South Pit was included in the mine life and economic analysis. A 45-year mine life will not exhaust the known mineral reserves and resources. Future studies should review the potential for additional refineries with supplementary capacity that could be built in parallel to further increase the productivity of the estimated reserves and resources.
The QPs have reviewed the project data for the TFLP, conducted field work, directed laboratory work, and observed operations of various types during this evaluation. Key QPs have visited the project site as well as the pilot plant during 2025. The QPs believe that the data provided by ABTC, and the geological interpretations Dahrouge has derived from the data, are an accurate and reasonable representation of the project, subject to those concerns written elsewhere in this report.
| 22.2 | Tonopah Flats Expansion Potential |
The current lithium resources remain open to the south, southwest, and at depth. It is reasonable to assume that there is the potential to significantly expand the resources with further drilling extending to the south and southwest property boundaries, and at greater depths. Conversion of additional Inferred resources to those of improved classification can be achieved with more infill drilling, especially in the northern half of the property, although the current Measured and Indicated resources are likely sufficient to begin more advanced project development.
| 22.3 | Project Risks |
Processing lithium-clay deposits is an uncommon practice in producing mines worldwide. Although there are currently several development projects for these deposits, the processing techniques and associated costs have little historical application and are not easily comparable to lithium in pegmatite and other existing types of lithium operations such as brine-based projects. The work to date has demonstrated the likely economic extraction of the resources reported herein, based on the test work in Chapter 10 and the process design and evaluation in Chapter 14. To address this risk, ABTC has constructed and continues to operate a multi-tonne per day pilot plant that operates on representative bulk samples from the deposit and these operations will continue to derisk the processing approach.
| barr.com |
|
|
Due to large ore deposits and limited availability of non-ore land, it is very crucial to backfill the mined-out open pit to ensure the success of this project. Implementation of a mine dispatch system will help optimize material routing in real time. This plan includes ROM ore handling and tailings handling to their respective dumps through conveyors and stackers, this however, poses a risk when the conveyors and stackers break down outside of their planned downtimes. To mitigate this risk, mining equipment or a mining contractor could be used to perform this ROM ore handling and tailings handling operations when needed.
The OPEX for this project is heavily weighted to the power consumption of the refinery. As a result, the power supply to the TFLP is a major risk factor. ABTC has addressed this through a combination of power sources—namely solar power production, with battery energy storage combined with grid power supplied by NV Energy. Furthermore, ABTC has an operational plan that prorates production during times of high and low power availability or constraint. Further refinement of this approach through power system modeling and process design modifications will help reduce the risk in this area.
As all developers and producers in the lithium space have experienced over the past several years, the price of LHM can vary widely. This represents a major risk to project economics. Expected reasonable near-term lithium price variations are addressed in the sensitivity analysis in Chapter 19. Sensitivity to product sale prices can often be reduced by seeking further refinements and optimizations in design (capital cost) and operations. As the project progresses to FS evaluations, this type of refinement will provide for project economics that are more robust against product price fluctuations.
There is some risk associated with modeling of faults at Tonopah Flats, which ultimately could affect the mineral resource estimate. Specifically, faults offsetting favorable lithologies for lithium can create deep alluvial channels which are barren of mineralization, as is the case at the western edge of the current model at Tonopah Flats. While it has been linked to mapped faults in the area, the supporting drill hole data to accurately place the location of the fault is limited. Although ABTC intentionally drilled to the east of the fault, once it was identified during the initial drilling, this risk could be mitigated with more drilling on the western portion of the deposit to control further geologic modeling. Additionally, minor offsets within the deposit probably exist, but have not been modeled due to the wide spacing of the drilling.
| barr.com |
|
|
23 Recommendations
While the PFS indicates cash flow, additional studies are needed to advance to the FS, as described below.
| 23.1 | Mining, Ore Handling, and Tailings Handling |
The following mining studies are recommended to advance this project to the level of an FS and the estimated cost for these studies is $250,000.
| ● | Conduct additional study on material density and swell factors for both ore and waste to support the accurate sizing of mining equipment, including haul truck beds and excavator buckets |
| ● | Undertake more detailed engineering and cost analysis for pre-mining site development activities |
| ● | Assess the feasibility of integrating electric, hybrid, and autonomous mining equipment to improve project economics and reduce the environmental footprint |
| ● | Complete detailed engineering for the ROM ore handling system to improve operational efficiency and throughput |
| ● | Update mine planning, costing and operational trade-off analyses (e.g., contractor vs. owner operated fleet, lease vs. purchase scenarios) to incorporate findings from the recommended studies |
| 23.2 | Metallurgy and Processing |
To support the FS, a comprehensive metallurgical testing and process development program is recommended. This work should be based on samples that are representative of the deposit, with an estimated cost of $550,000 excluding pilot plant improvements. Note that metallurgical drilling may be required to obtain sufficient material for testing; this cost is not included in the current estimate.
| 23.2.1 | Recommended Metallurgical Test Work |
The proposed test work should encompass a wide range of laboratory and pilot-scale evaluations, including:
| ● | Mineral Beneficiation: Evaluate separation techniques to improve recovery and concentrate quality |
| ● | Solid – Liquid Separation: Evaluate separation techniques |
| ● | Tailings Management: Analyze tailings composition, mineralogy, and washing efficiency to optimize disposal and potential reuse |
| ● | Thermophysical Data Collection: Support optimization of pretreatment conditions |
| ● | Hydroxide Conversion and Crystallization Optimization: Refine chemical conversion processes for final product quality |
| ● | Feed Variability Testing: Conduct variability assessments at both bench and pilot scale |
| barr.com |
|
|
| 23.2.1.1 | Geometallurgical Modeling and Data Integration |
| ● | Develop a geometallurgical model using exploration drilling and metallurgical testing data. The model should be designed to incorporate future drilling and standardized batch testing results |
| ● | Compile ABTC metallurgical testing data into a unified dataset to enable statistical analysis and development of a standardized batch testing procedure. This will support spatial variability testing and form the basis for production ore control |
| 23.2.1.2 | Pilot Plant Enhancements |
| ● | Incorporate the full beneficiation circuit into the existing pilot plant to reflect the complete process flow sheet |
| ● | Conduct 24-hour and 30-day continuous run campaigns to validate process stability and performance |
| ● | Perform stress testing to identify operational limits and failure modes |
| ● | Identify points of off-specification material generation and evaluate options for extraction or recirculation |
| ● | Develop operational strategies for underperforming unit operations |
| 23.2.1.3 | Process Safety and Ore Control |
| ● | As engineering further defines the process flow sheet, perform a high-level hazard assessment to guide safe and efficient design |
| ● | Establish ore control methodologies and procedures aligned with analytical laboratory QA/QC protocols to ensure consistent and reliable production |
| 23.3 | Passive Seismic Study |
A passive seismic study is recommended for the southern portion of the Tonopah Flats property, south of US 6/95. The survey could improve the understanding of the subsurface geologic structure and depth to basement rock in areas that have not yet been tested by exploration drilling. The cost for the seismic study is estimated to be approximately $30,000.
| 23.4 | Geotechnical |
Additional geotechnical drilling, laboratory testing and slope stability analyses need to be performed to support the FS. These include:
| ● | Drilling/Lab (Alluvium and Claystone) |
| ○ | Hydraulic conductivity testing on in situ material |
| ○ | Additional hydraulic conductivity testing on reconstituted |
| ○ | Additional consolidation testing on in situ material |
| barr.com |
|
|
| ○ | Additional triaxial testing on in situ and remolded material |
| ○ | Static DS on in situ and remolded material |
| ○ | Cyclic DSS on reconstituted samples |
| ○ | Possibly augment boring program with test pits to obtain intact block samples if we have problems getting intact samples |
| ○ | Permeability and standard proctor testing of claystone at various compaction levels for use as a liner |
| ● | Lab (Tailings) |
| ○ | Direct simple shear (DSS) testing |
| ○ | Consolidated-undrained triaxial testing (CIU) |
| ○ | Cyclic DSS |
| ○ | Hydraulic conductivity testing |
Additional slope stability analyses including deformation analyses are needed due to earthquake potential.
Costs for these items, including laboratory testing and drilling, are estimated to total approximately $250,000 to $300,000.
| 23.5 | Baseline Environmental Studies and NEPA Documentation |
ABTC submitted documentation presenting a description of proposed surface disturbance, schedule of operations, and conceptual site plans relating to a proposed mine and mineral processing operation at the Tonopah Flats property to the BLM Battle Mountain District Offices in December 2022. A Baseline Needs Assessment meeting was conducted in March 2023 to review the project and discuss the requisite baseline environmental analysis required to begin the NEPA process. Of the 21 identified baseline studies determined to be needed for the project, all but four have been completed. ABTC retained third-party specialists to conduct all required baseline analysis including biological, cultural, air, and water studies, among others. The four baseline studies still in progress and required to be completed include:
| ● | Raptor Surveys |
| ● | Geochemistry |
| ● | Hydrology |
| ● | Air Quality |
As these studies are completed, they provide data and key information for portions of the NEPA review process. The data will also be essential for the development of future mine operations permit applications, operating plans, and reclamation plans. ABTC forecasts that the NEPA document preparation will begin in the fourth quarter of 2025. The cost estimate to complete all baseline studies and documentation for the NEPA process is $1,000,000.
| barr.com |
|
|
| 23.6 | Feasibility Study |
The results of this PFS have been favorable, indicating that an FS should be developed as a next step. The cost of developing the FS, beyond the individual costs shown in other parts of Chapter 23, should range from $3,000,000 to $4,000,000. This budget assumes additional drilling, refinement of the process to optimize in terms of recovery as well as energy utilization, longer term demonstration of the pilot facility, additional process modeling, further detailed refinery design work, further tailings design work, environmental study advancement, and updated detailed economic evaluations. The work of the FS should bring the TFLP economics to an expected accuracy of +/-15% with an applied contingency not exceeding 10%. The budget does not include corporate and overhead costs, nor does it account for third-party test work.
| barr.com |
|
|
24 References
American Society of Civil Engineers (ASCE). (2025, June 26). ASCE Hazards Report [Design hazards report generated via ASCE Hazard Tool]. https://ascehazardtool.org/
Arthur, S. E., Mends, E. A., Tita, A. M., & Chu, P. (2025). The development of a beneficiation process to remove carbonates from lithium sedimentary claystones. Cleaner Engineering and Technology, 26, Article 100949. https://doi.org/10.1016/j.clet.2024.100949
Asher-Bolinder, S. (1991). Descriptive model of lithium in smectites of closed basins (Model 25lc). In G. J. Orris & J. D. Bliss (Eds.), Some industrial mineral deposit models: Descriptive deposit models (U.S. Geological Survey Open-File Report 91-11A, pp. 11–12). U.S. Geological Survey. https://doi.org/10.3133/ofr9111A
Austroid Corporation. (2024, November 4). Nevada Lithium Project [Project overview]. Rivaz Resources. Retrieved from Rivaz Resources website. https://www.rivaz-resources.com/posts-projects/nevada-lithium-project
Barr Engineering Co. (2025, August 7). Technical Memorandum regarding the Tonopah Flats PFS Study – Alluvium GDR. Unpublished internal report, prepared by Charlie Rehn, PE. Confidential; not publicly available.
Benchmark Mineral Intelligence. (2024, May 23). Battery cathode material deficits continue to be expected by the end of decade. Benchmark Source. https://source.benchmarkminerals.com/article/battery-cathode-material-deficits-continue-to-be-expected-by-the-end-of-decade
Benson, T. (2022, October 13). The origin of the Thacker Pass lithium deposit, the largest known lithium resource in the United States [Unpublished presentation]. Seminars on Lithium, co-sponsored by the Department of Natural Resources and Environmental Science and the Department of Civil and Environmental Engineering, University of Nevada, Reno
Bonham, H. F., & Garside, L. J. (1979). Geology of the Tonopah, Lone Mountain, Klondike, and Northern Mud Lake quadrangles, Nevada (Bulletin No. 92). Nevada Bureau of Mines and Geology.
du Bray, E. A., John, D. A., Colgan, J. P., Vikre, P. G., Cosca, M. A., & Morgan, L. E. (2019). Petrology of volcanic rocks associated with silver-gold (Ag-Au) epithermal deposits in the Tonopah, Divide, and Goldfield mining districts, Nevada (U.S. Geological Survey Scientific Investigations Report 2019–5024, 22 p.). U.S. Geological Survey. https://doi.org/10.3133/sir20195024
Fulcrum Lithium Ltd. (2025, April 7). Drill programs at the Alkali Flats and Fairway projects [Exploration results report]. Retrieved from https://static1.squarespace.com/static/64d05d4c0ae1111293327188/t/67f588479578de79617b4c43/1744144457183/pjn12583.pdf
Grand View Research, Inc. (2024). U.S. lithium market size, share & trends analysis report by product, by application, and segment forecasts, 2024–2030. https://www.grandviewresearch.com/industry-analysis/us-lithium-market-report
Greenwood, J., & Sopaci, E. (2025, April 18). 2025 open pit geotechnical investigation program (Barr Engineering Co. Technical Memorandum). ABTC Tonopah Flats Lithium Mine PFS Project.
Hazen Research, Inc. (2024, March 7). Ore characterization of the lithium claystone sample (Hazen Project 13098). Unpublished internal report, prepared by Solly Theron. Confidential; not publicly available.
Helvacı, C. (2015). Geological features of Neogene basins hosting borate deposits: An overview of deposits and future forecast, Turkey. Bulletin of the Mineral Research and Exploration, 151, 169–215. https://doi.org/10.19111/bmre.05207
| barr.com |
|
|
John, D. A., & Henry, C. D. (2022). Magmatic-tectonic settings of Cenozoic epithermal gold-silver deposits of the Great Basin, western United States. In Geological Society of Nevada Symposium Proceedings (pp. 765–796).
Karunadasa, K. S., Manoratne, C. H., Pitawala, H. M. T. G. A., & Rajapakse, R. M. G. (2019). Thermal decomposition of calcium carbonate (calcite polymorph) as examined by in situ high temperature X ray powder diffraction. Journal of Physics and Chemistry of Solids, 134, 21–28. https://doi.org/10.1016/j.jpcs.2019.05.023
Lindholm and Bickel. (2022). Technical Report and Estimate of Resources for the Tonopah West Silver-Gold Project, Nye and Esmeralda Counties, Nevada, USA.
Macquarie Group Limited. (2025, June 27). Macquarie Desk Strategy – Commodities. [Research report, distributed in the U.S. by Macquarie Capital (USA) Inc. and affiliates].
Morissette, C. L. (2012). The impact of geological environment on the lithium concentration and structural composition of hectorite clays (Master’s thesis). University of Nevada, Reno, 244 pp.
Mulholland, H. (2023, April 13). Future Battery Minerals unearths lithium claystones at Nevada Project in the US - Mining.com.au. Mining.com.au. Retrieved from https://mining.com.au/future-battery-minerals-unearths-lithium-claystones-at-nevada-project-in-the-us/
Murray, I. (2023, November 20). Pan American Energy Corp announces one of the largest identified lithium deposits in the US at the Horizon Lithium Project - Pan American Energy. Pan American Energy. Retrieved from https://panam-energy.com/pan-american-energy-corp-announces-one-of-the-largest-identified-lithium-deposits-in-the-us-at-the-horizon-lithium-project/
POWR Lithium. (2024, September 6). Halo Lithium Project - POWR Lithium. Retrieved from https://powrlithium.com/projects/halo-lithium-project-backup/
Read, J., & Stacey, P. (2009). Guidelines for open pit slope design. CSIRO Publishing. https://doi.org/10.1071/9780643101104
RESPEC Company, LLC, & Woods Process Services. (2024, April 5). Amended resource estimate and initial assessment with project economics for the Tonopah Flats lithium project, Esmeralda and Nye Counties, Nevada, USA (SK1300 Report RSI-M0219). Prepared for American Battery Technology Company
S&P Global Market Intelligence. (n.d.). Industry price chart [Data tool]. Retrieved July 31, 2025, from https://www.capitaliq.spglobal.com/web/client#industry/priceChart
Scorgins, A. (2015). Bulk density of industrial minerals: Reporting in accordance with the 2007 SME Guide. SME Mining Engineering, 1–10.
SGS Canada, Inc. (2025, June 23). An investigation into beneficiation process development for samples from the Tonopah property, Nevada, USA (Project 19832-01). Unpublished internal report, prepared by Arash Rafiei. Confidential; not publicly available.
Shaas. (2023, November 2). Enertopia announces inaugural 43-101 West Tonopah Mineral Resource Report. Enertopia Corporation. Retrieved from https://enertopia.com/enertopia-announces-inaugural-43-101-west-tonopah-mineral-resource-report/
Starkey, H. C. (1982). The role of clays in fixing lithium (U.S. Geological Survey Bulletin 1278–F, 17 pp.). U.S. Government Printing Office. https://doi.org/10.3133/b1278F
Stewart, J. H. (1988). Tectonics of the Walker Lane belt, western Great Basin: Mesozoic and Cenozoic deformation in a zone of shear. In W. G. Ernst (Ed.), Metamorphism and crustal evolution of the western United States (Rubey Vol. VII, pp. 683–713). Englewood Cliffs, NJ: Prentice-Hall.
Tearlach Resources Ltd. (2025, August 27). Tearlach’s Gabriel Project in Tonopah, Nevada — drill results assay up to 1,410 ppm lithium [Press release]. Seeking Alpha. Retrieved from Seeking Alpha website. https://seekingalpha.com/pr/19312018-tearlach-s-gabriel-project-in-tonopah-nevada-drill-results-assay-up-to-1410-ppm-lithium
| barr.com |
|
|
Tita, A. M., Mends, E. A., Hussaini, S., Thella, J., Smith, Y., & Chu, P. (2024). Beneficiation of Li bearing sedimentary claystone by centrifugation. Minerals Engineering, 218, Article 109042. https://doi.org/10.1016/j.mineng.2024.109042
U.S. Department of the Interior & U.S. Geological Survey. (2025). MINERAL COMMODITY SUMMARIES 2025. In U.S. Geological Survey (Version 1.2). https://pubs.usgs.gov/periodicals/mcs2025/mcs2025.pdf
Weather averages Tonopah, Nevada. (n.d.). US Climate Data. Last accessed 31 July 2025 https://www.usclimatedata.com/climate/tonopah/nevada/united-states/usnv0091
| barr.com |
|
|
25 Reliance on Information Provided by the Registrant
The following categories of information have been provided to Barr by ABTC:
| ● | Electronic copies of reports, maps and assay data that ABTC acquired from NAMC, a previous operator of the Tonopah Flats property. |
| ● | Electronic copies of documents, reports, maps and tables provided by ABTC with the results of drilling and sampling carried out by ABTC through the effective date of this report. |
| ● | Economic model of the solar generation and battery energy storage system intended to support operations at the site. Barr has relied upon the solar plant financial model as a key input to the economic evaluation of the TFLP. |
Barr has taken all appropriate steps, in our professional judgment, to ensure that the work, information, or advice from the above noted information and companies is sound.
Barr has fully relied on ABTC, to provide complete information concerning the pertinent legal status of ABTC and its affiliates, as well as current legal title, material terms of all agreements, and material environmental and permitting information that pertains to the TFLP.
Barr has relied fully upon information and opinions provided by ABTC with regard to the land tenure. Barr has no reason to believe that any material facts have been withheld or misstated and therefore Barr considers it reasonable to rely upon the registrant for the information summarized in Chapter 3 of this report.
Woods has relied upon pilot test work conducted by ABTC, in preparation of Chapters 10 and 14 of this report, as well as the preliminary engineering work of B&V, as provided by ABTC, in preparation of Chapter 14 of this report.
| barr.com |
|
|
Appendix A
List of Unpatented Lode Claims of the Tonopah Flats Property
List of Unpatented Mining Lode Claims
| BLM Number | Claim Name |
| 105265103 | ABTC 1 |
| 105265104 | ABTC 2 |
| 105265105 | ABTC 3 |
| 105265106 | ABTC 4 |
| 105265107 | ABTC 5 |
| 105265108 | ABTC 6 |
| 105265109 | ABTC 7 |
| 105265110 | ABTC 8 |
| 105265111 | ABTC 9 |
| 105265112 | ABTC 10 |
| 105265113 | ABTC 11 |
| 105265114 | ABTC 12 |
| 105265115 | ABTC 13 |
| 105265116 | ABTC 14 |
| 105265117 | ABTC 15 |
| 105265118 | ABTC 16 |
| 105265119 | ABTC 17 |
| 105265120 | ABTC 18 |
| 105265121 | ABTC 19 |
| 105265122 | ABTC 20 |
| 105265123 | ABTC 21 |
| 105265124 | ABTC 22 |
| 105265125 | ABTC 23 |
| 105265126 | ABTC 24 |
| 105265127 | ABTC 25 |
| 105265128 | ABTC 26 |
| 105265129 | ABTC 27 |
| 105265130 | ABTC 28 |
| 105265131 | ABTC 29 |
| 105265132 | ABTC 30 |
| 105265133 | ABTC 31 |
| 105265134 | ABTC 32 |
| 105265135 | ABTC 33 |
| 105265136 | ABTC 34 |
| barr.com |
| Appendix A – Page |
| BLM Number | Claim Name |
| 105265137 | ABTC 35 |
| 105265138 | ABTC 36 |
| 105265139 | ABTC 37 |
| 105265140 | ABTC 38 |
| 105265141 | ABTC 39 |
| 105265142 | ABTC 40 |
| 105265143 | ABTC 41 |
| 105265144 | ABTC 42 |
| 105265145 | ABTC 43 |
| 105265146 | ABTC 44 |
| 105265147 | ABTC 45 |
| 105265148 | ABTC 46 |
| 105265149 | ABTC 47 |
| 105265150 | ABTC 48 |
| 105265151 | ABTC 49 |
| 105265152 | ABTC 50 |
| 105265153 | ABTC 51 |
| 105265154 | ABTC 52 |
| 105265155 | ABTC 53 |
| 105265156 | ABTC 54 |
| 105265157 | ABTC 55 |
| 105265158 | ABTC 56 |
| 105265159 | ABTC 57 |
| 105265160 | ABTC 58 |
| 105265161 | ABTC 59 |
| 105265162 | ABTC 60 |
| 105265163 | ABTC 61 |
| 105265164 | ABTC 62 |
| 105265165 | ABTC 63 |
| 105265166 | ABTC 64 |
| 105265167 | ABTC 65 |
| 105265168 | ABTC 66 |
| 105265169 | ABTC 67 |
| 105265170 | ABTC 68 |
| 105265171 | ABTC 69 |
| 105265172 | ABTC 70 |
| 105265173 | ABTC 71 |
| barr.com |
| Appendix A – Page |
| BLM Number | Claim Name |
| 105265174 | ABTC 72 |
| 105265175 | ABTC 73 |
| 105265176 | ABTC 74 |
| 105265177 | ABTC 75 |
| 105265178 | ABTC 76 |
| 105265179 | ABTC 77 |
| 105265180 | ABTC 78 |
| 105265181 | ABTC 79 |
| 105265182 | ABTC 80 |
| 105265183 | ABTC 81 |
| 105265184 | ABTC 82 |
| 105265185 | ABTC 83 |
| 105265186 | ABTC 84 |
| 105265187 | ABTC 85 |
| 105265188 | ABTC 86 |
| 105265189 | ABTC 87 |
| 105265190 | ABTC 88 |
| 105265191 | ABTC 89 |
| 105265192 | ABTC 90 |
| 105265193 | ABTC 91 |
| 105265194 | ABTC 92 |
| 105265195 | ABTC 93 |
| 105265196 | ABTC 94 |
| 105265197 | ABTC 95 |
| 105265198 | ABTC 96 |
| 105265199 | ABTC 97 |
| 105265200 | ABTC 98 |
| 105265201 | ABTC 99 |
| 105265202 | ABTC 100 |
| 105265203 | ABTC 101 |
| 105265204 | ABTC 102 |
| 105265205 | ABTC 103 |
| 105265206 | ABTC 104 |
| 105265207 | ABTC 105 |
| 105265208 | ABTC 106 |
| 105265209 | ABTC 107 |
| 105265210 | ABTC 108 |
| barr.com |
| Appendix A – Page |
| BLM Number | Claim Name |
| 105265211 | ABTC 109 |
| 105265212 | ABTC 110 |
| 105265213 | ABTC 111 |
| 105265214 | ABTC 112 |
| 105265215 | ABTC 113 |
| 105265216 | ABTC 114 |
| 105265217 | ABTC 115 |
| 105265218 | ABTC 116 |
| 105265219 | ABTC 117 |
| 105265220 | ABTC 118 |
| 105265221 | ABTC 119 |
| 105265222 | ABTC 120 |
| 105265223 | ABTC 121 |
| 105265224 | ABTC 122 |
| 105265225 | ABTC 123 |
| 105265226 | ABTC 124 |
| 105265227 | ABTC 125 |
| 105265228 | ABTC 126 |
| 105265229 | ABTC 127 |
| 105265230 | ABTC 128 |
| 105265231 | ABTC 129 |
| 105265232 | ABTC 130 |
| 105265233 | ABTC 131 |
| 105265234 | ABTC 132 |
| 105265235 | ABTC 133 |
| 105265236 | ABTC 134 |
| 105265237 | ABTC 135 |
| 105265238 | ABTC 136 |
| 105265239 | ABTC 137 |
| 105265240 | ABTC 138 |
| 105265241 | ABTC 139 |
| 105265242 | ABTC 140 |
| 105265243 | ABTC 141 |
| 105265244 | ABTC 142 |
| 105265245 | ABTC 143 |
| 105265246 | ABTC 144 |
| 105265247 | ABTC 145 |
| barr.com |
| Appendix A – Page |
| BLM Number | Claim Name |
| 105265248 | ABTC 146 |
| 105265249 | ABTC 147 |
| 105265250 | ABTC 148 |
| 105265251 | ABTC 149 |
| 105265252 | ABTC 150 |
| 105265253 | ABTC 151 |
| 105265254 | ABTC 152 |
| 105265255 | ABTC 153 |
| 105265256 | ABTC 154 |
| 105265257 | ABTC 155 |
| 105265258 | ABTC 156 |
| 105265259 | ABTC 157 |
| 105265260 | ABTC 158 |
| 105265261 | ABTC 159 |
| 105265262 | ABTC 160 |
| 105265263 | ABTC 161 |
| 105265264 | ABTC 162 |
| 105265265 | ABTC 163 |
| 105265266 | ABTC 164 |
| 105265267 | ABTC 165 |
| 105265268 | ABTC 166 |
| 105265269 | ABTC 167 |
| 105265270 | ABTC 168 |
| 105265271 | ABTC 169 |
| 105265272 | ABTC 170 |
| 105265273 | ABTC 171 |
| 105265274 | ABTC 172 |
| 105265275 | ABTC 173 |
| 105265276 | ABTC 174 |
| 105265277 | ABTC 175 |
| 105265278 | ABTC 176 |
| 105265279 | ABTC 177 |
| 105265280 | ABTC 178 |
| 105265281 | ABTC 179 |
| 105265282 | ABTC 180 |
| 105265283 | ABTC 181 |
| 105265284 | ABTC 182 |
| barr.com |
| Appendix A – Page |
| BLM Number | Claim Name |
| 105265285 | ABTC 183 |
| 105265286 | ABTC 184 |
| 105265287 | ABTC 185 |
| 105265288 | ABTC 186 |
| 105265289 | ABTC 187 |
| 105265290 | ABTC 188 |
| 105265291 | ABTC 189 |
| 105265292 | ABTC 190 |
| 105265293 | ABTC 191 |
| 105265294 | ABTC 192 |
| 105265295 | ABTC 193 |
| 105265296 | ABTC 194 |
| 105265297 | ABTC 195 |
| 105265298 | ABTC 196 |
| 105265299 | ABTC 197 |
| 105265300 | ABTC 198 |
| 105265301 | ABTC 199 |
| 105265302 | ABTC 200 |
| 105265303 | ABTC 201 |
| 105265304 | ABTC 202 |
| 105265305 | ABTC 203 |
| 105265306 | ABTC 204 |
| 105265307 | ABTC 205 |
| 105265308 | ABTC 206 |
| 105265309 | ABTC 207 |
| 105265310 | ABTC 208 |
| 105265311 | ABTC 209 |
| 105265312 | ABTC 210 |
| 105265313 | ABTC 211 |
| 105265314 | ABTC 212 |
| 105265315 | ABTC 213 |
| 105265316 | ABTC 214 |
| 105265317 | ABTC 215 |
| 105265318 | ABTC 216 |
| 105265319 | ABTC 217 |
| 105265320 | ABTC 218 |
| 105265321 | ABTC 219 |
| barr.com |
| Appendix A – Page |
| BLM Number | Claim Name |
| 105265322 | ABTC 220 |
| 105265323 | ABTC 221 |
| 105265324 | ABTC 222 |
| 105265325 | ABTC 223 |
| 105265326 | ABTC 224 |
| 105265327 | ABTC 225 |
| 105265328 | ABTC 226 |
| 105265329 | ABTC 227 |
| 105265330 | ABTC 228 |
| 105265331 | ABTC 229 |
| 105265332 | ABTC 230 |
| 105265333 | ABTC 231 |
| 105265334 | ABTC 232 |
| 105265335 | ABTC 233 |
| 105265336 | ABTC 234 |
| 105265337 | ABTC 235 |
| 105265338 | ABTC 236 |
| 105265339 | ABTC 237 |
| 105265340 | ABTC 238 |
| 105265341 | ABTC 239 |
| 105265342 | ABTC 240 |
| 105265343 | ABTC 241 |
| 105265344 | ABTC 242 |
| 105265345 | ABTC 243 |
| 105265346 | ABTC 244 |
| 105265347 | ABTC 245 |
| 105265348 | ABTC 246 |
| 105265349 | ABTC 247 |
| 105265350 | ABTC 248 |
| 105265351 | ABTC 249 |
| 105265352 | ABTC 250 |
| 105265353 | ABTC 251 |
| 105265354 | ABTC 252 |
| 105265355 | ABTC 253 |
| 105265356 | ABTC 254 |
| 105265357 | ABTC 255 |
| 105265358 | ABTC 256 |
| barr.com |
| Appendix A – Page |
| BLM Number | Claim Name |
| 105265359 | ABTC 257 |
| 105265360 | ABTC 258 |
| 105265361 | ABTC 259 |
| 105265362 | ABTC 260 |
| 105265363 | ABTC 261 |
| 105265364 | ABTC 262 |
| 105265365 | ABTC 263 |
| 105265366 | ABTC 264 |
| 105265367 | ABTC 265 |
| 105265368 | ABTC 266 |
| 105265369 | ABTC 267 |
| 105265370 | ABTC 268 |
| 105265371 | ABTC 269 |
| 105265372 | ABTC 270 |
| 105265373 | ABTC 271 |
| 105265374 | ABTC 272 |
| 105265375 | ABTC 273 |
| 105265376 | ABTC 274 |
| 105265377 | ABTC 275 |
| 105265378 | ABTC 276 |
| 105265379 | ABTC 277 |
| 105265380 | ABTC 278 |
| 105265381 | ABTC 279 |
| 105265382 | ABTC 280 |
| 105265383 | ABTC 281 |
| 105265384 | ABTC 282 |
| 105265385 | ABTC 283 |
| 105265386 | ABTC 284 |
| 105265387 | ABTC 285 |
| 105265388 | ABTC 286 |
| 105265389 | ABTC 287 |
| 105265390 | ABTC 288 |
| 105265391 | ABTC 289 |
| 105265392 | ABTC 290 |
| 105265393 | ABTC 291 |
| 105265394 | ABTC 292 |
| 105265395 | ABTC 293 |
| barr.com |
| Appendix A – Page |
| BLM Number | Claim Name |
| 105265396 | ABTC 294 |
| 105265397 | ABTC 295 |
| 105265398 | ABTC 296 |
| 105265399 | ABTC 297 |
| 105265400 | ABTC 298 |
| 105265401 | ABTC 299 |
| 105265402 | ABTC 300 |
| 105265403 | ABTC 301 |
| 105265404 | ABTC 302 |
| 105265405 | ABTC 303 |
| 105265406 | ABTC 304 |
| 105265407 | ABTC 305 |
| NV105283737 | ABTC 306 |
| NV105283738 | ABTC 307 |
| NV105283739 | ABTC 308 |
| NV105283740 | ABTC 309 |
| NV105283741 | ABTC 310 |
| NV105283742 | ABTC 311 |
| NV105283743 | ABTC 312 |
| NV105283744 | ABTC 313 |
| NV105283745 | ABTC 314 |
| NV105283746 | ABTC 315 |
| NV105283747 | ABTC 316 |
| NV105283748 | ABTC 317 |
| NV105283749 | ABTC 318 |
| NV105283750 | ABTC 319 |
| NV105283751 | ABTC 320 |
| NV105283752 | ABTC 321 |
| NV105283753 | ABTC 322 |
| NV105283754 | ABTC 323 |
| NV105283755 | ABTC 324 |
| NV105283756 | ABTC 325 |
| NV105283757 | ABTC 326 |
| NV105283758 | ABTC 327 |
| NV105283759 | ABTC 328 |
| NV105283760 | ABTC 329 |
| NV105283761 | ABTC 330 |
| barr.com |
| Appendix A – Page |
| BLM Number | Claim Name |
| NV105283762 | ABTC 330 |
| NV105283763 | ABTC 332 |
| NV105283764 | ABTC 333 |
| NV105283765 | ABTC 334 |
| NV105283766 | ABTC 335 |
| NV105283767 | ABTC 336 |
| NV105283768 | ABTC 337 |
| NV105283769 | ABTC 338 |
| NV105283770 | ABTC 339 |
| NV105283771 | ABTC 340 |
| NV105283772 | ABTC 341 |
| NV105283773 | ABTC 342 |
| NV105283774 | ABTC 343 |
| NV105283775 | ABTC 344 |
| NV105283776 | ABTC 345 |
| NV105283777 | ABTC 346 |
| NV105283778 | ABTC 347 |
| NV105283779 | ABTC 348 |
| NV105283780 | ABTC 349 |
| NV105283781 | ABTC 350 |
| NV105283782 | ABTC 351 |
| NV105283783 | ABTC 352 |
| NV105283784 | ABTC 353 |
| NV105283785 | ABTC 354 |
| NV105283786 | ABTC 355 |
| NV105283787 | ABTC 356 |
| NV105283788 | ABTC 357 |
| NV105283789 | ABTC 358 |
| NV105283790 | ABTC 359 |
| NV105283791 | ABTC 360 |
| NV105283792 | ABTC 361 |
| NV105283793 | ABTC 362 |
| NV105283794 | ABTC 363 |
| NV105283795 | ABTC 364 |
| NV105283796 | ABTC 365 |
| NV105283797 | ABTC 366 |
| NV105283798 | ABTC 367 |
| barr.com |
| Appendix A – Page |
| BLM Number | Claim Name |
| NV105283799 | ABTC 368 |
| NV105283800 | ABTC 369 |
| NV105283801 | ABTC 370 |
| NV105283802 | ABTC 371 |
| NV105283803 | ABTC 372 |
| NV105283804 | ABTC 373 |
| NV105283805 | ABTC 374 |
| NV105283806 | ABTC 375 |
| NV105283807 | ABTC 376 |
| NV105283808 | ABTC 377 |
| NV105283809 | ABTC 378 |
| NV105283810 | ABTC 379 |
| NV105283811 | ABTC 380 |
| NV105283812 | ABTC 381 |
| NV105283813 | ABTC 382 |
| NV105283814 | ABTC 383 |
| NV105283815 | ABTC 384 |
| NV105283816 | ABTC 385 |
| NV105283817 | ABTC 386 |
| NV105283818 | ABTC 387 |
| NV105283819 | ABTC 388 |
| NV105283820 | ABTC 389 |
| NV105283821 | ABTC 390 |
| NV105283822 | ABTC 391 |
| NV105283823 | ABTC 392 |
| NV105283824 | ABTC 393 |
| NV105283825 | ABTC 394 |
| NV105283826 | ABTC 395 |
| NV105283827 | ABTC 396 |
| NV105283828 | ABTC 397 |
| NV105283829 | ABTC 398 |
| NV105283830 | ABTC 399 |
| NV105283831 | ABTC 400 |
| NV105283832 | ABTC 401 |
| NV105283833 | ABTC 402 |
| NV105283834 | ABTC 403 |
| NV105283835 | ABTC 404 |
| barr.com |
| Appendix A – Page |
| BLM Number | Claim Name |
| NV105283836 | ABTC 405 |
| NV105283837 | ABTC 406 |
| NV105283838 | ABTC 407 |
| NV105283839 | ABTC 408 |
| NV105283840 | ABTC 409 |
| NV105283841 | ABTC 410 |
| NV105283842 | ABTC 411 |
| NV105283843 | ABTC 412 |
| NV105283844 | ABTC 413 |
| NV105283845 | ABTC 414 |
| NV105283846 | ABTC 415 |
| NV105283847 | ABTC 416 |
| NV105283848 | ABTC 417 |
| NV105283849 | ABTC 418 |
| NV105283850 | ABTC 419 |
| NV105283851 | ABTC 420 |
| NV105283852 | ABTC 421 |
| NV105283853 | ABTC 422 |
| NV105283854 | ABTC 423 |
| NV105283855 | ABTC 424 |
| NV105283856 | ABTC 425 |
| NV105283857 | ABTC 426 |
| NV105283858 | ABTC 426 |
| NV105759793 | ABTC 428 |
| NV105759794 | ABTC 429 |
| NV105759795 | ABTC 430 |
| NV105759796 | ABTC 431 |
| NV105759797 | ABTC 432 |
| NV105759798 | ABTC 433 |
| NV105759799 | ABTC 434 |
| NV105759800 | ABTC 435 |
| NV105759801 | ABTC 436 |
| NV105759802 | ABTC 437 |
| NV105759803 | ABTC 438 |
| NV105759804 | ABTC 439 |
| NV105759805 | ABTC 440 |
| NV105759806 | ABTC 441 |
| barr.com |
| Appendix A – Page |
| BLM Number | Claim Name |
| NV105759807 | ABTC 442 |
| NV105759808 | ABTC 443 |
| NV105759809 | ABTC 444 |
| NV105759810 | ABTC 445 |
| NV105759811 | ABTC 446 |
| NV105759812 | ABTC 447 |
| NV105759813 | ABTC 448 |
| NV105759814 | ABTC 449 |
| NV105759815 | ABTC 450 |
| NV105759816 | ABTC 451 |
| NV105759817 | ABTC 452 |
| NV105759818 | ABTC 453 |
| NV105759819 | ABTC 454 |
| NV105759820 | ABTC 455 |
| NV105759821 | ABTC 456 |
| NV105759822 | ABTC 457 |
| NV105759823 | ABTC 458 |
| NV105759824 | ABTC 459 |
| NV105759825 | ABTC 460 |
| NV105759826 | ABTC 461 |
| NV105759827 | ABTC 462 |
| NV105759828 | ABTC 463 |
| NV105759829 | ABTC 464 |
| NV105759830 | ABTC 465 |
| NV105759831 | ABTC 466 |
| NV105759832 | ABTC 467 |
| NV105759833 | ABTC 468 |
| NV105759834 | ABTC 469 |
| NV105759835 | ABTC 470 |
| NV105759836 | ABTC 471 |
| NV105759837 | ABTC 472 |
| NV105759838 | ABTC 473 |
| NV105759839 | ABTC 474 |
| NV105759840 | ABTC 475 |
| NV105759841 | ABTC 476 |
| NV105759842 | ABTC 477 |
| NV105759843 | ABTC 478 |
| barr.com |
| Appendix A – Page |
| BLM Number | Claim Name |
| NV105759844 | ABTC 479 |
| NV105759845 | ABTC 480 |
| NV105759846 | ABTC 481 |
| NV105759847 | ABTC 482 |
| NV105759848 | ABTC 483 |
| NV105759849 | ABTC 484 |
| NV105759850 | ABTC 485 |
| NV105759851 | ABTC 486 |
| NV105759852 | ABTC 487 |
| NV105759853 | ABTC 488 |
| NV105759854 | ABTC 489 |
| NV105759855 | ABTC 490 |
| NV105759856 | ABTC 491 |
| NV105759857 | ABTC 492 |
| NV105759858 | ABTC 493 |
| NV105759859 | ABTC 494 |
| NV105759860 | ABTC 495 |
| NV105759861 | ABTC 496 |
| NV105759862 | ABTC 497 |
| NV105759863 | ABTC 498 |
| NV105759864 | ABTC 499 |
| NV105759865 | ABTC 500 |
| NV105759866 | ABTC 501 |
| NV105759867 | ABTC 502 |
| NV105759868 | ABTC 503 |
| NV105759869 | ABTC 504 |
| NV105759870 | ABTC 505 |
| NV105759871 | ABTC 506 |
| NV105759872 | ABTC 507 |
| NV105759873 | ABTC 508 |
| NV105759874 | ABTC 509 |
| NV105759875 | ABTC 510 |
| NV105759876 | ABTC 511 |
| NV105759877 | ABTC 512 |
| NV105759878 | ABTC 513 |
| NV105759879 | ABTC 514 |
| NV105759880 | ABTC 515 |
| barr.com |
| Appendix A – Page |
| BLM Number | Claim Name |
| NV105759881 | ABTC 516 |
| NV105759882 | ABTC 517 |
| barr.com |
| Appendix A – Page |
Exhibit 99.1

American Battery Technology Company Publishes Milestone Pre-Feasibility Study Accelerating Commercialization of its Tonopah Flats Lithium Project, One of the Largest Lithium Resources in the United States
Project highlighted by 21.8% IRR and $2.57 Billion NPV@8%, Upgraded Lithium Resource and Establishment of Lithium Reserves, Reinforcing Commercialization Pathway of Tonopah Flats Lithium Project
Reno, Nev., October 16, 2025 — American Battery Technology Company (NASDAQ: ABAT), an integrated critical battery materials company commercializing both its primary battery mineral manufacturing and lithium-ion battery recycling facilities, has published the S-K 1300 Technical Report and Pre-Feasibility Study (PFS) for its Tonopah Flats Lithium Project (TFLP) near Tonopah, Nevada. The study confirms the project’s robust economic potential and potential strategic importance as a cornerstone of the domestic critical mineral lithium supply chain.
“The project metrics demonstrated in this PFS are further validation that the first-principles physics based, internally-developed design for this claystone to battery grade critical mineral lithium hydroxide processing train is highly competitive in both the US and the global markets,” stated CEO Ryan Melsert. “It confirms the immense potential of the Tonopah Flats Lithium Project in this pivotal moment when the US is facing restrictions on the sourcing of critical minerals and extreme pressure to ramp the manufacturing of these critical minerals from domestic resources. We are excited to continue on our accelerated pathway to bringing this project to commercialization to contribute towards gaining US independence in its critical mineral manufacturing supply chain.”
Tonopah Flats Lithium Project PFS Highlights:
| ● | Facility Production: 30,000 tonnes/yr lithium hydroxide monohydrate (LHM), with project economics calculated for a 45-year life-of-mine utilizing only southern portion of property | |
| ● | Financially Competitive: After-tax NPV@8% of $2.57 billion, IRR 21.8%, and 7.5 year payback from initial investment | |
| ● | Highly Competitive Production Cost: Reduction to $4,307/tonne LHM production cost, 9.2% reduction from April 2024 Initial Assessment | |
| ● | Increased Grade: Grade entering refinery increased to approximately 2,100 ppm Li from approximately 800 ppm Li through beneficiation techniques to remove low-lithium bearing components from bulk claystone | |
| ● | Lowered Energy Cost: Integrated behind-the-meter onsite power generation with battery energy storage system (BESS) supplements grid electricity in order to synergistically optimize facility energy management, results in substantially lower effective cost of electricity |
| ● | Proven Scale-Up: Multi-tonne per day integrated pilot facility constructed and commissioned in 2024 to further optimize operational parameters, reduce energy consumption, and increase recovery and local recycling of chemical agents |
| ● | Significant Increase in Resourcei and Reserve Classifications: |
| ○ | Sizeable 53% increase in Measured and Indicated Resources, and total increase in lithium resources of 11% compared to April 2024 Initial Assessmenti | |
| ○ | Establishment of 2.73 million tonnes of LHM proven and probable reserves, under applicable Securities and Exchange Commission (SEC) rules, which is the part of a mineral resource that has been confirmed as economically and legally mineable through a comprehensive and reliable report |
| ● | Selected for Streamlined Permitting by Trump Administration: In June 2025, the ABTC TFLP was selected by the FAST-41 Permitting Council and the National Energy Dominance Council (NEDC) as a Transparency Priority Project in accordance with President Trump’s March 20th Executive Order “Immediate Measures to Increase American Mineral Production” in order to “identify priority projects that can be immediately approved or for which permits can be immediately issued, and take all necessary or appropriate actions within the agency’s authority to expedite and issue the relevant permits or approvals” |
| ○ | In August 2025 the TFLP was subsequently upgraded to a full Covered Project by the FAST-41 Permitting Council, resulting in even further resources being assigned towards the streamlining of these federal permitting efforts |
| ● | Significant Completion of Permitting Efforts: ABTC has completed and submitted all required NEPA Baseline Reports for the permitting of the TFLP, as well as a comprehensive Mine Plan of Operations (MPO), which are currently under review by the BLM | |
| ● | Initial Approval for Low-Cost Financing for Facility Buildout: In April 2025 ABTC received initial approval for low-cost debt financing of $900 million through a Letter of Interest from the US Export-Import Bank to support the buildout of the TFLP facility |
ABTC TFLP Lithium Resources and Reserves (million tonnes LHM)
| Mineral Classifications |
PFS October 2025 |
IA* April 2024 |
Change |
| TFLP Resources** | |||
| Measured | 5.98 | 2.78 | 115% |
| Indicated | 9.80 | 7.56 | 30% |
| Measured and Indicated | 15.78 | 10.34 | 53% |
| Inferred | 5.51 | 8.84 | -38% |
| Total Resource | 21.28 | 19.18 | 11% |
| TFLP Reserves | |||
| Proven | 0.98 | 0 | N/A |
| Probable | 1.75 | 0 | N/A |
| Total Reserve | 2.73 | 0 | N/A |
*Initial Assessment published in April 2024
** Lithium resources, inclusive of reserves The Tonopah Flats Lithium Project (TFLP) is a lithium-bearing claystone deposit approximately 11 km (7 miles) west of Tonopah, Nevada.
i Includes Inferred, Indicated, and Measured Resources, which have lower levels of geological confidence than reserves and in certain cases may not be considered when assessing the economic viability of a mining project. Important information regarding limitations with respect to resources is described at the end of this release.
Tonopah Flats Lithium Project Overview
ABTC owns 100% of the claims comprising the TFLP and has performed multiple rounds of exploration since 2021. ABTC has designed its own internally-developed first-principles physics based technologies for the extraction of lithium from these types of lithium bearing claystones.
Conventional processing of claystones relies on strong acid leaching, essentially utilizing large amounts of mineral acids to dissolve the full claystone structure, and then employing complicated impurity removal and conversion techniques to isolate the dissolved lithium from the large amounts of other dissolved species. This results in high operating costs due to the large use of chemical consumables, and also high footprints due to the use of large areas for tailings management.
ABTC has developed, and demonstrated at pilot-scale, a set of technologies that can liberate the lithium from these claystones without use of large amounts of acid and without dissolving the claystone structure itself. This allows for lower operating costs and smaller facility footprints while still achieving high recovery efficiencies. Through these techniques, ABTC is also able to directly manufacture a battery grade LHM product, as opposed to lithium carbonate traditionally made at conventional facilities. LHM is generally the required form of lithium when manufacturing high energy density nickel-oxide based cathode materials prevalent in the western hemisphere.
This PFS represents a significant step forward from the company’s Initial Assessment published in April 2024, providing an updated resource estimate, reserve estimate, detailed mining plan, updated mineral processing and metallurgical analysis, tailings and mine waste management, update on permitting considerations, and a resultant economic evaluation.
Pre-Feasibility Study Highlights
| Metric | Units | Value |
| Annual Production | Tonnes LHM/year | 30,000 |
| Life of Mine | Years | 45 |
| Total Initial CapEx | B US$ | 2.0 |
| Average Processing Cost | $ / tonne LHM | 4,307 |
| Average Total Operating Cost | $ / tonne LHM | 6,994 |
| Effective Cost of Electricity | $ / kWh | 0.035 |
| Average Head Grade | ppm Li | 805 |
| Average Grade at Refinery Input | ppm Li | 2,100 |
| Average LHM Price | $ / tonne LHM | 23,000 |
| IRR After-Tax | % | 21.8 |
| NPV 5% After-Tax | B US$ | 4.70 |
| NPV 8% After-Tax | B US$ | 2.57 |
| NPV 10% After-Tax | B US$ | 1.75 |
| Payback of Initial Investment | Years | 7.5 |
Mineral Resourcesi and Reserves
The Mineral Resource estimate has been updated with multiple additional drilling campaigns conducted in 2024 and 2025, and this resulted in the updating of the geologic and mineralization domains. The model was estimated with SGSim to effectively estimate grade and reduce the uncertainty of the Mineral Resource.
With addition of this increased exploration data, the Measured and Indicated resource increased by 53% from the Initial Assessment in April 2024, while the total resource increased by 11%.
Tonopah Flats Mineral Resources Estimate, Inclusive of Reserves
| Classification |
Tonnes (ktonnes) |
Grade (Li ppm) |
Contained Li (ktonnes) | LHM Equivalent (ktonnes) |
| Measured | 1,126,772 | 876 | 978 | 5,976 |
| Indicated | 2,534,419 | 639 | 1,620 | 9,799 |
| Measured and Indicated | 3,661,191 | 712 | 2,607 | 15,767 |
| Inferred | 2,151,226 | 423 | 911 | 5,508 |
ktonnes = kilotonnes
LHM = Lithium hydroxide monohydrate
ppm = parts per million
Tonnes = metric tonnes
The resulting Measured and Indicated Mineral Resource demonstrates a high level of quality and confidence, making it suitable for conversion into a Mineral Reserve—defined as indicated and measured mineral resources that, in the opinion of a qualified person, can be the basis of an economically viable project under a specific mine plan. Notably, the Mineral Resource exclusive of the current Mineral Reserve within the Measured and Indicated categories amounts to 2,333,767 ktonnes at 712 ppm Li, highlighting significant upside potential for additional reserve classification. This substantial resource volume outside the existing reserve underscores opportunities for future mine plan expansion, potentially extending the project’s life and enhancing its overall economic value.
Tonopah Flats Mineral Reserves Estimate
| Classification |
Tonnes (ktonnes) |
Grade (Li ppm) |
Contained Li (ktonnes) | LHM Equivalent (ktonnes) |
| Proven | 175,515 | 920 | 161 | 979 |
| Probable | 384,333 | 753 | 289 | 1,754 |
| Total Proven and Probable | 559,848 | 805 | 451 | 2,733 |
ktonnes = kilotonnes
LHM = Lithium hydroxide monohydrate
ppm = parts per million
Tonnes = metric tonnes
i Includes Inferred, Indicated, and Measured Resources, which have lower levels of geological confidence than reserves and in certain cases may not be considered when assessing the economic viability of a mining project. Important information regarding limitations with respect to resources is described at the end of this release.
Project Development and Commercialization Plan
The project is planned as a conventional surface mine with a dedicated on-site processing plant to directly produce battery grade LHM onsite. Construction of the facilities will be phased to optimize production and manage capital expenditure.
| ● | Phased Development: Incremental ramp-up of production capacity minimizes initial capital expenditure and operational risks | |
| ● | Mining Operations: The mine will operate 24/7, utilizing conventional surface mine techniques to feed the refinery at a rate of approximately 12.4 million tonnes per year. Production of initial phase will ramp up over the first two years, targeting full capacity by Year 3 | |
| ● | Processing & Refining: A commercial processing plant will be built on-site to produce battery-grade LHM allowing vertical integration and cost efficiency | |
| ● | Commercial On-site Processing Plant: The commercial processing plant will be constructed in three phases, starting with a 5,000 tonnes per annum (tpa) capacity and expanding to the full 30,000 tpa | |
| ● | Infrastructure: The project benefits from its strategic location near the town of Tonopah, with close access to existing infrastructure |
Next Steps and Recommendations
The PFS confirms that the Tonopah Flats project is technically and economically viable and should proceed to the next stage of development. To advance the project to commercialization, the company has several key steps planned. The immediate priority is to proceed with a Definitive Feasibility Study, with an estimated cost between $5.8 million and $6.8 million, to continue the commercialization of this project.
Key future activities will include:
| ● | Definitive Feasibility Study (DFS): Advancing the project to a DFS to further de-risk the project and refine engineering, execution plans, and cost estimates | |
| ● | Permitting and Environmental Review: Continuing with the permitting process to secure all necessary approvals for construction and operation and ongoing engagement with the Bureau of Land Management (BLM) and other cooperating agencies to finalize all required processes under the National Environmental Policy Act (NEPA) | |
| ● | Further Research & Testing: Additional metallurgical test work, geotechnical drilling, and a passive seismic study to continue to optimize performance of processing techniques | |
| ● | Detailed Engineering: Continuing detailed design for the mine, processing facility, and supporting infrastructure with internal team and contracted EPC firm | |
| ● | Infrastructure and Community Engagement: Continuing work with local utilities to ensure sufficient power infrastructure and the development of community engagement plans to address local needs and identify areas for mutual benefit to ensure that both the project and the local community grow together, creating lasting economic and social value for the region | |
| ● | Commitment to Environmental Stewardship: Dedicated to reducing environmental impact compared to conventional mining and refining practices, the project emphasizes responsible mining, land restoration, and protecting local ecosystems |
The independent Qualified Persons responsible for preparing the scientific and technical information disclosed in this release announcing the S-K 1300 Technical Report and Preliminary Feasibility Study are Daniel R. Palo (Barr Engineering Co.), Jeffrey Woods (Woods Process Services, LLC), and Jacob Anderson (Dahrouge Geologic Consulting Ltd.).
About American Battery Technology Company
American Battery Technology Company (ABTC), headquartered in Reno, Nevada, has pioneered first-of-kind technologies to unlock domestically manufactured and recycled battery metals critically needed to help meet the significant demand from the electric vehicle, stationary storage, and consumer electronics industries. Committed to a circular supply chain for battery metals, ABTC works to continually innovate and master new battery metals technologies that power a global transition to electrification and the future of sustainable energy.
Inferred Resource
Inferred Mineral Resource is that part of a mineral resource for which quantity and grade or quality are estimated on the basis of limited geological evidence and sampling. The level of geological uncertainty associated with an Inferred Mineral Resource is too high to apply relevant technical and economic factors likely to influence the prospects of economic extraction in a manner useful for evaluation of economic viability. Because an Inferred Mineral Resource has the lowest level of geological confidence of all mineral resources, which prevents the application of the modifying factors in a manner useful for evaluation of economic viability, an Inferred Mineral Resource may not be considered when assessing the economic viability of a mining project, and may not be converted to a mineral reserve.
Indicated Resource
Indicated Mineral Resource is that part of a mineral resource for which quantity and grade or quality are estimated on the basis of adequate geological evidence and sampling. The level of geological certainty associated with an Indicated Mineral Resource is sufficient to allow a qualified person to apply modifying factors in sufficient detail to support mine planning and evaluation of the economic viability of the deposit. Because an Indicated Mineral Resource has a lower level of confidence than the level of confidence of a Measured Mineral Resource, an Indicated Mineral Resource may only be converted to a Probable Mineral Reserve.
Measured Resource
Measured Mineral Resource is that part of a mineral resource for which quantity and grade or quality are estimated on the basis of conclusive geological evidence and sampling. The level of geological certainty associated with a Measured Mineral Resource is sufficient to allow a qualified person to apply modifying factors, as defined in this section, in sufficient detail to support detailed mine planning and final evaluation of the economic viability of the deposit. Because a Measured Mineral Resource has a higher level of confidence than the level of confidence of either an Indicated Mineral Resource or an Inferred Mineral Resource, a Measured Mineral Resource may be converted to a Proven Mineral Reserve or to a Probable Mineral Reserve.
Mineral Reserve
Mineral Reserve is an estimate of tonnage and grade or quality of indicated and measured mineral resources that, in the opinion of the qualified person, can be the basis of an economically viable project. More specifically, it is the economically mineable part of a measured or indicated mineral resource, which includes diluting materials and allowances for losses that may occur when the material is mined or extracted.
Probable Mineral Reserve
Probable Mineral Reserve is the economically mineable part of an indicated and, in some cases, a measured mineral resource.
Proven Mineral Reserve
Proven Mineral Reserve is the economically mineable part of a measured mineral resource and can only result from conversion of a measured mineral resource.
Pre-Feasibility Study
A Preliminary Feasibility Study (or Pre-Feasibility Study) is a comprehensive study of a range of options for the technical and economic viability of a mineral project that has advanced to a stage where a qualified person has determined (in the case of underground mining) a preferred mining method, or (in the case of surface mining) a pit configuration, and in all cases has determined an effective method of mineral processing and an effective plan to sell the product. A Pre-Feasibility Study includes a financial analysis based on reasonable assumptions, based on appropriate testing, about the modifying factors and the evaluation of any other relevant factors that are sufficient for a qualified person to determine if all or part of the Indicated and Measured Mineral Resources may be converted to mineral reserves at the time of reporting. The financial analysis must have the level of detail necessary to demonstrate, at the time of reporting, that extraction is economically viable. A Pre-Feasibility Study is less comprehensive and results in a lower confidence level than a feasibility study. A Pre-Feasibility study is more comprehensive and results in a higher confidence level than an Initial Assessment.
Initial Assessment
An Initial Assessment is a preliminary technical and economic study of the economic potential of all or parts of mineralization to support the disclosure of mineral resources. The Initial Assessment must be prepared by a qualified person and must include appropriate assessments of reasonably assumed technical and economic factors, together with any other relevant operational factors, that are necessary to demonstrate at the time of reporting that there are reasonable prospects for economic extraction. An Initial Assessment is required for disclosure of mineral resources but cannot be used as the basis for disclosure of mineral reserves. An Initial Assessment is preliminary in nature and includes Inferred Mineral Resources that are considered too speculative geologically to have the economic considerations applied that would enable them to be classified as mineral reserves. There is no certainty that the economic results of an initial assessment will be realized. The mineral resource estimates presented in the ABTC Tonopah Flats Initial Assessment were performed by third-party, qualified person RESPEC, LLC and were classified by geological and quantitative confidence in accordance with the Securities and Exchange Commission (SEC) Regulation S-K 1300.
Forward-Looking Statements
This press release contains “forward-looking statements” within the meaning of the safe harbor provisions of the U.S. Private Securities Litigation Reform Act of 1995. All statements, other than statements of historical fact, are “forward-looking statements.” Although the American Battery Technology Company’s (the “Company”) management believes that such forward-looking statements are reasonable, it cannot guarantee that such expectations are, or will be, correct. Forward looking statements include, among other things, statements concerning: offtake agreements with customers; the Company’s future sales of products to customers, including the amounts, timing, and types of products included within those sales; potential loans, grants, and debt financing arrangements, including due diligence, the amount and type of debt, its syndication, and the schedule for closing; the scale of the battery recycling operations; the anticipated production from the integrated pilot facility; the scale, construction, and operation of the battery recycling operations, integrated pilot facility, Tonopah Flats Lithium Project, and commercial lithium mine and refinery; and the costs, schedules, production and economic projections associated with the foregoing. These forward-looking statements involve a number of risks and uncertainties, which could cause the Company’s future results to differ materially from those anticipated. Potential risks and uncertainties include, among others, risks and uncertainties related to the Company’s ability to continue as a going concern; interpretations or reinterpretations of geologic information, unfavorable exploration results, inability to obtain permits required for future exploration, development or production, general economic conditions and conditions affecting the industries in which the Company operates; the uncertainty of regulatory requirements and approvals; fluctuating mineral and commodity prices, final investment approval and the ability to obtain necessary financing on acceptable terms or at all. Additional information regarding the factors that may cause actual results to differ materially from these forward-looking statements is available in the Company’s filings with the Securities and Exchange Commission, including the Annual Report on Form 10-K for the year ended June 30, 2025. The Company assumes no obligation to update any of the information contained or referenced in this press release.
###
American Battery Technology Company
Media Contact:
Tiffiany Moehring
tmoehring@batterymetals.com
720-254-1556