UNITED STATES
SECURITIES AND EXCHANGE COMMISSION
WASHINGTON, D.C. 20549
FORM 20-F
(Mark One)
| ☐ | REGISTRATION STATEMENT PURSUANT TO SECTION 12(b) OR 12(g) OF THE SECURITIES EXCHANGE ACT OF 1934 |
OR
| ☐ | ANNUAL REPORT PURSUANT TO SECTION 13 OR 15(d) OF THE SECURITIES EXCHANGE ACT OF 1934 |
OR
| ☒ | TRANSITION REPORT PURSUANT TO SECTION 13 OR 15(d) OF THE SECURITIES EXCHANGE ACT OF 1934 |
For the transition period from January 1, 2025 to June 30, 2025
OR
| ☐ | SHELL COMPANY REPORT PURSUANT TO SECTION 13 OR 15(d) OF THE SECURITIES EXCHANGE ACT OF 1934 |
Date of event requiring this shell company report __________
Commission file number 001-42604
TMD ENERGY LIMITED
(Exact name of Registrant as specified in its charter)
Cayman Islands
(Jurisdiction of incorporation or organization)
B-10-06, Block B, Plaza Mont Kiara
No. 2, Jalan Kiara, Mont Kiara
50480 Kuala Lumpur
Wilayah Persekutuan, West Malaysia
(Address of principal executive office)
Dato’ Sri Kam Choy Ho, Chief Executive Officer
Telephone: +603 6419 1266
Email: corporate@tmdel.com
At the address of the Company set forth above
(Name, Telephone, E-mail and Address of Company Contact Person)
Securities registered or to be registered pursuant to Section 12(b) of the Act:
| Title of each class | Trading Symbol(s) | Name of each exchange on which registered | ||
| Ordinary Shares, par value $0.0001 per share | TMDE | NYSE American LLC |
Securities registered or to be registered pursuant to Section 12(g): None
Securities for which there is a reporting obligation pursuant to Section 15(d) of the Act: None
Indicate the number of outstanding shares of each of the issuer’s classes of capital or common stock as of the close of the period covered by the Transition Report.
23,565,000 ordinary shares were outstanding as of June 30, 2025
Indicate by check mark if the registrant is a well-known seasoned issuer, as defined in Rule 405 of the Securities Act. ☐ Yes ☒ No
If this report is an annual or transition report, indicate by check mark if the registrant is not required to file reports pursuant to Section 13 or 15(d) of the Securities Exchange Act of 1934. ☐ Yes ☒ No
Indicate by check mark whether the registrant: (1) has filed all reports required to be filed by Section 13 or 15(d) of the Securities Exchange Act of 1934 during the preceding 12 months (or for such shorter period that the registrant was required to file such reports), and (2) has been subject to such filing requirements for the past 90 days. ☒ Yes ☐ No
Indicate by check mark whether the registrant has submitted every Interactive Data File required to be submitted pursuant to Rule 405 of Regulation S-T (§232.405 of this chapter) during the preceding 12 months (or for such shorter period that the registrant was required to submit such files). ☒ Yes ☐ No
Indicate by check mark whether the registrant is a large accelerated filer, an accelerated filer, a non-accelerated filer, or an emerging growth company. See the definitions of “large accelerated filer”, “accelerated filer” and “emerging growth company” in Rule 12b-2 of the Exchange Act.
| Large accelerated filer | ☐ | Accelerated filer | ☐ |
| Non-accelerated filer | ☒ | Emerging growth company | ☒ |
If an emerging growth company that prepares its financial statements in accordance with U.S. GAAP, indicate by check mark if the registrant has elected not to use the extended transition period for complying with any new or revised financial accounting standards† provided pursuant to Section 13(a) of the Exchange Act. ☒
† The term “new or revised financial accounting standard” refers to any update issued by the Financial Accounting Standards Board to its Accounting Standards Codification after April 5, 2012.
Indicate by check mark whether the registrant has filed a report on and attestation to its management’s assessment of the effectiveness of its internal control over financial reporting under Section 404(b) of the Sarbanes-Oxley Act (15 U.S.C. 7262(b)) by the registered public accounting firm that prepared or issued its audit report. ☐
If securities are registered pursuant to Section 12(b) of the Act, indicate by check mark whether the financial statements of the registrant included in the filing reflect the correction of an error to previously issued financial statements. ☐
Indicate by check mark whether any of those error corrections are restatements that required a recovery analysis of incentive- based compensation received by any of the registrant’s executive officers during the relevant recovery period pursuant to §240.10D-1(b). ☐
Indicate by check mark which basis of accounting the registration has used to prepare the financial statements included in this filing:
| U.S. GAAP ☒ | International Financial Reporting Standards as issued by the International Accounting Standards Board ☐ | Other ☐ |
If “Other” has been checked in response to the previous question, indicate by check mark which consolidated financial statement item the registrant has elected to follow. ☐ Item 17 ☐ Item 18
If this is an annual report, indicate by check mark whether the registrant is a shell company (as defined in Rule 12b-2 of the Securities Exchange Act of 1934). ☐ Yes ☒ No
(APPLICABLE ONLY TO ISSUERS INVOLVED IN BANKRUPTCY PROCEEDINGS DURING THE PAST FIVE YEARS)
Indicate by check mark whether the registrant has filed all documents and reports required to be filed by Sections 12, 13 or 15(d) of the Securities Exchange Act of 1934 subsequent to the distribution of securities under a plan confirmed by a court. ☐ Yes ☐ No
Table of Contents
| Page | ||||
| PART I. | ||||
| ITEM 5. | OPERATING AND FINANCIAL REVIEW AND PROSPECTS | 1 | ||
| ITEM 8. | FINANCIAL INFORMATION | 20 | ||
| PART II. | ||||
| ITEM 13. | DEFAULTS, DIVIDEND ARREARAGES AND DELINQUENCIES | 20 | ||
| ITEM 14. | MODIFICATIONS TO THE RIGHTS OF SECURITY HOLDERS AND USE OF PROCEEDS | 20 | ||
| PART III. | ||||
| ITEM 17. | FINANCIAL STATEMENTS | 21 | ||
| ITEM 18. | FINANCIAL STATEMENTS | 21 | ||
| ITEM 19. | EXHIBITS | 21 |
|
|
CONVENTIONS THAT APPLY TO THIS TRANSITION REPORT
Unless we indicate otherwise, references in this Transition Report to:
| ● | “6M2024” are to six months ended June 30, 2024; | |
| ● | “6M2025” are to six months ended June 30, 2025; | |
| ● | “Exchange Act” are to the U.S. Securities Exchange Act of 1934, as amended from time to time; | |
| ● | “FY2022” are to the financial year ended December 31, 2022; | |
| ● | “FY2023” are to the financial year ended December 31, 2023; | |
| ● | “FY2024” are to the financial year ended December 31, 2024; | |
| ● | “IPO” are to the Company’s initial public offering which was consummated on April 22, 2025; | |
| ● | “Labuan” are to Labuan, an island federal territory of Malaysia; | |
| ● | “Labuan Companies Act” are to Labuan Companies Act 1990 (Act 441) of Labuan, as amended and restated from time to time; | |
| ● | “Malaysia” are to the sovereign state of Malaysia; | |
| ● | “mt” are to the metric ton; | |
| ● | “M.T.” are to the motor tanker; | |
| ● | “Ordinary Shares” are the ordinary shares of our Company, par value of $0.0001 per share; | |
| ● | “our Board” are to the board of directors of our Company; | |
| ● | “our Company” are to TMD Energy Limited, a company incorporated in the Cayman Islands with limited liability on October 17, 2023; | |
| ● | “our Group”, “we”, “us” and “our” are to our Company and its subsidiaries, as the context requires; | |
| ● | “our Director(s)” are to the director(s) of our Company; | |
| ● | “RM” are to the legal currency of Malaysia; | |
| ● | “SEC” are to U.S. Securities and Exchange Commission; | |
| ● | “SGD” are to the legal currency of Singapore; | |
| ● | “Singapore” are to Republic of Singapore; | |
| ● | “STS” are to ship-to-ship; and | |
| ● | “$”, “USD”, “US$” or “U.S. dollars” are to the legal currency of the United States. |
|
|
SPECIAL NOTE REGARDING FORWARD-LOOKING STATEMENTS
This Transition Report contains forward-looking statements that involve risks and uncertainties, including statements based on our current expectations, assumptions, estimates and projections about us and our industry. These forward-looking statements are made under the “safe harbor” provision under Section 21E of the Securities Exchange Act of 1934, as amended, or the Exchange Act, and as defined in the Private Securities Litigation Reform Act of 1995. These statements involve known and unknown risks, uncertainties and other factors that may cause our actual results, performance or achievements to be materially different from those expressed or implied by the forward-looking statements. In some cases, these forward-looking statements can be identified by words or phrases such as “may”, “will”, “expect”, “anticipate”, “aim”, “estimate”, “intend”, “plan”, “believe”, “potential”, “continue”, “is/are likely to” or other similar expressions. The forward-looking statements included in this Transition Report relate to, among others:
| ● | timing of the development of future business; | |
| ● | capabilities of our business operations; | |
| ● | expected future economic performance; | |
| ● | competition in our market; | |
| ● | continued market acceptance of our services and products; | |
| ● | protection of our intellectual property rights; | |
| ● | changes in the laws that affect our operations; | |
| ● | inflation and fluctuations in foreign currency exchange rates; | |
| ● | our ability to obtain and maintain all necessary government certifications, approvals, and/or licenses to conduct our business; | |
| ● | continued development of a public trading market for our securities; | |
| ● | the cost of complying with current and future governmental regulations and the impact of any changes in the regulations on our operations; | |
| ● | managing our growth effectively; | |
| ● | projections of revenue, earnings, capital structure and other financial items; | |
| ● | fluctuations in operating results; and | |
| ● | health crisis, including due to pandemics such as the COVID-19 pandemic and government measures taken in response thereto. |
You should read these statements in conjunction with the risks disclosed in “Item 3. Key Information—3.D. Risk Factors” of our annual report on Form 20-F filed with the SEC on May 14, 2025 and other risks outlined in our other filings with the Securities and Exchange Commission, or the SEC. Moreover, we operate in an evolving environment. New risks may emerge from time to time, and it is not possible for our management to predict all risks, nor can we assess the impact of such risks on our business or the extent to which any risk, or combination of risks, may cause actual results to differ materially from those contained in any forward-looking statements. The forward-looking statements made in this Transition Report relate only to events or information as of the date on which the statements are made in this Transition Report. Except as required by law, we undertake no obligation to update any forward-looking statements to reflect events or circumstances after the date on which the statements are made or to reflect the occurrence of unanticipated events. You should read this Transition Report and the documents that we have referred to in this Transition Report, completely and with the understanding that our actual future results may be materially different from what we expect.
|
|
PART I.
| ITEM 5. | OPERATING AND FINANCIAL REVIEW AND PROSPECTS |
You should read the following discussion and analysis of the Group’s financial condition and results of operations in conjunction with the Group’s unaudited consolidated financial statements and the related notes included elsewhere in this transition report on Form 20-F. This discussion may contain forward-looking statements based upon current expectations that involve risks and uncertainties. The Group’s actual results may differ materially from those anticipated in these forward-looking statements as a result of various factors, including those set forth under “Item 3. Key Information — 3.D. Risk Factors” of our annual report on Form 20-F for the year ended December 31, 2024. We caution you that our businesses and financial performance are subject to substantial risks and uncertainties.
5.A. Operating Results
Holding Company Structure
Our Company is a holding company with no material operations of its own other than investment holding. We conduct our operations primarily through our indirect operating subsidiaries which are owned by Straits Marine Fuels & Energy Sdn. Bhd. (“SMF”), the sole direct subsidiary of our Company. Similarly, SMF is a holding company with no material operations of its own other than holding investment in all the indirect subsidiaries of our Company. As a result, both our Company and SMF’s ability to pay dividends depends upon dividends paid by our subsidiaries. Some of our subsidiaries have debt on their own with instruments governing their debt that may restrict their ability to pay dividend to us, unless those debts are repaid. The same restrictions may apply if they incur any new debt on their own in the future.
Straits Energy Resources Berhad (“Straits”), the holding company of our Company through its wholly-owned subsidiary, Straits Management Services Sdn. Bhd. will continue to provide overall group management and coordination services encompassing but not restricted to listing compliance and requirement, group consolidation and reporting, corporate governance, corporate secretarial, corporate finance, corporate banking, accounting, market and public relations at a management fee that will be reviewed annually for our group of companies.
Our Company, through our various subsidiaries, are involved in oil trading and bunkering with its own vessel management team overseeing its fleet of bunkering vessels servicing and providing quality bunker to both domestic and international liners and vessels of all nature, that ply through Malaysian waters. Being a Malaysian company operating in Malaysian waters, it is natural that this oil trading and bunkering unit maintain its financial records and statements in its domestic currency, RM. Our Company will be looking into possibilities of expanding its operation regionally out of Malaysian waters.
Recent Developments
We consummated our initial public offering on the NYSE American on April 22, 2025, issuing 3,100,000 ordinary shares at a price of $3.25 per share. In addition, we entered into an underwriting agreement with the underwriter on April 21, 2025, which granted the underwriter a 45-day option to purchase up to an additional 465,000 ordinary shares at the public offering price of $3.25 per share to cover any over-allotment. Subsequently, on April 22, 2025, the underwriter exercised the over-allotment option in full, purchasing an additional 465,000 ordinary shares at the public offering price of $3.25 per share. The initial public offering closed on April 22, 2025 and the exercise of the over-allotment option closed on April 24, 2025, with gross proceeds totaling $11.59 million, before deducting underwriting discounts and offering expenses. The ordinary shares began trading on April 21, 2025 on NYSE American and commenced trading under the ticker symbol “TMDE”.
On May 16, 2025, we had changed our fiscal year end from December 31 to June 30, to align with the fiscal year end of our holding company, Straits.
Factors Affecting Our Results of Operations
We rely on sales to key customers and purchases from a limited number of suppliers, where reduction or loss of key customers or supply chain disruptions and price volatility from supplier could diminish our operating results.
We have not derived a significant amount of revenue from volume commitments or any other understandings with our key customers related to future purchases. Orders from our key customers could be reduced or ceased at any time without obligation. Our Group also does not enter into long-term agreements with our customers. If any of our major customers terminate their business relationship with us, and we fail to secure new customers or new orders from other existing customers in a timely manner, a substantial reduction or termination of purchases by our key customer could significantly affect our operations.
In addition, we currently purchase refined marine fuel products from a limited number of suppliers. If our relationship with any of our key suppliers is terminated or if our key suppliers experience production disruptions, we may not be able to obtain a sufficient quantity of refined marine fuel on acceptable terms and without interruptions to our business. We may encounter difficulties and delays in obtaining marine fuel from alternative sources. Any interruption or delay in the supply of marine fuel, or the inability to obtain fuel from alternate sources at acceptable prices and within a reasonable timeframe, would impair our ability to meet scheduled deliveries to our customers and could lead to order cancellations or penalties.
|
|
We rely on the expertise of our senior management, and our inability to retain key personnel could disrupt our business and limit our growth.
Our business success and growth prospects depend significantly on the continued service of our senior management team and our ability to hire and retain key members of our management team. The unexpected loss of any of these key individuals could disrupt our operations, damage important business relationships, and delay strategic initiatives, potentially harming our competitive position. We face inherent challenges in attracting and retaining qualified personnel due to intense industry competition for executive talent. While we implement retention measures, there is no assurance that we will successfully maintain our current management team. Any disruption in leadership could materially adversely affect our operations.
Material disruptions in the availability or supply of oil may reduce the supply of our products and have a material impact on our operations.
Our operations face substantial risks from marine fuel supply disruptions that could impair our ability to fulfill customer demand. Global oil markets remain exposed to geopolitical conflicts, trade restrictions, and natural disasters that may reduce refinery output or disrupt logistics. Political instability in producing regions, terrorist activity, or military actions could abruptly constrain supply availability, while extreme weather or accidents might damage critical infrastructure. Such events typically trigger sudden price spikes and inventory shortages across the bunker fuel market.
These constraints would directly limit our sales volumes and erode our competitive pricing position. Although we maintain alternative supply arrangements, the integrated nature of oil markets means local disruptions often escalate into prolonged shortages. Our commodity-based business model leaves us particularly vulnerable to these shocks, as securing substitute fuel during crises becomes costly and time-consuming. Persistent supply issues could damage customer relationships and significantly pressure margins, leading to lasting effects on financial performance.
Adverse conditions in the shipping industry may reduce the demand for our products and services and negatively affect our results of operations and financial condition.
Our marine fuel supply business remains highly dependent on the cyclical performance of the shipping industry. Fluctuations in vessel charter rates, fuel costs, and operational expenses directly impact our customers’ purchasing capacity. During market downturns, when freight rates decline or operating costs rise, shipping companies typically reduce bunkering consumption, creating immediate pressure on our sales volumes and margins. The industry’s vulnerability to risks, including geopolitical conflicts, piracy incidents, trade disputes, and port security threats, can disrupt shipping routes and vessel operations, leading to sudden drops in regional fuel demand. Prolonged market weakness often forces shipowners to idle vessels or slow steam, further depressing bunker demand.
While we actively monitor industry trends and adjust our commercial strategies accordingly, these macroeconomic and geopolitical factors remain beyond our control. Our financial performance will continue to reflect shipping market volatility, with potential impacts on revenue stability, profitability, and cash flow generation. This inherent sector exposure represents a persistent challenge to our business model’s resilience.
Impact of Russia’s Invasion of Ukraine, Conflicts in Middle East and Related Supply Chain Issues
In February 2022, Russia launched a military attack on Ukraine, leading to further regional and international conflicts or armed action. As Russia is one of the largest exporters of crude oil in the world, this crisis had disrupted the oil supply and caused a spike in oil prices for the year ended December 31, 2022 (“FY2022”), which subsequently declined for the year ended December 31, 2023 (“FY2023”). Since late 2023, conflicts in the Middle East, including the Israel–Gaza war and related regional escalations, have contributed to heightened geopolitical instability. These developments, combined with increased security risks in major shipping lanes, disrupted global maritime trade by lengthening voyage times and raising operational costs across the industry.
The Russia-Ukraine conflict caused a spike in oil prices that was offset by a continuing growth in demand volume in our oil cargo bunkered in FY2023, resulting in our revenue dropping to $633.1 million in FY2023 from approximately $702.1 million in FY2022.
As the financial impact of this crisis had already been reflected in FY2022 and FY2023, there was no material impact on our revenue for the year ended December 31, 2024 (“FY2024”). In fact, after considering the increase in the volume of oil cargo bunkered, our revenue rose from $633.1 million in FY2023 to $688.6 million in FY2024, driven by the expansion of our marketplace.
Since then, the direct effect of the Russia-Ukraine conflict on our operations has moderated, and subsequent movements in oil prices have been influenced more by global economic conditions and trade policy developments and regional conflicts in the Middle East.
For the six months ended June 30, 2025, our performance was affected by a combination of factors. Middle East tensions contributed to additional volatility in oil prices and operational costs, serving as another headwind that, together with trade and tariff issues, led to a decline in our revenue.
In response to these market challenges, we have been strengthening collaboration with our key service providers and exploring alternative sourcing and supply chain options to enhance resilience and operational continuity. While these measures aim to mitigate potential impacts, there can be no assurance that they will fully shield us from ongoing geopolitical and trade policy volatility.
|
|
Escalating Trade Tensions and Impacts of Tariff Policy Volatility
Recent global trade developments have introduced heightened uncertainty into international commerce. In early 2025, the implementation of broad new tariffs on a wide range of imported goods significantly disrupted global trade dynamics, raising concerns across multiple sectors. Frequent changes in tariff rates and enforcement timelines further disrupted global shipping schedules, causing vessel delays, delivery rescheduling, and a slowdown in trade flows across major routes.
The prolonged tariff crisis reduced shipping activity and cargo movement, which in turn lowered demand for marine fuel. Coupled with softer global consumption, weaker economic growth, and a continuing shift toward alternative energy, these headwinds exerted downward pressure on oil demand and contributed to a significant decline in international oil prices, with the global average oil price declined.
For the six months ended June 30, 2025, revenue decreased to $276.3 million from $357.5 million for the six months ended June 30, 2024. This decline was primarily attributable to lower sales volume, despite our enlarged customer base compared to the six months ended June 30, 2024. In addition, weaker shipping activity and softer global consumption further depressed oil prices, which deteriorated our performance for the six months ended June 30, 2025.
In response, we are strengthening collaboration with our key service providers and exploring alternative sourcing and supply chain options to enhance resilience and operational continuity. While these strategic measures aim to mitigate potential impacts, there can be no assurance that they will fully shield us from the broader effects of ongoing trade policy shifts. We will continue to monitor developments closely and adapt our business strategy as needed to maintain operational stability and financial performance.
Nevertheless, any negative impact arising from an escalation of geopolitical tensions, including the Russia-Ukraine conflict, conflicts in the Middle East, a slowdown in global economy, or continued trade tension and tariff crisis could adversely affect our business conditions. The volatility of crude oil price and inflationary pressures can increase our operating cost and a prolonged crisis may adversely impact the supply and demand of oil cargo, which may result in a lower volume of oil cargo bunkered. In addition, any significant increase in marine fuel price might tighten the operating cash flows of our Group, which may, in turn, adversely affect our working capital requirements, financial conditions and prospects. These disruptions may also heighten many other risks disclosed in the “Risk Factors” section in our annual report on Form 20-F for the year ended December 31, 2024, including our ability to market our securities, raise equity or debt financing.
The ultimate impact of the conflict on our operations remains unknown and will depend on future developments. The Group will continuously monitor the situation closely and initiate any necessary mitigating actions when required.
Six Months Ended June 30, 2025 Compared to Six Months Ended June 30, 2024
Results of Operations
The following table summarizes the results of our operations during the six months ended June 30, 2025 and 2024, respectively, and provides information regarding the dollar and percentage increase or (decrease) during such years.
|
For the Six Months Ended June 30, |
||||||||||||||||
| 2025 | 2024 | Variance – | ||||||||||||||
| $’000 | $’000 | Increase (Decrease) | ||||||||||||||
| (Unaudited) | (Unaudited) | $’000 | % | |||||||||||||
| Revenues, net | 276,185 | 357,486 | (81,301 | ) | (22.7 | ) | ||||||||||
| Revenues – related party, net | 155 | 39 | 116 | 297.4 | ||||||||||||
| Total revenues | 276,340 | 357,525 | (81,185 | ) | (22.7 | ) | ||||||||||
| Cost of revenues | (272,275 | ) | (351,629 | ) | (79,354 | ) | (22.6 | ) | ||||||||
| Cost of revenues – related party | (82 | ) | (350 | ) | (268 | ) | (76.6 | ) | ||||||||
| Total cost of revenues | (272,357 | ) | (351,979 | ) | (79,622 | ) | (22.6 | ) | ||||||||
| Gross profit | 3,983 | 5,546 | (1,563 | ) | (28.2 | ) | ||||||||||
| Operating expenses | ||||||||||||||||
| Selling and marketing expenses | (38 | ) | (47 | ) | (9 | ) | (19.1 | ) | ||||||||
| General and administrative expenses | (3,330 | ) | (3,061 | ) | 269 | 8.8 | ||||||||||
| Depreciation expenses | (2,559 | ) | (2,305 | ) | 254 | 11.0 | ||||||||||
| Total operating expenses | (5,927 | ) | (5,413 | ) | 514 | 9.5 | ||||||||||
| (Loss) Income from operations | (1,944 | ) | 133 | (2,077 | ) | (1,561.7 | ) | |||||||||
| Other (expenses) income, net | ||||||||||||||||
| Interest income | 16 | 29 | (13 | ) | (44.8 | ) | ||||||||||
| Sundry (expense) income | (775 | ) | 3,229 | (4,004 | ) | (124.0 | ) | |||||||||
| Interest expenses | (2,803 | ) | (1,987 | ) | 816 | 41.1 | ||||||||||
| Share of losses of associate | (4 | ) | - | (4 | ) | (100.0 | ) | |||||||||
| Total other (expenses) income, net | (3,566 | ) | 1,271 | (4,837 | ) | (380.6 | ) | |||||||||
| (Loss) Income before income taxes | (5,510 | ) | 1,404 | (6,914 | ) | (492.5 | ) | |||||||||
| Income tax benefits (expenses) | 988 | (277 | ) | 1,265 | 456.7 | |||||||||||
| Net (loss) income | (4,522 | ) | 1,127 | (5,649 | ) | (501.2 | ) | |||||||||
| Less: loss (income) attributable to non-controlling interest | 212 | (287 | ) | 499 | 173.9 | |||||||||||
| Net (loss) income attributable to controlling interest | (4,310 | ) | 840 | (5,150 | ) | (613.1 | ) | |||||||||
| Other comprehensive (loss) income: | ||||||||||||||||
| Net (loss) income | (4,522 | ) | 1,127 | (5,649 | ) | (501.2 | ) | |||||||||
| Foreign currency translation adjustments | (96 | ) | (248 | ) | 152 | 61.3 | ||||||||||
| Total comprehensive (loss) income | (4,618 | ) | 879 | (5,497 | ) | (625.4 | ) | |||||||||
|
|
Key Components of Results of Operations
Revenues
Our Group’s revenue comprises of bunkering services, vessel chartering services and ship management services as tabulated below:
| Total Revenue | Inter-Segment | Revenue from Customers | ||||||||||||||||||||||||||||||
|
For the Six Months Ended June 30, |
For the Six Months Ended June 30, |
For the Six Months Ended June 30, |
Variance – | |||||||||||||||||||||||||||||
| 2025 | 2024 | 2025 | 2024 | 2025 | 2024 | Increase | ||||||||||||||||||||||||||
| $’000 | $’000 | $’000 | $’000 | $’000 | $’000 | (Decrease) | ||||||||||||||||||||||||||
| (Unaudited) | (Unaudited) | (Unaudited) | (Unaudited) | (Unaudited) | (Unaudited) | $’000 | % | |||||||||||||||||||||||||
| Analysis By Segment: | ||||||||||||||||||||||||||||||||
| Bunkering services | 275,440 | 357,350 | - | - | 275,440 | 357,350 | (81,910 | ) | (22.9 | ) | ||||||||||||||||||||||
| Vessel chartering services | 3,548 | 3,486 | 3,548 | 3,486 | - | - | - | - | ||||||||||||||||||||||||
| Ship management services | 5,074 | 965 | 4,174 | 790 | 900 | 175 | 725 | 414.3 | ||||||||||||||||||||||||
| Total Revenue | 284,062 | 361,801 | 7,722 | 4,276 | 276,340 | 357,525 | (81,185 | ) | (22.7 | ) | ||||||||||||||||||||||
Overall
Our Group’s overall revenue for the six months ended June 30, 2025 had decreased by 22.7%, or equivalent to $81.2 million, to $276.3 million from $357.5 million achieved for the six months ended June 30, 2024 due to decrease in contribution from the bunkering services segment, as it contributed more than 99% of our Group’s revenue for the six months ended June 30, 2025, offset by a slight increase in ship management services. The decrease in revenue for the six months ended June 30, 2025 was primarily attributable to a decrease in the volume of oil cargo bunkered of approximately 11.2%, from 578,614 metric ton for the six months ended June 30, 2024 to 514,025 metric ton for the six months ended June 30, 2025.
Bunkering Services
The decrease in the bunkering services revenue by $81.9 million to $275.4 million for the six months ended June 30, 2025 from $357.3 million for the six months ended June 30, 2024 was substantially attributable to the decrease of approximately 11.2% in volume of oil cargo bunkered, from 578,614 metric ton for the six months ended June 30, 2024 to 514,025 metric ton for the six months ended June 30, 2025. In addition, because the selling price of bunker fuel is generally benchmarked to the prevailing market oil price, the 17.9% decrease in the average oil price for the six months ended June 30, 2025 compared to the six months ended June 30, 2024 further reduced the revenue recognized from bunkering services.
We expanded our customer base in bunkering services from 53 customers for the six months ended June 30, 2024 to 77 for the six months ended June 30, 2025. Despite this expansion, bunkered volume declined due to a slowdown in global trade and shipping activity. The tariff crisis in early 2025, marked by broad new tariffs and frequent changes in implementation timelines, significantly disrupted shipping schedules and cargo flows. These disruptions, together with softer global consumption and weaker economic growth, reduced overall demand for marine fuel and directly contributed to the decline in oil cargo bunkered.
The combined impact of reduced bunkered volume and declining global marine fuel prices offset the benefits of customer base expansion, thereby constraining overall revenue growth in our bunkering services.
Vessel Chartering Services
Our vessel chartering services segment previously generated revenue by chartering vessels to third parties. There was no revenue from third parties related to vessel chartering services for the six months ended June 30, 2025 and 2024, as our Group temporarily discontinued the segment after the chartering contract expired in July 2023. The vessel was subsequently redeployed to our bunkering fleet to support the growth of our oil bunkering operations.
Ship Management Services
Our ship management services, supported by a competent team of qualified professional mariners, also managed third-party vessels, including tugboats used in the port and STS operations that are owned by other subsidiaries within the Straits Group, which are outside our Group.
The ship management services generated approximately $0.9 million and $0.2 million for the six months ended June 30, 2025 and 2024, respectively, due to the addition of new customers for the six months ended June 30, 2025.
Cost of revenues
Our cost of revenues represent direct expenses incurred to generate revenue. These costs are recorded and accrued as incurred. The cost of revenues primarily comprise oil cargo cost, along with other bunkering operation costs such as bunker own used, port charges, crew wages and consumables, transport costs and agency fees. It also includes vessel operation-related costs, such as vessel consumables, insurance, general upkeep and repair costs.
|
|
Its major cost components are as follow:
|
For the Six Months Ended June 30, |
||||||||||||||||
| 2025 | 2024 | Variance – | ||||||||||||||
| (Unaudited) | (Unaudited) | Increase (Decrease) | ||||||||||||||
| $’000 | $’000 | $’000 | % | |||||||||||||
| Oil cargo sold | 264,009 | 343,994 | (79,985 | ) | (23.3 | ) | ||||||||||
| Bunker own used | 1,818 | 2,136 | (318 | ) | (14.9 | ) | ||||||||||
| Crew wages | 1,815 | 1,767 | 48 | 2.7 | ||||||||||||
| Other operating cost | 4,715 | 4,082 | 633 | 15.5 | ||||||||||||
| Total cost of revenues | 272,357 | 351,979 | (79,622 | ) | (22.6 | ) | ||||||||||
Our overall cost of revenues decreased by 22.6%, or equivalent to $79.6 million, to $272.4 million for the six months ended June 30, 2025 from $352.0 million for the six months ended June 30, 2024, representing 98.6% and 98.4% of our total revenue respectively. This decrease was in line with the decline in the volume of cargo bunkered, with oil cargo costs dropped to $264.0 million for the six months ended June 30, 2025 from $344.0 million for the six months ended June 30, 2024. In addition, other operating costs increased to $4.7 million for the six months ended June 30, 2025 from $4.1 million for the six months ended June 30, 2024. The increase was primarily attributable to higher port-related operation costs, partially offset by a reduction in equipment upkeep expenses.
Gross Profit and Gross Profit Margin
Overall
|
For the Six Months Ended June 30, |
||||||||||||||||
| 2025 | 2024 | Variance – | ||||||||||||||
| (Unaudited) | (Unaudited) | Increase (Decrease) | ||||||||||||||
| $’000 | $’000 | $’000 | % | |||||||||||||
| Revenue | 276,340 | 357,525 | (81,185 | ) | (22.7 | ) | ||||||||||
| Cost of revenues | (272,357 | ) | (351,979 | ) | (79,622 | ) | (22.6 | ) | ||||||||
| Gross profit | 3,983 | 5,546 | (1,563 | ) | (28.2 | ) | ||||||||||
| Gross profit margin | 1.44 | % | 1.55 | % | (0.11 | )% | (7.1 | ) | ||||||||
As a result of the foregoing, we recorded an overall decrease of 28.2% in gross profit, or equivalent to $1.6 million, to $4.0 million for the six months ended June 30, 2025 from $5.6 million for the six months ended June 30, 2024.
Nevertheless, our gross profit margin decreased marginally by 0.11%, to 1.44% for the six months ended June 30, 2025 from 1.55% for the six months ended June 30, 2024 primarily reflecting increased operational expenses from our oil bunkering services, resulting in a marginal compression of our gross profit margin.
Bunkering Services
|
For the Six Months Ended June 30, |
||||||||||||||||
| 2025 | 2024 | Variance – | ||||||||||||||
| (Unaudited) | (Unaudited) | Increase (Decrease) | ||||||||||||||
| $’000 | $’000 | $’000 | % | |||||||||||||
| Revenue | 275,440 | 357,350 | (81,910 | ) | (22.9 | ) | ||||||||||
| Cost of revenues | (271,627 | ) | (351,979 | ) | (80,352 | ) | (22.8 | ) | ||||||||
| Gross profit | 3,813 | 5,371 | (1,558 | ) | (29.0 | ) | ||||||||||
| Gross profit margin | 1.38 | % | 1.50 | % | (0.12 | )% | (7.9 | ) | ||||||||
| Total metric ton sold (mt) | 514,025 | 578,614 | (64,589 | ) | (11.2 | ) | ||||||||||
| Average gross profit per metric ton | $ | 7.42 | $ | 9.28 | $ | (1.86 | ) | (20.0 | ) | |||||||
We recorded a decrease of 29.0% in gross profit of bunkering services, or equivalent to $1.6 million, to $3.8 million for the six months ended June 30, 2025 from $5.4 million for the six months ended June 30, 2024. Our gross profit margin decreased marginally by 0.12%, to 1.38% for the six months ended June 30, 2025 from 1.50% for the six months ended June 30, 2024.
The average gross profit per mt of oil cargo sold had decreased by approximately 20.0%, or equivalent to $1.86 per mt, to $7.42 per mt for the six months ended June 30, 2025 from $9.28 per mt for the six months ended June 30, 2024. This margin compression was largely due to elevated operating costs and sharp decline in demand for bunkering. Tariff-related delays and logistical disruptions increased transportation and handling expenses, while deferred tariff adjustments limited cost pass-through capabilities. Additionally, global oil demand softness and broader inflationary pressures narrowed the spread between selling prices and procurement costs, further eroding profitability.
|
|
Ship Management Services
Gross profit of ship management services was relatively stable, representing $169,761 for the six months ended June 30, 2025, up from $175,465 for the six months ended June 30, 2024.
The slight decrease in gross profit margin primarily reflects the recognition of certain direct costs associated with technical management and agency services for the six months ended June 30, 2025.
Selling and Marketing Expenses
The selling and marketing expenses comprise marketing, advertising and business development expenses incurred by the sales and marketing team.
Our selling and marketing expenses decreased by 19.1% or approximately $0.01 million, to $0.04 million for the six months ended June 30, 2025, down from $0.05 million for the six months ended June 30, 2024. The decrease was primarily attributable to a reversal of approximately $0.03 million in previously over provisioned marketing expenses, partially offset by an increase in spending of $0.04 million for business development for the six months ended June 30, 2025.
General and Administrative Expenses
The general and administrative expenses which increased by 8.8% or $0.2 million, to $3.3 million for the six months ended June 30, 2025 from $3.1 million for the six months ended June 30, 2024 comprise the following:
|
For the Six Months Ended June 30, |
||||||||||||||||
| 2025 | 2024 | Variance – | ||||||||||||||
| (Unaudited) | (Unaudited) | Increase (Decrease) | ||||||||||||||
| $’000 | $’000 | $’000 | % | |||||||||||||
| Staff cost | 1,505 | 1,174 | 331 | 28.2 | ||||||||||||
| Management fees | 373 | 91 | 282 | 309.9 | ||||||||||||
| Professional fees | 410 | 353 | 57 | 16.1 | ||||||||||||
| Leasing license | 170 | 160 | 10 | 6.3 | ||||||||||||
| Others | 872 | 1,283 | (411 | ) | (32.0 | ) | ||||||||||
| Total general and administrative expenses | 3,330 | 3,061 | 269 | 8.8 | ||||||||||||
Staff cost increased by $0.3 million, to $1.5 million for the six months ended June 30, 2025, up from $1.2 million for the six months ended June 30, 2024. Without significant change in the number of overall headcounts, the increase was primarily due to annual salary adjustments and bonus payments during the six months ended June 30, 2025. In addition, approximately $0.07 million of directors’ remuneration was incurred following our listing.
Management fees paid to Straits Management Services Sdn. Bhd., a related company within the Straits Group, increased to $0.4 million for the six months ended June 30, 2025 from $0.1 million for the six months ended June 30, 2024. These fees cover overall group management and coordination services, encompassing but not limited to listing compliance and requirement, group consolidation and reporting, corporate governance, corporate secretarial, corporate finance, corporate banking, accounting, market and public relations to the subsidiaries of our Company. The increase was mainly due to a higher fee being charged for the six months ended June 30, 2025.
Professional fees include statutory audit fees, tax fees, corporate secretarial fees, and legal fees. The professional fees remained relatively stable for the six months ended June 30, 2025, which mainly represented fee incurred in connection with our expenses related to investor relationship and a provision of audit fee for the consolidated financial statement.
Corporations incorporated under Labuan Companies Act 1990 are required to pay an annual leasing license fee of $20,000 to Labuan Financial Services Authority (“LFSA”). As such, there was leasing license fee of $0.01 million each for the six months ended June 30, 2025 and 2024. In addition, $0.02 million and $0.01 million represents other license fees charged for the six months ended June 30, 2025 and 2024, respectively.
The decrease in other general and administrative expenses for the six months ended June 30, 2025 primarily reflected the reduced in late charge in payment to suppliers driven by greater access to funding and implementation of our cost savings initiatives aimed at optimizing operational efficiency and reducing discretionary spending.
Depreciation
Depreciation represents the annual depreciation on the cost of Group’s fleet of 15 vessels, dry-dock cost, tools, office equipment, computer hardware and software, motor vehicles, real property and furniture and fittings.
|
|
The increase in depreciation by $0.3 million to $2.6 million for the six months ended June 30, 2025, up from $2.3 million for the six months ended June 30, 2024, was due to the addition of dry-dock cost which resulted in higher depreciation charges.
Other (Expense) Income, net
Interest Income
Interest income decreased to $16,072 for the six months ended June 30, 2025 from $28,903 for the six months ended June 30, 2024. The decrease was primarily attributable to an adjustment recorded in respect of interest income relating to earlier periods during the six months ended June 30, 2024, with no corresponding adjustment in the six months ended June 30, 2025. Interest income was derived from principal sums approximating $0.1 million and $2.4 million placed with lender bank of Tumpuan Megah Development Sdn. Bhd. (“Tumpuan Megah”) as a term deposit and in a designated current account respectively.
Sundry (Expense) Income
|
For the Six Months Ended June 30, |
||||||||||||||||
| 2025 | 2024 | Variance – | ||||||||||||||
| (Unaudited) | (Unaudited) | Increase (Decrease) | ||||||||||||||
| $’000 | $’000 | $’000 | % | |||||||||||||
| (Loss) Gain on foreign exchange | (1,496 | ) | 3,210 | (4,706 | ) | (146.6 | ) | |||||||||
| Miscellaneous income | 721 | 19 | 702 | 3,694.7 | ||||||||||||
| Total sundry (expense) income | (775 | ) | 3,229 | (4,004 | ) | (124.0 | ) | |||||||||
Although the majority of our business activities are denominated in USD, the functional currencies of our five subsidiaries remain RM and SGD. As a result, foreign currency gains and losses arise when USD-denominated balances of these subsidiaries are remeasured into their respective functional currencies. We currently do not have a foreign currency hedging policy, as the USD generated from our revenue is sufficient to cover our USD purchases. However, we continue to monitor our foreign exchange exposure and will consider hedging significant foreign currency exposure should the need arise. In the current state of RM and SGD strengthening against the USD, the weakening of the USD reduced the RM-equivalent and SGD-equivalent values of our USD-denominated cash balances, receivables and payables, resulting in a net foreign currency loss. We recorded a net foreign currency loss of $1.5 million for the six months ended June 30, 2025 as compared to net foreign currency gain of $3.2 million for the six months ended June 30, 2024.
Miscellaneous income primarily comprises late payment interest income of $0.6 million from a related party, Straits, arising from late payment at an interest rate of 8.25%.
Interest Expense
Interest expense included interest on trade financing facilities granted to Tumpuan Megah, term loan interest and vessel vendor financing interest.
The increase in interest expense by $0.8 million, to $2.8 million for the six months ended June 30, 2025, up from $2.0 million for the six months ended June 30, 2024, was due to a higher volume of trade financing facilities granted to Tumpuan Megah, which bear interest rates ranging from 5.75% to 7.75%.
Provision For Income Taxes
Cayman Islands
Our Company was incorporated in Cayman Islands. Under the current tax laws of Cayman Islands, we are not subject to income, corporation or capital gains tax, and no withholding tax is imposed upon the payment of dividends.
Malaysia
Profits of Malaysian corporations incorporated under the Companies Act 2016 are subject to the prevailing corporate income tax rate at 24%, and this is applicable to SMF, TMD Marine Fuels Sdn. Bhd. and Tumpuan Megah.
For corporations incorporated under the Labuan Companies Act 1990, that individually own each of our 15 vessels, their audited net profits are subject to the prevailing corporate income tax rate at 3%.
Singapore
For Singapore incorporated corporations, their prevailing corporate income tax rate is at 17% with the following partial tax exemption on its chargeable income:
| 1. | 75% of its first chargeable income of SGD10,000; and | |
| 2. | 50% of its next chargeable income of SGD190,000. |
|
|
With the aforementioned, our Group’s effective tax rate was 19.7% for the six months ended June 30, 2024. For the six months ended June 30, 2025, the Group recorded an income tax benefit of $1.0 million, representing (i) current tax expenses of $0.08 million for the ended June 30, 2025; (ii) deferred tax income arising from temporary differences amounted to $0.07 million; and (iii) over-provision of income tax expenses of $1.0 million in FY2024 due to the change in our fiscal year end.
| For the Six Months Ended June 30, |
||||||||||||||||
| 2025 | 2024 | Variance – | ||||||||||||||
| (Unaudited) | (Unaudited) | Increase (Decrease) | ||||||||||||||
| $’000 | $’000 | $’000 | % | |||||||||||||
| Current Income Tax | ||||||||||||||||
| Based on result for the period | 78 | 277 | (199 | ) | (71.8 | ) | ||||||||||
| Over provision in prior periods | (1,001 | ) | - | (1,001 | ) | (100.0 | ) | |||||||||
| (923 | ) | 277 | (1,200 | ) | (433.2 | ) | ||||||||||
| Deferred Tax | ||||||||||||||||
| Reversal of temporary differences | (65 | ) | - | (65 | ) | 100.0 | ||||||||||
| Under provision in prior periods | - | - | - | - | ||||||||||||
| (65 | ) | - | (65 | ) | 100.0 | |||||||||||
| Total income tax (benefit) expense | (988 | ) | 277 | (1,265 | ) | (456.7 | ) | |||||||||
With the change of fiscal year end from December 31 to June 30, the tax reporting period of Tumpuan Megah covered 18 months from January 1, 2024 to June 30, 2025. Given Tumpuan Megah recorded a net loss for the six months ended June 30, 2025, the tax loss position reduced the overall assessable profits for the full 18-month reporting period. As a result, the provision for income tax previously recognized for the year ended December 31, 2024 was overstated by $1.0 million.
Year Ended December 31, 2024 Compared to Year Ended December 31, 2023
Results of Operations
The following table summarizes the results of our operations during the fiscal years ended December 31, 2024 and 2023, respectively, and provides information regarding the dollar and percentage increase or (decrease) during such years.
|
For the Years Ended December 31, |
Variance – |
|||||||||||||||
| 2024 | 2023 | Increase (Decrease) | ||||||||||||||
| $’000 | $’000 | $’000 | % | |||||||||||||
| Revenues, net | 688,430 | 632,790 | 55,640 | 8.8 | ||||||||||||
| Revenues – related party, net | 178 | 290 | (112 | ) | (38.6 | ) | ||||||||||
| Total revenues | 688,608 | 633,080 | 55,528 | 8.8 | ||||||||||||
| Cost of revenues | (671,616 | ) | (619,867 | ) | 51,749 | 8.3 | ||||||||||
| Cost of revenues – related party | (947 | ) | (1,123 | ) | (176 | ) | (15.7 | ) | ||||||||
| Total cost of revenues | (672,563 | ) | (620,990 | ) | 51,573 | 8.3 | ||||||||||
| Gross profit | 16,045 | 12,090 | 3,955 | 32.7 | ||||||||||||
| Operating expenses | ||||||||||||||||
| Selling and marketing expenses | (40 | ) | (101 | ) | (61 | ) | (60.4 | ) | ||||||||
| General and administrative expenses | (5,249 | ) | (5,127 | ) | 122 | 2.4 | ||||||||||
| Depreciation expenses | (4,758 | ) | (4,257 | ) | 501 | 11.8 | ||||||||||
| Total operating expenses | (10,047 | ) | (9,485 | ) | 562 | 5.9 | ||||||||||
| Income from operations | 5,998 | 2,605 | 3,393 | 130.2 | ||||||||||||
| Other (expenses) income | ||||||||||||||||
| Interest income | 52 | 10 | 42 | 420.0 | ||||||||||||
| Sundry income, net | 2,022 | 3,321 | (1,299 | ) | (39.1 | ) | ||||||||||
| Interest expenses | (4,598 | ) | (2,203 | ) | (2,395 | ) | (108.7 | ) | ||||||||
| Share of losses of associate | (1 | ) | - | (1 | ) | (100.0 | ) | |||||||||
| Total other (expenses) income, net | (2,525 | ) | 1,128 | (3,653 | ) | 323.8 | ||||||||||
| Income before income taxes | 3,473 | 3,733 | (260 | ) | (7.0 | ) | ||||||||||
| Income tax expenses | (1,428 | ) | (774 | ) | 654 | 84.5 | ||||||||||
| Net income | 2,045 | 2,959 | (914 | ) | (30.9 | ) | ||||||||||
| Less: income attributable to non-controlling interest | (168 | ) | (963 | ) | (795 | ) | (82.6 | ) | ||||||||
| Net income attributable to controlling interest | 1,877 | 1,996 | (119 | ) | (6.0 | ) | ||||||||||
| Other comprehensive income: | ||||||||||||||||
| Net income | 2,045 | 2,959 | (914 | ) | (30.9 | ) | ||||||||||
| Foreign currency translation adjustments | 276 | 1,888 | (1,612 | ) | (85.4 | ) | ||||||||||
| Total comprehensive income | 2,321 | 4,847 | (2,526 | ) | (52.1 | ) | ||||||||||
|
|
Key Components of Results of Operations
Revenues
Our Group’s revenue comprises of bunkering services, vessel chartering services and ship management services as tabulated below:
| Total Revenue | Inter-Segment | Revenue from Customers | ||||||||||||||||||||||||||||||
| For the Years Ended December 31, |
For the Years Ended December 31, |
For the Years Ended December 31, |
Variance – Increase |
|||||||||||||||||||||||||||||
| 2024 | 2023 | 2024 | 2023 | 2024 | 2023 | (Decrease) | ||||||||||||||||||||||||||
| $’000 | $’000 | $’000 | $’000 | $’000 | $’000 | $’000 | % | |||||||||||||||||||||||||
| Analysis By Segment: | ||||||||||||||||||||||||||||||||
| Bunkering services | 688,210 | 631,608 | - | - | 688,210 | 631,608 | 56,602 | 9.0 | ||||||||||||||||||||||||
| Vessel chartering services | 7,097 | 8,041 | 7,097 | 6,847 | - | 1,194 | (1,194 | ) | (100.0 | ) | ||||||||||||||||||||||
| Ship management services | 1,917 | 1,911 | 1,519 | 1,633 | 398 | 278 | 120 | 43.2 | ||||||||||||||||||||||||
| Total Revenue | 697,224 | 641,560 | 8,616 | 8,480 | 688,608 | 633,080 | 55,528 | 8.8 | ||||||||||||||||||||||||
Overall
Our Group’s overall revenue for FY2024 had increased by 8.8%, or equivalent to $55.5 million, to $688.6 million from $633.1 million achieved in FY2023 due to rise in contribution from the bunkering services segment, as it contributed more than 99% of our Group’s revenue. The increase in revenue in FY2024 was primarily attributable to an increase in the volume of oil cargo bunkered of approximately 6.0%, from 933,418 metric ton in FY2023 to 989,512 metric ton in FY2024.
Bunkering Services
The increase in the bunkering services revenue by $56.6 million to $688.2 million in FY2024 from $631.6 million in FY2023 was substantially attributable to the increase of approximately 6.0% in volume of oil cargo bunkered, from 933,418 metric ton in FY2023 to 989,512 metric ton in FY2024.
The increase in bunkered volume was driven by both our Group’s ongoing efforts to meet customer demand through enhanced operational efficiency. In addition, we expanded our customer base in bunkering services from 90 customers in FY2023 to 101 in FY2024, which further contributed to the increase in bunkered volume and revenue.
We also benefited from higher vessel capacity, as one of our vessels, previously chartered to a third party in FY2023, was redeployed to our bunkering fleet in July 2023 following the expiration of the charter contract to support the expansion of our oil bunkering operations.
Vessel Chartering Services
Our vessel chartering services segment previously generated revenue by chartering vessels to third parties. There was no revenue from third parties related to vessel chartering services in FY2024, compared to $1.2 million in FY2023, as our Group temporarily discontinued the segment after the chartering contract expired in July 2023. The vessel was subsequently redeployed to our bunkering fleet to support the growth of our oil bunkering operations.
Ship Management Services
Our ship management services, supported by a competent team of qualified professional mariners, also managed third-party vessels, including tugboats used in the port and STS operations that are owned by other subsidiaries within the Straits Group, which are outside our Group.
The ship management services remained steady, generating approximately $0.4 million and $0.3 million in FY2024 and FY2023, respectively.
Cost of revenues
Our cost of revenues represent direct expenses incurred to generate revenue. These costs are recorded and accrued as incurred. The cost of revenues primarily comprise oil cargo cost, along with other bunkering operation costs such as bunker own used, port charges, crew wages and consumables, transport costs and agency fees. It also includes vessel operation-related costs, such as vessel consumables, insurance, general upkeep and repair costs.
|
|
Its major cost components are as follow:
|
For the Years Ended December 31, |
Variance – |
|||||||||||||||
| 2024 | 2023 | Increase (Decrease) | ||||||||||||||
| $’000 | $’000 | $’000 | % | |||||||||||||
| Oil cargo sold | 656,864 | 606,451 | 50,413 | 8.3 | ||||||||||||
| Bunker own used | 4,011 | 4,439 | (428 | ) | (9.6 | ) | ||||||||||
| Crew wages | 3,550 | 3,481 | 69 | 2.0 | ||||||||||||
| Other operating cost | 8,138 | 6,619 | 1,519 | 22.9 | ||||||||||||
| Total cost of revenues | 672,563 | 620,990 | 51,573 | 8.3 | ||||||||||||
Our overall cost of revenues increased by 8.3%, or equivalent to $51.6 million, to $672.6 million for FY2024 from $621.0 million for FY2023, representing 97.7% and 98.1% of our total revenue respectively. This increase was in line with the growth in the volume of cargo bunkered, with oil cargo costs rising to $656.9 million in FY2024 from $606.4 million in FY2023. In addition, other operating costs increased to $8.1 million in FY2024 from $6.6 million in FY2023, primarily due to higher vessel maintenance and bunkering loading costs.
Gross Profit and Gross Profit Margin
Overall
|
For the Years Ended December 31, |
Variance – |
|||||||||||||||
| 2024 | 2023 | Increase (Decrease) | ||||||||||||||
| $’000 | $’000 | $’000 | % | |||||||||||||
| Revenue | 688,608 | 633,080 | 55,528 | 8.8 | ||||||||||||
| Cost of revenues | (672,563 | ) | (620,990 | ) | (51,573 | ) | (8.3 | ) | ||||||||
| Gross profit | 16,045 | 12,090 | 3,955 | 32.7 | ||||||||||||
| Gross profit margin | 2.33 | % | 1.91 | % | 0.42 | % | 22.0 | |||||||||
As a result of the foregoing, we recorded an overall increase of 32.7% in gross profit, or equivalent to $3.9 million, to $16.0 million for FY2024 from $12.1 million in FY2023.
Nevertheless, our gross profit margin increased marginally by 0.42% to 2.33% in FY2024 from 1.91% in FY2023 due to improved margins in our oil bunkering services.
Bunkering Services
|
For the Years Ended December 31, |
Variance – |
|||||||||||||||
| 2024 | 2023 | Increase (Decrease) | ||||||||||||||
| $’000 | $’000 | $’000 | % | |||||||||||||
| Revenue | 688,210 | 631,608 | 56,602 | 9.0 | ||||||||||||
| Cost of revenues | (672,563 | ) | (620,610 | ) | 51,953 | 8.4 | ||||||||||
| Gross profit | 15,647 | 10,998 | 4,649 | 42.3 | ||||||||||||
| Gross profit margin | 2.27 | % | 1.74 | % | 0.53 | % | 30.5 | |||||||||
| Total metric ton sold (mt) | 989,512 | 933,418 | 56,094 | 6.0 | ||||||||||||
| Average gross profit per metric ton | $ | 15.81 | $ | 11.78 | $ | 4.03 | 34.2 | |||||||||
We recorded an increase of 42.3% in gross profit of bunkering services, or equivalent to $4.6 million, to $15.6 million in FY2024 from $11.0 million in FY2023. Our gross profit margin increased marginally by 0.53% to 2.27% in FY2024 from 1.74% in FY2023.
The average gross profit per metric ton of oil cargo sold had increased by approximately 34.2%, or equivalent to $4.03 per mt, to $15.81 in FY2024 from $11.78 in FY2023. This improvement was attributable to our strategic focus on penetrating new markets and expanding our customer base contributed to higher sales volumes. We successfully attracted new customers while maintaining strong relationships with existing buyers. Through maintaining a steady demand, we optimized resource usage and lowered the overall cost of providing services for FY2024. In addition, the increase in bunkering activities, which led to higher operational efficiencies, enabling us to leverage economies of scale and optimize our cost structure.
Vessel Chartering Services
|
For the Years Ended December 31, |
Variance – |
|||||||||||||||
| 2024 | 2023 | Increase (Decrease) | ||||||||||||||
| $’000 | $’000 | $’000 | % | |||||||||||||
| Revenue | - | 1,194 | (1,194 | ) | (100.0 | ) | ||||||||||
| Cost of revenues | - | (380 | ) | 380 | 100.0 | |||||||||||
| Gross profit | - | 814 | 814 | 100.0 | ||||||||||||
| Gross profit margin | - | 68.2 | % | (68.2 | )% | (100.0 | ) | |||||||||
|
|
We recorded a decrease in gross profit of vessel chartering services to nil in FY2024, down from $0.8 million in FY2023. Our gross profit margin decreased to nil in FY2024 from 68.2% in FY2023.
The drop in gross profit of vessel chartering services was due to our Group redeployed the chartered vessel to our bunkering fleet of vessels to meet the growing demand for our bunkering services following the expiration of the charter contract in July 2023.
Ship Management Services
Gross profit of ship management services increased to $ 0.4 million in FY2024, from $0.3 million in FY2023, remaining relatively stable.
Selling and Marketing Expenses
The selling and marketing expenses comprise marketing travelling and advertising expenses incurred by the sales and marketing team.
Our selling and marketing expenses decreased by 60.4% or approximately $0.06 million, to $0.04 million in FY2024, down from $0.1 million in FY2023, due to cost-saving plan on marketing expenses in FY2024.
General and Administrative Expenses
The general and administrative expenses which increased by 2.4% or $0.1 million, to $5.2 million in FY2024 from $5.1 million in FY2023 comprise the following:
|
For the Years Ended December 31, |
Variance – |
|||||||||||||||
| 2024 | 2023 | Increase (Decrease) | ||||||||||||||
| $’000 | $’000 | $’000 | % | |||||||||||||
| Staff cost | 2,300 | 2,266 | 34 | 1.5 | ||||||||||||
| Management fees | 499 | 487 | 12 | 2.5 | ||||||||||||
| Professional fees | 424 | 415 | 9 | 2.2 | ||||||||||||
| Leasing license | 300 | 300 | - | - | ||||||||||||
| Vessel deposit written off | - | 273 | (273 | ) | (100.0 | ) | ||||||||||
| Impairment/ assets written off | 71 | (5 | ) | 76 | 1,520.0 | |||||||||||
| Others | 1,655 | 1,391 | 264 | 19.0 | ||||||||||||
| Total general and administrative expenses | 5,249 | 5,127 | 122 | 2.4 | ||||||||||||
Staff cost increased by $0.03 million to $2.30 million in FY2024, up from $2.27 million in FY2023. This was mainly due to higher staff-related costs and the recruitment of a senior management member for a subsidiary, Straits Marine Services Pte. Ltd. in FY2024. This increase was partially offset by the adjustment for the over-provision of staff and director bonuses for FY2023 in Tumpuan Megah.
Management fees are paid to Straits Management Services Sdn. Bhd., a related company within the Straits Group, remained stable at $0.5 million in both FY2024 and FY2023. These fees cover overall group management and coordination services, encompassing but not limited to listing compliance and requirement, group consolidation and reporting, corporate governance, corporate secretarial, corporate finance, corporate banking, accounting, market and public relations to the subsidiaries of our Company.
Professional fees include statutory audit fees, tax fees, corporate secretarial fees, and legal fees. The increase in professional fees for FY2024 was due to legal expenses incurred in connection with securing additional trade facilities from local financial institutions.
Corporations incorporated under Labuan Companies Act 1990 are required to pay an annual leasing license fee of $20,000 to Labuan Financial Services Authority (“LFSA”). As such, there was leasing license fee of $0.3 million each in FY2024 and FY2023.
We paid a deposit of approximately $0.3 million in FY2020 for the purchase of a vessel. However, the deposit was written off during FY2023 as the vendor became uncontactable after the COVID-19 Pandemic, and the vessel was not maintained and was in a deplorable condition. We have taken the necessary action in our attempts to recover the deposit paid.
The significant change under impairment was mainly due to an allowance for expected credit loss of our accounts receivable amounted to $0.07 million in FY2024.
The increase in other general and administrative expenses mainly represented (i) an increase in environmental, social, and governance activities payable to a related party, Benua Hijau Sdn. Bhd., an entity owned by a controlling shareholder, amounting to $0.1 million; (ii) an increase of $0.1 million in bank charges for issuing $6.5 million in bank guarantees to suppliers; and (iii) an increase in operating costs, such as insurance and travelling expenses, amounting to $0.05 million due to the expansion of business.
Depreciation
Depreciation represents the annual depreciation on the cost of Group’s fleet of 15 vessels, dry-dock cost, tools, office equipment, computer hardware and software, motor vehicles, real property and furniture and fittings.
The increase in depreciation by $0.5 million to $4.8 million in FY2024, up from $4.3 million in FY2023, was due to the addition of dry-dock cost incurred during the year.
|
|
Other Income, net
Interest Income
Interest income increased to $0.05 million in FY 2024 from $0.01 million in FY2023. The increase arises from approximately $0.04 million which consists of principal sums approximating $0.1 million and $2.0 million placed with lender bank of Tumpuan Megah as a term deposit and in a designated current account respectively.
Sundry Income
|
For the Years Ended December 31, |
Variance – |
|||||||||||||||
| 2024 | 2023 | Increase (Decrease) | ||||||||||||||
| $’000 | $’000 | $’000 | % | |||||||||||||
| Gain on foreign exchange | 1,415 | 2,982 | (1,567 | ) | (52.5 | ) | ||||||||||
| Cancellation fees | - | 230 | (230 | ) | (100.0 | ) | ||||||||||
| Fair value adjustments | - | 46 | (46 | ) | (100.0 | ) | ||||||||||
| Miscellaneous income | 607 | 63 | 544 | 863.5 | ||||||||||||
| Total sundry income | 2,022 | 3,321 | (1,299 | ) | (39.1 | ) | ||||||||||
Our business activities are substantially denominated in USD, while our assets and liabilities are denominated in our functional currency. We currently do not have a foreign currency hedging policy, as the USD generated from our revenue is sufficient to cover our USD purchases. However, we continue to monitor our foreign exchange exposure and will consider hedging significant foreign currency exposure should the need arise. In the current state of RM strengthening against the USD, we recorded a lower net foreign currency gain of $1.4 million for FY2024 as compared to $3.0 million for FY2023.
Cancellation fees are received from customers who cancelled their purchase of oil cargo. There was no cancellation fee recorded in FY2024.
A fair value adjustment of approximately $0.1 million was made in FY2022 on a debt due from the vendor of Tumpuan Megah. Approximately $0.05 million of this impairment was written back in FY2023 following subsequent payment from the vendor. The debt was related to legal fees for a legal case involving Tumpuan Megah prior to the acquisition of Tumpuan Megah by Straits in 2018. The debt currently stood at approximately $1.8 million of which $0.8 million was being repaid through a repayment plan spanning a period beyond 12 months commencing from April 2023 till March 2027. No adjustment was made in FY2024.
Miscellaneous income includes interest income of $0.4 million from related party, Straits on late payment with interest rate at 8.25%. In addition, there was a $0.2 million adjustment related to the previously recognized value of the acquisition of SMF.
Interest Expense
Interest expense included interest on trade financing facilities granted to Tumpuan Megah, term loan interest and vessel vendor financing interest.
The increase in interest expense by $2.4 million to $4.6 million in FY2024, up from $2.2 million in FY2023, was due to a higher volume of trade financing facilities granted to Tumpuan Megah, which bear interest rates ranging from 5.82% to 8.25%.
Provision For Income Taxes
Cayman Islands
Our Company was incorporated in Cayman Islands. Under the current tax laws of Cayman Islands, we are not subject to income, corporation or capital gains tax, and no withholding tax is imposed upon the payment of dividends.
Malaysia
Profits of Malaysian corporations incorporated under the Companies Act 2016 are subject to the prevailing corporate income tax rate of 24%, and this is applicable to SMF, TMD Marine Fuels Sdn. Bhd. and Tumpuan Megah.
For corporations incorporated under the Labuan Companies Act 1990, that individually own each of our 15 vessels, their audited net profits are subject to the prevailing corporate income tax rate of 3%.
Singapore
For Singapore incorporated corporations, their prevailing corporate income tax rate is at 17% with the following partial tax exemption on its chargeable income:
| 3. | 75% of its first chargeable income of SGD10,000; and | |
| 4. | 50% of its next chargeable income of SGD190,000. |
|
|
With the aforementioned, our Group’s effective tax rate was 41.1% for FY2024 and 20.7% for FY2023. The increase in income tax expenses in FY2024 was primarily due to higher gross profit from our bunkering services, which led to increased operating income. In addition, certain bank charges and professional fees incurred in relation to bank facilities were non-deductible for tax purposes. Furthermore, a non-taxable exchange gain of approximately $2.5 million reduced chargeable income in FY2023, whereas a non-deductible exchange loss of approximately $0.5 million increased chargeable income in FY2024. The reduction in non-taxable income further contributed to the increase in chargeable income for FY2024. Consequently, higher tax expenses and an increased effective tax rate were observed in FY2024. No deferred tax was recognized in FY2024 after the crystallization of deferred tax liabilities arising from assets controlled transfer to Labuan companies.
|
For the Years Ended December 31, |
Variance – |
|||||||||||||||
| 2024 | 2023 | Increase (Decrease) | ||||||||||||||
| $’000 | $’000 | $’000 | % | |||||||||||||
| Current Income Tax | ||||||||||||||||
| Based on result for the year | 1,458 | 698 | 760 | 108.9 | ||||||||||||
| (Over) Under provision in prior years | (30 | ) | 168 | (198 | ) | (117.9 | ) | |||||||||
| 1,428 | 866 | 562 | 64.9 | |||||||||||||
| Deferred Tax | ||||||||||||||||
| Reversal of temporary differences | - | (88 | ) | 88 | 100.0 | |||||||||||
| Over provision in prior years | - | (4 | ) | 4 | 100.0 | |||||||||||
| - | (92 | ) | 92 | 100.0 | ||||||||||||
| Total income tax expense | 1,428 | 774 | 654 | 84.5 | ||||||||||||
5.B. Liquidity and Capital Resources
We are exposed to liquidity risk, which is the risk that we may encounter difficulties in meeting our financial obligations as they become due. We manage this risk by maintaining adequate levels of cash and cash equivalents, monitoring cash flows, and maintaining access to financing sources.
As of June 30, 2025, we had net working capital deficit of $8.7 million and a net loss of $4.5 million. Despite this, we believe that we can meet all our financial obligations as they become due in the foreseeable future. This conclusion is based on a detailed assessment of our financial position, forecast, and plans up to the date of approval of these financial statements.
Key considerations in this assessment include:
| ● | We maintained cash and cash equivalents of $7.1 million as of June 30, 2025. |
| ● | Our strong payment track record and long-standing relationships suggest that trade facilities amounting to approximately $91.8 million and supplier purchasing limits of $11.2 million will be available for the next 12 months. |
| ● | As of June 30, 2025, we had balances of available trade facilities amounting to $7.6 million to support our operational needs. |
| ● | We entered into a repayment plan with major debtors covering approximately $15.0 million, with scheduled monthly repayments from June 2025 to May 2026, which are expected to provide additional liquidity. |
Prior to the consummation of our initial public offering on April 22, 2025, our principal sources of liquidity to finance our operating activities were from the working capital, trade financing from financial institutions, suppliers credit financing and cash generated from business operation.
On April 22, 2025, we consummated our initial public offering on the NYSE American. In this offering, 3,100,000 ordinary shares were issued at a price of $3.25 per share. In addition, we entered into an underwriting agreement with the underwriter on April 21, 2025, which granted the underwriter a 45-day option to purchase up to an additional 465,000 ordinary shares at the public offering price of $3.25 per share to cover any over-allotment. Subsequently, on April 22, 2025, the underwriter exercised the over-allotment option in full, purchasing an additional 465,000 ordinary shares at the public offering price of $3.25 per share. The initial public offering closed on April 22, 2025 and the exercise of the over-allotment option closed on April 24, 2025, with gross proceeds totaling $11.59 million, before deducting underwriting discounts and offering expenses.
We believe that our existing cash resources, anticipated cashflow from operations, anticipated cash raised from financing together with net proceeds from our public offering will be sufficient to meet and fund our anticipated operation working capital and capital expansion requirements for the next 12 months from the date of this transition report.
If we experience an adverse operating environment or incur unanticipated capital expenditure requirements, or if we determine to accelerate our growth, then additional financing may be required. No assurance can be given, however, that such financing would be available at all or on favorable terms. Additional financing may include the use of debt, credit facilities from financial institutions, or the sale of equity or instruments convertible into equity securities, whether by our Group or its holding company. Any issuance of additional equity could result in immediate and possibly significant dilution to our existing shareholders, while incurrence of debt would increase fixed obligations and bring along operating covenants that could restrict our operations.
As at June 30, 2025, our cash and cash equivalents were approximately $7.1 million, comprising primarily in cash and cash equivalent.
|
|
Cash Flows and Working Capital
The following table sets forth a summary of our cash flows for the six months ended June 30, 2025 and 2024 and the years ended December 31, 2024 and 2023 as indicated.
|
For the Six Months Ended June 30, |
For the Years Ended December 31, |
|||||||||||||||
| 2025 | 2024 | 2024 | 2023 | |||||||||||||
| (Unaudited) | (Unaudited) | (Audited) | (Audited) | |||||||||||||
| $’000 | $’000 | $’000 | $’000 | |||||||||||||
| Net cash (used in) provided by operating activities | (20,251 | ) | (42,896 | ) | (24,290 | ) | 654 | |||||||||
| Net cash used in investing activities | (2,096 | ) | (1,942 | ) | (3,761 | ) | (3,148 | ) | ||||||||
| Net cash provided by (used in) financing activities | 12,778 | 45,136 | 38,655 | (2,489 | ) | |||||||||||
| Net (decrease) increase in cash and restricted cash | (9,569 | ) | 298 | 10,604 | (4,983 | ) | ||||||||||
| Effect of exchange rates on cash and restricted cash | 559 | 860 | 636 | (1,456 | ) | |||||||||||
| Cash and restricted cash, beginning of period / year | 16,070 | 4,830 | 4,830 | 11,269 | ||||||||||||
| Cash and restricted cash, end of period / year | 7,060 | 5,988 | 16,070 | 4,830 | ||||||||||||
Operating Activities
Our cash inflow from operating activities was principally from collections of revenue. Our cash outflows used in operating activities was principally for payment of oil cargo purchased, operating expenses, staff cost and general administrative expenses.
The net cash used in operating activities for the six months ended June 30, 2025 was $20.3 million, after adjusting for non-cash item which includes:
| i. | $2.6 million in depreciation charges for the six months ended June 30, 2025. The increase in depreciation charges was due to additional capital expenditure incurred on docking expenditure for the six months ended June 30, 2025. |
Meanwhile, the changes for the six months ended June 30, 2025 working capital were mainly attributable by the following operating assets and liabilities:
| i. | Increase in accounts receivable by $6.6 million due to the implementation of our accounts receivable repayment plan, in which installment agreements were established with customers for repayment of outstanding balances. In addition, slower collections from customers were observed for the six months ended June 30, 2025, primarily due to delays in cargo movement and the ongoing tariff situation. These disruptions affected delivery schedules and invoicing cycles, which in turn strained customer cash flows and extended payment timelines; | |
| ii. | Lower inventory levels were maintained amid market instability for the six months ended June 30, 2025, resulting in a decrease of $2.5 million; | |
| iii. | Increase in other receivables and current assets by $11.9 million, mainly due to advance payments related to marketing and business development activities of and a vessel deposit paid for sourcing target vessel amounting to total of $6.1 million. In addition, advance payments were made to suppliers for purchase of cargo oil increased by $3.7 million; and | |
| iv. | Decrease in income tax payable of $1.8 million as the operating entity, Tumpuan Megah, incurred a net loss for the six months ended June 30, 2025 which reduced the current tax expense and related tax payable. |
The net cash used in operating activities for the six months ended June 30, 2024 was $42.9 million, after adjusting for non-cash item which includes:
| i. | $2.3 million in depreciation charges for the six months ended June 30, 2024. The increase in depreciation charges was due to additional capital expenditure incurred for the six months ended June 30, 2024. |
Meanwhile, the changes in working capital for the six months ended June 30, 2024 were mainly attributable by the following operating assets and liabilities:
| i. | Decrease in accounts receivable by $2.3 million as we had established a repayment installment agreement with a customer for his repayment of the outstanding balance and hence leading to reduction in account receivables; | |
| ii. | The decrease in inventory was mainly due to the increase in the volume cargo bunkered, resulting a lower inventory level at period end; | |
| iii. | Increase in other receivables and current assets by $5.7 million was substantially due to advance payment amounting to $3.3 million in anticipation of higher demand by customers in coming months. There was a further $1.2 million pledged to a supplier for an additional $7.0 million in credit limit and $0.6 million in deferred IPO expenses; |
|
|
| iv. | Decrease in accounts payable by $29.7 million as payment to suppliers were made through trade financing facilities which had increased by $46.5 million; and | |
| v. | Increase in due from related parties by $4.5 million was attributable to working capital advances to related parties. |
The net cash used in operating activities for FY2024 was $24.3 million, after adjusting for non-cash item which includes:
| i. | $4.8 million in depreciation charges for FY2024. The increase in depreciation charges was due to additional capital expenditure incurred on docking expenditure in FY2024. |
Meanwhile, the changes in FY2024 working capital were mainly attributable by the following operating assets and liabilities:
| i. | Decrease in accounts receivable by $2.8 million as the collection of accounts receivable had improved due to our successful repayment plan implementation, in which we established a repayment installment agreement with a customer for the repayment of the outstanding balance and hence leading to a reduction in account receivables; | |
| ii. | The increase in the bunkered cargo volume and the implementation of improved inventory control, resulting in a lower inventory level maintained in FY2024 by $6.5 million; | |
| iii. | Decrease in other receivables and current assets by $5.1 million, mainly due to advance payments being utilized to settle previous secured orders with the increase in bunkering services. In addition, $1.3 million was paid for deferred IPO expenses; and | |
| iv. | Decrease in accounts payable and accrued expenses by $45.3 million following the acquisition of new bank facilities to support our operations. This enabled the settlement of accounts payable and advance payments for cargo expenses, thus reduced accrued expenses. |
The net cash provided by operating activities for FY2023 was $0.7 million, after adjusting for non-cash items which includes:
| i. | $4.3 million in depreciation charges for FY2023. The increase in depreciation charges was due to additional capital expenditure incurred during the year and the full effect of previous year’s capital expenditure incurred, as disclosed under the investing activities’ cash flow below; and | |
| ii. | Reversal of deferred tax of $0.1 million as the vessels were transferred from Tumpuan Megah to the respective Labuan companies as part of our risk management strategy and practices, representing the transfer of one vessel in FY2023. |
Meanwhile, the changes in FY2023 working capital were mainly attributable to the following operating assets and liabilities:
| i. | Increase in accounts receivable by $15.6 million as we extended our credit terms to garner higher cargo volumes despite the drop in overall revenue which was due to lower global cargo prices; | |
| ii. | The conversion of a water barge into a bunker vessel and cessation of the chartering out of a vessel in FY2023 to meet increasing fuel cargo demand enabled us to increase our inventory holding by $6.0 million; | |
| iii. | Increase in other receivables and current assets by $9.5 million was substantially due to advance payment amounting to $6.2 million in anticipation of higher demand by customers subsequent to year end. There was also a further $2.2 million pledged to a supplier for an additional $7.0 million in credit limit and $0.6 million in deferred IPO expenses; and | |
| iv. | Increase in accounts payable by $19.3 million, aligned with an increase of 54.0% of sales to approximately $24.0 million in the month of December 2023 as compared to the month of December 2022 and an increase in accrued expenses by $6.4 million due to deferring supplier payment for cargo oil procurement in response to the higher sales in December 2023. |
Investing Activities
Our cash flow used in investing activities was mainly carrying out our periodic dry-dock activities which amounted to $1.7 million and $1.8 million for the six months ended June 30, 2025 and 2024, respectively. The dry-dock activities are necessary to maintain our fleet of vessels in good performing conditions to ensure smooth bunkering operation apart from complying with the strict and stringent operation procedures and requirements of our suppliers and loading terminals. These spendings are financed by our internally generated funds.
Our cash flow used in investing activities was mainly carrying out our periodic dry-dock activities which amounted to $3.8 million and $3.1 million in FY2024 and FY2023, respectively. The dry-dock activities are necessary to maintain our fleet of vessels in good performing conditions to ensure smooth bunkering operation apart from complying with the strict and stringent operation procedures and requirements of our suppliers and loading terminals. These spendings are financed by our internally generated funds.
Financing Activities
Our cash flow provided by financing activities amounted to $12.8 million for the six months ended June 30, 2025. It mainly represented proceeds from issuance of common shares pursuant to IPO amounted to $11.6 million, as well as net borrowings of $7.4 million, representing trade facilities obtained from local financial institutions and repayment of our vessel vendors who provided vendor-financed borrowing for vessel acquisitions. These inflows were partly offset by advances of $6.2 million made to our related parties.
|
|
Our cash flows provided by financing activities amounting to $45.1 million for the six months ended June 30, 2024 was mainly from the drawdown of trade financing facilities from the local financial institutions to repay our payables and our vessel financing vendors who had provided us vendor financing borrowing in our acquisition of their vessels. The net drawdown and repayment to the borrowings was approximately of $45.3 million for the six months ended June 30, 2024.
Our cash flow provided by financing activities amounted to $38.7 million for FY2024. It mainly represented proceeds from borrowings obtained through additional trade facilities from banks, offset by repaying our vessel vendors who provided vendor-financed borrowing for vessel acquisitions amounting to a net amount of $50.9 million. In addition, we also advanced $12.2 million to our related parties.
Our cash flow used in financing activities amounted to $2.5 million for FY2023, representing a net amount of $2.8 million in repayment to our vessel vendors who provided vendor-financed borrowing for vessel acquisitions. In addition, we received proceeds totaling $0.3 million from our related parties.
Contractual obligations and Contingencies
In the normal course of our business, we are subject to contingencies, such as legal proceedings and claims arising out of our business, which cover a wide range of matters. Liabilities for contingencies are recorded when it is probable that a liability has been incurred and the amount of the assessment can be reasonably estimated.
As of the date of this transition report, we did not have any loss contingencies which require to be recognized or disclosed in our consolidated financial statements.
As of June 30, 2025, our contractual obligations were as follows:
| Less than 1 year |
Between 1-2 years |
Over 3 years | Total | |||||||||||||
| Contractual obligations | $ | $ | $ | $ | ||||||||||||
| Finance lease commitment | 14,758 | 29,516 | 29,104 | 73,378 | ||||||||||||
| Operating lease commitment | 26,833 | 14,695 | - | 41,528 | ||||||||||||
| Repayment of loan borrowings | 409,025 | 62,655 | 462,493 | 934,173 | ||||||||||||
| 450,616 | 106,866 | 491,597 | 1,049,079 | |||||||||||||
|
|
Analysis of items with major changes on the unaudited consolidated balance sheets as at June 30, 2025 and December 31, 2024
| As of | ||||||||
June 30, 2025 |
December 31, 2024 | |||||||
| (Unaudited) | (Audited) | |||||||
| $’000 | $’000 | |||||||
| ASSETS | ||||||||
| Current Assets | ||||||||
| Cash and cash equivalents | 7,060 | 16,070 | ||||||
| Accounts receivable, net | 28,372 | 20,322 | ||||||
| Inventories, net | 7,627 | 9,667 | ||||||
| Due from related parties | 17,993 | 11,593 | ||||||
| Other receivables and current assets | 30,959 | 20,207 | ||||||
| Income tax recoverable | 1,003 | - | ||||||
| Total current assets | 93,014 | 77,859 | ||||||
| Non-Current Assets | ||||||||
| Property, plant and equipment, net | 31,733 | 32,133 | ||||||
| Investments, net | 90 | 89 | ||||||
| Operating lease right of use asset (“ROU asset”), net | 38 | 17 | ||||||
| Deferred tax assets, net | 67 | - | ||||||
| Total Non-Current Assets | 31,928 | 32,239 | ||||||
| Total Assets | 124,942 | 110,098 | ||||||
| LIABILITIES AND SHAREHOLDERS’ EQUITY | ||||||||
| Current liabilities | ||||||||
| Accounts payable and accrued expenses | 7,057 | 7,426 | ||||||
| Other payables | 1,403 | 1,503 | ||||||
| Short-term loans | 91,807 | 79,269 | ||||||
| Due to related parties | 1,024 | 627 | ||||||
| Taxes payable | - | 774 | ||||||
| Operating lease liabilities - current portion | 24 | 9 | ||||||
| Long-term debt payable - current portion | 409 | 777 | ||||||
| Finance lease payable - current portion | 12 | 11 | ||||||
| Total current liabilities | 101,736 | 90,396 | ||||||
| Non-Current Liabilities | ||||||||
| Operating lease liabilities - non-current | 14 | 8 | ||||||
| Long term debt payable | 525 | 504 | ||||||
| Finance lease payable | 54 | 57 | ||||||
| Total Non-Current Liabilities | 593 | 569 | ||||||
| Total Liabilities | 102,329 | 90,965 | ||||||
| Shareholders’ Equity | ||||||||
| Ordinary share, par value $0.0001 per share; 500,000,000 shares authorized; 23,565,000 and 20,000,000 shares issued and outstanding at June 30, 2025 and December 31, 2024, respectively | 2 | 2 | ||||||
| Additional paid-in capital | 12,732 | 4,635 | ||||||
| Retained earnings | 8,274 | 12,582 | ||||||
| Accumulated other comprehensive income | 578 | 664 | ||||||
| Total equity attributable to equity holders’ of TMD Energy Limited | 21,586 | 17,883 | ||||||
| Non-controlling interests | 1,027 | 1,250 | ||||||
| Total Equity | 22,613 | 19,133 | ||||||
| Total Liabilities and Shareholders’ Equity | 124,942 | 110,098 | ||||||
Cash and Cash Equivalents
Cash and cash equivalents represent cash on hand and balances in bank accounts, including fixed deposits pledged for banking facilities. The decrease in cash and cash equivalents was primarily driven by an increase in accounts receivable, advances to suppliers and related parties, and deposits paid for sourcing a target vessel, partially offset by proceeds from our initial public offering.
|
|
Accounts Receivable, Net
Accounts receivable mainly arise from our bunkering services. The increase in receivables was due to the repayment installment agreement established with customers and slower payments from our customers as they were affected by the delays in cargo shipments and tariff crisis.
Inventory, Net
Inventory consists of marine gas oil (“MGO”) and low sulfur fuel oil (“LSFO”) held for sale, as well as bunker fuel for vessel operations. The vessels primarily use MGO as bunker fuel. The decrease in inventory was mainly due to lower sales resulting in reduced stock on hand and fewer purchases to maintain appropriate inventory levels.
Due From (To) Related Parties
This represents transactions occurring in the ordinary course of business, as well as advances provided to or received from related parties to support the Group’s operational activities. The increase was primarily attributable to an advance to Straits, part of which were unsecured, interest bearing at 8.25% and had no fixed repayment terms.
Other Receivables and Current Assets
These include advance payments, supplier deposits for trade purposes, and deferred offering costs. Supplier deposits were pledged to secure purchase credit limits and refundable only upon termination of the credit limit or offsetting against outstanding supplier balances. The increase was due to advance payments made to suppliers for marketing and business development activities, as well as deposit paid for sourcing target vessels. For the six months ended June 30, 2025, deferred offering costs were charged to shareholder’s equity after the completion of initial public offerings.
Property, Plant and Equipment, Net
Property, plant, and equipment, net, comprise vessels, docking fees, tools, equipment, and other assets. The decrease in property, plant and equipment, net was primarily attributable to the increase in accumulated depreciation, which outpaced additions in docking expenditures associated with our bunkering operations.
Accounts Payable and Accrued Expenses
With the availability of greater access to funding, we were enabled to place advance payments with suppliers, ensuring a smoother procurement process and securing orders ahead of schedule, resulting in a decrease in our accounts payable and accrued expenses.
Short-term Loans
Short-term loans represent trade facilities granted by various banking institutions to finance the purchase and importation of goods essential for our business operations. We successfully obtained additional trade facilities to meet our operational needs, ensuring adequate funding for timely supplier payments.
Long Term Liabilities
These consist of long-term debt used to finance leasehold properties, vessels, and motor vehicles. The decrease in long-term liabilities was mainly due to the repayment of a vessel installment loan, with no additional long-term debt incurred for the six months ended June 30, 2025.
Capital Expenditures
We had a capital expenditure of $2.1 million, $3.8 million and $3.1 million for the six months ended June 30, 2025, FY2024 and FY2023 respectively. These were financed through funds generated from operations.
Capital Commitments
As at June 30, 2025, there was no material capital expenditures or purchase commitment to acquire vessels. Should there arise a need to expand the existing fleet of vessels, we will seek financing from financial institutions or vendors of vessels with an extended long term payment schedule.
5.C. Research and Development, Patent and Licenses, etc.
Not applicable. The Company has not undertaken any Research and Development activities in the past three years.
5.D. Trend Information
Other than as disclosed elsewhere in this transition report, we are not aware of any trends, uncertainties, demands, commitments, or events for the six months ended June 30, 2025 that are reasonably likely to have a material and adverse effect on revenues, income, profitability, liquidity, or capital resources, or that would cause the disclosed financial information to be not necessarily indicative of future operating results or financial condition.
5.E. Critical Accounting Estimates
We prepare our unaudited consolidated financial statement in accordance with U.S. GAAP, which requires us to make judgement, estimation and assumptions that affect the reported amounts of assets and liabilities and the reported amounts of revenue and expenses during each reporting period. We continually evaluate these judgements, estimates and assumptions based on our own historical experience, knowledge and assessment of current business and other conditions and our expectations regarding the future based on available information, which together form our basis for making judgements about matters that are not readily apparent from other sources. Since the use of estimates is an integral component of the financial reporting process, our actual results could differ from these estimates. Some of our accounting policies require a higher degree of judgment than others in their application.
|
|
The selection of critical accounting policies, the judgments and other uncertainties affecting application of those policies and the sensitivity of reported results to changes in conditions and assumptions are factors that should be considered when reviewing our financial statements. Our critical accounting policies and practices include the following: (i) revenue recognition; (ii) allowance for doubtful accounts; (iii) impairment of long-lived assets; (iv) leases; and (v) income taxes. See Note 2 - Significant Accounting Policies to our unaudited consolidated financial statements for the disclosure of these accounting policies. We believe the following accounting estimates involve the most significant judgments used in the preparation of our financial statements.
Revenue Recognition
We adopted ASC Topic 606, Revenue from Contracts with Customers (“ASC 606”) for all years presented. The core principle of this new revenue standard is that a company should recognize revenue when control of the promised goods or services is transferred to the customers, in an amount that reflects the consideration to which the company expects to be entitled in exchange for those goods or services. The following five steps are applied to achieve that core principle by us in our determination of revenue recognition: (1) identification of the contract, or contracts, with a customer; (2) identification of the performance obligations in the contract; (3) determination of the transaction price; (4) allocation of the transaction price to the performance obligations in the contract; and (5) recognition of revenue when, or as, the company satisfy a performance obligation.
We derived our revenues from a diverse range of maritime services provided to clients within the industry.
| 1. | Sales of cargo oil and fresh water, and bunkering facilitation |
Revenue generated from sales of cargo oil and fresh water, and bunkering facilitation involves the procurement and delivery of marine gas oil, low sulfur fuel oil, and fresh water for delivery to customers’ ships. We recognize revenues at a point in time when cargo oil and fresh water have been delivered and accepted by the customer, indicating fulfillment of the performance obligation.
Sales of cargo oil and fresh water, and bunkering facilitation are not capable of being a distinct and separately identifiable. The performance obligation is only considered satisfied when sales of cargo oil and fresh water and bunkering facilitation are completed simultaneously.
| 2. | Vessel chartering services |
Revenue generated from vessel chartering services involves arranging charters for marine transportation for various purposes such as cargo transportation or offshore operations. We recognize revenues over time based on the time elapsed between the delivery of a vessel to a charterer and the return of a vessel from the charterer and invoicing is done on a monthly basis.
| 3. | Ship management services |
Revenue from ship management services involves providing technical management, crew management, marine consultancy, and shipping services. We recognize revenues at a point in time when services are rendered and accepted by customer indicating fulfillment of the performance obligation.
We considered as a principal for all the revenues we generate above as we are directly involved in the procurement, delivery, and provision of the goods and services to customers. As the principal, we assume the risks and rewards associated with the transactions, including responsibility for fulfilling the performance obligations and bearing any associated costs and risks, bears the risk of loss or damage to inventory, bears the credit risk associated with customers’ ability to pay for the goods or services. Therefore, we recognize revenue at the gross amount.
Credit Losses on Financial Instruments
The Company recognizes credit losses on financial instruments in accordance with ASC Topic 326, Financial Instruments – Credit Losses. The Company uses the Current Expected Credit Losses (“CECL”) model to estimate credit losses on financial assets measured at amortized cost, as well as certain off-balance sheet credit exposures.
Under the CECL model, the estimation of credit losses involves significant judgment and estimation uncertainty. Management exercises its judgment based on historical loss experience, current economic conditions, and reasonable and supportable forecasts. Changes in these factors could have a material impact on the estimated credit losses.
The Company has evaluated its account receivables and recognized a credit loss of $807, $69,474 and $nil for the six months ended June 30, 2025 and the years ended December 31, 2024 and 2023 respectively.
Recent accounting pronouncements
See the discussion of the recent accounting pronouncements contained in Note 2 to the unaudited consolidated financial statements, “Summary of Significant Accounting Policies”.
|
|
| ITEM 8. | FINANCIAL INFORMATION |
8.A. Consolidated Statements and Other Financial Information
We have appended the consolidated financial statements filed as part of this Transition Report.
8.B. Significant Changes
No significant change has occurred since the date of our consolidated financial statements filed as part of this Transition Report.
PART II.
| ITEM 13. | DEFAULTS, DIVIDEND ARREARAGES AND DELINQUENCIES |
None.
| ITEM 14. | MATERIAL MODIFICATIONS TO THE RIGHTS OF SECURITY HOLDERS AND USE OF PROCEEDS |
14.E. Use of Proceeds
On March 31, 2025, the registration statement (File No. 333-283704) (the “Registration Statement”) relating to the Company’s IPO was declared effective by the SEC. In connection therewith, the Company entered into an underwriting agreement with Maxim Group LLC, dated April 21, 2025. On April 22, 2025, the Company consummated the IPO of 3,100,000 ordinary shares, par value $0.0001 per share at a price of $3.25 per share (the “Offering Price”), pursuant to the Underwriting Agreement. The underwriters were granted a 45-day option to purchase up to additional 465,000 ordinary shares to cover over-allotments, if any. The underwriters exercised their over-allotment option fully on April 22, 2025, the underwriters purchased an additional 465,000 ordinary shares at the Offering Price.
The IPO (including the sale of the Ordinary Shares to cover over-allotment) generated gross proceeds to the Company of approximately $11.59 million. We incurred a total of $1.25 million listing expenses and the net offering proceeds to us after deducting the total expenses was $10.34 million. As at the date of this Transition Report, we had utilized 55%, 29% and 16% of the IPO proceeds for purchase of cargo, listing expenses and general and corporate expenses respectively.
|
|
PART III
| ITEM 17. | FINANCIAL STATEMENTS |
We have elected to provide financial statements pursuant to Item 18.
| ITEM 18. | FINANCIAL STATEMENTS |
On May 16, 2025, the Company announced the change of fiscal year end from December 31 to June 30, with effect from May 16, 2025. This change is being made to better align the fiscal year end of its holding company, Straits which has changed its fiscal year end from December 31 to June 30. As a result, the Company is required to file this Transition Report for the transition period, which is the six-month period from January 1, 2025 to June 30, 2025. After filing the Transition Report, the Company’s next fiscal year end will be June 30, 2026.
We have appended the consolidated financial statements filed as part of this Transition Report.
The financial statements have not been audited by, J&S Associate PLT, the Company’s independent registered public accounting firm.
| ITEM 19. | EXHIBITS |
| * | Filed with this Transition Report. |
| ** | Previously filed. |
|
|
SIGNATURES
The registrant hereby certifies that it meets all of the requirements for filing on the Transition Report on Form 20-F and that it has duly caused and authorized the undersigned to sign this Transition Report on its behalf.
| TMD Energy Limited | ||
| By: | /s/ Dato’ Sri Kam Choy Ho | |
| Name: | Dato’ Sri Kam Choy Ho | |
| Title: | Director and Chief Executive Officer | |
Date: September 29, 2025
|
|
INDEX TO FINANCIAL STATEMENTS
TMD ENERGY LIMITED
TABLE OF CONTENTS
| F- |
REPORT OF INDEPENDENT REGISTERED PUBLIC ACCOUNTING FIRM
J&S Associate PLT
Certified Public Accountants
Firm ID: 6743
Malaysia
Please note the Company’s transition report for the six-month period ended June 30, 2025 is unaudited, there will be no Report of Independent Registered Public Accounting Firm” included in the transition Form 20-F.
| F- |
TMD Energy Limited
Unaudited Consolidated Balance Sheets
As of June 30, 2025 and December 31, 2024
(Expressed in U.S. Dollars, except for the number of shares)
| As of | ||||||||
June 30, 2025 |
December 31, 2024 |
|||||||
| (Unaudited) | (Audited) | |||||||
| ASSETS | ||||||||
| Current Assets | ||||||||
| Cash and cash equivalents | $ | 7,060,410 | $ | 16,069,851 | ||||
| Accounts receivable, net | 28,371,702 | 20,321,697 | ||||||
| Inventories, net | 7,627,129 | 9,667,559 | ||||||
| Due from related parties | 17,992,929 | 11,592,567 | ||||||
| Other receivables and current assets | 30,958,684 | 20,206,845 | ||||||
| Income tax receivable | 1,003,350 | - | ||||||
| Total current assets | 93,014,204 | 77,858,519 | ||||||
| Non-Current Assets | ||||||||
| Property, plant and equipment, net | 31,733,289 | 32,133,461 | ||||||
| Investments, net | 89,712 | 88,908 | ||||||
| Operating lease right of use asset (“ROU asset”), net | 37,981 | 16,603 | ||||||
| Deferred tax assets, net | 67,217 | - | ||||||
| Total Non-Current Assets | 31,928,199 | 32,238,972 | ||||||
| Total Assets | $ | 124,942,403 | $ | 110,097,491 | ||||
| LIABILITIES AND SHAREHOLDERS’ EQUITY | ||||||||
| Current liabilities | ||||||||
| Accounts payable and accrued expenses | $ | 7,057,387 | $ | 7,426,422 | ||||
| Other payables | 1,402,444 | 1,502,965 | ||||||
| Short-term loans | 91,806,603 | 79,268,515 | ||||||
| Due to related parties | 1,024,058 | 626,745 | ||||||
| Taxes payable | - | 773,578 | ||||||
| Operating lease liabilities – current portion | 24,437 | 9,223 | ||||||
| Long-term debt payable – current portion | 409,025 | 776,753 | ||||||
| Finance lease payable – current portion | 11,979 | 11,053 | ||||||
| Total current liabilities | 101,735,933 | 90,395,254 | ||||||
| Non-Current Liabilities | ||||||||
| Operating lease liabilities – non current | 14,301 | 7,564 | ||||||
| Long term debt payable – non current | 525,148 | 504,319 | ||||||
| Finance lease payable – non current | 53,658 | 56,559 | ||||||
| Total Non-Current Liabilities | 593,107 | 568,442 | ||||||
| Total Liabilities | 102,329,040 | 90,963,696 | ||||||
| Shareholders’ Equity | ||||||||
| Ordinary share, par value $0.0001 per share;
500,000,000 shares authorized; 23,565,000 and 20,000,000 shares issued and outstanding at June 30, 2025 and December 31, 2024, respectively |
2,357 | 2,000 | ||||||
| Additional paid-in capital | 12,731,677 | 4,634,755 | ||||||
| Retained earnings | 8,274,248 | 12,583,150 | ||||||
| Accumulated other comprehensive income | 578,386 | 663,895 | ||||||
| Total equity attributable to equity holders’ of TMD Energy Limited | 21,586,668 | 17,883,800 | ||||||
| Non-controlling interests | 1,026,695 | 1,249,995 | ||||||
| Total Equity | 22,613,363 | 19,133,795 | ||||||
| Total Liabilities and Shareholders’ Equity | $ | 124,942,403 | $ | 110,097,491 | ||||
The accompanying notes are an integral part of these unaudited consolidated financial statements.
| F- |
TMD Energy Limited
Unaudited Consolidated Statements of Operations and Comprehensive (Loss) Income
For the Six Months Ended June 30, 2025 and the Years Ended December 31, 2024 and 2023
(Expressed in U.S. Dollars, except for the number of shares)
For the Six Months Ended |
For the Years Ended | |||||||||||
June 30, 2025 |
December 31, 2024 |
December 31, 2023 |
||||||||||
| (Unaudited) | (Audited) | (Audited) | ||||||||||
| Revenues, net | $ | 276,185,254 | $ | 688,430,008 | $ | 632,789,396 | ||||||
| Revenues – related parties, net | 154,866 | 177,534 | 290,377 | |||||||||
| Total revenues | 276,340,120 | 688,607,542 | 633,079,773 | |||||||||
| Cost of revenues | (272,274,995 | ) | (671,615,772 | ) | (619,866,604 | ) | ||||||
| Cost of revenues – related parties | (81,654 | ) | (947,060 | ) | (1,123,356 | ) | ||||||
| Total cost of revenues | (272,356,649 | ) | (672,562,832 | ) | (620,989,960 | ) | ||||||
| Gross profit | 3,983,471 | 16,044,710 | 12,089,813 | |||||||||
| Operating expenses | ||||||||||||
| Selling and marketing expenses | (38,067 | ) | (39,664 | ) | (101,302 | ) | ||||||
| General and administrative expenses | (3,330,264 | ) | (5,249,099 | ) | (5,127,137 | ) | ||||||
| Depreciation expenses | (2,558,809 | ) | (4,758,014 | ) | (4,257,189 | ) | ||||||
| Total operating expenses | (5,927,140 | ) | (10,046,777 | ) | (9,485,628 | ) | ||||||
| (Loss) Income from operations | (1,943,669 | ) | 5,997,933 | 2,604,185 | ||||||||
| Other (expenses) income, net | ||||||||||||
| Interest income | 16,072 | 52,126 | 10,264 | |||||||||
| Sundry (expense) income | (774,985 | ) | 2,022,473 | 3,321,563 | ||||||||
| Interest expenses | (2,802,798 | ) | (4,598,376 | ) | (2,203,061 | ) | ||||||
| Share of losses of associate | (4,029 | ) | (710 | ) | - | |||||||
| Total other (expenses) income, net | (3,565,740 | ) | (2,524,487 | ) | 1,128,766 | |||||||
| (Loss) Income before income taxes | (5,509,409 | ) | 3,473,446 | 3,732,951 | ||||||||
| Income tax benefits (expenses) | 988,034 | (1,428,299 | ) | (774,239 | ) | |||||||
| Net (loss) income | (4,521,375 | ) | 2,045,147 | 2,958,712 | ||||||||
| Less: loss (income) attributable to non-controlling interest | 212,473 | (167,910 | ) | (962,761 | ) | |||||||
| Net (loss) income attributable to controlling interest | $ | (4,308,902 | ) | $ | 1,877,237 | $ | 1,995,951 | |||||
| Weighted average number of ordinary shares outstanding: | ||||||||||||
| Ordinary shares - Basic and diluted | 21,359,033 | 20,000,000 | 20,000,000 | |||||||||
| (Loss) Earnings per share: | ||||||||||||
| Basic and diluted | $ | (0.20 | ) | $ | 0.09 | $ | 0.10 | |||||
| Other comprehensive (loss) income: | ||||||||||||
| Net (loss) income | $ | (4,521,375 | ) | $ | 2,045,147 | $ | 2,958,712 | |||||
| Foreign currency translation adjustments | (96,336 | ) | 276,068 | 1,887,789 | ||||||||
| Total comprehensive (loss) income | $ | (4,617,711 | ) | $ | 2,321,215 | $ | 4,846,501 | |||||
| Comprehensive (loss) income including non-controlling interest | $ | (4,617,711 | ) | $ | 2,321,215 | $ | 4,846,501 | |||||
| Comprehensive (loss) income attributable to non-controlling interest | 223,300 | (167,781 | ) | (832,987 | ) | |||||||
| Comprehensive (loss) income attributable to controlling interest | $ | (4,394,411 | ) | $ | 2,153,434 | $ | 4,013,514 | |||||
The accompanying notes are an integral part of these unaudited consolidated financial statements.
| F- |
TMD Energy Limited
Unaudited Consolidated Statements of Changes in Shareholders’ Equity
For the Six Months Ended June 30, 2025 and the Years Ended December 31, 2024 and 2023
(Expressed in U.S. Dollars, except for the number of shares)
| Ordinary Shares | Additional |
Accumulated Other |
Equity Attributable to TMD |
Non- | ||||||||||||||||||||||||||||
| Number of Shares | Amount | Paid-in Capital | Retained Earnings | Comprehensive (Loss) Income | Energy Limited | Controlling Interests | Total | |||||||||||||||||||||||||
| Balance as of December 31, 2022 (Audited) | 20,000,000 | $ | 2,000 | $ | 10,790,348 | $ | 5,344,116 | $ | (28,064 | ) | $ | 16,108,400 | $ | 3,932,230 | $ | 20,040,630 | ||||||||||||||||
| Return of capital for unissued shares | - | - | (2,676,807 | ) | - | - | (2,676,807 | ) | - | (2,676,807 | ) | |||||||||||||||||||||
| Net income | - | - | - | 1,995,951 | - | 1,995,951 | 962,761 | 2,958,712 | ||||||||||||||||||||||||
| Foreign
currency translation adjustments |
- | - | - | - | 2,017,563 | 2,017,563 | (129,774 | ) | 1,887,789 | |||||||||||||||||||||||
| Balance as of December 31, 2023 (Audited) | 20,000,000 | 2,000 | 8,113,541 | 7,340,067 | 1,989,499 | 17,445,107 | 4,765,217 | 22,210,324 | ||||||||||||||||||||||||
| Acquisition of subsidiary | - | - | - | - | - | - | 71,484 | 71,484 | ||||||||||||||||||||||||
| Return of capital for unissued shares | - | - | (5,311,880 | ) | - | - | (5,311,880 | ) | - | (5,311,880 | ) | |||||||||||||||||||||
| Acquisition of non-controlling interest | - | - | 1,833,094 | 3,365,846 | (1,601,801 | ) | 3,597,139 | (3,754,487 | ) | (157,348 | ) | |||||||||||||||||||||
| Net income | - | - | - | 1,877,237 | - | 1,877,237 | 167,910 | 2,045,147 | ||||||||||||||||||||||||
| Foreign currency translation adjustments | - | - | - | - | 276,197 | 276,197 | (129 | ) | 276,068 | |||||||||||||||||||||||
| Balance as of December 31, 2024 (Audited) | 20,000,000 | 2,000 | 4,634,755 | 12,583,150 | 663,895 | 17,883,800 | 1,249,995 | 19,133,795 | ||||||||||||||||||||||||
| Issuance of shares pursuant to IPO, net of offering cost | 3,565,000 | 357 | 8,096,922 | - | - | 8,097,279 | - | 8,097,279 | ||||||||||||||||||||||||
| Net loss | - | - | - | (4,308,902 | ) | - | (4,308,902 | ) | (212,473 | ) | (4,521,375 | ) | ||||||||||||||||||||
| Foreign currency translation adjustments | - | - | - | - | (85,509 | ) | (85,509 | ) | (10,827 | ) | (96,336 | ) | ||||||||||||||||||||
| Balance as of June 30, 2025 (Unaudited) | 23,565,000 | $ | 2,357 | $ | 12,731,677 | $ | 8,274,248 | $ | 578,386 | $ | 21,586,668 | $ | 1,026,695 | $ | 22,613,363 | |||||||||||||||||
The accompanying notes are an integral part of these unaudited consolidated financial statements.
| F- |
TMD Energy Limited
Unaudited Consolidated Statements of Cash Flows
For the Six Months Ended June 30, 2025 and the Years Ended December 31, 2024 and 2023
(Expressed in U.S. Dollars)
For the Six Months Ended |
For the Years Ended |
|||||||||||
June 30, 2025 |
December 31, 2024 |
December 31, 2023 |
||||||||||
| (Unaudited) | (Audited) | (Audited) | ||||||||||
| Cash flows from operating activities: | ||||||||||||
| Net (loss) income | $ | (4,521,375 | ) | $ | 2,045,147 | $ | 2,958,712 | |||||
| Adjustments to reconcile net (loss) income to net cash (used in) provided by operating activities: | ||||||||||||
| Depreciation expense | 2,558,809 | 4,758,014 | 4,257,189 | |||||||||
| Amortization of operating lease ROU assets | 11,602 | 21,033 | 21,107 | |||||||||
| Provision of expected credit losses | 807 | 69,474 | - | |||||||||
| Impairment of goodwill | - | 1,129 | - | |||||||||
| Written off of assets | - | 373 | - | |||||||||
| Deferred tax liabilities | (64,914 | ) | - | (92,664 | ) | |||||||
| Gain on disposal of assets | - | - | (18,724 | ) | ||||||||
| Share of losses of associate | 4,029 | 710 | - | |||||||||
| Change in assets and liabilities: | ||||||||||||
| Accounts receivable | (6,574,111 | ) | 2,769,950 | (15,597,836 | ) | |||||||
| Inventories, net | 2,493,022 | 6,487,098 | (6,016,083 | ) | ||||||||
| Due from related parties | 1,016,378 | (536,841 | ) | (740,331 | ) | |||||||
| Other receivables and current assets | (11,914,902 | ) | 5,121,986 | (9,480,769 | ) | |||||||
| Accounts payable and accrued expenses | (682,395 | ) | (45,253,722 | ) | 25,671,804 | |||||||
| Other payables | (811,143 | ) | (419,027 | ) | 68,039 | |||||||
| Taxes payable | (1,756,153 | ) | 651,026 | (355,168 | ) | |||||||
| Operating lease liabilities | (11,058 | ) | (6,761 | ) | (21,057 | ) | ||||||
| Net cash (used in) provided by operating activities | (20,251,404 | ) | (24,290,411 | ) | 654,219 | |||||||
| Cash flows from investing activities: | ||||||||||||
| Purchase of fixed assets | (2,095,807 | ) | (3,751,944 | ) | (3,149,397 | ) | ||||||
| Acquisition of investment | - | (83,089 | ) | (4,388 | ) | |||||||
| Increase investment in subsidiary | - | 74,120 | - | |||||||||
| Proceeds from disposal of fixed assets | - | - | 6,127 | |||||||||
| Net cash used in investing activities | (2,095,807 | ) | (3,760,913 | ) | (3,147,658 | ) | ||||||
| Cash flows from financing activities: | ||||||||||||
| Gross proceeds from issuance of common shares pursuant to initial public offering | 11,586,250 | - | - | |||||||||
| Proceeds from (Repayment to) borrowings | 7,443,090 | 50,910,672 | (2,768,651 | ) | ||||||||
| Repayment to finance lease payables | (5,561 | ) | (10,216 | ) | (41,328 | ) | ||||||
| (Advance to) Proceeds from related parties | (6,245,369 | ) | (12,245,223 | ) | 320,485 | |||||||
| Net cash provided by (used in) financing activities | 12,778,410 | 38,655,233 | (2,489,494 | ) | ||||||||
| Net (decrease) increase in cash and cash equivalents | (9,568,801 | ) | 10,603,909 | (4,982,933 | ) | |||||||
| Effect of exchange rate changes on cash and cash equivalents | 559,360 | 635,595 | (1,456,188 | ) | ||||||||
| Cash and cash equivalents, beginning of period / year | 16,069,851 | 4,830,347 | 11,269,468 | |||||||||
| Cash and cash equivalents, end of period / year | $ | 7,060,410 | $ | 16,069,851 | $ | 4,830,347 | ||||||
| Supplemental disclosures of cash flow information | ||||||||||||
| Income taxes paid | $ | 877,184 | $ | 776,331 | $ | 1,220,804 | ||||||
| Supplemental non-cash investing and financing activities | ||||||||||||
| Acquisition of non-controlling interest by issuance of ordinary shares | $ | - | $ | 2,798,887 | $ | - | ||||||
| Deferred offering costs charged to additional paid-in capital | 3,488,971 | - | - | |||||||||
| Recognized assets through finance lease liabilities | - | - | 100,771 | |||||||||
| Recognized ROU assets through lease liabilities | 31,350 | 15,359 | - | |||||||||
| Reversal of additional paid-in capital via decrease in related party receivables | $ | - | $ | 5,311,880 | $ | 2,676,807 | ||||||
The accompanying notes are an integral part of these unaudited consolidated financial statements.
| F- |
TMD Energy Limited
Notes to Unaudited Consolidated Financial Statements
For the Six Months Ended June 30, 2025 and the Years Ended December 31, 2024 and 2023
Note 1 - Organization and Principal Business
TMD Energy Limited (“TMDEL”) was incorporated on October 17, 2023 in the Cayman Islands. TMDEL is a holding company without any operations.
TMDEL consummated its initial public offering on the NYSE American on April 22, 2025, issuing 3,100,000 ordinary shares at a price of $3.25 per share. In addition, the Company entered into an underwriting agreement with the underwriter on April 21, 2025, which granted the underwriter a 45-day option to purchase up to an additional 465,000 ordinary shares at the public offering price of $3.25 per share to cover any over-allotment. Subsequently, on April 22, 2025, the underwriter exercised the over-allotment option in full, purchasing an additional 465,000 ordinary shares at the public offering price of $3.25 per share. The initial public offering closed on April 22, 2025 and the exercise of the over-allotment option closed on April 24, 2025, with gross proceeds totaling $11,586,250, before deducting underwriting discounts and offering expenses. The ordinary shares began trading on April 21, 2025 on NYSE American and commenced trading under the ticker symbol “TMDE”.
Business Re-organization
The re-organization of the legal entity structure was initialized with the acquisition of TMDEL by Straits Energy Resources Berhad (“Straits”) which was completed on November 21, 2023. Prior to this re-organization, Straits was the shareholder with direct or indirect control over all related entities involved in this re-organization.
| ● | On December 1, 2023, Straits increased its ownership in Straits Marine Fuels & Energy Sdn. Bhd. (“SMF”) and its seven subsidiaries (“SMF Group”) from 67% to 100%, with the acquisition of the balance 33% previously held by Tumpuan Megah Development Sdn. Bhd. (“Tumpuan Megah”). On December 14, 2023, TMDEL acquired 100% ownership of SMF Group from Straits by issuing 3,968,556 ordinary shares of TMDEL to Straits on May 31, 2024. | |
| ● | On January 10, 2024, SMF, the wholly-owned subsidiary of TMDEL, acquired 100% ownership of TMD Straits Ltd (“TMD Straits”) and TMD Sturgeon Ltd (“TMD Sturgeon”) from Straits by issuing 890,026 and 1,132,607 ordinary shares of TMDEL to Straits on May 31, 2024, respectively. | |
| ● | On January 24, 2024, SMF acquired 51% ownership of Straits Marine Services Pte. Ltd. (“SMS 1”) and its wholly-owned subsidiary, Straits Maritime Services Pte. Ltd. (“SMS 2”), from Straits by issuing 1,237,055 ordinary shares of TMDEL to Straits on May 31, 2024. | |
| ● | On January 24, 2024, SMF acquired 70% ownership of Tumpuan Megah and its six subsidiaries from Straits by issuing 8,108,179 ordinary shares of TMDEL to Straits on May 31, 2024. |
The above transaction was treated as a re-organization of the Companies under common control and the financial statements give retroactive effect to these transactions.
On May 31, 2024, SMF acquired the remaining 49% ownership interest of SMS 1 and its wholly-owned subsidiary from the non-controlling interest shareholder by issuing 1,188,543 ordinary shares of TMDEL on May 31, 2024. The non-controlling interest is adjusted in the financial statements prospectively.
On May 31, 2024, SMF acquired the remaining 30% ownership interest of Tumpuan Megah and its six subsidiaries from non-controlling interest shareholders by issuing 3,474,934 ordinary shares of TMDEL on May 31, 2024. The non-controlling interest is adjusted in the financial statements prospectively.
On July 1, 2024, the Company reorganized its legal entity structure, whereby SMF acquired 100% equity interest in all wholly-owned subsidiaries of Tumpuan Megah. All related entities have effectively become subsidiaries of SMF, with TMDEL effectively holding ownership and control of SMF and its subsidiaries.
The re-organization transaction is treated as a combination between entities under common control in accordance with ASC 805-50. These entities are considered under common control because they share the same ultimate parent entity, which holds a “controlling financial interest”, as defined by ASC 810, in both entities before and after the re-organization. The historical financial statements of each of the entities are the historical financial statements of the combined entity, with no adjustments made to the entities’ historical revenue, expenses, assets, or liabilities, the components of historical total equity are adjusted to reflect the capital structure of TMDEL in accordance to ASC 805-40-45-3 through 45-5.
| F- |
TMD Energy Limited
Notes to Unaudited Consolidated Financial Statements
For the Six Months Ended June 30, 2025 and the Years Ended December 31, 2024 and 2023
On January 3, 2024, Tumpuan Megah acquired a 30% equity interest in TMD Marine Fuels Sdn. Bhd. (“TMDF”) through the purchase of 300 ordinary shares for RM300. On February 23, 2024, Tumpuan Megah acquired an additional 149,700 ordinary shares in TMDF for RM149,700, maintaining its equity interest at 30%. The total cash consideration for these transactions amounted to RM150,000.
In contrast to the reorganization, TMDF is consolidated under ASC 810 due to TMDEL’s ability to exert control over its financial and operational policies, despite holding only a 30% equity interest.
TMDEL and its subsidiaries operate as a comprehensive provider of marine fuel logistics, and offers related services, including vessel chartering services and ship management services, within the maritime industry.
TMDEL and its consolidated subsidiaries are collectively referred to herein as the “Company” unless specific reference is made to an entity.
TMDEL and its subsidiaries as at June 30, 2025 is as follows:
Schedule of Subsidiaries
| Entity Name | Percentage of Ownership | Place of Incorporation | Principal activities | |||
| TMD Energy Limited (“TMDEL”) | Parent | Cayman Islands | Investment Holding | |||
| Straits Marine Fuels & Energy Sdn. Bhd. (“SMF”) | 100% | Malaysia | Investment Holding | |||
| Straits Marine Services Pte. Ltd. (“SMS 1”) |
100% | Singapore | Ship Management Services | |||
| Straits Maritime Services Pte. Ltd. (“SMS 2”) | 100% | Singapore | Provision of Shipping Services, General Cleaning & Disinfection | |||
| Tumpuan Megah Development Sdn. Bhd. (“Tumpuan Megah”) | 100% | Labuan, Malaysia | Provision of Bunkering Services for Marine Fuels and Petroleum-Based Products | |||
| Cavalla Asia Ltd | 100% | Labuan, Malaysia | Provision of Vessel Chartering Services | |||
| Dolphin Asia Ltd | 100% | Labuan, Malaysia | Provision of Vessel Chartering Services | |||
| Escolar Asia Ltd | 100% | Labuan, Malaysia | Provision of Vessel Chartering Services | |||
| Oscar Asia Ltd | 100% | Labuan, Malaysia | Provision of Vessel Chartering Services | |||
| Phoenix Asia Ltd | 100% | Labuan, Malaysia | Provision of Vessel Chartering Services | |||
| S3 Asia Ltd | 100% | Labuan, Malaysia | Provision of Vessel Chartering Services | |||
| TMD Straits Ltd | 100% | Labuan, Malaysia | Provision of Vessel Chartering Services | |||
| TMD Sturgeon Ltd | 100% | Labuan, Malaysia | Provision of Vessel Chartering Services | |||
| SMF Begonia Ltd | 100% | Labuan, Malaysia | Provision of Vessel Chartering Services | |||
| SMF Ixora Ltd | 100% | Labuan, Malaysia | Provision of Vessel Chartering Services | |||
| SMF Omura Ltd | 100% | Labuan, Malaysia | Provision of Vessel Chartering Services | |||
| SMF Eden Maritime Ltd | 100% | Labuan, Malaysia | Provision of Vessel Chartering Services | |||
| SMF Beluga Ltd | 51% | Labuan, Malaysia | Provision of Vessel Chartering Services | |||
| Sierra Pioneer Marine Ltd | 51% | Labuan, Malaysia | Provision of Vessel Chartering Services | |||
| Katsu Pioneer Marine Ltd | 51% | Labuan, Malaysia | Provision of Vessel Chartering Services | |||
| TMD Marine Fuels Sdn. Bhd. (“TMDF”) | 30% | Malaysia | Dealing in Oil and Petroleum Products, Oil Trading, Oil Bunkering and Related Services |
| F- |
TMD Energy Limited
Notes to Unaudited Consolidated Financial Statements
For the Six Months Ended June 30, 2025 and the Years Ended December 31, 2024 and 2023
The effective organizational flow chart of TMDEL and its subsidiaries as at June 30, 2025 is as follows:
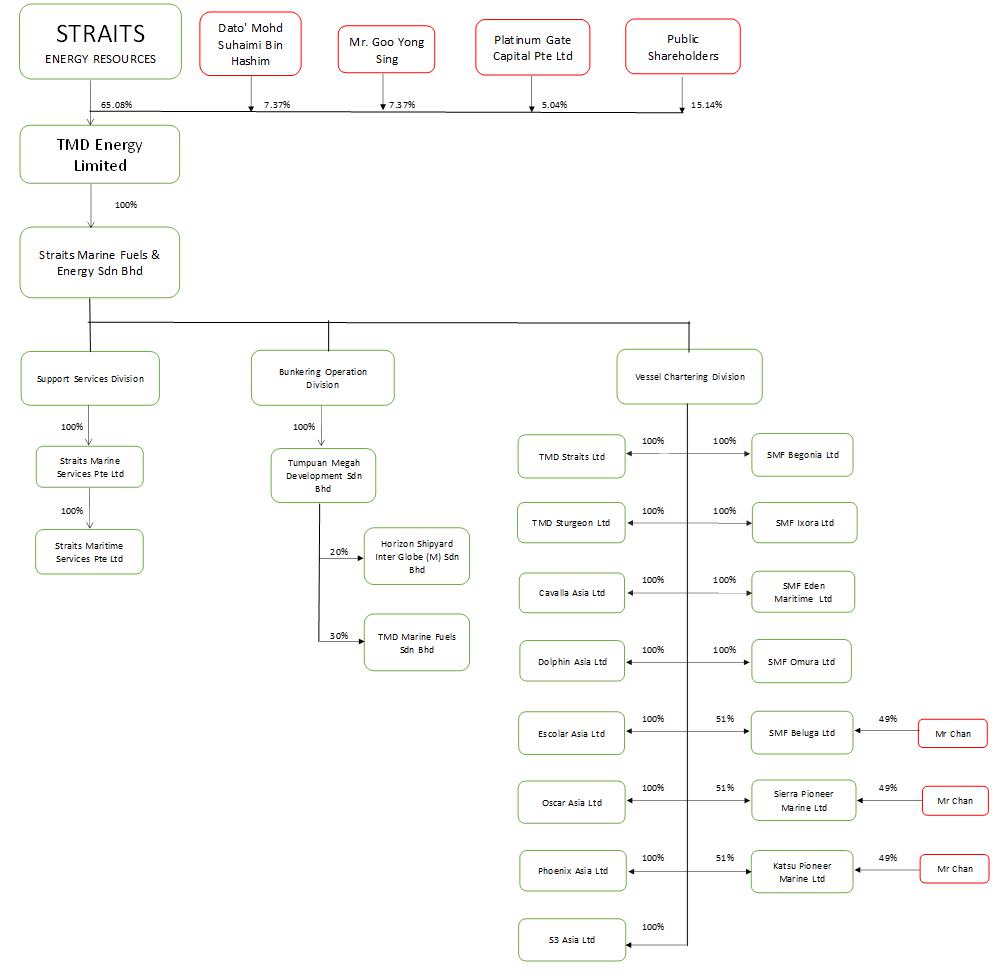
Note 2 - Summary of Significant Accounting Policies
Basis of Presentation and Consolidation
The unaudited consolidated financial statements and related notes include all the accounts of the Company and its subsidiaries, entities in which the Company directly and indirectly controls. The unaudited consolidated financial statements are prepared in accordance with accounting principles generally accepted in the United States of America (“U.S. GAAP”). All intercompany transactions and balances among the Company and its subsidiaries have been eliminated upon consolidation.
TMD Marine Fuels Sdn. Bhd.
TMDEL has consolidated the financial statements of TMDF, in which it holds a 30% equity interest, in accordance with ASC 810, Consolidation. Under ASC 810, entities may be consolidated when the reporting entity exercises control over the investee’s significant financial and operational policies, regardless of ownership percentage, if control exists.
Although TMDEL, through its subsidiary Tumpuan Megah, directly owns only 30% of TMDF, TMDF is considered to be under control due to the governance structure and ownership arrangements. Dato’ Mohd Suhaimi bin Hashim, who holds a 70% equity interest in TMDF, also serves as a common director of Tumpuan Megah. Additionally, Dato’ Sri Kam Choy Ho is the director of TMDF and also serves as a common director of Tumpuan Megah, TMDEL and Straits. As a result of the above, Tumpuan Megah has effective control over the governance, strategic decision making and operations of TMDF.
Based on this assessment of control, management has concluded that TMDEL has the ability to control TMDF’s financial and operational policies, justifying consolidation under ASC 810.
| F- |
TMD Energy Limited
Notes to Unaudited Consolidated Financial Statements
For the Six Months Ended June 30, 2025 and the Years Ended December 31, 2024 and 2023
Note 2 - Summary of Significant Accounting Policies (Continued)
Use of Estimates
The preparation of unaudited consolidated financial statements in conformity with U.S. GAAP requires the Company to make certain estimates and assumptions that affect the amounts reported and disclosed in the unaudited consolidated financial statements and related notes.
The most significant estimates and judgments include the allowance for doubtful accounts, useful life of property, plant and equipment, residual values for leased assets, income taxes and uncertain tax positions. Actual amounts could differ from those estimates.
Functional Currency and Foreign Currency Translation
The accompanying unaudited consolidated financial statements are presented in United States dollar (“$”), which is the reporting currency of the Company. For the subsidiaries whose functional currencies are Ringgit Malaysia (“RM”) and Singapore Dollar (“SGD”), results of operations and cash flows are translated at average exchange rates during the period, assets and liabilities are translated at the exchange rate at the end of the period, and equity is translated at historical exchange rates. The resulting translation adjustments are included in determining other comprehensive income or loss. Transaction gains and losses are reflected in the unaudited consolidated statements of operations and comprehensive (loss) income.
Fair Value of Financial Instruments
The Company follows the provisions of ASC Topic 820, Fair Value Measurements and Disclosures. It clarifies the definition of fair value, prescribes methods for measuring fair value, and establishes a fair value hierarchy to classify the inputs used in measuring fair value as follows:
| ● | Level 1 – Inputs are unadjusted quoted prices in active markets for identical assets or liabilities available at the measurement date. | |
| ● | Level 2 – Inputs are unadjusted quoted prices for similar assets and liabilities in active markets, quoted prices for identical or similar assets and liabilities in markets that are not active, inputs other than quoted prices that are observable, and inputs derived from or corroborated by observable market data. | |
| ● | Level 3 – Inputs are unobservable inputs which reflect the reporting entity’s own assumptions on what assumptions the market participants would use in pricing the asset or liability based on the best available information. |
Schedule of Fair Value Measurements
| Carrying Amount | Estimated | |||||||||||||||
| Level 1 | Level 2 | Level 3 | Fair Value | |||||||||||||
| June 30, 2025 | ||||||||||||||||
| Investment in equity securities | $ | - | $ | - | $ | 89,712 | $ | 89,712 | ||||||||
| December 31, 2024 | ||||||||||||||||
| Investment in equity securities | $ | - | $ | - | $ | 88,908 | $ | 88,908 | ||||||||
For other accounts, the carrying amounts reported in the accompanying unaudited consolidated balance sheets for cash and cash equivalents, accounts receivable, other receivables and current assets, short-term loans, accounts payable, and other payables, due to related parties and income tax payable approximate their fair value based on the short-term maturity of these instruments.
Cash and cash equivalents
Cash and cash equivalents are financial assets that are either cash or highly liquid investments if any with an original maturity term of 90 days or less.
| F- |
TMD Energy Limited
Notes to Unaudited Consolidated Financial Statements
For the Six Months Ended June 30, 2025 and the Years Ended December 31, 2024 and 2023
Note 2 - Summary of Significant Accounting Policies (Continued)
Accounts Receivable and Credit Losses on Financial Instruments
Accounts receivable consists principally of amounts due from trade customers. Credit is extended based on an evaluation of the customer’s financial condition and collateral is not generally required.
The Company recognizes credit losses on financial instruments in accordance with ASC Topic 326, Financial Instruments – Credit Losses. The Company uses the Current Expected Credit Losses (“CECL”) model to estimate credit losses on financial assets measured at amortized cost, as well as certain off-balance sheet credit exposures.
Under the CECL model, the estimation of credit losses involves significant judgment and estimation uncertainty. Management exercises its judgment based on historical loss experience, current economic conditions, and reasonable and supportable forecasts. Changes in these factors could have a material impact on the estimated credit losses.
The Company has evaluated its account receivables and recognized a credit loss of $807 for the six months ended June 30, 2025, and $69,474 and $nil for the years ended December 31, 2024 and 2023 respectively.
Inventories
Inventories, primarily consisting of marine gas oil and low sulfur fuel oil. Inventories are stated at the lower of cost or net realizable value, with net realized value represented by estimated selling prices in the ordinary course of business, less reasonably predictable costs of disposal and transportation.
Cost of inventory is determined using the weighted average method. Adjustments are recorded to write down the cost of inventory to the estimated net realizable value due to slow-moving merchandise, reduction in prices, and damaged products, which is dependent upon factors such as historical and forecasted consumer demand.
Deferred Offering Costs
Deferred offering costs represent legal, accounting, and other direct costs related to the Company’s initial public offering (“IPO”). These costs are capitalized as incurred and are included in the accompanying balance sheet as “Other receivables and current assets”. As of December 31, 2024, the Company recorded $1,839,846 of deferred offering costs.
On April 22, 2025, upon the completion of IPO of the Company, IPO costs capitalized as of December 31, 2024, together with other IPO costs incurred during the six months ended June 30, 2025, totaling $3,488,971, were charged to shareholder’s equity under additional paid-in capital.
Related Party Transactions
A related party is generally defined as (i) any person and or their immediate family hold 10% or more of the Company’s securities (ii) the Company’s management, (iii) someone that directly or indirectly controls, is controlled by or is under common control with the Company, or (iv) anyone who can significantly influence the financial and operating decisions of the Company. A transaction is considered to be a related party transaction when there is a transfer of resources or obligations between related parties. The Company conducts business with its related parties in the ordinary course of business. Related parties may be individuals or corporate entities.
Transactions involving related parties cannot be presumed to be carried out on an arm’s-length basis, as the requisite conditions of competitive, free market dealings may not exist. Representations about transactions with related parties, if made, shall not imply that the related party transactions were consummated on terms equivalent to those that prevail in arm’s-length transactions unless such representations can be substantiated. It is not, however, practical to determine the fair value of amounts due from/to related parties due to their related party nature.
| F- |
TMD Energy Limited
Notes to Unaudited Consolidated Financial Statements
For the Six Months Ended June 30, 2025 and the Years Ended December 31, 2024 and 2023
Note 2 - Summary of Significant Accounting Policies (Continued)
Property, Plant and Equipment
Property, plant and equipment are stated at cost less accumulated depreciation. Cost represents the purchase price of the asset and other costs incurred to bring the asset into its existing use. Identifiable significant improvements are capitalized and expenditures for maintenance, repairs, and betterments, including replacement of minor items, are charged to expense.
Depreciation is computed based on cost, less the estimated residual value, if any, using the straight-line method over the estimated useful life.
The residual value rate and useful life of property, plant and equipment are summarized as follows:
Schedule of Residual Value Rate and Useful Life of Property, Plant and Equipment
| Property, Plant and Equipment | Useful Life | |
| Dry-docking expenditures | 2.5 years from the date of dry dock | |
| Furniture and fittings | 5 – 10 years | |
| Leased property | Over the life of the lease | |
| Leasehold improvements | 5 –10 years | |
| Motor vehicles | 5 years | |
| Real properties | 40 years | |
| Shipping tools, equipment and computers | 2 – 10 years | |
| Vessels | 9 – 25 years |
Residual values for vessels
The Company determines the residual value of finance lease vessels based on the lightweight of the vessels valued at the metal scrap prices quoted by vessel demolition markets. The Company reassess the estimated residual value of the vessel once in every 5 years.
Dry-docking expenditures
Dry-docking expenditures such as inspection, manual, and certificate, engine maintenance, spare part, painting, vessel maintenance etc. are capitalized in accordance ASC 360-10-35 when such costs are considered to enhance the future economic benefits of the vessel. The expenditures are capitalized when they significantly extend the useful life of the vessel, improve the efficiency or performance of the vessel, or increase the capacity of the vessel.
Capitalized dry-docking expenditures are included in the carrying amount of the vessel and are depreciated over the period until the next scheduled dry-docking. If the criteria for capitalization are not met, the expenditures are expensed as incurred.
Goodwill
Goodwill represents the excess of the purchase price over the fair value of the identifiable net assets acquired in a business combination. The Company assesses goodwill for impairment in accordance with ASC subtopic 350-20, Intangibles—Goodwill and Other: Goodwill (“ASC 350-20”), which requires that goodwill be tested for impairment at the reporting unit level at least annually and more frequently upon the occurrence of certain events, as defined by ASC 350-20.
A reporting unit is defined as an operating segment or one level below an operating segment referred to as a component. The Company determines its reporting units by first identifying its operating segments, and then assesses whether any components of these segments constituted a business for which discrete financial information is available and where the Company’s segment manager regularly reviews the operating results of that component. The Company determined that it has one reporting unit because components below the consolidated level either did not have discrete financial information or their operating results were not regularly reviewed by the segment manager.
The Company has the option to first assess qualitative factors to determine whether it is necessary to perform the quantitative impairment test in accordance with ASC 350-20. If the Company believes, as a result of the qualitative assessment, that it is more-likely-than-not that the fair value of the reporting unit is less than its carrying amount, the quantitative impairment test described above is required. Otherwise, no further testing is required. In the qualitative assessment, the Company considers primary factors such as industry and market considerations, overall financial performance of the reporting unit, and other specific information related to the operations. The quantitative goodwill impairment test, used to identify both the existence of impairment and the amount of impairment loss, compares the fair value of a reporting unit with its carrying amount, including goodwill. If the carrying amount of a reporting unit is greater than zero and its fair value exceeds its carrying amount, goodwill of the reporting unit is considered not impaired. For the six months ended June 30, 2025 and the years ended December 31, 2024 and 2023, impairment of goodwill of $nil, $1,129 and $nil was identified, respectively.
| F- |
TMD Energy Limited
Notes to Unaudited Consolidated Financial Statements
For the Six Months Ended June 30, 2025 and the Years Ended December 31, 2024 and 2023
The attributable amount of goodwill is included in the determination of the amount of gain or loss recognized upon disposal of a portion of reporting unit that constitutes a business. When the Company disposes of a business within the reporting unit, the amount of goodwill disposed is measured on the basis of the relative fair value of the business disposed and the portion of the reporting unit retained. This relative fair value approach is not used when the business to be disposed was not integrated into the reporting unit after its acquisition, in which case the current carrying amount of the acquired goodwill should be included in the carrying amount of the business to be disposed.
Schedule of Goodwill
For the Six Months Ended |
For the Years Ended | |||||||||||
June 30, 2025 |
December 31, 2024 |
December 31, 2023 |
||||||||||
| (Unaudited) | (Audited) | (Audited) | ||||||||||
| Acquisition of TMDF | $ | - | $ | 1,129 | $ | - | ||||||
| Impairment of goodwill in relation to TMDF | - | (1,129 | ) | - | ||||||||
| Balance as of June 30, 2025 | - | - | - | |||||||||
Impairment of Long-Lived Assets
The Company accounts for impairment of long-lived assets in accordance with ASC 360, Property, Plant and Equipment. Long-lived assets consist primarily of property, plant and equipment. In accordance with ASC 360, the Company evaluates the carrying value of long-lived assets when it determines a triggering event has occurred, or whenever events or changes in circumstances indicate that the carrying amount of an asset may not be recoverable. When indicators exist, recoverability of assets is measured by a comparison of the carrying value of the asset group to the estimated undiscounted future net cash flows expected to be generated by the asset group. Examples of such triggering events include a significant disposal of a portion of such assets and adverse changes in the market involving the business employing the related assets. If such assets are determined not to be recoverable, the Company performs an analysis of the fair value of the asset group and will recognize an impairment loss when the fair value is less than the carrying amounts of such assets. The fair value, based on reasonable and supportable assumptions and projections, requires subjective judgments. Depending on the assumptions and estimates used, the appraised fair value projected in the evaluation of long-lived assets can vary within a range of outcomes. The Company considers the likelihood of possible outcomes in determining the best estimate for the fair value of the assets.
The Company engaged an independent third-party valuer to assess the cost of the vessels, ensuring that the carrying amount of the vessels does not exceed their recoverable amount.
| F- |
TMD Energy Limited
Notes to Unaudited Consolidated Financial Statements
For the Six Months Ended June 30, 2025 and the Years Ended December 31, 2024 and 2023
Note 2 - Summary of Significant Accounting Policies (Continued)
Investments
Cost Method Investments
The Company accounts for its investments that represent less than 20% ownership, and for which the Company does not have the ability to exercise significant influence under the cost method; using ASU 2016-01, Financial Instruments – Overall: Recognition and Measurement of Financial Assets and Financial Liabilities. The Company measure investments in equity securities without a readily determinable fair value using a measurement alternative that measures these securities at the cost method minus impairment, if any, plus or minus changes resulting from observable price changes on a non-recurring basis. Gains and losses on these securities are recognized in other income and expenses.
Equity Method Investments
The Company accounts for its investment that represents 20% to 50% ownership, and for which the Company have the ability to exercise significant influence through board representation under the equity method.
Under the equity method, investments are initially recognized at cost and adjusted thereafter to recognize the Company’s share of the investee’s profits or losses in the income statement, and its share of movements in other comprehensive (loss) income. Dividends received or receivable from investees are recognized as a reduction in the carrying amount of the investment.
When the Company’s share of losses in an investee equals or exceeds its interest in the investee, including any other unsecured receivables, the Company does not recognize further losses, unless it has incurred obligations or made payments on behalf of the investee.
The carrying amounts of equity-accounted investments are tested for impairment.
Lease Commitments
The Company adopted ASC Topic 842, Leases which generally requires lessees to recognize operating and financing lease liabilities and corresponding right-of-use (“ROU”) assets on the balance sheet and to provide enhanced disclosures surrounding the amount, timing and uncertainty of cash flows arising from leasing arrangements.
The Company determined if an arrangement is a lease at inception.
Operating leases are included in operating lease ROU assets and short and long-term lease liabilities in the unaudited consolidated balance sheets. Lease cost for operating leases is recognized on a straight-line basis which includes the amortization of the ROU asset and interest expense related to the operating lease liability and is recorded as rent expenses.
Finance leases are included in property and equipment, other current liabilities, and other long-term liabilities in the unaudited consolidated balance sheets. Lease cost for finance leases includes the amortization of the ROU asset, which is amortized on a straight-line basis and recorded as Depreciation and amortization expense; and interest expense on the finance lease liability, which is calculated using the effective interest method and recorded as interest expense.
Revenue Recognition
The Company adopted ASC Topic 606, Revenue from Contracts with Customers (“ASC 606”) for all years presented. The core principle of this new revenue standard is that a company should recognize revenue when control of the promised goods or services is transferred to the customers, in an amount that reflects the consideration to which the Company expects to be entitled in exchange for those goods or services. The following five steps are applied to achieve that core principle by the Company in its determination of revenue recognition: (1) identification of the contract, or contracts, with a customer; (2) identification of the performance obligations in the contract; (3) determination of the transaction price; (4) allocation of the transaction price to the performance obligations in the contract; and (5) recognition of revenue when, or as, the Company satisfy a performance obligation.
The Company’s derived its revenues from a diverse range of maritime services provided to clients within the industry.
| F- |
TMD Energy Limited
Notes to Unaudited Consolidated Financial Statements
For the Six Months Ended June 30, 2025 and the Years Ended December 31, 2024 and 2023
Sales of cargo oil and fresh water, and bunkering facilitation
Revenue generated from sales of cargo oil and fresh water, and bunkering facilitation involves the procurement and delivery of marine gas oil, low sulfur fuel oil, and fresh water for delivery to customers’ ships. The Company recognize revenues at a point in time when cargo oil and fresh water has been delivered and accepted by the customer, indicating fulfillment of the performance obligation.
Sales of cargo oil and fresh water, and bunkering facilitation are not capable of being a distinct and separately identifiable. The performance obligation is only considered satisfied when sales of cargo oil and fresh water and bunkering facilitation are completed simultaneously.
Vessel Chartering Services
Revenue generated from vessel chartering services involves arranging charters for marine transportation for various purposes such as cargo transportation or offshore operations. The Company recognizes revenues over time based on the time elapsed between the delivery of a vessel to a charterer and the return of a vessel from the charterer and invoicing is done on a monthly basis.
Ship Management Services
Revenue from ship management services involves providing technical management, crew management, marine consultancy, and shipping services. The Company recognize revenues at a point in time when services are rendered and accepted by customer indicating fulfillment of the performance obligation.
The Company is considered a principal for all the revenues it generates above as it is directly involved in the procurement, delivery, and provision of the goods and services to customers. As the principal, the Company assumes the risks and rewards associated with the transactions, including responsibility for fulfilling the performance obligations and bearing any associated costs and risks, bears the risk of loss or damage to inventory, bears the credit risk associated with customers’ ability to pay for the goods or services. Therefore, the Company recognizes revenue at the gross amount.
| F- |
TMD Energy Limited
Notes to Unaudited Consolidated Financial Statements
For the Six Months Ended June 30, 2025 and the Years Ended December 31, 2024 and 2023
Note 2 - Summary of Significant Accounting Policies (Continued)
Costs of Revenues
Cost of revenues primarily consist of cost of goods sold, cargo insurance, and cost incurred in the course of sales and distribution of cargo oil.
Share of losses of associates comprises our share in the net loss of associate, Horizon Shipyard Inter Globe (M) Sdn. Bhd., accounted for under the equity method.
Segment and Geographic Information
In November 2023, the Financial Accounting Standards Board (“FASB”) issued Accounting Standards Update, or ASU 2023-07 – Improvements to Reportable Segment Disclosures, which enhances the disclosures required for reportable segments in annual and interim consolidated financial statements, including additional, more detailed information about a reportable segment’s expenses. The standard is effective for fiscal years beginning after December 15, 2023, and interim periods within fiscal years beginning after December 15, 2024. The Company adopted ASU 2023-07 for the year ended December 31, 2024, retrospectively to all periods presented in the unaudited consolidated financial statement.
Based on the criteria established by ASC 280, Segment Reporting, the Company uses the management approach in determining its operating segments. The Company’s chief operating decision maker (“CODM”), identified as the chief executive officer of the Company, reviews consolidated results when making decisions, allocating resources and assessing performance of the Company, based on ASC 280, Segment Reporting.
The CODM assesses performance for the segment primarily by reviewing the segment net income (loss), which is also reported as consolidated net (loss) income on the unaudited consolidated statements of operations and comprehensive (loss) income. This assessment considers the Company’s strategic priorities, cash balance, and expected use of cash. Although the CODM also reviews revenue disaggregated by type of services provided, this information is not accompanied by any allocation of direct or indirect costs, and therefore does not constitute a separate measure of segment profit or loss. The CODM does not evaluate expenses, assets, or profitability at a disaggregated level. Instead, the CODM reviews and utilizes functional expenses (i.e., selling and marketing, general and administrative, and depreciation expenses) at the consolidated level to manage the Company’s operations. Other segment items included interest expense, total other (expense) income, net, and provision for income taxes, which are reflected in the segment and consolidated net (loss) income. The measure of segment assets is reported on the unaudited consolidated balance sheet as total consolidated assets, without reviewing segment assets at a different assets level or category.
The adoption of this ASU had no material impact on reportable segments identified and had no effect on the Company’s unaudited consolidated financial position, results of operations, or cash flows. Consequently, the Company has determined that it operates in one operating segment and serves both Malaysian and international customers.
Schedule of Revenue By Reportable Segments
| For the Six Months Ended | For the Years Ended | |||||||||||
|
June 30, 2025 |
December 31, 2024 |
December 31, 2023 |
||||||||||
| (Unaudited) | (Audited) | (Audited) | ||||||||||
| Revenue | $ | 276,340,120 | $ | 688,607,542 | $ | 633,079,773 | ||||||
| Cost of revenues | (272,356,649 | ) | (672,562,832 | ) | (620,989,960 | ) | ||||||
| Selling and marketing expenses | (38,067 | ) | (39,664 | ) | (101,302 | ) | ||||||
| General and administrative expenses | (3,330,264 | ) | (5,249,099 | ) | (5,127,137 | ) | ||||||
| Depreciation expenses | (2,558,809 | ) | (4,758,014 | ) | (4,257,189 | ) | ||||||
| Other (expenses) income | (2,577,706 | ) | (3,952,786 | ) | 354,527 | |||||||
| Net (loss) income of single operating segment | $ | (4,521,375 | ) | $ | 2,045,147 | $ | 2,958,712 | |||||
Basic earnings (loss) per ordinary share is computed by dividing net (loss) income attributable to ordinary shareholders by the weighted-average number of ordinary shares outstanding during the period. Diluted earnings (loss) per share is computed by dividing net (loss) income attributable to ordinary shareholders by the sum of the weighted-average number of ordinary shares outstanding and dilutive potential ordinary shares during the period.
| F- |
TMD Energy Limited
Notes to Unaudited Consolidated Financial Statements
For the Six Months Ended June 30, 2025 and the Years Ended December 31, 2024 and 2023
Note 2 - Summary of Significant Accounting Policies (Continued)
Income Taxes
The Company accounts for income taxes using an asset and liability approach which allows for the recognition and measurement of deferred tax assets based upon the likelihood of realization of tax benefits in future years. Under the asset and liability approach, deferred taxes are provided for the net tax effects of temporary differences between the carrying amounts of assets and liabilities for financial reporting purposes and the amounts used for income tax purposes. A valuation allowance is provided for deferred tax assets if it is more likely than not these items will either expire before the Company is able to realize their benefits, or that future deductibility is uncertain.
Under ASC 740, a tax position is recognized as a benefit only if it is “more likely than not” that the tax position would be sustained in a tax examination, with a tax examination being presumed to occur. The evaluation of a tax position is a two-step process. The first step is to determine whether it is more-likely-than-not that a tax position will be sustained upon examination, including the resolution of any related appeals or litigations based on the technical merits of that position. The second step is to measure a tax position that meets the more-likely-than-not threshold to determine the amount of benefit to be recognized in the financial statements. A tax position is measured at the largest amount of benefit that is greater than 50 percent likely of being realized upon ultimate settlement. Tax positions that previously failed to meet the more-likely-than-not recognition threshold should be recognized in the first subsequent period in which the threshold is met. Previously recognized tax positions that no longer meet the more-likely-than-not criteria should be de-recognized in the first subsequent financial reporting period in which the threshold is no longer met. Penalties and interest incurred related to underpayment of income tax are classified as income tax expense in the year incurred.
The Company applied the provisions of ASC 740-10-50, “Accounting for Uncertainty in Income Taxes”, which provides clarification related to the process associated with accounting for uncertain tax positions recognized in the Company’s financial statements. Audit periods remain open for review until the statute of limitations has passed. The completion of review or the expiration of the statute of limitations for a given audit period could result in an adjustment to the Company’s liability for income taxes. Any such adjustment could be material to the Company’s results of operations for any given quarterly or annual period based, in part, upon the results of operations for the given period.
Recently Issued Accounting Pronouncements
The Company considers the applicability and impact of all accounting standards updates (“ASUs”). Management periodically reviews new accounting standards that are issued. Under the Jumpstart Our Business Startups Act of 2012, as amended (the “JOBS Act”), the Company meets the definition of an emerging growth company, or EGC, and has elected the extended transition period for complying with new or revised accounting standards, which delays the adoption of these accounting standards until they would apply to private companies.
Recent accounting pronouncements not yet adopted
In December 2023, the FASB issued ASU No. 2023-09, Income Taxes (Topic 740): Improvements to Income Tax Disclosures (“ASU 2023-09”). The intent of ASU 2023-09 is to improve the disclosures around a company’s rate reconciliation information and certain types of income taxes companies are required to pay. Specifically, these new disclosure requirements will provide more transparency regarding income taxes companies pay in the United States and other countries, along with more disclosure around a company’s rate reconciliation, among other new disclosure requirements, such that users of financial statements can get better information about how the operations, related tax risks, tax planning and operational opportunities of companies affect their effective tax rates and future cash flow prospects. ASU 2023-09 is effective for annual fiscal years beginning after December 15, 2024, with early adoption permitted for annual financial statements that have not yet been issued or made available for issuance. The amendments under ASU 2023-09 should be applied on a prospective basis, although retrospective application is permitted. The Company is currently evaluating the potential impact of ASU 2023-09 on its unaudited consolidated financial statements and disclosures.
In November 2024, the FASB issued ASU No. 2024-03, Income Statement - Reporting Comprehensive Income - Expense Disaggregation Disclosures (Subtopic 220-40): Disaggregation of Income Statement Expenses (“ASU 2024-03”), and in January 2025, the FASB issued ASU No. 2025-01, Income Statement - Reporting Comprehensive Income - Expense Disaggregation Disclosures (Subtopic 220-40): Clarifying the Effective Date (“ASU 2025-01”). ASU 2024-03 requires additional disclosure of the nature of expenses included in the income statement as well as disclosures about specific types of expenses included in the expense captions presented in the income statement. ASU 2024-03, as clarified by ASU 2025-01, is effective for annual reporting periods beginning after December 15, 2026, and interim periods within annual reporting periods beginning after December 15, 2027. Both early adoption and retrospective application are permitted. The Company is currently evaluating the impact that the adoption of these standards will have on its unaudited consolidated financial statements.
In January 2025, the FASB issued ASU 2025-01 Income Statement — Reporting Comprehensive Income — Expense Disaggregation Disclosures (Subtopic 220-40). The FASB issued ASU 2024-03 on November 4, 2024. ASU 2024-03 states that the amendments are effective for public business entities for annual reporting periods beginning after December 15, 2026, and interim reporting periods beginning after December 15, 2027. Following the issuance of ASU 2024-03, the FASB was asked to clarify the initial effective date for entities that do not have an annual reporting period that ends on December 31 (referred to as non-calendar year-end entities). Because of how the effective date guidance was written, a non-calendar year-end entity may have concluded that it would be required to initially adopt the disclosure requirements in ASU 2024-03 in an interim reporting period, rather than in an annual reporting period. The FASB’s intent in the basis for conclusions of ASU 2024-03 is clear that all public business entities should initially adopt the disclosure requirements in the first annual reporting period beginning after December 15, 2026, and interim reporting periods within annual reporting periods beginning after December 15, 2027. The Company is currently evaluating this ASU to determine its impact on the Company’s disclosures.
The Company believe that other recent accounting pronouncements issued by the FASB, including its Emerging Issues Task Force, the American Institute of Certified Public Accountants, and the Securities and Exchange Commission do not have a material impact on our present or near future financial statements.
| F- |
TMD Energy Limited
Notes to Unaudited Consolidated Financial Statements
For the Six Months Ended June 30, 2025 and the Years Ended December 31, 2024 and 2023
Note 3 – Accounts receivable, net
Accounts receivable, net consist of the following:
Schedule of accounts receivable, net
| As of | ||||||||
|
June 30, 2025 |
December
31, 2024 |
|||||||
| (Unaudited) | (Audited) | |||||||
| Accounts receivable | $ | 29,942,050 | $ | 21,808,030 | ||||
| Allowance for doubtful accounts | (1,570,348 | ) | (1,486,333 | ) | ||||
| Total, net | $ | 28,371,702 | $ | 20,321,697 | ||||
As of the end of each of the financial year, the aging analysis of accounts receivable, net of allowance for expected credit loss, based on the invoice date is as follows:
Schedule of aging analysis of accounts receivable
| As of | ||||||||
|
June 30, 2025 |
December
31, 2024 |
|||||||
| (Unaudited) | (Audited) | |||||||
| Within 90 days | $ | 11,898,706 | $ | 7,998,811 | ||||
| Between 91 and 180 days | 1,636,109 | 11,774,674 | ||||||
| Between 181 and 365 days | 5,095,824 | 529,797 | ||||||
| More than 365 days | 9,741,063 | 18,415 | ||||||
| Total, net | $ | 28,371,702 | $ | 20,321,697 | ||||
The movement of allowances for expected credit loss is as follow:
Schedule of movement of allowances for expected credit loss
| As of | ||||||||
|
June 30, 2025 |
December
31, 2024 |
|||||||
| (Unaudited) | (Audited) | |||||||
| Balance at January 1, 2025 and 2024 | $ | 1,486,333 | $ | 1,371,341 | ||||
| Addition | 807 | 69,474 | ||||||
| Foreign exchange difference | 83,208 | 45,518 | ||||||
| Balance at June 30, 2025 and December 31, 2024 | $ | 1,570,348 | $ | 1,486,333 | ||||
The Company’s normal trade credit term is 30 days (2024: 30 days). Other credit terms are assessed and approved by the management on a case-by-case basis.
Subsequent to June 30, 2025, the Company received a total of $11,137,302 in payments on accounts receivable. The Company entered into installment agreements with major customers, which stipulated periodic payments over a specified duration, requiring the customers to fulfil all payment obligations. Under the terms of these installment agreements, $14,986,210 was scheduled with monthly repayments and will be fully settled by May 2026. For the six months ended June 30, 2025 and the years ended December 31, 2024 and 2023, allowances for expected credit loss were $807, $69,474 and $nil respectively.
Note 4 – Inventories, net
Inventories consist of the following:
Schedule of inventories
| As of | ||||||||
|
June 30, 2025 |
December
31, 2024 |
|||||||
| (Unaudited) | (Audited) | |||||||
| Bunkering marine oil | $ | 7,627,129 | $ | 9,667,559 | ||||
There was no inventory write-downs for the six months ended June 30, 2025, and the years ended December 31, 2024 and 2023.
| F- |
TMD Energy Limited
Notes to Unaudited Consolidated Financial Statements
For the Six Months Ended June 30, 2025 and the Years Ended December 31, 2024 and 2023
Note 5 – Other receivables and current assets
Other receivables and currents assets consist of the following:
Schedule of other receivables and currents assets
| As of | ||||||||
|
June 30, 2025 |
December 31, 2024 | |||||||
| (Unaudited) | (Audited) | |||||||
| Deferred offering costs | $ | - | $ | 1,839,846 | ||||
| Deposits | 8,220,641 | 5,434,606 | ||||||
| Prepayments and other deposits | 6,730,423 | 626,540 | ||||||
| Other receivables | 16,007,620 | 12,305,853 | ||||||
| Total | $ | 30,958,684 | $ | 20,206,845 | ||||
Deposits consist of cargo deposit paid to third party supplier for upgrading of payment term and credit limit, deposit paid to third party contingent suppliers for supply of fuel oil. The deposits paid to suppliers are pledged for the purpose of obtaining purchases credit limit and is only refundable to the Company in the event the credit limit is terminated or to offset against any outstanding amount due to the suppliers.
Prepayments and other deposits consist of advance payments related to marketing and business development activities. In addition, a payment of $2,500,000 was made to a vessel broker to assist in identifying a target vessel. The deposit is refundable if the broker is unable to locate a suitable vessel.
Other receivables consist of advance payment to suppliers for purchase of cargo oil.
Note 6 – Property and equipment, net
Property and equipment, net consist of the following:
Schedule of property and equipment, net
| As of | ||||||||
|
June 30, 2025 |
December 31, 2024 | |||||||
| (Unaudited) | (Audited) | |||||||
| At Cost: | ||||||||
| Dry-docking expenditures | $ | 15,998,313 | $ | 14,342,245 | ||||
| Furniture and fixtures | 68,964 | 58,174 | ||||||
| Motor vehicles | 284,462 | 252,916 | ||||||
| Real property | 836,276 | 784,966 | ||||||
| Renovation and improvements | 195,967 | 185,072 | ||||||
| Tools and equipment | 1,922,063 | 1,498,228 | ||||||
| Vessels | 34,399,918 | 34,399,919 | ||||||
| Total, at cost | 53,705,963 | 51,521,520 | ||||||
| Less: Accumulated depreciation | (21,972,674 | ) | (19,388,059 | ) | ||||
| Total, net | $ | 31,733,289 | $ | 32,133,461 | ||||
Depreciation expenses, including the depreciation expense of assets under finance leases were $2,558,809 for the six months ended June 30, 2025, and $4,758,014 and $4,257,189 for the years ended December 31, 2024 and 2023, respectively.
Note 7 – Investment and its valuations
Investments in Horizon Shipyard Inter Globe (M) Sdn. Bhd. (“Horizon”) consist of the following:
Schedule of investments
| As of | ||||||||
|
June 30, 2025 |
December 31, 2024 | |||||||
| (Unaudited) | (Audited) | |||||||
| Balance at January 1, 2025 and 2024 | $ | 88,908 | $ | 4,343 | ||||
| Investments during the period / year | - | 85,293 | ||||||
| Share of losses of associate | (4,029 | ) | (710 | ) | ||||
| Foreign exchange difference | 4,833 | (18 | ) | |||||
| Balance at June 30, 2025 and December 31, 2024 | $ | 89,712 | $ | 88,908 | ||||
| F- |
TMD Energy Limited
Notes to Unaudited Consolidated Financial Statements
For the Six Months Ended June 30, 2025 and the Years Ended December 31, 2024 and 2023
Investment in Horizon
On June 22, 2023, Tumpuan Megah subscribed 20% equity interest in Horizon through the purchase of 20,000 ordinary shares for RM20,000. Horizon is a company specializing in repair and maintenance of transport equipment except motor vehicles in Malaysia. The investment is accounted for using the measurement alternative.
The investment above consist of investment in equity securities without readily determinable fair values are investments in privately held companies, the Company adopted the guidance of ASC 321, Investments - Equity Securities, which allows an entity to measure investments in equity securities without a readily determinable fair value using a measurement alternative that measures these securities at cost minus impairment, if any, plus or minus changes resulting from observable price changes in orderly transactions for identical or similar investment of same issuer (the “Measurement Alternative”). The fair value of equity securities without readily determinable fair values that have been remeasured due to impairment are classified within Level 3. Management assesses each of these investments on an individual basis and is required to make a qualitative assessment for impairment at each reporting period.
On April 9, 2024, Tumpuan Megah subscribed additional 380,000 ordinary shares in Horizon in proportion with its existing shareholding in Horizon for cash consideration of RM380,000. Tumpuan Megah’s equity interest remained unchanged at 20% after subscription of additional shares.
After SMF acquired the remaining 30% ownership interest of Tumpuan Megah on May 31, 2024, the Company accounts for its investment that represents 20% ownership, and for which the Company have the ability to exercise significant influence through board representation under the equity method. Under the equity method, investments are initially recognized at cost and adjusted thereafter to recognize the Company’s share of the investee’s profits or losses in the income statement, and its share of movements in other comprehensive (loss) income. The carrying amounts of equity-accounted investments are tested for impairment. For the six months ended June 30, 2025 and the year ended December 31, 2024, share of losses of associate were $4,029 and $710, respectively.
The Company did not recognize an impairment loss for the six months ended June 30, 2025 and the years ended December 31, 2024, and 2023, respectively.
| F- |
TMD Energy Limited
Notes to Unaudited Consolidated Financial Statements
For the Six Months Ended June 30, 2025 and the Years Ended December 31, 2024 and 2023
Note 8 - Related party transactions
The nature and purpose of transaction amounts and outstanding balances for related parties consist of the following:
Schedule of nature and purpose of transaction amounts and outstanding balances for related parties
| As of | For the Six Months Ended | For the Years Ended | ||||||||||||||||||||||||||
|
June 30, 2025 |
December 31, 2024 |
June 30, 2025 |
December 31, 2024 | December 31, 2023 | Subsequent to June 30, | |||||||||||||||||||||||
| (Unaudited) | (Audited) | (Unaudited) | (Audited) | (Audited) | 2025 | |||||||||||||||||||||||
| Balances | Amounts | Amounts | ||||||||||||||||||||||||||
| Name | Relationship | Nature/Purpose | Receivables (Liabilities) | Sales (Purchases) | Settled | |||||||||||||||||||||||
| Benua Hijau Sdn. Bhd. | Entity owned by Controlling Shareholder | Corporate Social Responsibility expenses | $ | (156,136 | ) | $ | (98,504 | ) | $ | - | $ | (98,658 | ) | $ | - | $ | 18,085 | |||||||||||
| Black Hummer Security Sdn. Bhd. | An entity controlled by Tan Sri Mohd Bakri Bin Mohd Zinin, one of the directors of Tumpuan Megah | Security services | - | - | - | - | (1,448 | ) | - | |||||||||||||||||||
| Dato’ Mohd Suhaimi bin Hashim | Director of Tumpuan Megah and shareholder of TMDF | Advances | (237 | ) | (224 | ) | - | - | - | - | ||||||||||||||||||
| Pan Management Services Ltd | Entity owned by Controlling Shareholder | Management service | (72,942 | ) | (131,081 | ) | - | - | (234,137 | ) | 2,600 | |||||||||||||||||
| Raja Ismail Bin Raja Mohamed | Director of Tumpuan Megah | Reimbursable legal fees | 1,927,246 | 1,823,609 | - | - | - | - | ||||||||||||||||||||
| Sinar Maju Logistik Sdn. Bhd. | Entity owned by Controlling Shareholder | Shipping agency services | 137,715 | 95,841 | (47,325 | ) | (270,505 | ) | (525,067 | ) | 23,471 | |||||||||||||||||
| Sinar Maju Marin Sdn. Bhd. | Subsidiary of Sinar Maju Logistik Sdn. Bhd., Entity owned by Controlling Shareholder | Shipping agency services | (1,665 | ) | (1,710 | ) | (17,213 | ) | (69,404 | ) | (71,606 | ) | 1,665 | |||||||||||||||
| Straits Alliance Transport Sdn. Bhd. | Entity owned by Controlling Shareholder | Advances | 1,116 | 1,057 | - | - | - | - | ||||||||||||||||||||
| Straits Energy Resources Berhad | Controlling Shareholder | Working capital advances | 15,903,625 | 8,636,466 | - | - | - | 888,254 | ||||||||||||||||||||
| Straits Management Services Sdn. Bhd. | Entity owned by Controlling Shareholder | Management service | (793,078 | ) | (395,226 | ) | - | (499,091 | ) | (269,897 | ) | 42,307 | ||||||||||||||||
| Victoria STS (Labuan) Sdn. Bhd. | Entity owned by Controlling Shareholder | (i) Sales of marine gas oil | 11,592 | 27,762 | - | - | 151,349 | - | ||||||||||||||||||||
| (ii) Sales of ship management service | 8,480 | 935,522 | 154,866 | 177,534 | 122,240 | - | ||||||||||||||||||||||
| (iii) Purchase of tugboat services | - | - | (17,116 | ) | (9,402 | ) | (21,201 | ) | - | |||||||||||||||||||
| Victoria 3 Limited | Subsidiary of Victoria STS (Labuan) Sdn. Bhd., Entity owned by Controlling Shareholder | Sales of ship management service | 3,155 | 72,310 | - | - | 16,788 | - | ||||||||||||||||||||
| Total, net | $ | 16,968,871 | $ | 10,965,822 | $ | 73,212 | $ | (769,526 | ) | $ | (832,979 | ) | $ | 976,382 | ||||||||||||||
| F- |
TMD Energy Limited
Notes to Unaudited Consolidated Financial Statements
For the Six Months Ended June 30, 2025 and the Years Ended December 31, 2024 and 2023
Note 8 - Related party transactions (Continued)
Related party transactions other than sales and purchases:
|
For the Six Months Ended |
For the Years Ended | |||||||||||||||
|
June 30, 2025 |
December 31, 2024 | December 31, 2023 | ||||||||||||||
| Name | Relationship | Nature/Purpose | (Unaudited) | (Audited) | (Audited) | |||||||||||
| Benua Hijau Sdn. Bhd. | Entity owned by Controlling Shareholder | Corporate social responsibility expenses | $ | (79,458 | ) | $ | - | $ | - | |||||||
| Ho Hung Ming | Son of Dato’ Sri Kam Choy Ho | Remuneration | (38,894 | ) | (72,487 | ) | (67,895 | ) | ||||||||
| Straits Management Services Sdn. Bhd. | Entity owned by Controlling Shareholder | Management service | (373,129 | ) | - | - | ||||||||||
| Straits Energy Resources Berhad | Controlling Shareholder | Interest income | 617,809 | 375,365 | 32,089 | |||||||||||
| $ | 126,328 | $ | 302,878 | $ | (35,806 | ) | ||||||||||
Schedule of related party balances
| As of | ||||||||
|
June 30, 2025 |
December 31, 2024 | |||||||
| (Unaudited) | (Audited) | |||||||
| Due from related parties | $ | 17,992,929 | $ | 11,592,567 | ||||
| Due to related parties | (1,024,058 | ) | (626,745 | ) | ||||
| Total, net | $ | 16,968,871 | $ | 10,965,822 | ||||
The majority of the amounts due from and due to related parties are interest-free, unsecured, with no fixed terms of repayment, and are payable on demand.
Certain amounts due from the related party, Straits, totaling $16,892,805 (2024: $11,911,593), are interest-bearing at 8.25% (2024: 8.25%) per annum and have no fixed repayment terms.
Interest income from amounts due from related parties was $617,809, $375,365 and $32,089 for the six months ended June 30, 2025, and the years ended December 31, 2024 and 2023, respectively.
The Company received bank guarantees from a bank to support certain trade payables. Straits provided a corporate guarantee to the bank for these facilities. The guarantees ensure timely payment to suppliers in the event of default by the Company. The maximum potential liability under the guarantees is $1,798,391 as at June 30, 2025.
Amounts due from Raja Ismail Bin Raja Mohamed
The amounts due from Raja Ismail Bin Raja Mohamed (“Raja Ismail”) (not a principal shareholder) consist of reimbursable legal fees incurred by Tumpuan Megah, a subsidiary of the Company (with Straits as a controlling shareholder of the Company). These fees are recoverable from Raja Ismail through a personal guarantee provided to Straits under a binding personal guarantee agreement (the “Guarantee Agreement”). While the guarantee is formally provided to Straits, it indemnifies Tumpuan Megah by ensuring reimbursement of legal costs associated with arbitration, resulting in no net financial impact on Tumpuan Megah.
The Guarantee Agreement, which includes a continuing guarantee clause, binds Raja Ismail (the “Guarantor”) to cover all sums potentially payable by Tumpuan Megah in connection with the arbitration, and indemnifies Tumpuan Megah against any losses, damages, or expenses related to the case. Under ASC 310-10, receivables can be recognized at fair value if there is a contractual right to payment. This Agreement creates such a right, allowing the Company to recognize a receivable. Despite the general presumption against recognizing an asset when the counterparty disputes liability, the presumption is overcome here because (1) Raja Ismail has agreed to reimburse the legal fees, as outlined in the binding Guarantee Agreement, and (2) he has begun repaying these fees according to a set schedule, reinforcing the recovery certainty.
For accounting treatment, the Company records the legal fees as an expense and with a corresponding liability upon receipt of the bill. Simultaneously, a receivable from Raja Ismail is recorded to offset the expense under the terms of the Guarantee Agreement. This accounting approach ensures that all costs incurred in relation to the arbitration are contractually recoverable from Raja Ismail.
The sales revenues and purchases for related parties consist of the following:
Schedule of sales revenues and purchases for related parties
For the Six Months Ended |
For the Years Ended | |||||||||||
|
June 30, 2025 |
December 31, 2024 | December 31, 2023 | ||||||||||
| (Unaudited) | (Audited) | (Audited) | ||||||||||
| Related party sales revenues | $ | 154,866 | $ | 177,534 | $ | 290,377 | ||||||
| Related party purchases | (81,654 | ) | (947,060 | ) | (1,123,356 | ) | ||||||
| Total, net | $ | 73,212 | $ | (769,526 | ) | $ | (832,979 | ) | ||||
| F- |
TMD Energy Limited
Notes to Unaudited Consolidated Financial Statements
For the Six Months Ended June 30, 2025 and the Years Ended December 31, 2024 and 2023
Note 9 – Other payables
Other payables consist of the following:
Schedule of other payables
| As of | ||||||||
|
June 30, 2025 |
December 31, 2024 | |||||||
| (Unaudited) | (Audited) | |||||||
| Deferred interest income | $ | 11,354 | $ | 10,752 | ||||
| Professional fee | 330,465 | 233,756 | ||||||
| Insurance services | 78,880 | 290,809 | ||||||
| Secretary services | 110 | 5,490 | ||||||
| Vessel related expenses | 155,542 | 312,836 | ||||||
| Others | 826,093 | 649,322 | ||||||
| Total other payables | $ | 1,402,444 | $ | 1,502,965 | ||||
Note 10 – Loans borrowings
Short-term borrowings consist of the following:
Schedule of short-term borrowings
| As of | ||||||||
|
June 30, 2025 |
December 31, 2024 | |||||||
| (Unaudited) | (Audited) | |||||||
| Trade Financing Facilities | $ | 91,806,603 | $ | 79,268,515 | ||||
Line of Credit
Trade financing facilities is a line of credit facility which bears interest of 5.75% to 7.75% (2024: 5.82% to 8.25%) per annum and the repayment term were up to 90 days (2024: 90 days) from utilization date and is secured by the following:
| (i) | Registered legal charge by way of debenture over all the present and future assets, rights interests and undertakings of Tumpuan Megah, a subsidiary; |
| (ii) | Registered legal charge by way of debenture over all the present and future assets, rights, interests and undertakings of SMF, a subsidiary; |
| (iii) | Corporate guarantee by the Straits, majority shareholder of the Company; |
| (iv) | Personal guarantee by Dato’ Sri Kam Choy Ho, director of the Company; and |
| (v) | Upfront cash and sinking fund placement by Tumpuan Megah and Straits. |
Long-term borrowings consist of the following:
Schedule of long-term borrowings
| As of | ||||||||
| June
30, 2025 |
December 31, 2024 | |||||||
| (Unaudited) | (Audited) | |||||||
| Vendor installment loans | $ | 380,000 | $ | 744,480 | ||||
| Bank term loan | 554,173 | 536,592 | ||||||
| Total | 934,173 | 1,281,072 | ||||||
| Less: current portion of loans payable | (409,025 | ) | (776,753 | ) | ||||
| Long-term debt payable | $ | 525,148 | $ | 504,319 | ||||
Long-term borrowings maturities, excluding finance leases as follows:
Schedule of long-term borrowings maturity
| For the year ending June 30, | ||||
| 2026 | $ | 409,025 | ||
| 2027 | 29,928 | |||
| 2028 | 32,727 | |||
| 2029 | 35,690 | |||
| 2030 | 38,824 | |||
| Thereafter | 387,979 | |||
| Total | $ | 934,173 | ||
| F- |
TMD Energy Limited
Notes to Unaudited Consolidated Financial Statements
For the Six Months Ended June 30, 2025 and the Years Ended December 31, 2024 and 2023
Vendor Installment Loans
The Company has entered into installment loans for the purchase of vessels, which are used primarily for its bunkering operations. These loans are secured by the vessels acquired and bear fixed repayment schedules over the life of the loan, with periodic payments consisting of both principal and interest components.
As of June 30, 2025, the aggregate outstanding balance of installment loans for the purchase of vessels amounted to $380,000, which shall be settled within 1 year, with interest rates at 5.24% (2024: ranging from 5.24% to 7.93%). The Company is in compliance with all covenants and requirements stipulated in the loan agreements. The vessels acquired through these loans are recorded as assets on the Company’s balance sheet and are depreciated over their useful lives.
Interest expenses related to these installment loans are recognized over the life of the loans using the effective interest method.
Bank Term Loan
On June 24, 2022, the Company entered into a facility agreement for a term loan up to SGD824,000 (equivalent to $593,198) to partially finance the acquisition of leasehold property. Interest is charged at 1.20% per annum over the 3-month Compounded Singapore Overnight Rate Average (“SORA”) for the first two years from the date of first disbursement, and at 2.00% per annum over the 3-month Compounded SORA from the third year onwards. The loan is secured by way of legal mortgage over the property and guarantees provided by SMS 1.
Total interest expenses on loans borrowings were $2,801,233, $4,594,956 and $2,200,755 for the six months ended June 30, 2025 and the years ended December 31, 2024 and 2023, respectively.
| F- |
TMD Energy Limited
Notes to Unaudited Consolidated Financial Statements
For the Six Months Ended June 30, 2025 and the Years Ended December 31, 2024 and 2023
Note 11 – Leases
Classification related to operating and finance leases on the unaudited consolidated balance sheet consists of the following:
Schedule of operating and finance leases assets and liabilities
| As of | ||||||||
|
June 30, 2025 |
December 31, 2024 | |||||||
| (Unaudited) | (Audited) | |||||||
| Lease assets and liabilities | ||||||||
| Operating lease assets, net | $ | 37,981 | $ | 16,603 | ||||
| Finance lease assets, net | 15,432 | 40,454 | ||||||
| Operating lease liabilities – current | $ | 24,437 | $ | 9,223 | ||||
| Operating lease liabilities – noncurrent | 14,301 | 7,564 | ||||||
| Operating lease liabilities – total | $ | 38,738 | $ | 16,787 | ||||
| Finance lease liabilities – current | $ | 11,979 | $ | 11,053 | ||||
| Finance lease liabilities – noncurrent | 53,658 | 56,559 | ||||||
| Finance lease liabilities – total | $ | 65,637 | $ | 67,612 | ||||
Components of lease cost, weighted average remaining lease terms and discount rates of operating and finance leases consist of the following:
Schedule of lease cost, weighted average remaining lease terms and discount rates of operating and finance leases
|
For the Six Months Ended |
For the Years Ended | |||||||||||
|
June 30, 2025 |
December 31, 2024 | December 31, 2023 | ||||||||||
| (Unaudited) | (Audited) | (Audited) | ||||||||||
| Lease expenses | ||||||||||||
| Operating lease expenses – SG&A portion | $ | 13,225 | $ | 21,874 | $ | 23,089 | ||||||
| Finance lease expenses | ||||||||||||
| Depreciation expense of leased assets | 26,351 | 50,426 | 17,625 | |||||||||
| Interest expense of finance lease | $ | 1,564 | $ | 3,420 | $ | 2,306 | ||||||
| Other Information | ||||||||||||
| Cash paid for amounts included in the measurement of lease liabilities | ||||||||||||
| Operating cash flows – operating leases | $ | 12,683 | $ | 22,959 | $ | 23,039 | ||||||
| Operating cash flows – finance leases | 1,564 | 3,420 | 2,306 | |||||||||
| Financing cash flows – finance leases | $ | 5,562 | $ | 10,216 | $ | 41,328 | ||||||
| Operating lease right-of-use assets obtained in exchange for operating lease liabilities | $ | 31,350 | $ | 15,359 | $ | - | ||||||
| Weighted average remaining lease term (in years) | ||||||||||||
| Operating leases | 1.51 | 1.01 | 1.00 | |||||||||
| Finance leases | 4.91 | 5.41 | 3.25 | |||||||||
| Average discount rate | ||||||||||||
| Operating leases | 8.72 | % | 7.74 | % | 5.77 | % | ||||||
| Finance leases | 4.67 | % | 4.67 | % | 4.63 | % | ||||||
Future minimum payments under operating and finance leases consist of the following:
Schedule of future minimum payments under operating and finance leases
| Operating Leases |
Finance Leases |
|||||||
| Future minimum lease payments | ||||||||
| Period ended June 30, 2026 | $ | 26,833 | $ | 14,758 | ||||
| Period ended June 30, 2027 | 14,695 | 14,758 | ||||||
| Period ended June 30, 2028 | - | 14,758 | ||||||
| Period ended June 30, 2029 | - | 14,758 | ||||||
| Period ended June 30, 2030 | - | 14,346 | ||||||
| Total | $ | 41,528 | $ | 73,378 | ||||
| Less: Interest | (2,790 | ) | (7,741 | ) | ||||
| Present value of lease liabilities | $ | 38,738 | $ | 65,637 | ||||
| F- |
TMD Energy Limited
Notes to Unaudited Consolidated Financial Statements
For the Six Months Ended June 30, 2025 and the Years Ended December 31, 2024 and 2023
Note 12 – Equity
The Company is authorized to issue 500,000,000 shares of ordinary shares with $0.0001 par value.
As at date of incorporation, the Company has 100 shares of ordinary shares $0.0001 par value issued and outstanding. These shares were issued on the incorporation of the Company on October 17, 2023.
On May 31, 2024, the Company issued additionally 19,999,900 ordinary shares of $0.0001 par value for its re-organization transactions as follows:
| (i) | An aggregate 15,336,423 shares of ordinary shares to Straits for the acquisition of 100% in SMF, TMD Straits and TMD Sturgeon, 70% in Tumpuan Megah and 51% in SMS 1; |
| (ii) | 1,737,467 shares of ordinary shares to Dato’ Mohd Suhaimi bin Hashim for the acquisition of 15% Tumpuan Megah; |
| (iii) | 1,737,467 shares of ordinary shares to Yong Sing Goo for the acquisition of 15% Tumpuan Megah; and |
| (iv) | 1,188,543 shares of ordinary shares to Platinum Gate Capital Pte Ltd. for the acquisition of 49% SMS 1. |
On June 30, 2024, the Company reversed $5,311,880 of additional paid-in capital (“APIC”). This amount represented cash contributions from Straits intended for the acquisition of shares in Tumpuan Megah, which had been classified as APIC within Tumpuan Megah’s equity. However, the shares were never issued. As part of the restructuring exercise for the IPO, Straits formally terminated the share acquisition agreement, and this amount was reclassified as a liability under amounts due to related parties, Straits.
On April 22, 2025, the Company consummated its initial public offering on NYSE American, under the ticker symbol “TMDE”. Under this offering, 3,100,000 ordinary shares were issued at a price of $3.25 per share. In addition, the Company granted a 45-day option to the underwriter to purchase up to an additional 465,000 ordinary shares at the public offering price to cover over-allotment, if any. On April 22, 2025, the underwriter exercised the over-allotment option in full to purchase an additional 465,000 ordinary shares. On April 24, 2025, the Company closed its initial public offering and the exercise of the over-allotment option, received gross proceeds of $11,586,250 from the offering before deducting underwriting discounts and offering expenses.
On April 22, 2025, upon the completion of IPO of the Company, IPO costs capitalized as of December 31, 2024 amounted to $1,839,846, together with other IPO costs incurred during the period ended June 30, 2025, totaling $3,488,971, were charged to shareholder’s equity under APIC.
As at June 30, 2025, the Company has 23,565,000 shares of ordinary shares $0.0001 par value issued and outstanding.
Acquisition of non-controlling interest
On May 31, 2024, the Company’s subsidiary, SMF acquired 4,500,000 ordinary shares in Tumpuan Megah, representing 30% of the non-controlling interest in Tumpuan Megah, from Dato’ Mohd Suhaimi bin Hashim and Yong Sing Goo held equally. The purchase consideration amounting to RM9,720,989 (equivalent to $2,085,557) was settled by the issuance of 3,474,934 ordinary shares of TMDEL.
On May 31, 2024, SMF acquired 49,000 ordinary shares in SMS 1, representing 49% of the non-controlling interest in SMS 1, from Platinum Gate Capital Pte. Ltd. The purchase consideration amounting to RM3,324,902 (equivalent to $713,330) was settled by issuance of 1,188,543 ordinary shares of TMDEL.
These acquisitions are accounted for as transactions with non-controlling interests in accordance with ASC 810 (Consolidation). The impact on the Company’s equity and any adjustments to the non-controlling interests are reflected in the statement of equity and the foreign currency translation adjustments associated with these acquisitions are recorded as part of Accumulated Other Comprehensive Income in accordance with ASC 830 (Foreign Currency Matters).
Note 13 – Disaggregated revenue and geographic information
Disaggregated revenue by service lines as follows:
Schedule of disaggregated revenue by services lines
For the Six Months Ended |
For the Years Ended | |||||||||||
|
June 30, 2025 |
December 31, 2024 | December 31, 2023 | ||||||||||
| (Unaudited) | (Audited) | (Audited) | ||||||||||
| Revenue by service lines recognized at a point in time: | ||||||||||||
| Sales of cargo oil and fresh water, and bunkering facilitation | $ | 275,440,318 | $ | 688,210,369 | $ | 631,607,903 | ||||||
| Vessel chartering services | - | - | 1,193,594 | |||||||||
| Ship management services | 899,802 | 397,173 | 278,276 | |||||||||
| Total revenue | $ | 276,340,120 | $ | 688,607,542 | $ | 633,079,773 | ||||||
Geographic revenue information as follows:
Schedule of geographic revenue information
For the Six Months Ended |
For the Years Ended | |||||||||||
|
June 30, 2025 |
December 31, 2024 | December 31, 2023 | ||||||||||
| (Unaudited) | (Audited) | (Audited) | ||||||||||
| Revenue by geographic area: | ||||||||||||
| Hong Kong | $ | 30,697,646 | $ | 53,718,192 | $ | - | ||||||
| Malaysia | 245,507,942 | 634,482,899 | 633,022,743 | |||||||||
| Indonesia | - | - | 6,356 | |||||||||
| Singapore | 41,538 | 405,544 | 50,674 | |||||||||
| Vietnam | 92,994 | 907 | - | |||||||||
| Total revenue | $ | 276,340,120 | $ | 688,607,542 | $ | 633,079,773 | ||||||
| F- |
TMD Energy Limited
Notes to Unaudited Consolidated Financial Statements
For the Six Months Ended June 30, 2025 and the Years Ended December 31, 2024 and 2023
Note 14 – Income Taxes
Cayman Islands
Cayman Islands entities are not subject to income taxes on profits, income, gains or appreciation, and there is no taxation in the nature of inheritance tax or estate duty. There are no other taxes likely to be material to the Company levied by the Government of the Cayman Islands except for stamp duties which may be applicable on instruments executed in, or, after execution, brought within the jurisdiction of the Cayman Islands. The Cayman Islands is not party to any double tax treaties that are applicable to any payments made to or by our company. There are no exchange control regulations or currency restrictions in the Cayman Islands.
Payments of dividends and capital in respect of the Company’s ordinary shares will not be subject to taxation in the Cayman Islands and no withholding will be required on the payment of a dividend or capital to any holder of our ordinary shares, as the case may be, nor will gains derived from the disposal of our ordinary shares be subject to Cayman Islands income or corporation tax.
Malaysia
Malaysia Income Tax is calculated at 24% of the estimated assessable profits for the relevant year. Net operating losses can be carried forward for a limit of ten consecutive years starting from the year subsequent to the year in which the loss was incurred.
For Labuan Trading activity, the chargeable profits would subject to tax under Labuan Business Activity Act, 1990 (“LBATA”) of which 3% of net audited profits would be taxed.
Singapore
Singapore Income Tax is calculated at 17% of chargeable income for the relevant year. Net operating losses can be carried forward indefinitely to offset against future taxable income.
Taxable (loss) income before income taxes by jurisdiction are as follows:
Schedule of taxable income/(loss) before income taxes by jurisdiction
For the Six Months Ended |
For the Years Ended | |||||||||||
|
June 30, 2025 |
December 31, 2024 | December 31, 2023 | ||||||||||
| (Unaudited) | (Audited) | (Audited) | ||||||||||
| Labuan | $ | 1,022 | $ | 26,190 | $ | 25,263 | ||||||
| Malaysia | (1,039,138 | ) | 1,280,329 | 684,759 | ||||||||
| Singapore | 50,082 | 121,780 | 64,217 | |||||||||
| Total tax (benefits) expenses | $ | (988,034 | ) | $ | 1,428,299 | $ | 774,239 | |||||
Reconciliations of the statutory income tax rate and the Company’s effective income tax rate are as follow:
Schedule of reconciliations of the statutory income tax rate and effective income tax rate
For the Six Months Ended |
For the Years Ended | |||||||||||
|
June 30, 2025 |
December 31, 2024 | December 31, 2023 | ||||||||||
| (Unaudited) | (Audited) | (Audited) | ||||||||||
| Income tax expense at Labuan statutory rate | $ | 8,411 | 26,247 | $ | 25,375 | |||||||
| Income tax expense at Malaysia statutory rate | 283,787 | 613,388 | 710,438 | |||||||||
| Income tax expense at Singapore statutory rate | 69,507 | 110,461 | 91,240 | |||||||||
| Increases (decreases) due to: | ||||||||||||
| Other adjustments | (303,211 | ) | 743,918 | (177,593 | ) | |||||||
| Temporary differences | (45,490 | ) | (9,092 | ) | 13,072 | |||||||
| Other exemption, rebate and credit | - | (26,038 | ) | (56,397 | ) | |||||||
| (Over) Under provision in prior years(1) | (1,001,038 | ) | (30,585 | ) | 168,104 | |||||||
| Tax expense (benefits), net | $ | (988,034 | ) | 1,428,299 | $ | 774,239 | ||||||
| (1) | With the change of fiscal year end from December 31 to June 30, the reporting period of Tumpuan Megah covered 18 months from January 1, 2024 to June 30, 2025. Given Tumpuan Megah recorded a net loss for the six months ended June 30, 2025, the tax loss position reduced the overall assessable profits for the full 18-month reporting period. As a result, the provision for income tax previously recognized for the year ended December 31, 2024 was overstated by $1,001,038. |
| F- |
TMD Energy Limited
Notes to Unaudited Consolidated Financial Statements
For the Six Months Ended June 30, 2025 and the Years Ended December 31, 2024 and 2023
Note 15 – Commitments and contingencies
Contingencies
Legal proceedings between ING Bank N.V., O.W. Bunker Far East (Singapore) Pte. Ltd., and Tumpuan Megah Development Sdn. Bhd.
The Company’s subsidiary, Tumpuan Megah, is involved in a legal proceeding consisting of disputes over financing agreements, gas oil supply contracts, and an enforcement attempt of an English judgment against Tumpuan Megah for $937,353, along with interest and costs. The proceedings include applications, appeals, and hearings in Malaysian courts. On August 13, 2025, the Federal Court of Malaysia allowed the appeal filed by ING Bank N.V. and O.W. Bunker Far East (Singapore) Pte. Ltd. (collectively, the “Appellants”) against the Court of Appeal’s decision to order a trial of issues in connection with an application to set aside the High Court judgment dated March 22, 2021. That judgment registered a decision of the English High Court enforcing an arbitral award obtained by the Appellants against Tumpuan Megah. Accordingly, RM130,000 (equivalent to $30,745) was awarded to the Appellants. Consequently, Tumpuan Megah’s application to set aside the judgment will now resume in the High Court, with the hearing date to be scheduled in due course.
Tumpuan Megah is accompanied by an agreement from Straits to release to Tumpuan Megah all amounts it receives under a personal guarantee from the vendor (Raja Ismail), indemnifying Straits against Tumpuan Megah’s liabilities after deducting Straits’ cost and expense in recovery of such amount from the vendor, with the scope of indemnification potentially extending to liabilities arising from these legal proceedings.
There is no reasonable possibility that any losses may be incurred by the Company, as the Guaranteed Obligations are fully indemnified by Raja Ismail under the binding personal guarantee agreement (Guarantee Agreement referred to in Note 8) and there is no additional exposure to the Company as all costs and the potential liability have been indemnified under the agreement.
A claim for loss recovery generally can be recognized when a loss event has occurred and recovery is considered probable. If the claim is subject to dispute or litigation, a rebuttable presumption exists that recoverability of the claim is not probable. If the potential recovery exceeds the loss recognized in the financial statements or relates to a loss not yet recognized in the financial statements, such recovery should be recognized under the gain contingency model.
As a result of this indemnification agreement, where all potential liabilities are indemnified, no provisions have been made in the financial statements for these potential liabilities, nor has any recognition of loss contingency has been made under ASC 450-20. The total reimbursable legal fees are recorded as “Due from related parties”, which is disclosed in Note 8.
| F- |
TMD Energy Limited
Notes to Unaudited Consolidated Financial Statements
For the Six Months Ended June 30, 2025 and the Years Ended December 31, 2024 and 2023
Note 16 – Concentration, risks, and uncertainties
| a) | Concentration of credit risk |
Financial instruments that potentially subject the Company to concentration of credit risk are cash and cash equivalents, and accounts receivable arising from its normal business activities.
The Company is exposed to credit risks associated with deposits held in financial institutions. The aggregate deposit amounts in financial institutions exceeding the insurance limits set by local authorities which may be at risk in the event of a financial institution default. The Company regularly assesses and monitors credit risks associated with its deposit accounts and takes appropriate measures to mitigate potential losses.
The Company evaluates customer creditworthiness and maintains an allowance for expected credit losses. While the Company believes its allowance adequately covers estimated credit risks, certain long-outstanding receivables present heightened collection risks that may exceed the current allowance. The Company routinely assesses the financial strength of its customer and, based upon factors surrounding the credit risk, establishes an allowance, if required, for uncollectible accounts and, consequently, believes that its accounts receivable credit risk exposure beyond such allowance is limited. However, prolonged delinquencies could result in additional allowances or write-offs in future periods.
| b) | Foreign currency exchange rate risk |
The functional currencies of the subsidiaries are RM and SGD, respectively. The Company’s exposure to foreign currency exchange rate risk primarily relates to cash and cash equivalents, accounts receivable and accounts payable. Any significant fluctuation of the functional currencies against U.S. dollars may materially and adversely affect the Company’s cash flows, revenues, earnings and financial positions.
| c) | Liquidity risk |
The Company is exposed to liquidity risk, which is the risk that it may encounter difficulties in meeting its financial obligations as they become due. The Company manages this risk by maintaining adequate levels of cash and cash equivalents, monitoring cash flows, and maintaining access to financing sources.
As of June 30, 2025, the Company had net working capital deficit of $8,721,729 and a net loss of $4,521,375. Despite this, the Company believes that it can meet all its financial obligations as they become due in the foreseeable future. This conclusion is based on a detailed assessment of the Company’s financial position, forecast, and plans up to the date of approval of these financial statements.
Key considerations in this assessment include:
| ● | The Company maintained cash and cash equivalents of $7,060,410 as of June 30, 2025. |
| ● | The Company’s strong payment track record and long-standing relationships suggest that trade facilities amounting to approximately $91,806,603 and supplier purchasing limits of $11,221,250 will be available for the next 12 months. |
| ● | As of June 30, 2025, the Company had balances of available trade facilities amounting to $7,623,591 to support its operational needs. |
| ● | Tumpuan Megah entered into a repayment plan with major debtors covering $14,986,210, with scheduled monthly repayments from June 2025 to May 2026, which are expected to provide additional liquidity. |
Prior to the consummation of the initial public offering on April 22, 2025, the Company’s principal sources of liquidity to finance its operating activities were from the working capital, trade financing from financial institutions, suppliers credit financing and cash generated from business operation.
On April 22, 2025, the Company consummated its initial public offering on the NYSE American. In this offering, 3,100,000 ordinary shares were issued at a price of $3.25 per share. In addition, the Company entered into an underwriting agreement with the underwriter on April 21, 2025, which granted the underwriter a 45-day option to purchase up to an additional 465,000 ordinary shares at the public offering price of $3.25 per share to cover any over-allotment. Subsequently, on April 22, 2025, the underwriter exercised the over-allotment option in full, purchasing an additional 465,000 ordinary shares at the public offering price of $3.25 per share. The initial public offering closed on April 22, 2025 and the exercise of the over-allotment option closed on April 24, 2025, with gross proceeds totaling $11,586,250, before deducting underwriting discounts and offering expenses.
| F- |
TMD Energy Limited
Notes to Unaudited Consolidated Financial Statements
For the Six Months Ended June 30, 2025 and the Years Ended December 31, 2024 and 2023
The Company believes that its existing cash resources, anticipated cashflow from operations, anticipated cash raised from financing together with net proceeds from its public offering will be sufficient to meet and fund its anticipated operation working capital and capital expansion requirements for the next 12 months from the date of this transition report.
If the Company experiences an adverse operating environment or incur unanticipated capital expenditure requirements, or if the Company determines to accelerate its growth, then additional financing may be required. No assurance can be given, however, that such financing would be available at all or on favorable terms. Additional financing may include the use of debt, credit facilities from financial institutions, or the sale of equity or instruments convertible into equity securities, whether by the Group or its ultimate holding company. Any issuance of additional equity could result in immediate and possibly significant dilution to its existing shareholders, while incurrence of debt would increase fixed obligations and bring along operating covenants that could restrict its operations.
As at June 30, 2025, the Company’s cash and cash equivalents were approximately $7,060,410, comprising primarily in cash and cash equivalent.
| d) | Environment risk |
The Company is subject to numerous local and international environmental laws and regulations as its operation involved the risks of fuel spillage or seepage, environmental damage and hazardous waste disposal which subsequently could result in substantial claims, fines or penalties that will have a material adverse effect on our business and operating results. To mitigate any possible environmental and financial impact, the Company implements stringent standard operating procedures and policies throughout its bunkering and vessel operations.
| e) | Concentration risk |
Customers
For the six months ended June 30, 2025, Customer A, Customer B, Customer C and Customer D accounted for 91.43%, 0.72%, 0.71% and nil of the Company’s revenues, respectively. As of June 30, 2025, these customers accounted for 33%, 26%, 19% and 19% of the Company’s accounts receivable, respectively.
For the year ended December 31, 2024, Customer A, Customer B, Customer C and Customer D accounted for 92.43%, 1.03%, 1.42% and 0.86% of the Company’s revenues, respectively. As of December 31, 2024, these customers accounted for 13%, 32%, 23% and 30% of the Company’s accounts receivable, respectively.
For the year ended December 31, 2023, Customer A and Customer B accounted for 92.66%, and 1.66% of the Company’s revenues, respectively. As of December 31, 2023, these customers accounted for 44% and 36% of the Company’s accounts receivable, respectively.
Suppliers
For the six months ended June 30, 2025, Supplier A, Supplier B and Supplier C accounted for 71.81%, 2.71% and 1.37% of the Company’s total cost of revenues, respectively. As of June 30, 2025, these suppliers accounted for 33%, 38% and 26% of the Company’s accounts payable, respectively.
For the year ended December 31, 2024, Supplier A, Supplier D and Supplier C accounted for 79.59%, 2.56% and 1.19% of the Company’s total cost of revenues, respectively. As of December 31, 2024, these suppliers accounted for 39%, 38% and 19% of the Company’s accounts payable, respectively.
For the year ended December 31, 2023, Supplier A and Supplier D accounted for 46.01% and 36.26% of the Company’s total cost of revenues, respectively. As of December 31, 2023, these suppliers accounted for nil and 95% of the Company’s accounts payable, respectively.
Note 17 – Subsequent events
The Company evaluates all events and transactions that occur after June 30, 2025 up through the date the Company issues the unaudited consolidated financial statements. Other than the event disclosed elsewhere in these unaudited consolidated financial statements, there is no other subsequent event occurred that would require recognition or disclosure in the Company’s unaudited consolidated financial statements.
| F- |
Exhibit 12.1
Certification of the Chief Executive Officer
Pursuant to Section 302 of the Sarbanes-Oxley Act of 2002
I, Dato’ Sri Kam Choy Ho, certify that:
| 1. | I have reviewed this Transition Report on Form 20-F of TMD Energy Limited; |
| 2. | Based on my knowledge, this report does not contain any untrue statement of a material fact or omit to state a material fact necessary to make the statements made, in light of the circumstances under which such statements were made, not misleading with respect to the period covered by this report; |
| 3. | Based on my knowledge, the financial statements, and other financial information included in this report, fairly present in all material respects the financial condition, results of operations and cash flows of the company as of, and for, the periods presented in this report; |
| 4. | The company’s other certifying officer(s) and I are responsible for establishing and maintaining disclosure controls and procedures (as defined in Exchange Act Rules 13a-15(e) and 15d-15(e)) and internal control over financial reporting (as defined in Exchange Act Rules 13a-15(f) and 15d-15(f)) for the company and have: |
| a. | Designed such disclosure controls and procedures, or caused such disclosure controls and procedures to be designed under our supervision, to ensure that material information relating to the company, including its consolidated subsidiaries, is made known to us by others within those entities, particularly during the period in which this report is being prepared; | |
| b. | Designed such internal control over financial reporting, or caused such internal control over financial reporting to be designed under our supervision, to provide reasonable assurance regarding the reliability of financial reporting and the preparation of financial statements for external purposes in accordance with generally accepted accounting principles; | |
| c. | Evaluated the effectiveness of the company’s disclosure controls and procedures and presented in this report our conclusions about the effectiveness of the disclosure controls and procedures, as of the end of the period covered by this report based on such evaluation; and | |
| d. | Disclosed in this report any change in the company’s internal control over financial reporting that occurred during the period covered by the Transition Report on Form 20-F that has materially affected, or is reasonably likely to materially affect, the company’s internal control over financial reporting; and |
| 5. | The company’s other certifying officer(s) and I have disclosed, based on our most recent evaluation of internal control over financial reporting, to the company’s auditors and the audit committee of the company’s board of directors (or persons performing the equivalent functions): |
| a. | All significant deficiencies and material weaknesses in the design or operation of internal control over financial reporting which are reasonably likely to adversely affect the company’s ability to record, process, summarize and report financial information; and | |
| b. | Any fraud, whether or not material, that involves management or other employees who have a significant role in the company’s internal control over financial reporting. |
Date: September 29, 2025
| By: | /s/ Dato’ Sri Kam Choy Ho | |
| Name: | Dato’ Sri Kam Choy Ho | |
| Title: | Director
and Chief Executive Officer (Principal Executive Officer) |
Exhibit 12.2
Certification of the Chief Financial Officer
Pursuant to Section 302 of the Sarbanes-Oxley Act of 2002
I, Chee Mun Hoh, certify that:
| 1. | I have reviewed this Transition Report on Form 20-F of TMD Energy Limited; |
| 2. | Based on my knowledge, this report does not contain any untrue statement of a material fact or omit to state a material fact necessary to make the statements made, in light of the circumstances under which such statements were made, not misleading with respect to the period covered by this report; |
| 3. | Based on my knowledge, the financial statements, and other financial information included in this report, fairly present in all material respects the financial condition, results of operations and cash flows of the company as of, and for, the periods presented in this report; |
| 4. | The company’s other certifying officer(s) and I are responsible for establishing and maintaining disclosure controls and procedures (as defined in Exchange Act Rules 13a-15(e) and 15d-15(e)) and internal control over financial reporting (as defined in Exchange Act Rules 13a-15(f) and 15d-15(f)) for the company and have: |
| a. | Designed such disclosure controls and procedures, or caused such disclosure controls and procedures to be designed under our supervision, to ensure that material information relating to the company, including its consolidated subsidiaries, is made known to us by others within those entities, particularly during the period in which this report is being prepared; | |
| b. | Designed such internal control over financial reporting, or caused such internal control over financial reporting to be designed under our supervision, to provide reasonable assurance regarding the reliability of financial reporting and the preparation of financial statements for external purposes in accordance with generally accepted accounting principles; | |
| c. | Evaluated the effectiveness of the company’s disclosure controls and procedures and presented in this report our conclusions about the effectiveness of the disclosure controls and procedures, as of the end of the period covered by this report based on such evaluation; and | |
| d. | Disclosed in this report any change in the company’s internal control over financial reporting that occurred during the period covered by the Transition Report on Form 20-F that has materially affected, or is reasonably likely to materially affect, the company’s internal control over financial reporting; and |
| 5. | The company’s other certifying officer(s) and I have disclosed, based on our most recent evaluation of internal control over financial reporting, to the company’s auditors and the audit committee of the company’s board of directors (or persons performing the equivalent functions): |
| a. | All significant deficiencies and material weaknesses in the design or operation of internal control over financial reporting which are reasonably likely to adversely affect the company’s ability to record, process, summarize and report financial information; and | |
| b. | Any fraud, whether or not material, that involves management or other employees who have a significant role in the company’s internal control over financial reporting. |
Date: September 29, 2025
| By: | /s/ Chee Mun Hoh | |
| Name: | Chee Mun Hoh | |
| Title: | Chief
Financial Officer (Principal Financial Officer) |
Exhibit 13.1
Certification by the Chief Executive Officer
Pursuant to Section 906 of the Sarbanes-Oxley Act of 2002
In connection with the Transition Report of TMD Energy Limited (the “Company”) on Form 20-F for the period from January 1, 2025 to June 30, 2025, as filed with the Securities and Exchange Commission on the date hereof (the “Report”), I, Dato’ Sri Kam Choy Ho, Chief Executive Officer of the Company, certify, pursuant to 18 U.S.C. Section 1350, as adopted pursuant to Section 906 of the Sarbanes-Oxley Act of 2002, that to my knowledge:
(1) The Report fully complies with the requirements of Section 13(a) or 15(d) of the Securities Exchange Act of 1934, as amended; and
(2) The information contained in the Report fairly presents, in all material respects, the financial condition and results of operations of the Company.
| Date: September 29, 2025 | ||
| By: | /s/ Dato’ Sri Kam Choy Ho | |
| Name: | Dato’ Sri Kam Choy Ho | |
| Title: |
Director and Chief Executive Officer (Principal Executive Officer) |
|
Exhibit 13.2
Certification by the Chief Financial Officer
Pursuant to Section 906 of the Sarbanes-Oxley Act of 2002
In connection with the Transition Report of TMD Energy Limited (the “Company”) on Form 20-F for the period from January 1, 2025 to June 30, 2025, as filed with the Securities and Exchange Commission on the date hereof (the “Report”), I, Chee Mun Hoh, Chief Financial Officer of the Company, certify, pursuant to 18 U.S.C. Section 1350, as adopted pursuant to Section 906 of the Sarbanes-Oxley Act of 2002, that to my knowledge:
(1) The Report fully complies with the requirements of Section 13(a) or 15(d) of the Securities Exchange Act of 1934, as amended; and
(2) The information contained in the Report fairly presents, in all material respects, the financial condition and results of operations of the Company.
| Date: September 29, 2025 | ||
| By: | /s/ Chee Mun Hoh | |
| Name: | Chee Mun Hoh | |
| Title: |
Chief Financial Officer (Principal Financial Officer) |
|
Exhibit 99.1
REGULATIONS THAT MAY AFFECT OUR BUSINESS ACTIVITIES
The following sets forth a summary of the major laws and regulations applicable to our business in Malaysia and Singapore.
THE LAWS AND REGULATIONS OF MALAYSIA
The following section summarizes the principal laws and regulations of Malaysia which are relevant to our business. As this is a summary, it does not purport to be an exhaustive description of all relevant laws and regulations of which our business is subject to and are only intended to provide general information as to relevant laws and regulations which our business may be subjected to.
Merchant Shipping Ordinance 1952 (“MSO”)
The MSO is the principal legislation governing merchant shipping in Malaysia. In addition, the MSO has also adopted certain international maritime conventions making them laws under the MSO to be complied with.
The MSO provides for two types of ship registries, namely the domestic registry and the Malaysia International Ship Registry. In order to be registered as a Malaysian ship under the domestic registry, a ship needs to be wholly owned by either Malaysian citizens or a corporation incorporated in Malaysia in which the majority of directors and shareholders are Malaysians with principal office in Malaysia and management is carried out mainly in Malaysia. Prior to registration, the ship owner shall obtain a certificate specifying the ship’s tonnage and build and such other particulars descriptive of the identity of the ship. Upon being registered, the ship shall be issued with a certificate of registry. The registrar may issue in respect of any ship a provisional certificate of registry that shall be valid for a maximum period of one year before a permanent certificate of registry is issued.
If a ship is owned by a corporation which is incorporated in Malaysia and the office of such corporation is established in Malaysia, but the majority of the shareholding, including voting shares of such corporation are not held by Malaysians, the ship can still be registered as a Malaysian ship under the Malaysia International Ship Registry irrespective of where the ship was built. This is subject to the requirement that the ship is fitted with mechanical means of propulsion, is of not less than 1,600 gross tonnage and does not exceed the maximum age restrictions.
The Domestic Shipping Licensing Board is established pursuant to the MSO to regulate and control the licensing of ships engaged in domestic shipping, which is prescribed under the MSO as the use of ship to provide services, other than fishing, in Malaysian waters or the exclusive economic zone, or for the shipment of goods or the carriage of passengers from or to any port or place in Malaysia or from any port or place in Malaysia to any place in the exclusive economic zone or vice versa. The MSO also provides that no ship, other than a Malaysian ship, may engage in domestic shipping and a ship must have a licence before it can engage in domestic shipping unless exempted under the MSO. A Malaysian ship of less than 15 net tonnage, among others, is exempted from having such domestic shipping licence. The exclusive economic zone of Malaysia refers to an area beyond and adjacent to the territorial sea of Malaysia and extending to a distance of 200 nautical miles from the baselines from which the breadth of the territorial sea is measured and where the limits of the exclusive economic zone are modified and altered in accordance with the provisions of any written law relating to the exclusive economic zone, the exclusive economic zone shall mean the exclusive economic zone as so modified and altered.
The MSO further prescribes that Malaysian ships registered under the MSO shall be issued with, among others, the following certificates:
| (i) | International Ship Security Certificate; |
| (ii) | Safety Management Certificate; |
| (iii) | Cargo Ships Safety Equipment Certificate; |
| (iv) | Cargo Ships Safety Radio Certificate; |
| (v) | Cargo Ship Safety Construction Certificate; and |
| (vi) | Load Line Certificate. |
Generally, these certificates shall remain in force for five years or such shorter period as may be specified therein. A Malaysian ship is prohibited from proceeding to sea without the relevant certificates prescribed under the MSO.
The MSO also provides that a seafarer who is engaged on board a ship shall hold a certificate that verifies his competency and qualification to work on a ship. The owner of every ship shall also enter into agreements with his seafarers in relation to, among others, the nature and duration of an intended voyage, capacity in which the seafarers are to serve and their wages.
In addition, section 491B(1) of the MSO provides that any ship which is engaged or intends to engage in ship-to-ship activities in Malaysian waters shall be required to notify the Director of Marine of such activity. All bunkering activities are monitored under section 491B(3) of the MSO whereby the Director of Marine, upon receiving the notification, may impose such terms and conditions as he thinks fit, including prescribing the fees for anything to be done or permitted to be done under the MSO, on the activity. The owner, master or agent of the ship or any person who contravenes subsection (1) or (3) shall be guilty of an offence and shall, on conviction, be liable to a fine not exceeding one hundred thousand ringgit or to imprisonment for a term not exceeding two years or to both.
International Conventions Adopted by Statutes
International conventions relating to maritime law have been incorporated into Malaysian law in two ways, either by way of legislations embodying, in its own words, provisions having the effect of the convention or by legislations embodying the original text of the convention itself, usually in a schedule with separate changes to be made under Malaysian law for the satisfactory operation of the convention. Examples of some of these conventions are set out below:
| (A) | International Conventions Adopted by MSO |
The following international conventions are the conventions which have been incorporated into Malaysian law by the MSO:
| (i) | International Convention for the Safety of Life at Sea 1974, as amended (“SOLAS 1974”) |
SOLAS 1974 specifies among others, minimum safety standards for the construction, equipment and operation of ships. The convention includes regulations concerning the survey of various types of ships and the issuing of documents signifying that the ships meet the requirements of the convention. SOLAS 1974 also stipulates requirements for stowage and securing of cargo or cargo units and structural requirements for bulk carriers. The International Ship and Port Facility Security Code (“ISPS Code”) came into force under Chapter XI-2/3 of SOLAS 1974. The ISPS Code constitutes the basis for a comprehensive mandatory security regime for international shipping. The ISPS Code outlines detailed maritime and port security related requirements which SOLAS 1974 contracting governments, port authorities and shipping companies must adhere to. The International Safety Management Code (“ISM Code”) came into force under Chapter IX of SOLAS 1974. The ISM Code provides an international standard for the safety management and operation of ships and for pollution prevention. It establishes safety management objectives and requires safety management systems to be established by persons who have assumed responsibilities for operating the ships. The procedures required by the ISM Code should be documented and compiled in a Safety Management Manual, a copy of which should be kept on board.
|
|
| (ii) | International Regulations for Preventing Collisions at Sea 1972 (“COLREG 1972”) |
COLREG 1972 has been adopted by Malaysia as a schedule to the Merchant Shipping (Collisions Regulations) Order 1984 issued pursuant to the MSO. COLREG 1972 sets out the rules for safe navigation and other requirements for safe conduct as well as the requirements for vessels operating in restricted visibility to prevent any collision involving a vessel. The regulations shall be complied with by all vessels upon the high seas and in all connected therewith and navigable by sea-going vessels.
| (iii) | International Convention for the Prevention of Pollution from Ships 1973, as modified by the Protocol of 1978 (“MARPOL 1973”) |
MARPOL 1973 the main international convention covering prevention of pollution of the marine environment by ships from operational or accidental causes. Among others, MARPOL 1973 renders it mandatory for new oil tankers to have double hulls. MARPOL 1973 also sets out certain requirements to control pollution of the sea by sewage, wherein discharge of sewage into the sea is prohibited unless the ship has in operation an approved sewage treatment plant. The convention also limits on sulphur oxide and nitrogen oxide emissions from ship exhausts and prohibits deliberate emissions of ozone depleting substances.
The IMO regulates the emissions of sulphur oxides from ships first came into force in 2005 via Annex VI of MARPOL 1973. Since then, the limits on sulphur oxides have been progressively tightened. Since 1 January 2020, the limit for sulphur in fuel oil used on board ships operating outside designated emission control areas (i.e. the Baltic Sea area, the North Sea area, the North American area, (covering designated coastal areas off the United States and Canada) and the United States Caribbean Sea area (waters around Puerto Rico and the United States Virgin Islands) has been reduced to 0.50% m/m (mass by mass) as opposed to the previous limit of 3.5%.
| (iv) | International Convention on Tonnage Measurement of Ships 1969 (“TONNAGE 1969”) |
TONNAGE 1969 prescribes among others the standards wherein ships are to be surveyed and measured in relation to its gross and net tonnages.
| (v) | International Convention on Load Lines 1966, as amended by the Protocol of 1988 (“ICLL 1966”) |
ICLL 1966 prescribes the standards at which freeboards of ships are to be assigned and the load lines of ships are to be marked in accordance with the convention.
| (vi) | Convention on Limitation of Liability for Maritime Claims 1976, as amended by the Protocol of 1996 (“LLMC 1976”) |
LLMC 1976 prescribes that shipowners and salvors may limit their liability in respect of maritime claims in accordance with the rules of LLMC 1976.
The limit of liability for claims is calculated based on the tonnage of the ship. LLMC 1976 segregates the types of claims into two categories, (i) claims for loss of life or personal injury; and (ii) property claims (such as damage to other ships, property or harbour works). The limitation amount for claims for loss of life or personal injury is twice the limitation amount for property claims. However, shipowners and salvors are not entitled to limit their liability if it is proven that the loss resulted from their personal act or omission, committed with the intent to cause such a loss or recklessly and with knowledge that such loss would probably result.
|
|
| (vii) | International Convention on Standards of Training, Certification and Watchkeeping for Seafarers 1978, as amended (“STCW 1978”) |
The STCW 1978 has been adopted by Malaysia pursuant to the Merchant Shipping (Training and Certification) Rules 1999 issued under the MSO. The STCW 1978 prescribes minimum standards relating to training, certification and watchkeeping for seafarers which countries are obliged to meet.
| (viii) | International Convention on Oil Pollution Preparedness, Response and Cooperation 1990, as modified by the Protocol of 2000 (“OPRC 1990”) |
Parties to the OPRC 1990 are required to establish measures for dealing with pollution incidents. Ships are required to carry a shipboard oil pollution emergency plan and are required to report incidents of oil pollution to coastal authorities.
| (ix) | Maritime Labour Convention 2006, as amended (“MLC 2006”) |
The MLC 2006 sets out the requirements for working and living conditions for seafarers, including conditions of service, wages, health and medical care, occupational safety, accommodation, recreational facilities and provisions to be provided on board the Malaysian ship. The MLC 2006 requires all ships of 500 gross tonnage or more plying internationally to hold a valid Maritime Labour Certificate.
| (x) | Nairobi International Convention on the Removal of Wrecks 2007 (“WRC 2007”) |
The WRC 2007 provides for the removal of wrecks which pose a hazard to the safety of navigation or to the marine and coastal environments. Wreck is defined as a sunken or stranded ship, any part of or an object on a sunken or stranded ship, any object that is lost at sea from a ship and is stranded, sunken or adrift or a ship that is reasonably expected to sink or to strand.
The WRC 2007 places the onus to remove the wreck on the shipowners and renders shipowners financially liable for the costs of wreck removal. The shipowners are also required to maintain compulsory insurance or other financial security to cover liability under the WRC 2007.
| (B) | International Conventions Adopted by the Carriage of Goods by Sea Act 1950 (“CGSA”) and the Merchant Shipping Ordinance 1960 (Sabah) and the Merchant Shipping Ordinance 1960 (Sarawak) (collectively, the “MSO Sabah and Sarawak”) |
The International Convention for the Unification of Certain Rules of Law relating to Bills of Lading, Brussels, 1924 (“Hague Rules”) have been adopted by Malaysia through the CGSA and the MSO Sabah and Sarawak. The provisions govern carriage of goods by sea in ships carrying goods from any port in Malaysia to any other port whether in or outside Malaysia. Every sea carriage document issued in Malaysia which contains or is evidence of any contract to which the Hague Rules apply shall contain an express statement that it is to have effect subject to the Hague Rules.
The provisions of CGSA and MSO Sabah and Sarawak also provide, among others, rules relating to bills of lading; and the rights, responsibilities and liabilities of a carrier and a shipper under a contract of carriage of goods by sea.
| (C) | International Conventions Adopted by the Merchant Shipping (Oil Pollution) Act 1994 (now known as Merchant Shipping (Liability and Compensation for Oil and Bunker Oil Pollution) Act 1994) (“MSOPA”) |
The International Convention on Civil Liability for Bunker Oil Pollution Damage 2001 has been adopted by the MSOPA. The MSOPA provides for the civil liability for oil and bunker oil pollution by merchant ships in Malaysian waters and for matters connected therewith. Under the MSOPA, the owner of a ship at the time of an incident, or where the incident consists of a series of occurrences having the same origin, at the time of the first occurrence, shall, except as otherwise provided for by the MSOPA, be liable for any pollution damage caused by the ship as a result of the incident in any area of Malaysia.
The International Convention on Civil Liability for Oil Pollution Damage of 1992 (“CLC 1992”) applies to oil pollution damage resulting from spills of persistent oil from tankers and has been adopted by the MSOPA.
|
|
Port Authorities Act 1963 (Act 488) (“PAA”)
The PAA provides for the establishment of port authorities, for the functions of such authorities and for matters connected therewith. Different ports in Malaysia may have their own specific regulations and guidelines governing bunkering activities within their jurisdictions. Under section 3(2)(v) of the PAA, each port authority has the power to undertake or grant licence on such conditions as the authority may think fit to any company, firm, person or persons to undertake, any activities in the port as may appear to the port authority to be necessary, which may include bunkering operations.
Petroleum Development Act 1974 (Act 144) (“PDA”)
The PDA governs the exploration and exploitation of petroleum whether onshore or offshore by Petroliam Nasional Berhad, the corporation vested with the entire ownership in and the exclusive rights, powers, liberties and privileges in respect of petroleum in Malaysia, and to control the carrying on of downstream activities and development relating to petroleum and its products. In accordance with section 6(3) of the PDA and Regulation 3A(2) of the Petroleum Regulations 1974, an application for permission to initiate or continue any business marketing or distribution of petroleum or petroleum products shall be made to the Secretary General of the Ministry of Domestic Trade and Cost of Living (“KPDN”).
KPDN regulates marketing and distribution activities of petroleum materials or petroleum products through four (4) types of PDA permissions issued based on the following activities:
| 1. | To operate gas stations / mini gas station / portable container systems / skid tank /floating barge in Malaysia (PDA 1) |
| 2. | To carry out bunkering services (PDA 2) |
| 3. | To operate petroleum transportation services (PDA 3) |
| 4. | To carry out wholesale marketing of petroleum / LPG based materials (PDA 4) |
The Guidelines for application for PDA2 permission for bunkering services issued by KPDN (July 2022) requires all new applicants to have a minimum 30% equity held by Bumiputera. In addition, the PDA holder is required to obtain the prior approval of KPDN for any changes in shareholding structure and board of directors.
Customs Act 1967 (Act 235) (“Customs Act”)
The Customs Act regulate the import and export of goods in Malaysia, and the duties thereon. The Director General of Customs and Excise may, in his absolute discretion, permit or refuse to permit the taking of anything without payment of customs duty into a ship as ship’s stores as well as to permit or refuse to permit the use, within the territorial waters, of any ship’s stores on which customs duty has not been paid.
Control of Supplies Act 1961 (Act 122) (“CSA”)
The CSA sets out the provisions for the control and rationing of certain supplies. Pursuant to the CSA and the Control of Supplies Regulations 1974 (PU(A) 103/1974) (“CSR”), the dealing by wholesale or retail in any scheduled article or manufacture any scheduled article (which includes petrol, and all grades of diesel fuel, and mixture of diesel fuel and biofuel) except under and in accordance with a license issued under the CSR. Where a person has more than one place of business he shall take out a separate license in respect of each place of business. A wholesaler or a retailer shall not purchase a scheduled article except from a person who is licensed to deal in such scheduled article by wholesale unless authorised otherwise in writing by the Controller of Supplies under the CSA in respect of any particular seller or class of sellers of such scheduled article. A retailer shall not have in his possession or under his custody or control at any one time more than such quantity of any scheduled article as may be specified in the license.
|
|
Environmental Quality Act 1974 (Act 127) (“EQA”)
The EQA sets out provisions in respect of prevention, abatement, control of pollution and enhancement of the environment.
It is an offence under EQA for any person, unless licensed to do so, to among others –
| (i) | emit or discharge wastes into the atmosphere; |
| (ii) | emit or cause or permit to be emitted any noise greater in volume, intensity or quality; |
| (iii) | pollute or cause or permit to be polluted any soil or surface of any land; or |
| (iv) | emit, discharge or deposit any wastes into any inland waters, |
in contravention of the acceptable conditions specified in EQA.
The EQA also empowers the Minister charged with the responsibility for environment protection to make regulations specifying acceptable conditions for the emission, discharge or deposit of environmentally hazardous wastes or the emission of noise into the environment. Among the regulations which have been issued includes the Environmental Quality (Scheduled Wastes) Regulations 2005 (“2005 Regulations”).
Pursuant to the 2005 Regulations, every scheduled waste generator shall notify the Director General of Environmental Quality of the new categories and quantities of scheduled wastes which are generated within 30 days of its generation.
Scheduled wastes shall only be disposed of at prescribed premises and be treated at prescribed premises or on-site treatment facilities. In addition, scheduled wastes shall be properly stored in containers which are clearly labelled and marked for identification and warning purposes, delivered to and received at prescribed premises for treatment and disposal.
Local Government Act 1976 (Act 171)
Prior to the commencement of our business operations in Malaysia, we are required to apply for business premises licenses for each operating premises from the relevant local authority under the Local Government Act 1976, which confers power to the local authority to create by-laws in respect of all matters as are necessary or desirable for the maintenance of the health, safety and well-being of the inhabitants or for good order and government of the local authority area including to control and supervise, by registration, licensing or otherwise, including by prohibition, a trade, business or industry which is of an obnoxious nature or which could be a source of nuisance to the public or a class of public, and any person who fails to exhibit his license at all times in some prominent place on the licensed premises or fails to produce such license when required shall be liable to a fine not exceeding RM500 and/or to imprisonment for a term not exceeding six months.
Regulations Relating to Business Operations in Labuan
Our vessels are owned by our subsidiaries which are incorporated under the Labuan Companies Act. In addition to the regulations above, our Labuan subsidiaries are allowed to participate in business activities and enjoy tax benefits provided under the Labuan Business Activity Tax Act 1990 (Act 445) (“LBATA”). As they carry out Labuan leasing business, namely bareboat chartering, they are required to be licensed under the Labuan Financial Services and Securities Act 2010 (Act 704) (“LFSSA”). The licences impose various obligations on these subsidiaries including having sufficient and positive capital or working funds which commensurate with the Labuan leasing business at all times and establishing adequate set of internal policies and controls for its operations, compliance, corporate governance and risk management. The licence may be revoked for reasons including being convicted of an offence under the LFSSA or of a criminal offence in any recognised country or jurisdiction. If the licence of any of our Labuan subsidiary is revoked, such subsidiary is required from the date such revocation taking effect, cease to transact any further Labuan leasing business. The approval from the Labuan Financial Services Authority is required in respect of any change in shareholders of a Labuan company carrying on leasing activities by more than 10%.
A company that commits an offence against the LFSSA for which no penalty is expressly provided shall be liable to a fine not exceeding three million ringgit and in the case of a continuing offence, shall, in addition, be liable to a daily fine not exceeding five thousand ringgit for each day the offence continues to be committed. In addition, a person who, at the time of the commission of the offence, was a director or other similar officer or was purporting to act in any such capacity may be charged severally or jointly in the same proceedings with the body corporate.
|
|
Regulations Relating to Anti-Money Laundering and Counter-Terrorism Financing
The Anti-Money Laundering, Anti-Terrorism Financing and Proceeds of Unlawful Activities Act 2001 (Act 613) (the “AMLA 2001”) prohibits money laundering and terrorism financing activities. Any person who (a) engages in a transaction that involves proceeds of unlawful activity; (b) uses proceeds of unlawful activity; (c) removes from or brings into Malaysia proceeds of unlawful activity; or (d) conceals, disguises, or impedes the establishment of the true nature, origin, location, movement, disposition, title of, rights with respect to, or ownership of, proceeds of unlawful activity, commits a money laundering offence under the AMLA 2001.
In addition, a reporting institution under the First Schedule of the AMLA 2001 is obliged to observe the anti-money laundering and counter financing terrorism requirements and standards, which include reporting and record-keeping duties, such as submitting suspicious transaction reports, implementing risk-based application, and conducting customer due diligence.
Our Labuan incorporated subsidiaries are deemed to be a reporting institution. In addition, notwithstanding that our other subsidiaries do not fall within the First Schedule of AMLA 2001, we are required to comply with the provisions under the AMLA 2001.
Regulations Relating to Labour
The principal law that governs and regulates all labour relations — including contracts of service, payment of wages, employment of women, maternity protection, hours of work, holidays, leave policy, termination, layoff, retirement benefits, and employment of foreign employees — is the Employment Act 1955 (Act 265) (the “EA 1955”). EA 1955 applies to the Peninsular Malaysia and the Federal Territory of Labuan. Following the implementation of the Employment (Amendment of First Schedule) Order 2022, which came into force on January 1, 2023, the applicability of the EA 1955 has been expanded to include any person who has entered into a contract of service with an employer, irrespective of their monthly wages, is engaged in manual labour, serves as a supervisor of such manual labourer, serves as a domestic employee, or is engaged in any capacity in any vessel registered in Malaysia subject to certain conditions. Notwithstanding this, pursuant to Paragraph 1A of the First Schedule of the EA 1955, certain provisions in respect of overtime payments termination, layoff and retirement benefits will not apply to employees whose wages exceed RM4,000 a month.
The widening scope of the EA 1955 indicates that all employers should ensure that the terms of their existing contract of employment comply with the minimum standards prescribed under the EA 1955 as well as all other applicable statutory requirements, including the minimum retirement age and statutory contributions such as Social Security and Employees’ Provident Fund.
Other laws and regulations in relation to employment matters include the Industrial Relations Act 1967 (Act 177), Immigration Act 1959/63 (Act 155), Employment (Restriction) Act 1968 (Act 796), Employees Provident Fund Act 1991 (Act 452), Employees’ Social Security Act 1969 (Act 4), Employees’ Social Security (General) Regulations 1971, Employment Insurance System Act 2017 (Act 800), Minimum Retirement Age Act 2012 (Act 753) and Minimum Wages Order 2024.
In addition, the Occupational Safety and Health Act 1994 (Act 514) (“OSHA”) sets out provisions for securing the safety, health and welfare of persons at work and for protecting others against risks to safety or health in connection with the activities of persons at work. Under OSHA, our Group, as the employer, has a duty to ensure, so far as is practicable, the safety, health and welfare at work of all its employees, and the matters to which such duty extends includes: –
| (i) | the provision and maintenance of plants and systems of work that are, so far as is practicable, safe and without risks to health; |
|
|
| (ii) | the provision of such information, instruction, training and supervision as is necessary to ensure, so far as is practicable, the safety and health at work of all its employees; |
| (iii) | so far as is practicable, the maintenance of a place of work that is in a safe condition and without risks to health; and |
| (iv) | the provision of adequate facilities with regards to the welfare of its employees at work. |
In addition, the MSO which has ratified the Maritime Labour Convention 2006 sets out the requirements for working and living conditions for seafarers.
Our Group also has a duty to formulate a general safety and health policy for its employees at work and to bring the policy and any revisions of such policy to the notice of all of its employees.
Our Group is also under a duty to ensure, so far as is practicable, that it and other persons, not being its employees, who may be affected are not thereby exposed to risks to their safety or health from the conduct of their undertakings.
Regulation on Dividend Distributions
Malaysia Companies Act 2016 (Act 777)
Under the Malaysia Companies Act, a Malaysian company incorporated under the Malaysia Companies Act may only make a distribution to the shareholders out of profits of the company available if the company is solvent and if so authorized by its directors.
Labuan Companies Act
Correspondingly, the Labuan Companies Act provides that no dividend shall be payable to any shareholder of any Labuan company incorporated under the Labuan Companies Act except out of profits.
THE LAWS AND REGULATIONS OF SINGAPORE
The following section summarizes the principal laws and regulations of Singapore which are relevant to our business. As this is a summary, it does not purport to be an exhaustive description of all relevant laws and regulations of which our business is subject to and are only intended to provide general information as to relevant laws and regulations which our business may be subjected to.
Regulations on dividend distribution
The governing legislation for the distribution of dividends in Singapore is the Singapore Companies Act. Under section 403 of the Singapore Companies Act, no dividends can be paid to shareholders of a Singapore-incorporated company except out of profits, and there are certain restrictions on the use of profits for the purposes of dividend declaration. Any profits of a company applied towards the purchase or acquisition of its own shares pursuant to the share buyback provisions under the Singapore Companies Act, and any gains derived from the sale or disposal of treasury shares, cannot be payable as dividends to the shareholders of the company. The foregoing restriction does not apply to any part of the proceeds received by the company from a sale or disposal of its treasury shares which the company has applied towards the profits of the company where such part of the proceeds received from a sale or disposal of its treasury shares initially originated from (and was funded by) profits of the company in the first place.
In addition to complying with the Singapore Companies Act, the payment of dividends is also governed by case law and must be made in accordance with the company’s constitution and the Singapore Financial Reporting Standards. The Singapore Companies Act does not prescribe what constitutes distributable profits and guidance on this issue may be derived from case law.
|
|
Regulations on labor and employment
The Employment Act 1968 of Singapore (the “Employment Act”) generally extends to all employees regardless of their designation, salary level or type of work performed, with the exception of certain groups of employees (i.e., seafarers, domestic workers and public workers). It provides employees falling within its ambit certain protections such as minimum notice periods, restrictions in relation to the deductions from wages, minimum days of annual and sick leave, maternity/paternity leave and paid childcare leave. The Employment Act also applies to employees who are foreigners so long as they fall within the definition of “employee” under the Employment Act.
Employers in Singapore owe a statutory obligation to contribute to a Central Provident Fund, under the Central Provident Fund Act 1953 of Singapore, in relation to wages for employees who are Singapore citizens or permanent residents of Singapore. The specific contribution rate to be made by employers varies depending on whether the employee is a Singapore citizen or permanent resident and the age group and wage band of the employee.
Other employment-related benefits which are prescribed by law include statutory requirements relating to work injury compensation, and workplace safety and health, under the Work Injury Compensation Act 2019 of Singapore and the Workplace Safety and Health Act 2006 of Singapore, respectively. In addition, the employment of foreign manpower in Singapore is also governed by the Employment of Foreign Manpower Act 1990 of Singapore.
Regulations on data protection
The Personal Data Protection Act 2012 of Singapore (the “PDPA”) generally requires organizations to give notice and obtain consents prior to collection, use or disclosure of personal data (data, whether true or not, about an individual who can be identified from that data or other accessible information), and to provide individuals with the right to access and correct their own personal data. Organizations have mandatory obligations to assess data breaches they suffer, and to notify the Singapore Personal Data Protection Commission (the “PDPC”) and relevant individuals where the data breach is of a certain severity. The PDPA also imposes various baseline obligations upon organizations in connection with permitted uses of, accountability for, the protection of, the retention of, and overseas transfers of, personal data. In addition, the PDPA requires organizations to check “Do-Not-Call” registries prior to sending marketing messages addressed to Singapore telephone numbers, through voice calls, fax or text messages, including text messages transmitted over the Internet.
The PDPA creates various offenses in connection with the improper use of personal data, certain methods of collecting personal data, and certain failures to comply with PDPA requirements. These offences may be applicable to organizations, their officers and/or their employees. Offenders are liable on conviction to fines and/or imprisonment. The PDPA empowers the PDPC with significant regulatory powers to ensure compliance with the PDPA, including powers to investigate, give directions, and impose a financial penalty of up to SGD1 million, or 10% of the organization’s annual turnover in Singapore, whichever is higher. In addition, the PDPA created a right of private action, pursuant to which the Singapore courts may grant damages, injunctions, and relief by way of declaration, to persons who suffer loss or damages directly as a result of contraventions of certain PDPA requirements.
|
|