UNITED STATES
SECURITIES AND EXCHANGE COMMISSION
Washington, D.C. 20549
FORM 8-K
CURRENT REPORT
Pursuant to Section 13 or 15(d) of the
Securities Exchange Act of 1934
Date of Report (Date of earliest event reported): March 2, 2023
CARECLOUD, INC.
(Exact name of registrant as specified in its charter)
| Delaware | 001-36529 | 22-3832302 | ||
|
(State or other jurisdiction of incorporation) |
(Commission File Number) |
(IRS Employer Identification No.) |
7 Clyde Road, Somerset, New Jersey, 08873
(Address of principal executive offices, zip code)
(732) 873-5133
(Registrant’s telephone number, including area code)
Not
Applicable
(Former name or former address, if changed since last report)
Check the appropriate box below if the Form 8-K filing is intended to simultaneously satisfy the filing obligation of the registrant under any of the following provisions:
| ☐ | Written communications pursuant to Rule 425 under the Securities Act (17 CFR 230.425) |
| ☐ | Soliciting material pursuant to Rule 14a-12 under the Exchange Act (17 CFR 240.14a-12) |
| ☐ | Pre-commencement communications pursuant to Rule 14d-2(b) under the Exchange Act (17 CFR 240.14d-2(b)) |
| ☐ | Pre-commencement communications pursuant to Rule 13e-4(c) under the Exchange Act (17 CFR 240.13e-4(c)) |
Securities registered pursuant to Section 12(b) of the Act:
| Title of each class | Trading Symbol(s) | Name of each exchange on which registered | ||
| Common Stock, par value $0.001 per share | CCLD | Nasdaq Global Market | ||
| 11% Series A Cumulative Redeemable Perpetual Preferred Stock, par value $0.001 per share | CCLDP | Nasdaq Global Market | ||
| 8.75% Series B Cumulative Redeemable Perpetual Preferred Stock, par value $0.001 per share | CCLDO | Nasdaq Global Market |
Indicate by check mark whether the registrant is an emerging growth company as defined in Rule 405 of the Securities Act of 1933 (§230.405 of this chapter) or Rule 12b-2 of the Securities Exchange Act of 1934 (§240.12b-2 of this chapter).
Emerging growth company ☐
If an emerging growth company, indicate by check mark if the registrant has elected not to use the extended transition period for complying with any new or revised financial accounting standards provided pursuant to Section 13(a) of the Exchange Act. ☐
Item 2.02 Results of Operations and Financial Condition.
On March 2, 2023, the Registrant issued a press release, a copy of which is attached hereto as Exhibit 99.1 and is incorporated herein by reference.
The information furnished pursuant to Item 2.02 of this Form 8-K shall not be deemed “filed” for purposes of Section 18 of the Securities Exchange Act of 1934, as amended (the “Exchange Act”) or otherwise subject to the liabilities of that section, nor shall it be deemed incorporated by reference into any other filing under the Securities Act of 1933, as amended or the Exchange Act, except as expressly set forth by specific reference in such a filing.
Item 7.01 Regulation FD Disclosure.
On March 2, 2023, the Registrant provided slides to accompany its earnings presentation, a copy of which is attached hereto as Exhibit 99.2 and is incorporated herein by reference.
The information furnished pursuant to Item 7.01 of this Form 8-K shall not be deemed “filed” for purposes of Section 18 of the Securities Exchange Act of 1934, as amended (the “Exchange Act”) or otherwise subject to the liabilities of that section, nor shall it be deemed incorporated by reference into any other filing under the Securities Act of 1933, as amended or the Exchange Act, except as expressly set forth by specific reference in such a filing.
Item 9.01 Financial Statements and Exhibits.
(d) Exhibits
| Exhibit No. | Description | |
| 99.1 | Press release dated March 2, 2023. | |
| 99.2 | Slide presentation dated March 2, 2023. | |
| 104 | Cover Page Interactive Data File (embedded within the Inline XBRL document) |
|
|
SIGNATURE(S)
Pursuant to the requirements of the Securities Exchange Act of 1934, the registrant has duly caused this report to be signed on its behalf by the undersigned, hereunto duly authorized.
| CareCloud, Inc. | ||||
| Date: | March 2, 2023 | By: | /s/ A. Hadi Chaudhry | |
| A. Hadi Chaudhry | ||||
| Chief Executive Officer | ||||
|
|
Exhibit 99.1

CareCloud Reports Record Full Year 2022 Results
SOMERSET, N.J., March 2, 2023 (GLOBE NEWSWIRE) – CareCloud, Inc. (the “Company” or “CareCloud”) (Nasdaq: CCLD, CCLDP and CCLDO), a leader in healthcare technology solutions for medical practices and health systems nationwide, announced financial and operational results for the year ended December 31, 2022. The Company’s management will conduct a conference call with related slides today at 8:30 a.m. Eastern Time to discuss these results and management’s outlook for the year.
“2022 was a successful transformational year for CareCloud,” said A. Hadi Chaudhry, CareCloud’s Chief Executive Officer and President. “We launched several new products, including CareCloud Remote for home healthcare and CareCloud Wellness, which expanded our digital health portfolio to provide chronic care management and remote patient monitoring to a rapidly growing user base. The combination of broadening our service offering with these new products and successful focus on organic growth were primary drivers that helped us achieve record bookings in 2022, which is more than double the previous year. We are on a mission to redefine technology-enabled revenue cycle solutions for healthcare and are positioned well to build on this momentum in 2023.”
Full Year 2022 Highlights
| ● | Revenue of $138.8 million, as compared to $139.6 million in 2021 | |
| ● | Record GAAP net income of $5.4 million, compared to $2.8 million in 2021 | |
| ● | Adjusted net income of $16.3 million or $1.07 per share, compared to $18.5 million or $1.24 per share in 2021 | |
| ● | Record adjusted EBITDA of $22.2 million, an increase of $129,000 over $22.1 million in 2021 |
Fourth Quarter 2022 Highlights
| ● | Revenue of $32.5 million, as compared to $37.5 million in Q4 2021 | |
| ● | GAAP net income of $499,000, compared to $3.5 million in Q4 2021 | |
| ● | Adjusted net income of $3.9 million, or $0.25 per share | |
| ● | Adjusted EBITDA of $5.7 million, as compared to $6.1 million in Q4 2021 |
Full Year 2022 Financial Results
Revenue for 2022 was $138.8 million, a 1% decline compared to $139.6 million in 2021.
Bill Korn, CareCloud’s Chief Financial Officer remarked, “when we acquired Meridian Medical Management in mid-2020, their two largest clients were health systems which had each been acquired in 2016 and 2018, and were in the process of migrating away from Meridian onto the platforms utilized by their acquirers. We recognized that we could not stop this migration, for which significant money had already been expended, and understood that we would eventually lose this revenue, though we didn’t know how long the migrations would actually take. Both clients finished the majority of their migrations in mid-2022. Our 2021 revenue of $139.6 million would have been $118.1 million excluding these clients, and our 2022 revenue without these clients was $126.7 million. So, excluding these clients from both years, we would have recorded revenue growth of 7% in 2022.”
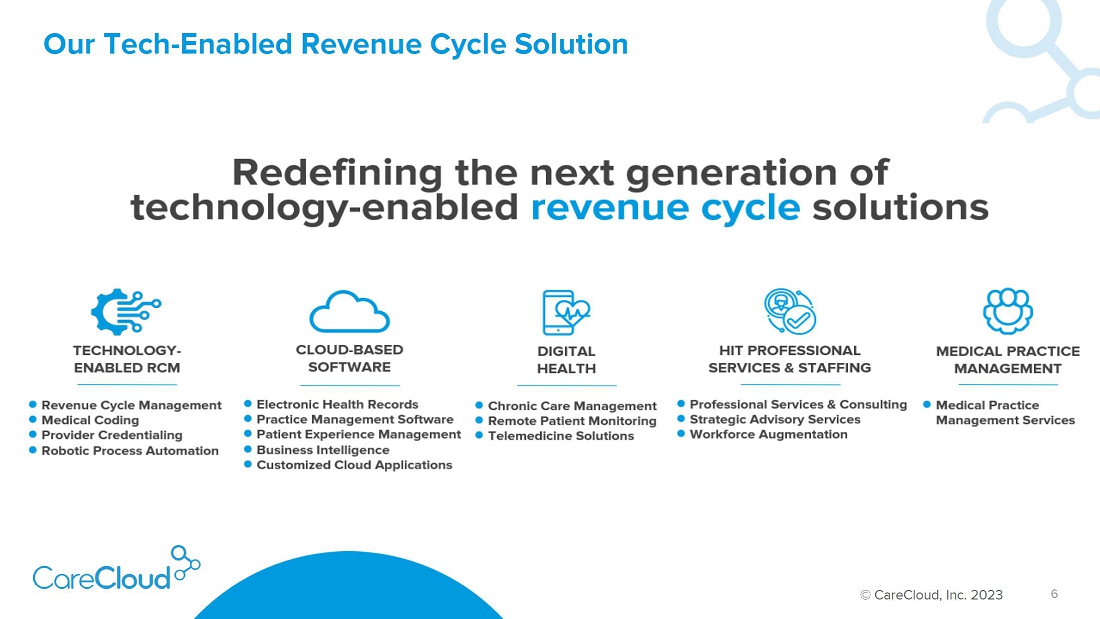
“Approximately 88% of our 2022 revenue came from technology-enabled business solutions. Clients using our technology-enabled revenue cycle management services represented approximately 52% of our revenue, with over 90% of that revenue coming from clients who also utilized our EHR or practices management software as well as our services. Approximately 12% of our revenue came from clients utilizing our cloud-based software without a services component, and 24% of our revenue came from professional services, such as our medSR professional services geared towards hospitals and large health systems and CareCloud FORCE workforce augmentation. All of these revenue streams leverage the power of our technology and our low-cost, world-class team.”
“Approximately 10% of our revenue was from clients where we are managing their entire medical practice, and approximately 2% of revenue came from other services.”
CareCloud’s GAAP net income was $5.4 million, compared to $2.8 million in 2021. This is CareCloud’s second consecutive year of positive GAAP net income since its IPO in 2014, representing approximately 92% growth year-over-year. GAAP net loss per share was $0.67, based on the net loss attributable to common shareholders, which takes into account the preferred stock dividends declared during the year.
Non-GAAP adjusted net income for 2022 was $16.3 million or $1.07 per share. Non-GAAP adjusted net income excludes non-cash expenses such as depreciation and amortization as well as the gain from the change in contingent consideration.
Adjusted EBITDA was $22.2 million, an increase of $129,000 from $22.1 million last year, despite the loss of revenue from the two large clients which were acquired and who were previously very profitable, and despite increasing our sales and marketing spending by approximately $1 million.
Fourth Quarter 2022 Financial Results
Revenue for the fourth quarter 2022 was $32.5 million, a decrease of 13% from the fourth quarter of 2021, primarily due to the decrease from the two large clients previously mentioned.
Fourth quarter 2022 GAAP net income was $499,000, compared to $3.5 million in the same period last year. “While the management team looks at adjusted EBITDA and cash flow from operations as the primary indicators of whether our business is growing in a sustainable way, achieving positive GAAP profitability for six consecutive quarters is a great indication of our progress,” remarked Bill Korn. GAAP net loss per share for fourth quarter 2022 was $0.22, based on the net income attributable to common shareholders.
Non-GAAP adjusted net income for fourth quarter 2022 was $3.9 million, or $0.25 per share, and is calculated using the end-of-period common shares outstanding. Non-GAAP adjusted net income exceeded the quarterly dividend paid to preferred shareholders.
Adjusted EBITDA for fourth quarter 2022 was $5.7 million, or 17% of revenue, compared to $6.1 million in the same period last year.
|
|
Cash Balances and Capital Structure
As of December 31, 2022, the Company had approximately $12.3 million of cash. During the fourth quarter 2022, cash flow from operations was approximately $6.0 million. Our net working capital on December 31, 2022 was approximately $12.3 million.
On December 31, 2022, the Company had 4,526,231 shares of non-convertible Series A Preferred Stock outstanding, and 1,344,128 shares of non-convertible Series B Preferred Stock outstanding. The Series A shares pay cash dividends at the rate of 11% per annum of the $25.00 per share liquidation preference (equivalent to $2.75 annually per share), but they are fully redeemable at the Company’s option at $25.00 per share. During 2022, the Company sold approximately 1.3 million shares of non-convertible Series B Preferred Stock, which is similar to Series A Preferred Stock, but with an 8.75% annual cash dividend. The Company used $20 million of the proceeds from the Series B offering to redeem 800,000 shares of Series A Preferred Stock on March 18, 2022. Series B shares are redeemable at the Company’s option beginning in February 2024.
2023 Guidance
CareCloud is providing the following forward-looking guidance for the fiscal year ending December 31, 2023:
| For the Fiscal Year Ending December 31, 2023 Forward-Looking Guidance |
||
| Revenue | $142 – $146 million | |
| Adjusted EBITDA | $24 – $27 million | |
The Company anticipates full year 2023 revenue of approximately $142 to $146 million. Revenue guidance is based on management’s expectations regarding revenues from existing clients, including adoption of CareCloud Wellness which was introduced in 2022, as well as new clients acquired through organic growth. We have excluded the effects of any future acquisitions or tuck-ins, and made assumptions about the timing for new customers going live and the adoption rates of new services. This implies 12% net organic growth from 2022 to 2023, excluding the revenue from the two large clients who were previously acquired and migrated off our services in mid-2022.
Adjusted EBITDA is expected to be $24 to $27 million for full year 2023, which implies growth of approximately 15% from 2022 to 2023, without the effects of any future acquisitions or tuck-ins.
Conference Call Information
CareCloud management will host a conference call today at 8:30 a.m. Eastern Time to discuss the full year 2022 results. The live webcast of the conference call and related presentation slides can be accessed under Events & Presentations at ir.carecloud.com/events/. An audio-only option is available by dialing 201-389-0920 and referencing “CareCloud Fourth Quarter 2022 Earnings Call.” Investors who opt for audio only will need to download the related slides at ir.carecloud.com/events/.
|
|
A replay of the conference call with slides will be available approximately one hour after conclusion of the call at the same link. An audio replay can also be accessed by dialing 412-317-6671 and providing access code 13736125.
About CareCloud
CareCloud (Nasdaq: CCLD, CCLDP, CCLDO) brings disciplined innovation to the business of healthcare. Our suite of technology-enabled solutions helps clients increase financial and operational performance, streamline clinical workflows and improve the patient experience. More than 40,000 providers count on CareCloud to improve patient care, while reducing administrative burdens and operating costs. Learn more about our products and services, including revenue cycle management (RCM), practice management (PM), electronic health records (EHR), business intelligence, patient experience management (PXM) and digital health at www.carecloud.com.
Follow CareCloud on LinkedIn, Twitter and Facebook.
For additional information, please visit our website at www.carecloud.com. To view CareCloud’s latest investor presentations, read recent press releases, and listen to interviews with management, please visit ir.carecloud.com.
Use of Non-GAAP Financial Measures
In our earnings releases, prepared remarks, conference calls, slide presentations, and webcasts, we use and discuss non-GAAP financial measures, as defined by SEC Regulation G. The GAAP financial measure most directly comparable to each non-GAAP financial measure used or discussed, and a reconciliation of the differences between each non-GAAP financial measure and the comparable GAAP financial measure, are included in this press release after the condensed consolidated financial statements. Our earnings press releases containing such non-GAAP reconciliations can be found in the Investor Relations section of our web site at ir.carecloud.com.
Forward-Looking Statements
This press release contains various forward-looking statements within the meaning of the safe harbor provisions of the U.S. Private Securities Litigation Reform Act of 1995. These statements relate to anticipated future events, future results of operations or future financial performance. In some cases, you can identify forward-looking statements by terminology such as “may,” “might,” “will,” “shall,” “should,” “could,” “intends,” “expects,” “plans,” “goals,” “projects,” “anticipates,” “believes,” “seek,” “estimates,” “forecast,” “predicts,” “possible,” “potential,” “target,” or “continue” or the negative of these terms or other comparable terminology.
Our operations involve risks and uncertainties, many of which are outside our control, and any one of which, or a combination of which, could materially affect our results of operations and whether the forward-looking statements ultimately prove to be correct. Forward-looking statements in this press release include, without limitation, statements reflecting management’s expectations for future financial performance and operating expenditures, expected growth, profitability and business outlook, the impact of the Covid-19 pandemic on our financial performance and business activities, and the expected results from the integration of our acquisitions.
|
|
These forward-looking statements are neither historical facts nor assurances of future performance. Instead, they are only predictions, are uncertain and involve substantial known and unknown risks, uncertainties and other factors which may cause our (or our industry’s) actual results, levels of activity or performance to be materially different from any future results, levels of activity or performance expressed or implied by these forward-looking statements. New risks and uncertainties emerge from time to time, and it is not possible for us to predict all of the risks and uncertainties that could have an impact on the forward-looking statements, including without limitation, risks and uncertainties relating to the Company’s ability to manage growth, migrate newly acquired customers and retain new and existing customers, maintain cost-effective global operations, increase operational efficiency and reduce operating costs, predict and properly adjust to changes in reimbursement and other industry regulations and trends, retain the services of key personnel, develop new technologies, upgrade and adapt legacy and acquired technologies to work with evolving industry standards, compete with other companies products and services competitive with ours, and other important risks and uncertainties referenced and discussed under the heading titled “Risk Factors” in the Company’s filings with the Securities and Exchange Commission. In addition, there is uncertainty about the spread of the Covid-19 virus and the impact it may have on the Company’s operations, the demand for the Company’s services, and economic activity in general.
The statements in this press release are made as of the date of this press release, even if subsequently made available by the Company on its website or otherwise. The Company does not assume any obligations to update the forward-looking statements provided to reflect events that occur or circumstances that exist after the date on which they were made.
SOURCE CareCloud
Company Contact:
Bill Korn
Chief Financial Officer
CareCloud, Inc.
bkorn@carecloud.com
Investor Contact:
Asher Dewhurst
ICR Westwicke
CareCloudIR@westwicke.com
|
|
CARECLOUD, INC.
CONSOLIDATED BALANCE SHEETS
AS OF DECEMBER 31, 2022 AND 2021
($ in thousands, except share and per share amounts)
| December 31, | December 31, | |||||||
| 2022 | 2021 | |||||||
| ASSETS | ||||||||
| Current assets: | ||||||||
| Cash | $ | 12,299 | $ | 9,340 | ||||
| Restricted cash | - | 1,000 | ||||||
| Accounts receivable - net | 14,773 | 17,006 | ||||||
| Contract asset | 4,399 | 4,725 | ||||||
| Inventory | 381 | 503 | ||||||
| Current assets - related party | 16 | 13 | ||||||
| Prepaid expenses and other current assets | 2,785 | 2,972 | ||||||
| Total current assets | 34,653 | 35,559 | ||||||
| Property and equipment - net | 5,056 | 5,404 | ||||||
| Operating lease right-of-use assets | 4,921 | 6,940 | ||||||
| Intangible assets - net | 29,520 | 30,778 | ||||||
| Goodwill | 61,186 | 61,186 | ||||||
| Other assets | 838 | 981 | ||||||
| TOTAL ASSETS | $ | 136,174 | $ | 140,848 | ||||
| LIABILITIES AND SHAREHOLDERS’ EQUITY | ||||||||
| Current liabilities: | ||||||||
| Accounts payable | $ | 5,681 | $ | 5,948 | ||||
| Accrued compensation | 4,248 | 4,251 | ||||||
| Accrued expenses | 4,432 | 5,091 | ||||||
| Operating lease liability (current portion) | 2,273 | 3,963 | ||||||
| Deferred revenue (current portion) | 1,386 | 1,085 | ||||||
| Deferred payroll taxes | - | 934 | ||||||
| Notes payable (current portion) | 319 | 344 | ||||||
| Contingent consideration (current portion) | - | 3,090 | ||||||
| Dividend payable | 4,059 | 3,856 | ||||||
| Consideration payable | - | 1,000 | ||||||
| Total current liabilities | 22,398 | 29,562 | ||||||
| Notes payable | 13 | 20 | ||||||
| Borrowings under line of credit | 8,000 | 8,000 | ||||||
| Operating lease liability | 3,207 | 4,545 | ||||||
| Deferred revenue | 342 | 341 | ||||||
| Deferred tax liability | 525 | 449 | ||||||
| Total liabilities | 34,485 | 42,917 | ||||||
| COMMITMENTS AND CONTINGENCIES | ||||||||
| SHAREHOLDERS’ EQUITY: | ||||||||
| Preferred stock, $0.001 par value - authorized 7,000,000 shares. Series A, issued and outstanding 4,526,231 and 5,299,227 shares at December 31, 2022 and December 31, 2021, respectively. Series B, issued and outstanding 1,344,128 shares at December 31, 2022 | 6 | 5 | ||||||
| Common stock, $0.001 par value - authorized 35,000,000 shares. Issued 15,970,204 and 15,657,641 shares at December 31, 2022 and December 31, 2021, respectively. Outstanding 15,229,405 and 14,916,842 shares at December 31, 2022 and December 31, 2021, respectively | 16 | 16 | ||||||
| Additional paid-in capital | 130,987 | 131,379 | ||||||
| Accumulated deficit | (25,621 | ) | (31,053 | ) | ||||
| Accumulated other comprehensive loss | (3,037 | ) | (1,754 | ) | ||||
| Less: 740,799 common shares held in treasury, at cost at December 31, 2022 and December 31, 2021 | (662 | ) | (662 | ) | ||||
| Total shareholders’ equity | 101,689 | 97,931 | ||||||
| TOTAL LIABILITIES AND SHAREHOLDERS’ EQUITY | $ | 136,174 | $ | 140,848 | ||||
See notes to consolidated financial statements.
|
|
CARECLOUD, INC.
CONSOLIDATED STATEMENTS OF OPERATIONS
FOR THE THREE MONTHS AND YEARS ENDED DECEMBER 31, 2022 AND 2021
($ in thousands, except share and per share amounts)
| Three Months Ended | Year Ended | |||||||||||||||
| December 31, | December 31, | |||||||||||||||
| 2022 | 2021 | 2022 | 2021 | |||||||||||||
| NET REVENUE | $ | 32,534 | $ | 37,462 | $ | 138,826 | $ | 139,599 | ||||||||
| OPERATING EXPENSES: | ||||||||||||||||
| Direct operating costs | 19,568 | 24,200 | 84,434 | 86,918 | ||||||||||||
| Selling and marketing | 2,474 | 2,317 | 9,788 | 8,786 | ||||||||||||
| General and administrative | 5,341 | 6,459 | 23,820 | 24,273 | ||||||||||||
| Research and development | 1,150 | 81 | 4,401 | 4,408 | ||||||||||||
| Change in contingent consideration | (200 | ) | (2,515 | ) | (3,090 | ) | (2,515 | ) | ||||||||
| Depreciation and amortization | 3,039 | 2,689 | 11,725 | 12,195 | ||||||||||||
| Net loss on lease termination, impairment and unoccupied lease charges | 210 | 340 | 1,138 | 2,005 | ||||||||||||
| Total operating expenses | 31,582 | 33,571 | 132,216 | 136,070 | ||||||||||||
| OPERATING INCOME | 952 | 3,891 | 6,610 | 3,529 | ||||||||||||
| OTHER: | ||||||||||||||||
| Interest income | 19 | 5 | 41 | 15 | ||||||||||||
| Interest expense | (102 | ) | (181 | ) | (405 | ) | (455 | ) | ||||||||
| Other expense - net | (337 | ) | (16 | ) | (637 | ) | (96 | ) | ||||||||
| INCOME BEFORE PROVISION FOR INCOME TAXES | 532 | 3,699 | 5,609 | 2,993 | ||||||||||||
| Income tax provision | 33 | 177 | 177 | 157 | ||||||||||||
| NET INCOME | $ | 499 | $ | 3,522 | $ | 5,432 | $ | 2,836 | ||||||||
| Preferred stock dividend | 3,855 | 3,644 | 15,517 | 14,052 | ||||||||||||
| NET LOSS ATTRIBUTABLE TO COMMON SHAREHOLDERS | $ | (3,356 | ) | $ | (122 | ) | $ | (10,085 | ) | $ | (11,216 | ) | ||||
| Net loss per common share: basic and diluted | $ | (0.22 | ) | $ | (0.01 | ) | $ | (0.67 | ) | $ | (0.77 | ) | ||||
| Weighted-average common shares used to compute basic and diluted loss per share | 15,224,347 | 14,900,391 | 15,109,587 | 14,541,061 | ||||||||||||
See notes to consolidated financial statements.
|
|
CARECLOUD, INC.
CONSOLIDATED STATEMENTS OF CASH FLOWS
FOR THE YEARS ENDED DECEMBER 31, 2022 AND 2021
($ in thousands)
| 2022 | 2021 | |||||||
| OPERATING ACTIVITIES: | ||||||||
| Net income | $ | 5,432 | $ | 2,836 | ||||
| Adjustments to reconcile net income to net cash provided by operating activities: | ||||||||
| Depreciation and amortization | 12,318 | 12,676 | ||||||
| Lease amortization | 3,286 | 3,574 | ||||||
| Deferred revenue | 302 | (72 | ) | |||||
| Provision for doubtful accounts | 740 | 890 | ||||||
| Provision for deferred income taxes | 76 | 289 | ||||||
| Foreign exchange loss (gain) | 610 | (16 | ) | |||||
| Interest accretion | 596 | 857 | ||||||
| Loss on sale of assets | - | 172 | ||||||
| Stock-based compensation expense | 4,914 | 5,396 | ||||||
| Change in contingent consideration | (3,090 | ) | (2,515 | ) | ||||
| Adjustment of goodwill | - | 36 | ||||||
| Changes in operating assets and liabilities, net of businesses acquired: | ||||||||
| Accounts receivable | 1,493 | (620 | ) | |||||
| Contract asset | 326 | (620 | ) | |||||
| Inventory | 122 | (104 | ) | |||||
| Other assets | 619 | 921 | ||||||
| Accounts payable and other liabilities | (6,593 | ) | (10,366 | ) | ||||
| Net cash provided by operating activities | 21,151 | 13,334 | ||||||
| INVESTING ACTIVITIES: | ||||||||
| Purchases of property and equipment | (2,588 | ) | (2,928 | ) | ||||
| Capitalized software | (9,179 | ) | (7,636 | ) | ||||
| Cash paid for acquisition (net) | - | (12,582 | ) | |||||
| Net cash used in investing activities | (11,767 | ) | (23,146 | ) | ||||
| FINANCING ACTIVITIES: | ||||||||
| Preferred stock dividends paid | (15,314 | ) | (14,437 | ) | ||||
| Settlement of contingent obligation | (1,000 | ) | - | |||||
| Settlement of tax withholding obligations on stock issued to employees | (1,197 | ) | (2,123 | ) | ||||
| Repayments of notes payable | (1,003 | ) | (1,045 | ) | ||||
| Financing and stock issuance costs | (32 | ) | (80 | ) | ||||
| Proceeds from exercise of warrants | - | 6,435 | ||||||
| Proceeds from issuance of Series B Preferred Stock, net of expenses | 30,901 | - | ||||||
| Proceeds from issuance of common stock, net of expenses | - | 2,731 | ||||||
| Redemption of Series A Preferred Stock | (20,005 | ) | - | |||||
| Proceeds from line of credit | 25,500 | 26,000 | ||||||
| Repayment of line of credit | (25,500 | ) | (18,000 | ) | ||||
| Net cash used in financing activities | (7,650 | ) | (519 | ) | ||||
| EFFECT OF EXCHANGE RATE CHANGES ON CASH | 225 | (254 | ) | |||||
| NET INCREASE (DECREASE) IN CASH AND RESTRICTED CASH | 1,959 | (10,585 | ) | |||||
| CASH AND RESTRICTED CASH - Beginning of the year | 10,340 | 20,925 | ||||||
| CASH AND RESTRICTED CASH - End of the year | $ | 12,299 | $ | 10,340 | ||||
| SUPPLEMENTAL NONCASH INVESTING AND FINANCING ACTIVITIES: | ||||||||
| Preferred stock cancelled in connection with an acquisition | $ | - | $ | (4,000 | ) | |||
| Contingent consideration at fair value at acquisition date | $ | - | $ | 5,605 | ||||
| Dividends declared, not paid | $ | 4,059 | $ | 3,856 | ||||
| Purchase of prepaid insurance with assumption of note | $ | 695 | $ | 967 | ||||
| SUPPLEMENTAL INFORMATION - Cash paid during the year for: | ||||||||
| Income taxes | $ | 153 | $ | 282 | ||||
| Interest | $ | 162 | $ | 103 | ||||
See notes to consolidated financial statements.
|
|
RECONCILIATION OF NON-GAAP FINANCIAL MEASURES
TO COMPARABLE GAAP MEASURES (UNAUDITED)
The following is a reconciliation of the non-GAAP financial measures used by us to describe our financial results determined in accordance with accounting principles generally accepted in the United States of America (“GAAP”). An explanation of these measures is also included below under the heading “Explanation of Non-GAAP Financial Measures.”
While management believes that these non-GAAP financial measures provide useful supplemental information to investors regarding the underlying performance of our business operations, investors are reminded to consider these non-GAAP measures in addition to, and not as a substitute for, financial performance measures prepared in accordance with GAAP. In addition, it should be noted that these non-GAAP financial measures may be different from non-GAAP measures used by other companies, and management may utilize other measures to illustrate performance in the future. Non-GAAP measures have limitations in that they do not reflect all of the amounts associated with our results of operations as determined in accordance with GAAP.
Adjusted EBITDA to GAAP Net Income
Set forth below is a reconciliation of adjusted EBITDA to our GAAP net income.
| Three Months Ended December 31, | Year Ended December 31, | |||||||||||||||
| 2022 | 2021 | 2022 | 2021 | |||||||||||||
| ($ in thousands) | ||||||||||||||||
| Net revenue | $ | 32,534 | $ | 37,462 | $ | 138,826 | $ | 139,599 | ||||||||
| GAAP net income | 499 | 3,522 | 5,432 | 2,836 | ||||||||||||
| Provision for income taxes | 33 | 177 | 177 | 157 | ||||||||||||
| Net interest expense | 83 | 176 | 364 | 440 | ||||||||||||
| Foreign exchange loss / other expense | 353 | 73 | 712 | 241 | ||||||||||||
| Stock-based compensation expense | 1,515 | 1,390 | 4,914 | 5,396 | ||||||||||||
| Depreciation and amortization | 3,039 | 2,689 | 11,725 | 12,195 | ||||||||||||
| Transaction and integration costs | 152 | 246 | 876 | 1,364 | ||||||||||||
| Net loss on lease termination, impairment and unoccupied lease charges | 210 | 340 | 1,138 | 2,005 | ||||||||||||
| Change in contingent consideration | (200 | ) | (2,515 | ) | (3,090 | ) | (2,515 | ) | ||||||||
| Adjusted EBITDA | $ | 5,684 | $ | 6,098 | $ | 22,248 | $ | 22,119 | ||||||||
|
|
Non-GAAP Adjusted Operating Income to GAAP Operating Income
Set forth below is a reconciliation of our non-GAAP adjusted operating income and non-GAAP adjusted operating margin to our GAAP operating income and GAAP operating margin.
| Three Months Ended December 31, | Year Ended December 31, | |||||||||||||||
| 2022 | 2021 | 2022 | 2021 | |||||||||||||
| ($ in thousands) | ||||||||||||||||
| Net revenue | $ | 32,534 | $ | 37,462 | $ | 138,826 | $ | 139,599 | ||||||||
| GAAP net income | 499 | 3,522 | 5,432 | 2,836 | ||||||||||||
| Provision for income taxes | 33 | 177 | 177 | 157 | ||||||||||||
| Net interest expense | 83 | 176 | 364 | 440 | ||||||||||||
| Other expense - net | 337 | 16 | 637 | 96 | ||||||||||||
| GAAP operating income | 952 | 3,891 | 6,610 | 3,529 | ||||||||||||
| GAAP operating margin | 2.9 | % | 10.4 | % | 4.8 | % | 2.5 | % | ||||||||
| Stock-based compensation expense | 1,515 | 1,390 | 4,914 | 5,396 | ||||||||||||
| Amortization of purchased intangible assets | 1,391 | 1,801 | 6,277 | 8,880 | ||||||||||||
| Transaction and integration costs | 152 | 246 | 876 | 1,364 | ||||||||||||
| Net loss on lease termination, impairment and unoccupied lease charges | 210 | 340 | 1,138 | 2,005 | ||||||||||||
| Change in contingent consideration | (200 | ) | (2,515 | ) | (3,090 | ) | (2,515 | ) | ||||||||
| Non-GAAP adjusted operating income | $ | 4,020 | $ | 5,153 | $ | 16,725 | $ | 18,659 | ||||||||
| Non-GAAP adjusted operating margin | 12.4 | % | 13.8 | % | 12.0 | % | 13.4 | % | ||||||||
Non-GAAP Adjusted Net Income to GAAP Net Income
Set forth below is a reconciliation of our non-GAAP adjusted net income and non-GAAP adjusted net income per share to our GAAP net income and GAAP net loss per share.
| Three Months Ended December 31, | Year Ended December 31, | |||||||||||||||
| 2022 | 2021 | 2022 | 2021 | |||||||||||||
| ($ in thousands, except for per share amounts) | ||||||||||||||||
| GAAP net income | $ | 499 | $ | 3,522 | $ | 5,432 | $ | 2,836 | ||||||||
| Foreign exchange loss / other expense | 353 | 73 | 712 | 241 | ||||||||||||
| Stock-based compensation expense | 1,515 | 1,390 | 4,914 | 5,396 | ||||||||||||
| Amortization of purchased intangible assets | 1,391 | 1,801 | 6,277 | 8,880 | ||||||||||||
| Transaction and integration costs | 152 | 246 | 876 | 1,364 | ||||||||||||
| Net loss on lease termination, impairment and unoccupied lease charges | 210 | 340 | 1,138 | 2,005 | ||||||||||||
| Change in contingent consideration | (200 | ) | (2,515 | ) | (3,090 | ) | (2,515 | ) | ||||||||
| Income tax expense related to goodwill | 14 | 150 | 75 | 290 | ||||||||||||
| Non-GAAP adjusted net income | $ | 3,934 | $ | 5,007 | $ | 16,334 | $ | 18,497 | ||||||||
| End-of-period shares | 15,229,405 | 14,916,842 | 15,229,405 | 14,916,842 | ||||||||||||
| Non-GAAP adjusted net income per share | $ | 0.25 | $ | 0.34 | $ | 1.07 | $ | 1.24 | ||||||||
|
|
For purposes of determining non-GAAP adjusted net income per share, we used the number of common shares outstanding as of December 31, 2022 and 2021, respectively.
| Three Months Ended December 31, | Year Ended December 31, | |||||||||||||||
| 2022 | 2021 | 2022 | 2021 | |||||||||||||
| GAAP net loss attributable to common shareholders, per share | $ | (0.22 | ) | $ | (0.01 | ) | $ | (0.67 | ) | $ | (0.77 | ) | ||||
| Impact of preferred stock dividend | 0.25 | 0.25 | 1.03 | 0.96 | ||||||||||||
| Net income per end-of-period share | 0.03 | 0.24 | 0.36 | 0.19 | ||||||||||||
| Foreign exchange loss / other expense | 0.02 | 0.01 | 0.05 | 0.02 | ||||||||||||
| Stock-based compensation expense | 0.10 | 0.09 | 0.32 | 0.36 | ||||||||||||
| Amortization of purchased intangible assets | 0.09 | 0.12 | 0.41 | 0.60 | ||||||||||||
| Transaction and integration costs | 0.01 | 0.02 | 0.06 | 0.09 | ||||||||||||
| Net loss on lease termination, impairment and unoccupied lease charges | 0.01 | 0.02 | 0.07 | 0.13 | ||||||||||||
| Change in contingent consideration | (0.01 | ) | (0.17 | ) | (0.20 | ) | (0.17 | ) | ||||||||
| Income tax expense related to goodwill | 0.00 | 0.01 | 0.00 | 0.02 | ||||||||||||
| Non-GAAP adjusted earnings per share | $ | 0.25 | $ | 0.34 | $ | 1.07 | $ | 1.24 | ||||||||
| End-of-period common shares | 15,229,405 | 14,916,842 | 15,229,405 | 14,916,842 | ||||||||||||
| In-the-money warrants and outstanding unvested RSUs | 598,245 | 684,528 | 598,245 | 684,528 | ||||||||||||
| Total fully diluted shares | 15,827,650 | 15,601,370 | 15,827,650 | 15,601,370 | ||||||||||||
| Non-GAAP adjusted diluted earnings per share | $ | 0.25 | $ | 0.32 | $ | 1.03 | $ | 1.19 | ||||||||
Explanation of Non-GAAP Financial Measures
We report our financial results in accordance with accounting principles generally accepted in the United States of America, or GAAP. However, management believes that, in order to properly understand our short-term and long-term financial and operational trends, investors may wish to consider the impact of certain non-cash or non-recurring items, when used as a supplement to financial performance measures in accordance with GAAP. These items result from facts and circumstances that vary in frequency and impact on continuing operations. Management also uses results of operations before such items to evaluate the operating performance of CareCloud and compare it against past periods, make operating decisions, and serve as a basis for strategic planning. These non-GAAP financial measures provide management with additional means to understand and evaluate the operating results and trends in our ongoing business by eliminating certain non-cash expenses and other items that management believes might otherwise make comparisons of our ongoing business with prior periods more difficult, obscure trends in ongoing operations, or reduce management’s ability to make useful forecasts. Management believes that these non-GAAP financial measures provide additional means of evaluating period-over-period operating performance. In addition, management understands that some investors and financial analysts find this information helpful in analyzing our financial and operational performance and comparing this performance to our peers and competitors.
Management uses adjusted EBITDA, adjusted operating income, adjusted operating margin, and non-GAAP adjusted net income to provide an understanding of aspects of operating results before the impact of investing and financing charges and income taxes. Adjusted EBITDA may be useful to an investor in evaluating our operating performance and liquidity because this measure excludes non-cash expenses as well as expenses pertaining to investing or financing transactions. Management defines “adjusted EBITDA” as the sum of GAAP net income (loss) before provision for (benefit from) income taxes, net interest expense, other (income) expense, stock-based compensation expense, depreciation and amortization, integration costs, transaction costs, impairment charges and changes in contingent consideration.
Management defines “non-GAAP adjusted operating income” as the sum of GAAP operating income (loss) before stock-based compensation expense, amortization of purchased intangible assets, integration costs, transaction costs, impairment charges and changes in contingent consideration, and “non-GAAP adjusted operating margin” as non-GAAP adjusted operating income divided by net revenue.
|
|
Management defines “non-GAAP adjusted net income” as the sum of GAAP net income (loss) before stock-based compensation expense, amortization of purchased intangible assets, other (income) expense, integration costs, transaction costs, impairment charges, changes in contingent consideration, any tax impact related to these preceding items and income tax expense related to goodwill, and “non-GAAP adjusted net income per share” as non-GAAP adjusted net income divided by common shares outstanding at the end of the period, including the shares which were issued but are subject to forfeiture and considered contingent consideration.
Management considers all of these non-GAAP financial measures to be important indicators of our operational strength and performance of our business and a good measure of our historical operating trends, in particular the extent to which ongoing operations impact our overall financial performance.
In addition to items routinely excluded from non-GAAP EBITDA, management excludes or adjusts each of the items identified below from the applicable non-GAAP financial measure referenced above for the reasons set forth with respect to that excluded item:
Foreign exchange / other expense. Other expense is excluded because foreign currency gains and losses and other non-operating expenses are expenditures that management does not consider part of ongoing operating results when assessing the performance of our business, and also because the total amount of the expense is partially outside of our control. Foreign currency gains and losses are based on global market factors which are unrelated to our performance during the period in which the gains and losses are recorded.
Stock-based compensation expense. Stock-based compensation expense is excluded because this is primarily a non-cash expenditure that management does not consider part of ongoing operating results when assessing the performance of our business, and also because the total amount of the expenditure is partially outside of our control because it is based on factors such as stock price, volatility, and interest rates, which may be unrelated to our performance during the period in which the expenses are incurred. Stock-based compensation expense includes cash-settled awards based on changes in the stock price.
Amortization of purchased intangible assets. Purchased intangible assets are amortized over their estimated useful lives and generally cannot be changed or influenced by management after the acquisition. Accordingly, this item is not considered by management in making operating decisions. Management does not believe such charges accurately reflect the performance of our ongoing operations for the period in which such charges are recorded.
Transaction costs. Transaction costs are upfront costs related to acquisitions and related transactions, such as brokerage fees, pre-acquisition accounting costs and legal fees, and other upfront costs related to specific transactions. Management believes that such expenses do not have a direct correlation to future business operations, and therefore, these costs are not considered by management in making operating decisions. Management does not believe such charges accurately reflect the performance of our ongoing operations for the period in which such charges are incurred.
Integration costs. Integration costs are severance payments for certain employees relating to our acquisitions and exit costs related to terminating leases and other contractual agreements. Accordingly, management believes that such expenses do not have a direct correlation to future business operations, and therefore, these costs are not considered by management in making operating decisions. Management does not believe such charges accurately reflect the performance of our ongoing operations for the period in which such charges are incurred.
Net loss on lease termination, impairment and unoccupied lease charges. Net loss on lease termination represents the write-off of leasehold improvements and gains or losses as a result of an early lease termination. Impairment charges represent charges recorded for a leased facility no longer being used by the Company and a non-cancellable vendor contract where the services are no longer being used. Unoccupied lease charges represent the portion of lease and related costs for vacant space not being utilized by the Company. Accordingly, management believes that such expenses do not have a direct correlation to future business operations, and therefore, these costs are not considered by management in making operating decisions. Management does not believe such charges accurately reflect the performance of our ongoing operations for the period in which such charges are incurred.
Changes in contingent consideration. Contingent consideration represents the amount payable to the sellers of certain acquired businesses based on the achievement of defined performance measures contained in the purchase agreements. Contingent consideration is adjusted to fair value at the end of each reporting period, and changes arise from changes in the forecasted revenues of the acquired businesses.
Income tax expense related to goodwill. Income tax expense resulting from the amortization of goodwill related to our acquisitions represents a charge to record the tax effect resulting from amortizing goodwill over 15 years for tax purposes. Goodwill is not amortized for GAAP reporting. This expense is not anticipated to result in a cash payment.
|
|
Exhibit 99.2