| Customers Bancorp, Inc. | ||
| Pennsylvania | 001-35542 | 27-2290659 | ||||||
| (State or other jurisdiction of incorporation or organization) |
(Commission File number) | (IRS Employer Identification No.) |
||||||
| ☐ | Written communications pursuant to Rule 425 under the Securities Act (17 CFR 230.425) | ||||
| ☐ | Soliciting material pursuant to Rule 14a-12 under the Exchange Act (17 CFR 240.14a-12) | ||||
| ☐ | Pre-commencement communications pursuant to Rule 14d-2(b) under the Exchange Act (17 CFR 240.14d-2(b)) | ||||
| ☐ | Pre-commencement communications pursuant to Rule 13e-4(c) under the Exchange Act (17 CFR 240.13e-4(c)) | ||||
| Title of Each Class | Trading Symbols | Name of Each Exchange on which Registered | ||||||||||||
| Voting Common Stock, par value $1.00 per share | CUBI | New York Stock Exchange | ||||||||||||
| Fixed-to-Floating Rate Non-Cumulative Perpetual Preferred Stock, Series E, par value $1.00 per share |
CUBI/PE | New York Stock Exchange | ||||||||||||
| Fixed-to-Floating Rate Non-Cumulative Perpetual Preferred Stock, Series F, par value $1.00 per share |
CUBI/PF | New York Stock Exchange | ||||||||||||
| 5.375% Subordinated Notes due 2034 | CUBB | New York Stock Exchange | ||||||||||||
| Exhibit | Description | |||||||
| Press Release dated January 25, 2023 | ||||||||
| Slide presentation dated January 2023 | ||||||||
| CUSTOMERS BANCORP, INC. | |||||
By: /s/ Carla A. Leibold |
|||||
| Name: Carla A. Leibold | |||||
| Title: Executive Vice President - Chief Financial Officer | |||||
| Exhibit No. | Description | |||||||
| Press Release dated January 25, 2023 | ||||||||
| Slide presentation dated January 2023 | ||||||||

*Non-GAAP measure. Customers' reasons for the use of the non-GAAP measure and a detailed reconciliation between the non-GAAP measure and the comparable GAAP amount are included at the end of this document. | ||||||||||||||
| (1) Mid-cap banks as reported by KRX Index. | ||||||||||||||
| (Dollars in thousands, except per share data) | USD | Per share | |||||||||
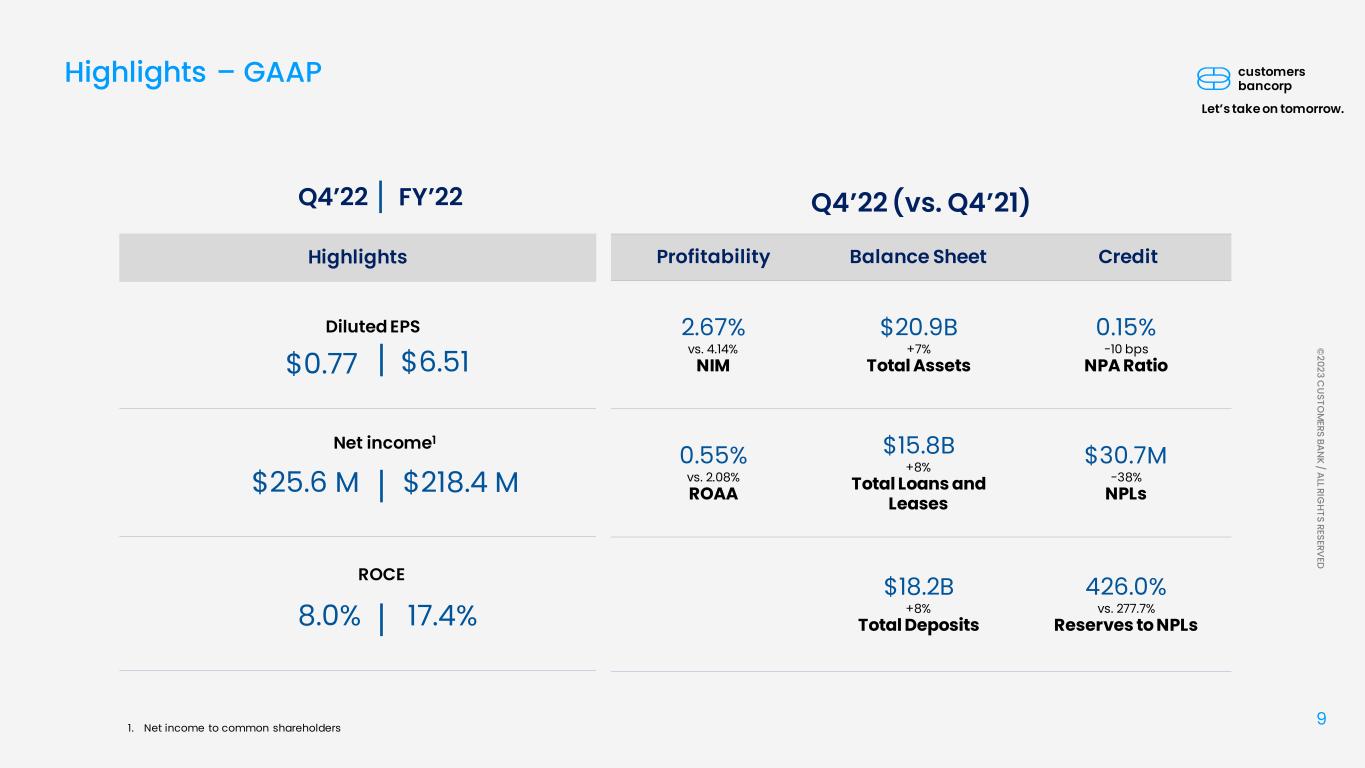
| GAAP net income available to shareholders | $ | 25,623 | $ | 0.77 | |||||||
| Less: PPP net loss, after-tax | (5,956) | (0.18) | |||||||||
| GAAP net income to common shareholders, excluding PPP | 31,579 | 0.95 | |||||||||
| Losses on investment securities | 13,543 | 0.41 | |||||||||
| Derivative credit valuation adjustment | 202 | 0.01 | |||||||||
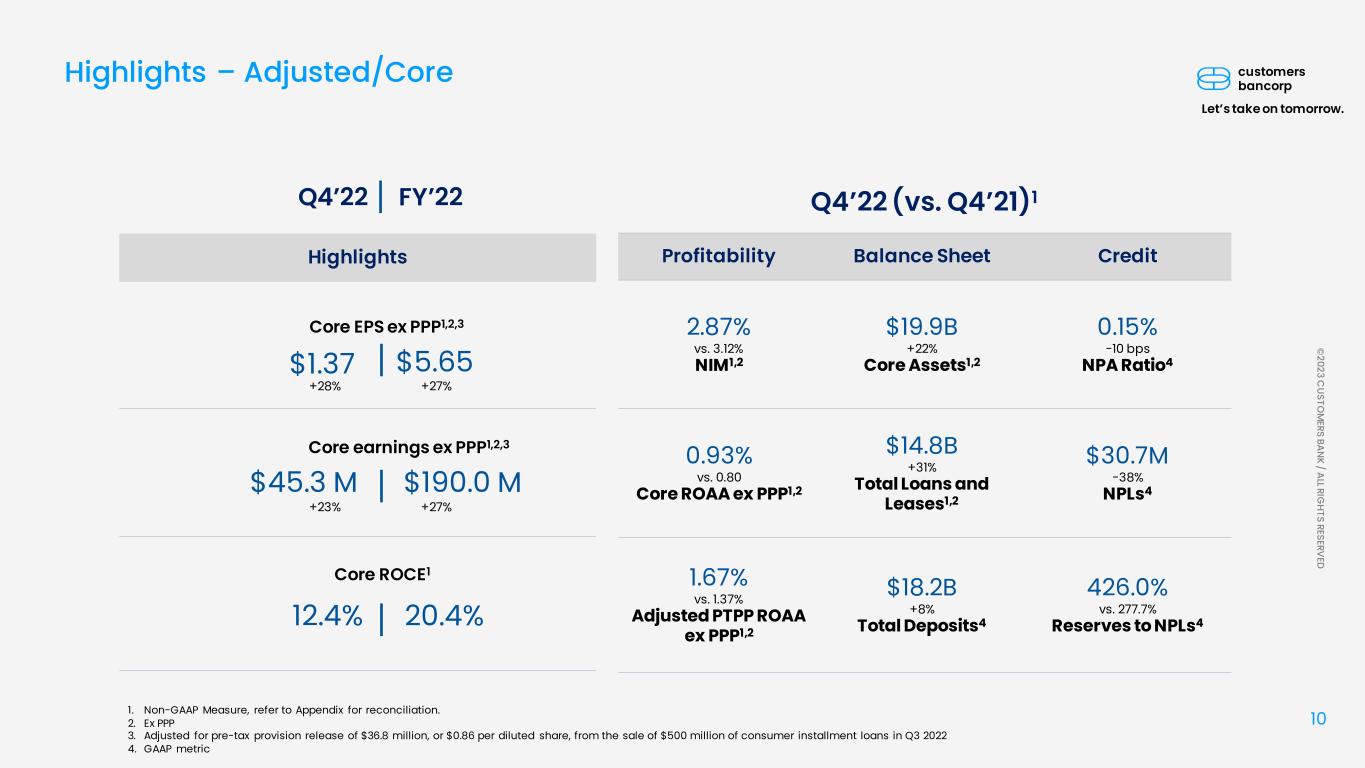
| Core earnings, excluding PPP | $ | 45,324 | $ | 1.37 | |||||||
(Dollars in thousands, except per share data) |
At or Three Months Ended | Increase (Decrease) | Twelve Months Ended | Increase (Decrease) | ||||||||||||||||||||||||||||||||||||||||||||||
| December 31, 2022 | December 31, 2021 | December 31, 2022 | December 31, 2021 | |||||||||||||||||||||||||||||||||||||||||||||||
| Profitability Metrics: | ||||||||||||||||||||||||||||||||||||||||||||||||||
| Net income available for common shareholders | $ | 25,623 | $ | 98,647 | $ | (73,024) | (74.0) | % | $ | 218,402 | $ | 300,134 | $ | (81,732) | (27.2) | % | ||||||||||||||||||||||||||||||||||
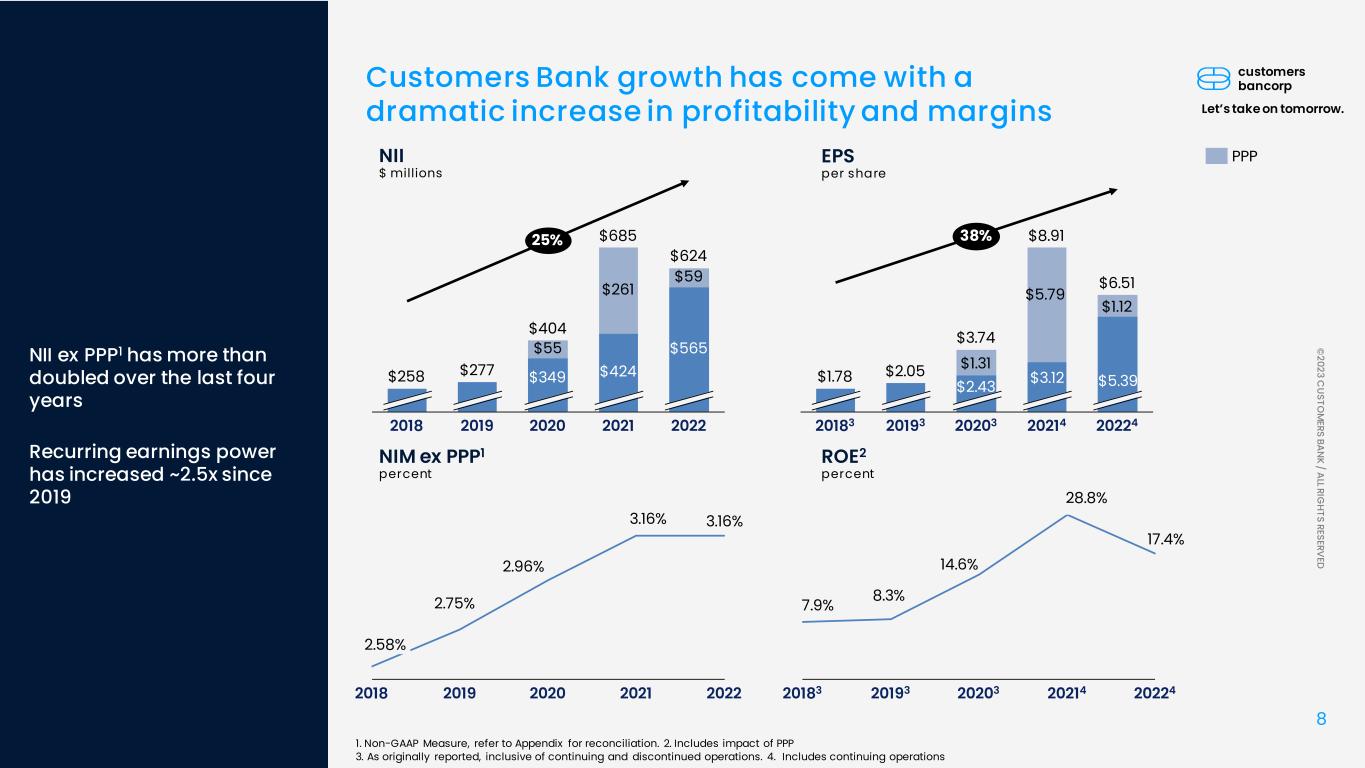
| Diluted earnings per share | $ | 0.77 | $ | 2.87 | $ | (2.10) | (73.2) | % | $ | 6.51 | $ | 8.91 | $ | (2.40) | (26.9) | % | ||||||||||||||||||||||||||||||||||
| Core earnings* | $ | 39,368 | $ | 101,213 | $ | (61,845) | (61.1) | % | $ | 256,415 | $ | 344,700 | $ | (88,285) | (25.6) | % | ||||||||||||||||||||||||||||||||||
| Core earnings per share* | $ | 1.19 | $ | 2.95 | $ | (1.76) | (59.7) | % | $ | 7.63 | $ | 10.23 | $ | (2.60) | (25.4) | % | ||||||||||||||||||||||||||||||||||
| Core earnings, excluding PPP* | $ | 45,324 | $ | 36,890 | $ | 8,434 | 22.9 | % | $ | 218,746 | $ | 149,650 | $ | 69,096 | 46.2 | % | ||||||||||||||||||||||||||||||||||
| Core earnings per share, excluding PPP* | $ | 1.37 | $ | 1.07 | $ | 0.30 | 28.0 | % | $ | 6.51 | $ | 4.44 | $ | 2.07 | 46.6 | % | ||||||||||||||||||||||||||||||||||
| Return on average assets ("ROAA") | 0.55 | % | 2.08 | % | (1.53) | 1.13 | % | 1.64 | % | (0.51) | ||||||||||||||||||||||||||||||||||||||||
| Core ROAA* | 0.81 | % | 2.13 | % | (1.32) | 1.32 | % | 1.86 | % | (0.54) | ||||||||||||||||||||||||||||||||||||||||
| Core ROAA, excluding PPP* | 0.93 | % | 0.80 | % | 0.13 | 1.14 | % | 0.84 | % | 0.30 | ||||||||||||||||||||||||||||||||||||||||
| Return on average common equity ("ROCE") | 8.05 | % | 33.18 | % | (25.13) | 17.40 | % | 28.75 | % | (11.35) | ||||||||||||||||||||||||||||||||||||||||
| Core ROCE* | 12.36 | % | 34.04 | % | (21.68) | 20.43 | % | 33.02 | % | (12.59) | ||||||||||||||||||||||||||||||||||||||||
| Adjusted pre-tax pre-provision net income* | $ | 81,377 | $ | 130,595 | $ | (49,218) | (37.7) | % | $ | 400,712 | $ | 471,046 | $ | (70,334) | (14.9) | % | ||||||||||||||||||||||||||||||||||
| Adjusted pre-tax pre-provision net income ROAA, excluding PPP* | 1.67 | % | 1.37 | % | 0.30 | 1.81 | % | 1.44 | % | 0.37 | ||||||||||||||||||||||||||||||||||||||||
| Net interest margin, tax equivalent | 2.67 | % | 4.14 | % | (1.47) | 3.19 | % | 3.70 | % | (0.51) | ||||||||||||||||||||||||||||||||||||||||
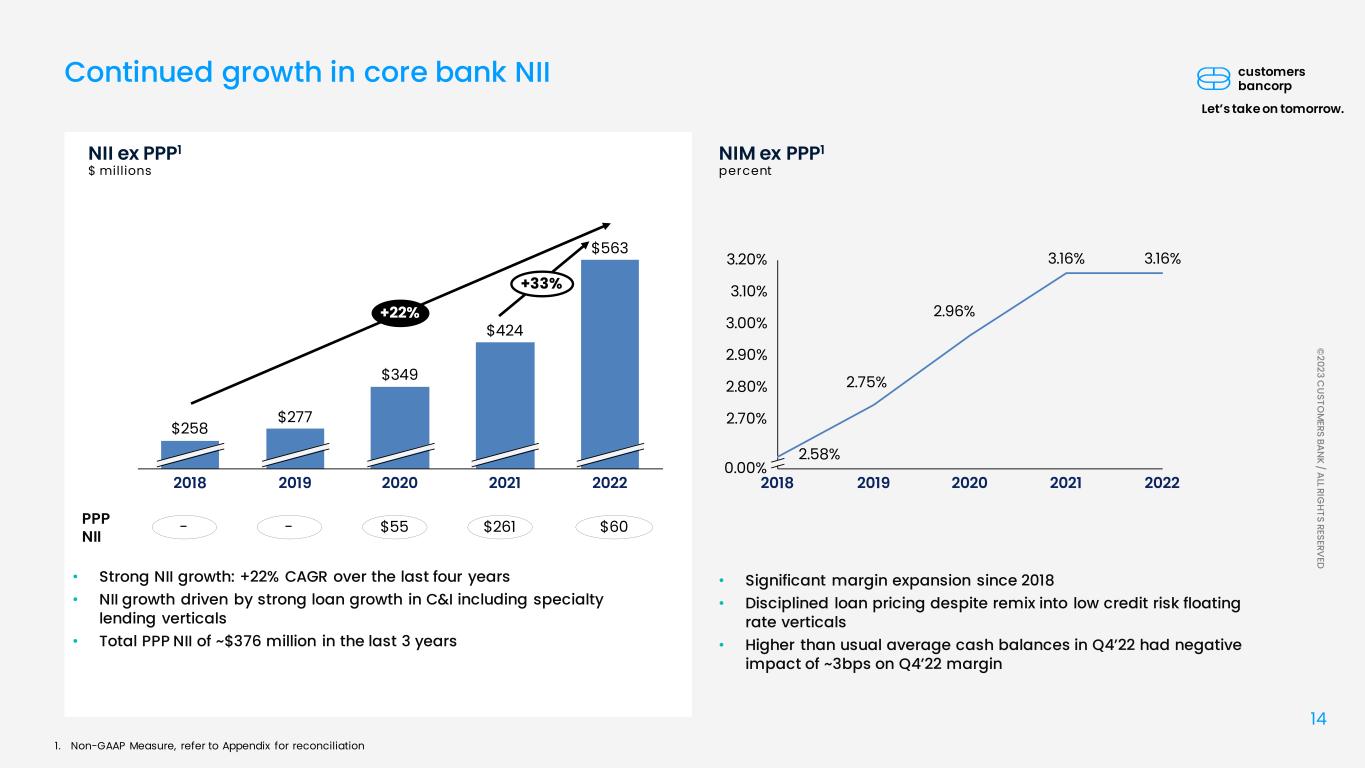
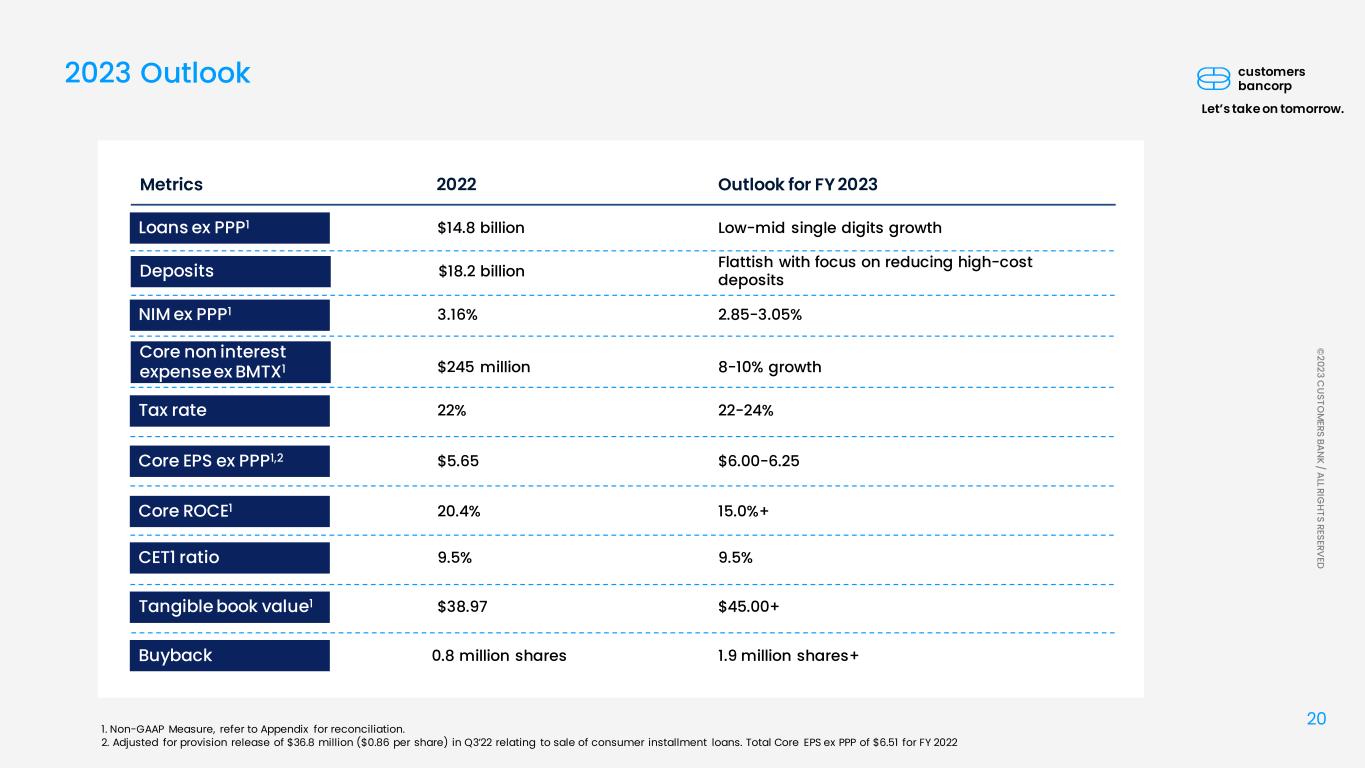
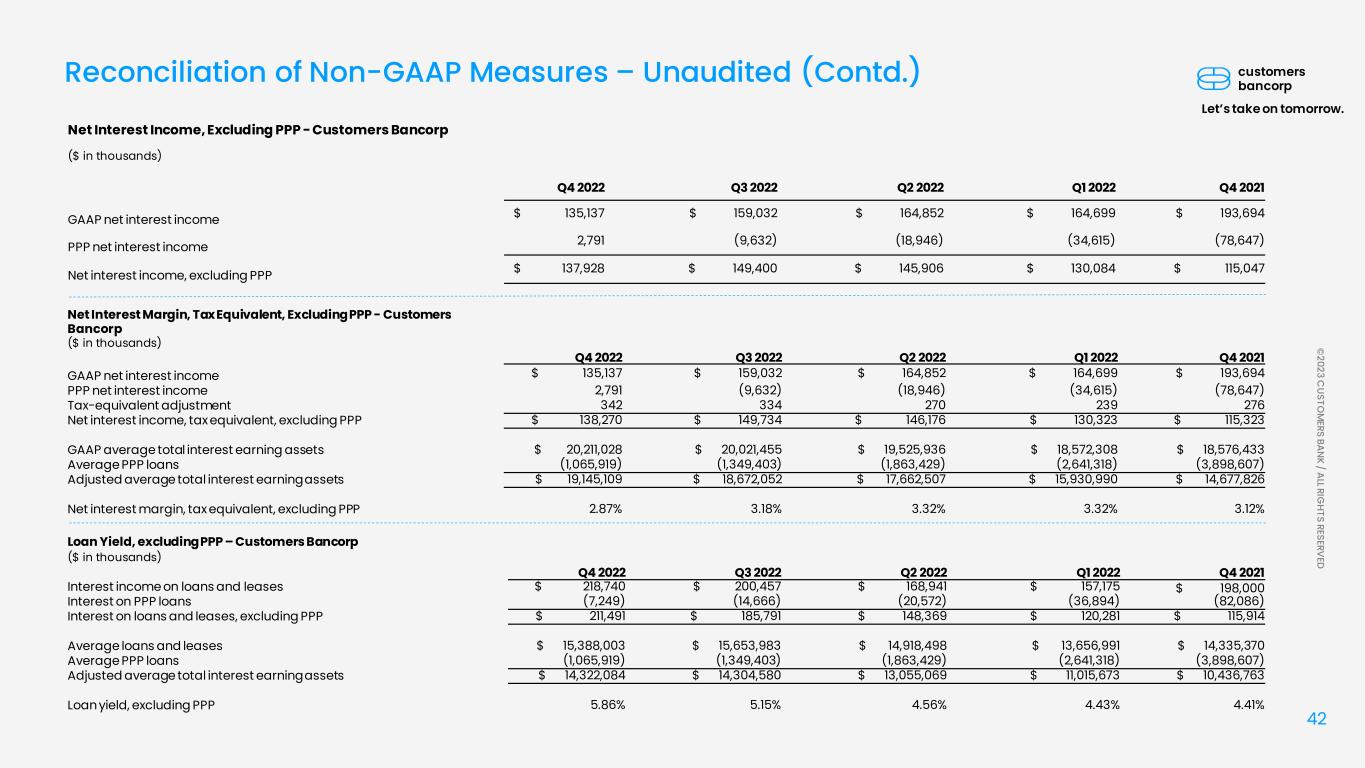
| Net interest margin, tax equivalent, excluding PPP loans* | 2.87 | % | 3.12 | % | (0.25) | 3.16 | % | 3.16 | % | — | ||||||||||||||||||||||||||||||||||||||||
| Loan yield | 5.64 | % | 5.48 | % | 0.16 | 5.00 | % | 4.73 | % | 0.27 | ||||||||||||||||||||||||||||||||||||||||
| Loan yield, excluding PPP* | 5.86 | % | 4.41 | % | 1.45 | 5.05 | % | 4.37 | % | 0.68 | ||||||||||||||||||||||||||||||||||||||||
| Cost of deposits | 2.73 | % | 0.36 | % | 2.37 | 1.31 | % | 0.44 | % | 0.87 | ||||||||||||||||||||||||||||||||||||||||
| Efficiency ratio | 49.20 | % | 38.70 | % | 10.50 | 44.81 | % | 40.38 | % | 4.43 | ||||||||||||||||||||||||||||||||||||||||
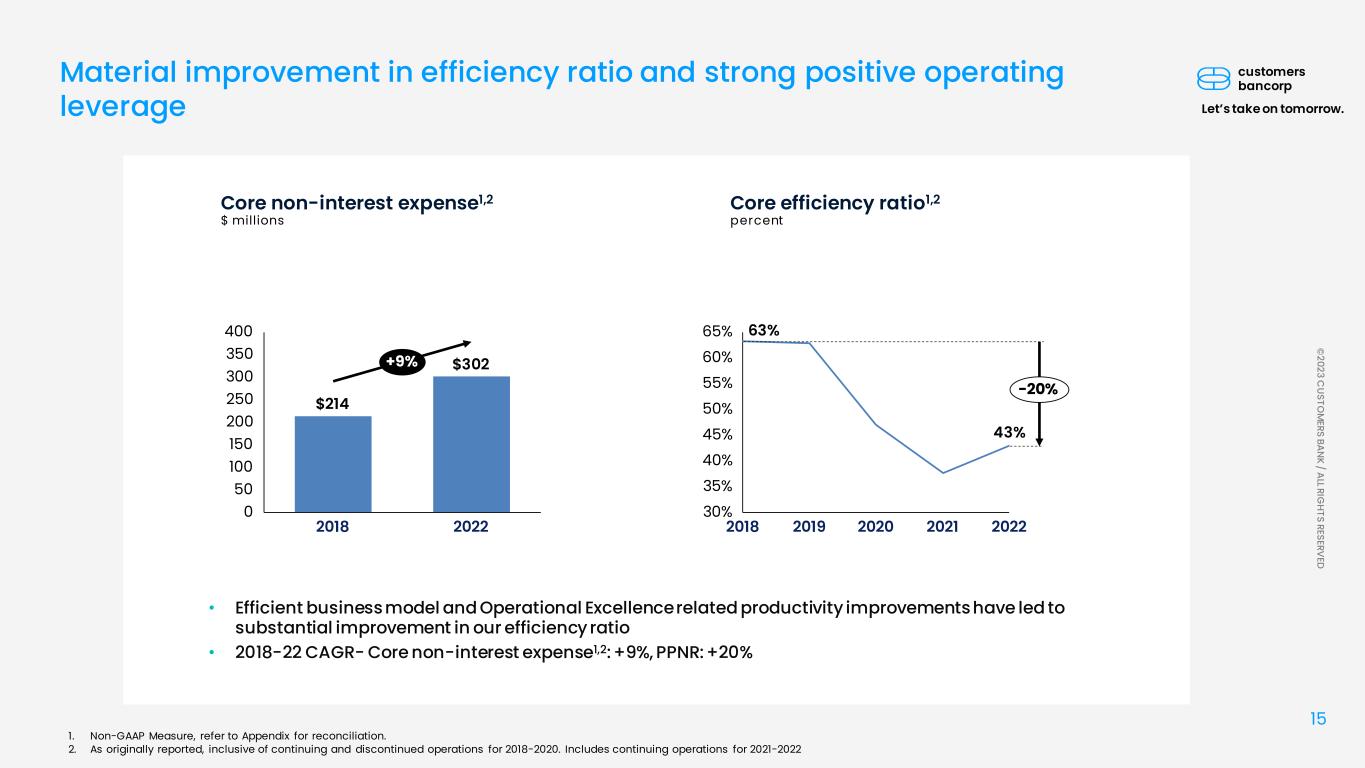
| Core efficiency ratio* | 49.12 | % | 38.14 | % | 10.98 | 43.02 | % | 37.54 | % | 5.48 | ||||||||||||||||||||||||||||||||||||||||
| Balance Sheet Trends: | ||||||||||||||||||||||||||||||||||||||||||||||||||
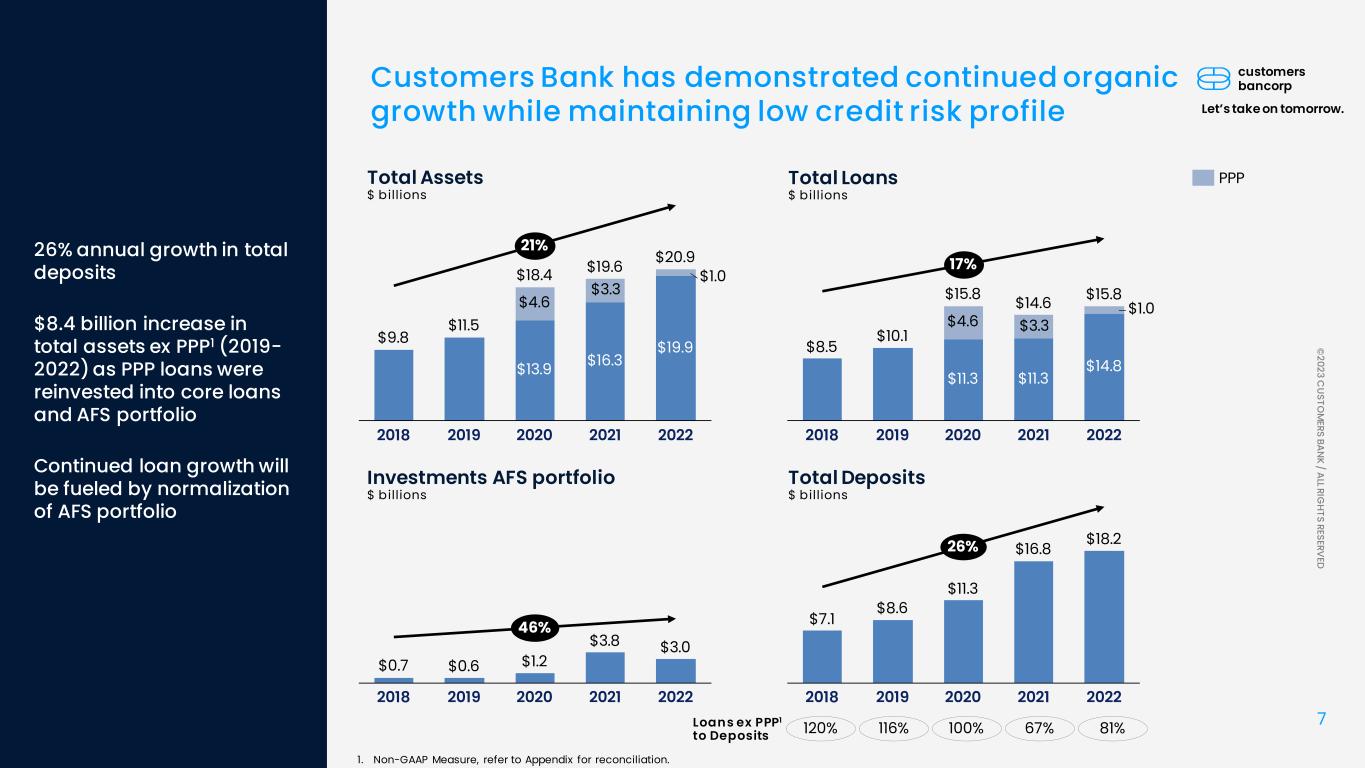
| Total assets | $ | 20,896,112 | $ | 19,575,028 | $ | 1,321,084 | 6.7 | % | ||||||||||||||||||||||||||||||||||||||||||
| Total assets, excluding PPP* | $ | 19,897,959 | $ | 16,325,020 | $ | 3,572,939 | 21.9 | % | ||||||||||||||||||||||||||||||||||||||||||
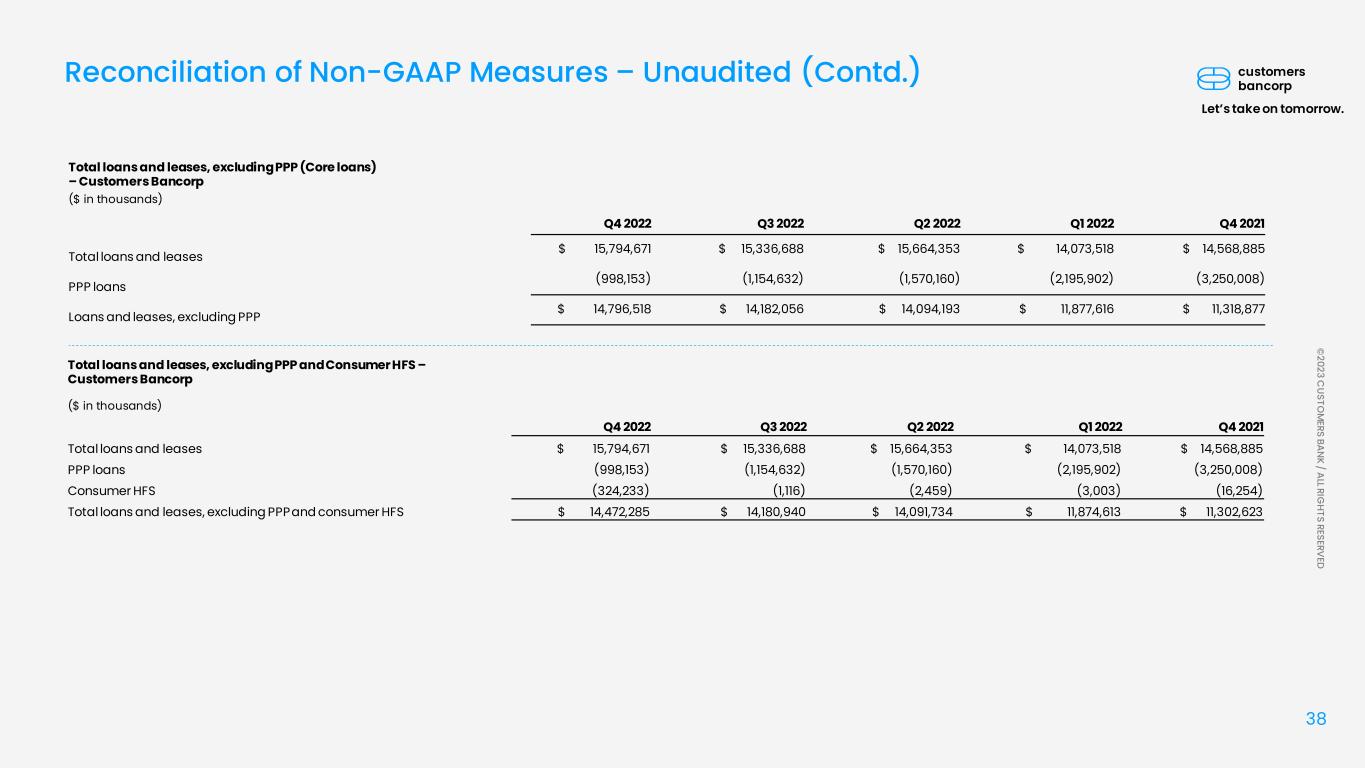
| Total loans and leases | $ | 15,794,671 | $ | 14,568,885 | $ | 1,225,786 | 8.4 | % | ||||||||||||||||||||||||||||||||||||||||||
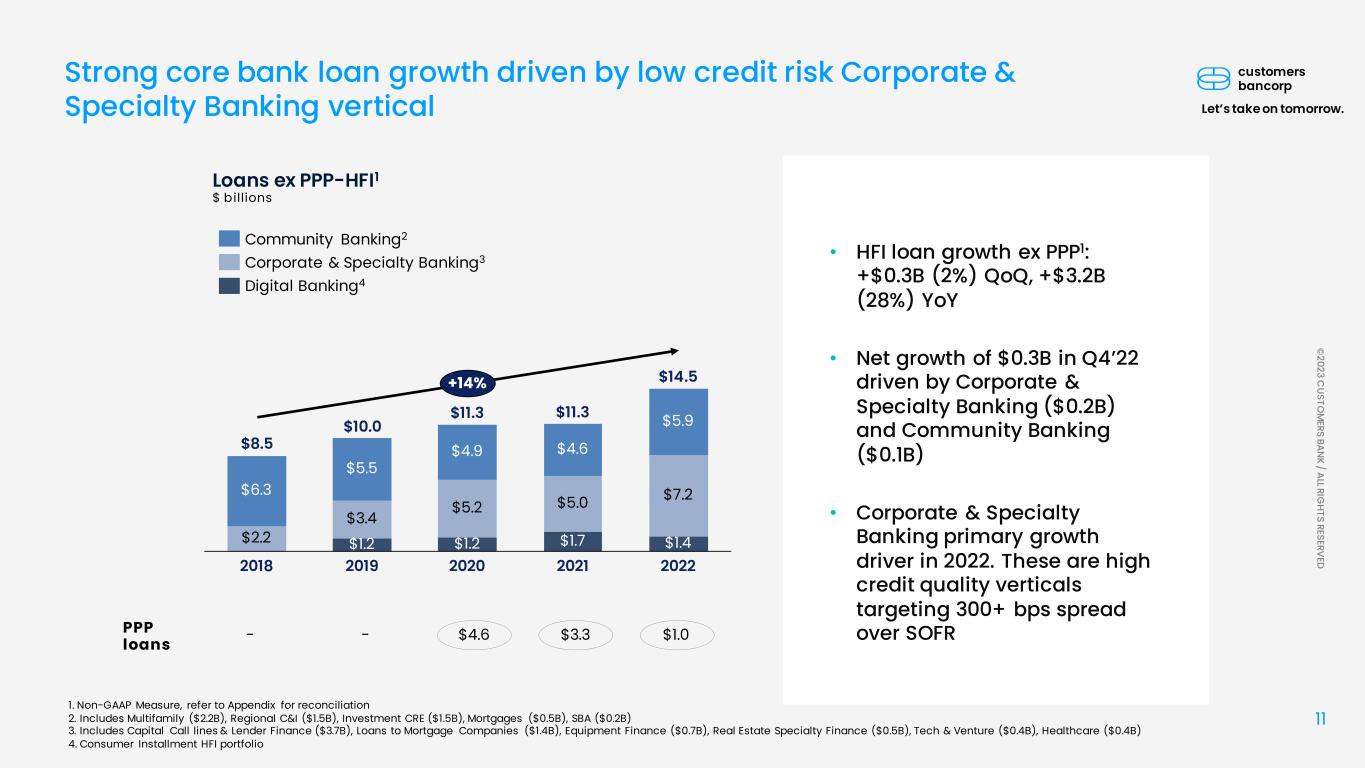
| Total loans and leases, excluding PPP* | $ | 14,796,518 | $ | 11,318,877 | $ | 3,477,641 | 30.7 | % | ||||||||||||||||||||||||||||||||||||||||||
| Non-interest bearing demand deposits | $ | 1,885,045 | $ | 4,459,790 | $ | (2,574,745) | (57.7) | % | ||||||||||||||||||||||||||||||||||||||||||
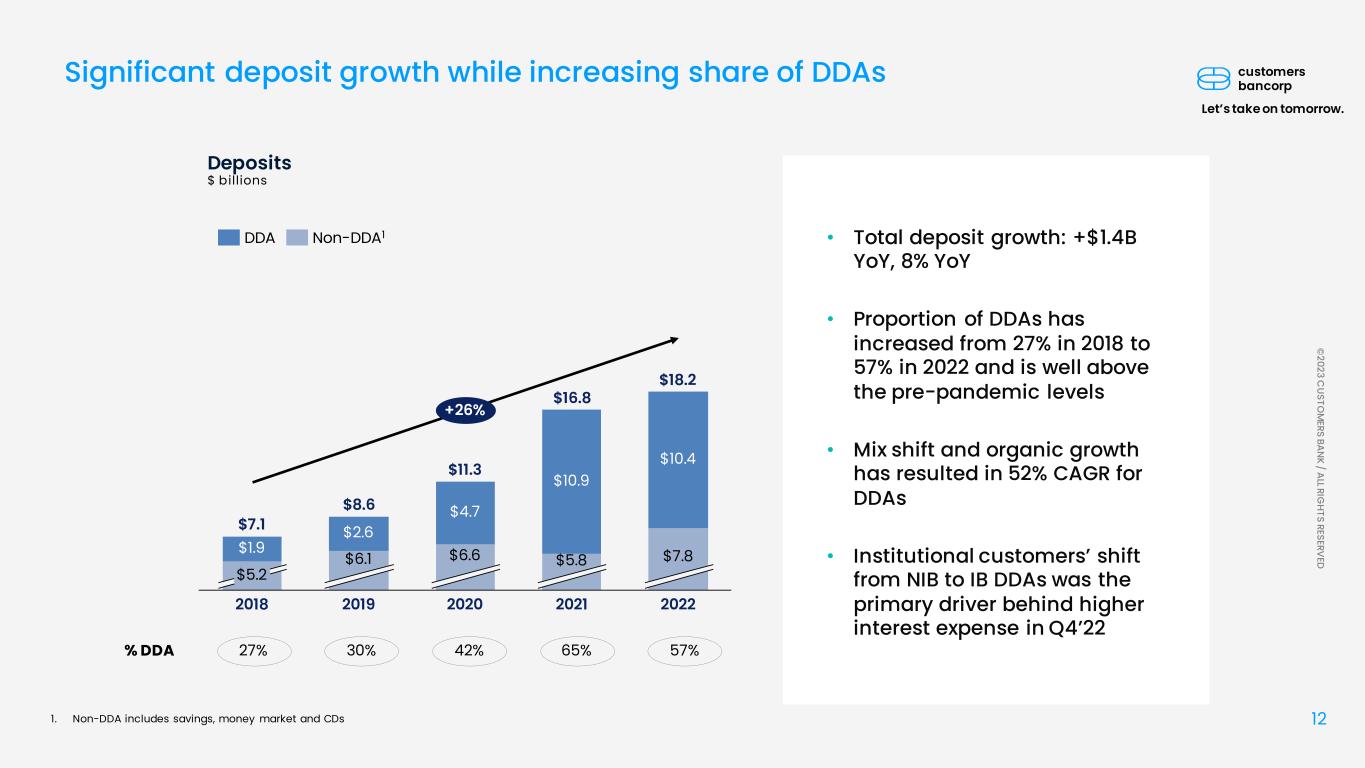
| Total deposits | $ | 18,156,953 | $ | 16,777,924 | $ | 1,379,029 | 8.2 | % | ||||||||||||||||||||||||||||||||||||||||||
| Capital Metrics: | ||||||||||||||||||||||||||||||||||||||||||||||||||
| Common Equity | $ | 1,265,167 | $ | 1,228,423 | $ | 36,744 | 3.0 | % | ||||||||||||||||||||||||||||||||||||||||||
| Tangible Common Equity* | $ | 1,261,538 | $ | 1,224,687 | $ | 36,851 | 3.0 | % | ||||||||||||||||||||||||||||||||||||||||||
| Common Equity to Total Assets | 6.05 | % | 6.28 | % | (0.23) | |||||||||||||||||||||||||||||||||||||||||||||
| Tangible Common Equity to Tangible Assets* | 6.04 | % | 6.26 | % | (0.22) | |||||||||||||||||||||||||||||||||||||||||||||
| Tangible Common Equity to Tangible Assets, excluding PPP* | 6.34 | % | 7.50 | % | (1.16) | |||||||||||||||||||||||||||||||||||||||||||||
| Book Value per common share | $ | 39.08 | $ | 37.32 | $ | 1.76 | 4.7 | % | ||||||||||||||||||||||||||||||||||||||||||
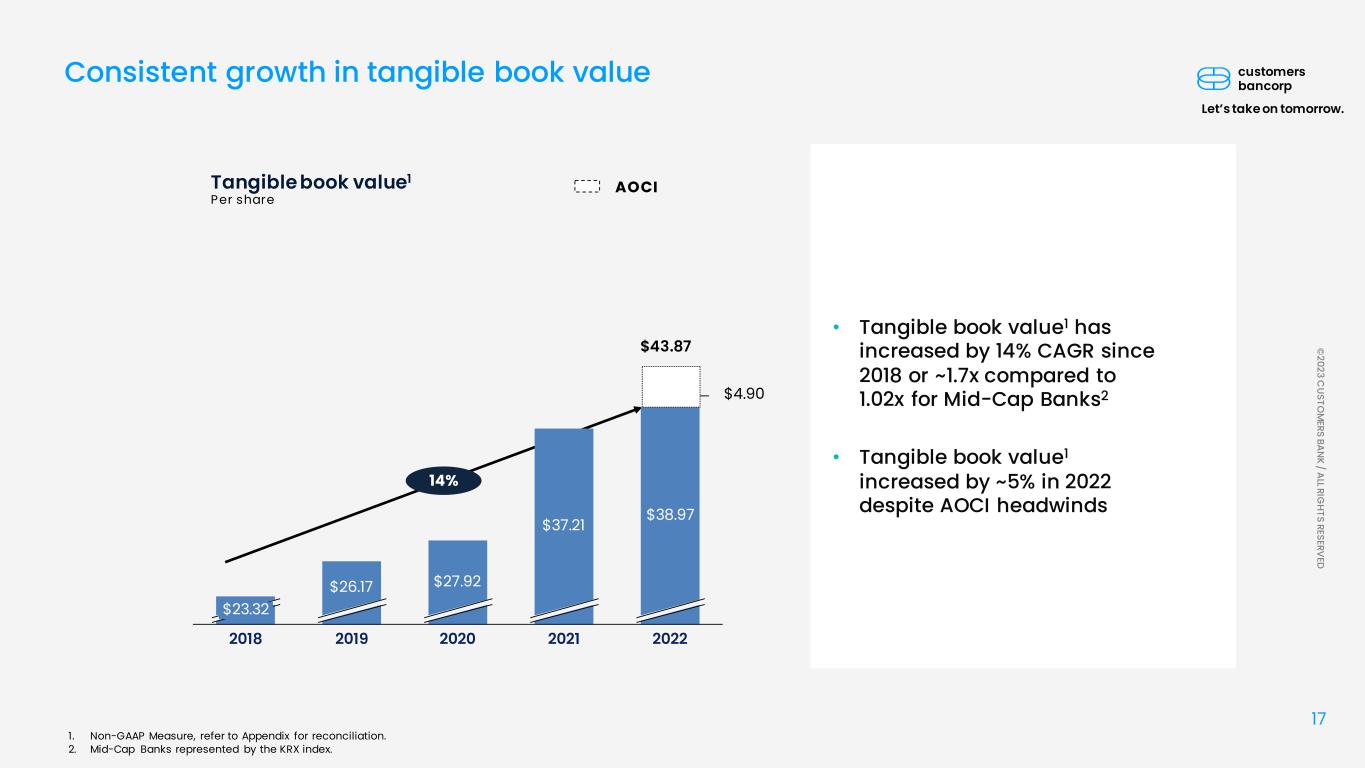
| Tangible Book Value per common share* | $ | 38.97 | $ | 37.21 | $ | 1.76 | 4.7 | % | ||||||||||||||||||||||||||||||||||||||||||
Common equity Tier 1 capital ratio (1) |
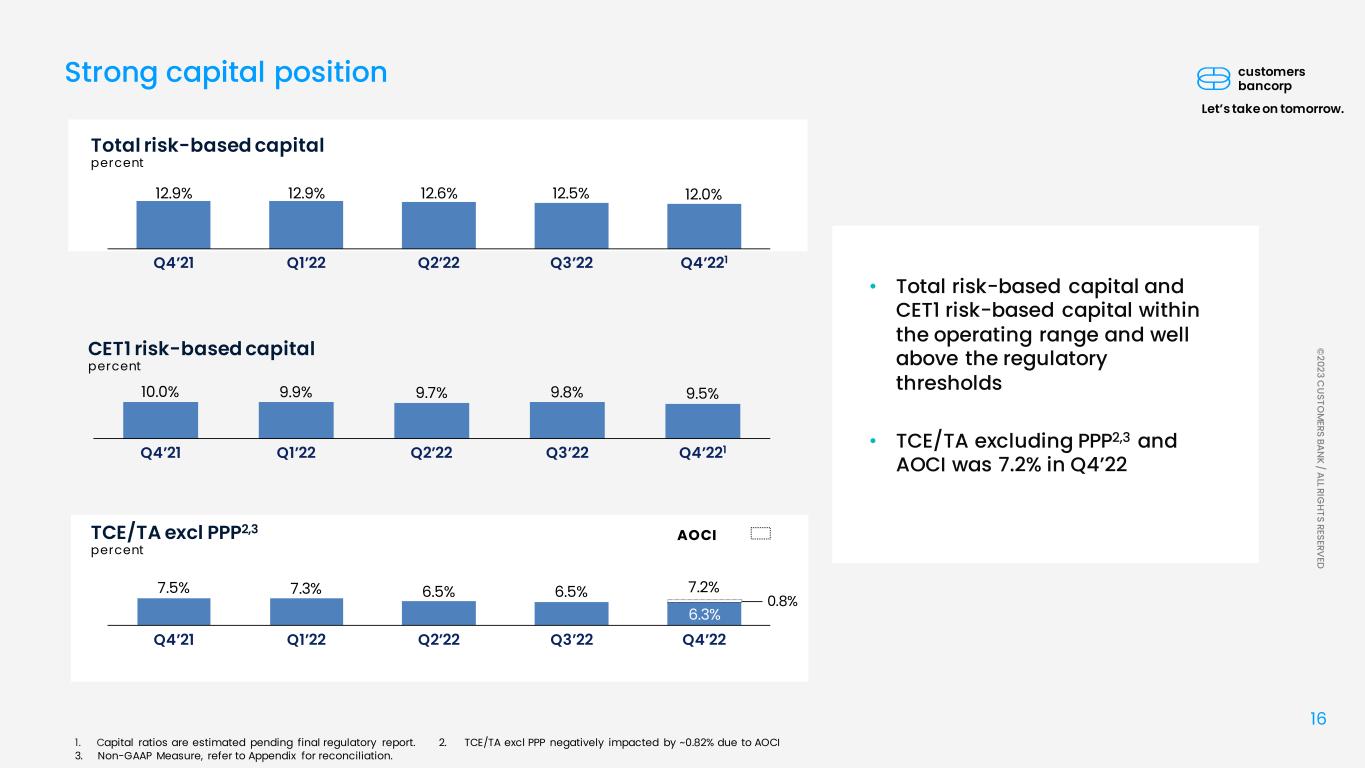
9.5 | % | 10.0 | % | (0.5) | |||||||||||||||||||||||||||||||||||||||||||||
Total risk based capital ratio (1) |
12.0 | % | 12.9 | % | (0.9) | |||||||||||||||||||||||||||||||||||||||||||||
(1) Regulatory capital ratios as of December 31, 2022 are estimates. | ||||||||||||||||||||||||||||||||||||||||||||||||||
*Non-GAAP measure. Customers' reasons for the use of the non-GAAP measure and a detailed reconciliation between the non-GAAP measure and the comparable GAAP amount are included at the end of this document. | ||||||||||||||||||||||||||||||||||||||||||||||||||
| (Dollars in thousands) | December 31, 2022 | % of Total | September 30, 2022 | % of Total | December 31, 2021 | % of Total | |||||||||||||||||||||||||||||
| Commercial: | |||||||||||||||||||||||||||||||||||
| Commercial & industrial: | |||||||||||||||||||||||||||||||||||
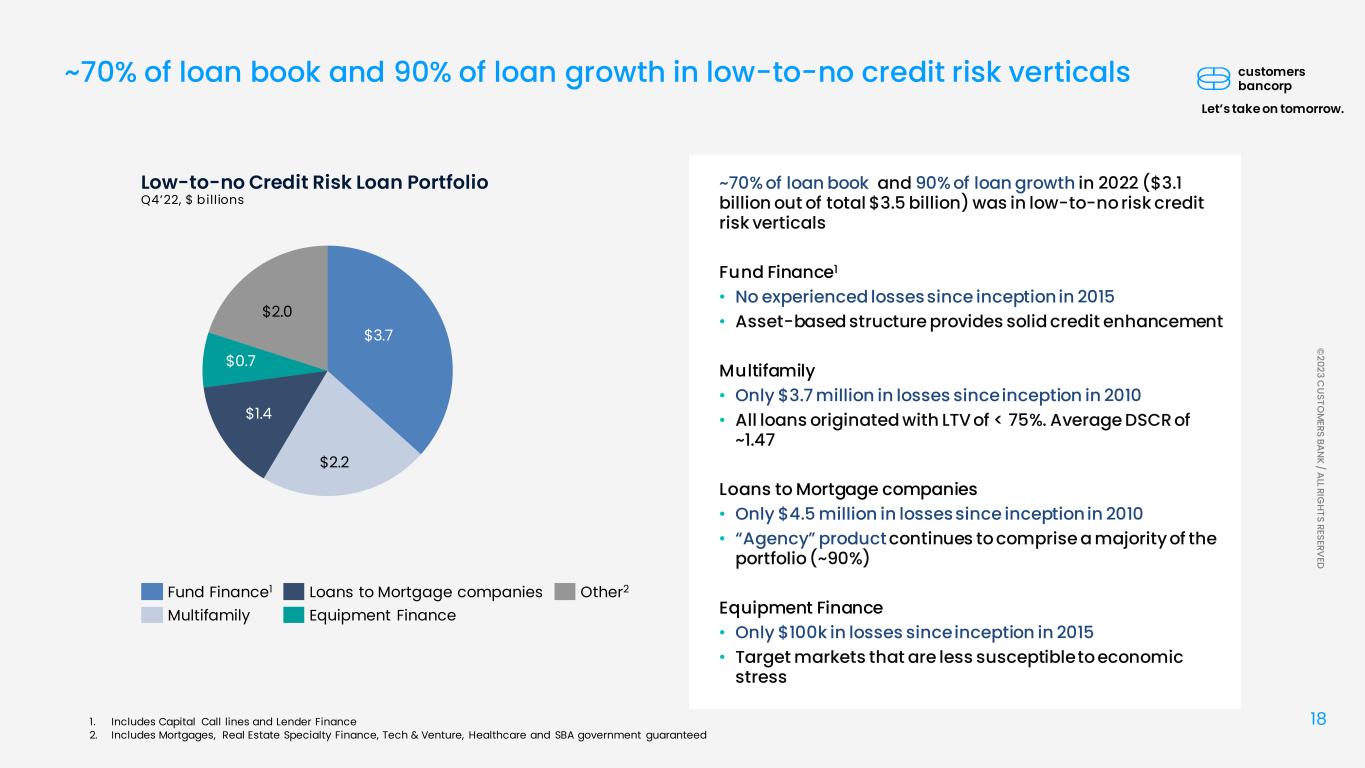
| Specialty lending | $ | 5,412,887 | 34.3 | % | $ | 5,103,974 | 33.3 | % | $ | 2,403,991 | 16.5 | % | |||||||||||||||||||||||
| Other commercial & industrial | 1,135,336 | 7.2 | 1,064,332 | 7.0 | 942,679 | 6.5 | |||||||||||||||||||||||||||||
| Multifamily | 2,217,098 | 14.0 | 2,267,376 | 14.8 | 1,486,308 | 10.2 | |||||||||||||||||||||||||||||
| Loans to mortgage companies | 1,447,919 | 9.2 | 1,708,587 | 11.1 | 2,362,438 | 16.2 | |||||||||||||||||||||||||||||
| Commercial real estate owner occupied | 885,339 | 5.6 | 726,670 | 4.7 | 654,922 | 4.5 | |||||||||||||||||||||||||||||
| Loans receivable, PPP | 998,153 | 6.3 | 1,154,632 | 7.5 | 3,250,008 | 22.3 | |||||||||||||||||||||||||||||
| Commercial real estate non-owner occupied | 1,290,730 | 8.2 | 1,263,211 | 8.2 | 1,121,238 | 7.7 | |||||||||||||||||||||||||||||
| Construction | 162,009 | 1.0 | 136,133 | 0.9 | 198,981 | 1.4 | |||||||||||||||||||||||||||||
| Total commercial loans and leases | 13,549,471 | 85.8 | 13,424,915 | 87.5 | 12,420,565 | 85.3 | |||||||||||||||||||||||||||||
| Consumer: | |||||||||||||||||||||||||||||||||||
| Residential | 498,781 | 3.1 | 466,888 | 3.0 | 350,984 | 2.4 | |||||||||||||||||||||||||||||
| Manufactured housing | 45,076 | 0.3 | 46,990 | 0.3 | 52,861 | 0.3 | |||||||||||||||||||||||||||||
| Installment: | |||||||||||||||||||||||||||||||||||
| Personal | 1,306,376 | 8.3 | 1,056,432 | 6.9 | 1,392,862 | 9.6 | |||||||||||||||||||||||||||||
| Other | 394,967 | 2.5 | 341,463 | 2.3 | 351,613 | 2.4 | |||||||||||||||||||||||||||||
| Total consumer loans | 2,245,200 | 14.2 | 1,911,773 | 12.5 | 2,148,320 | 14.7 | |||||||||||||||||||||||||||||
| Total loans and leases | $ | 15,794,671 | 100.0 | % | $ | 15,336,688 | 100.0 | % | $ | 14,568,885 | 100.0 | % | |||||||||||||||||||||||
| At or Three Months Ended | Increase (Decrease) | At or Three Months Ended | Increase (Decrease) | ||||||||||||||||||||||||||||||||
| (Dollars in thousands) | December 31, 2022 | September 30, 2022 | December 31, 2022 | December 31, 2021 | |||||||||||||||||||||||||||||||
| Allowance for credit losses on loans and leases | $ | 130,924 | $ | 130,197 | $ | 727 | $ | 130,924 | $ | 137,804 | $ | (6,880) | |||||||||||||||||||||||
| Provision (benefit) for credit losses on loans and leases | $ | 27,891 | $ | (7,836) | $ | 35,727 | $ | 27,891 | $ | 13,890 | $ | 14,001 | |||||||||||||||||||||||
| Net charge-offs (recoveries) from loans held for investment | $ | 27,164 | $ | 18,497 | $ | 8,667 | $ | 27,164 | $ | 7,582 | $ | 19,582 | |||||||||||||||||||||||
| Annualized net charge-offs (recoveries) to average loans and leases | 0.70 | % | 0.47 | % | 0.70 | % | 0.21 | % | |||||||||||||||||||||||||||
| Coverage of credit loss reserves for loans and leases held for investment | 0.93 | % | 0.95 | % | 0.93 | % | 1.12 | % | |||||||||||||||||||||||||||
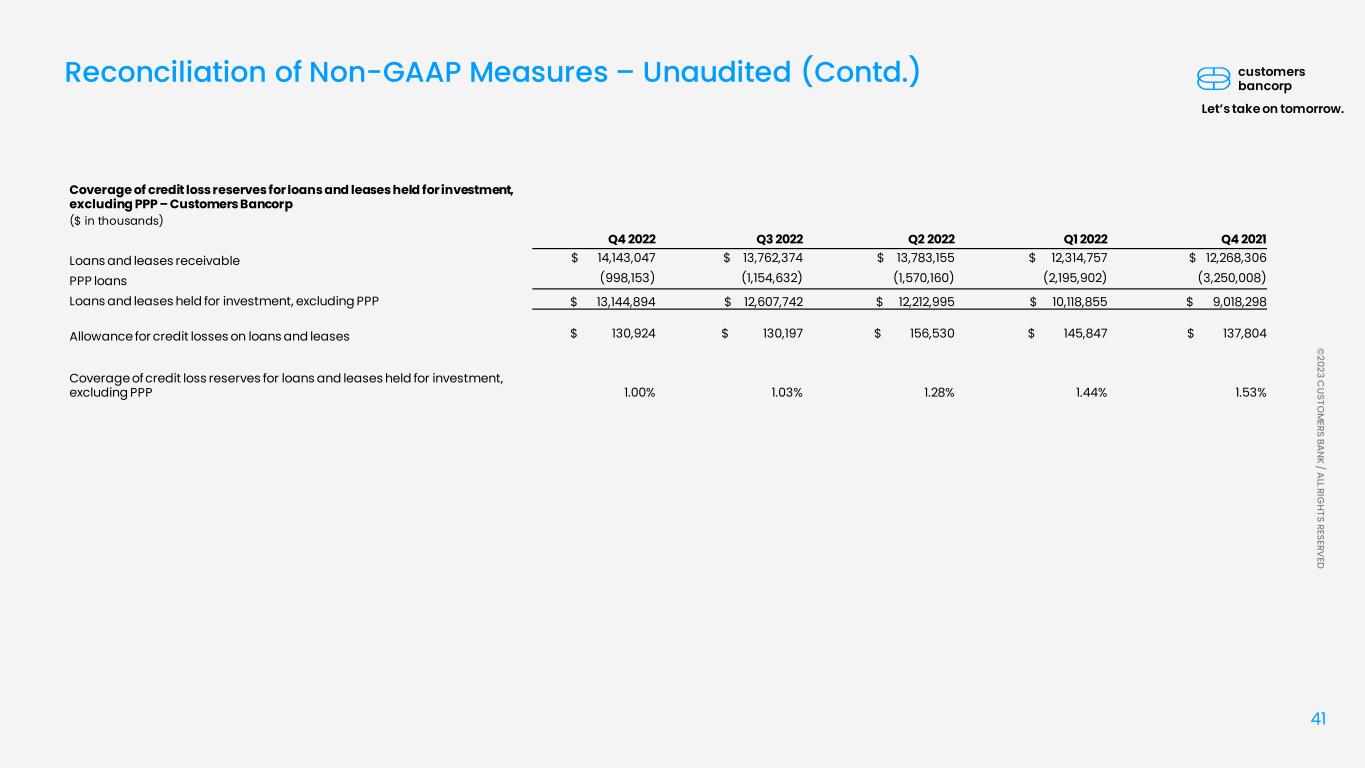
| Coverage of credit loss reserves for loans and leases held for investment, excluding PPP* | 1.00 | % | 1.03 | % | 1.00 | % | 1.53 | % | |||||||||||||||||||||||||||
*Non-GAAP measure. Customers' reasons for the use of the non-GAAP measure and a detailed reconciliation between the non-GAAP measure and the comparable GAAP amount are included at the end of this document. | |||||||||||||||||||||||||||||||||||
| Three Months Ended | Increase (Decrease) | Three Months Ended | Increase (Decrease) | |||||||||||||||||||||||||||||||||||
| (Dollars in thousands) | December 31, 2022 | September 30, 2022 | December 31, 2022 | December 31, 2021 | ||||||||||||||||||||||||||||||||||
| Provision (benefit) for credit losses on loans and leases | $ | 27,891 | $ | (7,836) | $ | 35,727 | $ | 27,891 | $ | 13,890 | $ | 14,001 | ||||||||||||||||||||||||||
| Provision (benefit) for credit losses on available for sale debt securities | 325 | (158) | 483 | 325 | — | 325 | ||||||||||||||||||||||||||||||||
| Provision (benefit) for credit losses | 28,216 | (7,994) | 36,210 | 28,216 | 13,890 | 14,326 | ||||||||||||||||||||||||||||||||
| Provision (benefit) for credit losses on unfunded commitments | 153 | 254 | (101) | 153 | 352 | (199) | ||||||||||||||||||||||||||||||||
| Total provision (benefit) for credit losses | $ | 28,369 | $ | (7,740) | $ | 36,109 | $ | 28,369 | $ | 14,242 | $ | 14,127 | ||||||||||||||||||||||||||
| (Dollars in thousands) | December 31, 2022 | September 30, 2022 | Increase (Decrease) | December 31, 2022 | December 31, 2021 | Increase (Decrease) | |||||||||||||||||||||||||||||
| Non-performing assets ("NPAs"): | |||||||||||||||||||||||||||||||||||
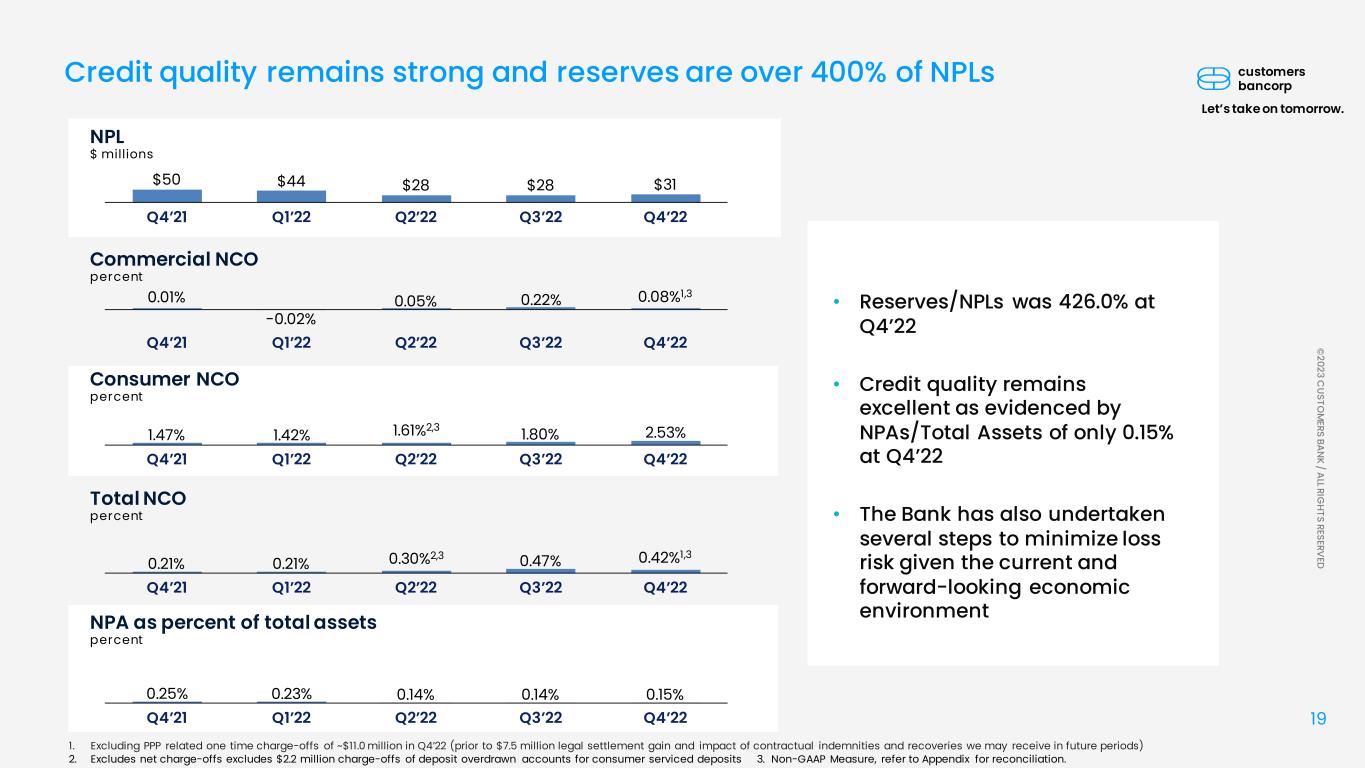
| Nonaccrual / non-performing loans ("NPLs") | $ | 30,737 | $ | 27,919 | $ | 2,818 | $ | 30,737 | $ | 49,620 | $ | (18,883) | |||||||||||||||||||||||
| Non-performing assets | $ | 30,783 | $ | 27,965 | $ | 2,818 | $ | 30,783 | $ | 49,760 | $ | (18,977) | |||||||||||||||||||||||
NPLs to total loans and leases |
0.19 | % | 0.18 | % | 0.19 | % | 0.34 | % | |||||||||||||||||||||||||||
Reserves to NPLs |
425.95 | % | 466.34 | % | 425.95 | % | 277.72 | % | |||||||||||||||||||||||||||
| NPAs to total assets | 0.15 | % | 0.14 | % | 0.15 | % | 0.25 | % | |||||||||||||||||||||||||||
| Loans and leases risk ratings: | |||||||||||||||||||||||||||||||||||
Commercial loans and leases (1) |
|||||||||||||||||||||||||||||||||||
| Pass | $ | 10,793,980 | $ | 10,262,647 | $ | 531,333 | $ | 10,793,980 | $ | 6,389,228 | $ | 4,404,752 | |||||||||||||||||||||||
| Special Mention | 138,829 | 104,560 | 34,269 | 138,829 | 230,065 | (91,236) | |||||||||||||||||||||||||||||
| Substandard | 291,118 | 329,878 | (38,760) | 291,118 | 266,939 | 24,179 | |||||||||||||||||||||||||||||
| Total commercial loans and leases | 11,223,927 | 10,697,085 | 526,842 | 11,223,927 | 6,886,232 | 4,337,695 | |||||||||||||||||||||||||||||
| Consumer loans | |||||||||||||||||||||||||||||||||||
| Performing | 1,899,376 | 1,893,977 | 5,399 | 1,899,376 | 2,114,950 | (215,574) | |||||||||||||||||||||||||||||
| Non-performing | 21,591 | 16,680 | 4,911 | 21,591 | 17,116 | 4,475 | |||||||||||||||||||||||||||||
| Total consumer loans | 1,920,967 | 1,910,657 | 10,310 | 1,920,967 | 2,132,066 | (211,099) | |||||||||||||||||||||||||||||
| Loans and leases receivable | $ | 13,144,894 | $ | 12,607,742 | $ | 537,152 | $ | 13,144,894 | $ | 9,018,298 | $ | 4,126,596 | |||||||||||||||||||||||
| (Dollars in thousands) | December 31, 2022 | % of Total | September 30, 2022 | % of Total | December 31, 2021 | % of Total | |||||||||||||||||||||||||||||
| Demand, non-interest bearing | $ | 1,885,045 | 10.4 | % | $ | 2,993,793 | 17.1 | % | $ | 4,459,790 | 26.6 | % | |||||||||||||||||||||||
| Demand, interest bearing | 8,476,027 | 46.7 | 7,124,663 | 40.7 | 6,488,406 | 38.7 | |||||||||||||||||||||||||||||
| Total demand deposits | 10,361,072 | 57.1 | 10,118,456 | 57.8 | 10,948,196 | 65.3 | |||||||||||||||||||||||||||||
| Savings | 811,798 | 4.5 | 592,002 | 3.4 | 973,317 | 5.8 | |||||||||||||||||||||||||||||
| Money market | 2,734,217 | 15.1 | 4,913,967 | 28.0 | 4,349,073 | 25.9 | |||||||||||||||||||||||||||||
| Time deposits | 4,249,866 | 23.3 | 1,898,013 | 10.8 | 507,338 | 3.0 | |||||||||||||||||||||||||||||
| Total deposits | $ | 18,156,953 | 100.0 | % | $ | 17,522,438 | 100.0 | % | $ | 16,777,924 | 100.0 | % | |||||||||||||||||||||||
| (Dollars in thousands except per share data) | December 31, 2022 | September 30, 2022 | December 31, 2021 | ||||||||||||||
| Customers Bancorp, Inc. | |||||||||||||||||
| Common Equity | $ | 1,265,167 | $ | 1,249,137 | $ | 1,228,423 | |||||||||||
| Tangible Common Equity* | $ | 1,261,538 | $ | 1,245,508 | $ | 1,224,687 | |||||||||||
| Common Equity to Total Assets | 6.05 | % | 6.13 | % | 6.28 | % | |||||||||||
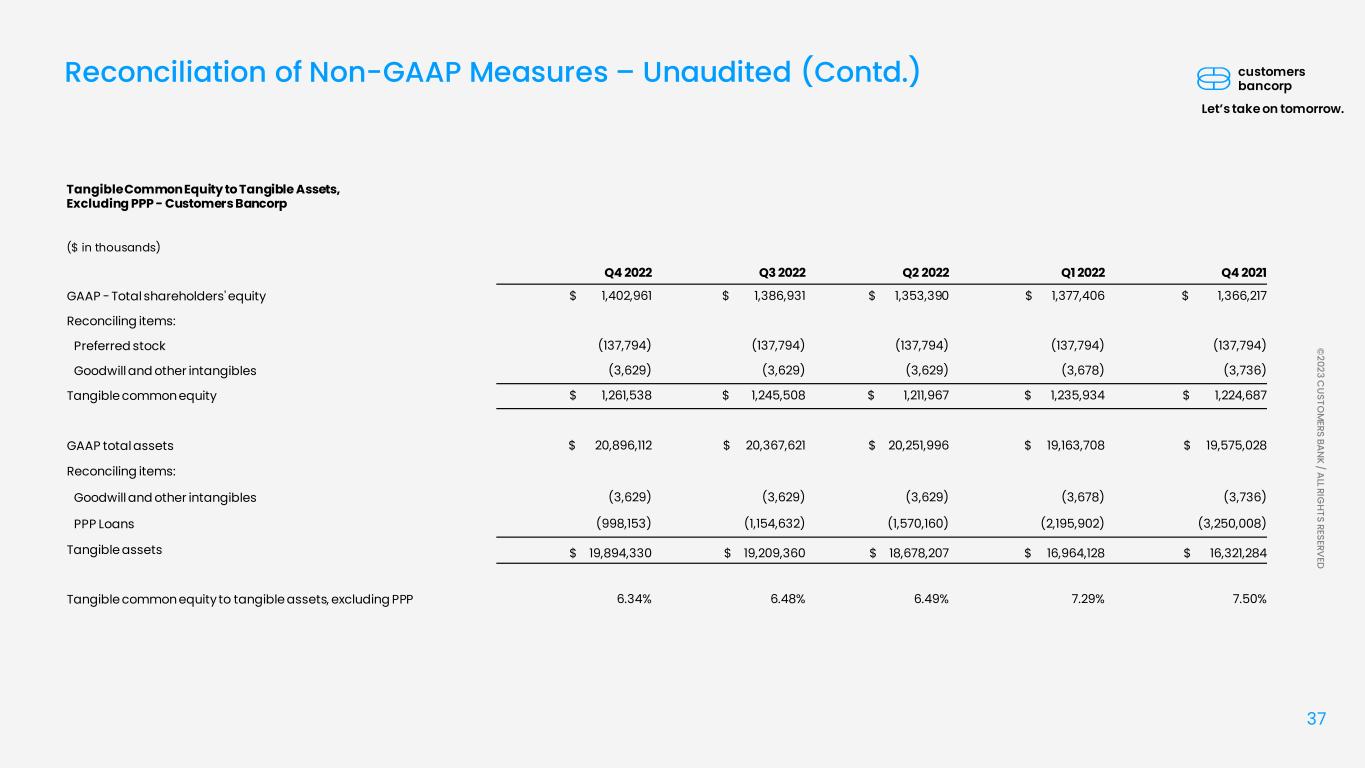
| Tangible Common Equity to Tangible Assets* | 6.04 | % | 6.12 | % | 6.26 | % | |||||||||||
| Tangible Common Equity to Tangible Assets, excluding PPP* | 6.34 | % | 6.48 | % | 7.50 | % | |||||||||||
| Book Value per common share | $ | 39.08 | $ | 38.46 | $ | 37.32 | |||||||||||
| Tangible Book Value per common share* | $ | 38.97 | $ | 38.35 | $ | 37.21 | |||||||||||
Common equity Tier 1 capital ratio (1) |
9.5 | % | 9.8 | % | 10.0 | % | |||||||||||
Total risk based capital ratio (1) |
12.0 | % | 12.5 | % | 12.9 | % | |||||||||||
(1) Regulatory capital ratios as of December 31, 2022 are estimates. | |||||||||||||||||
*Non-GAAP measure. Customers' reasons for the use of the non-GAAP measure and a detailed reconciliation between the non-GAAP measure and the comparable GAAP amount are included at the end of this document. | |||||||||||||||||
| Three Months Ended | Increase (Decrease) | Three Months Ended | Increase (Decrease) | ||||||||||||||||||||||||||||||||
| (Dollars in thousands) | December 31, 2022 | September 30, 2022 | December 31, 2022 | December 31, 2021 | |||||||||||||||||||||||||||||||
| Interchange and card revenue | $ | 71 | $ | 72 | $ | (1) | $ | 71 | $ | 84 | $ | (13) | |||||||||||||||||||||||
| Deposit fees | 958 | 989 | (31) | 958 | 1,026 | (68) | |||||||||||||||||||||||||||||
| Commercial lease income | 8,135 | 7,097 | 1,038 | 8,135 | 5,378 | 2,757 | |||||||||||||||||||||||||||||
| Bank-owned life insurance | 1,975 | 3,449 | (1,474) | 1,975 | 1,984 | (9) | |||||||||||||||||||||||||||||
| Mortgage warehouse transactional fees | 1,295 | 1,545 | (250) | 1,295 | 2,262 | (967) | |||||||||||||||||||||||||||||
| Gain (loss) on sale of SBA and other loans | — | 106 | (106) | — | 2,493 | (2,493) | |||||||||||||||||||||||||||||
| Loss on sale of consumer installment loans | — | (23,465) | 23,465 | — | — | — | |||||||||||||||||||||||||||||
| Loan fees | 4,017 | 3,008 | 1,009 | 4,017 | 2,513 | 1,504 | |||||||||||||||||||||||||||||
| Mortgage banking income | 90 | 125 | (35) | 90 | 262 | (172) | |||||||||||||||||||||||||||||
| Gain (loss) on sale of investment securities | (16,937) | (2,135) | (14,802) | (16,937) | (49) | (16,888) | |||||||||||||||||||||||||||||
| Unrealized gain (loss) on investment securities | 28 | (259) | 287 | 28 | — | 28 | |||||||||||||||||||||||||||||
| Unrealized gain (loss) on derivatives | 43 | 563 | (520) | 43 | 586 | (543) | |||||||||||||||||||||||||||||
| Legal settlement gain | 7,519 | — | 7,519 | 7,519 | — | 7,519 | |||||||||||||||||||||||||||||
| Other | 151 | (112) | 263 | 151 | 452 | (301) | |||||||||||||||||||||||||||||
| Total non-interest income | $ | 7,345 | $ | (9,017) | $ | 16,362 | $ | 7,345 | $ | 16,991 | $ | (9,646) | |||||||||||||||||||||||
| Three Months Ended | Increase (Decrease) | Three Months Ended | Increase (Decrease) | ||||||||||||||||||||||||||||||||
| (Dollars in thousands) | December 31, 2022 | September 30, 2022 | December 31, 2022 | December 31, 2021 | |||||||||||||||||||||||||||||||
| Salaries and employee benefits | $ | 29,194 | $ | 31,230 | $ | (2,036) | $ | 29,194 | $ | 29,940 | $ | (746) | |||||||||||||||||||||||
| Technology, communication and bank operations | 18,604 | 19,588 | (984) | 18,604 | 22,657 | (4,053) | |||||||||||||||||||||||||||||
| Professional services | 6,825 | 6,269 | 556 | 6,825 | 7,058 | (233) | |||||||||||||||||||||||||||||
| Occupancy | 3,672 | 2,605 | 1,067 | 3,672 | 4,336 | (664) | |||||||||||||||||||||||||||||
| Commercial lease depreciation | 6,518 | 5,966 | 552 | 6,518 | 4,625 | 1,893 | |||||||||||||||||||||||||||||
| FDIC assessments, non-income taxes and regulatory fees | 2,339 | 2,528 | (189) | 2,339 | 2,427 | (88) | |||||||||||||||||||||||||||||
| Loan servicing | 4,460 | 3,851 | 609 | 4,460 | 4,361 | 99 | |||||||||||||||||||||||||||||
| Loan workout | 714 | 217 | 497 | 714 | 226 | 488 | |||||||||||||||||||||||||||||
| Advertising and promotion | 1,111 | 762 | 349 | 1,111 | 344 | 767 | |||||||||||||||||||||||||||||
| Other | 4,982 | 3,182 | 1,800 | 4,982 | 5,574 | (592) | |||||||||||||||||||||||||||||
| Total non-interest expense | $ | 78,419 | $ | 76,198 | $ | 2,221 | $ | 78,419 | $ | 81,548 | $ | (3,129) | |||||||||||||||||||||||
*Non-GAAP measure. Customers' reasons for the use of the non-GAAP measure and a detailed reconciliation between the non-GAAP measure and the comparable GAAP amount are included at the end of this document. | ||||||||||||||
| CUSTOMERS BANCORP, INC. AND SUBSIDIARIES | |||||||||||||||||||||||||||||||||||||||||||||||
| EARNINGS SUMMARY - UNAUDITED | |||||||||||||||||||||||||||||||||||||||||||||||
(Dollars in thousands, except per share data and stock price data) |
Q4 | Q3 | Q2 | Q1 | Q4 | Twelve Months Ended December 31, | |||||||||||||||||||||||||||||||||||||||||
| 2022 | 2022 | 2022 | 2021 | 2021 | 2022 | 2021 | |||||||||||||||||||||||||||||||||||||||||
| GAAP Profitability Metrics: | |||||||||||||||||||||||||||||||||||||||||||||||
|
Net income available to common shareholders
(from continuing and discontinued operations)
|
$ | 25,623 | $ | 61,364 | $ | 56,519 | $ | 74,896 | $ | 98,647 | $ | 218,402 | $ | 300,134 | |||||||||||||||||||||||||||||||||
Per share amounts: |
|||||||||||||||||||||||||||||||||||||||||||||||
Earnings per share - basic |
$ | 0.79 | $ | 1.89 | $ | 1.73 | $ | 2.27 | $ | 3.02 | $ | 6.69 | $ | 9.29 | |||||||||||||||||||||||||||||||||
| Earnings per share - diluted | $ | 0.77 | $ | 1.85 | $ | 1.68 | $ | 2.18 | $ | 2.87 | $ | 6.51 | $ | 8.91 | |||||||||||||||||||||||||||||||||
Book value per common share (1) |
$ | 39.08 | $ | 38.46 | $ | 37.46 | $ | 37.61 | $ | 37.32 | $ | 39.08 | $ | 37.32 | |||||||||||||||||||||||||||||||||
CUBI stock price (1) |
$ | 28.34 | $ | 29.48 | $ | 33.90 | $ | 52.14 | $ | 65.37 | $ | 28.34 | $ | 65.37 | |||||||||||||||||||||||||||||||||
CUBI stock price as % of book value (1) |
73 | % | 77 | % | 90 | % | 139 | % | 175 | % | 73 | % | 175 | % | |||||||||||||||||||||||||||||||||
| Average shares outstanding - basic | 32,413,459 | 32,455,814 | 32,712,616 | 32,957,033 | 32,625,960 | 32,632,751 | 32,312,262 | ||||||||||||||||||||||||||||||||||||||||
| Average shares outstanding - diluted | 33,075,422 | 33,226,607 | 33,579,013 | 34,327,065 | 34,320,327 | 33,547,706 | 33,697,547 | ||||||||||||||||||||||||||||||||||||||||
Shares outstanding (1) |
32,373,697 | 32,475,502 | 32,449,486 | 32,957,847 | 32,913,267 | 32,373,697 | 32,913,267 | ||||||||||||||||||||||||||||||||||||||||
| Return on average assets ("ROAA") | 0.55 | % | 1.24 | % | 1.17 | % | 1.63 | % | 2.08 | % | 1.13 | % | 1.64 | % | |||||||||||||||||||||||||||||||||
| Return on average common equity ("ROCE") | 8.05 | % | 19.33 | % | 18.21 | % | 24.26 | % | 33.18 | % | 17.40 | % | 28.75 | % | |||||||||||||||||||||||||||||||||
| Net interest margin, tax equivalent | 2.67 | % | 3.16 | % | 3.39 | % | 3.60 | % | 4.14 | % | 3.19 | % | 3.70 | % | |||||||||||||||||||||||||||||||||
| Efficiency ratio | 49.20 | % | 50.00 | % | 42.14 | % | 39.42 | % | 38.70 | % | 44.81 | % | 40.38 | % | |||||||||||||||||||||||||||||||||
Non-GAAP Profitability Metrics (2): |
|||||||||||||||||||||||||||||||||||||||||||||||
| Core earnings | $ | 39,368 | $ | 82,270 | $ | 59,367 | $ | 75,410 | $ | 101,213 | $ | 256,415 | $ | 344,700 | |||||||||||||||||||||||||||||||||
| Adjusted pre-tax pre-provision net income | $ | 81,377 | $ | 100,994 | $ | 105,692 | $ | 112,649 | $ | 130,595 | $ | 400,712 | $ | 471,046 | |||||||||||||||||||||||||||||||||
| Per share amounts: | |||||||||||||||||||||||||||||||||||||||||||||||
| Core earnings per share - diluted | $ | 1.19 | $ | 2.48 | $ | 1.77 | $ | 2.20 | $ | 2.95 | $ | 7.63 | $ | 10.23 | |||||||||||||||||||||||||||||||||
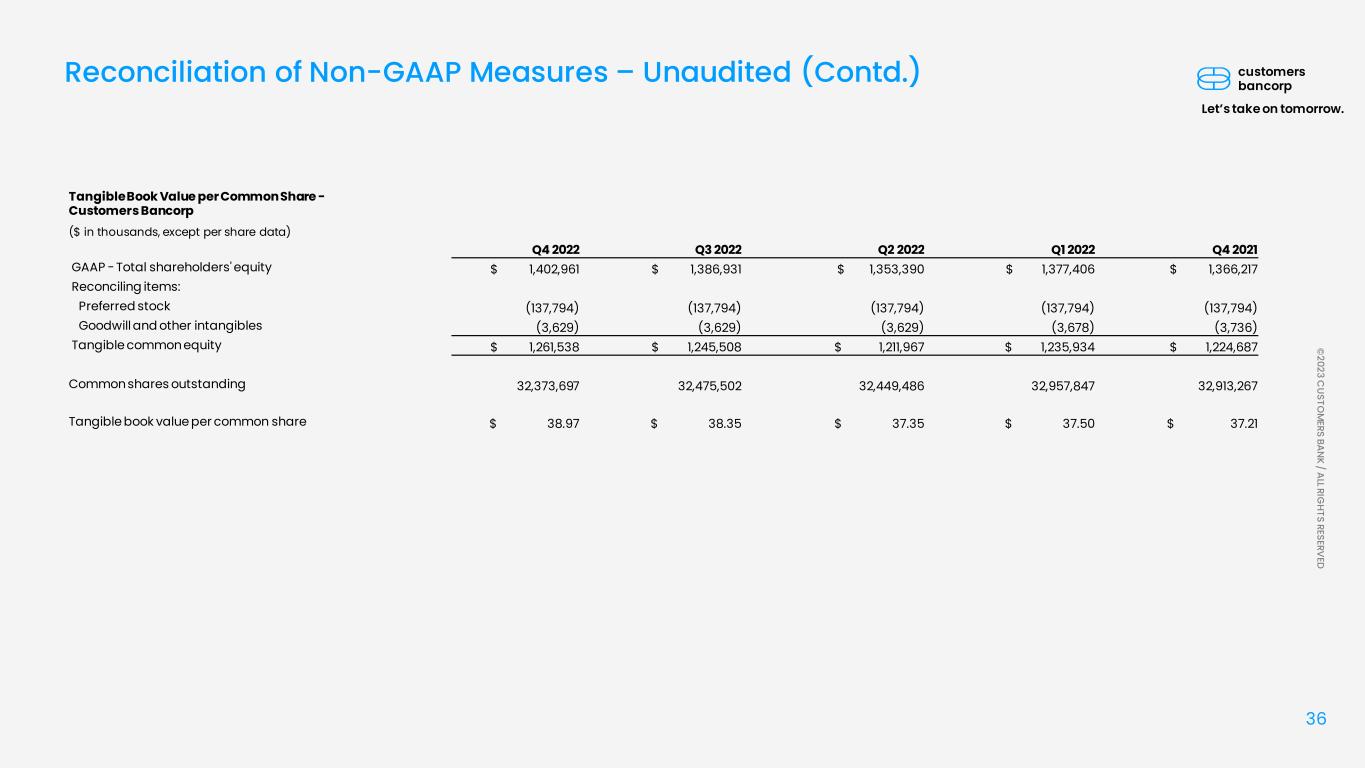
Tangible book value per common share (1) |
$ | 38.97 | $ | 38.35 | $ | 37.35 | $ | 37.50 | $ | 37.21 | $ | 38.97 | $ | 37.21 | |||||||||||||||||||||||||||||||||
CUBI stock price as % of tangible book value (1) |
73 | % | 77 | % | 91 | % | 139 | % | 176 | % | 73 | % | 176 | % | |||||||||||||||||||||||||||||||||
| Core ROAA | 0.81 | % | 1.64 | % | 1.23 | % | 1.64 | % | 2.13 | % | 1.32 | % | 1.86 | % | |||||||||||||||||||||||||||||||||
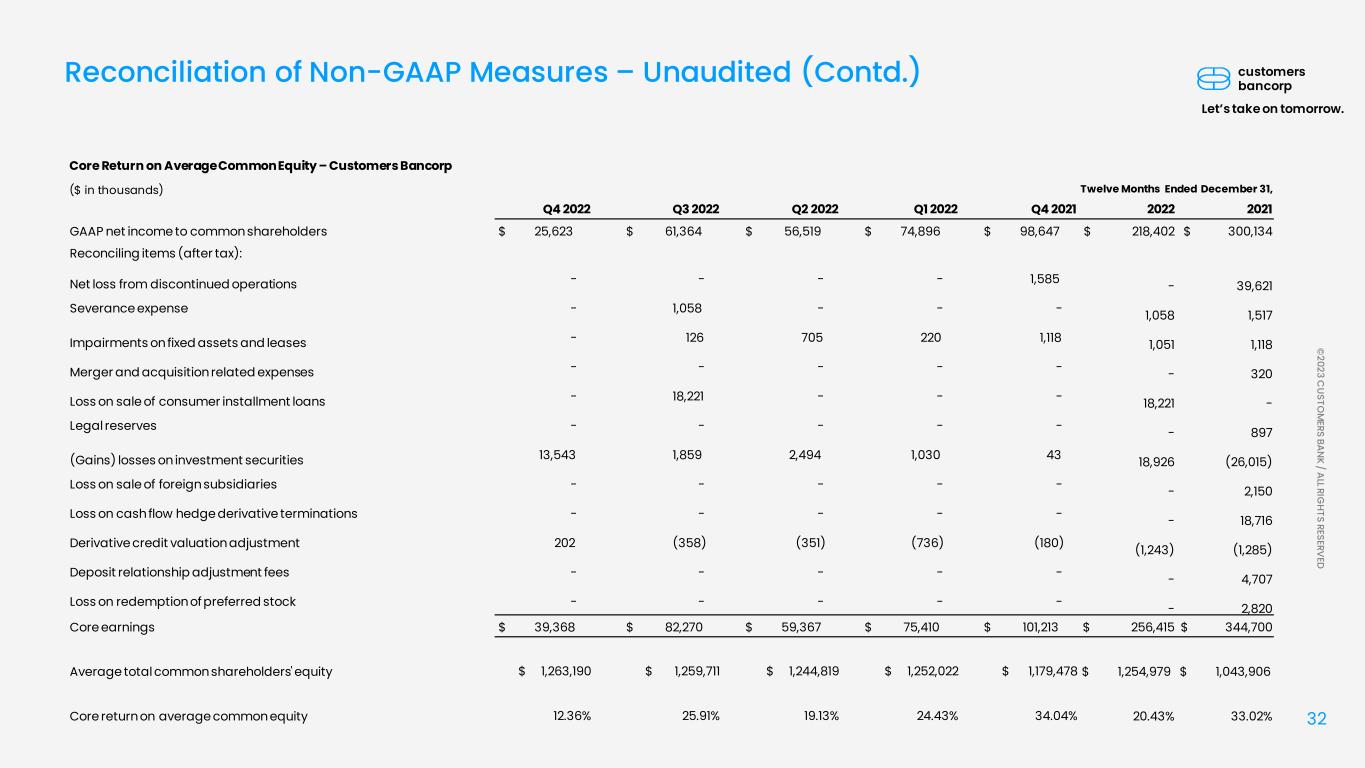
| Core ROCE | 12.36 | % | 25.91 | % | 19.13 | % | 24.43 | % | 34.04 | % | 20.43 | % | 33.02 | % | |||||||||||||||||||||||||||||||||
| Adjusted ROAA - pre-tax and pre-provision | 1.56 | % | 1.95 | % | 2.11 | % | 2.39 | % | 2.70 | % | 1.99 | % | 2.45 | % | |||||||||||||||||||||||||||||||||
| Adjusted ROCE - pre-tax and pre-provision | 24.59 | % | 31.01 | % | 33.37 | % | 35.89 | % | 43.25 | % | 31.16 | % | 44.00 | % | |||||||||||||||||||||||||||||||||
| Net interest margin, tax equivalent, excluding PPP loans | 2.87 | % | 3.18 | % | 3.32 | % | 3.32 | % | 3.12 | % | 3.16 | % | 3.16 | % | |||||||||||||||||||||||||||||||||
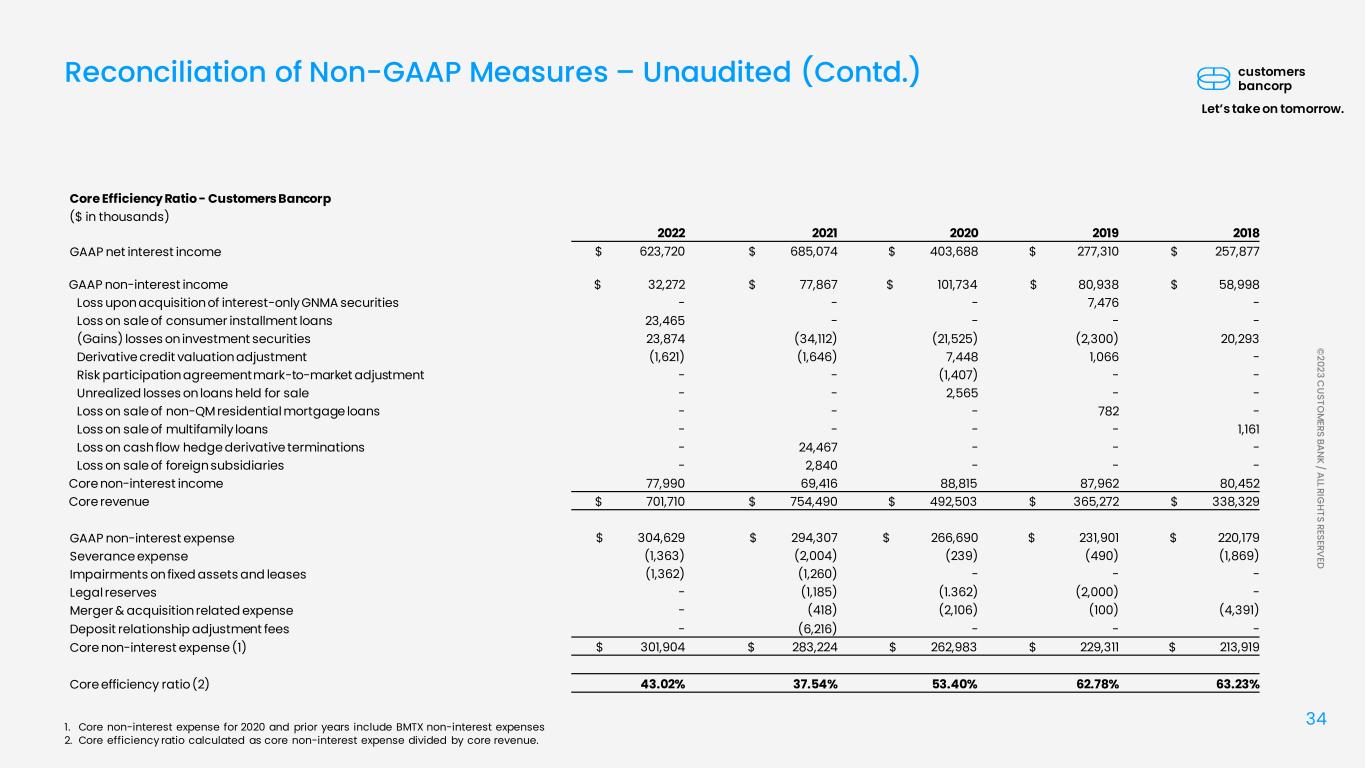
| Core efficiency ratio | 49.12 | % | 42.57 | % | 41.74 | % | 39.47 | % | 38.14 | % | 43.02 | % | 37.54 | % | |||||||||||||||||||||||||||||||||
| Asset Quality: | |||||||||||||||||||||||||||||||||||||||||||||||
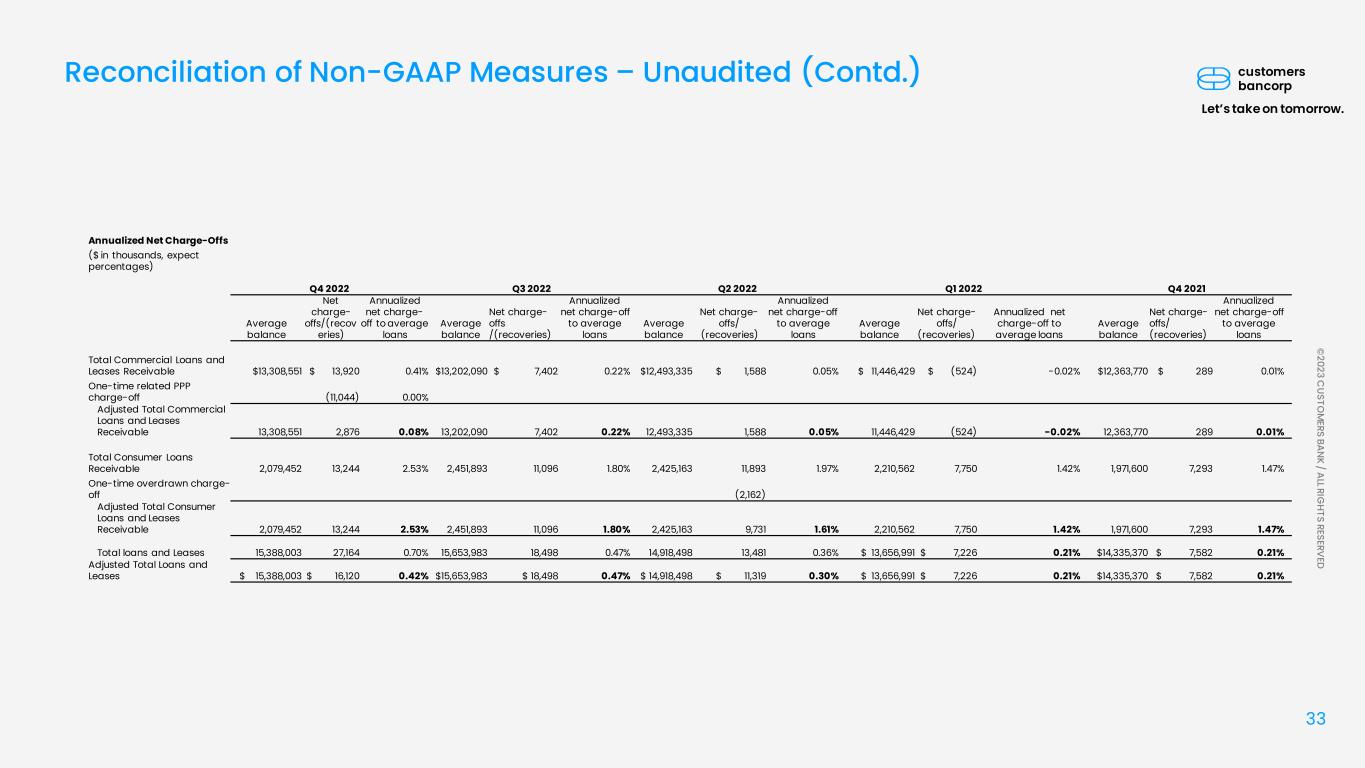
| Net charge-offs | $ | 27,164 | $ | 18,497 | $ | 13,481 | $ | 7,226 | $ | 7,582 | $ | 66,368 | $ | 33,798 | |||||||||||||||||||||||||||||||||
| Annualized net charge-offs to average total loans and leases | 0.70 | % | 0.47 | % | 0.36 | % | 0.21 | % | 0.21 | % | 0.45 | % | 0.22 | % | |||||||||||||||||||||||||||||||||
Non-performing loans ("NPLs") to total loans and leases (1) |
0.19 | % | 0.18 | % | 0.18 | % | 0.31 | % | 0.34 | % | 0.19 | % | 0.34 | % | |||||||||||||||||||||||||||||||||
Reserves to NPLs (1) |
425.95 | % | 466.34 | % | 557.76 | % | 333.15 | % | 277.72 | % | 425.95 | % | 277.72 | % | |||||||||||||||||||||||||||||||||
| Non-performing assets ("NPAs") to total assets | 0.15 | % | 0.14 | % | 0.14 | % | 0.23 | % | 0.25 | % | 0.15 | % | 0.25 | % | |||||||||||||||||||||||||||||||||
Customers Bank Capital Ratios (3): |
|||||||||||||||||||||||||||||||||||||||||||||||
| Common equity Tier 1 capital to risk-weighted assets | 11.07 | % | 11.42 | % | 11.46 | % | 11.60 | % | 11.83 | % | 11.07 | % | 11.83 | % | |||||||||||||||||||||||||||||||||
| Tier 1 capital to risk-weighted assets | 11.07 | % | 11.42 | % | 11.46 | % | 11.60 | % | 11.83 | % | 11.07 | % | 11.83 | % | |||||||||||||||||||||||||||||||||
| Total capital to risk-weighted assets | 12.24 | % | 12.65 | % | 12.91 | % | 13.03 | % | 13.11 | % | 12.24 | % | 13.11 | % | |||||||||||||||||||||||||||||||||
| Tier 1 capital to average assets (leverage ratio) | 8.15 | % | 8.10 | % | 8.09 | % | 8.21 | % | 7.93 | % | 8.15 | % | 7.93 | % | |||||||||||||||||||||||||||||||||
| (1) Metric is a spot balance for the last day of each quarter presented. | |||||||||||||||||||||||||||||||||||||||||||||||
| (2) Customers' reasons for the use of these non-GAAP measures and a detailed reconciliation between the non-GAAP measures and the comparable GAAP amounts are included at the end of this document. | |||||||||||||||||||||||||||||||||||||||||||||||
| (3) Regulatory capital ratios are estimated for Q4 2022 and actual for the remaining periods. In accordance with regulatory capital rules, Customers elected to apply the CECL capital transition provisions which delayed the effects of CECL on regulatory capital for two years until January 1, 2022, followed by a three-year transition period. The cumulative CECL capital transition impact as of December 31, 2021 which amounted to $61.6 million will be phased in at 25% per year beginning on January 1, 2022 through December 31, 2024. As of December 31, 2022, our regulatory capital ratios reflected 75%, or $46.2 million, benefit associated with the CECL transition provisions. | |||||||||||||||||||||||||||||||||||||||||||||||
| CUSTOMERS BANCORP, INC. AND SUBSIDIARIES | |||||||||||||||||||||||||||||||||||||||||
CONSOLIDATED STATEMENTS OF OPERATIONS - UNAUDITED | |||||||||||||||||||||||||||||||||||||||||
| (Dollars in thousands, except per share data) | Twelve Months Ended | ||||||||||||||||||||||||||||||||||||||||
| Q4 | Q3 | Q2 | Q1 | Q4 | December 31, | ||||||||||||||||||||||||||||||||||||
| 2022 | 2022 | 2022 | 2022 | 2021 | 2022 | 2021 | |||||||||||||||||||||||||||||||||||
| Interest income: | |||||||||||||||||||||||||||||||||||||||||
| Loans and leases | $ | 218,740 | $ | 200,457 | $ | 168,941 | $ | 157,175 | $ | 198,000 | $ | 745,313 | $ | 736,822 | |||||||||||||||||||||||||||
| Investment securities | 42,953 | 30,546 | 25,442 | 20,295 | 15,202 | 119,236 | 40,413 | ||||||||||||||||||||||||||||||||||
| Interest earning deposits | 6,754 | 2,949 | 919 | 330 | 604 | 10,952 | 1,585 | ||||||||||||||||||||||||||||||||||
| Other | 1,200 | 1,964 | 1,032 | 5,676 | 231 | 9,872 | 2,064 | ||||||||||||||||||||||||||||||||||
| Total interest income | 269,647 | 235,916 | 196,334 | 183,476 | 214,037 | 885,373 | 780,884 | ||||||||||||||||||||||||||||||||||
| Interest expense: | |||||||||||||||||||||||||||||||||||||||||
| Deposits | 124,366 | 65,380 | 22,781 | 13,712 | 15,415 | 226,239 | 62,641 | ||||||||||||||||||||||||||||||||||
| FHLB advances | 4,464 | 4,684 | 2,316 | — | 51 | 11,464 | 6,211 | ||||||||||||||||||||||||||||||||||
| Subordinated debt | 2,688 | 2,689 | 2,689 | 2,689 | 2,688 | 10,755 | 10,755 | ||||||||||||||||||||||||||||||||||
| FRB PPP liquidity facility and other borrowings | 2,992 | 4,131 | 3,696 | 2,376 | 2,189 | 13,195 | 16,203 | ||||||||||||||||||||||||||||||||||
| Total interest expense | 134,510 | 76,884 | 31,482 | 18,777 | 20,343 | 261,653 | 95,810 | ||||||||||||||||||||||||||||||||||
| Net interest income | 135,137 | 159,032 | 164,852 | 164,699 | 193,694 | 623,720 | 685,074 | ||||||||||||||||||||||||||||||||||
| Provision (benefit) for credit losses | 28,216 | (7,994) | 23,847 | 15,997 | 13,890 | 60,066 | 27,426 | ||||||||||||||||||||||||||||||||||
| Net interest income after provision (benefit) for credit losses | 106,921 | 167,026 | 141,005 | 148,702 | 179,804 | 563,654 | 657,648 | ||||||||||||||||||||||||||||||||||
| Non-interest income: | |||||||||||||||||||||||||||||||||||||||||
| Interchange and card revenue | 71 | 72 | 24 | 76 | 84 | 243 | 336 | ||||||||||||||||||||||||||||||||||
| Deposit fees | 958 | 989 | 964 | 940 | 1,026 | 3,851 | 3,774 | ||||||||||||||||||||||||||||||||||
| Commercial lease income | 8,135 | 7,097 | 6,592 | 5,895 | 5,378 | 27,719 | 21,107 | ||||||||||||||||||||||||||||||||||
| Bank-owned life insurance | 1,975 | 3,449 | 1,947 | 8,326 | 1,984 | 15,697 | 8,416 | ||||||||||||||||||||||||||||||||||
| Mortgage warehouse transactional fees | 1,295 | 1,545 | 1,883 | 2,015 | 2,262 | 6,738 | 12,874 | ||||||||||||||||||||||||||||||||||
| Gain (loss) on sale of SBA and other loans | — | 106 | 1,542 | 1,507 | 2,493 | 3,155 | 11,327 | ||||||||||||||||||||||||||||||||||
| Loss on sale of consumer installment loans | — | (23,465) | — | — | — | (23,465) | — | ||||||||||||||||||||||||||||||||||
| Loan fees | 4,017 | 3,008 | 2,618 | 2,545 | 2,513 | 12,188 | 7,527 | ||||||||||||||||||||||||||||||||||
| Mortgage banking income | 90 | 125 | 173 | 481 | 262 | 869 | 1,536 | ||||||||||||||||||||||||||||||||||
| Gain (loss) on sale of investment securities | (16,937) | (2,135) | (3,029) | (1,063) | (49) | (23,164) | 31,392 | ||||||||||||||||||||||||||||||||||
| Unrealized gain (loss) on investment securities | 28 | (259) | (203) | (276) | — | (710) | 2,720 | ||||||||||||||||||||||||||||||||||
| Loss on sale of foreign subsidiaries | — | — | — | — | — | — | (2,840) | ||||||||||||||||||||||||||||||||||
| Unrealized gain (loss) on derivatives | 43 | 563 | 821 | 964 | 586 | 2,391 | 3,208 | ||||||||||||||||||||||||||||||||||
| Loss on cash flow hedge derivative terminations | — | — | — | — | — | — | (24,467) | ||||||||||||||||||||||||||||||||||
| Legal settlement gain | 7,519 | — | — | — | — | 7,519 | — | ||||||||||||||||||||||||||||||||||
| Other | 151 | (112) | (586) | (212) | 452 | (759) | 957 | ||||||||||||||||||||||||||||||||||
| Total non-interest income | 7,345 | (9,017) | 12,746 | 21,198 | 16,991 | 32,272 | 77,867 | ||||||||||||||||||||||||||||||||||
| Non-interest expense: | |||||||||||||||||||||||||||||||||||||||||
| Salaries and employee benefits | 29,194 | 31,230 | 25,334 | 26,607 | 29,940 | 112,365 | 108,202 | ||||||||||||||||||||||||||||||||||
| Technology, communication and bank operations | 18,604 | 19,588 | 22,738 | 24,068 | 22,657 | 84,998 | 83,544 | ||||||||||||||||||||||||||||||||||
| Professional services | 6,825 | 6,269 | 7,415 | 6,956 | 7,058 | 27,465 | 26,688 | ||||||||||||||||||||||||||||||||||
| Occupancy | 3,672 | 2,605 | 4,279 | 3,050 | 4,336 | 13,606 | 12,143 | ||||||||||||||||||||||||||||||||||
| Commercial lease depreciation | 6,518 | 5,966 | 5,552 | 4,942 | 4,625 | 22,978 | 17,824 | ||||||||||||||||||||||||||||||||||
| FDIC assessments, non-income taxes and regulatory fees | 2,339 | 2,528 | 1,619 | 2,383 | 2,427 | 8,869 | 10,061 | ||||||||||||||||||||||||||||||||||
| Loan servicing | 4,460 | 3,851 | 4,341 | 2,371 | 4,361 | 15,023 | 10,763 | ||||||||||||||||||||||||||||||||||
| Merger and acquisition related expenses | — | — | — | — | — | — | 418 | ||||||||||||||||||||||||||||||||||
| Loan workout | 714 | 217 | 179 | (38) | 226 | 1,072 | 265 | ||||||||||||||||||||||||||||||||||
| Advertising and promotion | 1,111 | 762 | 353 | 315 | 344 | 2,541 | 1,520 | ||||||||||||||||||||||||||||||||||
| Deposit relationship adjustment fees | — | — | — | — | — | — | 6,216 | ||||||||||||||||||||||||||||||||||
| Other | 4,982 | 3,182 | 4,395 | 3,153 | 5,574 | 15,712 | 16,663 | ||||||||||||||||||||||||||||||||||
| Total non-interest expense | 78,419 | 76,198 | 76,205 | 73,807 | 81,548 | 304,629 | 294,307 | ||||||||||||||||||||||||||||||||||
| Income before income tax expense | 35,847 | 81,811 | 77,546 | 96,093 | 115,247 | 291,297 | 441,208 | ||||||||||||||||||||||||||||||||||
| Income tax expense | 7,136 | 17,899 | 18,896 | 19,332 | 12,993 | 63,263 | 86,940 | ||||||||||||||||||||||||||||||||||
| Net income from continuing operations | $ | 28,711 | $ | 63,912 | $ | 58,650 | $ | 76,761 | $ | 102,254 | $ | 228,034 | $ | 354,268 | |||||||||||||||||||||||||||
(continued) |
|||||||||||||||||||||||||||||||||||||||||
| CUSTOMERS BANCORP, INC. AND SUBSIDIARIES | |||||||||||||||||||||||||||||||||||||||||
CONSOLIDATED STATEMENTS OF OPERATIONS - UNAUDITED (CONTINUED) | |||||||||||||||||||||||||||||||||||||||||
| (Dollars in thousands, except per share data) | Twelve Months Ended | ||||||||||||||||||||||||||||||||||||||||
| Q4 | Q3 | Q2 | Q1 | Q4 | December 31, | ||||||||||||||||||||||||||||||||||||
| 2022 | 2022 | 2022 | 2022 | 2021 | 2022 | 2021 | |||||||||||||||||||||||||||||||||||
| Loss from discontinued operations before income taxes | $ | — | $ | — | $ | — | $ | — | $ | — | $ | — | $ | (20,354) | |||||||||||||||||||||||||||
| Income tax expense (benefit) from discontinued operations | — | — | — | — | 1,585 | — | 19,267 | ||||||||||||||||||||||||||||||||||
| Net loss from discontinued operations | — | — | — | — | (1,585) | — | (39,621) | ||||||||||||||||||||||||||||||||||
| Net income | 28,711 | 63,912 | 58,650 | 76,761 | 100,669 | 228,034 | 314,647 | ||||||||||||||||||||||||||||||||||
| Preferred stock dividends | 3,088 | 2,548 | 2,131 | 1,865 | 2,022 | 9,632 | 11,693 | ||||||||||||||||||||||||||||||||||
| Loss on redemption of preferred stock | — | — | — | — | — | — | 2,820 | ||||||||||||||||||||||||||||||||||
| Net income available to common shareholders | $ | 25,623 | $ | 61,364 | $ | 56,519 | $ | 74,896 | $ | 98,647 | $ | 218,402 | $ | 300,134 | |||||||||||||||||||||||||||
| Basic earnings per common share from continuing operations | $ | 0.79 | $ | 1.89 | $ | 1.73 | $ | 2.27 | $ | 3.07 | $ | 6.69 | $ | 10.51 | |||||||||||||||||||||||||||
| Basic earnings per common share | 0.79 | 1.89 | 1.73 | 2.27 | 3.02 | 6.69 | 9.29 | ||||||||||||||||||||||||||||||||||
| Diluted earnings per common share from continuing operations | 0.77 | 1.85 | 1.68 | 2.18 | 2.92 | 6.51 | 10.08 | ||||||||||||||||||||||||||||||||||
| Diluted earnings per common share | 0.77 | 1.85 | 1.68 | 2.18 | 2.87 | 6.51 | 8.91 | ||||||||||||||||||||||||||||||||||
CUSTOMERS BANCORP, INC. AND SUBSIDIARIES | |||||||||||||||||||||||||||||
CONSOLIDATED BALANCE SHEET - UNAUDITED | |||||||||||||||||||||||||||||
(Dollars in thousands) | |||||||||||||||||||||||||||||
| December 31, | September 30, | June 30, | March 31, | December 31, | |||||||||||||||||||||||||
| 2022 | 2022 | 2022 | 2022 | 2021 | |||||||||||||||||||||||||
ASSETS |
|||||||||||||||||||||||||||||
| Cash and due from banks | $ | 58,025 | $ | 41,520 | $ | 66,703 | $ | 55,515 | $ | 35,238 | |||||||||||||||||||
| Interest earning deposits | 397,781 | 362,945 | 178,475 | 219,085 | 482,794 | ||||||||||||||||||||||||
| Cash and cash equivalents | 455,806 | 404,465 | 245,178 | 274,600 | 518,032 | ||||||||||||||||||||||||
| Investment securities, at fair value | 2,987,500 | 2,943,694 | 3,144,882 | 4,169,853 | 3,817,150 | ||||||||||||||||||||||||
| Investment securities held to maturity | 840,259 | 886,294 | 495,039 | — | — | ||||||||||||||||||||||||
| Loans held for sale | 328,312 | 5,224 | 6,595 | 3,003 | 16,254 | ||||||||||||||||||||||||
| Loans receivable, mortgage warehouse, at fair value | 1,323,312 | 1,569,090 | 1,874,603 | 1,755,758 | 2,284,325 | ||||||||||||||||||||||||
| Loans receivable, PPP | 998,153 | 1,154,632 | 1,570,160 | 2,195,902 | 3,250,008 | ||||||||||||||||||||||||
| Loans and leases receivable | 13,144,894 | 12,607,742 | 12,212,995 | 10,118,855 | 9,018,298 | ||||||||||||||||||||||||
| Allowance for credit losses on loans and leases | (130,924) | (130,197) | (156,530) | (145,847) | (137,804) | ||||||||||||||||||||||||
| Total loans and leases receivable, net of allowance for credit losses on loans and leases | 15,335,435 | 15,201,267 | 15,501,228 | 13,924,668 | 14,414,827 | ||||||||||||||||||||||||
| FHLB, Federal Reserve Bank, and other restricted stock | 74,196 | 64,112 | 74,626 | 54,553 | 64,584 | ||||||||||||||||||||||||
| Accrued interest receivable | 123,374 | 107,621 | 98,727 | 94,669 | 92,239 | ||||||||||||||||||||||||
| Bank premises and equipment, net | 9,025 | 6,610 | 6,755 | 8,233 | 8,890 | ||||||||||||||||||||||||
| Bank-owned life insurance | 338,441 | 336,130 | 335,153 | 332,239 | 333,705 | ||||||||||||||||||||||||
| Goodwill and other intangibles | 3,629 | 3,629 | 3,629 | 3,678 | 3,736 | ||||||||||||||||||||||||
| Other assets | 400,135 | 408,575 | 340,184 | 298,212 | 305,611 | ||||||||||||||||||||||||
| Total assets | $ | 20,896,112 | $ | 20,367,621 | $ | 20,251,996 | $ | 19,163,708 | $ | 19,575,028 | |||||||||||||||||||
| LIABILITIES AND SHAREHOLDERS' EQUITY | |||||||||||||||||||||||||||||
| Demand, non-interest bearing deposits | $ | 1,885,045 | $ | 2,993,793 | $ | 4,683,030 | $ | 4,594,428 | $ | 4,459,790 | |||||||||||||||||||
| Interest bearing deposits | 16,271,908 | 14,528,645 | 12,261,689 | 11,821,132 | 12,318,134 | ||||||||||||||||||||||||
| Total deposits | 18,156,953 | 17,522,438 | 16,944,719 | 16,415,560 | 16,777,924 | ||||||||||||||||||||||||
| Federal funds purchased | — | 365,000 | 770,000 | 700,000 | 75,000 | ||||||||||||||||||||||||
| FHLB advances | 800,000 | 500,000 | 635,000 | — | 700,000 | ||||||||||||||||||||||||
| Other borrowings | 123,580 | 123,515 | 123,450 | 223,230 | 223,086 | ||||||||||||||||||||||||
| Subordinated debt | 181,952 | 181,882 | 181,812 | 181,742 | 181,673 | ||||||||||||||||||||||||
| Accrued interest payable and other liabilities | 230,666 | 287,855 | 243,625 | 265,770 | 251,128 | ||||||||||||||||||||||||
| Total liabilities | 19,493,151 | 18,980,690 | 18,898,606 | 17,786,302 | 18,208,811 | ||||||||||||||||||||||||
| Preferred stock | 137,794 | 137,794 | 137,794 | 137,794 | 137,794 | ||||||||||||||||||||||||
| Common stock | 35,012 | 34,948 | 34,922 | 34,882 | 34,722 | ||||||||||||||||||||||||
| Additional paid in capital | 551,721 | 549,066 | 545,670 | 542,402 | 542,391 | ||||||||||||||||||||||||
| Retained earnings | 924,134 | 898,511 | 837,147 | 780,628 | 705,732 | ||||||||||||||||||||||||
| Accumulated other comprehensive income (loss), net | (163,096) | (156,126) | (124,881) | (62,548) | (4,980) | ||||||||||||||||||||||||
| Treasury stock, at cost | (82,604) | (77,262) | (77,262) | (55,752) | (49,442) | ||||||||||||||||||||||||
| Total shareholders' equity | 1,402,961 | 1,386,931 | 1,353,390 | 1,377,406 | 1,366,217 | ||||||||||||||||||||||||
| Total liabilities and shareholders' equity | $ | 20,896,112 | $ | 20,367,621 | $ | 20,251,996 | $ | 19,163,708 | $ | 19,575,028 | |||||||||||||||||||
CUSTOMERS BANCORP, INC. AND SUBSIDIARIES |
|||||||||||||||||||||||||||||||||||||||||||||||||||||
| AVERAGE BALANCE SHEET / NET INTEREST MARGIN - UNAUDITED | |||||||||||||||||||||||||||||||||||||||||||||||||||||
(Dollars in thousands) |
|||||||||||||||||||||||||||||||||||||||||||||||||||||
| Three Months Ended | |||||||||||||||||||||||||||||||||||||||||||||||||||||
| December 31, 2022 | September 30, 2022 | December 31, 2021 | |||||||||||||||||||||||||||||||||||||||||||||||||||
| Average Balance | Interest Income or Expense | Average Yield or Cost (%) |
Average Balance | Interest Income or Expense | Average Yield or Cost (%) | Average Balance | Interest Income or Expense | Average Yield or Cost (%) | |||||||||||||||||||||||||||||||||||||||||||||
| Assets | |||||||||||||||||||||||||||||||||||||||||||||||||||||
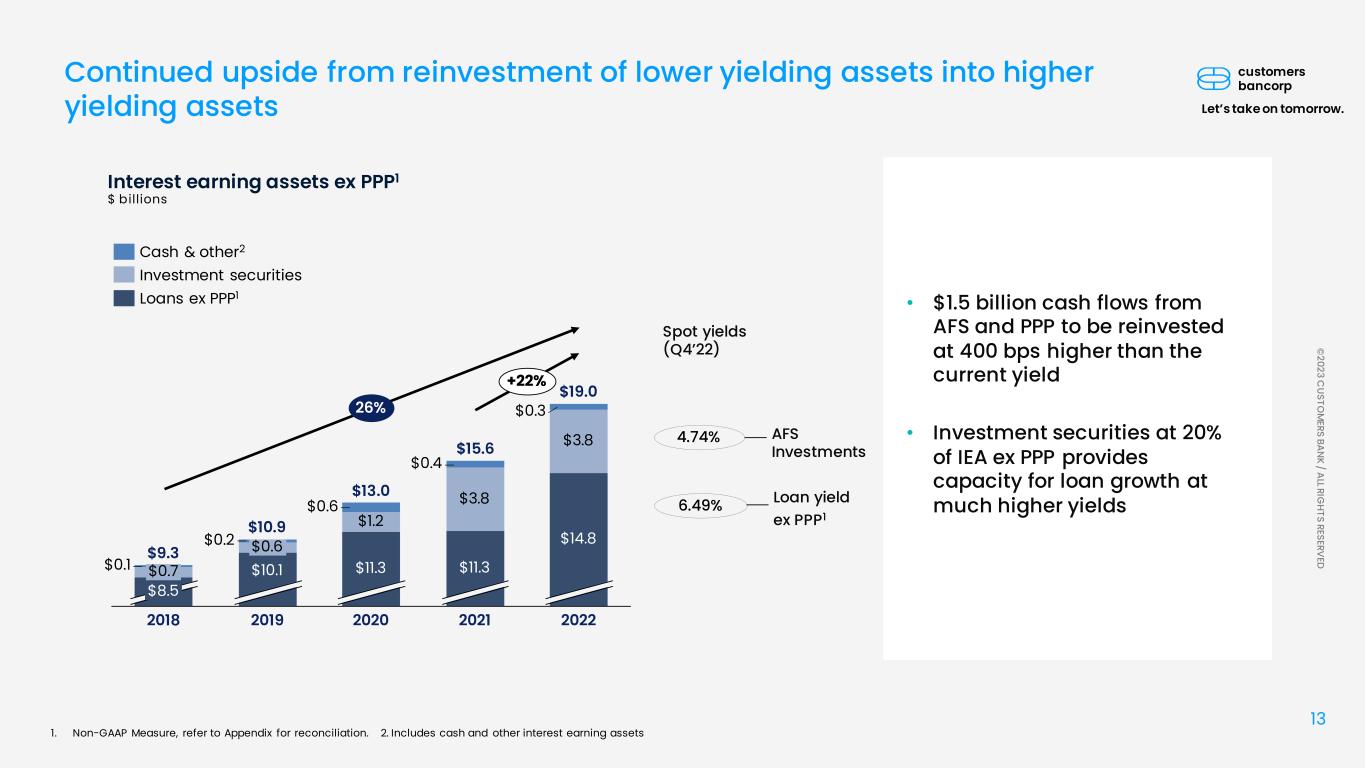
| Interest earning deposits | $ | 693,563 | $ | 6,754 | 3.86% | $ | 528,001 | $ | 2,949 | 2.22% | $ | 1,568,510 | $ | 604 | 0.15% | ||||||||||||||||||||||||||||||||||||||
Investment securities (1) |
4,061,555 | 42,953 | 4.23% | 3,770,922 | 30,546 | 3.24% | 2,621,844 | 15,202 | 2.32% | ||||||||||||||||||||||||||||||||||||||||||||
| Loans and leases: | |||||||||||||||||||||||||||||||||||||||||||||||||||||
| Commercial & industrial: | |||||||||||||||||||||||||||||||||||||||||||||||||||||
Specialty lending loans and leases (2) |
5,529,567 | 90,885 | 6.52% | 5,064,730 | 64,753 | 5.07% | 2,206,910 | 19,998 | 3.60% | ||||||||||||||||||||||||||||||||||||||||||||
Other commercial & industrial loans (2) |
1,670,000 | 22,796 | 5.42% | 1,585,136 | 18,794 | 4.70% | 1,307,276 | 12,905 | 3.92% | ||||||||||||||||||||||||||||||||||||||||||||
| Commercial loans to mortgage companies | 1,376,760 | 17,701 | 5.10% | 1,623,624 | 17,092 | 4.18% | 2,289,061 | 17,425 | 3.02% | ||||||||||||||||||||||||||||||||||||||||||||
| Multifamily loans | 2,235,885 | 22,481 | 3.99% | 2,206,953 | 20,427 | 3.67% | 1,327,732 | 12,462 | 3.72% | ||||||||||||||||||||||||||||||||||||||||||||
| Loans receivable, PPP | 1,065,919 | 7,249 | 2.70% | 1,349,403 | 14,666 | 4.31% | 3,898,607 | 82,086 | 8.35% | ||||||||||||||||||||||||||||||||||||||||||||
| Non-owner occupied commercial real estate loans | 1,430,420 | 18,536 | 5.14% | 1,372,244 | 15,595 | 4.51% | 1,334,184 | 12,793 | 3.80% | ||||||||||||||||||||||||||||||||||||||||||||
| Residential mortgages | 524,344 | 5,462 | 4.13% | 513,694 | 5,008 | 3.87% | 314,551 | 2,919 | 3.68% | ||||||||||||||||||||||||||||||||||||||||||||
| Installment loans | 1,555,108 | 33,630 | 8.58% | 1,938,199 | 44,122 | 9.03% | 1,657,049 | 37,412 | 8.96% | ||||||||||||||||||||||||||||||||||||||||||||
Total loans and leases (3) |
15,388,003 | 218,740 | 5.64% | 15,653,983 | 200,457 | 5.08% | 14,335,370 | 198,000 | 5.48% | ||||||||||||||||||||||||||||||||||||||||||||
| Other interest-earning assets | 67,907 | 1,200 | 7.01% | 68,549 | 1,964 | 11.37% | 50,709 | 231 | 1.81% | ||||||||||||||||||||||||||||||||||||||||||||
| Total interest-earning assets | 20,211,028 | 269,647 | 5.30% | 20,021,455 | 235,916 | 4.68% | 18,576,433 | 214,037 | 4.57% | ||||||||||||||||||||||||||||||||||||||||||||
| Non-interest-earning assets | 506,334 | 492,911 | 637,808 | ||||||||||||||||||||||||||||||||||||||||||||||||||
| Total assets | $ | 20,717,362 | $ | 20,514,366 | $ | 19,214,241 | |||||||||||||||||||||||||||||||||||||||||||||||
| Liabilities | |||||||||||||||||||||||||||||||||||||||||||||||||||||
| Interest checking accounts | 8,536,962 | 70,041 | 3.26% | 6,669,787 | 33,685 | 2.00% | 5,258,982 | 7,676 | 0.58% | ||||||||||||||||||||||||||||||||||||||||||||
| Money market deposit accounts | 3,094,206 | 21,220 | 2.72% | 5,789,991 | 24,348 | 1.67% | 5,293,529 | 5,683 | 0.43% | ||||||||||||||||||||||||||||||||||||||||||||
| Other savings accounts | 669,466 | 3,368 | 2.00% | 625,908 | 1,818 | 1.15% | 1,189,899 | 1,357 | 0.45% | ||||||||||||||||||||||||||||||||||||||||||||
| Certificates of deposit | 3,259,801 | 29,737 | 3.62% | 1,141,970 | 5,529 | 1.92% | 541,528 | 699 | 0.51% | ||||||||||||||||||||||||||||||||||||||||||||
Total interest-bearing deposits (4) |
15,560,435 | 124,366 | 3.17% | 14,227,656 | 65,380 | 1.82% | 12,283,938 | 15,415 | 0.50% | ||||||||||||||||||||||||||||||||||||||||||||
| Federal funds purchased | 151,467 | 1,437 | 3.76% | 513,011 | 2,871 | 2.22% | 815 | 1 | 0.15% | ||||||||||||||||||||||||||||||||||||||||||||
| Borrowings | 819,032 | 8,707 | 4.22% | 874,497 | 8,633 | 3.92% | 465,600 | 4,927 | 4.20% | ||||||||||||||||||||||||||||||||||||||||||||
| Total interest-bearing liabilities | 16,530,934 | 134,510 | 3.23% | 15,615,164 | 76,884 | 1.95% | 12,750,353 | 20,343 | 0.63% | ||||||||||||||||||||||||||||||||||||||||||||
Non-interest-bearing deposits (4) |
2,514,316 | 3,245,963 | 4,817,835 | ||||||||||||||||||||||||||||||||||||||||||||||||||
| Total deposits and borrowings | 19,045,250 | 2.80% | 18,861,127 | 1.62% | 17,568,188 | 0.46% | |||||||||||||||||||||||||||||||||||||||||||||||
| Other non-interest-bearing liabilities | 271,129 | 255,735 | 328,782 | ||||||||||||||||||||||||||||||||||||||||||||||||||
| Total liabilities | 19,316,379 | 19,116,862 | 17,896,970 | ||||||||||||||||||||||||||||||||||||||||||||||||||
| Shareholders' equity | 1,400,983 | 1,397,504 | 1,317,271 | ||||||||||||||||||||||||||||||||||||||||||||||||||
| Total liabilities and shareholders' equity | $ | 20,717,362 | $ | 20,514,366 | $ | 19,214,241 | |||||||||||||||||||||||||||||||||||||||||||||||
| Net interest income | 135,137 | 159,032 | 193,694 | ||||||||||||||||||||||||||||||||||||||||||||||||||
| Tax-equivalent adjustment | 342 | 334 | 276 | ||||||||||||||||||||||||||||||||||||||||||||||||||
| Net interest earnings | $ | 135,479 | $ | 159,366 | $ | 193,970 | |||||||||||||||||||||||||||||||||||||||||||||||
| Interest spread | 2.50% | 3.06% | 4.11% | ||||||||||||||||||||||||||||||||||||||||||||||||||
| Net interest margin | 2.66% | 3.16% | 4.14% | ||||||||||||||||||||||||||||||||||||||||||||||||||
| Net interest margin tax equivalent | 2.67% | 3.16% | 4.14% | ||||||||||||||||||||||||||||||||||||||||||||||||||
Net interest margin tax equivalent excl. PPP (5) |
2.87% | 3.18% | 3.12% | ||||||||||||||||||||||||||||||||||||||||||||||||||
| (continued) | |||||||||||||||||||||||||||||||||||||||||||||||||||||
CUSTOMERS BANCORP, INC. AND SUBSIDIARIES |
|||||||||||||||||||||||||||||||||||||||||||||||||||||
| AVERAGE BALANCE SHEET / NET INTEREST MARGIN - UNAUDITED (CONTINUED) | |||||||||||||||||||||||||||||||||||||||||||||||||||||
(Dollars in thousands) |
|||||||||||||||||||||||||||||||||||||||||||||||||||||
(1) For presentation in this table, average balances and the corresponding average yields for investment securities are based upon historical cost, adjusted for amortization of premiums and accretion of discounts. |
|||||||||||||||||||||||||||||||||||||||||||||||||||||
| (2) Includes owner occupied commercial real estate loans. | |||||||||||||||||||||||||||||||||||||||||||||||||||||
| (3) Includes non-accrual loans, the effect of which is to reduce the yield earned on loans and leases, and deferred loan fees. | |||||||||||||||||||||||||||||||||||||||||||||||||||||
(4) Total costs of deposits (including interest bearing and non-interest bearing) were 2.73%, 1.48% and 0.36% for the three months ended December 31, 2022, September 30, 2022 and December 31, 2021, respectively. |
|||||||||||||||||||||||||||||||||||||||||||||||||||||
(5) Non-GAAP tax-equivalent basis, using an estimated marginal tax rate of 26% for the three months ended December 31, 2022, September 30, 2022 and December 31, 2021, presented to approximate interest income as a taxable asset and excluding net interest income from PPP loans and related borrowings, along with the related PPP loan balances and PPP fees receivable from interest-earning assets. Management uses non-GAAP measures to present historical periods comparable to the current period presentation. In addition, management believes the use of these non-GAAP measures provides additional clarity when assessing Customers’ financial results. These disclosures should not be viewed as substitutes for results determined to be in accordance with U.S. GAAP, nor are they necessarily comparable to non-GAAP performance measures that may be presented by other entities. |
|||||||||||||||||||||||||||||||||||||||||||||||||||||
CUSTOMERS BANCORP, INC. AND SUBSIDIARIES | |||||||||||||||||||||||||||||||||||
| AVERAGE BALANCE SHEET / NET INTEREST MARGIN - UNAUDITED (CONTINUED) | |||||||||||||||||||||||||||||||||||
(Dollars in thousands) |
|||||||||||||||||||||||||||||||||||
| Twelve Months Ended | |||||||||||||||||||||||||||||||||||
| December 31, 2022 | December 31, 2021 | ||||||||||||||||||||||||||||||||||
Average Balance |
Interest Income or Expense | Average Yield or Cost (%) | Average Balance | Interest Income or Expense | Average Yield or Cost (%) | ||||||||||||||||||||||||||||||
| Assets | |||||||||||||||||||||||||||||||||||
| Interest earning deposits | $ | 620,071 | $ | 10,952 | 1.77% | $ | 1,169,416 | $ | 1,585 | 0.14% | |||||||||||||||||||||||||
Investment securities (1) |
3,992,934 | 119,236 | 2.99% | 1,753,649 | 40,413 | 2.30% | |||||||||||||||||||||||||||||
| Loans and leases: | |||||||||||||||||||||||||||||||||||
| Commercial & industrial: | |||||||||||||||||||||||||||||||||||
Specialty lending loans and leases (2) |
4,357,995 | 218,189 | 5.01% | 1,723,516 | 63,656 | 3.69% | |||||||||||||||||||||||||||||
Other commercial & industrial loans (2) |
1,540,435 | 69,564 | 4.52% | 1,344,489 | 51,536 | 3.83% | |||||||||||||||||||||||||||||
| Commercial loans to mortgage companies | 1,682,471 | 64,413 | 3.83% | 2,699,300 | 83,350 | 3.09% | |||||||||||||||||||||||||||||
| Multifamily loans | 1,957,672 | 73,987 | 3.78% | 1,501,878 | 56,582 | 3.77% | |||||||||||||||||||||||||||||
| Loans receivable, PPP | 1,724,659 | 79,381 | 4.60% | 5,108,192 | 279,158 | 5.46% | |||||||||||||||||||||||||||||
| Non-owner occupied commercial real estate loans | 1,356,086 | 59,087 | 4.36% | 1,349,563 | 51,430 | 3.81% | |||||||||||||||||||||||||||||
| Residential mortgages | 492,870 | 19,048 | 3.86% | 339,845 | 12,405 | 3.65% | |||||||||||||||||||||||||||||
| Installment loans | 1,798,977 | 161,644 | 8.99% | 1,517,165 | 138,705 | 9.14% | |||||||||||||||||||||||||||||
Total loans and leases (3) |
14,911,165 | 745,313 | 5.00% | 15,583,948 | 736,822 | 4.73% | |||||||||||||||||||||||||||||
| Other interest-earning assets | 64,204 | 9,872 | NM (6) |
59,308 | 2,064 | 3.48% | |||||||||||||||||||||||||||||
| Total interest-earning assets | 19,588,374 | 885,373 | 4.52% | 18,566,321 | 780,884 | 4.21% | |||||||||||||||||||||||||||||
| Non-interest-earning assets | 521,370 | 633,615 | |||||||||||||||||||||||||||||||||
| Total assets | $ | 20,109,744 | $ | 19,199,936 | |||||||||||||||||||||||||||||||
| Liabilities | |||||||||||||||||||||||||||||||||||
| Interest checking accounts | $ | 6,853,533 | $ | 125,100 | 1.83% | $ | 4,006,354 | $ | 27,605 | 0.69% | |||||||||||||||||||||||||
| Money market deposit accounts | 4,615,574 | 57,765 | 1.25% | 4,933,027 | 22,961 | 0.47% | |||||||||||||||||||||||||||||
| Other savings accounts | 716,838 | 6,727 | 0.94% | 1,358,708 | 7,584 | 0.56% | |||||||||||||||||||||||||||||
| Certificates of deposit | 1,352,787 | 36,647 | 2.71% | 619,859 | 4,491 | 0.72% | |||||||||||||||||||||||||||||
Total interest-bearing deposits (4) |
13,538,732 | 226,239 | 1.67% | 10,917,948 | 62,641 | 0.57% | |||||||||||||||||||||||||||||
| Federal funds purchased | 349,581 | 5,811 | 1.66% | 22,110 | 16 | 0.07% | |||||||||||||||||||||||||||||
| FRB PPP liquidity facility | — | — | —% | 2,636,925 | 9,229 | 0.35% | |||||||||||||||||||||||||||||
| Borrowings | 792,563 | 29,603 | 3.74% | 610,503 | 23,924 | 3.92% | |||||||||||||||||||||||||||||
| Total interest-bearing liabilities | 14,680,876 | 261,653 | 1.78% | 14,187,486 | 95,810 | 0.68% | |||||||||||||||||||||||||||||
Non-interest-bearing deposits (4) |
3,780,185 | 3,470,788 | |||||||||||||||||||||||||||||||||
| Total deposits and borrowings | 18,461,061 | 1.42% | 17,658,274 | 0.54% | |||||||||||||||||||||||||||||||
| Other non-interest-bearing liabilities | 255,911 | 304,078 | |||||||||||||||||||||||||||||||||
| Total liabilities | 18,716,972 | 17,962,352 | |||||||||||||||||||||||||||||||||
| Shareholders' equity | 1,392,772 | 1,237,584 | |||||||||||||||||||||||||||||||||
| Total liabilities and shareholders' equity | $ | 20,109,744 | $ | 19,199,936 | |||||||||||||||||||||||||||||||
| Net interest income | 623,720 | 685,074 | |||||||||||||||||||||||||||||||||
| Tax-equivalent adjustment | 1,185 | 1,147 | |||||||||||||||||||||||||||||||||
| Net interest earnings | $ | 624,905 | $ | 686,221 | |||||||||||||||||||||||||||||||
| Interest spread | 3.10% | 3.66% | |||||||||||||||||||||||||||||||||
| Net interest margin | 3.18% | 3.69% | |||||||||||||||||||||||||||||||||
| Net interest margin tax equivalent | 3.19% | 3.70% | |||||||||||||||||||||||||||||||||
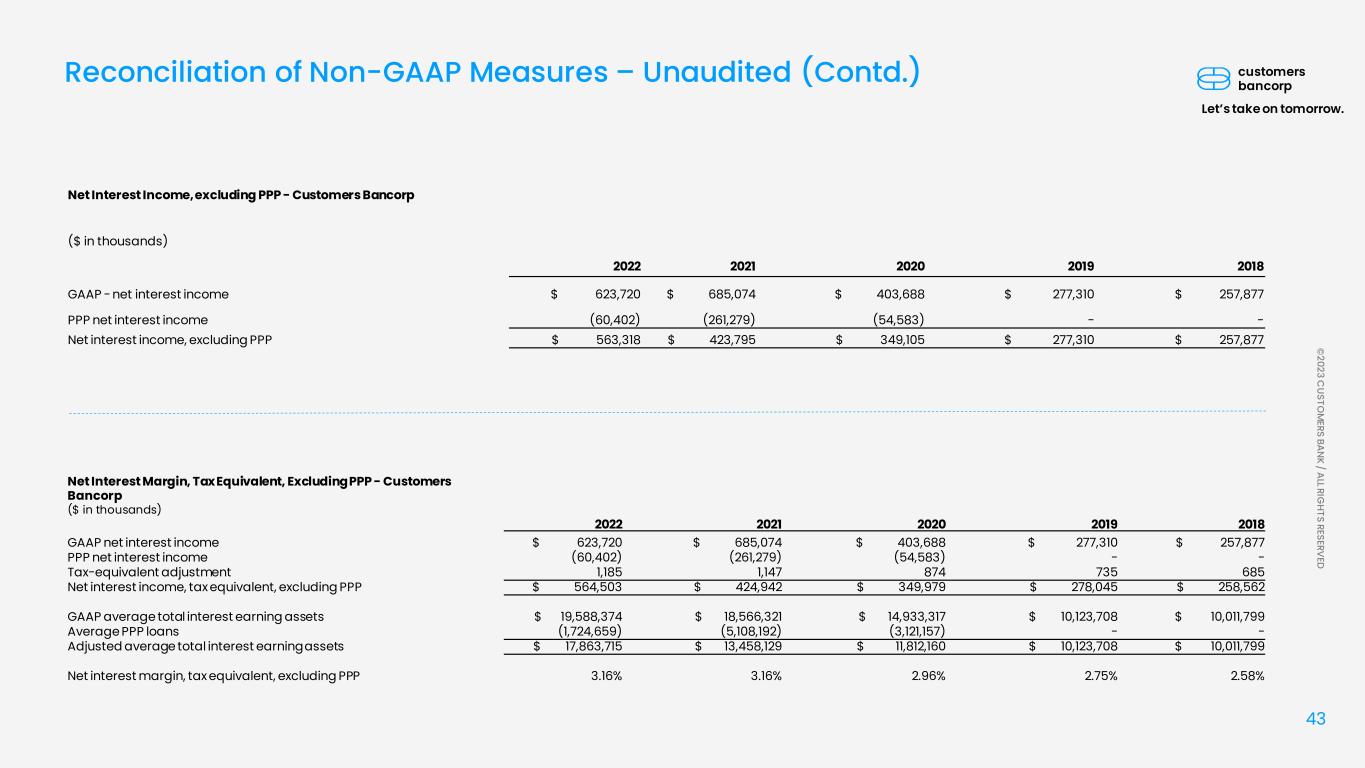
Net interest margin tax equivalent excl. PPP (5) |
3.16% | 3.16% | |||||||||||||||||||||||||||||||||
(1) For presentation in this table, average balances and the corresponding average yields for investment securities are based upon historical cost, adjusted for amortization of premiums and accretion of discounts. | |||||||||||||||||||||||||||||||||||
| (2) Includes owner occupied commercial real estate loans. | |||||||||||||||||||||||||||||||||||
| (3) Includes non-accrual loans, the effect of which is to reduce the yield earned on loans and leases, and deferred loan fees. | |||||||||||||||||||||||||||||||||||
(4) Total costs of deposits (including interest bearing and non-interest bearing) were 1.31% and 0.44% for the twelve months ended December 31, 2022 and 2021, respectively. | |||||||||||||||||||||||||||||||||||
| (continued) | |||||||||||||||||||||||||||||||||||
CUSTOMERS BANCORP, INC. AND SUBSIDIARIES | |||||||||||||||||||||||||||||||||||
| AVERAGE BALANCE SHEET / NET INTEREST MARGIN - UNAUDITED (CONTINUED) | |||||||||||||||||||||||||||||||||||
(Dollars in thousands) |
|||||||||||||||||||||||||||||||||||
(5) Non-GAAP tax-equivalent basis, using an estimated marginal tax rate of 26% for the twelve months ended December 31, 2022 and 2021, presented to approximate interest income as a taxable asset and excluding net interest income from PPP loans and related borrowings, along with the related PPP loan balances and PPP fees receivable from interest-earning assets. Management uses non-GAAP measures to present historical periods comparable to the current period presentation. In addition, management believes the use of these non-GAAP measures provides additional clarity when assessing Customers’ financial results. These disclosures should not be viewed as substitutes for results determined to be in accordance with U.S. GAAP, nor are they necessarily comparable to non-GAAP performance measures that may be presented by other entities. | |||||||||||||||||||||||||||||||||||
| (6) Not meaningful. | |||||||||||||||||||||||||||||||||||
| CUSTOMERS BANCORP, INC. AND SUBSIDIARIES | |||||||||||||||||||||||||||||
| PERIOD END LOAN AND LEASE COMPOSITION - UNAUDITED | |||||||||||||||||||||||||||||
| (Dollars in thousands) | |||||||||||||||||||||||||||||
| December 31, | September 30, | June 30, | March 31, | December 31, | |||||||||||||||||||||||||
| 2022 | 2022 | 2022 | 2022 | 2021 | |||||||||||||||||||||||||
| Commercial: | |||||||||||||||||||||||||||||
| Commercial & industrial: | |||||||||||||||||||||||||||||
| Specialty lending | $ | 5,412,887 | $ | 5,103,974 | $ | 4,599,640 | $ | 2,973,544 | $ | 2,403,991 | |||||||||||||||||||
| Other commercial & industrial | 1,135,336 | 1,064,332 | 1,037,443 | 947,895 | 942,679 | ||||||||||||||||||||||||
| Multifamily | 2,217,098 | 2,267,376 | 2,012,920 | 1,705,027 | 1,486,308 | ||||||||||||||||||||||||
| Loans to mortgage companies | 1,447,919 | 1,708,587 | 1,975,189 | 1,830,121 | 2,362,438 | ||||||||||||||||||||||||
| Commercial real estate owner occupied | 885,339 | 726,670 | 710,577 | 701,893 | 654,922 | ||||||||||||||||||||||||
| Loans receivable, PPP | 998,153 | 1,154,632 | 1,570,160 | 2,195,902 | 3,250,008 | ||||||||||||||||||||||||
| Commercial real estate non-owner occupied | 1,290,730 | 1,263,211 | 1,152,869 | 1,140,311 | 1,121,238 | ||||||||||||||||||||||||
| Construction | 162,009 | 136,133 | 195,687 | 161,024 | 198,981 | ||||||||||||||||||||||||
| Total commercial loans and leases | 13,549,471 | 13,424,915 | 13,254,485 | 11,655,717 | 12,420,565 | ||||||||||||||||||||||||
| Consumer: | |||||||||||||||||||||||||||||
| Residential | 498,781 | 466,888 | 460,228 | 469,426 | 350,984 | ||||||||||||||||||||||||
| Manufactured housing | 45,076 | 46,990 | 48,570 | 50,669 | 52,861 | ||||||||||||||||||||||||
| Installment: | |||||||||||||||||||||||||||||
| Personal | 1,306,376 | 1,056,432 | 1,613,628 | 1,584,011 | 1,392,862 | ||||||||||||||||||||||||
| Other | 394,967 | 341,463 | 287,442 | 313,695 | 351,613 | ||||||||||||||||||||||||
| Total consumer loans | 2,245,200 | 1,911,773 | 2,409,868 | 2,417,801 | 2,148,320 | ||||||||||||||||||||||||
| Total loans and leases | $ | 15,794,671 | $ | 15,336,688 | $ | 15,664,353 | $ | 14,073,518 | $ | 14,568,885 | |||||||||||||||||||
| CUSTOMERS BANCORP, INC. AND SUBSIDIARIES | |||||||||||||||||||||||||||||
| PERIOD END DEPOSIT COMPOSITION - UNAUDITED | |||||||||||||||||||||||||||||
| (Dollars in thousands) | |||||||||||||||||||||||||||||
| December 31, | September 30, | June 30, | March 31, | December 31, | |||||||||||||||||||||||||
| 2022 | 2022 | 2022 | 2022 | 2021 | |||||||||||||||||||||||||
| Demand, non-interest bearing | $ | 1,885,045 | $ | 2,993,793 | $ | 4,683,030 | $ | 4,594,428 | $ | 4,459,790 | |||||||||||||||||||
| Demand, interest bearing | 8,476,027 | 7,124,663 | 6,644,398 | 5,591,468 | 6,488,406 | ||||||||||||||||||||||||
| Total demand deposits | 10,361,072 | 10,118,456 | 11,327,428 | 10,185,896 | 10,948,196 | ||||||||||||||||||||||||
| Savings | 811,798 | 592,002 | 640,062 | 802,395 | 973,317 | ||||||||||||||||||||||||
| Money market | 2,734,217 | 4,913,967 | 4,254,205 | 4,981,077 | 4,349,073 | ||||||||||||||||||||||||
| Time deposits | 4,249,866 | 1,898,013 | 723,024 | 446,192 | 507,338 | ||||||||||||||||||||||||
| Total deposits | $ | 18,156,953 | $ | 17,522,438 | $ | 16,944,719 | $ | 16,415,560 | $ | 16,777,924 | |||||||||||||||||||
CUSTOMERS BANCORP, INC. AND SUBSIDIARIES |
||||||||||||||||||||||||||||||||||||||||||||||||||||||||||||||||||||||||||||||||||||||||||||
ASSET QUALITY - UNAUDITED |
||||||||||||||||||||||||||||||||||||||||||||||||||||||||||||||||||||||||||||||||||||||||||||
| (Dollars in thousands) | As of December 31, 2022 | As of September 30, 2022 | As of December 31, 2021 | |||||||||||||||||||||||||||||||||||||||||||||||||||||||||||||||||||||||||||||||||||||||||
| Total loans | Non accrual /NPLs | Allowance for credit losses | Total NPLs to total loans | Total reserves to total NPLs | Total loans | Non accrual /NPLs | Allowance for credit losses | Total NPLs to total loans | Total reserves to total NPLs | Total loans | Non accrual /NPLs | Allowance for credit losses | Total NPLs to total loans | Total reserves to total NPLs | ||||||||||||||||||||||||||||||||||||||||||||||||||||||||||||||||||||||||||||||
| Loan type | ||||||||||||||||||||||||||||||||||||||||||||||||||||||||||||||||||||||||||||||||||||||||||||
Commercial & industrial, including specialty lending (1) |
$ | 6,672,830 | $ | 1,761 | $ | 17,582 | 0.03 | % | 998.41 | % | $ | 6,307,803 | $ | 4,078 | $ | 15,131 | 0.06 | % | 371.04 | % | $ | 3,424,783 | $ | 6,096 | $ | 12,702 | 0.18 | % | 208.37 | % | ||||||||||||||||||||||||||||||||||||||||||||||||||||||||||||||
| Multifamily | 2,213,019 | 1,143 | 14,541 | 0.05 | % | 1272.18 | % | 2,263,268 | 1,158 | 14,244 | 0.05 | % | 1230.05 | % | 1,486,308 | 22,654 | 4,477 | 1.52 | % | 19.76 | % | |||||||||||||||||||||||||||||||||||||||||||||||||||||||||||||||||||||||
| Commercial real estate owner occupied | 885,339 | 2,768 | 6,454 | 0.31 | % | 233.16 | % | 726,670 | 2,198 | 6,220 | 0.30 | % | 282.98 | % | 654,922 | 2,475 | 3,213 | 0.38 | % | 129.82 | % | |||||||||||||||||||||||||||||||||||||||||||||||||||||||||||||||||||||||
| Commercial real estate non-owner occupied | 1,290,730 | — | 11,219 | — | % | — | % | 1,263,211 | — | 11,332 | — | % | — | % | 1,121,238 | 2,815 | 6,210 | 0.25 | % | 220.60 | % | |||||||||||||||||||||||||||||||||||||||||||||||||||||||||||||||||||||||
| Construction | 162,009 | — | 1,913 | — | % | — | % | 136,133 | — | 1,614 | — | % | — | % | 198,981 | — | 692 | — | % | — | % | |||||||||||||||||||||||||||||||||||||||||||||||||||||||||||||||||||||||
| Total commercial loans and leases receivable | 11,223,927 | 5,672 | 51,709 | 0.05 | % | 911.65 | % | 10,697,085 | 7,434 | 48,541 | 0.07 | % | 652.96 | % | 6,886,232 | 34,040 | 27,294 | 0.49 | % | 80.18 | % | |||||||||||||||||||||||||||||||||||||||||||||||||||||||||||||||||||||||
| Residential | 497,952 | 6,922 | 6,094 | 1.39 | % | 88.04 | % | 465,772 | 6,438 | 5,453 | 1.38 | % | 84.70 | % | 334,730 | 7,727 | 2,383 | 2.31 | % | 30.84 | % | |||||||||||||||||||||||||||||||||||||||||||||||||||||||||||||||||||||||
| Manufactured housing | 45,076 | 2,410 | 4,430 | 5.35 | % | 183.82 | % | 46,990 | 2,584 | 4,482 | 5.50 | % | 173.45 | % | 52,861 | 3,563 | 4,278 | 6.74 | % | 120.07 | % | |||||||||||||||||||||||||||||||||||||||||||||||||||||||||||||||||||||||
| Installment | 1,377,939 | 9,527 | 68,691 | 0.69 | % | 721.01 | % | 1,397,895 | 6,848 | 71,721 | 0.49 | % | 1047.33 | % | 1,744,475 | 3,783 | 103,849 | 0.22 | % | 2745.15 | % | |||||||||||||||||||||||||||||||||||||||||||||||||||||||||||||||||||||||
| Total consumer loans receivable | 1,920,967 | 18,859 | 79,215 | 0.98 | % | 420.04 | % | 1,910,657 | 15,870 | 81,656 | 0.83 | % | 514.53 | % | 2,132,066 | 15,073 | 110,510 | 0.71 | % | 733.17 | % | |||||||||||||||||||||||||||||||||||||||||||||||||||||||||||||||||||||||
Loans and leases receivable (1) |
13,144,894 | 24,531 | 130,924 | 0.19 | % | 533.71 | % | 12,607,742 | 23,304 | 130,197 | 0.18 | % | 558.69 | % | 9,018,298 | 49,113 | 137,804 | 0.54 | % | 280.59 | % | |||||||||||||||||||||||||||||||||||||||||||||||||||||||||||||||||||||||
| Loans receivable, PPP | 998,153 | — | — | — | % | — | % | 1,154,632 | — | — | — | % | — | % | 3,250,008 | — | — | — | % | — | % | |||||||||||||||||||||||||||||||||||||||||||||||||||||||||||||||||||||||
| Loans receivable, mortgage warehouse, at fair value | 1,323,312 | — | — | — | % | — | % | 1,569,090 | — | — | — | % | — | % | 2,284,325 | — | — | — | % | — | % | |||||||||||||||||||||||||||||||||||||||||||||||||||||||||||||||||||||||
| Total loans held for sale | 328,312 | 6,206 | — | 1.89 | % | — | % | 5,224 | 4,615 | — | 88.34 | % | — | % | 16,254 | 507 | — | 3.12 | % | — | % | |||||||||||||||||||||||||||||||||||||||||||||||||||||||||||||||||||||||
| Total portfolio | $ | 15,794,671 | $ | 30,737 | $ | 130,924 | 0.19 | % | 425.95 | % | $ | 15,336,688 | $ | 27,919 | $ | 130,197 | 0.18 | % | 466.34 | % | $ | 14,568,885 | $ | 49,620 | $ | 137,804 | 0.34 | % | 277.72 | % | ||||||||||||||||||||||||||||||||||||||||||||||||||||||||||||||
| CUSTOMERS BANCORP, INC. AND SUBSIDIARIES | |||||||||||||||||||||||||||||||||||||||||
| NET CHARGE-OFFS/(RECOVERIES) - UNAUDITED | |||||||||||||||||||||||||||||||||||||||||
| (Dollars in thousands) | |||||||||||||||||||||||||||||||||||||||||
| Q4 | Q3 | Q2 | Q1 | Q4 | Twelve Months Ended December 31, | ||||||||||||||||||||||||||||||||||||
| 2022 | 2022 | 2022 | 2022 | 2021 | 2022 | 2021 | |||||||||||||||||||||||||||||||||||
Loan type |
|||||||||||||||||||||||||||||||||||||||||
Commercial & industrial, including specialty lending (1) |
$ | 12,960 | $ | 2,581 | $ | (416) | $ | (59) | $ | 240 | $ | 15,066 | $ | 448 | |||||||||||||||||||||||||||
| Multifamily | — | — | 1,990 | (337) | — | 1,653 | 1,132 | ||||||||||||||||||||||||||||||||||
| Commercial real estate owner occupied | (2) | — | (42) | (7) | 66 | (51) | 249 | ||||||||||||||||||||||||||||||||||
| Commercial real estate non-owner occupied | 972 | 4,831 | 159 | (8) | (14) | 5,954 | 860 | ||||||||||||||||||||||||||||||||||
| Construction | (10) | (10) | (103) | (113) | (3) | (236) | (125) | ||||||||||||||||||||||||||||||||||
| Residential | 7 | (13) | (39) | (2) | (6) | (47) | 76 | ||||||||||||||||||||||||||||||||||
| Installment | 13,237 | 11,108 | 11,932 | 7,752 | 7,299 | 44,029 | 31,158 | ||||||||||||||||||||||||||||||||||
| Total net charge-offs (recoveries) from loans held for investment | $ | 27,164 | $ | 18,497 | $ | 13,481 | $ | 7,226 | $ | 7,582 | $ | 66,368 | $ | 33,798 | |||||||||||||||||||||||||||
CUSTOMERS BANCORP, INC. AND SUBSIDIARIES | |||||||||||||||||||||||||||||
RECONCILIATION OF GAAP TO NON-GAAP MEASURES - UNAUDITED | |||||||||||||||||||||||||||||
|
Core Earnings - Customers Bancorp
|
Twelve Months Ended
December 31,
|
|||||||||||||||||||||||||||||||||||||||||||||||||||||||||||||
| Q4 2022 | Q3 2022 | Q2 2022 | Q1 2022 | Q4 2021 | 2022 | 2021 | ||||||||||||||||||||||||||||||||||||||||||||||||||||||||
| (Dollars in thousands except per share data) | USD |
Per share |
USD |
Per share |
USD |
Per share |
USD |
Per share |
USD |
Per share |
USD |
Per share |
USD |
Per share |
||||||||||||||||||||||||||||||||||||||||||||||||
| GAAP net income to common shareholders | $ | 25,623 | $ | 0.77 | $ | 61,364 | $ | 1.85 | $ | 56,519 | $ | 1.68 | $ | 74,896 | $ | 2.18 | $ | 98,647 | $ | 2.87 | $ | 218,402 | $ | 6.51 | $ | 300,134 | $ | 8.91 | ||||||||||||||||||||||||||||||||||
| Reconciling items (after tax): | ||||||||||||||||||||||||||||||||||||||||||||||||||||||||||||||
| Net loss from discontinued operations | — | — | — | — | — | — | — | — | 1,585 | 0.05 | — | — | 39,621 | 1.18 | ||||||||||||||||||||||||||||||||||||||||||||||||
| Severance expense | — | — | 1,058 | 0.03 | — | — | — | — | — | — | 1,058 | 0.03 | 1,517 | 0.05 | ||||||||||||||||||||||||||||||||||||||||||||||||
| Impairments on fixed assets and leases | — | — | 126 | 0.00 | 705 | 0.02 | 220 | 0.01 | 1,118 | 0.03 | 1,051 | 0.03 | 1,118 | 0.03 | ||||||||||||||||||||||||||||||||||||||||||||||||
| Merger and acquisition related expenses | — | — | — | — | — | — | — | — | — | — | — | — | 320 | 0.01 | ||||||||||||||||||||||||||||||||||||||||||||||||
| Loss on sale of consumer installment loans | — | — | 18,221 | 0.55 | — | — | — | — | — | — | 18,221 | 0.54 | — | — | ||||||||||||||||||||||||||||||||||||||||||||||||
| Legal reserves | — | — | — | — | — | — | — | — | — | — | — | — | 897 | 0.03 | ||||||||||||||||||||||||||||||||||||||||||||||||
| (Gains) losses on investment securities | 13,543 | 0.41 | 1,859 | 0.06 | 2,494 | 0.07 | 1,030 | 0.03 | 43 | 0.00 | 18,926 | 0.56 | (26,015) | (0.77) | ||||||||||||||||||||||||||||||||||||||||||||||||
| Loss on sale of foreign subsidiaries | — | — | — | — | — | — | — | — | — | — | — | — | 2,150 | 0.06 | ||||||||||||||||||||||||||||||||||||||||||||||||
| Loss on cash flow hedge derivative terminations | — | — | — | — | — | — | — | — | — | — | — | — | 18,716 | 0.56 | ||||||||||||||||||||||||||||||||||||||||||||||||
| Derivative credit valuation adjustment | 202 | 0.01 | (358) | (0.01) | (351) | (0.01) | (736) | (0.02) | (180) | (0.01) | (1,243) | (0.04) | (1,285) | (0.04) | ||||||||||||||||||||||||||||||||||||||||||||||||
| Deposit relationship adjustment fees | — | — | — | — | — | — | — | — | — | — | — | — | 4,707 | 0.14 | ||||||||||||||||||||||||||||||||||||||||||||||||
| Loss on redemption of preferred stock | — | — | — | — | — | — | — | — | — | — | — | — | 2,820 | 0.08 | ||||||||||||||||||||||||||||||||||||||||||||||||
| Core earnings | $ | 39,368 | $ | 1.19 | $ | 82,270 | $ | 2.48 | $ | 59,367 | $ | 1.77 | $ | 75,410 | $ | 2.20 | $ | 101,213 | $ | 2.95 | $ | 256,415 | $ | 7.63 | $ | 344,700 | $ | 10.23 | ||||||||||||||||||||||||||||||||||
CUSTOMERS BANCORP, INC. AND SUBSIDIARIES | |||||||||||||||||||||||||||||
RECONCILIATION OF GAAP TO NON-GAAP MEASURES - UNAUDITED (CONTINUED) | |||||||||||||||||||||||||||||
(Dollars in thousands, except per share data) | |||||||||||||||||||||||||||||
|
Core Earnings, excluding PPP - Customers Bancorp
|
Twelve Months Ended
December 31,
|
|||||||||||||||||||||||||||||||||||||||||||||||||||||||||||||
| Q4 2022 | Q3 2022 | Q2 2022 | Q1 2022 | Q4 2021 | 2022 | 2021 | ||||||||||||||||||||||||||||||||||||||||||||||||||||||||
| (Dollars in thousands except per share data) | USD |
Per share |
USD |
Per share |
USD |
Per share |
USD |
Per share |
USD |
Per share |
USD |
Per share |
USD |
Per share |
||||||||||||||||||||||||||||||||||||||||||||||||
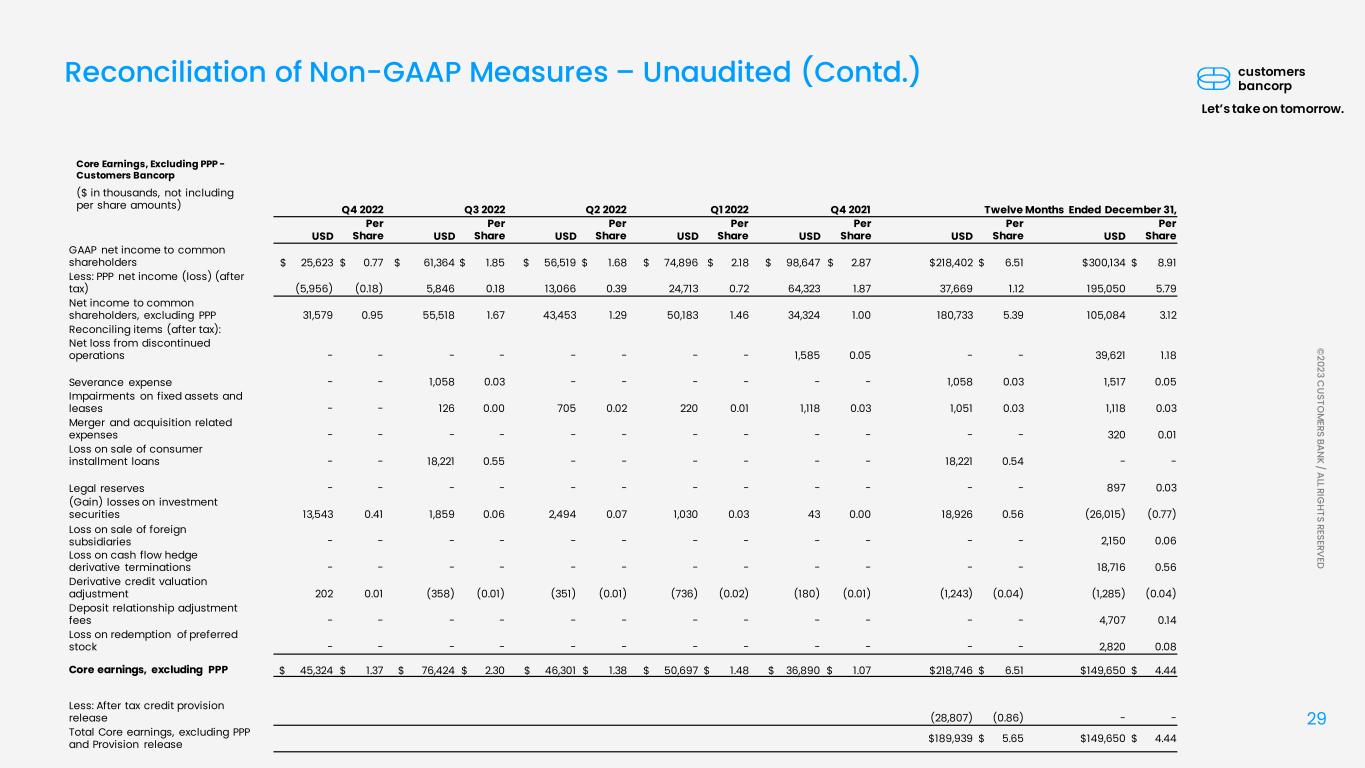
| GAAP net income to common shareholders | $ | 25,623 | $ | 0.77 | $ | 61,364 | $ | 1.85 | $ | 56,519 | $ | 1.68 | $ | 74,896 | $ | 2.18 | $ | 98,647 | $ | 2.87 | $ | 218,402 | $ | 6.51 | $ | 300,134 | $ | 8.91 | ||||||||||||||||||||||||||||||||||
| Less: PPP net income (loss) (after tax) | (5,956) | (0.18) | 5,846 | 0.18 | 13,066 | 0.39 | 24,713 | 0.72 | 64,323 | 1.87 | 37,669 | 1.12 | 195,050 | 5.79 | ||||||||||||||||||||||||||||||||||||||||||||||||
| Net income to common shareholders, excluding PPP | 31,579 | 0.95 | 55,518 | 1.67 | 43,453 | 1.29 | 50,183 | 1.46 | 34,324 | 1.00 | 180,733 | 5.39 | 105,084 | 3.12 | ||||||||||||||||||||||||||||||||||||||||||||||||
| Reconciling items (after tax): | ||||||||||||||||||||||||||||||||||||||||||||||||||||||||||||||
| Net loss from discontinued operations | — | — | — | — | — | — | — | — | 1,585 | 0.05 | — | — | 39,621 | 1.18 | ||||||||||||||||||||||||||||||||||||||||||||||||
| Severance expense | — | — | 1,058 | 0.03 | — | — | — | — | — | — | 1,058 | 0.03 | 1,517 | 0.05 | ||||||||||||||||||||||||||||||||||||||||||||||||
| Impairments on fixed assets and leases | — | — | 126 | 0.00 | 705 | 0.02 | 220 | 0.01 | 1,118 | 0.03 | 1,051 | 0.03 | 1,118 | 0.03 | ||||||||||||||||||||||||||||||||||||||||||||||||
| Merger and acquisition related expenses | — | — | — | — | — | — | — | — | — | — | — | — | 320 | 0.01 | ||||||||||||||||||||||||||||||||||||||||||||||||
| Loss on sale of consumer installment loans | — | — | 18,221 | 0.55 | — | — | — | — | — | — | 18,221 | 0.54 | — | — | ||||||||||||||||||||||||||||||||||||||||||||||||
| Legal reserves | — | — | — | — | — | — | — | — | — | — | — | — | 897 | 0.03 | ||||||||||||||||||||||||||||||||||||||||||||||||
| (Gains) losses on investment securities | 13,543 | 0.41 | 1,859 | 0.06 | 2,494 | 0.07 | 1,030 | 0.03 | 43 | 0.00 | 18,926 | 0.56 | (26,015) | (0.77) | ||||||||||||||||||||||||||||||||||||||||||||||||
| Loss on sale of foreign subsidiaries | — | — | — | — | — | — | — | — | — | — | — | — | 2,150 | 0.06 | ||||||||||||||||||||||||||||||||||||||||||||||||
| Loss on cash flow hedge derivative terminations | — | — | — | — | — | — | — | — | — | — | — | — | 18,716 | 0.56 | ||||||||||||||||||||||||||||||||||||||||||||||||
| Derivative credit valuation adjustment | 202 | 0.01 | (358) | (0.01) | (351) | (0.01) | (736) | (0.02) | (180) | (0.01) | (1,243) | (0.04) | (1,285) | (0.04) | ||||||||||||||||||||||||||||||||||||||||||||||||
| Deposit relationship adjustment fees | — | — | — | — | — | — | — | — | — | — | — | — | 4,707 | 0.14 | ||||||||||||||||||||||||||||||||||||||||||||||||
| Loss on redemption of preferred stock | — | — | — | — | — | — | — | — | — | — | — | — | 2,820 | 0.08 | ||||||||||||||||||||||||||||||||||||||||||||||||
| Core earnings, excluding PPP | $ | 45,324 | $ | 1.37 | $ | 76,424 | $ | 2.30 | $ | 46,301 | $ | 1.38 | $ | 50,697 | $ | 1.48 | $ | 36,890 | $ | 1.07 | $ | 218,746 | $ | 6.51 | $ | 149,650 | $ | 4.44 | ||||||||||||||||||||||||||||||||||
CUSTOMERS BANCORP, INC. AND SUBSIDIARIES | |||||||||||||||||||||||||||||
RECONCILIATION OF GAAP TO NON-GAAP MEASURES - UNAUDITED (CONTINUED) | |||||||||||||||||||||||||||||
(Dollars in thousands, except per share data) | |||||||||||||||||||||||||||||
| Core Return on Average Assets - Customers Bancorp |
Twelve Months Ended
December 31,
|
||||||||||||||||||||||||||||||||||||||||
| (Dollars in thousands except per share data) | Q4 2022 | Q3 2022 | Q2 2022 | Q1 2022 | Q4 2021 | 2022 | 2021 | ||||||||||||||||||||||||||||||||||
| GAAP net income | $ | 28,711 | $ | 63,912 | $ | 58,650 | $ | 76,761 | $ | 100,669 | $ | 228,034 | $ | 314,647 | |||||||||||||||||||||||||||
| Reconciling items (after tax): | |||||||||||||||||||||||||||||||||||||||||
| Net loss from discontinued operations | — | — | — | — | 1,585 | — | 39,621 | ||||||||||||||||||||||||||||||||||
| Severance expense | — | 1,058 | — | — | — | 1,058 | 1,517 | ||||||||||||||||||||||||||||||||||
| Impairments on fixed assets and leases | — | 126 | 705 | 220 | 1,118 | 1,051 | 1,118 | ||||||||||||||||||||||||||||||||||
Merger and acquisition related expenses |
— | — | — | — | — | — | 320 | ||||||||||||||||||||||||||||||||||
| Loss on sale of consumer installment loans | — | 18,221 | — | — | — | 18,221 | — | ||||||||||||||||||||||||||||||||||
| Legal reserves | — | — | — | — | — | — | 897 | ||||||||||||||||||||||||||||||||||
| (Gains) losses on investment securities | 13,543 | 1,859 | 2,494 | 1,030 | 43 | 18,926 | (26,015) | ||||||||||||||||||||||||||||||||||
| Loss on sale of foreign subsidiaries | — | — | — | — | — | — | 2,150 | ||||||||||||||||||||||||||||||||||
| Loss on cash flow hedge derivative terminations | — | — | — | — | — | — | 18,716 | ||||||||||||||||||||||||||||||||||
| Derivative credit valuation adjustment | 202 | (358) | (351) | (736) | (180) | (1,243) | (1,285) | ||||||||||||||||||||||||||||||||||
| Deposit relationship adjustment fees | — | — | — | — | — | — | 4,707 | ||||||||||||||||||||||||||||||||||
Core net income |
$ | 42,456 | $ | 84,818 | $ | 61,498 | $ | 77,275 | $ | 103,235 | $ | 266,047 | $ | 356,393 | |||||||||||||||||||||||||||
Average total assets |
$ | 20,717,362 | $ | 20,514,366 | $ | 20,056,020 | $ | 19,129,330 | $ | 19,214,241 | $ | 20,109,744 | $ | 19,199,936 | |||||||||||||||||||||||||||
| Core return on average assets | 0.81 | % | 1.64 | % | 1.23 | % | 1.64 | % | 2.13 | % | 1.32 | % | 1.86 | % | |||||||||||||||||||||||||||
| Core Return on Average Assets, excluding PPP - Customers Bancorp |
Twelve Months Ended
December 31,
|
||||||||||||||||||||||||||||||||||||||||
| (Dollars in thousands except per share data) | Q4 2022 | Q3 2022 | Q2 2022 | Q1 2022 | Q4 2021 | 2022 | 2021 | ||||||||||||||||||||||||||||||||||
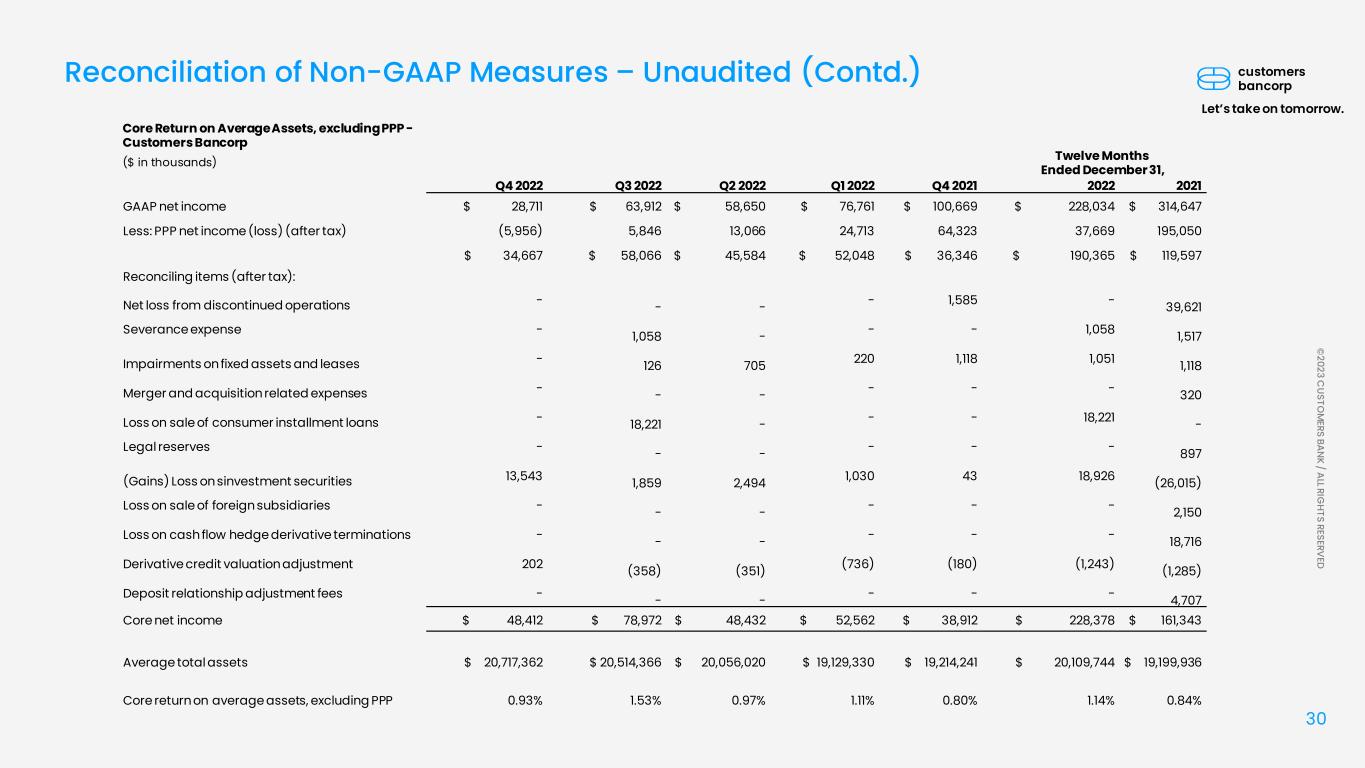
| GAAP net income | $ | 28,711 | $ | 63,912 | $ | 58,650 | $ | 76,761 | $ | 100,669 | $ | 228,034 | $ | 314,647 | |||||||||||||||||||||||||||
| Less: PPP net income (loss) (after tax) | (5,956) | 5,846 | 13,066 | 24,713 | 64,323 | 37,669 | 195,050 | ||||||||||||||||||||||||||||||||||
| Net income, excluding PPP | 34,667 | 58,066 | 45,584 | 52,048 | 36,346 | 190,365 | 119,597 | ||||||||||||||||||||||||||||||||||
| Reconciling items (after tax): | |||||||||||||||||||||||||||||||||||||||||
| Net loss from discontinued operations | — | — | — | — | 1,585 | — | 39,621 | ||||||||||||||||||||||||||||||||||
| Severance expense | — | 1,058 | — | — | — | 1,058 | 1,517 | ||||||||||||||||||||||||||||||||||
| Impairments on fixed assets and leases | — | 126 | 705 | 220 | 1,118 | 1,051 | 1,118 | ||||||||||||||||||||||||||||||||||
Merger and acquisition related expenses |
— | — | — | — | — | — | 320 | ||||||||||||||||||||||||||||||||||
| Loss on sale of consumer installment loans | — | 18,221 | — | — | — | 18,221 | — | ||||||||||||||||||||||||||||||||||
| Legal reserves | — | — | — | — | — | — | 897 | ||||||||||||||||||||||||||||||||||
| (Gains) losses on investment securities | 13,543 | 1,859 | 2,494 | 1,030 | 43 | 18,926 | (26,015) | ||||||||||||||||||||||||||||||||||
| Loss on sale of foreign subsidiaries | — | — | — | — | — | — | 2,150 | ||||||||||||||||||||||||||||||||||
| Loss on cash flow hedge derivative terminations | — | — | — | — | — | — | 18,716 | ||||||||||||||||||||||||||||||||||
| Derivative credit valuation adjustment | 202 | (358) | (351) | (736) | (180) | (1,243) | (1,285) | ||||||||||||||||||||||||||||||||||
| Deposit relationship adjustment fees | — | — | — | — | — | — | 4,707 | ||||||||||||||||||||||||||||||||||
Core net income, excluding PPP |
$ | 48,412 | $ | 78,972 | $ | 48,432 | $ | 52,562 | $ | 38,912 | $ | 228,378 | $ | 161,343 | |||||||||||||||||||||||||||
Average total assets |
$ | 20,717,362 | $ | 20,514,366 | $ | 20,056,020 | $ | 19,129,330 | $ | 19,214,241 | $ | 20,109,744 | $ | 19,199,936 | |||||||||||||||||||||||||||
| Core return on average assets, excluding PPP | 0.93 | % | 1.53 | % | 0.97 | % | 1.11 | % | 0.80 | % | 1.14 | % | 0.84 | % | |||||||||||||||||||||||||||
CUSTOMERS BANCORP, INC. AND SUBSIDIARIES | |||||||||||||||||||||||||||||
RECONCILIATION OF GAAP TO NON-GAAP MEASURES - UNAUDITED (CONTINUED) | |||||||||||||||||||||||||||||
(Dollars in thousands, except per share data) | |||||||||||||||||||||||||||||
| Adjusted Net Income and Adjusted ROAA - Pre-Tax Pre-Provision - Customers Bancorp |
Twelve Months Ended
December 31,
|
||||||||||||||||||||||||||||||||||||||||
| (Dollars in thousands except per share data) | Q4 2022 | Q3 2022 | Q2 2022 | Q1 2022 | Q4 2021 | 2022 | 2021 | ||||||||||||||||||||||||||||||||||
| GAAP net income | $ | 28,711 | $ | 63,912 | $ | 58,650 | $ | 76,761 | $ | 100,669 | $ | 228,034 | $ | 314,647 | |||||||||||||||||||||||||||
| Reconciling items: | |||||||||||||||||||||||||||||||||||||||||
Income tax expense |
7,136 | 17,899 | 18,896 | 19,332 | 12,993 | 63,263 | 86,940 | ||||||||||||||||||||||||||||||||||
Provision (benefit) for credit losses |
28,216 | (7,994) | 23,847 | 15,997 | 13,890 | 60,066 | 27,426 | ||||||||||||||||||||||||||||||||||
| Provision (benefit) for credit losses on unfunded commitments | 153 | 254 | 608 | (109) | 352 | 906 | (220) | ||||||||||||||||||||||||||||||||||
| Severance expense | — | 1,363 | — | — | — | 1,363 | 2,004 | ||||||||||||||||||||||||||||||||||
| Net loss from discontinued operations | — | — | — | — | 1,585 | — | 39,621 | ||||||||||||||||||||||||||||||||||
| Impairments on fixed assets and leases | — | 162 | 914 | 286 | 1,260 | 1,362 | 1,260 | ||||||||||||||||||||||||||||||||||
Merger and acquisition related expenses |
— | — | — | — | — | — | 418 | ||||||||||||||||||||||||||||||||||
| Loss on sale of consumer installment loans | — | 23,465 | — | — | — | 23,465 | — | ||||||||||||||||||||||||||||||||||
| Legal reserves | — | — | — | — | — | — | 1,185 | ||||||||||||||||||||||||||||||||||
| (Gains) losses on investment securities | 16,909 | 2,394 | 3,232 | 1,339 | 49 | 23,874 | (34,112) | ||||||||||||||||||||||||||||||||||
| Loss on sale of foreign subsidiaries | — | — | — | — | — | — | 2,840 | ||||||||||||||||||||||||||||||||||
| Loss on cash flow hedge derivative terminations | — | — | — | — | — | — | 24,467 | ||||||||||||||||||||||||||||||||||
| Derivative credit valuation adjustment | 252 | (461) | (455) | (957) | (203) | (1,621) | (1,646) | ||||||||||||||||||||||||||||||||||
| Deposit relationship adjustment fees | — | — | — | — | — | — | 6,216 | ||||||||||||||||||||||||||||||||||
Adjusted net income - pre-tax pre-provision |
$ | 81,377 | $ | 100,994 | $ | 105,692 | $ | 112,649 | $ | 130,595 | $ | 400,712 | $ | 471,046 | |||||||||||||||||||||||||||
Average total assets |
$ | 20,717,362 | $ | 20,514,366 | $ | 20,056,020 | $ | 19,129,330 | $ | 19,214,241 | $ | 20,109,744 | $ | 19,199,936 | |||||||||||||||||||||||||||
| Adjusted ROAA - pre-tax pre-provision | 1.56 | % | 1.95 | % | 2.11 | % | 2.39 | % | 2.70 | % | 1.99 | % | 2.45 | % | |||||||||||||||||||||||||||
| Adjusted Net Income and Adjusted ROAA - Pre-Tax Pre-Provision, excluding PPP - Customers Bancorp |
Twelve Months Ended
December 31,
|
||||||||||||||||||||||||||||||||||||||||
| (Dollars in thousands except per share data) | Q4 2022 | Q3 2022 | Q2 2022 | Q1 2022 | Q4 2021 | 2022 | 2021 | ||||||||||||||||||||||||||||||||||
| GAAP net income | $ | 28,711 | $ | 63,912 | $ | 58,650 | $ | 76,761 | $ | 100,669 | $ | 228,034 | $ | 314,647 | |||||||||||||||||||||||||||
| Less: PPP net income (loss) (after tax) | (5,956) | 5,846 | 13,066 | 24,713 | 64,323 | 37,669 | 195,050 | ||||||||||||||||||||||||||||||||||
| Net income, excluding PPP | 34,667 | 58,066 | 45,584 | 52,048 | 36,346 | 190,365 | 119,597 | ||||||||||||||||||||||||||||||||||
| Reconciling items: | |||||||||||||||||||||||||||||||||||||||||
Income tax expense |
7,136 | 17,899 | 18,896 | 19,332 | 12,993 | 63,263 | 86,940 | ||||||||||||||||||||||||||||||||||
Provision (benefit) for credit losses |
28,216 | (7,994) | 23,847 | 15,997 | 13,890 | 60,066 | 27,426 | ||||||||||||||||||||||||||||||||||
| Provision (benefit) for credit losses on unfunded commitments | 153 | 254 | 608 | (109) | 352 | 906 | (220) | ||||||||||||||||||||||||||||||||||
| Severance expense | — | 1,363 | — | — | — | 1,363 | 2,004 | ||||||||||||||||||||||||||||||||||
| Net loss from discontinued operations | — | — | — | — | 1,585 | — | 39,621 | ||||||||||||||||||||||||||||||||||
| Impairments on fixed assets and leases | — | 162 | 914 | 286 | 1,260 | 1,362 | 1,260 | ||||||||||||||||||||||||||||||||||
Merger and acquisition related expenses |
— | — | — | — | — | — | 418 | ||||||||||||||||||||||||||||||||||
| Loss on sale of consumer installment loans | — | 23,465 | — | — | — | 23,465 | — | ||||||||||||||||||||||||||||||||||
| Legal reserves | — | — | — | — | — | — | 1,185 | ||||||||||||||||||||||||||||||||||
| (Gains) losses on investment securities | 16,909 | 2,394 | 3,232 | 1,339 | 49 | 23,874 | (34,112) | ||||||||||||||||||||||||||||||||||
| Loss on sale of foreign subsidiaries | — | — | — | — | — | — | 2,840 | ||||||||||||||||||||||||||||||||||
| Loss on cash flow hedge derivative terminations | — | — | — | — | — | — | 24,467 | ||||||||||||||||||||||||||||||||||
| Derivative credit valuation adjustment | 252 | (461) | (455) | (957) | (203) | (1,621) | (1,646) | ||||||||||||||||||||||||||||||||||
| Deposit relationship adjustment fees | — | — | — | — | — | — | 6,216 | ||||||||||||||||||||||||||||||||||
Adjusted net income - pre-tax pre-provision, excluding PPP |
$ | 87,333 | $ | 95,148 | $ | 92,626 | $ | 87,936 | $ | 66,272 | $ | 363,043 | $ | 275,996 | |||||||||||||||||||||||||||
Average total assets |
$ | 20,717,362 | $ | 20,514,366 | $ | 20,056,020 | $ | 19,129,330 | $ | 19,214,241 | $ | 20,109,744 | $ | 19,199,936 | |||||||||||||||||||||||||||
| Adjusted ROAA - pre-tax pre-provision, excluding PPP | 1.67 | % | 1.84 | % | 1.85 | % | 1.86 | % | 1.37 | % | 1.81 | % | 1.44 | % | |||||||||||||||||||||||||||
CUSTOMERS BANCORP, INC. AND SUBSIDIARIES | |||||||||||||||||||||||||||||
RECONCILIATION OF GAAP TO NON-GAAP MEASURES - UNAUDITED (CONTINUED) | |||||||||||||||||||||||||||||
(Dollars in thousands, except per share data) | |||||||||||||||||||||||||||||
| Core Return on Average Common Equity - Customers Bancorp |
Twelve Months Ended
December 31,
|
||||||||||||||||||||||||||||||||||||||||
| (Dollars in thousands except per share data) | Q4 2022 | Q3 2022 | Q2 2022 | Q1 2022 | Q4 2021 | 2022 | 2021 | ||||||||||||||||||||||||||||||||||
| GAAP net income to common shareholders | $ | 25,623 | $ | 61,364 | $ | 56,519 | $ | 74,896 | $ | 98,647 | $ | 218,402 | $ | 300,134 | |||||||||||||||||||||||||||
| Reconciling items (after tax): | |||||||||||||||||||||||||||||||||||||||||
| Net loss from discontinued operations | — | — | — | — | 1,585 | — | 39,621 | ||||||||||||||||||||||||||||||||||
| Severance expense | — | 1,058 | — | — | — | 1,058 | 1,517 | ||||||||||||||||||||||||||||||||||
| Impairments on fixed assets and leases | — | 126 | 705 | 220 | 1,118 | 1,051 | 1,118 | ||||||||||||||||||||||||||||||||||
| Merger and acquisition related expenses | — | — | — | — | — | — | 320 | ||||||||||||||||||||||||||||||||||
| Loss on sale of consumer installment loans | — | 18,221 | — | — | — | 18,221 | — | ||||||||||||||||||||||||||||||||||
| Legal reserves | — | — | — | — | — | — | 897 | ||||||||||||||||||||||||||||||||||
| (Gains) losses on investment securities | 13,543 | 1,859 | 2,494 | 1,030 | 43 | 18,926 | (26,015) | ||||||||||||||||||||||||||||||||||
| Loss on sale of foreign subsidiaries | — | — | — | — | — | — | 2,150 | ||||||||||||||||||||||||||||||||||
| Loss on cash flow hedge derivative terminations | — | — | — | — | — | — | 18,716 | ||||||||||||||||||||||||||||||||||
| Derivative credit valuation adjustment | 202 | (358) | (351) | (736) | (180) | (1,243) | (1,285) | ||||||||||||||||||||||||||||||||||
| Deposit relationship adjustment fees | — | — | — | — | — | — | 4,707 | ||||||||||||||||||||||||||||||||||
| Loss on redemption of preferred stock | — | — | — | — | — | — | 2,820 | ||||||||||||||||||||||||||||||||||
| Core earnings | $ | 39,368 | $ | 82,270 | $ | 59,367 | $ | 75,410 | $ | 101,213 | $ | 256,415 | $ | 344,700 | |||||||||||||||||||||||||||
| Average total common shareholders' equity | $ | 1,263,190 | $ | 1,259,711 | $ | 1,244,819 | $ | 1,252,022 | $ | 1,179,478 | $ | 1,254,979 | $ | 1,043,906 | |||||||||||||||||||||||||||
| Core return on average common equity | 12.36 | % | 25.91 | % | 19.13 | % | 24.43 | % | 34.04 | % | 20.43 | % | 33.02 | % | |||||||||||||||||||||||||||
| Adjusted ROCE - Pre-Tax Pre-Provision - Customers Bancorp |
Twelve Months Ended
December 31,
|
||||||||||||||||||||||||||||||||||||||||
| (Dollars in thousands except per share data) | Q4 2022 | Q3 2022 | Q2 2022 | Q1 2022 | Q4 2021 | 2022 | 2021 | ||||||||||||||||||||||||||||||||||
| GAAP net income to common shareholders | $ | 25,623 | $ | 61,364 | $ | 56,519 | $ | 74,896 | $ | 98,647 | $ | 218,402 | $ | 300,134 | |||||||||||||||||||||||||||
| Reconciling items: | |||||||||||||||||||||||||||||||||||||||||
Income tax expense |
7,136 | 17,899 | 18,896 | 19,332 | 12,993 | 63,263 | 86,940 | ||||||||||||||||||||||||||||||||||
Provision (benefit) for credit losses |
28,216 | (7,994) | 23,847 | 15,997 | 13,890 | 60,066 | 27,426 | ||||||||||||||||||||||||||||||||||
| Provision (benefit) for credit losses on unfunded commitments | 153 | 254 | 608 | (109) | 352 | 906 | (220) | ||||||||||||||||||||||||||||||||||
| Net loss from discontinued operations | — | — | — | — | 1,585 | — | 39,621 | ||||||||||||||||||||||||||||||||||
| Severance expense | — | 1,363 | — | — | — | 1,363 | 2,004 | ||||||||||||||||||||||||||||||||||
| Impairments on fixed assets and leases | — | 162 | 914 | 286 | 1,260 | 1,362 | 1,260 | ||||||||||||||||||||||||||||||||||
| Merger and acquisition related expenses | — | — | — | — | — | — | 418 | ||||||||||||||||||||||||||||||||||
| Loss on sale of consumer installment loans | — | 23,465 | — | — | — | 23,465 | — | ||||||||||||||||||||||||||||||||||
| Legal reserves | — | — | — | — | — | — | 1,185 | ||||||||||||||||||||||||||||||||||
| (Gains) losses on investment securities | 16,909 | 2,394 | 3,232 | 1,339 | 49 | 23,874 | (34,112) | ||||||||||||||||||||||||||||||||||
| Loss on sale of foreign subsidiaries | — | — | — | — | — | — | 2,840 | ||||||||||||||||||||||||||||||||||
| Loss on cash flow hedge derivative terminations | — | — | — | — | — | — | 24,467 | ||||||||||||||||||||||||||||||||||
| Derivative credit valuation adjustment | 252 | (461) | (455) | (957) | (203) | (1,621) | (1,646) | ||||||||||||||||||||||||||||||||||
| Deposit relationship adjustment fees | — | — | — | — | — | — | 6,216 | ||||||||||||||||||||||||||||||||||
| Loss on redemption of preferred stock | — | — | — | — | — | — | 2,820 | ||||||||||||||||||||||||||||||||||
| Pre-tax pre-provision adjusted net income available to common shareholders | $ | 78,289 | $ | 98,446 | $ | 103,561 | $ | 110,784 | $ | 128,573 | $ | 391,080 | $ | 459,353 | |||||||||||||||||||||||||||
| Average total common shareholders' equity | $ | 1,263,190 | $ | 1,259,711 | $ | 1,244,819 | $ | 1,252,022 | $ | 1,179,478 | $ | 1,254,979 | $ | 1,043,906 | |||||||||||||||||||||||||||
| Adjusted ROCE - pre-tax pre-provision | 24.59 | % | 31.01 | % | 33.37 | % | 35.89 | % | 43.25 | % | 31.16 | % | 44.00 | % | |||||||||||||||||||||||||||
CUSTOMERS BANCORP, INC. AND SUBSIDIARIES | |||||||||||||||||||||||||||||
RECONCILIATION OF GAAP TO NON-GAAP MEASURES - UNAUDITED (CONTINUED) | |||||||||||||||||||||||||||||
(Dollars in thousands, except per share data) | |||||||||||||||||||||||||||||
| Net Interest Margin, Tax Equivalent, excluding PPP - Customers Bancorp |
Twelve Months Ended
December 31,
|
||||||||||||||||||||||||||||||||||||||||
| (Dollars in thousands except per share data) | Q4 2022 | Q3 2022 | Q2 2022 | Q1 2022 | Q4 2021 | 2022 | 2021 | ||||||||||||||||||||||||||||||||||
| GAAP net interest income | $ | 135,137 | $ | 159,032 | $ | 164,852 | $ | 164,699 | $ | 193,694 | $ | 623,720 | $ | 685,074 | |||||||||||||||||||||||||||
| PPP net interest (income) expense | 2,791 | (9,632) | (18,946) | (34,615) | (78,647) | (60,402) | (261,279) | ||||||||||||||||||||||||||||||||||
| Tax-equivalent adjustment | 342 | 334 | 270 | 239 | 276 | 1,185 | 1,147 | ||||||||||||||||||||||||||||||||||
| Net interest income, tax equivalent, excluding PPP | $ | 138,270 | $ | 149,734 | $ | 146,176 | $ | 130,323 | $ | 115,323 | $ | 564,503 | $ | 424,942 | |||||||||||||||||||||||||||
| GAAP average total interest earning assets | $ | 20,211,028 | $ | 20,021,455 | $ | 19,525,936 | $ | 18,572,308 | $ | 18,576,433 | $ | 19,588,374 | $ | 18,566,321 | |||||||||||||||||||||||||||
| Average PPP loans | (1,065,919) | (1,349,403) | (1,863,429) | (2,641,318) | (3,898,607) | (1,724,659) | (5,108,192) | ||||||||||||||||||||||||||||||||||
| Adjusted average total interest earning assets | $ | 19,145,109 | $ | 18,672,052 | $ | 17,662,507 | $ | 15,930,990 | $ | 14,677,826 | $ | 17,863,715 | $ | 13,458,129 | |||||||||||||||||||||||||||
| Net interest margin, tax equivalent, excluding PPP | 2.87 | % | 3.18 | % | 3.32 | % | 3.32 | % | 3.12 | % | 3.16 | % | 3.16 | % | |||||||||||||||||||||||||||
| Loan Yield, excluding PPP |
Twelve Months Ended
December 31,
|
||||||||||||||||||||||||||||||||||||||||
| (Dollars in thousands except per share data) | Q4 2022 | Q3 2022 | Q2 2022 | Q1 2022 | Q4 2021 | 2022 | 2021 | ||||||||||||||||||||||||||||||||||
| Interest income on loans and leases | $ | 218,740 | $ | 200,457 | $ | 168,941 | $ | 157,175 | $ | 198,000 | $ | 745,313 | $ | 736,822 | |||||||||||||||||||||||||||
| PPP interest income | (7,249) | (14,666) | (20,572) | (36,894) | (82,086) | (79,381) | (279,157) | ||||||||||||||||||||||||||||||||||
| Interest income on core loans (Loans and leases, excluding PPP) | $ | 211,491 | $ | 185,791 | $ | 148,369 | $ | 120,281 | $ | 115,914 | $ | 665,932 | $ | 457,665 | |||||||||||||||||||||||||||
| Average total loans and leases | $ | 15,388,003 | $ | 15,653,983 | $ | 14,918,498 | $ | 13,656,991 | $ | 14,335,370 | $ | 14,911,165 | $ | 15,583,948 | |||||||||||||||||||||||||||
| Average PPP loans | (1,065,919) | (1,349,403) | (1,863,429) | (2,641,318) | (3,898,607) | (1,724,659) | (5,108,192) | ||||||||||||||||||||||||||||||||||
| Adjusted average total loans and leases | $ | 14,322,084 | $ | 14,304,580 | $ | 13,055,069 | $ | 11,015,673 | $ | 10,436,763 | $ | 13,186,506 | $ | 10,475,756 | |||||||||||||||||||||||||||
| Loan yield, excluding PPP | 5.86 | % | 5.15 | % | 4.56 | % | 4.43 | % | 4.41 | % | 5.05 | % | 4.37 | % | |||||||||||||||||||||||||||
| Core Efficiency Ratio - Customers Bancorp |
Twelve Months Ended
December 31,
|
||||||||||||||||||||||||||||||||||||||||
| (Dollars in thousands except per share data) | Q4 2022 | Q3 2022 | Q2 2022 | Q1 2022 | Q4 2021 | 2022 | 2021 | ||||||||||||||||||||||||||||||||||
| GAAP net interest income | $ | 135,137 | $ | 159,032 | $ | 164,852 | $ | 164,699 | $ | 193,694 | $ | 623,720 | $ | 685,074 | |||||||||||||||||||||||||||
| GAAP non-interest income | $ | 7,345 | $ | (9,017) | $ | 12,746 | $ | 21,198 | $ | 16,991 | $ | 32,272 | $ | 77,867 | |||||||||||||||||||||||||||
| Loss on sale of consumer installment loans | — | 23,465 | — | — | — | 23,465 | — | ||||||||||||||||||||||||||||||||||
| (Gains) losses on investment securities | 16,909 | 2,394 | 3,232 | 1,339 | 49 | 23,874 | (34,112) | ||||||||||||||||||||||||||||||||||
| Derivative credit valuation adjustment | 252 | (461) | (455) | (957) | (203) | (1,621) | (1,646) | ||||||||||||||||||||||||||||||||||
| Loss on cash flow hedge derivative terminations | — | — | — | — | — | — | 24,467 | ||||||||||||||||||||||||||||||||||
| Loss on sale of foreign subsidiaries | — | — | — | — | — | — | 2,840 | ||||||||||||||||||||||||||||||||||
| Core non-interest income | 24,506 | 16,381 | 15,523 | 21,580 | 16,837 | 77,990 | 69,416 | ||||||||||||||||||||||||||||||||||
| Core revenue | $ | 159,643 | $ | 175,413 | $ | 180,375 | $ | 186,279 | $ | 210,531 | $ | 701,710 | $ | 754,490 | |||||||||||||||||||||||||||
| GAAP non-interest expense | $ | 78,419 | $ | 76,198 | $ | 76,205 | $ | 73,807 | $ | 81,548 | $ | 304,629 | $ | 294,307 | |||||||||||||||||||||||||||
| Severance expense | — | (1,363) | — | — | — | (1,363) | (2,004) | ||||||||||||||||||||||||||||||||||
| Impairments on fixed assets and leases | — | (162) | (914) | (286) | (1,260) | (1,362) | (1,260) | ||||||||||||||||||||||||||||||||||
| Legal reserves | — | — | — | — | — | — | (1,185) | ||||||||||||||||||||||||||||||||||
| Merger and acquisition related expenses | — | — | — | — | — | — | (418) | ||||||||||||||||||||||||||||||||||
| Deposit relationship adjustment fees | — | — | — | — | — | — | (6,216) | ||||||||||||||||||||||||||||||||||
| Core non-interest expense | $ | 78,419 | $ | 74,673 | $ | 75,291 | $ | 73,521 | $ | 80,288 | $ | 301,904 | $ | 283,224 | |||||||||||||||||||||||||||
Core efficiency ratio (1) |
49.12 | % | 42.57 | % | 41.74 | % | 39.47 | % | 38.14 | % | 43.02 | % | 37.54 | % | |||||||||||||||||||||||||||
CUSTOMERS BANCORP, INC. AND SUBSIDIARIES | |||||||||||||||||||||||||||||
RECONCILIATION OF GAAP TO NON-GAAP MEASURES - UNAUDITED (CONTINUED) | |||||||||||||||||||||||||||||
(Dollars in thousands, except per share data) | |||||||||||||||||||||||||||||
| Tangible Common Equity to Tangible Assets - Customers Bancorp | |||||||||||||||||||||||||||||
| (Dollars in thousands except per share data) | Q4 2022 | Q3 2022 | Q2 2022 | Q1 2022 | Q4 2021 | ||||||||||||||||||||||||
| GAAP total shareholders' equity | $ | 1,402,961 | $ | 1,386,931 | $ | 1,353,390 | $ | 1,377,406 | $ | 1,366,217 | |||||||||||||||||||
| Reconciling items: | |||||||||||||||||||||||||||||
| Preferred stock | (137,794) | (137,794) | (137,794) | (137,794) | (137,794) | ||||||||||||||||||||||||
| Goodwill and other intangibles | (3,629) | (3,629) | (3,629) | (3,678) | (3,736) | ||||||||||||||||||||||||
| Tangible common equity | $ | 1,261,538 | $ | 1,245,508 | $ | 1,211,967 | $ | 1,235,934 | $ | 1,224,687 | |||||||||||||||||||
| GAAP total assets | $ | 20,896,112 | $ | 20,367,621 | $ | 20,251,996 | $ | 19,163,708 | $ | 19,575,028 | |||||||||||||||||||
| Reconciling items: | |||||||||||||||||||||||||||||
| Goodwill and other intangibles | (3,629) | (3,629) | (3,629) | (3,678) | (3,736) | ||||||||||||||||||||||||
| Tangible assets | $ | 20,892,483 | $ | 20,363,992 | $ | 20,248,367 | $ | 19,160,030 | $ | 19,571,292 | |||||||||||||||||||
| Tangible common equity to tangible assets | 6.04 | % | 6.12 | % | 5.99 | % | 6.45 | % | 6.26 | % | |||||||||||||||||||
| Tangible Common Equity to Tangible Assets, excluding PPP - Customers Bancorp | |||||||||||||||||||||||||||||
| (Dollars in thousands except per share data) | Q4 2022 | Q3 2022 | Q2 2022 | Q1 2022 | Q4 2021 | ||||||||||||||||||||||||
| GAAP total shareholders' equity | $ | 1,402,961 | $ | 1,386,931 | $ | 1,353,390 | $ | 1,377,406 | $ | 1,366,217 | |||||||||||||||||||
| Reconciling items: | |||||||||||||||||||||||||||||
| Preferred stock | (137,794) | (137,794) | (137,794) | (137,794) | (137,794) | ||||||||||||||||||||||||
| Goodwill and other intangibles | (3,629) | (3,629) | (3,629) | (3,678) | (3,736) | ||||||||||||||||||||||||
| Tangible common equity | $ | 1,261,538 | $ | 1,245,508 | $ | 1,211,967 | $ | 1,235,934 | $ | 1,224,687 | |||||||||||||||||||
| GAAP total assets | $ | 20,896,112 | $ | 20,367,621 | $ | 20,251,996 | $ | 19,163,708 | $ | 19,575,028 | |||||||||||||||||||
| Loans receivable, PPP | (998,153) | (1,154,632) | (1,570,160) | (2,195,902) | (3,250,008) | ||||||||||||||||||||||||
| Total assets, excluding PPP | $ | 19,897,959 | $ | 19,212,989 | $ | 18,681,836 | $ | 16,967,806 | $ | 16,325,020 | |||||||||||||||||||
| Reconciling items: | |||||||||||||||||||||||||||||
| Goodwill and other intangibles | (3,629) | (3,629) | (3,629) | (3,678) | (3,736) | ||||||||||||||||||||||||
| Tangible assets, excluding PPP | $ | 19,894,330 | $ | 19,209,360 | $ | 18,678,207 | $ | 16,964,128 | $ | 16,321,284 | |||||||||||||||||||
| Tangible common equity to tangible assets, excluding PPP | 6.34 | % | 6.48 | % | 6.49 | % | 7.29 | % | 7.50 | % | |||||||||||||||||||
| Tangible Book Value per Common Share - Customers Bancorp | |||||||||||||||||||||||||||||
| (Dollars in thousands except share and per share data) | Q4 2022 | Q3 2022 | Q2 2022 | Q1 2022 | Q4 2021 | ||||||||||||||||||||||||
| GAAP total shareholders' equity | $ | 1,402,961 | $ | 1,386,931 | $ | 1,353,390 | $ | 1,377,406 | $ | 1,366,217 | |||||||||||||||||||
| Reconciling Items: | |||||||||||||||||||||||||||||
| Preferred stock | (137,794) | (137,794) | (137,794) | (137,794) | (137,794) | ||||||||||||||||||||||||
| Goodwill and other intangibles | (3,629) | (3,629) | (3,629) | (3,678) | (3,736) | ||||||||||||||||||||||||
| Tangible common equity | $ | 1,261,538 | $ | 1,245,508 | $ | 1,211,967 | $ | 1,235,934 | $ | 1,224,687 | |||||||||||||||||||
| Common shares outstanding | 32,373,697 | 32,475,502 | 32,449,486 | 32,957,847 | 32,913,267 | ||||||||||||||||||||||||
| Tangible book value per common share | $ | 38.97 | $ | 38.35 | $ | 37.35 | $ | 37.50 | $ | 37.21 | |||||||||||||||||||
| Core Loans (Total Loans and Leases, excluding PPP) | |||||||||||||||||||||||||||||
| (Dollars in thousands except per share data) | Q4 2022 | Q3 2022 | Q2 2022 | Q1 2022 | Q4 2021 | ||||||||||||||||||||||||
| Total loans and leases | $ | 15,794,671 | $ | 15,336,688 | $ | 15,664,353 | $ | 14,073,518 | $ | 14,568,885 | |||||||||||||||||||
| Loans receivable, PPP | (998,153) | (1,154,632) | (1,570,160) | (2,195,902) | (3,250,008) | ||||||||||||||||||||||||
| Core Loans (Loans and leases, excluding PPP) | $ | 14,796,518 | $ | 14,182,056 | $ | 14,094,193 | $ | 11,877,616 | $ | 11,318,877 | |||||||||||||||||||
CUSTOMERS BANCORP, INC. AND SUBSIDIARIES | |||||||||||||||||||||||||||||
RECONCILIATION OF GAAP TO NON-GAAP MEASURES - UNAUDITED (CONTINUED) | |||||||||||||||||||||||||||||
(Dollars in thousands, except per share data) | |||||||||||||||||||||||||||||
| Total Assets, excluding PPP | |||||||||||||||||||||||||||||
| (Dollars in thousands except per share data) | Q4 2022 | Q3 2022 | Q2 2022 | Q1 2022 | Q4 2021 | ||||||||||||||||||||||||
| Total assets | $ | 20,896,112 | $ | 20,367,621 | $ | 20,251,996 | $ | 19,163,708 | $ | 19,575,028 | |||||||||||||||||||
| Loans receivable, PPP | (998,153) | (1,154,632) | (1,570,160) | (2,195,902) | (3,250,008) | ||||||||||||||||||||||||
| Total assets, excluding PPP | $ | 19,897,959 | $ | 19,212,989 | $ | 18,681,836 | $ | 16,967,806 | $ | 16,325,020 | |||||||||||||||||||
| Coverage of credit loss reserves for loans and leases held for investment, excluding PPP | |||||||||||||||||||||||||||||
| (Dollars in thousands except per share data) | Q4 2022 | Q3 2022 | Q2 2022 | Q1 2022 | Q4 2021 | ||||||||||||||||||||||||
| Loans and leases receivable | $ | 14,143,047 | $ | 13,762,374 | $ | 13,783,155 | $ | 12,314,757 | $ | 12,268,306 | |||||||||||||||||||
| Loans receivable, PPP | (998,153) | (1,154,632) | (1,570,160) | (2,195,902) | (3,250,008) | ||||||||||||||||||||||||
| Loans and leases held for investment, excluding PPP | $ | 13,144,894 | $ | 12,607,742 | $ | 12,212,995 | $ | 10,118,855 | $ | 9,018,298 | |||||||||||||||||||
| Allowance for credit losses on loans and leases | $ | 130,924 | $ | 130,197 | $ | 156,530 | $ | 145,847 | $ | 137,804 | |||||||||||||||||||
| Coverage of credit loss reserves for loans and leases held for investment, excluding PPP | 1.00 | % | 1.03 | % | 1.28 | % | 1.44 | % | 1.53 | % | |||||||||||||||||||

