FYfalse20230001479094P6Mone yearone yearone year333111one yearthree years00014790942023-01-012023-12-3100014790942023-06-30iso4217:USD00014790942024-02-12xbrli:shares00014790942023-12-3100014790942022-12-31iso4217:USDxbrli:shares00014790942022-01-012022-12-3100014790942021-01-012021-12-310001479094us-gaap:PreferredStockMember2020-12-310001479094us-gaap:CommonStockMember2020-12-310001479094us-gaap:AdditionalPaidInCapitalMember2020-12-310001479094us-gaap:AccumulatedDistributionsInExcessOfNetIncomeMember2020-12-310001479094us-gaap:AccumulatedOtherComprehensiveIncomeMember2020-12-310001479094us-gaap:ParentMember2020-12-310001479094us-gaap:NoncontrollingInterestMember2020-12-3100014790942020-12-310001479094us-gaap:CommonStockMember2021-01-012021-12-310001479094us-gaap:AdditionalPaidInCapitalMember2021-01-012021-12-310001479094us-gaap:ParentMember2021-01-012021-12-310001479094us-gaap:PreferredStockMember2021-01-012021-12-310001479094us-gaap:AccumulatedDistributionsInExcessOfNetIncomeMember2021-01-012021-12-310001479094us-gaap:NoncontrollingInterestMember2021-01-012021-12-310001479094us-gaap:AccumulatedOtherComprehensiveIncomeMember2021-01-012021-12-310001479094us-gaap:PreferredStockMember2021-12-310001479094us-gaap:CommonStockMember2021-12-310001479094us-gaap:AdditionalPaidInCapitalMember2021-12-310001479094us-gaap:AccumulatedDistributionsInExcessOfNetIncomeMember2021-12-310001479094us-gaap:AccumulatedOtherComprehensiveIncomeMember2021-12-310001479094us-gaap:ParentMember2021-12-310001479094us-gaap:NoncontrollingInterestMember2021-12-3100014790942021-12-310001479094us-gaap:CommonStockMember2022-01-012022-12-310001479094us-gaap:AdditionalPaidInCapitalMember2022-01-012022-12-310001479094us-gaap:ParentMember2022-01-012022-12-310001479094us-gaap:AccumulatedDistributionsInExcessOfNetIncomeMember2022-01-012022-12-310001479094us-gaap:NoncontrollingInterestMember2022-01-012022-12-310001479094us-gaap:AccumulatedOtherComprehensiveIncomeMember2022-01-012022-12-310001479094us-gaap:PreferredStockMember2022-12-310001479094us-gaap:CommonStockMember2022-12-310001479094us-gaap:AdditionalPaidInCapitalMember2022-12-310001479094us-gaap:AccumulatedDistributionsInExcessOfNetIncomeMember2022-12-310001479094us-gaap:AccumulatedOtherComprehensiveIncomeMember2022-12-310001479094us-gaap:ParentMember2022-12-310001479094us-gaap:NoncontrollingInterestMember2022-12-310001479094us-gaap:CommonStockMember2023-01-012023-12-310001479094us-gaap:AdditionalPaidInCapitalMember2023-01-012023-12-310001479094us-gaap:ParentMember2023-01-012023-12-310001479094us-gaap:AccumulatedDistributionsInExcessOfNetIncomeMember2023-01-012023-12-310001479094us-gaap:NoncontrollingInterestMember2023-01-012023-12-310001479094us-gaap:AccumulatedOtherComprehensiveIncomeMember2023-01-012023-12-310001479094us-gaap:PreferredStockMember2023-12-310001479094us-gaap:CommonStockMember2023-12-310001479094us-gaap:AdditionalPaidInCapitalMember2023-12-310001479094us-gaap:AccumulatedDistributionsInExcessOfNetIncomeMember2023-12-310001479094us-gaap:AccumulatedOtherComprehensiveIncomeMember2023-12-310001479094us-gaap:ParentMember2023-12-310001479094us-gaap:NoncontrollingInterestMember2023-12-310001479094stag:STAGIndustrialIncMember2023-01-012023-12-31xbrli:pure0001479094stag:STAGIndustrialIncMember2022-01-012022-12-31stag:buildingstag:stateutr:sqft0001479094us-gaap:BuildingMember2023-12-310001479094stag:BuildingAndLandImprovementMembersrt:MaximumMember2023-12-310001479094us-gaap:LeaseholdImprovementsMember2023-01-012023-12-310001479094us-gaap:LeaseholdImprovementsMember2022-01-012022-12-310001479094us-gaap:PrepaidExpensesAndOtherCurrentAssetsMember2023-12-310001479094us-gaap:SeriesCPreferredStockMember2021-01-012021-12-3100014790942020-12-012020-12-310001479094us-gaap:TaxYear2021Member2020-12-012020-12-310001479094us-gaap:TaxYear2022Member2021-12-012021-12-310001479094us-gaap:TaxYear2023Member2022-12-012022-12-3100014790942023-12-012023-12-310001479094us-gaap:TaxYear2023Member2023-12-012023-12-310001479094stag:TaxableRealEstateInvestmentTrustSubsidyMember2023-01-012023-12-310001479094stag:TaxableRealEstateInvestmentTrustSubsidyMember2022-01-012022-12-310001479094stag:TaxableRealEstateInvestmentTrustSubsidyMember2021-01-012021-12-310001479094us-gaap:BuildingMember2023-12-310001479094us-gaap:BuildingMember2022-12-310001479094us-gaap:LeaseholdImprovementsMember2023-12-310001479094us-gaap:LeaseholdImprovementsMember2022-12-310001479094us-gaap:LandBuildingsAndImprovementsMember2023-12-310001479094us-gaap:LandBuildingsAndImprovementsMember2022-12-310001479094stag:PiscatawayNJQ22023Member2023-06-300001479094stag:PiscatawayNJQ22023Member2023-01-012023-06-300001479094stag:GreensboroNCQ22023Member2023-06-300001479094stag:GreensboroNCQ22023Member2023-01-012023-06-300001479094stag:AcquisitionsQ22023Member2023-06-300001479094stag:AcquisitionsQ22023Member2023-01-012023-06-300001479094stag:PortlandOR71823Member2023-09-30stag:buildings0001479094stag:PortlandOR71823Member2023-07-012023-09-300001479094stag:AllentownPA7242023Member2023-09-300001479094stag:AllentownPA7242023Member2023-07-012023-09-300001479094stag:PhiladelphiaPA7242023Member2023-09-300001479094stag:PhiladelphiaPA7242023Member2023-07-012023-09-300001479094stag:SacramentoCA8072023Member2023-09-300001479094stag:SacramentoCA8072023Member2023-07-012023-09-300001479094stag:ChicagoIL8102023Member2023-09-300001479094stag:ChicagoIL8102023Member2023-07-012023-09-300001479094stag:TampaFL28302023Member2023-09-300001479094stag:TampaFL28302023Member2023-07-012023-09-300001479094stag:IndianapolisIN9182023Member2023-09-300001479094stag:IndianapolisIN9182023Member2023-07-012023-09-300001479094stag:InlandEmpireCalifornia9252023Member2023-09-300001479094stag:InlandEmpireCalifornia9252023Member2023-07-012023-09-300001479094stag:DallasFTWorth9292023Member2023-09-300001479094stag:DallasFTWorth9292023Member2023-07-012023-09-300001479094stag:AcquisitionsQ32023Member2023-09-300001479094stag:AcquisitionsQ32023Member2023-07-012023-09-300001479094stag:WellfordSC310052023Member2023-12-310001479094stag:WellfordSC310052023Member2023-10-012023-12-310001479094stag:WellfordSC10052023Member2023-12-310001479094stag:WellfordSC10052023Member2023-10-012023-12-310001479094stag:SparksNV10192023Member2023-12-310001479094stag:SparksNV10192023Member2023-10-012023-12-310001479094stag:AcquisitionsQ42023Member2023-12-310001479094stag:AcquisitionsQ42023Member2023-10-012023-12-310001479094stag:Acquisitions2023Member2023-12-310001479094stag:Acquisitions2023Member2023-01-012023-12-310001479094stag:WellfordSC310052023Memberus-gaap:ConstructionInProgressMember2023-10-050001479094stag:KansasCityMO10622Member2022-03-310001479094stag:KansasCityMO10622Member2022-01-012022-03-310001479094stag:ChicagoIL13122Member2022-03-310001479094stag:ChicagoIL13122Member2022-01-012022-03-310001479094stag:ColumbusOH2082022Member2022-03-310001479094stag:ColumbusOH2082022Member2022-01-012022-03-310001479094stag:MacedoniaOH2082022Member2022-03-310001479094stag:MacedoniaOH2082022Member2022-01-012022-03-310001479094stag:MurfreesboroTN3102022Member2022-03-310001479094stag:MurfreesboroTN3102022Member2022-01-012022-03-310001479094stag:PiedmontSC3102022Member2022-03-310001479094stag:PiedmontSC3102022Member2022-01-012022-03-310001479094stag:MemphisTN3182022Member2022-03-310001479094stag:MemphisTN3182022Member2022-01-012022-03-310001479094stag:PiedmontSC3182022Member2022-03-310001479094stag:PiedmontSC3182022Member2022-01-012022-03-310001479094stag:AcquisitionsQ12022Member2022-03-310001479094stag:AcquisitionsQ12022Member2022-01-012022-03-310001479094stag:LithoniaGA412022Member2022-06-300001479094stag:LithoniaGA412022Member2022-04-012022-06-300001479094stag:ShakopeeMN442022Member2022-06-300001479094stag:ShakopeeMN442022Member2022-04-012022-06-300001479094stag:GrandRapidsMI41420221Member2022-06-300001479094stag:GrandRapidsMI41420221Member2022-04-012022-06-300001479094stag:ClintonPA4192022Member2022-06-300001479094stag:ClintonPA4192022Member2022-04-012022-06-300001479094stag:GreenvilleSC4222022Member2022-06-300001479094stag:GreenvilleSC4222022Member2022-04-012022-06-300001479094stag:BirminghamAL552022Member2022-06-300001479094stag:BirminghamAL552022Member2022-04-012022-06-300001479094stag:HollisterCA672022Member2022-06-300001479094stag:HollisterCA672022Member2022-04-012022-06-300001479094stag:FredericksburgVA6292022Member2022-06-300001479094stag:FredericksburgVA6292022Member2022-04-012022-06-300001479094stag:NorfolkVA6292022Member2022-06-300001479094stag:NorfolkVA6292022Member2022-04-012022-06-300001479094stag:AcquisitionsQ22022Member2022-06-300001479094stag:AcquisitionsQ22022Member2022-04-012022-06-300001479094stag:AtlantaGA7152022Member2022-09-300001479094stag:AtlantaGA7152022Member2022-07-012022-09-300001479094stag:FresnoCA7252022Member2022-09-300001479094stag:FresnoCA7252022Member2022-07-012022-09-300001479094stag:ElPasoTX7262022Member2022-09-300001479094stag:ElPasoTX7262022Member2022-07-012022-09-300001479094stag:PortlandOR9122022Member2022-09-300001479094stag:PortlandOR9122022Member2022-07-012022-09-300001479094stag:LouisvilleKY9212022Member2022-09-300001479094stag:LouisvilleKY9212022Member2022-07-012022-09-300001479094stag:AcquisitionsQ32022Member2022-09-300001479094stag:AcquisitionsQ32022Member2022-07-012022-09-300001479094stag:SaintCharlesIL122822Member2022-12-310001479094stag:SaintCharlesIL122822Member2022-10-012022-12-310001479094stag:AcquisitionsQ42022Member2022-12-310001479094stag:AcquisitionsQ42022Member2022-10-012022-12-310001479094stag:Acquisitions2022Member2022-12-310001479094stag:Acquisitions2022Member2022-01-012022-12-310001479094us-gaap:LeasesAcquiredInPlaceMember2023-12-310001479094us-gaap:LeasesAcquiredInPlaceMember2023-01-012023-12-310001479094us-gaap:LeasesAcquiredInPlaceMember2022-12-310001479094us-gaap:LeasesAcquiredInPlaceMember2022-01-012022-12-310001479094us-gaap:CustomerRelationshipsMember2023-12-310001479094us-gaap:CustomerRelationshipsMember2023-01-012023-12-310001479094us-gaap:CustomerRelationshipsMember2022-12-310001479094us-gaap:CustomerRelationshipsMember2022-01-012022-12-310001479094us-gaap:AboveMarketLeasesMember2023-12-310001479094us-gaap:AboveMarketLeasesMember2023-01-012023-12-310001479094us-gaap:AboveMarketLeasesMember2022-12-310001479094us-gaap:AboveMarketLeasesMember2022-01-012022-12-310001479094us-gaap:LeasesAcquiredInPlaceMarketAdjustmentMember2023-12-310001479094us-gaap:LeasesAcquiredInPlaceMarketAdjustmentMember2023-01-012023-12-310001479094us-gaap:LeasesAcquiredInPlaceMarketAdjustmentMember2022-12-310001479094us-gaap:LeasesAcquiredInPlaceMarketAdjustmentMember2022-01-012022-12-310001479094us-gaap:DisposalGroupDisposedOfBySaleNotDiscontinuedOperationsMember2023-12-310001479094us-gaap:DisposalGroupDisposedOfBySaleNotDiscontinuedOperationsMember2022-12-310001479094us-gaap:DisposalGroupDisposedOfBySaleNotDiscontinuedOperationsMember2021-12-310001479094us-gaap:DisposalGroupDisposedOfBySaleNotDiscontinuedOperationsMemberus-gaap:LandMember2023-12-310001479094us-gaap:DisposalGroupDisposedOfBySaleNotDiscontinuedOperationsMemberus-gaap:LandMember2022-12-310001479094us-gaap:DisposalGroupDisposedOfBySaleNotDiscontinuedOperationsMemberus-gaap:LandMember2021-12-310001479094us-gaap:DisposalGroupDisposedOfBySaleNotDiscontinuedOperationsMemberstag:A2023DisposalsMember2023-01-012023-12-310001479094us-gaap:DisposalGroupDisposedOfBySaleNotDiscontinuedOperationsMemberstag:A2023DisposalsMember2022-01-012022-12-310001479094us-gaap:DisposalGroupDisposedOfBySaleNotDiscontinuedOperationsMemberstag:A2023DisposalsMember2021-01-012021-12-310001479094us-gaap:DisposalGroupDisposedOfBySaleNotDiscontinuedOperationsMemberstag:A2022DisposalsMember2023-01-012023-12-310001479094us-gaap:DisposalGroupDisposedOfBySaleNotDiscontinuedOperationsMemberstag:A2022DisposalsMember2022-01-012022-12-310001479094us-gaap:DisposalGroupDisposedOfBySaleNotDiscontinuedOperationsMemberstag:A2022DisposalsMember2021-01-012021-12-310001479094us-gaap:DisposalGroupDisposedOfBySaleNotDiscontinuedOperationsMemberstag:A2021DisposalsMember2023-01-012023-12-310001479094us-gaap:DisposalGroupDisposedOfBySaleNotDiscontinuedOperationsMemberstag:A2021DisposalsMember2022-01-012022-12-310001479094us-gaap:DisposalGroupDisposedOfBySaleNotDiscontinuedOperationsMemberstag:A2021DisposalsMember2021-01-012021-12-310001479094us-gaap:DisposalGroupDisposedOfBySaleNotDiscontinuedOperationsMember2023-01-012023-12-310001479094us-gaap:DisposalGroupDisposedOfBySaleNotDiscontinuedOperationsMember2022-01-012022-12-310001479094us-gaap:DisposalGroupDisposedOfBySaleNotDiscontinuedOperationsMember2021-01-012021-12-310001479094us-gaap:FairValueMeasurementsNonrecurringMember2022-12-310001479094us-gaap:OperatingIncomeLossMember2022-01-012022-12-310001479094us-gaap:FairValueMeasurementsNonrecurringMemberus-gaap:MeasurementInputDiscountRateMember2022-01-012022-12-310001479094us-gaap:FairValueMeasurementsNonrecurringMemberus-gaap:MeasurementInputCapRateMember2022-01-012022-12-310001479094us-gaap:OtherIntangibleAssetsMember2023-12-310001479094us-gaap:OtherIntangibleAssetsMember2022-12-310001479094us-gaap:OtherIntangibleAssetsMember2023-01-012023-12-310001479094us-gaap:OtherIntangibleAssetsMember2022-01-012022-12-310001479094us-gaap:OtherIntangibleAssetsMember2021-01-012021-12-310001479094us-gaap:LineOfCreditMember2023-12-310001479094us-gaap:LineOfCreditMember2022-12-310001479094us-gaap:LineOfCreditMemberus-gaap:SecuredOvernightFinancingRateSofrOvernightIndexSwapRateMember2023-01-012023-12-31utr:Rate0001479094us-gaap:LineOfCreditMember2023-01-012023-12-310001479094us-gaap:LongTermDebtMemberstag:A200MillionUnsecuredTermLoanFMember2023-12-310001479094us-gaap:LongTermDebtMemberstag:A200MillionUnsecuredTermLoanFMember2022-12-310001479094stag:A200MillionUnsecuredTermLoanFMember2023-01-012023-12-310001479094stag:A300MillionUnsecuredTermLoanGMemberus-gaap:LongTermDebtMember2023-12-310001479094stag:A300MillionUnsecuredTermLoanGMemberus-gaap:LongTermDebtMember2022-12-310001479094stag:A300MillionUnsecuredTermLoanGMemberus-gaap:LongTermDebtMember2023-01-012023-12-310001479094us-gaap:LongTermDebtMemberstag:A150MillionUnsecuredTermLoanAMember2023-12-310001479094us-gaap:LongTermDebtMemberstag:A150MillionUnsecuredTermLoanAMember2022-12-310001479094stag:A150MillionUnsecuredTermLoanAMember2023-01-012023-12-310001479094us-gaap:LongTermDebtMemberstag:A1875MillionUnsecuredTermLoanHMember2023-12-310001479094us-gaap:LongTermDebtMemberstag:A1875MillionUnsecuredTermLoanHMember2022-12-310001479094us-gaap:LongTermDebtMemberstag:A1875MillionUnsecuredTermLoanHMember2023-01-012023-12-310001479094stag:A1875MillionUnsecuredTermLoanIMemberus-gaap:LongTermDebtMember2023-12-310001479094stag:A1875MillionUnsecuredTermLoanIMemberus-gaap:LongTermDebtMember2022-12-310001479094stag:A1875MillionUnsecuredTermLoanIMemberus-gaap:LongTermDebtMember2023-01-012023-12-310001479094us-gaap:LongTermDebtMember2023-12-310001479094us-gaap:LongTermDebtMember2022-12-310001479094stag:TermLoanMemberus-gaap:LongTermDebtMember2023-12-310001479094stag:TermLoanMemberus-gaap:LongTermDebtMember2022-12-310001479094us-gaap:UnsecuredDebtMemberstag:A100MillionSeriesFUnsecuredNotesMember2023-12-310001479094us-gaap:UnsecuredDebtMemberstag:A100MillionSeriesFUnsecuredNotesMember2022-12-310001479094stag:A100MillionSeriesFUnsecuredNotesMember2023-01-012023-12-310001479094us-gaap:UnsecuredDebtMemberstag:A50MillionSeriesAUnsecuredNotesMember2023-12-310001479094us-gaap:UnsecuredDebtMemberstag:A50MillionSeriesAUnsecuredNotesMember2022-12-310001479094stag:A50MillionSeriesAUnsecuredNotesMember2023-01-012023-12-310001479094stag:A100MillionSeriesDUnsecuredNotesMemberus-gaap:UnsecuredDebtMember2023-12-310001479094stag:A100MillionSeriesDUnsecuredNotesMemberus-gaap:UnsecuredDebtMember2022-12-310001479094stag:A100MillionSeriesDUnsecuredNotesMember2023-01-012023-12-310001479094stag:A75MillionSeriesGUnsecuredNotesMemberus-gaap:UnsecuredDebtMember2023-12-310001479094stag:A75MillionSeriesGUnsecuredNotesMemberus-gaap:UnsecuredDebtMember2022-12-310001479094stag:A75MillionSeriesGUnsecuredNotesMember2023-01-012023-12-310001479094us-gaap:UnsecuredDebtMemberstag:A50MillionSeriesBUnsecuredNotesMember2023-12-310001479094us-gaap:UnsecuredDebtMemberstag:A50MillionSeriesBUnsecuredNotesMember2022-12-310001479094stag:A50MillionSeriesBUnsecuredNotesMember2023-01-012023-12-310001479094stag:A80MillionSeriesCUnsecuredNotesMemberus-gaap:UnsecuredDebtMember2023-12-310001479094stag:A80MillionSeriesCUnsecuredNotesMemberus-gaap:UnsecuredDebtMember2022-12-310001479094stag:A80MillionSeriesCUnsecuredNotesMember2023-01-012023-12-310001479094us-gaap:UnsecuredDebtMemberstag:A20MillionSeriesEUnsecuredNotesMember2023-12-310001479094us-gaap:UnsecuredDebtMemberstag:A20MillionSeriesEUnsecuredNotesMember2022-12-310001479094stag:A20MillionSeriesEUnsecuredNotesMember2023-01-012023-12-310001479094us-gaap:UnsecuredDebtMemberstag:A100MillionSeriesHUnsecuredNotesMember2023-12-310001479094us-gaap:UnsecuredDebtMemberstag:A100MillionSeriesHUnsecuredNotesMember2022-12-310001479094stag:A100MillionSeriesHUnsecuredNotesMember2023-01-012023-12-310001479094us-gaap:UnsecuredDebtMemberstag:A275MillionSeriesIUnsecuredNotesMember2023-12-310001479094us-gaap:UnsecuredDebtMemberstag:A275MillionSeriesIUnsecuredNotesMember2022-12-310001479094stag:A275MillionSeriesIUnsecuredNotesMember2023-01-012023-12-310001479094us-gaap:UnsecuredDebtMemberstag:A400MillionSeriesKUnsecuredNotesMember2023-12-310001479094us-gaap:UnsecuredDebtMemberstag:A400MillionSeriesKUnsecuredNotesMember2022-12-310001479094stag:A400MillionSeriesKUnsecuredNotesMember2023-01-012023-12-310001479094us-gaap:UnsecuredDebtMemberstag:A50MillionSeriesJUnsecuredNotesMember2023-12-310001479094us-gaap:UnsecuredDebtMemberstag:A50MillionSeriesJUnsecuredNotesMember2022-12-310001479094stag:A50MillionSeriesJUnsecuredNotesMember2023-01-012023-12-310001479094us-gaap:UnsecuredDebtMember2023-12-310001479094us-gaap:UnsecuredDebtMember2022-12-310001479094us-gaap:UnsecuredDebtMemberstag:UnsecuredNotesMember2023-12-310001479094us-gaap:UnsecuredDebtMemberstag:UnsecuredNotesMember2022-12-310001479094stag:ThriventFinancialforLutheransDueDecember152023Memberus-gaap:MortgagesMember2023-12-310001479094stag:ThriventFinancialforLutheransDueDecember152023Memberus-gaap:MortgagesMember2022-12-310001479094stag:ThriventFinancialforLutheransDueDecember152023Member2023-01-012023-12-310001479094stag:UnitedOfOmahaLifeInsuranceCompanyMemberus-gaap:MortgagesMember2023-12-310001479094stag:UnitedOfOmahaLifeInsuranceCompanyMemberus-gaap:MortgagesMember2022-12-310001479094stag:UnitedOfOmahaLifeInsuranceCompanyMember2023-01-012023-12-310001479094us-gaap:MortgagesMember2023-12-310001479094us-gaap:MortgagesMember2022-12-310001479094us-gaap:SecuredOvernightFinancingRateSofrOvernightIndexSwapRateMember2023-12-310001479094us-gaap:LineOfCreditMemberus-gaap:SecuredOvernightFinancingRateSofrOvernightIndexSwapRateMember2023-01-012023-12-310001479094stag:TermLoansMemberus-gaap:SecuredOvernightFinancingRateSofrOvernightIndexSwapRateMember2023-01-012023-12-310001479094stag:TermLoansAFGMemberus-gaap:SecuredOvernightFinancingRateSofrOvernightIndexSwapRateMember2023-01-012023-12-310001479094stag:TermLoansHIMembersrt:ScenarioForecastMember2023-01-192024-06-290001479094us-gaap:LongTermDebtMemberstag:A1875MillionUnsecuredTermLoanHMembersrt:ScenarioForecastMember2024-01-120001479094stag:ThriventFinancialforLutheransDueDecember152023Memberus-gaap:MortgagesMember2023-01-012023-12-310001479094us-gaap:LineOfCreditMemberus-gaap:PrepaidExpensesAndOtherCurrentAssetsMember2023-12-310001479094us-gaap:LineOfCreditMemberus-gaap:PrepaidExpensesAndOtherCurrentAssetsMember2022-12-31stag:extention0001479094us-gaap:LineOfCreditMember2023-01-012023-12-310001479094srt:MinimumMember2023-01-012023-12-310001479094srt:MaximumMember2023-01-012023-12-310001479094us-gaap:InterestRateSwapMember2023-12-310001479094us-gaap:AccountsPayableAndAccruedLiabilitiesMember2023-12-310001479094us-gaap:AccountsPayableAndAccruedLiabilitiesMember2022-12-310001479094us-gaap:InterestExpenseMember2023-01-012023-12-310001479094us-gaap:InterestExpenseMember2022-01-012022-12-310001479094us-gaap:InterestExpenseMember2021-01-012021-12-310001479094stag:ThriventFinancialforLutheransDueDecember152023Memberus-gaap:MortgagesMember2023-12-152023-12-150001479094stag:A100MillionSeriesFUnsecuredNotesMember2023-01-052023-01-050001479094stag:TermLoansAFGMembersrt:ScenarioForecastMember2022-10-172024-06-290001479094stag:TermLoansAFGMemberus-gaap:LongTermDebtMember2022-09-012022-09-010001479094stag:TermLoansAFGMemberus-gaap:LongTermDebtMemberus-gaap:SecuredOvernightFinancingRateSofrOvernightIndexSwapRateMember2022-09-012022-09-010001479094us-gaap:LineOfCreditMember2022-09-300001479094us-gaap:LineOfCreditMember2022-07-260001479094us-gaap:LineOfCreditMemberus-gaap:SecuredOvernightFinancingRateSofrOvernightIndexSwapRateMember2022-07-262022-07-260001479094us-gaap:LongTermDebtMemberstag:A1875MillionUnsecuredTermLoanHMember2022-07-260001479094stag:A1875MillionUnsecuredTermLoanIMemberus-gaap:LongTermDebtMember2022-07-260001479094stag:TermLoansHIMemberus-gaap:LongTermDebtMemberus-gaap:SecuredOvernightFinancingRateSofrOvernightIndexSwapRateMember2022-07-262022-07-260001479094us-gaap:LongTermDebtMember2022-07-260001479094us-gaap:LongTermDebtMember2022-01-012022-12-310001479094us-gaap:UnsecuredDebtMemberstag:A400MillionUnsecuredNotesMember2022-04-280001479094us-gaap:UnsecuredDebtMemberstag:CreditFacilityTermLoansandNotesMember2022-04-280001479094us-gaap:UnsecuredDebtMemberstag:CreditFacilityTermLoansandNotesMember2023-12-310001479094us-gaap:LineOfCreditMember2023-12-310001479094us-gaap:LineOfCreditMember2022-12-310001479094us-gaap:LongTermDebtMember2023-12-310001479094us-gaap:LongTermDebtMember2022-12-310001479094us-gaap:UnsecuredDebtMember2023-12-310001479094us-gaap:UnsecuredDebtMember2022-12-310001479094us-gaap:MortgagesMember2023-12-310001479094us-gaap:MortgagesMember2022-12-31stag:interestRateSwaps0001479094us-gaap:InterestRateSwapMember2022-12-310001479094us-gaap:InterestRateSwapMember2023-01-012023-12-310001479094us-gaap:InterestRateSwapMember2022-01-012022-12-310001479094us-gaap:InterestRateSwapMember2021-01-012021-12-310001479094us-gaap:FairValueMeasurementsRecurringMemberus-gaap:InterestRateSwapMember2023-12-310001479094us-gaap:FairValueMeasurementsRecurringMemberus-gaap:InterestRateSwapMemberus-gaap:FairValueInputsLevel1Member2023-12-310001479094us-gaap:FairValueMeasurementsRecurringMemberus-gaap:FairValueInputsLevel2Memberus-gaap:InterestRateSwapMember2023-12-310001479094us-gaap:FairValueMeasurementsRecurringMemberus-gaap:FairValueInputsLevel3Memberus-gaap:InterestRateSwapMember2023-12-310001479094us-gaap:FairValueMeasurementsRecurringMemberus-gaap:InterestRateSwapMember2022-12-310001479094us-gaap:FairValueMeasurementsRecurringMemberus-gaap:InterestRateSwapMemberus-gaap:FairValueInputsLevel1Member2022-12-310001479094us-gaap:FairValueMeasurementsRecurringMemberus-gaap:FairValueInputsLevel2Memberus-gaap:InterestRateSwapMember2022-12-310001479094us-gaap:FairValueMeasurementsRecurringMemberus-gaap:FairValueInputsLevel3Memberus-gaap:InterestRateSwapMember2022-12-310001479094us-gaap:SeriesCPreferredStockMember2023-12-310001479094us-gaap:SeriesCPreferredStockMember2021-03-012021-03-010001479094us-gaap:SeriesCPreferredStockMember2021-03-310001479094stag:AtTheMarketProgram2022750MillionMember2023-12-310001479094us-gaap:CommonStockMemberstag:AtTheMarketProgram2022750MillionMember2023-12-310001479094us-gaap:CommonStockMemberstag:AtTheMarketProgram2022750MillionMember2023-01-012023-12-310001479094us-gaap:CommonStockMemberstag:AtTheMarketProgram2022750MillionMembersrt:WeightedAverageMember2023-12-310001479094us-gaap:CommonStockMemberstag:AtTheMarketProgram2019600MillionMember2022-01-012022-12-310001479094us-gaap:CommonStockMembersrt:WeightedAverageMemberstag:AtTheMarketProgram2019600MillionMember2022-12-310001479094us-gaap:CommonStockMemberstag:AtTheMarketProgramMemberus-gaap:SubsequentEventMember2024-01-090001479094us-gaap:CommonStockMemberstag:AtTheMarketProgramMemberus-gaap:SubsequentEventMember2024-01-092024-01-090001479094us-gaap:CommonStockMemberstag:AtTheMarketProgramMember2023-12-140001479094us-gaap:CommonStockMemberstag:AtTheMarketProgramMember2023-12-142023-12-140001479094us-gaap:CommonStockMemberstag:AtTheMarketProgramJune2023SaleMember2023-06-160001479094us-gaap:CommonStockMemberstag:AtTheMarketProgramJune2023SaleMember2023-06-162023-06-160001479094us-gaap:CommonStockMemberstag:AtTheMarketProgramJune2023SaleMember2023-07-270001479094us-gaap:CommonStockMemberstag:AtTheMarketProgramJune2023SaleMember2023-07-272023-07-270001479094us-gaap:CommonStockMemberstag:AtTheMarketProgramMember2023-05-050001479094us-gaap:CommonStockMemberstag:AtTheMarketProgramMember2023-05-052023-05-050001479094us-gaap:CommonStockMemberstag:AtTheMarketProgramMember2023-07-270001479094us-gaap:CommonStockMemberstag:AtTheMarketProgramMember2023-07-272023-07-2700014790942021-11-030001479094us-gaap:CommonStockMember2021-11-032021-11-030001479094us-gaap:CommonStockMember2021-11-0300014790942021-11-082021-11-080001479094us-gaap:CommonStockMemberus-gaap:OverAllotmentOptionMember2021-12-010001479094us-gaap:CommonStockMemberus-gaap:OverAllotmentOptionMember2021-12-012021-12-0100014790942021-12-272021-12-270001479094us-gaap:CommonStockMember2022-03-290001479094us-gaap:CommonStockMember2022-03-292022-03-290001479094us-gaap:CommonStockMemberstag:AtTheMarketProgramMember2021-04-050001479094us-gaap:CommonStockMemberstag:AtTheMarketProgramMember2021-04-052021-04-050001479094us-gaap:CommonStockMemberstag:AtTheMarketProgramMember2021-09-290001479094us-gaap:CommonStockMemberstag:AtTheMarketProgramMember2021-09-292021-09-290001479094us-gaap:CommonStockMember2021-09-290001479094us-gaap:CommonStockMember2021-09-292021-09-290001479094us-gaap:RestrictedStockMember2022-01-102022-01-100001479094us-gaap:RestrictedStockMember2021-01-072021-01-070001479094us-gaap:RestrictedStockMember2023-01-112023-01-110001479094us-gaap:RestrictedStockMember2020-12-310001479094us-gaap:RestrictedStockMember2021-01-012021-12-310001479094us-gaap:RestrictedStockMember2021-12-310001479094us-gaap:RestrictedStockMember2022-01-012022-12-310001479094us-gaap:RestrictedStockMember2022-12-310001479094us-gaap:RestrictedStockMember2023-01-012023-12-310001479094us-gaap:RestrictedStockMember2023-12-310001479094us-gaap:NoncontrollingInterestMemberstag:LongTermIncentivePlanUnitsMember2020-12-310001479094us-gaap:NoncontrollingInterestMemberstag:OtherNoncontrollingCommonUnitsMember2020-12-310001479094stag:LimitedPartnerNoncontrollingInterestMember2020-12-310001479094us-gaap:NoncontrollingInterestMemberstag:LongTermIncentivePlanUnitsMember2021-01-012021-12-310001479094us-gaap:NoncontrollingInterestMemberstag:OtherNoncontrollingCommonUnitsMember2021-01-012021-12-310001479094us-gaap:NoncontrollingInterestMemberstag:LongTermIncentivePlanUnitsMember2021-12-310001479094us-gaap:NoncontrollingInterestMemberstag:OtherNoncontrollingCommonUnitsMember2021-12-310001479094stag:LimitedPartnerNoncontrollingInterestMember2021-12-310001479094us-gaap:NoncontrollingInterestMemberstag:LongTermIncentivePlanUnitsMember2022-01-012022-12-310001479094us-gaap:NoncontrollingInterestMemberstag:OtherNoncontrollingCommonUnitsMember2022-01-012022-12-310001479094us-gaap:NoncontrollingInterestMemberstag:LongTermIncentivePlanUnitsMember2022-12-310001479094us-gaap:NoncontrollingInterestMemberstag:OtherNoncontrollingCommonUnitsMember2022-12-310001479094stag:LimitedPartnerNoncontrollingInterestMember2022-12-310001479094us-gaap:NoncontrollingInterestMemberstag:LongTermIncentivePlanUnitsMember2023-01-012023-12-310001479094us-gaap:NoncontrollingInterestMemberstag:OtherNoncontrollingCommonUnitsMember2023-01-012023-12-310001479094us-gaap:NoncontrollingInterestMemberstag:LongTermIncentivePlanUnitsMember2023-12-310001479094us-gaap:NoncontrollingInterestMemberstag:OtherNoncontrollingCommonUnitsMember2023-12-310001479094stag:LimitedPartnerNoncontrollingInterestMember2023-12-310001479094stag:LongTermIncentivePlanUnitsMember2023-01-012023-12-310001479094us-gaap:ShareBasedCompensationAwardTrancheOneMemberstag:LongTermIncentivePlanUnitsMember2022-01-102022-01-100001479094us-gaap:ShareBasedCompensationAwardTrancheOneMemberstag:LongTermIncentivePlanUnitsMember2023-01-112023-01-110001479094us-gaap:ShareBasedCompensationAwardTrancheOneMemberstag:LongTermIncentivePlanUnitsMember2021-01-072021-01-070001479094us-gaap:ShareBasedCompensationAwardTrancheOneMemberstag:LongTermIncentivePlanUnitsMember2023-03-312023-03-310001479094srt:ExecutiveVicePresidentMemberstag:LongTermIncentivePlanUnitsMember2023-03-312023-03-310001479094srt:ExecutiveVicePresidentMemberus-gaap:ShareBasedCompensationAwardTrancheOneMemberstag:LongTermIncentivePlanUnitsMember2023-03-312023-03-310001479094srt:ExecutiveVicePresidentMemberstag:LongTermIncentivePlanUnitsMember2021-01-012021-12-310001479094srt:ExecutiveVicePresidentMember2021-01-012021-12-310001479094us-gaap:CommonStockMembersrt:ExecutiveVicePresidentMember2021-10-152021-10-150001479094stag:LongTermIncentivePlanUnitsMember2023-03-312023-03-310001479094stag:LongTermIncentivePlanUnitsMember2023-01-112023-01-110001479094stag:LongTermIncentivePlanUnitsMember2022-01-102022-01-100001479094stag:LongTermIncentivePlanUnitsMember2021-01-072021-01-070001479094stag:LongTermIncentivePlanUnitsMember2020-12-310001479094stag:LongTermIncentivePlanUnitsMember2021-01-012021-12-310001479094stag:LongTermIncentivePlanUnitsMember2021-12-310001479094stag:LongTermIncentivePlanUnitsMember2022-01-012022-12-310001479094stag:LongTermIncentivePlanUnitsMember2022-12-310001479094stag:LongTermIncentivePlanUnitsMember2023-01-012023-06-300001479094stag:LongTermIncentivePlanUnitsMember2023-12-310001479094stag:OtherNoncontrollingCommonUnitsMember2023-01-012023-12-310001479094us-gaap:ShareBasedCompensationAwardTrancheOneMembersrt:DirectorMemberstag:LongTermIncentivePlanUnitsMember2021-01-072021-01-070001479094us-gaap:ShareBasedCompensationAwardTrancheOneMembersrt:DirectorMemberstag:LongTermIncentivePlanUnitsMember2022-01-102022-01-100001479094us-gaap:ShareBasedCompensationAwardTrancheOneMembersrt:DirectorMemberstag:LongTermIncentivePlanUnitsMember2023-01-112023-01-110001479094stag:EquityIncentivePlan2011Member2023-12-310001479094stag:EquityIncentivePlan2011Memberstag:LongTermIncentivePlanUnitsMember2023-01-012023-12-310001479094stag:EquityIncentivePlan2011Member2023-01-012023-12-310001479094us-gaap:PerformanceSharesMemberstag:EquityIncentivePlan2011Membersrt:MinimumMember2023-01-012023-12-310001479094us-gaap:PerformanceSharesMemberstag:EquityIncentivePlan2011Membersrt:MaximumMember2023-01-012023-12-310001479094us-gaap:PerformanceSharesMemberstag:EquityIncentivePlan2011Member2023-01-012023-12-31stag:benchmark0001479094stag:PerformanceSharesGratedIn2023Memberstag:EquityIncentivePlan2011Member2023-01-012023-12-310001479094us-gaap:PerformanceSharesMembersrt:ExecutiveVicePresidentMember2023-03-312023-03-310001479094us-gaap:PerformanceSharesMember2023-03-312023-03-310001479094us-gaap:PerformanceSharesMember2023-01-112023-01-110001479094us-gaap:PerformanceSharesMember2022-01-102022-01-100001479094us-gaap:PerformanceSharesMember2021-01-072021-01-070001479094stag:PerformanceUnitsGrantedIn2021Memberus-gaap:SubsequentEventMemberstag:LongTermIncentivePlanUnitsMember2024-01-082024-01-080001479094stag:PerformanceUnitsGrantedIn2020Memberstag:LongTermIncentivePlanUnitsMember2023-01-112023-01-110001479094stag:PerformanceUnitsGrantedIn2019Memberstag:LongTermIncentivePlanUnitsMember2022-01-102022-01-100001479094us-gaap:CommonStockMemberstag:PerformanceUnitsGrantedIn2021Memberus-gaap:SubsequentEventMember2024-01-082024-01-080001479094stag:PerformanceUnitsGrantedIn2020Memberus-gaap:CommonStockMember2023-01-112023-01-110001479094us-gaap:CommonStockMemberstag:PerformanceUnitsGrantedIn2019Member2022-01-102022-01-100001479094us-gaap:PerformanceSharesMember2023-12-310001479094us-gaap:PerformanceSharesMember2023-01-012023-12-310001479094stag:EquityIncentivePlan2011Member2022-12-310001479094us-gaap:GeneralAndAdministrativeExpenseMemberus-gaap:RestrictedStockMember2023-01-012023-12-310001479094us-gaap:GeneralAndAdministrativeExpenseMemberus-gaap:RestrictedStockMember2022-01-012022-12-310001479094us-gaap:GeneralAndAdministrativeExpenseMemberus-gaap:RestrictedStockMember2021-01-012021-12-310001479094us-gaap:GeneralAndAdministrativeExpenseMemberstag:LongTermIncentivePlanUnitsMember2023-01-012023-12-310001479094us-gaap:GeneralAndAdministrativeExpenseMemberstag:LongTermIncentivePlanUnitsMember2022-01-012022-12-310001479094us-gaap:GeneralAndAdministrativeExpenseMemberstag:LongTermIncentivePlanUnitsMember2021-01-012021-12-310001479094us-gaap:PerformanceSharesMemberus-gaap:GeneralAndAdministrativeExpenseMember2023-01-012023-12-310001479094us-gaap:PerformanceSharesMemberus-gaap:GeneralAndAdministrativeExpenseMember2022-01-012022-12-310001479094us-gaap:PerformanceSharesMemberus-gaap:GeneralAndAdministrativeExpenseMember2021-01-012021-12-310001479094us-gaap:GeneralAndAdministrativeExpenseMembersrt:DirectorMember2023-01-012023-12-310001479094us-gaap:GeneralAndAdministrativeExpenseMembersrt:DirectorMember2022-01-012022-12-310001479094us-gaap:GeneralAndAdministrativeExpenseMembersrt:DirectorMember2021-01-012021-12-310001479094us-gaap:GeneralAndAdministrativeExpenseMember2023-01-012023-12-310001479094us-gaap:GeneralAndAdministrativeExpenseMember2022-01-012022-12-310001479094us-gaap:GeneralAndAdministrativeExpenseMember2021-01-012021-12-310001479094us-gaap:CommonStockMembersrt:DirectorMember2023-01-012023-12-310001479094us-gaap:CommonStockMembersrt:DirectorMember2022-01-012022-12-310001479094us-gaap:CommonStockMembersrt:DirectorMember2021-01-012021-12-310001479094us-gaap:PerformanceSharesMemberstag:EquityIncentivePlan2011Memberus-gaap:ShareBasedCompensationAwardTrancheTwoMember2023-01-112023-01-110001479094us-gaap:PerformanceSharesMemberstag:EquityIncentivePlan2011Memberus-gaap:ShareBasedCompensationAwardTrancheTwoMember2021-01-072021-01-070001479094us-gaap:PerformanceSharesMemberstag:EquityIncentivePlan2011Memberus-gaap:ShareBasedCompensationAwardTrancheTwoMember2022-01-102022-01-100001479094us-gaap:AccruedIncomeReceivableMember2023-12-310001479094us-gaap:AccruedIncomeReceivableMember2022-12-310001479094srt:MinimumMember2023-12-310001479094srt:MaximumMember2023-12-310001479094us-gaap:OperatingExpenseMember2023-01-012023-12-310001479094us-gaap:OperatingExpenseMember2022-01-012022-12-310001479094us-gaap:OperatingExpenseMember2021-01-012021-12-310001479094us-gaap:StockCompensationPlanMember2023-01-012023-12-310001479094us-gaap:StockCompensationPlanMember2022-01-012022-12-310001479094us-gaap:StockCompensationPlanMember2021-01-012021-12-310001479094us-gaap:SubsequentEventMemberus-gaap:RestrictedStockMember2024-01-082024-01-080001479094us-gaap:SubsequentEventMembersrt:DirectorMemberstag:LongTermIncentivePlanUnitsMember2024-01-082024-01-080001479094srt:ExecutiveOfficerMemberus-gaap:SubsequentEventMemberstag:LongTermIncentivePlanUnitsMember2024-01-082024-01-080001479094us-gaap:SubsequentEventMemberstag:LongTermIncentivePlanUnitsMember2024-01-082024-01-080001479094us-gaap:PerformanceSharesMemberus-gaap:SubsequentEventMember2024-01-082024-01-080001479094stag:BirminghamAL122820Member2023-12-310001479094stag:BirminghamAL1228202Member2023-12-310001479094stag:BirminghamAL552022Member2023-12-310001479094stag:BirminghamAL1228203Member2023-12-310001479094stag:MontgomeryALQ42016Member2023-12-310001479094stag:MoodyAL08262021Member2023-12-310001479094stag:PhenixCityALQ42012Member2023-12-310001479094stag:AvondaleAZQ42017Member2023-12-310001479094stag:ChandlerAZ121520Member2023-12-310001479094stag:GilbertAZ06142021Member2023-12-310001479094stag:MesaAZ123020Member2023-12-310001479094stag:TucsonAZ121318Member2023-12-310001479094stag:BryantAR3121Member2023-12-310001479094stag:RogersARQ42011Member2023-12-310001479094stag:FresnoCA7252022Member2023-12-310001479094stag:HollisterCA672022Member2023-12-310001479094stag:LodiCA102320Member2023-12-310001479094stag:MenifeeCA92523Member2023-12-310001479094stag:MenifeeCA925232Member2023-12-310001479094stag:McClellanCA2620Member2023-12-310001479094stag:MorganHillCA10122021Member2023-12-310001479094stag:MorganHillCA08092021Member2023-12-310001479094stag:RanchoCordovaCA123020Member2023-12-310001479094stag:RanchoCordovaCA61120Member2023-12-310001479094stag:RosevilleCA08302021Member2023-12-310001479094stag:SacramentoCA102920Member2023-12-310001479094stag:SacramentoCA22521Member2023-12-310001479094stag:SacramentoCA10252021Member2023-12-310001479094stag:SacramentoCA12012021Member2023-12-310001479094stag:SacramentoCA122120216Member2023-12-310001479094stag:SacramentoCA122120217Member2023-12-310001479094stag:SacramentoCA80723Member2023-12-310001479094stag:SacramentoCA123019Member2023-12-310001479094stag:SanDiegoCAQ22017Member2023-12-310001479094stag:StocktonCA112320Member2023-12-310001479094stag:StocktonCA06302021Member2023-12-310001479094stag:StocktonCA1123202Member2023-12-310001479094stag:WestSacramentoCA12222021Member2023-12-310001479094stag:GrandJunctionCOQ32015Member2023-12-310001479094stag:JohnstownCO121819Member2023-12-310001479094stag:LongmontCOQ22018Member2023-12-310001479094stag:LovelandCO09242021Member2023-12-310001479094stag:LovelandCO092420212Member2023-12-310001479094stag:EastWindsorQ42016Member2023-12-310001479094stag:EastWindsorCTQ12012Member2023-12-310001479094stag:MilfordCT122320212Member2023-12-310001479094stag:MilfordCTQ12017Member2023-12-310001479094stag:NorthHavenCTQ12015Member2023-12-310001479094stag:WallingfordCTQ22017Member2023-12-310001479094stag:NewCastleDEQ32016Member2023-12-310001479094stag:DaytonaBeachFLQ12007Member2023-12-310001479094stag:FortMyersFL123020Member2023-12-310001479094stag:GibsontonFL83023Member2023-12-310001479094stag:GibsontonFL830232Member2023-12-310001479094stag:Jacksonville1FLQ12017Member2023-12-310001479094stag:Jacksonville2FLQ12017Member2023-12-310001479094stag:Jacksonville3FLQ12017Member2023-12-310001479094stag:Jacksonville4FLQ12017Member2023-12-310001479094stag:JacksonvilleFL101519Member2023-12-310001479094stag:LakeWorthFL123020Member2023-12-310001479094stag:LakeWorthFL1230202Member2023-12-310001479094stag:LakeWorthFL1230203Member2023-12-310001479094stag:LakelandFL123020Member2023-12-310001479094stag:OrlandoFLQ42013Member2023-12-310001479094stag:OrlandoFLQ22012Member2023-12-310001479094stag:TampaFL8519Member2023-12-310001479094stag:WestPlamBeachFL123020Member2023-12-310001479094stag:AtlantaGA7152022Member2023-12-310001479094stag:AugustaRichmondCountyGAQ32018Member2023-12-310001479094stag:BufordGA12312021Member2023-12-310001479094stag:CalhounGAQ22014Member2023-12-310001479094stag:DallasGAQ32012Member2023-12-310001479094stag:ForestPark2GAQ32016Member2023-12-310001479094stag:LithoniaGA412022Member2023-12-310001479094stag:NorcrossGAQ22016Member2023-12-310001479094stag:SavannahGAQ22014Member2023-12-310001479094stag:ShannonGAQ42013Member2023-12-310001479094stag:SmyrnaGAQ42012Member2023-12-310001479094stag:StathamGAQ42012Member2023-12-310001479094stag:StoneMountainGAQ32017Member2023-12-310001479094stag:IdahoFallsIDQ22013Member2023-12-310001479094stag:BartlettIL07202021Member2023-12-310001479094stag:BataviaIL122220Member2023-12-310001479094stag:BataviaIL10132021Member2023-12-310001479094stag:BataviaILQ22017Member2023-12-310001479094stag:BelvidereILQ22017Member2023-12-310001479094stag:BelvidereILQ22013ThreeMember2023-12-310001479094stag:BelvidereILQ22013FourMember2023-12-310001479094stag:BelvidereILQ22013FiveMember2023-12-310001479094stag:BelvidereILQ22013SixMember2023-12-310001479094stag:BelvidereILQ22013EightMember2023-12-310001479094stag:BelvidereILQ22013NineMember2023-12-310001479094stag:CaryIL122220Member2023-12-310001479094stag:CrystalLakeIL09162021Member2023-12-310001479094stag:CrystalLakeIL091620212Member2023-12-310001479094stag:CrystalLakeIL091620213Member2023-12-310001479094stag:CrystalLakeIL091620214Member2023-12-310001479094stag:ElginIL11122021Member2023-12-310001479094stag:ElginIL111220212Member2023-12-310001479094stag:ElginIL111220213Member2023-12-310001479094stag:ElmhurstIL1312022Member2023-12-310001479094stag:GurneeILQ42014Member2023-12-310001479094stag:HarvardILQ42013Member2023-12-310001479094stag:HodgkinsIL122820Member2023-12-310001479094stag:HodgkinsIL09292021Member2023-12-310001479094stag:ItascaIL07192021Member2023-12-310001479094stag:ItascaIL071920212Member2023-12-310001479094stag:ItascaILQ42016Member2023-12-310001479094stag:LisleIL101019Member2023-12-310001479094stag:MachesneyParkILQ22015Member2023-12-310001479094stag:McHenryILQ22018Member2023-12-310001479094stag:McHenryIL2Q22018Member2023-12-310001479094stag:ChicagoILQ320182Member2023-12-310001479094stag:MontgomeryILQ42012Member2023-12-310001479094stag:SaintCharlesIL122921Member2023-12-310001479094stag:SaintCharlesIL122822Member2023-12-310001479094stag:SaukVillageILQ42013Member2023-12-310001479094stag:SchaumburgIL62920Member2023-12-310001479094stag:VernonHillsIL09022021Member2023-12-310001479094stag:Waukegan1ILQ22017Member2023-12-310001479094stag:WestChicago1ILQ42016Member2023-12-310001479094stag:WestChicago2ILQ42016Member2023-12-310001479094stag:WestChicago3ILQ42016Member2023-12-310001479094stag:WestChicago4ILQ42016Member2023-12-310001479094stag:WestChicago5ILQ42016MemberMember2023-12-310001479094stag:WestChicagoIL8102023Member2023-12-310001479094stag:WestChicagoILQ22016Member2023-12-310001479094stag:WestDundeeIL11122021Member2023-12-310001479094stag:WoodDaleILQ42016Member2023-12-310001479094stag:AlbionINQ32006FourMember2023-12-310001479094stag:ElkhartINQ32007OneMember2023-12-310001479094stag:ElkhartINQ32007TwoMember2023-12-310001479094stag:FortWayneINQ42014Member2023-12-310001479094stag:GoshenINQ32011Member2023-12-310001479094stag:GreenwoodIN05172021Member2023-12-310001479094stag:IndianapolisIN08262021Member2023-12-310001479094stag:JeffersonvilleIN9212022Member2023-12-310001479094stag:LafayetteINQ42012OneMember2023-12-310001479094stag:LafayetteINQ42012TwoMember2023-12-310001479094stag:LafayetteINQ42012ThreeMember2023-12-310001479094stag:LebanonINQ32018Member2023-12-310001479094stag:LebanonIN121919Member2023-12-310001479094stag:LebanonIN101819Member2023-12-310001479094stag:MarionINQ42012Member2023-12-310001479094stag:PortageIN11719Member2023-12-310001479094stag:PortageINQ42012Member2023-12-310001479094stag:SouthBendINQ12012Member2023-12-310001479094stag:WhitestownIN9182023Member2023-12-310001479094stag:YoderIN102820Member2023-12-310001479094stag:AnkenyIA121919Member2023-12-310001479094stag:AnkenyIA120920212Member2023-12-310001479094stag:CouncilBluffsIAQ42017Member2023-12-310001479094stag:DesMoinesIA12232021Member2023-12-310001479094stag:DesMoinesIAQ32018Member2023-12-310001479094stag:MarionIAQ12013Member2023-12-310001479094stag:EdwardsvilleKSQ22017Member2023-12-310001479094stag:LenexaKS71019Member2023-12-310001479094stag:LenexaKSQ32014Member2023-12-310001479094stag:OlatheKS123119Member2023-12-310001479094stag:OlatheKSQ42016Member2023-12-310001479094stag:WichitaKSQ420121Member2023-12-310001479094stag:WichitaKSQ420122Member2023-12-310001479094stag:WichitaKSQ420124Member2023-12-310001479094stag:BardstownKYQ22007Member2023-12-310001479094stag:DanvilleKYQ42007Member2023-12-310001479094stag:ErlangerKYQ12016Member2023-12-310001479094stag:FlorenceKY12419Member2023-12-310001479094stag:FlorenceKYQ22018Member2023-12-310001479094stag:HebronKYQ22014Member2023-12-310001479094stag:BatonRougeLA61819Member2023-12-310001479094stag:BatonRougeLA618192Member2023-12-310001479094stag:BatonRougeLAQ22018Member2023-12-310001479094stag:ShreveportLAQ42015Member2023-12-310001479094stag:BiddefordMEQ12016Member2023-12-310001479094stag:GardinerMEQ32016Member2023-12-310001479094stag:LewistonMEQ42007Member2023-12-310001479094stag:PortlandMEQ120122Member2023-12-310001479094stag:ElkridgeMD32819Member2023-12-310001479094stag:HagerstownMD1228212Member2023-12-310001479094stag:HagerstownMD1228213Member2023-12-310001479094stag:HagerstownMD06302021Member2023-12-310001479094stag:HampsteadMDQ32013Member2023-12-310001479094stag:HuntValleyMD05172021Member2023-12-310001479094stag:WhiteMarshMD102318Member2023-12-310001479094stag:ChicopeeMAQ42012Member2023-12-310001479094stag:HudsonMA09292021Member2023-12-310001479094stag:MaldenMAQ22007OneMember2023-12-310001479094stag:MaldenMAQ22007TwoMember2023-12-310001479094stag:MiddleboroughMA82219Member2023-12-310001479094stag:NortonMAQ32011Member2023-12-310001479094stag:SouthEastonMAQ42017Member2023-12-310001479094stag:SterlingMA09292021Member2023-12-310001479094stag:StoughtonMAQ22015Member2023-12-310001479094stag:StoughtonMAQ220152Member2023-12-310001479094stag:WestboroughMAQ32016Member2023-12-310001479094stag:BellevilleMIQ32017Member2023-12-310001479094stag:CantonMI11020Member2023-12-310001479094stag:ChesterfieldMIQ22007OneMember2023-12-310001479094stag:ChesterfieldMIQ22007TwoMember2023-12-310001479094stag:ChesterfieldMIQ22007ThreeMember2023-12-310001479094stag:ChesterfieldMIQ22007FourMember2023-12-310001479094stag:GrandRapidsMI102020Member2023-12-310001479094stag:GrandRapidsMI41420221Member2023-12-310001479094stag:GrandRapidsMI41420222Member2023-12-310001479094stag:GrandRapidsMIQ42015Member2023-12-310001479094stag:HollandMIQ42012Member2023-12-310001479094stag:KentwoodMI81919Member2023-12-310001479094stag:KentwoodMI11092021Member2023-12-310001479094stag:KentwoodMIQ22013Member2023-12-310001479094stag:LansingMIQ22011Member2023-12-310001479094stag:LansingMIQ12012Member2023-12-310001479094stag:LansingMIQ42012Member2023-12-310001479094stag:LansingMIQ42013Member2023-12-310001479094stag:LivoniaMI121418Member2023-12-310001479094stag:LivoniaMI2121418Member2023-12-310001479094stag:MarshallMIQ22013Member2023-12-310001479094stag:NoviMIQ42012Member2023-12-310001479094stag:NoviMIQ32015Member2023-12-310001479094stag:NoviMIQ32018Member2023-12-310001479094stag:PlymouthMIQ22015Member2023-12-310001479094stag:RedfordMIQ12017Member2023-12-310001479094stag:RomulusMIQ22018Member2023-12-310001479094stag:RomulusMIQ22017Member2023-12-310001479094stag:SterlingHeightsMIQ42012Member2023-12-310001479094stag:WalkerMIQ42011Member2023-12-310001479094stag:WarrenMIQ12017Member2023-12-310001479094stag:WarrenMI21120Member2023-12-310001479094stag:WarrenMI06012021Member2023-12-310001479094stag:WarrenMIQ32016Member2023-12-310001479094stag:WixomMI11012021Member2023-12-310001479094stag:ZeelandMI4819Member2023-12-310001479094stag:BlaineMN22819Member2023-12-310001479094stag:BloomingtonMNQ12018Member2023-12-310001479094stag:BrooklynParkMNQ42016Member2023-12-310001479094stag:CarlosMNQ12011Member2023-12-310001479094stag:EaganMN11419Member2023-12-310001479094stag:InverGroveHeighMN22421Member2023-12-310001479094stag:MapleGroveMNQ22017Member2023-12-310001479094stag:MapleGroveMN12120Member2023-12-310001479094stag:MendotaHeightsMNQ22018Member2023-12-310001479094stag:NewHopeMNQ32013Member2023-12-310001479094stag:NewportMN122821Member2023-12-310001479094stag:OakdaleMN4219Member2023-12-310001479094stag:MinneapolisStPaulMN102218Member2023-12-310001479094stag:PlymouthMNQ32018Member2023-12-310001479094stag:PlymouthMN102919Member2023-12-310001479094stag:PlymouthMN1029192Member2023-12-310001479094stag:SavageMNQ32014Member2023-12-310001479094stag:ShakopeeMN442022Member2023-12-310001479094stag:ShakopeeMN11519Member2023-12-310001479094stag:StPaulMN11102021Member2023-12-310001479094stag:SouthSaintPaulMAQ22018Member2023-12-310001479094stag:SouthavenMS101920Member2023-12-310001479094stag:BerkeleyMO10122021Member2023-12-310001479094stag:EarthCityMOQ42016Member2023-12-310001479094stag:FentonMO102119Member2023-12-310001479094stag:HazelwoodMOQ32011Member2023-12-310001479094stag:KansasCityMO1062022Member2023-12-310001479094stag:OFallonMOQ32017Member2023-12-310001479094stag:OfallenMOQ32011Member2023-12-310001479094stag:BellevueNE12121Member2023-12-310001479094stag:LaVistaNE12302021Member2023-12-310001479094stag:OmahaNE31119Member2023-12-310001479094stag:OmahaNE91119Member2023-12-310001479094stag:OmahaNE911192Member2023-12-310001479094stag:OmahaNE10062021Member2023-12-310001479094stag:OmahaNE100620212Member2023-12-310001479094stag:FernleyNV6302021Member2023-12-310001479094stag:LasVegasNVQ22018Member2023-12-310001479094stag:LasVegasNVQ32017Member2023-12-310001479094stag:ParadiseNV82719Member2023-12-310001479094stag:ParadiseNV827192Member2023-12-310001479094stag:RenoNVQ32014Member2023-12-310001479094stag:SparksNVQ12017Member2023-12-310001479094stag:SparksNV10192023Member2023-12-310001479094stag:LondonderryNHQ12013Member2023-12-310001479094stag:NashuaNHQ12014Member2023-12-310001479094stag:BranchburgNJ122319Member2023-12-310001479094stag:BurlingtonNJQ120152Member2023-12-310001479094stag:BurlingtonNJQ12015Member2023-12-310001479094stag:FranklinTownshipNJQ12017Member2023-12-310001479094stag:LumbertonNJ8619Member2023-12-310001479094stag:MoorestownNJ61919Member2023-12-310001479094stag:MoorestownNJ619192Member2023-12-310001479094stag:MountLaurelNJ83120Member2023-12-310001479094stag:PedricktownNJQ22017Member2023-12-310001479094stag:PiscatawayNJ4242023Member2023-12-310001479094stag:SwedesboroNJQ32017Member2023-12-310001479094stag:WestamptonNJ11122021Member2023-12-310001479094stag:SantaTeresaNM7262022Member2023-12-310001479094stag:BuffaloNYQ22012Member2023-12-310001479094stag:CheektowagaNYQ32011Member2023-12-310001479094stag:FarmingtonNYQ32007Member2023-12-310001479094stag:GloversvilleNYQ42012OneMember2023-12-310001479094stag:GloversvilleNYQ42012TwoMember2023-12-310001479094stag:GloversvilleNYQ42012FourMember2023-12-310001479094stag:JohnstownNYQ42012TwoMember2023-12-310001479094stag:JohnstownNYQ42012ThreeMember2023-12-310001479094stag:JohnstownNYQ42012FourMember2023-12-310001479094stag:RochesterNY122820Member2023-12-310001479094stag:RochesterNY11020Member2023-12-310001479094stag:RonkonkomaNY22521Member2023-12-310001479094stag:CatawbaNC102720Member2023-12-310001479094stag:CharlotteNCQ42015Member2023-12-310001479094stag:CharlotteNCQ22018Member2023-12-310001479094stag:CharlotteNC92820Member2023-12-310001479094stag:DurhamNCQ42015Member2023-12-310001479094stag:GarnerNC121720Member2023-12-310001479094stag:GreensboroNC5052023Member2023-12-310001479094stag:GreensboroWinstonSalemNC102218Member2023-12-310001479094stag:HuntersvilleNCQ32012Member2023-12-310001479094stag:LexingtonNCQ12011Member2023-12-310001479094stag:MebaneNCQ32012OneMember2023-12-310001479094stag:MebaneNCQ32012TwoMember2023-12-310001479094stag:MebaneNCQ42013Member2023-12-310001479094stag:MocksvilleNC41219Member2023-12-310001479094stag:MooresvilleNCQ32017Member2023-12-310001479094stag:MooresvilleNCQ12011Member2023-12-310001479094stag:MountainHomeNCQ32014Member2023-12-310001479094stag:NewtonNCQ22011Member2023-12-310001479094stag:PinevilleNCQ22012Member2023-12-310001479094stag:RuralHallNCQ32008Member2023-12-310001479094stag:SalisburyNCQ12017Member2023-12-310001479094stag:SmithfieldNCQ42011Member2023-12-310001479094stag:TroutmanNCQ32018Member2023-12-310001479094stag:WinstonSalemNCQ42014Member2023-12-310001479094stag:YoungvilleNCQ32018Member2023-12-310001479094stag:BedfordHeightsOHQ12017Member2023-12-310001479094stag:BoardmanOHQ42007OneMember2023-12-310001479094stag:CanalWinchesterOH81920212Member2023-12-310001479094stag:CanalWinchesterOH8192021Member2023-12-310001479094stag:ColumbusOHQ32017Member2023-12-310001479094stag:ColumbusOH122220Member2023-12-310001479094stag:ColumbusOH2082022Member2023-12-310001479094stag:ColumbusOHQ12014Member2023-12-310001479094stag:DaytonOHQ42015Member2023-12-310001479094stag:EtnaOH102220Member2023-12-310001479094stag:FairbornOHQ22015Member2023-12-310001479094stag:FairfieldOHQ12016Member2023-12-310001479094stag:FairfieldOHQ22018Member2023-12-310001479094stag:GahannaOHQ42011Member2023-12-310001479094stag:GroveportOHQ32017Member2023-12-310001479094stag:HilliardOHQ42017Member2023-12-310001479094stag:MacedoniaOH2082022Member2023-12-310001479094stag:MacedoniaOHQ32015Member2023-12-310001479094stag:MapleHeightsOH31821Member2023-12-310001479094stag:MasonOHQ32014Member2023-12-310001479094stag:NorthJacksonOHQ42013Member2023-12-310001479094stag:NorthJacksonOHQ42011Member2023-12-310001479094stag:OakwoodVillageOHQ22015Member2023-12-310001479094stag:SalemOHQ32006Member2023-12-310001479094stag:SevilleOHQ42011Member2023-12-310001479094stag:StreetsboroOHQ42011Member2023-12-310001479094stag:StrongsvilleOH6172021Member2023-12-310001479094stag:StrongsvilleOHQ12014Member2023-12-310001479094stag:ToledoOHQ42012Member2023-12-310001479094stag:TwinsburgOH92920Member2023-12-310001479094stag:TwinsburgOHQ42007Member2023-12-310001479094stag:WestChesterOHQ42016Member2023-12-310001479094stag:WestJeffersonOH62819Member2023-12-310001479094stag:OklahomaCityOKQ42016Member2023-12-310001479094stag:OklahomaCityOKQ22015Member2023-12-310001479094stag:TulsaOKQ32015Member2023-12-310001479094stag:TulsaOK3920Member2023-12-310001479094stag:BeavertonOR7182023Member2023-12-310001479094stag:BeavertonOR71820232Member2023-12-310001479094stag:SalemORQ420111Member2023-12-310001479094stag:SalemORQ420112Member2023-12-310001479094stag:WilsonvilleOR9122022Member2023-12-310001479094stag:AllentownPA72420232Member2023-12-310001479094stag:AllentownPA72420233Member2023-12-310001479094stag:AllentownPA72420234Member2023-12-310001479094stag:AllentownPAQ12014Member2023-12-310001479094stag:BurgettstownPA22119Member2023-12-310001479094stag:CharleroiPA121118Member2023-12-310001479094stag:ClintonPAQ22017Member2023-12-310001479094stag:ClintonPAQ22018Member2023-12-310001479094stag:ClintonPAQ32018Member2023-12-310001479094stag:ClintonPA9320Member2023-12-310001479094stag:ClintonPA92420Member2023-12-310001479094stag:ClintonPA10120Member2023-12-310001479094stag:ClintonPA4192022Member2023-12-310001479094stag:CroydonPA111918Member2023-12-310001479094stag:ElizabethtownPAQ42014Member2023-12-310001479094stag:ExportPA9619Member2023-12-310001479094stag:HazletonPA12232021Member2023-12-310001479094stag:ImperialPA91619Member2023-12-310001479094stag:KulpsvillePA7242023Member2023-12-310001479094stag:LancasterPAQ42015Member2023-12-310001479094stag:Langhorne1PAQ32016Member2023-12-310001479094stag:Langhorne2PAQ32016Member2023-12-310001479094stag:LanghornePAQ42016Member2023-12-310001479094stag:LanghornePA3920Member2023-12-310001479094stag:LebanonPAQ22017Member2023-12-310001479094stag:MechanicsburgPAQ32014OneMember2023-12-310001479094stag:MechanicsburgPAQ32014TwoMember2023-12-310001479094stag:MechanicsburgPAQ32014ThreeMember2023-12-310001479094stag:MuhlenbergTWPPAQ22012Member2023-12-310001479094stag:NewGalileePA82119Member2023-12-310001479094stag:NewKensingtonPA2Q32018Member2023-12-310001479094stag:NewKingstonPAQ32014Member2023-12-310001479094stag:OharaPAQ42012Member2023-12-310001479094stag:PittstonPAQ32017Member2023-12-310001479094stag:ReadingPAQ22016Member2023-12-310001479094stag:WarrendalePA122018Member2023-12-310001479094stag:YorkPAQ32017Member2023-12-310001479094stag:YorkPAQ12018Member2023-12-310001479094stag:YorkPA3719Member2023-12-310001479094stag:YorkPA11092021Member2023-12-310001479094stag:YorkPA11032021Member2023-12-310001479094stag:ColumbiaSCQ32016Member2023-12-310001479094stag:DuncanSCQ32012OneMember2023-12-310001479094stag:DuncanSCQ32012TwoMember2023-12-310001479094stag:DuncanSC8232021Member2023-12-310001479094stag:EdgefieldSCQ22012Member2023-12-310001479094stag:FountainInnSCQ12018Member2023-12-310001479094stag:FountainInnSCQ42017Member2023-12-310001479094stag:FountainInnSCQ32016Member2023-12-310001479094stag:GaffneySCQ22017Member2023-12-310001479094stag:GooseCreekSC42919Member2023-12-310001479094stag:GreenwoodSCQ42012OneMember2023-12-310001479094stag:GreenwoodSCQ42012TwoMember2023-12-310001479094stag:GreerSCQ22018Member2023-12-310001479094stag:GreerSC12172021Member2023-12-310001479094stag:GreenvilleSC4222022Member2023-12-310001479094stag:GreenvilleSpartanburgSC42220222Member2023-12-310001479094stag:GreerSCQ32015OneMember2023-12-310001479094stag:GreerSCQ32015TwoMember2023-12-310001479094stag:GreerSCQ32015ThreeMember2023-12-310001479094stag:GreerSCQ32015FourMember2023-12-310001479094stag:LaurensSCQ42015Member2023-12-310001479094stag:PiedmontSCQ32015Member2023-12-310001479094stag:PiedmontSCQ320152Member2023-12-310001479094stag:PiedmontSCQ320153Member2023-12-310001479094stag:PiedmontSC11718Member2023-12-310001479094stag:PiedmontSC3719Member2023-12-310001479094stag:PiedmontSC3102022Member2023-12-310001479094stag:PiedmontSC3182022Member2023-12-310001479094stag:RockHillSCQ32016Member2023-12-310001479094stag:RockHIllSCQ22017Member2023-12-310001479094stag:RockHillSC111220Member2023-12-310001479094stag:SimpsonvilleSCQ32012Member2023-12-310001479094stag:SimpsonvilleSCQ320122Member2023-12-310001479094stag:SimpsonvilleSC121718Member2023-12-310001479094stag:SpartanburgSCQ42016Member2023-12-310001479094stag:SpartanburgSCQ42014Member2023-12-310001479094stag:SpartanburgSC425192Member2023-12-310001479094stag:SpartanburgSC42519Member2023-12-310001479094stag:SpartanburgSC12419Member2023-12-310001479094stag:SpartanburgSCQ22012Member2023-12-310001479094stag:SummervilleSC72219Member2023-12-310001479094stag:WellfordSC100520232Member2023-12-310001479094stag:WellfordSC10052023Member2023-12-310001479094stag:WestColumbiaSCQ12013Member2023-12-310001479094stag:WestColumbia1SCQ42016Member2023-12-310001479094stag:WestColumbiaSCQ42017Member2023-12-310001479094stag:WestColumbiaSC83019Member2023-12-310001479094stag:WestColumbiaSC112119Member2023-12-310001479094stag:WestColumbiaSC07272021Member2023-12-310001479094stag:WestColumbia2SCQ42016Member2023-12-310001479094stag:ChattanoogaTNQ32015OneMember2023-12-310001479094stag:ChattanoogaTNQ32015TwoMember2023-12-310001479094stag:ChattanoogaTNQ32015ThreeMember2023-12-310001479094stag:ClevelandTNQ22011Member2023-12-310001479094stag:ClintonTNQ22015Member2023-12-310001479094stag:JacksonTNQ42012Member2023-12-310001479094stag:KnoxvilleTNQ22015Member2023-12-310001479094stag:KnoxvilleTNQ32018Member2023-12-310001479094stag:KnoxvilleTN112119Member2023-12-310001479094stag:LebanonTN82919Member2023-12-310001479094stag:LebanonTN12232021Member2023-12-310001479094stag:LebanonTN8292019Member2023-12-310001479094stag:LoudonTNQ42015Member2023-12-310001479094stag:MadisonTNQ42011Member2023-12-310001479094stag:MascotTNQ12016Member2023-12-310001479094stag:MascotTNQ42013Member2023-12-310001479094stag:MemphisTN3182022Member2023-12-310001479094stag:MemphisTN92619Member2023-12-310001479094stag:MurfreesboroTN3102022Member2023-12-310001479094stag:MurfreesboroTNQ42014Member2023-12-310001479094stag:NashvilleTNQ32013Member2023-12-310001479094stag:VonoreTNQ42011Member2023-12-310001479094stag:ArlingtonTXQ22007Member2023-12-310001479094stag:ArlingtonTXQ22012Member2023-12-310001479094stag:CedarHillTXQ32016Member2023-12-310001479094stag:ConroeTXQ22018Member2023-12-310001479094stag:ElPaso1TXQ42017Member2023-12-310001479094stag:ElPaso2TXQ42017Member2023-12-310001479094stag:ElPasoTXQ32014OneMember2023-12-310001479094stag:ElPasoTXQ32014TwoMember2023-12-310001479094stag:ElPasoTXQ32014ThreeMember2023-12-310001479094stag:ElPasoTXQ32014FourMember2023-12-310001479094stag:ElPasoTXQ22015Member2023-12-310001479094stag:ElPasoTX10082021Member2023-12-310001479094stag:ElPasoTX72620228Member2023-12-310001479094stag:ElPasoTX72620229Member2023-12-310001479094stag:ElPasoTX726202210Member2023-12-310001479094stag:ElPasoTXQ42012Member2023-12-310001479094stag:GarlandTXQ22014Member2023-12-310001479094stag:GrapevineTX101320212Member2023-12-310001479094stag:GrapevineTX10132021Member2023-12-310001479094stag:HoustonTX32819Member2023-12-310001479094stag:HoustonTX42919Member2023-12-310001479094stag:HoustonTX121719Member2023-12-310001479094stag:HoustonTXQ22013Member2023-12-310001479094stag:HoustonTXQ42016Member2023-12-310001479094stag:Houston1TXQ22017Member2023-12-310001479094stag:Houston2TXQ22017Member2023-12-310001479094stag:Houston3TXQ22017Member2023-12-310001479094stag:HoustonTXQ120182Member2023-12-310001479094stag:WestHoustonTX12519Member2023-12-310001479094stag:HumbleTX32819Member2023-12-310001479094stag:IrvingTX9292023Member2023-12-310001479094stag:KatyTX72219Member2023-12-310001479094stag:KatyTX81919Member2023-12-310001479094stag:LaredoTXQ22019Member2023-12-310001479094stag:LaredoTX6617Member2023-12-310001479094stag:McAllenTX122920Member2023-12-310001479094stag:MissionTXQ32018Member2023-12-310001479094stag:RockwallTXQ22017Member2023-12-310001479094stag:StaffordTXQ42017Member2023-12-310001479094stag:WacoTXQ22011Member2023-12-310001479094stag:ProvoUT08192021Member2023-12-310001479094stag:ChesterVAQ32014Member2023-12-310001479094stag:FredericksburgVA6292022Member2023-12-310001479094stag:HarrisonburgVAQ42012Member2023-12-310001479094stag:IndependenceVAQ42012Member2023-12-310001479094stag:NorfolkVA6292022Member2023-12-310001479094stag:N.ChesterfieldVA51619Member2023-12-310001479094stag:RichmondVA2620Member2023-12-310001479094stag:RidgefieldWA101019Member2023-12-310001479094stag:AppletonWI06072021Member2023-12-310001479094stag:CaledoniaWIQ22018Member2023-12-310001479094stag:CudahyWI10920Member2023-12-310001479094stag:DePereWIQ32012Member2023-12-310001479094stag:DeforestWIQ42016Member2023-12-310001479094stag:DelavanWI81619Member2023-12-310001479094stag:DelavanWI816192Member2023-12-310001479094stag:EastTroyWIQ22014Member2023-12-310001479094stag:ElkhornWI111219Member2023-12-310001479094stag:ElkhornWI81619Member2023-12-310001479094stag:FranklinWI09282021Member2023-12-310001479094stag:GermantownWIQ32018Member2023-12-310001479094stag:GermantownWIQ320182Member2023-12-310001479094stag:GermantownWI123183Member2023-12-310001479094stag:GermantownWIQ42014Member2023-12-310001479094stag:HartlandWIQ42016Member2023-12-310001479094stag:HudsonWI2620Member2023-12-310001479094stag:JanesvilleWIQ42013Member2023-12-310001479094stag:KenoshaWIQ42016Member2023-12-310001479094stag:Madison1WIQ42017Member2023-12-310001479094stag:Madison2WIQ42017Member2023-12-310001479094stag:MayvilleWIQ32007Member2023-12-310001479094stag:MukwonagoWI09162021Member2023-12-310001479094stag:MuskegoWI2720Member2023-12-310001479094stag:NewBerlinWI121619Member2023-12-310001479094stag:NewBerlinWI12172021Member2023-12-310001479094stag:NewBerlinWIQ32013Member2023-12-310001479094stag:OakCreekWI121918Member2023-12-310001479094stag:OakCreekWI2Q32018Member2023-12-310001479094stag:PewaukeeWI121818Member2023-12-310001479094stag:PewaukeeWI1218182Member2023-12-310001479094stag:PleasantPrairieWI121918Member2023-12-310001479094stag:PleasantPrairieWIQ32018Member2023-12-310001479094stag:SunPrairieWIQ32011Member2023-12-310001479094stag:WestAllisWIQ420151Member2023-12-310001479094stag:WestAllisWIQ420152Member2023-12-310001479094stag:WestAllisWIQ420153Member2023-12-310001479094stag:WestAllisWIQ420154Member2023-12-310001479094stag:YorkvilleWIQ42014Member2023-12-31
UNITED STATES
SECURITIES AND EXCHANGE COMMISSION
Washington, D.C. 20549
FORM 10-K
|
|
|
|
|
|
| ☒ |
ANNUAL REPORT PURSUANT TO SECTION 13 OR 15(d) OF THE SECURITIES EXCHANGE ACT OF 1934 |
For the fiscal year ended December 31, 2023
OR
|
|
|
|
|
|
| ☐ |
TRANSITION REPORT PURSUANT TO SECTION 13 OR 15(d) OF THE SECURITIES EXCHANGE ACT OF 1934 |
For the transition period from to .
Commission file number 1-34907
STAG INDUSTRIAL, INC.
(Exact name of registrant as specified in its charter)
|
|
|
|
|
|
|
|
|
|
|
|
| Maryland |
|
27-3099608 |
| (State or other jurisdiction of |
|
(IRS Employer Identification No.) |
| incorporation or organization) |
|
|
|
|
|
|
One Federal Street
|
|
|
| 23rd Floor |
|
|
| Boston, |
Massachusetts |
|
02110 |
| (Address of principal executive offices) |
|
(Zip code) |
(617) 574-4777
(Registrant’s telephone number, including area code)
Not Applicable
(Former name, former address and former fiscal year, if changed since last report)
Securities registered pursuant to Section 12(b) of the Act:
|
|
|
|
|
|
|
|
|
| Title of each class |
Trading symbol(s) |
Name of each exchange on which registered |
| Common Stock, $0.01 par value |
STAG |
New York Stock Exchange |
Securities registered pursuant to Section 12(g) of the Act: None
Indicate by check mark if the registrant is a well-known seasoned issuer, as defined in Rule 405 of the Securities Act. Yes ☒ No ☐
Indicate by check mark if the registrant is not required to file reports pursuant to Section 13 or Section 15(d) of the Exchange Act. Yes ☐ No ☒
Indicate by check mark whether the registrant (1) has filed all reports required to be filed by Section 13 or 15(d) of the Securities Exchange Act of 1934 during the preceding 12 months (or for such shorter period that the registrant was required to file such reports), and (2) has been subject to such filing requirements for the past 90 days. Yes ☒ No ☐
Indicate by check mark whether the registrant has submitted electronically every Interactive Data File required to be submitted pursuant to Rule 405 of Regulation S-T (§232.405 of this chapter) during the preceding 12 months (or for such shorter period that the registrant was required to submit such files). Yes ☒ No ☐
Indicate by check mark whether the registrant is a large accelerated filer, an accelerated filer, a non-accelerated filer, a smaller reporting company, or an emerging growth company. See the definitions of “large accelerated filer,” “accelerated filer,” “smaller reporting company,” and “emerging growth company” in Rule 12b-2 of the Exchange Act.
Large accelerated filer ☒ Accelerated filer ☐ Non-accelerated filer ☐ Smaller reporting company ☐ Emerging growth company ☐
If an emerging growth company, indicate by check mark if the registrant has elected not to use the extended transition period for complying with any new or revised financial accounting standards provided pursuant to Section 13(a) of the Exchange Act. ☐
Indicate by check mark whether the registrant has filed a report on and attestation to its management’s assessment of the effectiveness of its internal control over financial reporting under Section 404(b) of the Sarbanes-Oxley Act (15 U.S.C.7262(b)) by the registered public accounting firm that prepared or issued its audit report. ☒
If securities are registered pursuant to Section 12(b) of the Act, indicate by check mark whether the financial statements of the registrant included in the filing reflect the correction of an error to previously issued financial statements. ☐
Indicate by check mark whether any of those error corrections are restatements that required a recovery analysis of incentive-based compensation received by any of the registrant’s executive officers during the relevant recovery period pursuant to §240.10D-1(b). ☐
Indicate by check mark whether the registrant is a shell company (as defined in Rule 12b-2 of the Exchange Act). Yes ☐ No ☒
The aggregate market value of the voting and non-voting common equity held by non-affiliates of the registrant was approximately $6,437 million based on the closing price on the New York Stock Exchange as of June 30, 2023.
Number of shares of the registrant’s common stock outstanding as of February 12, 2024: 181,783,304
DOCUMENTS INCORPORATED BY REFERENCE
Portions of the registrant’s definitive Proxy Statement with respect to its 2024 Annual Meeting of Stockholders to be filed not later than 120 days after the end of the registrant’s fiscal year are incorporated by reference into Part II, Item 5 and Part III, Items 10, 11, 12, 13 and 14 hereof as noted therein.
STAG INDUSTRIAL, INC.
Table of Contents
PART I.
Introduction
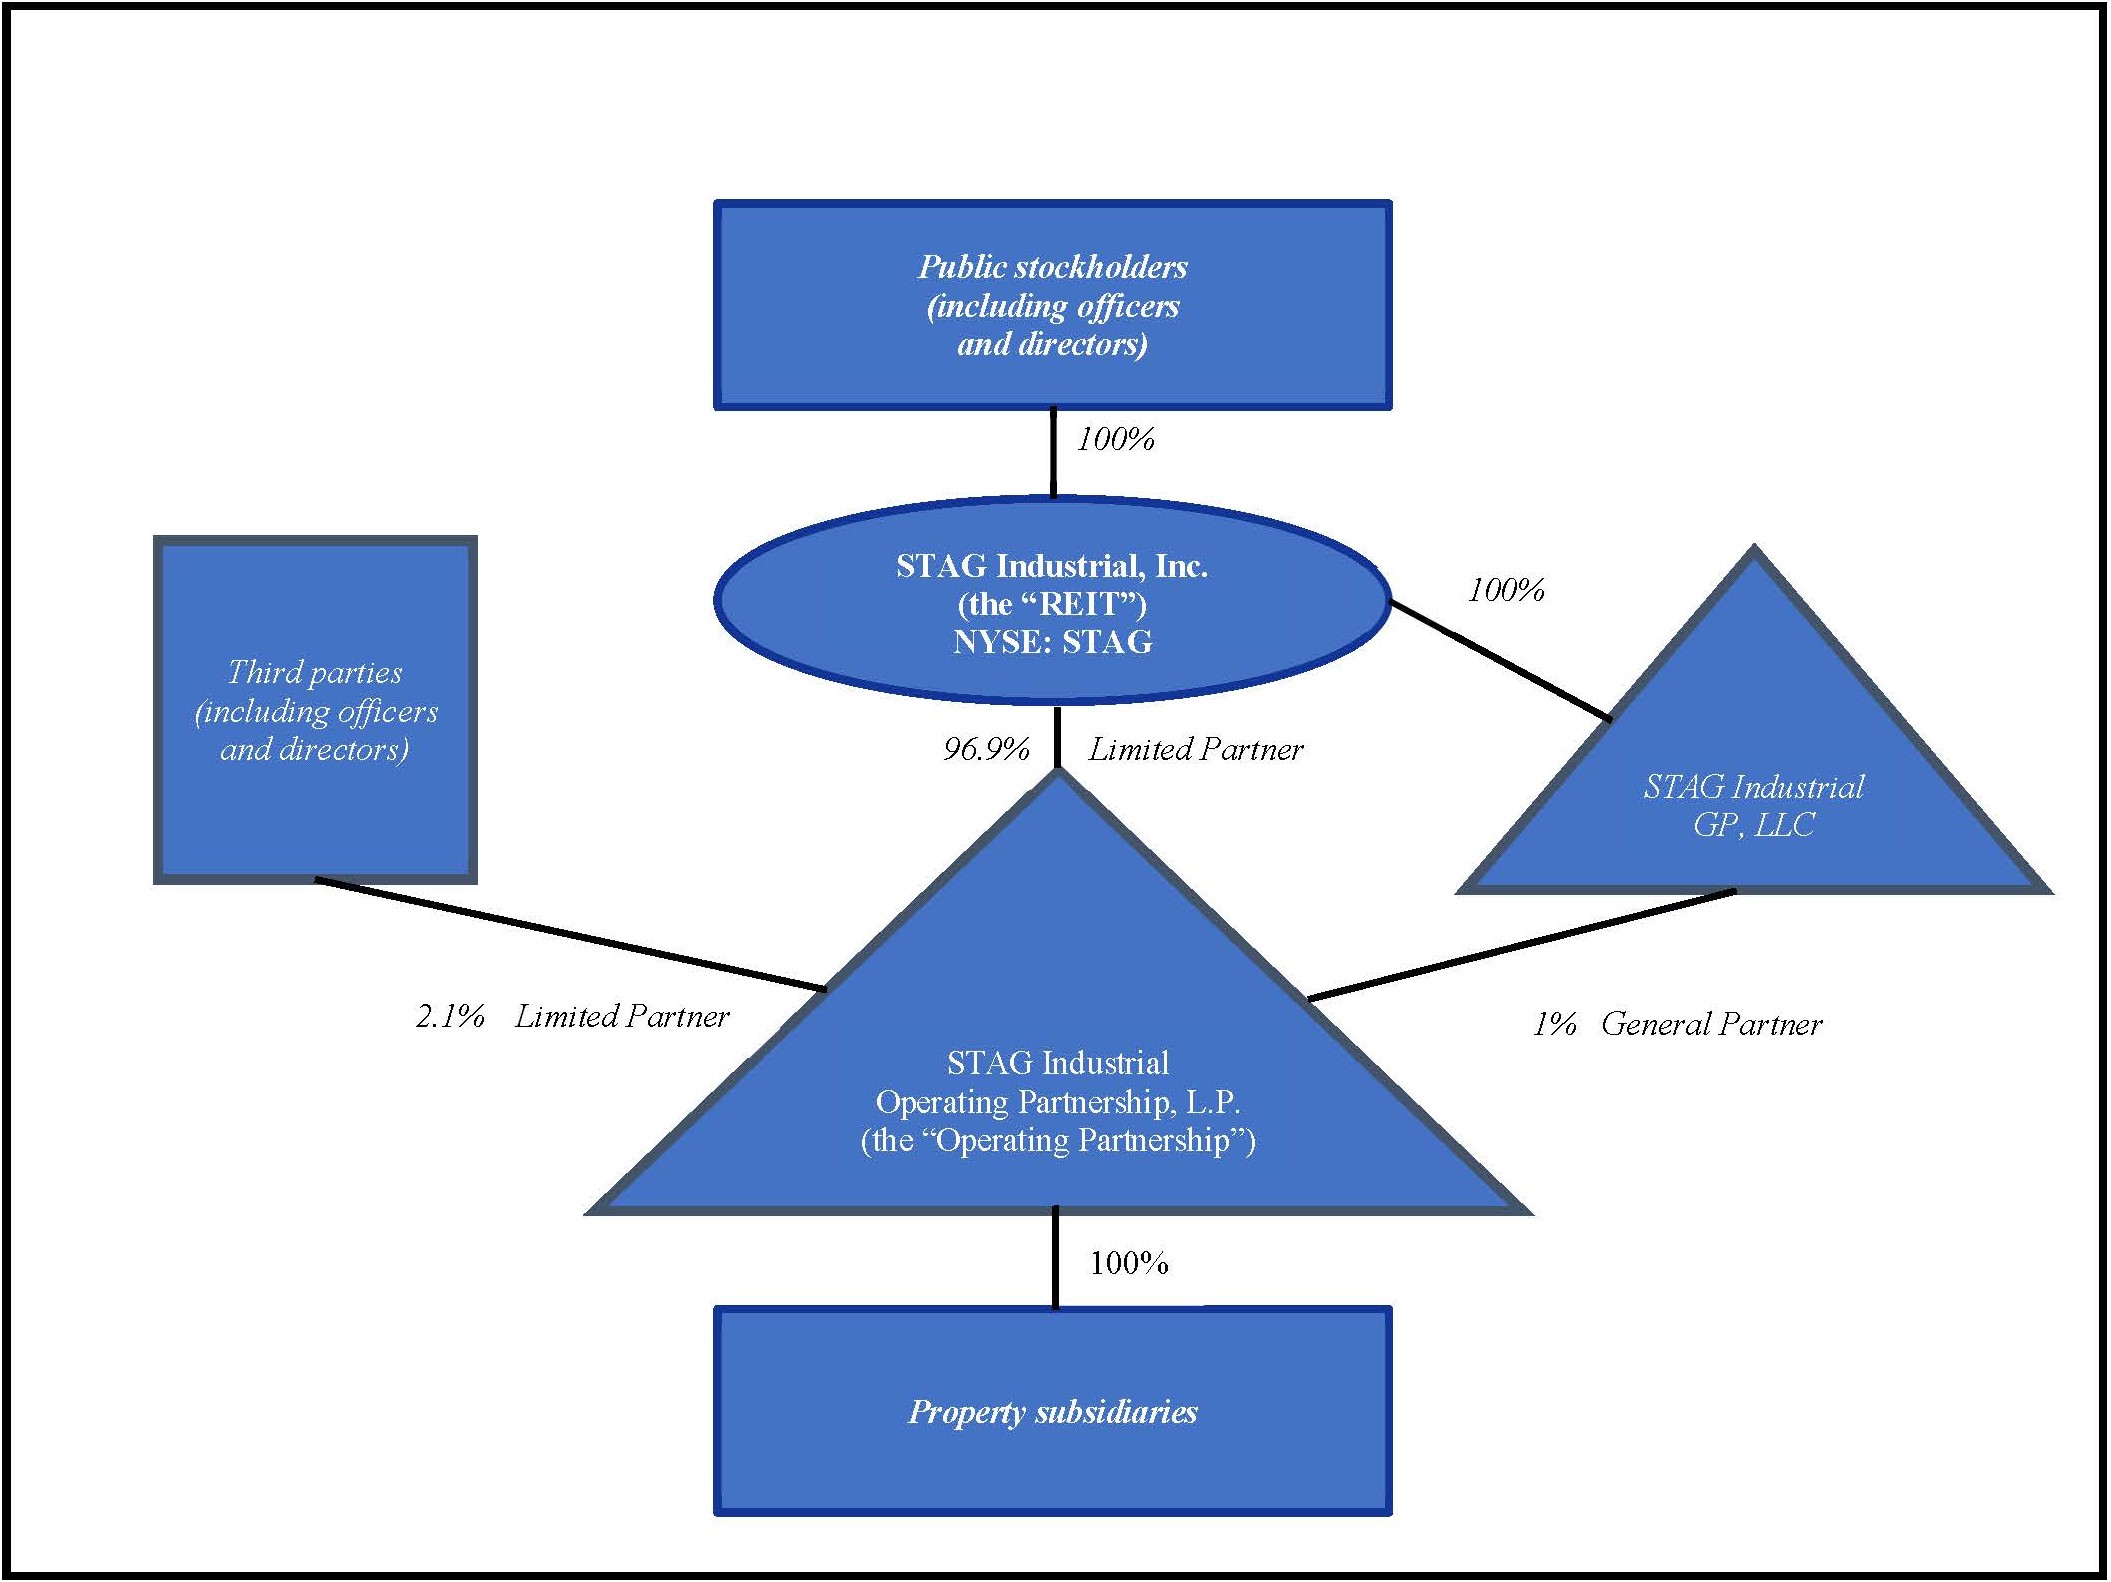
As used herein, except where the context otherwise requires, “Company,” “we,” “our” and “us,” refer to STAG Industrial, Inc. and our consolidated subsidiaries and partnerships, including our operating partnership, STAG Industrial Operating Partnership, L.P. (our “Operating Partnership”).
Forward-Looking Statements
This report, including the information incorporated by reference, contains “forward-looking statements” within the meaning of the safe harbor from civil liability provided for such statements by the Private Securities Litigation Reform Act of 1995 (set forth in Section 27A of the Securities Act of 1933, as amended (the “Securities Act”), and Section 21E of the Securities Exchange Act of 1934, as amended (the “Exchange Act”)). You can identify forward-looking statements by the use of words such as “anticipates,” “believes,” “estimates,” “expects,” “intends,” “may,” “plans,” “projects,” “seeks,” “should,” “will,” and variations of such words or similar expressions. Forward-looking statements in this report include, among others, statements about our future financial condition, results of operations, capitalization rates on future acquisitions, our business strategy and objectives, including our acquisition strategy, occupancy and leasing rates and trends, and expected liquidity needs and sources (including capital expenditures and the ability to obtain financing or raise capital). Our forward-looking statements reflect our current views about our plans, intentions, expectations, strategies and prospects, which are based on the information currently available to us and on assumptions we have made. Although we believe that our plans, intentions, expectations, strategies and prospects as reflected in or suggested by our forward-looking statements are reasonable, we can give no assurance that our plans, intentions, expectations, strategies or prospects will be attained or achieved and you should not place undue reliance on these forward-looking statements. Furthermore, actual results may differ materially from those described in the forward-looking statements and may be affected by a variety of risks and factors including, without limitation:
•the factors included in this report, including those set forth under the headings “Business,” “Risk Factors,” and “Management’s Discussion and Analysis of Financial Condition and Results of Operations;”
•the risk of global or national recessions and international, national, regional, and local economic conditions;
•our ability to raise equity capital on attractive terms;
•the competitive environment in which we operate;
•real estate risks, including fluctuations in real estate values, the general economic climate in local markets and competition for tenants in such markets, and the repurposing or redevelopment of retail properties into industrial properties (in part or whole);
•decreased rental rates or increased vacancy rates;
•the general level of interest rates and currencies;
•potential defaults (including bankruptcies or insolvency) on or non-renewal of leases by tenants;
•acquisition risks, including our ability to identify and complete accretive acquisitions and/or failure of such acquisitions to perform in accordance with projections;
•the timing of acquisitions and dispositions;
•technological developments, particularly those affecting supply chains and logistics;
•potential natural disasters, epidemics, pandemics or outbreak of infectious disease, such as the novel coronavirus disease (“COVID-19”), and other potentially catastrophic events such as acts of war and/or terrorism (including Russia’s invasion of Ukraine and the Israel-Hamas war, the risk of such conflicts widening and the related impact on macroeconomic conditions as a result of such conflicts);
•potential changes in the law or governmental regulations and interpretations of those laws and regulations, including changes in real estate and zoning laws or real estate investment trust (“REIT”) or corporate income tax laws, and potential increases in real property tax rates;
•financing risks, including the risks that our cash flows from operations may be insufficient to meet required payments of principal and interest and we may be unable to refinance our existing debt upon maturity or obtain new financing on attractive terms or at all;
•credit risk in the event of non-performance by the counterparties to the interest rate swaps and revolving and unfunded debt;
•how and when pending forward equity sales may settle;
•lack of or insufficient amounts of insurance;
•our ability to maintain our qualification as a REIT;
•our ability to retain key personnel;
•litigation, including costs associated with prosecuting or defending claims and any adverse outcomes; and
•possible environmental liabilities, including costs, fines or penalties that may be incurred due to necessary remediation of contamination of properties presently owned or previously owned by us.
Any forward-looking statement speaks only as of the date on which it is made. New risks and uncertainties arise over time, and it is not possible for us to predict those events or how they may affect us. Except as required by law, we are not obligated to, and do not intend to, update or revise any forward-looking statements, whether as a result of new information, future events or otherwise.
Item 1. Business
Certain Definitions
In this report:
“Cash Rent Change” means the percentage change in the base rent of the lease commenced during the period compared to the base rent of the Comparable Lease for assets included in the Operating Portfolio. The calculation compares the first base rent payment due after the lease commencement date compared to the base rent of the last monthly payment due prior to the termination of the lease, excluding holdover rent. Rent under gross or similar type leases are converted to a net rent based on an estimate of the applicable recoverable expenses.
“Comparable Lease” means a lease in the same space with a similar lease structure as compared to the previous in-place lease, excluding new leases for space that was not occupied under our ownership.
“GAAP” means generally accepted accounting principles in the United States.
“New Lease” means a lease that is signed for an initial term equal to or greater than 12 months for any vacant space, including a lease signed by a new tenant or an existing tenant that is expanding into new (additional) space.
“Occupancy rate” means the percentage of total leasable square footage for which either revenue recognition has commenced in accordance with GAAP or the lease term has commenced as of the close of the reporting period, whichever occurs earlier.
“Operating Portfolio” means all buildings that were acquired stabilized or have achieved Stabilization. The Operating Portfolio excludes non-core flex/office buildings, buildings contained in the Value Add Portfolio, and buildings classified as held for sale.
“Renewal Lease” means a lease signed by an existing tenant to extend the term for 12 months or more, including (i) a renewal of the same space as the current lease at lease expiration, (ii) a renewal of only a portion of the current space at lease expiration, or (iii) an early renewal or workout, which ultimately does extend the original term for 12 months or more.
“SL Rent Change” means the percentage change in the average monthly base rent over the term of the lease that commenced during the period compared to the Comparable Lease for assets included in the Operating Portfolio. Rent under gross or similar type leases are converted to a net rent based on an estimate of the applicable recoverable expenses, and this calculation excludes the impact of any holdover rent.
“Stabilization” for properties under development or being redeveloped means the earlier of achieving 90% occupancy or 12 months after completion. With respect to properties acquired and immediately added to the Value Add Portfolio, (i) if acquired with less than 75% occupancy as of the acquisition date, Stabilization will occur upon the earlier of achieving 90% occupancy or 12 months from the acquisition date; or (ii) if acquired and will be less than 75% occupied due to known move-outs within two years of the acquisition date, Stabilization will occur upon the earlier of achieving 90% occupancy after the known move-outs have occurred or 12 months after the known move-outs have occurred.
“Total annualized base rental revenue” means the contractual monthly base rent as of December 31, 2023 (which differs from rent calculated in accordance with GAAP) multiplied by 12. If a tenant is in a free rent period as of December 31, 2023, the total annualized base rental revenue is calculated based on the first contractual monthly base rent amount multiplied by 12.
“Value Add Portfolio” means our properties that meet any of the following criteria: (i) less than 75% occupied as of the acquisition date (ii) will be less than 75% occupied due to known move-outs within two years of the acquisition date; (iii) out of service with significant physical renovation of the asset; or (iv) development.
“Weighted Average Lease Term” means the contractual lease term in years, assuming that tenants exercise no renewal options, purchase options, or early termination rights, weighted by square footage.
Overview
We are a REIT focused on the acquisition, ownership, and operation of industrial properties throughout the United States. Our platform is designed to (i) identify properties for acquisition that offer relative value across CBRE-EA Tier 1 industrial real estate markets, industries, and tenants through the principled application of our proprietary risk assessment model, (ii) provide growth through sophisticated industrial operation and an attractive opportunity set, and (iii) capitalize our business appropriately given the characteristics of our assets.
We are organized and conduct our operations to maintain our qualification as a REIT under Sections 856 through 860 of the Internal Revenue Code of 1986, as amended (the “Code”), and generally are not subject to federal income tax to the extent we currently distribute our income to our stockholders and maintain our qualification as a REIT. We remain subject to state and local taxes on our income and property and to U.S. federal income and excise taxes on our undistributed income.
As of December 31, 2023, we owned 569 buildings in 41 states with approximately 112.3 million rentable square feet, consisting of 493 warehouse/distribution buildings, 70 light manufacturing buildings, one flex/office building, and five Value Add Portfolio buildings. In addition, as of December 31, 2023, we had six development projects (which are not included in the building count noted above). While the majority of our portfolio consists of single-tenant properties, we also own a growing number of multi-tenant properties. As of December 31, 2023, our buildings were approximately 98.2% leased, with no single tenant accounting for more than approximately 2.9% of our total annualized base rental revenue and no single industry accounting for more than approximately 11.0% of our total annualized base rental revenue. We intend to maintain a diversified mix of tenants to limit our exposure to any single tenant or industry.
As of December 31, 2023, our Operating Portfolio was approximately 98.4% leased. SL Rent Change on new and renewal leases together grew approximately 44.0% and 24.3% during the years ended December 31, 2023 and 2022, respectively, and our Cash Rent Change on new and renewal leases together grew approximately 31.0% and 14.3% during the years ended December 31, 2023 and 2022, respectively.
We have fully integrated acquisition, leasing and operations platforms led by a senior management team with decades of industrial real estate experience. Our mission is to deliver attractive long-term stockholder returns in all market environments by growing cash flow through disciplined investment in high-quality real estate while maintaining a strong balance sheet.
Our Strategy
Our primary business objectives are to own and operate a balanced and diversified portfolio that fits the needs of the markets we operate in, add value to the assets we acquire, and to enhance stockholder value over time by achieving sustainable long-term growth in distributable cash flow from operations.
We believe that our focus on owning and operating a portfolio of individually acquired industrial properties throughout CBRE-EA Tier 1 industrial markets in the United States will, when compared to other real estate portfolios, generate returns for our stockholders that are attractive in light of the associated risks for the following reasons.
•The acquisition of individual properties has historically been more cost effective versus competing with a larger pool of buyers who may need to deploy significant capital quickly on large portfolio transactions.
•Acquiring individually maintains our portfolio quality, as multi-asset portfolio acquisitions may include assets that are not desirable to us.
•The contribution of individual assets to an aggregated portfolio creates diversification, thereby lowering risk and creating value.
•Other institutional, industrial real estate buyers tend to focus on properties in a small number of super-primary markets. In contrast, we choose from a larger opportunity set of industrial properties across all CBRE-EA Tier 1 industrial markets in the United States.
•Our wider focus results in an advantage versus the local and regional buyers we compete with in many non-super-primary markets for acquisition opportunities who may not have the same access to debt or equity capital as us.
•Industrial properties generally require less capital expenditure than other commercial property types.
Regulation
General
We are subject to various laws, ordinances, rules and regulations of the United States and the states and local municipalities in which we own properties, including regulations relating to common areas and fire and safety requirements. We believe that we or our tenants, as applicable, have the necessary permits and approvals to operate each of our properties.
Americans with Disabilities Act
Our properties must comply with Title III of the Americans with Disabilities Act of 1990, as amended (the “ADA”) to the extent that such properties are “public accommodations” as defined under the ADA. Under the ADA, places of public accommodation must meet certain federal requirements related to access and use by disabled persons. The ADA may require removal of structural barriers to access by persons with disabilities in certain public areas of our properties where such removal is readily achievable. Although we believe that the properties in our portfolio in the aggregate substantially comply with current requirements of the ADA, and we have not received any notice for correction from any regulatory agency, we have not conducted a comprehensive audit or investigation of all of our properties to determine whether we are in compliance and therefore we may own properties that are not in compliance with the ADA.
ADA compliance is dependent upon the tenant’s specific use of the property, and as the use of a property changes or improvements to existing spaces are made, we will take steps to ensure compliance. Noncompliance with the ADA could result in additional costs to attain compliance, the imposition of fines by the federal government or the award of damages or attorney’s fees to private litigants. The obligation to make readily achievable accommodations is an ongoing one, and we will continue to assess our properties and to make alterations to achieve compliance as necessary.
Environmental Matters
Our properties are subject to various federal, state and local environmental laws. Under these laws, courts and government agencies have the authority to require us, as the owner of a contaminated property, to clean up the property, even if we did not know of or were not responsible for the contamination. These laws also apply to persons who owned a property at the time it became contaminated, and therefore it is possible we could incur these costs even after we sell a property. In addition to the costs of cleanup, environmental contamination can affect the value of a property and, therefore, an owner’s ability to borrow using the property as collateral (directly or indirectly) or to sell the property. Under applicable environmental laws, courts and government agencies also have the authority to require that a person who sent waste to a waste disposal facility, such as a landfill or an incinerator, pay for the clean-up of that facility if it becomes contaminated and threatens human health or the environment. We invest in properties historically used for industrial, light manufacturing and commercial purposes. Some of our properties contain, or may have contained, or are adjacent to or near other properties that have contained or currently contain, underground storage tanks used to store petroleum products and other hazardous or toxic substances, which create a potential for the release of petroleum products or other hazardous or toxic substances. We also own properties that are on or are adjacent to or near other properties upon which other persons, including former owners or tenants of our properties, have engaged, or may in the future engage, in activities that may generate or release petroleum products or other hazardous or toxic substances.
Environmental laws in the United States also require that owners of buildings containing asbestos properly manage and maintain the asbestos, adequately inform or train those who may come into contact with asbestos and undertake special precautions, including removal or other abatement, in the event that asbestos is disturbed during building renovation or demolition. These laws may impose fines and penalties on owners or who fail to comply with these requirements and may allow third parties to seek recovery from owners for personal injury associated with exposure to asbestos. Some of our buildings are known to have asbestos containing materials, and others, due to the age of the building and observed conditions, are suspected of having asbestos containing materials. We do not believe these conditions will materially and adversely affect us. In most or all instances, no immediate action was recommended to address the conditions.
Furthermore, various court decisions have established that third parties may recover damages for injury caused by property contamination. For instance, a person exposed to asbestos at one of our properties may seek to recover damages if he or she suffers injury from the asbestos. Lastly, some of these environmental laws restrict the use of a property or place conditions on various activities. An example would be laws that require a business using chemicals to manage them carefully and to notify local officials that the chemicals are being used.
We could be responsible for any of the costs discussed above. The costs to clean up a contaminated property, to defend against a claim, or to comply with environmental laws could be material and could adversely affect the funds available for distribution to our stockholders. All of our properties were subject to a Phase I or similar environmental assessment by independent environmental consultants at the time of acquisition. We generally expect to continue to obtain a Phase I or similar environmental assessment by independent environmental consultants on each property prior to acquiring it. However, these environmental assessments may not reveal all environmental costs that might have a material adverse effect on our business, assets, results of operations or liquidity and may not identify all potential environmental liabilities.
At the time of acquisition, we add each property to our portfolio environmental insurance policy that provides coverage for potential environmental liabilities, subject to the policy’s coverage conditions and limitations.
Compliance with these environmental laws, rules and regulations has not had, and is not expected to have, a material effect on our capital expenditures, results of operations and competitive position as compared to prior periods. We can make no assurances that future laws, ordinances or regulations will not impose material environmental liabilities on us, or the current environmental condition of our properties will not be affected by tenants, the condition of land or operations in the vicinity of our properties (such as releases from underground storage tanks), or by third parties unrelated to us.
Insurance
We carry comprehensive general liability, fire, extended coverage and rental loss insurance covering all of the properties in our portfolio under blanket insurance. In addition, we maintain a portfolio environmental insurance policy that provides coverage for potential environmental liabilities, subject to the policy’s coverage conditions and limitations. Generally, we do not carry insurance for certain losses, including, but not limited to, losses caused by floods (unless the property is located in a flood plain), earthquakes, acts of war, acts of terrorism or riots. We carry employment practices liability insurance that covers us against claims by employees, former employees or potential employees for various employment related matters including wrongful termination, discrimination, sexual harassment in the workplace, hostile work environment, and retaliation, subject to the policy’s coverage conditions and limitations. We carry comprehensive cyber liability insurance coverage that covers us against claims related to certain first party and third party losses including data restoration costs, crisis management expenses, credit monitoring costs, failure to implement and maintain reasonable security procedures, invasion of customer’s privacy and negligence, subject to the policy’s coverage conditions and limitations. We also carry directors and officers insurance. We believe the policy specifications and insured limits are appropriate and adequate given the relative risk of loss, the cost of the coverage and standard industry practice; however, our insurance coverage may not be sufficient to cover all of our losses.
Competition
In acquiring our target properties, we often compete with local or regional operators due to the smaller, single asset (versus portfolio) focus of our acquisition strategy. We also we compete with other public industrial property sector REITs, single-tenant REITs, income oriented non-traded REITs, and private real estate funds. Local real estate investors typically do not have the same access to capital that we do as a publicly traded institution. We also face significant competition from owners and managers of competing properties in leasing our properties to prospective tenants and in re-leasing space to existing tenants. Those owners and managers may be national, regional, or local operators, public or private.
Operating Segments
We manage our operations on an aggregated, single segment basis for purposes of assessing performance and making operating decisions, and accordingly, have only one reporting and operating segment. See Note 2 in the accompanying Notes to Consolidated Financial Statements under “Segment Reporting.”
Corporate Responsibility Program
We maintain a corporate responsibility program that incorporates environmental, social and governance (“ESG”) initiatives into our overall business, investment, and asset management strategies. We are also committed to reporting of our ESG initiatives. Since December 2021, we have published an annual “Environmental, Social and Governance Report”, which includes information regarding our ESG policies and programs, historic results, and performance targets, including our long-term greenhouse gas (GHG) reduction goal as approved by the Science-Based Targets Initiative (SBTi). In addition, annually we participate in the public disclosure rating process of the Global Real Estate Sustainability Benchmark, which is an entity that provides a ranking system to evaluate and compare ESG practices in the real estate industry.
Additional information regarding our corporate responsibility program will be included in our definitive Proxy Statement for our 2024 Annual Meeting of Stockholders and our 2022 Environmental, Social and Governance Report, or sustainability report, is currently available under the “Corporate Responsibility” section of our website at www.stagindustrial.com. However, the information located on, or accessible from, our website, including our sustainability report, is not, and should not be deemed to be, part of this report or incorporated into any other filing that we submit to the Securities and Exchange Commission (“SEC”).
Human Capital Management
We believe that demonstrating strong financial performance while also promoting awareness and respect for fundamental human rights is important to long-term value creation, business continuity and corporate success. As part of our commitment to providing a work environment that attracts, develops and retains high-performing individuals and that treats employees with dignity and respect:
•We offer equal employment opportunities to all of our employees and seek to foster a diverse and vibrant workplace with employees who possess a broad range of experiences, backgrounds, and skills. We continually assess and strive to enhance employee satisfaction and engagement. Our employees, many of whom have a relatively long tenure with the Company, have regular opportunities to participate in personal growth and professional development programs and social or team building events. We seek to identify and develop future leaders within the Company and periodically review with our Chief Executive Officer and board of directors the identity, skills, and characteristics of those persons who could succeed to senior and executive positions.
•We endeavor to maintain a workplace free from discrimination or harassment on the basis of race, color, religion, creed, gender, gender identity or expression, sexual orientation, genetic information, national origin, ancestry, age, disability, military or veteran status, and political affiliate or activities, among others. We conduct employee training to prevent discrimination and harassment and monitor and address employee conduct.
•We are committed to compensating our employees well and at competitive industry rates while, at the same time, monitoring our compensation programs to ensure that we are continuously attracting and retaining top talent. We also provide our employees with highly competitive health and wellness benefits, including medical, dental, vision, life, and short-term disability insurance, with premiums that are entirely paid for by the Company. We also offer flexible spending accounts for medical expenses, a program to pay commuting and office parking costs with pre-tax income, and a competitive vacation policy, including paid holidays, personal time off, and other leave benefits.
•We seek to foster a corporate culture where our stakeholders, including our employees, engage in, and collaborate to extend resources towards, community development. In furtherance of this commitment, we partner with, and support, local charitable organizations that we believe are contributing to the growth and development of the community, particularly organizations assisting at-risk youth. Through our partnerships with these organizations, in recent years, our employees have committed significant time and resources to support children and young adults, including through personal donations, fundraising, and volunteer work.
As of December 31, 2023, we had 95 employees, none represented by a labor union.
Additional information regarding our human capital programs and initiatives will be included in our definitive Proxy Statement for our 2024 Annual Meeting of Stockholders and is currently available under the “Corporate Responsibility” section of our website at www.stagindustrial.com. However, the information located on, or accessible from, our website is not, and should not be deemed to be, part of this report or incorporated into any other filing that we submit to the SEC.
Our Corporate Structure
STAG Industrial, Inc. was incorporated in Maryland on July 21, 2010. Shares of our common stock are publicly traded on the NYSE New York Stock Exchange (“NYSE”) under the symbol “STAG.”
Our Operating Partnership was formed as a Delaware limited partnership on December 21, 2009. We own all of our properties and conduct substantially all of our business through our Operating Partnership. We are the sole member of the sole general partner of our Operating Partnership. As of December 31, 2023, we owned approximately 97.9% of the common units of limited partnership interest in our Operating Partnership (“common units”), and our current and former executive officers, directors, employees and their affiliates, and third parties owned the remaining 2.1%. The common units are not publicly traded, but each common unit receives the same distribution as a share of our common stock, the value of each common unit is tied to the value of a share of our common stock, and each common unit, after one year, generally may be redeemed (that is, exchanged) for cash in an amount equivalent to the value of a share of our common stock or, if we choose, for a share of common stock on a one-for-one basis. When redeeming common units for cash, the value of a share of our common stock is calculated as the average common stock closing price on the NYSE for the 10 trading days immediately preceding the redemption notice date.
We are structured as an umbrella partnership REIT, also known as an “UPREIT,” with our publicly-traded entity, STAG Industrial, Inc., operating as the REIT in the UPREIT structure, and our Operating Partnership operating as the umbrella partnership. This UPREIT structure provides us an opportunity to acquire properties on a tax-deferred basis by issuing common units in our Operating Partnership in exchange for properties.
The following is a simplified diagram of our UPREIT structure at December 31, 2023.
Additional Information
Our principal executive offices are located at One Federal Street, 23rd Floor, Boston, Massachusetts 02110. Our telephone number is (617) 574-4777.
Our website is www.stagindustrial.com. Our Annual Report on Form 10-K, our Quarterly Reports on Form 10-Q, our Current Reports on Form 8-K and any amendments to any of those reports that we file with the SEC are available free of charge as soon as reasonably practicable through our website at www.stagindustrial.com. Also posted on our website, and available in print upon request, are charters of each independent committee of the board of directors, our code of business conduct and ethics and our corporate governance guidelines. Within the time period required by the SEC, we will post on our website any amendment to the code of business conduct and ethics and any waiver applicable to any executive officer, director or senior financial officer. The information found on, or otherwise accessible through, our website is not incorporated into, and does not form a part of, this report or any other report or document we file with or furnish to the SEC.
All reports, proxy and information statements and other information we file with the SEC are also available free of charge through the SEC’s website at www.sec.gov.
Item 1A. Risk Factors
The following risk factors and other information included in this report should be carefully considered. The risks and uncertainties described below are not the only risks we face. Additional risks and uncertainties not presently known to us or that we may currently deem immaterial also may impair our business operations.
Risks Related to Our Business and Operations
Adverse economic conditions may adversely affect our operating results and financial condition.
Our operating results and financial condition may be affected by market and economic challenges and uncertainties, which may result from a general economic downturn experienced by the nation as a whole, by the local economies where our properties are located or our tenants conduct business, or by the real estate industry, including the following: (i) poor economic conditions may result in tenant defaults under leases and extended vacancies at our properties; (ii) re-leasing may require concessions or reduced rental rates under the new leases due to reduced demand; (iii) adverse capital and credit market conditions may restrict our operating activities; and (iv) constricted access to credit may result in tenant defaults, non-renewals under leases or inability of potential buyers to acquire properties held for sale.
Also, to the extent we purchase real estate in an unstable market, we are subject to the risk that if the real estate market ceases to attract the same level of capital investment in the future, or the number of companies seeking to acquire properties decreases, the value of our investments may not appreciate or may decrease significantly below the amount we paid for these investments. Our operating results and financial condition could be negatively affected to the extent that an economic slowdown or downturn is prolonged or becomes more severe.
Recent macroeconomic trends, including inflation and rising interest rates, and developments affecting the financial services industry, may adversely affect our business, financial condition and results of operations.
Beginning in 2021 and continuing into the year ended December 31, 2023, inflation in the United States accelerated and, while moderating compared to year-over-year increases in 2021 and 2022, may continue at a relatively elevated level in the near-term. Beginning in 2022, in an effort to combat inflation and restore price stability, the Federal Reserve significantly raised its benchmark federal funds rate, which led to increases in interest rates in the credit markets. The Federal Reserve may continue to raise the federal funds rate, which will likely lead to higher interest rates in the credit markets and the possibility of slowing economic growth and/or a recession. Additionally, U.S. government policies implemented to address inflation, including actions by the Federal Reserve to increase interest rates, could negatively impact consumer spending, our tenants’ businesses, and/or future demand for industrial space.
Rising inflation could also have an adverse impact on our financing costs (either through near-term borrowings on our variable rate debt, including our unsecured credit facility, or refinancing of existing debt at higher interest rates), and general and administrative expenses and property operating expenses, as these costs could increase at a rate higher than our rental and other revenue. To the extent our exposure to increases in interest rates is not eliminated through interest rate swaps or other protection agreements, such increases may also result in higher debt service costs, which will adversely affect our cash flows. Historically, during periods of increasing interest rates, real estate valuations have generally decreased due to rising capitalization rates, which tend to move directionally with interest rates. Consequently, prolonged periods of higher interest rates may negatively impact the valuation of our real estate assets and could result in the decline of the market price of our common stock, which may adversely impact our ability and willingness to raise equity capital on favorable terms, including through our at-the-market (“ATM”) common stock offering program. Although the extent of any prolonged periods of higher interest rates remains unknown at this time, negative impacts to our cost of capital may adversely affect our future business plans and growth, at least in the near term.
Actual events involving limited liquidity, defaults, non-performance or other adverse developments that affect financial institutions, transactional counterparties or other companies in the financial services industry or the financial services industry generally, or concerns or rumors about any events of these kinds or other similar risks, have in the past and may in the future lead to market-wide liquidity problems. For example, on March 10, 2023, Silicon Valley Bank was closed by the California Department of Financial Protection and Innovation, which appointed the FDIC as receiver. Similarly, on March 12, 2023, Signature Bank and Silvergate Capital Corp. were each swept into receivership. In addition, if any parties with whom we conduct business are unable to access funds pursuant to such instruments or lending arrangements with such a financial institution, such parties’ ability to pay their obligations to us or to enter into new commercial arrangements requiring additional payments to us could be adversely affected.
Although we assess our banking relationships as we believe necessary or appropriate, our access to funding sources and other credit arrangements in amounts adequate to finance or capitalize our current and projected future business operations could be significantly impaired by factors that affect us, the financial services industry or economy in general. These factors could include, among others, events such as liquidity constraints or failures, the ability to perform obligations under various types of financial, credit or liquidity agreements or arrangements, disruptions or instability in the financial services industry or financial markets, or concerns or negative expectations about the prospects for companies in the financial services industry.
Our investments are concentrated in the industrial real estate sector, and we would be adversely affected by an economic downturn in that sector.
As of December 31, 2023, the majority of our buildings were industrial properties. This concentration may expose us to the risk of economic downturns in the industrial real estate sector to a greater extent than if our properties were more diversified across other sectors of the real estate industry.
We are subject to geographic and industry concentrations that make us susceptible to adverse events with respect to certain markets and industries.
We are subject to certain geographic and industry concentrations with respect to our properties. As a result of these concentrations, any adverse event or downturn in local economic conditions or industry conditions, changes in state or local governmental rules and regulations, acts of nature, epidemics, pandemics or other public health crises and actions taken in response thereto, and other factors affecting these markets or industries could adversely affect us and our tenants operating in those markets or industries. If any tenant is unable to withstand such adverse event or downturn or is otherwise unable to compete effectively in its market or business, it may be unable to meet its rental obligations, seek rental concessions, be unable to enter into new leases or forced to declare bankruptcy and reject our leases, which could materially and adversely affect us.
We have owned many of our properties for a limited time, and we may not be aware of characteristics or deficiencies involving any one or all of them.
Of the properties in our portfolio at December 31, 2023, 231 buildings totaling approximately 44.7 million rentable square feet have been acquired in the past five years. These properties may have characteristics or deficiencies unknown to us that could affect their valuation or revenue potential and such properties may not ultimately perform up to our expectations. We cannot assure you that the operating performance of the properties will not decline under our management.
Our growth depends upon future acquisitions of properties, and we may be unable to consummate acquisitions on advantageous terms and acquisitions may not perform as we expect.
The acquisition of properties entails various risks, including the risk that our investments may not perform as we expect. Our ability to continue to acquire properties in our pipeline that we believe to be suitable and compatible with our growth strategy may be constrained by numerous factors, including our ability to negotiate and execute a mutually-acceptable definitive purchase and sale agreement with the seller, our completion of satisfactory due diligence and the satisfaction of customary closing conditions, including the receipt of third-party consents and approvals. Further, we face competition for attractive investment opportunities from other well-capitalized real estate investors, including publicly-traded and non-traded REITs, private equity investors and other institutional investment funds that may have greater financial resources and a greater ability to borrow funds to acquire properties, the ability to offer more attractive terms to prospective tenants and the willingness to accept greater risk or lower returns than we can prudently manage. This competition may increase the demand for our target properties and, therefore, reduce the number of, or increase the price for, suitable acquisition opportunities, all of which could materially and adversely affect us. This competition will increase as investments in real estate become increasingly attractive relative to other forms of investment. In addition, we expect to finance future acquisitions through a combination of secured and unsecured borrowings, proceeds from equity or debt offerings by us or our Operating Partnership or its subsidiaries and proceeds from property contributions and divestitures which may not be available and which could adversely affect our cash flows.
We may face risks associated with acquiring properties in unfamiliar markets.
We have acquired, and may continue to acquire, properties in markets that are new to us. When we acquire properties located in these markets, we face risks associated with a lack of market knowledge or understanding of the local economy (including that competitors and counterparties may have much greater knowledge and understanding), forging new business relationships in the area and unfamiliarity with local government and laws.
A significant portion of our properties have leases that expire in the next two years and we may be unable to renew leases, lease vacant space or re-lease space on favorable terms.
Our operating results, cash flows, cash available for distribution, and the market price of our securities would be adversely affected if we are unable to lease, on economically favorable terms, a significant amount of space in our properties. Our properties may have some level of vacancy at the time of our acquisition and may incur a vacancy either by the continued default of a tenant under its lease or the expiration of one of our leases. As of December 31, 2023, leases with respect to approximately 18.9% (excluding month-to-month leases) of our total annualized base rental revenue will expire before December 31, 2025. We cannot assure you that expiring leases will be renewed or that our properties will be re-leased at base rental rates equal to or above the current market rental rates. In addition, our ability to release space at attractive rental rates will depend on (i) whether the property is specifically suited to the particular needs of a tenant, and (ii) the number of vacant or partially vacant industrial properties in a market or sub-market. In connection with a vacancy at one of our properties, we may face difficulty obtaining, or be unable to obtain, a new tenant for the vacant space. If the vacancy continues for a long period of time, we may suffer reduced revenue resulting in less cash available for distribution to stockholders and the resale value of the property could be diminished.
We face significant competition for tenants, which may negatively impact the occupancy and rental rates at our properties.
We compete with other owners, operators and developers of real estate, some of which own industrial properties in the same markets and sub-markets in which our properties are located. If our competitors offer space at rental rates below current market rates or below the rental rates we currently charge our tenants, we may lose potential tenants, and we may be pressured to lower our rental rates or to offer more substantial tenant improvements, early termination rights, below-market renewal options or other lease incentive payments to remain competitive. Competition for tenants could negatively impact the occupancy and rental rates of our properties.
Default by one or more of our tenants could materially and adversely affect us, and bankruptcy laws limit our remedies in the event of a tenant default.
The success of our tenants in operating their businesses will continue to be impacted by many current economic challenges, which impact their cost of doing business, including, but not limited to, inflation, labor shortages, supply chain constraints and increasing energy prices and interest rates. Additionally, macroeconomic and geopolitical risks create challenges that may exacerbate current market conditions in the United States. Any of our tenants may experience an adverse event or downturn in its business at any time that may significantly weaken its financial condition or cause its failure. As a result, such a tenant may fail to make rental payments when due, decline to extend or renew its lease upon expiration and/or declare bankruptcy and reject our lease. The default, financial distress or bankruptcy of a tenant could cause interruptions in the receipt of rental revenue and/or result in a vacancy, which is, in the case of a single-tenant property, likely to result in the complete reduction in the operating cash flows generated by the property and may decrease the value of that property. In addition, a majority of our leases generally require the tenant to pay all or substantially all of the operating expenses associated with the ownership of the property, such as utilities, real estate taxes, insurance and routine maintenance. Following a vacancy at a single-tenant property, we will be responsible for all of the operating costs at such property until it can be re-let, if at all.
The bankruptcy or insolvency of a tenant could diminish the income we receive from that tenant’s lease and we may not be able to evict a tenant solely because of its bankruptcy filing. On the other hand, a bankruptcy court might authorize the tenant to terminate its lease with us. If that happens, our claim against the bankrupt tenant for unpaid future rent would be an unsecured pre-petition claim, subject to statutory limitations, and therefore such amounts received in bankruptcy are likely to be substantially less than the remaining rent we otherwise were owed under the lease. In addition, any claim we have for unpaid past rent could be substantially less than the amount owed.
If our tenants are unable to obtain financing necessary to continue to operate their businesses and pay us rent, we could be materially and adversely affected.
Many of our tenants rely on external sources of financing to operate their businesses. The U.S. financial and credit markets have recently experienced liquidity disruptions, resulting in volatility in the markets and the unavailability of financing for many businesses. If such disruptions worsen or continue for a prolonged period of time, any of these tenants may be unable to obtain financing necessary to continue to operate its business, unable to meet its rental obligations, unable to enter into new leases or forced to declare bankruptcy and reject our leases, which could materially and adversely affect us.
Any future public health crisis, pandemic, epidemic or outbreak of infectious disease could have material and adverse effects on our business, operating results, financial condition and cash flows.
Any future public health crisis, pandemic, epidemic or outbreak of infectious disease, such as the COVID-19 pandemic, could have material and adverse effects on our business, operating results, financial condition and cash flows due to, among other factors: (i) government authorities requiring the closure of offices or other businesses or instituting quarantines of personnel; (ii) disruption in global supply and delivery chains; (iii) a general decline in business activity and demand for real estate; (iv) repurposing or redevelopment of defunct retail properties into industrial properties; (v) reduced economic activity, general economic decline or recession, which may impact our tenants’ businesses and may cause one or more of our tenants to be unable to make rent payments to us timely, or at all, or to otherwise seek modifications of lease obligations; (vi) difficulty accessing debt and equity capital on attractive terms, or at all; and (vii) the potential negative impact on the health of our personnel or our ability to recruit and retain key employees.
Risks Related to Our Organization and Structure
Our growth depends on external sources of capital, which are outside of our control and affect our ability to finance acquisitions, take advantage of strategic opportunities, satisfy debt obligations and make distributions to stockholders.
In order to maintain our qualification as a REIT, we are generally required under the Code to annually distribute at least 90% of our net taxable income, determined without regard to the dividends paid deduction and excluding any net capital gain. In addition, we will be subject to federal income tax at regular corporate rates to the extent that we distribute less than 100% of our net taxable income, including any net capital gains. Because of these requirements, we may not be able to fund future capital needs, including acquisition financing, from operating cash flow and rely on third-party sources to fund our capital needs. Our access to third-party sources of capital depends, in part, on general market conditions, the market’s perception of our growth potential, our current debt levels, our current and expected future earnings, our cash flow and distributions and the market price of our common stock. If we cannot raise equity or obtain financing from third-party sources on favorable terms, or at all, we may not be able to acquire properties when opportunities exist, meet the capital and operating needs of our existing properties or satisfy our debt service obligations. To the extent that capital is not available to acquire properties, profits may not be realized or their realization may be delayed, which could result in an earnings stream that is less predictable than some of our competitors or a failure to meet our projected earnings and distributable cash flow levels in a particular reporting period. Further, in order to meet the REIT distribution requirements and avoid the payment of income and excise taxes, we may need to borrow funds on a short-term basis even if the then-prevailing market conditions are not favorable for these borrowings. These short-term borrowing needs could result from differences in timing between the actual receipt of cash and inclusion of income for federal income tax purposes or the effect of non-deductible capital expenditures, the creation of reserves, certain restrictions on distributions under loan documents or required debt or amortization payments.
Certain provisions of our governing documents and Maryland law may delay or prevent a transaction or a change of control that might be in the best interest of stockholders.
Our charter and bylaws, the Operating Partnership agreement and Maryland law contain provisions that may delay or prevent a transaction or a change of control, including, among other provisions, the following:
Our charter contains 9.8% ownership limits. Our charter, subject to certain exceptions, authorizes our directors to take such actions as are necessary and desirable to limit any person to actual or constructive ownership of no more than 9.8% in value or in number of shares, whichever is more restrictive, of the outstanding shares of our capital stock and no more than 9.8% in value or in number of shares, whichever is more restrictive, of the outstanding shares of our common stock. While our board of directors, in its sole discretion, may exempt a proposed transferee from the ownership limits, it may not grant an exemption to any proposed transferee whose ownership could jeopardize our REIT status. These ownership limits may delay or prevent a transaction or a change of control that might be in the best interest of stockholders.
Our board of directors may create and issue a class or series of preferred stock without stockholder approval. Our board of directors may amend our charter, without stockholder approval, to (i) increase or decrease the aggregate number of shares of common stock or the number of shares of stock of any class or series, (ii) designate and issue from time to time one or more classes or series of preferred stock, (iii) classify or reclassify any unissued shares of stock, and (iv) determine the relative rights, preferences and privileges of any class or series of preferred stock. The issuance of preferred stock could have the effect of delaying or preventing a transaction or a change of control that might be in the best interests of stockholders.
Certain provisions in the Operating Partnership agreement may delay or prevent a change of control. Provisions in the Operating Partnership agreement could discourage third parties from making proposals involving an unsolicited acquisition or change of control transaction, although some stockholders might consider such proposals, if made, desirable. These provisions include, among others, redemption rights, transfer restrictions on the common units, the ability of the general partner to amend certain provisions in the Operating Partnership agreement without the consent of limited partners and the right of limited partners to consent to certain mergers and transfers of the general partnership interest. In addition, any potential change of control transaction may be further limited as a result of provisions related to the limited partnership interests designated as “LTIP Units” in our Operating Partnership (“LTIP units”) granted under the STAG Industrial, Inc. 2011 Equity Incentive Plan, as amended and restated (the “2011 Plan”), which require us to preserve the rights of LTIP unit holders and may restrict us from amending the Operating Partnership agreement in a manner that would have an adverse effect on the rights of LTIP unit holders.
Certain provisions of Maryland law could delay or prevent a change in control. Title 8, Subtitle 3 of the Maryland General Corporation Law (“MGCL”), permits our board of directors, without stockholder approval, to implement certain takeover defenses, some of which (for example, a classified board) we do not currently have. These provisions and other provisions of Maryland law may have the effect of inhibiting a third party from making an acquisition proposal or delaying or preventing a change of control under circumstances that might be in the best interest of stockholders.
Our board of directors can take many actions without stockholder approval.
Our board of directors has the general authority to oversee our operations and determine our major corporate policies. This authority includes significant flexibility and allows the board to take many actions, without stockholder approval, that could increase our operating expenses, impact our ability to make distributions or reduce the value of our assets. For example, our board of directors can, among other things, (i) change our investment, financing and borrowing strategies and our policies with respect to all other activities, including distributions, leasing, debt, capitalization and operations (including creditworthiness standards with respect to our tenants), (ii) subject to provisions in our charter, prevent the ownership, transfer and accumulation of shares in order to protect our status as a REIT or for any other reason deemed to be in the best interests of us and our stockholders, (iii) issue additional shares (which could dilute the ownership of existing stockholders) and increase or decrease the aggregate number of shares or the number of shares of any class or series or classify or reclassify any unissued shares, without obtaining stockholder approval, and (iv) determine that it is no longer in our best interests to continue to qualify as a REIT.
Our rights and the rights of our stockholders to take action against our directors and officers are limited.
Maryland law provides that a director or officer has no liability in that capacity if he or she performs his or her duties in good faith, in a manner he or she reasonably believes to be in our best interests and with the care that an ordinarily prudent person in a like position would use under similar circumstances. In addition, our charter eliminates our directors’ and officers’ liability to us and our stockholders for monetary damages, except for liability resulting from actual receipt of an improper benefit or profit in money, property or services or active and deliberate dishonesty established by a final judgment and which is material to the cause of action. Our bylaws require us to indemnify our directors and officers to the maximum extent permitted by Maryland law for liability actually incurred in connection with any proceeding to which they may be made, or threatened to be made, a party, except to the extent that the act or omission of the director or officer was material to the matter giving rise to the proceeding and was either committed in bad faith or was the result of active and deliberate dishonesty, the director or officer actually received an improper personal benefit in money, property or services, or, in the case of any criminal proceeding, the director or officer had reasonable cause to believe that the act or omission was unlawful. Additionally, the Operating Partnership agreement limits our liability and requires our Operating Partnership to indemnify us and our directors and officers to the maximum extent permitted by Delaware law against all claims that relate to the operations of our Operating Partnership, except for actions taken in bad faith, or with gross negligence or willful misconduct. As a result, we and our stockholders may have more limited rights against our directors and officers than might otherwise exist under common law. In addition, we may be obligated to fund the defense costs incurred by our directors and officers.
Our fiduciary duties as sole member of the general partner of our Operating Partnership could create conflicts of interest, which may impede business decisions that could benefit our stockholders.
We have fiduciary duties to the other limited partners in our Operating Partnership, including members of our management team and board of directors, the discharge of which may conflict with the interests of our stockholders. In addition, those persons holding common units will have the right to vote on certain amendments to the Operating Partnership agreement. These voting rights may be exercised in a manner that conflicts with the interests of our stockholders. For example, we are unable to modify the rights of limited partners to receive distributions as set forth in the Operating Partnership agreement in a manner that adversely affects their rights without their consent, even though such modification might be in the best interest of our stockholders.
Conflicts also may arise when the interests of our stockholders and the limited partners of our Operating Partnership diverge, particularly in circumstances in which there may be an adverse tax consequence to the limited partners. As a result of unrealized built-in gain attributable to contributed properties at the time of contribution, some holders of common units, including members of our management team, may suffer more adverse tax consequences than our stockholders upon the sale or refinancing of certain properties, including disproportionately greater allocations of items of taxable income and gain upon a realization event. As those holders will not receive a correspondingly greater distribution of cash proceeds, they may have different objectives regarding the appropriate pricing, timing and other material terms of any sale or refinancing of certain properties, or whether to sell or refinance such properties at all.
We are subject to financial reporting and other requirements for which our accounting, internal audit and other systems and resources may not be adequately prepared and we may not be able to accurately report our financial results.
We are subject to reporting and other obligations under the Exchange Act, including the requirements of Section 404 of the Sarbanes-Oxley Act of 2002. Section 404 requires annual management assessments of the effectiveness of our internal controls over financial reporting and a report by our independent registered public accounting firm addressing these assessments. These reporting and other obligations place significant demands on our management, administrative, operational, internal audit and accounting resources and cause us to incur significant expenses. We may need to upgrade our systems, implement additional financial and management controls and procedures, expand our internal audit function, or hire additional accounting, internal audit and finance staff. Any failure to maintain effective internal controls could have a material adverse effect on our business, operating results and market prices of our securities.
Risks Related to Ownership of Our Common Stock
The market price and trading volume of our common stock may be volatile.
The market price for our common stock has experienced significant price and volume fluctuations, often without regard to our operating performance. If the market price of our common stock declines significantly, you may be unable to sell your shares at or above the price at which you acquired them. A number of factors could negatively affect the market price or trading volume of our common stock, many of which are out of our control, including:
•actual or anticipated variations in our quarterly operating results or those of our competitors;
•publication of research reports about us, our competitors, our tenants or the real estate industry;
•changes in our distribution policy;
•increases in market interest rates that lead purchasers of our shares to demand a higher yield;
•the market’s perception of equity investments in REITs and changes in market valuations of similar REITs;
•difficulties or inability to access capital or extend or refinance existing debt or an adverse market reaction to any increased indebtedness we incur in the future;
•a change in credit ratings issued by analysts or nationally recognized statistical rating organizations;
•additions or departures of key management personnel;
•actions by institutional stockholders or speculation in the press or investment community; and
•general U.S. and worldwide market and economic conditions.
The cash available for distribution to stockholders may not be sufficient to make distributions at expected levels, nor can we assure you of our ability to make distributions in the future.
Distributions will be authorized and determined by our board of directors in its sole discretion from time to time and will depend upon a number of factors, including cash available for distribution, our operating results, operating expenses and financial condition (especially in relation to our anticipated future capital needs), REIT distribution requirements under the Code and other factors the board deems relevant. Consequently, our distribution levels may fluctuate. In addition, to the extent that we make distributions in excess of our current and accumulated earnings and profits, such distributions would generally be considered a return of capital for federal income tax purposes to the extent of the holder’s adjusted tax basis in its shares. A return of capital is not taxable, but it has the effect of reducing the holder’s adjusted tax basis in its investment. To the extent that distributions exceed the adjusted tax basis of a holder’s shares, they will be treated as gain from the sale or exchange of such stock. Further, if we borrow funds to make distributions, our future interest costs would increase, thereby reducing our earnings and cash available for distribution from what they otherwise would have been.
The number of shares of our common stock available for future sale, and future offerings of debt or equity securities may be dilutive to existing stockholders and adversely affect the market price of our common stock.
Our ability to execute our business strategy depends on our access to an appropriate blend of equity and debt financing, including common and preferred stock, debt securities, lines of credit and other forms of secured and unsecured debt. We have filed a registration statement with the SEC allowing us to offer, from time to time, an indefinite amount of equity and debt securities on an as-needed basis, including shares under our ATM common stock offering program. Sales of a substantial number of shares of our common stock (or the perception that such sales might occur), the vesting of equity awards under the 2011 Plan, the issuance of common stock or common units in connection with acquisitions, and other equity issuances may dilute the holdings of our existing stockholders or reduce the market prices of our securities, or both. Holders of our common stock are not entitled to preemptive rights or other protections against dilution. In addition, we may attempt to increase our capital resources by issuing preferred stock or debt securities (including commercial paper, medium-term notes and senior or subordinated notes). Any future issuances of preferred stock will rank senior to our common stock with respect to distributions and liquidation rights, which could limit our ability to make distributions to holders of common stock. In addition, upon liquidation, holders of debt securities would receive a distribution of our available assets prior to any distribution to the holders of common stock. Because our decision to issue securities in any future offering will depend on market conditions and other factors beyond our control, we cannot predict or estimate the amount, timing, or nature of our future offerings. Thus, our stockholders bear the risk of future offerings reducing the market prices of our securities and diluting their proportionate ownership.
We have in the past entered, and may in the future enter, into forward sale transactions that subject us to certain risks.
We have previously entered into forward sale agreements and may in the future enter into additional forward sale agreements, including under our ATM common stock offering program, that subject us to certain risks. The future issuance of any shares of common stock upon settlement of any forward sale agreement will result in dilution to our earnings per share, return on equity, and dividends per share. The purchase of common stock in connection with the unwinding of the forward purchaser’s hedge position could cause our stock price to increase (or prevent a decrease) over such time, thereby increasing the amount of cash we would owe (or decreasing the amount of cash owed to us) upon a cash settlement. In addition, pursuant to each forward sale agreement, the relevant forward purchaser will have the right to accelerate the settlement of the forward sale agreement in connection with certain specified events. In such cases, we could be required to settle that particular forward sale agreement and issue common stock irrespective of our capital needs.
Under Section 1032 of the Code, generally, no gains and losses are recognized by a corporation in dealing in its own shares, including pursuant to a “securities futures contract” as defined in the Code. However, because it is not clear whether a forward sale agreement qualifies as a “securities futures contract,” the U.S. federal income tax treatment of any cash settlement payment is uncertain. In the event that we recognize a significant gain from a forward sale agreement, we may not be able to satisfy the gross income requirements applicable to REITs under the Code, may not be able to rely upon certain relief provisions and could lose our REIT status under the Code. Even if relief provisions apply, we would be subject to a tax based on the amount of non-qualifying income.
General Real Estate Risks
Our performance is subject to general economic conditions and risks associated with our real estate assets.
The investment returns available from equity investments in real estate depend on the amount of income earned and capital appreciation generated by the properties, as well as the expenses incurred in connection with the properties. If our properties do not generate income sufficient to meet operating expenses, including debt service and capital expenditures, then our ability to make distributions to stockholders could be adversely affected. In addition, there are significant expenditures associated with an investment in real estate (such as debt payments, real estate taxes and maintenance costs) that generally do not decline when circumstances reduce the income from the property. Income from and the value of our properties may be adversely affected by, among other things:
•a global economic crisis that results in increased budget deficits and weakened financial condition of international, national and local governments, which may lead to reduced governmental spending, tax increases, public sector job losses, increased interest rates, currency devaluations, defaults on debt obligations or other adverse economic events;
•other periods of economic slowdown or recession, rising interest rates or declining demand for real estate, or the public perception that any of these events may occur;
•tenant turnover, the attractiveness of our properties to potential tenants and changes in supply of, or demand for, similar or competing properties in an area (including from general overbuilding or excess supply in the market);
•technological changes, such as reconfiguration of supply chains, autonomous vehicles, drones, robotics, 3D printing, online marketplaces for industrial space, or other developments;
•our ability to control rental rates and changes in operating costs and expenses, including costs of compliance with tax, real estate, environmental and zoning laws, rules and regulations and our potential liability thereunder;
•changes in the cost or availability of insurance, including coverage for mold or asbestos;
•unanticipated changes in costs associated with known adverse environmental conditions or retained liabilities for such conditions;
•periods of high interest rates and tight money supply;
•future terrorist attacks, which may result in declining economic activity, which could reduce the demand for, and the value of, our properties, and may adversely affect our tenants’ business and their ability to continue to honor their existing lease; and
•disruptions in the global supply chain caused by political, regulatory or other factors, including geopolitical developments outside the United States.
In addition, our investments could be materially adversely affected by changes in national and international political, environmental and socioeconomic circumstances, such as Russia’s invasion of Ukraine and the Israel-Hamas war, the possibility of such conflicts widening and their impact on macroeconomic conditions. Coupled with changes in Federal Reserve policies on interest rates and other economic disruptions, such circumstances may exacerbate inflation and adversely affect economic and market conditions, the level and volatility of real estate and securities prices and the liquidity of our investments. As military conflicts and related economic sanctions continue to evolve, it has become increasingly difficult to predict the impact of these events.
Real estate investments are not as liquid as other types of investments.
The lack of liquidity in real estate investments may limit our ability to vary our portfolio and react promptly to changes in economic or other conditions. In addition, significant expenditures associated with real estate investments, such as mortgage payments, real estate taxes and maintenance costs, are generally not reduced when circumstances cause a reduction in income from the investments. We intend to comply with the safe harbor rules relating to the number of properties that can be sold each year, the tax basis and the costs of improvements made to such sale properties, and other items that enable a REIT to avoid punitive taxation on property sales. Thus, our ability at any time to sell properties or contribute properties to real estate funds or other entities in which we have an ownership interest may be restricted.
Uninsured losses may adversely affect your returns.
There are certain losses, including losses from floods, earthquakes, acts of war, acts of terrorism or riots, that are not generally insured against or that are not generally fully insured against because it is not deemed economically feasible or prudent to do so. In addition, changes in the cost or availability of insurance could expose us to uninsured casualty losses. In the event that any of our properties incurs a casualty loss that is not fully covered by insurance, the value of our assets will be reduced by the amount of any such uninsured loss, we could experience a significant loss of invested capital and potential revenue in the property, we could remain obligated under any recourse debt associated with the property, and we may have no source of funding to repair or reconstruct the damaged property. Moreover, we may be liable for our Operating Partnership’s unsatisfied recourse obligations, including any obligations incurred by our Operating Partnership as the general partner of joint ventures.
Environmentally hazardous conditions may adversely affect our operating results.
Under various federal, state and local environmental laws, a current or previous owner of real property may be liable for the cost of remediation or removing hazardous or toxic substances on such property. Such laws often impose liability whether or not the owner knew of, or was responsible for, the presence of such hazardous or toxic substances. Even if more than one person may have been responsible for the contamination, each person covered by the environmental laws may be held responsible for all of the clean‑up costs incurred. In addition, third parties may sue the property owner for damages based on personal injury, natural resources, property damage or other costs, including investigation and clean‑up costs, resulting from the environmental contamination. The presence of hazardous or toxic substances on one of our properties, or the failure to properly remediate a contaminated property, could give rise to a lien in favor of the government for costs it may incur to address the contamination, or otherwise adversely affect our ability to sell or lease the property or borrow using the property as collateral. Environmental laws also may impose restrictions on the manner in which property may be used or businesses may be operated. A property owner who violates environmental laws may be subject to sanctions which may be enforced by governmental agencies or, in certain circumstances, private parties. In connection with the acquisition and ownership of our properties, we may be exposed to such costs. The costs of compliance with environmental regulatory requirements, defending against environmental claims or remediation of any contaminated property could materially adversely affect our business, operating results and cash available for distribution to stockholders.
Some of our properties contain asbestos‑containing building materials. Environmental laws require owners of buildings containing asbestos properly manage and maintain the asbestos, adequately inform or train those who may come into contact with asbestos and undertake special precautions in the event that asbestos is disturbed during building renovation or demolition. These laws may impose fines and penalties on owners who fail to comply with these requirements and may allow third parties to seek recovery from owners for personal injury associated with exposure to asbestos. In addition, some of our properties contain, or may have contained, or are adjacent to or near other properties that have contained or currently contain, underground storage tanks used to store petroleum products and other hazardous or toxic substances, which create a potential for the release of petroleum products or other hazardous or toxic substances. We also own properties that are on or are adjacent to or near other properties upon which other persons, including former owners or tenants of our properties, have engaged, or may in the future engage, in activities that may release petroleum products or other hazardous or toxic substances.
Before acquiring a property, we typically obtain a preliminary assessment of environmental conditions at the property, often referred to as “Phase I environmental site assessment.” However, this environmental assessment does not include soil sampling or subsurface investigations and typically does not include an asbestos survey. We may acquire properties with known adverse environmental conditions and/or material environmental conditions, liabilities or compliance concerns may arise after the environmental assessment has been completed. Further, in connection with property dispositions, we may agree to remain responsible for, and to bear the cost of, remediating or monitoring certain environmental conditions on the properties. Moreover, there can be no assurance that future laws, ordinances or regulations will not impose any material environmental liability, or the current environmental condition of our properties will not be affected by tenants, by the condition of land or operations in the vicinity of our properties (such as releases from underground storage tanks), or by third parties unrelated to us.
We are exposed to the potential impacts of future climate change and climate change-related risks.
Our properties may be exposed to rare catastrophic weather events, such as severe storms, floods or wildfires. If the frequency of extreme weather events increases due to climate change, our exposure to these events could increase. In addition, in connection with any development, redevelopment or renovation project, we may be harmed by potential changes to the supply chain or stricter energy efficiency standards for industrial buildings. To the extent climate change causes shifts in weather patterns, our markets could experience negative consequences, including declining demand for industrial space and our inability to operate our buildings. Climate change may also have indirect negative effects on our business by increasing the cost of, or decreasing the availability of, property insurance on terms we find acceptable and increasing the cost of energy, building materials and snow removal at our properties. In addition, compliance with new laws or regulations relating to climate change, including “green” building codes, may require us to make improvements to our existing properties or result in increased operating costs. Any such laws or regulations could also impose substantial costs on our tenants, thereby impacting their financial condition and ability to meet their obligations and to lease or re-lease our properties.
Compliance or failure to comply with the ADA and other regulations could result in substantial costs.
Under the ADA, places of public accommodation must meet certain federal requirements related to access and use by disabled persons. Noncompliance with these requirements could result in additional costs to attain compliance, the imposition of fines by the federal government or the award of damages or attorney’s fees to private litigants. If we are required to make unanticipated expenditures to comply with the ADA or other regulations, including removing access barriers, then our cash flows and cash available for distribution may be adversely affected. In addition, changes to the requirements set forth in the ADA or other regulations or the adoption of new requirements could require us to make significant unanticipated expenditures.
The ownership of properties subject to ground leases exposes us to certain risks.
We currently own and may acquire additional properties subject to ground leases, or leasehold interests in the land underlying the building. As lessee under a ground lease, we are exposed to the possibility of losing the property upon expiration, or an earlier breach by us, of the ground lease. Our ground leases may also contain provisions that limit our ability to sell the property or require us to obtain the consent of the landlord in order to assign or transfer our rights and obligations under the ground lease in connection with a sale of the property, which could adversely impact the price realized from any such sale. We also own properties that benefit from payment in lieu of tax (“PILOT”) programs or similar programs through leasehold interests with the relevant municipality serving as lessor. While we have the right to purchase the fee interests in these properties for a nominal purchase price, in the event of such a conversion, any preferential tax treatment offered by the PILOT programs will be lost.
We may be unable to sell properties, including as a result of uncertain market conditions.
We expect to hold our properties until a sale or other disposition is appropriate given our investment objectives. Our ability to dispose of any property on advantageous terms depends on factors beyond our control, including competition from other sellers and the availability of attractive financing for potential buyers. Due to the uncertainty of market conditions that may affect future property dispositions, we cannot assure you that we will be able to sell our properties at a profit. Accordingly, the extent to which you will receive cash distributions and realize potential appreciation on our investments will be dependent upon fluctuating market conditions. Furthermore, we cannot assure you that we will have the funds that may be required to correct defects or to make improvements before a property can be sold.
If we sell properties and provide financing to purchasers, defaults by the purchasers would adversely affect our cash flows.
Under certain circumstances, we may sell properties by providing financing to purchasers. If we provide financing to purchasers, we will bear the risk that the purchaser may default, which could adversely affect our cash flows and ability to make distributions to stockholders and may result in litigation and increased expenses. Even in the absence of a purchaser default, the reinvestment or distribution of the sales proceeds will be delayed until the promissory notes (or other property we may accept upon a sale) are actually paid, sold or refinanced.
Joint venture investments could be adversely affected by our lack of sole decision-making authority, our reliance on co-venturers’ financial condition and disputes between us and our co-venturers.
We may in the future selectively acquire, own and/or develop properties through partnerships, joint ventures or other co-investment entities with third parties when we deem such transactions are warranted by the circumstances. In such event, we would not be in a position to exercise sole decision-making authority regarding the property, partnership, joint venture or other entity and would be subject to risks not present were a third party not involved, including the possibility that partners might become bankrupt or fail to fund required capital contributions. Partners may have economic or other business interests that are inconsistent with our objectives, take actions contrary to our policies, or have other conflicts of interest. Such investments may also have the potential risk of impasses on decisions, such as a sale, because neither we nor the partner would have full control over the partnership or joint venture. In addition, prior consent of the partner may be required for a sale or transfer to a third party of our interests in the joint venture, which would restrict our ability to dispose of our interest. In addition, in certain circumstances, we may be liable for the actions of our third-party partners. Joint ventures may be subject to debt and, in volatile credit markets, the refinancing of such debt may require equity capital calls.
Risks Related to Our Debt Financings
Our operating results and financial condition could be adversely affected if we are unable to make payments on our debt.
Our charter and bylaws do not limit the amount of indebtedness we may incur, and we are subject to risks normally associated with debt financing, including the risk that our cash flows will be insufficient to meet required payments of principal and interest. There can be no assurance that we will be able to refinance any maturing indebtedness, that such refinancing would be on terms as favorable as the terms of the maturing indebtedness or that we will be able to otherwise obtain funds by selling assets or raising equity to make required payments on maturing indebtedness. In particular, loans obtained to fund property acquisitions may be secured by first mortgages on such properties. If we are unable to make our debt service payments as required, a lender could foreclose on the properties securing its debt, which would cause us to lose part or all of our investment. Certain of our existing secured indebtedness is, and future secured indebtedness may be, cross-collateralized and, consequently, a default on this indebtedness could cause us to lose part or all of our investment in multiple properties.
Increases in interest rates could increase our required debt payments and adversely affect our ability to make distributions to stockholders.
As of December 31, 2023, we had total outstanding debt of approximately $2.6 billion, including approximately $402.0 million of debt subject to variable interest rates (excluding amounts that were hedged to fix rates), and we expect that we will incur additional indebtedness in the future. Interest we pay on outstanding debt reduces our cash available for distribution. Since we have incurred and may continue to incur variable rate debt, increases in interest rates by the Federal Reserve or changes in the Term Secured Overnight Financing Rate (“Term SOFR”) would raise our interest costs, which reduces our cash flows and our ability to make distributions. If we are unable to refinance our indebtedness at maturity or meet our payment obligations, our financial condition and cash flows would be adversely affected, and we may lose the properties securing such indebtedness. In addition, if we need to repay existing debt during periods of rising interest rates, we could be required to sell one or more of our properties at times which may not permit realization of the maximum return on such investments.
The phase-out of LIBOR and transition to Term SOFR as a benchmark interest rate will have uncertain and possibly adverse effects.
In advance of the cessation of LIBOR on June 30, 2023, we amended our unsecured credit facility and term loans to be based on one-month Term SOFR, and as of December 31, 2023, we had no LIBOR-based debt or financial contracts. Due to the broad use of LIBOR as a reference rate, the impact of this transition to Term SOFR could adversely affect our financing costs, including spread pricing on our unsecured credit facility, unsecured term loans and any other variable rate debt obligations, as well as our operations and cash flows. There is no guarantee that the transition from LIBOR to Term SOFR will not result in financial market disruptions, significant increases in benchmark rates, or borrowing costs to borrowers, any of which could affect our interest expense and earnings and may have an adverse effect on our business, results of operations, financial condition, and stock price. Whether or not Term SOFR attains market acceptance as a LIBOR replacement tool remains uncertain.
Our loan covenants could limit our flexibility and adversely affect our financial condition and ability to make distributions.
Our existing mortgage notes and unsecured loan agreements require us to comply with certain financial and other covenants, including loan-to-value, debt service coverage, leverage and fixed charge coverage ratios and, in the case of an event of default, limitations on distributions. In addition, our existing unsecured loan agreements contain, and future agreements may contain, cross-default provisions which are triggered in the event that other material indebtedness is in default. These cross-default provisions may require us to repay or restructure the facilities in addition to any other debt that is in default. Future indebtedness may contain financial or other covenants more restrictive than those in our existing loan agreements.
We are a holding company and conduct substantially all of our business through our Operating Partnership. As a result, we rely on distributions from our Operating Partnership to pay dividends and meet our debt service and other obligations. The ability of our Operating Partnership to make distributions to us depends on the operating results of our Operating Partnership and the terms of any loans that encumber our properties. Such loans may contain lock box arrangements, reserve requirements, financial covenants, and other provisions that restrict the distribution of funds in the event of a default.
If debt is unavailable at reasonable rates, we may not be able to finance acquisitions or refinance our existing debt.
If debt is unavailable at reasonable rates, we may not be able to finance acquisitions or refinance existing debt when the loans come due on favorable terms, or at all. Most of our financing arrangements require us to make a lump-sum or “balloon” payment at maturity. Our ability to make a payment at maturity is uncertain and, in the event that we do not have sufficient funds, we will need to refinance this debt. If interest rates are higher when we refinance such debt, our net income, cash flow, and, consequently, our cash available for distribution to stockholders could be reduced. If the credit environment is constrained at the time a payment is due, we may not be able to refinance the existing debt on acceptable terms and may be forced to choose from a number of unfavorable options, including accepting unfavorable financing terms, selling properties on disadvantageous terms or defaulting and permitting the lender to foreclose.
In addition, adverse developments affecting the financial services industry or investor concerns regarding the U.S. or international financial systems could result in less favorable commercial financing terms, including higher interest rates or costs and more restrictive financial and operating covenants, or systemic limitations on access to credit and liquidity sources, thereby making it more difficult for us to acquire financing on acceptable terms or at all. Any decline in available funding or access to our cash and liquidity resources could, among other risks, adversely impact our ability to meet our financial or other obligations or reduce our net income and cash available for distribution to stockholders.
Our hedging strategies may not be successful in mitigating our risks associated with interest rates.
Our various derivative financial instruments involve certain risks, such as the risk that the counterparties fail to honor their obligations, that these arrangements may not be effective in reducing our exposure to interest rate changes, and that a court rules that such agreements are not legally enforceable. In addition, the nature, timing and costs of hedging transactions may influence the effectiveness of our hedging strategies. Poorly designed strategies or improperly executed transactions could actually increase our risk and losses. We cannot assure you that our hedging strategies and derivative financial instruments will adequately offset the risk of interest rate volatility or that such instruments will not result in losses that may adversely impact our financial condition.
Adverse changes in our credit ratings could negatively affect our financing activity.
The credit ratings of our unsecured debt are based on our operating performance, liquidity and leverage ratios, overall financial position and other factors employed by the credit rating agencies. Our credit ratings can affect the amount of capital we can access, as well as the terms and pricing of our debt. There can be no assurance that we will be able to maintain our current credit ratings, and in the event our credit ratings are downgraded, we would incur greater borrowing costs and may encounter difficulty in obtaining additional financing. Also, a downgrade in our credit ratings may trigger additional payments or other negative consequences under our unsecured credit facility and other debt instruments. Adverse changes in our credit ratings could harm our capital market activities, ability to manage debt maturities, future growth and acquisition activity.
U.S. Federal Income Tax Risks
Failure to qualify as a REIT would reduce our net earnings available for investment or distribution.
Our qualification as a REIT will depend upon our ability to meet requirements regarding our organization and ownership, distributions of our income, the nature and diversification of our income and assets and other tests imposed by the Code. If we fail to qualify as a REIT for any taxable year after electing REIT status, we will be subject to federal income tax on our taxable income at regular corporate rates. In addition, we would generally be disqualified from treatment as a REIT for the four taxable years following the year in which we failed to qualify as a REIT. Losing our REIT status would reduce our net earnings available for investment or distribution to stockholders because of the additional tax liability. In addition, dividends to stockholders would no longer qualify for the dividends‑paid deduction and we would no longer be required to make distributions. If this occurs, we might be required to borrow funds or liquidate some investments in order to pay the applicable tax.
Even if we maintain our qualification as a REIT for federal income tax purposes, we may be subject to other tax liabilities that reduce our cash flow and our ability to make distributions to stockholders.
Even if we maintain our qualification as a REIT for federal income tax purposes, we may be subject to some federal, state and local taxes.
For example, (i) we will be subject to federal corporate income tax on the undistributed income to the extent that we satisfy the REIT distribution requirements but distribute less than 100% of our REIT taxable income, (ii) we will be subject to a 4% nondeductible excise tax on the amount, if any, by which distributions we pay in any calendar year are less than the sum of 85% of our ordinary income, 95% of our capital gain net income and 100% of our undistributed income from prior years, (iii) we will be subject to the highest corporate income tax rate if we have net income from the sale of foreclosure property that we hold primarily for sale to customers in the ordinary course of business or other non‑qualifying income from foreclosure property, (iv) we will be subject to a 100% “prohibited transaction” tax on our gain from an asset sale, other than foreclosure property, that we hold primarily for sale to customers in the ordinary course of business, unless such sale were made by our taxable REIT subsidiary (“TRS”) or if we qualify for a safe harbor; and (v) our TRS will be subject to federal, state and local income tax at regular corporate rates on any income that it earns.
REIT distribution requirements could adversely affect our ability to execute our business plan.
From time to time, we may generate taxable income greater than our income for financial reporting purposes, or our taxable income may be greater than our cash available for distribution to stockholders. If we do not have other funds available in these situations, we could be required to borrow or raise equity on unfavorable terms, sell investments at disadvantageous prices, make taxable distributions of our stock or debt securities or find another alternative source of funds to distribute enough of our taxable income to satisfy the REIT distribution requirement and to avoid corporate income tax and the 4% excise tax in a particular year. These alternatives could increase our costs or reduce the value of our equity. In addition, to maintain our qualification as a REIT, we must satisfy certain tests on an ongoing basis concerning, among other things, the sources of our income, nature of our assets and the amounts we distribute to our stockholders. We may be required to make distributions to stockholders at times when it would be more advantageous to reinvest cash in our business or when we do not have funds readily available for distribution. Thus, compliance with the REIT requirements may hinder our ability to operate solely on the basis of maximizing profits and the value of our stockholders’ investment.
Re-characterization of sale‑leaseback transactions may cause us to lose our REIT status.
In certain circumstances, we expect to purchase properties and lease them back to the sellers of such properties. While we intend to structure such a sale‑leaseback transaction such that the lease will be characterized as a “true lease” for tax purposes, we cannot assure you that the Internal Revenue Service (“IRS”) will not challenge such characterization. In the event that any such sale‑leaseback transaction is challenged and re-characterized as a financing transaction or loan for federal income tax purposes, deductions for depreciation and cost recovery relating to such property would be disallowed. If a sale‑leaseback transaction were so re-characterized, we might fail to satisfy the REIT qualification “asset tests” or “income tests” and, consequently, lose our REIT status effective with the year of re-characterization. Alternatively, the amount of our REIT taxable income could be recalculated which might also cause us to fail to meet the distribution requirement for a taxable year.
The prohibited transactions tax may limit our ability to engage in certain transactions.
A REIT’s net income from prohibited transactions is subject to a 100% tax. In general, prohibited transactions are dispositions of property, other than foreclosure property, held primarily for sale to customers in the ordinary course of business. Although a safe harbor to the characterization of a disposition as a prohibited transaction is available, we cannot assure you that we can comply with the safe harbor or that we will avoid owning property that may be characterized as held primarily for sale to customers in the ordinary course of business. Consequently, we may choose not to engage in certain dispositions or may conduct such dispositions through a TRS.
We may be subject to adverse legislative or regulatory tax changes.
Federal income taxation rules are constantly under review by the IRS, the U.S. Department of the Treasury and persons involved in the legislative process. Changes to tax laws, with or without retroactive application, through new legislation, Treasury Regulations, administrative interpretations or court decisions could adversely affect us or our stockholders, including by negatively affecting our ability to qualify as a REIT or the federal income tax consequences of such qualification, or reducing the relative attractiveness of an investment in a REIT compared to a corporation not qualified as a REIT. We cannot predict the long-term effect of future law changes on us or our stockholders.
Other General Risks
We face risks associated with system failures through security breaches or cyber-attacks, as well as other significant disruptions of our information technology (“IT”) networks and related systems.
We face risks associated with security breaches, cyber-attacks, and other significant disruptions of our IT networks and related systems. The risk of a security breach, cyber-attack or disruption has increased as the number, intensity and sophistication of attempted attacks from around the world have increased. There can be no assurance that our security measures taken to manage the risk of a security breach, cyber-attack or disruption will be effective or that attempted security breaches, cyber-attacks or disruptions would not be successful or damaging. Any failure of our IT networks and related systems could (i) disrupt the proper functioning of our networks and systems, (ii) result in misstated financial reports, violations of loan covenants or missed reporting deadlines, (iii) disrupt our inability to monitor our compliance with REIT requirements, (iv) result in the unauthorized access to, and destruction, loss, theft, misappropriation or release of proprietary, confidential, sensitive or otherwise valuable information, (v) require significant management attention and resources to remedy any damages that result, (vi) subject us to claims for breach of contract or failure to safeguard personal information or termination of leases or other agreements, or (vii) damage our reputation among our tenants and investors generally.
We depend on key personnel; the loss of their full service could adversely affect us.
Our success depends to a significant degree upon the continued contributions of certain key personnel including, but not limited to, our executive officers, whose continued service is not guaranteed, and each of whom would be difficult to replace. Our ability to retain our management team or to attract suitable replacements should any members of the management team leave is dependent on the competitive nature of the employment market. Each executive officer may terminate his employment at any time and, under certain conditions, may receive cash severance, immediate vesting of equity awards and other benefits and may not be restricted from competing with us after their departure. The loss of services from key members of the management team or a limitation in their availability could be negatively perceived in the capital markets and may adversely impact our operating results, financial condition and cash flows. As of December 31, 2023, we have not obtained and do not expect to obtain key man life insurance on any of our key personnel. We also believe that, as we expand, our future success will depend upon our ability to hire and retain highly skilled managerial, investment, financing, operational, and marketing personnel. Competition for such personnel is intense, and we cannot assure you that we will be successful in attracting and retaining such skilled personnel.
An increased focus on metrics and reporting related to corporate responsibility, specifically related to ESG factors, may impose additional costs and expose us to new risks.
Investors and other stakeholders are focused on a variety of ESG matters and refer to rating systems developed by third party groups to compare companies. We do not participate, or may not score well, in some of these rating systems. Further, the criteria used in these rating systems change frequently, and our scores may drop as the criteria changes. We supplement our participation in these ratings systems with public disclosures regarding our ESG activities, but investors and other stakeholders may look for specific disclosures that we do not provide. Our failure to engage in certain ESG initiatives, to provide certain ESG disclosures or to participate, or score well, in certain ratings systems could result in reputational harm and could cause certain investors to be unwilling to invest in our stock, which could impair our ability to raise capital.
Our compensation plans may not be tied to or correspond with our improved financial results or the market prices for our securities, which may adversely affect us.
The compensation committee of our board of directors is responsible for overseeing our executive compensation plans. The compensation committee has significant discretion in structuring these compensation packages and may make compensation decisions based on any number of factors. As a result, compensation awards may not be tied to or correspond with improved financial results at the Company or the market prices for our securities.
Item 1B. Unresolved Staff Comments
None.
Item 1C. Cybersecurity
Introduction
We recognize the importance of maintaining the trust and confidence of our tenants, business partners and employees with respect to the integrity of our IT network and related systems. We seek to address cybersecurity risks and preserve the confidentiality, security and availability of the information collected and stored on our IT networks and related systems through a comprehensive approach focused on (i) identifying, evaluating and managing our cybersecurity risks, (ii) preventing or mitigating potential threats, and (iii) responding appropriately to security breaches, cyber-attacks, IT network failures and other incidents, if and when they occur. While risk management is primarily the responsibility of our senior management team, our board of directors plays a role in overseeing our cybersecurity risk management program. Our board of directors administers this oversight function directly and with support from its audit committee, which has been delegated the responsibility to evaluate our major financial risks, including our policies and practices to govern the process by which risk assessment and management is undertaken.
As of the date of this report, we are not aware of any cybersecurity threats, including as a result of any prior cybersecurity incidents, that have materially and adversely affected the Company (including our business strategy, results of operations or financial condition), nor are such threats reasonably likely to materially and adversely affect the same.
For additional information regarding our cybersecurity risks, see “Item 1.A. Risk Factors—Other General Risks—We face risks associated with system failures through security breaches or cyber-attacks, as well as other significant disruptions of our information technology (“IT”) networks and related systems” above.
Risk Management and Strategy
Our cybersecurity risk management program is focused on the key areas below:
•Governance. In fulfilling its oversight responsibility, our board of directors receives regular reports from our senior management team on our cybersecurity risks and exposures, infrastructure and countermeasures, and other monitoring, testing and recovery systems.
•Collaborative Approach. We use a comprehensive, cross-departmental approach for identifying, evaluating, preventing and/or mitigating cybersecurity threats and incidents, and have implemented controls and procedures that provide for the prompt escalation of significant cybersecurity incidents so that decisions regarding reporting and public disclosure of such incidents can be made in a timely manner.
•Technical Safeguards. We deploy technical safeguards intended to protect our IT networks and related systems from cybersecurity threats, including firewalls, intrusion prevention, detection and isolation systems, anti-virus and malware functionality, backup functionality. and access controls. These technical safeguards are regularly evaluated and improved through vulnerability assessments, network penetration testing and threat intelligence, including by third-party consultants, who also continually monitor our information security. Any significant developments related to our technical safeguards, including the results of any vulnerability assessments or network penetration testing, are reported to our board of directors, and we adjust our cybersecurity risk management policies and practices as necessary.
•Management of Third-Party Risks. We use a risk-based approach to evaluating cybersecurity risks presented by third parties, such as vendors, service providers, and external users of our IT networks and related systems, as well as risks related to our use of third-party systems that could adversely affect our business in the event of a cybersecurity incident centered on those systems.
•Education and Awareness. We provide regular, mandatory cybersecurity training for our employees to help them identify and avoid potential cybersecurity threats and understand our policies and guidelines related to our IT network and related systems. As part of this training program, we regularly test our employees for information security awareness, including through random electronic communications designed to simulate how a threat actor might attempt to compromise our IT network and related systems.
•Cybersecurity Insurance. We carry comprehensive cyber liability insurance coverage that covers us against claims related to certain first-party and third-party losses, including data restoration costs and crisis management expenses, subject to the policy’s coverage conditions and limitations.
Governance
Our board of directors, together with the audit committee of our board of directors, oversees our cybersecurity risk management program. In addition, the audit committee is responsible for reviewing with management the effectiveness of our internal control structure and procedures for financial reporting systems, including, among other things, our internal controls designed to assess, identify, and manage material risks from cybersecurity threats.
On regular basis, our board of directors receives a presentation on cybersecurity risks from our senior management team, which may, depending on relevance at the time of the report, address topics such as prevailing cybersecurity threats, vulnerability assessments and/or network integrity testing, infrastructure and practice updates, and other considerations applicable to our IT network and related systems and other third-party systems.
Members of management work collaboratively to develop and implement policies, practices and procedures to protect our IT networks and related systems from cybersecurity threats and to respond appropriately and timely to any cybersecurity incidents. The members of management responsible for our cybersecurity risk management program include our Vice President–Information Technology, our Chief Financial Officer, our General Counsel, our Chief Accounting Officer, our Head of Data, Analytics and Technology, and our Vice President–Financial Reporting and Accounting. Through ongoing communications from employees in each of our Data, Analytics and Technology and Information Technology departments, such members of management monitor our assessment of material cybersecurity risks, our prevention and detection of cybersecurity threats, and, if a cybersecurity incident were to occur, our mitigation and remediation of such incident.
We believe the members of our management team involved in assessing and managing material cybersecurity risks have the experience needed to perform their duties, including through education, certification, work experience or a combination thereof. For example, our Vice President–Information Technology has approximately 25 years of IT experience in various roles, the majority of which has been at publicly-reporting real estate companies. In addition, the other members of our management team identified above have from 14 years to 29 years of work experience managing risks or control environments, including experience at the Company and other professional businesses, or, as third-party advisors, helping businesses manage risks or control environments.
Item 2. Properties
As of December 31, 2023, we owned the properties in the following table.
|
|
|
|
|
|
|
|
|
|
|
|
|
|
|
|
|
|
|
|
|
|
|
|
|
|
|
| State |
|
City |
|
Number of Buildings |
|
Asset Type |
|
Total Rentable Square Feet |
| Alabama |
|
Birmingham |
|
4 |
|
Warehouse / Distribution |
|
362,916 |
|
|
Montgomery |
|
1 |
|
Warehouse / Distribution |
|
332,000 |
|
|
Moody |
|
1 |
|
Warehouse / Distribution |
|
595,346 |
|
|
Phenix City |
|
1 |
|
Warehouse / Distribution |
|
117,568 |
|
|
|
|
|
|
|
|
|
| Arkansas |
|
Bryant |
|
1 |
|
Warehouse / Distribution |
|
300,160 |
|
|
Rogers |
|
1 |
|
Warehouse / Distribution |
|
400,000 |
|
|
|
|
|
|
|
|
|
| Arizona |
|
Avondale |
|
1 |
|
Warehouse / Distribution |
|
186,643 |
|
|
Chandler |
|
1 |
|
Light Manufacturing |
|
104,352 |
|
|
Gilbert |
|
1 |
|
Warehouse / Distribution |
|
41,504 |
|
|
Mesa |
|
1 |
|
Light Manufacturing |
|
71,030 |
|
|
Tucson |
|
1 |
|
Warehouse / Distribution |
|
129,047 |
|
|
|
|
|
|
|
|
|
| California |
|
Fresno |
|
1 |
|
Warehouse / Distribution |
|
232,072 |
|
|
Hollister |
|
1 |
|
Warehouse / Distribution |
|
175,325 |
|
|
Lodi |
|
1 |
|
Warehouse / Distribution |
|
400,340 |
|
|
McClellan |
|
1 |
|
Warehouse / Distribution |
|
160,534 |
|
|
Menifee |
|
2 |
|
Warehouse/ Distribution |
|
157,146 |
|
|
Morgan Hill |
|
2 |
|
Light Manufacturing |
|
107,126 |
|
|
Rancho Cordova |
|
2 |
|
Warehouse / Distribution |
|
106,718 |
|
|
Roseville |
|
1 |
|
Warehouse / Distribution |
|
114,597 |
|
|
Sacramento |
|
7 |
|
Warehouse / Distribution |
|
846,519 |
|
|
Sacramento |
|
1 |
|
Light Manufacturing |
|
130,000 |
|
|
San Diego |
|
1 |
|
Warehouse / Distribution |
|
205,440 |
|
|
Stockton |
|
3 |
|
Warehouse / Distribution |
|
263,716 |
|
|
West Sacramento |
|
1 |
|
Warehouse / Distribution |
|
236,716 |
|
|
|
|
|
|
|
|
|
| Colorado |
|
Grand Junction |
|
1 |
|
Warehouse / Distribution |
|
82,800 |
|
|
Johnstown |
|
1 |
|
Warehouse / Distribution |
|
132,194 |
|
|
Longmont |
|
1 |
|
Light Manufacturing |
|
64,750 |
|
|
Loveland |
|
2 |
|
Warehouse / Distribution |
|
195,674 |
|
|
|
|
|
|
|
|
|
| Connecticut |
|
East Windsor |
|
2 |
|
Warehouse / Distribution |
|
271,111 |
|
|
Milford |
|
2 |
|
Warehouse / Distribution |
|
367,700 |
|
|
North Haven |
|
3 |
|
Warehouse / Distribution |
|
824,727 |
|
|
Wallingford |
|
1 |
|
Warehouse / Distribution |
|
105,000 |
|
|
|
|
|
|
|
|
|
| Delaware |
|
New Castle |
|
1 |
|
Warehouse / Distribution |
|
485,987 |
|
|
|
|
|
|
|
|
|
| Florida |
|
Daytona Beach |
|
1 |
|
Light Manufacturing |
|
142,857 |
|
|
Fort Myers |
|
1 |
|
Warehouse / Distribution |
|
260,620 |
|
|
Jacksonville |
|
5 |
|
Warehouse / Distribution |
|
1,256,750 |
|
|
Lake Worth |
|
2 |
|
Warehouse / Distribution |
|
157,758 |
|
|
Lake Worth |
|
1 |
|
Light Manufacturing |
|
42,158 |
|
|
Lakeland |
|
1 |
|
Warehouse / Distribution |
|
215,280 |
|
|
Orlando |
|
1 |
|
Warehouse / Distribution |
|
155,000 |
|
|
Orlando |
|
1 |
|
Light Manufacturing |
|
215,900 |
|
|
Tampa |
|
1 |
|
Warehouse / Distribution |
|
78,560 |
|
|
West Palm Beach |
|
1 |
|
Light Manufacturing |
|
112,353 |
|
|
|
|
|
|
|
|
|
| Georgia |
|
Atlanta |
|
1 |
|
Warehouse / Distribution |
|
175,532 |
|
|
Augusta |
|
1 |
|
Warehouse / Distribution |
|
203,726 |
|
|
Buford |
|
1 |
|
Warehouse / Distribution |
|
103,720 |
|
|
Calhoun |
|
1 |
|
Warehouse / Distribution |
|
151,200 |
|
|
Dallas |
|
1 |
|
Warehouse / Distribution |
|
92,807 |
|
|
Forest Park |
|
1 |
|
Warehouse / Distribution |
|
373,900 |
|
|
Lithonia |
|
1 |
|
Warehouse / Distribution |
|
210,858 |
|
|
|
|
|
|
|
|
|
|
|
|
|
|
|
|
|
|
|
|
|
|
|
|
|
|
|
| State |
|
City |
|
Number of Buildings |
|
Asset Type |
|
Total Rentable Square Feet |
|
|
Norcross |
|
1 |
|
Warehouse / Distribution |
|
152,036 |
|
|
Savannah |
|
1 |
|
Warehouse / Distribution |
|
504,300 |
|
|
Shannon |
|
1 |
|
Warehouse / Distribution |
|
568,516 |
|
|
Smyrna |
|
1 |
|
Warehouse / Distribution |
|
102,000 |
|
|
Statham |
|
1 |
|
Warehouse / Distribution |
|
225,692 |
|
|
Stone Mountain |
|
1 |
|
Warehouse / Distribution |
|
78,000 |
|
|
|
|
|
|
|
|
|
| Iowa |
|
Ankeny |
|
2 |
|
Warehouse / Distribution |
|
400,968 |
|
|
Council Bluffs |
|
1 |
|
Warehouse / Distribution |
|
90,000 |
|
|
Des Moines |
|
2 |
|
Warehouse / Distribution |
|
301,381 |
|
|
Marion |
|
1 |
|
Warehouse / Distribution |
|
95,500 |
|
|
|
|
|
|
|
|
|
| Idaho |
|
Idaho Falls |
|
1 |
|
Warehouse / Distribution |
|
78,690 |
|
|
|
|
|
|
|
|
|
| Illinois |
|
Bartlett |
|
1 |
|
Warehouse / Distribution |
|
207,575 |
|
|
Batavia |
|
2 |
|
Warehouse / Distribution |
|
204,642 |
|
|
Batavia |
|
1 |
|
Light Manufacturing |
|
56,676 |
|
|
Belvidere |
|
6 |
|
Warehouse / Distribution |
|
1,069,222 |
|
|
Cary |
|
1 |
|
Warehouse / Distribution |
|
79,049 |
|
|
Crystal Lake |
|
4 |
|
Warehouse / Distribution |
|
506,096 |
|
|
Elgin |
|
2 |
|
Warehouse / Distribution |
|
383,856 |
|
|
Elgin |
|
1 |
|
Light Manufacturing |
|
41,007 |
|
|
Elmhurst |
|
1 |
|
Warehouse / Distribution |
|
72,499 |
|
|
Gurnee |
|
1 |
|
Warehouse / Distribution |
|
338,740 |
|
|
Harvard |
|
1 |
|
Light Manufacturing |
|
126,304 |
|
|
Hodgkins |
|
2 |
|
Warehouse / Distribution |
|
518,109 |
|
|
Itasca |
|
3 |
|
Warehouse / Distribution |
|
311,355 |
|
|
Lisle |
|
1 |
|
Light Manufacturing |
|
105,925 |
|
|
Machesney Park |
|
1 |
|
Warehouse / Distribution |
|
80,000 |
|
|
McHenry |
|
2 |
|
Warehouse / Distribution |
|
169,311 |
|
|
Montgomery |
|
1 |
|
Warehouse / Distribution |
|
584,301 |
|
|
Saint Charles |
|
1 |
|
Light Manufacturing |
|
102,000 |
|
|
Sauk Village |
|
1 |
|
Warehouse / Distribution |
|
375,785 |
|
|
Schaumburg |
|
1 |
|
Warehouse / Distribution |
|
67,817 |
|
|
St. Charles |
|
1 |
|
Light Manufacturing |
|
115,491 |
|
|
Vernon Hills |
|
1 |
|
Warehouse / Distribution |
|
95,486 |
|
|
Waukegan |
|
1 |
|
Warehouse / Distribution |
|
131,252 |
|
|
West Chicago |
|
2 |
|
Warehouse / Distribution |
|
649,558 |
|
|
West Chicago |
|
5 |
|
Light Manufacturing |
|
305,874 |
|
|
West Dundee |
|
1 |
|
Warehouse / Distribution |
|
154,475 |
|
|
Wood Dale |
|
1 |
|
Light Manufacturing |
|
137,607 |
|
|
|
|
|
|
|
|
|
| Indiana |
|
Albion |
|
1 |
|
Light Manufacturing |
|
37,578 |
|
|
Elkhart |
|
2 |
|
Warehouse / Distribution |
|
170,100 |
|
|
Fort Wayne |
|
1 |
|
Warehouse / Distribution |
|
108,800 |
|
|
Goshen |
|
1 |
|
Warehouse / Distribution |
|
366,000 |
|
|
Greenwood |
|
1 |
|
Warehouse / Distribution |
|
154,440 |
|
|
Indianapolis |
|
1 |
|
Warehouse / Distribution |
|
78,600 |
|
|
Jeffersonville |
|
1 |
|
Warehouse / Distribution |
|
563,032 |
|
|
Lafayette |
|
3 |
|
Warehouse / Distribution |
|
466,400 |
|
|
Lebanon |
|
3 |
|
Warehouse / Distribution |
|
2,230,323 |
|
|
Marion |
|
1 |
|
Warehouse / Distribution |
|
249,920 |
|
|
Portage |
|
2 |
|
Warehouse / Distribution |
|
786,249 |
|
|
South Bend |
|
1 |
|
Warehouse / Distribution |
|
225,000 |
|
|
Whitestown |
|
1 |
|
Warehouse / Distribution |
|
258,000 |
|
|
Yoder |
|
1 |
|
Warehouse / Distribution |
|
764,177 |
|
|
|
|
|
|
|
|
|
| Kansas |
|
Edwardsville |
|
1 |
|
Warehouse / Distribution |
|
270,869 |
|
|
Lenexa |
|
3 |
|
Warehouse / Distribution |
|
581,059 |
|
|
Olathe |
|
2 |
|
Warehouse / Distribution |
|
725,839 |
|
|
Wichita |
|
3 |
|
Warehouse / Distribution |
|
248,550 |
|
|
|
|
|
|
|
|
|
|
|
|
|
|
|
|
|
|
|
|
|
|
|
|
|
|
|
| State |
|
City |
|
Number of Buildings |
|
Asset Type |
|
Total Rentable Square Feet |
|
|
|
|
|
|
|
|
|
| Kentucky |
|
Bardstown |
|
1 |
|
Warehouse / Distribution |
|
102,318 |
|
|
Danville |
|
1 |
|
Warehouse / Distribution |
|
757,047 |
|
|
Erlanger |
|
1 |
|
Warehouse / Distribution |
|
108,620 |
|
|
Florence |
|
2 |
|
Warehouse / Distribution |
|
641,136 |
|
|
Hebron |
|
1 |
|
Warehouse / Distribution |
|
109,000 |
|
|
|
|
|
|
|
|
|
| Louisiana |
|
Baton Rouge |
|
3 |
|
Warehouse / Distribution |
|
532,036 |
|
|
Shreveport |
|
1 |
|
Warehouse / Distribution |
|
420,259 |
|
|
|
|
|
|
|
|
|
| Massachusetts |
|
Chicopee |
|
1 |
|
Warehouse / Distribution |
|
217,000 |
|
|
Hudson |
|
1 |
|
Light Manufacturing |
|
128,000 |
|
|
Malden |
|
2 |
|
Light Manufacturing |
|
109,943 |
|
|
Middleborough |
|
1 |
|
Light Manufacturing |
|
80,100 |
|
|
Norton |
|
1 |
|
Warehouse / Distribution |
|
200,000 |
|
|
South Easton |
|
1 |
|
Light Manufacturing |
|
86,000 |
|
|
Sterling |
|
1 |
|
Warehouse / Distribution |
|
119,056 |
|
|
Stoughton |
|
2 |
|
Warehouse / Distribution |
|
258,213 |
|
|
Westborough |
|
1 |
|
Warehouse / Distribution |
|
121,700 |
|
|
|
|
|
|
|
|
|
| Maryland |
|
Elkridge |
|
1 |
|
Warehouse / Distribution |
|
167,223 |
|
|
Hagerstown |
|
3 |
|
Warehouse / Distribution |
|
1,424,620 |
|
|
Hampstead |
|
1 |
|
Warehouse / Distribution |
|
1,035,249 |
|
|
Hunt Valley |
|
1 |
|
Warehouse / Distribution |
|
46,867 |
|
|
White Marsh |
|
1 |
|
Warehouse / Distribution |
|
103,564 |
|
|
|
|
|
|
|
|
|
| Maine |
|
Biddeford |
|
2 |
|
Warehouse / Distribution |
|
265,126 |
|
|
Gardiner |
|
1 |
|
Warehouse / Distribution |
|
265,000 |
|
|
Lewiston |
|
1 |
|
Flex Office |
|
60,000 |
|
|
Portland |
|
1 |
|
Warehouse / Distribution |
|
100,600 |
|
|
|
|
|
|
|
|
|
| Michigan |
|
Belleville |
|
1 |
|
Light Manufacturing |
|
160,464 |
|
|
Canton |
|
1 |
|
Warehouse / Distribution |
|
491,049 |
|
|
Chesterfield |
|
4 |
|
Warehouse / Distribution |
|
478,803 |
|
|
Grand Rapids |
|
4 |
|
Warehouse / Distribution |
|
656,262 |
|
|
Holland |
|
1 |
|
Warehouse / Distribution |
|
195,000 |
|
|
Kentwood |
|
2 |
|
Warehouse / Distribution |
|
370,020 |
|
|
Kentwood |
|
1 |
|
Light Manufacturing |
|
85,157 |
|
|
Lansing |
|
4 |
|
Warehouse / Distribution |
|
770,425 |
|
|
Livonia |
|
2 |
|
Warehouse / Distribution |
|
285,306 |
|
|
Marshall |
|
1 |
|
Light Manufacturing |
|
57,025 |
|
|
Novi |
|
3 |
|
Warehouse / Distribution |
|
685,010 |
|
|
Plymouth |
|
1 |
|
Warehouse / Distribution |
|
125,214 |
|
|
Redford |
|
1 |
|
Warehouse / Distribution |
|
138,912 |
|
|
Romulus |
|
1 |
|
Warehouse / Distribution |
|
303,760 |
|
|
Romulus |
|
1 |
|
Light Manufacturing |
|
274,500 |
|
|
Sterling Heights |
|
1 |
|
Warehouse / Distribution |
|
108,000 |
|
|
Walker |
|
1 |
|
Warehouse / Distribution |
|
210,000 |
|
|
Warren |
|
4 |
|
Warehouse / Distribution |
|
981,540 |
|
|
Wixom |
|
1 |
|
Warehouse / Distribution |
|
126,720 |
|
|
Zeeland |
|
1 |
|
Warehouse / Distribution |
|
230,200 |
|
|
|
|
|
|
|
|
|
| Minnesota |
|
Blaine |
|
1 |
|
Warehouse / Distribution |
|
248,816 |
|
|
Bloomington |
|
1 |
|
Light Manufacturing |
|
145,351 |
|
|
Brooklyn Park |
|
1 |
|
Warehouse / Distribution |
|
200,720 |
|
|
Carlos |
|
1 |
|
Light Manufacturing |
|
196,270 |
|
|
Eagan |
|
1 |
|
Warehouse / Distribution |
|
276,550 |
|
|
Inver Grove Heigh |
|
1 |
|
Warehouse / Distribution |
|
80,655 |
|
|
Maple Grove |
|
2 |
|
Warehouse / Distribution |
|
207,875 |
|
|
Mendota Heights |
|
1 |
|
Warehouse / Distribution |
|
87,183 |
|
|
New Hope |
|
1 |
|
Light Manufacturing |
|
107,348 |
|
|
|
|
|
|
|
|
|
|
|
|
|
|
|
|
|
|
|
|
|
|
|
|
|
|
|
| State |
|
City |
|
Number of Buildings |
|
Asset Type |
|
Total Rentable Square Feet |
|
|
Newport |
|
1 |
|
Warehouse / Distribution |
|
83,000 |
|
|
Oakdale |
|
2 |
|
Warehouse / Distribution |
|
210,044 |
|
|
Plymouth |
|
3 |
|
Warehouse / Distribution |
|
357,085 |
|
|
Savage |
|
1 |
|
Warehouse / Distribution |
|
244,050 |
|
|
Shakopee |
|
1 |
|
Warehouse / Distribution |
|
160,000 |
|
|
Shakopee |
|
1 |
|
Light Manufacturing |
|
136,589 |
|
|
South Saint Paul |
|
1 |
|
Warehouse / Distribution |
|
422,727 |
|
|
St. Paul |
|
1 |
|
Warehouse / Distribution |
|
316,636 |
|
|
|
|
|
|
|
|
|
| Missouri |
|
Berkeley |
|
1 |
|
Warehouse / Distribution |
|
121,223 |
|
|
Earth City |
|
1 |
|
Warehouse / Distribution |
|
116,783 |
|
|
Fenton |
|
1 |
|
Warehouse / Distribution |
|
127,464 |
|
|
Hazelwood |
|
1 |
|
Warehouse / Distribution |
|
305,550 |
|
|
Kansas City |
|
1 |
|
Warehouse / Distribution |
|
702,000 |
|
|
O’Fallon |
|
2 |
|
Warehouse / Distribution |
|
186,854 |
|
|
|
|
|
|
|
|
|
| Mississippi |
|
Southaven |
|
1 |
|
Warehouse / Distribution |
|
556,600 |
|
|
|
|
|
|
|
|
|
| North Carolina |
|
Catawba |
|
1 |
|
Warehouse / Distribution |
|
137,785 |
|
|
Charlotte |
|
3 |
|
Warehouse / Distribution |
|
243,880 |
|
|
Durham |
|
1 |
|
Warehouse / Distribution |
|
80,600 |
|
|
Garner |
|
1 |
|
Warehouse / Distribution |
|
150,000 |
|
|
Greensboro |
|
2 |
|
Warehouse / Distribution |
|
261,909 |
|
|
Huntersville |
|
1 |
|
Warehouse / Distribution |
|
185,570 |
|
|
Lexington |
|
1 |
|
Warehouse / Distribution |
|
201,800 |
|
|
Mebane |
|
2 |
|
Warehouse / Distribution |
|
606,840 |
|
|
Mebane |
|
1 |
|
Light Manufacturing |
|
202,691 |
|
|
Mocksville |
|
1 |
|
Warehouse / Distribution |
|
129,600 |
|
|
Mooresville |
|
2 |
|
Warehouse / Distribution |
|
799,200 |
|
|
Mountain Home |
|
1 |
|
Warehouse / Distribution |
|
146,014 |
|
|
Newton |
|
1 |
|
Warehouse / Distribution |
|
217,200 |
|
|
Pineville |
|
1 |
|
Light Manufacturing |
|
75,400 |
|
|
Rural Hall |
|
1 |
|
Warehouse / Distribution |
|
250,000 |
|
|
Salisbury |
|
1 |
|
Warehouse / Distribution |
|
288,000 |
|
|
Smithfield |
|
1 |
|
Warehouse / Distribution |
|
307,845 |
|
|
Troutman |
|
1 |
|
Warehouse / Distribution |
|
301,000 |
|
|
Winston-Salem |
|
1 |
|
Warehouse / Distribution |
|
385,000 |
|
|
Youngsville |
|
1 |
|
Warehouse / Distribution |
|
365,000 |
|
|
|
|
|
|
|
|
|
| Nebraska |
|
Bellevue |
|
1 |
|
Warehouse / Distribution |
|
370,000 |
|
|
La Vista |
|
1 |
|
Warehouse / Distribution |
|
178,368 |
|
|
Omaha |
|
5 |
|
Warehouse / Distribution |
|
464,558 |
|
|
|
|
|
|
|
|
|
| New Hampshire |
|
Londonderry |
|
1 |
|
Warehouse / Distribution |
|
125,060 |
|
|
Nashua |
|
1 |
|
Warehouse / Distribution |
|
337,391 |
|
|
|
|
|
|
|
|
|
| New Jersey |
|
Branchburg |
|
1 |
|
Warehouse / Distribution |
|
113,973 |
|
|
Burlington |
|
2 |
|
Warehouse / Distribution |
|
756,990 |
|
|
Franklin Township |
|
1 |
|
Warehouse / Distribution |
|
183,000 |
|
|
Lumberton |
|
1 |
|
Light Manufacturing |
|
120,000 |
|
|
Moorestown |
|
2 |
|
Warehouse / Distribution |
|
187,569 |
|
|
Mt. Laurel |
|
1 |
|
Warehouse / Distribution |
|
112,294 |
|
|
Pedricktown |
|
1 |
|
Warehouse / Distribution |
|
247,220 |
|
|
Piscataway |
|
1 |
|
Warehouse / Distribution |
|
101,381 |
|
|
Swedesboro |
|
1 |
|
Warehouse / Distribution |
|
123,962 |
|
|
Westampton |
|
1 |
|
Warehouse / Distribution |
|
189,434 |
|
|
|
|
|
|
|
|
|
| New Mexico |
|
Santa Teresa |
|
1 |
|
Warehouse / Distribution |
|
92,325 |
|
|
|
|
|
|
|
|
|
| Nevada |
|
Fernley |
|
1 |
|
Light Manufacturing |
|
183,435 |
|
|
Las Vegas |
|
1 |
|
Warehouse / Distribution |
|
34,916 |
|
|
|
|
|
|
|
|
|
|
|
|
|
|
|
|
|
|
|
|
|
|
|
|
|
|
|
| State |
|
City |
|
Number of Buildings |
|
Asset Type |
|
Total Rentable Square Feet |
|
|
Las Vegas |
|
1 |
|
Light Manufacturing |
|
122,472 |
|
|
Paradise |
|
2 |
|
Light Manufacturing |
|
80,422 |
|
|
Reno |
|
1 |
|
Light Manufacturing |
|
87,264 |
|
|
Sparks |
|
2 |
|
Warehouse / Distribution |
|
326,986 |
|
|
|
|
|
|
|
|
|
| New York |
|
Buffalo |
|
1 |
|
Warehouse / Distribution |
|
117,000 |
|
|
Cheektowaga |
|
1 |
|
Warehouse / Distribution |
|
121,760 |
|
|
Farmington |
|
1 |
|
Warehouse / Distribution |
|
149,657 |
|
|
Gloversville |
|
3 |
|
Warehouse / Distribution |
|
211,554 |
|
|
Johnstown |
|
2 |
|
Warehouse / Distribution |
|
117,102 |
|
|
Johnstown |
|
1 |
|
Light Manufacturing |
|
42,325 |
|
|
Rochester |
|
2 |
|
Warehouse / Distribution |
|
252,860 |
|
|
Ronkonkoma |
|
1 |
|
Warehouse / Distribution |
|
64,224 |
|
|
|
|
|
|
|
|
|
| Ohio |
|
Bedford Heights |
|
1 |
|
Warehouse / Distribution |
|
173,034 |
|
|
Boardman |
|
1 |
|
Warehouse / Distribution |
|
176,930 |
|
|
Canal Winchester |
|
2 |
|
Warehouse / Distribution |
|
814,265 |
|
|
Columbus |
|
4 |
|
Warehouse / Distribution |
|
1,486,450 |
|
|
Dayton |
|
1 |
|
Warehouse / Distribution |
|
205,761 |
|
|
Etna |
|
1 |
|
Warehouse / Distribution |
|
1,232,149 |
|
|
Fairborn |
|
1 |
|
Warehouse / Distribution |
|
259,369 |
|
|
Fairfield |
|
2 |
|
Warehouse / Distribution |
|
364,948 |
|
|
Gahanna |
|
1 |
|
Warehouse / Distribution |
|
383,000 |
|
|
Groveport |
|
1 |
|
Warehouse / Distribution |
|
320,657 |
|
|
Hilliard |
|
1 |
|
Warehouse / Distribution |
|
237,500 |
|
|
Macedonia |
|
2 |
|
Warehouse / Distribution |
|
338,297 |
|
|
Maple Heights |
|
1 |
|
Warehouse / Distribution |
|
170,000 |
|
|
Mason |
|
1 |
|
Light Manufacturing |
|
116,200 |
|
|
North Jackson |
|
2 |
|
Warehouse / Distribution |
|
518,758 |
|
|
Oakwood Village |
|
1 |
|
Warehouse / Distribution |
|
75,000 |
|
|
Salem |
|
1 |
|
Light Manufacturing |
|
271,000 |
|
|
Seville |
|
1 |
|
Warehouse / Distribution |
|
75,000 |
|
|
Streetsboro |
|
1 |
|
Warehouse / Distribution |
|
343,416 |
|
|
Strongsville |
|
2 |
|
Warehouse / Distribution |
|
341,561 |
|
|
Toledo |
|
1 |
|
Warehouse / Distribution |
|
177,500 |
|
|
Twinsburg |
|
2 |
|
Warehouse / Distribution |
|
426,974 |
|
|
West Chester |
|
1 |
|
Warehouse / Distribution |
|
269,868 |
|
|
West Jefferson |
|
1 |
|
Warehouse / Distribution |
|
857,390 |
|
|
|
|
|
|
|
|
|
| Oklahoma |
|
Oklahoma City |
|
2 |
|
Warehouse / Distribution |
|
303,740 |
|
|
Tulsa |
|
2 |
|
Warehouse / Distribution |
|
309,600 |
|
|
|
|
|
|
|
|
|
| Oregon |
|
Beaverton |
|
2 |
|
Warehouse / Distribution |
|
121,426 |
|
|
Salem |
|
2 |
|
Light Manufacturing |
|
155,900 |
|
|
Wilsonville |
|
1 |
|
Warehouse / Distribution |
|
78,000 |
|
|
|
|
|
|
|
|
|
| Pennsylvania |
|
Allentown |
|
4 |
|
Warehouse / Distribution |
|
514,134 |
|
|
Burgettstown |
|
1 |
|
Warehouse / Distribution |
|
455,000 |
|
|
Charleroi |
|
1 |
|
Warehouse / Distribution |
|
119,161 |
|
|
Clinton |
|
7 |
|
Warehouse / Distribution |
|
1,531,972 |
|
|
Croydon |
|
1 |
|
Warehouse / Distribution |
|
101,869 |
|
|
Elizabethtown |
|
1 |
|
Warehouse / Distribution |
|
206,236 |
|
|
Export |
|
1 |
|
Warehouse / Distribution |
|
138,270 |
|
|
Hazleton |
|
1 |
|
Warehouse / Distribution |
|
589,580 |
|
|
Imperial |
|
1 |
|
Warehouse / Distribution |
|
315,634 |
|
|
Kulpsville |
|
1 |
|
Warehouse / Distribution |
|
152,625 |
|
|
Lancaster |
|
1 |
|
Warehouse / Distribution |
|
240,528 |
|
|
Langhorne |
|
2 |
|
Warehouse / Distribution |
|
180,000 |
|
|
Langhorne |
|
2 |
|
Light Manufacturing |
|
287,647 |
|
|
Lebanon |
|
1 |
|
Warehouse / Distribution |
|
211,358 |
|
|
Mechanicsburg |
|
3 |
|
Warehouse / Distribution |
|
747,054 |
|
|
|
|
|
|
|
|
|
|
|
|
|
|
|
|
|
|
|
|
|
|
|
|
|
|
|
| State |
|
City |
|
Number of Buildings |
|
Asset Type |
|
Total Rentable Square Feet |
|
|
Muhlenberg Township |
|
1 |
|
Warehouse / Distribution |
|
392,107 |
|
|
New Galilee |
|
1 |
|
Warehouse / Distribution |
|
410,389 |
|
|
New Kensington |
|
1 |
|
Warehouse / Distribution |
|
200,500 |
|
|
New Kingstown |
|
1 |
|
Warehouse / Distribution |
|
330,000 |
|
|
O’Hara Township |
|
1 |
|
Warehouse / Distribution |
|
887,084 |
|
|
Pittston |
|
1 |
|
Warehouse / Distribution |
|
437,446 |
|
|
Reading |
|
1 |
|
Warehouse / Distribution |
|
248,000 |
|
|
Warrendale |
|
1 |
|
Warehouse / Distribution |
|
179,394 |
|
|
York |
|
5 |
|
Warehouse / Distribution |
|
1,306,834 |
|
|
|
|
|
|
|
|
|
| South Carolina |
|
Columbia |
|
1 |
|
Light Manufacturing |
|
185,600 |
|
|
Duncan |
|
3 |
|
Warehouse / Distribution |
|
996,841 |
|
|
Edgefield |
|
1 |
|
Light Manufacturing |
|
126,190 |
|
|
Fountain Inn |
|
2 |
|
Warehouse / Distribution |
|
442,472 |
|
|
Fountain Inn |
|
1 |
|
Light Manufacturing |
|
203,888 |
|
|
Gaffney |
|
1 |
|
Warehouse / Distribution |
|
226,968 |
|
|
Goose Creek |
|
1 |
|
Warehouse / Distribution |
|
500,355 |
|
|
Greenwood |
|
2 |
|
Light Manufacturing |
|
175,055 |
|
|
Greer |
|
6 |
|
Warehouse / Distribution |
|
654,935 |
|
|
Laurens |
|
1 |
|
Warehouse / Distribution |
|
125,000 |
|
|
Piedmont |
|
7 |
|
Warehouse / Distribution |
|
1,387,556 |
|
|
Rock Hill |
|
3 |
|
Warehouse / Distribution |
|
720,120 |
|
|
Simpsonville |
|
3 |
|
Warehouse / Distribution |
|
1,138,494 |
|
|
Spartanburg |
|
9 |
|
Warehouse / Distribution |
|
1,802,623 |
|
|
Summerville |
|
1 |
|
Warehouse / Distribution |
|
88,583 |
|
|
Wellford |
|
1 |
|
Warehouse / Distribution |
|
233,433 |
|
|
West Columbia |
|
6 |
|
Warehouse / Distribution |
|
1,163,822 |
|
|
West Columbia |
|
1 |
|
Light Manufacturing |
|
464,206 |
|
|
|
|
|
|
|
|
|
| Tennessee |
|
Chattanooga |
|
3 |
|
Warehouse / Distribution |
|
646,200 |
|
|
Cleveland |
|
1 |
|
Warehouse / Distribution |
|
151,704 |
|
|
Clinton |
|
1 |
|
Warehouse / Distribution |
|
166,000 |
|
|
Jackson |
|
1 |
|
Warehouse / Distribution |
|
267,391 |
|
|
Knoxville |
|
2 |
|
Warehouse / Distribution |
|
335,310 |
|
|
Knoxville |
|
1 |
|
Light Manufacturing |
|
106,000 |
|
|
Lebanon |
|
2 |
|
Warehouse / Distribution |
|
407,552 |
|
|
Loudon |
|
1 |
|
Warehouse / Distribution |
|
104,074 |
|
|
Madison |
|
1 |
|
Warehouse / Distribution |
|
418,406 |
|
|
Mascot |
|
1 |
|
Warehouse / Distribution |
|
130,560 |
|
|
Mascot |
|
1 |
|
Light Manufacturing |
|
190,560 |
|
|
Memphis |
|
2 |
|
Warehouse / Distribution |
|
1,331,075 |
|
|
Murfreesboro |
|
2 |
|
Warehouse / Distribution |
|
212,312 |
|
|
Nashville |
|
1 |
|
Warehouse / Distribution |
|
154,485 |
|
|
Vonore |
|
1 |
|
Warehouse / Distribution |
|
342,700 |
|
|
|
|
|
|
|
|
|
| Texas |
|
Arlington |
|
2 |
|
Warehouse / Distribution |
|
290,324 |
|
|
Cedar Hill |
|
1 |
|
Warehouse / Distribution |
|
420,000 |
|
|
Conroe |
|
1 |
|
Warehouse / Distribution |
|
252,662 |
|
|
El Paso |
|
12 |
|
Warehouse / Distribution |
|
2,413,344 |
|
|
Garland |
|
1 |
|
Light Manufacturing |
|
253,900 |
|
|
Grapevine |
|
2 |
|
Warehouse / Distribution |
|
202,140 |
|
|
Houston |
|
8 |
|
Warehouse / Distribution |
|
999,124 |
|
|
Houston |
|
2 |
|
Light Manufacturing |
|
412,935 |
|
|
Humble |
|
1 |
|
Warehouse / Distribution |
|
289,200 |
|
|
Irving |
|
1 |
|
Warehouse / Distribution |
|
120,900 |
|
|
Katy |
|
2 |
|
Warehouse / Distribution |
|
244,903 |
|
|
Laredo |
|
2 |
|
Warehouse / Distribution |
|
462,658 |
|
|
McAllen |
|
1 |
|
Warehouse / Distribution |
|
301,200 |
|
|
Mission |
|
1 |
|
Warehouse / Distribution |
|
270,084 |
|
|
Rockwall |
|
1 |
|
Warehouse / Distribution |
|
389,546 |
|
|
Stafford |
|
1 |
|
Warehouse / Distribution |
|
68,300 |
|
|
|
|
|
|
|
|
|
|
|
|
|
|
|
|
|
|
|
|
|
|
|
|
|
|
|
| State |
|
City |
|
Number of Buildings |
|
Asset Type |
|
Total Rentable Square Feet |
|
|
Waco |
|
1 |
|
Warehouse / Distribution |
|
66,400 |
|
|
|
|
|
|
|
|
|
| Utah |
|
Provo |
|
1 |
|
Warehouse / Distribution |
|
177,071 |
|
|
|
|
|
|
|
|
|
| Virginia |
|
Chester |
|
1 |
|
Warehouse / Distribution |
|
100,000 |
|
|
Fredericksburg |
|
1 |
|
Warehouse / Distribution |
|
140,555 |
|
|
Harrisonburg |
|
1 |
|
Warehouse / Distribution |
|
357,673 |
|
|
Independence |
|
1 |
|
Warehouse / Distribution |
|
120,000 |
|
|
N. Chesterfield |
|
1 |
|
Warehouse / Distribution |
|
109,520 |
|
|
Norfolk |
|
1 |
|
Warehouse / Distribution |
|
102,512 |
|
|
Richmond |
|
1 |
|
Light Manufacturing |
|
78,128 |
|
|
|
|
|
|
|
|
|
| Washington |
|
Ridgefield |
|
1 |
|
Warehouse / Distribution |
|
141,400 |
|
|
|
|
|
|
|
|
|
| Wisconsin |
|
Appleton |
|
1 |
|
Warehouse / Distribution |
|
152,000 |
|
|
Caledonia |
|
1 |
|
Light Manufacturing |
|
53,680 |
|
|
Cudahy |
|
1 |
|
Warehouse / Distribution |
|
128,000 |
|
|
De Pere |
|
1 |
|
Warehouse / Distribution |
|
200,000 |
|
|
DeForest |
|
1 |
|
Warehouse / Distribution |
|
262,521 |
|
|
Delavan |
|
2 |
|
Light Manufacturing |
|
146,400 |
|
|
East Troy |
|
1 |
|
Warehouse / Distribution |
|
149,624 |
|
|
Elkhorn |
|
1 |
|
Warehouse / Distribution |
|
111,000 |
|
|
Elkhorn |
|
1 |
|
Light Manufacturing |
|
78,540 |
|
|
Franklin |
|
1 |
|
Warehouse / Distribution |
|
156,482 |
|
|
Germantown |
|
4 |
|
Warehouse / Distribution |
|
520,163 |
|
|
Hartland |
|
1 |
|
Warehouse / Distribution |
|
121,050 |
|
|
Hudson |
|
1 |
|
Warehouse / Distribution |
|
139,875 |
|
|
Janesville |
|
1 |
|
Warehouse / Distribution |
|
700,000 |
|
|
Kenosha |
|
1 |
|
Light Manufacturing |
|
175,052 |
|
|
Madison |
|
2 |
|
Warehouse / Distribution |
|
283,000 |
|
|
Mayville |
|
1 |
|
Light Manufacturing |
|
339,179 |
|
|
Mukwonago |
|
1 |
|
Warehouse / Distribution |
|
157,438 |
|
|
Muskego |
|
1 |
|
Warehouse / Distribution |
|
81,230 |
|
|
New Berlin |
|
3 |
|
Warehouse / Distribution |
|
590,663 |
|
|
|
Oak Creek |
|
2 |
|
Warehouse / Distribution |
|
232,144 |
|
|
Pewaukee |
|
2 |
|
Warehouse / Distribution |
|
288,201 |
|
|
Pleasant Prairie |
|
1 |
|
Warehouse / Distribution |
|
291,599 |
|
|
Pleasant Prairie |
|
1 |
|
Light Manufacturing |
|
105,637 |
|
|
Sun Prairie |
|
1 |
|
Warehouse / Distribution |
|
427,000 |
|
|
West Allis |
|
4 |
|
Warehouse / Distribution |
|
243,478 |
|
|
Yorkville |
|
1 |
|
Warehouse / Distribution |
|
98,151 |
|
|
Total |
|
569 |
|
|
|
112,271,592 |
Not reflected in the table above are six buildings under development.
As of December 31, 2023, one of our 569 buildings was encumbered by mortgage indebtedness totaling approximately $4.5 million (excluding unamortized deferred financing fees, debt issuance costs, and fair market value premiums or discounts). See Note 4 in the accompanying Notes to the Consolidated Financial Statements and the accompanying Schedule III for additional information.
Top Markets
The following table summarizes information about the 20 largest markets in our portfolio based on total annualized base rental revenue as of December 31, 2023.
|
|
|
|
|
|
|
|
|
|
|
|
|
Top 20 Markets(1) |
|
|
|
|
|
% of Total Annualized Base Rental Revenue |
| Chicago, IL |
|
|
|
|
|
6.9 |
% |
| Greenville, SC |
|
|
|
|
|
5.4 |
% |
| Pittsburgh, PA |
|
|
|
|
|
4.1 |
% |
| Detroit, MI |
|
|
|
|
|
4.1 |
% |
| Columbus, OH |
|
|
|
|
|
3.7 |
% |
| Minneapolis, MN |
|
|
|
|
|
3.6 |
% |
| South Central, PA |
|
|
|
|
|
3.3 |
% |
| Philadelphia, PA |
|
|
|
|
|
3.2 |
% |
| Houston, TX |
|
|
|
|
|
2.6 |
% |
| El Paso, TX |
|
|
|
|
|
2.4 |
% |
| Milwaukee, WI |
|
|
|
|
|
2.2 |
% |
| Charlotte, NC |
|
|
|
|
|
2.1 |
% |
| Indianapolis, IN |
|
|
|
|
|
2.1 |
% |
| Sacramento, CA |
|
|
|
|
|
1.9 |
% |
| Cleveland, OH |
|
|
|
|
|
1.8 |
% |
| Boston, MA |
|
|
|
|
|
1.7 |
% |
| Kansas City, MO |
|
|
|
|
|
1.7 |
% |
| Columbia, SC |
|
|
|
|
|
1.5 |
% |
| Grand Rapids, MI |
|
|
|
|
|
1.5 |
% |
| Cincinnati, OH |
|
|
|
|
|
1.3 |
% |
| Total |
|
|
|
|
|
57.1 |
% |
(1) Market classification based on CBRE-EA industrial market geographies.
Top Industries
The following table summarizes information about the 20 largest tenant industries in our portfolio based on total annualized base rental revenue as of December 31, 2023.
|
|
|
|
|
|
|
|
|
|
|
|
|
|
|
Top 20 Tenant Industries(1) |
|
|
|
|
|
|
|
% of Total
Annualized Base Rental Revenue |
| Air Freight & Logistics |
|
|
|
|
|
|
|
11.0 |
% |
| Containers & Packaging |
|
|
|
|
|
|
|
8.1 |
% |
| Automobile Components |
|
|
|
|
|
|
|
7.1 |
% |
| Machinery |
|
|
|
|
|
|
|
6.0 |
% |
| Commercial Services & Supplies |
|
|
|
|
|
|
|
5.8 |
% |
| Trading Companies & Distribution (Industrial Goods) |
|
|
|
|
|
|
|
5.4 |
% |
| Distributors (Consumer Goods) |
|
|
|
|
|
|
|
4.5 |
% |
| Building Products |
|
|
|
|
|
|
|
4.2 |
% |
| Consumer Staples Distribution |
|
|
|
|
|
|
|
3.7 |
% |
| Broadline Retail |
|
|
|
|
|
|
|
3.7 |
% |
| Household Durables |
|
|
|
|
|
|
|
3.6 |
% |
| Media |
|
|
|
|
|
|
|
3.1 |
% |
| Specialty Retail |
|
|
|
|
|
|
|
2.8 |
% |
| Ground Transportation |
|
|
|
|
|
|
|
2.6 |
% |
| Beverages |
|
|
|
|
|
|
|
2.4 |
% |
| Food Products |
|
|
|
|
|
|
|
2.2 |
% |
| Electronic Equip, Instruments |
|
|
|
|
|
|
|
2.1 |
% |
| Health Care Equipment & Supplies |
|
|
|
|
|
|
|
2.0 |
% |
| Chemicals |
|
|
|
|
|
|
|
2.0 |
% |
| Textiles, Apparel, Luxury Goods |
|
|
|
|
|
|
|
1.5 |
% |
| Total |
|
|
|
|
|
|
|
83.8 |
% |
(1) Industry classification based on Global Industry Classification Standard methodology.
Top Tenants
The following table summarizes information about the 20 largest tenants in our portfolio based on total annualized base rental revenue as of December 31, 2023.
|
|
|
|
|
|
|
|
|
|
|
|
|
|
|
Top 20 Tenants(1) |
|
Number of
Leases |
|
% of Total
Annualized Base
Rental Revenue |
| Amazon |
|
6 |
|
2.9 |
% |
| Soho Studio, LLC |
|
1 |
|
0.9 |
% |
| American Tire Distributors, Inc. |
|
7 |
|
0.9 |
% |
| Eastern Metal Supply, Inc. |
|
5 |
|
0.9 |
% |
| Tempur Sealy International, Inc. |
|
2 |
|
0.8 |
% |
| Hachette Book Group, Inc. |
|
1 |
|
0.8 |
% |
| Kenco Logistic Services, LLC |
|
3 |
|
0.7 |
% |
| Yanfeng US Automotive Interior |
|
2 |
|
0.7 |
% |
| WestRock Company |
|
7 |
|
0.7 |
% |
| Penguin Random House, LLC |
|
1 |
|
0.7 |
% |
| FedEx Corporation |
|
3 |
|
0.7 |
% |
| Lippert Component Manufacturing |
|
4 |
|
0.7 |
% |
| DS Smith North America |
|
2 |
|
0.7 |
% |
| GXO Logistics, Inc. |
|
2 |
|
0.7 |
% |
| AFL Telecommunications LLC |
|
2 |
|
0.6 |
% |
| DHL Supply Chain |
|
4 |
|
0.6 |
% |
| Carolina Beverage Group |
|
3 |
|
0.6 |
% |
| Iron Mountain Information Management |
|
5 |
|
0.6 |
% |
| Packaging Corp of America |
|
5 |
|
0.6 |
% |
| Berlin Packaging LLC |
|
4 |
|
0.6 |
% |
| Total |
|
69 |
|
16.4 |
% |
(1) Includes tenants, guarantors, and/or non-guarantor parents.
Scheduled Lease Expirations
As of December 31, 2023, our Weighted Average Lease Term was approximately 4.5 years. The following table summarizes lease expirations for leases in place as of December 31, 2023, plus available space, for each of the ten calendar years beginning with 2024 and thereafter in our portfolio.
|
|
|
|
|
|
|
|
|
|
|
|
|
|
|
|
|
|
|
|
|
|
|
|
|
|
|
|
|
|
|
|
|
|
|
|
| Lease Expiration Year |
|
Number of
Leases
Expiring |
|
Total Rentable
Square Feet(2)
|
|
% of Total
Occupied
Square Feet |
|
Total Annualized
Base Rental Revenue
(in thousands) |
|
% of Total Annualized
Base Rental Revenue |
|
|
|
| Available |
|
— |
|
2,062,300 |
|
|
— |
|
|
$ |
— |
|
|
— |
|
|
|
|
Month-to-month leases(1) |
|
1 |
|
141,869 |
|
|
0.1 |
% |
|
1,116 |
|
|
0.2 |
% |
|
|
|
| 2024 |
|
62 |
|
8,256,998 |
|
|
7.5 |
% |
|
44,397 |
|
|
7.6 |
% |
|
|
|
| 2025 |
|
104 |
|
13,442,258 |
|
|
12.2 |
% |
|
65,556 |
|
|
11.3 |
% |
|
|
|
| 2026 |
|
139 |
|
19,727,593 |
|
|
17.9 |
% |
|
104,264 |
|
|
18.0 |
% |
|
|
|
| 2027 |
|
116 |
|
16,263,260 |
|
|
14.8 |
% |
|
84,401 |
|
|
14.5 |
% |
|
|
|
| 2028 |
|
93 |
|
11,847,861 |
|
|
10.8 |
% |
|
63,905 |
|
|
11.0 |
% |
|
|
|
| 2029 |
|
79 |
|
12,912,794 |
|
|
11.7 |
% |
|
63,280 |
|
|
10.9 |
% |
|
|
|
| 2030 |
|
38 |
|
6,038,157 |
|
|
5.5 |
% |
|
37,409 |
|
|
6.4 |
% |
|
|
|
| 2031 |
|
43 |
|
7,529,932 |
|
|
6.8 |
% |
|
37,499 |
|
|
6.5 |
% |
|
|
|
| 2032 |
|
19 |
|
2,800,575 |
|
|
2.5 |
% |
|
19,507 |
|
|
3.4 |
% |
|
|
|
| 2033 |
|
14 |
|
2,327,202 |
|
|
2.1 |
% |
|
13,416 |
|
|
2.3 |
% |
|
|
|
| Thereafter |
|
31 |
|
8,920,793 |
|
|
8.1 |
% |
|
45,628 |
|
|
7.9 |
% |
|
|
|
| Total/weighted average |
|
739 |
|
112,271,592 |
|
|
100.0 |
% |
|
$ |
580,378 |
|
|
100.0 |
% |
|
|
|
(1)The month-to-month total rentable square footage includes a 40,000 square foot secondary short-term lease occupied by another tenant, whose lease count is included in their original long-term suite.
(2)Leases previously scheduled to expire in 2024, totaling approximately 7.0 million square feet, have been amended to extend their lease expiration date as of December 31, 2023. These leases amended are excluded from 2024 expirations and are reflected in the new year of expiration.
Item 3. Legal Proceedings
From time to time, we are a party to various lawsuits, claims and other legal proceedings that arise in the ordinary course of our business. We are not currently a party, as plaintiff or defendant, to any legal proceedings that, individually or in the aggregate, would be expected to have a material effect on our business, financial condition or results of operations if determined adversely to us.
Item 4. Mine Safety Disclosures
Not applicable.
PART II.
Item 5. Market for Registrant’s Common Equity, Related Stockholder Matters and Issuer Purchases of Equity Securities
Information about our equity compensation plans and other related stockholder matters is incorporated by reference to our definitive Proxy Statement for our 2024 Annual Meeting of Stockholders.
Market Information
Our common stock is listed on the NYSE and is traded under the symbol “STAG.”
Holders of Our Common Stock
As of February 12, 2024, we had 74 stockholders of record. This figure does not reflect the beneficial ownership of shares held in the nominee name.
Dividends
To maintain our qualification as a REIT, we must make annual distributions to our stockholders of at least 90% of our taxable net income (not including net capital gains). Dividends are declared at the discretion of our board of directors and depend on actual and anticipated cash from operations, our financial condition, capital requirements, the annual distribution requirements under the REIT provisions of the Code and other factors our board of directors may consider relevant.
Unregistered Sales of Equity Securities and Use of Proceeds
Recent Sales of Unregistered Equity Securities
During the quarter ended December 31, 2023, our Operating Partnership issued 119,965 common units upon exchange of outstanding LTIP units issued pursuant to the 2011 Plan. Subject to certain restrictions, common units in our Operating Partnership may be redeemed for cash in an amount equal to the value of a share of common stock or, at our election, for a share of common stock on a one-for-one basis.
During the quarter ended December 31, 2023, we issued 172,743 shares of common stock upon redemption of 172,743 common units in our Operating Partnership held by various limited partners. The issuance of such shares of common stock was either registered under the Securities Act or effected in reliance upon an exemption from registration provided by Section 4(a)(2) under the Securities Act and the rules and regulations promulgated thereunder.
All other issuances of unregistered securities during the quarter ended December 31, 2023, if any, have previously been disclosed in filings with the SEC.
Performance Graph
The following graph provides a comparison of the cumulative total return on our common stock with the cumulative total return on the Standard & Poor’s 500 Index and the MSCI US REIT Index. The MSCI US REIT Index represents performance of publicly-traded REITs. Returns over the indicated period are based on historical data and should not be considered indicative of future returns. The graph covers the period from December 31, 2018 to December 31, 2023 and assumes that $100 was invested in our common stock and in each index on December 31, 2018 and that all dividends were reinvested.
This performance graph shall not be deemed “filed” for purposes of Section 18 of the Exchange Act, or incorporated by reference into any filing by us under the Securities Act, except as shall be expressly set forth by specific reference in such filing.
Item 6. Reserved
Item 7. Management’s Discussion and Analysis of Financial Condition and Results of Operations
The following discussion of our financial condition and results of operations should be read in conjunction with our consolidated financial statements and related notes included elsewhere in this report. For the definitions of certain terms used in the following discussion, refer to Item 1, “Business - Certain Definitions” included elsewhere in this report.
Overview
We are a REIT focused on the acquisition, ownership, and operation of industrial properties throughout the United States. Our platform is designed to (i) identify properties for acquisition that offer relative value across CBRE-EA Tier 1 industrial property types and tenants through the principled application of our proprietary risk assessment model, (ii) provide growth through sophisticated industrial operation and an attractive opportunity set, and (iii) capitalize our business appropriately given the characteristics of our assets.
We are a Maryland corporation and our common stock is publicly traded on the NYSE under the symbol “STAG.”
We are organized and conduct our operations to maintain our qualification as a REIT under Sections 856 through 860 of the Code, and generally are not subject to federal income tax to the extent we currently distribute our income to our stockholders and maintain our qualification as a REIT. We remain subject to state and local taxes on our income and property and to U.S. federal income and excise taxes on our undistributed income.
Our qualification and taxation as a REIT depend upon our ability to meet on a continuing basis, through actual annual operating results, qualification tests in the federal income tax laws. Those tests involve the percentage of income that we earn from specified sources, the percentage of our assets that falls within specified categories, the diversity of our capital stock ownership and the percentage of our earnings that we distribute.
As of December 31, 2023, we owned 569 buildings in 41 states with approximately 112.3 million rentable square feet, consisting of 493 warehouse/distribution buildings, 70 light manufacturing buildings, one flex/office building, and five Value Add Portfolio buildings. We own both single- and multi-tenant properties, although the majority of our portfolio is single-tenant.
As of December 31, 2023, our buildings were approximately 98.2% leased, with no single tenant accounting for more than approximately 2.9% of our total annualized base rental revenue and no single industry accounting for more than approximately 11.0% of our total annualized base rental revenue.
We own all of our properties and conduct substantially all of our business through our Operating Partnership, which we control and manage. As of December 31, 2023, we owned approximately 97.9% of the common units in our Operating Partnership, and our current and former executive officers, directors, senior employees and their affiliates, and other third parties owned the remaining 2.1%.
In connection with the successful completion of the previously announced management succession plan, (i) on June 30, 2023, the term of Benjamin S. Butcher as Executive Chairman ended, and he continues to serve on our board of directors as a non-management director, and (ii) on July 1, 2023, Larry T. Guillemette become the independent Chairman of the Board. In addition, on March 31, 2023, Steven T. Kimball joined our Company as Executive Vice President–Real Estate Operations.
Factors That May Influence Future Results of Operations
Our ability to increase revenues or cash flow will depend in part on our (i) external growth, specifically acquisition activity, and (ii) internal growth, specifically occupancy and rental rates on our portfolio. A variety of other factors, including those noted below, also affect our future results of operations.
Outlook
The industrial real estate business is affected by the recent high inflationary, rising interest rate environment, disruption in the banking industry, and geopolitical tensions. These factors are key drivers of financial market volatility and raise concerns about a slowing global economy. While U.S. gross domestic product (“GDP”) declined during the first two quarters of 2022, GDP increased more than 2.0% during the year ended June 30, 2023 and surged in the third quarter of 2023 to a 4.9% annualized growth rate. Labor conditions held strong with a consistent 3.7% unemployment rate as of December 2023. Going forward, the general consensus among economists is to expect low growth in the United States with a continued historically elevated risk of recession. While the macro-economic conditions continue to evolve and could result in tighter credit conditions, weakening tenant cash flows, and rising vacancy rates, we believe we will continue to benefit from having a well-diversified portfolio across various markets, tenant industries, and lease terms. Additionally, we believe that recent moves toward more regional supply chains and geopolitical tensions have accelerated a number of trends that positively impact U.S. industrial demand. However, given the current uncertainty and events discussed above, our acquisition activity slowed in 2022 and 2023 relative to our historical acquisition pace.
We believe that the current economic environment, while volatile, will provide us with an opportunity to demonstrate the diversification of our portfolio. Specifically, we believe our existing portfolio should benefit from competitive rental rates and strong occupancy.
In addition to our diversified portfolio, we believe that certain characteristics of our business and capital structure should position us well in an uncertain environment, including our minimal floating rate debt exposure (taking into account our hedging activities), strong banking relationships, strong liquidity, access to capital, and the fact that many of our competitors for the assets we purchase tend to be smaller local and regional investors who may have been more heavily impacted by rising interest rates and lack of available capital.
Due to demographic/consumer trends, geopolitical uncertainty and recent legislation supporting U.S. infrastructure, we expect acceleration in a number of industrial specific trends to support stronger long term demand, including:
•the continued growth of e-commerce (as compared to the traditional retail store distribution model) and the concomitant demand by e-commerce industry participants for well-located, functional distribution space;
•the increasing attractiveness of the United States as a manufacturing and distribution location because of the size of the U.S. consumer market, an increase in overseas labor costs, a desire for greater supply chain resilience and redundancy which is driving higher inventory to sales ratios and greater domestic warehouse demand over the long term (i.e. the shortening and fattening of the supply chain); and
•the overall quality of the transportation infrastructure in the United States.
Our portfolio continues to benefit from historically low availability throughout the national industrial market. Demand moderated in 2023 relative to recent peaks, but remains solid across a broad array of our markets. Vacancy and availability rates, while rising, remain low by historical standards. The supply pipeline remains robust, albeit smaller and more notably concentrated in very large warehouses. Construction starts declined as a result of both moderating demand and volatile capital markets in 2023. The weakening global and U.S. economic trends could be a notable headwind and may result in relatively less demand for space and higher vacancy. We believe that the diversification of our portfolio by market, tenant industry, and tenant credit will prove to be a strength in this environment.
Conditions in Our Markets
The buildings in our portfolio are located in markets throughout the United States. Positive or negative changes in economic or other conditions, new supply, adverse weather conditions, natural disasters, epidemics, and other factors in these markets may affect our overall performance.
Rental Income
We receive income primarily in the form of rental income from the tenants who occupy our buildings. The amount of rental income generated by the buildings in our portfolio depends principally on occupancy and rental rates.
Future economic downturns or regional downturns affecting our submarkets that impair our ability to renew or re-lease space and the ability of our tenants to fulfill their lease commitments, as in the case of tenant bankruptcies, could adversely affect our ability to maintain or increase rental rates at our buildings. Our ability to lease our properties and the attendant rental rate is dependent upon, among other things, (i) the overall economy, (ii) the supply/demand dynamic in our markets, (iii) the quality of our properties, including age, clear height, and configuration, and (iv) our tenants’ ability to meet their contractual obligations to us.
The following table summarizes our Operating Portfolio leases that commenced during the year ended December 31, 2023. Any rental concessions in such leases are accounted for on a straight-line basis over the term of the lease.
|
|
|
|
|
|
|
|
|
|
|
|
|
|
|
|
|
|
|
|
|
|
|
|
|
|
|
|
|
|
|
|
|
|
|
|
|
|
|
|
|
|
|
|
|
|
|
|
|
|
|
| Operating Portfolio |
|
Square Feet |
|
Cash Basis Rent Per Square Foot |
|
SL Rent Per Square Foot |
|
Total Costs Per Square Foot(1) |
|
Cash Rent Change |
|
SL Rent Change |
|
Weighted Average Lease Term (years) |
|
Rental Concessions per Square Foot(2) |
|
|
|
|
|
|
|
|
| Year ended December 31, 2023 |
|
|
|
|
|
|
|
|
|
|
|
|
|
|
|
|
| New Leases |
|
2,991,646 |
|
|
$ |
7.16 |
|
|
$ |
7.62 |
|
|
$ |
3.78 |
|
|
43.3 |
% |
|
54.3 |
% |
|
5.3 |
|
|
$ |
0.67 |
|
| Renewal Leases |
|
10,322,350 |
|
|
$ |
5.59 |
|
|
$ |
5.89 |
|
|
$ |
1.13 |
|
|
26.9 |
% |
|
40.5 |
% |
|
4.3 |
|
|
$ |
0.07 |
|
| Total/weighted average |
|
13,313,996 |
|
|
$ |
5.94 |
|
|
$ |
6.28 |
|
|
$ |
1.72 |
|
|
31.0 |
% |
|
44.0 |
% |
|
4.5 |
|
|
$ |
0.21 |
|
|
|
|
|
|
|
|
|
|
|
|
|
|
|
|
|
|
|
|
|
|
|
|
|
|
|
|
|
|
|
|
|
|
|
|
|
|
|
|
|
|
|
|
|
|
|
|
|
|
|
|
|
|
|
|
|
|
|
|
|
|
|
|
|
|
|
|
|
|
|
|
|
|
|
|
|
|
|
|
|
|
|
|
|
|
|
|
|
|
|
|
|
|
|
|
|
|
|
|
|
|
|
|
|
|
|
|
|
|
|
|
|
|
|
|
|
|
|
|
|
|
|
|
|
|
|
|
|
|
|
|
|
|
|
|
|
|
|
|
|
|
|
|
|
|
|
|
|
|
|
|
|
|
|
|
|
|
|
|
|
|
|
|
|
|
|
|
|
|
|
(1)“Total Costs” means the costs for improvements of vacant and renewal spaces, as well as the contingent-based legal fees and commissions for leasing transactions. Total Costs per square foot represent the total costs expected to be incurred on the leases that commenced during the period and do not reflect actual expenditures for the period.
(2)Represents the total rental concessions for the entire lease term.
Additionally, for the year ended December 31, 2023, leases related to the Value Add Portfolio and first generation leasing, with a total of 1,609,083 square feet, are excluded from the Operating Portfolio statistics above.
Property Operating Expenses
Our property operating expenses generally consist of utilities, real estate taxes, management fees, insurance, and site repair and maintenance costs. For the majority of our tenants, our property operating expenses are controlled, in part, by the triple net provisions in tenant leases. In our triple net leases, the tenant is responsible for all aspects of and costs related to the building and its operation during the lease term, including utilities, taxes, insurance, and maintenance costs, but typically excluding roof and building structure. However, we also have modified gross leases and gross leases, as well as leases with expense caps, in our building portfolio, which may require us to absorb certain building related expenses of our tenants. In our modified gross leases, we are responsible for certain building related expenses during the lease term, but most of the expenses are passed through to the tenant for reimbursement to us. In our gross leases, we are responsible for all expenses related to the building and its operation during the lease term. Our overall performance will be affected by the extent to which we are able to pass-through property operating expenses to our tenants.
Scheduled Lease Expirations
Our ability to re-lease space subject to expiring leases will impact our results of operations and is affected by economic and competitive conditions in our markets and by the desirability of our individual buildings. Leases that comprise approximately 7.6% of our total annualized base rental revenue will expire during the period from January 1, 2024 to December 31, 2024, excluding month-to-month leases. We assume, based upon internal renewal probability estimates, that some of our tenants will renew and others will vacate and the associated space will be re-let subject to downtime assumptions. Using the aforementioned assumptions, we expect that, overall, the rental rates on the respective new leases will be greater than the rates under existing leases expiring during the period January 1, 2024 to December 31, 2024, thereby resulting in an increase in revenue from the same space.
Critical Accounting Estimates
The preparation of our consolidated financial statements in conformity with GAAP requires us to make estimates and assumptions that affect the reported amounts of assets and liabilities, the disclosure of contingent assets and liabilities at the date of the financial statements and the reported amounts of revenues and expenses during the reported period. Certain estimates, judgments and assumptions are inherently subjective and based on the existing business and market conditions, and are therefore continually evaluated based upon available information and experience. The following items require significant estimation or judgement.
Purchase Price Accounting
We have determined that judgments regarding the allocation of the purchase price of properties based upon the fair value of the assets acquired and liabilities assumed represents a critical accounting estimate that has the potential to be material in future periods and has been material in all periods presented in this Form 10-K. As discussed below in “Critical Accounting Policies,” we allocate the purchase price of properties based upon the fair value of the assets acquired and liabilities assumed, which generally consist of land, buildings, tenant improvements, mortgage debt assumed, and deferred leasing intangibles, which includes in-place leases, above market and below market leases, and tenant relationships, and therefore involves subjective analysis and uncertainty. The process for determining the allocation to these components requires estimates and assumptions, including rental rates, discount rates, exit capitalization rates, and land value per square foot. We do not believe that the conclusions we reached regarding the allocation of the purchase price of properties, in the current economic and operating environment, would result in a materially different conclusion within any reasonable range of assumptions that could have been applied. As discussed below, we continuously assess our portfolio for the impairment of tangible and intangible rental property and deferred leasing intangible liabilities.
Rental Property and Deferred Leasing Intangible Liabilities Impairment Assessment
We have determined that judgments regarding the impairment of tangible and intangible rental property and deferred leasing intangible liabilities represents a critical accounting estimate that has the potential to be material in future periods and has been material in certain periods presented in this Form 10-K. As discussed below in “Critical Accounting Policies,” we evaluate the carrying value of all tangible and intangible rental property assets and deferred leasing intangible liabilities (collectively, the “property”) held for use for possible impairment when an event or change in circumstance has occurred that indicates their carrying value may not be recoverable. The evaluation includes estimating and reviewing anticipated future undiscounted cash flows to be derived from the property. If such cash flows are less than the property’s carrying value, an impairment charge is recognized to the extent by which the asset’s carrying value exceeds the estimated fair value.
Estimating future cash flows is highly subjective and is based in part on assumptions related to anticipated hold period, future occupancy, rental rates, capital requirements, and exit capitalization rates that could differ from actual results. The discount rate used to present value the cash flows for determining fair value is also subjective. We do not believe that the conclusions we reached regarding the assessment of our rental property assets for impairment, in the current economic and operating environment, would result in a materially different conclusion within any reasonable range of assumptions that could have been applied. Should economic conditions worsen, and the values of industrial assets decline in future periods, then the assumptions and estimates we may make in future impairment analyses, and potential future measurement of impairment charges, could be sensitive and could result in a material change in the range of potential outcomes.
Critical Accounting Policies
The preparation of financial statements in conformity with GAAP requires management to use judgment in the application of accounting policies, including making estimates and assumptions. We base our estimates on historical experience and on various other assumptions believed to be reasonable under the circumstances. These judgments affect the reported amounts of assets and liabilities and disclosure of contingent assets and liabilities at the dates of the financial statements and the reported amounts of revenue and expenses during the reporting periods. If our judgment or interpretation of the facts and circumstances relating to various transactions had been different, it is possible that different accounting policies would have been applied resulting in a different presentation of our financial statements. From time to time, we evaluate our estimates and assumptions. In the event estimates or assumptions prove to be different from actual results, adjustments are made in subsequent periods to reflect more current information. Below is a discussion of accounting policies that we consider critical in that they may require complex judgment in their application or require estimates about matters that are inherently uncertain.
Rental Property and Deferred Leasing Intangibles
Rental property is carried at cost less accumulated depreciation and amortization. Expenditures for maintenance and repairs are expensed as incurred. Significant renovations and betterments that extend the economic useful lives of assets are capitalized.
We capitalize costs directly and indirectly related to the development, pre-development, redevelopment, or improvement of rental property. Real estate taxes, compensation costs of development personnel, insurance, interest, and other directly related costs during construction periods are capitalized as incurred, with depreciation commencing with the date the property is substantially completed. Such costs begin to be capitalized to the development projects from the point we are undergoing the necessary activities to get the development project ready for its intended use and cease when the development projects are substantially completed and held available for occupancy. Interest is capitalized based on actual capital expenditures from the period when development or redevelopment commences until the asset is ready for its intended use, at the weighted average borrowing rate of our unsecured indebtedness during the period.
For properties classified as held for sale, we cease depreciating and amortizing the rental property and value the rental property at the lower of depreciated and amortized cost or fair value less costs to dispose. We present those properties classified as held for sale with any qualifying assets and liabilities associated with those properties as held for sale in the accompanying Consolidated Balance Sheets.
Using information available at the time of acquisition, we allocate the purchase price of properties acquired based upon the fair value of the assets acquired and liabilities assumed, which generally consist of land, buildings, tenant improvements, mortgage debt assumed, and deferred leasing intangibles, which includes in-place leases, above market and below market leases, and tenant relationships. The process for determining the allocation to these components requires estimates and assumptions, including rental rates, discount rates and exit capitalization rates, and land value per square foot, as well as available market information, and therefore involves subjective analysis and uncertainty. The fair value of the tangible assets of an acquired property considers the value of the property as if it were vacant. The portion of the purchase price that is allocated to above and below market leases is valued based on the present value of the difference between prevailing market rates and the in-place rates measured over a period equal to the remaining term of the lease term plus the term of any bargain renewal options. The purchase price is further allocated to in-place lease values and tenant relationships based on our evaluation of the specific characteristics of each tenant’s lease and its overall relationship with the respective tenant.
The above and below market lease values are amortized into rental income over the remaining lease term. The value of in-place lease intangibles and tenant relationships are amortized over the remaining lease term (and expected renewal period of the respective lease for tenant relationships) as increases to depreciation and amortization expense. The remaining lease terms are adjusted for bargain renewal options or assumed exercises of early termination options, as applicable.
If a tenant subsequently terminates its lease, any unamortized portion of above and below market leases is accelerated into rental income and the in-place lease value and tenant relationships are accelerated into depreciation and amortization expense over the shortened lease term.
The purchase price allocated to deferred leasing intangible assets are included in rental property, net on the accompanying Consolidated Balance Sheets, and the purchase price allocated to deferred leasing intangible liabilities are included in deferred leasing intangibles, net on the accompanying Consolidated Balance Sheets under the liabilities section.
In determining the fair value of the debt assumed, we discount the spread between the future contractual interest payments and hypothetical future interest payments on mortgage debt based on a current market rate. The associated fair market value debt adjustment is amortized through interest expense over the life of the debt on a basis which approximates the effective interest method.
We evaluate the carrying value of all tangible and intangible rental property assets and deferred leasing intangible liabilities (collectively, the “property”) held for use for possible impairment when an event or change in circumstance has occurred that indicates their carrying value may not be recoverable. The evaluation includes estimating and reviewing anticipated future undiscounted cash flows to be derived from the property. If such cash flows are less than the property’s carrying value, an impairment charge is recognized to the extent by which the property’s carrying value exceeds the estimated fair value. Estimating future cash flows is highly subjective and is based in part on assumptions regarding anticipated hold period, future occupancy, rental rates, capital requirements, and exit capitalization rates that could differ from actual results. The discount rate used to present value the cash flows for determining fair value is also subjective.
Depreciation expense is computed using the straight-line method based on the following estimated useful lives.
|
|
|
|
|
|
|
|
|
| Description |
|
Estimated Useful Life |
| Building |
|
40 Years |
| Building and land improvements (maximum) |
|
20 years |
| Tenant improvements |
|
Shorter of useful life or terms of related lease |
|
|
|
|
|
|
|
|
|
Leases
For leases in which we are the lessee, we recognize a right-of-use asset and corresponding lease liability on the accompanying Consolidated Balance Sheets equal to the present value of the fixed lease payments. In determining operating right-of-use asset and lease liability for our operating leases, we estimate an appropriate incremental borrowing rate on a fully-collateralized basis for the terms of the leases. We utilize a market-based approach to estimate the incremental borrowing rate for each individual lease. Since the terms under our ground leases are significantly longer than the terms of borrowings available to us on a fully-collateralized basis, the estimate of this rate requires significant judgment, and considers factors such as yields on outstanding public debt and other market based pricing on longer duration financing instruments.
Goodwill
The excess of the cost of an acquired business over the net of the amounts assigned to assets acquired (including identified intangible assets) and liabilities assumed is recorded as goodwill. Our goodwill of approximately $4.9 million represents amounts allocated to the assembled workforce from the acquired management company, and is presented in prepaid expenses and other assets on the accompanying Consolidated Balance Sheets. Our goodwill has an indeterminate life and is not amortized, but is tested for impairment on an annual basis at December 31, or more frequently if events or changes in circumstances indicate that the asset might be impaired. We take a qualitative approach to consider whether an impairment of goodwill exists prior to quantitatively determining the fair value of the reporting unit in step one of the impairment test. We have recorded no impairments to goodwill as of December 31, 2023.
Use of Derivative Financial Instruments
We record all derivatives on the accompanying Consolidated Balance Sheets at fair value. The accounting for changes in the fair value of derivatives depends on the intended use of the derivative, whether we have elected to designate a derivative in a hedging relationship and apply hedge accounting, and whether the hedging relationship has satisfied the criteria necessary to apply hedge accounting. Derivatives designated and qualifying as a hedge of the exposure to changes in the fair value of an asset, liability, or firm commitment attributable to a particular risk, such as interest rate risk, are considered fair value hedges. Derivatives designated and qualifying as a hedge of the exposure to variability in expected future cash flows, or other types of forecasted transactions, are considered cash flow hedges.
Hedge accounting generally provides for the matching of the timing of gain or loss recognition on the hedging instrument with the recognition of the changes in the fair value of the hedged asset or liability that are attributable to the hedged risk in a fair value hedge or the earnings effect of the hedged forecasted transactions in a cash flow hedge. We may enter into derivative contracts that are intended to economically hedge certain of its risks, even though hedge accounting does not apply or we elect not to apply hedge accounting.
In accordance with fair value measurement guidance, we made an accounting policy election to measure the credit risk of our derivative financial instruments that are subject to master netting arrangements on a net basis by counterparty portfolio. Credit risk is the risk of failure of the counterparty to perform under the terms of the contract. We minimize the credit risk in our derivative financial instruments by entering into transactions with various high-quality counterparties. Our exposure to credit risk at any point is generally limited to amounts recorded as assets on the accompanying Consolidated Balance Sheets.
Fair Value of Financial Instruments
Financial instruments include cash and cash equivalents, restricted cash, tenant accounts receivable, interest rate swaps, accounts payable, accrued expenses, unsecured credit facility, unsecured term loans, unsecured notes, and mortgage notes. See Note 4 in the accompanying Notes to Consolidated Financial Statements for the fair value of our indebtedness. See Note 5 in the accompanying Notes to Consolidated Financial Statements for the fair value of our interest rate swaps.
We adopted fair value measurement provisions for our financial instruments recorded at fair value. The guidance establishes a three-tier value hierarchy, which prioritizes the inputs used in measuring fair value. These tiers include: Level 1, defined as observable inputs such as quoted prices in active markets; Level 2, defined as inputs other than quoted prices in active markets that are either directly or indirectly observable; and Level 3, defined as unobservable inputs in which little or no market data exists, therefore requiring an entity to develop its own assumptions.
Incentive and Equity-Based Employee Compensation Plans
We grant equity-based compensation awards to our employees and directors in the form of restricted shares of common stock, LTIP units, and performance units. See Notes 6, 7 and 8 in the accompanying Notes to Consolidated Financial Statements for further discussion of restricted shares of common stock, LTIP units, and performance units, respectively. We measure equity-based compensation expense based on the fair value of the awards on the grant date and recognize the expense ratably over the vesting period, and forfeitures are recognized in the period in which they occur.
On January 7, 2021, we adopted the STAG Industrial, Inc. Employee Retirement Vesting Program (the “Vesting Program”) to provide supplemental retirement benefits for eligible employees. For those employees who are retirement eligible or will become retirement eligible during the applicable vesting period under the terms of the Vesting Program, we accelerate equity-based compensation through the employee’s six-month retirement notification period or retirement eligibility date, respectively.
Revenue Recognition
All current leases are classified as operating leases and rental income is recognized on a straight-line basis over the term of the lease (and expected bargain renewal terms or assumed exercise of early termination options) when collectability is reasonably assured. Differences between rental income earned and amounts due under the lease are charged or credited, as applicable, to accrued rental income.
We determined that for all leases where we are the lessor, that the timing and pattern of transfer of the non-lease components and associated lease components are the same, and that the lease components, if accounted for separately, would be classified as an operating lease. Accordingly, we have made an accounting policy election to recognize the combined component in accordance with Accounting Standards Codification Topic 842 as rental income on the accompanying Consolidated Statements of Operations.
Rental income recognition commences when the tenant takes possession of or controls the physical use of the leased space and the leased space is substantially complete and ready for its intended use. In order to determine whether the leased space is substantially complete and ready for its intended use, we determine whether we or the tenant own the tenant improvements. When it is determined that we are the owner of the tenant improvements, rental income recognition begins when the tenant takes possession of or controls the physical use of the finished space, which is generally when our owned tenant improvements are completed. In instances when it is determined that the tenant is the owner of tenant improvements, rental income recognition begins when the tenant takes possession of or controls the physical use of the leased space.
When we are the owner of tenant improvements or other capital items, the cost to construct the tenant improvements or other capital items, including costs paid for or reimbursed by the tenants, is recorded as capital assets. For these tenant improvements or other capital items, the amount funded by or reimbursed by the tenants are recorded as deferred revenue, which is amortized on a straight-line basis as income over the shorter of the useful life of the capital asset or the term of the related lease.
Early lease termination fees are recorded in rental income on a straight-line basis from the notification date of such termination to the then remaining (not the original) lease term, if any, or upon collection if collection is not reasonably assured.
We evaluate cash basis versus accrual basis of rental income recognition based on the collectability of future lease payments.
Results of Operations
The following discussion of the results of our same store (as defined below) net operating income (“NOI”) should be read in conjunction with our consolidated financial statements included in this report. For a detailed discussion of NOI, including the reasons management believes NOI is useful to investors, see “Non-GAAP Financial Measures” below. Same store results are considered to be useful to investors in evaluating our performance because they provide information relating to changes in building-level operating performance without taking into account the effects of acquisitions or dispositions. We encourage the reader to not only look at our same store results, but also our total portfolio results, due to historic and future growth.
We define same store properties as properties that were in the Operating Portfolio for the entirety of the comparative periods presented. The results for same store properties exclude termination fees, solar income, and other income adjustments. Same store properties exclude Operating Portfolio properties with expansions placed into service after December 31, 2021. On December 31, 2023, we owned 513 industrial buildings consisting of approximately 101.7 million square feet, which represents approximately 90.6% of our total portfolio, that are considered our same store portfolio in the analysis below. Same store occupancy decreased approximately 0.7% to 98.4% as of December 31, 2023 compared to 99.1% as of December 31, 2022.
Discussions of selected operating information for our same store portfolio and our total portfolio for the comparison of the years ended December 31, 2022 and 2021 that are not included in this Form 10-K can be found in “Management’s Discussion and Analysis of Financial Condition and Results of Operations” in Part II, Item 7 of our Annual Report on Form 10-K for the year ended December 31, 2022, which was filed with the SEC on February 14, 2023.
Comparison of the year ended December 31, 2023 to the year ended December 31, 2022
The following table summarizes selected operating information for our same store portfolio and our total portfolio for the years ended December 31, 2023 and 2022 (dollars in thousands). This table includes a reconciliation from our same store portfolio to our total portfolio by also providing information for the years ended December 31, 2023 and 2022 with respect to the buildings acquired and sold after December 31, 2021, Operating Portfolio buildings with expansions placed into service or transferred from the Value Add Portfolio to the Operating Portfolio after December 31, 2021, flex/office buildings, Value Add Portfolio buildings, and buildings classified as held for sale.
|
|
|
|
|
|
|
|
|
|
|
|
|
|
|
|
|
|
|
|
|
|
|
|
|
|
|
|
|
|
|
|
|
|
|
|
|
|
|
|
|
|
|
|
|
|
|
|
|
|
|
|
|
|
|
|
|
|
|
|
|
|
|
|
|
|
|
|
|
|
|
|
| |
Same Store Portfolio |
|
Acquisitions/Dispositions |
|
Other |
|
Total Portfolio |
| |
Year ended December 31, |
|
Change |
|
Year ended December 31, |
|
Year ended December 31, |
|
Year ended December 31, |
|
Change |
| |
2023 |
|
2022 |
|
$ |
|
% |
|
2023 |
|
2022 |
|
2023 |
|
2022 |
|
2023 |
|
2022 |
|
$ |
|
% |
| Revenue |
|
|
|
|
|
|
|
|
|
|
|
|
|
|
|
|
|
|
|
|
|
|
|
| Operating revenue |
|
|
|
|
|
|
|
|
|
|
|
|
|
|
|
|
|
|
|
|
|
|
|
| Rental income |
$ |
634,020 |
|
|
$ |
601,536 |
|
|
$ |
32,484 |
|
|
5.4 |
% |
|
$ |
39,208 |
|
|
$ |
30,970 |
|
|
$ |
31,932 |
|
|
$ |
21,871 |
|
|
$ |
705,160 |
|
|
$ |
654,377 |
|
|
$ |
50,783 |
|
|
7.8 |
% |
| Other income |
211 |
|
|
369 |
|
|
(158) |
|
|
(42.8) |
% |
|
176 |
|
|
1,144 |
|
|
2,288 |
|
|
1,455 |
|
|
2,675 |
|
|
2,968 |
|
|
(293) |
|
|
(9.9) |
% |
| Total operating revenue |
634,231 |
|
|
601,905 |
|
|
32,326 |
|
|
5.4 |
% |
|
39,384 |
|
|
32,114 |
|
|
34,220 |
|
|
23,326 |
|
|
707,835 |
|
|
657,345 |
|
|
50,490 |
|
|
7.7 |
% |
| Expenses |
|
|
|
|
|
|
|
|
|
|
|
|
|
|
|
|
|
|
|
|
|
|
|
| Property |
124,540 |
|
|
115,807 |
|
|
8,733 |
|
|
7.5 |
% |
|
8,008 |
|
|
5,220 |
|
|
7,048 |
|
|
4,674 |
|
|
139,596 |
|
|
125,701 |
|
|
13,895 |
|
|
11.1 |
% |
Net operating income(1) |
$ |
509,691 |
|
|
$ |
486,098 |
|
|
$ |
23,593 |
|
|
4.9 |
% |
|
$ |
31,376 |
|
|
$ |
26,894 |
|
|
$ |
27,172 |
|
|
$ |
18,652 |
|
|
568,239 |
|
|
531,644 |
|
|
36,595 |
|
|
6.9 |
% |
| Other expenses |
|
|
|
|
|
|
|
|
|
|
|
|
|
|
|
|
|
|
|
|
|
|
|
| General and administrative |
|
|
|
|
|
|
|
|
|
|
|
|
|
|
|
47,491 |
|
|
46,958 |
|
|
533 |
|
|
1.1 |
% |
| Depreciation and amortization |
|
|
|
|
|
|
|
|
|
|
|
|
|
|
|
278,447 |
|
|
275,040 |
|
|
3,407 |
|
|
1.2 |
% |
| Loss on impairment |
|
|
|
|
|
|
|
|
|
|
|
|
|
|
|
— |
|
|
1,783 |
|
|
(1,783) |
|
|
(100.0) |
% |
| Other expenses |
|
|
|
|
|
|
|
|
|
|
|
|
|
|
|
4,693 |
|
|
4,363 |
|
|
330 |
|
|
7.6 |
% |
| Total other expenses |
|
|
|
|
|
|
|
|
|
|
|
|
|
|
|
330,631 |
|
|
328,144 |
|
|
2,487 |
|
|
0.8 |
% |
| Total expenses |
|
|
|
|
|
|
|
|
|
|
|
|
|
|
|
470,227 |
|
|
453,845 |
|
|
16,382 |
|
|
3.6 |
% |
| Other income (expense) |
|
|
|
|
|
|
|
|
|
|
|
|
|
|
|
|
|
|
|
|
|
|
| Interest and other income |
|
|
|
|
|
|
|
|
|
|
|
|
|
|
|
68 |
|
|
103 |
|
|
(35) |
|
|
(34.0) |
% |
| Interest expense |
|
|
|
|
|
|
|
|
|
|
|
|
|
|
|
(94,575) |
|
|
(78,018) |
|
|
(16,557) |
|
|
21.2 |
% |
| Debt extinguishment and modification expenses |
|
|
|
|
|
|
|
|
|
|
— |
|
|
(838) |
|
|
838 |
|
|
(100.0) |
% |
|
|
|
|
|
|
|
|
|
|
|
|
|
|
|
|
|
|
|
|
|
|
|
| Gain on the sales of rental property, net |
|
|
|
|
|
|
|
|
|
|
|
54,100 |
|
|
57,487 |
|
|
(3,387) |
|
|
(5.9) |
% |
| Total other income (expense) |
|
|
|
|
|
|
|
|
|
|
|
|
|
|
|
(40,407) |
|
|
(21,266) |
|
|
(19,141) |
|
|
90.0 |
% |
| Net income |
|
|
|
|
|
|
|
|
|
|
|
|
|
|
|
$ |
197,201 |
|
|
$ |
182,234 |
|
|
$ |
14,967 |
|
|
8.2 |
% |
(1)For a detailed discussion of NOI, including the reasons management believes NOI is useful to investors, see “Non-GAAP Financial Measures” below.
Net Income
Net income for our total portfolio increased by approximately $15.0 million or 8.2% to approximately $197.2 million for the year ended December 31, 2023 compared to approximately $182.2 million for the year ended December 31, 2022.
Same Store Total Operating Revenue
Same store total operating revenue consists primarily of rental income consisting of (i) fixed lease payments, variable lease payments, straight-line rental income, and above and below market lease amortization from our properties (“lease income”), and (ii) other tenant billings for insurance, real estate taxes and certain other expenses (“other billings”).
For a detailed reconciliation of our same store total operating revenue to net income, see the table above.
Same store rental income, which is comprised of lease income and other billings as discussed below, increased by approximately $32.5 million or 5.4% to approximately $634.0 million for the year ended December 31, 2023 compared to approximately $601.5 million for the year ended December 31, 2022.
Same store lease income increased approximately $22.8 million or 4.6% to approximately $518.4 million for the year ended December 31, 2023 compared to approximately $495.6 million for the year ended December 31, 2022. The increase was primarily due to an increase in rental income of approximately $29.8 million from the execution of new leases and lease renewals with existing tenants. This increase was partially offset by the reduction of base rent of approximately $5.5 million due to tenant vacancies and a net increase in the amortization of net above market leases of approximately $0.5 million. Additionally, there was a decrease in same store lease income of approximately $1.0 million which was primarily attributable to management’s evaluation of operating leases to determine the probability of collecting substantially all of the lessee’s remaining lease payments under the lease term. For those that are not probable of collection, we convert to the cash basis of accounting. Management determined two tenants should be converted from the cash basis of accounting back to the accrual basis of accounting, for which approximately $1.5 million of straight-line rental income was recognized. This was offset by certain other tenants converting from the accrual basis of accounting to the cash basis of accounting, for which approximately $2.5 million of straight-line rental income was either reversed or was not recognized.
Same store other billings increased approximately $9.7 million or 9.2% to approximately $115.6 million for the year ended December 31, 2023 compared to approximately $105.9 million for the year ended December 31, 2022. The increase was attributable to (i) an increase of approximately $5.7 million of real estate tax reimbursements due to an increase in real estate taxes levied by the taxing authority for certain tenants for which we pay the real estate taxes on their behalf, (ii) changes to lease terms where we began paying the real estate taxes on behalf of tenants that had previously paid the taxes directly to the taxing authorities, and (iii) occupancy of previously vacant buildings. The increase was also attributable to an increase of approximately $4.0 million in other expense reimbursements which was primarily due to an increase in corresponding expenses.
Same Store Operating Expenses
Same store operating expenses consist primarily of property operating expenses and real estate taxes and insurance.
For a detailed reconciliation of our same store portfolio operating expenses to net income, see the table above.
Total same store operating expenses increased approximately $8.7 million or 7.5% to approximately $124.5 million for the year ended December 31, 2023 compared to approximately $115.8 million for the year ended December 31, 2022. This increase was due to increases in real estate tax, insurance, repairs and maintenance, other expenses, and utilities expense of approximately $4.0 million, $2.5 million, $1.4 million, $1.4 million, and $0.2 million, respectively. These increases were partially offset by a reduction of snow removal expense of approximately $0.8 million.
Acquisitions and Dispositions Net Operating Income
For a detailed reconciliation of our acquisitions and dispositions NOI to net income, see the table above.
Subsequent to December 31, 2021, we acquired 35 buildings consisting of approximately 5.4 million square feet (excluding seven buildings that were included in the Value Add Portfolio at December 31, 2023 or transferred from the Value Add Portfolio to the Operating Portfolio after December 31, 2021), and sold 18 buildings consisting of approximately 3.8 million square feet.
For the years ended December 31, 2023 and December 31, 2022, the buildings acquired after December 31, 2021 contributed approximately $28.2 million and $16.0 million to NOI, respectively. For the years ended December 31, 2023 and December 31, 2022, the buildings sold after December 31, 2021 contributed approximately $3.2 million and $10.9 million to NOI, respectively. Refer to Note 3 in the accompanying Notes to consolidated Financial Statements for additional discussion regarding buildings acquired or sold.
Other Net Operating Income
Our other assets include our flex/office buildings, Value Add Portfolio, buildings classified as held for sale, and Operating Portfolio buildings with expansions placed in service or transferred from the Value Add Portfolio to the Operating Portfolio after December 31, 2021. Other NOI also includes termination, solar, and other income adjustments from buildings in our same store portfolio.
For a detailed reconciliation of our other NOI to net income, see the table above.
These buildings contributed approximately $23.1 million and $14.0 million to NOI for the years ended December 31, 2023 and December 31, 2022, respectively. Additionally, there was approximately $4.1 million and $4.7 million of termination, solar, and other income adjustments from certain buildings in our same store portfolio for the years ended December 31, 2023 and December 31, 2022, respectively.
Total Other Expenses
Total other expenses consist of general and administrative, depreciation and amortization, loss on impairment, and other expenses.
Total other expenses increased approximately $2.5 million or 0.8% for the year ended December 31, 2023 to approximately $330.6 million compared to approximately $328.1 million for the year ended December 31, 2022. This increase was primarily attributable to an increase in depreciation and amortization of approximately $3.4 million due to an increase in the depreciable asset base from net acquisitions after December 31, 2022, as well as an increase in general and administrative expenses of approximately $0.5 million primarily due to increases in compensation and other payroll costs and professional fees. Other expenses also increased approximately $0.3 million due to the relinquishment of an acquisition deposit of approximately $2.5 million related to the termination of an acquisition contract in January 2023, whereas the relinquishment of an acquisition deposit of approximately $2.1 million related to a terminated acquisition contract was recognized during the year ended December 31, 2022. These increases were partially offset by a decrease in loss on impairment of approximately $1.8 million, as there was no loss on impairment recognized during the year ended December 31, 2023, compared to a loss on impairment recognized at one building during the year ended December 31, 2022.
Total Other Income (Expense)
Total other income (expense) consists of interest and other income, interest expense, debt extinguishment and modification expenses, and gain on the sales of rental property, net. Interest expense includes interest incurred during the period as well as adjustments related to amortization of financing fees and debt issuance costs, and amortization of fair market value adjustments associated with the assumption of debt.
Total net other expense increased approximately $19.1 million or 90.0% to approximately $40.4 million for the year ended December 31, 2023 compared to approximately $21.3 million for the year ended December 31, 2022. This increase was primarily attributable to an increase in interest expense of approximately $16.6 million which was primarily attributable to the issuance of $400.0 million of unsecured notes on June 28, 2022, an additional $50.0 million (net) of unsecured term loans on July 26, 2022, and an increase in one-month Term SOFR. This increase was also attributable to a decrease in the gain on the sales of rental property, net of approximately $3.4 million. These increases were partially offset by a decrease in debt and modification expenses of approximately $0.8 million, as there were no debt and modification expenses during the year ended December 31, 2023.
Non-GAAP Financial Measures
In this report, we disclose funds from operations (“FFO”) and NOI, which meet the definition of “non-GAAP financial measures” as set forth in Item 10(e) of Regulation S-K promulgated by the SEC. As a result, we are required to include in this report a statement of why management believes that presentation of these measures provides useful information to investors.
Funds From Operations
FFO should not be considered as an alternative to net income (determined in accordance with GAAP) as an indication of our performance, and we believe that to understand our performance further, FFO should be compared with our reported net income (loss) in accordance with GAAP, as presented in our consolidated financial statements included in this report.
We calculate FFO in accordance with the standards established by the National Association of Real Estate Investment Trusts (“Nareit”). FFO represents GAAP net income (loss), excluding gains (or losses) from sales of depreciable operating buildings, impairment write-downs of depreciable real estate, real estate related depreciation and amortization (excluding amortization of deferred financing costs and fair market value of debt adjustment) and after adjustments for unconsolidated partnerships and joint ventures.
Management uses FFO as a supplemental performance measure because it is a widely recognized measure of the performance of REITs. FFO may be used by investors as a basis to compare our operating performance with that of other REITs.
However, because FFO excludes depreciation and amortization and captures neither the changes in the value of our buildings that result from use or market conditions nor the level of capital expenditures and leasing commissions necessary to maintain the operating performance of our buildings, all of which have real economic effects and could materially impact our results from operations, the utility of FFO as a measure of our performance is limited. In addition, other REITs may not calculate FFO in accordance with the Nareit definition, and, accordingly, our FFO may not be comparable to such other REITs’ FFO. FFO should not be used as a measure of our liquidity, and is not indicative of funds available for our cash needs, including our ability to pay dividends.
The following table summarizes a reconciliation of our FFO attributable to common stockholders and unit holders for the periods presented to net income, the nearest GAAP equivalent.
|
|
|
|
|
|
|
|
|
|
|
|
|
|
|
|
|
|
|
|
|
|
|
Year ended December 31, |
| Reconciliation of Net Income to FFO (in thousands) |
|
2023 |
|
2022 |
|
2021 |
| Net income |
|
$ |
197,201 |
|
|
$ |
182,234 |
|
|
$ |
196,432 |
|
| Rental property depreciation and amortization |
|
278,216 |
|
|
274,823 |
|
|
238,487 |
|
| Loss on impairment |
|
— |
|
|
1,783 |
|
|
— |
|
| Gain on the sales of rental property, net |
|
(54,100) |
|
|
(57,487) |
|
|
(97,980) |
|
| FFO |
|
$ |
421,317 |
|
|
$ |
401,353 |
|
|
$ |
336,939 |
|
| Preferred stock dividends |
|
— |
|
|
— |
|
|
(1,289) |
|
| Redemption of preferred stock |
|
— |
|
|
— |
|
|
(2,582) |
|
| Amount allocated to restricted shares of common stock and unvested units |
|
(546) |
|
|
(558) |
|
|
(838) |
|
| FFO attributable to common stockholders and unit holders |
|
$ |
420,771 |
|
|
$ |
400,795 |
|
|
$ |
332,230 |
|
Net Operating Income
We consider NOI to be an appropriate supplemental performance measure to net income (loss) because we believe it helps investors and management understand the core operations of our buildings. NOI is defined as rental income, which includes billings for common area maintenance, real estate taxes and insurance, less property expenses, real estate tax expense and insurance expense. NOI should not be viewed as an alternative measure of our financial performance since it excludes expenses which could materially impact our results of operations. Further, our NOI may not be comparable to that of other real estate companies, as they may use different methodologies for calculating NOI.
The following table summarizes a reconciliation of our NOI for the periods presented to net income, the nearest GAAP equivalent.
|
|
|
|
|
|
|
|
|
|
|
|
|
|
|
|
|
|
|
|
|
|
|
Year ended December 31, |
| Reconciliation of Net Income to NOI (in thousands) |
|
2023 |
|
2022 |
|
2021 |
| Net income |
|
$ |
197,201 |
|
|
$ |
182,234 |
|
|
$ |
196,432 |
|
| General and administrative |
|
47,491 |
|
|
46,958 |
|
|
$ |
48,629 |
|
| Depreciation and amortization |
|
278,447 |
|
|
275,040 |
|
|
$ |
238,699 |
|
| Interest and other income |
|
(68) |
|
|
(103) |
|
|
$ |
(121) |
|
| Interest expense |
|
94,575 |
|
|
78,018 |
|
|
$ |
63,484 |
|
| Loss on impairment |
|
— |
|
|
1,783 |
|
|
$ |
— |
|
|
|
|
|
|
|
|
| Debt extinguishment and modification expenses |
|
— |
|
|
838 |
|
|
$ |
2,152 |
|
| Other expenses |
|
4,693 |
|
|
4,363 |
|
|
$ |
2,878 |
|
| Gain on the sales of rental property, net |
|
(54,100) |
|
|
(57,487) |
|
|
$ |
(97,980) |
|
| Net operating income |
|
$ |
568,239 |
|
|
$ |
531,644 |
|
|
$ |
454,173 |
|
Cash Flows
Comparison of the year ended December 31, 2023 to the year ended December 31, 2022
The following table summarizes our cash flows for the year ended December 31, 2023 compared to the year ended December 31, 2022.
|
|
|
|
|
|
|
|
|
|
|
|
|
|
|
|
|
|
|
|
|
|
|
|
|
|
|
| |
|
Year ended December 31, |
|
Change |
| Cash Flows (dollars in thousands) |
|
2023 |
|
2022 |
|
$ |
|
% |
| Net cash provided by operating activities |
|
$ |
391,092 |
|
|
$ |
387,931 |
|
|
$ |
3,161 |
|
|
0.8 |
% |
| Net cash used in investing activities |
|
$ |
320,346 |
|
|
$ |
447,524 |
|
|
$ |
(127,178) |
|
|
(28.4) |
% |
| Net cash provided by (used in) financing activities |
|
$ |
(75,667) |
|
|
$ |
63,186 |
|
|
$ |
(138,853) |
|
|
(219.8) |
% |
Net cash provided by operating activities increased approximately $3.2 million to approximately $391.1 million for the year ended December 31, 2023, compared to approximately $387.9 million for the year ended December 31, 2022. The increase was primarily attributable to incremental operating cash flows from property acquisitions completed after December 31, 2022, and operating performance at existing properties. These increases were partially offset by the loss of cash flows from property dispositions completed after December 31, 2022 and fluctuations in working capital due to timing of payments and rental receipts.
Net cash used in investing activities decreased approximately $127.2 million to approximately $320.3 million for the year ended December 31, 2023, compared to approximately $447.5 million for the year ended December 31, 2022. The decrease was primarily attributable to the acquisition of 16 buildings during the year ended December 31, 2023 of approximately $321.9 million, compared to the acquisition of 26 buildings during the year ended December 31, 2022 of approximately $472.6 million. Additionally, there was a decrease in cash paid for additions of land and building and improvements of approximately $3.8 million during the year ended December 31, 2023 compared to the year ended December 31, 2022. These decreases in net cash used in investing activities were partially offset by decrease in proceeds from sales of rental property, net of approximately $29.7 million during the year ended December 31, 2023 compared to the year ended December 31, 2022.
Net cash provided by (used in) financing activities decreased approximately $138.9 million to approximately $75.7 million net cash used in financing activities for the year ended December 31, 2023, compared to approximately $63.2 million net cash provided by financing activities for the year ended December 31, 2022. This decrease was primarily attributable to the funding of the $400.0 million unsecured notes on June 28, 2022 and the $50.0 million (net) unsecured term loans on July 26, 2022, that did not occur during the year ended December 31, 2023, as well as the redemption of $100.0 million of unsecured notes on January 5, 2023 that did not occur during the year ended December 31, 2022. These decreases were partially offset by an increase in net borrowings of approximately $348.0 million under our unsecured credit facility and an increase in proceeds from sales of common stock, net of approximately $14.7 million during the year ended December 31, 2023 compared to the year ended December 31, 2022. Additionally, we paid in full a mortgage note of approximately $3.2 million during the year ended December 31, 2023, compared to the year ended December 31, 2022, in which we paid in full a mortgage note in the amount of approximately $46.6 million.
Liquidity and Capital Resources
We believe that our liquidity needs will be satisfied through cash flows generated by operations, disposition proceeds, and financing activities. Operating cash flow from rental income, expense recoveries from tenants, and other income from operations is our principal source of funds to pay operating expenses, debt service, recurring capital expenditures, and the distributions required to maintain our REIT qualification. We primarily rely on the capital markets (equity and debt securities) to fund our acquisition activity. We seek to increase cash flows from our properties by maintaining quality building standards that promote high occupancy rates and permit increases in rental rates, while reducing tenant turnover and controlling operating expenses. We believe that our revenue, together with proceeds from building sales and equity and debt financings, will continue to provide funds for our short-term and medium-term liquidity needs.
Our short-term liquidity requirements consist primarily of funds necessary to pay for operating expenses and other expenditures directly associated with our buildings, including interest expense, interest rate swap payments, scheduled principal payments on outstanding indebtedness, property acquisitions under contract, general and administrative expenses, and capital expenditures including development projects, tenant improvements and leasing commissions.
Our long-term liquidity needs, in addition to recurring short-term liquidity needs as discussed above, consist primarily of funds necessary to pay for property acquisitions and scheduled debt maturities. We intend to satisfy our long-term liquidity needs through cash flow from operations, the issuance of equity or debt securities, other borrowings, property dispositions, or, in connection with acquisitions of certain additional buildings, the issuance of common units in our Operating Partnership.
As of December 31, 2023, we had total immediate liquidity of approximately $615.4 million, comprised of approximately $20.7 million of cash and cash equivalents and approximately $594.7 million of immediate availability on our unsecured credit facility. When incorporating our total immediate liquidity of $615.4 million and approximately $41.3 million of forward sale proceeds available to us under our ATM common stock offering program through December 14, 2024, our total liquidity was approximately $656.7 million as of December 31, 2023.
In addition, we require funds to pay dividends to holders of our common stock and common units in our Operating Partnership. Any future dividends on our common stock are declared in the sole discretion of our board of directors, subject to the distribution requirements to maintain our REIT status for federal income tax purposes, and may be reduced or stopped for any reason, including to use funds for other liquidity requirements.
Indebtedness Outstanding
The following table summarizes certain information with respect to our indebtedness outstanding as of December 31, 2023.
|
|
|
|
|
|
|
|
|
|
|
|
|
|
|
|
|
|
|
|
|
|
|
|
|
|
|
|
|
| Indebtedness (dollars in thousands) |
|
Principal Outstanding as of December 31, 2023 (in thousands) |
|
|
|
Interest Rate(1)(2) |
|
Maturity Date |
|
Prepayment Terms(3) |
| Unsecured credit facility: |
|
|
|
|
|
|
|
|
|
|
Unsecured Credit Facility(4) |
|
$ |
402,000 |
|
|
|
|
Term SOFR + 0.855% |
|
October 23, 2026 |
|
i |
| Total unsecured credit facility |
|
402,000 |
|
|
|
|
|
|
|
|
|
|
|
|
|
|
|
|
|
|
|
|
| Unsecured term loans: |
|
|
|
|
|
|
|
|
|
|
| Unsecured Term Loan F |
|
200,000 |
|
|
|
|
2.94 |
% |
|
January 12, 2025 |
|
i |
| Unsecured Term Loan G |
|
300,000 |
|
|
|
|
1.78 |
% |
|
February 5, 2026 |
|
i |
| Unsecured Term Loan A |
|
150,000 |
|
|
|
|
2.14 |
% |
|
March 15, 2027 |
|
i |
| Unsecured Term Loan H |
|
187,500 |
|
|
|
|
3.73 |
% |
|
January 25, 2028 |
|
i |
| Unsecured Term Loan I |
|
187,500 |
|
|
|
|
3.49 |
% |
|
January 25, 2028 |
|
i |
| Total unsecured term loans |
|
1,025,000 |
|
|
|
|
|
|
|
|
|
| Total unamortized deferred financing fees and debt issuance costs |
|
(3,227) |
|
|
|
|
|
|
|
|
|
| Total carrying value unsecured term loans, net |
|
1,021,773 |
|
|
|
|
|
|
|
|
|
|
|
|
|
|
|
|
|
|
|
|
| Unsecured notes: |
|
|
|
|
|
|
|
|
|
|
| Series A Unsecured Notes |
|
50,000 |
|
|
|
|
4.98 |
% |
|
October 1, 2024 |
|
ii |
| Series D Unsecured Notes |
|
100,000 |
|
|
|
|
4.32 |
% |
|
February 20, 2025 |
|
ii |
| Series G Unsecured Notes |
|
75,000 |
|
|
|
|
4.10 |
% |
|
June 13, 2025 |
|
ii |
| Series B Unsecured Notes |
|
50,000 |
|
|
|
|
4.98 |
% |
|
July 1, 2026 |
|
ii |
| Series C Unsecured Notes |
|
80,000 |
|
|
|
|
4.42 |
% |
|
December 30, 2026 |
|
ii |
| Series E Unsecured Notes |
|
20,000 |
|
|
|
|
4.42 |
% |
|
February 20, 2027 |
|
ii |
| Series H Unsecured Notes |
|
100,000 |
|
|
|
|
4.27 |
% |
|
June 13, 2028 |
|
ii |
| Series I Unsecured Notes |
|
275,000 |
|
|
|
|
2.80 |
% |
|
September 29, 2031 |
|
ii |
| Series K Unsecured Notes |
|
400,000 |
|
|
|
|
4.12 |
% |
|
June 28, 2032 |
|
ii |
| Series J Unsecured Notes |
|
50,000 |
|
|
|
|
2.95 |
% |
|
September 28, 2033 |
|
ii |
| Total unsecured notes |
|
1,200,000 |
|
|
|
|
|
|
|
|
|
| Total unamortized deferred financing fees and debt issuance costs |
|
(4,128) |
|
|
|
|
|
|
|
|
|
| Total carrying value unsecured notes, net |
|
1,195,872 |
|
|
|
|
|
|
|
|
|
|
|
|
|
|
|
|
|
|
|
|
| Mortgage notes (secured debt): |
|
|
|
|
|
|
|
|
|
|
|
|
|
|
|
|
|
|
|
|
|
| United of Omaha Life Insurance Company |
|
4,537 |
|
|
|
|
3.71 |
% |
|
October 1, 2039 |
|
ii |
| Total mortgage notes |
|
4,537 |
|
|
|
|
|
|
|
|
|
| Net unamortized fair market value discount |
|
(136) |
|
|
|
|
|
|
|
|
|
| Total unamortized deferred financing fees and debt issuance costs |
|
— |
|
|
|
|
|
|
|
|
|
| Total carrying value mortgage notes, net |
|
4,401 |
|
|
|
|
|
|
|
|
|
Total / weighted average interest rate(5) |
|
$ |
2,624,046 |
|
|
|
|
3.79 |
% |
|
|
|
|
(1)Interest rate as of December 31, 2023. At December 31, 2023, the one-month Term SOFR was 5.35472%. The current interest rate is not adjusted to include the amortization of deferred financing fees or debt issuance costs incurred in obtaining debt or any unamortized fair market value premiums or discounts. The spread over the applicable rate for our unsecured credit facility and unsecured term loans is based on our debt rating and leverage ratio, as defined in the respective loan agreements.
(2)Our unsecured credit facility has a stated rate of one-month Term SOFR plus a 0.10% adjustment and a spread of 0.775%, less a sustainability-related interest rate adjustment of 0.02%. Our unsecured term loans have a stated interest rate of one-month Term SOFR plus a 0.10% adjustment and a spread of 0.85%, less a sustainability-related interest rate adjustment of 0.02%. As of December 31, 2023, one-month Term SOFR for the Unsecured Term Loans A, F, G, H, and I was swapped to a fixed rate of 1.31%, 2.11%, 0.95%, 2.90%, and 2.66%, respectively (which includes the 0.10% adjustment). One-month Term SOFR for the Unsecured Term Loan H will be swapped to a fixed rate of 2.50% effective January 12, 2024.
(3)Prepayment terms consist of (i) pre-payable with no penalty; and (ii) pre-payable with penalty.
(4)The capacity of our unsecured credit facility is $1.0 billion. The initial maturity date is October 24, 2025, or such later date which may be extended pursuant to two six-month extension options exercisable by us in our discretion upon advance written notice. Exercise of each six-month option is subject to the following conditions: (i) absence of a default immediately before the extension and immediately after giving effect to the extension, (ii) accuracy of representations and warranties as of the extension date (both immediately before and after the extension), as if made on the extension date, and (iii) payment of a fee. Neither extension option is subject to lender consent, assuming proper notice and satisfaction of the conditions. We are required to pay a facility fee on the aggregate commitment amount (currently $1.0 billion) at a rate per annum of 0.1% to 0.3%, depending on our debt rating, as defined in the credit agreement. The facility fee is due and payable quarterly.
(5)The weighted average interest rate was calculated using the fixed interest rate swapped on the notional amount of $1,025.0 million of debt and is not adjusted to include the amortization of deferred financing fees or debt issuance costs incurred in obtaining debt or any unamortized fair market value premiums or discounts.
The aggregate undrawn nominal commitments on our unsecured credit facility as of December 31, 2023 was approximately $594.7 million, including issued letters of credit. Our actual borrowing capacity at any given point in time may be less and is restricted to a maximum amount based on our debt covenant compliance.
On December 15, 2023, the mortgage note associated with Thrivent Financial for Lutherans in the amount of approximately $3.2 million was repaid in full.
On January 19, 2023, the sustainability-related interest rate adjustment for our Unsecured Term Loan H and Unsecured Term Loan I went into effect in connection with our 2022 public disclosure assessment score of “A” from the Global Real Estate Sustainability Benchmark (GRESB). The interest rate adjustment, a 0.02% interest rate reduction for each instrument, will end on June 29, 2024, in accordance with the respective loan agreements.
On January 5, 2023, we redeemed in full at maturity the $100.0 million in aggregate principal amount of the Series F Unsecured Notes with a fixed interest rate of 3.98%.
The following table summarizes our debt capital structure as of December 31, 2023.
|
|
|
|
|
|
|
|
|
|
|
| Debt Capital Structure |
|
December 31, 2023 |
|
|
| Total principal outstanding (in thousands) |
|
$ |
2,631,537 |
|
|
|
| Weighted average duration (years) |
|
4.3 |
|
|
|
|
|
|
|
|
| % Secured debt |
|
0.2 |
% |
|
|
| % Debt maturing next 12 months |
|
1.9 |
% |
|
|
Net Debt to Real Estate Cost Basis(1) |
|
36.3 |
% |
|
|
(1)“Net Debt” means amounts outstanding under our unsecured credit facility, unsecured term loans, unsecured notes, and mortgage notes, less cash and cash equivalents. “Real Estate Cost Basis” means the book value of rental property and deferred leasing intangibles, exclusive of the related accumulated depreciation and amortization.
We regularly pursue new financing opportunities to ensure an appropriate balance sheet position. As a result of these dedicated efforts, we are confident in our ability to meet future debt maturities and fund acquisitions. We believe that our current balance sheet is in an adequate position at the date of this filing, despite possible volatility in the credit markets.
Our interest rate exposure on our floating rate debt is managed through the use of interest rate swaps, which fix the rate of our long term floating rate debt. For a detailed discussion on our use of interest rate swaps, see “Interest Rate Risk” below.
Unsecured Indebtedness – Financial Covenants and Other Terms
The unsecured credit facility provides for a facility fee payable by us to the lenders at a rate per annum of 0.1% to 0.3%, depending on our debt rating, as defined in the credit agreement, of the aggregate commitments (currently $1.0 billion). The facility fee is due and payable quarterly.
Financial Covenants: Our ability to borrow, maintain borrowings and avoid default under our unsecured credit facility, unsecured term loans, and unsecured notes is subject to our ongoing compliance with a number of financial covenants, including:
•a maximum consolidated leverage ratio of not greater than 0.60:1.00;
•a maximum secured leverage ratio of not greater than 0.40:1.00;
•a maximum unencumbered leverage ratio of not greater than 0.60:1.00;
•a minimum fixed charge ratio of not less than or equal to 1.50:1.00;
•a minimum unsecured interest coverage ratio of not less than or equal to 1.75:1.00; and
•with respect to our unsecured notes, a minimum interest coverage ratio of not less than 1.50:1.00.
As of December 31, 2023, we were in compliance with the applicable financial covenants.
Pursuant to the terms of our unsecured debt agreements, we may not pay distributions that exceed the minimum amount required for us to qualify and maintain our status as a REIT if a default or event of default occurs and is continuing.
Pursuant to the terms of our unsecured loan agreements, if a default or event of default occurs and is continuing, we may not pay distributions that exceed the minimum amount required for us to qualify and maintain our status as a REIT.
Events of Default: Our unsecured credit facility and unsecured term loans contain customary events of default, including, but not limited to, non-payment of principal, interest, fees or other amounts, defaults in the compliance with the financial and other covenants contained in the applicable loan agreement, cross-defaults to other material debt, and bankruptcy or other insolvency events.
Borrower and Guarantors: Our Operating Partnership is the borrower under our unsecured credit facility and unsecured term loans and the issuer of the unsecured notes. The Company and certain of its subsidiaries guarantee the obligations under our unsecured loan agreements.
Supplemental Guarantor Information
We have filed a registration statement with the SEC allowing us to offer, from time to time, an indefinite amount of equity and debt securities on an as-needed basis, including debt securities of our Operating Partnership that are guaranteed by the Company. Any such guarantees issued by the Company will be full, irrevocable, unconditional, and absolute joint and several guarantees to the holders of each series of such outstanding guaranteed debt securities. Pursuant to Rule 3-10 of Regulation S-X, subsidiary issuers of obligations guaranteed by the parent are not required to provide separate financial statements, provided that the subsidiary obligor is consolidated into the parent company’s consolidated financial statements, the parent guarantee is “full and unconditional” and, subject to certain exceptions as set forth below, the alternative disclosure required by Rule 13-01 of Regulation S-X is provided, which includes narrative disclosure and summarized financial information. Accordingly, we have not presented separate consolidated financial statements of our Operating Partnership. Furthermore, as permitted under Rule 13-01(a)(4)(vi) of Regulation S-X, we have not presented summarized financial information for our Operating Partnership because the assets, liabilities, and results of operations of our Operating Partnership are not materially different than the corresponding amounts in the Company’s consolidated financial statements, and we believe the inclusion of such summarized financial information would be repetitive and would not provide incremental value to investors.
Equity
Preferred Stock
We are authorized to issue up to 20,000,000 shares of preferred stock, par value $0.01 per share. As of December 31, 2023 and December 31, 2022, there were no shares of preferred stock issued or outstanding.
Common Stock
We are authorized to issue up to 300,000,000 shares of common stock, par value $0.01 per share.
Pursuant to the equity distribution agreements for our ATM common stock offering program, we may from time to time sell common stock through sales agents and their affiliates, including shares sold on a forward basis under forward sale agreements. The following table summarizes our ATM common stock offering program as of December 31, 2023.
|
|
|
|
|
|
|
|
|
|
|
|
|
|
|
|
|
|
|
|
|
| ATM Common Stock Offering Program |
|
Date |
|
Maximum Aggregate Offering Price (in thousands) |
|
Aggregate Common Stock Available as of December 31, 2023 (in thousands) |
| 2022 $750 million ATM |
|
February 17, 2022 |
|
$ |
750,000 |
|
|
$ |
637,663 |
|
There was no settled activity under the ATM common stock offering program during the three months ended December 31, 2023.
Subsequent to December 31, 2023, on January 9, 2024 we sold 567,112 shares on a forward basis under the ATM common stock offering program at a sale price of $38.8818 per share (an aggregate of approximately $22.1 million gross sale price), or $38.5058 per share net of commissions. We did not receive any proceeds from the sale of such shares on a forward basis. We expect to fully physically settle the applicable forward sale agreement on one or more dates prior to the scheduled maturity date of January 9, 2025, at which point we would receive the proceeds net of certain costs; provided, however, we may elect to cash settle or net share settle such forward sale agreement at any time through the scheduled maturity date.
On December 14, 2023, we sold 1,100,000 shares on a forward basis under the ATM common stock offering program at a sale price of $38.00 per share (an aggregate of approximately $41.8 million gross sale price), or $37.62 per share net of commissions. We did not receive any proceeds from the sale of such shares on a forward basis. We expect to fully physically settle the applicable forward sale agreement on one or more dates prior to the scheduled maturity date of December 14, 2024, at which point we would receive the proceeds net of certain costs; provided, however, we may elect to cash settle or net share settle such forward sale agreement at any time through the scheduled maturity date.
On June 16, 2023, we sold 992,295 shares on a forward basis under the ATM common stock offering program at a weighted average sale price of $36.5319 per share (an aggregate of approximately $36.3 million in gross sale price), or $36.1820 per share net of commissions. We did not initially receive any proceeds from the sale of shares on a forward basis. On July 27, 2023, we physically settled in full the forward sales agreements by issuing 992,295 shares of common stock for net proceeds of approximately $35.9 million, or $36.2046 per share.
On May 5, 2023, we sold 725,698 shares on a forward basis under the ATM common stock offering program at a sale price of $35.0458 per share (an aggregate of approximately $25.4 million in gross sale price), or $34.6953 per share net of commissions. We did not initially receive any proceeds from the sale of shares on a forward basis. On July 27, 2023, we physically settled in full the forward sales agreements by issuing 725,698 shares of common stock for net proceeds of approximately $25.2 million, or $34.7714 per share.
Noncontrolling Interests
We own all of our properties and conduct substantially all of our business through our Operating Partnership. We are the sole member of the sole general partner of our Operating Partnership. As of December 31, 2023, we owned approximately 97.9% of the common units in our Operating Partnership, and our current and former executive officers, directors, senior employees and their affiliates, and third parties that contributed properties to us in exchange for common units in our Operating Partnership owned the remaining 2.1%.
Interest Rate Risk
We use interest rate swaps to fix the rate of our variable rate debt. As of December 31, 2023, all of our outstanding variable rate debt, with the exception of our unsecured credit facility, was fixed with interest rate swaps through maturity.
We recognize all derivatives on the balance sheet at fair value. If the derivative is designated as a hedge, depending on the nature of the hedge, changes in the fair value of derivatives are either offset against the change in fair value of the hedged assets, liabilities, or firm commitments through earnings or recognized in other comprehensive income (loss), which is a component of equity. Derivatives that are not designated as hedges must be adjusted to fair value and the changes in fair value must be reflected as income or expense.
We have established criteria for suitable counterparties in relation to various specific types of risk. We only use counterparties that have a credit rating of no lower than investment grade at swap inception from Moody’s Investor Services, Standard & Poor’s, Fitch Ratings, or other nationally recognized rating agencies.
The swaps are all designated as cash flow hedges of interest rate risk, and all are valued as Level 2 financial instruments. Level 2 financial instruments are defined as significant other observable inputs. As of December 31, 2023, we had 21 interest rate swaps outstanding that were in an asset position of approximately $50.4 million, including any adjustment for nonperformance risk related to these agreements.
As of December 31, 2023, we had approximately $1.4 billion of variable rate debt. As of December 31, 2023, all of our outstanding variable rate debt, with the exception of our unsecured credit facility, was fixed with interest rate swaps through maturity. To the extent interest rates increase, interest costs on our floating rate debt not fixed with interest rate swaps will increase, which could adversely affect our cash flow and our ability to pay principal and interest on our debt and our ability to make distributions to our security holders. From time to time, we may enter into interest rate swap agreements and other interest rate hedging contracts, including swaps, caps and floors. In addition, an increase in interest rates could decrease the amounts third parties are willing to pay for our assets, thereby limiting our ability to change our portfolio promptly in response to changes in economic or other conditions.
Off-balance Sheet Arrangements
As of December 31, 2023, we had letters of credit related to development projects and certain other agreements of approximately $3.3 million. As of December 31, 2023, we had no other material off-balance sheet arrangements.
Item 7A. Quantitative and Qualitative Disclosures about Market Risk
Our future income, cash flows and fair values relevant to financial instruments are dependent upon prevailing market interest rates. Market risk refers to the risk of loss from adverse changes in market prices and interest rates. The primary market risk we are exposed to is interest rate risk. We have used derivative financial instruments to manage, or hedge, interest rate risks related to our borrowings, primarily through interest rate swaps.
As of December 31, 2023, we had $1.4 billion of variable rate debt. As of December 31, 2023, all of our outstanding variable rate debt, with the exception of our unsecured credit facility which had a balance of $402.0 million, was fixed with interest rate swaps through maturity. To the extent we undertake additional variable rate indebtedness, if interest rates increase, then so will the interest costs on our unhedged variable rate debt, which could adversely affect our cash flow and our ability to pay principal and interest on our debt and our ability to make distributions to our security holders. Further, rising interest rates could limit our ability to refinance existing debt when it matures or significantly increase our future interest expense. From time to time, we enter into interest rate swap agreements and other interest rate hedging contracts, including swaps, caps and floors. While these agreements are intended to lessen the impact of rising interest rates on us, they also expose us to the risk that the other parties to the agreements will not perform, we could incur significant costs associated with the settlement of the agreements, the agreements will be unenforceable and the underlying transactions will fail to qualify as highly-effective cash flow hedges under GAAP. In addition, an increase in interest rates could decrease the amounts third parties are willing to pay for our assets, thereby limiting our ability to change our portfolio promptly in response to changes in economic or other conditions. In addition, an increase in interest rates could decrease the amounts third parties are willing to pay for our assets, thereby limiting our ability to change our portfolio promptly in response to changes in economic or other conditions. If interest rates increased by 100 basis points and assuming we had an outstanding balance of $402.0 million on our unsecured credit facility for the year ended December 31, 2023, our interest expense would have increased by approximately $4.0 million for the year ended December 31, 2023.
Item 8. Financial Statements and Supplementary Data
The required response under this Item 8, “Financial Statements and Supplementary Data” is submitted in a separate section of this report. See Index to Consolidated Financial Statements on page F-1.
Item 9. Changes in and Disagreements with Accountants on Accounting and Financial Disclosure
None.
Item 9A. Controls and Procedures
Evaluation of Disclosure Controls and Procedures
As required by SEC Rule 13a-15(b), we have evaluated, under the supervision of and with the participation of management, including our Chief Executive Officer and Chief Financial Officer, the effectiveness of the design and operation of our disclosure controls and procedures, as defined in Rules 13a-15(e) and 15d-15(e) of the Exchange Act, as of December 31, 2023. Based on the foregoing, our Chief Executive Officer and Chief Financial Officer concluded that our disclosure controls and procedures for the periods covered by this report were effective to provide reasonable assurance that information required to be disclosed by the Company in reports that we file or submit under the Exchange Act is recorded, processed, summarized and reported within the time periods specified in SEC rules and forms and is accumulated and communicated to our management, including our Chief Executive Officer and Chief Financial Officer, as appropriate to allow timely decisions regarding required disclosure.
Management’s Report on Internal Control Over Financial Reporting
Our management is responsible for establishing and maintaining adequate internal control over financial reporting, as such term is defined in Rules 13a-15(f) and 15d-15(f) of the Exchange Act. Under the supervision and with the participation of our management, including our Chief Executive Officer and Chief Financial Officer, we conducted an evaluation of the effectiveness of our internal control over financial reporting based on the framework in Internal Control—Integrated Framework (2013) issued by the Committee of Sponsoring Organizations of the Treadway Commission.
Based on our evaluation under the framework in Internal Control—Integrated Framework (2013), our management concluded that our internal control over financial reporting was effective as of December 31, 2023.
The effectiveness of our internal control over financial reporting as of December 31, 2023 has been audited by PricewaterhouseCoopers LLP, an independent registered public accounting firm, as stated in their report, which appears on page F-2 of this report.
Changes in Internal Controls
There was no change to our internal control over financial reporting during the fourth quarter ended December 31, 2023 that has materially affected, or is reasonably likely to materially affect, our internal control over financial reporting.
Item 9B. Other Information
During the quarter ended December 31, 2023, all items required to be disclosed in a Current Report on Form 8-K were reported under Form 8-K.
During the quarter ended December 31, 2023, none of the Company’s directors or officers adopted or terminated any Rule 10b5-1 trading arrangement or non-Rule 10b5-1 trading arrangement (as such terms are defined in Item 408 of Regulation S-K of the Securities Act). Similarly, in that same time period, the Company did not adopt or terminate any Rule 10b5-1 trading arrangement.
Item 9C. Disclosure Regarding Foreign Jurisdictions that Prevent Inspections
Not Applicable.
PART III.
Item 10. Directors, Executive Officers and Corporate Governance
The information required by Item 10 will be included in the Proxy Statement to be filed relating to our 2024 Annual Meeting of Stockholders and is incorporated herein by reference.
Item 11. Executive Compensation
The information required by Item 11 will be included in the Proxy Statement to be filed relating to our 2024 Annual Meeting of Stockholders and is incorporated herein by reference.
Item 12. Security Ownership of Certain Beneficial Owners and Management and Related Stockholder Matters
The information required by Item 12 will be included in the Proxy Statement to be filed relating to our 2024 Annual Meeting of Stockholders and is incorporated herein by reference.
Item 13. Certain Relationships and Related Transactions, and Director Independence
The information required by Item 13 will be included in the Proxy Statement to be filed relating to our 2024 Annual Meeting of Stockholders and is incorporated herein by reference.
Item 14. Principal Accountant Fees and Services
The information required by Item 14 will be included in the Proxy Statement to be filed relating to our 2024 Annual Meeting of Stockholders and is incorporated herein by reference.
PART IV.
Item 15. Exhibits and Financial Statement Schedules
1.Consolidated Financial Statements
The financial statements listed in the accompanying Index to Consolidated Financial Statements on page F-1 are filed as a part of this report.
2.Financial Statement Schedules
The financial statement schedules required by this Item are filed with this report and listed in the accompanying Index to Consolidated Financial Statements on page F-1. All other financial statement schedules are not applicable.
3.Exhibits
The following exhibits are filed as part of this report:
|
|
|
|
|
|
|
|
|
| Exhibit Number |
|
Description of Document |
| 3.1 |
|
|
|
| 3.2 |
|
|
|
| 4.1 |
|
|
|
| 4.2 |
|
|
|
| 10.1 |
|
|
|
| 10.2 |
|
|
|
| 10.3 |
|
|
|
| 10.4 |
|
|
|
| 10.5 |
|
|
|
| 10.6 |
|
|
|
| 10.7 |
|
|
|
| 10.8 |
|
|
|
| 10.8 |
|
|
|
| 10.9 |
|
|
|
| 10.10 |
|
|
|
| 10.11 |
|
|
|
| 10.12 |
|
|
|
| 10.13 |
|
|
|
| 10.14 |
|
|
|
| 10.15 |
|
|
|
| 10.16 |
|
|
|
|
|
|
|
|
|
|
|
|
| Exhibit Number |
|
Description of Document |
| 10.17 |
|
|
|
| 10.18 |
|
|
|
| 10.19 |
|
|
|
| 10.20 |
|
|
|
| 10.21 |
|
|
|
| 10.22 |
|
|
|
| 10.23 |
|
|
|
| 10.24 |
|
|
|
| 10.25 |
|
|
|
| 10.26 |
|
|
|
| 10.27 |
|
|
|
| 10.28 |
|
|
|
| 19.1 |
|
|
|
| 21.1 |
|
|
|
| 23.1 |
|
|
|
| 24.1 |
|
|
|
| 31.1 |
|
|
|
| 31.2 |
|
|
|
| 32.1 |
|
|
|
| 97.1 |
|
|
|
| 101 |
|
|
The following materials from STAG Industrial, Inc.’s Annual Report on Form 10-K for the year ended December 31, 2023 formatted in Inline XBRL (eXtensible Business Reporting Language): (i) the Consolidated Balance Sheets, (ii) the Consolidated Statements of Operations, (iii) the Consolidated Statements of Comprehensive Income, (vi) the Consolidated Statements of Equity, (v) the Consolidated Statements of Cash Flows, and (vi) related notes to these consolidated financial statements. |
| 104 |
|
|
Cover Page Interactive Data File (formatted in Inline XBRL and contained in Exhibit 101). |
* Represents management contract or compensatory plan or arrangement.
Item 16. Form 10-K Summary
None.
SIGNATURES
Pursuant to the requirements of Section 13 or 15(d) of the Securities Exchange Act of 1934, the registrant has duly caused this report to be signed on its behalf by the undersigned, thereunto duly authorized.
|
|
|
|
|
|
|
|
|
|
|
|
| |
STAG INDUSTRIAL, INC. |
| Dated: February 13, 2024 |
|
|
| |
|
/s/ William R. Crooker |
|
| |
By: |
William R. Crooker
President and Chief Executive Officer
|
KNOW ALL MEN BY THESE PRESENTS, that we, the undersigned officers and directors of STAG Industrial, Inc., hereby severally constitute William R. Crooker and Matts S. Pinard, and each of them singly, our true and lawful attorneys with full power to them, and each of them singly, to sign for us and in our names in the capacities indicated below, the Form 10-K filed herewith and any and all amendments to said Form 10-K, and generally to do all such things in our names and in our capacities as officers and directors to enable STAG Industrial, Inc. to comply with the provisions of the Securities Exchange Act of 1934, as amended, and all requirements of the Securities and Exchange Commission, hereby ratifying and confirming our signatures as they may be signed by our said attorneys, or any of them, to said Form 10-K and any and all amendments thereto.
Pursuant to the requirements of the Securities Exchange Act of 1934, this report has been signed below by the following persons on behalf of the registrant and in the capacities and dates indicated.
|
|
|
|
|
|
|
|
|
| Date |
Signature |
Title |
| |
|
|
| February 13, 2024 |
/s/ William R. Crooker |
President, Chief Executive Officer and Director
(principal executive officer) |
| William R. Crooker |
|
|
|
| February 13, 2024 |
/s/ Benjamin S. Butcher |
Director |
| Benjamin S. Butcher |
|
|
|
| February 13, 2024 |
/s/ Jit Kee Chin |
Director |
| Jit Kee Chin |
|
|
|
| February 13, 2024 |
/s/ Virgis W. Colbert |
Director |
| Virgis W. Colbert |
|
|
|
| February 13, 2024 |
/s/ Michelle S. Dilley |
Director |
| Michelle S. Dilley |
|
|
|
| February 13, 2024 |
/s/ Jeffrey D. Furber |
Director |
| Jeffrey D. Furber |
|
|
|
| February 13, 2024 |
/s/ Larry T. Guillemette |
Chairman of the Board |
| Larry T. Guillemette |
|
|
|
| February 13, 2024 |
/s/ Francis X. Jacoby III |
Director |
| Francis X. Jacoby III |
|
|
|
| February 13, 2024 |
/s/ Christopher P. Marr |
Director |
| Christopher P. Marr |
|
|
|
| February 13, 2024 |
/s/ Hans S. Weger |
Director |
| Hans S. Weger |
|
|
|
| February 13, 2024 |
/s/ Matts S. Pinard |
Chief Financial Officer, Executive Vice President and Treasurer (principal financial officer) |
| Matts S. Pinard |
|
|
|
| February 13, 2024 |
/s/ Jaclyn M. Paul |
Chief Accounting Officer (principal accounting officer) |
| Jaclyn M. Paul |
STAG INDUSTRIAL, INC.
INDEX TO CONSOLIDATED FINANCIAL STATEMENTS
Report of Independent Registered Public Accounting Firm
To the Board of Directors and Stockholders of STAG Industrial, Inc.
Opinions on the Financial Statements and Internal Control over Financial Reporting
We have audited the accompanying consolidated balance sheets of STAG Industrial, Inc. and its subsidiaries (the “Company”) as of December 31, 2023, and 2022, and the related consolidated statements of operations, comprehensive income, equity and cash flows for each of the three years in the period ended December 31, 2023, including the related notes and financial statement schedule listed in the accompanying index (collectively referred to as the “consolidated financial statements”). We also have audited the Company's internal control over financial reporting as of December 31, 2023, based on criteria established in Internal Control - Integrated Framework (2013) issued by the Committee of Sponsoring Organizations of the Treadway Commission (COSO).
In our opinion, the consolidated financial statements referred to above present fairly, in all material respects, the financial position of the Company as of December 31, 2023, and 2022, and the results of its operations and its cash flows for each of the three years in the period ended December 31, 2023, in conformity with accounting principles generally accepted in the United States of America. Also in our opinion, the Company maintained, in all material respects, effective internal control over financial reporting as of December 31, 2023, based on criteria established in Internal Control - Integrated Framework (2013) issued by the COSO.
Basis for Opinions
The Company's management is responsible for these consolidated financial statements, for maintaining effective internal control over financial reporting, and for its assessment of the effectiveness of internal control over financial reporting, included in Management’s Report on Internal Control over Financial Reporting appearing under Item 9A. Our responsibility is to express opinions on the Company’s consolidated financial statements and on the Company's internal control over financial reporting based on our audits. We are a public accounting firm registered with the Public Company Accounting Oversight Board (United States) (PCAOB) and are required to be independent with respect to the Company in accordance with the U.S. federal securities laws and the applicable rules and regulations of the Securities and Exchange Commission and the PCAOB.
We conducted our audits in accordance with the standards of the PCAOB. Those standards require that we plan and perform the audits to obtain reasonable assurance about whether the consolidated financial statements are free of material misstatement, whether due to error or fraud, and whether effective internal control over financial reporting was maintained in all material respects.
Our audits of the consolidated financial statements included performing procedures to assess the risks of material misstatement of the consolidated financial statements, whether due to error or fraud, and performing procedures that respond to those risks. Such procedures included examining, on a test basis, evidence regarding the amounts and disclosures in the consolidated financial statements. Our audits also included evaluating the accounting principles used and significant estimates made by management, as well as evaluating the overall presentation of the consolidated financial statements. Our audit of internal control over financial reporting included obtaining an understanding of internal control over financial reporting, assessing the risk that a material weakness exists, and testing and evaluating the design and operating effectiveness of internal control based on the assessed risk. Our audits also included performing such other procedures as we considered necessary in the circumstances. We believe that our audits provide a reasonable basis for our opinions.
Definition and Limitations of Internal Control over Financial Reporting
A company’s internal control over financial reporting is a process designed to provide reasonable assurance regarding the reliability of financial reporting and the preparation of financial statements for external purposes in accordance with generally accepted accounting principles. A company’s internal control over financial reporting includes those policies and procedures that (i) pertain to the maintenance of records that, in reasonable detail, accurately and fairly reflect the transactions and dispositions of the assets of the company; (ii) provide reasonable assurance that transactions are recorded as necessary to permit preparation of financial statements in accordance with generally accepted accounting principles, and that receipts and expenditures of the company are being made only in accordance with authorizations of management and directors of the company; and (iii) provide reasonable assurance regarding prevention or timely detection of unauthorized acquisition, use, or disposition of the company’s assets that could have a material effect on the financial statements.
Because of its inherent limitations, internal control over financial reporting may not prevent or detect misstatements. Also, projections of any evaluation of effectiveness to future periods are subject to the risk that controls may become inadequate because of changes in conditions, or that the degree of compliance with the policies or procedures may deteriorate.
Critical Audit Matters
The critical audit matter communicated below is a matter arising from the current period audit of the consolidated financial statements that was communicated or required to be communicated to the audit committee and that (i) relates to accounts or disclosures that are material to the consolidated financial statements and (ii) involved our especially challenging, subjective, or complex judgments. The communication of critical audit matters does not alter in any way our opinion on the consolidated financial statements, taken as a whole, and we are not, by communicating the critical audit matter below, providing a separate opinion on the critical audit matter or on the accounts or disclosures to which it relates.
Purchase Price Accounting
As described in Notes 2 and 3 to the consolidated financial statements, during 2023, the Company completed 16 property acquisitions for consideration of approximately $322 million, of which approximately $56 million of land, $248 million of buildings and improvements, $18.5 million of net leasing intangibles, and $0.5 million of other liabilities were recorded. Management allocates the purchase price of properties based upon the fair value of the assets acquired and liabilities assumed, which generally consist of land, buildings, tenant improvements, mortgage debt assumed, and deferred leasing intangibles, which includes in-place leases, above market and below market leases, and tenant relationships. The process for determining the allocation to these components requires estimates and assumptions, including rental rates, discount rates, exit capitalization rates, and land value per square foot.
The principal considerations for our determination that performing procedures relating to purchase price accounting is a critical audit matter are (i) there was significant judgment by management when developing the fair value measurement of the tangible and intangible assets acquired and liabilities assumed, which resulted in a high degree of auditor judgment and subjectivity in performing procedures relating to these estimates, (ii) significant audit effort was necessary in evaluating the significant assumptions, including rental rates, discount rates, exit capitalization rates, and land value per square foot, (iii) significant auditor judgment was necessary in evaluating audit evidence, and (iv) the audit effort included the involvement of professionals with specialized skill and knowledge to assist in evaluating the audit evidence obtained.
Addressing the matter involved performing procedures and evaluating audit evidence in connection with forming our overall opinion on the consolidated financial statements. These procedures included testing the effectiveness of controls relating to purchase price accounting, including controls over the allocation of the purchase price to the assets acquired and liabilities assumed. These procedures also included, among others, testing management’s process for estimating the fair value of assets acquired and liabilities assumed by (i) reading the purchase agreements and (ii) evaluating the appropriateness of methods and, for a sample of acquisitions, the reasonableness of significant assumptions used by management in developing the fair value measurement including rental rates, discount rates, exit capitalization rates, and land value per square foot. Evaluating these assumptions involved evaluating whether the assumptions used were reasonable considering past performance of the tangible and intangible assets acquired and liabilities assumed, consistency with external market and industry data, and considering whether the assumptions were consistent with evidence obtained in other areas of the audit. Procedures were also performed to test the completeness and accuracy of data provided by management. For certain acquisitions, professionals with specialized skill and knowledge were used to assist in evaluating the appropriateness of management’s methods and evaluating the reasonableness of the assumptions related to the rental rates, discount rates, exit capitalization rates, and land value per square foot.
/s/PricewaterhouseCoopers LLP
Boston, Massachusetts
February 13, 2024
We have served as the Company’s or its predecessor’s auditor since 2009.
STAG Industrial, Inc.
Consolidated Balance Sheets
(in thousands, except share data)
|
|
|
|
|
|
|
|
|
|
|
|
| |
December 31, 2023 |
|
December 31, 2022 |
| Assets |
|
|
|
| Rental Property: |
|
|
|
| Land |
$ |
698,633 |
|
|
$ |
647,098 |
|
Buildings and improvements, net of accumulated depreciation of $921,846 and $763,128, respectively |
4,838,522 |
|
|
4,706,745 |
|
Deferred leasing intangibles, net of accumulated amortization of $360,094 and $328,848, respectively |
435,722 |
|
|
508,935 |
|
| Total rental property, net |
5,972,877 |
|
|
5,862,778 |
|
| Cash and cash equivalents |
20,741 |
|
|
25,884 |
|
| Restricted cash |
1,127 |
|
|
905 |
|
| Tenant accounts receivable |
128,274 |
|
|
115,509 |
|
| Prepaid expenses and other assets |
80,455 |
|
|
71,733 |
|
| Interest rate swaps |
50,418 |
|
|
72,223 |
|
| Operating lease right-of-use assets |
29,566 |
|
|
31,313 |
|
| Assets held for sale, net |
— |
|
|
4,643 |
|
| Total assets |
$ |
6,283,458 |
|
|
$ |
6,184,988 |
|
| Liabilities and Equity |
|
|
|
| Liabilities: |
|
|
|
| Unsecured credit facility |
$ |
402,000 |
|
|
$ |
175,000 |
|
| Unsecured term loans, net |
1,021,773 |
|
|
1,020,440 |
|
| Unsecured notes, net |
1,195,872 |
|
|
1,295,442 |
|
| Mortgage notes, net |
4,401 |
|
|
7,898 |
|
| Accounts payable, accrued expenses and other liabilities |
83,152 |
|
|
97,371 |
|
|
|
|
|
| Tenant prepaid rent and security deposits |
44,238 |
|
|
40,847 |
|
| Dividends and distributions payable |
22,726 |
|
|
22,282 |
|
Deferred leasing intangibles, net of accumulated amortization of $26,613 and $24,593, respectively |
29,908 |
|
|
32,427 |
|
| Operating lease liabilities |
33,577 |
|
|
35,100 |
|
| Total liabilities |
2,837,647 |
|
|
2,726,807 |
|
| Commitments and contingencies (Note 11) |
|
|
|
| Equity: |
|
|
|
Preferred stock, par value $0.01 per share, 20,000,000 shares authorized at December 31, 2023 and December 31, 2022; none issued or outstanding |
— |
|
|
— |
|
Common stock, par value $0.01 per share, 300,000,000 shares authorized at December 31, 2023 and December 31, 2022, 181,690,867 and 179,248,980 shares issued and outstanding at December 31, 2023 and December 31, 2022, respectively |
1,817 |
|
|
1,792 |
|
| Additional paid-in capital |
4,272,376 |
|
|
4,188,677 |
|
| Cumulative dividends in excess of earnings |
(948,720) |
|
|
(876,145) |
|
| Accumulated other comprehensive income |
49,207 |
|
|
70,500 |
|
| Total stockholders’ equity |
3,374,680 |
|
|
3,384,824 |
|
| Noncontrolling interest |
71,131 |
|
|
73,357 |
|
| Total equity |
3,445,811 |
|
|
3,458,181 |
|
| Total liabilities and equity |
$ |
6,283,458 |
|
|
$ |
6,184,988 |
|
The accompanying notes are an integral part of these consolidated financial statements.
STAG Industrial, Inc.
Consolidated Statements of Operations
(in thousands, except share data)
|
|
|
|
|
|
|
|
|
|
|
|
|
|
|
|
|
|
| |
Year ended December 31, |
| |
2023 |
|
2022 |
|
2021 |
| Revenue |
|
|
|
|
|
| Rental income |
$ |
705,160 |
|
|
$ |
654,377 |
|
|
$ |
559,432 |
|
| Other income |
2,675 |
|
|
2,968 |
|
|
2,727 |
|
| Total revenue |
707,835 |
|
|
657,345 |
|
|
562,159 |
|
| Expenses |
|
|
|
|
|
| Property |
139,596 |
|
|
125,701 |
|
|
107,986 |
|
| General and administrative |
47,491 |
|
|
46,958 |
|
|
48,629 |
|
|
|
|
|
|
|
| Depreciation and amortization |
278,447 |
|
|
275,040 |
|
|
238,699 |
|
| Loss on impairment |
— |
|
|
1,783 |
|
|
— |
|
| Other expenses |
4,693 |
|
|
4,363 |
|
|
2,878 |
|
| Total expenses |
470,227 |
|
|
453,845 |
|
|
398,192 |
|
| Other income (expense) |
|
|
|
|
|
| Interest and other income |
68 |
|
|
103 |
|
|
121 |
|
| Interest expense |
(94,575) |
|
|
(78,018) |
|
|
(63,484) |
|
| Debt extinguishment and modification expenses |
— |
|
|
(838) |
|
|
(2,152) |
|
|
|
|
|
|
|
| Gain on the sales of rental property, net |
54,100 |
|
|
57,487 |
|
|
97,980 |
|
| Total other income (expense) |
(40,407) |
|
|
(21,266) |
|
|
32,465 |
|
| Net income |
$ |
197,201 |
|
|
$ |
182,234 |
|
|
$ |
196,432 |
|
| Less: income attributable to noncontrolling interest after preferred stock dividends |
4,356 |
|
|
3,908 |
|
|
4,098 |
|
| Net income attributable to STAG Industrial, Inc. |
$ |
192,845 |
|
|
$ |
178,326 |
|
|
$ |
192,334 |
|
| Less: preferred stock dividends |
— |
|
|
— |
|
|
1,289 |
|
| Less: redemption of preferred stock |
— |
|
|
— |
|
|
2,582 |
|
| Less: amount allocated to participating securities |
212 |
|
|
237 |
|
|
288 |
|
| Net income attributable to common stockholders |
$ |
192,633 |
|
|
$ |
178,089 |
|
|
$ |
188,175 |
|
| Weighted average common shares outstanding — basic |
180,221 |
|
|
178,753 |
|
|
163,442 |
|
| Weighted average common shares outstanding — diluted |
180,555 |
|
|
178,940 |
|
|
164,090 |
|
| Net income per share — basic and diluted |
|
|
|
|
|
| Net income per share attributable to common stockholders — basic |
$ |
1.07 |
|
|
$ |
1.00 |
|
|
$ |
1.15 |
|
| Net income per share attributable to common stockholders — diluted |
$ |
1.07 |
|
|
$ |
1.00 |
|
|
$ |
1.15 |
|
The accompanying notes are an integral part of these consolidated financial statements.
STAG Industrial, Inc.
Consolidated Statements of Comprehensive Income
(in thousands)
|
|
|
|
|
|
|
|
|
|
|
|
|
|
|
|
|
|
| |
Year ended December 31, |
| |
2023 |
|
2022 |
|
2021 |
| Net income |
$ |
197,201 |
|
|
$ |
182,234 |
|
|
$ |
196,432 |
|
| Other comprehensive income (loss): |
|
|
|
|
|
| Income (loss) on interest rate swaps |
(21,774) |
|
|
84,086 |
|
|
28,856 |
|
| Other comprehensive income (loss) |
(21,774) |
|
|
84,086 |
|
|
28,856 |
|
| Comprehensive income |
175,427 |
|
|
266,320 |
|
|
225,288 |
|
| Income attributable to noncontrolling interest after preferred stock dividends |
(4,356) |
|
|
(3,908) |
|
|
(4,098) |
|
| Other comprehensive (income) loss attributable to noncontrolling interest |
481 |
|
|
(1,803) |
|
|
(614) |
|
| Comprehensive income attributable to STAG Industrial, Inc. |
$ |
171,552 |
|
|
$ |
260,609 |
|
|
$ |
220,576 |
|
The accompanying notes are an integral part of these consolidated financial statements.
STAG Industrial, Inc.
Consolidated Statements of Equity
(in thousands, except share data)
|
|
|
|
|
|
|
|
|
|
|
|
|
|
|
|
|
|
|
|
|
|
|
|
|
|
|
|
|
|
|
|
|
|
|
|
|
|
|
|
|
|
|
|
|
|
|
|
|
|
|
|
|
|
| |
Preferred Stock |
|
Common Stock |
|
Additional Paid-in Capital |
|
Cumulative Dividends in Excess of Earnings |
|
Accumulated Other Comprehensive Income (Loss) |
|
Total Stockholders’ Equity |
|
Noncontrolling Interest - Unit Holders in Operating Partnership |
|
Total Equity |
| |
|
Shares |
|
Par Amount |
|
|
|
|
|
|
| Balance, December 31, 2020 |
$ |
75,000 |
|
|
158,209,823 |
|
|
$ |
1,582 |
|
|
$ |
3,421,721 |
|
|
$ |
(742,071) |
|
|
$ |
(40,025) |
|
|
$ |
2,716,207 |
|
|
$ |
54,845 |
|
|
$ |
2,771,052 |
|
|
|
|
|
|
|
|
|
|
|
|
|
|
|
|
|
|
|
| Proceeds from sales of common stock, net |
— |
|
|
19,238,685 |
|
|
192 |
|
|
706,680 |
|
|
— |
|
|
— |
|
|
706,872 |
|
|
— |
|
|
706,872 |
|
| Redemption of preferred stock |
(75,000) |
|
|
— |
|
|
— |
|
|
2,573 |
|
|
(2,582) |
|
|
— |
|
|
(75,009) |
|
|
— |
|
|
(75,009) |
|
Dividends and distributions, net ($1.45 per share/unit) |
— |
|
|
— |
|
|
— |
|
|
— |
|
|
(239,859) |
|
|
— |
|
|
(239,859) |
|
|
(8,293) |
|
|
(248,152) |
|
| Non-cash compensation activity, net |
— |
|
|
149,516 |
|
|
1 |
|
|
3,024 |
|
|
(154) |
|
|
— |
|
|
2,871 |
|
|
10,665 |
|
|
13,536 |
|
| Redemption of common units to common stock |
— |
|
|
171,318 |
|
|
2 |
|
|
2,852 |
|
|
— |
|
|
— |
|
|
2,854 |
|
|
(2,854) |
|
|
— |
|
| Rebalancing of noncontrolling interest |
— |
|
|
— |
|
|
— |
|
|
(6,812) |
|
|
— |
|
|
— |
|
|
(6,812) |
|
|
6,812 |
|
|
— |
|
| Other comprehensive income |
— |
|
|
— |
|
|
— |
|
|
— |
|
|
— |
|
|
28,242 |
|
|
28,242 |
|
|
614 |
|
|
28,856 |
|
| Net income |
— |
|
|
— |
|
|
— |
|
|
— |
|
|
192,334 |
|
|
— |
|
|
192,334 |
|
|
4,098 |
|
|
196,432 |
|
| Balance, December 31, 2021 |
$ |
— |
|
|
177,769,342 |
|
|
$ |
1,777 |
|
|
$ |
4,130,038 |
|
|
$ |
(792,332) |
|
|
$ |
(11,783) |
|
|
$ |
3,327,700 |
|
|
$ |
65,887 |
|
|
$ |
3,393,587 |
|
|
|
|
|
|
|
|
|
|
|
|
|
|
|
|
|
|
|
| Proceeds from sales of common stock, net |
— |
|
|
1,328,335 |
|
|
13 |
|
|
54,931 |
|
|
— |
|
|
— |
|
|
54,944 |
|
|
— |
|
|
54,944 |
|
|
|
|
|
|
|
|
|
|
|
|
|
|
|
|
|
|
|
Dividends and distributions, net ($1.46 per share/unit) |
— |
|
|
— |
|
|
— |
|
|
— |
|
|
(261,359) |
|
|
— |
|
|
(261,359) |
|
|
(5,832) |
|
|
(267,191) |
|
| Non-cash compensation activity, net |
— |
|
|
52,809 |
|
|
1 |
|
|
2,832 |
|
|
(780) |
|
|
— |
|
|
2,053 |
|
|
8,468 |
|
|
10,521 |
|
| Redemption of common units to common stock |
— |
|
|
98,494 |
|
|
1 |
|
|
1,856 |
|
|
— |
|
|
— |
|
|
1,857 |
|
|
(1,857) |
|
|
— |
|
| Rebalancing of noncontrolling interest |
— |
|
|
— |
|
|
— |
|
|
(980) |
|
|
— |
|
|
— |
|
|
(980) |
|
|
980 |
|
|
— |
|
| Other comprehensive income |
— |
|
|
— |
|
|
— |
|
|
— |
|
|
— |
|
|
82,283 |
|
|
82,283 |
|
|
1,803 |
|
|
84,086 |
|
| Net income |
— |
|
|
— |
|
|
— |
|
|
— |
|
|
178,326 |
|
|
— |
|
|
178,326 |
|
|
3,908 |
|
|
182,234 |
|
| Balance, December 31, 2022 |
$ |
— |
|
|
179,248,980 |
|
|
$ |
1,792 |
|
|
$ |
4,188,677 |
|
|
$ |
(876,145) |
|
|
$ |
70,500 |
|
|
$ |
3,384,824 |
|
|
$ |
73,357 |
|
|
$ |
3,458,181 |
|
|
|
|
|
|
|
|
|
|
|
|
|
|
|
|
|
|
|
| Proceeds from sales of common stock, net |
— |
|
|
1,967,009 |
|
|
20 |
|
|
69,436 |
|
|
— |
|
|
— |
|
|
69,456 |
|
|
— |
|
|
69,456 |
|
|
|
|
|
|
|
|
|
|
|
|
|
|
|
|
|
|
|
Dividends and distributions, net ($1.47 per share/unit) |
— |
|
|
— |
|
|
— |
|
|
— |
|
|
(265,337) |
|
|
— |
|
|
(265,337) |
|
|
(2,672) |
|
|
(268,009) |
|
| Non-cash compensation activity, net |
— |
|
|
102,704 |
|
|
1 |
|
|
1,748 |
|
|
(83) |
|
|
— |
|
|
1,666 |
|
|
9,090 |
|
|
10,756 |
|
| Redemption of common units to common stock |
— |
|
|
372,174 |
|
|
4 |
|
|
6,997 |
|
|
— |
|
|
— |
|
|
7,001 |
|
|
(7,001) |
|
|
— |
|
| Rebalancing of noncontrolling interest |
— |
|
|
— |
|
|
— |
|
|
5,518 |
|
|
— |
|
|
— |
|
|
5,518 |
|
|
(5,518) |
|
|
— |
|
| Other comprehensive loss |
— |
|
|
— |
|
|
— |
|
|
— |
|
|
— |
|
|
(21,293) |
|
|
(21,293) |
|
|
(481) |
|
|
(21,774) |
|
| Net income |
— |
|
|
— |
|
|
— |
|
|
— |
|
|
192,845 |
|
|
— |
|
|
192,845 |
|
|
4,356 |
|
|
197,201 |
|
| Balance, December 31, 2023 |
$ |
— |
|
|
181,690,867 |
|
|
$ |
1,817 |
|
|
$ |
4,272,376 |
|
|
$ |
(948,720) |
|
|
$ |
49,207 |
|
|
$ |
3,374,680 |
|
|
$ |
71,131 |
|
|
$ |
3,445,811 |
|
The accompanying notes are an integral part of these consolidated financial statements.
STAG Industrial, Inc.
Consolidated Statements of Cash Flows
(in thousands)
|
|
|
|
|
|
|
|
|
|
|
|
|
|
|
|
|
|
| |
Year ended December 31, |
| |
2023 |
|
2022 |
|
2021 |
| Cash flows from operating activities: |
|
|
|
|
|
| Net income |
$ |
197,201 |
|
|
$ |
182,234 |
|
|
$ |
196,432 |
|
| Adjustments to reconcile net income to net cash provided by operating activities: |
|
|
|
|
|
| Depreciation and amortization |
278,447 |
|
|
275,040 |
|
|
238,699 |
|
| Loss on impairment |
— |
|
|
1,783 |
|
|
— |
|
|
|
|
|
|
|
| Non-cash portion of interest expense |
3,905 |
|
|
3,747 |
|
|
2,931 |
|
| Amortization of above and below market leases, net |
(887) |
|
|
(352) |
|
|
2,051 |
|
| Straight-line rent adjustments, net |
(16,648) |
|
|
(17,610) |
|
|
(17,516) |
|
|
|
|
|
|
|
| Debt extinguishment and modification expenses |
— |
|
|
21 |
|
|
249 |
|
| Gain on the sales of rental property, net |
(54,100) |
|
|
(57,487) |
|
|
(97,980) |
|
| Non-cash compensation expense |
11,486 |
|
|
12,068 |
|
|
14,955 |
|
| Change in assets and liabilities: |
|
|
|
|
|
| Tenant accounts receivable |
1,915 |
|
|
(6,438) |
|
|
(36) |
|
| Prepaid expenses and other assets |
(23,870) |
|
|
(21,870) |
|
|
(18,664) |
|
| Accounts payable, accrued expenses and other liabilities |
(9,237) |
|
|
13,531 |
|
|
6,763 |
|
| Tenant prepaid rent and security deposits |
2,880 |
|
|
3,264 |
|
|
8,270 |
|
| Total adjustments |
193,891 |
|
|
205,697 |
|
|
139,722 |
|
| Net cash provided by operating activities |
391,092 |
|
|
387,931 |
|
|
336,154 |
|
| Cash flows from investing activities: |
|
|
|
|
|
| Acquisitions of land and buildings and improvements |
(303,991) |
|
|
(421,784) |
|
|
(1,211,023) |
|
| Additions of land and buildings and improvements |
(107,856) |
|
|
(111,653) |
|
|
(39,503) |
|
| Acquisitions of other assets |
— |
|
|
(2,134) |
|
|
(1,004) |
|
| Acquisitions of operating lease right-of-use assets |
— |
|
|
(3,541) |
|
|
(5,627) |
|
| Proceeds from sales of rental property, net |
105,602 |
|
|
135,348 |
|
|
187,972 |
|
|
|
|
|
|
|
| Acquisitions of tenant prepaid rent |
511 |
|
|
445 |
|
|
1,024 |
|
| Acquisition deposits, net |
3,850 |
|
|
1,428 |
|
|
(3,131) |
|
| Acquisitions of deferred leasing intangibles |
(18,462) |
|
|
(49,174) |
|
|
(154,755) |
|
| Acquisitions of operating lease liabilities |
— |
|
|
3,541 |
|
|
5,627 |
|
| Net cash used in investing activities |
(320,346) |
|
|
(447,524) |
|
|
(1,220,420) |
|
| Cash flows from financing activities: |
|
|
|
|
|
| Proceeds from unsecured credit facility |
1,167,000 |
|
|
1,288,000 |
|
|
2,665,000 |
|
| Repayment of unsecured credit facility |
(940,000) |
|
|
(1,409,000) |
|
|
(2,476,000) |
|
| Proceeds from unsecured term loans |
— |
|
|
375,000 |
|
|
1,125,000 |
|
| Repayment of unsecured term loans |
— |
|
|
(325,000) |
|
|
(1,125,000) |
|
| Proceeds from unsecured notes |
— |
|
|
400,000 |
|
|
325,000 |
|
| Repayment of unsecured notes |
(100,000) |
|
|
— |
|
|
— |
|
| Repayment of mortgage notes |
(3,503) |
|
|
(46,943) |
|
|
(2,225) |
|
| Redemption of preferred stock |
— |
|
|
— |
|
|
(75,000) |
|
| Payment of loan fees and costs |
(270) |
|
|
(5,211) |
|
|
(9,579) |
|
|
|
|
|
|
|
| Dividends and distributions |
(267,567) |
|
|
(266,817) |
|
|
(245,722) |
|
| Proceeds from sales of common stock, net |
69,485 |
|
|
54,753 |
|
|
706,991 |
|
| Repurchase and retirement of share-based compensation |
(812) |
|
|
(1,596) |
|
|
(1,342) |
|
| Net cash provided by (used in) financing activities |
(75,667) |
|
|
63,186 |
|
|
887,123 |
|
| Increase (decrease) in cash and cash equivalents and restricted cash |
(4,921) |
|
|
3,593 |
|
|
2,857 |
|
| Cash and cash equivalents and restricted cash—beginning of period |
26,789 |
|
|
23,196 |
|
|
20,339 |
|
| Cash and cash equivalents and restricted cash—end of period |
$ |
21,868 |
|
|
$ |
26,789 |
|
|
$ |
23,196 |
|
| Supplemental disclosure: |
|
|
|
|
|
Cash paid for interest, net of amounts capitalized of $2,600, $1,456, and $53 for 2023, 2022, and 2021, respectively |
$ |
89,979 |
|
|
$ |
72,740 |
|
|
$ |
58,392 |
|
| Supplemental schedule of non-cash investing and financing activities |
|
|
|
|
|
|
|
|
|
|
|
|
|
|
|
|
|
|
|
|
|
|
|
|
|
|
|
|
|
|
|
|
|
|
|
| Additions of land and buildings and improvements |
$ |
— |
|
|
$ |
(2,674) |
|
|
$ |
(465) |
|
| Transfer of other assets to building and other capital improvements |
$ |
— |
|
|
$ |
2,674 |
|
|
$ |
465 |
|
| Acquisitions of land and buildings and improvements |
$ |
(66) |
|
|
$ |
— |
|
|
$ |
(5,990) |
|
| Acquisitions of deferred leasing intangibles |
$ |
(6) |
|
|
$ |
— |
|
|
$ |
(948) |
|
| Partial disposal due to involuntary conversion of building |
$ |
2,968 |
|
|
$ |
— |
|
|
$ |
— |
|
| Investing other receivables due to involuntary conversion of building |
$ |
(2,968) |
|
|
$ |
— |
|
|
$ |
— |
|
| Change in additions of land, building, and improvements included in accounts payable, accrued expenses and other liabilities |
$ |
2,836 |
|
|
$ |
(7,897) |
|
|
$ |
(1,285) |
|
| Additions to building and other capital improvements from non-cash compensation |
$ |
(92) |
|
|
$ |
(62) |
|
|
$ |
(9) |
|
| Assumption of mortgage notes |
$ |
— |
|
|
$ |
— |
|
|
$ |
5,103 |
|
| Fair market value adjustment to mortgage notes acquired |
$ |
— |
|
|
$ |
— |
|
|
$ |
(161) |
|
| Change in loan fees, costs, and offering costs included in accounts payable, accrued expenses and other liabilities |
$ |
(30) |
|
|
$ |
192 |
|
|
$ |
930 |
|
|
|
|
|
|
|
|
|
|
|
|
|
| Dividends and distributions accrued |
$ |
22,726 |
|
|
$ |
22,282 |
|
|
$ |
21,906 |
|
The accompanying notes are an integral part of these consolidated financial statements.
STAG Industrial, Inc.
Notes to Consolidated Financial Statements
1. Organization and Description of Business
STAG Industrial, Inc. (the “Company”) is an industrial real estate operating company focused on the acquisition, ownership, and operation of industrial properties in the United States. The Company was formed as a Maryland corporation and has elected to be treated and intends to continue to qualify as a real estate investment trust (“REIT”) under Sections 856 through 860 of the Internal Revenue Code of 1986, as amended (the “Code”). The Company is structured as an umbrella partnership REIT, commonly called an UPREIT, and owns all of its properties and conducts substantially all of its business through its operating partnership, STAG Industrial Operating Partnership, L.P., a Delaware limited partnership (the “Operating Partnership”). As of December 31, 2023 and 2022, the Company owned a 97.9% and 97.9%, respectively, of the common units of the limited partnership interests in the Operating Partnership. The Company is the sole member of the general partner of the Operating Partnership. As used herein, the “Company” refers to STAG Industrial, Inc. and its consolidated subsidiaries, including the Operating Partnership, except where context otherwise requires.
As of December 31, 2023, the Company owned 569 industrial buildings in 41 states with approximately 112.3 million rentable square feet (square feet unaudited herein and throughout the Notes).
2. Summary of Significant Accounting Policies
Basis of Presentation
The Company’s consolidated financial statements include the accounts of the Company, the Operating Partnership, and their consolidated subsidiaries. Interests in the Operating Partnership not owned by the Company are referred to as “Noncontrolling Common Units.” These Noncontrolling Common Units are held by other limited partners in the form of common units (“Other Common Units”) and long-term incentive plan units (“LTIP units”) issued pursuant to the STAG Industrial, Inc. 2011 Equity Incentive Plan, as amended and restated (the “2011 Plan”). All significant intercompany balances and transactions have been eliminated in the consolidation of entities. The financial statements of the Company are presented on a consolidated basis for all periods presented.
Use of Estimates
The preparation of financial statements in conformity with generally accepted accounting principles (“GAAP”) requires management to make estimates and assumptions that affect the reported amounts of assets and liabilities and disclosure of contingent assets and liabilities at the date of the financial statements and the reported amounts of revenue and expenses during the reporting period. Actual results could differ from those estimates.
Rental Property and Deferred Leasing Intangibles
Rental property is carried at cost less accumulated depreciation and amortization. Expenditures for maintenance and repairs are expensed as incurred. Significant renovations and betterments that extend the economic useful lives of assets are capitalized.
The Company capitalizes costs directly and indirectly related to the development, pre-development, redevelopment, or improvement of rental property. Real estate taxes, compensation costs of development personnel, insurance, interest, and other directly related costs during construction periods are capitalized as incurred, with depreciation commencing on the date the property is substantially completed. Such costs begin to be capitalized to the development projects from the point the Company is undergoing the necessary activities to get the development project ready for its intended use and cease when the development projects are substantially completed and held available for occupancy. Interest is capitalized based on actual capital expenditures from the period when development or redevelopment commences until the asset is ready for its intended use, at the weighted average borrowing rate of the Company’s unsecured indebtedness during the period.
For properties classified as held for sale, the Company ceases depreciating and amortizing the rental property and values the rental property at the lower of depreciated and amortized cost or fair value less costs to dispose. The Company presents those properties classified as held for sale with any qualifying assets and liabilities associated with those properties as held for sale in the accompanying Consolidated Balance Sheets.
Using information available at the time of acquisition, the Company allocates the purchase price of properties acquired based upon the fair value of the assets acquired and liabilities assumed, which generally consist of land, buildings, tenant improvements, mortgage debt assumed, and deferred leasing intangibles, which includes in-place leases, above market and below market leases, and tenant relationships. The process for determining the allocation to these components requires estimates and assumptions, including rental rates, discount rates and exit capitalization rates, and land value per square foot, as well as available market information, and therefore involves subjective analysis and uncertainty. The fair value of the tangible assets of an acquired property considers the value of the property as if it were vacant. The portion of the purchase price that is allocated to above and below market leases is valued based on the present value of the difference between prevailing market rates and the in-place rates measured over a period equal to the remaining term of the lease term plus the term of any bargain renewal options. The purchase price is further allocated to in-place lease values and tenant relationships based on the Company’s evaluation of the specific characteristics of each tenant’s lease and its overall relationship with the respective tenant.
The above and below market lease values are amortized into rental income over the remaining lease term. The value of in-place lease intangibles and tenant relationships are amortized over the remaining lease term (and expected renewal period of the respective lease for tenant relationships) as increases to depreciation and amortization expense. The remaining lease terms are adjusted for bargain renewal options or assumed exercises of early termination options, as applicable. If a tenant subsequently terminates its lease, any unamortized portion of above and below market leases is accelerated into rental income and the in-place lease value and tenant relationships are accelerated into depreciation and amortization expense over the shortened lease term.
The purchase price allocated to deferred leasing intangible assets are included in rental property, net on the accompanying Consolidated Balance Sheets, and the purchase price allocated to deferred leasing intangible liabilities are included in deferred leasing intangibles, net on the accompanying Consolidated Balance Sheets under the liabilities section.
In determining the fair value of the debt assumed, the Company discounts the spread between the future contractual interest payments and hypothetical future interest payments on mortgage debt based on a current market rate. The associated fair market value debt adjustment is amortized through interest expense over the life of the debt on a basis which approximates the effective interest method.
The Company evaluates the carrying value of all tangible and intangible rental property assets and deferred leasing intangible liabilities (collectively, the “property”) held for use for possible impairment when an event or change in circumstance has occurred that indicates their carrying value may not be recoverable. The evaluation includes estimating and reviewing anticipated future undiscounted cash flows to be derived from the property. If such cash flows are less than the property’s carrying value, an impairment charge is recognized to the extent by which the property’s carrying value exceeds the estimated fair value. Estimating future cash flows is highly subjective and is based in part on assumptions regarding anticipated hold period, future occupancy, rental rates, capital requirements, and exit capitalization rates that could differ from actual results. The discount rate used to present value the cash flows for determining fair value is also subjective.
Depreciation expense is computed using the straight-line method based on the following estimated useful lives.
|
|
|
|
|
|
|
|
|
| Description |
|
Estimated Useful Life |
| Building |
|
40 Years |
| Building and land improvements (maximum) |
|
20 Years |
| Tenant improvements |
|
Shorter of useful life or terms of related lease |
|
|
|
|
|
|
|
|
|
Fully depreciated or amortized tenant improvements, deferred leasing intangible assets, or deferred leasing intangible liabilities and the associated accumulated depreciation or amortization are written-off. The Company wrote-off fully depreciated or amortized tenant improvements, deferred leasing intangible assets, and deferred leasing intangible liabilities of approximately $3.9 million, $63.0 million, $6.3 million, respectively, for the year ended December 31, 2023 and approximately $3.4 million, $53.8 million, $4.9 million, respectively, for the year ended December 31, 2022.
Leases
For leases in which the Company is the lessee, the Company recognizes a right-of-use asset and corresponding lease liability on the accompanying Consolidated Balance Sheets equal to the present value of the fixed lease payments. In determining the operating right-of-use asset and lease liability for the Company’s operating leases, the Company estimates an appropriate incremental borrowing rate on a fully-collateralized basis for the terms of the leases. The Company utilizes a market-based approach to estimate the incremental borrowing rate for each individual lease.
Additionally, since the terms of the Company’s ground leases are significantly longer than the terms of borrowings available to the Company on a fully-collateralized basis, the estimate of this rate requires significant judgment, and considers factors such as yields on outstanding public debt and other market based pricing on longer duration financing instruments.
Cash and Cash Equivalents
Cash and cash equivalents consist of cash and highly liquid short-term investments with original maturities of three months or less. The Company maintains cash and cash equivalents in United States banking institutions that may exceed amounts insured by the Federal Deposit Insurance Corporation. While the Company monitors the cash balances in its operating accounts, these cash balances could be impacted if the underlying financial institutions fail or are subject to other adverse conditions in the financial markets. To date, the Company has experienced no loss or lack of access to cash in its operating accounts, and mitigates this risk by using nationally recognized banking institutions.
Restricted Cash
Restricted cash may include tenant security deposits, cash held in escrow for real estate taxes and capital improvements as required by various mortgage note agreements, and cash held by the Company’s transfer agent for preferred stock dividends, if any, that are distributed subsequent to period end. Restricted cash may also include cash held by qualified intermediaries to facilitate a like-kind exchange of real estate under Section 1031 of the Code.
The following table presents a reconciliation of cash and cash equivalents and restricted cash reported on the accompanying Consolidated Balance Sheets to amounts reported on the accompanying Consolidated Statements of Cash Flows.
|
|
|
|
|
|
|
|
|
|
|
|
|
|
|
| Reconciliation of cash and cash equivalents and restricted cash (in thousands) |
|
December 31, 2023 |
|
December 31, 2022 |
| Cash and cash equivalents |
|
$ |
20,741 |
|
|
$ |
25,884 |
|
| Restricted cash |
|
1,127 |
|
|
905 |
|
| Total cash and cash equivalents and restricted cash |
|
$ |
21,868 |
|
|
$ |
26,789 |
|
Deferred Costs
Deferred financing fees and debt issuance costs include costs incurred in obtaining debt that are capitalized and are presented as a direct deduction from the carrying amount of the associated debt liability that is not a line-of-credit arrangement on the accompanying Consolidated Balance Sheets. Deferred financing fees and debt issuance costs related to line-of-credit arrangements are presented as an asset in prepaid expenses and other assets on the accompanying Consolidated Balance Sheets. The deferred financing fees and debt issuance costs are amortized through interest expense over the life of the respective loans on a basis which approximates the effective interest method. Any unamortized amounts upon early repayment of debt are written off in the period of repayment as a loss on extinguishment of debt. Fully amortized deferred financing fees and debt issuance costs are written off upon maturity of the underlying debt.
Leasing commissions include commissions and other direct and incremental costs incurred to obtain new tenant leases as well as to renew existing tenant leases, and are presented in prepaid expenses and other assets on the accompanying Consolidated Balance Sheets. Leasing commissions are capitalized and amortized over the terms of the related leases (and bargain renewal terms or assumed exercise of early termination options) using the straight-line method. If a lease terminates prior to the expiration of its initial term, any unamortized costs related to the lease are accelerated into amortization expense. Changes in leasing commissions are presented in the cash flows from operating activities section of the accompanying Consolidated Statements of Cash Flows.
Goodwill
The excess of the cost of an acquired business over the net of the amounts assigned to assets acquired (including identified intangible assets) and liabilities assumed is recorded as goodwill. Goodwill of the Company of approximately $4.9 million represents amounts allocated to the assembled workforce from the acquired management company, and is presented in prepaid expenses and other assets on the accompanying Consolidated Balance Sheets. The Company’s goodwill has an indeterminate life and is not amortized, but is tested for impairment on an annual basis at December 31, or more frequently if events or changes in circumstances indicate that the asset might be impaired. The Company takes a qualitative approach to consider whether an impairment of goodwill exists prior to quantitatively determining the fair value of the reporting unit in step one of the impairment test. The Company has recorded no impairments to goodwill through December 31, 2023.
Use of Derivative Financial Instruments
The Company records all derivatives on the accompanying Consolidated Balance Sheets at fair value. The accounting for changes in the fair value of derivatives depends on the intended use of the derivative, whether the Company has elected to designate a derivative in a hedging relationship and apply hedge accounting, and whether the hedging relationship has satisfied the criteria necessary to apply hedge accounting. Derivatives designated and qualifying as a hedge of the exposure to changes in the fair value of an asset, liability, or firm commitment attributable to a particular risk, such as interest rate risk, are considered fair value hedges. Derivatives designated and qualifying as a hedge of the exposure to variability in expected future cash flows, or other types of forecasted transactions, are considered cash flow hedges. Hedge accounting generally provides for the matching of the timing of gain or loss recognition on the hedging instrument with the recognition of the changes in the fair value of the hedged asset or liability that are attributable to the hedged risk in a fair value hedge or the earnings effect of the hedged forecasted transactions in a cash flow hedge. The Company may enter into derivative contracts that are intended to economically hedge certain of its risks, even though hedge accounting does not apply or the Company elects not to apply hedge accounting.
In accordance with fair value measurement guidance, the Company made an accounting policy election to measure the credit risk of its derivative financial instruments that are subject to master netting arrangements on a net basis by counterparty portfolio. Credit risk is the risk of failure of the counterparty to perform under the terms of the contract. The Company minimizes the credit risk in its derivative financial instruments by entering into transactions with various high-quality counterparties. The Company’s exposure to credit risk at any point is generally limited to amounts recorded as assets on the accompanying Consolidated Balance Sheets.
Fair Value of Financial Instruments
Financial instruments include cash and cash equivalents, restricted cash, tenant accounts receivable, interest rate swaps, accounts payable, accrued expenses, unsecured credit facility, unsecured term loans, unsecured notes, and mortgage notes. See Note 4 for the fair value of the Company’s indebtedness. See Note 5 for the fair value of the Company’s interest rate swaps.
The Company adopted fair value measurement provisions for its financial instruments recorded at fair value. The guidance establishes a three-tier value hierarchy, which prioritizes the inputs used in measuring fair value. These tiers include: Level 1, defined as observable inputs such as quoted prices in active markets; Level 2, defined as inputs other than quoted prices in active markets that are either directly or indirectly observable; and Level 3, defined as unobservable inputs in which little or no market data exists, therefore requiring an entity to develop its own assumptions.
Offering Costs
Underwriting commissions and direct offering costs have been reflected as a reduction of additional paid-in capital on the accompanying Consolidated Balance Sheets and Consolidated Statements of Equity. Indirect costs associated with equity offerings are expensed as incurred and included in general and administrative expenses on the accompanying Consolidated Statements of Operations.
Dividends
Earnings and profits, which determine the taxability of dividends to stockholders, will differ from income reported for financial reporting purposes due to the differences for federal income tax purposes in the treatment of gains on the sale of real property, revenue and expense recognition, and in the estimated useful lives and basis used to compute depreciation. In addition, the Company’s distributions may include a return of capital. To the extent that the Company makes distributions in excess of its current and accumulated earnings and profits, such distributions would generally be considered a return of capital for federal income tax purposes to the extent of the holder’s adjusted tax basis in its shares. A return of capital may not be taxable. A return of capital has the effect of reducing the holder’s adjusted tax basis in its investment, which may or may not be taxable to the holder.
The Company paid dividends to holders of the 6.875% Series C Cumulative Redeemable Preferred Stock, par value $0.01 per share (“Series C Preferred Stock”), of approximately $1.3 million ($0.429688 per share) during the year ended December 31, 2021, of which $0.400294 per share was treated as ordinary income for tax purposes, $0.022149 per share was treated as unrecaptured section 1250 capital gain for tax purposes, and $0.007245 per share was treated as other capital gain for income tax purposes.
The following table summarizes the tax treatment of dividends per share of common stock for federal income tax purposes.
|
|
|
|
|
|
|
|
|
|
|
|
|
|
|
|
|
|
|
|
|
|
|
|
|
|
|
|
|
|
|
|
|
|
|
|
|
|
|
| |
|
Year ended December 31, |
| |
|
2023 |
|
2022 |
|
2021 |
| Federal Income Tax Treatment of Dividends per Common Share |
|
Per Share |
|
% |
|
Per Share |
|
% |
|
Per Share |
|
% |
| Ordinary income |
|
$ |
1.243518 |
|
|
83.7 |
% |
|
$ |
1.172486 |
|
|
80.4 |
% |
|
$ |
1.119899 |
|
|
81.3 |
% |
| Return of capital |
|
— |
|
|
— |
% |
|
0.165158 |
|
|
11.3 |
% |
|
0.175355 |
|
|
12.7 |
% |
| Unrecaptured section 1250 capital gain |
|
0.089829 |
|
|
6.0 |
% |
|
0.014248 |
|
|
1.0 |
% |
|
0.061970 |
|
|
4.5 |
% |
| Other capital gain |
|
0.151665 |
|
|
10.3 |
% |
|
0.107278 |
|
|
7.3 |
% |
|
0.020269 |
|
|
1.5 |
% |
|
|
|
|
|
|
|
|
|
|
|
|
|
Total (1) |
|
$ |
1.485012 |
|
|
100.0 |
% |
|
$ |
1.459170 |
|
|
100.0 |
% |
|
$ |
1.377493 |
|
|
100.0 |
% |
(1)The December 2020 monthly common stock dividend of $0.12 per share was partially included in the stockholder’s 2021 tax year in the amount of $0.04833 per share. The December 2021 monthly common stock dividend of $0.120833 per share was included in the stockholder’s 2022 tax year. The December 2022 monthly common stock dividend of $0.121667 per share was included in the stockholder’s 2023 tax year. The December 2023 monthly common stock dividend of $0.1225 per share was partially included in the stockholder’s 2023 tax year in the amount of $0.015845 per share and the remainder will be included in the stockholder’s 2024 tax year.
Revenue Recognition
All current leases are classified as operating leases and rental income is recognized on a straight-line basis over the term of the lease (and expected bargain renewal terms or assumed exercise of early termination options) when collectability is reasonably assured. Differences between rental income earned and amounts due under the lease are charged or credited, as applicable, to accrued rental income.
The Company determined that for all leases where the Company is the lessor, that the timing and pattern of transfer of the non-lease components and associated lease components are the same, and that the lease components, if accounted for separately, would be classified as an operating lease. Accordingly, the Company has made an accounting policy election to recognize the combined component in accordance with Accounting Standards Codification Topic 842 as rental income on the accompanying Consolidated Statements of Operations.
Rental income recognition commences when the tenant takes possession of or controls the physical use of the leased space and the leased space is substantially complete and ready for its intended use. In order to determine whether the leased space is substantially complete and ready for its intended use, the Company determines whether the Company or the tenant own the tenant improvements. When it is determined that the Company is the owner of the tenant improvements, rental income recognition begins when the tenant takes possession of or controls the physical use of the finished space, which is generally when the Company owned tenant improvements are completed. In instances when it is determined that the tenant is the owner of tenant improvements, rental income recognition begins when the tenant takes possession of or controls the physical use of the leased space.
The Company evaluates its operating leases to determine if it is probable it will collect substantially all of the lessee’s remaining lease payments under the lease term. For those that are not probable of collection, the Company converts to the cash basis of accounting. If the Company subsequently determines that it is probable it will collect substantially all of the lessee’s remaining lease payments under the lease term, the Company will reinstate the accrued rent balance adjusting for the amount related to the period when the lease was accounted for on a cash basis.
When the Company is the owner of tenant improvements or other capital items, the cost to construct the tenant improvements or other capital items, including costs paid for or reimbursed by the tenants, is recorded as capital assets. For these tenant improvements or other capital items, the costs funded by or reimbursed by the tenants are recorded as deferred revenue, which is amortized on a straight-line basis as income over the shorter of the useful life of the capital asset or the term of the related lease.
Early lease termination fees are recorded in rental income on a straight-line basis from the notification date of such termination to the then remaining (not the original) lease term, if any, or upon collection if collection is not reasonably assured.
Gain on the Sales of Rental Property, net
The timing of the derecognition of a rental property and the corresponding recognition of gain on the sales of rental property, net is measured by various criteria related to the terms of the sale transaction and if the Company has lost control of the property and the acquirer has gained control of the property after the transaction.
If the derecognition criteria is met, the full gain is recognized.
Incentive and Equity-Based Employee Compensation Plans
The Company grants equity-based compensation awards to its employees and directors in the form of restricted shares of common stock, LTIP units, and performance units. See Notes 6, 7 and 8 for further discussion of restricted shares of common stock, LTIP units, and performance units, respectively. The Company measures equity-based compensation expense based on the fair value of the awards on the grant date and recognizes the expense ratably over the vesting period, and forfeitures are recognized in the period in which they occur.
On January 7, 2021, the Company adopted the STAG Industrial, Inc. Employee Retirement Vesting Program (the “Vesting Program”) to provide supplemental retirement benefits for eligible employees. For those employees who are retirement eligible or will become retirement eligible during the applicable vesting period under the terms of the Vesting Program, the Company accelerates equity-based compensation through the employee’s six-month retirement notification period or retirement eligibility date, respectively.
Related-Party Transactions
The Company did not have any related-party transactions during the years ended December 31, 2023, 2022 and 2021.
Taxes
Federal Income Taxes
The Company elected to be taxed as a REIT under the Code commencing with its taxable year ended December 31, 2011 and intends to continue to qualify as a REIT. As a REIT, the Company is generally not subject to corporate level federal income tax on the earnings distributed currently to its stockholders that it derives from its REIT qualifying activities. As a REIT, the Company is required to distribute at least 90% of its REIT taxable income to its stockholders and meet the various other requirements imposed by the Code relating to such matters as operating results, asset holdings, distribution levels and diversity of stock ownership.
The Company will not be required to make distributions with respect to income derived from the activities conducted through subsidiaries that the Company elects to treat as taxable REIT subsidiaries (“TRS”) for federal income tax purposes, nor will it have to comply with income, assets, or ownership restrictions inside of the TRS. Certain activities that the Company undertakes must or should be conducted by a TRS, such as performing non-customary services for its tenants and holding assets that it cannot hold directly. A TRS is subject to federal and state income taxes. The Company’s TRS recognized a net income (loss) of approximately $0, $0.1 million and $(8,000), for the years ended December 31, 2023, 2022 and 2021, respectively, which has been included on the accompanying Consolidated Statements of Operations.
State and Local Income, Excise, and Franchise Tax
The Company and certain of its subsidiaries are subject to certain state and local income, excise and franchise taxes. Taxes in the amount of approximately $2.0 million, $2.1 million and $1.7 million have been recorded in other expenses on the accompanying Consolidated Statements of Operations for the years ended December 31, 2023, 2022 and 2021, respectively.
Uncertain Tax Positions
Tax benefits of uncertain tax positions are recognized only if it is more likely than not that the tax position will be sustained based solely on its technical merits, with the taxing authority having full knowledge of all relevant information. The measurement of a tax benefit for an uncertain tax position that meets the “more likely than not” threshold is based on a cumulative probability model under which the largest amount of tax benefit recognized is the amount with a greater than 50% likelihood of being realized upon ultimate settlement with the taxing authority having full knowledge of all the relevant information. As of December 31, 2023, 2022 and 2021, there were no liabilities for uncertain tax positions.
Earnings Per Share
The Company uses the two-class method of computing earnings per common share, which is an earnings allocation formula that determines earnings per share for common stock and any participating securities according to dividends declared (whether paid or unpaid) and participation rights in undistributed earnings. Basic net income per common share is computed by dividing net income available to common stockholders by the weighted average number of shares of common stock outstanding for the period. Diluted net income per common share is computed by dividing net income available to common stockholders by the sum of the weighted average number of shares of common stock outstanding and any dilutive securities for the period.
Segment Reporting
The Company manages its operations on an aggregated, single segment basis for purposes of assessing performance and making operating decisions and, accordingly, has only one reporting and operating segment.
Concentrations of Credit Risk
Concentrations of credit risk relevant to the Company may arise when a number of financing arrangements, including revolving credit facilities or derivatives, are entered into with the same lenders or counterparties, and have similar economic features that would cause their inability to meet contractual obligations. The Company mitigates the concentration of credit risk as it relates to financing arrangements by entering into loan syndications with multiple, reputable financial institutions and diversifying its debt counterparties. The Company also reduces exposure by diversifying its derivatives across multiple counterparties who meet established credit and capital guidelines.
Concentrations of credit risk may also arise when the Company enters into leases with multiple tenants concentrated in the same industry, or into a significant lease or multiple leases with a single tenant, or tenants are located in the same geographic region, or have similar economic features that would cause their inability to meet contractual obligations, including those to the Company, to be similarly affected. The Company regularly monitors its tenant base to assess potential concentrations of credit risk through financial statement review, tenant management calls, and press releases. Management believes the current credit risk of the Company’s portfolio is reasonably well diversified and does not contain any unusual concentration of credit risk.
3. Rental Property
The following table summarizes the components of rental property, net as of December 31, 2023 and 2022.
|
|
|
|
|
|
|
|
|
|
|
|
|
|
|
| Rental Property (in thousands) |
|
December 31, 2023 |
|
December 31, 2022 |
| Land |
|
$ |
698,633 |
|
|
$ |
647,098 |
|
Buildings, net of accumulated depreciation of $622,941 and $513,053, respectively |
|
4,330,799 |
|
|
4,232,964 |
|
Tenant improvements, net of accumulated depreciation of $36,920 and $31,578, respectively |
|
39,145 |
|
|
44,526 |
|
Building and land improvements, net of accumulated depreciation of $261,985 and $218,497, respectively |
|
369,724 |
|
|
339,274 |
|
| Construction in progress |
|
98,854 |
|
|
89,981 |
|
Deferred leasing intangibles, net of accumulated amortization of $360,094 and $328,848, respectively |
|
435,722 |
|
|
508,935 |
|
| Total rental property, net |
|
$ |
5,972,877 |
|
|
$ |
5,862,778 |
|
Acquisitions
The following tables summarize the acquisitions of the Company during the years ended December 31, 2023 and 2022. The Company accounted for all of its acquisitions as asset acquisitions.
|
|
|
|
|
|
|
|
|
|
|
|
|
|
|
|
|
|
|
|
|
|
|
|
|
|
|
| Year ended December 31, 2023 |
| Market(1) |
|
Date Acquired |
|
Square Feet |
|
Number of Buildings |
|
Purchase Price
(in thousands) |
|
|
|
|
|
|
|
|
|
|
|
|
|
|
|
|
|
|
|
|
|
|
|
|
|
|
|
|
|
|
|
|
|
|
|
|
|
|
|
|
|
|
|
|
|
|
|
|
|
|
|
|
|
|
|
|
|
|
|
|
|
|
|
|
|
|
|
|
|
|
|
|
|
|
|
|
|
|
|
|
|
| Central New Jersey, NJ |
|
April 24, 2023 |
|
101,381 |
|
|
1 |
|
|
$ |
26,660 |
|
| Greensboro, NC |
|
May 5, 2023 |
|
133,622 |
|
|
1 |
|
|
14,004 |
|
|
|
|
|
|
|
|
|
|
|
|
|
|
|
|
|
|
|
|
|
|
|
|
|
|
|
|
|
|
|
|
|
|
|
|
|
|
|
|
|
|
|
|
|
|
|
|
|
|
|
|
|
|
|
|
|
|
|
|
|
|
|
|
| Three and Six months ended June 30, 2023 |
|
|
|
235,003 |
|
|
2 |
|
|
40,664 |
|
| Portland, OR |
|
July 18, 2023 |
|
121,426 |
|
|
2 |
|
|
20,685 |
|
| Allentown, PA |
|
July 24, 2023 |
|
222,042 |
|
|
3 |
|
|
34,859 |
|
| Philadelphia, PA |
|
July 24, 2023 |
|
152,625 |
|
|
1 |
|
|
15,031 |
|
| Sacramento, CA |
|
August 7, 2023 |
|
96,658 |
|
|
1 |
|
|
13,725 |
|
| Chicago, IL |
|
August 10, 2023 |
|
400,088 |
|
|
1 |
|
|
41,348 |
|
Tampa, FL(2) |
|
August 30, 2023 |
|
— |
|
|
— |
|
|
9,572 |
|
| Indianapolis, IN |
|
September 18, 2023 |
|
258,000 |
|
|
1 |
|
|
21,306 |
|
| Riverside, CA |
|
September 25, 2023 |
|
157,146 |
|
|
2 |
|
|
36,095 |
|
| Dallas, TX |
|
September 29, 2023 |
|
120,900 |
|
|
1 |
|
|
21,288 |
|
| Three months ended September 30, 2023 |
|
|
|
1,528,885 |
|
|
12 |
|
|
213,909 |
|
Greenville, SC(3) |
|
October 5, 2023 |
|
— |
|
|
— |
|
|
18,735 |
|
| Greenville, SC |
|
October 5, 2023 |
|
233,433 |
|
|
1 |
|
|
18,735 |
|
| Reno, NV |
|
October 19, 2023 |
|
165,000 |
|
|
1 |
|
|
29,971 |
|
| Three months ended December 31, 2023 |
|
|
|
398,433 |
|
|
2 |
|
|
67,441 |
|
| Year ended December 31, 2023 |
|
|
|
2,162,321 |
|
|
16 |
|
|
$ |
322,014 |
|
(1) As defined by CBRE-EA industrial market geographies. If the building is located outside of a CBRE-EA defined market, the city and state is reflected.
(2) The Company acquired vacant land parcels.
(3) The Company acquired one building under development.
|
|
|
|
|
|
|
|
|
|
|
|
|
|
|
|
|
|
|
|
|
|
|
|
|
|
|
| Year ended December 31, 2022 |
Market(1) |
|
Date Acquired |
|
Square Feet |
|
Number of Buildings |
|
Purchase Price
(in thousands) |
| Kansas City, MO |
|
January 6, 2022 |
|
702,000 |
|
|
1 |
|
|
$ |
60,428 |
|
| Chicago, IL |
|
January 31, 2022 |
|
72,499 |
|
|
1 |
|
|
8,128 |
|
| Columbus, OH |
|
February 8, 2022 |
|
138,213 |
|
|
1 |
|
|
11,492 |
|
| Cleveland, OH |
|
February 8, 2022 |
|
136,800 |
|
|
1 |
|
|
13,001 |
|
| Nashville, TN |
|
March 10, 2022 |
|
109,807 |
|
|
1 |
|
|
12,810 |
|
| Greenville, SC |
|
March 10, 2022 |
|
289,103 |
|
|
1 |
|
|
28,274 |
|
| Memphis, TN |
|
March 18, 2022 |
|
195,622 |
|
|
1 |
|
|
15,828 |
|
| Greenville, SC |
|
March 18, 2022 |
|
155,717 |
|
|
1 |
|
|
16,390 |
|
| Three months ended March 31, 2022 |
|
|
|
1,799,761 |
|
|
8 |
|
|
166,351 |
|
| Atlanta, GA |
|
April 1, 2022 |
|
210,858 |
|
|
1 |
|
|
21,119 |
|
| Minneapolis, MN |
|
April 4, 2022 |
|
160,000 |
|
|
1 |
|
|
13,472 |
|
| Grand Rapids, MI |
|
April 14, 2022 |
|
211,125 |
|
|
2 |
|
|
12,274 |
|
| Pittsburgh, PA |
|
April 19, 2022 |
|
400,000 |
|
|
1 |
|
|
50,178 |
|
Greenville, SC(2) |
|
April 22, 2022 |
|
— |
|
|
— |
|
|
5,559 |
|
| Birmingham, AL |
|
May 5, 2022 |
|
67,168 |
|
|
1 |
|
|
7,871 |
|
| San Jose, CA |
|
June 7, 2022 |
|
175,325 |
|
|
1 |
|
|
29,630 |
|
| Fredricksburg, VA |
|
June 29, 2022 |
|
140,555 |
|
|
1 |
|
|
20,257 |
|
| Norfolk, VA |
|
June 29, 2022 |
|
102,512 |
|
|
1 |
|
|
10,561 |
|
| Three months ended June 30, 2022 |
|
|
|
1,467,543 |
|
|
9 |
|
|
170,921 |
|
| Atlanta, GA |
|
July 15, 2022 |
|
159,048 |
|
|
1 |
|
|
10,062 |
|
| Fresno, CA |
|
July 25, 2022 |
|
232,072 |
|
|
1 |
|
|
30,121 |
|
| El Paso, TX |
|
July 26, 2022 |
|
326,166 |
|
|
4 |
|
|
37,792 |
|
| Portland, OR |
|
September 12, 2022 |
|
78,000 |
|
|
1 |
|
|
11,281 |
|
| Louisville, KY |
|
September 21, 2022 |
|
563,032 |
|
|
1 |
|
|
38,064 |
|
| Three months ended September 30, 2022 |
|
|
|
1,358,318 |
|
|
8 |
|
|
127,320 |
|
| Chicago, IL |
|
December 28, 2022 |
|
115,491 |
|
|
1 |
|
|
8,055 |
|
| Three months ended December 31, 2022 |
|
|
|
115,491 |
|
|
1 |
|
|
8,055 |
|
| Year ended December 31, 2022 |
|
|
|
4,741,113 |
|
|
26 |
|
|
$ |
472,647 |
|
(1) As defined by CBRE-EA industrial market geographies. If the building is located outside of a CBRE-EA defined market, the city and state is reflected.
(2) The Company acquired vacant land parcels.
The following table summarizes the allocation of the consideration paid at the date of acquisition during the years ended December 31, 2023 and 2022 for the acquired assets and liabilities in connection with the acquisitions identified in the tables above.
|
|
|
|
|
|
|
|
|
|
|
|
|
|
|
|
|
|
|
|
|
|
|
|
|
|
|
|
|
Year ended December 31, 2023 |
|
Year ended December 31, 2022 |
| Acquired Assets and Liabilities |
|
Purchase price (in thousands) |
|
Weighted average amortization period (years) of intangibles at acquisition |
|
Purchase price (in thousands) |
|
Weighted average amortization period (years) of intangibles at acquisition |
| Land |
|
$ |
56,055 |
|
|
N/A |
|
$ |
39,346 |
|
|
N/A |
| Buildings |
|
217,420 |
|
|
N/A |
|
360,209 |
|
|
N/A |
| Tenant improvements |
|
1,407 |
|
|
N/A |
|
2,640 |
|
|
N/A |
| Building and land improvements |
|
12,988 |
|
|
N/A |
|
19,589 |
|
|
N/A |
| Construction in progress |
|
16,187 |
|
|
N/A |
|
— |
|
|
N/A |
| Other assets |
|
— |
|
|
N/A |
|
2,134 |
|
|
N/A |
| Operating lease right-of-use assets |
|
— |
|
|
N/A |
|
3,541 |
|
|
N/A |
| Deferred leasing intangibles - In-place leases |
|
16,914 |
|
|
5.1 |
|
34,321 |
|
|
7.9 |
| Deferred leasing intangibles - Tenant relationships |
|
6,870 |
|
|
8.9 |
|
18,418 |
|
|
11.1 |
| Deferred leasing intangibles - Above market leases |
|
523 |
|
|
2.7 |
|
2,456 |
|
|
11.6 |
| Deferred leasing intangibles - Below market leases |
|
(5,839) |
|
|
6.4 |
|
(6,021) |
|
|
7.5 |
| Operating lease liabilities |
|
— |
|
|
N/A |
|
(3,541) |
|
|
N/A |
|
|
|
|
|
|
|
|
|
|
|
|
|
|
|
|
|
|
|
|
|
|
|
|
|
|
|
| Tenant prepaid rent |
|
(511) |
|
|
N/A |
|
(445) |
|
|
N/A |
| Total purchase price |
|
322,014 |
|
|
|
|
472,647 |
|
|
|
|
|
|
|
|
|
|
|
|
|
|
|
|
|
|
|
|
|
Dispositions
The following table summarizes the Company’s dispositions for the years ended December 31, 2023, 2022, and 2021. All of the dispositions were sold to third parties and were accounted for under the full accrual method.
|
|
|
|
|
|
|
|
|
|
|
|
|
|
|
|
|
|
|
|
|
|
|
Year ended December 31, |
| Sales of rental property, net (dollars in thousands) |
|
2023 |
|
2022 |
|
2021 |
| Number of buildings |
|
10 |
|
8 |
|
22 |
| Number of land parcels |
|
— |
|
|
1 |
|
— |
|
| Building square feet (in millions) |
|
$ |
2.0 |
|
|
1.8 |
|
2.7 |
2023 dispositions contribution to net income(1) |
|
$ |
2,354 |
|
|
$ |
5,926 |
|
|
$ |
5,033 |
|
2022 dispositions contribution to net income(1) |
|
$ |
— |
|
|
$ |
1,008 |
|
|
$ |
4,699 |
|
2021 dispositions contribution to net income(1) |
|
$ |
— |
|
|
$ |
— |
|
|
$ |
862 |
|
| Proceeds from sales of rental property, net |
|
$ |
105,602 |
|
|
$ |
135,348 |
|
|
$ |
187,972 |
|
| Net book value |
|
$ |
51,502 |
|
|
$ |
77,861 |
|
|
$ |
89,992 |
|
| Gain on the sales of rental property, net |
|
$ |
54,100 |
|
|
$ |
57,487 |
|
|
$ |
97,980 |
|
(1) Exclusive of any loss on impairment, gain on involuntary conversion, and gain on the sales of rental property, net.
Loss on Impairment
The following table summarizes the Company’s loss on impairment for asset held and used during the year ended December 31, 2022. The Company did not recognize a loss on impairment during the years ended December 31, 2023 and 2021.
|
|
|
|
|
|
|
|
|
|
|
|
|
|
|
|
|
|
|
|
|
|
|
|
|
|
|
|
|
|
|
|
|
Market(1) |
|
Buildings |
|
Event or Change in Circumstance Leading to Impairment Evaluation(2) |
|
Valuation technique utilized to estimate fair value |
|
Fair Value(3) |
|
Loss on Impairment |
| (in thousands) |
| Hartford, CT |
|
1 |
|
|
Change in estimated hold period |
(4) |
Discounted cash flows |
(5) |
$ |
834 |
|
|
$ |
1,783 |
|
|
|
|
|
|
|
|
| Year ended December 31, 2022 |
|
|
|
|
|
$ |
1,783 |
|
|
|
|
|
|
|
|
|
|
|
|
|
|
|
|
|
|
|
|
|
|
|
|
|
|
|
|
|
|
|
|
|
|
|
|
|
|
|
|
|
|
|
|
(1)As defined by CBRE-EA industrial market geographies. If the building is located outside of a CBRE-EA defined market, the city and state is reflected.
(2)The Company tested the asset group for impairment utilizing a probability weighted recovery analysis of certain scenarios, and it was determined that the carrying value of the property and intangibles were not recoverable from the estimated future undiscounted cash flows.
(3)The estimated fair value of the property is based on Level 3 inputs and is a non-recurring fair value measurement. Level 3 is defined as unobservable inputs in which little or no market data exists, therefore requiring an entity to develop its own assumptions.
(4)This property was sold during the year ended December 31, 2023.
(5)Level 3 inputs used to determine fair value for the property impaired: discount rate of 10.0% and exit capitalization rate of 8.5%.
Involuntary Conversion
In December 2023, the Company recorded an estimated loss on involuntary conversion of approximately $3.0 million for the year ended December 31, 2023 related to a tornado that damaged one of the Company’s buildings. An insurance policy provides coverage for these losses, and accordingly the loss on involuntary conversion was fully offset for the year ended December 31, 2023. As of December 31, 2023, the receivable from the insurance coverage is estimated to be approximately $3.0 million , which is included in prepaid expenses and other assets on the accompanying Consolidated Balance Sheets.
Deferred Leasing Intangibles
The following table summarizes the deferred leasing intangibles, net on the accompanying Consolidated Balance Sheets as of December 31, 2023 and 2022.
|
|
|
|
|
|
|
|
|
|
|
|
|
|
|
|
|
|
|
|
|
|
|
|
|
|
|
|
|
|
|
|
|
|
|
|
|
|
|
|
|
December 31, 2023 |
|
December 31, 2022 |
| Deferred Leasing Intangibles (in thousands) |
|
Gross |
|
Accumulated Amortization |
|
Net |
|
Gross |
|
Accumulated Amortization |
|
Net |
| Above market leases |
|
$ |
79,946 |
|
|
$ |
(35,698) |
|
|
$ |
44,248 |
|
|
$ |
86,172 |
|
|
$ |
(34,954) |
|
|
$ |
51,218 |
|
| Other intangible lease assets |
|
715,870 |
|
|
(324,396) |
|
|
391,474 |
|
|
751,611 |
|
|
(293,894) |
|
|
457,717 |
|
| Total deferred leasing intangible assets |
|
$ |
795,816 |
|
|
$ |
(360,094) |
|
|
$ |
435,722 |
|
|
$ |
837,783 |
|
|
$ |
(328,848) |
|
|
$ |
508,935 |
|
|
|
|
|
|
|
|
|
|
|
|
|
|
| Below market leases |
|
$ |
56,521 |
|
|
$ |
(26,613) |
|
|
$ |
29,908 |
|
|
$ |
57,020 |
|
|
$ |
(24,593) |
|
|
$ |
32,427 |
|
| Total deferred leasing intangible liabilities |
|
$ |
56,521 |
|
|
$ |
(26,613) |
|
|
$ |
29,908 |
|
|
$ |
57,020 |
|
|
$ |
(24,593) |
|
|
$ |
32,427 |
|
The following table summarizes the amortization expense and the net increase (decrease) to rental income for the amortization of deferred leasing intangibles during the years ended December 31, 2023, 2022 and 2021.
|
|
|
|
|
|
|
|
|
|
|
|
|
|
|
|
|
|
|
|
|
| |
|
Year ended December 31, |
| Deferred Leasing Intangibles Amortization (in thousands) |
|
2023 |
|
2022 |
|
2021 |
| Net increase (decrease) to rental income related to above and below market lease amortization |
|
$ |
865 |
|
|
$ |
329 |
|
|
$ |
(2,073) |
|
| Amortization expense related to other intangible lease assets |
|
$ |
89,036 |
|
|
$ |
95,901 |
|
|
$ |
88,729 |
|
The following table summarizes the amortization of deferred leasing intangibles over the next five calendar years as of December 31, 2023.
|
|
|
|
|
|
|
|
|
|
|
|
|
|
|
| Year |
|
Amortization Expense Related to Other Intangible Lease Assets (in thousands) |
|
Net Increase (Decrease) to Rental Income Related to Above and Below Market Lease Amortization (in thousands) |
| 2024 |
|
$ |
78,001 |
|
|
$ |
812 |
|
| 2025 |
|
$ |
65,955 |
|
|
$ |
402 |
|
| 2026 |
|
$ |
56,307 |
|
|
$ |
(448) |
|
| 2027 |
|
$ |
44,613 |
|
|
$ |
(1,317) |
|
| 2028 |
|
$ |
37,521 |
|
|
$ |
(1,334) |
|
4. Debt
The following table summarizes the Company’s outstanding indebtedness, including borrowings under the Company’s unsecured credit facility, unsecured term loans, unsecured notes, and mortgage notes as of December 31, 2023 and 2022.
|
|
|
|
|
|
|
|
|
|
|
|
|
|
|
|
|
|
|
|
|
|
|
|
|
|
|
|
|
|
|
|
|
| Indebtedness (dollars in thousands) |
|
December 31, 2023 |
|
December 31, 2022 |
|
Interest Rate(1)(2) |
|
Maturity Date |
|
Prepayment Terms(3) |
| Unsecured credit facility: |
|
|
|
|
|
|
|
|
|
|
Unsecured Credit Facility(4) |
|
$ |
402,000 |
|
|
$ |
175,000 |
|
|
Term SOFR + 0.855% |
|
October 23, 2026 |
|
i |
| Total unsecured credit facility |
|
402,000 |
|
|
175,000 |
|
|
|
|
|
|
|
|
|
|
|
|
|
|
|
|
|
|
| Unsecured term loans: |
|
|
|
|
|
|
|
|
|
|
| Unsecured Term Loan F |
|
200,000 |
|
|
200,000 |
|
|
2.94 |
% |
|
January 12, 2025 |
|
i |
| Unsecured Term Loan G |
|
300,000 |
|
|
300,000 |
|
|
1.78 |
% |
|
February 5, 2026 |
|
i |
| Unsecured Term Loan A |
|
150,000 |
|
|
150,000 |
|
|
2.14 |
% |
|
March 15, 2027 |
|
i |
| Unsecured Term Loan H |
|
187,500 |
|
|
187,500 |
|
|
3.73 |
% |
|
January 25, 2028 |
|
i |
| Unsecured Term Loan I |
|
187,500 |
|
|
187,500 |
|
|
3.49 |
% |
|
January 25, 2028 |
|
i |
| Total unsecured term loans |
|
1,025,000 |
|
|
1,025,000 |
|
|
|
|
|
|
|
| Total unamortized deferred financing fees and debt issuance costs |
|
(3,227) |
|
|
(4,560) |
|
|
|
|
|
|
|
| Total carrying value unsecured term loans, net |
|
1,021,773 |
|
|
1,020,440 |
|
|
|
|
|
|
|
|
|
|
|
|
|
|
|
|
|
|
| Unsecured notes: |
|
|
|
|
|
|
|
|
|
|
| Series F Unsecured Notes |
|
— |
|
|
100,000 |
|
|
3.98 |
% |
|
January 5, 2023 |
|
ii |
| Series A Unsecured Notes |
|
50,000 |
|
|
50,000 |
|
|
4.98 |
% |
|
October 1, 2024 |
|
ii |
| Series D Unsecured Notes |
|
100,000 |
|
|
100,000 |
|
|
4.32 |
% |
|
February 20, 2025 |
|
ii |
| Series G Unsecured Notes |
|
75,000 |
|
|
75,000 |
|
|
4.10 |
% |
|
June 13, 2025 |
|
ii |
| Series B Unsecured Notes |
|
50,000 |
|
|
50,000 |
|
|
4.98 |
% |
|
July 1, 2026 |
|
ii |
| Series C Unsecured Notes |
|
80,000 |
|
|
80,000 |
|
|
4.42 |
% |
|
December 30, 2026 |
|
ii |
| Series E Unsecured Notes |
|
20,000 |
|
|
20,000 |
|
|
4.42 |
% |
|
February 20, 2027 |
|
ii |
| Series H Unsecured Notes |
|
100,000 |
|
|
100,000 |
|
|
4.27 |
% |
|
June 13, 2028 |
|
ii |
| Series I Unsecured Notes |
|
275,000 |
|
|
275,000 |
|
|
2.80 |
% |
|
September 29, 2031 |
|
ii |
| Series K Unsecured Notes |
|
400,000 |
|
|
400,000 |
|
|
4.12 |
% |
|
June 28, 2032 |
|
ii |
| Series J Unsecured Notes |
|
50,000 |
|
|
50,000 |
|
|
2.95 |
% |
|
September 28, 2033 |
|
ii |
| Total unsecured notes |
|
1,200,000 |
|
|
1,300,000 |
|
|
|
|
|
|
|
| Total unamortized deferred financing fees and debt issuance costs |
|
(4,128) |
|
|
(4,558) |
|
|
|
|
|
|
|
| Total carrying value unsecured notes, net |
|
1,195,872 |
|
|
1,295,442 |
|
|
|
|
|
|
|
|
|
|
|
|
|
|
|
|
|
|
| Mortgage notes (secured debt): |
|
|
|
|
|
|
|
|
|
|
| Thrivent Financial for Lutherans |
|
— |
|
|
3,296 |
|
|
4.78 |
% |
|
December 15, 2023 |
|
iii |
| United of Omaha Life Insurance Company |
|
4,537 |
|
|
4,744 |
|
|
3.71 |
% |
|
October 1, 2039 |
|
ii |
| Total mortgage notes |
|
4,537 |
|
|
8,040 |
|
|
|
|
|
|
|
| Net unamortized fair market value discount |
|
(136) |
|
|
(137) |
|
|
|
|
|
|
|
| Total unamortized deferred financing fees and debt issuance costs |
|
— |
|
|
(5) |
|
|
|
|
|
|
|
| Total carrying value mortgage notes, net |
|
4,401 |
|
|
7,898 |
|
|
|
|
|
|
|
Total / weighted average interest rate(5) |
|
$ |
2,624,046 |
|
|
2,498,780 |
|
|
3.79 |
% |
|
|
|
|
(1)Interest rate as of December 31, 2023. At December 31, 2023, the one-month Term Secured Overnight Financing Rate (“Term SOFR”) was 5.35472%. The current interest rate is not adjusted to include the amortization of deferred financing fees or debt issuance costs incurred in obtaining debt or any unamortized fair market value premiums or discounts. The spread over the applicable rate for the Company’s unsecured credit facility and unsecured term loans is based on the Company’s debt rating and leverage ratio, as defined in the respective loan agreements.
(2)The unsecured credit facility has a stated rate of one-month Term SOFR plus a 0.10% adjustment and a spread of 0.775%, less a sustainability-related interest rate adjustment of 0.02%. The unsecured term loans have a stated interest rate of one-month Term SOFR plus a 0.10% adjustment and a spread of 0.85%, less a sustainability-related interest rate adjustment of 0.02%. As of December 31, 2023, one-month Term SOFR for the Unsecured Term Loans A, F, G, H, and I was swapped to a fixed rate of 1.31%, 2.11%, 0.95%, 2.90%, and 2.66%, respectively (which includes the 0.10% adjustment). One-month Term SOFR for the Unsecured Term Loan H will be swapped to a fixed rate of 2.50% effective January 12, 2024.
(3)Prepayment terms consist of (i) pre-payable with no penalty; (ii) pre-payable with penalty; and (iii) pre-payable without penalty three months prior to the maturity date.
(4)The capacity of the unsecured credit facility is $1.0 billion. Deferred financing fees and debt issuance costs, net of accumulated amortization related to the unsecured credit facility of approximately $3.3 million and $5.2 million are included in prepaid expenses and other assets on the accompanying Consolidated Balance Sheets as of December 31, 2023 and December 31, 2022, respectively. The initial maturity date is October 24, 2025, or such later date which may be extended pursuant to two six-month extension options exercisable by the Company in its discretion upon advance written notice. Exercise of each six-month option is subject to the following conditions: (i) absence of a default immediately before the extension and immediately after giving effect to the extension; (ii) accuracy of representations and warranties as of the extension date (both immediately before and after the extension), as if made on the extension date; and (iii) payment of a fee. Neither extension option is subject to lender consent, assuming proper notice and satisfaction of the conditions. We are required to pay a facility fee on the aggregate commitment amount (currently $1.0 billion) at a rate per annum of 0.1% to 0.3%, depending on our debt rating, as defined in the credit agreement. The facility fee is due and payable quarterly.
(5)The weighted average interest rate was calculated using the fixed interest rate swapped on the notional amount of $1,025.0 million of debt, and is not adjusted to include the amortization of deferred financing fees or debt issuance costs incurred in obtaining debt or any unamortized fair market value premiums or discounts.
The aggregate undrawn nominal commitment on the unsecured credit facility as of December 31, 2023 was approximately $594.7 million, including issued letters of credit. The Company’s actual borrowing capacity at any given point in time may be less or restricted to a maximum amount based on the Company’s debt covenant compliance. Total accrued interest for the Company’s indebtedness was approximately $14.6 million and $13.1 million as of December 31, 2023 and 2022, respectively, and is included in accounts payable, accrued expenses and other liabilities on the accompanying Consolidated Balance Sheets.
The following table summarizes the costs included in interest expense related to the Company’s debt arrangements on the accompanying Consolidated Statement of Operations for the years ended December 31, 2023, 2022 and 2021.
|
|
|
|
|
|
|
|
|
|
|
|
|
|
|
|
|
|
|
|
|
|
|
|
|
|
|
|
|
Year ended December 31, |
| Costs Included in Interest Expense (in thousands) |
|
|
|
|
|
2023 |
|
2022 |
|
2021 |
| Amortization of deferred financing fees and debt issuance costs and fair market value premiums/discounts |
|
|
|
|
|
$ |
3,905 |
|
|
$ |
3,747 |
|
|
$ |
2,931 |
|
| Facility, unused, and other fees |
|
|
|
|
|
$ |
1,759 |
|
|
$ |
1,548 |
|
|
$ |
1,642 |
|
2023 Debt Activity
On December 15, 2023, the mortgage note associated with Thrivent Financial for Lutherans in the amount of approximately $3.2 million was repaid in full.
On January 19, 2023, the sustainability-related interest rate adjustment for the Unsecured Term Loan H and Unsecured Term Loan I went into effect in connection with the Company's 2022 public disclosure assessment score of “A” from the Global Real Estate Sustainability Benchmark (GRESB). The interest rate adjustment, a 0.02% interest rate reduction for each instrument, will end on June 29, 2024, in accordance with the respective loan agreements.
On January 5, 2023, the Company redeemed in full at maturity the $100.0 million in aggregate principal amount of the Series F Unsecured Notes with a fixed interest rate of 3.98%.
2022 Debt Activity
On October 3, 2022, the Company achieved a 2022 public disclosure assessment score of “A” from the Global Real Estate Sustainability Benchmark (GRESB). The improved score triggered a sustainability-related interest rate adjustment for the Unsecured Term Loan A, Unsecured Term Loan F, Unsecured Term Loan G, and Unsecured Credit Facility. The interest rate adjustment, a 0.02% interest rate reduction for each instrument, went into effect on October 17, 2022 and will end on June 29, 2024, in accordance with the respective loan agreements.
On September 1, 2022, the mortgage note associated with the Wells Fargo Bank, National Association CMBS Loan was repaid in full.
On September 1, 2022, the Company entered into separate amended and restated loan agreements for the Unsecured Term Loan A, the Unsecured Term Loan F, and the Unsecured Term Loan G (“Amended and Restated Unsecured Term Loans”), to provide that borrowings under the Amended and Restated Unsecured Term Loans bear a current annual interest rate of one-month Term SOFR, plus an adjustment of 0.10% and a spread of 0.85%, based on the Company’s debt rating and leverage ratio (as defined in the applicable loan agreement). Other than the interest rate provisions described above, the material terms of the Amended and Restated Unsecured Term Loans, including the maturity dates, remain unchanged.
On July 26, 2022, the Company entered into an amended and restated credit agreement for the unsecured credit facility (the “July 2022 Credit Agreement”), which provided for an increase in the aggregate commitments available for borrowing under the unsecured credit facility from $750.0 million to up to $1.0 billion. The July 2022 Credit Agreement also provided for the replacement of one-month LIBOR for one-month Term SOFR, plus a 0.10% adjustment. In connection with the July 2022 Credit Agreement, the Company incurred approximately $1.4 million in costs which are being deferred and amortized through the maturity date of the unsecured credit facility. The unamortized fees will continue to be deferred and amortized through the maturity date.
Other than the increase in the borrowing commitments and the interest rate provisions described above, the material terms of the unsecured credit facility remain unchanged.
On July 26, 2022, the Company entered into (i) an unsecured term loan agreement with Wells Fargo Bank, National Association and the other lenders party thereto, providing for a new senior unsecured term loan in the original principal amount of $187.5 million (“Unsecured Term Loan H”) and (ii) an unsecured term loan agreement with Bank of America, N.A., and the other lenders party thereto, providing for a new senior unsecured term loan in the original principal amount of $187.5 million (“Unsecured Term Loan I”). In connection with the new unsecured term loans, the $150.0 million Unsecured Term Loan D and the $175.0 million Unsecured Term Loan E were repaid in full. Each of the Unsecured Term Loan H and the Unsecured Term Loan I bears a current annual interest rate of one-month Term SOFR, plus a 0.10% adjustment and a spread of 0.85% based on the Company’s debt rating and leverage ratio (as defined in the applicable loan agreement), and matures on January 25, 2028. In connection with the new unsecured term loans, the Company incurred approximately $1.2 million in costs which are being deferred and amortized through the maturity dates on the unsecured term loans. The Company also recognized debt extinguishment and modification expenses of approximately $0.8 million related to unamortized deferred financing fees and debt issuance costs related to the Unsecured Term Loan D and the Unsecured Term Loan E and other third-party costs.
On April 28, 2022, the Company entered into a note purchase agreement (the “April 2022 NPA”) for the private placement by the Operating Partnership of $400.0 million senior unsecured notes (the “Series K Unsecured Notes”) maturing June 28, 2032, with a fixed annual interest rate of 4.12%. The April 2022 NPA contains a number of financial covenants substantially similar to the financial covenants contained in the Company’s unsecured credit facility and other unsecured notes, plus a financial covenant that requires the Company to maintain a minimum interest coverage ratio of not less than 1.50:1.00. The Operating Partnership issued the Series K Unsecured Notes on June 28, 2022. The Company and certain wholly owned subsidiaries of the Operating Partnership are guarantors of the Series K Unsecured Notes.
Financial Covenant Considerations
The Company’s ability to borrow under the unsecured credit facility, unsecured term loans, and unsecured notes are subject to its ongoing compliance with a number of customary financial covenants, including:
•a maximum consolidated leverage ratio of not greater than 0.60:1.00;
•a maximum secured leverage ratio of not greater than 0.40:1.00;
•a maximum unencumbered leverage ratio of not greater than 0.60:1.00;
•a minimum fixed charge ratio of not less than or equal to 1.50:1.00;
•a minimum unsecured interest coverage ratio of not less than or equal to 1.75:1.00; and
•with respect to the unsecured notes, a minimum interest coverage ratio of not less than 1.50:1.00.
The Company was in compliance with all such applicable restrictions and financial and other covenants as of December 31, 2023 and 2022 related to its unsecured credit facility, unsecured term loans, and unsecured notes. In the event of a default under the unsecured credit facility or the unsecured term loans, the Company’s dividend distributions are limited to the minimum amount necessary for the Company to maintain its status as a REIT.
Each of the Company’s mortgage notes has specific properties and assignments of rents and leases that are collateral for these loans. The real estate net book value of the properties that are collateral for the Company’s debt arrangements was approximately $7.5 million and $14.8 million at December 31, 2023 and 2022, respectively, and is limited to senior, property-level secured debt financing arrangements.
Fair Value of Debt
The following table summarizes the aggregate principal amount outstanding under the Company’s debt arrangements and the corresponding estimate of fair value as of December 31, 2023 and 2022. The fair value of the Company’s debt is based on Level 3 inputs.
|
|
|
|
|
|
|
|
|
|
|
|
|
|
|
|
|
|
|
|
|
|
|
|
|
|
|
| |
|
December 31, 2023 |
|
December 31, 2022 |
| Indebtedness (in thousands) |
|
Principal Outstanding |
|
Fair Value |
|
Principal Outstanding |
|
Fair Value |
| Unsecured credit facility |
|
$ |
402,000 |
|
|
$ |
402,000 |
|
|
$ |
175,000 |
|
|
$ |
175,000 |
|
| Unsecured term loans |
|
1,025,000 |
|
|
1,025,000 |
|
|
1,025,000 |
|
|
1,025,000 |
|
| Unsecured notes |
|
1,200,000 |
|
|
1,074,003 |
|
|
1,300,000 |
|
|
1,150,283 |
|
| Mortgage notes |
|
4,537 |
|
|
3,535 |
|
|
8,040 |
|
|
6,855 |
|
| Total principal amount |
|
2,631,537 |
|
|
$ |
2,504,538 |
|
|
2,508,040 |
|
|
$ |
2,357,138 |
|
| Net unamortized fair market value discount |
|
(136) |
|
|
|
|
(137) |
|
|
|
| Total unamortized deferred financing fees and debt issuance costs |
|
(7,355) |
|
|
|
|
(9,123) |
|
|
|
| Total carrying value |
|
$ |
2,624,046 |
|
|
|
|
$ |
2,498,780 |
|
|
|
Future Principal Payments of Debt
The following table summarizes the Company’s aggregate future principal payments of the Company’s debt at December 31, 2023.
|
|
|
|
|
|
|
|
|
| Year |
|
Future Principal Payments of Debt
(in thousands) |
| 2024 |
|
$ |
50,215 |
|
| 2025 |
|
777,223 |
|
| 2026 |
|
430,231 |
|
| 2027 |
|
170,240 |
|
| 2028 |
|
475,249 |
|
| Thereafter |
|
728,379 |
|
| Total aggregate principal payments |
|
$ |
2,631,537 |
|
|
|
|
|
|
|
|
|
|
5. Derivative Financial Instruments
Risk Management Objective of Using Derivatives
The Company’s use of derivative instruments is limited to the utilization of interest rate swaps to manage interest rate risk exposure on existing and future liabilities and not for speculative purposes. The principal objective of such arrangements is to minimize the risks and related costs associated with the Company’s operating and financial structure.
As of December 31, 2023, the Company had 21 interest rate swaps outstanding, all of which are used to hedge the variable cash flows associated with unsecured loans. All of the Company’s interest rate swaps convert the related loans’ Term SOFR components to effectively fixed interest rates, and the Company has concluded that each of the hedging relationships are highly effective. The following table summarizes the fair value of the interest rate swaps outstanding as of December 31, 2023 and 2022.
|
|
|
|
|
|
|
|
|
|
|
|
|
|
|
|
|
|
|
|
|
|
|
|
|
|
|
| Balance Sheet Line Item (in thousands) |
|
Notional Amount December 31, 2023 |
|
Fair Value December 31, 2023 |
|
Notional Amount December 31, 2022 |
|
Fair Value December 31, 2022 |
| Interest rate swaps-Asset |
|
$ |
1,200,000 |
|
|
$ |
50,418 |
|
|
$ |
1,650,000 |
|
|
$ |
72,223 |
|
| Interest rate swaps-Liability |
|
$ |
— |
|
|
$ |
— |
|
|
$ |
— |
|
|
$ |
— |
|
Cash Flow Hedges of Interest Rate Risk
The Company’s objectives in using interest rate swaps are to add stability to interest expense and to manage its exposure to interest rate movements. The Company uses interest rate swaps to fix the rate of its long term variable rate debt. Interest rate swaps designated as cash flow hedges involve the receipt of variable amounts from a counterparty in exchange for the Company making fixed-rate payments over the life of the agreements without exchange of the underlying notional amount.
For derivatives designated and that qualify as cash flow hedges of interest rate risk, the gain or loss on the derivative is recorded in accumulated other comprehensive income (loss) and subsequently reclassified to interest expense in the same periods during which the hedged transaction affects earnings.
Amounts reported in accumulated other comprehensive income (loss) related to derivatives designated as qualifying cash flow hedges will be reclassified to interest expense as interest payments are made on the Company’s variable rate debt. The Company estimates that approximately $29.6 million will be reclassified from accumulated other comprehensive income (loss) as a decrease to interest expense over the next 12 months.
The following table summarizes the effect of cash flow hedge accounting and the location of the amounts related to the Company’s derivatives in the consolidated financial statements for the years ended December 31, 2023, 2022 and 2021.
|
|
|
|
|
|
|
|
|
|
|
|
|
|
|
|
|
|
|
|
|
| |
|
Year ended December 31, |
| Effect of Cash Flow Hedge Accounting (in thousands) |
|
2023 |
|
2022 |
|
2021 |
| Income recognized in accumulated other comprehensive income (loss) on interest rate swaps |
|
$ |
12,333 |
|
|
$ |
85,726 |
|
|
$ |
12,520 |
|
| Income (loss) reclassified from accumulated other comprehensive income (loss) into income as interest expense |
|
$ |
34,107 |
|
|
$ |
1,640 |
|
|
$ |
(16,336) |
|
| Total interest expense presented in the Consolidated Statements of Operations in which the effects of cash flow hedges are recorded |
|
$ |
94,575 |
|
|
$ |
78,018 |
|
|
$ |
63,484 |
|
Credit-risk-related Contingent Features
The Company has agreements with each of its derivative counterparties that contain a provision where the Company could be declared in default on its derivative obligations if repayment of the underlying indebtedness is accelerated by the lender due to the Company’s default on the indebtedness.
As of December 31, 2023, the Company had not breached the provisions of these agreements and had not posted any collateral related to these agreements.
Fair Value of Interest Rate Swaps
The Company’s valuation of the interest rate swaps is determined using widely accepted valuation techniques including discounted cash flow analysis on the expected cash flows of each derivative. This analysis reflects the contractual terms of the derivatives, including the period to maturity, and uses observable market-based inputs including interest rate curves. The fair values of interest rate swaps are determined by using the market standard methodology of netting the discounted future fixed cash payments and the discounted expected variable cash receipts. The variable cash receipts are based on an expectation of future interest rates (forward curves) derived from observable market interest rate curves.
The Company incorporates credit valuation adjustments to appropriately reflect both its own nonperformance risk and the respective counterparty’s nonperformance risk in the fair value measurements. In adjusting the fair value of its derivative contracts for the effect of nonperformance risk, the Company has considered the impact of netting and any applicable credit enhancements, such as collateral postings, thresholds, mutual puts, and guarantees.
Although the Company has determined that the majority of the inputs used to value its derivatives fall within Level 2 of the fair value hierarchy, the credit valuation adjustments associated with its derivatives utilize Level 3 inputs, such as estimates of current credit spreads to evaluate the likelihood of default by the Company or its counterparties. However, as of December 31, 2023 and 2022, the Company has assessed the significance of the impact of the credit valuation adjustments on the overall valuation of its derivative positions and has determined that the credit valuation adjustments are not significant to the overall valuation of its derivatives. As a result, the Company has determined that its derivative valuations in their entirety are classified in Level 2 of the fair value hierarchy.
The following table summarizes the Company’s financial instruments that were recorded at fair value on a recurring basis as of December 31, 2023 and 2022.
|
|
|
|
|
|
|
|
|
|
|
|
|
|
|
|
|
|
|
|
|
|
|
|
|
|
|
| |
|
|
|
Fair Value Measurements as of December 31, 2023 Using |
| Balance Sheet Line Item (in thousands) |
|
Fair Value December 31, 2023 |
|
Level 1 |
|
Level 2 |
|
Level 3 |
| Interest rate swaps-Asset |
|
$ |
50,418 |
|
|
$ |
— |
|
|
$ |
50,418 |
|
|
$ |
— |
|
|
|
|
|
|
|
|
|
|
|
|
|
|
|
|
|
|
|
|
|
|
|
|
|
|
|
|
|
|
|
|
|
|
|
|
|
| |
|
|
|
Fair Value Measurements as of December 31, 2022 Using |
| Balance Sheet Line Item (in thousands) |
|
Fair Value December 31, 2022 |
|
Level 1 |
|
Level 2 |
|
Level 3 |
| Interest rate swaps-Asset |
|
$ |
72,223 |
|
|
$ |
— |
|
|
$ |
72,223 |
|
|
$ |
— |
|
|
|
|
|
|
|
|
|
|
6. Equity
Preferred Stock
The Company is authorized to issue up to 20,000,000 shares of preferred stock, par value $0.01 per share. As of December 31, 2023 and December 31, 2022, there were no shares of preferred stock issued or outstanding.
On March 1, 2021, the Company gave notice to redeem all 3,000,000 issued and outstanding shares of the Series C Preferred Stock on March 31, 2021. The Company redeemed the Series C Preferred Stock on March 31, 2021 at a cash redemption price of $25.00 per share, plus accrued and unpaid dividends to, but excluding, the redemption date. The Company recognized a deemed dividend to the holders of the Series C Preferred Stock of approximately $2.6 million on the accompanying Consolidated Statements of Operations for the year ended December 31, 2021 related to redemption costs and the original issuance costs of the Series C Preferred Stock.
Common Stock
The Company is authorized to issue up to 300,000,000 shares of common stock, par value $0.01 per share.
The following table summarizes the terms of the Company’s at-the-market (“ATM”) common stock offering program as of December 31, 2023.
|
|
|
|
|
|
|
|
|
|
|
|
|
|
|
|
|
|
|
|
|
| ATM Common Stock Offering Program |
|
Date |
|
Maximum Aggregate Offering Price (in thousands) |
|
Aggregate Available as of December 31, 2023 (in thousands) |
| 2022 $750 million ATM |
|
February 17, 2022 |
|
$ |
750,000 |
|
|
$ |
637,663 |
|
The following tables summarize the activity for the ATM common stock offering program during the years ended December 31, 2023 and 2022 (in thousands, except share data).
|
|
|
|
|
|
|
|
|
|
|
|
|
|
|
|
|
|
|
|
|
|
|
|
|
| |
|
Year ended December 31, 2023 |
| ATM Common Stock Offering Program |
|
Shares
Sold |
|
Weighted Average Price Per Share |
|
|
|
|
|
Net Proceeds (in thousands) |
2022 $750 million ATM(1) |
|
249,016 |
|
|
$ |
35.55 |
|
|
|
|
|
|
$ |
8,765 |
|
| Total/weighted average |
|
249,016 |
|
|
$ |
35.55 |
|
|
|
|
|
|
$ |
8,765 |
|
(1)Excludes shares sold on a forward basis under the ATM common stock offering program during the year ended December 31, 2023, which are discussed below.
|
|
|
|
|
|
|
|
|
|
|
|
|
|
|
|
|
|
|
|
|
|
|
Year ended December 31, 2022 |
| ATM Common Stock Offering Program |
|
Shares
Sold |
|
Weighted Average Price Per Share |
|
Net Proceeds (in thousands) |
2019 $600 million ATM(1) |
|
128,335 |
|
|
$ |
45.03 |
|
|
$ |
5,721 |
|
| Total/weighted average |
|
128,335 |
|
|
$ |
45.03 |
|
|
$ |
5,721 |
|
(1)This program ended during the quarter ended March 31, 2022. Excludes shares sold on a forward basis under the ATM common stock offering program during the year ended December 31, 2022, which are discussed below.
Subsequent to December 31, 2023, on January 9, 2024, the Company sold 567,112 shares on a forward basis under the ATM common stock offering program at a sale price of $38.8818 per share (an aggregate of approximately $22.1 million gross sale price), or $38.5058 per share net of commissions. The Company did not receive any proceeds from the sale of such shares on a forward basis. The Company expects to fully physically settle the applicable forward sale agreement on one or more dates prior to the scheduled maturity date of January 9, 2025, at which point we would receive the proceeds net of certain costs; provided, however, the Company may elect to cash settle or net share settle such forward sale agreement at any time through the scheduled maturity date.
On December 14, 2023, the Company sold 1,100,000 shares on a forward basis under the ATM common stock offering program at a sale price of $38.00 per share (an aggregate of $41.8 million gross sale price), or $37.62 per share net of commissions. The Company did not receive any proceeds from the sale of such shares on a forward basis. The Company expects to fully physically settle the applicable forward sale agreement on one or more dates prior to the scheduled maturity date of December 14, 2024, at which point we would receive the proceeds net of certain costs; provided, however, the Company may elect to cash settle or net share settle such forward sale agreement at any time through the scheduled maturity date.
On June 16, 2023, the Company sold 992,295 shares on a forward basis under the ATM common stock offering program at a weighted average sale price of $36.5319 per share (an aggregate of approximately $36.3 million gross sale price), or $36.1820 per share net of commissions. The Company did not initially receive any proceeds from the sale of such shares on a forward basis. On July 27, 2023, the Company physically settled in full the forward sales agreements by issuing 992,295 shares of common stock for net proceeds of approximately $35.9 million, or $36.2046 per share.
On May 5, 2023, the Company sold 725,698 shares on a forward basis under the ATM common stock offering program at a sale price of $35.0458 per share (an aggregate of approximately $25.4 million gross sale price), or $34.6953 per share net of commissions. The Company did not initially receive any proceeds from the sale of such shares on a forward basis. On July 27, 2023, the Company physically settled in full the forward sales agreements by issuing 725,698 shares of common stock for net proceeds of approximately $25.2 million, or $34.7714 per share.
On November 3, 2021, the Company completed an underwritten public offering of an aggregate of 8,000,000 shares of common stock at a price to the underwriters of $41.99 per share, consisting of (i) 5,250,000 shares offered directly by the Company and (ii) 2,750,000 shares offered by the forward dealer in connection with certain forward sales agreements. The offering closed on November 8, 2021 and the Company received net proceeds from the sale of shares offered directly by the Company of approximately $220.4 million. On December 1, 2021, the underwriters exercised their option to purchase an additional 1,200,000 offered by the forward dealer in connection with certain forward sales agreements for an offering price of $41.87 per share and the underwriters’ option closed on December 3, 2021. On December 27, 2021, the Company partially physically settled the forward sales agreement by issuing 2,750,000 shares of common stock and received net proceeds of approximately $115.0 million. On March 29, 2022, the Company physically settled in full the forward sales agreement by issuing 1,200,000 shares of common stock for net proceeds of approximately $49.7 million, or $41.39 per share.
On April 5, 2021, the Company sold 1,446,760 shares on a forward basis under the ATM common stock offering program at a price of $34.56 per share, or $50.0 million, and $34.2144 per share net of sales agent fees. The Company does not initially receive any proceeds from the sale of shares on a forward basis. On September 29, 2021, the Company physically settled in full the forward sales agreements under the ATM common stock offering program by issuing 1,446,760 shares of common stock and received net proceeds of approximately $48.4 million, or $33.4585 per share.
On September 29, 2021, the Company physically settled in full the forward sales agreements completed on November 16, 2020 by issuing the remaining 4,681,923 shares of common stock and received net proceeds of approximately $133.8 million, or $28.5791 per share.
Restricted Stock-Based Compensation
Pursuant to the 2011 Plan, the Company grants restricted shares of common stock to certain employees of the Company. The restricted shares of common stock are subject to time-based vesting. Restricted shares of common stock granted in 2023, 2022, and 2021, subject to the recipient’s continued employment, will vest over four years in equal installments on January 1 of each year beginning in 2024, 2023, and 2022, respectively. Holders of restricted shares of common stock have voting rights and rights to receive dividends. Restricted shares of common stock may not be sold, assigned, transferred, pledged or otherwise disposed of and are subject to a risk of forfeiture prior to the expiration of the applicable vesting period.
The following table summarizes activity related to the Company’s unvested restricted shares of common stock during the years ended December 31, 2023, 2022 and 2021.
|
|
|
|
|
|
|
|
|
|
|
|
|
|
|
| Unvested Restricted Shares of Common Stock |
|
Shares |
|
Weighted Average Grant Date Fair Value per Share |
| Balance at December 31, 2020 |
|
184,890 |
|
|
$ |
27.70 |
|
| Granted |
|
90,304 |
|
|
$ |
29.77 |
|
Vested(1) |
|
(79,140) |
|
|
$ |
27.01 |
|
| Forfeited |
|
(10,339) |
|
|
$ |
30.32 |
|
| Balance at December 31, 2021 |
|
185,715 |
|
|
$ |
28.86 |
|
| Granted |
|
58,580 |
|
|
$ |
44.19 |
|
Vested(1) |
|
(73,556) |
|
|
$ |
28.03 |
|
| Forfeited |
|
(14,036) |
|
|
$ |
36.16 |
|
| Balance at December 31, 2022 |
|
156,703 |
|
|
$ |
34.32 |
|
| Granted |
|
55,954 |
|
|
$ |
34.73 |
|
Vested(1) |
|
(68,625) |
|
|
$ |
31.71 |
|
| Forfeited |
|
— |
|
|
$ |
— |
|
| Balance at December 31, 2023 |
|
144,032 |
|
|
$ |
35.73 |
|
(1)The Company repurchased and retired 24,210, 25,836, and 27,706 restricted shares of common stock that vested during the years ended December 31, 2023, 2022, and 2021, respectively.
The unrecognized compensation expense associated with the Company’s restricted shares of common stock at December 31, 2023 was approximately $2.9 million and is expected to be recognized over a weighted average period of approximately 2.3 years.
The following table summarizes the fair value at vesting for the restricted shares of common stock that vested during the years ended December 31, 2023, 2022 and 2021.
|
|
|
|
|
|
|
|
|
|
|
|
|
|
|
|
|
|
|
|
|
| |
|
Year ended December 31, |
| Vested Restricted Shares of Common Stock |
|
2023 |
|
2022 |
|
2021 |
| Vested restricted shares of common stock |
|
68,625 |
|
|
73,556 |
|
|
79,140 |
|
| Fair value of vested restricted shares of common stock (in thousands) |
|
$ |
2,217 |
|
|
$ |
3,528 |
|
|
$ |
2,581 |
|
7. Noncontrolling Interest
The following table summarizes the activity for noncontrolling interest in the Company during the years ended December 31, 2023, 2022 and 2021.
|
|
|
|
|
|
|
|
|
|
|
|
|
|
|
|
|
|
|
|
|
|
|
|
|
|
|
| Noncontrolling Interest |
|
LTIP Units |
|
Other
Common Units |
|
Total
Noncontrolling Common Units |
|
Noncontrolling Interest Percentage |
| Balance at December 31, 2020 |
|
1,692,423 |
|
|
1,592,815 |
|
|
3,285,238 |
|
|
2.0 |
% |
| Granted/Issued |
|
405,844 |
|
|
— |
|
|
405,844 |
|
|
N/A |
| Forfeited |
|
— |
|
|
— |
|
|
— |
|
|
N/A |
| Conversions from LTIP units to Other Common Units |
|
(149,143) |
|
|
149,143 |
|
|
— |
|
|
N/A |
| Redemptions from Other Common Units to common stock |
|
— |
|
|
(171,318) |
|
|
(171,318) |
|
|
N/A |
|
|
|
|
|
|
|
|
|
| Balance at December 31, 2021 |
|
1,949,124 |
|
|
1,570,640 |
|
|
3,519,764 |
|
|
1.9 |
% |
| Granted/Issued |
|
470,237 |
|
|
— |
|
|
470,237 |
|
|
N/A |
| Forfeited |
|
(6,791) |
|
|
— |
|
|
(6,791) |
|
|
N/A |
| Conversions from LTIP units to Other Common Units |
|
(98,494) |
|
|
98,494 |
|
|
— |
|
|
N/A |
| Redemptions from Other Common Units to common stock |
|
— |
|
|
(98,494) |
|
|
(98,494) |
|
|
N/A |
|
|
|
|
|
|
|
|
|
| Balance at December 31, 2022 |
|
2,314,076 |
|
|
1,570,640 |
|
|
3,884,716 |
|
|
2.1 |
% |
| Granted/Issued |
|
326,215 |
|
|
— |
|
|
326,215 |
|
|
N/A |
| Forfeited |
|
(9,119) |
|
|
— |
|
|
(9,119) |
|
|
N/A |
| Conversions from LTIP units to Other Common Units |
|
(269,252) |
|
|
269,252 |
|
|
— |
|
|
N/A |
| Redemptions from Other Common Units to common stock |
|
— |
|
|
(372,174) |
|
|
(372,174) |
|
|
N/A |
|
|
|
|
|
|
|
|
|
| Balance at December 31, 2023 |
|
2,361,920 |
|
|
1,467,718 |
|
|
3,829,638 |
|
|
2.1 |
% |
The Company adjusts the carrying value of noncontrolling interest to reflect its share of the book value of the Operating Partnership when there has been a change in the Company’s ownership of the Operating Partnership. Such adjustments are recorded to additional paid-in capital as a rebalancing of noncontrolling interest on the accompanying Consolidated Statements of Equity.
LTIP Units
LTIP units are granted to certain executive officers and senior employees of the Company as part of their compensation, and to independent directors for their service. LTIP units are valued by reference to the value of the Company’s common stock and are subject to such conditions and restrictions as the compensation committee of the board of directors may determine, including continued employment or service. Vested LTIP units can be converted to Other Common Units on a one-for-one basis once an equity transaction has occurred that results in the accretion of the member’s capital account to the economic equivalent of an Other Common Unit. All LTIP units, whether vested or not, will receive the same monthly per unit distributions as Other Common Units, which equal per share dividends on common stock.
LTIP units granted in January 2023, 2022, and 2021 to certain senior executive officers and senior employees, subject to the recipient’s continued employment, will vest quarterly over four years, with the first vesting date having been March 31, 2023, 2022, and 2021, respectively. LTIP units granted in January 2023, 2022, and 2021 to independent directors, subject to the recipient’s continued service, will vest on January 1, 2024, 2023, and 2022, respectively.
Refer to Note 8 for a discussion of the LTIP units granted in January 2024, 2023, and 2022, pursuant to the 2021, 2020, and 2019 performance units, respectively.
On March 13, 2023, the Company executed an employment agreement with Steven T. Kimball to serve as the Company's Executive Vice President of Real Estate Operations, effective March 31, 2023. On March 31, 2023, pursuant to the 2011 Plan, the Company awarded Mr. Kimball an initial LTIP unit grant equal in value to approximately $0.6 million, which equated to 19,345 LTIP units, which will vest in equal installments on a quarterly basis over four years, with the first vesting date having been March 31, 2023, subject to Mr. Kimball’s continued employment.
On August 17, 2021, the Company and David G. King, the Company’s Executive Vice President and Director of Real Estate Operations, agreed that Mr. King’s employment with the Company would terminate effective September 17, 2021. Pursuant to the terms and conditions of the executive employment agreement and the several LTIP unit agreements and performance award agreements between the Company and Mr. King, Mr. King received a severance package from the Company, including a lump sum cash payment, the continuation of certain insurance benefits, immediate vesting of outstanding LTIP units and eligibility to receive a pro-rated award payment for outstanding performance units. Accordingly, the Company accelerated the expense recognition of Mr. King's unvested LTIP units in the amount of approximately $0.5 million, which is included in general and administrative expenses for the year ended December 31, 2021 on the accompanying Consolidated Statements of Operations. Additionally, the unrecognized compensation expense associated with Mr. King’s performance units will not be recognized. The Company also incurred approximately $1.6 million related to the lump sum cash payment and continuation of certain insurance benefits, which is included in general and administrative expenses during the year ended December 31, 2021 on the accompanying Consolidated Statements of Operations. On October 15, 2021, Mr. King received 57,100 shares of common stock for his pro-rated award payment for outstanding performance units.
The fair value of the LTIP units at the date of grant was determined by a lattice-binomial option-pricing model based on a Monte Carlo simulation. The fair value of the LTIP units is based on Level 3 inputs and is a non-recurring fair value measurement. The following table summarizes the assumptions used in valuing such LTIP units granted during the years ended December 31, 2023, 2022 and 2021 (excluding those LTIP units granted pursuant to the settlements of performance units; refer to Note 8 for details).
|
|
|
|
|
|
|
|
|
|
|
|
|
|
|
|
|
|
|
|
|
|
|
|
|
|
|
| LTIP Units |
|
Assumptions |
| Grant date |
|
March 31, 2023 |
|
January 11, 2023 |
|
January 10, 2022 |
|
January 7, 2021 |
| Expected term (years) |
|
10 |
|
10 |
|
10 |
|
10 |
| Expected stock price volatility |
|
37.0 |
% |
|
37.0 |
% |
|
34.0 |
% |
|
34.0 |
% |
| Expected dividend yield |
|
4.0 |
% |
|
4.0 |
% |
|
4.0 |
% |
|
5.0 |
% |
| Risk-free interest rate |
|
3.810 |
% |
|
3.900 |
% |
|
1.204 |
% |
|
0.229 |
% |
| Fair value of LTIP units at issuance (in thousands) |
|
$ |
628 |
|
|
$ |
4,635 |
|
|
$ |
4,385 |
|
|
$ |
4,316 |
|
| LTIP units at issuance |
|
19,345 |
|
|
139,026 |
|
|
104,241 |
|
|
153,430 |
|
| Fair value unit price per LTIP unit at issuance |
|
$ |
32.47 |
|
|
$ |
33.34 |
|
|
$ |
42.07 |
|
|
$ |
28.13 |
|
The expected stock price volatility is based on a mix of the historical and implied volatilities of the Company and certain peer group companies. The expected dividend yield is based on the Company’s average historical dividend yield and the dividend yield as of the valuation date for each award.
The risk-free interest rate is based on U.S. Treasury note yields matching a three-year time period.
The following table summarizes activity related to the Company’s unvested LTIP units during the years ended December 31, 2023, 2022 and 2021.
|
|
|
|
|
|
|
|
|
|
|
|
|
|
|
| Unvested LTIP Units |
|
LTIP Units |
|
Weighted Average Grant Date Fair Value per Share |
| Balance at December 31, 2020 |
|
211,448 |
|
|
$ |
26.54 |
|
| Granted |
|
405,844 |
|
|
$ |
28.13 |
|
| Vested |
|
(427,184) |
|
|
$ |
27.47 |
|
| Forfeited |
|
— |
|
|
$ |
— |
|
| Balance at December 31, 2021 |
|
190,108 |
|
|
$ |
27.84 |
|
| Granted |
|
470,237 |
|
|
$ |
42.07 |
|
| Vested |
|
(513,438) |
|
|
$ |
38.67 |
|
| Forfeited |
|
(6,791) |
|
|
$ |
34.02 |
|
| Balance at December 31, 2022 |
|
140,116 |
|
|
$ |
35.60 |
|
| Granted |
|
326,215 |
|
|
$ |
33.29 |
|
| Vested |
|
(280,286) |
|
|
$ |
33.81 |
|
| Forfeited |
|
(9,119) |
|
|
$ |
34.11 |
|
| Balance at December 31, 2023 |
|
176,926 |
|
|
$ |
34.25 |
|
The unrecognized compensation expense associated with the Company’s LTIP units at December 31, 2023 was approximately $3.3 million and is expected to be recognized over a weighted average period of approximately 2.5 years.
The following table summarizes the fair value at vesting for the LTIP units that vested during years ended December 31, 2023, 2022 and 2021.
|
|
|
|
|
|
|
|
|
|
|
|
|
|
|
|
|
|
|
|
|
| |
|
Year ended December 31, |
| Vested LTIP units |
|
2023 |
|
2022 |
|
2021 |
| Vested LTIP units |
|
280,286 |
|
|
513,438 |
|
|
427,184 |
|
| Fair value of vested LTIP units (in thousands) |
|
$ |
9,507 |
|
|
$ |
21,662 |
|
|
$ |
16,390 |
|
Other Common Units
Other Common Units and shares of the Company’s common stock have essentially the same economic characteristics in that Other Common Units directly, and shares of the Company’s common stock indirectly, through the Company’s interest in the Operating Partnership, share equally in the total net income or loss distributions of the Operating Partnership. Subject to certain restrictions, investors who own Other Common Units have the right to cause the Operating Partnership to redeem any or all of their Other Common Units for cash equal to the then-current value of one share of the Company’s common stock, or, at the Company’s election, shares of common stock on a one-for-one basis. When redeeming the Other Common Unit for cash, the value of a share of common stock is calculated as the average common stock closing price on the NYSE for the 10 days immediately preceding the redemption notice date. Each Other Common Unit receives the same monthly distribution as a share of common stock.
8. Equity Incentive Plan
The 2011 Plan provides for the issuance of equity-based awards, including stock options, stock appreciation rights, restricted stock, restricted stock units, unrestricted stock awards and other awards based on shares of the Company’s common stock, such as LTIP units in the Operating Partnership, that may be made by the Company directly to the executive officers, directors, employees, and other individuals providing bona fide services to or for the Company.
Subject to certain adjustments identified within the 2011 Plan, the aggregate number of shares of the Company’s common stock that may be awarded under the 2011 Plan is 10,142,461 shares. Under the 2011 Plan, each LTIP unit awarded will be equivalent to an award of one share of common stock reserved under the 2011 Plan, thereby reducing the number of shares of common stock available for other equity awards on a one-for-one basis.
The 2011 Plan may be terminated, amended, modified or suspended at any time by the board of directors, subject to stockholder approval as required by law or stock exchange rules. The 2011 Plan expires on April 24, 2033.
Under the 2011 Plan, the Company grants performance units to certain key employees of the Company. The ultimate value of the performance units depends on the Company’s total stockholder return (“TSR”) over a three-year period (the “measuring period”). At the end of the measuring period, the performance units convert into shares of common stock, or, at the Company’s election and with the award recipient’s consent, LTIP units or other securities (“Award Shares”), at a rate depending on the Company’s TSR over the measuring period as compared to various benchmarks and on the absolute amount of the Company’s TSR. A recipient of performance units may receive as few as zero shares or as many as 250% of the number of target units, plus deemed dividends.
For the performance units granted in 2021 and 2022, at the end of the measuring period the performance units convert into common stock or LTIP units at a rate depending on the Company’s TSR over the measuring period as compared to three different benchmarks and on the absolute amount of the Company’s TSR. The target amount of the performance units is nominally allocated as: (i) 25% to the Company’s TSR compared to the TSR of an industry peer group; (ii) 25% to the Company’s TSR compared to the TSR of a size-based peer group; and (iii) 50% to the Company’s TSR compared to the TSR of the companies in the MSCI US REIT index.
For the performance units granted in 2023, at the end of the measuring period the performance units convert into common stock or LTIP units at a rate depending on the Company’s TSR over the measuring period as compared to two different benchmarks and on the absolute amount of the Company’s TSR. The target amount of the performance units is nominally allocated as follows: (i) 50% to the Company’s TSR compared to the TSR of an industry peer group; and (ii) 50% to the Company’s TSR compared to the TSR of the companies in the MSCI US REIT Index.
No dividends are paid to the recipient during the measuring period. At the end of the measuring period, if the Company’s TSR is such that the recipient earns Award Shares, the recipient will receive additional Award Shares relating to dividends deemed to have been paid and reinvested on the Award Shares. The Company, in the discretion of the compensation committee of the board of directors, may pay the cash value of the deemed dividends instead of issuing additional Award Shares. The Award Shares are immediately vested at the end of the measuring period.
In January 2023, 2022, and 2021, the Company granted performance units approved by the compensation committee of the board of directors, under the 2011 Plan to certain key employees of the Company. The measuring periods commenced on January 1, 2023, 2022, and 2021, respectively, and end on December 31, 2025, 2024, and 2023, respectively.
On March 31, 2023, in connection with the execution of the employment agreement discussed in Note 7, the Company granted Mr. Kimball performance units under the 2011 Plan with a target grant date fair value equal to approximately $0.6 million. The terms and measuring period of the performance units granted to Mr. Kimball are the same as the performance units granted in January 2023.
The fair value of the performance units as of the grant date was determined by a lattice-binomial option-pricing model based on a Monte Carlo simulation. The fair value of the performance units is based on Level 3 inputs and non-recurring fair value measurements. The performance unit equity compensation expense is recognized ratably from the grant date into earnings over the respective vesting periods. The following table summarizes the assumptions used in valuing the performance units granted during the years ended December 31, 2023, 2022 and 2021.
|
|
|
|
|
|
|
|
|
|
|
|
|
|
|
|
|
|
|
|
|
|
|
|
|
|
|
| Performance Units |
|
Assumptions |
| Grant date |
|
March 31, 2023 |
|
January 11, 2023 |
|
January 10, 2022 |
|
January 7, 2021 |
| Expected stock price volatility |
|
25.4 |
% |
|
37.4 |
% |
|
34.1 |
% |
|
34.4 |
% |
| Expected dividend yield |
|
4.0 |
% |
|
4.0 |
% |
|
4.0 |
% |
|
5.0 |
% |
| Risk-free interest rate |
|
3.8725 |
% |
|
3.9060 |
% |
|
1.1979 |
% |
|
0.2271 |
% |
| Fair value of performance units grant (in thousands) |
|
$ |
609 |
|
|
$ |
4,517 |
|
|
$ |
6,289 |
|
|
$ |
5,522 |
|
|
|
|
|
|
|
|
|
|
|
|
|
|
|
|
|
|
|
|
|
|
|
|
|
|
|
|
|
|
|
|
|
|
|
|
|
|
|
|
|
|
|
|
|
|
The expected stock price volatility is based on a mix of the historical and implied volatilities of the Company and certain peer group companies. The expected dividend yield is based on the Company’s average historical dividend yield and the dividend yield as of the valuation date for each award. The risk-free interest rate is based on U.S. Treasury note yields matching the three-year time period of the performance period.
During the years ended December 31, 2023, 2022, and 2021, it was determined that the Company’s total stockholder return exceeded the threshold percentage and return hurdle for each of the 2021, 2020, and 2019 performance units, respectively. The following table summarizes the compensation committee of the board of directors approved issuances of LTIP units and shares of common stock for the conclusion of the measuring periods for performance units for the years ended December 31, 2023, 2022, and 2021.
|
|
|
|
|
|
|
|
|
|
|
|
|
|
|
|
|
|
|
|
|
| Settlement of Performance Units in LTIP Units or Shares of Common Stock |
|
2021 Performance Units |
|
2020 Performance Units |
|
2019 Performance Units |
| Measuring period conclusion date |
|
December 31, 2023 |
|
December 31, 2022 |
|
December 31, 2021 |
| Issuance date |
|
January 8, 2024 |
|
January 11, 2023 |
|
January 10, 2022 |
| Vested LTIP units |
|
257,282 |
|
167,844 |
|
365,996 |
| Vested shares of common stock |
|
49,106 |
|
40,660 |
|
27,934 |
| Shares of common stock repurchased and retired |
|
4,716 |
|
875 |
|
8,257 |
The unrecognized compensation expense associated with the Company’s performance units at December 31, 2023 was approximately $5.1 million and is expected to be recognized over a weighted average period of approximately 1.7 years.
At December 31, 2023 and 2022, the number of shares available for issuance under the 2011 Plan were 4,226,328 and 1,269,097, respectively. The number of shares available for issuance under the 2011 Plan as of December 31, 2023 do not include an allocation for the 2023 and 2022 performance units as the awards were not determinable as of December 31, 2023. The number of shares available for issuance under the 2011 Plan as of December 31, 2022 do not include an allocation for the 2022 and 2021 performance units as the awards were not determinable as of December 31, 2022.
Non-cash Compensation Expense
The following table summarizes the amounts recorded in general and administrative expenses in the accompanying Consolidated Statements of Operations for the amortization of restricted shares of common stock, LTIP units, performance units, and the Company’s director compensation for the years ended December 31, 2023, 2022 and 2021.
|
|
|
|
|
|
|
|
|
|
|
|
|
|
|
|
|
|
|
|
|
|
|
|
| |
|
Year ended December 31, |
|
| Non-Cash Compensation Expense (in thousands) |
|
2023 |
|
2022 |
|
2021 |
|
| Restricted shares of common stock |
|
$ |
1,936 |
|
|
$ |
2,103 |
|
|
$ |
2,236 |
|
|
| LTIP units |
|
4,194 |
|
|
3,996 |
|
|
6,489 |
|
(1) |
| Performance units |
|
4,754 |
|
|
5,423 |
|
|
5,730 |
|
|
Director compensation(2) |
|
583 |
|
|
504 |
|
|
488 |
|
|
| Total non-cash compensation expense |
|
$ |
11,467 |
|
|
$ |
12,026 |
|
|
$ |
14,943 |
|
|
(1)Inclusive of approximately $0.5 million non-cash compensation expense during the year ended December 31, 2021 associated with the severance cost of an executive officer, as discussed in Note 7.
(2)All of the Company’s independent directors elected to receive shares of common stock in lieu of cash for their service during the years ended December 31, 2023, 2022 and 2021. The number of shares of common stock granted was calculated based on the trailing 10 days average common stock price on the third business day preceding the grant date.
9. Leases
Lessor Leases
The Company has operating leases in which it is the lessor for its rental property. Certain leases contain variable lease payments based upon changes in the Consumer Price Index (“CPI”). Billings for real estate taxes and other expenses are also considered to be variable lease payments. Certain leases contain options to renew or terminate the lease, and options for the lessee to purchase the rental property, all of which are predominately at the sole discretion of the lessee.
The following table summarizes the components of rental income included in the accompanying Consolidated Statements of Operations for the years ended December 31, 2023, 2022 and 2021.
|
|
|
|
|
|
|
|
|
|
|
|
|
|
|
|
|
|
|
|
|
| |
|
Year ended December 31, |
| Rental Income (in thousands) |
|
2023 |
|
2022 |
|
2021 |
| Fixed lease payments |
|
$ |
540,447 |
|
|
$ |
500,267 |
|
|
$ |
424,356 |
|
| Variable lease payments |
|
146,954 |
|
|
135,888 |
|
|
118,584 |
|
| Straight-line rental income |
|
16,894 |
|
|
17,893 |
|
|
18,565 |
|
| Net increase (decrease) to rental income related to above and below market lease amortization |
|
865 |
|
|
329 |
|
|
(2,073) |
|
| Total rental income |
|
$ |
705,160 |
|
|
$ |
654,377 |
|
|
$ |
559,432 |
|
As of December 31, 2023 and December 31, 2022, the Company had accrued rental income of approximately $105.9 million and $91.2 million, respectively, included in tenant accounts receivable on the accompanying Consolidated Balance Sheets.
As of December 31, 2023 and December 31, 2022, the Company’s total liability associated with tenant lease security deposits was approximately $21.8 million and $19.1 million, respectively, which is included in tenant prepaid rent and security deposits on the accompanying Consolidated Balance Sheets.
The following table summarizes the maturity of fixed lease payments under the Company’s leases as of December 31, 2023.
|
|
|
|
|
|
|
|
|
| Year |
|
Maturity of Fixed Lease Payments (in thousands) |
| 2024 |
|
$ |
561,111 |
|
| 2025 |
|
$ |
517,432 |
|
| 2026 |
|
$ |
438,581 |
|
| 2027 |
|
$ |
353,012 |
|
| 2028 |
|
$ |
288,264 |
|
| Thereafter |
|
$ |
709,107 |
|
Lessee Leases
The Company has operating leases in which it is the lessee for its ground leases and corporate office leases. These leases have remaining lease terms of approximately 2.3 years to 46.7 years. Certain ground leases contain options to extend the leases for ten years to 20 years, all of which are reasonably certain to be exercised, and are included in the computation of the Company’s right-of-use assets and operating lease liabilities.
The following table summarizes supplemental information related to operating lease right-of-use assets and operating lease liabilities recognized in the Company’s Consolidated Balance Sheets as of December 31, 2023 and December 31, 2022.
|
|
|
|
|
|
|
|
|
|
|
|
|
|
|
| Operating Lease Term and Discount Rate |
|
December 31, 2023 |
|
December 31, 2022 |
| Weighted average remaining lease term (years) |
|
31.6 |
|
31.2 |
| Weighted average discount rate |
|
6.8 |
% |
|
6.7 |
% |
The following table summarizes the operating lease cost included in the Company’s Consolidated Statements of Operations for the years ended December 31, 2023, 2022 and 2021.
|
|
|
|
|
|
|
|
|
|
|
|
|
|
|
|
|
|
|
|
|
| |
|
Year ended December 31, |
| Operating Lease Cost (in thousands) |
|
2023 |
|
2022 |
|
2021 |
| Operating lease cost included in property expense attributable to ground leases |
|
$ |
2,467 |
|
|
$ |
2,372 |
|
|
$ |
1,740 |
|
| Operating lease cost included in general and administrative expense attributable to corporate office leases |
|
1,732 |
|
|
1,747 |
|
|
1,735 |
|
| Total operating lease cost |
|
$ |
4,199 |
|
|
$ |
4,119 |
|
|
$ |
3,475 |
|
The following table summarizes supplemental cash flow information related to operating leases in the Company’s Consolidated Statements of Cash Flows for the years ended December 31, 2023, 2022 and 2021.
|
|
|
|
|
|
|
|
|
|
|
|
|
|
|
|
|
|
|
|
|
| |
|
Year ended December 31, |
| Operating Leases (in thousands) |
|
2023 |
|
2022 |
|
2021 |
| Cash paid for amounts included in the measurement of lease liabilities (operating cash flows) |
|
$ |
3,890 |
|
|
$ |
3,784 |
|
|
$ |
2,426 |
|
| Right-of-use assets obtained in exchange for new lease liabilities |
|
$ |
141 |
|
|
$ |
— |
|
|
$ |
146 |
|
The following table summarizes the maturity of operating lease liabilities under the Company’s ground leases and corporate office leases as of December 31, 2023.
|
|
|
|
|
|
|
|
|
| Year |
|
Maturity of Operating Lease Liabilities(1)
(in thousands)
|
| 2024 |
|
$ |
3,975 |
|
| 2025 |
|
4,022 |
|
| 2026 |
|
3,014 |
|
| 2027 |
|
2,023 |
|
| 2028 |
|
2,064 |
|
| Thereafter |
|
79,898 |
|
| Total lease payments |
|
94,996 |
|
| Less: Imputed interest |
|
(61,419) |
|
| Present value of operating lease liabilities |
|
$ |
33,577 |
|
(1)Operating lease liabilities do not include estimates of CPI rent changes required by certain ground lease agreements. Therefore, actual payments may differ from those presented.
10. Earnings Per Share
Under the two-class method of computing earnings per share, restricted shares of common stock are considered participating securities as these stock-based awards contain non-forfeitable rights to dividends, unless and until a forfeiture occurs, and these awards must be included in the computation of earnings per share pursuant to the two-class method. During the years ended December 31, 2023, 2022 and 2021, there were 142,875, 161,704 and 198,171, respectively, unvested shares of restricted stock on a weighted average basis that were considered participating securities. Participating securities are included in the computation of diluted earnings per share using the treasury stock method if the impact is more dilutive than the two-class method. Other potentially dilutive shares of common stock from the Company’s performance units and forward sales agreements are considered when calculating diluted earnings per share.
The following table reconciles the numerators and denominators in the computation of basic and diluted earnings per common share for the years ended December 31, 2023, 2022 and 2021.
|
|
|
|
|
|
|
|
|
|
|
|
|
|
|
|
|
|
|
|
|
|
|
Year ended December 31, |
| Earnings Per Share (in thousands, except per share data) |
|
2023 |
|
2022 |
|
2021 |
| Numerator |
|
|
|
|
|
|
| Net income attributable to common stockholders |
|
$ |
192,633 |
|
|
$ |
178,089 |
|
|
$ |
188,175 |
|
| Denominator |
|
|
|
|
|
|
| Weighted average common shares outstanding — basic |
|
180,221 |
|
|
178,753 |
|
|
163,442 |
|
Effect of dilutive securities(1) |
|
|
|
|
|
|
| Share-based compensation |
|
332 |
|
|
187 |
|
|
640 |
|
| Shares issuable under forward sales agreements |
|
2 |
|
|
— |
|
|
8 |
|
| Weighted average common shares outstanding — diluted |
|
180,555 |
|
|
178,940 |
|
|
164,090 |
|
| Net income per share — basic and diluted |
|
|
|
|
|
|
| Net income per share attributable to common stockholders — basic |
|
$ |
1.07 |
|
|
$ |
1.00 |
|
|
$ |
1.15 |
|
| Net income per share attributable to common stockholders — diluted |
|
$ |
1.07 |
|
|
$ |
1.00 |
|
|
$ |
1.15 |
|
(1)During the years ended December 31, 2023, 2022, and 2021, there were 143, 162, and 198, unvested restricted shares of common stock (on a weighted average basis), respectively, that were not included in the computation of diluted earnings per share because the allocation of income under the two-class method was more dilutive.
11. Commitments and Contingencies
The Company is subject to various legal proceedings and claims that arise in the ordinary course of business. These matters are generally covered by insurance subject to deductible requirements. Management believes that the ultimate settlement of these actions will not have a material adverse effect on the Company’s financial position, results of operations, or cash flows.
The Company has letters of credit of approximately $3.3 million as of December 31, 2023 related to construction projects and certain other agreements.
12. Employee Benefit Plans
Effective April 20, 2011, the Company adopted a 401(k) Defined Contribution Savings Plan (the “Plan”) for its employees. Under the Plan, as amended, employees, as defined, are eligible to participate in the Plan after they have completed three months of service.
The Company provides a discretionary match of 50% of the employee’s contributions annually up to 6.0% of the employee’s annual compensation, subject to a cap imposed by federal tax law. The Company’s aggregate matching contribution for the years ended December 31, 2023, 2022 and 2021 was approximately $0.5 million, $0.5 million and $0.5 million, respectively. The Company’s contribution is subject to vest over three years, such that employees who have been with the Company for three years are fully vested in past and future contributions.
13. Subsequent Events
The Company identified the following events subsequent to December 31, 2023 that are not recognized in the financial statements.
On January 8, 2024, the Company granted 40,557 restricted shares of common stock to certain employees of the Company pursuant to the 2011 Plan. The restricted shares of common stock granted will vest over four years in equal installments on January 1 of each year beginning January 1, 2025. The fair value of the restricted shares of common stock at the date of grant was $38.99 per share.
On January 8, 2024, the Company granted 29,187 LTIP units to non-employee, independent directors and 95,048 LTIP units to certain executive officers and senior employees pursuant to the 2011 Plan. The LTIP units granted to non-employee, independent directors will vest on January 1, 2025. The LTIP units granted to certain executive officers and senior employees will vest in equal quarterly installments over four years, with the first vesting date being March 31, 2024. The aggregate fair value of the LTIP units at the date of grant was approximately $4.6 million, as determined by a lattice-binomial option-pricing model based on a Monte Carlo simulation using an expected term of ten years, a weighted average volatility factor of 25.0%, a weighted average expected dividend yield of 4.0%, and a weighted average risk-free interest rate of 4.11%. The fair value of the LTIP units is based on Level 3 inputs and is a non-recurring fair value measurement.
On January 8, 2024, the Company granted performance units to certain executive officers and senior employees pursuant to the 2011 Plan. The terms of the January 8, 2024 performance units are substantially the same as the 2023 performance units discussed in Note 8, except that the measuring period commenced on January 1, 2024 and ends on December 31, 2026. The aggregate fair value of the performance units at the date of grant was approximately $6.5 million, as determined by a lattice-binomial option-pricing model based on a Monte Carlo simulation using a weighted average volatility factor of 24.5%, a weighted average expected dividend yield of 4.0%, and a weighted average risk-free interest rate of 4.113%. The fair value of the performance units is based on Level 3 inputs and is a non-recurring fair value measurement.
STAG Industrial, Inc.
Schedule III—Real Estate and Accumulated Depreciation
December 31, 2023
(in thousands)
|
|
|
|
|
|
|
|
|
|
|
|
|
|
|
|
|
|
|
|
|
|
|
|
|
|
|
|
|
|
|
|
|
|
|
|
|
|
|
|
|
|
|
|
|
|
|
|
|
|
|
|
|
|
|
|
|
|
|
|
|
|
|
|
|
|
|
|
|
Initial Cost to STAG Industrial, Inc. |
|
|
|
Gross Amounts at Which Carried at December 31, 2023 |
|
|
|
|
| State & City |
|
Address |
|
Encumbrances(1) |
|
Building & Improvements(2) |
|
Land(3) |
|
Costs Capitalized Subsequent to Acquisition and Valuation Provision |
|
Building & Improvements |
|
Land |
|
Total |
|
Accumulated Depreciation(4) |
|
Year Acquired |
| Alabama |
|
|
|
|
|
|
|
|
|
|
|
|
|
|
|
|
|
|
|
|
| Birmingham |
|
103 Shades Creek Circle |
|
$ |
— |
|
|
$ |
6,772 |
|
|
$ |
1,307 |
|
|
$ |
353 |
|
|
$ |
7,125 |
|
|
$ |
1,307 |
|
|
$ |
8,432 |
|
|
$ |
(703) |
|
|
2020 |
| Birmingham |
|
2991 Shannon Oxmoor Road |
|
— |
|
|
5,828 |
|
|
1,341 |
|
|
39 |
|
|
5,867 |
|
|
1,341 |
|
|
7,208 |
|
|
(557) |
|
|
2020 |
| Birmingham |
|
101 39th Street North |
|
— |
|
|
6,239 |
|
|
590 |
|
|
— |
|
|
6,239 |
|
|
590 |
|
|
6,829 |
|
|
(322) |
|
|
2022 |
| Birmingham |
|
101 Shades Creek Circle |
|
— |
|
|
3,951 |
|
|
836 |
|
|
167 |
|
|
4,118 |
|
|
836 |
|
|
4,954 |
|
|
(422) |
|
|
2020 |
| Montgomery |
|
4300 Alatex Road |
|
— |
|
|
7,523 |
|
|
418 |
|
|
1,789 |
|
|
9,312 |
|
|
418 |
|
|
9,730 |
|
|
(2,660) |
|
|
2016 |
| Moody |
|
2415 Highway 78 East |
|
— |
|
|
31,467 |
|
|
2,293 |
|
|
262 |
|
|
31,729 |
|
|
2,293 |
|
|
34,022 |
|
|
(2,637) |
|
|
2021 |
| Phenix City |
|
16 Downing Drive |
|
— |
|
|
1,415 |
|
|
276 |
|
|
280 |
|
|
1,695 |
|
|
276 |
|
|
1,971 |
|
|
(578) |
|
|
2012 |
| Arizona |
|
|
|
|
|
|
|
|
|
|
|
|
|
|
|
|
|
|
|
|
| Avondale |
|
925 N. 127th Avenue |
|
— |
|
|
13,163 |
|
|
1,674 |
|
|
28 |
|
|
13,191 |
|
|
1,674 |
|
|
14,865 |
|
|
(2,710) |
|
|
2017 |
| Chandler |
|
464 E. Chilton Drive |
|
— |
|
|
9,728 |
|
|
2,847 |
|
|
671 |
|
|
10,399 |
|
|
2,847 |
|
|
13,246 |
|
|
(1,022) |
|
|
2020 |
| Gilbert |
|
335 South Hamilton Court |
|
— |
|
|
5,784 |
|
|
2,107 |
|
|
271 |
|
|
6,055 |
|
|
2,107 |
|
|
8,162 |
|
|
(505) |
|
|
2021 |
| Mesa |
|
7447 E. Ray Road |
|
— |
|
|
7,930 |
|
|
1,277 |
|
|
311 |
|
|
8,241 |
|
|
1,277 |
|
|
9,518 |
|
|
(842) |
|
|
2020 |
| Tucson |
|
6161 South Palo Verde Road |
|
— |
|
|
7,656 |
|
|
996 |
|
|
157 |
|
|
7,813 |
|
|
996 |
|
|
8,809 |
|
|
(1,283) |
|
|
2018 |
| Arkansas |
|
|
|
|
|
|
|
|
|
|
|
|
|
|
|
|
|
|
|
|
| Bryant |
|
3700 Bryant Crossing Drive |
|
— |
|
|
17,386 |
|
|
1,143 |
|
|
— |
|
|
17,386 |
|
|
1,143 |
|
|
18,529 |
|
|
(1,530) |
|
|
2021 |
| Rogers |
|
1101 Easy Street |
|
— |
|
|
7,878 |
|
|
1,072 |
|
|
1,625 |
|
|
9,503 |
|
|
1,072 |
|
|
10,575 |
|
|
(2,953) |
|
|
2011 |
| California |
|
|
|
|
|
|
|
|
|
|
|
|
|
|
|
|
|
|
|
|
| Fresno |
|
2624 E. Edgar Avenue |
|
— |
|
|
23,590 |
|
|
3,049 |
|
|
— |
|
|
23,590 |
|
|
3,049 |
|
|
26,639 |
|
|
(1,176) |
|
|
2022 |
| Hollister |
|
2401 Bert Drive |
|
— |
|
|
26,049 |
|
|
2,913 |
|
|
600 |
|
|
26,649 |
|
|
2,913 |
|
|
29,562 |
|
|
(1,175) |
|
|
2022 |
| Lodi |
|
1170 South Guild Avenue |
|
— |
|
|
34,550 |
|
|
4,975 |
|
|
— |
|
|
34,550 |
|
|
4,975 |
|
|
39,525 |
|
|
(3,324) |
|
|
2020 |
| Menifee |
|
33360 Zeiders Road |
|
— |
|
|
16,013 |
|
|
2,248 |
|
|
8 |
|
|
16,021 |
|
|
2,248 |
|
|
18,269 |
|
|
(159) |
|
|
2023 |
| Menifee |
|
33380 Zeiders Road |
|
— |
|
|
13,505 |
|
|
2,227 |
|
|
15 |
|
|
13,520 |
|
|
2,227 |
|
|
15,747 |
|
|
(134) |
|
|
2023 |
| McClellan |
|
4841 Urbani Avenue |
|
— |
|
|
14,582 |
|
|
1,048 |
|
|
— |
|
|
14,582 |
|
|
1,048 |
|
|
15,630 |
|
|
(1,773) |
|
|
2020 |
| Morgan Hill |
|
18695 Madrone Parkway |
|
— |
|
|
7,608 |
|
|
2,562 |
|
|
— |
|
|
7,608 |
|
|
2,562 |
|
|
10,170 |
|
|
(504) |
|
|
2021 |
| Morgan Hill |
|
18255 Sutter Boulevard |
|
— |
|
|
19,849 |
|
|
3,943 |
|
|
— |
|
|
19,849 |
|
|
3,943 |
|
|
23,792 |
|
|
(1,421) |
|
|
2021 |
| Rancho Cordova |
|
2587 Mercantile Drive |
|
— |
|
|
4,346 |
|
|
678 |
|
|
33 |
|
|
4,379 |
|
|
678 |
|
|
5,057 |
|
|
(400) |
|
|
2020 |
| Rancho Cordova |
|
2431 Mercantile Drive |
|
— |
|
|
4,747 |
|
|
498 |
|
|
409 |
|
|
5,156 |
|
|
498 |
|
|
5,654 |
|
|
(592) |
|
|
2020 |
| Roseville |
|
8825 Washington Boulevard |
|
— |
|
|
11,398 |
|
|
2,140 |
|
|
— |
|
|
11,398 |
|
|
2,140 |
|
|
13,538 |
|
|
(940) |
|
|
2021 |
| Sacramento |
|
1635 Main Avenue |
|
— |
|
|
8,609 |
|
|
845 |
|
|
165 |
|
|
8,774 |
|
|
845 |
|
|
9,619 |
|
|
(856) |
|
|
2020 |
| Sacramento |
|
5440 Stationers Way |
|
— |
|
|
21,258 |
|
|
2,203 |
|
|
225 |
|
|
21,483 |
|
|
2,203 |
|
|
23,686 |
|
|
(2,080) |
|
|
2021 |
| Sacramento |
|
5601 Warehouse Way |
|
— |
|
|
8,137 |
|
|
1,347 |
|
|
821 |
|
|
8,958 |
|
|
1,347 |
|
|
10,305 |
|
|
(630) |
|
|
2021 |
| Sacramento |
|
8500 Carbide Court |
|
— |
|
|
5,226 |
|
|
1,614 |
|
|
— |
|
|
5,226 |
|
|
1,614 |
|
|
6,840 |
|
|
(359) |
|
|
2021 |
| Sacramento |
|
8440 Florin Road |
|
— |
|
|
12,184 |
|
|
3,921 |
|
|
— |
|
|
12,184 |
|
|
3,921 |
|
|
16,105 |
|
|
(994) |
|
|
2021 |
| Sacramento |
|
900 National Drive |
|
— |
|
|
7,560 |
|
|
1,479 |
|
|
— |
|
|
7,560 |
|
|
1,479 |
|
|
9,039 |
|
|
(524) |
|
|
2021 |
| Sacramento |
|
5961 Outfall Circle |
|
— |
|
|
11,026 |
|
|
1,914 |
|
|
— |
|
|
11,026 |
|
|
1,914 |
|
|
12,940 |
|
|
(164) |
|
|
2023 |
|
|
|
|
|
|
|
|
|
|
|
|
|
|
|
|
|
|
|
|
|
|
|
|
|
|
|
|
|
|
|
|
|
|
|
|
|
|
|
|
|
|
|
|
|
|
|
|
|
|
|
|
|
|
|
|
|
|
|
|
|
|
|
|
|
|
|
|
|
Initial Cost to STAG Industrial, Inc. |
|
|
|
Gross Amounts at Which Carried at December 31, 2023 |
|
|
|
|
| State & City |
|
Address |
|
Encumbrances(1) |
|
Building & Improvements(2) |
|
Land(3) |
|
Costs Capitalized Subsequent to Acquisition and Valuation Provision |
|
Building & Improvements |
|
Land |
|
Total |
|
Accumulated Depreciation(4) |
|
Year Acquired |
| Sacramento |
|
7728 Wilbur Way |
|
— |
|
|
9,171 |
|
|
857 |
|
|
— |
|
|
9,171 |
|
|
857 |
|
|
10,028 |
|
|
(1,281) |
|
|
2019 |
| San Diego |
|
2055 Dublin Drive |
|
— |
|
|
14,895 |
|
|
2,290 |
|
|
445 |
|
|
15,340 |
|
|
2,290 |
|
|
17,630 |
|
|
(3,022) |
|
|
2017 |
| Stockton |
|
4091 Gold River Lane |
|
— |
|
|
4,124 |
|
|
663 |
|
|
475 |
|
|
4,599 |
|
|
663 |
|
|
5,262 |
|
|
(405) |
|
|
2020 |
| Stockton |
|
3841 Metro Drive |
|
— |
|
|
12,552 |
|
|
1,806 |
|
|
524 |
|
|
13,076 |
|
|
1,806 |
|
|
14,882 |
|
|
(1,113) |
|
|
2021 |
| Stockton |
|
3843 Gold River Lane |
|
— |
|
|
4,129 |
|
|
660 |
|
|
— |
|
|
4,129 |
|
|
660 |
|
|
4,789 |
|
|
(403) |
|
|
2020 |
| West Sacramento |
|
3525 Carlin Drive |
|
— |
|
|
34,119 |
|
|
4,350 |
|
|
— |
|
|
34,119 |
|
|
4,350 |
|
|
38,469 |
|
|
(851) |
|
|
2021 |
| Colorado |
|
|
|
|
|
|
|
|
|
|
|
|
|
|
|
|
|
|
|
|
| Grand Junction |
|
2139 Bond Street |
|
— |
|
|
3,896 |
|
|
314 |
|
|
336 |
|
|
4,232 |
|
|
314 |
|
|
4,546 |
|
|
(919) |
|
|
2015 |
| Johnstown |
|
4150 Ronald Reagan Boulevard |
|
— |
|
|
14,964 |
|
|
1,133 |
|
|
27 |
|
|
14,991 |
|
|
1,133 |
|
|
16,124 |
|
|
(1,779) |
|
|
2019 |
| Longmont |
|
4300 Godding Hollow Parkway |
|
— |
|
|
5,322 |
|
|
734 |
|
|
978 |
|
|
6,300 |
|
|
734 |
|
|
7,034 |
|
|
(1,051) |
|
|
2018 |
| Loveland |
|
4550 Byrd Drive |
|
— |
|
|
16,591 |
|
|
3,452 |
|
|
136 |
|
|
16,727 |
|
|
3,452 |
|
|
20,179 |
|
|
(1,096) |
|
|
2021 |
| Loveland |
|
4510 Byrd Drive |
|
— |
|
|
14,134 |
|
|
3,047 |
|
|
3,191 |
|
|
17,325 |
|
|
3,047 |
|
|
20,372 |
|
|
(1,348) |
|
|
2021 |
| Connecticut |
|
|
|
|
|
|
|
|
|
|
|
|
|
|
|
|
|
|
|
|
| East Windsor |
|
4 Craftsman Road |
|
— |
|
|
5,711 |
|
|
400 |
|
|
191 |
|
|
5,902 |
|
|
400 |
|
|
6,302 |
|
|
(1,453) |
|
|
2016 |
| East Windsor |
|
24 Thompson Road |
|
— |
|
|
4,571 |
|
|
348 |
|
|
1,182 |
|
|
5,753 |
|
|
348 |
|
|
6,101 |
|
|
(2,009) |
|
|
2012 |
| Milford |
|
200 Research Drive |
|
— |
|
|
13,853 |
|
|
1,650 |
|
|
1,706 |
|
|
15,559 |
|
|
1,650 |
|
|
17,209 |
|
|
(1,007) |
|
|
2021 |
| Milford |
|
40 Pepes Farm Road |
|
— |
|
|
10,040 |
|
|
1,264 |
|
|
1,179 |
|
|
11,219 |
|
|
1,264 |
|
|
12,483 |
|
|
(2,616) |
|
|
2017 |
| North Haven |
|
300 Montowese Avenue Extension |
|
— |
|
|
39,253 |
|
|
4,086 |
|
|
4,658 |
|
|
43,911 |
|
|
4,086 |
|
|
47,997 |
|
|
(11,743) |
|
|
2015 |
| Wallingford |
|
5 Sterling Drive |
|
— |
|
|
6,071 |
|
|
585 |
|
|
347 |
|
|
6,418 |
|
|
585 |
|
|
7,003 |
|
|
(1,298) |
|
|
2017 |
| Delaware |
|
|
|
|
|
|
|
|
|
|
|
|
|
|
|
|
|
|
|
|
| New Castle |
|
400 Lukens Drive |
|
— |
|
|
17,767 |
|
|
2,616 |
|
|
198 |
|
|
17,965 |
|
|
2,616 |
|
|
20,581 |
|
|
(5,169) |
|
|
2016 |
| Florida |
|
|
|
|
|
|
|
|
|
|
|
|
|
|
|
|
|
|
|
|
| Daytona Beach |
|
530 Fentress Boulevard |
|
— |
|
|
875 |
|
|
1,237 |
|
|
2,388 |
|
|
3,263 |
|
|
1,237 |
|
|
4,500 |
|
|
(1,671) |
|
|
2007 |
| Fort Myers |
|
16341 Domestic Avenue |
|
— |
|
|
22,005 |
|
|
2,729 |
|
|
— |
|
|
22,005 |
|
|
2,729 |
|
|
24,734 |
|
|
(1,971) |
|
|
2020 |
| Gibsonton |
|
6400-6280 Powell Road Powell 200 |
|
— |
|
|
— |
|
|
4,143 |
|
|
— |
|
|
— |
|
|
4,143 |
|
|
4,143 |
|
|
— |
|
|
2023 |
| Gibsonton |
|
1283 US Highway 41S Powell 100 |
|
— |
|
|
6,831 |
|
|
5,429 |
|
|
— |
|
|
6,831 |
|
|
5,429 |
|
|
12,260 |
|
|
— |
|
|
2023 |
| Jacksonville |
|
775 Whittaker Road |
|
— |
|
|
3,391 |
|
|
451 |
|
|
415 |
|
|
3,806 |
|
|
451 |
|
|
4,257 |
|
|
(934) |
|
|
2017 |
| Jacksonville |
|
9601 North Main Street |
|
— |
|
|
7,803 |
|
|
650 |
|
|
640 |
|
|
8,443 |
|
|
650 |
|
|
9,093 |
|
|
(1,947) |
|
|
2017 |
| Jacksonville |
|
550 Gun Club Road |
|
— |
|
|
7,837 |
|
|
674 |
|
|
1,557 |
|
|
9,394 |
|
|
674 |
|
|
10,068 |
|
|
(2,216) |
|
|
2017 |
| Jacksonville |
|
555 Zoo Parkway |
|
— |
|
|
7,025 |
|
|
596 |
|
|
1,170 |
|
|
8,195 |
|
|
596 |
|
|
8,791 |
|
|
(1,856) |
|
|
2017 |
| Jacksonville |
|
9779 Pritchard Road |
|
— |
|
|
14,319 |
|
|
1,284 |
|
|
1,414 |
|
|
15,733 |
|
|
1,284 |
|
|
17,017 |
|
|
(2,271) |
|
|
2019 |
| Lake Worth |
|
2230 4th Avenue North |
|
— |
|
|
2,530 |
|
|
1,533 |
|
|
— |
|
|
2,530 |
|
|
1,533 |
|
|
4,063 |
|
|
(270) |
|
|
2020 |
| Lake Worth |
|
3600 23rd Avenue South |
|
— |
|
|
4,729 |
|
|
1,502 |
|
|
— |
|
|
4,729 |
|
|
1,502 |
|
|
6,231 |
|
|
(460) |
|
|
2020 |
| Lake Worth |
|
2269 4th Avenue North |
|
— |
|
|
4,751 |
|
|
2,254 |
|
|
— |
|
|
4,751 |
|
|
2,254 |
|
|
7,005 |
|
|
(499) |
|
|
2020 |
| Lakeland |
|
4675 Drane Field Road |
|
— |
|
|
13,060 |
|
|
1,099 |
|
|
— |
|
|
13,060 |
|
|
1,099 |
|
|
14,159 |
|
|
(1,307) |
|
|
2020 |
| Orlando |
|
1854 Central Florida Parkway |
|
— |
|
|
4,814 |
|
|
1,339 |
|
|
1,692 |
|
|
6,506 |
|
|
1,339 |
|
|
7,845 |
|
|
(1,623) |
|
|
2013 |
| Orlando |
|
7050 Overland Road |
|
— |
|
|
1,996 |
|
|
721 |
|
|
116 |
|
|
2,112 |
|
|
721 |
|
|
2,833 |
|
|
(742) |
|
|
2012 |
| Tampa |
|
4330 Williams Road |
|
— |
|
|
6,390 |
|
|
829 |
|
|
71 |
|
|
6,461 |
|
|
829 |
|
|
7,290 |
|
|
(1,021) |
|
|
2019 |
| West Palm Beach |
|
4268 Westroads Drive |
|
— |
|
|
6,835 |
|
|
2,906 |
|
|
600 |
|
|
7,435 |
|
|
2,906 |
|
|
10,341 |
|
|
(736) |
|
|
2020 |
| Georgia |
|
|
|
|
|
|
|
|
|
|
|
|
|
|
|
|
|
|
|
|
| Atlanta |
|
4200 SW Shirley Drive |
|
— |
|
|
8,382 |
|
|
1,679 |
|
|
3,795 |
|
|
12,177 |
|
|
1,679 |
|
|
13,856 |
|
|
(431) |
|
|
2022 |
| Augusta |
|
1816 Tobacco Road |
|
— |
|
|
6,249 |
|
|
937 |
|
|
— |
|
|
6,249 |
|
|
937 |
|
|
7,186 |
|
|
(1,288) |
|
|
2018 |
|
|
|
|
|
|
|
|
|
|
|
|
|
|
|
|
|
|
|
|
|
|
|
|
|
|
|
|
|
|
|
|
|
|
|
|
|
|
|
|
|
|
|
|
|
|
|
|
|
|
|
|
|
|
|
|
|
|
|
|
|
|
|
|
|
|
|
|
|
Initial Cost to STAG Industrial, Inc. |
|
|
|
Gross Amounts at Which Carried at December 31, 2023 |
|
|
|
|
| State & City |
|
Address |
|
Encumbrances(1) |
|
Building & Improvements(2) |
|
Land(3) |
|
Costs Capitalized Subsequent to Acquisition and Valuation Provision |
|
Building & Improvements |
|
Land |
|
Total |
|
Accumulated Depreciation(4) |
|
Year Acquired |
| Buford |
|
4823 Roy Carlson Boulevard |
|
— |
|
|
9,195 |
|
|
1,061 |
|
|
938 |
|
|
10,133 |
|
|
1,061 |
|
|
11,194 |
|
|
(614) |
|
|
2021 |
| Calhoun |
|
103 Enterprise Drive |
|
— |
|
|
2,743 |
|
|
388 |
|
|
118 |
|
|
2,861 |
|
|
388 |
|
|
3,249 |
|
|
(754) |
|
|
2014 |
| Dallas |
|
351 Thomas D. Murphy Drive |
|
— |
|
|
1,712 |
|
|
475 |
|
|
— |
|
|
1,712 |
|
|
475 |
|
|
2,187 |
|
|
(650) |
|
|
2012 |
| Forest Park |
|
5345 Old Dixie Highway |
|
— |
|
|
8,189 |
|
|
1,715 |
|
|
1,562 |
|
|
9,751 |
|
|
1,715 |
|
|
11,466 |
|
|
(2,493) |
|
|
2016 |
| Lithonia |
|
1995 Lithonia Industrial Boulevard |
|
— |
|
|
18,052 |
|
|
943 |
|
|
301 |
|
|
18,353 |
|
|
943 |
|
|
19,296 |
|
|
(955) |
|
|
2022 |
| Norcross |
|
4075 Blue Ridge Industrial Parkway |
|
— |
|
|
2,415 |
|
|
1,589 |
|
|
2,390 |
|
|
4,805 |
|
|
1,589 |
|
|
6,394 |
|
|
(928) |
|
|
2016 |
| Savannah |
|
1086 Oracal Parkway |
|
— |
|
|
13,034 |
|
|
439 |
|
|
119 |
|
|
13,153 |
|
|
439 |
|
|
13,592 |
|
|
(3,502) |
|
|
2014 |
| Shannon |
|
212 Burlington Drive |
|
— |
|
|
12,922 |
|
|
393 |
|
|
1,332 |
|
|
14,254 |
|
|
393 |
|
|
14,647 |
|
|
(3,612) |
|
|
2013 |
| Smyrna |
|
3500 Highlands Parkway |
|
— |
|
|
3,092 |
|
|
264 |
|
|
1,649 |
|
|
4,741 |
|
|
264 |
|
|
5,005 |
|
|
(1,238) |
|
|
2012 |
| Statham |
|
1965 Statham Drive |
|
— |
|
|
6,130 |
|
|
588 |
|
|
1,410 |
|
|
7,540 |
|
|
588 |
|
|
8,128 |
|
|
(2,415) |
|
|
2012 |
| Stone Mountain |
|
1635 Stone Ridge Drive |
|
— |
|
|
2,548 |
|
|
612 |
|
|
780 |
|
|
3,328 |
|
|
612 |
|
|
3,940 |
|
|
(768) |
|
|
2017 |
| Idaho |
|
|
|
|
|
|
|
|
|
|
|
|
|
|
|
|
|
|
|
|
| Idaho Falls |
|
3900 South American Way |
|
— |
|
|
2,712 |
|
|
356 |
|
|
140 |
|
|
2,852 |
|
|
356 |
|
|
3,208 |
|
|
(846) |
|
|
2013 |
| Illinois |
|
|
|
|
|
|
|
|
|
|
|
|
|
|
|
|
|
|
|
|
| Bartlett |
|
1590 W. Stearns Road |
|
— |
|
|
19,493 |
|
|
2,198 |
|
|
694 |
|
|
20,187 |
|
|
2,198 |
|
|
22,385 |
|
|
(1,533) |
|
|
2021 |
| Batavia |
|
1100 North Raddant Road |
|
— |
|
|
7,763 |
|
|
1,124 |
|
|
— |
|
|
7,763 |
|
|
1,124 |
|
|
8,887 |
|
|
(748) |
|
|
2020 |
| Batavia |
|
1862 Suncast Lane |
|
— |
|
|
4,427 |
|
|
598 |
|
|
274 |
|
|
4,701 |
|
|
598 |
|
|
5,299 |
|
|
(353) |
|
|
2021 |
| Batavia |
|
1100 Paramount Parkway |
|
— |
|
|
4,238 |
|
|
618 |
|
|
677 |
|
|
4,915 |
|
|
618 |
|
|
5,533 |
|
|
(949) |
|
|
2017 |
| Belvidere |
|
775 Logistics Drive |
|
— |
|
|
16,914 |
|
|
2,341 |
|
|
31 |
|
|
16,945 |
|
|
2,341 |
|
|
19,286 |
|
|
(3,951) |
|
|
2017 |
| Belvidere |
|
725 Landmark Drive |
|
— |
|
|
3,485 |
|
|
538 |
|
|
121 |
|
|
3,606 |
|
|
538 |
|
|
4,144 |
|
|
(992) |
|
|
2013 |
| Belvidere |
|
888 Landmark Drive |
|
— |
|
|
6,824 |
|
|
670 |
|
|
78 |
|
|
6,902 |
|
|
670 |
|
|
7,572 |
|
|
(1,864) |
|
|
2013 |
| Belvidere |
|
3915 & 3925 Morreim Drive |
|
— |
|
|
4,291 |
|
|
668 |
|
|
31 |
|
|
4,322 |
|
|
668 |
|
|
4,990 |
|
|
(1,201) |
|
|
2013 |
| Belvidere |
|
725 & 729 Logistics Drive |
|
— |
|
|
3,699 |
|
|
866 |
|
|
274 |
|
|
3,973 |
|
|
866 |
|
|
4,839 |
|
|
(1,235) |
|
|
2013 |
| Belvidere |
|
857 Landmark Drive |
|
— |
|
|
8,269 |
|
|
1,542 |
|
|
1,665 |
|
|
9,934 |
|
|
1,542 |
|
|
11,476 |
|
|
(2,960) |
|
|
2013 |
| Belvidere |
|
984 Landmark Drive |
|
— |
|
|
71 |
|
|
216 |
|
|
— |
|
|
71 |
|
|
216 |
|
|
287 |
|
|
(71) |
|
|
2013 |
| Cary |
|
680 Industrial Drive |
|
— |
|
|
3,331 |
|
|
498 |
|
|
16 |
|
|
3,347 |
|
|
498 |
|
|
3,845 |
|
|
(338) |
|
|
2020 |
| Crystal Lake |
|
220 Exchange Drive |
|
— |
|
|
8,455 |
|
|
1,343 |
|
|
69 |
|
|
8,524 |
|
|
1,343 |
|
|
9,867 |
|
|
(704) |
|
|
2021 |
| Crystal Lake |
|
300 Exchange Drive |
|
— |
|
|
9,742 |
|
|
1,568 |
|
|
— |
|
|
9,742 |
|
|
1,568 |
|
|
11,310 |
|
|
(817) |
|
|
2021 |
| Crystal Lake |
|
450 Congress Parkway |
|
— |
|
|
8,860 |
|
|
1,456 |
|
|
8 |
|
|
8,868 |
|
|
1,456 |
|
|
10,324 |
|
|
(791) |
|
|
2021 |
| Crystal Lake |
|
215 Exchange Drive |
|
— |
|
|
10,737 |
|
|
1,790 |
|
|
— |
|
|
10,737 |
|
|
1,790 |
|
|
12,527 |
|
|
(881) |
|
|
2021 |
| Elgin |
|
1360 Madeline Lane |
|
— |
|
|
19,754 |
|
|
1,135 |
|
|
89 |
|
|
19,843 |
|
|
1,135 |
|
|
20,978 |
|
|
(1,243) |
|
|
2021 |
| Elgin |
|
1385 Madeline Lane |
|
— |
|
|
15,346 |
|
|
1,057 |
|
|
357 |
|
|
15,703 |
|
|
1,057 |
|
|
16,760 |
|
|
(1,039) |
|
|
2021 |
| Elgin |
|
1690 Cambridge Drive |
|
— |
|
|
3,332 |
|
|
270 |
|
|
184 |
|
|
3,516 |
|
|
270 |
|
|
3,786 |
|
|
(224) |
|
|
2021 |
| Elmhurst |
|
934 North Church Road |
|
— |
|
|
6,326 |
|
|
874 |
|
|
560 |
|
|
6,886 |
|
|
874 |
|
|
7,760 |
|
|
(389) |
|
|
2022 |
| Gurnee |
|
3818 Grandville Avenue & 1200 Northwestern Avenue |
|
— |
|
|
11,231 |
|
|
1,716 |
|
|
1,272 |
|
|
12,503 |
|
|
1,716 |
|
|
14,219 |
|
|
(3,389) |
|
|
2014 |
| Harvard |
|
875 West Diggins Street |
|
— |
|
|
2,875 |
|
|
1,157 |
|
|
895 |
|
|
3,770 |
|
|
1,157 |
|
|
4,927 |
|
|
(1,223) |
|
|
2013 |
| Hodgkins |
|
6600 River Road |
|
— |
|
|
30,599 |
|
|
2,570 |
|
|
— |
|
|
30,599 |
|
|
2,570 |
|
|
33,169 |
|
|
(2,777) |
|
|
2020 |
| Hodgkins |
|
6620 River Road |
|
— |
|
|
6,163 |
|
|
3,127 |
|
|
— |
|
|
6,163 |
|
|
3,127 |
|
|
9,290 |
|
|
(509) |
|
|
2021 |
| Itasca |
|
1251 W. Ardmore Avenue |
|
— |
|
|
3,621 |
|
|
1,223 |
|
|
— |
|
|
3,621 |
|
|
1,223 |
|
|
4,844 |
|
|
(271) |
|
|
2021 |
| Itasca |
|
1500 Bryn Mawr Avenue |
|
— |
|
|
3,871 |
|
|
2,073 |
|
|
— |
|
|
3,871 |
|
|
2,073 |
|
|
5,944 |
|
|
(322) |
|
|
2021 |
| Itasca |
|
1800 Bruning Drive |
|
— |
|
|
12,216 |
|
|
2,428 |
|
|
1,224 |
|
|
13,440 |
|
|
2,428 |
|
|
15,868 |
|
|
(3,690) |
|
|
2016 |
|
|
|
|
|
|
|
|
|
|
|
|
|
|
|
|
|
|
|
|
|
|
|
|
|
|
|
|
|
|
|
|
|
|
|
|
|
|
|
|
|
|
|
|
|
|
|
|
|
|
|
|
|
|
|
|
|
|
|
|
|
|
|
|
|
|
|
|
|
Initial Cost to STAG Industrial, Inc. |
|
|
|
Gross Amounts at Which Carried at December 31, 2023 |
|
|
|
|
| State & City |
|
Address |
|
Encumbrances(1) |
|
Building & Improvements(2) |
|
Land(3) |
|
Costs Capitalized Subsequent to Acquisition and Valuation Provision |
|
Building & Improvements |
|
Land |
|
Total |
|
Accumulated Depreciation(4) |
|
Year Acquired |
| Lisle |
|
4925 Indiana Avenue |
|
— |
|
|
8,368 |
|
|
2,302 |
|
|
— |
|
|
8,368 |
|
|
2,302 |
|
|
10,670 |
|
|
(1,330) |
|
|
2019 |
| Machesney Park |
|
7166 Greenlee Drive |
|
— |
|
|
3,525 |
|
|
300 |
|
|
43 |
|
|
3,568 |
|
|
300 |
|
|
3,868 |
|
|
(915) |
|
|
2015 |
| McHenry |
|
831/833 Ridgeview Drive |
|
— |
|
|
3,818 |
|
|
576 |
|
|
314 |
|
|
4,132 |
|
|
576 |
|
|
4,708 |
|
|
(800) |
|
|
2018 |
| McHenry |
|
921 Ridgeview Drive |
|
— |
|
|
4,004 |
|
|
448 |
|
|
27 |
|
|
4,031 |
|
|
448 |
|
|
4,479 |
|
|
(766) |
|
|
2018 |
| Montgomery |
|
2001 Baseline Road |
|
— |
|
|
— |
|
|
173 |
|
|
— |
|
|
— |
|
|
173 |
|
|
173 |
|
|
— |
|
|
2018 |
| Montgomery |
|
2001 Baseline Road |
|
— |
|
|
12,373 |
|
|
2,190 |
|
|
4,730 |
|
|
17,103 |
|
|
2,190 |
|
|
19,293 |
|
|
(4,869) |
|
|
2012 |
| Saint Charles |
|
3810-3820 Stern Avenue |
|
— |
|
|
7,028 |
|
|
1,321 |
|
|
606 |
|
|
7,634 |
|
|
1,321 |
|
|
8,955 |
|
|
(482) |
|
|
2021 |
| Saint Charles |
|
3850 Ohio Avenue |
|
— |
|
|
5,976 |
|
|
1,160 |
|
|
45 |
|
|
6,021 |
|
|
1,160 |
|
|
7,181 |
|
|
(258) |
|
|
2022 |
| Sauk Village |
|
21399 Torrence Avenue |
|
— |
|
|
5,405 |
|
|
877 |
|
|
676 |
|
|
6,081 |
|
|
877 |
|
|
6,958 |
|
|
(1,762) |
|
|
2013 |
| Schaumburg |
|
710 East State Parkway |
|
— |
|
|
4,086 |
|
|
689 |
|
|
177 |
|
|
4,263 |
|
|
689 |
|
|
4,952 |
|
|
(509) |
|
|
2020 |
| Vernon Hills |
|
888 Forest Edge Drive |
|
— |
|
|
9,383 |
|
|
2,416 |
|
|
938 |
|
|
10,321 |
|
|
2,416 |
|
|
12,737 |
|
|
(711) |
|
|
2021 |
| Waukegan |
|
3751 Sunset Avenue |
|
— |
|
|
5,030 |
|
|
1,004 |
|
|
149 |
|
|
5,179 |
|
|
1,004 |
|
|
6,183 |
|
|
(1,073) |
|
|
2017 |
| West Chicago |
|
1300 Northwest Avenue |
|
— |
|
|
2,036 |
|
|
768 |
|
|
902 |
|
|
2,938 |
|
|
768 |
|
|
3,706 |
|
|
(1,018) |
|
|
2016 |
| West Chicago |
|
1400 Northwest Avenue |
|
— |
|
|
668 |
|
|
382 |
|
|
282 |
|
|
950 |
|
|
382 |
|
|
1,332 |
|
|
(270) |
|
|
2016 |
| West Chicago |
|
1450 Northwest Avenue |
|
— |
|
|
768 |
|
|
450 |
|
|
272 |
|
|
1,040 |
|
|
450 |
|
|
1,490 |
|
|
(321) |
|
|
2016 |
| West Chicago |
|
1145 & 1149 Howard |
|
— |
|
|
842 |
|
|
369 |
|
|
402 |
|
|
1,244 |
|
|
369 |
|
|
1,613 |
|
|
(342) |
|
|
2016 |
| West Chicago |
|
1270 Nuclear Drive |
|
— |
|
|
892 |
|
|
216 |
|
|
1,160 |
|
|
2,052 |
|
|
216 |
|
|
2,268 |
|
|
(324) |
|
|
2016 |
| West Chicago |
|
537 Discovery Drive |
|
— |
|
|
32,618 |
|
|
5,961 |
|
|
692 |
|
|
33,310 |
|
|
5,961 |
|
|
39,271 |
|
|
(398) |
|
|
2023 |
| West Chicago |
|
1726-1850 Blackhawk Drive |
|
— |
|
|
6,135 |
|
|
915 |
|
|
1,383 |
|
|
7,518 |
|
|
915 |
|
|
8,433 |
|
|
(2,045) |
|
|
2016 |
| West Dundee |
|
901-907 Wesemann Drive |
|
— |
|
|
12,640 |
|
|
948 |
|
|
45 |
|
|
12,685 |
|
|
948 |
|
|
13,633 |
|
|
(912) |
|
|
2021 |
| Wood Dale |
|
321 Forster Avenue |
|
— |
|
|
4,982 |
|
|
1,226 |
|
|
823 |
|
|
5,805 |
|
|
1,226 |
|
|
7,031 |
|
|
(1,080) |
|
|
2016 |
| Indiana |
|
|
|
|
|
|
|
|
|
|
|
|
|
|
|
|
|
|
|
|
| Albion |
|
600 South 7th Street |
|
— |
|
|
407 |
|
|
53 |
|
|
— |
|
|
407 |
|
|
53 |
|
|
460 |
|
|
(322) |
|
|
2006 |
| Elkhart |
|
2701 Marina Drive |
|
— |
|
|
210 |
|
|
25 |
|
|
143 |
|
|
353 |
|
|
25 |
|
|
378 |
|
|
(145) |
|
|
2007 |
| Elkhart |
|
3501 E. County Road 6 |
|
— |
|
|
3,519 |
|
|
422 |
|
|
1,175 |
|
|
4,694 |
|
|
422 |
|
|
5,116 |
|
|
(1,809) |
|
|
2007 |
| Fort Wayne |
|
3424 Centennial Drive |
|
— |
|
|
3,076 |
|
|
112 |
|
|
106 |
|
|
3,182 |
|
|
112 |
|
|
3,294 |
|
|
(815) |
|
|
2014 |
| Goshen |
|
2600 College Avenue |
|
— |
|
|
5,998 |
|
|
1,442 |
|
|
2,198 |
|
|
8,196 |
|
|
1,442 |
|
|
9,638 |
|
|
(2,665) |
|
|
2011 |
| Greenwood |
|
2441 E. Main Street |
|
— |
|
|
12,745 |
|
|
911 |
|
|
1,004 |
|
|
13,749 |
|
|
911 |
|
|
14,660 |
|
|
(1,126) |
|
|
2021 |
| Indianapolis |
|
7701 West New York Street |
|
— |
|
|
3,931 |
|
|
620 |
|
|
— |
|
|
3,931 |
|
|
620 |
|
|
4,551 |
|
|
(305) |
|
|
2021 |
| Jeffersonville |
|
101 Jacobs Way |
|
— |
|
|
35,174 |
|
|
2,891 |
|
|
1,311 |
|
|
36,485 |
|
|
2,891 |
|
|
39,376 |
|
|
(1,540) |
|
|
2022 |
| Lafayette |
|
1520 Kepner Drive |
|
— |
|
|
2,205 |
|
|
295 |
|
|
65 |
|
|
2,270 |
|
|
295 |
|
|
2,565 |
|
|
(682) |
|
|
2012 |
| Lafayette |
|
1540-1530 Kepner Drive |
|
— |
|
|
3,405 |
|
|
410 |
|
|
372 |
|
|
3,777 |
|
|
410 |
|
|
4,187 |
|
|
(1,126) |
|
|
2012 |
| Lafayette |
|
1521 Kepner Drive |
|
— |
|
|
7,920 |
|
|
906 |
|
|
514 |
|
|
8,434 |
|
|
906 |
|
|
9,340 |
|
|
(2,614) |
|
|
2012 |
| Lebanon |
|
100 Purity Drive |
|
— |
|
|
21,160 |
|
|
1,654 |
|
|
— |
|
|
21,160 |
|
|
1,654 |
|
|
22,814 |
|
|
(3,692) |
|
|
2018 |
| Lebanon |
|
800 Edwards Drive |
|
— |
|
|
36,091 |
|
|
2,359 |
|
|
— |
|
|
36,091 |
|
|
2,359 |
|
|
38,450 |
|
|
(4,679) |
|
|
2019 |
| Lebanon |
|
121 N. Enterprise Boulevard |
|
— |
|
|
50,300 |
|
|
2,948 |
|
|
253 |
|
|
50,553 |
|
|
2,948 |
|
|
53,501 |
|
|
(6,120) |
|
|
2019 |
| Marion |
|
2201 E. Loew Road |
|
— |
|
|
2,934 |
|
|
243 |
|
|
718 |
|
|
3,652 |
|
|
243 |
|
|
3,895 |
|
|
(1,287) |
|
|
2012 |
| Portage |
|
6515 Ameriplex Drive |
|
— |
|
|
28,094 |
|
|
1,626 |
|
|
746 |
|
|
28,840 |
|
|
1,626 |
|
|
30,466 |
|
|
(4,403) |
|
|
2019 |
| Portage |
|
725 George Nelson Drive |
|
— |
|
|
5,416 |
|
|
— |
|
|
— |
|
|
5,416 |
|
|
— |
|
|
5,416 |
|
|
(1,614) |
|
|
2012 |
| South Bend |
|
3310 William Richardson Court |
|
— |
|
|
4,718 |
|
|
411 |
|
|
299 |
|
|
5,017 |
|
|
411 |
|
|
5,428 |
|
|
(1,572) |
|
|
2012 |
| Whitestown |
|
4330 S 500 E |
|
— |
|
|
17,621 |
|
|
1,525 |
|
|
— |
|
|
17,621 |
|
|
1,525 |
|
|
19,146 |
|
|
(184) |
|
|
2023 |
| Yoder |
|
2909 Pleasant Center Road |
|
— |
|
|
24,504 |
|
|
941 |
|
|
665 |
|
|
25,169 |
|
|
941 |
|
|
26,110 |
|
|
(3,600) |
|
|
2020 |
|
|
|
|
|
|
|
|
|
|
|
|
|
|
|
|
|
|
|
|
|
|
|
|
|
|
|
|
|
|
|
|
|
|
|
|
|
|
|
|
|
|
|
|
|
|
|
|
|
|
|
|
|
|
|
|
|
|
|
|
|
|
|
|
|
|
|
|
|
Initial Cost to STAG Industrial, Inc. |
|
|
|
Gross Amounts at Which Carried at December 31, 2023 |
|
|
|
|
| State & City |
|
Address |
|
Encumbrances(1) |
|
Building & Improvements(2) |
|
Land(3) |
|
Costs Capitalized Subsequent to Acquisition and Valuation Provision |
|
Building & Improvements |
|
Land |
|
Total |
|
Accumulated Depreciation(4) |
|
Year Acquired |
| Iowa |
|
|
|
|
|
|
|
|
|
|
|
|
|
|
|
|
|
|
|
|
| Ankeny |
|
5910 Southeast Rio Circle |
|
— |
|
|
13,709 |
|
|
846 |
|
|
107 |
|
|
13,816 |
|
|
846 |
|
|
14,662 |
|
|
(1,793) |
|
|
2019 |
| Ankeny |
|
6150 Southeast Rio Circle |
|
— |
|
|
19,104 |
|
|
1,421 |
|
|
— |
|
|
19,104 |
|
|
1,421 |
|
|
20,525 |
|
|
(1,189) |
|
|
2021 |
| Council Bluffs |
|
1209 31st Avenue |
|
— |
|
|
4,438 |
|
|
414 |
|
|
— |
|
|
4,438 |
|
|
414 |
|
|
4,852 |
|
|
(875) |
|
|
2017 |
| Des Moines |
|
3915 Delaware Avenue |
|
— |
|
|
9,342 |
|
|
1,685 |
|
|
1,298 |
|
|
10,640 |
|
|
1,685 |
|
|
12,325 |
|
|
(740) |
|
|
2021 |
| Des Moines |
|
1900 E. 17th Street |
|
— |
|
|
4,477 |
|
|
556 |
|
|
96 |
|
|
4,573 |
|
|
556 |
|
|
5,129 |
|
|
(901) |
|
|
2018 |
| Marion |
|
6301 North Gateway Drive |
|
— |
|
|
2,229 |
|
|
691 |
|
|
188 |
|
|
2,417 |
|
|
691 |
|
|
3,108 |
|
|
(840) |
|
|
2013 |
| Kansas |
|
|
|
|
|
|
|
|
|
|
|
|
|
|
|
|
|
|
|
|
| Edwardsville |
|
9601 Woodend Road |
|
— |
|
|
13,007 |
|
|
1,360 |
|
|
544 |
|
|
13,551 |
|
|
1,360 |
|
|
14,911 |
|
|
(3,092) |
|
|
2017 |
| Lenexa |
|
9700 Lackman Road |
|
— |
|
|
9,649 |
|
|
1,759 |
|
|
33 |
|
|
9,682 |
|
|
1,759 |
|
|
11,441 |
|
|
(1,421) |
|
|
2019 |
| Lenexa |
|
14000 Marshall Drive |
|
— |
|
|
7,610 |
|
|
2,368 |
|
|
— |
|
|
7,610 |
|
|
2,368 |
|
|
9,978 |
|
|
(2,959) |
|
|
2014 |
| Olathe |
|
1202 South Lone Elm Road |
|
— |
|
|
16,272 |
|
|
1,193 |
|
|
67 |
|
|
16,339 |
|
|
1,193 |
|
|
17,532 |
|
|
(2,418) |
|
|
2019 |
| Olathe |
|
16231 South Lone Elm Road |
|
— |
|
|
20,763 |
|
|
2,431 |
|
|
4,199 |
|
|
24,962 |
|
|
2,431 |
|
|
27,393 |
|
|
(7,394) |
|
|
2016 |
| Wichita |
|
2655/2755 South Eastmoor Street |
|
— |
|
|
1,815 |
|
|
88 |
|
|
10 |
|
|
1,825 |
|
|
88 |
|
|
1,913 |
|
|
(557) |
|
|
2012 |
| Wichita |
|
2652 South Eastmoor Street |
|
— |
|
|
1,839 |
|
|
107 |
|
|
183 |
|
|
2,022 |
|
|
107 |
|
|
2,129 |
|
|
(682) |
|
|
2012 |
| Wichita |
|
2510 South Eastmoor Street |
|
— |
|
|
833 |
|
|
76 |
|
|
328 |
|
|
1,161 |
|
|
76 |
|
|
1,237 |
|
|
(452) |
|
|
2012 |
| Kentucky |
|
|
|
|
|
|
|
|
|
|
|
|
|
|
|
|
|
|
|
|
| Bardstown |
|
300 Spencer Mattingly Lane |
|
— |
|
|
2,295 |
|
|
379 |
|
|
563 |
|
|
2,858 |
|
|
379 |
|
|
3,237 |
|
|
(991) |
|
|
2007 |
| Danville |
|
1355 Lebanon Road |
|
— |
|
|
11,593 |
|
|
965 |
|
|
4,418 |
|
|
16,011 |
|
|
965 |
|
|
16,976 |
|
|
(5,467) |
|
|
2011 |
| Erlanger |
|
1500-1532 Interstate Drive |
|
— |
|
|
3,791 |
|
|
635 |
|
|
346 |
|
|
4,137 |
|
|
635 |
|
|
4,772 |
|
|
(1,090) |
|
|
2016 |
| Florence |
|
9200 Brookfield Court |
|
— |
|
|
7,853 |
|
|
863 |
|
|
88 |
|
|
7,941 |
|
|
863 |
|
|
8,804 |
|
|
(1,350) |
|
|
2019 |
| Florence |
|
1100 Burlington Pike |
|
— |
|
|
10,672 |
|
|
3,109 |
|
|
334 |
|
|
11,006 |
|
|
3,109 |
|
|
14,115 |
|
|
(2,648) |
|
|
2018 |
| Hebron |
|
2151 Southpark Drive |
|
— |
|
|
4,526 |
|
|
370 |
|
|
866 |
|
|
5,392 |
|
|
370 |
|
|
5,762 |
|
|
(1,510) |
|
|
2014 |
| Louisiana |
|
|
|
|
|
|
|
|
|
|
|
|
|
|
|
|
|
|
|
|
| Baton Rouge |
|
6565 Exchequer Drive |
|
— |
|
|
5,871 |
|
|
1,619 |
|
|
626 |
|
|
6,497 |
|
|
1,619 |
|
|
8,116 |
|
|
(1,078) |
|
|
2019 |
| Baton Rouge |
|
6735 Exchequer Drive |
|
— |
|
|
6,643 |
|
|
2,567 |
|
|
— |
|
|
6,643 |
|
|
2,567 |
|
|
9,210 |
|
|
(1,219) |
|
|
2019 |
| Baton Rouge |
|
12100 Little Cayman Avenue |
|
— |
|
|
15,402 |
|
|
1,962 |
|
|
53 |
|
|
15,455 |
|
|
1,962 |
|
|
17,417 |
|
|
(2,971) |
|
|
2018 |
| Shreveport |
|
7540 Bert Kouns Industrial Loop |
|
— |
|
|
5,572 |
|
|
1,804 |
|
|
1,390 |
|
|
6,962 |
|
|
1,804 |
|
|
8,766 |
|
|
(1,735) |
|
|
2015 |
| Maine |
|
|
|
|
|
|
|
|
|
|
|
|
|
|
|
|
|
|
|
|
| Biddeford |
|
1 Baker's Way |
|
— |
|
|
8,164 |
|
|
1,369 |
|
|
4,849 |
|
|
13,013 |
|
|
1,369 |
|
|
14,382 |
|
|
(3,662) |
|
|
2016 |
| Gardiner |
|
47 Market Street |
|
— |
|
|
8,983 |
|
|
948 |
|
|
23 |
|
|
9,006 |
|
|
948 |
|
|
9,954 |
|
|
(2,662) |
|
|
2016 |
| Lewiston |
|
19 Mollison Way |
|
— |
|
|
5,374 |
|
|
173 |
|
|
1,064 |
|
|
6,438 |
|
|
173 |
|
|
6,611 |
|
|
(2,624) |
|
|
2007 |
| Portland |
|
125 Industrial Way |
|
— |
|
|
3,648 |
|
|
891 |
|
|
2,019 |
|
|
5,667 |
|
|
891 |
|
|
6,558 |
|
|
(1,127) |
|
|
2012 |
| Maryland |
|
|
|
|
|
|
|
|
|
|
|
|
|
|
|
|
|
|
|
|
| Elkridge |
|
6685 Santa Barbara Court |
|
— |
|
|
8,764 |
|
|
2,982 |
|
|
113 |
|
|
8,877 |
|
|
2,982 |
|
|
11,859 |
|
|
(1,362) |
|
|
2019 |
| Hagerstown |
|
11835 Newgate Boulevard |
|
— |
|
|
55,177 |
|
|
6,036 |
|
|
— |
|
|
55,177 |
|
|
6,036 |
|
|
61,213 |
|
|
(3,804) |
|
|
2021 |
| Hagerstown |
|
11841 Newgate Boulevard |
|
— |
|
|
55,448 |
|
|
6,174 |
|
|
121 |
|
|
55,569 |
|
|
6,174 |
|
|
61,743 |
|
|
(3,971) |
|
|
2021 |
| Hagerstown |
|
105 Enterprise Lane |
|
— |
|
|
11,213 |
|
|
3,472 |
|
|
— |
|
|
11,213 |
|
|
3,472 |
|
|
14,685 |
|
|
(1,114) |
|
|
2021 |
| Hampstead |
|
630 Hanover Pike |
|
— |
|
|
34,933 |
|
|
780 |
|
|
2,875 |
|
|
37,808 |
|
|
780 |
|
|
38,588 |
|
|
(10,140) |
|
|
2013 |
| Hunt Valley |
|
11100 Gilroy Road |
|
— |
|
|
4,900 |
|
|
538 |
|
|
24 |
|
|
4,924 |
|
|
538 |
|
|
5,462 |
|
|
(401) |
|
|
2021 |
| White Marsh |
|
6210 Days Cove Road |
|
— |
|
|
6,912 |
|
|
963 |
|
|
728 |
|
|
7,640 |
|
|
963 |
|
|
8,603 |
|
|
(1,184) |
|
|
2018 |
| Massachusetts |
|
|
|
|
|
|
|
|
|
|
|
|
|
|
|
|
|
|
|
|
|
|
|
|
|
|
|
|
|
|
|
|
|
|
|
|
|
|
|
|
|
|
|
|
|
|
|
|
|
|
|
|
|
|
|
|
|
|
|
|
|
|
|
|
|
|
|
|
|
|
|
|
|
|
|
|
|
|
|
|
|
|
|
|
|
|
|
|
|
Initial Cost to STAG Industrial, Inc. |
|
|
|
Gross Amounts at Which Carried at December 31, 2023 |
|
|
|
|
| State & City |
|
Address |
|
Encumbrances(1) |
|
Building & Improvements(2) |
|
Land(3) |
|
Costs Capitalized Subsequent to Acquisition and Valuation Provision |
|
Building & Improvements |
|
Land |
|
Total |
|
Accumulated Depreciation(4) |
|
Year Acquired |
| Chicopee |
|
2189 Westover Road |
|
— |
|
|
5,614 |
|
|
504 |
|
|
3,114 |
|
|
8,728 |
|
|
504 |
|
|
9,232 |
|
|
(1,993) |
|
|
2012 |
| Hudson |
|
4 Robert Bonazzoli Avenue |
|
— |
|
|
12,628 |
|
|
723 |
|
|
76 |
|
|
12,704 |
|
|
723 |
|
|
13,427 |
|
|
(867) |
|
|
2021 |
| Malden |
|
219 Medford Street |
|
— |
|
|
2,817 |
|
|
366 |
|
|
— |
|
|
2,817 |
|
|
366 |
|
|
3,183 |
|
|
(1,197) |
|
|
2007 |
| Malden |
|
243 Medford Street |
|
— |
|
|
3,961 |
|
|
507 |
|
|
— |
|
|
3,961 |
|
|
507 |
|
|
4,468 |
|
|
(1,682) |
|
|
2007 |
| Middleborough |
|
16 Leona Drive |
|
— |
|
|
7,243 |
|
|
2,397 |
|
|
172 |
|
|
7,415 |
|
|
2,397 |
|
|
9,812 |
|
|
(1,734) |
|
|
2019 |
| Norton |
|
202 South Washington Street |
|
— |
|
|
6,105 |
|
|
2,839 |
|
|
250 |
|
|
6,355 |
|
|
2,839 |
|
|
9,194 |
|
|
(2,063) |
|
|
2011 |
| South Easton |
|
55 Bristol Drive |
|
— |
|
|
5,826 |
|
|
403 |
|
|
1,536 |
|
|
7,362 |
|
|
403 |
|
|
7,765 |
|
|
(1,135) |
|
|
2017 |
| Sterling |
|
15 Chocksett Road |
|
— |
|
|
10,797 |
|
|
1,472 |
|
|
— |
|
|
10,797 |
|
|
1,472 |
|
|
12,269 |
|
|
(792) |
|
|
2021 |
| Stoughton |
|
100 Campanelli Parkway |
|
— |
|
|
2,613 |
|
|
2,256 |
|
|
1,660 |
|
|
4,273 |
|
|
2,256 |
|
|
6,529 |
|
|
(1,713) |
|
|
2015 |
| Stoughton |
|
12 Campanelli Parkway |
|
— |
|
|
1,138 |
|
|
538 |
|
|
369 |
|
|
1,507 |
|
|
538 |
|
|
2,045 |
|
|
(484) |
|
|
2015 |
| Westborough |
|
35 Otis Street |
|
— |
|
|
5,733 |
|
|
661 |
|
|
23 |
|
|
5,756 |
|
|
661 |
|
|
6,417 |
|
|
(1,244) |
|
|
2016 |
| Michigan |
|
|
|
|
|
|
|
|
|
|
|
|
|
|
|
|
|
|
|
|
| Belleville |
|
8200 Haggerty Road |
|
— |
|
|
6,484 |
|
|
724 |
|
|
616 |
|
|
7,100 |
|
|
724 |
|
|
7,824 |
|
|
(1,501) |
|
|
2017 |
| Canton |
|
47440 Michigan Avenue |
|
— |
|
|
23,694 |
|
|
2,378 |
|
|
314 |
|
|
24,008 |
|
|
2,378 |
|
|
26,386 |
|
|
(3,176) |
|
|
2020 |
| Chesterfield |
|
50501 E. Russell Schmidt |
|
— |
|
|
1,099 |
|
|
207 |
|
|
12 |
|
|
1,111 |
|
|
207 |
|
|
1,318 |
|
|
(468) |
|
|
2007 |
| Chesterfield |
|
50371 E. Russell Schmidt |
|
— |
|
|
798 |
|
|
150 |
|
|
477 |
|
|
1,275 |
|
|
150 |
|
|
1,425 |
|
|
(474) |
|
|
2007 |
| Chesterfield |
|
50271 E. Russell Schmidt |
|
— |
|
|
802 |
|
|
151 |
|
|
210 |
|
|
1,012 |
|
|
151 |
|
|
1,163 |
|
|
(487) |
|
|
2007 |
| Chesterfield |
|
50900 E. Russell Schmidt |
|
— |
|
|
5,006 |
|
|
942 |
|
|
2,365 |
|
|
7,371 |
|
|
942 |
|
|
8,313 |
|
|
(3,177) |
|
|
2007 |
| Grand Rapids |
|
5445 International Parkway |
|
— |
|
|
7,039 |
|
|
1,241 |
|
|
43 |
|
|
7,082 |
|
|
1,241 |
|
|
8,323 |
|
|
(750) |
|
|
2020 |
| Grand Rapids |
|
5079 33rd Street |
|
— |
|
|
4,907 |
|
|
892 |
|
|
297 |
|
|
5,204 |
|
|
892 |
|
|
6,096 |
|
|
(331) |
|
|
2022 |
| Grand Rapids |
|
5333 33rd Street |
|
— |
|
|
3,460 |
|
|
1,052 |
|
|
192 |
|
|
3,652 |
|
|
1,052 |
|
|
4,704 |
|
|
(303) |
|
|
2022 |
| Grand Rapids |
|
5050 Kendrick Street, SE |
|
— |
|
|
7,332 |
|
|
169 |
|
|
34 |
|
|
7,366 |
|
|
169 |
|
|
7,535 |
|
|
(1,979) |
|
|
2015 |
| Holland |
|
4757 128th Avenue |
|
— |
|
|
3,273 |
|
|
279 |
|
|
208 |
|
|
3,481 |
|
|
279 |
|
|
3,760 |
|
|
(1,044) |
|
|
2012 |
| Kentwood |
|
4660 East Paris Avenue, SE |
|
— |
|
|
7,875 |
|
|
307 |
|
|
29 |
|
|
7,904 |
|
|
307 |
|
|
8,211 |
|
|
(1,216) |
|
|
2019 |
| Kentwood |
|
4647 60th Street SE |
|
— |
|
|
16,933 |
|
|
1,256 |
|
|
1,803 |
|
|
18,736 |
|
|
1,256 |
|
|
19,992 |
|
|
(1,347) |
|
|
2021 |
| Kentwood |
|
4070 East Paris Avenue |
|
— |
|
|
2,436 |
|
|
407 |
|
|
120 |
|
|
2,556 |
|
|
407 |
|
|
2,963 |
|
|
(731) |
|
|
2013 |
| Lansing |
|
7009 West Mount Hope Highway |
|
— |
|
|
7,706 |
|
|
501 |
|
|
7,357 |
|
|
15,063 |
|
|
501 |
|
|
15,564 |
|
|
(4,279) |
|
|
2011 |
| Lansing |
|
2780 Sanders Road |
|
— |
|
|
3,961 |
|
|
580 |
|
|
460 |
|
|
4,421 |
|
|
580 |
|
|
5,001 |
|
|
(1,211) |
|
|
2012 |
| Lansing |
|
5640 Pierson Highway |
|
— |
|
|
7,056 |
|
|
429 |
|
|
100 |
|
|
7,156 |
|
|
429 |
|
|
7,585 |
|
|
(2,259) |
|
|
2012 |
| Lansing |
|
2051 South Canal Road |
|
— |
|
|
5,176 |
|
|
907 |
|
|
100 |
|
|
5,276 |
|
|
907 |
|
|
6,183 |
|
|
(1,542) |
|
|
2013 |
| Livonia |
|
38150 Plymouth Road |
|
— |
|
|
7,032 |
|
|
1,390 |
|
|
1,419 |
|
|
8,451 |
|
|
1,390 |
|
|
9,841 |
|
|
(1,712) |
|
|
2018 |
| Livonia |
|
38220 Plymouth Road |
|
— |
|
|
8,918 |
|
|
848 |
|
|
1,016 |
|
|
9,934 |
|
|
848 |
|
|
10,782 |
|
|
(1,588) |
|
|
2018 |
| Marshall |
|
1511 George Brown Drive |
|
— |
|
|
1,042 |
|
|
199 |
|
|
130 |
|
|
1,172 |
|
|
199 |
|
|
1,371 |
|
|
(406) |
|
|
2013 |
| Novi |
|
22925 Venture Drive |
|
— |
|
|
3,649 |
|
|
252 |
|
|
363 |
|
|
4,012 |
|
|
252 |
|
|
4,264 |
|
|
(1,197) |
|
|
2012 |
| Novi |
|
25250 Regency Drive |
|
— |
|
|
6,035 |
|
|
626 |
|
|
23 |
|
|
6,058 |
|
|
626 |
|
|
6,684 |
|
|
(1,683) |
|
|
2015 |
| Novi |
|
43800 Gen Mar Drive |
|
— |
|
|
16,918 |
|
|
1,381 |
|
|
925 |
|
|
17,843 |
|
|
1,381 |
|
|
19,224 |
|
|
(3,061) |
|
|
2018 |
| Plymouth |
|
14835 Pilot Drive |
|
— |
|
|
4,620 |
|
|
365 |
|
|
250 |
|
|
4,870 |
|
|
365 |
|
|
5,235 |
|
|
(1,312) |
|
|
2015 |
| Redford |
|
12100 Inkster Road |
|
— |
|
|
6,114 |
|
|
728 |
|
|
621 |
|
|
6,735 |
|
|
728 |
|
|
7,463 |
|
|
(1,757) |
|
|
2017 |
| Romulus |
|
9800 Inkster Road |
|
— |
|
|
14,942 |
|
|
1,254 |
|
|
— |
|
|
14,942 |
|
|
1,254 |
|
|
16,196 |
|
|
(3,209) |
|
|
2018 |
| Romulus |
|
27651 Hildebrandt Road |
|
— |
|
|
14,949 |
|
|
1,080 |
|
|
289 |
|
|
15,238 |
|
|
1,080 |
|
|
16,318 |
|
|
(3,322) |
|
|
2017 |
| Sterling Heights |
|
42600 Merrill Street |
|
— |
|
|
4,191 |
|
|
1,133 |
|
|
1,469 |
|
|
5,660 |
|
|
1,133 |
|
|
6,793 |
|
|
(1,684) |
|
|
2012 |
|
|
|
|
|
|
|
|
|
|
|
|
|
|
|
|
|
|
|
|
|
|
|
|
|
|
|
|
|
|
|
|
|
|
|
|
|
|
|
|
|
|
|
|
|
|
|
|
|
|
|
|
|
|
|
|
|
|
|
|
|
|
|
|
|
|
|
|
|
Initial Cost to STAG Industrial, Inc. |
|
|
|
Gross Amounts at Which Carried at December 31, 2023 |
|
|
|
|
| State & City |
|
Address |
|
Encumbrances(1) |
|
Building & Improvements(2) |
|
Land(3) |
|
Costs Capitalized Subsequent to Acquisition and Valuation Provision |
|
Building & Improvements |
|
Land |
|
Total |
|
Accumulated Depreciation(4) |
|
Year Acquired |
| Walker |
|
2640 Northridge Drive |
|
— |
|
|
4,593 |
|
|
855 |
|
|
1,127 |
|
|
5,720 |
|
|
855 |
|
|
6,575 |
|
|
(1,583) |
|
|
2011 |
| Warren |
|
13301 Stephens Road |
|
— |
|
|
5,820 |
|
|
502 |
|
|
206 |
|
|
6,026 |
|
|
502 |
|
|
6,528 |
|
|
(1,283) |
|
|
2017 |
| Warren |
|
27027 Mound Road |
|
— |
|
|
17,584 |
|
|
1,984 |
|
|
31 |
|
|
17,615 |
|
|
1,984 |
|
|
19,599 |
|
|
(2,262) |
|
|
2020 |
| Warren |
|
25295 Guenther Road |
|
— |
|
|
19,273 |
|
|
531 |
|
|
307 |
|
|
19,580 |
|
|
531 |
|
|
20,111 |
|
|
(1,620) |
|
|
2021 |
| Warren |
|
7500 Tank Avenue |
|
— |
|
|
16,035 |
|
|
1,290 |
|
|
— |
|
|
16,035 |
|
|
1,290 |
|
|
17,325 |
|
|
(4,042) |
|
|
2016 |
| Wixom |
|
48238 Frank Street |
|
— |
|
|
14,433 |
|
|
293 |
|
|
— |
|
|
14,433 |
|
|
293 |
|
|
14,726 |
|
|
(946) |
|
|
2021 |
| Zeeland |
|
750 E. Riley Avenue |
|
— |
|
|
12,100 |
|
|
487 |
|
|
— |
|
|
12,100 |
|
|
487 |
|
|
12,587 |
|
|
(2,225) |
|
|
2019 |
| Minnesota |
|
|
|
|
|
|
|
|
|
|
|
|
|
|
|
|
|
|
|
|
| Blaine |
|
3705 95th Avenue NE |
|
— |
|
|
16,873 |
|
|
2,258 |
|
|
46 |
|
|
16,919 |
|
|
2,258 |
|
|
19,177 |
|
|
(2,715) |
|
|
2019 |
| Bloomington |
|
11300 Hampshire Avenue South |
|
— |
|
|
8,542 |
|
|
1,702 |
|
|
23 |
|
|
8,565 |
|
|
1,702 |
|
|
10,267 |
|
|
(1,670) |
|
|
2018 |
| Brooklyn Park |
|
6688 93rd Avenue North |
|
— |
|
|
11,988 |
|
|
1,926 |
|
|
— |
|
|
11,988 |
|
|
1,926 |
|
|
13,914 |
|
|
(2,767) |
|
|
2016 |
| Carlos |
|
4750 County Road 13 NE |
|
— |
|
|
5,470 |
|
|
960 |
|
|
151 |
|
|
5,621 |
|
|
960 |
|
|
6,581 |
|
|
(1,722) |
|
|
2011 |
| Eagan |
|
3355 Discovery Road |
|
— |
|
|
15,290 |
|
|
2,526 |
|
|
— |
|
|
15,290 |
|
|
2,526 |
|
|
17,816 |
|
|
(2,724) |
|
|
2019 |
| Inver Grove Height |
|
8450 Courthouse Boulevard |
|
— |
|
|
6,964 |
|
|
2,595 |
|
|
— |
|
|
6,964 |
|
|
2,595 |
|
|
9,559 |
|
|
(633) |
|
|
2021 |
| Maple Grove |
|
6250 Sycamore Lane North |
|
— |
|
|
6,634 |
|
|
969 |
|
|
649 |
|
|
7,283 |
|
|
969 |
|
|
8,252 |
|
|
(1,654) |
|
|
2017 |
| Maple Grove |
|
8175 Jefferson Highway |
|
— |
|
|
10,397 |
|
|
2,327 |
|
|
156 |
|
|
10,553 |
|
|
2,327 |
|
|
12,880 |
|
|
(1,362) |
|
|
2020 |
| Mendota Heights |
|
2250 Pilot Knob Road |
|
— |
|
|
3,492 |
|
|
1,494 |
|
|
1,177 |
|
|
4,669 |
|
|
1,494 |
|
|
6,163 |
|
|
(1,207) |
|
|
2018 |
| New Hope |
|
5520 North Highway 169 |
|
— |
|
|
1,902 |
|
|
1,919 |
|
|
449 |
|
|
2,351 |
|
|
1,919 |
|
|
4,270 |
|
|
(739) |
|
|
2013 |
| Newport |
|
710 Hastings Avenue |
|
— |
|
|
8,367 |
|
|
1,765 |
|
|
— |
|
|
8,367 |
|
|
1,765 |
|
|
10,132 |
|
|
(546) |
|
|
2021 |
| Oakdale |
|
550-590 Hale Avenue North |
|
— |
|
|
6,468 |
|
|
647 |
|
|
245 |
|
|
6,713 |
|
|
647 |
|
|
7,360 |
|
|
(1,226) |
|
|
2019 |
| Oakdale |
|
585-595 Hale Avenue |
|
— |
|
|
5,022 |
|
|
1,396 |
|
|
298 |
|
|
5,320 |
|
|
1,396 |
|
|
6,716 |
|
|
(1,078) |
|
|
2018 |
| Plymouth |
|
9800 13th Avenue North |
|
— |
|
|
4,978 |
|
|
1,599 |
|
|
— |
|
|
4,978 |
|
|
1,599 |
|
|
6,577 |
|
|
(1,133) |
|
|
2018 |
| Plymouth |
|
6050 Nathan Lane |
|
— |
|
|
5,855 |
|
|
1,109 |
|
|
61 |
|
|
5,916 |
|
|
1,109 |
|
|
7,025 |
|
|
(948) |
|
|
2019 |
| Plymouth |
|
6075 Trenton Lane North |
|
— |
|
|
6,919 |
|
|
1,569 |
|
|
— |
|
|
6,919 |
|
|
1,569 |
|
|
8,488 |
|
|
(1,077) |
|
|
2019 |
| Savage |
|
14399 Huntington Avenue |
|
— |
|
|
3,836 |
|
|
3,194 |
|
|
1,253 |
|
|
5,089 |
|
|
3,194 |
|
|
8,283 |
|
|
(1,772) |
|
|
2014 |
| Shakopee |
|
5101/4901 Valley Industrial Boulevard |
|
— |
|
|
11,596 |
|
|
584 |
|
|
13 |
|
|
11,609 |
|
|
584 |
|
|
12,193 |
|
|
(734) |
|
|
2022 |
| Shakopee |
|
1451 Dean Lakes Trail |
|
— |
|
|
12,496 |
|
|
927 |
|
|
61 |
|
|
12,557 |
|
|
927 |
|
|
13,484 |
|
|
(1,615) |
|
|
2019 |
| Saint Paul |
|
1700 Wynne Avenue |
|
— |
|
|
23,675 |
|
|
2,258 |
|
|
— |
|
|
23,675 |
|
|
2,258 |
|
|
25,933 |
|
|
(1,681) |
|
|
2021 |
| South Saint Paul |
|
411 Farwell Avenue |
|
— |
|
|
14,904 |
|
|
2,378 |
|
|
498 |
|
|
15,402 |
|
|
2,378 |
|
|
17,780 |
|
|
(2,967) |
|
|
2018 |
| Mississippi |
|
|
|
|
|
|
|
|
|
|
|
|
|
|
|
|
|
|
|
|
| Southaven |
|
228 Access Drive |
|
— |
|
|
28,566 |
|
|
1,000 |
|
|
175 |
|
|
28,741 |
|
|
1,000 |
|
|
29,741 |
|
|
(2,875) |
|
|
2020 |
| Missouri |
|
|
|
|
|
|
|
|
|
|
|
|
|
|
|
|
|
|
|
|
| Berkeley |
|
8901 Springdale Avenue |
|
— |
|
|
9,855 |
|
|
1,423 |
|
|
545 |
|
|
10,400 |
|
|
1,423 |
|
|
11,823 |
|
|
(733) |
|
|
2021 |
| Earth City |
|
1 American Eagle Plaza |
|
— |
|
|
2,751 |
|
|
1,123 |
|
|
273 |
|
|
3,024 |
|
|
1,123 |
|
|
4,147 |
|
|
(746) |
|
|
2016 |
| Fenton |
|
2501 & 2509 Cassens Drive |
|
— |
|
|
9,358 |
|
|
791 |
|
|
244 |
|
|
9,602 |
|
|
791 |
|
|
10,393 |
|
|
(1,373) |
|
|
2019 |
| Hazelwood |
|
7275 Hazelwood Avenue |
|
— |
|
|
5,030 |
|
|
1,382 |
|
|
2,094 |
|
|
7,124 |
|
|
1,382 |
|
|
8,506 |
|
|
(2,183) |
|
|
2011 |
| Kansas City |
|
4001 North Norfleet Road |
|
— |
|
|
48,342 |
|
|
4,239 |
|
|
— |
|
|
48,342 |
|
|
4,239 |
|
|
52,581 |
|
|
(3,229) |
|
|
2022 |
| O'Fallon |
|
6705 Keaton Corporate Parkway |
|
— |
|
|
3,606 |
|
|
1,233 |
|
|
606 |
|
|
4,212 |
|
|
1,233 |
|
|
5,445 |
|
|
(1,076) |
|
|
2017 |
| O'Fallon |
|
3801 Lloyd King Drive |
|
— |
|
|
2,579 |
|
|
1,242 |
|
|
1,303 |
|
|
3,882 |
|
|
1,242 |
|
|
5,124 |
|
|
(1,191) |
|
|
2011 |
| Nebraska |
|
|
|
|
|
|
|
|
|
|
|
|
|
|
|
|
|
|
|
|
| Bellevue |
|
10601 S 15th Street |
|
— |
|
|
20,384 |
|
|
1,691 |
|
|
135 |
|
|
20,519 |
|
|
1,691 |
|
|
22,210 |
|
|
(2,079) |
|
|
2021 |
| La Vista |
|
11720 Peel Circle |
|
— |
|
|
14,679 |
|
|
1,232 |
|
|
— |
|
|
14,679 |
|
|
1,232 |
|
|
15,911 |
|
|
(984) |
|
|
2021 |
|
|
|
|
|
|
|
|
|
|
|
|
|
|
|
|
|
|
|
|
|
|
|
|
|
|
|
|
|
|
|
|
|
|
|
|
|
|
|
|
|
|
|
|
|
|
|
|
|
|
|
|
|
|
|
|
|
|
|
|
|
|
|
|
|
|
|
|
|
Initial Cost to STAG Industrial, Inc. |
|
|
|
Gross Amounts at Which Carried at December 31, 2023 |
|
|
|
|
| State & City |
|
Address |
|
Encumbrances(1) |
|
Building & Improvements(2) |
|
Land(3) |
|
Costs Capitalized Subsequent to Acquisition and Valuation Provision |
|
Building & Improvements |
|
Land |
|
Total |
|
Accumulated Depreciation(4) |
|
Year Acquired |
| Omaha |
|
10488 S. 136th Street |
|
— |
|
|
13,736 |
|
|
1,602 |
|
|
65 |
|
|
13,801 |
|
|
1,602 |
|
|
15,403 |
|
|
(2,003) |
|
|
2019 |
| Omaha |
|
9995 I Street |
|
— |
|
|
3,202 |
|
|
572 |
|
|
241 |
|
|
3,443 |
|
|
572 |
|
|
4,015 |
|
|
(463) |
|
|
2019 |
| Omaha |
|
10025 I Street |
|
— |
|
|
2,414 |
|
|
579 |
|
|
133 |
|
|
2,547 |
|
|
579 |
|
|
3,126 |
|
|
(400) |
|
|
2019 |
| Omaha |
|
9931 South 136th Street |
|
— |
|
|
2,636 |
|
|
828 |
|
|
355 |
|
|
2,991 |
|
|
828 |
|
|
3,819 |
|
|
(272) |
|
|
2021 |
| Omaha |
|
9950 South 134th Street |
|
— |
|
|
3,398 |
|
|
868 |
|
|
6 |
|
|
3,404 |
|
|
868 |
|
|
4,272 |
|
|
(243) |
|
|
2021 |
| Nevada |
|
|
|
|
|
|
|
|
|
|
|
|
|
|
|
|
|
|
|
|
| Fernley |
|
190 Resource Drive |
|
— |
|
|
11,401 |
|
|
1,034 |
|
|
— |
|
|
11,401 |
|
|
1,034 |
|
|
12,435 |
|
|
(999) |
|
|
2021 |
| Las Vegas |
|
730 Pilot Road |
|
— |
|
|
12,390 |
|
|
2,615 |
|
|
897 |
|
|
13,287 |
|
|
2,615 |
|
|
15,902 |
|
|
(2,468) |
|
|
2018 |
| Las Vegas |
|
3450 West Teco Avenue |
|
— |
|
|
3,259 |
|
|
770 |
|
|
80 |
|
|
3,339 |
|
|
770 |
|
|
4,109 |
|
|
(654) |
|
|
2017 |
| Paradise |
|
4565 Wynn Road |
|
— |
|
|
4,514 |
|
|
949 |
|
|
— |
|
|
4,514 |
|
|
949 |
|
|
5,463 |
|
|
(667) |
|
|
2019 |
| Paradise |
|
6460 Arville Street |
|
— |
|
|
3,415 |
|
|
1,465 |
|
|
251 |
|
|
3,666 |
|
|
1,465 |
|
|
5,131 |
|
|
(699) |
|
|
2019 |
| Reno |
|
9025 Moya Boulevard |
|
— |
|
|
3,356 |
|
|
1,372 |
|
|
107 |
|
|
3,463 |
|
|
1,372 |
|
|
4,835 |
|
|
(1,042) |
|
|
2014 |
| Sparks |
|
325 E. Nugget Avenue |
|
— |
|
|
6,328 |
|
|
938 |
|
|
977 |
|
|
7,305 |
|
|
938 |
|
|
8,243 |
|
|
(2,009) |
|
|
2017 |
| Sparks |
|
655 Spice Islands Drive |
|
— |
|
|
25,466 |
|
|
2,831 |
|
|
— |
|
|
25,466 |
|
|
2,831 |
|
|
28,297 |
|
|
(190) |
|
|
2023 |
| New Hampshire |
|
|
|
|
|
|
|
|
|
|
|
|
|
|
|
|
|
|
|
|
| Londonderry |
|
29 Jack's Bridge Road/Clark Road |
|
— |
|
|
6,683 |
|
|
730 |
|
|
223 |
|
|
6,906 |
|
|
730 |
|
|
7,636 |
|
|
(2,130) |
|
|
2013 |
| Nashua |
|
80 Northwest Boulevard |
|
— |
|
|
8,470 |
|
|
1,431 |
|
|
2,263 |
|
|
10,733 |
|
|
1,431 |
|
|
12,164 |
|
|
(2,640) |
|
|
2014 |
| New Jersey |
|
|
|
|
|
|
|
|
|
|
|
|
|
|
|
|
|
|
|
|
| Branchburg |
|
291 Evans Way |
|
— |
|
|
10,852 |
|
|
2,367 |
|
|
149 |
|
|
11,001 |
|
|
2,367 |
|
|
13,368 |
|
|
(1,455) |
|
|
2019 |
| Burlington |
|
8 Campus Drive |
|
— |
|
|
15,797 |
|
|
3,267 |
|
|
266 |
|
|
16,063 |
|
|
3,267 |
|
|
19,330 |
|
|
(1,364) |
|
|
2015 |
| Burlington |
|
6 Campus Drive |
|
— |
|
|
19,237 |
|
|
4,030 |
|
|
1,644 |
|
|
20,881 |
|
|
4,030 |
|
|
24,911 |
|
|
(5,230) |
|
|
2015 |
| Franklin Township |
|
17 & 20 Veronica Avenue |
|
— |
|
|
8,264 |
|
|
2,272 |
|
|
1,555 |
|
|
9,819 |
|
|
2,272 |
|
|
12,091 |
|
|
(2,431) |
|
|
2017 |
| Lumberton |
|
101 Mount Holly Bypass |
|
— |
|
|
6,372 |
|
|
1,121 |
|
|
456 |
|
|
6,828 |
|
|
1,121 |
|
|
7,949 |
|
|
(1,341) |
|
|
2019 |
| Moorestown |
|
550 Glen Avenue |
|
— |
|
|
5,627 |
|
|
466 |
|
|
122 |
|
|
5,749 |
|
|
466 |
|
|
6,215 |
|
|
(953) |
|
|
2019 |
| Moorestown |
|
600 Glen Court |
|
— |
|
|
4,749 |
|
|
510 |
|
|
39 |
|
|
4,788 |
|
|
510 |
|
|
5,298 |
|
|
(961) |
|
|
2019 |
| Mt. Laurel |
|
103 Central Avenue |
|
— |
|
|
6,672 |
|
|
616 |
|
|
950 |
|
|
7,622 |
|
|
616 |
|
|
8,238 |
|
|
(770) |
|
|
2020 |
| Pedricktown |
|
One Gateway Boulevard |
|
— |
|
|
10,250 |
|
|
2,414 |
|
|
4,544 |
|
|
14,794 |
|
|
2,414 |
|
|
17,208 |
|
|
(2,674) |
|
|
2017 |
| Piscataway |
|
100 New England Avenue |
|
— |
|
|
17,096 |
|
|
7,566 |
|
|
— |
|
|
17,096 |
|
|
7,566 |
|
|
24,662 |
|
|
(474) |
|
|
2023 |
| Swedesboro |
|
2165 Center Square Road |
|
— |
|
|
5,129 |
|
|
1,212 |
|
|
818 |
|
|
5,947 |
|
|
1,212 |
|
|
7,159 |
|
|
(1,225) |
|
|
2017 |
| Westampton |
|
800 Highland Drive |
|
— |
|
|
27,798 |
|
|
3,647 |
|
|
1,619 |
|
|
29,417 |
|
|
3,647 |
|
|
33,064 |
|
|
(1,314) |
|
|
2021 |
| New Mexico |
|
|
|
|
|
|
|
|
|
|
|
|
|
|
|
|
|
|
|
|
| Santa Teresa |
|
150 Earhardt Drive |
|
— |
|
|
8,904 |
|
|
723 |
|
|
— |
|
|
8,904 |
|
|
723 |
|
|
9,627 |
|
|
(391) |
|
|
2022 |
| New York |
|
|
|
|
|
|
|
|
|
|
|
|
|
|
|
|
|
|
|
|
| Buffalo |
|
1236-50 William Street |
|
— |
|
|
2,924 |
|
|
146 |
|
|
— |
|
|
2,924 |
|
|
146 |
|
|
3,070 |
|
|
(943) |
|
|
2012 |
| Cheektowaga |
|
40-60 Industrial Parkway |
|
— |
|
|
2,699 |
|
|
216 |
|
|
1,076 |
|
|
3,775 |
|
|
216 |
|
|
3,991 |
|
|
(1,401) |
|
|
2011 |
| Farmington |
|
5786 Collett Road |
|
— |
|
|
5,282 |
|
|
410 |
|
|
896 |
|
|
6,178 |
|
|
410 |
|
|
6,588 |
|
|
(2,432) |
|
|
2007 |
| Gloversville |
|
125 Belzano Drive |
|
— |
|
|
1,299 |
|
|
117 |
|
|
7 |
|
|
1,306 |
|
|
117 |
|
|
1,423 |
|
|
(435) |
|
|
2012 |
| Gloversville |
|
122 Belzano Drive |
|
— |
|
|
2,559 |
|
|
151 |
|
|
175 |
|
|
2,734 |
|
|
151 |
|
|
2,885 |
|
|
(820) |
|
|
2012 |
| Gloversville |
|
109 Belzano Drive |
|
— |
|
|
1,486 |
|
|
154 |
|
|
164 |
|
|
1,650 |
|
|
154 |
|
|
1,804 |
|
|
(524) |
|
|
2012 |
| Johnstown |
|
123 Union Avenue |
|
— |
|
|
1,592 |
|
|
216 |
|
|
33 |
|
|
1,625 |
|
|
216 |
|
|
1,841 |
|
|
(487) |
|
|
2012 |
| Johnstown |
|
231 Enterprise Drive |
|
— |
|
|
955 |
|
|
151 |
|
|
96 |
|
|
1,051 |
|
|
151 |
|
|
1,202 |
|
|
(414) |
|
|
2012 |
| Johnstown |
|
150 Enterprise Avenue |
|
— |
|
|
1,440 |
|
|
140 |
|
|
— |
|
|
1,440 |
|
|
140 |
|
|
1,580 |
|
|
(503) |
|
|
2012 |
|
|
|
|
|
|
|
|
|
|
|
|
|
|
|
|
|
|
|
|
|
|
|
|
|
|
|
|
|
|
|
|
|
|
|
|
|
|
|
|
|
|
|
|
|
|
|
|
|
|
|
|
|
|
|
|
|
|
|
|
|
|
|
|
|
|
|
|
|
Initial Cost to STAG Industrial, Inc. |
|
|
|
Gross Amounts at Which Carried at December 31, 2023 |
|
|
|
|
| State & City |
|
Address |
|
Encumbrances(1) |
|
Building & Improvements(2) |
|
Land(3) |
|
Costs Capitalized Subsequent to Acquisition and Valuation Provision |
|
Building & Improvements |
|
Land |
|
Total |
|
Accumulated Depreciation(4) |
|
Year Acquired |
| Rochester |
|
2883 Brighton Henrietta Townline Road |
|
— |
|
|
6,964 |
|
|
619 |
|
|
934 |
|
|
7,898 |
|
|
619 |
|
|
8,517 |
|
|
(809) |
|
|
2020 |
| Rochester |
|
1350 Scottsville Road |
|
— |
|
|
6,702 |
|
|
208 |
|
|
109 |
|
|
6,811 |
|
|
208 |
|
|
7,019 |
|
|
(804) |
|
|
2020 |
| Ronkonkoma |
|
845 South 1st Street |
|
(4,537) |
|
|
6,091 |
|
|
1,213 |
|
|
40 |
|
|
6,131 |
|
|
1,213 |
|
|
7,344 |
|
|
(583) |
|
|
2021 |
| North Carolina |
|
|
|
|
|
|
|
|
|
|
|
|
|
|
|
|
|
|
|
|
| Catawba |
|
3389 Catawba Industrial Place |
|
— |
|
|
8,166 |
|
|
1,692 |
|
|
— |
|
|
8,166 |
|
|
1,692 |
|
|
9,858 |
|
|
(856) |
|
|
2020 |
| Charlotte |
|
1401 Tar Heel Road |
|
— |
|
|
3,842 |
|
|
515 |
|
|
63 |
|
|
3,905 |
|
|
515 |
|
|
4,420 |
|
|
(859) |
|
|
2015 |
| Charlotte |
|
2027 Gateway Boulevard |
|
— |
|
|
3,654 |
|
|
913 |
|
|
30 |
|
|
3,684 |
|
|
913 |
|
|
4,597 |
|
|
(677) |
|
|
2018 |
| Charlotte |
|
3115 Beam Road |
|
— |
|
|
4,839 |
|
|
369 |
|
|
179 |
|
|
5,018 |
|
|
369 |
|
|
5,387 |
|
|
(565) |
|
|
2020 |
| Durham |
|
2702 Weck Drive |
|
— |
|
|
2,589 |
|
|
753 |
|
|
258 |
|
|
2,847 |
|
|
753 |
|
|
3,600 |
|
|
(720) |
|
|
2015 |
| Garner |
|
2337 US Highway 70E |
|
— |
|
|
11,790 |
|
|
3,420 |
|
|
— |
|
|
11,790 |
|
|
3,420 |
|
|
15,210 |
|
|
(1,231) |
|
|
2020 |
| Greensboro |
|
719 North Regional Road |
|
— |
|
|
12,396 |
|
|
366 |
|
|
— |
|
|
12,396 |
|
|
366 |
|
|
12,762 |
|
|
(239) |
|
|
2023 |
| Greensboro |
|
415 Westcliff Road |
|
— |
|
|
6,383 |
|
|
691 |
|
|
208 |
|
|
6,591 |
|
|
691 |
|
|
7,282 |
|
|
(1,187) |
|
|
2018 |
| Huntersville |
|
13201 Reese Boulevard Unit 100 |
|
— |
|
|
3,123 |
|
|
1,061 |
|
|
980 |
|
|
4,103 |
|
|
1,061 |
|
|
5,164 |
|
|
(1,202) |
|
|
2012 |
| Lexington |
|
200 Woodside Drive |
|
— |
|
|
3,863 |
|
|
232 |
|
|
1,386 |
|
|
5,249 |
|
|
232 |
|
|
5,481 |
|
|
(1,767) |
|
|
2011 |
| Mebane |
|
7412 Oakwood Street |
|
— |
|
|
4,570 |
|
|
481 |
|
|
552 |
|
|
5,122 |
|
|
481 |
|
|
5,603 |
|
|
(1,700) |
|
|
2012 |
| Mebane |
|
7600 Oakwood Street |
|
— |
|
|
4,148 |
|
|
443 |
|
|
— |
|
|
4,148 |
|
|
443 |
|
|
4,591 |
|
|
(1,412) |
|
|
2012 |
| Mebane |
|
7110 E. Washington Street |
|
— |
|
|
4,981 |
|
|
358 |
|
|
1,649 |
|
|
6,630 |
|
|
358 |
|
|
6,988 |
|
|
(1,710) |
|
|
2013 |
| Mocksville |
|
171 Enterprise Way |
|
— |
|
|
5,582 |
|
|
1,091 |
|
|
616 |
|
|
6,198 |
|
|
1,091 |
|
|
7,289 |
|
|
(988) |
|
|
2019 |
| Mooresville |
|
119 Super Sport Drive |
|
— |
|
|
17,889 |
|
|
4,195 |
|
|
765 |
|
|
18,654 |
|
|
4,195 |
|
|
22,849 |
|
|
(3,654) |
|
|
2017 |
| Mooresville |
|
313 Mooresville Boulevard |
|
— |
|
|
6,968 |
|
|
701 |
|
|
466 |
|
|
7,434 |
|
|
701 |
|
|
8,135 |
|
|
(2,479) |
|
|
2011 |
| Mountain Home |
|
199 N. Egerton Road |
|
— |
|
|
2,359 |
|
|
523 |
|
|
— |
|
|
2,359 |
|
|
523 |
|
|
2,882 |
|
|
(627) |
|
|
2014 |
| Newton |
|
1500 Prodelin Drive |
|
— |
|
|
7,338 |
|
|
732 |
|
|
1,283 |
|
|
8,621 |
|
|
732 |
|
|
9,353 |
|
|
(2,339) |
|
|
2011 |
| Pineville |
|
10519 Industrial Drive |
|
— |
|
|
1,179 |
|
|
392 |
|
|
— |
|
|
1,179 |
|
|
392 |
|
|
1,571 |
|
|
(341) |
|
|
2012 |
| Rural Hall |
|
300 Forum Parkway |
|
— |
|
|
5,375 |
|
|
439 |
|
|
1,007 |
|
|
6,382 |
|
|
439 |
|
|
6,821 |
|
|
(2,215) |
|
|
2011 |
| Salisbury |
|
990 Cedar Springs Road |
|
— |
|
|
5,009 |
|
|
1,535 |
|
|
3,008 |
|
|
8,017 |
|
|
1,535 |
|
|
9,552 |
|
|
(2,021) |
|
|
2017 |
| Smithfield |
|
3250 Highway 70 Business West |
|
— |
|
|
10,397 |
|
|
613 |
|
|
1,245 |
|
|
11,642 |
|
|
613 |
|
|
12,255 |
|
|
(2,294) |
|
|
2011 |
| Troutman |
|
279 & 281 Old Murdock Road |
|
— |
|
|
13,124 |
|
|
802 |
|
|
297 |
|
|
13,421 |
|
|
802 |
|
|
14,223 |
|
|
(2,494) |
|
|
2018 |
| Winston-Salem |
|
2655 Annapolis Drive |
|
— |
|
|
10,716 |
|
|
610 |
|
|
80 |
|
|
10,796 |
|
|
610 |
|
|
11,406 |
|
|
(3,110) |
|
|
2014 |
| Youngsville |
|
200 K-Flex Way |
|
— |
|
|
16,150 |
|
|
1,836 |
|
|
— |
|
|
16,150 |
|
|
1,836 |
|
|
17,986 |
|
|
(2,815) |
|
|
2018 |
| Ohio |
|
|
|
|
|
|
|
|
|
|
|
|
|
|
|
|
|
|
|
|
| Bedford Heights |
|
26801 Fargo Avenue |
|
— |
|
|
5,267 |
|
|
837 |
|
|
1,019 |
|
|
6,286 |
|
|
837 |
|
|
7,123 |
|
|
(1,707) |
|
|
2017 |
| Boardman |
|
365 McClurg Road |
|
— |
|
|
3,473 |
|
|
282 |
|
|
1,197 |
|
|
4,670 |
|
|
282 |
|
|
4,952 |
|
|
(1,928) |
|
|
2007 |
| Canal Winchester |
|
6200-6250 Winchester Boulevard |
|
— |
|
|
37,431 |
|
|
6,403 |
|
|
— |
|
|
37,431 |
|
|
6,403 |
|
|
43,834 |
|
|
(2,813) |
|
|
2021 |
| Canal Winchester |
|
6260-6300 Winchester Boulevard |
|
— |
|
|
19,432 |
|
|
3,708 |
|
|
402 |
|
|
19,834 |
|
|
3,708 |
|
|
23,542 |
|
|
(1,670) |
|
|
2021 |
| Columbus |
|
1605 Westbelt Drive |
|
— |
|
|
5,222 |
|
|
337 |
|
|
195 |
|
|
5,417 |
|
|
337 |
|
|
5,754 |
|
|
(1,202) |
|
|
2017 |
| Columbus |
|
5330 Crosswinds Drive |
|
— |
|
|
45,112 |
|
|
3,410 |
|
|
458 |
|
|
45,570 |
|
|
3,410 |
|
|
48,980 |
|
|
(4,497) |
|
|
2020 |
| Columbus |
|
200 McCormick Boulevard |
|
— |
|
|
8,960 |
|
|
988 |
|
|
77 |
|
|
9,037 |
|
|
988 |
|
|
10,025 |
|
|
(595) |
|
|
2022 |
| Columbus |
|
3900-3990 Business Park Drive |
|
— |
|
|
2,976 |
|
|
489 |
|
|
657 |
|
|
3,633 |
|
|
489 |
|
|
4,122 |
|
|
(1,141) |
|
|
2014 |
| Dayton |
|
2815 South Gettysburg Avenue |
|
— |
|
|
5,896 |
|
|
331 |
|
|
529 |
|
|
6,425 |
|
|
331 |
|
|
6,756 |
|
|
(1,833) |
|
|
2015 |
| Etna |
|
8591 Mink Street SW |
|
— |
|
|
73,402 |
|
|
2,939 |
|
|
120 |
|
|
73,522 |
|
|
2,939 |
|
|
76,461 |
|
|
(7,643) |
|
|
2020 |
| Fairborn |
|
1340 E Dayton Yellow Springs Road |
|
— |
|
|
5,569 |
|
|
867 |
|
|
272 |
|
|
5,841 |
|
|
867 |
|
|
6,708 |
|
|
(1,887) |
|
|
2015 |
|
|
|
|
|
|
|
|
|
|
|
|
|
|
|
|
|
|
|
|
|
|
|
|
|
|
|
|
|
|
|
|
|
|
|
|
|
|
|
|
|
|
|
|
|
|
|
|
|
|
|
|
|
|
|
|
|
|
|
|
|
|
|
|
|
|
|
|
|
Initial Cost to STAG Industrial, Inc. |
|
|
|
Gross Amounts at Which Carried at December 31, 2023 |
|
|
|
|
| State & City |
|
Address |
|
Encumbrances(1) |
|
Building & Improvements(2) |
|
Land(3) |
|
Costs Capitalized Subsequent to Acquisition and Valuation Provision |
|
Building & Improvements |
|
Land |
|
Total |
|
Accumulated Depreciation(4) |
|
Year Acquired |
| Fairfield |
|
4275 Thunderbird Lane |
|
— |
|
|
2,788 |
|
|
948 |
|
|
1,175 |
|
|
3,963 |
|
|
948 |
|
|
4,911 |
|
|
(1,045) |
|
|
2016 |
| Fairfield |
|
3840 Port Union Road |
|
— |
|
|
5,337 |
|
|
1,086 |
|
|
390 |
|
|
5,727 |
|
|
1,086 |
|
|
6,813 |
|
|
(1,304) |
|
|
2018 |
| Gahanna |
|
1120 Morrison Road |
|
— |
|
|
3,806 |
|
|
1,265 |
|
|
3,805 |
|
|
7,611 |
|
|
1,265 |
|
|
8,876 |
|
|
(2,108) |
|
|
2011 |
| Groveport |
|
5830 Green Pointe Drive South |
|
— |
|
|
10,828 |
|
|
642 |
|
|
424 |
|
|
11,252 |
|
|
642 |
|
|
11,894 |
|
|
(2,258) |
|
|
2017 |
| Hilliard |
|
4251 Leap Road |
|
— |
|
|
7,412 |
|
|
550 |
|
|
1,498 |
|
|
8,910 |
|
|
550 |
|
|
9,460 |
|
|
(1,838) |
|
|
2017 |
| Macedonia |
|
8295 Bavaria Drive |
|
— |
|
|
10,219 |
|
|
1,001 |
|
|
107 |
|
|
10,326 |
|
|
1,001 |
|
|
11,327 |
|
|
(624) |
|
|
2022 |
| Macedonia |
|
1261 Highland Road |
|
— |
|
|
8,063 |
|
|
1,690 |
|
|
524 |
|
|
8,587 |
|
|
1,690 |
|
|
10,277 |
|
|
(2,245) |
|
|
2015 |
| Maple Heights |
|
16645 Granite Road |
|
— |
|
|
4,357 |
|
|
922 |
|
|
— |
|
|
4,357 |
|
|
922 |
|
|
5,279 |
|
|
(413) |
|
|
2021 |
| Mason |
|
7258 Innovation Way |
|
— |
|
|
4,582 |
|
|
673 |
|
|
— |
|
|
4,582 |
|
|
673 |
|
|
5,255 |
|
|
(1,280) |
|
|
2014 |
| North Jackson |
|
500 South Bailey Road |
|
— |
|
|
4,356 |
|
|
1,528 |
|
|
2,179 |
|
|
6,535 |
|
|
1,528 |
|
|
8,063 |
|
|
(1,458) |
|
|
2013 |
| North Jackson |
|
382 Rosemont Road |
|
— |
|
|
7,681 |
|
|
486 |
|
|
1,269 |
|
|
8,950 |
|
|
486 |
|
|
9,436 |
|
|
(2,296) |
|
|
2011 |
| Oakwood Village |
|
26350 Broadway |
|
— |
|
|
3,041 |
|
|
343 |
|
|
178 |
|
|
3,219 |
|
|
343 |
|
|
3,562 |
|
|
(907) |
|
|
2015 |
| Salem |
|
800 Pennsylvania Avenue |
|
— |
|
|
7,674 |
|
|
858 |
|
|
1,471 |
|
|
9,145 |
|
|
858 |
|
|
10,003 |
|
|
(3,556) |
|
|
2006 |
| Seville |
|
276 West Greenwich Road |
|
— |
|
|
1,591 |
|
|
273 |
|
|
212 |
|
|
1,803 |
|
|
273 |
|
|
2,076 |
|
|
(629) |
|
|
2011 |
| Streetsboro |
|
9777 Mopar Drive |
|
— |
|
|
4,909 |
|
|
2,161 |
|
|
1,157 |
|
|
6,066 |
|
|
2,161 |
|
|
8,227 |
|
|
(1,854) |
|
|
2011 |
| Strongsville |
|
14450 Foltz Industrial Parkway |
|
— |
|
|
16,487 |
|
|
1,315 |
|
|
— |
|
|
16,487 |
|
|
1,315 |
|
|
17,802 |
|
|
(1,291) |
|
|
2021 |
| Strongsville |
|
12930 Darice Parkway |
|
— |
|
|
5,750 |
|
|
491 |
|
|
963 |
|
|
6,713 |
|
|
491 |
|
|
7,204 |
|
|
(1,869) |
|
|
2014 |
| Toledo |
|
1800 Jason Street |
|
— |
|
|
6,487 |
|
|
213 |
|
|
250 |
|
|
6,737 |
|
|
213 |
|
|
6,950 |
|
|
(2,107) |
|
|
2012 |
| Twinsburg |
|
8601 Independence Parkway |
|
— |
|
|
19,772 |
|
|
3,855 |
|
|
— |
|
|
19,772 |
|
|
3,855 |
|
|
23,627 |
|
|
(2,042) |
|
|
2020 |
| Twinsburg |
|
7990 Bavaria Road |
|
— |
|
|
8,027 |
|
|
590 |
|
|
87 |
|
|
8,114 |
|
|
590 |
|
|
8,704 |
|
|
(3,037) |
|
|
2007 |
| West Chester |
|
9696 International Boulevard |
|
— |
|
|
8,868 |
|
|
936 |
|
|
— |
|
|
8,868 |
|
|
936 |
|
|
9,804 |
|
|
(2,135) |
|
|
2016 |
| West Jefferson |
|
1550 West Main Street |
|
— |
|
|
70,213 |
|
|
2,015 |
|
|
31 |
|
|
70,244 |
|
|
2,015 |
|
|
72,259 |
|
|
(10,849) |
|
|
2019 |
| Oklahoma |
|
|
|
|
|
|
|
|
|
|
|
|
|
|
|
|
|
|
|
|
| Oklahoma City |
|
4949 Southwest 20th Street |
|
— |
|
|
2,211 |
|
|
746 |
|
|
124 |
|
|
2,335 |
|
|
746 |
|
|
3,081 |
|
|
(830) |
|
|
2016 |
| Oklahoma City |
|
5101 South Council Road |
|
— |
|
|
9,199 |
|
|
1,614 |
|
|
1,466 |
|
|
10,665 |
|
|
1,614 |
|
|
12,279 |
|
|
(2,854) |
|
|
2015 |
| Tulsa |
|
11607 E. 43rd Street North |
|
— |
|
|
8,242 |
|
|
966 |
|
|
— |
|
|
8,242 |
|
|
966 |
|
|
9,208 |
|
|
(2,405) |
|
|
2015 |
| Tulsa |
|
10757 East Ute Street |
|
— |
|
|
7,167 |
|
|
644 |
|
|
125 |
|
|
7,292 |
|
|
644 |
|
|
7,936 |
|
|
(946) |
|
|
2020 |
| Oregon |
|
|
|
|
|
|
|
|
|
|
|
|
|
|
|
|
|
|
|
|
| Beaverton |
|
5805 SW 107th Avenue |
|
— |
|
|
10,602 |
|
|
2,463 |
|
|
— |
|
|
10,602 |
|
|
2,463 |
|
|
13,065 |
|
|
(162) |
|
|
2023 |
| Beaverton |
|
5807 SW 107th Avenue |
|
— |
|
|
4,936 |
|
|
1,237 |
|
|
— |
|
|
4,936 |
|
|
1,237 |
|
|
6,173 |
|
|
(77) |
|
|
2023 |
| Salem |
|
4060 Fairview Industrial Drive |
|
— |
|
|
3,039 |
|
|
599 |
|
|
821 |
|
|
3,860 |
|
|
599 |
|
|
4,459 |
|
|
(1,272) |
|
|
2011 |
| Salem |
|
4050 Fairview Industrial Drive |
|
— |
|
|
1,372 |
|
|
266 |
|
|
562 |
|
|
1,934 |
|
|
266 |
|
|
2,200 |
|
|
(658) |
|
|
2011 |
| Wilsonville |
|
9400 SW Barber Street |
|
— |
|
|
10,142 |
|
|
696 |
|
|
79 |
|
|
10,221 |
|
|
696 |
|
|
10,917 |
|
|
(403) |
|
|
2022 |
| Pennsylvania |
|
|
|
|
|
|
|
|
|
|
|
|
|
|
|
|
|
|
|
|
| Allentown |
|
6670 Grant Way |
|
— |
|
|
9,945 |
|
|
1,237 |
|
|
24 |
|
|
9,969 |
|
|
1,237 |
|
|
11,206 |
|
|
(147) |
|
|
2023 |
| Allentown |
|
6690 Grant Way |
|
— |
|
|
11,735 |
|
|
1,535 |
|
|
27 |
|
|
11,762 |
|
|
1,535 |
|
|
13,297 |
|
|
(172) |
|
|
2023 |
| Allentown |
|
7072 Snowdrift Road |
|
— |
|
|
7,008 |
|
|
1,088 |
|
|
— |
|
|
7,008 |
|
|
1,088 |
|
|
8,096 |
|
|
(121) |
|
|
2023 |
| Allentown |
|
7132 Daniels Drive |
|
— |
|
|
7,199 |
|
|
1,962 |
|
|
2,130 |
|
|
9,329 |
|
|
1,962 |
|
|
11,291 |
|
|
(2,756) |
|
|
2014 |
| Burgettstown |
|
157 Starpointe Boulevard |
|
— |
|
|
23,416 |
|
|
1,248 |
|
|
178 |
|
|
23,594 |
|
|
1,248 |
|
|
24,842 |
|
|
(3,854) |
|
|
2019 |
| Charleroi |
|
200 Simko Boulevard |
|
— |
|
|
10,539 |
|
|
935 |
|
|
136 |
|
|
10,675 |
|
|
935 |
|
|
11,610 |
|
|
(1,972) |
|
|
2018 |
| Clinton |
|
2300 Sweeney Drive |
|
— |
|
|
19,339 |
|
|
— |
|
|
25 |
|
|
19,364 |
|
|
— |
|
|
19,364 |
|
|
(4,235) |
|
|
2017 |
| Clinton |
|
2251 Sweeney Drive |
|
— |
|
|
12,390 |
|
|
— |
|
|
— |
|
|
12,390 |
|
|
— |
|
|
12,390 |
|
|
(2,135) |
|
|
2018 |
|
|
|
|
|
|
|
|
|
|
|
|
|
|
|
|
|
|
|
|
|
|
|
|
|
|
|
|
|
|
|
|
|
|
|
|
|
|
|
|
|
|
|
|
|
|
|
|
|
|
|
|
|
|
|
|
|
|
|
|
|
|
|
|
|
|
|
|
|
Initial Cost to STAG Industrial, Inc. |
|
|
|
Gross Amounts at Which Carried at December 31, 2023 |
|
|
|
|
| State & City |
|
Address |
|
Encumbrances(1) |
|
Building & Improvements(2) |
|
Land(3) |
|
Costs Capitalized Subsequent to Acquisition and Valuation Provision |
|
Building & Improvements |
|
Land |
|
Total |
|
Accumulated Depreciation(4) |
|
Year Acquired |
| Clinton |
|
2400 Sweeney Drive Extension |
|
— |
|
|
16,840 |
|
|
— |
|
|
931 |
|
|
17,771 |
|
|
— |
|
|
17,771 |
|
|
(2,807) |
|
|
2018 |
| Clinton |
|
1200 Clifford Ball Drive |
|
— |
|
|
10,524 |
|
|
— |
|
|
— |
|
|
10,524 |
|
|
— |
|
|
10,524 |
|
|
(1,136) |
|
|
2020 |
| Clinton |
|
1111 Clifford Ball Drive |
|
— |
|
|
5,668 |
|
|
— |
|
|
— |
|
|
5,668 |
|
|
— |
|
|
5,668 |
|
|
(623) |
|
|
2020 |
| Clinton |
|
1300 Clifford Ball Drive |
|
— |
|
|
18,152 |
|
|
— |
|
|
— |
|
|
18,152 |
|
|
— |
|
|
18,152 |
|
|
(1,889) |
|
|
2020 |
| Clinton |
|
1100 Clifford Ball Drive |
|
— |
|
|
40,282 |
|
|
— |
|
|
7 |
|
|
40,289 |
|
|
— |
|
|
40,289 |
|
|
(2,561) |
|
|
2022 |
| Croydon |
|
3001 State Road |
|
— |
|
|
4,628 |
|
|
829 |
|
|
— |
|
|
4,628 |
|
|
829 |
|
|
5,457 |
|
|
(871) |
|
|
2018 |
| Elizabethtown |
|
11 and 33 Industrial Road |
|
— |
|
|
5,315 |
|
|
1,000 |
|
|
804 |
|
|
6,119 |
|
|
1,000 |
|
|
7,119 |
|
|
(1,672) |
|
|
2014 |
| Export |
|
1003 Corporate Lane |
|
— |
|
|
5,604 |
|
|
667 |
|
|
155 |
|
|
5,759 |
|
|
667 |
|
|
6,426 |
|
|
(946) |
|
|
2019 |
| Hazleton |
|
69 Green Mountain Road |
|
— |
|
|
43,685 |
|
|
4,995 |
|
|
1,162 |
|
|
44,847 |
|
|
4,995 |
|
|
49,842 |
|
|
(3,459) |
|
|
2021 |
| Imperial |
|
200 Solar Drive |
|
— |
|
|
22,135 |
|
|
1,762 |
|
|
— |
|
|
22,135 |
|
|
1,762 |
|
|
23,897 |
|
|
(2,965) |
|
|
2019 |
| Kulpsville |
|
1510 Gehman Road |
|
— |
|
|
10,390 |
|
|
3,171 |
|
|
— |
|
|
10,390 |
|
|
3,171 |
|
|
13,561 |
|
|
(196) |
|
|
2023 |
| Lancaster |
|
2919 Old Tree Drive |
|
— |
|
|
5,134 |
|
|
1,520 |
|
|
1,280 |
|
|
6,414 |
|
|
1,520 |
|
|
7,934 |
|
|
(2,167) |
|
|
2015 |
| Langhorne |
|
2151 Cabot Boulevard West |
|
— |
|
|
3,771 |
|
|
1,370 |
|
|
103 |
|
|
3,874 |
|
|
1,370 |
|
|
5,244 |
|
|
(911) |
|
|
2016 |
| Langhorne |
|
2201 Cabot Boulevard West |
|
— |
|
|
3,018 |
|
|
1,308 |
|
|
528 |
|
|
3,546 |
|
|
1,308 |
|
|
4,854 |
|
|
(1,059) |
|
|
2016 |
| Langhorne |
|
121 Wheeler Court |
|
— |
|
|
6,327 |
|
|
1,884 |
|
|
1,083 |
|
|
7,410 |
|
|
1,884 |
|
|
9,294 |
|
|
(1,794) |
|
|
2016 |
| Langhorne |
|
1 Cabot Boulevard East |
|
— |
|
|
4,203 |
|
|
1,155 |
|
|
83 |
|
|
4,286 |
|
|
1,155 |
|
|
5,441 |
|
|
(766) |
|
|
2020 |
| Lebanon |
|
1 Keystone Drive |
|
— |
|
|
5,083 |
|
|
1,380 |
|
|
731 |
|
|
5,814 |
|
|
1,380 |
|
|
7,194 |
|
|
(1,969) |
|
|
2017 |
| Mechanicsburg |
|
6350 Brackbill Boulevard |
|
— |
|
|
5,079 |
|
|
1,482 |
|
|
1,813 |
|
|
6,892 |
|
|
1,482 |
|
|
8,374 |
|
|
(1,802) |
|
|
2014 |
| Mechanicsburg |
|
6360 Brackbill Boulevard |
|
— |
|
|
7,042 |
|
|
1,800 |
|
|
989 |
|
|
8,031 |
|
|
1,800 |
|
|
9,831 |
|
|
(2,133) |
|
|
2014 |
| Mechanicsburg |
|
245 Salem Church Road |
|
— |
|
|
7,977 |
|
|
1,452 |
|
|
726 |
|
|
8,703 |
|
|
1,452 |
|
|
10,155 |
|
|
(2,384) |
|
|
2014 |
| Muhlenberg Township |
|
171-173 Tuckerton Road |
|
— |
|
|
13,784 |
|
|
843 |
|
|
2,498 |
|
|
16,282 |
|
|
843 |
|
|
17,125 |
|
|
(4,789) |
|
|
2012 |
| New Galilee |
|
1750 Shenango Road |
|
— |
|
|
25,553 |
|
|
1,127 |
|
|
354 |
|
|
25,907 |
|
|
1,127 |
|
|
27,034 |
|
|
(3,531) |
|
|
2019 |
| New Kensington |
|
115 Hunt Valley Road |
|
— |
|
|
9,145 |
|
|
177 |
|
|
— |
|
|
9,145 |
|
|
177 |
|
|
9,322 |
|
|
(1,487) |
|
|
2018 |
| New Kingstown |
|
6 Doughten Road |
|
— |
|
|
8,625 |
|
|
2,041 |
|
|
619 |
|
|
9,244 |
|
|
2,041 |
|
|
11,285 |
|
|
(2,628) |
|
|
2014 |
| O'Hara Township |
|
100 Papercraft Park |
|
— |
|
|
18,612 |
|
|
1,435 |
|
|
8,226 |
|
|
26,838 |
|
|
1,435 |
|
|
28,273 |
|
|
(9,038) |
|
|
2012 |
| Pittston |
|
One Commerce Road |
|
— |
|
|
19,603 |
|
|
677 |
|
|
97 |
|
|
19,700 |
|
|
677 |
|
|
20,377 |
|
|
(3,807) |
|
|
2017 |
| Reading |
|
2001 Centre Avenue |
|
— |
|
|
5,294 |
|
|
1,708 |
|
|
1,554 |
|
|
6,848 |
|
|
1,708 |
|
|
8,556 |
|
|
(1,355) |
|
|
2016 |
| Warrendale |
|
410-426 Keystone Drive |
|
— |
|
|
12,089 |
|
|
1,853 |
|
|
786 |
|
|
12,875 |
|
|
1,853 |
|
|
14,728 |
|
|
(2,151) |
|
|
2018 |
| York |
|
2925 East Market Street |
|
— |
|
|
14,209 |
|
|
2,152 |
|
|
381 |
|
|
14,590 |
|
|
2,152 |
|
|
16,742 |
|
|
(2,678) |
|
|
2017 |
| York |
|
57 Grumbacher Road |
|
— |
|
|
14,832 |
|
|
966 |
|
|
28 |
|
|
14,860 |
|
|
966 |
|
|
15,826 |
|
|
(2,451) |
|
|
2018 |
| York |
|
420 Emig Road |
|
— |
|
|
7,886 |
|
|
869 |
|
|
— |
|
|
7,886 |
|
|
869 |
|
|
8,755 |
|
|
(1,537) |
|
|
2019 |
| York |
|
915 Woodland View Drive |
|
— |
|
|
5,754 |
|
|
1,139 |
|
|
151 |
|
|
5,905 |
|
|
1,139 |
|
|
7,044 |
|
|
(491) |
|
|
2021 |
| York |
|
2800 Concord Road |
|
— |
|
|
21,154 |
|
|
1,478 |
|
|
1,332 |
|
|
22,486 |
|
|
1,478 |
|
|
23,964 |
|
|
(1,570) |
|
|
2021 |
| South Carolina |
|
|
|
|
|
|
|
|
|
|
|
|
|
|
|
|
|
|
|
|
| Columbia |
|
128 Crews Drive |
|
— |
|
|
5,171 |
|
|
783 |
|
|
287 |
|
|
5,458 |
|
|
783 |
|
|
6,241 |
|
|
(1,439) |
|
|
2016 |
| Duncan |
|
110 Hidden Lakes Circle |
|
— |
|
|
10,981 |
|
|
1,002 |
|
|
2,685 |
|
|
13,666 |
|
|
1,002 |
|
|
14,668 |
|
|
(4,207) |
|
|
2012 |
| Duncan |
|
112 Hidden Lakes Circle |
|
— |
|
|
6,739 |
|
|
709 |
|
|
1,586 |
|
|
8,325 |
|
|
709 |
|
|
9,034 |
|
|
(2,675) |
|
|
2012 |
| Duncan |
|
175 Spartangreen Boulevard |
|
— |
|
|
12,390 |
|
|
936 |
|
|
52 |
|
|
12,442 |
|
|
936 |
|
|
13,378 |
|
|
(933) |
|
|
2021 |
| Edgefield |
|
One Tranter Drive |
|
— |
|
|
938 |
|
|
220 |
|
|
887 |
|
|
1,825 |
|
|
220 |
|
|
2,045 |
|
|
(770) |
|
|
2012 |
| Fountain Inn |
|
107 Southchase Boulevard |
|
— |
|
|
8,308 |
|
|
766 |
|
|
577 |
|
|
8,885 |
|
|
766 |
|
|
9,651 |
|
|
(1,735) |
|
|
2018 |
| Fountain Inn |
|
141 Southchase Boulevard |
|
— |
|
|
14,984 |
|
|
1,878 |
|
|
81 |
|
|
15,065 |
|
|
1,878 |
|
|
16,943 |
|
|
(3,353) |
|
|
2017 |
|
|
|
|
|
|
|
|
|
|
|
|
|
|
|
|
|
|
|
|
|
|
|
|
|
|
|
|
|
|
|
|
|
|
|
|
|
|
|
|
|
|
|
|
|
|
|
|
|
|
|
|
|
|
|
|
|
|
|
|
|
|
|
|
|
|
|
|
|
Initial Cost to STAG Industrial, Inc. |
|
|
|
Gross Amounts at Which Carried at December 31, 2023 |
|
|
|
|
| State & City |
|
Address |
|
Encumbrances(1) |
|
Building & Improvements(2) |
|
Land(3) |
|
Costs Capitalized Subsequent to Acquisition and Valuation Provision |
|
Building & Improvements |
|
Land |
|
Total |
|
Accumulated Depreciation(4) |
|
Year Acquired |
| Fountain Inn |
|
111 Southchase Boulevard |
|
— |
|
|
4,260 |
|
|
719 |
|
|
95 |
|
|
4,355 |
|
|
719 |
|
|
5,074 |
|
|
(1,225) |
|
|
2016 |
| Gaffney |
|
50 Peachview Boulevard |
|
— |
|
|
4,383 |
|
|
1,233 |
|
|
2,286 |
|
|
6,669 |
|
|
1,233 |
|
|
7,902 |
|
|
(1,427) |
|
|
2017 |
| Goose Creek |
|
6 Corporate Parkway |
|
— |
|
|
29,360 |
|
|
4,459 |
|
|
— |
|
|
29,360 |
|
|
4,459 |
|
|
33,819 |
|
|
(4,323) |
|
|
2019 |
| Greenwood |
|
215 Mill Avenue |
|
— |
|
|
1,824 |
|
|
166 |
|
|
641 |
|
|
2,465 |
|
|
166 |
|
|
2,631 |
|
|
(668) |
|
|
2012 |
| Greenwood |
|
308-310 Maxwell Avenue |
|
— |
|
|
1,168 |
|
|
169 |
|
|
848 |
|
|
2,016 |
|
|
169 |
|
|
2,185 |
|
|
(554) |
|
|
2012 |
| Greer |
|
8 Shelter Drive |
|
— |
|
|
4,939 |
|
|
681 |
|
|
3,478 |
|
|
8,417 |
|
|
681 |
|
|
9,098 |
|
|
(1,859) |
|
|
2018 |
| Greer |
|
1000 Robinson Road |
|
— |
|
|
25,631 |
|
|
849 |
|
|
— |
|
|
25,631 |
|
|
849 |
|
|
26,480 |
|
|
(1,461) |
|
|
2021 |
| Greer |
|
1817 East Poinsett Street |
|
— |
|
|
66,163 |
|
|
3,674 |
|
|
— |
|
|
66,163 |
|
|
3,674 |
|
|
69,837 |
|
|
— |
|
|
2022 |
| Greer |
|
1809 East Poinsett Street |
|
— |
|
|
627 |
|
|
1,885 |
|
|
— |
|
|
627 |
|
|
1,885 |
|
|
2,512 |
|
|
— |
|
|
2022 |
| Greer |
|
129 Metro Court |
|
— |
|
|
1,434 |
|
|
129 |
|
|
392 |
|
|
1,826 |
|
|
129 |
|
|
1,955 |
|
|
(508) |
|
|
2015 |
| Greer |
|
149 Metro Court |
|
— |
|
|
1,731 |
|
|
128 |
|
|
558 |
|
|
2,289 |
|
|
128 |
|
|
2,417 |
|
|
(563) |
|
|
2015 |
| Greer |
|
153 Metro Court |
|
— |
|
|
460 |
|
|
153 |
|
|
155 |
|
|
615 |
|
|
153 |
|
|
768 |
|
|
(207) |
|
|
2015 |
| Greer |
|
154 Metro Court |
|
— |
|
|
2,963 |
|
|
306 |
|
|
959 |
|
|
3,922 |
|
|
306 |
|
|
4,228 |
|
|
(1,055) |
|
|
2015 |
| Laurens |
|
103 Cherry Blossom Drive |
|
— |
|
|
4,033 |
|
|
151 |
|
|
52 |
|
|
4,085 |
|
|
151 |
|
|
4,236 |
|
|
(970) |
|
|
2015 |
| Piedmont |
|
1100 Piedmont Highway |
|
— |
|
|
4,093 |
|
|
231 |
|
|
450 |
|
|
4,543 |
|
|
231 |
|
|
4,774 |
|
|
(1,135) |
|
|
2015 |
| Piedmont |
|
1102 Piedmont Highway |
|
— |
|
|
2,092 |
|
|
158 |
|
|
45 |
|
|
2,137 |
|
|
158 |
|
|
2,295 |
|
|
(535) |
|
|
2015 |
| Piedmont |
|
1104 Piedmont Highway |
|
— |
|
|
2,166 |
|
|
204 |
|
|
— |
|
|
2,166 |
|
|
204 |
|
|
2,370 |
|
|
(671) |
|
|
2015 |
| Piedmont |
|
513 Old Griffin Road |
|
— |
|
|
9,260 |
|
|
797 |
|
|
2,022 |
|
|
11,282 |
|
|
797 |
|
|
12,079 |
|
|
(1,818) |
|
|
2018 |
| Piedmont |
|
1610 Old Grove Road |
|
— |
|
|
18,893 |
|
|
1,971 |
|
|
— |
|
|
18,893 |
|
|
1,971 |
|
|
20,864 |
|
|
(4,406) |
|
|
2019 |
| Piedmont |
|
100 Exchange Logistics Park Drive |
|
— |
|
|
25,151 |
|
|
569 |
|
|
1,001 |
|
|
26,152 |
|
|
569 |
|
|
26,721 |
|
|
(1,445) |
|
|
2022 |
| Piedmont |
|
119 Matrix Parkway |
|
— |
|
|
13,912 |
|
|
331 |
|
|
56 |
|
|
13,968 |
|
|
331 |
|
|
14,299 |
|
|
(799) |
|
|
2022 |
| Rock Hill |
|
2751 Commerce Drive, Unit C |
|
— |
|
|
6,146 |
|
|
1,411 |
|
|
1,222 |
|
|
7,368 |
|
|
1,411 |
|
|
8,779 |
|
|
(1,767) |
|
|
2016 |
| Rock Hill |
|
1953 Langston Street |
|
— |
|
|
4,333 |
|
|
1,095 |
|
|
948 |
|
|
5,281 |
|
|
1,095 |
|
|
6,376 |
|
|
(1,224) |
|
|
2017 |
| Rock Hill |
|
2225 Williams Industrial Boulevard |
|
— |
|
|
10,903 |
|
|
1,118 |
|
|
— |
|
|
10,903 |
|
|
1,118 |
|
|
12,021 |
|
|
(1,227) |
|
|
2020 |
| Simpsonville |
|
101 Harrison Bridge Road |
|
— |
|
|
2,960 |
|
|
957 |
|
|
3,659 |
|
|
6,619 |
|
|
957 |
|
|
7,576 |
|
|
(1,896) |
|
|
2012 |
| Simpsonville |
|
103 Harrison Bridge Road |
|
— |
|
|
3,364 |
|
|
470 |
|
|
1,071 |
|
|
4,435 |
|
|
470 |
|
|
4,905 |
|
|
(1,371) |
|
|
2012 |
| Simpsonville |
|
1312 Old Stage Road |
|
— |
|
|
24,200 |
|
|
1,454 |
|
|
3,426 |
|
|
27,626 |
|
|
1,454 |
|
|
29,080 |
|
|
(4,682) |
|
|
2018 |
| Spartanburg |
|
5675 North Blackstock Road |
|
— |
|
|
14,791 |
|
|
1,867 |
|
|
806 |
|
|
15,597 |
|
|
1,867 |
|
|
17,464 |
|
|
(4,045) |
|
|
2016 |
| Spartanburg |
|
950 Brisack Road |
|
— |
|
|
3,564 |
|
|
342 |
|
|
2,084 |
|
|
5,648 |
|
|
342 |
|
|
5,990 |
|
|
(1,393) |
|
|
2014 |
| Spartanburg |
|
2071 Fryml Drive |
|
— |
|
|
7,509 |
|
|
663 |
|
|
161 |
|
|
7,670 |
|
|
663 |
|
|
8,333 |
|
|
(1,168) |
|
|
2019 |
| Spartanburg |
|
2171 Fryml Drive |
|
— |
|
|
4,480 |
|
|
530 |
|
|
86 |
|
|
4,566 |
|
|
530 |
|
|
5,096 |
|
|
(850) |
|
|
2019 |
| Spartanburg |
|
2010 Nazareth Church Road |
|
— |
|
|
16,535 |
|
|
895 |
|
|
745 |
|
|
17,280 |
|
|
895 |
|
|
18,175 |
|
|
(2,683) |
|
|
2019 |
| Spartanburg |
|
150-160 National Avenue |
|
— |
|
|
5,797 |
|
|
493 |
|
|
1,019 |
|
|
6,816 |
|
|
493 |
|
|
7,309 |
|
|
(2,110) |
|
|
2012 |
| Summerville |
|
105 Eastport Lane |
|
— |
|
|
4,710 |
|
|
1,157 |
|
|
534 |
|
|
5,244 |
|
|
1,157 |
|
|
6,401 |
|
|
(751) |
|
|
2019 |
| Wellford |
|
462 Casual Drive |
|
— |
|
|
16,147 |
|
|
2,588 |
|
|
— |
|
|
16,147 |
|
|
2,588 |
|
|
18,735 |
|
|
(135) |
|
|
2023 |
| Wellford |
|
452 Casual Drive |
|
— |
|
|
16,554 |
|
|
2,548 |
|
|
— |
|
|
16,554 |
|
|
2,548 |
|
|
19,102 |
|
|
— |
|
|
2023 |
| West Columbia |
|
185 McQueen Street |
|
— |
|
|
6,946 |
|
|
715 |
|
|
2,355 |
|
|
9,301 |
|
|
715 |
|
|
10,016 |
|
|
(2,689) |
|
|
2013 |
| West Columbia |
|
610 Kelsey Court |
|
— |
|
|
9,488 |
|
|
488 |
|
|
— |
|
|
9,488 |
|
|
488 |
|
|
9,976 |
|
|
(1,957) |
|
|
2016 |
| West Columbia |
|
825 Bistline Drive |
|
— |
|
|
9,151 |
|
|
240 |
|
|
1,008 |
|
|
10,159 |
|
|
240 |
|
|
10,399 |
|
|
(2,004) |
|
|
2017 |
| West Columbia |
|
810 Bistline Drive |
|
— |
|
|
10,881 |
|
|
564 |
|
|
— |
|
|
10,881 |
|
|
564 |
|
|
11,445 |
|
|
(1,609) |
|
|
2019 |
| West Columbia |
|
1000 Technology Drive |
|
— |
|
|
26,023 |
|
|
1,422 |
|
|
5 |
|
|
26,028 |
|
|
1,422 |
|
|
27,450 |
|
|
(4,521) |
|
|
2019 |
| West Columbia |
|
842 Bistline Drive |
|
— |
|
|
12,723 |
|
|
1,217 |
|
|
1,749 |
|
|
14,472 |
|
|
1,217 |
|
|
15,689 |
|
|
(1,250) |
|
|
2021 |
|
|
|
|
|
|
|
|
|
|
|
|
|
|
|
|
|
|
|
|
|
|
|
|
|
|
|
|
|
|
|
|
|
|
|
|
|
|
|
|
|
|
|
|
|
|
|
|
|
|
|
|
|
|
|
|
|
|
|
|
|
|
|
|
|
|
|
|
|
Initial Cost to STAG Industrial, Inc. |
|
|
|
Gross Amounts at Which Carried at December 31, 2023 |
|
|
|
|
| State & City |
|
Address |
|
Encumbrances(1) |
|
Building & Improvements(2) |
|
Land(3) |
|
Costs Capitalized Subsequent to Acquisition and Valuation Provision |
|
Building & Improvements |
|
Land |
|
Total |
|
Accumulated Depreciation(4) |
|
Year Acquired |
| West Columbia |
|
222 Old Wire Road |
|
— |
|
|
4,646 |
|
|
551 |
|
|
2,301 |
|
|
6,947 |
|
|
551 |
|
|
7,498 |
|
|
(2,419) |
|
|
2016 |
| Tennessee |
|
|
|
|
|
|
|
|
|
|
|
|
|
|
|
|
|
|
|
|
| Chattanooga |
|
1800 Crutchfield Street Building A |
|
— |
|
|
2,181 |
|
|
187 |
|
|
14 |
|
|
2,195 |
|
|
187 |
|
|
2,382 |
|
|
(539) |
|
|
2015 |
| Chattanooga |
|
1800 Crutchfield Street Building B |
|
— |
|
|
4,448 |
|
|
380 |
|
|
84 |
|
|
4,532 |
|
|
380 |
|
|
4,912 |
|
|
(1,121) |
|
|
2015 |
| Chattanooga |
|
1295 Stuart Street |
|
— |
|
|
7,959 |
|
|
424 |
|
|
397 |
|
|
8,356 |
|
|
424 |
|
|
8,780 |
|
|
(2,541) |
|
|
2015 |
| Cleveland |
|
4405 Michigan Avenue Road NE |
|
— |
|
|
3,161 |
|
|
554 |
|
|
84 |
|
|
3,245 |
|
|
554 |
|
|
3,799 |
|
|
(1,204) |
|
|
2011 |
| Clinton |
|
1330 Carden Farm Drive |
|
— |
|
|
3,101 |
|
|
403 |
|
|
241 |
|
|
3,342 |
|
|
403 |
|
|
3,745 |
|
|
(924) |
|
|
2015 |
| Jackson |
|
1094 Flex Drive |
|
— |
|
|
2,374 |
|
|
230 |
|
|
628 |
|
|
3,002 |
|
|
230 |
|
|
3,232 |
|
|
(1,070) |
|
|
2012 |
| Knoxville |
|
2525 Quality Drive |
|
— |
|
|
3,104 |
|
|
447 |
|
|
433 |
|
|
3,537 |
|
|
447 |
|
|
3,984 |
|
|
(905) |
|
|
2015 |
| Knoxville |
|
2522 and 2526 Westcott Boulevard |
|
— |
|
|
4,919 |
|
|
472 |
|
|
728 |
|
|
5,647 |
|
|
472 |
|
|
6,119 |
|
|
(886) |
|
|
2018 |
| Knoxville |
|
5700 Casey Drive |
|
— |
|
|
7,812 |
|
|
1,117 |
|
|
811 |
|
|
8,623 |
|
|
1,117 |
|
|
9,740 |
|
|
(1,593) |
|
|
2019 |
| Lebanon |
|
535 Maddox-Simpson Parkway |
|
— |
|
|
15,890 |
|
|
468 |
|
|
50 |
|
|
15,940 |
|
|
468 |
|
|
16,408 |
|
|
(3,424) |
|
|
2019 |
| Lebanon |
|
675 Maddox-Simpson Parkway |
|
— |
|
|
5,891 |
|
|
519 |
|
|
— |
|
|
5,891 |
|
|
519 |
|
|
6,410 |
|
|
(389) |
|
|
2021 |
| Lebanon |
|
Maddox-Simpson Parkway |
|
— |
|
|
430 |
|
|
549 |
|
|
— |
|
|
430 |
|
|
549 |
|
|
979 |
|
|
— |
|
|
2019 |
| Loudon |
|
1700 Elizabeth Lee Parkway |
|
— |
|
|
3,686 |
|
|
170 |
|
|
2,113 |
|
|
5,799 |
|
|
170 |
|
|
5,969 |
|
|
(1,220) |
|
|
2015 |
| Madison |
|
538 Myatt Drive |
|
— |
|
|
2,790 |
|
|
1,655 |
|
|
1,891 |
|
|
4,681 |
|
|
1,655 |
|
|
6,336 |
|
|
(2,742) |
|
|
2011 |
| Mascot |
|
9575 Commission Drive |
|
— |
|
|
3,179 |
|
|
284 |
|
|
75 |
|
|
3,254 |
|
|
284 |
|
|
3,538 |
|
|
(924) |
|
|
2016 |
| Mascot |
|
2122 Holston Bend Drive |
|
— |
|
|
11,092 |
|
|
385 |
|
|
611 |
|
|
11,703 |
|
|
385 |
|
|
12,088 |
|
|
(1,291) |
|
|
2013 |
| Memphis |
|
7625 Appling Center Drive |
|
— |
|
|
13,463 |
|
|
539 |
|
|
— |
|
|
13,463 |
|
|
539 |
|
|
14,002 |
|
|
(830) |
|
|
2022 |
| Memphis |
|
4880 East Tuggle Road |
|
— |
|
|
41,078 |
|
|
2,501 |
|
|
1,539 |
|
|
42,617 |
|
|
2,501 |
|
|
45,118 |
|
|
(6,358) |
|
|
2019 |
| Murfreesboro |
|
1975 Joe B. Jackson Parkway |
|
— |
|
|
9,617 |
|
|
2,206 |
|
|
6 |
|
|
9,623 |
|
|
2,206 |
|
|
11,829 |
|
|
(570) |
|
|
2022 |
| Murfreesboro |
|
540 New Salem Road |
|
— |
|
|
2,799 |
|
|
722 |
|
|
151 |
|
|
2,950 |
|
|
722 |
|
|
3,672 |
|
|
(1,011) |
|
|
2014 |
| Nashville |
|
3258 Ezell Pike |
|
— |
|
|
3,455 |
|
|
547 |
|
|
276 |
|
|
3,731 |
|
|
547 |
|
|
4,278 |
|
|
(981) |
|
|
2013 |
| Vonore |
|
90 Deer Crossing Road |
|
— |
|
|
7,821 |
|
|
2,355 |
|
|
85 |
|
|
7,906 |
|
|
2,355 |
|
|
10,261 |
|
|
(2,547) |
|
|
2011 |
| Texas |
|
|
|
|
|
|
|
|
|
|
|
|
|
|
|
|
|
|
|
|
| Arlington |
|
3311 Pinewood Drive |
|
— |
|
|
2,374 |
|
|
413 |
|
|
385 |
|
|
2,759 |
|
|
413 |
|
|
3,172 |
|
|
(1,122) |
|
|
2007 |
| Arlington |
|
401 N. Great Southwest Parkway |
|
— |
|
|
5,767 |
|
|
1,246 |
|
|
1,438 |
|
|
7,205 |
|
|
1,246 |
|
|
8,451 |
|
|
(2,043) |
|
|
2012 |
| Cedar Hill |
|
1650 U.S. Highway 67 |
|
— |
|
|
11,870 |
|
|
4,066 |
|
|
1,919 |
|
|
13,789 |
|
|
4,066 |
|
|
17,855 |
|
|
(4,177) |
|
|
2016 |
| Conroe |
|
16548 Donwick Drive |
|
— |
|
|
20,995 |
|
|
1,853 |
|
|
1,018 |
|
|
22,013 |
|
|
1,853 |
|
|
23,866 |
|
|
(3,594) |
|
|
2018 |
| El Paso |
|
32 Celerity Wagon |
|
— |
|
|
3,532 |
|
|
— |
|
|
264 |
|
|
3,796 |
|
|
— |
|
|
3,796 |
|
|
(819) |
|
|
2017 |
| El Paso |
|
48 Walter Jones Boulevard |
|
— |
|
|
10,250 |
|
|
— |
|
|
304 |
|
|
10,554 |
|
|
— |
|
|
10,554 |
|
|
(2,479) |
|
|
2017 |
| El Paso |
|
1601 Northwestern Drive |
|
— |
|
|
9,052 |
|
|
1,248 |
|
|
850 |
|
|
9,902 |
|
|
1,248 |
|
|
11,150 |
|
|
(2,768) |
|
|
2014 |
| El Paso |
|
6500 N. Desert Boulevard |
|
— |
|
|
7,518 |
|
|
1,124 |
|
|
474 |
|
|
7,992 |
|
|
1,124 |
|
|
9,116 |
|
|
(2,279) |
|
|
2014 |
| El Paso |
|
1550 Northwestern Drive |
|
— |
|
|
14,011 |
|
|
1,854 |
|
|
2,433 |
|
|
16,444 |
|
|
1,854 |
|
|
18,298 |
|
|
(4,542) |
|
|
2014 |
| El Paso |
|
1701 Northwestern Drive |
|
— |
|
|
9,897 |
|
|
1,581 |
|
|
2,031 |
|
|
11,928 |
|
|
1,581 |
|
|
13,509 |
|
|
(3,069) |
|
|
2014 |
| El Paso |
|
7801 Northern Pass Road |
|
— |
|
|
5,893 |
|
|
1,136 |
|
|
— |
|
|
5,893 |
|
|
1,136 |
|
|
7,029 |
|
|
(1,842) |
|
|
2015 |
| El Paso |
|
12285 Gateway Boulevard West |
|
— |
|
|
22,548 |
|
|
1,725 |
|
|
— |
|
|
22,548 |
|
|
1,725 |
|
|
24,273 |
|
|
(1,529) |
|
|
2021 |
| El Paso |
|
9571 Pan American Drive |
|
— |
|
|
9,382 |
|
|
1,101 |
|
|
— |
|
|
9,382 |
|
|
1,101 |
|
|
10,483 |
|
|
(434) |
|
|
2022 |
| El Paso |
|
9555 Plaza Circle |
|
— |
|
|
4,666 |
|
|
626 |
|
|
146 |
|
|
4,812 |
|
|
626 |
|
|
5,438 |
|
|
(270) |
|
|
2022 |
| El Paso |
|
9494 Escobar Drive |
|
— |
|
|
8,551 |
|
|
701 |
|
|
— |
|
|
8,551 |
|
|
701 |
|
|
9,252 |
|
|
(400) |
|
|
2022 |
| El Paso |
|
47 Butterfield Circle & 12 Leigh Fisher Boulevard |
|
— |
|
|
3,000 |
|
|
— |
|
|
1,832 |
|
|
4,832 |
|
|
— |
|
|
4,832 |
|
|
(1,696) |
|
|
2012 |
|
|
|
|
|
|
|
|
|
|
|
|
|
|
|
|
|
|
|
|
|
|
|
|
|
|
|
|
|
|
|
|
|
|
|
|
|
|
|
|
|
|
|
|
|
|
|
|
|
|
|
|
|
|
|
|
|
|
|
|
|
|
|
|
|
|
|
|
|
Initial Cost to STAG Industrial, Inc. |
|
|
|
Gross Amounts at Which Carried at December 31, 2023 |
|
|
|
|
| State & City |
|
Address |
|
Encumbrances(1) |
|
Building & Improvements(2) |
|
Land(3) |
|
Costs Capitalized Subsequent to Acquisition and Valuation Provision |
|
Building & Improvements |
|
Land |
|
Total |
|
Accumulated Depreciation(4) |
|
Year Acquired |
| Garland |
|
2901 W. Kingsley Road |
|
— |
|
|
5,166 |
|
|
1,344 |
|
|
3,408 |
|
|
8,574 |
|
|
1,344 |
|
|
9,918 |
|
|
(2,056) |
|
|
2014 |
| Grapevine |
|
2402 Esters Boulevard |
|
— |
|
|
9,522 |
|
|
— |
|
|
109 |
|
|
9,631 |
|
|
— |
|
|
9,631 |
|
|
(716) |
|
|
2021 |
| Grapevine |
|
2400 Esters Boulevard |
|
— |
|
|
15,029 |
|
|
— |
|
|
301 |
|
|
15,330 |
|
|
— |
|
|
15,330 |
|
|
(1,127) |
|
|
2021 |
| Houston |
|
18601 Intercontinental Crossing Drive |
|
— |
|
|
8,744 |
|
|
1,505 |
|
|
— |
|
|
8,744 |
|
|
1,505 |
|
|
10,249 |
|
|
(1,673) |
|
|
2019 |
| Houston |
|
9302 Ley Road |
|
— |
|
|
8,879 |
|
|
1,236 |
|
|
— |
|
|
8,879 |
|
|
1,236 |
|
|
10,115 |
|
|
(1,255) |
|
|
2019 |
| Houston |
|
10343 Ella Boulevard |
|
— |
|
|
16,586 |
|
|
1,747 |
|
|
— |
|
|
16,586 |
|
|
1,747 |
|
|
18,333 |
|
|
(1,917) |
|
|
2019 |
| Houston |
|
4949 Windfern Road |
|
— |
|
|
7,610 |
|
|
2,255 |
|
|
578 |
|
|
8,188 |
|
|
2,255 |
|
|
10,443 |
|
|
(2,466) |
|
|
2013 |
| Houston |
|
7300 Airport Boulevard |
|
— |
|
|
14,087 |
|
|
2,546 |
|
|
1,053 |
|
|
15,140 |
|
|
2,546 |
|
|
17,686 |
|
|
(2,660) |
|
|
2016 |
| Houston |
|
13627 West Hardy |
|
— |
|
|
4,989 |
|
|
1,502 |
|
|
— |
|
|
4,989 |
|
|
1,502 |
|
|
6,491 |
|
|
(1,511) |
|
|
2017 |
| Houston |
|
868 Pear Street |
|
— |
|
|
5,508 |
|
|
953 |
|
|
— |
|
|
5,508 |
|
|
953 |
|
|
6,461 |
|
|
(1,468) |
|
|
2017 |
| Houston |
|
14620 Henry Road |
|
— |
|
|
7,052 |
|
|
927 |
|
|
66 |
|
|
7,118 |
|
|
927 |
|
|
8,045 |
|
|
(1,471) |
|
|
2017 |
| Houston |
|
7049 Brookhollow West Drive |
|
— |
|
|
9,371 |
|
|
809 |
|
|
15 |
|
|
9,386 |
|
|
809 |
|
|
10,195 |
|
|
(1,563) |
|
|
2018 |
| Houston |
|
10401 S. Sam Houston Parkway |
|
— |
|
|
9,456 |
|
|
1,108 |
|
|
318 |
|
|
9,774 |
|
|
1,108 |
|
|
10,882 |
|
|
(1,260) |
|
|
2019 |
| Humble |
|
18727 Kenswick Drive |
|
— |
|
|
21,476 |
|
|
2,255 |
|
|
— |
|
|
21,476 |
|
|
2,255 |
|
|
23,731 |
|
|
(2,993) |
|
|
2019 |
| Irving |
|
2450 Valley View Lane |
|
— |
|
|
15,312 |
|
|
5,976 |
|
|
— |
|
|
15,312 |
|
|
5,976 |
|
|
21,288 |
|
|
(144) |
|
|
2023 |
| Katy |
|
1800 North Mason Road |
|
— |
|
|
7,571 |
|
|
2,192 |
|
|
— |
|
|
7,571 |
|
|
2,192 |
|
|
9,763 |
|
|
(1,290) |
|
|
2019 |
| Katy |
|
21601 Park Row Drive |
|
— |
|
|
3,412 |
|
|
1,655 |
|
|
— |
|
|
3,412 |
|
|
1,655 |
|
|
5,067 |
|
|
(545) |
|
|
2019 |
| Laredo |
|
13710 IH 35 Frontage Road |
|
— |
|
|
13,847 |
|
|
2,538 |
|
|
— |
|
|
13,847 |
|
|
2,538 |
|
|
16,385 |
|
|
(2,240) |
|
|
2019 |
| Laredo |
|
13808 Humphrey Road |
|
— |
|
|
12,410 |
|
|
1,535 |
|
|
— |
|
|
12,410 |
|
|
1,535 |
|
|
13,945 |
|
|
(2,853) |
|
|
2017 |
| McAllen |
|
5601 West Military Highway |
|
— |
|
|
13,549 |
|
|
818 |
|
|
1,612 |
|
|
15,161 |
|
|
818 |
|
|
15,979 |
|
|
(1,426) |
|
|
2020 |
| Mission |
|
802 Trinity Street |
|
— |
|
|
12,623 |
|
|
1,882 |
|
|
663 |
|
|
13,286 |
|
|
1,882 |
|
|
15,168 |
|
|
(2,468) |
|
|
2018 |
| Rockwall |
|
3400 Discovery Boulevard |
|
— |
|
|
16,066 |
|
|
2,683 |
|
|
— |
|
|
16,066 |
|
|
2,683 |
|
|
18,749 |
|
|
(4,053) |
|
|
2017 |
| Stafford |
|
13720 Stafford Road |
|
— |
|
|
6,570 |
|
|
339 |
|
|
41 |
|
|
6,611 |
|
|
339 |
|
|
6,950 |
|
|
(1,283) |
|
|
2017 |
| Waco |
|
101 Apron Road |
|
— |
|
|
1,394 |
|
|
— |
|
|
922 |
|
|
2,316 |
|
|
— |
|
|
2,316 |
|
|
(867) |
|
|
2011 |
| Utah |
|
|
|
|
|
|
|
|
|
|
|
|
|
|
|
|
|
|
|
|
| Provo |
|
3715 S. Tracy Hall Parkway |
|
— |
|
|
27,225 |
|
|
1,945 |
|
|
— |
|
|
27,225 |
|
|
1,945 |
|
|
29,170 |
|
|
(1,842) |
|
|
2021 |
| Virginia |
|
|
|
|
|
|
|
|
|
|
|
|
|
|
|
|
|
|
|
|
| Chester |
|
2001 Ware Bottom Spring Road |
|
— |
|
|
3,276 |
|
|
775 |
|
|
— |
|
|
3,276 |
|
|
775 |
|
|
4,051 |
|
|
(1,060) |
|
|
2014 |
| Fredericksburg |
|
2031 International Parkway |
|
— |
|
|
15,235 |
|
|
2,182 |
|
|
— |
|
|
15,235 |
|
|
2,182 |
|
|
17,417 |
|
|
(728) |
|
|
2022 |
| Harrisonburg |
|
4500 Early Road |
|
— |
|
|
11,057 |
|
|
1,455 |
|
|
1,416 |
|
|
12,473 |
|
|
1,455 |
|
|
13,928 |
|
|
(3,591) |
|
|
2012 |
| Independence |
|
One Compair Way |
|
— |
|
|
2,061 |
|
|
226 |
|
|
— |
|
|
2,061 |
|
|
226 |
|
|
2,287 |
|
|
(628) |
|
|
2012 |
| Norfolk |
|
4555 Progress Road |
|
— |
|
|
7,990 |
|
|
1,259 |
|
|
— |
|
|
7,990 |
|
|
1,259 |
|
|
9,249 |
|
|
(381) |
|
|
2022 |
| North Chesterfield |
|
8001 Greenpine Road |
|
— |
|
|
6,174 |
|
|
1,599 |
|
|
— |
|
|
6,174 |
|
|
1,599 |
|
|
7,773 |
|
|
(1,143) |
|
|
2019 |
| Richmond |
|
5250 Klockner Drive |
|
— |
|
|
3,801 |
|
|
819 |
|
|
726 |
|
|
4,527 |
|
|
819 |
|
|
5,346 |
|
|
(882) |
|
|
2020 |
| Washington |
|
|
|
|
|
|
|
|
|
|
|
|
|
|
|
|
|
|
|
|
| Ridgefield |
|
6111 S. 6th Way |
|
— |
|
|
9,711 |
|
|
2,307 |
|
|
780 |
|
|
10,491 |
|
|
2,307 |
|
|
12,798 |
|
|
(1,746) |
|
|
2019 |
| Wisconsin |
|
|
|
|
|
|
|
|
|
|
|
|
|
|
|
|
|
|
|
|
| Appleton |
|
1919 W. College Avenue |
|
— |
|
|
5,757 |
|
|
261 |
|
|
— |
|
|
5,757 |
|
|
261 |
|
|
6,018 |
|
|
(482) |
|
|
2021 |
| Caledonia |
|
1343 27th Street |
|
— |
|
|
3,339 |
|
|
225 |
|
|
— |
|
|
3,339 |
|
|
225 |
|
|
3,564 |
|
|
(666) |
|
|
2018 |
| Cudahy |
|
5831 S. Pennsylvania Avenue |
|
— |
|
|
4,751 |
|
|
1,427 |
|
|
— |
|
|
4,751 |
|
|
1,427 |
|
|
6,178 |
|
|
(672) |
|
|
2020 |
| De Pere |
|
2191 American Boulevard |
|
— |
|
|
6,042 |
|
|
525 |
|
|
101 |
|
|
6,143 |
|
|
525 |
|
|
6,668 |
|
|
(2,022) |
|
|
2012 |
| DeForest |
|
505-507 Stokely Drive |
|
— |
|
|
5,298 |
|
|
1,131 |
|
|
684 |
|
|
5,982 |
|
|
1,131 |
|
|
7,113 |
|
|
(1,286) |
|
|
2016 |
|
|
|
|
|
|
|
|
|
|
|
|
|
|
|
|
|
|
|
|
|
|
|
|
|
|
|
|
|
|
|
|
|
|
|
|
|
|
|
|
|
|
|
|
|
|
|
|
|
|
|
|
|
|
|
|
|
|
|
|
|
|
|
|
|
|
|
|
|
Initial Cost to STAG Industrial, Inc. |
|
|
|
Gross Amounts at Which Carried at December 31, 2023 |
|
|
|
|
| State & City |
|
Address |
|
Encumbrances(1) |
|
Building & Improvements(2) |
|
Land(3) |
|
Costs Capitalized Subsequent to Acquisition and Valuation Provision |
|
Building & Improvements |
|
Land |
|
Total |
|
Accumulated Depreciation(4) |
|
Year Acquired |
| Delavan |
|
329 Hallberg Street |
|
— |
|
|
2,032 |
|
|
127 |
|
|
30 |
|
|
2,062 |
|
|
127 |
|
|
2,189 |
|
|
(368) |
|
|
2019 |
| Delavan |
|
1714 Hobbs Drive |
|
— |
|
|
4,676 |
|
|
241 |
|
|
89 |
|
|
4,765 |
|
|
241 |
|
|
5,006 |
|
|
(746) |
|
|
2019 |
| East Troy |
|
2761 Buell Drive |
|
— |
|
|
4,936 |
|
|
304 |
|
|
57 |
|
|
4,993 |
|
|
304 |
|
|
5,297 |
|
|
(1,289) |
|
|
2014 |
| Elkhorn |
|
555 Koopman Lane |
|
— |
|
|
3,897 |
|
|
351 |
|
|
501 |
|
|
4,398 |
|
|
351 |
|
|
4,749 |
|
|
(771) |
|
|
2019 |
| Elkhorn |
|
390 Koopman Lane |
|
— |
|
|
3,621 |
|
|
210 |
|
|
— |
|
|
3,621 |
|
|
210 |
|
|
3,831 |
|
|
(627) |
|
|
2019 |
| Franklin |
|
5215 W Airways Avenue |
|
— |
|
|
8,193 |
|
|
1,551 |
|
|
— |
|
|
8,193 |
|
|
1,551 |
|
|
9,744 |
|
|
(718) |
|
|
2021 |
| Germantown |
|
N117 W18456 Fulton Drive |
|
— |
|
|
5,956 |
|
|
442 |
|
|
— |
|
|
5,956 |
|
|
442 |
|
|
6,398 |
|
|
(944) |
|
|
2018 |
| Germantown |
|
N106 W13131 Bradley Way |
|
— |
|
|
3,296 |
|
|
359 |
|
|
346 |
|
|
3,642 |
|
|
359 |
|
|
4,001 |
|
|
(657) |
|
|
2018 |
| Germantown |
|
N102 W19400 Willow Creek Way |
|
— |
|
|
10,908 |
|
|
1,175 |
|
|
— |
|
|
10,908 |
|
|
1,175 |
|
|
12,083 |
|
|
(1,908) |
|
|
2018 |
| Germantown |
|
11900 N. River Lane |
|
— |
|
|
5,977 |
|
|
1,186 |
|
|
— |
|
|
5,977 |
|
|
1,186 |
|
|
7,163 |
|
|
(1,949) |
|
|
2014 |
| Hartland |
|
500 North Shore Drive |
|
— |
|
|
4,634 |
|
|
1,526 |
|
|
— |
|
|
4,634 |
|
|
1,526 |
|
|
6,160 |
|
|
(1,169) |
|
|
2016 |
| Hudson |
|
2700 Harvey Street |
|
— |
|
|
7,982 |
|
|
683 |
|
|
6 |
|
|
7,988 |
|
|
683 |
|
|
8,671 |
|
|
(1,087) |
|
|
2020 |
| Janesville |
|
2929 Venture Drive |
|
— |
|
|
17,477 |
|
|
828 |
|
|
1,168 |
|
|
18,645 |
|
|
828 |
|
|
19,473 |
|
|
(5,564) |
|
|
2013 |
| Kenosha |
|
9625 55th Street |
|
— |
|
|
3,968 |
|
|
797 |
|
|
763 |
|
|
4,731 |
|
|
797 |
|
|
5,528 |
|
|
(1,253) |
|
|
2016 |
| Madison |
|
4718 Helgesen Drive |
|
— |
|
|
6,365 |
|
|
609 |
|
|
531 |
|
|
6,896 |
|
|
609 |
|
|
7,505 |
|
|
(1,308) |
|
|
2017 |
| Madison |
|
4722 Helgesen Drive |
|
— |
|
|
4,489 |
|
|
444 |
|
|
39 |
|
|
4,528 |
|
|
444 |
|
|
4,972 |
|
|
(835) |
|
|
2017 |
| Mayville |
|
605 Fourth Street |
|
— |
|
|
4,118 |
|
|
547 |
|
|
623 |
|
|
4,741 |
|
|
547 |
|
|
5,288 |
|
|
(2,111) |
|
|
2007 |
| Mukwonago |
|
103 Hill Court |
|
— |
|
|
10,844 |
|
|
1,478 |
|
|
219 |
|
|
11,063 |
|
|
1,478 |
|
|
12,541 |
|
|
(862) |
|
|
2021 |
| Muskego |
|
S64 W15660 Commerce Center Parkway |
|
— |
|
|
5,497 |
|
|
393 |
|
|
154 |
|
|
5,651 |
|
|
393 |
|
|
6,044 |
|
|
(871) |
|
|
2020 |
| New Berlin |
|
16250 West Woods Edge Drive |
|
— |
|
|
15,917 |
|
|
277 |
|
|
— |
|
|
15,917 |
|
|
277 |
|
|
16,194 |
|
|
(1,945) |
|
|
2019 |
| New Berlin |
|
16555 W. Smalls Road |
|
— |
|
|
20,176 |
|
|
955 |
|
|
— |
|
|
20,176 |
|
|
955 |
|
|
21,131 |
|
|
(1,259) |
|
|
2021 |
| New Berlin |
|
5600 S. Moorland Road |
|
— |
|
|
6,409 |
|
|
1,068 |
|
|
43 |
|
|
6,452 |
|
|
1,068 |
|
|
7,520 |
|
|
(1,852) |
|
|
2013 |
| Oak Creek |
|
525 West Marquette Avenue |
|
— |
|
|
4,249 |
|
|
526 |
|
|
100 |
|
|
4,349 |
|
|
526 |
|
|
4,875 |
|
|
(782) |
|
|
2018 |
| Oak Creek |
|
7475 South 6th Street |
|
— |
|
|
6,125 |
|
|
805 |
|
|
355 |
|
|
6,480 |
|
|
805 |
|
|
7,285 |
|
|
(1,237) |
|
|
2018 |
| Pewaukee |
|
W288 N2801 Duplainville Road |
|
— |
|
|
6,678 |
|
|
841 |
|
|
1,001 |
|
|
7,679 |
|
|
841 |
|
|
8,520 |
|
|
(1,859) |
|
|
2018 |
| Pewaukee |
|
W277 N2837 Duplainville Road |
|
— |
|
|
4,516 |
|
|
439 |
|
|
52 |
|
|
4,568 |
|
|
439 |
|
|
5,007 |
|
|
(992) |
|
|
2018 |
| Pleasant Prairie |
|
10411 80th Avenue |
|
— |
|
|
18,219 |
|
|
2,297 |
|
|
— |
|
|
18,219 |
|
|
2,297 |
|
|
20,516 |
|
|
(2,623) |
|
|
2018 |
| Pleasant Prairie |
|
8901 102nd Street |
|
— |
|
|
4,899 |
|
|
523 |
|
|
713 |
|
|
5,612 |
|
|
523 |
|
|
6,135 |
|
|
(984) |
|
|
2018 |
| Sun Prairie |
|
1615 Commerce Drive |
|
— |
|
|
5,809 |
|
|
2,360 |
|
|
2,499 |
|
|
8,308 |
|
|
2,360 |
|
|
10,668 |
|
|
(3,081) |
|
|
2011 |
| West Allis |
|
2207 S. 114th Street |
|
— |
|
|
1,757 |
|
|
462 |
|
|
2,040 |
|
|
3,797 |
|
|
462 |
|
|
4,259 |
|
|
(963) |
|
|
2015 |
| West Allis |
|
2075 S. 114th Street |
|
— |
|
|
1,848 |
|
|
444 |
|
|
1,698 |
|
|
3,546 |
|
|
444 |
|
|
3,990 |
|
|
(807) |
|
|
2015 |
| West Allis |
|
2145 S. 114th Street |
|
— |
|
|
846 |
|
|
252 |
|
|
1,051 |
|
|
1,897 |
|
|
252 |
|
|
2,149 |
|
|
(479) |
|
|
2015 |
| West Allis |
|
2025 S. 114th Street |
|
— |
|
|
956 |
|
|
251 |
|
|
801 |
|
|
1,757 |
|
|
251 |
|
|
2,008 |
|
|
(392) |
|
|
2015 |
| Yorkville |
|
13900 West Grandview Parkway |
|
— |
|
|
4,886 |
|
|
416 |
|
|
323 |
|
|
5,209 |
|
|
416 |
|
|
5,625 |
|
|
(1,301) |
|
|
2014 |
|
|
Total |
|
$ |
(4,537) |
|
|
$ |
5,430,290 |
|
|
$ |
698,633 |
|
|
$ |
330,078 |
|
|
$ |
5,760,368 |
|
|
$ |
698,633 |
|
|
$ |
6,459,001 |
|
|
$ |
(921,846) |
|
|
|
(1)Balance excludes the net unamortized balance of fair market value discount of approximately $0.1 million.
(2)The initial costs of buildings and improvements is the acquisition costs plus building expansions and non-cash transfers of acquired other assets to initial cost of building and improvements, less asset impairment write-downs and disposals of building and tenant improvements.
(3)Represents values at acquisition date less any impairments.
(4)Depreciation expense is computed using the straight-line method based on the following estimated useful lives:
|
|
|
|
|
|
|
|
|
| Description |
|
Estimated Useful Life |
| Building |
|
40 Years |
| Building and land improvements (maximum) |
|
20 Years |
| Tenant improvements |
|
Shorter of useful life or terms of related lease |
As of December 31, 2023, the aggregate cost for federal income tax purposes of investments in real estate was approximately $7.4 billion.
|
|
|
|
|
|
|
|
|
|
|
|
|
|
|
|
|
|
|
|
|
|
|
Year ended December 31, |
| |
|
2023 |
|
2022 |
|
2021 |
| Real Estate: |
|
|
|
|
|
|
| Balance at beginning of period |
|
$ |
6,123,295 |
|
|
$ |
5,664,907 |
|
|
$ |
4,521,301 |
|
| Additions during period |
|
|
|
|
|
|
| Other acquisitions |
|
304,057 |
|
|
423,918 |
|
|
1,217,478 |
|
| Improvements, etc. |
|
105,112 |
|
|
120,151 |
|
|
40,797 |
|
| Other additions |
|
— |
|
|
— |
|
|
— |
|
| Deductions during period |
|
|
|
|
|
|
| Cost of real estate sold |
|
(66,565) |
|
|
(80,470) |
|
|
(107,192) |
|
| Write-off of tenant improvements |
|
(3,930) |
|
|
(3,428) |
|
|
(7,477) |
|
| Asset impairments and involuntary conversion |
|
(2,968) |
|
|
(1,783) |
|
|
— |
|
| Balance at the end of the period including assets held for sale |
|
6,459,001 |
|
|
6,123,295 |
|
|
5,664,907 |
|
| Assets held for sale |
|
— |
|
|
(6,324) |
|
|
— |
|
| Balance at the end of the period excluding assets held for sale |
|
$ |
6,459,001 |
|
|
$ |
6,116,971 |
|
|
$ |
5,664,907 |
|
| Accumulated Depreciation: |
|
|
|
|
|
|
| Balance at beginning of period |
|
$ |
764,809 |
|
|
$ |
611,867 |
|
|
$ |
495,466 |
|
| Additions during period |
|
|
|
|
|
|
| Depreciation and amortization expense |
|
177,358 |
|
|
170,088 |
|
|
142,966 |
|
| Other additions |
|
— |
|
|
— |
|
|
— |
|
| Deductions during period |
|
|
|
|
|
|
| Disposals |
|
(20,321) |
|
|
(17,146) |
|
|
(26,565) |
|
| Balance at the end of the period including assets held for sale |
|
921,846 |
|
|
764,809 |
|
|
611,867 |
|
| Assets held for sale |
|
— |
|
|
(1,681) |
|
|
— |
|
| Balance at the end of the period excluding assets held for sale |
|
$ |
921,846 |
|
|
$ |
763,128 |
|
|
$ |
611,867 |
|
EX-19.1
2
q42023-ex191staginsidertra.htm
EX-19.1
Document
[Policy Terms as of February 18, 2020]
STAG INDUSTRIAL, INC.
INSIDER TRADING POLICY
I.Trading in Company Securities While in Possession of Material Nonpublic Information is Prohibited
The purchase or sale of securities by any person who possesses material nonpublic information is a violation of federal and state securities laws. Furthermore, it is important that the appearance, as well as the fact, of trading on the basis of material nonpublic information be avoided. Therefore, it is the policy of STAG Industrial, Inc. (the “Company”) that any person subject to this Policy who possesses material nonpublic information pertaining to the Company may not trade in the Company’s securities, advise anyone else to do so, or communicate the information to anyone else until you know that the information has been disseminated to the public.
No director, officer, employee or consultant of the Company who is aware of material nonpublic information relating to the Company may, directly or through family members or other persons or entities,
•buy or sell securities of the Company, other than pursuant to a trading plan that complies with Rule 10b5-1 promulgated by the Securities and Exchange Commission (“SEC”),
•engage in any other action to take personal advantage of that information, or
•pass that information on to others outside the Company, including friends and family (a practice referred to as “tipping”).
In addition, it is the policy of the Company that no officer, director, employee or consultant who, in the course of working for the Company, learns of material nonpublic information of another company with which the Company does business, such as a customer or supplier, may trade in that company’s securities until that information becomes public or is no longer material.
II.All Employees, Officers, Directors and their Family Members and Affiliates Are Subject to this Policy
This Policy applies to all directors, officers, employees and consultants of the Company and entities (such as trusts, limited partnerships and corporations) over which such individuals have or share voting or investment control. For the purposes of this Policy, officers, outside directors and consultants are included within the term “employee.” This Policy also applies to any other persons whom the Company’s insider trading Compliance Officer may designate because they have access to material nonpublic information concerning the Company, as well as any person who receives material nonpublic information from any Company insider. Employees, officers and directors are responsible for ensuring compliance by family members and members of their households and by entities over which they exercise voting or investment control.
III.Executive Officers, Directors and Certain Named Employees Are Subject to Additional Restrictions
A.Section 16 Insiders
The Company has designated those persons listed on Exhibit A attached hereto as the directors and executive officers who are subject to the reporting provisions and trading restrictions of Section 16 of the Securities Exchange Act of 1934 (the “Exchange Act”) and the underlying rules and regulations promulgated by the SEC. Each person listed on Exhibit A is referred to herein as a “Section 16 Insider.” The Company will amend Exhibit A from time to time as necessary to reflect the addition and the resignation or departure of Section 16 Insiders.
B.Insider Employees
The Company has designated all of its employees as persons who have frequent access to material nonpublic information concerning the Company (“Insider Employees”). The Company will amend this designation from time to time as necessary to reflect the addition and departure of Inside Employees.
C.Additional Restrictions
Because Section 16 Insiders and Insider Employees are more likely than other employees to possess material nonpublic information about the Company, and in light of the reporting requirements to which Section 16 Insiders are subject under Section 16 of the Exchange Act, Section 16 Insiders and Insider Employees are subject to the additional restrictions set forth in Appendix I hereto. For purposes of this Policy, Section 16 Insiders and Insider Employees are each referred to as “Insiders.”
IV.Insider Trading Compliance Officer
The Company has designated Jeffrey M. Sullivan, Executive Vice President, General Counsel and Secretary, as its Insider Trading Compliance Officer (the “Compliance Officer”).
The duties of the Compliance Officer will include the following:
1.Administering this Policy and monitoring and enforcing compliance with all policy provisions and procedures.
2.Responding to all inquiries relating to this Policy and its procedures.
3.Designating and announcing special trading blackout periods during which no Insiders may trade in Company securities.
4.Providing copies of this Policy and other appropriate materials to all current and new directors, officers and employees, and such other persons as the Compliance Officer determines have access to material nonpublic information concerning the Company.
5.Administering, monitoring and enforcing compliance with federal and state insider trading laws and regulations; and assisting in the preparation and filing of all required SEC reports relating to trading in Company securities, including without limitation Forms 3, 4, 5 and 144 and Schedules 13D and 13G.
6.Revising the Policy as necessary to reflect changes in federal or state insider trading laws and regulations.
7.Maintaining as Company records originals or copies of all documents required by the provisions of this Policy or the procedures set forth herein, and copies of all required SEC reports relating to insider trading, including without limitation Forms 3, 4, 5 and 144 and Schedules 13D and 13G.
8.Maintaining the accuracy of the list of Section 16 Insiders as set forth on Exhibit A and the list of Insider Employees, and updating such lists periodically as necessary to reflect additions or deletions.
The Compliance Officer may designate one or more individuals who may perform the Compliance Officer’s duties in the event that the Compliance Officer is unable or unavailable to perform such duties. In fulfilling his or her duties under this Policy, the Compliance Officer shall be authorized to consult with the Company’s outside counsel.
V.Applicability of This Policy to Transactions in Company Securities
A.General Rule.
This Policy applies to all transactions in the Company’s securities, including common stock and any other securities the Company may issue from time to time, such as preferred stock, warrants and convertible debentures, as well as to derivative securities relating to the Company’s stock, whether or not issued by the Company, such as exchange-traded options. For purposes of this Policy, the term “trade” includes any transaction in the Company’s securities, including gifts and pledges.
B.Equity Incentive Plan
The trading prohibitions and restrictions set forth in this Policy do not apply to the mere exercise of stock options for cash, but do apply to all sales of securities acquired through the exercise of stock options. Thus, this Policy does apply to the “same-day sale” or cashless exercise of Company stock options.
VI.Definition of “Material Nonpublic Information”
A.“Material”
Information about the Company is “material” if it would be expected to affect the investment or voting decisions of a reasonable shareholder or investor, or if the disclosure of the information would be expected to significantly alter the total mix of the information in the marketplace about the Company. In simple terms, material information is any type of information which could reasonably be expected to affect the market price of the Company’s securities. Both positive and negative information may be material. While it is not possible to identify all information that would be deemed material, the following types of information ordinarily would be considered material:
•financial performance, especially quarterly and year-end operating results, and significant changes in financial performance or liquidity;
•Company projections and strategic plans;
•potential mergers or acquisitions, the purchase or sale of Company assets or major partnering or joint venture agreements;
•new major contracts or finance sources or the loss thereof;
•significant changes or developments in portfolio development;
•significant pricing changes;
•stock splits, public or private securities/debt offerings, or changes in Company dividend policies or amounts;
•significant changes in senior management or membership of the Board of Directors; and
•actual or threatened major litigation, or the resolution of such litigation.
B.“Nonpublic”
Material information is “nonpublic” if it has not been widely disseminated to the general public through a report filed with the SEC or through major newswire services, national news services or financial news services. For the purpose of this Policy, information will be considered public after the close of trading on the second full trading day following the Company’s widespread public release of the information.
C.Consult the Compliance Officer When in Doubt
Any employees who are unsure whether the information that they possess is material or nonpublic must consult the Compliance Officer for guidance before trading in any Company securities.
VII.Employees May Not Disclose Material Nonpublic Information to Others or Make Recommendations Regarding Trading in Company Securities
No employee may disclose material nonpublic information concerning the Company to any other person (including family members) where such information may be used by such person to his or her advantage in the trading of the securities of companies to which such information relates, a practice commonly known as “tipping.” No employee or related person may make recommendations or express opinions as to trading in the Company’s securities while in possession of material nonpublic information, except such person may advise others not to trade in the Company’s securities if doing so might violate the law or this policy.
VIII.Employees May Not Participate in Chat Rooms
Employees are prohibited from participating in chat room discussions or other Internet forums regarding the Company’s securities or business.
IX.Only Designated Company Spokespersons Are Authorized to Disclose Material Nonpublic Information
The Company is required under the federal securities laws to avoid the selective disclosure of material nonpublic information. The Company has established procedures for releasing material information in a manner that is designed to achieve broad dissemination of the information immediately upon its release. Employees may not, therefore, disclose material information to anyone outside the Company, including family members and friends, other than in accordance with those established procedures. Any inquiries from outsiders regarding material nonpublic information about the Company should be forwarded to the Compliance Officer.
X.Hedging and Pledging Transactions Are Prohibited
The Company prohibits our officers, directors and employees and their respective family members from, among other prohibited activities, (1) directly or indirectly engaging in strategies using puts, calls, equity swaps or other derivative securities on an exchange or in any other market in order to hedge or offset any decreases in the market value of any directly or indirectly owned securities of the Company; (2) engaging in short sale transactions or forward sale transactions or any short-term or speculative transactions in the Company’s securities or in other transactions in the Company’s securities that may lead to inadvertent violations of insider trading laws; and (3) pledging securities of the Company as collateral for a loan or otherwise using securities of the Company to secure a debt, including through the use of traditional margin accounts with a broker.
The summary of the paragraph above is that the Company’s securities cannot be pledged as collateral nor can any hedging activity occur that may change the full risks and rewards of ownership or put pressure on the Company’s stock price other than buying or selling shares outright. If you are considering any transaction other than buying or selling common or preferred stock, you should first consult with the Compliance Officer.
XI.The Company May Suspend All Trading Activities by Employees
In order to avoid any questions and to protect both employees and the Company from any potential liability, from time to time the Company may impose a “blackout” period during which some or all of the Company’s employees may not buy or sell the Company’s securities. The Compliance Officer will impose such a blackout period if, in his judgment, there exists nonpublic information that would make trades by the Company’s employees (or certain of the Company’s employees) inappropriate in light of the risk that such trades could be viewed as violating applicable securities laws.
XII.Violations of Insider Trading Laws or This Policy Can Result in Severe Consequences
A.Civil and Criminal Penalties
The consequences of prohibited insider trading or tipping can be severe. Persons violating insider trading or tipping rules may be required to disgorge the profit made or the loss avoided by the trading, pay civil penalties up to three times the profit made or loss avoided, face private action for damages, as well as being subject to criminal penalties, including up to 20 years in prison and fines of up to $5 million. The Company and/or the supervisors of the person violating the rules may also be required to pay major civil or criminal penalties.
B.Company Discipline
Violation of this Policy or federal or state insider trading laws by any director, officer or employee may subject the director to removal proceedings and the officer or employee to disciplinary action by the Company, including termination for cause.
C.Reporting Violations
Any person who violates this Policy or any federal or state laws governing insider trading, or knows of any such violation by any other person, must report the violation immediately to the Compliance Officer or the Audit Committee of the Company’s Board of Directors. Upon learning of any such violation, the Compliance Officer or Audit Committee, in consultation with the Company’s legal counsel, will determine whether the Company should release any material nonpublic information or whether the Company should report the violation to the SEC or other appropriate governmental authority.
XIII.Every Individual Is Responsible
Every employee has the individual responsibility to comply with this Policy against illegal insider trading. An employee may, from time to time, have to forego a proposed transaction in the Company’s securities even if he or she planned to make the transaction before learning of the material nonpublic information and even though the employee believes that he or she may suffer an economic loss or forego anticipated profit by waiting.
XIV.This Policy Continues to Apply Following Termination of Employment
The Policy continues to apply to transactions in the Company’s securities even after termination of employment. If an employee is in possession of material nonpublic information when his or her employment terminates, he or she may not trade in the Company’s securities until that information has become public or is no longer material.
XV.The Compliance Officer Is Available to Answer Questions about This Policy
Please direct all inquiries regarding any of the provisions or procedures of this Policy to the Compliance Officer.
XVI.This Policy Is Subject to Revision
The Company may change the terms of this Policy from time to time to respond to developments in law and practice. The Company will take steps to inform all affected persons of any material change to this Policy.
XVII.All Employees Must Acknowledge Their Agreement to Comply with This Policy
The Policy will be delivered to all employees upon its adoption by the Company, and to all new other employees at the start of their employment or relationship with the Company. Upon first receiving a copy of the Policy or any revised versions, each employee must sign an acknowledgment that he or she has received a copy and agrees to comply with the Policy’s terms. This acknowledgment and agreement will constitute consent for the Company to impose sanctions for violation of this Policy and to issue any necessary stop-transfer orders to the Company’s transfer agent to enforce compliance with this Policy.
[Policy Terms as of February 18, 2020]
APPENDIX I
Special Restrictions on Transactions in Company Securities by
Executive Officers, Directors and Insider Employees
I.Overview
To minimize the risk of apparent or actual violations of the rules governing insider trading, we have adopted these special restrictions relating to transactions in Company securities by Insiders. As with the other provisions of this Policy, Insiders are responsible for ensuring compliance with this Appendix I, including restrictions on all trading during certain periods, by family members and members of their households and by entities over which they exercise voting or investment control. Insiders should provide each of these persons or entities with a copy of this Policy.
II.Trading Lockouts
In addition to the restrictions that are applicable to all employees, any trade by an Insider that is subject to the Insider Trading Policy will not be permitted during a “trading lockout.” The trading lockout generally begins following the close of trading on the last day of each fiscal quarter and ending at the close of trading on the second full trading day following the public release of the Company’s quarterly financial results for such quarter (and financial results for the full year, in the case of the last fiscal quarter of a fiscal year). In addition to the times when the trading lockout is scheduled to be in effect, the Company may impose a special blackout period at its discretion due to the existence of material nonpublic information, such as a pending acquisition, that is likely to be widely known among Insiders. Following termination of employment or other service, Insiders will be subject to the trading lockout, as well as any special blackout period in effect at the time of termination, for one full fiscal quarter thereafter. Even when the lockout is not in effect, Insiders and other Company personnel are prohibited from trading in the Company’s securities while in possession of material nonpublic information. The Company’s Compliance Officer will advise Insiders when the trading lockout begins and ends.
III.Hardship Exemptions
The Compliance Officer may, on a case by case basis, authorize a transaction in the Company’s securities during the trading lockout (but in no event during a special blackout period) due to financial or other hardship. Any request for a hardship exemption must be in writing and must describe the amount and nature of the proposed transaction and the circumstances of the hardship. (The request may be made as part of a pre-clearance request, so long as it is in writing.) The Insider requesting the hardship exemption must also certify to the Compliance Officer within two business days prior to the date of the proposed trade that he or she is not in possession of material nonpublic information concerning the Company.
The existence of the foregoing procedure does not in any way obligate the Compliance Officer to approve any hardship exemption requested by an Insider.
IV.Individual Account Plan Blackout Periods
Certain trading restrictions apply during a blackout period applicable to any Company individual account plan in which participants may hold Company stock. For the purpose of such restrictions, a “blackout period” is a period in which the plan participants are temporarily restricted from making trades in Company stock. During any blackout period, directors and executive officers are prohibited from trading in shares of the Company’s stock that were acquired in connection with such director’s or officer’s service or employment with the Company. Such trading restriction is required by law, and no hardship exemptions are available. The Company will notify directors and executive officers in the event of any blackout period.
V.Pre-Clearance of Trades
As part of the Company’s Insider Trading Policy, all purchases and sales of equity securities of the Company by Section 16 Insiders and Insider Employees, other than transactions that are not subject to the Policy or transactions pursuant to a Rule 10b5-1 trading plan approved by the Board of Directors or its Audit Committee, must be pre- cleared by the Compliance Officer. The intent of this requirement is to prevent inadvertent violations of the Policy, avoid trades involving the appearance of improper insider trading, facilitate timely Form 4 reporting and avoid transactions that are subject to disgorgement under Section 16(b) of the Exchange Act.
Requests for pre-clearance must be submitted to the Compliance Officer at least two business days in advance of each proposed transaction. If the Insider leaves a voicemail message or submits the request by email does not receive a response from the Compliance Officer within 24 hours, the Insider will be responsible for following up to ensure that the message was received.
A request for pre-clearance should provide the following information:
•the nature of the proposed transaction and the expected date of the transaction;
•number of shares involved;
•if the transaction involves a stock option exercise, the specific option to be exercised; and
•identity of and contact information for the broker proposed to execute the transaction.
Once the proposed transaction is pre-cleared, the Section 16 Insider or Insider Employee may proceed with it on the approved terms, provided that he or she complies with all other securities law requirements, such as Rule 144 and prohibitions regarding trading on the basis of inside information, and with any special trading blackout imposed by the Company prior to the completion of the trade. The Section 16 Insider and his or her broker will be responsible for immediately reporting the results of the transaction as further described below.
In addition, pre-clearance is required for the establishment of a Rule 10b5-1 trading plan. However, pre-clearance will not be required for individual transactions effected pursuant to a pre-cleared Rule 10b5-1 trading plan that specifies or establishes a formula for determining the dates, prices and amounts of planned trades. Of course, the results of transactions effected under a trading plan must be reported immediately to the Company since they will be reportable on Form 4 within two business days following the execution of the trade, subject to an extension of not more than two additional business days where the Section 16 Insider is not immediately aware of the execution of the trade.
Notwithstanding the foregoing, any transactions by the Compliance Officer shall be subject to pre-clearance by the Chief Executive Officer, President or Chief Operating Officer.
VI.Pre-clearance of Brokers
Each market transaction in the Company’s stock by a Section 16 Insider, or any person whose trades must be reported by that Insider on Form 4 (such as a member of the Insider’s immediate family who lives in the Insider’s household), must be executed by a broker pre- cleared by the Company through the Compliance Officer.
VII.Reporting of Transactions
To facilitate timely reporting under Section 16 of the Exchange Act of Insider transactions in Company stock, Section 16 Insiders are required to (a) report the details of each transaction immediately after it is executed and (b) arrange with persons whose trades must be reported by the Insider under Section 16 (such as immediate family members living in the Insider’s household) to immediately report directly to the Company and to the Insider the details of any transactions they have in the Company’s stock.
Transaction details to be reported include:
•transaction date (trade date);
•number of shares involved;
•price per share at which the transaction was executed (before addition or deduction of brokerage commission and other transaction fees);
•if the transaction was a stock option exercise, the specific option exercised; and
•contact information for the broker who executed the transaction.
The transaction details must be reported to the Compliance Officer, with copies to the Company personnel who will assist the Section 16 Insider in preparing his or her Form 4.
VIII.Transactions That Are Prohibited or Discouraged Under This Policy
Insiders are subject to the policies listed under Part X of the Insider Trading Policy, which are applicable to all employees.
IX.Nominating and Corporate Governance Committee
The Nominating and Corporate Governance Committee (the “Committee”) will be responsible for monitoring and recommending any modification to the Insider Trader Policy, if necessary or advisable, to the Board of Directors.
X.Persons Subject to Section 16
Most purchases and sales of Company securities by its directors, executive officers and greater-than-10% stockholders are subject to Section 16 of the Exchange Act. The Committee will review, at least annually, those individuals who are deemed to be executive officers for purposes of Section 16 and will recommend any changes regarding such status to the Board of Directors. For our purposes, an executive officer is generally defined as the chief executive officer, president, principal financial officer, principal accounting officer, general counsel or controller, any vice president in charge of a principal business unit, division or function or any other officer or person who performs a policy making function.
XI.Form 4 Reporting
Under Section 16, most trades by Insiders are subject to reporting on Form 4 within two business days following the trade date (which in the case of an open market trade is the date when the broker places the buy or sell order, not the date when the trade is settled). To facilitate timely reporting, all transactions that are subject to Section 16 must be reported to the Company on the same day as the trade date, or, with respect to transactions effected pursuant to a Rule 10b5-1 plan, on the day the Insider is advised of the terms of the transaction.
XII.Named Employees Considered Insiders
The Committee will review, at least annually, those individuals deemed to be “Insiders” for purposes of this Appendix I. Insiders shall include persons subject to Section 16 and such other persons as the Committee deems to be Insiders. Generally, Insiders shall be any person who by function of their employment is consistently in possession of material nonpublic information or performs an operational role, such as head of a division or business unit, that is material to the Company as a whole.
XIII.Special Guidelines for 10b5-1 Trading Plans
Notwithstanding the foregoing, an Insider will not be deemed to have violated the Insider Trading Policy if he or she effects a transaction that meets all of the enumerated criteria below.
A.The transaction must be made pursuant to a documented plan (the “Plan”) entered into in good faith that complies with all provisions of Rule 10b5-1 (the “Rule”), including, without limitation:
1.Each Plan must:
a.specify the amount of securities to be purchased or sold and the price at which and the date on which the securities are to be purchased or sold, or
b.include a written formula or algorithm, or computer program, for determining the amount of securities to be purchased or sold and the price at which and the date on which the securities were to be purchased or sold.
2.In any case, then such Plan must prohibit the Insider and any other person who possesses material nonpublic information from exercising any subsequent influence over how, when, or whether to effect purchases or sales.
B.Each Plan must be approved prior to the effective time of any transactions under such Plan by the Company’s Board of Directors. The Company reserves the right to withhold approval of any Plan that the Board of Directors determines, in its sole discretion,
1.fails to comply with the Rule; or
2.exposes the Company or the Insider to liability under any other applicable state or federal rule, regulation or law; or
3.creates any appearance of impropriety; or
4.fails to meet the guidelines established by the Company; or
5.otherwise fails to satisfy review by the Board of Directors for any reason, such failure to be determined in the sole discretion of the Board of Directors.
C.Any modifications to the Plan or deviations from the Plan without prior approval of the Board of Directors will result in a failure to comply with the Insider Trading Policy. Any such modifications or deviations are subject to the approval of the Board of Directors in accordance with Section B above.
D.Each Plan must be established at a time outside of the blackout period.
E.Each Plan must provide appropriate mechanisms to ensure that the Insider complies with all rules and regulations, including Rule 144, Rule 701 and Section 16(b), applicable to securities transactions under the Plan by the Insider.
F.Each Plan must provide for the suspension of all transactions under such Plan in the event that the Company, in its sole discretion, deems such suspension necessary and advisable, including suspensions necessary to comply with trading restrictions imposed in connection with any lock-up agreement required in connection with a securities issuance transaction or other similar events.
G.None of the Company, the Board of Directors nor any of the Company’s officers, employees or other representatives shall be deemed, solely by their approval of an Insider’s Plan, to have represented that any Plan complies with the Rule or to have assumed any liability or responsibility to the Insider or any other party if such Plan fails to comply with the Rule.
[Exhibit as of February 6, 2024]
EXHIBIT A
SECTION 16 INSIDERS
OFFICERS
Name Title
William R. Crooker Chief Executive Officer and President
Michael C. Chase Executive Vice President and Chief Investment Officer
Jaclyn M. Paul Chief Accounting Officer
Steven T. Kimball Executive Vice President—Real Estate Operations
Matts S. Pinard Executive Vice President, Chief Financial Officer and Treasurer
Jeffrey M. Sullivan Executive Vice President, General Counsel and Secretary Enclosed is a copy of the Insider Trading Policy as adopted by STAG Industrial, Inc. (the “Company”) and currently in effect. PLEASE READ IT VERY CAREFULLY. As it indicates, the consequences of insider trading can be drastic to both you and the Company.
BOARD OF DIRECTORS
Benjamin S. Butcher
Jit Kee Chin
Virgis W. Colbert
William R. Crooker
Michelle S. Dilley
Jeffrey D. Furber
Larry T. Guillemette
Christopher P. Marr
Francis X. Jacoby III
Hans S. Weger
STAG INDUSTRIAL, INC.
Re: Insider Trading Policy
Ladies and Gentlemen:
To show that you have read the policy and agree to be bound by it, please sign and return the attached copy of this letter to Jeffrey M. Sullivan, the Company’s Executive Vice President, General Counsel and Secretary, as soon as possible.
Very truly yours,
William R. Crooker
Chief Executive Officer and President
_____________________________________________________________________________
CERTIFICATION
The undersigned certifies that the undersigned has read, understands and agrees to comply with the Insider Trading Policy of STAG Industrial, Inc. (the “Company”). The undersigned agrees that the undersigned will be subject to sanctions, including, as to employees of the Company, termination of employment, that may be imposed by the Company, in its discretion, for violation of the Company’s policy, and that the Company may give stop-transfer and other instructions to the Company’s transfer agent against the transfer of Company securities by the undersigned in a transaction that the Company considers to be in contravention of its policy.
Employee or Insider:
Signature
Printed Name
Date
EX-21.1
3
q42023-ex21110k.htm
EX-21.1
Document
Exhibit 21.1
Subsidiaries of STAG Industrial, Inc., a Maryland corporation
|
|
|
|
|
|
|
|
|
| Name |
|
Jurisdiction of
Formation/Incorporation |
| STAG Allentown, LLC |
|
Delaware |
| STAG Arlington 2, L.P. |
|
Delaware |
| STAG Belvidere III, LLC |
|
Delaware |
| STAG Belvidere IV, LLC |
|
Delaware |
| STAG Belvidere IX, LLC |
|
Delaware |
| STAG Belvidere V, LLC |
|
Delaware |
| STAG Belvidere VI, LLC |
|
Delaware |
| STAG Belvidere VIII, LLC |
|
Delaware |
| STAG Burlington 3, LLC |
|
Delaware |
| STAG Burlington, LLC |
|
Delaware |
| STAG CA GP, LLC |
|
Delaware |
| STAG CA Holdings, LP |
|
Delaware |
| STAG Columbia, LLC |
|
Delaware |
| STAG De Pere, LLC |
|
Delaware |
| STAG Duncan, LLC |
|
Delaware |
| STAG Edgefield, LLC |
|
Delaware |
| STAG El Paso 1, LP |
|
Delaware |
| STAG El Paso 2, LP |
|
Delaware |
| STAG El Paso 3, LP |
|
Delaware |
| STAG El Paso 4, LP |
|
Delaware |
| STAG El Paso 5, LP |
|
Delaware |
| STAG El Paso, LP |
|
Delaware |
| STAG Elizabethtown, LLC |
|
Delaware |
| STAG Fairborn, LLC |
|
Delaware |
| STAG Garland, LP |
|
Delaware |
| STAG Germantown, LLC |
|
Delaware |
| STAG GI Investments Holdings, LLC |
|
Delaware |
| STAG GI Streetsboro, LLC |
|
Delaware |
| STAG Gloversville 1, LLC |
|
Delaware |
| STAG Gloversville 2, LLC |
|
Delaware |
| STAG Gloversville 4, LLC |
|
Delaware |
| STAG Greer, LLC |
|
Delaware |
| STAG Gurnee 2, LLC |
|
Delaware |
| STAG Hampstead, LLC |
|
Delaware |
| STAG Harvard, LLC |
|
Delaware |
| STAG Houston 14, LP |
|
Delaware |
| STAG Houston 2, L.P. |
|
Delaware |
| STAG III Arlington, L.P. |
|
Delaware |
| STAG III Boardman, LLC |
|
Delaware |
| STAG III Malden, LLC |
|
Delaware |
| STAG IND El Paso 6, LP |
|
Delaware |
| STAG IND Houston 11, LP |
|
Delaware |
| STAG IND Houston 9, LP |
|
Delaware |
| STAG IND Mission, LP |
|
Delaware |
| STAG IND Stafford, LP |
|
Delaware |
| STAG Industrial GP, LLC |
|
Delaware |
| STAG Industrial Holdings, LLC |
|
Delaware |
| STAG Industrial Holdings II, LLC |
|
Delaware |
| STAG Industrial Management, LLC |
|
Delaware |
| STAG Industrial Operating Partnership, L.P. |
|
Delaware |
| STAG Industrial TRS, LLC |
|
Delaware |
| STAG Investments Holdings III, LLC |
|
Delaware |
| STAG Investments Holdings IV, LLC |
|
Delaware |
| STAG IV Seville, LLC |
|
Delaware |
| STAG IV Waco, LP |
|
Delaware |
| STAG Johnstown 2, LLC |
|
Delaware |
|
|
|
|
|
|
|
|
|
| Name |
|
Jurisdiction of
Formation/Incorporation |
| STAG Johnstown 3, LLC |
|
Delaware |
| STAG Johnstown 4, LLC |
|
Delaware |
| STAG Katy 2, LP |
|
Delaware |
| STAG Katy, LP |
|
Delaware |
| STAG Lancaster, LLC |
|
Delaware |
| STAG Laurens, LLC |
|
Delaware |
| STAG Lebanon, LLC |
|
Delaware |
| STAG Livonia 1, LLC |
|
Delaware |
| STAG Livonia 2, LLC |
|
Delaware |
| STAG Machesney Park, LLC |
|
Delaware |
| STAG McHenry 2, LP |
|
Delaware |
| STAG Mechanicsburg 1, LLC |
|
Delaware |
| STAG Mechanicsburg 2, LLC |
|
Delaware |
| STAG Mechanicsburg 3, LLC |
|
Delaware |
| STAG Montgomery, LLC |
|
Delaware |
| STAG Mooresville 2, LP |
|
Delaware |
| STAG NC GP 2, LLC |
|
Delaware |
| STAG NC GP, LLC |
|
Delaware |
| STAG NC Holdings, LP |
|
Delaware |
| STAG New Hope, LLC |
|
Delaware |
| STAG North Haven, LLC |
|
Delaware |
| STAG Norton, LLC |
|
Delaware |
| STAG O’Hara, LLC |
|
Delaware |
| STAG Omaha 4, LLC |
|
Delaware |
| STAG Omaha 5, LLC |
|
Delaware |
| STAG Piedmont 1, LLC |
|
Delaware |
| STAG Piedmont 2, LLC |
|
Delaware |
| STAG Piedmont 3 LLC |
|
Delaware |
| STAG Pineville, LLC |
|
Delaware |
| STAG Plymouth 3, LLC |
|
Delaware |
| STAG Portage, LLC |
|
Delaware |
| STAG Reading, LLC |
|
Delaware |
| STAG Rock Hill 2, LLC |
|
Delaware |
| STAG Rockwall, LP |
|
Delaware |
| STAG Romulus 2, LLC |
|
Delaware |
| STAG Ronkonkoma, LLC |
|
Delaware |
| STAG Sauk Village, LLC |
|
Delaware |
| STAG Simpsonville, LLC |
|
Delaware |
| STAG South Saint Paul, LLC |
|
Delaware |
| STAG Sparks 2, LLC |
|
Delaware |
| STAG Spartanburg 3, LLC |
|
Delaware |
| STAG Spartanburg, LLC |
|
Delaware |
| STAG Stoughton 1, LLC |
|
Delaware |
| STAG Stoughton 2, LLC |
|
Delaware |
| STAG TX GP 2, LLC |
|
Delaware |
| STAG TX GP, LLC |
|
Delaware |
| STAG TX Grapevine, LP |
|
Delaware |
| STAG TX Holdings, LP |
|
Delaware |
| STAG West Columbia 3, LLC |
|
Delaware |
| STAG West Houston, LP |
|
Delaware |
| STAG York, LLC |
|
Delaware |
| STIR Investments GP III, LLC |
|
Delaware |
| STIR Investments GP IV, LLC |
|
Delaware |
| STIR Investments GP, LLC |
|
Delaware |
EX-23.1
4
q42023-ex23110k.htm
EX-23.1
Document
Exhibit 23.1
CONSENT OF INDEPENDENT REGISTERED PUBLIC ACCOUNTING FIRM
We hereby consent to the incorporation by reference in the Registration Statements on Form S-3 (No. 333-262791) and Form S-8 (No. 333-173599, 333-188483, 333-224681 and 333-271508) of STAG Industrial, Inc. of our report dated February 13, 2024, relating to the financial statements, financial statement schedule, and the effectiveness of internal control over financial reporting, which appears in this Form 10-K.
/s/ PricewaterhouseCoopers LLP
Boston, Massachusetts
February 13, 2024
EX-31.1
5
q42023-ex31110k.htm
EX-31.1
Document
Exhibit 31.1
Certification of Chief Executive Officer Pursuant to Section 302 of the Sarbanes-Oxley Act of 2002
I, William R. Crooker, certify that:
1.I have reviewed this annual report on Form 10-K of STAG Industrial, Inc.;
2.Based on my knowledge, this report does not contain any untrue statement of a material fact or omit to state a material fact necessary to make the statements made, in light of the circumstances under which such statements were made, not misleading with respect to the period covered by this report;
3.Based on my knowledge, the financial statements, and other financial information included in this report, fairly present in all material respects the financial condition, results of operations and cash flows of the registrant as of, and for, the periods presented in this report;
4.The registrant’s other certifying officer(s) and I are responsible for establishing and maintaining disclosure controls and procedures (as defined in Exchange Act Rules 13a-15(e) and 15d-15(e)) and internal control over financial reporting (as defined in Exchange Act Rules 13a-15(f) and 15d-15(f)) for the registrant and have:
(a)Designed such disclosure controls and procedures, or caused such disclosure controls and procedures to be designed under our supervision, to ensure that material information relating to the registrant, including its consolidated subsidiaries, is made known to us by others within those entities, particularly during the period in which this report is being prepared;
(b)Designed such internal control over financial reporting, or caused such internal control over financial reporting to be designed under our supervision, to provide reasonable assurance regarding the reliability of financial reporting and the preparation of financial statements for external purposes in accordance with generally accepted accounting principles;
(c)Evaluated the effectiveness of the registrant’s disclosure controls and procedures and presented in this report our conclusions about the effectiveness of the disclosure controls and procedures, as of the end of the period covered by this report based on such evaluation; and
(d)Disclosed in this report any change in the registrant’s internal control over financial reporting that occurred during the registrant’s most recent fiscal quarter (the registrant’s fourth fiscal quarter in the case of an annual report) that has materially affected, or is reasonably likely to materially affect, the registrant’s internal control over financial reporting; and
5.The registrant’s other certifying officer(s) and I have disclosed, based on our most recent evaluation of internal control over financial reporting, to the registrant’s auditors and the audit committee of the registrant’s board of directors (or persons performing the equivalent functions):
(a)All significant deficiencies and material weaknesses in the design or operation of internal control over financial reporting which are reasonably likely to adversely affect the registrant’s ability to record, process, summarize and report financial information; and
(b)Any fraud, whether or not material, that involves management or other employees who have a significant role in the registrant’s internal control over financial reporting.
|
|
|
|
|
|
| Date: February 13, 2024 |
/s/ William R. Crooker |
|
William R. Crooker
President and Chief Executive Officer
|
EX-31.2
6
q42023-ex31210k.htm
EX-31.2
Document
Exhibit 31.2
Certification of Chief Financial Officer Pursuant to Section 302 of the Sarbanes-Oxley Act of 2002
I, Matts S. Pinard, certify that:
1.I have reviewed this annual report on Form 10-K of STAG Industrial, Inc.;
2.Based on my knowledge, this report does not contain any untrue statement of a material fact or omit to state a material fact necessary to make the statements made, in light of the circumstances under which such statements were made, not misleading with respect to the period covered by this report;
3.Based on my knowledge, the financial statements, and other financial information included in this report, fairly present in all material respects the financial condition, results of operations and cash flows of the registrant as of, and for, the periods presented in this report;
4.The registrant’s other certifying officer(s) and I are responsible for establishing and maintaining disclosure controls and procedures (as defined in Exchange Act Rules 13a-15(e) and 15d-15(e)) and internal control over financial reporting (as defined in Exchange Act Rules 13a-15(f) and 15d-15(f)) for the registrant and have:
(a)Designed such disclosure controls and procedures, or caused such disclosure controls and procedures to be designed under our supervision, to ensure that material information relating to the registrant, including its consolidated subsidiaries, is made known to us by others within those entities, particularly during the period in which this report is being prepared;
(b)Designed such internal control over financial reporting, or caused such internal control over financial reporting to be designed under our supervision, to provide reasonable assurance regarding the reliability of financial reporting and the preparation of financial statements for external purposes in accordance with generally accepted accounting principles;
(c)Evaluated the effectiveness of the registrant’s disclosure controls and procedures and presented in this report our conclusions about the effectiveness of the disclosure controls and procedures, as of the end of the period covered by this report based on such evaluation; and
(d)Disclosed in this report any change in the registrant’s internal control over financial reporting that occurred during the registrant’s most recent fiscal quarter (the registrant’s fourth fiscal quarter in the case of an annual report) that has materially affected, or is reasonably likely to materially affect, the registrant’s internal control over financial reporting; and
5.The registrant’s other certifying officer(s) and I have disclosed, based on our most recent evaluation of internal control over financial reporting, to the registrant’s auditors and the audit committee of the registrant’s board of directors (or persons performing the equivalent functions):
(a)All significant deficiencies and material weaknesses in the design or operation of internal control over financial reporting which are reasonably likely to adversely affect the registrant’s ability to record, process, summarize and report financial information; and
(b)Any fraud, whether or not material, that involves management or other employees who have a significant role in the registrant’s internal control over financial reporting.
|
|
|
|
|
|
| Date: February 13, 2024 |
/s/ Matts S. Pinard |
|
Matts S. Pinard
Chief Financial Officer, Executive Vice President
and Treasurer
|
EX-32.1
7
q42023-ex32110k.htm
EX-32.1
Document
Exhibit 32.1
Certification Pursuant To
18 U.S.C. Section 1350,
as Adopted Pursuant to
Section 906 of The Sarbanes-Oxley Act of 2002
In connection with the Annual Report of STAG Industrial, Inc. on Form 10-K for the fiscal year ended December 31, 2023 as filed with the Securities and Exchange Commission on the date hereof (the “Report”), the undersigned officers of STAG Industrial, Inc., certify, pursuant to 18 U.S.C. section 1350, as adopted pursuant to Section 906 of the Sarbanes‑Oxley Act of 2002, that:
(1)the Report, containing the financial statements, fully complies with the requirements of section 13(a) or 15(d) of the Securities Exchange Act of 1934, as amended; and
(2)the information contained in the Report fairly presents, in all material respects, the financial condition and results of operations of STAG Industrial, Inc.
|
|
|
|
|
|
| Date: February 13, 2024 |
/s/ William R. Crooker |
|
William R. Crooker
President and Chief Executive Officer
|
| |
|
| |
/s/ Matts S. Pinard |
| |
Matts S. Pinard
Chief Financial Officer, Executive Vice President and Treasurer
|
EX-97.1
8
q42023-ex971recoverypolicy.htm
EX-97.1
Document
Exhibit 97.1
RECOVERY POLICY
The Board of Directors (the “Board”) of STAG Industrial, Inc. (together with STAG Industrial Operating Partnership, L.P. and its other subsidiaries, the “Company”) adopts this Recovery Policy (this “Policy”) as of the Effective Date (as defined below).
1.Definitions
a.“Committee” means the Compensation Committee of the Board (or, if the Compensation Committee of the Board is not a committee of the Board responsible for the Company’s executive compensation decisions and composed entirely of independent directors, a majority of the independent directors serving on the Board).
b.“Covered Compensation” means all Incentive-Based Compensation received by a Section 16 Officer (i) at any time during the performance period for the Incentive- Based Compensation, (ii) after the person began service as a Section 16 Officer, (iii) while the Company had a class of securities listed on a national securities exchange or a national securities association, and (iv) after the effective date of the NYSE listing standard (or any other national securities exchange or national securities association on which the Company’s securities are listed).
c.“Covered Officer” means each current or former “officer” of the Company as defined under Rule 16a-1(f) under the Exchange Act, which shall be deemed to include any individuals identified by the Company as executive officers pursuant to Item 401(b) of Regulation S-K under the Exchange Act.
d.“Effective Date” means November 1, 2023.
e.“Erroneously Awarded Compensation” means the amount of Covered Compensation received by a Section 16 Officer during the Lookback Period that exceeds the amount of Covered Compensation that otherwise would have been received by the Section 16 Officer had such amount been determined based on the applicable Restatement, computed without regard to any taxes paid (i.e., on a pre- tax basis). Where the amount of Erroneously Awarded Compensation is not subject to mathematical recalculation directly from the information in a Restatement (e.g., Covered Compensation based on stock price or total stockholder return), the Committee will determine the amount of such Covered Compensation that constitutes Erroneously Awarded Compensation, if any, based on a reasonable estimate of the effect of the Restatement on the Financial Reporting Measure, and the Committee shall maintain documentation of such determination and provide such documentation to the NYSE.
f.“Exchange Act” means the Securities Exchange Act of 1934, as amended.
g.“Financial Reporting Measure” means any measure determined and presented in accordance with the accounting principles used in preparing the Company’s financial statements, and any measure derived wholly or in part from such measure. Stock price and total stockholder return are Financial Reporting Measures. Financial Reporting Measures may or may not be filed with the SEC and may be presented outside the Company’s financial statements.
h.“Incentive-Based Compensation” means any compensation that is granted, earned or vested based wholly or in part upon the attainment of a Financial Reporting Measure.
i.“Lookback Period” means the three completed fiscal years (plus any transition period of less than nine months that is within or immediately following the three completed fiscal years and that results from a change in the Company’s fiscal year) immediately preceding the date on which the Company is required to prepare a Restatement for a given reporting period, with such date being the earlier of (i) the date the Board, a committee of the Board, or the officer or officers of the Company authorized to take such action if Board action is not required, concludes, or reasonably should have concluded, that the Company is required to prepare a Restatement, and (ii) the date a court, regulator or other legally authorized body directs the Company to prepare a Restatement.
j.“NYSE” means the New York Stock Exchange.
k.“Restatement” means a required accounting restatement of any Company financial statement due to the material noncompliance of the Company with any financial reporting requirement under the U.S. federal securities laws, including a required accounting restatement to correct an error in previously issued financial statements that is material to the previously issued financial statements, or that would result in a material misstatement if the error were corrected in the current period or left uncorrected in the current period. Changes to the Company’s financial statements that do not represent error corrections under the then-current relevant accounting standards will not constitute Restatements. For clarification and without expanding the definition of Restatement, error corrections recorded in the current period financial statements when the error is immaterial to the previously issued financial statements and the correction is immaterial to the current period financial statements (commonly referred to as “out-of-period” adjustments) will not constitute Restatements.
l.“SEC” means the United States Securities and Exchange Commission.
2.Recoupment of Erroneously Awarded Compensation
Subject to the other provisions of this Section 2, in the event of a Restatement, any Erroneously Awarded Compensation (a) that is then owed or otherwise due a Section 16 Officer but has not yet been paid shall be forfeited and (b) that has been received by a Section 16 Officer shall be subject to reasonably prompt repayment to the Company. The Committee shall pursue the forfeiture and/or repayment of such Erroneously Awarded Compensation, except as provided below.
Notwithstanding the foregoing, the Committee may determine not to pursue the forfeiture and/or recovery of Erroneously Awarded Compensation from any person if the Committee determines that such forfeiture and/or recovery would be impracticable due to any of the following circumstances: (a) the direct expense paid to a third party (for example, reasonable legal expenses and consulting fees) to assist in enforcing this Policy would exceed the amount to be recovered (following reasonable attempts by the Company to recover such Erroneously Awarded Compensation, the documentation of such attempts, and the provision of such documentation to the NYSE); (b) recovery would likely cause any otherwise tax-qualified retirement plan, under which benefits are broadly available to employees of Company, to fail to meet the requirements of 26 U.S.C. 401(a)(13) or 26 U.S.C. 411(a) and regulations thereunder; or (c) the applicable listing rules otherwise do not require recovery.
For purposes of this Policy, Incentive-Based Compensation will be deemed received in the Company’s fiscal period during which the Financial Reporting Measure specified in the Incentive-Based Compensation award is attained, even if the payment or grant of the Incentive- Based Compensation occurs after the end of that period.
In the event that the Committee determines that any person shall repay any Erroneously Awarded Compensation, the Committee shall provide written notice to such person by email or certified mail to the physical address on file with the Company for such person.
3.Indemnification
The Company shall not indemnify any Section 16 Officer against the loss of Erroneously Awarded Compensation.
4.Miscellaneous
This Policy shall be administered and interpreted by the Committee. The Committee may cause the Company to take such action as the Committee deems necessary or appropriate to implement this Policy, and any determination by the Committee with respect to and not inconsistent with this Policy shall be final, conclusive and binding on all interested parties. Any determinations of the Committee under this Policy, if any, need not be uniform with respect to all persons and may be made selectively among persons, whether or not such persons are similarly situated.
This Policy is intended to comply with Section 10D of the Exchange Act, Rule 10D-1 thereunder, and the applicable rules of the NYSE (or any other national securities exchange or national securities association on which the Company’s securities are listed), and this Policy will be interpreted and administered consistently with that intent.
5.Amendment and Termination
To the extent permitted by, and in a manner consistent with applicable law, including SEC and NYSE rules, the Committee may terminate, suspend or amend this Policy at any time in its discretion. This Policy shall automatically and immediately terminate once none of the Company’s securities are listed on the NYSE or other national securities exchange or national securities association.