UNITED STATES
SECURITIES AND EXCHANGE COMMISSION
Washington, D.C. 20549
FORM 6-K
REPORT OF FOREIGN PRIVATE ISSUER PURSUANT TO RULE 13a-16 OR 15d-16
UNDER THE SECURITIES EXCHANGE ACT OF 1934
For the Month of November 2023
Commission File Number: 001-35254
AVINO SILVER & GOLD MINES LTD. |
Suite 900, 570 Granville Street, Vancouver, BC V6C 3P1
(Address of principal executive offices)
Indicate by check mark whether the registrant files or will file annual reports under cover Form 20-F or Form 40-F.
☐ Form 20-F ☒ Form 40-F
Explanatory Note
Avino Silver & Gold Mines Ltd. (the “Company”) is furnishing this Form 6-K to provide its financial information for the nine months ended September 30, 2023, and to incorporate such financial information into the Company’s registration statements referenced below.
Exhibits 99.1 and 99.2 attached hereto are hereby incorporated by reference into the Company’s Registration Statements on Form F-10 (Registration Statement File number 333-270315); Form F-3 (Registration Statement File numbers 333-252081 and 333-226963) and on Form S-8 (Registration Statement File number 333-195120) to be a part thereof from the date on which this report is submitted, to the extent not superseded by documents or reports subsequently filed.
Exhibits:
The following exhibits are filed as part of this Form 6-K.
Exhibit No. |
|
Document |
|
|
|
|
Unaudited financial statements for the three and nine months ended September 30, 2023 and 2022 |
|
|
||
101.INS |
|
Inline XBRL Instance Document (the instance document does not appear in the Interactive Data File because its XBRL tags are embedded within the Inline XBRL document). |
101.SCH |
|
Inline XBRL Taxonomy Extension Schema Document |
101.CAL |
|
Inline XBRL Taxonomy Extension Calculation Linkbase Document |
101.DEF |
|
Inline XBRL Taxonomy Extension Definition Linkbase Document |
101.LAB |
|
Inline XBRL Taxonomy Extension Label Linkbase Document |
101.PRE |
|
Inline XBRL Taxonomy Extension Presentation Linkbase Document |
104 |
|
Cover Page Interactive Data File (formatted as inline XBRL and contained in Exhibit 101). |
2 |
SIGNATURES
Pursuant to the requirements of the Securities Exchange Act of 1934, the registrant has duly caused this report to be signed on its behalf by the undersigned hereunto duly authorized.
AVINO SILVER & GOLD MINES LTD. |
|||
|
|
||
Date: November 8, 2023 |
By: |
/s/ Jennifer Trevitt |
|
Jennifer Trevitt |
|||
Corporate Secretary |
|||
3 |
EXHIBIT 99.1
|
|
AVINO SILVER & GOLD MINES LTD.
Condensed Consolidated Interim Financial Statements
For the three and nine months ended September 30, 2023 and 2022
(Unaudited)
| -1- |
|
AVINO SILVER & GOLD MINES LTD. Condensed Consolidated Interim Statements of Financial Position (Expressed in thousands of US dollars - Unaudited) |
|
|
|
Note |
|
|
September 30, 2023 (unaudited) |
|
|
December 31, 2022 |
|
|||
ASSETS |
|
|
|
|
|
|
|
|
|
|||
Current assets |
|
|
|
|
|
|
|
|
|
|||
Cash |
|
|
|
|
$1,856 |
|
|
$11,245 |
|
|||
Amounts receivable |
|
|
|
|
|
2,473 |
|
|
|
2,672 |
|
|
Amounts due from related parties |
|
|
11 | (b) |
|
|
31 |
|
|
|
- |
|
Taxes recoverable |
|
|
5 |
|
|
|
5,812 |
|
|
|
3,737 |
|
Prepaid expenses and other assets |
|
|
|
|
|
|
2,063 |
|
|
|
1,671 |
|
Inventory |
|
|
6 |
|
|
|
8,873 |
|
|
|
6,260 |
|
Total current assets |
|
|
|
|
|
|
21,108 |
|
|
|
25,585 |
|
Exploration and evaluation assets |
|
|
8 |
|
|
|
50,451 |
|
|
|
49,804 |
|
Plant, equipment and mining properties |
|
|
10 |
|
|
|
51,039 |
|
|
|
44,056 |
|
Long-term investments |
|
|
7 |
|
|
|
891 |
|
|
|
1,746 |
|
Other assets |
|
|
|
|
|
|
4 |
|
|
|
5 |
|
Total assets |
|
|
|
|
|
$123,493 |
|
|
$121,196 |
|
||
LIABILITIES |
|
|
|
|
|
|
|
|
|
|
|
|
Current liabilities |
|
|
|
|
|
|
|
|
|
|
|
|
Accounts payable and accrued liabilities |
|
|
|
|
|
$11,675 |
|
|
$9,469 |
|
||
Amounts due to related parties |
|
|
11 | (b) |
|
|
- |
|
|
|
28 |
|
Taxes payable |
|
|
|
|
|
|
85 |
|
|
|
895 |
|
Note payable |
|
|
12 |
|
|
|
- |
|
|
|
4,926 |
|
Warrant liability |
|
|
13 |
|
|
|
- |
|
|
|
475 |
|
Current portion of finance lease obligations |
|
|
|
|
|
|
1,738 |
|
|
|
971 |
|
Current portion of equipment loans |
|
|
|
|
|
|
165 |
|
|
|
- |
|
Total current liabilities |
|
|
|
|
|
|
13,663 |
|
|
|
16,764 |
|
Finance lease obligations |
|
|
|
|
|
|
1,406 |
|
|
|
745 |
|
Equipment loans |
|
|
|
|
|
|
234 |
|
|
|
- |
|
Reclamation provision |
|
|
14 |
|
|
|
544 |
|
|
|
445 |
|
Deferred income tax liabilities |
|
|
|
|
|
|
4,941 |
|
|
|
5,221 |
|
Total liabilities |
|
|
|
|
|
|
20,788 |
|
|
|
23,175 |
|
EQUITY |
|
|
|
|
|
|
|
|
|
|
|
|
Share capital |
|
|
15 |
|
|
|
149,776 |
|
|
|
145,515 |
|
Equity reserves |
|
|
|
|
|
|
10,581 |
|
|
|
9,852 |
|
Treasury shares |
|
|
|
|
|
|
(97) |
|
|
(97) | ||
Accumulated other comprehensive loss |
|
|
|
|
|
|
(5,569) |
|
|
(5,223) | ||
Accumulated deficit |
|
|
|
|
|
|
(51,986) |
|
|
(52,026) | ||
Total equity |
|
|
|
|
|
|
102,705 |
|
|
|
98,021 |
|
Total liabilities and equity |
|
|
|
|
|
$123,493 |
|
|
$ | 121,196 |
|
|
Commitments – Note 18
Approved by the Board of Directors on November 8, 2023:
Peter Bojtos Director David Wolfin Director
The accompanying notes are an integral part of the condensed consolidated interim financial statements
| -2- |
|
AVINO SILVER & GOLD MINES LTD. Condensed Consolidated Interim Statements of Operations and Comprehensive Income (Loss) (Expressed in thousands of US dollars - Unaudited) |
|
|
|
|
|
|
Three months ended September 30, |
|
|
Nine months ended September 30, |
|
|||||||||||
|
|
Note |
|
|
2023 |
|
|
2022 |
|
|
2023 |
|
|
2022 |
|
|||||
Revenue from mining operations |
|
|
16 |
|
|
$ | 12,316 |
|
|
$ | 9,118 |
|
|
$ | 31,359 |
|
|
$ | 29,538 |
|
Cost of sales |
|
|
16 |
|
|
|
9,952 |
|
|
|
7,058 |
|
|
|
26,101 |
|
|
|
18,832 |
|
Mine operating income |
|
|
|
|
|
|
2,364 |
|
|
|
2,060 |
|
|
|
5,258 |
|
|
|
10,706 |
|
|
|
|
|
|
|
|
|
|
|
|
|
|
|
|
|
|
|
|
|
|
Operating expenses |
|
|
|
|
|
|
|
|
|
|
|
|
|
|
|
|
|
|
|
|
General and administrative expenses |
|
|
17 |
|
|
|
1,280 |
|
|
|
997 |
|
|
|
3,999 |
|
|
|
3,469 |
|
Share-based payments |
|
|
15 |
|
|
|
627 |
|
|
|
556 |
|
|
|
1,809 |
|
|
|
1,618 |
|
Income (loss) before other items |
|
|
|
|
|
|
457 |
|
|
|
507 |
|
|
|
(550 | ) |
|
|
5,619 |
|
Other items |
|
|
|
|
|
|
|
|
|
|
|
|
|
|
|
|
|
|
|
|
Interest and other income |
|
|
|
|
|
|
5 |
|
|
|
15 |
|
|
|
234 |
|
|
|
67 |
|
Loss on long-term investments |
|
|
7 |
|
|
|
(295 | ) |
|
|
(1,221 | ) |
|
|
(899 | ) |
|
|
(2,503 | ) |
Fair value adjustment on warrant liability |
|
|
13 |
|
|
|
20 |
|
|
|
86 |
|
|
|
478 |
|
|
|
2,692 |
|
Unrealized foreign exchange gain (loss) |
|
|
|
|
|
|
(234 | ) |
|
|
251 |
|
|
|
182 |
|
|
|
(231 | ) |
Project evaluation expenses |
|
|
|
|
|
|
- |
|
|
|
(5 | ) |
|
|
- |
|
|
|
(80 | ) |
Finance cost |
|
|
|
|
|
|
(3 | ) |
|
|
(87 | ) |
|
|
(80 | ) |
|
|
(188 | ) |
Accretion of reclamation provision |
|
|
14 |
|
|
|
(13 | ) |
|
|
(11 | ) |
|
|
(36 | ) |
|
|
(32 | ) |
Interest expense |
|
|
|
|
|
|
(158 | ) |
|
|
(23 | ) |
|
|
(275 | ) |
|
|
(66 | ) |
Income (loss) before income taxes |
|
|
|
|
|
|
(221 |
|
|
|
(488 |
|
|
|
(946 |
|
|
|
5,278 |
|
Income taxes: |
|
|
|
|
|
|
|
|
|
|
|
|
|
|
|
|
|
|
|
|
Current income tax recovery (expense) |
|
|
|
|
|
|
111 |
|
|
|
(142 | ) |
|
|
645 |
|
|
|
(642 | ) |
Deferred income tax recovery (expense) |
|
|
|
|
|
|
(693 | ) |
|
|
(499 | ) |
|
|
280 |
|
|
|
(2,836 | ) |
Income tax recovery (expense) |
|
|
|
|
|
|
(582 | ) |
|
|
(641 | ) |
|
|
925 |
|
|
|
(3,478 | ) |
|
|
|
|
|
|
|
|
|
|
|
|
|
|
|
|
|
|
|
|
|
Net income (loss) |
|
|
|
|
|
|
(803 | ) |
|
|
(1,129 | ) |
|
|
(21 | ) |
|
|
1,800 |
|
|
|
|
|
|
|
|
|
|
|
|
|
|
|
|
|
|
|
|
|
|
Other comprehensive income (loss) |
|
|
|
|
|
|
|
|
|
|
|
|
|
|
|
|
|
|
|
|
Currency translation differences |
|
|
|
|
|
|
230 |
|
|
|
(290 | ) |
|
|
(346 | ) |
|
|
(52 | ) |
Total comprehensive income (loss) |
|
|
|
|
|
$ | (573 | ) |
|
$ | (1,419 | ) |
|
$ | (367 | ) |
|
|
1,748 |
|
Income (loss) per share |
|
|
15 | (e) |
|
|
|
|
|
|
|
|
|
|
|
|
|
|
|
|
Basic |
|
|
|
|
|
$ | (0.01 | ) |
|
($0.01) |
|
|
$ | 0.00 |
|
|
$ | 0.02 |
|
|
Diluted |
|
|
|
|
|
$ | (0.01 | ) |
|
($0.01) |
|
|
$ | 0.00 |
|
|
$ | 0.02 |
|
|
Weighted average number of common shares outstanding |
|
|
15 | (e) |
|
|
|
|
|
|
|
|
|
|
|
|
|
|
|
|
Basic |
|
|
|
|
|
|
122,433,272 |
|
|
|
117,876,825 |
|
|
|
120,093,760 |
|
|
|
113,027,305 |
|
Diluted |
|
|
|
|
|
|
122,433,272 |
|
|
|
117,876,825 |
|
|
|
120,093,760 |
|
|
|
116,275,433 |
|
The accompanying notes are an integral part of the condensed consolidated interim financial statements
| -3- |
|
AVINO SILVER & GOLD MINES LTD. Condensed Consolidated Interim Statements of Changes in Equity (Expressed in thousands of US dollars - Unaudited) |
|
|
|
Note |
|
|
Number of Common Shares |
|
|
Share Capital Amount |
|
|
Equity Reserves |
|
|
Treasury Shares |
|
|
Accumulated Other Comprehensive Income (Loss) |
|
|
Accumulated Deficit |
|
|
Total Equity |
|
||||||||
Balance, January 1, 2022 |
|
|
|
|
|
102,243,211 |
|
|
$ | 129,953 |
|
|
$ | 9,573 |
|
|
$ | (97 | ) |
|
$ | (4,969 | ) |
|
$ | (55,953 | ) |
|
$ | 78,507 |
|
|
|
|
|
|
|
|
|
|
|
|
|
|
|
|
|
|
|
|
|
|
|
|
|
|
|
|
|
|
|
|
|
|
|
Common shares issued for acquisition of La Preciosa |
|
|
|
|
|
15,075,000 |
|
|
|
14,630 |
|
|
|
- |
|
|
|
- |
|
|
|
- |
|
|
|
- |
|
|
|
14,630 |
|
|
Exercise of options |
|
|
|
|
|
48,000 |
|
|
|
46 |
|
|
|
(15 | ) |
|
|
- |
|
|
|
- |
|
|
|
- |
|
|
|
31 |
|
|
Issuance costs |
|
|
|
|
|
- |
|
|
|
(13 | ) |
|
|
- |
|
|
|
- |
|
|
|
- |
|
|
|
- |
|
|
|
(13 | ) | |
Share-based payments |
|
|
|
|
|
- |
|
|
|
- |
|
|
|
1,618 |
|
|
|
- |
|
|
|
- |
|
|
|
- |
|
|
|
1,618 |
|
|
Net income for the period |
|
|
|
|
|
- |
|
|
|
- |
|
|
|
- |
|
|
|
- |
|
|
|
- |
|
|
|
1,800 |
|
|
|
1,800 |
|
|
Options cancelled or expired |
|
|
15 |
|
|
|
- |
|
|
|
- |
|
|
|
(831 | ) |
|
|
- |
|
|
|
- |
|
|
|
831 |
|
|
|
- |
|
Carrying value of exercise of RSUs |
|
|
15 |
|
|
|
982,879 |
|
|
|
899 |
|
|
|
(899 | ) |
|
|
- |
|
|
|
- |
|
|
|
- |
|
|
|
- |
|
Currency translation differences |
|
|
|
|
|
|
- |
|
|
|
- |
|
|
|
- |
|
|
|
- |
|
|
|
(52 | ) |
|
|
- |
|
|
|
(52 | ) |
Balance, September 30, 2022 |
|
|
|
|
|
|
118,349,090 |
|
|
$ | 145,515 |
|
|
$ | 9,446 |
|
|
$ | (97 | ) |
|
$ | (5,021 | ) |
|
$ | (53,322 | ) |
|
$ | 96,521 |
|
Balance, January 1, 2023 |
|
|
|
|
|
|
118,349,090 |
|
|
$ | 145,515 |
|
|
$ | 9,852 |
|
|
$ | (97 | ) |
|
$ | (5,223 | ) |
|
$ | (52,026 | ) |
|
$ | 98,021 |
|
|
|
|
|
|
|
|
|
|
|
|
|
|
|
|
|
|
|
|
|
|
|
|
|
|
|
|
|
|
|
|
|
|
Common shares issued: |
|
|
|
|
|
|
|
|
|
|
|
|
|
|
|
|
|
|
|
|
|
|
|
|
|
|
|
|
|
|
|
|
At the market issuances |
|
|
15 |
|
|
|
5,360,300 |
|
|
|
3,597 |
|
|
|
- |
|
|
|
- |
|
|
|
- |
|
|
|
- |
|
|
|
3,597 |
|
Carrying value of RSUs exercised |
|
|
15 |
|
|
|
1,005,333 |
|
|
|
1,019 |
|
|
|
(1,019 | ) |
|
|
- |
|
|
|
- |
|
|
|
- |
|
|
|
- |
|
Issuance costs |
|
|
15 |
|
|
|
- |
|
|
|
(355 | ) |
|
|
- |
|
|
|
- |
|
|
|
- |
|
|
|
- |
|
|
|
(355 | ) |
Share-based payments |
|
|
15 |
|
|
|
- |
|
|
|
- |
|
|
|
1,809 |
|
|
|
- |
|
|
|
- |
|
|
|
- |
|
|
|
1,809 |
|
Net loss for the period |
|
|
15 |
|
|
|
- |
|
|
|
- |
|
|
|
- |
|
|
|
- |
|
|
|
- |
|
|
|
(21 | ) |
|
|
(21 | ) |
Options cancelled or expired |
|
|
15 |
|
|
|
- |
|
|
|
- |
|
|
|
(61 | ) |
|
|
- |
|
|
|
- |
|
|
|
61 |
|
|
|
- |
|
Currency translation differences |
|
|
|
|
|
|
- |
|
|
|
- |
|
|
|
- |
|
|
|
- |
|
|
|
(346 | ) |
|
|
- |
|
|
|
(346 | ) |
Balance, September 30, 2023 |
|
|
|
|
|
|
124,714,723 |
|
|
$ | 149,776 |
|
|
$ | 10,581 |
|
|
$ | (97 | ) |
|
$ | (5,569 | ) |
|
$ | (51,986 | ) |
|
$ | 102,705 |
|
The accompanying notes are an integral part of the condensed consolidated interim financial statements
| -4- |
|
AVINO SILVER & GOLD MINES LTD. Condensed Consolidated Interim Statements of Cash Flows (Expressed in thousands of US dollars - Unaudited) |
|
|
|
|
|
Nine months ended September 30, |
|
|||||||
|
|
Note |
|
|
2023 |
|
|
2022 |
|
|||
|
|
|
|
|
|
|
|
|
|
|||
Cash generated by (used in): |
|
|
|
|
|
|
|
|
|
|||
|
|
|
|
|
|
|
|
|
|
|||
Operating Activities |
|
|
|
|
|
|
|
|
|
|||
Net income |
|
|
|
|
$ | (21 | ) |
|
$ | 1,800 |
|
|
Adjustments for non-cash items: |
|
|
|
|
|
|
|
|
|
|
|
|
Deferred income tax expense (recovery) |
|
|
|
|
|
(280 | ) |
|
|
2,836 |
|
|
Depreciation and depletion |
|
|
|
|
|
2,175 |
|
|
|
1,558 |
|
|
Accretion of reclamation provision |
|
|
14 |
|
|
|
36 |
|
|
|
32 |
|
Loss on investments |
|
|
7 |
|
|
|
899 |
|
|
|
2,503 |
|
Unrealized foreign exchange gain |
|
|
|
|
|
|
(241 | ) |
|
|
(88 | ) |
Unwinding of fair value adjustment |
|
|
12 |
|
|
|
74 |
|
|
|
177 |
|
Fair value adjustment on warrant liability |
|
|
13 |
|
|
|
(478 | ) |
|
|
(2,692 | ) |
Write down of equipment and materials and supplies inventory |
|
|
|
|
|
|
95 |
|
|
|
- |
|
Share-based payments |
|
|
|
|
|
|
1,809 |
|
|
|
1,618 |
|
|
|
|
|
|
|
|
4,068 |
|
|
|
7,744 |
|
|
|
|
|
|
|
|
|
|
|
|
|
|
Net change in non-cash working capital items |
|
|
19 |
|
|
|
(3,201 | ) |
|
|
768 |
|
Cash provided by operating activities |
|
|
|
|
|
|
867 |
|
|
|
8,512 |
|
|
|
|
|
|
|
|
|
|
|
|
|
|
Financing Activities |
|
|
|
|
|
|
|
|
|
|
|
|
Shares and units issued for cash, net of issuance costs |
|
|
|
|
|
|
3,242 |
|
|
|
30 |
|
Lease liability payments |
|
|
|
|
|
|
(933 | ) |
|
|
(933 | ) |
Equipment loan payments |
|
|
|
|
|
|
(184 | ) |
|
|
- |
|
Cash provided by (used in) financing activities |
|
|
|
|
|
|
2,125 |
|
|
|
(903 | ) |
|
|
|
|
|
|
|
|
|
|
|
|
|
Investing Activities |
|
|
|
|
|
|
|
|
|
|
|
|
Exploration and evaluation expenditures |
|
|
|
|
|
|
(809 | ) |
|
|
(793 | ) |
Additions to plant, equipment and mining properties |
|
|
|
|
|
|
(6,575 | ) |
|
|
(5,347 | ) |
Acquisition of La Preciosa |
|
|
4 |
|
|
|
(5,000 | ) |
|
|
(15,289 | ) |
Cash provided by (used in) investing activities |
|
|
|
|
|
|
(12,384 | ) |
|
|
(21,429 | ) |
|
|
|
|
|
|
|
|
|
|
|
|
|
Change in cash |
|
|
|
|
|
|
(9,392 | ) |
|
|
(13,820 | ) |
|
|
|
|
|
|
|
|
|
|
|
|
|
Effect of exchange rate changes on cash |
|
|
|
|
|
|
3 |
|
|
|
(25 | ) |
|
|
|
|
|
|
|
|
|
|
|
|
|
Cash, beginning |
|
|
|
|
|
|
11,245 |
|
|
|
24,765 |
|
|
|
|
|
|
|
|
|
|
|
|
|
|
Cash, ending |
|
|
|
|
|
$ | 1,856 |
|
|
$ | 10,920 |
|
Supplementary Cash Flow Information (Note 19)
The accompanying notes are an integral part of the condensed consolidated interim financial statements
| -5- |
|
AVINO SILVER & GOLD MINES LTD. Notes to the unaudited condensed consolidated interim financial statements For the nine months ended September 30, 2023 and 2022 (Expressed in thousands of US dollars, except where otherwise noted) |
|
1. NATURE OF OPERATIONS
Avino Silver & Gold Mines Ltd. (the “Company” or “Avino”) was incorporated in 1968 under the laws of the Province of British Columbia, Canada. The Company is engaged in the production and sale of silver, gold, and copper and the acquisition, exploration, and advancement of mineral properties. The Company’s head office and principal place of business is Suite 900, 570 Granville Street, Vancouver, BC, Canada. The Company is a reporting issuer in Canada and the United States, and trades on the Toronto Stock Exchange (“TSX”), the NYSE American, and the Frankfurt and Berlin Stock Exchanges. The Company operates the Avino Mine which produces copper, silver and gold at the historic Avino property in the state of Durango, Mexico. The Company also owns interests in mineral properties located in British Columbia and Yukon, Canada.
2. BASIS OF PRESENTATION
Statement of Compliance
These unaudited condensed consolidated interim financial statements have been prepared in accordance with International Accounting Standard (“IAS”) 34 – Interim Financial Reporting under International Financial Reporting Standards (“IFRS”) issued by the International Accounting Standards Board (“IASB”). These unaudited condensed consolidated interim financial statements follow the same accounting policies and methods of application as the most recent annual audited consolidated financial statements of the Company. These unaudited condensed consolidated interim financial statements do not contain all of the information required for full annual consolidated financial statements. Accordingly, these unaudited condensed consolidated interim financial statements should be read in conjunction with the Company’s December 31, 2022, annual consolidated financial statements, which were prepared in accordance with IFRS as issued by the IASB.
These unaudited condensed consolidated interim financial statements are expressed in US dollars and have been prepared on a historical cost basis except for financial instruments that have been measured at fair value. In addition, these unaudited condensed consolidated interim financial statements have been prepared using the accrual basis of accounting on a going concern basis.
Critical Accounting Judgments and Estimates
The Company’s management makes judgments in its process of applying the Company’s accounting policies to the preparation of its unaudited condensed consolidated interim financial statements. In addition, the preparation of financial data requires that the Company’s management make assumptions and estimates of the impacts on the carrying amounts of the Company’s assets and liabilities at the end of the reporting period from uncertain future events and on the reported amounts of revenues and expenses during the reporting period. Actual results may differ from those estimates as the estimation process is inherently uncertain. Estimates are reviewed on an ongoing basis based on historical experience and other factors that are considered to be relevant under the circumstances. Revisions to estimates and the resulting impacts on the carrying amounts of the Company’s assets and liabilities are accounted for prospectively.
The critical judgments and estimates applied in the preparation of the Company’s unaudited condensed consolidated interim financial statements for the nine months ended September 30, 2023, are consistent with those applied and disclosed in Note 2 to the Company’s audited consolidated financial statements for the year ended December 31, 2022.
| -6- |
|
AVINO SILVER & GOLD MINES LTD. Notes to the unaudited condensed consolidated interim financial statements For the nine months ended September 30, 2023 and 2022 (Expressed in thousands of US dollars, except where otherwise noted) |
|
Basis of Consolidation
The unaudited condensed consolidated interim financial statements include the accounts of the Company and its Mexican subsidiaries as follows:
Subsidiary |
|
Ownership Interest |
|
|
Jurisdiction |
|
Nature of Operations |
||
Oniva Silver and Gold Mines S.A. de C.V. |
|
|
100% |
|
Mexico |
|
Mexican operations and administration |
||
Nueva Vizcaya Mining, S.A. de C.V. |
|
|
100% |
|
Mexico |
|
Mexican administration |
||
Promotora Avino, S.A. de C.V. (“Promotora”) |
|
|
79.09% |
|
Mexico |
|
Holding company |
||
|
Compañía Minera Mexicana de Avino, S.A. de C.V. (“Avino Mexico”) |
|
98.45% direct 1.22% indirect (Promotora) 99.67% effective |
|
|
Mexico |
|
Mining and exploration |
||
La Luna Silver & Gold Mines Ltd. |
|
|
100% |
|
Canada |
|
Holding company |
||
La Preciosa Silver & Gold Mines Ltd. |
|
|
100% |
|
Canada |
|
Holding company |
||
Proyectos Mineros La Preciosa S.A. de C.V. |
|
|
100% |
|
Mexico |
|
Mining and exploration |
||
Cervantes LLP |
|
|
100% |
|
U.S. |
|
Holding company |
||
Intercompany balances and transactions, including unrealized income and expenses arising from intercompany transactions, are eliminated in preparing the unaudited condensed consolidated interim financial statements.
3. RECENT ACCOUNTING PRONOUNCEMENTS
New and amended IFRS that are effective for the current year:
In the current year, the Company has applied the below amendments to IFRS Standards and Interpretations issued by the IASB that were effective for annual periods that begin on or after January 1, 2023. These standards did not have a material impact on the Company’s disclosures or on the amounts in the current reporting periods.
Amendments to IAS 1 – Presentation of Financial Statements and IFRS Practice Statement 2 Making Material Judgments – Disclosure of Accounting Policies
The amendments change the requirements in IAS 1 with regards to disclosure of accounting policies. The amendments replace all instances of the term “significant accounting policies” with “material accounting policy information.” Accounting policy information is material if, when considered together with other information included in an entity’s financial statements, it can reasonable by expected to influence decisions that the primary users of general purpose financial statements make on the basis of those financial statements.
| -7- |
|
AVINO SILVER & GOLD MINES LTD. Notes to the unaudited condensed consolidated interim financial statements For the nine months ended September 30, 2023 and 2022 (Expressed in thousands of US dollars, except where otherwise noted) |
|
The supporting paragraphs in IAS 1 are also amended to clarify that accounting policy information that relates to immaterial transactions, other events, or conditions, is immaterial and not required to be disclosed. Accounting policy information may be material because of the nature of the related transactions, other events, or conditions, even of the amounts are immaterial. However, not all accounting policy information relating to material transactions, other events, or conditions, is itself material. The IASB has also developed guidance and examples to explain and demonstrate the application of the “four-step materiality process” described in IFRS Practice Statement 2.
The amendments were applied effective January 1, 2023, and did not have a material impact on the Company’s interim consolidated financial statements.
Amendments to IAS 8 – Accounting Policies, Changes in Accounting Estimates and Errors – Definition of Accounting Estimates
The amendments replace the definition of a change in accounting estimates with a definition of accounting estimates. Under the new definition, accounting estimates are “monetary amounts in financial statements that are subject to measurement uncertainty.”
The definition of a change in accounting estimates was deleted; however, the IASB retained the concept of changes in accounting estimates in the Standard with the following clarifications:
|
· |
A change in accounting estimate that results from new information or new developments is not a correct of an error |
|
|
|
|
· |
The effects of a change in an input or a measurement technique used to develop an accounting estimate are changes in accounting estimates if they do not result from the correction of prior period errors |
The amendments were applied effective January 1, 2023, and did not have a material impact on the Company’s interim consolidated financial statements.
Amendments to IAS 12 – Deferred Tax Related to Assets and Liabilities Arising from a Single Transaction
The amendments clarify that companies are required to recognize deferred taxes on transactions where both assets and liabilities are recognized, such as with leases and decommissioning liabilities. The amendments were applied effective January 1, 2023, and did not have a material impact on the Company’s interim consolidated financial statements.
Future Changes in Accounting Policies Not Yet Effective as at September 30, 2023:
Certain new accounting standards and interpretations have been published that are not mandatory for the current period and have not been early adopted. These standards are not expected to have a material impact on the Company in the current or future reporting periods.
Amendments to IAS 1 – Classification of Liabilities as Current or Non-Current with Covenants
The amendments aim to promote consistency in applying the requirements by helping companies determine whether, in the statement of financial position, debt and other liabilities with an uncertain settlement date should be classified as current (due or potentially due to be settled within one year) or non-current.
In addition, the amendment requires entities to disclose information to enable users of the financial statements to understand the risk that non-current liabilities with covenants could become repayable within twelve months. The amendments are applied on or after the first annual reporting period beginning on or after January 1, 2024, with early application permitted. The amendment is not expected to have a material impact on the Company’s consolidated financial statements.
Amendments to IFRS 16 – Lease Liability in a Sale and Leaseback
| -8- |
|
AVINO SILVER & GOLD MINES LTD. Notes to the unaudited condensed consolidated interim financial statements For the nine months ended September 30, 2023 and 2022 (Expressed in thousands of US dollars, except where otherwise noted) |
|
The amendments require a seller/lessee to subsequently measure lease liabilities arising from a leaseback in a way that it does not recognize any amount of the gain or loss that relates to the right of use it retains. The new requirements do not prevent a seller/lessee from recognizing in profit or loss any gain or loss relating to the partial or full termination of a lease. A seller-lessee applies the amendments retrospectively in accordance with IAS 8 Accounting Policies, Change in Accounting Estimates and Errors to sale or leaseback transactions entered into after the date of initial application.
The amendments are applied on or after the first annual reporting period beginning on or after January 1, 2024, with early application permitted. The amendment is not expected to have a material impact on the Company’s consolidated financial statements.
4. ACQUISITION OF LA PRECIOSA
On March 21, 2022, the Company closed the acquisition with Coeur Mining Inc. (“Coeur”) of all of the issued and outstanding shares of Proyectos Mineros La Preciosa S.A de C.V, a Mexican corporation, and Cervantes LLC, a Delaware LLC, that together hold the La Preciosa property in Mexico (“La Preciosa”).
Total consideration paid to Coeur was comprised of:
|
a) |
Cash consideration of $15.3 million paid; |
|
|
|
|
b) |
A promissory note for $5 million in favour of Coeur, payable without interest on or before March 21, 2023 (paid prior to March 21, 2023); |
|
|
|
|
c) |
14,000,000 common shares of Avino, with a value of $13.65 million on issuance; |
|
|
|
|
d) |
7,000,000 share purchase warrants with a total value at $2.24 million exercisable at $1.09 per share until September 21, 2023, representing a 25% premium to Avino’s 20-day volume weighted average trading price as of October 26, 2021; |
Additionally, Avino issued the following consideration for which payment is contingent on a future event and due to acquisition date uncertainty these are valued at Nil. A liability for these contingent payments will be recognized when related activity and events occur.
|
e) |
An additional cash payment of $8.75 million, to be paid no later than 12 months after initial production at La Preciosa, up to one-half of which may be paid in common shares of Avino (provided Coeur’s total shareholdings cannot exceed 19.9% of the Company’s total issued and outstanding shares); |
|
|
|
|
f) |
A 1.25% net smelter returns royalty on the Gloria and Abundancia areas of La Preciosa, and a 2.00% gross value royalty on all other areas of La Preciosa; and |
|
|
|
|
g) |
A payment of $0.25 per silver equivalent ounce (subject to inflationary adjustment) of new mineral reserves (as defined by NI 43-101) discovered and declared outside of the current mineral resource area at La Preciosa, subject to a cap of $50 million, and any such payments will be credited against any existing or future payments owing on the gross value royalty. |
The transaction has been accounted for as an asset acquisition as La Preciosa is in the exploration and evaluation stage and had not demonstrated technical feasibility, commercial viability, or the ability to provide economic benefits. La Preciosa did not have the workforce, resources and/or reserves, mine plan, or financial resources to the meet the definition of a business for accounting purposes.
| -9- |
|
AVINO SILVER & GOLD MINES LTD. Notes to the unaudited condensed consolidated interim financial statements For the nine months ended September 30, 2023 and 2022 (Expressed in thousands of US dollars, except where otherwise noted) |
|
The purchase consideration has been assigned based on the relative fair values of the assets acquired and liabilities assumed and is summarized as follows:
Cash paid |
|
$ | 15,301 |
|
Note payable |
|
|
4,665 |
|
Common shares |
|
|
14,630 |
|
Share purchase warrants |
|
|
2,240 |
|
Total purchase consideration |
|
|
36,836 |
|
Transaction costs |
|
|
270 |
|
Total acquisition cost |
|
$ | 37,106 |
|
|
|
|
|
|
Cash |
|
$ | 168 |
|
Other current assets |
|
|
1,121 |
|
Plant and equipment |
|
|
1,621 |
|
Exploration and evaluation assets |
|
|
34,524 |
|
Accounts payable |
|
|
(328 | ) |
Net assets acquired |
|
$ | 37,106 |
|
5. TAXES RECOVERABLE
The Company’s taxes recoverable consist of the Mexican I.V.A. (“VAT”) and income taxes recoverable and Canadian sales taxes (“GST/HST”) recoverable.
|
|
September 30, 2023 |
|
|
December 31, 2022 |
|
||
VAT recoverable |
|
$ | 2,483 |
|
|
$ | 1,385 |
|
GST recoverable |
|
|
41 |
|
|
|
25 |
|
Income taxes recoverable |
|
|
3,288 |
|
|
|
2,327 |
|
|
|
$ | 5,812 |
|
|
$ | 3,737 |
|
6. INVENTORY
|
|
September 30, 2023 |
|
|
December 31, 2022 |
|
||
Process material stockpiles |
|
$ | 3,262 |
|
|
$ | 2,788 |
|
Concentrate inventory |
|
|
3,154 |
|
|
|
1,617 |
|
Materials and supplies |
|
|
2,457 |
|
|
|
1,855 |
|
|
|
$ | 8,873 |
|
|
$ | 6,260 |
|
The amount of inventory recognized as an expense for the three and nine months ended September 30, 2023 totalled $9,952 and $26,101 (three and nine months ended September 30, 2022 – $7,058 and $18,832). See Note 16 for further details. During the nine months ended September 30, 2023, the Company wrote down $84 of materials and supplies inventory (September 30, 2022 – Nil).
| -10- |
|
AVINO SILVER & GOLD MINES LTD. Notes to the unaudited condensed consolidated interim financial statements For the nine months ended September 30, 2023 and 2022 (Expressed in thousands of US dollars, except where otherwise noted) |
|
7. LONG-TERM INVESTMENTS
The Company classifies its long-term investments as designated at fair value through profit and loss under IFRS 9. Long-term investments are summarized as follows:
|
|
Fair Value December 31, |
|
|
|
|
|
Movements in foreign |
|
|
Fair value adjustments |
|
|
Fair Value September 30, |
|
|||||
|
|
2022 |
|
|
Net Additions |
|
|
exchange |
|
|
for the period |
|
|
2023 |
|
|||||
Talisker Resources Common Shares |
|
$ | 1,640 |
|
|
$ | - |
|
|
$ | 8 |
|
|
$ | (838 | ) |
|
$ | 810 |
|
Silver Wolf Exploration Ltd. Common Shares |
|
|
51 |
|
|
|
36 |
|
|
|
- |
|
|
|
(34 | ) |
|
|
53 |
|
Endurance Gold Corp. Common Shares |
|
|
55 |
|
|
|
- |
|
|
|
- |
|
|
|
(27 | ) |
|
|
28 |
|
|
|
$ | 1,746 |
|
|
$ | 36 |
|
|
$ | 8 |
|
|
$ | (899 | ) |
|
$ | 891 |
|
Silver Wolf Exploration Ltd.
During the nine months ended September 30, 2023, the Company received 500,000 common shares as part of the terms in the Option Agreement with Silver Wolf Exploration Ltd. Upon acquisition, the fair value of these common shares were recorded as “Option Income” as a credit to exploration and evaluation assets (see Note 8). Any subsequent revaluation under IFRS 9 at fair value through profit and loss will be recorded as a gain or loss on long-term investments.
See Note 8 for full details of the Option Agreement.
8. EXPLORATION AND EVALUATION ASSETS
The Company has accumulated the following acquisition, exploration and evaluation costs which are not subject to depletion:
|
|
Avino, Mexico |
|
|
La Preciosa, Mexico |
|
|
British Columbia & Yukon, Canada |
|
|
Total |
|
||||
|
||||||||||||||||
|
|
|
|
|
||||||||||||
Balance, January 1, 2022 |
|
$ | 11,052 |
|
|
$ | - |
|
|
$ | 1 |
|
|
$ | 11,053 |
|
|
|
|
|
|
|
|
|
|
|
|
|
|
|
|
|
|
Costs incurred during 2022: |
|
|
|
|
|
|
|
|
|
|
|
|
|
|
|
|
Acquisition costs – Note 4 |
|
|
- |
|
|
|
37,618 |
|
|
|
|
|
|
|
37,618 |
|
Drilling and exploration |
|
|
719 |
|
|
|
296 |
|
|
|
- |
|
|
|
1,015 |
|
Assessments and taxes |
|
|
94 |
|
|
|
61 |
|
|
|
- |
|
|
|
155 |
|
Effect of movements in exchange rates |
|
|
(30 | ) |
|
|
- |
|
|
|
- |
|
|
|
(30 | ) |
Option income |
|
|
(7 | ) |
|
|
- |
|
|
|
- |
|
|
|
(7 | ) |
|
|
|
|
|
|
|
|
|
|
|
|
|
|
|
|
|
Balance, December 31, 2022 |
|
$ | 11,828 |
|
|
$ | 37,975 |
|
|
$ | 1 |
|
|
$ | 49,804 |
|
Costs incurred during 2023: |
|
|
|
|
|
|
|
|
|
|
|
|
|
|
|
|
Drilling and exploration |
|
|
583 |
|
|
|
384 |
|
|
|
- |
|
|
|
967 |
|
Assessments and taxes |
|
|
88 |
|
|
|
(243 | ) |
|
|
- |
|
|
|
(155 | ) |
Effect of movements in exchange rates |
|
|
22 |
|
|
|
(124 | ) |
|
|
- |
|
|
|
(102 | ) |
Option income |
|
|
(63 | ) |
|
|
- |
|
|
|
- |
|
|
|
(63 | ) |
|
|
|
|
|
|
|
|
|
|
|
|
|
|
|
|
|
Balance, September 30, 2023 |
|
$ | 12,458 |
|
|
$ | 37,992 |
|
|
$ | 1 |
|
|
$ | 50,451 |
|
| -11- |
|
AVINO SILVER & GOLD MINES LTD. Notes to the unaudited condensed consolidated interim financial statements For the nine months ended September 30, 2023 and 2022 (Expressed in thousands of US dollars, except where otherwise noted) |
|
(a) Avino, Mexico
Option Agreement – Silver Wolf Exploration Ltd. (formerly Gray Rock Resources Ltd.) (“Silver Wolf”)
On March 11, 2021, the Company was informed that Silver Wolf received TSX Venture Exchange approval on the previously-announced entrance into an option agreement to grant Silver Wolf the exclusive right to acquire a 100% interest in the Ana Maria and El Laberinto properties in Mexico (the “Option Agreement”). In exchange, Avino received Silver Wolf share purchase warrants to acquire 300,000 common shares of Silver Wolf at an exercise price of C$0.20 per share for a period of 36 months from the date of the TSX Venture Exchange’s final acceptance of the Option Agreement (the “Approval Date”). In order to exercise the option, Silver Wolf will:
1. Issue to Avino a total of C$600 in cash or common shares of Silver Wolf as follows:
|
a. |
C$50 in common shares of Silver Wolf within 30 days of March 8, 2021 (received on March 26, 2021 – see Note 7 for details); |
|
|
|
|
b. |
A further C$50 in cash or shares of Silver Wolf at Avino’s discretion on or before March 8, 2022 (received on March 30, 2022 – See Note 7 for details); |
|
|
|
|
c. |
A further C$100 in cash or shares of Silver Wolf at Avino’s discretion on or before March 8, 2023 (received on March 13, 2023 – See Note 7 for details); |
|
|
|
|
d. |
A further C$200 in cash or shares of Silver Wolf at Avino’s discretion on or before March 8, 2024; and |
|
|
|
|
e. |
A further C$200 in cash or shares of Silver Wolf at Avino’s discretion on or before March 8, 2025; and |
|
|
|
2. Incur a total of C$750 in exploration expenditures on the properties, as follows:
|
a. |
C$50 on or before March 8, 2022; |
|
|
|
|
b. |
A further C$100 on or before March 8, 2023; and |
|
|
|
|
c. |
A further C$600 on or before March 8, 2025. |
All exploration expenditure requirements on the properties have been met as of September 30, 2023
Under the Option Agreement, all share issuances will be based on the average volume weighted trading price of Silver Wolf’s shares on the TSX Venture Exchange for the ten (10) trading days immediately preceding the date of issuance of the shares, and the shares will be subject to resale restrictions under applicable securities legislation for 4 months and a day from their date of issue.
The Option Agreement between the Company and Silver Wolf is considered a related party transaction as the two companies have directors in common.
Unification La Platosa properties
The Unification La Platosa properties, consisting of three leased concessions in addition to the leased concessions situated within the Avino mine area property near the towns of Panuco de Coronado and San Jose de Avino and surrounding the Avino Mine.
In February 2012, the Company’s wholly-owned Mexican subsidiary entered into a new agreement with Minerales de Avino, S.A. de C.V. (“Minerales”) whereby Minerales has indirectly granted to the Company the exclusive right to explore and mine the La Platosa property known as the “ET zone”. The ET zone includes the Avino Mine, where production at levels intended by management was achieved on July 1, 2015.
Under the agreement, the Company has obtained the exclusive right to explore and mine the property for an initial period of 15 years, with the option to extend the agreement for another 5 years. In consideration of the granting of these rights, the Company issued 135,189 common shares with a fair value of C$250 during the year ended December 31, 2012.
The Company has agreed to pay to Minerales a royalty equal to 3.5% of net smelter returns (“NSR”). In addition, after the start of production, if the minimum monthly processing rate of the mine facilities is less than 15,000 tonnes, then the Company must pay to Minerales a minimum royalty equal to the applicable NSR royalty based on the processing at a monthly rate of 15,000 tonnes.
| -12- |
|
AVINO SILVER & GOLD MINES LTD. Notes to the unaudited condensed consolidated interim financial statements For the nine months ended September 30, 2023 and 2022 (Expressed in thousands of US dollars, except where otherwise noted) |
|
Minerales has also granted to the Company the exclusive right to purchase a 100% interest in the property at any time during the term of the agreement (or any renewal thereof), upon payment of $8 million within 15 days of the Company’s notice of election to acquire the property. The purchase would be subject to a separate purchase agreement for the legal transfer of the property.
(b) La Preciosa, Mexico
On March 21, 2022, the Company received approval for the closing of the acquisition of the La Preciosa property from Coeur Mining Inc. (“Coeur”). See Note 4 for further details
(c) British Columbia & Yukon, Canada
Eagle Property - Yukon
The Company has a 100% interest in 14 quartz leases located in the Mayo Mining Division of Yukon, Canada, which collectively comprise the Eagle property.
During the nine months ended September 30, 2023, the Company sold to a subsidiary of Hecla Mining Company (“Hecla”) the Eagle Property for cash consideration of C$250. The gain on sale of the Eagle Property was recorded to “Interest and other income” on the condensed consolidated interim statements of operations and comprehensive income (loss).
| -13- |
|
AVINO SILVER & GOLD MINES LTD. Notes to the unaudited condensed consolidated interim financial statements For the nine months ended September 30, 2023 and 2022 (Expressed in thousands of US dollars, except where otherwise noted) |
|
Minto and Olympic-Kelvin properties – British Columbia
On May 2, 2022, the Company has granted Endurance Gold Corporation the right to acquire an option to earn 100% ownership of the former Minto Gold Mine, Olympic and Kelvin gold prospects contained within a parcel of crown grant and mineral claims (the “Olympic Claims”).
Under the terms of the letter agreement, Endurance can earn a 100% interest in the Olympic Claims if they pay Avino a total cash consideration in the aggregate amount of C$100, issue up to a total of 1,500,000 common shares (“Shares”) of Endurance and incur exploration expenditures in the aggregate amount of C$300; all of which is to be incurred by December 31, 2024. In the event that Endurance earns the 100% interest, the Olympic Claims will be subject to a 2% net smelter return royalty (“NSR”), of which 1% NSR can be purchased by the Endurance for C$750 and the remaining balance of the NSR can be purchased for C$1,000.
As part of the final requirement to earn its interest, Endurance agreed to grant to Avino 750,000 share purchase warrants (“Warrants”) by December 31, 2024, that offer Avino the option to purchase additional shares in the Company for a period of three years from the date of issuance. The exercise price of the Warrants will be set at a 25% premium to the 20-day VWAP share price at the issuance date. During the Option period, if Endurance is successful in defining a compliant mineral resource of at least 500,000 gold-equivalent ounces on the Olympic Claims then Endurance will be obliged to pay Avino a C$1,000 discovery bonus.
The Option agreement is subject to the TSX Venture Exchange acceptance, and any Shares or Warrants to be issued will be subject to a four-month hold period on issuance as per the policies of the TSX Venture Exchange.
During the year ended December 31, 2022, Endurance granted 200,000 common shares and paid C$25 as per the terms of the agreement, which required payment upon signing of a letter agreement between the two parties. As of September 30, 2023, Endurance was in compliance with all terms of the Option agreement, and there were no requirements during the nine months ended September 30, 2023.
9. NON-CONTROLLING INTEREST
At September 30, 2023, the Company had an effective 99.67% (December 31, 2022 - 99.67%) interest in its subsidiary Avino Mexico and the remaining 0.33% (December 31, 2022 - 0.33%) interest represents a non-controlling interest. The accumulated deficit and current period income attributable to the non-controlling interest are insignificant and accordingly have not been presented separately in the unaudited condensed consolidated interim financial statements.
| -14- |
|
AVINO SILVER & GOLD MINES LTD. Notes to the unaudited condensed consolidated interim financial statements For the nine months ended September 30, 2023 and 2022 (Expressed in thousands of US dollars, except where otherwise noted) |
|
10. PLANT, EQUIPMENT AND MINING PROPERTIES
|
|
Mining properties |
|
|
Office equipment, furniture, and fixtures |
|
|
Computer equipment |
|
|
Mine machinery and transportation equipment |
|
|
Mill machinery and processing equipment |
|
|
Buildings and construction in process |
|
|
Total |
|
||||||||
|
|
$ |
|
|
$ |
|
|
$ |
|
|
$ |
|
|
$ |
|
|
$ |
|
|
$ |
|
||||||||
COST |
|
|
|
|
|
|
|
|
|
|
|
|
|
|
|
|
|
|
|
|
|
||||||||
Balance at January 1, 2022 |
|
|
13,038 |
|
|
|
595 |
|
|
|
335 |
|
|
|
14,240 |
|
|
|
18,613 |
|
|
|
11,778 |
|
|
|
58,599 |
|
|
Additions / Transfers |
|
|
1,649 |
|
|
|
185 |
|
|
|
441 |
|
|
|
2,383 |
|
|
|
4,781 |
|
|
|
2,907 |
|
|
|
12,346 |
|
|
Writedowns |
|
|
- |
|
|
|
- |
|
|
|
- |
|
|
|
(1,692 | ) |
|
|
(100 | ) |
|
|
- |
|
|
|
(1,792 | ) | |
Effect of movements in exchange rates |
|
|
- |
|
|
|
(17 | ) |
|
|
(2 | ) |
|
|
(1 | ) |
|
|
- |
|
|
|
8 |
|
|
|
(12 | ) | |
Balance at December 31, 2022 |
|
|
14,687 |
|
|
|
763 |
|
|
|
774 |
|
|
|
14,930 |
|
|
|
23,294 |
|
|
|
14,693 |
|
|
|
69,141 |
|
|
Additions / Transfers |
|
|
1,725 |
|
|
|
74 |
|
|
|
698 |
|
|
|
3,182 |
|
|
|
2,809 |
|
|
|
678 |
|
|
|
9,166 |
|
|
Writedowns |
|
|
- |
|
|
|
(3 | ) |
|
|
(22 | ) |
|
|
(623 | ) |
|
|
- |
|
|
|
- |
|
|
|
(648 | ) | |
Effect of movements in exchange rates |
|
|
(17 | ) |
|
|
- |
|
|
|
- |
|
|
|
- |
|
|
|
- |
|
|
|
- |
|
|
|
(17 | ) | |
Balance at September 30, 2023 |
|
|
16,395 |
|
|
|
834 |
|
|
|
1,450 |
|
|
|
17,489 |
|
|
|
26,103 |
|
|
|
15,371 |
|
|
|
77,642 |
|
|
|
|
|
|
|
|
|
|
|
|
|
|
|
|
|
|
|
|
|
|
|
|
|
|
|
|
|
|
|
|
ACCUMULATED DEPLETION AND DEPRECIATION |
|
|
|
|
|
|
|
|
|
|
|
|
|
|
|
|
|
|
|
|
|
|
|
|
|
|
|
|
|
Balance at January 1, 2022 |
|
|
8,856 |
|
|
|
294 |
|
|
|
267 |
|
|
|
4,944 |
|
|
|
6,667 |
|
|
|
1,896 |
|
|
|
22,924 |
|
|
Additions / Transfers |
|
|
250 |
|
|
|
147 |
|
|
|
331 |
|
|
|
1,616 |
|
|
|
146 |
|
|
|
1,133 |
|
|
|
3,623 |
|
|
Writedowns |
|
|
- |
|
|
|
- |
|
|
|
- |
|
|
|
(1,382 | ) |
|
|
(80 | ) |
|
|
- |
|
|
|
(1,462 | ) | |
Balance at December 31, 2022 |
|
|
9,106 |
|
|
|
441 |
|
|
|
598 |
|
|
|
5,178 |
|
|
|
6,733 |
|
|
|
3,029 |
|
|
|
25,085 |
|
|
Additions / Transfers |
|
|
267 |
|
|
|
89 |
|
|
|
133 |
|
|
|
682 |
|
|
|
780 |
|
|
|
204 |
|
|
|
2,155 |
|
|
Writedowns |
|
|
- |
|
|
|
(2 | ) |
|
|
(21 | ) |
|
|
(612 | ) |
|
|
(2 | ) |
|
|
- |
|
|
|
(637 | ) | |
Balance at September 30, 2023 |
|
|
9,373 |
|
|
|
528 |
|
|
|
710 |
|
|
|
5,248 |
|
|
|
7,511 |
|
|
|
3,233 |
|
|
|
26,603 |
|
|
|
|
|
|
|
|
|
|
|
|
|
|
|
|
|
|
|
|
|
|
|
|
|
|
|
|
|
|
|
|
NET BOOK VALUE |
|
|
|
|
|
|
|
|
|
|
|
|
|
|
|
|
|
|
|
|
|
|
|
|
|
|
|
|
|
At September 30, 2023 |
|
|
7,022 |
|
|
|
306 |
|
|
|
740 |
|
|
|
12,241 |
|
|
|
18,592 |
|
|
|
12,138 |
|
|
|
51,039 |
|
|
At December 31, 2022 |
|
|
5,581 |
|
|
|
322 |
|
|
|
176 |
|
|
|
9,752 |
|
|
|
16,561 |
|
|
|
11,664 |
|
|
|
44,056 |
|
|
At January 1, 2022 |
|
|
4,182 |
|
|
|
301 |
|
|
|
68 |
|
|
|
9,296 |
|
|
|
11,946 |
|
|
|
9,882 |
|
|
|
35,675 |
|
|
| -15- |
|
AVINO SILVER & GOLD MINES LTD. Notes to the unaudited condensed consolidated interim financial statements For the nine months ended September 30, 2023 and 2022 (Expressed in thousands of US dollars, except where otherwise noted) |
|
Included in Buildings and construction in process above are assets under construction of $3,267 as at September 30, 2023 (December 31, 2022 - $3,817) on which no depreciation was charged in the periods then ended. Once the assets are available for use, they will be transferred to the appropriate class of plant, equipment and mining properties.
As at September 30, 2023, plant, equipment and mining properties included a net carrying amount of $5,553 (December 31, 2022 - $2,417) for mining equipment and right of use assets under lease.
11. RELATED PARTY TRANSACTIONS AND BALANCES
All related party transactions are recorded at the exchange amount which is the amount agreed to by the Company and the related party.
(a) Key management personnel
The Company has identified its directors and certain senior officers as its key management personnel. The compensation costs for key management personnel for the three and nine months ended September 30, 2023 and 2022 is as follows:
|
|
Three months ended September 30, |
|
|
Nine months ended September 30, |
|
||||||||||
|
|
2023 |
|
|
2022 |
|
|
2023 |
|
|
2022 |
|
||||
Salaries, benefits, and consulting fees |
|
$ | 289 |
|
|
$ | 237 |
|
|
$ | 869 |
|
|
$ | 975 |
|
Share-based payments |
|
|
502 |
|
|
|
427 |
|
|
|
1,472 |
|
|
|
1,251 |
|
|
|
$ | 791 |
|
|
$ | 664 |
|
|
$ | 2,341 |
|
|
$ | 2,226 |
|
(b) Amounts due to/from related parties
In the normal course of operations the Company transacts with companies related to Avino’s directors or officers. All amounts payable and receivable are non-interest bearing, unsecured and due on demand.
The following table summarizes the amounts were due to/(from) related parties:
|
|
September 30, 2023 |
|
|
December 31, 2022 |
|
||
Oniva International Services Corp. |
|
$ | 100 |
|
|
$ | 100 |
|
Silver Wolf Exploration Ltd. |
|
|
(131 | ) |
|
|
(72 | ) |
|
|
$ | (31 | ) |
|
$ | 28 |
|
For services provided to the Company as President and Chief Executive Officer, the Company pays Intermark Capital Corporation (“ICC”), a company controlled by David Wolfin, the Company’s President and CEO and also a director, for consulting services. For the nine months ended September 30, 2023, the Company paid $215 (September 30, 2022 - $263) to ICC.
(c) Other related party transactions
The Company has a cost sharing agreement with Oniva International Services Corp. (“Oniva”) for office and administration services. Pursuant to the cost sharing agreement, the Company will reimburse Oniva for the Company’s percentage of overhead and corporate expenses and for out-of-pocket expenses incurred on behalf of the Company, with a 2.5% markup. David Wolfin, President & CEO, and a director of the Company, is the sole owner of Oniva. The cost sharing agreement may be terminated with one-month notice by either party without penalty. During the three and nine months ended September 30, 2023, administrative fees of $11 and $36 were paid to Oniva (three and nine months ended September 30, 2022 - $11 and $31)
| -16- |
|
AVINO SILVER & GOLD MINES LTD. Notes to the unaudited condensed consolidated interim financial statements For the nine months ended September 30, 2023 and 2022 (Expressed in thousands of US dollars, except where otherwise noted) |
|
The transactions with Oniva during the three and nine months ended September 30, 2023 and 2022, are summarized below:
|
|
Three months ended September 30, |
|
|
Nine months ended September 30, |
|
||||||||||
|
|
2023 |
|
|
2022 |
|
|
2023 |
|
|
2022 |
|
||||
Salaries and benefits |
|
$ | 240 |
|
|
$ | 218 |
|
|
$ | 729 |
|
|
$ | 670 |
|
Office and miscellaneous |
|
|
107 |
|
|
|
119 |
|
|
|
364 |
|
|
|
325 |
|
|
|
$ | 347 |
|
|
$ | 337 |
|
|
$ | 1,093 |
|
|
$ | 995 |
|
12. NOTE PAYABLE
On March 21, 2022, the Company closed the acquisition of the La Preciosa property from Coeur Mining Inc. (see Note 4 for further details). As part of the agreement, the Company issued a promissory note payable of $5 million due on or before March 21, 2023. The present value of the note payable was calculated using a discount interest rate of 6.71%.
Prior to March 21, 2023, the Company repaid the promissory note payable in full.
The continuity of the note payable is as follows:
|
|
September 30, |
|
|
December 31, |
|
||
|
|
2023 |
|
|
2022 |
|
||
Balance at beginning of the period |
|
$ | 4,926 |
|
|
$ | - |
|
Additions |
|
|
- |
|
|
|
4,665 |
|
Repayments |
|
|
(5,000 | ) |
|
|
- |
|
Unwinding of fair value adjustment |
|
|
74 |
|
|
|
261 |
|
Balance at end of the period |
|
|
- |
|
|
|
4,926 |
|
Less: Current portion |
|
|
- |
|
|
|
(4,926 | ) |
Non-current portion |
|
$ | - |
|
|
$ | - |
|
| -17- |
|
AVINO SILVER & GOLD MINES LTD. Notes to the unaudited condensed consolidated interim financial statements For the nine months ended September 30, 2023 and 2022 (Expressed in thousands of US dollars, except where otherwise noted) |
|
13. WARRANT LIABILITY
The Company’s warrant liability arises as a result of the issuance of warrants exercisable in US dollars. As the denomination is different from the Canadian dollar functional currency of the entity issuing the underlying shares, the Company recognizes a derivative liability for these warrants and re-measures the liability at the end of each reporting period using the Black-Scholes model. Changes in respect of the Company’s warrant liability are as follows:
|
|
September 30, 2023 |
|
|
December 31, 2022 |
|
||
Balance at beginning of the period |
|
$ | 475 |
|
|
$ | 741 |
|
Warrants issued |
|
|
- |
|
|
|
2,240 |
|
Fair value adjustment |
|
|
(478 | ) |
|
|
(2,935 | ) |
Effect of movement in exchange rates |
|
|
3 |
|
|
|
(111 | ) |
Balance at end of the period |
|
$ | - |
|
|
$ | 475 |
|
Continuity of warrants during the periods is as follows:
|
|
Underlying Shares |
|
|
Weighted Average Exercise Price |
|
||
Warrants outstanding and exercisable, January 1, 2022 |
|
|
1,950,412 |
|
|
$ | 0.80 |
|
Granted |
|
|
7,000,000 |
|
|
$ | 1.09 |
|
Warrants outstanding and exercisable, December 31, 2022 |
|
|
8,950,412 |
|
|
$ | 1.03 |
|
Expired |
|
|
(8,950,412 | ) |
|
$ | 1.03 |
|
Warrants outstanding and exercisable, September 30, 2023 |
|
|
- |
|
|
|
- |
|
As at September 30, 2023, the weighted average remaining contractual life of warrants outstanding was Nil years (December 31, 2022 – 0.73 years).
Valuation of the warrant liability requires the use of estimates and assumptions including the expected stock price volatility. The expected volatility used in valuing warrants is based on volatility observed in historical periods. Changes in the underlying assumptions can materially affect the fair value estimates. The fair value of the warrant liability was calculated using the Black-Scholes model with the following weighted average assumptions and resulting fair values:
|
|
September 30, 2023 |
|
|
December 31, 2022 |
|
||
Weighted average assumptions: |
|
|
|
|
|
|
||
Risk-free interest rate |
|
- |
% |
|
|
4.07 | % | |
Expected dividend yield |
|
- |
% |
|
|
0 | % | |
Expected warrant life (years) |
|
|
- |
|
|
|
0.73 |
|
Expected stock price volatility |
|
- |
% |
|
|
56.80 | % | |
Weighted average fair value |
|
$ | - |
|
|
$ | 0.05 |
|
14. RECLAMATION PROVISION
Management’s estimate of the reclamation provision at September 30, 2023, is $544 (December 31, 2022 – $445), and the undiscounted value of the obligation is $1,663 (December 31, 2022 – $1,454).
The present value of the obligation was calculated using a risk-free interest rate of 9.61% (December 31, 2022 – 9.65%) and an inflation rate of 4.00% (December 31, 2022 – 7.82%). Reclamation activities are estimated to begin in 2025 for the San Gonzalo Mine and in 2041 for the Avino Mine.
| -18- |
|
AVINO SILVER & GOLD MINES LTD. Notes to the unaudited condensed consolidated interim financial statements For the nine months ended September 30, 2023 and 2022 (Expressed in thousands of US dollars, except where otherwise noted) |
|
A reconciliation of the changes in the Company’s reclamation provision is as follows:
|
|
September 30, 2023 |
|
|
December 31, 2022 |
|
||
|
|
|
|
|
|
|
||
Balance at beginning of the period |
|
$ | 445 |
|
|
$ | 726 |
|
Changes in estimates |
|
|
- |
|
|
|
(364 | ) |
Unwinding of discount related to continuing operations |
|
|
36 |
|
|
|
44 |
|
Effect of movements in exchange rates |
|
|
63 |
|
|
|
39 |
|
Balance at end of the period |
|
$ | 544 |
|
|
$ | 445 |
|
15. SHARE CAPITAL AND SHARE-BASED PAYMENTS
(a) Authorized: Unlimited common shares without par value
(b) Issued:
|
(i) |
During the nine months ended September 30, 2023, the Company issued 5,360,300 common shares in an at-the-market offering under prospectus supplement for gross proceeds of $3,597. The Company paid a 2.75% cash commission of $99 on gross proceeds, for net proceeds of $3,498. The Company also incurred $255 in share issuance costs related to its base shelf prospectus and prospectus supplement filings. |
|
|
|
|
|
Dring the nine months ended September 30, 2023, the Company issued 1,005,333 common shares upon exercise of RSUs. As a result, $1,019 was recorded to share capital. |
|
|
|
|
(ii) |
During the year ended December 31, 2022, the Company issued 14,000,000 common shares as part of the acquisition of La Preciosa from Coeur Mining Inc.. As a result, $13,650 was recorded to share capital, and exploration and evaluation assets as acquisition costs, representing the closing price on the Toronto Stock Exchange on March 21, 2022, the date of the issuance and closing. |
The Company further issued 1,075,000 common shares as payment for services provided during the acquisition, and as a result $980 was recorded to share capital and exploration and evaluation assets as acquisition costs.
During the year ended December 31, 2022, the Company issued 48,000 common shares following the exercise of 48,000 options. As a result, $46 was recorded to share capital, representing cash proceeds of $31 and the fair value upon issuance of $15.
During the year ended December 31, 2022, the Company issued 982,879 common shares upon exercise of RSUs. As a result, $899 was recorded to share capital.
| -19- |
|
AVINO SILVER & GOLD MINES LTD. Notes to the unaudited condensed consolidated interim financial statements For the nine months ended September 30, 2023 and 2022 (Expressed in thousands of US dollars, except where otherwise noted) |
|
(c) Stock options:
The Company has a stock option plan to purchase the Company’s common shares, under which it may grant stock options of up to 10% of the Company’s total number of shares issued and outstanding on a non-diluted basis. The stock option plan provides for the granting of stock options to directors, officers, and employees, and to persons providing investor relations or consulting services, the limits being based on the Company’s total number of issued and outstanding shares per year. The stock options vest on the date of grant, except for those issued to persons providing investor relations services, which vest over a period of one year. The option price must be greater than or equal to the discounted market price on the grant date, and the option term cannot exceed ten years from the grant date.
Continuity of stock options is as follows:
|
|
Underlying Shares |
|
|
Weighted Average Exercise Price (C$) |
|
||
|
|
|
|
|
|
|
||
Stock options outstanding, January 1, 2022 |
|
|
2,839,000 |
|
|
$ | 1.68 |
|
Granted |
|
|
2,390,000 |
|
|
$ | 1.20 |
|
Exercised |
|
|
(48,000 | ) |
|
$ | 0.79 |
|
Expired |
|
|
(880,000 | ) |
|
$ | 1.98 |
|
Cancelled / Forfeited |
|
|
(45,000 | ) |
|
$ | 1.40 |
|
Stock options outstanding, December 31, 2022 |
|
|
4,256,000 |
|
|
$ | 1.36 |
|
Granted |
|
|
2,545,000 |
|
|
$ | 1.12 |
|
Expired |
|
|
(105,000 | ) |
|
$ | 1.30 |
|
Cancelled / Forfeited |
|
|
(30,000 | ) |
|
$ | 1.40 |
|
Stock options outstanding, September 30, 2023 |
|
|
6,666,000 |
|
|
$ | 1.27 |
|
Stock options exercisable, September 30, 2023 |
|
|
5,328,500 |
|
|
$ | 1.31 |
|
The following table summarizes information about the stock options outstanding and exercisable at September 30, 2023:
|
|
|
|
Outstanding |
|
|
Exercisable |
|
||||||||||||
Expiry Date |
|
Price (C$) |
|
|
Number of Options |
|
|
Weighted Average Remaining Contractual Life (Years) |
|
|
Number of Options |
|
|
Weighted Average Remaining Contractual Life (Years) |
|
|||||
August 21, 2024 |
|
$ | 0.79 |
|
|
|
126,000 |
|
|
|
0.89 |
|
|
|
126,000 |
|
|
|
0.89 |
|
August 4, 2025 |
|
$ | 1.64 |
|
|
|
1,660,000 |
|
|
|
1.85 |
|
|
|
1,660,000 |
|
|
|
1.85 |
|
March 25, 2027 |
|
$ | 1.20 |
|
|
|
2,330,000 |
|
|
|
3.48 |
|
|
|
2,330,000 |
|
|
|
3.48 |
|
May 4, 2027 |
|
$ | 0.92 |
|
|
|
25,000 |
|
|
|
3.59 |
|
|
|
25,000 |
|
|
|
3.59 |
|
March 29, 2028 |
|
$ | 1.12 |
|
|
|
2,375,000 |
|
|
|
4.50 |
|
|
|
1,187,500 |
|
|
|
4.50 |
|
July 10, 2028 |
|
$ | 1.12 |
|
|
|
150,000 |
|
|
|
4.78 |
|
|
|
- |
|
|
|
4.78 |
|
|
|
|
|
|
|
|
|
|
|
|
|
|
|
|
|
|
|
|
|
|
|
|
|
|
|
|
|
6,666,000 |
|
|
|
3.31 |
|
|
|
5,328,500 |
|
|
|
3.14 |
|
Valuation of stock options requires the use of estimates and assumptions including the expected stock price volatility. The expected volatility used in valuing stock options is based on volatility observed in historical periods. Changes in the underlying assumptions can materially affect the fair value estimates. The fair value of the stock options was calculated using the Black-Scholes model with the following weighted average assumptions and resulting fair values:
| -20- |
|
AVINO SILVER & GOLD MINES LTD. Notes to the unaudited condensed consolidated interim financial statements For the nine months ended September 30, 2023 and 2022 (Expressed in thousands of US dollars, except where otherwise noted) |
|
|
|
September 30, 2023 |
|
|
December 31, 2022 |
|
||
Weighted average assumptions: |
|
|
|
|
|
|
||
Risk-free interest rate |
|
|
3.10 | % |
|
|
2.49 | % |
Expected dividend yield |
|
|
0.00 | % |
|
|
0.0 | % |
Expected warrant life (years) |
|
|
5.00 |
|
|
|
5.00 |
|
Expected stock price volatility |
|
|
61.10 | % |
|
|
59.98 | % |
Expected forfeiture rate |
|
|
17 | % |
|
|
20 | % |
Weighted average fair value |
|
$ | 0.60 |
|
|
$ | 0.63 |
|
During the nine months ended September 30, 2023, the Company charged $783 (nine months ended September 30, 2022 - $504) to operations as share-based payments for the fair value of stock options granted.
(d) Restricted Share Units:
On April 19, 2018, the Company’s Restricted Share Unit (“RSU”) Plan was approved by its shareholders. The RSU Plan is administered by the Compensation Committee under the supervision of the Board of Directors as compensation to officers, directors, consultants, and employees. The Compensation Committee determines the terms and conditions upon which a grant is made, including any performance criteria or vesting period.
Upon vesting, each RSU entitles the participant to receive one common share, provided that the participant is continuously employed with or providing services to the Company. RSUs track the value of the underlying common shares, but do not entitle the recipient to the underlying common shares until such RSUs vest, nor do they entitle a holder to exercise voting rights or any other rights attached to ownership or control of the common shares, until the RSU vests and the RSU participant receives common shares.
Continuity of RSUs is as follows:
|
|
Underlying Shares |
|
|
Weighted Average Price (C$) |
|
||
|
|
|
|
|
|
|
||
RSUs outstanding, January 1, 2022 |
|
|
1,439,477 |
|
|
$ | 1.32 |
|
Granted |
|
|
1,799,000 |
|
|
$ | 1.19 |
|
Exercised |
|
|
(982,879 | ) |
|
$ | 1.18 |
|
Cancelled / Forfeited |
|
|
(64,932 | ) |
|
$ | 1.40 |
|
RSUs outstanding, December 31, 2022 |
|
|
2,190,666 |
|
|
$ | 1.27 |
|
Granted |
|
|
1,878,320 |
|
|
$ | 1.11 |
|
Exercised |
|
|
(1,005,333 | ) |
|
$ | 1.37 |
|
Cancelled / Forfeited |
|
|
(15,333 | ) |
|
$ | 1.14 |
|
RSUs outstanding, September 30, 2023 |
|
|
3,048,320 |
|
|
$ | 1.03 |
|
The following table summarizes information about the RSUs outstanding at September 30, 2023:
Issuance Date |
|
Price (C$) |
|
|
Number of RSUs Outstanding |
|
||
March 25, 2022 |
|
$ | 1.19 |
|
|
|
1,182,000 |
|
March 29, 2023 |
|
$ | 1.12 |
|
|
|
1,797,000 |
|
July 10, 2023 |
|
$ | 0.94 |
|
|
|
69,320 |
|
|
|
|
|
|
|
|
3,048,320 |
|
During the nine months ended September 30, 2023, 1,878,320 RSUs (year ended December 31, 2022 – 1,799,000) were granted. The weighted average fair value at the measurement date was C$1.11, based on the TSX market price of the Company’s shares on the date the RSUs were granted.
| -21- |
|
AVINO SILVER & GOLD MINES LTD. Notes to the unaudited condensed consolidated interim financial statements For the nine months ended September 30, 2023 and 2022 (Expressed in thousands of US dollars, except where otherwise noted) |
|
During the nine months ended September 30, 2023, the Company charged $1,026 (September 30, 2022 - $870) to operations as share-based payments for the fair value of the RSUs vested. The fair value of the RSUs is recognized over the vesting period with reference to vesting conditions and the estimated RSUs expected to vest.
(e) Earnings (loss) per share:
The calculations for basic earnings (loss) per share and diluted earnings (loss) per share are as follows:
|
|
Three months ended September 30, |
|
|
Nine months ended September 30, |
|
||||||||||
|
|
2023 |
|
|
2022 |
|
|
2023 |
|
|
2022 |
|
||||
Net income (loss) for the period |
|
$ | (803 | ) |
|
$ | (1,129 | ) |
|
$ | (21 | ) |
|
$ | 1,800 |
|
Basic weighted average number of shares outstanding |
|
|
122,433,272 |
|
|
|
117,876,825 |
|
|
|
120,093,760 |
|
|
|
113,027,305 |
|
Effect of dilutive share options, warrants, and RSUs (‘000) |
|
|
- |
|
|
|
- |
|
|
|
- |
|
|
|
3,248,128 |
|
Diluted weighted average number of shares outstanding |
|
|
122,433,272 |
|
|
|
117,876,825 |
|
|
|
120,093,760 |
|
|
|
116,275,433 |
|
Basic income (loss) per share |
|
$ | (0.01 | ) |
|
$ | (0.01 | ) |
|
$ | (0.00 | ) |
|
$ | 0.02 |
|
Diluted income (loss) per share |
|
$ | (0.01 | ) |
|
$ | (0.01 | ) |
|
$ | (0.00 | ) |
|
$ | 0.02 |
|
16. REVENUE AND COST OF SALES
The Company’s revenues for the three and nine months ended September 30, 2023 and 2022, are all attributable to Mexico, from shipments of concentrate from the Avino Mine.
|
|
Three months ended September 30, |
|
|
Nine months ended September 30, |
|
||||||||||
|
|
2023 |
|
|
2022 |
|
|
2023 |
|
|
2022 |
|
||||
Concentrate sales |
|
$ | 11,599 |
|
|
$ | 9,445 |
|
|
$ | 31,429 |
|
|
$ | 30,423 |
|
Provisional pricing adjustments |
|
|
717 |
|
|
|
(327 | ) |
|
|
(70 | ) |
|
|
(885 | ) |
|
|
$ | 12,316 |
|
|
$ | 9,118 |
|
|
$ | 31,359 |
|
|
$ | 29,538 |
|
Cost of sales consists of changes in inventories, direct costs including personnel costs, mine site costs, energy costs (principally diesel fuel and electricity), maintenance and repair costs, operating supplies, external services, third party transport fees, depreciation and depletion, and other expenses for the periods. Direct costs include the costs of extracting co-products.
| -22- |
|
AVINO SILVER & GOLD MINES LTD. Notes to the unaudited condensed consolidated interim financial statements For the nine months ended September 30, 2023 and 2022 (Expressed in thousands of US dollars, except where otherwise noted) |
|
Cost of sales is based on the weighted average cost of inventory sold for the periods and consists of the following:
|
|
Three months ended September 30, |
|
|
Nine months ended September 30, |
|
||||||||||
|
|
2023 |
|
|
2022 |
|
|
2023 |
|
|
2022 |
|
||||
Production costs |
|
$ | 9,228 |
|
|
$ | 6,544 |
|
|
$ | 23,939 |
|
|
$ | 17,378 |
|
Write down of equipment and materials and supplies inventory |
|
|
4 |
|
|
|
- |
|
|
|
95 |
|
|
|
- |
|
Depreciation and depletion |
|
|
720 |
|
|
|
514 |
|
|
|
2,067 |
|
|
|
1,454 |
|
|
|
$ | 9,952 |
|
|
$ | 7,058 |
|
|
$ | 26,101 |
|
|
$ | 18,832 |
|
17. GENERAL AND ADMINISTRATIVE EXPENSES
General and administrative expenses on the condensed consolidated interim statements of operations consist of the following:
|
|
Three months ended September 30, |
|
|
Nine months ended September 30, |
|
||||||||||
|
|
2023 |
|
|
2022 |
|
|
2023 |
|
|
2022 |
|
||||
Salaries and benefits |
|
$ | 383 |
|
|
$ | 326 |
|
|
$ | 1,069 |
|
|
$ | 1,123 |
|
Office and miscellaneous |
|
|
391 |
|
|
|
261 |
|
|
|
1,008 |
|
|
|
855 |
|
Management and consulting fees |
|
|
109 |
|
|
|
110 |
|
|
|
312 |
|
|
|
345 |
|
Investor relations |
|
|
49 |
|
|
|
84 |
|
|
|
216 |
|
|
|
234 |
|
Travel and promotion |
|
|
37 |
|
|
|
29 |
|
|
|
130 |
|
|
|
75 |
|
Professional fees |
|
|
195 |
|
|
|
89 |
|
|
|
898 |
|
|
|
501 |
|
Directors fees |
|
|
43 |
|
|
|
30 |
|
|
|
132 |
|
|
|
116 |
|
Regulatory and compliance fees |
|
|
35 |
|
|
|
36 |
|
|
|
126 |
|
|
|
116 |
|
Depreciation |
|
|
38 |
|
|
|
37 |
|
|
|
108 |
|
|
|
104 |
|
|
|
$ | 1,280 |
|
|
$ | 997 |
|
|
$ | 3,999 |
|
|
$ | 3,469 |
|
18. COMMITMENTS
The Company has a cost sharing agreement to reimburse Oniva for a percentage of its overhead expenses, to reimburse 100% of its out-of-pocket expenses incurred on behalf of the Company, and to pay a percentage fee based on Oniva’s total overhead and corporate expenses. The agreement may be terminated with one-month notice by either party. Transactions and balances with Oniva are disclosed in Note 11.
The Company and its subsidiaries have various operating lease agreements for their office premises, use of land, and equipment. Commitments in respect of these lease agreements are as follows:
|
|
September 30, 2023 |
|
|
December 31, 2022 |
|
||
Not later than one year |
|
$ | 117 |
|
|
$ | 105 |
|
Later than one year and not later than five years |
|
|
382 |
|
|
|
347 |
|
Later than five years |
|
|
362 |
|
|
|
398 |
|
|
|
$ | 861 |
|
|
$ | 850 |
|
Office lease payments recognized as an expense during the nine months ended September 30, 2023, totalled $27 (September 30, 2022 - $8).
| -23- |
|
AVINO SILVER & GOLD MINES LTD. Notes to the unaudited condensed consolidated interim financial statements For the nine months ended September 30, 2023 and 2022 (Expressed in thousands of US dollars, except where otherwise noted) |
|
19. SUPPLEMENTARY CASH FLOW INFORMATION
|
|
September 30, 2023 |
|
|
September 30, 2022 |
|
||
Net change in non-cash working capital items: |
|
|
|
|
|
|
||
Inventory |
|
$ | (2,720 | ) |
|
$ | (1,986 | ) |
Prepaid expenses and other assets |
|
|
(329 | ) |
|
|
(535 | ) |
Taxes recoverable |
|
|
(2,075 | ) |
|
|
28 |
|
Taxes payable |
|
|
(809 | ) |
|
|
687 |
|
Amounts due to related parties |
|
|
(59 | ) |
|
|
(79 | ) |
Accounts payable and accrued liabilities |
|
|
2,592 |
|
|
|
2,101 |
|
Amounts receivable |
|
|
199 |
|
|
|
552 |
|
|
|
$ | (3,201 | ) |
|
$ | 768 |
|
|
|
September 30, 2023 |
|
|
September 30, 2022 |
|
||
Other supplementary information: |
|
|
|
|
|
|
||
Interest paid |
|
$ | 180 |
|
|
$ | 73 |
|
Taxes paid |
|
|
29 |
|
|
|
- |
|
|
|
$ | 209 |
|
|
$ | 73 |
|
|
|
September 30, 2023 |
|
|
September 30, 2022 |
|
||
Non-cash investing and financing activities: |
|
|
|
|
|
|
||
Acquisition of La Preciosa, net of cash & transaction costs |
|
$ | - |
|
|
$ | 21,535 |
|
Shares acquired under terms of option agreements |
|
|
41 |
|
|
|
15 |
|
Transfer of share-based payments reserve upon exercise of RSUs |
|
|
1,019 |
|
|
|
- |
|
Transfer of share-based payments reserve upon option exercise |
|
|
- |
|
|
|
15 |
|
Equipment acquired under finance leases and equipment loans |
|
|
2,888 |
|
|
|
1,589 |
|
|
|
$ | 3,948 |
|
|
$ | 23,174 |
|
20. FINANCIAL INSTRUMENTS
The fair values of the Company’s amounts due to related parties and accounts payable approximate their carrying values because of the short-term nature of these instruments. Cash, amounts receivable, long-term investments, and warrant liability are recorded at fair value. The carrying amounts of the Company’s term facility, equipment loans, and finance lease obligations are a reasonable approximation of their fair values based on current market rates for similar financial instruments.
The Company’s financial instruments are exposed to certain financial risks, including credit risk, liquidity risk, and market risk.
| -24- |
|
AVINO SILVER & GOLD MINES LTD. Notes to the unaudited condensed consolidated interim financial statements For the nine months ended September 30, 2023 and 2022 (Expressed in thousands of US dollars, except where otherwise noted) |
|
(a) Credit Risk
Credit risk is the risk that one party to a financial instrument will cause a financial loss for the other party by failing to discharge an obligation. The Company has exposure to credit risk through its cash, long-term investments and amounts receivable. The Company manages credit risk, in respect of cash and short-term investments, by maintaining the majority of cash and short-term investments at highly rated financial institutions.
The Company is exposed to a significant concentration of credit risk with respect to its trade accounts receivable balance because all of its concentrate sales are with three (December 31, 2022 – two) counterparties (see Note 21). However, the Company has not recorded any allowance against its trade receivables because to-date all balances owed have been settled in full when due (typically within 60 days of submission) and because of the nature of the counterparties.
The Company’s maximum exposure to credit risk at the end of any period is equal to the carrying amount of these financial assets as recorded in the unaudited condensed consolidated interim statement of financial position. At September 30, 2023, no amounts were held as collateral.
(b) Liquidity Risk
Liquidity risk is the risk that the Company will encounter difficulty in satisfying financial obligations as they become due. The Company manages its liquidity risk by forecasting cash flows required by its operating, investing and financing activities. The Company had cash at September 30, 2023, in the amount of $1,856 and working capital of $7,445 in order to meet short-term business requirements. Accounts payable have contractual maturities of approximately 30 to 90 days, or are due on demand and are subject to normal trade terms. The current portions of note payable and finance lease obligations are due within 12 months of the condensed consolidated interim statement of financial position date. Amounts due to related parties are without stated terms of interest or repayment.
The maturity profiles of the Company’s contractual obligations and commitments as at September 30, 2023, are summarized as follows:
|
|
Total |
|
|
Less Than 1 Year |
|
|
1-5 years |
|
|
More Than 5 Years |
|
||||
Accounts payable and accrued liabilities |
|
$ | 11,675 |
|
|
$ | 11,675 |
|
|
$ | - |
|
|
$ | - |
|
Minimum rental and lease payments |
|
|
850 |
|
|
|
105 |
|
|
|
347 |
|
|
|
398 |
|
Equipment loans |
|
|
439 |
|
|
|
191 |
|
|
|
248 |
|
|
|
- |
|
Finance lease obligations |
|
|
3,796 |
|
|
|
1,918 |
|
|
|
1,878 |
|
|
|
- |
|
Total |
|
$ | 16,760 |
|
|
$ | 13,889 |
|
|
$ | 2,473 |
|
|
$ | 398 |
|
(c) Market Risk
Market risk consists of interest rate risk, foreign currency risk and price risk. These are discussed further below.
Interest Rate Risk
Interest rate risk consists of two components:
|
|
(i) |
To the extent that payments made or received on the Company’s monetary assets and liabilities are affected by changes in the prevailing market interest rates, the Company is exposed to interest rate cash flow risk. |
| -25- |
|
AVINO SILVER & GOLD MINES LTD. Notes to the unaudited condensed consolidated interim financial statements For the nine months ended September 30, 2023 and 2022 (Expressed in thousands of US dollars, except where otherwise noted) |
|
|
|
(ii) |
To the extent that changes in prevailing market rates differ from the interest rates on the Company’s monetary assets and liabilities, the Company is exposed to interest rate price risk. |
In management’s opinion, the Company is not materially exposed to interest rate risk, as any material debt obligations that bear interest are fixed and not subject to floating interest rates. A 10% change in the interest rate would not result in a material impact on the Company’s operations.
Foreign Currency Risk
Foreign currency risk is the risk that the fair value or future cash flows of a financial instrument will fluctuate due to changes in foreign exchange rates. The Company is exposed to foreign currency risk to the extent that the following monetary assets and liabilities are denominated in Mexican pesos and Canadian dollars:
|
|
September 30, 2023 |
|
|
December 31, 2022 |
|
||||||||||
|
|
MXN |
|
|
CDN |
|
|
MXN |
|
|
CDN |
|
||||
Cash |
|
$ | 2,451 |
|
|
$ | 113 |
|
|
$ | 4,097 |
|
|
$ | 250 |
|
Due from related parties |
|
|
2,310 |
|
|
|
- |
|
|
|
1,402 |
|
|
|
- |
|
Long-term investments |
|
|
- |
|
|
|
1,204 |
|
|
|
- |
|
|
|
2,365 |
|
Reclamation bonds |
|
|
- |
|
|
|
6 |
|
|
|
- |
|
|
|
4 |
|
Amounts receivable |
|
|
6,478 |
|
|
|
56 |
|
|
|
- |
|
|
|
34 |
|
Accounts payable and accrued liabilities |
|
|
(93,198 | ) |
|
|
(346 | ) |
|
|
(85,486 | ) |
|
|
(108 | ) |
Due to related parties |
|
|
- |
|
|
|
(135 | ) |
|
|
- |
|
|
|
(135 | ) |
Finance lease obligations |
|
|
(598 | ) |
|
|
(256 | ) |
|
|
(161 | ) |
|
|
(343 | ) |
Net exposure |
|
|
(82,557 | ) |
|
|
642 |
|
|
|
(80,148 | ) |
|
|
2,067 |
|
US dollar equivalent |
|
$ | 468 |
|
|
$ | (43 | ) |
|
$ | (4,136 | ) |
|
$ | 1,526 |
|
Based on the net US dollar denominated asset and liability exposures as at September 30, 2023, a 10% fluctuation in the US/Mexican and Canadian/US exchange rates would impact the Company’s earnings for the nine months ended September 30, 2023, by approximately $425 (year ended December 31, 2022 - $275). The Company has not entered into any foreign currency contracts to mitigate this risk.
Price Risk
Price risk is the risk that the fair value or future cash flows of a financial instrument will fluctuate due to changes in market prices, other than those arising from interest rate risk or foreign currency risk.
The Company is exposed to price risk with respect to its amounts receivable, as certain trade accounts receivable are recorded based on provisional terms that are subsequently adjusted according to quoted metal prices at the date of final settlement. Quoted metal prices are affected by numerous factors beyond the Company’s control and are subject to volatility, and the Company does not employ hedging strategies to limit its exposure to price risk. At September 30, 2023, based on outstanding accounts receivable that were subject to pricing adjustments, a 10% change in metals prices would have an impact on net earnings (loss) of approximately $58 (December 31, 2022 - $65).
The Company is exposed to price risk with respect to its long-term investments, as these investments are carried at fair value based on quoted market prices. Changes in market prices result in gains or losses being recognized in net income (loss). At September 30, 2023, a 10% change in market prices would have an impact on net earnings (loss) of approximately $87 (December 31, 2022 - $175).
The Company’s profitability and ability to raise capital to fund exploration, evaluation and production activities is subject to risks associated with fluctuations in mineral prices. Management closely monitors commodity prices, individual equity movements, and the stock market to determine the appropriate course of action to be taken by the Company.
| -26- |
|
AVINO SILVER & GOLD MINES LTD. Notes to the unaudited condensed consolidated interim financial statements For the nine months ended September 30, 2023 and 2022 (Expressed in thousands of US dollars, except where otherwise noted) |
|
(d) Classification of Financial Instruments
IFRS 13 Financial Instruments: Disclosures establishes a fair value hierarchy that prioritizes the inputs to valuation techniques used to measure fair value as follows:
Level 1 – quoted prices (unadjusted) in active markets for identical assets or liabilities;
Level 2 – inputs other than quoted prices included in Level 1 that are observable for the asset or liability, either directly (i.e., as prices) or indirectly (i.e., derived from prices); and
Level 3 – inputs for the asset or liability that are not based on observable market data (unobservable inputs).
The following table sets forth the Company’s financial assets and financial liabilities measured at fair value on a recurring basis by level within the fair value hierarchy as at September 30, 2023:
|
|
Level 1 |
|
|
Level 2 |
|
|
Level 3 |
|
|||
Financial assets |
|
|
|
|
|
|
|
|
|
|||
Cash |
|
$ | 1,856 |
|
|
$ | - |
|
|
$ | - |
|
Amounts receivable |
|
|
- |
|
|
|
2,473 |
|
|
|
- |
|
Long-term investments |
|
|
891 |
|
|
|
- |
|
|
|
- |
|
Total financial assets |
|
$ | 2,747 |
|
|
$ | 2,473 |
|
|
$ | - |
|
The Company uses Black-Scholes model to measure its Level 3 financial instruments. As at September 30, 2023, the Company’s has no Level 3 financial instruments.
21. SEGMENTED INFORMATION
The Company’s revenues for the three and nine months ended September 30, 2023 are all attributable to Mexico, from shipments of concentrate produced by the Avino Mine, and is considered to be one single reportable operating segment.
On the condensed consolidated interim statements of operations, the Company had revenue from the following product mixes:
|
|
Three months ended September 30, |
|
|
Nine months ended September 30, |
|
||||||||||
|
|
2023 |
|
|
2022 |
|
|
2023 |
|
|
2022 |
|
||||
Silver |
|
$ | 4,280 |
|
|
$ | 3,454 |
|
|
$ | 11,610 |
|
|
$ | 10,722 |
|
Copper |
|
|
5,907 |
|
|
|
5,625 |
|
|
|
14,658 |
|
|
|
17,884 |
|
Gold |
|
|
3,669 |
|
|
|
2,310 |
|
|
|
9,516 |
|
|
|
7,141 |
|
Penalties, treatment costs and refining charges |
|
|
(1,540 | ) |
|
|
(2,271 | ) |
|
|
(4,425 | ) |
|
|
(6,209 | ) |
Total revenue from mining operations |
|
$ | 12,316 |
|
|
$ | 9,118 |
|
|
$ | 31,359 |
|
|
$ | 29,538 |
|
| -27- |
|
AVINO SILVER & GOLD MINES LTD. Notes to the unaudited condensed consolidated interim financial statements For the nine months ended September 30, 2023 and 2022 (Expressed in thousands of US dollars, except where otherwise noted) |
|
For the three and nine months ended September 30, 2023, the Company had three customers (September 30, 2022 – three customers) that accounted for total revenues as follows:
|
|
Three months ended September 30, |
|
|
Nine months ended September 30, |
|
||||||||||
|
|
2023 |
|
|
2022 |
|
|
2023 |
|
|
2022 |
|
||||
Customer #1 |
|
$ | 9,101 |
|
|
$ | 7,710 |
|
|
$ | 26,209 |
|
|
$ | 25,569 |
|
Customer #2 |
|
|
3,220 |
|
|
|
1,415 |
|
|
|
5,246 |
|
|
|
3,161 |
|
Other customers |
|
|
(5 | ) |
|
|
(7 | ) |
|
|
(96 | ) |
|
|
808 |
|
Total revenue from mining operations |
|
$ | 12,316 |
|
|
$ | 9,118 |
|
|
$ | 31,359 |
|
|
$ | 29,538 |
|
Geographical information relating to the Company’s non-current assets (other than financial instruments) is as follows:
|
|
September 30, 2023 |
|
|
December 31, 2022 |
|
||
Exploration and evaluation assets - Mexico |
|
$ | 50,450 |
|
|
$ | 49,803 |
|
Exploration and evaluation assets - Canada |
|
|
1 |
|
|
|
1 |
|
Total exploration and evaluation assets |
|
$ | 50,451 |
|
|
$ | 49,804 |
|
|
|
September 30, 2023 |
|
|
December 31, 2022 |
|
||
Plant, equipment, and mining properties - Mexico |
|
$ | 50,843 |
|
|
$ | 43,812 |
|
Plant, equipment, and mining properties - Canada |
|
|
196 |
|
|
|
244 |
|
Total plant, equipment, and mining properties |
|
$ | 51,039 |
|
|
$ | 44,056 |
|
22. SUBSEQUENT EVENTS
At-The-Market Sales – Subsequent to September 30, 2023, the Company issued 1,091,425 common shares in at-the-market offerings under prospectus supplement for gross proceeds of $556.
| -28- |
EXHIBIT 99.2
|
| MANAGEMENT’S DISCUSSION AND ANALYSIS FOR THE NINE MONTHS ENDED SEPTEMBER 30, 2023 |
The following discussion and analysis of the operations, results, and financial position of Avino Silver & Gold Mines Ltd. (the “Company” or “Avino”) should be read in conjunction with the Company’s condensed consolidated interim financial statements for the three and nine months ended September 30, 2023, and the Company’s audited consolidated financial statements as at and for the year ended December 31, 2022, and the notes thereto.
This Management’s Discussion and Analysis (“MD&A”) is dated November 8, 2023 and discloses specified information up to that date. The condensed interim consolidated financial statements are prepared in accordance with International Financial Reporting Standards (“IFRS”) as issued by the International Accounting Standards Board (“IASB”). Unless otherwise cited, references to dollar amounts are in US dollars. This MD&A contains “forward-looking statements” that are subject to risk factors including those set out in the “Cautionary Statement” at the end of this MD&A. All information contained in this MD&A is current and has been approved by the Company’s Board of Directors as of November 8, 2023, unless otherwise indicated. Throughout this report we refer to “Avino”, the “Company”, “we”, “us”, “our”, or “its”. All these terms are used in respect of Avino Silver & Gold Mines Ltd. We recommend that readers consult the “Cautionary Statement” on the last page of this report. Additional information relating to the Company is available on the Company’s website at www.avino.com and on SEDAR+ at www.sedarplus.ca.
Business Description
Founded in 1968, the Company is engaged in the production and sale of silver, gold, and copper bulk concentrate, and the acquisition, exploration, and evaluation of mineral properties. The Company holds mineral claims and leases in Durango, Mexico, and in British Columbia and Yukon, Canada. Avino is a reporting issuer in all of the provinces of Canada, except for Quebec, and a foreign private issuer with the Securities and Exchange Commission in the United States. The Company’s shares trade on the Toronto Stock Exchange (“TSX”) and the NYSE American under the symbol “ASM”, and on the Berlin and Frankfurt Stock Exchanges under the symbol “GV6”.
Discussion of Operations
The Company’s production, exploration, and evaluation activities during the nine months ended September 30, 2023, have been conducted on its Avino Property.
The Company holds a 99.67% effective interest in Compañía Minera Mexicana de Avino, S.A. de C.V. (“Avino Mexico”), a Mexican corporation which owns the Avino Property. The Avino Property covers approximately 1,104 contiguous hectares, and is located approximately 80 km north-east of the city of Durango. The Avino Property is equipped with milling and processing facilities that presently process all output from the Avino Mine located on the property.
The Company operates the Avino Mine which produces copper, silver and gold at the historic Avino property in the state of Durango, Mexico. The Company also holds 100% interest in Proyectos Mineros La Preciosa S.A. de C.V . (“La Preciosa”), a Mexican corporation which owns the La Preciosa Property. The Company also owns interests in mineral properties located in British Columbia and Yukon, Canada.
|
| MANAGEMENT’S DISCUSSION AND ANALYSIS FOR THE NINE MONTHS ENDED SEPTEMBER 30, 2023 |
Operational Highlights
| HIGHLIGHTS (Expressed in US$) |
| Third Quarter 2023 |
|
| Third Quarter 2022 |
|
| Change |
|
| YTD 2023 |
|
| YTD 2022 |
|
| Change |
|
|||||||
| Operating |
|
|
|
|
|
|
|
|
|
|
|
|
|
|
|
|
|
|
|
|
|
|
|
|
|
| Tonnes Milled |
|
| 154,507 |
|
|
| 162,169 |
|
|
| -5 | % |
|
| 471,635 |
|
|
| 391,531 |
|
|
| 20 | % | |
| Silver Ounces Produced |
|
| 237,165 |
|
|
| 285,444 |
|
|
| -17 | % |
|
| 703,920 |
|
|
| 675,339 |
|
|
| 4 | % | |
| Gold Ounces Produced |
|
| 2,077 |
|
|
| 1,201 |
|
|
| 73 | % |
|
| 5,883 |
|
|
| 3,352 |
|
|
| 76 | % | |
| Copper Pounds Produced |
|
| 1,143,827 |
|
|
| 2,101,635 |
|
|
| -46 | % |
|
| 3,987,016 |
|
|
| 4,963,327 |
|
|
| -20 | % | |
| Silver Equivalent Ounces1 Produced |
|
| 591,208 |
|
|
| 778,008 |
|
|
| -24 | % |
|
| 1,856,772 |
|
|
| 1,885,375 |
|
|
| -2 | % | |
| Concentrate Sales and Cash Costs |
|
|
|
|
|
|
|
|
|
|
|
|
|
|
|
|
|
|
|
|
|
|
|
|
|
| Silver Equivalent Payable Ounces Sold2 |
|
| 543,686 |
|
|
| 603,360 |
|
|
| -10 | % |
|
| 1,502,424 |
|
|
| 1,693,168 |
|
|
| -11 | % | |
| Cash Cost per Silver Equivalent Payable Ounce1,2,3 |
| $ | 16.90 |
|
| $ | 10.29 |
|
|
| 64 | % |
| $ | 15.83 |
|
| $ | 9.71 |
|
|
| 63 | % | |
| All-in Sustaining Cash Cost per Silver Equivalent Payable Ounce1,2,3 |
| $ | 22.69 |
|
| $ | 17.32 |
|
|
| 31 | % |
| $ | 21.95 |
|
| $ | 17.59 |
|
|
| 25 | % | |
1. In Q3 2023, AgEq was calculated using metals prices of $23.26 oz Ag, $1,927 oz Au and $3.80 lb Cu. In Q3 2022, AgEq was calculated using metals prices of $19.32 oz Ag, $1,734 oz Au and $3.51 lb Cu. For YTD 2023, AgEq was calculated using metals prices of $23.46 oz Ag, $1,942 oz Au and $3.87 lb Cu. For YTD 2022, AgEq was calculated using metal prices of $22.05 oz Ag, $1,856 oz Au and $4.10 lb Cu. Calculated figures may not add up due to rounding.
2. “Silver equivalent payable ounces sold” for the purposes of cash costs and all-in sustaining costs consists of the sum of payable silver ounces, gold ounces and copper tonnes sold, before penalties, treatment charges, and refining charges, multiplied by the ratio of the average spot gold and copper prices to the average spot silver price for the corresponding period.
3. The Company reports non-IFRS measures which include cash cost per silver equivalent payable ounce and all-in sustaining cash cost per payable ounce,. These measures are widely used in the mining industry as a benchmark for performance, but do not have a standardized meaning and the calculation methods may differ from methods used by other companies with similar reported measures. See Non-IFRS Measures section for further information and detailed reconciliations.
Financial Highlights
| HIGHLIGHTS (Expressed in 000’s of US$) |
| Third Quarter 2023 |
|
| Third Quarter 2022 |
|
| Change |
|
| YTD 2023 |
|
| YTD 2022 |
|
| Change |
|
|||||||
| Financial Operating Performance |
|
|
|
|
|
|
|
||||||||||||||||||
| Revenues |
| $ | 12,316 |
|
| $ | 9,118 |
|
|
| 35 | % |
| $ | 31,359 |
|
| $ | 29,538 |
|
|
| 6 | % | |
| Mine operating income |
| $ | 2,364 |
|
| $ | 2,060 |
|
|
| 15 | % |
| $ | 5,258 |
|
| $ | 10,706 |
|
|
| -51 | % | |
| Net income (loss) |
| $ | (803 | ) |
| $ | (1,129 | ) |
|
| -29 | % |
| $ | (21 | ) |
| $ | 1,800 |
|
|
| -101 | % | |
| Earnings before interest, taxes and amortization (“EBITDA”)1 |
| $ | 704 |
|
| $ | 170 |
|
|
| 314 | % |
| $ | 1,385 |
|
| $ | 7,056 |
|
|
| -80 | % | |
| Adjusted earnings1 |
| $ | 1,551 |
|
| $ | 389 |
|
|
| 299 | % |
| $ | 2,630 |
|
| $ | 6,213 |
|
|
| -58 | % | |
| Cash flow from / (used in) operations |
| $ | (82 | ) |
| $ | 1,366 |
|
|
| -106 | % |
| $ | 868 |
|
| $ | 8,512 |
|
|
| -90 | % | |
| Per Share Amounts |
|
|
|
|
|
|
|
|
|
|
|
|
|
|
|
|
|
|
|
|
|
|
|
|
|
| Earnings (loss) per share |
| $ | (0.01 | ) |
| $ | (0.01 | ) |
| -% |
|
| $ | 0.00 |
|
| $ | 0.02 |
|
|
| -100 | % | ||
| Adjusted earnings per share1 |
| $ | 0.01 |
|
| $ | 0.00 |
|
|
| 100 | % |
| $ | 0.02 |
|
| $ | 0.05 |
|
|
| -60 | % | |
|
|
|
|
|
|
|
|
|
|
|
|
|
|
|
|
|
|
|
|
|
|
|
|
|
|
|
| HIGHLIGHTS (Expressed in 000’s of US$) |
| September 30, 2023 |
|
| June 30, 2023 |
|
| Change |
|
| September 30, 2023 |
|
| December 31, 2022 |
|
| Change |
|
|||||||
| Liquidity & Working Capital |
|
|
|
|
|
|
|
|
|
|
|
|
|
|
|
|
|
|
|
|
|
|
|
|
|
| Cash |
| $ | 1,856 |
|
| $ | 1,207 |
|
|
| 54 | % |
| $ | 1,856 |
|
| $ | 11,245 |
|
|
| -83 | % | |
| Working capital |
| $ | 7,445 |
|
| $ | 4,584 |
|
|
| 62 | % |
| $ | 7,445 |
|
| $ | 8,821 |
|
|
| -16 | % | |
1. The Company reports non-IFRS measures which include cash cost per silver equivalent payable ounce, all-in sustaining cash cost per payable ounce, EBITDA, adjusted earnings, adjusted earnings per share, and working capital. These measures are widely used in the mining industry as a benchmark for performance, but do not have a standardized meaning and the calculation methods may differ from methods used by other companies with similar reported measures. See Non-IFRS Measures section for further information and detailed reconciliations.
| 2| Page |
|
| MANAGEMENT’S DISCUSSION AND ANALYSIS FOR THE NINE MONTHS ENDED SEPTEMBER 30, 2023 |
3rd Quarter 2023 Highlights
Consistent Production at Avino
|
| · | On October 19, 2023, the Company released its third quarter production results. The silver equivalent production was steady albeit lower compared to Q3 2022 and decreased by 24% to 591,208 ounces. Based on year-to-date production and the current timeline associated with processing the previously-mentioned surface material from La Preciosa, the Company is adjusting its internal production estimate to 2.4 – 2.7 million silver equivalent ounces for 2023. For full details see the news release link above. |
Avino Announced Continuing Exceptional Drill Results for Avino
|
| · | On September 14, 2023, the Company released the results of four holes from below Level 17, the current deepest workings at the Elena Tolosa (“ET”) area of the Avino system. These latest deep step-out holes test the SW extent of the robust Avino vein, and one infill hole was drilled to confirm local continuity. This drilling follows the continuity of the steeply dipping mineralization and aids in understanding the deep source of the mineralization. The Company is looking at the potential geometry and controls of the mineralization to come up with a model. Avino has completed its planned and budgeted drilling program for the year by drilling 7,545 metres in 13 drill holes. Our geologists on site are working through the recommendations made by our consulting geologists to study the potential of the entire ore body. The 2023 results will be reviewed to determine exploration plans and budget for 2024.The Drill holes hits substantial widths at grades well above our current cutoff grade on all four drill holes. |
Avino Announced Best Drill Intercept in Company History
|
| · | On July 5, 2023, the Company released the results of three holes from below Level 17, the current deepest workings at the Elena Tolosa (“ET”) area of the Avino system. Drill Hole ET-23-13 showed 44.40 metres true width of mineralization and is a step-out 50 metres to the west of Avino’s most westerly drill hole at 200 metres downdip below Level 17. This mineralized intercept is exceptionally wide and has very high silver, gold and copper grades. The vein system continues to be open along strike and at depth. |
Oxide Tailings Project
|
|
| The metallurgical results from the testwork program were completed in April and is forming the basis of the metallurgical analysis in an ongoing Pre-Feasibility Study (“PFS”) on the project. This Project has been in our portfolio for many years and factors prominently into our 5-year growth plan to become an intermediate silver producer in Mexico. These results also build on the studies in the 2017 Preliminary Economic Assessment (“PEA”) and increase the level of confidence in the Project through the extensive testwork completed. In the February 2023 mineral resource estimate update, the Oxide Tailings mineral resource was increased by 407% in the measured and indicated categories to total 5.7 million tonnes, and an increase of 287% to the silver equivalent ounces resulting in 17.4 million. |
La Preciosa Update:
|
| · | The Company continues to conduct community engagement in the nearby towns adjacent to the property. Avino is fully committed to moving this project forward as it factors prominently in the Company's 5-year growth strategy. |
Dry Stack Tailings Facility:
|
| · | The facility has been fully operational for a year. The conveyor system is installed and is currently transporting the pressed dry residues to the Avino open pit area. A tab is now available on our website that provides further information on our tailings management system, along with a video (in Spanish) from the minesite that can be viewed. In addition, a selection of short videos of the facility in operation can be viewed under Videos and Media. |
|
|
|
|
| 3| Page |
|
| MANAGEMENT’S DISCUSSION AND ANALYSIS FOR THE NINE MONTHS ENDED SEPTEMBER 30, 2023 |
Financial Results – Three months ended September 30, 2023, compared to three months ended September 30, 2022
|
|
| Three months ended September 30, |
|
|||||
|
|
| 2023 |
|
| 2022 |
|
||
| Revenue from mining operations |
| $ | 12,316 |
|
| $ | 9,118 |
|
| Cost of sales |
|
| 9,952 |
|
|
| 7,058 |
|
| Mine operating income |
|
| 2,364 |
|
|
| 2,060 |
|
|
|
|
|
|
|
|
|
|
|
| Operating expenses: |
|
|
|
|
|
|
|
|
| General and administrative expenses |
|
| 1,280 |
|
|
| 997 |
|
| Share-based payments |
|
| 627 |
|
|
| 556 |
|
| Income before other items |
|
| 457 |
|
|
| 507 |
|
|
|
|
|
|
|
|
|
|
|
| Other items: |
|
|
|
|
|
|
|
|
| Interest and other income |
|
| 5 |
|
|
| 15 |
|
| Loss on long-term investments |
|
| (295 | ) |
|
| (1,121 | ) |
| Fair value adjustment on warrant liability |
|
| 20 |
|
|
| 86 |
|
| Unrealized foreign exchange gain (loss) |
|
| (234 | ) |
|
| 251 |
|
| Project evaluation expenses |
|
| - |
|
|
| (5 | ) |
| Finance cost |
|
| (3 | ) |
|
| (87 | ) |
| Accretion of reclamation provision |
|
| (13 | ) |
|
| (11 | ) |
| Interest expense |
|
| (158 | ) |
|
| (23 | ) |
| Loss before income taxes |
|
| (221 | ) |
|
| (488 | ) |
|
|
|
|
|
|
|
|
|
|
| Income taxes: |
|
|
|
|
|
|
|
|
| Current income tax (expense) recovery |
|
| 111 |
|
|
| (142 | ) |
| Deferred income tax expense |
|
| (693 | ) |
|
| (499 | ) |
| Income tax expense |
|
| (592 | ) |
|
| (641 | ) |
| Net loss |
|
| (803 | ) |
|
| (1,129 | ) |
|
|
|
|
|
|
|
|
|
|
| Other comprehensive income (loss): |
|
|
|
|
|
|
|
|
| Currency translation differences |
|
| 203 |
|
|
| (290 | ) |
| Total comprehensive loss |
| $ | (573 | ) |
| $ | (1,129 | ) |
| Loss per share |
|
|
|
|
|
|
|
|
| Basic |
| $ | (0.01 | ) |
| $ | (0.01 | ) |
| Diluted |
| $ | (0.01 | ) |
| $ | (0.01 | ) |
| Weighted average number of common shares outstanding |
|
|
|
|
|
|
|
|
| Basic |
|
| 122,433,272 |
|
|
| 117,876,825 |
|
| Diluted |
|
| 122,433,272 |
|
|
| 117,876,825 |
|
| 4| Page |
|
| MANAGEMENT’S DISCUSSION AND ANALYSIS FOR THE NINE MONTHS ENDED SEPTEMBER 30, 2023 |
Revenues
The Company recognized revenues of $12.3 million on the sale of Avino Mine bulk copper/silver/gold concentrate, compared to $9.1 million revenues for Q3 2022, an increase of $3.2 million.
Metal prices for revenues recognized during the period were $23.26 per ounce of silver, $1,927 per ounce of gold, and $8,372 per tonne of copper, compared to averages of $19.32, $1,734, and $7,730, respectively, for the third quarter of 2022.
Cost of Sales & Mine Operating Income
Cost of sales was $9.9 million, compared to $7.1 million in Q3 2022, an increase of $2.8 million. The increase in cost of sales is partially attributable to increased mined tonnes, with 206,608 tonnes hauled to surface from underground in Q3 2023 compared to 156,323 tonnes in Q3 2022, an increase of 32%. Further, a stronger Mexican peso compared to the US dollar increased unit costs in Q3 2023 compared to Q3 2022 and resulted in increased labour and contractor costs. The Company prides itself in operating primarily with local workers and contractors for its mining operations.
Mine operating income, after depreciation and depletion, was $2.3 million, compared to income of $2.0 million in Q3 2022. The mine operating income in line with prior year quarter which is a direct result of the Company being in production and making consistent concentrate deliveries with no significant variances in production and prices during this comparatives periods.
General and Administrative Expenses & Share-Based Payments
General and administrative expenses was $1.2 million, compared to $1.0 million in Q3 2022, in line with expectations, showing the Company had another consistent quarter compared with prior periods. Share-based payments was $0.6 million, compared to $0.6 million in Q3 2022, consistent with prior quarter.
Other Items
Other Items totaled a loss of $0.7 million for the period, a change of $0.3 million compared to loss of $1.0 million related to other items in Q3 2022.
Unrealized loss on long-term investment was $0.3 million, a decrease of $0.9 million compared to a loss of $1.2 million in Q3 2022. This is a direct result of fluctuations in the Company’s investment in shares of Talisker Resources from period to period, as well as the Company’s investment in shares of Silver Wolf Exploration and Endurance Gold.
Foreign exchange loss for the period was $0.2 million, a change of $0.5 million compared to a gain of $0.3 million in Q3 2022. Foreign exchange gains or losses result from transactions in currencies other than the Canadian dollar functional currency. During the three months ended September 30, 2023, the Mexican peso weakened slightly in relation to the US dollar, which resulted in an unrealized loss on the net asset position in Mexico, while in Q3 2022, the US dollar showed strong appreciation to both currencies resulting in an unrealized foreign exchange gain.
The remaining Other Items resulted in a loss of $0.2 million, a difference of $0.1 million when compared to a loss of $0.1 million in Q3 2022.
| 5| Page |
|
| MANAGEMENT’S DISCUSSION AND ANALYSIS FOR THE NINE MONTHS ENDED SEPTEMBER 30, 2023 |
Current and Deferred Income Taxes
Current income tax recovery of $0.1 million in Q3 2023, compared to $0.2 million in income tax expense for Q3 2022, remains fairly consistent. The movement relates primarily to movements in the calculation of the Special Mining Duty tax that applies to mining profits generated in Mexico.
Deferred income tax expense was $0.7 million, a change of $0.2 million compared to $0.5 million in Q3 2022. Deferred income tax fluctuates due to movements in taxable and deductible temporary differences related to the special mining duty in Mexico and to changes in inventory, plant, equipment and mining properties, and exploration and evaluation assets, amongst other factors. The changes in current income taxes and deferred income taxes during the current and comparable periods primarily relate to movements in the tax bases and mining profits and/or losses in Mexico.
Net Income/Loss
Net loss was $0.8 million for the period, or $0.01 per share, compared to a net loss of $1.1 million, or $0.01 per share during Q3 2022. The changes are a result of the items noted above, which are primarily increases in revenues, cost of sales, mine operating income and movements in the fair value adjustment of the long-term investments and unrealized foreign exchange. The remain items were consistent showing no significant variances, as noted above.
EBITDA & Adjusted Income/Loss (see “Non-IFRS Measures”)
EBITDA was $0.7 million, a positive increase of $0.5 million when compared to $0.2 million for Q3 2022. The changes in EBITDA are primarily a factor of the items above, excluding any changes in depreciation and depletion, and any changes in income taxes. See Non-IFRS Measures for a reconciliation for EBITDA.
Adjusted earnings for the period was $1.5 million, a positive increase of $1.1 million when compared to adjusted earnings of $0.4 million in the corresponding quarter in 2022. Changes to adjusted losses are a result of the items noted above in EBITDA, further excluding share-based payments, gains and losses related to warrants, and movements in unrealized foreign exchange. See Non-IFRS Measures for a reconciliation for adjusted losses.
Cash Costs & All-in Sustaining Cash Costs (see “Non-IFRS Measures”)
Cash costs per silver equivalent payable ounce was $16.90, compared to $10.29 for Q3 2022. The increase in cost per ounce is a result of higher mine cost with less ounces produced and sold in Q3 2023 when compared to Q3 2022, primarily due to lower mill productivity and performance in the current quarter. The increase is also attributable to a stronger Mexican peso during the quarter, which directly impacted labour and contractor costs.
All-in sustaining cash costs per silver equivalent payable ounce was $22.69, compared to $17.32 for Q3 2022. The increase is primarily a result of items above, with no significant difference between the comparable quarter in sustaining capital and exploration costs.
See Non-IFRS Measures for a reconciliation for cash costs and all-in sustaining cash costs.
| 6| Page |
|
| MANAGEMENT’S DISCUSSION AND ANALYSIS FOR THE NINE MONTHS ENDED SEPTEMBER 30, 2023 |
Nine months ended September 30, 2023, compared to the nine months ended September 30, 2022:
| (000’s) |
| 2023 |
|
| 2022 |
|
||
| Revenue from mining operations |
| $ | 31,359 |
|
| $ | 29,538 |
|
| Cost of sales |
|
| 26,101 |
|
|
| 18,832 |
|
| Mine operating income (loss) |
|
| 5,258 |
|
|
| 10,706 |
|
| Operating expenses |
|
|
|
|
|
|
|
|
| General and administrative expenses |
|
| 3,999 |
|
|
| 3,469 |
|
| Share-based payments |
|
| 1,809 |
|
|
| 1,618 |
|
| Income (loss) before other items |
|
| (550 | ) |
|
| 5,619 |
|
| Other items |
|
|
|
|
|
|
|
|
| Interest and other income |
|
| 234 |
|
|
| 67 |
|
| Loss on long-term investments |
|
| (899 | ) |
|
| (2,503 | ) |
| Fair value adjustment on warrant liability |
|
| 478 |
|
|
| 2,692 |
|
| Unrealized foreign exchange gain (loss) |
|
| 182 |
|
|
| (231 | ) |
| Project evaluation expenses |
|
| - |
|
|
| (80 | ) |
| Finance costs |
|
| (80 | ) |
|
| (188 | ) |
| Accretion of reclamation provision |
|
| (36 | ) |
|
| (32 | ) |
| Interest expense |
|
| (275 | ) |
|
| (66 | ) |
| Net income (loss) before income taxes |
|
| (946 | ) |
|
| 5,278 |
|
| Income taxes |
|
|
|
|
|
|
|
|
| Current income tax (expense) recovery |
|
| 645 |
|
|
| (642 | ) |
| Deferred income tax (expense) recovery |
|
| 280 |
|
|
| (2,836 | ) |
| Income tax (expense) recovery |
|
| 925 |
|
|
| (3,478 | ) |
|
|
|
|
|
|
|
|
|
|
| Net income (loss) |
| $ | (21 | ) |
| $ | 1,800 |
|
|
|
|
|
|
|
|
|
|
|
| Earnings (loss) per share |
|
|
|
|
|
|
|
|
| Basic |
| $ | 0.00 |
|
| $ | 0.02 |
|
| Diluted |
| $ | 0.00 |
|
| $ | 0.02 |
|
| 7| Page |
|
| MANAGEMENT’S DISCUSSION AND ANALYSIS FOR THE NINE MONTHS ENDED SEPTEMBER 30, 2023 |
Revenues
The Company recognized revenues net of penalties, treatment costs and refining charges, of $31.3 million on the sale of Avino Mine bulk copper/silver/gold concentrate, compared to $29.5 million revenues for nine months of 2022, an increase of $1.8 million. The increase is a result of higher realized metal prices in 2023 for gold and silver, partially offset by lower payable silver equivalent ounces sold in the current period of 1.5 million, compared to 1.7 million in the same period for 2022, as well as lower realized copper prices.
Metal prices for revenues recognized during the period were $23.46 per ounce of silver, $1,942 per ounce of gold, and $8,539 per tonne of copper, compared to $22.05 per ounce of silver, $1,856 per ounce of gold, and $9,045 per tonne of copper for the same period in 2022.
Cost of Sales & Mine Operating Income
Cost of sales was $26.1 million, compared to $18.9 million in 2022, an increase of $7.2 million. The increase in cost of sales is partially attributable to 20% higher milled tonnes during the nine months 2023 compared to 2022, as well as 32% higher mined tonnes in the same period, which resulted in higher overall overhead costs despite lower ounces sold in the current year when compared to 2022. The increase is also attributable to a stronger Mexican peso during the period, which directly impacted labour and contractor costs. The Company prides itself in operating primarily with local workers and contractors for its mining operations.
Mine operating income, after depreciation and depletion, was $5.3 million, compared to $10.7 million in 2022. The decrease in mine operating income is a result of the increased cost of sales noted above, with higher revenues and cost mainly due to higher tonnes processed and lower grades than in the same period for 2022. This resulted in lower sold ounces. Further, unit costs were directly impacted due to a stronger Mexican Peso, especially labour and contractor costs. These increases were partially offset by higher realized metal prices during 2023 compared to 2022, as noted above.
General and Administrative Expenses & Share-Based Payments
General and administrative expenses was $4.0 million, compared to $3.5 million during the corresponding period in 2022, with the increases coming from the increased corporate activity relating to the acquisition of La Preciosa and increased professional fees.
Share-based payments was $1.8 million, compared to $1.6 million for the same period in 2022, a increase of $0.2 million. The increase is a direct result of the timing of option and RSU grants, and fluctuations in share price from period to period.
Other Items
Other Items totaled loss of $0.4 million for the period, a change of $0.1 million compared to $0.3 million related to Other items for the comparable period in 2022.
Unrealized loss on long-term investments was $0.9 million, a positive movement to income of $1.6 million compared to a loss of $2.5 million in 2022. This is a direct result of fluctuations in the Company’s investment in shares of Talisker Resources from period to period, and to a less extent, the Company’s investment in shares of Silver Wolf Exploration and Endurance Gold Corp..
Fair value adjustment on warrant liability was a gain of $0.5 million, a decrease to income of $2.2 million compared to a gain of $2.7 million during nine months of 2022. The fair value adjustment on the Company’s warrant liability relates to the issuance of US dollar-denominated warrants, which are re-valued each reporting period, and the value fluctuates with changes in the US-Canadian dollar exchange rate, and in the variables used in the valuation model, such as the Company’s US share price, and expected share price volatility.
| 8| Page |
|
| MANAGEMENT’S DISCUSSION AND ANALYSIS FOR THE NINE MONTHS ENDED SEPTEMBER 30, 2023 |
Foreign exchange gain for the period was $0.2 million, a change of $0.4 million compared to a loss of $0.2 million in the comparable period of 2022. Foreign exchange gains or losses result from transactions in currencies other than the Canadian dollar functional currency. During the period, the Canadian dollar and the US dollar depreciated in relation to the Mexican peso, resulting in a foreign exchange gain. During the nine months ended September 30, 2022, the US dollar appreciated slightly in relation to the Canadian dollar and the Mexican peso, resulting in a foreign exchange loss.
The remaining Other Items had no impact on net income for the nine months ended September 30, 2023 and 2022
Current and Deferred Income Taxes
Current income tax recovery was $0.6 million in 2023, a change of $1.2 million compared to $0.6 in income tax expense for the comparable period of 2022. The movements are a result of higher profits generated in 2022, resulting in increased income tax expense, whereas in 2023, the Company was in a recovery position as a result of less profitable mining operations.
Deferred income tax recovery was $0.3 million, a change of $3.1 million compared to a tax expense of $2.8 million in 2022. Deferred income tax fluctuates due to movements in taxable and deductible temporary differences related to the special mining duty in Mexico and to changes in inventory, plant, equipment and mining properties, and exploration and evaluation assets, amongst other factors. The changes in current income taxes and deferred income taxes during the current and comparable periods primarily relate to movements in the tax bases and mining profits and/or losses in Mexico.
Net Income/Loss
Net loss from all operations was $0.02 million for the period, or $0.00 per share, compared to income of $1.8 million, or $0.02 per share during comparable period of 2022. The changes are a result of the items noted above, which are primarily increases in revenues and cost of sales resulting in a decrease of mine operating income, slightly increases in share-based payments. Net income/loss was further impacted by movements in unrealized foreign exchange, fair value adjustments on the warrant liability, and an increased unrealized loss on investments as noted above.
EBITDA & Adjusted Income/Loss (see “Non-IFRS Measures”)
EBITDA was $1.4 million, a decrease of $5.7 million when compared to $7.1 million for comparable period of 2022. The changes in EBITDA are primarily a factor of the items above, excluding any changes in depreciation and depletion, and any changes in income taxes. See Non-IFRS Measures for a reconciliation for EBITDA.
Adjusted earnings for the period was $2.6 million, a decrease of $3.6 million when compared to adjusted earnings of $6.2 million in the corresponding period in 2022. Changes to adjusted losses are a result of the items noted above in EBITDA, further excluding share-based payments, gains and losses related to warrants, and movements in unrealized foreign exchange. See Non-IFRS Measures for a reconciliation for adjusted earnings.
Cash Costs & All-in Sustaining Cash Costs (see “Non-IFRS Measures”)
Cash costs per silver equivalent payable ounce, excluding stand-by costs, was $15.83, compared to $9.71 for the same period in 2022. The increase in cost per ounce is partially attributable to 20% and 32% higher milled and mined tonnes, respectively, in the nine months ended September 30, 2023 compared to 2022, which resulted in higher overall overhead costs despite lower ounces sold in the current period. The increase is also attributable to a stronger Mexican peso, which directly impacted labour and contractor costs, and as outlined in the “Cost of Sales & Mine Operating Income” section.
| 9| Page |
|
| MANAGEMENT’S DISCUSSION AND ANALYSIS FOR THE NINE MONTHS ENDED SEPTEMBER 30, 2023 |
All-in sustaining cash costs per silver equivalent payable ounce was $21.95, compared to $17.59 for the same period in 2022. The increase is primarily a result of the items noted above, offset by large reductions in penalties, exploration expenses and sustaining capital expenditures.
See Non-IFRS Measures for a reconciliation for cash costs and all-in sustaining cash costs.
Avino Mine Production Highlights
|
|
| Q3 2023 |
|
| Q3 2022 |
|
| Change % |
|
| YTD 2023 |
|
| YTD 2022 |
|
| Change % |
|
||||||
| Total Mill Feed (dry tonnes) |
|
| 154,507 |
|
|
| 162,169 |
|
|
| -5 | % |
|
| 471,635 |
|
|
| 391,531 |
|
|
| 20 | % |
| Feed Grade Silver (g/t) |
|
| 56 |
|
|
| 59 |
|
|
| -6 | % |
|
| 53 |
|
|
| 58 |
|
|
| -9 | % |
| Feed Grade Gold (g/t) |
|
| 0.58 |
|
|
| 0.31 |
|
|
| 86 | % |
|
| 0.53 |
|
|
| 0.35 |
|
|
| 51 | % |
| Feed Grade Copper (%) |
|
| 0.42 |
|
|
| 0.66 |
|
|
| -36 | % |
|
| 0.46 |
|
|
| 0.64 |
|
|
| -28 | % |
| Recovery Silver (%) |
|
| 86 | % |
|
| 92 | % |
|
| -7 | % |
|
| 87 | % |
|
| 92 | % |
|
| -5 | % |
| Recovery Gold (%) |
|
| 72 | % |
|
| 74 | % |
|
| -2 | % |
|
| 73 | % |
|
| 76 | % |
|
| -5 | % |
| Recovery Copper (%) |
|
| 80 | % |
|
| 89 | % |
|
| -11 | % |
|
| 83 | % |
|
| 90 | % |
|
| -8 | % |
| Total Silver Produced (oz) |
|
| 237,165 |
|
|
| 285,444 |
|
|
| -17 | % |
|
| 703,920 |
|
|
| 675,339 |
|
|
| 4 | % |
| Total Gold Produced (oz) |
|
| 2,077 |
|
|
| 1,201 |
|
|
| 73 | % |
|
| 5,883 |
|
|
| 3,352 |
|
|
| 76 | % |
| Total Copper Produced (lbs) |
|
| 1,143,827 |
|
|
| 2,101,635 |
|
|
| -46 | % |
|
| 3,987,016 |
|
|
| 4,963,327 |
|
|
| -20 | % |
| Total Silver Equivalent Produced (oz)* |
|
| 591,208 |
|
|
| 778,008 |
|
|
| -24 | % |
|
| 1,856,772 |
|
|
| 1,885,375 |
|
|
| -2 | % |
*In Q3 2023, AgEq was calculated using metals prices of $23.26 oz Ag, $1,927 oz Au and $3.80 lb Cu. In Q3 2022, AgEq was calculated using metals prices of $19.22 oz Ag, $1,729 oz Au and $3.51 lb Cu. For YTD 2023, AgEq was calculated using metals prices of $23.46 oz Ag, $1,942 oz Au and $3.87 lb Cu. For YTD 2022, AgEq was calculated using metal prices of $21.94 oz Ag, $1,825 oz Au and $4.12 lb Cu.
Under National Instrument 43-101, the Company is required to disclose that it has not based its production decisions on NI 43-101-compliant reserve estimates, preliminary economic assessments, or feasibility studies, and historically projects without such reports have increased uncertainty and risk of economic viability. The Company's decision to place a mine into operation at levels intended by management, expand a mine, make other production-related decisions, or otherwise carry out mining and processing operations is largely based on internal non-public Company data, and on reports based on exploration and mining work by the Company and by geologists and engineers engaged by the Company. The results of this work are evident in the Company's discovery of the San Gonzalo and Avino Mine resources, and in the Company's record of mineral production and financial returns since operations at levels intended by management commenced at the San Gonzalo Mine in 2012.
Exploration
Continuing Exceptional Drill Results for Avino
|
| · | On September 14, 2023, the Company released the results of four holes from below Level 17, the current deepest workings at the Elena Tolosa (“ET”) area of the Avino system. The Drill holes hits substantial widths at grades well above our current cutoff grade on all four drill holes. |
Selected Intercept Highlights:
|
| · | Hole ET 23-13: 0.70 % Cu, 31 Ag g/t and 0.21 Au g/t over 44.40 metres true width |
|
|
|
| o | including 1.10 % Cu, 42 Ag g/t and 0.58 Au g/t over 9.85 metres true width |
|
|
|
|
|
|
| · | Hole ET 23-10: 0.39 % Cu, 36 Ag g/t and 0.07 Au g/t over 27.15 metres true width |
|
|
|
| o | including 0.47 % Cu, 59 Ag g/t g and 0.09 Au g/t over 13.2 metres true width |
| 10| Page |
|
| MANAGEMENT’S DISCUSSION AND ANALYSIS FOR THE NINE MONTHS ENDED SEPTEMBER 30, 2023 |
Details are shown in the table below.
Table 1 – Summary Drill Results
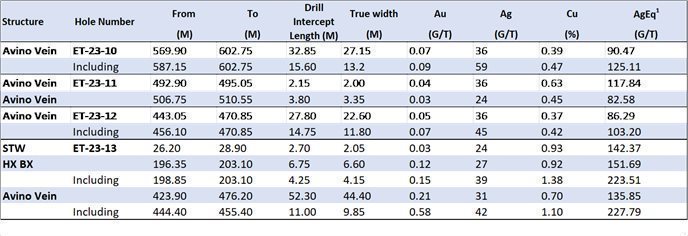
| 1. | AgEq in drill results above assumes $1,850/ oz Au and $22.00 oz/ Ag, and $4.00/ lb Cu, and 100% metallurgical recovery |
| 2. | STW = Stockwork Veins, HX BX = Hanging wall Breccia |
Avino Drills Best Intercept in Company History
On July 5, 2023, the Company released the results of three holes from below Level 17, the current deepest workings at the Elena Tolosa (“ET”) area of the Avino system. Drill Hole ET-23-09 showed 57 metres true width of mineralization and is a step-out 50 metres to the west of Avino’s most westerly drill hole at 200 metres downdip below Level 17. This mineralized intercept is exceptionally wide and has very high silver, gold and copper grades. The vein system continues to be open along strike and at depth.
Selected Intercept Highlights:
|
| · | Hole ET 23-09: 296 AgEq g/t over 57 metres true width, including 407 AgEq g/t over 37 metres true width and 2,866 AgEq g/t over 3.43 metres true width (To view images of the corresponding core, please click here) |
|
|
|
|
|
| · | Hole ET 23-07: 230 AgEq g/t over 11 metres true width |
|
|
|
|
Previously, the Company reported the extension of the Avino Vein to a further 500 metres downdip below the lowest current production mining level. Drill Hole ET-23-09 shows 57 metres true width of mineralization and is a step out 50 metres to the west of Avino’s most westerly drill hole at 200 metres downdip below Level 17. This continuing exploration program is testing the continuity of the steeply dipping mineralization. Avino has enlisted several world-renowned consulting geologists to contribute to the geological theory to drive understanding of the mineralization characteristics. The depth extent of at least 750 metres of known mineralization is unusual in comparison with most Mexican epithermal deposits.
| 11| Page |
|
| MANAGEMENT’S DISCUSSION AND ANALYSIS FOR THE NINE MONTHS ENDED SEPTEMBER 30, 2023 |
Details are shown in the table below.
Table 1 – Summary Drill Results
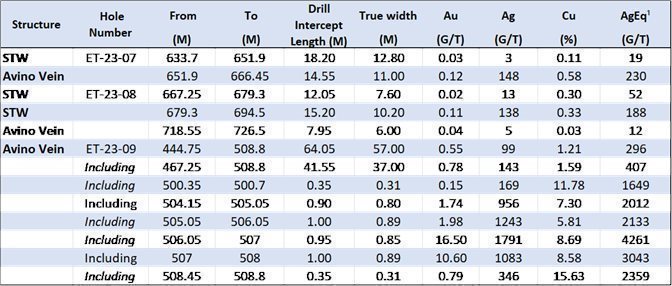
| 1. | AgEq in drill results below assumes $22.00 oz/ Ag and $1,850/ oz Au and $4.00/ lb. Cu, and 100% metallurgical recovery. |
| 2. | STW = Stockwork Veins |
The Company has budgeted 8,000 metres of drilling in 2023, with a focus on at depth below the current Elena Tolosa production area. To date, the Company has completed approximately 7,500 metres of drilling in 2023. Further results on the area below the current production area at Elena Tolosa will be released in the coming weeks.
Additional information on the Company’s exploration and evaluation properties by region is as follows:
(a) Avino, Mexico
The Company’s subsidiary Avino Mexico owns 42 mineral claims and leases four mineral claims in the state of Durango, Mexico. The Company’s mineral claims in Mexico are divided into the following four groups:
(i) Avino Mine area property
The Avino mine area property is situated around the towns of Panuco de Coronado and San Jose de Avino and surrounding the historic Avino mine site. There are four exploration concessions covering 154.4 hectares, 24 exploitation concessions covering 1,284.7 hectares, and one leased exploitation concession covering 98.83 hectares.
(ii) Gomez Palacio/Ana Maria property
The Ana Maria property is located near the town of Gomez Palacio, and consists of nine exploration concessions covering 2,549 hectares, and is also known as the Ana Maria property.
(iii) Santiago Papasquiaro property
| 12| Page |
|
| MANAGEMENT’S DISCUSSION AND ANALYSIS FOR THE NINE MONTHS ENDED SEPTEMBER 30, 2023 |
The Santiago Papasquiaro property is located near the village of Santiago Papasquiaro, and consists of four exploration concessions covering 2,552.6 hectares and one exploitation concession covering 602.9 hectares.
(iv) Unification La Platosa properties
The Unification La Platosa properties, consisting of three leased concessions in addition to the leased concession described in note (i) above, are situated within the Avino mine area property near the towns of Panuco de Coronado and San Jose de Avino and surrounding the Avino Mine.
(b) La Preciosa, Mexico
On March 21, 2022, the Company received approval for the closing of the acquisition of the La Preciosa property from Coeur Mining Inc. (“Coeur”).
La Preciosa consists of 15 exploration concessions totaling 6,011 hectares located in Durango, Mexico, within the municipalities of Panuco de Coronado and Canatlan. The property is located within 20 kilometres of the Company’s current Avino mining operations.
(c) British Columbia & Yukon, Canada
Eagle Property - Yukon
The Company has a 100% interest in 14 quartz leases located in the Mayo Mining Division of Yukon, Canada, which collectively comprise the Eagle property.
During the nine months ended September 30, 2023, the Company sold to a subsidiary of Hecla Mining Company (“Hecla”) the Eagle Property for cash consideration of C$250.
Minto and Olympic-Kelvin properties – British Columbia
On May 2, 2022, the Company has granted Endurance Gold Corporation the right to acquire an option to earn 100% ownership of the former Minto Gold Mine, Olympic and Kelvin gold prospects contained within a parcel of crown grant and mineral claims (the “Olympic Claims”).
As of September 30, 2023, Endurance was in compliance with all terms of the Option agreement. See Note 8 of the interim condensed consolidated financial statements for further details.
Qualified Person(s)
Peter Latta, P.Eng, MBA, VP Technical Services, Avino, is a qualified person within the context of National Instrument 43-101, and has reviewed and approved the technical data in this document.
| 13| Page |
|
| MANAGEMENT’S DISCUSSION AND ANALYSIS FOR THE NINE MONTHS ENDED SEPTEMBER 30, 2023 |
Non – IFRS Measures
EBITDA and Adjusted earnings
Earnings, or loss, before interest, taxes and amortization (“EBITDA”) is a non IFRS financial measure which excludes the following items from net earnings:
|
| · | Income tax expense |
|
| · | Finance cost |
|
| · | Amortization and depletion |
Adjusted earnings excludes the following additional items from EBITDA
|
| · | Share based compensation; |
|
| · | Non-operational items including foreign exchange movements, fair value adjustments on outstanding warrants and other non-recurring items |
Management believes EBITDA and adjusted earnings provides an indication of continuing capacity to generate operating cash flow to fund capital needs, service debt obligations and fund capital expenditures. These measures are intended to provide additional information to investors and analysts. There are not standardized definitions under IFRS and should not be considered in isolation or as a substitute for measures of operating performance prepared in accordance with IFRS.
Adjusted earnings excludes share-based payments, and non-operating or recurring items such as foreign exchange gains and losses and fair value adjustments on outstanding warrants. Under IFRS, entities must reflect within compensation expense the cost of share-based payments. In the Company’s circumstances, share-based compensation can involve significant amounts that will not be settled in cash but are settled by issuance of shares in exchange. The Company discloses adjusted earnings to aid in understanding the results of the company.
The following table provides a reconciliation of net earnings in the financial statements to EBITDA and adjusted earnings:
| Expressed in 000’s of US$, unless otherwise noted |
| Q3 2023 |
|
| Q3 2022 |
|
| YTD 2023 |
|
| YTD 2022 |
|
||||
| Net income (loss) for the period |
| $ | (803 | ) |
| $ | (1,129 | ) |
| $ | (21 | ) |
| $ | 1,800 |
|
| Depreciation and depletion |
|
| 758 |
|
|
| 551 |
|
|
| 2,175 |
|
|
| 1,558 |
|
| Interest income and other |
|
| (5 | ) |
|
| (14 | ) |
|
| (234 | ) |
|
| (66 | ) |
| Interest expense |
|
| 158 |
|
|
| 23 |
|
|
| 275 |
|
|
| 66 |
|
| Finance cost |
|
| 3 |
|
|
| 87 |
|
|
| 80 |
|
|
| 188 |
|
| Accretion of reclamation provision |
|
| 13 |
|
|
| 11 |
|
|
| 36 |
|
|
| 32 |
|
| Current income tax expense (recovery) |
|
| (111 | ) |
|
| 142 |
|
|
| (645 | ) |
|
| 642 |
|
| Deferred income tax expense (recovery) |
|
| 693 |
|
|
| 499 |
|
|
| (280 | ) |
|
| 2,836 |
|
| EBITDA |
| $ | 706 |
|
| $ | 170 |
|
| $ | 1,386 |
|
| $ | 7,056 |
|
| Fair value adjustment on warrant liability |
|
| (20 | ) |
|
| (86 | ) |
|
| (478 | ) |
|
| (2,692 | ) |
| Share-based payments |
|
| 627 |
|
|
| 556 |
|
|
| 1,809 |
|
|
| 1,618 |
|
| Write down of equipment and supplies and materials inventory |
|
| 4 |
|
|
| - |
|
|
| 95 |
|
|
|
|
|
| Foreign exchange loss (gain) |
|
| 234 |
|
|
| (251 | ) |
|
| (182 | ) |
|
| 231 |
|
| Adjusted earnings (loss) |
| $ | 1,551 |
|
| $ | 389 |
|
| $ | 2,629 |
|
| $ | 6,213 |
|
| Shares outstanding (diluted) |
|
| 125,907,227 |
|
|
| 120,386,601 |
|
|
| 124,189,165 |
|
|
| 113,814,123 |
|
| Adjusted earnings (loss) per share |
| $ | 0.01 |
|
| $ | 0.00 |
|
| $ | 0.02 |
|
| $ | 0.05 |
|
| 14| Page |
|
| MANAGEMENT’S DISCUSSION AND ANALYSIS FOR THE NINE MONTHS ENDED SEPTEMBER 30, 2023 |
Cash Cost and All-in Sustaining Cash Cost per Silver Equivalent Payable Ounce
The following tables provide a reconciliation of cost of sales from the consolidated financial statements to cash cost and all-in sustaining cash cost per silver equivalent payable ounce sold. In each table, “silver equivalent payable ounces sold” consists of the sum of payable silver ounces, gold ounces and copper tonnes sold, before penalties, treatment charges, and refining charges, multiplied by the ratio of the average spot gold and copper prices for the corresponding period.
Cash cost per payable ounce and all-in sustaining cash cost per payable ounce are measures developed by mining companies in an effort to provide a comparable standard. However, there can be no assurance that our reporting of these non-IFRS measures is similar to that reported by other mining companies. Total cash cost per payable ounce and all-in sustaining cash cost per payable ounce are measures used by the Company to manage and evaluate operating performance of the Company’s mining operations, and are widely reported in the silver and gold mining industry as benchmarks for performance, but do not have standardized meanings prescribed by IFRS as issued by the IASB, and are disclosed in addition to IFRS measures.
Cash cost per payable ounce
Management believes that the Company’s ability to control the cash cost per payable silver equivalent ounce is one of its key performance drivers impacting both the Company’s financial condition and results of operations. Achieving a low silver equivalent production cost base allows the Company to remain profitable from mining operations even during times of low commodity prices, and provides more flexibility in responding to changing market conditions. In addition, a profitable operation results in the generation of positive cash flows, which then improve the Company’s financial condition.
The Company’s calculation of all-in sustaining cash costs includes sustaining capital expenditures of $723 for the Nine months ended September 30, 2023 (September 30, 2022 - $2,834) and all of which is attributable to the Avino Mine.
To facilitate a better understanding of these measures as calculated by the Company, detailed reconciliations between the non-IFRS measures and the Company’s consolidated financial statements are provided below. The measures presented are intended to provide additional information, and should not be considered in isolation nor should they be considered substitutes for IFRS measures. Calculated figures may not add up accurately due to rounding.
| 15| Page |
|
| MANAGEMENT’S DISCUSSION AND ANALYSIS FOR THE NINE MONTHS ENDED SEPTEMBER 30, 2023 |
The following table reconciles cost of sales to cash cost per payable AgEq oz and all-in sustaining cash cost per payable AgEq oz for the preceding quarters:
| Expressed in 000’s of US$, unless otherwise noted |
| Avino – Consolidated |
|
|||||||||||||||||||||||||||||
|
|
| Q3 2023 |
|
| Q2 2023 |
|
| Q1 2023 |
|
| Q4 2022 |
|
| Q3 2022 |
|
| Q2 2022 |
|
| Q1 2022 |
|
| Q4 2021 |
|
||||||||
| Cost of sales |
| $ | 9,952 |
|
| $ | 8,175 |
|
| $ | 7,974 |
|
| $ | 10,293 |
|
| $ | 7,058 |
|
| $ | 5,468 |
|
| $ | 6,306 |
|
| $ | 4,912 |
|
| Exploration expenses |
|
| (41 | ) |
|
| (27 | ) |
|
| (95 | ) |
|
| (472 | ) |
|
| (336 | ) |
|
| (305 | ) |
|
| (296 | ) |
|
| (214 | ) |
| Write down of equipment and supplies and materials inventory |
|
| (4 | ) |
|
| (91 | ) |
|
| - |
|
|
| (330 | ) |
|
| - |
|
|
| - |
|
|
| - |
|
|
| - |
|
| Depletion and depreciation |
|
| (720 | ) |
|
| (677 | ) |
|
| (670 | ) |
|
| (592 | ) |
|
| (514 | ) |
|
| (481 | ) |
|
| (459 | ) |
|
| (741 | ) |
| Cash production cost |
|
| 9,187 |
|
|
| 7,380 |
|
|
| 7,209 |
|
|
| 8,899 |
|
|
| 6,208 |
|
|
| 4,682 |
|
|
| 5,551 |
|
|
| 3,957 |
|
| Payable silver equivalent ounces sold |
|
| 543,686 |
|
|
| 452,011 |
|
|
| 506,727 |
|
|
| 756,536 |
|
|
| 603,360 |
|
|
| 594,700 |
|
|
| 495,109 |
|
|
| 435,885 |
|
| Cash cost per silver equivalent ounce |
| $ | 16.90 |
|
| $ | 16.33 |
|
| $ | 14.22 |
|
| $ | 11.76 |
|
| $ | 10.29 |
|
| $ | 7.87 |
|
| $ | 11.21 |
|
| $ | 9.08 |
|
| General and administrative expenses |
|
| 1,907 |
|
|
| 2,338 |
|
|
| 1,524 |
|
|
| 2,094 |
|
|
| 1,553 |
|
|
| 2,218 |
|
|
| 1,316 |
|
|
| 967 |
|
| Treatment & refining charges |
|
| 1,001 |
|
|
| 651 |
|
|
| 709 |
|
|
| 784 |
|
|
| 568 |
|
|
| 700 |
|
|
| 766 |
|
|
| 529 |
|
| Penalties |
|
| 535 |
|
|
| 634 |
|
|
| 898 |
|
|
| 1,649 |
|
|
| 1,705 |
|
|
| 897 |
|
|
| 1,578 |
|
|
| 1,200 |
|
| Sustaining capital expenditures |
|
| 289 |
|
|
| 270 |
|
|
| 164 |
|
|
| 639 |
|
|
| 672 |
|
|
| 1,586 |
|
|
| 576 |
|
|
| 774 |
|
| Exploration expenses |
|
| 41 |
|
|
| 27 |
|
|
| 95 |
|
|
| 472 |
|
|
| 336 |
|
|
| 305 |
|
|
| 296 |
|
|
| 214 |
|
| Share-based payments and G&A depreciation |
|
| (665 | ) |
|
| (878 | ) |
|
| (374 | ) |
|
| (442 | ) |
|
| (591 | ) |
|
| (899 | ) |
|
| (230 | ) |
|
| (125 | ) |
| Cash operating cost |
| $ | 12,335 |
|
| $ | 10,422 |
|
| $ | 10,223 |
|
| $ | 14,095 |
|
| $ | 10,451 |
|
| $ | 9,489 |
|
| $ | 9,853 |
|
| $ | 7,516 |
|
| AISC per silver equivalent ounce |
| $ | 22.69 |
|
| $ | 23.06 |
|
| $ | 20.17 |
|
| $ | 18.63 |
|
| $ | 17.32 |
|
| $ | 15.95 |
|
| $ | 19.90 |
|
| $ | 17.24 |
|
The following table reconciles cash cost per AgEq oz production cost to all-in sustaining cash cost per AgEq oz for the Nine months ended September 30, 2023, and 2022:
| Expressed in 000’s of US$, unless otherwise noted |
| Avino - Consolidated |
|
|||||
|
|
| YTD 2023 |
|
| YTD 2022 |
|
||
| Cost of sales |
| $ | 26,101 |
|
| $ | 18,832 |
|
| Exploration expenses |
|
| (163 | ) |
|
| (937 | ) |
| Write down of equipment and supplies and materials inventory |
|
| (95 | ) |
|
| - |
|
| Depletion and depreciation |
|
| (2,067 | ) |
|
| (1,454 | ) |
| Cash production cost |
|
| 23,776 |
|
|
| 16,441 |
|
| Payable silver equivalent ounces sold |
|
| 1,502,424 |
|
|
| 1,693,198 |
|
| Cash cost per silver equivalent ounce |
| $ | 15.83 |
|
| $ | 9.71 |
|
| General and administrative expenses |
|
| 5,808 |
|
|
| 5,087 |
|
| Treatment & refining charges |
|
| 2,361 |
|
|
| 2,034 |
|
| Penalties |
|
| 2,066 |
|
|
| 4,179 |
|
| Sustaining capital expenditures |
|
| 723 |
|
|
| 2,834 |
|
| Exploration expenses |
|
| 163 |
|
|
| 937 |
|
| Share-based payments and G&A depreciation |
|
| (1,917 | ) |
|
| (1,721 | ) |
| Cash operating cost |
| $ | 32,981 |
|
| $ | 29,791 |
|
| AISC per silver equivalent ounce |
| $ | 21.95 |
|
| $ | 17.59 |
|
| 16| Page |
|
| MANAGEMENT’S DISCUSSION AND ANALYSIS FOR THE NINE MONTHS ENDED SEPTEMBER 30, 2023 |
Working Capital
|
|
| September 30, 2023 |
|
| December 31, 2022 |
|
||
| Current assets |
| $ | 21,108 |
|
| $ | 25,585 |
|
| Current liabilities |
|
| (13,663 | ) |
|
| (16,764 | ) |
| Working capital |
| $ | 7,445 |
|
| $ | 8,821 |
|
Results of Operations
Summary of Quarterly Results
| (000’s) |
| 2023 |
|
| 2023 |
|
| 2022 |
|
| 2022 |
|
| 2022 |
|
| 2022 |
|
| 2021 |
|
| 2021 |
|
||||||||
| Quarter ended |
| Sep 30 Q3 |
|
| Jun 30 Q2 |
|
| Mar 31 Q1 |
|
| Dec 31 Q4 |
|
| Sep 30 Q3 |
|
| Jun 30 Q2 |
|
| Mar 31 Q1 |
|
| Dec 31 Q3 |
|
||||||||
| Revenue |
| $ | 12,316 |
|
| $ | 9,218 |
|
| $ | 9,825 |
|
| $ | 14,649 |
|
| $ | 9,118 |
|
| $ | 9,370 |
|
| $ | 11,050 |
|
| $ | 9,318 |
|
| Net income (loss) |
|
| (803 | ) |
|
| 1,134 |
|
|
| (352 | ) |
|
| 1,296 |
|
|
| (1,129 | ) |
|
| 2,283 |
|
|
| 646 |
|
|
| 2,629 |
|
| Earnings (loss) per share - basic |
| $ | (0.01 | ) |
| $ | 0.01 |
|
| $ | 0.00 |
|
| $ | 0.01 |
|
| $ | (0.01 | ) |
| $ | 0.02 |
|
| $ | 0.01 |
|
| $ | 0.03 |
|
| Earnings (loss) per share - diluted |
| $ | (0.01 | ) |
| $ | 0.01 |
|
| $ | 0.00 |
|
| $ | 0.01 |
|
| $ | (0.01 | ) |
| $ | 0.02 |
|
| $ | 0.01 |
|
| $ | 0.04 |
|
| Total Assets |
| $ | 123,493 |
|
| $ | 120,469 |
|
| $ | 118,606 |
|
| $ | 121,196 |
|
| $ | 118,404 |
|
| $ | 118,092 |
|
| $ | 114,507 |
|
| $ | 86,264 |
|
|
| · | Revenue increased in Q3 2023 compared to previous quarters due to higher realized metal prices and favourable provisional pricing movements, especially when compared to Q1 and Q2 2023. |
|
| · | The Company was in a loss position for Q3 2023 primarily due to higher operating costs resulting primarily from a stronger Mexican Peso than Q1 2023 and prior quarters in 2022 and 2021. For further details see “Financial Results” section. |
|
| · | Total assets increased have increased overall when compared to previous quarters, as result of the acquisition of La Preciosa as well as operating and financing cash flow generation. |
Quarterly results will fluctuate with changes in revenues, cost of sales, general and administrative expenses, including non-cash items such as share-based payments, and other items including foreign exchange and deferred income taxes.
Cash Flow
| (000’s) |
| September 30, 2023 |
|
| September 30, 2022 |
|
||
| Cash generated by operating activities |
| $ | 867 |
|
| $ | 8,512 |
|
| Cash generated by (used in) financing activities |
|
| 2,125 |
|
|
| (903 | ) |
| Cash used in investing activities |
|
| (12,384 | ) |
|
| (21,429 | ) |
| Change in cash |
|
| (9,392 | ) |
|
| (13,820 | ) |
| Effect of exchange rate changes on cash |
|
| 3 |
|
|
| (25 | ) |
| Cash, beginning of period |
|
| 11,245 |
|
|
| 24,765 |
|
| Cash, end of period |
| $ | 1,856 |
|
| $ | 10,920 |
|
| 17| Page |
|
| MANAGEMENT’S DISCUSSION AND ANALYSIS FOR THE NINE MONTHS ENDED SEPTEMBER 30, 2023 |
Operating Activities
Cash generated by operating activities for the nine months ended September 30, 2023, was $0.9 million, a decrease of $7.6 million compared to $8.5 million for the nine months ended September 30, 2022. Cash movements from operating activities can fluctuate with changes in net income and working capital movements. In 2023, cash generated from operating activities decreased by $7.6 million primarily due to lower mine operating income as a result of higher levels of production with limited increase in sales volumes during the quarter and an increase in operating costs resulting from the strengthening of the Mexican Peso compared to the US dollar. Other movements are primarily a result of working capital changes between the two periods.
Financing Activities
Cash provided by financing activities was $2.1 million for the nine months ended September 30, 2023, compared to $0.9 million used for the nine months ended September 30, 2022. The movement is a result of proceeds from shares issued on the ATM, partially offset by higher payments of lease and equipment loan. During the nine months ended September 30, 2023, the Company received net proceeds from issuance of shares for cash of $3.2 million (September 30, 2022 – $0.03 million). The Company also made finance lease and equipment loan payments totalling $1.1 million (September 30, 2022 - $0.9 million).
Investing Activities
Cash used in investing activities for the nine months ended September 30, 2023, was $12.4 million compared to $21.4 million for the nine months ended September 30, 2022. Cash used in investing activities included $7.4 million (September 30, 2022 - $6.1 million) spent on the acquisition of property and equipment and exploration expenditures, as well as $5.0 million related to the repayment of the promissory note associated with the acquisition of La Preciosa during the nine months ended September 30, 2023, compared to $15.3 million in the upfront payments in the nine months ended September 30, 2022.
Liquidity and Capital Resources
The Company’s ability to generate sufficient amounts of cash, in both the short term and the long term, to maintain existing capacity and to fund ongoing exploration, is dependent upon the discovery of economically recoverable reserves or resources and the ability of the Company to continue with sustainable and profitable mining operations.
Management expects that the Company’s ongoing liquidity requirements will be funded from cash generated from current operations and from further financing, as required, in order to fund ongoing exploration activities, and meet its objectives, including ongoing advancement at the Avino Mine. The Company continues to evaluate financing opportunities to advance its projects. The Company’s ability to secure adequate financing is, in part, dependent on overall market conditions, the prices of silver, gold, and copper, and other factors.
| 18| Page |
|
| MANAGEMENT’S DISCUSSION AND ANALYSIS FOR THE NINE MONTHS ENDED SEPTEMBER 30, 2023 |
The Company’s recent financing activities are summarized in the table below.
| Intended Use of Proceeds
|
| Actual Use of Proceeds
|
| During 2023, the Company received net proceeds of $3.2 million in connection with a brokered at-the-market offering issued under prospectus supplements.
|
| As of the date of this MD&A, the Company is using the funds as intended.
During 2023, all funds were used for exploration and evaluation activities, the acquisition of property and equipment, and the repayments of capital equipment acquired under lease and loan.
|
| During 2021, the Company received net proceeds of $18.1 million in connection with a brokered at-the-market offering issued under prospectus supplements, $0.8 million in connection with warrants exercised and $0.2 million in connection with stock options exercised.
|
| As of the date of this MD&A, the Company is using the funds as intended. During 2021, the Company announced an increase to its exploration from 12,000 to 30,600 metres of exploration and resource drilling. As of the date of this MD&A, over 20,000 metres of the program had been completed.
In supporting mining operations in Mexico, the Company acquired la Preciosa for net cash consideration of $15.4 million. During 2022, the remaining $3.7 million was used for exploration and evaluation activities, the acquisition of property and equipment, the repayment of capital equipment acquired under lease and loan.
|
| During 2020, the Company received net proceeds of $4.7 million in connection with a brokered at-the-market offering issued under prospectus supplements and $3.7 million in connection with warrants exercised. |
| As of the date of this MD&A, the Company had used, and was continuing to use, the funds as intended. There has been no impact on the ability of the Company to achieve its business objectives and milestones. |
Off-Balance Sheet Arrangements
The Company has no off-balance sheet arrangements.
| 19| Page |
|
| MANAGEMENT’S DISCUSSION AND ANALYSIS FOR THE NINE MONTHS ENDED SEPTEMBER 30, 2023 |
Transactions with Related Parties
All related party transactions are recorded at the exchange amount which is the amount agreed to by the Company and the related party.
(a) Key management personnel
The Company has identified its directors and certain senior officers as its key management personnel. The compensation costs for key management personnel for the three and nine months ended September 30, 2023 and 2022 is as follows:
|
|
| Three months ended September 30, |
|
| Nine months ended September 30, |
|
||||||||||
|
|
| 2023 |
|
| 2022 |
|
| 2023 |
|
| 2022 |
|
||||
| Salaries, benefits, and consulting fees |
| $ | 289 |
|
| $ | 237 |
|
| $ | 869 |
|
| $ | 975 |
|
| Share-based payments |
|
| 502 |
|
|
| 427 |
|
|
| 1,472 |
|
|
| 1,251 |
|
|
|
| $ | 791 |
|
| $ | 664 |
|
| $ | 2,341 |
|
| $ | 2,226 |
|
(b) Amounts due to/(from) related parties
In the normal course of operations the Company transacts with companies related to Avino’s directors or officers. All amounts payable and receivable are non-interest bearing, unsecured and due on demand.
The following table summarizes the amounts were due to/(from) related parties:
|
|
| September 30, 2023 |
|
| December 31, 2022 |
|
||
| Oniva International Services Corp. |
| $ | 100 |
|
| $ | 100 |
|
| Silver Wolf Exploration Ltd. |
|
| (131 | ) |
|
| (72 | ) |
|
|
| $ | (31 | ) |
| $ | 28 |
|
For services provided to the Company as President and Chief Executive Officer, the Company pays Intermark Capital Corporation (“ICC”), a company controlled by David Wolfin, the Company’s President and CEO and also a director, for consulting services. For the nine months ended September 30, 2023, the Company paid $215 (September 30, 2022 - $263) to ICC.
(c) Other related party transactions
The Company has a cost sharing agreement with Oniva International Services Corp. (“Oniva”) for office and administration services. Pursuant to the cost sharing agreement, the Company will reimburse Oniva for the Company’s percentage of overhead and corporate expenses and for out-of-pocket expenses incurred on behalf of the Company, with a 2.5% markup. David Wolfin, President & CEO, and a director of the Company, is the sole owner of Oniva. The cost sharing agreement may be terminated with one-month notice by either party without penalty. During the three and nine months ended September 30, 2023, administrative fees of $11 and $36 were paid to Oniva (three and nine months ended September 30, 2022 - $11 and $31)
| 20| Page |
|
| MANAGEMENT’S DISCUSSION AND ANALYSIS FOR THE NINE MONTHS ENDED SEPTEMBER 30, 2023 |
The transactions with Oniva during the three and nine months ended September 30, 2023 and 2022, are summarized below:
|
|
| Three months ended September 30, |
|
| Nine months ended September 30, |
|
||||||||||
|
|
| 2023 |
|
| 2022 |
|
| 2023 |
|
| 2022 |
|
||||
| Salaries and benefits |
| $ | 240 |
|
| $ | 218 |
|
| $ | 729 |
|
| $ | 670 |
|
| Office and miscellaneous |
|
| 107 |
|
|
| 119 |
|
|
| 364 |
|
|
| 325 |
|
|
|
| $ | 347 |
|
| $ | 337 |
|
| $ | 1,093 |
|
| $ | 995 |
|
Financial Instruments and Risks
The fair values of the Company’s amounts due to related parties and accounts payable approximate their carrying values because of the short-term nature of these instruments. Cash, amounts receivable, long-term investments, and warrant liability are recorded at fair value. The carrying amounts of the Company’s term facility, equipment loans, and finance lease obligations are a reasonable approximation of their fair values based on current market rates for similar financial instruments.
The Company’s financial instruments are exposed to certain financial risks, including credit risk, liquidity risk, and market risk.
(a) Credit Risk
Credit risk is the risk that one party to a financial instrument will cause a financial loss for the other party by failing to discharge an obligation. The Company has exposure to credit risk through its cash, long-term investments and amounts receivable. The Company manages credit risk, in respect of cash and short-term investments, by maintaining the majority of cash and short-term investments at highly rated financial institutions.
The Company is exposed to a significant concentration of credit risk with respect to its trade accounts receivable balance because all of its concentrate sales are with three (December 31, 2022 – two) counterparties. However, the Company has not recorded any allowance against its trade receivables because to-date all balances owed have been settled in full when due (typically within 60 days of submission) and because of the nature of the counterparties.
The Company’s maximum exposure to credit risk at the end of any period is equal to the carrying amount of these financial assets as recorded in the unaudited condensed consolidated interim statement of financial position. At September 30, 2023, no amounts were held as collateral.
(b) Liquidity Risk
Liquidity risk is the risk that the Company will encounter difficulty in satisfying financial obligations as they become due. The Company manages its liquidity risk by forecasting cash flows required by its operating, investing and financing activities. The Company had cash at September 30, 2023, in the amount of $1,856 and working capital of $7,445 in order to meet short-term business requirements. Accounts payable have contractual maturities of approximately 30 to 90 days, or are due on demand and are subject to normal trade terms. The current portions of note payable and finance lease obligations are due within 12 months of the condensed consolidated interim statement of financial position date. Amounts due to related parties are without stated terms of interest or repayment.
| 21| Page |
|
| MANAGEMENT’S DISCUSSION AND ANALYSIS FOR THE NINE MONTHS ENDED SEPTEMBER 30, 2023 |
The maturity profiles of the Company’s contractual obligations and commitments as at September 30, 2023, are summarized as follows:
|
|
| Total |
|
| Less Than 1 Year |
|
| 1-5 years |
|
| More Than 5 Years |
|
||||
| Accounts payable and accrued liabilities |
| $ | 11,675 |
|
| $ | 11,675 |
|
| $ | - |
|
| $ | - |
|
| Minimum rental and lease payments |
|
| 850 |
|
|
| 105 |
|
|
| 347 |
|
|
| 398 |
|
| Equipment loans |
|
| 439 |
|
|
| 191 |
|
|
| 248 |
|
|
| - |
|
| Finance lease obligations |
|
| 3,796 |
|
|
| 1,918 |
|
|
| 1,878 |
|
|
| - |
|
| Total |
| $ | 16,760 |
|
| $ | 13,889 |
|
| $ | 2,473 |
|
| $ | 398 |
|
(c) Market Risk
Market risk consists of interest rate risk, foreign currency risk and price risk. These are discussed further below.
Interest Rate Risk
Interest rate risk consists of two components:
|
| (i) | To the extent that payments made or received on the Company’s monetary assets and liabilities are affected by changes in the prevailing market interest rates, the Company is exposed to interest rate cash flow risk. |
|
|
|
|
|
| (ii) | To the extent that changes in prevailing market rates differ from the interest rates on the Company’s monetary assets and liabilities, the Company is exposed to interest rate price risk. |
|
|
|
|
In management’s opinion, the Company is not materially exposed to interest rate risk, as any material debt obligations that bear interest are fixed and not subject to floating interest rates. A 10% change in the interest rate would not a result in a material impact on the Company’s operations.
| 22| Page |
|
| MANAGEMENT’S DISCUSSION AND ANALYSIS FOR THE NINE MONTHS ENDED SEPTEMBER 30, 2023 |
Foreign Currency Risk
Foreign currency risk is the risk that the fair value or future cash flows of a financial instrument will fluctuate due to changes in foreign exchange rates. The Company is exposed to foreign currency risk to the extent that the following monetary assets and liabilities are denominated in Mexican pesos and Canadian dollars:
|
|
| September 30, 2023 |
|
| December 31, 2022 |
|
||||||||||
|
|
| MXN |
|
| CDN |
|
| MXN |
|
| CDN |
|
||||
| Cash |
| $ | 2,451 |
|
| $ | 113 |
|
| $ | 4,097 |
|
| $ | 250 |
|
| Due from related parties |
|
| 2,310 |
|
|
| - |
|
|
| 1,402 |
|
|
| - |
|
| Long-term investments |
|
| - |
|
|
| 1,204 |
|
|
| - |
|
|
| 2,365 |
|
| Reclamation bonds |
|
| - |
|
|
| 6 |
|
|
| - |
|
|
| 4 |
|
| Amounts receivable |
|
| 6,478 |
|
|
| 56 |
|
|
| - |
|
|
| 34 |
|
| Accounts payable and accrued liabilities |
|
| (93,198 | ) |
|
| (346 | ) |
|
| (85,486 | ) |
|
| (108 | ) |
| Due to related parties |
|
| - |
|
|
| (135 | ) |
|
| - |
|
|
| (135 | ) |
| Finance lease obligations |
|
| (598 | ) |
|
| (256 | ) |
|
| (161 | ) |
|
| (343 | ) |
| Net exposure |
|
| (82,557 | ) |
|
| 642 |
|
|
| (80,148 | ) |
|
| 2,067 |
|
| US dollar equivalent |
| $ | 468 |
|
| $ | (43 | ) |
| $ | (4,136 | ) |
| $ | 1,526 |
|
Based on the net US dollar denominated asset and liability exposures as at September 30, 2023, a 10% fluctuation in the US/Mexican and Canadian/US exchange rates would impact the Company’s earnings for the nine months ended September 30, 2023, by approximately $425 (year ended December 31, 2022 - $275). The Company has not entered into any foreign currency contracts to mitigate this risk.
Price Risk
Price risk is the risk that the fair value or future cash flows of a financial instrument will fluctuate due to changes in market prices, other than those arising from interest rate risk or foreign currency risk.
The Company is exposed to price risk with respect to its amounts receivable, as certain trade accounts receivable are recorded based on provisional terms that are subsequently adjusted according to quoted metal prices at the date of final settlement. Quoted metal prices are affected by numerous factors beyond the Company’s control and are subject to volatility, and the Company does not employ hedging strategies to limit its exposure to price risk. At September 30, 2023, based on outstanding accounts receivable that were subject to pricing adjustments, a 10% change in metals prices would have an impact on net earnings (loss) of approximately $58 (December 31, 2022 - $65).
The Company is exposed to price risk with respect to its long-term investments, as these investments are carried at fair value based on quoted market prices. Changes in market prices result in gains or losses being recognized in net income (loss). At September 30, 2023, a 10% change in market prices would have an impact on net earnings (loss) of approximately $87 (December 31, 2022 - $175).
The Company’s profitability and ability to raise capital to fund exploration, evaluation and production activities is subject to risks associated with fluctuations in mineral prices. Management closely monitors commodity prices, individual equity movements, and the stock market to determine the appropriate course of action to be taken by the Company.
| 23| Page |
|
| MANAGEMENT’S DISCUSSION AND ANALYSIS FOR THE NINE MONTHS ENDED SEPTEMBER 30, 2023 |
(d) Classification of Financial Instruments
IFRS 13 Financial Instruments: Disclosures establishes a fair value hierarchy that prioritizes the inputs to valuation techniques used to measure fair value as follows:
Level 1 – quoted prices (unadjusted) in active markets for identical assets or liabilities;
Level 2 – inputs other than quoted prices included in Level 1 that are observable for the asset or liability, either directly (i.e., as prices) or indirectly (i.e., derived from prices); and
Level 3 – inputs for the asset or liability that are not based on observable market data (unobservable inputs).
The following table sets forth the Company’s financial assets and financial liabilities measured at fair value on a recurring basis by level within the fair value hierarchy as at September 30, 2023:
|
|
| Level 1 |
|
| Level 2 |
|
| Level 3 |
|
|||
| Financial assets |
|
|
|
|
|
|
|
|
|
|||
| Cash |
| $ | 1,856 |
|
| $ | - |
|
| $ | - |
|
| Amounts receivable |
|
| - |
|
|
| 2,473 |
|
|
| - |
|
| Long-term investments |
|
| 891 |
|
|
| - |
|
|
| - |
|
| Total financial assets |
| $ | 2,747 |
|
| $ | 2,473 |
|
| $ | - |
|
The Company uses Black-Scholes model to measure its Level 3 financial instruments. As at September 30, 2023, the Company’s has no Level 3 financial instruments.
Commitments
The Company has a cost sharing agreement to reimburse Oniva for a percentage of its overhead expenses, to reimburse 100% of its out-of-pocket expenses incurred on behalf of the Company, and to pay a percentage fee based on Oniva’s total overhead and corporate expenses. The agreement may be terminated with one-month notice by either party. Transactions and balances with Oniva are disclosed in Note 11.
The Company and its subsidiaries have various operating lease agreements for their office premises, use of land, and equipment. Commitments in respect of these lease agreements are as follows:
|
|
| September 30, 2023 |
|
| December 31, 2022 |
|
||
| Not later than one year |
| $ | 117 |
|
| $ | 105 |
|
| Later than one year and not later than five years |
|
| 382 |
|
|
| 347 |
|
| Later than five years |
|
| 362 |
|
|
| 398 |
|
|
|
| $ | 861 |
|
| $ | 850 |
|
Office lease payments recognized as an expense during the nine months ended September 30, 2023, totalled $27 (September 30, 2022 - $12).
Subsequent Events
At-The-Market Sales – Subsequent to September 30, 2023, the Company issued 1,091,425 common shares in at-the-market offerings under prospectus supplement for gross proceeds of $556.
| 24| Page |
|
| MANAGEMENT’S DISCUSSION AND ANALYSIS FOR THE NINE MONTHS ENDED SEPTEMBER 30, 2023 |
Outstanding Share Data
The Company’s authorized share capital consists of an unlimited number of common shares without par value.
As at November 8, 2023 the following common shares, warrants, and stock options were outstanding:
|
|
| Number of shares |
|
| Exercise price |
|
| Remaining life (years) |
|
|||
| Share capital |
|
| 125,806,148 |
|
|
| - |
|
|
| - |
|
| Restricted Share Units (“RSUs”) |
|
| 2,994,709 |
|
|
| - |
|
| 1.38 – 2.39 |
|
|
| Stock options |
|
| 6,666,000 |
|
| C$0.79 - C$1.64 |
|
| 0.79 – 4.67 |
|
||
| Fully diluted |
|
| 135,466,857 |
|
|
|
|
|
|
|
|
|
The following are details of outstanding stock options as at September 30, 2023 and November 8, 2023:
| Expiry Date |
| Exercise Price Per Share |
| Number of Shares Remaining Subject to Options (September 30, 2023) |
|
| Number of Shares Remaining Subject to Options (November 8, 2023) |
|
||
| August 21, 2024 |
| C$0.79 |
|
| 126,000 |
|
|
| 126,000 |
|
| August 4, 2025 |
| C$1.64 |
|
| 1,660,000 |
|
|
| 1,660,000 |
|
| March 25, 2027 |
| C$1.20 |
|
| 2,330,000 |
|
|
| 2,330,000 |
|
| May 4, 2027 |
| C$0.92 |
|
| 25,000 |
|
|
| 25,000 |
|
| March 29, 2028 |
| C$1.12 |
|
| 2,375,000 |
|
|
| 2,375,000 |
|
| July 10, 2028 |
| C$1.12 |
|
| 150,000 |
|
|
| 150,000 |
|
| Total: |
|
|
|
| 6,666,000 |
|
|
| 6,666,000 |
|
The following are details of outstanding RSUs as at September 30, 2023 and November 8, 2023:
| Expiry Date |
| Number of Shares Remaining Subject to RSUs (September 30, 2023) |
|
| Number of Shares Remaining Subject to RSUs (November 8, 2023) |
|
||
| March 25, 2025 |
|
| 1,182,000 |
|
|
| 1,162,265 |
|
| March 29, 2026 |
|
| 1,866,320 |
|
|
| 1,832,444 |
|
| Total: |
|
| 3,048,320 |
|
|
| 2,994,709 |
|
Recent Accounting Pronouncements
New and amended IFRS that are effective for the current year:
In the current year, the Company has applied the below amendments to IFRS Standards and Interpretations issued by the IASB that were effective for annual periods that begin on or after January 1, 2023. These standards did not have a material impact on the Company’s disclosures or on the amounts in the current reporting periods.
Amendments to IAS 1 – Presentation of Financial Statements and IFRS Practice Statement 2 Making Material Judgments – Disclosure of Accounting Policies
The amendments change the requirements in IAS 1 with regards to disclosure of accounting policies. The amendments replace all instances of the term “significant accounting policies” with “material accounting policy information.” Accounting policy information is material if, when considered together with other information included in an entity’s financial statements, it can reasonable by expected to influence decisions that the primary users of general purpose financial statements make on the basis of those financial statements.
| 25| Page |
|
| MANAGEMENT’S DISCUSSION AND ANALYSIS FOR THE NINE MONTHS ENDED SEPTEMBER 30, 2023 |
The supporting paragraphs in IAS 1 are also amended to clarify that accounting policy information that relates to immaterial transactions, other events, or conditions, is immaterial and not required to be disclosed. Accounting policy information may be material because of the nature of the related transactions, other events, or conditions, even of the amounts are immaterial. However, not all accounting policy information relating to material transactions, other events, or conditions, is itself material. The IASB has also developed guidance and examples to explain and demonstrate the application of the “four-step materiality process” described in IFRS Practice Statement 2.
The amendments were applied effective January 1, 2023, and did not have a material impact on the Company’s interim consolidated financial statements.
Amendments to IAS 8 – Accounting Policies, Changes in Accounting Estimates and Errors – Definition of Accounting Estimates
The amendments replace the definition of a change in accounting estimates with a definition of accounting estimates. Under the new definition, accounting estimates are “monetary amounts in financial statements that are subject to measurement uncertainty.”
The definition of a change in accounting estimates was deleted; however, the IASB retained the concept of changes in accounting estimates in the Standard with the following clarifications:
|
| · | A change in accounting estimate that results from new information or new developments is not a correct of an error |
|
|
|
|
|
| · | The effects of a change in an input or a measurement technique used to develop an accounting estimate are changes in accounting estimates if they do not result from the correction of prior period errors |
The amendments were applied effective January 1, 2023, and did not have a material impact on the Company’s interim consolidated financial statements.
Amendments to IAS 12 – Deferred Tax Related to Assets and Liabilities Arising from a Single Transaction
The amendments clarify that companies are required to recognize deferred taxes on transactions where both assets and liabilities are recognized, such as with leases and decommissioning liabilities. The amendments were applied effective January 1, 2023, and did not have a material impact on the Company’s interim consolidated financial statements.
Future Changes in Accounting Policies Not Yet Effective as at September 30, 2023:
Certain new accounting standards and interpretations have been published that are not mandatory for the current period and have not been early adopted. These standards are not expected to have a material impact on the Company in the current or future reporting periods.
Amendments to IAS 1 – Classification of Liabilities as Current or Non-Current with Covenants
The amendments aim to promote consistency in applying the requirements by helping companies determine whether, in the statement of financial position, debt and other liabilities with an uncertain settlement date should be classified as current (due or potentially due to be settled within one year) or non-current.
In addition, the amendment requires entities to disclose information to enable users of the financial statements to understand the risk that non-current liabilities with covenants could become repayable within twelve months. The amendments are applied on or after the first annual reporting period beginning on or after January 1, 2024, with early application permitted. The amendment is not expected to have a material impact on the Company’s consolidated financial statements.
| 26| Page |
|
| MANAGEMENT’S DISCUSSION AND ANALYSIS FOR THE NINE MONTHS ENDED SEPTEMBER 30, 2023 |
Amendments to IFRS 16 – Lease Liability in a Sale and Leaseback
The amendments require a seller/lessee to subsequently measure lease liabilities arising from a leaseback in a way that it does not recognize any amount of the gain or loss that relates to the right of use it retains. The new requirements do not prevent a seller/lessee from recognizing in profit or loss any gain or loss relating to the partial or full termination of a lease. A seller-lessee applies the amendments retrospectively in accordance with IAS 8 Accounting Policies, Change in Accounting Estimates and Errors to sale or leaseback transactions entered into after the date of initial application.
The amendments are applied on or after the first annual reporting period beginning on or after January 1, 2024, with early application permitted. The amendment is not expected to have a material impact on the Company’s consolidated financial statements.
Disclosure Controls and Procedures
Management, including our principal executive officer and principal financial officer, has evaluated the effectiveness of the design and operation of the Company’s disclosure controls and procedures on financial reporting (as defined in NI 52-109 - Certification of Disclosure in Issuers’ Annual and Interim Filings and as defined in Rules 13a-15(e) and 15d-15(e) under the Exchange Act) and has concluded that, based on its evaluation, that the Company’s disclosure controls and procedures were not effective as of September 30, 2023 due to a material weakness in internal control over financial reporting that was disclosed in our management’s discussion and analysis for the year ended December 31, 2022.
Changes in Internal Control Over Financial Reporting
There have been no changes in our internal control over financial reporting (as defined in Rules 13a-15(f) or 15d-15(f) of the Exchange Act) that occurred during the Nine months ended September 30, 2023 that have materially affected, or are reasonably likely to materially affect, the Company’s internal control over financial reporting.
Based on this evaluation, management concluded that as of September 30, 2023, the Company’s internal controls over financial reporting, as defined in NI 52-109 - Certification of Disclosure in Issuer’s Annual and Interim Filings and as defined in Rule 13a-15(f) and 15d-15(f) under the Exchange Act) were ineffective as of September 30, 2023.
Remediation
The Company has begun implementing a remediation plan to address the material weakness described in the management’s discussion and analysis for the year ended December 31, 2022. The material weakness will not be considered remediated until the applicable controls operate for a sufficient period of time and management has concluded, through testing, that these controls are operating effectively. We expect that the remediation of the material weakness will be completed prior to the end of the year ended December 31, 2023.
| 27| Page |
|
| MANAGEMENT’S DISCUSSION AND ANALYSIS FOR THE NINE MONTHS ENDED SEPTEMBER 30, 2023 |
Cautionary Statement
This MD&A is based on a review of the Company’s operations, financial position and plans for the future based on facts and circumstances as of November 8, 2023. Except for historical information or statements of fact relating to the Company, this document contains “forward-looking statements” within the meaning of applicable Canadian securities regulations. Forward-looking statements in this document include, but are not limited to, those regarding the economic outlook for the mining industry, expectations regarding metals prices, expectations regarding production output, production costs, cash costs and other operating results, expectations regarding growth prospects and the outlook for the Company’s operations, and statements regarding the Company’s liquidity, capital resources, and capital expenditures. There can be no assurance that such statements will prove to be accurate, and future events and actual results could differ materially from those anticipated in such statements. Important factors that could cause actual results to differ materially from our expectations are disclosed in the Company’s documents filed from time to time via SEDAR+ with the Canadian regulatory agencies to whose policies we are bound. Forward-looking statements are based on the estimates and opinions of management on the date the statements are made, and we do not undertake any obligation to update forward-looking statements should conditions or our estimates or opinions change, except as required by applicable securities regulations. These statements involve known and unknown risks, uncertainties, and other factors that may cause the Company’s actual results, levels of activity, performance or achievements to be materially different from any future results, levels of activity, performance or achievements expressed or implied by these forward-looking statements.
| 28| Page |