UNITED STATES
SECURITIES AND EXCHANGE COMMISSION
WASHINGTON, DC 20549
FORM 40-F
☐ |
REGISTRATION STATEMENT PURSUANT TO SECTION 12 OF THE SECURITIES EXCHANGE ACT OF 1934 |
☒ |
ANNUAL REPORT PURSUANT TO SECTION 13 OR 15(d) OF THE SECURITIES EXCHANGE ACT OF 1934 |
For the fiscal year ended December 31, 2022 |
|
Commission File Number 001-35254 |
Avino Silver & Gold Mines Ltd. |
(Exact name of Registrant as specified in its charter) |
British Columbia, Canada
(Jurisdiction of Incorporation or Organization)
Primary Standard Industrial Classification Code Number |
|
I.R.S. Employer Identification Number |
1041 |
|
N/A |
Suite 900, 570 Granville Street, Vancouver
British Columbia, V6C 3P1, Canada
604-682-3701
(Address and telephone number of Registrant’s principal executive offices)
National Registered Agents, Inc.
1015 15th Street, N.W., Suite 1000
Washington, DC 20005
(202) 572-3133
(Name, address (including zip code) and telephone number (including area code)
of agent for service in the United States)
Securities registered or to be registered pursuant to Section 12(b) of the Act.
Title of each class |
|
Trading Symbol(s) |
|
Name of each exchange on which registered |
Common Shares, without Par Value |
|
ASM |
|
NYSE American, LLC |
Securities registered or to be registered pursuant to Section 12(g) of the Act: N/A
Securities for which there is a reporting obligation pursuant to Section 15(d) of the Act: N/A
For annual reports, indicate by check mark the information filed with this Form:
☒ Annual information form ☒ Audited annual financial statements
Indicate the number of outstanding shares of each of the issuer’s classes of capital or common stock as of the close of the period covered by the annual report:
There were 118,349,090 common shares, without par value, issued and outstanding as of December 31, 2022.
Indicate by check mark whether the registrant (1) has filed all reports required to be filed by Section 13 or 15(d) of the Securities Exchange Act of 1934 during the preceding 12 months (or for such shorter period that the registrant was required to file such reports), and (2) has been subject to such filing requirements for the past 90 days.
☒ Yes ☐ No
Indicate by check mark whether the registrant has submitted electronically every Interactive Data File required to be submitted pursuant to Rule 405 of Regulation S-T (§ 2.405 of this chapter) during the preceding 12 months (or for such shorter period that the registrant was required to submit such files).
☒ Yes ☐ No
Indicate by check mark whether the registrant is an emerging growth company as defined in Rule 12b-2 of the Exchange Act.
Emerging Growth Company ☐
If an emerging growth company that prepares its financial statements in accordance with U.S. GAAP, indicate by check mark if the registrant has elected not to use the extended transition period for complying with any new or revised financial accounting standards† provided pursuant to Section 13(a) of the Exchange Act. ☐
† The term “new or revised financial accounting standard” refers to any update issued by the Financial Accounting Standards Board to its Accounting Standards Codification after April 5, 2012.
Indicate by check mark whether the registrant has filed a report on and attestation to its management’s assessment of the effectiveness of its internal control over financial reporting under Section 404(b) of the Sarbanes-Oxley Act (15 U.S.C. 7262(b)) by the registered public accounting firm that prepared or issued its audit report. ☒
If securities are registered pursuant to Section 12(b) of the Act, indicate by check mark whether the financial statements of the registrant included in the filing reflect the correction of an error to previously issued financial statements. ☐
Indicate by check mark whether any of those error corrections are restatements that required a recovery analysis of incentive-based compensation received by any of the registrant’s executive officers during the relevant recovery period pursuant to §240.10D-1(b). ☐
EXPLANATORY NOTE
Avino Silver & Gold Mines Ltd. (“we”, “us”, “our”, or the “Company”) is a Canadian corporation that is permitted, under a multijurisdictional disclosure system adopted by the United States, to prepare this annual report on Form 40-F (“Annual Report”) pursuant to Section 13 of the Securities Exchange Act of 1934, as amended (the “Exchange Act”), in accordance with disclosure requirements in effect in Canada, which are different from those of the United States.
FORWARD LOOKING STATEMENTS
This Annual Report, including the Exhibits incorporated by reference into Annual Report, contains “forward-looking information” and “forward-looking statements” within the meaning of applicable Canadian and U.S. securities legislation. These forward-looking statements reflect our current view about future plans, intentions or expectations and include, in particular, statements about our plans, strategies and prospects and may be identified by terminology such as “may,” “will,” “should,” “expect,” “scheduled,” “plan,” “intend,” “anticipate,” “believe,” “estimate,” “aim,” “potential,” or “continue” or the negative of those terms or other comparable terminology. These forward-looking statements are subject to risks, uncertainties and assumptions about us. Although we believe that our plans, intentions and expectations are reasonable, we may not achieve our plans, intentions or expectations.
Important factors that could cause actual results to differ materially from the forward-looking statements we make in this Annual Report are set forth under the caption “Risk Factors” contain in our Annual Information Form filed as Exhibit 99.1. We undertake no obligation to update any of the forward-looking statements after the date of this Annual Report to conform those statements to reflect the occurrence of unanticipated events, except as required by applicable law. You should read this Annual Report with the understanding that our actual future results, levels of activity, performance and achievements may be materially different from what we expect. We qualify all our forward-looking statements by these cautionary statements.
DIFFERENCES IN UNITED STATES AND CANADIAN REPORTING PRACTICES
The Company is permitted, under a multijurisdictional disclosure system adopted by the United States, to prepare this Annual Report in accordance with Canadian disclosure requirements, which are different from those of the United States. The Company prepares its financial statements, which are filed with this Annual Report in accordance with International Financial Reporting Standards as issued by the International Accounting Standards Board. Therefore, they are not comparable in all respects to financial statements of United States companies that are prepared in accordance with United States generally accepted accounting principles.
MINERAL RESOURCE AND MINERAL RESERVE ESTIMATES
Unless otherwise indicated, all mineral resource and mineral reserve estimates included in the documents incorporated by reference into this Annual Report have been prepared in accordance with Canadian National Instrument 43-101 (“NI 43-101”) and the Canadian Institute of Mining and Metallurgy Classification System. NI 43-101 is a rule developed by the Canadian securities administrators, which establishes standards for all public disclosure an issuer makes of scientific and technical information concerning mineral projects. Canadian standards, including NI 43-101, differ from the requirements of the United States Securities and Exchange Commission (the “SEC”). Accordingly, mineral resource and mineral reserve estimates, and other scientific and technical information, contained in the documents incorporated by reference into this Annual Report may not be comparable to similar information disclosed by companies that have mining operations and report information pursuant SEC regulations.
RESOURCE AND RESERVE ESTIMATES
The terms “mineral reserve”, “proven mineral reserve” and “probable mineral reserve” are Canadian mining terms as defined in accordance with National Instrument 43-101 – Standards of Disclosure for Mineral Projects (“NI 43-101”), which references the guidelines set out in the Canadian Institute of Mining, Metallurgy and Petroleum (the “CIM”) – CIM Definition Standards on Mineral Resources and Mineral Reserves (“CIM Standards”), adopted by the CIM Council, as amended.
| 2 |
Until recently, the CIM Standards differed significantly from standards in the United States. The SEC adopted amendments to its disclosure rules to modernize the mineral property disclosure requirements for issuers whose securities are registered with the SEC under the Exchange Act. These amendments became effective February 25, 2019 (the “SEC Modernization Rules”) with compliance required for the first fiscal year beginning on or after January 1, 2021. The SEC Modernization Rules replace the historical disclosure requirements for mining registrants that were included in SEC Industry Guide 7. As a result of the adoption of the SEC Modernization Rules, the SEC now recognizes estimates of “measured mineral resources”, “indicated mineral resources” and “inferred mineral resources”. In addition, the SEC has amended its definitions of “proven mineral reserves” and “probable mineral reserves” to be “substantially similar” to the corresponding definitions under the CIM Standards, as required under NI 43-101.
United States investors are cautioned that while the above terms are “substantially similar” to the corresponding CIM Definition Standards, there are differences in the definitions under the SEC Modernization Rules and the CIM Standards. Accordingly, there is no assurance any mineral reserves or mineral resources that the Company may report as “proven mineral reserves”, “probable mineral reserves”, “measured mineral resources”, “indicated mineral resources” and “inferred mineral resources” under NI 43-101 would be the same had the Company prepared the reserve or resource estimates under the standards adopted under the SEC Modernization Rules.
United States investors are also cautioned that while the SEC now recognizes “indicated mineral resources” and “inferred mineral resources”, no assurance can be given that the mineralization in these categories will be converted into a higher category of mineral resources or into mineral reserves. Mineralization described using these terms has a greater amount of uncertainty as to their existence and feasibility than mineralization that has been characterized as reserves. Accordingly, investors are cautioned not to assume that any “indicated mineral resources” or “inferred mineral resources” that the Company reports are or will be economically or legally mineable. Further, “inferred mineral resources” have a greater amount of uncertainty as to their existence and as to whether they can be mined legally or economically. Therefore, United States investors are also cautioned not to assume that all or any part of the “inferred mineral resources” exist. In accordance with Canadian securities laws, estimates of “inferred mineral resources” cannot form the basis of feasibility or other economic studies, except in limited circumstances where permitted under NI 43-101.
Accordingly, information contained in this Annual Report on Form 40-F and the documents incorporated by reference herein containing descriptions of the Company’s mineral deposits may not be comparable to similar information made public by U.S. companies subject to the reporting and disclosure requirements under the United States federal securities laws and the rules and regulations thereunder.
PRINCIPAL DOCUMENTS
The following documents are part of, and are hereby incorporated by reference in, this Annual Report on Form 40-F (“Annual Report”):
A. |
Annual Information Form |
Annual Information Form or the fiscal year ended December 31, 2022, see Exhibit 99.1 to this Annual Report.
B. |
Audited Annual Financial Statements |
Audited Consolidated Financial Statements for the fiscal year ended December 31, 2022 and 2021, and notes thereto, together with the report of the independent registered public accounting firm thereon, see Exhibit 99.2 of this Annual Report.
| 3 |
C. |
Management's Discussion and Analysis |
Management's Discussion and Analysis of Financial Condition and Results of Operations for the fiscal year ended December 31, 2022, see Exhibit 99.3 of this Annual Report; and
D. |
Technical Report |
NI 43-101 Technical Report: Mineral Resource Estimate Update for the Avino Property, Durango, Mexico, 43-101 Technical Report, dated February 16, 2023. See Exhibit 99.4 of this Annual Report.
CONTROLS AND PROCEDURES
A. |
Certifications. |
The required certifications for the Principal Executive Officer and Principal Financial Officer are attached as Exhibits 99.6, 99.7, 99.8 and 99.9 to this Annual Report.
B. |
Disclosure Controls and Procedures. |
As required by paragraph (b) of Rules 13a-15 or 15d-15 under the Exchange Act, our principal executive officer and principal financial officer evaluated our Company’s disclosure controls and procedures (as defined in rules 13a-15(e) and 15d-15(e) of the Exchange Act) as of the end of the period covered by this Annual Report. Based on the evaluation, these officers concluded that as of the end of the period covered by this Annual Report, our disclosure controls and procedures were not effective to ensure that the information required to be disclosed by our Company in reports it files or submits under the Exchange Act is recorded, processed, summarized and reported within the time period specified in the rules and forms of the Securities and Exchange Commission. These disclosure controls and procedures include controls and procedures designed to ensure that such information is accumulated and communicated to our Company’s management, including our Company’s principal executive officer and principal financial officer, to allow timely decisions regarding required disclosure. As discussed below, management has identified a material weakness in internal control over financial reporting due to the design of management review controls over non-routine transactions, as well as lack of requisite skills or available resources. As a result of this material weakness, management has determined that the Company’s disclosure controls and procedures were not effective as of end of the period covered by this Annual Report.
In addition, because of the inherent limitations in all control systems, no evaluation of controls can provide absolute assurance that all control issues, if any, within our Company have been detected.
C. |
Management's Annual Report on Internal Control Over Financial Reporting. |
Management is responsible for establishing and maintaining adequate internal control over financial reporting (as defined in Rules 13a-15(f) and 15d-15(f) of the Exchange Act) for our Company. Our Company’s internal control over financial reporting is designed to provide reasonable assurance, not absolute assurance, regarding the reliability of financial reporting and the preparation of financial statements for external purposes in accordance with International Financial Reporting Standards. Internal control over financial reporting includes those policies and procedures that: (i) pertain to the maintenance of records that, in reasonable detail, accurately and fairly reflect the transactions and dispositions of our Company’s assets; (ii) provide reasonable assurance that transactions are recorded as necessary to permit preparation of financial statements in accordance with International Financial Reporting Standards, and that our Company’s receipts and expenditures are being made only in accordance with authorizations of our management and directors; and (iii) provide reasonable assurance regarding prevention or timely detection of unauthorized acquisition, use or disposition of assets that could have a material effect on our financial statements.
| 4 |
For the purposes of Exchange Act Rules 13a-15(e), 13a-15(f), 15d-15(e), and 15d-15(f), management, including our principal executive officer and principal financial officer, conducted an evaluation of the design and operation of our internal controls over financial reporting as of December 31, 2022, based on the criteria set forth in Internal Control – Integrated Framework (2013) issued by the Committee of Sponsoring Organizations of the Treadway Commission. This evaluation included review of the documentation of controls, evaluation of the design effectiveness of controls, testing of the operating effectiveness of controls and a conclusion on this evaluation.
A material weakness is a deficiency, or a combination of deficiencies, in internal control over financial reporting, such that there is a reasonable possibility that a material misstatement of the Company’s annual or interim financial statements will not be prevented or detected on a timely basis.
Based on this evaluation, management concluded that as of December 31, 2022, the Company’s internal controls over financial reporting, as defined in Rule 13a-15(f) and 15d-15(f) under the Exchange Act) were not effective as a result of a material weakness related to the design of management review controls over non-routine transactions, as well as lack of requisite skills or available resources, as of December 31, 2022. The Company has identified and is in the process of implementing remediation efforts to improve the effectiveness of our internal control over financial reporting. We are acquiring access to additional technical accounting research tools and are implementing a more formal process for the analysis and review of the proper application of IFRS accounting for non-routine transactions, as well as instituting additional diligence procedures in reviewing non-routine transactions.
While we believe the steps taken to date and those planned for implementation will improve the effectiveness of our internal control over financial reporting, we have not completed all remediation efforts. We will not be able to fully remediate the material weakness until these controls have been designed, implemented and management has determined through testing, that they have been operating effectively for a sufficient period of time.
Deloitte LLP, the Company’s independent registered public accounting firm, who audited and reported on our consolidated financial statements, has issued an attestation report on the effectiveness of our internal control over financial reporting as of December 31, 2022. The attestation report is included within the consolidated financial statements in this Annual Report on Form 40-F.
Because of the inherent limitations in all control systems, no evaluation of controls can provide absolute assurance that all control issues, if any, within our company have been detected. These inherent limitations include the realities that judgments in decision-making can be faulty and that breakdowns can occur because of simple error or mistake.
D. |
Attestation Report of the Independent Registered Public Accounting Firm. |
See Exhibit 99.2 of this Annual Report.
E. |
Changes in Internal Control Over Financial Reporting. |
During the year ended December 31, 2022, there were no changes in the Company’s internal control over financial reporting that have materially affected, or are reasonable likely to materially affect, its internal control over financial reporting.
NOTICES PURSUANT TO REGULATION BTR
The Company was not required by Rule 104 of Regulation BTR to send any notices to any of its directors or executive officers during the fiscal year ended December 31, 2022.
AUDIT COMMITTEE FINANCIAL EXPERT
Following are the members of the Audit Committee:
Peter Bojtos |
|
|
Independent |
|
|
Financial expert |
Ronald Andrews |
|
|
Independent |
|
|
Financial expert |
Jasman Yee |
|
|
Independent |
|
|
Financial expert |
The Company’s Board of Directors has determined that Mr. Peter Bojtos, Mr. Ronald Andrews, and Mr. Jasman Yee are qualified as Audit Committee Financial Experts. Mr. Bojtos, Mr. Ronald Andrews, and Mr. Yee are independent as determined by the NYSE American rules.
An Audit Committee Financial Expert must possess five attributes: (i) an understanding of IFRS and financial statements; (ii) the ability to assess the general application of such principles in connection with the accounting for estimates, accruals and reserves; (iii) experience preparing auditing, analyzing or evaluating financial statements that present a breadth and level of complexity of accounting issues that are generally comparable to the breadth and complexity of issues that can reasonably be expected to be raised by the registrant’s financial statements, or experience actively supervising one or more persons engaged in such activities; (iv) an understanding of internal controls and procedures for financial reporting; and (v) an understanding of audit committee functions.
| 5 |
Mr. Bojtos is a professional engineer with over 48 years of worldwide experience in the mining industry. He has an extensive background in corporate management as well as in all facets of the industry from exploration through the feasibility study stage to mine construction, operations and decommissioning. Mr. Bojtos graduated from the University of Leicester, England in 1972, following which he worked at open-pit iron-ore and underground base-metal and uranium mines in West Africa, the United States and Canada. Following that, he worked in Toronto for Kerr Addison Mines Ltd., a Noranda Group company, in increasingly senior management and officer positions for 12 years. From 1990 to 1992 he was the President & CEO of RFC Resource Finance Corp. developing a zinc mine in Washington State. From 1992 to 1993 Mr. Bojtos was the President & CEO of Consolidated Nevada Goldfields Corp. which operated precious metal mines in the United States. From 1993 to 1995 he was Chairman & CEO of Greenstone Resources Ltd, constructing and operating several gold mines in Central America. From 2017 to 2019 he was president of Pembridge Resources plc. He has served on over two dozen public company boards from 1996 to present.
Mr. Andrews has a Bachelor of Science degree in horticulture from Washington State University and a Master’s degree in Political Science. Mr. Andrews is the owner and operator of Andrews Orchards and sells and distributes agricultural chemicals and fertilizers. Mr. Andrews has acted as director and chairman of the audit committee of several public mining companies.
Mr. Yee is a professional metallurgist with BASc, P.Eng (BC) 1970 graduate of the University of British Columbia with a degree in chemical engineering, a 1974 graduate of Toronto’s Ryerson Polytechnical Institute with a degree in economics, and holds a certificate for completing the Canadian Securities Course.
CODE OF ETHICS
The Company has adopted a Code of Ethics that applies to all directors, officers, consultants and employees of the Company.
This Code of Ethics covers a wide range of financial and non-financial business practices and procedures. This Code of Ethics does not cover every issue that may arise, but it sets out basic principles to guide all executive and staff of the Company. If a law or regulation conflicts with a policy in this Code of Ethics, then personnel must comply with such law or regulation. If any person has any questions about this Code of Ethics or potential conflicts with a law or regulation, they should refer to the Company’s Whistleblower Policy.
All executive and staff should recognize that they hold an important role in the overall corporate governance and ethical standards of the Company. Each person is capable and empowered to ensure that the Company’s, its shareholders’ and other stakeholders’ interests are appropriately balanced, protected and preserved. Accordingly, the Code of Ethics provides principles to which all personnel are expected to adhere and advocate. The Code of Ethics embodies rules regarding individual and peer responsibilities, as well as responsibilities to the Company, the shareholders, other stakeholders, and the public generally.
A copy of the Code of Ethics and Whistleblower Policy has been filed as an exhibit with the SEC and are available at the Company’s website at www.avino.com. You may obtain a copy of the Code of Ethics and Whistleblower Policy upon request by contacting the Company’s Corporate Secretary at Suite 900, 570 Granville Street, Vancouver, British Columbia V6C 3P1, Canada.
PRINCIPAL ACCOUNTANT FEES AND SERVICES
The Company’s independent auditor for the fiscal year ended December 31, 2022, was Deloitte LLP (Vancouver, Canada PCAOB ID No. 1208), Chartered Professional Accountants, and for the fiscal year ended December 31, 2021, was Manning Elliott LLP, Chartered Professional Accountants.
At the request of the Company, Manning Elliott LLP, Chartered Professional Accountants (the “Former Auditor”) resigned as auditor of the Company effective August 8, 2022. The audit committee of the board of directors of the Company (the “Audit Committee”) has considered the Former Auditor’s resignation and has recommended that Deloitte LLP, Chartered Professional Accountants (the “New Auditor”) be appointed to fill the vacancy in the office of auditor created by the resignation of the Former Auditor until the next annual meeting of shareholders of the Company. The Board of Directors of the Company has considered and acknowledged the Former Auditor’s resignation and on recommendation of the Audit Committee, has appointed the New Auditor as auditor of the Company to hold office until the next annual meeting of shareholders of the Company. The Former Auditor audited the Company’s financial statements for the year ended December 31, 2021, and did not expressed any modified opinions in its report on such financial statements of the Company and from that date until the date of the resignation of the Former Auditor.
| 6 |
The following summarizes the significant professional services rendered by Deloitte LLP, Chartered Professional Accountants and Manning Elliott LLP, Chartered Professional Accountants, respectively, for the years ended December 31, 2022, and 2021.
Financial Year Ending December 31 |
Audit Fees1 |
Audit Related Fees2 |
Tax Fees3 |
All Other Fees4 |
20225 |
C$543,560 |
C$25,923 |
Nil |
Nil |
20216 |
C$375,000 |
Nil |
Nil |
C$68,512 |
1 “Audit Fees” include fees necessary to perform the audit of the Company’s consolidated financial statements. Audit Fees include quarterly reviews, fees for review of tax provisions and for accounting consultations on matters reflected in the financial statements. Audit Fees also include audit or other attest services required by legislation or regulation, such as comfort letters, consents, reviews of securities filings and statutory audits.
2 “Audit-Related Fees” include services that are traditionally performed by the auditor. These audit-related services include audit or attest services not required by legislation or regulation.
3 “Tax Fees” include fees for all tax services other than those included in “Audit Fees” and “Audit- Related Fees”.
4 “All Other Fees” include fees relating to the aggregate fees billed in each of the last two fiscal years for products and services provided by the Company’s external auditor, other than the services reported under footnotes 1 to 3 above.
5 Deloitte LLP was the auditor for the year ended December 31, 2022, and the table represents the fees billed by them.
6 Manning Elliott LLP was the auditor for the year ended December 31, 2021, and the table represents the fees billed by them.
AUDIT COMMITTEE PRE-APPROVAL POLICIES AND PROCEDURES
The Company’s Audit Committee pre-approves all services provided by its independent auditors. All services and fees described above were reviewed and pre-approved by the Audit Committee.
OFF BALANCE ARRANGEMENTS
The Company has no off-balance sheet arrangements. See Management's Discussion and Analysis of Financial Condition and Results of Operations for the fiscal year ended December 31, 2022, for an analysis of material cash requirements from known contractual and other obligations.
MINE SAFETY DISCLOSURE
The Company does not operate any mine in the United States and has no mine safety incidents to report for the year ended December 31, 2022.
DISCLOSURE REGARDING FOREIGN JURISDICTIONS THAT PREVENT INSPECTIONS
None.
CONSENT TO SERVICE OF PROCESS
The Company has previously filed with the SEC an Appointment of Agent for Service of Process and Undertaking on Form F-X with respect to the class of securities in relation to which the obligation to file this Form 40-F arises. Any change to the name or address of the Company's agent for service shall be communicated promptly to the SEC by amendment to the Form F-X referencing the file number of the Company.
| 7 |
EXHIBITS
| 8 |
SIGNATURE
Pursuant to the requirements of the Exchange Act, the registrant hereby certifies that it meets all of the requirements for filing this Form 40-F and has duly caused this annual report to be signed on its behalf by the undersigned, thereto duly authorized.
|
Avino Silver & Gold Mines, Ltd. |
|
|
|
|
|
|
Date: March 31, 2023 |
By: |
/s/ David Wolfin |
|
|
|
David Wolfin, President, Chief Executive Officer and Director |
|
|
|
(Principal Executive Officer”) |
|
| 9 |
EXHIBIT INDEX
10 |
EXHIBIT 99.1
ANNUAL INFORMATION FORM
FOR THE FINANCIAL YEAR ENDED DECEMBER 31, 2022
DATED MARCH 31, 2023
| 1 |
ANNUAL INFORMATION FORM
FOR THE FINANCIAL YEAR ENDED DECEMBER 31, 2022
TABLE OF CONTENTS
| PRELIMINARY NOTES |
| 3 |
|
| CORPORATE STRUCTURE |
| 6 |
|
| GENERAL DEVELOPMENT OF THE BUSINESS |
| 7 |
|
| DESCRIPTION OF THE BUSINESS |
| 11 |
|
| MINERAL RESOURCE ESTIMATES |
| 20 |
|
| MATERIAL MINERAL PROJECTS |
| 20 |
|
| RISK FACTORS |
| 21 |
|
| DIVIDENDS |
| 32 |
|
| GENERAL DESCRIPTION OF CAPITAL STRUCTURE |
| 33 |
|
| MARKET FOR SECURITIES |
| 33 |
|
| DIRECTORS AND OFFICERS |
| 34 |
|
| CEASE TRADE ORDERS, BANKRUPTCIES, PENALTIES OR SANCTIONS |
| 36 |
|
| CONFLICTS OF INTEREST |
| 37 |
|
| PROMOTERS |
| 37 |
|
| LEGAL PROCEEDINGS AND REGULATORY ACTIONS |
| 37 |
|
| INTEREST OF MANAGEMENT AND OTHERS IN MATERIAL TRANSACTIONS |
| 38 |
|
| TRANSFER AGENT AND REGISTRAR |
| 38 |
|
| MATERIAL CONTRACTS |
| 38 |
|
| NAMES AND INTERESTS OF EXPERTS |
| 38 |
|
| AUDIT COMMITTEE INFORMATION |
| 39 |
|
| ADDITIONAL INFORMATION |
| 40 |
|
|
|
|
|
|
| APPENDIX “A” - DEFINITIONS, TECHNICAL TERMS, ABBREVIATIONS |
| A1 |
|
| APPENDIX “B” - AUDIT COMMITTEE CHARTER |
| B1 |
|
| APPENDIX “C” - MATERIAL MINERAL PROJECTS |
| C1 |
|
| 2 |
PRELIMINARY NOTES
Effective Date of Information
All information in this annual information form (this “AIF”) of Avino Silver and Gold Mines Ltd. (“Avino Silver & Gold” or the “Company”) is as at December 31, 2022, unless otherwise indicated. This AIF is dated March 31, 2023.
Additional Information
Additional information is provided in the Company’s audited consolidated financial statements for the years ended December 31, 2022 and 2021 (the “2022 Annual Financial Statements”) and Management’s Discussion and Analysis dated March 28, 2023 for the year ended December 31, 2022 (the “2022 Annual MD&A”), each of which has been filed on the Company’s profile on the System for Electronic Document Analysis and Retrieval (“SEDAR”) (www.sedar.com). Additional information, including directors’ and officers’ remuneration and indebtedness and information concerning the principal holders of the Company’s securities, and securities authorized for issuance under equity compensation plans, where applicable, will be contained in the Company’s Management Information Circular to be filed in connection with its upcoming annual meeting of shareholders for 2023 (the “2023 Circular”). This information, including the 2022 Annual MD&A and the 2022 Annual Financial Statements, and other additional information relating to the Company may be found in the Company’s public filings with provincial securities regulatory authorities which can be found on the Company’s profile on the SEDAR website at www.sedar.com and with the U.S. Securities and Exchange Commission (the “SEC”) on the Electronic Data-Gathering, Analysis and Retrieval (“EDGAR”) website at www.sec.gov/edgar.html or, in the case of the 2023 Circular, will be made available in accordance with the time requirements of Canadian and U.S. securities laws.
Non-IFRS Measures
The Company has included certain non-IFRS and other financial measures, which the Company believes, that together with measures determined in accordance with International Financial Reporting Standards as issued by the International Accounting Standards Board (“IFRS”), provide investors with an improved ability to evaluate the underlying performance of the Company. Non-IFRS financial measures do not have any standardized meaning prescribed under IFRS, and therefore they may not be comparable to similar non-IFRS and other financial performance measures employed by other companies. The data is intended to provide additional information and should not be considered in isolation or as a substitute for measures of performance prepared in accordance with IFRS.
Reconciliations and descriptions can be found under the heading, “Non-IFRS Measures” of the 2022 MD&A, which section is incorporated by reference herein and is available on SEDAR at www.sedar.com.
Interpretation and Definitions
A glossary of certain technical terms, abbreviations and measurement conversions is set forth in Appendix “A”.
***
| 3 |
Currency and Exchange Rate
Unless otherwise indicated, in this AIF all references to “dollar” or the use of the symbol “$” are to the United States dollar and all references to “C$” are to the Canadian dollar. The daily average exchange rate for Canadian dollars in terms of the United States dollar on December 31, 2022 and March 30, 2023 as reported by the Bank of Canada was 1.3544 and 1.3533, respectively.
| United States Dollars into Canadian Dollars |
2022 |
2021 |
2020 |
| Closing | 1.3544 | 1.2678 | 1.2732 |
| Average | 1.3017 | 1.2537 | 1.3412 |
| High | 1.3856 | 1.2942 | 1.4496 |
| Low | 1.2451 | 1.2040 | 1.2718 |
Forward‐Looking Statements
Statements contained in this AIF that are not current or historical factual statements may constitute “forward-looking information” or “forward-looking statements” within the meaning of applicable Canadian and United States securities laws (“forward-looking statements”). These forward-looking statements are presented for the purpose of assisting the Company’s securityholders and prospective investors in understanding management’s views regarding those future outcomes and may not be appropriate for other purposes. When used in this AIF, the words “may”, “would”, “could”, “will”, “intend”, “plan”, “anticipate”, “believe”, “seek”, “propose”, “estimate”, “expect”, and similar expressions, as they relate to the Company, are intended to identify forward-looking statements. All such forward-looking statements are subject to important risks, uncertainties and assumptions. These statements are forward-looking because they are based on current expectations, estimates and assumptions. It is important to know that: (i) unless otherwise indicated, forward-looking statements in this AlF and its appendices describe expectations as at the date hereof; and (ii) actual results and events could differ materially from those expressed or implied. Capitalized terms used but not defined in this “Forward-Looking Statements” section of the AIF shall have the meaning ascribed to such term elsewhere in the AIF.
Specific forward-looking statements in this AIF include, but are not limited to: any objectives, expectations, intentions, plans, results, levels of activity, goals or achievements; estimates of mineral resources; the realization of mineral resource estimates; the impairment of mineral properties and non-producing properties; the timing and amount of estimated future production, production guidance, costs of production, capital expenditures, costs and timing of development; the success of exploration and development activities.
With respect to underground development improvements, equipment procurement and the drilling program and expected results thereof; material uncertainties that may impact the Company’s liquidity in the short term; the effects of COVID-19; changes in accounting policies not yet in effect; permitting timelines; government regulation of mining operations; environmental risks; labour relations, employee recruitment and retention; the timing and possible outcomes of pending disputes or litigation; negotiations or regulatory investigations; exchange rate fluctuations; cyclical or seasonal aspects of our business; our dividend policy; capital expenditures; the Company’s ability to operate mine; statements relating to the future financial condition, assets, liabilities (contingent or otherwise), business, operations or prospects of the Company; the suspension of certain operating metrics such as cash costs and all-in sustaining costs; the liquidity of the Common Shares; and other events or conditions that may occur in the future.
Inherent in the forward-looking statements are known and unknown risks, uncertainties and other factors beyond the Company’s ability to control or predict that may cause the actual results, performance or achievements of the Company, or developments in the Company’s business or in its industry, to differ materially from the anticipated results, performance, achievements or developments expressed or implied by such forward-looking statements.
| 4 |
Some of the risks and other factors (some of which are beyond the Company’s control) that could cause results to differ materially from those expressed in the forward-looking statements and information contained in this AIF include, but are not limited to: risks associated with market fluctuations in commodity prices; risks related to changing global economic conditions, which may affect the Company’s results of operations and financial condition including the market reaction to the COVID-19 pandemic; actual and potential risks and uncertainties relating to the ultimate geographic spread of COVID-19, the severity of the disease and the duration of the COVID-19 pandemic and issues relating to its resurgence and/or the emergence of new strains of COVID-19, including potential material adverse effects on the Company’s business, operations and financial performance; actions that have been and may be taken by governmental authorities to contain COVID-19 or to treat its impact on the Company’s business; the actual and potential negative impacts of COVID-19 on the global economy and financial markets; risks related to mineral resources, development and production and the Company’s ability to sustain or increase present production; risks related to global financial and economic conditions; risks related to government regulation and environmental compliance; risks related to mining property claims and titles, and surface rights and access; risks related to labour relations, disputes and/or disruptions, employee recruitment and retention; the Company’s material properties are located in Mexico and are subject to changes in political and economic conditions and regulations in that country; risks related to the Company’s relationship with the communities where it operates; risks related to actions by certain non-governmental organizations; substantially all of the Company’s assets are located outside of Canada, which could impact the enforcement of civil liabilities obtained in Canadian and U.S. courts; risks related to currency fluctuations that may adversely affect the financial condition of the Company; the Company may need additional capital in the future and may be unable to obtain it or to obtain it on favourable terms; risks associated with the Company’s outstanding debt and its ability to make scheduled payments of interest and principal thereon; the Company may engage in hedging activities; risks associated with the Company’s business objectives; risks relating to mining and exploration activities and future mining operations; operational risks and hazards inherent in the mining industry; risks related to competition in the mining industry; risks relating to negative operating cash flows; risks relating to the possibility that the Company’s working capital requirements may be higher than anticipated and/or its revenue may be lower than anticipated over relevant periods; and risks relating to climate change and the legislation governing it.
The list above is not exhaustive of the factors that may affect any of the Company’s forward-looking statements. Investors and others should carefully consider these and other factors and not place undue reliance on the forward-looking statements. The forward-looking statements contained in this AIF represent the Company’s views only as of the date such statements were made. Forward-looking statements contained in this AIF are based on management’s plans, estimates, projections, beliefs and opinions as at the time such statements were made and the assumptions related to these plans, estimates, projections, beliefs and opinions may change. Although forward-looking statements contained in this AIF are based on what management considers to be reasonable assumptions based on information currently available to it, there can be no assurances that actual events, performance or results will be consistent with these forward- looking statements, and management’s assumptions may prove to be incorrect. Some of the important risks and uncertainties that could affect forward-looking statements are described further in the AIF. The Company cannot guarantee future results, levels of activity, performance or achievements, should one or more of these risks and uncertainties materialize, or should underlying assumptions prove incorrect, the actual results or developments may differ materially from those contemplated by the forward-looking statements. The Company does not undertake to update any forward-looking statements, even if new information becomes available, as a result of future events or for any other reason, except to the extent required by applicable securities laws.
***
| 5 |
CORPORATE STRUCTURE
Name, Address and Incorporation
The Company was incorporated by Memorandum of Association under the laws of the Province of British Columbia on May 15, 1968, and on August 22, 1969, by virtue of an amalgamation with Ace Mining Company Ltd., became a public company whose common shares are registered under the Exchange Act, changing its name to Avino Mines & Resources Limited. On April 12, 1995, the Company changed its corporate name to International Avino Mines Ltd. and effected a reverse stock split of one common share for every five common shares outstanding. On August 29, 1997, the Company changed its corporate name to Avino Silver & Gold Mines Ltd., its current name, to better reflect the business of the Company of exploring for and mining silver and gold.
The Company is a reporting issuer in all Provinces of Canada, except for Quebec, a foreign private issuer in the United States, and is listed on the Toronto Stock Exchange, under the symbol “ASM”, on the NYSE-American under the symbol “ASM”, and on the Berlin and Frankfurt Stock Exchanges under the symbol “GV6”. The principal executive office of the Company is located at Suite 900, 570 Granville Street, Vancouver, British Columbia V6C 3P1, and its telephone number is 604-682-3701.
The Company is a natural resource company primarily engaged in the extracting and processing of silver and to a lesser extent, gold and copper and the acquisition and exploration of natural resource properties. The Company’s principal business activities have been the exploration for and extracting and processing of silver, gold and copper at mineral properties located in the State of Durango, Mexico. The Company also owns other exploration and evaluation assets in British Columbia and the Yukon, Canada.
The Common Shares trade on the Toronto Stock Exchange (the “TSX”) under the symbol “ASM.TO” and on the NYSE American under the symbol “ASM”.
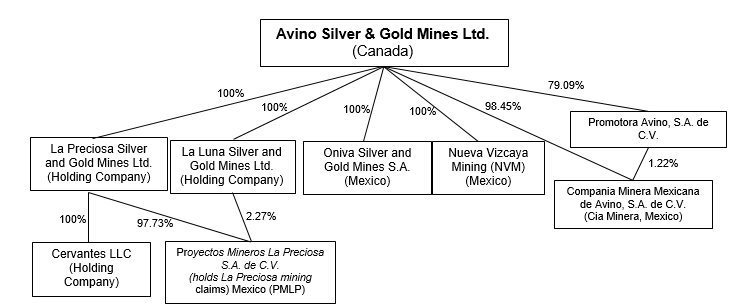
Inter-Corporate Relationships
The organizational chart below indicates the inter-corporate relationships between the Company and its material subsidiaries (and includes their jurisdiction of organization) as of the date hereof. Unless otherwise indicated, all such subsidiaries are wholly owned.
| 6 |
GENERAL DEVELOPMENT OF THE BUSINESS
Overview
Avino Silver & Gold Mines Ltd. (the “Company” or “Avino”) was incorporated in 1968 under the laws of the Province of British Columbia, Canada. The Company is engaged in the production and sale of silver, gold, and copper and the acquisition, exploration, and advancement of mineral properties.
The Company’s head office and principal place of business is Suite 900, 570 Granville Street, Vancouver, BC, Canada. The Company is a reporting issuer in Canada and the United States, and trades on the Toronto Stock Exchange (“TSX”), the NYSE American, and the Frankfurt and Berlin Stock Exchanges.
In Durango, Mexico, the Company operates the Avino Mine which produces copper, silver and gold at the historic Avino property in the state of Durango, Mexico (the “Avino Property”), after declaring commercial production effective July 1, 2015. As of today, the Company continues to produce from the Avino Mine. Also in Durango, the Company also holds 100% interest in Proyectos Mineros La Preciosa S.A. de C.V . (“La Preciosa”), a Mexican corporation which owns the La Preciosa property in Durango, Mexico (the “La Preciosa Property”), located approximately 20 kms southwest of the Avino Property. The Avino Property and La Preciosa Property are referred to collectively herein as the “Property”.
In British Columbia, Canada, the Company previously owned Bralorne Gold Mines Ltd. (“Bralorne”), a British Columbia company, which owns the past producing Bralorne Gold Mine in British Columbia, as a wholly-owned subsidiary. On December 13, 2019, the Company completed the sale of Bralorne to Talisker. The sale includes the Bralorne Gold Mine and is part of the Company’s plan to focus on its core mining operations in Mexico. For more information regarding the sale, please see below under the heading, “Three Year History – Fiscal 2020”.
Avino’s remaining Mexican properties, as well as its Canadian properties, are all in the exploration stage. In order to determine if a commercially viable mineral deposit exists in any of these properties, further geological work will need to be done, and based upon the results of that work a final evaluation will need to be made to conclude on economic and legal feasibility. The Company is currently focusing on extracting and processing resources at the Avino Mine and continuing to advance the La Preciosa Property. The Company’s three other Canadian properties are not deemed to be material and are subject to care and maintenance for further exploration and evaluation, if any.
Three Year History
Fiscal 2020
On December 13, 2019, Avino closed an agreement to sell all of the issued and outstanding shares of Bralorne to Talisker for:
|
| (i) | A cash consideration of C$8.7 million; |
|
|
|
|
|
| (ii) | The issuance of 12,580,000 common shares of Talisker (the “Talisker Shares”); |
|
|
|
|
|
| (iii) | The issuance of 6,290,000 share purchase warrants (the “Talisker Warrants”) exercisable at C$0.25 per share for a period of three years after the Closing Date |
In addition, as part of the sale of Bralorne to Talisker, Avino also assigned all of its rights and obligations to the nine BRX mineral claims to Talisker. As a result of the sale, Avino acquired the Talisker Shares, representing 9.9% of the total issued and outstanding shares of Talisker, and the Talisker Shares and Talisker Warrants represent 14.85% of Talisker on a fully diluted basis assuming the exercise of the Talisker Warrants. The Talisker Shares and Talisker Warrants were acquired by Avino for investment purposes.
| 7 |
On February 25, 2020, the Company exercised its Talisker Warrant to purchase 6,290,000 common shares. On that same date, the Company sold 3,000,000 common shares of Talisker. As a result of these transactions, the Company, as of February 25, 2020, held 15,870,000 common shares of Talisker representing approximately 9.6% of Talisker common shares at that time.
On April 2, 2020, the Company announced it is temporarily suspending operations at the Avino Mine in Durango, Mexico until the end of April, 2020 to comply with the Mexican Government’s order that comprises all non-essential businesses including the mining industry, to help fight against COVID-19. The Avino Mine will transition to care and maintenance utilizing a reduced workforce to protect current mining operations, employees and the local communities while production operations are temporarily suspended.
On June 1, 2020, the Company announced it is starting a phased ramp-up of operational activities today at its Avino Mine near Durango, Mexico. On May 15, 2020, the Mexican Federal Government authorized the resumption of mining activities as of June 1, 2020, for municipalities that present low or no known cases of COVID-19, subject to criteria defined by the Secretariat of Health.
On July 10, 2020, the Company reported that members from the Mexican mining union have blocked the entrance to the Avino Mine near Durango, Mexico. The group includes the Company’s unionized workers. The Company remains receptive to having good-faith discussions with representatives of the authorized union. As a result of the strike at the site, the Company has temporarily halted mining and mill processing operations.
On August 13, 2020, the Company announced that its board of directors has determined to proceed with an option agreement dated August 12, 2020 (the “Option Agreement”) with Gray Rock Resources Ltd. (“Gray Rock”), as optionee. Pursuant to the terms of the Option Agreement, Gray Rock was granted the exclusive right to acquire an 100% interest in the Ana Maria and El Laberinto properties in Mexico (the “Option”).
On October 8, 2020, the Company announced that, through continued good faith negotiations, the Company and the Mexican Mining Union have reached an agreement and the strike at the mine has ended.
In 2020, the Company issued approximately 6.73 million common shares in an at-the-market offering under prospectus supplement for gross proceeds of approximately $4.94 million. The Company paid a 3% cash commission of approximately $0.15 million, for net proceeds of $4.79 million. The Company also issued approximately 4.2 million common shares following the exercise of warrants for cash proceeds of approximately $3.36 million, 464,122 common shares upon exercise of broker warrants for cash proceeds of $0.3 million, and 48,000 common shares upon exercise of stock options for cash proceeds of $28 thousand.
Fiscal 2021
On January 13, 2021, the Company announced an updated mineral resource estimate for the Company’s Avino Property located near Durango in west-central Mexico. The updated estimate includes the Avino Property’s Avino Mine (Elena Tolosa – “ET”) vein systems, the San Gonzalo Mine, and the Avino Property’s Oxide Tailings.
On January 29, 2021, the Company announced that it had entered into a sales agreement with Cantor Fitzgerald & Co. (the “Designated Agent”), H.C. Wainwright & Co., LLC, Roth Capital Partners, LLC, and A.G.P./Alliance Global Partners (collectively, with the Designated Agent, the “Agents”), as agents or as principals, for the distribution of the Offered Shares in the United States up to the aggregate sales amount of $25.0 million (the “Maximum Amount”), in accordance with the terms of the Sales Agreement (the “Offering”). Pursuant to the Offering, the Company sold, through the Designated Agent, approximately 10.3 million common shares at average price per share of $1.87 for gross proceeds of approximately $19.2 million.
| 8 |
On August 3, 2021, the Company announced that mining operations had restarted at its Avino Mine.
On October 27, 2021, the Company announced that it has entered into a share purchase agreement (the “La Preciosa Transaction”) with Coeur Mining Inc. (“Coeur”) to acquire through the purchase of shares of certain holding companies, the La Preciosa Property. The La Preciosa Property is located adjacent to the Avino Mine in the state of Durango, Mexico. The La Preciosa Transaction closed on March 21, 2022.
The Company acquired the La Preciosa property for consideration of $20,000,000, of which $15,000,000 was paid at the closing of the La Preciosa Transaction and the remaining $5,000,000 was payable pursuant to a non-interest bearing promissory note, which was paid before the first anniversary of the closing date.
Avino also issued to Coeur 14,000,000 common shares and share purchase warrants exercisable to acquire up to 7,000,000 common shares at $1.09 per share until September 23, 2023.
Additional cash consideration of $8.75 million will be payable by the Company to Coeur within 12 months of initial production of the La Preciosa Property. Avino may elect to pay up to half of the contingent cash consideration in Avino shares, subject to certain limitations. Coeur will retain ownership of a 1.25% net smelter royalty on the Gloria and Abundancia areas of the La Preciosa Property, and a 2.00% gross value royalty on all areas of the La Preciosa Property, other than the Gloria and Abundancia areas. The Company has also agreed to pay Coeur $0.25 per silver equivalent ounce (subject to inflationary adjustment) of new mineral reserves (as defined by NI 43-101) discovered and declared outside of the current mineral resource area at the La Preciosa Property, subject to a cap of $50 million, and any such payments will be credited against any existing or future payments owing on the gross value royalty.
So long as Coeur holds 10% or more of the outstanding shares of Avino, Coeur has the option to nominate one director for election to the Avino board or designate a board observer. At closing, Coeur has also been granted pre-emptive rights to maintain its equity ownership position in Avino and has entered into a voting agreement with Avino.
The completion of the La Preciosa Transaction was subject to a number of customary conditions precedent, as well as, the authorization of the Mexican Federal Economic Commission. The Toronto Stock Exchange provided approval of the project and the NYSE American has approved the listing of the common shares and warrants to be issued in the La Preciosa Transaction.
Fiscal 2022
On March 21, 2022, the Company announced the closing of the La Preciosa Transaction. The La Preciosa Property hosts of one of the largest undeveloped primary silver resources in Mexico and is located adjacent to Avino’s existing operations at the Avino Property. Avino believes that the La Preciosa Transaction has a strong rationale given the close proximity of the La Preciosa Property to Avino’s existing mine and infrastructure which could yield numerous financial and operational synergies, including reducing the environmental footprint associated with the development of a stand alone La Preciosa operation.
On April 7, 2022, the Company announced the results from the Oxide Tailings Project that sits within our tailings storage facility #1 (“TSF#1”) on the Avino Property. The 2021 drill program included 110 drill holes for a total of 3,645 metres of drilling. The drilling follows up the 2015/2016 campaign for which the 2016 NI 43-101 Preliminary Economic Assessment (“PEA”) is based on, which can be found on Avino’s SEDAR profile. The drill density of the current program should be sufficient to upgrade most of the existing inferred mineral resources to the measured and indicated categories, and to potentially expand the resources. Furthermore, a comprehensive sampling program is underway for an upcoming metallurgical testing program. Once completed and assuming results are conclusive, the existing PEA will be used as the framework for an updated study with the intention of increasing confidence to the Pre-Feasibility Study level.
| 9 |
On May 2, 2022, the Company announced that in with its strategic plans to become an intermediate producer in Mexico, the Company has granted Endurance Gold Corporation (“Endurance”) the right to acquire an option to earn 100% ownership of the former Minto Gold Mine, Olympic and Kelvin gold prospects contained within a parcel of crown grants and mineral claims (the “Olympic Claims”). The Olympic Claims are owned by Avino and are located on the north and south shores of BC Hydro’s Carpenter Lake Reservoir in the Bridge River Valley, east of the Royal Shear trend.
Under the terms of the letter agreement, Endurance can earn a 100% interest in the Olympic Claims if they pay Avino a total cash consideration in the aggregate amount of C$100,000, issue up to a total of 1,500,000 common shares (‘Shares’) of Endurance and incur exploration expenditures in the aggregate amount of C$300,000; all of which is to be incurred by December 31, 2024.
In the event that Endurance earns the 100% interest, the Olympic Claims will be subject to a 2% net smelter return royalty (“NSR”), of which 1% NSR can be purchased by the Endurance for C$750,000 and the remaining balance of the NSR can be purchased for C$1,000,000.
As part of the final requirement to earn its interest, Endurance agreed to grant to Avino 750,000 share purchase warrants (“Warrants”) by December 31, 2024, that offer Avino the option to purchase additional shares in the Company for a period of three years from the date of issuance. The exercise price of the Warrants will be set at a 25% premium to the 20-day VWAP share price at the issuance date. During the Option, if Endurance is successful in defining a compliant mineral resource of at least 500,000 gold-equivalent ounces on the Olympic Claims then Endurance will be obliged to pay Avino a C$1,000,000 discovery bonus.
The Option agreement is subject to the TSX Venture Exchange acceptance, and any Shares or Warrants to be issued will be subject to a four-month hold period on issuance as per the policies of the TSX Venture Exchange.
Continuing Operations and Actual and Anticipated Impact of COVID-19
The Company’s business, operations and financial condition could be materially adversely affected by the outbreak of epidemics, pandemics or other health crises, such as the outbreak of COVID-19 that was designated as a pandemic by the World Health Organization on March 11, 2020. The international response to the spread of COVID-19 has led to significant restrictions on travel, temporary business closures, quarantines, global stock market volatility and a general reduction in consumer activity. Such public health crises can result in operating, supply chain and project development delays and disruptions, global stock market and financial market volatility, declining trade and market sentiment, reduced movement of people and labour shortages, and travel and shipping disruption and shutdowns, including as a result of government regulation and prevention measures, or a fear of any of the foregoing, all of which could affect commodity prices, interest rates, credit risk and inflation. In addition, the current COVID-19 pandemic, and any future emergence and spread of similar pathogens could have an adverse impact on global economic conditions which may adversely impact the Company’s operations, and the operations of suppliers, contractors and service providers, including smelter and refining service providers, and the demand for the Company’s production.
Sustainability Performance
In August 2022, the Company announce that it has received for the first time, the ESR “Empresa Socialmente Responsible ESR 2022” Award granted by the Mexican Center for Philanthropy (El Centro Mexicano para la Filantropia or Cemefi, and the Alliance for Corporate Social Responsibility (Alizanza por la Responsabilidad Social Empresarial or (AliaRSE)).
The ESR® Award is obtained through a diagnostic process based on indicators reviewed and endorsed annually by a committee of experts in the various CSR areas, supported with documentary evidence, an assessment differentiated by company size and by maturity levels, and an external verification process.
| 10 |
DESCRIPTION OF THE BUSINESS
Summary
The Company is engaged in the evaluation, acquisition, exploration, development and operation of precious metals and polymetallic mineral properties, primarily those already producing or with the potential for near- term production. The Company’s geographic focus is Mexico. The Company owns and operates the Avino Mine on the Avino Property in Durango, Mexico and owns the La Preciosa Property in Durango, Mexico.
Principal Product
The Company produces copper concentrates containing silver, gold and copper. The Company believes that because of the availability of alternate processing and commercialization options for its concentrates, it is not dependent on a particular purchaser with regard to the sale of its products.
Production
The Company operates the 100% owned Avino Mine on the Avino Property located near in the State of Durango, Mexico. The Company previously produced a silver-gold concentrate from the San Gonzalo Mine on the same property; however, in 2019, the Company ceased production operations at San Gonzalo to focus on the Avino Mine.
The Avino Mine produces a copper concentrate containing copper, silver and gold. Ore mined at the Avino Mine is milled on the Avino Property.
In the second quarter of 2016, the Company declared that effective April 1, 2016, extracting and processing resources at levels intended by management had been achieved at the Avino Mine following an advancement and test period of 19 months. The decision was based on the following criteria:
|
| · | All critical capital components have been acquired and installed to achieve desired mining and processing results; |
|
|
|
|
|
| · | The necessary labor force, including production and development mining contractors, has been secured to mine and process at planned levels of output; |
|
|
|
|
|
| · | The mill has consistently processed at levels above design capacity and budgeted production levels of 1,250 tpd with consistent recoveries and grades; and |
|
|
|
|
|
| · | The Company entered into a long-term sales agreement with Samsung C&T U.K. Limited (“Samsung”). Further, Samsung has provided Avino with a term facility which has provided capital to facilitate further expansion and development of the Avino Mine. |
Subsequently, on July 11, 2018, upon further review of the Company’s experience at the Avino and San Gonzalo mines, the Company concluded to change its accounting policy under IFRS 6 and IAS 16 in accounting for the Company’s Exploration and Evaluation Assets and Development Costs, including the determination that the Company commenced production effective July 1, 2015. The voluntary change in accounting policy was intended to provide investors with a better reflection of the Company’s business activities to enhance the comparability of the Company’s financial statements to the Company’s peers and to make the Company’s financial statements more relevant to the economic decision-making needs of users.
As a result of applying the change in accounting policy, we have determined that we would have been deemed to be in the production phase effective July 1, 2015. Accordingly, we have retrospectively applied this change in accounting policy for (i) the year ended December 31, 2015; (ii) the year ended December 31, 2016; and (iii) the year ended December 31, 2017.
| 11 |
Consolidated Results and Developments
Financial Results
|
|
| 2022 | 2021 | 2020 |
|||
| Revenue from mining operations |
| $ | 44,187 | $ | 11,228 | $ | 16,022 |
| Cost of sales |
| 29,125 | 7,681 | 15,832 |
|||
| Mine operating income |
| 15,062 | 3,547 | 190 |
|||
|
|
|
|
|
|
|
|
|
| Operating expenses |
|
|
|
|
|||
| General and administrative expenses |
| 5,156 | 3,566 | 2,902 |
|||
| Share-based payments |
| 2,024 | 1,469 | 1,857 |
|||
| Income (loss) before other items |
| 7,882 | (1,488) | (4,569) |
|||
|
|
|
|
|
|
|
|
|
| Other items |
|
|
|
|
|||
| Interest and other income |
| 20 | 178 | 332 |
|||
| Unrealized gain (loss) on long-term investments |
| (2,103) | (423) | (124) |
|||
| Fair value adjustment on warrant liability |
| 2,395 | 1,581 | (650) |
|||
| Realized loss on warrants exercised |
|
| - |
| (1,106) |
| (2,733) |
| Foreign exchange loss |
| (17) | (61) | (811) |
|||
| Project evaluation expenses |
|
| (81) |
| (176) |
| - |
| Finance cost |
| (273) | (52) | (211) |
|||
| Accretion of reclamation provision |
| (44) | (47) | (99) |
|||
| Interest expense |
|
| (99) |
| (24) |
| (25) |
| Income (loss) from continuing operations before income taxes | 7,680 | (1,618) | (8,890) |
||||
| Income taxes: |
|
|
|
||||
| Current income tax expense |
| (1,144) | (27) | (161) |
|||
| Deferred income tax (expense) recovery |
| (3,440) | (412) | 1,569 |
|||
| Income tax (expense) recovery | (4,584) | (439) | 1,408 |
||||
| Net income (loss) from continuing operations | 3,096 | (2,057) | (7,482) |
||||
| Loss from discontinued operations and on disposal |
| - |
| - |
| (169) |
|
| Net income (loss) |
|
| 3,096 |
| (2,057) |
| (7,651) |
|
|
|
|
|
|
|
|
|
| Other comprehensive income (loss) |
|
|
|
|
|
|
|
| Currency translation differences | (254) | (159) | (247) |
||||
| Total comprehensive income (loss) |
| $ | 2,842 | $ | (2,216) | $ | (7,898) |
| Earnings (loss) per share from continuing operations |
|
|
|
|
|
|
|
| Basic & Diluted |
|
| $0.03 |
| $(0.02) |
| $(0.09) |
| Earnings (loss) per share |
|
|
|
|
|
||
| Basic & Diluted |
| $0.03 | $(0.02) | $(0.09) |
|||
| Weighted average number of common shares outstanding |
|
|
|
| |||
| Basic | 114,372,371 | 100,161,357 | 83,180,069 |
||||
| Diluted | 117,615,898 | 100,161,357 | 83,180,069 |
||||
| 12 |
Financial Results – Year ended December 31, 2022, compared to year ended December 31, 2021
Revenues
The Company recognized revenues net of penalties, treatment costs and refining charges, of $44.2 million on the sale of Avino Mine bulk copper/silver/gold concentrate, compared to revenues of $11.2 million for year ended December 31, 2021, an increase of $33.0 million, or 294%. The increase is a direct result of a full year of revenues during 2022 compared to only 4 months of revenues in 2021, following the restart of mining operations in August 2021. The Company sold 2.45 million silver equivalent payable ounces in 2022, compared to 525 thousand silver equivalent payable ounces in 2021, representing an increase of 367%.
The increase in revenues were partially offset by lower metal prices in 2022 compared to 2021. Metal prices for revenues recognized during the period were $21.51 per ounce of silver, $1,788 per ounce of gold, and $8,552 per tonne of copper, in the prior year quarter, compared to $23.18, $1,802, and $9,524, respectively, for the same period in 2021.
Cost of Sales & Mine Operating Income
Cost of sales was $28.8 million, compared to $7.7 million in 2021, an increase of $21.1 million, or 275%. The increase in cost of sales is inline with the increase in ounces sold and revenues noted above and is directly attributable to mining operations being active during the full year ended December 31, 2022.
In 2022, tonnes milled increased by 228%, and total silver equivalent ounces produced increased by 215%, when compared to 2021. This is a direct result of full mining operations for the twelve-month period in 2022 when compared to four months of production mining operations in 2021. Further, a write down of equipment was recorded for the period totaling $0.3 million, compared with $Nil in prior year.
Mine operating income was $15.4 million, compared to mine operating income of $3.5 million, an increase of $11.9 million. This is a direct result of the items noted above.
General and Administrative Expenses & Share-Based Payments
General and administrative expenses was $5.1 million, compared to $3.6 million in 2021, with the increases coming from the increased corporate activity surrounding ramp up procedures and the acquisition of La Preciosa.
Share-based payments was $2.0 million, compared to $1.5 million in 2021, a increase of $0.5 million. Movements in share-based payments are a direct result of the 2022 option and RSU grants carrying a higher expense when compared to the vesting of option and RSU issuances from 2020 and prior years, as well as the fact that there were no grants in 2021.
Other Items
Other items totaled $0.5 million in losses for the period, an increase of $0.4 million compared to a loss of $0.1 million related to other items in the comparable period in 2021.
Unrealized loss on long-term investments was $2.1 million, an increase of $1.7 million compared to a loss of $0.4 million in 2021. This is a direct result of fluctuations in the Company’s investment in shares of Talisker Resources from period to period, as well as the Company’s investment in shares of Silver Wolf Exploration.
Fair value adjustment on warrant liability was a gain of $2.4 million, a favourable change of $0.8 million compared to a gain of $1.6 million in 2021. The fair value adjustment on the Company’s warrant liability relates to the issuance of US dollar-denominated warrants, which are re-valued each reporting period, and the value fluctuates with changes in the US-Canadian dollar exchange rate, and in the variables used in the valuation model, such as the Company’s US share price, and expected share price volatility.
| 13 |
Realized loss on warrants exercised was $Nil, a positive movement of $1.1 million compared to $1.1 million in 2021. During the current period, no warrants were exercised compared to 1.0 million warrants exercised in the comparable period in 2021.
Finance costs totaled $0.3 million in losses for the year, an increase of $0.2 million compared to a loss of $0.1 million in 2021. This is a direct result of the unwinding of the fair value adjustment on the note payable, which was issued in Q1 2022. There were no corresponding fair value adjustments to notes payable in 2021.
The remaining Other Items resulted in a loss of $0.2 million, fairly unchanged compared to a loss of $0.1 million for the same remaining Other items in 2021.
Current and Deferred Income Taxes
Current income tax expense increase to $1.1 million compared to under $0.1 million in income tax expense for the prior year period. Given the return to profitable mining operations, the higher amount of current income tax expenses in 2022 is a result of income generated in the current period and relates primarily to the special mining duties tax on profits in Mexico.
Deferred income tax expense was $3.4 million, a change of $3.0 million compared to a expense of $0.4 million for the comparable period in 2021. Deferred income tax fluctuates due to movements in taxable and deductible temporary differences related to the special mining duty in Mexico and to changes in inventory, plant, equipment and mining properties, and exploration and evaluation assets, amongst other factors. The changes in current income taxes and deferred income taxes during the current and comparable periods primarily relate to movements in the tax bases and mining profits and/or losses in Mexico.
Net Income/Loss
Net income from all operations was $3.1 million for the period, or $0.03 per share, compared to a loss of $2.1 million, or $0.02 per share during the comparable period in 2021. The changes are a result of the items noted above, which are primarily increases in revenues and mine operating income, and movements in the fair value adjustment of the warrant liability and realized loss on warrants exercised. The positive movement in net income/loss was partially offset by increases to share-based payments, an increase to general and administrative expenses and an increased unrealized loss on investments, as well as increased current and deferred income tax expense, as noted above.
Financial Results – Year ended December 31, 2021, compared to year ended December 31, 2020
Revenues
The Company recognized revenues net of penalties, treatment costs and refining charges, of $11.2 million on the sale of Avino Mine bulk copper/silver/gold concentrate, compared to revenues of $16.0 million for year ended December 31, 2020, a decrease of $4.8 million. The decrease in revenues is a direct result of the shutdown of mining operations until August 2021, as well as additional COVID-19 protocols, with the only revenues in the current period being from sales that occurred in the second half of 2021 and from the finalization of provisionally priced invoices.
Metal prices for revenues recognized during the period were $23.18 per ounce of silver, $1,802 per ounce of gold, and $9,524 per tonne of copper, in the prior year quarter, compared to $23.73, $1,885, and $6,610, respectively, for the same period in 2020.
| 14 |
Cost of Sales & Mine Operating Income
Cost of sales was $7.7 million, compared to $15.8 million in 2020, a decrease of $8.1 million. The decrease in cost of sales is attributable to lower production costs by $6.5 million as a result of lower tonnages mined and milled. Further, the Company incurred $0.8 million in stand-by costs, compared to $2.4 million in the comparable period for 2020, a decrease of $1.6 million. Depreciation and depletion remained consistent with 2020 at $2.0 million for the period.
Mine operating income was $3.5 million, compared to mine operating income of $0.2 million, an increase of $3.3 million. This was a direct result of higher feed grade for silver, gold, and copper, and increased metal prices for copper when compared to 2020,as well as the factors noted above.
General and Administrative Expenses & Share-Based Payments
General and administrative expenses was $3.6 million, compared to $2.9 million in 2020, an increase of $0.7 million The increase is attributable to increased administrative and support activity following the restart of mining operations in Q3 2021, as well as the cost reduction measures put into place following the government mandated COVID-19 shutdown in Q2 2020.
Share-based payments was $1.5 million, compared to $1.9 million in 2020, a decrease of $0.4 million. The decrease is a direct result of no option or RSU grants occurring during 2021, whereas there were grants for both in 2020. Any share-based payment expense in 2021 related to options vesting in Q1-Q3 2021, as well as the three-year vesting period for RSUs issued in previous years.
Other Items
Other items totaled $0.1 million in losses for the period, a favourable change of $4.2 million compared to a loss of $4.3 million related to other items in the comparable period in 2020.
Unrealized loss on long-term investment was $0.4 million, a decrease of $0.3 million compared to a loss of $0.1 million in 2020. This is a direct result of fluctuations in the Company’s investment in shares of Talisker Resources from period to period, as well as the Company’s investment in shares of Silver Wolf Exploration.
Fair value adjustment on warrant liability was a gain of $1.6 million, a favourable change of $2.3 million compared to a loss of $0.7 million in 2020. The fair value adjustment on the Company’s warrant liability relates to the issuance of US dollar-denominated warrants, which are re-valued each reporting period, and the value fluctuates with changes in the US-Canadian dollar exchange rate, and in the variables used in the valuation model, such as the Company’s US share price, and expected share price volatility.
Realized loss on warrants exercised was $1.1 million, a decrease of $1.6 million compared to $2.7 million in 2020. During the current period, 1.0 million warrants were exercised, compared to 4.2 million warrants in the comparable period in 2020. These exercises generated all of the non-cash losses noted above.
Foreign exchange loss for the period was $0.1 million, a decrease of $0.7 million compared to a loss of $0.8 million in the comparable period in 2020. Foreign exchange gains or losses result from transactions in currencies other than the Canadian dollar functional currency. Overall, during the year ended December 31, 2021, the Canadian dollar remained fairly constant in relation to the US dollar and Mexican peso, resulting in minimal foreign exchange loss. During the comparable period in 2020, the Canadian dollar depreciated in relation to the US dollar and Mexican peso, resulting in higher foreign exchange loss.
The remaining Other Items resulted in a loss of $0.1 million, a change of $0.1 million compared to a loss of $Nil million for the same remaining Other items in 2020.
| 15 |
Current and Deferred Income Taxes
Current income tax expense remained fairly unchanged when compared to 2020, with under $0.1 million in income tax expense for the current period and $0.2 million for the comparable period in 2020. Given the return to profitable mining operations, the lower amount of current income tax expenses in 2021 is a result of the current period application of income tax losses built up during 2020 and the first half of 2021.
Deferred income tax expense was $0.4 million, a change of $2.0 million compared to a recovery of $1.6 million for the comparable period in 2020. Deferred income tax fluctuates due to movements in taxable and deductible temporary differences related to the special mining duty in Mexico and to changes in inventory, plant, equipment and mining properties, and exploration and evaluation assets, amongst other factors. The changes in current income taxes and deferred income taxes during the current and comparable periods primarily relate to movements in the tax bases and mining profits and/or losses in Mexico.
Net Income/Loss
Net loss from all operations was $2.1 million for the period, or $0.02 per share, compared to a loss of $7.7 million, or $0.09 per share during the comparable period in 2020. The changes are a result of the items noted above, primarily increases to mine operating income, the decreased losses relating to warrants exercised, the favourable change in the fair value adjustment on warrant liability, and movements in unrealized foreign exchange between the two comparable periods.
Statement of Financial Position
| (000’s) | December 31, 2022 | December 31, 2021 | December 31, 2020 |
| Cash | $ 11,245 | $ 24,765 | $ 11,713 |
| Total current assets | 25,585 | 35,478 | 19,702 |
| Total assets | 121,196 | 86,278 | 68,780 |
| Total current liabilities | 16,764 | 3,843 | 5,022 |
| Total liabilities | 23,175 | 7,771 | 9,772 |
| Share capital | 145,515 | 129,953 | 108,383 |
| Accumulated deficit | (52,096) | (55,953) | (54,339) |
| Total equity | 98,021 | 78,507 | 59,008 |
Operating Results
Avino Mine Production Highlights
|
| Q4 2022 | Q4 2021 | Change % | YTD 2022 | YTD 2021 | Change % |
| Total Mill Feed (dry tonnes) | 150,292 | 103,513 | 45% | 541,823 | 154,498 | 251% |
| Feed Grade Silver (g/t) | 70 | 56 | 26% | 62 | 53 | 16% |
| Feed Grade Gold (g/t) | 0.62 | 0.86 | -28% | 0.42 | 0.88 | -52% |
| Feed Grade Copper (%) | 0.53 | 0.55 | -4% | 0.61 | 0.60 | 2% |
| Recovery Silver (%) | 92% | 89% | 3% | 92% | 89% | 3% |
| Recovery Gold (%) | 81% | 75% | 8% | 78% | 76% | 3% |
| Recovery Copper (%) | 88% | 90% | -2% | 89% | 91% | -2% |
| Total Silver Produced (oz) | 309,856 | 163,933 | 89% | 985,185 | 236,035 | 317% |
| Total Gold Produced (oz) | 2,426 | 2,158 | 12% | 5,778 | 3,328 | 74% |
| Total Copper Produced (lbs) | 1,540.851 | 1,128,728 | 37% | 6,504,177 | 1,856,722 | 250% |
| Total Silver Equivalent Produced (oz)* | 770,127 | 541,432 | 42% | 2,655,502 | 826,589 | 221% |
In Q4 2022, AgEq was calculated using metal prices of $21.18 oz Ag, $1,729 oz Au, and $3.63 lb Cu. In Q4 2021, AgEq was calculated using metals prices of $23.32 oz Ag, $1,783 oz Au and $4.39 lb Cu. In FY 2022, AgEq was calculated using metal prices of $21.75 oz Ag, $1,801 oz Au and $4.00 lb Cu. In FY 2021, AgEq was calculated using metal prices of $23.84 oz Ag, $1,786 oz Au and $4.32 lb Cu.
| 16 |
Under National Instrument 43-101 (“NI 43-101”), the Company is required to disclose that it has not based its production decisions on NI 43-101-compliant reserve estimates, preliminary economic assessments, or feasibility studies, and historically projects without such reports have increased uncertainty and risk of economic viability. The Company’s decision to place a mine into operation at levels intended by management, expand a mine, make other production-related decisions, or otherwise carry out mining and processing operations is largely based on internal non-public Company data, and on reports based on exploration and mining work by the Company and by geologists and engineers engaged by the Company. The results of this work are evident in the Company’s discovery of the San Gonzalo and Avino Mine resources, and in the Company’s record of mineral production and financial returns since operations at levels intended by management commenced at the San Gonzalo Mine in 2012.
Additional Sales and Cost Information
| Concentrate Sales and Cash Costs |
|||||
|
| 2022 | 2021 | Change |
||
| Silver Equivalent Payable Ounces Sold2 | 2,449,704 | 524,993 | 367% |
||
| Cash Cost per Silver Equivalent Payable Ounce1,2,3 | $ | 10.34 | $ | 8.07 | 28% |
| All-in Sustaining Cash Cost per Silver Equivalent Payable Ounce1,2,3 | $ | 17.91 | $ | 24.07 | -26% |
| 1. | In Q4 2022, AgEq was calculated using metal prices of $21.18 oz Ag, $1,729 oz Au, and $3.63 lb Cu. In Q4 2021, AgEq was calculated using metals prices of $23.32 oz Ag, $1,783 oz Au and $4.39 lb Cu. In FY 2022, AgEq was calculated using metal prices of $21.75 oz Ag, $1,801 oz Au and $4.00 lb Cu. In FY 2021, AgEq was calculated using metal prices of $23.84 oz Ag, $1,786 oz Au and $4.32 lb Cu. |
| 2. | Silver equivalent payable ounces sold” for the purposes of cash costs and all-in sustaining costs consists of the sum of payable silver ounces, gold ounces and copper tonnes sold, before penalties, treatment charges, and refining charges, multiplied by the ratio of the average spot gold and copper prices to the average spot silver price for the corresponding period. |
| 3. | The Company reports non-IFRS measures which include cash cost per silver equivalent payable ounce and all-in sustaining cash cost per payable ounce. These measures are widely used in the mining industry as a benchmark for performance, but do not have a standardized meaning and the calculation methods may differ from methods used by other companies with similar reported measures. See “Non-IFRS Measures” section for further details, containing information on the location of reconciliations within the Company’s Annual MD&A. |
2022
Cash costs per silver equivalent payable ounce was $10.34, compared to $8.07 for the comparable period in 2021. Throughout 2022, mining activities continued to ramp-up and thus certain incremental and non-recurring costs were incurred to reach the current mill throughput. Cash costs at the Avino Mine are expected to stabilize at these levels moving forward.
All-in sustaining cash costs per silver equivalent payable ounce for the year was $17.91, compared to $24.07 in 2021. The decrease is a result of higher ounces produced and sold, with a similar level of administrative and support costs, which resulted in a decrease in overall all-in sustaining cash costs.
| 17 |
Employees
As of December 31, 2022, the Company had 228 employees located in Mexico and 11 employees in Canada. Certain of the Company’s senior management as well as administrative and corporate services are located in Canada and are contracted by the Company through their companies or through the Company’s cost sharing agreement for overhead and corporate services with Oniva International Services Corp. However, because these people are hired through companies, they are not technically deemed employees of the Company.
In addition, the Company, from time to time, employs outside contractors on a fee‐for‐service basis.
Specialized Skill and Knowledge
Various aspects of the Company’s business require specialized skills and knowledge. Such skills and knowledge include the areas of geology, drilling, metallurgy, engineering, logistical planning and implementation of programs as well as finance and accounting and legal/regulatory compliance. While competitive conditions exist in the industry, the Company has been able to locate and retain employees and consultants with such skills and believes it will continue to be able to do so in the foreseeable future.
Competitive Conditions
Competition in the mineral exploration industry is intense. The Company competes with other mining companies, many of which have significant financial resources and technical facilities for the acquisition and development of, and production from, mineral interests, as well as for the recruitment and retention of qualified employees and consultants. The ability of the Company to acquire viable mineral properties in the future will depend not only on its ability to develop its present properties, but also on its ability to select and acquire suitable producing properties or prospects for development or mineral exploration.
Business Cycles
The mining business is highly cyclical. The marketability of minerals and mineral concentrates is also affected by worldwide economic cycles. The ultimate economic viability of the Company’s projects is related and sensitive to the market price of gold and silver as well the market price of by‐products such as zinc, lead and copper. Metal prices fluctuate widely and are affected by numerous factors such as global supply, demand, inflation, exchange rates, interest rates, forward selling by producers, central bank sales and purchases, production, global or regional political, economic or financial situations and other factors beyond the control of the Company.
Changes to Contracts and Economic Dependence
The Company’s cash flow is dependent on delivery of its ore concentrate to market. The Company’s contracts with the concentrate purchasers provide for provisional payments based on periodic deliveries. The Company may sell its concentrate to a metal trader while it is at the smelter in order to help manage its cash flow. The Company has not had any problems collecting payments from concentrate purchasers in a reliable and timely manner and expects no such difficulties in the foreseeable future. However, this cash flow is dependent on continued mine production which can be subject to interruption for various reasons including fluctuations in metal prices and concentrate shipment difficulties. Additionally, unforeseen cessation in smelter provider capabilities could severely impact the Company’s capital resources. Although the Company sells its concentrate to a limited number of customers, it is not economically dependent upon any one customer as there are other markets throughout the world for the Company’s concentrate.
Environmental Protection
The Company’s mining, exploration and development activities are subject to various federal, state and municipal laws and regulations relating to the protection of the environment, including requirements for closure and reclamation of mining properties. In all jurisdictions where the Company operates, specific statutory and regulatory requirements and standards must be met throughout the exploration, development and operations stages of a mining property with regard to matters including water quality, air quality, wildlife protection, solid and hazardous waste management and disposal, noise, land use and reclamation. Changes in any applicable governmental regulations to which the Company is subject may adversely affect its operations. Failure to comply with any condition set out in any required permit or with applicable regulatory requirements may result in the Company being unable to continue to carry out its activities. The impact of these requirements cannot accurately be predicted.
| 18 |
Management estimates costs associated with reclamation of mining properties as well as remediation costs for inactive properties. The Company uses assumptions about future costs, including inflation, prices, mineral processing recovery rates, production levels and capital and reclamation costs. Such assumptions are based on the Company’s current mining plan and the best available information for making such estimates. Details and quantification of the Company’s reclamation and closure costs are discussed in the 2022 Annual Financial Statements.
The Company is focused on strengthening monitoring, controls and disclosure of environmental issues that affect employees and the surrounding communities. Through proactive public engagement, the Company continues to gain a better understanding of the concerns of area-wide citizens and regulators and continues to work collaboratively to identify the most reasonable and cost-effective measures to address the most pressing concerns.
Foreign Operations
As of the date hereof, substantially all of the Company’s long-term assets, comprising its mineral properties, are located in Mexico.
Tax Considerations
With current operations in Mexico, the Company is subject to the tax considerations of those jurisdictions. Certain changes to Mexican tax laws affect the Company.
During 2013, the Mexico Senate passed tax reform legislation, which took effect on January 1, 2014. The tax reform includes an increase in the corporate tax rate from 28% to 30%, the introduction of a special mining royalty of 7.5% on the profits derived from the sale of minerals, and the introduction of a mining royalty of 0.5% on the gross income derived from the sale of gold, silver and platinum. These changes may have a material impact on the Company’s future earnings and cash flows, and possibly on future capital investment decisions.
In light of the current Mexican presidential administration, it cannot be predicted whether, when, in what form, or with what effective dates, new tax laws may be enacted, or regulations and rulings may be enacted, promulgated or issued under existing or new tax laws, which could result in an increase in the Company’s or investors’ tax liability or require changes in the manner in which the Company operates in order to minimize or mitigate any adverse effects of changes in tax law or in the interpretation thereof.
***
| 19 |
MINERAL RESOURCE ESTIMATES
Below is a summary of current mineral resources at the Avino Property and at the La Preciosa Property (as reported in the Report) grouped into the measured, indicated and inferred categories.
The mineral resource estimates were prepared by Michael O’Brien P.Geo., Pr.Sci.Nat., who is a “Qualified Person” within the meaning of National Instrument 43-101 and who is an employee of Red Pennant Communications Corp.) and independent of Avino, as defined by Section 1.5 of NI 43-101.
Table 1-2: Property – Mineral Resources (Effective Date: Nov 30, 2022)
|
Area | Category | Mass (Mt) | Average Grade | Metal Content |
||||||
|
|
|
| AgEQ (g/t) | Ag (g/t) | Au (g/t) | Cu (%) | AgEQ (million tr oz) | Ag (million tr oz) | Au (thousand tr oz) | Cu (million lb) |
| Avino Mine | MEA | 8.023 | 145 | 73 | 0.54 | 0.33 | 37.42 | 18.89 | 138.42 | 58.91 |
| IND | 26.638 | 144 | 60 | 0.54 | 0.41 | 123.34 | 51.06 | 459.23 | 242.48 |
|
| M&I | 34.662 | 144 | 63 | 0.54 | 0.39 | 160.76 | 69.96 | 596.65 | 301.40 |
|
| INF | 19.313 | 112 | 46 | 0.34 | 0.37 | 69.61 | 28.42 | 212.64 | 158.49 |
|
| La Preciosa | MEA | - | - | - | - | - | - | - | - | - |
| IND | 17.441 | 202 | 176 | 0.34 | - | 113.14 | 98.59 | 189.19 | - |
|
| M&I | 17.441 | 202 | 176 | 0.34 | - | 113.14 | 98.59 | 189.19 | - |
|
| INF | 4.397 | 170 | 151 | 0.25 | - | 24.10 | 21.33 | 35.48 | - |
|
| TOTALS | MEA | 8.023 | 145 | 73 | 0.54 | 0.33 | 37.42 | 18.89 | 138.42 | 58.91 |
| IND | 44.079 | 167 | 106 | 0.46 | 0.25 | 236.48 | 149.65 | 648.42 | 242.48 |
|
| M&I | 52.103 | 164 | 101 | 0.47 | 0.26 | 273.90 | 168.55 | 785.84 | 301.40 |
|
| INF | 23.710 | 123 | 65 | 0.33 | 0.30 | 93.71 | 49.75 | 248.12 | 158.49 |
|
Notes:
| 1. | Figures may not add to totals shown due to rounding. |
| 2. | Mineral Resources that are not Mineral Reserves do not have demonstrated economic viability. |
| 3. | The Mineral Resource estimate is classified in accordance with the CIM Definition Standards for Mineral Resources and Mineral Reserves incorporated by reference into NI 43-101 Standards of Disclosure for Mineral Projects. |
| 4. | Based on recent mining costs (Section 21.0 of the Report), Mineral Resources are reported at cut-off grades 60 g/t, 130 g/t, and 50 g/t AgEQ grade for ET, San Gonzalo, and oxide tailings, respectively. |
| 5. | AgEQ or silver equivalent ounces are notational, based on the combined value of metals expressed as silver ounces. |
| 6. | Metal price assumptions are shown in Table 1-3 of the Report. |
| 7. | Metal recovery is based on operational results and column testing, shown in Table 1-3 of the Report. |
| 8. | The silver equivalent was back-calculated using the formulas described in Section 14.0 of the Report. |
| 20 |
MATERIAL MINERAL PROJECTS
Appendix “C” contains a summary description of the Company’s material mineral projects, namely the Avino Property, and the La Preciosa Property. Certain of the scientific and technical information relating to the Company’s mineral projects in this section has been derived from the relevant technical report, entitled “Mineral Resource Estimate Update for the Avino Property, Durango, Mexico” with an effective date of February 16, 2023 prepared by Tetra Tech Canada Inc. and Red Pennant Geoscience Corp. (the “ Report”).
The information set forth in Appendix “C” are extracts, as updated and conformed to be consistent with other disclosure within this AIF, from the Report. All scientific and technical information in Appendix “C” has also been reviewed and approved by Peter Latta, P. Eng., a current member of the Company’s management, who is a “qualified person” for the purposes of NI 43-101. Defined terms and abbreviations used in Appendix “C” relating to the various properties and not otherwise defined have the meanings attributed to them in the Report. A copy of the Report can be accessed online and is available for review on the Company’s SEDAR profile at www.sedar.com and on EDGAR at www.sec.gov. Reference should be made to the full text of the Report for further information. The content of the Report does not form part of this AIF.
RISK FACTORS
An investment in our common shares involves a high degree of risk and should be considered speculative. You should carefully consider the following risks set out below and other information before investing in our common shares. If any event arising from these risks occurs, our business, prospects, financial condition, results of operations or cash flows could be adversely affected, the trading price of our common shares could decline and all or part of your investment may be lost.
Our operations are highly speculative due to the high-risk nature of our business, which include the acquisition, financing, exploration, development of mineral properties and operation of mines. The risks and uncertainties set out below are not the only ones we face. Additional risks and uncertainties not currently known to us or that we currently deem immaterial, may also impair our operations. If any of the risks actually occur, our business, financial condition and operating results could be adversely affected. As a result, the trading price of our common shares could decline, and investors could lose part or all of their investment. Our business is subject to significant risks and past performance is not a guarantee of future performance.
Our results of operations, cash flows and the value of our properties are highly dependent on the market prices of silver and gold and certain base metals and these prices can be volatile.
The profitability of our silver and gold mining operations and the value of our mining properties are directly related to the market price of silver, and to a lesser extent gold and other base metals. The price of silver may also have a significant influence on the market price of our common shares. The market price of silver historically has fluctuated significantly and is affected by numerous factors beyond our control. These factors include supply and demand fundamentals, global or national political or economic conditions, expectations with respect to the rate of inflation, the relative strength of the U.S. dollar and other currencies, interest rates, silver and gold sales and loans by central banks, forward sales by metal producers, accumulation and divestiture by exchange traded funds, and a number of other factors.
| 21 |
We derive a significant portion of our revenue from the sale of silver and our results of operations will fluctuate as the prices of this metals change. A period of significant and sustained lower silver prices would materially and adversely affect our results of operations and cash flows. During the past fiscal year, silver prices have decreased and, in the event, mineral prices decline or remain low for prolonged periods of time; we might be unable to develop our existing exploration properties, which may adversely affect our results of operations, financial performance, and cash flows. An asset impairment charge may result from the occurrence of unexpected adverse events that impact our estimates of expected cash flows generated from our producing properties or the market value of our non-producing properties, including a material diminution in the price of silver and/or gold.
The completion of the acquisition of La Preciosa Property and operations thereof may impose additional risks to the Company.
In October 2021, the Company entered into definitive agreements to acquire the La Preciosa Property, a exploration stage silver resource mineral property located adjacent to the Company’s existing operations at the Avino Property in Durango, Mexico. The completion of the acquisition of the La Preciosa Property raises potential additional risks to the Company including integrating the La Preciosa Property into the Company’s operations and the need to raise additional capital to develop, mine and operate the property.
We may be required to raise additional capital to mine our properties.
The Company is currently focusing on further defining plans to mine its Avino mineralized material, as well as further exploration of the Avino properties in Mexico. The Company may be required to raise capital to further advance the Avino Mine and its infrastructure, as well as to explore the Avino properties. Our ability to raise funds will depend on several factors, including, but not limited to, current economic conditions, our perceived value for our properties, our prospects, metal prices, businesses competing for financing and our financial condition. There can be no assurance that we will be able to raise funds, or to raise funds on commercially reasonable terms. Historically, the Company has raised funds through equity financing and the exercise of options and warrants. The raising of capital may have a dilutive effect on the Company’s per share book value.
We have experienced net operating losses.
We began extracting and processing resources at levels intended by management at the San Gonzalo Mine during the fourth quarter of 2012 (ceasing operations in 2019), and at the Avino Mine in the third quarter of 2015. While we are profitable for the year ended December 31, 2022, for the years ended December 31, 2021, and 2020, we incurred net losses from continuing operations of $7,482,000, and $2,335,000, respectively. Prior to the 2013 fiscal year, we had not been profitable. There is no assurance that our operations will be profitable in the future.
We have no proven or probable mineral reserves, and our decision to commence extracting and processing resources at levels intended by management was not based on a study demonstrating economic recovery of any mineral reserves and is therefore inherently risky.
We have not established the presence of any proven or probable mineral reserves at any of our properties. Any mineralized material discovered or produced by us should not be considered proven or probable reserves.
In order to demonstrate the existence of proven or probable reserves, it would be necessary for us to perform additional exploration to demonstrate the existence of sufficient mineralized material with satisfactory continuity and obtain a positive feasibility study which demonstrates with reasonable certainty that the deposit can be economically and legally extracted and produced. We have not completed a feasibility study with regard to all or a portion of any of our properties to date. Since we commenced extracting and processing resources of mineralized material at levels intended by management at the Avino Mine without a feasibility study, there is inherent uncertainty as to whether the mineralized material can be economically produced or if so, for what period of time. The absence of proven or probable reserves makes it more likely that our properties may cease to be profitable and that the money we spend on exploration and evaluation may never be recovered.
| 22 |
You may experience future dilution as a result of future equity offerings.
In order to raise additional capital, we may in the future offer additional shares of our common shares or other securities convertible into or exchangeable for our common shares at prices that may not be the same as the price per share paid by investors. We may sell shares or other securities in any other offering at a price per share that is less than the then current trading price, and investors purchasing shares or other securities in the future could have rights superior to existing stockholders. The price per share at which we sell additional shares of our common shares, or securities convertible or exchangeable into common shares, in future transactions may be higher or lower than the price per share paid by an investor.
Impact of COVID-19 on mining operations.
Mexico has been particularly impacted by the COVID-19 pandemic. The Company’s mining operations were temporarily shut-down in April 2020 first as a result of governmental COVID-19 quarantine and containment measures, and later in July 2020 due to a labour strike, which was resolved in October 2020. The labour settlement agreement was approved by Mexican governmental labour authority. Although the Company takes appropriate measures and safeguards to protect its staff from infection, these events can result in volatility and disruption to supply chains, operations, transportation, and mobility of people, which are beyond the control of the Company, and which have had and could continue to adversely affect the availability of components, supplies and materials, labour, interest rates, credit ratings, credit risk, inflation, business operations, financial markets, exchange rates, and other factors material to the Company, including in particular, the Company’s revenues and concentrate delivery schedule.
In 2012 and 2015, we decided to begin extracting and processing resources at levels intended by management at the San Gonzalo Mine and the Avino Mine, respectively, without preparing a pre-feasibility study or bankable feasibility study which may subject us to more risks.
We decided to begin extracting and processing resources at levels intended by management at the San Gonzalo Mine (which ceased operations during 2019) and the Avino Mine without preparing a pre-feasibility study or bankable feasibility study which is a more common practice within the mining industry and therefore may subject us to more business risks. Our decision to begin extracting and processing resources at the San Gonzalo Mine and the Avino Mine were based on limited prior historical information, bulk sample drilling programs, small pilot plant and bench scale testing. Therefore, our decision to begin extracting and processing resources at the San Gonzalo Mine and the Avino Mine were based on limited information which may or may not be representative of information regarding the mines had we otherwise prepared a more comprehensive study. In addition, basing our decision to begin extracting and processing resources on limited information may make us susceptible to risks including:
|
| · | certain difficulties in obtaining expected metallurgical recoveries when scaling up to extracting and processing activities at levels intended by management from pilot plant scale; |
|
|
|
|
|
| · | the inability to predict the amount of minerals within an area to be mine due the limited sample drilling programs which makes it a challenge to predict our revenues; |
|
|
|
|
|
| · | the preliminary nature of mine plans and processing concepts and applying them to full scale extracting and processing activities at levels intended by management. |
|
|
|
|
|
| · | determining operating/capital cost estimates and possible variances associated with constructing, commissioning and operating the Avino facilities based on limited information; |
|
|
|
|
|
| · | that metallurgical flow sheets and recoveries are based on information at the time and may not be representative of results of the Avino Mine; and |
|
|
|
|
|
| · | that we may underestimate capital and operating costs without a comprehensive bankable feasibility study. |
| 23 |
Company has a limited number of customers.
The Company produces concentrates containing silver and gold. The Company sells its concentrates to metals traders and smelters. During the year ended December 31, 2022, one customer accounted for more than 75% of revenues. The Company believes that a small number of customers will continue to represent a significant portion of its total revenue. However, the Company does not consider itself economically dependent upon any single customer or combination of customers due to the existence of other potential metals traders or smelters capable of purchasing the Company’s production. There is a risk that the Company could be subject to limited smelter availability and capacity, or it may not be able to maintain its current significant customers or secure significant new customers on similar terms, any of which may have a material adverse effect on the Company’s business, financial condition, operating results and cash flows.
Company may be subject to substantial decommissioning and reclamation costs.
The Company reviews and reassesses its reclamation obligations at each of its mines based on updated mine life estimates, rehabilitation and closure plans. As at December 31, 2021, the Company had a provision of approximately $0.445 million for future reclamation and remediation associated with the expected retirement of its mineral properties, plant, and equipment. The present value of these reclamation provisions may be subject to change as a result of management’s estimates of ultimate decommissioning and reclamation costs, changes in the remediation technology or changes to applicable laws, regulations and interest rates. Such changes will be recorded in the accounts of the Company as they occur.
The costs of performing the decommissioning and reclamation must be funded by the Company’s operations. These costs can be significant and are subject to change. The Company cannot predict what level of decommissioning and reclamation may be required in the future by regulators. If the Company is required to comply with significant additional regulations or if the actual cost of future decommissioning and reclamation is significantly higher than current estimates, this could have an adverse impact on the Company’s future cash flows, earnings, results of operations and financial condition.
Company’s operations are subject to political risk and government regulations
The Company’s mining, exploration and development activities are focused in Mexico and Canada, and are subject to national and local laws and regulations, governing prospects, taxes, labour standards, occupational health, land use, environmental protection, mine safety and others which currently or in the future may have a substantial adverse impact on the Company. In order to comply with applicable laws, the Company may be required to incur significant capital or operating expenditures. Existing and possible future environmental legislation, regulation and action could cause additional expense, capital expenditures, restriction, and delays in the activities of the Company, the extent of which cannot be reasonably predicted. Violations may require compensation of those suffering loss or damage by reason of the Company’s mining activities, and the Company may be fined if convicted of an offence under such legislation.
Mining and exploration activities in Mexico and/or Canada may be affected in varying degrees by political instabilities and government regulations relating to the mining industry. Any changes in regulations or shifts in political conditions are beyond the Company’s control and may adversely affect the business. Operations may also be affected to varying degrees by government regulations with respect to restrictions on production, price controls, export controls, income taxes, expropriation of property, environmental legislation and mine safety. The status of Mexico as a developing country may make it more difficult for the Company to obtain any required financing for projects. The effect of all these factors cannot be accurately predicted. Notwithstanding the progress achieved in improving Mexican political institutions and revitalizing its economy, the present administration, or any successor government, may not be able to sustain the progress achieved. The Company does not carry political risk insurance.
| 24 |
Under the Foreign Investment Law of Mexico, there is no limitation on foreign capital participation in mining operations; however, the applicable laws may change in a way which may adversely impact the Company and its ability to repatriate profits. Under Mexican Income Tax Law, dividends are subject to a withholding tax. Corporations with their tax residence in Mexico are taxed on their worldwide income. Mexico levies a value-added tax, known as the IVA, which is an indirect tax levied on the value added to goods and services, and it is imposed on corporations that carry out activities within Mexican territory.
During 2013, the Mexico Senate passed tax reform legislation, which took effect on January 1, 2014. The tax reform includes an increase in the corporate tax rate from 28% to 30%, the introduction of a special mining royalty of 7.5% on the profits derived from the sale of minerals, and the introduction of a mining royalty of 0.5% on the gross income derived from the sale of gold, silver and platinum. These changes may have a material impact on the Company’s future earnings and cash flows, and possibly on future capital investment decisions.
Exploration and development risks.
The business of exploration and development for minerals involves a high degree of risk and few properties become producing mines. Unprofitable efforts result not only from the failure to discover mineral deposits, but from finding mineral deposits which, though present, are insufficient in quantity and quality to return a profit from production. There is no assurance that the Company’s future exploration and development activities will result in any discoveries of commercial bodies of ore. The marketability of minerals acquired or discovered by the Company may be affected by numerous factors which are beyond the control of the Company and which cannot be accurately predicted, such as market fluctuations, the proximity and capacity of mining facilities, mineral markets and processing equipment, and such other factors as government regulations, including regulations relating to royalties, allowable production, importing and exporting of minerals, and environmental protection, the combination of which factors may result in the Company not receiving an adequate return on invested capital.
The mining industry is highly speculative and involves substantial risks.
Even when mining is conducted on properties known to contain significant quantities of mineral deposits it is generally accepted in the mining industry that most exploration projects do not result in the discovery of mineable deposits of ore that can be extracted in a commercially economic manner. There may be limited availability of water, which is essential to milling operations, and interruptions may be caused by adverse weather conditions. Operations are subject to a variety of existing laws and regulations relating to exploration and development, permitting procedures, safety precautions, property reclamation, employee health and safety, air quality standards, pollution and other environmental protection controls. Mining activities are subject to substantial operating hazards, some of which are not insurable or may not be insured for economic reasons.
The commercial quantities of ore cannot be accurately predicted.
Whether an ore body will be commercially viable depends on a number of factors including the particular attributes of the deposit, such as size, grade and proximity to infrastructure, as well as minerals prices and government regulations, including regulations relating to prices, taxes, royalties, land tenure, land use, importing and exporting of minerals and environmental protection. The exact effect of these factors cannot be accurately predicted, but the combination of these factors may result in a mineral deposit being unprofitable.
There are no assurances that we can produce minerals on a commercially viable basis.
The Company’s ability to generate revenue and profit is expected to occur through exploration, evaluation, advancement and operation of its existing properties as well as through acquisitions of interests in new properties. Substantial expenditures will be incurred in an attempt to establish the economic feasibility of mining activities by identifying mineral deposits and establishing ore reserves through drilling and other techniques, developing metallurgical processes to extract metals from ore, designing facilities and planning mining activities. The economic feasibility of a project depends on numerous factors, including the cost of mining and production facilities required to extract the desired minerals, the total mineral deposits that can be mined using a given facility, the proximity of the mineral deposits to refining facilities, and the market price of the minerals at the time of sale. There is no assurance that existing or future exploration programs or acquisitions will result in the identification of deposits that can be mined profitably.
| 25 |
Mining activities and exploration activities are subject to various federal, state, provincial and local laws and regulations.
Laws and regulations govern the development, mining, production, importing and exporting of minerals, taxes, labour standards, occupational health, waste disposal, protection of the environment, mine safety, toxic substances, and other matters. In many cases, licenses and permits are required to conduct mining operations. Amendments to current laws and regulations governing operations and activities of mining companies or more stringent implementation thereof could have a substantial adverse impact on the Company. Applicable laws and regulations will require the Company to make certain capital and operating expenditures to initiate new activity. Under certain circumstances, the Company may be required to suspend an activity once it is started until a particular problem is remedied or to undertake other remedial actions.
Mining activities are inherently risky and subject to accidents.
Mining activities are risky and heavily regulated. Despite our attempts to minimize accidents through strict safety procedures, individuals may be injured or harmed working in our mines. Should any accidents occur, our mine may be partially or fully shut down to aid regulators in their investigation, even if it is determined we are not at fault for the cause of the accident. In this regard, there were two accidental deaths at the Company’s San Gonzalo mine in March 2016, and an accidental death at the Avino Mine complex processing facility in June 2014. We do not believe that we were at fault in these accidents and, unfortunately, believe that the accidents were the result of the employees not following the proper safety protocols. Following the accidents, local authorities allowed us to resume mining activities. Notwithstanding our belief that we were not at fault for the accidents, we may nevertheless be found liable and subject to fines and/or penalties or we may be required to revise and implement new safety procedures that would make it more costly to operate our mines. Currently, we do not have insurance covering accidents, but may obtain insurance in the future.
Our concentrates are subject to theft and loss.
The concentrates produced by the Company have significant value, and are loaded onto road vehicles for transport to smelters in Mexico or to seaports for export to smelters in foreign markets, such as Europe and Asia, where the metals are extracted. The geographic location of the Company’s operating mines in Mexico and trucking routes taken through the country to the smelters and ports for delivery, give rise to risks including concentrate theft, road blocks and terrorist attacks, losses caused by adverse weather conditions, delays in delivery of shipments, and environmental liabilities in the event of an accident or spill. In addition, the Company may have significant concentrate inventories at its facilities or on consignment at other warehouses awaiting shipment. The Company has taken steps to secure its concentrate, whether in storage or in transit. The Company has insurance coverage for its inventory while in transit; however, recovery of the full market value may not always be possible. Despite these risk mitigation measures, there remains a continued risk that theft of concentrate may have a material impact on the Company’s financial results.
| 26 |
Our mining operations are subject to number of risks including uninsured risks which may result in suspension of operations.
Mining operations generally involve a high degree of risk which even a combination of experience, knowledge and careful evaluation may not be able to overcome. The business of mining and exploration is subject to a variety of risks including, but not limited to, fires, power outages, labour disruptions, industrial accidents, flooding, explosions, cave-ins, landslides, environmental hazards, technical failures, and the inability to obtain suitable or adequate machinery, equipment or labour. Such occurrences, against which the Company cannot, or may elect not to insure, may delay production, increase production costs or result in liabilities. The payment of such liabilities may have a material adverse effect on the Company’s financial position. The economics of developing mineral properties are affected by such factors as the cost of operations, variations in the grade and metallurgy of the ore mined, fluctuations in mineral markets, costs of processing and equipment, transportation costs, government regulations including regulations relating to royalties, allowable production, importing and exporting of mineral product, and environmental protection rules and regulations.
During the period between the end of April to June 2020, the Company was required to shut down operations at the Avino Mine due to COVID-19 pandemic safety measures imposed by the Mexican authorities. In June 2020, mining operations briefly resumed, until a labour strike in July 2020 resulting in a suspension of operations. The labour strike was resolved in October 2020.
The exercise of our outstanding warrants, stock options into common shares and issuance of RSUs will result in ownership dilution to our shareholders and could temporarily suppress the price of our common shares.
As at December 31, 2022, we had outstanding warrants to purchase 8,950,412 common shares at a weighted average exercise price of $1.03 per share. As at December 31, 2022, there were outstanding share options exercisable into 4,256,000 common shares at a weighted average exercise price of C$1.36 and RSUs outstanding for the issuance of a further 2,190,666 common shares granted at a weighted average price of C$1.27. If all these options and warrants are exercised and RSUs are issued, such issuance will cause ownership dilution to our shareholders. The dilution may result in a decline in the market price of our common shares.
Market forces may adversely affect the marketability of mineral resources.
There is no assurance that, even if commercial quantities of mineral resources are discovered, that these can be sold at a profit. Factors beyond the control of the Company may affect the marketability of any mineral occurrences discovered. The prices of silver, gold and copper have experienced volatile and significant movements over short periods of time, and are affected by numerous factors beyond the control of the Company, including international economic and political trends, expectations of inflation, currency exchange fluctuations (specifically, the United States dollar relative to the Canadian dollar and other currencies), interest rates and global or regional consumption patterns (such as the development of gold coin programs), speculative activities and increased production due to improved mining and production methods.
The Company is subject to foreign corrupt practices laws.
The Company is subject to the Foreign Corrupt Practices Act (the “FCPA”), the Corruption of Foreign Public Officials Act (Canada) (“CFPOA”), and other laws that prohibit improper payments or offers of payments to foreign governments and their officials and political parties by persons and issuers as defined by the statutes, for the purpose of obtaining or retaining business. It is our policy to implement safeguards to discourage these practices by our employees; however, our existing safeguards and any future improvements may prove to be ineffective, and our employees, consultants, sales agents or distributors may engage in conduct for which the Company might be held responsible. Violations of the FCPA, CFPOA, and/or other laws may result in criminal or civil sanctions and the Company may be subject to other liabilities, which could negatively affect our business, operating results and financial condition. The Company is also subject to the Extractive Sector Transparency Measures Act (Canada) (“ESTMA”), which requires us to maintain records of specific payments (including taxes, royalties, fees, production entitlements, bonuses, dividends, and infrastructure improvements) to all government entities in Canada and abroad, and to publicly disclose payments of $100,000 or more in any payment category on an annual basis within 150 days of our fiscal year end, to increase transparency and deter corruption in the extractive industry sector.
| 27 |
The validity of the title to our mining properties may be challenged.
In those jurisdictions where the Company has property interests, the Company undertakes searches of mining records and obtains title opinions from reputable counsel in accordance with mining industry practices to confirm satisfactory title to properties in which it holds or intends to acquire an interest, but the Company does not obtain title insurance with respect to such properties. The possibility exists that title to one or more of its properties, particularly title to undeveloped properties, might be defective because of errors or omissions in the chain of title, including defects in conveyances and defects in locating or maintaining such claims, prior unregistered agreements or transfers, and title may be affected by undetected defects or native land claims. For unsurveyed mineral claims, the location and boundaries of such mining claims may be in doubt. The ownership and validity of mining claims are often uncertain and may be contested. The Company is not aware of any challenges to the location or area of its mineral claims. There is, however, no guarantee that title to the Company’s properties will not be challenged or impugned in the future. The properties may be subject to prior unregistered agreements or transfers.
In Mexico and British Columbia legal rights applicable to mining concessions or mineral claims, as applicable, are different and separate from legal rights applicable to surface lands; accordingly, title holders of mining concessions or mineral claims must accommodate and agree with surface land-owners on compensation in respect of mining activities conducted on such land.
We do not intend to pay dividends in the foreseeable future.
We have never paid, and we do not intend to pay, any cash dividends in the foreseeable future.
Certain provisions of organizational documents may discourage takeovers and business combinations that our shareholders may consider in their best interests, which could negatively affect our stock price.
Certain provisions of our Articles of Incorporation (“Articles”) may have the effect of delaying or preventing a change in control of our Company or deterring tender offers for our common shares that other shareholders may consider in their best interests.
Our Articles authorize us to issue an unlimited number of common shares. Shareholder approval is not necessary to issue our common shares. Issuance of these common shares could have the effect of making it more difficult and more expensive for a person or group to acquire control of us and could effectively be used as an anti-takeover device.
Our Articles provide for an advance notice procedure for shareholders to nominate director candidates for election or to bring business before an annual meeting of shareholders, including proposed nominations of persons for election to our board of directors, and require that special meetings of shareholders be called by the board or shareholders who hold at least 5% of the total issued and outstanding shares.
Our business is subject to competition.
There is a limited supply of desirable mineral lands available for acquisition, claim staking or leasing in the areas where the Company contemplates expanding its operations and conducting exploration activities. Many participants are engaged in the mining business, including large, established mining companies. There can be no assurance that the Company will be able to compete successfully for new mining properties. The resource industry is intensely competitive in all its phases, and the Company competes with many companies possessing greater financial resources and technical facilities than itself. Competition could adversely affect the Company’s ability to acquire suitable producing properties or prospects exploration in the future.
| 28 |
Uncertainty of exploration and evaluation programs.
The Company’s profitability is significantly affected by the costs and results of its exploration and evaluation programs. As mines have limited lives, the Company actively seeks to expand its mineral resources, primarily through exploration, evaluation and strategic acquisitions. Exploration for minerals is highly speculative in nature, involves many risks and is frequently unsuccessful. Among the many uncertainties inherent in any silver, gold, and/or copper exploration and evaluation program are the location of economic ore bodies, the development of appropriate metallurgical processes, the receipt of necessary governmental permits and the construction of mining and processing facilities. Assuming the discovery of an economic deposit, depending on the type of mining operation involved, several years may elapse from the initial phases of drilling until commercial operations are commenced and, during such time, the economic feasibility of extracting and processing resources may change. Accordingly, the Company’s exploration and evaluation programs may not result in any new economically viable mining operations or yield new mineral resources to expand current mineral resources.
If the Company fails to obtain or maintain the necessary permits, this may adversely affect the Company’s financial condition and business.
Existing and possible future environmental legislation, regulations and actions could give rise to additional expense, capital expenditures, restrictions and delays in the activities of the Company, the extent of which cannot be predicted. Regulatory requirements and environmental standards are subject to constant evaluation and may become more restrictive, which could materially affect the business of the Company or its ability to develop its properties. Before production can commence on any of its mineral properties, the Company must obtain regulatory and environmental approvals. There is no assurance that such approvals will be obtained, or if they are obtained, if they will be granted on a timely basis. The cost of compliance with existing and future governmental regulations has the potential to reduce the profitability of operations or preclude entirely the economic development of the Company’s mineral projects and properties.
Permitting of exploration programs in Mexico requires the completion of agreements with the indigenous communities in the vicinity of the project. The timing for the completion of such agreements is unpredictable. The process of obtaining such agreements is also affected by the two-year election cycle for the councils of the indigenous communities.
Political or economic instability or unexpected regulatory change may adversely affect the Company.
The Company is subject to a number of factors beyond its control. Our primary property is located in a foreign country that may be subject to political and economic instability, or unexpected legislative change than is usually the case in certain other countries, provinces and states. Our mineral exploration and mining activities could be adversely affected by:
|
| · | political instability and violence; |
|
|
|
|
|
| · | war and civil disturbances; |
|
|
|
|
|
| · | expropriation or nationalization; |
|
|
|
|
|
| · | changing fiscal regimes; |
|
|
|
|
|
| · | fluctuations in currency exchange rates; |
|
|
|
|
|
| · | high rates of inflation; |
|
|
|
|
|
| · | underdeveloped industrial and economic infrastructure; |
|
|
|
|
|
| · | changes in the regulatory environment governing exploration and evaluation assets; and |
|
|
|
|
|
| · | unenforceability of contractual rights, any of which may adversely affect our business in that country. |
| 29 |
We may be adversely affected by fluctuations in foreign exchange rates.
We maintain our bank accounts in Canadian and U.S. Dollars and Mexican pesos. Any appreciation in the currency of Mexico or other countries where we may carry out exploration and mining activities against the Canadian or U.S. Dollar will increase our costs of carrying out operations in such countries. In addition, any increase in the Canadian Dollar against the U.S. Dollar will result in a loss on our financial statements to the extent we hold funds in Canadian Dollars. Copper, gold and silver are typically sold in U.S. dollars. As a result, the Company is subject to foreign exchange risks relating to the relative value of the U.S. dollar as compared to the Canadian dollar and the Mexican peso. To the extent that the Company generates revenues at the Avino Mine, it will be subject to foreign exchange risks as revenues will be received in U.S. dollars while certain operating and capital costs will be incurred primarily in Mexican pesos. A decline in the U.S. dollar would result in a decrease in the Company’s revenues and adversely impact the Company’s financial performance.
We may be subject to land reclamation requirements.
Although variable, depending on location and the governing authority, land reclamation requirements are generally imposed on mineral exploration and mining companies, in order to minimize the long-term effects of land disturbance. Reclamation may include requirements to control dispersion of potentially deleterious effluents and reasonably re-establish pre-disturbance land forms and vegetation. In order to carry out reclamation obligations imposed on us in connection with our mineral exploration and mining activities we must allocate financial resources that might otherwise be spent on further exploration or acquisition programs.
Acquisitions the Company may undertake may change our business or expose us to risks.
The Company undertakes evaluations of opportunities to acquire additional silver and gold mining properties. Any resultant acquisitions may be significant in size, may change the scale of the Company’s business, and may expose the Company to new geographic, political, operating, financial and geological risks. The Company’s success in its acquisition activities depends on its ability to identify suitable acquisition candidates, acquire them on acceptable terms, and integrate their operations successfully. Any acquisitions would be accompanied by risks, such as a significant decline in the price of silver or gold, the mineralized material proving to be below expectations, the difficulty of assimilating the operations and personnel of any acquired companies, the potential disruption of the Company’s ongoing business, the inability of management to maximize the financial and strategic position of the Company through the successful integration of acquired assets and businesses, the maintenance of uniform standards, controls, procedures and policies, the impairment of relationships with customers and contractors as a result of any integration of new management personnel and the potential unknown liabilities associated with acquired mining properties. There can be no assurance that the Company would be successful in overcoming these risks or any other problems encountered in connection with such acquisitions.
Current global financial conditions may adversely affect the Company’s ability to secure financing.
Financial markets globally have been subject to increased volatility. Access to financing has been negatively affected by liquidity crises and uncertainty with respect to sovereign defaults throughout the world. These factors may impact the ability of the Company to obtain loans and other forms of financing in the future and, if obtained, on terms favourable to the Company. If these levels of volatility and market turmoil continue or worsen, the Company may not be able to secure appropriate debt or equity financing when needed, any of which could affect the trading price of the Company’s securities in an adverse manner.
| 30 |
There may be potential conflicts of interest between the Company and our directors, officers, affiliates and promoters.
There are potential conflicts of interest to which the directors, officers, insiders and promoters of the Company will be subject in connection with the operations of the Company. The directors, officers, insiders and promoters of the Company are engaged in and will continue to be engaged in corporations or businesses which may be in competition with the Company. Accordingly, situations may arise where such directors, officers, insiders and promoters will be in direct competition with the Company. The Company has a process to identify and declare any conflicts. Conflicts, if any, will be subject to the procedures and remedies as provided under the Business Corporations Act of British Columbia.
We are dependent on our management.
We are dependent on the services of key executives including our President and Chief Executive Officer and other highly skilled and experienced executives and personnel focused on advancing our corporate objectives as well as the identification of new opportunities for growth and funding. Due to our relatively small size, the loss of these persons or our inability to attract and retain additional highly skilled employees required for our activities may have a material adverse effect on our business and financial condition.
We are subject to competition for recruitment and retention of qualified personnel.
We compete with other exploration and mining companies, many of which have greater financial resources than us or are further in their advancement, for the recruitment and retention of qualified employees and other personnel. Competition for exploration and mining resources at all levels is highly cyclical and can quickly become very intense, particularly affecting the availability of manpower, drill rigs and supplies. Recruiting and retaining qualified personnel in the future is critical to the Company’s success. As the Company explores its Avino Mine and other properties, the need for skilled labour will increase. The number of persons skilled in the exploration of mining properties is limited and competition for this workforce is intense. The exploration and other initiatives of the Company may be significantly delayed or otherwise adversely affected if the Company cannot recruit and retain qualified personnel and/or obtain other exploration and mining resources as and when required.
Our common shares are subject to limited and volatile trading volume.
Although the Company’s common shares are listed on the NYSE American, the TSX, the Frankfurt Stock Exchange, referred to herein as the “FSE”, and the Berlin Stock Exchange, the volume of trading has been limited and volatile in the past and may likely to continue to be so in the future, reducing the liquidity of an investment in the Company’s common shares and making it difficult for investors to readily sell their common shares in the open market. Without a liquid market for the Company’s common shares, investors may be unable to sell their shares at favorable times and prices and may be required to hold their shares in declining markets or to sell them at unfavorable prices.
Our common shares are subject to volatile share price.
In recent years, securities markets in general have experienced a high level of price volatility. The market price of many resource companies, particularly those, like the Company, that are considered speculative exploration and mining companies, have experienced wide fluctuations in price, resulting in substantial losses to investors who have sold their shares at a low price point. These fluctuations are based only in part on the level of progress of exploration, and can reflect general economic and market trends, world events or investor sentiment, and may sometimes bear no apparent relation to any objective factors or criteria. Significant fluctuation in the Company’s common share price is likely to continue.
| 31 |
Difficulty for United States investors to effect services of process against the Company.
The Company is incorporated under the laws of the Province of British Columbia, Canada. Consequently, it will be difficult for United States investors to affect service of process in the United States upon the directors or officers of the Company, or to realize in the United States upon judgments of United States courts predicated upon civil liabilities under the Exchange Act. The majority of the Company’s directors and officers are residents of Canada and all of the Company’s material assets are located outside of the United States. A judgment of a United States court predicated solely upon such civil liabilities would probably be enforceable in Canada by a Canadian court if the United States court in which the judgment was obtained had jurisdiction, as determined by the Canadian court, in the matter. There is substantial doubt whether an original action could be brought successfully in Canada against any of such persons or the Company predicated solely upon such civil liabilities.
Disruptions to our information technology systems, including future cyber-attacks and security breaches, and the costs of maintaining secure and effective information technology systems could negatively affect our business and results of operations.
The efficient operation of our businesses is dependent on computer hardware and software systems. Information systems are vulnerable to security breaches by computer hackers and cyber terrorists. We rely on industry accepted security measures and technology to securely maintain confidential and proprietary information maintained on our information systems and continue to invest in maintaining and upgrading these systems and applications to ensure risk is controlled. Regardless of our efforts to maintain and upgrade our cyber security systems, there can be no assurance that we will not suffer an intrusion, that unauthorized parties will not gain access to confidential or personal information, or that any such incident will be discovered promptly. The techniques used by criminals to obtain unauthorized access to sensitive data change frequently and often are not recognized until launched against a target, and we may be unable to anticipate these techniques or implement adequate preventative measures. The failure to promptly detect, determine the extent of and appropriately respond to a significant data security breach could have a material adverse impact on our business, financial condition and results of operations. In addition, the unavailability of the information systems or failure of these systems to perform as anticipated for any reason, including a major disaster or business interruption resulting in an inability to access data stored in these systems or sustain the data center systems necessary to support functions to meet our needs, and any inability to respond to, or recover from, such an event, could disrupt our business and could result in decreased performance and increased overhead costs, causing our business and results of operations to suffer.
We are a multinational company that faces complex taxation regimes in various jurisdictions. Audits, investigations, and tax proceedings could have a material adverse effect on our business, results of operations, and financial condition.
We are subject to income and non-income taxes in numerous jurisdictions. Income tax accounting often involves complex issues, and judgment is required in determining our worldwide provision for income taxes and other tax liabilities. In particular, most of the jurisdictions in which we conduct business have detailed transfer pricing rules, which require that all transactions with non-resident related parties be priced using arm’s length pricing principles within the meaning of such rules. In addition, the application of withholding tax, value added tax, goods and services tax, sales taxes and other non-income taxes is not always clear and we may be subject to tax audits relating to such withholding or non-income taxes. We believe that our tax positions are reasonable and our tax reserves are adequate to cover any potential liability. However, tax authorities in certain jurisdictions may disagree with our position, including the propriety of our related party arm’s length transfer pricing policies and the tax treatment of corresponding expenses and income. If any of these tax authorities were successful in challenging our positions, we may be liable for additional income tax and penalties and interest related thereto in excess of any reserves established therefor, which may have a significant impact on our results and operations and future cash flow.
| 32 |
Changes to tax laws in any of the jurisdictions in which we operate or plan to operate in the future could have a material adverse effect on our business, results of operations, and financial condition.
We are a multinational company that is subject to complex taxation regimes in numerous jurisdictions. Our future effective tax rates could be affected by changes in tax laws or their interpretation in any of those jurisdictions. Tax laws, including tax rates, in the jurisdictions in which we operate may change as a result of macroeconomic or other factors outside of our control. Changes in tax laws, treaties, or regulations or their interpretation or enforcement are unpredictable. Any of these occurrences could have a material adverse effect on our results of operations and financial condition.
DIVIDENDS
The Company has not, since its incorporation, paid any dividends on any of the Common Shares and it is not contemplated that any dividends will be declared on the Common Shares in the immediate or foreseeable future. The directors of the Company will determine any future dividend policy on the basis of earnings, the Company’s financial position and other relevant factors.
GENERAL DESCRIPTION OF CAPITAL STRUCTURE
The Company is authorized to issue an unlimited number of Common Shares. As of March 30, 2023, 119,195,457 Common Shares were issued, and outstanding.
Holders of Common Shares are entitled to receive dividends, if any, as and when declared by the Board out of monies properly applicable to the payment of dividends, in such amount and in such form as the Board may from time to time determine, and all dividends which the Board may declare on the Common Shares shall be declared and paid in equal amounts per share on all Common Shares at the time outstanding. In the event of the dissolution, liquidation or winding-up of the Company, whether voluntary or involuntary, or any other distribution of assets of the Company among its shareholders for the purpose of winding up its affairs, the holder of the Common Shares shall be entitled to receive the remaining property and assets of the Company.
As of December 31, 2022, there were outstanding warrants to purchase 8,950,412 Common Shares, stock options outstanding to purchase 4,256,000 Common Shares, and outstanding restricted share units (“RSUs”) for a further 2,190,666 Common Shares. See “Note 14 – Warrant liability” and “Note 16 – Share capital and share-based payments” to the 2022 Annual Financial Statements for additional information regarding the Company’s convertible securities.
Constraints
To the best of its knowledge, the Company is not aware of any constraints imposed on the ownership of its securities to ensure that the Company has a required level of Canadian ownership.
Ratings
To the best of its knowledge, the Company is not aware of any ratings, including provisional ratings, from rating organizations for the Company’s securities that are outstanding and continue in effect.
MARKET FOR SECURITIES
The Common Shares are traded on the TSX under the symbol “ASM”. The closing price of the Common Shares on the TSX on December 30, 2022 was C$0.92 and on March 30, 2023 was C$1.19. The Common Shares are traded on the NYSE American under the symbol “ASM”. The closing price of the Common Shares on the NYSE American on December 30, 2022 was $0.68 and on March 30, 2023 was $0.88.
| 33 |
The following table sets forth the high and low market prices and the volume of the Common Shares traded on the TSX during the periods indicated:
| Period | High (C$) | Low (C$) | Total Volume |
| January 2022 | 1.15 | 0.90 | 1,122,100 |
| February 2022 | 1.08 | 0.89 | 925,000 |
| March 2022 | 1.36 | 1.03 | 1,335,900 |
| April 2022 | 1.24 | 0.90 | 1,065,000 |
| May 2022 | 0.95 | 0.76 | 667,700 |
| June 2022 | 0.92 | 0.69 | 497,000 |
| July 2022 | 0.81 | 0.64 | 385,700 |
| August 2022 | 0.87 | 0.70 | 494,600 |
| September 2022 | 0.74 | 0.66 | 555,700 |
| October 2022 | 0.87 | 0.71 | 471,200 |
| November 2022 | 1.00 | 0.80 | 797,200 |
| December 2022 | 0.97 | 0.82 | 491,700 |
| January 2023 | 1.15 | 0.95 | 952,800 |
| February 2023 | 1.07 | 0.89 | 622,900 |
| To March 30, 2023 | 1.18 | 1.11 | 808,581 |
The following table sets forth the high and low market prices and the volume of the Common Shares traded on the NYSE American during the periods indicated:
| Period | High ($) | Low ($) | Total Volume |
| January 2022 | 0.93 | 0.70 | 11,078,200 |
| February 2022 | 0.85 | 0.70 | 7,951,100 |
| March 2022 | 1.06 | 0.80 | 14,816,400 |
| April 2022 | 0.99 | 0.70 | 10,905,000 |
| May 2022 | 0.74 | 0.57 | 7,927,000 |
| June 2022 | 0.74 | 0.54 | 5,953,900 |
| July 2022 | 0.64 | 0.49 | 5,889,700 |
| August 2022 | 0.67 | 0.53 | 5,534,800 |
| September 2022 | 0.57 | 0.48 | 7,146,000 |
| October 2022 | 0.65 | 0.50 | 8,275,200 |
| November 2022 | 0.75 | 0.58 | 8,360,900 |
| December 2022 | 0.72 | 0.60 | 6,055,800 |
| January 2023 | 0.85 | 0.69 | 8,428,100 |
| February 2023 | 0.81 | 0.67 | 7,282,600 |
| To March 30, 2023 | 0.89 | 0.83 | 8,983,349 |
| 34 |
DIRECTORS AND OFFICERS
Name, Occupation and Security Holding
The table below sets forth the name, province or state and country of residence, position with the Company, principal occupation during the previous five years and the number of voting securities beneficially owned, directly or indirectly, or over which control or direction is exercised, for the directors and executive officers of the Company.
As of December 31, 2022, directors and executive officers of the Company, as a group, beneficially owned, directly or indirectly, or exercised control or direction over an aggregate of 4,708,639 Common Shares representing approximately 3.97% of its issued and outstanding Common Shares.
The terms of the directors of the Company expires at the annual general meeting of shareholders where they can be nominated for re-election. The officers hold their office at the discretion of the Board, but typically on an annual basis, after the annual general meeting, the directors pass resolutions to appoint officers and constitute committees.
| Name and Residence and Position with the Company | Principal Occupation for Five Preceding Years | Number of Company Shares Owned |
|
DIRECTORS
|
||
| David Wolfin, British Columbia, Canada Director since: October 1995 | Mining Executive; Officer and/or Director of several other reporting issuers, including Chairman, Chief Executive Officer and Director of Silver Wolf Exploration Ltd. | 27,510 (Directly) 2,739,200 (Indirectly) |
| Peter Bojtos, Colorado, United States Chairman, Audit Committee Chair Director since: June 2018 | Professional Engineer with over 50 years of worldwide experience in the mining industry | 168,000 (Directly) |
| Ronald Andrews, Idaho, United States Director since: May 2019 | Owner and operator of Andrews Orchards, President of West Wind Property Inc., and Director of Coral Gold Resources Ltd. from January 2010 to November 2020 | 300,000 (Directly) |
| Jasman Yee, British Columbia, Canada Director since: January 2011 | Professional Engineer and Metallurgist | 411,520 (Directly) |
|
OFFICERS
|
||
| David Wolfin, British Columbia, Canada President and Chief Executive Officer | See information for Mr. Wolfin set forth above in the “Directors” section of this table. | See above |
| Nathan Harte, British Columbia, Canada Chief Financial Officer | Chief Financial Officer of the Company and Silver Wolf Exploration Ltd. | 177,675 |
| Peter Latta, British Columbia, Canada Vice President Technical Services | Vice President Technical Services of the Company and President of Silver Wolf Exploration Ltd. | 92,900 |
| Carlos Rodriguez, Durango, Mexico Chief Operating Officer | Chief Operating Officer of the Company | 791,834 |
| 35 |
Standing Committees of the Board
There are currently three standing committees of the Board: the Audit Committee, the Compensation Committee and Governance and Nominating Committee. The following table identifies the members of each of these Committees:
| Board Committee | Committee Members |
| Audit Committee | Peter Bojtos (Chair) Ronald Andrews Jasman Yee |
| Compensation Committee | Ronald Andrews (Chair) Peter Bojtos Jasman Yee |
| Governance and Nominating Committee | Jasman Yee (Chair) Ronald Andrews Peter Bojtos |
CEASE TRADE ORDERS, BANKRUPTCIES, PENALTIES OR SANCTIONS
Except as stated below, no director or executive officer of the Company is, as at the date hereof, or has been, within 10 years before the date hereof, a director, chief executive officer or chief financial officer of any company that:
|
| (a) | was subject to an order that was issued while the director was acting in the capacity as director, chief executive officer or chief financial officer, or |
|
|
|
|
|
| (b) | was subject to an order that was issued after the director or executive officer ceased to be a director, chief executive officer or chief financial officer and which resulted from an event that occurred while that person was acting in the capacity as director, chief executive officer or chief financial officer. |
Ronald Andrews was a director of Berkley Renewables Inc. (“Berkley”) at the time it was cease traded by the Ontario and B.C. Securities Commissions on May 6, 2019 for failing to file required records, and the cease trade order has not been rescinded. Mr. Andrews resigned from the board of directors of Berkley on May 15, 2019.
No director or executive officer of the Company, or a shareholder holding a sufficient number of securities of the Company to affect materially the control of the Company:
|
| (a) | is, as at the date hereof, or has been, within 10 years before the date hereof, a director or executive officer of any company that, while that person was acting in that capacity, or within a year of that person ceasing to act in that capacity, became bankrupt, made a proposal under any legislation relating to bankruptcy or insolvency or was subject to or instituted any proceedings, arrangement, or compromise with creditors or had a receiver, receiver-manager or trustee appointed to hold its assets; or |
|
|
|
|
|
| (b) | has, within 10 years before the date hereof, become bankrupt, made a proposal under any legislation relating to bankruptcy or insolvency, or become subject to or instituted any proceedings, arrangement or compromise with creditors, or had a receiver, receiver- manager or trustee appointed to hold the assets of the director or executive officer. |
| 36 |
On August 29, 2018, Deloitte Restructuring Inc. was made the Court-appointed receiver of Sage Gold Inc. (“Sage”) of which Peter Bojtos was a director, pursuant to Section 243(1) of the Bankruptcy and Insolvency Act (Canada) and Section 101 of the Courts of Justice Act. The Ontario Superior Court of Justice approved a Sales and Investor Solicitation Procedure to the Receiver to conduct the sale of all or substantially all of the property assets and undertakings of Sage. Mr. Bojtos’ directorship with Sage ceased on March 22, 2019.
No director or executive officer of the Company, or a shareholder holding a sufficient number of securities of the Company to affect materially the control of the Company has been subject to:
|
| (a) | any penalties or sanctions imposed by a court relating to securities legislation or by a securities regulatory authority or has entered into a settlement agreement with a securities regulatory authority; or |
|
|
|
|
|
| (b) | any other penalties or sanctions imposed by a court or regulatory body that would likely be considered important to a reasonable investor in making an investment decision. |
CONFLICTS OF INTEREST
To the best of the Company’s knowledge, there are no existing or potential conflicts of interest among the Company, its directors, officers or other insiders of the Company other than as described in the following paragraph.
Various officers, directors or other insiders of the Company may hold senior positions with entities involved in the mining industry or otherwise be involved in transactions within the mining industry and may develop or already have other interests outside the Company. If any such conflict of interest arises, a director who is in such a conflict will be required to disclose the conflict to a meeting of the directors of the Company and abstain from voting for or against matters concerning the matter in respect of which the conflict arises in accordance with the Business Corporations Act (British Columbia). Directors and officers are required to disclose any conflicts or potential conflicts to the Board of Directors as soon as they become aware of them and they will govern themselves in respect thereof to the best of their ability in accordance with the obligations imposed upon them by law.
Code of Ethics
We have adopted a Code of Ethics, which is applicable to all directors, officers and employees. A copy of the Code can be obtained from the Company’s website (www.avino.com/about/corporate-governance) or by contacting the Company.
PROMOTERS
We do not presently have and have not within the last two completed financial years had, any promoters other than the directors of the Company.
LEGAL PROCEEDINGS AND REGULATORY ACTIONS
Legal Proceedings
The Company is not currently and has not since the commencement of the Company’s the last completed financial year been a party to any legal proceedings, nor are any of the Company’s properties presently or since the commencement of the Company’s the last completed financial year, been subject to any legal proceedings.
| 37 |
Regulatory Actions
There have not been any:
|
| (a) | penalties or sanctions imposed against the Company by a court relating to securities legislation or by a securities regulatory authority during the financial year ended December 31, 2022; |
|
|
|
|
|
| (b) | other penalties or sanctions imposed against the Company by a court or by a regulatory authority that would likely be considered important to a reasonable investor making an investment decision; or |
|
|
|
|
|
| (c) | settlement agreements entered into by the Company before a court relating to securities legislation or with a securities regulatory authority during the financial year ended December 31, 2022. |
INTEREST OF MANAGEMENT AND OTHERS IN MATERIAL TRANSACTIONS
No director or executive officer of the Company or shareholder holding more than 10% of any outstanding securities of the Company or any associate or affiliate of any such person or company, has or had in the three most recently completed financial years of the Company any material interest, direct or indirect, in any transaction that has materially affected or will materially affect the Company or any of its subsidiaries.
TRANSFER AGENT AND REGISTRAR
The transfer agent and registrar of the Company is Computershare Investor Services Inc., (“Computershare”). Computershare’s principal location for the Common Shares is located at 100 University Avenue, 8th Floor, Toronto, ON, M5J 2Y1.
MATERIAL CONTRACTS
Aside from contracts entered into in the ordinary course of business and not required to be filed under section 12.2 of National Instrument 51-102 – Continuous Disclosure Obligations (“NI 51-102”), the following are the only contracts regarded as material which were entered into by the Company within the most recently completed fiscal year or before the most recently completed fiscal year that are still in effect:
| 1. | Share Purchase Agreement dated October 27, 2021 entered into among the Company, Coeur Mining, Inc., Coeur La Preciosa Silver Corp., Proyectos Mineros La Preciosa S.A De C.V, Coeur Explorations, Inc. Cervantes, LLC, La Preciosa Silver & Gold Mines Ltd and La Luna Silver & Gold Mines Ltd. to acquire the La Preciosa Property silver project. |
|
|
|
| 2. | Sales Agreement dated January 13, 2021 entered into among the Company and Cantor Fitzgerald & Co., H. C. Wainwright & Co., LLC, Roth Capital Partners, LLC, and A.G.P./Alliance Global Partners, LLC re the ATM Offering of $25,000,000 for distribution in the United States only. |
NAMES AND INTERESTS OF EXPERTS
The following persons, firms and companies named below have prepared or certified a statement or report described or included in a filing, or referred to in a filing, made under NI 51-102 by the Company during, or relating to, the Company’s most recently completed financial year and whose profession, or business gives rise to the report or statement or opinion made by the person or company:
| 38 |
Hassan Ghaffari, P.Eng., M.A.Sc., Jianhui (John) Huang, Ph.D., P.Eng and Michael F. O’Brien, P.Geo., M.Sc., Pr.Sci.Nat., FAusIMM are the Qualified Persons who prepared the Report.
Deloitte LLP was the auditor of the Company for the year ended December 31, 2022 and is independent of the Company within the meaning of the rules of professional conduct of the Chartered Professional Accountants of British Columbia and within the meaning of the U.S. Securities Act of 1933, as amended, and the applicable rules and regulations thereunder adopted by the SEC and the Public Company Accounting Oversight Board (United States).
Manning Elliott LLP, Chartered Professional Accountants, provided an auditor’s report in respect to our financial statements for the year ended December 31, 2021, and is independent of the Company within the meaning of the rules of professional conduct of the Chartered Professional Accountants of British Columbia and within the meaning of the U.S. Securities Act of 1933, as amended, and the applicable rules and regulations thereunder adopted by the SEC and the Public Company Accounting Oversight Board (United States).
Our Canadian legal counsel is Harper Grey LLP of Vancouver BC, and our US counsel is Lewis Brisbois Bisgaard & Smith LLP of San Francisco, CA.
To our knowledge, none of the experts named in the foregoing section held at the time of or after such person prepared the statement, report or valuation, any registered or beneficial interests, direct or indirect, in any of our securities or other property or of one of its associates or affiliates or is or is expected to be elected, appointed or employed as a director, officer or employee of the Company or of any associate or affiliate of the Company.
AUDIT COMMITTEE INFORMATION
The Audit Committee is responsible for monitoring the Company’s accounting and financial reporting practices and procedures, the adequacy of internal accounting controls and procedures, the quality and integrity of financial statements and for directing the auditors’ examination of specific areas.
Audit Committee Charter
A copy of the Company’s Audit Committee Charter is attached to this document as Appendix “B”.
Composition of the Audit Committee
The members of the Audit Committee are Peter Bojtos (Chair), Ronald Andrews and Jasman Yee, all of whom are “independent” directors as defined in National Instrument 52-110 – Audit Committees (“NI 52- 110”). Each member of the Audit Committee is considered to be “financially literate” within the meaning of NI 52-110, which includes the ability to read and understand a set of financial statements that present a breadth and level of complexity of accounting issues that are generally comparable to the breadth and complexity of the Combined Company’s financial statements. Additionally, as specified in the Company’s Audit Committee Charter, the nature and role of each member has been set out in accordance with the meanings of the terms “independent” and “financially literate,” as defined in Section 803 of the NYSE American Company Guide and Rule 10A-3 of the United States Securities Exchange Act of 1934, as amended.
| 39 |
Relevant Education and Experience
The relevant education and experience of each of the proposed members of the Audit Committee is as follows:
| Member | Relevant Education and Experience |
| Peter Bojtos (Chair) | Kerr Addison Mines Ltd., senior management and officer for 12 years. From 1990 to 1992 President & CEO of RFC Resource Finance Corp. From 1992 to 1993 the President & CEO of Consolidated Nevada Goldfields Corp. From 1993 to 1995 he was Chairman & CEO of Greenstone Resources Ltd, constructing and operating several gold mines in Central America. Over the past 30 years has served on numerous boards and audit committees. |
| Jasman Yee | BASc, P.Eng (BC) 1970 graduate of the University of British Columbia with a degree in chemical engineering, a 1974 graduate of Toronto’s Ryerson Polytechnical Institute with a degree in economics, and holds a certificate for completing the Canadian Securities Course. |
| Ronald Andrews | Served on the boards of Bonner Mall and Coral Gold Resources Ltd., and he has served as labor foreman for Kennecott Mining Company. Mr. Andrews has a Bachelor of Science degree from Washington State University and a Masters in Political Science. |
Pre‐Approval Policies and Procedures
The Audit Committee will pre-approve all audit and non-audit services not prohibited by law to be provided by the independent auditors of the Company.
External Auditor’s Service Fees
The fees billed by the Company’s external auditor in the last two fiscal years for audit fees are as follows:
| Financial Year | Audit Fees1 (C$) | Audit Related Fees2 (C$) | Tax Fees3 (C$) | All Other Fees4 (C$) |
| 20225 | 543,560 | 25,923 | - | - |
| 20216 | 375,000 | - | - | 68,512 |
1 “Audit Fees” include fees necessary to perform the audit of the Company’s consolidated financial statements. Audit Fees include quarterly reviews, fees for review of tax provisions and for accounting consultations on matters reflected in the financial statements. Audit Fees also include audit or other attest services required by legislation or regulation, such as comfort letters, consents, reviews of securities filings and statutory audits.
2 “Audit-Related Fees” include services that are traditionally performed by the auditor. These audit-related services include audit or attest services not required by legislation or regulation.
3 “Tax Fees” include fees for all tax services other than those included in “Audit Fees” and “Audit- Related Fees”.
4 “All Other Fees” include fees relating to the aggregate fees billed in each of the last two fiscal years for products and services provided by the Company’s external auditor, other than the services reported under footnotes 1 to 3 above.
5 Deloitte LLP was the auditor for the year ended December 31, 2022, and the table represents the fees billed by them.
6 Manning Elliott LLP was the auditor for the year ended December 31, 2021, and the table represents the fees billed by them.
| 40 |
ADDITIONAL INFORMATION
Additional information relating to the Company may be found on the System for Electronic Document Analysis and Retrieval (“SEDAR”) at www.sedar.com, under the Company’s profile. Further financial information is also provided in the Company’s audited financial statements and management discussion & analysis for the year ended December 31, 2022.
Dated: March 31, 2023
***
| 41 |
APPENDIX “A”
DEFINITIONS, TECHNICAL TERMS, ABBREVIATIONS
Glossary of Mining Terms
| agglomeration
| Cementing crushed or ground rock particles together into larger pieces, usually to make them easier to handle; used frequently in heap-leaching operations.
|
| anomalous
| A value, or values, in which the amplitude is statistically between that of a low contrast anomaly and a high contrast anomaly in a given data set.
|
| anomaly
| Any concentration of metal noticeably above or below the average background concentration.
|
| assay
| An analysis to determine the presence, absence or quantity of one or more components.
|
| Breccia
| A rock in which angular fragments are surrounded by a mass of finer-grained material.
|
| cretaceous
| The geologic period extending from 135 million to 65 million years ago.
|
| cubic meters or m3
| A metric measurement of volume, being a cube one meter in length on each side.
|
| cyanidation
| A method of extracting exposed silver or gold grains from crushed or ground ore by dissolving it in a weak cyanide solution.
|
| diamond drill
| A rotary type of rock drill that cuts a core of rock that is recovered in long cylindrical sections, two centimeters or more in diameter.
|
| fault
| A fracture in a rock where there has been displacement of the two sides.
|
| grade
| The concentration of each ore metal in a rock sample, usually given as weight percent. Where extremely low concentrations are involved, the concentration may be given in grams per tonne (g/t or gpt) or ounces per ton (oz/t). The grade of an ore deposit is calculated, often using sophisticated statistical procedures, as an average of the grades of a very large number of samples collected from throughout the deposit.
|
| hectare or ha
| An area totaling 10,000 square meters.
|
| highly anomalous
| An anomaly which is 50 to 100 times average background, i.e. it is statistically much greater in amplitude.
|
| induced polarization (IP)
| A method of ground geophysics surveying employing an electrical current to determine indications of mineralization.
|
| A1 |
| Inferred Mineral Resource
| An Inferred Mineral Resources is that part of a Mineral Resource for which quantity and grade or quality can be estimated on the basis of geological evidence and limited sampling and reasonably assumed, but not verified, geological and grade or quantity continuity. An inferred Mineral Resource estimate is based on limited information and sampling gathered through appropriate techniques from locations such as outcrops, trenches, pits, workings and drill holes. An Inferred Mineral Resource has a lower level of confidence than that applying to an Indicated Mineral Resource and must not be converted to a Mineral Reserve. It is reasonably expected that the majority of Inferred Mineral Resources could be upgraded to Indicated Mineral Resources with continued exploration.
Inferred Mineral Resources must not be included in the economic analysis, production schedules, or estimated mine life in publicly disclosed pre-feasibility or feasibility studies, or in the life of mine plans and cash flow models of developed mines. Inferred Mineral Resources can only be used in economic studies as provided under National Instrument 43-101, Standards of Disclosure for Mineral Projects.
|
| Indicated Mineral Resource
| An Indicated Mineral Resource is that part of a Mineral Resource for which quantity, grade or quality, densities, shape and physical characteristics are estimated with sufficient confidence to allow the application of Modifying Factors in sufficient detail to support mine planning and evaluation of the economic viability of the deposit. Geological evidence is derived from adequately detailed and reliable exploration, sampling and testing and is sufficient to assume geological and grade or quality continuity between points of observation.
|
| Measured Mineral Resource
| A Measured Mineral Resource is that part of a Mineral Resource for which quantity, grade or quality, densities, shape, and physical characteristics are estimated with confidence sufficient to allow the application of Modifying Factors to support detailed mine planning and final evaluation of the economic viability of the deposit.
Geological evidence is derived from detailed and reliable exploration, sampling and testing and is sufficient to confirm geological and grade or quality continuity between points of observation.
A Measured Mineral Resource has a higher level of confidence than that applying to either an Indicated Mineral Resource or an Inferred Mineral Resource. It may be converted to a Proven Mineral Reserve or to a Probable Mineral Reserve
|
| A2 |
| Mineral Reserve
| A Mineral Reserve is the economically mineable part of a Measured or Indicated Mineral Resource demonstrated by at least a Preliminary Feasibility Study. This Study must include adequate information on mining, processing, metallurgical, economic, and other relevant factors that demonstrate, at the time of reporting, that economic extraction could reasonably be justified. A Mineral Reserve includes diluting materials and allowances for losses that may occur when the material is mined.
Mineral resources are sub-divided in order of increasing confidence into Probable Mineral Reserves and Proven Mineral Reserves. A Probable Mineral Reserve has a lower level of confidence than a Proven Mineral Reserve. The term “mineral reserve” need not necessarily signify that extraction facilities are in place or operative or that all governmental approvals have been received. It does signify that there are reasonable expectations of such approvals.
|
| Mineral Resource
| A concentration or occurrence of diamonds, natural solid inorganic material, or natural solid fossilized organic material including base and precious metals, coal, and industrial minerals in or on the Earth’s crust in such form and quantity and of such a grade or quality that it has reasonable prospects for economic extraction. The location, quantity, grade, geological characteristics and continuity of a Mineral Resource are known, estimated or interpreted from specific geological evidence and knowledge.
A Mineral Resource is an inventory of mineralization that under realistically assumed and justifiable technical and economic conditions might become economically extractable.
|
| mineralization
| Usually implies minerals of value occurring in rocks.
|
| Modifying Factors
| Modifying Factors are considerations used to convert mineral resources to mineral reserves. These include, but are not restricted to, mining, processing, metallurgical, infrastructure, economic, marketing, legal, environmental, social and governmental factors.
|
| net smelter returns (NSR) royalty
| Payment of a percentage of net mining revenue after deducting applicable smelter charges.
|
| NI 43-101
| National Instrument 43-101, Standards of Disclosure for Mineral Projects, adopted by the Canadian Securities Administrators in Canada.
|
| Oxide
| A compound of oxygen and some other element.
|
| ore
| A natural aggregate of one or more minerals which may be mined and sold at a profit, or from which some part may be profitably separated.
|
| A3 |
| prefeasibility study and preliminary feasibility study
| Each means a comprehensive study of the viability of a mineral project that has advanced to a stage where mining method, in the case of underground mining, or the pit configuration, in the case of open pit mining, has been established, and which, if an effective method of mineral processing has been determined, includes a financial analysis based on reasonable assumptions of technical, engineering, operating and economic factors, and the evaluation of other relevant factors which are sufficient for a qualified person, acting reasonably, to determine if all or part of the mineral resource may be classified as a mineral reserve.
|
| Probable Mineral Reserve
| Is the economically mineable part of an Indicated and, in some circumstances, a Measured Mineral Resource demonstrated by at least a Preliminary Feasibility Study. This Study must include adequate information on mining, processing, metallurgical, economic, and other relevant factors that demonstrate, at the time of reporting, that economic extraction can be justified.
|
| Proven Mineral Reserve
| Is the economically mineable part of a Measured Mineral Resource demonstrated by at least a Preliminary Feasibility Study. This Study must include adequate information on mining, processing, metallurgical, economic, and other relevant factors that demonstrate, at the time of reporting, that economic extraction is justified.
The term should be restricted to that part of the deposit where production planning is taking place and for which any variation in the estimate would not significantly affect potential economic viability.
|
| quartz
| Silica or SiO2, a common constituent of veins, especially those containing silver and gold mineralization.
|
| Tailings
| Material rejected from a mill after most of the recoverable valuable minerals have been extracted.
|
| ton
| Imperial measurement of weight equivalent to 2,000 pounds.
|
| Tonne
| Metric measurement of weight equivalent to 2,205 pounds (1,000 kg)
|
| Tpd
| Tonnes per day.
|
| Trench
| A long, narrow excavation dug through overburden, or blasted out of rock, to expose a vein or ore structure.
|
| veins
| The mineral deposits that are found filling openings in rocks created by faults or replacing rocks on either side of faults.
|
| A4 |
APPENDIX “B”
AUDIT COMMITTEE CHARTER
| 1. | Purpose of the Committee |
|
|
|
| 1.1 | The purpose of the Audit Committee is to assist the Board in its oversight of the integrity of the Company’s financial statements and other relevant public disclosures, the Company’s compliance with legal and regulatory requirements relating to financial reporting, the external auditors’ qualifications and independence and the performance of the internal audit function and the external auditors. |
|
|
|
| 2. | Members of the Audit Committee |
|
|
|
| 2.1 | All Members of the Audit Committee must be “financially literate” as defined under NI 52-110, having sufficient accounting or related financial management expertise to read and understand a set of financial statements, including the related notes, that present a breadth and level of complexity of accounting issues that are generally comparable to the breadth and complexity of the issues that can reasonably be expected to be raised by the Company’s financial statements. |
|
|
|
| 2.2 | The Audit Committee shall consist of no less than three Directors. |
|
|
|
| 2.3 | All Members of the Audit Committee must be “independent” as defined under NI 52-110. |
|
|
|
| 3. | Relationship with External Auditors |
|
|
|
| 3.1 | The external auditors are the independent representatives of the shareholders, but the external auditors are also accountable to the Board of Directors and the Audit Committee. |
|
|
|
| 3.2 | The external auditors must be able to complete their audit procedures and reviews with professional independence, free from any undue interference from the management or directors. |
|
|
|
| 3.3 | The Audit Committee must direct and ensure that the management fully co-operates with the external auditors in the course of carrying out their professional duties. |
|
|
|
| 3.4 | The Audit Committee will have direct communications access at all times with the external auditors. |
|
|
|
| 4. | Non-Audit Services |
|
|
|
| 4.1 | The external auditors are prohibited from providing any non-audit services to the Company, without the express written consent of the Audit Committee. In determining whether the external auditors will be granted permission to provide non-audit services to the Company, the Audit Committee must consider that the benefits to the Company from the provision of such services, outweighs the risk of any compromise to or loss of the independence of the external auditors in carrying out their auditing mandate. |
|
|
|
| 4.2 | Notwithstanding section 4.1, the external auditors are prohibited at all times from carrying out any of the following services, while they are appointed the external auditors of the Company: |
|
| (i) | acting as an agent of the Company for the sale of all or substantially all of the undertaking of the Company; and |
|
|
|
|
|
| (ii) | performing any non-audit consulting work for any director or senior officer of the Company in their personal capacity, but not as a director, officer or insider of any other entity not associated or related to the Company. |
| B1 |
| 5. | Appointment of Auditors |
|
|
|
| 5.1 | The external auditors will be appointed each year by the shareholders of the Company at the annual general meeting of the shareholders. |
|
|
|
| 5.2 | The Audit Committee will nominate the external auditors for appointment, such nomination to be approved by the Board of Directors. |
|
|
|
| 6. | Evaluation of Auditors |
|
|
|
| 6.1 | The Audit Committee will review the performance of the external auditors on at least an annual basis, and notify the Board of Directors and the external auditors in writing of any concerns in regards to the performance of the external auditors, or the accounting or auditing methods, procedures, standards, or principles applied by the external auditors, or any other accounting or auditing issues which come to the attention of the Audit Committee. |
|
|
|
| 7. | Remuneration of the Auditors |
|
|
|
| 7.1 | The remuneration of the external auditors will be determined by the Board of Directors, upon the annual authorization of the shareholders at each general meeting of the shareholders. |
|
|
|
| 7.2 | The remuneration of the external auditors will be determined based on the time required to complete the audit and preparation of the audited financial statements, and the difficulty of the audit and performance of the standard auditing procedures under International Financial Reporting Standards (“IFRS”) as issued by the International Accounting Standards (“IASB”). |
|
|
|
| 8. | Termination of the Auditors |
|
|
|
| 8.1 | The Audit Committee has the power to terminate the services of the external auditors, with or without the approval of the Board of Directors, provided the Committee is acting reasonable and responsible. |
|
|
|
| 9. | Funding of Auditing and Consulting Services |
|
|
|
| 9.1 | Auditing expenses will be funded by the Company. The auditors must not perform any other consulting services for the Company, which could impair or interfere with their role as the independent auditors of the Company. |
|
|
|
| 10. | Role and Responsibilities of the Internal Auditor |
|
|
|
| 10.1 | Due to the Company’s size and limited financial resources, the CEO and CFO of the Company shall be responsible for implementing internal controls and performing the role of the internal auditor to ensure that such controls are adequate. |
|
|
|
| 11. | Oversight of Internal Controls |
|
|
|
| 11.1 | The Audit Committee will have the oversight responsibility for ensuring that the internal controls are implemented and monitored, and that such internal controls are effective. |
|
|
|
| 12. | Continuous Disclosure Requirements |
|
|
|
| 12.1 | Due to the Company’s size and limited financial resources, the Secretary of the Company is responsible for ensuring that the Company’s continuous reporting requirements are met and in compliance with applicable regulatory requirements. |
| B2 |
| 13. | Other Auditing Matters |
|
|
|
| 13.1 | The Audit Committee may meet with the Auditors independently of the management of the Company at any time, provided the Committee is acting reasonable and responsible. |
|
|
|
| 13.2 | The Auditors are authorized and directed to respond to all enquiries from the Audit Committee in a thorough and timely fashion, without reporting these enquiries or actions to the Board of Directors or the management of the Company. |
|
|
|
| 14. | Annual Review |
|
|
|
| 14.1 | The Audit Committee Charter will be reviewed annually by the Board of Directors and the Audit Committee to assess the adequacy of this Charter. |
|
|
|
| 15. | Independent Advisers |
|
|
|
| 15.1 | The Audit Committee shall have the power to retain legal, accounting or other advisors to assist the Committee. |
| B3 |
APPENDIX “C”
MATERIAL MINERAL PROJECTS
See attached.
| C1 |
PROPERTY DESCRIPTION AND LOCATION
The Property is located in the state of Durango, Mexico, within the municipalities of Pánuco de Coronado and Canatlán, and is approximately 85 km by existing road, northeast of the city of Victoria de Durango, the state capital. The Property is situated on the eastern flank of the Sierra Madre Occidental Mountain range. It can be found on the Instituto Nacional de Estadística, Geografía e Informática General Carlos Real Topographic Map G13D72, centered on coordinates 24°25’42.4200”N Latitude and 104°27’27.2380”W Longitude (554,987.8815 mE, 2,701,771.0046 mN) in the Universal Transverse Mercator (WGS 84), Zone 13R (Northern Hemisphere).
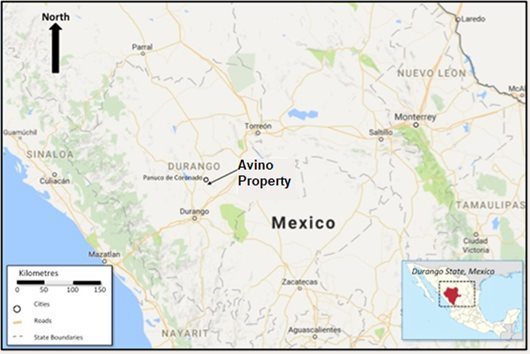
Figure 4-1: General Location of the Property (Avino 2021)
The current Property consists of two parts:
| · | The historic Avino Mine area concessions, which contain the Elena Tolosa and San Gonzalo mine workings, processing infrastructure, and associated vein systems; and |
| · | The newly acquired (March 21, 2022) La Preciosa Mining concessions, which contain the La Preciosa Veins. |
| C2 |
Figure 4-2 shows the relative location of these vein systems on the Avino Property and La Preciosa Property.
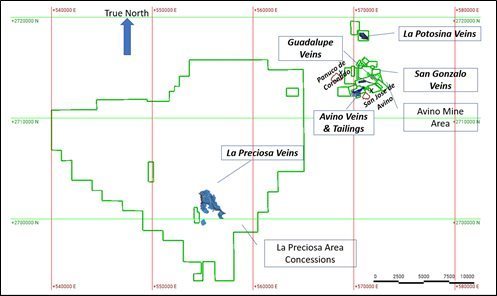
Figure 4-2: General Location of Various Veins (Avino 2023)
Avino Property Area
Property Ownership
The Avino Property comprises 26 mineral concessions, totalling 1,301.4314 ha.
In 1968, Avino Mines and Resources Ltd. acquired a 49% interest in CMMA and Minera San José de Avino SA, which together held mineral claims totalling 2,626 ha (6,488 ac). Avino Mines and Resources Ltd. retained Vancouver-based Cannon-Hicks & Associates Ltd. (Cannon-Hicks), a mining consulting firm, to conduct the exploration and development of the Property. Cannon-Hicks’s exploration activities included surface and underground sampling and diamond drilling (VSE 1979).
On July 17, 2006, the Company completed the acquisition of Compañía Minera Mexicana de Avino, S.A. de C.V. (“Avino Mexico”), a Mexican corporation, through the acquisition of an additional 39.25% interest in Avino Mexico, which, combined with the Company’s pre-existing 49% share of Avino Mexico, brought the Company’s ownership interest in Avino Mexico to 88.25%. The additional 39.25% interest in Avino Mexico was obtained through the acquisition of 79.09% of the common shares of Promotora, which in turn owns 49.75% of Avino Mexico’s common shares, and the direct acquisition of 1% of the common shares of Avino Mexico.
July 17, 2006, the acquisition was accomplished by a share exchange by which the Company issued 3,164,702 shares as consideration, which we refer to as the “Payment Shares”, for the purchase of the additional 39.25% interest in Avino Mexico. The Payment Shares were valued based on the July 17, 2006, closing market price of the Company’s shares on the TSX.
The Company acquired a further 1.1% interest in Avino Mexico through the acquisition from an estate subject to approval and transfer of the shares to the Company by the trustee for the estate. On December 21, 2007, approval was received, and the Company obtained the 1.1% interest from the estate for no additional consideration.
On February 16, 2009, the Company converted existing loans advanced to Avino Mexico into new additional shares of Avino Mexico. As a result, the Company’s ownership interest in Avino Mexico increased to 99.28%.
| C3 |
On June 4, 2013, the Company converted existing loans advanced to Avino Mexico into new additional shares of Avino Mexico, resulting in the Company’s ownership increasing by 0.38% to an effective 99.67%. The issuance of shares to the Company by Avino Mexico on June 4, 2013, resulted in a reduction in the non-controlling interest from 0.72% to 0.34%.
On August 26, 2015, the Company converted existing loans advanced to Avino Mexico into new additional shares, resulting in an increase of the Company’s ownership by 0.01% to an effective 99.67%. The intercompany loans and investments are eliminated upon consolidation of the financial statements. The Company had a pre-existing effective ownership interest of 99.66% in Avino, Mexico, prior to the 0.01% increase. The issuance of shares to the Company by Avino Mexico on August 26, 2015, resulted in a reduction in the non-controlling interest from 0.34% to 0.33%.
Mineral Concessions and Agreements
The Avino Property comprises 26 mineral concessions, totalling 1,301.4314 ha (see Figure 4-3 of the Report). Ownership proportions and mineral concessions are summarized in Table 4-1 and Table 4-2, respectively.
Table 4-1: Summary of Avino Property Ownership
| Company | Relationship to Avino Silver and Gold Mines Ltd. | Effective Ownership of Avino Mine Property (%) |
| CMMA | Subsidiary | 98.45 |
| Promotora | Subsidiary | 1.22 |
| Total Effective Ownership of Avino Mine Property | - | 99.67 |
| Estate of Ysita | Non-controlling interest | 0.33 |
| Total | - | 100.00 |
| C4 |
Table 4-2: Mineral Concessions – Avino Property Area (Avino 2023)
| S. No. | Concession Name | Concession No. | Area (Ha) | Expiration date |
| 1 | AMPLIACION DE LA POTOSINA | 185326 | 84.0000 | December 14, 2039 |
| 2 | AMPLIACION SAN GONZALO | 191837 | 5.8495 | December 19, 2041 |
| 3 | AMPLIACION LA MALINCHE | 204177 | 6.0103 | December 18, 2046 |
| 4 | EL POTRERITO | 185328 | 9.0000 | December 14, 2039 |
| 5 | LA MALINCHE | 203256 | 9.0000 | June 28, 2046 |
| 6 | LA POTOSINA | 185336 | 16.0000 | December 14, 2039 |
| 7 | SAN GONZALO | 190748 | 12.0000 | April 29, 2041 |
| 8 | YOLANDA | 191083 | 43.4577 | April 29, 2041 |
| 9 | AGRUP. SAN JOSE | 164985 | 8.0000 | August 13, 2029 |
| 10 | AGRUP. SAN JOSE, (EL TROMPO) | 184397 | 81.5466 | October 13, 2039 |
| 11 | AGRUP. SAN JOSE, (GRAN LUCERO) | 189477 | 161.4684 | December 5, 2040 |
| 12 | AGRUP. SAN JOSE, (PURISIMA CHICA) | 155597 | 136.7076 | September 30, 2023 |
| 13 | AGRUP. SAN JOSE, (SAN CARLOS) | 117411 | 4.4505 | December 05, 2023 |
| 14 | AGRUP. SAN JOSE, (SAN PEDRO Y SAN PABLO) | 139615 | 12.0000 | June 22, 2023 |
| 15 | AGUILA MEXICANA | 215733 | 36.7681 | March 12, 2054 |
| 16 | ARANJUEZ | 214612 | 96.0000 | October 2, 2051 |
| 17 | AVINO GRANDE IX | 216005 | 19.5576 | April 2, 2052 |
| 18 | AVINO GRANDE VIII | 215224 | 22.8816 | February 14, 2052 |
| 19 | EL CARACOL | 215732 | 102.3821 | March 12, 2052 |
| 20 | EL FUERTE | 216103 | 100.3274 | April 9, 2052 |
| 21 | FERNANDO | 205401 | 72.1287 | August 29, 2047 |
| 22 | LA ESTELA | 179658 | 14.0000 | December 11, 2036 |
| 23 | LOS ANGELES | 154410 | 23.7130 | March 25, 2023 |
| 24 | NEGRO JOSE | 218252 | 58.0000 | October 17, 2052 |
| 25 | SAN MARTIN DE PORRES | 222909 | 30.0000 | September 15, 2054 |
| 26 | SANTA ANA | 195678 | 136.1823 | September 14, 2042 |
| -- | TOTAL | -- | 1,301.4314 | -- |
Notes: Figures may not add to totals shown due to rounding.
In May 1970, Avino Mines and Resources Ltd. signed a formal agreement with Selco Mining and Development (Selco), a division of Selection Trust Company. Due to other commitments, Selco abandoned its interest in the project in 1973 (VSE 1979). On February 18, 2012, through its subsidiary company CMMA, Avino re-entered into an agreement (the Agreement) with Minerales, whereby Minerales indirectly granted Avino the exclusive mining and occupation rights to the La Platosa concession. The La Platosa concession covers 98.83 ha and hosts the Avino Vein and ET Zone.
| C5 |
Pursuant to the Agreement, Avino has the exclusive right to explore and mine the concession for an initial period of 15 years, with the option to extend the agreement for another 5 years. In consideration of the grant of these rights, Avino has paid Minerales the sum of $250,000 by the issuance of 135,189 common shares of Avino. Avino will have a period of 24 months for the development of mining facilities.
Avino has agreed to pay Minerales a royalty equal to 3.5% of NSRs, at the commencement of commercial production from the concession. In addition, after the development period, if the minimum monthly processing rate of the mine facilities is less than 15,000 t, then Avino must pay Minerals, in any event, a minimum royalty equal to the applicable Net Smelter Return (NSR) royalty based on processing at a minimum monthly rate of 15,000 t. In the event of a force majeure, Avino shall pay the minimum royalty as follows:
|
| · | First quarter: payment of 100% of the minimum royalty |
|
| · | Second quarter: payment of 75% of the minimum royalty |
|
| · | Third quarter: payment of 50% of the minimum royalty |
|
| · | Fourth quarter: payment of 25% of the minimum royalty |
|
| · | In the case of force majeure still in place after one year of payments, payment shall recommence at a rate of 100% of the minimum royalty and shall continue being made as per the quarterly schedule |
Minerales has also granted Avino the exclusive right to purchase a 100% interest in the concession at any time during the term of the Agreement (or any renewal thereof) upon payment of $8 million within 15 days of Avino’s notice of election to acquire the Property. The purchase would be completed under a separate purchase agreement for the legal transfer of the concession. This agreement replaces all other previous agreements.
During May of each year, Avino must file assessment work made on each concession for the immediately preceding calendar year. During January and July of each year, Avino must pay in advance the mining taxes, which are based on the surface of the concession and the number of years that have elapsed since it was issued.
Consistent with the mining regulations of Mexico, cadastral surveys have been carried out for all the listed mineral concessions as part of the field staking prior to recording (Slim 2005d). It is believed that all concessions are current and up-to-date. Mineral concessions in Mexico do not include surface rights. Avino has entered into agreements with communal landowners (Ejidos) of San José de Avino for the temporary occupation and surface rights of the concessions.
La Preciosa Property Area
Mineral Tenure
The La Preciosa Property consists of 15 Mining Concessions that amount to 6,641.5809 ha. Proyectos Mineros La Preciosa, S.A. de C.V. (PMLP) holds 100% of the registered, legal, and beneficial interest in and to these Mining Concessions.
By a share purchase agreement dated October 27, 2021, with Coeur Mining Inc. and its affiliates, Avino agreed to indirectly acquire PMLP and the La Preciosa Property. The closing of the proposed acquisition was subject to significant conditions, including that there shall not have occurred any event, change, or circumstance which has had or would reasonably be expected to have a material adverse effect, the authorization of the Mexican Federal Economic Competition Commission, approval of the transaction by the NYSE American, any other necessary third-party approvals, and the completion of all other covenants and conditions required to be performed by the parties prior to closing. The transaction was completed on March 21, 2022.
| C6 |
Table 4-3 provides information about the Mining Concessions in the La Preciosa Property area. Figure 4-4 of the Report depicts the location of the Mining Concessions and surface estates controlled.
Table 4-3: Mineral Concessions - La Preciosa Property (Avino 2023)
| S. No. | Concession Name | Concession No. | Area (Ha) | Expiration date |
| 1 | EL CHOQUE CUATRO | 220251 | 629.7778 | July 1, 2053 |
| 2 | EL CHOQUE SEIS | 220583 | 249.0000 | September 1, 2053 |
| 3 | EL CHOQUE TRES | 218953 | 10.0000 | January 28, 2053 |
| 4 | FRACCION LA PRECIOSA | 185128 | 2.5249 | July 14, 2038 |
| 5 | LA B | 214232 | 28.2006 | September 5, 2051 |
| 6 | LA PRECIOSA | 182517 | 143.6119 | July 14, 2038 |
| 7 | LUPITA | 182584 | 27.1878 | August 11, 2038 |
| 8 | SAN PATRICIO | 189616 | 29.4740 | December 4, 2040 |
| 9 | SANTA MONICA SUR | 223097 | 900.0000 | October 15, 2054 |
| 10 | EL NIÑO | 236219 | 10.0000 | May 24, 2060 |
| 11 | LA PEÑA | 204828 | 57.3190 | May 12, 2047 |
| 12 | CENTINELA | 244180 | 0.1048 | June 29, 2065 |
| 13 | DON MIGUEL HIDALGO Y COSTILLA | 244480 | 0.2168 | October 5, 2065 |
| 14 | HURACAN 4 R1A | 246910 | 1,768.4591 | January 19, 2054 |
| 15 | TIFON 3 R1A | 246466 | 2,785.7042 | February 16, 2056 |
| -- | TOTAL | -- | 6,641.5809 | -- |
Notes: Figures may not add to totals shown due to rounding.
The Dirección General de Minas (General Bureau of Mines) administers Mining Concessions in Mexico. A legal survey (Trabajos Periciales) of each Mining Concession was completed as a requirement of, and condition precedent to, the General Bureau of Mines granting such Concession.
Pursuant to an amendment of the Mexican Mining Law (Law), by Congressional Decree of February 22, 2005, published in the Diaro Oficial de la Federación April 28, 2005, there is no longer any distinction between an Exploration Concession and an Exploitation Concession. Consequently, all Concessions are “Mining Concessions” (Exploration and Exploitation), and as a result, all Exploration and Exploitation Concessions have been converted into Mining Concessions, expiring 50 years from the date they were originally granted.
Payment of Mining Duties are required for each Mining Concession and, each year, are payable semiannually in January and July to the Secretaría de Economía (Secretariat of Economy). The Mining Duties are calculated by determining the correct Cuota1 (Fee), which varies based upon the age of the Mining Concession. The Fee is then multiplied by the number of hectares encompassed by the Mining Concession, the product of which equals the semiannual Mining Duty payable for the respective Mining Concession. A copy of the payment receipt of the Mining Duty must be filed with the Dirección General de Regulación Minera, a sub-directorate of the General Bureau of Mines, semiannually each February and August.
1The Base Rate or “Fee” is adjusted annually and published the Diario Oficial De La Federación each December for use in calculating Mining Duties payable due the following year.
| C7 |
Informes Estadístico Sobre La Producción, Beneficio y Destino de Minerales o Sustancias Concesibles (Production Reports), detailing the production, beneficiation, and destination of concessionable minerals, must be submitted annually by January 30. These reports must be submitted for each Mining Concession bearing production and all Mining Concessions with over six (6) years of age, whether bearing production or not.
The surface estates overlying the project are owned by a mixture of ejidos2 and private parties.
Other Royalties, Back-in Rights, Payments, Agreements, and Encumbrances
In addition to a 1.25% net smelter royalty on the Gloria and Abundancia areas of the La Preciosa Property, and a 2.00% gross value royalty on all areas of the La Preciosa Property, other than the Gloria and Abundancia areas, reserved to Coeur, and the Company’s agreement to pay to Coeur $0.25 per silver equivalent ounce (subject to inflationary adjustment) of new mineral reserves (as defined by NI 43-101) discovered and declared outside of the current mineral resource area at La Preciosa Property, subject to a cap of $50 million, and any such payments being credited against any existing or future payments owing on the gross value royalty (see “General Development of the Business – Fiscal 2021” above), the La Preciosa Property has the following other royalty or payment agreements:
|
| · | A Consulting and Finder’s Fee Agreement dated May 1, 2002, as amended (Agreement) by and between Silver Standard Resources, Inc., the predecessor in interest of and to PMLP and La Cuesta International, Inc. (LCI). In accordance with the terms thereof, PMLP pays a Finder’s Fee to LCI, comprised of: (I.) an advance royalty, every six (6) months, equal to the greater of (i.) USD$5,000 or (ii.) 2% of direct exploration costs in and to the Mining Concession San Juan (Título #226663) and (II.) a one-quarter of one percent (0.25%) NSR royalty on production derived from the Mining Concession San Juan (Título #226663), which is located adjacent to the project, if any. The maximum amount payable under the terms of the Agreement is USD$2,000,000. PMLP has the right, at any time, to acquire from LCI all of the NSR payable in respect to LCI, including any amount remaining payable under the NSR. LCI shall not sell, transfer, or otherwise assign all or any portion of its interest in the NSR (NSR Interest) to any other party without first offering the NSR Interest to PMLP. Reciprocally, PMLP shall not sell, transfer, or otherwise assign all or any portion of its interest in and to the Mining Concession to any other party without first offering the Mining Concession to LCI; |
|
|
|
|
|
| · | A Net Smelter Return Royalty Agreement dated June 19, 2002 (Sanluis Agreement #1) by and among Minas Luismin S.A. de C.V., Minas Sanluis, S.A. de C.V., collectively, the owner and the predecessor in interest of and to PMLP and Corporación Turística Sanluis, S.A. de C.V., the holder and predecessor in interest of and to SANLUIS Corporación, S.A.B. de C.V. In accordance with the terms thereof, the Owner conveyed a three percent (3%) NSR royalty (Sanluis Royalty #1) on production to the holder, derived from Mining Concessions El Choque Tres (Título #218953) and La B (Título #214232), if any. Sanluis Royalty #1 is a covenant that runs with, and binds, these two (2) Mining Concessions and the legal title thereto, the owners thereof, and their successors and/or assigns. The Sanluis Agreement #1 provides that owner has a right of first refusal to acquire the Sanluis Royalty #1 if the holder receives a bona fide proposal to acquire the Sanluis Royalty #1 from a third party; |
2 An ejido is one of two types of social property in Mexico, granted by the government that combines communal ownership with individual use. The ejido consists of common use land, community development land, and individual parcels, which may be assigned to ejido members.
| C8 |
|
| · | On June 12, 2014, SANLUIS Corporación, S.A.B. de C.V. extended to Coeur its right of first refusal pursuant to the terms, covenants, and obligations of the Sanluis Agreement #1. Coeur exercised its right of first refusal and on July 2, 2014, repurchased the Sanluis Royalty #1 encumbering the two (2) Mining Concessions El Choque Tres (Título #21895) and La B (Título #214232) for USD$12,000,000.00. The repurchase price also reflects the concurrent extension and exercise of the right of first refusal of the Sanluis Royalty #2 described immediately hereinbelow. |
|
|
|
|
|
| · | A Net Smelter Return Royalty Agreement dated June 19, 2002, (Sanluis Agreement #2) by and among Minas Luismin S.A. de C.V., Minera Thesalia, S.A. de C.V., collectively, the owner and the predecessor in interest of and to PMLP and Corporación Turística Sanluis, S.A. de C.V., the holder and predecessor in interest of and to SANLUIS Corporación, S.A.B. de C.V. In accordance with the terms thereof, the Owner conveyed a three percent (3%) NSR royalty (Sanluis Royalty #2) on production to the holder, derived from Mining Concessions La Preciosa (Título #182517), Lupita (Título #182584), Fracción La Preciosa (Título #185128), and San Patricio (Título #189616), if any. Sanluis Royalty #1 is a covenant that runs with, and binds, these four (4) Mining Concessions and the title thereto, the owners thereof, and their successors and/or assigns. The Sanluis Agreement #2 provides that owner has a right of first refusal to acquire the Sanluis Royalty #2 if the holder receives a bona fide proposal to acquire the Sanluis Royalty #2 from a third party; |
|
|
|
|
|
| · | On June 12, 2014, SANLUIS Corporación, S.A.B. de C.V. extended to Coeur its right of first refusal pursuant to the terms, covenants, and obligations of the Sanluis Agreement #2. Coeur exercised its right of first refusal and on July 2, 2014, repurchased the Sanluis Royalty #2 encumbering the four (4) Mining Concessions La Preciosa (Título #182517), Lupita (Título #182584), Fracción La Preciosa (Título #185128), and San Patricio (Título #189616) for USD$12,000,000.00. The repurchase price also reflects the concurrent extension and exercise of the right of first refusal of the Sanluis Royalty #2 described immediately hereinabove. |
|
|
|
|
|
| · | On June 12, 2013, PMLP executed a Contrato de Ocupación Temporal Para La Extracción, Explotación, Uso y Aprovechamiento de Las Fuentes de Agua del Subsuelo (Temporary Occupancy Agreement) with Fernando Rivas Cossío, an ejidatario of the ejido Vicente Suarez (Posesionario). This Temporary Occupancy Agreement covers approx. five and nine-tenths (5.9) hectares, and has a term of thirty (30) years from June 12, 2013. In accordance with the terms of the Temporary Occupancy Agreement, the annual rent payable to the Posesionario is USD$75,000. PMLP has prepaid the annual rent through June 12, 2018; |
|
|
|
|
|
| · | On June 12, 2013, PMLP executed a Temporary Occupancy Agreement with Fernando Rivas Cossío, an ejidatario of the ejido Vicente Suarez (Posesionario). This Temporary Occupancy Agreement covers approx. eight and four-tenths (8.4) hectares, and has a term of thirty (30) years from June 12, 2013. In accordance with the terms of the Temporary Occupancy Agreement, the annual rent payable to the Posesionario is USD$75,000. PMLP has prepaid the annual rent through June 12, 2018; |
|
|
|
|
|
| · | On July 23, 2013, PMLP executed a Temporary Occupancy Agreement with Alejandro Hernández Jarquín (Propietario). This Temporary Occupancy Agreement covers approx. one thousand two hundred eighteen and five-tenths (1,218.5) hectares, has a term of twenty-five (25) years from July 23, 2013, and expressly allows for the exploration, exploitation, and beneficiation of concessionable minerals. In accordance with the terms of the Temporary Occupancy Agreement, a lump sum payment was tendered upon the execution thereof, equaling MXN$16,463,966.40, and represents the sum total consideration due from the Compañía thereunder. The land encumbered by this Temporary Occupancy Agreement overlies a portion of the Mining Concession El Choque Tres (Título #218953), El Choque Cuatro (Título #220251), La B (Título #214232), La Preciosa (Título #182517), and San Juan (Título #226663); |
| C9 |
|
| · | On February 7, 2014, PMLP executed a Temporary Occupancy Agreement with Unidád Comercial Agricola y Ganadera Don Joaquin S. de R.L. de C.V. (Propietario). This Temporary Occupancy Agreement covers approx. twenty (20) hectares, has a term of twenty-five (25) years from February 7, 2014, and expressly allows for the exploration, exploitation, and beneficiation of concessionable minerals. In accordance with the terms of the Temporary Occupancy Agreement, the annual rent payable to the Propietario is USD$18,000. PMLP has prepaid the annual rent through February 9, 2019. On February 10, 2019, PMLP must prepay the ensuing five (5) year’s annual rent, through February 9, 2024. Thereafter, there is no longer an obligation to prepay the annual rent. The land encumbered by this Temporary Occupancy Agreement overlies a portion of the Mining Concession San Juan (Título #226663); |
|
|
|
|
|
| · | On February 7, 2014, PMLP executed a Temporary Occupancy Agreement with Jorge Soto Enríquez (Propietario). This Temporary Occupancy Agreement covers approx. six (6) hectares, has a term of twenty-five (25) years from February 7, 2014, and expressly allows for the exploration, exploitation, and beneficiation of concessionable minerals. In accordance with the terms of the Temporary Occupancy Agreement the annual rent payable to the Propietario is USD$5,400. PMLP has prepaid the annual rent through February 9, 2019. On February 10, 2019, PMLP must prepay the ensuing five (5) year’s annual rent, through February 9, 2024. Thereafter, there is no longer an obligation to prepay the annual rent. The land encumbered by this Temporary Occupancy Agreement overlies, to varying degrees, portions of the Mining Concessions El Choque Cuatro (Título #220251), San Juan (Título #226663), and Santa Monica (Título #221288); |
|
|
|
|
|
| · | On February 7, 2014, PMLP executed a Temporary Occupancy Agreement with Jorge Soto Enríquez (Propietario). This Temporary Occupancy Agreement covers approx. ninety-four (94) hectares, has a term of twenty-five (25) years from February 7, 2014, and expressly allows for the exploration, exploitation, and beneficiation of concessionable minerals. In accordance with the terms of the Temporary Occupancy Agreement, the annual rent payable to the Propietario is USD$84,600. PMLP has prepaid the annual rent through February 9, 2019. On February 10, 2019, PMLP must prepay the ensuing five (5) year’s annual rent, through February 9, 2024. Thereafter, there is no longer an obligation to prepay the annual rent. The land encumbered by this Temporary Occupancy Agreement overlies, to varying degrees, portions of the Mining Concessions El Choque Cuatro (Título #220251), San Juan (Título #226663), and Santa Monica (Título #221288); |
|
|
|
|
|
| · | On February 13, 2014, PMLP executed a Temporary Occupancy Agreement with Petra Higareda Briceño Viuda de García (Propietario). This Temporary Occupancy Agreement covers approx. fifty-four and nine-tenths (54.9) hectares, has a term of twenty-five (25) years from February 13, 2014, and expressly allows for the exploration, exploitation, and beneficiation of concessionable minerals. In accordance with the terms of the Temporary Occupancy Agreement, the annual rent payable to the Propietario is USD$49,422.93. PMLP has prepaid the annual rent through February 13, 2019. The land encumbered by this Temporary Occupancy Agreement overlies, to varying degrees, portions of the Mining Concessions El Choque Cuatro (Título #220251) and La Preciosa (Título #182517); |
|
|
|
|
|
| · | On February 18, 2014, PMLP executed a Temporary Occupancy Agreement with ejido Lázaro Cárdenas (Ejido). This Temporary Occupancy Agreement covers approx. one hundred fifty-seven and two-tenths (157.2) hectares, has a term of thirty (30) years from February 18, 2014, and expressly allows for the exploration, exploitation, and beneficiation of concessionable minerals. In accordance with the terms of the Temporary Occupancy Agreement, the annual rent payable to the Ejido is MXN$785,944.95. The annual rent shall be adjusted annually in accordance with the changes to the Mexican CPI. The land encumbered by this Temporary Occupancy Agreement overlies, to varying degrees, portions of the Mining Concessions El Choque Cuatro (Título #220251), El Choque Seis (Título #220583), and Santa Monica (Título #221288); |
|
|
|
|
|
| · | On February 19, 2014, PMLP executed a Temporary Occupancy Agreement with ejido Francisco Javier Mina (Ejido). This Temporary Occupancy Agreement covers approx. eighty-nine and two-tenths (89.2) hectares, has a term of thirty (30) years from February 19, 2014, and expressly allows for the exploration, exploitation, and beneficiation of concessionable minerals. In accordance with the terms of the Temporary Occupancy Agreement, the annual rent payable to the Ejido is MXN$445,846.69. The annual rent shall be adjusted annually in accordance with the changes to the Mexican CPI. The land encumbered by this Temporary Occupancy Agreement overlies, to varying degrees, portions of the Mining Concessions El Choque Cuatro (Título #220251), El Choque Seis (Título #220583), and Santa Monica (Título #221288); |
|
|
|
|
|
| · | On April 11, 2014 PMLP executed a Temporary Occupancy Agreement with Candelaria Uves Solórzano (Propietario). This Temporary Occupancy Agreement covers approx. two hundred eighteen and eight-tenths (218.8) hectares, has a term of twenty-five (25) years from April 11, 2014, and expressly allows for the exploration, exploitation, and beneficiation of concessionable minerals. In accordance with the terms of the Temporary Occupancy Agreement, the annual rent payable to the Propietario is USD$196,911.89. PMLP has prepaid the annual rent through March 28, 2019. However, beginning March 28, 2015, and continuing until March 28, 2019, PMLP must prepay, in each of those years, for the future lease periods from March 29, 2019, through March 28, 2024. On March 28, 2024, PMLP must prepay the annual rent for the ensuing five (5) years or until March 28, 2029. On March 28, 2029, PMLP must prepay the annual rent for the ensuing five (5) years or until March 28, 2034. The last annual rent payment under the terms of the Temporary Occupancy Agreement is scheduled to be made March 28, 2034, a prepayment of the annual rent for the last year of the term of the Temporary Occupancy Agreement, 2039. The land encumbered by this Temporary Occupancy Agreement overlies, to varying degrees, portions of the Mining Concessions El Choque Cuatro (Título #220251), El Choque Seis (Título #220583), Fracción La Preciosa (Título #185128), La B (Título #214232), La Preciosa (Título #182517), San Patricio (Título #189616), and Santa Monica (Título #221288). |
| C10 |
There are no other known royalties, back-in rights, payments, agreements, or encumbrances.
Environmental Liabilities and Permits
Please refer to the section titled “Environmental Studies, Permitting and Social Community Impact” of the Report for a discussion regarding environmental and permitting factors related to the Property.
Significant Factors and Risks
Pursuit of the purchase or control of the necessary and convenient surface estates that overlie the La Preciosa part of the property is ongoing. There are risks that some of these surface estates, or portions thereof, may not be acquired due to unrealistic expectations of the parties, uncured or incurable defects in the legal land title, and/or survey and legal description inaccuracies.
The accuracy and completeness of ownership records maintained by the several Registros Públicos de la Propiedad y del Commercio (RPPyC) and Direcciones de Catastro within the state of Durango varies greatly. Prior to commencing negotiations for the purchase or control of a surface estate, legal land titles are thoroughly abstracted to determine legal ownership and the defects affecting validity of said ownership. Many Certificados and Constancias, issued by the several RPPyC, Direcciones de Recaudación, and Registros Agrario Nacional, are requested and obtained, in order to cross reference our own research with that of these government entities. Any disparities between the two are flagged for curing or ameliorating the title risk(s).
Well before consummating the purchase or leasehold transaction, each surface estate parcel is surveyed in the field using high-precision equipment manufactured by Trimble Navigation, LTD. Any discrepancies between the survey results, legal descriptions within the chain of title, and/or previous surveys are analyzed and curative actions are taken to formally reconcile and/or correct the legal dimensions of said surface estate. Many of the surface estates overlying the project have been secured by long-term leasehold agreements.
| C11 |
ACCESSIBILITY, CLIMATE, LOCAL RESOURCES, INFRASTRUCTURE, AND PHYSIOGRAPHY
Avino Property
Topography, Elevation, and Vegetation
The Property lies on the western edge of the high plains of northern Mexico, an extensive volcanic plateau characterized by narrow, northwest-trending ranges separated by wide, flat-floored filled basins. In the Durango area, the basins have elevations of between 1,900 to 2,100 metres above sea level (masl) and the higher peaks rise to 3,000 m. The Property elevation in the area of the mineralized zones at the Property is between 1,990 and 2,265 m. The highest elevations on the Property are at the northwest trending La Preciosa Ridge, which overlies the La Gloria and Abundancia veins. A broad valley forms to the east of the ridge and extends approximately 1 km toward another lower lying ridge to the northeast. Grasses, small shrubs, and cactuses comprise the typical vegetation on the steep hillsides with larger bushes and mesquite trees in the lower lying areas near springs and streams. Nearby farmers produce beans and maize with groundwater sourced from thick gravel beds in the surrounding plains or via dry farming during the rainy season. Local cattle graze on land dominated by rocky soils supporting nopal (prickly pear) and huizache (acacia) scrubland.
Accessibility and Local Resources
The Property is easily accessible by road, and the mine is an important employer of the local community from which skilled workers are available. Access is provided by Highway 40, a four-lane highway leading from Durango, past the airport and onto the city of Torreon in Coahuila. Successive turn-offs for the Property are at Francisco I Madero, Ignacio Zaragoza, and San José de Avino (Slim 2005d). The Avino mineral concessions are covered by a network of dirt roads, which provide easy transport access between all areas of interest on the Property and the mill at the Avino Property (Gunning 2009).
The nearest major city is Durango, with a population of 616,068. Durango is a major mining centre in Mexico where experienced labour and services can be obtained. The two towns nearest the mine are Pánuco de Coronado and San José de Avino, where the majority of the employees lived while working at the mine when it was in operation. Pánuco de Coronado has a population of 12,656, and San José de Avino is a small centre with a population of 868.
Climate and Length of Operating Season
The climate is temperate and semi-arid. In the region, the mean annual rainfall is 522 mm, and the average annual temperature is 16.7°C. The warmest month of the year is June, with an average temperature of 21.8°C, and January the coldest month of the year with an average temperature of 11.1°C. The driest month is April, with 6 mm of rainfall. In September, the precipitation reaches its peak, with an average of 123 mm (https://en.climate-data.org/north-america/mexico/durango/durango-3559/). In the winter, the temperature can drop below freezing, and frost and even light snowfall can occur.
Exploration, development, and mining activities may take place throughout the year without any significant seasonal impact.
Infrastructure
Infrastructure is disclosed in the section titled “Project Infrastructure” of the Report.
La Preciosa Property
Figure 5-1 of the Report shows the La Preciosa Property regional location.
| C12 |
Length of Operating Season
Mining activities can take place year-round.
Surface Rights, Land Availability, and Mining Areas
Surface rights in the La Preciosa Property area are held by a combination of private landowners, ejidos, and ejidatarios, which are ejido members with rights to use specific tracts of land within the ejido. Ejidos are areas of communal land used for agriculture where community members jointly control rights to access and use the land. Ejidos are registered with Mexico’s National Agrarian Registry.
Ownership
The issuer has verified who the registered landowners are who hold surface rights within the boundaries of the proposed mining activities.
HISTORY
Avino Property Area
Avino Mine, 1555 to 1968
The Avino deposit was originally discovered around 1555 by the Spanish conquistador Don Francisco de Ibarra. In 1562, Francisco de Ibarra was appointed governor of the newly formed province of Nueva Vizcaya in the Viceroyalty of Nueva España (New Spain) and, in 1563, founded the town of Durango. Francisco de Ibarra led several expeditions in search of silver deposits in the region and is recognized as having established Minas de Avino, present-day Avino Mine; San Martín, Durango; and Pánuco, Sinaloa. Mining operations at the Avino Mine are said to have commenced in 1562–1563 and have been in production until the early 1900s. Operations at the Avino Mine continued up to the onset of the War of Independence (1810), when operations were interrupted but then restarted and continued through to the early 1900s.
In 1880, the mines were taken over by Avino Mines Ltd., a company controlled by American and British interests. The introduction of more modern industrial technology helped the Avino Mine develop into a significant mining operation at the beginning of the 20th century. By 1908, the Avino Mine was considered one of the largest open pit mines in the world and equipped with one of the largest lixification smelters (Gallegos 1960; VSE 1979; Slim 2005d).
During the early phases of the Mexican Revolution in 1910, proceeds from the mine supplied funds to the revolutionary forces. Since much of the fighting occurred in and around Durango, and the risk posed by brigands hiding in the mountains was high, the mine was abandoned in 1912.
Between 1912 and 1968, the mine was worked intermittently on a small scale (Avino Annual Report 1980). There is no documentary record of production from the Avino Mine during this period.
The Property was acquired under current ownership in 1968.
Avino Vein System Deposit
The Avino Vein system was the mainstay of historical exploitation and is situated adjacent to the mine offices and processing plant. The upper portion of the deposit was extensively mined in an open pit, and the lower portion is currently accessible via a ramp and has been extensively developed and mined from more than 6 km of horizontal drifts, with vertical spacings between 15 m and 25 m. The ET Mine workings extend to a maximum depth of 360 m vertically below the portal of the ramp. An old vertical shaft, no longer used for hoisting, is used for ventilation and to supply water and power for development and mining. The western portion of the Avino Vein system is referred to as the San Luis. In 2016–2017, the focus of exploration drilling was on the region between the ET Mine and San Luis. The eastern extension of the Avino Vein system is known as Chirumbo.
| C13 |
San Gonzalo Vein Deposit
Shallow workings from an old mine are present in the San Gonzalo Vein and consist of small underground workings which were originally accessed by a five-level vertical shaft.
Current access to the San Gonzalo deposit (SG Mine) is via a ramp that is being actively developed. All old working levels have been dewatered. The deposit has been explored and exploited by more than 4 km of horizontal drifts with upper levels at 40 m vertical spacing and lower levels at 25 m vertical spacing.
Guadalupe Vein Deposit
The Guadalupe Vein extends between the Avino Vein and the San Gonzalo Vein and is a current exploration target.
San Juventino Vein Deposit
The San Juventino Vein is adjacent to the eastern end of the Avino Vein and is a current exploration target.
La Preciosa Property
In the late 19th century, the La Preciosa part of the Property was known as Mina La Preciosa. Early work was focused on the north end of La Preciosa Ridge where the Gloria and Abundancia veins outcropped to surface. Mining ceased at the onset of the Mexican Revolution, in 1910, and further mining did not occur until the 1970s. It has been estimated by Orko personnel that a total of ~30,000 t were extracted during that time (MP 2012).
Luismin operated under the name Minera Thesalia as a joint venture with Tormex S.A. and conducted exploration on the area in 1981, 1982, 1988, and 1994. This work consisted of a surface and underground channel sampling program, a single east-west line of induced polarization (IP) resistivity across the La Preciosa Property, and drilled seven diamond drill core holes totaling 1,319 m. This included five surface drillholes targeting the Gloria and Abundancia veins 50-75 m below the primary underground workings, and two holes drilled from within those older workings.
Luismin expanded the historic underground workings to a size of approximately 3 m by 3 m. This allowed for the underground drilling and also for a program of channel sampling. A reported 11,739 t of material was removed from the sides of the historic underground workings at reported grades of 0.43 g/t Au and 157 g/t Ag. That material was stockpiled outside the portal of those underground workings and is still in-place. While Luismin staff did calculate several MREs during that time, based on limited information, the channel sampling and shallow drilling were not used for the calculation of the current Mineral Resources.
Orko (subsequently Orko Silver Corp.) entered into a Joint Venture (JV) agreement with Luismin in 2003 and subsequently acquired the control of the La Preciosa area with Luismin maintaining a royalty.
Orko performed a series of exploration programs beginning in 2005 and lasting until 2008, and drilled 388 core holes for a total of 152,368 m on targets at Orito, San Juan, and La Preciosa. Additional surface sampling and mapping was also performed during that time.
Orko signed a JV agreement with Pan-American Silver (PAS) in 2009. PAS drilled 363 drillholes for a total of 91,096 m during 2009-2010. The desired result was a Measured Resource to support a feasibility study issued in 2012 by Quantitative Geoscience Pty. Ltd. and included a technical report by Snowden Engineering Inc. (Snowden) done in 2011 (Snowden, 2011a). PAS work included the use of some drillholes for geotechnical purposes, and four metallurgical test programs performed by SGS Mineral Services in Durango, Mexico. Problems with those metallurgical test programs were noted by Snowden and future work was recommended.
| C14 |
In April 2013, the acquisition of Orko was completed by Coeur. Since completion of the acquisition, activities have included land and water resources acquisition plus additional efforts on geological and technical studies. All involved property owners were identified and their titles verified to be in good standing prior to acquisition of surface rights.
By a share purchase agreement dated October 27, 2021 with Coeur and its affiliates, Avino indirectly acquired PMLP and the La Preciosa Property on March 21, 2022.
GEOLOGICAL SETTING AND MINERALIZATION
Avino Mine Property Area
Regional Geology
Mineral deposits of the Sierra Madre Occidental plateau and the La Preciosa District consist mainly of silver and gold mineralization with or without significant base metal components. The known deposits form a northwest-trending belt from the state of Zacatecas and the large Fresnillo silver deposit on the southeast to the Guanaceví silver deposit near the border with the state of Chihuahua.
The historic Avino Mine and associated vein systems are located within the Sierra de Gamon, on the east flank of the Sierra Madre Occidental. The area is a geological window into the Lower Volcanic series and consists mainly of volcanic flows, sills, and tuffaceous layers of andesite, rhyolite, and trachyte. Individual rock units typically vary from 300 m to 800 m in thickness. Andesitic rocks outcrop over most of the region, with other rock types occurring more sparsely to the north (Slim 2005d).
Approximately 50 km north of the project area is the El Castillo Mine (Argonaut Gold is the operator), which is thought to be a porphyry-style gold system related to Oligocene granodiorite-diorite porphyries that intrude Cretaceous clastic and carbonate sediments in an extensional tectonic setting. Gold mineralization occurs throughout the magmatic-hydrothermal system.
San Sebastian, located 60 km to the east of the Property, contains several productive vein systems including Francine, Don Sergio, and Andrea. Production by Hecla from the Francine vein was high-grade silver, with significant gold values. Mineralization occurs in poly-phase chalcedonic quartz veins with an average width of 1.6 m. Production from the Don Sergio vein was high-grade gold, with some silver values. Several epithermal veins exist within the San Sebastian valley. The Francine, Professor, Middle, and North vein systems are hosted within a series of shale units, with interbedded fine-grained sandstones. The Don Sergio, Jessica, Andrea, and Antonella veins located in the Cerro Pedernalito area, about 6 km from the Francine vein, are hosted in the same formation, with the addition of diorite intrusion. Mining ceased in 2005; however, Hecla is continuing with an active exploration program in the area, in particular on the Hugh Zone.
Directly adjacent to the project area on the west is the San Juan project of Silver Standard. Orko conducted prospecting, geological mapping, and some surface sampling. Vein targets, La Plomosa, La Plomosa Sur, El Vaquero, San Juan, Nancy Sur, and the down-dip projection of the Nancy vein are known on the San Juan property. La Plomosa vein has approximately 80 m of historical drifting and one drillhole.
Immediately south of La Plomosa and San Juan are the large Victoria and Salamandra concessions of Canasil Resources Inc. under joint venture with Blackcomb Minerals Inc. Salamandra is a skarn silver-zinc-copper prospect.
| C15 |
La Parrilla mine of First Majestic Silver Corporation is located near the Durango-Zacatecas border, approximately 65 km southeast of the city of Durango and 80 km south of the project area. La Parrilla is currently in production at a rate of 800 tpd. First Majestic is focusing on the La Rosa/Los Rosarios, San Marcos, San José, San Nicolás, Vacas, Quebradilla, La Luz, and Recuerdo structures. The silver-lead-zinc mineralization is hosted in vein-fault zones, breccias, and replacement bodies. These occur within the porphyritic diorite intrusive rocks and in the adjacent limestone, skarn, and hornfels rocks. While the geology is different than that at the project area, it does illustrate another example of precious metal mineral endowment in the region.
There are numerous precious metal exploration and expansion projects underway in Durango State and adjacent areas, including Metates, La Cienega, La Parrilla, Pitarrilla, Guanacevi, San Agustin, Peñasquito, Santa Cruz, San Sebastian, and Topia, as well as an expansion at the Tayoltita (San Dimas) operations. Neighboring Zacatecas state is also very active.
A large monzonitic intrusion is observed in the region in the form of dykes and small stocks, which appear to be linked to the onset of the Avino Vein mineralization. Other post-mineralization dykes of intermediate to felsic composition crop out in various areas and appear to cause minor structural displacements. Occurrences of thin mafic sills are also found in various parts of the region and are believed to be related to recent volcanism.
Higher areas of the Sierra Madre Occidental surrounding the mine are composed of rhyolites and ignimbrites of the Upper Volcanic Series, with thicknesses approaching 1,500 m.
The Laramide orogenic event is believed to have affected the Avino district. Later extrusive and intrusive igneous events appear to have caused the formation of various systems of pre-mineralization faulting. These fault systems usually produce normal displacement of the pre-existing rocks and generally strike northwest-southeast (subparallel to the Avino Vein system). Additional normal fault systems are also observed in the region, striking northeast-southwest and dipping towards the south (subparallel to the San Gonzalo Vein system).
The rugged topography is a result of erosion of the post-mineralization faulted blocks. One of the most significant regional features of the district is the Avino Fault, which strikes northwest 20° southeast, dips southeast, and appears to terminate the Avino Vein mineralization, juxtaposing the Upper and Lower Volcanic series.
Avino Mine Concessions Geology and Mineralization
The Avino concession is located within a 12 km (north-south) by 8.5 km (east-west) caldera. The area contains numerous low-sulphidation epithermal veins, breccias, stockwork, and silicified zones that grade into a “near porphyry” environment, particularly in the Avino Mine area. The caldera has been uplifted by regional north-trending block faulting (a graben structure), exposing a window of andesitic pyroclastic rocks of the lower volcanic sequence within the caldera. The Lower Volcanic Sequence is overlain by the Upper Volcanic Sequence, consisting of rhyolite to trachyte flows and extensive ignimbrites and intruded by monzonite bodies.
The basal andesite-bearing conglomerate and underlying Paleozoic basement sedimentary rocks (consisting of shales, sandstones, and conglomerates) have been identified on the Avino concession in the south-central portion of the caldera, covering the Guadalupe, Santiago, San Jorge, the San Gonzalo Trend, Malinche, Porterito, and Yolanda areas. A northerly trending felsic dyke, possibly a feeder to the upper volcanic sequence, transects the Avino area and many of the veins. The Aguila Mexicana low-temperature vein system trends north-northwest at a similar orientation to the felsic dyke and with similar continuity across the area. The two structures have been interpreted to occur along deep crustal faults that controlled volcanism and mineralization, with the felsic dyke structure controlling the emplacement of the Avino, Nuestra Senora, and El Fuerte-Potosina volcanic centres and the Aguila Mexicana structure controlling the Cerro San Jose and El Fuerte-Potosina volcanic centres (Paulter 2006).
| C16 |
Silver- and gold-bearing veins cross-cut the various lithologies and are generally oriented north-northwest–south-southeast and northwest–southeast (Figure 7-2). The rocks have been weathered and leached in the upper sections as a result of contact with atmospheric waters; the oxide tailings material (see “Geological Setting and Mineralization” in the Report) is primarily from this source, whereas the sulphide tailings are predominantly from material sourced at depth below the leached zone. In Mexico, these types of deposits can have large lateral extents but can be limited in the vertical continuity of grades.
In the oxide zone, mineralization is primarily hosted by the minerals argentite, bromargyrite, chalcopyrite, chalcocite, galena, sphalerite, bornite, native silver, gold, and native copper. Other minerals are present in mineralized areas but not hosting the metals of interest, including hematite, chlorite, quartz, barite, pyrite, arsenopyrite, and pyrrhotite. Malachite, anglesite, and limonite are common in the quartz zones of the weathered parts of the oxide material.
Avino Vein
The Avino Vein (see Figure 7-3 of the Report) is 1.6 km long and 60 m wide on the surface. The Avino Vein is the most striking and important example of the epithermal mineralization of the district, whose structures are normally weathered and leached in their upper section as a result of contact with atmospheric waters producing a band of oxide minerals and zones of supergene enrichment to a depth of about 70 m.
In the oxide portion of the Avino Vein, the common minerals encountered include hematite, limonite, anglesite, and copper carbonate in white or green, somewhat chloritized, quartz zones. The common primary and secondary minerals encountered are argentite, bromargyrite, chalcopyrite, chalcocite, galena sphalerite, bornite, native silver, free gold, and native copper. Other minerals present in mineralized areas include quartz, pyrite, chlorite, barite, arsenopyrite, pyrrhotite, and specularite.
Higher silver values are reported to decrease overall with depth, except at vein intersections and vein inflections, where higher values persist to depth. The same can be said for gold, although the higher values start just below the onset of silver mineralization at or near the surface. In contrast, higher copper values coincide with vein intersections and may increase with depth. Sporadic, localized copper enrichment occurs toward the footwall contact and may represent a different phase of fluid emplacement. Despite the overall decrease in precious metal grade with depth, local increases in metal grades are apparent in the mine sampling and exploration drilling, possibly reflecting changes in boiling level with pressure variations in the epithermal system.
The Avino Vein has been followed longitudinally for more than 1,300 m and vertically for more than 600 m. It strikes north at 66° east with an east-west splay and dips to the south and southeast at 60° to 70°. Steeply dipping, high-grade zones within the vein and stock-work zones are frequently found in the upper part of the vein, as well as at its intersections with a number of lateral veins. An example of a higher-grade area of mineralization encountered with a major lateral vein intersecting the Avino was the El Hundido, which exceeded 40 m in thickness. In the lower areas of the vein and mine, mineralized cross-veins, branch-veins, and stockwork zones have been found in the footwall at San Luis and El Hundido and are assumed to persist with depth.
The hanging wall of the Avino Vein is andesite, while the footwall is a monzonite intrusive with andesite sections. A post-mineralization fault parallel with the vein occurs in the hanging wall at a distance of several m in the area of San Luis; in the central part of El Hundido, this fault is located at the contact with the vein over a distance of about 300 m, up to the area of Santa Elena and San Antonio. From that point, and proceeding toward the El Chirumbo Mine, this fault cuts the vein between the face at San Carlos and the exposure at the underground ramp. The fault then enters the footwall, where it remains until a point about 30 m east of the west face of the Chirumbo area, producing a downward displacement of the vein of between 50 m to 100 m.
At Chirumbo, the fault largely replaces the vein due to strong leaching by post-mineralization circulating water in the gouge. On the east face at Chirumbo, the fault again enters the hanging wall; in this zone, the vein is composed of branches and stockwork, and to the east of this point, the fault crosses the vein numerous times.
| C17 |
The deposit is epithermal and made up of veins and dependent stockwork structures, mainly in the hanging wall and often associated with vein intersections. Four vein systems have been described, which, in decreasing order of importance, are:
|
| · | System striking east-west, dipping south at 60° to 70°, including the Avino Vein and its possible extension in the Cerro de San Jose. |
|
|
|
|
|
| · | System striking north 60° to 70° west, dipping 60° to 80° southwest, comprising the following important veins: El Trompo, San Juventino, San Jorge, Platosa, Los Reyes, Potosina, El Fuerte, and Conejo. |
|
|
|
|
|
| · | System striking north 20° to 30° west, dipping between 60° to 80° to either the southwest or northeast, comprising the following significant veins: San Gonzalo, Aguila Mexicana, and La Calcita, as well as the Stockwork La Potosina and the Stockwork El Fuerte. |
|
|
|
|
|
| · | Systems striking north 60° to 80° east, dipping 60° to 80° southeast, comprising the following veins: Santiago, Retana, Nuestra Senora, and San Pedro and San Pablo. |
Alteration has been reported in three main types:
|
| · | Propylitic alteration is most common in andesite, giving the andesite a greenish tint. |
|
|
|
|
|
| · | Argillaceous alteration appears mainly in the upper parts of the veins and manifests itself as a whitening of the country rock due to alunite and montmorillonite clays. |
|
|
|
|
|
| · | Silicification, chloritization, and pyritization alteration are observed in the hanging wall and footwall and are more prominent closer to the vein. |
San Gonzalo Vein
The San Gonzalo Vein is located approximately 1.4 km northeast of the Avino Vein. The San Gonzalo Vein system constitutes a strongly developed vein system over 25 m wide, trending 300° to 325°/80° northeast to 77° south. It is characterized by banded textures and open-space filling. The main vein has an average width of 2 m, but the silica-pyrite or iron oxide-sericite alteration with additional stock working extends across 300 m, south of the main San Gonzalo Vein to the Los Angeles Vein.
The San Gonzalo is a typical narrow vein, precious metal deposit with some erratic values and extends approximately 2 km to the northwest to the Santa Ana-Malinche area (Gunning 2009).
The Cerro San Jose-La Estella-San Gonzalo Cerro San Jose represents a distinct hydrothermal centre with similar characteristics to the Avino system, which include the following (Paulter 2006):
|
| · | Occur on a topographic high |
|
|
|
|
|
| · | Strong to intense silicification and brecciation |
|
|
|
|
|
| · | Easterly trending stockwork system similar to the trend of the Avino Vein |
|
|
|
|
|
| · | Similar temperatures of formation to Avino |
|
|
|
|
|
| · | Presence of an intersecting northwesterly trending vein system (la Estella at San Jose and San Juventino at Avino) |
|
|
|
|
|
| · | Emplacement along a northerly trending, deep crustal fault zone (defined by the Aguila Mexicana Vein at Cerro San Jose and the felsic dyke at Avino) |
| C18 |
Guadalupe Vein
The Guadalupe Vein is located approximately 0.7 km northeast of the Avino Vein. It consists of northwest-southeast and east-west striking steep-dipping vein sets. The geometry is similar to the San Gonzalo vein, but the base metal mineralization more closely resembles the Avino hanging wall breccia.
La Potosina Veins
The La Potosina Veins are located close to the northern margin of the caldera, approximately 7 km north of the Avino mine and processing plant. It consists of complementary northwest-southeast striking steep-dipping vein sets. The geometry is complex, with at least two ages of fault displacement.
Oxide and Sulphide Tailings
The Avino tailings deposit is adjacent to the processing plant, approximately 300 m west-southwest of the mine offices. The tailings have been built up over several decades of mining and processing, and several units have been defined based on the oxidation of the tailings and metal content.
Due to the historical processing sequence, the oxide tailings are primarily derived from weathered and oxidized rocks close to the surface on the Property, whereas the sulphide tailings are predominantly derived from material sourced at depth from the underground workings below the weathered/leached zone.
The tailings have been included in the current Mineral Resource.
La Preciosa Property Area
Regional Geology
The La Preciosa Property concessions are situated on the eastern flank of the Cretaceous to mid-Tertiary Sierra Madre Occidental (Figure 7-4 of the Report). The SMO is the largest silicic igneous province in North America and it stretches from the USA-Mexico border to the latitude of Guadalajara, where the SMO is covered by the late Miocene to Quaternary Trans-Mexican Volcanic Belt.
The SMO is part of the Basin and Range physiographic province where magmatism and tectonism were related to the subduction of the Farallon Plate beneath North America. Physiographically, the core of the SMO forms the boundary between the Mexican Basin and Range Province to the east and the Gulf Extensional Province to the west.
Figure 7-4 of the Report shows a simplified geological map of Northern Mexico showing the main assemblages of the Sierra Madre Occidental (from Ferrari et al. 2007). The Lower Volcanic Complex (LVC) is shown in blue and the Upper Volcanic Supergroup (UVS) is shown in pink and orange.
| C19 |
The stratigraphy of the SMO comprises the following main sequences:
| · | Late Cretaceous to Paleocene plutonic rocks. |
|
|
|
| · | Paleocene-Eocene (ca. 67-55 Ma) andesites and lesser rhyolites, traditionally grouped into the LVC (McDowell and Keizer 1977). |
|
|
|
| · | Silicic ignimbrites mainly deposited during two pulses, e.g., Oligocene (ca. 32-28 Ma) and Early Miocene (ca. 24-20 Ma) and grouped into the UVS (McDowell and Keizer 1977). |
|
|
|
| · | Transitional basaltic-andesitic lavas that erupted toward the end of, and after, each ignimbrite pulse. |
|
|
|
| · | Post-subduction volcanism consisting of alkaline basalts and ignimbrites deposited in the Late Miocene, Pliocene, and Pleistocene. |
In the area, deformed metasedimentary rocks of Cretaceous age are exposed in small windows through the Tertiary volcanic rocks of the SMO. These consist of folded and foliated clastic metasedimentary rocks that are unconformably overlain by undeformed Early Tertiary conglomerate and sandstone of the Ahuichila Formation (Aguirre-Diaz and McDowell 1993), which are in turn overlain by a sequence of intermediate tuffs, flows, and agglomerate of the Paleocene-Eocene age LVC. The LVC sequence is overlain by a thick sequence of rhyolite and intermediate to felsic ignimbrite, tuff, and volcanic breccia of Oligocene-age that are exposed along cliffs to the west.
The region is transected by the regional northwest-striking San Luis-Tepehuanes fault system (Nieto-Samaniego et al. 1999), which roughly coincides with the eastern margin of the SMO. This fault system comprises a complex network of northwest- to north-striking, west-dipping fault segments that are associated with east to northeast tilting of Tertiary stratigraphy. In the Durango region, the fault system is made up of north-northwest trending normal faults and associated (half) grabens that were active during two stages of extension between ca. 32 and 24 Ma (Nieto-Samaniego et al. 1999). The basins and parts of the lower hills in the region are covered with varying thicknesses of Pliocene to Pleistocene basalt that erupted from numerous vents now marked by small volcanic cinder cones and domes.
La Preciosa Local Geology and Mineral Deposits
Local Geology
The oldest rocks in the La Preciosa area are Jurassic-Cretaceous metasedimentary graphitic schist, chlorite schist, and layers of quartzite. These metasedimentary rocks do not outcrop at surface but are intersected in drill core. Overlying the metasedimentary sequence is a thick package of unmetamorphosed polylithic conglomerate containing lenses of arkosic sandstone of unknown age.
The sedimentary package is overlain by intermediate tuff and agglomerate of the regional Tertiary age LVC. In places, the flows are porphyritic or glomeroporphyritic, and the tuffs are partly welded. The youngest rocks within the property are basalt flows that erupted from several Pleistocene-age volcanic vents and which now fill the lower valleys. Cerro Prieto, Cerro Blanco, and Cerro La Chicharronera are prominent examples of the volcanic vents. Other nearby (9 km west) volcanic vents is the Holocene age, La Breña-El Jagüey maar complex, which is part of the Durango Volcanic Field. Sporadic mafic to felsic dikes and sills of unknown age are found in the deeper parts of the area and rarely at surface.
The area contains a series of Tertiary-age silver-bearing (±gold) epithermal quartz veins associated with barite, fluorite, and sporadic base metals, primarily zinc and lead. There are two major vein and vein-breccia systems exposed on a series of hills and ridges, which are separated by a flat-floored valley roughly 800 m wide. The conglomerate and Tertiary Lower Volcanic andesitic rocks are the main host rocks for quartz veins, although vein mineralization does extend into the basement metasedimentary rocks.
The main veins system on the Abundancia Ridge consists of dominantly south-striking and west-dipping veins plus east-southeast-striking, south dipping crosscutting veins. For example, the Abundancia Ridge vein system has been traced on surface for more than 1.5 km, and drilling has revealed that the veins continue to the north, beneath basalt cover.
| C20 |
Along the eastern side of the La Preciosa Property, a series of hills expose a north- to northwest-striking, shallow west-dipping vein system with associated hanging wall veining and alteration. This vein system is referred to as the Martha vein or fault zone and has been traced by drilling for over 2.5 km along strike.
Mineralization at the La Preciosa Property is hosted within multiple discrete poly-phase quartz veins, often displaying banded, smoky, drusy, and chalcedony textures. Also, in each stage there is variably crustiform banded fracture fill/breccia cement mineralogy. Fluorite, amethyst, a substantial number of barite laths, calcite, and rhodochrosite may also be present, and sulfide mineralization in the form of sphalerite, galena, pyrite, chalcopyrite, acanthite, sparse native silver, and free gold, as well as iron and manganese oxides have been noted in drill core. The principal silver bearing mineral at the La Preciosa Property is acanthite-pseudomorphic after argentite or as microcrystalline to amorphous grains.
Vein mineralization does extend into the basement metasedimentary rocks, but its extent and distribution is not well understood. The main vein system on the Abundancia ridge consists of dominantly southward-striking and westward-dipping veins plus east-southeast–striking, south-dipping crosscutting veins. The Abundancia ridge vein system has been traced on surface for over 1.5 km. Along the eastern part of the La Preciosa Property, a series of hillocks expose a north- to northwest-striking, shallow west-dipping vein system with associated hanging wall veining and alteration. This vein system is referred to as the Martha vein or fault zone and has been traced by drilling for over 2.5 km along strike.
Examination of mineralized samples identified mainly argentite, tennantite/tetrahedrite, and Ag sulphosalts in samples. The majority of gold/electrum is inter-grown with or occupying the same paragenetic position as argentite, silver sulphosalts, sphalerite, and galena, mostly transitional between quartz and carbonate/iron carbonate in formation.
Wall rocks hosting mineralization are variably silicified, with proximal patchy illite-smectite alteration and distal chlorite alteration. The presence of manganocalcite has been noted in several drillholes, but it is not uniformly distributed. In shallower drillholes, pyrolusite and limonite often appear on fracture surfaces.
The host rocks and veins have undergone intense weathering. The base of oxidation is erratically distributed as weathering is controlled by the presence of post mineralization faults which allowed the percolation of oxidized meteoric groundwater to vertical depths of 350 m below surface. Weathering minerals include iron oxides, iron carbonates, manganese oxides, and unidentified clays.
Lithological Units
The main rock types occurring in the La Preciosa Property area include volcanic flows, pyroclastic rocks, sedimentary rocks (clastic and epiclastic rocks), metamorphic rocks, and subvolcanic dikes. The lithological descriptions below include the alteration products that were most commonly observed.
Alteration
The principal visible alteration facies observed in the Property consist of:
|
| · | Patchy albite-epidote±chlorite flanks the deposit to the west, north, and southeast, and produces strengthening of the rock. Chlorite, brucite, and epidote are the most common minerals present in this facies. |
|
|
|
|
|
| · | Silica-sericite-pyrite occurs along northwest and east-northeast trending corridors, and does not appear to be intense enough to affect rock strength. Illite and muscovite are the most common minerals in this facies. |
|
|
|
|
|
| · | Pseudomorphic clays and carbonate after phenocrysts occurs throughout all porphyritic lithologies and does not define specific trends or affect rock strength. Illite, phengite, and montmorillonite, iron-carbonates, and lesser chlorite are the most common in this facies. |
|
|
|
|
|
| · | Pervasive texture destructive silica defining northwest-trends are often defined by zones of breccia. |
|
|
|
|
|
| · | Fault-fill clays are restricted to post-mineral faults. Montmorillonite is the most common mineral in this facies. |
| C21 |
The most frequently occurring are (in order of decreasing frequency): montmorillonite, illite, phengite, iron carbonate, silica, chlorite, brucite, muscovite, kaolinite, calcite, and epidote. Among the alteration minerals, muscovite is the mineral that appears to have best spatial correlation with faults.
The deposit lacks a distinct halo of a high illite crystallinity surrounding mineralization. This lack of an alteration halo is interpreted as being due to a combination of the strong lithological control over illite crystallinity, and to the scale of this alteration study, which was conducted along the main mineralized zones. It is possible that a broad zone of illite crystallinity high would be defined at a more regional scale.
Mineralization
The area has been cut by numerous structures, both northwest and northeast oriented (to north-northwest and north-northeast), as well as ~eastwest; post-Oligocene extension resulting in graben-style faults, possibly with low-angle listric-type movement. Subsequent mineralization occurred along these low and high-angle faults, and also followed the low-angle contact of the basement or conglomerate with the tuff. The Martha vein, with a dip of ~20° to the southwest, defines the unconformity at depth. The shallowly dipping Abundancia vein dips ~50° to the west-northwest, and the high-angle La Gloria vein in the west dips ~75° to the west-southwest. Internal to this main system of veins are also areas of veinlets and stockwork, which constitute most of the mineralization.
Mineralization is controlled by three types of structures:
|
| · | Type 1: structures commonly associated with faults and exhibit crustiform, cockade, and colloform textures that are representative of multiple vein opening stages. These veins generally have widths of greater than 30 cm and can form vein systems up to several m wide. Cavities are also common in these veins. Quartz stockwork comprising mm- to cm-scale quartz veinlets is common both in the hanging wall and footwall of Type 1 vein systems. |
|
|
|
|
|
| · | Type 2: structures consist of veins that range in width from 1 cm to several tens of cm, and rarely include veins up to 6 m wide (e.g., Abundancia and La Gloria veins). Type 2 veins are dominated by colloform textures with sugary quartz and euhedral crystals projecting into cavities along the vein centers. Dilation (or jigsaw) breccia veins are also common, with angular clasts of wall rock (typically fine-grained volcaniclastic rock) in quartz and (or) calcite cement. Colloform textures and crystal growth into cavities are characteristics of open-space filling which commonly occurs in extensional settings. |
|
|
|
|
|
| · | Type 3: structures are commonly associated with abundant hematite alteration of the host rock, breccia, minor stockwork development, and patchy or narrow quartz vein development. Type 3 structures are typically fault zones up to several m wide with variably developed quartz-carbonate-calcite veins and fault breccia. |
As previously mentioned, the mineralization in the area occurs in veins, veinlets, and stockwork. These veins average in true width under 15 m (Martha Vein) and consist of several stages of banded crustiform to colloform, quartz (and cryptocrystalline quartz at shallow depths), adularia, barite, and typically later carbonates (both calcite and rhodochrosite); illite commonly replaces the adularia. There are variable amounts of pyrite, sphalerite, and galena plus argentite, and variable amounts of tetrahedrite - tennantite, freibergite, and Ag sulfosalt.
| C22 |
Local Mineralization
The district has many characteristics that are typical of epithermal veins in Mexico, particularly of the Ag-rich variety. Quartz veins are accompanied by adularia, barite, calcite, rhodochrosite of variable timing, as well as acanthite, freibergite, Ag sulfosalts and minor electrum, plus variable amounts of pyrite, honey-colored sphalerite, tennantite/tetrahedrite, chalcopyrite and galena, and supergene Fe and Mn oxides; the hypogene minerals are characteristic of intermediate-sulphidation deposits in Mexico. Mineralization is believed to be Tertiary in age both the LVS and UVS are mineralized, but the basalts are recent and not mineralized.
Petrographic studies of the veins in the Deposit find that multiple stages of silver and base metal mineralization are associated with repeated fluid boiling and mixing events, defined by crustiform banded fill/cement assemblages within a framework of intermittent and more significant fracturing/rupturing of wall rock and pre-existing vein/cement assemblages. There is a repetition of common hydrothermal fill/cement mineralogy, including mineralized minerals, such that correlation of vein/cement assemblages/events between drillhole intersections would be difficult.
The occurrence of adularia and style of early quartz and chalcedonic quartz replacement amongst wall rock replacement and fracture-fill/cement assemblages confirms silver and base metal mineralization associated with low sulphidation, epithermal style systems developed on the Martha and Olin structures at the project. Significant widths of mineralized quartz and carbonate dominated fracture-fill and breccia cement assemblages have developed as a result of extended episodes of hydrothermal fluid flow and repeated rupturing of wall rock and pre-existing vein/cement assemblages. Internal crustiform banding within the different voluminous fill/cement assemblages represents incremental opening and filling of fractures/cavities between major rupturing events.
The Martha vein is the largest vein in the deposit by far, with at least three times the volume of the next largest vein, La Abundancia. Both veins are low angle, the Martha vein dips ~20-30°, following the southwest-dipping contact of volcaniclastic rocks overlying an immature conglomeratic unit (consisting mainly of polylithic clast-supported fragmental rock with angular to sub-rounded clasts) or the underlying schist.
There are also high-angle veins in the west on the ridge, such as La Gloria vein, the largest of this set of veins. These high-angle veins can be considered as a mineralized zone or lode of stock work, silicification, breccias, veins, vein breccias, veinlets, and a general mix of multiple styles of mineralization. Within this broader zone, for example the Martha lode ranges from 1 to 35 m thicknesses and averages approximately 5 m.
Structural Geology
There are three main types of syn-mineralization veins and faults in the property:
|
| · | Type 1 – Silver-gold bearing, south-southeast– and south-striking, shallow west-dipping structures (e.g., the Martha fault zone). |
|
|
|
|
|
|
|
|
| o | These structures are commonly associated with faults and exhibit crustiform, cockade, and colloform textures that are representative of multiple vein opening stages. Veins generally have widths greater than 30 cm and can form vein zones up to several m wide. |
|
|
|
|
|
|
|
| o | Steep down-dip (i.e., shallow west-plunging) mineral lineation and associated steps indicate that these structures developed as normal faults. |
|
|
|
|
|
|
| · | Type 2 – Silver-gold bearing, south-southeast– to south-southwest–striking, moderate to sub vertical west-dipping structures (e.g., the Abundancia and La Gloria veins). |
|
| C23 |
|
| o | These structures contain veins that range in width from 1 cm to several tens of cm, and include rare up to 6 m wide veins. Vein textures comprise colloform banding, dilation (jig-saw) breccia, and euhedral crystals projecting into cavities along the vein centers typical of extensional veins. Few faults are associated with these veins, although vein walls are sometimes characterized by smooth and striated post-mineralization faults. |
|
|
|
|
|
| o | Type 2 veins developed as extensional veins in the hanging wall and footwall of Type 1 structures. Rare syn-mineralization faults display steep-west plunging mineral lineation and associated steps indicating normal dip-slip movement. |
|
| · | Type 3 – East-southeast-striking, moderate to steep south-dipping structures (e.g., two ESE structures, La Plomosa, and Transversal veins) with sporadic silver-gold bearing quartz veins. These structures are up to several m wide, consisting of fault zones with variably developed quartz-carbonate-calcite veins and fault breccia commonly associated with hematite alteration of the host rock. |
|
|
|
|
|
| · | Dominantly moderate to steeply west-plunging mineral lineation and associated steps along southwest-dipping veins indicate that these structures developed as normal-dextral oblique-slip faults. |
DEPOSIT TYPES
Regionally, the Property is situated within a 12 km by 8.5 km caldera that hosts numerous low- to intermediate-sulphidation silver-gold epithermal veins, breccias, stockwork, and silicified zones, grading into a “near porphyry” environment in the Avino Property.
The historic mining on the Avino Property was mainly on the Avino Vein, a steep-dipping (50 to 80 degree), silver-gold-copper-rich epithermal vein. The steep-dipping San Gonzalo Vein, however, has a much lower copper content than the Avino Vein and is more equivalent to other silver-lead-zinc deposits of the Sierra Madres.
The numerous veins in the La Preciosa area tend to be narrower and flatter 15 to 40 degree dips). Low-sulphidation vein systems are commonly characterized by low concentrations of sulphide minerals, alteration mineralogy dominated by quartz-adularia-sericite, and a lack of extensive wall-rock alteration. Conversely, high-sulphidation vein systems are commonly characterized by sulphur saturation leading to the presence of native sulphur and sulphide minerals, quartz-alunite alteration, and extensive wall-rock alteration. The Mexican silver deposits are usually within the intermediate sulphidation range rather than either of the end member classifications.
Low sulphidation deposits occur as veins, breccias, and disseminated precious metal mineralization deposited by the circulation of neutral to weakly acidic hydrothermal fluids along regional fault structures, fracture zones, or through highly permeable lithologies such as ignimbrite and agglomerate. Because the fluids are relatively neutral, very little alteration is evident and the veins and nearby wall rock may commonly include illite, sericite, and adularia. Generally, this style of mineralization is distal from a heat source.
Sillitoe and Hedenquist (2003) subdivide epithermal deposits into High- (HS), Low- (LS) and Intermediate-sulphidation (IS) types based on mineralogy, deposit morphology, associated alteration, and geologic setting.
Type IS epithermal deposits occur in a broadly similar spectrum (to HS deposits) of andesitic-dacitic arcs, but commonly do not show such a close connection with porphyry Cu deposits as do many of the HS deposits. However, high silica igneous rocks such as rhyolite are related to only a few IS deposits. IS deposits form from fluids spanning broadly the same salinity range as those responsible for the HS type, although Au-Ag, Ag-Au, and base-metal rich Ag-(Au) subtypes reveal progressively higher mineralized material fluid salinities.
| C24 |
The veins in the project area consist of several stages of banded, crustiform (to colloform), quartz and cryptocrystalline quartz at shallow depths, adularia, barite, and typically later carbonates both calcite and rhodochrosite, “illitic clay” (illite) commonly replaces the adularia (Coote 2010). There are variable amounts of pyrite, sphalerite and galena plus argentite, and variable amounts of tetrahedrite-tennantite, freibergite and Ag sulfosalts.
The Ag:Au ratio is high, approximately 500:1 for the resource. Supergene oxidation extends to at least 300 m depth, and includes manganese oxide. There is abundant adularia, bladed calcite textures, and coexisting vapour-rich and liquid-rich inclusions, all indicating an ascending, boiling fluid consistent with the abundant evidence for brecciation which suggests that that mixing caused metal deposition and carbonate formation.
In Mexico, and particularly within the Mexican Silver Belt, these types of deposits can have large lateral extents but may be limited vertically. There are many silver-gold mines in Mexico, some of which form large mining districts and others that exploit multiple veins over limited vertical horizons that are sometimes only 100 m in depth (Gunning 2009).
Adjacent to the Elena Tolosa Mine in the Avino Mine area, the oxide tailings have been predominantly sourced from legacy open pit operations, and the sulphide tailings have been predominantly sourced from later underground workings. Exposure to surface weathering and historic process activities has homogenized the tailings material to produce a deposit partly included in the Mineral Resource for the Property.
EXPLORATION
Avino Property Area
Early Exploration , 1968 to 2001
Exploration in the Avino Mine area has been ongoing since before production commenced, and the majority of the recorded work has been focused on the main Avino Vein and surrounding area. The following is a summary of significant exploration work conducted either by Avino or on behalf of Avino until the mine closed in 2001.
Pre-production exploration was carried out by CMMA and others and covered 2,500 m of drifting and cross-cuts, as well as 8,000 m of surface and underground diamond drilling. Extensive rehabilitation was completed involving Selco, including connecting three of the old—possibly pre-1900—underground mine workings.
In 1970, a contract was signed with Selco, who spent more than $1 million in exploration and FSs before returning the historic Avino Property back to CMMA in 1972, reportedly because of low metal prices. The majority of the documentation examined covered feasibility work and was related to investigations of old underground workings that were likely developed in the late 1800s. A contract was signed in October 1973 with S.G.L. Ltd. and Sheridan Geophysics Ltd., under which a new 500 t/d processing plant was completed in May 1974.
Since 1992, exploration in/for the mine has been limited to traditional underground mine development with associated sampling and planning for production feed. In the late 1990s, it appears that development was not kept up, as company monthly reports showed decreasing historical reserve allocations for production and mill feed.
The only recorded exploration, apart from limited prospecting, is documented in the 1993 report by Servicios Administratos Luismin, SA de CV, the engineering branch of Cía Minera de San Luis Exploration. The study reported on detailed analysis and sampling of the then known showings with the emphasis on the Avino Vein and Potosina/El Fuerte area. The extensive underground sampling program carried out by Luismin provided a later direction for underground mining. The report made recommendations for follow-up for drilling and underground development for the main Avino Vein, as well as trenching and drilling recommendations for the Potosina/El Fuerte area. It is believed that these recommendations were never implemented for the prospective areas. Additionally, the report included a property-scale geological mapping and lithogeochemical sampling program, which was contoured and coloured for gold, silver, copper, lead, zinc, arsenic, antimony, and mercury.
| C25 |
Other notable observations from the study include the following:
|
| · | All mineralization, except for Nuestra Senora and Potosina/El Fuerte, radiate outwards in a west-to-northwest direction from the Cerro San Jose. The Cerro San Jose is a silicified and partly hornfelsed body of volcanic rock probably overlying an intrusive stock, which could have been the source of most mineralization in the historic Avino Mine area. |
|
|
|
|
|
| · | Mineralization in all radiating structures is described as being strongest 2 km to 3 km from Cerro San Jose. This resembles many of the gold deposits in Nevada, where the source of mineralization is a near-surface acid-intrusive but with mineralized bodies lying 1 km to 5 km away along high-angle faults. |
|
|
|
|
|
| · | The two strongest and widest structures appear to be the Avino and Aguila Mexicana veins. |
|
|
|
|
|
| · | The Avino Vein has three main mineralized zones—San Luis, ET (La Gloria/Hundido) and Chirumbo areas—which rake to the west and are open at depth. |
|
|
|
|
|
| · | The existence of other mineralization cutting the Cerro San Jose mineralization in the Nuestra Senora and Potosina/El Fuerte areas could offer the potential for bulk mineable stockwork zones. |
Assay values from outcrop sampling of surface-mapped veins towards the San Jose hill ranged from lows of 2 g/t silver and trace gold over true thicknesses from 0.1 m to 2.3 m up to a high of 755 g/t silver with a corresponding 1.5 g/t gold over a thickness of 0.45 m.
No systematic sampling, trenching, or drilling of either the outcrops or the veins is known to have occurred during the program undertaken in 1993.
Recent Exploration, 2001 to Present
After the temporary mine closure in 2001, Avino intermittently conducted exploration work, with the intention of expanding and better defining known areas of mineralization. Historic near-to-surface mining activities are being relied upon for guidance, and modern techniques are being employed to integrate, manage, and interpret results. Included in the list of exploration activities is an induced polarization geophysical survey, 1,500 soil samples, satellite imagery, mapping, trenching, tailings investigations, bulk sampling, underground channel sampling, and surface drilling.
Tailings Investigations (Oxides), 2003 and 2004
Two specific mineralogical assessments were conducted in 2003 and 2004 on samples from the tailings on the at the Avino Mine. The purpose of the program was to provide data for an independent investigation of the 1990 drilling results on the oxide tailings (discussed in the section titled “Drilling”) in terms of verifying assay grades and volumes, as well as to examine the metallurgical characteristics of the material. The results and implications of these findings are discussed further in the section titled “Mineral Processing and Metallurgical Testing”.
The following information regarding the 2004 sampling is summarized by Slim (2005d).
| C26 |
The 2004 tailings fieldwork was under the direction of MineStart, and excavation of the sample pits was under contract with Desarrollos Rod Construcciones of Durango. Given the hydraulic deposition of the tailings, four important factors required examination: anomaly characteristics of the samples and total population, assay comparison by the fence, examination of downstream decrease in assays, and factors arising from the downstream construction.
Comparison of the 2004 assays with those from 1990 shows consistency in assay values and provides confidence in the 1990 sampling and assaying program.
The preliminary investigations in 2003 showed the need for a sampling of the oxide tailings to validate the assay results of the 1990 drilling and to carry out metallurgical characterization, the latter requiring large samples.
The sampling exercise carried out in 2004, using shallow (4 m deep) backhoe trenches and hand-dug pits, represented a local corroboration of the previous sampling but could not be considered to constitute a representative random sampling of the oxide tailings.
The trench sampling material (Z-series) from the 1993 campaign was also considered to be non-representative.
Tailings Sampling (Sulphides), 2005
Some sampling was carried out in 2005 by means of hand-dug pits on the “upper bench” of sulphide tailings. The silver and gold values generally ranged from 40.0 g/t to 100.0 g/t and 0.3 g/t to 0.6 g/t, respectively. While these values give a general idea of the potential grade of the sulphide tailings, they have not been verified to be representative of the sulphide tailings, even at a local scale.
Bulk Sample Program of San Gonzalo Vein, 2011
Avino completed a 10,000 t bulk sample program at the San Gonzalo deposit following a comprehensive review of the data and discussions with Tetra Tech. The bulk sample feed grade was 261 g/t silver and 0.9 g/t gold. Silver and gold recoveries were stated to be 76% and 59%, respectively, and 232 dry t of flotation concentrate was produced.
| C27 |
Underground Channel Sampling of San Gonzalo and Avino Vein, 2010 to Present
Underground channel sampling began in 2010 and has continued to the present at ET Mine (Avino Vein system) and San Gonzalo Mine. Channel sampling data generated since 2010 are summarized in Table 0‑1 and Table 0‑2.
Table 0‑1: Summary Underground Channel Sampling by Level for the Avino (ET) Underground Mine
| Level | Elevation (m) | Total Sampled (m) | Average Channel Length (m) | Ag (g/t) | Au (g/t) | Cu (%) |
| 6.5 | 2,271 | 373.6 | 3.9 | 113.01 | 0.98 | 0.51 |
| 7 | 2,241.8 | 1,197.6 | 6.1 | 72.50 | 0.42 | 0.44 |
| 7.5 | 2,212.8 | 230.5 | 7.0 | 66.15 | 0.49 | 0.50 |
| 8 | 2,199.1 | 486.3 | 6.2 | 141.32 | 1.14 | 0.22 |
| 8.5 | 2,171.9 | 576.9 | 6.6 | 123.19 | 1.37 | 0.48 |
| 9 | 2,147.1 | 1,343.8 | 7.5 | 121.65 | 1.52 | 0.57 |
| 9.5 | 2,128 | 768.2 | 9.1 | 122.42 | 2.26 | 0.76 |
| 10 | 2,115 | 2,905.9 | 7.3 | 72.12 | 0.60 | 0.49 |
| 10.5 | 2,101 | 1,468 | 7.1 | 106.90 | 0.77 | 0.65 |
| 11 | 2,083 | 1,214.7 | 9.6 | 87.57 | 0.48 | 0.73 |
| 11.5 | 2,067.2 | 1,289.9 | 7.5 | 89.65 | 0.44 | 0.63 |
| 12 | 2,051 | 1,092 | 8.2 | 94.87 | 0.41 | 0.76 |
| 12.5 | 2,034.3 | 1,356.5 | 7.8 | 84.94 | 0.51 | 0.69 |
| 13 | 2,016.1 | 645.8 | 6.1 | 61.64 | 0.24 | 0.63 |
| 13.5 | 1,995.5 | 386.3 | 5.2 | 57.01 | 0.24 | 0.51 |
| 14 | 1,975 | 578 | 5.4 | 54.56 | 0.13 | 0.52 |
| 14.5 | 1,954.3 | 2,622.4 | 6.3 | 54.18 | 0.38 | 0.56 |
| 15 | 1,932.5 | 2,341.1 | 6.0 | 63.98 | 0.48 | 0.58 |
| 15.5 | 1,910 | 2,182.4 | 5.8 | 59.15 | 0.41 | 0.57 |
| 16 | 1,889 | 3,638.4 | 5.4 | 49.16 | 0.56 | 0.57 |
| 16.5 | 1,870 | 3,491.1 | 5.2 | 50.71 | 0.40 | 0.68 |
| 17 | 1,849 | 3,146.68 | 6.6 | 48.26 | 0.42 | 0.71 |
Table 0‑2: Summary of Underground Channel Sampling by Level for the San Gonzalo Mine
| Level | Elevation (m) | Number of Channels | Total Sampled (m) | Average Channel Length (m) | Ag (g/t) | Au (g/t) | Cu (%) |
| 1 | 2,311.9 | 114 | 272.8 | 2.4 | 157.65 | 0.43 | - |
| 2 | 2,265.3 | 314 | 840.6 | 2.7 | 115.75 | 0.40 | - |
| 3 | 2,218.3 | 378 | 1,046.1 | 2.8 | 119.92 | 0.41 | - |
| 4 | 2,180.0 | 685 | 1,814.2 | 2.6 | 241.59 | 1.15 | - |
| 5 | 2,138.5 | 740 | 2,031.9 | 2.7 | 285.70 | 1.57 | - |
| 6 | 2,091.8 | 603 | 1,667.8 | 2.8 | 186.70 | 1.14 | - |
| 6.5 | 2,064.4 | 243 | 682.4 | 2.8 | 177.17 | 0.86 | - |
| 7 | 2,046.9 | 190 | 517.4 | 2.7 | 111.50 | 0.71 | - |
| 7.5 | 2,020.0 | 114 | 295.6 | 2.6 | 179.90 | 1.01 | - |
| C28 |
Underground Channel Sampling of San Gonzalo and Angelica Vein, 2010 to Present
Underground channel sampling began in 2010 and has continued to the present. Channel sampling between 2010 and 2012 was summarized by Tetra Tech (2013).
La Preciosa Property Area
Summary of Past Exploration
Exploration and other work at the La Preciosa Property date back to mining in the late 1800s on the Abundancia and La Gloria veins, two prominent veins exposed on the surface of La Preciosa Ridge. This work, which ceased in the early 1900s, and small-scale underground mining in the 1970s, resulted in the production of a small amount of material from these two veins, estimated by MP (Head and Collins 2012) to be less than 30,000 t. This tonnage estimation was not validated by Coeur but site inspections support that a small amount of mining was previously done.
The majority of work at the La Preciosa Property that is material to the mineral resources is from contemporary exploration, mainly drilling, conducted by Luismin, Orko, and PAS (Table 9‑3 of the Report). In addition to the drilling completed by these companies, other exploration activities, consisting of:
|
| · | Prospect sampling by Orko in 2004, followed by geologic mapping by Orko geologists. |
|
|
|
|
|
| · | Completion of three IP ground geophysical surveys in 2005 that totaled 40 line-km. The resistivity data did not appear to be a useful product of this work, but the chargeability component did identify an anomaly in the valley between La Preciosa Ridge and Zona Oriente. |
|
|
|
|
|
| · | A large geochemical soil sampling program over a grid spanning 5 km north to south and 2 km east to west. This program produced anomalous analytical results from areas near shallowly covered veins such as Veta Nueva, Orito, and Nancy. |
Historic exploration (along with recognition of late 1800s/early 1900s mining) was responsible for the identification of anomalous silver and gold in soils and outcropping veins.
Coeur Exploration and Development
Coeur’s 2013-2014 drilling program was divided into three types:
|
| · | Type I drilling: completion of 21 reverse circulation (RC) drillholes to test and condemn waste dumps and tailings impoundment areas, drilling commenced January 2014 and completed February 2014. |
|
|
|
|
|
| · | Type II drilling: infill core drilling between February 2014 and mid-April 2014 completed a 75-hole drilling program totaling 11,437 m. Drilling targeted the first three years of the mine plan to convert inferred to indicated resources and reduce risk in achieving the early mine plan. All drilling was concentrated around the Abundancia Ridge area. |
|
|
|
|
|
| · | Type III drilling: from December 2013 to March 2014 Major Drilling, under KP supervision, completed seven HQ3 core holes specifically to obtain geotechnical data in the area of the design pits, tailings impoundment, and process plant footprint. Subsequently, these holes also were sampled for geochemical data. |
| C29 |
Coeur has completed development and exploration work at the La Preciosa Property in 2013-2014, as shown in Table 9‑3.
Table 9‑3: 2013 – 2014 Coeur Exploration and Development Work Summary
| Quantity | Data Type | Totals | Target |
| 75 drillholes | Core Holes | 11,437 m | In-fill drilling, resource conversion |
| 21 drillholes | RC Holes | 8,543 m | Waste dumps and tailings, condemnation drilling |
| 7 drillholes | Core Holes | 2,244 m | Geotechnical information |
| 103 drillholes | Drill Samples | 12,358 samples | New assay samples from older drillholes |
| N/A | Geophysical | 300 km2 | Magnetic survey for lithological and structural domains |
| N/A | Geologic Mapping (surface and underground) |
| Define structural geology |
| N/A | Drillholes (scanned 109 new and old drillholes) | 35,754 m | IR measurements to define alteration |
| N/A | Drillholes (scanned 26 new and old drillholes) | 6,166 m | Televiewer scans for structural geology and geotechnical data |
In the opinion of the QP, Coeur’s drilling, sampling, and logging was done to industry standards. A total of 25.908 m of RC samples, or 17 intervals, was logged as NR (no return), which is 0.3% of the total amount of RC drilled in 2014 (Table 9‑3). RC drilling was specifically focused on exploring sites for waste rock and tailings facilities. Core recovery is reported as 100%, no NR intervals were reported. Because the 2014 core drilling program was designed to infill between existing drillholes, the resulting samples are representative of the mineralization as a whole and are not biased in their location, orientation, sampling method, or metal grade. Since the core drilling infilled the area designed to be mined in the first three years of the mine plan, the spatial density of sampling is good, sufficient for much of the material to be classified as indicated or measured.
In the opinion of the QP, the quantity and quality of the lithological, geotechnical, collar, and downhole survey data collected in the exploration and infill drill programs completed by Coeur, Orko, PAS, and Lusmin are sufficient to support Mineral Resource estimation as follows:
|
| · | Core logging meets industry standards for gold exploration. |
|
|
|
|
|
| · | Collar surveys have been performed using industry-standard instrumentation. |
|
|
|
|
|
| · | Downhole surveys were performed using industry-standard instrumentation. |
|
|
|
|
|
| · | Recovery data from core drill programs are acceptable. |
|
|
|
|
|
| · | Geotechnical logging of drill core meets industry standards for planned open pit operations. |
|
|
|
|
|
| · | Drill orientations are generally appropriate for the mineralization style, and have been drilled at orientations that are optimal for the orientation of mineralization for the bulk of the deposit area. |
Core logging did not reveal any unusual geologic features that have not been observed in previous logging in the La Preciosa Property area. Assay results and location of mineralized intercepts are consistent in spatial location and grade of previous drilling in the La Preciosa Property area and no unusually high-grade intercepts or previously unknown mineralized areas were encountered, i.e., the distribution of sample grades from the 2014 drill program are similar to distributions of grades from previous drill programs.
| C30 |
DRILLING
Avino Property Area
Drilling activities performed by Avino since the acquisition of the Avino Mine area are summarized in the following sections. Drillhole assay results have been previously reported (except ET 12-07 to ET-12-09) by Gunning (2009), Tetra Tech (2012), and Tetra Tech (2013) and are not disclosed here.
The most recent exploration drilling is summarized in Table 10-1. The location of this drilling is summarized in Figure 10-1 where the holes are indicated by red traces.
Table 10-1: Exploration Drilling 2019-22
| Hole_ID | Easting_UTM | Northing_ UTM | Elev_(m) | Depth_(m) | Zone |
| ET_21_01 | 569,943.9 | 2,712,246.7 | 2,234.6 | 329.0 | Avino_Vein |
| ET_21_02 | 569,943.9 | 2,712,245.9 | 2,234.6 | 308.0 | Avino_Vein |
| ET_21_02B | 569,947.4 | 2,712,247.0 | 2,233.7 | 381.0 | Avino_Vein |
| ET_21_03 | 570,023.8 | 2,712,291.3 | 2,235.5 | 336.2 | Avino_Vein |
| ET_21_04 | 569,935.9 | 2,712,251.8 | 2,234.0 | 314.0 | Avino_Vein |
| ET_21_05 | 570,532.8 | 2,712,261.2 | 2,184.1 | 260.2 | Avino_Vein |
| ET_21_05B | 570,533.5 | 2,712,261.3 | 2,183.2 | 514.2 | Avino_Vein |
| ET_21_06 | 570,532.9 | 2,712,261.3 | 2,183.3 | 604.2 | Avino_Vein |
| ET_21_07 | 570,424.0 | 2,712,250.3 | 2,183.3 | 503.0 | Avino_Vein |
| ET_21_08 | 570,424.5 | 2,712,249.9 | 2,183.3 | 527.0 | Avino_Vein |
| ET_22_01 | 570,341.1 | 2,712,214.3 | 2,180.2 | 519.4 | Avino_Vein |
| ET_22_02 | 570,341.4 | 2,712,213.8 | 2,180.1 | 558.5 | Avino_Vein |
| ET_22_03 | 570,341.6 | 2,712,213.7 | 2,180.1 | 661.4 | Avino_Vein |
| ET_22_04 | 570,708.2 | 2,712,572.4 | 2,220.7 | 489.4 | Avino_Vein |
| ET_22_05 | 570,230.1 | 2,712,169.2 | 2,178.1 | 540.1 | Avino_Vein |
| ET_22_06 | 570,045.5 | 2,712,078.3 | 2,205.6 | 627.3 | Avino_Vein |
| ET_22_07 | 570,424.1 | 2,712,247.2 | 2,182.9 | 600.9 | Avino_Vein |
| ET_22_08 | 570,342.6 | 2,712,213.8 | 2,180.1 | 584.0 | Avino_Vein |
| ET_22_09 | 570,391.4 | 2,712,220.0 | 2,180.6 | 602.7 | Avino_Vein |
| ET_22_10 | 570,489.5 | 2,712,123.9 | 2,171.3 | 709.1 | Avino_Vein |
| ET_22_11 | 570,585.1 | 2,712,295.5 | 2,186.7 | 545.4 | Avino_Vein |
| ET_22_12 | 570,391.7 | 2,712,219.8 | 2,180.6 | 666.2 | Avino_Vein |
| ET_22_13 | 570,282.8 | 2,712,193.2 | 2,180.1 | 597.4 | Avino_Vein |
| C31 |
Early Drilling (Prior to Mine Closure), 1968 to 2001
Avino Vein
Between 1968 and 2001, at least 25 diamond drillholes, ranging in length from 132.20 to 575.20 m, are reported to have been drilled from the surface into the Avino Vein. Included in this total are 10 holes that were drilled by Selco in 1970 when they were rehabilitating some of the old underground workings to provide access for sampling (Slim 2005d). No further information on these drillholes was available to the QP, and they are not included in the resource estimate for the Avino Vein.
Oxide Tailings, 1990 to 1991
Between November 10 and December 5, 1990, and March 8 and May 30, 1991, Avino completed 6 trenches and 28 vertical drillholes in the tailings along 7 fences at a spacing of roughly 50 m by 50 m (Benitez Sanchez 1991). Drilling was completed transversely to the drainage pattern of the tailings. Cut at 1 m vertical increments, 461 samples were assayed for silver and gold at the mine assay laboratory, and occasional moisture contents were reported. Assay results from these drillholes have been previously reported (Tetra Tech 2012). Although the Z-series trenches are included in Table 10-1 and Figure 10-1, they are not included in the oxide tailings resource estimate (see section titled “Mineral Resource Estimates – Avino Property – Avino Vein”) as they are not considered representative of the tailings at a local scale (see Section 9.1.2.1 of the Report). During 2015 and 2016, further drilling was carried out on the oxide tailings.
Recent Drilling (Post Mine Closure), 2001 to Present
A total of 145 drillholes with a total length of 40,848 m have been completed on the Avino Vein system, 140 holes 26,026 m on the San Gonzalo Vein system, 44 holes 6,365 m on the Guadalupe Vein, and 26 holes 5,175 m on the La Potosina Veins, totalling 355 holes and 78,414 m of core drilling. Additional exploration holes have been drilled elsewhere on the histroic Avino Mine, but those drilling results are not considered material. Most holes were surveyed downhole using a Tropari single-shot magnetic instrument.
Avino Vein
In 2016, 5,510 m (34 holes see Figure 10-1) were drilled in an infill program in the San Luis/Avino Vein system. In 2017, 1,478 m (7 holes, see Figure 10-1) were drilled in the Chirumbo section (eastern extension) of the Avino Vein. In 2018, 1,345 m (13 holes, see Figure 10-1) were drilled north of the historic open pit and in the Chirumbo section on the Avino Vein.
A total of 25,845 m (97 holes, see Table 10-1) of documented drilling has been used for Mineral Resource estimation on the Avino Vein system.
| C32 |
San Gonzalo Vein
A total of 23,804 m (105 holes, Figure 10-1) of documented drilling has been used for Mineral Resource estimation on the San Gonzalo Vein system.
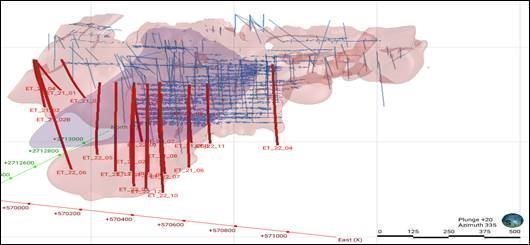
Figure 10-1: Drillholes Completed in 2021 and 2022 on the Avino Vein System, ET Mine. 2018 drill traces in red, previous drilling in blue (Red Pennant 2022)
Guadalupe Veins
During 2021 and 2022, exploration drilling was carried out on the Guadalupe veins. These veins are positioned strategically close to and between the ET and San Gonzalo mining operations. A total of 1,106 m of documented drilling has been drilled on the Guadalupe Vein.
La Potosina Veins
During 2021 and 2022, exploration drilling was carried out on the La Potosina veins. A total of 733 m of documented drilling has been drilled on the La Potosina Vein.
Oxide Tailings, 2015 to 2016
During 2015 and 2016, Avino drilled 57 holes in the oxide tailings deposit. Tailings drillholes completed before 2016 on the oxide tailings have been previously reported (Tetra Tech 2022).
Oxide Tailings, 2021 to 2022
During 2021 and 2022, Avino drilled 127 new vertical holes using the sonic drilling method on the oxide tailings deposit. Collar coordinates are provided in Table 10-2 and Figure 10-3 of the Report. The 2015/16 holes are indicated in red.
Specific Gravity Results
Bulk density samples were analyzed from all 2006 to 2022 drilling programs on the Avino and San Gonzalo Veins. Analytical procedures are discussed in section titled “Sample Preparation, Analyses, and Security – Avino Mine – Review of Drillhole Quality Assurance/Quality Control Samples”. Table 10-3 summarizes the results of these specific gravity measurements.
| C33 |
Table 10-3: Avino and San Gonzalo Density Data Summary
| Domain | Number | Minimum | Maximum | Mean | Variance | Coefficient of Variation |
| Avino Vein System |
||||||
| 10 (Main) | 40 | 2.53 | 3.00 | 2.71 | 0.02 | 0.05 |
| 20 | 42 | 2.43 | 2.90 | 2.68 | 0.01 | 0.03 |
| Wall Rock | 93 | 2.29 | 3.00 | 2.65 | 0.04 | 0.07 |
| Combined | 175 | 2.29 | 3.00 | 2.67 | 0.03 | 0.06 |
| San Gonzalo Vein System |
||||||
| 10 | 50 | 2.40 | 3.00 | 2.64 | 0.03 | 0.07 |
| 20 | 2 | 2.73 | 2.78 | 2.76 | 0.00 | 0.01 |
| Wall Rock | 41 | 2.40 | 3.00 | 2.69 | 0.02 | 0.05 |
| Combined | 93 | 2.40 | 3.00 | 2.67 | 0.03 | 0.06 |
| C34 |
La Preciosa Property
The issuer has not drilled on the concessions since taking ownership.
During 2014, Coeur drilled 75 HQ diamond drillholes for a total of 11,437 m, with an average depth of 150 m, and with core recoveries of 85%. Drilling was done by Layne de Mexico S.A de C.V.
In addition to infill core drilling, an additional 2,244 m of core was drilled for the geotechnical investigation by Major. These core holes were logged and on completion of geotechnical work, the core was split, sampled, and assayed; however, the assay and geology data were not available in time for use in the resource model.
All drillholes, except for RC drillholes intended by Coeur for condemnation drilling, are diamond core holes of varying diameters, mainly HQ and some NQ diameter drillholes. Exploration and development drilling to delineate mineral resources has been performed in sequential campaigns by Luismin, Orko, PAS, and Coeur as summarized in Table 10-4 (excludes RC drilling because RC was not used in resource estimation).
Table 10-4: Drilling Summary
| Company | Years | Area | Number of Drillholes | Meters of Drilling | Hole Number Prefixes |
| Luismin | 1981, 1982, 1994 | La Preciosa | 8 | 1,630 | BP |
| Orko | 2006 | Orito | 7 | 2,326 | BO |
| 2007 | San Juan | 8 | 3,554 | SJ |
|
| 2005 | La Preciosa | 1 | 451 | BC |
|
| 2006 | 6 | 1,910 | BB |
||
| 2005–2008 | 366 | 144,126 | BP05-BP08 |
||
| PAS | 2009–2010 | La Preciosa | 363 | 91,095 | BP09-BP-10 |
| Orko | 2011–2012 | La Preciosa | 5 | 500 | BP11-BP12 |
| Coeur | 2013–2014 | La Preciosa | 103 | 22,324 | CLP14, KP14, KP13, DH13 |
| Totals | 867 | 267,916 |
|
||
| C35 |
2017 Underground Channel Sampling
Channel sampling was carried out by Coeur in drifts on the Abundancia and Gloria Veins. 426 samples (482.2 m) were captured on the Abundancia Vein and 336 samples (380.5) on the Gloria Vein. The La Preciosa area had previously been drilled intensively in the vicinity of the underground development, allowing the channel sampling data to be compared with drill hole samples. The channel samples were statistically compared with diamond drill samples where both types were present within 10 m of each other within the relevant veins. The samples were composited to 1 m lengths and nearest neighbours (Gloria: 45 pairs, Abundancia: 35 pairs) were compared by means of scatterplots and quantile-quantile (Q-Q) plots to assess whether it was reasonable or not to consider them as a single population. The channel samples and closest drill samples within 10 m proximity are shown in Figure 14-12.
Drilling by Luismin
Of the seven Luismin drillholes in the La Preciosa Property database, two were drilled from underground workings and five from the surface. The primary targets were the Abundancia and La Gloria veins, which run semi-parallel to the north-northwest-striking Abundancia Ridge, at depths of 50 to 75 m below the primary underground workings on the 2065 m level (elevation). Lusmin drilled one additional drillhole 313 m deep in 1994 in the eastern vein breccia system, but data for this drillhole are not available. There are no available details on the Luismin drilling procedures, except that the drill core was either small-diameter BQ or AX size. The remaining half-core from these holes is stored in the original core boxes on site.
Drilling by Orko (2005 to 2008, 2011, 2012)
Orko began drilling in March 2005, ultimately completing 388 diamond drillholes totaling 152,368 m of core, spaced on roughly 100 m centers, with all but 16 of the holes targeting various veins. Orko used Major for all of its drilling using Longyear 44, 38A, and 38B core drills. Drill core diameters started at HQ-diameter, with reductions to NQ-diameter at around 260 m downhole. Between rod changes the drillers inserted a wooden “run” block in the core boxes marked with the downhole depth in both ft. and m. Downhole surveys were taken approximately every 50 m down the hole with a Reflex survey instrument. The results of these surveys indicated only moderate deviation in downhole azimuths and inclinations.
Drill core was collected on a daily basis from the drill rig by Orko technicians, who taped the boxes shut prior to transporting the core to the site core shed. Once at the shed, technicians cleaned the boxes and core, marked the boxes with the hole number, box number, and the depth intervals, and reconciled these data with the depths marked on the driller’s core run blocks.
After completion of each hole, a PVC pipe was placed in the hole collar and a concrete cap was poured around the collar PVC pipe, and a length of PVC pipe was left protruding above the concrete cap. The concrete cap was inscribed with the drillhole number, total hole depth, and the azimuth and inclination of the hole at the collar. An independent surveyor was contracted to survey the collar coordinates on a regular basis.
| C36 |
Drilling by PAS
PAS began drilling in June 2009, under the terms of PAS’s Option Agreement to acquire a joint venture interest in the La Preciosa Property from Orko, and PAS completed 331 diamond drillholes. The drilling focused on in-filling the 100 m center grid previously completed by Orko. PAS’s drilling resulted in a spacing of 50 m on every other section (100 m apart) over an area approximately 800 m by 800 m. This selective tighter spaced drilling area is located in the northern part of the deposit. Additionally, infill drillholes were drilled on selected sections as well as on two 15- to 20-m close-spaced fences to assess the short-range continuity of geology and mineralization. Major was also used by PAS to do the drilling program, which resulted in similar drilling and downhole surveying procedures as Orko, although greater capacity drill rigs were employed which resulted in fewer NQ-diameter drillholes. Beginning in early 2010, selected drillholes were surveyed using a Reflex ACT/QPQ orientation tool to obtain oriented drill core for geotechnical purposes. The drillhole collar monuments and the survey of collar coordinates followed the same procedures established earlier by Orko.
Drilling by Coeur
Between January and April 2014 Coeur drilled a total of 75 HQ core drill, 21 RC holes totaling 19,980 m, and 7 geotechnical core holes totaling 2,244 m. A majority of Coeur’s drillholes were oriented west to east at varying dips, depending on the target vein orientation, to minimize the drillhole intersection angle with the vein. In general, the downhole length of the drill intersection approximates the true thickness of the vein, but this length can vary from hole to hole. Most of the 2013 drillholes were completed in the main deposit area, an area approximately 3,000 m north to south by 2000 m east to west.
RC drillholes were drilled on -45° to -60°, to -90° inclination with north-northeast and southwest-west azimuths. Infill drillholes were designed to increase the amount of Measured and Inferred material in the first three years of the mine plan (an area encompassing Abundancia Ridge). These drillholes were inclined from -40° to -85°, with azimuths from north-northeast to southwest-west.
Downhole surveying in core and RC drillholes was done from top to bottom approximately every 10 m downhole using a gyroscope survey instrument. Results of these surveys indicated only minor deviation in azimuth and inclination. Collars were surveyed with total station instrument using WGS 84 coordinate system.
Drill core was collected on daily from the drill rig by Coeur technicians, who taped the boxes shut prior to transporting the core to the onsite core shed. In the core shed technicians cleaned the boxes and core, marked the boxes with the drillhole number, box sequence number, depth intervals, and checked recorded depths against the depths marked on the driller’s core run blocks. Color digital photographs of each core box were taken before the core was split and sampled. Core was then laid out and logged, using paper logging forms, by project geologists, who also marked sampling intervals according to Coeur quality assurance (QA) / quality control (QC) sampling protocols. Briefly sampling criteria requires samples to be greater than 50 cm and less than 200 cm in length. Logging describes all common features, such as rock type, alteration, mineralization, faults, etc.
RC drill sampling was done on 5 ft. or 1.5 m intervals. Samples were collected after passing through a cyclone under both wet and dry conditions. Samples were placed in plastic bags when drilling dry material and in Micropore bags when the drilling was wet.
After completion of each hole, a PVC pipe was placed in the drillhole collar and a cement cap or monument was poured around the collar PVC pipe and inscribed with the drillhole number, total drillhole depth, and the azimuth and inclination of the hole at the collar. An independent surveyor was contracted to survey the coordinates of each collar on a regular basis.
Core Recovery and Rock Quality Designation
Only Orko drilling had drillhole core recovery and rock quality designation (RQD) values recorded in the acQuire database, these types of data were not recorded by PAS or Luismin. Although Coeur recorded core recovery and RQD measurements, at the time of that report was written those data had not been entered into the acQuire database, thus no analysis was done.
| C37 |
Orko’s recovery values are reasonable with a mean core recovery of 94.5% and a mean RQD of 54.3%. For both silver and gold there is a decrease in Ag and Au grade with increasing core recovery where recovery is >20%, which suggests that there is a small sampling bias with loss of material in higher grade zones. Grades decrease slightly with increasing core recovery, however maximum grades increase with increasing core recovery because of the greater number of intervals with better core recovery. It is important to note that the data are not normalized for the number of recovery measurements. Because the highest Ag and Au grades are typically found in quartz veins, and core recovery in quartz veins tends to be lower because the veins are fractured, the grade-recovery relationship is expected. Given the small number of recovery measurements in the range of 0-40 percent recovery, and lower maximum grades in the 0-40% range, the impact of core recovery on the resource estimate is insignificant.
QP Opinion
The QP is satisfied that the amount and quality of drilling is sufficient to support a Mineral Resource estimate.
SAMPLE PREPARATION, ANALYSES, AND SECURITY
Avino Mine
Drilling and Trenching of Oxide Tailings, 1990 to 1991
The oxide tailings were sampled prior to the institution of NI 43-101 and associated QA/QC requirements, and as such, no QA/QC measures were utilized during the 1990–1991 program. As a result, the resource estimate for the oxide tailings in section titled “Mineral Resource Estimates – Avino Property – Avino Vein” is all classified as Inferred. 28 holes were drilled, and six trenches were completed, from which a total of 461 samples were collected for assaying. The analyses were completed in the on-site laboratory, which is described in the section titled “Sample Preparation, Analyses, and Security – Avino Mine – Blanks” and was visited during the site visit, as summarized in the section titled “Data Verification – Avino Mine Area – Site Visits”.
Avino’s current on-site, non-certified laboratory facility consists of sample preparation, crushing and pulverizing, a fire assay, and an atomic absorption (AA) section. However, the procedures and facilities used from 1990 to 1991 may be different from the current sample analysis procedures. Because of the uncertainty associated with these analyses, two separate verification exercises have been completed. Slim (2005d) collected several samples from the oxide tailings, and the results of this verification are discussed in the section titled “Sample Preparation, Analyses, and Security – Avino Mine – Tailings Investigations (Test Pits in Oxide Tailings), 2004”. In 2012, Mr. M.F. O’Brien, QP, collected numerous verification samples from the oxide tailings, and these results are discussed in the section titled “Data Verification – Avino Mine Area – The QP conclusion and Opinion”.
Tailings Investigations (Test Pits in Oxide Tailings), 2004
The sampling method and approach adopted by Slim (2005d) on the test pits in the oxide tailings incorporated the following steps:
A backhoe was used to excavate sample pits to a depth of 4 m. Hand samples were taken at 1 m vertical increments from the sidewalls of each pit.
The sample mass collected from each sampling point generally amounted to between 2 kg and 5 kg.
The sampling program was ostensibly based on the 1990 CMMA sampling program. 14 sample pits were excavated to a depth of 4 m and generated 86 samples.
| C38 |
The samples were air-freighted to PRA laboratories in Vancouver, British Columbia, from Durango, Mexico. The samples had been initially bagged and sealed with identification tags attached. The samples were allotted new identification numbers and were subsequently un-bagged and dried. The dry samples were individually mixed and blended and then split into four one-quarter fractions as directed by Slim (2005d). One fraction was used to determine the head grade assay, while another quarter was used to create composite samples used for the subsequent metallurgical test work program. Instructions were followed with the compositing of the samples and the test work program.
Excess sample was archived for future test work or analyses. For analytical techniques employed during the test work program, the standard fire assay (with AA spectrophotometric finish) was initially used for the silver analyses.
However, this method is not very accurate for silver values of less than 100 g/t. Subsequently, the inductively coupled plasma mass spectroscopy (ICP-MS) method, which uses multi-acid digestion, was used for silver. This method also resulted in analyses being obtained for other elements of interest (e.g., copper, zinc, lead). The standard fire assay method was used for gold analyses. Cyanide and lime concentrations were measured using standard titrimetric methods. Total sulphur was measured using a standard Leco furnace, and sulphide sulphur assays were measured using the standard wet chemical gravimetric analysis (Slim 2005d).
The PRA laboratories (part of Inspectorate Laboratories [Inspectorate]) in Nevada and British Columbia are International Organization for Standardization (ISO) 9001:2008 certified, full-service laboratories that are independent of Avino. The QP did not independently verify nor compare the results of the sampling program.
Drilling Program, San Gonzalo, 2007 to Present
For the drilling programs at San Gonzalo, the core is sawed at Avino’s core storage facility at the secure mine site. Samples of vein material, usually from a few cm to 1.5 m, are placed and sealed in plastic bags, which are collected by personnel from SGS Laboratories in Durango at the mine site facilities. Samples are prepared in Durango, and pulps are sent to the Inspectorate facility in Sparks, Nevada, for analysis. Since 2016, all drill core samples have been sent to SGS Durango for sample preparation and assaying. A switch was made for faster turnaround times.
Sample preparation in Durango involves the initial drying of the entire sample. Two-stage crushing is used to create a product which is at least 80% minus 10 mesh. A Jones riffle splitter is then used to separate a nominal 300 g portion of the sample. This 300 g sub-sample is then pulverized to more than 90% passing a 150-mesh screen. Inspectorate Laboratories states that they use sterile sand to clean the pulverizer between samples (Gunning 2009).
Gold analyses are by 30 g fire assay with an AA finish. Silver, zinc, and lead are analyzed as part of a multi-element inductively coupled argon plasma package using four-acid digestion with over-limit results for silver being reanalyzed with assay procedures using fire assay and gravimetric. Avino employs a rigorous QC program that includes standardized material, blank reference materials (blanks), and core duplicates. However, for the 2007 program, Avino did not perform any independent QA/QC and relied on the internal QA/QC procedures completed by the laboratories (Gunning 2009).
Inspectorate Laboratories in Nevada and British Columbia are ISO 9001:2008 certified, full-service laboratories that are independent of Avino.
Avino used a series of standard reference materials (SRMs), blanks, and duplicates as part of their QA/QC program during the analysis of assays from San Gonzalo Vein drillholes. The QP compiled and reviewed these results in the section titled “Data Verification – Avino Mine Area – Drillhole Database Verification”.
| C39 |
Drilling Programs, ET Zone of the Avino Vein, 2006 to Present
Sample lengths of NQ drill core were diamond sawed into halves by mine staff and transported in sealed and labelled bags to ISGS in Durango for preparation into pulps and rejects. Gold and silver are analyzed by fire assay using aqua regia leach and AA finish. Other elements are reported from a 29-element ICP-MS package. Sample preparation and analysis and QA/QC procedures are described in the section titled “Sample Preparation, Analyses, and Security – Drilling Program, San Gonzalo, 2007 to Present”.
Avino used a series of certified reference materials, blanks, and duplicates as part of their QA/QC program during the analysis of assays from Avino Vein drillholes. The QP compiled and reviewed these results in the section titled “Sample Preparation, Analyses, and Security – Avino Mine Area – Drillhole Database Verification”.
Avino Laboratory
The Avino laboratory has fire assay, AA, and sieving analysis equipment and has been recently upgraded with new AA equipment. A high standard of neatness and cleanliness is being maintained to reduce the risk of contamination. The laboratory was reviewed by Mr. O’Brien during site visits in 2012 and 2016.
SGS Laboratory, Durango
The SGS Laboratory in Durango processes the current drill core samples from Avino. It is a well-appointed modern facility which was visited by the QP in 2012.
Review of Drillhole Quality Assurance/Quality Control Samples
QA/QC samples continued to be submitted in the sample stream from 2021 to 2022 during the drilling programs on the Property. 143 standards, 275 duplicates and 57 blank samples were included in the 5,117 samples assayed. The QA/QC submission rate is 9.28%.
Standards for Exploration Drilling, 2021 to 2022
Nine different reference standards, bracketing the expected ranges of grades for gold, silver, and copper, were analyzed during 2021/2022. Six standard reference materials CDN-ME-1405, 1406, 1414, 1603, 1705, and 1709 were submitted during the period.
Performance graphs showing the assay results compared to the reference standards and relative to the three standard deviation acceptability limits for each reference material and gold, silver, and copper are shown in Figure 11-1 to Figure 11-18, inclusive, of the Report.
Duplicate Assays
Laboratory crushed duplicate results for gold, silver, and copper are summarized in Figure 11-19 to Figure 11-21, inclusive, of the Report. Power fit curves have been generated to measure the correlation. The graphs for the three metals show no significant bias between originals and duplicates.
Blanks
Analysis of blank submissions of barren cement-based material resulted in the expected negligible Au assays except for one isolated submission, which is likely to reflect a ticket swap rather than contamination.
| C40 |
QP Opinion
The QP is unaware of any drilling, sampling, or recovery factors affecting the reliability of the samples. It is the QP’s opinion that the sample preparation, security, and analytical procedures followed by Avino are fit for the purpose of the Report.
La Preciosa Property
Sample Collection Methods
Luismin (1981, 1982, 1994)
No documents/reports are available that describe the sampling methods used by Luismin. Based on descriptions provided by visual inspection of Luismin core by previous QPs, the core was split using a conventional manual splitter and properly “marked and neatly stored”. Luismin reportedly collected a total of only 130 samples for assay, with variable sample lengths that ranged from 0.5 to 2.0 m. The breaks between samples reportedly respected geologic features.
Orko (2003–2008, 2011, 2012)
Orko technicians transported core from the drill rigs daily to the core logging facility, where it was cleaned and the core boxes marked with the hole number, box number, and from-to depth intervals. Each box of core was then photographed and moved to a rack for examination by a geologist who logged lithology, structure, alteration, mineralization type, intensity, and sulfide percentage and oxidation and assigned codes for rock types, structures, and veins. Logging was done manually on paper logging forms. Following geologic logging, geotechnical data including core recovery, was recorded. After logging was complete, the geologist marked the sample intervals on the core and on the core box dividers with a permanent marker, along with a cutting line along the longitudinal axis of the core and recorded the sample interval depths and corresponding sample numbers on the geological log. The core was then sawn in half along the cut line by an Orko technician using a water-cooled diamond saw, after which one half of the interval was placed in a plastic sample bag along with a sample tag. The remaining half was returned to the core boxes that then were placed on numbered racks in a large, secure, storage shed at the project site.
To determine material density, a single piece of the sampled core was removed from each sample sack, allowed to air-dry, and then dry weighed for measurement of specific gravity. Once measured, the core piece was returned to the appropriate sample bag and the whole sample was placed in a rice sack for transport to the Inspectorate de Mexico sample preparation facility in the city of Durango. Prior to transport, each rice sack was weighed and the total weight recorded. All samples were in the possession of Orko personnel from the diamond drill rigs to the Inspectorate lab.
PAS (2008–2010)
PAS followed the same drillhole logging and sampling procedures and protocols developed by Orko, beginning with PAS drillhole BP10-458 onwards. The geologists determined the diamond core sample intervals and marked the positions of the intervals on both the core and the core box dividers. The core was then cut along the cut line marked on the core by the geologists using a water cooled diamond bladed saw, and both halves were placed back in the core boxes for transport to the core sampling area. Sample bags and sample tags were labeled with the consecutive sample numbers assigned to the sample intervals, with numbers reserved for insertion of QA/QC samples. The pieces of half core to be assayed were then placed in the appropriate labeled sample bags along with the corresponding sample tag, and then the bags containing the individual samples were inserted in groups of ten into labeled rice sacks along with the labeled standard and blank QA/QC samples. The rice bags filled with samples were stored on site until transported by a PAS employee to the SGS de Mexico laboratory in the city of Durango, Mexico.
| C41 |
Coeur (2013–2014)
The Coeur development program consisted of RC and core drilling. The RC drilling program was conducted by two drill rigs contracted from Layne de Mexico. One geologist was assigned to each active drilling shift. Geologists were provided with a package of sample tags which indicated the sample identification and the interval. Sample tags were included inside each sample bag and a permanent marker was used to note the sample identification and interval on each sample bag. A geologic description was recorded on a paper log at the drill rig, including any additional notes on the drilling or sample. This log was later transferred to an electronic format. Coeur’s company protocol for quality control (Coeur 2012) was applied throughout the sample collection process. All RC samples were collected by Coeur technicians, accompanied by a project geologist. Samples were collected at 1.5 m intervals in two 5 g buckets. The entire sample was weighed, with typical weights ranging from 100-125 kg. The sample was initially split in half using a single Jones-type splitter with one half of this split bagged for analysis at the commercial laboratory. The remaining sample is split once more, retaining 1/8 of the original sample, and bagged for storage in the project warehouse.
Core was collected at the drill rig and transported to the core logging facility on a daily basis, where it was cleaned and the boxes were marked with hole number, box number, and the sample interval. Each box of core was photographed and moved to a rack for examination by a geologist. After geologic and geotechnical logging were complete, geologists then marked sample intervals on the core and on the core box dividers with a permanent marker, along with the cutting line along the longitudinal axis of the core. All sample intervals and corresponding sample numbers were recorded on the geologic log. The core was then sawn in half along the cut line by a Coeur technician using a water cooled diamond saw. One half of the interval was placed in a plastic sample bag along with a sample tag. The remaining half was returned to the core box and placed on numbered racks in a large, secure, storage shed at the project site.
Sample Preparation and Analysis Procedures
Luismin (1981, 1982, 1994)
The drillhole samples collected by Luismin were transported to the company’s in-house laboratory in Durango. No written records of the chain of custody, sample preparation, or sample analysis procedures are known to exist.
Orko (2003–2008, 2011, 2012)
Sample Preparation
Orko used two sample preparation labs located in the city of Durango – Inspectorate and SGS. During 2005 to 2007, SGS was the primary lab used and Inspectorate served as the secondary lab. From hole BP07-93, the primary and secondary lab designations were switched and Inspectorate became the primary lab in order to improve assay turn-around times. Upon receipt at both the SGS and Inspectorate sample preparation laboratories, the samples were placed in order according to sample number, and then crushed, and a sub-sample split was taken for pulverization. The remaining coarse rejects were returned to the project site and stored. Neither preparation lab was ISO nor IEC certified at the time the Project samples were processed.
Sample Analysis
The sample pulps were sent to Inspectorate’s analytical laboratory in Reno, Nevada, USA, which was ISO 9001:2008 certified, and to the SGS analytical laboratory in Toronto, Canada, which was accredited by ISO/IEC 17025. Sample pulps representing check assays also were sent to these analytical facilities, as well as to ALS Chemex in North Vancouver, Canada and ALS Chemex in Reno, Nevada, USA, each of whom is independent of Coeur. At the SGS analytical laboratory in Toronto, the pulps were analyzed by several methods. Gold content was determined by fire assay at a detection limit of 5 ppb Au. Silver was analyzed by Atomic Absorption Spectrometry (AAS), at a calibrated detection limit of 0.3 g/t Ag and an upper limit threshold of 300 g/t Ag. Samples with silver values greater than 300 g/t Ag based on this analytical method were re-run by fire assay with a gravimetric finish. All samples also were subjected to strong acid digestion followed by a 40 element Inductively Coupled Plasma (ICP) analyses, including silver.
| C42 |
Some of the elements in the ICP package have threshold limits for ICP analysis. Examples include silver, which due to its 10 g/t upper ICP threshold does not allow the method to be used for this Project because over half of all samples exceed this value. Similarly, the base metals Pb and Zn and the element Ba have an upper threshold of > 10,000 g/t, (or 1.0%), which also precludes the use of ICP analysis for these elements. For the minerals containing any of the 40 elements that are totally digestible by strong acids, such as oxide, sulfide, and carbonate species, the ICP analysis method works well. However, for minerals containing any of these elements that are resistant to the strong acid digestion, only partial values will result.
The laboratory procedures used at the Inspectorate lab in Reno were similar to those used by SGS and described above. However, silver was an exception where, due to more precise instrument calibration, the detection limits were a lower 0.1 g/t (g/t) Ag and the upper threshold limit was 200 g/t Ag. As a result, samples having silver contents greater than 200 g/t were subsequently re-analyzed by fire assay with a gravimetric finish.
Orko completed two drillholes in 2011 and three drillholes in 2012 for a total of 500 m. Only 29.2 m of this drilling was sampled and assayed, according to the Orko database. No record of QA/QC procedures and results exists for these drill campaigns.
PAS (2008–2010)
Sample Preparation
Except for the pulp duplicate samples, all PAS samples were prepared and assayed by SGS in Durango, Mexico. Upon arrival at SGS, the samples were assembled in numerical order according to the sample tag numbers, individually crushed, then riffle split to provide a sub-sample for pulverizing. The pulverized, approximately 200 g sub-sample, was placed in a small labeled paper packet. After the required assay aliquots were removed, the residual material remaining in the packet was returned to PAS for storage on site at the Project, along with the coarse reject that remained after splitting of the assay sub-sample.
Pulp duplicate samples were analyzed at Inspectorate’s lab in Sparks, Nevada.
Sample Analysis
Sample pulps analyzed at SGS used the following procedures:
|
| · | For gold analyses at SGS, all samples were initially assayed using fire assay procedures with AAS finish. The detection limit for this procedure was 0.005 g/t and the maximum assay threshold was 10 g/t. For samples initially assaying more than 10 g/t Au, these were rerun using a fire assay with gravimetric finish procedure having a detection limit of 3 g/t Au, |
|
|
|
|
|
| · | For silver analyses at SGS, all samples were initially analyzed using 3-acid digestion with an AAS finish (0.3 g/t detection limit). For samples with analyses greater than the 300 g Ag threshold limit, the samples were rerun using a fire assay with gravimetric finish procedure having a detection limit of 5 g/t Ag. In addition, 33element trace analyses using a 2-acid digestion and ICP finish having a 2 g/t detection limit and a threshold of 10 g/t for silver were completed for all samples, |
|
|
|
|
|
| · | For gold analyses at Inspectorate, all samples were run by fire assay with a gravimetric finish that had a detection limit of 3 g/t Au, and |
|
|
|
|
|
| · | Silver analyses for all samples run at Inspectorate were initially run using a 4-acid digestion with ICP finish (0.1 g/t Ag detection limit) that had a 200 g/t Ag upper threshold limit. For samples with analyses greater than 200 g/t, the samples were rerun using fire assay with a gravimetric finish that had a detection limit of 5 g/t and an upper threshold limit of 5,000 grams per tonne Au. |
| C43 |
Coeur (2013–2014)
Sample Preparation
All Coeur samples in 2013 and 2014 were submitted to an accredited commercial laboratory. Coeur contracted ALS Laboratory (ALS) in Zacatecas, ZAC, MX to complete all sample preparation on RC cuttings and split HQ drill core. The sample is logged in the tracking system, weighed, dried, and finely crushed to better than 70% passing a 2 mm screen. A riffle split of up to 250 g is taken and pulverized to better than 85% passing a 75 micron screen. The method is appropriate for both RC cuttings and drill core.
Sample Analysis
Sample pulps were created in Zacatecas and sent to ALS’s analytical laboratory in Vancouver, BC, CA which is ISO 9001:2008 certified. Orko era pulps representing re-assays were sent to ALS Vancouver, as well as to SGS in Lakefield, ON, CA which is ISO 17025 certified. Both labs are independent of Coeur.
Silver Detection
At ALS, silver content was determined by Inductively Coupled Plasma-Atomic Emission Spectroscopy (ICP-AES). A 0.25 g sample is digested with perchloric, nitric, hydrofluoric, and hydrochloric acids. The residue is topped up with dilute hydrochloric acid and the resulting solution is analyzed. The lower and upper detection limits (LDL and UDL) for this method are 0.5 ppm and 100 ppm, respectively. At 100 ppm the sample triggers an additional 4-Acid Digestion ICP-AES analysis that is optimized for accuracy and precision at high metal concentrations. This method utilizes the same acids as the prior method, but includes additional stages of heating and drying, along with the addition of de-ionized water to aid in further digestion. The LDL and UDL for this method are 1 ppm and 1500 ppm, respectively.
At SGS, silver content was determined by Inductively Coupled Plasma-Atomic Absorption Finish. This is a 4-Acid digestion. A 2 g sample is digested with perchloric, nitric, hydrofluoric, and hydrochloric acids. The LDL and UDL are 0.3 g/t and 300 g/t respectively.
Gold Detection
Gold content was determined by ICP-AES, following an initial Fire Assay Fusion of a precious metal bead. The sample bead is digested in 0.5 ml dilute nitric acid in the microwave oven. 0.5 ml of concentrated hydrochloric acid is then added for further digestion. The LDL and UDL of this method are 0.001 ppm and 10 ppm, respectively. At 10 ppm the sample triggers an additional Gravimetric analysis. This includes the creation of a lead button containing the 30 g sample, which is then cupelled to remove the lead. The remaining gold and silver bead is parted in dilute nitric acid and weighed as gold. The LDL and UDL for this method are 0.05 ppm and 1000 ppm, respectively.
At SGS, gold content was determined by exploration grade fire assay. This is a 30 g fire assay with an ICP finish. The LDL and UDL are 1 ppb and 10000 ppb, respectively.
Multi-Element Detection
At ALS, an additional suite of 40 elements were also analyzed by ICP for all new samples created in 2013 and 2014. The drilling also encountered base metal values of zinc and lead which triggered the multi-element over limit method.
| C44 |
Sample Security
RC samples were collected and bagged at the drill rig by Coeur technicians, supervised by a project geologist. The bags are labeled with a unique sample ID and the interval meterage. Core samples were bagged by Coeur technicians at the project logging and storage facility. Samples were delivered daily by Coeur technicians and a project geologist to ALS in Zacatecas, ZAC, MX. Sample prep was completed Zacatecas and pulps samples were shipped to ALS Vancouver, BC, CA for analytical test work.
Chain of custody for delivery is established by transmittal sheets and sample receipt documents from the lab. Final chain of custody is ensured through electronic delivery of work orders and PDF assay certificates.
Hard copies of assay certificates and the geologic logs were stored at the Coeur project office in Durango, MX. The geologic logs include the sample sequence list, including inserted QA/QC. Electronic copiers of all data were stored by Coeur on a corporate server in Chicago. Ultimately all data are stored in an acQuire database located on an independent, backed-up server.
Coarse reject and sample pulps were returned to the Project site by laboratory staff and stored onsite in multiple secure storage facilities (the current core storage and logging facility).
Analytical Results
Assay Methods
Table 11-3 contains a listing of the assay methods and associated metadata used by Coeur. The sample preparation, security and analytical procedures are adequate and within industry accepted norms.
Based on a review of the database and procedures, a visit to the core storage and logging facilities, the QP is satisfied that the documented sample preparation, security, and analytical procedures are adequate and within industry accepted norms and suitable to support an MRE.
Table 11-3: Assay Methods
| Analytical Laboratory | Element | Analytical Method | Units | Lower Limit | Upper Limit |
| ALS | Ag | ME-ICP41 | ppm | 0.2 | 100 |
| ALS | Ag | ME-ICP61 | ppm | 0.5 | 100 |
| ALS | Ag | ME-OG46 | ppm | 1 | 1,500 |
| ALS | Ag | ME-OG62 | ppm | 1 | 1,500 |
| ALS | Ag | GRA21 | ppm | 5 | 10,000 |
| SGS | Ag | GE-AAS42E | g/t | 0.3 | 300 |
| ALS | Au | ICP21 | ppm | 0.001 | 10 |
| ALS | Au | GRA21 | ppm | 0.005 | 1,000 |
| SGS | Au | GE-FAI313 | ppb | 1 | 10,000 |
Data Delivery and Storage
Following the completion of analyses at the commercial laboratory, electronic results are delivered via email to a distribution list of Coeur recipients, approved by the project manager. ALS also provides secure online access to review the status of work orders and offers the ability to download data files and certificates.
Data are loaded into the acQuire database by a database manager or geologist with sufficient acQuire permissions. AcQuire is designed to securely store all original data. Acquire uses calculated and derived fields to produce data in a consistent format that can be uploaded into a 3D modeling package which allows for a further visual review of the data.
| C45 |
Quality Assurance and Quality Control, Check Samples, and Check Assays
Luismin QA/QC (1981, 1982, 1994)
There are no records of any QA/QC programs or protocols prior to 2003.
Orko QA/QC (2003–2008, 2011, 2012)
Orko QA/QC Procedures
Orko maintained a QA/QC program during its tenure that consisted primarily of inserting standards and blanks into the sample sequence. Although no duplicates were included in the regularly submitted sample batches, duplicates (check samples) were submitted to a secondary laboratory in separate batches to check for systematic bias by the primary assay laboratory.
According to earlier technical reports (MDA, 2009, Snowden 2011a, MP 2012), alternating standards and blanks were inserted every tenth sample in the sample sequence, equivalent to a 5% insertion rate for each sample type. MP noted that based on the 88,235 core samples submitted by Orko to the primary laboratories, a 5% insertion rate is roughly equivalent to 4,400 blanks and an equal number of standards. However, MP stated that in the QA/QC files in the database provided for its MRE, there were data for a slightly smaller number of standards (3,994 standards, 4.3% of the total samples), but a significantly lesser number of blanks (1,127 blanks, or 1.3% of the total samples) and 1,103 duplicates. Similar quantities of Orko QA/QC data were reported by Mine Development Associates (MDA) and Snowden. The data verification process performed by the QPs responsible for the Report also detected a shortfall in the amount of expected QA/QC data, which is discussed in the following section titled “Data Verification” of the Report.
MP and Snowden stated in their technical reports that Orko’s blank samples consisted of a combination of basalt core drilled during its exploration program and material collected from basalt boulders found in the La Preciosa area. The basalt blanks reportedly used were designated as Orko-2, Orko-4, Orko-5, Orko-7, and Orko-9. MDA noted in its technical report that SGS provided certificates for the basalt blanks based on approximately 150 analyses by aqua regia digestion and ICP-AES finish, but that no round-robin multi-laboratory analyses were done to substantiate the SGS values for the blanks.
Early on in Orko’s exploration program, two commercial standards were used in a small number of sample batches, one of which was certified for gold and silver, and the other for gold only. The accepted values for these standards are unknown. For most of Orko’s tenure, custom standards were used that were prepared from a stockpile of mineralized material situated near the Luismin portal. An unspecified amount of this material was sent to SGS’s metallurgical division for certification prior to preparation of the standards. MDA reported that this certification was based on approximately 150 analyses. As with the SGS-certified basalt blanks, MDA noted that values established for the standards were not supported by round-robin testing at multiple labs. Over the course of Orko’s exploration activities, four such custom standards were compiled, numbered as follows with accepted values in parenthesis: Orko-1 (0.210 g/t Au, 293.40 g/t Ag), Orko-3 (0.068 g/t Au, 112.00 g/t Ag), Orko-6 (0.072 g/t Au, 146.10 g/t Ag), and Orko-8 (0.134 g/t Au, 237.90 g/t Ag). In addition to these standards, in accordance with recommendations by MDA, a fifth standard was compiled that was subjected to round-robin multi-lab analyses. This standard, Orko-10, did not have a final certified value at the time MDA issued its technical report (results from one of the five round-robin labs had not been received). This standard subsequently saw limited use by PAS, and is discussed in the section titled “Sample Preparation, Analyses, and Security – La Preciosa Area – Quality Assurance and Quality Control, Check Samples, and Check Assays” of the Report.
| C46 |
Orko QA/QC Results
The results of Orko’s QA/QC results are not easily interpreted. The standards were problematic because they were not certified, and record keeping was reported to have been inadequate such that the identity of the standards in the sample batches and assay certificates was not always certain (MDA 2009). The standard deviation (SD) of some of the standards was unusually high, particularly silver for Orko-1 and gold for all standards. The relative closeness of the accepted silver values for the high grade standards (Orko-1: 293.40 g/t Ag, and (Orko-8: 237.90 g/t Ag) and the moderate grade standards (Orko-3: 112.00 g/t Ag and Orko-6: 146.10 g/t Ag) result in overlapping of the two-SD ranges for the standard pairs, making it unclear whether some observed “failures” falling outside of these ranges were due to inconsistencies in the standards themselves, mislabeling of the standards during sample submission (as noted by MDA), or actual errors in the assay analyses. Snowden’s graphical plots of the standard results suggest that there may have been some switching of standard labels for standards Orko–3 and Orko-8.
A discussion of Orko’s QA/QC sampling issues and duplicate samples can be found in the Section 12 of the Report entitled “Data Verification – La Preciosa Area”.
Orko completed two drillholes in 2011 and three drillholes in 2012 for a total of 500 m. Only 29.2 m of this drilling was sampled and assayed, according to the Orko database. Therefore, no record of QA/QC procedures and results exists for these drill campaigns.
Coeur QA/QC Program (2013–2014)
Coeur maintained a QA/QC program that was structured on guidelines set forth in the written company QA/QC policy. QA/QC consisted of routine insertion of standards, blanks, and duplicates into the primary sample stream for both RC and core samples. Umpire check assays have been commissioned in 2014. Table 11-4 defines the suggested Test % for QA/QC sample insertion based upon the total count of primary samples.
Table 11-4: Coeur Development Program QA/QC Recommendations
|
| Primary Lab Control | External Control Samples |
|||||||||||||
| Sample Type | Duplicates | Standards | Blanks | Pulps | Rejects | Standards | Blanks | Duplicates |
|||||||
| Duplicate Type | Sample | Prep | Analytical |
|
|
|
|
|
|
|
|||||
| Suggested Test % | 2.5% | 2.5% | 2.5% | 5.0% | 5.0% | 10.0% | 1.0% | 1.0% | 1.0% | 0.5% |
|||||
Certified Standards and Blanks
The 2013 and 2014 assay campaigns utilized five certified commercial standards and one round robin tested standard. The campaigns used one certified blank and one round robin tested blank. The certified standards were purchased from CDN Resource Laboratories Ltd., in Langley, B.C., Canada and SGS de Mexico, in Durango, Mexico. The blank was purchased from Rocklabs, in Auckland, New Zealand. Table 11-5 lists the standards and blank and their certified silver and gold values.
| C47 |
Table 11-5: Coeur Certified Standards and Blanks
| Standard ID | Certifying Lab | Element | Standard Value (ppm) | 1 SD (ppm) |
| CDN-ME-1101 | CDN | Ag | 68 | 2.3 |
| CDN-ME-1101 | CDN | Au | 0.564 | 0.28 |
| CDN-ME-1205 | CDN | Ag | 25.6 | 1.2 |
| CDN-ME-1205 | CDN | Au | 2.20 | 0.14 |
| CDN-ME-1303 | CDN | Ag | 152 | 10 |
| CDN-ME-1303 | CDN | Au | 0.924 | 0.1 |
| CDN-ME-1304 | CDN | Ag | 34.0 | 1.6 |
| CDN-ME-1304 | CDN | Au | 1.8 | 0.06 |
| HGRS-02 | SGS | Ag | 98.7 | 4.0 |
| HGRS-02 | SGS | Au | 0.01 | 0.003 |
| ORKO-10 | SGS (round robin) | Ag | 145.466 | 4.227 |
| ORKO-10 | SGS (round robin) | Au | 0.057 | 0.005 |
| AuBlank58 | Rocklabs | Ag | < 0.002 | N/A |
| AuBlank58 | Rocklabs | Au | N/A | N/A |
| BLANK-5 | Acme, ALS, SGS (round robin) | Ag | < 5 | N/A |
| BLANK-5 | Acme, ALS, SGS (round robin) | Au | < 0.004 | N/A |
QA/QC comparison analyses are completed in the acQuire database using separate tools for blanks, standards, and duplicates. Performance of the standards was tracked over time and against lower and upper cut-off limits. Run plots were generated, with multiple user controlled options. Plots generated for that report include the assay value plotted against the certificate number, which depicts the standard’s performance over time. The plots also contain error lines indicating the acceptable minimum and maximum values for the given standard and assay method. Coeur policy recognizes QA/QC failures as ± 3 SDs for standards and ± 5 times the lower detection of the assay method for blanks.
When a blank or standard fails QA/QC it is moved to a “rejected” status in acQuire, along with all primary, duplicate, and lab QA/QC samples above and below the failure, and up to the next or previous passing blank or standard. This partial batch of samples must be re-run at the original laboratory, and with the same analysis method as the failed method. In the case of the Project, the QA/QC focuses on silver and gold, although the primary analysis includes multi-element ICP. Coeur does not re-run the multi-element ICP on failed sample batches. If the blank or standard fails a second re-assay the entire batch must be analyzed a third time at a second commercial laboratory, using an analysis method similar to that of the original test work.
Coeur QA/QC Results
Blanks and Standards
In 2013-2014, Coeur submitted 21,991 primary samples for assay at two commercial laboratories. 1,018 blanks and 1,369 standards where inserted into the sample streams, representing insertion rates of 4.63% and 6.23%, respectively. The combined insertion rates exceed the total of 10% standards and blanks suggested by Coeur protocol and included in Table 11-4. All standards and blanks were analyzed at ALS in Vancouver, BC, CA and/or SGS in Lakefield, ON, CA. Table 11-6 of the Report is an actual example of a QA/QC report exported directly from the acQuire database. The report tables the statistical performance of all standards and blanks, defined the assaying laboratory and by the analytical method utilized. The column # Outside Limit is the count of failed standard or blanks.
| C48 |
The manual insertion of standards and blanks includes an inherent risk for mislabeled or incorrectly inserted samples. Original standards and blanks failed QA/QC and the sample batches were re-assayed. Further review was conducted on the failed standards and blanks by Coeur and Acme Laboratories. The result of the review identified 189 standards and seven blanks that were likely assigned an incorrect standard ID or blank ID. These samples were reclassified based on the original assay results which produced silver and gold values that were associated with another active project standard or blank. The result of the reclassification was the approval of the Round 1 QA/QC for these samples.
Further details of Coeur’s QA/QC procedures are set out in Sections 11 and 12 of the Report.
All QA/QC samples that have not successfully passed Coeur’s QA/QC procedures remain in a “rejected” status in the acQuire database. Additionally, all primary samples associated with these failed control samples remain in a “rejected” status and are unavailable for use in the resource evaluation. When a control sample passes QA/QC, the new primary assay value of the associated primary samples will be moved to an “accepted” status in the acQuire database.
Duplicates
In 2013-2014 Coeur submitted 15,107 new primary samples to ALS. These samples are subjected to Coeur’s duplicate QA/QC protocol, included in Table 11-4. The protocol suggests an equal distribution of duplicate samples at various check stages. These include the sample (S), prep (C), and analytical (P) stages. Coeur submitted 1,347 duplicates resulting in an insertion rate of 8.92% which exceeded the total suggested insertion rate of 7.5%. Check stage totals and resulting failures are included in Table 11-9. The Threshold is a dynamic value that eliminates sample pairs from the population based on their assay value’s proximity to the lower detection level of the method used. For this exercise the Threshold is equal to 10 times the lower detection of the method. Any primary sample with an assay value less than this is considered below the Threshold and is removed from the analysis. Failed duplicates will be re-assayed in 2014 with the primary sample and all associated duplicates per Coeur QA/QC protocol.
Table 11-9: Duplicate Sample Summary
| Check Stage | Sample Type | Count | Count Above Threshold | % Acceptable Difference | Failed Duplicates | % Failure |
| Sample | (S) Sample | 661 | 236 | N/A | N/A | N/A |
| Prep | (C) Crush | 343 | 173 | 25% | 14 | 8.1% |
| Analytical | (P) Pulp | 343 | 172 | 20% | 18 | 10.5% |
| Eligible Primary Samples | Duplicate Samples | Insertion Rate |
||||
| 15,107 | 1,347 | 8.92% |
||||
Umpire Assays
Umpire assays for the 2013-2014 sample campaigns are currently in progress. Per Coeur policy, a random selection of pulps chosen throughout the range of grades was selected from each assay certificate from the primary lab and sent to another laboratory for check analysis; using the same analytical digestion method and instrumental finish.
| C49 |
Opinions and Recommendations of the Qualified Person
Based on a review of the core shack and sampling facilities while the Coeur team were still working at La Preciosa and periodic reviews of the Avino area database and procedures, the QP is satisfied that the QA/QC, check samples, and check assays are adequate and within industry accepted norms and suitable to support an MRE.
DATA VERIFICATION
According to NI 43-101 standards for mineral project disclosure, “data verification” means the process of confirming that data has been generated with proper procedures, has been accurately transcribed from the original source and is suitable to be used. Data verification carried out by the current QPs and applied to the property is summarized in Table 12-1.
Table 12-1: QPs Opinion on Data Verification
| Item | Data Type | Source | Verification Method | QP | Remarks |
| Topography Data | Digital contours | Avino | Quantitative 3D comparison with public domain SRTM data | MO’B | no material discrepancies |
| Underground excavations | Wireframe files | Avino | Sectional checks with drill trace data 3D comparison using field GPS spot checks of adit entrances | MO’B | reviewed and modified by QP to close open shapes, no material discrepancies |
| Drill Collar Positions | Digital point data | Avino | Quantitative 3D comparison with topography and field GPS spot checks | MO’B | no material discrepancies |
| Drill downhole surveys | Digital point data | Avino | 3D model sectional reviews to detect extreme deviations of desurveyed hole traces | MO’B | no material discrepancies |
| Grade data | Digital Database | Avino | 5% random check against laboratory assay certificates, 3D review of sample grades and positions | MO’B | no material discrepancies, direct digital uploads since 2019 have reduced transcription risk |
| Lithology logs | Digital database | Avino | random comparisons with paper logs and vein cores during site visits | MO’B | no material discrepancies |
| Geology Model | Wireframe files | Avino | wIreframes backtagged to litho codes in drill database and sectional reviews | MO’B | modified by QP to close open shapes and invert negative volumes, no material discrepancies |
| Metallurgy & Process | Test results & operation data | Avino & Test Reports | QP reviewed operation and lab data | JH | Data present in the report are the summary of the test results and operation data. Tailings reprocessing design was based on the test results |
| Capital and Operating Costs | Operation data | Avino | QP reviewed operation data | HG | Operation data reviewed is summarized in the report. |
| Infrastructure | Operation data | Avino & Site Visit | QP visited the site and reviewed operation data | HG | QP visited the site and verified the infrastructure. |
| Mining | Operation data | Avino & Site Visit | QP visited the site and reviewed operation data | HG | QP visited the site and reviewed operation data |
| Environmental | Report | Avino | QP reviewed the report and data | HG | QP reviewed the report |
| Market Studies | Report | Avino | QP reviewed the report and data | JH | QP reviewed the report and summary is provided in the report |
| C50 |
More detailed descriptions of processes and results are described below.
Avino Property Area
Drillhole Database Verification
The QP reviewed the drillhole data provided by Avino in the form of a Microsoft Access database before and after loading the data into Leapfrog Geo™, on a hole-by-hole basis, including drillhole collar, survey, lithology, and assay data.
During several site visits between 2012 and February 2020, the QP verified several drill hole logs against the physical cores for ET06_02, ET07_01, ET07_03, SG15_03, and SG15_02. No significant discrepancies were found.
Collars for exploration drillholes are marked by concrete monuments, and the collars have been surveyed. Subsequent collars have been similarly marked and were observed during a site visit in June 2016.
A check of collar coordinates at the La Preciosa Property with a handheld global positioning system during a site visit in 2020 Confirmed the positions of drill collars previously reported by Coeur.
The QP opinion on the reliability of the Avino drillhole data is discussed in the section titled “Data Verification – Avino Mine Area – The QP Conclusion and Opinion”, and detailed recommendations are provided in the section titled “Recommendations – Geology”.
Collar and Assay Data
In early 2020, Ausenco (under supervision of the QP) validated the drillhole database for the Avino Mine area , and it was consolidated into a consistent and comprehensive Microsoft Access database that is maintained by mine personnel with offsite backup in the Avino office in Durango and on the Cloud using Egnyte. The QP subsequently reviewed the data in December 2022. Table 12-2 summarizes the database validation results.
The Avino Vein lithology data for 13 historic drillholes at the Avino ET Mine and all channel samples are very sparse owing to the age of the records. The upper part of the deposit model has consequently been modelled using assay data and development mapping information. As the deficient lithology information pertains mainly to parts of the deposit that have been mined out, the QP considers the database to be adequate to support Mineral Resource estimation.
| C51 |
Table 12-2: Number of Records and Discrepancies for the Avino (ET and San Gonzalo) Drillhole and Channel Sampling Data
| Deposit | Number of Records | Discrepancies | Discrepancy Rate (%) |
| Avino Vein |
|||
| Survey Data | 11,415 | - | - |
| No Surveys for Collar | - | 0 | - |
| Duplicate Collar and Surveys | - | 0 | - |
| Duplicate Survey Depths | - | 0 | - |
| Assays | 42,564 |
| 0 |
| No Sample for Collars |
| 0 |
|
| Overlapping Segments | - | 0 | - |
| Collar Max Depth Exceeded | - | 0 | - |
| Lithology | 4,074 | - | - |
| From to Depth Overlap | - | 26 | 0.6 |
| No Samples for Collar | 13 | 13 historic holes | - |
| Collar Max Depth Exceeded | - | 0 | - |
| San Gonzalo Vein |
|||
| Survey Data | 3,636 | - | 0 |
| No Survey for Collar | - | 0 | - |
| Duplicate Collar and Surveys | - | 0 | - |
| Duplicate Survey Depths | - | 0 | - |
| Incomplete Survey Data | - | 0 | - |
| Assays | 17,514 |
| 0 |
| No Samples for Collars | - | 0 | - |
| Overlapping Segments | - | 1 | - |
| Collar Max Depth Exceeded | - | 2 | - |
| Lithology | 140 holes | - | 0 |
| From to Depth Overlap | - | 0 | - |
| No Samples for Collar | - | 0 | - |
| Collar Max Depth Exceeded | - | 0 | - |
| Guadalupe Vein |
|||
| Survey Data | 3,636 | - | 0 |
| No Survey for Collar | - | 0 | - |
| Duplicate Collar and Surveys | - | 0 | - |
| Duplicate Survey Depths | - | 0 | - |
| Incomplete Survey Data | - | 0 | - |
| Assays | 17,514 | - | 0 |
| No Samples for Collars | - | 0 | - |
| Overlapping Segments | - | 3 | - |
| Collar Max Depth Exceeded | - | 0 | - |
| Lithology | 140 holes | - | 0 |
| From to Depth Overlap | - | 0 | - |
| No Samples for Collar | - | 0 | - |
| Collar Max Depth Exceeded | - | 0 | - |
| La Potosina Vein |
|||
| Survey Data | 3,636 | - | 0 |
| No Survey for Collar | - | 0 | - |
| Duplicate Collar and Surveys | - | 0 | - |
| Duplicate Survey Depths | - | 0 | - |
| Incomplete Survey Data | - | 0 | - |
| Assays | 17,514 | - | 0 |
| No Samples for Collars | - | 0 | - |
| Overlapping Segments | - | 13 historic holes | - |
| Collar Max Depth Exceeded | - | 0 | - |
| Lithology | 622 | - | - |
| From to Depth Overlap | - | 3 | 0.5 |
| No Samples for Collar | - | 0 | - |
| Collar Max Depth Exceeded | - | 0 | - |
The QP believes that the sample assay integrity is adequate for Mineral Resource estimation.
Downhole Survey Data
Downhole survey data exists for 650 drillholes completed on the Avino Property. The QP believes that the downhole survey data is adequate for 3D geological modelling and to support Mineral Resource estimation. Routine photography of drillcore and underground drifts is being carried out. A digital photographic record is kept of all drillcores and underground drifts for future reference and to facilitate consistent core logging and geology interpretation.
The QP believes that logging and record keeping are adequate to support Mineral Resource estimation.
Assay Verification of 1990/1991 Drillholes in Oxide Tailings
Tetra Tech (2013) verified 54% of drillholes in this database (15 of 28 drillholes) and 58% of both silver and gold assays (444 of 766 values) used for this estimation. QG Consulting verified the oxide tailings data in 2016, and the QP reviewed the work again in 2017 and is unaware of any significant errors.
| C52 |
The QP opinion of the reliability of the 1990 to 1991 oxide tailings assays is discussed in the section titled “Data Verification – Avino Mine Area – The QP Conclusion and Opinion”.
Oxide Tailings Verification Samples
As was reported by Tetra Tech (2013), during a previous site visit conducted on June 7 and 8, 2012, Michael F. O’Brien visited the tailings heaps and supervised the collection of eight samples from the oxide tailings (3 kg to 4 kg each). The samples were collected from gulleys that had eroded into the tailings pile and provided a vertical section through the tailings. It is believed that while such samples cannot provide a statistically representative reflection of the overall grade, they do provide some insight into the grade of the tailings near the surface. The eight samples were each split into three separate sub-samples, which were submitted in turn to the Avino Mine laboratory together with SGS laboratories in Durango and Vancouver.
Statistical analysis of the three sets of results demonstrated that there is a good correlation between the three laboratories, and this conclusion remains valid.
The sampling exercise in 2012 provided the opportunity to review the artificial sedimentary deposit that comprises the Avino oxide tailings and supported the previous assumptions of the tailings, such as regarding the oxide tailings as two superimposed units with slightly different chemical and particle size characteristics and pronounced horizontal continuity. The source data and plans prepared more than 20 years ago, after the initial drilling campaign, were examined at the mine and found to be of professional standard and provide support for their use in the estimation of the oxide tailings. The overall homogeneity of the material, horizontal continuity, and relatively high confidence in the volume and tonnage mitigate any uncertainty in the historical dataset. The pattern of sample grades from the 2015/2016 drill campaigns and the earlier drilling form a coherent pattern with no obvious discontinuity between campaigns.
Site Visits
Michael F. O’Brien conducted site visits on June 7 and 8, 2012, June 6 and 7, 2016, June 12 to 15, 2017, February 11 to 13, 2020, and July 20, 2021. During the latest visit, the QP visited the Project on July 20, 2021, and reviewed the tailings deposit and deep drilling for the Avino Vein System.
The QP Conclusion and Opinion
The drill dataset has been produced over a long period of time within a brownfield property. All data used for this study is obtained from work carried out by the staff of the current issuer, which has owned the Property continuously since the start of this work.
The QP believes that the geological and sampling data are adequate and that appropriate and current verification work has been carried out to support Mineral Resource estimation.
Avino and San Gonzalo Veins
Drillhole Database
The drillhole data for the Property has been consolidated into a single Microsoft Access database, with the exception of the shallow surface drilling for the oxide tailings deposit. The consolidated database with an offsite and cloud-based backup has materially improved the consistency and security of the exploration data. The QP recommends that the exploration data pertaining to the oxide tailings deposit and the QA/QC information be integrated into the database.
| C53 |
Downhole Survey Data
Downhole survey data and the location of the Avino and San Gonzalo Vein intersections observed in drillholes have been verified by both surface and underground mapping, providing confidence in the location, orientation, and true width of both veins.
Geology Data and Interpretation
The legacy data from the Avino Vein is understandably deficient in recorded lithology data. Modelling of the Avino Vein and San Gonzalo Vein systems made use of grade as well as lithology data. Consequently, the QP regards the lithology database as adequate and fit for the purposes of resource estimation. The recent mining history supports that the potential economic units persistently demonstrate continuity as new exposures become available.
Specific Gravity Samples
Based on a review of specific gravity data from drillholes in the Avino and San Gonzalo Veins, the QP concludes that future bulk density measurements should be completed using a water displacement method (see section titled “Sample Preparation, Analyses, and Security – Avino Mine – Review of Drillhole Quality Assurance/Quality Control Samples”). A comparison of the two measurement techniques used for these specific gravity samples indicates that the results are acceptable for this study. However, the QP considers that the current level of data is inadequate for meaningful spatial estimation and recommends that the frequency at which specific gravity measurements are collected should be increased. To supplement the specific gravity data generated from drillhole samples, the QP recommends that large grab samples be obtained from the underground development at approximately 30 m intervals and subjected to the water displacement method of specific gravity determination.
QA/QC Samples
The rate of QA/QC SRMs, blanks, and duplicates insertions meets recommended industry standards. HARD charts indicate less assay precision than would be expected for pulp duplicates.
The QP has found no evidence of systematic laboratory bias, indicating that the assay results are adequate.
Tailings
The identified grade pattern is similar in character to other tailings deposits, such as overall homogeneity and a pronounced horizontal continuity.
Verification samples taken by the QP have confirmed the presence of gold and silver mineralization at grades similar to those obtained in the original tailings drilling campaign, with a low silver bias consistent with the superficial position of the samples in the zone most likely to have suffered surface leaching. The verification samples also confirm that the mine laboratory assays are not materially different from those of external laboratories.
QP Opinion
There were no limitations on or failure to conduct data verification.
The QP believes the assay, sample location, vein lithology, and specific gravity data from the Avino and San Gonzalo Veins are adequate to support the purpose of the Report and a current Mineral Resource on both vein and tailings deposits.
| C54 |
La Preciosa Property
Current Verifications
The QP visited the project on July 20, 2021, and reviewed drill cores, the logging facilities, vein outcrops, and drill collar positions.
Five well-marked collars were located, and positions were checked with a hand-held GPS unit (GPSMAP 66i). Plan positional differences were well within the expected limits of error (see Table 12-3).
Table 12-3: Summary of Collar Locations and Positions
| Field measured | Database | Plan Difference |
|||
| DHID | Easting | Northing | Easting | Northing | (m) |
| BP07-126 | 555161.0 | 2702386.0 | 555161.0 | 2702385.3 | 0.7 |
| BP09-355 | 555159.0 | 2702383.0 | 555159.7 | 2702382.3 | 1.0 |
| BP09-357 | 555159.0 | 2702383.0 | 555159.9 | 2702382.1 | 1.2 |
| BP09-361 | 555203.0 | 2702431.0 | 555203.0 | 2702431.0 | 0.1 |
| BP09-360 | 555204.0 | 2702431.0 | 555203.6 | 2702431.0 | 0.4 |
The core shack and core processing facilities were visited, and several representative cores were reviewed and compared with logging sheets. Logging matched the cores reviewed (BP07-102, CLP14-077) and assay grades were supported by signs of mineralization. The core storage and logging facilities are clean and weather-proof, and the core stacks and boxes are clearly labelled.
Underground drift development on the Gloria and Abundancia Vein and outcrops were visited, and the veins were examined.
Historic Verifications
The Project drillhole database was validated by the Coeur technical services group. It has been verified and deemed appropriate for resource modeling. A review and validation of the 2013 - 2014 assay, collar coordinate, downhole survey, and assay data has been performed by Coeur.
The historic drillhole database has been verified by Orko (pre-2009), MDA (2009), PAS (2008-2010), Snowden (2011), MP (2012), and Independent Mining Consultants (IMC) (2013).
Orko – Pre-2009
Prior to 2009, Orko reportedly sent 331 duplicate sample pulps from five of its drillholes to ALS Global (formerly ALSChemex) in North Vancouver, B.C., Canada, as a check against Inspectorate’s primary assay results for these holes. Although the analytical methods used for silver by ALS for some of the check samples reportedly differed slightly from those methods used by Inspectorate, the results for these check samples indicated an only slight high bias on the part of Inspectorate for silver grades less than 30 g/t Ag, and a corresponding very slight high bias across the board for Inspectorate gold assays, as determined using fire assay with gravimetric finish methods. The QP responsible for this section of the Report reviewed scatterplots of 317 of these 331 gold and silver check analyses provided in earlier technical reports (which did not provide reasons for the 14 check assays missing from scatterplot comparisons). Based on these reviews, in the opinion of the QP, these check assay data fall within acceptable limits (M3 2013).
| C55 |
In addition to the 331 duplicate samples, Orko submitted coarse rejects to SGS for 134 samples from drillhole BP07-102 that were originally prepared and assayed by Inspectorate. SGS in turn prepared pulp duplicates for these samples that were subsequently submitted to ALS. MP, consultants to Orko and the QPs for the November 5, 2012 technical report on the Project, created Q-Q plots of assays for 120 of the 134 samples from the three labs that were available in the MP database. These plots indicated reasonable correlation with no biases between Inspectorate and SGS for gold or silver. The Q-Q plots for Inspectorate versus ALS showed similar correlations, but with an apparent slight high bias for silver in the Inspectorate assays. In the opinion of the QP responsible for this section of the Report, these comparisons are acceptable for both gold and silver between all three laboratories (M3 2013).
Mine Development Associates – 2009
As a follow-up to the pre-2009 check assay programs conducted by Orko, MDA in 2009 conducted a comprehensive check assay program that included pulp and coarse reject samples reportedly representing each of the mineralized vein intercepts. Submitted by MDA to ALS in Reno, Nevada, these checks samples consisted of 240 pulp rejects, of which 61 original pulps were assayed by SGS and 179 original pulps, which were assayed by Inspectorate. Q-Q plots of the results revealed acceptable correlation between the two primary laboratories (SGS and Inspectorate) and the secondary laboratory (ALS), with no indication of biases. In conjunction with this check assay effort, MDA inserted QA/QC blanks and gold and silver standard samples into the check assay batches at select but unequal intervals. The QA/QC results for the blank samples indicated no failures for silver and 2 failures (out of 10) for gold. All standard assays fell within the acceptable ranges (M3 2013).
For determination of material density, Orko had routinely conducted one density measurement from each sample sent for assay, using a single piece of half-core removed from each sample and a water immersion method that resulted in a set of recorded densities that exceeded 88,000 in number. After each density analysis, the samples used were returned to the appropriate sample sacks for shipment to the laboratory for assay. Concerned that Orko’s density determinations were possibly biased high because the method used did not account for the presence of vugs in the vein samples, MDA had Orko complete an additional 92 density determinations using a dry analysis technique on whole core representing the Martha vein and other lesser veins from the deposit. In the opinion of the QP responsible for this section of the technical report, this density validation testing generated specific gravity values that are not significantly different than the average specific gravities obtained by Orko’s analyses (M3 2013).
PAS – 2008-2010
The Snowden (September 2011) and MP (November 2012) technical reports both make reference to a suite of pulp duplicate samples representing the Martha vein from both earlier Orko and PAS drillholes. According to the Snowden technical report, “To eliminate any concerns about the quality of Orko data, PAS undertook a specific testing program of original data by reassaying drillhole samples and by comparing recent PAS drillhole sample grades with earlier Orko sample grades, which also showed grade biases”. The Snowden technical report further states in Table 11.3 that the duplicate samples, which totaled 146 in number, were submitted “because of problems in correlating mineralization over short distances between Orko and Pan American holes”. The MP technical report added that of the 146 duplicate pulps, 43 of the pulps were originally assayed by Inspectorate, while 103 were originally assayed by SGS. The duplicate assays for all 146 pulps were generated by SGS. However, neither report provides any details of the results of comparisons between the duplicate sample pairs (M3 2013).
To follow up on MDA’s validations of material density, PAS applied four different testing methods to the same individual rock samples removed from 252 different sample intervals in the remaining half core. These included 133 samples from veins and adjacent silicified material and 119 samples from un-silicified andesite, the most common host rock to the Project mineralization. The selection of each of the 252 samples considered the variable degree of oxidation in the deposit by taking approximately 40 samples of vein/silicified material and approximately 40 samples of andesite from shallow (highly oxidized), middle (moderately oxidized), and deep (weakly oxidized to unoxidized) portions of the deposit. One of the four measurement techniques employed included data for determination of a “void index” that could be used to derive bulk density. The selected samples (most of which were previously measured for specific gravity by Orko) weighed between 400 grams and 600 grams in order to reduce measurement error. Prior to testing, each sample was geologically described. The resulting specific gravity measurements were reportedly made by a technician in the metallurgical laboratory at PAS’s La Colorado mine operations in Zacatecas, Mexico. The results of these measurements indicated that the Orko-specific gravity data were suitable for use in Mineral Resource estimation, provided that a bulk density conversion factor of 0.99 was applied to the average specific gravity for each of the material types (vein, vein silicification, and various host rocks). In the opinion of the QP responsible for this section of the Report, this fine tuning of the measured specific gravities for the various material types is acceptable, but not material to estimation of Mineral Resources in the Project deposit (M3 2013).
| C56 |
Snowden – 2011
The Snowden technical report (Snowden 2011a; 2011b) does not mention the collection by Snowden of any independent drill core samples or existing coarse reject or pulp duplicates for check assay. Snowden reportedly reviewed original assay certificates from SGS in Durango, Mexico and from Inspectorate’s laboratory in Sparks, Nevada, which included 441 assays from PAS’s drilling and 3,188 assays from Orko drillholes. In total, 44 errors were noted in the PAS database assay files (an error rate of 1.4%), 41 of which were determined to be related to a single assay batch that apparently was subsequently reassayed. Two of the three remaining errors reportedly involved the entry of incorrect assay detection limits. Nine errors were noted in the Orko assay database, seven of which were reportedly due to cases where the average values of acceptable duplicate assay pairs were entered rather than the primary sample assays. Snowden did not perform or recommend additional material density (specific gravity) testing (M3 2013).
Mining Plus – 2012
MP independently collected 74 samples consisting of 23 samples of half (sawn) core and 46 existing coarse rejects. Although the MP technical report states that, “All results from this program returned values well within acceptable limits”, no actual data for the duplicate sample analyses were provided. MP also reportedly compared the results of 3,285 assays representing the major zones of mineralization reported on laboratory certificates with entries in the assay database and found six errors (an error rate of only 0.2%), and concluded that none of these errors were materially significant with respect to mineral resource estimation (M3 2013). MP checked collar coordinates for 17 drillholes using a hand-held GPS unit and noted no significant discrepancies (considering the accuracy of the GPS unit) with the values in the project database. Downhole survey data also were reviewed by MP, which found errors believed to have been caused either by inaccurate data transcription or by errors in the actual survey measurements. Where original data could be located, these downhole survey data were verified or corrected. MP also noted variances between drillhole azimuths and inclinations at the drillhole collars and the initial downhole survey data points. In MP’s view, the reason for these discrepancies probably was due to the drill set-ups not corresponding to the planned azimuths and inclinations. To address these differences, MP reported that hole collar markers were removed and new collar measurements made of drillhole azimuths and inclinations, except where prevented by deterioration of the drillhole collars due to caving and/or the presence of the magnetic basalts on the eastern portion of the project drill pattern. Also, MP reported removing the downhole survey data for several drillholes for which it determined that the trace of these holes as defined by the downhole surveys was physically impossible. In summary, outside of the errors described above, MP noted that with the collection of downhole survey data on 50 m intervals, the potential impact of individual survey errors is limited. MP did not perform or recommend additional material density (specific gravity) testing (M3 2013).
IMC – 2013
Only five additional drillholes that were not included in the MP MRE were considered for inclusion in the IMC MRE summarized in the section titled “Mineral Resource Estimates”, (holes 1, 2, 3, 4, and 5) and only one of these has assay data (BP12-718). In the opinion of the QPs responsible for that technical report, no additional independent validations of these data were warranted. This opinion is based on the lack of any significant amount of additional data that post-dates the MP study and technical report, and in light of the documented acceptable agreement between duplicate sampling and assaying exercises and material density validations conducted by previous QPs (M3, MDA, Snowden, and MP). The QA/QC information that has been described in this section was loaded into the IMC system and analyzed to confirm previous work.
| C57 |
In summary, the primary basis for confirmation of the drillhole database are the inserted standards that have been completed during the assay programs. There were also a number of inserted blank samples. As described earlier, there are a total of 1,103 duplicate assays in the QA/QC database. These are a mixture of:
|
| · | Duplicate Pulps to the same lab: 43 samples |
|
| · | Check Pulps to a second lab: 793 samples |
|
| · | Coarse Rejects to the same lab: 192 samples |
|
| · | Coarse Rejects to a second lab: 75 samples |
The analysis by previous QPs and IMC do not indicate any particular issues with bias in the above data sets. However, none of the above programs are sufficiently consistent in procedure, data distribution, or purpose to be considered as a major component of the QA/QC data. The above duplicate samples represent 1.1% of the total assay database. The reliability of the entire drill program is therefore relying on the inserted standards and blank samples.
Standards
There are 4,580 standards inserted into 104,720 assays (4.4%) of which 547 standards were inserted into the 12,955 assays above 25 g/t (4.2%).
Blanks
There are 1,765 blanks out of 104,720 assays (1.7%) of which 348 blanks were inserted into the 12,955 assays above 25 g/t (2.7%).
Blanks were not inserted on a regular basis, although it appears that blanks were likely inserted after high-grade intercepts on a visual judgment basis rather than on a consistent insertion basis.
Standards were generally inserted throughout the database. The percentage inclusion is similar in both mineralized material and waste components of the deposit. IMC prepared maps and sections of the holes that contain standards and found them to cover the area of the mineral resource on a relatively consistent basis. Analysis of tested standards versus the published Standard Value in the MP Report dated November 5, 2012 do not show any immediate issues regarding assay lab bias, regardless of the lab used for the primary assay. There are some confusing data points in the QA/QC database that present different certified values for some standards compared to the MP Report. IMC has chosen to use the certified values as published in the MP Report.
The statistical analysis of the QA/QC database indicates that the project database can be accepted for estimation of mineral resources, based almost entirely on the reliable results from inserted standards. However, the QA/QC database in general does not meet industry “best practices” in the opinion of IMC.
Coeur Validation of Drill Data
Assay data were imported into an acQuire database using assay import object. The commercial laboratories provide assay data in a pre-constructed Comma-Separated Values (CSV) template that imports seamlessly into the acQuire database when no errors are present. AcQuire imports adhere to very strict rules relating to sample IDs, assay data, and lab job numbers. When these rules are violated, an error report is generated. There is no manual data entry related to the assay import process. In addition, continuous comparison of the database values against the original PDF certificates is a valuable check on the database integrity.
| C58 |
Coeur Geologic Data Validation
In 2014 Coeur initiated and completed a comprehensive review and data entry campaign for all drillhole geologic logs from Orko, PAS, and Coeur. The review included 843 drillholes for a total of 259,919 m. The Project was contracted to HRC and included review and data entry of hardcopy and scanned geologic drill logs. HRC inspected four database tables; lithology, alteration, mineralization, and structure. A list of accepted logging codes was provided by Coeur with edits applied as needed as the Project proceeded. HRC supplemented the data process with an internal validation process that reviewed the logs for legibility, completeness, and consistency with regards to geologic interpretation. Select drillholes were reviewed in 3D to identify potential error in interpretation. Mechanical audits were completed to identify overlapping intervals, gaps in geology, and inconsistencies in drill depths.
Coeur Collar Survey Checks
Drillhole collars are checked visually in MineSight Comprehensive Modeling and Mine Planning Platform and on topographic based maps to confirm that holes are on the correct drill pads and map coordinates.
Downhole survey data are imported into an acQuire database using an import object. The 2013-2104 downhole surveys were completed by IDS Mexico. IDS provided CSV data files that, in most cases, imported seamlessly into acQuire. On several occasions the CSV file was constructed from a different template, and additional manual formatting was required and completed by the geologic database manager. On import, the data are checked for overlapping intervals and intervals below the recorded length of the drillhole.
Coeur Validation of Historical Drillhole Data
Coeur continued to verify Orko era data in 2013 and 2014. A 2013 report includes a review of the original Orko database and reviews subsets of the data loaded into the acQuire Database. This review included drillhole collar, downhole survey, density, RQD, and sample ID and assays. The review also outlines the general acQuire database structure. Recommendations are proposed and have been addressed by Coeur, or are included in that report as recommendations for further work. Coeur identified the need to verify assay data against original hardcopy assay certificates. Coeur initiated this project in 2014. Verification of samples against hard copy assay certificates was conducted manually at both the Chihuahua Exploration office and the Chicago Corporate office. The initial comparisons checked 298 standards and 497 primary samples that were analyzed at Inspectorate from 2006 through 2008. No discrepancies between the two datasets were identified. This amounts to verification of 2.9% of QA/QC samples and 0.7% of primary samples. The Orko and PAS assay results required verification for use in resource estimation. Further evaluation of the Orko master database was completed in 2014. Inspectorate provided official data files and certificates for 100% of the lab jobs completed from 2007 - 2009. The Inspectorate results were loaded to acQuire directly from the data files and are presumed validated, but will benefit from an additional check against the hardcopy certificate.
SGS data files provided by Orko had been modified. Coeur was able to obtain 426 of 753 (57%) original data files and 634 of the original PDF certificates from the SGS. The data files received were loaded directly into acQuire and the resulting data are considered validated. QA/QC procedures were completed on the imported SGS data files, per Coeur’s company protocol. A combined silver and gold total of 3,180 identifiable QA/QC values were analyzed in acQuire, resulting in 30 failures. Seven pairs of data were excluded from the analysis due to either the standard value exceeding the UDL of the assay method, or because the standard was not certified for a gravimetric analysis. Coeur policy mandates that a standard fails when the value exceeds ± three SDs of the standard value and a blank fails if it exceeds ± five times the LDL of the analysis method. Failure rates for silver and gold for from the SGS data files were 0.7% and 1.3%, respectively. Assay pairs from the Orko master database and the SGS data files were compared in acQuire to validate the primary assay database. A combination of 46,551 sample pairs of silver and gold were analyzed using x-y scatter plots. (Figure 12-1 and Figure 12-2) The silver and gold values should be exact matches and therefore a failure is defined as any deviation greater than zero. The comparison resulted in 510 failures, or 1.1% of the pairs. Figure 12-1 and Figure 12-2 visually indicate that the failures are of relatively low magnitude. Coeur is confident 54 of the silver failures are the result of Orko gravimetric results being merged into a fire assay field. These are not true failures, but the result of manual data manipulation. The remaining silver and gold failures are assumed to be attributed to manual error or discrepancies with reporting of assays at or near the detection level of the assay method.
| C59 |
The data and statistics presented in this section illustrate that Coeur was able to verify 60% of the primary SGS sample count and was able to verify a 43% increase in the QA/QC sample count. The QA/QC insertion rate of 12%, from the SGS data files indicated that the validated data contained an acceptable quantity of QA/QC samples which exceeded Coeur’s current internal requirement. The QA/QC completed on the SGS data performed well, with low failure rates. The primary assay comparison produced very low failure rates and overall low magnitude failures. In summary, these comparisons represent 60% of the primary assay database and 57% of the total lab jobs stored in acQuire. The remainders of the outstanding original data files are considered to be unobtainable. Therefore, Coeur considered the performance of the Orko data that was verified by the SGS data files to be indicative of the performance of the entire Orko master database, and subsequently acceptable for use in resource evaluation.
Coeur Data Collection Campaigns
Density
The Orko master density database contained 89,226 records of calculated density, with an average density of 2.51 g/cm3. In 2014, Coeur developed a standardized procedure to improve the accuracy of density measurements. In March 2014 Coeur employees completed 1,667 density measurements using the new procedure (see Table 12-4). The average density of these measurements was 2.52 g/cm3.
Table 12-4: Density Data 2014 Summary
| Lithology | Density (g/cm3) |
| Basalt | 2.38 |
| Metamorphic | 2.67 |
| Sedimentary | 2.50 |
| Volcanic | 2.48 |
Geomechanical
In 2013, KP initiated a geomechanical drill program. The drilling consisted of two holes completed in 2013 and four holes completed in 2014. The drilling was completed by Major Drilling using HQ3 diameter core using triple tube techniques. The geomechanical core was oriented using the Reflex ACTIII device. The drill core was split and assayed using Coeur’s procedures discussed in that report. The assay results for these drillholes are not included in the resource estimation data set.
Reassay of Pulps
Initial silver assaying by Orko at SGS used a 3-acid digestion with ICP-AES finish for all samples, followed by fire assays for samples exceeding 300 g/t Ag. In 2013, 313 pulp samples were reassayed and demonstrated that using a 4-acid digestion with an ICP finish resulted in a more complete sample digestion and, on average, higher Ag grades. In 2014, Coeur selected all Orko era samples within the 25 - 100 ppm silver grade range for reassay by the 4-Acid ICP method. Coeur submitted 6,059 and 825 pulp samples to ALS and SGS, respectively. Reassay results from ALS showed an average increase in Ag grade of 11% when comparing Coeur’s 4-acid digestion ICP results to Orko’s 3-acid digestion results. Reassay results from showed an average increase in Ag grade of 2.2% when comparing Coeur’s 4-acid digestion ICP results to Orko’s 3-acid digestion results.
| C60 |
Coeur Review of Orko Era Drill Core Sampling
Core drilled during the Orko and PAS campaigns was selectively sampled based on geologic observation during the core logging process. In 2013, Coeur initiated a campaign to re-log, sample, and assay portions of the previously unsplit core. During the review of the core and logs, Coeur geologists identified samples that ended in mineralized material as well as structures and alteration that were unsampled. The geologists collected these new samples from 35 drillholes along three parallel sections. The program resulted in 3,520 new primary samples added to the acQuire database.
Coeur Review of Orko Era Quartz Vein Sampling
In addition to the legacy drill core sampling, Coeur geologists reviewed the database to identify un-sampled intervals logged as quartz vein. A total of 95 samples, representing 120 meters of core length, were identified in the drillhole database. If the material was available and un-sampled, the vein interval and several meters of core above and below it would be sampled and assayed.
Spectroscopy Study
In 2014, Coeur contracted SRK Consulting of Toronto, Ontario to conduct an Infrared Absorption scan for alteration on the Project drill core. SRK scanned 76 drillholes for a combined 8,568 intervals totaling 24,987 m. The spectral data identifies the presence or absence of clay species and is useful for geotechnical purposes such as identifying fault zones, zones of high cohesive strength, and depth to water. The spectral dataset is stored in the project acQuire database.
Data Verification Conclusion
The QP is satisfied that the sampling and assay data, topographic information, and drill core management for this project have been comprehensively verified and are suitable to be used for mineral resource estimation.
MINERAL PROCESSING AND METALLURGICAL TESTING
Avino Property Area
Avino has not based its production decisions on any Feasibility Study or Mineral Reserves demonstrating economic and technical viability, and as a result, there is increased uncertainty and multiple technical and economic risks of failure that are associated with these production decisions. These risks, among others, include areas that would be analyzed in more detail in an FS, such as applying economic analysis to Mineral Resources and Mineral Reserves, more detailed metallurgy, and a number of specialized studies in areas such as mining and recovery methods, market analysis, and environmental and community impacts. Information in this section was provided by Avino. The information presented in subsequent sections were based on excerpts summarized from a previous technical report (Tetra Tech 2018) and revised with more recent press release material to reflect the activities at the Project site.
The Avino processing plant is currently processing materials from the Avino Property. The target metal values are gold, silver, and copper. There is potential tailings resource from previous operations; currently, there is no operation on tailings material. The materials from the previous San Gonzalo Mine were processed from October 2012 to Q4 2019 with the target values of gold, silver, lead, and zinc. There are four grinding and flotation lines with a total capacity of 2,500 t/d, including two 1,000 t/d and one 250 t/d lines to recover copper, gold, and silver into a copper concentrate, and a separate 250 t/d line, which was used to produce materials from the previously operating San Gonzalo Mine, which has ceased operation since the end of 2019.
| C61 |
Avino Vein
The Avino Vein material is currently being processed at the Avino processing plant using froth flotation to produce a marketable copper concentrate with silver and gold credits. A gravity concentration circuit was also incorporated in three of the four processing lines. The material has been successfully processed in the past.
The Avino Vein was mined during the 27 years of open pit and underground production prior to 2001. From 1997 to 2001, the mine and processing plant production averaged 1,000 t/d and achieved up to 1,300 t/d. The mine and plant operations were then suspended. Following several years of redevelopment, in Q4 2014, Avino completed its Avino mining facility and plant expansion. Full-scale operations commenced on January 1, 2015, and commercial production was declared effective on April 1, 2016, following a 19-month advancement and test period.
The feed from the Avino Vein has been processed using froth flotation to produce a copper concentrate with silver and gold credits. In the 2022 operation, the average silver, gold, and copper recoveries reporting to a silver/gold/copper concentrate and a gravity concentrate were 92%, 78%, and 89%, respectively. The total material processed was 541,823 t.
Bismuth was identified as a deleterious material in the concentrate. Avino had conducted preliminary test work to reduce the bismuth content in the concentrate to improve the smelter return. SGS completed six batch flotation tests to explore the possibility of bismuth and copper separation from a copper concentrate produced from the Avino processing plant. The separation tests included:
|
| · | Floating copper minerals with suppressing bismuth-bearing minerals |
|
|
|
|
|
| · | Floating bismuth-bearing minerals with suppressing copper minerals on the copper concentrate reground to 80% passing approximately 25 µm |
The test results show that approximately 30% of the bismuth in the bulk copper concentrate could be floated into a concentrate containing 18.7% Bi from the copper concentrate containing 1.8% Bi using flotation separation. The copper and silver reporting to the bismuth concentrate were 1.3% and 14.7%, respectively. SGS indicated that compared to the floating copper and suppressing bismuth process, and it appears that the process with floating bismuth and suppressing copper is feasible and promising. SGS recommended that further copper and bismuth separation test work using the flotation procedure, including a mineralogical study, be conducted.
Oxide Tailings
The potential for processing the oxide tailings resource from previous operations has been studied. The subsections summarize the metallurgical characterization obtained from previous test work and the study conducted by MMI in 2005 (Slim 2005c). MMI’s report used the metallurgical results and conclusions drawn by PRA (Huang, 2003; Huang and Tan 2005). The revised and final report by MMI was dated October 2005 (Slim 2005d).
The section titled “Mineral Processing and Metallurgical Testing – Avino Mine Area – Oxide Tailings” below is reproduced from the 2013 PEA (Tetra Tech 2013), with some minor modifications to summarize the findings of the metallurgical test programs conducted so far.
| C62 |
Historical Metallurgical Test Results
Several metallurgical evaluations have been completed on various samples from the oxide TSF, according to the MMI report produced in 2003 (Slim 2003). The first cyanidation tests were conducted in 1982, followed by further tests performed over the years. The summarized cyanidation test results are shown in Table 13-1, taken from the 2003 MMI report (Slim 2003), while the reported flotation test results are given in Table 13-2. The results obtained from the test work program initiated by MMI in 2003 and 2004 were reported in the MMI 2005 technical report (Slim 2005d) and are included in Table 13-1 for comparison purposes. The results will be discussed in greater detail later in this section.
Table 13-1: Cyanidation Test Results (Slim 2003)
| Author | Date of Test | Extraction (%) | Leaching Time (h) | Particle Size (µm) |
|
| Ag | Au |
||||
| Denver Equipment | 1982 | 69.3 | 66.7 | 24 | 66.6% < 149 |
| Penoles | 1987 | 78.3 | 88.9 | 24 | 87% < 74 |
| Maja | 1990 | 85.9 | 80.9 | 24 | 100% < 105 |
| Chryssoulis | 1990 | 85.9 | 80.9 | 24 | no data |
| Rosales | 1996 | 83.9 | 76.9 | 23 | 75% < 74 |
| MMI | 2003 | 77.1 | 71.4 | 24 | 86% < 74 |
| MMI | 2003 | 88.8 | 88.4 | 48 | 86% < 74 |
Table 13-2: Flotation Test Results
| Author | Date of Test | Recovery (%) | Particle Size (µm) |
|
| Ag | Au |
|||
| Penoles | 1987 | 60.2 | 47.1 | 87% < 74 |
| Rosales | 1996 | 69.4 | 66.9 | 75% < 74 |
For the tests outlined in Table 13-1 and Table 13-2, no details have been provided regarding:
|
| · | The location or the manner in which the samples were taken |
|
| · | Why these particular samples were taken |
|
| · | The test parameters employed |
|
| · | The assay techniques used, etc. |
The first set of results for tests conducted on MMI samples from the 2003 sampling campaign indicates a silver extraction of 77.1% and gold extraction of 71.4%. However, these results cannot be verified since the origin of this set of numbers, as quoted in the MMI technical report (Slim 2005d), is not known. The second set of results was reported in the 2003 PRA report (Huang 2003). Considered in general terms, it would appear that the cyanidation test results were reasonably consistent over the indicated period. However, no specific conclusions should be drawn, since nothing is known about the head grades of the samples, the samples used, or the test and assay procedures used at the time that these tests were conducted.
The flotation results vary widely for similar particle sizes, with recoveries ranging from 60% to 69% for silver and 47% to 67% for gold. However, the test details of these reported cyanidation and flotation tests are unknown.
The MMI Technical Report
Avino commissioned MMI to produce a document that was NI 43-101 compliant with respect to detailing the indicated oxide tailings resource (subsequently referred to as an Inferred Resource) and to define the metallurgical characterization and assay results for this material. The proposed economic processing of this tailings material could then be used to form the financial analysis basis for restarting the mine.
| C63 |
The first report prepared by MMI was titled “Tailings Valuation” and was dated November 2003 (Slim 2003). Two further reports by MMI titled “Preliminary Feasibility” (Slim 2005a) and “Tailings Valuation” (Slim 2005b) were produced in May 2005. The “Tailings Valuation” report (Slim 2005b) was subsequently revised and re-titled “A Tailings Resource” in July 2005 (Slim 2005c). This July 2005 MMI report (Slim 2005c) was reviewed by the Canadian Securities Administrators and returned to MMI for revision. The revised MMI report was re-issued as “A Tailings Resource” dated October 2005 (Slim 2005d) and was resubmitted to the CSRA for review. The October 2005 report (Slim 2005d) was produced for Avino Mines, Cia Minera Mexicana, Durango, Mexico, by Bryan Slim of MMI, North Vancouver, British Columbia, Canada. The document was submitted as a technical report to the CSRA.
PRA conducted two sets of test programs under the direction of MMI. One was conducted in 2003, for which no sample origin can be determined (Huang 2003), and the other, a more detailed test program, was conducted in 2004 (Huang and Tan 2005). The 2004 test work and the assaying program were designed and supervised by MMI. It was conducted on the samples collected from the tailings dam by MMI in 2004 while also using the results from the preliminary metallurgical scoping tests completed during 2003 as a guide. PRA staff at their facilities in Vancouver, British Columbia, conducted all the test work from both MMI test programs.
Introduction to the MMI 2003 Metallurgical Test Program
The 2003 test program consisted of the following tests, as summarized in Table 13-3. The cyanidation extraction results obtained were used in a preliminary report by MMI (Slim 2003). MMI considered using a 2,000 t/d vat leaching process to recover silver and gold from the oxide tailings; however, this treatment process option was revised when the results of the 2004 test program became available.
Table 13-3: Test Procedures – MMI 2003 Test Program (Slim 2003)
| Process/Procedure | Details of Test | Sample Identify |
| Sample Preparation | No details documented | Sample L and Sample U |
| Head Assays | Fire assays, AA, and ICP multi-acid | Composite of L and U |
| Specific Gravity | Standard pycnometer test | Composite of L and U |
| Cyanidation Leach | P80 = 68 µm; 40% solids; pH 10.5; 1.0 g/L NaCN; 48 h; dO2 > 7.9 mg/L 0.4 kg sample | Composite of L and U |
| Flotation | Rougher and two scavenger stages; P80 = 85 µm; 35% solids; pH 5.5; PAX & A208 with MIBC; 1 kg sample | Composite of L and U |
| Mineralogical | Examination of flotation tailings | Composite of L and U |
| Sample Preparation | No details documented | Sample L and Sample U |
Notes: dO2 = dissolved oxygen; PAX = potassium amyl xanthate; NaCN = sodium cyanide
The exact origin of Sample L and Sample U is not known and does not appear to have been documented. The manner in which each of the samples was collected by MMI has also not been documented. The size of both samples, 0.8 kg for Sample L and 0.9 kg for Sample U, is small, and their representation is questioned. Also, there appears to be no documentation relating to the arrival and receipt of these samples at PRA. There is no receiving log in PRA Report No. 0302303 (Huang 2003). Also, no assay certificates have been recovered to date. Even though these tests were considered to be scoping tests only, the results cannot be validated. Considering all the above factors, it is apparent that these results cannot be used with any degree of validity in reviewing process options for recovering silver and gold.
| C64 |
Introduction to the MMI 2004 Metallurgical Test Program
The 2004 test program was a better-structured program, which included the pre-concentration processes such as gravity concentration and flotation, both with and without regrinding, in an attempt to upgrade the material into a smaller mass for the subsequent treatment for the recovery of silver and gold. Also, cyanidation leach tests were conducted on as-received samples and reground samples to attempt to improve the liberation of silver and gold from the associated minerals. One column leach test was also performed.
Additional work completed included establishing the specific gravity and bulk density of the material, determining the Bond Mill Work Index on an oxide sample from the open pit, settling and filtration tests following cyanidation tests, and electrowinning tests using Electrometals electrowinning (EMEW) technology. All the different test procedures are summarized in Table 13-4.
Table 13-4: Test Procedures – MMI 2004 Test Program (Slim 2003)
| Process/Procedure | Details of Test | Sample Identify |
| Sample Preparation | Individually numbered; dried; weighed; subsequently composited | Composites A, B, and C |
| Head Assays | Fire assays, AA and ICP multi-acid | Individual samples and Composites A, B, and C |
| Specific Gravity | Standard pycnometer test | Composites A, B, and C |
| Bulk Density | Standard volume displacement test | Composites A, B, and C |
| Mineralogical Examination | Examination of as-received samples | Selected Samples |
| Test Product Assays | Fire assays, AA and ICP multi-acid | All test Products |
| Bond Mill Work Index | Six cycles; closing screen size 150 µm | Oxide Sample |
| Size-assay Distribution | Screened and assayed the size fractions | Selected Samples |
| Gravity Concentration | Various test conditions | Composites A, B, and C |
| Cyanidation Leach | Various test conditions | Composites A, B, and C |
| Flotation | Various test conditions | Composites A, B, and C |
| Column Leach Test | Agglomerated feed; 81 d duration; 0.5 to 1.0 g/L NaCN; pH 10.5; 0.05 mL/s | Composite of A and B |
| EMEW | Various test conditions | PLS from Leach Test |
| ABA | Acid generation tests | Composites A, B, and C |
The results obtained from this test program led MMI to include the heap leach process as the recommended treatment option in their report dated May 2005 (Slim 2005a).
| C65 |
2022–2023 Test Work
SGS is conducting a metallurgical test program on tailings samples generated from the tailings storage facility. The preliminary test results show that regrinding the tailings samples to 80% passing approximately 75 µm improved silver and gold extractions for the early-stage oxide tailings composite sample to approximately 89% and 88%, respectively, compared to 82.7% for silver and 78.7% for gold without regrinding. For the recent oxide tailings composite sample, the silver and gold extractions were improved to approximately 83% or slightly higher with regrinding to 80% passing 75 µm, compared to 77.9% for silver and 76.6% for gold without regrinding.
Evaluation and Review of Metallurgical Tests
Tetra Tech reviewed the metallurgical tests conducted during the MMI 2004 test program. The most promising process option should be selected as the recommended process treatment route based on the evaluation of the results obtained from the test program. This process option should then be evaluated with respect to capital and operating cost estimates. The process implications of the procedures and processes investigated and the results obtained are discussed in this section.
Sample Preparation and Characteristics
Bagged samples carrying the MMI identification tags were prepared at the Avino mine site under the direct supervision of MMI personnel. These samples were then transported from the mine site to Durango, Mexico, and shipped via airfreight to Vancouver, British Columbia. The samples were delivered to the PRA facility and unpacked in the presence of MMI personnel to ensure that no tampering had occurred to the samples en route. The samples were subsequently renumbered by MMI prior to PRA staff un-bagging and drying the samples. These details are shown on the PRA sample receiving log (Huang and Tan 2005). The individual samples were initially air-dried, followed by a low temperature of less than 50°C of oven drying.
The individual samples were subsequently homogenized, riffled, and split into four one-quarter fractions. One of these fractions was used for head assay determinations. A second fraction was used for compositing selected individual samples to create the sample Composite A, representing the oxide material of the lower bench of the tailings dam. Similarly, Composite B, representing the oxide material of the middle bench of the tailings dam, was prepared by compositing selected individual samples, as was Composite C, representing the sulphide tailings of the upper bench.
Although the samples had arrived at PRA from the Avino mine site without any indication of tampering, the sampling regime is considered deficient. First, the sampling of the oxide section of the tailings dam was incomplete. The sampling did not replicate the 1990 CMMA program, and certain parts of the tailings dam were not sampled. Second, the samples taken by MMI only represented the first 4 m of the depth of the tailings dam. Indications are, however, that the overall depth of the oxide section of the tailings dam varies between 7 m and 27 m. These two major deficiencies were also recognized by the Canadian Securities Administrators as deficiencies during their review. Both these items were addressed in the final MMI report dated October 2005 (Slim 2005d). The October 2005 report recommended a more detailed program of sampling of the whole tailings dam up to bedrock or ground soil level, as well as conducting metallurgical characterization tests using representative material from this more detailed sampling process whenever this is to be performed. However, since the MMI technical report, as reviewed by the Canadian Securities Administrators, subsequently referred to the oxide tailings as an Inferred Resource (Slim 2005d), this and other sampling discrepancies noted in the MMI test program will not be discussed any further.
| C66 |
Moisture Content
The moisture contents of the samples, as received from the Avino mine site tailings dam, varied widely, from a low value of 5.12% to a high value of 28.25% moisture. A frequency distribution for moisture content of all the oxide tailings samples as received by PRA is given in Table 13-5. The bi-nodal distribution is apparent.
Table 13-5: Moisture Content of Samples
| Frequency Distribution |
|
| Moisture Content (%) | Number |
| 5.00 - 7.50 | 9 |
| 7.51 - 10.00 | 14 |
| 10.01 - 12.50 | 19 |
| 12.51 - 15.00 | 16 |
| 15.01 - 17.50 | 5 |
| 17.51 - 20.00 | 5 |
These high moisture content values in the tailings dam confirm the high moisture content values found during the 1990 sampling program conducted by CMMA. Although the precise sampling procedure and drying conditions are unrecorded, a datasheet provided by Avino, as ostensibly related to this sampling program, provides assay values and moisture contents obtained during the program. The moisture values obtained varied from a low moisture value of 13.89% to a high value of 29.4% and a calculated average of 22.87% moisture. A possible reason for the high moisture content of the tailings material is that the mine was operational during this period when the sampling program was undertaken, i.e., 1990, and that routine tailings deposition was still in progress.
The specific reason for the relatively high moisture content found during the 2004 MMI sampling program is not apparent. The MMI technical report (Slim 2005d) has referred to the possibility of the original manner of tailings deposition, which has resulted in localized areas of high moisture content. Also, the presence of artesian springs under the tailings dam has been mentioned as a possible reason. It was also observed that any rainwater run-off from the higher levels above the tailings dam would collect at the head of the tailings dam and subsequently seep through the dam, exiting at the foot of the dam. Whatever the reason(s) may be, areas of high moisture content do exist and will influence the method of recovery of the tailings and the subsequent agglomeration process.
Head Assays and Test Products Assays
Gold assaying was completed using the standard fire assay procedure. Initially, the silver was also analyzed by the fire assay procedure followed by an AA spectrophotometric finish. However, this fire assay-based method for silver is not very accurate in the low concentration range of less than 100 g/t for silver. Assaying for silver was then done using ICP-MS, preceded by the total digestion of the sample in a suite of mineral acids. A further method was also investigated, namely that of total acid digestion followed by an AA finish. The results obtained with this acid digestion and AA method were similar to the ICP-MS. Therefore, the assay method selected for all the silver assays was the ICP-MS method, preceded by the total digestion of the sample in a suite of mineral acids (ICP‑MS). All the other analyses for the various products arising from the metallurgical tests were done by the standard and universal methods using titration, ICP-MS, or AA methods.
All the various head sample analyses conducted during the test program are listed in Table 13-6. The reference to the test number relates to the stage of the test work that the sample was submitted for analysis. The average values for the four different composite samples tested, namely Composite A, Composite B, Composite C, and the Composite A + B blended sample, have all been calculated and are given in the table together with the respective standard deviation values. The standard deviation of the head samples representing Composite A and Composite B are shown to be within 10% of the deviation from the average value, which is considered reasonable.
| C67 |
However, the average silver value of all the head assay analyses assayed as head samples representing Composite A and Composite B is only 86.8 g/t silver. This average silver grade is less than the 95.5 g/t silver as given in the MMI technical report as being the overall silver grade of the material of the whole oxide tailings dam (Slim 2005d). Similarly, the average gold value of all the head assay analyses assayed as head samples representing both Composite A and Composite B (i.e., representing the oxide tailings dam) taken during the test work program is 0.44 g/t gold, which also is less than the 0.53 g/t gold, as quoted in the MMI technical report (Slim 2005d). For silver, this amounts to a difference of about 9% based on the MMI quoted head grade of 95.5 g/t silver, while for gold, the difference is larger at 17% based on the MMI quoted gold value of 0.53 g/t gold. It is of interest that the average head assay for the Composite A + B sample is closer to the calculated average from Composite A and for Composite B, namely 89.6 g/t compared with 86.8 g/t for silver and 0.41 g/t compared with 0.44 g/t for gold. The above discussion assumes that the tonnages of the tailings dam labelled Composite A (lower bench) will be mixed in equal proportion to the area of the tailings dam designated as Composite B (middle bench). In the absence of specific tailings dam volumes or tonnages, this assumption may be an oversimplification and may, therefore, not be entirely valid. However, the assay values for Composite B are lower than the overall average head grade of the tailings samples collected.
A further comment regarding the assay results above relates to the methods employed for the assaying techniques for silver from these samples. The MMI technical report (Slim 2005d) states that for the CMMA 1990 tailings drilling program, the silver assaying was completed using the standard mine practice of fire assay followed by acid digestion and AA finish. The PRA metallurgical test work program used multi-acid digestion followed by the ICP assay method for silver analyses. It is anticipated that there will not be a significant difference between the silver assays as reported in 1990 and those from the MMI test program as conducted by PRA, but the extent of this difference cannot be quantified in this review. Similarly, no comment can be given on the accuracy of the assays conducted by CMMA, since the standards of precision of sampling, sample preparation, and detailed methodology of the assaying methods are unknown. However, a summary sheet containing assay values has been provided by Avino as being the silver and gold grades obtained from the 1990 CMMA sampling program. No calculations have been performed using these assay values, and are only included in the Report since it is part of the CMMA sampling program. The MMI report (Slim 2005d) provides a grid map identifying the various sample holes.
Table 13-6: Head Assays
| Test No. | Assays (g/t) | Test No. | Assays (g/t) |
||
| Ag | Au | Ag | Au |
||
| Composite A | Composite B |
||||
| SA9 | 99.8 | 0.37 | SA10 | 88.3 | 0.55 |
| Ave. 1 | 103.4 | 0.34 | Ave. 1 | 82.6 | 0.68 |
| Ave. 2 | 105.3 | 0.36 | Ave. 2 | 88.4 | 0.51 |
| C1 | 95.2 | 0.35 | C4 | 76.3 | 0.52 |
| C2 | 94.3 | 0.35 | C5 | 70.6 | 0.49 |
| C3 | 94.1 | 0.36 | C6 | 71.4 | 0.50 |
| C7 | 88.7 | 0.36 | C9 | 70.3 | 0.52 |
| C8 | 88.7 | 0.36 | C10 | 70.3 | 0.52 |
| C13 | 95.9 | 0.28 | C15 | 77.2 | 0.49 |
| C14 | 98.9 | 0.37 | C16 | 78.3 | 0.52 |
| C17 | 95.2 | 0.35 | C18 | 77.2 | 0.49 |
| Average Value | 96.3 | 0.35 | Average Value | 77.3 | 0.53 |
| Standard Deviation | 5.27 | 0.025 | Standard Deviation | 6.72 | 0.054 |
| Composite C | Column Composite A + B |
||||
| C11 | 39.8 | 0.34 | C4 | 87.4 | 0.42 |
| C12 | 39.8 | 0.34 | C5 | 90.1 | 0.40 |
| Ave. 1 | 31.7 | 0.29 | C6 | 91.4 | 0.42 |
| Ave. 2 | 39.8 | 0.39 | C9 | - | - |
| Average Value | 37.8 | 0.34 | Average Value | 89.6 | 0.41 |
| Standard Deviation | 4.05 | 0.041 | Standard Deviation | 2.04 | 0.012 |
Mineralogical Evaluation
At the start of the 2004 metallurgical test program, MMI requested that a sample from some of the individual samples be submitted for mineralogical analysis. The mineralogical findings have not been reported in PRA Report No. 0406407 (Huang and Tan 2005) and were not alluded to in the MMI technical report (Slim 2005d) or any preceding reports. The reason(s) why these results have not been communicated to Avino or the test program investigators at PRA is unknown.
Bond Ball Mill Work Index
Although this information was not required to treat the oxide tailings dam material, a Bond Ball Mill Work Index determination test was done on an oxide material sample. The work index was determined to be 12.3 kWh/t using a closing screen size of 74 µm (200 mesh) with the convergence of the specific energy input (grams of product per revolution) found after five testing cycles. This makes the sample tested a moderately hard rock type. The details regarding the origin of this sample have not been documented, and its relevance as data is therefore questioned.
Bulk Density and Specific Gravity
Bulk density and specific gravity determinations were conducted on samples specifically identified by MMI. The specific gravity measurements were done using the standard pycnometric method, while the bulk density values were obtained by measuring the volume of dry solids in a measuring cylinder. The values obtained are reproduced in Table 13-7.
Table 13-7: Bulk Density and Specific Gravity
| Location/Bench | Sample Identity | P80 Size (µm) | Bulk Density (g/cm3) | Specific Gravity |
| Upper Bench | S2 | 226 | 1.66 | 2.74 |
| Lower Bench | S10 | 326 | 1.73 | 2.62 |
| Lower Bench | S22 | 367 | 1.73 | 2.76 |
| Middle Bench | S45 | 254 | 1.60 | 2.76 |
| Middle Bench | S50 | 201 | 1.63 | 2.74 |
| Upper Bench | S74 | 301 | 1.57 | 2.72 |
| Average | - | - | 1.65 | 2.72 |
| C68 |
The bulk density values determined for the oxide tailings material were found to vary between 1.57 g/cm3 and 1.73 g/cm3, with an average of 1.65 g/cm3. This average value is in reasonable accord with the bulk density of 1.605 g/cm3, as quoted in the MMI technical report. The specific values obtained were generally consistent, with an average value of 2.72.
Particle Size – Assay Analysis
A particle size–fraction analysis was done on the same samples used for the bulk density and specific gravity determinations. These tests were conducted to determine whether the silver and gold predominantly occurred in a particular particle size range. The size-assay analyses indicated that the metal distributions varied according to the location but that all displayed varying degrees of the bi-nodal distribution for silver, gold, and mass.
Sample S10 from Composite A from the Lower Bench of the tailings dam indicated one maximum metal distribution occurring in size range of 149 µm to 210 µm and another in the minus 37 µm size range. The maximum mass distributions are generally similar, although it occurs over a wider range in coarse size, namely 105 µm to 210 µm. The second sample from this bench, Sample S22, was similar but with a shifted maximum metal and mass distribution in the 210 µm to 297 µm size range and a secondary maximum metal and mass distribution in the minus 37 µm size range.
Sample S45 from the Middle Bench of the tailings dam, and part of Composite B, indicated maximum metal distribution in the 149 µm to 210 µm size range with maximum mass distribution in the 105 µm to 149 µm size range. The secondary maximum metal and mass distribution was found in the minus 37 µm size range. The second sample from the Middle Bench, Sample S50, had the maximum metal and mass distributions in the 105 µm to 149 µm size range and the minus 37 µm size range.
The two samples from the Upper Bench of the tailings dam of Composite C displayed totally different particle size distributions. Sample S2 was bi-nodal with one maximum for metal and mass distribution in the size range of 105 µm to 149 µm and the second maximum occurring for the size range of minus 37 µm. Sample S74 displayed only one maximum metal and mass distribution over the relatively wide coarse particle size range of 105 µm to 297 µm. This sample was almost entirely devoid of slimes or minus 37 µm material.
These samples reflect the operating discharge conditions and history during plant operations and tailings deposition. The results typify the use of a tailings cyclone situated on the tailings dam wall discharging the coarse undersize material onto the wall area with the finer cyclone overflow material flowing downstream and settling within the tailings dam. Changes in the size distribution would be anticipated with downstream distance from the point of discharge by the cyclones at the tailings dam wall. This is typified by the size distribution of Sample S74, which purports to be a cyclone underflow sample taken at the point of discharge and which was found to be almost totally devoid of fines or minus 37 µm material.
Gravity Concentration Tests
Pre-concentration tests using the centrifugal gravity concentration method were conducted to evaluate the potential upgrading of silver and gold. The laboratory-size concentrator used was the Falcon Model SB40 centrifugal concentrator. The tests were conducted on samples from Composites A, B, and C. MMI dictated the test parameters used for these tests, including a set of tests where the samples were reground prior to conducting the gravity concentration test. The results from the gravity concentration tests are summarized in Table 13-8.
| C69 |
The mass recoveries varied between 20% and 25%, indicating that the tests were performed in a uniform and consistent manner. The highest silver recovery obtained was 40% (after regrinding) for Composite C and decreased to 31% for Composite B (after regrinding) and about 27% for Composite A, also after regrinding. The gold recoveries were higher than the equivalent silver recoveries, particularly after regrinding, indicating that the liberation of the precious metals could be incomplete.
However, the upgrading factor for both silver and gold is very low, namely about 1.4 for silver and up to 2.3 for gold. No further upgrading or silver and gold recovery tests were conducted on the gravity concentrates, possibly due to the relatively low grades and recoveries obtained. Also of interest is that no historical test work was documented by MMI where gravity concentration was used to produce a saleable high-grade concentrate.
Table 13-8: Summary of Results of Gravity Concentration Tests
| Sample Identity | Head Grade | Concentrate Grade | Recovery (%) | P80 (µm) | Remarks (Note: All tests are 3-pass tests) |
||||
| Ag (g/t) | Au (g/t) | Ag (g/t) | Au (g/t) | Mass | Ag | Au |
|||
| Composite A | 93.8 | 0.35 | 124.7 | 0.52 | 24.1 | 32.1 | 36.5 | 269 | Pressure 1.5 psi; no regrind |
| Composite B | 70.3 | 0.50 | 96.9 | 0.71 | 23.6 | 32.5 | 33.3 | 180 | - |
| Composite C | 39.7 | 0.33 | 58.0 | 0.65 | 24.1 | 35.2 | 47.0 | 254 | - |
| Composite A | 92.1 | 0.33 | 126.1 | 0.71 | 19.7 | 27.2 | 42.1 | 76 | Pressure 1.0 psi; reground |
| Composite B | 70.5 | 0.56 | 96.5 | 1.29 | 22.4 | 30.7 | 51.5 | 77 | - |
| Composite C | 40.7 | 0.38 | 65.5 | 0.98 | 24.8 | 39.9 | 64.3 | 79 | - |
Flotation
Different scoping flotation tests were conducted on samples from Composite A and Composite B using various reagent schemes and conditions as dictated by MMI. The results of the flotation tests are summarized in Table 13-9. The test results reported led to the following conclusions.
For Composite A, a regrind from a P80 size of 238 µm (as received particle size) to a P80 of 72 µm improved the flotation recovery of silver from 18% to 23% and that of gold from 18% to 39%. The standard reagents were used for these tests (Tests F1, F3, and F4). For Composite B, a regrind from a P80 size of 173 µm (as received particle size) to a P80 of 74 µm improved the flotation recovery of silver from 22% to 33% and that of gold from 12% to 32% (Tests F2, F5, and F6). A particle size fraction analysis conducted on the tailings of Test F4 (Composite A) indicated that the major proportion of the mass and the silver and gold is present in the slimes or minus 37 µm size fraction. However, significant losses of silver and particularly gold occurred in the coarser sizes, namely the size range 53 µm to 105 µm, indicating that the degree of liberation could be improved and that some metal appears to be occluded in the coarser particle sizes. Some silver may also occur within secondary oxide minerals and be unrecoverable by flotation. A similar mass and metal distribution were obtained in the case of Test F9 (also Composite A), which was a flotation test performed using a sulphidization reagent.
Variable mass, metal recoveries, and concentrate grades were obtained in testing the various flotation reagent suites. However, the maximum silver grade obtained for a rougher concentrate was 909 g/t silver, while the overall recoveries for silver could not be improved beyond approximately 40%. This indicated that mineral surface alteration or oxidation, or occlusion of precious metals in gangue, was inhibiting the concentration by the flotation process. Since the silver recoveries obtained were deemed low and unsatisfactory, no further flotation tests were conducted, and no extraction tests were performed on flotation concentrates.
| C70 |
The head assays obtained during the flotation testing stage gave inconsistent results. Table 13-9 shows the actual head assays obtained for each flotation test compared with the head assay obtained for silver for the composite samples. For Composite A, the individual silver head values for each flotation test conducted are all higher than the assay for the composite sample, except in the case of Test F11. The gold (and silver) values obtained for Tests F7, F8, and F9 are known to have resulted from the poor sampling technique adopted for these three tests. The composite head assay gold value of 0.36 g/t gold is probably a reasonably representative assay value for Composite A. For Composite B, the silver head value for the composite sample is slightly lower than the assays for the individual flotation tests. For gold, the composite sample value is higher at 0.52 g/t gold than the assays for the individual tests.
The historical results of the flotation tests reported in Table 13-2 are significantly higher at 60% to 69% recovery for silver and 47% to 67% for gold. However, in the absence of information regarding the origins of these samples, the lack of head grade data and the absence of sampling and flotation procedures involved, these results will not be considered when selecting the processing options for the oxide tailings dam material.
Table 13-9: Summary of Results of Flotation Tests
| Sample Identity & Test No. | Head Grade | Concentrate Grade | Recovery (%) | P80 (µm) | Remarks (Note: All tests are 3-pass tests) |
||||
| Ag (g/t) | Au (g/t) | Ag (g/t) | Au (g/t) | Mass | Ag | Au |
|||
| Composite A/F1 | 112.2 | 0.35 | 908.7 | 3.17 | 2.1 | 17.8 | 18.4 | 238 | 3-stage ro., pH 8; |
| Composite A/F3 | 119.2 | 0.39 | 734.6 | 3.88 | 2.6 | 21.0 | 30.4 | 103 | Conditioning NaCN |
| Composite A/F4 | 104.6 | 0.40 | 630.9 | 3.36 | 3.8 | 22.6 | 38.6 | 72 | Na2CO3; A404, PAX |
| Composite A/F7 | 111.9 | 1.39 | 654.6 | 5.56 | 2.3 | 16.3 | 34.9 | ~75 | 2-stage ro., nil NaCN |
| Composite A/F8 | 108.5 | 2.38 | 887.2 | 11.91 | 0.9 | 7.8 | 30.7 | ~75 | 2-stage ro., nil NaCN |
| Composite A/F9 | 114.5 | 1.67 | 723.9 | 5.86 | 2.7 | 20.8 | 45 | ~75 | 2-stage ro., NaS2, PAX |
| Composite A/F10 | 103.5 | 0.58 | 401.3 | 1.62 | 8.9 | 34.6 | 39.8 | ~75 | With Na2CO3, CuSO4 |
| Composite A/F11 | 99.6 | 0.34 | 484.8 | 1.83 | 8.8 | 42.2 | 48.3 | ~75 | With CuSO4, A208 |
| Composite B/F2 | 88.4 | 0.42 | 695.4 | 2.65 | 2.6 | 22.0 | 12.2 | 173 | 3-stage ro., pH 8 |
| Composite B/F5 | 89.7 | 0.47 | 806.1 | 4.18 | 2.9 | 27.0 | 24.6 | 92 | Conditioning NaCN |
| Composite B/F6 | 89.9 | 0.51 | 867.1 | 5.45 | 2.9 | 32.5 | 32.1 | 74 | Na2CO3; A404, PAX |
| Composite A: Head | 99.8 | 0.36 | - | - | - | - | - | - | - |
| Composite B: Head | 88.3 | 0.52 | - | - | - | - | - | - | - |
Notes: CuSO4 = copper sulphate; NaCO3 = sodium carbonate, ro = Rougher
| C71 |
Cyanidation Tests
Cyanide leaching tests were conducted on samples from Composite A, Composite B, and Composite C using different leaching conditions. The first set of tests was to determine the effect of regrinding the tailings samples prior to leaching, while subsequent tests determined the effect of cyanide concentration in the leach solution.
For Composite A, the silver extractions varied from 66% for the unground (as received) sample to 80% for the reground samples, while the gold extractions varied from 82% to 89%, respectively. For Composite B, the silver extractions ranged between 69% for as-received material to 77% for samples that were reground. The corresponding gold extractions varied between 82% and 87%. Although the cyanide consumption increased with the regrinding of samples tested for both Composite A and Composite B, the increase in extraction may compensate for the additional cost of cyanide reagent and regrinding, provided that the filtration characteristics are not detrimentally affected. Higher cyanide concentrations in the leach solution improved the extractions of silver and gold but increased the cyanide consumption significantly. The results from the sulphide tailings, namely Composite C, indicate that between 73% and 87% of the silver can be extracted, with between 77% and 85% of the gold. However, the cyanide consumption values were higher than the results from the oxide tailings. Only two leach tests were conducted on reground samples from Composite C, each having a P80 of about 69 µm. A summary of the cyanide leach test results is given in Table 13-10.
Table 13-10: Summary of Results of PRA Cyanidation Tests
| Sample Identity and Test No. | Extraction (%) | Reagent Usage (kg/t) | NaCN Concentration (g/L) | P80 (µm) |
||
| Ag | Au | NaCN | Lime |
|||
| Composite A+/C1 | 66.4 | 81.5 | 1.8 | 1.4 | 1.0 | 269 |
| Composite A+/C2 | 79.3 | 85.7 | 1.6 | 1.8 | 1.0 | 103 |
| Composite A+/C3 | 80.4 | 89.1 | 2.6 | 1.6 | 1.0 | 78 |
| Composite A+/C7 | 78.6 | 82.7 | 2.2 | 1.8 | 0.5 | 74 |
| Composite A+/C8 | 89.7 | 85.5 | 5.1 | 0.8 | 2.0 | 74 |
| Composite A*/C13 | 79.7 | 86.8 | 1.5 | 1.3 | 0.5 | 74 |
| Composite A*/C14 | 83.1 | 82.1 | 3.7 | 0.8 | 2.0 | 74 |
| Composite A*/C17 | 79.4 | 90.9 | 1.0 | 1.2 | 1.0 | 74 |
| Composite B+/C4 | 69.1 | 82.0 | 2.6 | 1.8 | 1.0 | 180 |
| Composite B+/C5 | 77.1 | 88.3 | 1.7 | 1.8 | 1.0 | 100 |
| Composite B+/C6 | 77.3 | 86.9 | 1.7 | 1.9 | 1.0 | 84 |
| Composite B+/C9 | 73.2 | 86.0 | 2.6 | 1.2 | 0.5 | 84 |
| Composite B+/C10 | 79.5 | 86.4 | 4.5 | 1.0 | 2.0 | 84 |
| Composite B*/C15 | 72.9 | 82.6 | 1.6 | 2.0 | 0.5 | 84 |
| Composite B*/C16 | 75.4 | 83.4 | 3.8 | 1.0 | 2.0 | 84 |
| Composite B*/C18 | 67.7 | 78.6 | 0.9 | 1.3 | 1.0 | 84 |
| Composite C+/C11 | 73.8 | 77.3 | 4.0 | 2.8 | 1.0 | 69 |
| Composite C+/C12 | 86.6 | 85.0 | 7.3 | 2.6 | 2.0 | 67 |
Notes: “+” indicates Original Composite Sample, “*” indicates New Composite Sample, Tests C17 and C18 = 24 h leach duration; other tests + 72 h leach duration.
| C72 |
During the cyanide leach test program, a new Composite A and Composite B sample had to be prepared since the original composite samples had been exhausted. A comparison of results from the two composite samples indicated similar behaviour patterns, although there are some noticeable differences in the extractions. Also, the cyanide and lime consumption values, as recorded, are inconsistent. This indicates that absolute numbers cannot be assigned to a single test, although any observed trends would be valid. The averages of similar tests would more likely predict the overall responses more accurately. It is also apparent that non-systematic variations in the assay results could have arisen from subtle variations in mineralogy, sample preparation, the sample regrinding process, and possibly daily variations in temperature.
The cyanide leach extraction results quoted by MMI in Table 13-10 and the averaged results from the present test program are summarized below in Table 13-11 and will be discussed in the following section.
The average extraction results obtained from samples from Composite A and Composite B in the present study are generally lower than those from the historical test work, as detailed in Table 13-11. However, in the absence of details, these historical results cannot be used in the overall evaluation of this process. The MMI claim of a 77% silver extraction, based on the MMI (2003) test program, cannot be considered an acceptable result since only one test was done. The sample origin is purported to be four holes dug at approximately 25 m intervals with samples scraped into a bag, one for the lower bench and one for the upper bench of the oxide tailings dam. Clearly, a sample collected in this manner cannot be considered representative. Also, the other MMI (2003) claim for an extraction result of 89% silver and 88% gold cannot be validated. Therefore, these test results cannot be considered valid and will not be used in further discussions or evaluations.
Table 13-11: Summary of Cyanidation Test Results Used by the MMI Reports
| Sample Identity and Test No. | Extraction (%) | Remarks |
|
| Ag | Au |
||
| Composite A/C1 | 66 | 82 | As received; 1.0 g/L NaCN |
| Composite A/C7 & C13 | 80 | 85 | Average; reground; 0.5 g/L NaCN |
| Composite B/C4 | 69 | 82 | As received; 1.0 g/L NaCN |
| Composite B/C9 & C15 | 73 | 84 | Average; reground; 0.5 g/L NaCN |
| MMI 2003 | 77 | 71 | Results from the 2003 test program |
| MMI 2003 | 88 | 88 | Origin of results unrecorded |
| MMI 2004/C8 & C10 | 85 | 86 | Average; reground; 2.0 g/L NaCN |
| C73 |
The MMI (2004) results, as claimed in the technical report and listed in Table 13-11 above, are also considered unusable. The reasons for this statement are that these results were obtained with a reground sample and leached at a high cyanide concentration of 2.0 g/L sodium cyanide, whereas the other tests were done using 1.0 g/L sodium cyanide. Both these conditions, the regrinding of the tailings material and a high cyanide concentration leach condition, will not be implemented in a recovery process, and these results are considered unrealistic.
The extraction results from the cyanidation tests obtained using as-received samples from Composite A and Composite B, namely 66% to 69% for silver and 82% for gold, were encouraging.
In 2022 and 2023 a further test program was conducted by SGS at Durango, Mexico. The test program shows that with regrinding to 80% passing approximately 75 µm, silver and gold extractions for the early-stage oxide tailings composite sample improved to approximately 89% and 88%, compared to 82.7% for silver and 78.7% for gold without regrinding. For the recent oxide tailings composite sample, the silver and gold extractions were improved to approximately 83% or slightly higher with regrinding to 80% passing 75 µm, compared to 77.9% for silver and 76.6% for gold without regrinding.
Column Leach Test
One column leach test was conducted on a 30.9 kg sample of an equal mix of material from Composite A and Composite B. The sample was mixed with water, Portland Cement, and lime and then agglomerated to a P80 size of 2,614 µm. After curing, the sample was put into a column with a diameter of 102 mm and a height of 3 m. The column test was run for 81 d after the solution flow rate and pH had stabilized. The silver extraction obtained was 73.0%, while the gold extraction was 78.9%. These results compare very well to the average extraction values calculated from the cyanidation tests of the individual composite samples leached in the as-received condition, namely 67.8% for silver and 81.8% for gold. The cyanide consumption values are also comparable. The results obtained from the column test and the calculated average extraction values obtained from the tests conducted on the as-received samples of Composite A and Composite B have been summarized in Table 13-12.
| C74 |
The kinetics of leaching had slowed down significantly by Day 81 when the test was terminated, although there was evidence that some leaching was still in progress.
Table 13-12: Summary of Results of Column Leach Tests
| Sample Identity and Test No. | Extraction (%) | Reagent Usage (kg/t) | NaCN Concentration (g/L) | P80 (µm) | Remarks |
|||
| Ag | Au | NaCN | Lime | Cement |
||||
| Column Test, Composites A and B | 73.0 | 78.9 | 2.32 | 13.73 | 21.8 | 0.5 and 2.0 | 2,614 | pH 11; |
| Composites A and B Average, Tests C1 and C4 | 67.8 | 81.8 | 2.18 | 1.59 | - | 1.0 | 225 | pH 10.5/11; bottle roll |
A particle size assay analysis of the leach residue of the column test found that the highest unleached (undissolved) silver grade was in the coarsest size range of plus 210 µm, while the highest gold value was found in the minus 37 µm size range. This suggests both inadequate liberation of the silver grains and/or minerals, occlusion of gold possibly by clay minerals, or the presence of tarnished/coated mineral surfaces, or the presence of refractory minerals. The subsequent leaching of de-agglomerated column leach test residue resulted in a negligible extraction of silver and gold. This indicates that the column leach test had virtually reached its maximum potential extraction, confirming that the leaching rate had slowed down.
Only one column leach test was conducted. Also, the material tested was a mixture of samples from Composite A and Composite B, that is, a mixture of material from the lower and the middle benches of the oxide tailings dam. Flow problems were encountered during the test, which resulted in the column having to be unloaded and the material having to be re-agglomerated. The test was re-started after filling the column. Generally, the results from one test cannot be regarded as representative of the whole oxide tailings dam. However, despite these limitations and problems encountered, the encouraging results obtained and the close comparison with the bottle-roll tests implies that the results are relatively reliable. The extraction values obtained from the column test, namely 73.0% for silver and 78.9% for gold, will therefore be used in evaluating this treatment process. The reagent consumption values also appear to be very high, namely 13.73 kg/t for lime, 21.8 kg/t for cement, and 2.32 kg/t for cyanide. However, lime and cement consumption values obtained in laboratory tests generally approximate commercial operations, although in this case, they seem to be unrealistically high. The cyanide consumption of a commercial operation would typically only be 30% to 50% of that measured in a laboratory test.
Acid-base Accounting
The ABA results predict the overall acid-generating potential of selected samples. A net acid general potential was found for the sulphide tailings but not the oxide tailings. The processing of the sulphide tailings for silver and gold recovery could modify the ABA and increase the stability of the ultimate residues. Alternatively, the sulphide tailings would require the addition of lime during the process of relocating this material. This would ensure that the sulphide tailings would not cause acid-generating environmental problems.
Electrowinning
Electrowinning metal recovery tests were conducted using EMEW technology (from the Electrometals Electrowinning company), specifically designed for the electrodeposition of metals from dilute solution tenors. The tests were carried out using filtered cyanide leach pregnant solutions. Although the test results were favourable, it appears unlikely at this stage that this technology could be applied in this situation, given the high solution volumes generated and the very low silver concentrations anticipated in the pregnant solution from the heap. However, further test work using the EMEW metal recovery system should be undertaken if the Project advances to the Feasibility Study level because the potential for savings in capital and operating costs need to be investigated.
| C75 |
Test Result Review
Gravity Concentration
Review of Results
As indicated in Table 13-8, the upgrading for silver from the as-received oxide tailings was poor, with a maximum concentrate grade of 125 g/t silver at a mass recovery of 20%. The upgrading of gold is similarly poor. The re-grinding of the samples prior to gravity concentration led to an almost negligible improvement in upgrading silver to 126 g/t silver, while for gold, a maximum concentrate grade of 1.29 g/t gold was obtained. The sulphide tailings response to gravity concentration is equally poor, with even lower-grade gravity concentrates being obtained despite slightly improved recoveries observed for both silver and gold.
Conclusion
The poor results obtained, in that no high-grade metal concentrate could be produced, coupled with the fact that no extraction tests for silver and gold were conducted on the gravity concentrates produced, has resulted in the gravity concentration treatment option not being selected for further consideration.
Flotation
Review of Results
The flotation results have been summarized in Table 13-9. The results indicate that the overall recoveries for silver and gold are low, namely between 8% and 42% for silver and 12% to 48% for gold. The re-grinding of both the tailings samples (Composite A and Composite B) is seen to improve the recoveries, while the testing of various reagent regimes also resulted in improvements to the overall recoveries of silver and gold in some cases. However, the overall recoveries are generally considered low at less than 40% for silver and less than 48% for gold, coupled with producing a very low-grade concentrate. This poor flotation response is probably the result of surface alterations and/or inadequate liberation of the silver- and gold-bearing minerals. No extraction tests were conducted on any flotation concentrates produced, so the total extent of extraction is unknown. No tests were conducted on the sulphide tailings material (Composite C), and its response to flotation as a pre-concentration process is therefore not known.
Conclusion
Flotation will not be considered a treatment option for recovering silver and gold from the oxide tailings dam material. For the reasons specified above, namely a generally low recovery of silver and gold, the option of using flotation to recover silver and gold will not be considered a processing method in the treatment of the oxide tailings dam material.
Cyanide Leaching
| C76 |
Review of Results
Cyanidation leach tests were done on samples from Composite A and Composite B under different conditions of particle size and solution cyanide concentration. The results have been summarized in Table 13-10. The results generally indicated that cyanidation was still occurring after 72 h of the leaching time used for the laboratory tests, but at a much-reduced rate. The base metals copper and zinc also dissolved during the cyanide leach and contributed to the overall consumption of cyanide. Increasing the cyanide concentration in the leach solution generally improved the extraction of silver and gold but also increased the overall cyanide consumption. The extraction of silver and gold from Composite A increased with the fineness of grind size, while Composite B did not improve the extraction for finer grinds than P80 of 100 µm. The cyanide consumption figures are inconsistent in some cases, although trends are apparent. Although limited test work was done on material from Composite C, namely the sulphide tailings, a set of results has been included in Table 13-13 below for comparison purposes.
Table 13-13: Cyanide Leaching Parameters
| Sample Identity | Head Grade (g/t) | Extraction (%) | Reagent Usage (kg/t) | NaCN Concentration (g/L) | P80 (µm) | Remarks |
|||
| Ag | Au | Ag | Au | NaCN | Lime |
||||
| Composite A | 94.7 | 0.35 | 66.4 | 81.5 | 1.8 | 1.4 | 1.0 | 269 | As-received sample |
| Composite B | 95.9 | 0.28 | 69.1 | 82.0 | 2.6 | 1.8 | 1.0 | 180 |
|
| Average of A and B | 95.3 | 0.32 | 67.8 | 81.8 | 2.2 | 1.6 | 1.0 | 225 |
|
| Composite A | 94.7 | 0.35 | 79.3 | 85.7 | 1.6 | 1.8 | 1.0 | 103 | Reground sample |
| Composite B | 70.3 | 0.52 | 77.1 | 88.3 | 1.7 | 1.8 | 1.0 | 100 |
|
| Average of A & B | 82.5 | 0.44 | 78.2 | 87.0 | 1.7 | 1.8 | 1.0 | 102 |
|
| Composite C | 39.8 | 0.34 | 73.8 | 77.3 | 4.0 | 2.8 | 1.0 | 69 |
|
Conclusion
As-received (unground) and reground tailings dam material will be expected to show the following extraction results under normal leaching conditions: approximately 68% for silver and 82% for gold. The reground material will give higher extractions at approximately 78% for silver and 87% for gold (see results in Table 13-12). Although the regrinding of tailings material is considered an expensive treatment method, cyanidation with and without regrinding as a treatment option is discussed in the section titled “Recovery Methods”.
The 2022-2023 test program shows that with regrinding to 80% passing approximately 75 µm, silver and gold extractions for the early-stage oxide tailings composite sample improved to approximately 89% and 88%, compared to 82.7% for silver and 78.7% for gold without regrinding. For the recent oxide tailings composite sample, the silver and gold extractions were improved to approximately 83% or slightly higher with regrinding to 80% passing 75 µm, compared to 77.9% for silver and 76.6% for gold without regrinding.
Column Leach Test
Review of Results
One column leach test was conducted using a blend of equal proportions of as-received (unground) Composite A and Composite B oxide tailings material. Despite interruptions in the leaching cycle due to the de-agglomeration of material in the column and the resultant percolation of fines, the overall extraction of silver was 73% and 79% for gold (see Table 13-12 for the results). Although the test was terminated after a total leaching time of 81 d, indications were that the leaching process was nearing completion but had not been finalized at that stage. The above extraction results compare very well with the average extraction results obtained from the bottle roll leach tests, namely 68% extraction for silver and 82% for gold. The cyanide consumption of 2.3 kg/t for the column test was also comparable with that obtained for the bottle roll leach tests, namely 2.2 kg/t. The lime consumption for the column test was significantly higher, probably due to the two repeated agglomeration exercises.
| C77 |
Conclusion
Although only one column leach test was performed, the extraction results are in keeping with those obtained from the bottle roll tests. The results in Table 13-12 will be used for developing the process design criteria.
Precious Metal Recovery
Review of Results
Only one technology was tested for recovering precious metals from cyanide leach solutions. The pregnant solution from leach tests performed on oxide tailings material was used to conduct electrowinning tests. Three tests were conducted using the EMEW technology. These tests indicated that silver could be electrowon from solutions with a starting concentration of about 58 mg/L silver to a depleted electrolyte with about 3 mg/L silver. The deposition was also shown to be very selective regarding the co-deposition of base metals. However, the pregnant solution from a leaching heap is expected to be significantly less than 58 mg/L silver, possibly as low as 16 mg/L silver. It is unclear whether the EMEW technology could operate efficiently under such low silver tenors.
The alternative process options for recovering precious metals would likely be activated carbon or the zinc precipitation method. No tests were conducted on these two process options. The use of an activated carbon circuit to recover silver is not recommended because of the added operational complexity. Also, the relatively high grade of the silver in the solution will result in the treatment of relatively large amounts of carbon, which will add to the cost of the Project.
Conclusion
MMI reported no other historical test work results, nor are any alternative technology results known to have taken place that tested the recovery of silver from the Avino mine site tailings material. The Merrill-Crowe process will be the preferred technology to recover silver and gold from the pregnant leach solution.
Sulphide Tailings
Limited test work has been completed on material from the sulphide tailings before 2012. The two sets of results on the reground sulphide samples indicate that 73% and 87% of the silver and 77% and 85% of the gold can be extracted using 1 g/L and 2 g/L cyanide solutions, respectively. However, the cyanide consumptions were higher than the results from the oxide tailings. No further testing has been conducted on the sulphide tailings samples after 2012.
The 2022-2023 test work also tested a sulphide composite sample. The bottle roll test results show that the silver and gold extraction improved from 69.1% to 76.1% for silver and from 77.0% to 82.8% for gold with regrinding the tailings sample to 80% passing approximately 75 µm, compared to without regrinding treatment.
La Preciosa Property
Extensive metallurgical investigations were conducted to support the previous studies, including a feasibility study completed in 2014, NI 43-101 Technical Report Feasibility Study for La Preciosa Silver-Gold Project, prepared by M3 of Tucson, Arizona. Metallurgical testing prior to 2013 was summarized and reported in the PEA report, Snowden Mining Industry Consultants, 2011a. Pan American Silver Corp. and Orko Silver Corp, La Preciosa silver property, Durango Mexico, Preliminary economic assessment – Technical Report: NI 43-101 report prepared by A. Finch, M. Stewart, J. Snider, T.L. Drielick, T.L., and G. Hawthorn for Pan American Silver Corp. and Orko Silver Corp., June 2011. The previous test work was mainly focused on the gold and silver recovery by cyanidation. In 2021, SGS Minerals at Durango, Mexico, conducted further test work, mainly focusing on investigating the flotation performance of the samples generated from the Abundancia, Gloria, and Martha mineralization zones (SGS 2021).
| C78 |
The section titled “Mineral Processing and Metallurgical Testing – La Preciosa Area – 2014 Feasibility Study Test Work” below is reproduced from the 2014 Feasibility Study Report (M3 Engineering & Technology Corporation 2013) with minor updating.
2014 Feasibility Study Test Work
The deposit is amenable to conventional process technology and can be processed in a conventional crushing, grinding, leaching, and Merrill-Crowe silver recovery circuit with detoxified tailings prior to reporting to a tailings storage facility.
The metallurgical and mineralogy investigations were developed by the following techniques: XRD, QEMSCAN, clay, and near infrared analyses, flotation, comminution parameters, variability and development, sodium cyanide leaching, bulk sodium cyanide leaching, sodium cyanide detoxification, Merrill-Crowe simulation, flocculant screening, conventional, high rate and paste thickening, vacuum and pressure filtration, pressure clarification, and slurry rheology.
Mineralogy Highlights:
|
| · | The gold grains are contained in iron hydroxide that is enclosed in quartz-rich particles. |
|
|
|
|
|
| · | The majority of the located gold occurrences in the samples would be considered to be liberated. |
|
|
|
|
|
| · | Gold particles precipitated in direct association with pyrite and non-sulfide gangue minerals were generally low in gold content and were of smaller average diameter than the liberated gold particles. Some of this gold was found as inclusions within the pyrite or gangue particle and may not be amenable to cyanide leaching. Gold was detected in association with silver sulfide minerals. |
|
|
|
|
|
| · | The major portion of the silver in this sample occurs as silver sulfide (acanthite, Ag2S). Traces of silver-selenium sulfide (possibly aguilarite) and complex silver-antimony-zinc sulfide were also observed. Silver-bearing grains range from 15 - 100 μm in size. The silver-bearing grains observed and described here are locked in quartz or are associated with pyrite, galena and lead carbonate, and iron oxide or iron hydroxide. Acanthite also occurred as very fine veins within quartz. |
|
|
|
|
|
| · | Minerals detected by short-wave infrared and visible light include: copiapite, cerussite, epidote, goethite, gypsum, hematite, illite, illite-NH4, jarosite, kaolinite, montmorillonite, nontronite, quartz, saponite. Oxidation state did not correlate with silver dissolution. |
Bond crusher work index values were measured from 65 whole core samples. The results are shown below:
|
| · | The Bond crusher work index averaged 9.7 ± 3.4 kWh/t and varied from 21.3 kWh/t to 5.2 kWh/t for all samples tested. |
|
|
|
|
|
| · | Bond abrasion index (Ai) tests were completed on 47 samples. Ai results ranged from 0.37 g to 1.27 g, and averaged 0.74 g ± 0.25 g. |
|
|
|
|
|
| · | Bond ball mill work index (BWi) tests were completed on 47 samples. BWi results ranged from 14.7 kWh/t to 18.2 kWh/t and averaged 16.1 ± 1.0 kW/t. |
|
|
|
|
|
| · | Bond rod mill work index (RWi) tests were completed on 36 samples. RWi results ranged from 12.7 kWh/t to 18.1 kWh/t and averaged 15.3 ± 1.4 kW/t. |
|
|
|
|
|
| · | SAG mill comminution tests were completed. |
| C79 |
Silver dissolution testing in the variability study consisted of 141 bottle roll tests with samples ground to a particle size of 80% passing approximately 45 μm, and 23 bottle roll tests with the samples ground to a particle size of 80% passing approximately 74 μm. The ground material was leached for 72 hours at a pulp density of 40% solids in 1.5 g/l NaCN at a pH of 11.5. Lead nitrate was not added.
The exploratory cyanide leach series investigated various alternative leaching schemes to determine silver and gold recoveries or improve metal leaching kinetics. The exploratory leaches included feed and residue size classification, baseline cyanide leaching, two-stage leaching, hot leaching, leaching of sand and slime size fractions, O2 enriched leaching, and pressure conditioning and pressure leaching.
Thirteen leach tests were completed as standard NaCN bottle roll tests conducted for 72 or 96 hours at pH 11.5, pulp density of 40% w/w, and ambient temperature. The test series evaluated three particle sizes: 80% passing 30, 45, and 75 μm, and two sodium cyanide concentrations of 1.5 and 4.0 g/l.
Feasibility study silver and gold recovery was calculated based on head grade versus tailings grade regression of the variability average grade, lithology elevation bench, and selected exploratory bottle roll tests.
The weighted silver and gold recovery was determined to be 84% and 61% respectively, based on life of mine head grades. The test results and regression projections for the gold and silver recoveries are shown in Figure 13-1 and Figure 13-2 of the Report.
2021 Test Work
Further test work conducted in 2021 was focused on metallurgical response of the samples to conventional flotation concentration. The samples tested were from Abundancia, Gloria, and Martha mineralization zones. The test work is summarized the following sections.
Metallurgical Test Samples
A total of 34 samples from Abundancia, Gloria, and Martha mineralization zones, were sent to SGS by Compañía Minera Mexicana de Avino S.A. de C.V.
The received samples were crushed to 100% passing 6 mesh, and the main interested chemical elements were analyzed. Two composite samples, labeled as Martha composite and Abundancia-Gloria composite, were formed for the metallurgical testing.
The chemical analysis was conducted on the as-received induvial samples and two composite samples. Table 13-14 shows the head assay results for the two composite samples.
Table 13-14: Head Grade of Composite Samples
| Sample | Au | Ag | Pb | Zn | Fe | S |
| g/t | g/t | % | % | % | % |
|
| Martha Composite | 0.43 | 231 | 0.126 | 0.287 | 2.6 | 0.40 |
| Abundancia-Gloria Composite | 0.32 | 241 | 0.147 | 0.271 | 2.8 | 0.31 |
The total sulphur contents of the composite samples were low, at 0.31% S and 0.40% S respectively.
The specific gravity was 2.74 g/cm3 for the Martha composite and was 2.77 g/cm3 for the Abundancia-Gloria composite.
| C80 |
Flotation Study
SGS completed a comprehensive flotation test program on the two composite samples. The test work includes bulk flotation and selective flotation.
The bulk flotation was focused on the recoveries of gold and silver. Different types of flotation collectors, including various promotors, were tested. A dispersant, namely DL-160, was also explored in an effort to mitigate the effect of slime on the flotation.
Martha Composite
For the Martha composite sample, the flotation results indicate that:
|
| · | Gold recoveries to rougher concentrates ranged from 51.3% to 64.6%, with the concentrate grades of between 1.63 g/t Au and 2.49 g/t Au. |
|
|
|
|
|
| · | Silver recoveries to rougher concentrates ranged from 76.9% to 87.3%, with the concentrate grades in the range of 1,224 g/t Ag to 2,068 g/t Ag. |
|
|
|
|
|
| · | A finer primary grind size, which changed from 80% passing 150 µm to 80% passing 106 µm, did not substantially improve the metal recovery. |
A further reduction of the primary grind size to 80% passing 75 µm can improve gold and silver metallurgical performances, however the improvements are not substantial.
The cleaner flotation test results show that the bulk rougher concentrate grade can be improved substantially to approximately 12,000 g/t Ag with a silver recovery of 73.6%.
A locked cycle test (LCT) was conducted on the Martha composite sample at a primary grind size of 80% passing 106 µm with A-31, A-7583, XF-322N, and PAX as collectors.
The locked cycle test results on the Martha composite sample show that 54.2% of the gold and 81.4% of the silver reported to a final concentrate containing 7.36 g/t Au and 6,455 g/t Ag respectively. The concentrate from the LCT test was assayed for multi-elements, the impurity levels of the concentrate are expected to lower than the current penalty thresholds set up by the smelters who process the concentrates from the Avino mine.
In comparison to the bulk flotation flowsheet, selective flotation was also conducted to evaluate whether it is feasible to produce gold and silver bearing lead and zinc concentrates, respectively.
The selective flotation test results on the Martha composite sample show that:
|
| · | Overall lead recovery to lead rougher concentrate ranged from 37.1% to 42.1%; the concentrate grade was low, varying from 0.4% Pb to 0.6% Pb. |
|
|
|
|
|
| · | Overall zinc recoveries to a lower than 1% Zn concentrate were only from 33.6% to 38.9%. |
The results indicate that the sample did not respond well to the selective flotation procedure tested.
Abundancia-Gloria Composite
Similar to the Martha composite sample, the Abundancia-Gloria composite sample was also tested for its metallurgical response to the bulk and selective flotation procedures. The bulk flotation test results are summarized in Figure 13-5 and Figure 13-6 of the Report. The flotation results indicate that the Abundancia-Gloria sample produced similar metallurgical performances as the Martha sample.
| C81 |
The test results show that excluding the results from Test 12 and Test 17, the metal recoveries to the bulk concentrates ranged from 59.0% to 63.7% for gold and from 79.5% to 82.3% for silver respectively. The silver grade of the concentrate is in the range of 1,900 to 2,600 g/t. Similarly, no significant improvement was observed when the tests were conducted at a finer grind size of 80% passing 106 µm, compared to 80% passing 150 µm.
A further reduction of the primary grind size to 80% passing 75 µm can significantly improve gold recovery, but no obvious improvement for silver recovery.
The cleaner test results show that the bulk rougher concentrate grade can be improved substantially to approximately 11,300 g/t Ag with a recovery of 70.2%.
A LCT test was also conducted on the Abundancia-Gloria sample at a primary grind size of 80% passing 106 µm with A-31, A-7583, XF-322N, and PAX as collectors.
The locked cycle test results on the Abundancia-Gloria composite sample were as follows:
|
| · | Gold recovery was 53.3% with a concentrate grade of 9.1 g/t Au. |
|
|
|
|
|
| · | Silver recovery was 76.9% with a concentrate grade of 10,650 g/t Ag. |
The concentrate from the LCT test was assayed for multi-elements, the impurity levels of the concentrate are expected to lower than the current penalty thresholds set up by the smelters who process the concentrates from the Avino mine. A separate flotation LCT test was conducted on the Abundancia-Gloria sample using a more complex flowsheet with regrinding coarser than 75 µm fraction of the rougher flotation tailings. Silver recovery was slightly improved to 79.1%.
Similar to the Martha composite sample, selective flotation was also conducted on the Abundancia-Gloria composite sample to evaluate whether it is feasible to produce gold and silver bearing lead and zinc concentrates respectively. The selective flotation test results show that it may be not feasible to produce separate gold and silver bearing concentrates because the lead and zinc grades of the separate concentrates are too low to further upgrade. Further test work and economical assessments should be conducted to optimize concentrate product plan.
Gold and Silver Occurrences in Flotation Tailings
Size fraction analysis tests were carried out on a blend of the flotation tailings generated from various flotation tests to investigate the loss of gold and silver in each size fraction. The results indicate that:
|
| · | The finest size faction (less than 20 µm) had the highest gold grade, and more than one-third of the total gold in the flotation tailings was identified in the finest fraction. |
|
|
|
|
|
| · | Silver was nearly evenly distributed in middle size fractions, but higher in the finest and coarsest fractions. |
A diagnostic leaching test was conducted on the flotation tailings fractions. The test results are summarized in Figure 13-7 and Figure 13-8 of the Report.
The results show that:
|
| · | The exposed gold in the different size fractions ranges from 83.7 to 87.2%, while the exposed silver is lower in the range of 56.3% to 84.7%. |
|
|
|
|
|
| · | Between 9.9% and 32.2% of the silver in the different size fractions is associated with silicate minerals, compared to approximately 1% or less for the gold. |
|
|
|
|
|
| · | Compared to silver, gold is more closely associated with carbonate minerals. |
| C82 |
A separate diagnostic leaching test was conducted on a flotation tailing generated from the Abundancia-Gloria sample with a grind size of 80% passing 150 µm to investigate the associations of gold and silver with different types of minerals. The gold and silver occurrences of the tailings sample are shown in Table 13-15.
Table 13-15: Diagnostic Leaching Test Results – Abundancia-Gloria Flotation Tailings
| Stage | Extraction, % |
|
| Gold | Silver |
|
| Free | 71.8 | 57.1 |
| Locked in Carbonates | 11.5 | 7.1 |
| Locked in Sulfides | 8.5 | 5.4 |
| Locked in Silicates | 8.2 | 30.4 |
| Total | 100.0 | 100.0 |
Mineral Resource Estimates
The current mineral resources for the property (Avino Property and La Preciosa Property) are summarized in Table 14-1.
Table 14-1: Avino Property – Mineral Resources (Effective Date: Nov 30, 2022)
| Area | Category | Mass (Mt) | Average Grade | Metal Content |
||||||
|
|
|
| AgEQ (g/t) | Ag (g/t) | Au (g/t) | Cu (%) | AgEQ (million tr oz) | Ag (million tr oz) | Au (thousand tr oz) | Cu (million lb) |
| Avino Mine | MEA | 8.023 | 145 | 73 | 0.54 | 0.33 | 37.42 | 18.89 | 138.42 | 58.91 |
| IND | 26.638 | 144 | 60 | 0.54 | 0.41 | 123.34 | 51.06 | 459.23 | 242.48 |
|
| M&I | 34.662 | 144 | 63 | 0.54 | 0.39 | 160.76 | 69.96 | 596.65 | 301.40 |
|
| INF | 19.313 | 112 | 46 | 0.34 | 0.37 | 69.61 | 28.42 | 212.64 | 158.49 |
|
| La Preciosa | MEA | - | - | - | - | - | - | - | - | - |
| IND | 17.441 | 202 | 176 | 0.34 | - | 113.14 | 98.59 | 189.19 | - |
|
| M&I | 17.441 | 202 | 176 | 0.34 | - | 113.14 | 98.59 | 189.19 | - |
|
| INF | 4.397 | 170 | 151 | 0.25 | - | 24.10 | 21.33 | 35.48 | - |
|
| TOTALS | MEA | 8.023 | 145 | 73 | 0.54 | 0.33 | 37.42 | 18.89 | 138.42 | 58.91 |
| IND | 44.079 | 167 | 106 | 0.46 | 0.25 | 236.48 | 149.65 | 648.42 | 242.48 |
|
| M&I | 52.103 | 164 | 101 | 0.47 | 0.26 | 273.90 | 168.55 | 785.84 | 301.40 |
|
| INF | 23.710 | 123 | 65 | 0.33 | 0.30 | 93.71 | 49.75 | 248.12 | 158.49 |
|
Notes:
| C83 |
| 1. | Figures may not add to totals shown due to rounding. |
| 2. | Mineral Resources that are not Mineral Reserves do not have demonstrated economic viability. |
| 3. | The Mineral Resource estimate is classified in accordance with the CIM Definition Standards for Mineral Resources and Mineral Reserves incorporated by reference into NI 43-101 Standards of Disclosure for Mineral Projects. |
| 4. | Based on recent mining costs (Section 21.0 of the Report), Mineral Resources are reported at cut-off grades 60 g/t, 130 g/t, and 50 g/t AgEQ grade for ET, San Gonzalo, and oxide tailings, respectively. |
| 5. | AgEQ or silver equivalent ounces are notational, based on the combined value of metals expressed as silver ounces |
| 6. | Metal price assumptions are shown in Table 14-2. |
| 7. | Metal recovery is based on operational results and column testing, shown in Table 14-2. |
| 8. | The silver equivalent was back-calculated using the formulas described in Section 14.0 of the Report. |
|
|
|
Table 14-2: Silver Equivalent-Based Metal Prices and Operational Recovery Parameters
| Metal | Price | Unit | Recovery (%) |
| San Gonzalo Vein System |
|||
| Ag | 21.00 | $/oz | 83 |
| Au | 1,800.00 | $/oz | 73 |
| ET, Guadalupe, and La Potosina Deposits |
|||
| Ag | 21.00 | $/oz | 90 |
| Au | 1,800.00 | $/oz | 75 |
| Cu | 3.50 | $/lb | 89 |
| Avino Tailings |
|||
| Ag | 21.00 | $/oz | 82 |
| Au | 1,250.00 | $/oz | 78 |
| La Preciosa Veins |
|||
| Ag | 19.00 | $/oz | 90 |
| Au | 1,750.00 | $/oz | 75 |
| C84 |
Avino Property
Resource Summary
The following table provides a synopsis of the Mineral Resources reported in this section. Table 14-3 summarizes the Mineral Resources at the Avino Mine Area.
Table 14-3: Avino Mine Area – Mineral Resources (Effective Date: Nov 30, 2022)
| Area/Zone | Category | Mass (Mt) | Average Grade | Metal Content |
|||||||
| AgEQ (g/t) | Ag (g/t) | Au (g/t) | Cu (%) | AgEQ (million tr oz) | Ag (million tr oz) | Au (thousand tr oz) | Cu (million lb) |
||||
| ET Avino | MEA | 3.883 | 171 | 69 | 0.53 | 0.57 | 21.39 | 8.58 | 67.00 | 48.91 |
|
| IND | 23.916 | 146 | 58 | 0.53 | 0.44 | 112.41 | 44.59 | 409.00 | 234.08 |
||
| M&I | 27.800 | 150 | 60 | 0.53 | 0.46 | 133.80 | 53.17 | 476.00 | 283.00 |
||
| INF | 17.591 | 106 | 37 | 0.34 | 0.40 | 59.76 | 20.72 | 191.00 | 154.18 |
||
| San Gonzalo | MEA | 0.331 | 332 | 244 | 1.17 | 0.00 | 3.53 | 2.59 | 12.42 | 0.00 |
|
| IND | 0.302 | 293 | 230 | 0.84 | 0.00 | 2.85 | 2.23 | 8.14 | 0.00 |
||
| M&I | 0.633 | 313 | 237 | 1.01 | 0.00 | 6.38 | 4.83 | 20.56 | 0.00 |
||
| INF | 0.246 | 297 | 271 | 0.35 | 0.00 | 2.35 | 2.14 | 2.74 | 0.00 |
||
| Guadalupe | MEA | 0.000 | 0 | 0 | 0.00 | 0.00 | 0.00 | 0.00 | 0.00 | 0.00 |
|
| IND | 0.401 | 169 | 70 | 0.79 | 0.37 | 2.17 | 0.90 | 10.24 | 3.27 |
||
| M&I | 0.401 | 169 | 70 | 0.79 | 0.37 | 2.17 | 0.90 | 10.24 | 3.27 |
||
| INF | 0.354 | 159 | 82 | 0.62 | 0.30 | 1.81 | 0.93 | 7.00 | 2.30 |
||
| La Potosina | MEA | 0.000 | 0 | 0 | 0.00 | 0.00 | 0.00 | 0.00 | 0.00 | 0.00 |
|
| IND | 0.142 | 220 | 186 | 0.41 | 0.04 | 1.00 | 0.85 | 1.85 | 0.13 |
||
| M&I | 0.142 | 220 | 186 | 0.41 | 0.04 | 1.00 | 0.85 | 1.85 | 0.13 |
||
| INF | 0.844 | 176 | 149 | 0.29 | 0.05 | 4.79 | 4.05 | 7.90 | 1.01 |
||
| Tailings Deposit | MEA | 3.809 | 102 | 63 | 0.48 | 0.12 | 12.50 | 7.72 | 59.00 | 10.00 |
|
| IND | 1.877 | 81 | 41 | 0.49 | 0.12 | 4.91 | 2.49 | 30.00 | 5.00 |
||
| M&I | 5.686 | 95 | 56 | 0.48 | 0.12 | 17.41 | 10.21 | 88.00 | 15.00 |
||
| INF | 0.278 | 101 | 65 | 0.44 | 0.11 | 0.90 | 0.58 | 4.00 | 1.00 |
||
| TOTALS | MEA | 8.023 | 145 | 73 | 0.54 | 0.33 | 37.42 | 18.89 | 138.42 | 58.91 |
|
| IND | 26.638 | 144 | 60 | 0.54 | 0.41 | 123.34 | 51.06 | 459.23 | 242.48 |
||
| M&I | 34.662 | 144 | 63 | 0.54 | 0.39 | 160.76 | 69.96 | 596.65 | 301.40 |
||
| INF | 19.313 | 112 | 46 | 0.34 | 0.37 | 69.61 | 28.42 | 212.64 | 158.49 |
||
Notes:
| 1. | Figures may not add to totals shown due to rounding. |
| 2. | Mineral Resources that are not Mineral Reserves do not have demonstrated economic viability. |
| 3. | The Mineral Resource estimate is classified in accordance with the CIM Definition Standards for Mineral Resources and Mineral Reserves incorporated by reference into NI 43-101 Standards of Disclosure for Mineral Projects. |
| 4. | Based on recent mining costs (Section 21.0 of the Report), Mineral Resources are reported at cut-off grades 60 g/t, 130 g/t, and 50 g/t AgEQ grade for ET, San Gonzalo, and oxide tailings, respectively. |
| 5. | AgEQ or silver equivalent ounces are notational, based on the combined value of metals expressed as silver ounces |
| 6. | Cut-off grades were calculated using the following consensus metal price assumptions: gold price of $1,800/oz, silver price of $21.00/oz, and copper price of $3.50/lb. |
| 7. | Metal recovery is based on operational results and column testing, shown in Table 14-5. |
| 8. | The silver equivalent was back-calculated using the following formulas: |
|
| a) ET, Guadalupe, La Potosina: AgEQ = Ag (g/t) + 71.43 * Au (g/t) + 113.04 * Cu (%) |
|
| b) San Gonzalo: Ag Eq = Ag (g/t) + 75.39 * Au (g/t) |
|
| c) Oxide Tailings: Ag Eq = Ag (g/t) + 81.53 * Au (g/t) |
The cut-off grades are summarized in Table 14-4 and are based on current operational and economic conditions at the Avino Mine.
Table 14-4: Avino Silver Equivalent Cut-off Grades
| Deposit | Cut-off AgEQ (g/t) |
| Avino Vein (ET) | 60 |
| San Gonzalo Vein (SG) | 120 |
| Guadalupe | 100 |
| La Potosina | 100 |
| Tailings Deposit | 50 |
Table 14-5: Metallurgical Recovery for Deposits based on Operational Performance and Column Tests
| Metal | ET, Guadalupe, La Potosina | San Gonzalo | Oxide Tailings |
| Ag | 90 | 83 | 82 |
| Au | 75 | 73 | 78 |
| Cu | 89 | - | - |
| C85 |
Avino Vein
The Avino Vein and the surrounding system are interpreted as part of a low- to intermediate-sulphidation system of silver-gold epithermal veins, breccias, stockworks, and silicified zones. The Avino system is relatively thick (up to 60 m thick in places) and exhibits lower silver but higher copper grades than the San Gonzalo Vein system.
The Avino Veins system at ET Mine is a broad zone (up to 60 m thick) of anastomosing veins, breccias, and stockworks, with more persistent downdip continuity. The average dip of the veins is 60° to 65°. The mineralized system has been exposed to a down-plunge extent of 770 m (to 1,620 m amsl) and is still open to depth. The Avino system can be summarized as two persistent vein structures with a breccia containing mineralized veinlets between the veins and similar breccias in the hanging wall.
Horizontal and vertical sections highlighting interpretation are shown in Figure 14-1 and Figure 14-2 of the Report. The QP believes that it is reasonable to extend the geometric interpretation of the Avino Vein system to accommodate the mineralization physically sampled in the underground development.
In 2022, the Avino Vein system was remodelled by Avino using Leapfrog Geo to account for the broader extents of the breccias, stockworks, deeper vein extension, and listric geometry.
Mineralized zones were modeled by Avino in Leapfrog Geo™ software, utilizing the drillhole data, topography, and underground development information. The model was verified by the QP using Leapfrog Geo™ software. The QP believes the domain models are adequate for Mineral Resource estimation. The Avino mineralized vein was modelled as a broad breccia zone. The breccia zone is aligned east-northeast–west-southwest and dips steeply (40° to 80°) south. The Hanging-wall Breccia (coded BX Hw) is aligned east-west with increasing separation from the main Avino Vein towards the east.
The QP believes that the 3D geological model of the ET breccia and vein deposit is adequate to support the Mineral Resource estimates.
San Gonzalo Vein
The San Gonzalo Vein is interpreted as part of a low- to intermediate-sulphidation system of silver-gold epithermal veins and silicified zones. The individual veins in the San Gonzalo system are relatively narrow (mostly less than 3 m thick in places) and exhibit higher silver but lower copper grades than the Avino Vein system.
Guadalupe Vein
The Guadalupe Vein System was modelled in 2022 by Avino using Leapfrog Geo software as a series of intersecting veins. The RG vein has an average thickness of 3.1 m, and the VG Vein has an average thickness of 1.0 m.
The QP believes that the 3D geological model of the Guadalupe vein deposit is adequate to support the Mineral Resource estimates.
La Potosina Vein
The La Potosina Vein System was modelled in 2022 by Avino using Leapfrog Geo software as a series of intersecting veins. The QP believes that the 3D geological model of the La Potosina vein deposit is adequate to support the Mineral Resource estimates.
| C86 |
Tailings
In the Avino tailings deposit, a prominent bench separates the lower portion of the deposit (referred to as the “oxide lower bench” in various documents) from the upper portion of the oxide tailings (the “middle bench”). Overlying the oxide tailings are a volume of sulphide tailings material (the “upper bench” or “sulphide tailings”). The sulphide tailings material lacks representative sampling data.
Exploratory Data Analysis
Raw Data Assay and Statistics
Avino Elena Tolosa
Table 14-6 shows the length-weighted metal statistics for the sample data for the Avino (ET) Mine. Assayed metals include silver, gold, and copper. Metals considered in the Avino ET resource estimate include silver, gold, and copper.
Table 14-6: Length-weighted Metal Statistics for the Sample Data for the Avino (ET) Mine
| Description | Name | Count | Length | Mean | Standard deviation | Coefficient of variation | Minimum | Median | Maximum |
| Drill Data | Ag_ppm | 14,549 | 13,282.0 | 29.68 | 115.76 | 3.90 | 0.0050 | 7.00 | 5373 |
| Au_ppm | 14,549 | 13,282.0 | 0.23 | 1.13 | 4.83 | 0.0003 | 0.04 | 94 |
|
| Cu_ppm | 14,548 | 13,281.6 | 1595.24 | 4241.29 | 2.66 | 0.5000 | 345.00 | 219,000 |
|
| Pb_ppm | 14,549 | 13,282.0 | 848.60 | 3732.04 | 4.40 | 1.0000 | 118.00 | 282,000 |
|
| Zn_ppm | 14,549 | 13,282.0 | 1445.15 | 5111.55 | 3.54 | 0.5000 | 565.00 | 309,700 |
|
| Channel Data | Ag_ppm | 51,349 | 52,345.1 | 88.84 | 265.50 | 2.99 | 0.0003 | 39.00 | 14768 |
| Au_ppm | 51,349 | 52,345.1 | 0.62 | 2.30 | 3.69 | 0.0003 | 0.22 | 277 |
|
| Cu_ppm | 51,349 | 52,345.1 | 4783.70 | 7113.78 | 1.49 | 0.0100 | 3,000.00 | 660,000 |
|
| Pb_ppm | 40,671 | 39,177.9 | 1523.08 | 7282.17 | 4.78 | 1.0000 | 400.00 | 627,900 |
|
| Zn_ppm | 40,652 | 39,156.9 | 2120.06 | 8237.02 | 3.89 | 1.0000 | 800.00 | 270,000 |
San Gonzalo
The length-weighted metal statistics for the sample data for the San Gonzalo mineralization are summarized in Table 14-7. Metals considered in the San Gonzalo Vein resource estimate include silver and gold.
| C87 |
Table 14-7: Metal Grade Statistics for 2 m Composites for the San Gonzalo Vein Systems
| Metal | Domain | Number of Composites | Mean | CV | Variance | Minimum | Maximum | Capping Value | Number Capped |
| Ag (g/t) | SG1 | 6,669 | 283.66 | 2.08 | 349,328.43 | 0 | 14,768.40 | 5,000 | 25 |
| Ag (g/t) | SG2 | 117 | 72.32 | 1.11 | 6,500.57 | 0.9 | 890.24 | 0 | - |
| Ag (g/t) | SG3 | 38 | 95.94 | 1.39 | 17,852.42 | 1.69 | 604.45 | 0 | - |
| Ag (g/t) | SG4 | 168 | 200.05 | 2.81 | 315,058.50 | 3.72 | 5,265.20 | 3,000 | 2 |
| Ag (g/t) | SG5 | 40 | 111.98 | 1.71 | 36,807.33 | 1.5 | 708.1 | 600 | 2 |
| Ag (g/t) | SG6 | 54 | 40.25 | 1.99 | 6,418.32 | 0.7 | 331.2 | 0 | - |
| Au (g/t) | SG1 | 6,669 | 1.48 | 2.8 | 17.22 | 0 | 204.17 | 0 | - |
| Au (g/t) | SG2 | 117 | 0.56 | 1.04 | 0.35 | 0.01 | 3.79 | 0 | - |
| Au (g/t) | SG3 | 38 | 0.58 | 1.07 | 0.38 | 0.02 | 3.05 | 0 | - |
| Au (g/t) | SG4 | 168 | 0.69 | 2.24 | 2.41 | 0.01 | 13.96 | 10 | 2 |
| Au (g/t) | SG5 | 40 | 0.74 | 2.26 | 2.78 | 0.01 | 9.84 | 4 | 2 |
| Au (g/t) | SG6 | 54 | 0.3 | 2.08 | 0.39 | 0 | 2.77 | 0 | - |
Guadalupe
The length-weighted metal statistics for the sample data for the Guadalupe deposit are summarized in Table 14-8.
Table 14-8: Length-weighted Metal Statistics for the Sample Data for the Guadalupe Deposit
| Metal Grade | Count | Length | Mean | Standard deviation | Coefficient of variation | Minimum | Median | Maximum |
| Ag_ppm | 1,390 | 1,105.765 | 16.02 | 60.03 | 3.75 | 0.050 | 4.00 | 1724.60 |
| Au_ppm | 1,390 | 1,105.765 | 0.14 | 0.80 | 5.57 | 0.003 | 0.03 | 43.05 |
| Cu_ppm | 1,390 | 1,105.765 | 586.60 | 1,931.15 | 3.29 | 0.500 | 55.00 | 28,400.00 |
| Pb_ppm | 1,390 | 1,105.765 | 881.39 | 5,169.56 | 5.87 | 2.000 | 161.00 | 147,100.00 |
| Zn_ppm | 1,390 | 1,105.765 | 1,730.27 | 6,342.74 | 3.67 | 10.000 | 674.00 | 178,600.00 |
| C88 |
La Potosina
The length-weighted metal statistics for the sample data for the La Potosina deposit are summarized in Table 14-9.
Table 14-9: Length-weighted Metal Statistics for the Sample Data for the La Potosina Deposit
| Metal Grade | Count | Length | Mean | Standard deviation | Coefficient of variation | Minimum | Median | Maximum |
| Ag_ppm | 990 | 732.51 | 52.25 | 184.66 | 3.53 | 0.400 | 6.00 | 3,305.18 |
| Au_ppm | 990 | 732.51 | 0.12 | 0.25 | 2.10 | 0.003 | 0.04 | 2.57 |
| Cu_ppm | 990 | 732.51 | 170.57 | 663.22 | 3.89 | 0.500 | 17.00 | 17,500.00 |
|
|
|
|
|
|
| table continues… |
||
| Pb_ppm | 990 | 732.51 | 964.37 | 3513.44 | 3.64 | 1.000 | 112.00 | 75,900.00 |
| Zn_ppm | 988 | 731.56 | 2298.44 | 8603.66 | 3.74 | 2.500 | 225.00 | 254,000.00 |
Oxide Tailings
The oxide tailings drillhole dataset included 91 drillholes with a total metreage of 1,396 m that was completed in the tailings from 1990 to 2016. The data are presented in Table 14-10.
Table 14-10: Oxide Tailings Samples Summary
| Name | Count | Length | Mean | Standard deviation | Coefficient of variation | Minimum | Median | Maximum |
| Ag (ppm) | 3,021 | 4,483.45 | 50.19 | 34.94 | 0.70 | 0.150 | 37.40 | 233.00 |
| Au (ppm) | 3,022 | 4,484.95 | 0.41 | 0.19 | 0.46 | 0.006 | 0.40 | 1.73 |
| Co (ppm) | 3,239 | 4,828.33 | 4.80 | 3.74 | 0.78 | 0.005 | 5.00 | 120.00 |
| Cu (ppm) | 3,022 | 4,484.95 | 1,064.19 | 658.99 | 0.62 | 0.080 | 980.00 | 6,980.00 |
| Pb (ppm) | 3,018 | 4,478.95 | 4,273.70 | 4,165.13 | 0.97 | 0.570 | 2,150.00 | 24,900.00 |
| Zn (ppm) | 3,022 | 4,484.95 | 1,170.19 | 970.35 | 0.83 | 0.090 | 982.00 | 32,500.00 |
| C89 |
The tailings data have been subdivided by domain unit, and the metal grade statistics are summarized in Table 14-11.
Table 14-11: Metal Grade Statistics in Tailings Deposit by Domain
| Metal | Name | Count | Length | Mean | Standard deviation | Variance | Minimum | Maximum |
|
| Ag_ppm |
| 3,176 | 4,483.45 | 50.19 | 0.70 | 1,221.02 | 0.150 | 233.00 |
|
| Sulf_2 | 954 | 1,327.5 | 19.90 | 0.43 | 74.62 | 3.800 | 75.00 |
||
| Oxidos_Recientes | 1,005 | 1,454.75 | 36.39 | 0.33 | 145.72 | 0.150 | 127.83 |
||
| Roca_De_Relleno | 37 | 41.5 | 53.40 | 0.61 | 1,045.96 | 16.000 | 152.75 |
||
| Sulf_1 | 107 | 141.35 | 69.53 | 0.17 | 142.19 | 47.000 | 130.00 |
||
| Oxidos_Antiguos | 991 | 1,419.4 | 91.98 | 0.29 | 716.02 | 1.000 | 233.00 |
||
| Macizo_Rocoso | 9 | 7.45 | 43.09 | 0.83 | 1,266.94 | 4.000 | 112.00 |
||
| Au_ppm |
| 3,177 | 4,484.95 | 0.41 | 0.46 | 0.04 | 0.006 | 1.73 |
|
| Sulf_2 | 954 | 1,327.5 | 0.24 | 0.48 | 0.01 | 0.084 | 0.90 |
||
| Oxidos_Recientes | 1,005 | 1,454.75 | 0.51 | 0.35 | 0.03 | 0.006 | 1.73 |
||
| Roca_De_Relleno | 37 | 41.5 | 0.12 | 0.86 | 0.01 | 0.029 | 0.40 |
||
| Sulf_1 | 107 | 141.35 | 0.45 | 0.16 | 0.01 | 0.273 | 0.66 |
||
| Oxidos_Antiguos | 992 | 1420.9 | 0.47 | 0.30 | 0.02 | 0.010 | 1.08 |
||
| Macizo_Rocoso | 9 | 7.45 | 0.17 | 0.57 | 0.01 | 0.030 | 0.31 |
||
| Cu_ppm |
| 3,177 | 4,484.95 | 1,064.19 | 0.62 | 434,271.09 | 0.080 | 6,980.00 |
|
| Sulf_2 | 954 | 1,327.5 | 567.34 | 0.64 | 130,474.25 | 0.500 | 3,260.00 |
||
| Oxidos_Recientes | 1,005 | 1,454.75 | 1,245.56 | 0.62 | 588,218.91 | 5.000 | 6,160.00 |
||
| Roca_De_Relleno | 37 | 41.5 | 1,014.48 | 0.46 | 216,239.28 | 259.000 | 2,060.00 |
||
| Sulf_1 | 107 | 141.35 | 1,057.74 | 0.23 | 57,144.55 | 598.000 | 1,690.00 |
||
| Oxidos_Antiguos | 992 | 1420.9 | 1,361.58 | 0.35 | 223,029.27 | 0.080 | 3,590.00 |
||
| Macizo_Rocoso | 9 | 7.45 | 902.72 | 0.75 | 456,280.66 | 178.000 | 2,890.00 |
||
| Pb_ppm |
| 3,173 | 4,478.95 | 4,273.70 | 0.97 | 17,348,205.17 | 0.570 | 24,900.00 |
|
| Sulf_2 | 954 | 1,327.5 | 1,049.40 | 0.56 | 343,842.82 | 9.000 | 5,510.00 |
||
| Oxidos_Recientes | 1,005 | 1,454.75 | 2,153.80 | 0.44 | 898,457.53 | 10.000 | 9,496.00 |
||
| Roca_De_Relleno | 37 | 41.5 | 2,969.64 | 0.35 | 1,083,494.73 | 1530.000 | 5,790.00 |
||
| Sulf_1 | 107 | 141.35 | 6,741.50 | 0.25 | 2,770,466.54 | 2580.000 | 11,100.00 |
||
| Oxidos_Antiguos | 988 | 1414.9 | 9,488.00 | 0.34 | 10,283,948.86 | 0.570 | 24,900.00 |
||
| Macizo_Rocoso | 9 | 7.45 | 3,845.13 | 1.22 | 21,891,772.03 | 135.000 | 17,800.00 |
||
| Zn_ppm |
| 3,177 | 4,484.95 | 1,170.19 | 0.83 | 941,573.16 | 0.090 | 32,500.00 |
|
| Sulf_2 | 954 | 1,327.5 | 1,030.25 | 1.08 | 1,228,825.83 | 2.500 | 22,500.00 |
||
| Oxidos_Recientes | 1,005 | 1,454.75 | 980.30 | 0.48 | 224,959.57 | 34.000 | 3,931.00 |
||
| Roca_De_Relleno | 37 | 41.5 | 2,082.80 | 0.28 | 348,703.18 | 924.000 | 3,300.00 |
||
| Sulf_1 | 107 | 141.35 | 932.31 | 0.31 | 81,052.91 | 460.000 | 1,810.00 |
||
| Oxidos_Antiguos | 992 | 1,420.9 | 1,463.54 | 0.40 | 347,036.76 | 0.090 | 5,120.00 |
||
| Macizo_Rocoso | 9 | 7.45 | 735.97 | 0.91 | 444,724.14 | 161.000 | 2,670.00 |
||
Mineral Resource Statement
The Mineral Resource was estimated in October 2021 and restricted to continuous regions amenable to underground exploitation using costs derived from the nearby Avino Mine to provide reasonable prospects for eventual extraction. The Mineral Resources are summarized in Table 14-44 of the Report.
| C90 |
QP Comments
The QP believes that the Mineral Resources have been estimated using good industry practice and conform to the 2014 CIM Definition Standards. Mineral Resources are constrained by reasonable open pit mining assumptions.
There are no other known environmental, legal, title, taxation, socioeconomic, marketing, political, or other relevant factors that would materially affect the estimation of Mineral Resources that are not discussed in the Report.
MINERAL RESERVE ESTIMATES
There are currently no Mineral Reserves reported on the Property.
MINING METHODS
Avino Vein
Avino is currently conducting mining activity on the Avino Vein using sublevel long hole stoping and room and pillar mining methods. The last three years of production from the Avino Mine are summarized in Table 1-4. This data is summarized from the information listed in Avino’s press releases.
San Gonzalo Vein
Avino reported that by Q4 2019, mining at the San Gonzalo Vein reached the end of its current resources, and underground mining activities at the mine were stopped. However, the mine remains open for continued exploration at different levels of the mine. No operation for the San Gonzalo Vein’s mineralization has been reported since 2020.
Oxide Tailings
Avino previously planned to mine and move the oxide tailings Mineral Resource on-site using a conventional truck and loader surface mining equipment. There is no current plan or current economic plan to mine the tailings mineral resource.
La Preciosa Property
Currently, there are no commercial operations in the La Preciosa Property.
PROJECT INFRASTRUCTURE
The Property is easily accessible by road and is an important part of the local community from which skilled workers are available. The history of operations at the Avino mine site provides ample evidence of sufficient infrastructure and services in the area. The San Gonzalo Mine entered commercial production in October 2012, followed by the reopening of the ET Mine in January 2015. Currently, only the ET Mine is in operation, and the mined materials are fed to a conventional flotation plant with four separate circuits. The processing plant, including crushing, grinding, flotation, and downstream dewatering processes, had been upgraded from 1,500 t/d to a total capacity of 2,500 t/d in 2017/18.
The offices, miner’s quarters, secured explosives storage facilities, warehouse, laboratory, and other associated facilities are all in place. The proposed tailings leach facilities are planned to be located southeast of the existing tailings storage pond.
| C91 |
Before 2016, the site was serviced with an existing power line providing only 1,000 kW of power with 500 kW servicing the process plant, 400 kW for San Gonzalo Mine, and the balance for the well at Galeana, employee accommodation facility, and water reclaim from the TSF. The new power line from Guadalupe Victoria to the mine site was completed in June 2016. The power line was energized and tested on June 8, 2016. The line was fully functional at the design capacity of 5.0 MW. Current power consumption at the mine is approximately 3.5 MW, leaving sufficient additional power for potential future expansion projects, including the proposed oxide tailings retreatment project using heap leach followed by gold and silver recovery by Merrill-Crowe precipitation, and possible further expansion or upgrading of the processing plant. Additionally, the previous power line was left to service local communities, providing backup power for the mine. A C-27 CAT diesel power generator, which can produce 700 kW, is now used as a backup.
There is a water treatment plant (WTP) for treating excess water from the Avino underground mine operation before discharging it to El Caracol Dam. The effluent is sampled daily when the WTP is operational.
ENVIRONMENTAL STUDIES, PERMITTING AND SOCIAL COMMUNITY IMPACT
Avino Property Area
Environmental Studies
Construction of the new TSF by depositing the tailings in a historical open pit is ongoing, and the facility is in operation now. The new TSF construction was conducted based on the recommendations in the 2013 PEA (Tetra Tech 2013), intended to advance the tailings resource towards a production decision for a Merrill-Crowe precipitation heap leach operation.
In November 2015, to get a head start on the assessment work, Avino began a program of sampling the lower oxide bench in areas not in use. The program used a hydraulic drill with a 2 m split spoon auger to drill vertical holes to a depth of 20 m to 30 m; 12 holes were drilled by the end of 2015, totalling 227 m. By the end of February 2016, 40 holes had been drilled, totalling over 650 m; assays have been received and compiled.
Avino will decommission the current TSF and begin installing wells that will be used to pump out the retained water in the dam. This will speed up the sonic drilling program planned for the upper benches, provide samples for the metallurgical program, and increase confidence in the oxide tailings resource below the sulphide tailing.
Environmental Setting
Flora and fauna of the surrounding San Gonzalo Property are anticipated to be similar to what may be found in the area of oxide tailings, although the presence of these species has not been confirmed at the oxide tailings site. Vegetation observed on the San Gonzalo Property at the time of permitting includes catclaw mimosa; cactus species, such as paddle cactus and desert Christmas cactus; needle bush, gobernadora; and persimmon trees.
Within the adjacent San Gonzalo Mine Project area, there were 15 species of major mammals, 51 species of birds, 10 species of reptiles, and 3 species of amphibians reported at the time of permitting. Of these species, 4 mammal species, 14 species of birds, 9 reptiles, and 3 amphibians species are listed by Official Mexican Standard NOM 059-SEMARNAT-2001 or in the Convention on International Trade in Endangered Species of Wild Fauna and Flora (CITES) (Ministry of Environment and Natural Resources [MENR] 2008a) (see Table 20-1 to Table 20-4 to the Report).
| C92 |
Environmental Permitting
Permits and authorizations required for the Project operation include:
|
| · | An operating permit |
|
| · | An application for surface tenures |
|
| · | A wastewater discharge registration |
|
| · | A hazardous waste generator’s registration |
An EIA under the Ley General del Equilibrio Ecológico y la Protección al Ambiente (LGEEPA), Article 28 (General Law of Ecological Equilibrium and Environmental Protection), is required by the MENR (Secretaría de Medio Ambiente y Recursos Naturales [SEMARNAT]). Prior to this EIA, authorization regarding environmental impact matters is required by the SEMARNAT.
Additional surface tenures will likely be required to relocate any tailings to areas outside the current surface tenure rights.
Current Permits for the Oxide Tailings
There are no current operating permits for the mining and exploitation of the oxide tailings. However, a conditionally approved Environmental Impact Statement (EIS) (Manifestación de Impacto Ambiental [MIA]) for the exploitation and associated transmission line is in place for the Avino mine site where the tailings are located. Changes to the operating methods may be required if mining of the tailings was not included in the original mining plan. Based on this information, revisions to the permits will be required. An EIA and EIS (MIA) will be mandatory if new operating permits are required.
Current Permits
To obtain authorization regarding environmental impact matters, Avino must prepare an EIS or MIA. Avino prepared an EIS, known as “Manifestación de Impacto Ambiental, modalidad Particular” (MIA-P) for the San Gonzalo Mine and submitted it to the MENR in August of 2008. The applicable regulations fall under federal jurisdiction, Article 28, sections II, III, and VII of the LGEEPA and the Reglamento en Materia de Evaluacion del Impacto Ambiental (REIA), sections K, L, and O (Environmental Impact Assessment Matter Regulation).
Given the planned activities for the site, the Ministry also required an assessment in “Environmental Impact Matter for Change of Land Use” (Materia de Impacto Ambiental para el Cambio de Uso de Suelo) for forested areas and mining infrastructure and electrification for a surface area of 9.08 ha.
The authorization from the Ministry also requires the mine to present mitigation measures for all potential environmental impacts, as per Article 30, LGEEPA and Article 44, REIA, which Avino detailed in its EIS to the authorities.
Based on the information provided by Avino to the Mexican authorities, a conditional authorization was granted, subject to additional prevention and mitigation measures to avoid, minimize, or compensate for any environmental impacts during the different stages of the adjacent San Gonzalo Mine (Article 35, section II, LGEEPA), which include an assessment of the “Environmental Impact Matter for Change of Land Use” described above. This permit is valid for 11 years from the date it was issued to perform various activities onsite. Any modification to the Project must be sent to the MENR in writing before commencing changes.
Aside from complying with all prevention, protection, control, and mitigation measures laid out in the proposed MIA-P, Avino must develop an Environmental Quality Monitoring Program (EQMP) or Programa de Seguimiento de la Calidad Ambiental. The proposed EQMP must be presented to the MENR within six months of receiving the conditional authorization. Once the MENR has assessed the monitoring program, Avino needs to deliver progress reports semi-annually for a period of at least five years. Lastly, Avino must obtain proper authorization from the MENR for “Change of Land Use” as well as the corresponding “Change of Use for Forested Ground to Mining Infrastructure”.
| C93 |
It is important to note that the current conditional authorization can be cancelled for many reasons; one of them includes improper disposal of liquid/solid waste (hazardous or non-hazardous).
A second permit for “Change of Forest Land Use to Mining Infrastructure” (Cambio de Utilización de Terreno Forestal a Infraestructura Minera) was requested by the SEMARNAT and granted in September of 2008 for the adjacent San Gonzalo Mine. The corresponding legislation is Article 62, section IX of the Ley General de Desarrollo Forestal Sustentable (General Law for Sustainable Forest Development) and Article 27 of the Regulation. In addition, the Official Mexican Standards NOM-060-SEMARNAT-1994 and NOM-061-SEMARNAT-1994 must be adhered to. As per the authorization, Avino must complete its change in land use within 18 months of the date of the permit.
Applicable Legislation
To remain in compliance with current permits, the following eight applicable Official Mexican Standards for the Project must be complied with:
|
| · | Official Mexican Standards NOM-001-SEMARNAT-1996, which establishes the maximum limits allowed for contaminants in wastewater discharges in national waters and goods. |
|
|
|
|
|
| · | Official Mexican Standard NOM-041-SEMARNAT-1999, which establishes the maximum limits allowed for the emission of polluted gas generated from the exhaust pipe of automotive vehicles circulating, which utilize gas as fuel. |
|
|
|
|
|
| · | Official Mexican Standard NOM-043-SEMARNAT-1993, which establishes the maximum levels allowed for emissions from fixed sources of solid particles to the atmosphere. |
|
|
|
|
|
| · | Official Mexican Standard NOM-045-SEMARNAT-1996, which establishes the maximum levels of emission (smokes opacity) generated from automotive vehicles circulating which utilize diesel or mixtures that include diesel as fuel. |
|
|
|
|
|
| · | Official Mexican Standard NOM-052-SEMARNAT-2005, which establishes the characteristics, the process of identification, classification, and listing of hazardous waste. |
|
|
|
|
|
| · | Official Mexican Standard NOM-054-SEMARNAT-1993, which establishes the procedure to determine the incompatibility between two or more types of residues considered harmful by NOM-052-SEMARNAT-2005. |
|
|
|
|
|
| · | Official Mexican Standard NOM-059-SEMARNAT-2001, which regulates the environmental protection of Mexico’s native species of wild flora and fauna and specifications for their inclusion, exclusion, or change-list of species in risk. |
|
|
|
|
|
| · | Official Mexican Standard NOM-060-SEMARNAT-1994, which establishes protection measures for forestry grounds. |
In addition, other Official Mexican Standards regarding the change in land use and mining must be followed and may include:
|
| · | Official Mexican Standard NOM-061-SEMARNAT-1994, which refers to the specifications to mitigate the adverse effects caused to Wild Animals and Uncultivated Vegetation as a result of forestry utilization, and which nomenclature was modified. |
|
|
|
|
|
| · | Official Mexican Standard NOM-062-SEMARNAT-1994, which establishes specifications to mitigate adverse effects on biodiversity that are caused by the change of land use in forested areas. |
|
|
|
|
|
| · | Official Mexican Standard NOM-120-SEMARNAT-1997, which establishes environmental protection specifications for mining exploration activities in dry and temperate climate regions. |
|
|
|
|
|
| · | Official Mexican Standard NOM-141-SEMARNAT-2003, which establishes requirements for tailings characterization and specifications and criteria for site preparation, design, construction, operation, and post-operation of tailings dams. |
| C94 |
Dependent on the mining plan, additional Official Mexican Standards for mining operations will also be required for the Project:
|
| · | Official Mexican Standard NOM-147-SEMARNAT/SSA1-2004, which establishes criteria for determining the concentrations of remediation of soils contaminated with arsenic, barium, beryllium, cadmium, hexavalent chromium, mercury, nickel, silver, lead, selenium, thallium, and/or vanadium; published in the Official Gazette on March 2, 2007. |
|
|
|
|
|
| · | Draft Official Mexican Standard PROY-NOM-157-SEMARNAT-2009, which establishes the elements and procedures to implement management plans for mining waste. |
|
|
|
|
|
| · | Draft Official Mexican Standard NOM-155-SEMARNAT-2007, which establishes environmental protection requirements for systems leaching gold and silver ores. |
|
|
|
|
|
| · | General Law for the Prevention and Management of Waste (Ley General para la Prevención y Gestión Integral de los Residuos [LGPGIR]) and applicable regulations, which regulated the following registrations and authorizations: |
|
| 1. | Hazardous Waste Generator’s Registration and other compliance documents such as Manifest, Monthly Log of Hazardous Waste Generation; Ecological Waybills for the Importation and/or Exportation of Hazardous Materials and Wastes; Semi-annual Report on Hazardous Wastes Sent to Recycling, Treatment or Final Disposition; and Accidental Hazardous Waste Spill Manifest |
|
|
|
|
|
| 2. | LGEEPA |
|
| a. | Official Mexican Standard NOM-023-STPS-2003, which establishes standards for work in mines and health and safety conditions at these sites |
|
|
|
|
|
| b. | Official Mexican Standard NOM-055-SEMARNAT-2003, which establishes the requirements to be met by sites that will use a hazardous waste landfill |
|
|
|
|
|
| c. | Official Mexican Standard NOM-147-SEMARNAT/SSA1-2004, which establishes criteria for determining the concentrations of remediation of soils contaminated by arsenic, barium, beryllium, cadmium, and chromium |
Environmental Monitoring and Reporting
The conditional authorization sets out the requirements for environmental monitoring and reporting, on a semi-annual basis, for a minimum of five years. Details are provided in the section titled “Environmental Studies, Permitting and Social Community Impact”.
Environmental Management
Environmental liabilities (pasivos ambientales) of brownfields, or site recycling as it is called within the Mexican environmental legislation, are regulated by Articles 68, 69, and 70 of the LGPGIR or General Law for the Prevention and Comprehensive Management of Waste. It is based on the “polluter pay” principle, according to the LGEEPA and the LGPGIR. The federal government coordinates with provincial and municipal authorities to manage the environmental liabilities, whether the sites are orphaned or not. The LGPGIR requires a complete clean-up of contaminated sites.
| C95 |
Water Management
Fresh water for the Project is available from a well drilled in 1996, west of the mine site, and surface water from a dam, which is divided 60%/40% with the town of Panuco de Coronado. The Project has previously been charged annually for water use. Piping infrastructure from these water sources is still in place.
Additional water was also obtained from underground workings and re-circulation from the tailings thickener and tailings dam. There is potential for the water from the underground workings to be acid-producing (Slim 2005d). Treatment of water from the underground workings is ongoing prior to use, depending on the water quality.
Sulphide Tailings Management
ABA tests have indicated that mild acid generation may already have started on the tailings dam. A gap analysis and additional tests to further characterize the current conditions of the tailings should be completed to properly design a tailings management plan.
Three preliminary options have been identified for the management of the sulphide tailings:
|
| · | Reprocessing the tailings |
|
| · | Retreating of the tailings on the heap |
|
| · | Relocation and treatment for remediation |
The feasibility of these options is not known at this stage.
The absence of complete sulphide tailings metallurgical information makes identification of the feasibility of the options difficult. A detailed trade-off study should be undertaken to characterize the current conditions of the tailings and to determine whether the retreatment of this material would contribute to the profitability of the Project. However, at this stage, only limited metallurgical test data is available since no detailed metallurgical test work was undertaken on this material during the MMI 2004 test program.
Alternatively, the treatment of the sulphide tailings for gold recovery will afford an opportunity to recover silver and gold from the material as well as treating this material with the lime to ensure that this material will not be a net acid producer. Indications are that the sulphide tailings will also require treatment for environmental remediation purposes in the future. These costs could be partially or completely offset by treating this material separately or together with the oxide tailings material by the heap leach process.
Relocating the sulphide tailings may afford a more expedient option to address this potential environmental problem. For the Report, it will be assumed that the sulphide tailings will be moved to another location northeast of the proposed site for the leach pad.
Mine Closure and Reclamation
An updated mine closure plan and reclamation will be required for the Project. The mine closure plan should include information such as:
|
| · | Justification for the closure plan considering technical, environmental, and legal aspects |
|
| · | Objectives and how they will be met |
|
| · | Photo evidence and details of the environmental situation prior to commencing closure activities |
|
| · | Schedule of activities |
|
| · | The progressive reclamation of the site during the life of the operation |
|
| · | The design of tailings disposal areas |
|
| · | The reclamation and re-vegetation of the surface disturbances wherever practicable |
|
| · | A cost estimate of the work required to close and reclaim the mine |
|
| · | A plan for ongoing and post-closure monitoring and reporting at the site |
| C96 |
No cost estimates have been generated at this time to ensure the Project meets the environmental requirements once the processing of the heap material has been terminated.
As per federal regulations, under LGEEPA, both the SEMARNAT and Procuraduría Federal de Proteccíon al Ambiente (PROFEPA) (Federal Attorney for Environmental Protection) ministries require Avino to present, in its first semi-annual report, a general plan to remediate the site with dates, activities, techniques, and costs that will guarantee restoration of affected areas, considering complete reforestation of impacted sites, removal of foundations and infrastructure that are no longer useful, roads that no longer have any use, removal and proper disposal of all rubbish, closing off adits that are no longer needed, and restoration of the TSF when its operational life is finished. Avino will also need to present a reforestation program for the entire surface area affected during mining operations. This program will include caveats to safeguard flora and fauna.
Socio-economic and Community Considerations
This socio-economic section of the Report:
|
| · | Identifies communities that may potentially be affected by the development of the Project |
|
| · | Identifies potential positive and adverse effects of the Project on local communities |
|
| · | Advises on further study requirements |
Project Location
The Project is located approximately 82 km northeast of the City of Durango, in Durango. The Property is located within the municipalities of Pánuco de Coronado and Canatlán, and is approximately 85 km by existing road, northeast of the city of Victoria de Durango.
Consultation with Communities
The community is currently being consulted regularly in conjunction with respect to both the dry stack tailings project and the fresh-water requirements for local agriculture. In addition, Avino provides several resources for schools and churches within the adjacent towns. A list of activities and related costs are summarized in Table 20-5 to Table 20-12 of the Report.
The implementation of an effective community engagement program is fundamental to the successful environmental permitting of mining projects. A comprehensive community engagement program should be initiated as soon as possible. The consultation will include addressing concerns about the heap-leach pile that may be present within or adjacent to the Property.
Consultation and development of a working relationship with local communities typically involve the development of a series of agreements that lay the groundwork for conversations. These include:
|
| · | Memorandums of understanding |
|
| · | Protocol agreements |
|
| · | Community consultation / participation agreements |
As project exploration and development proceeds, other agreements will become necessary, including:
|
| · | Socioeconomic/community economic benefits agreements |
|
| · | Environmental monitoring agreements |
|
| · | Training agreements |
|
| · | Accommodation/impact benefit agreements |
| C97 |
Potential Positive Effects on Local Communities
Potential positive effects of the proposed project development include:
|
| · | Long-term, meaningful employment in mining operations and related positions (e.g., environmental monitors, service industry sector) |
|
|
|
|
|
| · | Economic development and contract opportunities for local communities (existing and new businesses), and community infrastructure improvements |
Potential Adverse Effects on Local Communities
For potential adverse effects of the proposed project development, it will be assumed that the sulphide tailings will be moved to another location northeast of the proposed site for the leach pad. Again, it should also be mentioned that this proposed site is very close to the town of San Jose de Avino, which may result in objections from the local community.
La Preciosa Property Area
The area was divided into two study areas for environmental applications: one for the mine area and one for the access, power, and waterlines. All plant and animal studies and clearances, surface and groundwater baseline data, drainage basin studies, and storm water drainage volumes and flows were defined. Local and site studies have been completed for groundwater characterization (water quality, water level, pit-inflow rates), surface water quality, and geochemical characterization of mining wastes (waste rock and tailings). Monitoring and management plans have been developed for groundwater monitoring, waste rock, tailings, prevention, and control of potential petroleum and chemical spills, sediment control plans, and tailing designs were completed based on those studies. A mine closure and reclamation plan and closure cost estimate has been prepared.
CAPITAL AND OPERATING COSTS
Avino has not based its production decisions on any Feasibility Study or Mineral Reserves demonstrating economic and technical viability, and as a result, there is increased uncertainty and multiple technical and economic risks of failure that are associated with these production decisions. These risks, among others, include areas that would be analyzed in more detail in a Feasibility Study, such as applying economic analysis to Mineral Resources and Mineral Reserves, more detailed metallurgy, and a number of specialized studies in areas such as mining and recovery methods, market analysis, and environmental and community impacts. Information in this section was provided by Avino. The information presented in subsequent sections were based on excerpts summarized from a previous technical report (Tetra Tech 2018) and revised with more recent press release material to reflect the activities at the Project site.
Avino Veins
Avino is currently conducting mining activity, including mineral processing, on the materials from the ET Mine. No cost estimate is applicable for the ongoing operations, and all costs below are based on actual expenditure from Q1 2020 to Q3 2022, excluding the proposed tailings reprocessing project completed in 2017.
Capital Costs
The actual capital expenditures for the last three years on the Avino Vein are summarized in Table 21-1 of the Report. The San Gonzalo Mine ceased its operation at the end of 2019. Mine and Processing plant capital costs were mainly attributed to equipment purchases, construction, and site upgrading.
| C98 |
Operating Costs
The mine and process operating costs for processing mineralized materials from the Avino Mine and historical stockpiles are summarized in Table 21-2 of the Report. The costs include operating and maintenance labour together with the operation-associated consumables and supplies. The cost of electrical power was included in the processing costs. The geological component was mostly related to technical labour. The San Gonzalo Mine ceased its operation at the end of 2019. As part of the ramp-up of operations, 10,806 t of AHAG stockpile material was processed during Q3 2021.
Tailings Resources
In 2017, Tetra Tech prepared a PEA technical report for the silver and gold recoveries from the oxide tailings (Tetra Tech 2017). That PEA technical report is not current.
La Preciosa Property
Currently there are no commercial operations on the property. Avino has not conducted capital and operating cost estimates on the property.
ECONOMIC ANALYSIS
Avino Veins
Avino is currently conducting mining activity, including mineral processing, on the materials from the Avino Vein, ET Mine. There is no economic analysis performed on this vein.
Tailings Resources
In 2017, Tetra Tech prepared a PEA technical report for the silver and gold recoveries from the oxide tailings (Tetra Tech 2017). That PEA technical report is not current.
La Preciosa Property
Currently there are no commercial operations on the La Preciosa Property. Avino has not conducted project economic analysis on the La Preciosa Property.
ADJACENT PROPERTIES
Arcelia Gold Corp., through its wholly owned subsidiary, Arcelia Gold, S.A. de C.V. owns two (2) Mining Concessions (La Peña, Título #204828 and El Niño, Título #236219) that are adjacent to and contiguous with the El Choque Tres, El Choque Cuatro, La Preciosa, and San Juan Mining Concessions of PMLP.
Canasil Resources, Inc., through its wholly owned subsidiary, Minera Canasil, S.A. de C.V. owns two (2) Mining Concessions (Carina, Título #233344 and Reducción Victoria Fracción B, Título #235845) that are adjacent to and contiguous with the San Juan Mining Concession of PMLP.
OTHER RELEVANT DATA AND INFORMATION
There is no additional information or explanation necessary to make the Report understandable and not misleading.
| C99 |
INTERPRETATION AND CONCLUSIONS
Geology
The Property is located in Durango State in North Central Mexico, within the Sierra Madre Silver Belt, and 82 km northeast of Durango City. The current Property is comprised of 23 mineral concessions, totalling 1,103.934 ha.
The Property is located within a large caldera, which hosts numerous epithermal veins and breccias, grading into a “near porphyry” environment. The dominant rock types in the region of the Avino Property include andesitic, rhyolitic, and trachytic pyroclastic rocks. The area was intruded by monzonite dykes and stocks, which appear to be related to mineralization. Silver- and gold-bearing veins crosscut the various lithologies and are generally oriented north-northwest to south-southeast and northwest to southeast. The rocks have been weathered and leached in the upper sections from contact with atmospheric waters, resulting in an oxidized and reduced, or sulphide, portion of the mine.
Five deposits are present on the historic Avino Mine part of the property and have been subjected to exploration drilling, namely: the Avino breccias and veins, the San Gonzalo Vein, Guadalupe vein system, the La Potosina vein system and the tailings dam (which includes an oxide and a sulphide portion).
The recently acquired large area of La Preciosa concessions were extensively drilled by Coeur and earlier operators. The flat-lying, narrow silver and gold-bearing veins in this area represent a significant part of the mineral resources.
Resource Estimates
The Mineral Resources of the Property are summarized in Table 1-2 (included in the AIF at p. 20) and Table 14.1 of the Report.
Mineral Processing
Avino is currently conducting mining activities on the Avino Vein at the flotation processing plant at the Avino mine site. Production decisions for both the existing operation and the San Gonzalo Mine were being made without Mineral Reserves or any studies of economic viability that have been prepared in accordance with NI 43-101. As a result, there is increased uncertainty and multiple technical and economic risks of failure, which are associated with these production decisions. These risks, among others, include areas that would be analyzed in more detail in an FS, such as applying economic analysis to Mineral Resources and Mineral Reserves, more detailed metallurgy, and a number of specialized studies in areas such as mining and recovery methods, market analysis, and environmental and community impacts.
For the oxide tailings, the preliminary test results indicate that the tailings samples responded well to cyanide leaching, including column leaching treatment. The 2022-2023 test program shows that with regrinding to 80% passing approximately 75 µm, silver and gold extractions for the early-stage oxide tailings composite sample improved to approximately 89% and 88%, compared to 82.7% for silver and 78.7% for gold without regrinding. For the recent oxide tailings composite sample, the silver and gold extractions were improved to approximately 83% or slightly higher with regrinding to 80% passing 75 µm, compared to 77.9% for silver and 76.6% for gold without regrinding. Further evaluations are required to better understand the metallurgical performance of the oxide tailings and the economics of reprocessing the tailings.
For the sulphide tailings, the 2022-2023 test work also tested a sulphide tailings composite sample. The bottle roll test results show that the silver and gold extraction improved from 69.1% to 76.1% for silver and from 77.0% to 82.8% for gold with regrinding the tailings sample to 80% passing approximately 75 µm, compared to without regrinding treatment.
| C100 |
For the La Preciosa mineralization, extensive metallurgical investigations were conducted to support the previous studies, including a feasibility study completed in 2014, NI 43-101 Feasibility Study. The previous test work was mainly focused on the gold and silver recovery by cyanidation. The 2014 test work shows that the mineralization is moderately hard to ball mill grinding. In 2021, SGS Minerals at Durango, Mexico, conducted further test work, mainly focusing on investigating the flotation performance of the samples generated from the Abundancia, Gloria, and Martha mineralization zones (SGS, 2021). The flotation locked cycle tests at a primary grind size of 80% passing 106 µm, show that the samples responded reasonably well to the flotation concentration process.
A separate flotation LCT test was conducted on the Abundancia-Gloria sample using a more complex flowsheet with regrinding coarser than 75 µm fraction of the rougher flotation tailings. Silver recovery was slightly improved to 79.1%.
The 2021 test work also tested the metallurgical response of the two composite samples to centrifugal gravity concentration. The results show that most of the gold and silver in the two samples should not occur in coarse free gold and silver forms.
Further test work should be conducted to optimize the process conditions. The optimization should improve the metallurgical performance. The samples, representative of the planned mill feeds, should be tested.
Mining
Avino is currently conducting mining activity on the Avino Vein. Sublevel stoping mining method is used to feed the processing plant. Mining activities at the San Gonzalo Vein reached the end of its current resources, and underground mining activities at the mine were stopped. However, the mine remains open for continued exploration at different levels of the mine (more information can be found in Section 16.0 of the Report).
The oxide tailings Mineral Resource is proposed to be mined/moved using a conventional truck/loader surface mining method. However, currently, this plan has not been realized.
Capital and Operating Costs
Avino is currently conducting mining activity on the Avino Vein. No cost estimate is applicable, and all costs are based on actual expenditures. The capital and operating costs are detailed in Section 21.0 of the Report.
In 2017, Tetra Tech prepared a PEA technical report for the silver and gold recoveries from the oxide tailings (Tetra Tech 2017). That PEA technical report is not current.
Currently there are no commercial operations on the La Preciosa property. Avino has not conducted capital and operating cost estimates on the property.
Economic Analysis
Avino is currently conducting mining activity, including mineral processing on the materials from the Avino Vein, ET Mine. There is no economic analysis performed on this vein.
In 2017, Tetra Tech prepared a PEA technical report for the silver and gold recoveries from the oxide tailings (Tetra Tech 2017). That PEA technical report is not current.
Currently there are no commercial operations on the La Preciosa property. Avino has not conducted capital and operating cost estimates on the property.
| C101 |
RECOMMENDATIONS
Geology
The QP’s recommendations are itemized in the following subsections. The estimated cost for the proposed future work (drilling and remote sensing) is estimated to be approximately C$2,000,000.
Density Sampling and Analysis
The QP recommends that Avino continues to develop the database for specific gravity data using drill cores. The QP also recommends that grab samples from controlled underground exposures (location and lithology description) be used to supplement the data. The QP further recommends that some large samples be cut from the faces of the oxide tailings deposit, weighed, and measured to determine the specific gravity of the deposit.
QA/QC Sampling
The QP recommends that standards and blank submissions be included in the master database for the Property to avoid the difficulty of locating such data when it resides in separate spreadsheet reports.
The QP recommends that QA/QC performance graphs be updated monthly to allow questionable sample batches to be repeated timeously.
Avino Deep Drilling
The QP recommends that further drilling (8,000 m) be carried out to explore the deep extension of the Avino breccias below 17 level at Elena Tolosa. This drilling can be carried out from a prospect crosscut in the hanging wall of the Avino breccias on 17 level or as long hole drilling from surface. Drilling and sampling costs for this work are estimated at C$1,950,000.
Exploration Optimization
|
| · | The recent consolidation of the two parts of the property, namely the historic Avino Mine and the large La Preciosa Property area, provide an opportunity to optimize exploration effort. |
|
|
|
|
|
| · | The large size of the La Preciosa concessions and the flat-lying veins and recent advancements of remote sensing techniques, suggest that geophysical techniques and multi-spectral techniques may be applied to the consolidated property with the following advantages: |
|
|
|
|
|
| · | Improved spectral resolution: Hyperspectral imaging can detect subtle variations in the electromagnetic spectrum, allowing for highly detailed and accurate identification of minerals and metals. This improved spectral resolution can reveal even trace amounts of minerals, making it a powerful tool for exploration. |
|
|
|
|
|
| · | Enhanced mapping capabilities: Hyperspectral techniques can generate highly detailed maps of mineral and metal distribution, helping to identify new deposits and locate areas of high mineral potential. |
|
|
|
|
|
| · | Non-destructive testing: Hyperspectral techniques are non-destructive, meaning that samples do not need to be physically altered or destroyed in order to analyze their composition. This allows for more efficient and cost-effective exploration. |
|
|
|
|
|
| · | Rapid data acquisition: Hyperspectral imaging can cover large areas in a relatively short amount of time, making it possible to collect vast amounts of data quickly and efficiently. This allows for more comprehensive and accurate assessments of mineral resources. |
|
|
|
|
|
| · | Reduced environmental impact: Because hyperspectral techniques are non-destructive, they can be used without causing significant environmental damage or disruption. This makes them a more sustainable and environmentally friendly option for mineral exploration. |
|
|
|
|
|
| · | It is recommended that a suitable specialist consultant be engaged to carry out remote sensing and hyperspectral work to identify key geological features such as alteration, faulting and sub-cropping volcanic centres that can be followed up by drilling. A budget of C$50,000 should be sufficient for hyperspectral work. |
| C102 |
Mining
Tetra Tech recommends that Avino prepare a long-term mine plan for the Avino area mineral resources based on the resource estimate. Mining methods for the historical tailings extraction and for the La Preciosa deposit should be developed and assessed.
The estimated cost for the mine plan development is estimated to be approximately C$300,000.
Metallurgy and Process
Avino Vein
Avino is currently conducting mining activities on the Avino Vein, ET Mine, including metal recovery using a flotation process. Tetra Tech recommends that Avino further optimize the processing conditions, including metallurgical tests, to improve metallurgical performances for the Avino Vein plant feeds. Further metallurgical test work should be conducted to investigate separating bismuth from copper-gold-silver concentrate. The bismuth removal should reduce the impurity penalty; however, a trade-off study should also be required to assess copper, gold, and silver loss into the bismuth product and how to handle the high bismuth material.
The costs for the metallurgical tests are estimated to be approximately C$80,000.
Oxide and Sulphide Tailings
Further tests are recommended to evaluate the metallurgical performances of the tailings samples, including the sulphide tailings samples. The test work should be conducted on samples that better represent the tailings Mineral Resources. The test work should focus on the processing condition optimization, including regrinding particle size, cyanide concentration and leaching retention time. Cyanide destruction tests on the leach residues and leach residue characterization should also be conducted. A detailed trade-off study should be undertaken to characterize the current conditions of the sulphide tailings and to determine whether the re-treatment of this material would contribute to the profitability of the oxide tailings project.
The estimated cost for the test work, excluding sampling, is approximately C$150,000.
Environmental
The cost of permitting has not been considered at this stage of the oxide tailings project. Government agencies should be consulted prior to the permitting process to determine if the current permits for the San Gonzalo Mine can be revised. The cost of expropriating agricultural land for the leach pad and water, which would have to be redirected to the heap leach project but is currently used for agricultural purposes, has also not been assessed. Once the mine plan, site layout, and tailings management plan are further along and have definitive locations, the cost of these factors should be addressed. The cost of monitoring environmental effects post-mine closure needs to be estimated.
The estimated costs for the studies are estimated to be approximately C$80,000.
Mining of Sulphide Tailings
The potential for handling sulphide tailings as a mineralized material rather than waste material should be investigated based on appropriate metallurgical tests. Further optimization of the mine plan for the oxide tailings should be conducted. The estimated cost for the study is approximately C$20,000.
***
| C103 |
EXHIBIT 99.2
|
AVINO SILVER & GOLD MINES LTD.
Consolidated Financial Statements
For the years ended December 31, 2022 and 2021
Management’s Responsibility for Financial Reporting
The consolidated financial statements of Avino Silver & Gold Mines Ltd. (the “Company”) are the responsibility of the Company’s management. The consolidated financial statements are prepared in accordance with International Financial Reporting Standards as issued by the International Accounting Standards Board, and reflect management’s best estimates and judgments based on information currently available.
Management has developed and is maintaining a system of internal controls to ensure that the Company’s assets are safeguarded, transactions are authorized and properly recorded, and financial information is reliable.
The Board of Directors is responsible for ensuring that management fulfills its responsibilities. The Audit Committee reviews the results of the annual audit and reviews the consolidated financial statements prior to their submission to the Board of Directors for approval.
“David Wolfin” |
|
“Nathan Harte” |
|
|
|
|
David Wolfin President & CEO March 28, 2023 |
|
Nathan Harte, CPA Chief Financial Officer March 28, 2023 |

Report of Independent Registered Public Accounting Firm
To the Shareholders and the Board of Directors of
Avino Silver & Gold Mines Ltd.
Opinion on the Financial Statements
We have audited the accompanying consolidated statement of financial position of Avino Silver & Gold Mines Ltd. and subsidiaries (the "Company") as at December 31, 2022, the related consolidated statements of operations and comprehensive income (loss), changes in equity, and cash flows for the year ended December 31, 2022, and the related notes (collectively referred to as the "financial statements"). In our opinion, the financial statements present fairly, in all material respects, the financial position of the Company as at December 31, 2022, and its financial performance and its cash flows for the year ended December 31, 2022, in accordance with International Financial Reporting Standards as issued by the International Accounting Standards Board.
We have also audited, in accordance with the standards of the Public Company Accounting Oversight Board (United States) (PCAOB), the Company's internal control over financial reporting as of December 31, 2022, based on criteria established in Internal Control - Integrated Framework (2013) issued by the Committee of Sponsoring Organizations of the Treadway Commission and our report dated March 28, 2023, expressed an adverse opinion on the Company's internal control over financial reporting because of a material weakness.
Basis for Opinion
These financial statements are the responsibility of the Company's management. Our responsibility is to express an opinion on the Company's financial statements based on our audits. We are a public accounting firm registered with the PCAOB and are required to be independent with respect to the Company in accordance with the U.S. federal securities laws and the applicable rules and regulations of the Securities and Exchange Commission and the PCAOB.
We conducted our audits in accordance with the standards of the PCAOB. Those standards require that we plan and perform the audit to obtain reasonable assurance about whether the financial statements are free of material misstatement, whether due to error or fraud. Our audits included performing procedures to assess the risks of material misstatement of the financial statements, whether due to error or fraud, and performing procedures that respond to those risks. Such procedures included examining, on a test basis, evidence regarding the amounts and disclosures in the financial statements. Our audits also included evaluating the accounting principles used and significant estimates made by management, as well as evaluating the overall presentation of the financial statements. We believe that our audits provide a reasonable basis for our opinion.
Critical Audit Matter
The critical audit matter communicated below is a matter arising from the current-year audit of the financial statements that was communicated or required to be communicated to the audit committee and that (1) relates to accounts or disclosures that are material to the financial statements and (2) involved our especially challenging, subjective, or complex judgments. The communication of critical audit matters does not alter in any way our opinion on the financial statements, taken as a whole, and we are not, by communicating the critical audit matter below, providing a separate opinion on the critical audit matter or on the accounts or disclosures to which it relates.
Plant, equipment and mining properties - Assessment of Whether Indicators of Impairment Exist –
Refer to Notes 2 and 3 to the financial statements
Critical Audit Matter Description
The Company’s determination of whether or not an indicator of impairment exists at the cash generating unit (“CGU”) level requires significant management judgment. Changes in metal price forecasts or discount rates, increases in estimated future costs of production, increases in estimated future non expansionary capital expenditures, reductions in the amount of recoverable resources and exploration potential and adverse current economic conditions can result in a write-down of the carrying amounts of the Company’s plant, equipment and mining properties.
While there are several factors that are required to determine whether or not an indicator of impairment exists, the judgments with the highest degree of subjectivity are changes in metal price forecasts (for silver, gold, and copper) and discount rates. Auditing these estimates and factors required a high degree of subjectivity in applying audit procedures and in evaluating the results of those procedures. This resulted in an increased extent of audit effort, including the involvement of fair value specialists.
How the Critical Audit Matter Was Addressed in the Audit
Our audit procedures related to the changes in metal price forecasts (for silver, gold, and copper) and discount rates considered in the assessment of indicators of impairment included the following, among others:
|
· |
Evaluated the effectiveness of the Company’s controls over management’s assessment of indicators of impairment. |
|
|
· |
With the assistance of fair value specialists: |
|
|
|
· |
Evaluated the future metal prices (for silver, gold, and copper) by comparing management forecasts to third party forecasts, and |
|
|
· |
Evaluated the reasonableness of the change in discount rates by testing the source information underlying the determination of the discount rates. |
/s/ Deloitte LLP
Chartered Professional Accountants
Vancouver, Canada
March 28, 2023
We have served as the Company's auditor since 2022.

Report of Independent Registered Public Accounting Firm
To the Shareholders and the Board of Directors of
Avino Silver & Gold Mines Ltd.
Opinion on Internal Control over Financial Reporting
We have audited the internal control over financial reporting of Avino Silver & Gold Mines Ltd. and subsidiaries (the “Company") as of December 31, 2022, based on criteria established in Internal Control - Integrated Framework (2013) issued by the Committee of Sponsoring Organizations of the Treadway Commission (COSO). In our opinion, because of the effect of the material weakness identified below on the achievement of the objectives of the control criteria, the Company has not maintained effective internal control over financial reporting as of December 31, 2022, based on criteria established in Internal Control - Integrated Framework (2013) issued by COSO.
We have also audited, in accordance with the standards of the Public Company Accounting Oversight Board (United States) (PCAOB), the consolidated financial statements as at and for the year ended December 31, 2022 of the Company and our report dated March 28, 2023 expressed an unqualified opinion on those financial statements.
Basis for Opinion
The Company's management is responsible for maintaining effective internal control over financial reporting and for its assessment of the effectiveness of internal control over financial reporting, included in the accompanying Management’s Report on internal control over financial reporting. Our responsibility is to express an opinion on the Company’s internal control over financial reporting based on our audit. We are a public accounting firm registered with the PCAOB and are required to be independent with respect to the Company in accordance with the U.S. federal securities laws and the applicable rules and regulations of the Securities and Exchange Commission and the PCAOB.
We conducted our audit in accordance with the standards of the PCAOB. Those standards require that we plan and perform the audit to obtain reasonable assurance about whether effective internal control over financial reporting was maintained in all material respects. Our audit included obtaining an understanding of internal control over financial reporting, assessing the risk that a material weakness exists, testing and evaluating the design and operating effectiveness of internal control based on the assessed risk, and performing such other procedures as we considered necessary in the circumstances. We believe that our audit provides a reasonable basis for our opinion.
Definition and Limitations of Internal Control over Financial Reporting
A company’s internal control over financial reporting is a process designed to provide reasonable assurance regarding the reliability of financial reporting and the preparation of financial statements for external purposes in accordance with generally accepted accounting principles. A company’s internal control over financial reporting includes those policies and procedures that (1) pertain to the maintenance of records that, in reasonable detail, accurately and fairly reflect the transactions and dispositions of the assets of the company; (2) provide reasonable assurance that transactions are recorded as necessary to permit preparation of financial statements in accordance with generally accepted accounting principles, and that receipts and expenditures of the company are being made only in accordance with authorizations of management and directors of the company; and (3) provide reasonable assurance regarding prevention or timely detection of unauthorized acquisition, use, or disposition of the company’s assets that could have a material effect on the financial statements.
Because of its inherent limitations, internal control over financial reporting may not prevent or detect misstatements. Also, projections of any evaluation of effectiveness to future periods are subject to the risk that controls may become inadequate because of changes in conditions, or that the degree of compliance with the policies or procedures may deteriorate.
Material Weakness
A material weakness is a deficiency, or a combination of deficiencies, in internal control over financial reporting, such that there is a reasonable possibility that a material misstatement of the company’s annual or interim financial statements will not be prevented or detected on a timely basis. The following material weakness has been identified and included in management's assessment. The Company identified a material weakness relating to the design of management review controls over non-routine transactions, as well as lack of requisite skills or available resources. This material weakness was considered in determining the nature, timing, and extent of audit tests applied in our audit of the consolidated financial statements as of and for the year ended December 31, 2022, of the Company, and this report does not affect our report on such financial statements.
/s/ Deloitte LLP
Chartered Professional Accountants
Vancouver, Canada
March 28, 2023

REPORT OF INDEPENDENT REGISTERED PUBLIC ACCOUNTING FIRM |
To the Shareholders and the Board of Directors of Avino Silver & Gold Mines Ltd.
Opinion on the Consolidated Financial Statements
We have audited the accompanying consolidated financial statements of Avino Silver & Gold Mines Ltd. and its subsidiaries (together, the “Company”), which comprise the consolidated statement of financial position as at December 31, 2021, and the consolidated statement of operations and comprehensive income (loss), consolidated statement of changes in equity and consolidated statements of cash flow for the year ended December 31, 2021, and the related notes, including a summary of significant accounting policies and other explanatory information (collectively referred to as the “consolidated financial statements”). In our opinion, the consolidated financial statements present fairly, in all material respects, the financial position of the Company as at December 31, 2021, and its financial performance and its cash flows for the year ended December 31, 2021 in accordance with International Financial Reporting Standards as issued by the International Accounting Standards Board.
Basis for Opinion
These consolidated financial statements are the responsibility of the Company’s management. Our responsibility is to express an opinion on the Company’s consolidated financial statements based on our audit. We are a public accounting firm registered with the Public Company Accounting Oversight Board (PCAOB) and are required to be independent with respect to the Company in accordance with the U.S. federal securities laws and the applicable rules and regulations of the Securities and Exchange Commission and the PCAOB.
We conducted our audit in accordance with the standards of the PCAOB. Those standards require that we plan and perform the audit to obtain reasonable assurance about whether the consolidated financial statements are free from material misstatement, whether due to fraud or error. Our audit included performing procedures to assess the risks of material misstatement of the consolidated financial statements, whether due to fraud or error, and performing procedures that respond to those risks. Such procedures include examining, on a test basis, evidence regarding the amounts and disclosures in the consolidated financial statements. Our audit also included evaluating the accounting principles used and significant estimates made by management, as well as evaluating the overall presentation of the consolidated financial statements. We believe that the audit evidence we have obtained in our audit is sufficient and appropriate to provide a reasonable basis for our audit opinion.

CHARTERED PROFESSIONAL ACCOUNTANTS
Vancouver, British Columbia, Canada
March 16, 2022
We had served as the Company’s auditor from 2007 to 2021.
|
AVINO SILVER & GOLD MINES LTD. Consolidated Statements of Financial Position (Expressed in thousands of US dollars) |
|
|||||||||||
|
|
|
|
|
|
|
|
|
|
|||
|
|
Note |
|
|
December 31, 2022 |
|
|
December 31, 2021 |
|
|||
ASSETS |
|
|
|
|
|
|
|
|
|
|||
Current assets |
|
|
|
|
|
|
|
|
|
|||
Cash |
|
|
|
|
$ | 11,245 |
|
|
$ | 24,765 |
|
|
Amounts receivable |
|
|
|
|
|
2,672 |
|
|
|
1,208 |
|
|
Taxes recoverable |
|
|
6 |
|
|
|
3,737 |
|
|
|
3,364 |
|
Prepaid expenses and other assets |
|
|
|
|
|
|
1,671 |
|
|
|
962 |
|
Inventory |
|
|
7 |
|
|
|
6,260 |
|
|
|
5,179 |
|
Total current assets |
|
|
|
|
|
|
25,585 |
|
|
|
35,478 |
|
Exploration and evaluation assets |
|
|
9 |
|
|
|
49,804 |
|
|
|
11,053 |
|
Plant, equipment and mining properties |
|
|
11 |
|
|
|
44,056 |
|
|
|
35,675 |
|
Long-term investments |
|
|
8 |
|
|
|
1,746 |
|
|
|
3,939 |
|
Other assets |
|
|
|
|
|
|
5 |
|
|
|
133 |
|
Total assets |
|
|
|
|
|
$ | 121,196 |
|
|
$ | 86,278 |
|
LIABILITIES |
|
|
|
|
|
|
|
|
|
|
|
|
Current liabilities |
|
|
|
|
|
|
|
|
|
|
|
|
Accounts payable and accrued liabilities |
|
|
|
|
|
$ | 9,469 |
|
|
$ | 3,260 |
|
Amounts due to related parties |
|
|
12 | (b) |
|
|
28 |
|
|
|
163 |
|
Taxes payable |
|
|
24 |
|
|
|
895 |
|
|
|
31 |
|
Note payable |
|
|
13 |
|
|
|
4,926 |
|
|
|
- |
|
Current portion of warrant liability |
|
|
14 |
|
|
|
475 |
|
|
|
- |
|
Current portion of finance lease obligations |
|
|
|
|
|
|
971 |
|
|
|
389 |
|
Total current liabilities |
|
|
|
|
|
|
16,764 |
|
|
|
3,843 |
|
Finance lease obligations |
|
|
|
|
|
|
745 |
|
|
|
680 |
|
Warrant liability |
|
|
14 |
|
|
|
- |
|
|
|
741 |
|
Reclamation provision |
|
|
15 |
|
|
|
445 |
|
|
|
726 |
|
Deferred income tax liabilities |
|
|
24 |
|
|
|
5,221 |
|
|
|
1,781 |
|
Total liabilities |
|
|
|
|
|
|
23,175 |
|
|
|
7,771 |
|
EQUITY |
|
|
|
|
|
|
|
|
|
|
|
|
Share capital |
|
|
16 |
|
|
|
145,515 |
|
|
|
129,953 |
|
Equity reserves |
|
|
|
|
|
|
9,852 |
|
|
|
9,573 |
|
Treasury shares (14,180 shares, at cost) |
|
|
|
|
|
|
(97 | ) |
|
|
(97 | ) |
Accumulated other comprehensive loss |
|
|
|
|
|
|
(5,223 | ) |
|
|
(4,969 | ) |
Accumulated deficit |
|
|
|
|
|
|
(52,026 | ) |
|
|
(55,953 | ) |
Total equity |
|
|
|
|
|
|
98,021 |
|
|
|
78,507 |
|
Total liabilities and equity |
|
|
|
|
|
$ | 121,196 |
|
|
$ | 86,278 |
|
Commitments – Note 19
Approved by the Board of Directors on March 28, 2023
|
Peter Bojtos |
Director |
David Wolfin |
Director |
|
The accompanying notes are an integral part of the consolidated financial statements
| -1- |
|
AVINO SILVER & GOLD MINES LTD. Consolidated Statements of Operations and Comprehensive Income (Loss) (Expressed in thousands of US dollars, other than per share amounts) | ||||||||||||
|
|
|
|
|
|
|
||||||
|
|
Note |
|
|
2022 |
|
|
2021 |
|
|||
Revenue from mining operations |
|
|
17 |
|
|
$ | 44,187 |
|
|
$ | 11,228 |
|
Cost of sales |
|
|
17 |
|
|
|
29,125 |
|
|
|
7,681 |
|
Mine operating income |
|
|
|
|
|
|
15,062 |
|
|
|
3,547 |
|
|
|
|
|
|
|
|
|
|
|
|
|
|
Operating expenses |
|
|
|
|
|
|
|
|
|
|
|
|
General and administrative expenses |
|
|
18 |
|
|
|
5,156 |
|
|
|
3,566 |
|
Share-based payments |
|
|
16 | (c)(d) |
|
|
2,024 |
|
|
|
1,469 |
|
|
|
|
|
|
|
|
7,882 |
|
|
|
(1,488 | ) |
|
|
|
|
|
|
|
|
|
|
|
|
|
Other items |
|
|
|
|
|
|
|
|
|
|
|
|
Interest and other income |
|
|
|
|
|
|
20 |
|
|
|
178 |
|
Unrealized loss on long-term investments |
|
|
8 |
|
|
|
(2,103 | ) |
|
|
(423 | ) |
Fair value adjustment on warrant liability |
|
|
14 |
|
|
|
2,395 |
|
|
|
1,581 |
|
Realized loss on warrants exercised |
|
|
|
|
|
|
- |
|
|
|
(1,106 | ) |
Foreign exchange loss |
|
|
|
|
|
|
(17 | ) |
|
|
(61 | ) |
Project evaluation expenses |
|
|
|
|
|
|
(81 | ) |
|
|
(176 | ) |
Finance cost |
|
|
|
|
|
|
(273 | ) |
|
|
(52 | ) |
Accretion of reclamation provision |
|
|
15 |
|
|
|
(44 | ) |
|
|
(47 | ) |
Interest expense |
|
|
|
|
|
|
(99 | ) |
|
|
(24 | ) |
Income (loss) from continuing operations before income taxes |
|
|
|
|
|
|
7,680 |
|
|
|
(1,618 | ) |
|
|
|
|
|
|
|
|
|
|
|
|
|
Income taxes: |
|
|
|
|
|
|
|
|
|
|
|
|
Current income tax expense |
|
|
24 |
|
|
|
(1,144 | ) |
|
|
(27 | ) |
Deferred income tax expense |
|
|
24 |
|
|
|
(3,440 | ) |
|
|
(412 | ) |
Income tax expense |
|
|
|
|
|
|
(4,584 | ) |
|
|
(439 | ) |
Net income (loss) |
|
|
|
|
|
|
3,096 |
|
|
|
(2,057 | ) |
|
|
|
|
|
|
|
|
|
|
|
|
|
Other comprehensive income (loss) |
|
|
|
|
|
|
|
|
|
|
|
|
Items that may be reclassified subsequently to profit or loss: |
|
|
|
|
|
|
|
|
|
|
|
|
Currency translation differences |
|
|
|
|
|
|
(254 | ) |
|
|
(159 | ) |
Total comprehensive income (loss) |
|
|
|
|
|
$ | 2,842 |
|
|
$ | (2,216 | ) |
|
|
|
|
|
|
|
|
|
|
|
|
|
Earnings (loss) per share |
|
|
16 | (e) |
|
|
|
|
|
|
|
|
Basic |
|
|
|
|
|
$ | 0.03 |
|
|
$ | (0.02 | ) |
Diluted |
|
|
|
|
|
$ | 0.03 |
|
|
$ | (0.02 | ) |
Weighted average number of common shares outstanding |
|
|
16 | (e) |
|
|
|
|
|
|
|
|
Basic |
|
|
|
|
|
|
114,372,371 |
|
|
|
100,161,357 |
|
Diluted |
|
|
|
|
|
|
117,615,898 |
|
|
|
100,161,357 |
|
The accompanying notes are an integral part of the consolidated financial statements
| -2- |
|
AVINO SILVER & GOLD MINES LTD. Consolidated Statements of Changes in Equity (Expressed in thousands of US dollars) |
|
|
|
Note |
|
|
Number of Common Shares |
|
|
Share Capital Amount |
|
|
Equity Reserves |
|
|
Treasury Shares |
|
|
Accumulated Other Comprehensive Loss |
|
|
Accumulated Deficit |
|
|
Total Equity |
|
||||||||
January 1, 2021 |
|
|
|
|
|
89,568,682 |
|
|
$ | 108,303 |
|
|
$ | 9,951 |
|
|
$ | (97 | ) |
|
$ | (4,810 | ) |
|
$ | (54,339 | ) |
|
$ | 59,008 |
|
|
Common shares issued: |
|
|
|
|
|
|
|
|
|
|
|
|
|
|
|
|
|
|
|
|
|
|
|
|
|
|
|
|
|
|
|
|
At the market issuances |
|
|
|
|
|
10,050,000 |
|
|
|
18,497 |
|
|
|
- |
|
|
|
- |
|
|
|
- |
|
|
|
- |
|
|
|
18,497 |
|
|
Exercise of warrants |
|
|
|
|
|
1,030,362 |
|
|
|
1,911 |
|
|
|
- |
|
|
|
- |
|
|
|
- |
|
|
|
- |
|
|
|
1,911 |
|
|
Exercise of options |
|
|
|
|
|
264,000 |
|
|
|
364 |
|
|
|
(126 | ) |
|
|
- |
|
|
|
- |
|
|
|
- |
|
|
|
238 |
|
|
Issuance costs |
|
|
|
|
|
- |
|
|
|
(400 | ) |
|
|
- |
|
|
|
- |
|
|
|
- |
|
|
|
- |
|
|
|
(400 | ) | |
Options cancelled or expired |
|
|
|
|
|
- |
|
|
|
- |
|
|
|
(443 | ) |
|
|
- |
|
|
|
- |
|
|
|
443 |
|
|
|
- |
|
|
Carrying value of RSUs exercised |
|
|
|
|
|
1,330,167 |
|
|
|
1,278 |
|
|
|
(1,278 | ) |
|
|
- |
|
|
|
- |
|
|
|
- |
|
|
|
- |
|
|
Share-based payments |
|
|
|
|
|
- |
|
|
|
- |
|
|
|
1,469 |
|
|
|
- |
|
|
|
- |
|
|
|
- |
|
|
|
1,469 |
|
|
Net loss for the year |
|
|
|
|
|
- |
|
|
|
- |
|
|
|
- |
|
|
|
- |
|
|
|
- |
|
|
|
(2,057 | ) |
|
|
(2,057 | ) | |
Currency translation differences |
|
|
|
|
|
- |
|
|
|
- |
|
|
|
- |
|
|
|
- |
|
|
|
(159 | ) |
|
|
- |
|
|
|
(159 | ) | |
Balance, December 31, 2021 |
|
|
|
|
|
102,243,211 |
|
|
$ | 129,953 |
|
|
$ | 9,573 |
|
|
$ | (97 | ) |
|
$ | (4,969 | ) |
|
$ | (55,953 | ) |
|
$ | 78,507 |
|
|
Common shares issued: |
|
|
|
|
|
|
|
|
|
|
|
|
|
|
|
|
|
|
|
|
|
|
|
|
|
|
|
|
|
|
|
|
Exercise of options |
|
|
16(b) |
|
|
48,000 |
|
|
|
46 |
|
|
|
(15 | ) |
|
|
- |
|
|
|
- |
|
|
|
- |
|
|
|
31 |
|
|
Issuance costs |
|
|
|
|
|
|
- |
|
|
|
(13 | ) |
|
|
- |
|
|
|
- |
|
|
|
- |
|
|
|
- |
|
|
|
(13 | ) |
Options cancelled or expired |
|
|
16(c) |
|
|
- |
|
|
|
- |
|
|
|
(831 | ) |
|
|
- |
|
|
|
- |
|
|
|
831 |
|
|
|
- |
|
|
Carrying value of RSUs exercised |
|
|
16(d) |
|
|
982,879 |
|
|
|
899 |
|
|
|
(899 | ) |
|
|
- |
|
|
|
- |
|
|
|
- |
|
|
|
- |
|
|
Share-based payments |
|
|
16(c)(d) |
|
|
- |
|
|
|
- |
|
|
|
2,024 |
|
|
|
- |
|
|
|
- |
|
|
|
- |
|
|
|
2,024 |
|
|
Net income for the year |
|
|
16(e) |
|
|
- |
|
|
|
- |
|
|
|
- |
|
|
|
- |
|
|
|
- |
|
|
|
3,096 |
|
|
|
3,096 |
|
|
Shares issued – acquisition of Properties |
|
|
4,16(b) |
|
|
15,075,000 |
|
|
|
14,630 |
|
|
|
- |
|
|
|
- |
|
|
|
- |
|
|
|
- |
|
|
|
14,630 |
|
|
Currency translation differences |
|
|
|
|
|
|
- |
|
|
|
- |
|
|
|
- |
|
|
|
- |
|
|
|
(254 | ) |
|
|
- |
|
|
|
(254 | ) |
Balance, December 31, 2022 |
|
|
|
|
|
|
118,349,090 |
|
|
$ | 145,515 |
|
|
$ | 9,852 |
|
|
$ | (97 | ) |
|
$ | (5,223 | ) |
|
$ | (52,026 | ) |
|
$ | 98,021 |
|
The accompanying notes are an integral part of the consolidated financial statements
| -3- |
|
AVINO SILVER & GOLD MINES LTD. Consolidated Statements of Cash Flows (Expressed in thousands of US dollars) |
|
|
|
Note |
|
|
2022 |
|
|
2021 |
|
|||
|
|
|
|
|
|
|
|
|
|
|||
Cash generated by (used in): |
|
|
|
|
|
|
|
|
|
|||
|
|
|
|
|
|
|
|
|
|
|||
Operating activities |
|
|
|
|
|
|
|
|
|
|||
Net income (loss) |
|
|
|
|
$ | 3,096 |
|
|
$ | (2,057 | ) | |
Adjustments for non-cash items: |
|
|
|
|
|
|
|
|
|
|
|
|
Deferred income tax expense |
|
|
24 |
|
|
|
3,440 |
|
|
|
412 |
|
Depreciation and depletion |
|
|
|
|
|
|
2,186 |
|
|
|
2,116 |
|
Write down of equipment |
|
|
11 |
|
|
|
330 |
|
|
|
- |
|
Accretion of reclamation provision |
|
|
|
|
|
|
44 |
|
|
|
47 |
|
Unrealized loss on investments |
|
|
8 |
|
|
|
2,103 |
|
|
|
423 |
|
Unrealized foreign exchange gain |
|
|
|
|
|
|
(303 | ) |
|
|
(265 | ) |
Unwinding of fair value adjustment on term facility |
|
|
|
|
|
|
262 |
|
|
|
(13 | ) |
Fair value adjustment on warrant liability |
|
|
14 |
|
|
|
(2,395 | ) |
|
|
(1,581 | ) |
Realized loss on warrants exercised |
|
|
|
|
|
|
- |
|
|
|
1,106 |
|
Share-based payments |
|
|
|
|
|
|
2,024 |
|
|
|
1,469 |
|
|
|
|
|
|
|
|
10,787 |
|
|
|
1,657 |
|
|
|
|
|
|
|
|
|
|
|
|
|
|
Net change in non-cash working capital items |
|
|
20 |
|
|
|
1,044 |
|
|
|
(1,548 | ) |
Cash provided by operating activities |
|
|
|
|
|
|
11,831 |
|
|
|
109 |
|
|
|
|
|
|
|
|
|
|
|
|
|
|
Financing activities |
|
|
|
|
|
|
|
|
|
|
|
|
Shares and units issued for cash, net of issuance costs |
|
|
|
|
|
|
- |
|
|
|
18,098 |
|
Proceeds from option exercise |
|
|
|
|
|
|
30 |
|
|
|
238 |
|
Proceeds from warrant exercise |
|
|
|
|
|
|
- |
|
|
|
805 |
|
Term facility payments |
|
|
|
|
|
|
- |
|
|
|
(2,500 | ) |
Finance lease payments |
|
|
|
|
|
|
(1,179 | ) |
|
|
(477 | ) |
Equipment loan payments |
|
|
|
|
|
|
- |
|
|
|
(72 | ) |
Cash provided by (used in) financing activities |
|
|
|
|
|
|
(1,149 | ) |
|
|
16,092 |
|
|
|
|
|
|
|
|
|
|
|
|
|
|
Investing activities |
|
|
|
|
|
|
|
|
|
|
|
|
Exploration and evaluation expenditures |
|
|
|
|
|
|
(1,131 | ) |
|
|
(1,294 | ) |
Additions to plant, equipment and mining properties |
|
|
|
|
|
|
(7,836 | ) |
|
|
(1,913 | ) |
Acquisition of La Preciosa |
|
|
5 |
|
|
|
(15,134 | ) |
|
|
- |
|
Cash used in investing activities |
|
|
|
|
|
|
(24,101 | ) |
|
|
(3,207 | ) |
|
|
|
|
|
|
|
|
|
|
|
|
|
Change in cash |
|
|
|
|
|
|
(13,419 | ) |
|
|
12,994 |
|
|
|
|
|
|
|
|
|
|
|
|
|
|
Effect of exchange rate changes on cash |
|
|
|
|
|
|
(101 | ) |
|
|
58 |
|
|
|
|
|
|
|
|
|
|
|
|
|
|
Cash, Beginning |
|
|
|
|
|
|
24,765 |
|
|
|
11,713 |
|
|
|
|
|
|
|
|
|
|
|
|
|
|
Cash, Ending |
|
|
|
|
|
$ | 11,245 |
|
|
$ | 24,765 |
|
Supplementary Cash Flow Information (Note 20)
The accompanying notes are an integral part of the consolidated financial statements
| -4- |
|
AVINO SILVER & GOLD MINES LTD. Notes to the consolidated financial statements For the years ended December 31, 2022 and 2021 (Expressed in thousands of US dollars, except where otherwise noted) |
|
1. NATURE OF OPERATIONS
Avino Silver & Gold Mines Ltd. (the “Company” or “Avino”) was incorporated in 1968 under the laws of the Province of British Columbia, Canada. The Company is engaged in the production and sale of silver, gold, and copper and the acquisition, exploration, and advancement of mineral properties.
The Company’s head office and principal place of business is Suite 900, 570 Granville Street, Vancouver, BC, Canada. The Company is a reporting issuer in Canada and the United States, and trades on the Toronto Stock Exchange (“TSX”), the NYSE American, and the Frankfurt and Berlin Stock Exchanges.
The Company operates the Avino Mine which produces copper, silver and gold at the historic Avino property in the state of Durango, Mexico. The Company also holds 100% interest in Proyectos Mineros La Preciosa S.A. de C.V . (“La Preciosa”), a Mexican corporation which owns the La Preciosa Property. The Company also owns interests in mineral properties located in British Columbia and Yukon, Canada.
Risks associated with Public Health Crises, including COVID-19
The Company's business, operations and financial condition could be materially adversely affected by the outbreak of epidemics, pandemics or other health crises, such as the outbreak of COVID-19 that was designated as a pandemic by the World Health Organization on March 11, 2020. The international response to the spread of COVID-19 has led to significant restrictions on travel, temporary business closures, quarantines, global stock market volatility and a general reduction in consumer activity. Such public health crises can result in operating, supply chain and project development delays and disruptions, global stock market and financial market volatility, declining trade and market sentiment, reduced movement of people and labour shortages, and travel and shipping disruption and shutdowns, including as a result of government regulation and prevention measures, or a fear of any of the foregoing, all of which could affect commodity prices, interest rates, credit risk and inflation. In addition, the current COVID-19 pandemic, and any future emergence and spread of similar pathogens could have an adverse impact on global economic conditions which may adversely impact the Company's operations, and the operations of suppliers, contractors and service providers, including smelter and refining service providers, and the demand for the Company's production.
The Company may experience business interruptions, including suspended (whether government mandated or otherwise) or reduced operations relating to COVID-19 and other such events outside of the Company's control, which could have a material adverse impact on its business, operations and operating results, financial condition and liquidity.
As at the date of the consolidated financial statements, the duration of the business disruptions internationally and related financial impact of COVID-19 cannot be reasonably estimated. It is unknown whether and how the Company may be affected if the pandemic persists for an extended period of time. In particular, the region in which we operate may not have sufficient public infrastructure to adequately respond or efficiently and quickly recover from such event, which could have a materially adverse effect on the Company's operations. The Company's exposure to such public health crises also includes risks to employee health and safety. Should an employee, contractor, community member or visitor become infected with a serious illness that has the potential to spread rapidly, this could place the Company's workforce at risk.
| -5- |
|
AVINO SILVER & GOLD MINES LTD. Notes to the consolidated financial statements For the years ended December 31, 2022 and 2021 (Expressed in thousands of US dollars, except where otherwise noted) |
|
2. BASIS OF PRESENTATION
Statement of Compliance
These consolidated financial statements have been prepared in accordance with International Financial Reporting Standards (“IFRS”) as issued by the International Accounting Standards Board (“IASB”).
Basis of Presentation
These consolidated financial statements are expressed in US dollars and have been prepared on a historical cost basis except for financial instruments that have been measured at fair value. In addition, these consolidated financial statements have been prepared using the accrual basis of accounting on a going concern basis. The accounting policies set out below have been applied consistently to all periods presented in these consolidated financial statements as if the policies have always been in effect.
Foreign Currency Translation
Foreign currency transactions
Transactions in currencies other than the functional currency are recorded at the rates of exchange prevailing on the dates of the transactions. At each financial position reporting date, monetary assets and liabilities that are denominated in foreign currencies are translated at the rates prevailing at the date of the statement of financial position. Non-monetary items that are measured in terms of historical cost in a foreign currency are not re-translated.
Foreign operations
Subsidiaries that have functional currencies other than the US dollar translate their statement of operations items at the average rate during the year. Assets and liabilities are translated at exchange rates prevailing at the end of each reporting period. Exchange rate variations resulting from the retranslation at the closing rate of the net investment in these subsidiaries, together with differences between their statement of operations items translated at actual and average rates, are recognized in accumulated other comprehensive income (loss). On disposition or partial disposition of a foreign operation, the cumulative amount of related exchange difference is recognized in the statement of operations.
Significant Accounting Judgments and Estimates
The Company’s management makes judgments in its process of applying the Company’s accounting policies to the preparation of its consolidated financial statements. In addition, the preparation of financial data requires that the Company’s management make assumptions and estimates of the impacts on the carrying amounts of the Company’s assets and liabilities at the end of the reporting period from uncertain future events and on the reported amounts of revenues and expenses during the reporting period. Actual results may differ from those estimates as the estimation process is inherently uncertain. Estimates are reviewed on an ongoing basis based on historical experience and other factors that are considered to be relevant under the circumstances. Revisions to estimates and the resulting impacts on the carrying amounts of the Company’s assets and liabilities are accounted for prospectively.
| -6- |
|
AVINO SILVER & GOLD MINES LTD. Notes to the consolidated financial statements For the years ended December 31, 2022 and 2021 (Expressed in thousands of US dollars, except where otherwise noted) |
|
a) Critical judgments exercised by management in applying accounting policies that have the most significant effect on the amounts presented in these consolidated financial statements are as follows:
i. Economic recoverability and probability of future economic benefits from exploration and evaluation costs
Management has determined that mine and camp, exploratory drilling, and other exploration and evaluation-related costs that were capitalized have future economic benefits and are economically recoverable. Management uses several criteria in its assessments of economic recoverability and probability of future economic benefits including geologic and metallurgic information, scoping studies, accessible facilities, existing permits, and mine plans.
ii. Commencement of production at levels intended by management
Prior to reaching production levels intended by management, costs incurred are capitalized as part of the costs of related exploration and evaluation assets, and proceeds from concentrate sales are offset against costs capitalized. Depletion of capitalized costs for mining properties and depreciation of plant and equipment begin when operating levels intended by management have been reached. Management considers several factors in determining when a mining property has reached the intended production levels, including production capacity, recoveries, and number of uninterrupted production days.
The basis for achievement of production levels intended by management as indicated by technical feasibility and commercial viability is generally established with proven reserves based on a NI 43-101-compliant technical report or a comparable resource statement and feasibility study, combined with pre-production operating statistics and other factors. In cases where the Company does not have a 43-101-compliant reserve report, on which to base a production decision, the technical feasibility and commercial viability of extracting a mineral resource are considered in light of additional factors including but not limited to:
· |
Acquisition and installation of all critical capital components to achieve desired mining and processing results has been completed. Capital components have been acquired directly and are also available on an as-needed basis from the underground mining contractor; |
|
· |
The necessary labour force, including mining contractors, has been secured to mine and process at planned levels of output; | |
· |
The mill has consistently processed at levels at or above design capacity and budgeted production levels with consistent recoveries and grades; and, |
|
· |
Establishing sales agreements with respect to the sale of concentrates. |
When technical feasibility and commercial viability are considered demonstrable according to the above criteria and other factors, the Company performs an impairment assessment and records an impairment loss, if any, before reclassifying exploration and evaluation costs to plant, equipment, and mining properties.
iii. Functional currency
The functional currency for the Company and its subsidiaries is the currency of the primary economic environment, in which the entity operates. The Company has determined the functional currency of the Company to be the Canadian dollar. The Company has determined the functional currency of its Mexican subsidiaries to be the US dollar. Determination of functional currency may involve certain judgments to determine the primary economic environment. The Company reconsiders the functional currency of its entities, if there is a change in events and conditions, which determine the primary economic environment.
| -7- |
|
AVINO SILVER & GOLD MINES LTD. Notes to the consolidated financial statements For the years ended December 31, 2022 and 2021 (Expressed in thousands of US dollars, except where otherwise noted) |
|
b) Significant assumptions about the future and other sources of estimation uncertainty that management has made at the consolidated statement of financial position date that could result in a material adjustment to the carrying amounts of assets and liabilities in the event that actual results differ from assumptions made relate to, but are not limited to, the following:
i. Stockpile and concentrate inventory valuations
Concentrate and stockpile mineralized material are valued at the lower of average cost or net realizable value. The assumptions used in the valuation of concentrate and stockpile mineralized material include estimates of copper, silver, and gold contained in the stockpiles and finished goods assumptions for the amount of copper, silver, and gold that is expected to be recovered from the concentrate. If these estimates or assumptions prove to be inaccurate, the Company could be required to write down the recorded value of its concentrate and stockpile mineralized material inventory, which would result in an increase in the Company’s expenses and a reduction in its working capital.
ii. Estimated reclamation provisions
The Company’s provision for reclamation represents management’s best estimate of the present value of the future cash outflows required to settle estimated reclamation and closure costs at the Avino and San Gonzalo properties. The provision reflects estimates of future costs, inflation, foreign exchange rates and assumptions of risks associated with the future cash outflows, and the applicable risk-free interest rates for discounting the future cash outflows. Changes in the above factors could result in a change to the provision recognized by the Company. Changes to reclamation and closure cost obligations are recorded with a corresponding change to the carrying amounts of the related exploration and evaluation assets or mining properties. Adjustments to the carrying amounts of related mining properties result in a change to future depletion expense.
iii. Valuation of share-based payments and warrants
The Company uses the Black-Scholes Option Pricing Model for valuation of share-based payments and warrants. Option pricing models require the input of subjective assumptions including expected price volatility, interest rate, and forfeiture rate. Changes in the input assumptions can materially affect fair value estimates and the Company’s net income or loss and its equity reserves. Warrant liabilities are accounting for as derivate liabilities (see Note 16).
iv. Impairment of plant, equipment and mining properties, and exploration and evaluation assets
Management considers both external and internal sources of information in assessing whether there are any indications that the Company’s plant, equipment, and mining properties, and exploration and evaluation assets are impaired. External sources of information management considers include changes in the market, economic and legal environments, in which the Company operates, that are not within its control and that affect the recoverable amount of its plant, equipment, and mining properties. Internal sources of information that management considers include the manner in which mining properties and plant and equipment are being used, or are expected to be used, and indications of economic performance of the assets.
| -8- |
|
AVINO SILVER & GOLD MINES LTD. Notes to the consolidated financial statements For the years ended December 31, 2022 and 2021 (Expressed in thousands of US dollars, except where otherwise noted) |
|
In determining the recoverable amounts of the Company’s plant, equipment and mining properties, management makes estimates of the undiscounted future pre-tax cash flows expected to be derived from the Company’s mining properties, and the appropriate discount rate. Reductions in metal price forecasts, increases in estimated future costs of production, increases in estimated future non expansionary capital expenditures, reductions in the amount of recoverable resources and exploration potential, and adverse current economic conditions are examples of factors that could result in a write down of the carrying amounts of the Company’s plant, equipment and mining properties, and exploration and evaluation assets.
Impairment
There is significant judgment involved in assessing whether any indications of impairment exist for plant, equipment and mineral properties, with consideration given to both external and internal sources of information.
Information the Company considers include changes in the technological market, economic and legal environment in which the Company operates that are not within its control that affect the recoverable amount of mineral properties. Internal sources of information include the manner in which mineral property, plant and equipment are being used or are expected to be used and indications of the economic performance of the assets.
Changes in metal price forecasts, changes in discount rates, increases or decreases in estimated future costs of production, increases or decreases in estimated future capital costs, reductions or increases in the amount of recoverable mineral resources and/or adverse or favorable current economics can result in a write-down or write-up of the carrying amounts of the Company’s mining interests.
Based on the Company’s assessment with respect to possible indicators of impairment of its mineral properties, including the impact of COVID-19 on our operations and the prevailing market metals prices, the Company concluded that as of December 31, 2022 and 2021, no impairment indicators were identified.
v. Depreciation rate for plant and equipment and depletion rate for mining properties
Depreciation and depletion expenses are allocated based on estimates for useful lives of assets. Should the asset life, depletion rates, or depreciation rates differ from the initial estimate, the revised life or rate would be reflected prospectively through income or loss. A change in the mineral resource estimate may impact depletion expense on a prospective basis.
vi. Recognition and measurement of deferred tax assets and liabilities
Actual amounts of income tax expense are not final until tax returns are filed and accepted by the relevant authorities. This occurs subsequent to the issuance of the consolidated financial statements and the final determination of actual amounts may not be completed for a number of years. Therefore, tax assets and liabilities and net income in subsequent periods will be affected by the amount that estimates differ from the final tax return. Estimates of future taxable income are based on forecasted cash flows from operations and the application of existing tax laws in each jurisdiction. Forecasted cash flows from operations are based on projections internally developed and reviewed by management. Weight is attached to tax planning opportunities that are within the Company’s control, and are feasible and implementable without significant obstacles. The likelihood that tax positions taken will be sustained upon examination by applicable tax authorities is assessed based on individual facts and circumstances of the relevant tax position evaluated in light of all available evidence. Where applicable tax laws and regulations are either unclear or subject to ongoing varying interpretations, it is reasonably possible that changes in these estimates can occur that could materially affect the amounts of deferred tax assets and liabilities.
| -9- |
|
AVINO SILVER & GOLD MINES LTD. Notes to the consolidated financial statements For the years ended December 31, 2022 and 2021 (Expressed in thousands of US dollars, except where otherwise noted) |
|
Basis of Consolidation
The audited consolidated financial statements include the accounts of the Company and its Mexican subsidiaries as follows:
|
|
|
|
|
|
|
Subsidiary |
|
Ownership Interest |
|
Jurisdiction |
|
Nature of Operations |
Oniva Silver and Gold Mines S.A. de C.V. |
|
100% |
|
Mexico |
|
Mexican administration |
Nueva Vizcaya Mining, S.A. de C.V. |
|
100% |
|
Mexico |
|
Mexican administration |
Promotora Avino, S.A. de C.V. (“Promotora”) |
|
79.09% |
|
Mexico |
|
Holding company |
|
Compañía Minera Mexicana de Avino, S.A. de C.V. (“Avino Mexico”) |
|
98.45% direct 1.22% indirect (Promotora) 99.67% effective |
|
Mexico |
|
Mining and exploration |
La Luna Silver & Gold Mines Ltd. |
|
100% |
|
Canada |
|
Holding company |
La Preciosa Silver & Gold Mines Ltd. |
|
100% |
|
Canada |
|
Holding company |
Proyectos Mineros La Preciosa S.A. de C.V. |
|
100% |
|
Mexico |
|
Mining and exploration |
Cervantes LLP |
|
100% |
|
U.S. |
|
Holding company |
Intercompany balances and transactions, including unrealized income and expenses arising from intercompany transactions, are eliminated in preparing the audited consolidated financial statements.
3. SIGNIFICANT ACCOUNTING POLICIES
Exploration and evaluation assets and development costs
(i) Exploration and evaluation expenditures
The Company capitalizes all costs relating to the acquisition, exploration and evaluation of mineral claims. Expenditures incurred before the Company has obtained the legal rights to explore a specific area are expensed. The Company’s capitalized exploration and evaluation costs are classified as intangible assets. Such costs include, but are not limited to, certain camp costs, geophysical studies, exploratory drilling, geological and sampling expenditures, and depreciation of plant and equipment during the exploration stage. Costs not directly attributable to exploration and evaluation activities, including general administrative overhead costs, are expensed in the period in which they occur. Proceeds from the sale of mineral products or farm outs during the exploration and evaluation stage are deducted from the related capitalized costs.
The carrying values of capitalized amounts are reviewed annually, or when indicators of impairment are present. In the case of undeveloped properties, there may be only inferred resources to allow management to form a basis for the impairment review. The review is based on the Company’s intentions for the development of such properties. If a mineral property does not prove to be viable, all unrecoverable costs associated with the property are charged to the consolidated statement of comprehensive income (loss) at the time the determination is made.
| -10- |
|
AVINO SILVER & GOLD MINES LTD. Notes to the consolidated financial statements For the years ended December 31, 2022 and 2021 (Expressed in thousands of US dollars, except where otherwise noted) |
|
When the technical feasibility and commercial viability of extracting mineral resources have been demonstrated, exploration and evaluation costs are assessed for impairment, reclassified to mining properties and become subject to depletion. Management considers the technical feasibility and commercial viability of extracting a mineral resource to be demonstrable upon the completion of a positive feasibility study and the establishment of mineral reserves. For certain mineral projects, management may determine the completion of a feasibility study to be cost prohibitive, unnecessary or to present undue risk to the structural integrity of the ore body. Under such circumstances, management considers technical feasibility to be demonstrable when the Company has obtained the necessary environmental and mining permits, land surface and mineral access rights, and the mineral project can be physically constructed and operated in a technically sound manner to produce a saleable mineral product. In assessing whether commercial viability is demonstrable, management considers if its internal economic assessment indicates that the mineral project can be mined to generate a reasonable return on investment for the risk undertaken, and markets or long-term contracts for the product exist.
(ii) Development expenditures
Mine development costs are capitalized until the mineral property is capable of operating in the manner intended by management. The Company evaluates the following factors in determining whether a mining property is capable of operating in the manner intended by management:
|
· |
The completion and assessment of a reasonable commissioning period of the mill and mining facilities; |
|
|
|
|
· |
Consistent operating results are achieved during the test period; |
|
|
|
|
· |
Existence of clear indicators that operating levels intended by management will be sustainable for the foreseeable future; |
|
|
|
|
· |
Plant / mill has reached a pre-determined percentage of design capacity; |
|
|
|
|
· |
Adequate funding is available and can be allocated to the operating activities; and, |
|
|
|
|
· |
Long term sales arrangements have been secured. |
The carrying values of capitalized development costs are reviewed annually, or when indicators are present, for impairment.
| -11- |
|
AVINO SILVER & GOLD MINES LTD. Notes to the consolidated financial statements For the years ended December 31, 2022 and 2021 (Expressed in thousands of US dollars, except where otherwise noted) |
|
Plant, equipment and mining properties
Upon demonstrating the technical feasibility and commercial viability of extracting mineral resources, all expenditures incurred to that date for the mine are reclassified to mining properties. Expenditures capitalized to mining properties include all costs related to obtaining or expanding access to resources including extensions of the haulage ramp and installation of underground infrastructure, and the estimated reclamation provision. Expenditures incurred with respect to a mining property are capitalized when it is probable that additional future economic benefits will flow to the Company. Otherwise, such expenditures are classified as a cost of sales.
Plant and equipment are recorded at historical cost less accumulated depreciation and any accumulated impairment losses. Historical costs include expenditures that are directly attributable to bringing the asset to a location and condition necessary to operate in a manner intended by management. Such costs are accumulated as construction in progress until the asset is available for use, at which point the asset is classified as plant, equipment and mining properties and depreciation commences.
After the date that management’s intended production levels have been achieved, mining properties are depleted using the straight-line method over the estimated remaining life of the mine. The Company estimates the remaining life of its producing mineral properties on an annual basis using a combination of quantitative and qualitative factors including historical results, mineral resource estimates, and management’s intent to operate the property. Such estimation is a subjective process and the accuracy of any mineral resource estimate is a function of the quantity and quality of available data and of the assumptions made and judgments used in engineering and geological interpretation. Differences between management’s assumptions including economic assumptions such as metal prices, discount rate and market conditions could have a material effect in the future on the Company’s financial position, results of operation and cash flows
The Company does not have sufficient reserve information to form a basis for the application of the units-of-production method for depreciation and depletion.
As at December 31, 2022 and 2021, the Company estimated a remaining mine life for the Avino Mine of 20 and 20 years, respectively.
Upon the acquisition of an asset or a group of assets and liabilities that does not constitute a business, the Company identifies and recognizes the individual identifiable assets acquired and liabilities assumed. The cost of the group is allocated to the individual identifiable assets and liabilities on the basis of their relative fair values at the date of purchase. Such a transaction or event does not give rise to goodwill. Transaction costs related to the acquisition is capitalized as part of cost of assets acquired.
Accumulated mill, machinery, plant facilities, and certain equipment are depreciated using the straight-line method over their estimated useful lives, not to exceed the life of the mine for any assets that are inseparable from the mine. When parts of an item of plant and equipment have different useful lives, they are accounted for as separate items (or components) of plant and equipment.
| -12- |
|
AVINO SILVER & GOLD MINES LTD. Notes to the consolidated financial statements For the years ended December 31, 2022 and 2021 (Expressed in thousands of US dollars, except where otherwise noted) |
|
Plant and equipment are depreciated using the following annual rates and methods:
Office equipment, furniture, and fixtures |
5 years straight line balance |
Computer equipment |
3 years straight line balance |
Mine machinery and transportation equipment |
5 years straight line balance |
Mill machinery and processing equipment |
5 - 20 years straight line |
Buildings |
5 - 20 years straight line |
Impairment
At each financial position reporting date, the carrying amounts of the Company’s assets are reviewed to determine whether there is any indication that those assets are impaired. If any such indication exists, the recoverable amount of the asset is estimated in order to determine the extent of the impairment, if any. Where the asset does not generate cash flows that are independent from other assets, the Company estimates the recoverable amount of the cash-generating unit to which the asset belongs.
An asset’s recoverable amount is the higher of fair value less costs to sell and value in use. Fair value is determined as the price that would be received to sell an asset or paid to transfer a liability in an orderly transaction between market participants at the measurement date. In assessing value in use, the estimated future cash flows are discounted to their present value using a pre-tax discount rate that reflects current market assessments of the time value of money and the risks specific to the asset. If the recoverable amount of an asset or cash generating unit is estimated to be less than its carrying amount, the carrying amount of the asset is reduced to its recoverable amount and the impairment loss is recognized in profit or loss for the period.
Where an impairment loss subsequently reverses, the carrying amount of the asset (or cash-generating unit) is increased to the revised estimate of its recoverable amount, provided the increased carrying amount does not exceed the carrying amount that would have been determined had no impairment loss been recognized for the asset (or cash-generating unit) in prior years. A reversal of an impairment loss is recognized immediately in profit or loss.
Leases
The Company assesses whether a contract is, or contains, a lease, at inception of the contract. The Company recognizes a right-of-use asset and a corresponding lease liability with respect to all lease arrangements in which it is the lessee, except for short-term leases (defined as leases with a lease term of 12 months or less) and leases of low value assets (such as tablets and personal computers, small items of office furniture and telephones). For these leases, the Company recognizes the lease payments as an operating expense on a straight-line basis over the term of the lease unless another systematic basis is more representative of the time pattern in which economic benefits from the leased assets are consumed.
The lease liability is initially measured at the present value of the lease payments that are not paid at the commencement date, discounted by using the rate implicit in the lease. If this rate cannot be readily determined, the Company uses its incremental borrowing rate.
The incremental borrowing rate depends on the term, currency and start date of the lease and is determined based on a series of inputs including: the risk-free rate based on government bond rates; a country-specific risk adjustment; a credit risk adjustment based on bond yields; and an entity-specific adjustment when the risk profile of the entity that enters into the lease is different to that of the Company and the lease does not benefit from a guarantee from the Company.
Lease payments included in the measurement of the lease liability comprise:
|
· |
Fixed lease payments (including in-substance fixed payments), less any lease incentives receivable |
|
|
|
|
· |
Variable lease payments that depend on an index or rate, initially measured using the index or rate at the commencement date |
|
|
|
|
· |
The amount expected to be payable by the lessee under residual value guarantees |
|
|
|
|
· |
The exercise price of purchase options, if the lessee is reasonably certain to exercise the options |
|
|
|
|
· |
Payments of penalties for terminating the lease, if the lease term reflects the exercise of an option to terminate the lease |
| -13- |
|
AVINO SILVER & GOLD MINES LTD. Notes to the consolidated financial statements For the years ended December 31, 2022 and 2021 (Expressed in thousands of US dollars, except where otherwise noted) |
|
The lease liability is presented as a separate line in the consolidated statement of financial position. The lease liability is subsequently measured by increasing the carrying amount to reflect interest on the lease liability (using the effective interest method) and by reducing the carrying amount to reflect the lease payments made.
The Company remeasures the lease liability (and makes a corresponding adjustment to the related right-of-use asset) whenever:
|
· |
The lease term has changed or there is a significant event or change in circumstances resulting in a change in the assessment of exercise of a purchase option, in which case the lease liability is remeasured by discounting the revised lease payments using a revised discount rate |
|
|
|
|
· |
The lease payments change due to changes in an index or rate or a change in expected payment under a guaranteed residual value, in which cases the lease liability is remeasured by discounting the revised lease payments using an unchanged discount rate (unless the lease payments change is due to a change in a floating interest rate, in which case a revised discount rate is used) |
|
|
|
|
· |
A lease contract is modified and the lease modification is not accounted for as a separate lease, in which case the lease liability is remeasured based on the lease term of the modified lease by discounting the revised lease payments using a revised discount rate at the effective date of the modification |
The right-of-use assets comprise the initial measurement of the corresponding lease liability, lease payments made at or before the commencement day, less any lease incentives received and any initial direct costs. They are subsequently measured at cost less accumulated depreciation and impairment losses. Right-of-use assets are depreciated over the shorter period of lease term and useful life of the right-of-use asset. If a lease transfers ownership of the underlying asset or the cost of the right-of-use asset reflects that the Company expects to exercise a purchase option, the related right-of-use asset is depreciated over the useful life of the underlying asset. The depreciation starts at the commencement date of the lease.
The Company applies IAS 36 to determine whether a right-of-use asset is impaired and accounts for any identified impairment loss as described in the ‘Plant, Equipment and Mining Properties’ policy.
Inventory
Material extracted from the Company's mine is classified as either process material or waste. Process material represents mineralized material that, at the time of extraction, the Company expects to process into a saleable form and sell at a profit, while waste is considered uneconomic to process and its extraction cost is included in direct mining costs. Raw materials are comprised of process material stockpiles. Process material is accumulated in stockpiles that are subsequently processed into bulk copper, silver, and gold concentrate in a saleable form. The Company has bulk copper, silver, and gold concentrate inventory in saleable form that has not yet been sold. Mine operating supplies represent commodity consumables and other raw materials used in the production process, as well as spare parts and other maintenance supplies that are not classified as capital items.
Inventories are valued at the lower of cost and net realizable value (“NRV”). Cost is determined on a weighted average basis and includes all costs incurred, based on normal production capacity, in bringing each product to its present location and condition. Cost of inventories comprises direct labor, materials and contractor expenses, depletion and depreciation on mining properties, plant and equipment, and an allocation of mine site costs. As mineralized material is removed for processing, costs are removed based on the average cost per tonne in the stockpile. Stockpiled process material tonnages are verified by periodic surveys.
NRV of mineralized material is determined with reference to relevant market prices less the estimated costs of completion and the estimated costs necessary to make the sale. NRV of materials and supplies is generally calculated by reference to salvage or scrap values when it is determined that the supplies are obsolete. NRV provisions are recorded within cost of sales in the consolidated statement of operations, and are reversed to reflect subsequent recoveries where the inventory is still on hand.
| -14- |
|
AVINO SILVER & GOLD MINES LTD. Notes to the consolidated financial statements For the years ended December 31, 2022 and 2021 (Expressed in thousands of US dollars, except where otherwise noted) |
|
Revenue from Contracts with Customers
Revenue is recognized to the extent that it is probable that the economic benefits will flow to the Company and the revenue and costs to sell can be reliably measured. Revenue is measured at the fair value of the consideration received, excluding discounts, rebates, and other sales tax or duty.
Performance Obligations
Based on the criteria outlined in IFRS 15, the Company applied significant judgment in determining that the primary performance obligation relating to its sales contracts is the delivery of concentrates. Shipping and insurance services arranged by the Company for concentrate sales that occur after the transfer of control are also considered performance obligations.
Transfer of Control
Based on the criteria outlined in IFRS 15, the Company applied significant judgment in determining when the transfer of control occurs. Management based its assessment on a number of indicators of control, which include but are not limited to, whether the Company has the present right of payment and whether the physical possession of the goods, significant risks and rewards, and legal title have been transferred to the customer.
Provisional Pricing
Based on the criteria outlined in IFRS 15, the Company applied significant judgment in determining variable consideration. The Company identified two provisional pricing components in concentrate sales, represents variable consideration in the form of a) adjustments between original and final assay results relating to the quantity and quality of concentrate shipments, as well as b) pricing adjustments between provisional and final invoicing based on market prices for base and precious metals.
Based on the Company’s historical accuracy in the assay process, as evidenced by the negligible historical adjustments relating to assay differences, the Company concluded the variability in consideration caused by the assaying results is negligible. The Company does not expect a significant amount of reversal related to assaying differences. The Company records revenues based on provisional invoices based on quoted market prices of the London Bullion Market Association and the London Metal Exchange during the quotation period outlined in the concentrate sales agreement. The Company applied judgment to determine the amount of variable consideration to be recognized during the period for which the likelihood of significant reversal is low.
| -15- |
|
AVINO SILVER & GOLD MINES LTD. Notes to the consolidated financial statements For the years ended December 31, 2022 and 2021 (Expressed in thousands of US dollars, except where otherwise noted) |
|
Financial Instruments
Measurement – initial recognition
All financial assets and financial liabilities are initially recorded on the Company’s consolidated statement of financial position when the Company becomes a party to the contractual provisions of the instrument. All financial asset and liabilities are initially recorded at fair value, net of attributable transaction costs, except for those classified as fair value through profit or loss (“FVTPL”). Subsequent measurement of financial assets and financial liabilities depends on the classifications of such assets and liabilities.
Classification – financial assets
Amortized cost:
Financial assets that are held within a business model whose objective is to hold financial assets in order to collect contractual cash flows, and that the contractual terms of the financial assets give rise on specified date to cash flows that are solely payments of principal and interest on the principal amount outstanding, are measured subsequent to initial recognition at amortized cost.
The amortized cost of a financial asset is the amount at which the financial asset is measured at initial recognition minus the principal repayments, plus the cumulative amortization using the effective interest method of any difference between that initial amount and the maturity amount, adjusted for any loss allowance. Interest income is recognized using the effect interest method, and is recognized in Interest and other income, on the consolidated statements of operations and comprehensive income (loss)
The Company financial assets at amortized costs include its cash, amounts receivable not related to sales of concentrate, investments (short-term), and reclamation bonds.
Fair value through other comprehensive income (“FVTOCI”)
Financial assets that are held within a business model whose objective is to hold financial assets in order to both collect contractual cash flows and selling financial assets, and that the contractual terms of the financial assets give rise on specified date to cash flows that are solely payments of principal and interest on the principal amount outstanding.
Upon initial recognition of equity securities, the Company may make an irrevocable election (on an instrument-by-instrument basis) to designate its equity securities that would otherwise be measured at FVTPL to present subsequent changes in fair value in other comprehensive income. Designation at FVTOCI is not permitted if the equity investment is held for trading or if it is contingent consideration recognized by an acquirer in a business combination. Investments in equity instruments at FVTOCI are initially measured at fair value plus transaction costs. Subsequently, they are measured at fair value with gains and losses arising from changes in fair value recognized in other OCI. The cumulative gain or loss is not reclassified to profit or loss on disposal of the instrument; instead, it is transferred to retained earnings.
The Company currently has no financial assets designated as FVTOCI.
Fair value through profit or loss (“FVTPL”)
By default, all other financial assets are measured subsequently at FVTPL, which includes amounts receivable from concentrate sales.
Classification – financial liabilities
Financial liabilities that are not contingent consideration of an acquirer in a business combination, held for trading or designated as at FVTPL, are measured at amortized cost using the effective interest method.
| -16- |
|
AVINO SILVER & GOLD MINES LTD. Notes to the consolidated financial statements For the years ended December 31, 2022 and 2021 (Expressed in thousands of US dollars, except where otherwise noted) |
|
Financial liabilities at amortized cost include accounts payable, amounts due to related parties, term facility, equipment loans, and finance lease obligations.
Financial liabilities classified FVTPL include financial liabilities held for trading and financial liabilities designated upon initial recognition as FVTPL. Fair value changes on financial liabilities classified as FVTPL are recognized in the consolidated statements of operations. The Company has classified share purchase warrants with an exercise price in US dollars (see Note 16) as financial liabilities at FVTPL. As these warrants are exercised, the fair value of the recorded warrant liability on date of exercise is included in share capital along with the proceeds from the exercise. If these warrants expire, the related decrease in warrant liability is recognized in the consolidated statements of operations and comprehensive income (loss).
The Company has no hedging arrangements and does not apply hedge accounting.
Impairment
The Company recognizes a loss allowance for expected credit losses on its financial assets when necessary. The amount of expected credit losses is updated at each reporting period to reflect changes in credit risk since initial recognition of the respective financial instruments.
Share capital
a) Common shares
common shares are classified as equity. Transaction costs directly attributable to the issuance of common shares and equity warrants are recognized as a deduction from equity, net of any tax effects. Transaction costs directly attributable to derivative warrants are charged to operations as a finance cost.
b) Repurchase of share capital (treasury shares)
when share capital recognized as equity is repurchased, the amount of the consideration paid, which includes directly attributable costs, net of any tax effects, is recognized as a deduction from equity. Repurchased shares are classified as treasury shares and are presented as a deduction from total equity. When treasury shares are sold or reissued subsequently, the amount received is recognized as an increase in equity, and the resulting surplus or deficit on the transaction is transferred to accumulated deficit.
Share-based payment transactions
The Company’s share option plan and restricted share unit (“RSU”) plan allows directors, officers, employees, and consultants to acquire common shares of the Company.
The fair value of options granted is measured at fair value at the grant date based on the market value of the Company’s common shares on that date.
The fair value of equity-settled RSUs is measured at the grant date based on the market value of the Company’s common shares on that date, and each tranche is recognized using the graded vesting method over the period during which the RSUs vest. At each financial position reporting date, the amount recognized as an expense is adjusted to reflect the actual number of RSUs that are expected to vest.
All options and RSUs are recognized in the consolidated statements of operations and comprehensive income (loss) as an expense or in the consolidated statements of financial position as exploration and evaluation assets over the vesting period with a corresponding increase in equity reserves in the consolidated statements of financial position.
| -17- |
|
AVINO SILVER & GOLD MINES LTD. Notes to the consolidated financial statements For the years ended December 31, 2022 and 2021 (Expressed in thousands of US dollars, except where otherwise noted) |
|
Reclamation and other provisions
Provisions are recognized where a legal or constructive obligation has been incurred as a result of past events, it is probable that an outflow of resources embodying economic benefit will be required to settle the obligation, and a reliable estimate of the amount of the obligation can be made. If material, provisions are measured at the present value of the expenditures expected to be required to settle the obligation. The increase in any provision due to the passage of time is recognized as accretion expense.
The Company records the present value of estimated costs of legal and constructive obligations required to restore properties in the period in which the obligation is incurred. The nature of these restoration activities includes dismantling and removing structures, rehabilitating mines and restoration, reclamation, and re-vegetation of affected areas.
The fair value of the liability for a rehabilitation provision is recorded when it is incurred. When the liability is initially recognized, the present value of the estimated cost is capitalized by increasing the carrying amount of the related mining property or exploration and evaluation asset. Over time, the discounted liability is increased for the change in present value based on the discount rates that reflect current market assessments and the risks specific to the liability, which is accreted over time through periodic charges to income or loss. A revision in estimates or new disturbance will result in an adjustment to the provision with an offsetting adjustment to the mineral property or the exploration and evaluation asset. Additional disturbances, changes in costs, or changes in assumptions are recognized as adjustments to the corresponding assets and reclamation liabilities when they occur.
Earnings per share
The Company presents basic and diluted earnings per share data for its common shares, calculated by dividing the earnings attributable to common shareholders of the Company by the weighted average number of common shares outstanding during the year. Diluted earnings per share is determined by adjusting the earnings attributable to common shareholders and the weighted average number of common shares outstanding for the effects of all potentially dilutive common shares.
Income taxes
Income taxes in the years presented are comprised of current and deferred tax. Income tax is recognized in profit or loss except to the extent that it relates to items recognized directly in equity, in which case it is recognized as equity.
Deferred tax is recognized using the statement of financial position asset and liability method, which provides for temporary differences between the carrying amounts of assets and liabilities for financial reporting purposes and the amounts used for taxation purposes. The amount of deferred tax recognized is based on the expected manner of realization or settlement of the carrying amount of assets and liabilities, using tax rates enacted or substantively enacted at the consolidated statement of financial position date. A deferred tax asset is recognized only to the extent that it is probable that future taxable profits will be available against which the asset can be utilized.
Deferred tax assets and liabilities are not recognized if the temporary differences arise from the initial recognition of goodwill or an asset or liability in a transaction other than a business combination that affects neither accounting profit nor taxable profit.
| -18- |
|
AVINO SILVER & GOLD MINES LTD. Notes to the consolidated financial statements For the years ended December 31, 2022 and 2021 (Expressed in thousands of US dollars, except where otherwise noted) |
|
4. RECENT ACCOUNTING PRONOUNCEMENTS
Application of new and revised accounting standards:
Property, Plant and Equipment — Proceeds before Intended Use (Amendments to IAS 16)
The amendments prohibit deducting from the cost of an item of property, plant and equipment any proceeds from selling items produced while bringing that asset to the location and condition necessary for it to be capable of operating in the manner intended by management. Instead, an entity recognizes the proceeds from selling such items, and the cost of producing those items, in profit or loss. The amendments are applied on or after the first annual reporting period beginning on or after January 1, 2022, with early application permitted. The amendments are applied retrospectively, but only to items of property, plant and equipment that are brought to the location and condition necessary for them to be capable of operating in the manner intended by management on or after the beginning of the earliest period presented in the financial statements in which the Company first applies the amendments. This amendment will impact the Company’s accounting for proceeds from mineral sales prior to reaching commercial production at levels intended by management. The Company adopted the amendments to IAS 16 with no material impact on the financial statements.
Future Changes in Accounting Policies Not Yet Effective as at December 31, 2022:
Certain new accounting standards and interpretations have been published that are not mandatory for the current period and have not been early adopted. These standards are not expected to have a material impact on the Company in the current or future reporting periods.
5. ACQUISITION OF LA PRECIOSA
On March 21, 2022, the Company closed the acquisition with Coeur Mining Inc. (“Coeur”) of all of the issued and outstanding shares of Proyectos Mineros La Preciosa S.A de C.V, a Mexican corporation, and Cervantes LLC, a Delaware LLC, that together hold the La Preciosa property in Mexico (“La Preciosa”). Total consideration paid to Coeur was comprised of:
|
a) |
Cash consideration of $15.3 million paid; |
|
|
|
|
b) |
A promissory note for $5 million in favour of Coeur, payable without interest on or before March 21, 2023; |
|
|
|
|
c) |
14,000,000 common shares of Avino, with a value of $13.65 million on issuance; |
|
|
|
|
d) |
7,000,000 share purchase warrants with a total value at $2.24 million exercisable at $1.09 per share until September 21, 2023, representing a 25% premium to Avino’s 20-day volume weighted average trading price as of October 26, 2021; |
Additionally, Avino issued the following consideration for which payment is contingent on a future event and due to acquisition date uncertainty these are valued at Nil. A liability for these contingent payments will be recognized when related activity and events occur.
|
e) |
An additional cash payment of $8.75 million, to be paid no later than 12 months after initial production at La Preciosa, up to one-half of which may be paid in common shares of Avino (provided Coeur’s total shareholdings cannot exceed 19.9% of the Company’s total issued and outstanding shares); |
|
|
|
|
f) |
A 1.25% net smelter returns royalty on the Gloria and Abundancia areas of La Preciosa, and a 2.00% gross value royalty on all other areas of La Preciosa; and |
|
|
|
|
g) |
A payment of $0.25 per silver equivalent ounce (subject to inflationary adjustment) of new mineral reserves (as defined by NI 43-101) discovered and declared outside of the current mineral resource area at La Preciosa, subject to a cap of $50 million, and any such payments will be credited against any existing or future payments owing on the gross value royalty. |
The transaction has been accounted for as an asset acquisition as La Preciosa is in the exploration and evaluation stage and had not demonstrated technical feasibility, commercial viability, or the ability to provide economic benefits. La Preciosa did not have the workforce, resources and/or reserves, mine plan, or financial resources to meet the definition of a business for accounting purposes.
| -19- |
|
AVINO SILVER & GOLD MINES LTD. Notes to the consolidated financial statements For the years ended December 31, 2022 and 2021 (Expressed in thousands of US dollars, except where otherwise noted) |
|
The purchase consideration has been assigned based on the relative fair values of the assets acquired and liabilities assumed and is summarized as follows:
Cash paid |
$ | 15,301 | ||
Note payable |
4,665 | |||
Common shares |
14,630 | |||
Share purchase warrants |
2,240 | |||
Total purchase consideration |
36,836 | |||
Transaction costs |
270 | |||
Total acquisition cost |
$ | 37,106 | ||
Cash |
$ | 168 | ||
Other current assets |
471 | |||
Plant and equipment |
1,621 | |||
Exploration and evaluation assets |
37,618 | |||
Accounts payable |
(2,772 | ) | ||
Net assets acquired |
$ | 37,106 |
Common shares of $14,630 above includes $980 attributed to the value of 1,075,000 common shares issued for advisory services as part of the completion of the acquisition.
6. TAXES RECOVERABLE
The Company’s taxes recoverable consist of the Mexican I.V.A. (“VAT”) and income taxes recoverable and Canadian sales taxes (“GST/HST”) recoverable.
|
|
December 31, 2022 |
|
|
December 31, 2021 |
|
||
VAT recoverable |
|
$ | 1,385 |
|
|
$ | 790 |
|
GST recoverable |
|
|
25 |
|
|
|
26 |
|
Income taxes recoverable |
|
|
2,327 |
|
|
|
2,548 |
|
|
|
$ | 3,737 |
|
|
$ | 3,364 |
|
7. INVENTORY
|
December 31, 2022 |
December 31, 2021 |
|||||||
Process material stockpiles |
$ | 2,788 | $ | 1,083 | ||||
Concentrate inventory |
1,617 | 2,467 | ||||||
Materials and supplies |
1,855 | 1,629 | ||||||
| $ | 6,260 | $ | 5,179 | |||||
The amount of inventory recognized as an expense for the year ended December 31, 2022 totalled $28,795 (2021 – $7,282, 2020 – $15,832). See Note 17 for further details.
| -20- |
|
AVINO SILVER & GOLD MINES LTD. Notes to the consolidated financial statements For the years ended December 31, 2022 and 2021 (Expressed in thousands of US dollars, except where otherwise noted) |
|
8. LONG-TERM INVESTMENTS
The Company classifies its long-term investments as designated at fair value through profit and loss under IFRS 9. Long-term investments are summarized as follows:
|
|
Fair Value December 31, |
|
|
Net Additions |
|
|
Movements in foreign |
|
|
Fair value adjustments |
|
|
Fair Value December 31, |
|
|||||
|
|
2021 |
|
|
|
|
Exchange |
|
|
for the period |
|
|
2022 |
|
||||||
Talisker Resources |
|
$ | 3,880 |
|
|
$ | - |
|
|
$ | (134 | ) |
|
$ | (2,106 | ) |
|
$ | 1,640 |
|
Silver Wolf Exploration Ltd. |
|
|
59 |
|
|
|
30 |
|
|
|
(35 | ) |
|
|
(3 | ) |
|
|
51 |
|
Endurance Gold Corp |
|
|
- |
|
|
|
53 |
|
|
|
(4 | ) |
|
|
6 |
|
|
|
55 |
|
|
|
$ | 3,939 |
|
|
$ | 83 |
|
|
$ | (173 | ) |
|
$ | (2,103 | ) |
|
$ | 1,746 |
|
Silver Wolf Exploration Ltd.
During the year ended December 31, 2022, the Company received 250,000 common shares (December 31, 2021 - received 131,718 common shares and 300,000 share purchase warrant at an exercise price of C$0.20) as part of the terms in the Option Agreement with Silver Wolf Exploration Ltd. Upon acquisition, the fair value of these common shares were recorded as “Option Income” as a credit to exploration and evaluation assets (see Note 9). Any subsequent revaluation under IFRS 9 at fair value through profit and loss will be recorded as a gain or loss on long-term investments.
Endurance Gold Corp.
During the year ended December 31, 2022, the Company received 200,000 common shares as part of the terms of the Option Agreement with Endurance Gold Corp. Upon acquisition, the fair value of these common shares were recorded as “Other Income” on the statement of profit and loss. Any subsequent revaluation under IFRS 9 at fair value through profit and loss will be recorded as a gain or loss on long-term investments.
See Note 9 for full details of the Option Agreement.
9. EXPLORATION AND EVALUATION ASSETS
The Company has accumulated the following acquisition, exploration and evaluation costs which are not subject to depletion:
|
|
Avino, Mexico |
|
|
La Preciosa, Mexico |
|
|
British Columbia & Yukon, Canada |
|
|
Total |
|
||||
|
||||||||||||||||
|
|
|
|
|
||||||||||||
Balance, January 1, 2021 |
|
$ | 10,051 |
|
|
$ | - |
|
|
$ | 1 |
|
|
$ | 10,052 |
|
|
|
|
|
|
|
|
|
|
|
|
|
|
|
|
|
|
Costs incurred during 2021: |
|
|
|
|
|
|
|
|
|
|
|
|
|
|
|
|
Drilling and exploration |
|
|
1,047 |
|
|
|
- |
|
|
|
- |
|
|
|
1,047 |
|
Assessments and taxes |
|
|
68 |
|
|
|
- |
|
|
|
- |
|
|
|
68 |
|
Effect of movements in exchange rates |
|
|
3 |
|
|
|
- |
|
|
|
- |
|
|
|
3 |
|
Option income - Note 9 |
|
|
(117 | ) |
|
|
- |
|
|
|
- |
|
|
|
(117 | ) |
|
|
|
|
|
|
|
|
|
|
|
|
|
|
|
|
|
Balance, December 31, 2021 |
|
$ | 11,052 |
|
|
$ | - |
|
|
$ | 1 |
|
|
$ | 11,053 |
|
Costs incurred during 2022: |
|
|
|
|
|
|
|
|
|
|
|
|
|
|
|
|
Acquisition costs – Note 5 |
|
|
- |
|
|
|
37,618 |
|
|
|
- |
|
|
|
37,618 |
|
Drilling and exploration |
|
|
719 |
|
|
|
296 |
|
|
|
- |
|
|
|
1,015 |
|
Assessments and taxes |
|
|
94 |
|
|
|
61 |
|
|
|
- |
|
|
|
155 |
|
Option income – Note 9 |
|
|
(30 | ) |
|
|
- |
|
|
|
- |
|
|
|
(30 | ) |
Effect of movements in exchange rates |
|
|
(7 | ) |
|
|
- |
|
|
|
- |
|
|
|
(7 | ) |
|
|
|
|
|
|
|
|
|
|
|
|
|
|
|
|
|
Balance, December 31, 2022 |
|
$ | 11,828 |
|
|
$ | 37,975 |
|
|
$ | 1 |
|
|
$ | 49,804 |
|
| -21- |
|
AVINO SILVER & GOLD MINES LTD. Notes to the consolidated financial statements For the years ended December 31, 2022 and 2021 (Expressed in thousands of US dollars, except where otherwise noted) |
|
Additional information on the Company’s exploration and evaluation properties by region is as follows:
(a) Durango, Mexico
The Company’s subsidiary Avino Mexico owns 42 mineral claims and leases four mineral claims in the state of Durango, Mexico. The Company’s mineral claims in Mexico are divided into the following four groups:
(i) Avino Mine area property
The Avino Mine area property is situated around the towns of Panuco de Coronado and San Jose de Avino and surrounding the historic Avino mine site. There are four exploration concessions covering 154.4 hectares, 24 exploitation concessions covering 1,284.7 hectares, and one leased exploitation concession covering 98.83 hectares. Within the Avino Mine site area is the Company’s San Gonzalo Mine, which achieved production at levels intended by management as of October 1, 2012, and on this date accumulated exploration and evaluation costs were transferred to mining properties.
(ii) Gomez Palacio/Ana Maria property
The Ana Maria property is located near the town of Gomez Palacio, and consists of nine exploration concessions covering 2,549 hectares, and is also known as the Ana Maria property.
Option Agreement – Silver Wolf Exploration Ltd. (formerly Gray Rock Resources Ltd.) (“Silver Wolf”)
On March 11, 2021, the Company was informed that Silver Wolf received TSX Venture Exchange approval on the previously-announced entrance into an option agreement to grant Silver Wolf the exclusive right to acquire a 100% interest in the Ana Maria and El Laberinto properties in Mexico (the “Option Agreement”). In exchange, Avino received Silver Wolf share purchase warrants to acquire 300,000 common shares of Silver Wolf at an exercise price of C$0.20 per share for a period of 36 months from the date of the TSX Venture Exchange’s final acceptance of the Option Agreement (the “Approval Date”). In order to exercise the option, Silver Wolf will:
|
|
|
1. |
Issue to Avino a total of C$600 in cash or common shares of Silver Wolf as follows: |
|
|
|
|
a. |
C$50 in common shares of Silver Wolf within 30 days of March 8, 2021 (received on March 26, 2021 – see Note 8 for details); |
|
|
|
|
|
|
|
|
|
|
b. |
A further C$50 in cash or shares of Silver Wolf at Avino’s discretion on or before March 8, 2022 (received on March 30, 2022 – See Note 8 for details); |
|
|
|
|
|
|
|
|
|
|
c. |
A further C$100 in cash or shares of Silver Wolf at Avino’s discretion on or before March 8, 2023 (received on March 13, 2023 – See Note 25 for details); |
|
|
|
|
|
|
|
|
|
|
d. |
A further C$200 in cash or shares of Silver Wolf at Avino’s discretion on or before March 8, 2024; and |
|
|
|
|
|
|
|
|
|
|
e. |
A further C$200 in cash or shares of Silver Wolf at Avino’s discretion on or before March 8, 2025; and |
|
|
|
|
|
|
|
|
|
2. |
Incur a total of C$750 in exploration expenditures on the properties, as follows: |
|
|
|
|
a. |
C$50 on or before March 8, 2022 (completed); |
|
|
|
|
|
|
|
|
|
|
b. |
A further C$100 on or before March 8, 2023 (completed); and |
|
|
|
|
|
|
|
|
|
|
c. |
A further C$600 on or before March 8, 2025. |
|
|
|
|
|
|
Under the Option Agreement, all share issuances will be based on the average volume weighted trading price of Silver Wolf’s shares on the TSX Venture Exchange for the ten trading days immediately preceding the date of issuance of the shares, and the shares will be subject to resale restrictions under applicable securities legislation for 4 months and a day from their date of issue.
| -22- |
|
AVINO SILVER & GOLD MINES LTD. Notes to the consolidated financial statements For the years ended December 31, 2022 and 2021 (Expressed in thousands of US dollars, except where otherwise noted) |
|
The Option Agreement between the Company and Silver Wolf is considered a related party transaction as the two companies have directors in common.
(iii) Santiago Papasquiaro property
The Santiago Papasquiaro property is located near the village of Santiago Papasquiaro, and consists of four exploration concessions covering 2,552.6 hectares and one exploitation concession covering 602.9 hectares.
(iv) Unification La Platosa properties
The Unification La Platosa properties, consisting of three leased concessions in addition to the leased concession described in note (i) above, are situated within the Avino Mine area property near the towns of Panuco de Coronado and San Jose de Avino and surrounding the Avino Mine.
In February 2012, the Company’s wholly-owned Mexican subsidiary entered into a new agreement with Minerales de Avino, S.A. de C.V. (“Minerales”) whereby Minerales has indirectly granted to the Company the exclusive right to explore and mine the La Platosa property known as the “ET zone”. The ET zone includes the Avino Mine, where production at levels intended by management was achieved on July 1, 2015.
Under the agreement, the Company has obtained the exclusive right to explore and mine the property for an initial period of 15 years, with the option to extend the agreement for another 5 years. In consideration of the granting of these rights, the Company issued 135,189 common shares with a fair value of C$250 during the year ended December 31, 2012.
The Company has agreed to pay to Minerales a royalty equal to 3.5% of net smelter returns (“NSR”). In addition, after the start of production, if the minimum monthly processing rate of the mine facilities is less than 15,000 tonnes, then the Company must pay to Minerales a minimum royalty equal to the applicable NSR royalty based on the processing at a monthly rate of 15,000 tonnes.
Minerales has also granted to the Company the exclusive right to purchase a 100% interest in the property at any time during the term of the agreement (or any renewal thereof), upon payment of $8 million within 15 days of the Company’s notice of election to acquire the property. The purchase would be subject to a separate purchase agreement for the legal transfer of the property.
(b) La Preciosa, Mexico
During the year ended December 31, 2022, the Company received approval for the closing of the acquisition of the La Preciosa property from Coeur Mining Inc. (“Coeur”).
La Preciosa consists of 15 exploration concessions totaling 6,011 hectares located in Durango, Mexico, within the municipalities of Panuco de Coronado and Canatlan. The property is located within 20 kilometres of the Company’s current Avino mining operations. For further details on the transaction, see Note 5.
(c) British Columbia, Canada
(i) Minto and Olympic-Kelvin properties
On May 2, 2022, the Company granted Endurance Gold Corp. (“Endurance”) the right to acquire an option to earn 100% ownership of the former Minto Gold Mine, Olympic and Kelvin gold prospects contained within a parcel of crown grant and mineral claims (the “Olympic Claims”).
| -23- |
|
AVINO SILVER & GOLD MINES LTD. Notes to the consolidated financial statements For the years ended December 31, 2022 and 2021 (Expressed in thousands of US dollars, except where otherwise noted) |
|
Under the terms of the letter agreement, Endurance can earn a 100% interest in the Olympic Claims if they pay Avino a total cash consideration in the aggregate amount of C$100, issue up to a total of 1,500,000 common shares (“Shares”) of Endurance and incur exploration expenditures in the aggregate amount of C$300; all of which is to be incurred by December 31, 2024. In the event that Endurance earns the 100% interest, the Olympic Claims will be subject to a 2% net smelter return royalty (“NSR”), of which 1% NSR can be purchased by the Endurance for C$750 and the remaining balance of the NSR can be purchased for C$1,000.
As part of the final requirement to earn its interest, Endurance agreed to grant to Avino 750,000 share purchase warrants (“Warrants”) by December 31, 2024, that offer Avino the option to purchase additional shares in the Company for a period of three years from the date of issuance. The exercise price of the Warrants will be set at a 25% premium to the 20-day VWAP share price at the issuance date. During the Option term, if Endurance is successful in defining a compliant mineral resource of at least 500,000 gold-equivalent ounces on the Olympic Claims then Endurance will be obliged to pay Avino a C$1,000 discovery bonus.
The Option agreement is subject to the TSX Venture Exchange acceptance, and any Shares or Warrants to be issued will be subject to a four-month hold period on issuance as per the policies of the TSX Venture Exchange.
During the year ended December 31, 2022, Endurance granted 200,000 common shares and paid C$25 as per the terms of the agreement, which required payment upon signing of a letter agreement between the two parties
(ii) Yukon, Canada
The Company has a 100% interest in 14 quartz leases located in the Mayo Mining Division of Yukon, Canada, which collectively comprise the Eagle Property.
Subsequent to December 31, 2022, the Company agreed to sell to a subsidiary of Hecla Mining Company (“Hecla”) the Eagle Property for cash consideration of C$250.
10. NON-CONTROLLING INTEREST
At December 31, 2022, the Company had an effective 99.67% (December 31, 2021 - 99.67%) interest in its subsidiary Avino Mexico and the remaining 0.33% (December 31, 2021 - 0.33%) interest represents a non-controlling interest. The accumulated deficit and current period income attributable to the non-controlling interest are insignificant and accordingly have not been recognized in the consolidated financial statements.
| -24- |
|
AVINO SILVER & GOLD MINES LTD. Notes to the consolidated financial statements For the years ended December 31, 2022 and 2021 (Expressed in thousands of US dollars, except where otherwise noted) |
|
11. PLANT, EQUIPMENT AND MINING PROPERTIES
|
|
Mining properties |
|
|
Office equipment, furniture, and fixtures |
|
|
Computer equipment |
|
|
Mine machinery and transportation equipment |
|
|
Mill machinery and processing equipment |
|
|
Buildings and construction in process |
|
|
Total |
|
|||||||
|
|
$ |
|
|
$ |
|
|
$ |
|
|
$ |
|
|
$ |
|
|
$ |
|
|
$ |
|
|||||||
COST |
|
|
|
|
|
|
|
|
|
|
|
|
|
|
|
|
|
|
|
|
|
|||||||
Balance at December 31, 2020 |
|
|
13,149 |
|
|
|
563 |
|
|
|
347 |
|
|
|
12,955 |
|
|
|
17,483 |
|
|
|
11,263 |
|
|
|
55,760 |
|
Additions / Transfers |
|
|
(113 | ) |
|
|
31 |
|
|
|
(12 | ) |
|
|
1,285 |
|
|
|
1,130 |
|
|
|
508 |
|
|
|
2,829 |
|
Effect of movements in exchange rates |
|
|
2 |
|
|
|
1 |
|
|
|
- |
|
|
|
- |
|
|
|
- |
|
|
|
7 |
|
|
|
10 |
|
Balance at December 31, 2021 |
|
|
13,038 |
|
|
|
595 |
|
|
|
335 |
|
|
|
14,240 |
|
|
|
18,613 |
|
|
|
11,778 |
|
|
|
58,599 |
|
Additions / Transfers |
|
|
1,649 |
|
|
|
185 |
|
|
|
441 |
|
|
|
2,383 |
|
|
|
4,781 |
|
|
|
2,907 |
|
|
|
12,346 |
|
Writedowns |
|
|
- |
|
|
|
- |
|
|
|
- |
|
|
|
(1,692 | ) |
|
|
(100 | ) |
|
|
- |
|
|
|
(1,792 | ) |
Effect of movements in exchange rates |
|
|
- |
|
|
|
(17 | ) |
|
|
(2 | ) |
|
|
(1 | ) |
|
|
- |
|
|
|
8 |
|
|
|
(12 | ) |
Balance at December 31, 2022 |
|
|
14,687 |
|
|
|
763 |
|
|
|
774 |
|
|
|
14,930 |
|
|
|
23,294 |
|
|
|
14,693 |
|
|
|
69,141 |
|
|
|
|
|
|
|
|
|
|
|
|
|
|
|
|
|
|
|
|
|
|
|
|
|
|
|
|
|
|
ACCUMULATED DEPLETION AND DEPRECIATION |
|
|
|
|
|
|
|
|
|
|
|
|
|
|
|
|
|
|
|
|
|
|
|
|
|
|
|
|
Balance at January 1, 2021 |
|
|
8,643 |
|
|
|
187 |
|
|
|
256 |
|
|
|
4,907 |
|
|
|
5,297 |
|
|
|
1,624 |
|
|
|
20,914 |
|
Additions / Transfers |
|
|
213 |
|
|
|
107 |
|
|
|
11 |
|
|
|
37 |
|
|
|
1,370 |
|
|
|
272 |
|
|
|
2,010 |
|
Effect of movements in exchange rates |
|
|
- |
|
|
|
- |
|
|
|
- |
|
|
|
- |
|
|
|
- |
|
|
|
- |
|
|
|
- |
|
Balance at December 31, 2021 |
|
|
8,856 |
|
|
|
294 |
|
|
|
267 |
|
|
|
4,944 |
|
|
|
6,667 |
|
|
|
1,896 |
|
|
|
22,924 |
|
Additions / Transfers |
|
|
250 |
|
|
|
147 |
|
|
|
331 |
|
|
|
1,616 |
|
|
|
146 |
|
|
|
1,133 |
|
|
|
3,623 |
|
Writedowns |
|
|
- |
|
|
|
- |
|
|
|
- |
|
|
|
(1,382 | ) |
|
|
(80 | ) |
|
|
- |
|
|
|
(1,462 | ) |
Balance at December 31, 2022 |
|
|
9,106 |
|
|
|
441 |
|
|
|
598 |
|
|
|
5,178 |
|
|
|
6,733 |
|
|
|
3,029 |
|
|
|
25,085 |
|
|
|
|
|
|
|
|
|
|
|
|
|
|
|
|
|
|
|
|
|
|
|
|
|
|
|
|
|
|
NET BOOK VALUE |
|
|
|
|
|
|
|
|
|
|
|
|
|
|
|
|
|
|
|
|
|
|
|
|
|
|
|
|
At December 31, 2022 |
|
|
5,581 |
|
|
|
322 |
|
|
|
176 |
|
|
|
9,752 |
|
|
|
16,561 |
|
|
|
11,664 |
|
|
|
44,056 |
|
At December 31, 2021 |
|
|
4,182 |
|
|
|
301 |
|
|
|
68 |
|
|
|
9,296 |
|
|
|
11,946 |
|
|
|
9,882 |
|
|
|
35,675 |
|
At December 31, 2020 |
|
|
4,506 |
|
|
|
376 |
|
|
|
91 |
|
|
|
8,048 |
|
|
|
12,186 |
|
|
|
9,639 |
|
|
|
34,846 |
|
| -25- |
|
AVINO SILVER & GOLD MINES LTD. Notes to the consolidated financial statements For the years ended December 31, 2022 and 2021 (Expressed in thousands of US dollars, except where otherwise noted) |
|
Included in Buildings above are assets under construction of $3,817 as at December 31, 2022 (2021 - $6,348) on which no depreciation was charged in the periods then ended. Once the assets are ready for service, they will be transferred to the appropriate class of plant, equipment and mining properties.
As of December 31, 2022, the Company performed an evaluation of the property plant and equipment and recorded a write-down of $330 (December 31, 2021 - Nil) against the carrying value of mine and mill machinery and transportation equipment due to damage and obsolescence.
As at December 31, 2022, plant, equipment and mining properties included a net carrying amount of $2,417 (2021 - $1,306) for mining equipment and right of use assets under finance lease.
12. RELATED PARTY TRANSACTIONS AND BALANCES
All related party transactions are recorded at the exchange amount which is the amount agreed to by the Company and the related party.
(a) Key management personnel
The Company has identified its directors and certain senior officers as its key management personnel. The compensation costs for key management personnel for the years ended December 31, 2022, and 2021, is as follows:
|
|
2022 |
|
|
2021 |
|
||
Salaries, benefits, and consulting fees |
|
$ | 1,228 |
|
|
$ | 1,021 |
|
Share-based payments |
|
|
1,566 |
|
|
|
1,188 |
|
|
|
$ | 2,794 |
|
|
$ | 2,209 |
|
(b) Amounts due to/from related parties
In the normal course of operations, the Company transacts with companies related to Avino’s directors or officers. All amounts payable and receivable are non-interest bearing, unsecured and due on demand. The following table summarizes the amounts due to/(from) related parties:
|
|
December 31, 2022 |
|
|
December 31, 2021 |
|
||
Oniva International Services Corp. |
|
$ | 100 |
|
|
$ | 107 |
|
Silver Wolf Exploration Ltd. |
|
|
(72 | ) |
|
|
- |
|
Directors Fees |
|
|
- |
|
|
|
56 |
|
|
|
$ | 28 |
|
|
$ | 163 |
|
For services provided to the Company as President and Chief Executive Officer, the Company pays Intermark Capital Corporation (“ICC”), a company controlled by David Wolfin, the Company’s president and CEO and also a director, for consulting services. For the year ended December 31, 2022, and 2021, the Company paid $326 and $239, respectively, to ICC.
(c) Other related party transactions
The Company has a cost sharing agreement with Oniva International Services Corp. (“Oniva”) for office and administration services. Pursuant to the cost sharing agreement, the Company will reimburse Oniva for the Company’s percentage of overhead and corporate expenses and for out-of-pocket expenses incurred on behalf of the Company. David Wolfin, President & CEO, and a director of the Company, is the sole owner of Oniva. The cost sharing agreement may be terminated with one-month notice by either party without penalty.
| -26- |
|
AVINO SILVER & GOLD MINES LTD. Notes to the consolidated financial statements For the years ended December 31, 2022 and 2021 (Expressed in thousands of US dollars, except where otherwise noted) |
|
The transactions with Oniva during the year ended December 31, 2022, and 2021, are summarized below:
|
|
2022 |
|
|
2021 |
|
||
Salaries and benefits |
|
$ | 878 |
|
|
$ | 766 |
|
Office and miscellaneous |
|
|
461 |
|
|
|
403 |
|
|
|
$ | 1,339 |
|
|
$ | 1,169 |
|
13. NOTE PAYABLE
On March 21, 2022, the Company closed the acquisition of the La Preciosa property from Coeur Mining Inc. (see Note 5 for further details). As part of the agreement, the Company issued a promissory note payable of $5 million due on or before March 21, 2023. The present value of $4,665 of the note payable was calculated using a discount interest rate of 6.71%.
The note is unsecured and non-interest bearing assuming that the note is paid in full on or before March 21, 2023. If the note is not paid by March 21, 2023, a sum of $1 million shall be added to the principal amount and the note shall bear interest at a rate of 7% per annum and will be payable on demand.
The continuity of the note payable is as follows:
|
|
December 31, |
|
|
December 31, |
|
||
|
|
2022 |
|
|
2021 |
|
||
Balance at beginning of the period |
|
$ | - |
|
|
$ | - |
|
Additions |
|
|
4,665 |
|
|
|
- |
|
Repayments |
|
|
- |
|
|
|
- |
|
Unwinding of fair value adjustment |
|
|
261 |
|
|
|
- |
|
Balance at end of the period |
|
$ | 4,926 |
|
|
$ | - |
|
14. WARRANT LIABILITY
The Company’s warrant liability arises as a result of the issuance of warrants exercisable in US dollars. As the denomination is different from the Canadian dollar functional currency of the entity issuing the underlying shares, the Company recognizes a derivative liability for these warrants and re-measures the liability at the end of each reporting period using the Black-Scholes model. Changes in respect of the Company’s warrant liability are as follows:
|
|
December 31, 2022 |
|
|
December 31, 2021 |
|
||
Balance at beginning of the period |
|
$ | 741 |
|
|
$ | 2,295 |
|
Warrants issued |
|
|
2,240 |
|
|
|
- |
|
Fair value adjustment |
|
|
(2,395 | ) |
|
|
(1,581 | ) |
Effect of movement in exchange rates |
|
|
(111 | ) |
|
|
27 |
|
Balance at end of the period |
|
$ | 475 |
|
|
$ | 741 |
|
| -27- |
|
AVINO SILVER & GOLD MINES LTD. Notes to the consolidated financial statements For the years ended December 31, 2022 and 2021 (Expressed in thousands of US dollars, except where otherwise noted) |
|
Continuity of warrants during the periods is as follows:
|
|
Underlying Shares |
|
|
Weighted Average Exercise Price |
|
||
Warrants outstanding and exercisable, January 1, 2021 |
|
|
2,980,774 |
|
|
$ | 0.80 |
|
Exercised |
|
|
(1,030,362 | ) |
|
$ | 0.80 |
|
Warrants outstanding and exercisable, December 31, 2021 |
|
|
1,950,412 |
|
|
$ | 0.80 |
|
Issued |
|
|
7,000,000 |
|
|
$ | 1.09 |
|
Warrants outstanding and exercisable, December 31, 2022 |
|
|
8,950,412 |
|
|
$ | 1.03 |
|
|
|
|
|
All Warrants Outstanding and Exercisable |
|
|||||||
Expiry Date |
|
Exercise Price per Share |
|
|
December 31, 2022 |
|
|
December 31, 2021 |
|
|||
September 21, 2023 |
|
$ | 1.09 |
|
|
|
7,000,000 |
|
|
|
- |
|
September 25, 2023 |
|
$ | 0.80 |
|
|
|
1,950,412 |
|
|
|
1,950,412 |
|
|
|
|
|
|
|
|
8,950,412 |
|
|
|
1,950,412 |
|
As at December 31, 2022, the weighted average remaining contractual life of warrants outstanding was 0.73 years (December 31, 2021 – 1.73 years).
Valuation of the warrant liability requires the use of estimates and assumptions including the expected stock price volatility. The expected volatility used in valuing warrants is based on volatility observed in historical periods. Changes in the underlying assumptions can materially affect the fair value estimates. The fair value of the warrant liability was calculated using the Black-Scholes model with the following weighted average assumptions and resulting fair values:
|
|
December 31, 2022 |
|
|
December 31, 2021 |
|
||
Weighted average assumptions: |
|
|
|
|
|
|
||
Risk-free interest rate |
|
|
4.07 | % |
|
|
0.91 | % |
Expected dividend yield |
|
|
0 | % |
|
|
0 | % |
Expected warrant life (years) |
|
|
0.73 |
|
|
|
1.73 |
|
Expected stock price volatility |
|
|
56.80 | % |
|
|
83.13 | % |
Weighted average fair value |
|
$ | 0.05 |
|
|
$ | 0.38 |
|
During the year ended December 31, 2022, the Company recorded $Nil realized loss on the exercise of warrants (December 31, 2021 - $1,106, as result of the exercise of 1,030,362 warrants for the issuance of 1,030,362 common shares).
| -28- |
|
AVINO SILVER & GOLD MINES LTD. Notes to the consolidated financial statements For the years ended December 31, 2022 and 2021 (Expressed in thousands of US dollars, except where otherwise noted) |
|
15. RECLAMATION PROVISION
Management’s estimate of the reclamation provision at December 31, 2022, is $445 (December 31, 2021 – $726), and the undiscounted value of the obligation is $1,454 (December 31, 2021 – $1,252).
The present value of the obligation was calculated using a risk-free interest rate of 9.65% (December 31, 2021 – 7.78%) and an inflation rate of 7.82% (December 31, 2021 – 7.36%). Reclamation activities are estimated to begin in 2023 for the San Gonzalo Mine and in 2041 for the Avino Mine.
A reconciliation of the changes in the Company’s reclamation provision for the years ended December 31, 2022 and 2021, is as follows:
|
|
December 31, 2022 |
|
|
December 31, 2021 |
|
||
|
|
|
|
|
|
|
||
Balance at beginning of the period |
|
$ | 726 |
|
|
$ | 808 |
|
Changes in estimates |
|
|
(364 | ) |
|
|
(105 | ) |
Unwinding of discount related to continuing operations |
|
|
44 |
|
|
|
47 |
|
Effect of movements in exchange rates |
|
|
39 |
|
|
|
(24 | ) |
Balance at end of the period |
|
$ | 445 |
|
|
$ | 726 |
|
16. SHARE CAPITAL AND SHARE-BASED PAYMENTS
(a) Authorized: Unlimited common shares without par value.
(b) Issued:
(i) During the year ended December 31, 2022, the Company issued 14,000,000 common shares as part of the acquisition of La Preciosa from Coeur Mining Inc.. As a result, $13,650 was recorded to share capital, and exploration and evaluation assets as acquisition costs, representing the closing price on the Toronto Stock Exchange on March 21, 2022, the date of the issuance and closing.
The Company further issued 1,075,000 common shares as payment for services provided during the acquisition, and as a result $980 was recorded to share capital and exploration and evaluation assets as acquisition costs.
During the year ended December 31, 2022, the Company issued 48,000 common shares following the exercise of 48,000 options. As a result, $46 was recorded to share capital, representing cash proceeds of $31 and the fair value upon issuance of $15.
During the year ended December 31, 2022, the Company issued 982,879 common shares upon exercise of RSUs. As a result, $899 was recorded to share capital.
(ii) During the year ended December 31, 2021, the Company issued 10,050,000 common shares in an at-the-market offering under prospectus supplement for gross proceeds of $19,020. The Company paid a 2.75% cash commission of $523 on gross proceeds, for net proceeds of $18,497, and incurred additional $400 in issuance costs during the period.
During the year ended December 31, 2021, the Company issued 1,030,362 common shares following the exercise of 1,030,362 warrants. As a result, $1,911 was recorded to share capital, representing cash proceeds of $824, fair value of the warrants on the date of exercise (see Note 14 for valuation methodology of $US denominated warrants) of $1,106, and movements in foreign exchange of $(19).
During the year ended December 31, 2021, the Company issued 264,000 common shares following the exercise of 264,000 options. As a result, $364 was recorded to share capital, representing cash proceeds of $237 and the fair value upon issuance of $127.
| -29- |
|
AVINO SILVER & GOLD MINES LTD. Notes to the consolidated financial statements For the years ended December 31, 2022 and 2021 (Expressed in thousands of US dollars, except where otherwise noted) |
|
(c) Stock options:
The Company has a stock option plan to purchase the Company’s common shares, under which it may grant stock options of up to 10% of the Company’s total number of shares issued and outstanding on a non-diluted basis. The stock option plan provides for the granting of stock options to directors, officers, and employees, and to persons providing investor relations or consulting services, the limits being based on the Company’s total number of issued and outstanding shares per year. The stock options vest on the date of grant, except for those issued to persons providing investor relations services, which vest over a period of one year. The option price must be greater than or equal to the discounted market price on the grant date, and the option term cannot exceed ten years from the grant date.
Continuity of stock options is as follows:
|
|
Underlying Shares |
|
|
Weighted Average Exercise Price (C$) |
|
||
|
|
|
|
|
|
|
||
Stock options outstanding, January 1, 2021 |
|
|
3,483,000 |
|
|
$ | 1.77 |
|
Exercised |
|
|
264,000 | ) |
|
$ | 1.16 |
|
Expired |
|
|
(360,000 | ) |
|
$ | 2.95 |
|
Cancelled / Forfeited |
|
|
(20,000 | ) |
|
$ | 1.64 |
|
Stock options outstanding, December 31, 2021 |
|
|
2,839,000 |
|
|
$ | 1.68 |
|
Granted |
|
|
2,390,000 |
|
|
$ | 1.20 |
|
Exercised |
|
|
(48,000 | ) |
|
$ | 0.79 |
|
Expired |
|
|
(880,000 | ) |
|
$ | 1.98 |
|
Cancelled / Forfeited |
|
|
(45,000 | ) |
|
$ | 1.40 |
|
Stock options outstanding, December 31, 2022 |
|
|
4,256,000 |
|
|
$ | 1.36 |
|
Stock options exercisable, December 31, 2022 |
|
|
3,658,500 |
|
|
$ | 1.39 |
|
The following table summarizes information about the stock options outstanding and exercisable at December 31, 2022:
|
|
|
|
Outstanding |
|
|
Exercisable |
|
||||||||||||
Expiry Date |
|
Price (C$) |
|
|
Number of Options |
|
|
Weighted Average Remaining Contractual Life (Years) |
|
|
Number of Options |
|
|
Weighted Average Remaining Contractual Life (Years) |
|
|||||
August 28, 2023 |
|
$ | 1.30 |
|
|
|
105,000 |
|
|
|
0.66 |
|
|
|
105,000 |
|
|
|
0.66 |
|
August 21, 2024 |
|
$ | 0.79 |
|
|
|
126,000 |
|
|
|
1.64 |
|
|
|
126,000 |
|
|
|
1.64 |
|
August 4, 2025 |
|
$ | 1.64 |
|
|
|
1,660,000 |
|
|
|
2.59 |
|
|
|
1,660,000 |
|
|
|
2.59 |
|
March 25, 2027 |
|
$ | 1.20 |
|
|
|
2,340,000 |
|
|
|
4.23 |
|
|
|
1,755,000 |
|
|
|
4.23 |
|
May 4, 2027 |
|
$ | 0.92 |
|
|
|
25,000 |
|
|
|
4.34 |
|
|
|
12,500 |
|
|
|
4.34 |
|
|
|
|
|
|
|
|
4,256,000 |
|
|
|
3.43 |
|
|
|
3,658,500 |
|
|
|
3.43 |
|
Valuation of stock options requires the use of estimates and assumptions including the expected stock price volatility. The expected volatility used in valuing stock options is based on volatility observed in historical periods. Changes in the underlying assumptions can materially affect the fair value estimates. The fair value of the stock options was calculated using the Black-Scholes model with the following weighted average assumptions and resulting fair values:
| -30- |
|
AVINO SILVER & GOLD MINES LTD. Notes to the consolidated financial statements For the years ended December 31, 2022 and 2021 (Expressed in thousands of US dollars, except where otherwise noted) |
|
|
|
December 31, 2022 |
|
|
December 31, 2021 |
|
||
Weighted average assumptions: |
|
|
|
|
|
|
||
Risk-free interest rate |
|
|
2.49 | % |
|
-% |
|
|
Expected dividend yield |
|
|
0.00 | % |
|
-% |
|
|
Expected option life (years) |
|
|
5.00 |
|
|
|
- |
|
Expected stock price volatility |
|
|
59.98 | % |
|
-% |
|
|
Expected forfeiture rate |
|
|
20 | % |
|
-% |
|
|
Weighted average fair value |
|
$ | 0.63 |
|
|
|
- |
|
During the year ended December 31, 2022, the Company charged $869 (year ended December 31, 2021 - $362) to operations as share-based payments for the fair value of stock options granted.
(d) Restricted Share Units:
On April 19, 2018, the Company’s Restricted Share Unit (“RSU”) Plan was approved by its shareholders. The RSU Plan is administered by the Compensation Committee under the supervision of the Board of Directors as compensation to officers, directors, consultants, and employees. The Compensation Committee determines the terms and conditions upon which a grant is made, including any performance criteria or vesting period.
Upon vesting, each RSU entitles the participant to receive one common share, provided that the participant is continuously employed with or providing services to the Company. RSUs track the value of the underlying common shares, but do not entitle the recipient to the underlying common shares until such RSUs vest, nor do they entitle a holder to exercise voting rights or any other rights attached to ownership or control of the common shares, until the RSU vests and the RSU participant receives common shares.
Continuity of RSUs is as follows:
|
|
Underlying Shares |
|
|
Weighted Average Price (C$) |
|
||
|
|
|
|
|
|
|
||
RSUs outstanding, January 1, 2021 |
|
|
2,874,000 |
|
|
$ | 1.28 |
|
Exercised |
|
|
(1,330,167 | ) |
|
$ | 1.22 |
|
Cancelled / Forfeited |
|
|
(104,356 | ) |
|
$ | 1.54 |
|
RSUs outstanding, December 31, 2021 |
|
|
1,439,477 |
|
|
$ | 1.32 |
|
Granted |
|
|
1,799,000 |
|
|
$ | 1.19 |
|
Exercised |
|
|
(982,879 | ) |
|
$ | 1.18 |
|
Forfeited |
|
|
(64,932 | ) |
|
$ | 1.40 |
|
RSUs outstanding, December 31, 2022 |
|
|
2,190,666 |
|
|
$ | 1.27 |
|
The following table summarizes information about the RSUs outstanding at December 31, 2022:
Issuance Date |
|
Price (C$) |
|
|
Number of RSUs Outstanding |
|
||
August 4, 2020 |
|
$ | 1.64 |
|
|
|
412,666 |
|
March 25, 2022 |
|
$ | 1.19 |
|
|
|
1,778,000 |
|
|
|
|
|
|
|
|
2,190,666 |
|
-31- |
|
AVINO SILVER & GOLD MINES LTD. Notes to the consolidated financial statements For the years ended December 31, 2022 and 2021 (Expressed in thousands of US dollars, except where otherwise noted) |
|
During the year ended December 31, 2022, 1,799,000 RSUs (year ended December 31, 2021 – Nil) were granted. The weighted average fair value at the measurement date was C$1.19, based on the TSX market price of the Company’s shares on the date the RSUs were granted.
During the year ended December 31, 2022, the Company charged $1,155 (December 31, 2021 - $1,107) to operations as share-based payments for the fair value of the RSUs vested. The fair value of the RSUs is recognized over the vesting period with reference to vesting conditions and the estimated RSUs expected to vest.
(e) Earnings (loss) per share:
The calculations for basic earnings (loss) per share and diluted earnings (loss) per share are as follows:
|
|
2022 |
|
|
2021 |
|
||
Net income (loss) from continuing operations for the period |
|
$ | 3,096 |
|
|
$ | (2,057 | ) |
Net income (loss) for the period |
|
$ | 3,096 |
|
|
$ | (2,057 | ) |
Basic weighted average number of shares outstanding |
|
|
114,372,371 |
|
|
|
100,161,357 |
|
Effect of dilutive share options, warrants, and RSUs (‘000) |
|
|
3,243,527 |
|
|
|
- |
|
Diluted weighted average number of shares outstanding |
|
|
117,615,898 |
|
|
|
100,161,137 |
|
Basic and diluted earnings (loss) from continuing operations per share |
|
$ | 0.03 |
|
|
$ | (0.02 | ) |
Basic and diluted earnings (loss) per share |
|
$ | 0.03 |
|
|
$ | (0.02 | ) |
3,573,960 potential common shares are anti-dilutive for the year ended December 31, 2021, and are therefore excluded from the weighted average number of common shares for the purpose of diluted earnings (loss) per share.
17. REVENUE AND COST OF SALES
The Company’s revenues for the year ended December 31, 2022 and 2021, are all attributable to Mexico, from shipments of concentrate from the Avino Mine, and processing of Historical Above Ground Stockpiles.
|
|
2022 |
|
|
2021 |
|
||
Concentrate sales |
|
$ | 43,648 |
|
|
$ | 11,208 |
|
Provisional pricing adjustments |
|
|
539 |
|
|
|
20 |
|
|
|
$ | 44,187 |
|
|
$ | 11,228 |
|
Cost of sales consists of changes in inventories, direct costs including personnel costs, mine site costs, energy costs (principally diesel fuel and electricity), maintenance and repair costs, operating supplies, external services, third party transport fees, depreciation and depletion, and other expenses for the periods. Direct costs include the costs of extracting co-products. Stand-by costs consist of care and maintenance costs incurred during the work stoppages at the Avino Mine during the year ended December 31, 2021.
Cost of sales is based on the weighted average cost of inventory sold for the periods and consists of the following:
| -32- |
|
AVINO SILVER & GOLD MINES LTD. Notes to the consolidated financial statements For the years ended December 31, 2022 and 2021 (Expressed in thousands of US dollars, except where otherwise noted) |
|
|
|
2022 |
|
|
2021 |
|
||
Production costs |
|
$ | 26,749 |
|
|
$ | 4,905 |
|
Stand-by costs |
|
|
- |
|
|
|
800 |
|
Write down of equipment |
|
|
330 |
|
|
|
- |
|
Depreciation and depletion |
|
|
2,046 |
|
|
|
1,976 |
|
|
|
$ | 29,125 |
|
|
$ | 7,681 |
|
18. GENERAL AND ADMINISTRATIVE EXPENSES
General and administrative expenses on the consolidated statements of operations consist of the following:
|
|
2022 |
|
|
2021 |
|
||
Salaries and benefits |
|
$ | 1,892 |
|
|
$ | 1,277 |
|
Office and miscellaneous |
|
|
1,189 |
|
|
|
647 |
|
Professional fees |
|
|
713 |
|
|
|
402 |
|
Management and consulting fees |
|
|
499 |
|
|
|
451 |
|
Investor relations |
|
|
303 |
|
|
|
227 |
|
Directors fees |
|
|
153 |
|
|
|
182 |
|
Regulatory and compliance fees |
|
|
146 |
|
|
|
170 |
|
Depreciation |
|
|
140 |
|
|
|
140 |
|
Travel and promotion |
|
|
121 |
|
|
|
70 |
|
|
|
$ | 5,156 |
|
|
$ | 3,566 |
|
19. COMMITMENTS
The Company has a cost sharing agreement to reimburse Oniva for a percentage of its overhead expenses, to reimburse 100% of its out-of-pocket expenses incurred on behalf of the Company, and to pay a percentage fee based on Oniva’s total overhead and corporate expenses. The agreement may be terminated with one-month notice by either party. Transactions and balances with Oniva are disclosed in Note 12.
The Company and its subsidiaries have various lease agreements for their office premises, use of land, and equipment. Commitments in respect of these lease agreements are as follows:
|
|
December 31, 2022 |
|
|
December 31, 2021 |
|
||
Not later than one year |
|
$ | 105 |
|
|
$ | 96 |
|
Later than one year and not later than five years |
|
|
347 |
|
|
|
330 |
|
Later than five years |
|
|
398 |
|
|
|
462 |
|
|
|
$ | 850 |
|
|
$ | 888 |
|
Office lease payments recognized as an expense during the year ended December 31, 2022, totalled $18 (December 31, 2021 - $16).
| -33- |
|
AVINO SILVER & GOLD MINES LTD. Notes to the consolidated financial statements For the years ended December 31, 2022 and 2021 (Expressed in thousands of US dollars, except where otherwise noted) |
|
20.SUPPLEMENTARY CASH FLOW INFORMATION
|
|
2022 |
|
|
2021 |
|
||
Net change in non-cash working capital items: |
|
|
|
|
|
|
||
Accounts payable and accrued liabilities |
|
$ | 3,603 |
|
|
$ | 1,240 |
|
Prepaid expenses and other assets |
|
|
(904 | ) |
|
|
(203 | ) |
Amounts receivable |
|
|
(1,464 | ) |
|
|
(680 | ) |
Taxes payable |
|
|
863 |
|
|
|
25 |
|
Amounts due to related parties |
|
|
(127 | ) |
|
|
8 |
|
Taxes recoverable |
|
|
71 |
|
|
|
1,727 |
|
Inventory |
|
|
(998 | ) |
|
|
(3,664 | ) |
|
|
$ | 1,044 |
|
|
$ | 1,547 |
|
|
|
2022 |
|
|
2021 |
|
||
Other non-cash supplementary information: |
|
|
|
|
|
|
||
Interest paid |
|
$ | 92 |
|
|
$ | 92 |
|
Taxes paid |
|
|
14 |
|
|
|
589 |
|
|
|
$ | 106 |
|
|
$ | 581 |
|
|
|
|
|
|
|
|
|
|
|
|
2022 |
|
|
2021 |
|
||
Non-cash investing and financing activities: |
|
|
|
|
|
|
|
|
Acquisition of La Preciosa, net of cash & transaction costs |
|
$ | 21,535 |
|
|
$ | - |
|
Shares acquired under terms of option agreements |
|
|
83 |
|
|
|
109 |
|
Transfer of share-based payments reserve upon exercise of RSUs |
|
|
899 |
|
|
|
1,278 |
|
Transfer of share-based payments reserve upon option exercise |
|
|
15 |
|
|
|
126 |
|
Transfer of share-based payments reserve upon option cancellation or expiry |
|
|
831 |
|
|
|
443 |
|
Equipment acquired under finance leases and equipment loans |
|
|
1,827 |
|
|
|
1,058 |
|
|
|
$ | 25,190 |
|
|
$ | 3,014 |
|
21. FINANCIAL INSTRUMENTS
The fair values of the Company’s amounts due to related parties and accounts payable approximate their carrying values because of the short-term nature of these instruments. Cash, amounts receivable, long-term investments, and warrant liability are recorded at fair value. The carrying amounts of the Company’s note payable, equipment loans, and finance lease obligations are a reasonable approximation of their fair values based on current market rates for similar financial instruments.
The Company’s financial instruments are exposed to certain financial risks, including credit risk, liquidity risk, and market risk.
(a) Credit Risk
Credit risk is the risk that one party to a financial instrument will cause a financial loss for the other party by failing to discharge an obligation. The Company has exposure to credit risk through its cash, long-term investments and amounts receivable. The Company manages credit risk, in respect of cash and short-term investments, by maintaining the majority of cash and short-term investments at highly rated financial institutions.
The Company is exposed to a significant concentration of credit risk with respect to its trade accounts receivable balance because all of its concentrate sales are with two (December 31, 2021 – two) counterparty (see Note 23). However, the Company has not recorded any allowance against its trade receivables because to-date all balances owed have been settled in full when due (typically within 60 days of submission) and because of the highly-rated nature of the counterparties.
The Company’s maximum exposure to credit risk at the end of any period is equal to the carrying amount of these financial assets as recorded in the audited consolidated statement of financial position. At December 31, 2022 and 2021, no amounts were held as collateral.
| -34- |
|
AVINO SILVER & GOLD MINES LTD. Notes to the consolidated financial statements For the years ended December 31, 2022 and 2021 (Expressed in thousands of US dollars, except where otherwise noted) |
|
21. FINANCIAL INSTRUMENTS
Liquidity risk is the risk that the Company will encounter difficulty in satisfying financial obligations as they become due. The Company manages its liquidity risk by forecasting cash flows required by its operating, investing and financing activities. The Company had cash at December 31, 2022, in the amount of $11,245 and working capital of $12,083 in order to meet short-term business requirements. Accounts payable have contractual maturities of approximately 30 to 90 days, or are due on demand and are subject to normal trade terms. The current portions of term facility, equipment loans, and finance lease obligations are due within 12 months of the consolidated statement of financial position date. Amounts due to related parties are without stated terms of interest or repayment.
The maturity profiles of the Company’s contractual obligations and commitments as at December 31, 2022, are summarized as follows:
|
|
Total |
|
|
Less Than 1 Year |
|
|
1-5 years |
|
|
More Than 5 Years |
|
||||
Accounts payable and accrued liabilities |
|
$ | 9,469 |
|
|
$ | 9,469 |
|
|
$ | - |
|
|
$ | - |
|
Amounts due to related parties |
|
|
28 |
|
|
|
28 |
|
|
|
- |
|
|
|
- |
|
Minimum rental and lease payments |
|
|
850 |
|
|
|
105 |
|
|
|
347 |
|
|
|
398 |
|
Note Payable |
|
|
5,000 |
|
|
|
5,000 |
|
|
|
|
|
|
|
|
|
Finance lease obligations |
|
|
1,819 |
|
|
|
1,043 |
|
|
|
776 |
|
|
|
- |
|
Total |
|
$ | 17,166 |
|
|
$ | 15,645 |
|
|
$ | 1,123 |
|
|
$ | 398 |
|
(c) Market Risk
Market risk consists of interest rate risk, foreign currency risk and price risk. These are discussed further below.
Interest Rate Risk
Interest rate risk consists of two components:
(i) To the extent that payments made or received on the Company’s monetary assets and liabilities are affected by changes in the prevailing market interest rates, the Company is exposed to interest rate cash flow risk.
(ii) To the extent that changes in prevailing market rates differ from the interest rates on the Company’s monetary assets and liabilities, the Company is exposed to interest rate price risk.
In management’s opinion, the Company is exposed to interest rate risk primarily on its outstanding term facility, as the interest rate is subject to floating rates of interest. A 10% change in the interest rate would not result in a material impact on the Company’s operations.
| -35- |
|
AVINO SILVER & GOLD MINES LTD. Notes to the consolidated financial statements For the years ended December 31, 2022 and 2021 (Expressed in thousands of US dollars, except where otherwise noted) |
|
Foreign Currency Risk
Foreign currency risk is the risk that the fair value or future cash flows of a financial instrument will fluctuate due to changes in foreign exchange rates. The Company is exposed to foreign currency risk to the extent that the following monetary assets and liabilities are denominated in Mexican pesos and Canadian dollars:
|
|
December 31, 2022 |
|
|
December 31, 2021 |
|
||||||||||
|
|
MXN |
|
|
CDN |
|
|
MXN |
|
|
CDN |
|
||||
Cash |
|
$ | 4,097 |
|
|
$ | 250 |
|
|
$ | 3,576 |
|
|
$ | 1,450 |
|
Due from related parties |
|
|
1,402 |
|
|
|
- |
|
|
|
- |
|
|
|
- |
|
Long-term investments |
|
|
- |
|
|
|
2,365 |
|
|
|
- |
|
|
|
4,976 |
|
Reclamation bonds |
|
|
- |
|
|
|
4 |
|
|
|
- |
|
|
|
6 |
|
Amounts receivable |
|
|
- |
|
|
|
34 |
|
|
|
- |
|
|
|
33 |
|
Accounts payable and accrued liabilities |
|
|
(85,486 | ) |
|
|
(108 | ) |
|
|
(57,604 | ) |
|
|
(211 | ) |
Due to related parties |
|
|
- |
|
|
|
(135 | ) |
|
|
- |
|
|
|
(206 | ) |
Finance lease obligations |
|
|
(161 | ) |
|
|
(343 | ) |
|
|
(1 | ) |
|
|
(394 | ) |
Net exposure |
|
|
(80,148 | ) |
|
|
2,067 |
|
|
|
(54,029 | ) |
|
|
5,654 |
|
US dollar equivalent |
|
$ | (4,136 | ) |
|
$ | 1,526 |
|
|
$ | (2,363 | ) |
|
$ | (4,054 | ) |
Based on the net US dollar denominated asset and liability exposures as at December 31, 2022, a 10% fluctuation in the US/Mexican and Canadian/US exchange rates would impact the Company’s earnings for the year ended December 31, 2022, by approximately $275 (year ended December 31, 2021 - $143). The Company has not entered into any foreign currency contracts to mitigate this risk.
Price Risk
Price risk is the risk that the fair value or future cash flows of a financial instrument will fluctuate due to changes in market prices, other than those arising from interest rate risk or foreign currency risk.
The Company is exposed to price risk with respect to its amounts receivable, as certain trade accounts receivable are recorded based on provisional terms that are subsequently adjusted according to quoted metal prices at the date of final settlement. Quoted metal prices are affected by numerous factors beyond the Company’s control and are subject to volatility, and the Company does not employ hedging strategies to limit its exposure to price risk. At December 31, 2022, based on outstanding accounts receivable that were subject to pricing adjustments, a 10% change in metals prices would have an impact on net earnings (loss) of $65 (December 31, 2021 - $26).
The Company is exposed to price risk with respect to its long-term investments, as these investments are carried at fair value based on quoted market prices. Changes in market prices result in gains or losses being recognized in net income (loss). At December 31, 2022, a 10% change in market prices would have an impact on net earnings (loss) of approximately $175 (December 31, 2021 - $330).
The Company’s profitability and ability to raise capital to fund exploration, evaluation and production activities is subject to risks associated with fluctuations in mineral prices. Management closely monitors commodity prices, individual equity movements, and the stock market to determine the appropriate course of action to be taken by the Company.
| -36- |
|
AVINO SILVER & GOLD MINES LTD. Notes to the consolidated financial statements For the years ended December 31, 2022 and 2021 (Expressed in thousands of US dollars, except where otherwise noted) |
|
(d) Classification of Financial Instruments
IFRS 7 Financial Instruments: Disclosuresestablishes a fair value hierarchy that prioritizes the inputs to valuation techniques used to measure fair value as follows:
Level 1 – quoted prices (unadjusted) in active markets for identical assets or liabilities;
Level 2 – inputs other than quoted prices included in Level 1 that are observable for the asset or liability, either directly (i.e., as prices) or indirectly (i.e., derived from prices); and
Level 3 – inputs for the asset or liability that are not based on observable market data (unobservable inputs).
The following table sets forth the Company’s financial assets and financial liabilities measured at fair value on a recurring basis by level within the fair value hierarchy as at December 31, 2022:
|
|
Level 1 |
|
|
Level 2 |
|
|
Level 3 |
|
|||
Financial assets |
|
|
|
|
|
|
|
|
|
|||
Cash |
|
$ | 11,245 |
|
|
$ | - |
|
|
$ | - |
|
Amounts receivable |
|
|
- |
|
|
|
2,672 |
|
|
|
- |
|
Long-term investments |
|
|
1,746 |
|
|
|
- |
|
|
|
- |
|
Total financial assets |
|
$ | 12,991 |
|
|
$ | 2,672 |
|
|
$ | - |
|
Financial liabilities |
|
|
|
|
|
|
|
|
|
|
|
|
Warrant liability |
|
|
- |
|
|
|
- |
|
|
|
(475 | ) |
Total financial liabilities |
|
$ | - |
|
|
$ | - |
|
|
$ | (475 | ) |
The Company uses Black-Scholes model to measure its Level 3 financial instruments. As at December 31, 2022, the Company’s Level 3 financial instruments consisted of the warrant liability.
For the Company’s warrant liability valuation and fair value adjustments during the years ended December 31, 2022 and 2021, see Note 14 of the consolidated financial statements.
22. CAPITAL MANAGEMENT
The Company’s objectives when managing capital are to safeguard the Company’s ability to continue as a going concern in order to pursue the exploration and expansion of its properties and to maintain a flexible capital structure for its projects for the benefit of its stakeholders. In the management of capital, the Company includes equity (comprising of all issued share capital, equity reserves, retained earnings or accumulated deficit, and other comprehensive income (loss)), the note payable, and finance lease obligations, are listed as follows:
|
|
December 31, |
|
|
December 31, |
|
||
|
|
2022 |
|
|
2021 |
|
||
Equity |
|
$ | 98,021 |
|
|
$ | 78,507 |
|
Note payable |
|
|
4,926 |
|
|
|
- |
|
Finance lease obligations |
|
|
1,716 |
|
|
|
1,069 |
|
|
|
$ | 104,663 |
|
|
$ | 79,576 |
|
The Company manages its capital structure and makes adjustments to it in light of changes in economic conditions and the risk characteristics of the underlying assets. To maintain or adjust its capital structure, the Company may attempt to incur new debt or issue new shares. Management reviews the Company’s capital structure on an ongoing basis and believes that this approach, given the relative size of the Company, is reasonable. At December 31, 2022, the Company expects its capital resources and projected future cash flows from operations to support its normal operating requirements on an ongoing basis, and planned development and exploration of its mineral properties and other expansionary plans. At December 31, 2022, there was no externally imposed capital requirement to which the Company was subject and with which the Company did not comply.
| -37- |
|
AVINO SILVER & GOLD MINES LTD. Notes to the consolidated financial statements For the years ended December 31, 2022 and 2021 (Expressed in thousands of US dollars, except where otherwise noted) |
|
23. SEGMENTED INFORMATION
The Company reviews its segment reporting to ensure it reflects the operational structure of the Company and enables the Company's Chief Operating Decision Maker (the Company’s CEO) to review operating segment performance. We have determined that each producing mine represents an operating segment, of which there is one as of December 31, 2022.
The Company’s revenues for the year ended December 31, 2022, of $44,187 (2021 - $11,228) are all attributable to one reportable segment in Mexico, from shipments of concentrate produced by the Avino Mine and processed material from the Avino Historic Above Ground stockpiles.
On the consolidated statements of operations, the Company had revenue from the following product mixes:
|
|
2022 |
|
|
2021 |
|
||
Silver |
|
$ | 16,570 |
|
|
$ | 3,421 |
|
Copper |
|
|
10,258 |
|
|
|
5,566 |
|
Gold |
|
|
25,875 |
|
|
|
4,344 |
|
Penalties, treatment costs and refining charges |
|
|
(8,516 | ) |
|
|
(2,103 | ) |
Total revenue from mining operations |
|
$ | 44,187 |
|
|
$ | 11,228 |
|
For the year ended December 31, 2022 and 2021, the Company had the following customers that accounted for total revenues as follows:
|
|
2022 |
|
|
2021 |
|
||
Customer #1 |
|
$ | 39,911 |
|
|
$ | 5,521 |
|
Customer #2 |
|
|
3,479 |
|
|
|
3,045 |
|
Other customers |
|
|
797 |
|
|
|
2,662 |
|
Total revenue from mining operations |
|
$ | 44,187 |
|
|
$ | 11,228 |
|
Geographical information relating to the Company’s non-current assets (other than financial instruments) is as follows:
|
|
December 31, 2022 |
|
|
December 31, 2021 |
|
||
Exploration and evaluation assets - Mexico |
|
$ | 46,541 |
|
|
$ | 11,052 |
|
Exploration and evaluation assets - Canada |
|
|
1 |
|
|
|
1 |
|
Total exploration and evaluation assets |
|
$ | 46,542 |
|
|
$ | 11,053 |
|
|
|
December 31, 2022 |
|
|
December 31, 2021 |
|
||
Plant, equipment, and mining properties - Mexico |
|
$ | 43,812 |
|
|
$ | 35,390 |
|
Plant, equipment, and mining properties - Canada |
|
|
244 |
|
|
|
285 |
|
Total plant, equipment, and mining properties |
|
$ | 44,056 |
|
|
$ | 35,675 |
|
| -38- |
|
AVINO SILVER & GOLD MINES LTD. Notes to the consolidated financial statements For the years ended December 31, 2022 and 2021 (Expressed in thousands of US dollars, except where otherwise noted) |
|
24. INCOME TAXES
(a) Income tax expense
Income tax expense included in the consolidated statements of operations and comprehensive income (loss) is as follows:
|
|
2022 |
|
|
2021 |
|
||
|
|
|
|
|
|
|
||
Current income tax expense |
|
$ | 1,144 |
|
|
$ | 27 |
|
Deferred income tax expense (recovery) |
|
|
3,440 |
|
|
|
412 |
|
Total income tax expense (recovery) |
|
$ | 4,584 |
|
|
$ | 439 |
|
The reconciliation of income taxes calculated at the Canadian statutory tax rate to the income tax expense recognized in the year is as follows:
|
|
2022 |
|
|
2021 |
|
||
|
|
|
|
|
|
|
||
Net income (loss) before income taxes |
|
$ | 7,680 |
|
|
$ | (1,618 | ) |
Net loss from discontinued operations before income taxes |
|
|
- |
|
|
|
- |
|
Net income (loss) before income taxes |
|
$ | 7,680 |
|
|
$ | (1,618 | ) |
|
|
|
|
|
|
|
|
|
Combined statutory tax rate |
|
|
27.00 | % |
|
|
27.00 | % |
|
|
|
|
|
|
|
|
|
Income tax expense (recovery) at the Canadian statutory rate |
|
|
2,074 |
|
|
|
(437 | ) |
|
|
|
|
|
|
|
|
|
Reconciling items: |
|
|
|
|
|
|
|
|
Effect of difference in foreign tax rates |
|
|
326 |
|
|
|
11 |
|
Non-deductible/non-taxable items |
|
|
1,205 |
|
|
|
675 |
|
Change in unrecognized deductible temporary differences |
|
|
1,169 |
|
|
|
122 |
|
Impact of foreign exchange |
|
|
(351 | ) |
|
|
75 |
|
Special mining duties |
|
|
385 |
|
|
|
17 |
|
Revisions to estimates |
|
|
(215 | ) |
|
|
313 |
|
Share issue costs |
|
|
(3 | ) |
|
|
(249 | ) |
Other items |
|
|
(6 | ) |
|
|
(88 | ) |
|
|
|
|
|
|
|
|
|
Income tax expense (recovery) recognized in the year |
|
$ | 4,584 |
|
|
$ | 439 |
|
The Company recognized a non-cash expense of $408 for the year ended December 31, 2022 (2021 – expense of $Nil; 2020 – recovery of $164) related to the deferred tax impact of the special mining duty.
|
|
December 31, |
|
|
December 31, |
|
||
|
|
2022 |
|
|
2021 |
|
||
|
|
|
|
|
|
|
||
Deferred income tax assets |
|
$ | 1,426 |
|
|
$ | 4,341 |
|
Deferred income tax liabilities |
|
|
(6,647 | ) |
|
|
(6,122 | ) |
|
|
|
|
|
|
|
|
|
|
|
$ | (5,221 | ) |
|
$ | (1,781 | ) |
| -39- |
|
AVINO SILVER & GOLD MINES LTD. Notes to the consolidated financial statements For the years ended December 31, 2022 and 2021 (Expressed in thousands of US dollars, except where otherwise noted) |
|
The approximate tax effects of each type of temporary difference that gives rise to potential deferred income tax assets and liabilities are as follows:
|
|
December 31, 2022 |
|
|
December 31, 2021 |
|
||
|
|
|
|
|
|
|
||
Reclamation provision |
|
$ | 167 |
|
|
$ | 272 |
|
Non-capital losses |
|
|
- |
|
|
|
3,525 |
|
Other deductible temporary differences |
|
|
1,259 |
|
|
|
543 |
|
Exploration and evaluation assets |
|
|
(3,310 | ) |
|
|
(3,326 | ) |
Plant, equipment and mining properties |
|
|
(3,337 | ) |
|
|
(2,795 | ) |
|
|
|
|
|
|
|
|
|
Net deferred income tax liabilities |
|
$ | (5,221 | ) |
|
$ | (1,781 | ) |
The net deferred tax liability presented in these consolidated financial statements is due to the difference in the carrying amounts and tax bases of the Mexican plant, equipment and mining properties which were acquired in the purchase of Avino Mexico. The carrying values of the Mexican plant, equipment and mining properties includes an estimated fair value adjustment recorded upon the July 17, 2006, acquisition of control of Avino Mexico that was based on a share exchange, while the tax bases of these assets are historical undeducted tax amounts that were nil on acquisition. The deferred tax liability is attributable to assets in the tax jurisdiction of Mexico.
(b)Unrecognized deductible temporary differences:
Temporary differences and tax losses arising in Canada have not been recognized as deferred income tax assets due to the fact that management has determined it is not probable that sufficient future taxable profits will be earned in Canada to recover such assets. Unrecognized deductible temporary differences are summarized as follows:
|
|
December 31, 2022 |
|
|
December 31, 2021 |
|
||
|
|
|
|
|
|
|
||
Tax losses carried forward - Canada |
|
$ | 20,370 |
|
|
$ | 17,968 |
|
Tax losses carried forward - Mexico |
|
|
42,575 |
|
|
|
- |
|
Share issue costs |
|
|
841 |
|
|
|
1,478 |
|
Plant, equipment and mining properties |
|
|
411 |
|
|
|
341 |
|
Exploration and evaluation assets |
|
|
1,156 |
|
|
|
1,244 |
|
Investments |
|
|
1,289 |
|
|
|
(15 | ) |
|
|
|
|
|
|
|
|
|
Unrecognized deductible temporary differences |
|
$ | 66,642 |
|
|
$ | 21,016 |
|
The Company has capital losses of $12,637 carried forward and $7,733 in non-capital tax losses carried forward available to reduce future Canadian taxable income. The capital losses can be carried forward indefinitely until used. The non-capital losses have an expiry date range of 2023 to 2042.
The Company has non-capital tax losses of $42,575 carried forward available to reduce future Mexican taxable income and have an expiry date range of 2023 to 2032.
| -40- |
|
AVINO SILVER & GOLD MINES LTD. Notes to the consolidated financial statements For the years ended December 31, 2022 and 2021 (Expressed in thousands of US dollars, except where otherwise noted) |
|
25. SUBSEQUENT EVENTS
At-The-Market Sales – Subsequent to December 31, 2022, the Company issued 253,700 common shares in at-the-market offerings under prospectus supplement for gross proceeds of $207. The Company paid a 2.75% cash commission of $6 on gross proceeds, for net proceeds of $201.
Option Agreement – Subsequent to December 31, 2022, the Company elected and received the second anniversary payment of 500,000 common shares of Silver Wolf as per the Option Agreement (see Note 9).
Note Payable – Subsequent to December 31, 2022, the Company made the $5 million payment on the outstanding note payable to Coeur. See Note 13 for more details.
Non-Core Claims Sale – Subsequent to December 31, 2022, the Company agreed to sell to a subsidiary of Hecla Mining Company (“Hecla”) the Eagle Property, consisting of 100% interest in and to the 14 quartz mineral claims located in the Keno Hill Area of the May Mining District of Yukon for cash consideration of C$250.
| -41- |
EXHIBIT 99.3
|
|
MANAGEMENT’S DISCUSSION AND ANALYSIS |
|
| FOR THE YEAR ENDED DECEMBER 31, 2022 |
The following discussion and analysis of the operations, results, and financial position of Avino Silver & Gold Mines Ltd. (the “Company” or “Avino”) should be read in conjunction with the Company’s audited consolidated financial statements as at and for the year ended December 31, 2022, and the notes thereto.
This Management’s Discussion and Analysis (“MD&A”) is dated March 28, 2023, and discloses specified information up to that date. The consolidated financial statements are prepared in accordance with International Financial Reporting Standards (“IFRS”) as issued by the International Accounting Standards Board (“IASB”). Unless otherwise cited, references to dollar amounts are in US dollars. This MD&A contains “forward-looking statements” that are subject to risk factors including those set out in the “Cautionary Statement” at the end of this MD&A. All information contained in this MD&A is current and has been approved by the Company’s Board of Directors as of March 28, 2023, unless otherwise indicated. Throughout this report we refer to “Avino”, the “Company”, “we”, “us”, “our”, or “its”. All these terms are used in respect of Avino Silver & Gold Mines Ltd. We recommend that readers consult the “Cautionary Statement” on the last page of this report. Additional information relating to the Company is available on the Company’s website at www.avino.com and on SEDAR at www.sedar.com.
Business Description
Founded in 1968, the Company is engaged in the production and sale of silver, gold, and copper bulk concentrate, and the acquisition, exploration, and evaluation of mineral properties. The Company holds mineral claims and leases in Durango, Mexico, and in British Columbia and Yukon, Canada. Avino is a reporting issuer in all of the provinces of Canada, except for Quebec, and a foreign private issuer with the Securities and Exchange Commission in the United States. The Company’s shares trade on the Toronto Stock Exchange (“TSX”) and the NYSE American under the symbol “ASM”, and on the Berlin and Frankfurt Stock Exchanges under the symbol “GV6”.
Discussion of Operations
The Company’s production, exploration, and evaluation activities during the year ended December 31, 2022, have been conducted on its Avino Property.
The Company holds a 99.67% effective interest in Compañía Minera Mexicana de Avino, S.A. de C.V. (“Avino Mexico”), a Mexican corporation which owns the Avino Property. The Avino Property covers approximately 1,104 contiguous hectares, and is located approximately 80 km north-east of the city of Durango. The Avino Property is equipped with milling and processing facilities that presently process all output from the Avino Mine located on the property.
The Company operates the Avino Mine which produces copper, silver and gold at the historic Avino property in the state of Durango, Mexico. The Company also holds 100% interest in Proyectos Mineros La Preciosa S.A. de C.V . (“La Preciosa”), a Mexican corporation which owns the La Preciosa Property. The Company also owns interests in mineral properties located in British Columbia and Yukon, Canada.
| 1 | Page |
|
|
MANAGEMENT’S DISCUSSION AND ANALYSIS |
|
| FOR THE YEAR ENDED DECEMBER 31, 2022 |
Operational Highlights
| HIGHLIGHTS (Expressed in US$, unless otherwise noted) | Fourth Quarter 2022 | Fourth Quarter 2021 |
Change | Year 2022 | Year 2021 |
Change |
||||
| Operating |
|
|
|
|||||||
| Tonnes Milled | 150,292 | 103,513 | 45% | 541,823 | 165,304 | 228% |
||||
| Silver Ounces Produced | 309,856 | 163,933 | 89% | 985,195 | 245,372 | 302% |
||||
| Gold Ounces Produced | 2,426 | 2,158 | 12% | 5,778 | 3,386 | 71% |
||||
| Copper Pounds Produced | 1,540,851 | 1,128,728 | 37% | 6,504,177 | 1,869,306 | 248% |
||||
| Silver Equivalent Ounces1 Produced | 770,127 | 541,432 | 42% | 2,655,502 | 842,373 | 215% |
||||
| Concentrate Sales and Cash Costs |
|
|
|
|
||||||
| Silver Equivalent Payable Ounces Sold2 | 756,536 | 417,881 | 81% | 2,449,704 | 524,993 | 367% |
||||
| Cash Cost per Silver Equivalent Payable Ounce1,2,3 | $ | 11.76 | $ | 9.08 | 30% | $ | 10.34 | $ | 8.07 | 28% |
| All-in Sustaining Cash Cost per Silver Equivalent Payable Ounce1,2,3 | $ | 18.63 | $ | 17.24 | 8% | $ | 17.91 | $ | 24.07 | -26% |
1. In Q4 2022, AgEq was calculated using metal prices of $21.18 oz Ag, $1,729 oz Au, and $3.63 lb Cu. In Q4 2021, AgEq was calculated using metals prices of $23.32 oz Ag, $1,783 oz Au and $4.39 lb Cu. In FY 2022, AgEq was calculated using metal prices of $21.75 oz Ag, $1,801 oz Au and $4.00 lb Cu. In FY 2021, AgEq was calculated using metal prices of $23.84 oz Ag, $1,786 oz Au and $4.32 lb Cu.
2. “Silver equivalent payable ounces sold” for the purposes of cash costs and all-in sustaining costs consists of the sum of payable silver ounces, gold ounces and copper tonnes sold, before penalties, treatment charges, and refining charges, multiplied by the ratio of the average spot gold and copper prices to the average spot silver price for the corresponding period.
3. The Company reports non-IFRS measures which include cash cost per silver equivalent payable ounce and all-in sustaining cash cost per payable ounce. These measures are widely used in the mining industry as a benchmark for performance, but do not have a standardized meaning and the calculation methods may differ from methods used by other companies with similar reported measures. See Non-IFRS Measures section for further information and detailed reconciliations.
Financial Highlights
| HIGHLIGHTS (Expressed in 000’s of US$) | Fourth Quarter 2022 | Fourth Quarter 2021 |
Change | Year 2022 | Year 2021 |
Change |
||||
| Financial Operating Performance |
|
|
|
|
||||||
| Revenues | $ | 14,649 | $ | 9,318 | 57% | $ | 44,187 | $ | 11,228 | 294% |
| Mine operating income | $ | 4,356 | $ | 4,406 | -1% | $ | 15,062 | $ | 3,547 | 325% |
| Net income (loss) | $ | 1,296 | $ | 2,629 | -51% | $ | 3,096 | $ | (2,057) | 251% |
| Earnings before interest, taxes and amortization (“EBITDA”)1 | $ | 3,207 | $ | 4,821 | -33% | $ | 10,263 | $ | 443 | 2217% |
| Adjusted earnings1 | $ | 4,026 | $ | 4,746 | -15% | $ | 10,239 | $ | 2,298 | 346% |
| Cash provided by operating activities | $ | 3,320 | $ | 3,518 | -6% | $ | 11,831 | $ | 109 | NM% |
| Per Share Amounts |
|
|
|
|
|
|||||
| Earnings (loss) per share – basic & diluted | $ | 0.01 | $ | 0.03 | -67% | $ | 0.03 | $ | (0.02) | 250% |
| Adjusted earnings per share1 | $ | 0.03 | $ | 0.05 | -33% | $ | 0.08 | $ | 0.02 | 267% |
| HIGHLIGHTS (Expressed in 000’s of US$) | December 31, 2022 | September 30, 2022 | Change | December 31, 2022 | December 31, 2021 |
Change |
||||
| Liquidity & Working Capital |
|
|
|
|
|
|
|
|
|
|
| Cash | $ | 11,245 | $ | 10,920 | 3% | $ | 11,245 | $ | 24,765 | -55% |
| Working capital1 | $ | 8,821 | $ | 12,273 | -28% | $ | 8,821 | $ | 31,635 | -72% |
1. The Company reports non-IFRS measures which include cash cost per silver equivalent payable ounce, all-in sustaining cash cost per payable ounce, EBITDA, adjusted earnings, adjusted earnings per share, and working capital. These measures are widely used in the mining industry as a benchmark for performance, but do not have a standardized meaning and the calculation methods may differ from methods used by other companies with similar reported measures. See Non-IFRS Measures section for further information and detailed reconciliations.
NM = not meaningful
| 2 | Page |
|
|
MANAGEMENT’S DISCUSSION AND ANALYSIS |
|
| FOR THE YEAR ENDED DECEMBER 31, 2022 |
4th Quarter and FY 2022 Highlights
Closing of Strategic Acquisition of La Preciosa Silver Project from Coeur Mining Inc. (“Coeur”)
|
| · | On March 21, 2022, the Company announced that it has closed the acquisition with Coeur to acquire the La Preciosa silver project, which is located adjacent to the Avino Mine in the state of Durango, Mexico, for upfront consideration of $29.7 million on closing and $5 million due within 12 months of closing. Further contingent consideration including cash, royalties and a mineral reserve discovery payment. Currently the company is conducting community engagement in the nearby towns adjacent to the property to move forward with the growth plan. |
Beats Yearly Silver Equivalent Production Estimate at Avino; Ramped Up to 3.0 Million AgEq Oz Annualized Production During 2nd Half of 2022
|
| · | Given the restart of operations in late 2021, the Company successfully beat the internal annual production estimate of 2.2 to 2.4 million silver equivalent ounces, with over 2.65 million silver equivalent ounces produced during the year. |
|
| · | 457,798 silver equivalent ounces were produced in Q1 2022, as the Company continued its ramp-up of production. Q1 2022 marked the second full quarter following the restart of operations in August 2021. |
|
| · | 649,569 silver equivalent ounces were produced in Q2 2022, as the Company continued its ramp-up of production, with a significant increase shown over Q1 2022. |
|
| · | A record 778,008 silver equivalent ounces were produced in Q3 2022, marking a 20% increase over Q2 2022. |
|
| · | 770,127 silver equivalent ounces were produced in Q4 2022, which represents second highest production quarter in recent times and inline with Q3 2022 production. |
Dry-Stack Tailings Facility Commissioned
|
| · | The installation and commissioning of the dry-stack tailings project has been completed as well as the start-up testing, and the facility is now fully operational. Avino chose dry-stack tailings for its environmental, safety and economic advantages. Dry-stack tailings improve the overall tailings facility safety and stability and reduces the need to extract water from local sources by recycling the water removed from tailings. In addition, dry-stack tailings require less storage area which results in a smaller environmental footprint. |
Avino ET Area Drills Higher Grade Silver and Copper in Multiple Holes
|
| · | On June 13, 2022, the Company announced drill results from the Avino Elena Tolosa Area (“ET”) to define the continuity of widths and grades of the Avino vein extending significant potential depth of at least 290 metre down dip below the current development, the results confirm the mineralization continues and also contains significantly higher cooper mineralization in the ET area. |
|
| · | On October 11, 2022, the Company announced drill results from a further six holes at the Avino Elena Tolosa Area (“ET”) to define the continuity of widths and grades of the Avino vein extending significant potential depth of at least 290 metre down dip below the deepest levels of development. The results confirm the mineralization continues and also contains significantly higher copper mineralization in the ET area. |
|
| · | On January 5, 2023 the Company announced assays results showing the Avino vein now extending 315 metres below the deepest level 17 mining area demonstrating the Avino vein is getting richer in Cooper. |
See Avino Mine Section on Pages 11-12 for further detailed tables and information on the exploration work at Avino.
| 3 | Page |
|
|
MANAGEMENT’S DISCUSSION AND ANALYSIS |
|
| FOR THE YEAR ENDED DECEMBER 31, 2022 |
Avino Receives ESR Award:
|
| · | Avino received for the first time, the ESR “Empresa Socialmente Responsible ESR 2022” Award granted by the Mexican Center for Philanthropy (El Centro Mexicano para la Filantropia or Cemefi, and the Alliance for Corporate Social Responsibility (Alizanza por la Responsabilidad Social Empresarial or (AliaRSE)). The ESR® Award is obtained through a diagnostic process based on indicators reviewed and endorsed annually by a committee of experts in the various CSR areas, supported with documentary evidence, an assessment differentiated by company size and by maturity levels, and an external verification process. Avino continues to view its social responsibility with importance and care of our communities |
Working Capital & Liquidity at December 31, 2022
|
| · | The Company’s cash balance at December 31, 2022, totaled $11.2 million compared to $24.8 million at December 31, 2021. Working capital totaled $12.1 million at December 31, 2022, compared to $31.6 million at December 31, 2021. |
Financial Results – Three months ended December 31, 2022, compared to three months ended December 31, 2021
| (000’s) |
| 2022 |
|
| 2021 |
|
||
| Revenue from mining operations |
| $ | 14,649 |
|
| $ | 9,318 |
|
| Cost of sales |
|
| 10,393 |
|
|
| 4,912 |
|
| Mine operating income |
|
| 4,356 |
|
|
| 4,406 |
|
| Operating expenses |
|
|
|
|
|
|
|
|
| General and administrative expenses |
|
| 1,687 |
|
|
| 840 |
|
| Share-based payments |
|
| 406 |
|
|
| 79 |
|
|
|
|
| 2,263 |
|
|
| 3,487 |
|
|
|
|
|
|
|
|
|
|
|
| Other items |
|
|
|
|
|
|
|
|
| Interest and other (expense) income |
|
| (47 | ) |
|
| 35 |
|
| Unrealized gain on long-term investments |
|
| 400 |
|
|
| 579 |
|
| Fair value adjustment on warrant liability |
|
| (297 | ) |
|
| 21 |
|
| Unrealized foreign exchange gain |
|
| 213 |
|
|
| 132 |
|
| Project evaluation expenses |
|
| - |
|
|
| (176 | ) |
| Finance costs |
|
| (85 | ) |
|
| (6 | ) |
| Accretion of reclamation provision |
|
| (12 | ) |
|
| (11 | ) |
| Interest expense |
|
| (33 | ) |
|
| (9 | ) |
| Net income before income taxes |
|
| 2,402 |
|
|
| 4,052 |
|
|
|
|
|
|
|
|
|
|
|
| Income taxes |
|
|
|
|
|
|
|
|
| Current income tax expense |
|
| (502 | ) |
|
| (2 | ) |
| Deferred income tax expense |
|
| (604 | ) |
|
| (1,421 | ) |
| Income tax expense |
|
| (1,106 | ) |
|
| (1,423 | ) |
|
|
|
|
|
|
|
|
|
|
| Net income |
| $ | 1,296 |
|
| $ | 2,629 |
|
|
|
|
|
|
|
|
|
|
|
| Earnings per share |
|
|
|
|
|
|
|
|
| Basic |
| $ | 0.01 |
|
| $ | 0.03 |
|
| Diluted |
| $ | 0.01 |
|
| $ | 0.03 |
|
| 4 | Page |
|
|
MANAGEMENT’S DISCUSSION AND ANALYSIS |
|
| FOR THE YEAR ENDED DECEMBER 31, 2022 |
Revenues
The Company recognized revenues net of penalties, treatment costs and refining charges, of $14.7 million on the sale of Avino Mine bulk copper/silver/gold concentrate, compared to revenues of $9.3 million for Q4 2021, an increase of $5.4 million.
The increase in revenues is a direct result of higher production, and thus increased payable ounces sold. The Company sold 756,536 AgEq oz compared to 417,881 AgEq oz sold in Q4 2021. The increase in sales was partly offset by lower realized metal prices in Q4 2022 compared to the prior year quarter.
Metal prices for revenues recognized during the period were $21.54 per ounce of silver, $1,735 per ounce of gold, and $7,982 per tonne of copper, compared to averages of $22.83 per ounce of silver, $1,802 per ounce of gold, and $9,548 per tonne of copper, for Q4 2021.
Cost of Sales & Mine Operating Income
Cost of sales was $10.0 million, compared to $4.9 million in Q4 2021, an increase of $5.1 million. The increase in cost of sales is attributable to the ramp up of mining operations throughout 2022.
Mine operating income, after depreciation and depletion, was $4.6 million, compared to $4.4 million income in Q4 2021. The increase in mine operating income is a direct result of the Company higher volume sold for Q4 2022, partly offset by lower metal realized prices alongside higher feed grades during Q4 2021 compared to Q4 2022. Write down of equipment recorded for the period totaled $0.3 million compared with $Nil in prior year quarter.
General and Administrative Expenses & Share-Based Payments
General and administrative expenses was $1.7 million, compared to $0.8 million in Q4 2021, an increase of $0.9 million. The increase is a result of increased operational administrative activity, corporate activity surrounding ramp up procedures, and the acquisition of la Preciosa.
Share-based payments was $0.4 million, compared to $0.1 million in Q4 2021, an increase of $0.3 million. The increase is a direct result of the 2022 option and RSU grants carrying a higher expense when compared to the vesting of option and RSU issuances from 2020 and prior years.
Other Items
Other items totaled $0.1 million in income for the period, a decrease of $0.5 million compared to income of $0.6 million related to other items in Q4 2021.
Unrealized gain on long-term investment was $0.4 million, a decrease of $0.2 million compared to $0.6 million gain in Q4 2021. This is a direct result of fluctuations in the Company’s investment in shares of Talisker Resources from period to period, as well as the Company’s investment in shares of Silver Wolf Exploration.
Fair value adjustment on warrant liability was a loss of $0.3 million, a decrease to income of $0.3 million compared to a gain of $Nil million in Q4 2021. The fair value adjustment on the Company’s warrant liability relates to the issuance of US dollar-denominated warrants, which are re-valued each reporting period, and the value fluctuates with changes in the US-Canadian dollar exchange rate, and in the variables used in the valuation model, such as the Company’s US share price, and expected share price volatility.
Foreign exchange gain for the period was $0.2 million, an increase of $0.1 million compared to a gain of $0.1 million in Q4 2021. Foreign exchange gains or losses result from transactions in currencies other than the Canadian dollar functional currency. During the three months ended December 31, 2022, the Canadian dollar and the US dollar appreciated slightly in relation to the Mexican peso, resulting in a foreign exchange gain.
| 5 | Page |
|
|
MANAGEMENT’S DISCUSSION AND ANALYSIS |
|
| FOR THE YEAR ENDED DECEMBER 31, 2022 |
The remaining Other Items resulted in loss of $0.2 million, a change of $Nil compared to a loss of $0.2 million for Q4 2021.
Current and Deferred Income Taxes
Current income tax expense was $0.5 million for Q4 2022, compared to $Nil income tax expense for Q4 2021. The current expense is the result of the return to profitable mining operations.
Deferred income tax expense was $0.6 million, a change of $0.8 million compared to an expense of $1.4 million in Q4 2021. Deferred income tax fluctuates due to movements in taxable and deductible temporary differences related to the special mining duty in Mexico and to changes in inventory, plant, equipment and mining properties, and exploration and evaluation assets, amongst other factors. The changes in current income taxes and deferred income taxes during the current and comparable periods primarily relate to movements in the tax bases and mining profits and/or losses in Mexico.
Net Income/Loss
Net income from all operations was $1.3 million for the period, or $0.01 per share, compared to income of $2.6 million, or $0.03 per share during Q4 2021. The changes are a result of the items noted above, which are primarily increases in revenues. The positive movement in income/loss was partially offset by increases in share-based payments and G&A expenses, a decreased unrealized gain on investments between the two comparable quarters, increase in unrealized loss on fair value of warrant liability, impairment loss recorded in current quarter, as noted above.
EBITDA & Adjusted Earnings/Loss (see “Non-IFRS Measures”)
EBITDA was $3.2 million, a decrease of $1.6 million when compared to $4.8 million for Q4 2021. The changes in EBITDA are primarily a factor of the items above, excluding any changes in depreciation and depletion, and any changes in income taxes. See Non-IFRS Measures for a reconciliation for EBITDA.
Adjusted earnings for the period was $3.7 million, a decrease of $1.0 million when compared to $4.7 million in the corresponding quarter in 2021. Changes to adjusted earnings are a result of the items noted above in EBITDA, further excluding share-based payments, gains and losses related to warrants, and movements in unrealized foreign exchange. See Non-IFRS Measures for a reconciliation for adjusted earnings.
Cash Costs & All-in Sustaining Cash Costs (see “Non-IFRS Measures”)
Cash costs per silver equivalent payable ounce was $11.76, compared to $9.08 for Q4 2021. The increase in cash costs is a result of higher grades mined during the prior year period, which resulted in lower unit costs on a per ounce sold basis.
All-in sustaining cash costs per silver equivalent payable ounce was $18.63, compared to $17.55 for Q4 2021. The increase in all-in sustaining cash costs during the current period is attributable to higher operational and administrative expenses, higher exploration expenses and higher sustaining capital expenses directly attributable to the production increase mentioned above.
See Non-IFRS Measures for a reconciliation for cash costs and all-in sustaining cash costs.
| 6 | Page |
|
|
MANAGEMENT’S DISCUSSION AND ANALYSIS |
|
| FOR THE YEAR ENDED DECEMBER 31, 2022 |
Annual Selected Information – Year ended December 31, 2022, compared to year ended December 31, 2021
|
|
| 2022 |
|
| 2021 |
|
| 2020 |
|
|||
| Revenue from mining operations |
| $ | 44,187 |
|
| $ | 11,228 |
|
| $ | 16,022 |
|
| Cost of sales |
|
| 29,125 |
|
|
| 7,681 |
|
|
| 15,832 |
|
| Mine operating income |
|
| 15,062 |
|
|
| 3,547 |
|
|
| 190 |
|
|
|
|
|
|
|
|
|
|
|
|
|
|
|
| Operating expenses |
|
|
|
|
|
|
|
|
|
|
|
|
| General and administrative expenses |
|
| 5,156 |
|
|
| 3,566 |
|
|
| 2,902 |
|
| Share-based payments |
|
| 2,024 |
|
|
| 1,469 |
|
|
| 1,857 |
|
|
|
| 7,882 |
|
|
| (1,488 | ) |
|
| (4,569 | ) | |
|
|
|
|
|
|
|
|
|
|
|
|
|
|
| Other items |
|
|
|
|
|
|
|
|
|
|
|
|
| Interest and other income |
|
| 20 |
|
|
| 178 |
|
|
| 332 |
|
| Unrealized gain (loss) on long-term investments |
|
| (2,103 | ) |
|
| (423 | ) |
|
| (124 | ) |
| Fair value adjustment on warrant liability |
|
| 2,395 |
|
|
| 1,581 |
|
|
| (650 | ) |
| Realized loss on warrants exercised |
|
| - |
|
|
| (1,106 | ) |
|
| (2,733 | ) |
| Foreign exchange loss |
|
| (17 | ) |
|
| (61 | ) |
|
| (811 | ) |
| Project evaluation expenses |
|
| (81 | ) |
|
| (176 | ) |
|
| - |
|
| Finance cost |
|
| (273 | )) |
|
| (52 | ) |
|
| (211 | ) |
| Accretion of reclamation provision |
|
| (44 | )) |
|
| (47 | ) |
|
| (99 | ) |
| Interest expense |
|
| (99 | )) |
|
| (24 | ) |
|
| (25 | ) |
| Income (loss) from continuing operations before income taxes |
|
| 7,680 |
|
|
| (1,618 | ) |
|
| (8,890 | ) |
| Income taxes: |
|
|
|
|
|
|
|
|
|
|
|
|
| Current income tax expense |
|
| (1,144 | ) |
|
| (27 | ) |
|
| (161 | ) |
| Deferred income tax (expense) recovery |
|
| (3,440 | ) |
|
| (412 | ) |
|
| 1,569 |
|
| Income tax (expense) recovery |
|
| (4,584 | ) |
|
| (439 |
|
|
| 1,408 |
|
| Net income (loss) from continuing operations |
|
| 3,096 |
|
|
| (2,057 | ) |
|
| (7,482 | ) |
| Loss from discontinued operations and on disposal |
|
| - |
|
|
| - |
|
|
| (169 | ) |
| Net income (loss) |
|
| 3,096 |
|
|
| (2,057 | ) |
|
| (7,651 | ) |
|
|
|
|
|
|
|
|
|
|
|
|
|
|
| Other comprehensive income (loss) |
|
|
|
|
|
|
|
|
|
|
|
|
| Currency translation differences |
|
| (254 | ) |
|
| (159 | ) |
|
| (247 | ) |
| Total comprehensive income (loss) |
| $ | 2,842 |
|
| $ | (2,216 | ) |
| $ | (7,898 | ) |
| Earnings (loss) per share from continuing operations |
|
|
|
|
|
|
|
|
|
|
|
|
| Basic & Diluted |
| $ | 0.03 |
|
| $ | (0.02 | ) |
| $ | (0.09 | ) |
| Earnings (loss) per share |
|
|
|
|
|
|
|
|
|
|
|
|
| Basic & Diluted |
| $ | 0.03 |
|
| $ | (0.02 | ) |
| $ | (0.09 | ) |
| Weighted average number of common shares outstanding |
|
|
|
|
|
|
|
|
|
|
|
|
| Basic |
|
| 114,372,371 |
|
|
| 100,161,357 |
|
|
| 83,180,069 |
|
| Diluted |
|
| 117,615,898 |
|
|
| 100,161,357 |
|
|
| 83,180,069 |
|
| 7 | Page |
|
|
MANAGEMENT’S DISCUSSION AND ANALYSIS |
|
| FOR THE YEAR ENDED DECEMBER 31, 2022 |
Revenues
The Company recognized revenues net of penalties, treatment costs and refining charges, of $44.2 million on the sale of Avino Mine bulk copper/silver/gold concentrate, compared to revenues of $11.2 million for year ended December 31, 2021, an increase of $33.0 million, or 294%. The increase is a direct result of a full year of revenues during 2022 compared to only 4 months of revenues in 2021, following the restart of mining operations in August 2021. The Company sold 2.45 million silver equivalent payable ounces in 2022, compared to 525 thousand silver equivalent payable ounces in 2021, representing an increase of 367%.
The increase in revenues were partially offset by lower metal prices in 2022 compared to 2021. Metal prices for revenues recognized during the period were $21.51 per ounce of silver, $1,788 per ounce of gold, and $8,552 per tonne of copper, in the prior year quarter, compared to $23.18, $1,802, and $9,524, respectively, for the same period in 2021.
Cost of Sales & Mine Operating Income
Cost of sales was $28.8 million, compared to $7.7 million in 2021, an increase of $21.1 million, or 275%. The increase in cost of sales is inline with the increase in ounces sold and revenues noted above and is directly attributable to mining operations being active during the full year ended December 31, 2022.
In 2022, tonnes milled increased by 228%, and total silver equivalent ounces produced increased by 215%, when compared to 2021. This is a direct result of full mining operations for the twelve-month period in 2022 when compared to four months of production mining operations in 2021. Further, a write down of equipment was recorded for the period totaling $0.3 million, compared with $Nil in prior year.
Mine operating income was $15.4 million, compared to mine operating income of $3.5 million, an increase of $11.9 million. This is a direct result of the items noted above.
General and Administrative Expenses & Share-Based Payments
General and administrative expenses was $5.1 million, compared to $3.6 million in 2021, with the increases coming from the increased corporate activity surrounding ramp up procedures and the acquisition of La Preciosa.
Share-based payments was $2.0 million, compared to $1.5 million in 2021, an increase of $0.5 million. Movements in share-based payments are a direct result of the 2022 option and RSU grants carrying a higher expense when compared to the vesting of option and RSU issuances from 2020 and prior years, as well as the fact that there were no grants in 2021.
Other Items
Other items totaled $0.5 million in losses for the period, an increase of $0.4 million compared to a loss of $0.1 million related to other items in the comparable period in 2021.
Unrealized loss on long-term investments was $2.1 million, an increase of $1.7 million compared to a loss of $0.4 million in 2021. This is a direct result of fluctuations in the Company’s investment in shares of Talisker Resources from period to period, as well as the Company’s investment in shares of Silver Wolf Exploration.
Fair value adjustment on warrant liability was a gain of $2.4 million, a favourable change of $0.8 million compared to a gain of $1.6 million in 2021. The fair value adjustment on the Company’s warrant liability relates to the issuance of US dollar-denominated warrants, which are re-valued each reporting period, and the value fluctuates with changes in the US-Canadian dollar exchange rate, and in the variables used in the valuation model, such as the Company’s US share price, and expected share price volatility.
| 8 | Page |
|
|
MANAGEMENT’S DISCUSSION AND ANALYSIS |
|
| FOR THE YEAR ENDED DECEMBER 31, 2022 |
Realized loss on warrants exercised was $Nil, a positive movement of $1.1 million compared to $1.1 million in 2021. During the current period, no warrants were exercised compared to 1.0 million warrants exercised in the comparable period in 2021.
Finance costs totaled $0.3 million in losses for the year, an increase of $0.2 million compared to a loss of $0.1 million in 2021. This is a direct result of the unwinding of the fair value adjustment on the note payable, which was issued in Q1 2022. There were no corresponding fair value adjustments to notes payable in 2021.
The remaining Other Items resulted in a loss of $0.2 million, fairly unchanged compared to a loss of $0.1 million for the same remaining Other items in 2021.
Current and Deferred Income Taxes
Current income tax expense increase to $1.1 million compared to under $0.1 million in income tax expense for the prior year period. Given the return to profitable mining operations, the higher amount of current income tax expenses in 2022 is a result of income generated in the current period and relates primarily to the special mining duties tax on profits in Mexico.
Deferred income tax expense was $3.4 million, a change of $3.0 million compared to an expense of $0.4 million for the comparable period in 2021. Deferred income tax fluctuates due to movements in taxable and deductible temporary differences related to the special mining duty in Mexico and to changes in inventory, plant, equipment and mining properties, and exploration and evaluation assets, amongst other factors. The changes in current income taxes and deferred income taxes during the current and comparable periods primarily relate to movements in the tax bases and mining profits and/or losses in Mexico, as the Company applied operating losses in 2022 with a net impact of $2.8 million to deferred income tax expense, which consisted of the majority of the $3.0 million change compared to the prior year.
Net Income/Loss
Net income from all operations was $3.1 million for the period, or $0.03 per share, compared to a loss of $2.1 million, or $0.02 per share during the comparable period in 2021. The changes are a result of the items noted above, which are primarily increases in revenues and mine operating income, and movements in the fair value adjustment of the warrant liability and realized loss on warrants exercised. The positive movement in net income/loss was partially offset by increases to share-based payments, an increase to general and administrative expenses and an increased unrealized loss on investments, as well as increased current and deferred income tax expense, as noted above.
EBITDA & Adjusted Earnings/Loss (see “Non-IFRS Measures”)
EBITDA was $10.3 million, compared to $0.4 million for 2021. The changes in EBITDA are primarily a factor of the items above, excluding any changes in depreciation and depletion, and any changes in income taxes. See Non-IFRS Measures for a reconciliation for EBITDA.
Adjusted earnings for the period was $10.2 million, an increase of $7.9 million when compared to $2.3 million in 2021. Changes to adjusted earnings are a result of the items noted above in EBITDA, further excluding share-based payments, gains and losses related to warrants, a $0.3 million write down on equipment, and movements in unrealized foreign exchange. See Non-IFRS Measures for a reconciliation for adjusted earnings.
| 9 | Page |
|
|
MANAGEMENT’S DISCUSSION AND ANALYSIS |
|
| FOR THE YEAR ENDED DECEMBER 31, 2022 |
Cash Costs & All-in Sustaining Cash Costs (see “Non-IFRS Measures”)
Cash costs per silver equivalent payable ounce was $10.34, compared to $8.07 for the comparable period in 2021. Throughout 2022, mining activities continued to ramp-up and thus certain incremental and non-recurring costs were incurred to reach the current mill throughput. Cash costs at the Avino Mine are expected to stabilize at these levels moving forward.
All-in sustaining cash costs per silver equivalent payable ounce for the year was $17.91, compared to $24.07 in 2021. The decrease is a result of higher ounces produced and sold, with a similar level of administrative and support costs, which resulted in a decrease in overall all-in sustaining cash costs.
See Non-IFRS Measures for a reconciliation for cash costs and all-in sustaining cash costs.
Avino Mine Production Highlights
|
| Q4 2022 | Q4 2021 | Change % | YTD 2022 | YTD 2021 | Change % |
| Total Mill Feed (dry tonnes) | 150,292 | 103,513 | 45% | 541,823 | 154,498 | 251% |
| Feed Grade Silver (g/t) | 70 | 56 | 26% | 62 | 53 | 16% |
| Feed Grade Gold (g/t) | 0.62 | 0.86 | -28% | 0.42 | 0.88 | -52% |
| Feed Grade Copper (%) | 0.53 | 0.55 | -4% | 0.61 | 0.60 | 2% |
| Recovery Silver (%) | 92% | 89% | 3% | 92% | 89% | 3% |
| Recovery Gold (%) | 81% | 75% | 8% | 78% | 76% | 3% |
| Recovery Copper (%) | 88% | 90% | -2% | 89% | 91% | -2% |
| Total Silver Produced (oz) | 309,856 | 163,933 | 89% | 985,185 | 236,035 | 317% |
| Total Gold Produced (oz) | 2,426 | 2,158 | 12% | 5,778 | 3,328 | 74% |
| Total Copper Produced (lbs) | 1,540.851 | 1,128,728 | 37% | 6,504,177 | 1,856,722 | 250% |
| Total Silver Equivalent Produced (oz)* | 770,127 | 541,432 | 42% | 2,655,502 | 826,589 | 221% |
In Q4 2022, AgEq was calculated using metal prices of $21.18 oz Ag, $1,729 oz Au, and $3.63 lb Cu. In Q4 2021, AgEq was calculated using metals prices of $23.32 oz Ag, $1,783 oz Au and $4.39 lb Cu. In FY 2022, AgEq was calculated using metal prices of $21.75 oz Ag, $1,801 oz Au and $4.00 lb Cu. In FY 2021, AgEq was calculated using metal prices of $23.84 oz Ag, $1,786 oz Au and $4.32 lb Cu.
Under National Instrument 43-101, the Company is required to disclose that it has not based its production decisions on NI 43-101-compliant reserve estimates, preliminary economic assessments, or feasibility studies, and historically projects without such reports have increased uncertainty and risk of economic viability. The Company’s decision to place a mine into operation at levels intended by management, expand a mine, make other production-related decisions, or otherwise carry out mining and processing operations is largely based on internal non-public Company data, and on reports based on exploration and mining work by the Company and by geologists and engineers engaged by the Company. The results of this work are evident in the Company’s discovery of the San Gonzalo and Avino Mine resources, and in the Company’s record of mineral production and financial returns since operations at levels intended by management commenced at the San Gonzalo Mine in 2012.
Avino Mine Exploration
The Company has completed over 15,500 metres of drilling, delivering on the promise to re-invest into exploration at Avino. The main focus of exploration work was on the area at depth below the current Elena Tolosa production area, further drilling of 17 additional holes on the Oxide Tailings project, and La Potosina.
Avino – Elena Tolosa Area
On January 5, 2023, Avino announced the results of four drills holes from below Level 17, the current deepest working at the mine. This drilling shows the Avino Vein to extend a further 315 metres downdip. This exploration program is designed to test the continuity of steeply dipping mineralization and understand the source of mineralization. As a result of this drilling, the Avino Vein is now known to be 900 metres downdip. Additionally, it appears the Avino Vein is getting richer in copper as we go deeper with grade of 1.63% copper over 16.66 metres in Hole ET 22-12.
| 10 | Page |
|
|
MANAGEMENT’S DISCUSSION AND ANALYSIS |
|
| FOR THE YEAR ENDED DECEMBER 31, 2022 |
Selected intercepts include:
| Structure | Hole Number | From (m) | To (m) | Drill Intercept Length (m) | True Width (m) | Au (g/t) | Ag (g/t) | Cu (%) | AgEq¹ (g/t) |
| AVINO VEIN | ET-22-10 | 655.70 | 657.35 | 1.65 | 1.45 | 0.05 | 6 | 0.01 | 11 |
| HW STW | ET-22-11 | 405.25 | 408.50 | 3.25 | 3.00 | 0.38 | 13 | 0.72 | 140 |
|
| Including | 406.85 | 408.50 | 1.65 | 1.45 | 0.74 | 24 | 1.30 | 258 |
| AVINO VEIN | ET-22-12 | 596.30 | 620.75 | 24.45 | 16.66 | 0.03 | 26 | 1.63 | 248 |
|
| Including | 598.60 | 610.65 | 12.05 | 8.57 | 0.04 | 34 | 2.49 | 371 |
| NEW AREA | ET-22-13 | 35.80 | 37.10 | 1.30 | 1.10 | 2.46 | 9 | 0.30 | 254 |
| HW BX |
| 275.80 | 282.00 | 6.20 | 5.82 | 0.23 | 22 | 0.36 | 89 |
| AVINO VEIN | and | 539.65 | 573.10 | 33.45 | 23.64 | 0.06 | 23 | 0.34 | 73 |
|
| Including | 553.60 | 564.85 | 11.25 | 7.95 | 0.05 | 24 | 0.47 | 90 |
Hole ET 22-12: 248 AgEq g/t in 16.66 metres of drilling, including 371 AgEq g/t over 8.57 metres true width
Hole ET 22-13: 254 AgEq g/t including 2.46 Au g/t, over 1.10 meters true width at only 35 meters from surface, as well as 73 AgEq g/t over 23.64 metres true width, including 90 AgEq g/t over 7.95 metres true width
Details are shown in the table and images below.
Table 1 – Summary Drill Results
| 1. | AgEq in drill results above assumes $1,800/ oz Au and $22.00 oz/ Ag, and $4.30/ lb Cu, and 100% metallurgical recovery |
| 2. | HW BX = Hanging Wall Breccia and HW STW = Hanging Wall Stockworks |
Avino – Oxide Tailings
In 2022, Avino performed all remaining recommended drilling from 2017 Preliminary Economic Assessment (“PEA”). Further, the Company completed its comprehensive metallurgical test work and is awaiting results.
Qualified Person(s)
Peter Latta, P.Eng, MBA, VP Technical Services, Avino, is a qualified person within the context of National Instrument 43-101, and has reviewed and approved the technical data in this document.
| 11 | Page |
|
|
MANAGEMENT’S DISCUSSION AND ANALYSIS |
|
| FOR THE YEAR ENDED DECEMBER 31, 2022 |
Non – IFRS Measures
EBITDA and Adjusted EBITDA
Earnings, or loss, before interest, taxes and amortization (“EBITDA”) is a non IFRS financial measure which excludes the following items from net earnings:
|
| · | Income tax expense |
|
| · | Finance cost |
|
| · | Amortization and depletion |
Adjusted EBITDA excludes the following additional items from EBITDA
|
| · | Share based compensation; |
|
| · | Non-operational items including foreign exchange movements, fair value adjustments on outstanding warrants and other non-recurring items |
Management believes EBITDA and adjusted earnings provides an indication of continuing capacity to generate operating cash flow to fund capital needs, service debt obligations and fund capital expenditures. These measures are intended to provide additional information to investors and analysts. There are not standardized definitions under IFRS as issued by the IASB and should not be considered in isolation or as a substitute for measures of operating performance prepared in accordance with IFRS as issued by the IASB.
Adjusted earnings excludes share-based payments, and non-operating or recurring items such as foreign exchange gains and losses and fair value adjustments on outstanding warrants. Under IFRS, entities must reflect within compensation expense the cost of share-based payments. In the Company’s circumstances, share-based compensation can involve significant amounts that will not be settled in cash but are settled by issuance of shares in exchange. The Company discloses adjusted earnings to aid in understanding the results of the company.
The following table provides a reconciliation of net earnings in the financial statements to EBITDA and adjusted earnings:
| Expressed in 000’s of US$, unless otherwise noted |
| Q4 2022 |
|
| Q4 2021 |
|
| YTD 2022 |
|
| YTD 2021 |
|
||||
| Net income (loss) for the period |
| $ | 1,296 |
|
| $ | 2,629 |
|
| $ | 3,096 |
|
| $ | (2,057) | |
| Depreciation and depletion |
|
| 628 |
|
|
| 778 |
|
|
| 2,186 |
|
|
| 2,116 |
|
| Interest income and other |
|
| 47 |
|
|
| (35) |
|
| (19) |
|
| (178) | |||
| Interest expense |
|
| 33 |
|
|
| 9 |
|
|
| 99 |
|
|
| 24 |
|
| Finance cost |
|
| 85 |
|
|
| 6 |
|
|
| 273 |
|
|
| 52 |
|
| Accretion of reclamation provision |
|
| 12 |
|
|
| 11 |
|
|
| 44 |
|
|
| 47 |
|
| Current income tax expense |
|
| 502 |
|
|
| 2 |
|
|
| 1,144 |
|
|
| 27 |
|
| Deferred income tax expense |
|
| 604 |
|
|
| 1,421 |
|
|
| 3,440 |
|
|
| 412 |
|
| EBITDA |
| $ | 3,207 |
|
| $ | 4,821 |
|
| $ | 10,263 |
|
| $ | 443 |
|
| Fair value adjustment on warrant liability |
|
| 297 |
|
|
| (21) |
|
| (2,395) |
|
| (1,581) | |||
| Realized loss on warrants exercised |
|
| - |
|
|
| - |
|
|
| - |
|
| n 1,106 |
|
|
| Share-based payments |
|
| 406 |
|
|
| 78 |
|
|
| 1,618 |
|
|
| 1,469 |
|
| Stand-by costs during strike action |
|
| - |
|
|
| - |
|
|
| - |
|
|
| 800 |
|
| Write down of equipment |
|
| 330 |
|
|
| - |
|
|
| 330 |
|
|
| - |
|
| Foreign exchange loss (gain) |
|
| (214) |
|
| (132) |
|
| 17 |
|
|
| 61 |
|
||
| Adjusted EBITDA earnings (loss) |
| $ | 4,026 |
|
| $ | 4,746 |
|
| $ | 10,239 |
|
| $ | 2,298 |
|
| 12 | Page |
|
|
MANAGEMENT’S DISCUSSION AND ANALYSIS |
|
| FOR THE YEAR ENDED DECEMBER 31, 2022 |
Cash cost per payable ounce, and all-in sustaining cash cost per payable ounce
Cash cost per payable ounce, all-in sustaining cash cost per payable ounce, and cash flow per share are measures developed by mining companies in an effort to provide a comparable standard. However, there can be no assurance that our reporting of these non-IFRS measures is similar to that reported by other mining companies. Total cash cost per payable ounce, all-in sustaining cash cost per payable ounce, and cash flow per share are measures used by the Company to manage and evaluate operating performance of the Company’s mining operations, and are widely reported in the silver and gold mining industry as benchmarks for performance, but do not have standardized meanings prescribed by IFRS as issued by the IASB, and are disclosed in addition to IFRS measures.
Cash cost per payable ounce
Management believes that the Company’s ability to control the cash cost per payable silver equivalent ounce is one of its key performance drivers impacting both the Company’s financial condition and results of operations. Achieving a low silver equivalent production cost base allows the Company to remain profitable from mining operations even during times of low commodity prices, and provides more flexibility in responding to changing market conditions. In addition, a profitable operation results in the generation of positive cash flows, which then improve the Company’s financial condition.
All-in sustaining cash cost per silver equivalent payable ounce
The Company has adopted the reporting of “all-in sustaining cash cost per silver equivalent payable ounce”. This measure has no standardized meaning throughout the industry. However, it is intended to provide additional information. Avino presents all-in sustaining cash cost, because it believes that it more fully defines the total current cost associated with producing a silver equivalent payable ounce. Further, the Company believes that this measure allows investors of the Company to better understand its cost of producing silver equivalent payable ounces, and better assess the Company’s ability to generate cash flow from operations. Although the measure seeks to reflect the full cost per silver equivalent ounce of production from current operations, it does not include capital expenditures attributable to mine expansions, exploration, and evaluation costs attributable to growth projects, income tax payments, and financing costs. In addition, the calculation of all-in sustaining cash costs does not include depreciation and depletion expense as it does not reflect the impact of expenditures incurred in prior periods.
The Company’s calculation of all-in sustaining cash costs includes sustaining capital expenditures of $3,473 for the year ended December 31, 2022 (December 31, 2021 - $1,780) all of which is attributable to the Avino Mine
Cash Cost and All-in Sustaining Cash Cost per Silver Equivalent Payable Ounce
The following table provide a reconciliation of cost of sales from the consolidated financial statements to cash cost and all-in sustaining cash cost per silver equivalent payable ounce sold. In each table, “silver equivalent payable ounces sold” consists of the sum of payable silver ounces, gold ounces and copper tonnes sold, before penalties, treatment charges, and refining charges, multiplied by the ratio of the average spot gold and copper prices for the corresponding period.
| 13 | Page |
|
|
MANAGEMENT’S DISCUSSION AND ANALYSIS |
|
| FOR THE YEAR ENDED DECEMBER 31, 2022 |
The following table reconciles cost of sales to cash cost per payable AgEq oz and all-in sustaining cash cost per payable AgEq oz for the preceding quarters:
| Expressed in 000’s of US$, unless otherwise noted |
| Avino – Consolidated |
|
|||||||||||||||||||||||||||||
|
|
| Q4 2022 |
|
| Q3 2022 |
|
| Q2 2022 |
|
| Q1 2022 |
|
| Q4 2021 |
|
| Q3 2021 |
|
| Q2 2021 |
|
| Q1 2021 |
|
||||||||
| Cost of sales |
| $ | 10,293 |
|
| $ | 7,058 |
|
| $ | 5,468 |
|
| $ | 6,306 |
|
| $ | 4,912 |
|
| $ | 1,043 |
|
| $ | 1,017 |
|
| $ | 709 |
|
| Exploration expenses |
|
| (472) |
|
| (336) |
|
| (305) |
|
| (296) |
|
| (214) |
|
| (308) |
|
| (129) |
|
| - |
|
|||||||
| Stand-by costs during strike action |
|
| - |
|
|
| - |
|
|
| - |
|
|
| - |
|
|
| - |
|
|
| - |
|
|
| (425) |
|
| (246) | ||
| Write down of equipment |
|
| (330) |
|
|
| - |
|
|
| - |
|
|
| - |
|
|
| - |
|
|
| - |
|
|
| - |
|
|
| - |
|
| Depletion and depreciation |
|
| (592) |
|
| (514) |
|
| (481) |
|
| (459) |
|
| (741) |
|
| (319) |
|
| (463) |
|
| (463) | ||||||||
| Cash production cost |
|
| 8,899 |
|
|
| 6,208 |
|
|
| 4,682 |
|
|
| 5,551 |
|
|
| 3,957 |
|
|
| 416 |
|
|
| - |
|
|
| - |
|
| Payable silver equivalent ounces sold |
|
| 756,536 |
|
|
| 603,360 |
|
|
| 594,700 |
|
|
| 495,109 |
|
|
| 435,885 |
|
|
| 107,112 |
|
|
| - |
|
|
| - |
|
| Cash cost per silver equivalent ounce |
| $ | 11.76 |
|
| $ | 10.29 |
|
| $ | 7.87 |
|
| $ | 11.21 |
|
| $ | 9.08 |
|
| $ | 3.87 |
|
| $ | - |
|
| $ | - |
|
| General and administrative expenses |
|
| 2,094 |
|
|
| 1,553 |
|
|
| 2,218 |
|
|
| 1,316 |
|
|
| 967 |
|
|
| 1,094 |
|
|
| 1,475 |
|
|
| 1,550 |
|
| Treatment & refining charges |
|
| 784 |
|
|
| 568 |
|
|
| 700 |
|
|
| 766 |
|
|
| 529 |
|
|
| 127 |
|
|
| - |
|
|
| - |
|
| Penalties |
|
| 1,649 |
|
|
| 1,705 |
|
|
| 897 |
|
|
| 1,578 |
|
|
| 1,200 |
|
|
| 255 |
|
|
| - |
|
|
| - |
|
| Sustaining capital expenditures |
|
| 639 |
|
|
| 672 |
|
|
| 1,586 |
|
|
| 576 |
|
|
| 774 |
|
|
| 855 |
|
|
| 57 |
|
|
| 103 |
|
| Exploration expenses |
|
| 472 |
|
|
| 336 |
|
|
| 305 |
|
|
| 296 |
|
|
| 214 |
|
|
| 308 |
|
|
| 129 |
|
|
| - |
|
| Stand-by costs during stoppages |
|
| - |
|
|
| - |
|
|
| - |
|
|
| - |
|
|
| - |
|
|
| - |
|
|
| 425 |
|
|
| 246 |
|
| Share-based payments and G&A depreciation |
|
| (442) |
|
| (591) |
|
| (899) |
|
| (230) |
|
| (125) |
|
| (312) |
|
| (528) |
|
| (645) | ||||||||
| Cash operating cost |
| $ | 14,095 |
|
| $ | 10,451 |
|
| $ | 9,489 |
|
| $ | 9,853 |
|
| $ | 7,516 |
|
| $ | 2,743 |
|
| $ | 1,558 |
|
| $ | 1,254 |
|
| AISC per silver equivalent ounce |
| $ | 18.63 |
|
| $ | 17.32 |
|
| $ | 15.95 |
|
| $ | 19.90 |
|
| $ | 17.24 |
|
| $ | 25.60 |
|
| $ | - |
|
| $ | - |
|
The following table reconciles cash cost per AgEq oz production cost to all-in sustaining cash cost per AgEq oz for the year ended December 31, 2022, and 2021:
| Expressed in 000’s of US$, unless otherwise noted |
| Avino - Consolidated |
|
|||||
|
|
| 2022 |
|
| 2021 |
|
||
| Cost of sales |
| $ | 29,125 |
|
| $ | 7,681 |
|
| Exploration expenses |
|
| (1,410) |
|
| (651) | ||
| Stand-by costs during strike action |
|
| - |
|
|
| (672) | |
| Write down of equipment |
|
| (330) |
|
|
| - |
|
| Depletion and depreciation |
|
| (2,046) |
|
| (1,976) | ||
| Cash production cost |
|
| 25,339 |
|
|
| 4,382 |
|
| Payable silver equivalent ounces sold |
|
| 2,449,704 |
|
|
| 542,997 |
|
| Cash cost per silver equivalent ounce |
| $ | 10.34 |
|
| $ | 8.07 |
|
| General and administrative expenses |
|
| 7,180 |
|
|
| 5,084 |
|
| Treatment & refining charges |
|
| 2,817 |
|
|
| 656 |
|
| Penalties |
|
| 5,828 |
|
|
| 1,455 |
|
| Sustaining capital expenditures |
|
| 3,473 |
|
|
| 1,781 |
|
| Exploration expenses |
|
| 1,410 |
|
|
| 651 |
|
| Stand-by costs during stoppages |
|
| - |
|
|
| 672 |
|
| Share-based payments and G&A depreciation |
|
| (2,164) |
|
| (1,609) | ||
| Cash operating cost |
| $ | 43,883 |
|
| $ | 13,072 |
|
| AISC per silver equivalent ounce |
| $ | 17.91 |
|
| $ | 24.07 |
|
| 14 | Page |
|
|
MANAGEMENT’S DISCUSSION AND ANALYSIS |
|
| FOR THE YEAR ENDED DECEMBER 31, 2022 |
Working Capital
|
|
| December 31, 2022 |
|
| December 31, 2021 |
|
||
| Current assets |
| $ | 25,585 |
|
| $ | 35,478 |
|
| Current liabilities |
|
| (16,764 | ) |
|
| (3,843 | ) |
| Working capital |
| $ | 8,821 |
|
| $ | 31,635 |
|
Results of Operations
Summary of Quarterly Results
| (000’s) |
| 2022 |
|
| 2022 |
|
| 2022 |
|
| 2022 |
|
| 2021 |
|
| 2021 |
|
| 2021 |
|
| 2021 |
|
||||||||
| Quarter ended |
| Dec 31 Q4 |
|
| Sep 30 Q3 |
|
| Jun 30 Q2 |
|
| Mar 31 Q1 |
|
| Dec 31 Q4 |
|
| Sep 30 Q3 |
|
| Jun 30 Q2 |
|
| Mar 31 Q1 |
|
||||||||
| Revenue |
| $ | 14,649 |
|
| $ | 9,118 |
|
| $ | 9,370 |
|
| $ | 11,050 |
|
| $ | 9,318 |
|
| $ | 1,881 |
|
| $ | - |
|
| $ | 29 |
|
| Net income (loss) from all operations for the quarter |
|
| 1,296 |
|
|
| (1,129 | ) |
|
| 2,283 |
|
|
| 646 |
|
|
| 2,629 |
|
|
| (214 | ) |
|
| (2,654 | ) |
|
| (1,818 | ) |
| Earnings (loss) per share from all operations - basic |
| $ | 0.01 |
|
| $ | (0.01 | ) |
| $ | 0.02 |
|
| $ | 0.01 |
|
| $ | 0.03 |
|
| $ | (0.00 | ) |
| $ | (0.03 | ) |
| $ | (0.02 | ) |
| Earnings (loss) per share from all operations - diluted |
| $ | 0.01 |
|
| $ | (0.01 | ) |
| $ | 0.02 |
|
| $ | 0.01 |
|
| $ | 0.04 |
|
| $ | (0.00 | ) |
| $ | (0.03 | ) |
| $ | (0.02 | ) |
| Total Assets |
| $ | 121,196 |
|
| $ | 115,310 |
|
| $ | 114,998 |
|
| $ | 111,413 |
|
| $ | 86,264 |
|
| $ | 82,109 |
|
| $ | 83,024 |
|
| $ | 84,550 |
|
|
| · | Revenue increased in Q4 2022 compared with prior quarters due to higher production and sales levels in the current period. Overall, revenue had been constant in the fourth preceding quarters, but increasing in general due to the restart of operations and the commencement of sales in September 2021. |
|
|
|
|
|
| · | Net income in Q4 2022 increased primarily due to increased revenues, offset by higher cost of sales and administrative expenses and other items. For further details see “Financial Results” section. |
|
|
|
|
|
| · | Total assets has increased compared to previous quarters as result of the acquisition of La Preciosa as well as the increased operating cash flow generation. |
Quarterly results will fluctuate with changes in revenues, cost of sales, general and administrative expenses, including non-cash items such as share-based payments, and other items including foreign exchange and deferred income taxes.
Discussion and analysis relating to the Company’s financial position, as well as movements in cash flow, is as follows:
| 15 | Page |
|
|
MANAGEMENT’S DISCUSSION AND ANALYSIS |
|
| FOR THE YEAR ENDED DECEMBER 31, 2022 |
Selected Annual Information - Statement of Financial Position
| (000’s) |
| December 31, 2022 |
|
| December 31, 2021 |
|
| December 31, 2020 |
|
|||
| Cash |
| $ | 11,245 |
|
| $ | 24,765 |
|
| $ | 11,713 |
|
| Total current assets |
|
| 25,585 |
|
|
| 35,478 |
|
|
| 19,702 |
|
| Total assets |
|
| 121,196 |
|
|
| 86,278 |
|
|
| 68,780 |
|
| Total current liabilities |
|
| 16,764 |
|
|
| 3,843 |
|
|
| 5,022 |
|
| Total liabilities |
|
| 23,175 |
|
|
| 7,771 |
|
|
| 9,772 |
|
| Share capital |
|
| 145,515 |
|
|
| 129,953 |
|
|
| 108,383 |
|
| Accumulated deficit |
|
| (52,096 | ) |
|
| (55,953 | ) |
|
| (54,339 | ) |
| Total equity |
|
| 98,021 |
|
|
| 78,507 |
|
|
| 59,008 |
|
Cash Flow
| (000’s) |
| December 31, 2022 |
|
| December 31, 2021 |
|
||
| Cash generated by operating activities |
| $ | 11,831 |
|
| $ | 109 |
|
| Cash generated by (used in) financing activities |
|
| (1,149 | ) |
|
| 16,092 |
|
| Cash used in investing activities |
|
| (24,101 | ) |
|
| (3,207 | ) |
| Change in cash |
|
| (13,419 | ) |
|
| 12,994 |
|
| Effect of exchange rate changes on cash |
|
| (101 | ) |
|
| 58 |
|
| Cash, beginning of period |
|
| 24,765 |
|
|
| 11,713 |
|
| Cash, end of period |
| $ | 11,245 |
|
| $ | 24,765 |
|
Operating Activities
Cash generated by operating activities for the year ended December 31, 2022, was $11.8 million compared to $0.1 million used for the year ended December 31, 2021. Cash movements from operating activities can fluctuate with changes in net income or loss, movements in non-cash items impacting net income or loss, and movements in working capital. In 2022, cash generated by operating activities increased by $11.7 million primarily due to the Company being engaged in production and sales activities for the full year, generating mine operating income of $15.1 million, compared to $3.5 million in 2021, a difference of $11.6 million.
Financing Activities
Cash used by financing activities was $1.1 million for the year ended December 31, 2022, compared to $16.1 million generated for the year ended December 31, 2021. Cash used by financing activities for the years ended December 31, 2022 and 2021, relates to the issuance of shares for cash, by way of at-the-market sales and the exercise of warrants and stock options. Cash used in financing activities relates to the repayment of the term facility, as well as on its existing finance leases and equipment loan for mining equipment.
During the year ended December 31, 2022, the Company received net proceeds from issuance of shares for cash of Nil (December 31, 2021 - $18.1 million), received proceeds from warrants exercise of Nil (December 31, 2021 - $0.8 million) and received proceeds from stock options exercised by $0.03 million (December 31, 2021 - $0.2 million). The Company also made term facility repayments of Nil (December 31, 2021 - $2.5 million) and made finance lease and equipment loan payments totalling $1.2 million (December 31, 2021 - $0.5 million).
Investing Activities
Cash used in investing activities for the year ended December 31, 2022, was $24.1 million compared to $3.2 million for year ended December 31, 2021. Cash used in investing activities included cash capital expenditures of $8.9 million (December 31, 2021 - $1.9 million) on the acquisition of property and equipment and exploration expenditures, as well as $15.1 million related to the acquisition of La Preciosa.
| 16 | Page |
|
|
MANAGEMENT’S DISCUSSION AND ANALYSIS |
|
| FOR THE YEAR ENDED DECEMBER 31, 2022 |
Liquidity and Capital Resources
The Company’s ability to generate sufficient amounts of cash, in both the short term and the long term, to maintain existing capacity and to fund ongoing exploration, is dependent upon the discovery of economically recoverable reserves or resources and the ability of the Company to obtain the financing necessary to generate and sustain profitable operations.
Management expects that the Company’s ongoing liquidity requirements will be funded from cash generated from current operations and from further financing, as required, in order to fund ongoing exploration activities, and meet its objectives, including ongoing advancement at the Avino Mine. The Company continues to evaluate financing opportunities to advance its projects. The Company’s ability to secure adequate financing is, in part, dependent on overall market conditions, the prices of silver, gold, and copper, and other factors outside the Company’s control. There is no guarantee the Company will be able to secure any or all necessary financing in the future. The Company’s recent financing activities are summarized in the table below.
| Intended Use of Proceeds | Actual Use of Proceeds |
| During 2021, the Company received net proceeds of $18.1 million in connection with a brokered at-the-market offering issued under prospectus supplements, $0.8 million in connection with warrants exercised and $0.2 million in connection with stock options exercised.
The intended use of the funds is to fund the acquisition of La Preciosa mine and exploration and evaluation expenses.
| As of the date of this MD&A, the Company has used the funds as intended. During 2021, the Company announced an increase to its exploration from 12,000 to 30,600 metres of exploration and resource drilling. As of the date of this MD&A, over 20,000 metres of the program had been completed.
In supporting mining operations in Mexico, the Company acquired la Preciosa for net cash consideration of $15.4 million. During the year ended December 31, 2022, the remaining $3.7 million was used for exploration and evaluation activities, the acquisition of property and equipment, the repayment of capital equipment acquired under lease and loan.
|
| During 2020, the Company received net proceeds of $4.7 million in connection with a brokered at-the-market offering issued under prospectus supplements and $3.7 million in connection with warrants exercised.
| As of the date of this MD&A, the Company had used, and was continuing to use, the funds as intended. There has been no impact on the ability of the Company to achieve its business objectives and milestones.
The Company intends to continue to explore its properties, as described above, subject to market conditions and the ability to continue to obtain suitable financing.
|
Off-Balance Sheet Arrangements
The Company has no off-balance sheet arrangements.
Transactions with Related Parties
All related party transactions are recorded at the exchange amount which is the amount agreed to by the Company and the related party.
| 17 | Page |
|
|
MANAGEMENT’S DISCUSSION AND ANALYSIS |
|
| FOR THE YEAR ENDED DECEMBER 31, 2022 |
| (a) | Key management personnel |
The Company has identified its directors and certain senior officers as its key management personnel. The compensation costs for key management personnel for the years ended December 31, 2022 and 2021 is as follows:
|
|
| 2022 |
|
| 2021 |
|
||
| Salaries, benefits, and consulting fees |
| $ | 1,228 |
|
| $ | 1,021 |
|
| Share-based payments |
|
| 1,566 |
|
|
| 1,188 |
|
|
|
| $ | 2,794 |
|
| $ | 2,209 |
|
| (b) | Amounts due to/from related parties |
In the normal course of operations the Company transacts with companies related to Avino’s directors or officers. All amounts payable and receivable are non-interest bearing, unsecured and due on demand. The following table summarizes the amounts due to / (from) related parties:
|
|
| December 31, 2022 |
|
| December 31, 2021 |
|
||
| Oniva International Services Corp. |
| $ | 100 |
|
| $ | 107 |
|
| Silver Wolf Exploration Ltd. |
|
| (72 | ) |
|
| - |
|
| Directors Fees |
|
| - |
|
|
| 56 |
|
|
|
| $ | 28 |
|
| $ | 163 |
|
For services provided to the Company as President and Chief Executive Officer, the Company pays Intermark Capital Corporation (“ICC”), a company controlled by David Wolfin, the Company’s president and CEO and also a director, for consulting services. For the year ended December 31, 2022 and 2021, the Company paid $326 and $239, respectively, to ICC.
| (c) | Other related party transactions |
The Company has a cost sharing agreement with Oniva International Services Corp. (“Oniva”) for office and administration services. Pursuant to the cost sharing agreement, the Company will reimburse Oniva for the Company’s percentage of overhead and corporate expenses and for out-of-pocket expenses incurred on behalf of the Company. David Wolfin, President & CEO, and a director of the Company, is the sole owner of Oniva. The cost sharing agreement may be terminated with one-month notice by either party without penalty.
| 18 | Page |
|
|
MANAGEMENT’S DISCUSSION AND ANALYSIS |
|
| FOR THE YEAR ENDED DECEMBER 31, 2022 |
The transactions with Oniva during the year ended December 31, 2022 and 2021, are summarized below:
|
|
| 2022 |
|
| 2021 |
|
||
| Salaries and benefits |
| $ | 878 |
|
| $ | 766 |
|
| Office and miscellaneous |
|
| 461 |
|
|
| 403 |
|
|
|
| $ | 1,339 |
|
| $ | 1,169 |
|
Financial Instruments and Risks
The fair values of the Company’s amounts due to related parties and accounts payable approximate their carrying values because of the short-term nature of these instruments. Cash, amounts receivable, long-term investments, and warrant liability are recorded at fair value. The carrying amounts of the Company’s term facility, equipment loans, and finance lease obligations are a reasonable approximation of their fair values based on current market rates for similar financial instruments.
The Company’s financial instruments are exposed to certain financial risks, including credit risk, liquidity risk, and market risk.
(a) Credit Risk
Credit risk is the risk that one party to a financial instrument will cause a financial loss for the other party by failing to discharge an obligation. The Company has exposure to credit risk through its cash, long-term investments and amounts receivable. The Company manages credit risk, in respect of cash and short-term investments, by maintaining the majority of cash and short-term investments at highly rated financial institutions.
The Company is exposed to a significant concentration of credit risk with respect to its trade accounts receivable balance because all of its concentrate sales are with two (December 31, 2021 – two) counterparty. However, the Company has not recorded any allowance against its trade receivables because to-date all balances owed have been settled in full when due (typically within 60 days of submission) and because of the highly-rated nature of the counterparties.
The Company’s maximum exposure to credit risk at the end of any period is equal to the carrying amount of these financial assets as recorded in the audited consolidated statement of financial position. At December 31, 2022, no amounts were held as collateral.
| 19 | Page |
|
|
MANAGEMENT’S DISCUSSION AND ANALYSIS |
|
| FOR THE YEAR ENDED DECEMBER 31, 2022 |
(b) Liquidity Risk
Liquidity risk is the risk that the Company will encounter difficulty in satisfying financial obligations as they become due. The Company manages its liquidity risk by forecasting cash flows required by its operating, investing and financing activities. The Company had cash at December 31, 2022, in the amount of $11,245 and working capital of $12,083 in order to meet short-term business requirements. Accounts payable have contractual maturities of approximately 30 to 90 days, or are due on demand and are subject to normal trade terms. The current portions of term facility, equipment loans, and finance lease obligations are due within 12 months of the consolidated statement of financial position date. Amounts due to related parties are without stated terms of interest or repayment.
The maturity profiles of the Company’s contractual obligations and commitments as at December 31, 2022, are summarized as follows:
|
|
| Total |
|
| Less Than 1 Year |
|
| 1-5 years |
|
| More Than 5 Years |
|
||||
| Accounts payable and accrued liabilities |
| $ | 9,469 |
|
| $ | 9,469 |
|
| $ | - |
|
| $ | - |
|
| Amounts due to related parties |
|
| 28 |
|
|
| 28 |
|
|
| - |
|
|
| - |
|
| Minimum rental and lease payments |
|
| 850 |
|
|
| 105 |
|
|
| 347 |
|
|
| 398 |
|
| Note Payable |
|
| 5,000 |
|
|
| 5,000 |
|
|
|
|
|
|
|
|
|
| Finance lease obligations |
|
| 1,819 |
|
|
| 1,043 |
|
|
| 776 |
|
|
| - |
|
| Total |
| $ | 17,166 |
|
| $ | 15,645 |
|
| $ | 1,123 |
|
| $ | 398 |
|
(c) Market Risk
Market risk consists of interest rate risk, foreign currency risk and price risk. These are discussed further below.
Interest Rate Risk
Interest rate risk consists of two components:
|
| (i) | To the extent that payments made or received on the Company’s monetary assets and liabilities are affected by changes in the prevailing market interest rates, the Company is exposed to interest rate cash flow risk. |
|
|
|
|
|
| (ii) | To the extent that changes in prevailing market rates differ from the interest rates on the Company’s monetary assets and liabilities, the Company is exposed to interest rate price risk. |
In management’s opinion, the Company is exposed to interest rate risk primarily on its outstanding term facility, as the interest rate is subject to floating rates of interest. A 10% change in the interest rate would not result in a material impact on the Company’s operations.
| 20 | Page |
|
|
MANAGEMENT’S DISCUSSION AND ANALYSIS |
|
| FOR THE YEAR ENDED DECEMBER 31, 2022 |
Foreign Currency Risk
Foreign currency risk is the risk that the fair value or future cash flows of a financial instrument will fluctuate due to changes in foreign exchange rates. The Company is exposed to foreign currency risk to the extent that the following monetary assets and liabilities are denominated in Mexican pesos and Canadian dollars:
|
|
| December 31, 2022 |
|
| December 31, 2021 |
|
||||||||||
|
|
| MXN |
|
| CDN |
|
| MXN |
|
| CDN |
|
||||
| Cash |
| $ | 4,097 |
|
| $ | 250 |
|
| $ | 3,576 |
|
| $ | 1,450 |
|
| Due from related parties |
|
| 1,402 |
|
|
| - |
|
|
| - |
|
|
| - |
|
| Long-term investments |
|
| - |
|
|
| 2,365 |
|
|
| - |
|
|
| 4,976 |
|
| Reclamation bonds |
|
| - |
|
|
| 4 |
|
|
| - |
|
|
| 6 |
|
| Amounts receivable |
|
| - |
|
|
| 34 |
|
|
| - |
|
|
| 33 |
|
| Accounts payable and accrued liabilities |
|
| (85,486 | ) |
|
| (108 | ) |
|
| (57,604 | ) |
|
| (211 | ) |
| Due to related parties |
|
| - |
|
|
| (135 | ) |
|
| - |
|
|
| (206 | ) |
| Finance lease obligations |
|
| (161 | ) |
|
| (343 | ) |
|
| (1 | ) |
|
| (394 | ) |
| Net exposure |
|
| (80,148 | ) |
|
| 2,067 |
|
|
| (54,029 | ) |
|
| 5,654 |
|
| US dollar equivalent |
| $ | (4,136 | ) |
| $ | 1,526 |
|
| $ | (2,363 | ) |
| $ | (4,054 | ) |
Based on the net US dollar denominated asset and liability exposures as at December 31, 2022, a 10% fluctuation in the US/Mexican and Canadian/US exchange rates would impact the Company’s earnings for the year ended December 31, 2022, by approximately $275 (year ended December 31, 2021 - $143). The Company has not entered into any foreign currency contracts to mitigate this risk.
Price Risk
Price risk is the risk that the fair value or future cash flows of a financial instrument will fluctuate due to changes in market prices, other than those arising from interest rate risk or foreign currency risk.
The Company is exposed to price risk with respect to its amounts receivable, as certain trade accounts receivable are recorded based on provisional terms that are subsequently adjusted according to quoted metal prices at the date of final settlement. Quoted metal prices are affected by numerous factors beyond the Company’s control and are subject to volatility, and the Company does not employ hedging strategies to limit its exposure to price risk. At December 31, 2022, based on outstanding accounts receivable that were subject to pricing adjustments, a 10% change in metals prices would have an impact on net earnings (loss) of $65 (December 31, 2021 - $26).
The Company is exposed to price risk with respect to its long-term investments, as these investments are carried at fair value based on quoted market prices. Changes in market prices result in gains or losses being recognized in net income (loss). At December 31, 2022, a 10% change in market prices would have an impact on net earnings (loss) of approximately $175 (December 31, 2021 - $330).
The Company’s profitability and ability to raise capital to fund exploration, evaluation and production activities is subject to risks associated with fluctuations in mineral prices. Management closely monitors commodity prices, individual equity movements, and the stock market to determine the appropriate course of action to be taken by the Company.
| 21 | Page |
|
|
MANAGEMENT’S DISCUSSION AND ANALYSIS |
|
| FOR THE YEAR ENDED DECEMBER 31, 2022 |
(d) Classification of Financial Instruments
IFRS 7 Financial Instruments: Disclosures establishes a fair value hierarchy that prioritizes the inputs to valuation techniques used to measure fair value as follows:
Level 1 – quoted prices (unadjusted) in active markets for identical assets or liabilities;
Level 2 – inputs other than quoted prices included in Level 1 that are observable for the asset or liability, either directly (i.e., as prices) or indirectly (i.e., derived from prices); and
Level 3 – inputs for the asset or liability that are not based on observable market data (unobservable inputs).
The following table sets forth the Company’s financial assets and financial liabilities measured at fair value on a recurring basis by level within the fair value hierarchy as at December 31, 2022:
|
|
| Level 1 |
|
| Level 2 |
|
| Level 3 |
|
|||
| Financial assets |
|
|
|
|
|
|
|
|
|
|||
| Cash |
| $ | 11,245 |
|
| $ | - |
|
| $ | - |
|
| Amounts receivable |
|
| - |
|
|
| 2,672 |
|
|
| - |
|
| Long-term investments |
|
| 1,746 |
|
|
| - |
|
|
| - |
|
| Total financial assets |
| $ | 12,991 |
|
| $ | 2,672 |
|
| $ | - |
|
| Financial liabilities |
|
|
|
|
|
|
|
|
|
|
|
|
| Warrant liability |
|
| - |
|
|
| - |
|
|
| (475 | ) |
| Total financial liabilities |
| $ | - |
|
| $ | - |
|
| $ | (475 | ) |
The Company uses Black-Scholes model to measure its Level 3 financial instruments. As at December 31, 2022, the Company’s Level 3 financial instruments consisted of the warrant liability.
For the Company’s warrant liability valuation and fair value adjustments during the years ended December 31, 2022 and 2021, see Note 14 of the consolidated financial statements.
Risks associated with Public Health Crises, including COVID-19
The Company’s business, operations and financial condition could be materially adversely affected by the outbreak of epidemics, pandemics or other health crises, such as the outbreak of COVID-19 that was designated as a pandemic by the World Health Organization on March 11, 2020. The international response to the spread of COVID-19 has led to significant restrictions on travel, temporary business closures, quarantines, global stock market volatility and a general reduction in consumer activity. Such public health crises can result in operating, supply chain and project development delays and disruptions, global stock market and financial market volatility, declining trade and market sentiment, reduced movement of people and labour shortages, and travel and shipping disruption and shutdowns, including as a result of government regulation and prevention measures, or a fear of any of the foregoing, all of which could affect commodity prices, interest rates, credit risk and inflation. In addition, the current COVID-19 pandemic, and any future emergence and spread of similar pathogens could have an adverse impact on global economic conditions which may adversely impact the Company’s operations, and the operations of suppliers, contractors and service providers, including smelter and refining service providers, and the demand for the Company’s production.
The Company may experience business interruptions, including suspended (whether government mandated or otherwise) or reduced operations relating to COVID-19 and other such events outside of the Company’s control, which could have a material adverse impact on its business, operations and operating results, financial condition and liquidity.
| 22 | Page |
|
|
MANAGEMENT’S DISCUSSION AND ANALYSIS |
|
| FOR THE YEAR ENDED DECEMBER 31, 2022 |
As at the date of this MD&A, the duration of the business disruptions internationally and related financial impact of COVID-19 cannot be reasonably estimated. It is unknown whether and how the Company may be affected if the pandemic persists for an extended period of time. In particular, the region in which we operate may not have sufficient public infrastructure to adequately respond or efficiently and quickly recover from such event, which could have a materially adverse effect on the Company’s operations. The Company’s exposure to such public health crises also includes risks to employee health and safety. Should an employee, contractor, community member or visitor become infected with a serious illness that has the potential to spread rapidly, this could place the Company’s workforce at risk.
Mexico has been particularly impacted by the COVID-19 pandemic. The Company’s mining operations have been temporarily shut-down since April 2020, first as a result of governmental COVID-19 quarantine and containment measures, and later in July 2020 due to a labour strike, which was resolved in October 2020. The labour settlement agreement must be approved by the Mexican governmental labour authority. On August 3, 2021, the Company announced that mining operations had resumed. Although the Company takes appropriate measures and safeguards to protect its staff from infection, these events can result in volatility and disruption to supply chains, operations, transportation, and mobility of people, which are beyond the control of the Company, and which have had and could continue to adversely affect the availability of components, supplies and materials, labour, interest rates, credit ratings, credit risk, inflation, business operations, financial markets, exchange rates, and other factors material to the Company, including in particular, the Company’s revenues and concentrate delivery schedule.
Commitments
The Company has a cost sharing agreement to reimburse Oniva for a percentage of its overhead expenses, to reimburse 100% of its out-of-pocket expenses incurred on behalf of the Company, and to pay a percentage fee based on Oniva’s total overhead and corporate expenses. The agreement may be terminated with one-month notice by either party. Transactions and balances with Oniva are disclosed in Note 12 of the consolidated financial statements.
The Company and its subsidiaries have various operating lease agreements for their office premises, use of land, and equipment. Commitments in respect of these lease agreements are as follows:
|
|
| December 31, 2022 |
|
| December 31, 2021 |
|
||
| Not later than one year |
| $ | 105 |
|
| $ | 96 |
|
| Later than one year and not later than five years |
|
| 347 |
|
|
| 330 |
|
| Later than five years |
|
| 398 |
|
|
| 462 |
|
|
|
| $ | 850 |
|
| $ | 888 |
|
Office lease payments recognized as an expense during the year ended December 31, 2022, totalled $18 (December 31, 2021 - $16).
Subsequent Events
At-The-Market Sales – Subsequent to December 31, 2022, the Company issued 253,700 common shares in at-the-market offerings under prospectus supplement for gross proceeds of $207. The Company paid a 2.75% cash commission of $6 on gross proceeds, for net proceeds of $201.
Option Agreement – Subsequent to December 31, 2022, the Company elected and received the second anniversary payment of 500,000 common shares of Silver Wolf as per the Option Agreement.
| 23 | Page |
|
|
MANAGEMENT’S DISCUSSION AND ANALYSIS |
|
| FOR THE YEAR ENDED DECEMBER 31, 2022 |
Note Payable – Subsequent to December 31, 2022, the Company made the $5 million repayment on the outstanding note payable to Coeur. See Note 13 for more details.
Non-Core Claims Sale – Subsequent to December 31, 2022, the Company agreed to sell to a subsidiary of Hecla Mining Company (“Hecla”) the Eagle Property, consisting of 100% interest in and to the 14 quartz mineral claims located in the Keno Hill Area of the May Mining District of Yukon for cash consideration of C$250.
Outstanding Share Data
The Company’s authorized share capital consists of an unlimited number of common shares without par value.
As at March 28, 2023, the following common shares, warrants, and stock options were outstanding:
|
|
| Number of shares |
|
| Exercise price |
|
| Remaining life (years) |
|
|||
| Share capital |
|
| 119,195,457 |
|
|
| - |
|
|
| - |
|
| Warrants (US$) |
|
| 8,950,412 |
|
| $0.80 - $1.09 |
|
| 0.52 – 0.53 |
|
||
| Restricted Share Units (“RSUs”) |
|
| 1,597,999 |
|
|
| - |
|
| 0.39 – 2.03 |
|
|
| Stock options |
|
| 4,256,000 |
|
| C$0.79 - C$1.64 |
|
| 0.45 – 4.14 |
|
||
| Fully diluted |
|
| 133,999,868 |
|
|
|
|
|
|
|
|
|
The following are details of outstanding stock options as at December 31, 2022 and March 28, 2023:
| Expiry Date |
| Exercise Price Per Share |
| Number of Shares Remaining Subject to Options (December 31, 2022) |
|
| Number of Shares Remaining Subject to Options (March 28, 2023) |
|
||
| August 28, 2023 |
| C$1.30 |
|
| 105,000 |
|
|
| 105,000 |
|
| August 21, 2024 |
| C$0.79 |
|
| 126,000 |
|
|
| 126,000 |
|
| August 4, 2025 |
| C$1.64 |
|
| 1,660,000 |
|
|
| 1,660,000 |
|
| March 25, 2027 |
| C$1.20 |
|
| 2,340,000 |
|
|
| 2,340,000 |
|
| May 4, 2027 |
| C$0.92 |
|
| 25,000 |
|
|
| 25,000 |
|
| Total: |
|
|
|
| 4,256,000 |
|
|
| 4,256,000 |
|
The following are details of outstanding warrants as at December 31, 2022 and March 28, 2023:
| Expiry Date |
| Exercise Price Per Share |
|
| Number of Underlying Shares (December 31, 2022) |
|
| Number of Underlying Shares (March 28, 2023) |
|
|||
| September 21, 2023 |
| $ | 1.09 |
|
|
| 7,000,000 |
|
|
| 7,000,000 |
|
| September 25, 2023 |
| $ | 0.80 |
|
|
| 1,950,412 |
|
|
| 1,950,412 |
|
| Total: |
|
|
|
|
|
| 8,950,412 |
|
|
| 8,950,412 |
|
The following are details of outstanding RSUs as at December 31, 2022 and March 28, 2023:
| Expiry Date |
| Number of Shares Remaining Subject to RSUs (December 31, 2022) |
|
| Number of Shares Remaining Subject to RSUs (March 28, 2023) |
|
||
| August 4, 2023 |
|
| 412,666 |
|
|
| 412,666 |
|
| March 25, 2025 |
|
| 1,778,000 |
|
|
| 1,185,333 |
|
| Total: |
|
| 2,190,666 |
|
|
| 1,597,999 |
|
| 24 | Page |
|
|
MANAGEMENT’S DISCUSSION AND ANALYSIS |
|
| FOR THE YEAR ENDED DECEMBER 31, 2022 |
Recent Accounting Pronouncements
Application of new and revised accounting standards:
Property, Plant and Equipment — Proceeds before Intended Use (Amendments to IAS 16)
The amendments prohibit deducting from the cost of an item of property, plant and equipment any proceeds from selling items produced while bringing that asset to the location and condition necessary for it to be capable of operating in the manner intended by management. Instead, an entity recognizes the proceeds from selling such items, and the cost of producing those items, in profit or loss. The amendments are applied on or after the first annual reporting period beginning on or after January 1, 2022, with early application permitted. The amendments are applied retrospectively, but only to items of property, plant and equipment that are brought to the location and condition necessary for them to be capable of operating in the manner intended by management on or after the beginning of the earliest period presented in the financial statements in which the Company first applies the amendments. This amendment will impact the Company’s accounting for proceeds from mineral sales prior to reaching commercial production at levels intended by management. The Company adopted the amendments to IAS 16 with no material impact on the financial statements.
Future Changes in Accounting Policies Not Yet Effective as at December 31, 2022:
Certain new accounting standards and interpretations have been published that are not mandatory for the current period and have not been early adopted. These standards are not expected to have a material impact on the Company in the current or future reporting periods.
Disclosure Controls and Procedures
Management, including our principal executive officer and principal financial officer, has evaluated the effectiveness of the design and operation of the Company’s disclosure controls and procedures on financial reporting (as defined in NI 52-109 - Certification of Disclosure in Issuers’ Annual and Interim Filings and as defined in Rules 13a-15(e) and 15d-15(e) under the Exchange Act) and has concluded that, based on its evaluation, that the Company’s disclosure controls and procedures were not effective as of December 31, 2022 due to a material weakness in internal control over financial reporting. Notwithstanding such material weakness in internal control over financial reporting, our management concluded that the financial statements present fairly in accordance with IFRS as issued by the IASB.
Management’s Report on Internal Controls over Financial Reporting (“ICFR”)
The management of the Company is responsible for establishing and maintaining adequate internal controls over financial reporting. Internal controls over financial reporting is a process to provide reasonable assurance regarding the reliability of the Company’s financial reporting for external purposes in accordance with IFRS as issued by the IASB. Internal controls over financial reporting includes maintaining records that in reasonable detail accurately and fairly reflect the Company’s transactions and dispositions of the assets of the Company; providing reasonable assurance that transactions are recorded as necessary for preparation of the Company’s consolidated financial statements in accordance with IFRS as issued by the IASB; providing reasonable assurance that receipts and expenditures are made in accordance with authorizations of management and the directors of the Company; and providing reasonable assurance that unauthorized acquisition, use or disposition of the Company’s assets that could have a material effect on the Company’s consolidated financial statements would be prevented or detected on a timely basis. Our management and the Board of Directors do not expect that our disclosure controls and procedures or internal controls over financial reporting will prevent all errors or all instances of fraud. A control system, no matter how well designed and operated, can provide only reasonable (not absolute) assurance that the control system’s objectives will be met. Further, the design, maintenance and testing of a control system must reflect the fact that there are resource constraints and the benefits of controls must be considered relative to their costs.
| 25 | Page |
|
|
MANAGEMENT’S DISCUSSION AND ANALYSIS |
|
| FOR THE YEAR ENDED DECEMBER 31, 2022 |
Because of the inherent limitations in all control systems, no evaluation of controls can provide absolute assurance that all control gaps and instances of fraud have been detected. These inherent limitations include the reality that judgment in decision-making can be faulty, and that breakdowns can occur because of simple errors or mistakes. Controls can also be circumvented by the individual acts of some persons, by collusion of two or more people, or by management override of the controls. The design, maintenance and testing of any system of controls is based in part upon certain assumptions about the likelihood of future events, and any control system may not succeed in achieving its stated goals under all potential future conditions.
A material weakness is a deficiency, or a combination of deficiencies, in internal control over financial reporting, such that there is a reasonable possibility that a material misstatement of our annual or interim financial statements will not be prevented or detected on a timely basis.
Management, including our principal executive officer and principal financial officer, conducted an evaluation of the effectiveness of the Company’s internal controls over financial reporting based on the framework and criteria established in Internal Control – Integrated Framework, issued by the Committee of Sponsoring Organizations of the Treadway Commission (2013) (‘COSO’). This evaluation included review of the documentation of controls, evaluation of the design effectiveness of controls, testing of the operating effectiveness of controls and a conclusion on this evaluation.
Based on this evaluation, management concluded that as of December 31, 2022, the Company’s internal controls over financial reporting, as defined in NI 52-109 - Certification of Disclosure in Issuer’s Annual and Interim Filings and as defined in Rule 13a-15(f) and 15d-15(f) under the Exchange Act) were not effective as a result of a material weakness related to the design of management review controls over non-routine transactions, as well as lack of requisite skills or available resources, as of December 31, 2022. The Company has identified and is in the process of implementing remediation efforts to improve the effectiveness of our internal control over financial reporting. We are acquiring access to additional technical accounting research tools and are implementing a more formal process for the analysis and review of the proper application of IFRS accounting for non-routine transactions, as well as instituting additional diligence procedures in reviewing non-routine transactions.
While we believe the steps taken to date and those planned for implementation will improve the effectiveness of our internal control over financial reporting, we have not completed all remediation efforts. We will not be able to fully remediate the material weakness until these controls have been designed, implemented and management has determined through testing, that they have been operating effectively for a sufficient period of time.
The consolidated financial statements as at and for the year ended December 31, 2022, have been audited by Deloitte LLP, an independent registered public accounting firm, and its attestation report on management's assessment of the Company’s internal control over financial reporting as of December 31, 2022 appearing immediately preceding the Company’s audited consolidated financial statements.
Changes in Control over Financial Reporting
There have been no changes in the Company’s internal control over financial reporting (as defined in Rule 13a‑15(f) and 15d‑15(f) under the Exchange Act) during the quarter and year ended December 31, 2022, that have materially affected, or that are reasonably likely to materially affect, the Company’s internal control over financial reporting.
Cautionary Statement
| This MD&A is based on a review of the Company’s operations, financial position and plans for the future based on facts and circumstances as of March 28, 2023. Except for historical information or statements of fact relating to the Company, this document contains “forward-looking statements” within the meaning of applicable Canadian securities regulations. Forward-looking statements in this document include, but are not limited to, those regarding the economic outlook for the mining industry, expectations regarding metals prices, expectations regarding production output, production costs, cash costs and other operating results, expectations regarding growth prospects and the outlook for the Company’s operations, and statements regarding the Company’s liquidity, capital resources, and capital expenditures. There can be no assurance that such statements will prove to be accurate, and future events and actual results could differ materially from those anticipated in such statements. Important factors that could cause actual results to differ materially from our expectations are disclosed in the Company’s documents filed from time to time via SEDAR with the Canadian regulatory agencies to whose policies we are bound. Forward-looking statements are based on the estimates and opinions of management on the date the statements are made, and we do not undertake any obligation to update forward-looking statements should conditions or our estimates or opinions change, except as required by applicable securities regulations. These statements involve known and unknown risks, uncertainties, and other factors that may cause the Company’s actual results, levels of activity, performance or achievements to be materially different from any future results, levels of activity, performance or achievements expressed or implied by these forward-looking statements. |
| 26 | Page |
EXHIBIT 99.6
CERTIFICATION
I, David Wolfin, certify that:
| 1. | I have reviewed this annual report on Form 40-F of Avino Silver & Gold Mines, Ltd. (the “Company”); |
| 2. | Based on my knowledge, this report does not contain any untrue statement of a material fact or omit to state a material fact necessary to make the statements made, in light of the circumstances under which such statements were made, not misleading with respect to the period covered by this report; |
| 3. | Based on my knowledge, the financial statements, and other financial information included in this report, fairly present in all material respects the financial condition, results of operations and cash flows of the Company as of, and for, the periods presented in this report; |
| 4. | The Company’s other certifying officers and I are responsible for establishing and maintaining disclosure controls and procedures (as defined in Exchange Act Rules 13a-15(e) and 15d-15(e)) and internal control over financial reporting (as defined in Exchange Act Rules 13a-15(f) and 15d-15(f)) for the Company and have: |
| (a) | Designed such disclosure controls and procedures, or caused such disclosure controls and procedures to be designed under our supervision, to ensure that material information relating to the Company, including its consolidated subsidiaries, is made known to us by others within those entities, particularly during the period in which this report is being prepared; |
| (b) | Designed such internal control over financial reporting, or caused such internal control over financial reporting to be designed under our supervision, to provide reasonable assurance regarding the reliability of financial reporting and the preparation of financial statements for external purposes in accordance with generally accepted accounting principles; |
| (c) | Evaluated the effectiveness of the Company’s disclosure controls and procedures and presented in this report our conclusions about the effectiveness of the disclosure controls and procedures, as of the end of the period covered by this report based on such evaluation; and |
| (d) | Disclosed in this report any change in the Company’s internal control over financial reporting that occurred during the period covered by the annual report that has materially affected, or is reasonably likely to materially affect, the Company’s internal control over financial reporting; and |
| 5. | The Company’s other certifying officer and I have disclosed, based on our most recent evaluation of internal control over financial reporting, to the Company’s auditors and the audit committee of the Company’s board of directors (or persons performing the equivalent functions): |
| (a) | All significant deficiencies and material weaknesses in the design or operation of internal control over financial reporting which are reasonably likely to adversely affect the Company’s ability to record, process, summarize and report financial information; and |
| (b) | Any fraud, whether or not material, that involves management or other employees who have a significant role in the Company’s internal control over financial reporting. |
Date: March 31, 2023
|
| /s/ David Wolfin |
|
|
| David Wolfin |
|
|
| President, Chief Executive Officer and Director |
|
|
| (Principal Executive Officer) |
|
EXHIBIT 99.7
CERTIFICATION
I, Nathan Harte, certify that:
| 1. | I have reviewed this annual report on Form 40-F of Avino Silver & Gold Mines, Ltd. (the “Company”); |
| 2. | Based on my knowledge, this report does not contain any untrue statement of a material fact or omit to state a material fact necessary to make the statements made, in light of the circumstances under which such statements were made, not misleading with respect to the period covered by this report; |
| 3. | Based on my knowledge, the financial statements, and other financial information included in this report, fairly present in all material respects the financial condition, results of operations and cash flows of the Company as of, and for, the periods presented in this report; |
| 4. | The Company’s other certifying officers and I are responsible for establishing and maintaining disclosure controls and procedures (as defined in Exchange Act Rules 13a-15(e) and 15d-15(e)) and internal control over financial reporting (as defined in Exchange Act Rules 13a-15(f) and 15d-15(f)) for the Company and have: |
| (a) | Designed such disclosure controls and procedures, or caused such disclosure controls and procedures to be designed under our supervision, to ensure that material information relating to the Company, including its consolidated subsidiaries, is made known to us by others within those entities, particularly during the period in which this report is being prepared; |
| (b) | Designed such internal control over financial reporting, or caused such internal control over financial reporting to be designed under our supervision, to provide reasonable assurance regarding the reliability of financial reporting and the preparation of financial statements for external purposes in accordance with generally accepted accounting principles; |
| (c) | Evaluated the effectiveness of the Company’s disclosure controls and procedures and presented in this report our conclusions about the effectiveness of the disclosure controls and procedures, as of the end of the period covered by this report based on such evaluation; and |
| (d) | Disclosed in this report any change in the Company’s internal control over financial reporting that occurred during the period covered by the annual report that has materially affected, or is reasonably likely to materially affect, the Company’s internal control over financial reporting; and |
| 5. | The Company’s other certifying officer and I have disclosed, based on our most recent evaluation of internal control over financial reporting, to the Company’s auditors and the audit committee of the Company’s board of directors (or persons performing the equivalent functions): |
| (a) | All significant deficiencies and material weaknesses in the design or operation of internal control over financial reporting which are reasonably likely to adversely affect the Company’s ability to record, process, summarize and report financial information; and |
| (b) | Any fraud, whether or not material, that involves management or other employees who have a significant role in the Company’s internal control over financial reporting. |
Date: March 31, 2023
|
| /s/ Nathan Harte |
|
|
| Nathan Harte |
|
|
| Chief Financial Officer |
|
|
| (Principal Financial Officer) |
|
EXHIBIT 99.8
CERTIFICATION
PURSUANT TO SECTION 906 OF THE SARBANES-OXLEY ACT OF 2002
(SUBSECTIONS (a) AND (b) OF SECTION 1350, CHAPTER 63 OF
TITLE 18, UNITED STATES CODE)
Pursuant to section 906 of the Sarbanes-Oxley Act of 2002 (subsections (a) and (b) of section 1350, chapter 63 of Title 18, United States Code), each of the undersigned officers of Avino Silver & Gold Mines, Ltd. (the “Company”), does hereby certify with respect to the Annual Report of the Company on Form 40-F for the year ended December 31, 2022, as filed with the Securities and Exchange Commission (the “Form 40-F”) that, to the best of their knowledge:
| (1) | the Form 40-F fully complies with the requirements of section 13(a) or 15(d) of the Securities Exchange Act of 1934; and |
| (2) | the information contained in the Form 40-F fairly presents, in all material respects, the financial condition and results of operations of the Company. |
Date: March 31, 2023
|
| /s/ David Wolfin |
|
|
| David Wolfin |
|
|
| President, Chief Executive Officer and Director |
|
|
| (Principal Executive Officer) |
|
EXHIBIT 99.9
CERTIFICATION
PURSUANT TO SECTION 906 OF THE SARBANES-OXLEY ACT OF 2002
(SUBSECTIONS (a) AND (b) OF SECTION 1350, CHAPTER 63 OF
TITLE 18, UNITED STATES CODE)
Pursuant to section 906 of the Sarbanes-Oxley Act of 2002 (subsections (a) and (b) of section 1350, chapter 63 of Title 18, United States Code), each of the undersigned officers of Avino Silver & Gold Mines, Ltd. (the “Company”), does hereby certify with respect to the Annual Report of the Company on Form 40-F for the year ended December 31, 2022, as filed with the Securities and Exchange Commission (the “Form 40-F”) that, to the best of their knowledge:
| (1) | the Form 40-F fully complies with the requirements of section 13(a) or 15(d) of the Securities Exchange Act of 1934; and |
| (2) | the information contained in the Form 40-F fairly presents, in all material respects, the financial condition and results of operations of the Company. |
Date: March 31, 2023
|
| /s/ Nathan Harte |
|
|
| Nathan Harte |
|
|
| Chief Financial Officer |
|
|
| (Principal Financial Officer) |
|
EXHIBIT 99.11
Consent of Independent Registered Public Accounting Firm
We consent to the incorporation by reference in Registration Statement No. 333-195120 on Form S-8 and Registration Statement Nos. 333-226963 and 333-252081 on Form F-3 and to the use of our reports dated March 31, 2023, relating to the financial statements of Avino Silver & Gold Mines Ltd. (the “Company”) and the effectiveness of the Company’s internal control over financial reporting appearing in this Annual Report on Form 40-F for the year ended December 31, 2022.
/s/ Deloitte LLP
Chartered Professional Accountants
Vancouver, Canada
March 31, 2023
EXHIBIT 99.12
Consent of Independent Registered Public Accounting Firm
We consent to the incorporation by reference in this annual report on Form F-40 and to the Registration Statements on Form S-8 (SEC File No.: 333-195120) and Form F-3 (SEC File Nos.: 333--226963 and 252081) of our report dated March 16, 2022, relating to the consolidated financial statements of Avino Silver & Gold Mines Ltd. as of December 31, 2021 and for the year ended December 31, 2021.
| /s/ Manning Elliott LLP |
|
| Manning Elliott LLP |
|
|
|
|
| Vancouver, Canada
March 31, 2023 |
|
EXHIBIT 99.13
CONSENT OF TETRA TECH CANADA INC.
We hereby consent to the use of our name contained in the technical reports entitled Mineral Resource Estimate Update for the Avino Property, Durango, Mexico, 43-101 Technical Report, dated February 16, 2023 in the Company’s annual report on Form 40-F for the fiscal year ended December 31, 2022, and to the Company's Registration Statements on Form S-8 (SEC File No.: 333-195120) and Form F-3 (SEC File Nos.: 333-226963 and 252081).
|
| TETRA TECH CANADA INC. | ||
|
|
|
|
|
| Dated: March 31, 2023 | By: | /s/ Hassan Ghaffari | |
|
|
| Hassan Ghaffari, P.Eng. |
|
EXHIBIT 99.14
CONSENT OF TETRA TECH CANADA INC.
We hereby consent to the use of our name contained in the technical report entitled Mineral Resource Estimate Update for the Avino Property, Durango, Mexico, 43-101 Technical Report, dated February 16, 2023 in the Company’s annual report on Form 40-F for the fiscal year ended December 31, 2022, and in the Company's Registration Statements on Form S-8 (SEC File No.: 333-195120) and Form F-3 (SEC File Nos.: 333-226963 and 252081).
|
| TETRA TECH CANADA INC. | ||
|
|
|
|
|
| Dated: March 31, 2023 | By: | /s/ Jianhui (John) Huang | |
|
|
| Jianhui (John) Huang, Ph.D., P. Eng. |
|
EXHIBIT 99.15
CONSENT OF RED PENNANT GEOSCIENCE LTD.
We hereby consent to the use of our name contained in the technical report entitled Mineral Resource Estimate Update for the Avino Property, Durango, Mexico, 43-101 Technical Report dated February 16, 2023 in the Company’s annual report on Form 40-F for the fiscal year ended December 31, 2022, and in the Company's Registration Statements on Form S-8 (SEC File No.: 333-195120) and Form F-3 (SEC File Nos.: 333-226963 and 252081).
|
| Red Pennant Geoscience Ltd. | ||
|
|
|
|
|
| Dated: March 31, 2023 | By: | /s/ Michael O’Brien | |
|
|
| Michael O’Brien, P. Geo | |