UNITED STATES
SECURITIES AND EXCHANGE COMMISSION
Washington, D.C. 20549
FORM 8-K
CURRENT REPORT
Pursuant to Section 13 OR 15(d) of The Securities Exchange Act of 1934
Date of Report (Date of earliest event reported): November 3, 2025
NATIONAL BANK HOLDINGS CORPORATION
(Exact name of registrant as specified in its charter)
Delaware |
|
001-35654 |
|
27-0563799 |
(State or other jurisdiction |
|
(Commission |
|
(IRS Employer |
7800 East Orchard Road, Suite 300, Greenwood Village, Colorado 80111
(Address of principal executive offices) (Zip Code)
303-892-8715
(Registrant’s telephone, including area code)
Not Applicable
(Former name or former address, if changed since last report.)
Check the appropriate box below if the Form 8-K filing is intended to simultaneously satisfy the filing obligation of the registrant under any of the following provisions (see General Instruction A.2. below):
☐Written Communications pursuant to Rule 425 under the Securities Act (17 CFR 230.425)
☐Soliciting material pursuant to Rule 14a-12 under the Exchange Act (17 CFR 240.14a-12)
☐Pre-commencement communications pursuant to Rule 14d-2(b) under the Exchange Act (17 CFR 240.14d-2(b))
☐Pre-commencement communications pursuant to Rule 13e-4(c) under the Exchange Act (17 CFR 240.13e-4(c))
Securities registered pursuant to Section 12(b) of the Act:
Title of each class: |
|
Trading Symbol |
|
Name of each exchange on which registered: |
Class A Common Stock, Par Value $0.01 |
|
NBHC |
|
NYSE |
Indicate by check mark whether the registrant is an emerging growth company as defined in Rule 405 of the Securities Act of 1933(§230.405 of this chapter) or Rule 12b-2 of the Securities Exchange Act of 1934 (§240.12b-2 of this chapter).
Emerging growth company ☐
If an emerging growth company, indicate by check mark if the registrant has elected not to use the extended transition period for complying with any new or revised financial accounting standards provided pursuant to Section 13(a) of the Exchange Act. ☐
Item 7.01. Regulation FD Disclosure.
On November 3, 2025, National Bank Holdings Corporation’s (“NBHC”) posted an updated investor presentation on its website. NBHC expects to use this updated presentation, either in whole or in part, in connection with presentations to investors, analysts and others. A copy of the investor deck is attached hereto as Exhibit 99.1 and incorporated herein by reference. The investor deck is also available on NBHC’s website at www.nationalbankholdings.com under “Events & Presentations.”
The information provided under Item 7.01 of this Current Report on Form 8-K, including Exhibit 99.1, is being furnished and is not deemed to be “filed” with the U.S. Securities and Exchange Commission (the “SEC”) for the purposes of Section 18 of the Securities Exchange Act of 1934, as amended (the “Exchange Act”) or otherwise subject to the liabilities of that section and is not incorporated by reference into any filing of NBHC under the Securities Act of 1933, as amended (the “Securities Act”) or the Exchange Act, whether made before or after the date hereof, except as shall be expressly set forth by specific reference to this Current Report on Form 8-K in such a filing. NBHC does not incorporate by reference to this Current Report on Form 8-K information presented at any website referenced in this report or in the exhibit attached hereto.
Item 9.01. Financial Statements and Exhibits.
Exhibit No. |
|
Description of Exhibit |
99.1 |
|
|
|
|
|
104 |
|
Cover Page Interactive Data File (embedded within the Inline XBRL document) |
CAUTIONARY NOTE REGARDING FORWARD-LOOKING STATEMENTS
This Current Report on Form 8-K contains forward-looking statements within the meaning of the Private Securities Litigation Reform Act of 1995 related to, among other things, our strategy, plans, beliefs, goals, intentions, and expectations regarding the proposed acquisition of Vista Bancshares, Inc. (”Vista”); business plans; growth opportunities; expense control initiatives; anticipated expenses, cash requirements and sources of liquidity; capital allocation strategies and plans; and future financial performance. These statements do not discuss historical facts but instead relate to expectations, beliefs, plans, predictions, forecasts, objectives, assumptions or future events or performance. Forward-looking statements are generally identified by words such as “anticipate,” “believe,” “can,” “would,” “should,” “could,” “may,” “predict,” “seek,” “potential,” “will,” “estimate,” “target,” “plan,” “project,” “continuing,” “ongoing,” “expect,” “intend,” “goal,” “focus,” “maintains,” “future,” “ultimately,” “likely,” “ensure,” “strategy,” “objective,” and similar words or phrases. These statements are only predictions and involve estimates, known and unknown risks, assumptions and uncertainties. We have based these statements largely on our current expectations and projections about future events and financial trends that we believe may affect our financial condition, liquidity, results of operations, business strategy and growth prospects. Forward-looking statements involve certain important risks, uncertainties and other factors, any of which could cause actual results to differ materially from those in such statements and, therefore, you are cautioned not to place undue reliance on such statements.
Factors that could cause actual results to differ from those discussed in the forward-looking statements include, but are not limited to: our ability to obtain required regulatory or shareholder approvals, which could be delayed due to, among other things, the current U.S. Federal government shutdown, or meet other closing conditions to complete the acquisition of Vista when expected or at all, and to realize the anticipated benefits of the proposed transaction; business and economic conditions along with external events both generally and in the financial services industry; susceptibility to credit risk and fluctuations in the value of real estate and other collateral securing a significant portion of our loan portfolio, including with regards to real estate acquired through foreclosure, and the accuracy of appraisals related to such real estate; the allowance for credit losses and fair value adjustments may be insufficient to absorb losses in our loan portfolio; our ability to maintain sufficient liquidity to meet the requirements of deposit withdrawals and other business needs; changes and uncertainty impacting monetary supply and the businesses of our clients and counterparties, including levels of market interest rates, inflation, currency values, monetary and fiscal policies, and the volatility of trading markets; changes in the fair value of our investment securities and the ability of companies in which we invest to commercialize their technology or product concepts; the loss of certain executive officers and key personnel; any service interruptions, cyber incidents or other breaches relating to our technology systems, security systems or infrastructure or those of our third-party providers; the occurrence of fraud or other financial crimes within our business; competition from other financial institutions and financial services providers and the effects of disintermediation within the banking business including consolidation within the industry; changes and uncertainty with respect to federal government lending programs like the Small Business Administration’s Preferred Lender Program and the Federal Housing Administration’s insurance programs, including the impact of a government shutdown on such programs; impairment of our mortgage servicing rights, disruption in the secondary market for mortgage loans, declines in real estate values, or being required to repurchase mortgage loans or reimburse investors; developments in technology, such as artificial intelligence, the success of our digital growth strategy, and our ability to incorporate innovative technologies in our business and provide products and services that satisfy our clients’ expectations for convenience and security; our ability to execute our organic growth and acquisition strategies; the accuracy of projected operating results for assets and businesses we acquire as well as our ability to drive organic loan growth to replace loans in our existing portfolio with comparable loans as loans are paid down; changes and uncertainty with respect to federal, state and local laws, regulations and policies, along with executive orders applicable to our business, including tax laws, tariff policies and Federal Reserve interest rate policies; our ability to comply with and manage costs related to extensive government regulation and supervision, including current and future regulations affecting bank holding companies and depository institutions; the application of any increased assessment rates imposed by the Federal Deposit Insurance Corporation; claims or legal action brought against us by third parties or government agencies; and other factors, risks, trends and uncertainties described elsewhere in our other filings with the Securities and Exchange Commission. The forward-looking statements are made as of the date of this communication, and we undertake no obligation to update any forward-looking statement to reflect events or circumstances after the date on which the statement is made or to reflect the occurrence of unanticipated events or circumstances, except as required by applicable law.
Annualized, pro forma, projected, and estimated numbers are used for illustrative purposes only, are not forecasts and may not reflect actual results. Except to the extent required by applicable law or regulation, NBHC disclaims any obligation to revise or publicly release any revision or update to any of the forward-looking statements included herein to reflect events or circumstances that occur after the date on which such statements were made. As forward-looking statements involve significant risks and uncertainties, caution should be exercised against placing undue reliance on such statements.
Important Additional Information and Where to Find It
NBHC has filed with the SEC a Registration Statement on Form S-4 to register the shares of NBHC Common Stock to be issued to the shareholders of Vista in connection with the proposed transaction. The Registration Statement includes a proxy statement/prospectus, which will be sent to the shareholders of Vista in connection with the proposed transaction.
INVESTORS AND SECURITY HOLDERS ARE URGED TO READ THE REGISTRATION STATEMENT ON FORM S-4, THE PROXY STATEMENT/PROSPECTUS INCLUDED WITHIN THE REGISTRATION STATEMENT ON FORM S-4 AND ANY OTHER RELEVANT DOCUMENTS TO BE FILED WITH THE SEC IN CONNECTION WITH THE PROPOSED TRANSACTION OR INCORPORATED BY REFERENCE INTO THE PROXY/STATEMENT PROSPECTUS, AS WELL AS ANY AMENDMENTS OR SUPPLEMENTS TO THESE DOCUMENTS, CAREFULLY AND IN THEIR ENTIRETY, WHEN THEY ARE AVAILABLE, BECAUSE THEY WILL CONTAIN IMPORTANT INFORMATION ABOUT NBHC, VISTA AND THE PROPOSED TRANSACTION.
Investors and security holders may obtain free copies of these documents through the website maintained by the SEC at http://www.sec.gov. You will also be able to obtain these documents, when they are filed, free of charge, by directing a request to National Bank Holdings Corporation, Attention: Investor Relations, 7800 E. Orchard Road, Suite 300, Greenwood Village, CO 80111, by e-mailing ir@nationalbankholdings.com or by calling (720) 554-6640.
No Offer or Solicitation
This communication is for informational purposes only and is not intended to and does not constitute an offer to subscribe for, buy or sell, or the solicitation of an offer to subscribe for, buy or sell, or an invitation to subscribe for, buy or sell any securities or a solicitation of any vote or approval in any jurisdiction, nor shall there be any sale, issuance or transfer of securities in any jurisdiction in which such offer, invitation, sale or solicitation would be unlawful prior to registration or qualification under the securities laws of any such jurisdiction. No offer of securities shall be made except by means of a prospectus meeting the requirements of Section 10 of the Securities Act, and otherwise in accordance with applicable law.
SIGNATURE
Pursuant to the requirements of the Securities Exchange Act of 1934, the registrant has duly caused this report to be signed on its behalf by the undersigned hereunto duly authorized.
|
National Bank Holdings Corporation |
|
|
By: |
/s/ Angela N. Petrucci |
|
Name: Angela N. Petrucci |
|
Title: Chief Administrative Officer & General Counsel |
Date: November 3, 2025 |
|
|
Investor Presentation Q3 – 2025 |
|
Legal Disclaimers Cautionary Note Regarding Forward-Looking Statements This communication contains forward-looking statements within the meaning of the Private Securities Litigation Reform Act of 1995 related to, among other things, our business plans; growth opportunities; expense control initiatives; anticipated expenses, cash requirements and sources of liquidity; capital allocation strategies and plans; and future financial performance. These statements do not discuss historical facts but instead relate to expectations, beliefs, plans, predictions, forecasts, objectives, assumptions or future events or performance. Forward-looking statements are generally identified by words such as “anticipate,” “believe,” “can,” “would,” “should,” “could,” “may,” “predict,” “seek,” “potential,” “will,” “estimate,” “target,” “plan,” “project,” “continuing,” “ongoing,” “expect,” “intend,” “goal,” “focus,” “maintains,” “future,” “ultimately,” “likely,” “ensure,” “strategy,” “objective,” and similar words or phrases. These statements are only predictions and involve estimates, known and unknown risks, assumptions and uncertainties. We have based these statements largely on our current expectations and projections about future events and financial trends that we believe may affect our financial condition, liquidity, results of operations, business strategy and growth prospects. Forward-looking statements involve certain important risks, uncertainties and other factors, any of which could cause actual results to differ materially from those in such statements and, therefore, you are cautioned not to place undue reliance on such statements. Factors that could cause actual results to differ from those discussed in the forward-looking statements include, but are not limited to: our ability to obtain required regulatory or shareholder approvals, which could be delayed due to, among other things, the current U.S. Federal government shutdown, or meet other closing conditions, to complete the acquisition of Vista Bancshares, Inc. (”Vista”) when expected or at all and to realize the anticipated benefits of the proposed transaction; business and economic conditions along with external events both generally and in the financial services industry; susceptibility to credit risk and fluctuations in the value of real estate and other collateral securing a significant portion of our loan portfolio, including with regards to real estate acquired through foreclosure, and the accuracy of appraisals related to such real estate; the allowance for credit losses and fair value adjustments may be insufficient to absorb losses in our loan portfolio; our ability to maintain sufficient liquidity to meet the requirements of deposit withdrawals and other business needs; changes and uncertainty impacting monetary supply and the businesses of our clients and counterparties, including levels of market interest rates, inflation, currency values, monetary and fiscal policies, and the volatility of trading markets; changes in the fair value of our investment securities and the ability of companies in which we invest to commercialize their technology or product concepts; the loss of certain executive officers and key personnel; any service interruptions, cyber incidents or other breaches relating to our technology systems, security systems or infrastructure or those of our third-party providers; the occurrence of fraud or other financial crimes within our business; competition from other financial institutions and financial services providers and the effects of disintermediation within the banking business including consolidation within the industry; changes and uncertainty with respect to federal government lending programs like the Small Business Administration’s Preferred Lender Program and the Federal Housing Administration’s insurance programs, including the impact of a government shutdown on such programs; impairment of our mortgage servicing rights, disruption in the secondary market for mortgage loans, declines in real estate values, or being required to repurchase mortgage loans or reimburse investors; developments in technology, such as artificial intelligence, the success of our digital growth strategy, and our ability to incorporate innovative technologies in our business and provide products and services that satisfy our clients’ expectations for convenience and security; our ability to execute our organic growth and acquisition strategies; the accuracy of projected operating results for assets and businesses we acquire as well as our ability to drive organic loan growth to replace loans in our existing portfolio with comparable loans as loans are paid down; changes and uncertainty with respect to federal, state and local laws, regulations and policies, along with executive orders applicable to our business, including tax laws, tariff policies and Federal Reserve interest rate policies; our ability to comply with and manage costs related to extensive government regulation and supervision, including current and future regulations affecting bank holding companies and depository institutions; the application of any increased assessment rates imposed by the Federal Deposit Insurance Corporation; claims or legal action brought against us by third parties or government agencies; and other factors, risks, trends and uncertainties described elsewhere in our other filings with the Securities and Exchange Commission. The forward-looking statements are made as of the date of this communication, and we undertake no obligation to update any forward-looking statement to reflect events or circumstances after the date on which the statement is made or to reflect the occurrence of unanticipated events or circumstances, except as required by applicable law Important Additional Information and Where to Find It NBHC has filed with the SEC a Registration Statement on Form S-4 to register the shares of NBHC common stock to be issued to the shareholders of Vista in connection with the proposed acquisition of Vista. The Registration Statement will include a proxy statement/prospectus, which will be sent to the shareholders of Vista in connection with the proposed transaction. INVESTORS AND SECURITY HOLDERS ARE URGED TO READ THE REGISTRATION STATEMENT ON FORM S-4, THE PROXY STATEMENT/PROSPECTUS INCLUDED WITHIN THE REGISTRATION STATEMENT ON FORM S-4 AND ANY OTHER RELEVANT DOCUMENTS TO BE FILED WITH THE SEC IN CONNECTION WITH THE PROPOSED TRANSACTION OR INCORPORATED BY REFERENCE INTO THE PROXY/STATEMENT PROSPECTUS, AS WELL AS ANY AMENDMENTS OR SUPPLEMENTS TO THESE DOCUMENTS, CAREFULLY AND IN THEIR ENTIRETY, WHEN THEY ARE AVAILABLE, BECAUSE THEY WILL CONTAIN IMPORTANT INFORMATION ABOUT NBHC, VISTA AND THE PROPOSED TRANSACTION. Investors and security holders may obtain free copies of these documents through the website maintained by the SEC at http://www.sec.gov. Investors and security holders will also be able to obtain these documents, when they are filed, free of charge, by directing a request to National Bank Holdings Corporation, Attention: Investor Relations, 7800 E. Orchard Road, Suite 300, Greenwood Village, CO 80111, by e-mailing ir@nationalbankholdings.com or by calling (720) 554-6640. No Offer or Solicitation This communication is for informational purposes only and is not intended to and does not constitute an offer to subscribe for, buy or sell, or the solicitation of an offer to subscribe for, buy or sell, or an invitation to subscribe for, buy or sell any securities or a solicitation of any vote or approval in any jurisdiction, nor shall there be any sale, issuance or transfer of securities in any jurisdiction in which such offer, invitation, sale or solicitation would be unlawful prior to registration or qualification under the securities laws of any such jurisdiction. No offer of securities shall be made except by means of a prospectus meeting the requirements of Section 10 of the Securities Act of 1933, and otherwise in accordance with applicable law. Further Information: This presentation should be read together with “Management’s Discussion and Analysis of Financial Condition and Results of Operations” and the consolidated financial statements and the related notes thereto included in our Form 10-K and quarterly reports 2 |
|
About Non-GAAP Financial Measures 3 Certain of the financial measures and ratios we present are supplemental measures that are not required by, or are not presented in accordance with, U.S. generally accepted accounting principles (GAAP). We refer to these financial measures and ratios as “non-GAAP financial measures.” We consider the use of select non-GAAP financial measures and ratios to be useful for financial and operational decision making and useful in evaluating period-to-period comparisons. We believe that these non-GAAP financial measures provide meaningful supplemental information regarding our performance by excluding certain expenditures or assets that we believe are not indicative of our primary business operating results or by presenting certain metrics on a fully taxable equivalent basis. We believe that management and investors benefit from referring to these non-GAAP financial measures in assessing our performance and when planning, forecasting, analyzing and comparing past, present and future periods. These non-GAAP financial measures should not be considered a substitute for financial information presented in accordance with GAAP and you should not rely on non-GAAP financial measures alone as measures of our performance. The non-GAAP financial measures we present may differ from non-GAAP financial measures used by our peers or other companies. We compensate for these differences by providing the equivalent GAAP measures whenever we present the non-GAAP financial measures and by including a reconciliation of the impact of the components adjusted for in the non-GAAP financial measure so that both measures and the individual components may be considered when analyzing our performance. A reconciliation of non-GAAP financial measures to the comparable GAAP financial measures is included in the Reconciliation of Non-GAAP Measures section of the Appendix. |
|
Table of Contents Financial Performance 08 Vista Acquisition 15 Credit 19 Balance Sheet 24 2UniFi 29 Cambr 31 Management Team 33 Corporate Governance 36 Appendix 43 |
|
(1)As of September 30, 2025. Includes one banking center shared by NBH Bank and BOJH Trust. (2)Represents a non-GAAP financial measure. ROAA and ROAE totaled 1.43% and 10.25% respectively. See Appendix for a reconciliation of these measures. (3)Adjusted for acquisition-related expenses. See Appendix for a reconciliation of this measure. (4)Excluding other intangible asset amortization. 5 Attractive Markets Company Highlights Headquarters Denver, CO Banking Centers(1) 91 Listing NYSE: NBHC 36 banking centers ‒Denver: #5 in Hottest U.S. Housing Markets (U.S. News 2025) ‒Colorado: #6 Best Economy in the U.S. (U.S. News 2025) ‒Colorado: #8 Best State to Start a Business (WalletHub 2025) ‒Colorado: #11 Best State to Raise a Family (WalletHub 2025) 15 banking centers across Texas, Utah, New Mexico, and Idaho ‒Texas: #2 America’s Top States for Business (CNBC 2025) ‒Texas: #2 Best Economy in the U.S. (U.S. News 2025) ‒Utah: #3 Best Economy in the U.S. (U.S. News 2025) ‒Utah: #3 Best State to Start a Business (WalletHub 2025) ‒Idaho: #4 Best Economy in the U.S. (U.S. News 2025) 32 banking centers ‒Overland Park, KS: central hub for the #1 county in Kansas by household income and projected population growth(1) ‒Kansas City: #2 in Most Resilient U.S. Housing Markets (U.S. News 2025) ‒Kansas City: #8 in Hottest Housing Markets (Zillow 2025) ‒Kansas City: #10 in Affordable Starter Home Cities (Zillow 2025) (1)Ranking based on aggregate population growth for 2022-2027 (2)Includes one banking center shared by NBH Bank and BOJH Trust Balance Sheet 3Q25 Total Assets $10.2 billion Total Loans $7.4 billion Total Deposits $8.5 billion Key Ratios 3Q25 Common Equity Tier 1 14.69% Tier 1 Leverage 11.49% ROATA(2) 1.54% / 1.60%(3) ROATCE(2) 14.21% / 14.72%(3) Net Interest Margin FTE(2) 3.98% ACL / Loans 1.19% Efficiency Ratio FTE(2)(4) 60.65% / 57.32%(3) 8 banking centers(2) ‒Wyoming: #1 in State Tax Competitiveness Index (Tax Foundation 2024) ‒Wyoming: #1 Tax Friendly state for middle income families (Kiplinger 2024) |
|
96.7% 122.6% (50%) 0% 50% 100% 150% 200% S&P600 Bank median NBHC $0.80 $0.87 $0.94 $1.04 $1.12 $0.89 2020 2021 2022 2023 2024 YTD25 6 Shareholder Returns Source: S&P Global Market Intelligence, FactSet Research Systems, Bloomberg; market data as of 9/30/2025 (1)Peer median of the following group of 54 regional banks included in the S&P Small Cap 600 Index, not including NBHC: ABCB, AUB, AX, BANC, BANF, BANR, BKU, BOH, CASH, CATY, CBU, CFFN, CHCO, CPF, CUBI, CVBF, DCOM, EGBN, FBK, FBNC, FBP, FCF, FFBC, FHB, FULT, HAFC, HFWA, HOPE, HTH, INDB, LKFN, NBTB, NWBI, OFG, PFBC, PFS, PRK, RNST, SBCF, SBSI, SFBS, SFNC, STBA, STEL, TBBK, TFIN, TMP, TRMK, TRST, UCB, VBTX, WABC, WAFD, WSFS. (2)Represents a non-GAAP financial measure. YE22’s and YTD25’s adjustments relate to acquisition-related expenses incurred and YE24’s adjustment relates to non-recurring loss on security sales. See Appendix for a reconciliation of these measures to the most comparable GAAP financial measure. . 10-year Performance of NBH Shareholder Returns vs. S&P 600 Regional Banks(1) Historical Dividend Per Share Dividend Payout Ratio Target 30 - 40% of core earnings CAGR: 9% $88.6 $93.6 $28.3 $142.0 $118.8 $94.9 YE20 YE21 YE22 YE23 YE24 YTD25 Net Income Non-Adjusted Adjusted $123.9 $1.4 $93.5 $5.1 (2) ($ in millions) $99.6 $71.3 (2) (2) |
|
Recent Recognitions $71.3 7 |
|
Financial Performance |
|
Deposits Approximately 77% FDIC insured deposits Capital Ratios 14.69% Common Equity Tier 1 Ratio Q3 2025 Financial Highlights (1) Based on NBHC’s closing price on September 15, 2025. (2) Adjusted for acquisition-related expenses related to the pending acquisition of Vista. (3) Represents a non-GAAP financial measure. See Appendix for a reconciliation of these measures to the most comparable GAAP financial measure. (4) Excluding other intangible asset amortization. ▪ Announced the definitive agreement and plan of merger with Vista Bancshares, Inc. (“Vista”). The approximate aggregate transaction value was $365.4 million(1). Vista operates in Dallas-Ft. Worth, Austin, and Lubbock, Texas, as well as Palm Beach, Florida. Upon completion of the transaction and on a pro forma basis, the combined company will have approximately $12.4 billion in assets and $10.4 billion in deposits. ▪ Launched 2UniFi in July 2025, an innovative financial ecosystem that we believe can change the way business owners and operators access the U.S. banking system ▪ Quarterly adjusted net income increased $2.6 million, or 7.6%, to $36.6 million(3), or $0.96 per diluted share(2)(3) ▪ Adjusted return on average tangible assets of 1.60%(2)(3) and adjusted return on average tangible common equity of 14.72%(2)(3) ▪ The net interest margin FTE widened 11 basis points to 3.98%(3) compared to the same period prior year ▪ Solid capital with tangible common equity to tangible assets ratio of 10.57%(3) and tier 1 leverage ratio of 11.49% ▪ Grew tangible book value per share 10.2% over prior year ▪ Cash/investment securities portfolio with an average duration of 2.9 years ▪ Generated quarterly loan fundings totaling $421.2 million, bringing total year-to-date loan fundings to $1.0 billion ▪ Executed $8.8 million of share buybacks in the third quarter Expense 60.65% efficiency ratio FTE(3)(4) / 57.32% adjusted(2)(3)(4) ACL / Loans 1.19% Loans Loans outstanding of $7.4 billion Net Income $35.3 million / $36.6 million adjusted (2)(3) 3.98% Net interest margin FTE(3) 9 |
|
10 Profitable Steady Growth $80.4 $88.6 $93.6 $28.3 $142.0 $118.8 $93.5 YE19 YE20 YE21 YE22 YE23 YE24 YTD25 Net Income Non-Adjusted Adjusted $123.9 $5.1 (1) $94.9 $1.4 (1) $2.55 $2.85 $3.01 $0.87 $3.72 $3.08 $2.43 YE19 YE20 YE21 YE22 YE23 YE24 YTD25 EPS (Fully Diluted) Non-Adjusted Adjusted $0.14 $3.22 (1) (1) $2.47 $0.04 ($ in millions) 1.42% 1.44% 1.37% 0.95% 1.57% 1.30% 1.38% 1.32% 1.36% 1.40% YE19 YE20 YE21 YE22 YE23 YE24 YTD25 ROATA(1) Non-Adjusted Adjusted (1) (1) 61.6% 60.9% 63.4% 62.2% 56.0% 61.5% 59.8% 61.1% 60.6% 63.0% 57.1% 54.3% 58.7% 57.5% YE19 YE20 YE21 YE22 YE23 YE24 YTD25 Efficiency Ratio FTE(1) Non-Adjusted Excluding other intangible asset amortization, adjusted $112.9 $132.1 $110.8 $143.5 $190.0 $159.1 $129.0 YE19 YE20 YE21 YE22 YE23 YE24 YTD25 Non-Adjusted Adjusted (1) $6.6 $165.7 $128.4 $130.8 $1.8 (1) Pre-Provision Net Revenue FTE(1) ($ in millions) 13.07% 13.27% 12.87% 9.91% 18.23% 13.65% 13.05% 13.75% 14.20% 13.23% YE19 YE20 YE21 YE22 YE23 YE24 YTD25 ROATCE(1) Non-Adjusted Adjusted (1) (1) (1)Represents a non-GAAP financial measure. YE22 adjusted for $15.1 million of acquisition-related expenses. YE24 adjusted for $6.6 million of non-recurring loss on security sales. YTD25 adjusted for $1.7 million of acquisition-related expenses. See Appendix for a reconciliation of these measures to the most comparable GAAP financial measure. (1) (1) $3.05 $2.18 (1) $71.3 $99.6 (1) $15.1 (1) |
|
11 Growth Trends $5.9 $6.7 $7.2 $9.6 $9.9 $9.8 $10.2 YE19 YE20 YE21 YE22 YE23 YE24 YTD25 Total Assets $4.4 $4.2 $4.5 $7.2 $7.7 $7.8 $7.4 $0.2 YE19 YE20 YE21 YE22 YE23 YE24 YTD25 Total Loans Non-PPP Loans PPP Loans $651.4 $707.3 $728.8 $776.0 $860.3 $961.8 $1,037.9 YE19 YE20 YE21 YE22 YE23 YE24 YTD25 ($ in billions) ($ in billions) ($ in millions) Tangible Common Equity(3) (1) Includes $2.3 billion of total assets added through the Rock Canyon Bank and Bank of Jackson Hole acquisitions in 2022. (2)Includes $1.7 billion of loans added through the Rock Canyon Bank and Bank of Jackson Hole acquisitions in 2022. (3)Represents a non-GAAP financial measure. See Appendix for a reconciliation of these measures to the most comparable GAAP financial measure. $4.4 (2) (1) |
|
12 Trust and Wealth Partners ▪ Trust and Wealth Management solution tailored to high net worth individuals ▪ Scalable Private Wealth team provides a broad range of financial and retirement planning solutions, creating an opportunity to further leverage the platform to new and existing NBH clients ▪ Established relationships with strong investment and research partners drives ability to cross-sell ▪ Fee income drives revenue diversification and attractive recurring earnings 550+ High Net Worth Client Accounts $1.1 billion AUM |
|
13 Prudent Stewards of Capital TIER 1 LEVERAGE 11.49% COMMON EQUITY TIER 1 RISK-BASED 14.69% TIER 1 RISK-BASED 14.69% TOTAL RISK-BASED 16.63% TANGIBLE COMMON EQUITY TO TANGIBLE ASSETS(1) 10.57% Capital Ratios – YTD25 (1)Represents a non-GAAP financial measure. See Appendix for a reconciliation of these measures to the most comparable GAAP financial measures. (2)Presented on a one-quarter lag. (3)Peer median includes the following group of 57 regional banks included in the S&P 600 Regional Banks Index, not including NBHC, that have reported ROATCE results for 2Q25: ABCB, AUB, AX, BANC, BANF, BOH, BKU, BANR, BHLB, BRKL, CFFN, CATY, CPF, CHCO, CBU, CUBI, CVBF, DCOM, EGBN, FBK, FBNC, FBP, FCF, FFBC, FHB, FULT, HAFC, HFWA, HTH, HOPE, INDB, LKFN, NBTB, NWBI, OFG, PPBI, PRK, CASH, PFBC, PFS, RNST, STBA, SBCF, SFBS, SFNC, SBSI, STEL, TBBK, TMP, TFIN, TRST, TRMK, UCB, VBTX, WAFD, WABC, WSFS, as reported via S&P Global Market Intelligence through August 8, 2025. ▪ $573 million in excess capital over 7.0% common equity tier 1 risk-based regulatory requirement ▪ Double-leverage ratio of 94.1% ▪ Executed $8.8 million of share repurchases in 3Q25; $37.0 million remaining under the current share authorization program ▪ Holding company cash reserves of $79.2 million sufficient to support shareholder dividend payments ▪ High quality capital stack NBHC 14.18% PEER MEDIAN(3) 12.54% ROATCE (1)(2) – 2Q25 |
|
Highlights ▪ Net interest margin (FTE) widened 11 basis points to a strong 3.98% in 3Q25 over the same period prior year, driven by disciplined loan and deposit pricing. ▪ Cost of funds improved 26 basis points to 2.10% in 3Q25 over the same period prior year. ▪ Net interest income (FTE) grew to $90.2 million in 3Q25 over the same period prior year. $89.5 $92.0 $88.6 $89.3 $90.2 3Q24 4Q24 1Q25 2Q25 3Q25 14 Net Interest Income Net Interest Income FTE(1) 3.87% 3.99% 3.93% 3.95% 3.98% 3Q24 4Q24 1Q25 2Q25 3Q25 Net Interest Margin FTE(1) ($ in millions) 2.36% 2.15% 2.07% 2.09% 2.10% 3Q24 4Q24 1Q25 2Q25 3Q25 Cost of Funds (1)Represents a non-GAAP financial measure. See Appendix for a reconciliation of these measures to the most comparable GAAP financial measures. |
|
Vista Acquisition |
|
16 Pricing Structure Leadership and Branding Timing and Approvals • $365mm Deal Value (1) • Price / TBVPS: 1.52x • Deal Value / ‘26E Net Income: 11.0x (2) • Deal Value / ‘26E Net Income + Cost Savings: 7.6x (2)(3) • Each common share of Vista to be exchanged for 3.1161x shares of NBHC and $31.62 of cash • ~80% stock / ~20% cash consideration • Pro forma ownership: ~84% NBHC / ~16% Vista • John Steinmetz will lead the combined Texas market and will be named Executive Vice Chair and Executive Managing Director of Strategic Initiatives at NBH Bank (has served as Vista CEO for over 10 years) • One current Vista director to be added to NBHC board • NBH Bank franchise will be rebranded as Vista Bank across the combined enterprise over time • Approved by both Boards of Directors • Subject to Vista shareholder approval, regulatory approval, and other customary closing conditions • Anticipated closing in Q1 2026 Well Structured Transaction With Significant Strategic Value 16 Source: S&P Capital IQ Pro, FactSet Research Systems Inc., NBHC and Vista filings (1) Based on 2,310,790 outstanding shares of Vista, includes $12mm payment for cashing out of Vista warrants and options; Based on 123,132 Vista options at a weighted average strike price of $63.80 and 22,618 Vista warrants at a weighted average strike price of $110.53, and NBHC share price of $37.96 as of 9/15/2025, and approximately $7mm of stock consideration in exchange for restricted shares of Vista to be issued in connection with the transaction (2) Vista 2026E earnings per Vista management (3) Includes impact of 100% phased-in cost savings for illustrative purposes |
|
17 Creating a Premier Western Franchise • Enhances NBHC’s financial performance and growth profile • Expect strong EPS accretion of ~17%, 20%+ IRR, and earnback ~3 years • Leverages NBHC’s access to capital and expected to improve 2026 ROATCE 350bps+ • Significant revenue synergy opportunities (none modeled) to leverage NBHC liquidity to accelerate Texas’s growth, enhance banking capabilities offered to Vista’s middle market clients and introduce NBH Trust and Wealth services to Vista’s Private Client network • Materially accelerates NBHC’s growth strategy in Texas, the third largest state by deposits • Texas is one of the best banking markets in the country in terms of size, economy and growth • 5-year projected population growth in Texas is 5.6% or more than 2x the national average • Vista’s strong loan growth CAGR of 21% since 2021 • Robust commercial banking capabilities with aligned risk management practices • Attractive loan yields and strong asset quality • Strong cultural fit through similar relationship banking approach and community engagement • Vista executive team to lead combined Texas market • Vista brand to be retained and rolled out across the combined enterprise over time • Comprehensive due diligence completed, including thorough credit review • Capital remains robust – pro forma CET1 ratio of 12.5% • NBHC has a strong track record of successfully executing and integrating M&A transactions Attractive Financial Impact Expansion into Demographically Attractive Texas Markets Enhanced Growth Profile with High Quality Originations Deepens Management Bench Low Risk Transaction Source: S&P Capital IQ Pro, FactSet Research Systems Inc., NBHC and Vista filings; Financial data as of the quarter ended June 30, 2025 unless otherwise stated (1) Full-year impact and 100% phased-in cost savings presented for illustrative purposes (2) Includes sale of 7 West Texas branches ($119 million of associated loans) (3) Presented at illustrative transaction close inclusive of estimated purchase accounting adjustments (4) Vista has one banking center in Palm Beach, Florida that is not shown; Represents 9% of Vista deposits as of 6/30/2025; Footprint excludes ATM-only location in Lubbock, Texas (5) Pro forma amounts based on 6/30/25 and exclude purchase accounting adjustments (6) Based on NBHC share price of $37.96 as of 9/15/2025 and 7.4 million shares issued to Vista Pro Forma Banking Center Footprint (4) CO UT MO TX KS NM ID WY $12.4bn Assets $9.3bn Loans $10.4bn Deposits $1.7bn Mkt. Cap (6) Pro Forma Financial Highlights (5) (3) ~20% of Pro Forma Deposits (5) (1) (1) (2) |
|
18 Attractive Pro Forma Financial Impact ~53% 2026E Efficiency Ratio ~15.4% 2026E ROATCE ~1.3% 2026E ROAA Enhanced Pro Forma Profitability(1) Attractive Financial Impact Robust Capital at Closing 14.1% Total Capital Ratio 12.5% CET1 Ratio 9.4% TCE / TA ~3 years TBV Earnback 7.8% TBV Dilution ~17% 2026 EPS Accretion(1) (Fully Phased-in) (1) Full-year impact and 100% phased-in cost savings presented for illustrative purposes |
|
Credit |
|
20 Uniquely Diversified $7.4 Billion Loan Portfolio Concentrations ▪ Self-imposed concentration limits ensure a granular and diverse loan portfolio and protect against downside risk to any particular industry or real estate sector ▪ Individual industry sectors are limited to no more than 15% of total loan commitments, with the majority being 10% or less ▪ Non-owner occupied CRE is 132% of risk-based capital and no specific property type exceeds 7% ▪ New commercial loans originated YTD: - Average funding of $1.7 million - Weighted average commitment, including unused, of $2.0 million ▪ Residential loans originated YTD: - Average funding of $527 thousand - Average FICO of 776 - Average LTV of 54% ▪ Top 25 originated relationships as of September 2025: - Average funded balance of $26 million - Average commitment of $31 million Granular and Well-Diversified Loan Portfolio 3% 4% Residential 17% Non-owner occupied CRE 22% C&I 45% and Owner-occupied CRE 16% 7% 4% 2% 2%2% 1% 4% 15% 1% 1% 7% 12% 5% 3% 3% 3% 2% 2% 2% 2% 2%1% 1% 1% 15% |
|
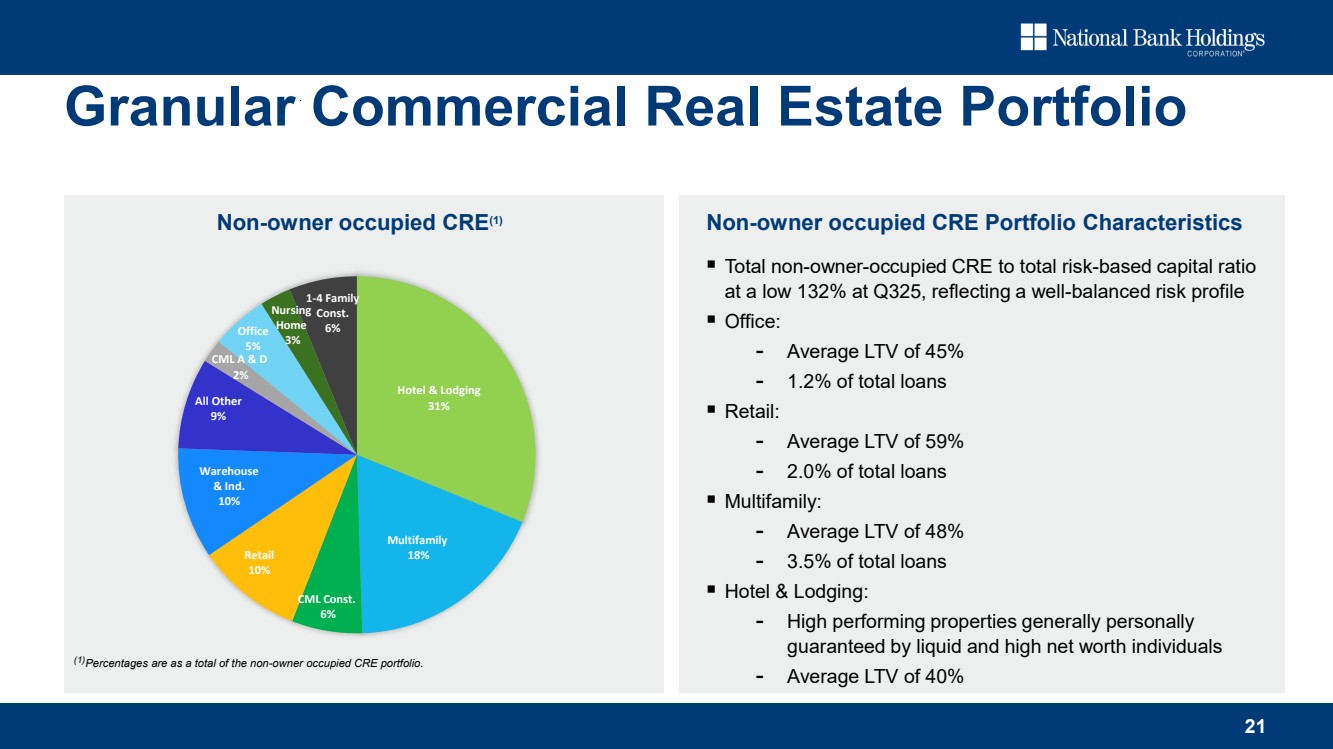
21 Granular Commercial Real Estate Portfolio Hotel & Lodging 31% Multifamily 18% CML Const. 6% Retail 10% Warehouse & Ind. 10% All Other 9% CML A & D 2% Office 5% Nursing Home 3% 1-4 Family Const. 6% ▪ Total non-owner-occupied CRE to total risk-based capital ratio at a low 132% at Q325, reflecting a well-balanced risk profile ▪ Office: - Average LTV of 45% - 1.2% of total loans ▪ Retail: - Average LTV of 59% - 2.0% of total loans ▪ Multifamily: - Average LTV of 48% - 3.5% of total loans ▪ Hotel & Lodging: - High performing properties generally personally guaranteed by liquid and high net worth individuals - Average LTV of 40% Non-owner occupied CRE(1) Non-owner occupied CRE Portfolio Characteristics (1)Percentages are as a total of the non-owner occupied CRE portfolio. |
|
22 Strong Credit Quality History YE22 YE23 YE24 3Q25 Loan charge-offs 0.17% 0.34% 0.41% 0.28% 0.06% 0.03% 0.05% 0.08% 0.05% 0.05% 0.01% YE22 YE23 YE24 3Q25 Non-performing loans Acquired non-performing loans OREO 0.37% 0.01% Non-performing Loans Non-performing Asset Composition Net Charge-Offs(1) Total Classified Loans 0.28% (1)As a % of average total loans $17 $28 $36 $27 0.23% 0.37% 0.46% 0.36% YE22 YE23 YE24 3Q25 Non-performing loans Non-performing loans as a % of total loans 0.03% 0.42% 0.47% 0.02% 0.13% $23 $52 $128 $170 $17 $16 $19 $22 0.6% 0.7% 1.9% 2.6% YE22 YE23 YE24 3Q25 Classified loans Acquired loans % of total loans $147 $192 $40 $68 (0.05)% ($ in millions) |
|
23 Credit Loss Protection $88.3 Total Loan Loss Coverage Including Loan Marks 1.43%(1) ACL/Total Loans 1.19% Loan Marks/Total Loans 0.24%(1) $18.1 $106.4 All dollars in millions (1)Represents a non-GAAP financial measure. Calculated to include loan marks of $18.1 divided by total loans of $7,429. ACL 9/30/2025 Loan Marks 9/30/2025 TOTAL 9/30/2025 |
|
Balance Sheet |
|
▪ Portfolio built on a relationship-banking strategy, with emphasis on depository and treasury management relationships ▪ Self-imposed concentration limits; individual industry sectors are limited to no more than 15% of total loan commitments, with the majority being 10% or less ▪ Industries requiring in-depth knowledge are managed by specialty banking teams, with dedicated specialist underwriters ▪ New loan fundings over the trailing twelve months totaled $1.5 billion, led by commercial loan fundings of $997.3 million ▪ Generated quarterly loan fundings totaling $421.2 million with a weighted average rate of 6.9% at the time of origination FY19 FY20 FY21 FY22 FY23 FY24 3Q25 $1.5 (2) (1)Excludes loans held-for-sale (2)Over the trailing twelve months $1.2 $1.5 $1.2 $2.0 Owner-Occupied CRE 16% Non-Owner Occupied CRE 22% Resi Mortgage & Consumer 17% C & I 45% Loan Composition ($7.4 Billion) Quarterly Loan Fundings ($ in millions) Total Loan Fundings(1) ($ in billions) 25 Solid Loan Growth $359.3 $480.0 $255.7 $322.7 $421.2 3Q24 4Q24 1Q25 2Q25 3Q25 $1.5 $1.5 |
|
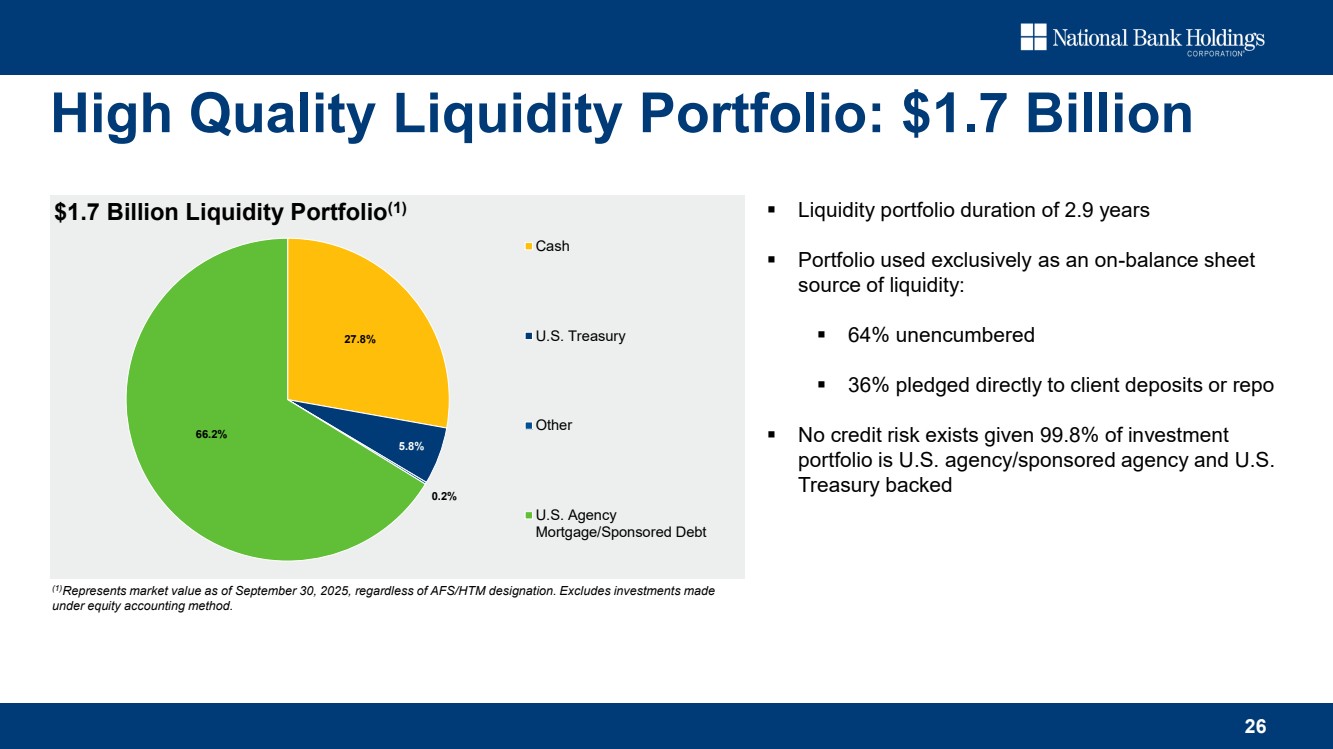
27.8% 5.8% 0.2% 66.2% Cash U.S. Treasury Other U.S. Agency Mortgage/Sponsored Debt 26 High Quality Liquidity Portfolio: $1.7 Billion ▪ Liquidity portfolio duration of 2.9 years ▪ Portfolio used exclusively as an on-balance sheet source of liquidity: ▪ 64% unencumbered ▪ 36% pledged directly to client deposits or repo ▪ No credit risk exists given 99.8% of investment portfolio is U.S. agency/sponsored agency and U.S. Treasury backed $1.7 Billion Liquidity Portfolio(1) (1)Represents market value as of September 30, 2025, regardless of AFS/HTM designation. Excludes investments made under equity accounting method. |
|
Granular Deposit Base ▪ No exposure to venture capital or crypto deposits ▪ Total deposits increased to $8.5 billion during 2025 ▪ Cost of average transaction deposits decreased 23 basis points to 1.84% during 2025 ▪ The mix of transaction deposits to total deposits was 86.3% Low Cost Deposits $5.9 $7.0 $7.3 $7.1 $0.8 $1.0 $1.0 $1.1 YE22 YE23 YE24 YTD25 Average Transaction Deposits Average Time Deposits 51% 47% 44% 41% 37% 41% 44% 45% 9% 8% 9% 10% 3% 4% 3% 4% $7.9 $8.2 $8.2 $8.5 0% 50% 100% YE22 YE23 YE24 YTD25 Demand & NOW Savings & MM CDs < $250k CDs >= $250k Total 87% Non-Time 88% Non-Time 88% Non-Time 86% Non-Time 4.50% 5.50% 4.50% 4.25% 0.26% 1.26% 2.07% 1.84% 0.33% 1.37% 2.23% 2.05% FY22 FY23 FY24 YTD25 Fed Funds rate Cost of transaction deposits Cost of deposits 27 Low Cost Transaction Deposits Low Cost Transaction Accounts Deposit Composition ($ in billions) |
|
28 Relationship Focused Deposit Base: $8.5 Billion ▪ Approximately 77% FDIC insured ▪ Granular deposit base: - Average deposit balance on full relationship basis just $58 thousand - Average deposit balance per account $30 thousand ▪ Approximately $0.5 billion of deposits collateralized ▪ No concentrations to any industry, sector or geography ▪ No venture capital or crypto deposits 3% Deposit Composition4% Time Deposits 14% Savings & Money Market Deposits 45% Non-interest bearing DDA 27% Interest bearing DDA 14% Transaction Accounts 41% |
|
2UniFi |
|
Financial Capital Social Capital Technical Capital Cultural Capital Operational Efficiency FDIC insured account., protected deposits, treasury management, recurring billing, invoicing Improved operating information, financial statement preparation, marketplace opportunities Cash Flow Analysis, predictive analytics, personalization Budgeting & Growth Planning Goals, savings, needs by phase, access to growth vehicles, credit, growth projections, growth tracking Financial Management Data Insights & Reporting Fraud protection, faster and lower cost payment processing, B2B payments Digital Security Mentorship & Guidance Dedicated mentors, situational mentorship, crowdsourced information, referrals Connect businesses, partner linking, partnership formation, collective support, business collaborations Community of Support Verified network, direct value connections, affinity groups Partnership & Collaboration Fair Access Reduce bias in lending, get equal access to relevant advice and capital needs User needs validation, bring users into the process, user testing, bias and assumption reduction User Alignment & Buy-in Education and guidance, day-to-day activity decision-making, strategic planning Education & Financial Literacy Easier access to trade finance / working capital and SBA loans Digital Lending 30 2UniFi: an innovation platform that builds 'capital' and drives outcomes for SMBs. |
|
Cambr |
|
Strategic Rationale ▪ Cambr offers the use of a deposit administration platform (the Cambr platform) to various depository institutions, each known as a Bank of Record, that hold the deposits of individual clients. Cambr utilizes the Cambr platform to facilitate the placement of the Bank of Record depositors’ funds into destination banks. ▪ Cambr has relationships with leading embedded finance companies and their partner banks to provide them these deposit services. ▪ Cambr allocates these deposits to a network of banks. ▪ Cambr generates revenue through a revenue share based on the interest income derived from the bank network. About Cambr Relationship Schematic Diversifies NBH’s Deposit Franchise with Minimal Overhead Costs End User Bank of Record NBH Custodial Account Cambr Deposit Network $ $ $ Embedded Finance Program Data Deposit Flows Account Details & Instructions ▪ Funding Flexibility: Certain relationships with Banks of Record enable NBH to keep deposits or “push” them to the bank network as needed ▪ Manage liquidity ▪ Manage capital (leverage ratio) ▪ Minimal Overhead: The Cambr platform is primarily fixed expense base with minimal variable expenses ▪ Competitive Hedge: Benefit from ongoing embedded finance competition and disruption in the banking industry ▪ Income Diversification: Cambr income is not tied to NBH balance sheet growth ▪ Multitude of Use Cases: Cambr’s technology can support deposit management for a broad range of business segments Cambr Overview 32 |
|
Management Team |
|
34 Experienced Management Team Nicole Van Denabeele Chief Financial Officer (22 years in financial industry) • Previously EVP, Chief Accounting Officer at NBHC, and President of Bank Midwest • Controller at Polsinelli, PC • Senior Vice President, Assistant Controller at UMB Financial Corporation • Auditor at Deloitte, LLP Tim Laney Chairman & CEO (44 years in banking) • Head of Business Services at Regions Financial, where he also led the transformation of wholesale lines of business • Senior management roles in small business, commercial banking, private banking, corporate marketing and change management and Management Operating Committee member at Bank of America; also served as President, Bank of America, Florida Richard Newfield Chief Risk Management Officer (41 years in banking) • Head of Business Services Credit at Regions Financial • Senior roles in risk management, credit, commercial banking, global bank debt and corporate marketing at Bank of America Aldis Birkans President (27 years in financial industry) • Previously Chief Financial Officer at NBHC • Previously Senior Vice President, Treasurer at NBHC • Vice President, Assistant Treasurer at M&I Bank • Senior Vice President, Corporate and Investment Bank Treasury at Citigroup Angela Petrucci Chief Administrative Officer & General Counsel (25 years in legal and banking) • Previously Senior Vice President, General Counsel at NBH Bank • In House Counsel at Accenture • Associate at Chapman and Cutler LLP • Started career as a commercial banker at First Chicago Bank (now JP Morgan Chase) Dan Sznewajs Chief Corporate Development Officer & Treasurer (22 years in financial industry) • Previously Director of Financial Planning & Analysis at NBHC • Vice President, Financial Institutions Group at Goldman Sachs • Commissioned Examiner in the Safety & Soundness Division at the Federal Reserve Bank of Chicago |
|
35 Management & Directors NBHC MANAGEMENT & DIRECTORS BENEFICIAL OWNERSHIP(1) PERCENT OF CLASS(2) G. Timothy Laney 509,106 1.33% Aldis Birkans 113,885 0.30% Nicole Van Denabeele 16,296 0.04% Richard U. Newfield, Jr. 192,179 0.50% Angela Petrucci 38,791 0.10% Dan Sznewajs 2,553 0.01% Ralph W. Clermont 76,346 0.20% Robert E. Dean 33,412 0.09% Robin A. Doyle 5,777 0.02% Alka Gupta 11,268 0.03% Fred J. Joseph 25,861 0.07% Patrick Sobers 23,049 0.06% Micho F. Spring 43,740 0.11% Art Zeile 18,035 0.05% All current NBHC management and directors as a group (14 persons) 1,110,298 2.89% Beneficial Ownership (as of 09/30/25) 1) Reflects number of shares of NBHC Common Stock beneficially owned as of September 30, 2025, based on NBHC’s review of filings with the SEC and information provided by the individuals. Includes unvested restricted shares for which the director or officer has voting power and shares issuable upon the exercise of options as well as indirect ownership. Does not include unvested performance stock units. (2) Calculated in accordance with Item 403 of Regulation S-K, and based on 37,815,589 shares of Class A common stock outstanding and entitled to vote and 331,950 shares of unvested restricted stock entitled to vote. |
|
Corporate Governance |
|
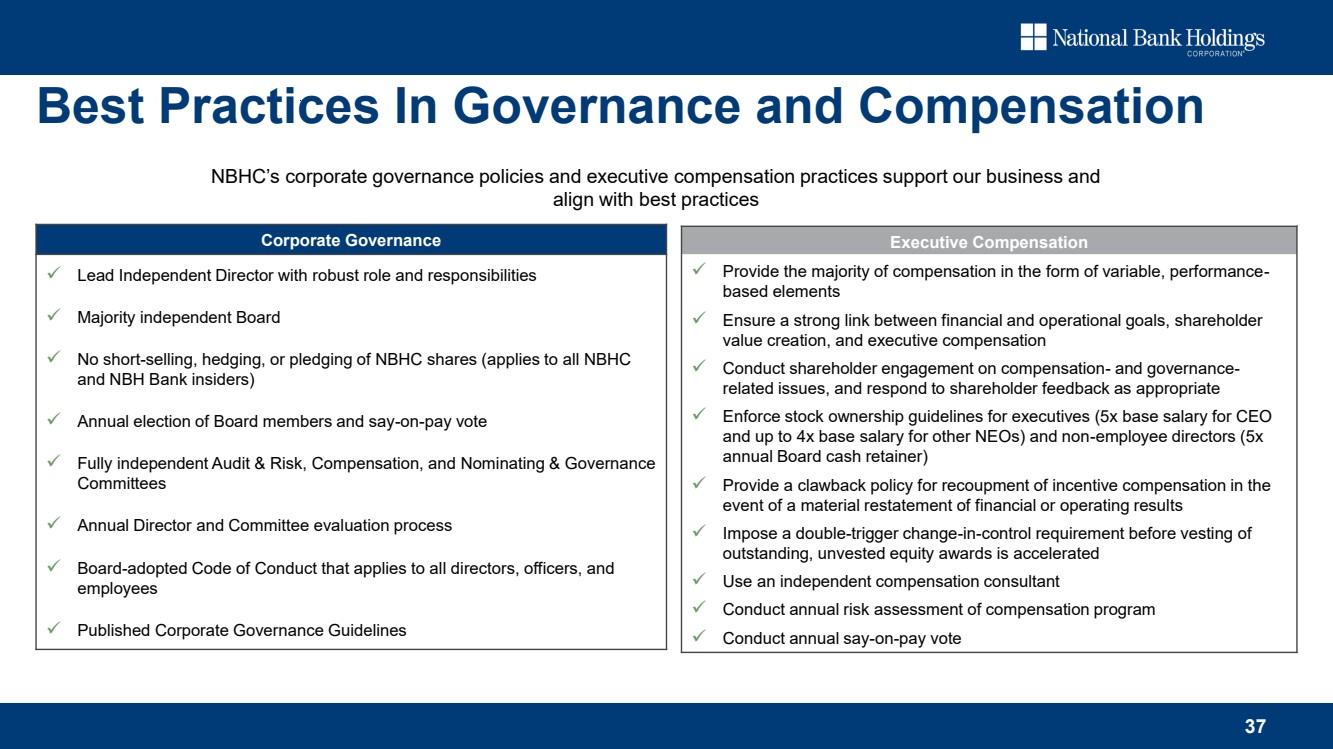
37 Best Practices In Governance and Compensation Corporate Governance ✓ Lead Independent Director with robust role and responsibilities ✓ Majority independent Board ✓ No short-selling, hedging, or pledging of NBHC shares (applies to all NBHC and NBH Bank insiders) ✓ Annual election of Board members and say-on-pay vote ✓ Fully independent Audit & Risk, Compensation, and Nominating & Governance Committees ✓ Annual Director and Committee evaluation process ✓ Board-adopted Code of Conduct that applies to all directors, officers, and employees ✓ Published Corporate Governance Guidelines Executive Compensation ✓ Provide the majority of compensation in the form of variable, performance-based elements ✓ Ensure a strong link between financial and operational goals, shareholder value creation, and executive compensation ✓ Conduct shareholder engagement on compensation- and governance-related issues, and respond to shareholder feedback as appropriate ✓ Enforce stock ownership guidelines for executives (5x base salary for CEO and up to 4x base salary for other NEOs) and non-employee directors (5x annual Board cash retainer) ✓ Provide a clawback policy for recoupment of incentive compensation in the event of a material restatement of financial or operating results ✓ Impose a double-trigger change-in-control requirement before vesting of outstanding, unvested equity awards is accelerated ✓ Use an independent compensation consultant ✓ Conduct annual risk assessment of compensation program ✓ Conduct annual say-on-pay vote NBHC’s corporate governance policies and executive compensation practices support our business and align with best practices |
|
Fred J. Joseph ▪ Financial services regulator for 30 years as the Banking and Securities Commissioner for the State of Colorado ▪ Member of the Investor Issues Committee for FINRA A N I Compensation Independent Governance & Nominating Committee Chair Audit & Risk Appointed within the last five years G. Timothy Laney ▪ CEO and Chairman ▪ Former Sr Executive VP & Head of Business Services at Regions Financial ▪ 24-year tenure at Bank of America, and a member of Bank of America’s Management Operating Committee C N * I Robust Lead Director Responsibilities ▪ Mr. Clermont presides at all Board meetings where the Chairman is not present and at all executive sessions of independent Directors ▪ Acts as liaison between Chairman and independent Directors ▪ Reviews and approves Board meeting agendas and information presented to Board ▪ Engages with major shareholders as needed ▪ As the independent Lead Director, Mr. Clermont is an ex officio member of all Board committees with full voting rights NBHC Board of Directors A Art Zeile ▪ Current CEO of DHI Group ▪ Extensive experience in software, telecommunications, internet, datacenter and security technologies, with a particular focus on cybersecurity ▪ Began career as an Officer in the U.S. Air Force Patrick Sobers ▪ 30+ years of financial services experience ▪ 10 years with NBH Bank (Former EVP, Head of Business and Consumer Banking) ▪ Member of NBH Bank’s board of directors since 2017 ▪ Several leadership positions at Bank of America, including Southeast Region’s Consumer Banking Executive 38 Ralph W. Clermont ▪ Lead Independent Director ▪ Former Managing Partner of KPMG, St. Louis office ▪ 39+ years of banking and audit experience A* C N I Robert E. Dean ▪ Former Senior Managing Director of Ernst & Young Corporate Finance ▪ Practiced corporate, banking and securities law with Gibson, Dunn & Crutcher A C N* I A C I Micho F. Spring ▪ Former chair of Global Corporate Practice at Weber Shandwick ▪ Formerly CEO of Boston Telecommunications Company ▪ Served four years as Deputy Mayor of Boston A N I A Alka Gupta ▪ Fortune 500 executive and tech entrepreneur with deep experience in digital transformation ▪ Currently a Venture Partner at Fin Venture Capital ▪ Co-Founder of and former President at GlobaliD, Inc. C I * Robin A. Doyle ▪ Served in several senior management roles over a 28 year career at J.P. Morgan, including as an executive member of J.P. Morgan’s board of directors risk policy committee ▪ Founding board member for the Rutgers Business School Center for Women in Business A I I |
|
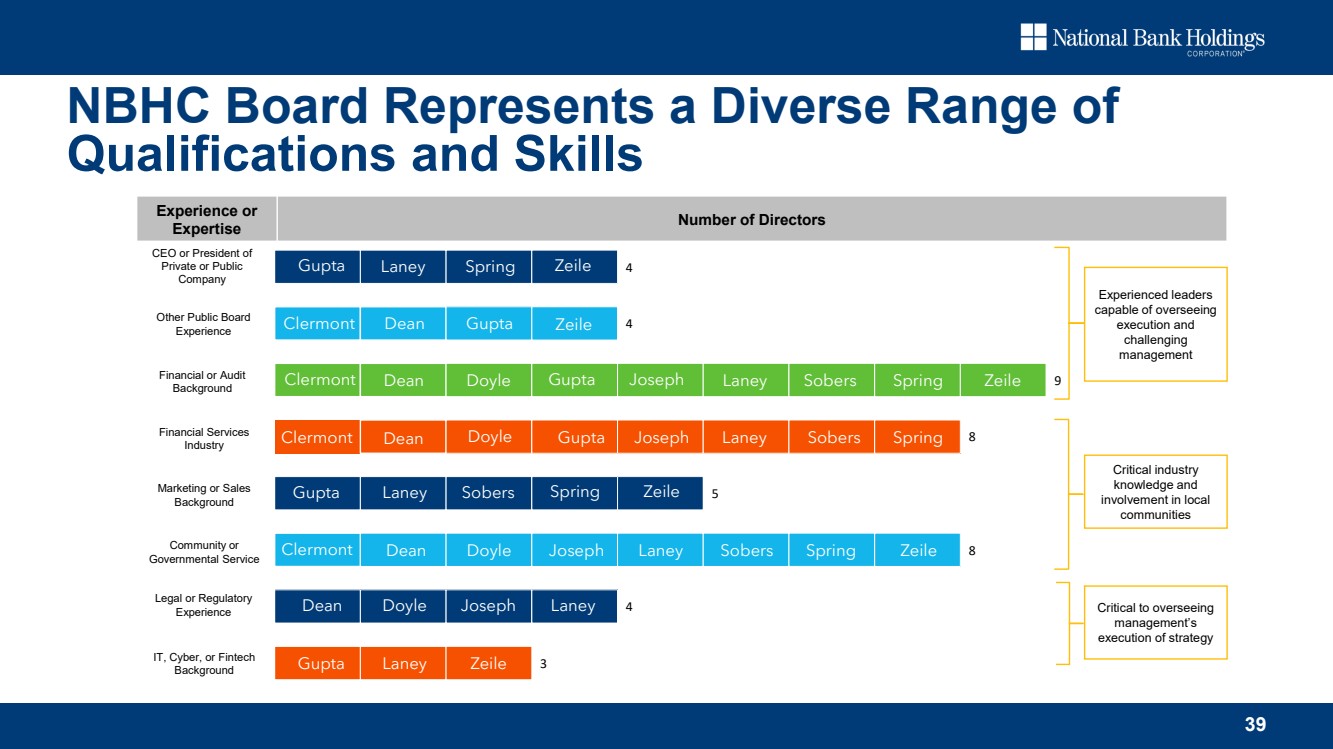
39 NBHC Board Represents a Diverse Range of Qualifications and Skills 4 4 9 8 5 8 4 3 Gupta Joseph Spring Zeile Clermont Zeile Sobers Laney Sobers Spring Zeile Experience or Expertise Number of Directors Experienced leaders capable of overseeing execution and challenging management Critical industry knowledge and involvement in local communities Critical to overseeing management’s execution of strategy Gupta Clermont Dean Laney Gupta Laney Laney Dean Zeile Spring Gupta Spring Zeile Zeile Clermont Gupta Dean Dean Laney Clermont Doyle Sobers Dean Gupta Joseph Spring Doyle Doyle Doyle Sobers Joseph CEO or President of Private or Public Company Other Public Board Experience Financial or Audit Background Financial Services Industry Marketing or Sales Background Community or Governmental Service Joseph Legal or Regulatory Experience IT, Cyber, or Fintech Background Laney Zeile Laney Sobers Spring |
|
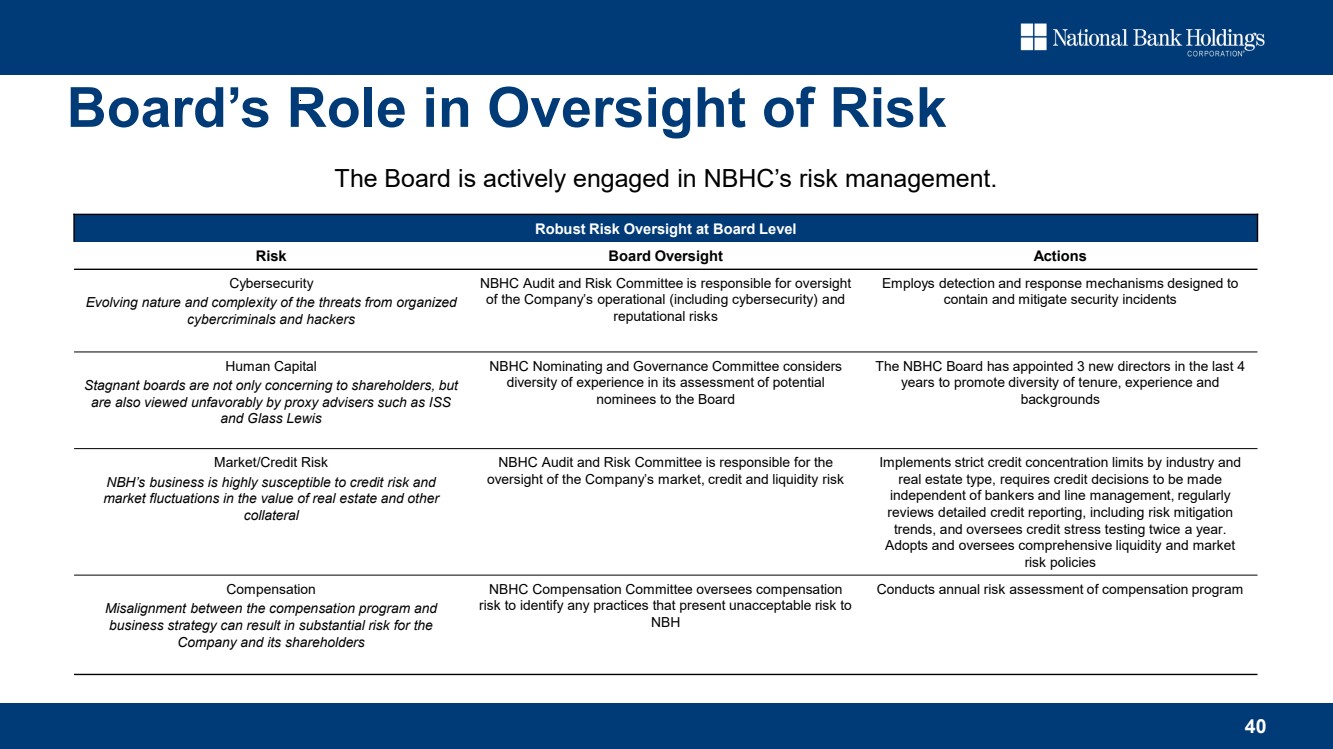
40 Board’s Role in Oversight of Risk The Board is actively engaged in NBHC’s risk management. Robust Risk Oversight at Board Level Risk Board Oversight Actions Cybersecurity Evolving nature and complexity of the threats from organized cybercriminals and hackers NBHC Audit and Risk Committee is responsible for oversight of the Company’s operational (including cybersecurity) and reputational risks Employs detection and response mechanisms designed to contain and mitigate security incidents Human Capital Stagnant boards are not only concerning to shareholders, but are also viewed unfavorably by proxy advisers such as ISS and Glass Lewis NBHC Nominating and Governance Committee considers diversity of experience in its assessment of potential nominees to the Board The NBHC Board has appointed 3 new directors in the last 4 years to promote diversity of tenure, experience and backgrounds Market/Credit Risk NBH’s business is highly susceptible to credit risk and market fluctuations in the value of real estate and other collateral NBHC Audit and Risk Committee is responsible for the oversight of the Company’s market, credit and liquidity risk Implements strict credit concentration limits by industry and real estate type, requires credit decisions to be made independent of bankers and line management, regularly reviews detailed credit reporting, including risk mitigation trends, and oversees credit stress testing twice a year. Adopts and oversees comprehensive liquidity and market risk policies Compensation Misalignment between the compensation program and business strategy can result in substantial risk for the Company and its shareholders NBHC Compensation Committee oversees compensation risk to identify any practices that present unacceptable risk to NBH Conducts annual risk assessment of compensation program |
|
Long-Term Incentive Award 42% Annual Cash Incentive Award 31% Base Salary 27% 41 Executive Compensation Program NBH’s executive compensation practices align management incentives with long-term shareholder interests Components of Executive Compensation (2024) 2024 Compensation Breakdown Additional Compensation Features Component Metrics Base Salary (Cash) • Reviewed annually Annual Cash Incentive Award (At-Risk Cash) • 2024 Corporate Measures(1): − Core Net Income (40%) − Asset Quality (30%) − Enterprise Risk Management & Doing Good (15%) − Qualitative (15%) Long-Term Incentive Award (PSUs & Restricted Stock) • 3-year Cumulative Adjusted EPS • 3-year Relative TSR • 3-year ROTA Link to Strategy • Among other things, attract and retain executives capable of driving achievement of the Company’s strategic objectives • Ensure the goals and interests of management are aligned with those of our shareholders, clients, and communities we serve • Balance compensation to reward both short-term results and the strategic decisions and actions necessary to run a sustainable business and create long-term value • Motivate executives to deliver a high level of performance and achieve strategic goals within clear and acceptable risk parameters • Attract and retain highly qualified executives through a balance of cash and equity compensation • Financial metrics and relative targets established are a reflection of what Compensation Committee deems important to align the NEO’s performance with the achievement of the Company’s strategic goals and key long-term financial targets • Evaluate executive compensation and Company performance relative to peers • Stock Ownership Guidelines: − CEO: 5x base salary − OTHER NEOs: (up to 4x base salary) • Pursuant to new NYSE and SEC rules, in 2023 we adopted a compensation recovery policy to recover performance-based compensation from executive officers after a material accounting restatement. Clawback provisions are also in place in all NEO employment and equity award agreements for financial misstatements and other misconduct. • Usage of an independent compensation consultant (Pay Governance) • Frequent outreach to shareholders • Greater emphasis on “at risk” pay since 2014 Compensation Metrics Tied to Long-Term Strategy CEO (1) Corporate measures apply to compensation of CEO, President, CFO, CRMO, and CAO; as a bank business line EVP, NEO Randall’s Annual Cash Incentive Award is based on the following measures: Core Net Income (5.0%), Asset Quality (5.0%), ERM & Doing Good (5.0%), Line of Business Specific Metrics (70%) and Qualitative (15%). 2024 Compensation Breakdown Other NEOs At Risk At Risk: 73% At Risk: 58% Long-Term Incentive Award 31% Annual Cash Incentive Award 27% Base Salary 42% |
|
42 Doing Good At NBH Environmental ▪ Committed to using environmentally friendly office products and materials and optimizing our office and banking center space. ▪ Continued investment in our mobile and digital platforms, resulting in a reduction in paper and fuel emissions. ▪ Providing financing for green and sustainable businesses and exploring opportunities to invest in these industries. Community Engagement & Support ▪ Support a number of causes with a focus on helping people find work, affordable housing, and become financially empowered. ▪ Grant associates eight paid hours each year to donate their time to non-profit organizations. ▪ Completed our 10th Do More Charity Challenge®, bringing our total contribution to over $2.0 million to nonprofits in the communities we serve. ▪ Organized and hosted the third Do More Concert with proceeds benefiting the Habitat for Humanity. Human Capital ▪ We believe that our Company’s long-term success is deeply tied to having a dedicated and engaged workforce and a commitment to the communities we serve. ▪ We strive for all of our associates to feel safe and empowered at work. To that end, we maintain a whistleblower hotline that allows associates and others to anonymously voice concerns. ▪ We invest in the professional development and long-term financial stability of our workforce by offering tuition reimbursement and the opportunity to participate in our 401(k) plan, which includes contribution matches from the Company. Additionally, we offer a stock purchase plan (ESPP) to our associates to purchase shares in our Company at a 10% discount. NBH’s long-standing commitment to “Doing Good” in all of its business activities |
|
Appendix |
|
44 Reconciliation of Non ($ in millions, except per share) -GAAP Measures (1) Represents acquisition-related expenses related to the Bank of Jackson Hole and Rock Canyon Bank acquisitions in 2022 and the pending Vista acquisition in 2025. (2) Represents non-recurring loss on security sales in 2024. |
|
45 Reconciliation of Non-GAAP Measures (cont’d) ($ in millions, except per share) (1) Represents a non-GAAP financial measure. YE22 adjusted for $8.0 million and $15.1 million of acquisition-related expenses, respectively. YE24 adjusted for $6.6 million of non-recurring loss on security sales. YTD25 adjusted for $1.7 million of acquisition-related expenses. |
|
46 Reconciliation of Non-GAAP Measures (cont’d) ($ in millions, except per share) |
|
47 Reconciliation of Non-GAAP Measures (cont’d) ($ in millions, except per share) |
|
Thank you. |