| REGISTRATION STATEMENT PURSUANT TO SECTION 12 OF THE SECURITIES EXCHANGE ACT OF 1934 | |||||
| ANNUAL REPORT PURSUANT TO SECTION 13(a) OR 15(d) OF THE SECURITIES EXCHANGE ACT OF 1934 | |||||
For the fiscal year ended December 31, 2023 |
Commission File Number 1-34513 |
||||
| CENOVUS ENERGY INC. | ||
| (Exact name of Registrant as specified in its charter) | ||
| Not applicable | ||
| (Translation of Registrant’s name into English (if applicable)) | ||
| Canada | ||
| (Province or other jurisdiction of incorporation or organization) | ||
| 1311 | ||
| (Primary Standard Industrial Classification Code Number (if applicable)) | ||
| Not applicable | ||
| (I.R.S. Employer Identification Number (if applicable)) | ||
|
4100, 225 – 6 Avenue S.W.
Calgary, Alberta, Canada T2P 1N2
(403) 766-2000
| ||
| (Address and telephone number of Registrant’s principal executive offices) | ||
|
CT Corporation System
28 Liberty Street
New York, NY 10005
(212) 894-8940
| ||
| (Name, address (including zip code) and telephone number (including area code) of agent for service in the United States) | ||
| Title of each class | Trading Symbol(s) | Name of each exchange on which registered | ||||||
| Common shares, no par value (together with associated common share purchase rights) | CVE | New York Stock Exchange | ||||||
| Warrants (each warrant entitles the holder to purchase one common share at an exercise price of C$6.54 per share) | CVE WS | New York Stock Exchange | ||||||
| None | ||
| (Title of Class) | ||
| None | ||
| (Title of Class) | ||
Annual information form |
Audited annual financial statements |
|||||||||||||
Yes ☐ No |
|||||
Yes ☐ No |
|||||
| CENOVUS ENERGY INC. | |||||||||||
| Date: February 15, 2024 | /s/ Karamjit S. Sandhar | ||||||||||
| Name: Karamjit S. Sandhar | |||||||||||
|
Title: Executive Vice-President &
Chief Financial Officer
|
|||||||||||
| Exhibits | Documents | ||||
| Clawback Policy | |||||
Annual Information Form of Cenovus Energy Inc. for the fiscal year ended December 31, 2023. |
|||||
Management’s Discussion and Analysis of Cenovus Energy Inc. for the fiscal year ended December 31, 2023. |
|||||
Consolidated Annual Financial Statements of Cenovus Energy Inc. for the fiscal year ended December 31, 2023. |
|||||
Supplementary Information – Oil and Gas Activities (unaudited) for the fiscal year ended December 31, 2023. |
|||||
Certification of Chief Executive Officer pursuant to Rule 13a-14(a) or 15d-14(a) of the Securities Exchange Act of 1934. |
|||||
Certification of Chief Financial Officer pursuant to Rule 13a-14(a) or 15d-14(a) of the Securities Exchange Act of 1934. |
|||||
Certification of Chief Executive Officer pursuant to 18 U.S.C. Section 1350. |
|||||
Certification of Chief Financial Officer pursuant to 18 U.S.C. Section 1350. |
|||||
Consent of PricewaterhouseCoopers LLP. |
|||||
Consent of McDaniel & Associates Consultants Ltd. |
|||||
Consent of GLJ Ltd. |
|||||
| 101 | Interactive data file |
||||
| 104 | Cover page interactive data file (formatted as Inline XBRL and contained in Exhibit 101) | ||||
|
INTERNAL USE ONLY
LAST UPDATED NOVEMBER 1, 2023
|
CENOVUS ENERGY | Page 1 of #NUM_PAGES# |
||||
|
INTERNAL USE ONLY
LAST UPDATED NOVEMBER 1, 2023
|
CENOVUS ENERGY | Page 2 of #NUM_PAGES# |
||||
|
INTERNAL USE ONLY
LAST UPDATED NOVEMBER 1, 2023
|
CENOVUS ENERGY | Page 3 of #NUM_PAGES# |
||||
|
INTERNAL USE ONLY
LAST UPDATED NOVEMBER 1, 2023
|
CENOVUS ENERGY | Page 4 of #NUM_PAGES# |
||||
|
INTERNAL USE ONLY
LAST UPDATED NOVEMBER 1, 2023
|
CENOVUS ENERGY | Page 5 of #NUM_PAGES# |
||||
|
INTERNAL USE ONLY
LAST UPDATED NOVEMBER 1, 2023
|
CENOVUS ENERGY | Page 6 of #NUM_PAGES# |
||||

Annual Information Form |
 |
||||
For the year ended December 31, 2023 | |||||
| TABLE OF CONTENTS | ||
Cenovus Energy Inc. – 2023 Annual Information Form |
2 |
||||
| CORPORATE STRUCTURE | ||
Percentage Owned (1) |
Jurisdiction of Incorporation,
Continuance, Formation or
Organization
|
|||||||
| FCCL Partnership (“FCCL”) | 100 | Alberta | ||||||
| Sunrise Oil Sands Partnership | 100 | Alberta | ||||||
| Husky Marketing and Supply Company | 100 | Delaware | ||||||
| Husky Energy Marketing Partnership | 100 | Alberta | ||||||
| Cenovus Energy Marketing Services Ltd. | 100 | Alberta | ||||||
| Husky Canadian Petroleum Marketing Partnership | 100 | Alberta | ||||||
| Husky Oil Limited Partnership | 100 | Alberta | ||||||
| Lima Refining Company | 100 | Delaware | ||||||
Ohio Refining Company LLC (2) |
100 | Delaware | ||||||
| WRB Refining LP | 50 | Delaware | ||||||
| GENERAL DEVELOPMENT OF THE BUSINESS | ||
Cenovus Energy Inc. – 2023 Annual Information Form |
3 |
||||
Cenovus Energy Inc. – 2023 Annual Information Form |
4 |
||||
Cenovus Energy Inc. – 2023 Annual Information Form |
5 |
||||
Cenovus Energy Inc. – 2023 Annual Information Form |
6 |
||||
| DESCRIPTION OF THE BUSINESS | ||
Cenovus Energy Inc. – 2023 Annual Information Form |
7 |
||||
| 2023 | 2022 | ||||||||||||||||||||||
|
Revenue
($ millions)
|
Percent of Consolidated Revenues
(percent)
|
Revenue
($ millions)
|
Percent of Consolidated Revenues
(percent)
|
||||||||||||||||||||
Crude Oil (1) (2) |
23,524 | 45 | 29,931 | 45 | |||||||||||||||||||
Gasoline (3) |
12,897 | 25 | 15,064 | 23 | |||||||||||||||||||
Distillates (3) (4) |
11,364 | 22 | 13,617 | 20 | |||||||||||||||||||
Cenovus Energy Inc. – 2023 Annual Information Form |
8 |
||||
Cenovus Energy Inc. – 2023 Annual Information Form |
9 |
||||
Cenovus Energy Inc. – 2023 Annual Information Form |
10 |
||||
Cenovus Energy Inc. – 2023 Annual Information Form |
11 |
||||
| 2023 | 2022 | ||||||||||||||||||||||
| Lloydminster Upgrader | Lloydminster Refinery |
Total | Lloydminster Upgrader | Lloydminster Refinery |
Total | ||||||||||||||||||
|
Heavy Crude Oil Unit Throughput Capacity (1)
(Mbbls/d)
|
81.5 | 29.0 | 110.5 | 81.5 | 29.0 | 110.5 | |||||||||||||||||
Heavy Crude Oil Unit Throughput (Mbbls/d) |
73.1 | 27.6 | 100.7 | 68.7 | 24.2 | 92.9 | |||||||||||||||||
Crude Utilization (percent) |
90 | 95 | 91 | 84 | 83 | 84 | |||||||||||||||||
Total Production (Mbbls/d) |
81.5 | 27.7 | 114.2 | 76.0 | 24.3 | 105.2 | |||||||||||||||||
| Synthetic Crude Oil | 47.6 | — | 47.6 | 46.0 | — | 46.0 | |||||||||||||||||
| Asphalt | — | 15.4 | 15.4 | — | 13.5 | 13.5 | |||||||||||||||||
| Diesel | 12.9 | — | 12.9 | 9.3 | — | 9.3 | |||||||||||||||||
| Other | 21.0 | 12.3 | 33.3 | 20.7 | 10.8 | 31.5 | |||||||||||||||||
Ethanol (2) |
— | — | 5.0 | — | — | 4.9 | |||||||||||||||||
Cenovus Energy Inc. – 2023 Annual Information Form |
12 |
||||
|
British
Columbia
|
Alberta | Saskatchewan | Manitoba | Ontario | Quebec | Nova Scotia | Total |
|||||||||||||||||||
Cardlocks |
36 | 22 | 4 | 7 | 21 | 1 | 1 | 92 | ||||||||||||||||||
Bulk Plants |
3 | 7 | 2 | 1 | — | — | — | 13 | ||||||||||||||||||
| Travel Centres | 15 | 16 | 3 | 3 | 19 | — | — | 56 | ||||||||||||||||||
| Total | 54 | 45 | 9 | 11 | 40 | 1 | 1 | 161 | ||||||||||||||||||
| 2023 | 2022 | ||||||||||
Crude Oil Unit Throughput Capacity (1) (2) (Mbbls/d) |
635.2 | 551.5 | |||||||||
Crude Oil Unit Throughput (2) (Mbbls/d) |
459.7 | 400.8 | |||||||||
| Heavy Crude Oil | 173.9 | 116.1 | |||||||||
| Light and Medium Crude Oil | 285.8 | 284.7 | |||||||||
Crude Utilization (2) (3) (percent) |
75 | 80 | |||||||||
Total Refined Product Production (Mbbls/d) |
485.0 | 419.9 | |||||||||
| Gasoline | 231.2 | 199.8 | |||||||||
Distillates (4) |
167.0 | 153.4 | |||||||||
| Asphalt | 19.8 | 8.9 | |||||||||
| Other | 67.0 | 57.8 | |||||||||
| 2023 | 2022 | ||||||||||||||||||||||||||||
| Lima | Toledo | Superior | Total | Lima | Toledo | Superior | Total | ||||||||||||||||||||||
Crude Oil Unit Throughput Capacity (1) (Mbbls/d) |
178.7 | 160.0 | 49.0 | 387.7 | 175.0 | 80.0 | 49.0 | 304.0 | |||||||||||||||||||||
Crude Oil Unit Throughput (2) (Mbbls/d) |
152.7 | 83.1 | 22.6 | 258.4 | 157.9 | 36.3 | — | 194.2 | |||||||||||||||||||||
Crude Utilization (3) (percent) |
85 | 57 | 61 | 71 | 90 | 45 | — | 76 | |||||||||||||||||||||
Cenovus Energy Inc. – 2023 Annual Information Form |
13 |
||||
Cenovus Energy Inc. – 2023 Annual Information Form |
14 |
||||
Cenovus Energy Inc. – 2023 Annual Information Form |
15 |
||||
| 2023 | |||||
| Upstream Operations | 2,860 | ||||
| Downstream Operations | 2,241 | ||||
Corporate (1) |
1,824 | ||||
| Total FTE Employees | 6,925 | ||||
| RISK FACTORS | ||
| RESERVES DATA AND OTHER OIL AND GAS INFORMATION | ||
Cenovus Energy Inc. – 2023 Annual Information Form |
16 |
||||
Cenovus Energy Inc. – 2023 Annual Information Form |
17 |
||||
Crude Oil and NGLs (1) |
Natural Gas (2) |
|||||||||||||||||||||||||||||||||||||
| Year |
WTI Cushing Oklahoma
(US$/bbl)
|
Edmonton Par Price 40 API
(C$/bbl)
|
Western Canadian Select
(C$/bbl)
|
Edmonton C5+
(C$/bbl)
|
Brent
(US$/bbl)
|
AECO
(C$/MMBtu)
|
China
(US$/Mcf)
|
Indonesia
(US$/Mcf)
|
Inflation Rate
(%/year)
|
Exchange Rate
(US$/C$)
|
||||||||||||||||||||||||||||
| 2024 | 73.67 | 92.91 | 76.74 | 96.79 | 78.00 | 2.20 | 8.79 | 7.28 | 0.0 | 0.7517 | ||||||||||||||||||||||||||||
| 2025 | 74.98 | 95.04 | 79.77 | 98.75 | 79.18 | 3.37 | 8.99 | 7.38 | 2.0 | 0.7517 | ||||||||||||||||||||||||||||
| 2026 | 76.14 | 96.07 | 81.12 | 100.71 | 80.36 | 4.05 | 9.28 | 7.45 | 2.0 | 0.7550 | ||||||||||||||||||||||||||||
| 2027 | 77.66 | 97.99 | 82.88 | 102.72 | 81.79 | 4.13 | 9.36 | 7.57 | 2.0 | 0.7550 | ||||||||||||||||||||||||||||
| 2028 | 79.22 | 99.95 | 85.04 | 104.78 | 83.41 | 4.21 | 9.49 | 7.69 | 2.0 | 0.7550 | ||||||||||||||||||||||||||||
| 2029 | 80.80 | 101.95 | 86.74 | 106.87 | 85.09 | 4.30 | 9.97 | 7.81 | 2.0 | 0.7550 | ||||||||||||||||||||||||||||
| 2030 | 82.42 | 103.98 | 88.48 | 109.01 | 86.79 | 4.38 | 10.77 | 7.96 | 2.0 | 0.7550 | ||||||||||||||||||||||||||||
| 2031 | 84.06 | 106.07 | 90.24 | 111.19 | 88.52 | 4.47 | — | 8.07 | 2.0 | 0.7550 | ||||||||||||||||||||||||||||
| 2032 | 85.75 | 108.18 | 92.04 | 113.41 | 90.29 | 4.56 | — | 8.07 | 2.0 | 0.7550 | ||||||||||||||||||||||||||||
| 2033 | 87.46 | 110.35 | 93.89 | 115.67 | 92.10 | 4.65 | — | — | 2.0 | 0.7550 | ||||||||||||||||||||||||||||
| 2034 | 89.21 | 112.56 | 95.77 | 117.98 | 93.94 | 4.74 | — | — | 2.0 | 0.7550 | ||||||||||||||||||||||||||||
| 2035+ | +2.0%/yr | +2.0%/yr | +2.0%/yr | +2.0%/yr | +2.0%/yr | +2.0%/yr | — | — | 2.0 | 0.7550 | ||||||||||||||||||||||||||||
Cenovus Energy Inc. – 2023 Annual Information Form |
18 |
||||
Gross Reserves |
Bitumen
(MMbbls)
|
Light and Medium Oil
(MMbbls)
|
NGLs
(MMbbls)
|
Conventional
Natural Gas
(Bcf)
|
Total
(MMBOE)
|
||||||||||||||||||||||||
| Canada | |||||||||||||||||||||||||||||
| Proved | |||||||||||||||||||||||||||||
Developed Producing |
978 | 32 | 47 | 1,247 | 1,266 | ||||||||||||||||||||||||
Developed Non-Producing |
117 | 1 | 1 | 29 | 123 | ||||||||||||||||||||||||
Undeveloped |
4,316 | 5 | 12 | 347 | 4,390 | ||||||||||||||||||||||||
| Total Proved | 5,411 | 38 | 60 | 1,622 | 5,779 | ||||||||||||||||||||||||
| Probable | 2,487 | 125 | 36 | 975 | 2,812 | ||||||||||||||||||||||||
| Total Proved Plus Probable | 7,899 | 163 | 96 | 2,598 | 8,591 | ||||||||||||||||||||||||
| China | |||||||||||||||||||||||||||||
| Proved | |||||||||||||||||||||||||||||
Developed Producing |
— | — | 10 | 262 | 53 | ||||||||||||||||||||||||
Developed Non-Producing |
— | — | — | — | — | ||||||||||||||||||||||||
Undeveloped |
— | — | — | — | — | ||||||||||||||||||||||||
| Total Proved | — | — | 10 | 262 | 53 | ||||||||||||||||||||||||
| Probable | — | — | 2 | 76 | 15 | ||||||||||||||||||||||||
| Total Proved Plus Probable | — | — | 12 | 337 | 68 | ||||||||||||||||||||||||
Indonesia |
|||||||||||||||||||||||||||||
| Proved | |||||||||||||||||||||||||||||
Developed Producing |
— | — | 4 | 178 | 33 | ||||||||||||||||||||||||
Developed Non-Producing |
— | — | — | — | — | ||||||||||||||||||||||||
Undeveloped |
— | — | — | — | — | ||||||||||||||||||||||||
| Total Proved | — | — | 4 | 178 | 33 | ||||||||||||||||||||||||
| Probable | — | — | 1 | 49 | 9 | ||||||||||||||||||||||||
| Total Proved Plus Probable | — | — | 5 | 226 | 43 | ||||||||||||||||||||||||
| Total Company | |||||||||||||||||||||||||||||
| Proved | |||||||||||||||||||||||||||||
Developed Producing |
978 | 32 | 61 | 1,686 | 1,353 | ||||||||||||||||||||||||
Developed Non-Producing |
117 | 1 | 1 | 29 | 123 | ||||||||||||||||||||||||
Undeveloped |
4,316 | 5 | 12 | 347 | 4,390 | ||||||||||||||||||||||||
| Total Proved | 5,411 | 38 | 74 | 2,062 | 5,866 | ||||||||||||||||||||||||
| Probable | 2,487 | 125 | 40 | 1,100 | 2,836 | ||||||||||||||||||||||||
| Total Proved Plus Probable | 7,899 | 163 | 114 | 3,162 | 8,702 | ||||||||||||||||||||||||
Cenovus Energy Inc. – 2023 Annual Information Form |
19 |
||||
Net Reserves |
Bitumen
(MMbbls)
|
Light and Medium Oil
(MMbbls)
|
NGLs
(MMbbls)
|
Conventional
Natural Gas
(Bcf)
|
Total
(MMBOE)
|
||||||||||||||||||||||||
| Canada | |||||||||||||||||||||||||||||
| Proved | |||||||||||||||||||||||||||||
Developed Producing |
729 | 29 | 39 | 1,145 | 987 | ||||||||||||||||||||||||
Developed Non-Producing |
83 | — | 1 | 25 | 89 | ||||||||||||||||||||||||
Undeveloped |
3,242 | 4 | 9 | 314 | 3,308 | ||||||||||||||||||||||||
| Total Proved | 4,054 | 33 | 49 | 1,485 | 4,383 | ||||||||||||||||||||||||
| Probable | 1,790 | 106 | 29 | 874 | 2,070 | ||||||||||||||||||||||||
| Total Proved Plus Probable | 5,844 | 139 | 78 | 2,359 | 6,453 | ||||||||||||||||||||||||
| China | |||||||||||||||||||||||||||||
| Proved | |||||||||||||||||||||||||||||
Developed Producing |
— | — | 9 | 248 | 51 | ||||||||||||||||||||||||
Developed Non-Producing |
— | — | — | — | — | ||||||||||||||||||||||||
Undeveloped |
— | — | — | — | — | ||||||||||||||||||||||||
| Total Proved | — | — | 9 | 248 | 51 | ||||||||||||||||||||||||
| Probable | — | — | 2 | 72 | 14 | ||||||||||||||||||||||||
| Total Proved Plus Probable | — | — | 12 | 319 | 65 | ||||||||||||||||||||||||
Indonesia |
|||||||||||||||||||||||||||||
| Proved | |||||||||||||||||||||||||||||
Developed Producing |
— | — | 2 | 127 | 23 | ||||||||||||||||||||||||
Developed Non-Producing |
— | — | — | — | — | ||||||||||||||||||||||||
Undeveloped |
— | — | — | — | — | ||||||||||||||||||||||||
| Total Proved | — | — | 2 | 127 | 23 | ||||||||||||||||||||||||
| Probable | — | — | — | 27 | 5 | ||||||||||||||||||||||||
| Total Proved Plus Probable | — | — | 2 | 154 | 28 | ||||||||||||||||||||||||
| Total Company | |||||||||||||||||||||||||||||
| Proved | |||||||||||||||||||||||||||||
Developed Producing |
729 | 29 | 50 | 1,520 | 1,061 | ||||||||||||||||||||||||
Developed Non-Producing |
83 | — | 1 | 25 | 89 | ||||||||||||||||||||||||
Undeveloped |
3,242 | 4 | 9 | 314 | 3,308 | ||||||||||||||||||||||||
| Total Proved | 4,054 | 33 | 60 | 1,859 | 4,457 | ||||||||||||||||||||||||
| Probable | 1,790 | 106 | 32 | 973 | 2,089 | ||||||||||||||||||||||||
| Total Proved Plus Probable | 5,844 | 139 | 92 | 2,832 | 6,546 | ||||||||||||||||||||||||
Cenovus Energy Inc. – 2023 Annual Information Form |
20 |
||||
Discounted at % per year |
Unit Value Discounted at 10% (1) |
||||||||||||||||||||||||||||||||||
Before Income Taxes ($ millions) |
0% | 5% | 10% | 15% | 20% | $/BOE | |||||||||||||||||||||||||||||
| Canada | |||||||||||||||||||||||||||||||||||
| Proved | |||||||||||||||||||||||||||||||||||
Developed Producing |
26,962 | 27,286 | 24,780 | 22,361 | 20,297 | 25.10 | |||||||||||||||||||||||||||||
Developed Non-Producing |
4,299 | 3,327 | 2,643 | 2,146 | 1,774 | 29.85 | |||||||||||||||||||||||||||||
Undeveloped |
158,294 | 68,154 | 35,176 | 20,599 | 13,109 | 10.63 | |||||||||||||||||||||||||||||
| Total Proved | 189,554 | 98,767 | 62,599 | 45,106 | 35,180 | 14.28 | |||||||||||||||||||||||||||||
| Probable | 135,037 | 39,441 | 18,178 | 11,229 | 8,003 | 8.78 | |||||||||||||||||||||||||||||
| Total Proved Plus Probable | 324,591 | 138,208 | 80,776 | 56,336 | 43,183 | 12.52 | |||||||||||||||||||||||||||||
| China | |||||||||||||||||||||||||||||||||||
| Proved | |||||||||||||||||||||||||||||||||||
Developed Producing |
3,044 | 2,762 | 2,527 | 2,329 | 2,160 | 50.02 | |||||||||||||||||||||||||||||
Developed Non-Producing |
— | — | — | — | — | — | |||||||||||||||||||||||||||||
Undeveloped |
— | — | — | — | — | — | |||||||||||||||||||||||||||||
| Total Proved | 3,044 | 2,762 | 2,527 | 2,329 | 2,160 | 50.02 | |||||||||||||||||||||||||||||
| Probable | 890 | 734 | 616 | 524 | 453 | 43.27 | |||||||||||||||||||||||||||||
| Total Proved Plus Probable | 3,934 | 3,496 | 3,143 | 2,853 | 2,613 | 48.53 | |||||||||||||||||||||||||||||
Indonesia |
|||||||||||||||||||||||||||||||||||
| Proved | |||||||||||||||||||||||||||||||||||
Developed Producing |
650 | 576 | 517 | 469 | 429 | 22.36 | |||||||||||||||||||||||||||||
Developed Non-Producing |
— | — | — | — | — | — | |||||||||||||||||||||||||||||
Undeveloped |
— | — | — | — | — | — | |||||||||||||||||||||||||||||
| Total Proved | 650 | 576 | 517 | 469 | 429 | 22.36 | |||||||||||||||||||||||||||||
| Probable | 214 | 166 | 131 | 106 | 87 | 26.34 | |||||||||||||||||||||||||||||
| Total Proved Plus Probable | 863 | 742 | 648 | 575 | 516 | 23.07 | |||||||||||||||||||||||||||||
| Total Company | |||||||||||||||||||||||||||||||||||
| Proved | |||||||||||||||||||||||||||||||||||
Developed Producing |
30,656 | 30,624 | 27,824 | 25,159 | 22,886 | 26.22 | |||||||||||||||||||||||||||||
Developed Non-Producing |
4,299 | 3,327 | 2,643 | 2,146 | 1,774 | 29.85 | |||||||||||||||||||||||||||||
Undeveloped |
158,294 | 68,154 | 35,176 | 20,599 | 13,109 | 10.63 | |||||||||||||||||||||||||||||
| Total Proved | 193,248 | 102,106 | 65,643 | 47,904 | 37,769 | 14.73 | |||||||||||||||||||||||||||||
| Probable | 136,140 | 40,340 | 18,925 | 11,860 | 8,543 | 9.06 | |||||||||||||||||||||||||||||
| Total Proved Plus Probable | 329,388 | 142,446 | 84,568 | 59,764 | 46,312 | 12.92 | |||||||||||||||||||||||||||||
Cenovus Energy Inc. – 2023 Annual Information Form |
21 |
||||
Discounted at % per year |
|||||||||||||||||||||||||||||
After Income Taxes (1) ($ millions) |
0% | 5% | 10% | 15% | 20% | ||||||||||||||||||||||||
| Canada | |||||||||||||||||||||||||||||
| Proved | |||||||||||||||||||||||||||||
Developed Producing |
20,670 | 21,867 | 20,027 | 18,117 | 16,456 | ||||||||||||||||||||||||
Developed Non-Producing |
3,324 | 2,551 | 2,013 | 1,624 | 1,335 | ||||||||||||||||||||||||
Undeveloped |
121,683 | 51,820 | 26,386 | 15,204 | 9,489 | ||||||||||||||||||||||||
| Total Proved | 145,677 | 76,238 | 48,426 | 34,945 | 27,280 | ||||||||||||||||||||||||
| Probable | 103,067 | 29,900 | 13,749 | 8,488 | 6,047 | ||||||||||||||||||||||||
| Total Proved Plus Probable | 248,744 | 106,138 | 62,174 | 43,432 | 33,327 | ||||||||||||||||||||||||
| China | |||||||||||||||||||||||||||||
| Proved | |||||||||||||||||||||||||||||
Developed Producing |
2,340 | 2,122 | 1,940 | 1,786 | 1,656 | ||||||||||||||||||||||||
Developed Non-Producing |
— | — | — | — | — | ||||||||||||||||||||||||
Undeveloped |
— | — | — | — | — | ||||||||||||||||||||||||
| Total Proved | 2,340 | 2,122 | 1,940 | 1,786 | 1,656 | ||||||||||||||||||||||||
| Probable | 674 | 555 | 465 | 395 | 341 | ||||||||||||||||||||||||
| Total Proved Plus Probable | 3,014 | 2,677 | 2,405 | 2,182 | 1,996 | ||||||||||||||||||||||||
Indonesia |
|||||||||||||||||||||||||||||
| Proved | |||||||||||||||||||||||||||||
Developed Producing |
457 | 408 | 369 | 336 | 309 | ||||||||||||||||||||||||
Developed Non-Producing |
— | — | — | — | — | ||||||||||||||||||||||||
Undeveloped |
— | — | — | — | — | ||||||||||||||||||||||||
| Total Proved | 457 | 408 | 369 | 336 | 309 | ||||||||||||||||||||||||
| Probable | 130 | 101 | 80 | 65 | 53 | ||||||||||||||||||||||||
| Total Proved Plus Probable | 587 | 509 | 449 | 401 | 362 | ||||||||||||||||||||||||
| Total Company | |||||||||||||||||||||||||||||
Developed Producing |
23,467 | 24,397 | 22,336 | 20,239 | 18,421 | ||||||||||||||||||||||||
Developed Non-Producing |
3,324 | 2,551 | 2,013 | 1,624 | 1,335 | ||||||||||||||||||||||||
Undeveloped |
121,683 | 51,820 | 26,386 | 15,204 | 9,489 | ||||||||||||||||||||||||
| Total Proved | 148,475 | 78,768 | 50,734 | 37,067 | 29,245 | ||||||||||||||||||||||||
| Probable | 103,870 | 30,555 | 14,293 | 8,947 | 6,441 | ||||||||||||||||||||||||
| Total Proved Plus Probable | 252,345 | 109,324 | 65,027 | 46,014 | 35,686 | ||||||||||||||||||||||||
Cenovus Energy Inc. – 2023 Annual Information Form |
22 |
||||
($ millions) |
Revenue | Royalties | Operating Costs |
Development Costs |
Total Abandonment and Reclamation Costs (1) |
Future Net Revenue Before Income Taxes |
Income Taxes |
Future Net Revenue After Income Taxes |
|||||||||||||||||||||||||||||||||||||||
| Canada | |||||||||||||||||||||||||||||||||||||||||||||||
| Total Proved | 476,182 | 119,705 | 110,143 | 45,085 | 11,694 | 189,554 | 43,877 | 145,677 | |||||||||||||||||||||||||||||||||||||||
| Total Proved Plus Probable | 790,920 | 204,022 | 173,890 | 75,173 | 13,244 | 324,591 | 75,847 | 248,744 | |||||||||||||||||||||||||||||||||||||||
| China | |||||||||||||||||||||||||||||||||||||||||||||||
| Total Proved | 4,126 | 222 | 621 | 168 | 70 | 3,044 | 704 | 2,340 | |||||||||||||||||||||||||||||||||||||||
| Total Proved Plus Probable | 5,238 | 282 | 783 | 168 | 71 | 3,934 | 920 | 3,014 | |||||||||||||||||||||||||||||||||||||||
Indonesia |
|||||||||||||||||||||||||||||||||||||||||||||||
| Total Proved | 2,184 | 713 | 789 | 2 | 31 | 650 | 193 | 457 | |||||||||||||||||||||||||||||||||||||||
| Total Proved Plus Probable | 2,829 | 1,026 | 907 | 2 | 31 | 863 | 276 | 587 | |||||||||||||||||||||||||||||||||||||||
| Total Company | |||||||||||||||||||||||||||||||||||||||||||||||
| Total Proved | 482,491 | 120,640 | 111,553 | 45,255 | 11,795 | 193,248 | 44,773 | 148,475 | |||||||||||||||||||||||||||||||||||||||
| Total Proved Plus Probable | 798,987 | 205,330 | 175,579 | 75,343 | 13,346 | 329,388 | 77,043 | 252,345 | |||||||||||||||||||||||||||||||||||||||
| Reserves Category | Product Types |
Future Net Revenue Before Income Taxes Discounted at 10% per Year
($ millions)
|
Unit Value
Discounted at 10% per Year (1)
($/BOE)
|
|||||||||||
| Total Proved | Bitumen |
61,276 | 15.11 | |||||||||||
Light and Medium Oil (2) |
391 | 4.96 | ||||||||||||
Conventional Natural Gas (3) |
3,976 | 12.28 | ||||||||||||
| Total | 65,643 | 14.73 | ||||||||||||
| Total Proved Plus | Bitumen |
75,386 | 12.90 | |||||||||||
| Probable | Light and Medium Oil (2) |
3,348 | 16.56 | |||||||||||
Conventional Natural Gas (3) |
5,835 | 11.66 | ||||||||||||
| Total | 84,568 | 12.92 | ||||||||||||
Cenovus Energy Inc. – 2023 Annual Information Form |
23 |
||||
($ millions) |
2024 | 2025 | 2026 | 2027 | 2028 | Remainder | Total | ||||||||||||||||||||||||||||||||||
| Canada | |||||||||||||||||||||||||||||||||||||||||
| Total Proved | 2,970 | 1,972 | 1,830 | 1,648 | 1,536 | 35,128 | 45,085 | ||||||||||||||||||||||||||||||||||
| Total Proved Plus Probable | 3,472 | 2,668 | 2,131 | 2,052 | 1,816 | 63,034 | 75,173 | ||||||||||||||||||||||||||||||||||
| China | |||||||||||||||||||||||||||||||||||||||||
| Total Proved | 33 | 53 | 60 | 5 | 5 | 11 | 168 | ||||||||||||||||||||||||||||||||||
| Total Proved Plus Probable | 33 | 53 | 60 | 5 | 5 | 11 | 168 | ||||||||||||||||||||||||||||||||||
Indonesia |
|||||||||||||||||||||||||||||||||||||||||
| Total Proved | 2 | — | — | — | — | — | 2 | ||||||||||||||||||||||||||||||||||
| Total Proved Plus Probable | 2 | — | — | — | — | — | 2 | ||||||||||||||||||||||||||||||||||
| Total Company | |||||||||||||||||||||||||||||||||||||||||
| Total Proved | 3,005 | 2,025 | 1,890 | 1,653 | 1,542 | 35,139 | 45,255 | ||||||||||||||||||||||||||||||||||
| Total Proved Plus Probable | 3,507 | 2,721 | 2,191 | 2,057 | 1,821 | 63,045 | 75,343 | ||||||||||||||||||||||||||||||||||
Cenovus Energy Inc. – 2023 Annual Information Form |
24 |
||||
Gross Reserves, Total Proved |
Bitumen
(MMbbls)
|
Light and Medium Oil
(MMbbls)
|
NGLs
(MMbbls)
|
Conventional
Natural Gas
(Bcf)
|
Total
(MMBOE)
|
||||||||||||||||||||||||
| Canada | |||||||||||||||||||||||||||||
As at December 31, 2022 |
5,592 | 42 | 66 | 1,680 | 5,980 | ||||||||||||||||||||||||
| Extensions and Improved Recovery | 110 | 3 | 5 | 159 | 144 | ||||||||||||||||||||||||
| Discoveries | — | — | — | — | — | ||||||||||||||||||||||||
| Technical Revisions | (84) | (2) | (2) | 2 | (88) | ||||||||||||||||||||||||
| Economic Factors | 1 | — | — | (9) | (1) | ||||||||||||||||||||||||
| Acquisitions | 9 | — | — | 1 | 9 | ||||||||||||||||||||||||
| Dispositions | — | — | — | (3) | (1) | ||||||||||||||||||||||||
Production (1) |
(217) | (5) | (8) | (208) | (264) | ||||||||||||||||||||||||
As at December 31, 2023 |
5,411 | 38 | 60 | 1,622 | 5,779 | ||||||||||||||||||||||||
| China | |||||||||||||||||||||||||||||
As at December 31, 2022 |
— | — | 12 | 331 | 67 | ||||||||||||||||||||||||
| Extensions and Improved Recovery | — | — | — | — | — | ||||||||||||||||||||||||
| Discoveries | — | — | — | — | — | ||||||||||||||||||||||||
| Technical Revisions | — | — | 1 | — | 1 | ||||||||||||||||||||||||
| Economic Factors | — | — | — | — | — | ||||||||||||||||||||||||
| Acquisitions | — | — | — | — | — | ||||||||||||||||||||||||
| Dispositions | — | — | — | — | — | ||||||||||||||||||||||||
Production |
— | — | (3) | (70) | (15) | ||||||||||||||||||||||||
As at December 31, 2023 |
— | — | 10 | 262 | 53 | ||||||||||||||||||||||||
Indonesia |
|||||||||||||||||||||||||||||
As at December 31, 2022 |
— | — | 4 | 183 | 35 | ||||||||||||||||||||||||
| Extensions and Improved Recovery | — | — | — | 14 | 2 | ||||||||||||||||||||||||
| Discoveries | — | — | — | — | — | ||||||||||||||||||||||||
| Technical Revisions | — | — | 1 | 9 | 2 | ||||||||||||||||||||||||
| Economic Factors | — | — | — | — | — | ||||||||||||||||||||||||
| Acquisitions | — | — | — | — | — | ||||||||||||||||||||||||
| Dispositions | — | — | — | — | — | ||||||||||||||||||||||||
Production |
— | — | (1) | (28) | (5) | ||||||||||||||||||||||||
As at December 31, 2023 |
— | — | 4 | 178 | 33 | ||||||||||||||||||||||||
| Total Company | |||||||||||||||||||||||||||||
As at December 31, 2022 |
5,592 | 42 | 82 | 2,194 | 6,082 | ||||||||||||||||||||||||
| Extensions and Improved Recovery | 110 | 3 | 5 | 173 | 146 | ||||||||||||||||||||||||
| Discoveries | — | — | — | — | — | ||||||||||||||||||||||||
| Technical Revisions | (84) | (2) | (1) | 11 | (85) | ||||||||||||||||||||||||
| Economic Factors | 1 | — | — | (9) | (1) | ||||||||||||||||||||||||
| Acquisitions | 9 | — | — | 1 | 9 | ||||||||||||||||||||||||
| Dispositions | — | — | — | (3) | (1) | ||||||||||||||||||||||||
Production (1) |
(217) | (5) | (12) | (305) | (284) | ||||||||||||||||||||||||
As at December 31, 2023 |
5,411 | 38 | 74 | 2,062 | 5,866 | ||||||||||||||||||||||||
Cenovus Energy Inc. – 2023 Annual Information Form |
25 |
||||
Gross Reserves, Probable |
Bitumen
(MMbbls)
|
Light and Medium Oil
(MMbbls)
|
NGLs
(MMbbls)
|
Conventional
Natural Gas
(Bcf)
|
Total
(MMBOE)
|
||||||||||||||||||||||||
| Canada | |||||||||||||||||||||||||||||
As at December 31, 2022 |
2,448 | 129 | 35 | 897 | 2,762 | ||||||||||||||||||||||||
| Extensions and Improved Recovery | 46 | 4 | 3 | 91 | 68 | ||||||||||||||||||||||||
| Discoveries | — | — | — | — | — | ||||||||||||||||||||||||
| Technical Revisions | (36) | (7) | (1) | (10) | (46) | ||||||||||||||||||||||||
| Economic Factors | — | — | — | (2) | — | ||||||||||||||||||||||||
| Acquisitions | 29 | — | — | — | 29 | ||||||||||||||||||||||||
| Dispositions | — | — | — | (1) | — | ||||||||||||||||||||||||
Production (1) |
— | — | — | — | — | ||||||||||||||||||||||||
As at December 31, 2023 |
2,487 | 125 | 36 | 975 | 2,812 | ||||||||||||||||||||||||
| China | |||||||||||||||||||||||||||||
As at December 31, 2022 |
— | — | 2 | 65 | 13 | ||||||||||||||||||||||||
| Extensions and Improved Recovery | — | — | — | — | — | ||||||||||||||||||||||||
| Discoveries | — | — | — | — | — | ||||||||||||||||||||||||
| Technical Revisions | — | — | — | 12 | 2 | ||||||||||||||||||||||||
| Economic Factors | — | — | — | — | — | ||||||||||||||||||||||||
| Acquisitions | — | — | — | — | — | ||||||||||||||||||||||||
| Dispositions | — | — | — | — | — | ||||||||||||||||||||||||
Production |
— | — | — | — | — | ||||||||||||||||||||||||
As at December 31, 2023 |
— | — | 2 | 76 | 15 | ||||||||||||||||||||||||
Indonesia |
|||||||||||||||||||||||||||||
As at December 31, 2022 |
— | — | 2 | 67 | 12 | ||||||||||||||||||||||||
| Extensions and Improved Recovery | — | — | — | (14) | (2) | ||||||||||||||||||||||||
| Discoveries | — | — | — | — | — | ||||||||||||||||||||||||
| Technical Revisions | — | — | — | (5) | (1) | ||||||||||||||||||||||||
| Economic Factors | — | — | — | — | — | ||||||||||||||||||||||||
| Acquisitions | — | — | — | — | — | ||||||||||||||||||||||||
| Dispositions | — | — | — | — | — | ||||||||||||||||||||||||
Production |
— | — | — | — | — | ||||||||||||||||||||||||
As at December 31, 2023 |
— | — | 1 | 49 | 9 | ||||||||||||||||||||||||
| Total Company | |||||||||||||||||||||||||||||
As at December 31, 2022 |
2,448 | 129 | 39 | 1,029 | 2,787 | ||||||||||||||||||||||||
| Extensions and Improved Recovery | 46 | 4 | 3 | 78 | 65 | ||||||||||||||||||||||||
| Discoveries | — | — | — | — | — | ||||||||||||||||||||||||
| Technical Revisions | (36) | (7) | (1) | (3) | (44) | ||||||||||||||||||||||||
| Economic Factors | — | — | — | (3) | — | ||||||||||||||||||||||||
| Acquisitions | 29 | — | — | — | 29 | ||||||||||||||||||||||||
| Dispositions | — | — | — | (1) | — | ||||||||||||||||||||||||
Production (1) |
— | — | — | — | — | ||||||||||||||||||||||||
As at December 31, 2023 |
2,487 | 125 | 40 | 1,100 | 2,836 | ||||||||||||||||||||||||
Cenovus Energy Inc. – 2023 Annual Information Form |
26 |
||||
Gross Reserves, Total Proved Plus Probable |
Bitumen
(MMbbls)
|
Light and Medium Oil
(MMbbls)
|
NGLs
(MMbbls)
|
Conventional
Natural Gas
(Bcf)
|
Total
(MMBOE)
|
||||||||||||||||||||||||
| Canada | |||||||||||||||||||||||||||||
As at December 31, 2022 |
8,040 | 171 | 101 | 2,577 | 8,742 | ||||||||||||||||||||||||
| Extensions and Improved Recovery | 157 | 6 | 7 | 250 | 212 | ||||||||||||||||||||||||
| Discoveries | — | — | — | — | — | ||||||||||||||||||||||||
| Technical Revisions | (120) | (9) | (3) | (8) | (134) | ||||||||||||||||||||||||
| Economic Factors | 1 | — | — | (11) | (1) | ||||||||||||||||||||||||
| Acquisitions | 38 | — | — | 1 | 38 | ||||||||||||||||||||||||
| Dispositions | — | — | — | (4) | (1) | ||||||||||||||||||||||||
Production (1) |
(217) | (5) | (8) | (208) | (264) | ||||||||||||||||||||||||
As at December 31, 2023 |
7,899 | 163 | 96 | 2,598 | 8,591 | ||||||||||||||||||||||||
| China | |||||||||||||||||||||||||||||
As at December 31, 2022 |
— | — | 14 | 396 | 80 | ||||||||||||||||||||||||
| Extensions and Improved Recovery | — | — | — | — | — | ||||||||||||||||||||||||
| Discoveries | — | — | — | — | — | ||||||||||||||||||||||||
| Technical Revisions | — | — | 1 | 11 | 3 | ||||||||||||||||||||||||
| Economic Factors | — | — | — | — | — | ||||||||||||||||||||||||
| Acquisitions | — | — | — | — | — | ||||||||||||||||||||||||
| Dispositions | — | — | — | — | — | ||||||||||||||||||||||||
Production |
— | — | (3) | (70) | (15) | ||||||||||||||||||||||||
As at December 31, 2023 |
— | — | 12 | 337 | 68 | ||||||||||||||||||||||||
Indonesia |
|||||||||||||||||||||||||||||
As at December 31, 2022 |
— | — | 6 | 250 | 47 | ||||||||||||||||||||||||
| Extensions and Improved Recovery | — | — | — | — | — | ||||||||||||||||||||||||
| Discoveries | — | — | — | — | — | ||||||||||||||||||||||||
| Technical Revisions | — | — | — | 4 | 1 | ||||||||||||||||||||||||
| Economic Factors | — | — | — | — | — | ||||||||||||||||||||||||
| Acquisitions | — | — | — | — | — | ||||||||||||||||||||||||
| Dispositions | — | — | — | — | — | ||||||||||||||||||||||||
Production |
— | — | (1) | (28) | (5) | ||||||||||||||||||||||||
As at December 31, 2023 |
— | — | 5 | 226 | 43 | ||||||||||||||||||||||||
| Total Company | |||||||||||||||||||||||||||||
As at December 31, 2022 |
8,040 | 171 | 121 | 3,223 | 8,869 | ||||||||||||||||||||||||
| Extensions and Improved Recovery | 157 | 6 | 7 | 250 | 212 | ||||||||||||||||||||||||
| Discoveries | — | — | — | — | — | ||||||||||||||||||||||||
| Technical Revisions | (120) | (9) | (2) | 8 | (130) | ||||||||||||||||||||||||
| Economic Factors | 1 | — | — | (11) | (1) | ||||||||||||||||||||||||
| Acquisitions | 38 | — | — | 1 | 38 | ||||||||||||||||||||||||
| Dispositions | — | — | — | (4) | (1) | ||||||||||||||||||||||||
Production (1) |
(217) | (5) | (12) | (305) | (284) | ||||||||||||||||||||||||
As at December 31, 2023 |
7,899 | 163 | 114 | 3,162 | 8,702 | ||||||||||||||||||||||||
Cenovus Energy Inc. – 2023 Annual Information Form |
27 |
||||
|
Bitumen
(MMbbls)
|
Light and Medium Oil
(MMbbls)
|
NGLs
(MMbbls)
|
Conventional
Natural Gas
(Bcf)
|
Total
(MMBOE)
|
||||||||||||||||||||||||||||||||||||||||
|
First
Attributed
|
Total |
First
Attributed
|
Total |
First
Attributed
|
Total |
First
Attributed
|
Total |
First
Attributed
|
Total |
|||||||||||||||||||||||||||||||||||
| 2021 | 694 | 4,490 | 23 | 23 | 5 | 9 | 278 | 356 | 768 | 4,582 | ||||||||||||||||||||||||||||||||||
| 2022 | 313 | 4,442 | 2 | 4 | 3 | 13 | 158 | 382 | 344 | 4,523 | ||||||||||||||||||||||||||||||||||
| 2023 | 105 | 4,316 | 1 | 5 | 2 | 12 | 64 | 347 | 119 | 4,390 | ||||||||||||||||||||||||||||||||||
|
Bitumen
(MMbbls)
|
Light and Medium Oil
(MMbbls)
|
NGLs
(MMbbls)
|
Conventional
Natural Gas
(Bcf)
|
Total
(MMBOE)
|
||||||||||||||||||||||||||||||||||||||||
|
First
Attributed
|
Total |
First
Attributed
|
Total |
First
Attributed
|
Total |
First
Attributed
|
Total |
First
Attributed
|
Total |
|||||||||||||||||||||||||||||||||||
| 2021 | 289 | 1,692 | 139 | 140 | 6 | 16 | 267 | 440 | 478 | 1,922 | ||||||||||||||||||||||||||||||||||
| 2022 | 633 | 2,281 | 1 | 116 | 4 | 19 | 186 | 513 | 669 | 2,502 | ||||||||||||||||||||||||||||||||||
| 2023 | 84 | 2,320 | 4 | 119 | 4 | 21 | 106 | 561 | 109 | 2,553 | ||||||||||||||||||||||||||||||||||
Cenovus Energy Inc. – 2023 Annual Information Form |
28 |
||||
Cenovus Energy Inc. – 2023 Annual Information Form |
29 |
||||
| Crude Oil | Natural Gas | Total | ||||||||||||||||||||||||
| Gross | Net | Gross | Net | Gross | Net | |||||||||||||||||||||
| Canada | ||||||||||||||||||||||||||
Oil Sands (1) |
3,380 | 3,272 | 412 | 393 | 3,792 | 3,665 | ||||||||||||||||||||
Conventional (2) |
706 | 532 | 4,036 | 3,075 | 4,742 | 3,607 | ||||||||||||||||||||
Offshore – Atlantic (3) |
37 | 17 | — | — | 37 | 17 | ||||||||||||||||||||
| 4,123 | 3,821 | 4,448 | 3,468 | 8,571 | 7,289 | |||||||||||||||||||||
| International | ||||||||||||||||||||||||||
Offshore – China (4) |
— | — | 17 | 10 | 17 | 10 | ||||||||||||||||||||
Offshore – Indonesia (5) |
— | — | 13 | 5 | 13 | 5 | ||||||||||||||||||||
| — | — | 30 | 15 | 30 | 15 | |||||||||||||||||||||
| Total | 4,123 | 3,821 | 4,478 | 3,483 | 8,601 | 7,304 | ||||||||||||||||||||
| Crude Oil | Natural Gas | Total | ||||||||||||||||||||||||
| Gross | Net | Gross | Net | Gross | Net | |||||||||||||||||||||
| Canada | ||||||||||||||||||||||||||
Oil Sands (2) |
6,029 | 5,761 | 668 | 606 | 6,697 | 6,367 | ||||||||||||||||||||
Conventional (3) |
548 | 424 | 1,365 | 1,069 | 1,913 | 1,493 | ||||||||||||||||||||
Offshore – Atlantic (4) |
4 | 2 | — | — | 4 | 2 | ||||||||||||||||||||
| 6,581 | 6,187 | 2,033 | 1,675 | 8,614 | 7,862 | |||||||||||||||||||||
| International | ||||||||||||||||||||||||||
| Offshore – China | — | — | — | — | — | — | ||||||||||||||||||||
Offshore – Indonesia (5) |
— | — | 1 | — | 1 | — | ||||||||||||||||||||
| — | — | 1 | — | 1 | — | |||||||||||||||||||||
| Total | 6,581 | 6,187 | 2,034 | 1,675 | 8,615 | 7,862 | ||||||||||||||||||||
Cenovus Energy Inc. – 2023 Annual Information Form |
30 |
||||
| Offshore | |||||||||||||||||||||||||||||||||||||||||||||||||||||
Oil Sands (1) |
Conventional (1) |
Atlantic (1) |
China | Indonesia | Total (2) |
||||||||||||||||||||||||||||||||||||||||||||||||
| Gross | Net | Gross | Net | Gross | Net | Gross | Net | Gross | Net | Gross | Net | ||||||||||||||||||||||||||||||||||||||||||
| Crude Oil | 397 | 393 | 8 | 6 | — | — | — | — | — | — | 405 | 399 | |||||||||||||||||||||||||||||||||||||||||
| Natural Gas | — | — | 38 | 32 | — | — | — | — | 1 | — | 39 | 32 | |||||||||||||||||||||||||||||||||||||||||
| Total | 397 | 393 | 46 | 38 | — | — | — | — | 1 | — | 444 | 431 | |||||||||||||||||||||||||||||||||||||||||
| (thousands of acres) | Gross | Net | |||||||||
| Canada | 8,721 | 7,260 | |||||||||
| China | 1,925 | 1,441 | |||||||||
| Indonesia | 1,384 | 554 | |||||||||
| Total | 12,030 | 9,255 | |||||||||
Cenovus Energy Inc. – 2023 Annual Information Form |
31 |
||||
| ($ millions) | Canada | China | Indonesia (1) |
2023 | |||||||||||||||||||
| Acquisitions | |||||||||||||||||||||||
| Unproved | 31 | — | — | 31 | |||||||||||||||||||
| Proved | 11 | — | — | 11 | |||||||||||||||||||
| Total Acquisitions | 42 | — | — | 42 | |||||||||||||||||||
| Exploration Costs | 80 | 4 | — | 84 | |||||||||||||||||||
| Development Costs | 3,389 | 3 | 14 | 3,406 | |||||||||||||||||||
| Total Costs Incurred | 3,511 | 7 | 14 | 3,532 | |||||||||||||||||||
| ($ millions) | Canada | China | Indonesia (1) |
2022 | |||||||||||||||||||
| Acquisitions | |||||||||||||||||||||||
| Unproved | — | — | — | — | |||||||||||||||||||
| Proved | 1,621 | — | — | 1,621 | |||||||||||||||||||
| Total Acquisitions | 1,621 | — | — | 1,621 | |||||||||||||||||||
| Exploration Costs | 34 | 3 | — | 37 | |||||||||||||||||||
| Development Costs | 2,404 | 4 | 74 | 2,482 | |||||||||||||||||||
| Total Costs Incurred | 4,059 | 7 | 74 | 4,140 | |||||||||||||||||||
Cenovus Energy Inc. – 2023 Annual Information Form |
32 |
||||
| Total Proved | Total Proved Plus Probable |
||||||||||
| Canada | |||||||||||
Bitumen (Mbbls/d) (1) |
570.1 | 601.1 | |||||||||
Light and Medium Oil (Mbbls/d) |
17.7 | 18.6 | |||||||||
NGLs (Mbbls/d) |
19.8 | 21.4 | |||||||||
Conventional Natural Gas (MMcf/d) |
530.7 | 576.4 | |||||||||
Total (MBOE/d) |
696.0 | 737.1 | |||||||||
| China | |||||||||||
NGLs (Mbbls/d) |
7.6 | 8.3 | |||||||||
Conventional Natural Gas (MMcf/d) |
184.5 | 202.8 | |||||||||
Total (MBOE/d) |
38.4 | 42.1 | |||||||||
Indonesia |
|||||||||||
NGLs (Mbbls/d) |
2.3 | 2.5 | |||||||||
Conventional Natural Gas (MMcf/d) |
95.7 | 100.0 | |||||||||
Total (MBOE/d) |
18.2 | 19.1 | |||||||||
| Total Company | |||||||||||
Bitumen (Mbbls/d) (1) |
570.1 | 601.1 | |||||||||
Light and Medium Oil (Mbbls/d) |
17.7 | 18.6 | |||||||||
NGLs (Mbbls/d) |
29.6 | 32.2 | |||||||||
Conventional Natural Gas (MMcf/d) |
810.9 | 879.1 | |||||||||
Total (MBOE/d) |
752.6 | 798.4 | |||||||||
Cenovus Energy Inc. – 2023 Annual Information Form |
33 |
||||
| 2023 | Q4 | Q3 | Q2 | Q1 | |||||||||||||||||||||||||
| Canada | |||||||||||||||||||||||||||||
Bitumen |
|||||||||||||||||||||||||||||
| Foster Creek | 186.3 | 198.8 | 189.3 | 167.0 | 190.0 | ||||||||||||||||||||||||
| Christina Lake | 237.4 | 239.6 | 237.6 | 234.9 | 237.2 | ||||||||||||||||||||||||
| Sunrise | 48.9 | 50.1 | 54.5 | 46.5 | 44.5 | ||||||||||||||||||||||||
| Lloydminster Thermal | 104.1 | 106.6 | 104.6 | 106.2 | 99.0 | ||||||||||||||||||||||||
| Lloydminster Conventional Heavy Oil | 16.7 | 17.5 | 15.6 | 17.0 | 16.8 | ||||||||||||||||||||||||
Total Bitumen (Mbbls/d) |
593.4 | 612.6 | 601.6 | 571.6 | 587.5 | ||||||||||||||||||||||||
Light and Medium Oil (Mbbls/d) |
14.1 | 15.8 | 15.2 | 10.1 | 15.3 | ||||||||||||||||||||||||
NGLs (Mbbls/d) |
21.7 | 22.8 | 23.9 | 18.0 | 22.0 | ||||||||||||||||||||||||
Conventional Natural Gas (MMcf/d) |
566.0 | 581.9 | 592.7 | 504.3 | 584.9 | ||||||||||||||||||||||||
Total (MBOE/d) |
723.5 | 748.1 | 739.5 | 683.7 | 722.3 | ||||||||||||||||||||||||
| China | |||||||||||||||||||||||||||||
NGLs (Mbbls/d) |
8.8 | 9.5 | 10.0 | 6.2 | 9.5 | ||||||||||||||||||||||||
Conventional Natural Gas (MMcf/d) |
190.6 | 207.8 | 202.7 | 150.3 | 201.5 | ||||||||||||||||||||||||
Total (MBOE/d) |
40.5 | 44.2 | 43.8 | 31.2 | 43.0 | ||||||||||||||||||||||||
Indonesia |
|||||||||||||||||||||||||||||
NGLs (Mbbls/d) |
2.0 | 1.9 | 1.7 | 2.5 | 1.9 | ||||||||||||||||||||||||
Conventional Natural Gas (MMcf/d) |
76.0 | 86.6 | 72.0 | 74.8 | 70.6 | ||||||||||||||||||||||||
Total (MBOE/d) |
14.7 | 16.3 | 13.7 | 15.0 | 13.7 | ||||||||||||||||||||||||
| Total Company | |||||||||||||||||||||||||||||
Bitumen (Mbbls/d) |
593.4 | 612.6 | 601.6 | 571.6 | 587.5 | ||||||||||||||||||||||||
Light and Medium Oil (Mbbls/d) |
14.1 | 15.8 | 15.2 | 10.1 | 15.3 | ||||||||||||||||||||||||
NGLs (Mbbls/d) |
32.5 | 34.2 | 35.6 | 26.7 | 33.4 | ||||||||||||||||||||||||
Conventional Natural Gas (MMcf/d) |
832.6 | 876.3 | 867.4 | 729.4 | 857.0 | ||||||||||||||||||||||||
Total (MBOE/d) |
778.7 | 808.6 | 797.0 | 729.9 | 779.0 | ||||||||||||||||||||||||
Cenovus Energy Inc. – 2023 Annual Information Form |
34 |
||||
| Canada | 2023 | Q4 | Q3 | Q2 | Q1 | ||||||||||||||||||||||||
Foster Creek Bitumen ($/bbl) |
|||||||||||||||||||||||||||||
Sales Price |
78.18 | 74.06 | 98.93 | 75.41 | 62.45 | ||||||||||||||||||||||||
Royalties |
16.61 | 19.89 | 20.65 | 13.71 | 11.44 | ||||||||||||||||||||||||
Transportation and Blending |
11.98 | 11.33 | 10.55 | 12.80 | 13.45 | ||||||||||||||||||||||||
Operating Expenses |
11.44 | 9.82 | 10.91 | 12.21 | 12.99 | ||||||||||||||||||||||||
Netback |
38.15 | 33.02 | 56.82 | 36.69 | 24.57 | ||||||||||||||||||||||||
Christina Lake Bitumen ($/bbl) |
|||||||||||||||||||||||||||||
Sales Price |
68.38 | 65.95 | 91.72 | 66.39 | 49.83 | ||||||||||||||||||||||||
Royalties |
18.19 | 16.67 | 28.55 | 14.91 | 12.76 | ||||||||||||||||||||||||
Transportation and Blending |
6.69 | 7.36 | 5.76 | 5.91 | 7.70 | ||||||||||||||||||||||||
Operating Expenses |
8.52 | 7.59 | 9.32 | 8.09 | 9.11 | ||||||||||||||||||||||||
Netback |
34.98 | 34.33 | 48.09 | 37.48 | 20.26 | ||||||||||||||||||||||||
Sunrise Bitumen ($/bbl) |
|||||||||||||||||||||||||||||
Sales Price |
75.23 | 76.55 | 96.67 | 70.93 | 50.44 | ||||||||||||||||||||||||
Royalties |
4.28 | 6.81 | 4.69 | 3.15 | 1.78 | ||||||||||||||||||||||||
Transportation and Blending |
12.47 | 12.41 | 12.29 | 12.58 | 12.67 | ||||||||||||||||||||||||
Operating Expenses |
17.02 | 13.92 | 15.94 | 17.38 | 22.03 | ||||||||||||||||||||||||
Netback |
41.46 | 43.41 | 63.75 | 37.82 | 13.96 | ||||||||||||||||||||||||
Total Bitumen ($/bbl) |
|||||||||||||||||||||||||||||
Sales Price |
73.13 | 70.07 | 94.53 | 71.18 | 55.72 | ||||||||||||||||||||||||
Royalties |
14.20 | 15.03 | 19.70 | 11.78 | 9.94 | ||||||||||||||||||||||||
Transportation and Blending |
8.19 | 8.25 | 7.42 | 8.06 | 9.09 | ||||||||||||||||||||||||
Operating Expenses |
12.52 | 10.95 | 12.55 | 12.70 | 14.01 | ||||||||||||||||||||||||
Netback |
38.22 | 35.84 | 54.86 | 38.64 | 22.68 | ||||||||||||||||||||||||
Light and Medium Oil ($/bbl) |
|||||||||||||||||||||||||||||
Sales Price |
109.03 | 113.62 | 106.85 | 116.67 | 104.35 | ||||||||||||||||||||||||
Royalties |
9.63 | 7.95 | 9.79 | 15.94 | 9.77 | ||||||||||||||||||||||||
Transportation and Blending |
5.91 | 6.17 | 3.20 | 21.10 | 4.13 | ||||||||||||||||||||||||
Operating Expenses |
47.08 | 40.13 | 42.03 | 97.36 | 46.19 | ||||||||||||||||||||||||
Netback (1) |
46.41 | 59.37 | 51.83 | (17.73) | 44.26 | ||||||||||||||||||||||||
Conventional Natural Gas (2) ($/Mcf) |
|||||||||||||||||||||||||||||
Sales Price |
3.90 | 3.32 | 3.06 | 2.63 | 6.45 | ||||||||||||||||||||||||
Royalties |
0.08 | 0.12 | 0.12 | (0.28) | 0.32 | ||||||||||||||||||||||||
Transportation and Blending |
0.47 | 0.55 | 0.42 | 0.41 | 0.51 | ||||||||||||||||||||||||
Operating Expenses |
2.19 | 2.06 | 2.07 | 2.45 | 2.21 | ||||||||||||||||||||||||
Netback |
1.16 | 0.59 | 0.45 | 0.05 | 3.41 | ||||||||||||||||||||||||
NGLs ($/bbl) |
|||||||||||||||||||||||||||||
Sales Price |
48.25 | 50.25 | 47.74 | 46.59 | 48.05 | ||||||||||||||||||||||||
Royalties |
7.68 | 4.88 | 4.79 | 8.23 | 13.39 | ||||||||||||||||||||||||
Transportation and Blending |
8.49 | 9.34 | 8.00 | 9.53 | 7.27 | ||||||||||||||||||||||||
Operating Expenses |
12.98 | 12.31 | 12.36 | 14.54 | 13.09 | ||||||||||||||||||||||||
Netback |
19.10 | 23.72 | 22.59 | 14.29 | 14.30 | ||||||||||||||||||||||||
Cenovus Energy Inc. – 2023 Annual Information Form |
35 |
||||
| China | 2023 | Q4 | Q3 | Q2 | Q1 | ||||||||||||||||||||||||
Conventional Natural Gas ($/Mcf) |
|||||||||||||||||||||||||||||
Sales Price |
12.95 | 13.04 | 12.49 | 12.92 | 13.36 | ||||||||||||||||||||||||
Royalties |
0.70 | 0.71 | 0.66 | 0.68 | 0.72 | ||||||||||||||||||||||||
Transportation and Blending |
— | — | — | — | — | ||||||||||||||||||||||||
Operating Expenses |
1.26 | 1.21 | 1.08 | 1.99 | 0.93 | ||||||||||||||||||||||||
Netback |
10.99 | 11.12 | 10.75 | 10.25 | 11.71 | ||||||||||||||||||||||||
NGLs ($/bbl) |
|||||||||||||||||||||||||||||
Sales Price |
98.11 | 109.31 | 99.72 | 82.24 | 95.39 | ||||||||||||||||||||||||
Royalties |
11.13 | 18.59 | 13.14 | 4.71 | 5.54 | ||||||||||||||||||||||||
Transportation and Blending |
— | — | — | — | — | ||||||||||||||||||||||||
Operating Expenses |
7.38 | 7.23 | 6.50 | 11.69 | 5.62 | ||||||||||||||||||||||||
Netback |
79.60 | 83.49 | 80.08 | 65.84 | 84.23 | ||||||||||||||||||||||||
| Indonesia | 2023 | Q4 | Q3 | Q2 | Q1 | ||||||||||||||||||||||||
Conventional Natural Gas ($/Mcf) |
|||||||||||||||||||||||||||||
Sales Price |
8.60 | 8.64 | 8.44 | 8.55 | 8.78 | ||||||||||||||||||||||||
Royalties |
1.16 | 0.83 | 0.82 | 1.07 | 2.00 | ||||||||||||||||||||||||
Transportation and Blending |
— | — | — | — | — | ||||||||||||||||||||||||
Operating Expenses |
1.78 | 1.81 | 1.93 | 1.52 | 1.87 | ||||||||||||||||||||||||
Netback |
5.66 | 6.00 | 5.69 | 5.96 | 4.91 | ||||||||||||||||||||||||
NGLs ($/bbl) |
|||||||||||||||||||||||||||||
Sales Price |
106.87 | 124.02 | 115.17 | 91.66 | 101.79 | ||||||||||||||||||||||||
Royalties |
56.84 | 64.60 | 58.53 | 49.17 | 57.48 | ||||||||||||||||||||||||
Transportation and Blending |
— | — | — | — | — | ||||||||||||||||||||||||
Operating Expenses |
11.17 | 10.87 | 12.15 | 8.25 | 14.52 | ||||||||||||||||||||||||
Netback |
38.86 | 48.55 | 44.49 | 34.24 | 29.79 | ||||||||||||||||||||||||
Cenovus Energy Inc. – 2023 Annual Information Form |
36 |
||||
| Total Company | 2023 | Q4 | Q3 | Q2 | Q1 | ||||||||||||||||||||||||
Bitumen ($/bbl) |
|||||||||||||||||||||||||||||
Sales Price |
73.13 | 70.07 | 94.53 | 71.18 | 55.72 | ||||||||||||||||||||||||
Royalties |
14.20 | 15.03 | 19.70 | 11.78 | 9.94 | ||||||||||||||||||||||||
Transportation and Blending |
8.19 | 8.25 | 7.42 | 8.06 | 9.09 | ||||||||||||||||||||||||
Operating Expenses |
12.52 | 10.95 | 12.55 | 12.70 | 14.01 | ||||||||||||||||||||||||
Netback |
38.22 | 35.84 | 54.86 | 38.64 | 22.68 | ||||||||||||||||||||||||
Light and Medium Oil ($/bbl) |
|||||||||||||||||||||||||||||
Sales Price |
109.03 | 113.62 | 106.85 | 116.67 | 104.35 | ||||||||||||||||||||||||
Royalties |
9.63 | 7.95 | 9.79 | 15.94 | 9.77 | ||||||||||||||||||||||||
Transportation and Blending |
5.91 | 6.17 | 3.20 | 21.10 | 4.13 | ||||||||||||||||||||||||
Operating Expenses |
47.08 | 40.13 | 42.03 | 97.36 | 46.19 | ||||||||||||||||||||||||
Netback (1) |
46.41 | 59.37 | 51.83 | (17.73) | 44.26 | ||||||||||||||||||||||||
Conventional Natural Gas (2) ($/Mcf) |
|||||||||||||||||||||||||||||
Sales Price |
6.42 | 6.18 | 5.73 | 5.37 | 8.27 | ||||||||||||||||||||||||
Royalties |
0.32 | 0.33 | 0.31 | 0.06 | 0.55 | ||||||||||||||||||||||||
Transportation and Blending |
0.32 | 0.36 | 0.29 | 0.28 | 0.35 | ||||||||||||||||||||||||
Operating Expenses |
1.94 | 1.83 | 1.83 | 2.26 | 1.88 | ||||||||||||||||||||||||
Netback |
3.84 | 3.66 | 3.30 | 2.77 | 5.49 | ||||||||||||||||||||||||
NGLs ($/bbl) |
|||||||||||||||||||||||||||||
Sales Price |
65.38 | 70.76 | 65.61 | 59.12 | 64.54 | ||||||||||||||||||||||||
Royalties |
11.65 | 12.04 | 9.71 | 11.27 | 13.66 | ||||||||||||||||||||||||
Transportation and Blending |
5.66 | 6.23 | 5.36 | 6.42 | 4.79 | ||||||||||||||||||||||||
Operating Expenses |
11.35 | 10.82 | 10.70 | 13.28 | 11.05 | ||||||||||||||||||||||||
Netback |
36.72 | 41.67 | 39.84 | 28.15 | 35.04 | ||||||||||||||||||||||||
Cenovus Energy Inc. – 2023 Annual Information Form |
37 |
||||
| DIVIDENDS | ||
| ($ per share) | 2023 | 2022 | 2021 | ||||||||
| Base Dividends | 0.525 | 0.350 | 0.088 | ||||||||
| Variable Dividends | — | 0.114 | — | ||||||||
| ($ per share) | 2023 (1) |
2022 (2) |
2021 |
||||||||
| Series 1 First Preferred Shares | 0.644 | 0.644 | 0.633 | ||||||||
| Series 2 First Preferred Shares | 1.584 | 0.781 | 0.462 | ||||||||
| Series 3 First Preferred Shares | 1.172 | 1.172 | 1.172 | ||||||||
| Series 5 First Preferred Shares | 1.148 | 1.148 | 1.148 | ||||||||
| Series 7 First Preferred Shares | 0.984 | 0.984 | 0.984 | ||||||||
| DESCRIPTION OF CAPITAL STRUCTURE | ||
Units Outstanding (thousands) |
|||||
| Common Shares | 1,871,868 | ||||
| Cenovus Warrants | 7,625 | ||||
| Series 1 First Preferred Shares | 10,740 | ||||
| Series 2 First Preferred Shares | 1,260 | ||||
| Series 3 First Preferred Shares | 10,000 | ||||
| Series 5 First Preferred Shares | 8,000 | ||||
| Series 7 First Preferred Shares | 6,000 | ||||
Cenovus Energy Inc. – 2023 Annual Information Form |
38 |
||||
| As at December 31, 2023 | Dividend Reset Date |
Dividend Rate
(percent)
|
Number of Preferred Shares (thousands) |
||||||||||||||
| Series 1 First Preferred Shares | March 31, 2026 | 2.58 | 10,740 | ||||||||||||||
Series 2 First Preferred Shares (1) |
Quarterly | 6.77 | 1,260 | ||||||||||||||
| Series 3 First Preferred Shares | December 31, 2024 | 4.69 | 10,000 | ||||||||||||||
| Series 5 First Preferred Shares | March 31, 2025 | 4.59 | 8,000 | ||||||||||||||
| Series 7 First Preferred Shares | June 30, 2025 | 3.94 | 6,000 | ||||||||||||||
Cenovus Energy Inc. – 2023 Annual Information Form |
39 |
||||
Cenovus Energy Inc. – 2023 Annual Information Form |
40 |
||||
|
S&P Global
Ratings
(“S&P”)
|
Moody’s
Investors Service
(“Moody’s”)
|
Morningstar
DBRS
(“DBRS”)
|
Fitch
Ratings Inc.
(“Fitch”)
|
||||||||||||||||||||
Senior Unsecured Long-Term Notes |
BBB- | Baa2 | BBB (high) | BBB | |||||||||||||||||||
| Outlook/Trend | Positive | Positive | Stable | Stable | |||||||||||||||||||
| Series 1 First Preferred Shares | P-3 | — | Pfd-3 (high) | — | |||||||||||||||||||
| Series 2 First Preferred Shares | P-3 | — | Pfd-3 (high) | — | |||||||||||||||||||
| Series 3 First Preferred Shares | P-3 | — | Pfd-3 (high) | — | |||||||||||||||||||
| Series 5 First Preferred Shares | P-3 | — | Pfd-3 (high) | — | |||||||||||||||||||
| Series 7 First Preferred Shares | P-3 | — | Pfd-3 (high) | — | |||||||||||||||||||
Cenovus Energy Inc. – 2023 Annual Information Form |
41 |
||||
| MARKET FOR SECURITIES | ||
| TSX | NYSE | ||||||||||||||||||||||||||||||||||
Price Range ($ per share) |
Volume (1) (thousands) |
Price Range (US$ per share) |
Volume (2) (thousands) |
||||||||||||||||||||||||||||||||
High |
Low |
Close |
High |
Low |
Close |
||||||||||||||||||||||||||||||
January |
28.00 | 24.10 | 26.58 | 196,994 | 21.03 | 17.80 | 19.98 | 136,968 | |||||||||||||||||||||||||||
February |
26.97 | 23.73 | 25.16 | 192,436 | 20.21 | 17.58 | 18.44 | 131,897 | |||||||||||||||||||||||||||
March |
26.47 | 20.67 | 23.58 | 286,440 | 19.49 | 14.98 | 17.46 | 180,824 | |||||||||||||||||||||||||||
April |
25.83 | 21.78 | 22.74 | 228,536 | 19.22 | 15.98 | 16.80 | 175,537 | |||||||||||||||||||||||||||
May |
23.12 | 20.31 | 21.69 | 191,242 | 17.01 | 14.98 | 15.98 | 148,969 | |||||||||||||||||||||||||||
June |
24.19 | 20.99 | 22.50 | 179,636 | 18.11 | 15.90 | 16.98 | 142,433 | |||||||||||||||||||||||||||
July |
25.64 | 22.11 | 25.08 | 189,342 | 19.47 | 16.55 | 19.02 | 141,627 | |||||||||||||||||||||||||||
August |
27.17 | 24.60 | 26.94 | 209,397 | 20.08 | 18.30 | 19.93 | 167,266 | |||||||||||||||||||||||||||
September |
28.62 | 26.54 | 28.28 | 177,079 | 21.24 | 19.68 | 20.82 | 151,109 | |||||||||||||||||||||||||||
October |
29.18 | 26.04 | 26.42 | 162,252 | 21.37 | 18.93 | 19.08 | 160,994 | |||||||||||||||||||||||||||
November |
27.01 | 23.43 | 24.07 | 216,540 | 19.74 | 17.05 | 17.76 | 190,591 | |||||||||||||||||||||||||||
December |
24.42 | 21.16 | 22.08 | 232,377 | 18.09 | 15.56 | 16.65 | 230,074 | |||||||||||||||||||||||||||
Cenovus Energy Inc. – 2023 Annual Information Form |
42 |
||||
| TSX | NYSE | ||||||||||||||||||||||||||||||||||
Price Range ($ per share) |
Volume (1) (thousands) |
Price Range (US$ per share) |
Volume (2) (thousands) |
||||||||||||||||||||||||||||||||
High |
Low |
Close |
High |
Low |
Close |
||||||||||||||||||||||||||||||
January |
21.39 | 17.77 | 20.08 | 394 | 15.96 | 13.00 | 15.08 | 48 | |||||||||||||||||||||||||||
February |
20.40 | 17.64 | 18.60 | 292 | 15.25 | 13.00 | 13.60 | 78 | |||||||||||||||||||||||||||
March |
19.88 | 14.50 | 17.11 | 442 | 14.58 | 10.56 | 12.42 | 50 | |||||||||||||||||||||||||||
April |
19.28 | 15.33 | 16.20 | 413 | 14.36 | 11.40 | 12.07 | 116 | |||||||||||||||||||||||||||
May |
16.50 | 14.20 | 15.25 | 214 | 12.12 | 10.40 | 11.01 | 18 | |||||||||||||||||||||||||||
June |
17.50 | 14.69 | 16.05 | 185 | 13.20 | 11.12 | 12.20 | 42 | |||||||||||||||||||||||||||
July |
19.00 | 15.69 | 18.62 | 240 | 14.35 | 12.08 | 14.12 | 34 | |||||||||||||||||||||||||||
August |
20.52 | 17.26 | 20.40 | 426 | 15.13 | 13.35 | 14.03 | 63 | |||||||||||||||||||||||||||
September |
22.09 | 19.62 | 21.72 | 374 | 16.20 | 14.32 | 16.05 | 106 | |||||||||||||||||||||||||||
October |
22.63 | 19.63 | 19.86 | 248 | 16.53 | 14.28 | 14.36 | 95 | |||||||||||||||||||||||||||
November |
20.35 | 17.00 | 17.54 | 185 | 14.72 | 12.50 | 12.88 | 49 | |||||||||||||||||||||||||||
December |
18.00 | 14.75 | 15.49 | 208 | 12.74 | 10.82 | 11.75 | 36 | |||||||||||||||||||||||||||
Price Range ($ per share) |
Volume (1) (thousands) |
||||||||||||||||
High |
Low |
Close |
|||||||||||||||
January |
15.81 | 13.99 | 15.29 | 78 | |||||||||||||
February |
15.67 | 14.51 | 15.07 | 67 | |||||||||||||
March |
15.24 | 13.29 | 13.80 | 132 | |||||||||||||
April |
14.82 | 13.36 | 14.00 | 53 | |||||||||||||
May |
14.35 | 12.33 | 12.60 | 71 | |||||||||||||
June |
13.95 | 12.60 | 13.28 | 56 | |||||||||||||
July |
13.46 | 11.37 | 12.50 | 1,233 | |||||||||||||
August |
12.49 | 11.85 | 12.25 | 86 | |||||||||||||
September |
12.54 | 11.52 | 11.83 | 131 | |||||||||||||
October |
12.80 | 11.55 | 12.79 | 120 | |||||||||||||
November |
13.57 | 12.61 | 13.55 | 92 | |||||||||||||
December |
14.00 | 13.16 | 13.94 | 59 | |||||||||||||
Price Range ($ per share) |
Volume (1) (thousands) |
||||||||||||||||
High |
Low |
Close |
|||||||||||||||
January |
16.50 | 15.00 | 16.40 | 6 | |||||||||||||
February |
16.98 | 15.62 | 16.75 | 5 | |||||||||||||
March |
17.00 | 15.70 | 15.70 | 27 | |||||||||||||
April |
16.74 | 15.70 | 16.50 | 6 | |||||||||||||
May |
16.50 | 15.35 | 15.50 | 16 | |||||||||||||
June |
16.00 | 15.21 | 15.30 | 10 | |||||||||||||
July |
15.77 | 14.51 | 15.05 | 39 | |||||||||||||
August |
15.70 | 14.75 | 14.75 | 15 | |||||||||||||
September |
15.20 | 14.40 | 15.20 | 15 | |||||||||||||
October |
15.20 | 14.61 | 14.61 | 29 | |||||||||||||
November |
15.09 | 14.52 | 15.00 | 46 | |||||||||||||
December |
15.10 | 14.56 | 14.87 | 61 | |||||||||||||
Cenovus Energy Inc. – 2023 Annual Information Form |
43 |
||||
Price Range ($ per share) |
Volume (1) (thousands) |
||||||||||||||||
High |
Low |
Close |
|||||||||||||||
January |
20.95 | 19.90 | 20.55 | 115 | |||||||||||||
February |
21.23 | 20.55 | 20.83 | 91 | |||||||||||||
March |
21.03 | 19.10 | 19.53 | 79 | |||||||||||||
April |
19.90 | 19.21 | 19.30 | 97 | |||||||||||||
May |
19.19 | 17.52 | 18.00 | 81 | |||||||||||||
June |
19.40 | 18.00 | 18.45 | 46 | |||||||||||||
July |
19.39 | 18.21 | 18.89 | 156 | |||||||||||||
August |
18.96 | 17.60 | 17.80 | 91 | |||||||||||||
September |
19.45 | 17.71 | 19.25 | 154 | |||||||||||||
October |
19.45 | 18.60 | 19.05 | 147 | |||||||||||||
November |
21.49 | 18.86 | 20.99 | 443 | |||||||||||||
December |
22.21 | 20.95 | 22.21 | 128 | |||||||||||||
Price Range ($ per share) |
Volume (1) (thousands) |
||||||||||||||||
High |
Low |
Close |
|||||||||||||||
January |
22.10 | 20.52 | 22.06 | 50 | |||||||||||||
February |
22.15 | 21.47 | 21.47 | 73 | |||||||||||||
March |
21.78 | 19.23 | 20.08 | 42 | |||||||||||||
April |
21.55 | 19.85 | 20.55 | 48 | |||||||||||||
May |
20.59 | 18.51 | 19.74 | 45 | |||||||||||||
June |
19.70 | 18.45 | 19.19 | 154 | |||||||||||||
July |
20.01 | 18.80 | 19.99 | 104 | |||||||||||||
August |
19.97 | 18.11 | 18.73 | 113 | |||||||||||||
September |
19.25 | 18.25 | 19.25 | 202 | |||||||||||||
October |
19.20 | 18.15 | 18.65 | 119 | |||||||||||||
November |
22.08 | 18.64 | 22.00 | 208 | |||||||||||||
December |
22.78 | 21.74 | 22.72 | 186 | |||||||||||||
Price Range ($ per share) |
Volume (1) (thousands) |
||||||||||||||||
High |
Low |
Close |
|||||||||||||||
January |
21.34 | 20.00 | 20.85 | 34 | |||||||||||||
February |
21.76 | 20.85 | 21.01 | 86 | |||||||||||||
March |
21.50 | 19.48 | 19.98 | 76 | |||||||||||||
April |
20.59 | 19.90 | 20.00 | 33 | |||||||||||||
May |
20.24 | 18.39 | 18.80 | 82 | |||||||||||||
June |
20.00 | 18.80 | 18.85 | 278 | |||||||||||||
July |
20.08 | 18.85 | 20.00 | 333 | |||||||||||||
August |
20.00 | 18.31 | 18.50 | 111 | |||||||||||||
September |
18.81 | 18.06 | 18.81 | 46 | |||||||||||||
October |
19.24 | 17.96 | 18.58 | 89 | |||||||||||||
November |
21.39 | 18.56 | 21.30 | 166 | |||||||||||||
December |
22.25 | 21.21 | 22.25 | 208 | |||||||||||||
Cenovus Energy Inc. – 2023 Annual Information Form |
44 |
||||
| DIRECTORS AND EXECUTIVE OFFICERS | ||
| Name and Residence | Date Elected or Appointed as Director, Independence Status and Committee Membership |
Principal Occupation During the Past Five Years | ||||||
|
Keith M. Casey
San Antonio, Texas
United States
|
April 29, 2020
Independent
HRC (1)
SSR (2)
|
Mr. Casey is the Chief Executive Officer of Pin Oak Group, LLC, a private midstream company, since February 2022. Mr. Casey served as Chief Executive Officer of Tatanka Midstream LLC, a private midstream company, from March 2020 to January 2022. Mr. Casey served as Executive Vice-President Commercial and Value Chain, from August 2016 to October 2018; and Executive Vice-President, Operations from May 2014 to August 2016 with Andeavor Corporation, formerly known as Tesoro Corporation, an integrated petroleum refining, logistics, and marketing company. | ||||||
|
Michael J. Crothers
Calgary, Alberta
Canada
|
November 1, 2023
Independent
Governance
HRC (1)
|
Mr. Crothers is a Director of Keyera Corp., a publicly traded integrated energy infrastructure company, since June 2021. Mr. Crothers served as President and Country Chair for Shell Canada Limited, a public global energy and petrochemical company, from December 2015 to May 2021; and as Vice President Canada Integrated Gas from December 2017 to May 2021. Mr. Crothers also serves as Chair of the Board of Directors of Northern RNA, a private life sciences company, since April 2021, and as a Director of Convrg Innovations Inc., formerly Westgen Technologies, a private clean tech company, since August 2022. | ||||||
|
James D. Girgulis
Luxembourg
Grand-Duchy of Luxembourg
|
November 1, 2023 Non-Independent Governance |
Mr. Girgulis is Managing Director of Hutchison Whampoa Europe Investments S.à r.l., a private investment company, and Managing Director of CK Hutchison Group Telecom Finance S.A., a public limited company, both since January 2023. From April 2022 to January 2023, Mr. Girgulis was Managing Director of CK Hutchison Networks Europe Investments S.à r.l., a private investment company. From April 2021 to March 2022, Mr. Girgulis was Special Advisor to the Executive at Cenovus following Cenovus's combination with Husky in January 2021. Mr. Girgulis was Senior Vice-President, General Counsel & Secretary of Husky, a public integrated energy company, from April 2012 to March 2021. | ||||||
|
Jane E. Kinney
Toronto, Ontario
Canada
|
April 24, 2019
Independent
Audit
SSR (2)
|
Ms. Kinney is a director of Intact Financial Corporation, a publicly traded insurance company, since May 2019; and a director and Chair of Nautilus Indemnity Holdings Limited, a private insurance company, since February and July 2021, respectively. Ms. Kinney was appointed Vice Chair, Leadership Team Member of Deloitte LLP Canada (“Deloitte”), an audit and consulting firm, in June 2010 and served in this role until her retirement in June 2019. | ||||||
|
Harold N. Kvisle
Calgary, Alberta
Canada
|
April 25, 2018
Independent
Governance
HRC (1)
|
Mr. Kvisle is a director, since May 2009, and Chairman, since January 2016, of ARC Resources Ltd., a publicly traded oil and gas company. Mr. Kvisle has been Board Chair, since January 2019, of Finning International Inc., a publicly traded heavy equipment company. Mr. Kvisle served as a director of Cona Resources Ltd. (“Cona”), a publicly traded heavy oil company, from November 2011 to May 2018 when Cona was acquired by Waterous Energy Fund. | ||||||
|
Eva L. Kwok
Vancouver, British Columbia Canada
|
January 1, 2021
Independent
Governance
|
Mrs. Kwok is Chair, a director and Chief Executive Officer of Amara Holdings Inc., a private investment holding company, since November 2010. Mrs. Kwok is also a director of CK Life Sciences Int’l., (Holdings) Inc., a publicly traded nutraceutical, pharmaceutical and agriculture-related company, since June 2002; CK Infrastructure Holdings Limited, a publicly traded global infrastructure investment and development company, since September 2004; CK Asset Holdings Limited, a publicly traded global property investment, development, management and utility infrastructure company, since May 2022; and was a director of Husky, from August 2000 until March 2021, prior to Husky’s amalgamation with Cenovus. | ||||||
Cenovus Energy Inc. – 2023 Annual Information Form |
45 |
||||
| Name and Residence | Date Elected or Appointed as Director, Independence Status and Committee Membership |
Principal Occupation During the Past Five Years | ||||||
|
Melanie A. Little
Alpharetta, Georgia
United States
|
January 1, 2023
Independent
HRC (1)
SSR (2)
|
Ms. Little is the President and Chief Executive Officer of Colonial Pipeline Company, a privately owned refined products terminaling and pipeline company, since January 2023. Ms. Little served as Executive Vice-President and Chief Operating Officer of Magellan Midstream Partners, L.P. (“Magellan”), a public partnership that transports, stores and distributes petroleum products acquired by ONEOK in September 2023, from June 2022 to January 2023, and as Senior Vice-President, Operations and Environmental, Health, Safety and Security of Magellan, from July 2017 to May 2022. Ms. Little served as a director of Diversified Energy Company plc, a public oil and gas producer, from December 2019 to December 2022. | ||||||
|
Richard J. Marcogliese Alamo, California
United States
|
April 27, 2016
Independent
Audit
SSR (2)
|
Mr. Marcogliese is the Principal of iRefine, LLC, a privately owned petroleum refining consulting company, since June 2011; and a director of Delek US Holdings, Inc., a publicly traded downstream energy company, since January 2020. Mr. Marcogliese served as Executive Advisor of Pilko & Associates L.P., a private chemical and energy advisory company, from June 2011 to December 2019. | ||||||
|
Jonathan M. McKenzie
Calgary, Alberta
Canada |
April 26, 2023
Non-Independent (3)
|
Mr. McKenzie was appointed President & Chief Executive Officer of Cenovus effective April 26, 2023. From January 2021 to April 2023, Mr. McKenzie was Executive Vice-President & Chief Operating Officer of Cenovus; and from May 2018 to January 2021, Mr. McKenzie was Executive Vice-President and Chief Financial Officer of Cenovus. |
||||||
|
Claude Mongeau
Montreal, Quebec
Canada |
December 1, 2016
Independent
Audit
Governance
|
Mr. Mongeau was appointed Lead Independent Director of Cenovus effective April 26, 2023. Mr. Mongeau is a director of The Toronto-Dominion Bank, an international financial institution, since March 2015; and a director of Norfolk Southern Corporation, a publicly traded North American rail transportation provider, since September 2019. Mr. Mongeau served as a director of TELUS Corporation, a publicly traded telecommunications company, from May 2017 to August 2019. |
||||||
|
Alexander J. Pourbaix
Calgary, Alberta
Canada
|
November 6, 2017
Non-Independent (3)
|
Mr. Pourbaix was appointed Executive Chair of the Board of Cenovus effective April 26, 2023. Mr. Pourbaix served as President & Chief Executive Officer of Cenovus from November 2017 to April 2023; and is a director of NRG Energy, Inc., a publicly traded energy and home services company, since November 2023; and Canadian Utilities Limited, a publicly traded diversified global energy infrastructure corporation, since November 2019. Mr. Pourbaix served as a director of Trican Well Service Ltd., a publicly traded oilfield services provider, from May 2012 to December 2019. | ||||||
|
Wayne E. Shaw
Toronto, Ontario
Canada |
January 1, 2021
Independent
Audit
SSR (2)
|
Mr. Shaw is the President of G.E. Shaw Investments Limited, a private investment holding company, since 2012. Prior to his retirement in April 2013, he was a Senior Partner with Stikeman Elliott LLP, Barristers and Solicitors, Toronto, Ontario. Mr. Shaw was a director of Husky, from August 2000 until March 2021, prior to Husky’s amalgamation with Cenovus. |
||||||
|
Frank J. Sixt
Hong Kong Special
Administrative Region
|
January 1, 2021
Independent
Governance
|
Mr. Sixt is an Executive Director, Group Finance Director and Deputy Managing Director of CK Hutchison Holdings Limited, a publicly traded ports and related services, retail, infrastructure and telecommunications company. Mr. Sixt is also the Non-Executive Chairman of TOM Group Limited, a publicly traded technology and media company; an Executive Director of CK Infrastructure Holdings Limited, a publicly traded global infrastructure investment and development company; a Non-Executive Director of TPG Telecom Limited and Chairman of Hutchison Telecommunications (Australia) Limited, both publicly traded telecommunications service provider companies; and an Alternate Director to a Director of HK Electric Investments Manager Limited as the trustee-manager of HK Electric Investments, manager of a publicly traded power industry focused trust and of HK Electric Investments Limited, a publicly traded power industry focused trust. Mr. Sixt was a Commissioner of PT Indosat Tbk, a publicly traded telecommunications service provider. Mr. Sixt is a Director of the Li Ka Shing (Canada) Foundation, the Li Ka Shing Foundation Limited and he was a director of Husky, from August 2000 until March 2021, prior to Husky’s amalgamation with Cenovus. |
||||||
Cenovus Energy Inc. – 2023 Annual Information Form |
46 |
||||
| Name and Residence | Date Elected or Appointed as Director, Independence Status and Committee Membership |
Principal Occupation During the Past Five Years | ||||||
|
Rhonda I. Zygocki
Friday Harbor, Washington
United States |
April 27, 2016
Independent
Governance
HRC (1)
|
Ms. Zygocki served as Executive Vice President, Policy and Planning of Chevron Corporation (“Chevron”), a publicly traded integrated energy company, from March 2011 until her retirement in February 2015 and prior thereto, during her 34 years with Chevron, she held a number of senior management and executive leadership positions in international operations, public affairs, strategic planning, policy, government affairs and health, environment and safety. | ||||||
| Name and Residence | Office Held and Principal Occupation During the Past Five Years | ||||
|
Alexander J. Pourbaix
Calgary, Alberta
Canada
|
Executive Chair of the Board
Mr. Pourbaix’s biographical information is included under “Directors”.
|
||||
|
Jonathan M. McKenzie
Calgary, Alberta
Canada
|
President & Chief Executive Officer
Mr. McKenzie’s biographical information is included under “Directors”.
|
||||
|
Karamjit S. Sandhar
Calgary, Alberta
Canada
|
Executive Vice-President & Chief Financial Officer
Mr. Sandhar was appointed Executive Vice-President & Chief Financial Officer, effective September 1, 2023. From January 2021 to August 2023, Mr. Sandhar was Executive Vice-President, Strategy & Corporate Development; from January 2020 to January 2021, Mr. Sandhar was Senior Vice-President, Conventional; and Senior Vice-President, Deep Basin prior to the Deep Basin segment being renamed the Conventional segment in the first quarter of 2020. From December 2017 to December 2019, Mr. Sandhar was Senior Vice-President, Strategy & Corporate Development.
|
||||
|
Keith A. Chiasson
Calgary, Alberta
Canada
|
Executive Vice-President & Chief Operating Officer
Mr. Chiasson was appointed Executive Vice-President & Chief Operating Officer effective September 1, 2023. From March 2019 to August 2023, Mr. Chiasson was Executive Vice-President, Downstream; from December 2017 to February 2019, Mr. Chiasson was Senior Vice-President, Downstream; from May 2017 to December 2017, Mr. Chiasson was Vice-President, Oil Sands Production Operations; and from July 2016 to May 2017, Mr. Chiasson was Vice-President, Operations.
|
||||
|
Rhona M. DelFrari
Calgary, Alberta
Canada
|
Chief Sustainability Officer & Executive Vice-President, Stakeholder Engagement
Ms. DelFrari was appointed Chief Sustainability Officer & Executive Vice-President, Stakeholder Engagement effective March 1, 2023. From January 2021 to February 2023, Ms. DelFrari was Chief Sustainability Officer & Senior Vice-President, Stakeholder Engagement; from October 2019 to December 2020, Ms. DelFrari was Vice-President, Sustainability & Engagement; and from October 2017 to September 2019, Ms. DelFrari was Vice-President, Communications & Community Engagement.
|
||||
|
J. Drew Zieglgansberger
Calgary, Alberta
Canada
|
Executive Vice-President & Chief Commercial Officer
Mr. Zieglgansberger was appointed Executive Vice-President & Chief Commercial Officer effective September 1, 2023. From March 2022 to August 2023, Mr. Zieglgansberger was Executive Vice-President, Natural Gas & Technical Services; from January 2021 to February 2022, Executive Vice-President, Upstream – Conventional & Integration; from January 2020 to January 2021, Executive Vice-President, Strategy & Corporate Development; and from January 2018 to December 2019, Executive Vice-President, Upstream.
|
||||
|
Doreen A. Cole
Calgary, Alberta
Canada
|
Executive Vice-President, Downstream
Ms. Cole was appointed Executive Vice-President, Downstream effective September 1, 2023. From September 2021 to August 2023, Ms. Cole was Senior Vice-President, Downstream Manufacturing. From December 2017 to July 2021, Ms. Cole was Managing Director of The Syncrude Project, an oil sands joint venture project.
|
||||
Cenovus Energy Inc. – 2023 Annual Information Form |
47 |
||||
| Name and Residence | Office Held and Principal Occupation During the Past Five Years | ||||
|
P. Andrew Dahlin
Calgary, Alberta
Canada
|
Executive Vice-President, Natural Gas & Technical Services
Mr. Dahlin was appointed Executive Vice-President, Natural Gas & Technical Services, effective September 1, 2023. From March 2022 to August 2023, Mr. Dahlin was Executive Vice-President, Corporate & Operations Services; and from January 2021 to February 2022, Mr. Dahlin was Executive Vice-President, Safety & Operations Technical Services. From November 2020 to January 2021, Mr. Dahlin was Executive Vice-President, Downstream & Midstream of Husky; from May 2020 to November 2020, Mr. Dahlin was Executive Vice President, Western Canada Upstream of Husky; and from May 2018 to April 2020, Mr. Dahlin was Senior Vice President, Heavy Oil & Oil Sands of Husky Oil Operations Limited.
|
||||
|
Jeffrey R. Hart
Calgary, Alberta
Canada
|
Executive Vice-President, Corporate & Operations Services
Mr. Hart was appointed Executive Vice-President, Corporate & Operations Services effective September 1, 2023. From January 2021 to August 2023, Mr. Hart was Executive Vice-President & Chief Financial Officer; from November 2018 to January 2021, Mr. Hart was Chief Financial Officer of Husky; from April 2018 to November 2018, Mr. Hart was Acting Chief Financial Officer of Husky; and from October 2015 to April 2018, Mr. Hart was Vice President, Controller of Husky Oil Operations Limited.
|
||||
|
Norrie C. Ramsay
Calgary, Alberta
Canada
|
Executive Vice-President, Upstream – Thermal, Major Projects & Offshore
Dr. Ramsay was appointed Executive Vice-President, Upstream – Thermal, Major Projects & Offshore effective January 1, 2021. From January 2020 to December 2020, Dr. Ramsay was Executive Vice-President, Upstream; from December 2019 to January 2020, Dr. Ramsay was Executive Vice-President. From September 2015 to November 2019, Dr. Ramsay was Senior Vice-President at TC Energy.
|
||||
|
Gary F. Molnar
Calgary, Alberta
Canada
|
Senior Vice-President, Legal, General Counsel & Corporate Secretary
Mr. Molnar was appointed Senior Vice-President Legal, General Counsel & Corporate Secretary effective January 1, 2021. From December 2015 to December 2020, Mr. Molnar was Vice-President, Legal, Assistant General Counsel & Corporate Secretary.
|
||||
|
Susan M. Anderson
Calgary, Alberta
Canada
|
Senior Vice-President, People Services
Ms. Anderson was appointed Senior Vice-President, People Services effective March 1, 2022. From January 2021 to February 2022, Ms. Anderson was Vice-President, Supply Chain Management. From November 2017 to January 2021, Ms. Anderson was Vice-President and Chief Procurement Officer of Husky.
|
||||
Cenovus Energy Inc. – 2023 Annual Information Form |
48 |
||||
| AUDIT COMMITTEE | ||
Cenovus Energy Inc. – 2023 Annual Information Form |
49 |
||||
| ($ thousands) | 2023 | 2022 | |||||||||
Audit Fees (1) |
4,423 | 4,069 | |||||||||
Audit-Related Fees (2) |
655 | 321 | |||||||||
Tax Fees (3) |
137 | 227 | |||||||||
All Other Fees (4) |
120 | 67 | |||||||||
| Total | 5,335 | 4,684 | |||||||||
| LEGAL PROCEEDINGS AND REGULATORY ACTIONS | ||
Cenovus Energy Inc. – 2023 Annual Information Form |
50 |
||||
| INTEREST OF MANAGEMENT AND OTHERS IN MATERIAL TRANSACTIONS | ||
TRANSFER AGENTS AND REGISTRARS | ||
| In Canada: | In the United States: | ||||
|
Computershare Investor Services, Inc.
8th Floor, 100 University Avenue
Toronto, ON M5J 2Y1
Canada
|
Computershare Trust Company NA
150 Royall St.
Canton, MA 02021
U.S.
|
||||
|
Tel: 1-866-332-8898
Website: www.investorcentre.com/cenovus
| |||||
| MATERIAL CONTRACTS | ||
Cenovus Energy Inc. – 2023 Annual Information Form |
51 |
||||
| Name of Holder | Designation of Securities |
Number of Securities subject to Transfer Restrictions (1) |
Percentage of Class |
||||||||||||||
| Hutchison Whampoa Europe Investments S.à r.l. | Common Shares | 316,927,051 | 16.9 | ||||||||||||||
| L.F. Investments S.à r.l. | Common Shares | 231,194,699 | 12.4 | ||||||||||||||
| Total | 548,121,750 | 29.3 | |||||||||||||||
Cenovus Energy Inc. – 2023 Annual Information Form |
52 |
||||
| INTERESTS OF EXPERTS | ||
| ADDITIONAL INFORMATION | ||
| ACCOUNTING MATTERS | ||
Cenovus Energy Inc. – 2023 Annual Information Form |
53 |
||||
| ABBREVIATIONS AND CONVERSIONS | ||
| Crude Oil and NGLs | Natural Gas | Other | |||||||||||||||
| bbl | barrel | Mcf | thousand cubic feet | BOE | barrel of oil equivalent | ||||||||||||
| Mbbls/d | thousand barrels per day | MMcf | million cubic feet | MBOE/d | thousand barrels of oil equivalent per day | ||||||||||||
| MMbbls | million barrels | MMcf/d | million cubic feet per day | MMBOE | million barrels of oil equivalent | ||||||||||||
| WTI | West Texas Intermediate | Bcf | billion cubic feet | OPEC | Organization of Petroleum Exporting Countries | ||||||||||||
| WCS | Western Canadian Select | MMBtu | million British thermal units | OPEC+ | OPEC and a group of 10 non-OPEC members | ||||||||||||
| AWB | Access Western Blend | GHG | greenhouse gas | ||||||||||||||
| CDB | Christina Dilbit Blend | AECO | Alberta Energy Company | ||||||||||||||
| CLB | Cold Lake Blend | ||||||||||||||||
| WDB | Western Canada Dilbit Blend | ||||||||||||||||
| FORWARD-LOOKING INFORMATION | ||
Cenovus Energy Inc. – 2023 Annual Information Form |
54 |
||||
Cenovus Energy Inc. – 2023 Annual Information Form |
55 |
||||
Cenovus Energy Inc. – 2023 Annual Information Form |
56 |
||||
| APPENDIX A | ||
| Independent Qualified Reserves Evaluator | Effective Date of Evaluation Report | Location of Reserves |
Evaluated Net Present Value of Future Net Revenue
(Before Income Taxes, 10% Discount Rate)
($ millions)
|
||||||||
| McDaniel & Associates Consultants Ltd. | December 31, 2023 | Canada | 77,706 | ||||||||
| McDaniel & Associates Consultants Ltd. | December 31, 2023 | China | 3,143 | ||||||||
| McDaniel & Associates Consultants Ltd. | December 31, 2023 | Indonesia | 648 | ||||||||
| GLJ Ltd. | December 31, 2023 | Canada | 3,071 | ||||||||
| 84,568 | |||||||||||
| /s/ Brian R. Hamm | /s/ Jodi L. Anhorn | |||||||
|
Brian R. Hamm, P. Eng.
President & CEO
McDaniel & Associates Consultants Ltd.
Calgary, Alberta, Canada
|
Jodi L. Anhorn, M.Sc., P. Eng.
President and Chief Executive Officer
GLJ Ltd.
Calgary, Alberta, Canada
|
|||||||
Cenovus Energy Inc. – 2023 Annual Information Form |
57 |
||||
| APPENDIX B | ||
| /s/ Jonathan M. McKenzie | /s/ Karamjit S. Sandhar | |||||||
|
Jonathan M. McKenzie
President & Chief Executive Officer
Cenovus Energy Inc.
|
Karamjit S. Sandhar
Executive Vice-President & Chief Financial Officer
Cenovus Energy Inc.
|
|||||||
/s/ Alexander J. Pourbaix |
/s/ Richard J. Marcogliese |
|||||||
|
Alexander J. Pourbaix
Executive Chair
Cenovus Energy Inc.
|
Richard J. Marcogliese
Director and Chair of the Safety, Sustainability and Reserves Committee
Cenovus Energy Inc.
|
|||||||
Cenovus Energy Inc. – 2023 Annual Information Form |
58 |
||||
| APPENDIX C | ||
Cenovus Energy Inc. – 2023 Annual Information Form |
59 |
||||
Cenovus Energy Inc. – 2023 Annual Information Form |
60 |
||||
Cenovus Energy Inc. – 2023 Annual Information Form |
61 |
||||
Cenovus Energy Inc. – 2023 Annual Information Form |
62 |
||||
Cenovus Energy Inc. – 2023 Annual Information Form |
63 |
||||
Cenovus Energy Inc. – 2023 Annual Information Form |
64 |
||||
Cenovus Energy Inc. – 2023 Annual Information Form |
65 |
||||
Cenovus Energy Inc. – 2023 Annual Information Form |
66 |
||||

For the year ended December 31, 2023 | ||
| Cenovus Energy Inc. – 2023 Management's Discussion and Analysis | 2 |
||||
| OVERVIEW OF CENOVUS | ||
| YEAR IN REVIEW | ||
| Cenovus Energy Inc. – 2023 Management's Discussion and Analysis | 3 |
||||
| Cenovus Energy Inc. – 2023 Management's Discussion and Analysis | 4 |
||||
| ($ millions, except where indicated) | 2023 |
2022 | 2021 | |||||||||||||||||
Upstream Production Volumes (1) (MBOE/d) |
778.7 | 786.2 | 791.5 | |||||||||||||||||
Downstream Crude Oil Unit Throughput (2) (Mbbls/d) |
560.4 | 493.7 | 508.0 | |||||||||||||||||
Downstream Production Volumes (Mbbls/d) |
599.2 | 525.1 | 537.7 | |||||||||||||||||
Revenues |
52,204 | 66,897 | 46,357 | |||||||||||||||||
Operating Margin (3) |
11,022 | 14,263 | 9,373 | |||||||||||||||||
| Cash From (Used In) Operating Activities | 7,388 | 11,403 | 5,919 | |||||||||||||||||
Adjusted Funds Flow (3) |
8,803 | 10,978 | 7,248 | |||||||||||||||||
Per Share – Basic (3) ($) |
4.64 | 5.63 | 3.59 | |||||||||||||||||
Per Share – Diluted (3) ($) |
4.57 | 5.47 | 3.54 | |||||||||||||||||
| Capital Investment | 4,298 | 3,708 | 2,563 | |||||||||||||||||
Free Funds Flow (3) |
4,505 | 7,270 | 4,685 | |||||||||||||||||
Net Earnings (Loss) (4) |
4,109 | 6,450 | 587 | |||||||||||||||||
Per Share – Basic ($) |
2.15 | 3.29 | 0.27 | |||||||||||||||||
Per Share – Diluted ($) |
2.12 | 3.20 | 0.27 | |||||||||||||||||
| Total Assets | 53,915 | 55,869 | 54,104 | |||||||||||||||||
Total Long-Term Liabilities |
18,993 | 20,259 | 23,191 | |||||||||||||||||
Long-Term Debt, Including Current Portion |
7,108 | 8,691 | 12,385 | |||||||||||||||||
Net Debt |
5,060 | 4,282 | 9,591 | |||||||||||||||||
| Cash Returns to Shareholders | 2,798 | 3,457 | 475 | |||||||||||||||||
| Common Shares – Base Dividends | 990 | 682 | 176 | |||||||||||||||||
Base Dividends Per Common Share ($) |
0.525 | 0.350 | 0.088 | |||||||||||||||||
| Common Shares – Variable Dividends | — | 219 | — | |||||||||||||||||
Variable Dividends Per Common Share ($) |
— | 0.114 | — | |||||||||||||||||
| Purchase of Common Shares Under NCIB | 1,061 | 2,530 | 265 | |||||||||||||||||
| Payment for Purchase of Warrants | 711 | — | — | |||||||||||||||||
| Preferred Share Dividends | 36 | 26 | 34 | |||||||||||||||||
| Cenovus Energy Inc. – 2023 Management's Discussion and Analysis | 5 |
||||
| OPERATING AND FINANCIAL RESULTS | ||
| Percent Change | |||||||||||||||||
| 2023 | 2022 | ||||||||||||||||
Upstream Production Volumes by Segment (1) (MBOE/d) |
|||||||||||||||||
Oil Sands |
595.4 | 1 | 588.7 | ||||||||||||||
Conventional |
119.9 | (6) | 127.2 | ||||||||||||||
Offshore |
63.4 | (10) | 70.3 | ||||||||||||||
Total Production Volumes |
778.7 | (1) | 786.2 | ||||||||||||||
| Upstream Production Volumes by Product | |||||||||||||||||
Bitumen (Mbbls/d) |
576.7 | 1 | 570.3 | ||||||||||||||
Heavy Crude Oil (Mbbls/d) |
16.7 | 2 | 16.3 | ||||||||||||||
Light Crude Oil (Mbbls/d) |
14.1 | (26) | 19.1 | ||||||||||||||
NGLs (Mbbls/d) |
32.5 | (10) | 36.2 | ||||||||||||||
Conventional Natural Gas (MMcf/d) |
832.6 | (4) | 866.1 | ||||||||||||||
Total Production Volumes (MBOE/d) |
778.7 | (1) | 786.2 | ||||||||||||||
Oil and Gas Reserves (MMBOE) |
|||||||||||||||||
Total Proved |
5,866 | (4) | 6,082 | ||||||||||||||
Probable |
2,836 | 2 | 2,787 | ||||||||||||||
| Total Proved Plus Probable | 8,702 | (2) | 8,869 | ||||||||||||||
| Cenovus Energy Inc. – 2023 Management's Discussion and Analysis | 6 |
||||
| Percent Change | |||||||||||||||||
| 2023 | 2022 | ||||||||||||||||
Downstream Crude Oil Unit Throughput (Mbbls/d) |
|||||||||||||||||
Canadian Refining |
100.7 | 8 | 92.9 | ||||||||||||||
U.S. Refining |
459.7 | 15 | 400.8 | ||||||||||||||
Total Crude Oil Unit Throughput |
560.4 | 14 | 493.7 | ||||||||||||||
Downstream Production Volumes (1) (Mbbls/d) |
|||||||||||||||||
Canadian Refining |
114.2 | 9 | 105.2 | ||||||||||||||
U.S. Refining |
485.0 | 16 | 419.9 | ||||||||||||||
Total Downstream Production |
599.2 | 14 | 525.1 | ||||||||||||||
| Cenovus Energy Inc. – 2023 Management's Discussion and Analysis | 7 |
||||
| ($ millions) | 2023 | 2022 | |||||||||
Gross Sales (1) |
63,708 | 79,152 | |||||||||
| Less: Royalties | 3,270 | 4,868 | |||||||||
Revenues (1) |
60,438 | 74,284 | |||||||||
| Expenses | |||||||||||
Purchased Product (1) |
31,425 | 39,150 | |||||||||
Transportation and Blending (1) |
11,088 | 12,301 | |||||||||
| Operating Expenses | 6,891 | 6,839 | |||||||||
| Realized (Gain) Loss on Risk Management Activities | 12 | 1,731 | |||||||||
Operating Margin |
11,022 | 14,263 | |||||||||
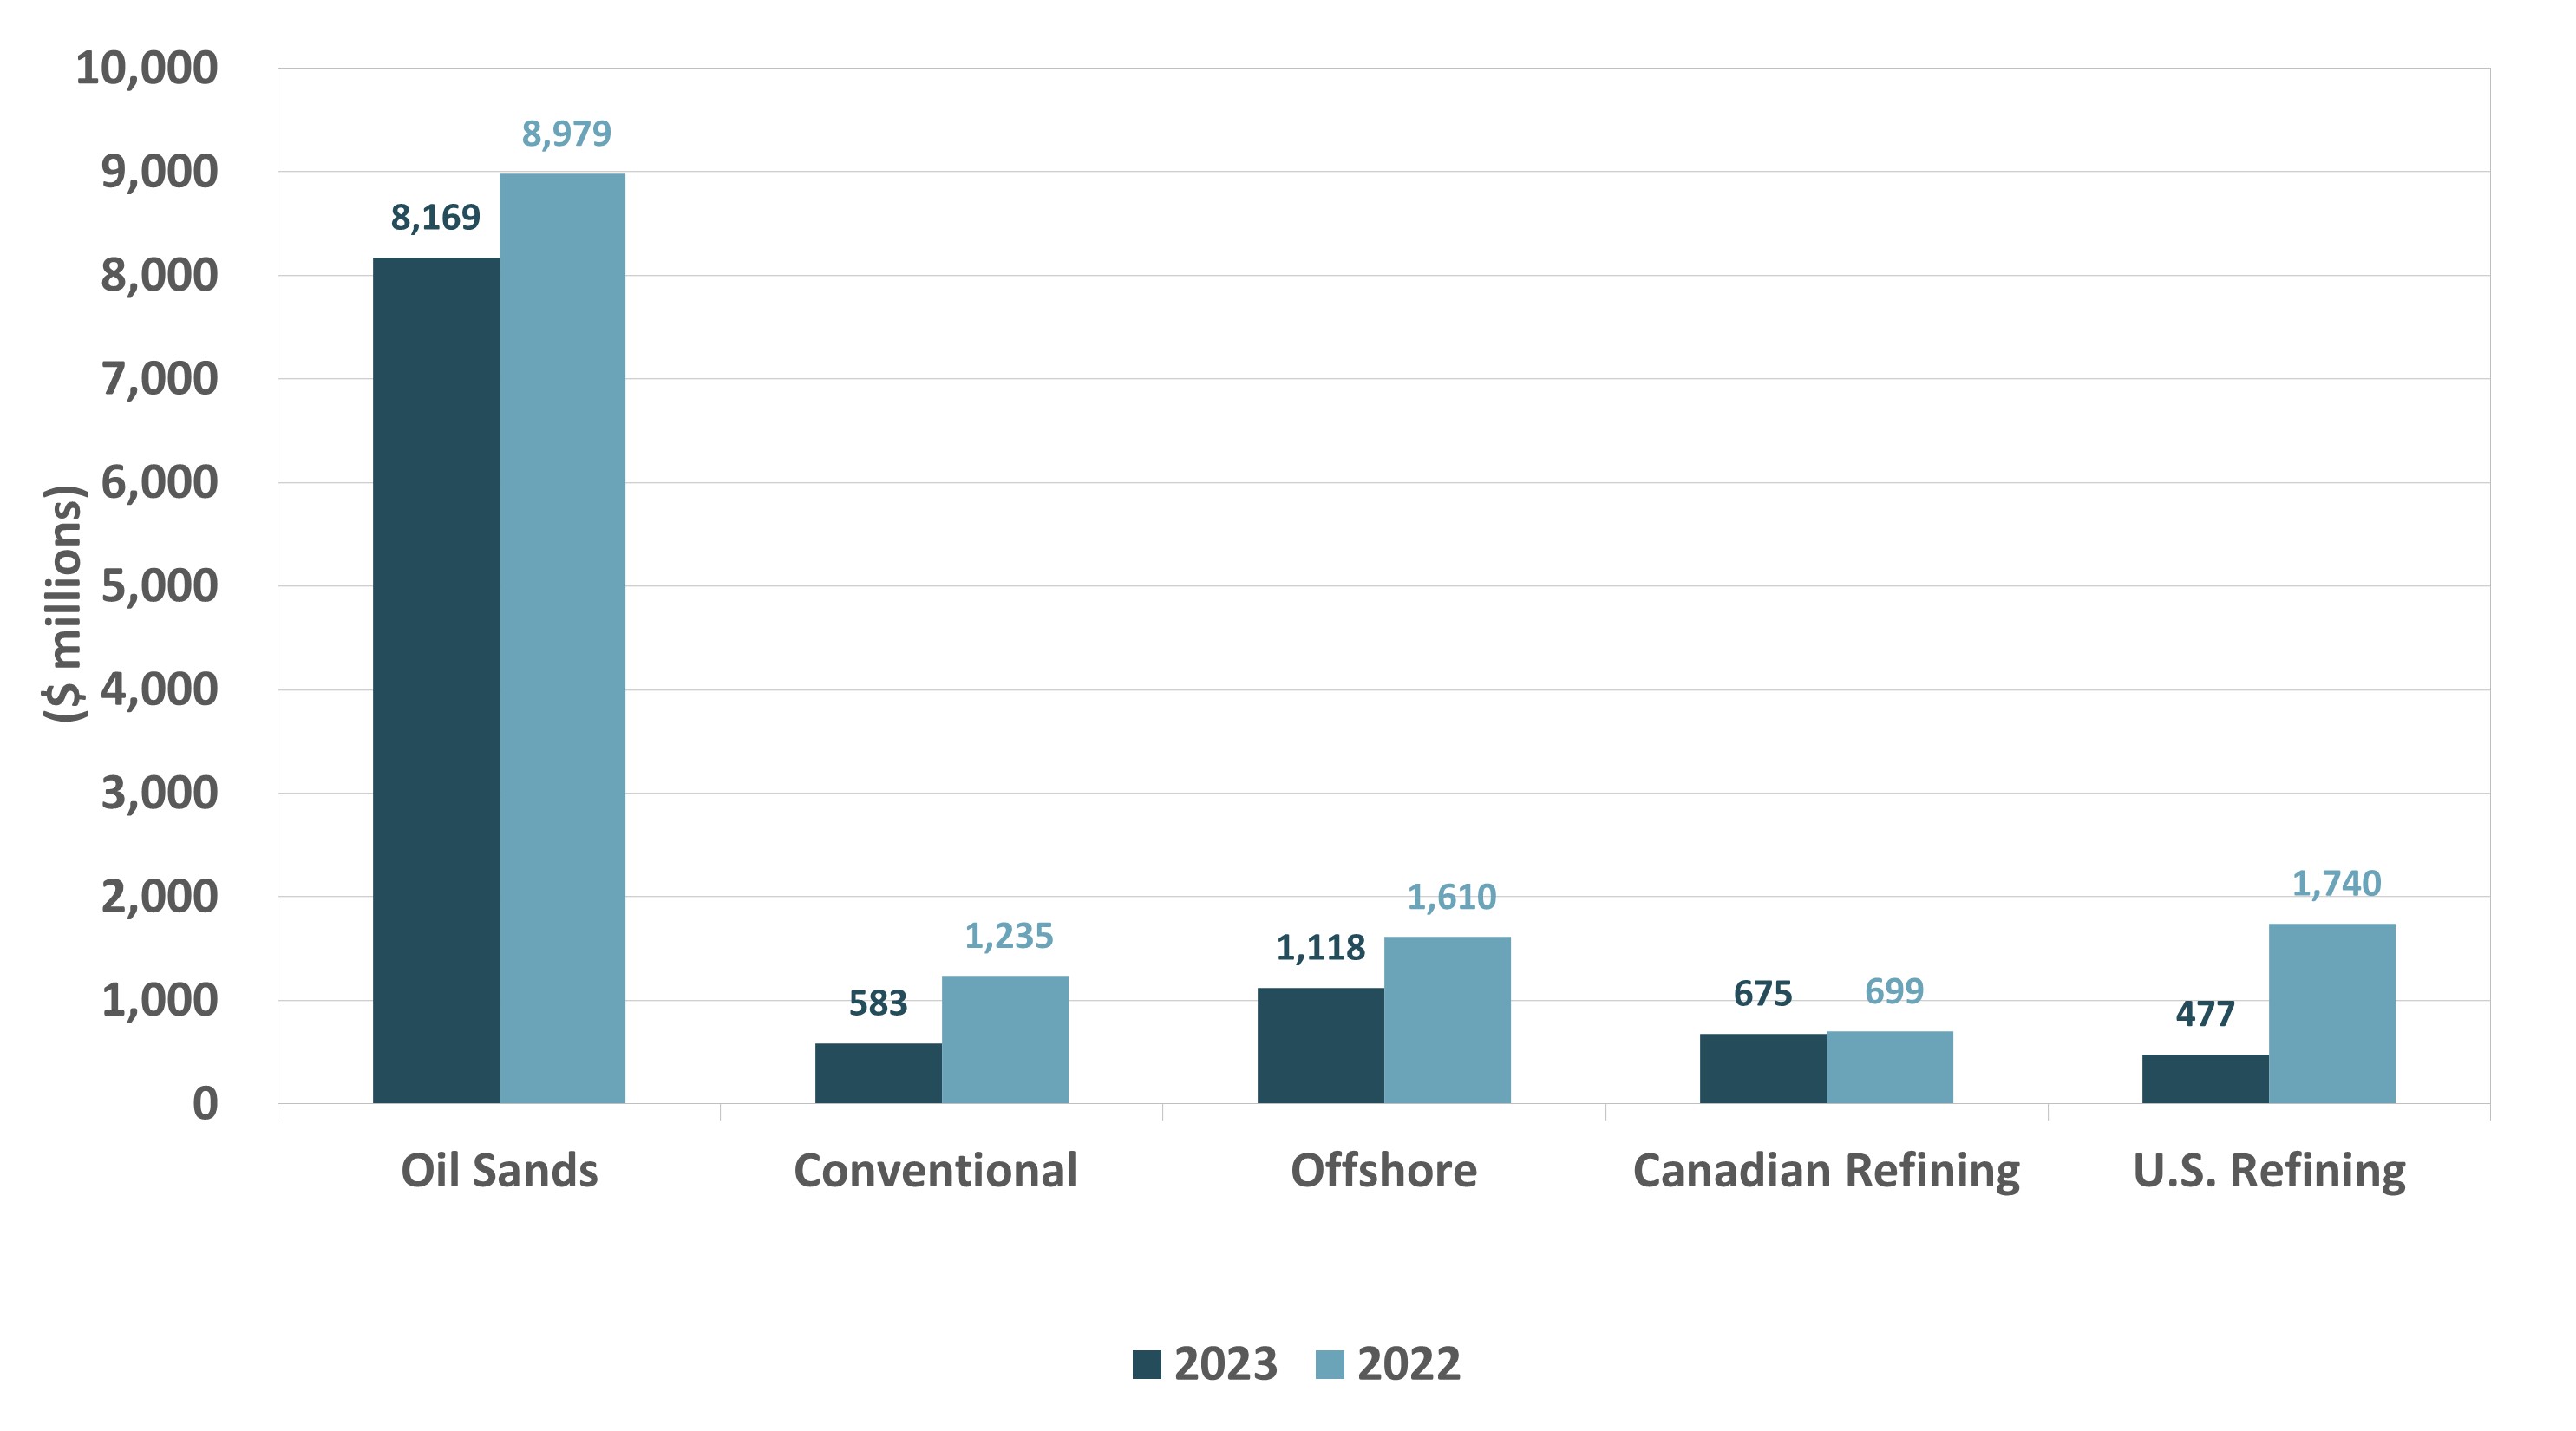
| Cenovus Energy Inc. – 2023 Management's Discussion and Analysis | 8 |
||||
| ($ millions) | 2023 | 2022 | |||||||||
| Cash From (Used in) Operating Activities | 7,388 | 11,403 | |||||||||
| (Add) Deduct: | |||||||||||
Settlement of Decommissioning Liabilities |
(222) | (150) | |||||||||
| Net Change in Non-Cash Working Capital | (1,193) | 575 | |||||||||
Adjusted Funds Flow |
8,803 | 10,978 | |||||||||
As at ($ millions) |
December 31, 2023 |
December 31, 2022 |
|||||||||
| Short-Term Borrowings | 179 | 115 | |||||||||
| Current Portion of Long-Term Debt | — | — | |||||||||
| Long-Term Portion of Long-Term Debt | 7,108 | 8,691 | |||||||||
| Total Debt | 7,287 | 8,806 | |||||||||
| Less: Cash and Cash Equivalents | (2,227) | (4,524) | |||||||||
Net Debt |
5,060 | 4,282 | |||||||||
| Cenovus Energy Inc. – 2023 Management's Discussion and Analysis | 9 |
||||
| ($ millions) | 2023 | 2022 | |||||||||
| Upstream | |||||||||||
| Oil Sands | 2,382 | 1,792 | |||||||||
| Conventional | 452 | 344 | |||||||||
| Offshore | 642 | 310 | |||||||||
| Total Upstream | 3,476 | 2,446 | |||||||||
| Downstream | |||||||||||
| Canadian Refining | 145 | 117 | |||||||||
| U.S. Refining | 602 | 1,059 | |||||||||
| Total Downstream | 747 | 1,176 | |||||||||
| Corporate and Eliminations | 75 | 86 | |||||||||
| Total Capital Investment | 4,298 | 3,708 | |||||||||
|
Net Stratigraphic Test Wells
and Observation Wells
|
Net Production Wells (1) |
||||||||||||||||||||||
| 2023 | 2022 | 2023 | 2022 | ||||||||||||||||||||
Foster Creek |
87 | 52 | 44 | 29 | |||||||||||||||||||
| Christina Lake | 53 | — | 27 | 31 | |||||||||||||||||||
| Sunrise | 38 | 15 | 24 | 10 | |||||||||||||||||||
Lloydminster Thermal |
71 | 98 | 9 | 33 | |||||||||||||||||||
| Lloydminster Conventional Heavy Oil | 3 | 8 | 34 | 11 | |||||||||||||||||||
Other (2) |
3 | 22 | — | — | |||||||||||||||||||
| 255 | 195 | 138 | 114 | ||||||||||||||||||||
| 2023 | 2022 | ||||||||||||||||||||||||||||||||||
| (net wells) | Drilled | Completed | Tied-in | Drilled | Completed | Tied-in | |||||||||||||||||||||||||||||
| Conventional | 38 | 37 | 41 | 31 | 35 | 36 | |||||||||||||||||||||||||||||
| Cenovus Energy Inc. – 2023 Management's Discussion and Analysis | 10 |
||||
| COMMODITY PRICES UNDERLYING OUR FINANCIAL RESULTS | ||
| (Average US$/bbl, unless otherwise indicated) | 2023 | Percent Change | 2022 | Q4 2023 | Q3 2023 | Q4 2022 | |||||||||||||||||||||||||||||
Dated Brent |
82.62 | (18) | 101.19 | 84.05 | 86.76 | 88.71 | |||||||||||||||||||||||||||||
| WTI | 77.62 | (18) | 94.23 | 78.32 | 82.26 | 82.65 | |||||||||||||||||||||||||||||
| Differential Dated Brent-WTI | 5.00 | (28) | 6.96 | 5.73 | 4.50 | 6.06 | |||||||||||||||||||||||||||||
| WCS at Hardisty | 58.97 | (22) | 76.01 | 56.43 | 69.35 | 56.99 | |||||||||||||||||||||||||||||
| Differential WTI-WCS at Hardisty | 18.65 | 2 | 18.22 | 21.89 | 12.91 | 25.66 | |||||||||||||||||||||||||||||
WCS at Hardisty (C$/bbl) |
79.59 | (19) | 98.51 | 76.95 | 93.06 | 77.42 | |||||||||||||||||||||||||||||
| WCS at Nederland | 69.74 | (19) | 85.77 | 71.59 | 77.89 | 67.65 | |||||||||||||||||||||||||||||
| Differential WTI-WCS at Nederland | 7.88 | (7) | 8.46 | 6.73 | 4.37 | 15.00 | |||||||||||||||||||||||||||||
| Condensate (C5 at Edmonton) | 76.61 | (18) | 93.78 | 76.24 | 77.96 | 83.40 | |||||||||||||||||||||||||||||
| Differential Condensate-WTI Premium/(Discount) | (1.01) | (124) | (0.45) | (2.08) | (4.30) | 0.75 | |||||||||||||||||||||||||||||
Differential Condensate-WCS (2) Premium/(Discount) |
17.64 | 1 | 17.77 | 19.81 | 8.61 | 26.41 | |||||||||||||||||||||||||||||
Condensate (C$/bbl) |
103.43 | (15) | 121.78 | 103.90 | 104.63 | 113.25 | |||||||||||||||||||||||||||||
| Synthetic at Edmonton | 79.61 | (19) | 98.66 | 78.64 | 84.95 | 86.79 | |||||||||||||||||||||||||||||
| Differential Synthetic-WTI Premium/(Discount) | 1.99 | 55 | 4.43 | 0.32 | 2.69 | 4.14 | |||||||||||||||||||||||||||||
Synthetic at Edmonton (C$/bbl) |
107.47 | (16) | 128.19 | 107.21 | 114.01 | 117.87 | |||||||||||||||||||||||||||||
| Refined Product Prices | |||||||||||||||||||||||||||||||||||
| Chicago Regular Unleaded Gasoline (“RUL”) | 97.86 | (19) | 120.63 | 83.72 | 105.59 | 102.80 | |||||||||||||||||||||||||||||
| Chicago Ultra-low Sulphur Diesel (“ULSD”) | 109.70 | (24) | 143.85 | 107.24 | 113.77 | 140.95 | |||||||||||||||||||||||||||||
Refining Benchmarks |
|||||||||||||||||||||||||||||||||||
Chicago 3-2-1 Crack Spread (3) |
24.19 | (29) | 34.15 | 13.24 | 26.06 | 32.87 | |||||||||||||||||||||||||||||
Group 3 3-2-1 Crack Spread (3) |
29.66 | (11) | 33.21 | 18.55 | 36.96 | 29.99 | |||||||||||||||||||||||||||||
| Renewable Identification Numbers (“RINs”) | 7.04 | (9) | 7.72 | 4.77 | 7.42 | 8.54 | |||||||||||||||||||||||||||||
| Natural Gas Prices | |||||||||||||||||||||||||||||||||||
AECO (4) (C$/Mcf) |
2.64 | (50) | 5.31 | 2.30 | 2.60 | 5.11 | |||||||||||||||||||||||||||||
NYMEX (5) (US$/Mcf) |
2.74 | (59) | 6.64 | 2.88 | 2.55 | 6.26 | |||||||||||||||||||||||||||||
| Foreign Exchange Rates | |||||||||||||||||||||||||||||||||||
| US$ per C$1 - Average | 0.741 | (4) | 0.769 | 0.734 | 0.746 | 0.737 | |||||||||||||||||||||||||||||
| US$ per C$1 - End of Period | 0.756 | 2 | 0.738 | 0.756 | 0.740 | 0.738 | |||||||||||||||||||||||||||||
| RMB per C$1 - Average | 5.247 | 1 | 5.170 | 5.304 | 5.402 | 5.241 | |||||||||||||||||||||||||||||
| Cenovus Energy Inc. – 2023 Management's Discussion and Analysis | 11 |
||||
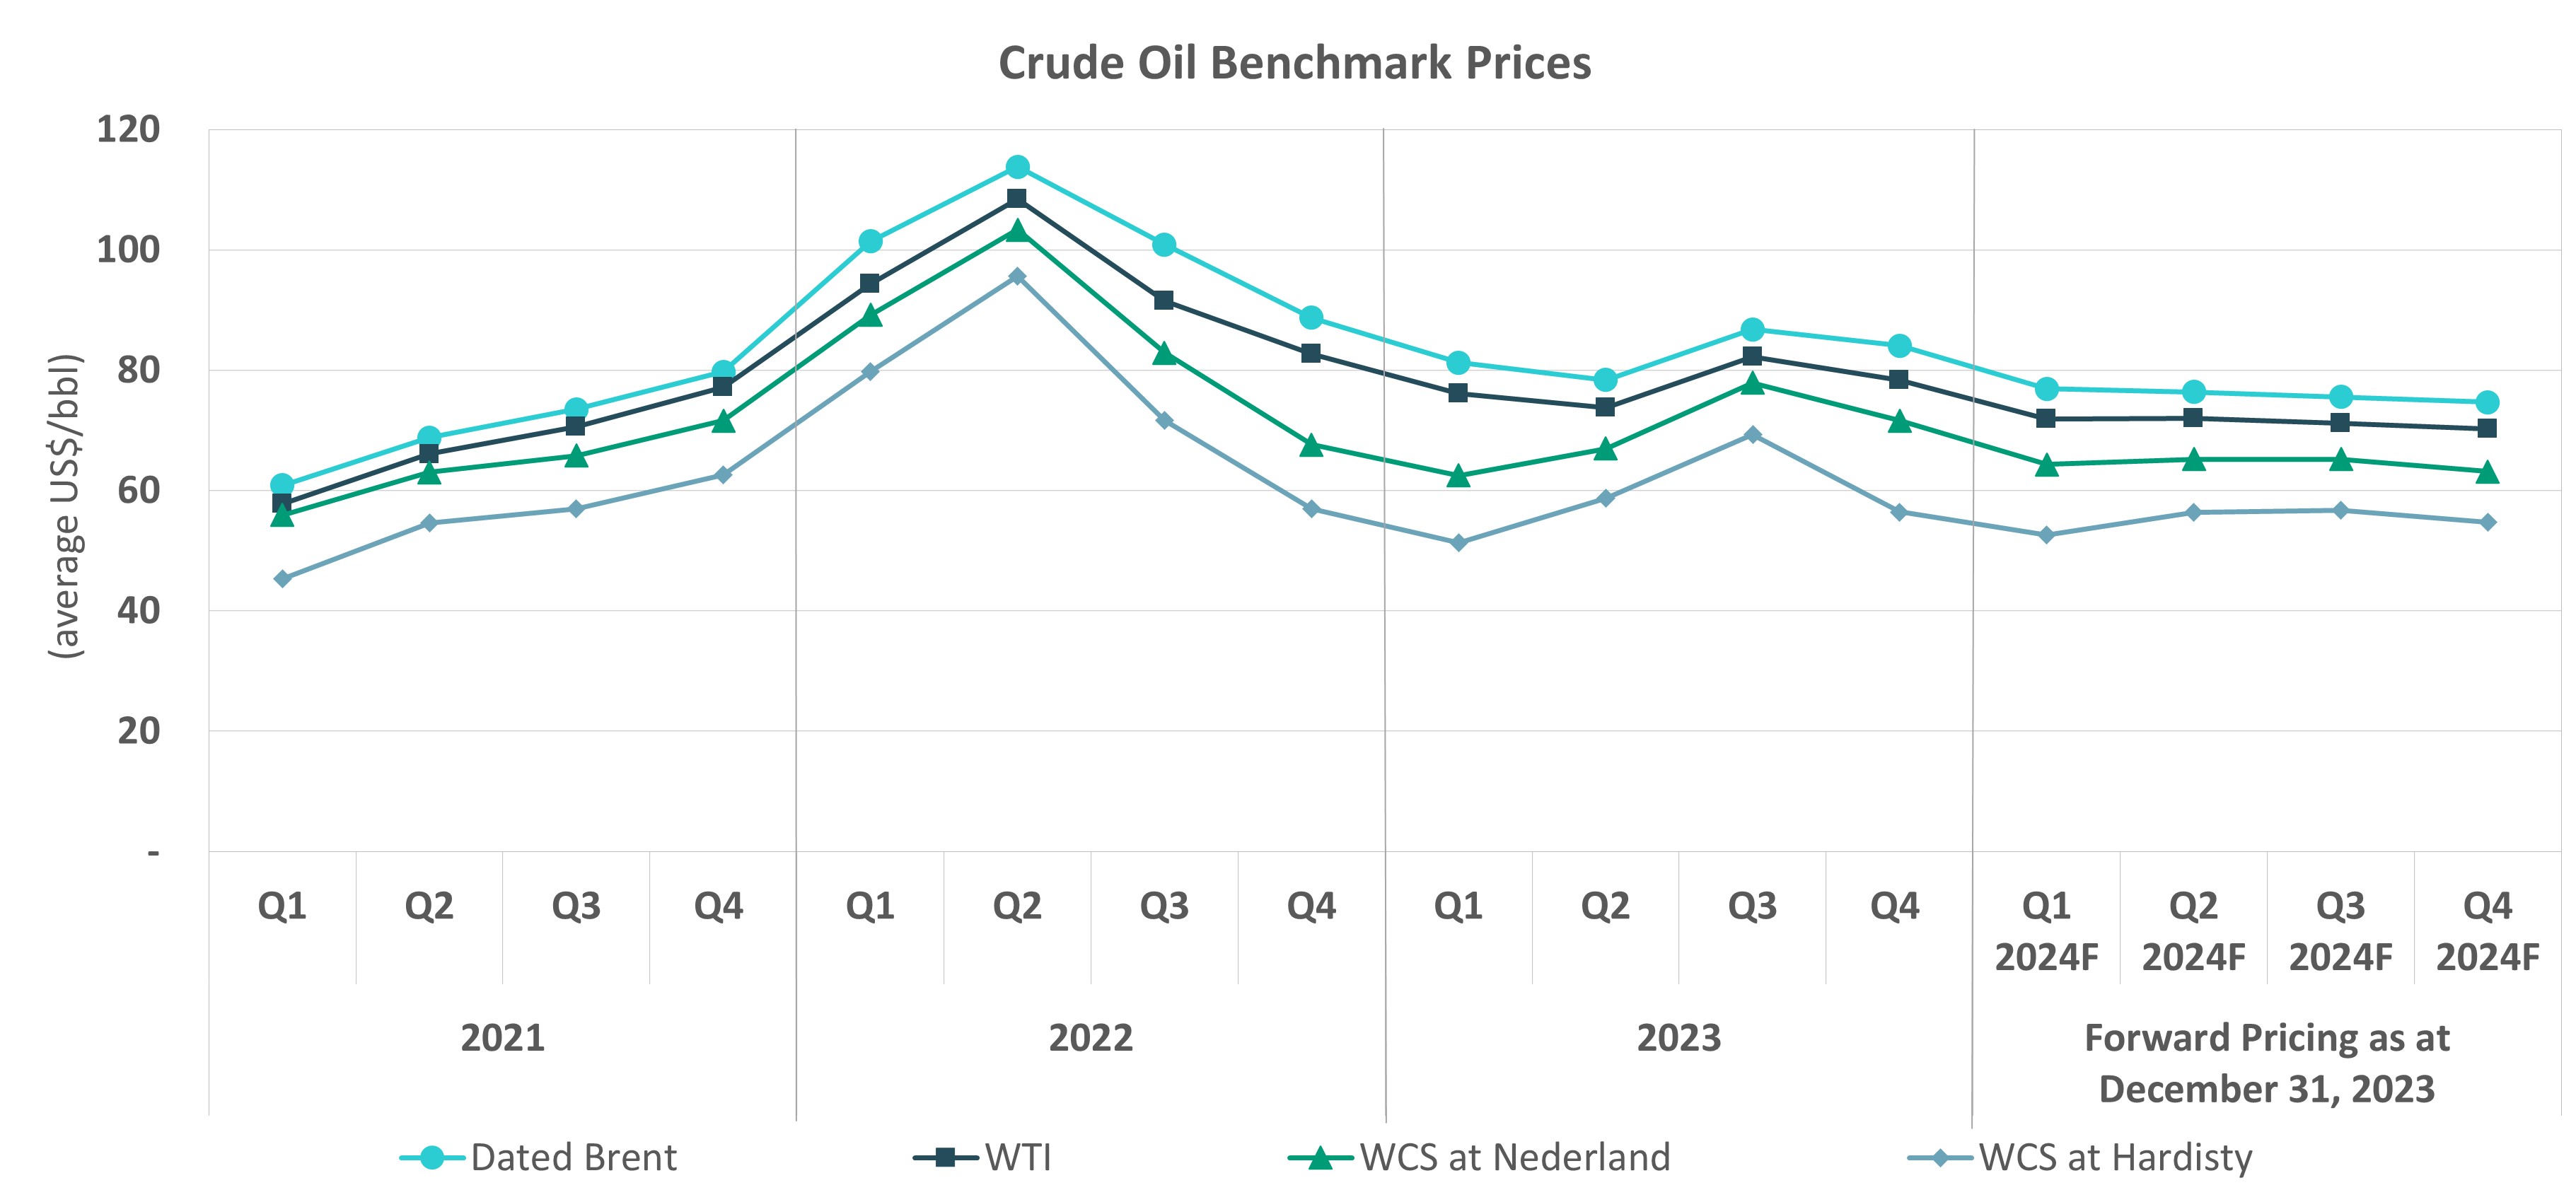
| Cenovus Energy Inc. – 2023 Management's Discussion and Analysis | 12 |
||||
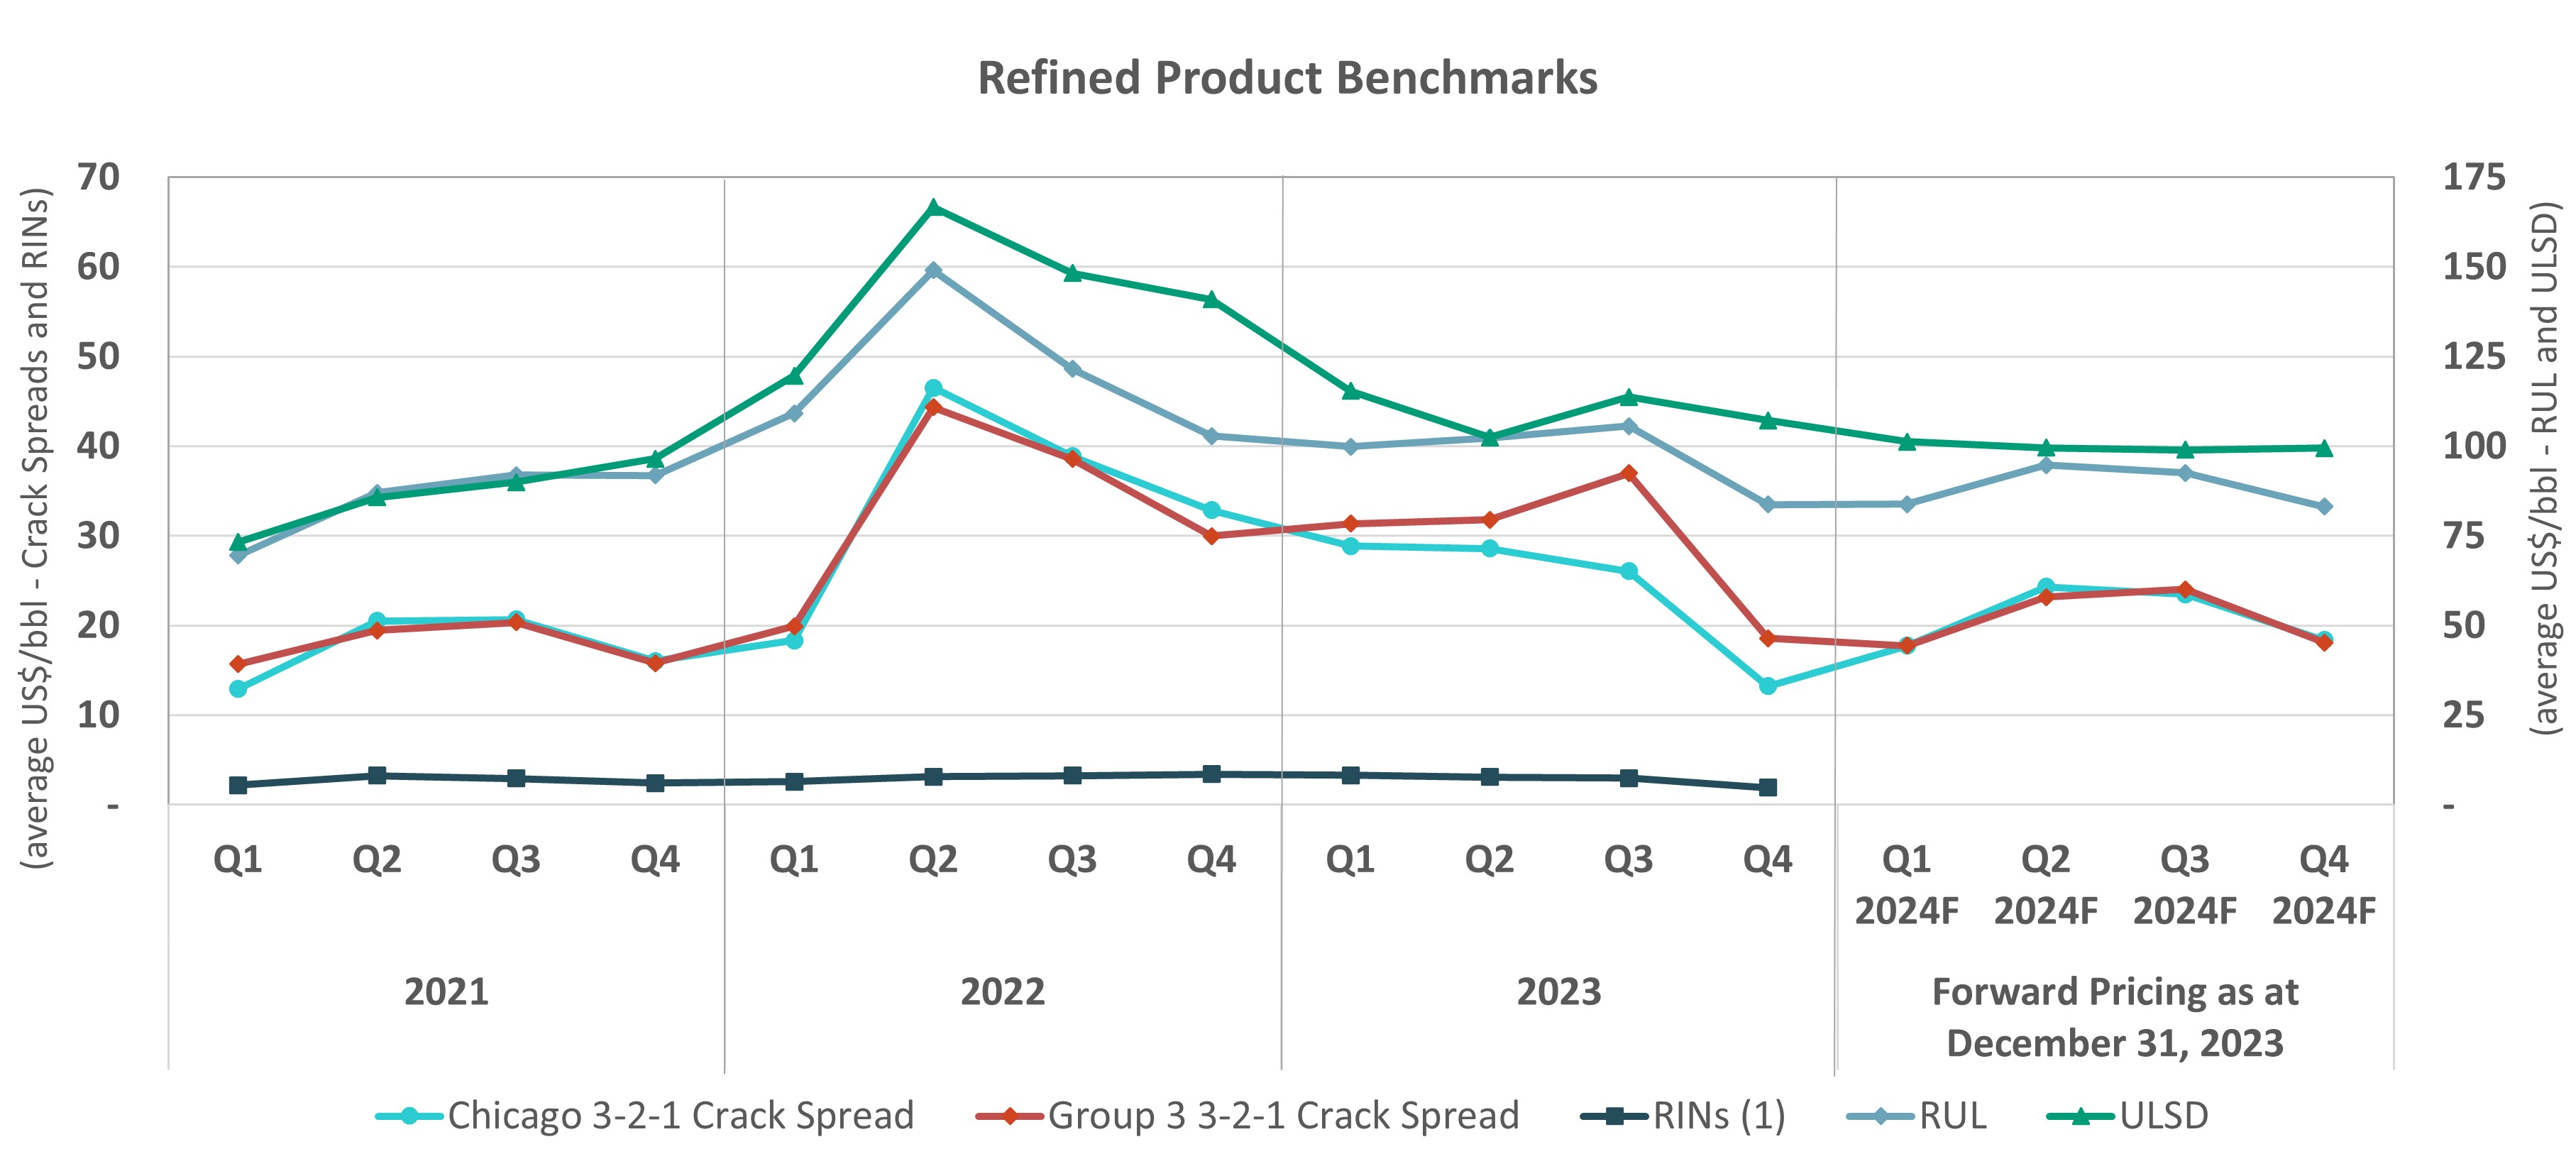
| Cenovus Energy Inc. – 2023 Management's Discussion and Analysis | 13 |
||||
| OUTLOOK | ||
| Cenovus Energy Inc. – 2023 Management's Discussion and Analysis | 14 |
||||
| Cenovus Energy Inc. – 2023 Management's Discussion and Analysis | 15 |
||||
|
Capital Investment
($ millions)
|
Production
(MBOE/d)
|
Crude Oil Unit Throughput
(Mbbls/d)
|
|||||||||||||||
| Upstream | |||||||||||||||||
| Oil Sands | 2,500 - 2,750 | 590 - 610 | |||||||||||||||
| Conventional | 350 - 425 | 120 - 130 | |||||||||||||||
| Offshore | 850 - 950 | 60 - 70 | |||||||||||||||
| Downstream | 750 - 850 | 630 - 670 | |||||||||||||||
| Corporate and Eliminations | 60 - 70 | ||||||||||||||||
| Cenovus Energy Inc. – 2023 Management's Discussion and Analysis | 16 |
||||
| REPORTABLE SEGMENTS | ||
| Cenovus Energy Inc. – 2023 Management's Discussion and Analysis | 17 |
||||
| ($ millions) | 2023 | 2022 | |||||||||
| Revenues | |||||||||||
Gross Sales (1) |
26,192 | 34,683 | |||||||||
| Less: Royalties | 3,059 | 4,493 | |||||||||
| 23,133 | 30,190 | ||||||||||
| Expenses | |||||||||||
Purchased Product (1) |
1,457 | 4,718 | |||||||||
Transportation and Blending |
10,774 | 12,036 | |||||||||
Operating |
2,716 | 2,930 | |||||||||
| Realized (Gain) Loss on Risk Management | 17 | 1,527 | |||||||||
| Operating Margin | 8,169 | 8,979 | |||||||||
Unrealized (Gain) Loss on Risk Management |
15 | (68) | |||||||||
| Depreciation, Depletion and Amortization | 2,993 | 2,763 | |||||||||
| Exploration Expense | 19 | 9 | |||||||||
| (Income) Loss from Equity-Accounted Affiliates | 6 | 8 | |||||||||
| Segment Income (Loss) | 5,136 | 6,267 | |||||||||
| Cenovus Energy Inc. – 2023 Management's Discussion and Analysis | 18 |
||||
| 2023 | 2022 | ||||||||||
Total Sales Volumes (1) (MBOE/d) |
589.5 | 585.8 | |||||||||
Total Realized Price (2) ($/BOE) |
73.02 | 91.70 | |||||||||
Crude Oil Production by Asset (Mbbls/d) |
|||||||||||
| Foster Creek | 186.3 | 191.0 | |||||||||
| Christina Lake | 237.4 | 246.5 | |||||||||
Sunrise (3) |
48.9 | 31.3 | |||||||||
| Lloydminster Thermal | 104.1 | 99.9 | |||||||||
| Lloydminster Conventional Heavy Oil | 16.7 | 16.3 | |||||||||
Total Crude Oil Production (4) (5) (Mbbls/d) |
593.4 | 586.6 | |||||||||
Natural Gas (6) (MMcf/d) |
11.9 | 12.3 | |||||||||
Total Production (MBOE/d) |
595.4 | 588.7 | |||||||||
Effective Royalty Rate (7) (percent) |
|||||||||||
| Foster Creek | 25.1 | 30.5 | |||||||||
| Christina Lake | 29.5 | 30.8 | |||||||||
Sunrise |
6.8 | 7.3 | |||||||||
Lloydminster (8) |
9.5 | 10.5 | |||||||||
| Total Effective Royalty Rate | 21.9 | 25.2 | |||||||||
Transportation and Blending Expense (2) ($/BOE) |
8.18 | 7.89 | |||||||||
Operating Expense (2) ($/BOE) |
12.54 | 13.75 | |||||||||
Per Unit DD&A (2) ($/BOE) |
12.94 | 11.90 | |||||||||
| Cenovus Energy Inc. – 2023 Management's Discussion and Analysis | 19 |
||||
| Cenovus Energy Inc. – 2023 Management's Discussion and Analysis | 20 |
||||
($/BOE) |
2023 | Percent Change |
2022 | ||||||||||||||
| Foster Creek | |||||||||||||||||
Fuel |
3.48 | (43) | 6.07 | ||||||||||||||
Non-Fuel |
7.96 | 22 | 6.52 | ||||||||||||||
Total |
11.44 | (9) | 12.59 | ||||||||||||||
| Christina Lake | |||||||||||||||||
Fuel |
2.98 | (41) | 5.07 | ||||||||||||||
Non-Fuel |
5.54 | 14 | 4.87 | ||||||||||||||
Total |
8.52 | (14) | 9.94 | ||||||||||||||
| Sunrise | |||||||||||||||||
| Fuel | 4.78 | (32) | 7.01 | ||||||||||||||
Non-Fuel |
12.24 | 17 | 10.48 | ||||||||||||||
Total |
17.02 | (3) | 17.49 | ||||||||||||||
Other Oil Sands (2) |
|||||||||||||||||
Fuel |
4.54 | (38) | 7.35 | ||||||||||||||
Non-Fuel |
15.78 | 5 | 15.10 | ||||||||||||||
Total |
20.32 | (9) | 22.45 | ||||||||||||||
| Total Oil Sands | |||||||||||||||||
Fuel |
3.60 | (39) | 5.95 | ||||||||||||||
Non-Fuel |
8.94 | 15 | 7.80 | ||||||||||||||
| Total | 12.54 | (9) | 13.75 | ||||||||||||||
| Cenovus Energy Inc. – 2023 Management's Discussion and Analysis | 21 |
||||
| Year Ended December 31, | |||||||||||
| ($/BOE) | 2023 | 2022 | |||||||||
Sales Price |
73.02 | 91.70 | |||||||||
Royalties |
14.20 | 20.96 | |||||||||
Transportation and Blending |
8.18 | 7.89 | |||||||||
Operating Expenses |
12.54 | 13.75 | |||||||||
Netback |
38.10 | 49.10 | |||||||||
| ($ millions) | 2023 | 2022 | |||||||||
| Revenues | |||||||||||
Gross Sales (1) |
3,273 | 4,439 | |||||||||
| Less: Royalties | 112 | 298 | |||||||||
| 3,161 | 4,141 | ||||||||||
| Expenses | |||||||||||
| Purchased Product | 1,695 | 2,023 | |||||||||
Transportation and Blending (1) |
298 | 250 | |||||||||
| Operating | 590 | 541 | |||||||||
| Realized (Gain) Loss on Risk Management | (5) | 92 | |||||||||
| Operating Margin | 583 | 1,235 | |||||||||
Unrealized (Gain) Loss on Risk Management |
(19) | 13 | |||||||||
| Depreciation, Depletion and Amortization | 386 | 370 | |||||||||
| Exploration Expense | 6 | 1 | |||||||||
| Segment Income (Loss) | 210 | 851 | |||||||||
| Cenovus Energy Inc. – 2023 Management's Discussion and Analysis | 22 |
||||
| 2023 | 2022 | ||||||||||
Total Sales Volumes (MBOE/d) |
119.9 | 127.2 | |||||||||
Total Realized Price (1) ($/BOE) |
31.76 | 48.15 | |||||||||
Light Crude Oil ($/bbl) |
101.34 | 118.64 | |||||||||
NGLs ($/bbl) |
48.25 | 63.22 | |||||||||
Conventional Natural Gas ($/Mcf) |
3.91 | 6.50 | |||||||||
| Production by Product | |||||||||||
Light Crude Oil (Mbbls/d) |
5.9 | 7.5 | |||||||||
NGLs (Mbbls/d) |
21.7 | 23.8 | |||||||||
Conventional Natural Gas (MMcf/d) |
554.1 | 576.1 | |||||||||
Total Production (MBOE/d) |
119.9 | 127.2 | |||||||||
Conventional Natural Gas Production (percentage of total) |
77 | 75 | |||||||||
Crude Oil and NGLs Production (percentage of total) |
23 | 25 | |||||||||
Effective Royalty Rate (percent) |
10.8 | 15.4 | |||||||||
Transportation Expense (1) ($/BOE) |
4.16 | 3.16 | |||||||||
Operating Expense (1) ($/BOE) |
13.02 | 11.18 | |||||||||
Per Unit DD&A (1) ($/BOE) |
8.76 | 8.23 | |||||||||
| Cenovus Energy Inc. – 2023 Management's Discussion and Analysis | 23 |
||||
| ($/BOE) | 2023 | 2022 | |||||||||
| Sales Price | 31.76 | 48.15 | |||||||||
Royalties |
2.56 | 6.38 | |||||||||
| Transportation and Blending | 4.16 | 3.16 | |||||||||
Operating Expenses |
13.02 | 11.18 | |||||||||
| Netback | 12.02 | 27.43 | |||||||||
| Cenovus Energy Inc. – 2023 Management's Discussion and Analysis | 24 |
||||
| 2023 | 2022 | ||||||||||||||||||||||||||||||||||
| ($ millions) | Atlantic | Asia Pacific | Offshore |
Atlantic | Asia Pacific | Offshore |
|||||||||||||||||||||||||||||
| Revenues | |||||||||||||||||||||||||||||||||||
| Gross Sales | 400 | 1,217 | 1,617 | 578 | 1,442 | 2,020 | |||||||||||||||||||||||||||||
Less: Royalties |
15 | 84 | 99 | (3) | 80 | 77 | |||||||||||||||||||||||||||||
| 385 | 1,133 | 1,518 | 581 | 1,362 | 1,943 | ||||||||||||||||||||||||||||||
| Expenses | |||||||||||||||||||||||||||||||||||
Transportation and Blending |
16 | — | 16 | 15 | — | 15 | |||||||||||||||||||||||||||||
Operating |
262 | 122 | 384 | 204 | 114 | 318 | |||||||||||||||||||||||||||||
Operating Margin (1) |
107 | 1,011 | 1,118 | 362 | 1,248 | 1,610 | |||||||||||||||||||||||||||||
| Depreciation, Depletion and Amortization | 487 | 585 | |||||||||||||||||||||||||||||||||
| Exploration Expense | 17 | 91 | |||||||||||||||||||||||||||||||||
| (Income) Loss from Equity-Accounted Affiliates | (57) | (23) | |||||||||||||||||||||||||||||||||
| Segment Income (Loss) | 671 | 957 | |||||||||||||||||||||||||||||||||
| Cenovus Energy Inc. – 2023 Management's Discussion and Analysis | 25 |
||||
| 2023 | 2022 | ||||||||||
Sales Volumes |
|||||||||||
Atlantic (Mbbls/d) |
9.6 | 11.3 | |||||||||
Asia Pacific (MBOE/d) |
|||||||||||
| China | 40.5 | 48.2 | |||||||||
Indonesia (1) |
14.7 | 10.5 | |||||||||
| Total Asia Pacific | 55.2 | 58.7 | |||||||||
Total Sales Volumes (MBOE/d) |
64.8 | 70.0 | |||||||||
Total Realized Price (2) ($/BOE) |
81.63 | 89.72 | |||||||||
Atlantic - Light Crude Oil ($/bbl) |
113.74 | 140.65 | |||||||||
Asia Pacific (1) ($/BOE) |
76.04 | 79.96 | |||||||||
NGLs ($/bbl) |
99.73 | 110.05 | |||||||||
Conventional Natural Gas ($/Mcf) |
11.71 | 11.98 | |||||||||
| Production by Product | |||||||||||
Atlantic - Light Crude Oil (Mbbls/d) |
8.2 | 11.6 | |||||||||
Asia Pacific (1) |
|||||||||||
NGLs (Mbbls/d) |
10.8 | 12.4 | |||||||||
Conventional Natural Gas (MMcf/d) |
266.6 | 277.7 | |||||||||
Total Asia Pacific (MBOE/d) |
55.2 | 58.7 | |||||||||
Total Production (MBOE/d) |
63.4 | 70.3 | |||||||||
Effective Royalty Rate (percent) |
|||||||||||
| Atlantic | 3.7 | (0.5) | |||||||||
Asia Pacific (1) |
10.3 | 11.5 | |||||||||
Operating Expense (2) ($/BOE) |
17.20 | 12.64 | |||||||||
| Atlantic | 67.93 | 42.03 | |||||||||
Asia Pacific (1) |
8.37 | 7.00 | |||||||||
Per Unit DD&A (2) ($/BOE) |
25.57 | 30.76 | |||||||||
| Cenovus Energy Inc. – 2023 Management's Discussion and Analysis | 26 |
||||
| 2023 | ||||||||||||||||||||||||||
| ($/BOE, except where indicated) | Atlantic ($/bbl) |
China | Indonesia (2) |
Total Offshore | ||||||||||||||||||||||
| Sales Price | 113.74 | 82.14 | 59.16 | 81.63 | ||||||||||||||||||||||
Royalties |
4.24 | 5.68 | 13.75 | 7.29 | ||||||||||||||||||||||
| Transportation and Blending | 4.44 | — | — | 0.66 | ||||||||||||||||||||||
| Operating Expenses | 67.93 | 7.51 | 10.76 | 17.20 | ||||||||||||||||||||||
Netback |
37.13 | 68.95 | 34.65 | 56.48 | ||||||||||||||||||||||
| 2022 | ||||||||||||||||||||||||||
| ($/BOE, except where indicated) | Atlantic ($/bbl) |
China | Indonesia (2) |
Total Offshore | ||||||||||||||||||||||
| Sales Price | 140.65 | 81.99 | 70.66 | 89.72 | ||||||||||||||||||||||
Royalties |
(0.74) | 4.57 | 30.19 | 7.57 | ||||||||||||||||||||||
| Transportation and Blending | 3.79 | — | — | 0.61 | ||||||||||||||||||||||
| Operating Expenses | 42.03 | 5.62 | 13.32 | 12.64 | ||||||||||||||||||||||
Netback |
95.57 | 71.80 | 27.15 | 68.90 | ||||||||||||||||||||||
| Cenovus Energy Inc. – 2023 Management's Discussion and Analysis | 27 |
||||
| ($ millions) | 2023 | 2022 | |||||||||
| Revenues | 6,233 | 7,792 | |||||||||
| Purchased Product | 4,919 | 6,389 | |||||||||
Gross Margin (1) |
1,314 | 1,403 | |||||||||
| Expenses | |||||||||||
| Operating | 639 | 704 | |||||||||
| Operating Margin | 675 | 699 | |||||||||
| Depreciation, Depletion and Amortization | 185 | 208 | |||||||||
| Segment Income (Loss) | 490 | 491 | |||||||||
| 2023 | 2022 | ||||||||||
| Total Canadian Refining | |||||||||||
Heavy Crude Oil Unit Throughput Capacity (1) (Mbbls/d) |
110.5 | 110.5 | |||||||||
Heavy Crude Oil Unit Throughput (Mbbls/d) |
100.7 | 92.9 | |||||||||
Crude Utilization (percent) |
91 | 84 | |||||||||
Total Production (2) (Mbbls/d) |
114.2 | 105.2 | |||||||||
| Synthetic Crude Oil | 47.6 | 46.0 | |||||||||
| Asphalt | 15.4 | 13.5 | |||||||||
| Diesel | 12.9 | 9.3 | |||||||||
| Other | 33.3 | 31.5 | |||||||||
| Ethanol | 5.0 | 4.9 | |||||||||
Refining Margin (3) ($/bbl) |
32.04 | 33.92 | |||||||||
Unit Operating Expense (4) ($/bbl) |
12.68 | 13.91 | |||||||||
| Cenovus Energy Inc. – 2023 Management's Discussion and Analysis | 28 |
||||
| 2023 | 2022 | ||||||||||
| Lloydminster Upgrader | |||||||||||
Heavy Crude Oil Unit Throughput Capacity (1) (Mbbls/d) |
81.5 | 81.5 | |||||||||
Heavy Crude Oil Unit Throughput (Mbbls/d) |
73.1 | 68.7 | |||||||||
Crude Utilization (percent) |
90 | 84 | |||||||||
Production (Mbbls/d) |
81.5 | 76.0 | |||||||||
Refining Margin (2) ($/bbl) |
34.48 | 36.04 | |||||||||
Unit Operating Expense (3) ($/bbl) |
12.32 | 12.65 | |||||||||
Upgrading Differential (4) ($/bbl) |
31.14 | 32.84 | |||||||||
| Lloydminster Refinery | |||||||||||
Heavy Crude Oil Unit Throughput Capacity (1) (Mbbls/d) |
29.0 | 29.0 | |||||||||
Heavy Crude Oil Unit Throughput (Mbbls/d) |
27.6 | 24.2 | |||||||||
Crude Utilization (percent) |
95 | 83 | |||||||||
Production (Mbbls/d) |
27.7 | 24.3 | |||||||||
Refining Margin (2) ($/bbl) |
25.58 | 27.91 | |||||||||
Unit Operating Expense (3) ($/bbl) |
13.62 | 17.49 | |||||||||
| Cenovus Energy Inc. – 2023 Management's Discussion and Analysis | 29 |
||||
| ($ millions) | 2023 | 2022 |
|||||||||
Revenues (1) |
26,393 | 30,218 | |||||||||
Purchased Product (1) |
23,354 | 26,020 | |||||||||
Gross Margin (2) |
3,039 | 4,198 | |||||||||
| Expenses | |||||||||||
| Operating | 2,562 | 2,346 | |||||||||
| Realized (Gain) Loss on Risk Management | — | 112 | |||||||||
| Operating Margin | 477 | 1,740 | |||||||||
Unrealized (Gain) Loss on Risk Management |
(17) | 18 | |||||||||
| Depreciation, Depletion and Amortization | 486 | 640 | |||||||||
| Segment Income (Loss) | 8 | 1,082 | |||||||||
| Cenovus Energy Inc. – 2023 Management's Discussion and Analysis | 30 |
||||
| 2023 | 2022 | ||||||||||
| Total U.S. Refining | |||||||||||
Crude Oil Unit Throughput Capacity (1) (2) (Mbbls/d) |
635.2 | 551.5 | |||||||||
Crude Oil Unit Throughput (2) (Mbbls/d) |
459.7 | 400.8 | |||||||||
| Heavy Crude Oil | 173.9 | 116.1 | |||||||||
| Light and Medium Crude Oil | 285.8 | 284.7 | |||||||||
Crude Utilization (2) (percent) |
75 | 80 | |||||||||
Total Refined Product Production (Mbbls/d) |
485.0 | 419.9 | |||||||||
| Gasoline | 231.2 | 199.8 | |||||||||
Distillates (3) |
167.0 | 153.4 | |||||||||
| Asphalt | 19.8 | 8.9 | |||||||||
| Other | 67.0 | 57.8 | |||||||||
Refining Margin (4) ($/bbl) |
18.12 | 28.70 | |||||||||
Unit Operating Expense (5) ($/bbl) |
15.27 | 16.04 | |||||||||
| 2023 | 2022 | ||||||||||||||||||||||||||||
| Lima | Toledo | Superior | Wood River and Borger (1) |
Lima | Toledo | Superior | Wood River and Borger (1) |
||||||||||||||||||||||
Crude Oil Unit Throughput Capacity (2) (Mbbls/d) |
178.7 | 160.0 | 49.0 | 247.5 | 175.0 | 80.0 | 49.0 | 247.5 | |||||||||||||||||||||
Crude Oil Unit Throughput (Mbbls/d) |
152.7 | 83.1 | 22.6 | 201.3 | 157.9 | 36.3 | — | 206.6 | |||||||||||||||||||||
Crude Utilization (3) (percent) |
85 | 57 | 61 | 81 | 90 | 45 | — | 83 | |||||||||||||||||||||
| Cenovus Energy Inc. – 2023 Management's Discussion and Analysis | 31 |
||||
| Cenovus Energy Inc. – 2023 Management's Discussion and Analysis | 32 |
||||
| ($ millions) | 2023 | 2022 | |||||||||
| Realized (Gain) Loss on Risk Management | (3) | 31 | |||||||||
| Unrealized (Gain) Loss on Risk Management | 73 | (89) | |||||||||
General and Administrative |
688 | 865 | |||||||||
| Finance Costs | 671 | 820 | |||||||||
| Interest Income | (133) | (81) | |||||||||
| Integration, Transaction and Other Costs | 85 | 106 | |||||||||
| Foreign Exchange (Gain) Loss, Net | (67) | 343 | |||||||||
| Revaluation (Gain) Loss | 34 | (549) | |||||||||
| Re-measurement of Contingent Payments | 59 | 162 | |||||||||
| (Gain) Loss on Divestiture of Assets | (14) | (269) | |||||||||
Other (Income) Loss, Net |
(63) | (532) | |||||||||
| ($ millions) | 2023 | 2022 | |||||||||
| Unrealized Foreign Exchange (Gain) Loss | (210) | 365 | |||||||||
| Realized Foreign Exchange (Gain) Loss | 143 | (22) | |||||||||
| (67) | 343 | ||||||||||
| Cenovus Energy Inc. – 2023 Management's Discussion and Analysis | 33 |
||||
| ($ millions) | 2023 | 2022 | |||||||||
| Current Tax | |||||||||||
| Canada | 1,041 | 1,252 | |||||||||
| United States | (109) | 104 | |||||||||
| Asia Pacific | 224 | 262 | |||||||||
| Other International | 25 | 21 | |||||||||
| Total Current Tax Expense (Recovery) | 1,181 | 1,639 | |||||||||
| Deferred Tax Expense (Recovery) | (250) | 642 | |||||||||
| 931 | 2,281 | ||||||||||
| Cenovus Energy Inc. – 2023 Management's Discussion and Analysis | 34 |
||||
| QUARTERLY RESULTS | ||
| 2023 | 2022 | ||||||||||||||||||||||||||||
| ($ millions, except where indicated) | Q4 | Q3 | Q2 | Q1 | Q4 | Q3 | Q2 | Q1 | |||||||||||||||||||||
Average Commodity Prices (1) (US$/bbl) |
|||||||||||||||||||||||||||||
| Dated Brent | 84.05 | 86.76 | 78.39 | 81.27 | 88.71 | 100.85 | 113.78 | 101.41 | |||||||||||||||||||||
| WTI | 78.32 | 82.26 | 73.78 | 76.13 | 82.65 | 91.55 | 108.41 | 94.29 | |||||||||||||||||||||
| WCS at Hardisty | 56.43 | 69.35 | 58.74 | 51.36 | 56.99 | 71.69 | 95.61 | 79.76 | |||||||||||||||||||||
| Differential WTI-WCS at Hardisty | 21.89 | 12.91 | 15.04 | 24.77 | 25.66 | 19.86 | 12.80 | 14.53 | |||||||||||||||||||||
Chicago 3-2-1 Crack Spread (2) |
13.24 | 26.06 | 28.57 | 28.88 | 32.87 | 38.87 | 46.50 | 18.35 | |||||||||||||||||||||
| RINs | 4.77 | 7.42 | 7.72 | 8.20 | 8.54 | 8.11 | 7.80 | 6.44 | |||||||||||||||||||||
Upstream Production Volumes |
|||||||||||||||||||||||||||||
Bitumen (Mbbls/d) |
595.1 | 586.0 | 554.6 | 570.7 | 593.5 | 568.2 | 540.3 | 578.8 | |||||||||||||||||||||
Heavy Crude Oil (Mbbls/d) |
17.5 | 15.6 | 17.0 | 16.8 | 15.8 | 16.8 | 16.4 | 16.2 | |||||||||||||||||||||
Light Crude Oil (Mbbls/d) |
15.8 | 15.2 | 10.1 | 15.3 | 17.1 | 16.0 | 20.8 | 21.9 | |||||||||||||||||||||
NGLs (Mbbls/d) |
34.2 | 35.6 | 26.7 | 33.4 | 38.5 | 32.1 | 36.7 | 37.6 | |||||||||||||||||||||
Conventional Natural Gas (MMcf/d) |
876.3 | 867.4 | 729.4 | 857.0 | 852.0 | 868.7 | 882.2 | 865.3 | |||||||||||||||||||||
Total Production Volumes (MBOE/d) |
808.6 | 797.0 | 729.9 | 779.0 | 806.9 | 777.9 | 761.5 | 798.6 | |||||||||||||||||||||
|
Downstream Crude Oil Unit Throughput (3)
(Mbbls/d)
|
579.1 | 664.3 | 537.8 | 457.9 | 473.3 | 533.5 | 457.3 | 501.8 | |||||||||||||||||||||
Downstream Production Volumes (Mbbls/d) |
627.4 | 706.0 | 571.9 | 487.7 | 506.3 | 572.6 | 482.1 | 538.0 | |||||||||||||||||||||
Revenues |
13,134 | 14,577 | 12,231 | 12,262 | 14,063 | 17,471 | 19,165 | 16,198 | |||||||||||||||||||||
Operating Margin (4) |
2,151 | 4,369 | 2,400 | 2,102 | 2,782 | 3,339 | 4,678 | 3,464 | |||||||||||||||||||||
| Cash From (Used in) Operating Activities | 2,946 | 2,738 | 1,990 | (286) | 2,970 | 4,089 | 2,979 | 1,365 | |||||||||||||||||||||
Adjusted Funds Flow (4) |
2,062 | 3,447 | 1,899 | 1,395 | 2,346 | 2,951 | 3,098 | 2,583 | |||||||||||||||||||||
Per Share - Basic (4) ($) |
1.10 | 1.82 | 1.00 | 0.73 | 1.22 | 1.53 | 1.57 | 1.30 | |||||||||||||||||||||
Per Share - Diluted (4) ($) |
1.09 | 1.81 | 0.98 | 0.71 | 1.19 | 1.49 | 1.53 | 1.27 | |||||||||||||||||||||
Capital Investment |
1,170 | 1,025 | 1,002 | 1,101 | 1,274 | 866 | 822 | 746 | |||||||||||||||||||||
Free Funds Flow (4) |
892 | 2,422 | 897 | 294 | 1,072 | 2,085 | 2,276 | 1,837 | |||||||||||||||||||||
Excess Free Funds Flow (4) |
471 | 1,989 | 505 | (499) | 786 | 1,756 | 2,020 | 2,615 | |||||||||||||||||||||
Net Earnings (Loss) (5) |
743 | 1,864 | 866 | 636 | 784 | 1,609 | 2,432 | 1,625 | |||||||||||||||||||||
Per Share - Basic ($) |
0.39 | 0.98 | 0.45 | 0.33 | 0.40 | 0.83 | 1.23 | 0.81 | |||||||||||||||||||||
Per Share - Diluted ($) |
0.39 | 0.97 | 0.44 | 0.32 | 0.39 | 0.81 | 1.19 | 0.79 | |||||||||||||||||||||
| Total Assets | 53,915 | 54,427 | 53,747 | 54,000 | 55,869 | 55,086 | 55,894 | 55,655 | |||||||||||||||||||||
Total Long-Term Liabilities |
18,993 | 18,395 | 19,831 | 19,917 | 20,259 | 19,378 | 20,742 | 21,889 | |||||||||||||||||||||
| Long-Term Debt, Including Current Portion | 7,108 | 7,224 | 8,534 | 8,681 | 8,691 | 8,774 | 11,228 | 11,744 | |||||||||||||||||||||
Net Debt |
5,060 | 5,976 | 6,367 | 6,632 | 4,282 | 5,280 | 7,535 | 8,407 | |||||||||||||||||||||
| Cash Returns to Shareholders | 731 | 1,225 | 584 | 258 | 807 | 873 | 1,233 | 544 | |||||||||||||||||||||
| Common Shares – Base Dividends | 261 | 264 | 265 | 200 | 201 | 205 | 207 | 69 | |||||||||||||||||||||
Base Dividends Per Common Share ($) |
0.140 | 0.140 | 0.140 | 0.105 | 0.105 | 0.105 | 0.105 | 0.035 | |||||||||||||||||||||
| Common Shares – Variable Dividends | — | — | — | — | 219 | — | — | — | |||||||||||||||||||||
Variable Dividends Per Common Share ($) |
— | — | — | — | 0.114 | — | — | — | |||||||||||||||||||||
| Purchase of Common Shares Under NCIB | 350 | 361 | 310 | 40 | 387 | 659 | 1,018 | 466 | |||||||||||||||||||||
| Payment for Purchase of Warrants | 111 | 600 | — | — | — | — | — | — | |||||||||||||||||||||
| Preferred Share Dividends | 9 | — | 9 | 18 | — | 9 | 8 | 9 | |||||||||||||||||||||
| Cenovus Energy Inc. – 2023 Management's Discussion and Analysis | 35 |
||||
| Cenovus Energy Inc. – 2023 Management's Discussion and Analysis | 36 |
||||
 Operating Margin decreased $631 million to $2.2 billion in the fourth quarter of 2023, compared with 2022 primarily due to significantly lower market crack spreads and lower synthetic crude oil prices relative to crude oil feedstock impacting our downstream business. In addition, we processed feedstock from inventory purchased at higher prices in prior periods and recorded non-cash inventory write-downs on our refined products inventory in the fourth quarter. The decreases were partially offset by higher throughput and refined product production due to the Toledo Acquisition and the start-up of the Toledo and Superior refineries. Also offsetting the decrease was a higher Operating Margin from our upstream business mainly due to increased sales volumes, and higher realized pricing from the Oil Sands segment.
| Cenovus Energy Inc. – 2023 Management's Discussion and Analysis | 37 |
||||
| OIL AND GAS RESERVES | ||
|
As at December 31, 2023
(before royalties) (1)
|
Bitumen (2)
(MMbbls)
|
Light and Medium Oil
(MMbbls)
|
NGLs
(MMbbls)
|
Conventional
Natural Gas (3)
(Bcf)
|
Total
(MMBOE)
|
||||||||||||||||||||||||
| Total Proved | 5,411 | 38 | 74 | 2,062 | 5,866 | ||||||||||||||||||||||||
| Probable | 2,487 | 125 | 40 | 1,100 | 2,836 | ||||||||||||||||||||||||
| Total Proved Plus Probable | 7,899 | 163 | 114 | 3,162 | 8,702 | ||||||||||||||||||||||||
|
As at December 31, 2022
(before royalties) (1)
|
Bitumen (2)
(MMbbls)
|
Light and Medium Oil
(MMbbls)
|
NGLs
(MMbbls)
|
Conventional
Natural Gas (3)
(Bcf)
|
Total
(MMBOE)
|
||||||||||||||||||||||||
| Total Proved | 5,592 | 42 | 82 | 2,194 | 6,082 | ||||||||||||||||||||||||
| Probable | 2,448 | 129 | 39 | 1,029 | 2,787 | ||||||||||||||||||||||||
| Total Proved Plus Probable | 8,040 | 171 | 121 | 3,223 | 8,869 | ||||||||||||||||||||||||
| Cenovus Energy Inc. – 2023 Management's Discussion and Analysis | 38 |
||||
| LIQUIDITY AND CAPITAL RESOURCES | ||
($ millions) |
2023 | 2022 | |||||||||
| Cash From (Used In) | |||||||||||
| Operating Activities | 7,388 | 11,403 | |||||||||
| Investing Activities | (5,295) | (2,314) | |||||||||
| Net Cash Provided (Used) Before Financing Activities | 2,093 | 9,089 | |||||||||
| Financing Activities | (4,313) | (7,676) | |||||||||
| Effect of Foreign Exchange on Cash and Cash Equivalents | (77) | 238 | |||||||||
| Increase (Decrease) in Cash and Cash Equivalents | (2,297) | 1,651 | |||||||||
| As at December 31, | 2023 |
2022 | |||||||||
Cash and Cash Equivalents |
2,227 | 4,524 | |||||||||
Total Debt |
7,287 | 8,806 | |||||||||
| Cenovus Energy Inc. – 2023 Management's Discussion and Analysis | 39 |
||||
| Three Months Ended December 31, | Year Ended December 31, | ||||||||||||||||||||||
| ($ millions) | 2023 | 2022 | 2023 | 2022 | |||||||||||||||||||
| Cash From (Used in) Operating Activities | 2,946 | 2,970 | 7,388 | 11,403 | |||||||||||||||||||
| (Add) Deduct: | |||||||||||||||||||||||
Settlement of Decommissioning Liabilities |
(65) | (49) | (222) | (150) | |||||||||||||||||||
| Net Change in Non-Cash Working Capital | 949 | 673 | (1,193) | 575 | |||||||||||||||||||
| Adjusted Funds Flow | 2,062 | 2,346 | 8,803 | 10,978 | |||||||||||||||||||
Capital Investment |
1,170 | 1,274 | 4,298 | 3,708 | |||||||||||||||||||
Free Funds Flow |
892 | 1,072 | 4,505 | 7,270 | |||||||||||||||||||
| Add (Deduct): | |||||||||||||||||||||||
| Base Dividends Paid on Common Shares | (261) | (201) | |||||||||||||||||||||
| Dividends Paid on Preferred Shares | (9) | — | |||||||||||||||||||||
Settlement of Decommissioning Liabilities |
(65) | (49) | |||||||||||||||||||||
| Principal Repayment of Leases | (72) | (74) | |||||||||||||||||||||
| Acquisitions, Net of Cash Acquired | (14) | (7) | |||||||||||||||||||||
| Proceeds From Divestitures | — | 45 | |||||||||||||||||||||
Excess Free Funds Flow |
471 | 786 | |||||||||||||||||||||
| Three Months Ended | |||||||||||||||||||||||
| ($ millions) | December 31, 2023 | September 30, 2023 | June 30, 2023 | March 31, 2023 | |||||||||||||||||||
| Excess Free Funds Flow | 471 | 1,989 | 505 | (499) | |||||||||||||||||||
| Target Return | 236 | 995 | 253 | — | |||||||||||||||||||
Less: Purchase of Common Shares Under NCIB |
(350) | (361) | (310) | (40) | |||||||||||||||||||
Less: Payment for Purchase of Warrants |
(111) | (600) | — | — | |||||||||||||||||||
| Amount Available for Variable Dividend | — | 34 | — | — | |||||||||||||||||||
| Cenovus Energy Inc. – 2023 Management's Discussion and Analysis | 40 |
||||
| ($ millions) | Maturity | Amount Available | |||||||||
| Cash and Cash Equivalents | n/a | 2,227 | |||||||||
Committed Credit Facility (1) |
|||||||||||
Revolving Credit Facility – Tranche A |
November 10, 2026 | 3,700 | |||||||||
Revolving Credit Facility – Tranche B |
November 10, 2025 | 1,800 | |||||||||
| Uncommitted Demand Facilities | |||||||||||
Cenovus Energy Inc. (2) |
n/a | 1,071 | |||||||||
WRB (3) |
n/a | 119 | |||||||||
| Cenovus Energy Inc. – 2023 Management's Discussion and Analysis | 41 |
||||
| As at | December 31, 2023 | December 31, 2022 | |||||||||
Net Debt to Capitalization Ratio (percent) |
15 | 13 | |||||||||
Net Debt to Adjusted Funds Flow Ratio (times) |
0.6 | 0.4 | |||||||||
Net Debt to Adjusted EBITDA Ratio (times) |
0.5 | 0.3 | |||||||||
| 2023 | 2022 | ||||||||||
Common Shares Purchased and Cancelled Under NCIB (millions of common shares) |
43.6 | 112.5 | |||||||||
Weighted Average Price per Common Share ($) |
24.32 | 22.49 | |||||||||
Purchase of Common Shares Under NCIB ($ millions) |
(1,061) | (2,530) | |||||||||
| As at February 12, 2024 |
Units Outstanding
(thousands)
|
Units Exercisable
(thousands)
|
|||||||||
Common Shares |
1,867,826 | n/a | |||||||||
| Cenovus Warrants | 7,614 | n/a | |||||||||
| Series 1 First Preferred Shares | 10,740 | n/a | |||||||||
| Series 2 First Preferred Shares | 1,260 | n/a | |||||||||
| Series 3 First Preferred Shares | 10,000 | n/a | |||||||||
| Series 5 First Preferred Shares | 8,000 | n/a | |||||||||
| Series 7 First Preferred Shares | 6,000 | n/a | |||||||||
Stock Options |
12,852 | 7,615 | |||||||||
| Other Stock-Based Compensation Plans | 19,230 | 1,772 | |||||||||
| Cenovus Energy Inc. – 2023 Management's Discussion and Analysis | 42 |
||||
| As at December 31, 2023 | |||||||||||||||||||||||||||||||||||||||||
| ($ millions) | 2024 | 2025 | 2026 | 2027 | 2028 | Thereafter | Total | ||||||||||||||||||||||||||||||||||
| Commitments | |||||||||||||||||||||||||||||||||||||||||
Transportation and Storage (1) |
2,018 | 1,927 | 1,680 | 1,663 | 1,641 | 15,738 | 24,667 | ||||||||||||||||||||||||||||||||||
Product Purchases |
617 | — | — | — | — | — | 617 | ||||||||||||||||||||||||||||||||||
Real Estate |
57 | 57 | 59 | 63 | 58 | 604 | 898 | ||||||||||||||||||||||||||||||||||
Obligation to Fund HCML |
94 | 94 | 94 | 89 | 52 | 90 | 513 | ||||||||||||||||||||||||||||||||||
Other Long-Term Commitments (2) |
417 | 194 | 184 | 175 | 166 | 965 | 2,101 | ||||||||||||||||||||||||||||||||||
Total Commitments |
3,203 | 2,272 | 2,017 | 1,990 | 1,917 | 17,397 | 28,796 | ||||||||||||||||||||||||||||||||||
| Long-Term Debt (Principal and Interest) | 313 | 489 | 303 | 1,523 | 1,484 | 7,145 | 11,257 | ||||||||||||||||||||||||||||||||||
| Decommissioning Liabilities | 259 | 296 | 291 | 286 | 283 | 6,063 | 7,478 | ||||||||||||||||||||||||||||||||||
| Contingent Payment | 168 | — | — | — | — | — | 168 | ||||||||||||||||||||||||||||||||||
Lease Liabilities (Principal and Interest) (3) |
438 | 367 | 345 | 294 | 275 | 2,635 | 4,354 | ||||||||||||||||||||||||||||||||||
| Total Commitments and Obligations | 4,381 | 3,424 | 2,956 | 4,093 | 3,959 | 33,240 | 52,053 | ||||||||||||||||||||||||||||||||||
| Cenovus Energy Inc. – 2023 Management's Discussion and Analysis | 43 |
||||
| RISK MANAGEMENT AND RISK FACTORS | ||
| Cenovus Energy Inc. – 2023 Management's Discussion and Analysis | 44 |
||||
| Cenovus Energy Inc. – 2023 Management's Discussion and Analysis | 45 |
||||
As at December 31, 2023 |
Sensitivity Range | Increase | Decrease | |||||||||||
| Power Commodity Price | ± C$20.00/MWh (1) Applied to Power Hedges |
92 | (92) | |||||||||||
| Cenovus Energy Inc. – 2023 Management's Discussion and Analysis | 46 |
||||
| Cenovus Energy Inc. – 2023 Management's Discussion and Analysis | 47 |
||||
| Cenovus Energy Inc. – 2023 Management's Discussion and Analysis | 48 |
||||
| Cenovus Energy Inc. – 2023 Management's Discussion and Analysis | 49 |
||||
| Cenovus Energy Inc. – 2023 Management's Discussion and Analysis | 50 |
||||
| Cenovus Energy Inc. – 2023 Management's Discussion and Analysis | 51 |
||||
| Cenovus Energy Inc. – 2023 Management's Discussion and Analysis | 52 |
||||
| Cenovus Energy Inc. – 2023 Management's Discussion and Analysis | 53 |
||||
| Cenovus Energy Inc. – 2023 Management's Discussion and Analysis | 54 |
||||
| Cenovus Energy Inc. – 2023 Management's Discussion and Analysis | 55 |
||||
| Cenovus Energy Inc. – 2023 Management's Discussion and Analysis | 56 |
||||
| Cenovus Energy Inc. – 2023 Management's Discussion and Analysis | 57 |
||||
| Cenovus Energy Inc. – 2023 Management's Discussion and Analysis | 58 |
||||
| Cenovus Energy Inc. – 2023 Management's Discussion and Analysis | 59 |
||||
| Cenovus Energy Inc. – 2023 Management's Discussion and Analysis | 60 |
||||
| Cenovus Energy Inc. – 2023 Management's Discussion and Analysis | 61 |
||||
| CRITICAL ACCOUNTING JUDGMENTS, ESTIMATION UNCERTAINTIES AND ACCOUNTING POLICIES | ||
| Cenovus Energy Inc. – 2023 Management's Discussion and Analysis | 62 |
||||
| Cenovus Energy Inc. – 2023 Management's Discussion and Analysis | 63 |
||||
| Cenovus Energy Inc. – 2023 Management's Discussion and Analysis | 64 |
||||
| CONTROL ENVIRONMENT | ||
| ADVISORY | ||
| Cenovus Energy Inc. – 2023 Management's Discussion and Analysis | 65 |
||||
| Cenovus Energy Inc. – 2023 Management's Discussion and Analysis | 66 |
||||
| Cenovus Energy Inc. – 2023 Management's Discussion and Analysis | 67 |
||||
| Crude Oil and NGLs | Natural Gas | Other | |||||||||||||||
| bbl | barrel | Mcf | thousand cubic feet | BOE | barrel of oil equivalent | ||||||||||||
| Mbbls/d | thousand barrels per day | MMcf | million cubic feet | MBOE | thousand barrels of oil equivalent |
||||||||||||
| WCS | Western Canadian Select | MMcf/d | million cubic feet per day | MBOE/d | thousand barrels of oil equivalent per day |
||||||||||||
| WTI | West Texas Intermediate | Bcf | billion cubic feet | MMBOE | million barrels of oil equivalent | ||||||||||||
| CO2e | carbon dioxide equivalent | ||||||||||||||||
| DD&A | depreciation, depletion and amortization |
||||||||||||||||
| GHG | greenhouse gas | ||||||||||||||||
| NCIB | normal course issuer bid | ||||||||||||||||
| AECO | Alberta Energy Company | ||||||||||||||||
| NYMEX | New York Mercantile Exchange | ||||||||||||||||
| OPEC | Organization of Petroleum Exporting Countries |
||||||||||||||||
| OPEC+ | OPEC and a group of 11 non-OPEC members |
||||||||||||||||
| SAGD | steam-assisted gravity drainage | ||||||||||||||||
| USGC | U.S. Gulf Coast | ||||||||||||||||
| Cenovus Energy Inc. – 2023 Management's Discussion and Analysis | 68 |
||||
| 2023 | 2022 | 2021 | 2023 | 2022 | 2021 | 2023 | 2022 | 2021 | |||||||||||||||||||||||||||||||||||||||||||||
| ($ millions) | Upstream (1) |
Downstream (1) |
Total | ||||||||||||||||||||||||||||||||||||||||||||||||||
| Revenues | |||||||||||||||||||||||||||||||||||||||||||||||||||||
Gross Sales (2) |
31,082 | 41,142 | 27,925 | 32,626 | 38,010 | 26,258 | 63,708 | 79,152 | 54,183 | ||||||||||||||||||||||||||||||||||||||||||||
Less: Royalties |
3,270 | 4,868 | 2,454 | — | — | — | 3,270 | 4,868 | 2,454 | ||||||||||||||||||||||||||||||||||||||||||||
| 27,812 | 36,274 | 25,471 | 32,626 | 38,010 | 26,258 | 60,438 | 74,284 | 51,729 | |||||||||||||||||||||||||||||||||||||||||||||
| Expenses | |||||||||||||||||||||||||||||||||||||||||||||||||||||
Purchased Product (2) |
3,152 | 6,741 | 4,059 | 28,273 | 32,409 | 23,111 | 31,425 | 39,150 | 27,170 | ||||||||||||||||||||||||||||||||||||||||||||
Transportation and Blending (2) |
11,088 | 12,301 | 8,795 | — | — | — | 11,088 | 12,301 | 8,795 | ||||||||||||||||||||||||||||||||||||||||||||
Operating |
3,690 | 3,789 | 3,241 | 3,201 | 3,050 | 2,258 | 6,891 | 6,839 | 5,499 | ||||||||||||||||||||||||||||||||||||||||||||
| Realized (Gain) Loss on Risk Management | 12 | 1,619 | 788 | — | 112 | 104 | 12 | 1,731 | 892 | ||||||||||||||||||||||||||||||||||||||||||||
| Operating Margin | 9,870 | 11,824 | 8,588 | 1,152 | 2,439 | 785 | 11,022 | 14,263 | 9,373 | ||||||||||||||||||||||||||||||||||||||||||||
| 2023 | |||||||||||||||||||||||||||||||||||||||||||||||||||||||||||||||||||||||
Upstream (1) |
Downstream (1) |
Total | |||||||||||||||||||||||||||||||||||||||||||||||||||||||||||||||||||||
| ($ millions) | Q4 | Q3 | Q2 | Q1 | Q4 | Q3 | Q2 | Q1 | Q4 | Q3 | Q2 | Q1 | |||||||||||||||||||||||||||||||||||||||||||||||||||||||||||
| Revenues | |||||||||||||||||||||||||||||||||||||||||||||||||||||||||||||||||||||||
Gross Sales (2) |
7,797 | 8,783 | 7,285 | 7,217 | 8,404 | 9,658 | 7,427 | 7,137 | 16,201 | 18,441 | 14,712 | 14,354 | |||||||||||||||||||||||||||||||||||||||||||||||||||||||||||
Less: Royalties |
902 | 1,135 | 637 | 596 | — | — | — | — | 902 | 1,135 | 637 | 596 | |||||||||||||||||||||||||||||||||||||||||||||||||||||||||||
| 6,895 | 7,648 | 6,648 | 6,621 | 8,404 | 9,658 | 7,427 | 7,137 | 15,299 | 17,306 | 14,075 | 13,758 | ||||||||||||||||||||||||||||||||||||||||||||||||||||||||||||
| Expenses | |||||||||||||||||||||||||||||||||||||||||||||||||||||||||||||||||||||||
Purchased Product (2) |
663 | 900 | 751 | 838 | 7,888 | 7,947 | 6,447 | 5,991 | 8,551 | 8,847 | 7,198 | 6,829 | |||||||||||||||||||||||||||||||||||||||||||||||||||||||||||
Transportation and Blending (2) |
2,894 | 2,397 | 2,770 | 3,027 | — | — | — | — | 2,894 | 2,397 | 2,770 | 3,027 | |||||||||||||||||||||||||||||||||||||||||||||||||||||||||||
Operating |
864 | 914 | 883 | 1,029 | 826 | 778 | 843 | 754 | 1,690 | 1,692 | 1,726 | 1,783 | |||||||||||||||||||||||||||||||||||||||||||||||||||||||||||
| Realized (Gain) Loss on Risk Management | 19 | (10) | (13) | 16 | (6) | 11 | (6) | 1 | 13 | 1 | (19) | 17 | |||||||||||||||||||||||||||||||||||||||||||||||||||||||||||
| Operating Margin | 2,455 | 3,447 | 2,257 | 1,711 | (304) | 922 | 143 | 391 | 2,151 | 4,369 | 2,400 | 2,102 | |||||||||||||||||||||||||||||||||||||||||||||||||||||||||||
| Cenovus Energy Inc. – 2023 Management's Discussion and Analysis | 69 |
||||
| 2022 | |||||||||||||||||||||||||||||||||||||||||||||||||||||||||||||||||||||||
Upstream (1) |
Downstream (1) |
Total | |||||||||||||||||||||||||||||||||||||||||||||||||||||||||||||||||||||
| ($ millions) | Q4 | Q3 | Q2 | Q1 | Q4 | Q3 | Q2 | Q1 | Q4 | Q3 | Q2 | Q1 | |||||||||||||||||||||||||||||||||||||||||||||||||||||||||||
| Revenues | |||||||||||||||||||||||||||||||||||||||||||||||||||||||||||||||||||||||
Gross Sales (2) |
8,251 | 10,250 | 11,719 | 10,922 | 8,302 | 10,873 | 10,719 | 8,116 | 16,553 | 21,123 | 22,438 | 19,038 | |||||||||||||||||||||||||||||||||||||||||||||||||||||||||||
Less: Royalties |
875 | 1,226 | 1,582 | 1,185 | — | — | — | — | 875 | 1,226 | 1,582 | 1,185 | |||||||||||||||||||||||||||||||||||||||||||||||||||||||||||
| 7,376 | 9,024 | 10,137 | 9,737 | 8,302 | 10,873 | 10,719 | 8,116 | 15,678 | 19,897 | 20,856 | 17,853 | ||||||||||||||||||||||||||||||||||||||||||||||||||||||||||||
| Expenses | |||||||||||||||||||||||||||||||||||||||||||||||||||||||||||||||||||||||
Purchased Product (2) |
1,079 | 2,383 | 1,461 | 1,818 | 6,993 | 9,680 | 8,919 | 6,817 | 8,072 | 12,063 | 10,380 | 8,635 | |||||||||||||||||||||||||||||||||||||||||||||||||||||||||||
Transportation and Blending (2) |
2,984 | 2,826 | 3,272 | 3,219 | — | — | — | — | 2,984 | 2,826 | 3,272 | 3,219 | |||||||||||||||||||||||||||||||||||||||||||||||||||||||||||
Operating |
955 | 915 | 1,010 | 909 | 759 | 780 | 866 | 645 | 1,714 | 1,695 | 1,876 | 1,554 | |||||||||||||||||||||||||||||||||||||||||||||||||||||||||||
| Realized (Gain) Loss on Risk Management | 134 | 51 | 563 | 871 | (8) | (77) | 87 | 110 | 126 | (26) | 650 | 981 | |||||||||||||||||||||||||||||||||||||||||||||||||||||||||||
| Operating Margin | 2,224 | 2,849 | 3,831 | 2,920 | 558 | 490 | 847 | 544 | 2,782 | 3,339 | 4,678 | 3,464 | |||||||||||||||||||||||||||||||||||||||||||||||||||||||||||
Year Ended December 31, 2023 |
|||||||||||||||||
| ($ millions) | Atlantic | Asia Pacific | Offshore (1) |
||||||||||||||
| Revenues | |||||||||||||||||
| Gross Sales | 400 | 1,217 | 1,617 | ||||||||||||||
Less: Royalties |
15 | 84 | 99 | ||||||||||||||
| 385 | 1,133 | 1,518 | |||||||||||||||
| Expenses | |||||||||||||||||
Transportation and Blending |
16 | — | 16 | ||||||||||||||
Operating |
262 | 122 | 384 | ||||||||||||||
| Operating Margin | 107 | 1,011 | 1,118 | ||||||||||||||
Year Ended December 31, 2022 |
|||||||||||||||||
| ($ millions) | Atlantic | Asia Pacific | Offshore (1) |
||||||||||||||
| Revenues | |||||||||||||||||
| Gross Sales | 578 | 1,442 | 2,020 | ||||||||||||||
Less: Royalties |
(3) | 80 | 77 | ||||||||||||||
| 581 | 1,362 | 1,943 | |||||||||||||||
| Expenses | |||||||||||||||||
Transportation and Blending |
15 | — | 15 | ||||||||||||||
Operating |
204 | 114 | 318 | ||||||||||||||
| Operating Margin | 362 | 1,248 | 1,610 | ||||||||||||||
| Cenovus Energy Inc. – 2023 Management's Discussion and Analysis | 70 |
||||
| Three Months Ended December 31, | Year Ended December 31, | ||||||||||||||||||||||
| ($ millions) | 2023 | 2022 | 2023 | 2022 | |||||||||||||||||||
| Cash From (Used in) Operating Activities | 2,946 | 2,970 | 7,388 | 11,403 | |||||||||||||||||||
| (Add) Deduct: | |||||||||||||||||||||||
Settlement of Decommissioning Liabilities |
(65) | (49) | (222) | (150) | |||||||||||||||||||
Net Change in Non-Cash Working Capital |
949 | 673 | (1,193) | 575 | |||||||||||||||||||
Adjusted Funds Flow |
2,062 | 2,346 | 8,803 | 10,978 | |||||||||||||||||||
| Capital Investment | 1,170 | 1,274 | 4,298 | 3,708 | |||||||||||||||||||
Free Funds Flow |
892 | 1,072 | 4,505 | 7,270 | |||||||||||||||||||
| Add (Deduct): | |||||||||||||||||||||||
| Base Dividends Paid on Common Shares | (261) | (201) | |||||||||||||||||||||
| Dividends Paid on Preferred Shares | (9) | — | |||||||||||||||||||||
Settlement of Decommissioning Liabilities |
(65) | (49) | |||||||||||||||||||||
| Principal Repayment of Leases | (72) | (74) | |||||||||||||||||||||
| Acquisitions, Net of Cash Acquired | (14) | (7) | |||||||||||||||||||||
| Proceeds From Divestitures | — | 45 | |||||||||||||||||||||
| Payment on Divestiture of Assets | — | — | |||||||||||||||||||||
Excess Free Funds Flow |
471 | 786 | |||||||||||||||||||||
| Three Months Ended December 31, 2023 | |||||||||||||||||||||||||||||
| Basis of Refining Margin Calculation | |||||||||||||||||||||||||||||
| ($ millions) | Lloydminster Upgrader | Lloydminster Refinery | Lloydminster Upgrader and Lloydminster Refinery Total | Other (1) |
Total Canadian
Refining (2)
|
||||||||||||||||||||||||
| Revenues | 1,191 | 263 | 1,454 | 103 | 1,557 | ||||||||||||||||||||||||
| Purchased Product | 964 | 233 | 1,197 | 66 | 1,263 | ||||||||||||||||||||||||
| Gross Margin | 227 | 30 | 257 | 37 | 294 | ||||||||||||||||||||||||
| Operating Statistics | |||||||||||||||||||||||||||||
| Lloydminster Upgrader | Lloydminster Refinery | Lloydminster Upgrader and Lloydminster Refinery Total | |||||||||||||||||||||||||||
Heavy Crude Oil Unit Throughput (Mbbls/d) |
73.6 | 26.7 | 100.3 | ||||||||||||||||||||||||||
Refining Margin ($/bbl) |
33.48 | 11.96 | 27.74 | ||||||||||||||||||||||||||
| Cenovus Energy Inc. – 2023 Management's Discussion and Analysis | 71 |
||||
| Three Months Ended December 31, 2022 | |||||||||||||||||||||||||||||
| Basis of Refining Margin Calculation | |||||||||||||||||||||||||||||
| ($ millions) | Lloydminster Upgrader | Lloydminster Refinery |
Lloydminster Upgrader and Lloydminster
Refinery Total
|
Other (1) |
Total Canadian
Refining (2)
|
||||||||||||||||||||||||
| Revenues | 905 | 240 | 1,145 | 627 | 1,772 | ||||||||||||||||||||||||
| Purchased Product | 574 | 170 | 744 | 580 | 1,324 | ||||||||||||||||||||||||
| Gross Margin | 331 | 70 | 401 | 47 | 448 | ||||||||||||||||||||||||
| Operating Statistics | |||||||||||||||||||||||||||||
| Lloydminster Upgrader | Lloydminster Refinery | Lloydminster Upgrader and Lloydminster Refinery Total | |||||||||||||||||||||||||||
|
Heavy Crude Oil Unit Throughput
(Mbbls/d)
|
68.4 | 25.9 | 94.3 | ||||||||||||||||||||||||||
Refining Margin ($/bbl) |
52.60 | 29.36 | 46.21 | ||||||||||||||||||||||||||
Year Ended December 31, 2023 |
|||||||||||||||||||||||||||||
| Basis of Refining Margin Calculation | |||||||||||||||||||||||||||||
| ($ millions) | Lloydminster Upgrader | Lloydminster Refinery | Lloydminster Upgrader and Lloydminster Refinery Total | Other (1) |
Total Canadian
Refining (2)
|
||||||||||||||||||||||||
| Revenues | 4,810 | 1,002 | 5,812 | 421 | 6,233 | ||||||||||||||||||||||||
| Purchased Product | 3,890 | 744 | 4,634 | 285 | 4,919 | ||||||||||||||||||||||||
| Gross Margin | 920 | 258 | 1,178 | 136 | 1,314 | ||||||||||||||||||||||||
| Operating Statistics | |||||||||||||||||||||||||||||
| Lloydminster Upgrader | Lloydminster Refinery | Lloydminster Upgrader and Lloydminster Refinery Total | |||||||||||||||||||||||||||
Heavy Crude Oil Unit Throughput (Mbbls/d) |
73.1 | 27.6 | 100.7 | ||||||||||||||||||||||||||
Refining Margin ($/bbl) |
34.48 | 25.58 | 32.04 | ||||||||||||||||||||||||||
| Year Ended December 31, 2022 | |||||||||||||||||||||||||||||
| Basis of Refining Margin Calculation | |||||||||||||||||||||||||||||
| ($ millions) | Lloydminster Upgrader | Lloydminster Refinery |
Lloydminster Upgrader and Lloydminster
Refinery Total
|
Other (1) |
Total Canadian Refining (2) |
||||||||||||||||||||||||
| Revenues | 3,822 | 1,056 | 4,878 | 2,914 | 7,792 | ||||||||||||||||||||||||
| Purchased Product | 2,918 | 809 | 3,727 | 2,662 | 6,389 | ||||||||||||||||||||||||
| Gross Margin | 904 | 247 | 1,151 | 252 | 1,403 | ||||||||||||||||||||||||
| Operating Statistics | |||||||||||||||||||||||||||||
| Lloydminster Upgrader | Lloydminster Refinery | Lloydminster Upgrader and Lloydminster Refinery Total | |||||||||||||||||||||||||||
|
Heavy Crude Oil Unit Throughput
(Mbbls/d)
|
68.7 | 24.2 | 92.9 | ||||||||||||||||||||||||||
Refining Margin ($/bbl) |
36.04 | 27.91 | 33.92 | ||||||||||||||||||||||||||
| Cenovus Energy Inc. – 2023 Management's Discussion and Analysis | 72 |
||||
| Three Months Ended | |||||||||||||||||||||||||||||
| 2023 | 2022 | ||||||||||||||||||||||||||||
| ($ millions) | Q4 | Q3 | Q2 | Q1 | Q4 | ||||||||||||||||||||||||
Revenues (1) (2) |
6,847 | 7,853 | 6,064 | 5,629 | 6,530 | ||||||||||||||||||||||||
Purchased Product (1) (2) |
6,625 | 6,467 | 5,364 | 4,898 | 5,669 | ||||||||||||||||||||||||
| Gross Margin | 222 | 1,386 | 700 | 731 | 861 | ||||||||||||||||||||||||
| Crude Oil Unit Throughput (Mbbls/d) | 478.8 | 555.9 | 442.5 | 359.2 | 379.0 | ||||||||||||||||||||||||
| Refining Margin ($/bbl) | 5.03 | 27.10 | 17.40 | 22.62 | 24.70 | ||||||||||||||||||||||||
| Year Ended December 31, | |||||||||||
| ($ millions) | 2023 | 2022 | |||||||||
Revenues (1) (2) |
26,393 | 30,218 | |||||||||
Purchased Product (1) (2) |
23,354 | 26,020 | |||||||||
| Gross Margin | 3,039 | 4,198 | |||||||||
Crude Oil Unit Throughput (Mbbls/d) |
459.7 | 400.8 | |||||||||
Refining Margin ($/bbl) |
18.12 | 28.70 | |||||||||
| Cenovus Energy Inc. – 2023 Management's Discussion and Analysis | 73 |
||||
| Basis of Netback Calculation | ||||||||||||||||||||||||||||||||
Three Months Ended December 31, 2023 ($ millions) |
Foster Creek | Christina Lake | Sunrise |
Other Oil Sands (1) |
Total Bitumen and Heavy Oil | Natural Gas |
Total Oil Sands |
|||||||||||||||||||||||||
| Gross Sales | 1,312 | 1,447 | 357 | 778 | 3,894 | 2 | 3,896 | |||||||||||||||||||||||||
| Royalties | 353 | 366 | 32 | 86 | 837 | 1 | 838 | |||||||||||||||||||||||||
| Purchased Product | — | — | — | — | — | — | — | |||||||||||||||||||||||||
| Transportation and Blending | 200 | 161 | 58 | 39 | 458 | — | 458 | |||||||||||||||||||||||||
| Operating | 174 | 167 | 65 | 203 | 609 | 1 | 610 | |||||||||||||||||||||||||
| Netback | 585 | 753 | 202 | 450 | 1,990 | — | 1,990 | |||||||||||||||||||||||||
| Realized (Gain) Loss on Risk Management | 24 | |||||||||||||||||||||||||||||||
| Operating Margin | 1,966 | |||||||||||||||||||||||||||||||
| Basis of Netback Calculation | Adjustments | ||||||||||||||||||||||
Three Months Ended December 31, 2023 ($ millions) |
Total Oil Sands | Condensate | Third-party Sourced |
Other (2) |
Total Oil Sands (3) |
||||||||||||||||||
| Gross Sales | 3,896 | 2,329 | 156 | 96 | 6,477 | ||||||||||||||||||
| Royalties | 838 | — | — | 3 | 841 | ||||||||||||||||||
| Purchased Product | — | — | 156 | 70 | 226 | ||||||||||||||||||
| Transportation and Blending | 458 | 2,329 | — | 22 | 2,809 | ||||||||||||||||||
| Operating | 610 | — | — | 5 | 615 | ||||||||||||||||||
| Netback | 1,990 | — | — | (4) | 1,986 | ||||||||||||||||||
| Realized (Gain) Loss on Risk Management | 24 | — | — | — | 24 | ||||||||||||||||||
| Operating Margin | 1,966 | — | — | (4) | 1,962 | ||||||||||||||||||
| Basis of Netback Calculation | ||||||||||||||||||||||||||||||||
Three Months Ended December 31, 2022 ($ millions) |
Foster Creek | Christina Lake | Sunrise |
Other Oil Sands (1) |
Total Bitumen and Heavy Oil | Natural Gas |
Total Oil Sands |
|||||||||||||||||||||||||
| Gross Sales | 1,282 | 1,453 | 222 | 745 | 3,702 | 4 | 3,706 | |||||||||||||||||||||||||
| Royalties | 338 | 344 | 13 | 88 | 783 | 1 | 784 | |||||||||||||||||||||||||
| Purchased Product | — | — | — | — | — | — | — | |||||||||||||||||||||||||
| Transportation and Blending | 255 | 157 | 42 | 39 | 493 | — | 493 | |||||||||||||||||||||||||
| Operating | 194 | 221 | 60 | 257 | 732 | 3 | 735 | |||||||||||||||||||||||||
| Netback | 495 | 731 | 107 | 361 | 1,694 | — | 1,694 | |||||||||||||||||||||||||
| Realized (Gain) Loss on Risk Management | 59 | |||||||||||||||||||||||||||||||
| Operating Margin | 1,635 | |||||||||||||||||||||||||||||||
| Basis of Netback Calculation | Adjustments | ||||||||||||||||||||||
Three Months Ended December 31, 2022 ($ millions) |
Total Oil Sands | Condensate | Third-party Sourced (4) |
Other (2) |
Total Oil Sands (3) (4) |
||||||||||||||||||
Gross Sales |
3,706 | 2,415 | 422 | 110 | 6,653 | ||||||||||||||||||
| Royalties | 784 | — | — | — | 784 | ||||||||||||||||||
Purchased Product |
— | — | 422 | 94 | 516 | ||||||||||||||||||
| Transportation and Blending | 493 | 2,415 | — | 14 | 2,922 | ||||||||||||||||||
| Operating | 735 | — | — | (2) | 733 | ||||||||||||||||||
| Netback | 1,694 | — | — | 4 | 1,698 | ||||||||||||||||||
| Realized (Gain) Loss on Risk Management | 59 | — | — | — | 59 | ||||||||||||||||||
| Operating Margin | 1,635 | — | — | 4 | 1,639 | ||||||||||||||||||
| Cenovus Energy Inc. – 2023 Management's Discussion and Analysis | 74 |
||||
| Basis of Netback Calculation | ||||||||||||||||||||||||||||||||
Year Ended December 31, 2023 ($ millions) |
Foster Creek | Christina Lake | Sunrise |
Other Oil Sands (1) |
Total Bitumen and Heavy Oil | Natural Gas |
Total Oil Sands |
|||||||||||||||||||||||||
| Gross Sales | 5,347 | 5,848 | 1,298 | 3,208 | 15,701 | 8 | 15,709 | |||||||||||||||||||||||||
| Royalties | 1,136 | 1,556 | 74 | 285 | 3,051 | 5 | 3,056 | |||||||||||||||||||||||||
| Purchased Product | — | — | — | — | — | — | — | |||||||||||||||||||||||||
| Transportation and Blending | 819 | 572 | 215 | 153 | 1,759 | — | 1,759 | |||||||||||||||||||||||||
| Operating | 782 | 729 | 294 | 884 | 2,689 | 9 | 2,698 | |||||||||||||||||||||||||
| Netback | 2,610 | 2,991 | 715 | 1,886 | 8,202 | (6) | 8,196 | |||||||||||||||||||||||||
| Realized (Gain) Loss on Risk Management | 17 | |||||||||||||||||||||||||||||||
| Operating Margin | 8,179 | |||||||||||||||||||||||||||||||
| Basis of Netback Calculation | Adjustments | ||||||||||||||||||||||
Year Ended December 31, 2023 ($ millions) |
Total Oil Sands | Condensate | Third-party Sourced | Other (2) |
Total Oil Sands (3) |
||||||||||||||||||
| Gross Sales | 15,709 | 8,907 | 1,199 | 377 | 26,192 | ||||||||||||||||||
| Royalties | 3,056 | — | — | 3 | 3,059 | ||||||||||||||||||
| Purchased Product | — | — | 1,199 | 258 | 1,457 | ||||||||||||||||||
| Transportation and Blending | 1,759 | 8,907 | — | 108 | 10,774 | ||||||||||||||||||
| Operating | 2,698 | — | — | 18 | 2,716 | ||||||||||||||||||
| Netback | 8,196 | — | — | (10) | 8,186 | ||||||||||||||||||
| Realized (Gain) Loss on Risk Management | 17 | — | — | — | 17 | ||||||||||||||||||
| Operating Margin | 8,179 | — | — | (10) | 8,169 | ||||||||||||||||||
| Basis of Netback Calculation | ||||||||||||||||||||||||||||||||
Year Ended December 31, 2022 ($ millions) |
Foster Creek | Christina Lake | Sunrise |
Other Oil Sands (1) |
Total Bitumen and Heavy Oil | Natural Gas |
Total Oil Sands |
|||||||||||||||||||||||||
| Gross Sales | 6,723 | 7,951 | 950 | 3,967 | 19,591 | 18 | 19,609 | |||||||||||||||||||||||||
| Royalties | 1,783 | 2,244 | 59 | 390 | 4,476 | 6 | 4,482 | |||||||||||||||||||||||||
| Purchased Product | — | — | — | — | — | — | — | |||||||||||||||||||||||||
| Transportation and Blending | 814 | 588 | 135 | 149 | 1,686 | — | 1,686 | |||||||||||||||||||||||||
| Operating | 870 | 898 | 193 | 960 | 2,921 | 20 | 2,941 | |||||||||||||||||||||||||
| Netback | 3,256 | 4,221 | 563 | 2,468 | 10,508 | (8) | 10,500 | |||||||||||||||||||||||||
| Realized (Gain) Loss on Risk Management | 1,527 | |||||||||||||||||||||||||||||||
| Operating Margin | 8,973 | |||||||||||||||||||||||||||||||
| Basis of Netback Calculation | Adjustments | ||||||||||||||||||||||
Year Ended December 31, 2022 ($ millions) |
Total Oil Sands | Condensate | Third-party Sourced (4) |
Other (2) |
Total Oil Sands (3) (4) |
||||||||||||||||||
Gross Sales |
19,609 | 10,307 | 4,409 | 358 | 34,683 | ||||||||||||||||||
| Royalties | 4,482 | — | — | 11 | 4,493 | ||||||||||||||||||
Purchased Product |
— | — | 4,409 | 309 | 4,718 | ||||||||||||||||||
| Transportation and Blending | 1,686 | 10,307 | — | 43 | 12,036 | ||||||||||||||||||
| Operating | 2,941 | — | — | (11) | 2,930 | ||||||||||||||||||
| Netback | 10,500 | — | — | 6 | 10,506 | ||||||||||||||||||
| Realized (Gain) Loss on Risk Management | 1,527 | — | — | — | 1,527 | ||||||||||||||||||
| Operating Margin | 8,973 | — | — | 6 | 8,979 | ||||||||||||||||||
| Cenovus Energy Inc. – 2023 Management's Discussion and Analysis | 75 |
||||
| Basis of Netback Calculation | Adjustments | |||||||||||||||||||
Three Months Ended December 31, 2023 ($ millions) |
Conventional | Third-party Sourced |
Other (1) |
Conventional (2) |
||||||||||||||||
| Gross Sales | 331 | 437 | 38 | 806 | ||||||||||||||||
| Royalties | 27 | — | — | 27 | ||||||||||||||||
| Purchased Product | — | 437 | — | 437 | ||||||||||||||||
| Transportation and Blending | 54 | — | 24 | 78 | ||||||||||||||||
| Operating | 141 | — | 5 | 146 | ||||||||||||||||
| Netback | 109 | — | 9 | 118 | ||||||||||||||||
| Realized (Gain) Loss on Risk Management | (5) | — | — | (5) | ||||||||||||||||
| Operating Margin | 114 | — | 9 | 123 | ||||||||||||||||
| Basis of Netback Calculation | Adjustments | |||||||||||||||||||
Three Months Ended December 31, 2022 ($ millions) |
Conventional | Third-party Sourced (3) |
Other (1) |
Conventional (2) (3) |
||||||||||||||||
| Gross Sales | 555 | 563 | 35 | 1,153 | ||||||||||||||||
| Royalties | 69 | — | 1 | 70 | ||||||||||||||||
| Purchased Product | — | 563 | — | 563 | ||||||||||||||||
| Transportation and Blending | 47 | — | 12 | 59 | ||||||||||||||||
| Operating | 135 | — | 3 | 138 | ||||||||||||||||
| Netback | 304 | — | 19 | 323 | ||||||||||||||||
| Realized (Gain) Loss on Risk Management | 75 | — | — | 75 | ||||||||||||||||
| Operating Margin | 229 | — | 19 | 248 | ||||||||||||||||
| Basis of Netback Calculation | Adjustments | |||||||||||||||||||
Year Ended December 31, 2023 ($ millions) |
Conventional | Third-party Sourced | Other (1) |
Conventional (2) |
||||||||||||||||
| Gross Sales | 1,390 | 1,695 | 188 | 3,273 | ||||||||||||||||
| Royalties | 112 | — | — | 112 | ||||||||||||||||
| Purchased Product | — | 1,695 | — | 1,695 | ||||||||||||||||
| Transportation and Blending | 182 | — | 116 | 298 | ||||||||||||||||
| Operating | 570 | — | 20 | 590 | ||||||||||||||||
| Netback | 526 | — | 52 | 578 | ||||||||||||||||
| Realized (Gain) Loss on Risk Management | (5) | — | — | (5) | ||||||||||||||||
| Operating Margin | 531 | — | 52 | 583 | ||||||||||||||||
| Basis of Netback Calculation | Adjustments | |||||||||||||||||||
Year Ended December 31, 2022 ($ millions) |
Conventional | Third-party Sourced (3) |
Other (1) |
Conventional (2) (3) |
||||||||||||||||
| Gross Sales | 2,238 | 2,023 | 178 | 4,439 | ||||||||||||||||
| Royalties | 297 | — | 1 | 298 | ||||||||||||||||
| Purchased Product | — | 2,023 | — | 2,023 | ||||||||||||||||
| Transportation and Blending | 147 | — | 103 | 250 | ||||||||||||||||
| Operating | 520 | — | 21 | 541 | ||||||||||||||||
| Netback | 1,274 | — | 53 | 1,327 | ||||||||||||||||
| Realized (Gain) Loss on Risk Management | 84 | 8 | — | 92 | ||||||||||||||||
| Operating Margin | 1,190 | (8) | 53 | 1,235 | ||||||||||||||||
| Cenovus Energy Inc. – 2023 Management's Discussion and Analysis | 76 |
||||
| Basis of Netback Calculation | Adjustments | ||||||||||||||||||||||||||||||||||
Three Months Ended December 31, 2023 ($ millions) |
Atlantic | China | Indonesia (1) |
Total Asia Pacific |
Total Offshore | Equity Adjustment (1) |
Other (2) |
Total Offshore (3) |
|||||||||||||||||||||||||||
| Gross Sales | 168 | 346 | 91 | 437 | 605 | (91) | — | 514 | |||||||||||||||||||||||||||
| Royalties | 4 | 30 | 18 | 48 | 52 | (18) | — | 34 | |||||||||||||||||||||||||||
| Purchased Product | — | — | — | — | — | — | — | — | |||||||||||||||||||||||||||
| Transportation and Blending | 7 | — | — | — | 7 | — | — | 7 | |||||||||||||||||||||||||||
| Operating | 71 | 29 | 17 | 46 | 117 | (15) | 1 | 103 | |||||||||||||||||||||||||||
| Netback | 86 | 287 | 56 | 343 | 429 | (58) | (1) | 370 | |||||||||||||||||||||||||||
| Realized (Gain) Loss on Risk Management | — | — | — | — | |||||||||||||||||||||||||||||||
| Operating Margin | 429 | (58) | (1) | 370 | |||||||||||||||||||||||||||||||
| Basis of Netback Calculation | Adjustments | ||||||||||||||||||||||||||||||||||
Three Months Ended December 31, 2022 ($ millions) |
Atlantic | China | Indonesia (1) |
Total Asia Pacific |
Total Offshore | Equity Adjustment (1) |
Other (2) |
Total Offshore (3) |
|||||||||||||||||||||||||||
| Gross Sales | 86 | 359 | 77 | 436 | 522 | (77) | — | 445 | |||||||||||||||||||||||||||
| Royalties | 1 | 20 | 27 | 47 | 48 | (27) | — | 21 | |||||||||||||||||||||||||||
| Purchased Product | — | — | — | — | — | — | — | — | |||||||||||||||||||||||||||
| Transportation and Blending | 3 | — | — | — | 3 | — | — | 3 | |||||||||||||||||||||||||||
| Operating | 48 | 24 | 17 | 41 | 89 | (15) | 10 | 84 | |||||||||||||||||||||||||||
| Netback | 34 | 315 | 33 | 348 | 382 | (35) | (10) | 337 | |||||||||||||||||||||||||||
| Realized (Gain) Loss on Risk Management | — | — | — | — | |||||||||||||||||||||||||||||||
| Operating Margin | 382 | (35) | (10) | 337 | |||||||||||||||||||||||||||||||
| Basis of Netback Calculation | Adjustments | ||||||||||||||||||||||||||||||||||
Year Ended December 31, 2023 ($ millions) |
Atlantic | China | Indonesia (1) |
Total Asia Pacific |
Total Offshore | Equity Adjustment (1) |
Other (2) |
Total Offshore (3) |
|||||||||||||||||||||||||||
| Gross Sales | 400 | 1,217 | 317 | 1,534 | 1,934 | (317) | — | 1,617 | |||||||||||||||||||||||||||
| Royalties | 15 | 84 | 74 | 158 | 173 | (74) | 99 | ||||||||||||||||||||||||||||
| Purchased Product | — | — | — | — | — | — | — | — | |||||||||||||||||||||||||||
| Transportation and Blending | 16 | — | — | — | 16 | — | — | 16 | |||||||||||||||||||||||||||
| Operating | 239 | 111 | 58 | 169 | 408 | (47) | 23 | 384 | |||||||||||||||||||||||||||
| Netback | 130 | 1,022 | 185 | 1,207 | 1,337 | (196) | (23) | 1,118 | |||||||||||||||||||||||||||
| Realized (Gain) Loss on Risk Management | — | — | — | — | |||||||||||||||||||||||||||||||
| Operating Margin | 1,337 | (196) | (23) | 1,118 | |||||||||||||||||||||||||||||||
| Basis of Netback Calculation | Adjustments | ||||||||||||||||||||||||||||||||||
Year Ended December 31, 2022 ($ millions) |
Atlantic | China | Indonesia (1) |
Total Asia Pacific |
Total Offshore | Equity Adjustment (1) |
Other (2) |
Total Offshore (3) |
|||||||||||||||||||||||||||
| Gross Sales | 578 | 1,442 | 271 | 1,713 | 2,291 | (271) | — | 2,020 | |||||||||||||||||||||||||||
| Royalties | (3) | 80 | 116 | 196 | 193 | (116) | — | 77 | |||||||||||||||||||||||||||
| Purchased Product | — | — | — | — | — | — | — | — | |||||||||||||||||||||||||||
| Transportation and Blending | 15 | — | — | — | 15 | — | — | 15 | |||||||||||||||||||||||||||
| Operating | 175 | 99 | 51 | 150 | 325 | (36) | 29 | 318 | |||||||||||||||||||||||||||
| Netback | 391 | 1,263 | 104 | 1,367 | 1,758 | (119) | (29) | 1,610 | |||||||||||||||||||||||||||
| Realized (Gain) Loss on Risk Management | — | — | — | — | |||||||||||||||||||||||||||||||
| Operating Margin | 1,758 | (119) | (29) | 1,610 | |||||||||||||||||||||||||||||||
| Cenovus Energy Inc. – 2023 Management's Discussion and Analysis | 77 |
||||
Three Months Ended December 31, |
Year Ended December 31, | ||||||||||||||||||||||
| (MBOE/d) | 2023 | 2022 | 2023 | 2022 | |||||||||||||||||||
| Oil Sands | |||||||||||||||||||||||
| Foster Creek | 192.6 | 184.7 | 187.4 | 189.4 | |||||||||||||||||||
| Christina Lake | 238.6 | 246.5 | 234.3 | 247.5 | |||||||||||||||||||
| Sunrise | 50.8 | 42.0 | 47.3 | 30.2 | |||||||||||||||||||
| Other Oil Sands | 123.4 | 118.5 | 120.5 | 118.7 | |||||||||||||||||||
| Total Oil Sands | 605.4 | 591.7 | 589.5 | 585.8 | |||||||||||||||||||
| Conventional | 123.8 | 125.5 | 119.9 | 127.2 | |||||||||||||||||||
| Offshore | |||||||||||||||||||||||
| Atlantic | 15.0 | 7.3 | 9.6 | 11.3 | |||||||||||||||||||
| Asia Pacific | |||||||||||||||||||||||
| China | 44.2 | 47.1 | 40.5 | 48.2 | |||||||||||||||||||
| Indonesia | 16.3 | 12.8 | 14.7 | 10.5 | |||||||||||||||||||
| Total Asia Pacific | 60.5 | 59.9 | 55.2 | 58.7 | |||||||||||||||||||
| Total Offshore | 75.5 | 67.2 | 64.8 | 70.0 | |||||||||||||||||||
| Sales Before Internal Consumption | 804.7 | 784.4 | 774.2 | 783.0 | |||||||||||||||||||
Less: Internal Consumption (2) |
(104.5) | (93.4) | (92.6) | (86.6) | |||||||||||||||||||
| Total Upstream Sales | 700.2 | 691.0 | 681.6 | 696.4 | |||||||||||||||||||
| Cenovus Energy Inc. – 2023 Management's Discussion and Analysis | 78 |
||||
| Cenovus Energy Inc. – 2023 Management's Discussion and Analysis | 79 |
||||
Three Months Ended March 31, 2023 (1) |
Three Months Ended June 30, 2023 (2) |
||||||||||||||||||||||||||||||||||
| ($ millions) | Previously Reported | Revisions | Revised Balance | Previously Reported | Revisions | Revised Balance | |||||||||||||||||||||||||||||
| Oil Sands Segment | |||||||||||||||||||||||||||||||||||
Gross Sales |
5,911 | (204) | 5,707 | 6,556 | (119) | 6,437 | |||||||||||||||||||||||||||||
| Purchased Product | 559 | (204) | 355 | 533 | (119) | 414 | |||||||||||||||||||||||||||||
| 5,352 | — | 5,352 | 6,023 | — | 6,023 | ||||||||||||||||||||||||||||||
| Conventional Segment | |||||||||||||||||||||||||||||||||||
| Gross Sales | 1,031 | 6 | 1,037 | 615 | 5 | 620 | |||||||||||||||||||||||||||||
| Purchased Product | 510 | (27) | 483 | 352 | (15) | 337 | |||||||||||||||||||||||||||||
| Transportation and Blending | 48 | 33 | 81 | 46 | 20 | 66 | |||||||||||||||||||||||||||||
| 473 | — | 473 | 217 | — | 217 | ||||||||||||||||||||||||||||||
| U.S. Refining Segment | |||||||||||||||||||||||||||||||||||
| Gross Sales | 5,860 | (231) | 5,629 | 6,198 | (134) | 6,064 | |||||||||||||||||||||||||||||
| Purchased Product | 5,129 | (231) | 4,898 | 5,498 | (134) | 5,364 | |||||||||||||||||||||||||||||
| 731 | — | 731 | 700 | — | 700 | ||||||||||||||||||||||||||||||
| Corporate and Eliminations Segment | |||||||||||||||||||||||||||||||||||
| Gross Sales | (1,925) | 429 | (1,496) | (2,092) | 248 | (1,844) | |||||||||||||||||||||||||||||
| Purchased Product | (1,499) | 479 | (1,020) | (1,757) | 287 | (1,470) | |||||||||||||||||||||||||||||
| Transportation and Blending | (141) | (134) | (275) | (109) | (98) | (207) | |||||||||||||||||||||||||||||
| Operating | (231) | 84 | (147) | (185) | 59 | (126) | |||||||||||||||||||||||||||||
| (54) | — | (54) | (41) | — | (41) | ||||||||||||||||||||||||||||||
| Consolidated | |||||||||||||||||||||||||||||||||||
| Purchased Product | 5,792 | 17 | 5,809 | 5,709 | 19 | 5,728 | |||||||||||||||||||||||||||||
| Transportation and Blending | 2,853 | (101) | 2,752 | 2,641 | (78) | 2,563 | |||||||||||||||||||||||||||||
| Operating | 1,552 | 84 | 1,636 | 1,541 | 59 | 1,600 | |||||||||||||||||||||||||||||
| 10,197 | — | 10,197 | 9,891 | — | 9,891 | ||||||||||||||||||||||||||||||
| Cenovus Energy Inc. – 2023 Management's Discussion and Analysis | 80 |
||||
| Three Months Ended March 31, 2022 |
Three Months Ended June 30, 2022 |
||||||||||||||||||||||||||||||||||||||||||||||
| ($ millions) | Previously Reported | Revisions | Segment Aggregation | Revised Balance | Previously Reported | Revisions | Segment Aggregation | Revised Balance | |||||||||||||||||||||||||||||||||||||||
| Conventional Segment | |||||||||||||||||||||||||||||||||||||||||||||||
| Gross Sales | 1,112 | 25 | — | 1,137 | 1,079 | 34 | — | 1,113 | |||||||||||||||||||||||||||||||||||||||
| Transportation and Blending | 34 | 25 | — | 59 | 34 | 34 | — | 68 | |||||||||||||||||||||||||||||||||||||||
| 1,078 | — | — | 1,078 | 1,045 | — | — | 1,045 | ||||||||||||||||||||||||||||||||||||||||
| Canadian Refining Segment | |||||||||||||||||||||||||||||||||||||||||||||||
| Gross Sales | 1,044 | — | 563 | 1,607 | 1,521 | — | 724 | 2,245 | |||||||||||||||||||||||||||||||||||||||
| Purchased Product | 804 | 2 | 529 | 1,335 | 1,296 | (2) | 686 | 1,980 | |||||||||||||||||||||||||||||||||||||||
| Transportation and Blending | 2 | (2) | — | — | (2) | 2 | — | — | |||||||||||||||||||||||||||||||||||||||
| Operating | 124 | — | 27 | 151 | 180 | — | 31 | 211 | |||||||||||||||||||||||||||||||||||||||
| Depreciation, Depletion and Amortization |
42 | — | 8 | 50 | 64 | — | 8 | 72 | |||||||||||||||||||||||||||||||||||||||
| 72 | — | (1) | 71 | (17) | — | (1) | (18) | ||||||||||||||||||||||||||||||||||||||||
| Retail Segment | |||||||||||||||||||||||||||||||||||||||||||||||
| Gross Sales | 694 | — | (694) | — | 849 | — | (849) | — | |||||||||||||||||||||||||||||||||||||||
| Purchased Product | 660 | — | (660) | — | 811 | — | (811) | — | |||||||||||||||||||||||||||||||||||||||
| Operating | 27 | — | (27) | — | 31 | — | (31) | — | |||||||||||||||||||||||||||||||||||||||
| Depreciation, Depletion and Amortization |
8 | — | (8) | — | 8 | — | (8) | — | |||||||||||||||||||||||||||||||||||||||
| (1) | — | 1 | — | (1) | — | 1 | — | ||||||||||||||||||||||||||||||||||||||||
| Corporate and Eliminations Segment | |||||||||||||||||||||||||||||||||||||||||||||||
| Gross Sales | (1,761) | (25) | 131 | (1,655) | (1,782) | (34) | 125 | (1,691) | |||||||||||||||||||||||||||||||||||||||
| Purchased Product | (1,282) | 39 | 131 | (1,112) | (1,111) | 69 | 125 | (917) | |||||||||||||||||||||||||||||||||||||||
| Transportation and Blending | (221) | (110) | — | (331) | (188) | (145) | — | (333) | |||||||||||||||||||||||||||||||||||||||
| Operating | (267) | 46 | — | (221) | (395) | 42 | — | (353) | |||||||||||||||||||||||||||||||||||||||
| 9 | — | — | 9 | (88) | — | — | (88) | ||||||||||||||||||||||||||||||||||||||||
| Consolidated | |||||||||||||||||||||||||||||||||||||||||||||||
| Purchased Product | 7,482 | 41 | — | 7,523 | 9,396 | 67 | — | 9,463 | |||||||||||||||||||||||||||||||||||||||
| Transportation and Blending | 2,975 | (87) | — | 2,888 | 3,048 | (109) | — | 2,939 | |||||||||||||||||||||||||||||||||||||||
| Operating | 1,287 | 46 | — | 1,333 | 1,481 | 42 | — | 1,523 | |||||||||||||||||||||||||||||||||||||||
| 11,744 | — | — | 11,744 | 13,925 | — | — | 13,925 | ||||||||||||||||||||||||||||||||||||||||
| Cenovus Energy Inc. – 2023 Management's Discussion and Analysis | 81 |
||||
| Three Months Ended September 30, 2022 |
Three Months Ended December 31, 2022 |
||||||||||||||||||||||||||||||||||||||||
| ($ millions) | Previously Reported | Revisions | Segment Aggregation | Revised Balance | Previously Reported | Revisions | Revised Balance | ||||||||||||||||||||||||||||||||||
| Oil Sands Segment | |||||||||||||||||||||||||||||||||||||||||
| Gross Sales | 8,778 | (14) | — | 8,764 | 6,731 | (78) | 6,653 | ||||||||||||||||||||||||||||||||||
| Purchased Product | 1,933 | (14) | — | 1,919 | 594 | (78) | 516 | ||||||||||||||||||||||||||||||||||
| 6,845 | — | — | 6,845 | 6,137 | — | 6,137 | |||||||||||||||||||||||||||||||||||
| Conventional Segment | |||||||||||||||||||||||||||||||||||||||||
| Gross Sales | 1,010 | 26 | — | 1,036 | 1,131 | 22 | 1,153 | ||||||||||||||||||||||||||||||||||
| Transportation and Blending | 38 | 26 | — | 64 | 37 | 22 | 59 | ||||||||||||||||||||||||||||||||||
| 972 | — | — | 972 | 1,094 | — | 1,094 | |||||||||||||||||||||||||||||||||||
| Canadian Refining Segment | |||||||||||||||||||||||||||||||||||||||||
| Gross Sales | 1,478 | — | 690 | 2,168 | 1,772 | — | 1,772 | ||||||||||||||||||||||||||||||||||
| Purchased Product | 1,092 | 3 | 655 | 1,750 | 1,324 | — | 1,324 | ||||||||||||||||||||||||||||||||||
| Transportation and Blending | 3 | (3) | — | — | — | — | — | ||||||||||||||||||||||||||||||||||
| Operating | 134 | — | 38 | 172 | 170 | — | 170 | ||||||||||||||||||||||||||||||||||
| Depreciation, Depletion and Amortization |
37 | — | 5 | 42 | 44 | — | 44 | ||||||||||||||||||||||||||||||||||
| 212 | — | (8) | 204 | 234 | — | 234 | |||||||||||||||||||||||||||||||||||
| Retail Segment | |||||||||||||||||||||||||||||||||||||||||
| Gross Sales | 881 | — | (881) | — | — | — | — | ||||||||||||||||||||||||||||||||||
| Purchased Product | 846 | — | (846) | — | — | — | — | ||||||||||||||||||||||||||||||||||
| Operating | 38 | — | (38) | — | — | — | — | ||||||||||||||||||||||||||||||||||
| Depreciation, Depletion and Amortization |
5 | — | (5) | — | — | — | — | ||||||||||||||||||||||||||||||||||
| (8) | — | 8 | — | — | — | — | |||||||||||||||||||||||||||||||||||
| U.S. Refining Segment | |||||||||||||||||||||||||||||||||||||||||
| Gross Sales | 8,719 | (14) | — | 8,705 | 6,608 | (78) | 6,530 | ||||||||||||||||||||||||||||||||||
| Purchased Product | 7,944 | (14) | — | 7,930 | 5,747 | (78) | 5,669 | ||||||||||||||||||||||||||||||||||
| 775 | — | — | 775 | 861 | — | 861 | |||||||||||||||||||||||||||||||||||
| Corporate and Eliminations Segment | |||||||||||||||||||||||||||||||||||||||||
| Gross Sales | (2,619) | 2 | 191 | (2,426) | (1,749) | 134 | (1,615) | ||||||||||||||||||||||||||||||||||
| Purchased Product | (2,267) | 65 | 191 | (2,011) | (1,320) | 168 | (1,152) | ||||||||||||||||||||||||||||||||||
| Transportation and Blending | (119) | (128) | — | (247) | (136) | (128) | (264) | ||||||||||||||||||||||||||||||||||
| Operating | (256) | 65 | — | (191) | (352) | 94 | (258) | ||||||||||||||||||||||||||||||||||
| 23 | — | — | 23 | 59 | — | 59 | |||||||||||||||||||||||||||||||||||
| Consolidated | |||||||||||||||||||||||||||||||||||||||||
| Purchased Product | 10,012 | 40 | — | 10,052 | 6,908 | 12 | 6,920 | ||||||||||||||||||||||||||||||||||
| Transportation and Blending | 2,684 | (105) | — | 2,579 | 2,826 | (106) | 2,720 | ||||||||||||||||||||||||||||||||||
| Operating | 1,439 | 65 | — | 1,504 | 1,362 | 94 | 1,456 | ||||||||||||||||||||||||||||||||||
| 14,135 | — | — | 14,135 | 11,096 | — | 11,096 | |||||||||||||||||||||||||||||||||||
| Cenovus Energy Inc. – 2023 Management's Discussion and Analysis | 82 |
||||
| Twelve Months Ended December 31, 2022 | |||||||||||||||||
| ($ millions) | Previously Reported | Revisions | Revised Balance | ||||||||||||||
| Oil Sands Segment | |||||||||||||||||
| Gross Sales | 34,775 | (92) | 34,683 | ||||||||||||||
| Purchased Product | 4,810 | (92) | 4,718 | ||||||||||||||
| 29,965 | — | 29,965 | |||||||||||||||
| Conventional Segment | |||||||||||||||||
| Gross Sales | 4,332 | 107 | 4,439 | ||||||||||||||
| Transportation and Blending | 143 | 107 | 250 | ||||||||||||||
| 4,189 | — | 4,189 | |||||||||||||||
| U.S. Refining Segment | |||||||||||||||||
| Gross Sales | 30,310 | (92) | 30,218 | ||||||||||||||
| Purchased Product | 26,112 | (92) | 26,020 | ||||||||||||||
| 4,198 | — | 4,198 | |||||||||||||||
| Corporate and Eliminations Segment | |||||||||||||||||
| Gross Sales | (7,464) | 77 | (7,387) | ||||||||||||||
| Purchased Product | (5,533) | 341 | (5,192) | ||||||||||||||
| Transportation and Blending | (664) | (511) | (1,175) | ||||||||||||||
| Operating | (1,270) | 247 | (1,023) | ||||||||||||||
| 3 | — | 3 | |||||||||||||||
| Consolidated | |||||||||||||||||
| Purchased Product | 33,801 | 157 | 33,958 | ||||||||||||||
| Transportation and Blending | 11,530 | (404) | 11,126 | ||||||||||||||
| Operating | 5,569 | 247 | 5,816 | ||||||||||||||
| 50,900 | — | 50,900 | |||||||||||||||
| Cenovus Energy Inc. – 2023 Management's Discussion and Analysis | 83 |
||||
| Twelve Months Ended December 31, 2021 | |||||||||||||||||||||||
| ($ millions) | Previously Reported | Revisions | Segment Aggregation | Revised Balance | |||||||||||||||||||
| Conventional Segment | |||||||||||||||||||||||
| Gross Sales | 3,235 | 81 | — | 3,316 | |||||||||||||||||||
| Transportation and Blending | 74 | 81 | — | 155 | |||||||||||||||||||
| 3,161 | — | — | 3,161 | ||||||||||||||||||||
| Canadian Refining Segment | |||||||||||||||||||||||
| Gross Sales | 4,472 | — | 1,743 | 6,215 | |||||||||||||||||||
| Purchased Product | 3,552 | — | 1,604 | 5,156 | |||||||||||||||||||
| Operating | 388 | — | 98 | 486 | |||||||||||||||||||
| Depreciation, Depletion and Amortization |
167 | — | 59 | 226 | |||||||||||||||||||
| 365 | — | (18) | 347 | ||||||||||||||||||||
| Retail Segment | |||||||||||||||||||||||
| Gross Sales | 2,158 | — | (2,158) | — | |||||||||||||||||||
| Purchased Product | 2,019 | — | (2,019) | — | |||||||||||||||||||
| Operating | 98 | — | (98) | — | |||||||||||||||||||
| Depreciation, Depletion and Amortization |
59 | — | (59) | — | |||||||||||||||||||
| (18) | — | 18 | — | ||||||||||||||||||||
| Corporate and Eliminations Segment | |||||||||||||||||||||||
| Gross Sales | (5,706) | (81) | 415 | (5,372) | |||||||||||||||||||
| Purchased Product | (4,259) | 163 | 415 | (3,681) | |||||||||||||||||||
| Transportation and Blending | (676) | (363) | — | (1,039) | |||||||||||||||||||
| Operating | (783) | 119 | — | (664) | |||||||||||||||||||
| 12 | — | — | 12 | ||||||||||||||||||||
| Consolidated | |||||||||||||||||||||||
| Purchased Product | 23,326 | 163 | — | 23,489 | |||||||||||||||||||
| Transportation and Blending | 8,038 | (282) | — | 7,756 | |||||||||||||||||||
| Operating | 4,716 | 119 | — | 4,835 | |||||||||||||||||||
| 36,080 | — | — | 36,080 | ||||||||||||||||||||
| Cenovus Energy Inc. – 2023 Management's Discussion and Analysis | 84 |
||||

For the year ended December 31, 2023 | ||
| TABLE OF CONTENTS | ||
Cenovus Energy Inc. – 2023 Consolidated Financial Statements |
2 |
||||
| /s/ Jonathan M. McKenzie | /s/ Karamjit S. Sandhar | ||||
| Jonathan M. McKenzie | Karamjit S. Sandhar | ||||
| President & Chief Executive Officer | Executive Vice-President & Chief Financial Officer | ||||
| Cenovus Energy Inc. | Cenovus Energy Inc. | ||||
| February 14, 2024 | |||||
Cenovus Energy Inc. – 2023 Consolidated Financial Statements |
3 |
||||

Cenovus Energy Inc. – 2023 Consolidated Financial Statements |
4 |
||||
Cenovus Energy Inc. – 2023 Consolidated Financial Statements |
5 |
||||
| Chartered Professional Accountants | ||
| Calgary, Alberta, Canada | ||
| February 14, 2024 | ||
| We have served as the Company’s auditor since 2008. | ||
Cenovus Energy Inc. – 2023 Consolidated Financial Statements |
6 |
||||
CONSOLIDATED STATEMENTS OF EARNINGS (LOSS) | ||
| Notes | 2023 | 2022 |
|||||||||||||||
| Revenues | 1 | ||||||||||||||||
| Gross Sales | 55,474 | 71,765 | |||||||||||||||
| Less: Royalties | 3,270 | 4,868 | |||||||||||||||
| 52,204 | 66,897 | ||||||||||||||||
| Expenses | 1 | ||||||||||||||||
Purchased Product (1) |
24,715 | 33,958 | |||||||||||||||
Transportation and Blending (1) |
10,141 | 11,126 | |||||||||||||||
Operating (1) |
6,352 | 5,816 | |||||||||||||||
| (Gain) Loss on Risk Management | 35 | 61 | 1,636 | ||||||||||||||
| Depreciation, Depletion and Amortization | 11,19,20,22 |
4,644 | 4,679 | ||||||||||||||
| Exploration Expense | 18 | 42 | 101 | ||||||||||||||
| (Income) Loss From Equity-Accounted Affiliates | 21 | (51) | (15) | ||||||||||||||
| General and Administrative | 6 | 688 | 865 | ||||||||||||||
| Finance Costs | 7 | 671 | 820 | ||||||||||||||
| Interest Income | (133) | (81) | |||||||||||||||
| Integration, Transaction and Other Costs | 8 | 85 | 106 | ||||||||||||||
| Foreign Exchange (Gain) Loss, Net | 9 | (67) | 343 | ||||||||||||||
Revaluation (Gain) Loss |
5 | 34 | (549) | ||||||||||||||
| Re-measurement of Contingent Payments | 26 | 59 | 162 | ||||||||||||||
| (Gain) Loss on Divestiture of Assets | 10 | (14) | (269) | ||||||||||||||
| Other (Income) Loss, Net | 12 | (63) | (532) | ||||||||||||||
| Earnings (Loss) Before Income Tax | 5,040 | 8,731 | |||||||||||||||
| Income Tax Expense (Recovery) | 13 | 931 | 2,281 | ||||||||||||||
| Net Earnings (Loss) | 4,109 | 6,450 | |||||||||||||||
Net Earnings (Loss) Per Common Share ($) |
14 | ||||||||||||||||
| Basic | 2.15 | 3.29 | |||||||||||||||
| Diluted | 2.12 | 3.20 | |||||||||||||||
Cenovus Energy Inc. – 2023 Consolidated Financial Statements |
7 |
||||
| CONSOLIDATED STATEMENTS OF COMPREHENSIVE INCOME (LOSS) | ||
| Notes | 2023 | 2022 | |||||||||||||||
| Net Earnings (Loss) | 4,109 | 6,450 | |||||||||||||||
| Other Comprehensive Income (Loss), Net of Tax | 31 | ||||||||||||||||
| Items That Will not be Reclassified to Profit or Loss: | |||||||||||||||||
Actuarial Gain (Loss) Relating to Pension and Other Post-Employment Benefits |
29 | (44) | 71 | ||||||||||||||
Change in the Fair Value of Equity Instruments at FVOCI (1) |
35 | 56 | 2 | ||||||||||||||
| Items That may be Reclassified to Profit or Loss: | |||||||||||||||||
| Foreign Currency Translation Adjustment | (274) | 713 | |||||||||||||||
| Total Other Comprehensive Income (Loss), Net of Tax | (262) | 786 | |||||||||||||||
| Comprehensive Income (Loss) | 3,847 | 7,236 | |||||||||||||||
Cenovus Energy Inc. – 2023 Consolidated Financial Statements |
8 |
||||
| CONSOLIDATED BALANCE SHEETS | ||
| Notes | 2023 | 2022 | |||||||||||||||
| Assets | |||||||||||||||||
| Current Assets | |||||||||||||||||
| Cash and Cash Equivalents | 15 | 2,227 | 4,524 | ||||||||||||||
| Accounts Receivable and Accrued Revenues | 16 | 3,035 | 3,473 | ||||||||||||||
| Income Tax Receivable | 416 | 121 | |||||||||||||||
| Inventories | 17 | 4,030 | 4,312 | ||||||||||||||
| Total Current Assets | 9,708 | 12,430 | |||||||||||||||
| Restricted Cash | 27 | 211 | 209 | ||||||||||||||
| Exploration and Evaluation Assets, Net | 1,18 |
738 | 685 | ||||||||||||||
| Property, Plant and Equipment, Net | 1,19 |
37,250 | 36,499 | ||||||||||||||
| Right-of-Use Assets, Net | 1,20 |
1,680 | 1,845 | ||||||||||||||
| Income Tax Receivable | 25 | 25 | |||||||||||||||
| Investments in Equity-Accounted Affiliates | 21 | 366 | 365 | ||||||||||||||
| Other Assets | 22 | 318 | 342 | ||||||||||||||
| Deferred Income Taxes | 13 | 696 | 546 | ||||||||||||||
| Goodwill | 1,23 |
2,923 | 2,923 | ||||||||||||||
| Total Assets | 53,915 | 55,869 | |||||||||||||||
| Liabilities and Equity | |||||||||||||||||
| Current Liabilities | |||||||||||||||||
| Accounts Payable and Accrued Liabilities | 24 | 5,480 | 6,124 | ||||||||||||||
| Income Tax Payable | 88 | 1,211 | |||||||||||||||
| Short-Term Borrowings | 25 | 179 | 115 | ||||||||||||||
| Lease Liabilities | 20 | 299 | 308 | ||||||||||||||
| Contingent Payments | 26 | 164 | 263 | ||||||||||||||
| Total Current Liabilities | 6,210 | 8,021 | |||||||||||||||
| Long-Term Debt | 25 | 7,108 | 8,691 | ||||||||||||||
| Lease Liabilities | 20 | 2,359 | 2,528 | ||||||||||||||
| Contingent Payments | 26 | — | 156 | ||||||||||||||
| Decommissioning Liabilities | 27 | 4,155 | 3,559 | ||||||||||||||
| Other Liabilities | 28 | 1,183 | 1,042 | ||||||||||||||
| Deferred Income Taxes | 13 | 4,188 | 4,283 | ||||||||||||||
| Total Liabilities | 25,203 | 28,280 | |||||||||||||||
| Shareholders’ Equity | 28,698 | 27,576 | |||||||||||||||
| Non-Controlling Interest | 14 | 13 | |||||||||||||||
| Total Liabilities and Equity | 53,915 | 55,869 | |||||||||||||||
| Commitments and Contingencies | 38 | ||||||||||||||||
| /s/ Alexander J. Pourbaix | /s/ Jane E. Kinney | ||||
| Alexander J. Pourbaix | Jane E. Kinney | ||||
| Director | Director | ||||
| Cenovus Energy Inc. | Cenovus Energy Inc. | ||||
| February 14, 2024 | |||||
Cenovus Energy Inc. – 2023 Consolidated Financial Statements |
9 |
||||
| CONSOLIDATED STATEMENTS OF EQUITY | ||
Shareholders’ Equity |
|||||||||||||||||||||||||||||||||||||||||||||||
| Common Shares | Preferred Shares | Warrants |
Paid in
Surplus
|
Retained
Earnings
|
AOCI (1) |
Total | Non-Controlling Interest | ||||||||||||||||||||||||||||||||||||||||
(Note 30) |
(Note 30) |
(Note 30) |
(Note 31) |
||||||||||||||||||||||||||||||||||||||||||||
As at December 31, 2021 |
17,016 | 519 | 215 | 4,284 | 878 | 684 | 23,596 | 12 | |||||||||||||||||||||||||||||||||||||||
| Net Earnings (Loss) | — | — | — | — | 6,450 | — | 6,450 | — | |||||||||||||||||||||||||||||||||||||||
| Other Comprehensive Income (Loss), Net of Tax |
— | — | — | — | — | 786 | 786 | — | |||||||||||||||||||||||||||||||||||||||
| Total Comprehensive Income (Loss) | — | — | — | — | 6,450 | 786 | 7,236 | — | |||||||||||||||||||||||||||||||||||||||
| Common Shares Issued Under Stock Option Plans |
170 | — | — | (32) | — | — | 138 | — | |||||||||||||||||||||||||||||||||||||||
|
Purchase of Common Shares Under
NCIB (2)
|
(959) | — | — | (1,571) | — | — | (2,530) | — | |||||||||||||||||||||||||||||||||||||||
| Warrants Exercised | 93 | — | (31) | — | — | — | 62 | — | |||||||||||||||||||||||||||||||||||||||
| Stock-Based Compensation Expense |
— | — | — | 10 | — | — | 10 | — | |||||||||||||||||||||||||||||||||||||||
| Base Dividends on Common Shares | — | — | — | — | (682) | — | (682) | — | |||||||||||||||||||||||||||||||||||||||
| Variable Dividends on Common Shares
|
— | — | — | — | (219) | — | (219) | — | |||||||||||||||||||||||||||||||||||||||
| Dividends on Preferred Shares | — | — | — | — | (35) | — | (35) | — | |||||||||||||||||||||||||||||||||||||||
| Non-Controlling Interest | — | — | — | — | — | — | — | 1 | |||||||||||||||||||||||||||||||||||||||
As at December 31, 2022 |
16,320 | 519 | 184 | 2,691 | 6,392 | 1,470 | 27,576 | 13 | |||||||||||||||||||||||||||||||||||||||
| Net Earnings (Loss) | — | — | — | — | 4,109 | — | 4,109 | — | |||||||||||||||||||||||||||||||||||||||
| Other Comprehensive Income (Loss), Net of Tax |
— | — | — | — | — | (262) | (262) | — | |||||||||||||||||||||||||||||||||||||||
| Total Comprehensive Income (Loss) | — | — | — | — | 4,109 | (262) | 3,847 | — | |||||||||||||||||||||||||||||||||||||||
| Common Shares Issued Under Stock Option Plans |
58 | — | — | (12) | — | — | 46 | — | |||||||||||||||||||||||||||||||||||||||
|
Purchase of Common Shares Under
NCIB (2)
|
(373) | — | — | (688) | — | — | (1,061) | — | |||||||||||||||||||||||||||||||||||||||
| Warrants Exercised | 26 | — | (8) | — | — | — | 18 | — | |||||||||||||||||||||||||||||||||||||||
| Warrants Purchased and Cancelled | — | — | (151) | — | (562) | — | (713) | — | |||||||||||||||||||||||||||||||||||||||
| Stock-Based Compensation Expense
|
— | — | — | 11 | — | — | 11 | — | |||||||||||||||||||||||||||||||||||||||
| Base Dividends on Common Shares | — | — | — | — | (990) | — | (990) | — | |||||||||||||||||||||||||||||||||||||||
| Dividends on Preferred Shares | — | — | — | — | (36) | — | (36) | — | |||||||||||||||||||||||||||||||||||||||
| Non-Controlling Interest | — | — | — | — | — | — | — | 1 | |||||||||||||||||||||||||||||||||||||||
As at December 31, 2023 |
16,031 | 519 | 25 | 2,002 | 8,913 | 1,208 | 28,698 | 14 | |||||||||||||||||||||||||||||||||||||||
Cenovus Energy Inc. – 2023 Consolidated Financial Statements |
10 |
||||
| CONSOLIDATED STATEMENTS OF CASH FLOWS | ||
| Notes | 2023 | 2022 | |||||||||||||||
| Operating Activities | |||||||||||||||||
| Net Earnings (Loss) | 4,109 | 6,450 | |||||||||||||||
| Depreciation, Depletion and Amortization | 11,19,20,22 |
4,644 | 4,679 | ||||||||||||||
| Deferred Income Tax Expense (Recovery) | 13 | (250) | 642 | ||||||||||||||
| Unrealized (Gain) Loss on Risk Management | 35 | 52 | (126) | ||||||||||||||
| Unrealized Foreign Exchange (Gain) Loss | 9 | (210) | 365 | ||||||||||||||
| Realized Foreign Exchange (Gain) Loss on Non-Operating Items | 98 | 146 | |||||||||||||||
Revaluation (Gain) Loss |
5 | 34 | (549) | ||||||||||||||
| Re-measurement of Contingent Payments | 26 | 59 | (469) | ||||||||||||||
| (Gain) Loss on Divestiture of Assets | 10 | (14) | (269) | ||||||||||||||
| Unwinding of Discount on Decommissioning Liabilities | 27 | 220 | 176 | ||||||||||||||
| (Income) Loss From Equity-Accounted Affiliates | 21 | (51) | (15) | ||||||||||||||
| Distributions Received From Equity-Accounted Affiliates | 21 | 149 | 65 | ||||||||||||||
| Other | (37) | (117) | |||||||||||||||
| Settlement of Decommissioning Liabilities | 27 | (222) | (150) | ||||||||||||||
| Net Change in Non-Cash Working Capital | 37 | (1,193) | 575 | ||||||||||||||
| Cash From (Used in) Operating Activities | 7,388 | 11,403 | |||||||||||||||
| Investing Activities | |||||||||||||||||
| Acquisitions, Net of Cash Acquired | 5 | (515) | (397) | ||||||||||||||
| Capital Investment | 1 | (4,298) | (3,708) | ||||||||||||||
| Proceeds From Divestitures | 10 | 12 | 1,514 | ||||||||||||||
| Payment on Divestiture of Assets | 10 | — | (50) | ||||||||||||||
| Net Change in Investments and Other | (125) | (211) | |||||||||||||||
| Net Change in Non-Cash Working Capital | 37 | (369) | 538 | ||||||||||||||
| Cash From (Used in) Investing Activities | (5,295) | (2,314) | |||||||||||||||
| Net Cash Provided (Used) Before Financing Activities | 2,093 | 9,089 | |||||||||||||||
| Financing Activities | 37 | ||||||||||||||||
| Net Issuance (Repayment) of Short-Term Borrowings | 58 | 34 | |||||||||||||||
Repayment of Long-Term Debt |
25 | (1,346) | (4,149) | ||||||||||||||
| Principal Repayment of Leases | 20 | (288) | (302) | ||||||||||||||
| Common Shares Issued Under Stock Option Plans | 46 | 138 | |||||||||||||||
| Purchase of Common Shares Under NCIB | 30 | (1,061) | (2,530) | ||||||||||||||
| Payment for Purchase of Warrants | 30 | (711) | — | ||||||||||||||
| Proceeds From Exercise of Warrants | 18 | 62 | |||||||||||||||
| Base Dividends Paid on Common Shares | 14 | (990) | (682) | ||||||||||||||
| Variable Dividends Paid on Common Shares | 14 | — | (219) | ||||||||||||||
| Dividends Paid on Preferred Shares | 14 | (36) | (26) | ||||||||||||||
| Other | (3) | (2) | |||||||||||||||
| Cash From (Used in) Financing Activities | (4,313) | (7,676) | |||||||||||||||
Effect of Foreign Exchange on Cash and Cash Equivalents |
(77) | 238 | |||||||||||||||
| Increase (Decrease) in Cash and Cash Equivalents | (2,297) | 1,651 | |||||||||||||||
| Cash and Cash Equivalents, Beginning of Year | 4,524 | 2,873 | |||||||||||||||
| Cash and Cash Equivalents, End of Year | 2,227 | 4,524 | |||||||||||||||
Cenovus Energy Inc. – 2023 Consolidated Financial Statements |
11 |
||||
1. DESCRIPTION OF BUSINESS AND SEGMENTED DISCLOSURES | ||
Cenovus Energy Inc. – 2023 Consolidated Financial Statements |
12 |
||||
| Upstream | |||||||||||||||||||||||||||||||||||||||||||||||
| For the years ended December 31, | Oil Sands | Conventional | Offshore | Total | |||||||||||||||||||||||||||||||||||||||||||
| 2023 | 2022 |
2023 | 2022 |
2023 | 2022 |
2023 | 2022 |
||||||||||||||||||||||||||||||||||||||||
| Revenues | |||||||||||||||||||||||||||||||||||||||||||||||
Gross Sales (1) |
26,192 | 34,683 | 3,273 | 4,439 | 1,617 | 2,020 | 31,082 | 41,142 | |||||||||||||||||||||||||||||||||||||||
Less: Royalties |
3,059 | 4,493 | 112 | 298 | 99 | 77 | 3,270 | 4,868 | |||||||||||||||||||||||||||||||||||||||
| 23,133 | 30,190 | 3,161 | 4,141 | 1,518 | 1,943 | 27,812 | 36,274 | ||||||||||||||||||||||||||||||||||||||||
| Expenses | |||||||||||||||||||||||||||||||||||||||||||||||
Purchased Product (1) |
1,457 | 4,718 | 1,695 | 2,023 | — | — | 3,152 | 6,741 | |||||||||||||||||||||||||||||||||||||||
Transportation and Blending (1) |
10,774 | 12,036 | 298 | 250 | 16 | 15 | 11,088 | 12,301 | |||||||||||||||||||||||||||||||||||||||
Operating |
2,716 | 2,930 | 590 | 541 | 384 | 318 | 3,690 | 3,789 | |||||||||||||||||||||||||||||||||||||||
| Realized (Gain) Loss on Risk Management |
17 | 1,527 | (5) | 92 | — | — | 12 | 1,619 | |||||||||||||||||||||||||||||||||||||||
| Operating Margin | 8,169 | 8,979 | 583 | 1,235 | 1,118 | 1,610 | 9,870 | 11,824 | |||||||||||||||||||||||||||||||||||||||
|
Unrealized (Gain) Loss on
Risk Management
|
15 | (68) | (19) | 13 | — | — | (4) | (55) | |||||||||||||||||||||||||||||||||||||||
| Depreciation, Depletion and Amortization |
2,993 | 2,763 | 386 | 370 | 487 | 585 | 3,866 | 3,718 | |||||||||||||||||||||||||||||||||||||||
| Exploration Expense | 19 | 9 | 6 | 1 | 17 | 91 | 42 | 101 | |||||||||||||||||||||||||||||||||||||||
| (Income) Loss From Equity- Accounted Affiliates |
6 | 8 | — | — | (57) | (23) | (51) | (15) | |||||||||||||||||||||||||||||||||||||||
| Segment Income (Loss) | 5,136 | 6,267 | 210 | 851 | 671 | 957 | 6,017 | 8,075 | |||||||||||||||||||||||||||||||||||||||
| Downstream | |||||||||||||||||||||||||||||||||||
Canadian Refining |
U.S. Refining |
Total | |||||||||||||||||||||||||||||||||
| For the years ended December 31, | 2023 | 2022 |
2023 | 2022 |
2023 | 2022 |
|||||||||||||||||||||||||||||
| Revenues | |||||||||||||||||||||||||||||||||||
Gross Sales (1) |
6,233 | 7,792 | 26,393 | 30,218 | 32,626 | 38,010 | |||||||||||||||||||||||||||||
Less: Royalties |
— | — | — | — | — | — | |||||||||||||||||||||||||||||
| 6,233 | 7,792 | 26,393 | 30,218 | 32,626 | 38,010 | ||||||||||||||||||||||||||||||
| Expenses | |||||||||||||||||||||||||||||||||||
Purchased Product (1) |
4,919 | 6,389 | 23,354 | 26,020 | 28,273 | 32,409 | |||||||||||||||||||||||||||||
Transportation and Blending |
— | — | — | — | — | — | |||||||||||||||||||||||||||||
Operating |
639 | 704 | 2,562 | 2,346 | 3,201 | 3,050 | |||||||||||||||||||||||||||||
| Realized (Gain) Loss on Risk Management |
— | — | — | 112 | — | 112 | |||||||||||||||||||||||||||||
| Operating Margin | 675 | 699 | 477 | 1,740 | 1,152 | 2,439 | |||||||||||||||||||||||||||||
|
Unrealized (Gain) Loss on Risk
Management
|
— | — | (17) | 18 | (17) | 18 | |||||||||||||||||||||||||||||
| Depreciation, Depletion and Amortization |
185 | 208 | 486 | 640 | 671 | 848 | |||||||||||||||||||||||||||||
| Exploration Expense | — | — | — | — | — | — | |||||||||||||||||||||||||||||
| (Income) Loss From Equity-Accounted Affiliates |
— | — | — | — | — | — | |||||||||||||||||||||||||||||
| Segment Income (Loss) | 490 | 491 | 8 | 1,082 | 498 | 1,573 | |||||||||||||||||||||||||||||
Cenovus Energy Inc. – 2023 Consolidated Financial Statements |
13 |
||||
| Corporate and Eliminations | Consolidated | ||||||||||||||||||||||
| For the years ended December 31, | 2023 | 2022 |
2023 | 2022 |
|||||||||||||||||||
| Revenues | |||||||||||||||||||||||
Gross Sales (1) |
(8,234) | (7,387) | 55,474 | 71,765 | |||||||||||||||||||
Less: Royalties |
— | — | 3,270 | 4,868 | |||||||||||||||||||
| (8,234) | (7,387) | 52,204 | 66,897 | ||||||||||||||||||||
| Expenses | |||||||||||||||||||||||
Purchased Product (1) |
(6,710) | (5,192) | 24,715 | 33,958 | |||||||||||||||||||
Transportation and Blending (1) |
(947) | (1,175) | 10,141 | 11,126 | |||||||||||||||||||
Operating (1) |
(539) | (1,023) | 6,352 | 5,816 | |||||||||||||||||||
| Realized (Gain) Loss on Risk Management | (3) | 31 | 9 | 1,762 | |||||||||||||||||||
Unrealized (Gain) Loss on Risk Management |
73 | (89) | 52 | (126) | |||||||||||||||||||
| Depreciation, Depletion and Amortization | 107 | 113 | 4,644 | 4,679 | |||||||||||||||||||
| Exploration Expense | — | — | 42 | 101 | |||||||||||||||||||
| (Income) Loss From Equity-Accounted Affiliates | — | — | (51) | (15) | |||||||||||||||||||
| Segment Income (Loss) | (215) | (52) | 6,300 | 9,596 | |||||||||||||||||||
| General and Administrative | 688 | 865 | 688 | 865 | |||||||||||||||||||
| Finance Costs | 671 | 820 | 671 | 820 | |||||||||||||||||||
| Interest Income | (133) | (81) | (133) | (81) | |||||||||||||||||||
| Integration, Transaction and Other Costs | 85 | 106 | 85 | 106 | |||||||||||||||||||
| Foreign Exchange (Gain) Loss, Net | (67) | 343 | (67) | 343 | |||||||||||||||||||
Revaluation (Gain) Loss |
34 | (549) | 34 | (549) | |||||||||||||||||||
| Re-measurement of Contingent Payment | 59 | 162 | 59 | 162 | |||||||||||||||||||
| (Gain) Loss on Divestiture of Assets | (14) | (269) | (14) | (269) | |||||||||||||||||||
| Other (Income) Loss, Net | (63) | (532) | (63) | (532) | |||||||||||||||||||
| 1,260 | 865 | 1,260 | 865 | ||||||||||||||||||||
| Earnings (Loss) Before Income Tax | 5,040 | 8,731 | |||||||||||||||||||||
| Income Tax Expense (Recovery) | 931 | 2,281 | |||||||||||||||||||||
| Net Earnings (Loss) | 4,109 | 6,450 | |||||||||||||||||||||
Cenovus Energy Inc. – 2023 Consolidated Financial Statements |
14 |
||||
| For the years ended December 31, | 2023 | 2022 | |||||||||
| Upstream | |||||||||||
| Oil Sands | |||||||||||
Crude Oil (1) |
22,550 | 28,921 | |||||||||
NGLs (2) |
352 | 877 | |||||||||
Natural Gas and Other |
231 | 392 | |||||||||
| Conventional | |||||||||||
| Crude Oil | 589 | 429 | |||||||||
NGLs (2) |
799 | 926 | |||||||||
Natural Gas and Other (1) |
1,773 | 2,786 | |||||||||
| Offshore | |||||||||||
| Crude Oil | 385 | 581 | |||||||||
| NGLs | 280 | 354 | |||||||||
| Natural Gas | 853 | 1,008 | |||||||||
| Total Upstream | 27,812 | 36,274 | |||||||||
| Downstream | |||||||||||
Canadian Refining |
|||||||||||
| Synthetic Crude Oil | 2,124 | 2,360 | |||||||||
| Diesel | 1,752 | 2,164 | |||||||||
| Asphalt | 571 | 620 | |||||||||
| Gasoline | 522 | 948 | |||||||||
| Other Products and Services | 1,264 | 1,700 | |||||||||
U.S. Refining |
|||||||||||
| Gasoline | 12,375 | 14,116 | |||||||||
| Distillates | 9,612 | 11,453 | |||||||||
| Asphalt | 864 | 533 | |||||||||
Other Products (1) |
3,542 | 4,116 | |||||||||
| Total Downstream | 32,626 | 38,010 | |||||||||
Corporate and Eliminations (1) |
(8,234) | (7,387) | |||||||||
| Consolidated | 52,204 | 66,897 | |||||||||
Cenovus Energy Inc. – 2023 Consolidated Financial Statements |
15 |
||||
Revenues (1) |
|||||||||||
| For the years ended December 31, | 2023 | 2022 | |||||||||
Canada (2) |
25,128 | 33,314 | |||||||||
United States (2) |
25,943 | 32,221 | |||||||||
| China | 1,133 | 1,362 | |||||||||
| Consolidated | 52,204 | 66,897 | |||||||||
Non-Current Assets (1) |
|||||||||||
| As at December 31, | 2023 | 2022 |
|||||||||
| Canada | 35,876 | 35,194 | |||||||||
| United States | 5,230 | 4,824 | |||||||||
| China | 1,608 | 2,064 | |||||||||
| Indonesia | 344 | 365 | |||||||||
| Consolidated | 43,058 | 42,447 | |||||||||
| E&E Assets | PP&E | ROU Assets | |||||||||||||||||||||||||||||||||
| As at December 31, | 2023 | 2022 | 2023 | 2022 | 2023 | 2022 | |||||||||||||||||||||||||||||
| Oil Sands | 729 | 674 | 24,443 | 24,657 | 849 | 638 | |||||||||||||||||||||||||||||
| Conventional | — | 6 | 2,209 | 2,020 | 1 | 2 | |||||||||||||||||||||||||||||
Offshore |
9 | 5 | 2,798 | 2,549 | 102 | 152 | |||||||||||||||||||||||||||||
| Canadian Refining | — | — | 2,469 | 2,466 | 28 | 252 | |||||||||||||||||||||||||||||
| U.S. Refining | — | — | 5,014 | 4,482 | 268 | 329 | |||||||||||||||||||||||||||||
| Corporate and Eliminations | — | — | 317 | 325 | 432 | 472 | |||||||||||||||||||||||||||||
| Consolidated | 738 | 685 | 37,250 | 36,499 | 1,680 | 1,845 | |||||||||||||||||||||||||||||
| Goodwill | Total Assets | ||||||||||||||||||||||
| As at December 31, | 2023 | 2022 | 2023 | 2022 | |||||||||||||||||||
| Oil Sands | 2,923 | 2,923 | 31,673 | 32,248 | |||||||||||||||||||
| Conventional | — | — | 2,429 | 2,410 | |||||||||||||||||||
| Offshore | — | — | 3,511 | 3,339 | |||||||||||||||||||
| Canadian Refining | — | — | 2,960 | 3,172 | |||||||||||||||||||
| U.S. Refining | — | — | 8,660 | 8,324 | |||||||||||||||||||
| Corporate and Eliminations | — | — | 4,682 | 6,376 | |||||||||||||||||||
| Consolidated | 2,923 | 2,923 | 53,915 | 55,869 | |||||||||||||||||||
Cenovus Energy Inc. – 2023 Consolidated Financial Statements |
16 |
||||
| For the years ended December 31, | 2023 | 2022 | |||||||||
| Capital Investment | |||||||||||
| Oil Sands | 2,382 | 1,792 | |||||||||
| Conventional | 452 | 344 | |||||||||
| Offshore | |||||||||||
| Asia Pacific | 7 | 8 | |||||||||
| Atlantic | 635 | 302 | |||||||||
| Total Upstream | 3,476 | 2,446 | |||||||||
Canadian Refining |
145 | 117 | |||||||||
U.S. Refining |
602 | 1,059 | |||||||||
| Total Downstream | 747 | 1,176 | |||||||||
| Corporate and Eliminations | 75 | 86 | |||||||||
| 4,298 | 3,708 | ||||||||||
Acquisitions (Note 5) |
|||||||||||
Oil Sands (2) |
37 | 1,609 | |||||||||
| Conventional | 5 | 12 | |||||||||
U.S. Refining (3) |
385 | — | |||||||||
| 427 | 1,621 | ||||||||||
| Total Capital Expenditures | 4,725 | 5,329 | |||||||||
Cenovus Energy Inc. – 2023 Consolidated Financial Statements |
17 |
||||
2. BASIS OF PREPARATION AND STATEMENT OF COMPLIANCE | ||
3. SUMMARY OF ACCOUNTING POLICIES | ||
Cenovus Energy Inc. – 2023 Consolidated Financial Statements |
18 |
||||
Cenovus Energy Inc. – 2023 Consolidated Financial Statements |
19 |
||||
Cenovus Energy Inc. – 2023 Consolidated Financial Statements |
20 |
||||
Cenovus Energy Inc. – 2023 Consolidated Financial Statements |
21 |
||||
Cenovus Energy Inc. – 2023 Consolidated Financial Statements |
22 |
||||
Cenovus Energy Inc. – 2023 Consolidated Financial Statements |
23 |
||||
Cenovus Energy Inc. – 2023 Consolidated Financial Statements |
24 |
||||
Cenovus Energy Inc. – 2023 Consolidated Financial Statements |
25 |
||||
Cenovus Energy Inc. – 2023 Consolidated Financial Statements |
26 |
||||
4. CRITICAL ACCOUNTING JUDGMENTS AND KEY SOURCES OF ESTIMATION UNCERTAINTY | ||
Cenovus Energy Inc. – 2023 Consolidated Financial Statements |
27 |
||||
Cenovus Energy Inc. – 2023 Consolidated Financial Statements |
28 |
||||
Cenovus Energy Inc. – 2023 Consolidated Financial Statements |
29 |
||||
5. ACQUISITIONS | ||
| As at | February 28, 2023 | |||||||
| 100 Percent of the Identifiable Assets Acquired and Liabilities Assumed | ||||||||
| Cash | 69 | |||||||
| Accounts Receivable and Accrued Revenues | 3 | |||||||
| Inventories | 387 | |||||||
| Property, Plant and Equipment | 770 | |||||||
| Right-of-Use Assets | 33 | |||||||
| Other Assets | 10 | |||||||
| Accounts Payable and Accrued Liabilities | (139) | |||||||
| Lease Liabilities | (33) | |||||||
| Decommissioning Liabilities | (5) | |||||||
| Other Liabilities | (73) | |||||||
| Total Identifiable Net Assets | 1,022 | |||||||
| As at | February 28, 2023 | |||||||
| Total Purchase Consideration | 514 | |||||||
Fair Value of Pre-Existing 50 Percent Ownership Interest in Toledo |
508 | |||||||
| Fair Value of Identifiable Net Assets | (1,022) | |||||||
| Goodwill | — | |||||||
Cenovus Energy Inc. – 2023 Consolidated Financial Statements |
30 |
||||
| As at | August 31, 2022 | ||||
| Cash, Net of Closing Adjustments | 394 | ||||
| Bay Du Nord | 40 | ||||
| Variable Payment | 600 | ||||
| Total Consideration | 1,034 | ||||
| As at | August 31, 2022 | ||||
| 100 Percent of the Identifiable Assets Acquired and Liabilities Assumed | |||||
| Cash | 9 | ||||
| Accounts Receivable and Accrued Revenues | 164 | ||||
| Inventories | 88 | ||||
| Property, Plant and Equipment | 3,218 | ||||
| Accounts Payable and Accrued Liabilities | (313) | ||||
| Income Tax Payable | (39) | ||||
| Decommissioning Liabilities | (48) | ||||
| Deferred Income Tax Liabilities | (486) | ||||
| Total Identifiable Net Assets | 2,593 | ||||
Cenovus Energy Inc. – 2023 Consolidated Financial Statements |
31 |
||||
| As at | August 31, 2022 | |||||||
| Total Purchase Consideration | 1,034 | |||||||
Fair Value of Pre-Existing 50 Percent Ownership Interest in SOSP |
1,559 | |||||||
| Fair Value of Identifiable Net Assets | (2,593) | |||||||
| Goodwill | — | |||||||
6. GENERAL AND ADMINISTRATIVE | ||
| For the years ended December 31, | 2023 | 2022 | |||||||||
| Salaries and Benefits | 249 | 204 | |||||||||
| Administrative and Other | 342 | 297 | |||||||||
Stock-Based Compensation Expense (Recovery) (Note 32) |
97 | 373 | |||||||||
| Other Incentive Benefits Expense (Recovery) | — | (9) | |||||||||
| 688 | 865 | ||||||||||
7. FINANCE COSTS | ||
| For the years ended December 31, | 2023 | 2022 | |||||||||
| Interest Expense – Short-Term Borrowings and Long-Term Debt | 362 | 478 | |||||||||
Net Premium (Discount) on Redemption of Long-Term Debt (1) |
(84) | (29) | |||||||||
Interest Expense – Lease Liabilities (Note 20) |
161 | 163 | |||||||||
Unwinding of Discount on Decommissioning Liabilities (Note 27) |
220 | 176 | |||||||||
| Other | 32 | 37 | |||||||||
| 691 | 825 | ||||||||||
| Capitalized Interest | (20) | (5) | |||||||||
| 671 | 820 | ||||||||||
8. INTEGRATION, TRANSACTION AND OTHER COSTS | ||
| For the years ended December 31, | 2023 | 2022 | |||||||||
Integration Costs (1) |
46 | 95 | |||||||||
Transaction Costs (Note 5) |
11 | 11 | |||||||||
Other (2) |
28 | — | |||||||||
| 85 | 106 | ||||||||||
Cenovus Energy Inc. – 2023 Consolidated Financial Statements |
32 |
||||
9. FOREIGN EXCHANGE (GAIN) LOSS, NET | ||
| For the years ended December 31, | 2023 | 2022 | |||||||||
| Unrealized Foreign Exchange (Gain) Loss on Translation of: | |||||||||||
| U.S. Dollar Debt Issued From Canada | (231) | 365 | |||||||||
| Other | 21 | — | |||||||||
| Unrealized Foreign Exchange (Gain) Loss | (210) | 365 | |||||||||
| Realized Foreign Exchange (Gain) Loss | 143 | (22) | |||||||||
| (67) | 343 | ||||||||||
10. DIVESTITURES | ||
11. IMPAIRMENT CHARGES AND REVERSALS | ||
Cenovus Energy Inc. – 2023 Consolidated Financial Statements |
33 |
||||
| 2024 | 2025 | 2026 | 2027 | 2028 | Average Annual Increase Thereafter | ||||||||||||||||||||||||||||||
West Texas Intermediate (“WTI”) (US$/bbl) (1) |
73.67 | 74.98 | 76.14 | 77.66 | 79.22 | 2.00 | % | ||||||||||||||||||||||||||||
Western Canadian Select at Hardisty (2) (C$/bbl) |
76.74 | 79.77 | 81.12 | 82.88 | 85.04 | 2.00 | % | ||||||||||||||||||||||||||||
Condensate at Edmonton (C$/bbl) |
96.79 | 98.75 | 100.71 | 102.72 | 104.78 | 2.00 | % | ||||||||||||||||||||||||||||
Alberta Energy Company Natural Gas (C$/Mcf) (3) |
2.20 | 3.37 | 4.05 | 4.13 | 4.21 | 2.00 | % | ||||||||||||||||||||||||||||
| 2023 | 2024 | 2025 | 2026 | 2027 | Average Annual Increase Thereafter | ||||||||||||||||||||||||||||||
WTI (US$/bbl) |
80.33 | 78.50 | 76.95 | 77.61 | 79.16 | 2.00 | % | ||||||||||||||||||||||||||||
WCS (C$/bbl) |
76.54 | 77.75 | 77.55 | 80.07 | 81.89 | 2.00 | % | ||||||||||||||||||||||||||||
Condensate at Edmonton (C$/bbl) |
106.22 | 101.35 | 98.94 | 100.19 | 101.74 | 2.00 | % | ||||||||||||||||||||||||||||
Alberta Energy Company Natural Gas (C$/Mcf) |
4.23 | 4.40 | 4.21 | 4.27 | 4.34 | 2.00 | % | ||||||||||||||||||||||||||||
Cenovus Energy Inc. – 2023 Consolidated Financial Statements |
34 |
||||
| (US$/bbl) | 2023 | 2024 | 2025 | 2026 | 2027 | ||||||||||||||||||||||||
WTI |
80.33 | 78.50 | 76.95 | 77.61 | 79.16 | ||||||||||||||||||||||||
Differential WTI – WTS (1) |
(0.56) | (0.56) | (0.56) | (0.56) | (0.56) | ||||||||||||||||||||||||
Differential WTI – WCS |
(23.32) | (19.09) | (17.42) | (15.87) | (15.74) | ||||||||||||||||||||||||
| Chicago 3-2-1 Crack Spread | 29.37 | 24.10 | 22.12 | 21.70 | 21.67 | ||||||||||||||||||||||||
Cenovus Energy Inc. – 2023 Consolidated Financial Statements |
35 |
||||
|
One Percent Increase in
the Discount Rate
|
One Percent Decrease in
the Discount Rate
|
Five Percent Increase in the Forward Price Estimates |
Five Percent Decrease in the Forward Price Estimates |
||||||||||||||||||||
Increase (Decrease) to Impairment Amount |
69 | (65) | (268) | 268 | |||||||||||||||||||
| Increase (Decrease) to Impairment Reversal Amount | (72) | 14 | 168 | (342) | |||||||||||||||||||
12. OTHER INCOME (LOSS), NET | ||
13. INCOME TAXES | ||
| For the years ended December 31, | 2023 | 2022 | |||||||||
| Current Tax | |||||||||||
| Canada | 1,041 | 1,252 | |||||||||
| United States | (109) | 104 | |||||||||
| Asia Pacific | 224 | 262 | |||||||||
| Other International | 25 | 21 | |||||||||
| Total Current Tax Expense (Recovery) | 1,181 | 1,639 | |||||||||
| Deferred Tax Expense (Recovery) | (250) | 642 | |||||||||
| 931 | 2,281 | ||||||||||
Cenovus Energy Inc. – 2023 Consolidated Financial Statements |
36 |
||||
| For the years ended December 31, | 2023 | 2022 | |||||||||
| Earnings (Loss) Before Income Tax | 5,040 | 8,731 | |||||||||
Canadian Statutory Rate (percent) |
23.7 | 23.7 | |||||||||
| Expected Income Tax Expense (Recovery) | 1,194 | 2,069 | |||||||||
| Effect on Taxes Resulting From: | |||||||||||
| Statutory and Other Rate Differences | (38) | 17 | |||||||||
| Non-Taxable Capital (Gains) Losses | (15) | 84 | |||||||||
| Non-Recognition of Capital (Gains) Losses | (30) | 84 | |||||||||
| Adjustments Arising From Prior Year Tax Filings | (16) | 15 | |||||||||
| Recognition of U.S. Tax Basis | (115) | — | |||||||||
| Other | (49) | 12 | |||||||||
| Total Tax Expense (Recovery) | 931 | 2,281 | |||||||||
Effective Tax Rate (percent) |
18.5 | 26.1 | |||||||||
| For the years ended December 31, | 2023 | 2022 | |||||||||
| Deferred Income Tax Assets | |||||||||||
| Deferred Income Tax Assets to be Settled Within Twelve Months | (315) | (31) | |||||||||
| Deferred Income Tax Assets to be Settled After More Than Twelve Months | (1,174) | (747) | |||||||||
| (1,489) | (778) | ||||||||||
| Deferred Income Tax Liabilities | |||||||||||
| Deferred Income Tax Liabilities to be Settled Within Twelve Months | 138 | 55 | |||||||||
| Deferred Income Tax Liabilities to be Settled After More Than Twelve Months | 4,843 | 4,460 | |||||||||
| 4,981 | 4,515 | ||||||||||
| Net Deferred Income Tax Liability | 3,492 | 3,737 | |||||||||
| Deferred Income Tax Assets | Unused Tax Losses | Risk Management | Other | Total | |||||||||||||||||||
As at December 31, 2021 |
(655) | (11) | (788) | (1,454) | |||||||||||||||||||
| Charged (Credited) to Earnings | 490 | 11 | 158 | 659 | |||||||||||||||||||
| Charged (Credited) to Other Comprehensive Income | 9 | — | 8 | 17 | |||||||||||||||||||
As at December 31, 2022 |
(156) | — | (622) | (778) | |||||||||||||||||||
| Charged (Credited) to Earnings | (777) | — | 54 | (723) | |||||||||||||||||||
| Charged (Credited) to Other Comprehensive Income | 19 | — | (7) | 12 | |||||||||||||||||||
As at December 31, 2023 |
(914) | — | (575) | (1,489) | |||||||||||||||||||
Cenovus Energy Inc. – 2023 Consolidated Financial Statements |
37 |
||||
| Deferred Income Tax Liabilities | PP&E | Risk Management | Other | Total | |||||||||||||||||||
As at December 31, 2021 |
3,949 | — | 97 | 4,046 | |||||||||||||||||||
| Charged (Credited) to Earnings | 25 | 11 | (53) | (17) | |||||||||||||||||||
| Charged (Credited) to Sunrise Purchase Price Allocation | 486 | — | — | 486 | |||||||||||||||||||
As at December 31, 2022 |
4,460 | 11 | 44 | 4,515 | |||||||||||||||||||
| Charged (Credited) to Earnings | 495 | (8) | (14) | 473 | |||||||||||||||||||
| Charged (Credited) to Other Comprehensive Income | (7) | — | — | (7) | |||||||||||||||||||
As at December 31, 2023 |
4,948 | 3 | 30 | 4,981 | |||||||||||||||||||
| Net Deferred Income Tax Liabilities | Total | ||||
As at December 31, 2021 |
2,592 | ||||
| Charged (Credited) to Earnings | 642 | ||||
| Charged (Credited) to Sunrise Purchase Price Allocation | 486 | ||||
| Charged (Credited) to Other Comprehensive Income | 17 | ||||
As at December 31, 2022 |
3,737 | ||||
| Charged (Credited) to Earnings | (250) | ||||
| Charged (Credited) to Other Comprehensive Income | 5 | ||||
As at December 31, 2023 |
3,492 | ||||
| As at December 31, | 2023 | 2022 | |||||||||
| Canada | 8,547 | 8,505 | |||||||||
| United States | 8,058 | 6,477 | |||||||||
| Asia Pacific | 347 | 457 | |||||||||
| 16,952 | 15,439 | ||||||||||
Cenovus Energy Inc. – 2023 Consolidated Financial Statements |
38 |
||||
14. PER SHARE AMOUNTS | ||
| For the years ended December 31, | 2023 | 2022 | |||||||||
| Net Earnings (Loss) | 4,109 | 6,450 | |||||||||
| Effect of Cumulative Dividends on Preferred Shares | (36) | (35) | |||||||||
| Net Earnings (Loss) – Basic and Diluted | 4,073 | 6,415 | |||||||||
Basic – Weighted Average Number of Shares (thousands) |
1,895,487 | 1,951,262 | |||||||||
| Dilutive Effect of Warrants | 22,223 | 44,845 | |||||||||
| Dilutive Effect of Net Settlement Rights | 7,150 | 10,045 | |||||||||
| Dilutive Effect of Cenovus Replacement Stock Options | 580 | — | |||||||||
Diluted – Weighted Average Number of Shares (thousands) |
1,925,440 | 2,006,152 | |||||||||
Net Earnings (Loss) Per Common Share – Basic ($) |
2.15 | 3.29 | |||||||||
Net Earnings (Loss) Per Common Share – Diluted (1) (2) ($) |
2.12 | 3.20 | |||||||||
| 2023 | 2022 | ||||||||||||||||||||||
For the years ended December 31, |
Per Share | Amount | Per Share | Amount | |||||||||||||||||||
| Base Dividends | 0.525 | 990 | 0.350 | 682 | |||||||||||||||||||
| Variable Dividends | — | — | 0.114 | 219 | |||||||||||||||||||
| Total Common Share Dividends Declared and Paid | 0.525 | 990 | 0.464 | 901 | |||||||||||||||||||
| For the years ended December 31, | 2023 | 2022 | |||||||||
| Series 1 First Preferred Shares | 7 | 7 | |||||||||
| Series 2 First Preferred Shares | 2 | 1 | |||||||||
| Series 3 First Preferred Shares | 12 | 12 | |||||||||
| Series 5 First Preferred Shares | 9 | 9 | |||||||||
| Series 7 First Preferred Shares | 6 | 6 | |||||||||
| Total Preferred Share Dividends Declared | 36 | 35 | |||||||||
Cenovus Energy Inc. – 2023 Consolidated Financial Statements |
39 |
||||
15. CASH AND CASH EQUIVALENTS | ||
| As at December 31, | 2023 | 2022 | |||||||||
| Cash | 2,109 | 3,195 | |||||||||
| Short-Term Investments | 118 | 1,329 | |||||||||
| 2,227 | 4,524 | ||||||||||
16. ACCOUNTS RECEIVABLE AND ACCRUED REVENUES | ||
| As at December 31, | 2023 | 2022 | |||||||||
| Trade and Accruals | 2,722 | 2,962 | |||||||||
| Prepaids and Deposits | 242 | 402 | |||||||||
| Joint Operations Receivables | 49 | 51 | |||||||||
| Other | 22 | 58 | |||||||||
| 3,035 | 3,473 | ||||||||||
17. INVENTORIES | ||
| As at December 31, | 2023 | 2022 | |||||||||
| Product | |||||||||||
| Crude Oil | 2,084 | 2,424 | |||||||||
| Diluent | 379 | 366 | |||||||||
Natural Gas and NGLs |
68 | 50 | |||||||||
| Refined Products | 1,073 | 1,169 | |||||||||
| Total Product | 3,604 | 4,009 | |||||||||
| Parts and Supplies | 426 | 303 | |||||||||
| 4,030 | 4,312 | ||||||||||
Cenovus Energy Inc. – 2023 Consolidated Financial Statements |
40 |
||||
18. EXPLORATION AND EVALUATION ASSETS, NET | ||
| Total | |||||
| As at December 31, 2021 | 720 | ||||
| Additions | 37 | ||||
Write-downs (1) |
(64) | ||||
| Change in Decommissioning Liabilities | (12) | ||||
| Exchange Rate Movements and Other | 4 | ||||
| As at December 31, 2022 | 685 | ||||
| Acquisition | 31 | ||||
| Additions | 84 | ||||
Transfer to PP&E (Note 19) |
(60) | ||||
Write-downs (1) |
(29) | ||||
| Change in Decommissioning Liabilities | 28 | ||||
| Exchange Rate Movements and Other | (1) | ||||
| As at December 31, 2023 | 738 | ||||
Cenovus Energy Inc. – 2023 Consolidated Financial Statements |
41 |
||||
19. PROPERTY, PLANT AND EQUIPMENT, NET | ||
| Crude Oil and Natural Gas Properties | Processing, Transportation and Storage Assets | Refining Assets |
Other Assets (1) |
Total | |||||||||||||||||||||||||
| COST | |||||||||||||||||||||||||||||
As at December 31, 2021 |
38,443 | 228 | 10,495 | 1,735 | 50,901 | ||||||||||||||||||||||||
Acquisitions (Note 5) (2) |
3,230 | — | — | — | 3,230 | ||||||||||||||||||||||||
| Additions | 2,409 | 11 | 1,143 | 108 | 3,671 | ||||||||||||||||||||||||
| Change in Decommissioning Liabilities | (186) | (6) | (29) | (32) | (253) | ||||||||||||||||||||||||
Divestitures (Notes 5 and 10) (2) |
(557) | — | — | — | (557) | ||||||||||||||||||||||||
| Exchange Rate Movements and Other | 189 | 21 | 523 | 14 | 747 | ||||||||||||||||||||||||
As at December 31, 2022 |
43,528 | 254 | 12,132 | 1,825 | 57,739 | ||||||||||||||||||||||||
Acquisitions (Note 5) (3) |
11 | — | 770 | — | 781 | ||||||||||||||||||||||||
| Additions | 3,392 | 14 | 719 | 89 | 4,214 | ||||||||||||||||||||||||
Transfer from E&E (Note 18) |
60 | — | — | — | 60 | ||||||||||||||||||||||||
| Change in Decommissioning Liabilities | 542 | — | 21 | 18 | 581 | ||||||||||||||||||||||||
Divestitures (Note 5) (3) |
(17) | — | (633) | (17) | (667) | ||||||||||||||||||||||||
| Exchange Rate Movements and Other | (91) | 4 | (239) | (7) | (333) | ||||||||||||||||||||||||
| As at December 31, 2023 | 47,425 | 272 | 12,770 | 1,908 | 62,375 | ||||||||||||||||||||||||
| ACCUMULATED DEPRECIATION, DEPLETION AND AMORTIZATION | |||||||||||||||||||||||||||||
As at December 31, 2021 |
10,912 | 53 | 4,572 | 1,139 | 16,676 | ||||||||||||||||||||||||
Depreciation, Depletion and Amortization (4) |
3,461 | 37 | 466 | 103 | 4,067 | ||||||||||||||||||||||||
Impairment Charges (Note 11) |
— | — | 1,499 | — | 1,499 | ||||||||||||||||||||||||
Impairment Reversals (Note 11) |
— | — | (1,233) | — | (1,233) | ||||||||||||||||||||||||
Divestitures (Notes 5 and 10) (2) |
(84) | — | — | — | (84) | ||||||||||||||||||||||||
| Exchange Rate Movements and Other | 13 | 16 | 243 | 43 | 315 | ||||||||||||||||||||||||
As at December 31, 2022 |
14,302 | 106 | 5,547 | 1,285 | 21,240 | ||||||||||||||||||||||||
Depreciation, Depletion and Amortization (4) |
3,692 | 19 | 554 | 86 | 4,351 | ||||||||||||||||||||||||
Divestitures (Note 5) (3) |
(8) | — | (299) | (12) | (319) | ||||||||||||||||||||||||
| Exchange Rate Movements and Other | (11) | 4 | (135) | (5) | (147) | ||||||||||||||||||||||||
| As at December 31, 2023 | 17,975 | 129 | 5,667 | 1,354 | 25,125 | ||||||||||||||||||||||||
| CARRYING VALUE | |||||||||||||||||||||||||||||
As at December 31, 2022 |
29,226 | 148 | 6,585 | 540 | 36,499 | ||||||||||||||||||||||||
As at December 31, 2023 |
29,450 | 143 | 7,103 | 554 | 37,250 | ||||||||||||||||||||||||
| As at December 31, | 2023 | 2022 | |||||||||
| Crude Oil and Natural Gas Properties | 2,507 | 2,142 | |||||||||
| Refining Assets | 243 | 137 | |||||||||
| 2,750 | 2,279 | ||||||||||
Cenovus Energy Inc. – 2023 Consolidated Financial Statements |
42 |
||||
20. LEASES | ||
| Real Estate | Transportation and Storage Assets (1) |
Refining Assets |
Other Assets (2) |
Total | |||||||||||||||||||||||||
| COST | |||||||||||||||||||||||||||||
As at December 31, 2021 |
592 | 1,841 | 161 | 62 | 2,656 | ||||||||||||||||||||||||
| Additions | — | 22 | 1 | 2 | 25 | ||||||||||||||||||||||||
| Exchange Rate Movements and Other | 7 | (23) | 12 | 10 | 6 | ||||||||||||||||||||||||
As at December 31, 2022 |
599 | 1,840 | 174 | 74 | 2,687 | ||||||||||||||||||||||||
Acquisitions (Note 5) (3) |
1 | 24 | 8 | — | 33 | ||||||||||||||||||||||||
| Additions | 1 | 56 | — | — | 57 | ||||||||||||||||||||||||
Divestitures (Note 5) (3) |
— | — | (19) | — | (19) | ||||||||||||||||||||||||
| Exchange Rate Movements and Other | (13) | 44 | (2) | (4) | 25 | ||||||||||||||||||||||||
As at December 31, 2023 |
588 | 1,964 | 161 | 70 | 2,783 | ||||||||||||||||||||||||
| ACCUMULATED DEPRECIATION | |||||||||||||||||||||||||||||
As at December 31, 2021 |
92 | 520 | 33 | 1 | 646 | ||||||||||||||||||||||||
| Depreciation | 36 | 226 | 21 | 14 | 297 | ||||||||||||||||||||||||
| Exchange Rate Movements and Other | (1) | (101) | 4 | (3) | (101) | ||||||||||||||||||||||||
As at December 31, 2022 |
127 | 645 | 58 | 12 | 842 | ||||||||||||||||||||||||
| Depreciation | 36 | 223 | 22 | 12 | 293 | ||||||||||||||||||||||||
Divestitures (Note 5) (3) |
— | — | (12) | — | (12) | ||||||||||||||||||||||||
| Exchange Rate Movements and Other | (7) | (5) | (3) | (5) | (20) | ||||||||||||||||||||||||
As at December 31, 2023 |
156 | 863 | 65 | 19 | 1,103 | ||||||||||||||||||||||||
| CARRYING VALUE | |||||||||||||||||||||||||||||
As at December 31, 2022 |
472 | 1,195 | 116 | 62 | 1,845 | ||||||||||||||||||||||||
As at December 31, 2023 |
432 | 1,101 | 96 | 51 | 1,680 | ||||||||||||||||||||||||
Cenovus Energy Inc. – 2023 Consolidated Financial Statements |
43 |
||||
| 2023 | 2022 | ||||||||||
| Lease Liabilities, Beginning of Year | 2,836 | 2,957 | |||||||||
Acquisitions (Note 5) (1) |
33 | — | |||||||||
| Additions | 57 | 25 | |||||||||
Interest Expense (Note 7) |
161 | 163 | |||||||||
| Lease Payments | (449) | (465) | |||||||||
Divestitures (Note 5) (1) |
(11) | — | |||||||||
| Exchange Rate Movements and Other | 31 | 156 | |||||||||
| Lease Liabilities, End of Year | 2,658 | 2,836 | |||||||||
| Less: Current Portion | 299 | 308 | |||||||||
| Long-Term Portion | 2,359 | 2,528 | |||||||||
21. JOINT ARRANGEMENTS | ||
| For the years ended December 31, | 2023 | 2022 | |||||||||
| Revenue | 615 | 383 | |||||||||
| Expenses | 545 | 350 | |||||||||
| Net Earnings (Loss) | 70 | 33 | |||||||||
Cenovus Energy Inc. – 2023 Consolidated Financial Statements |
44 |
||||
| As at December 31, | 2023 | 2022 | |||||||||
Current Assets (1) |
334 | 247 | |||||||||
| Non-Current Assets | 1,751 | 1,926 | |||||||||
| Current Liabilities | 140 | 160 | |||||||||
Non-Current Liabilities |
1,188 | 1,293 | |||||||||
| Net Assets | 757 | 720 | |||||||||
For the years ended December 31, |
2023 | 2022 | |||||||||
HMLP Net Earnings (Loss) |
231 | 190 | |||||||||
Cenovus's Share of HMLP Net Earnings (Loss) (1) |
(1) | (23) | |||||||||
Cenovus's Share of HMLP Other Comprehensive Income (Loss) (1) |
(2) | 8 | |||||||||
| Distributions Received | 56 | 23 | |||||||||
| Contributions Paid | 62 | 31 | |||||||||
22. OTHER ASSETS | ||
| As at December 31, | 2023 | 2022 | |||||||||
Private Equity Investments (Note 35) |
131 | 55 | |||||||||
| Precious Metals | 76 | 86 | |||||||||
| Net Investment in Finance Leases | 61 | 62 | |||||||||
Long-Term Receivables and Prepaids |
50 | 120 | |||||||||
Intangible Assets (1) |
— | 19 | |||||||||
| 318 | 342 | ||||||||||
Cenovus Energy Inc. – 2023 Consolidated Financial Statements |
45 |
||||
23. GOODWILL | ||
| 2023 | 2022 | ||||||||||
| Carrying Value, Beginning of Year | 2,923 | 3,473 | |||||||||
Goodwill Disposed (Note 5) |
— | (550) | |||||||||
| Carrying Value, End of Year | 2,923 | 2,923 | |||||||||
| As at December 31, | 2023 | 2022 | |||||||||
| Primrose (Foster Creek) | 1,171 | 1,171 | |||||||||
| Christina Lake | 1,101 | 1,101 | |||||||||
| Lloydminster Thermal | 651 | 651 | |||||||||
| 2,923 | 2,923 | ||||||||||
24. ACCOUNTS PAYABLE AND ACCRUED LIABILITIES | ||
| As at December 31, | 2023 | 2022 | |||||||||
| Accruals | 3,931 | 3,412 | |||||||||
| Trade | 1,075 | 2,331 | |||||||||
| Employee Long-Term Incentives | 284 | 162 | |||||||||
| Interest | 69 | 80 | |||||||||
| Joint Operations Payable | 75 | 66 | |||||||||
| Risk Management | 19 | 39 | |||||||||
| Provisions for Onerous and Unfavourable Contracts | 18 | 25 | |||||||||
| Other | 9 | 9 | |||||||||
| 5,480 | 6,124 | ||||||||||
25. DEBT AND CAPITAL STRUCTURE | ||
| As at December 31, | Notes | 2023 | 2022 | ||||||||||||||
| Uncommitted Demand Facilities | i | — | — | ||||||||||||||
| WRB Uncommitted Demand Facilities | ii | 179 | 115 | ||||||||||||||
| Total Debt Principal | 179 | 115 | |||||||||||||||
Cenovus Energy Inc. – 2023 Consolidated Financial Statements |
46 |
||||
| As at December 31, | Notes | 2023 | 2022 | ||||||||||||||
Committed Credit Facility (1) |
i | — | — | ||||||||||||||
| U.S. Dollar Denominated Unsecured Notes | ii | 5,028 | 6,537 | ||||||||||||||
| Canadian Dollar Unsecured Notes | ii | 2,000 | 2,000 | ||||||||||||||
| Total Debt Principal | 7,028 | 8,537 | |||||||||||||||
| Debt Premiums (Discounts), Net, and Transaction Costs | 80 | 154 | |||||||||||||||
| Long-Term Debt | 7,108 | 8,691 | |||||||||||||||
| 2023 | 2022 | ||||||||||||||||||||||
| As at December 31, | US$ Principal | C$ Principal and Equivalent | US$ Principal | C$ Principal and Equivalent | |||||||||||||||||||
| U.S. Dollar Denominated Unsecured Notes | |||||||||||||||||||||||
5.38% due July 15, 2025 |
133 | 176 | 133 | 181 | |||||||||||||||||||
4.25% due April 15, 2027 |
373 | 493 | 373 | 505 | |||||||||||||||||||
4.40% due April 15, 2029 |
183 | 241 | 240 | 324 | |||||||||||||||||||
2.65% due January 15, 2032 |
500 | 661 | 500 | 677 | |||||||||||||||||||
5.25% due June 15, 2037 |
333 | 441 | 583 | 790 | |||||||||||||||||||
6.80% due September 15, 2037 |
191 | 253 | 387 | 524 | |||||||||||||||||||
6.75% due November 15, 2039 |
652 | 862 | 935 | 1,267 | |||||||||||||||||||
4.45% due September 15, 2042 |
91 | 121 | 97 | 131 | |||||||||||||||||||
5.20% due September 15, 2043 |
27 | 36 | 29 | 39 | |||||||||||||||||||
5.40% due June 15, 2047 |
569 | 752 | 800 | 1,083 | |||||||||||||||||||
3.75% due February 15, 2052 |
750 | 992 | 750 | 1,016 | |||||||||||||||||||
| 3,802 | 5,028 | 4,827 | 6,537 | ||||||||||||||||||||
| Canadian Dollar Unsecured Notes | |||||||||||||||||||||||
3.60% due March 10, 2027 |
750 | 750 | |||||||||||||||||||||
3.50% due February 7, 2028 |
1,250 | 1,250 | |||||||||||||||||||||
| 2,000 | 2,000 | ||||||||||||||||||||||
| Total Unsecured Notes | 7,028 | 8,537 | |||||||||||||||||||||
Cenovus Energy Inc. – 2023 Consolidated Financial Statements |
47 |
||||
| U.S. Dollar Unsecured Notes |
Canadian Dollar Unsecured Notes | Total | |||||||||||||||||||||
As at December 31, 2023 |
US$ Principal | C$ Principal Equivalent | C$ Principal | C$ Principal and Equivalent | |||||||||||||||||||
| 2024 | — | — | — | — | |||||||||||||||||||
| 2025 | 133 | 176 | — | 176 | |||||||||||||||||||
| 2026 | — | — | — | — | |||||||||||||||||||
| 2027 | 373 | 493 | 750 | 1,243 | |||||||||||||||||||
| 2028 | — | — | 1,250 | 1,250 | |||||||||||||||||||
| Thereafter | 3,296 | 4,359 | — | 4,359 | |||||||||||||||||||
| 3,802 | 5,028 | 2,000 | 7,028 | ||||||||||||||||||||
Cenovus Energy Inc. – 2023 Consolidated Financial Statements |
48 |
||||
| As at December 31, | 2023 | 2022 | |||||||||
| Short-Term Borrowings | 179 | 115 | |||||||||
| Current Portion of Long-Term Debt | — | — | |||||||||
| Long-Term Portion of Long-Term Debt | 7,108 | 8,691 | |||||||||
| Total Debt | 7,287 | 8,806 | |||||||||
| Less: Cash and Cash Equivalents | (2,227) | (4,524) | |||||||||
| Net Debt | 5,060 | 4,282 | |||||||||
| Net Earnings (Loss) | 4,109 | 6,450 | |||||||||
| Add (Deduct): | |||||||||||
| Finance Costs | 671 | 820 | |||||||||
| Interest Income | (133) | (81) | |||||||||
| Income Tax Expense (Recovery) | 931 | 2,281 | |||||||||
| Depreciation, Depletion and Amortization | 4,644 | 4,679 | |||||||||
| Exploration and Evaluation Asset Write-downs | 29 | 64 | |||||||||
| (Income) Loss From Equity-Accounted Affiliates | (51) | (15) | |||||||||
| Unrealized (Gain) Loss on Risk Management | 52 | (126) | |||||||||
| Foreign Exchange (Gain) Loss, Net | (67) | 343 | |||||||||
Revaluation (Gain) Loss |
34 | (549) | |||||||||
| Re-measurement of Contingent Payments | 59 | 162 | |||||||||
| (Gain) Loss on Divestiture of Assets | (14) | (269) | |||||||||
| Other (Income) Loss, Net | (63) | (532) | |||||||||
Adjusted EBITDA (1) |
10,201 | 13,227 | |||||||||
Net Debt to Adjusted EBITDA (times) |
0.5 | 0.3 | |||||||||
| As at December 31, | 2023 | 2022 | |||||||||
| Net Debt | 5,060 | 4,282 | |||||||||
| Cash From (Used in) Operating Activities | 7,388 | 11,403 | |||||||||
| (Add) Deduct: | |||||||||||
| Settlement of Decommissioning Liabilities | (222) | (150) | |||||||||
| Net Change in Non-Cash Working Capital | (1,193) | 575 | |||||||||
Adjusted Funds Flow (1) |
8,803 | 10,978 | |||||||||
Net Debt to Adjusted Funds Flow (times) |
0.6 | 0.4 | |||||||||
| As at December 31, | 2023 | 2022 | |||||||||
| Net Debt | 5,060 | 4,282 | |||||||||
| Shareholders’ Equity | 28,698 | 27,576 | |||||||||
| Capitalization | 33,758 | 31,858 | |||||||||
Net Debt to Capitalization (percent) |
15 | 13 | |||||||||
Cenovus Energy Inc. – 2023 Consolidated Financial Statements |
49 |
||||
26. CONTINGENT PAYMENTS | ||
| 2023 | 2022 | ||||||||||
| Contingent Payments, Beginning of Year | 419 | — | |||||||||
| Initial Recognition | — | 600 | |||||||||
| Liabilities Settled or Payable | (314) | (92) | |||||||||
Re-measurement |
59 | (89) | |||||||||
| Contingent Payments, End of Year | 164 | 419 | |||||||||
| Less: Current Portion | 164 | 263 | |||||||||
| Long-Term Portion | — | 156 | |||||||||
| 2022 | |||||
| Contingent Payments, Beginning of Year | 236 | ||||
Re-measurement |
251 | ||||
| Liabilities Settled | (487) | ||||
| Contingent Payments, End of Year | — | ||||
27. DECOMMISSIONING LIABILITIES | ||
| 2023 | 2022 | ||||||||||
| Decommissioning Liabilities, Beginning of Year | 3,559 | 3,906 | |||||||||
| Liabilities Incurred | 14 | 22 | |||||||||
Liabilities Acquired (Note 5) (1) (2) |
5 | 48 | |||||||||
| Liabilities Settled | (221) | (215) | |||||||||
Liabilities Divested (Note 5) (1) (2) |
(5) | (89) | |||||||||
| Change in Estimated Future Cash Flows | 330 | 693 | |||||||||
| Change in Discount Rates | 265 | (980) | |||||||||
Unwinding of Discount on Decommissioning Liabilities (Note 7) |
220 | 176 | |||||||||
| Exchange Rate Movements and Other | (12) | (2) | |||||||||
| Decommissioning Liabilities, End of Year | 4,155 | 3,559 | |||||||||
Cenovus Energy Inc. – 2023 Consolidated Financial Statements |
50 |
||||
| Sensitivity | 2023 | 2022 | |||||||||||||||||||||||||||
| As at December 31, | Range | Increase | Decrease | Increase | Decrease | ||||||||||||||||||||||||
| Credit-Adjusted Risk-Free Rate | ± one percent |
(387) | 515 | (319) | 419 | ||||||||||||||||||||||||
| Inflation Rate | ± one percent |
519 | (392) | 419 | (320) | ||||||||||||||||||||||||
28. OTHER LIABILITIES | ||
| As at December 31, | 2023 | 2022 | |||||||||
Renewable Volume Obligation, Net (1) |
397 | 101 | |||||||||
| Pension and Other Post-Employment Benefit Plan | 276 | 201 | |||||||||
Provision for West White Rose Expansion Project (2) |
156 | 204 | |||||||||
| Provisions for Onerous and Unfavourable Contracts | 72 | 95 | |||||||||
| Employee Long-Term Incentives | 100 | 245 | |||||||||
| Drilling Provisions | 25 | 31 | |||||||||
| Deferred Revenue | — | 45 | |||||||||
| Other | 157 | 120 | |||||||||
| 1,183 | 1,042 | ||||||||||
29. PENSIONS AND OTHER POST-EMPLOYMENT BENEFITS | ||
Cenovus Energy Inc. – 2023 Consolidated Financial Statements |
51 |
||||
| DB Pension Plan | OPEB Plans | ||||||||||||||||||||||||||||
| 2023 | 2022 | 2023 | 2022 | ||||||||||||||||||||||||||
| Defined Benefit Obligation | |||||||||||||||||||||||||||||
| Defined Benefit Obligation, Beginning of Year | 172 | 220 | 174 | 225 | |||||||||||||||||||||||||
| Current Service Costs | 10 | 16 | 14 | 8 | |||||||||||||||||||||||||
| Past Service Costs - Curtailment and Plan Amendments | — | — | 10 | — | |||||||||||||||||||||||||
Interest Costs (1) |
9 | 7 | 10 | 7 | |||||||||||||||||||||||||
| Benefits Paid | (8) | (12) | (9) | (8) | |||||||||||||||||||||||||
| Plan Participant Contributions | 3 | 2 | — | — | |||||||||||||||||||||||||
| Re-measurements: | |||||||||||||||||||||||||||||
| (Gains) Losses From Experience Adjustments | 4 | 1 | 1 | (2) | |||||||||||||||||||||||||
| (Gains) Losses From Changes in Financial Assumptions | 13 | (64) | 50 | (57) | |||||||||||||||||||||||||
| Exchange Rate Movements and Other | (1) | 2 | (1) | 1 | |||||||||||||||||||||||||
| Defined Benefit Obligation, End of Year | 202 | 172 | 249 | 174 | |||||||||||||||||||||||||
| Plan Assets | |||||||||||||||||||||||||||||
| Fair Value of Plan Assets, Beginning of Year | 147 | 159 | — | — | |||||||||||||||||||||||||
| Employer Contributions | 18 | 16 | 9 | 8 | |||||||||||||||||||||||||
| Plan Participant Contributions | 3 | 2 | — | — | |||||||||||||||||||||||||
| Benefits Paid | (7) | (10) | (9) | (8) | |||||||||||||||||||||||||
Interest Income (1) |
8 | 4 | — | — | |||||||||||||||||||||||||
| Re-measurements: | |||||||||||||||||||||||||||||
| Return on Plan Assets (Excluding Interest Income) | 10 | (26) | — | — | |||||||||||||||||||||||||
| Exchange Rate Movements and Other | (1) | 2 | — | — | |||||||||||||||||||||||||
| Fair Value of Plan Assets, End of Year | 178 | 147 | — | — | |||||||||||||||||||||||||
Defined Benefit Pension and OPEB Asset (Liability) (2) |
(24) | (25) | (249) | (174) | |||||||||||||||||||||||||
| DB Pension Plan and DC Pension Plan |
OPEB Plans | ||||||||||||||||||||||||||||
| For the years ended December 31, | 2023 | 2022 | 2023 | 2022 | |||||||||||||||||||||||||
| Defined Benefit Plan Cost | |||||||||||||||||||||||||||||
| Current Service Costs | 10 | 16 | 14 | 8 | |||||||||||||||||||||||||
Past Service Costs – Curtailments and Plan Amendments |
— | — | 10 | — | |||||||||||||||||||||||||
| Net Interest Costs | 1 | 3 | 10 | 7 | |||||||||||||||||||||||||
| Re-measurements: | |||||||||||||||||||||||||||||
| Return on Plan Assets (Excluding Interest Income) | (10) | 26 | — | — | |||||||||||||||||||||||||
| (Gains) Losses From Experience Adjustments | 4 | 1 | 1 | (2) | |||||||||||||||||||||||||
| (Gains) Losses From Changes in Demographic Assumptions | — | — | — | — | |||||||||||||||||||||||||
| (Gains) Losses From Changes in Financial Assumptions | 13 | (64) | 50 | (57) | |||||||||||||||||||||||||
| Defined Benefit Plan Cost (Recovery) | 18 | (18) | 85 | (44) | |||||||||||||||||||||||||
Defined Contribution Plan Cost (1) |
99 | 72 | — | — | |||||||||||||||||||||||||
| Total Plan Cost | 117 | 54 | 85 | (44) | |||||||||||||||||||||||||
Cenovus Energy Inc. – 2023 Consolidated Financial Statements |
52 |
||||
| As at December 31, | 2023 | 2022 | |||||||||
| Level 1 – Cash and Cash Equivalents | 5 | 7 | |||||||||
| Level 2 – Equity and Fixed Income Funds | 161 | 130 | |||||||||
| Level 3 – Real Estate Funds and Other | 12 | 10 | |||||||||
| 178 | 147 | ||||||||||
| Defined Benefit Plan | OPEB Plans | ||||||||||||||||||||||||||||
| For the years ended December 31, | 2023 | 2022 | 2023 | 2022 | |||||||||||||||||||||||||
Discount Rate (percent) |
4.58 | 5.12 | 4.65 | 5.13 | |||||||||||||||||||||||||
Future Salary Growth Rate (percent) |
4.00 | 4.05 | N/A | N/A | |||||||||||||||||||||||||
Average Longevity (years) |
88.4 | 88.4 | 88.4 | 88.4 | |||||||||||||||||||||||||
Health Care Cost Trend Rate (percent) |
N/A | N/A | 5.24 | 5.24 | |||||||||||||||||||||||||
Cenovus Energy Inc. – 2023 Consolidated Financial Statements |
53 |
||||
| 2023 | 2022 | ||||||||||||||||||||||
| As at December 31, | Increase | Decrease | Increase | Decrease | |||||||||||||||||||
| Discount Rate | (54) | 66 | (43) | 51 | |||||||||||||||||||
30. SHARE CAPITAL AND WARRANTS | ||
| 2023 | 2022 | ||||||||||||||||||||||
|
Number of
Common
Shares
(thousands)
|
Amount |
Number of
Common
Shares
(thousands)
|
Amount | ||||||||||||||||||||
| Outstanding, Beginning of Year | 1,909,190 | 16,320 | 2,001,211 | 17,016 | |||||||||||||||||||
| Issued Upon Exercise of Warrants | 2,610 | 26 | 9,399 | 93 | |||||||||||||||||||
| Issued Under Stock Option Plans | 3,679 | 58 | 11,069 | 170 | |||||||||||||||||||
| Purchase of Common Shares under NCIB | (43,611) | (373) | (112,489) | (959) | |||||||||||||||||||
| Outstanding, End of Year | 1,871,868 | 16,031 | 1,909,190 | 16,320 | |||||||||||||||||||
Cenovus Energy Inc. – 2023 Consolidated Financial Statements |
54 |
||||
| As at December 31, 2023 | Dividend Reset Date |
Dividend Rate
(percent)
|
Number of Preferred Shares (thousands) |
||||||||||||||
| Series 1 First Preferred Shares | March 31, 2026 | 2.58 | 10,740 | ||||||||||||||
Series 2 First Preferred Shares (1) |
Quarterly | 6.77 | 1,260 | ||||||||||||||
| Series 3 First Preferred Shares | December 31, 2024 | 4.69 | 10,000 | ||||||||||||||
| Series 5 First Preferred Shares | March 31, 2025 | 4.59 | 8,000 | ||||||||||||||
| Series 7 First Preferred Shares | June 30, 2025 | 3.94 | 6,000 | ||||||||||||||
Cenovus Energy Inc. – 2023 Consolidated Financial Statements |
55 |
||||
| 2023 | 2022 | ||||||||||||||||||||||
|
Number of
Warrants
(thousands)
|
Amount |
Number of
Warrants
(thousands)
|
Amount | ||||||||||||||||||||
| Outstanding, Beginning of Year | 55,720 | 184 | 65,119 | 215 | |||||||||||||||||||
| Exercised | (2,610) | (8) | (9,399) | (31) | |||||||||||||||||||
| Purchased and Cancelled | (45,485) | (151) | — | — | |||||||||||||||||||
| Outstanding, End of Year | 7,625 | 25 | 55,720 | 184 | |||||||||||||||||||
| Retained Earnings Prior to Ovintiv Split | Stock-Based Compensation | Total | |||||||||||||||
As at December 31, 2021 |
3,966 | 318 | 4,284 | ||||||||||||||
| Stock-Based Compensation Expense | — | 10 | 10 | ||||||||||||||
| Purchase of Common Shares Under NCIB | (1,571) | — | (1,571) | ||||||||||||||
| Common Shares Issued on Exercise of Stock Options | — | (32) | (32) | ||||||||||||||
As at December 31, 2022 |
2,395 | 296 | 2,691 | ||||||||||||||
| Stock-Based Compensation Expense | — | 11 | 11 | ||||||||||||||
| Purchase of Common Shares Under NCIB | (688) | — | (688) | ||||||||||||||
| Common Shares Issued on Exercise of Stock Options | — | (12) | (12) | ||||||||||||||
As at December 31, 2023 |
1,707 | 295 | 2,002 | ||||||||||||||
31. ACCUMULATED OTHER COMPREHENSIVE INCOME (LOSS) | ||
| Pension and Other Post-Retirement Benefits | Private Equity Instruments | Foreign Currency Translation Adjustment | Total | ||||||||||||||||||||
As at December 31, 2021 |
28 | 27 | 629 | 684 | |||||||||||||||||||
| Other Comprehensive Income (Loss), Before Tax | 96 | 2 | 713 | 811 | |||||||||||||||||||
| Income Tax (Expense) Recovery | (25) | — | — | (25) | |||||||||||||||||||
As at December 31, 2022 |
99 | 29 | 1,342 | 1,470 | |||||||||||||||||||
| Other Comprehensive Income (Loss), Before Tax | (58) | 63 | (286) | (281) | |||||||||||||||||||
Reclassification on Divestiture (Note 5) |
— | — | 12 | 12 | |||||||||||||||||||
| Income Tax (Expense) Recovery | 14 | (7) | — | 7 | |||||||||||||||||||
As at December 31, 2023 |
55 | 85 | 1,068 | 1,208 | |||||||||||||||||||
Cenovus Energy Inc. – 2023 Consolidated Financial Statements |
56 |
||||
32. STOCK-BASED COMPENSATION PLANS | ||
Risk-Free Interest Rate (percent) |
3.42 | ||||
Expected Dividend Yield (percent) |
1.78 | ||||
Expected Volatility (1) (percent) |
31.95 | ||||
Expected Life (years) |
5.45 | ||||
| Number of Stock Options with Associated Net Settlement Rights | Weighted Average Exercise Price |
||||||||||
For the year ended December 31, 2023 |
(thousands) | ($/unit) | |||||||||
| Outstanding, Beginning of Year | 14,349 | 12.38 | |||||||||
| Granted | 1,571 | 24.34 | |||||||||
| Exercised | (3,839) | 13.08 | |||||||||
| Forfeited | (128) | 15.78 | |||||||||
| Expired | (58) | 19.89 | |||||||||
| Outstanding, End of Year | 11,895 | 13.66 | |||||||||
Cenovus Energy Inc. – 2023 Consolidated Financial Statements |
57 |
||||
| Outstanding | Exercisable | ||||||||||||||||||||||||||||
As at December 31, 2023 |
Number of Stock Options with Associated Net Settlement Rights |
Weighted Average Remaining Contractual Life | Weighted Average Exercise Price | Number of Stock Options with Associated Net Settlement Rights |
Weighted Average Exercise Price | ||||||||||||||||||||||||
Range of Exercise Price ($) |
(thousands) | (years) | ($/unit) | (thousands) | ($/unit) | ||||||||||||||||||||||||
5.00 to 9.99 |
4,303 | 3.83 | 8.77 | 2,218 | 8.85 | ||||||||||||||||||||||||
10.00 to 14.99 |
4,163 | 2.92 | 11.93 | 3,894 | 11.94 | ||||||||||||||||||||||||
15.00 to 19.99 |
1,851 | 5.13 | 19.88 | 536 | 19.88 | ||||||||||||||||||||||||
20.00 to 24.99 |
1,561 | 6.17 | 24.25 | 10 | 22.75 | ||||||||||||||||||||||||
25.00 to 29.99 |
17 | 6.70 | 27.71 | — | — | ||||||||||||||||||||||||
| 11,895 | 4.03 | 13.66 | 6,658 | 11.56 | |||||||||||||||||||||||||
| Number of Cenovus Replacement Stock Options | Weighted Average Exercise Price | ||||||||||
For the year ended December 31, 2023 |
(thousands) | ($/unit) | |||||||||
| Outstanding, Beginning of Year | 3,467 | 9.99 | |||||||||
| Exercised | (2,113) | 9.97 | |||||||||
| Forfeited | (23) | 6.58 | |||||||||
| Expired | (326) | 21.09 | |||||||||
| Outstanding, End of Year | 1,005 | 6.49 | |||||||||
| Outstanding | Exercisable | ||||||||||||||||||||||||||||
As at December 31, 2023 |
Number of Cenovus Replacement Stock Options | Weighted Average Remaining Contractual Life | Weighted Average Exercise Price | Number of Cenovus Replacement Stock Options | Weighted Average Exercise Price | ||||||||||||||||||||||||
Range of Exercise Price ($) |
(thousands) | (years) | ($/unit) | (thousands) | ($/unit) | ||||||||||||||||||||||||
3.00 to 4.99 |
782 | 1.22 | 3.54 | 782 | 3.54 | ||||||||||||||||||||||||
5.00 to 9.99 |
28 | 0.42 | 6.19 | 28 | 6.19 | ||||||||||||||||||||||||
10.00 to 14.99 |
— | — | — | — | — | ||||||||||||||||||||||||
15.00 to 19.99 |
195 | 0.18 | 18.35 | 195 | 18.35 | ||||||||||||||||||||||||
| 1,005 | 0.99 | 6.49 | 1,005 | 6.49 | |||||||||||||||||||||||||
Cenovus Energy Inc. – 2023 Consolidated Financial Statements |
58 |
||||
| Number of Performance Share Units | |||||
For the year ended December 31, 2023 |
(thousands) | ||||
| Outstanding, Beginning of Year | 8,678 | ||||
| Granted | 2,539 | ||||
| Vested and Paid Out | (972) | ||||
| Forfeited | (231) | ||||
| Units in Lieu of Base Dividends | 229 | ||||
| Outstanding, End of Year | 10,243 | ||||
| Number of Restricted Share Units | |||||
For the year ended December 31, 2023 |
(thousands) | ||||
| Outstanding, Beginning of Year | 6,655 | ||||
| Granted | 2,961 | ||||
| Vested and Paid Out | (2,300) | ||||
| Forfeited | (243) | ||||
| Units in Lieu of Base Dividends | 161 | ||||
| Outstanding, End of Year | 7,234 | ||||
| Number of Deferred Share Units |
|||||
For the year ended December 31, 2023 |
(thousands) | ||||
| Outstanding, Beginning of Year | 1,506 | ||||
| Granted to Directors | 126 | ||||
| Granted | 59 | ||||
| Units in Lieu of Dividends | 37 | ||||
| Redeemed | (37) | ||||
| Outstanding, End of Year | 1,691 | ||||
Cenovus Energy Inc. – 2023 Consolidated Financial Statements |
59 |
||||
| For the years ended December 31, | 2023 | 2022 | |||||||||
| Stock Options With Associated Net Settlement Rights | 11 | 15 | |||||||||
| Cenovus Replacement Stock Options | (5) | 53 | |||||||||
| Performance Share Units | 47 | 183 | |||||||||
| Restricted Share Units | 46 | 100 | |||||||||
| Deferred Share Units | (2) | 22 | |||||||||
| Total Stock-Based Compensation Expense (Recovery) | 97 | 373 | |||||||||
33. EMPLOYEE SALARIES AND BENEFIT EXPENSES | ||
| For the years ended December 31, | 2023 | 2022 | |||||||||
| Salaries, Bonuses and Other Short-Term Employee Benefits | 1,344 | 1,246 | |||||||||
| Pension and Post-Employment Benefits | 125 | 92 | |||||||||
Stock-Based Compensation (Note 32) |
97 | 373 | |||||||||
| Other Incentive Benefits (Recovery) | — | (9) | |||||||||
| Termination Benefits | 14 | 27 | |||||||||
| 1,580 | 1,729 | ||||||||||
34. RELATED PARTY TRANSACTIONS | ||
| For the years ended December 31, | 2023 | 2022 | |||||||||
| Salaries, Director Fees and Other Short-Term Benefits | 40 | 40 | |||||||||
| Pension and Post-Employment Benefits | 3 | 4 | |||||||||
| Stock-Based Compensation | 40 | 140 | |||||||||
| Termination Benefits | — | 3 | |||||||||
| 83 | 187 | ||||||||||
35. FINANCIAL INSTRUMENTS | ||
Cenovus Energy Inc. – 2023 Consolidated Financial Statements |
60 |
||||
| 2023 | 2022 | ||||||||||
| Fair Value, Beginning of Year | 55 | 53 | |||||||||
| Acquisition | 13 | — | |||||||||
| Changes in Fair Value | 63 | 2 | |||||||||
| Fair Value, End of Year | 131 | 55 | |||||||||
| 2023 | 2022 | ||||||||||||||||||||||||||||||||||
| Risk Management | Risk Management | ||||||||||||||||||||||||||||||||||
| As at December 31, | Asset | Liability | Net | Asset | Liability | Net | |||||||||||||||||||||||||||||
| Crude Oil, Natural Gas, Condensate and Refined Products | 11 | 19 | (8) | 2 | 40 | (38) | |||||||||||||||||||||||||||||
| Power Swap Contracts | 2 | — | 2 | 1 | 7 | (6) | |||||||||||||||||||||||||||||
| Renewable Power Contracts | 18 | — | 18 | 90 | — | 90 | |||||||||||||||||||||||||||||
| 31 | 19 | 12 | 93 | 47 | 46 | ||||||||||||||||||||||||||||||
| As at December 31, | 2023 | 2022 | |||||||||
| Level 2 – Prices Sourced From Observable Data or Market Corroboration | (6) | (44) | |||||||||
| Level 3 – Prices Sourced From Partially Unobservable Data | 18 | 90 | |||||||||
| 12 | 46 | ||||||||||
Cenovus Energy Inc. – 2023 Consolidated Financial Statements |
61 |
||||
| 2023 | 2022 | ||||||||||
| Fair Value of Contracts, Beginning of Year | 46 | (68) | |||||||||
| Change in Fair Value of Contracts in Place at Beginning of Year | — | (5) | |||||||||
| Change in Fair Value of Contracts Entered Into During the Year | (45) | (1,641) | |||||||||
| Fair Value of Contracts Realized During the Year | 9 | 1,762 | |||||||||
| Unrealized Foreign Exchange Gain (Loss) on U.S. Dollar Contracts | 2 | (2) | |||||||||
| Fair Value of Contracts, End of Year | 12 | 46 | |||||||||
| 2023 | 2022 | ||||||||||||||||||||||||||||||||||
| Risk Management | Risk Management | ||||||||||||||||||||||||||||||||||
| As at December 31, | Asset | Liability | Net | Asset | Liability | Net | |||||||||||||||||||||||||||||
| Recognized Risk Management Positions | |||||||||||||||||||||||||||||||||||
| Gross Amount | 71 | 59 | 12 | 153 | 107 | 46 | |||||||||||||||||||||||||||||
| Amount Offset | (40) | (40) | — | (60) | (60) | — | |||||||||||||||||||||||||||||
| Net Amount | 31 | 19 | 12 | 93 | 47 | 46 | |||||||||||||||||||||||||||||
| For the years ended December 31, | 2023 | 2022 | |||||||||
| Realized (Gain) Loss | 9 | 1,762 | |||||||||
| Unrealized (Gain) Loss | 52 | (126) | |||||||||
(Gain) Loss on Risk Management |
61 | 1,636 | |||||||||
| 2023 | 2022 | ||||||||||||||||||||||||||||
As at December 31, |
Sensitivity Range | Increase | Decrease | Increase | Decrease | ||||||||||||||||||||||||
| WCS Forward Prices | ± $10.00 per barrel |
(21) | 45 | (68) | 157 | ||||||||||||||||||||||||
Cenovus Energy Inc. – 2023 Consolidated Financial Statements |
62 |
||||
36. RISK MANAGEMENT | ||
As at December 31, 2023 |
Notional Volumes (1) (2) |
Terms (3) |
Weighted
Average
Price (1) (2)
|
Fair Value Asset (Liability) | |||||||||||||||||||
Futures Contracts Related to Blending (4) |
|||||||||||||||||||||||
| WTI Fixed – Sell | 3.5 MMbbls |
January 2024 – December 2024 | US$75.22/bbl |
16 | |||||||||||||||||||
| WTI Fixed – Buy | 1.5 MMbbls |
January 2024 – December 2024 | US$73.69/bbl |
(4) | |||||||||||||||||||
| Power Swap Contacts | 2 | ||||||||||||||||||||||
| Renewable Power Contracts | 18 | ||||||||||||||||||||||
Other Financial Positions (5) |
(20) | ||||||||||||||||||||||
| Total Fair Value | 12 | ||||||||||||||||||||||
Cenovus Energy Inc. – 2023 Consolidated Financial Statements |
63 |
||||
As at December 31, 2023 |
Sensitivity Range | Increase | Decrease | |||||||||||
| Power Commodity Price | ± C$20.00/MWh (1) Applied to Power Hedges |
92 | (92) | |||||||||||
As at December 31, 2022 |
Sensitivity Range | Increase | Decrease | |||||||||||
| WCS and Condensate Differential Price | ± US$2.50/bbl Applied to WCS and Differential Hedges Tied to Production |
13 | (13) | |||||||||||
| Power Commodity Price | ± C$20.00/MWh Applied to Power Hedges |
113 | (113) | |||||||||||
| U.S. to Canadian Dollar Exchange Rate | ± $0.05 in the U.S. to Canadian Dollar Exchange Rate |
14 | (17) | |||||||||||
Cenovus Energy Inc. – 2023 Consolidated Financial Statements |
64 |
||||
| As at December 31, | 2023 | 2022 | ||||||||||||
$0.05 Increase in the Canadian per U.S. Dollar Foreign Exchange Rate |
197 | 246 | ||||||||||||
$0.05 Decrease in the Canadian per U.S. Dollar Foreign Exchange Rate |
(197) | (246) | ||||||||||||
Cenovus Energy Inc. – 2023 Consolidated Financial Statements |
65 |
||||
As at December 31, 2023 |
1 Year | Years 2 and 3 | Years 4 and 5 | Thereafter | Total | ||||||||||||||||||||||||
Accounts Payable and Accrued Liabilities (1) |
5,480 | — | — | — | 5,480 | ||||||||||||||||||||||||
Short-Term Borrowings |
179 | — | — | — | 179 | ||||||||||||||||||||||||
| Contingent Payments | 168 | — | — | — | 168 | ||||||||||||||||||||||||
Lease Liabilities (2) |
438 | 712 | 569 | 2,635 | 4,354 | ||||||||||||||||||||||||
Long-Term Debt (2) |
313 | 792 | 3,007 | 7,145 | 11,257 | ||||||||||||||||||||||||
As at December 31, 2022 |
1 Year | Years 2 and 3 | Years 4 and 5 | Thereafter | Total | ||||||||||||||||||||||||
Accounts Payable and Accrued Liabilities (1) |
6,124 | — | — | — | 6,124 | ||||||||||||||||||||||||
Short-Term Borrowings |
115 | — | — | — | 115 | ||||||||||||||||||||||||
| Contingent Payments | 271 | 167 | — | — | 438 | ||||||||||||||||||||||||
Lease Liabilities (2) |
426 | 746 | 596 | 2,889 | 4,657 | ||||||||||||||||||||||||
Long-Term Debt (2) |
401 | 983 | 2,014 | 11,196 | 14,594 | ||||||||||||||||||||||||
37. SUPPLEMENTARY CASH FLOW INFORMATION | ||
| As at December 31, | 2023 | 2022 | |||||||||
| Total Current Assets | 9,708 | 12,430 | |||||||||
| Total Current Liabilities | 6,210 | 8,021 | |||||||||
| Working Capital | 3,498 | 4,409 | |||||||||
| For the years ended December 31, | 2023 | 2022 | |||||||||
| Accounts Receivable and Accrued Revenues | 314 | 838 | |||||||||
| Income Tax Receivable | (295) | (58) | |||||||||
| Inventories | 216 | (143) | |||||||||
| Accounts Payable and Accrued Liabilities | (685) | (524) | |||||||||
| Income Tax Payable | (1,112) | 1,000 | |||||||||
| Total Change in Non-Cash Working Capital | (1,562) | 1,113 | |||||||||
| Net Change in Non-Cash Working Capital – Operating Activities | (1,193) | 575 | |||||||||
| Net Change in Non-Cash Working Capital – Investing Activities | (369) | 538 | |||||||||
| Total Change in Non-Cash Working Capital | (1,562) | 1,113 | |||||||||
| For the years ended December 31, | 2023 | 2022 | |||||||||
| Interest Paid | 402 | 647 | |||||||||
| Interest Received | 130 | 78 | |||||||||
Income Taxes Paid |
2,595 | 723 | |||||||||
Cenovus Energy Inc. – 2023 Consolidated Financial Statements |
66 |
||||
| Dividends Payable | Warrant Purchase Payable | Short-Term Borrowings | Long-Term Debt | Lease Liabilities | |||||||||||||||||||||||||
As at December 31, 2021 |
— | — | 79 | 12,385 | 2,957 | ||||||||||||||||||||||||
| Changes From Financing Cash Flows: | |||||||||||||||||||||||||||||
| Net Issuance (Repayment) of Short-Term Borrowings | — | — | 34 | — | — | ||||||||||||||||||||||||
Repayment of Long-Term Debt |
— | — | — | (4,149) | — | ||||||||||||||||||||||||
| Principal Repayment of Leases | — | — | — | — | (302) | ||||||||||||||||||||||||
| Base Dividends Paid on Common Shares | (682) | — | — | — | — | ||||||||||||||||||||||||
| Variable Dividends Paid on Common Shares | (219) | — | — | — | — | ||||||||||||||||||||||||
| Dividends Paid on Preferred Shares | (26) | — | — | — | — | ||||||||||||||||||||||||
| Non-Cash Changes: | |||||||||||||||||||||||||||||
| Net Premium (Discount) on Redemption of Long-Term Debt | — | — | — | (29) | — | ||||||||||||||||||||||||
| Finance and Transaction Costs | — | — | — | (28) | — | ||||||||||||||||||||||||
| Lease Additions | — | — | — | — | 25 | ||||||||||||||||||||||||
| Base Dividends Declared on Common Shares | 682 | — | — | — | — | ||||||||||||||||||||||||
| Variable Dividends Declared on Common Shares | 219 | — | — | — | — | ||||||||||||||||||||||||
| Dividends Declared on Preferred Shares | 35 | — | — | — | — | ||||||||||||||||||||||||
| Exchange Rate Movements and Other | — | — | 2 | 512 | 156 | ||||||||||||||||||||||||
As at December 31, 2022 |
9 | — | 115 | 8,691 | 2,836 | ||||||||||||||||||||||||
| Changes From Financing Cash Flows: | |||||||||||||||||||||||||||||
| Net Issuance (Repayment) of Short-Term Borrowings | — | — | 58 | — | — | ||||||||||||||||||||||||
Repayment of Long-Term Debt |
— | — | — | (1,346) | — | ||||||||||||||||||||||||
| Principal Repayment of Leases | — | — | — | — | (288) | ||||||||||||||||||||||||
| Base Dividends Paid on Common Shares | (990) | — | — | — | — | ||||||||||||||||||||||||
| Dividends Paid on Preferred Shares | (36) | — | — | — | — | ||||||||||||||||||||||||
| Payment for Purchase of Warrants | — | (711) | — | — | — | ||||||||||||||||||||||||
| Finance and Transaction Costs | — | (2) | — | — | — | ||||||||||||||||||||||||
| Non-Cash Changes: | |||||||||||||||||||||||||||||
| Net Premium (Discount) on Redemption of Long-Term Debt | — | — | — | (84) | — | ||||||||||||||||||||||||
| Finance and Transaction Costs | — | 2 | — | (19) | — | ||||||||||||||||||||||||
| Lease Acquisitions | — | — | — | — | 33 | ||||||||||||||||||||||||
| Lease Additions | — | — | — | — | 57 | ||||||||||||||||||||||||
| Lease Divestitures | — | — | — | — | (11) | ||||||||||||||||||||||||
| Base Dividends Declared on Common Shares | 990 | — | — | — | — | ||||||||||||||||||||||||
| Dividends Declared on Preferred Shares | 36 | — | — | — | — | ||||||||||||||||||||||||
| Warrants Purchased and Cancelled | — | 711 | — | — | — | ||||||||||||||||||||||||
| Exchange Rate Movements and Other | — | — | 6 | (134) | 31 | ||||||||||||||||||||||||
As at December 31, 2023 |
9 | — | 179 | 7,108 | 2,658 | ||||||||||||||||||||||||
Cenovus Energy Inc. – 2023 Consolidated Financial Statements |
67 |
||||
38. COMMITMENTS AND CONTINGENCIES | ||
As at December 31, 2023 |
1 Year | 2 Years | 3 Years | 4 Years | 5 Years | Thereafter | Total | ||||||||||||||||||||||||||||||||||
Transportation and Storage (1) (2) |
2,018 | 1,927 | 1,680 | 1,663 | 1,641 | 15,738 | 24,667 | ||||||||||||||||||||||||||||||||||
Product Purchases |
617 | — | — | — | — | — | 617 | ||||||||||||||||||||||||||||||||||
Real Estate |
57 | 57 | 59 | 63 | 58 | 604 | 898 | ||||||||||||||||||||||||||||||||||
Obligation to Fund HCML |
94 | 94 | 94 | 89 | 52 | 90 | 513 | ||||||||||||||||||||||||||||||||||
Other Long-Term Commitments (3) |
417 | 194 | 184 | 175 | 166 | 965 | 2,101 | ||||||||||||||||||||||||||||||||||
Total Commitments |
3,203 | 2,272 | 2,017 | 1,990 | 1,917 | 17,397 | 28,796 | ||||||||||||||||||||||||||||||||||
As at December 31, 2022 |
1 Year | 2 Years | 3 Years | 4 Years | 5 Years | Thereafter | Total | ||||||||||||||||||||||||||||||||||
Transportation and Storage (1) (2) |
1,747 | 2,011 | 1,542 | 1,416 | 1,360 | 13,005 | 21,081 | ||||||||||||||||||||||||||||||||||
| Product Purchases | 1,626 | 1,509 | 922 | 922 | 922 | 3,457 | 9,358 | ||||||||||||||||||||||||||||||||||
Real Estate |
48 | 50 | 50 | 50 | 54 | 604 | 856 | ||||||||||||||||||||||||||||||||||
Obligation to Fund HCML |
92 | 105 | 96 | 96 | 91 | 143 | 623 | ||||||||||||||||||||||||||||||||||
| Other Long-Term Commitments | 381 | 90 | 75 | 74 | 65 | 395 | 1,080 | ||||||||||||||||||||||||||||||||||
Total Commitments |
3,894 | 3,765 | 2,685 | 2,558 | 2,492 | 17,604 | 32,998 | ||||||||||||||||||||||||||||||||||
39. PRIOR PERIOD REVISIONS | ||
Cenovus Energy Inc. – 2023 Consolidated Financial Statements |
68 |
||||
| Year Ended December 31, 2022 | |||||||||||||||||
| Oil Sands Segment | Previously Reported | Revisions | Revised Balance | ||||||||||||||
Gross Sales |
34,775 | (92) | 34,683 | ||||||||||||||
| Purchased Product | 4,810 | (92) | 4,718 | ||||||||||||||
| 29,965 | — | 29,965 | |||||||||||||||
| Conventional Segment | |||||||||||||||||
| Gross Sales | 4,332 | 107 | 4,439 | ||||||||||||||
| Transportation and Blending | 143 | 107 | 250 | ||||||||||||||
| 4,189 | — | 4,189 | |||||||||||||||
|
U.S. Refining Segment
|
|||||||||||||||||
Gross Sales |
30,310 | (92) | 30,218 | ||||||||||||||
| Purchased Product | 26,112 | (92) | 26,020 | ||||||||||||||
| 4,198 | — | 4,198 | |||||||||||||||
|
Corporate and Eliminations Segment |
|||||||||||||||||
| Gross Sales | (7,464) | 77 | (7,387) | ||||||||||||||
Purchased Product |
(5,533) | 341 | (5,192) | ||||||||||||||
| Transportation and Blending | (664) | (511) | (1,175) | ||||||||||||||
| Operating | (1,270) | 247 | (1,023) | ||||||||||||||
| 3 | — | 3 | |||||||||||||||
|
Consolidated |
|||||||||||||||||
| Purchased Product | 33,801 | 157 | 33,958 | ||||||||||||||
| Transportation and Blending | 11,530 | (404) | 11,126 | ||||||||||||||
| Operating | 5,569 | 247 | 5,816 | ||||||||||||||
| 50,900 | — | 50,900 | |||||||||||||||
Cenovus Energy Inc. – 2023 Consolidated Financial Statements |
69 |
||||

| DISCLOSURES ABOUT OIL AND GAS PRODUCING ACTIVITIES TOPIC 932 “EXTRACTIVE ACTIVITIES – OIL AND GAS” (unaudited) | ||
| Cenovus Energy Inc. | 2 |
Supplementary Information – Oil and Gas Activities (unaudited) | ||||||
| Bitumen | Crude Oil | Natural Gas Liquids | Natural Gas | Total | ||||||||||||||||||||||||||||||||||||||||||||||||||||||||||
(MMbbls) (3) |
(MMbbls) (3) |
(MMbbls) (3) |
(Bcf) (3) |
(MMBOE) (3) |
||||||||||||||||||||||||||||||||||||||||||||||||||||||||||
| Canada | ||||||||||||||||||||||||||||||||||||||||||||||||||||||||||||||
| 2022 | ||||||||||||||||||||||||||||||||||||||||||||||||||||||||||||||
| Beginning of year | 4,409 | 72 | 58 | 1,532 | 4,794 | |||||||||||||||||||||||||||||||||||||||||||||||||||||||||
| Technical revisions and improved recovery | 79 | (3) | 2 | 42 | 85 | |||||||||||||||||||||||||||||||||||||||||||||||||||||||||
| Revisions due to price | (469) | 7 | — | 14 | (460) | |||||||||||||||||||||||||||||||||||||||||||||||||||||||||
| Total revisions to prior estimates | (390) | 4 | 2 | 56 | (375) | |||||||||||||||||||||||||||||||||||||||||||||||||||||||||
| Extensions and discoveries | 21 | 5 | 3 | 178 | 58 | |||||||||||||||||||||||||||||||||||||||||||||||||||||||||
| Purchase of reserves in place | 237 | — | — | 2 | 238 | |||||||||||||||||||||||||||||||||||||||||||||||||||||||||
| Sale of reserves in place | (102) | (1) | (2) | (30) | (110) | |||||||||||||||||||||||||||||||||||||||||||||||||||||||||
| Production | (154) | (12) | (6) | (200) | (206) | |||||||||||||||||||||||||||||||||||||||||||||||||||||||||
| End of year | 4,021 | 68 | 55 | 1,538 | 4,399 | |||||||||||||||||||||||||||||||||||||||||||||||||||||||||
| Developed | 792 | 62 | 45 | 1,208 | 1,100 | |||||||||||||||||||||||||||||||||||||||||||||||||||||||||
| Undeveloped | 3,229 | 6 | 10 | 330 | 3,299 | |||||||||||||||||||||||||||||||||||||||||||||||||||||||||
| Total | 4,021 | 68 | 55 | 1,538 | 4,399 | |||||||||||||||||||||||||||||||||||||||||||||||||||||||||
| 2023 | ||||||||||||||||||||||||||||||||||||||||||||||||||||||||||||||
| Beginning of year | 4,021 | 68 | 55 | 1,538 | 4,399 | |||||||||||||||||||||||||||||||||||||||||||||||||||||||||
| Technical revisions and improved recovery | (33) | (2) | (3) | (14) | (40) | |||||||||||||||||||||||||||||||||||||||||||||||||||||||||
| Revisions due to price | 160 | (3) | (2) | (40) | 148 | |||||||||||||||||||||||||||||||||||||||||||||||||||||||||
| Total revisions to prior estimates | 127 | (5) | (5) | (54) | 109 | |||||||||||||||||||||||||||||||||||||||||||||||||||||||||
| Extensions and discoveries | 85 | 4 | 3 | 134 | 115 | |||||||||||||||||||||||||||||||||||||||||||||||||||||||||
| Purchase of reserves in place | 7 | — | — | — | 7 | |||||||||||||||||||||||||||||||||||||||||||||||||||||||||
| Sale of reserves in place | — | — | — | (3) | (1) | |||||||||||||||||||||||||||||||||||||||||||||||||||||||||
| Production | (163) | (10) | (6) | (205) | (214) | |||||||||||||||||||||||||||||||||||||||||||||||||||||||||
| End of year | 4,077 | 56 | 47 | 1,411 | 4,415 | |||||||||||||||||||||||||||||||||||||||||||||||||||||||||
| Developed | 781 | 50 | 37 | 1,083 | 1,049 | |||||||||||||||||||||||||||||||||||||||||||||||||||||||||
| Undeveloped | 3,296 | 6 | 10 | 328 | 3,367 | |||||||||||||||||||||||||||||||||||||||||||||||||||||||||
| Total | 4,077 | 56 | 47 | 1,411 | 4,415 | |||||||||||||||||||||||||||||||||||||||||||||||||||||||||
| Cenovus Energy Inc. | 3 |
Supplementary Information – Oil and Gas Activities (unaudited) | ||||||
| Bitumen | Crude Oil | Natural Gas Liquids | Natural Gas | Total | ||||||||||||||||||||||||||||||||||||||||||||||||||||||||||
(MMbbls) (3) |
(MMbbls) (3) |
(MMbbls) (3) |
(Bcf) (3) |
(MMBOE) (3) |
||||||||||||||||||||||||||||||||||||||||||||||||||||||||||
| China | ||||||||||||||||||||||||||||||||||||||||||||||||||||||||||||||
| 2022 | ||||||||||||||||||||||||||||||||||||||||||||||||||||||||||||||
| Beginning of year | — | — | 16 | 382 | 80 | |||||||||||||||||||||||||||||||||||||||||||||||||||||||||
| Technical revisions and improved recovery | — | — | (1) | 11 | 1 | |||||||||||||||||||||||||||||||||||||||||||||||||||||||||
| Total revisions to prior estimates | — | — | (1) | 11 | 1 | |||||||||||||||||||||||||||||||||||||||||||||||||||||||||
| Production | — | — | (4) | (79) | (17) | |||||||||||||||||||||||||||||||||||||||||||||||||||||||||
| End of year | — | — | 11 | 314 | 64 | |||||||||||||||||||||||||||||||||||||||||||||||||||||||||
| Developed | — | — | 11 | 314 | 64 | |||||||||||||||||||||||||||||||||||||||||||||||||||||||||
| Undeveloped | — | — | — | — | — | |||||||||||||||||||||||||||||||||||||||||||||||||||||||||
| Total | — | — | 11 | 314 | 64 | |||||||||||||||||||||||||||||||||||||||||||||||||||||||||
| 2023 | ||||||||||||||||||||||||||||||||||||||||||||||||||||||||||||||
| Beginning of year | — | — | 11 | 314 | 64 | |||||||||||||||||||||||||||||||||||||||||||||||||||||||||
| Technical revisions and improved recovery | — | — | 1 | (1) | 1 | |||||||||||||||||||||||||||||||||||||||||||||||||||||||||
| Total revisions to prior estimates | — | — | 1 | (1) | 1 | |||||||||||||||||||||||||||||||||||||||||||||||||||||||||
| Production | — | — | (3) | (65) | (14) | |||||||||||||||||||||||||||||||||||||||||||||||||||||||||
| End of year | — | — | 9 | 248 | 51 | |||||||||||||||||||||||||||||||||||||||||||||||||||||||||
| Developed | — | — | 9 | 248 | 51 | |||||||||||||||||||||||||||||||||||||||||||||||||||||||||
| Undeveloped | — | — | — | — | — | |||||||||||||||||||||||||||||||||||||||||||||||||||||||||
| Total | — | — | 9 | 248 | 51 | |||||||||||||||||||||||||||||||||||||||||||||||||||||||||
| Total Consolidated Entities | ||||||||||||||||||||||||||||||||||||||||||||||||||||||||||||||
| 2022 | ||||||||||||||||||||||||||||||||||||||||||||||||||||||||||||||
| Beginning of year | 4,409 | 72 | 74 | 1,914 | 4,874 | |||||||||||||||||||||||||||||||||||||||||||||||||||||||||
| Technical revisions and improved recovery | 79 | (3) | 1 | 53 | 86 | |||||||||||||||||||||||||||||||||||||||||||||||||||||||||
| Revisions due to price | (469) | 7 | — | 14 | (460) | |||||||||||||||||||||||||||||||||||||||||||||||||||||||||
| Total revisions to prior estimates | (390) | 4 | 1 | 67 | (374) | |||||||||||||||||||||||||||||||||||||||||||||||||||||||||
| Extensions and discoveries | 21 | 5 | 3 | 178 | 58 | |||||||||||||||||||||||||||||||||||||||||||||||||||||||||
| Purchase of reserves in place | 237 | — | — | 2 | 238 | |||||||||||||||||||||||||||||||||||||||||||||||||||||||||
| Sale of reserves in place | (102) | (1) | (2) | (30) | (110) | |||||||||||||||||||||||||||||||||||||||||||||||||||||||||
| Production | (154) | (12) | (10) | (279) | (223) | |||||||||||||||||||||||||||||||||||||||||||||||||||||||||
| End of year | 4,021 | 68 | 66 | 1,852 | 4,463 | |||||||||||||||||||||||||||||||||||||||||||||||||||||||||
| Developed | 792 | 62 | 56 | 1,522 | 1,164 | |||||||||||||||||||||||||||||||||||||||||||||||||||||||||
| Undeveloped | 3,229 | 6 | 10 | 330 | 3,299 | |||||||||||||||||||||||||||||||||||||||||||||||||||||||||
| Total | 4,021 | 68 | 66 | 1,852 | 4,463 | |||||||||||||||||||||||||||||||||||||||||||||||||||||||||
| 2023 | ||||||||||||||||||||||||||||||||||||||||||||||||||||||||||||||
| Beginning of year | 4,021 | 68 | 66 | 1,852 | 4,463 | |||||||||||||||||||||||||||||||||||||||||||||||||||||||||
| Technical revisions and improved recovery | (33) | (2) | (2) | (15) | (39) | |||||||||||||||||||||||||||||||||||||||||||||||||||||||||
| Revisions due to price | 160 | (3) | (2) | (40) | 148 | |||||||||||||||||||||||||||||||||||||||||||||||||||||||||
| Total revisions to prior estimates | 127 | (5) | (4) | (55) | 109 | |||||||||||||||||||||||||||||||||||||||||||||||||||||||||
| Extensions and discoveries | 85 | 4 | 3 | 134 | 115 | |||||||||||||||||||||||||||||||||||||||||||||||||||||||||
| Purchase of reserves in place | 7 | — | — | — | 7 | |||||||||||||||||||||||||||||||||||||||||||||||||||||||||
| Sale of reserves in place | — | — | — | (3) | (1) | |||||||||||||||||||||||||||||||||||||||||||||||||||||||||
| Production | (163) | (10) | (9) | (270) | (227) | |||||||||||||||||||||||||||||||||||||||||||||||||||||||||
| End of year | 4,077 | 56 | 56 | 1,659 | 4,466 | |||||||||||||||||||||||||||||||||||||||||||||||||||||||||
| Developed | 781 | 50 | 46 | 1,331 | 1,099 | |||||||||||||||||||||||||||||||||||||||||||||||||||||||||
| Cenovus Energy Inc. | 4 |
Supplementary Information – Oil and Gas Activities (unaudited) | ||||||
| Bitumen | Crude Oil | Natural Gas Liquids | Natural Gas | Total | ||||||||||||||||||||||||||||||||||||||||||||||||||||||||||
(MMbbls) (3) |
(MMbbls) (3) |
(MMbbls) (3) |
(Bcf) (3) |
(MMBOE) (3) |
||||||||||||||||||||||||||||||||||||||||||||||||||||||||||
| Undeveloped | 3,296 | 6 | 10 | 328 | 3,367 | |||||||||||||||||||||||||||||||||||||||||||||||||||||||||
| Total | 4,077 | 56 | 56 | 1,659 | 4,466 | |||||||||||||||||||||||||||||||||||||||||||||||||||||||||
Indonesia (4) |
||||||||||||||||||||||||||||||||||||||||||||||||||||||||||||||
| 2022 | ||||||||||||||||||||||||||||||||||||||||||||||||||||||||||||||
| Beginning of year | — | — | 2 | 149 | 27 | |||||||||||||||||||||||||||||||||||||||||||||||||||||||||
| Technical revisions and improved recovery | — | — | 1 | (7) | — | |||||||||||||||||||||||||||||||||||||||||||||||||||||||||
| Revisions due to price | — | — | — | (8) | (2) | |||||||||||||||||||||||||||||||||||||||||||||||||||||||||
| Total revisions to prior estimates | — | — | 1 | (15) | (2) | |||||||||||||||||||||||||||||||||||||||||||||||||||||||||
| Production | — | — | (1) | (10) | (2) | |||||||||||||||||||||||||||||||||||||||||||||||||||||||||
| End of year | — | — | 2 | 124 | 23 | |||||||||||||||||||||||||||||||||||||||||||||||||||||||||
| Developed | — | — | 2 | 124 | 23 | |||||||||||||||||||||||||||||||||||||||||||||||||||||||||
| Undeveloped | — | — | — | — | — | |||||||||||||||||||||||||||||||||||||||||||||||||||||||||
| Total | — | — | 2 | 124 | 23 | |||||||||||||||||||||||||||||||||||||||||||||||||||||||||
| 2023 | ||||||||||||||||||||||||||||||||||||||||||||||||||||||||||||||
| Beginning of year | — | — | 2 | 124 | 23 | |||||||||||||||||||||||||||||||||||||||||||||||||||||||||
| Technical revisions and improved recovery | — | — | — | 14 | 2 | |||||||||||||||||||||||||||||||||||||||||||||||||||||||||
| Revisions due to price | — | — | — | — | — | |||||||||||||||||||||||||||||||||||||||||||||||||||||||||
| Total revisions to prior estimates | — | — | — | 14 | 2 | |||||||||||||||||||||||||||||||||||||||||||||||||||||||||
| Extensions and discoveries | — | — | — | 10 | 2 | |||||||||||||||||||||||||||||||||||||||||||||||||||||||||
| Production | — | — | (1) | (21) | (4) | |||||||||||||||||||||||||||||||||||||||||||||||||||||||||
| End of year | — | — | 2 | 126 | 23 | |||||||||||||||||||||||||||||||||||||||||||||||||||||||||
| Developed | — | — | 2 | 126 | 23 | |||||||||||||||||||||||||||||||||||||||||||||||||||||||||
| Undeveloped | — | — | — | — | — | |||||||||||||||||||||||||||||||||||||||||||||||||||||||||
| Total | — | — | 2 | 126 | 23 | |||||||||||||||||||||||||||||||||||||||||||||||||||||||||
| Cenovus Energy Inc. | 5 |
Supplementary Information – Oil and Gas Activities (unaudited) | ||||||
| Cenovus Energy Inc. | 6 |
Supplementary Information – Oil and Gas Activities (unaudited) | ||||||
| Crude Oil and Natural Gas Liquids | Natural Gas | |||||||||||||||||||||||||||||||||||||||||||||||||||||||||||||||||||||||||||||||||||||
Brent Crude Oil |
WTI (1)
Cushing
Oklahoma
|
WCS (2) |
Edmonton MSW (3) |
Edmonton C5+ | Henry Hub Louisiana | AECO (4) |
||||||||||||||||||||||||||||||||||||||||||||||||||||||||||||||||||||||||||||||||
| (US$/bbl) | (US$/bbl) | (C$/bbl) | (C$/bbl) | (C$/bbl) | (US$/MMBtu) | (C$/MMBtu) | ||||||||||||||||||||||||||||||||||||||||||||||||||||||||||||||||||||||||||||||||
| 2023 | 83.17 | 78.22 | 81.15 | 100.50 | 103.67 | 2.64 | 2.78 | |||||||||||||||||||||||||||||||||||||||||||||||||||||||||||||||||||||||||||||||
| 2022 | 101.24 | 93.67 | 96.99 | 118.70 | 119.73 | 6.36 | 5.65 | |||||||||||||||||||||||||||||||||||||||||||||||||||||||||||||||||||||||||||||||
| Year Ended December 31, 2023 | |||||||||||||||||||||||||||||||||||||||||
| ($ millions) | Canada | China | Total Consolidated Entities | Indonesia | |||||||||||||||||||||||||||||||||||||
| Future cash inflows | 270,046 | 4,005 | 274,051 | 1,494 | |||||||||||||||||||||||||||||||||||||
| Less future: | |||||||||||||||||||||||||||||||||||||||||
| Production costs | 76,463 | 617 | 77,080 | 784 | |||||||||||||||||||||||||||||||||||||
| Development costs | 34,682 | 169 | 34,851 | 2 | |||||||||||||||||||||||||||||||||||||
Asset retirement obligation payments (1) |
7,382 | 64 | 7,446 | 30 | |||||||||||||||||||||||||||||||||||||
| Income taxes | 34,273 | 720 | 34,993 | 272 | |||||||||||||||||||||||||||||||||||||
| Future net cash flows | 117,246 | 2,435 | 119,681 | 406 | |||||||||||||||||||||||||||||||||||||
| Less 10 percent annual discount for estimated timing of cash flow |
73,666 | 421 | 74,087 | 84 | |||||||||||||||||||||||||||||||||||||
| Discounted future net cash flow | 43,580 | 2,014 | 45,594 | 322 | |||||||||||||||||||||||||||||||||||||
| Year Ended December 31, 2022 | |||||||||||||||||||||||||||||||||||||||||
| ($ millions) | Canada | China | Total Consolidated Entities | Indonesia | |||||||||||||||||||||||||||||||||||||
| Future cash inflows | 338,151 | 5,298 | 343,449 | 1,516 | |||||||||||||||||||||||||||||||||||||
| Less future: | |||||||||||||||||||||||||||||||||||||||||
| Production costs | 93,888 | 711 | 94,599 | 861 | |||||||||||||||||||||||||||||||||||||
| Development costs | 34,596 | 40 | 34,636 | — | |||||||||||||||||||||||||||||||||||||
Asset retirement obligation payments (1) |
6,850 | 107 | 6,957 | 36 | |||||||||||||||||||||||||||||||||||||
| Income taxes | 46,420 | 1,008 | 47,428 | 247 | |||||||||||||||||||||||||||||||||||||
| Future net cash flows | 156,397 | 3,432 | 159,829 | 372 | |||||||||||||||||||||||||||||||||||||
| Less 10 percent annual discount for estimated timing of cash flow |
100,553 | 829 | 101,382 | 95 | |||||||||||||||||||||||||||||||||||||
| Discounted future net cash flow | 55,844 | 2,603 | 58,447 | 277 | |||||||||||||||||||||||||||||||||||||
| Cenovus Energy Inc. | 7 |
Supplementary Information – Oil and Gas Activities (unaudited) | ||||||
| Year Ended December 31, 2023 | |||||||||||||||||||||||||||||||||||||||||
| ($ millions) | Canada | China | Total Consolidated Entities | Indonesia | |||||||||||||||||||||||||||||||||||||
| Balance, beginning of year | 55,844 | 2,603 | 58,447 | 277 | |||||||||||||||||||||||||||||||||||||
| Changes resulting from: | |||||||||||||||||||||||||||||||||||||||||
|
Sales of oil and gas produced during the period, net of
operating costs (1)
|
(8,848) | (1,022) | (9,870) | (197) | |||||||||||||||||||||||||||||||||||||
| Extensions, discoveries and improved recovery, net of related cost |
4,990 | — | 4,990 | 38 | |||||||||||||||||||||||||||||||||||||
| Purchases of proved reserves in place | 60 | — | 60 | — | |||||||||||||||||||||||||||||||||||||
| Sales of proved reserves in place | (2) | — | (2) | — | |||||||||||||||||||||||||||||||||||||
Net change in prices and production costs (1) |
(14,192) | 109 | (14,083) | 153 | |||||||||||||||||||||||||||||||||||||
| Revisions to quantity estimates | (437) | 41 | (396) | 57 | |||||||||||||||||||||||||||||||||||||
| Accretion of discount | 6,302 | 260 | 6,562 | 35 | |||||||||||||||||||||||||||||||||||||
Changes in estimated future development costs |
(4,770) | (112) | (4,882) | (15) | |||||||||||||||||||||||||||||||||||||
| Costs incurred | 3,389 | 3 | 3,392 | 14 | |||||||||||||||||||||||||||||||||||||
| Other | (1,037) | 198 | (839) | 38 | |||||||||||||||||||||||||||||||||||||
| Net change in income taxes | 2,281 | (66) | 2,215 | (78) | |||||||||||||||||||||||||||||||||||||
| Balance, end of year | 43,580 | 2,014 | 45,594 | 322 | |||||||||||||||||||||||||||||||||||||
| Year Ended December 31, 2022 | |||||||||||||||||||||||||||||||||||||||||
| ($ millions) | Canada | China | Total Consolidated Entities | Indonesia | |||||||||||||||||||||||||||||||||||||
| Balance, beginning of year | 36,588 | 2,661 | 39,249 | 204 | |||||||||||||||||||||||||||||||||||||
| Changes resulting from: | |||||||||||||||||||||||||||||||||||||||||
|
Sales of oil and gas produced during the period, net of
operating costs (1)
|
(10,575) | (1,263) | (11,838) | (119) | |||||||||||||||||||||||||||||||||||||
| Extensions, discoveries and improved recovery, net of related cost |
7,735 | — | 7,735 | 231 | |||||||||||||||||||||||||||||||||||||
| Purchases of proved reserves in place | 3,194 | — | 3,194 | — | |||||||||||||||||||||||||||||||||||||
| Sales of proved reserves in place | (2,155) | — | (2,155) | — | |||||||||||||||||||||||||||||||||||||
Net change in prices and production costs (1) |
30,271 | 1,362 | 31,633 | (51) | |||||||||||||||||||||||||||||||||||||
| Revisions to quantity estimates | (3,017) | 40 | (2,977) | (24) | |||||||||||||||||||||||||||||||||||||
| Accretion of discount | 4,056 | 213 | 4,269 | 34 | |||||||||||||||||||||||||||||||||||||
Changes in estimated future development costs |
(4,383) | (31) | (4,414) | (35) | |||||||||||||||||||||||||||||||||||||
| Costs incurred | 2,404 | 4 | 2,408 | 74 | |||||||||||||||||||||||||||||||||||||
| Other | (1,557) | (14) | (1,571) | (13) | |||||||||||||||||||||||||||||||||||||
| Net change in income taxes | (6,717) | (369) | (7,086) | (24) | |||||||||||||||||||||||||||||||||||||
| Balance, end of year | 55,844 | 2,603 | 58,447 | 277 | |||||||||||||||||||||||||||||||||||||
| Cenovus Energy Inc. | 8 |
Supplementary Information – Oil and Gas Activities (unaudited) | ||||||
| Year Ended December 31, 2023 | |||||||||||||||||||||||||||||||||||||||||
| ($ millions) | Canada | China | Total Consolidated Entities | Indonesia (1) |
|||||||||||||||||||||||||||||||||||||
Oil and gas sales, net of royalties, transportation and blending and realized risk management |
12,427 | 1,133 | 13,560 | 243 | |||||||||||||||||||||||||||||||||||||
| Less: | |||||||||||||||||||||||||||||||||||||||||
| Operating costs and accretion of asset retirement obligations |
3,773 | 124 | 3,897 | 49 | |||||||||||||||||||||||||||||||||||||
| Depreciation, depletion and amortization | 3,402 | 464 | 3,866 | 78 | |||||||||||||||||||||||||||||||||||||
| Exploration expense | 37 | 5 | 42 | 2 | |||||||||||||||||||||||||||||||||||||
| Operating income | 5,215 | 540 | 5,755 | 114 | |||||||||||||||||||||||||||||||||||||
| Income taxes | 1,311 | 221 | 1,532 | 46 | |||||||||||||||||||||||||||||||||||||
| Results of operations | 3,904 | 319 | 4,223 | 68 | |||||||||||||||||||||||||||||||||||||
| Year Ended December 31, 2022 | |||||||||||||||||||||||||||||||||||||||||
| ($ millions) | Canada | China | Total Consolidated Entities | Indonesia (1) |
|||||||||||||||||||||||||||||||||||||
Oil and gas sales, net of royalties, transportation and blending and realized risk management |
14,250 | 1,362 | 15,612 | 155 | |||||||||||||||||||||||||||||||||||||
| Less: | |||||||||||||||||||||||||||||||||||||||||
| Operating costs and accretion of asset retirement obligations |
3,836 | 111 | 3,947 | 37 | |||||||||||||||||||||||||||||||||||||
| Depreciation, depletion and amortization | 3,172 | 546 | 3,718 | 64 | |||||||||||||||||||||||||||||||||||||
| Exploration expense | 24 | 77 | 101 | — | |||||||||||||||||||||||||||||||||||||
| Operating income | 7,218 | 628 | 7,846 | 54 | |||||||||||||||||||||||||||||||||||||
| Income taxes | 1,711 | 157 | 1,868 | 22 | |||||||||||||||||||||||||||||||||||||
| Results of operations | 5,507 | 471 | 5,978 | 32 | |||||||||||||||||||||||||||||||||||||
| Cenovus Energy Inc. | 9 |
Supplementary Information – Oil and Gas Activities (unaudited) | ||||||
| Year Ended December 31, 2023 | |||||||||||||||||||||||||||||||||||||||||
| ($ millions) | Canada | China | Total Consolidated Entities | Indonesia (1) |
|||||||||||||||||||||||||||||||||||||
| Proved oil and gas properties | 44,342 | 3,083 | 47,425 | 436 | |||||||||||||||||||||||||||||||||||||
Unproved oil and gas properties (2) |
729 | 9 | 738 | — | |||||||||||||||||||||||||||||||||||||
| Total capital cost | 45,071 | 3,092 | 48,163 | 436 | |||||||||||||||||||||||||||||||||||||
| Accumulated depreciation, depletion and amortization | 16,487 | 1,488 | 17,975 | 157 | |||||||||||||||||||||||||||||||||||||
| Net capitalized costs | 28,584 | 1,604 | 30,188 | 279 | |||||||||||||||||||||||||||||||||||||
| Year Ended December 31, 2022 | |||||||||||||||||||||||||||||||||||||||||
| ($ millions) | Canada | China | Total Consolidated Entities | Indonesia (1) |
|||||||||||||||||||||||||||||||||||||
| Proved oil and gas properties | 40,425 | 3,103 | 43,528 | 432 | |||||||||||||||||||||||||||||||||||||
Unproved oil and gas properties (2) |
680 | 5 | 685 | — | |||||||||||||||||||||||||||||||||||||
| Total capital cost | 41,105 | 3,108 | 44,213 | 432 | |||||||||||||||||||||||||||||||||||||
| Accumulated depreciation, depletion and amortization | 13,251 | 1,051 | 14,302 | 114 | |||||||||||||||||||||||||||||||||||||
| Net capitalized costs | 27,854 | 2,057 | 29,911 | 318 | |||||||||||||||||||||||||||||||||||||
| Year Ended December 31, 2023 | |||||||||||||||||||||||||||||||||||||||||
| ($ millions) | Canada | China | Total Consolidated Entities | Indonesia (1) |
|||||||||||||||||||||||||||||||||||||
| Acquisitions | |||||||||||||||||||||||||||||||||||||||||
Unproved (2) |
31 | — | 31 | — | |||||||||||||||||||||||||||||||||||||
Proved (3) (4) |
11 | — | 11 | — | |||||||||||||||||||||||||||||||||||||
| Total acquisitions | 42 | — | 42 | — | |||||||||||||||||||||||||||||||||||||
| Exploration costs | 80 | 4 | 84 | — | |||||||||||||||||||||||||||||||||||||
| Development costs | 3,389 | 3 | 3,392 | 14 | |||||||||||||||||||||||||||||||||||||
| Total costs incurred | 3,511 | 7 | 3,518 | 14 | |||||||||||||||||||||||||||||||||||||
| Year Ended December 31, 2022 | |||||||||||||||||||||||||||||||||||||||||
| ($ millions) | Canada | China | Total Consolidated Entities | Indonesia (1) |
|||||||||||||||||||||||||||||||||||||
| Acquisitions | |||||||||||||||||||||||||||||||||||||||||
Unproved (2) |
— | — | — | — | |||||||||||||||||||||||||||||||||||||
Proved (3) (4) |
1,621 | — | 1,621 | — | |||||||||||||||||||||||||||||||||||||
| Total acquisitions | 1,621 | — | 1,621 | — | |||||||||||||||||||||||||||||||||||||
| Exploration costs | 34 | 3 | 37 | — | |||||||||||||||||||||||||||||||||||||
| Development costs | 2,404 | 4 | 2,408 | 74 | |||||||||||||||||||||||||||||||||||||
| Total costs incurred | 4,059 | 7 | 4,066 | 74 | |||||||||||||||||||||||||||||||||||||
| Cenovus Energy Inc. | 10 |
Supplementary Information – Oil and Gas Activities (unaudited) | ||||||
| 1. | I have reviewed this annual report on Form 40-F of Cenovus Energy Inc.; | |||||||
| 2. | Based on my knowledge, this report does not contain any untrue statement of a material fact or omit to state a material fact necessary to make the statements made, in light of the circumstances under which such statements were made, not misleading with respect to the period covered by this report; | |||||||
| 3. | Based on my knowledge, the financial statements, and other financial information included in this report, fairly present in all material respects the financial condition, results of operations and cash flows of the issuer as of, and for, the periods presented in this report; | |||||||
| 4. | The issuer’s other certifying officer(s) and I are responsible for establishing and maintaining disclosure controls and procedures (as defined in Exchange Act Rules 13a-15(e) and 15d-15(e)) and internal control over financial reporting (as defined in Exchange Act Rules 13a-15(f) and 15d-15(f)) for the issuer and have: | |||||||
| (a) | Designed such disclosure controls and procedures, or caused such disclosure controls and procedures to be designed under our supervision, to ensure that material information relating to the issuer, including its consolidated subsidiaries, is made known to us by others within those entities, particularly during the period in which this report is being prepared; | |||||||
| (b) | Designed such internal control over financial reporting, or caused such internal control over financial reporting to be designed under our supervision, to provide reasonable assurance regarding the reliability of financial reporting and the preparation of financial statements for external purposes in accordance with generally accepted accounting principles; | |||||||
| (c) | Evaluated the effectiveness of the issuer’s disclosure controls and procedures and presented in this report our conclusions about the effectiveness of the disclosure controls and procedures, as of the end of the period covered by this report based on such evaluation; and | |||||||
| (d) | Disclosed in this report any change in the issuer’s internal control over financial reporting that occurred during the period covered by the annual report that has materially affected, or is reasonably likely to materially affect, the issuer’s internal control over financial reporting; and | |||||||
| 5. | The issuer’s other certifying officer(s) and I have disclosed, based on our most recent evaluation of internal control over financial reporting, to the issuer’s auditors and the audit committee of the issuer’s board of directors (or persons performing the equivalent functions): | |||||||
| (a) | All significant deficiencies and material weaknesses in the design or operation of internal control over financial reporting which are reasonably likely to adversely affect the issuer’s ability to record, process, summarize and report financial information; and | |||||||
| (b) | Any fraud, whether or not material, that involves management or other employees who have a significant role in the issuer’s internal control over financial reporting. | |||||||
| /s/ Jonathan M. McKenzie | |||||
|
Jonathan M. McKenzie
President & Chief Executive Officer
|
|||||
| (Principal Executive Officer) | |||||
| 1. | I have reviewed this annual report on Form 40-F of Cenovus Energy Inc.; |
|||||||
| 2. | Based on my knowledge, this report does not contain any untrue statement of a material fact or omit to state a material fact necessary to make the statements made, in light of the circumstances under which such statements were made, not misleading with respect to the period covered by this report; |
|||||||
| 3. | Based on my knowledge, the financial statements, and other financial information included in this report, fairly present in all material respects the financial condition, results of operations and cash flows of the issuer as of, and for, the periods presented in this report; |
|||||||
| 4. | The issuer’s other certifying officer(s) and I are responsible for establishing and maintaining disclosure controls and procedures (as defined in Exchange Act Rules 13a-15(e) and 15d-15(e)) and internal control over financial reporting (as defined in Exchange Act Rules 13a-15(f) and 15d-15(f)) for the issuer and have: |
|||||||
| (a) | Designed such disclosure controls and procedures, or caused such disclosure controls and procedures to be designed under our supervision, to ensure that material information relating to the issuer, including its consolidated subsidiaries, is made known to us by others within those entities, particularly during the period in which this report is being prepared; |
|||||||
| (b) | Designed such internal control over financial reporting, or caused such internal control over financial reporting to be designed under our supervision, to provide reasonable assurance regarding the reliability of financial reporting and the preparation of financial statements for external purposes in accordance with generally accepted accounting principles; |
|||||||
| (c) | Evaluated the effectiveness of the issuer’s disclosure controls and procedures and presented in this report our conclusions about the effectiveness of the disclosure controls and procedures, as of the end of the period covered by this report based on such evaluation; and |
|||||||
| (d) | Disclosed in this report any change in the issuer’s internal control over financial reporting that occurred during the period covered by the annual report that has materially affected, or is reasonably likely to materially affect, the issuer’s internal control over financial reporting; and |
|||||||
| 5. | The issuer’s other certifying officer(s) and I have disclosed, based on our most recent evaluation of internal control over financial reporting, to the issuer’s auditors and the audit committee of the issuer’s board of directors (or persons performing the equivalent functions): |
|||||||
| (a) | All significant deficiencies and material weaknesses in the design or operation of internal control over financial reporting which are reasonably likely to adversely affect the issuer’s ability to record, process, summarize and report financial information; and |
|||||||
| (b) | Any fraud, whether or not material, that involves management or other employees who have a significant role in the issuer’s internal control over financial reporting. |
|||||||
|
Karamjit S. Sandhar
Executive Vice-President &
Chief Financial Officer
(Principal Financial Officer)
|
|||||
| 1. | The Report fully complies with the requirements of section 13(a) or 15(d) of the Securities Exchange Act of 1934; and |
||||
| 2. | The information contained in the Report fairly presents, in all material respects, the financial condition and results of operations of the Company. |
||||
| /s/ Jonathan M. McKenzie | |||||
|
Jonathan M. McKenzie
President & Chief Executive Officer
|
|||||
| 1. | The Report fully complies with the requirements of section 13(a) or 15(d) of the Securities Exchange Act of 1934; and |
||||
| 2. | The information contained in the Report fairly presents, in all material respects, the financial condition and results of operations of the Company. |
||||
| /s/ Karamjit S. Sandhar | |||||
|
Karamjit S. Sandhar
Executive Vice-President &
Chief Financial Officer
|
|||||