0001471265false12/312024Q1http://fasb.org/us-gaap/2023#AccountingStandardsUpdate202202MemberP3Yhttp://fasb.org/us-gaap/2023#OtherAssetshttp://fasb.org/us-gaap/2023#OtherAssetshttp://fasb.org/us-gaap/2023#OtherLiabilitieshttp://fasb.org/us-gaap/2023#OtherLiabilities00014712652024-01-012024-03-3100014712652024-04-30xbrli:shares00014712652024-03-31iso4217:USD00014712652023-12-31iso4217:USDxbrli:shares00014712652023-01-012023-03-310001471265us-gaap:CommonStockMember2023-12-310001471265us-gaap:AdditionalPaidInCapitalMember2023-12-310001471265us-gaap:RetainedEarningsMember2023-12-310001471265us-gaap:AccumulatedOtherComprehensiveIncomeMember2023-12-310001471265us-gaap:RetainedEarningsMember2024-01-012024-03-310001471265us-gaap:AccumulatedOtherComprehensiveIncomeMember2024-01-012024-03-310001471265us-gaap:CommonStockMember2024-01-012024-03-310001471265us-gaap:AdditionalPaidInCapitalMember2024-01-012024-03-310001471265us-gaap:CommonStockMember2024-03-310001471265us-gaap:AdditionalPaidInCapitalMember2024-03-310001471265us-gaap:RetainedEarningsMember2024-03-310001471265us-gaap:AccumulatedOtherComprehensiveIncomeMember2024-03-310001471265us-gaap:CommonStockMember2022-12-310001471265us-gaap:AdditionalPaidInCapitalMember2022-12-310001471265us-gaap:RetainedEarningsMember2022-12-310001471265us-gaap:AccumulatedOtherComprehensiveIncomeMember2022-12-3100014712652022-12-310001471265us-gaap:RetainedEarningsMember2023-01-012023-03-310001471265us-gaap:AccumulatedOtherComprehensiveIncomeMember2023-01-012023-03-3100014712652022-01-012022-12-310001471265us-gaap:RetainedEarningsMembersrt:CumulativeEffectPeriodOfAdoptionAdjustmentMember2022-12-310001471265srt:CumulativeEffectPeriodOfAdoptionAdjustmentMember2022-12-310001471265us-gaap:CommonStockMember2023-01-012023-03-310001471265us-gaap:AdditionalPaidInCapitalMember2023-01-012023-03-310001471265us-gaap:CommonStockMember2023-03-310001471265us-gaap:AdditionalPaidInCapitalMember2023-03-310001471265us-gaap:RetainedEarningsMember2023-03-310001471265us-gaap:AccumulatedOtherComprehensiveIncomeMember2023-03-3100014712652023-03-31nwbi:bank_location0001471265us-gaap:USGovernmentAgenciesDebtSecuritiesMember2024-03-310001471265us-gaap:USGovernmentSponsoredEnterprisesDebtSecuritiesMember2024-03-310001471265us-gaap:USStatesAndPoliticalSubdivisionsMember2024-03-310001471265us-gaap:CorporateDebtSecuritiesMember2024-03-310001471265nwbi:FixedRatePassThroughMortgageBackedSecuritiesMember2024-03-310001471265nwbi:VariableRatePassThroughMortgageBackedSecuritiesMember2024-03-310001471265nwbi:FixedRateAgencyCMOsMortgageBackedSecuritiesMember2024-03-310001471265nwbi:VariableRateAgencyCMOsMortgageBackedSecuritiesMember2024-03-310001471265us-gaap:ResidentialMortgageBackedSecuritiesMember2024-03-310001471265us-gaap:USGovernmentAgenciesDebtSecuritiesMember2023-12-310001471265us-gaap:USGovernmentSponsoredEnterprisesDebtSecuritiesMember2023-12-310001471265us-gaap:USStatesAndPoliticalSubdivisionsMember2023-12-310001471265us-gaap:CorporateDebtSecuritiesMember2023-12-310001471265nwbi:FixedRatePassThroughMortgageBackedSecuritiesMember2023-12-310001471265nwbi:VariableRatePassThroughMortgageBackedSecuritiesMember2023-12-310001471265nwbi:FixedRateAgencyCMOsMortgageBackedSecuritiesMember2023-12-310001471265nwbi:VariableRateAgencyCMOsMortgageBackedSecuritiesMember2023-12-310001471265us-gaap:ResidentialMortgageBackedSecuritiesMember2023-12-31nwbi:position0001471265us-gaap:USGovernmentAgenciesDebtSecuritiesMembernwbi:AAPlusRatingMember2024-03-310001471265us-gaap:USGovernmentAgenciesDebtSecuritiesMember2024-03-310001471265us-gaap:ResidentialMortgageBackedSecuritiesMembernwbi:AAPlusRatingMember2024-03-310001471265nwbi:AAPlusRatingMember2024-03-310001471265nwbi:PersonalBankingMembernwbi:OriginatedLoanMemberus-gaap:ResidentialMortgageMember2024-03-310001471265nwbi:PersonalBankingMembernwbi:AcquiredLoanMemberus-gaap:ResidentialMortgageMember2024-03-310001471265nwbi:PersonalBankingMemberus-gaap:ResidentialMortgageMember2024-03-310001471265nwbi:PersonalBankingMembernwbi:OriginatedLoanMemberus-gaap:ResidentialMortgageMember2023-12-310001471265nwbi:PersonalBankingMembernwbi:AcquiredLoanMemberus-gaap:ResidentialMortgageMember2023-12-310001471265nwbi:PersonalBankingMemberus-gaap:ResidentialMortgageMember2023-12-310001471265nwbi:PersonalBankingMembernwbi:OriginatedLoanMemberus-gaap:HomeEquityLoanMember2024-03-310001471265nwbi:PersonalBankingMemberus-gaap:HomeEquityLoanMembernwbi:AcquiredLoanMember2024-03-310001471265nwbi:PersonalBankingMemberus-gaap:HomeEquityLoanMember2024-03-310001471265nwbi:PersonalBankingMembernwbi:OriginatedLoanMemberus-gaap:HomeEquityLoanMember2023-12-310001471265nwbi:PersonalBankingMemberus-gaap:HomeEquityLoanMembernwbi:AcquiredLoanMember2023-12-310001471265nwbi:PersonalBankingMemberus-gaap:HomeEquityLoanMember2023-12-310001471265nwbi:PersonalBankingMemberus-gaap:AutomobileLoanMembernwbi:OriginatedLoanMember2024-03-310001471265nwbi:PersonalBankingMemberus-gaap:AutomobileLoanMembernwbi:AcquiredLoanMember2024-03-310001471265nwbi:PersonalBankingMemberus-gaap:AutomobileLoanMember2024-03-310001471265nwbi:PersonalBankingMemberus-gaap:AutomobileLoanMembernwbi:OriginatedLoanMember2023-12-310001471265nwbi:PersonalBankingMemberus-gaap:AutomobileLoanMembernwbi:AcquiredLoanMember2023-12-310001471265nwbi:PersonalBankingMemberus-gaap:AutomobileLoanMember2023-12-310001471265nwbi:PersonalBankingMembernwbi:OriginatedLoanMemberus-gaap:ConsumerLoanMember2024-03-310001471265nwbi:PersonalBankingMembernwbi:AcquiredLoanMemberus-gaap:ConsumerLoanMember2024-03-310001471265nwbi:PersonalBankingMemberus-gaap:ConsumerLoanMember2024-03-310001471265nwbi:PersonalBankingMembernwbi:OriginatedLoanMemberus-gaap:ConsumerLoanMember2023-12-310001471265nwbi:PersonalBankingMembernwbi:AcquiredLoanMemberus-gaap:ConsumerLoanMember2023-12-310001471265nwbi:PersonalBankingMemberus-gaap:ConsumerLoanMember2023-12-310001471265nwbi:PersonalBankingMembernwbi:OriginatedLoanMember2024-03-310001471265nwbi:PersonalBankingMembernwbi:AcquiredLoanMember2024-03-310001471265nwbi:PersonalBankingMember2024-03-310001471265nwbi:PersonalBankingMembernwbi:OriginatedLoanMember2023-12-310001471265nwbi:PersonalBankingMembernwbi:AcquiredLoanMember2023-12-310001471265nwbi:PersonalBankingMember2023-12-310001471265nwbi:OriginatedLoanMemberus-gaap:CommercialRealEstateMembernwbi:CommercialBankingMember2024-03-310001471265us-gaap:CommercialRealEstateMembernwbi:AcquiredLoanMembernwbi:CommercialBankingMember2024-03-310001471265us-gaap:CommercialRealEstateMembernwbi:CommercialBankingMember2024-03-310001471265nwbi:OriginatedLoanMemberus-gaap:CommercialRealEstateMembernwbi:CommercialBankingMember2023-12-310001471265us-gaap:CommercialRealEstateMembernwbi:AcquiredLoanMembernwbi:CommercialBankingMember2023-12-310001471265us-gaap:CommercialRealEstateMembernwbi:CommercialBankingMember2023-12-310001471265nwbi:CommercialRealEstateOwnerOccupiedMembernwbi:OriginatedLoanMembernwbi:CommercialBankingMember2024-03-310001471265nwbi:CommercialRealEstateOwnerOccupiedMembernwbi:AcquiredLoanMembernwbi:CommercialBankingMember2024-03-310001471265nwbi:CommercialRealEstateOwnerOccupiedMembernwbi:CommercialBankingMember2024-03-310001471265nwbi:CommercialRealEstateOwnerOccupiedMembernwbi:OriginatedLoanMembernwbi:CommercialBankingMember2023-12-310001471265nwbi:CommercialRealEstateOwnerOccupiedMembernwbi:AcquiredLoanMembernwbi:CommercialBankingMember2023-12-310001471265nwbi:CommercialRealEstateOwnerOccupiedMembernwbi:CommercialBankingMember2023-12-310001471265nwbi:OriginatedLoanMemberus-gaap:CommercialLoanMembernwbi:CommercialBankingMember2024-03-310001471265us-gaap:CommercialLoanMembernwbi:AcquiredLoanMembernwbi:CommercialBankingMember2024-03-310001471265us-gaap:CommercialLoanMembernwbi:CommercialBankingMember2024-03-310001471265nwbi:OriginatedLoanMemberus-gaap:CommercialLoanMembernwbi:CommercialBankingMember2023-12-310001471265us-gaap:CommercialLoanMembernwbi:AcquiredLoanMembernwbi:CommercialBankingMember2023-12-310001471265us-gaap:CommercialLoanMembernwbi:CommercialBankingMember2023-12-310001471265nwbi:OriginatedLoanMembernwbi:CommercialBankingMember2024-03-310001471265nwbi:AcquiredLoanMembernwbi:CommercialBankingMember2024-03-310001471265nwbi:CommercialBankingMember2024-03-310001471265nwbi:OriginatedLoanMembernwbi:CommercialBankingMember2023-12-310001471265nwbi:AcquiredLoanMembernwbi:CommercialBankingMember2023-12-310001471265nwbi:CommercialBankingMember2023-12-310001471265nwbi:OriginatedLoanMember2024-03-310001471265nwbi:AcquiredLoanMember2024-03-310001471265nwbi:OriginatedLoanMember2023-12-310001471265nwbi:AcquiredLoanMember2023-12-310001471265nwbi:PersonalBankingMemberus-gaap:ResidentialMortgageMember2024-01-012024-03-310001471265nwbi:PersonalBankingMemberus-gaap:HomeEquityLoanMember2024-01-012024-03-310001471265nwbi:PersonalBankingMemberus-gaap:AutomobileLoanMember2024-01-012024-03-310001471265nwbi:PersonalBankingMemberus-gaap:ConsumerLoanMember2024-01-012024-03-310001471265nwbi:PersonalBankingMember2024-01-012024-03-310001471265us-gaap:CommercialRealEstateMembernwbi:CommercialBankingMember2024-01-012024-03-310001471265nwbi:CommercialRealEstateOwnerOccupiedMembernwbi:CommercialBankingMember2024-01-012024-03-310001471265us-gaap:CommercialLoanMembernwbi:CommercialBankingMember2024-01-012024-03-310001471265nwbi:CommercialBankingMember2024-01-012024-03-310001471265nwbi:PersonalBankingMembernwbi:OffBalanceSheetExposureMemberus-gaap:ResidentialMortgageMember2024-03-310001471265nwbi:PersonalBankingMembernwbi:OffBalanceSheetExposureMemberus-gaap:ResidentialMortgageMember2024-01-012024-03-310001471265nwbi:PersonalBankingMembernwbi:OffBalanceSheetExposureMemberus-gaap:ResidentialMortgageMember2023-12-310001471265nwbi:PersonalBankingMembernwbi:OffBalanceSheetExposureMemberus-gaap:HomeEquityLoanMember2024-03-310001471265nwbi:PersonalBankingMembernwbi:OffBalanceSheetExposureMemberus-gaap:HomeEquityLoanMember2024-01-012024-03-310001471265nwbi:PersonalBankingMembernwbi:OffBalanceSheetExposureMemberus-gaap:HomeEquityLoanMember2023-12-310001471265nwbi:PersonalBankingMembernwbi:OffBalanceSheetExposureMember2024-03-310001471265nwbi:PersonalBankingMembernwbi:OffBalanceSheetExposureMember2024-01-012024-03-310001471265nwbi:PersonalBankingMembernwbi:OffBalanceSheetExposureMember2023-12-310001471265nwbi:OffBalanceSheetExposureMemberus-gaap:CommercialRealEstateMembernwbi:CommercialBankingMember2024-03-310001471265nwbi:OffBalanceSheetExposureMemberus-gaap:CommercialRealEstateMembernwbi:CommercialBankingMember2024-01-012024-03-310001471265nwbi:OffBalanceSheetExposureMemberus-gaap:CommercialRealEstateMembernwbi:CommercialBankingMember2023-12-310001471265nwbi:CommercialRealEstateOwnerOccupiedMembernwbi:OffBalanceSheetExposureMembernwbi:CommercialBankingMember2024-03-310001471265nwbi:CommercialRealEstateOwnerOccupiedMembernwbi:OffBalanceSheetExposureMembernwbi:CommercialBankingMember2024-01-012024-03-310001471265nwbi:CommercialRealEstateOwnerOccupiedMembernwbi:OffBalanceSheetExposureMembernwbi:CommercialBankingMember2023-12-310001471265nwbi:OffBalanceSheetExposureMemberus-gaap:CommercialLoanMembernwbi:CommercialBankingMember2024-03-310001471265nwbi:OffBalanceSheetExposureMemberus-gaap:CommercialLoanMembernwbi:CommercialBankingMember2024-01-012024-03-310001471265nwbi:OffBalanceSheetExposureMemberus-gaap:CommercialLoanMembernwbi:CommercialBankingMember2023-12-310001471265nwbi:OffBalanceSheetExposureMembernwbi:CommercialBankingMember2024-03-310001471265nwbi:OffBalanceSheetExposureMembernwbi:CommercialBankingMember2024-01-012024-03-310001471265nwbi:OffBalanceSheetExposureMembernwbi:CommercialBankingMember2023-12-310001471265nwbi:OffBalanceSheetExposureMember2024-03-310001471265nwbi:OffBalanceSheetExposureMember2024-01-012024-03-310001471265nwbi:OffBalanceSheetExposureMember2023-12-310001471265nwbi:PersonalBankingMemberus-gaap:ResidentialMortgageMember2023-03-310001471265nwbi:PersonalBankingMemberus-gaap:ResidentialMortgageMember2023-01-012023-03-310001471265nwbi:PersonalBankingMembersrt:CumulativeEffectPeriodOfAdoptionAdjustmentMemberus-gaap:ResidentialMortgageMember2022-12-310001471265nwbi:PersonalBankingMemberus-gaap:ResidentialMortgageMember2022-12-310001471265nwbi:PersonalBankingMemberus-gaap:HomeEquityLoanMember2023-03-310001471265nwbi:PersonalBankingMemberus-gaap:HomeEquityLoanMember2023-01-012023-03-310001471265nwbi:PersonalBankingMemberus-gaap:HomeEquityLoanMembersrt:CumulativeEffectPeriodOfAdoptionAdjustmentMember2022-12-310001471265nwbi:PersonalBankingMemberus-gaap:HomeEquityLoanMember2022-12-310001471265nwbi:PersonalBankingMemberus-gaap:AutomobileLoanMember2023-03-310001471265nwbi:PersonalBankingMemberus-gaap:AutomobileLoanMember2023-01-012023-03-310001471265nwbi:PersonalBankingMemberus-gaap:AutomobileLoanMembersrt:CumulativeEffectPeriodOfAdoptionAdjustmentMember2022-12-310001471265nwbi:PersonalBankingMemberus-gaap:AutomobileLoanMember2022-12-310001471265nwbi:PersonalBankingMemberus-gaap:ConsumerLoanMember2023-03-310001471265nwbi:PersonalBankingMemberus-gaap:ConsumerLoanMember2023-01-012023-03-310001471265nwbi:PersonalBankingMembersrt:CumulativeEffectPeriodOfAdoptionAdjustmentMemberus-gaap:ConsumerLoanMember2022-12-310001471265nwbi:PersonalBankingMemberus-gaap:ConsumerLoanMember2022-12-310001471265nwbi:PersonalBankingMember2023-03-310001471265nwbi:PersonalBankingMember2023-01-012023-03-310001471265nwbi:PersonalBankingMembersrt:CumulativeEffectPeriodOfAdoptionAdjustmentMember2022-12-310001471265nwbi:PersonalBankingMember2022-12-310001471265us-gaap:CommercialRealEstateMembernwbi:CommercialBankingMember2023-03-310001471265us-gaap:CommercialRealEstateMembernwbi:CommercialBankingMember2023-01-012023-03-310001471265us-gaap:CommercialRealEstateMembersrt:CumulativeEffectPeriodOfAdoptionAdjustmentMembernwbi:CommercialBankingMember2022-12-310001471265us-gaap:CommercialRealEstateMembernwbi:CommercialBankingMember2022-12-310001471265nwbi:CommercialRealEstateOwnerOccupiedMembernwbi:CommercialBankingMember2023-03-310001471265nwbi:CommercialRealEstateOwnerOccupiedMembernwbi:CommercialBankingMember2023-01-012023-03-310001471265nwbi:CommercialRealEstateOwnerOccupiedMembersrt:CumulativeEffectPeriodOfAdoptionAdjustmentMembernwbi:CommercialBankingMember2022-12-310001471265nwbi:CommercialRealEstateOwnerOccupiedMembernwbi:CommercialBankingMember2022-12-310001471265us-gaap:CommercialLoanMembernwbi:CommercialBankingMember2023-03-310001471265us-gaap:CommercialLoanMembernwbi:CommercialBankingMember2023-01-012023-03-310001471265srt:CumulativeEffectPeriodOfAdoptionAdjustmentMemberus-gaap:CommercialLoanMembernwbi:CommercialBankingMember2022-12-310001471265us-gaap:CommercialLoanMembernwbi:CommercialBankingMember2022-12-310001471265nwbi:CommercialBankingMember2023-03-310001471265nwbi:CommercialBankingMember2023-01-012023-03-310001471265srt:CumulativeEffectPeriodOfAdoptionAdjustmentMembernwbi:CommercialBankingMember2022-12-310001471265nwbi:CommercialBankingMember2022-12-310001471265nwbi:PersonalBankingMembernwbi:OffBalanceSheetExposureMemberus-gaap:ResidentialMortgageMember2023-03-310001471265nwbi:PersonalBankingMembernwbi:OffBalanceSheetExposureMemberus-gaap:ResidentialMortgageMember2023-01-012023-03-310001471265nwbi:PersonalBankingMembernwbi:OffBalanceSheetExposureMembersrt:CumulativeEffectPeriodOfAdoptionAdjustmentMemberus-gaap:ResidentialMortgageMember2022-12-310001471265nwbi:PersonalBankingMembernwbi:OffBalanceSheetExposureMemberus-gaap:ResidentialMortgageMember2022-12-310001471265nwbi:PersonalBankingMembernwbi:OffBalanceSheetExposureMemberus-gaap:HomeEquityLoanMember2023-03-310001471265nwbi:PersonalBankingMembernwbi:OffBalanceSheetExposureMemberus-gaap:HomeEquityLoanMember2023-01-012023-03-310001471265nwbi:PersonalBankingMembernwbi:OffBalanceSheetExposureMemberus-gaap:HomeEquityLoanMembersrt:CumulativeEffectPeriodOfAdoptionAdjustmentMember2022-12-310001471265nwbi:PersonalBankingMembernwbi:OffBalanceSheetExposureMemberus-gaap:HomeEquityLoanMember2022-12-310001471265nwbi:PersonalBankingMembernwbi:OffBalanceSheetExposureMember2023-03-310001471265nwbi:PersonalBankingMembernwbi:OffBalanceSheetExposureMember2023-01-012023-03-310001471265nwbi:PersonalBankingMembernwbi:OffBalanceSheetExposureMembersrt:CumulativeEffectPeriodOfAdoptionAdjustmentMember2022-12-310001471265nwbi:PersonalBankingMembernwbi:OffBalanceSheetExposureMember2022-12-310001471265nwbi:OffBalanceSheetExposureMemberus-gaap:CommercialRealEstateMembernwbi:CommercialBankingMember2023-03-310001471265nwbi:OffBalanceSheetExposureMemberus-gaap:CommercialRealEstateMembernwbi:CommercialBankingMember2023-01-012023-03-310001471265nwbi:OffBalanceSheetExposureMemberus-gaap:CommercialRealEstateMembersrt:CumulativeEffectPeriodOfAdoptionAdjustmentMembernwbi:CommercialBankingMember2022-12-310001471265nwbi:OffBalanceSheetExposureMemberus-gaap:CommercialRealEstateMembernwbi:CommercialBankingMember2022-12-310001471265nwbi:CommercialRealEstateOwnerOccupiedMembernwbi:OffBalanceSheetExposureMembernwbi:CommercialBankingMember2023-03-310001471265nwbi:CommercialRealEstateOwnerOccupiedMembernwbi:OffBalanceSheetExposureMembernwbi:CommercialBankingMember2023-01-012023-03-310001471265nwbi:CommercialRealEstateOwnerOccupiedMembernwbi:OffBalanceSheetExposureMembersrt:CumulativeEffectPeriodOfAdoptionAdjustmentMembernwbi:CommercialBankingMember2022-12-310001471265nwbi:CommercialRealEstateOwnerOccupiedMembernwbi:OffBalanceSheetExposureMembernwbi:CommercialBankingMember2022-12-310001471265nwbi:OffBalanceSheetExposureMemberus-gaap:CommercialLoanMembernwbi:CommercialBankingMember2023-03-310001471265nwbi:OffBalanceSheetExposureMemberus-gaap:CommercialLoanMembernwbi:CommercialBankingMember2023-01-012023-03-310001471265nwbi:OffBalanceSheetExposureMembersrt:CumulativeEffectPeriodOfAdoptionAdjustmentMemberus-gaap:CommercialLoanMembernwbi:CommercialBankingMember2022-12-310001471265nwbi:OffBalanceSheetExposureMemberus-gaap:CommercialLoanMembernwbi:CommercialBankingMember2022-12-310001471265nwbi:OffBalanceSheetExposureMembernwbi:CommercialBankingMember2023-03-310001471265nwbi:OffBalanceSheetExposureMembernwbi:CommercialBankingMember2023-01-012023-03-310001471265nwbi:OffBalanceSheetExposureMembersrt:CumulativeEffectPeriodOfAdoptionAdjustmentMembernwbi:CommercialBankingMember2022-12-310001471265nwbi:OffBalanceSheetExposureMembernwbi:CommercialBankingMember2022-12-310001471265nwbi:OffBalanceSheetExposureMember2023-03-310001471265nwbi:OffBalanceSheetExposureMember2023-01-012023-03-310001471265nwbi:OffBalanceSheetExposureMembersrt:CumulativeEffectPeriodOfAdoptionAdjustmentMember2022-12-310001471265nwbi:OffBalanceSheetExposureMember2022-12-3100014712652023-01-012023-12-310001471265us-gaap:CommercialRealEstateMembernwbi:RealEstateCollateralDependentLoansMembernwbi:CommercialBankingMember2024-03-310001471265us-gaap:CommercialRealEstateMembernwbi:EquipmentCollateralDependentLoansMembernwbi:CommercialBankingMember2024-03-310001471265nwbi:RealEstateCollateralDependentLoansMemberus-gaap:CommercialLoanMembernwbi:CommercialBankingMember2024-03-310001471265us-gaap:CommercialLoanMembernwbi:EquipmentCollateralDependentLoansMembernwbi:CommercialBankingMember2024-03-310001471265nwbi:RealEstateCollateralDependentLoansMembernwbi:CommercialBankingMember2024-03-310001471265nwbi:EquipmentCollateralDependentLoansMembernwbi:CommercialBankingMember2024-03-310001471265nwbi:RealEstateCollateralDependentLoansMember2024-03-310001471265nwbi:EquipmentCollateralDependentLoansMember2024-03-310001471265us-gaap:CommercialRealEstateMembernwbi:RealEstateCollateralDependentLoansMembernwbi:CommercialBankingMember2023-12-310001471265nwbi:RealEstateCollateralDependentLoansMemberus-gaap:CommercialLoanMembernwbi:CommercialBankingMember2023-12-310001471265nwbi:RealEstateCollateralDependentLoansMembernwbi:CommercialBankingMember2023-12-310001471265nwbi:RealEstateCollateralDependentLoansMember2023-12-310001471265nwbi:PersonalBankingMemberus-gaap:PaymentDeferralMemberus-gaap:ResidentialMortgageMember2024-01-012024-03-310001471265nwbi:PersonalBankingMemberus-gaap:ExtendedMaturityMemberus-gaap:ResidentialMortgageMember2024-01-012024-03-310001471265nwbi:PersonalBankingMemberus-gaap:ExtendedMaturityAndInterestRateReductionMemberus-gaap:ResidentialMortgageMember2024-01-012024-03-31xbrli:pure0001471265nwbi:PersonalBankingMemberus-gaap:ExtendedMaturityMemberus-gaap:ResidentialMortgageMember2023-01-012023-03-310001471265nwbi:PersonalBankingMemberus-gaap:ExtendedMaturityAndInterestRateReductionMemberus-gaap:ResidentialMortgageMember2023-01-012023-03-310001471265nwbi:PersonalBankingMemberus-gaap:HomeEquityLoanMemberus-gaap:PaymentDeferralMember2024-01-012024-03-310001471265nwbi:PersonalBankingMemberus-gaap:HomeEquityLoanMemberus-gaap:ExtendedMaturityMember2024-01-012024-03-310001471265nwbi:PersonalBankingMemberus-gaap:HomeEquityLoanMemberus-gaap:ExtendedMaturityAndInterestRateReductionMember2024-01-012024-03-310001471265nwbi:PersonalBankingMemberus-gaap:HomeEquityLoanMemberus-gaap:ExtendedMaturityMember2023-01-012023-03-310001471265nwbi:PersonalBankingMemberus-gaap:HomeEquityLoanMemberus-gaap:ExtendedMaturityAndInterestRateReductionMember2023-01-012023-03-310001471265nwbi:PersonalBankingMemberus-gaap:PaymentDeferralMemberus-gaap:ConsumerLoanMember2024-01-012024-03-310001471265nwbi:PersonalBankingMemberus-gaap:ExtendedMaturityMemberus-gaap:ConsumerLoanMember2024-01-012024-03-310001471265nwbi:PersonalBankingMemberus-gaap:ExtendedMaturityAndInterestRateReductionMemberus-gaap:ConsumerLoanMember2024-01-012024-03-310001471265nwbi:PersonalBankingMemberus-gaap:ExtendedMaturityMemberus-gaap:ConsumerLoanMember2023-01-012023-03-310001471265nwbi:PersonalBankingMemberus-gaap:ExtendedMaturityAndInterestRateReductionMemberus-gaap:ConsumerLoanMember2023-01-012023-03-310001471265nwbi:PersonalBankingMemberus-gaap:PaymentDeferralMember2024-01-012024-03-310001471265nwbi:PersonalBankingMemberus-gaap:ExtendedMaturityMember2024-01-012024-03-310001471265nwbi:PersonalBankingMemberus-gaap:ExtendedMaturityAndInterestRateReductionMember2024-01-012024-03-310001471265nwbi:PersonalBankingMemberus-gaap:ExtendedMaturityMember2023-01-012023-03-310001471265nwbi:PersonalBankingMemberus-gaap:ExtendedMaturityAndInterestRateReductionMember2023-01-012023-03-310001471265us-gaap:CommercialRealEstateMemberus-gaap:PaymentDeferralMembernwbi:CommercialBankingMember2024-01-012024-03-310001471265us-gaap:CommercialRealEstateMemberus-gaap:ExtendedMaturityMembernwbi:CommercialBankingMember2024-01-012024-03-310001471265us-gaap:CommercialRealEstateMemberus-gaap:ExtendedMaturityAndInterestRateReductionMembernwbi:CommercialBankingMember2024-01-012024-03-310001471265us-gaap:CommercialRealEstateMemberus-gaap:ExtendedMaturityMembernwbi:CommercialBankingMember2023-01-012023-03-310001471265us-gaap:CommercialRealEstateMemberus-gaap:ExtendedMaturityAndInterestRateReductionMembernwbi:CommercialBankingMember2023-01-012023-03-310001471265us-gaap:CommercialLoanMemberus-gaap:PaymentDeferralMembernwbi:CommercialBankingMember2024-01-012024-03-310001471265us-gaap:ExtendedMaturityMemberus-gaap:CommercialLoanMembernwbi:CommercialBankingMember2024-01-012024-03-310001471265us-gaap:ExtendedMaturityAndInterestRateReductionMemberus-gaap:CommercialLoanMembernwbi:CommercialBankingMember2024-01-012024-03-310001471265us-gaap:ExtendedMaturityMemberus-gaap:CommercialLoanMembernwbi:CommercialBankingMember2023-01-012023-03-310001471265us-gaap:ExtendedMaturityAndInterestRateReductionMemberus-gaap:CommercialLoanMembernwbi:CommercialBankingMember2023-01-012023-03-310001471265us-gaap:PaymentDeferralMembernwbi:CommercialBankingMember2024-01-012024-03-310001471265us-gaap:ExtendedMaturityMembernwbi:CommercialBankingMember2024-01-012024-03-310001471265us-gaap:ExtendedMaturityAndInterestRateReductionMembernwbi:CommercialBankingMember2024-01-012024-03-310001471265us-gaap:ExtendedMaturityMembernwbi:CommercialBankingMember2023-01-012023-03-310001471265us-gaap:ExtendedMaturityAndInterestRateReductionMembernwbi:CommercialBankingMember2023-01-012023-03-310001471265us-gaap:PaymentDeferralMember2024-01-012024-03-310001471265us-gaap:ExtendedMaturityMember2024-01-012024-03-310001471265us-gaap:ExtendedMaturityAndInterestRateReductionMember2024-01-012024-03-310001471265us-gaap:ExtendedMaturityMember2023-01-012023-03-310001471265us-gaap:ExtendedMaturityAndInterestRateReductionMember2023-01-012023-03-310001471265nwbi:PersonalBankingMemberus-gaap:ResidentialMortgageMemberus-gaap:FinancialAssetNotPastDueMember2024-01-012024-03-310001471265nwbi:PersonalBankingMemberus-gaap:FinancingReceivables30To59DaysPastDueMemberus-gaap:ResidentialMortgageMember2024-01-012024-03-310001471265nwbi:PersonalBankingMemberus-gaap:FinancingReceivablesEqualToGreaterThan90DaysPastDueMemberus-gaap:ResidentialMortgageMember2024-01-012024-03-310001471265nwbi:PersonalBankingMemberus-gaap:HomeEquityLoanMemberus-gaap:FinancialAssetNotPastDueMember2024-01-012024-03-310001471265nwbi:PersonalBankingMemberus-gaap:HomeEquityLoanMemberus-gaap:FinancingReceivables30To59DaysPastDueMember2024-01-012024-03-310001471265nwbi:PersonalBankingMemberus-gaap:HomeEquityLoanMemberus-gaap:FinancingReceivablesEqualToGreaterThan90DaysPastDueMember2024-01-012024-03-310001471265nwbi:PersonalBankingMemberus-gaap:ConsumerLoanMemberus-gaap:FinancialAssetNotPastDueMember2024-01-012024-03-310001471265nwbi:PersonalBankingMemberus-gaap:FinancialAssetNotPastDueMember2024-01-012024-03-310001471265nwbi:PersonalBankingMemberus-gaap:FinancingReceivables30To59DaysPastDueMember2024-01-012024-03-310001471265nwbi:PersonalBankingMemberus-gaap:FinancingReceivablesEqualToGreaterThan90DaysPastDueMember2024-01-012024-03-310001471265us-gaap:CommercialRealEstateMembernwbi:CommercialBankingMemberus-gaap:FinancialAssetNotPastDueMember2024-01-012024-03-310001471265us-gaap:CommercialLoanMembernwbi:CommercialBankingMemberus-gaap:FinancialAssetNotPastDueMember2024-01-012024-03-310001471265us-gaap:CommercialLoanMemberus-gaap:FinancingReceivables30To59DaysPastDueMembernwbi:CommercialBankingMember2024-01-012024-03-310001471265us-gaap:CommercialLoanMembernwbi:CommercialBankingMemberus-gaap:FinancingReceivables60To89DaysPastDueMember2024-01-012024-03-310001471265nwbi:CommercialBankingMemberus-gaap:FinancialAssetNotPastDueMember2024-01-012024-03-310001471265us-gaap:FinancingReceivables30To59DaysPastDueMembernwbi:CommercialBankingMember2024-01-012024-03-310001471265nwbi:CommercialBankingMemberus-gaap:FinancingReceivables60To89DaysPastDueMember2024-01-012024-03-310001471265us-gaap:FinancialAssetNotPastDueMember2024-01-012024-03-310001471265us-gaap:FinancingReceivables30To59DaysPastDueMember2024-01-012024-03-310001471265us-gaap:FinancingReceivables60To89DaysPastDueMember2024-01-012024-03-310001471265us-gaap:FinancingReceivablesEqualToGreaterThan90DaysPastDueMember2024-01-012024-03-310001471265nwbi:PersonalBankingMemberus-gaap:FinancingReceivables30To59DaysPastDueMemberus-gaap:ResidentialMortgageMember2024-03-310001471265nwbi:PersonalBankingMemberus-gaap:ResidentialMortgageMemberus-gaap:FinancingReceivables60To89DaysPastDueMember2024-03-310001471265nwbi:PersonalBankingMemberus-gaap:FinancingReceivablesEqualToGreaterThan90DaysPastDueMemberus-gaap:ResidentialMortgageMember2024-03-310001471265nwbi:PersonalBankingMemberus-gaap:FinancialAssetPastDueMemberus-gaap:ResidentialMortgageMember2024-03-310001471265nwbi:PersonalBankingMemberus-gaap:ResidentialMortgageMemberus-gaap:FinancialAssetNotPastDueMember2024-03-310001471265nwbi:PersonalBankingMemberus-gaap:HomeEquityLoanMemberus-gaap:FinancingReceivables30To59DaysPastDueMember2024-03-310001471265nwbi:PersonalBankingMemberus-gaap:HomeEquityLoanMemberus-gaap:FinancingReceivables60To89DaysPastDueMember2024-03-310001471265nwbi:PersonalBankingMemberus-gaap:HomeEquityLoanMemberus-gaap:FinancingReceivablesEqualToGreaterThan90DaysPastDueMember2024-03-310001471265nwbi:PersonalBankingMemberus-gaap:HomeEquityLoanMemberus-gaap:FinancialAssetPastDueMember2024-03-310001471265nwbi:PersonalBankingMemberus-gaap:HomeEquityLoanMemberus-gaap:FinancialAssetNotPastDueMember2024-03-310001471265nwbi:PersonalBankingMemberus-gaap:AutomobileLoanMemberus-gaap:FinancingReceivables30To59DaysPastDueMember2024-03-310001471265nwbi:PersonalBankingMemberus-gaap:AutomobileLoanMemberus-gaap:FinancingReceivables60To89DaysPastDueMember2024-03-310001471265nwbi:PersonalBankingMemberus-gaap:AutomobileLoanMemberus-gaap:FinancingReceivablesEqualToGreaterThan90DaysPastDueMember2024-03-310001471265nwbi:PersonalBankingMemberus-gaap:AutomobileLoanMemberus-gaap:FinancialAssetPastDueMember2024-03-310001471265nwbi:PersonalBankingMemberus-gaap:AutomobileLoanMemberus-gaap:FinancialAssetNotPastDueMember2024-03-310001471265nwbi:PersonalBankingMemberus-gaap:FinancingReceivables30To59DaysPastDueMemberus-gaap:ConsumerLoanMember2024-03-310001471265nwbi:PersonalBankingMemberus-gaap:ConsumerLoanMemberus-gaap:FinancingReceivables60To89DaysPastDueMember2024-03-310001471265nwbi:PersonalBankingMemberus-gaap:ConsumerLoanMemberus-gaap:FinancingReceivablesEqualToGreaterThan90DaysPastDueMember2024-03-310001471265nwbi:PersonalBankingMemberus-gaap:FinancialAssetPastDueMemberus-gaap:ConsumerLoanMember2024-03-310001471265nwbi:PersonalBankingMemberus-gaap:ConsumerLoanMemberus-gaap:FinancialAssetNotPastDueMember2024-03-310001471265nwbi:PersonalBankingMemberus-gaap:FinancingReceivables30To59DaysPastDueMember2024-03-310001471265nwbi:PersonalBankingMemberus-gaap:FinancingReceivables60To89DaysPastDueMember2024-03-310001471265nwbi:PersonalBankingMemberus-gaap:FinancingReceivablesEqualToGreaterThan90DaysPastDueMember2024-03-310001471265nwbi:PersonalBankingMemberus-gaap:FinancialAssetPastDueMember2024-03-310001471265nwbi:PersonalBankingMemberus-gaap:FinancialAssetNotPastDueMember2024-03-310001471265us-gaap:CommercialRealEstateMemberus-gaap:FinancingReceivables30To59DaysPastDueMembernwbi:CommercialBankingMember2024-03-310001471265us-gaap:CommercialRealEstateMembernwbi:CommercialBankingMemberus-gaap:FinancingReceivables60To89DaysPastDueMember2024-03-310001471265us-gaap:CommercialRealEstateMembernwbi:CommercialBankingMemberus-gaap:FinancingReceivablesEqualToGreaterThan90DaysPastDueMember2024-03-310001471265us-gaap:CommercialRealEstateMemberus-gaap:FinancialAssetPastDueMembernwbi:CommercialBankingMember2024-03-310001471265us-gaap:CommercialRealEstateMembernwbi:CommercialBankingMemberus-gaap:FinancialAssetNotPastDueMember2024-03-310001471265nwbi:CommercialRealEstateOwnerOccupiedMemberus-gaap:FinancingReceivables30To59DaysPastDueMembernwbi:CommercialBankingMember2024-03-310001471265nwbi:CommercialRealEstateOwnerOccupiedMembernwbi:CommercialBankingMemberus-gaap:FinancingReceivables60To89DaysPastDueMember2024-03-310001471265nwbi:CommercialRealEstateOwnerOccupiedMembernwbi:CommercialBankingMemberus-gaap:FinancingReceivablesEqualToGreaterThan90DaysPastDueMember2024-03-310001471265nwbi:CommercialRealEstateOwnerOccupiedMemberus-gaap:FinancialAssetPastDueMembernwbi:CommercialBankingMember2024-03-310001471265nwbi:CommercialRealEstateOwnerOccupiedMembernwbi:CommercialBankingMemberus-gaap:FinancialAssetNotPastDueMember2024-03-310001471265us-gaap:CommercialLoanMemberus-gaap:FinancingReceivables30To59DaysPastDueMembernwbi:CommercialBankingMember2024-03-310001471265us-gaap:CommercialLoanMembernwbi:CommercialBankingMemberus-gaap:FinancingReceivables60To89DaysPastDueMember2024-03-310001471265us-gaap:CommercialLoanMembernwbi:CommercialBankingMemberus-gaap:FinancingReceivablesEqualToGreaterThan90DaysPastDueMember2024-03-310001471265us-gaap:FinancialAssetPastDueMemberus-gaap:CommercialLoanMembernwbi:CommercialBankingMember2024-03-310001471265us-gaap:CommercialLoanMembernwbi:CommercialBankingMemberus-gaap:FinancialAssetNotPastDueMember2024-03-310001471265us-gaap:FinancingReceivables30To59DaysPastDueMembernwbi:CommercialBankingMember2024-03-310001471265nwbi:CommercialBankingMemberus-gaap:FinancingReceivables60To89DaysPastDueMember2024-03-310001471265nwbi:CommercialBankingMemberus-gaap:FinancingReceivablesEqualToGreaterThan90DaysPastDueMember2024-03-310001471265us-gaap:FinancialAssetPastDueMembernwbi:CommercialBankingMember2024-03-310001471265nwbi:CommercialBankingMemberus-gaap:FinancialAssetNotPastDueMember2024-03-310001471265us-gaap:FinancingReceivables30To59DaysPastDueMember2024-03-310001471265us-gaap:FinancingReceivables60To89DaysPastDueMember2024-03-310001471265us-gaap:FinancingReceivablesEqualToGreaterThan90DaysPastDueMember2024-03-310001471265us-gaap:FinancialAssetPastDueMember2024-03-310001471265us-gaap:FinancialAssetNotPastDueMember2024-03-310001471265nwbi:PersonalBankingMemberus-gaap:FinancingReceivables30To59DaysPastDueMemberus-gaap:ResidentialMortgageMember2023-12-310001471265nwbi:PersonalBankingMemberus-gaap:ResidentialMortgageMemberus-gaap:FinancingReceivables60To89DaysPastDueMember2023-12-310001471265nwbi:PersonalBankingMemberus-gaap:FinancingReceivablesEqualToGreaterThan90DaysPastDueMemberus-gaap:ResidentialMortgageMember2023-12-310001471265nwbi:PersonalBankingMemberus-gaap:FinancialAssetPastDueMemberus-gaap:ResidentialMortgageMember2023-12-310001471265nwbi:PersonalBankingMemberus-gaap:ResidentialMortgageMemberus-gaap:FinancialAssetNotPastDueMember2023-12-310001471265nwbi:PersonalBankingMemberus-gaap:HomeEquityLoanMemberus-gaap:FinancingReceivables30To59DaysPastDueMember2023-12-310001471265nwbi:PersonalBankingMemberus-gaap:HomeEquityLoanMemberus-gaap:FinancingReceivables60To89DaysPastDueMember2023-12-310001471265nwbi:PersonalBankingMemberus-gaap:HomeEquityLoanMemberus-gaap:FinancingReceivablesEqualToGreaterThan90DaysPastDueMember2023-12-310001471265nwbi:PersonalBankingMemberus-gaap:HomeEquityLoanMemberus-gaap:FinancialAssetPastDueMember2023-12-310001471265nwbi:PersonalBankingMemberus-gaap:HomeEquityLoanMemberus-gaap:FinancialAssetNotPastDueMember2023-12-310001471265nwbi:PersonalBankingMemberus-gaap:AutomobileLoanMemberus-gaap:FinancingReceivables30To59DaysPastDueMember2023-12-310001471265nwbi:PersonalBankingMemberus-gaap:AutomobileLoanMemberus-gaap:FinancingReceivables60To89DaysPastDueMember2023-12-310001471265nwbi:PersonalBankingMemberus-gaap:AutomobileLoanMemberus-gaap:FinancingReceivablesEqualToGreaterThan90DaysPastDueMember2023-12-310001471265nwbi:PersonalBankingMemberus-gaap:AutomobileLoanMemberus-gaap:FinancialAssetPastDueMember2023-12-310001471265nwbi:PersonalBankingMemberus-gaap:AutomobileLoanMemberus-gaap:FinancialAssetNotPastDueMember2023-12-310001471265nwbi:PersonalBankingMemberus-gaap:FinancingReceivables30To59DaysPastDueMemberus-gaap:ConsumerLoanMember2023-12-310001471265nwbi:PersonalBankingMemberus-gaap:ConsumerLoanMemberus-gaap:FinancingReceivables60To89DaysPastDueMember2023-12-310001471265nwbi:PersonalBankingMemberus-gaap:ConsumerLoanMemberus-gaap:FinancingReceivablesEqualToGreaterThan90DaysPastDueMember2023-12-310001471265nwbi:PersonalBankingMemberus-gaap:FinancialAssetPastDueMemberus-gaap:ConsumerLoanMember2023-12-310001471265nwbi:PersonalBankingMemberus-gaap:ConsumerLoanMemberus-gaap:FinancialAssetNotPastDueMember2023-12-310001471265nwbi:PersonalBankingMemberus-gaap:FinancingReceivables30To59DaysPastDueMember2023-12-310001471265nwbi:PersonalBankingMemberus-gaap:FinancingReceivables60To89DaysPastDueMember2023-12-310001471265nwbi:PersonalBankingMemberus-gaap:FinancingReceivablesEqualToGreaterThan90DaysPastDueMember2023-12-310001471265nwbi:PersonalBankingMemberus-gaap:FinancialAssetPastDueMember2023-12-310001471265nwbi:PersonalBankingMemberus-gaap:FinancialAssetNotPastDueMember2023-12-310001471265us-gaap:CommercialRealEstateMemberus-gaap:FinancingReceivables30To59DaysPastDueMembernwbi:CommercialBankingMember2023-12-310001471265us-gaap:CommercialRealEstateMembernwbi:CommercialBankingMemberus-gaap:FinancingReceivables60To89DaysPastDueMember2023-12-310001471265us-gaap:CommercialRealEstateMembernwbi:CommercialBankingMemberus-gaap:FinancingReceivablesEqualToGreaterThan90DaysPastDueMember2023-12-310001471265us-gaap:CommercialRealEstateMemberus-gaap:FinancialAssetPastDueMembernwbi:CommercialBankingMember2023-12-310001471265us-gaap:CommercialRealEstateMembernwbi:CommercialBankingMemberus-gaap:FinancialAssetNotPastDueMember2023-12-310001471265nwbi:CommercialRealEstateOwnerOccupiedMemberus-gaap:FinancingReceivables30To59DaysPastDueMembernwbi:CommercialBankingMember2023-12-310001471265nwbi:CommercialRealEstateOwnerOccupiedMembernwbi:CommercialBankingMemberus-gaap:FinancingReceivables60To89DaysPastDueMember2023-12-310001471265nwbi:CommercialRealEstateOwnerOccupiedMembernwbi:CommercialBankingMemberus-gaap:FinancingReceivablesEqualToGreaterThan90DaysPastDueMember2023-12-310001471265nwbi:CommercialRealEstateOwnerOccupiedMemberus-gaap:FinancialAssetPastDueMembernwbi:CommercialBankingMember2023-12-310001471265nwbi:CommercialRealEstateOwnerOccupiedMembernwbi:CommercialBankingMemberus-gaap:FinancialAssetNotPastDueMember2023-12-310001471265us-gaap:CommercialLoanMemberus-gaap:FinancingReceivables30To59DaysPastDueMembernwbi:CommercialBankingMember2023-12-310001471265us-gaap:CommercialLoanMembernwbi:CommercialBankingMemberus-gaap:FinancingReceivables60To89DaysPastDueMember2023-12-310001471265us-gaap:CommercialLoanMembernwbi:CommercialBankingMemberus-gaap:FinancingReceivablesEqualToGreaterThan90DaysPastDueMember2023-12-310001471265us-gaap:FinancialAssetPastDueMemberus-gaap:CommercialLoanMembernwbi:CommercialBankingMember2023-12-310001471265us-gaap:CommercialLoanMembernwbi:CommercialBankingMemberus-gaap:FinancialAssetNotPastDueMember2023-12-310001471265us-gaap:FinancingReceivables30To59DaysPastDueMembernwbi:CommercialBankingMember2023-12-310001471265nwbi:CommercialBankingMemberus-gaap:FinancingReceivables60To89DaysPastDueMember2023-12-310001471265nwbi:CommercialBankingMemberus-gaap:FinancingReceivablesEqualToGreaterThan90DaysPastDueMember2023-12-310001471265us-gaap:FinancialAssetPastDueMembernwbi:CommercialBankingMember2023-12-310001471265nwbi:CommercialBankingMemberus-gaap:FinancialAssetNotPastDueMember2023-12-310001471265us-gaap:FinancingReceivables30To59DaysPastDueMember2023-12-310001471265us-gaap:FinancingReceivables60To89DaysPastDueMember2023-12-310001471265us-gaap:FinancingReceivablesEqualToGreaterThan90DaysPastDueMember2023-12-310001471265us-gaap:FinancialAssetPastDueMember2023-12-310001471265us-gaap:FinancialAssetNotPastDueMember2023-12-310001471265nwbi:SpecialMentionAndSubstandardMembersrt:MinimumMember2024-03-310001471265nwbi:PersonalBankingMemberus-gaap:PassMemberus-gaap:ResidentialMortgageMember2024-03-310001471265nwbi:PersonalBankingMemberus-gaap:SubstandardMemberus-gaap:ResidentialMortgageMember2024-03-310001471265nwbi:PersonalBankingMemberus-gaap:HomeEquityLoanMemberus-gaap:PassMember2024-03-310001471265nwbi:PersonalBankingMemberus-gaap:HomeEquityLoanMemberus-gaap:SubstandardMember2024-03-310001471265nwbi:PersonalBankingMemberus-gaap:AutomobileLoanMemberus-gaap:PassMember2024-03-310001471265nwbi:PersonalBankingMemberus-gaap:AutomobileLoanMemberus-gaap:SubstandardMember2024-03-310001471265nwbi:PersonalBankingMemberus-gaap:PassMemberus-gaap:ConsumerLoanMember2024-03-310001471265nwbi:PersonalBankingMemberus-gaap:ConsumerLoanMemberus-gaap:SubstandardMember2024-03-310001471265us-gaap:CommercialRealEstateMemberus-gaap:PassMembernwbi:CommercialBankingMember2024-03-310001471265us-gaap:CommercialRealEstateMemberus-gaap:SpecialMentionMembernwbi:CommercialBankingMember2024-03-310001471265us-gaap:CommercialRealEstateMembernwbi:CommercialBankingMemberus-gaap:SubstandardMember2024-03-310001471265nwbi:CommercialRealEstateOwnerOccupiedMemberus-gaap:PassMembernwbi:CommercialBankingMember2024-03-310001471265nwbi:CommercialRealEstateOwnerOccupiedMemberus-gaap:SpecialMentionMembernwbi:CommercialBankingMember2024-03-310001471265nwbi:CommercialRealEstateOwnerOccupiedMembernwbi:CommercialBankingMemberus-gaap:SubstandardMember2024-03-310001471265us-gaap:PassMemberus-gaap:CommercialLoanMembernwbi:CommercialBankingMember2024-03-310001471265us-gaap:SpecialMentionMemberus-gaap:CommercialLoanMembernwbi:CommercialBankingMember2024-03-310001471265us-gaap:CommercialLoanMembernwbi:CommercialBankingMemberus-gaap:SubstandardMember2024-03-310001471265nwbi:PersonalBankingMemberus-gaap:PassMemberus-gaap:ResidentialMortgageMember2023-12-310001471265nwbi:PersonalBankingMemberus-gaap:SubstandardMemberus-gaap:ResidentialMortgageMember2023-12-310001471265nwbi:PersonalBankingMemberus-gaap:ResidentialMortgageMember2023-01-012023-12-310001471265nwbi:PersonalBankingMemberus-gaap:HomeEquityLoanMemberus-gaap:PassMember2023-12-310001471265nwbi:PersonalBankingMemberus-gaap:HomeEquityLoanMemberus-gaap:SubstandardMember2023-12-310001471265nwbi:PersonalBankingMemberus-gaap:HomeEquityLoanMember2023-01-012023-12-310001471265nwbi:PersonalBankingMemberus-gaap:AutomobileLoanMemberus-gaap:PassMember2023-12-310001471265nwbi:PersonalBankingMemberus-gaap:AutomobileLoanMemberus-gaap:SubstandardMember2023-12-310001471265nwbi:PersonalBankingMemberus-gaap:AutomobileLoanMember2023-01-012023-12-310001471265nwbi:PersonalBankingMemberus-gaap:PassMemberus-gaap:ConsumerLoanMember2023-12-310001471265nwbi:PersonalBankingMemberus-gaap:ConsumerLoanMemberus-gaap:SubstandardMember2023-12-310001471265nwbi:PersonalBankingMemberus-gaap:ConsumerLoanMember2023-01-012023-12-310001471265us-gaap:CommercialRealEstateMemberus-gaap:PassMembernwbi:CommercialBankingMember2023-12-310001471265us-gaap:CommercialRealEstateMemberus-gaap:SpecialMentionMembernwbi:CommercialBankingMember2023-12-310001471265us-gaap:CommercialRealEstateMembernwbi:CommercialBankingMemberus-gaap:SubstandardMember2023-12-310001471265us-gaap:CommercialRealEstateMembernwbi:CommercialBankingMember2023-01-012023-12-310001471265nwbi:CommercialRealEstateOwnerOccupiedMemberus-gaap:PassMembernwbi:CommercialBankingMember2023-12-310001471265nwbi:CommercialRealEstateOwnerOccupiedMemberus-gaap:SpecialMentionMembernwbi:CommercialBankingMember2023-12-310001471265nwbi:CommercialRealEstateOwnerOccupiedMembernwbi:CommercialBankingMemberus-gaap:SubstandardMember2023-12-310001471265nwbi:CommercialRealEstateOwnerOccupiedMembernwbi:CommercialBankingMember2023-01-012023-12-310001471265us-gaap:PassMemberus-gaap:CommercialLoanMembernwbi:CommercialBankingMember2023-12-310001471265us-gaap:SpecialMentionMemberus-gaap:CommercialLoanMembernwbi:CommercialBankingMember2023-12-310001471265us-gaap:CommercialLoanMembernwbi:CommercialBankingMemberus-gaap:SubstandardMember2023-12-310001471265us-gaap:CommercialLoanMembernwbi:CommercialBankingMember2023-01-012023-12-310001471265us-gaap:CoreDepositsMember2024-03-310001471265us-gaap:CoreDepositsMember2023-12-3100014712652023-06-302023-06-300001471265nwbi:TermNotesPayableToBanksMembersrt:FederalHomeLoanBankOfPittsburghMember2024-03-310001471265nwbi:TermNotesPayableToBanksMembersrt:FederalHomeLoanBankOfPittsburghMember2023-12-310001471265srt:FederalHomeLoanBankOfPittsburghMemberus-gaap:NotesPayableToBanksMember2024-03-310001471265srt:FederalHomeLoanBankOfPittsburghMemberus-gaap:NotesPayableToBanksMember2023-12-310001471265us-gaap:SecuritiesSoldUnderAgreementsToRepurchaseMember2024-03-310001471265us-gaap:SecuritiesSoldUnderAgreementsToRepurchaseMember2023-12-310001471265nwbi:SecuritiesReceivedUnderAgreementsToRepurchaseMember2024-03-310001471265nwbi:SecuritiesReceivedUnderAgreementsToRepurchaseMember2023-12-310001471265srt:FederalHomeLoanBankOfPittsburghMembernwbi:ResidentialFirstMortgageAndOtherLoansMember2024-03-310001471265srt:FederalHomeLoanBankOfPittsburghMemberus-gaap:LineOfCreditMember2024-03-310001471265srt:FederalHomeLoanBankOfPittsburghMemberus-gaap:LineOfCreditMember2023-12-310001471265srt:FederalHomeLoanBankOfPittsburghMember2024-03-31nwbi:advance0001471265nwbi:TermNotesPayableToBanksMembersrt:FederalHomeLoanBankOfPittsburghMemberus-gaap:DebtInstrumentRedemptionPeriodOneMember2024-03-310001471265nwbi:TermNotesPayableToBanksMembersrt:FederalHomeLoanBankOfPittsburghMemberus-gaap:DebtInstrumentRedemptionPeriodTwoMember2024-03-310001471265nwbi:TermNotesPayableToBanksMembersrt:FederalHomeLoanBankOfPittsburghMemberus-gaap:DebtInstrumentRedemptionPeriodThreeMember2024-03-310001471265nwbi:TermNotesPayableToBanksMembersrt:FederalHomeLoanBankOfPittsburghMemberus-gaap:DebtInstrumentRedemptionPeriodFourMember2024-03-310001471265nwbi:TermNotesPayableToBanksMembersrt:FederalHomeLoanBankOfPittsburghMemberus-gaap:DebtInstrumentRedemptionPeriodFiveMember2024-03-310001471265nwbi:TermNotesPayableToBanksMembersrt:FederalHomeLoanBankOfPittsburghMembernwbi:DebtInstrumentRedemptionPeriodSixMember2024-03-310001471265nwbi:TermNotesPayableToBanksMembersrt:FederalHomeLoanBankOfPittsburghMembernwbi:DebtInstrumentRedemptionPeriodSevenMember2024-03-310001471265nwbi:TermNotesPayableToBanksMembersrt:FederalHomeLoanBankOfPittsburghMembernwbi:DebtInstrumentRedemptionPeriodEightMember2024-03-310001471265us-gaap:SubordinatedDebtMember2020-09-090001471265us-gaap:SubordinatedDebtMembernwbi:SecuredOvernightFinancingRateSOFRMember2020-09-092020-09-090001471265us-gaap:SubordinatedDebtMember2023-12-310001471265us-gaap:SubordinatedDebtMember2023-01-012023-12-310001471265us-gaap:SubordinatedDebtMember2023-01-012023-03-310001471265us-gaap:SubordinatedDebtMember2024-01-012024-03-31nwbi:business_trust0001471265nwbi:NorthwestBancorpCapitalTrustIIIMembernwbi:SecuredOvernightFinancingRateSOFRMemberus-gaap:TrustPreferredSecuritiesSubjectToMandatoryRedemptionMember2024-01-012024-03-310001471265nwbi:NorthwestBancorpCapitalTrustIIIMemberus-gaap:TrustPreferredSecuritiesSubjectToMandatoryRedemptionMember2024-03-310001471265nwbi:NorthwestBancorpCapitalTrustIIIMemberus-gaap:TrustPreferredSecuritiesSubjectToMandatoryRedemptionMember2023-12-310001471265nwbi:SecuredOvernightFinancingRateSOFRMembernwbi:NorthwestBancorpStatutoryTrustIVMemberus-gaap:TrustPreferredSecuritiesSubjectToMandatoryRedemptionMember2024-01-012024-03-310001471265nwbi:NorthwestBancorpStatutoryTrustIVMemberus-gaap:TrustPreferredSecuritiesSubjectToMandatoryRedemptionMember2024-03-310001471265nwbi:NorthwestBancorpStatutoryTrustIVMemberus-gaap:TrustPreferredSecuritiesSubjectToMandatoryRedemptionMember2023-12-310001471265nwbi:SecuredOvernightFinancingRateSOFRMembernwbi:LNBStatutoryTrustIIMemberus-gaap:TrustPreferredSecuritiesSubjectToMandatoryRedemptionMember2024-01-012024-03-310001471265nwbi:LNBStatutoryTrustIIMemberus-gaap:TrustPreferredSecuritiesSubjectToMandatoryRedemptionMember2024-03-310001471265nwbi:LNBStatutoryTrustIIMemberus-gaap:TrustPreferredSecuritiesSubjectToMandatoryRedemptionMember2023-12-310001471265nwbi:SecuredOvernightFinancingRateSOFRMembernwbi:UnionNationalCapitalTrustIMemberus-gaap:TrustPreferredSecuritiesSubjectToMandatoryRedemptionMember2024-01-012024-03-310001471265nwbi:UnionNationalCapitalTrustIMemberus-gaap:TrustPreferredSecuritiesSubjectToMandatoryRedemptionMember2024-03-310001471265nwbi:UnionNationalCapitalTrustIMemberus-gaap:TrustPreferredSecuritiesSubjectToMandatoryRedemptionMember2023-12-310001471265nwbi:UnionNationalCapitalTrustIIMembernwbi:SecuredOvernightFinancingRateSOFRMemberus-gaap:TrustPreferredSecuritiesSubjectToMandatoryRedemptionMember2024-01-012024-03-310001471265nwbi:UnionNationalCapitalTrustIIMemberus-gaap:TrustPreferredSecuritiesSubjectToMandatoryRedemptionMember2024-03-310001471265nwbi:UnionNationalCapitalTrustIIMemberus-gaap:TrustPreferredSecuritiesSubjectToMandatoryRedemptionMember2023-12-310001471265nwbi:SecuredOvernightFinancingRateSOFRMemberus-gaap:TrustPreferredSecuritiesSubjectToMandatoryRedemptionMembernwbi:MFBCStatutoryTrustMember2024-01-012024-03-310001471265us-gaap:TrustPreferredSecuritiesSubjectToMandatoryRedemptionMembernwbi:MFBCStatutoryTrustMember2024-03-310001471265us-gaap:TrustPreferredSecuritiesSubjectToMandatoryRedemptionMembernwbi:MFBCStatutoryTrustMember2023-12-310001471265nwbi:UniversalPreferredTrustMembernwbi:SecuredOvernightFinancingRateSOFRMemberus-gaap:TrustPreferredSecuritiesSubjectToMandatoryRedemptionMember2024-01-012024-03-310001471265nwbi:UniversalPreferredTrustMemberus-gaap:TrustPreferredSecuritiesSubjectToMandatoryRedemptionMember2024-03-310001471265nwbi:UniversalPreferredTrustMemberus-gaap:TrustPreferredSecuritiesSubjectToMandatoryRedemptionMember2023-12-310001471265us-gaap:TrustPreferredSecuritiesSubjectToMandatoryRedemptionMember2024-03-310001471265us-gaap:TrustPreferredSecuritiesSubjectToMandatoryRedemptionMember2023-12-310001471265us-gaap:TrustPreferredSecuritiesSubjectToMandatoryRedemptionMember2024-01-012024-03-310001471265us-gaap:TrustPreferredSecuritiesSubjectToMandatoryRedemptionMember2023-01-012023-03-310001471265us-gaap:StandbyLettersOfCreditMember2024-03-310001471265nwbi:PrivateLabelCreditCardFacilitiesMember2024-03-310001471265nwbi:PrivateLabelCreditCardFacilitiesMembernwbi:CreditCardsIssuedMember2024-03-310001471265us-gaap:PensionPlansDefinedBenefitMember2024-01-012024-03-310001471265us-gaap:PensionPlansDefinedBenefitMember2023-01-012023-03-310001471265us-gaap:OtherPostretirementBenefitPlansDefinedBenefitMember2024-01-012024-03-310001471265us-gaap:OtherPostretirementBenefitPlansDefinedBenefitMember2023-01-012023-03-310001471265us-gaap:CarryingReportedAmountFairValueDisclosureMember2024-03-310001471265us-gaap:EstimateOfFairValueFairValueDisclosureMember2024-03-310001471265us-gaap:FairValueInputsLevel1Member2024-03-310001471265us-gaap:FairValueInputsLevel2Member2024-03-310001471265us-gaap:FairValueInputsLevel3Member2024-03-310001471265us-gaap:InterestRateLockCommitmentsMemberus-gaap:CarryingReportedAmountFairValueDisclosureMember2024-03-310001471265us-gaap:InterestRateLockCommitmentsMemberus-gaap:EstimateOfFairValueFairValueDisclosureMember2024-03-310001471265us-gaap:FairValueInputsLevel1Memberus-gaap:InterestRateLockCommitmentsMember2024-03-310001471265us-gaap:InterestRateLockCommitmentsMemberus-gaap:FairValueInputsLevel2Member2024-03-310001471265us-gaap:InterestRateLockCommitmentsMemberus-gaap:FairValueInputsLevel3Member2024-03-310001471265us-gaap:CarryingReportedAmountFairValueDisclosureMemberus-gaap:ForwardContractsMember2024-03-310001471265us-gaap:ForwardContractsMemberus-gaap:EstimateOfFairValueFairValueDisclosureMember2024-03-310001471265us-gaap:FairValueInputsLevel1Memberus-gaap:ForwardContractsMember2024-03-310001471265us-gaap:ForwardContractsMemberus-gaap:FairValueInputsLevel2Member2024-03-310001471265us-gaap:FairValueInputsLevel3Memberus-gaap:ForwardContractsMember2024-03-310001471265us-gaap:CarryingReportedAmountFairValueDisclosureMemberus-gaap:CurrencySwapMember2024-03-310001471265us-gaap:EstimateOfFairValueFairValueDisclosureMemberus-gaap:CurrencySwapMember2024-03-310001471265us-gaap:FairValueInputsLevel1Memberus-gaap:CurrencySwapMember2024-03-310001471265us-gaap:CurrencySwapMemberus-gaap:FairValueInputsLevel2Member2024-03-310001471265us-gaap:FairValueInputsLevel3Memberus-gaap:CurrencySwapMember2024-03-310001471265us-gaap:InterestRateSwapMemberus-gaap:CarryingReportedAmountFairValueDisclosureMemberus-gaap:DesignatedAsHedgingInstrumentMember2024-03-310001471265us-gaap:InterestRateSwapMemberus-gaap:EstimateOfFairValueFairValueDisclosureMemberus-gaap:DesignatedAsHedgingInstrumentMember2024-03-310001471265us-gaap:FairValueInputsLevel1Memberus-gaap:InterestRateSwapMemberus-gaap:DesignatedAsHedgingInstrumentMember2024-03-310001471265us-gaap:InterestRateSwapMemberus-gaap:FairValueInputsLevel2Memberus-gaap:DesignatedAsHedgingInstrumentMember2024-03-310001471265us-gaap:InterestRateSwapMemberus-gaap:FairValueInputsLevel3Memberus-gaap:DesignatedAsHedgingInstrumentMember2024-03-310001471265us-gaap:NondesignatedMemberus-gaap:InterestRateSwapMemberus-gaap:CarryingReportedAmountFairValueDisclosureMember2024-03-310001471265us-gaap:NondesignatedMemberus-gaap:InterestRateSwapMemberus-gaap:EstimateOfFairValueFairValueDisclosureMember2024-03-310001471265us-gaap:NondesignatedMemberus-gaap:FairValueInputsLevel1Memberus-gaap:InterestRateSwapMember2024-03-310001471265us-gaap:NondesignatedMemberus-gaap:InterestRateSwapMemberus-gaap:FairValueInputsLevel2Member2024-03-310001471265us-gaap:NondesignatedMemberus-gaap:InterestRateSwapMemberus-gaap:FairValueInputsLevel3Member2024-03-310001471265us-gaap:CreditRiskContractMemberus-gaap:CarryingReportedAmountFairValueDisclosureMember2024-03-310001471265us-gaap:CreditRiskContractMemberus-gaap:EstimateOfFairValueFairValueDisclosureMember2024-03-310001471265us-gaap:FairValueInputsLevel1Memberus-gaap:CreditRiskContractMember2024-03-310001471265us-gaap:CreditRiskContractMemberus-gaap:FairValueInputsLevel2Member2024-03-310001471265us-gaap:CreditRiskContractMemberus-gaap:FairValueInputsLevel3Member2024-03-310001471265us-gaap:CarryingReportedAmountFairValueDisclosureMember2023-12-310001471265us-gaap:EstimateOfFairValueFairValueDisclosureMember2023-12-310001471265us-gaap:FairValueInputsLevel1Member2023-12-310001471265us-gaap:FairValueInputsLevel2Member2023-12-310001471265us-gaap:FairValueInputsLevel3Member2023-12-310001471265us-gaap:InterestRateLockCommitmentsMemberus-gaap:CarryingReportedAmountFairValueDisclosureMember2023-12-310001471265us-gaap:InterestRateLockCommitmentsMemberus-gaap:EstimateOfFairValueFairValueDisclosureMember2023-12-310001471265us-gaap:FairValueInputsLevel1Memberus-gaap:InterestRateLockCommitmentsMember2023-12-310001471265us-gaap:InterestRateLockCommitmentsMemberus-gaap:FairValueInputsLevel2Member2023-12-310001471265us-gaap:InterestRateLockCommitmentsMemberus-gaap:FairValueInputsLevel3Member2023-12-310001471265us-gaap:CarryingReportedAmountFairValueDisclosureMemberus-gaap:ForwardContractsMember2023-12-310001471265us-gaap:ForwardContractsMemberus-gaap:EstimateOfFairValueFairValueDisclosureMember2023-12-310001471265us-gaap:FairValueInputsLevel1Memberus-gaap:ForwardContractsMember2023-12-310001471265us-gaap:ForwardContractsMemberus-gaap:FairValueInputsLevel2Member2023-12-310001471265us-gaap:FairValueInputsLevel3Memberus-gaap:ForwardContractsMember2023-12-310001471265us-gaap:InterestRateSwapMemberus-gaap:CarryingReportedAmountFairValueDisclosureMemberus-gaap:DesignatedAsHedgingInstrumentMember2023-12-310001471265us-gaap:InterestRateSwapMemberus-gaap:EstimateOfFairValueFairValueDisclosureMemberus-gaap:DesignatedAsHedgingInstrumentMember2023-12-310001471265us-gaap:FairValueInputsLevel1Memberus-gaap:InterestRateSwapMemberus-gaap:DesignatedAsHedgingInstrumentMember2023-12-310001471265us-gaap:InterestRateSwapMemberus-gaap:FairValueInputsLevel2Memberus-gaap:DesignatedAsHedgingInstrumentMember2023-12-310001471265us-gaap:InterestRateSwapMemberus-gaap:FairValueInputsLevel3Memberus-gaap:DesignatedAsHedgingInstrumentMember2023-12-310001471265us-gaap:NondesignatedMemberus-gaap:InterestRateSwapMemberus-gaap:CarryingReportedAmountFairValueDisclosureMember2023-12-310001471265us-gaap:NondesignatedMemberus-gaap:InterestRateSwapMemberus-gaap:EstimateOfFairValueFairValueDisclosureMember2023-12-310001471265us-gaap:NondesignatedMemberus-gaap:FairValueInputsLevel1Memberus-gaap:InterestRateSwapMember2023-12-310001471265us-gaap:NondesignatedMemberus-gaap:InterestRateSwapMemberus-gaap:FairValueInputsLevel2Member2023-12-310001471265us-gaap:NondesignatedMemberus-gaap:InterestRateSwapMemberus-gaap:FairValueInputsLevel3Member2023-12-310001471265us-gaap:CarryingReportedAmountFairValueDisclosureMemberus-gaap:CurrencySwapMember2023-12-310001471265us-gaap:EstimateOfFairValueFairValueDisclosureMemberus-gaap:CurrencySwapMember2023-12-310001471265us-gaap:FairValueInputsLevel1Memberus-gaap:CurrencySwapMember2023-12-310001471265us-gaap:CurrencySwapMemberus-gaap:FairValueInputsLevel2Member2023-12-310001471265us-gaap:FairValueInputsLevel3Memberus-gaap:CurrencySwapMember2023-12-310001471265us-gaap:CreditRiskContractMemberus-gaap:CarryingReportedAmountFairValueDisclosureMember2023-12-310001471265us-gaap:CreditRiskContractMemberus-gaap:EstimateOfFairValueFairValueDisclosureMember2023-12-310001471265us-gaap:FairValueInputsLevel1Memberus-gaap:CreditRiskContractMember2023-12-310001471265us-gaap:CreditRiskContractMemberus-gaap:FairValueInputsLevel2Member2023-12-310001471265us-gaap:CreditRiskContractMemberus-gaap:FairValueInputsLevel3Member2023-12-310001471265us-gaap:FairValueInputsLevel1Memberus-gaap:FairValueMeasurementsRecurringMemberus-gaap:USGovernmentAgenciesDebtSecuritiesMember2024-03-310001471265us-gaap:FairValueMeasurementsRecurringMemberus-gaap:FairValueInputsLevel2Memberus-gaap:USGovernmentAgenciesDebtSecuritiesMember2024-03-310001471265us-gaap:FairValueMeasurementsRecurringMemberus-gaap:FairValueInputsLevel3Memberus-gaap:USGovernmentAgenciesDebtSecuritiesMember2024-03-310001471265us-gaap:FairValueMeasurementsRecurringMemberus-gaap:USGovernmentAgenciesDebtSecuritiesMember2024-03-310001471265us-gaap:FairValueInputsLevel1Memberus-gaap:FairValueMeasurementsRecurringMemberus-gaap:USGovernmentSponsoredEnterprisesDebtSecuritiesMember2024-03-310001471265us-gaap:FairValueMeasurementsRecurringMemberus-gaap:USGovernmentSponsoredEnterprisesDebtSecuritiesMemberus-gaap:FairValueInputsLevel2Member2024-03-310001471265us-gaap:FairValueMeasurementsRecurringMemberus-gaap:FairValueInputsLevel3Memberus-gaap:USGovernmentSponsoredEnterprisesDebtSecuritiesMember2024-03-310001471265us-gaap:FairValueMeasurementsRecurringMemberus-gaap:USGovernmentSponsoredEnterprisesDebtSecuritiesMember2024-03-310001471265us-gaap:FairValueInputsLevel1Memberus-gaap:USStatesAndPoliticalSubdivisionsMemberus-gaap:FairValueMeasurementsRecurringMember2024-03-310001471265us-gaap:USStatesAndPoliticalSubdivisionsMemberus-gaap:FairValueMeasurementsRecurringMemberus-gaap:FairValueInputsLevel2Member2024-03-310001471265us-gaap:USStatesAndPoliticalSubdivisionsMemberus-gaap:FairValueMeasurementsRecurringMemberus-gaap:FairValueInputsLevel3Member2024-03-310001471265us-gaap:USStatesAndPoliticalSubdivisionsMemberus-gaap:FairValueMeasurementsRecurringMember2024-03-310001471265us-gaap:FairValueInputsLevel1Memberus-gaap:FairValueMeasurementsRecurringMemberus-gaap:CorporateDebtSecuritiesMember2024-03-310001471265us-gaap:FairValueMeasurementsRecurringMemberus-gaap:FairValueInputsLevel2Memberus-gaap:CorporateDebtSecuritiesMember2024-03-310001471265us-gaap:FairValueMeasurementsRecurringMemberus-gaap:FairValueInputsLevel3Memberus-gaap:CorporateDebtSecuritiesMember2024-03-310001471265us-gaap:FairValueMeasurementsRecurringMemberus-gaap:CorporateDebtSecuritiesMember2024-03-310001471265us-gaap:FairValueInputsLevel1Memberus-gaap:FairValueMeasurementsRecurringMember2024-03-310001471265us-gaap:FairValueMeasurementsRecurringMemberus-gaap:FairValueInputsLevel2Member2024-03-310001471265us-gaap:FairValueMeasurementsRecurringMemberus-gaap:FairValueInputsLevel3Member2024-03-310001471265us-gaap:FairValueMeasurementsRecurringMember2024-03-310001471265us-gaap:FairValueInputsLevel1Memberus-gaap:FairValueMeasurementsRecurringMemberus-gaap:GovernmentNationalMortgageAssociationCertificatesAndObligationsGNMAMember2024-03-310001471265us-gaap:FairValueMeasurementsRecurringMemberus-gaap:FairValueInputsLevel2Memberus-gaap:GovernmentNationalMortgageAssociationCertificatesAndObligationsGNMAMember2024-03-310001471265us-gaap:FairValueMeasurementsRecurringMemberus-gaap:FairValueInputsLevel3Memberus-gaap:GovernmentNationalMortgageAssociationCertificatesAndObligationsGNMAMember2024-03-310001471265us-gaap:FairValueMeasurementsRecurringMemberus-gaap:GovernmentNationalMortgageAssociationCertificatesAndObligationsGNMAMember2024-03-310001471265us-gaap:FairValueInputsLevel1Memberus-gaap:FairValueMeasurementsRecurringMemberus-gaap:FederalNationalMortgageAssociationCertificatesAndObligationsFNMAMember2024-03-310001471265us-gaap:FairValueMeasurementsRecurringMemberus-gaap:FederalNationalMortgageAssociationCertificatesAndObligationsFNMAMemberus-gaap:FairValueInputsLevel2Member2024-03-310001471265us-gaap:FairValueMeasurementsRecurringMemberus-gaap:FairValueInputsLevel3Memberus-gaap:FederalNationalMortgageAssociationCertificatesAndObligationsFNMAMember2024-03-310001471265us-gaap:FairValueMeasurementsRecurringMemberus-gaap:FederalNationalMortgageAssociationCertificatesAndObligationsFNMAMember2024-03-310001471265us-gaap:FairValueInputsLevel1Memberus-gaap:FairValueMeasurementsRecurringMemberus-gaap:FederalHomeLoanMortgageCorporationCertificatesAndObligationsFHLMCMember2024-03-310001471265us-gaap:FairValueMeasurementsRecurringMemberus-gaap:FairValueInputsLevel2Memberus-gaap:FederalHomeLoanMortgageCorporationCertificatesAndObligationsFHLMCMember2024-03-310001471265us-gaap:FairValueMeasurementsRecurringMemberus-gaap:FairValueInputsLevel3Memberus-gaap:FederalHomeLoanMortgageCorporationCertificatesAndObligationsFHLMCMember2024-03-310001471265us-gaap:FairValueMeasurementsRecurringMemberus-gaap:FederalHomeLoanMortgageCorporationCertificatesAndObligationsFHLMCMember2024-03-310001471265us-gaap:FairValueInputsLevel1Memberus-gaap:FairValueMeasurementsRecurringMemberus-gaap:MortgageBackedSecuritiesIssuedByPrivateEnterprisesMember2024-03-310001471265us-gaap:FairValueMeasurementsRecurringMemberus-gaap:FairValueInputsLevel2Memberus-gaap:MortgageBackedSecuritiesIssuedByPrivateEnterprisesMember2024-03-310001471265us-gaap:FairValueMeasurementsRecurringMemberus-gaap:FairValueInputsLevel3Memberus-gaap:MortgageBackedSecuritiesIssuedByPrivateEnterprisesMember2024-03-310001471265us-gaap:FairValueMeasurementsRecurringMemberus-gaap:MortgageBackedSecuritiesIssuedByPrivateEnterprisesMember2024-03-310001471265us-gaap:FairValueInputsLevel1Memberus-gaap:FairValueMeasurementsRecurringMemberus-gaap:InterestRateLockCommitmentsMember2024-03-310001471265us-gaap:FairValueMeasurementsRecurringMemberus-gaap:InterestRateLockCommitmentsMemberus-gaap:FairValueInputsLevel2Member2024-03-310001471265us-gaap:FairValueMeasurementsRecurringMemberus-gaap:InterestRateLockCommitmentsMemberus-gaap:FairValueInputsLevel3Member2024-03-310001471265us-gaap:FairValueMeasurementsRecurringMemberus-gaap:InterestRateLockCommitmentsMember2024-03-310001471265us-gaap:FairValueInputsLevel1Memberus-gaap:FairValueMeasurementsRecurringMemberus-gaap:ForwardContractsMember2024-03-310001471265us-gaap:FairValueMeasurementsRecurringMemberus-gaap:ForwardContractsMemberus-gaap:FairValueInputsLevel2Member2024-03-310001471265us-gaap:FairValueMeasurementsRecurringMemberus-gaap:FairValueInputsLevel3Memberus-gaap:ForwardContractsMember2024-03-310001471265us-gaap:FairValueMeasurementsRecurringMemberus-gaap:ForwardContractsMember2024-03-310001471265us-gaap:FairValueInputsLevel1Memberus-gaap:FairValueMeasurementsRecurringMemberus-gaap:CurrencySwapMember2024-03-310001471265us-gaap:FairValueMeasurementsRecurringMemberus-gaap:CurrencySwapMemberus-gaap:FairValueInputsLevel2Member2024-03-310001471265us-gaap:FairValueMeasurementsRecurringMemberus-gaap:FairValueInputsLevel3Memberus-gaap:CurrencySwapMember2024-03-310001471265us-gaap:FairValueMeasurementsRecurringMemberus-gaap:CurrencySwapMember2024-03-310001471265us-gaap:FairValueInputsLevel1Memberus-gaap:FairValueMeasurementsRecurringMemberus-gaap:InterestRateSwapMemberus-gaap:DesignatedAsHedgingInstrumentMember2024-03-310001471265us-gaap:FairValueMeasurementsRecurringMemberus-gaap:InterestRateSwapMemberus-gaap:FairValueInputsLevel2Memberus-gaap:DesignatedAsHedgingInstrumentMember2024-03-310001471265us-gaap:FairValueMeasurementsRecurringMemberus-gaap:InterestRateSwapMemberus-gaap:FairValueInputsLevel3Memberus-gaap:DesignatedAsHedgingInstrumentMember2024-03-310001471265us-gaap:FairValueMeasurementsRecurringMemberus-gaap:InterestRateSwapMemberus-gaap:DesignatedAsHedgingInstrumentMember2024-03-310001471265us-gaap:NondesignatedMemberus-gaap:FairValueInputsLevel1Memberus-gaap:FairValueMeasurementsRecurringMemberus-gaap:InterestRateSwapMember2024-03-310001471265us-gaap:NondesignatedMemberus-gaap:FairValueMeasurementsRecurringMemberus-gaap:InterestRateSwapMemberus-gaap:FairValueInputsLevel2Member2024-03-310001471265us-gaap:NondesignatedMemberus-gaap:FairValueMeasurementsRecurringMemberus-gaap:InterestRateSwapMemberus-gaap:FairValueInputsLevel3Member2024-03-310001471265us-gaap:NondesignatedMemberus-gaap:FairValueMeasurementsRecurringMemberus-gaap:InterestRateSwapMember2024-03-310001471265us-gaap:FairValueInputsLevel1Memberus-gaap:FairValueMeasurementsRecurringMemberus-gaap:CreditRiskContractMember2024-03-310001471265us-gaap:FairValueMeasurementsRecurringMemberus-gaap:CreditRiskContractMemberus-gaap:FairValueInputsLevel2Member2024-03-310001471265us-gaap:FairValueMeasurementsRecurringMemberus-gaap:CreditRiskContractMemberus-gaap:FairValueInputsLevel3Member2024-03-310001471265us-gaap:FairValueMeasurementsRecurringMemberus-gaap:CreditRiskContractMember2024-03-310001471265us-gaap:FairValueInputsLevel1Memberus-gaap:FairValueMeasurementsRecurringMemberus-gaap:USGovernmentAgenciesDebtSecuritiesMember2023-12-310001471265us-gaap:FairValueMeasurementsRecurringMemberus-gaap:FairValueInputsLevel2Memberus-gaap:USGovernmentAgenciesDebtSecuritiesMember2023-12-310001471265us-gaap:FairValueMeasurementsRecurringMemberus-gaap:FairValueInputsLevel3Memberus-gaap:USGovernmentAgenciesDebtSecuritiesMember2023-12-310001471265us-gaap:FairValueMeasurementsRecurringMemberus-gaap:USGovernmentAgenciesDebtSecuritiesMember2023-12-310001471265us-gaap:FairValueInputsLevel1Memberus-gaap:FairValueMeasurementsRecurringMemberus-gaap:USGovernmentSponsoredEnterprisesDebtSecuritiesMember2023-12-310001471265us-gaap:FairValueMeasurementsRecurringMemberus-gaap:USGovernmentSponsoredEnterprisesDebtSecuritiesMemberus-gaap:FairValueInputsLevel2Member2023-12-310001471265us-gaap:FairValueMeasurementsRecurringMemberus-gaap:FairValueInputsLevel3Memberus-gaap:USGovernmentSponsoredEnterprisesDebtSecuritiesMember2023-12-310001471265us-gaap:FairValueMeasurementsRecurringMemberus-gaap:USGovernmentSponsoredEnterprisesDebtSecuritiesMember2023-12-310001471265us-gaap:FairValueInputsLevel1Memberus-gaap:USStatesAndPoliticalSubdivisionsMemberus-gaap:FairValueMeasurementsRecurringMember2023-12-310001471265us-gaap:USStatesAndPoliticalSubdivisionsMemberus-gaap:FairValueMeasurementsRecurringMemberus-gaap:FairValueInputsLevel2Member2023-12-310001471265us-gaap:USStatesAndPoliticalSubdivisionsMemberus-gaap:FairValueMeasurementsRecurringMemberus-gaap:FairValueInputsLevel3Member2023-12-310001471265us-gaap:USStatesAndPoliticalSubdivisionsMemberus-gaap:FairValueMeasurementsRecurringMember2023-12-310001471265us-gaap:FairValueInputsLevel1Memberus-gaap:FairValueMeasurementsRecurringMemberus-gaap:CorporateDebtSecuritiesMember2023-12-310001471265us-gaap:FairValueMeasurementsRecurringMemberus-gaap:FairValueInputsLevel2Memberus-gaap:CorporateDebtSecuritiesMember2023-12-310001471265us-gaap:FairValueMeasurementsRecurringMemberus-gaap:FairValueInputsLevel3Memberus-gaap:CorporateDebtSecuritiesMember2023-12-310001471265us-gaap:FairValueMeasurementsRecurringMemberus-gaap:CorporateDebtSecuritiesMember2023-12-310001471265us-gaap:FairValueInputsLevel1Memberus-gaap:FairValueMeasurementsRecurringMember2023-12-310001471265us-gaap:FairValueMeasurementsRecurringMemberus-gaap:FairValueInputsLevel2Member2023-12-310001471265us-gaap:FairValueMeasurementsRecurringMemberus-gaap:FairValueInputsLevel3Member2023-12-310001471265us-gaap:FairValueMeasurementsRecurringMember2023-12-310001471265us-gaap:FairValueInputsLevel1Memberus-gaap:FairValueMeasurementsRecurringMemberus-gaap:GovernmentNationalMortgageAssociationCertificatesAndObligationsGNMAMember2023-12-310001471265us-gaap:FairValueMeasurementsRecurringMemberus-gaap:FairValueInputsLevel2Memberus-gaap:GovernmentNationalMortgageAssociationCertificatesAndObligationsGNMAMember2023-12-310001471265us-gaap:FairValueMeasurementsRecurringMemberus-gaap:FairValueInputsLevel3Memberus-gaap:GovernmentNationalMortgageAssociationCertificatesAndObligationsGNMAMember2023-12-310001471265us-gaap:FairValueMeasurementsRecurringMemberus-gaap:GovernmentNationalMortgageAssociationCertificatesAndObligationsGNMAMember2023-12-310001471265us-gaap:FairValueInputsLevel1Memberus-gaap:FairValueMeasurementsRecurringMemberus-gaap:FederalNationalMortgageAssociationCertificatesAndObligationsFNMAMember2023-12-310001471265us-gaap:FairValueMeasurementsRecurringMemberus-gaap:FederalNationalMortgageAssociationCertificatesAndObligationsFNMAMemberus-gaap:FairValueInputsLevel2Member2023-12-310001471265us-gaap:FairValueMeasurementsRecurringMemberus-gaap:FairValueInputsLevel3Memberus-gaap:FederalNationalMortgageAssociationCertificatesAndObligationsFNMAMember2023-12-310001471265us-gaap:FairValueMeasurementsRecurringMemberus-gaap:FederalNationalMortgageAssociationCertificatesAndObligationsFNMAMember2023-12-310001471265us-gaap:FairValueInputsLevel1Memberus-gaap:FairValueMeasurementsRecurringMemberus-gaap:FederalHomeLoanMortgageCorporationCertificatesAndObligationsFHLMCMember2023-12-310001471265us-gaap:FairValueMeasurementsRecurringMemberus-gaap:FairValueInputsLevel2Memberus-gaap:FederalHomeLoanMortgageCorporationCertificatesAndObligationsFHLMCMember2023-12-310001471265us-gaap:FairValueMeasurementsRecurringMemberus-gaap:FairValueInputsLevel3Memberus-gaap:FederalHomeLoanMortgageCorporationCertificatesAndObligationsFHLMCMember2023-12-310001471265us-gaap:FairValueMeasurementsRecurringMemberus-gaap:FederalHomeLoanMortgageCorporationCertificatesAndObligationsFHLMCMember2023-12-310001471265us-gaap:FairValueInputsLevel1Memberus-gaap:FairValueMeasurementsRecurringMemberus-gaap:MortgageBackedSecuritiesIssuedByPrivateEnterprisesMember2023-12-310001471265us-gaap:FairValueMeasurementsRecurringMemberus-gaap:FairValueInputsLevel2Memberus-gaap:MortgageBackedSecuritiesIssuedByPrivateEnterprisesMember2023-12-310001471265us-gaap:FairValueMeasurementsRecurringMemberus-gaap:FairValueInputsLevel3Memberus-gaap:MortgageBackedSecuritiesIssuedByPrivateEnterprisesMember2023-12-310001471265us-gaap:FairValueMeasurementsRecurringMemberus-gaap:MortgageBackedSecuritiesIssuedByPrivateEnterprisesMember2023-12-310001471265us-gaap:FairValueInputsLevel1Memberus-gaap:FairValueMeasurementsRecurringMemberus-gaap:InterestRateLockCommitmentsMember2023-12-310001471265us-gaap:FairValueMeasurementsRecurringMemberus-gaap:InterestRateLockCommitmentsMemberus-gaap:FairValueInputsLevel2Member2023-12-310001471265us-gaap:FairValueMeasurementsRecurringMemberus-gaap:InterestRateLockCommitmentsMemberus-gaap:FairValueInputsLevel3Member2023-12-310001471265us-gaap:FairValueMeasurementsRecurringMemberus-gaap:InterestRateLockCommitmentsMember2023-12-310001471265us-gaap:FairValueInputsLevel1Memberus-gaap:FairValueMeasurementsRecurringMemberus-gaap:ForwardContractsMember2023-12-310001471265us-gaap:FairValueMeasurementsRecurringMemberus-gaap:ForwardContractsMemberus-gaap:FairValueInputsLevel2Member2023-12-310001471265us-gaap:FairValueMeasurementsRecurringMemberus-gaap:FairValueInputsLevel3Memberus-gaap:ForwardContractsMember2023-12-310001471265us-gaap:FairValueMeasurementsRecurringMemberus-gaap:ForwardContractsMember2023-12-310001471265us-gaap:FairValueInputsLevel1Memberus-gaap:FairValueMeasurementsRecurringMemberus-gaap:InterestRateSwapMemberus-gaap:DesignatedAsHedgingInstrumentMember2023-12-310001471265us-gaap:FairValueMeasurementsRecurringMemberus-gaap:InterestRateSwapMemberus-gaap:FairValueInputsLevel2Memberus-gaap:DesignatedAsHedgingInstrumentMember2023-12-310001471265us-gaap:FairValueMeasurementsRecurringMemberus-gaap:InterestRateSwapMemberus-gaap:FairValueInputsLevel3Memberus-gaap:DesignatedAsHedgingInstrumentMember2023-12-310001471265us-gaap:FairValueMeasurementsRecurringMemberus-gaap:InterestRateSwapMemberus-gaap:DesignatedAsHedgingInstrumentMember2023-12-310001471265us-gaap:NondesignatedMemberus-gaap:FairValueInputsLevel1Memberus-gaap:FairValueMeasurementsRecurringMemberus-gaap:InterestRateSwapMember2023-12-310001471265us-gaap:NondesignatedMemberus-gaap:FairValueMeasurementsRecurringMemberus-gaap:InterestRateSwapMemberus-gaap:FairValueInputsLevel2Member2023-12-310001471265us-gaap:NondesignatedMemberus-gaap:FairValueMeasurementsRecurringMemberus-gaap:InterestRateSwapMemberus-gaap:FairValueInputsLevel3Member2023-12-310001471265us-gaap:NondesignatedMemberus-gaap:FairValueMeasurementsRecurringMemberus-gaap:InterestRateSwapMember2023-12-310001471265us-gaap:FairValueInputsLevel1Memberus-gaap:FairValueMeasurementsRecurringMemberus-gaap:CurrencySwapMember2023-12-310001471265us-gaap:FairValueMeasurementsRecurringMemberus-gaap:CurrencySwapMemberus-gaap:FairValueInputsLevel2Member2023-12-310001471265us-gaap:FairValueMeasurementsRecurringMemberus-gaap:FairValueInputsLevel3Memberus-gaap:CurrencySwapMember2023-12-310001471265us-gaap:FairValueMeasurementsRecurringMemberus-gaap:CurrencySwapMember2023-12-310001471265us-gaap:FairValueInputsLevel1Memberus-gaap:FairValueMeasurementsRecurringMemberus-gaap:CreditRiskContractMember2023-12-310001471265us-gaap:FairValueMeasurementsRecurringMemberus-gaap:CreditRiskContractMemberus-gaap:FairValueInputsLevel2Member2023-12-310001471265us-gaap:FairValueMeasurementsRecurringMemberus-gaap:CreditRiskContractMemberus-gaap:FairValueInputsLevel3Member2023-12-310001471265us-gaap:FairValueMeasurementsRecurringMemberus-gaap:CreditRiskContractMember2023-12-310001471265us-gaap:FairValueInputsLevel3Member2022-12-310001471265us-gaap:FairValueInputsLevel3Member2024-01-012024-03-310001471265us-gaap:FairValueInputsLevel3Member2023-01-012023-03-310001471265us-gaap:FairValueInputsLevel3Member2023-03-310001471265us-gaap:FairValueInputsLevel1Membernwbi:ImpairedLoansMemberus-gaap:FairValueMeasurementsNonrecurringMember2024-03-310001471265nwbi:ImpairedLoansMemberus-gaap:FairValueInputsLevel2Memberus-gaap:FairValueMeasurementsNonrecurringMember2024-03-310001471265us-gaap:FairValueInputsLevel3Membernwbi:ImpairedLoansMemberus-gaap:FairValueMeasurementsNonrecurringMember2024-03-310001471265nwbi:ImpairedLoansMemberus-gaap:FairValueMeasurementsNonrecurringMember2024-03-310001471265us-gaap:FairValueInputsLevel1Memberus-gaap:FairValueMeasurementsNonrecurringMember2024-03-310001471265us-gaap:FairValueInputsLevel2Memberus-gaap:FairValueMeasurementsNonrecurringMember2024-03-310001471265us-gaap:FairValueInputsLevel3Memberus-gaap:FairValueMeasurementsNonrecurringMember2024-03-310001471265us-gaap:FairValueMeasurementsNonrecurringMember2024-03-310001471265us-gaap:FairValueInputsLevel1Membernwbi:ImpairedLoansMemberus-gaap:FairValueMeasurementsNonrecurringMember2023-12-310001471265nwbi:ImpairedLoansMemberus-gaap:FairValueInputsLevel2Memberus-gaap:FairValueMeasurementsNonrecurringMember2023-12-310001471265us-gaap:FairValueInputsLevel3Membernwbi:ImpairedLoansMemberus-gaap:FairValueMeasurementsNonrecurringMember2023-12-310001471265nwbi:ImpairedLoansMemberus-gaap:FairValueMeasurementsNonrecurringMember2023-12-310001471265us-gaap:FairValueInputsLevel1Memberus-gaap:FairValueMeasurementsNonrecurringMember2023-12-310001471265us-gaap:FairValueInputsLevel2Memberus-gaap:FairValueMeasurementsNonrecurringMember2023-12-310001471265us-gaap:FairValueInputsLevel3Memberus-gaap:FairValueMeasurementsNonrecurringMember2023-12-310001471265us-gaap:FairValueMeasurementsNonrecurringMember2023-12-310001471265nwbi:ImpairedLoansMemberus-gaap:MeasurementInputCostToSellMemberus-gaap:ValuationTechniqueConsensusPricingModelMemberus-gaap:FairValueMeasurementsNonrecurringMember2024-03-310001471265nwbi:MeasurementInputAnnualServiceCostMemberus-gaap:ValuationTechniqueDiscountedCashFlowMemberus-gaap:FairValueMeasurementsNonrecurringMember2024-03-310001471265us-gaap:ValuationTechniqueDiscountedCashFlowMemberus-gaap:MeasurementInputPrepaymentRateMembersrt:MinimumMemberus-gaap:FairValueMeasurementsNonrecurringMember2024-03-310001471265us-gaap:ValuationTechniqueDiscountedCashFlowMembersrt:MaximumMemberus-gaap:MeasurementInputPrepaymentRateMemberus-gaap:FairValueMeasurementsNonrecurringMember2024-03-310001471265srt:WeightedAverageMemberus-gaap:ValuationTechniqueDiscountedCashFlowMemberus-gaap:MeasurementInputPrepaymentRateMemberus-gaap:FairValueMeasurementsNonrecurringMember2024-03-310001471265us-gaap:MeasurementInputExpectedTermMemberus-gaap:ValuationTechniqueDiscountedCashFlowMembersrt:MinimumMemberus-gaap:FairValueMeasurementsNonrecurringMember2024-03-310001471265us-gaap:MeasurementInputExpectedTermMemberus-gaap:ValuationTechniqueDiscountedCashFlowMembersrt:MaximumMemberus-gaap:FairValueMeasurementsNonrecurringMember2024-03-310001471265srt:WeightedAverageMemberus-gaap:MeasurementInputExpectedTermMemberus-gaap:ValuationTechniqueDiscountedCashFlowMemberus-gaap:FairValueMeasurementsNonrecurringMember2024-03-310001471265us-gaap:MeasurementInputOptionVolatilityMemberus-gaap:ValuationTechniqueDiscountedCashFlowMemberus-gaap:FairValueMeasurementsNonrecurringMember2024-03-310001471265us-gaap:ValuationTechniqueDiscountedCashFlowMembersrt:MinimumMembernwbi:MeasurementInputForwardYieldCurveMemberus-gaap:FairValueMeasurementsNonrecurringMember2024-03-310001471265us-gaap:ValuationTechniqueDiscountedCashFlowMembersrt:MaximumMembernwbi:MeasurementInputForwardYieldCurveMemberus-gaap:FairValueMeasurementsNonrecurringMember2024-03-310001471265us-gaap:MeasurementInputCostToSellMemberus-gaap:ValuationTechniqueConsensusPricingModelMemberus-gaap:FairValueMeasurementsNonrecurringMember2024-03-310001471265nwbi:ValuationTechniqueQuotedPricingMemberus-gaap:FairValueMeasurementsRecurringMembernwbi:MeasurementInputPullThroughRateMember2024-03-310001471265us-gaap:InterestRateSwapMemberus-gaap:DesignatedAsHedgingInstrumentMember2023-12-31nwbi:derivative0001471265us-gaap:InterestRateSwapMembersrt:MinimumMemberus-gaap:DesignatedAsHedgingInstrumentMember2023-01-012023-12-310001471265us-gaap:InterestRateSwapMembersrt:MaximumMemberus-gaap:DesignatedAsHedgingInstrumentMember2023-01-012023-12-310001471265us-gaap:InterestRateSwapMemberus-gaap:DesignatedAsHedgingInstrumentMember2024-03-310001471265us-gaap:NondesignatedMemberus-gaap:InterestRateSwapMember2024-03-310001471265us-gaap:NondesignatedMemberus-gaap:CurrencySwapMember2024-03-310001471265us-gaap:NondesignatedMemberus-gaap:InterestRateLockCommitmentsMember2024-03-310001471265us-gaap:NondesignatedMemberus-gaap:ForwardContractsMember2024-03-310001471265us-gaap:NondesignatedMemberus-gaap:CreditRiskContractMember2024-03-310001471265us-gaap:NondesignatedMember2024-03-310001471265us-gaap:NondesignatedMemberus-gaap:InterestRateSwapMember2023-12-310001471265us-gaap:NondesignatedMemberus-gaap:CurrencySwapMember2023-12-310001471265us-gaap:NondesignatedMemberus-gaap:InterestRateLockCommitmentsMember2023-12-310001471265us-gaap:NondesignatedMemberus-gaap:ForwardContractsMember2023-12-310001471265us-gaap:NondesignatedMemberus-gaap:CreditRiskContractMember2023-12-310001471265us-gaap:NondesignatedMember2023-12-310001471265us-gaap:OtherIncomeMember2024-01-012024-03-310001471265us-gaap:OtherIncomeMember2023-01-012023-03-310001471265nwbi:MortgageBankingIncomeMember2024-01-012024-03-310001471265nwbi:MortgageBankingIncomeMember2023-01-012023-03-310001471265nwbi:InterestRateSwapIssuedMay112023Memberus-gaap:DesignatedAsHedgingInstrumentMember2024-03-310001471265nwbi:InterestRateSwapIssuedMay122023ContractOneMemberus-gaap:DesignatedAsHedgingInstrumentMember2024-03-310001471265nwbi:InterestRateSwapIssuedMay192023ContractTwoMemberus-gaap:DesignatedAsHedgingInstrumentMember2024-03-310001471265nwbi:InterestRateSwapIssuedMay312023ContractThreeMemberus-gaap:DesignatedAsHedgingInstrumentMember2024-03-310001471265nwbi:InterestRateSwapIssuedJuly262023ContractFourMemberus-gaap:DesignatedAsHedgingInstrumentMember2024-03-310001471265nwbi:InterestRateSwapIssuedJuly312023ContractFiveMemberus-gaap:DesignatedAsHedgingInstrumentMember2024-03-310001471265nwbi:InterestRateSwapIssuedAugust92023ContractSixMemberus-gaap:DesignatedAsHedgingInstrumentMember2024-03-310001471265us-gaap:AccumulatedNetUnrealizedInvestmentGainLossMember2023-12-310001471265us-gaap:AccumulatedGainLossNetCashFlowHedgeParentMember2023-12-310001471265us-gaap:AccumulatedDefinedBenefitPlansAdjustmentMember2023-12-310001471265us-gaap:AccumulatedNetUnrealizedInvestmentGainLossMember2024-01-012024-03-310001471265us-gaap:AccumulatedGainLossNetCashFlowHedgeParentMember2024-01-012024-03-310001471265us-gaap:AccumulatedDefinedBenefitPlansAdjustmentMember2024-01-012024-03-310001471265us-gaap:AccumulatedNetUnrealizedInvestmentGainLossMember2024-03-310001471265us-gaap:AccumulatedGainLossNetCashFlowHedgeParentMember2024-03-310001471265us-gaap:AccumulatedDefinedBenefitPlansAdjustmentMember2024-03-310001471265us-gaap:AccumulatedNetUnrealizedInvestmentGainLossMember2022-12-310001471265us-gaap:AccumulatedDefinedBenefitPlansAdjustmentMember2022-12-310001471265us-gaap:AccumulatedNetUnrealizedInvestmentGainLossMember2023-01-012023-03-310001471265us-gaap:AccumulatedDefinedBenefitPlansAdjustmentMember2023-01-012023-03-310001471265us-gaap:AccumulatedNetUnrealizedInvestmentGainLossMember2023-03-310001471265us-gaap:AccumulatedDefinedBenefitPlansAdjustmentMember2023-03-310001471265us-gaap:SubsequentEventMember2024-04-012024-04-300001471265srt:MaximumMemberus-gaap:SubsequentEventMember2024-04-300001471265srt:MinimumMemberus-gaap:SubsequentEventMember2024-04-012024-04-300001471265srt:MaximumMemberus-gaap:SubsequentEventMember2024-04-012024-04-30
UNITED STATES
SECURITIES AND EXCHANGE COMMISSION
WASHINGTON, D.C. 20549
FORM 10-Q
☒ Quarterly Report Pursuant to Section 13 or 15(d) of the Securities Exchange Act of 1934
For the quarterly period ended March 31, 2024
OR
☐ Transition Report Pursuant to Section 13 or 15(d) of the Securities Exchange Act of 1934
For the transition period from to
Commission File Number 001-34582
NORTHWEST BANCSHARES, INC.
(Exact name of registrant as specified in its charter)
|
|
|
|
|
|
|
|
|
|
|
|
|
|
|
|
|
|
|
|
|
|
Maryland |
|
27-0950358 |
|
(State or other jurisdiction of incorporation or organization) |
|
(I.R.S. Employer Identification No.) |
|
|
|
|
|
|
|
|
3 Easton Oval |
Suite 500 |
Columbus |
Ohio |
|
43219 |
|
(Address of Principal Executive Offices) |
|
(Zip Code) |
(814) 726-2140
(Registrant’s telephone number, including area code)
Not applicable
(Former name, former address and former fiscal year, if changed since last report)
Indicate by check mark whether the registrant is a shell company (as defined in Rule 12b-2 of the Exchange Act).Yes ☐ No ☒
Securities registered pursuant to Section 12(b) of the Act:
|
|
|
|
|
|
|
|
|
|
|
|
|
|
|
| Title of each class |
|
Trading symbol(s) |
|
Name of each exchange on which registered |
| Common Stock, $0.01 Par Value |
|
NWBI |
|
NASDAQ Stock Market, LLC |
Indicate by check mark whether the registrant (1) has filed all reports required to be filed by Section 13 or 15(d) of the Securities Exchange Act of 1934 during the preceding 12 months (or for such shorter period that the Registrant was required to file such reports), and (2) has been subject to such filing requirements for the past 90 days. Yes ☒ No ☐
Indicate by check mark whether the registrant has submitted electronically every Interactive Data File required to be submitted pursuant to Rule 405 of Regulation S-T during the preceding 12 months (or for such shorter period that the registrant was required to submit such files).
Yes ☒ No ☐
Indicate by check mark whether the registrant is a large accelerated filer, an accelerated filer, a non-accelerated filer, smaller reporting company, or an emerging growth company. See the definitions of “large accelerated filer,” “accelerated filer,” “smaller reporting company,” and “emerging growth company” in Rule 12b-2 of the Exchange Act.
☒ Large accelerated filer ☐ Accelerated filer
☐ Non-accelerated filer ☐ Smaller reporting company
☐ Emerging growth company
If an emerging growth company, indicate by check mark if the registrant has elected not to use the extended transition period for complying with any new or revised financial accounting standards provided pursuant to Section 13(a) of the Exchange Act. ☐
Indicate the number of shares outstanding of each of the issuer’s classes of common stock, as of the latest practicable date:
Common Stock ($0.01 par value), 127,264,095 shares outstanding as of April 30, 2024.
NORTHWEST BANCSHARES, INC.
Table of Contents
|
|
|
|
|
|
|
|
|
|
|
|
|
|
|
| |
|
|
|
|
| PART I |
|
FINANCIAL INFORMATION |
|
|
| |
|
|
|
|
|
|
|
|
|
| |
|
|
|
|
| |
|
|
|
|
| |
|
|
|
|
| |
|
|
|
|
| |
|
|
|
|
| |
|
|
|
|
| |
|
|
|
|
| |
|
|
|
|
| |
|
|
|
|
| |
|
|
|
|
| |
|
|
|
|
| |
|
|
|
|
| |
|
|
|
|
|
|
|
|
|
| |
|
|
|
|
|
|
|
|
|
| |
|
|
|
|
|
|
|
|
|
| |
|
|
|
|
|
|
|
|
|
| |
|
|
|
|
|
|
|
|
|
| |
|
|
|
|
|
|
|
|
|
| |
|
|
|
|
|
|
|
|
|
| |
|
|
|
|
|
|
|
|
|
| |
|
|
|
|
|
|
|
|
|
| |
|
|
|
|
|
|
|
|
|
| |
|
|
|
|
|
|
|
|
|
| |
|
|
|
|
| |
|
|
|
|
| |
|
|
|
|
| |
|
|
|
|
Item 1. FINANCIAL STATEMENTS
NORTHWEST BANCSHARES, INC. AND SUBSIDIARIES
CONSOLIDATED STATEMENTS OF FINANCIAL CONDITION (Unaudited)
(in thousands, except share data)
|
|
|
|
|
|
|
|
|
|
|
|
|
March 31, 2024 |
|
December 31, 2023 |
| Assets |
|
|
|
| Cash and cash equivalents |
$ |
119,319 |
|
|
122,260 |
|
|
|
|
|
|
|
|
|
Marketable securities available-for-sale (amortized cost of $1,298,108 and $1,240,003, respectively) |
1,094,009 |
|
|
1,043,359 |
|
Marketable securities held-to-maturity (fair value of $680,353 and $699,506, respectively) |
801,107 |
|
|
814,839 |
|
| Total cash and cash equivalents and marketable securities |
2,014,435 |
|
|
1,980,458 |
|
|
|
|
|
|
|
|
|
| Loans held-for-sale |
8,082 |
|
|
8,768 |
|
|
|
|
|
|
|
|
|
|
|
|
|
|
|
|
|
|
|
|
|
|
|
|
|
|
|
|
|
|
|
|
|
| Loans held for investment |
11,493,164 |
|
|
11,406,041 |
|
|
|
|
|
| Allowance for credit losses |
(124,897) |
|
|
(125,243) |
|
| Loans receivable, net |
11,376,349 |
|
|
11,289,566 |
|
|
|
|
|
|
|
|
|
| FHLB stock, at cost |
30,811 |
|
|
30,146 |
|
| Accrued interest receivable |
50,680 |
|
|
47,353 |
|
| Real estate owned, net |
50 |
|
|
104 |
|
| Premises and equipment, net |
130,565 |
|
|
138,838 |
|
| Bank-owned life insurance |
252,842 |
|
|
251,895 |
|
| Goodwill |
380,997 |
|
|
380,997 |
|
| Other intangible assets, net |
4,589 |
|
|
5,290 |
|
| Other assets |
268,945 |
|
|
294,458 |
|
| Total assets |
$ |
14,510,263 |
|
|
14,419,105 |
|
|
|
|
|
| Liabilities and shareholders’ equity |
|
|
|
| Liabilities: |
|
|
|
| Noninterest-bearing demand deposits |
$ |
2,618,379 |
|
|
2,669,023 |
|
| Interest-bearing demand deposits |
2,557,866 |
|
|
2,634,546 |
|
| Money market deposit accounts |
1,952,537 |
|
|
1,968,218 |
|
| Savings deposits |
2,156,048 |
|
|
2,105,234 |
|
| Time deposits |
2,786,814 |
|
|
2,602,881 |
|
| Total deposits |
12,071,644 |
|
|
11,979,902 |
|
|
|
|
|
|
|
|
|
| Borrowed funds |
400,783 |
|
|
398,895 |
|
| Subordinated debt |
114,276 |
|
|
114,189 |
|
| Junior subordinated debentures |
129,639 |
|
|
129,574 |
|
| Advances by borrowers for taxes and insurance |
46,970 |
|
|
45,253 |
|
| Accrued interest payable |
17,395 |
|
|
13,669 |
|
| Other liabilities |
177,107 |
|
|
186,306 |
|
| Total liabilities |
12,957,814 |
|
|
12,867,788 |
|
|
|
|
|
| Shareholders’ equity: |
|
|
|
Preferred stock, $0.01 par value: 50,000,000 authorized, no shares issued |
— |
|
|
— |
|
Common stock, $0.01 par value: 500,000,000 shares authorized, 127,253,189 and 127,110,453 shares issued and outstanding, respectively |
1,273 |
|
|
1,271 |
|
| Additional paid-in capital |
1,026,173 |
|
|
1,024,852 |
|
| Retained earnings |
678,427 |
|
|
674,686 |
|
|
|
|
|
| Accumulated other comprehensive loss |
(153,424) |
|
|
(149,492) |
|
| Total shareholders’ equity |
1,552,449 |
|
|
1,551,317 |
|
| Total liabilities and shareholders’ equity |
$ |
14,510,263 |
|
|
14,419,105 |
|
See accompanying notes to unaudited Consolidated Financial Statements.
NORTHWEST BANCSHARES, INC. AND SUBSIDIARIES
CONSOLIDATED STATEMENTS OF INCOME (Unaudited)
(in thousands, except share data)
|
|
|
|
|
|
|
|
|
|
|
|
|
|
|
|
|
Quarter ended March 31, |
|
|
| |
2024 |
|
2023 |
|
|
|
|
| Interest income: |
|
|
|
|
|
|
|
| Loans receivable |
$ |
149,571 |
|
|
123,745 |
|
|
|
|
|
| Mortgage-backed securities |
7,944 |
|
|
8,537 |
|
|
|
|
|
| Taxable investment securities |
794 |
|
|
845 |
|
|
|
|
|
| Tax-free investment securities |
491 |
|
|
700 |
|
|
|
|
|
| FHLB stock dividends |
607 |
|
|
690 |
|
|
|
|
|
| Interest-earning deposits |
832 |
|
|
423 |
|
|
|
|
|
Total interest income |
160,239 |
|
|
134,940 |
|
|
|
|
|
| Interest expense: |
|
|
|
|
|
|
|
| Deposits |
47,686 |
|
|
11,238 |
|
|
|
|
|
| Borrowed funds |
9,315 |
|
|
11,238 |
|
|
|
|
|
Total interest expense |
57,001 |
|
|
22,476 |
|
|
|
|
|
Net interest income |
103,238 |
|
|
112,464 |
|
|
|
|
|
| Provision for credit losses - loans |
4,234 |
|
|
4,870 |
|
|
|
|
|
| Provision for credit losses - unfunded commitments |
(799) |
|
|
126 |
|
|
|
|
|
Net interest income after provision for credit losses |
99,803 |
|
|
107,468 |
|
|
|
|
|
| Noninterest income: |
|
|
|
|
|
|
|
|
|
|
|
|
|
|
|
|
|
|
|
|
|
|
|
| Gain on sale of SBA loans |
873 |
|
|
279 |
|
|
|
|
|
|
|
|
|
|
|
|
|
| Service charges and fees |
15,523 |
|
|
13,189 |
|
|
|
|
|
|
|
|
|
|
|
|
|
|
|
|
|
|
|
|
|
| Trust and other financial services income |
7,127 |
|
|
6,449 |
|
|
|
|
|
|
|
|
|
|
|
|
|
| Gain on real estate owned, net |
57 |
|
|
108 |
|
|
|
|
|
| Income from bank-owned life insurance |
1,502 |
|
|
1,269 |
|
|
|
|
|
| Mortgage banking income |
452 |
|
|
524 |
|
|
|
|
|
| Other operating income |
2,429 |
|
|
2,151 |
|
|
|
|
|
Total noninterest income |
27,963 |
|
|
23,969 |
|
|
|
|
|
| Noninterest expense: |
|
|
|
|
|
|
|
| Compensation and employee benefits |
51,540 |
|
|
46,604 |
|
|
|
|
|
| Premises and occupancy costs |
7,627 |
|
|
7,471 |
|
|
|
|
|
| Office operations |
2,767 |
|
|
3,010 |
|
|
|
|
|
| Collections expense |
336 |
|
|
387 |
|
|
|
|
|
| Processing expenses |
14,725 |
|
|
14,350 |
|
|
|
|
|
| Marketing expenses |
2,149 |
|
|
2,892 |
|
|
|
|
|
| Federal deposit insurance premiums |
3,023 |
|
|
2,223 |
|
|
|
|
|
| Professional services |
4,065 |
|
|
4,758 |
|
|
|
|
|
| Amortization of intangible assets |
701 |
|
|
909 |
|
|
|
|
|
| Real estate owned expense |
66 |
|
|
181 |
|
|
|
|
|
| Merger, asset disposition and restructuring expense |
955 |
|
|
2,802 |
|
|
|
|
|
|
|
|
|
|
|
|
|
| Other expenses |
2,070 |
|
|
1,863 |
|
|
|
|
|
Total noninterest expense |
90,024 |
|
|
87,450 |
|
|
|
|
|
| Income before income taxes |
37,742 |
|
|
43,987 |
|
|
|
|
|
| Federal and state income taxes expense |
8,579 |
|
|
10,308 |
|
|
|
|
|
| Net income |
$ |
29,163 |
|
|
33,679 |
|
|
|
|
|
| Basic earnings per share |
$ |
0.23 |
|
|
0.27 |
|
|
|
|
|
| Diluted earnings per share |
$ |
0.23 |
|
|
0.26 |
|
|
|
|
|
See accompanying notes to unaudited Consolidated Financial Statements.
NORTHWEST BANCSHARES, INC. AND SUBSIDIARIES
CONSOLIDATED STATEMENTS OF COMPREHENSIVE INCOME/(LOSS) (Unaudited)
(in thousands)
|
|
|
|
|
|
|
|
|
|
|
|
|
|
|
|
|
Quarter ended March 31, |
|
|
| |
2024 |
|
2023 |
|
|
|
|
| Net income |
$ |
29,163 |
|
|
33,679 |
|
|
|
|
|
| Other comprehensive (loss)/income net of tax: |
|
|
|
|
|
|
|
| Net unrealized holding (losses)/gains on marketable securities: |
|
|
|
|
|
|
|
Unrealized holding (losses)/gains, net of tax of $1,758 and ($3,308), respectively |
(5,698) |
|
|
13,017 |
|
|
|
|
|
Reclassification adjustment for losses/(gains) included in net income, net of tax of $0 and $0, respectively |
— |
|
|
— |
|
|
|
|
|
| Net unrealized holding (losses)/gains on marketable securities |
(5,698) |
|
|
13,017 |
|
|
|
|
|
|
|
|
|
|
|
|
|
Change in fair value of interest rate swaps, net of tax of ($630) and $0, respectively |
2,154 |
|
|
— |
|
|
|
|
|
|
|
|
|
|
|
|
|
|
|
|
|
|
|
|
|
| Defined benefit plan: |
|
|
|
|
|
|
|
Actuarial reclassification adjustments for prior period service costs and actuarial gains included in net income, net of tax of $147 and $152, respectively |
(388) |
|
|
(382) |
|
|
|
|
|
|
|
|
|
|
|
|
|
|
|
|
|
|
|
|
|
|
|
|
|
|
|
|
|
| Other comprehensive (loss)/income |
(3,932) |
|
|
12,635 |
|
|
|
|
|
|
|
|
|
|
|
|
|
| Total comprehensive income |
$ |
25,231 |
|
|
46,314 |
|
|
|
|
|
See accompanying notes to unaudited Consolidated Financial Statements.
NORTHWEST BANCSHARES, INC. AND SUBSIDIARIES
CONSOLIDATED STATEMENTS OF CHANGES IN SHAREHOLDERS’ EQUITY (Unaudited)
(in thousands, expect share data)
|
|
|
|
|
|
|
|
|
|
|
|
|
|
|
|
|
|
|
|
|
|
|
|
|
|
|
|
|
|
|
|
|
|
|
|
|
|
|
|
|
|
|
Additional paid-in capital |
|
Retained earnings |
|
Accumulated
other comprehensive loss |
|
|
|
Total shareholders’ equity |
| |
Common stock |
|
|
|
| Quarter ended March 31, 2024 |
Shares |
|
Amount |
|
|
|
| Beginning balance at December 31, 2023 |
127,110,453 |
|
|
$ |
1,271 |
|
|
1,024,852 |
|
|
674,686 |
|
|
(149,492) |
|
|
|
|
1,551,317 |
|
|
|
|
|
|
|
|
|
|
|
|
|
|
|
| Comprehensive income: |
|
|
|
|
|
|
|
|
|
|
|
|
|
| Net income |
— |
|
|
— |
|
|
— |
|
|
29,163 |
|
|
— |
|
|
|
|
29,163 |
|
|
|
|
|
|
|
|
|
|
|
|
|
|
|
Other comprehensive loss, net of tax of $1,275 |
— |
|
|
— |
|
|
— |
|
|
— |
|
|
(3,932) |
|
|
|
|
(3,932) |
|
|
|
|
|
|
|
|
|
|
|
|
|
|
|
| Total comprehensive income/(loss) |
— |
|
|
— |
|
|
— |
|
|
29,163 |
|
|
(3,932) |
|
|
|
|
25,231 |
|
|
|
|
|
|
|
|
|
|
|
|
|
|
|
|
|
|
|
|
|
|
|
|
|
|
|
|
|
|
|
|
|
|
|
|
|
|
|
|
|
|
|
| Exercise of stock options |
10 |
|
|
— |
|
|
20 |
|
|
— |
|
|
— |
|
|
|
|
20 |
|
|
|
|
|
|
|
|
|
|
|
|
|
|
|
| Stock-based compensation expense |
146,086 |
|
|
2 |
|
|
1,301 |
|
|
— |
|
|
— |
|
|
|
|
1,303 |
|
|
|
|
|
|
|
|
|
|
|
|
|
|
|
|
|
|
|
|
|
|
|
|
|
|
|
|
|
|
|
|
|
|
|
|
|
|
|
|
|
|
|
| Stock-based compensation forfeited |
(3,360) |
|
|
— |
|
|
— |
|
|
— |
|
|
— |
|
|
|
|
— |
|
|
|
|
|
|
|
|
|
|
|
|
|
|
|
Dividends paid ($0.20 per share) |
— |
|
|
— |
|
|
— |
|
|
(25,422) |
|
|
— |
|
|
|
|
(25,422) |
|
|
|
|
|
|
|
|
|
|
|
|
|
|
|
| Ending balance at March 31, 2024 |
127,253,189 |
|
|
$ |
1,273 |
|
|
1,026,173 |
|
|
678,427 |
|
|
(153,424) |
|
|
|
|
1,552,449 |
|
|
|
|
|
|
|
|
|
|
|
|
|
|
|
|
|
|
|
|
|
|
|
|
|
|
|
|
|
|
|
|
|
|
|
|
|
|
|
|
|
|
|
|
Additional paid-in capital |
|
Retained earnings |
|
Accumulated
other comprehensive loss |
|
|
|
Total shareholders’ equity |
| |
Common stock |
|
|
|
| Quarter ended March 31, 2023 |
Shares |
|
Amount |
|
|
|
| Beginning balance at December 31, 2022 |
127,028,848 |
|
|
$ |
1,270 |
|
|
1,019,647 |
|
|
641,727 |
|
|
(171,158) |
|
|
|
|
1,491,486 |
|
|
|
|
|
|
|
|
|
|
|
|
|
|
|
| Comprehensive income: |
|
|
|
|
|
|
|
|
|
|
|
|
|
| Net income |
— |
|
|
— |
|
|
— |
|
|
33,679 |
|
|
— |
|
|
|
|
33,679 |
|
|
|
|
|
|
|
|
|
|
|
|
|
|
|
Other comprehensive income, net of tax of ($3,157) |
— |
|
|
— |
|
|
— |
|
|
— |
|
|
12,635 |
|
|
|
|
12,635 |
|
|
|
|
|
|
|
|
|
|
|
|
|
|
|
| Total comprehensive income |
— |
|
|
— |
|
|
— |
|
|
33,679 |
|
|
12,635 |
|
|
|
|
46,314 |
|
|
|
|
|
|
|
|
|
|
|
|
|
|
|
| Adoption of ASU No. 2022-02 |
— |
|
|
— |
|
|
— |
|
|
(329) |
|
|
— |
|
|
|
|
(329) |
|
|
|
|
|
|
|
|
|
|
|
|
|
|
|
| Exercise of stock options |
38,218 |
|
|
1 |
|
|
464 |
|
|
— |
|
|
— |
|
|
|
|
465 |
|
|
|
|
|
|
|
|
|
|
|
|
|
|
|
| Stock-based compensation expense |
33,048 |
|
|
— |
|
|
744 |
|
|
— |
|
|
— |
|
|
|
|
744 |
|
|
|
|
|
|
|
|
|
|
|
|
|
|
|
|
|
|
|
|
|
|
|
|
|
|
|
|
|
|
|
|
|
|
|
|
|
|
|
|
|
|
|
| Stock-based compensation forfeited |
(34,714) |
|
|
— |
|
|
— |
|
|
— |
|
|
— |
|
|
|
|
— |
|
|
|
|
|
|
|
|
|
|
|
|
|
|
|
|
|
|
|
|
|
|
|
|
|
|
|
|
|
|
|
|
|
|
|
|
|
|
|
|
|
|
|
Dividends paid ($0.20 per share) |
— |
|
|
— |
|
|
— |
|
|
(25,405) |
|
|
— |
|
|
|
|
(25,405) |
|
|
|
|
|
|
|
|
|
|
|
|
|
|
|
| Ending balance at March 31, 2023 |
127,065,400 |
|
|
$ |
1,271 |
|
|
1,020,855 |
|
|
649,672 |
|
|
(158,523) |
|
|
|
|
1,513,275 |
|
See accompanying notes to unaudited Consolidated Financial Statements.
NORTHWEST BANCSHARES, INC. AND SUBSIDIARIES
CONSOLIDATED STATEMENTS OF CASH FLOWS (Unaudited)
(in thousands)
|
|
|
|
|
|
|
|
|
|
|
|
|
Quarter ended March 31, |
| |
2024 |
|
2023 |
| Operating activities: |
|
|
|
| Net income |
$ |
29,163 |
|
|
33,679 |
|
| Adjustments to reconcile net income to net cash provided by operating activities: |
|
|
|
| Provision for credit losses |
3,435 |
|
|
4,996 |
|
|
|
|
|
| Net (gain)/loss on sale of assets |
(6,023) |
|
|
1,254 |
|
| Mortgage banking activity |
(794) |
|
|
(179) |
|
| Gain on sale of SBA loans |
(852) |
|
|
— |
|
|
|
|
|
| Net depreciation, amortization and accretion |
4,646 |
|
|
2,154 |
|
| Decrease in other assets |
33,565 |
|
|
6,958 |
|
| Decrease in other liabilities |
(2,427) |
|
|
(24,494) |
|
| Net amortization on marketable securities |
625 |
|
|
876 |
|
| Noncash compensation expense related to stock benefit plans |
1,303 |
|
|
744 |
|
| Noncash write-down of other assets |
5,929 |
|
|
37 |
|
|
|
|
|
|
|
|
|
|
|
|
|
|
|
|
|
| Origination of loans held-for-sale |
(43,052) |
|
|
(30,712) |
|
| Proceeds from sale of loans held-for-sale |
45,183 |
|
|
34,530 |
|
|
|
|
|
| Net cash provided by operating activities |
70,701 |
|
|
29,843 |
|
|
|
|
|
| Investing activities: |
|
|
|
|
|
|
|
| Purchase of marketable securities available-for-sale |
(79,052) |
|
|
— |
|
| Proceeds from maturities and principal reductions of marketable securities held-to-maturity |
13,553 |
|
|
15,028 |
|
| Proceeds from maturities and principal reductions of marketable securities available-for-sale |
20,501 |
|
|
28,246 |
|
|
|
|
|
| Proceeds from bank-owned life insurance |
— |
|
|
1,633 |
|
| Loan originations |
(1,055,402) |
|
|
(923,686) |
|
|
|
|
|
|
|
|
|
| Proceeds from loan maturities and principal reductions |
962,835 |
|
|
748,472 |
|
|
|
|
|
| Net redemptions of FHLB stock |
(665) |
|
|
(1,376) |
|
| Proceeds from sale of real estate owned |
114 |
|
|
186 |
|
|
|
|
|
| (Purchases)/disposals of premises and equipment, net |
(5,471) |
|
|
1,340 |
|
| Net cash used in investing activities |
(143,587) |
|
|
(130,157) |
|
|
|
|
|
| Financing activities: |
|
|
|
| Net increase in deposits |
91,742 |
|
|
72,631 |
|
|
|
|
|
|
|
|
|
| Net increase in short-term borrowings |
1,888 |
|
|
7,475 |
|
| Increase in advances by borrowers for taxes and insurance |
1,717 |
|
|
2,280 |
|
| Cash dividends paid on common stock |
(25,422) |
|
|
(25,405) |
|
|
|
|
|
| Proceeds from stock options exercised |
20 |
|
|
465 |
|
| Net cash provided by financing activities |
69,945 |
|
|
57,446 |
|
| Net decrease in cash and cash equivalents |
$ |
(2,941) |
|
|
$ |
(42,868) |
|
|
|
|
|
| Cash and cash equivalents at beginning of period |
$ |
122,260 |
|
|
139,365 |
|
| Net decrease in cash and cash equivalents |
(2,941) |
|
|
(42,868) |
|
| Cash and cash equivalents at end of period |
$ |
119,319 |
|
|
96,497 |
|
|
|
|
|
| Cash paid during the period for: |
|
|
|
Interest on deposits and borrowings (including interest credited to deposit accounts of $37,257 and $10,676, respectively) |
$ |
53,275 |
|
|
23,471 |
|
| Income taxes |
612 |
|
|
291 |
|
|
|
|
|
| Non-cash activities: |
|
|
|
| Loan foreclosures and repossessions |
$ |
1,148 |
|
|
847 |
|
|
|
|
|
See accompanying notes to unaudited Consolidated Financial Statements.
NOTES TO CONSOLIDATED FINANCIAL STATEMENTS (Unaudited)
(1) Basis of Presentation and Informational Disclosures
Northwest Bancshares, Inc. (the “Company” or “NWBI”), a Maryland corporation headquartered in Columbus, Ohio, is a bank holding company regulated by the Board of Governors of the Federal Reserve System (“FRB”). The primary activity of the Company is the ownership of all of the issued and outstanding common stock of Northwest Bank, a Pennsylvania-chartered savings bank (“Northwest”). Northwest is regulated by the Federal Deposit Insurance Corporation (“FDIC”) and the Pennsylvania Department of Banking. Northwest operates 142 community-banking offices throughout Pennsylvania, Western New York, Eastern Ohio, and Indiana.
The accompanying unaudited Consolidated Financial Statements include the accounts of the Company and its subsidiary, Northwest, and Northwest’s subsidiaries Northwest Capital Group, Inc., Great Northwest Corporation, and Mutual Federal Interest Company, Inc. The unaudited Consolidated Financial Statements have been prepared in accordance with United States generally accepted accounting principles for interim financial information and with the instructions for Form 10-Q and Article 10 of Regulation S-X. Accordingly, they do not include all of the information or footnotes required for complete annual financial statements. In the opinion of management, all adjustments necessary for the fair presentation of the Company’s financial position and results of operations have been included. The Consolidated Financial Statements have been prepared using the accounting policies described in the financial statements included in the Company’s Annual Report on Form 10-K for the year ended December 31, 2023 updated, as required, for any new pronouncements or changes.
Certain items previously reported have been reclassified to conform to the current year’s reporting format.
The results of operations for the quarter ended March 31, 2024 are not necessarily indicative of the results that may be expected for the year ending December 31, 2024, or any other period.
Recently Adopted Accounting Standards
In March 2023, the Financial Accounting Standards Board ("FASB") issued Accounting Standards Update ("ASU") No. 2023-02, "Investments—Equity Method and Joint Ventures (Topic 323): Accounting for Investments in Tax Credit Structures Using the Proportional Amortization Method." This ASU allows reporting entities to elect to account for qualifying tax equity investments using the proportional amortization method, regardless of the program giving rise to the related income tax credits. Entities must make an accounting policy election to apply the proportional amortization method on a tax credit-program-by-tax-credit-program basis. The ASU’s amendments also remove the specialized guidance for low-income-housing tax credit ("LIHTC") investments that are not accounted for using the proportional amortization method and instead require that those LIHTC investments be accounted for using the guidance in other accounting standards. This guidance is effective for fiscal years beginning after December 15, 2023, with early adoption permitted. This ASU is applied on a modified retrospective or retrospective basis with the amendments to remove the specialized guidance for LIHTC also being able to be applied on a prospective basis. This guidance was adopted on January 1, 2024 and did not have a material impact to the Company's financial statements.
(2) Marketable Securities
The following table shows the portfolio of marketable securities available-for-sale at March 31, 2024 (in thousands):
|
|
|
|
|
|
|
|
|
|
|
|
|
|
|
|
|
|
|
|
|
|
|
|
|
Amortized
cost |
|
Gross
unrealized
holding
gains |
|
Gross
unrealized
holding
losses |
|
Fair
value |
| Debt issued by the U.S government and agencies: |
|
|
|
|
|
|
|
| Due after one year through five years |
$ |
20,000 |
|
|
— |
|
|
(1,204) |
|
|
18,796 |
|
| Due after ten years |
48,182 |
|
|
— |
|
|
(10,260) |
|
|
37,922 |
|
|
|
|
|
|
|
|
|
| Debt issued by government-sponsored enterprises: |
|
|
|
|
|
|
|
|
|
|
|
|
|
|
|
| Due after one year through five years |
45,987 |
|
|
— |
|
|
(5,819) |
|
|
40,168 |
|
| Due after five years through ten years |
360 |
|
|
— |
|
|
(9) |
|
|
351 |
|
|
|
|
|
|
|
|
|
|
|
|
|
|
|
|
|
|
|
|
|
|
|
|
|
|
|
|
|
|
|
|
|
| Municipal securities: |
|
|
|
|
|
|
|
|
|
|
|
|
|
|
|
| Due after one year through five years |
4,279 |
|
|
14 |
|
|
(426) |
|
|
3,867 |
|
| Due after five years through ten years |
27,921 |
|
|
47 |
|
|
(1,886) |
|
|
26,082 |
|
| Due after ten years |
53,464 |
|
|
— |
|
|
(9,142) |
|
|
44,322 |
|
|
|
|
|
|
|
|
|
| Corporate debt issues: |
|
|
|
|
|
|
|
|
|
|
|
|
|
|
|
| Due after five years through ten years |
8,467 |
|
|
— |
|
|
(833) |
|
|
7,634 |
|
|
|
|
|
|
|
|
|
| Residential mortgage-backed securities: |
|
|
|
|
|
|
|
| Fixed rate pass-through |
232,854 |
|
|
93 |
|
|
(26,711) |
|
|
206,236 |
|
| Variable rate pass-through |
6,738 |
|
|
12 |
|
|
(69) |
|
|
6,681 |
|
|
|
|
|
|
|
|
|
| Fixed rate agency CMOs |
776,087 |
|
|
— |
|
|
(147,127) |
|
|
628,960 |
|
| Variable rate agency CMOs |
73,769 |
|
|
35 |
|
|
(814) |
|
|
72,990 |
|
| Total residential mortgage-backed securities |
1,089,448 |
|
|
140 |
|
|
(174,721) |
|
|
914,867 |
|
| Total marketable securities available-for-sale |
$ |
1,298,108 |
|
|
201 |
|
|
(204,300) |
|
|
1,094,009 |
|
The following table shows the portfolio of marketable securities available-for-sale at December 31, 2023 (in thousands):
|
|
|
|
|
|
|
|
|
|
|
|
|
|
|
|
|
|
|
|
|
|
|
|
|
Amortized
cost |
|
Gross
unrealized
holding
gains |
|
Gross
unrealized
holding
losses |
|
Fair
value |
| Debt issued by the U.S. government and agencies: |
|
|
|
|
|
|
|
| Due after one year through five years |
$ |
20,000 |
|
|
— |
|
|
(1,135) |
|
|
18,865 |
|
| Due after ten years |
49,383 |
|
|
— |
|
|
(9,934) |
|
|
39,449 |
|
|
|
|
|
|
|
|
|
| Debt issued by government-sponsored enterprises: |
|
|
|
|
|
|
|
|
|
|
|
|
|
|
|
| Due after one year through five years |
45,986 |
|
|
— |
|
|
(5,763) |
|
|
40,223 |
|
|
|
|
|
|
|
|
|
| Due after five years through ten years |
386 |
|
|
— |
|
|
(12) |
|
|
374 |
|
|
|
|
|
|
|
|
|
|
|
|
|
|
|
|
|
|
|
|
|
|
|
|
|
|
|
|
|
|
|
|
|
| Municipal securities: |
|
|
|
|
|
|
|
|
|
|
|
|
|
|
|
| Due after one year through five years |
4,279 |
|
|
22 |
|
|
(427) |
|
|
3,874 |
|
| Due after five years through ten years |
20,725 |
|
|
— |
|
|
(1,437) |
|
|
19,288 |
|
| Due after ten years |
60,762 |
|
|
125 |
|
|
(8,580) |
|
|
52,307 |
|
|
|
|
|
|
|
|
|
| Corporate debt issues: |
|
|
|
|
|
|
|
|
|
|
|
|
|
|
|
| Due after five years through ten years |
8,466 |
|
|
— |
|
|
(778) |
|
|
7,688 |
|
|
|
|
|
|
|
|
|
| Residential mortgage-backed securities: |
|
|
|
|
|
|
|
| Fixed rate pass-through |
209,069 |
|
|
27 |
|
|
(25,222) |
|
|
183,874 |
|
| Variable rate pass-through |
7,140 |
|
|
11 |
|
|
(71) |
|
|
7,080 |
|
|
|
|
|
|
|
|
|
| Fixed rate agency CMOs |
789,842 |
|
|
— |
|
|
(143,055) |
|
|
646,787 |
|
| Variable rate agency CMOs |
23,965 |
|
|
38 |
|
|
(453) |
|
|
23,550 |
|
| Total residential mortgage-backed securities |
1,030,016 |
|
|
76 |
|
|
(168,801) |
|
|
861,291 |
|
| Total marketable securities available-for-sale |
$ |
1,240,003 |
|
|
223 |
|
|
(196,867) |
|
|
1,043,359 |
|
The following table shows the portfolio of marketable securities held-to-maturity at March 31, 2024 (in thousands):
|
|
|
|
|
|
|
|
|
|
|
|
|
|
|
|
|
|
|
|
|
|
|
|
|
Amortized
cost |
|
Gross
unrealized
holding
gains |
|
Gross
unrealized
holding
losses |
|
Fair
value |
| Debt issued by government-sponsored enterprises: |
|
|
|
|
|
|
|
| Due after one year through five years |
$ |
89,472 |
|
|
— |
|
|
(11,232) |
|
|
78,240 |
|
| Due after five years through ten years |
34,987 |
|
|
— |
|
|
(5,877) |
|
|
29,110 |
|
|
|
|
|
|
|
|
|
| Residential mortgage-backed securities: |
|
|
|
|
|
|
|
| Fixed rate pass-through |
144,158 |
|
|
— |
|
|
(21,062) |
|
|
123,096 |
|
| Variable rate pass-through |
432 |
|
|
1 |
|
|
— |
|
|
433 |
|
| Fixed rate agency CMOs |
531,529 |
|
|
— |
|
|
(82,578) |
|
|
448,951 |
|
| Variable rate agency CMOs |
529 |
|
|
— |
|
|
(6) |
|
|
523 |
|
| Total residential mortgage-backed securities |
676,648 |
|
|
1 |
|
|
(103,646) |
|
|
573,003 |
|
| Total marketable securities held-to-maturity |
$ |
801,107 |
|
|
1 |
|
|
(120,755) |
|
|
680,353 |
|
The following table shows the portfolio of marketable securities held-to-maturity at December 31, 2023 (in thousands):
|
|
|
|
|
|
|
|
|
|
|
|
|
|
|
|
|
|
|
|
|
|
|
|
|
Amortized
cost |
|
Gross
unrealized
holding
gains |
|
Gross
unrealized
holding
losses |
|
Fair
value |
| Debt issued by government-sponsored enterprises: |
|
|
|
|
|
|
|
| Due after one year through five years |
$ |
69,471 |
|
|
— |
|
|
(8,100) |
|
|
61,371 |
|
| Due after five years through ten years |
54,987 |
|
|
— |
|
|
(8,700) |
|
|
46,287 |
|
|
|
|
|
|
|
|
|
|
|
|
|
|
|
|
|
| Residential mortgage-backed securities: |
|
|
|
|
|
|
|
| Fixed rate pass-through |
147,874 |
|
|
— |
|
|
(20,834) |
|
|
127,040 |
|
| Variable rate pass-through |
449 |
|
|
1 |
|
|
— |
|
|
450 |
|
| Fixed rate agency CMOs |
541,529 |
|
|
— |
|
|
(77,694) |
|
|
463,835 |
|
| Variable rate agency CMOs |
529 |
|
|
— |
|
|
(6) |
|
|
523 |
|
| Total residential mortgage-backed securities |
690,381 |
|
|
1 |
|
|
(98,534) |
|
|
591,848 |
|
| Total marketable securities held-to-maturity |
$ |
814,839 |
|
|
1 |
|
|
(115,334) |
|
|
699,506 |
|
The following table shows the contractual maturity of our residential mortgage-backed securities available-for-sale at March 31, 2024 (in thousands):
|
|
|
|
|
|
|
|
|
|
|
|
|
Amortized
cost |
|
Fair
value |
|
|
|
|
|
|
|
|
|
|
|
|
|
|
|
|
| Residential mortgage-backed securities: |
|
|
|
| Due within one year |
$ |
116 |
|
|
116 |
|
| Due after one year through five years |
22,934 |
|
|
21,419 |
|
| Due after five years through ten years |
26,966 |
|
|
25,177 |
|
| Due after ten years |
1,039,432 |
|
|
868,155 |
|
| Total residential mortgage-backed securities |
$ |
1,089,448 |
|
|
914,867 |
|
|
|
|
|
The following table shows the contractual maturity of our residential mortgage-backed securities held-to-maturity at March 31, 2024 (in thousands):
|
|
|
|
|
|
|
|
|
|
|
|
|
Amortized
cost |
|
Fair
value |
|
|
|
|
|
|
|
|
|
|
|
|
|
|
|
|
| Residential mortgage-backed securities: |
|
|
|
| Due in less than one year |
$ |
38 |
|
|
38 |
|
| Due after one year through five years |
20,144 |
|
|
17,635 |
|
| Due after five years through ten years |
20,209 |
|
|
16,304 |
|
| Due after ten years |
636,257 |
|
|
539,026 |
|
| Total residential mortgage-backed securities |
$ |
676,648 |
|
|
573,003 |
|
|
|
|
|
The following table shows the fair value of and gross unrealized losses on available-for-sale investment securities and held to maturity investment securities, for which an allowance for credit losses has not been recorded, aggregated by investment category and length of time that the individual securities have been in a continuous unrealized loss position at March 31, 2024 (in thousands):
|
|
|
|
|
|
|
|
|
|
|
|
|
|
|
|
|
|
|
|
|
|
|
|
|
|
|
|
|
|
|
|
|
|
|
|
| |
Less than 12 months |
|
12 months or more |
|
Total |
|
Fair
value |
|
Unrealized
loss |
|
Fair
value |
|
Unrealized
loss |
|
Fair
value |
|
Unrealized
loss |
| U.S. government-sponsored enterprises |
$ |
— |
|
|
— |
|
|
204,587 |
|
|
(34,401) |
|
|
204,587 |
|
|
(34,401) |
|
| Municipal securities |
498 |
|
|
(2) |
|
|
67,691 |
|
|
(11,452) |
|
|
68,189 |
|
|
(11,454) |
|
| Corporate issues |
— |
|
|
— |
|
|
7,634 |
|
|
(833) |
|
|
7,634 |
|
|
(833) |
|
|
|
|
|
|
|
|
|
|
|
|
|
| Residential mortgage-backed securities - agency |
57,715 |
|
|
(855) |
|
|
1,380,123 |
|
|
(277,512) |
|
|
1,437,838 |
|
|
(278,367) |
|
|
|
|
|
|
|
|
|
|
|
|
|
| Total |
$ |
58,213 |
|
|
(857) |
|
|
1,660,035 |
|
|
(324,198) |
|
|
1,718,248 |
|
|
(325,055) |
|
The following table shows the fair value of and gross unrealized losses on available-for-sale investment securities and held to maturity investment securities, for which an allowance for credit losses has not been recorded, aggregated by investment category and length of time that the individual securities have been in a continuous unrealized loss position at December 31, 2023 (in thousands):
|
|
|
|
|
|
|
|
|
|
|
|
|
|
|
|
|
|
|
|
|
|
|
|
|
|
|
|
|
|
|
|
|
|
|
|
| |
Less than 12 months |
|
12 months or more |
|
Total |
|
Fair
value |
|
Unrealized
loss |
|
Fair
value |
|
Unrealized
loss |
|
Fair
value |
|
Unrealized
loss |
| U.S. government-sponsored enterprises |
$ |
— |
|
|
— |
|
|
206,569 |
|
|
(33,644) |
|
|
206,569 |
|
|
(33,644) |
|
| Corporate debt issues |
— |
|
|
— |
|
|
7,688 |
|
|
(778) |
|
|
7,688 |
|
|
(778) |
|
|
|
|
|
|
|
|
|
|
|
|
|
| Municipal securities |
2,753 |
|
|
(81) |
|
|
66,046 |
|
|
(10,363) |
|
|
68,799 |
|
|
(10,444) |
|
| Residential mortgage-backed securities - agency |
17,976 |
|
|
(242) |
|
|
1,423,707 |
|
|
(267,093) |
|
|
1,441,683 |
|
|
(267,335) |
|
| Total |
$ |
20,729 |
|
|
(323) |
|
|
1,704,010 |
|
|
(311,878) |
|
|
1,724,739 |
|
|
(312,201) |
|
The Company does not believe that the available-for-sale debt securities that were in an unrealized loss position as of March 31, 2024, which were comprised of 497 individual securities, represents a credit loss impairment. All of these securities were issued by U.S. government agencies, U.S. government-sponsored enterprises, local municipalities, or represent corporate debt. The securities issued by the U.S. government agencies or U.S. government-sponsored enterprises are either explicitly or implicitly guaranteed by the U.S. government, are highly rated by major rating agencies and have a long history of no credit losses. The securities issued by local municipalities and the corporate debt issues were all highly rated by major rating agencies and have no history of credit losses. The unrealized losses were primarily attributable to changes in the interest rate environment and not due to the credit quality of these investment securities. As of March 31, 2024, the Company does not have the intent to sell these investment securities and it is more likely than not that we will not be required to sell these securities before their anticipated recovery, which may be at maturity.
All of the Company’s held-to-maturity debt securities are issued by U.S. government agencies or U.S. government-sponsored enterprises. These securities are either explicitly or implicitly guaranteed by the U.S. government, are highly rated by major rating agencies and have a long history of no credit losses. The decline in fair value of the held-to-maturity debt securities were primarily attributable to changes in the interest rate environment and not due to the credit quality of these investment securities, therefore, the Company did not record an allowance for credit losses for these securities as of March 31, 2024.
The following table presents the credit quality of our held-to-maturity securities, based on the latest information available as of March 31, 2024 (in thousands). The credit ratings are sourced from nationally recognized rating agencies, which include Moody’s and S&P, and they are presented based on asset type. All of our held-to-maturity securities were current in their payment of principal and interest as of March 31, 2024.
|
|
|
|
|
|
|
|
|
|
|
|
|
AA+ |
|
Total |
|
|
|
|
|
|
|
|
|
|
|
|
|
|
|
|
| Held-to-maturity securities (at amortized cost): |
|
|
|
| Debt issued by the U.S. government-sponsored enterprises |
$ |
124,459 |
|
|
124,459 |
|
| Residential mortgage-backed securities |
676,648 |
|
|
676,648 |
|
| Total marketable securities held-to-maturity |
$ |
801,107 |
|
|
801,107 |
|
(3) Loans Receivable
The following table shows a summary of our loans receivable at amortized cost basis at March 31, 2024 and December 31, 2023 (in thousands):
|
|
|
|
|
|
|
|
|
|
|
|
|
|
|
|
|
|
|
|
|
|
|
|
|
|
|
|
|
|
|
|
|
|
|
|
|
March 31, 2024 |
|
December 31, 2023 |
| |
Originated (1) |
|
Acquired (2) |
|
Total |
|
Originated (1) |
|
Acquired (2) |
|
Total |
| Personal Banking: |
|
|
|
|
|
|
|
|
|
|
|
|
|
|
|
|
|
|
|
|
|
|
|
| Residential mortgage loans (3) |
$ |
3,243,079 |
|
|
139,769 |
|
|
3,382,848 |
|
|
3,283,299 |
|
|
144,886 |
|
|
3,428,185 |
|
| Home equity loans |
1,079,671 |
|
|
116,936 |
|
|
1,196,607 |
|
|
1,103,410 |
|
|
124,448 |
|
|
1,227,858 |
|
| Vehicle loans |
1,944,752 |
|
|
60,104 |
|
|
2,004,856 |
|
|
1,943,540 |
|
|
65,061 |
|
|
2,008,601 |
|
| Consumer loans |
108,035 |
|
|
5,476 |
|
|
113,511 |
|
|
111,446 |
|
|
5,980 |
|
|
117,426 |
|
| Total Personal Banking |
6,375,537 |
|
|
322,285 |
|
|
6,697,822 |
|
|
6,441,695 |
|
|
340,375 |
|
|
6,782,070 |
|
|
|
|
|
|
|
|
|
|
|
|
|
| Commercial Banking: |
|
|
|
|
|
|
|
|
|
|
|
| Commercial real estate loans (4) |
2,436,853 |
|
|
227,137 |
|
|
2,663,990 |
|
|
2,389,537 |
|
|
238,920 |
|
|
2,628,457 |
|
| Commercial real estate loans - owner occupied |
338,744 |
|
|
25,794 |
|
|
364,538 |
|
|
319,195 |
|
|
26,358 |
|
|
345,553 |
|
| Commercial loans |
1,743,656 |
|
|
31,240 |
|
|
1,774,896 |
|
|
1,623,481 |
|
|
35,248 |
|
|
1,658,729 |
|
| Total Commercial Banking |
4,519,253 |
|
|
284,171 |
|
|
4,803,424 |
|
|
4,332,213 |
|
|
300,526 |
|
|
4,632,739 |
|
| Total loans receivable, gross |
10,894,790 |
|
|
606,456 |
|
|
11,501,246 |
|
|
10,773,908 |
|
|
640,901 |
|
|
11,414,809 |
|
|
|
|
|
|
|
|
|
|
|
|
|
| Allowance for credit losses |
(118,837) |
|
|
(6,060) |
|
|
(124,897) |
|
|
(118,079) |
|
|
(7,164) |
|
|
(125,243) |
|
| Total loans receivable, net (5) |
$ |
10,775,953 |
|
|
600,396 |
|
|
11,376,349 |
|
|
10,655,829 |
|
|
633,737 |
|
|
11,289,566 |
|
(1) Includes originated and loan pools purchased in an asset acquisition.
(2) Includes loans subject to purchase accounting in a business combination.
(3) Includes $8 million and $9 million of loans held-for-sale at March 31, 2024 and December 31, 2023, respectively.
(4) Includes $213,000 and $0 of loans held-for-sale at March 31, 2024 and December 31, 2023, respectively.
(5) Includes $68 million of net unearned income, unamortized premiums and discounts and deferred fees and costs at March 31, 2024 and December 31, 2023.
The following table provides information related to the allowance for credit losses by portfolio segment and by class of financing receivable for the quarter ended March 31, 2024 (in thousands):
|
|
|
|
|
|
|
|
|
|
|
|
|
|
|
|
|
|
|
|
|
|
|
|
|
|
|
|
|
|
|
|
|
Balance as of March 31, 2024 |
|
Current period provision |
|
Charge-offs |
|
Recoveries |
|
|
|
Balance as of December 31, 2023 |
| Allowance for Credit Losses |
|
|
|
|
|
|
|
|
|
|
|
| Personal Banking: |
|
|
|
|
|
|
|
|
|
|
|
| Residential mortgage loans |
$ |
16,821 |
|
|
(1,399) |
|
|
(162) |
|
|
189 |
|
|
|
|
18,193 |
|
| Home equity loans |
5,334 |
|
|
145 |
|
|
(412) |
|
|
198 |
|
|
|
|
5,403 |
|
| Vehicle loans |
21,061 |
|
|
(3,694) |
|
|
(2,588) |
|
|
432 |
|
|
|
|
26,911 |
|
| Consumer loans |
1,452 |
|
|
1,849 |
|
|
(1,985) |
|
|
389 |
|
|
|
|
1,199 |
|
| Total Personal Banking |
44,668 |
|
|
(3,099) |
|
|
(5,147) |
|
|
1,208 |
|
|
|
|
51,706 |
|
|
|
|
|
|
|
|
|
|
|
|
|
| Commercial Banking: |
|
|
|
|
|
|
|
|
|
|
|
| Commercial real estate loans |
54,474 |
|
|
3,073 |
|
|
(349) |
|
|
483 |
|
|
|
|
51,267 |
|
| Commercial real estate loans - owner occupied |
4,055 |
|
|
272 |
|
|
— |
|
|
8 |
|
|
|
|
3,775 |
|
| Commercial loans |
21,700 |
|
|
3,988 |
|
|
(1,163) |
|
|
380 |
|
|
|
|
18,495 |
|
| Total Commercial Banking |
80,229 |
|
|
7,333 |
|
|
(1,512) |
|
|
871 |
|
|
|
|
73,537 |
|
| Total |
$ |
124,897 |
|
|
4,234 |
|
|
(6,659) |
|
|
2,079 |
|
|
|
|
125,243 |
|
|
|
|
|
|
|
|
|
|
|
|
|
| Allowance for Credit Losses - off-balance sheet exposure |
|
|
|
|
|
|
|
|
|
|
|
| Personal Banking: |
|
|
|
|
|
|
|
|
|
|
|
|
|
|
|
|
|
|
|
|
|
|
|
| Residential mortgage loans |
$ |
1 |
|
|
(1) |
|
|
— |
|
|
— |
|
|
|
|
2 |
|
| Home equity loans |
64 |
|
|
(1) |
|
|
— |
|
|
— |
|
|
|
|
65 |
|
|
|
|
|
|
|
|
|
|
|
|
|
| Total Personal Banking |
65 |
|
|
(2) |
|
|
— |
|
|
— |
|
|
|
|
67 |
|
|
|
|
|
|
|
|
|
|
|
|
|
| Commercial Banking: |
|
|
|
|
|
|
|
|
|
|
|
| Commercial real estate loans |
6,218 |
|
|
71 |
|
|
— |
|
|
— |
|
|
|
|
6,147 |
|
| Commercial real estate loans - owner occupied |
154 |
|
|
(19) |
|
|
— |
|
|
— |
|
|
|
|
173 |
|
| Commercial loans |
9,887 |
|
|
(849) |
|
|
— |
|
|
— |
|
|
|
|
10,736 |
|
| Total Commercial Banking |
16,259 |
|
|
(797) |
|
|
— |
|
|
— |
|
|
|
|
17,056 |
|
| Total off-balance sheet exposure |
$ |
16,324 |
|
|
(799) |
|
|
— |
|
|
— |
|
|
|
|
17,123 |
|
|
|
|
|
|
|
|
|
|
|
|
|
|
|
|
|
|
|
|
|
|
|
|
|
The following table provides information related to the allowance for credit losses by portfolio segment and by class of financing receivable for the quarter ended March 31, 2023 (in thousands):
|
|
|
|
|
|
|
|
|
|
|
|
|
|
|
|
|
|
|
|
|
|
|
|
|
|
|
|
|
|
|
|
|
|
|
|
|
Balance as of March 31, 2023 |
|
Current period provision |
|
Charge-offs |
|
Recoveries |
|
ASU 2022-02 Adoption |
|
Balance as of December 31, 2022 |
| Allowance for Credit Losses |
|
|
|
|
|
|
|
|
|
|
|
| Personal Banking: |
|
|
|
|
|
|
|
|
|
|
|
| Residential mortgage loans |
$ |
19,238 |
|
|
(1) |
|
|
(207) |
|
|
185 |
|
|
— |
|
|
19,261 |
|
| Home equity loans |
5,481 |
|
|
(450) |
|
|
(164) |
|
|
193 |
|
|
— |
|
|
5,902 |
|
| Vehicle loans |
26,166 |
|
|
4,253 |
|
|
(1,668) |
|
|
522 |
|
|
— |
|
|
23,059 |
|
| Consumer loans |
732 |
|
|
796 |
|
|
(1,066) |
|
|
337 |
|
|
— |
|
|
665 |
|
| Total Personal Banking |
51,617 |
|
|
4,598 |
|
|
(3,105) |
|
|
1,237 |
|
|
— |
|
|
48,887 |
|
|
|
|
|
|
|
|
|
|
|
|
|
| Commercial Banking: |
|
|
|
|
|
|
|
|
|
|
|
| Commercial real estate loans |
45,404 |
|
|
121 |
|
|
(657) |
|
|
1,008 |
|
|
426 |
|
|
44,506 |
|
| Commercial real estate loans - owner occupied |
3,351 |
|
|
(674) |
|
|
— |
|
|
21 |
|
|
— |
|
|
4,004 |
|
| Commercial loans |
20,885 |
|
|
825 |
|
|
(865) |
|
|
286 |
|
|
— |
|
|
20,639 |
|
| Total Commercial Banking |
69,640 |
|
|
272 |
|
|
(1,522) |
|
|
1,315 |
|
|
426 |
|
|
69,149 |
|
| Total |
$ |
121,257 |
|
|
4,870 |
|
|
(4,627) |
|
|
2,552 |
|
|
426 |
|
|
118,036 |
|
|
|
|
|
|
|
|
|
|
|
|
|
| Allowance for Credit Losses - off-balance sheet exposure |
|
|
|
|
|
|
|
|
|
|
|
| Personal Banking: |
|
|
|
|
|
|
|
|
|
|
|
| Residential mortgage loans |
$ |
3 |
|
|
(1) |
|
|
— |
|
|
— |
|
|
— |
|
|
4 |
|
| Home equity loans |
60 |
|
|
(14) |
|
|
— |
|
|
— |
|
|
— |
|
|
74 |
|
|
|
|
|
|
|
|
|
|
|
|
|
| Total Personal Banking |
63 |
|
|
(15) |
|
|
— |
|
|
— |
|
|
— |
|
|
78 |
|
|
|
|
|
|
|
|
|
|
|
|
|
| Commercial Banking: |
|
|
|
|
|
|
|
|
|
|
|
| Commercial real estate loans |
5,924 |
|
|
549 |
|
|
— |
|
|
— |
|
|
— |
|
|
5,375 |
|
| Commercial real estate loans - owner occupied |
441 |
|
|
62 |
|
|
— |
|
|
— |
|
|
— |
|
|
379 |
|
| Commercial loans |
6,611 |
|
|
(470) |
|
|
— |
|
|
— |
|
|
— |
|
|
7,081 |
|
| Total Commercial Banking |
12,976 |
|
|
141 |
|
|
— |
|
|
— |
|
|
— |
|
|
12,835 |
|
| Total off-balance sheet exposure |
$ |
13,039 |
|
|
126 |
|
|
— |
|
|
— |
|
|
— |
|
|
12,913 |
|
The following table provides information related to the loan portfolio by portfolio segment and by class of financing receivable at March 31, 2024 (in thousands):
|
|
|
|
|
|
|
|
|
|
|
|
|
|
|
|
|
|
|
|
|
|
|
|
|
|
|
|
|
| |
Total loans
receivable |
|
Allowance for
credit losses |
|
Nonaccrual
loans |
|
Loans 90 days past due and accruing |
|
|
|
|
|
| Personal Banking: |
|
|
|
|
|
|
|
|
|
|
|
|
| Residential mortgage loans |
$ |
3,382,848 |
|
|
16,821 |
|
|
7,109 |
|
|
1,509 |
|
|
|
|
|
|
| Home equity loans |
1,196,607 |
|
|
5,334 |
|
|
4,409 |
|
|
1 |
|
|
|
|
|
|
| Vehicle loans |
2,004,856 |
|
|
21,061 |
|
|
4,360 |
|
|
59 |
|
|
|
|
|
|
| Consumer loans |
113,511 |
|
|
1,452 |
|
|
269 |
|
|
627 |
|
|
|
|
|
|
| Total Personal Banking |
6,697,822 |
|
|
44,668 |
|
|
16,147 |
|
|
2,196 |
|
|
|
|
|
|
|
|
|
|
|
|
|
|
|
|
|
|
|
| Commercial Banking: |
|
|
|
|
|
|
|
|
|
|
|
|
| Commercial real estate loans |
2,663,990 |
|
|
54,474 |
|
|
73,133 |
|
|
— |
|
|
|
|
|
|
| Commercial real estate loans - owner occupied |
364,538 |
|
|
4,055 |
|
|
1,319 |
|
|
— |
|
|
|
|
|
|
| Commercial loans |
1,774,896 |
|
|
21,700 |
|
|
4,461 |
|
|
256 |
|
|
|
|
|
|
| Total Commercial Banking |
4,803,424 |
|
|
80,229 |
|
|
78,913 |
|
|
256 |
|
|
|
|
|
|
|
|
|
|
|
|
|
|
|
|
|
|
|
| Total |
$ |
11,501,246 |
|
|
124,897 |
|
|
95,060 |
|
|
2,452 |
|
|
|
|
|
|
The following table provides information related to the loan portfolio by portfolio segment and by class of financing receivable at December 31, 2023 (in thousands):
|
|
|
|
|
|
|
|
|
|
|
|
|
|
|
|
|
|
|
|
|
|
|
|
|
|
|
|
|
| |
Total loans
receivable |
|
Allowance for
credit losses |
|
Nonaccrual
loans |
|
Loans 90 days past due and accruing |
|
|
|
|
|
| Personal Banking: |
|
|
|
|
|
|
|
|
|
|
|
|
| Residential mortgage loans |
$ |
3,428,185 |
|
|
18,193 |
|
|
8,727 |
|
|
1,671 |
|
|
|
|
|
|
| Home equity loans |
1,227,858 |
|
|
5,403 |
|
|
4,492 |
|
|
26 |
|
|
|
|
|
|
| Vehicle loans |
2,008,601 |
|
|
26,911 |
|
|
4,816 |
|
|
44 |
|
|
|
|
|
|
| Consumer loans |
117,426 |
|
|
1,199 |
|
|
229 |
|
|
722 |
|
|
|
|
|
|
| Total Personal Banking |
6,782,070 |
|
|
51,706 |
|
|
18,264 |
|
|
2,463 |
|
|
|
|
|
|
|
|
|
|
|
|
|
|
|
|
|
|
|
| Commercial Banking: |
|
|
|
|
|
|
|
|
|
|
|
|
| Commercial real estate loans |
2,628,457 |
|
|
51,267 |
|
|
71,297 |
|
|
225 |
|
|
|
|
|
|
| Commercial real estate loans - owner occupied |
345,553 |
|
|
3,775 |
|
|
676 |
|
|
— |
|
|
|
|
|
|
| Commercial loans |
1,658,729 |
|
|
18,495 |
|
|
4,147 |
|
|
10 |
|
|
|
|
|
|
| Total Commercial Banking |
4,632,739 |
|
|
73,537 |
|
|
76,120 |
|
|
235 |
|
|
|
|
|
|
|
|
|
|
|
|
|
|
|
|
|
|
|
| Total |
$ |
11,414,809 |
|
|
125,243 |
|
|
94,384 |
|
|
2,698 |
|
|
|
|
|
|
We present the amortized cost of our loans on nonaccrual status including such loans with no allowance. The following table presents the amortized cost of our loans on nonaccrual status as of the beginning and end of the quarter ended March 31, 2024 (in thousands):
|
|
|
|
|
|
|
|
|
|
|
|
|
|
|
|
|
|
|
|
|
|
|
|
|
|
|
|
|
|
|
|
|
|
|
March 31, 2024 |
|
|
| |
Nonaccrual loans at January 1, 2024 |
|
Nonaccrual loans with an allowance |
|
Nonaccrual loans with no allowance |
|
Total nonaccrual loans at the end of the period |
|
Loans 90 days past due and accruing |
|
|
| Personal Banking: |
|
|
|
|
|
|
|
|
|
|
|
| Residential mortgage loans |
$ |
8,727 |
|
|
6,703 |
|
|
406 |
|
|
7,109 |
|
|
1,509 |
|
|
|
| Home equity loans |
4,492 |
|
|
4,254 |
|
|
155 |
|
|
4,409 |
|
|
1 |
|
|
|
| Vehicle loans |
4,816 |
|
|
3,481 |
|
|
879 |
|
|
4,360 |
|
|
59 |
|
|
|
| Consumer loans |
229 |
|
|
269 |
|
|
— |
|
|
269 |
|
|
627 |
|
|
|
| Total Personal Banking |
18,264 |
|
|
14,707 |
|
|
1,440 |
|
|
16,147 |
|
|
2,196 |
|
|
|
|
|
|
|
|
|
|
|
|
|
|
|
| Commercial Banking: |
|
|
|
|
|
|
|
|
|
|
|
| Commercial real estate loans |
71,297 |
|
|
50,794 |
|
|
22,339 |
|
|
73,133 |
|
|
— |
|
|
|
| Commercial real estate loans - owner occupied |
676 |
|
|
1,319 |
|
|
— |
|
|
1,319 |
|
|
— |
|
|
|
| Commercial loans |
4,147 |
|
|
4,305 |
|
|
156 |
|
|
4,461 |
|
|
256 |
|
|
|
| Total Commercial Banking |
76,120 |
|
|
56,418 |
|
|
22,495 |
|
|
78,913 |
|
|
256 |
|
|
|
|
|
|
|
|
|
|
|
|
|
|
|
| Total |
$ |
94,384 |
|
|
71,125 |
|
|
23,935 |
|
|
95,060 |
|
|
2,452 |
|
|
|
During the quarter ended March 31, 2024, we did not recognize any interest income on nonaccrual loans.
The following table presents the amortized cost of our loans on nonaccrual status as of the year ended December 31, 2023 (in thousands):
|
|
|
|
|
|
|
|
|
|
|
|
|
|
|
|
|
|
|
|
|
|
|
|
|
|
|
|
|
|
|
|
|
|
|
December 31, 2023 |
|
|
| |
Nonaccrual loans at January 1, 2023 |
|
Nonaccrual loans with an allowance |
|
Nonaccrual loans with no allowance |
|
Total nonaccrual loans at the end of the period |
|
Loans 90 days past due and accruing |
|
|
| Personal Banking: |
|
|
|
|
|
|
|
|
|
|
|
| Residential mortgage loans |
$ |
7,574 |
|
|
8,304 |
|
|
423 |
|
|
8,727 |
|
|
1,671 |
|
|
|
| Home equity loans |
4,145 |
|
|
4,084 |
|
|
408 |
|
|
4,492 |
|
|
26 |
|
|
|
| Vehicle loans |
3,771 |
|
|
4,187 |
|
|
629 |
|
|
4,816 |
|
|
44 |
|
|
|
| Consumer loans |
256 |
|
|
229 |
|
|
— |
|
|
229 |
|
|
722 |
|
|
|
| Total Personal Banking |
15,746 |
|
|
16,804 |
|
|
1,460 |
|
|
18,264 |
|
|
2,463 |
|
|
|
|
|
|
|
|
|
|
|
|
|
|
|
| Commercial Banking: |
|
|
|
|
|
|
|
|
|
|
|
| Commercial real estate loans |
62,239 |
|
|
47,359 |
|
|
23,938 |
|
|
71,297 |
|
|
225 |
|
|
|
| Commercial real estate loans - owner occupied |
624 |
|
|
676 |
|
|
— |
|
|
676 |
|
|
— |
|
|
|
| Commercial loans |
2,627 |
|
|
3,996 |
|
|
151 |
|
|
4,147 |
|
|
10 |
|
|
|
| Total Commercial Banking |
65,490 |
|
|
52,031 |
|
|
24,089 |
|
|
76,120 |
|
|
235 |
|
|
|
|
|
|
|
|
|
|
|
|
|
|
|
| Total |
$ |
81,236 |
|
|
68,835 |
|
|
25,549 |
|
|
94,384 |
|
|
2,698 |
|
|
|
During the year ended December 31, 2023, we did not recognize any interest income on nonaccrual loans.
A loan is considered to be collateral dependent when the borrower is experiencing financial difficulty and repayment is expected to be provided substantially through the sale or operation of the collateral. The following table presents the amortized cost basis of collateral-dependent loans by class of loans and collateral type as of as of March 31, 2024 (in thousands):
|
|
|
|
|
|
|
|
|
|
|
|
|
|
|
|
|
|
|
|
|
|
| |
Real estate |
|
Equipment |
|
|
|
Total |
|
|
|
|
|
|
|
|
|
|
|
|
|
|
|
|
|
|
|
|
|
|
|
|
|
|
|
|
|
|
|
|
|
|
|
|
|
|
|
|
|
|
|
|
|
|
|
|
|
|
|
|
|
|
|
|
|
|
|
|
|
|
|
|
|
|
|
|
|
|
|
|
| Commercial Banking: |
|
|
|
|
|
|
|
|
|
| Commercial real estate loans |
$ |
66,587 |
|
|
1,256 |
|
|
|
67,843 |
|
|
|
|
|
|
|
|
|
|
|
|
| Commercial loans |
146 |
|
— |
|
|
|
|
146 |
|
|
| Total Commercial Banking |
66,733 |
|
1,256 |
|
|
|
67,989 |
|
|
|
|
|
|
|
|
|
|
|
|
| Total |
$ |
66,733 |
|
|
1,256 |
|
|
|
67,989 |
|
|
The following table presents the amortized cost basis of collateral-dependent loans by class of loans as of December 31, 2023 (in thousands):
|
|
|
|
|
|
|
|
|
|
|
|
|
|
|
|
|
|
| |
Real estate |
|
|
|
|
|
Total |
|
|
|
|
|
|
|
|
|
|
|
|
|
|
|
|
|
|
|
|
|
|
|
|
|
|
|
|
|
|
|
|
|
|
|
|
|
|
|
|
|
|
|
|
|
|
|
|
|
|
|
|
|
|
|
|
|
|
|
|
|
|
|
|
|
|
|
|
|
|
|
|
| Commercial Banking: |
|
|
|
|
|
|
|
|
|
| Commercial real estate loans |
$ |
66,934 |
|
|
|
|
|
|
66,934 |
|
|
|
|
|
|
|
|
|
|
|
|
|
| Commercial loans |
150 |
|
|
|
|
|
|
150 |
|
|
|
| Total Commercial Banking |
67,084 |
|
|
|
|
|
|
67,084 |
|
|
|
|
|
|
|
|
|
|
|
|
|
| Total |
$ |
67,084 |
|
|
|
|
|
|
67,084 |
|
|
|
Occasionally, the Company modifies loans to borrowers in financial distress by providing principal forgiveness, term extensions, an other-than-insignificant payment delay, or interest rate reduction. When principal forgiveness is provided, the amount of forgiveness is charged off against the allowance for credit losses.
In some cases, the Company provides multiple types of concessions to one loan. Typically, one type of concession, such as a term extension, is granted initially. If the borrower continues to experience financial difficulty, another concession, such as principal forgiveness, may be granted. For loans included in the "combination" columns below, multiple types of modifications have been made on the same loan within the current reporting period. The combination is at least two of the following: a term extension, principal forgiveness, an other-than-insignificant payment delay, and/or an interest rate reduction.
The following table presents the amortized cost basis of loans for the periods indicated that were both experiencing financial difficulty and modified during the respective period, by class and by type of modification. The percentage of the amortized cost basis of loans that were modified to borrowers in financial distress as compared to the amortized cost basis of each class of financial receivable is also presented below (dollars in thousands).
|
|
|
|
|
|
|
|
|
|
|
|
|
|
|
|
|
|
|
|
|
|
|
|
|
|
|
|
|
|
|
|
|
|
|
|
|
|
|
|
|
|
|
|
|
|
|
|
|
|
|
|
|
|
|
|
|
For the quarter ended March 31, |
|
|
2024 |
|
|
|
|
|
2023 |
|
|
Payment delay |
|
Term extension |
|
|
|
|
|
Combination term extension and interest rate reduction |
|
Total class of financing receivable |
|
|
|
|
|
Term extension |
|
|
|
|
|
Combination term extension and interest rate reduction |
|
Total class of financing receivable |
| Personal Banking: |
|
|
|
|
|
|
|
|
|
|
|
|
|
|
|
|
|
|
|
|
|
|
|
|
|
|
Residential mortgage loans |
|
$ |
364 |
|
|
490 |
|
|
|
|
|
|
— |
|
|
0.03 |
% |
|
|
|
|
|
180 |
|
|
|
|
|
|
— |
|
|
0.01 |
% |
| Home equity loans |
|
— |
|
|
552 |
|
|
|
|
|
|
84 |
|
|
0.05 |
% |
|
|
|
|
|
110 |
|
|
|
|
|
|
— |
|
|
0.01 |
% |
|
|
|
|
|
|
|
|
|
|
|
|
|
|
|
|
|
|
|
|
|
|
|
|
|
|
|
Consumer loans |
|
— |
|
|
— |
|
|
|
|
|
|
2 |
|
|
— |
% |
|
|
|
|
|
— |
|
|
|
|
|
|
3 |
|
|
— |
% |
| Total Personal Banking |
|
364 |
|
|
1,042 |
|
|
|
|
|
|
86 |
|
|
0.02 |
% |
|
|
|
|
|
290 |
|
|
|
|
|
|
3 |
|
|
— |
% |
|
|
|
|
|
|
|
|
|
|
|
|
|
|
|
|
|
|
|
|
|
|
|
|
|
|
|
| Commercial Banking: |
|
|
|
|
|
|
|
|
|
|
|
|
|
|
|
|
|
|
|
|
|
|
|
|
|
|
| Commercial real estate loans |
|
28,877 |
|
|
243 |
|
|
|
|
|
|
— |
|
|
1.09 |
% |
|
|
|
|
|
242 |
|
|
|
|
|
|
— |
|
|
0.01 |
% |
|
|
|
|
|
|
|
|
|
|
|
|
|
|
|
|
|
|
|
|
|
|
|
|
|
|
|
| Commercial loans |
|
— |
|
|
56 |
|
|
|
|
|
|
10 |
|
|
— |
% |
|
|
|
|
|
765 |
|
|
|
|
|
|
— |
|
|
0.06 |
% |
| Total Commercial Banking |
|
28,877 |
|
|
299 |
|
|
|
|
|
|
10 |
|
|
0.61 |
% |
|
|
|
|
|
1,007 |
|
|
|
|
|
|
— |
|
|
0.02 |
% |
|
|
|
|
|
|
|
|
|
|
|
|
|
|
|
|
|
|
|
|
|
|
|
|
|
|
|
| Total |
|
$ |
29,241 |
|
|
1,341 |
|
|
|
|
|
|
96 |
|
|
0.27 |
% |
|
|
|
|
|
1,297 |
|
|
|
|
|
|
3 |
|
|
0.01 |
% |
As of March 31, 2024 and December 31, 2023, the Company has committed to lend additional amounts totaling $41,000 and $31,000, respectively, to the borrowers experiencing financial difficulty for which the terms of the loan have been modified.
The following table presents the effect of the loan modifications presented above to borrowers experiencing financial difficulty for the periods indicated:
|
|
|
|
|
|
|
|
|
|
|
|
|
|
|
|
|
|
|
|
|
|
|
|
|
|
|
|
|
|
|
|
|
|
|
|
|
|
|
|
|
|
|
|
|
|
|
|
|
|
|
|
|
|
|
For the quarter ended March 31, |
|
|
|
|
|
|
|
|
|
|
|
|
|
|
|
|
|
|
|
|
|
|
|
2024 |
|
2023 |
|
|
|
|
|
|
|
|
|
|
|
|
|
|
|
|
|
|
|
|
| |
|
|
Weighted-average interest rate reduction |
|
Weighted-average term extension in months |
|
Weighted-average payment deferral in years |
|
Weighted-average interest rate reduction |
|
Weighted-average term extension in months |
|
|
|
|
|
|
|
|
|
|
|
|
|
|
|
|
|
|
|
|
| Personal Banking: |
|
|
|
|
|
|
|
|
|
|
|
|
|
|
|
|
|
|
|
|
|
|
|
|
|
|
|
|
|
|
|
| Residential mortgage loans |
|
|
— |
% |
|
143 |
|
0.50 |
|
— |
% |
|
147 |
|
|
|
|
|
|
|
|
|
|
|
|
|
|
|
|
|
|
|
|
| Home equity loans |
|
|
2 |
% |
|
97 |
|
— |
|
|
— |
% |
|
115 |
|
|
|
|
|
|
|
|
|
|
|
|
|
|
|
|
|
|
|
|
|
|
|
|
|
|
|
|
|
|
|
|
|
|
|
|
|
|
|
|
|
|
|
|
|
|
|
|
|
|
|
|
| Consumer loans |
|
|
12 |
% |
|
356 |
|
— |
|
|
12 |
% |
|
356 |
|
|
|
|
|
|
|
|
|
|
|
|
|
|
|
|
|
|
|
|
| Total Personal Banking |
|
|
3 |
% |
|
118 |
|
0.50 |
|
12 |
% |
|
137 |
|
|
|
|
|
|
|
|
|
|
|
|
|
|
|
|
|
|
|
|
|
|
|
|
|
|
|
|
|
|
|
|
|
|
|
|
|
|
|
|
|
|
|
|
|
|
|
|
|
|
|
|
| Commercial Banking: |
|
|
|
|
|
|
|
|
|
|
|
|
|
|
|
|
|
|
|
|
|
|
|
|
|
|
|
|
|
|
|
| Commercial real estate loans |
|
|
— |
% |
|
106 |
|
1.00 |
|
— |
% |
|
24 |
|
|
|
|
|
|
|
|
|
|
|
|
|
|
|
|
|
|
|
|
|
|
|
|
|
|
|
|
|
|
|
|
|
|
|
|
|
|
|
|
|
|
|
|
|
|
|
|
|
|
|
|
| Commercial loans |
|
|
4 |
% |
|
118 |
|
— |
|
|
— |
% |
|
9 |
|
|
|
|
|
|
|
|
|
|
|
|
|
|
|
|
|
|
|
|
| Total Commercial Banking |
|
|
4 |
% |
|
108 |
|
1.00 |
|
— |
% |
|
13 |
|
|
|
|
|
|
|
|
|
|
|
|
|
|
|
|
|
|
|
|
| Total loans |
|
|
3 |
% |
|
116 |
|
1.00 |
|
12 |
% |
|
41 |
|
|
|
|
|
|
|
|
|
|
|
|
|
|
|
|
|
|
|
|
The Company closely monitors the performance of loans that are modified to borrowers experiencing financial difficulty to understand the effectiveness of its modification efforts. The following table presents the performance of loans modified within the previous twelve months of March 31, 2024:
|
|
|
|
|
|
|
|
|
|
|
|
|
|
|
|
|
|
|
|
|
|
|
|
|
|
|
|
| |
|
|
|
|
Current |
|
30-59 days
delinquent |
|
60-89 days
delinquent |
|
90 days or
greater
delinquent |
| Personal Banking: |
|
|
|
|
|
|
|
|
|
|
|
| Residential mortgage loans |
|
|
|
|
$ |
406 |
|
|
84 |
|
|
— |
|
|
364 |
|
| Home equity loans |
|
|
|
|
616 |
|
|
3 |
|
|
— |
|
|
17 |
|
|
|
|
|
|
|
|
|
|
|
|
|
| Consumer loans |
|
|
|
|
2 |
|
|
— |
|
|
— |
|
|
— |
|
| Total Personal Banking |
|
|
|
|
1,024 |
|
|
87 |
|
|
— |
|
|
381 |
|
|
|
|
|
|
|
|
|
|
|
|
|
| Commercial Banking: |
|
|
|
|
|
|
|
|
|
|
|
| Commercial real estate loans |
|
|
|
|
29,121 |
|
|
— |
|
|
— |
|
|
— |
|
|
|
|
|
|
|
|
|
|
|
|
|
| Commercial loans |
|
|
|
|
10 |
|
|
9 |
|
|
47 |
|
|
— |
|
| Total Commercial Banking |
|
|
|
|
29,131 |
|
|
9 |
|
|
47 |
|
|
— |
|
| Total loans |
|
|
|
|
$ |
30,155 |
|
|
96 |
|
|
47 |
|
|
381 |
|
All loans modified since the adoption of ASU 2022-02 were current on their payments as of March 31, 2023.
A modification is considered to be in default when the loan is 90 days or more past due. The following table provides the amortized cost basis of financing receivables that had a payment default during the period ended March 31, 2024 and were modified within the previous twelve months to borrowers experiencing financial difficulty (in thousands):
|
|
|
|
|
|
|
|
|
|
|
|
|
|
|
|
|
|
|
|
|
|
|
|
|
|
|
|
Term extension |
|
Payment delay |
|
|
|
|
|
|
|
| Personal Banking: |
|
|
|
|
|
|
|
|
|
|
|
|
|
|
| Residential mortgage loans |
|
|
|
|
$ |
— |
|
|
$ |
364 |
|
|
|
|
|
|
|
|
| Home equity loans |
|
|
|
|
17 |
|
|
— |
|
|
|
|
|
|
|
|
|
|
|
|
|
|
|
|
|
|
|
|
|
|
|
|
|
|
|
|
|
|
|
|
|
|
|
|
|
|
| Total Personal Banking |
|
|
|
|
17 |
|
|
364 |
|
|
|
|
|
|
|
|
|
|
|
|
|
|
|
|
|
|
|
|
|
|
|
|
|
|
|
|
|
|
|
|
|
|
|
|
|
|
|
|
|
|
|
|
|
|
|
|
|
|
|
|
|
|
|
|
|
|
|
|
|
|
|
|
|
|
|
|
|
|
|
|
|
|
|
|
|
|
|
|
|
|
|
|
|
|
|
|
|
|
|
|
|
|
|
|
|
|
|
|
|
|
|
|
|
|
|
|
|
|
|
|
|
| Total |
|
|
|
|
$ |
17 |
|
|
$ |
364 |
|
|
|
|
|
|
|
|
No loans modified since the adoption of ASU 2022-02 subsequently defaulted during the quarter ended March 31, 2023.
The modifications to borrowers experiencing financial distress are included in their respective portfolio segment and the current loan balance and updated loan terms are run through their respective ACL models to arrive at the quantitative portion of the ACL. Subsequent performance of the loans will be measured by delinquency status and will be captured through our ACL models or our qualitative factor assessment, as deemed appropriate. If we no longer believe the loan demonstrates similar risks to their respective portfolio segment an individual assessment will be performed. Upon the Company's determination that a modified loan (or portion of a loan) has subsequently been deemed uncollectible, the loan (or a portion of the loan) is written off. Therefore, the amortized cost basis of the loan is reduced by the uncollectible amount and the allowance for credit losses is adjusted by the same amount.
The following table provides information related to the amortized cost basis of loan payment delinquencies at March 31, 2024 (in thousands):
|
|
|
|
|
|
|
|
|
|
|
|
|
|
|
|
|
|
|
|
|
|
|
|
|
|
|
|
|
|
|
|
|
|
|
|
|
|
|
|
|
|
| |
30-59 days
delinquent |
|
60-89 days
delinquent |
|
90 days or
greater
delinquent |
|
Total
delinquency |
|
Current |
|
Total loans
receivable |
|
90 days or
greater
delinquent
and accruing |
|
|
|
|
|
|
|
|
|
|
|
|
|
|
| Personal Banking: |
|
|
|
|
|
|
|
|
|
|
|
|
|
| Residential mortgage loans |
$ |
38,502 |
|
|
70 |
|
|
5,813 |
|
|
44,385 |
|
|
3,338,463 |
|
|
3,382,848 |
|
|
1,509 |
|
| Home equity loans |
4,608 |
|
|
761 |
|
|
2,823 |
|
|
8,192 |
|
|
1,188,415 |
|
|
1,196,607 |
|
|
1 |
|
| Vehicle loans |
9,177 |
|
|
2,246 |
|
|
2,496 |
|
|
13,919 |
|
|
1,990,937 |
|
|
2,004,856 |
|
|
59 |
|
| Consumer loans |
734 |
|
|
299 |
|
|
849 |
|
|
1,882 |
|
|
111,629 |
|
|
113,511 |
|
|
627 |
|
| Total Personal Banking |
53,021 |
|
|
3,376 |
|
|
11,981 |
|
|
68,378 |
|
|
6,629,444 |
|
|
6,697,822 |
|
|
2,196 |
|
|
|
|
|
|
|
|
|
|
|
|
|
|
|
| Commercial Banking: |
|
|
|
|
|
|
|
|
|
|
|
|
|
| Commercial real estate loans |
6,181 |
|
|
807 |
|
|
6,041 |
|
|
13,029 |
|
|
2,650,961 |
|
|
2,663,990 |
|
|
— |
|
| Commercial real estate loans - owner occupied |
215 |
|
|
— |
|
|
890 |
|
|
1,105 |
|
|
363,433 |
|
|
364,538 |
|
|
— |
|
| Commercial loans |
3,091 |
|
|
1,284 |
|
|
3,421 |
|
|
7,796 |
|
|
1,767,100 |
|
|
1,774,896 |
|
|
256 |
|
| Total Commercial Banking |
9,487 |
|
|
2,091 |
|
|
10,352 |
|
|
21,930 |
|
|
4,781,494 |
|
|
4,803,424 |
|
|
256 |
|
| Total loans |
$ |
62,508 |
|
|
5,467 |
|
|
22,333 |
|
|
90,308 |
|
|
11,410,938 |
|
|
11,501,246 |
|
|
2,452 |
|
The following table provides information related to the amortized cost basis of loan payment delinquencies at December 31, 2023 (in thousands):
|
|
|
|
|
|
|
|
|
|
|
|
|
|
|
|
|
|
|
|
|
|
|
|
|
|
|
|
|
|
|
|
|
|
|
|
|
|
|
|
|
|
| |
30-59 days
delinquent |
|
60-89 days
delinquent |
|
90 days or
greater
delinquent |
|
Total
delinquency |
|
Current |
|
Total loans
receivable |
|
90 days or
greater
delinquent
and accruing |
|
|
|
|
|
|
|
|
|
|
|
|
|
|
| Personal Banking: |
|
|
|
|
|
|
|
|
|
|
|
|
|
Residential mortgage loans |
$ |
30,041 |
|
|
7,796 |
|
|
7,995 |
|
|
45,832 |
|
|
3,382,353 |
|
|
3,428,185 |
|
|
1,671 |
|
Home equity loans |
5,761 |
|
|
982 |
|
|
3,126 |
|
|
9,869 |
|
|
1,217,989 |
|
|
1,227,858 |
|
|
26 |
|
| Vehicle loans |
10,382 |
|
|
3,326 |
|
|
3,051 |
|
|
16,759 |
|
|
1,991,842 |
|
|
2,008,601 |
|
|
44 |
|
Consumer loans |
829 |
|
|
428 |
|
|
927 |
|
|
2,184 |
|
|
115,242 |
|
|
117,426 |
|
|
722 |
|
| Total Personal Banking |
47,013 |
|
|
12,532 |
|
|
15,099 |
|
|
74,644 |
|
|
6,707,426 |
|
|
6,782,070 |
|
|
2,463 |
|
|
|
|
|
|
|
|
|
|
|
|
|
|
|
| Commercial Banking: |
|
|
|
|
|
|
|
|
|
|
|
|
|
Commercial real estate loans |
2,010 |
|
|
1,031 |
|
|
6,535 |
|
|
9,576 |
|
|
2,618,881 |
|
|
2,628,457 |
|
|
225 |
|
| Commercial real estate loans - owner occupied |
1,194 |
|
|
— |
|
|
177 |
|
|
1,371 |
|
|
344,182 |
|
|
345,553 |
|
|
— |
|
Commercial loans |
4,196 |
|
|
703 |
|
|
2,780 |
|
|
7,679 |
|
|
1,651,050 |
|
|
1,658,729 |
|
|
10 |
|
| Total Commercial Banking |
7,400 |
|
|
1,734 |
|
|
9,492 |
|
|
18,626 |
|
|
4,614,113 |
|
|
4,632,739 |
|
|
235 |
|
| Total originated loans |
$ |
54,413 |
|
|
14,266 |
|
|
24,591 |
|
|
93,270 |
|
|
11,321,539 |
|
|
11,414,809 |
|
|
2,698 |
|
|
|
|
|
|
|
|
|
|
|
|
|
|
|
|
|
|
|
|
|
|
|
|
|
|
|
|
|
|
|
|
|
|
|
|
|
|
|
|
|
|
|
|
|
|
|
|
|
|
|
|
|
|
|
|
|
|
|
|
|
|
|
|
|
|
|
|
|
|
|
|
|
|
|
|
|
|
|
|
|
|
|
|
|
|
|
|
|
|
|
|
|
|
|
|
|
|
|
|
|
|
|
|
|
|
|
|
|
|
|
|
|
|
|
|
|
|
|
|
|
|
|
|
|
|
|
|
|
|
|
|
|
|
|
|
|
|
|
|
|
|
|
|
|
|
|
|
|
|
|
|
|
|
|
|
|
|
|
|
|
|
|
|
|
|
|
|
|
|
|
|
|
|
|
|
|
|
|
|
|
|
|
|
|
|
|
|
|
|
|
|
|
|
|
|
|
|
|
|
|
|
|
|
|
|
|
|
|
|
|
Credit Quality Indicators: For Commercial Banking we categorize loans into risk categories based on relevant information about the ability of borrowers to service their debt such as: current financial information, historical payment experience, credit documentation, public information, and current economic trends, among other factors. We analyze loans individually by classifying the loans by credit risk. Credit relationships greater than or equal to $1.0 million classified as special mention or substandard are reviewed quarterly for deterioration or improvement to determine if the loan is appropriately classified. We use the following definitions for risk ratings other than pass:
Special Mention — Loans designated as special mention have specific, well-defined risk issues, which create a high level of uncertainty regarding the long-term viability of the business. Loans in this class are considered to have high-risk characteristics. A special mention loan exhibits material negative financial trends due to company-specific or systemic conditions. If these potential weaknesses are not mitigated, they threaten the borrower’s capacity to meet its debt obligations. Special mention loans still demonstrate sufficient financial flexibility to react to and positively address the root cause of the adverse financial trends without significant deviations from their current business strategy. Their potential weaknesses deserve our close attention and warrant enhanced monitoring.
Substandard — Loans classified as substandard are inadequately protected by the current net worth and payment capacity of the obligor or of the collateral pledged, if any. Loans so classified have a well-defined weakness or weaknesses that jeopardize the liquidation of the debt. They are characterized by the distinct possibility that we will sustain some loss if the deficiencies are not corrected.
Doubtful — Loans classified as doubtful have all the weaknesses inherent in those classified as substandard. In addition, those weaknesses make collection or liquidation in full highly questionable and improbable. A loan classified as doubtful exhibits discernible loss potential, but a complete loss seems very unlikely. The possibility of a loss on a doubtful loan is high, but because of certain important and reasonably specific pending factors that may strengthen the loan, its classification as an estimated loss is deferred until a more exact status can be determined.
Loss — Loans classified as loss are considered uncollectible and of such value that the continuance as a loan is not warranted. A loss classification does not mean that the loan has no recovery or salvage value; instead, it means that it is not practical or desirable to defer writing off all or a portion of a basically worthless loan even though partial recovery may be possible in the future.
For Personal Banking loans a pass risk rating is maintained until they are 90 days or greater past due, and risk rating reclassification is based primarily on past due status of the loan. The risk rating categories can generally be described by the following groupings:
Pass — Loans classified as pass are homogeneous loans that are less than 90 days past due from the required payment date at month-end.
Substandard — Loans classified as substandard are homogeneous loans that are greater than 90 days past due from the required payment date at month-end, or homogenous retail loans that are greater than 180 days past due from the required payment date at month-end that has been written down to the value of underlying collateral, less costs to sell.
Doubtful — Loans classified as doubtful are homogeneous loans that are greater than 180 days past due from the required payment date at month-end and not written down to the value of underlying collateral. These loans are generally charged-off in the month in which the 180 day period elapses.
The following table presents the amortized cost basis of our loan portfolio by year of origination and credit quality indicator and the current period charge-offs by year of origination for each portfolio segment as of March 31, 2024 (in thousands):
|
|
|
|
|
|
|
|
|
|
|
|
|
|
|
|
|
|
|
|
|
|
|
|
|
|
|
|
|
|
|
|
|
|
|
|
|
|
|
|
|
|
|
|
|
|
|
|
|
|
|
|
|
|
|
YTD March 31, 2024 |
|
2023 |
|
2022 |
|
2021 |
|
2020 |
|
Prior |
|
Revolving loans |
|
Revolving loans converted to term loans |
|
Total loans
receivable |
| Personal Banking: |
|
|
|
|
|
|
|
|
|
|
|
|
|
|
|
|
|
| Residential mortgage loans |
|
|
|
|
|
|
|
|
|
|
|
|
|
|
|
|
|
| Pass |
$ |
7,577 |
|
|
192,489 |
|
|
660,443 |
|
|
782,217 |
|
|
496,755 |
|
|
1,230,826 |
|
|
— |
|
|
— |
|
|
3,370,307 |
|
| Substandard |
— |
|
|
89 |
|
|
2,551 |
|
|
357 |
|
|
1,208 |
|
|
8,336 |
|
|
— |
|
|
— |
|
|
12,541 |
|
| Total residential mortgage loans |
7,577 |
|
|
192,578 |
|
|
662,994 |
|
|
782,574 |
|
|
497,963 |
|
|
1,239,162 |
|
|
— |
|
|
— |
|
|
3,382,848 |
|
| Residential mortgage current period charge-offs |
— |
|
|
— |
|
|
— |
|
|
— |
|
|
(113) |
|
|
(49) |
|
|
— |
|
|
— |
|
|
(162) |
|
| Home equity loans |
|
|
|
|
|
|
|
|
|
|
|
|
|
|
|
|
|
| Pass |
5,488 |
|
|
67,059 |
|
|
97,697 |
|
|
101,645 |
|
|
140,326 |
|
|
276,751 |
|
|
460,391 |
|
|
42,600 |
|
|
1,191,957 |
|
| Substandard |
— |
|
|
— |
|
|
98 |
|
|
54 |
|
|
197 |
|
|
2,027 |
|
|
1,086 |
|
|
1,188 |
|
|
4,650 |
|
| Total home equity loans |
5,488 |
|
|
67,059 |
|
|
97,795 |
|
|
101,699 |
|
|
140,523 |
|
|
278,778 |
|
|
461,477 |
|
|
43,788 |
|
|
1,196,607 |
|
| Home equity current period charge-offs |
— |
|
|
— |
|
|
(35) |
|
|
(2) |
|
|
— |
|
|
(154) |
|
|
(189) |
|
|
(32) |
|
|
(412) |
|
| Vehicle loans |
|
|
|
|
|
|
|
|
|
|
|
|
|
|
|
|
|
| Pass |
196,998 |
|
|
615,730 |
|
|
618,045 |
|
|
351,286 |
|
|
113,020 |
|
|
105,357 |
|
|
— |
|
|
— |
|
|
2,000,436 |
|
| Substandard |
— |
|
|
753 |
|
|
1,310 |
|
|
1,274 |
|
|
257 |
|
|
826 |
|
|
— |
|
|
— |
|
|
4,420 |
|
| Total vehicle loans |
196,998 |
|
|
616,483 |
|
|
619,355 |
|
|
352,560 |
|
|
113,277 |
|
|
106,183 |
|
|
— |
|
|
— |
|
|
2,004,856 |
|
| Vehicle current period charge-offs |
— |
|
|
(715) |
|
|
(664) |
|
|
(748) |
|
|
(117) |
|
|
(344) |
|
|
— |
|
|
— |
|
|
(2,588) |
|
| Consumer loans |
|
|
|
|
|
|
|
|
|
|
|
|
|
|
|
|
|
| Pass |
7,204 |
|
|
21,506 |
|
|
10,028 |
|
|
4,627 |
|
|
1,667 |
|
|
5,099 |
|
|
61,766 |
|
|
717 |
|
|
112,614 |
|
| Substandard |
— |
|
|
51 |
|
|
63 |
|
|
9 |
|
|
— |
|
|
51 |
|
|
622 |
|
|
101 |
|
|
897 |
|
| Total consumer loans |
7,204 |
|
|
21,557 |
|
|
10,091 |
|
|
4,636 |
|
|
1,667 |
|
|
5,150 |
|
|
62,388 |
|
|
818 |
|
|
113,511 |
|
| Consumer loan current period charge-offs |
(13) |
|
|
(1,263) |
|
|
(139) |
|
|
(83) |
|
|
(13) |
|
|
(247) |
|
|
(206) |
|
|
(21) |
|
|
(1,985) |
|
| Total Personal Banking |
217,267 |
|
|
897,677 |
|
|
1,390,235 |
|
|
1,241,469 |
|
|
753,430 |
|
|
1,629,273 |
|
|
523,865 |
|
|
44,606 |
|
|
6,697,822 |
|
| Commercial Banking: |
|
|
|
|
|
|
|
|
|
|
|
|
|
|
|
|
|
| Commercial real estate loans |
|
|
|
|
|
|
|
|
|
|
|
|
|
|
|
|
|
| Pass |
62,822 |
|
|
232,766 |
|
|
496,664 |
|
|
303,781 |
|
|
319,596 |
|
|
931,515 |
|
|
28,002 |
|
|
24,423 |
|
|
2,399,569 |
|
| Special mention |
— |
|
|
2,831 |
|
|
24,683 |
|
|
27,294 |
|
|
7,111 |
|
|
28,946 |
|
|
733 |
|
|
— |
|
|
91,598 |
|
| Substandard |
1,256 |
|
|
1,909 |
|
|
2,779 |
|
|
29,626 |
|
|
19,575 |
|
|
117,501 |
|
|
78 |
|
|
99 |
|
|
172,823 |
|
|
|
|
|
|
|
|
|
|
|
|
|
|
|
|
|
|
|
|
|
|
|
|
|
|
|
|
|
|
|
|
|
|
|
|
|
| Total commercial real estate loans |
64,078 |
|
|
237,506 |
|
|
524,126 |
|
|
360,701 |
|
|
346,282 |
|
|
1,077,962 |
|
|
28,813 |
|
|
24,522 |
|
|
2,663,990 |
|
| Commercial real estate current period charge-offs |
— |
|
|
— |
|
|
(44) |
|
|
— |
|
|
— |
|
|
(305) |
|
|
— |
|
|
— |
|
|
(349) |
|
| Commercial real estate loans - owner occupied |
|
|
|
|
|
|
|
|
|
|
|
|
|
|
|
|
|
| Pass |
22,976 |
|
|
12,903 |
|
|
51,065 |
|
|
47,955 |
|
|
13,886 |
|
|
163,028 |
|
|
2,171 |
|
|
1,304 |
|
|
315,288 |
|
| Special mention |
— |
|
|
13,365 |
|
|
2,381 |
|
|
1,210 |
|
|
1,728 |
|
|
20,965 |
|
|
— |
|
|
— |
|
|
39,649 |
|
| Substandard |
— |
|
|
— |
|
|
— |
|
|
111 |
|
|
1,647 |
|
|
6,145 |
|
|
— |
|
|
1,698 |
|
|
9,601 |
|
|
|
|
|
|
|
|
|
|
|
|
|
|
|
|
|
|
|
|
|
|
|
|
|
|
|
|
|
|
|
|
|
|
|
|
|
| Total commercial real estate loans - owner occupied |
22,976 |
|
|
26,268 |
|
|
53,446 |
|
|
49,276 |
|
|
17,261 |
|
|
190,138 |
|
|
2,171 |
|
|
3,002 |
|
|
364,538 |
|
| Commercial real estate - owner occupied current period charge-offs |
— |
|
|
— |
|
|
— |
|
|
— |
|
|
— |
|
|
— |
|
|
— |
|
|
— |
|
|
— |
|
| Commercial loans |
|
|
|
|
|
|
|
|
|
|
|
|
|
|
|
|
|
| Pass |
203,185 |
|
|
424,258 |
|
|
402,658 |
|
|
67,493 |
|
|
24,976 |
|
|
79,847 |
|
|
492,660 |
|
|
3,442 |
|
|
1,698,519 |
|
| Special mention |
8,019 |
|
|
31,014 |
|
|
3,860 |
|
|
4 |
|
|
298 |
|
|
217 |
|
|
9,045 |
|
|
4 |
|
|
52,461 |
|
| Substandard |
— |
|
|
8,050 |
|
|
3,954 |
|
|
886 |
|
|
222 |
|
|
3,162 |
|
|
3,884 |
|
|
3,758 |
|
|
23,916 |
|
|
|
|
|
|
|
|
|
|
|
|
|
|
|
|
|
|
|
|
|
|
|
|
|
|
|
|
|
|
|
|
|
|
|
|
|
| Total commercial loans |
211,204 |
|
|
463,322 |
|
|
410,472 |
|
|
68,383 |
|
|
25,496 |
|
|
83,226 |
|
|
505,589 |
|
|
7,204 |
|
|
1,774,896 |
|
| Commercial loans current period charge-offs |
— |
|
|
(47) |
|
|
(734) |
|
|
(75) |
|
|
(175) |
|
|
(132) |
|
|
— |
|
|
— |
|
|
(1,163) |
|
| Total Commercial Banking |
298,258 |
|
|
727,096 |
|
|
988,044 |
|
|
478,360 |
|
|
389,039 |
|
|
1,351,326 |
|
|
536,573 |
|
|
34,728 |
|
|
4,803,424 |
|
|
|
|
|
|
|
|
|
|
|
|
|
|
|
|
|
|
|
| Total loans |
$ |
515,525 |
|
|
1,624,773 |
|
|
2,378,279 |
|
|
1,719,829 |
|
|
1,142,469 |
|
|
2,980,599 |
|
|
1,060,438 |
|
|
79,334 |
|
|
11,501,246 |
|
For the quarter ended March 31, 2024, $3 million of revolving loans were converted to term loans.
The following table presents the amortized cost basis of our loan portfolio by year of origination and credit quality indicator for each portfolio segment as of December 31, 2023 (in thousands):
|
|
|
|
|
|
|
|
|
|
|
|
|
|
|
|
|
|
|
|
|
|
|
|
|
|
|
|
|
|
|
|
|
|
|
|
|
|
|
|
|
|
|
|
|
|
|
|
|
|
|
|
|
|
|
|
2023 |
|
2022 |
|
2021 |
|
2020 |
|
2019 |
|
Prior |
|
Revolving loans |
|
Revolving loans converted to term loans |
|
Total loans
receivable |
|
| Personal Banking: |
|
|
|
|
|
|
|
|
|
|
|
|
|
|
|
|
|
|
| Residential mortgage loans |
|
|
|
|
|
|
|
|
|
|
|
|
|
|
|
|
|
|
| Pass |
$ |
186,081 |
|
|
665,379 |
|
|
792,488 |
|
|
506,068 |
|
|
244,678 |
|
|
1,019,152 |
|
|
— |
|
|
— |
|
|
3,413,846 |
|
|
| Substandard |
— |
|
|
1,581 |
|
|
— |
|
|
1,252 |
|
|
311 |
|
|
11,195 |
|
|
— |
|
|
— |
|
|
14,339 |
|
|
| Total residential mortgage loans |
186,081 |
|
|
666,960 |
|
|
792,488 |
|
|
507,320 |
|
|
244,989 |
|
|
1,030,347 |
|
|
— |
|
|
— |
|
|
3,428,185 |
|
|
| Residential mortgage current period charge-offs |
— |
|
|
(9) |
|
|
(5) |
|
|
(130) |
|
|
(23) |
|
|
(1,023) |
|
|
— |
|
|
— |
|
|
(1,189) |
|
|
| Home equity loans |
|
|
|
|
|
|
|
|
|
|
|
|
|
|
|
|
|
|
| Pass |
71,497 |
|
|
100,639 |
|
|
106,043 |
|
|
146,121 |
|
|
94,144 |
|
|
197,259 |
|
|
463,868 |
|
|
43,526 |
|
|
1,223,097 |
|
|
| Substandard |
— |
|
|
236 |
|
|
54 |
|
|
197 |
|
|
35 |
|
|
1,733 |
|
|
1,447 |
|
|
1,059 |
|
|
4,761 |
|
|
| Total home equity loans |
71,497 |
|
|
100,875 |
|
|
106,097 |
|
|
146,318 |
|
|
94,179 |
|
|
198,992 |
|
|
465,315 |
|
|
44,585 |
|
|
1,227,858 |
|
|
| Home equity current period charge-offs |
— |
|
|
(53) |
|
|
(46) |
|
|
— |
|
|
(48) |
|
|
(352) |
|
|
(144) |
|
|
(209) |
|
|
(852) |
|
|
| Vehicle loans |
|
|
|
|
|
|
|
|
|
|
|
|
|
|
|
|
|
|
| Pass |
664,876 |
|
|
682,275 |
|
|
397,809 |
|
|
132,775 |
|
|
67,853 |
|
|
58,153 |
|
|
— |
|
|
— |
|
|
2,003,741 |
|
|
| Substandard |
646 |
|
|
1,418 |
|
|
1,453 |
|
|
299 |
|
|
556 |
|
|
488 |
|
|
— |
|
|
— |
|
|
4,860 |
|
|
| Total vehicle loans |
665,522 |
|
|
683,693 |
|
|
399,262 |
|
|
133,074 |
|
|
68,409 |
|
|
58,641 |
|
|
— |
|
|
— |
|
|
2,008,601 |
|
|
| Vehicle current period charge-offs |
(678) |
|
|
(1,844) |
|
|
(1,967) |
|
|
(475) |
|
|
(652) |
|
|
(853) |
|
|
— |
|
|
— |
|
|
(6,468) |
|
|
| Consumer loans |
|
|
|
|
|
|
|
|
|
|
|
|
|
|
|
|
|
|
| Pass |
24,277 |
|
|
11,582 |
|
|
5,552 |
|
|
2,072 |
|
|
1,355 |
|
|
6,603 |
|
|
64,214 |
|
|
820 |
|
|
116,475 |
|
|
| Substandard |
55 |
|
|
43 |
|
|
19 |
|
|
6 |
|
|
6 |
|
|
46 |
|
|
726 |
|
|
50 |
|
|
951 |
|
|
| Total consumer loans |
24,332 |
|
|
11,625 |
|
|
5,571 |
|
|
2,078 |
|
|
1,361 |
|
|
6,649 |
|
|
64,940 |
|
|
870 |
|
|
117,426 |
|
|
| Consumer loan current period charge-offs |
(3,412) |
|
|
(511) |
|
|
(390) |
|
|
(157) |
|
|
(177) |
|
|
(980) |
|
|
(317) |
|
|
(38) |
|
|
(5,983) |
|
|
| Total Personal Banking |
947,432 |
|
|
1,463,153 |
|
|
1,303,418 |
|
|
788,790 |
|
|
408,938 |
|
|
1,294,629 |
|
|
530,255 |
|
|
45,455 |
|
|
6,782,070 |
|
|
| Commercial Banking: |
|
|
|
|
|
|
|
|
|
|
|
|
|
|
|
|
|
|
| Commercial real estate loans |
|
|
|
|
|
|
|
|
|
|
|
|
|
|
|
|
|
|
| Pass |
223,335 |
|
|
470,762 |
|
|
303,873 |
|
|
332,620 |
|
|
228,382 |
|
|
745,244 |
|
|
27,583 |
|
|
24,804 |
|
|
2,356,603 |
|
|
| Special Mention |
2,819 |
|
|
24,735 |
|
|
27,871 |
|
|
5,365 |
|
|
4,053 |
|
|
38,665 |
|
|
711 |
|
|
— |
|
|
104,219 |
|
|
| Substandard |
1,920 |
|
|
750 |
|
|
26,850 |
|
|
18,167 |
|
|
37,044 |
|
|
82,717 |
|
|
79 |
|
|
108 |
|
|
167,635 |
|
|
|
|
|
|
|
|
|
|
|
|
|
|
|
|
|
|
|
|
|
|
|
|
|
|
|
|
|
|
|
|
|
|
|
|
|
|
|
|
| Total commercial real estate loans |
228,074 |
|
|
496,247 |
|
|
358,594 |
|
|
356,152 |
|
|
269,479 |
|
|
866,626 |
|
|
28,373 |
|
|
24,912 |
|
|
2,628,457 |
|
|
Commercial real estate current period
charge-offs |
(14) |
|
|
— |
|
|
(492) |
|
|
— |
|
|
(51) |
|
|
(1,741) |
|
|
— |
|
|
— |
|
|
(2,298) |
|
|
Commercial real estate loans -
owner occupied |
|
|
|
|
|
|
|
|
|
|
|
|
|
|
|
|
|
|
| Pass |
24,725 |
|
|
51,986 |
|
|
47,655 |
|
|
15,984 |
|
|
28,614 |
|
|
140,175 |
|
|
2,378 |
|
|
2,390 |
|
|
313,907 |
|
|
| Special Mention |
1,221 |
|
|
120 |
|
|
1,218 |
|
|
— |
|
|
14,386 |
|
|
2,952 |
|
|
— |
|
|
— |
|
|
19,897 |
|
|
| Substandard |
— |
|
|
— |
|
|
118 |
|
|
1,666 |
|
|
4,646 |
|
|
4,641 |
|
|
— |
|
|
678 |
|
|
11,749 |
|
|
|
|
|
|
|
|
|
|
|
|
|
|
|
|
|
|
|
|
|
|
|
|
|
|
|
|
|
|
|
|
|
|
|
|
|
|
|
|
Total commercial real estate loans -
owner occupied |
25,946 |
|
|
52,106 |
|
|
48,991 |
|
|
17,650 |
|
|
47,646 |
|
|
147,768 |
|
|
2,378 |
|
|
3,068 |
|
|
345,553 |
|
|
| Commercial real estate - owner occupied current period charge-offs |
— |
|
|
— |
|
|
— |
|
|
— |
|
|
— |
|
|
(68) |
|
|
— |
|
|
— |
|
|
(68) |
|
|
| Commercial loans |
|
|
|
|
|
|
|
|
|
|
|
|
|
|
|
|
|
|
| Pass |
482,605 |
|
|
430,378 |
|
|
73,469 |
|
|
26,868 |
|
|
34,090 |
|
|
54,617 |
|
|
531,742 |
|
|
4,110 |
|
|
1,637,879 |
|
|
| Special Mention |
508 |
|
|
3,671 |
|
|
52 |
|
|
299 |
|
|
240 |
|
|
26 |
|
|
1,882 |
|
|
— |
|
|
6,678 |
|
|
| Substandard |
— |
|
|
3,015 |
|
|
872 |
|
|
356 |
|
|
2,361 |
|
|
840 |
|
|
4,729 |
|
|
1,999 |
|
|
14,172 |
|
|
|
|
|
|
|
|
|
|
|
|
|
|
|
|
|
|
|
|
|
|
|
|
|
|
|
|
|
|
|
|
|
|
|
|
|
|
|
|
| Total commercial loans |
483,113 |
|
|
437,064 |
|
|
74,393 |
|
|
27,523 |
|
|
36,691 |
|
|
55,483 |
|
|
538,353 |
|
|
6,109 |
|
|
1,658,729 |
|
|
Commercial loans current period
charge-offs |
(35) |
|
|
(2,072) |
|
|
(517) |
|
|
(430) |
|
|
(205) |
|
|
(845) |
|
|
(60) |
|
|
(2) |
|
|
(4,166) |
|
|
| Total Commercial Banking |
737,133 |
|
|
985,417 |
|
|
481,978 |
|
|
401,325 |
|
|
353,816 |
|
|
1,069,877 |
|
|
569,104 |
|
|
34,089 |
|
|
4,632,739 |
|
|
|
|
|
|
|
|
|
|
|
|
|
|
|
|
|
|
|
|
|
| Total loans |
$ |
1,684,565 |
|
|
2,448,570 |
|
|
1,785,396 |
|
|
1,190,115 |
|
|
762,754 |
|
|
2,364,506 |
|
|
1,099,359 |
|
|
79,544 |
|
|
11,414,809 |
|
|
For the year ended December 31, 2023, $19 million of revolving loans were converted to term loans.
(4) Goodwill and Other Intangible Assets
The following table provides information for intangible assets subject to amortization at the dates indicated (in thousands):
|
|
|
|
|
|
|
|
|
|
|
|
|
March 31, 2024 |
|
December 31, 2023 |
| Amortizable intangible assets: |
|
|
|
| Core deposit intangibles - gross |
$ |
74,899 |
|
|
74,899 |
|
|
|
|
|
| Less: accumulated amortization |
(70,310) |
|
|
(69,609) |
|
| Core deposit intangibles - net |
$ |
4,589 |
|
|
5,290 |
|
|
|
|
|
|
|
|
|
|
|
|
|
|
|
|
|
|
|
|
|
| Total intangible assets - net |
$ |
4,589 |
|
|
5,290 |
|
The following table shows the actual aggregate amortization expense for the quarters ended March 31, 2024 and 2023, as well as the estimated aggregate amortization expense, based upon current levels of intangible assets, for the current fiscal year and each of the succeeding fiscal years until the intangible assets are fully amortized (in thousands):
|
|
|
|
|
|
| For the quarter ended March 31, 2024 |
$ |
701 |
|
| For the quarter ended March 31, 2023 |
909 |
|
|
|
|
|
| For the year ending December 31, 2024 |
2,452 |
|
| For the year ending December 31, 2025 |
1,662 |
|
| For the year ending December 31, 2026 |
871 |
|
| For the year ending December 31, 2027 |
305 |
|
|
|
|
|
The following table provides information for the changes in the carrying amount of goodwill (in thousands):
|
|
|
|
|
|
|
|
|
|
|
Total |
|
|
|
|
|
|
|
|
|
| Balance at December 31, 2023 |
|
$ |
380,997 |
|
|
|
|
|
|
|
| Balance at March 31, 2024 |
|
$ |
380,997 |
|
We performed our annual goodwill impairment test as of June 30, 2023 in accordance with ASC 350, Intangibles - Goodwill and Other, and concluded that goodwill was not impaired.
(5) Borrowed Funds
(a) Borrowings
Borrowed funds at March 31, 2024 and December 31, 2023 are presented in the following table:
|
|
|
|
|
|
|
|
|
|
|
|
|
|
|
|
|
|
|
|
|
|
|
|
|
March 31, 2024 |
|
December 31, 2023 |
|
Amount |
|
Average rate |
|
Amount |
|
Average rate |
| Term notes payable to the FHLB of Pittsburgh, due within one year |
$ |
275,000 |
|
|
5.65 |
% |
|
$ |
175,000 |
|
|
5.71 |
% |
| Notes payable to the FHLB of Pittsburgh, due within one year |
55,600 |
|
|
5.67 |
% |
|
163,500 |
|
|
5.70 |
% |
|
|
|
|
|
|
|
|
|
|
|
|
|
|
|
|
|
|
|
|
|
|
|
|
|
|
|
|
|
|
|
|
| Collateralized borrowings, due within one year |
29,882 |
|
|
1.62 |
% |
|
35,495 |
|
1.72 |
% |
| Collateral received, due within one year |
40,301 |
|
|
5.08 |
% |
|
24,900 |
|
|
5.26 |
% |
| Total borrowed funds |
$ |
400,783 |
|
|
|
|
$ |
398,895 |
|
|
|
Borrowings from the Federal Home Loan Bank (“FHLB”) of Pittsburgh, if any, are secured by our residential first mortgage and other qualifying loans. At March 31, 2024, the carrying value of these loans was $6.0 billion. Certain of these borrowings are subject to restrictions or penalties in the event of prepayment.
The revolving line of credit with the FHLB of Pittsburgh carries a commitment of $250 million. The rate is adjusted daily by the FHLB of Pittsburgh, and any borrowings on this line may be repaid at any time without penalty. At March 31, 2024 and December 31, 2023, the balance of the revolving line of credit was $56 million and $164 million, respectively.
At March 31, 2024 and December 31, 2023, collateralized borrowings due within one year were $30 million and $35 million, respectively. These borrowings are collateralized by cash or various securities held in safekeeping by the FHLB. At March 31, 2024, the carrying value of the cash and securities used as collateral was $50 million.
At March 31, 2024 and December 31, 2023, collateral received was $40 million and $25 million, respectively. This represents collateral posted to us from our derivative counterparties.
At March 31, 2024 and December 31, 2023, term notes payable to the FHLB of Pittsburgh due within one year were $275 million and $175 million, respectively. The March 31, 2024 total is made up of eight advances: $100 million at 5.68% maturing April 5, 2024; $25 million at 5.63% maturing April 26, 2024; $25 million at 5.61% maturing April 30, 2024; $25 million at 5.65% maturing May 9, 2024; $25 million at 5.64% maturing May 13, 2024; $25 million at 5.64% maturing May 13, 2024; $25 million at 5.63% maturing May 20, 2024; $25 million at 5.63% maturing May 31, 2024.
On September 9, 2020, the Company issued $125 million of 4.00% fixed-to-floating rate subordinated notes with a maturity date of September 15, 2030. The subordinated notes, which qualify as Tier 2 capital, bear interest at an annual rate of 4.00%, payable semi-annually in arrears commencing on March 15, 2021, and a floating rate of interest equivalent to the 3-month Secured Overnight Financing Rate (“SOFR”) plus 3.89% payable quarterly in arrears commencing on December 15, 2025. During the year-ended December 31, 2023 the Company repurchased $10 million of subordinated notes leaving $115 million of subordinated notes outstanding. The subordinated debt issuance costs of approximately $2 million are being amortized over five years on a straight-line basis into interest expense. At March 31, 2024 and December 31, 2023, subordinated debentures, net of issuance costs, were $114 million. For the three months ended March 31, 2024 and March 31, 2023 total interest expense paid on the subordinate notes was $1.2 million.
(b) Trust Preferred Securities
The Company has seven statutory business trusts: Northwest Bancorp Capital Trust III, a Delaware statutory business trust, Northwest Bancorp Statutory Trust IV, a Connecticut statutory business trust, LNB Trust II, a Delaware statutory business trust, Union National Capital Trust I (“UNCT I”), a Delaware statutory business trust, Union National Capital Trust II (“UNCT II”), a Delaware statutory business trust, MFBC Statutory Trust I, a Delaware statutory trust, and Universal Preferred Trust, a Delaware statutory trust (the “Trusts”). The Trusts exist solely to issue preferred securities to third parties for cash, issue common securities to the Company in exchange for capitalization of the Trusts, invest the proceeds from the sale of trust securities in an equivalent amount of debentures of the Company, and engage in other activities that are incidental to those previously listed.
The Trusts have invested the proceeds of the offerings in junior subordinated deferrable interest debentures issued by the Company. The structure of these debentures mirrors the structure of the trust-preferred securities. These subordinated debentures are the sole assets of the Trusts. As the shareholders of the trust preferred securities are the primary beneficiaries of the Trusts, the Trusts are not consolidated in our financial statements.
The following table sets forth a summary of the cumulative trust preferred securities and the junior subordinated debt held by the Trust as of the date listed (dollars in thousands).
|
|
|
|
|
|
|
|
|
|
|
|
|
|
|
|
|
|
|
|
|
|
|
|
|
|
|
|
|
|
|
|
|
|
|
|
|
Maturity date |
|
Interest rate |
|
|
|
Capital debt securities |
|
March 31, 2024 |
|
December 31, 2023 |
| Northwest Bancorp Capital Trust III |
|
|
December 30, 2035 |
|
3-month SOFR plus 1.38% |
|
|
|
$ |
50,000 |
|
|
$ |
51,547 |
|
|
51,547 |
|
| Northwest Bancorp Statutory Trust IV |
|
|
December 15, 2035 |
|
3-month SOFR plus 1.38% |
|
|
|
50,000 |
|
|
51,547 |
|
|
51,547 |
|
| LNB Trust II |
|
|
June 15, 2037 |
|
3-month SOFR plus 1.48% |
|
|
|
7,875 |
|
|
8,119 |
|
|
8,119 |
|
| Union National Capital Trust I (1) |
|
|
January 23, 2034 |
|
3-month SOFR plus 2.85% |
|
|
|
8,000 |
|
|
8,005 |
|
|
7,999 |
|
| Union National Capital Trust II (1) |
|
|
November 23, 2034 |
|
3-month SOFR plus 2.00% |
|
|
|
3,000 |
|
|
2,803 |
|
|
2,796 |
|
| MFBC Statutory Trust I (1) |
|
|
September 15, 2035 |
|
3-month SOFR plus 1.70% |
|
|
|
5,000 |
|
|
3,814 |
|
|
3,788 |
|
| Universal Preferred Trust (1) |
|
|
October 7, 2035 |
|
3-month SOFR plus 1.69% |
|
|
|
5,000 |
|
|
3,804 |
|
|
3,778 |
|
|
|
|
|
|
|
|
|
|
$ |
128,875 |
|
|
129,639 |
|
|
129,574 |
|
(1) Net of discounts due to the fair value adjustment made at the time of acquisition.
Cash distributions on the trust securities are made on a quarterly basis to the extent interest on the debentures is received by the Trusts. We have the right to defer payment of interest on the subordinated debentures at any time, or from time-to-time, for periods not exceeding five years. If interest payments on the subordinated debentures are deferred, the distributions on the trust securities also are deferred. To date there have been no interest deferrals. Interest on the subordinated debentures and distributions on the trust securities is cumulative. Our obligation constitutes a full, irrevocable, and unconditional guarantee on a subordinated basis of the obligations of the trust under the preferred securities. For each of the three month periods ended March 31, 2024 and March 31, 2023 total interest expense paid on trust preferred securities was $2 million.
The Trusts must redeem the preferred securities when the debentures are paid at maturity or upon an earlier redemption of the debentures to the extent the debentures are redeemed. All or part of the debentures may be redeemed at any time. Also, the debentures may be redeemed at any time if existing laws or regulations, or the interpretation or application of these laws or regulations, change causing:
•the interest on the debentures to no longer be deductible by the Company for federal income tax purposes;
•the trusts to become subject to federal income tax or to certain other taxes or governmental charges;
•the trusts to register as an investment company; or
•the preferred securities to no longer qualify as Tier I capital.
We may, at any time, dissolve any of the Trusts and distribute the debentures to the trust security holders, subject to receipt of any required regulatory approvals.
(6) Guarantees
We issue standby letters of credit in the normal course of business. Standby letters of credit are conditional commitments issued by the Company to guarantee the performance of a customer to a third party. Standby letters of credit generally are contingent upon the failure of the customer to perform according to the terms of the underlying contract with the third party. We are required to perform under a standby letter of credit when drawn upon by the guaranteed third party in the case of nonperformance by our customer. The credit risk associated with standby letters of credit is essentially the same as that involved in extending loans to customers and is subject to normal loan underwriting procedures. Collateral may be obtained based on management’s credit assessment of the customer. At March 31, 2024, the maximum potential amount of future payments we could be required to make under these non-recourse standby letters of credit was $60 million, of which $43 million is fully collateralized. At March 31, 2024, we had a liability which represents deferred income of $1 million related to the standby letters of credit.
In addition, we maintain a $10 million unsecured line of credit with a correspondent bank for private label credit card facilities for certain existing commercial clients of the Bank, of which $9 million in notional value of credit cards have been issued. These issued credit cards had an outstanding balance of $1 million at March 31, 2024. The clients of the Bank are responsible for repaying any balances due on these credit cards directly to the correspondent bank; however, if the customer fails to repay their balance, the Bank could be required to satisfy the obligation to correspondent bank and initiate collection from our customer as part of the existing credit facility of that customer.
(7) Earnings Per Share
Basic earnings per common share (“EPS”) is computed by dividing net income available to common shareholders by the weighted average number of common shares outstanding for the period, without considering any dilutive items. Diluted EPS reflects the potential dilution that could occur if securities or other contracts to issue common stock were exercised or converted into common stock or resulted in the issuance of common stock that then shared in the earnings of the Company.
The following table sets forth the computation of basic and diluted EPS (in thousands, except share data and per share amounts):
|
|
|
|
|
|
|
|
|
|
|
|
|
|
|
|
|
Quarter ended March 31, |
|
|
| |
2024 |
|
2023 |
|
|
|
|
| Net income |
$ |
29,163 |
|
|
33,679 |
|
|
|
|
|
| Less: Dividends and undistributed earnings allocated to participating securities |
74 |
|
|
146 |
|
|
|
|
|
| Net income available to common shareholders |
$ |
29,089 |
|
|
33,533 |
|
|
|
|
|
|
|
|
|
|
|
|
|
| Weighted average common shares outstanding |
126,814,233 |
|
|
126,498,512 |
|
|
|
|
|
| Add: Effect of common share options and other stock awards |
784,738 |
|
|
551,751 |
|
|
|
|
|
| Total weighted average common shares and dilutive potential shares |
127,598,971 |
|
|
127,050,263 |
|
|
|
|
|
|
|
|
|
|
|
|
|
| Basic earnings per share |
$ |
0.23 |
|
|
0.27 |
|
|
|
|
|
|
|
|
|
|
|
|
|
| Diluted earnings per share |
$ |
0.23 |
|
|
0.26 |
|
|
|
|
|
(8) Pension and Other Post-Retirement Benefits
The following table sets forth the net periodic costs for the defined benefit pension plans and post-retirement healthcare plans for the periods indicated (in thousands):
|
|
|
|
|
|
|
|
|
|
|
|
|
|
|
|
|
|
|
|
|
|
|
|
| |
Quarter ended March 31, |
| |
Pension benefits |
|
Other post-retirement benefits |
| |
2024 |
|
2023 |
|
2024 |
|
2023 |
| Service cost |
$ |
1,425 |
|
|
1,560 |
|
|
— |
|
|
— |
|
| Interest cost |
2,205 |
|
|
2,245 |
|
|
15 |
|
|
7 |
|
| Expected return on plan assets |
(3,776) |
|
|
(3,479) |
|
|
— |
|
|
— |
|
| Amortization of prior service cost |
(563) |
|
|
(564) |
|
|
— |
|
|
— |
|
| Amortization of the net loss |
18 |
|
|
20 |
|
|
10 |
|
|
10 |
|
| Net periodic cost |
$ |
(691) |
|
|
(218) |
|
|
25 |
|
|
17 |
|
Because of the current funding status, we do not anticipate a funding requirement during the year ending December 31, 2024.
(9) Disclosures About Fair Value of Financial Instruments
We are required to disclose fair value information about financial instruments whether or not recognized in the Consolidated Statement of Financial Condition. Fair value information of certain financial instruments and all nonfinancial instruments is not required to be disclosed. Accordingly, the aggregate fair value amounts presented do not represent the underlying value of the Company.
Financial assets and liabilities recognized or disclosed at fair value on a recurring basis and certain financial assets and liabilities on a non-recurring basis are accounted for using a three-level hierarchy of valuation techniques based on whether the inputs to those valuation techniques are observable or unobservable. This hierarchy gives the highest priority to quoted prices with readily available independent data in active markets for identical assets or liabilities (Level 1) and the lowest priority to unobservable market inputs (Level 3). When various inputs for measurement fall within different levels of the fair value hierarchy, the lowest level input that has a significant impact on fair value measurement is used.
Financial assets and liabilities are categorized based upon the following characteristics or inputs to the valuation techniques:
• Level 1 - Financial assets and liabilities for which inputs are observable and are obtained from reliable quoted prices for identical assets or liabilities in actively traded markets. This is the most reliable fair value measurement and includes, for example, active exchange-traded equity securities.
• Level 2 - Financial assets and liabilities for which values are based on quoted prices in markets that are not active or for which values are based on similar assets or liabilities that are actively traded. Level 2 also includes pricing models in which the inputs are corroborated by market data, for example, matrix pricing.
• Level 3 - Financial assets and liabilities for which values are based on prices or valuation techniques that require inputs that are both unobservable and significant to the overall fair value measurement. Level 3 inputs include the following:
◦Quotes from brokers or other external sources that are not considered binding;
◦Quotes from brokers or other external sources where it cannot be determined that market participants would in fact transact for the asset or liability at the quoted price; and
◦Quotes and other information from brokers or other external sources where the inputs are not deemed observable.
We are responsible for the valuation process and as part of this process may use data from outside sources in establishing fair value. We perform due diligence to understand the inputs used or how the data was calculated or derived. We also corroborate the reasonableness of external inputs in the valuation process.
The carrying amounts reported in the Consolidated Statement of Financial Condition approximate fair value for the following financial instruments: cash and cash equivalents, marketable securities available-for-sale, loans held-for-sale, accrued interest receivable, interest rate lock commitments, forward commitments, interest rate swaps, savings and checking deposits, foreign exchange swaps, risk participation agreements, and accrued interest payable.
Marketable Securities
Where available, market values are based on quoted market prices, dealer quotes, and prices obtained from independent pricing services.
Debt Securities — available-for-sale - Generally, debt securities are valued using pricing for similar securities, recently executed transactions and other pricing models utilizing observable inputs. The valuation for most debt securities is classified as Level 2. Securities within Level 2 include corporate bonds, municipal bonds, mortgage-backed securities and U.S. government obligations. Certain debt securities which were AAA rated at purchase do not have an active market, and as such we have used an alternative method to determine the fair value of these securities. The fair value has been determined using a discounted cash flow model using market assumptions, which generally include cash flow, collateral and other market assumptions. As such, securities which otherwise would have been classified as Level 2 securities if an active market for those assets or similar assets existed are included herein as Level 3 assets.
Debt Securities — held-to-maturity - The fair value of debt securities held-to-maturity is determined in the same manner as debt securities available-for-sale.
Loans Receivable
Loans with comparable characteristics including collateral and re-pricing structures are segregated for valuation purposes. Each loan pool is separately valued utilizing a discounted cash flow analysis. Projected monthly cash flows are discounted to present value using a market rate for comparable loans, which is not considered an exit price. Characteristics of comparable loans include remaining term, coupon interest, and estimated prepayment speeds. Delinquent loans are separately evaluated given the impact delinquency has on the projected future cash flow of the loan including the approximate discount or market rate, which is not considered an exit price.
Loans Held-for-Sale
The estimated fair value of loans held-for-sale is based on market bids obtained from potential buyers.
FHLB Stock
Due to the restrictions placed on transferability of FHLB stock, it is not practical to determine the fair value. FHLB stock is recorded at cost.
Deposit Liabilities
The estimated fair value of deposits with no stated maturity, which includes demand deposits, money market, and other savings accounts, is the amount payable on demand. Although market premiums paid for depository institutions reflect an additional value for these low-cost deposits, adjusting fair value for any value expected to be derived from retaining those deposits for a future period of time or from the benefit that results from the ability to fund interest-earning assets with these deposit liabilities is prohibited. The fair value estimates of deposit liabilities do not include the benefit that results from the low-cost funding provided by these deposits compared to the cost of borrowing funds in the market. Fair values for time deposits are estimated using a discounted cash flow calculation that applies contractual cost currently being offered in the existing portfolio to current market rates being offered locally for deposits of similar remaining maturities. The valuation adjustment for the portfolio consists of the present value of the difference of these two cash flows, discounted at the assumed market rate of the corresponding maturity.
Borrowed Funds
Fixed rate advances are valued by comparing their contractual cost to the prevailing market cost. The carrying amount of repurchase agreements approximates their fair value.
Subordinated Debentures
The fair value of our subordinated debentures is calculated using the discounted cash flows at rates observable for other similarly traded liabilities.
Junior Subordinated Debentures
The fair value of junior subordinated debentures is calculated using the discounted cash flows at the prevailing rate of interest.
Interest Rate Lock Commitments and Forward Commitments
The fair value of interest rate lock commitments is based on the value of underlying loans held-for-sale which is based on quoted prices for similar loans in the secondary market. This value is then adjusted based on the probability of the loan closing (i.e., the “pull-through” amount, a significant unobservable input). The fair value of forward sale commitments is based on quoted prices from the secondary market based on the settlement date of the contracts.
Cash Flow Hedges, Interest Rate and Foreign Exchange Swap Agreements and Risk Participation Agreements
The fair value of interest rate swaps is based upon the present value of the expected future cash flows using the SOFR discount curve, the basis for the underlying interest rate. To price interest rate swaps, cash flows are first projected for each payment date using the fixed rate for the fixed side of the swap and the forward rates for the floating side of the swap. These swap cash flows are then discounted to time zero using SOFR zero-coupon interest rates. The sum of the present value of both legs is the fair market value of the interest rate swap. These valuations have been derived from our third party vendor’s proprietary models rather than actual market quotations. The proprietary models are based upon financial principles and assumptions that we believe to be reasonable. The fair value of the foreign exchange swap is derived from proprietary models rather than actual market quotations. The proprietary models are based upon financial principles and assumptions that we believe to be reasonable. Risk participation agreements are entered into when Northwest purchases a portion of a commercial loan that has an interest rate swap. Northwest assumes credit risk on its portion of the interest rate swap should the borrower fail to pay as agreed. The value of risk participation agreements is determined based on the value of the swap after considering the credit quality, probability of default, and loss given default of the borrower.
Off-Balance Sheet Financial Instruments
These financial instruments generally are not sold or traded, and estimated fair values are not readily available. However, the fair value of commitments to extend credit and standby letters of credit is estimated using the fees currently charged to enter into similar agreements. Commitments to extend credit are generally short-term in nature and, if drawn upon, are issued under current market terms. At March 31, 2024 and December 31, 2023, there was no significant unrealized appreciation or depreciation on these financial instruments.
The following table sets forth the carrying amount and estimated fair value of our financial instruments included in the Consolidated Statement of Financial Condition at March 31, 2024 (in thousands):
|
|
|
|
|
|
|
|
|
|
|
|
|
|
|
|
|
|
|
|
|
|
|
|
|
|
|
|
|
|
|
Carrying
amount |
|
Estimated
fair value |
|
Level 1 |
|
Level 2 |
|
Level 3 |
| Financial assets: |
|
|
|
|
|
|
|
|
|
| Cash and cash equivalents |
$ |
119,319 |
|
|
119,319 |
|
|
119,319 |
|
|
— |
|
|
— |
|
| Securities available-for-sale |
1,094,009 |
|
|
1,094,009 |
|
|
— |
|
|
1,094,009 |
|
|
— |
|
| Securities held-to-maturity |
801,107 |
|
|
680,353 |
|
|
— |
|
|
680,353 |
|
|
— |
|
| Loans receivable, net |
11,368,267 |
|
|
10,370,310 |
|
|
— |
|
|
— |
|
|
10,370,310 |
|
| Loans held-for-sale |
8,082 |
|
|
8,082 |
|
|
— |
|
|
213 |
|
|
7,869 |
|
| Accrued interest receivable |
50,680 |
|
|
50,680 |
|
|
50,680 |
|
|
— |
|
|
— |
|
| Interest rate lock commitments |
479 |
|
|
479 |
|
|
— |
|
|
— |
|
|
479 |
|
| Forward commitments |
58 |
|
|
58 |
|
|
— |
|
|
58 |
|
|
— |
|
| Foreign exchange swaps |
2 |
|
|
2 |
|
|
— |
|
|
2 |
|
|
— |
|
| Interest rate swaps designated as hedging instruments |
2,300 |
|
|
2,300 |
|
|
— |
|
|
2,300 |
|
|
— |
|
| Interest rate swaps not designated as hedging instruments |
45,188 |
|
|
45,188 |
|
|
— |
|
|
45,188 |
|
|
— |
|
| FHLB stock |
30,811 |
|
|
30,811 |
|
|
— |
|
|
— |
|
|
— |
|
| Total financial assets |
$ |
13,520,302 |
|
|
12,401,591 |
|
|
169,999 |
|
|
1,822,123 |
|
|
10,378,658 |
|
|
|
|
|
|
|
|
|
|
|
| Financial liabilities: |
|
|
|
|
|
|
|
|
|
| Savings and checking deposits |
$ |
9,284,830 |
|
|
9,284,830 |
|
|
9,284,830 |
|
|
— |
|
|
— |
|
| Time deposits |
2,786,814 |
|
|
2,333,365 |
|
|
— |
|
|
— |
|
|
2,333,365 |
|
|
|
|
|
|
|
|
|
|
|
| Borrowed funds |
400,783 |
|
|
389,997 |
|
|
389,997 |
|
|
— |
|
|
— |
|
| Subordinated debt |
114,276 |
|
|
112,027 |
|
|
— |
|
|
112,027 |
|
|
— |
|
| Junior subordinated debentures |
129,639 |
|
|
123,167 |
|
|
— |
|
|
— |
|
|
123,167 |
|
|
|
|
|
|
|
|
|
|
|
|
|
|
|
|
|
|
|
|
|
|
|
|
|
|
|
|
|
|
|
| Interest rate swaps not designated as hedging instruments |
45,220 |
|
|
45,220 |
|
|
— |
|
|
45,220 |
|
|
— |
|
| Risk participation agreements |
17 |
|
|
17 |
|
|
— |
|
|
17 |
|
|
— |
|
| Accrued interest payable |
17,395 |
|
|
17,395 |
|
|
17,395 |
|
|
— |
|
|
— |
|
| Total financial liabilities |
$ |
12,778,974 |
|
|
12,306,018 |
|
|
9,692,222 |
|
|
157,264 |
|
|
2,456,532 |
|
The following table sets forth the carrying amount and estimated fair value of our financial instruments included in the Consolidated Statement of Financial Condition at December 31, 2023 (in thousands):
|
|
|
|
|
|
|
|
|
|
|
|
|
|
|
|
|
|
|
|
|
|
|
|
|
|
|
|
|
|
|
Carrying
amount |
|
Estimated
fair value |
|
Level 1 |
|
Level 2 |
|
Level 3 |
| Financial assets: |
|
|
|
|
|
|
|
|
|
| Cash and cash equivalents |
$ |
122,260 |
|
|
122,260 |
|
|
122,260 |
|
|
— |
|
|
— |
|
| Securities available-for-sale |
1,043,359 |
|
|
1,043,359 |
|
|
— |
|
|
1,043,359 |
|
|
— |
|
| Securities held-to-maturity |
814,839 |
|
|
699,506 |
|
|
— |
|
|
699,506 |
|
|
— |
|
| Loans receivable, net |
11,280,798 |
|
|
10,274,593 |
|
|
— |
|
|
— |
|
|
10,274,593 |
|
| Residential mortgage loans held-for-sale |
8,768 |
|
|
8,768 |
|
|
— |
|
|
— |
|
|
8,768 |
|
| Accrued interest receivable |
47,353 |
|
|
47,353 |
|
|
47,353 |
|
|
— |
|
|
— |
|
| Interest rate lock commitments |
641 |
|
|
641 |
|
|
— |
|
|
— |
|
|
641 |
|
| Forward commitments |
12 |
|
|
12 |
|
|
— |
|
|
12 |
|
|
— |
|
| Interest rate swaps designated as hedging instruments |
713 |
|
|
713 |
|
|
— |
|
|
713 |
|
|
— |
|
| Interest rate swaps not designated as hedging instruments |
41,406 |
|
|
41,406 |
|
|
— |
|
|
41,406 |
|
|
— |
|
| FHLB stock |
30,146 |
|
|
30,146 |
|
|
— |
|
|
— |
|
|
— |
|
| Total financial assets |
$ |
13,390,295 |
|
|
12,268,757 |
|
|
169,613 |
|
|
1,784,996 |
|
|
10,284,002 |
|
|
|
|
|
|
|
|
|
|
|
| Financial liabilities: |
|
|
|
|
|
|
|
|
|
| Savings and checking accounts |
$ |
9,377,021 |
|
|
9,377,021 |
|
|
9,377,021 |
|
|
— |
|
|
— |
|
| Time deposits |
2,602,881 |
|
|
2,113,177 |
|
|
— |
|
|
— |
|
|
2,113,177 |
|
| Borrowed funds |
398,895 |
|
|
386,446 |
|
|
386,446 |
|
|
— |
|
|
— |
|
| Subordinated debt |
114,189 |
|
|
109,471 |
|
|
— |
|
|
109,471 |
|
|
— |
|
| Junior subordinated debentures |
129,574 |
|
|
112,159 |
|
|
— |
|
|
— |
|
|
112,159 |
|
| Foreign exchange swaps |
291 |
|
|
291 |
|
|
— |
|
|
291 |
|
|
— |
|
| Interest rate swaps designated as hedging instruments |
1,198 |
|
|
1,198 |
|
|
— |
|
|
1,198 |
|
|
— |
|
| Interest rate swaps not designated as hedging instruments |
41,437 |
|
|
41,437 |
|
|
— |
|
|
41,437 |
|
|
— |
|
| Risk participation agreements |
14 |
|
|
14 |
|
|
— |
|
|
14 |
|
|
— |
|
| Accrued interest payable |
13,669 |
|
|
13,669 |
|
|
13,669 |
|
|
— |
|
|
— |
|
| Total financial liabilities |
$ |
12,679,169 |
|
|
12,154,883 |
|
|
9,777,136 |
|
|
152,411 |
|
|
2,225,336 |
|
Fair value estimates are made at a point-in-time, based on relevant market data and information about the instrument. The methods and assumptions detailed above were used in estimating the fair value of financial instruments at both March 31, 2024 and December 31, 2023.
The following table represents assets and liabilities measured at fair value on a recurring basis at March 31, 2024 (in thousands):
|
|
|
|
|
|
|
|
|
|
|
|
|
|
|
|
|
|
|
|
|
|
|
|
|
Level 1 |
|
Level 2 |
|
Level 3 |
|
Total assets
at fair value |
|
|
|
|
|
|
|
|
|
|
|
|
|
|
|
|
| Debt securities: |
|
|
|
|
|
|
|
| U.S. government and agencies |
$ |
— |
|
|
56,718 |
|
|
— |
|
|
56,718 |
|
| Government-sponsored enterprises |
— |
|
|
40,519 |
|
|
— |
|
|
40,519 |
|
| States and political subdivisions |
— |
|
|
74,271 |
|
|
— |
|
|
74,271 |
|
| Corporate |
— |
|
|
7,634 |
|
|
— |
|
|
7,634 |
|
| Total debt securities |
— |
|
|
179,142 |
|
|
— |
|
|
179,142 |
|
|
|
|
|
|
|
|
|
| Residential mortgage-backed securities: |
|
|
|
|
|
|
|
| GNMA |
— |
|
|
31,305 |
|
|
— |
|
|
31,305 |
|
| FNMA |
— |
|
|
98,861 |
|
|
— |
|
|
98,861 |
|
| FHLMC |
— |
|
|
82,746 |
|
|
— |
|
|
82,746 |
|
| Non-agency |
— |
|
|
5 |
|
|
— |
|
|
5 |
|
| Collateralized mortgage obligations: |
|
|
|
|
|
|
|
| GNMA |
— |
|
|
374,391 |
|
|
— |
|
|
374,391 |
|
| FNMA |
— |
|
|
144,489 |
|
|
— |
|
|
144,489 |
|
| FHLMC |
— |
|
|
183,070 |
|
|
— |
|
|
183,070 |
|
|
|
|
|
|
|
|
|
|
|
|
|
|
|
|
|
| Total mortgage-backed securities |
— |
|
|
914,867 |
|
|
— |
|
|
914,867 |
|
|
|
|
|
|
|
|
|
| Interest rate lock commitments |
— |
|
|
— |
|
|
479 |
|
|
479 |
|
| Forward commitments |
— |
|
|
58 |
|
|
— |
|
|
58 |
|
| Foreign exchange swaps |
— |
|
|
2 |
|
|
— |
|
|
2 |
|
| Interest rate swaps designated as hedging instruments |
— |
|
|
2,300 |
|
|
— |
|
|
2,300 |
|
| Interest rate swaps not designated as hedging instruments |
— |
|
|
45,188 |
|
|
— |
|
|
45,188 |
|
| Total assets |
$ |
— |
|
|
1,141,557 |
|
|
479 |
|
|
1,142,036 |
|
|
|
|
|
|
|
|
|
|
|
|
|
|
|
|
|
|
|
|
|
|
|
|
|
|
|
|
|
|
|
|
|
| Interest rate swaps not designated as hedging instruments |
— |
|
|
45,220 |
|
|
— |
|
|
45,220 |
|
| Risk participation agreements |
— |
|
|
17 |
|
|
— |
|
|
17 |
|
| Total liabilities |
$ |
— |
|
|
45,237 |
|
|
— |
|
|
45,237 |
|
The following table represents assets and liabilities measured at fair value on a recurring basis at December 31, 2023 (in thousands):
|
|
|
|
|
|
|
|
|
|
|
|
|
|
|
|
|
|
|
|
|
|
|
|
|
Level 1 |
|
Level 2 |
|
Level 3 |
|
Total assets
at fair value |
|
|
|
|
|
|
|
|
|
|
|
|
|
|
|
|
| Debt securities: |
|
|
|
|
|
|
|
| U.S. government and agencies |
$ |
— |
|
|
58,314 |
|
|
— |
|
|
58,314 |
|
| Government-sponsored enterprises |
— |
|
|
40,597 |
|
|
— |
|
|
40,597 |
|
| States and political subdivisions |
— |
|
|
75,469 |
|
|
— |
|
|
75,469 |
|
| Corporate |
— |
|
|
7,688 |
|
|
— |
|
|
7,688 |
|
| Total debt securities |
— |
|
|
182,068 |
|
|
— |
|
|
182,068 |
|
|
|
|
|
|
|
|
|
| Residential mortgage-backed securities: |
|
|
|
|
|
|
|
| GNMA |
— |
|
|
17,441 |
|
|
— |
|
|
17,441 |
|
| FNMA |
— |
|
|
102,678 |
|
|
— |
|
|
102,678 |
|
| FHLMC |
— |
|
|
70,830 |
|
|
— |
|
|
70,830 |
|
| Non-agency |
— |
|
|
5 |
|
|
— |
|
|
5 |
|
| Collateralized mortgage obligations: |
|
|
|
|
|
|
|
| GNMA |
— |
|
|
331,784 |
|
|
— |
|
|
331,784 |
|
| FNMA |
— |
|
|
148,892 |
|
|
— |
|
|
148,892 |
|
| FHLMC |
— |
|
|
189,661 |
|
|
— |
|
|
189,661 |
|
|
|
|
|
|
|
|
|
|
|
|
|
|
|
|
|
| Total mortgage-backed securities |
— |
|
|
861,291 |
|
|
— |
|
|
861,291 |
|
|
|
|
|
|
|
|
|
| Interest rate lock commitments |
— |
|
|
— |
|
|
641 |
|
|
641 |
|
| Forward commitments |
— |
|
|
12 |
|
|
— |
|
|
12 |
|
| Interest rate swaps designated as hedging instruments |
— |
|
|
713 |
|
|
— |
|
|
713 |
|
| Interest rate swaps not designated as hedging instruments |
— |
|
|
41,406 |
|
|
— |
|
|
41,406 |
|
| Total assets |
$ |
— |
|
|
1,085,490 |
|
|
641 |
|
|
1,086,131 |
|
|
|
|
|
|
|
|
|
| Foreign exchange swaps |
$ |
— |
|
|
291 |
|
|
— |
|
|
291 |
|
| Interest rate swaps designated as hedging instruments |
— |
|
|
1,198 |
|
|
— |
|
|
1,198 |
|
| Interest rate swaps not designated as hedging instruments |
— |
|
|
41,437 |
|
|
— |
|
|
41,437 |
|
| Risk participation agreements |
— |
|
|
14 |
|
|
— |
|
|
14 |
|
| Total liabilities |
$ |
— |
|
|
42,940 |
|
|
— |
|
|
42,940 |
|
The following table presents the changes in Level 3 assets and liabilities measured at fair value on a recurring basis (in thousands):
|
|
|
|
|
|
|
|
|
|
|
|
|
|
|
|
|
For the quarter ended March 31, |
|
|
|
2024 |
|
2023 |
|
|
|
|
| Beginning balance, |
$ |
641 |
|
|
559 |
|
|
|
|
|
|
|
|
|
|
|
|
|
|
|
|
|
|
|
|
|
|
|
|
|
|
|
|
|
|
|
|
|
|
|
|
|
| Interest rate lock commitments: |
|
|
|
|
|
|
|
|
|
|
|
|
|
|
|
| Net activity |
(162) |
|
|
(173) |
|
|
|
|
|
|
|
|
|
|
|
|
|
|
|
|
|
|
|
|
|
|
|
|
|
|
|
|
|
| Ending balance |
$ |
479 |
|
|
386 |
|
|
|
|
|
|
|
|
|
|
|
|
|
Certain assets and liabilities are measured at fair value on a nonrecurring basis after initial recognition such as loans held-for-sale, loans individually assessed, real estate owned, and mortgage servicing rights.
The following table represents the fair market measurement for only those nonrecurring assets that had a fair market value below the carrying amount as of March 31, 2024 (in thousands):
|
|
|
|
|
|
|
|
|
|
|
|
|
|
|
|
|
|
|
|
|
|
|
|
|
Level 1 |
|
Level 2 |
|
Level 3 |
|
Total assets
at fair value |
| Loans individually assessed |
$ |
— |
|
|
— |
|
|
39,123 |
|
|
39,123 |
|
| Mortgage servicing rights |
— |
|
|
— |
|
|
173 |
|
|
173 |
|
| Real estate owned, net |
— |
|
|
— |
|
|
50 |
|
|
50 |
|
| Total assets |
$ |
— |
|
|
— |
|
|
39,346 |
|
|
39,346 |
|
The following table represents the fair market measurement for only those nonrecurring assets that had a fair market value below the carrying amount as of December 31, 2023 (in thousands):
|
|
|
|
|
|
|
|
|
|
|
|
|
|
|
|
|
|
|
|
|
|
|
|
|
Level 1 |
|
Level 2 |
|
Level 3 |
|
Total assets
at fair value |
| Loans individually assessed |
$ |
— |
|
|
— |
|
|
36,747 |
|
|
36,747 |
|
| Mortgage servicing rights |
— |
|
|
— |
|
|
133 |
|
|
133 |
|
| Real estate owned, net |
— |
|
|
— |
|
|
104 |
|
|
104 |
|
| Total assets |
$ |
— |
|
|
— |
|
|
36,984 |
|
|
36,984 |
|
Individually Assessed Loans - A loan is considered to be individually assessed as described in Note 1(f) of the Notes to the Consolidated Financial Statements in Item 8 of Part II of our 2023 Annual Report on Form 10-K. We classify loans individually assessed as nonrecurring Level 3.
Mortgage servicing rights - Mortgage servicing rights represent the value of servicing residential mortgage loans, when the mortgage loans have been sold into the secondary market and the associated servicing has been retained. The value is determined through a discounted cash flow analysis, which uses interest rates, prepayment speeds and delinquency rate assumptions as inputs. All of these assumptions require a significant degree of management judgment. Servicing rights and the related mortgage loans are segregated into categories or homogeneous pools based upon common characteristics. Adjustments are only made when the estimated discounted future cash flows are less than the carrying value, as determined by individual pool. As such, mortgage servicing rights are classified as nonrecurring Level 3.
Real Estate Owned - Real estate owned is comprised of property acquired through foreclosure or voluntarily conveyed by borrowers. These assets are recorded on the date acquired at the lower of the related loan balance or fair value, less estimated disposition costs, with the fair value being determined by appraisal. Subsequently, foreclosed assets are valued at the lower of the amount recorded at acquisition date or fair value, less estimated disposition costs. We classify real estate owned as nonrecurring Level 3.
The following table presents additional quantitative information about assets measured at fair value on a recurring and nonrecurring basis and for which we have utilized Level 3 inputs to determine fair value at March 31, 2024 (in thousands):
|
|
|
|
|
|
|
|
|
|
|
|
|
|
|
|
|
|
|
|
|
|
|
|
|
| |
Fair value |
|
Valuation techniques |
|
Significant
unobservable inputs |
|
Range (weighted average) |
|
|
|
|
|
|
|
|
|
|
|
|
|
|
|
|
|
|
|
|
|
|
|
|
|
|
|
|
|
|
|
|
|
|
|
|
|
| Loans individually assessed |
$ |
39,123 |
|
|
Appraisal value (1) |
|
Estimated cost to sell |
|
10% |
|
|
|
|
|
|
|
|
|
|
|
|
|
|
|
|
|
|
|
| Mortgage servicing rights |
173 |
|
|
Discounted cash flow |
|
Annual service cost |
|
$89 |
|
|
|
|
|
|
Prepayment rate |
|
6.6% to 18.2% (10.7%) |
|
|
|
|
|
|
Expected life (months) |
|
51.0 to 102.3 (72.3) |
|
|
|
|
|
|
Option adjusted spread |
|
729 basis points |
|
|
|
|
|
|
Forward yield curve |
|
5.43% to 5.33% |
|
|
|
|
|
|
|
|
|
|
| Real estate owned, net |
50 |
|
|
Appraisal value (1) |
|
Estimated cost to sell |
|
10% |
|
|
|
|
|
|
|
|
|
|
| Loans held for sale |
7,869 |
|
|
Quoted prices for similar loans in active markets adjusted by an expected pull-through rate |
|
Estimated pull-through rate |
|
100% |
|
(1)Fair value is generally determined through independent appraisals of the underlying collateral, which may include Level 3 inputs that are not identifiable, or by using the discounted cash flow method if the loan is not collateral dependent.
(10) Derivative Financial Instruments
We are a party to derivative financial instruments in the normal course of business to manage our own exposure to fluctuations in interest rates and to meet the needs of our customers. The primary derivatives that we use are interest rate swaps and caps and foreign exchange contracts, which are entered into with counterparties that meet established credit standards. We believe that the credit risk inherent in all of our derivative contracts is minimal based on our credit standards and the netting and collateral provisions of the interest rate swap agreements.
Derivatives Designated as Hedging Instruments
During the year-ended December 31, 2023, the Company entered into seven separate pay-fixed interest rate swaps in order to synthetically convert short-term three month FHLB advances to fixed-rate term funding with an aggregate value of $175 million with maturities ranging from three to five years. Our risk management objective and strategy for these interest rate swaps at such time was to reduce our exposure to variability in interest-related cash outflows attributable to changes in the USD-SOFR swap rate, the designated benchmark interest rate being hedged. Based upon our contemporaneous quantitative analysis at the inception of the interest rate swaps, we have determined these interest rate swaps qualify for hedge accounting in accordance with ASC 815, Derivatives and Hedging. Our cash flow hedges are recorded within other assets on the Consolidated Statement of Financial Condition at their estimated fair value.
As long as the hedge remains highly effective, the changes in the fair value of derivatives designated, and that qualify, as cash flow hedges are recorded in accumulated other comprehensive income and are subsequently reclassified into earnings in the period that the hedged forecasted transaction affects earnings. A hedging relationship that is determined to not be highly effective no longer qualifies for hedge accounting and any gain or loss is recognized immediately into earnings. Amount reclassified into earnings are included in interest expense in the Consolidated Statement of Income.
Derivatives Not Designated as Hedging Instruments
We act as an interest rate or foreign exchange swap counterparty for certain commercial borrowers in the normal course of servicing our customers, which are accounted for at fair value. We manage our exposure to such interest rate or foreign exchange swaps by entering into corresponding and offsetting interest rate swaps with third parties that mirror the terms of the swaps we have with the commercial borrowers. These positions (referred to as “customer swaps”) directly offset each other and our exposure is the fair value of the derivatives due to changes in credit risk of our commercial borrowers and third parties. Customer swaps are recorded within other assets or other liabilities on the Consolidated Statement of Financial Condition at their estimated fair value. Changes to the fair value of assets and liabilities arising from these derivatives are included, net, in other operating income in the Consolidated Statement of Income.
We enter into interest rate lock commitments for residential mortgage loans which commit us to lend funds to a potential borrower at a specific interest rate within a specified period of time. Interest rate lock commitments that relate to the origination of mortgage loans that will be held-for-sale are considered derivative financial instruments under applicable accounting guidance. Interest rate lock commitments on loans held-for-sale are carried at fair value in other assets on the Consolidated Statement of Financial Condition. Northwest sells loans to the secondary market on a mandatory or best efforts basis. The loans sold on a mandatory basis commit us to deliver a specific principal amount of mortgage loans to an investor at a specified price, by a specified date, or the commitment must be paired off. These forward commitments entered into on a mandatory delivery basis meet the definition of a derivative financial instrument. All closed loans to be sold on a mandatory delivery basis are classified as held-for-sale on the Consolidated Statement of Financial Condition. Changes to the fair value of the interest rate lock commitments and the forward commitments are recorded in mortgage banking income in the Consolidated Statements of Income.
We enter into risk participation agreements with financial institution counterparties for interest rate swaps related to loans in which we are a participant. The risk participation agreements provide credit protection to the financial institution should the borrower fail to perform on its interest rate derivative contract with the financial institution. These risk participation agreements are recorded within other liabilities on the Consolidated Statement of Financial Condition at their estimated fair value. Changes to the fair value of the the risk participation agreements are included in other operating income in the Consolidated Statement of Income.
The following table presents information regarding our derivative financial instruments for the periods indicated (in thousands):
|
|
|
|
|
|
|
|
|
|
|
|
|
|
|
|
|
|
|
|
|
|
|
|
|
Asset derivatives |
|
Liability derivatives |
|
Notional amount |
|
Fair value |
|
Notional amount |
|
Fair value |
| At March 31, 2024 |
|
|
|
|
|
|
|
| Derivatives designated as hedging instruments: |
|
|
|
|
|
|
|
| Interest rate swap agreements |
$ |
175,000 |
|
|
2,300 |
|
|
— |
|
|
— |
|
| Derivatives not designated as hedging instruments: |
|
|
|
|
|
|
|
| Interest rate swap agreements |
740,173 |
|
|
45,188 |
|
|
740,173 |
|
|
45,220 |
|
| Foreign exchange swap agreements |
2,975 |
|
|
2 |
|
|
— |
|
|
— |
|
| Interest rate lock commitments |
18,591 |
|
|
479 |
|
|
— |
|
|
— |
|
| Forward commitments |
2,713 |
|
|
58 |
|
|
— |
|
|
— |
|
| Risk participation agreements |
— |
|
|
— |
|
|
92,281 |
|
|
17 |
|
| Total Derivatives |
$ |
939,452 |
|
|
48,027 |
|
|
832,454 |
|
|
45,237 |
|
|
|
|
|
|
|
|
|
| At December 31, 2023 |
|
|
|
|
|
|
|
|
|
|
|
|
|
|
|
|
|
|
|
|
|
|
|
| Derivatives designated as hedging instruments: |
|
|
|
|
|
|
|
| Interest rate swap agreements |
$ |
75,000 |
|
|
713 |
|
|
100,000 |
|
|
1,198 |
|
| Derivatives not designated as hedging instruments: |
|
|
|
|
|
|
|
| Interest rate swap agreements |
725,139 |
|
|
41,406 |
|
|
725,139 |
|
|
41,437 |
|
| Foreign exchange swap agreements |
— |
|
|
— |
|
|
12,278 |
|
|
291 |
|
| Interest rate lock commitments |
21,857 |
|
|
641 |
|
|
— |
|
|
— |
|
| Forward commitments |
281 |
|
|
12 |
|
|
— |
|
|
— |
|
| Risk participation agreements |
— |
|
|
— |
|
|
101,727 |
|
|
14 |
|
| Total derivatives |
$ |
822,277 |
|
|
42,772 |
|
|
939,144 |
|
|
42,940 |
|
The following table presents income or expense recognized on derivatives for the periods indicated (in thousands):
|
|
|
|
|
|
|
|
|
|
|
|
|
|
|
|
|
For the quarter ended March 31, |
|
|
|
2024 |
|
2023 |
|
|
|
|
| Hedging derivatives: |
|
|
|
|
|
|
|
| Decrease in interest expense |
$ |
733 |
|
|
— |
|
|
|
|
|
|
|
|
|
|
|
|
|
| Non-hedging swap derivatives: |
|
|
|
|
|
|
|
| Increase/(decrease) in other income |
$ |
287 |
|
|
(202) |
|
|
|
|
|
| Decrease in mortgage banking income |
$ |
(115) |
|
|
(174) |
|
|
|
|
|
The following table presents information regarding our derivative financial instruments designated as hedging for the quarter ended March 31, 2024 (in thousands):
|
|
|
|
|
|
|
|
|
|
|
|
|
|
|
|
|
|
|
|
|
|
|
|
|
|
|
|
|
|
|
Notional amount |
|
Effective rate |
|
Estimated decrease to interest expense in the next twelve months |
|
Maturity date |
|
Remaining term
(in months) |
| Interest rate products: |
|
|
|
|
|
|
|
|
|
| Issued May 11, 2023 |
$ |
25,000 |
|
|
3.50 |
% |
|
$ |
(546) |
|
|
5/11/2027 |
|
37 |
| Issued May 12, 2023 |
25,000 |
|
|
3.55 |
% |
|
(534) |
|
|
5/12/2028 |
|
49 |
| Issued May 19, 2023 |
25,000 |
|
|
3.83 |
% |
|
(460) |
|
|
11/19/2027 |
|
44 |
| Issued May 31, 2023 |
25,000 |
|
|
4.03 |
% |
|
(406) |
|
|
11/30/2026 |
|
32 |
| Issued July 26, 2023 |
25,000 |
|
|
4.22 |
% |
|
(359) |
|
|
7/26/2028 |
|
52 |
| Issued July 31, 2023 |
25,000 |
|
|
4.30 |
% |
|
(336) |
|
|
1/31/2028 |
|
46 |
| Issued August 9, 2023 |
25,000 |
|
|
4.32 |
% |
|
(339) |
|
|
8/9/2027 |
|
40 |
| Total |
$ |
175,000 |
|
|
|
|
$ |
(2,980) |
|
|
|
|
|
(11) Legal Proceedings
We establish accruals for legal proceedings when information related to the loss contingencies represented by those matters indicates both that a loss is probable and that the amount of loss can be reasonably estimated. As of March 31, 2024, we do not anticipate that the aggregate ultimate liability arising out of any pending or threatened legal proceedings will be material to our Consolidated Financial Statements. Any such accruals are adjusted thereafter as appropriate to reflect changes in circumstances. Due to the inherent subjectivity of assessments and unpredictability of outcomes of legal proceedings, any amounts accrued may not represent the ultimate loss to us from legal proceedings.
(12) Changes in Accumulated Other Comprehensive Income
The following tables show the changes in accumulated other comprehensive income by component for the periods indicated (in thousands):
|
|
|
|
|
|
|
|
|
|
|
|
|
|
|
|
|
|
|
|
|
|
|
|
| |
For the quarter ended March 31, 2024 |
| |
Unrealized
losses
on securities
available-for-sale |
|
Change in
fair value
of interest
rate swaps |
|
Change in
defined benefit
pension plans |
|
Total |
| Balance as of December 31, 2023 |
$ |
(150,659) |
|
|
(374) |
|
|
1,541 |
|
|
(149,492) |
|
|
|
|
|
|
|
|
|
|
|
|
|
|
|
|
|
|
|
|
|
|
|
|
|
| Other comprehensive (loss)/income before reclassification adjustments (1) (2) |
(5,698) |
|
|
2,154 |
|
|
— |
|
|
(3,544) |
|
| Amounts reclassified from accumulated other comprehensive income (3) |
— |
|
|
— |
|
|
(388) |
|
|
(388) |
|
|
|
|
|
|
|
|
|
| Net other comprehensive (loss)/income |
(5,698) |
|
|
2,154 |
|
|
(388) |
|
|
(3,932) |
|
|
|
|
|
|
|
|
|
| Balance as of March 31, 2024 |
$ |
(156,357) |
|
|
1,780 |
|
|
1,153 |
|
|
(153,424) |
|
|
|
|
|
|
|
|
|
|
|
|
|
|
|
|
|
|
|
|
|
| |
For the quarter ended March 31, 2023 |
|
Unrealized
losses
on securities
available-for-sale |
|
|
|
Change in
defined benefit
pension plans |
|
Total |
| Balance as of December 31, 2022 |
$ |
(164,206) |
|
|
|
|
(6,952) |
|
|
(171,158) |
|
|
|
|
|
|
|
|
|
|
|
|
|
|
|
|
|
|
|
|
|
|
|
|
|
| Other comprehensive income before reclassification adjustments (4) |
13,017 |
|
|
|
|
— |
|
|
13,017 |
|
| Amounts reclassified from accumulated other comprehensive income (5) |
— |
|
|
|
|
(382) |
|
|
(382) |
|
|
|
|
|
|
|
|
|
| Net other comprehensive income/(loss) |
13,017 |
|
|
|
|
(382) |
|
|
12,635 |
|
|
|
|
|
|
|
|
|
| Balance as of March 31, 2023 |
$ |
(151,189) |
|
|
|
|
(7,334) |
|
|
(158,523) |
|
(1)Consists of unrealized holding losses, net of tax of $1,758.
(2)Change in fair value of interest rate swaps, net of tax ($630).
(3)Consists of realized gains, net of tax of $147.
(4)Consists of unrealized holding gains, net of tax of ($3,308).
(5)Consists of realized gains, net of tax of $152.
(13) Subsequent Events
In April 2024, the Company approved and announced its intention to pursue a limited, strategic repositioning of the securities portfolio to optimize its balance sheet by liquidating lower-yielding securities in an effort to generate additional future earnings. This initiative will be accomplished through the sale of up to 15% of the Company’s available-for-sale investment securities portfolio. The securities losses recognized will be limited to $40 million, equivalent to approximately $30 million after tax. The Company expects a yield gain of 375 to 400 basis points from the repositioning and will attempt to manage the payback period so that it will be approximately three years. The characteristics of investment securities to be sold have an average yield less than 2.00% with a remaining maturity of greater than four years. The proceeds will be used to reduce borrowings in the short term while also opportunistically reinvesting into securities with similar risk, maturity and duration characteristics.
Item 2. MANAGEMENT’S DISCUSSION AND ANALYSIS OF FINANCIAL CONDITION AND RESULTS OF OPERATIONS
Forward-Looking Statements
In addition to historical information, this document may contain certain forward-looking statements, as defined in the Private Securities Litigation Reform Act of 1995. These forward-looking statements contained herein are subject to certain risks and uncertainties that could cause actual results to differ materially from those expressed or implied in the forward-looking statements. Readers are cautioned not to place undue reliance on these forward-looking statements, as they reflect management’s analysis only as of the date of this report. We have no obligation to revise or update these forward-looking statements to reflect events or circumstances that arise after the date of this report.
Important factors that might cause such a difference include, but are not limited to:
• inflation and changes in the interest rate environment that reduce our margins, our loan origination, or the fair value of financial instruments;
• changes in asset quality, including increases in default rates on loans and higher levels of nonperforming loans and loan charge-offs generally;
• changes in laws or government regulations or policies affecting financial institutions, including changes in regulatory fees and capital requirements;
• changes in federal, state, or local tax laws and tax rates;
• general economic conditions, either nationally or in our market areas, that are different than expected, including inflationary or recessionary pressures;
• adverse changes in the securities and credit markets;
• cyber-security concerns, including an interruption or breach in the security of our website or other information systems;
• technological changes that may be more difficult or expensive than expected;
• changes in liquidity, including the size and composition of our deposit portfolio, and the percentage of uninsured deposits in the portfolio;
• the ability of third-party providers to perform their obligations to us;
• competition among depository and other financial institutions, including with respect to deposit gathering, service charges and fees;
• our ability to enter new markets successfully and capitalize on growth opportunities;
• our ability to manage our internal growth and our ability to successfully integrate acquired entities, businesses or branch offices;
• changes in consumer spending, borrowing and savings habits;
• our ability to continue to increase and manage our commercial and personal loans;
• possible impairments of securities held by us, including those issued by government entities and government sponsored enterprises;
• changes in the value of our goodwill or other intangible assets;
• the impact of the economy on our loan portfolio (including cash flow and collateral values), investment portfolio, customers and capital market activities;
• our ability to receive regulatory approvals for proposed transactions or new lines of business;
• the effects of any federal government shutdown or the inability of the federal government to manage debt limits;
• changes in the financial performance and/or condition of our borrowers;
• the effect of changes in accounting policies and practices, as may be adopted by the regulatory agencies, as well as the Securities and Exchange Commission, the Public Company Accounting Oversight Board, the Financial Accounting Standards Board (“FASB”) and other accounting standard setters;
• changes in the level and direction of loan delinquencies and write-offs and changes in estimates of the adequacy of the allowance for credit losses;
• our ability to access cost-effective funding;
• the effect of global or national war, conflict, or terrorism;
• our ability to manage market risk, credit risk and operational risk;
• the disruption to local, regional, national and global economic activity caused by infectious disease outbreaks, and the significant impact that any such outbreaks may have on our growth, operations and earnings;
• the effects of natural disasters and extreme weather events;
• changes in our ability to continue to pay dividends, either at current rates or at all;
• our ability to retain key employees; and
• our compensation expense associated with equity allocated or awarded to our employees.
Overview of Critical Accounting Policies Involving Estimates
Please refer to Note 1 of the Notes to Consolidated Financial Statements in Item 8 of Part II of our 2023 Annual Report on Form 10-K.
Recently Issued Accounting Standards
The following Accounting Standard Updates (“ASU”) issued by the Financial Accounting Standards Board ("FASB") have
not yet been adopted.
In October 2023, the FASB issued ASU No. 2023-06, "Disclosure Improvements." This ASU includes amendments on several subtopics in the FASB Accounting Standards Codification ("Codification") to incorporate certain disclosures and presentation requirements currently residing in SEC Regulations S-X and S-K. The adoption of this ASU may lead to certain disclosure being relocated into the financial statements. The effective date for each amendment will be the date on which the SEC’s removal of that related disclosure from Regulation S-X or Regulation S-K becomes effective, with early adoption prohibited. These amendments are to be applied prospectively. If the SEC has not removed the applicable requirements from Regulation S-X or Regulation S-K by June 30, 2027, the pending content of the related amendment will be removed from the Codification and will not become effective for any entity. We do not believe this guidance will have a material impact on the Company's financial statements.
In December 2023, the FASB issued ASU No. 2023-09, "Improvements to Income Tax Disclosures." This ASU requires additional disaggregated disclosures on entity's effective tax rate reconciliation and additional details on income taxes paid. This guidance is effective for annual periods beginning after December 15, 2025, with early adoption permitted. This ASU is applied prospectively with the option to apply the ASU retrospectively. We do not believe this guidance will have a material impact on the Company's financial statements.
Comparison of Financial Condition
Total assets at March 31, 2024 were $14.5 billion, an increase of $91 million, or 1%, from $14.4 billion at December 31, 2023. This increase in assets was primarily driven by increases in loans receivable and marketable securities. A discussion of significant changes follows.
Total marketable securities remained consistent at $1.9 billion at March 31, 2024, an increase of $37 million, or 2%, from December 31, 2023. Available-for-sale securities increased by $51 million, driven by securities purchases during the current period, while held-to-maturity securities decreased $14 million, driven by maturity and regular monthly cash flows.
Gross loans receivable increased by $86 million, or 1%, to $11.5 billion at March 31, 2024, from $11.4 billion at December 31, 2023. This increase was attributable to organic loan growth. Our commercial banking portfolio increased by $170 million, or 4%, to $4.8 billion at March 31, 2024, from $4.6 billion at December 31, 2023, primarily as a result of the new commercial lending verticals that we implemented during the prior year. Specifically, our commercial and industrial (C&I) loan portfolio increased by $116 million, or 7%. The increase in our total commercial banking was partially offset by a decrease in our personal banking loan portfolio by $84 million, or 1%, to $6.7 billion at March 31, 2024 from $6.8 billion at December 31, 2023. Cash flows from our personal banking portfolio were redirected to partially fund commercial banking growth.
The following table provides the various loan sectors in our commercial real estate portfolio at March 31, 2024:
|
|
|
|
|
|
|
|
|
|
| Property type |
|
|
Percent of portfolio |
| 5 or more unit dwelling |
|
|
15.2 |
% |
| Nursing home |
|
|
12.8 |
|
| Retail building |
|
|
11.8 |
|
| Commercial office building - non-owner occupied |
|
|
9.1 |
|
| Manufacturing & industrial building |
|
|
5.0 |
|
| Residential acquisition & development - 1-4 family, townhouses and apartments |
|
|
4.3 |
|
| Multi-use building - commercial, retail and residential |
|
|
4.1 |
|
| Warehouse/storage building |
|
|
3.9 |
|
| Multi-use building - office and warehouse |
|
|
3.3 |
|
| Commercial office building - owner occupied |
|
|
3.3 |
|
| Other medical facility |
|
|
3.1 |
|
| Single family dwelling |
|
|
2.7 |
|
| Student housing |
|
|
2.2 |
|
| Hotel/motel |
|
|
2.1 |
|
| Agricultural real estate |
|
|
2.0 |
|
| 2-4 family |
|
|
2.0 |
|
| All other |
|
|
13.1 |
|
| Total |
|
|
100.0 |
% |
The following table describes the collateral of our commercial real estate portfolio by state at March 31, 2024:
|
|
|
|
|
|
|
|
|
|
| State |
|
|
Percent of portfolio |
| New York |
|
|
33.0 |
% |
| Pennsylvania |
|
|
30.2 |
|
| Ohio |
|
|
20.3 |
|
| Indiana |
|
|
8.1 |
|
| All other |
|
|
8.4 |
|
| Total |
|
|
100.0 |
% |
Total deposits increased by $92 million, or 1%, to $12.1 billion at March 31, 2024 from $12.0 billion at December 31, 2023. This increase was driven by a $184 million, or 7%, increase in time deposits as we continued competitively positioning our deposit products, and a $51 million, or 2%, increase in savings deposits. Partially offsetting this increase was a decrease in demand deposit accounts by $127 million, or 2%, as customers shifted balances into higher yielding time deposit accounts.
As of March 31, 2024, we had $449 million of brokered deposits, which made up 16% of our time deposits and 4.0% of our total deposit balance at year end. The balance carried an average all-in cost of 5.43% and an average original term of 12 months. These deposits were purchased through a registered broker, as part of an Asset/Liability Committee (“ALCO”) strategy to increase and diversify funding sources.
In addition, at quarter end we had $527 million of deposits through our participation in the Intrafi Network Deposits and FIS Insured Deposit programs. These deposits are part of a reciprocal program that allows our depositors to receive expanded FDIC coverage by placing multiple interest-bearing demand accounts at other member banks and Northwest receives an equal amount of deposits from other member banks. The balance carried an average cost of 3.88%.
At March 31, 2024 and December 31, 2023, we had total deposits in excess of $250,000 (the limit for FDIC insurance) of $1.8 billion. At those dates, we had no deposits that were uninsured for any other reason. The following table presents details regarding the Company's uninsured deposits portfolio:
|
|
|
|
|
|
|
|
|
|
|
|
|
|
|
|
|
|
|
|
|
|
|
As of March 31, 2024 |
|
|
|
Balance |
|
Percent of
total deposits |
|
Number of relationships |
|
|
|
|
| Uninsured deposits per the Call Report (1) |
$2,806,650 |
|
|
23.25 |
% |
|
4,965 |
|
|
|
|
|
| Less intercompany deposit accounts |
1,019,792 |
|
|
8.45 |
% |
|
12 |
|
|
|
|
|
| Less collateralized deposit accounts |
408,083 |
|
|
3.38 |
% |
|
255 |
|
|
|
|
|
| Uninsured deposits excluding intercompany and collateralized accounts |
$1,378,775 |
|
|
11.42 |
% |
|
4,698 |
|
|
|
|
|
|
|
|
|
|
|
|
|
|
|
|
|
|
|
|
|
|
|
|
(1) Uninsured deposits presented may be different from actual amounts due to titling of accounts.
Our largest uninsured depositor, excluding intercompany and collateralized deposit accounts, had an aggregate uninsured deposit balance of $19 million, or 0.16% of total deposits, as of March 31, 2024. Our top ten largest uninsured depositors, excluding intercompany and collateralized deposit accounts, had an aggregate uninsured deposit balance of $103 million, or 0.85% of total deposits, as of March 31, 2024. The average uninsured deposit account balance, excluding intercompany and collateralized accounts, was $293,000 as of March 31, 2024.
Total shareholders’ equity remained steady at $1.6 billion, or $12.20 per share, at both March 31, 2024 and December 31, 2023, increasing by $1 million in the current quarter. This increase was the result of year-to-date earnings of $29 million, partially offset by $25 million of cash dividend payments for the quarter ended March 31, 2024, as well as a change in accumulated other comprehensive loss of $4 million, or 3%, primarily due to an increase in unrealized loss on our available-for-sale investment portfolio as a result of higher market interest rates.
Regulatory Capital
Financial institutions and their holding companies are subject to various regulatory capital requirements. Failure to meet minimum capital requirements can initiate certain mandatory and possibly additional discretionary actions by the regulators that, if undertaken, could have a direct, material effect on a company’s financial statements. Under capital adequacy guidelines and the regulatory framework for prompt corrective action, financial institutions must meet specific capital guidelines that involve quantitative measures of its assets, liabilities and certain off-balance sheet items as calculated under regulatory accounting guidelines. Capital amounts and classifications are also subject to qualitative judgments made by the regulators about components, risk-weighting and other factors.
Applicable rules limit an organization’s capital distributions and certain discretionary bonus payments if the organization does not hold a “capital conservation buffer” consisting of 2.5% of Total, Tier 1 and Common Equity Tier 1 (“CET1”) capital to risk-weighted assets in addition to the amount necessary to meet its minimum risk-based capital requirements.
Quantitative measures, established by regulation to ensure capital adequacy, require financial institutions to maintain minimum amounts and ratios (set forth in the table below) of Total, CET1 and Tier 1 capital (as defined in the regulations) to risk-weighted assets (as defined), and of Tier 1 capital to average assets (as defined). Capital requirements are presented in the tables below (dollars in thousands).
|
|
|
|
|
|
|
|
|
|
|
|
|
|
|
|
|
|
|
|
|
|
|
|
|
|
|
|
|
|
|
|
|
|
|
|
| |
At March 31, 2024 |
| |
Actual |
|
Minimum capital requirements (1) |
|
Well capitalized requirements |
| |
Amount |
|
Ratio |
|
Amount |
|
Ratio |
|
Amount |
|
Ratio |
| Total capital (to risk weighted assets) |
|
|
|
|
|
|
|
|
|
|
|
| Northwest Bancshares, Inc. |
$ |
1,805,374 |
|
|
15.951 |
% |
|
$ |
1,188,406 |
|
|
10.500 |
% |
|
$ |
1,131,815 |
|
|
10.000 |
% |
| Northwest Bank |
1,529,840 |
|
|
13.529 |
% |
|
1,187,335 |
|
|
10.500 |
% |
|
1,130,795 |
|
|
10.000 |
% |
|
|
|
|
|
|
|
|
|
|
|
|
| Tier 1 capital (to risk weighted assets) |
|
|
|
|
|
|
|
|
|
|
|
| Northwest Bancshares, Inc. |
1,555,043 |
|
|
13.739 |
% |
|
962,043 |
|
|
8.500 |
% |
|
905,452 |
|
|
8.000 |
% |
| Northwest Bank |
1,393,786 |
|
|
12.326 |
% |
|
961,176 |
|
|
8.500 |
% |
|
904,636 |
|
|
8.000 |
% |
|
|
|
|
|
|
|
|
|
|
|
|
| CET1 capital (to risk weighted assets) |
|
|
|
|
|
|
|
|
|
|
|
| Northwest Bancshares, Inc. |
1,429,393 |
|
|
12.629 |
% |
|
792,270 |
|
|
7.000 |
% |
|
735,680 |
|
|
6.500 |
% |
| Northwest Bank |
1,393,786 |
|
|
12.326 |
% |
|
791,557 |
|
|
7.000 |
% |
|
735,017 |
|
|
6.500 |
% |
|
|
|
|
|
|
|
|
|
|
|
|
| Tier 1 capital (leverage) (to average assets) |
|
|
|
|
|
|
|
|
|
|
|
| Northwest Bancshares, Inc. |
1,555,043 |
|
|
10.828 |
% |
|
574,453 |
|
|
4.000 |
% |
|
718,066 |
|
|
5.000 |
% |
| Northwest Bank |
1,393,786 |
|
|
9.712 |
% |
|
574,060 |
|
|
4.000 |
% |
|
717,575 |
|
|
5.000 |
% |
(1) Amounts and ratios include the capital conservation buffer of 2.5%, which does not apply to Tier 1 capital to average assets (leverage ratio).
|
|
|
|
|
|
|
|
|
|
|
|
|
|
|
|
|
|
|
|
|
|
|
|
|
|
|
|
|
|
|
|
|
|
|
|
| |
At December 31, 2023 |
| |
Actual |
|
Minimum capital requirements (1) |
|
Well capitalized requirements |
| |
Amount |
|
Ratio |
|
Amount |
|
Ratio |
|
Amount |
|
Ratio |
| Total capital (to risk weighted assets) |
|
|
|
|
|
|
|
|
|
|
|
| Northwest Bancshares, Inc. |
$ |
1,799,883 |
|
|
16.040 |
% |
|
$ |
1,178,234 |
|
|
10.500 |
% |
|
$ |
1,122,128 |
|
|
10.000 |
% |
| Northwest Bank |
1,520,736 |
|
|
13.564 |
% |
|
1,177,257 |
|
|
10.500 |
% |
|
1,121,197 |
|
|
10.000 |
% |
|
|
|
|
|
|
|
|
|
|
|
|
| Tier I capital (to risk weighted assets) |
|
|
|
|
|
|
|
|
|
|
|
| Northwest Bancshares, Inc. |
1,553,766 |
|
|
13.847 |
% |
|
953,809 |
|
|
8.500 |
% |
|
897,702 |
|
|
8.000 |
% |
| Northwest Bank |
1,388,808 |
|
|
12.387 |
% |
|
953,018 |
|
|
8.500 |
% |
|
896,958 |
|
|
8.000 |
% |
|
|
|
|
|
|
|
|
|
|
|
|
| CET1 capital (to risk weighted assets) |
|
|
|
|
|
|
|
|
|
|
|
| Northwest Bancshares, Inc. |
1,428,181 |
|
|
12.727 |
% |
|
785,489 |
|
|
7.000 |
% |
|
729,383 |
|
|
6.500 |
% |
| Northwest Bank |
1,388,808 |
|
|
12.387 |
% |
|
784,838 |
|
|
7.000 |
% |
|
728,778 |
|
|
6.500 |
% |
|
|
|
|
|
|
|
|
|
|
|
|
| Tier I capital (leverage) (to average assets) |
|
|
|
|
|
|
|
|
|
|
|
| Northwest Bancshares, Inc. |
1,553,766 |
|
|
10.841 |
% |
|
573,290 |
|
|
4.000 |
% |
|
716,612 |
|
|
5.000 |
% |
| Northwest Bank |
1,388,808 |
|
|
9.697 |
% |
|
572,903 |
|
|
4.000 |
% |
|
716,128 |
|
|
5.000 |
% |
(1) Amounts and ratios include the capital conservation buffer of 2.5%, which does not apply to Tier 1 capital to average assets (leverage ratio).
Liquidity
We are required to maintain a sufficient level of liquid assets, as determined by management and reviewed for adequacy by the FDIC and the Pennsylvania Department of Banking and Securities during their regular examinations. Northwest frequently monitors its liquidity position primarily using the ratio of unencumbered available-for-sale liquid assets as a percentage of deposits and borrowings (“liquidity ratio”). Northwest Bank’s liquidity ratio at March 31, 2024 was 9.77%. We adjust liquidity levels in order to meet funding needs for deposit outflows, payment of real estate taxes and insurance on mortgage loan escrow accounts, repayment of borrowings and loan commitments. At March 31, 2024, Northwest had $3.3 billion of additional borrowing capacity available with the FHLB, including $250 million on an overnight line of credit, which had a drawn balance of $56 million at March 31, 2024, as well as $264 million of borrowing capacity available with the Federal Reserve Bank and $105 million with two correspondent banks.
Dividends
We paid $25 million in cash dividends during the quarters ended March 31, 2024 and 2023. The common stock dividend payout ratio (dividends declared per share divided by net income per diluted share) for March 31, 2024 and 2023 was 87.0% and 76.9% on dividends of $0.20 per share. On April 17, 2024, the Board of Directors declared a cash dividend of $0.20 per share payable on May 15, 2024 to shareholders of record as of May 2, 2024. This represents the 118th consecutive quarter we have paid a cash dividend.
Nonperforming Assets
The following table sets forth information with respect to nonperforming assets. Nonaccrual loans are those loans on which the accrual of interest has ceased. Generally, when a loan is 90 days past due, we fully reverse all accrued interest thereon and cease to accrue interest thereafter. Exceptions are made for loans that have contractually matured, are in the process of being modified to extend the maturity date and are otherwise current as to principal and interest, and well-secured loans that are in the process of collection. Loans may also be placed on nonaccrual before they reach 90 days past due if conditions exist that call into question our ability to collect all contractual interest. Other nonperforming assets represent property acquired through foreclosure or repossession. Foreclosed property is carried at the lower of its fair value less estimated costs to sell or the principal balance of the related loan.
|
|
|
|
|
|
|
|
|
|
|
|
|
March 31, 2024 |
|
December 31, 2023 |
| |
(in thousands) |
| Loans 90 days or more past due: |
|
|
|
| Residential mortgage loans |
$ |
5,813 |
|
|
7,995 |
|
| Home equity loans |
2,823 |
|
|
3,126 |
|
| Vehicle loans |
2,496 |
|
|
3,051 |
|
| Other consumer loans |
849 |
|
|
927 |
|
| Commercial real estate loans |
6,041 |
|
|
6,535 |
|
| Commercial real estate - owner occupied |
890 |
|
|
177 |
|
| Commercial loans |
3,421 |
|
|
2,780 |
|
| Total loans 90 days or more past due |
$ |
22,333 |
|
|
24,591 |
|
| Total real estate owned (REO) |
$ |
50 |
|
|
104 |
|
| Total loans 90 days or more past due and REO |
22,383 |
|
|
24,695 |
|
| Total loans 90 days or more past due to net loans receivable |
0.20 |
% |
|
0.22 |
% |
| Total loans 90 days or more past due and REO to total assets |
0.15 |
% |
|
0.17 |
% |
| Nonperforming assets: |
|
|
|
| Nonaccrual loans - loans 90 days or more past due |
19,881 |
|
|
21,894 |
|
| Nonaccrual loans - loans less than 90 days past due |
75,179 |
|
|
72,490 |
|
| Loans 90 days or more past due still accruing |
2,452 |
|
|
2,698 |
|
| Total nonperforming loans |
97,512 |
|
|
97,082 |
|
| Total nonperforming assets |
$ |
97,562 |
|
|
97,186 |
|
| Total nonaccrual loans to total loans |
0.83 |
% |
|
0.83 |
% |
Allowance for Credit Losses
On an ongoing basis, the Credit Administration department, as well as loan officers and department heads, review and monitor the loan portfolio for problem loans. This portfolio monitoring includes a review of the monthly delinquency reports as well as historical comparisons and trend analysis. Personal and small business commercial loans are classified primarily by delinquency status. In addition, a meeting is held every quarter with each vertical to monitor the performance and status of commercial loans on an internal watch list. On an on-going basis, the loan officer, in conjunction with a portfolio manager, grades or classifies problem commercial loans or potential problem commercial loans based upon their knowledge of the lending relationship and other information previously accumulated. This rating is also reviewed independently by our Loan Review department on a periodic basis. Our loan grading system for problem commercial loans is consistent with industry regulatory guidelines which classifies loans as “substandard”, “doubtful” or “loss”. Loans that do not expose us to risk sufficient to warrant classification in one of the previous categories, but which possess some weaknesses, are designated as “special mention”. A “substandard” loan is any loan that is 90 days or more contractually delinquent or is inadequately protected by the current net worth and paying capacity of the obligor or of the collateral pledged, if any. Loans classified as “doubtful” have all the weaknesses inherent in those classified as “substandard” with the added characteristic that the weaknesses present make collection or liquidation in full, on the basis of currently existing facts, conditions or values, highly questionable and improbable. Loans classified as “loss” have all the weakness inherent in those classified as “doubtful” and are considered uncollectible.
Credit relationships that have been classified as substandard or doubtful and are greater than or equal to $1.0 million are reviewed by the Credit Administration department to determine if they no longer continue to demonstrate similar risk characteristics to their loan pool. If a loan no longer demonstrates similar risk characteristics to their loan pool they are removed from the pool and an individual assessment will be performed.
If it is determined that a loan needs to be individually assessed, the Credit Administration department determines the proper measure of fair value for each loan based on one of three methods: (1) the present value of expected future cash flows discounted at the loan’s effective interest rate; (2) the loan’s observable market price; or (3) the fair value of the collateral if the loan is collateral dependent, less costs of sale or disposal.
If the measurement of the fair value of the loan is more or less than the amortized cost basis of the loan, the Credit Administration department adjusts the specific allowance associated with that individual loan accordingly.
If a substandard or doubtful loan is not individually assessed, it is grouped with other loans that possess common characteristics for credit losses and analysis. For the purpose of calculating reserves, we have grouped our loans into seven segments: residential mortgage loans, home equity loans, vehicle loans, consumer loans, commercial real estate loans, commercial real estate loans - owner occupied and commercial loans. The allowance for credit losses is measured using a combination of statistical models and qualitative assessments. We use a twenty four month forecasting period and revert to historical average loss rates thereafter. Reversion to average loss rates takes place over twelve months. Historical average loss rates are calculated using historical data beginning in October 2009 through the current period.
The credit losses for individually assessed loans along with the estimated loss for each homogeneous pool are consolidated into one summary document. This summary schedule along with the support documentation used to establish this schedule is presented to management’s Allowance for Credit Losses Committee (“ACL Committee”) monthly. The ACL Committee reviews and approves the processes and ACL documentation presented. Based on this review and discussion, the appropriate amount of ACL is estimated and any adjustments to reconcile the actual ACL with this estimate are determined. The ACL Committee also considers if any changes to the methodology are needed. In addition to the ACL Committee’s review and approval, a review is performed by the Risk Management Committee of the Board of Directors on a quarterly basis and annually by internal audit.
In addition to the reviews by management’s ACL Committee and the Board of Directors’ Risk Management Committee, regulators from either the FDIC and/or the Pennsylvania Department of Banking and Securities perform an extensive review on at least an annual basis for the adequacy of the ACL and its conformity with regulatory guidelines and pronouncements. Any recommendations or enhancements from these independent parties are considered by management and the ACL Committee and implemented accordingly.
We acknowledge that this is a dynamic process and consists of factors, many of which are external and out of our control that can change frequently, rapidly and substantially. The adequacy of the ACL is based upon estimates using all the information previously discussed as well as current and known circumstances and events. There is no assurance that actual portfolio losses will not be substantially different than those that were estimated.
We utilize a structured methodology each period when analyzing the adequacy of the allowance for credit losses and the related provision for credit losses, which the ACL Committee assesses regularly for appropriateness. As part of the analysis as of March 31, 2024, we considered the most recent economic conditions and forecasts available which incorporated the impact of material recent economic events. In addition, we considered the overall trends in asset quality, reserves on individually assessed loans, historical loss rates and collateral valuations. The ACL decreased by $346,000 to $125 million, or 1.09% of total loans at March 31, 2024 from $125 million, or 1.10% of total loans, at December 31, 2023. This decrease was primarily attributable to changes within our personal banking loan portfolio driven by improvements in economic forecasts, which was offset by growth within our commercial loan portfolio during the year.
Total classified loans remain low with a slight increase to $229 million at March 31, 2024 from $218 million at December 31, 2023. This increase was primarily within our commercial portfolio.
We also consider how the levels of nonaccrual loans and historical charge-offs have influenced the required amount of allowance for credit losses. Nonaccrual loans of $95 million at March 31, 2024, remained steady, increasing by $1 million, or 1%, from $94 million at December 31, 2023, or 0.83% of total loans receivable as of both period ends. As a percentage of average loans, annualized net charge-offs increased slightly to 0.16% for the quarter ended March 31, 2024 compared to 0.11% for the year ended December 31, 2023.
Comparison of Operating Results for the Quarters Ended March 31, 2024 and 2023
Net income for the quarter ended March 31, 2024 was $29 million, or $0.23 per diluted share, a decrease of $5 million, or 13%, from net income of $34 million, or $0.26 per diluted share, for the quarter ended March 31, 2023. The decrease in net income resulted primarily from a decrease in net interest income, partially offset by an increase in noninterest income. Net interest income decreased by $9 million, or 8%, and noninterest income increased $4 million, or 17%. Net income for the quarter ended March 31, 2024 represents annualized returns on average equity and average assets of 7.57% and 0.81%, respectively, compared to 9.11% and 0.97% for the same quarter last year. A further discussion of notable changes follows.
To make it easier to compare both the results across several periods and the yields on various types of earning assets (some taxable, some not), we present net interest income in the discussion below on a fully taxable equivalent “FTE basis” (i.e., as if all income were taxable and at the same rate). For example, $100 of tax-exempt income would be presented as $126, an amount that, if taxed at the statutory federal income tax rate of 21%, would yield $100. See the "Average Balance Sheet" for information regarding tax-equivalent adjustments and GAAP results.
Net Interest Income
Net interest income (FTE) was $104 million for the quarter ended March 31, 2024 and net interest margin was 3.10%. Compared to the same quarter of the prior year, net interest income (FTE) decreased $9 million and net interest margin decreased by 36 basis points. The decrease in net interest income (FTE) and the net interest margin reflects higher interest-bearing deposit costs and a shift in funding mix to higher cost deposits and borrowings due to the higher interest rate environment. Partly offsetting the decline in net interest income and the net interest margin were higher earning asset balances and yields.
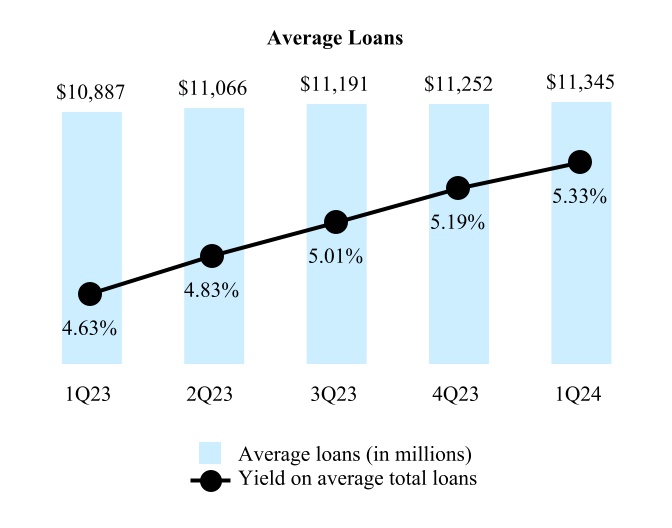
Average loans receivable increased 4% from the quarter ended March 31, 2023 driven by commercial loans, which grew by $553 million, as we have continued to build-out our commercial lending verticals. Interest income on loans receivable increased by $26 million, or 21%, from the same quarter in prior year as the result of increases in both the average yield and the average balance on loans receivable. The average yield on loans receivable increased to 5.33% for the quarter ended March 31, 2024 due to the elevated market interest rates as well as a change in mix to higher yield loan products.
Average investments declined 11% from the first quarter of 2023 driven by the sale of investment securities during the prior year coupled with principal payments and maturities. Interest income on investment securities decreased by $1 million, or 8%, from the quarter ended March 31, 2023.
Average deposits grew 4% from the quarter ended March 31, 2023 driven by a $1.4 billion increase in our average time deposits due to customer preferences for this fixed maturity product type. This increase was partially offset by a decrease in money market balances as customers shifted balances into higher yielding time deposit accounts. Interest expense on deposits increased by $36 million primarily attributable to increases in the interest rates paid on deposit accounts as we continued competitively positioning our deposit products, as well as a change in mix to higher cost products.
Compared to the quarter ended March 31, 2023, average borrowings saw a 37% reduction, primarily attributable to the strategic pay-down of wholesale borrowings. This decrease was made possible by a substantial increase in cash reserves, resulting from a notable rise in the average balance of deposits, which also decreased interest expense on borrowings by $2 million.
Average Balance Sheet
(in thousands)
The following table sets forth certain information relating to the Company’s average balance sheet and reflects the average yield on interest-earning assets and average cost of interest-bearing liabilities for the periods indicated. Such yields and costs are derived by dividing income or expense by the average balance of assets or liabilities, respectively, for the periods presented. Average balances are calculated using daily averages.
|
|
|
|
|
|
|
|
|
|
|
|
|
|
|
|
|
|
|
|
|
|
|
|
|
|
|
|
|
|
|
|
|
|
|
|
| |
Quarter ended March 31, |
| |
2024 |
|
2023 |
|
Average
balance |
|
Interest |
|
Avg.
yield/
cost (h) |
|
Average
balance |
|
Interest |
|
Avg.
yield/
cost (h) |
| Assets |
|
|
|
|
|
|
|
|
|
|
|
| Interest-earning assets: |
|
|
|
|
|
|
|
|
|
|
|
| Residential mortgage loans |
$ |
3,392,524 |
|
|
32,674 |
|
|
3.85 |
% |
|
$ |
3,493,617 |
|
|
32,009 |
|
|
3.66 |
% |
| Home equity loans |
1,205,273 |
|
|
17,294 |
|
|
5.77 |
% |
|
1,284,425 |
|
|
16,134 |
|
|
5.09 |
% |
| Consumer loans |
2,033,620 |
|
|
25,033 |
|
|
4.95 |
% |
|
2,123,672 |
|
|
20,794 |
|
|
3.97 |
% |
|
|
|
|
|
|
|
|
|
|
|
|
| Commercial real estate loans |
2,999,224 |
|
|
43,425 |
|
|
5.73 |
% |
|
2,824,120 |
|
|
37,031 |
|
|
5.24 |
% |
| Commercial loans |
1,714,667 |
|
|
31,857 |
|
|
7.35 |
% |
|
1,161,298 |
|
|
18,353 |
|
|
6.32 |
% |
| Loans receivable (a) (b) (d) (includes FTE adjustments of $712 and $576, respectively) |
11,345,308 |
|
|
150,283 |
|
|
5.33 |
% |
|
10,887,132 |
|
|
124,321 |
|
|
4.63 |
% |
| Mortgage-backed securities (c) |
1,717,306 |
|
|
7,944 |
|
|
1.85 |
% |
|
1,909,676 |
|
|
8,537 |
|
|
1.79 |
% |
| Investment securities (c) (d) (includes FTE adjustments of $145 and $216, respectively) |
333,752 |
|
|
1,430 |
|
|
1.71 |
% |
|
384,717 |
|
|
1,761 |
|
|
1.83 |
% |
| FHLB stock, at cost |
32,249 |
|
|
607 |
|
|
7.57 |
% |
|
39,631 |
|
|
690 |
|
|
7.06 |
% |
| Other interest-earning deposits |
61,666 |
|
|
832 |
|
|
5.34 |
% |
|
38,324 |
|
|
423 |
|
|
4.41 |
% |
| Total interest-earning assets (includes FTE adjustments of $857 and $792, respectively) |
13,490,281 |
|
|
161,096 |
|
|
4.80 |
% |
|
13,259,480 |
|
|
135,732 |
|
|
4.15 |
% |
| Noninterest-earning assets (e) |
918,331 |
|
|
|
|
|
|
862,016 |
|
|
|
|
|
|
|
|
|
|
|
|
|
|
|
|
|
| Total assets |
$ |
14,408,612 |
|
|
|
|
|
|
$ |
14,121,496 |
|
|
|
|
|
|
|
|
|
|
|
|
|
|
|
|
|
| Liabilities and shareholders’ equity |
|
|
|
|
|
|
|
|
|
|
|
| Interest-bearing liabilities: |
|
|
|
|
|
|
|
|
|
|
|
| Savings deposits (g) |
$ |
2,122,035 |
|
|
5,036 |
|
|
0.95 |
% |
|
$ |
2,198,988 |
|
|
690 |
|
|
0.13 |
% |
| Interest-bearing demand deposits (g) |
2,538,823 |
|
|
5,402 |
|
|
0.86 |
% |
|
2,612,883 |
|
|
951 |
|
|
0.15 |
% |
| Money market deposit accounts (g) |
1,961,332 |
|
|
7,913 |
|
|
1.62 |
% |
|
2,408,582 |
|
|
4,403 |
|
|
0.74 |
% |
| Time deposits (g) |
2,697,983 |
|
|
29,335 |
|
|
4.37 |
% |
|
1,293,609 |
|
|
5,194 |
|
|
1.63 |
% |
| Borrowed funds (f) |
469,697 |
|
|
5,708 |
|
|
4.89 |
% |
|
740,218 |
|
|
7,938 |
|
|
4.35 |
% |
| Subordinated debentures |
114,225 |
|
|
1,148 |
|
|
4.02 |
% |
|
113,870 |
|
|
1,148 |
|
|
4.03 |
% |
| Junior subordinated debentures |
129,597 |
|
|
2,459 |
|
|
7.51 |
% |
|
129,335 |
|
|
2,152 |
|
|
6.66 |
% |
| Total interest-bearing liabilities |
10,033,692 |
|
|
57,001 |
|
|
2.28 |
% |
|
9,497,485 |
|
|
22,476 |
|
|
0.96 |
% |
| Noninterest-bearing demand deposits (g) |
2,567,781 |
|
|
|
|
|
|
2,889,973 |
|
|
|
|
|
| Noninterest-bearing liabilities |
257,269 |
|
|
|
|
|
|
235,213 |
|
|
|
|
|
|
|
|
|
|
|
|
|
|
|
|
|
| Total liabilities |
12,858,742 |
|
|
|
|
|
|
12,622,671 |
|
|
|
|
|
| Shareholders’ equity |
1,549,870 |
|
|
|
|
|
|
1,498,825 |
|
|
|
|
|
| Total liabilities and shareholders’ equity |
$ |
14,408,612 |
|
|
|
|
|
|
$ |
14,121,496 |
|
|
|
|
|
| Net interest income/Interest rate spread |
|
|
104,095 |
|
|
2.52 |
% |
|
|
|
113,256 |
|
|
3.19 |
% |
| Net interest-earning assets/Net interest margin |
$ |
3,456,589 |
|
|
|
|
3.10 |
% |
|
$ |
3,761,995 |
|
|
|
|
3.46 |
% |
| Ratio of interest-earning assets to interest- bearing liabilities |
1.34X |
|
|
|
|
|
1.40X |
|
|
|
|
(a)Average gross loans includes loans held as available-for-sale and loans placed on nonaccrual status.
(b)Interest income includes accretion/amortization of deferred loan fees/expenses, which were not material.
(c)Average balances do not include the effect of unrealized gains or losses on securities held as available-for-sale.
(d)Interest income on tax-free investment securities and tax-free loans are presented on a FTE basis.
(e)Average balances include the effect of unrealized gains or losses on securities held as available-for-sale.
(f)Average balances include FHLB borrowings and collateralized borrowings.
(g)Average cost of deposits were 1.61% and 0.40%, respectively, average cost of interest-bearing deposits were 2.06% and 0.54%, respectively .
(h)Annualized. Shown on a FTE basis. The FTE basis adjusts for the tax benefit of income on certain tax exempt loans and investments using the federal statutory rate applicable to each period presented. We believe this measure to be the preferred industry measurement of net interest income and provides relevant comparison between taxable and non-taxable amounts. GAAP basis yields were: loans — 5.30% and 4.61%, respectively; investment securities — 1.54% and 1.61%, respectively; interest-earning assets — 4.78% and 4.13%, respectively. GAAP basis net interest rate spreads were 2.49% and 3.17%, respectively; and GAAP basis net interest margins were 3.08% and 3.44%, respectively.
Rate/Volume Analysis
(in thousands)
The following table represents the extent to which changes in interest rates and changes in the volume of interest-earning assets and interest-bearing liabilities have affected interest income and interest expense during the periods indicated. Information is provided in each category with respect to (i) changes attributable to changes in volume (changes in volume multiplied by prior rate), (ii) changes attributable to changes in rate (changes in rate multiplied by prior volume), and (iii) net change. Changes that cannot be attributed to either rate or volume have been allocated to both rate and volume.
|
|
|
|
|
|
|
|
|
|
|
|
|
|
|
|
|
|
|
For the quarter ended March 31, 2024 vs. 2023 |
|
Increase/(decrease) due to |
|
Total
increase/(decrease) |
|
Rate |
|
Volume |
|
| Interest-earning assets: |
|
|
|
|
|
| Loans receivable |
$ |
19,893 |
|
|
6,069 |
|
|
25,962 |
|
| Mortgage-backed securities |
296 |
|
|
(889) |
|
|
(593) |
|
| Investment securities |
(112) |
|
|
(219) |
|
|
(331) |
|
| FHLB stock, at cost |
56 |
|
|
(139) |
|
|
(83) |
|
| Other interest-earning deposits |
95 |
|
|
314 |
|
|
409 |
|
| Total interest-earning assets |
20,228 |
|
|
5,136 |
|
|
25,364 |
|
|
|
|
|
|
|
| Interest-bearing liabilities: |
|
|
|
|
|
| Savings deposits |
4,529 |
|
|
(183) |
|
|
4,346 |
|
| Interest-bearing demand deposits |
4,609 |
|
|
(158) |
|
|
4,451 |
|
| Money market deposit accounts |
5,314 |
|
|
(1,804) |
|
|
3,510 |
|
| Time deposits |
8,871 |
|
|
15,270 |
|
|
24,141 |
|
| Borrowed funds |
1,057 |
|
|
(3,287) |
|
|
(2,230) |
|
| Subordinated debt |
(4) |
|
|
4 |
|
|
— |
|
| Junior subordinated debentures |
302 |
|
|
5 |
|
|
307 |
|
| Total interest-bearing liabilities |
24,678 |
|
|
9,847 |
|
|
34,525 |
|
|
|
|
|
|
|
| Net change in net interest income |
$ |
(4,450) |
|
|
(4,711) |
|
|
(9,161) |
|
Provision for Credit Losses
|
|
|
|
|
|
|
|
|
|
|
|
|
|
|
|
|
|
|
|
|
|
|
|
|
|
|
|
|
|
|
|
|
|
|
1Q23 |
|
2Q23 |
|
3Q23 |
|
4Q23 |
|
1Q24 |
|
|
|
|
| Provision for credit losses - loans (in thousands) |
$4,870 |
|
|
6,010 |
|
|
3,983 |
|
|
3,801 |
|
|
4,234 |
|
|
|
|
|
| Provision for credit losses - unfunded commitments (in thousands) |
126 |
|
|
2,920 |
|
|
(2,981) |
|
|
4,145 |
|
|
(799) |
|
|
|
|
|
| Annualized net charge-offs to average loans |
0.08 |
% |
|
0.10 |
% |
|
0.13 |
% |
|
0.12 |
% |
|
0.16 |
% |
|
|
|
|
|
|
|
|
|
|
|
|
|
|
|
|
|
|
|
|
|
|
|
|
|
|
|
|
|
|
|
|
The provision for credit losses decreased by $2 million, or 31%, from the quarter ended March 31, 2023. This decrease included a $1 million decrease in the provision for credit losses - loans driven by changes in the economic forecasts reflected in our allowance for credit loss models, as well as a $1 million decrease in the provision for credit losses - unfunded commitments driven by the timing of origination and funding of commercial construction loans and lines of credit. Classified assets continue to remain low at $229 million, at March 31, 2024 from $209 million at March 31, 2023, or 2% of total loans as of both periods.
In determining the amount of the current period provision, we considered current and forecasted economic conditions, including but not limited to improvements in unemployment levels, expected economic growth, bankruptcy filings, and changes in real estate values and the impact of these factors on the quality of our loan portfolio and historical loss experience. We analyze the allowance for credit losses as described in the section entitled “Allowance for Credit Losses.” The provision that is recorded is sufficient, in our judgment, to bring this reserve to a level that reflects the current expected lifetime losses in our loan portfolio relative to loan mix, a reasonable and supportable economic forecast period and historical loss experience at March 31, 2024.
Noninterest Income
(a) Other noninterest income includes the gain on sale of SBA loans, net gain on real estate owned, mortgage banking income, and other operating income. See the "Consolidated Statements of Income" in Item 1. Financial Statements of this report.
Noninterest income increased by $4 million, or 17%, from the quarter ended March 31, 2023. This increase was primarily due to a $2 million, or 18%, increase in service charges and fees to $16 million for the quarter ended March 31, 2024 from $13 million for the quarter ended March 31, 2023 driven by commercial loan fees and deposit related fees based on customer activity in the current quarter as well as gain on sale of SBA loans and improvements in trust and other financial services income.
Noninterest Expense
(a) Other noninterest expense includes office operations, collections expense, marketing expense, FDIC insurance expense, amortization of intangible assets, real estate owned expense, merger, asset disposition and restructuring expense, and other expenses. See the "Consolidated Statements of Income" in Item 1. Financial Statements of this report.
Noninterest expense increased by $3 million, or 3%, from the quarter ended March 31, 2023. This increase was primarily attributable to an increase in compensation and employee benefits expense of $5 million, or 11%, to $52 million for the quarter ended March 31, 2024, from $47 million for the quarter ended March 31, 2023 driven primarily by the build out of the commercial business and related credit, risk management, and internal audit support functions. Partially offsetting this increase was a decrease in non-personnel expense related to a decline in merger, asset disposition and restructuring expense of $2 million, or 66%, as a result of the severance and fixed asset charges related to the branch optimization and personnel reduction incurred during the first quarter of the prior year.
Income Taxes
The provision for income taxes decreased by $1.7 million, or 17%, to $8.6 million for the quarter ended March 31, 2024 from $10.3 million for the quarter ended March 31, 2023. This decrease in income taxes was due primarily to a decrease in our income before taxes in the current year. We anticipate our effective tax rate to be between 22.0% and 24.0% for the year ending December 31, 2024.
Item 3. QUANTITATIVE AND QUALITATIVE DISCLOSURES ABOUT MARKET RISK
As the holding company for a savings bank, one of our primary market risks is interest rate risk. Interest rate risk is the sensitivity of net interest income to variations in interest rates over a specified time period. The sensitivity results from differences in the time periods in which interest rate sensitive assets and liabilities mature or re-price. We attempt to control interest rate risk by matching, within acceptable limits, the re-pricing periods of assets and liabilities. We have attempted to limit our exposure to interest sensitivity by increasing core deposits, enticing customers to extend certificates of deposit maturities, borrowing funds with fixed-rates and longer maturities and by shortening the maturities of our assets by emphasizing the origination of more short-term fixed rate loans and adjustable rate loans. We also have the ability to sell a portion of the long-term, fixed-rate mortgage loans that we originate. In addition, we purchase shorter term or adjustable-rate investment securities and mortgage-backed securities.
We have an Asset/Liability Committee consisting of members of management which meets monthly to review market interest rates, economic conditions, the pricing of interest-earning assets and interest-bearing liabilities and the balance sheet structure. On a quarterly basis, this Committee also reviews the interest rate risk position and cash flow projections.
The Board of Directors has a Risk Management Committee which meets quarterly and reviews interest rate risk and trends, our interest sensitivity position, the liquidity position and the market risk inherent in the investment portfolio.
In an effort to assess interest rate risk and market risk, we utilize a simulation model to determine the effect of immediate incremental increases and decreases in interest rates on net income and the market value of equity. Certain assumptions are made regarding loan prepayments and decay rates of savings and interest-bearing demand accounts. Because it is difficult to accurately project the market reaction of depositors and borrowers, the effect of actual changes in interest rates on these assumptions may differ from simulated results. We have established the following guidelines for assessing interest rate risk:
Net interest income simulation. Given a parallel shift of 100 basis points (“bps”), 200 bps and 300 bps in interest rates, the estimated net income may not decrease by more than 5%, 10% and 15%, respectively, within a one-year period.
Net income simulation. Given a parallel shift of 100 bps, 200 bps and 300 bps in interest rates, the estimated net income may not decrease by more than 10%, 20% and 30%, respectively, within a one-year period.
Market value of equity simulation. The market value of equity is the present value of assets and liabilities. Given a parallel shift of 100 bps, 200 bps and 300 bps in interest rates, the market value of equity may not decrease by more than 15%, 30% and 35%, respectively, from the computed economic value at current interest rate levels.
The following table illustrates the simulated impact of a 100 bps, 200 bps or 300 bps upward or a 100 bps, 200 bps or 300 bps downward movement in interest rates on net income, return on average equity, earnings per share and market value of equity. This analysis was prepared assuming that interest-earning asset and interest-bearing liability levels at March 31, 2024 remain constant. The impact of the rate movements was computed by simulating the effect of an immediate and sustained shift in interest rates over a twelve-month period from March 31, 2024 levels.
|
|
|
|
|
|
|
|
|
|
|
|
|
|
|
|
|
|
|
|
|
|
|
|
|
|
|
|
|
|
|
|
|
|
|
|
|
|
|
| |
|
Increase |
|
Decrease |
| Parallel shift in interest rates over the next 12 months |
|
100 bps |
|
200 bps |
|
300 bps |
|
100 bps |
|
200 bps |
|
300 bps |
| Projected percentage increase/(decrease) in net interest income |
|
(1.7) |
% |
|
(3.7) |
% |
|
(5.7) |
% |
|
(1.4 |
%) |
|
(6.2 |
%) |
|
(11.6 |
%) |
| Projected percentage increase/(decrease) in net income |
|
(4.0) |
% |
|
(8.9) |
% |
|
(13.8) |
% |
|
(3.4 |
%) |
|
(15.1 |
%) |
|
(28.4 |
%) |
| Projected increase/(decrease) in return on average equity |
|
(3.9) |
% |
|
(8.5) |
% |
|
(13.3) |
% |
|
(3.2 |
%) |
|
(14.5 |
%) |
|
(27.4 |
%) |
| Projected increase/(decrease) in earnings per share |
|
$ |
(0.05) |
|
|
$ |
(0.10) |
|
|
$ |
(0.15) |
|
|
$ |
(0.04) |
|
|
$ |
(0.17) |
|
|
$ |
(0.31) |
|
| Projected percentage increase/(decrease) in market value of equity |
|
(8.1 |
%) |
|
(16.5 |
%) |
|
(24.5 |
%) |
|
6.6 |
% |
|
8.7 |
% |
|
8.1 |
% |
The figures included in the table above represent projections that were computed based upon certain assumptions including prepayment rates and decay rates. These assumptions are inherently uncertain and, as a result, cannot precisely predict the impact of changes in interest rates. Actual results may differ significantly due to timing, magnitude and frequency of interest rate changes and changes in market conditions, and actions that may be taken by management in response to interest rate changes.
Item 4. CONTROLS AND PROCEDURES
Under the supervision of and with the participation of management, including the Principal Executive Officer and Principal Financial Officer, we evaluated the effectiveness of the design and operation of the Company’s disclosure controls and procedures (as defined in Rule 13a-15(e) under the Exchange Act) as of the end of the period covered by this quarterly report (the “Evaluation Date”). Based upon that evaluation, the Principal Executive Officer and Principal Financial Officer concluded that, as of the Evaluation Date, these disclosure controls and procedures were effective.
There were no changes in the internal controls over financial reporting during the period covered by this report or in other factors that have materially affected, or are reasonably likely to materially affect the internal controls over financial reporting.
PART II. OTHER INFORMATION
Item 1. LEGAL PROCEEDINGS
We are subject to a number of asserted and unasserted claims encountered in the normal course of business. We believe that any additional liability, other than that which has already been accrued, that may result from such potential litigation will not have a material adverse effect on the financial statements. However, we cannot presently determine whether or not any claims against us will have a material adverse effect on our results of operations in any future reporting period. Refer to Note 11.
Item 1A. RISK FACTORS
Except as previously disclosed, there have been no material updates or additions to the risk factors previously disclosed in our Annual Report on Form 10-K for the year ended December 31, 2023 as filed with the Securities and Exchange Commission. Additional risks not presently known to us, or that we currently deem immaterial, may also adversely affect our business, financial condition or results of operations.
Item 2. UNREGISTERED SALES OF EQUITY SECURITIES, USE OF PROCEEDS, AND ISSUER PURCHASES OF EQUITY SECURITIES
a) Not applicable.
b) Not applicable.
c) On December 13, 2012, the Board of Directors approved a program that authorizes the repurchase of approximately 5,000,000 shares of common stock. This program does not have an expiration date. During the quarter ended March 31, 2024, there were no shares of common stock repurchased and there are a maximum of 2,261,130 remaining shares that can be purchased under the current repurchase program.
Item 3. DEFAULTS UPON SENIOR SECURITIES
Not applicable.
Item 4. MINE SAFETY DISCLOSURES
Not applicable.
Item 5. OTHER INFORMATION
During the three months ended March 31, 2024, no directors or executive officers of the Company adopted or terminated any contract, instruction or written plan for the purchase or sale of the Company securities that was intended to satisfy the affirmative defense conditions of Rule 10b5-1(c) and/or any “Rule 10b5-1 trading arrangement.”
Item 6. EXHIBITS
|
|
|
|
|
|
|
Employment Agreement by and between Northwest Bank, Northwest Bancshares, Inc. and Douglas M. Schosser |
|
|
|
Certification of the Chief Executive Officer pursuant to Rule 13a-15 or 15d-15 of the Securities Exchange Act of 1934, as adopted pursuant to Section 302 of the Sarbanes-Oxley Act of 2002. |
| |
|
|
Certification of the Chief Financial Officer pursuant to Rule 13a-15 or 15d-15 of the Securities Exchange Act of 1934, as adopted pursuant to Section 302 of the Sarbanes-Oxley Act of 2002. |
| |
|
|
Certification of the Chief Executive Officer and Chief Financial Officer pursuant to 18 U.S.C. Section 1350, as adopted pursuant to Section 906 of the Sarbanes-Oxley Act of 2002. |
|
|
|
|
|
|
| 101.INS |
The instance document does not appear in the interactive data file because its XBRL tags are embedded within the inline XBRL document. |
| 101.SCH |
XBRL Taxonomy Extension Schema Document. |
| 101.CAL |
XBRL Taxonomy Extension Calculation Linkbase Document. |
| 101.DEF |
XBRL Taxonomy Extension Definition Linkbase Document. |
| 101.LAB |
XBRL Taxonomy Extension Label Linkbase. |
| 101.PRE |
XBRL Taxonomy Extension Presentation Linkbase Document. |
| 104 |
The cover page of this Quarterly Report on Form 10-Q, formatted in inline XBRL. |
Signature
Pursuant to the requirements of the Securities Exchange Act of 1934, the Registrant has duly caused this report to be signed by the undersigned thereunto duly authorized.
|
|
|
|
|
|
|
|
|
|
|
|
| NORTHWEST BANCSHARES, INC. |
| (Registrant) |
| |
|
|
| |
|
|
| Date: |
May 3, 2024 |
By: |
/s/ Louis J. Torchio |
| |
|
Louis J. Torchio |
| |
|
President and Chief Executive Officer |
| |
|
(Duly Authorized Officer) |
| |
|
|
| |
|
|
| Date: |
May 3, 2024 |
By: |
/s/ Jeffrey J. Maddigan |
| |
|
|
Jeffrey J. Maddigan |
| |
|
Executive Vice President, Finance, Accounting and Corporate Treasurer |
|
|
(Principal Accounting Officer) |
| |
|
|
EX-31.1
2
a2024-03x31nwbixexx311.htm
EX-31.1
Document
Exhibit 31.1
Certification
I, Louis J. Torchio, certify that:
1. I have reviewed this quarterly report on Form 10-Q of Northwest Bancshares, Inc.;
2. Based on my knowledge, this report does not contain any untrue statements of a material fact or omit to state a material fact necessary to make the statements made, in light of the circumstances under which such statements were made, not misleading with respect to the period covered by this report;
3. Based on my knowledge, the financial statements, and other financial information included in this report, fairly present in all material respects the financial condition, results of operations and cash flows of the registrant as of, and for, the periods presented in this report;
4. The registrant’s other certifying officer and I are responsible for establishing and maintaining disclosure controls and procedures (as defined in Exchange Act Rules 13a-15(e) and 15d-15(e)) and internal control over financial reporting (as defined in Exchange Act Rules 13a-15(f) and 15d-15(f)) for the registrant and have:
a) Designed such disclosure controls and procedures, or caused such disclosure controls and procedures to be designed under our supervision, to ensure that material information relating to the registrant, including its consolidated subsidiaries, is made known to us by others within those entities, particularly during the period in which this report is being prepared;
b) Designed such internal control over financial reporting, or caused such internal control over financial reporting to be designed under our supervision, to provide reasonable assurance regarding the reliability of financial reporting and the preparation of financial statements for external purposes in accordance with generally accepted accounting principles;
c) Evaluated the effectiveness of the registrant’s disclosure controls and procedures and presented in this report our conclusions about the effectiveness of the disclosure controls and procedures, as of the end of the period covered by this report based on such evaluation; and
d) Disclosed in this report any change in the registrant’s internal control over financial reporting that occurred during the registrant’s most recent fiscal quarter (the registrant’s fourth fiscal quarter in the case of an annual report) that has materially affected, or is reasonably likely to materially affect, the registrant’s internal control over financial reporting; and
5. The registrant’s other certifying officer and I have disclosed, based on our most recent evaluation of internal control over financial reporting, to the registrant’s auditors and the audit committee of the registrant’s board of directors (or persons performing the equivalent functions):
a) All significant deficiencies and material weaknesses in the design or operation of internal control over financial reporting which are reasonably likely to adversely affect the registrant’s ability to record, process, summarize and report financial information; and
b) Any fraud, whether or not material, that involves management or other employees who have a significant role in the registrant’s internal control over financial reporting.
|
|
|
|
|
|
|
|
|
| May 3, 2024 |
|
/s/ Louis J. Torchio |
| Date |
|
Louis J. Torchio |
| |
|
President and Chief Executive Officer |
EX-31.2
3
a2024-03x31nwbixexx312.htm
EX-31.2
Document
Exhibit 31.2
Certification
I, Douglas M. Schosser, certify that:
1. I have reviewed this quarterly report on Form 10-Q of Northwest Bancshares, Inc.;
2. Based on my knowledge, this report does not contain any untrue statements of a material fact or omit to state a material fact necessary to make the statements made, in light of the circumstances under which such statements were made, not misleading with respect to the period covered by this report;
3. Based on my knowledge, the financial statements, and other financial information included in this report, fairly present in all material respects the financial condition, results of operations and cash flows of the registrant as of, and for, the periods presented in this report;
4. The registrant’s other certifying officer and I are responsible for establishing and maintaining disclosure controls and procedures (as defined in Exchange Act Rules 13a-15(e) and 15d-15(e)) and internal control over financial reporting (as defined in Exchange Act Rules 13a-15(f) and 15d-15(f)) for the registrant and have:
a) Designed such disclosure controls and procedures, or caused such disclosure controls and procedures to be designed under our supervision, to ensure that material information relating to the registrant, including its consolidated subsidiaries, is made known to us by others within those entities, particularly during the period in which this report is being prepared;
b) Designed such internal control over financial reporting, or caused such internal control over financial reporting to be designed under our supervision, to provide reasonable assurance regarding the reliability of financial reporting and the preparation of financial statements for external purposes in accordance with generally accepted accounting principles;
c) Evaluated the effectiveness of the registrant’s disclosure controls and procedures and presented in this report our conclusions about the effectiveness of the disclosure controls and procedures, as of the end of the period covered by this report based on such evaluation; and
d) Disclosed in this report any change in the registrant’s internal control over financial reporting that occurred during the registrant’s most recent fiscal quarter (the registrant’s fourth fiscal quarter in the case of an annual report) that has materially affected, or is reasonably likely to materially affect, the registrant’s internal control over financial reporting; and
5. The registrant’s other certifying officer and I have disclosed, based on our most recent evaluation of internal control over financial reporting, to the registrant’s auditors and the audit committee of the registrant’s board of directors (or persons performing the equivalent functions):
a) All significant deficiencies and material weaknesses in the design or operation of internal control over financial reporting which are reasonably likely to adversely affect the registrant’s ability to record, process, summarize and report financial information; and
b) Any fraud, whether or not material, that involves management or other employees who have a significant role in the registrant’s internal control over financial reporting.
|
|
|
|
|
|
|
|
|
| May 3, 2024 |
|
/s/ Douglas M. Schosser |
| Date |
|
Douglas M. Schosser |
| |
|
Senior Executive Vice President, Chief Financial Officer |
EX-32.1
4
a2024-03x31nwbixexx321.htm
EX-32.1
Document
Exhibit 32.1
Certification by the Chief Executive Officer and Chief Financial Officer
The undersigned officers of Northwest Bancshares, Inc. (the “Company”) hereby certify that, to the best of their knowledge:
1. The Company’s quarterly report on Form 10-Q for the period ended March 31, 2024 (the “Report”) fully complies with the requirements of section 13(a) or 15(d) of the Securities Exchange Act of 1934, and
2. The information contained in the Report fairly presents, in all material respects, the financial condition and results of operations of the Company.
|
|
|
|
|
|
|
|
|
| May 3, 2024 |
|
/s/ Louis J. Torchio |
| Date |
|
Louis J. Torchio |
| |
|
President and Chief Executive Officer |
| |
|
|
| |
|
|
| May 3, 2024 |
|
/s/ Douglas M. Schosser |
| Date |
|
Douglas M. Schosser |
| |
|
Senior Executive Vice President, Chief Financial Officer |
The purpose of this statement is solely to comply with Title 18, Chapter 63, Section 1350 of the United States Code, as amended by Section 906 of the Sarbanes-Oxley Act of 2002.
A signed original of this written statement required by Section 906 has been provided to Northwest Bancshares, Inc. and will be retained by Northwest Bancshares, Inc. and furnished to the Securities and Exchange Commission or its staff upon request.