00014712652023FYFALSEhttp://fasb.org/us-gaap/2023#AccountingStandardsUpdate201613Memberhttp://fasb.org/us-gaap/2023#InterestReceivablehttp://fasb.org/us-gaap/2023#InterestReceivableP3YP7YP1Yhttp://fasb.org/us-gaap/2023#OtherAssetshttp://fasb.org/us-gaap/2023#OtherAssetshttp://fasb.org/us-gaap/2023#OtherLiabilitieshttp://fasb.org/us-gaap/2023#OtherLiabilitiesP0YP0YP0YP0YP5YP5YP3Yhttp://fasb.org/us-gaap/2023#OtherAssetshttp://fasb.org/us-gaap/2023#OtherAssetshttp://fasb.org/us-gaap/2023#OtherLiabilitieshttp://fasb.org/us-gaap/2023#OtherLiabilities00014712652023-01-012023-12-3100014712652024-02-20xbrli:shares00014712652023-06-30iso4217:USD00014712652023-12-3100014712652022-12-31iso4217:USDxbrli:shares00014712652022-01-012022-12-3100014712652021-01-012021-12-310001471265us-gaap:CommonStockMember2020-12-310001471265us-gaap:AdditionalPaidInCapitalMember2020-12-310001471265us-gaap:RetainedEarningsMember2020-12-310001471265us-gaap:AccumulatedOtherComprehensiveIncomeMember2020-12-3100014712652020-12-310001471265us-gaap:RetainedEarningsMember2021-01-012021-12-310001471265us-gaap:AccumulatedOtherComprehensiveIncomeMember2021-01-012021-12-310001471265us-gaap:CommonStockMember2021-01-012021-12-310001471265us-gaap:AdditionalPaidInCapitalMember2021-01-012021-12-310001471265us-gaap:CommonStockMember2021-12-310001471265us-gaap:AdditionalPaidInCapitalMember2021-12-310001471265us-gaap:RetainedEarningsMember2021-12-310001471265us-gaap:AccumulatedOtherComprehensiveIncomeMember2021-12-3100014712652021-12-310001471265us-gaap:RetainedEarningsMember2022-01-012022-12-310001471265us-gaap:AccumulatedOtherComprehensiveIncomeMember2022-01-012022-12-310001471265us-gaap:CommonStockMember2022-01-012022-12-310001471265us-gaap:AdditionalPaidInCapitalMember2022-01-012022-12-310001471265us-gaap:CommonStockMember2022-12-310001471265us-gaap:AdditionalPaidInCapitalMember2022-12-310001471265us-gaap:RetainedEarningsMember2022-12-310001471265us-gaap:AccumulatedOtherComprehensiveIncomeMember2022-12-310001471265us-gaap:RetainedEarningsMember2023-01-012023-12-310001471265us-gaap:AccumulatedOtherComprehensiveIncomeMember2023-01-012023-12-310001471265us-gaap:RetainedEarningsMembersrt:CumulativeEffectPeriodOfAdoptionAdjustmentMember2022-12-310001471265srt:CumulativeEffectPeriodOfAdoptionAdjustmentMember2022-12-310001471265us-gaap:CommonStockMember2023-01-012023-12-310001471265us-gaap:AdditionalPaidInCapitalMember2023-01-012023-12-310001471265us-gaap:CommonStockMember2023-12-310001471265us-gaap:AdditionalPaidInCapitalMember2023-12-310001471265us-gaap:RetainedEarningsMember2023-12-310001471265us-gaap:AccumulatedOtherComprehensiveIncomeMember2023-12-31nwbi:bank_locationnwbi:segment0001471265srt:MinimumMember2023-12-310001471265srt:MaximumMember2023-12-310001471265us-gaap:PensionPlansDefinedBenefitMember2023-12-31xbrli:pure0001471265us-gaap:PensionPlansDefinedBenefitMember2022-12-310001471265us-gaap:RestrictedStockMember2023-01-012023-12-310001471265us-gaap:RestrictedStockMember2022-01-012022-12-310001471265us-gaap:RestrictedStockMember2021-01-012021-12-310001471265us-gaap:EmployeeStockOptionMember2023-12-310001471265us-gaap:EmployeeStockOptionMember2023-01-012023-12-310001471265us-gaap:USGovernmentAgenciesDebtSecuritiesMember2023-12-310001471265us-gaap:USGovernmentSponsoredEnterprisesDebtSecuritiesMember2023-12-310001471265us-gaap:USStatesAndPoliticalSubdivisionsMember2023-12-310001471265us-gaap:CorporateDebtSecuritiesMember2023-12-310001471265nwbi:FixedRatePassThroughMortgageBackedSecuritiesMember2023-12-310001471265nwbi:VariableRatePassThroughMortgageBackedSecuritiesMember2023-12-310001471265nwbi:FixedRateAgencyCMOsMortgageBackedSecuritiesMember2023-12-310001471265nwbi:VariableRateAgencyCMOsMortgageBackedSecuritiesMember2023-12-310001471265us-gaap:ResidentialMortgageBackedSecuritiesMember2023-12-310001471265us-gaap:USGovernmentAgenciesDebtSecuritiesMember2022-12-310001471265us-gaap:USGovernmentSponsoredEnterprisesDebtSecuritiesMember2022-12-310001471265us-gaap:USStatesAndPoliticalSubdivisionsMember2022-12-310001471265us-gaap:CorporateDebtSecuritiesMember2022-12-310001471265nwbi:FixedRatePassThroughMortgageBackedSecuritiesMember2022-12-310001471265nwbi:VariableRatePassThroughMortgageBackedSecuritiesMember2022-12-310001471265nwbi:FixedRateAgencyCMOsMortgageBackedSecuritiesMember2022-12-310001471265nwbi:VariableRateAgencyCMOsMortgageBackedSecuritiesMember2022-12-310001471265us-gaap:ResidentialMortgageBackedSecuritiesMember2022-12-310001471265us-gaap:FederalNationalMortgageAssociationCertificatesAndObligationsFNMAMember2023-12-310001471265us-gaap:FederalNationalMortgageAssociationCertificatesAndObligationsFNMAMember2022-12-310001471265us-gaap:GovernmentNationalMortgageAssociationCertificatesAndObligationsGNMAMember2023-12-310001471265us-gaap:GovernmentNationalMortgageAssociationCertificatesAndObligationsGNMAMember2022-12-310001471265us-gaap:FederalHomeLoanMortgageCorporationCertificatesAndObligationsFHLMCMember2023-12-310001471265us-gaap:FederalHomeLoanMortgageCorporationCertificatesAndObligationsFHLMCMember2022-12-310001471265us-gaap:OtherInvestmentCompaniesMember2023-12-310001471265us-gaap:OtherInvestmentCompaniesMember2022-12-310001471265us-gaap:MortgageBackedSecuritiesIssuedByUSGovernmentSponsoredEnterprisesMember2023-12-310001471265us-gaap:MortgageBackedSecuritiesIssuedByUSGovernmentSponsoredEnterprisesMember2022-12-31nwbi:position0001471265srt:FitchAAPlusRatingMemberus-gaap:USGovernmentAgenciesDebtSecuritiesMember2023-12-310001471265us-gaap:USGovernmentAgenciesDebtSecuritiesMember2023-12-310001471265srt:FitchAAPlusRatingMemberus-gaap:ResidentialMortgageBackedSecuritiesMember2023-12-310001471265srt:FitchAAPlusRatingMember2023-12-310001471265nwbi:PersonalBankingMembernwbi:OriginatedLoanMemberus-gaap:ResidentialMortgageMember2023-12-310001471265nwbi:AcquiredLoanMembernwbi:PersonalBankingMemberus-gaap:ResidentialMortgageMember2023-12-310001471265nwbi:PersonalBankingMemberus-gaap:ResidentialMortgageMember2023-12-310001471265nwbi:PersonalBankingMembernwbi:OriginatedLoanMemberus-gaap:ResidentialMortgageMember2022-12-310001471265nwbi:AcquiredLoanMembernwbi:PersonalBankingMemberus-gaap:ResidentialMortgageMember2022-12-310001471265nwbi:PersonalBankingMemberus-gaap:ResidentialMortgageMember2022-12-310001471265nwbi:PersonalBankingMembernwbi:OriginatedLoanMemberus-gaap:HomeEquityLoanMember2023-12-310001471265nwbi:AcquiredLoanMembernwbi:PersonalBankingMemberus-gaap:HomeEquityLoanMember2023-12-310001471265nwbi:PersonalBankingMemberus-gaap:HomeEquityLoanMember2023-12-310001471265nwbi:PersonalBankingMembernwbi:OriginatedLoanMemberus-gaap:HomeEquityLoanMember2022-12-310001471265nwbi:AcquiredLoanMembernwbi:PersonalBankingMemberus-gaap:HomeEquityLoanMember2022-12-310001471265nwbi:PersonalBankingMemberus-gaap:HomeEquityLoanMember2022-12-310001471265us-gaap:AutomobileLoanMembernwbi:PersonalBankingMembernwbi:OriginatedLoanMember2023-12-310001471265nwbi:AcquiredLoanMemberus-gaap:AutomobileLoanMembernwbi:PersonalBankingMember2023-12-310001471265us-gaap:AutomobileLoanMembernwbi:PersonalBankingMember2023-12-310001471265us-gaap:AutomobileLoanMembernwbi:PersonalBankingMembernwbi:OriginatedLoanMember2022-12-310001471265nwbi:AcquiredLoanMemberus-gaap:AutomobileLoanMembernwbi:PersonalBankingMember2022-12-310001471265us-gaap:AutomobileLoanMembernwbi:PersonalBankingMember2022-12-310001471265nwbi:PersonalBankingMemberus-gaap:ConsumerLoanMembernwbi:OriginatedLoanMember2023-12-310001471265nwbi:AcquiredLoanMembernwbi:PersonalBankingMemberus-gaap:ConsumerLoanMember2023-12-310001471265nwbi:PersonalBankingMemberus-gaap:ConsumerLoanMember2023-12-310001471265nwbi:PersonalBankingMemberus-gaap:ConsumerLoanMembernwbi:OriginatedLoanMember2022-12-310001471265nwbi:AcquiredLoanMembernwbi:PersonalBankingMemberus-gaap:ConsumerLoanMember2022-12-310001471265nwbi:PersonalBankingMemberus-gaap:ConsumerLoanMember2022-12-310001471265nwbi:PersonalBankingMembernwbi:OriginatedLoanMember2023-12-310001471265nwbi:AcquiredLoanMembernwbi:PersonalBankingMember2023-12-310001471265nwbi:PersonalBankingMember2023-12-310001471265nwbi:PersonalBankingMembernwbi:OriginatedLoanMember2022-12-310001471265nwbi:AcquiredLoanMembernwbi:PersonalBankingMember2022-12-310001471265nwbi:PersonalBankingMember2022-12-310001471265us-gaap:CommercialRealEstateMembernwbi:OriginatedLoanMembernwbi:CommercialBankingMember2023-12-310001471265nwbi:AcquiredLoanMemberus-gaap:CommercialRealEstateMembernwbi:CommercialBankingMember2023-12-310001471265us-gaap:CommercialRealEstateMembernwbi:CommercialBankingMember2023-12-310001471265us-gaap:CommercialRealEstateMembernwbi:OriginatedLoanMembernwbi:CommercialBankingMember2022-12-310001471265nwbi:AcquiredLoanMemberus-gaap:CommercialRealEstateMembernwbi:CommercialBankingMember2022-12-310001471265us-gaap:CommercialRealEstateMembernwbi:CommercialBankingMember2022-12-310001471265nwbi:OriginatedLoanMembernwbi:CommercialBankingMembernwbi:CommercialRealEstateOwnerOccupiedMember2023-12-310001471265nwbi:AcquiredLoanMembernwbi:CommercialBankingMembernwbi:CommercialRealEstateOwnerOccupiedMember2023-12-310001471265nwbi:CommercialBankingMembernwbi:CommercialRealEstateOwnerOccupiedMember2023-12-310001471265nwbi:OriginatedLoanMembernwbi:CommercialBankingMembernwbi:CommercialRealEstateOwnerOccupiedMember2022-12-310001471265nwbi:AcquiredLoanMembernwbi:CommercialBankingMembernwbi:CommercialRealEstateOwnerOccupiedMember2022-12-310001471265nwbi:CommercialBankingMembernwbi:CommercialRealEstateOwnerOccupiedMember2022-12-310001471265us-gaap:CommercialLoanMembernwbi:OriginatedLoanMembernwbi:CommercialBankingMember2023-12-310001471265us-gaap:CommercialLoanMembernwbi:AcquiredLoanMembernwbi:CommercialBankingMember2023-12-310001471265us-gaap:CommercialLoanMembernwbi:CommercialBankingMember2023-12-310001471265us-gaap:CommercialLoanMembernwbi:OriginatedLoanMembernwbi:CommercialBankingMember2022-12-310001471265us-gaap:CommercialLoanMembernwbi:AcquiredLoanMembernwbi:CommercialBankingMember2022-12-310001471265us-gaap:CommercialLoanMembernwbi:CommercialBankingMember2022-12-310001471265nwbi:OriginatedLoanMembernwbi:CommercialBankingMember2023-12-310001471265nwbi:AcquiredLoanMembernwbi:CommercialBankingMember2023-12-310001471265nwbi:CommercialBankingMember2023-12-310001471265nwbi:OriginatedLoanMembernwbi:CommercialBankingMember2022-12-310001471265nwbi:AcquiredLoanMembernwbi:CommercialBankingMember2022-12-310001471265nwbi:CommercialBankingMember2022-12-310001471265nwbi:OriginatedLoanMember2023-12-310001471265nwbi:AcquiredLoanMember2023-12-310001471265nwbi:OriginatedLoanMember2022-12-310001471265nwbi:AcquiredLoanMember2022-12-310001471265nwbi:SmallBusinessEquipmentFinanceLoanMember2022-01-012022-12-310001471265nwbi:OneToFourFamilyJumboMortgageLoanMember2022-01-012022-12-310001471265nwbi:PersonalBankingMemberus-gaap:ResidentialMortgageMember2023-01-012023-12-310001471265nwbi:PersonalBankingMembersrt:CumulativeEffectPeriodOfAdoptionAdjustmentMemberus-gaap:ResidentialMortgageMember2022-12-310001471265nwbi:PersonalBankingMemberus-gaap:HomeEquityLoanMember2023-01-012023-12-310001471265nwbi:PersonalBankingMembersrt:CumulativeEffectPeriodOfAdoptionAdjustmentMemberus-gaap:HomeEquityLoanMember2022-12-310001471265us-gaap:AutomobileLoanMembernwbi:PersonalBankingMember2023-01-012023-12-310001471265us-gaap:AutomobileLoanMembernwbi:PersonalBankingMembersrt:CumulativeEffectPeriodOfAdoptionAdjustmentMember2022-12-310001471265nwbi:PersonalBankingMemberus-gaap:ConsumerLoanMember2023-01-012023-12-310001471265nwbi:PersonalBankingMemberus-gaap:ConsumerLoanMembersrt:CumulativeEffectPeriodOfAdoptionAdjustmentMember2022-12-310001471265nwbi:PersonalBankingMember2023-01-012023-12-310001471265nwbi:PersonalBankingMembersrt:CumulativeEffectPeriodOfAdoptionAdjustmentMember2022-12-310001471265us-gaap:CommercialRealEstateMembernwbi:CommercialBankingMember2023-01-012023-12-310001471265us-gaap:CommercialRealEstateMembersrt:CumulativeEffectPeriodOfAdoptionAdjustmentMembernwbi:CommercialBankingMember2022-12-310001471265nwbi:CommercialBankingMembernwbi:CommercialRealEstateOwnerOccupiedMember2023-01-012023-12-310001471265srt:CumulativeEffectPeriodOfAdoptionAdjustmentMembernwbi:CommercialBankingMembernwbi:CommercialRealEstateOwnerOccupiedMember2022-12-310001471265us-gaap:CommercialLoanMembernwbi:CommercialBankingMember2023-01-012023-12-310001471265us-gaap:CommercialLoanMembersrt:CumulativeEffectPeriodOfAdoptionAdjustmentMembernwbi:CommercialBankingMember2022-12-310001471265nwbi:CommercialBankingMember2023-01-012023-12-310001471265srt:CumulativeEffectPeriodOfAdoptionAdjustmentMembernwbi:CommercialBankingMember2022-12-310001471265nwbi:PersonalBankingMemberus-gaap:ResidentialMortgageMembernwbi:OffBalanceSheetExposureMember2023-12-310001471265nwbi:PersonalBankingMemberus-gaap:ResidentialMortgageMembernwbi:OffBalanceSheetExposureMember2023-01-012023-12-310001471265nwbi:PersonalBankingMembersrt:CumulativeEffectPeriodOfAdoptionAdjustmentMemberus-gaap:ResidentialMortgageMembernwbi:OffBalanceSheetExposureMember2022-12-310001471265nwbi:PersonalBankingMemberus-gaap:ResidentialMortgageMembernwbi:OffBalanceSheetExposureMember2022-12-310001471265nwbi:PersonalBankingMembernwbi:OffBalanceSheetExposureMemberus-gaap:HomeEquityLoanMember2023-12-310001471265nwbi:PersonalBankingMembernwbi:OffBalanceSheetExposureMemberus-gaap:HomeEquityLoanMember2023-01-012023-12-310001471265nwbi:PersonalBankingMembersrt:CumulativeEffectPeriodOfAdoptionAdjustmentMembernwbi:OffBalanceSheetExposureMemberus-gaap:HomeEquityLoanMember2022-12-310001471265nwbi:PersonalBankingMembernwbi:OffBalanceSheetExposureMemberus-gaap:HomeEquityLoanMember2022-12-310001471265nwbi:PersonalBankingMembernwbi:OffBalanceSheetExposureMember2023-12-310001471265nwbi:PersonalBankingMembernwbi:OffBalanceSheetExposureMember2023-01-012023-12-310001471265nwbi:PersonalBankingMembersrt:CumulativeEffectPeriodOfAdoptionAdjustmentMembernwbi:OffBalanceSheetExposureMember2022-12-310001471265nwbi:PersonalBankingMembernwbi:OffBalanceSheetExposureMember2022-12-310001471265us-gaap:CommercialRealEstateMembernwbi:OffBalanceSheetExposureMembernwbi:CommercialBankingMember2023-12-310001471265us-gaap:CommercialRealEstateMembernwbi:OffBalanceSheetExposureMembernwbi:CommercialBankingMember2023-01-012023-12-310001471265us-gaap:CommercialRealEstateMembersrt:CumulativeEffectPeriodOfAdoptionAdjustmentMembernwbi:OffBalanceSheetExposureMembernwbi:CommercialBankingMember2022-12-310001471265us-gaap:CommercialRealEstateMembernwbi:OffBalanceSheetExposureMembernwbi:CommercialBankingMember2022-12-310001471265nwbi:OffBalanceSheetExposureMembernwbi:CommercialBankingMembernwbi:CommercialRealEstateOwnerOccupiedMember2023-12-310001471265nwbi:OffBalanceSheetExposureMembernwbi:CommercialBankingMembernwbi:CommercialRealEstateOwnerOccupiedMember2023-01-012023-12-310001471265srt:CumulativeEffectPeriodOfAdoptionAdjustmentMembernwbi:OffBalanceSheetExposureMembernwbi:CommercialBankingMembernwbi:CommercialRealEstateOwnerOccupiedMember2022-12-310001471265nwbi:OffBalanceSheetExposureMembernwbi:CommercialBankingMembernwbi:CommercialRealEstateOwnerOccupiedMember2022-12-310001471265us-gaap:CommercialLoanMembernwbi:OffBalanceSheetExposureMembernwbi:CommercialBankingMember2023-12-310001471265us-gaap:CommercialLoanMembernwbi:OffBalanceSheetExposureMembernwbi:CommercialBankingMember2023-01-012023-12-310001471265us-gaap:CommercialLoanMembersrt:CumulativeEffectPeriodOfAdoptionAdjustmentMembernwbi:OffBalanceSheetExposureMembernwbi:CommercialBankingMember2022-12-310001471265us-gaap:CommercialLoanMembernwbi:OffBalanceSheetExposureMembernwbi:CommercialBankingMember2022-12-310001471265nwbi:OffBalanceSheetExposureMembernwbi:CommercialBankingMember2023-12-310001471265nwbi:OffBalanceSheetExposureMembernwbi:CommercialBankingMember2023-01-012023-12-310001471265srt:CumulativeEffectPeriodOfAdoptionAdjustmentMembernwbi:OffBalanceSheetExposureMembernwbi:CommercialBankingMember2022-12-310001471265nwbi:OffBalanceSheetExposureMembernwbi:CommercialBankingMember2022-12-310001471265nwbi:OffBalanceSheetExposureMember2023-12-310001471265nwbi:OffBalanceSheetExposureMember2023-01-012023-12-310001471265srt:CumulativeEffectPeriodOfAdoptionAdjustmentMembernwbi:OffBalanceSheetExposureMember2022-12-310001471265nwbi:OffBalanceSheetExposureMember2022-12-3100014712652020-01-012020-12-310001471265nwbi:PersonalBankingMemberus-gaap:ResidentialMortgageMember2022-01-012022-12-310001471265nwbi:PersonalBankingMemberus-gaap:ResidentialMortgageMember2021-12-310001471265nwbi:PersonalBankingMemberus-gaap:HomeEquityLoanMember2022-01-012022-12-310001471265nwbi:PersonalBankingMemberus-gaap:HomeEquityLoanMember2021-12-310001471265us-gaap:AutomobileLoanMembernwbi:PersonalBankingMember2022-01-012022-12-310001471265us-gaap:AutomobileLoanMembernwbi:PersonalBankingMember2021-12-310001471265nwbi:PersonalBankingMemberus-gaap:ConsumerLoanMember2022-01-012022-12-310001471265nwbi:PersonalBankingMemberus-gaap:ConsumerLoanMember2021-12-310001471265nwbi:PersonalBankingMember2022-01-012022-12-310001471265nwbi:PersonalBankingMember2021-12-310001471265us-gaap:CommercialRealEstateMembernwbi:CommercialBankingMember2022-01-012022-12-310001471265us-gaap:CommercialRealEstateMembernwbi:CommercialBankingMember2021-12-310001471265nwbi:CommercialBankingMembernwbi:CommercialRealEstateOwnerOccupiedMember2022-01-012022-12-310001471265nwbi:CommercialBankingMembernwbi:CommercialRealEstateOwnerOccupiedMember2021-12-310001471265us-gaap:CommercialLoanMembernwbi:CommercialBankingMember2022-01-012022-12-310001471265us-gaap:CommercialLoanMembernwbi:CommercialBankingMember2021-12-310001471265nwbi:CommercialBankingMember2022-01-012022-12-310001471265nwbi:CommercialBankingMember2021-12-310001471265nwbi:PersonalBankingMemberus-gaap:ResidentialMortgageMembernwbi:OffBalanceSheetExposureMember2022-01-012022-12-310001471265nwbi:PersonalBankingMemberus-gaap:ResidentialMortgageMembernwbi:OffBalanceSheetExposureMember2021-12-310001471265nwbi:PersonalBankingMembernwbi:OffBalanceSheetExposureMemberus-gaap:HomeEquityLoanMember2022-01-012022-12-310001471265nwbi:PersonalBankingMembernwbi:OffBalanceSheetExposureMemberus-gaap:HomeEquityLoanMember2021-12-310001471265nwbi:PersonalBankingMembernwbi:OffBalanceSheetExposureMember2022-01-012022-12-310001471265nwbi:PersonalBankingMembernwbi:OffBalanceSheetExposureMember2021-12-310001471265us-gaap:CommercialRealEstateMembernwbi:OffBalanceSheetExposureMembernwbi:CommercialBankingMember2022-01-012022-12-310001471265us-gaap:CommercialRealEstateMembernwbi:OffBalanceSheetExposureMembernwbi:CommercialBankingMember2021-12-310001471265nwbi:OffBalanceSheetExposureMembernwbi:CommercialBankingMembernwbi:CommercialRealEstateOwnerOccupiedMember2022-01-012022-12-310001471265nwbi:OffBalanceSheetExposureMembernwbi:CommercialBankingMembernwbi:CommercialRealEstateOwnerOccupiedMember2021-12-310001471265us-gaap:CommercialLoanMembernwbi:OffBalanceSheetExposureMembernwbi:CommercialBankingMember2022-01-012022-12-310001471265us-gaap:CommercialLoanMembernwbi:OffBalanceSheetExposureMembernwbi:CommercialBankingMember2021-12-310001471265nwbi:OffBalanceSheetExposureMembernwbi:CommercialBankingMember2022-01-012022-12-310001471265nwbi:OffBalanceSheetExposureMembernwbi:CommercialBankingMember2021-12-310001471265nwbi:OffBalanceSheetExposureMember2022-01-012022-12-310001471265nwbi:OffBalanceSheetExposureMember2021-12-310001471265nwbi:PersonalBankingMemberus-gaap:ResidentialMortgageMember2021-01-012021-12-310001471265nwbi:PersonalBankingMemberus-gaap:ResidentialMortgageMember2020-12-310001471265nwbi:PersonalBankingMemberus-gaap:HomeEquityLoanMember2021-01-012021-12-310001471265nwbi:PersonalBankingMemberus-gaap:HomeEquityLoanMember2020-12-310001471265us-gaap:AutomobileLoanMembernwbi:PersonalBankingMember2021-01-012021-12-310001471265us-gaap:AutomobileLoanMembernwbi:PersonalBankingMember2020-12-310001471265nwbi:PersonalBankingMemberus-gaap:ConsumerLoanMember2021-01-012021-12-310001471265nwbi:PersonalBankingMemberus-gaap:ConsumerLoanMember2020-12-310001471265nwbi:PersonalBankingMember2021-01-012021-12-310001471265nwbi:PersonalBankingMember2020-12-310001471265us-gaap:CommercialRealEstateMembernwbi:CommercialBankingMember2021-01-012021-12-310001471265us-gaap:CommercialRealEstateMembernwbi:CommercialBankingMember2020-12-310001471265nwbi:CommercialBankingMembernwbi:CommercialRealEstateOwnerOccupiedMember2021-01-012021-12-310001471265nwbi:CommercialBankingMembernwbi:CommercialRealEstateOwnerOccupiedMember2020-12-310001471265us-gaap:CommercialLoanMembernwbi:CommercialBankingMember2021-01-012021-12-310001471265us-gaap:CommercialLoanMembernwbi:CommercialBankingMember2020-12-310001471265nwbi:CommercialBankingMember2021-01-012021-12-310001471265nwbi:CommercialBankingMember2020-12-310001471265nwbi:PersonalBankingMemberus-gaap:ResidentialMortgageMembernwbi:OffBalanceSheetExposureMember2021-01-012021-12-310001471265nwbi:PersonalBankingMemberus-gaap:ResidentialMortgageMembernwbi:OffBalanceSheetExposureMember2020-12-310001471265nwbi:PersonalBankingMembernwbi:OffBalanceSheetExposureMemberus-gaap:HomeEquityLoanMember2021-01-012021-12-310001471265nwbi:PersonalBankingMembernwbi:OffBalanceSheetExposureMemberus-gaap:HomeEquityLoanMember2020-12-310001471265nwbi:PersonalBankingMembernwbi:OffBalanceSheetExposureMember2021-01-012021-12-310001471265nwbi:PersonalBankingMembernwbi:OffBalanceSheetExposureMember2020-12-310001471265us-gaap:CommercialRealEstateMembernwbi:OffBalanceSheetExposureMembernwbi:CommercialBankingMember2021-01-012021-12-310001471265us-gaap:CommercialRealEstateMembernwbi:OffBalanceSheetExposureMembernwbi:CommercialBankingMember2020-12-310001471265nwbi:OffBalanceSheetExposureMembernwbi:CommercialBankingMembernwbi:CommercialRealEstateOwnerOccupiedMember2021-01-012021-12-310001471265nwbi:OffBalanceSheetExposureMembernwbi:CommercialBankingMembernwbi:CommercialRealEstateOwnerOccupiedMember2020-12-310001471265us-gaap:CommercialLoanMembernwbi:OffBalanceSheetExposureMembernwbi:CommercialBankingMember2021-01-012021-12-310001471265us-gaap:CommercialLoanMembernwbi:OffBalanceSheetExposureMembernwbi:CommercialBankingMember2020-12-310001471265nwbi:OffBalanceSheetExposureMembernwbi:CommercialBankingMember2021-01-012021-12-310001471265nwbi:OffBalanceSheetExposureMembernwbi:CommercialBankingMember2020-12-310001471265nwbi:OffBalanceSheetExposureMember2021-01-012021-12-310001471265nwbi:OffBalanceSheetExposureMember2020-12-310001471265nwbi:RealEstateCollateralDependentLoansMemberus-gaap:CommercialRealEstateMembernwbi:CommercialBankingMember2023-12-310001471265us-gaap:CommercialLoanMembernwbi:RealEstateCollateralDependentLoansMembernwbi:CommercialBankingMember2023-12-310001471265nwbi:RealEstateCollateralDependentLoansMembernwbi:CommercialBankingMember2023-12-310001471265nwbi:RealEstateCollateralDependentLoansMember2023-12-310001471265nwbi:RealEstateCollateralDependentLoansMembernwbi:PersonalBankingMemberus-gaap:ResidentialMortgageMember2022-12-310001471265nwbi:EquipmentCollateralDependentLoansMembernwbi:PersonalBankingMemberus-gaap:ResidentialMortgageMember2022-12-310001471265nwbi:RealEstateCollateralDependentLoansMembernwbi:PersonalBankingMemberus-gaap:HomeEquityLoanMember2022-12-310001471265nwbi:EquipmentCollateralDependentLoansMembernwbi:PersonalBankingMemberus-gaap:HomeEquityLoanMember2022-12-310001471265nwbi:RealEstateCollateralDependentLoansMembernwbi:PersonalBankingMember2022-12-310001471265nwbi:EquipmentCollateralDependentLoansMembernwbi:PersonalBankingMember2022-12-310001471265nwbi:RealEstateCollateralDependentLoansMemberus-gaap:CommercialRealEstateMembernwbi:CommercialBankingMember2022-12-310001471265nwbi:EquipmentCollateralDependentLoansMemberus-gaap:CommercialRealEstateMembernwbi:CommercialBankingMember2022-12-310001471265us-gaap:CommercialLoanMembernwbi:RealEstateCollateralDependentLoansMembernwbi:CommercialBankingMember2022-12-310001471265us-gaap:CommercialLoanMembernwbi:EquipmentCollateralDependentLoansMembernwbi:CommercialBankingMember2022-12-310001471265nwbi:RealEstateCollateralDependentLoansMembernwbi:CommercialBankingMember2022-12-310001471265nwbi:EquipmentCollateralDependentLoansMembernwbi:CommercialBankingMember2022-12-310001471265nwbi:RealEstateCollateralDependentLoansMember2022-12-310001471265nwbi:EquipmentCollateralDependentLoansMember2022-12-310001471265nwbi:PersonalBankingMemberus-gaap:ResidentialMortgageMemberus-gaap:PaymentDeferralMember2023-01-012023-12-310001471265nwbi:PersonalBankingMemberus-gaap:ResidentialMortgageMemberus-gaap:ExtendedMaturityMember2023-01-012023-12-310001471265us-gaap:ExtendedMaturityAndInterestRateReductionMembernwbi:PersonalBankingMemberus-gaap:ResidentialMortgageMember2023-01-012023-12-310001471265nwbi:PersonalBankingMemberus-gaap:PaymentDeferralMemberus-gaap:HomeEquityLoanMember2023-01-012023-12-310001471265nwbi:PersonalBankingMemberus-gaap:ExtendedMaturityMemberus-gaap:HomeEquityLoanMember2023-01-012023-12-310001471265us-gaap:ExtendedMaturityAndInterestRateReductionMembernwbi:PersonalBankingMemberus-gaap:HomeEquityLoanMember2023-01-012023-12-310001471265nwbi:PersonalBankingMemberus-gaap:ConsumerLoanMemberus-gaap:PaymentDeferralMember2023-01-012023-12-310001471265nwbi:PersonalBankingMemberus-gaap:ConsumerLoanMemberus-gaap:ExtendedMaturityMember2023-01-012023-12-310001471265us-gaap:ExtendedMaturityAndInterestRateReductionMembernwbi:PersonalBankingMemberus-gaap:ConsumerLoanMember2023-01-012023-12-310001471265nwbi:PersonalBankingMemberus-gaap:PaymentDeferralMember2023-01-012023-12-310001471265nwbi:PersonalBankingMemberus-gaap:ExtendedMaturityMember2023-01-012023-12-310001471265us-gaap:ExtendedMaturityAndInterestRateReductionMembernwbi:PersonalBankingMember2023-01-012023-12-310001471265us-gaap:CommercialRealEstateMembernwbi:CommercialBankingMemberus-gaap:PaymentDeferralMember2023-01-012023-12-310001471265us-gaap:CommercialRealEstateMembernwbi:CommercialBankingMemberus-gaap:ExtendedMaturityMember2023-01-012023-12-310001471265us-gaap:ExtendedMaturityAndInterestRateReductionMemberus-gaap:CommercialRealEstateMembernwbi:CommercialBankingMember2023-01-012023-12-310001471265us-gaap:CommercialLoanMembernwbi:CommercialBankingMemberus-gaap:PaymentDeferralMember2023-01-012023-12-310001471265us-gaap:CommercialLoanMembernwbi:CommercialBankingMemberus-gaap:ExtendedMaturityMember2023-01-012023-12-310001471265us-gaap:CommercialLoanMemberus-gaap:ExtendedMaturityAndInterestRateReductionMembernwbi:CommercialBankingMember2023-01-012023-12-310001471265nwbi:CommercialBankingMemberus-gaap:PaymentDeferralMember2023-01-012023-12-310001471265nwbi:CommercialBankingMemberus-gaap:ExtendedMaturityMember2023-01-012023-12-310001471265us-gaap:ExtendedMaturityAndInterestRateReductionMembernwbi:CommercialBankingMember2023-01-012023-12-310001471265us-gaap:PaymentDeferralMember2023-01-012023-12-310001471265us-gaap:ExtendedMaturityMember2023-01-012023-12-310001471265us-gaap:ExtendedMaturityAndInterestRateReductionMember2023-01-012023-12-310001471265us-gaap:FinancialAssetNotPastDueMembernwbi:PersonalBankingMemberus-gaap:ResidentialMortgageMember2023-01-012023-12-310001471265nwbi:PersonalBankingMemberus-gaap:ResidentialMortgageMemberus-gaap:FinancingReceivables30To59DaysPastDueMember2023-01-012023-12-310001471265nwbi:PersonalBankingMemberus-gaap:FinancingReceivables60To89DaysPastDueMemberus-gaap:ResidentialMortgageMember2023-01-012023-12-310001471265us-gaap:FinancingReceivablesEqualToGreaterThan90DaysPastDueMembernwbi:PersonalBankingMemberus-gaap:ResidentialMortgageMember2023-01-012023-12-310001471265us-gaap:FinancialAssetNotPastDueMembernwbi:PersonalBankingMemberus-gaap:HomeEquityLoanMember2023-01-012023-12-310001471265nwbi:PersonalBankingMemberus-gaap:FinancingReceivables30To59DaysPastDueMemberus-gaap:HomeEquityLoanMember2023-01-012023-12-310001471265nwbi:PersonalBankingMemberus-gaap:FinancingReceivables60To89DaysPastDueMemberus-gaap:HomeEquityLoanMember2023-01-012023-12-310001471265us-gaap:FinancingReceivablesEqualToGreaterThan90DaysPastDueMembernwbi:PersonalBankingMemberus-gaap:HomeEquityLoanMember2023-01-012023-12-310001471265us-gaap:FinancialAssetNotPastDueMembernwbi:PersonalBankingMemberus-gaap:ConsumerLoanMember2023-01-012023-12-310001471265nwbi:PersonalBankingMemberus-gaap:ConsumerLoanMemberus-gaap:FinancingReceivables30To59DaysPastDueMember2023-01-012023-12-310001471265nwbi:PersonalBankingMemberus-gaap:ConsumerLoanMemberus-gaap:FinancingReceivables60To89DaysPastDueMember2023-01-012023-12-310001471265us-gaap:FinancingReceivablesEqualToGreaterThan90DaysPastDueMembernwbi:PersonalBankingMemberus-gaap:ConsumerLoanMember2023-01-012023-12-310001471265us-gaap:FinancialAssetNotPastDueMembernwbi:PersonalBankingMember2023-01-012023-12-310001471265nwbi:PersonalBankingMemberus-gaap:FinancingReceivables30To59DaysPastDueMember2023-01-012023-12-310001471265nwbi:PersonalBankingMemberus-gaap:FinancingReceivables60To89DaysPastDueMember2023-01-012023-12-310001471265us-gaap:FinancingReceivablesEqualToGreaterThan90DaysPastDueMembernwbi:PersonalBankingMember2023-01-012023-12-310001471265us-gaap:FinancialAssetNotPastDueMemberus-gaap:CommercialRealEstateMembernwbi:CommercialBankingMember2023-01-012023-12-310001471265us-gaap:CommercialRealEstateMembernwbi:CommercialBankingMemberus-gaap:FinancingReceivables30To59DaysPastDueMember2023-01-012023-12-310001471265us-gaap:CommercialRealEstateMemberus-gaap:FinancingReceivables60To89DaysPastDueMembernwbi:CommercialBankingMember2023-01-012023-12-310001471265us-gaap:FinancingReceivablesEqualToGreaterThan90DaysPastDueMemberus-gaap:CommercialRealEstateMembernwbi:CommercialBankingMember2023-01-012023-12-310001471265us-gaap:FinancialAssetNotPastDueMemberus-gaap:CommercialLoanMembernwbi:CommercialBankingMember2023-01-012023-12-310001471265us-gaap:CommercialLoanMembernwbi:CommercialBankingMemberus-gaap:FinancingReceivables30To59DaysPastDueMember2023-01-012023-12-310001471265us-gaap:CommercialLoanMemberus-gaap:FinancingReceivables60To89DaysPastDueMembernwbi:CommercialBankingMember2023-01-012023-12-310001471265us-gaap:CommercialLoanMemberus-gaap:FinancingReceivablesEqualToGreaterThan90DaysPastDueMembernwbi:CommercialBankingMember2023-01-012023-12-310001471265us-gaap:FinancialAssetNotPastDueMembernwbi:CommercialBankingMember2023-01-012023-12-310001471265nwbi:CommercialBankingMemberus-gaap:FinancingReceivables30To59DaysPastDueMember2023-01-012023-12-310001471265us-gaap:FinancingReceivables60To89DaysPastDueMembernwbi:CommercialBankingMember2023-01-012023-12-310001471265us-gaap:FinancingReceivablesEqualToGreaterThan90DaysPastDueMembernwbi:CommercialBankingMember2023-01-012023-12-310001471265us-gaap:FinancialAssetNotPastDueMember2023-01-012023-12-310001471265us-gaap:FinancingReceivables30To59DaysPastDueMember2023-01-012023-12-310001471265us-gaap:FinancingReceivables60To89DaysPastDueMember2023-01-012023-12-310001471265us-gaap:FinancingReceivablesEqualToGreaterThan90DaysPastDueMember2023-01-012023-12-31nwbi:contract0001471265us-gaap:ResidentialMortgageMember2023-01-012023-12-310001471265us-gaap:CommercialRealEstateMember2023-01-012023-12-310001471265us-gaap:CommercialLoanMember2023-01-012023-12-310001471265us-gaap:HomeEquityLoanMember2023-01-012023-12-310001471265nwbi:CommercialRealEstateOwnerOccupiedMember2023-01-012023-12-310001471265us-gaap:InterestRateBelowMarketReductionMembernwbi:PersonalBankingMemberus-gaap:ResidentialMortgageMember2023-01-012023-12-310001471265nwbi:PaymentModificationMembernwbi:PersonalBankingMemberus-gaap:ResidentialMortgageMember2023-01-012023-12-310001471265us-gaap:InterestRateBelowMarketReductionMembernwbi:PersonalBankingMemberus-gaap:HomeEquityLoanMember2023-01-012023-12-310001471265nwbi:PaymentModificationMembernwbi:PersonalBankingMemberus-gaap:HomeEquityLoanMember2023-01-012023-12-310001471265us-gaap:InterestRateBelowMarketReductionMembernwbi:PersonalBankingMember2023-01-012023-12-310001471265nwbi:PaymentModificationMembernwbi:PersonalBankingMember2023-01-012023-12-310001471265us-gaap:InterestRateBelowMarketReductionMemberus-gaap:CommercialRealEstateMembernwbi:CommercialBankingMember2023-01-012023-12-310001471265nwbi:PaymentModificationMemberus-gaap:CommercialRealEstateMembernwbi:CommercialBankingMember2023-01-012023-12-310001471265us-gaap:CommercialLoanMemberus-gaap:InterestRateBelowMarketReductionMembernwbi:CommercialBankingMember2023-01-012023-12-310001471265us-gaap:CommercialLoanMembernwbi:PaymentModificationMembernwbi:CommercialBankingMember2023-01-012023-12-310001471265us-gaap:InterestRateBelowMarketReductionMembernwbi:CommercialBankingMember2023-01-012023-12-310001471265nwbi:PaymentModificationMembernwbi:CommercialBankingMember2023-01-012023-12-310001471265us-gaap:InterestRateBelowMarketReductionMember2023-01-012023-12-310001471265nwbi:PaymentModificationMember2023-01-012023-12-310001471265us-gaap:InterestRateBelowMarketReductionMembernwbi:PersonalBankingMemberus-gaap:ResidentialMortgageMember2022-01-012022-12-310001471265nwbi:PaymentModificationMembernwbi:PersonalBankingMemberus-gaap:ResidentialMortgageMember2022-01-012022-12-310001471265nwbi:PersonalBankingMemberus-gaap:ResidentialMortgageMemberus-gaap:ExtendedMaturityMember2022-01-012022-12-310001471265nwbi:OtherModificationMembernwbi:PersonalBankingMemberus-gaap:ResidentialMortgageMember2022-01-012022-12-310001471265us-gaap:InterestRateBelowMarketReductionMembernwbi:PersonalBankingMemberus-gaap:HomeEquityLoanMember2022-01-012022-12-310001471265nwbi:PaymentModificationMembernwbi:PersonalBankingMemberus-gaap:HomeEquityLoanMember2022-01-012022-12-310001471265nwbi:PersonalBankingMemberus-gaap:ExtendedMaturityMemberus-gaap:HomeEquityLoanMember2022-01-012022-12-310001471265nwbi:OtherModificationMembernwbi:PersonalBankingMemberus-gaap:HomeEquityLoanMember2022-01-012022-12-310001471265us-gaap:InterestRateBelowMarketReductionMembernwbi:PersonalBankingMember2022-01-012022-12-310001471265nwbi:PaymentModificationMembernwbi:PersonalBankingMember2022-01-012022-12-310001471265nwbi:PersonalBankingMemberus-gaap:ExtendedMaturityMember2022-01-012022-12-310001471265nwbi:OtherModificationMembernwbi:PersonalBankingMember2022-01-012022-12-310001471265us-gaap:InterestRateBelowMarketReductionMemberus-gaap:CommercialRealEstateMembernwbi:CommercialBankingMember2022-01-012022-12-310001471265nwbi:PaymentModificationMemberus-gaap:CommercialRealEstateMembernwbi:CommercialBankingMember2022-01-012022-12-310001471265us-gaap:CommercialRealEstateMembernwbi:CommercialBankingMemberus-gaap:ExtendedMaturityMember2022-01-012022-12-310001471265nwbi:OtherModificationMemberus-gaap:CommercialRealEstateMembernwbi:CommercialBankingMember2022-01-012022-12-310001471265us-gaap:CommercialLoanMemberus-gaap:InterestRateBelowMarketReductionMembernwbi:CommercialBankingMember2022-01-012022-12-310001471265us-gaap:CommercialLoanMembernwbi:PaymentModificationMembernwbi:CommercialBankingMember2022-01-012022-12-310001471265us-gaap:CommercialLoanMembernwbi:CommercialBankingMemberus-gaap:ExtendedMaturityMember2022-01-012022-12-310001471265us-gaap:CommercialLoanMembernwbi:OtherModificationMembernwbi:CommercialBankingMember2022-01-012022-12-310001471265us-gaap:InterestRateBelowMarketReductionMembernwbi:CommercialBankingMember2022-01-012022-12-310001471265nwbi:PaymentModificationMembernwbi:CommercialBankingMember2022-01-012022-12-310001471265nwbi:CommercialBankingMemberus-gaap:ExtendedMaturityMember2022-01-012022-12-310001471265nwbi:OtherModificationMembernwbi:CommercialBankingMember2022-01-012022-12-310001471265us-gaap:InterestRateBelowMarketReductionMember2022-01-012022-12-310001471265nwbi:PaymentModificationMember2022-01-012022-12-310001471265us-gaap:ExtendedMaturityMember2022-01-012022-12-310001471265nwbi:OtherModificationMember2022-01-012022-12-310001471265nwbi:PersonalBankingMemberus-gaap:ResidentialMortgageMemberus-gaap:FinancingReceivables30To59DaysPastDueMember2023-12-310001471265nwbi:PersonalBankingMemberus-gaap:FinancingReceivables60To89DaysPastDueMemberus-gaap:ResidentialMortgageMember2023-12-310001471265us-gaap:FinancingReceivablesEqualToGreaterThan90DaysPastDueMembernwbi:PersonalBankingMemberus-gaap:ResidentialMortgageMember2023-12-310001471265nwbi:PersonalBankingMemberus-gaap:FinancialAssetPastDueMemberus-gaap:ResidentialMortgageMember2023-12-310001471265us-gaap:FinancialAssetNotPastDueMembernwbi:PersonalBankingMemberus-gaap:ResidentialMortgageMember2023-12-310001471265nwbi:PersonalBankingMemberus-gaap:FinancingReceivables30To59DaysPastDueMemberus-gaap:HomeEquityLoanMember2023-12-310001471265nwbi:PersonalBankingMemberus-gaap:FinancingReceivables60To89DaysPastDueMemberus-gaap:HomeEquityLoanMember2023-12-310001471265us-gaap:FinancingReceivablesEqualToGreaterThan90DaysPastDueMembernwbi:PersonalBankingMemberus-gaap:HomeEquityLoanMember2023-12-310001471265nwbi:PersonalBankingMemberus-gaap:FinancialAssetPastDueMemberus-gaap:HomeEquityLoanMember2023-12-310001471265us-gaap:FinancialAssetNotPastDueMembernwbi:PersonalBankingMemberus-gaap:HomeEquityLoanMember2023-12-310001471265us-gaap:AutomobileLoanMembernwbi:PersonalBankingMemberus-gaap:FinancingReceivables30To59DaysPastDueMember2023-12-310001471265us-gaap:AutomobileLoanMembernwbi:PersonalBankingMemberus-gaap:FinancingReceivables60To89DaysPastDueMember2023-12-310001471265us-gaap:FinancingReceivablesEqualToGreaterThan90DaysPastDueMemberus-gaap:AutomobileLoanMembernwbi:PersonalBankingMember2023-12-310001471265us-gaap:AutomobileLoanMembernwbi:PersonalBankingMemberus-gaap:FinancialAssetPastDueMember2023-12-310001471265us-gaap:FinancialAssetNotPastDueMemberus-gaap:AutomobileLoanMembernwbi:PersonalBankingMember2023-12-310001471265nwbi:PersonalBankingMemberus-gaap:ConsumerLoanMemberus-gaap:FinancingReceivables30To59DaysPastDueMember2023-12-310001471265nwbi:PersonalBankingMemberus-gaap:ConsumerLoanMemberus-gaap:FinancingReceivables60To89DaysPastDueMember2023-12-310001471265us-gaap:FinancingReceivablesEqualToGreaterThan90DaysPastDueMembernwbi:PersonalBankingMemberus-gaap:ConsumerLoanMember2023-12-310001471265nwbi:PersonalBankingMemberus-gaap:FinancialAssetPastDueMemberus-gaap:ConsumerLoanMember2023-12-310001471265us-gaap:FinancialAssetNotPastDueMembernwbi:PersonalBankingMemberus-gaap:ConsumerLoanMember2023-12-310001471265nwbi:PersonalBankingMemberus-gaap:FinancingReceivables30To59DaysPastDueMember2023-12-310001471265nwbi:PersonalBankingMemberus-gaap:FinancingReceivables60To89DaysPastDueMember2023-12-310001471265us-gaap:FinancingReceivablesEqualToGreaterThan90DaysPastDueMembernwbi:PersonalBankingMember2023-12-310001471265nwbi:PersonalBankingMemberus-gaap:FinancialAssetPastDueMember2023-12-310001471265us-gaap:FinancialAssetNotPastDueMembernwbi:PersonalBankingMember2023-12-310001471265us-gaap:CommercialRealEstateMembernwbi:CommercialBankingMemberus-gaap:FinancingReceivables30To59DaysPastDueMember2023-12-310001471265us-gaap:CommercialRealEstateMemberus-gaap:FinancingReceivables60To89DaysPastDueMembernwbi:CommercialBankingMember2023-12-310001471265us-gaap:FinancingReceivablesEqualToGreaterThan90DaysPastDueMemberus-gaap:CommercialRealEstateMembernwbi:CommercialBankingMember2023-12-310001471265us-gaap:FinancialAssetPastDueMemberus-gaap:CommercialRealEstateMembernwbi:CommercialBankingMember2023-12-310001471265us-gaap:FinancialAssetNotPastDueMemberus-gaap:CommercialRealEstateMembernwbi:CommercialBankingMember2023-12-310001471265nwbi:CommercialBankingMemberus-gaap:FinancingReceivables30To59DaysPastDueMembernwbi:CommercialRealEstateOwnerOccupiedMember2023-12-310001471265us-gaap:FinancingReceivables60To89DaysPastDueMembernwbi:CommercialBankingMembernwbi:CommercialRealEstateOwnerOccupiedMember2023-12-310001471265us-gaap:FinancingReceivablesEqualToGreaterThan90DaysPastDueMembernwbi:CommercialBankingMembernwbi:CommercialRealEstateOwnerOccupiedMember2023-12-310001471265us-gaap:FinancialAssetPastDueMembernwbi:CommercialBankingMembernwbi:CommercialRealEstateOwnerOccupiedMember2023-12-310001471265us-gaap:FinancialAssetNotPastDueMembernwbi:CommercialBankingMembernwbi:CommercialRealEstateOwnerOccupiedMember2023-12-310001471265us-gaap:CommercialLoanMembernwbi:CommercialBankingMemberus-gaap:FinancingReceivables30To59DaysPastDueMember2023-12-310001471265us-gaap:CommercialLoanMemberus-gaap:FinancingReceivables60To89DaysPastDueMembernwbi:CommercialBankingMember2023-12-310001471265us-gaap:CommercialLoanMemberus-gaap:FinancingReceivablesEqualToGreaterThan90DaysPastDueMembernwbi:CommercialBankingMember2023-12-310001471265us-gaap:CommercialLoanMemberus-gaap:FinancialAssetPastDueMembernwbi:CommercialBankingMember2023-12-310001471265us-gaap:FinancialAssetNotPastDueMemberus-gaap:CommercialLoanMembernwbi:CommercialBankingMember2023-12-310001471265nwbi:CommercialBankingMemberus-gaap:FinancingReceivables30To59DaysPastDueMember2023-12-310001471265us-gaap:FinancingReceivables60To89DaysPastDueMembernwbi:CommercialBankingMember2023-12-310001471265us-gaap:FinancingReceivablesEqualToGreaterThan90DaysPastDueMembernwbi:CommercialBankingMember2023-12-310001471265us-gaap:FinancialAssetPastDueMembernwbi:CommercialBankingMember2023-12-310001471265us-gaap:FinancialAssetNotPastDueMembernwbi:CommercialBankingMember2023-12-310001471265us-gaap:FinancingReceivables30To59DaysPastDueMember2023-12-310001471265us-gaap:FinancingReceivables60To89DaysPastDueMember2023-12-310001471265us-gaap:FinancingReceivablesEqualToGreaterThan90DaysPastDueMember2023-12-310001471265us-gaap:FinancialAssetPastDueMember2023-12-310001471265us-gaap:FinancialAssetNotPastDueMember2023-12-310001471265nwbi:PersonalBankingMemberus-gaap:ResidentialMortgageMemberus-gaap:FinancingReceivables30To59DaysPastDueMember2022-12-310001471265nwbi:PersonalBankingMemberus-gaap:FinancingReceivables60To89DaysPastDueMemberus-gaap:ResidentialMortgageMember2022-12-310001471265us-gaap:FinancingReceivablesEqualToGreaterThan90DaysPastDueMembernwbi:PersonalBankingMemberus-gaap:ResidentialMortgageMember2022-12-310001471265nwbi:PersonalBankingMemberus-gaap:FinancialAssetPastDueMemberus-gaap:ResidentialMortgageMember2022-12-310001471265us-gaap:FinancialAssetNotPastDueMembernwbi:PersonalBankingMemberus-gaap:ResidentialMortgageMember2022-12-310001471265nwbi:PersonalBankingMemberus-gaap:FinancingReceivables30To59DaysPastDueMemberus-gaap:HomeEquityLoanMember2022-12-310001471265nwbi:PersonalBankingMemberus-gaap:FinancingReceivables60To89DaysPastDueMemberus-gaap:HomeEquityLoanMember2022-12-310001471265us-gaap:FinancingReceivablesEqualToGreaterThan90DaysPastDueMembernwbi:PersonalBankingMemberus-gaap:HomeEquityLoanMember2022-12-310001471265nwbi:PersonalBankingMemberus-gaap:FinancialAssetPastDueMemberus-gaap:HomeEquityLoanMember2022-12-310001471265us-gaap:FinancialAssetNotPastDueMembernwbi:PersonalBankingMemberus-gaap:HomeEquityLoanMember2022-12-310001471265us-gaap:AutomobileLoanMembernwbi:PersonalBankingMemberus-gaap:FinancingReceivables30To59DaysPastDueMember2022-12-310001471265us-gaap:AutomobileLoanMembernwbi:PersonalBankingMemberus-gaap:FinancingReceivables60To89DaysPastDueMember2022-12-310001471265us-gaap:FinancingReceivablesEqualToGreaterThan90DaysPastDueMemberus-gaap:AutomobileLoanMembernwbi:PersonalBankingMember2022-12-310001471265us-gaap:AutomobileLoanMembernwbi:PersonalBankingMemberus-gaap:FinancialAssetPastDueMember2022-12-310001471265us-gaap:FinancialAssetNotPastDueMemberus-gaap:AutomobileLoanMembernwbi:PersonalBankingMember2022-12-310001471265nwbi:PersonalBankingMemberus-gaap:ConsumerLoanMemberus-gaap:FinancingReceivables30To59DaysPastDueMember2022-12-310001471265nwbi:PersonalBankingMemberus-gaap:ConsumerLoanMemberus-gaap:FinancingReceivables60To89DaysPastDueMember2022-12-310001471265us-gaap:FinancingReceivablesEqualToGreaterThan90DaysPastDueMembernwbi:PersonalBankingMemberus-gaap:ConsumerLoanMember2022-12-310001471265nwbi:PersonalBankingMemberus-gaap:FinancialAssetPastDueMemberus-gaap:ConsumerLoanMember2022-12-310001471265us-gaap:FinancialAssetNotPastDueMembernwbi:PersonalBankingMemberus-gaap:ConsumerLoanMember2022-12-310001471265nwbi:PersonalBankingMemberus-gaap:FinancingReceivables30To59DaysPastDueMember2022-12-310001471265nwbi:PersonalBankingMemberus-gaap:FinancingReceivables60To89DaysPastDueMember2022-12-310001471265us-gaap:FinancingReceivablesEqualToGreaterThan90DaysPastDueMembernwbi:PersonalBankingMember2022-12-310001471265nwbi:PersonalBankingMemberus-gaap:FinancialAssetPastDueMember2022-12-310001471265us-gaap:FinancialAssetNotPastDueMembernwbi:PersonalBankingMember2022-12-310001471265us-gaap:CommercialRealEstateMembernwbi:CommercialBankingMemberus-gaap:FinancingReceivables30To59DaysPastDueMember2022-12-310001471265us-gaap:CommercialRealEstateMemberus-gaap:FinancingReceivables60To89DaysPastDueMembernwbi:CommercialBankingMember2022-12-310001471265us-gaap:FinancingReceivablesEqualToGreaterThan90DaysPastDueMemberus-gaap:CommercialRealEstateMembernwbi:CommercialBankingMember2022-12-310001471265us-gaap:FinancialAssetPastDueMemberus-gaap:CommercialRealEstateMembernwbi:CommercialBankingMember2022-12-310001471265us-gaap:FinancialAssetNotPastDueMemberus-gaap:CommercialRealEstateMembernwbi:CommercialBankingMember2022-12-310001471265nwbi:CommercialBankingMemberus-gaap:FinancingReceivables30To59DaysPastDueMembernwbi:CommercialRealEstateOwnerOccupiedMember2022-12-310001471265us-gaap:FinancingReceivables60To89DaysPastDueMembernwbi:CommercialBankingMembernwbi:CommercialRealEstateOwnerOccupiedMember2022-12-310001471265us-gaap:FinancingReceivablesEqualToGreaterThan90DaysPastDueMembernwbi:CommercialBankingMembernwbi:CommercialRealEstateOwnerOccupiedMember2022-12-310001471265us-gaap:FinancialAssetPastDueMembernwbi:CommercialBankingMembernwbi:CommercialRealEstateOwnerOccupiedMember2022-12-310001471265us-gaap:FinancialAssetNotPastDueMembernwbi:CommercialBankingMembernwbi:CommercialRealEstateOwnerOccupiedMember2022-12-310001471265us-gaap:CommercialLoanMembernwbi:CommercialBankingMemberus-gaap:FinancingReceivables30To59DaysPastDueMember2022-12-310001471265us-gaap:CommercialLoanMemberus-gaap:FinancingReceivables60To89DaysPastDueMembernwbi:CommercialBankingMember2022-12-310001471265us-gaap:CommercialLoanMemberus-gaap:FinancingReceivablesEqualToGreaterThan90DaysPastDueMembernwbi:CommercialBankingMember2022-12-310001471265us-gaap:CommercialLoanMemberus-gaap:FinancialAssetPastDueMembernwbi:CommercialBankingMember2022-12-310001471265us-gaap:FinancialAssetNotPastDueMemberus-gaap:CommercialLoanMembernwbi:CommercialBankingMember2022-12-310001471265nwbi:CommercialBankingMemberus-gaap:FinancingReceivables30To59DaysPastDueMember2022-12-310001471265us-gaap:FinancingReceivables60To89DaysPastDueMembernwbi:CommercialBankingMember2022-12-310001471265us-gaap:FinancingReceivablesEqualToGreaterThan90DaysPastDueMembernwbi:CommercialBankingMember2022-12-310001471265us-gaap:FinancialAssetPastDueMembernwbi:CommercialBankingMember2022-12-310001471265us-gaap:FinancialAssetNotPastDueMembernwbi:CommercialBankingMember2022-12-310001471265us-gaap:FinancingReceivables30To59DaysPastDueMember2022-12-310001471265us-gaap:FinancingReceivables60To89DaysPastDueMember2022-12-310001471265us-gaap:FinancingReceivablesEqualToGreaterThan90DaysPastDueMember2022-12-310001471265us-gaap:FinancialAssetPastDueMember2022-12-310001471265us-gaap:FinancialAssetNotPastDueMember2022-12-310001471265nwbi:SpecialMentionAndSubstandardMembersrt:MinimumMember2023-12-310001471265nwbi:PersonalBankingMemberus-gaap:ResidentialMortgageMemberus-gaap:PassMember2023-12-310001471265us-gaap:SubstandardMembernwbi:PersonalBankingMemberus-gaap:ResidentialMortgageMember2023-12-310001471265nwbi:PersonalBankingMemberus-gaap:PassMemberus-gaap:HomeEquityLoanMember2023-12-310001471265us-gaap:SubstandardMembernwbi:PersonalBankingMemberus-gaap:HomeEquityLoanMember2023-12-310001471265us-gaap:AutomobileLoanMembernwbi:PersonalBankingMemberus-gaap:PassMember2023-12-310001471265us-gaap:SubstandardMemberus-gaap:AutomobileLoanMembernwbi:PersonalBankingMember2023-12-310001471265nwbi:PersonalBankingMemberus-gaap:ConsumerLoanMemberus-gaap:PassMember2023-12-310001471265us-gaap:SubstandardMembernwbi:PersonalBankingMemberus-gaap:ConsumerLoanMember2023-12-310001471265us-gaap:CommercialRealEstateMembernwbi:CommercialBankingMemberus-gaap:PassMember2023-12-310001471265us-gaap:SpecialMentionMemberus-gaap:CommercialRealEstateMembernwbi:CommercialBankingMember2023-12-310001471265us-gaap:SubstandardMemberus-gaap:CommercialRealEstateMembernwbi:CommercialBankingMember2023-12-310001471265nwbi:CommercialBankingMemberus-gaap:PassMembernwbi:CommercialRealEstateOwnerOccupiedMember2023-12-310001471265us-gaap:SpecialMentionMembernwbi:CommercialBankingMembernwbi:CommercialRealEstateOwnerOccupiedMember2023-12-310001471265us-gaap:SubstandardMembernwbi:CommercialBankingMembernwbi:CommercialRealEstateOwnerOccupiedMember2023-12-310001471265us-gaap:CommercialLoanMembernwbi:CommercialBankingMemberus-gaap:PassMember2023-12-310001471265us-gaap:CommercialLoanMemberus-gaap:SpecialMentionMembernwbi:CommercialBankingMember2023-12-310001471265us-gaap:CommercialLoanMemberus-gaap:SubstandardMembernwbi:CommercialBankingMember2023-12-310001471265nwbi:PersonalBankingMemberus-gaap:ResidentialMortgageMemberus-gaap:PassMember2022-12-310001471265us-gaap:SubstandardMembernwbi:PersonalBankingMemberus-gaap:ResidentialMortgageMember2022-12-310001471265nwbi:PersonalBankingMemberus-gaap:PassMemberus-gaap:HomeEquityLoanMember2022-12-310001471265us-gaap:SubstandardMembernwbi:PersonalBankingMemberus-gaap:HomeEquityLoanMember2022-12-310001471265us-gaap:AutomobileLoanMembernwbi:PersonalBankingMemberus-gaap:PassMember2022-12-310001471265us-gaap:SubstandardMemberus-gaap:AutomobileLoanMembernwbi:PersonalBankingMember2022-12-310001471265nwbi:PersonalBankingMemberus-gaap:ConsumerLoanMemberus-gaap:PassMember2022-12-310001471265us-gaap:SubstandardMembernwbi:PersonalBankingMemberus-gaap:ConsumerLoanMember2022-12-310001471265us-gaap:CommercialRealEstateMembernwbi:CommercialBankingMemberus-gaap:PassMember2022-12-310001471265us-gaap:SpecialMentionMemberus-gaap:CommercialRealEstateMembernwbi:CommercialBankingMember2022-12-310001471265us-gaap:SubstandardMemberus-gaap:CommercialRealEstateMembernwbi:CommercialBankingMember2022-12-310001471265nwbi:CommercialBankingMemberus-gaap:PassMembernwbi:CommercialRealEstateOwnerOccupiedMember2022-12-310001471265us-gaap:SpecialMentionMembernwbi:CommercialBankingMembernwbi:CommercialRealEstateOwnerOccupiedMember2022-12-310001471265us-gaap:SubstandardMembernwbi:CommercialBankingMembernwbi:CommercialRealEstateOwnerOccupiedMember2022-12-310001471265us-gaap:CommercialLoanMembernwbi:CommercialBankingMemberus-gaap:PassMember2022-12-310001471265us-gaap:CommercialLoanMemberus-gaap:SpecialMentionMembernwbi:CommercialBankingMember2022-12-310001471265us-gaap:CommercialLoanMemberus-gaap:SubstandardMembernwbi:CommercialBankingMember2022-12-310001471265us-gaap:LoanOriginationCommitmentsMember2023-12-310001471265us-gaap:LoanOriginationCommitmentsMember2022-12-310001471265us-gaap:CommitmentsToExtendCreditMember2023-12-310001471265us-gaap:CommitmentsToExtendCreditMember2022-12-310001471265us-gaap:StandbyLettersOfCreditMember2023-12-310001471265us-gaap:StandbyLettersOfCreditMember2022-12-310001471265nwbi:PrivateLabelCreditCardFacilitiesMember2023-12-310001471265nwbi:CreditCardsIssuedMembernwbi:PrivateLabelCreditCardFacilitiesMember2023-12-310001471265srt:FederalHomeLoanBankOfPittsburghMember2023-12-31nwbi:subclass0001471265nwbi:FederalHomeLoanBankCapitalStockSubclassB1Membersrt:MinimumMembersrt:FederalHomeLoanBankOfPittsburghMember2023-01-012023-12-310001471265nwbi:FederalHomeLoanBankCapitalStockSubclassB1Membersrt:MaximumMembersrt:FederalHomeLoanBankOfPittsburghMember2023-01-012023-12-310001471265nwbi:FederalHomeLoanBankCapitalStockSubclassB1Membersrt:FederalHomeLoanBankOfPittsburghMember2023-01-012023-12-310001471265srt:MinimumMembernwbi:FederalHomeLoanBankCapitalStockSubclassB2Membersrt:FederalHomeLoanBankOfPittsburghMember2023-01-012023-12-310001471265nwbi:FederalHomeLoanBankCapitalStockSubclassB2Membersrt:MaximumMembersrt:FederalHomeLoanBankOfPittsburghMember2023-01-012023-12-310001471265nwbi:FederalHomeLoanBankCapitalStockSubclassB2Membersrt:FederalHomeLoanBankOfPittsburghMember2023-01-012023-12-310001471265srt:FederalHomeLoanBankOfIndianapolisMembersrt:MinimumMembernwbi:FederalHomeLoanBankCapitalStockSubclassB2Member2023-01-012023-12-310001471265srt:FederalHomeLoanBankOfIndianapolisMembernwbi:FederalHomeLoanBankCapitalStockSubclassB2Membersrt:MaximumMember2023-01-012023-12-310001471265srt:FederalHomeLoanBankOfIndianapolisMembernwbi:FederalHomeLoanBankCapitalStockSubclassB2Member2023-01-012023-12-310001471265srt:FederalHomeLoanBankOfIndianapolisMember2023-01-012023-12-310001471265srt:FederalHomeLoanBankOfPittsburghMember2022-12-310001471265srt:FederalHomeLoanBankOfIndianapolisMember2023-12-310001471265srt:FederalHomeLoanBankOfIndianapolisMember2022-12-310001471265us-gaap:LandAndLandImprovementsMember2023-12-310001471265us-gaap:LandAndLandImprovementsMember2022-12-310001471265us-gaap:BuildingAndBuildingImprovementsMember2023-12-310001471265us-gaap:BuildingAndBuildingImprovementsMember2022-12-310001471265nwbi:FurnitureFixturesAndEquipmentMember2023-12-310001471265nwbi:FurnitureFixturesAndEquipmentMember2022-12-310001471265us-gaap:LeaseholdImprovementsMember2023-12-310001471265us-gaap:LeaseholdImprovementsMember2022-12-310001471265us-gaap:CoreDepositsMember2023-12-310001471265us-gaap:CoreDepositsMember2022-12-310001471265us-gaap:CustomerContractsMember2023-12-310001471265us-gaap:CustomerContractsMember2022-12-310001471265nwbi:TermNotesPayableToBanksMembersrt:FederalHomeLoanBankOfPittsburghMember2023-12-310001471265nwbi:TermNotesPayableToBanksMembersrt:FederalHomeLoanBankOfPittsburghMember2022-12-310001471265us-gaap:NotesPayableToBanksMembersrt:FederalHomeLoanBankOfPittsburghMember2023-12-310001471265us-gaap:NotesPayableToBanksMembersrt:FederalHomeLoanBankOfPittsburghMember2022-12-310001471265us-gaap:SecuritiesSoldUnderAgreementsToRepurchaseMember2023-12-310001471265us-gaap:SecuritiesSoldUnderAgreementsToRepurchaseMember2022-12-310001471265nwbi:SecuritiesReceivedUnderAgreementsToRepurchaseMember2023-12-310001471265nwbi:SecuritiesReceivedUnderAgreementsToRepurchaseMember2022-12-310001471265srt:FederalHomeLoanBankOfPittsburghMembernwbi:ResidentialFirstMortgageAndOtherLoansMember2023-12-31nwbi:advance0001471265us-gaap:DebtInstrumentRedemptionPeriodOneMembernwbi:TermNotesPayableToBanksMembersrt:FederalHomeLoanBankOfPittsburghMember2023-12-310001471265nwbi:TermNotesPayableToBanksMemberus-gaap:DebtInstrumentRedemptionPeriodTwoMembersrt:FederalHomeLoanBankOfPittsburghMember2023-12-310001471265nwbi:TermNotesPayableToBanksMemberus-gaap:DebtInstrumentRedemptionPeriodThreeMembersrt:FederalHomeLoanBankOfPittsburghMember2023-12-310001471265nwbi:TermNotesPayableToBanksMemberus-gaap:DebtInstrumentRedemptionPeriodFourMembersrt:FederalHomeLoanBankOfPittsburghMember2023-12-310001471265us-gaap:DebtInstrumentRedemptionPeriodFiveMembernwbi:TermNotesPayableToBanksMembersrt:FederalHomeLoanBankOfPittsburghMember2023-12-310001471265nwbi:TermNotesPayableToBanksMembernwbi:DebtInstrumentRedemptionPeriodSixMembersrt:FederalHomeLoanBankOfPittsburghMember2023-12-310001471265nwbi:TermNotesPayableToBanksMembernwbi:DebtInstrumentRedemptionPeriodSevenMembersrt:FederalHomeLoanBankOfPittsburghMember2023-12-310001471265us-gaap:SubordinatedDebtMember2020-09-090001471265us-gaap:SubordinatedDebtMember2020-09-092020-09-090001471265us-gaap:SubordinatedDebtMember2022-12-310001471265us-gaap:SubordinatedDebtMember2023-01-012023-12-310001471265us-gaap:SubordinatedDebtMember2022-01-012022-12-310001471265us-gaap:SubordinatedDebtMember2021-01-012021-12-31nwbi:business_trust0001471265us-gaap:TrustPreferredSecuritiesSubjectToMandatoryRedemptionMembernwbi:NorthwestBancorpCapitalTrustIIIMemberus-gaap:SecuredOvernightFinancingRateSofrOvernightIndexSwapRateMember2023-01-012023-12-310001471265us-gaap:TrustPreferredSecuritiesSubjectToMandatoryRedemptionMembernwbi:NorthwestBancorpCapitalTrustIIIMember2023-12-310001471265us-gaap:TrustPreferredSecuritiesSubjectToMandatoryRedemptionMembernwbi:NorthwestBancorpCapitalTrustIIIMember2022-12-310001471265us-gaap:TrustPreferredSecuritiesSubjectToMandatoryRedemptionMembernwbi:NorthwestBancorpStatutoryTrustIVMemberus-gaap:SecuredOvernightFinancingRateSofrOvernightIndexSwapRateMember2023-01-012023-12-310001471265us-gaap:TrustPreferredSecuritiesSubjectToMandatoryRedemptionMembernwbi:NorthwestBancorpStatutoryTrustIVMember2023-12-310001471265us-gaap:TrustPreferredSecuritiesSubjectToMandatoryRedemptionMembernwbi:NorthwestBancorpStatutoryTrustIVMember2022-12-310001471265us-gaap:TrustPreferredSecuritiesSubjectToMandatoryRedemptionMembernwbi:LNBTrustIIMemberus-gaap:SecuredOvernightFinancingRateSofrOvernightIndexSwapRateMember2023-01-012023-12-310001471265us-gaap:TrustPreferredSecuritiesSubjectToMandatoryRedemptionMembernwbi:LNBTrustIIMember2023-12-310001471265us-gaap:TrustPreferredSecuritiesSubjectToMandatoryRedemptionMembernwbi:LNBTrustIIMember2022-12-310001471265us-gaap:TrustPreferredSecuritiesSubjectToMandatoryRedemptionMemberus-gaap:SecuredOvernightFinancingRateSofrOvernightIndexSwapRateMembernwbi:UnionNationalCapitalTrustIMember2023-01-012023-12-310001471265us-gaap:TrustPreferredSecuritiesSubjectToMandatoryRedemptionMembernwbi:UnionNationalCapitalTrustIMember2023-12-310001471265us-gaap:TrustPreferredSecuritiesSubjectToMandatoryRedemptionMembernwbi:UnionNationalCapitalTrustIMember2022-12-310001471265us-gaap:TrustPreferredSecuritiesSubjectToMandatoryRedemptionMembernwbi:UnionNationalCapitalTrustIIMemberus-gaap:SecuredOvernightFinancingRateSofrOvernightIndexSwapRateMember2023-01-012023-12-310001471265us-gaap:TrustPreferredSecuritiesSubjectToMandatoryRedemptionMembernwbi:UnionNationalCapitalTrustIIMember2023-12-310001471265us-gaap:TrustPreferredSecuritiesSubjectToMandatoryRedemptionMembernwbi:UnionNationalCapitalTrustIIMember2022-12-310001471265us-gaap:TrustPreferredSecuritiesSubjectToMandatoryRedemptionMembernwbi:MFBCStatutoryTrustMemberus-gaap:SecuredOvernightFinancingRateSofrOvernightIndexSwapRateMember2023-01-012023-12-310001471265us-gaap:TrustPreferredSecuritiesSubjectToMandatoryRedemptionMembernwbi:MFBCStatutoryTrustMember2023-12-310001471265us-gaap:TrustPreferredSecuritiesSubjectToMandatoryRedemptionMembernwbi:MFBCStatutoryTrustMember2022-12-310001471265us-gaap:TrustPreferredSecuritiesSubjectToMandatoryRedemptionMemberus-gaap:SecuredOvernightFinancingRateSofrOvernightIndexSwapRateMembernwbi:UniversalPreferredTrustMember2023-01-012023-12-310001471265us-gaap:TrustPreferredSecuritiesSubjectToMandatoryRedemptionMembernwbi:UniversalPreferredTrustMember2023-12-310001471265us-gaap:TrustPreferredSecuritiesSubjectToMandatoryRedemptionMembernwbi:UniversalPreferredTrustMember2022-12-310001471265us-gaap:TrustPreferredSecuritiesSubjectToMandatoryRedemptionMember2023-12-310001471265us-gaap:TrustPreferredSecuritiesSubjectToMandatoryRedemptionMember2022-12-310001471265us-gaap:TrustPreferredSecuritiesSubjectToMandatoryRedemptionMember2023-01-012023-12-310001471265us-gaap:TrustPreferredSecuritiesSubjectToMandatoryRedemptionMember2022-01-012022-12-310001471265us-gaap:TrustPreferredSecuritiesSubjectToMandatoryRedemptionMember2021-01-012021-12-310001471265us-gaap:DomesticCountryMember2023-12-310001471265us-gaap:StateAndLocalJurisdictionMember2023-12-310001471265us-gaap:EmployeeStockOptionMember2023-01-012023-12-310001471265us-gaap:EmployeeStockOptionMember2022-01-012022-12-310001471265us-gaap:EmployeeStockOptionMember2021-01-012021-12-3100014712652020-08-01nwbi:hour0001471265us-gaap:PensionPlansDefinedBenefitMember2023-01-012023-12-310001471265us-gaap:PensionPlansDefinedBenefitMember2022-01-012022-12-310001471265us-gaap:PensionPlansDefinedBenefitMember2021-01-012021-12-310001471265us-gaap:PensionPlansDefinedBenefitMemberus-gaap:AccumulatedDefinedBenefitPlansAdjustmentNetUnamortizedGainLossMember2023-12-310001471265us-gaap:PensionPlansDefinedBenefitMemberus-gaap:AccumulatedDefinedBenefitPlansAdjustmentNetPriorServiceCostCreditMember2023-12-310001471265us-gaap:PensionPlansDefinedBenefitMember2021-12-310001471265us-gaap:DefinedBenefitPlanDebtSecurityMemberus-gaap:PensionPlansDefinedBenefitMembersrt:MinimumMember2023-12-310001471265us-gaap:DefinedBenefitPlanDebtSecurityMemberus-gaap:PensionPlansDefinedBenefitMembersrt:MaximumMember2023-12-310001471265us-gaap:PensionPlansDefinedBenefitMembersrt:MinimumMemberus-gaap:DefinedBenefitPlanEquitySecuritiesMember2023-12-310001471265us-gaap:PensionPlansDefinedBenefitMemberus-gaap:DefinedBenefitPlanEquitySecuritiesMembersrt:MaximumMember2023-12-310001471265us-gaap:DefinedBenefitPlanDebtSecurityMemberus-gaap:PensionPlansDefinedBenefitMembersrt:MinimumMember2022-12-310001471265us-gaap:DefinedBenefitPlanDebtSecurityMemberus-gaap:PensionPlansDefinedBenefitMembersrt:MaximumMember2022-12-310001471265us-gaap:DefinedBenefitPlanDebtSecurityMemberus-gaap:PensionPlansDefinedBenefitMember2023-12-310001471265us-gaap:DefinedBenefitPlanDebtSecurityMemberus-gaap:PensionPlansDefinedBenefitMember2022-12-310001471265us-gaap:PensionPlansDefinedBenefitMembersrt:MinimumMemberus-gaap:DefinedBenefitPlanEquitySecuritiesMember2022-12-310001471265us-gaap:PensionPlansDefinedBenefitMemberus-gaap:DefinedBenefitPlanEquitySecuritiesMembersrt:MaximumMember2022-12-310001471265us-gaap:PensionPlansDefinedBenefitMemberus-gaap:DefinedBenefitPlanEquitySecuritiesMember2023-12-310001471265us-gaap:PensionPlansDefinedBenefitMemberus-gaap:DefinedBenefitPlanEquitySecuritiesMember2022-12-310001471265us-gaap:PensionPlansDefinedBenefitMembersrt:MinimumMembernwbi:OtherSecuritiesMember2023-12-310001471265us-gaap:PensionPlansDefinedBenefitMembersrt:MinimumMembernwbi:OtherSecuritiesMember2022-12-310001471265us-gaap:PensionPlansDefinedBenefitMembernwbi:OtherSecuritiesMembersrt:MaximumMember2023-12-310001471265us-gaap:PensionPlansDefinedBenefitMembernwbi:OtherSecuritiesMembersrt:MaximumMember2022-12-310001471265us-gaap:PensionPlansDefinedBenefitMembernwbi:OtherSecuritiesMember2023-12-310001471265us-gaap:PensionPlansDefinedBenefitMembernwbi:OtherSecuritiesMember2022-12-310001471265us-gaap:DefinedBenefitPlanEquitySecuritiesMember2023-12-310001471265us-gaap:DefinedBenefitPlanEquitySecuritiesMemberus-gaap:FairValueInputsLevel1Member2022-12-310001471265us-gaap:DefinedBenefitPlanDebtSecurityMember2023-12-310001471265us-gaap:DefinedBenefitPlanDebtSecurityMemberus-gaap:FairValueInputsLevel1Member2022-12-310001471265us-gaap:MoneyMarketFundsMember2023-12-310001471265us-gaap:MoneyMarketFundsMemberus-gaap:FairValueInputsLevel1Member2022-12-310001471265nwbi:MunicipalObligationsMember2023-12-310001471265nwbi:MunicipalObligationsMemberus-gaap:FairValueInputsLevel1Member2022-12-310001471265us-gaap:FairValueInputsLevel1Member2022-12-310001471265us-gaap:OtherPostretirementBenefitPlansDefinedBenefitMember2023-01-012023-12-310001471265us-gaap:OtherPostretirementBenefitPlansDefinedBenefitMember2022-01-012022-12-310001471265us-gaap:OtherPostretirementBenefitPlansDefinedBenefitMember2021-01-012021-12-310001471265us-gaap:OtherPostretirementBenefitPlansDefinedBenefitMember2023-12-310001471265us-gaap:OtherPostretirementBenefitPlansDefinedBenefitMember2022-12-310001471265us-gaap:OtherPostretirementBenefitPlansDefinedBenefitMember2021-12-310001471265nwbi:A2018EquityIncentivePlanMemberus-gaap:RestrictedStockMember2018-04-180001471265nwbi:A2018EquityIncentivePlanMembernwbi:EmployeesMemberus-gaap:RestrictedStockMember2020-05-202020-05-200001471265srt:DirectorMembernwbi:A2018EquityIncentivePlanMemberus-gaap:RestrictedStockMember2020-05-202020-05-200001471265nwbi:A2018EquityIncentivePlanMemberus-gaap:RestrictedStockMember2020-05-202020-05-200001471265nwbi:A2018EquityIncentivePlanMemberus-gaap:RestrictedStockMember2021-01-012021-12-310001471265nwbi:A2018EquityIncentivePlanMemberus-gaap:RestrictedStockMember2022-01-012022-12-310001471265srt:MinimumMembernwbi:A2018EquityIncentivePlanMemberus-gaap:RestrictedStockMember2018-04-182018-04-180001471265nwbi:A2018EquityIncentivePlanMembersrt:MaximumMemberus-gaap:RestrictedStockMember2018-04-182018-04-180001471265nwbi:A2018EquityIncentivePlanMemberus-gaap:RestrictedStockMember2018-04-182023-12-310001471265nwbi:A2018EquityIncentivePlanMemberus-gaap:RestrictedStockMember2023-01-012023-12-310001471265nwbi:A2022EquityIncentivePlanMember2022-05-180001471265us-gaap:ShareBasedCompensationAwardTrancheOneMemberus-gaap:RestrictedStockUnitsRSUMember2022-05-182022-05-180001471265us-gaap:RestrictedStockMember2022-05-182022-05-180001471265us-gaap:PerformanceSharesMember2022-05-182022-05-180001471265srt:MinimumMemberus-gaap:PerformanceSharesMember2022-05-182022-05-180001471265us-gaap:PerformanceSharesMembersrt:MaximumMember2022-05-182022-05-180001471265us-gaap:ShareBasedPaymentArrangementEmployeeMemberus-gaap:RestrictedStockUnitsRSUMember2022-05-182022-05-180001471265us-gaap:ShareBasedPaymentArrangementEmployeeMemberus-gaap:PerformanceSharesMember2022-05-182022-05-180001471265us-gaap:ShareBasedPaymentArrangementNonemployeeMemberus-gaap:RestrictedStockMember2022-05-182022-05-180001471265us-gaap:ShareBasedPaymentArrangementEmployeeMemberus-gaap:RestrictedStockUnitsRSUMember2022-01-012022-12-310001471265us-gaap:ShareBasedPaymentArrangementEmployeeMemberus-gaap:RestrictedStockUnitsRSUMember2023-03-152023-03-150001471265us-gaap:ShareBasedPaymentArrangementEmployeeMemberus-gaap:PerformanceSharesMember2023-03-152023-03-150001471265us-gaap:ShareBasedPaymentArrangementNonemployeeMemberus-gaap:RestrictedStockMember2023-03-152023-03-150001471265us-gaap:ShareBasedPaymentArrangementEmployeeMemberus-gaap:RestrictedStockUnitsRSUMember2023-03-272023-03-270001471265us-gaap:ShareBasedPaymentArrangementEmployeeMemberus-gaap:RestrictedStockUnitsRSUMember2023-01-012023-12-310001471265nwbi:A2022EquityIncentivePlanMember2022-05-182023-12-310001471265nwbi:A2018EquityIncentivePlanMember2023-01-012023-12-310001471265us-gaap:RestrictedStockUnitsRSUMember2023-12-310001471265us-gaap:PerformanceSharesMember2023-12-310001471265nwbi:RSUsAndPSUsMember2023-01-012023-12-310001471265us-gaap:RestrictedStockMember2023-12-310001471265us-gaap:EmployeeStockOptionMembernwbi:A2018EquityIncentivePlanMember2023-12-310001471265nwbi:A2018EquityIncentivePlanMembernwbi:EmployeesMember2021-05-252021-05-250001471265srt:DirectorMembernwbi:A2018EquityIncentivePlanMember2021-05-252021-05-250001471265nwbi:A2018EquityIncentivePlanMember2021-05-252021-05-250001471265us-gaap:EmployeeStockOptionMembernwbi:A2018EquityIncentivePlanMember2023-01-012023-12-310001471265nwbi:ExercisePriceDollars971Member2023-01-012023-12-310001471265nwbi:ExercisePriceDollars12.37Member2023-01-012023-12-310001471265nwbi:ExercisePriceDollars13.15Member2023-01-012023-12-310001471265nwbi:ExercisePriceDollars1368Member2023-01-012023-12-310001471265nwbi:ExercisePriceDollars971Member2023-12-310001471265nwbi:ExercisePriceDollars12.37Member2023-12-310001471265nwbi:ExercisePriceDollars13.15Member2023-12-310001471265nwbi:ExercisePriceDollars1368Member2023-12-310001471265nwbi:ExercisePriceDollars14.15Member2023-01-012023-12-310001471265nwbi:ExercisePriceDollars15.57Member2023-01-012023-12-310001471265nwbi:ExercisePriceDollars16.59Member2023-01-012023-12-310001471265nwbi:ExercisePriceDollars17.27Member2023-01-012023-12-310001471265nwbi:ExercisePriceDollars1425TotalAverageMember2023-01-012023-12-310001471265nwbi:ExercisePriceDollars14.15Member2023-12-310001471265nwbi:ExercisePriceDollars15.57Member2023-12-310001471265nwbi:ExercisePriceDollars16.59Member2023-12-310001471265nwbi:ExercisePriceDollars17.27Member2023-12-310001471265nwbi:ExercisePriceDollars1425TotalAverageMember2023-12-310001471265us-gaap:CarryingReportedAmountFairValueDisclosureMember2023-12-310001471265us-gaap:EstimateOfFairValueFairValueDisclosureMember2023-12-310001471265us-gaap:FairValueInputsLevel1Member2023-12-310001471265us-gaap:FairValueInputsLevel2Member2023-12-310001471265us-gaap:FairValueInputsLevel3Member2023-12-310001471265us-gaap:CarryingReportedAmountFairValueDisclosureMemberus-gaap:InterestRateLockCommitmentsMember2023-12-310001471265us-gaap:EstimateOfFairValueFairValueDisclosureMemberus-gaap:InterestRateLockCommitmentsMember2023-12-310001471265us-gaap:FairValueInputsLevel1Memberus-gaap:InterestRateLockCommitmentsMember2023-12-310001471265us-gaap:FairValueInputsLevel2Memberus-gaap:InterestRateLockCommitmentsMember2023-12-310001471265us-gaap:FairValueInputsLevel3Memberus-gaap:InterestRateLockCommitmentsMember2023-12-310001471265us-gaap:CarryingReportedAmountFairValueDisclosureMemberus-gaap:ForwardContractsMember2023-12-310001471265us-gaap:EstimateOfFairValueFairValueDisclosureMemberus-gaap:ForwardContractsMember2023-12-310001471265us-gaap:FairValueInputsLevel1Memberus-gaap:ForwardContractsMember2023-12-310001471265us-gaap:FairValueInputsLevel2Memberus-gaap:ForwardContractsMember2023-12-310001471265us-gaap:FairValueInputsLevel3Memberus-gaap:ForwardContractsMember2023-12-310001471265us-gaap:DesignatedAsHedgingInstrumentMemberus-gaap:InterestRateSwapMemberus-gaap:CarryingReportedAmountFairValueDisclosureMember2023-12-310001471265us-gaap:DesignatedAsHedgingInstrumentMemberus-gaap:InterestRateSwapMemberus-gaap:EstimateOfFairValueFairValueDisclosureMember2023-12-310001471265us-gaap:DesignatedAsHedgingInstrumentMemberus-gaap:InterestRateSwapMemberus-gaap:FairValueInputsLevel1Member2023-12-310001471265us-gaap:DesignatedAsHedgingInstrumentMemberus-gaap:InterestRateSwapMemberus-gaap:FairValueInputsLevel2Member2023-12-310001471265us-gaap:DesignatedAsHedgingInstrumentMemberus-gaap:FairValueInputsLevel3Memberus-gaap:InterestRateSwapMember2023-12-310001471265us-gaap:InterestRateSwapMemberus-gaap:CarryingReportedAmountFairValueDisclosureMemberus-gaap:NondesignatedMember2023-12-310001471265us-gaap:InterestRateSwapMemberus-gaap:EstimateOfFairValueFairValueDisclosureMemberus-gaap:NondesignatedMember2023-12-310001471265us-gaap:InterestRateSwapMemberus-gaap:FairValueInputsLevel1Memberus-gaap:NondesignatedMember2023-12-310001471265us-gaap:InterestRateSwapMemberus-gaap:FairValueInputsLevel2Memberus-gaap:NondesignatedMember2023-12-310001471265us-gaap:FairValueInputsLevel3Memberus-gaap:InterestRateSwapMemberus-gaap:NondesignatedMember2023-12-310001471265us-gaap:CarryingReportedAmountFairValueDisclosureMemberus-gaap:CurrencySwapMember2023-12-310001471265us-gaap:EstimateOfFairValueFairValueDisclosureMemberus-gaap:CurrencySwapMember2023-12-310001471265us-gaap:FairValueInputsLevel1Memberus-gaap:CurrencySwapMember2023-12-310001471265us-gaap:FairValueInputsLevel2Memberus-gaap:CurrencySwapMember2023-12-310001471265us-gaap:FairValueInputsLevel3Memberus-gaap:CurrencySwapMember2023-12-310001471265us-gaap:CreditRiskContractMemberus-gaap:CarryingReportedAmountFairValueDisclosureMember2023-12-310001471265us-gaap:CreditRiskContractMemberus-gaap:EstimateOfFairValueFairValueDisclosureMember2023-12-310001471265us-gaap:CreditRiskContractMemberus-gaap:FairValueInputsLevel1Member2023-12-310001471265us-gaap:CreditRiskContractMemberus-gaap:FairValueInputsLevel2Member2023-12-310001471265us-gaap:CreditRiskContractMemberus-gaap:FairValueInputsLevel3Member2023-12-310001471265us-gaap:CarryingReportedAmountFairValueDisclosureMember2022-12-310001471265us-gaap:EstimateOfFairValueFairValueDisclosureMember2022-12-310001471265us-gaap:FairValueInputsLevel2Member2022-12-310001471265us-gaap:FairValueInputsLevel3Member2022-12-310001471265us-gaap:CarryingReportedAmountFairValueDisclosureMemberus-gaap:InterestRateLockCommitmentsMember2022-12-310001471265us-gaap:EstimateOfFairValueFairValueDisclosureMemberus-gaap:InterestRateLockCommitmentsMember2022-12-310001471265us-gaap:FairValueInputsLevel1Memberus-gaap:InterestRateLockCommitmentsMember2022-12-310001471265us-gaap:FairValueInputsLevel2Memberus-gaap:InterestRateLockCommitmentsMember2022-12-310001471265us-gaap:FairValueInputsLevel3Memberus-gaap:InterestRateLockCommitmentsMember2022-12-310001471265us-gaap:CarryingReportedAmountFairValueDisclosureMemberus-gaap:ForwardContractsMember2022-12-310001471265us-gaap:EstimateOfFairValueFairValueDisclosureMemberus-gaap:ForwardContractsMember2022-12-310001471265us-gaap:FairValueInputsLevel1Memberus-gaap:ForwardContractsMember2022-12-310001471265us-gaap:FairValueInputsLevel2Memberus-gaap:ForwardContractsMember2022-12-310001471265us-gaap:FairValueInputsLevel3Memberus-gaap:ForwardContractsMember2022-12-310001471265us-gaap:InterestRateSwapMemberus-gaap:CarryingReportedAmountFairValueDisclosureMemberus-gaap:NondesignatedMember2022-12-310001471265us-gaap:InterestRateSwapMemberus-gaap:EstimateOfFairValueFairValueDisclosureMemberus-gaap:NondesignatedMember2022-12-310001471265us-gaap:InterestRateSwapMemberus-gaap:FairValueInputsLevel1Memberus-gaap:NondesignatedMember2022-12-310001471265us-gaap:InterestRateSwapMemberus-gaap:FairValueInputsLevel2Memberus-gaap:NondesignatedMember2022-12-310001471265us-gaap:FairValueInputsLevel3Memberus-gaap:InterestRateSwapMemberus-gaap:NondesignatedMember2022-12-310001471265us-gaap:CarryingReportedAmountFairValueDisclosureMemberus-gaap:CurrencySwapMember2022-12-310001471265us-gaap:EstimateOfFairValueFairValueDisclosureMemberus-gaap:CurrencySwapMember2022-12-310001471265us-gaap:FairValueInputsLevel1Memberus-gaap:CurrencySwapMember2022-12-310001471265us-gaap:FairValueInputsLevel2Memberus-gaap:CurrencySwapMember2022-12-310001471265us-gaap:FairValueInputsLevel3Memberus-gaap:CurrencySwapMember2022-12-310001471265us-gaap:CreditRiskContractMemberus-gaap:CarryingReportedAmountFairValueDisclosureMember2022-12-310001471265us-gaap:CreditRiskContractMemberus-gaap:EstimateOfFairValueFairValueDisclosureMember2022-12-310001471265us-gaap:CreditRiskContractMemberus-gaap:FairValueInputsLevel1Member2022-12-310001471265us-gaap:CreditRiskContractMemberus-gaap:FairValueInputsLevel2Member2022-12-310001471265us-gaap:CreditRiskContractMemberus-gaap:FairValueInputsLevel3Member2022-12-310001471265us-gaap:USGovernmentAgenciesDebtSecuritiesMemberus-gaap:FairValueInputsLevel1Memberus-gaap:FairValueMeasurementsRecurringMember2023-12-310001471265us-gaap:USGovernmentAgenciesDebtSecuritiesMemberus-gaap:FairValueInputsLevel2Memberus-gaap:FairValueMeasurementsRecurringMember2023-12-310001471265us-gaap:FairValueInputsLevel3Memberus-gaap:USGovernmentAgenciesDebtSecuritiesMemberus-gaap:FairValueMeasurementsRecurringMember2023-12-310001471265us-gaap:USGovernmentAgenciesDebtSecuritiesMemberus-gaap:FairValueMeasurementsRecurringMember2023-12-310001471265us-gaap:USGovernmentSponsoredEnterprisesDebtSecuritiesMemberus-gaap:FairValueInputsLevel1Memberus-gaap:FairValueMeasurementsRecurringMember2023-12-310001471265us-gaap:USGovernmentSponsoredEnterprisesDebtSecuritiesMemberus-gaap:FairValueInputsLevel2Memberus-gaap:FairValueMeasurementsRecurringMember2023-12-310001471265us-gaap:USGovernmentSponsoredEnterprisesDebtSecuritiesMemberus-gaap:FairValueInputsLevel3Memberus-gaap:FairValueMeasurementsRecurringMember2023-12-310001471265us-gaap:USGovernmentSponsoredEnterprisesDebtSecuritiesMemberus-gaap:FairValueMeasurementsRecurringMember2023-12-310001471265us-gaap:USStatesAndPoliticalSubdivisionsMemberus-gaap:FairValueInputsLevel1Memberus-gaap:FairValueMeasurementsRecurringMember2023-12-310001471265us-gaap:USStatesAndPoliticalSubdivisionsMemberus-gaap:FairValueInputsLevel2Memberus-gaap:FairValueMeasurementsRecurringMember2023-12-310001471265us-gaap:USStatesAndPoliticalSubdivisionsMemberus-gaap:FairValueInputsLevel3Memberus-gaap:FairValueMeasurementsRecurringMember2023-12-310001471265us-gaap:USStatesAndPoliticalSubdivisionsMemberus-gaap:FairValueMeasurementsRecurringMember2023-12-310001471265us-gaap:CorporateDebtSecuritiesMemberus-gaap:FairValueInputsLevel1Memberus-gaap:FairValueMeasurementsRecurringMember2023-12-310001471265us-gaap:CorporateDebtSecuritiesMemberus-gaap:FairValueInputsLevel2Memberus-gaap:FairValueMeasurementsRecurringMember2023-12-310001471265us-gaap:CorporateDebtSecuritiesMemberus-gaap:FairValueInputsLevel3Memberus-gaap:FairValueMeasurementsRecurringMember2023-12-310001471265us-gaap:CorporateDebtSecuritiesMemberus-gaap:FairValueMeasurementsRecurringMember2023-12-310001471265us-gaap:FairValueInputsLevel1Memberus-gaap:FairValueMeasurementsRecurringMember2023-12-310001471265us-gaap:FairValueInputsLevel2Memberus-gaap:FairValueMeasurementsRecurringMember2023-12-310001471265us-gaap:FairValueInputsLevel3Memberus-gaap:FairValueMeasurementsRecurringMember2023-12-310001471265us-gaap:FairValueMeasurementsRecurringMember2023-12-310001471265us-gaap:GovernmentNationalMortgageAssociationCertificatesAndObligationsGNMAMemberus-gaap:FairValueInputsLevel1Memberus-gaap:FairValueMeasurementsRecurringMember2023-12-310001471265us-gaap:GovernmentNationalMortgageAssociationCertificatesAndObligationsGNMAMemberus-gaap:FairValueInputsLevel2Memberus-gaap:FairValueMeasurementsRecurringMember2023-12-310001471265us-gaap:GovernmentNationalMortgageAssociationCertificatesAndObligationsGNMAMemberus-gaap:FairValueInputsLevel3Memberus-gaap:FairValueMeasurementsRecurringMember2023-12-310001471265us-gaap:GovernmentNationalMortgageAssociationCertificatesAndObligationsGNMAMemberus-gaap:FairValueMeasurementsRecurringMember2023-12-310001471265us-gaap:FairValueInputsLevel1Memberus-gaap:FairValueMeasurementsRecurringMemberus-gaap:FederalNationalMortgageAssociationCertificatesAndObligationsFNMAMember2023-12-310001471265us-gaap:FairValueInputsLevel2Memberus-gaap:FairValueMeasurementsRecurringMemberus-gaap:FederalNationalMortgageAssociationCertificatesAndObligationsFNMAMember2023-12-310001471265us-gaap:FairValueInputsLevel3Memberus-gaap:FairValueMeasurementsRecurringMemberus-gaap:FederalNationalMortgageAssociationCertificatesAndObligationsFNMAMember2023-12-310001471265us-gaap:FairValueMeasurementsRecurringMemberus-gaap:FederalNationalMortgageAssociationCertificatesAndObligationsFNMAMember2023-12-310001471265us-gaap:FederalHomeLoanMortgageCorporationCertificatesAndObligationsFHLMCMemberus-gaap:FairValueInputsLevel1Memberus-gaap:FairValueMeasurementsRecurringMember2023-12-310001471265us-gaap:FederalHomeLoanMortgageCorporationCertificatesAndObligationsFHLMCMemberus-gaap:FairValueInputsLevel2Memberus-gaap:FairValueMeasurementsRecurringMember2023-12-310001471265us-gaap:FairValueInputsLevel3Memberus-gaap:FederalHomeLoanMortgageCorporationCertificatesAndObligationsFHLMCMemberus-gaap:FairValueMeasurementsRecurringMember2023-12-310001471265us-gaap:FederalHomeLoanMortgageCorporationCertificatesAndObligationsFHLMCMemberus-gaap:FairValueMeasurementsRecurringMember2023-12-310001471265us-gaap:MortgageBackedSecuritiesIssuedByPrivateEnterprisesMemberus-gaap:FairValueInputsLevel1Memberus-gaap:FairValueMeasurementsRecurringMember2023-12-310001471265us-gaap:MortgageBackedSecuritiesIssuedByPrivateEnterprisesMemberus-gaap:FairValueInputsLevel2Memberus-gaap:FairValueMeasurementsRecurringMember2023-12-310001471265us-gaap:FairValueInputsLevel3Memberus-gaap:MortgageBackedSecuritiesIssuedByPrivateEnterprisesMemberus-gaap:FairValueMeasurementsRecurringMember2023-12-310001471265us-gaap:MortgageBackedSecuritiesIssuedByPrivateEnterprisesMemberus-gaap:FairValueMeasurementsRecurringMember2023-12-310001471265us-gaap:FairValueInputsLevel1Memberus-gaap:FairValueMeasurementsRecurringMemberus-gaap:InterestRateLockCommitmentsMember2023-12-310001471265us-gaap:FairValueInputsLevel2Memberus-gaap:FairValueMeasurementsRecurringMemberus-gaap:InterestRateLockCommitmentsMember2023-12-310001471265us-gaap:FairValueInputsLevel3Memberus-gaap:FairValueMeasurementsRecurringMemberus-gaap:InterestRateLockCommitmentsMember2023-12-310001471265us-gaap:FairValueMeasurementsRecurringMemberus-gaap:InterestRateLockCommitmentsMember2023-12-310001471265us-gaap:FairValueInputsLevel1Memberus-gaap:ForwardContractsMemberus-gaap:FairValueMeasurementsRecurringMember2023-12-310001471265us-gaap:FairValueInputsLevel2Memberus-gaap:ForwardContractsMemberus-gaap:FairValueMeasurementsRecurringMember2023-12-310001471265us-gaap:FairValueInputsLevel3Memberus-gaap:ForwardContractsMemberus-gaap:FairValueMeasurementsRecurringMember2023-12-310001471265us-gaap:ForwardContractsMemberus-gaap:FairValueMeasurementsRecurringMember2023-12-310001471265us-gaap:DesignatedAsHedgingInstrumentMemberus-gaap:InterestRateSwapMemberus-gaap:FairValueInputsLevel1Memberus-gaap:FairValueMeasurementsRecurringMember2023-12-310001471265us-gaap:DesignatedAsHedgingInstrumentMemberus-gaap:InterestRateSwapMemberus-gaap:FairValueInputsLevel2Memberus-gaap:FairValueMeasurementsRecurringMember2023-12-310001471265us-gaap:DesignatedAsHedgingInstrumentMemberus-gaap:FairValueInputsLevel3Memberus-gaap:InterestRateSwapMemberus-gaap:FairValueMeasurementsRecurringMember2023-12-310001471265us-gaap:DesignatedAsHedgingInstrumentMemberus-gaap:InterestRateSwapMemberus-gaap:FairValueMeasurementsRecurringMember2023-12-310001471265us-gaap:InterestRateSwapMemberus-gaap:FairValueInputsLevel1Memberus-gaap:FairValueMeasurementsRecurringMemberus-gaap:NondesignatedMember2023-12-310001471265us-gaap:InterestRateSwapMemberus-gaap:FairValueInputsLevel2Memberus-gaap:FairValueMeasurementsRecurringMemberus-gaap:NondesignatedMember2023-12-310001471265us-gaap:FairValueInputsLevel3Memberus-gaap:InterestRateSwapMemberus-gaap:FairValueMeasurementsRecurringMemberus-gaap:NondesignatedMember2023-12-310001471265us-gaap:InterestRateSwapMemberus-gaap:FairValueMeasurementsRecurringMemberus-gaap:NondesignatedMember2023-12-310001471265us-gaap:FairValueInputsLevel1Memberus-gaap:CurrencySwapMemberus-gaap:FairValueMeasurementsRecurringMember2023-12-310001471265us-gaap:FairValueInputsLevel2Memberus-gaap:CurrencySwapMemberus-gaap:FairValueMeasurementsRecurringMember2023-12-310001471265us-gaap:FairValueInputsLevel3Memberus-gaap:CurrencySwapMemberus-gaap:FairValueMeasurementsRecurringMember2023-12-310001471265us-gaap:CurrencySwapMemberus-gaap:FairValueMeasurementsRecurringMember2023-12-310001471265us-gaap:CreditRiskContractMemberus-gaap:FairValueInputsLevel1Memberus-gaap:FairValueMeasurementsRecurringMember2023-12-310001471265us-gaap:CreditRiskContractMemberus-gaap:FairValueInputsLevel2Memberus-gaap:FairValueMeasurementsRecurringMember2023-12-310001471265us-gaap:CreditRiskContractMemberus-gaap:FairValueInputsLevel3Memberus-gaap:FairValueMeasurementsRecurringMember2023-12-310001471265us-gaap:CreditRiskContractMemberus-gaap:FairValueMeasurementsRecurringMember2023-12-310001471265us-gaap:USGovernmentAgenciesDebtSecuritiesMemberus-gaap:FairValueInputsLevel1Memberus-gaap:FairValueMeasurementsRecurringMember2022-12-310001471265us-gaap:USGovernmentAgenciesDebtSecuritiesMemberus-gaap:FairValueInputsLevel2Memberus-gaap:FairValueMeasurementsRecurringMember2022-12-310001471265us-gaap:FairValueInputsLevel3Memberus-gaap:USGovernmentAgenciesDebtSecuritiesMemberus-gaap:FairValueMeasurementsRecurringMember2022-12-310001471265us-gaap:USGovernmentAgenciesDebtSecuritiesMemberus-gaap:FairValueMeasurementsRecurringMember2022-12-310001471265us-gaap:USGovernmentSponsoredEnterprisesDebtSecuritiesMemberus-gaap:FairValueInputsLevel1Memberus-gaap:FairValueMeasurementsRecurringMember2022-12-310001471265us-gaap:USGovernmentSponsoredEnterprisesDebtSecuritiesMemberus-gaap:FairValueInputsLevel2Memberus-gaap:FairValueMeasurementsRecurringMember2022-12-310001471265us-gaap:USGovernmentSponsoredEnterprisesDebtSecuritiesMemberus-gaap:FairValueInputsLevel3Memberus-gaap:FairValueMeasurementsRecurringMember2022-12-310001471265us-gaap:USGovernmentSponsoredEnterprisesDebtSecuritiesMemberus-gaap:FairValueMeasurementsRecurringMember2022-12-310001471265us-gaap:USStatesAndPoliticalSubdivisionsMemberus-gaap:FairValueInputsLevel1Memberus-gaap:FairValueMeasurementsRecurringMember2022-12-310001471265us-gaap:USStatesAndPoliticalSubdivisionsMemberus-gaap:FairValueInputsLevel2Memberus-gaap:FairValueMeasurementsRecurringMember2022-12-310001471265us-gaap:USStatesAndPoliticalSubdivisionsMemberus-gaap:FairValueInputsLevel3Memberus-gaap:FairValueMeasurementsRecurringMember2022-12-310001471265us-gaap:USStatesAndPoliticalSubdivisionsMemberus-gaap:FairValueMeasurementsRecurringMember2022-12-310001471265us-gaap:CorporateDebtSecuritiesMemberus-gaap:FairValueInputsLevel1Memberus-gaap:FairValueMeasurementsRecurringMember2022-12-310001471265us-gaap:CorporateDebtSecuritiesMemberus-gaap:FairValueInputsLevel2Memberus-gaap:FairValueMeasurementsRecurringMember2022-12-310001471265us-gaap:CorporateDebtSecuritiesMemberus-gaap:FairValueInputsLevel3Memberus-gaap:FairValueMeasurementsRecurringMember2022-12-310001471265us-gaap:CorporateDebtSecuritiesMemberus-gaap:FairValueMeasurementsRecurringMember2022-12-310001471265us-gaap:FairValueInputsLevel1Memberus-gaap:FairValueMeasurementsRecurringMember2022-12-310001471265us-gaap:FairValueInputsLevel2Memberus-gaap:FairValueMeasurementsRecurringMember2022-12-310001471265us-gaap:FairValueInputsLevel3Memberus-gaap:FairValueMeasurementsRecurringMember2022-12-310001471265us-gaap:FairValueMeasurementsRecurringMember2022-12-310001471265us-gaap:GovernmentNationalMortgageAssociationCertificatesAndObligationsGNMAMemberus-gaap:FairValueInputsLevel1Memberus-gaap:FairValueMeasurementsRecurringMember2022-12-310001471265us-gaap:GovernmentNationalMortgageAssociationCertificatesAndObligationsGNMAMemberus-gaap:FairValueInputsLevel2Memberus-gaap:FairValueMeasurementsRecurringMember2022-12-310001471265us-gaap:GovernmentNationalMortgageAssociationCertificatesAndObligationsGNMAMemberus-gaap:FairValueInputsLevel3Memberus-gaap:FairValueMeasurementsRecurringMember2022-12-310001471265us-gaap:GovernmentNationalMortgageAssociationCertificatesAndObligationsGNMAMemberus-gaap:FairValueMeasurementsRecurringMember2022-12-310001471265us-gaap:FairValueInputsLevel1Memberus-gaap:FairValueMeasurementsRecurringMemberus-gaap:FederalNationalMortgageAssociationCertificatesAndObligationsFNMAMember2022-12-310001471265us-gaap:FairValueInputsLevel2Memberus-gaap:FairValueMeasurementsRecurringMemberus-gaap:FederalNationalMortgageAssociationCertificatesAndObligationsFNMAMember2022-12-310001471265us-gaap:FairValueInputsLevel3Memberus-gaap:FairValueMeasurementsRecurringMemberus-gaap:FederalNationalMortgageAssociationCertificatesAndObligationsFNMAMember2022-12-310001471265us-gaap:FairValueMeasurementsRecurringMemberus-gaap:FederalNationalMortgageAssociationCertificatesAndObligationsFNMAMember2022-12-310001471265us-gaap:FederalHomeLoanMortgageCorporationCertificatesAndObligationsFHLMCMemberus-gaap:FairValueInputsLevel1Memberus-gaap:FairValueMeasurementsRecurringMember2022-12-310001471265us-gaap:FederalHomeLoanMortgageCorporationCertificatesAndObligationsFHLMCMemberus-gaap:FairValueInputsLevel2Memberus-gaap:FairValueMeasurementsRecurringMember2022-12-310001471265us-gaap:FairValueInputsLevel3Memberus-gaap:FederalHomeLoanMortgageCorporationCertificatesAndObligationsFHLMCMemberus-gaap:FairValueMeasurementsRecurringMember2022-12-310001471265us-gaap:FederalHomeLoanMortgageCorporationCertificatesAndObligationsFHLMCMemberus-gaap:FairValueMeasurementsRecurringMember2022-12-310001471265us-gaap:MortgageBackedSecuritiesIssuedByPrivateEnterprisesMemberus-gaap:FairValueInputsLevel1Memberus-gaap:FairValueMeasurementsRecurringMember2022-12-310001471265us-gaap:MortgageBackedSecuritiesIssuedByPrivateEnterprisesMemberus-gaap:FairValueInputsLevel2Memberus-gaap:FairValueMeasurementsRecurringMember2022-12-310001471265us-gaap:FairValueInputsLevel3Memberus-gaap:MortgageBackedSecuritiesIssuedByPrivateEnterprisesMemberus-gaap:FairValueMeasurementsRecurringMember2022-12-310001471265us-gaap:MortgageBackedSecuritiesIssuedByPrivateEnterprisesMemberus-gaap:FairValueMeasurementsRecurringMember2022-12-310001471265us-gaap:FairValueInputsLevel1Memberus-gaap:FairValueMeasurementsRecurringMemberus-gaap:InterestRateLockCommitmentsMember2022-12-310001471265us-gaap:FairValueInputsLevel2Memberus-gaap:FairValueMeasurementsRecurringMemberus-gaap:InterestRateLockCommitmentsMember2022-12-310001471265us-gaap:FairValueInputsLevel3Memberus-gaap:FairValueMeasurementsRecurringMemberus-gaap:InterestRateLockCommitmentsMember2022-12-310001471265us-gaap:FairValueMeasurementsRecurringMemberus-gaap:InterestRateLockCommitmentsMember2022-12-310001471265us-gaap:FairValueInputsLevel1Memberus-gaap:ForwardContractsMemberus-gaap:FairValueMeasurementsRecurringMember2022-12-310001471265us-gaap:FairValueInputsLevel2Memberus-gaap:ForwardContractsMemberus-gaap:FairValueMeasurementsRecurringMember2022-12-310001471265us-gaap:FairValueInputsLevel3Memberus-gaap:ForwardContractsMemberus-gaap:FairValueMeasurementsRecurringMember2022-12-310001471265us-gaap:ForwardContractsMemberus-gaap:FairValueMeasurementsRecurringMember2022-12-310001471265us-gaap:InterestRateSwapMemberus-gaap:FairValueInputsLevel1Memberus-gaap:FairValueMeasurementsRecurringMemberus-gaap:NondesignatedMember2022-12-310001471265us-gaap:InterestRateSwapMemberus-gaap:FairValueInputsLevel2Memberus-gaap:FairValueMeasurementsRecurringMemberus-gaap:NondesignatedMember2022-12-310001471265us-gaap:FairValueInputsLevel3Memberus-gaap:InterestRateSwapMemberus-gaap:FairValueMeasurementsRecurringMemberus-gaap:NondesignatedMember2022-12-310001471265us-gaap:InterestRateSwapMemberus-gaap:FairValueMeasurementsRecurringMemberus-gaap:NondesignatedMember2022-12-310001471265us-gaap:FairValueInputsLevel1Memberus-gaap:CurrencySwapMemberus-gaap:FairValueMeasurementsRecurringMember2022-12-310001471265us-gaap:FairValueInputsLevel2Memberus-gaap:CurrencySwapMemberus-gaap:FairValueMeasurementsRecurringMember2022-12-310001471265us-gaap:FairValueInputsLevel3Memberus-gaap:CurrencySwapMemberus-gaap:FairValueMeasurementsRecurringMember2022-12-310001471265us-gaap:CurrencySwapMemberus-gaap:FairValueMeasurementsRecurringMember2022-12-310001471265us-gaap:CreditRiskContractMemberus-gaap:FairValueInputsLevel1Memberus-gaap:FairValueMeasurementsRecurringMember2022-12-310001471265us-gaap:CreditRiskContractMemberus-gaap:FairValueInputsLevel2Memberus-gaap:FairValueMeasurementsRecurringMember2022-12-310001471265us-gaap:CreditRiskContractMemberus-gaap:FairValueInputsLevel3Memberus-gaap:FairValueMeasurementsRecurringMember2022-12-310001471265us-gaap:CreditRiskContractMemberus-gaap:FairValueMeasurementsRecurringMember2022-12-310001471265nwbi:ImpairedLoansMemberus-gaap:FairValueMeasurementsNonrecurringMemberus-gaap:FairValueInputsLevel1Member2023-12-310001471265nwbi:ImpairedLoansMemberus-gaap:FairValueMeasurementsNonrecurringMemberus-gaap:FairValueInputsLevel2Member2023-12-310001471265us-gaap:FairValueInputsLevel3Membernwbi:ImpairedLoansMemberus-gaap:FairValueMeasurementsNonrecurringMember2023-12-310001471265nwbi:ImpairedLoansMemberus-gaap:FairValueMeasurementsNonrecurringMember2023-12-310001471265us-gaap:FairValueMeasurementsNonrecurringMemberus-gaap:FairValueInputsLevel1Member2023-12-310001471265us-gaap:FairValueMeasurementsNonrecurringMemberus-gaap:FairValueInputsLevel2Member2023-12-310001471265us-gaap:FairValueInputsLevel3Memberus-gaap:FairValueMeasurementsNonrecurringMember2023-12-310001471265us-gaap:FairValueMeasurementsNonrecurringMember2023-12-310001471265nwbi:ImpairedLoansMemberus-gaap:FairValueMeasurementsNonrecurringMemberus-gaap:FairValueInputsLevel1Member2022-12-310001471265nwbi:ImpairedLoansMemberus-gaap:FairValueMeasurementsNonrecurringMemberus-gaap:FairValueInputsLevel2Member2022-12-310001471265us-gaap:FairValueInputsLevel3Membernwbi:ImpairedLoansMemberus-gaap:FairValueMeasurementsNonrecurringMember2022-12-310001471265nwbi:ImpairedLoansMemberus-gaap:FairValueMeasurementsNonrecurringMember2022-12-310001471265us-gaap:FairValueMeasurementsNonrecurringMemberus-gaap:FairValueInputsLevel1Member2022-12-310001471265us-gaap:FairValueMeasurementsNonrecurringMemberus-gaap:FairValueInputsLevel2Member2022-12-310001471265us-gaap:FairValueInputsLevel3Memberus-gaap:FairValueMeasurementsNonrecurringMember2022-12-310001471265us-gaap:FairValueMeasurementsNonrecurringMember2022-12-310001471265us-gaap:FairValueInputsLevel3Membernwbi:ImpairedLoansMember2023-12-310001471265us-gaap:MeasurementInputCostToSellMembernwbi:ImpairedLoansMemberus-gaap:ValuationTechniqueConsensusPricingModelMember2023-12-310001471265us-gaap:ValuationTechniqueDiscountedCashFlowMembernwbi:MeasurementInputAnnualServiceCostMember2023-12-310001471265us-gaap:ValuationTechniqueDiscountedCashFlowMembersrt:MinimumMemberus-gaap:MeasurementInputPrepaymentRateMember2023-12-310001471265us-gaap:ValuationTechniqueDiscountedCashFlowMemberus-gaap:MeasurementInputPrepaymentRateMembersrt:MaximumMember2023-12-310001471265us-gaap:ValuationTechniqueDiscountedCashFlowMembersrt:WeightedAverageMemberus-gaap:MeasurementInputPrepaymentRateMember2023-12-310001471265us-gaap:MeasurementInputExpectedTermMemberus-gaap:ValuationTechniqueDiscountedCashFlowMembersrt:MinimumMember2023-12-310001471265us-gaap:MeasurementInputExpectedTermMemberus-gaap:ValuationTechniqueDiscountedCashFlowMembersrt:MaximumMember2023-12-310001471265us-gaap:MeasurementInputExpectedTermMemberus-gaap:ValuationTechniqueDiscountedCashFlowMembersrt:WeightedAverageMember2023-12-310001471265us-gaap:ValuationTechniqueDiscountedCashFlowMemberus-gaap:MeasurementInputOptionVolatilityMember2023-12-310001471265nwbi:MeasurementInputForwardYieldCurveMemberus-gaap:ValuationTechniqueDiscountedCashFlowMembersrt:MinimumMember2023-12-310001471265nwbi:MeasurementInputForwardYieldCurveMemberus-gaap:ValuationTechniqueDiscountedCashFlowMembersrt:MaximumMember2023-12-310001471265us-gaap:MeasurementInputCostToSellMemberus-gaap:ValuationTechniqueConsensusPricingModelMember2023-12-310001471265nwbi:ValuationTechniqueQuotedPricingMembernwbi:MeasurementInputPullThroughRateMember2023-12-310001471265nwbi:NorthwestBancsharesIncMember2023-12-310001471265srt:SubsidiariesMember2023-12-310001471265nwbi:NorthwestBancsharesIncMember2022-12-310001471265srt:SubsidiariesMember2022-12-310001471265us-gaap:AccumulatedNetUnrealizedInvestmentGainLossMember2023-12-310001471265us-gaap:AccumulatedNetUnrealizedInvestmentGainLossMember2022-12-310001471265us-gaap:AccumulatedGainLossNetCashFlowHedgeParentMember2023-12-310001471265us-gaap:AccumulatedGainLossNetCashFlowHedgeParentMember2022-12-310001471265us-gaap:AccumulatedDefinedBenefitPlansAdjustmentMember2023-12-310001471265us-gaap:AccumulatedDefinedBenefitPlansAdjustmentMember2022-12-310001471265us-gaap:AccumulatedNetUnrealizedInvestmentGainLossMember2023-01-012023-12-310001471265us-gaap:AccumulatedGainLossNetCashFlowHedgeParentMember2023-01-012023-12-310001471265us-gaap:AccumulatedDefinedBenefitPlansAdjustmentMember2023-01-012023-12-310001471265us-gaap:AccumulatedNetUnrealizedInvestmentGainLossMember2021-12-310001471265us-gaap:AccumulatedDefinedBenefitPlansAdjustmentMember2021-12-310001471265us-gaap:AccumulatedNetUnrealizedInvestmentGainLossMember2022-01-012022-12-310001471265us-gaap:AccumulatedDefinedBenefitPlansAdjustmentMember2022-01-012022-12-310001471265us-gaap:AccumulatedNetUnrealizedInvestmentGainLossMember2020-12-310001471265us-gaap:AccumulatedDefinedBenefitPlansAdjustmentMember2020-12-310001471265us-gaap:AccumulatedNetUnrealizedInvestmentGainLossMember2021-01-012021-12-310001471265us-gaap:AccumulatedDefinedBenefitPlansAdjustmentMember2021-01-012021-12-310001471265srt:ParentCompanyMember2023-12-310001471265srt:ParentCompanyMember2022-12-310001471265srt:ParentCompanyMember2023-01-012023-12-310001471265srt:ParentCompanyMember2022-01-012022-12-310001471265srt:ParentCompanyMember2021-01-012021-12-310001471265srt:ParentCompanyMember2021-12-310001471265srt:ParentCompanyMember2020-12-310001471265us-gaap:DesignatedAsHedgingInstrumentMemberus-gaap:InterestRateSwapMember2023-12-31nwbi:derivative0001471265us-gaap:DesignatedAsHedgingInstrumentMemberus-gaap:InterestRateSwapMembersrt:MaximumMember2023-01-012023-12-310001471265us-gaap:DesignatedAsHedgingInstrumentMembersrt:MinimumMemberus-gaap:InterestRateSwapMember2023-01-012023-12-310001471265us-gaap:InterestRateSwapMemberus-gaap:NondesignatedMember2023-12-310001471265us-gaap:CurrencySwapMemberus-gaap:NondesignatedMember2023-12-310001471265us-gaap:InterestRateLockCommitmentsMemberus-gaap:NondesignatedMember2023-12-310001471265us-gaap:ForwardContractsMemberus-gaap:NondesignatedMember2023-12-310001471265us-gaap:CreditRiskContractMemberus-gaap:NondesignatedMember2023-12-310001471265us-gaap:InterestRateSwapMemberus-gaap:NondesignatedMember2022-12-310001471265us-gaap:CurrencySwapMemberus-gaap:NondesignatedMember2022-12-310001471265us-gaap:InterestRateLockCommitmentsMemberus-gaap:NondesignatedMember2022-12-310001471265us-gaap:ForwardContractsMemberus-gaap:NondesignatedMember2022-12-310001471265us-gaap:CreditRiskContractMemberus-gaap:NondesignatedMember2022-12-310001471265us-gaap:OtherIncomeMember2023-01-012023-12-310001471265us-gaap:OtherIncomeMember2022-01-012022-12-310001471265us-gaap:OtherIncomeMember2021-01-012021-12-310001471265nwbi:MortgageBankingIncomeMember2023-01-012023-12-310001471265nwbi:MortgageBankingIncomeMember2022-01-012022-12-310001471265nwbi:MortgageBankingIncomeMember2021-01-012021-12-310001471265us-gaap:DesignatedAsHedgingInstrumentMembernwbi:InterestRateSwapIssuedMay112023Member2023-12-310001471265us-gaap:DesignatedAsHedgingInstrumentMembernwbi:InterestRateSwapIssuedMay122023ContractOneMember2023-12-310001471265us-gaap:DesignatedAsHedgingInstrumentMembernwbi:InterestRateSwapIssuedMay192023ContractTwoMember2023-12-310001471265us-gaap:DesignatedAsHedgingInstrumentMembernwbi:InterestRateSwapIssuedMay312023ContractThreeMember2023-12-310001471265us-gaap:DesignatedAsHedgingInstrumentMembernwbi:InterestRateSwapIssuedJuly262023ContractFourMember2023-12-310001471265us-gaap:DesignatedAsHedgingInstrumentMembernwbi:InterestRateSwapIssuedJuly312023ContractFiveMember2023-12-310001471265nwbi:InterestRateSwapIssuedAugust92023ContractSixMemberus-gaap:DesignatedAsHedgingInstrumentMember2023-12-31
UNITED STATES SECURITIES AND EXCHANGE COMMISSION
Washington, D.C. 20549
FORM 10-K
☒ Annual Report Pursuant to Section 13 or 15(d) of the Securities Exchange Act of 1934.
For the Fiscal Year Ended December 31, 2023
OR
☐ Transition Report Pursuant to Section 13 or 15(d) of the Securities Exchange Act of 1934.
For the transition period from _____ to _____
Commission File No. 001-34582
NORTHWEST BANCSHARES, INC.
(Exact name of registrant as specified in its charter)
|
|
|
|
|
|
|
|
|
|
|
|
|
|
|
|
|
|
| Maryland |
|
27-0950358 |
| (State or other jurisdiction of incorporation or organization) |
|
(I.R.S. Employer Identification Number) |
|
|
|
|
|
|
| 3 Easton Oval, |
Suite 500, |
Columbus, |
Ohio |
|
43219 |
| (Address of Principal Executive Offices) |
|
(Zip Code) |
(814) 726-2140
(Registrant’s telephone number)
Securities Registered Pursuant to Section 12(b) of the Act:
|
|
|
|
|
|
|
|
|
|
|
|
|
|
|
Title of each class |
|
Trading symbol(s) |
|
Name of each exchange on which registered |
| Common Stock, $0.01 Par Value |
|
NWBI |
|
NASDAQ Stock Market, LLC |
Securities Registered Pursuant to Section 12(g) of the Act:
None
Indicate by check mark if the registrant is a well-known seasoned issuer, as defined in Rule 405 of the Securities Act. Yes ☒ No ☐
Indicate by check mark if the registrant is not required to file reports pursuant to Section 13 or Section 15(d) of the Act. Yes ☐ No ☒
Indicate by check mark whether the Registrant (1) has filed all reports required to be filed by Section 13 or 15(d) of the Securities Exchange Act of 1934 during the preceding twelve months (or for such shorter period that the Registrant was required to file such reports) and (2) has been subject to such requirements for the past 90 days. Yes ☒ No ☐
Indicate by check mark whether the registrant has submitted electronically every Interactive Data File required to be submitted pursuant to Rule 405 of Regulation S-T (§ 232.405 of this chapter) during the preceding 12 months (or for such shorter period that the registrant was required to submit such files). Yes ☒ No ☐
Indicate by check mark whether the registrant is a large accelerated filer, an accelerated filer, a non-accelerated filer, smaller reporting company, or an emerging growth company. See the definition of “large accelerated filer,” “accelerated filer,” “smaller reporting company,” and “emerging growth company” in Rule 12b-2 of the Exchange Act.
☒ Large accelerated filer ☐ Accelerated filer
☐ Non-accelerated filer ☐ Smaller reporting company
☐ Emerging growth company
If an emerging growth company, indicate by check mark if the registrant has elected not to use the extended transition period for complying with any new or revised financial accounting standards provided pursuant to Section 13(a) of the Exchange Act. ☐
Indicate by check mark whether the registrant has filed a report on and attestation to its management’s assessment of the effectiveness of its internal control over financial reporting under Section 404(b) of the Sarbanes-Oxley Act (15 U.S.C. 7262(b)) by the registered public accounting firm that prepared or issued its audit report. ☒
If securities are registered pursuant to Section 12(b) of the Act, indicate by check mark whether the financial statements of the registrant included in the filing reflect the correction of an error to previously issued financial statements. Yes ☐ No ☒
Indicate by check mark whether any of those error corrections are restatements that required a recovery analysis of incentive-based compensation received by any of the registrant's executive officers during the relevant recovery period pursuant to §240.10D-1(b). Yes ☐ No ☒
Indicate by check mark whether the Registrant is a shell company (as defined in Rule 12b-2 of the Exchange Act). Yes ☐ No ☒
As of February 20, 2024, there were 127,112,705 shares outstanding of the Registrant’s Common Stock.
The aggregate market value of the voting and non-voting common equity held by non-affiliates of the Registrant, computed by reference to the last sale price on June 30, 2023, as reported by the Nasdaq Global Select Market, was approximately $1.347 billion.
DOCUMENTS INCORPORATED BY REFERENCE
Proxy Statement for the 2024 Annual Meeting of Stockholders of the Registrant (Part III).
TABLE OF CONTENTS
FORWARD-LOOKING STATEMENTS
This document contains forward-looking statements, which can be identified by the use of words such as “estimate,” “project,” “believe,” “intend,” “anticipate,” “plan,” “seek,” “expect” and words of similar meaning. These forward-looking statements include, but are not limited to:
•statements of our goals, intentions and expectations;
•statements regarding our business plans, prospects, growth and operating strategies;
•statements regarding the asset quality of our loan and investment portfolios; and
•estimates of our risks and future costs and benefits.
These forward-looking statements are based on current beliefs and expectations of our management and are inherently subject to significant business, economic and competitive uncertainties and contingencies, many of which are beyond our control. In addition, these forward-looking statements are subject to assumptions with respect to future business strategies and decisions that are subject to change.
The following factors, among others, could cause actual results to differ materially from the anticipated results or other expectations expressed in the forward-looking statements:
•inflation and changes in the interest rate environment that reduce our margins, our loan origination, or the fair value of financial instruments;
•changes in asset quality, including increases in default rates on loans and higher levels of nonperforming loans and loan charge-offs generally;
•changes in laws or government regulations or policies affecting financial institutions, including changes in regulatory fees and capital requirements;
•changes in federal, state, or local tax laws and tax rates;
•general economic conditions, either nationally or in our market areas, that are different than expected, including inflationary or recessionary pressures;
•adverse changes in the securities and credit markets;
•cyber-security concerns, including an interruption or breach in the security of our website or other information systems;
•technological changes that may be more difficult or expensive than expected;
•changes in liquidity, including the size and composition of our deposit portfolio, and the percentage of uninsured deposits in the portfolio;
•the ability of third-party providers to perform their obligations to us;
•competition among depository and other financial institutions, including with respect to deposit gathering, service charges and fees;
•our ability to enter new markets successfully and capitalize on growth opportunities;
•our ability to manage our internal growth and our ability to successfully integrate acquired entities, businesses or branch offices;
•changes in consumer spending, borrowing and saving habits;
•our ability to continue to increase and manage our commercial and personal loans;
•possible impairments of securities held by us, including those issued by government entities and government sponsored enterprises;
•changes in the value of our goodwill or other intangible assets;
•the impact of the economy on our loan portfolio (including cash flow and collateral values), investment portfolio, customers and capital market activities;
•our ability to receive regulatory approvals for proposed transactions or new lines of business;
•the effects of any federal government shutdown or the inability of the federal government to manage debt limits;
•changes in the financial performance and/or condition of our borrowers;
•the effect of changes in accounting policies and practices, as may be adopted by the regulatory agencies, as well as the Securities and Exchange Commission, the Public Company Accounting Oversight Board, the Financial Accounting Standards Board (“FASB”) and other accounting standard setters.
•changes in the level and direction of loan delinquencies and write-offs and changes in estimates of the adequacy of the allowance for credit losses;
•our ability to access cost-effective funding;
•the effect of global or national war, conflict, or terrorism;
•our ability to manage market risk, credit risk and operational risk;
•the disruption to local, regional, national and global economic activity caused by infectious disease outbreaks, and the significant impact that any such outbreaks may have on our growth, operations and earnings;
•the effects of natural disasters and extreme weather events;
•changes in our ability to continue to pay dividends, either at current rates or at all;
•our ability to retain key employees; and
•our compensation expense associated with equity allocated or awarded to our employees.
Because of these and other uncertainties, our actual future results may be materially different from the results indicated by these forward-looking statements. Please see “Item 1A. Risk Factors”.
Except as may be required by law, we disclaim any intention or obligation to update or revise any forward-looking statements, whether as a result of new information, future events or otherwise.
ITEM 1. BUSINESS
Northwest Bancshares, Inc.
Northwest Bancshares, Inc., a Maryland corporation, was incorporated in 2009 to be the successor corporation to Northwest Bancorp, Inc., the former stock holding company for Northwest Bank, upon completion of the mutual-to-stock conversion of Northwest Bancorp, MHC. The terms “Northwest”, “the Company”, “we”, “us” and “our” refer to Northwest Bancshares, Inc., unless indicated otherwise by the context.
The conversion was completed in 2009 when the Company sold 68,878,267 shares of common stock at $10.00 per share in the related offering. Concurrent with the completion of the offering, shares of Northwest Bancorp, Inc. common stock owned by public stockholders were exchanged for shares of Northwest Bancshares, Inc.’s common stock. We also issued 1,277,565 shares of common stock and contributed $1.0 million in cash from the offering proceeds to Northwest Charitable Foundation, a charitable foundation that we established for the benefit of the communities in which Northwest Bank operates. As of December 31, 2023, the Company had 127,110,453 shares outstanding and a market capitalization of approximately $1.586 billion.
Our executive offices are located at 3 Easton Oval, Suite 500, Columbus, Ohio 43219. We also maintain administrative offices located at 100 Liberty Street, Warren, Pennsylvania 16365. The telephone number for these addresses is (814) 726-2140.
The Company’s website (www.northwest.com) contains a direct link to Northwest Bancshares, Inc.’s filings with the Securities and Exchange Commission, including copies of annual reports on Form 10-K, quarterly reports on Form 10-Q, current reports on Form 8-K, and amendments to these filings, if any. Information on our website shall not be considered a part of this report. Copies of our filings may be obtained, without charge, by written request to Shareholder Relations, 100 Liberty Street, P.O. Box 128, Warren, Pennsylvania 16365, or emailing shareholderrelations@northwest.com.
Northwest Bank
Northwest Bank is a Pennsylvania-chartered savings bank headquartered in Warren, Pennsylvania, which is located in northwestern Pennsylvania. Northwest Bank is a community-oriented financial institution offering personal and business banking solutions, investment management and trust services. Northwest Bank’s mutual savings bank predecessor was founded in 1896.
As of December 31, 2023, Northwest Bank operated 142 community-banking locations throughout its market area in Pennsylvania, western New York, eastern Ohio, and Indiana. Our principal lending activities are the origination of loans secured by first mortgages on owner-occupied, one-to-four-family residences, shorter term consumer loans, and commercial business and commercial real estate loans.
Our principal sources of funds are personal and business deposits, borrowed funds and the principal and interest payments on loans and marketable securities. Our principal source of income is interest received on loans and marketable securities. Our principal expenses are the cost of employee compensation and benefits and the interest paid on deposits and borrowed funds.
Northwest Bank’s principal executive office is located at 100 Liberty Street, Warren, Pennsylvania 16365, and the telephone number at that address is (814) 726-2140.
Market Area and Competition
Northwest Bank is headquartered in northwestern Pennsylvania and has expanded primarily through acquisitions, into the southwestern and central regions of Pennsylvania, as well as western New York, northeastern Ohio, and Indiana. As of December 31, 2023, we operated 142 community banking locations across these market areas. All of the aforementioned market areas are served by a number of competing financial institutions. As a result, we encounter strong competition both in attracting deposits and in originating loans. Our most direct competition for deposits comes from other banks, brokerage houses and credit unions in our market areas. We expect continued competition from these financial institutions in the foreseeable future. With the continued acceptance of internet banking by our customers and consumers generally, competition for deposits has increased from institutions operating outside of our market area.
The following description of our market area is based upon information obtained from SNL Securities, the Bureau of Labor Statistics, the Federal Housing Financial Agency and the Mortgage Bankers Association.
Pennsylvania Market Area. Our retail branch network of 83 community banking offices within the Commonwealth of Pennsylvania encompasses 23 counties. Our western Pennsylvania market has a diverse economy driven by healthcare and education industries, service businesses, technology companies and small manufacturing operations. Our southeastern Pennsylvania market is primarily driven by service businesses but also serves as a bedroom community to the cities of Baltimore, Maryland and Philadelphia, Pennsylvania.
Our Pennsylvania market area has a total population of approximately 4.3 million and total households of approximately 1.8 million as of December 31, 2023. The Pennsylvania markets in which we operate our retail branches contain approximately half of Pennsylvania’s population and a similar percentage of households. These markets have experienced a 1.5% decrease in population between 2020 and 2024. As of December 31, 2023, the market’s average median household income has increased over the last year by 6.7%, to $67,574, compared to the national median income level of $75,874. The household income growth rate in Pennsylvania of 10.3%, is projected to be slightly higher than the national average growth rates during the next five years of 10.1%. As of December 31, 2023, the market’s unemployment rate was 2.8%, slightly lower than both the Commonwealth of Pennsylvania rate of 3.5% and the national average of 3.7%.
As of September 30, 2023, the most recent date for which data is available, the House Price Index for the last four quarters in the state of Pennsylvania increased by 8.1%, compared to an increase in the national average of 5.5%. As of September 30, 2023, the foreclosure rate for mortgage loans on one-to-four unit residential properties in the state of Pennsylvania was one in every 1,324 housing units, compared to the national average of one in every 1,389 housing units.
Western New York Market Area. Our retail branch network of 28 community banking offices in New York encompasses four counties in the western portion of the state. This market has a diverse economy driven by healthcare and education industries, service businesses, technology companies and small manufacturing operations.
Our New York market area has a total population of approximately 2.0 million and total households of approximately 864,000 as of December 31, 2023. This area has experienced an decrease in population between 2020 and 2024, of 0.7%. The average median household income in this market increased by 0.6% over the last year to $65,563 as of December 31, 2023, compared to the national median income level of $75,874. As of December 31, 2023, the unemployment rate for our New York market area was 3.9%, compared to the national average of 3.7%.
As of September 30, 2023, the House Price Index for the last four quarters in our New York market increased by 7.6%, compared to an increase in the national average of 5.5%. As of September 30, 2023, the foreclosure rate for mortgage loans on one-to-four unit residential properties in the state of New York was one in every 1,269 housing units, compared to the national average of one in every 1,389 housing units.
Northeastern Ohio Market Area. Our retail branch network of 11 community banking offices includes two counties in northeastern Ohio, including the Cleveland metro area. The major employment sectors in this market are similar to the contiguous market in western Pennsylvania.
Our Ohio market area has a total population of approximately 854,000 and total households of approximately 356,000 as of December 31, 2023. This area has experienced an increase in population between 2020 and 2024, of 1.5%. The median household income for our Ohio market increased 7.3% over the last year to $68,601 as of December 31, 2023, compared to the national median income level of $75,874. As of December 31, 2023, the unemployment rate for our Ohio market was 3.1%, compared to the national average of 3.7%.
As of September 30, 2023, the House Price Index for the last four quarters in our Ohio market area increased by 8.5%, compared to an increase in the national average of 5.5%. As of September 30, 2023, the foreclosure rate for mortgage loans on one-to-four unit residential properties in the state of Ohio was one in every 955 housing units, compared to the national average of one in every 1,389 housing units.
Indiana Market Area. Our retail branch network of 20 community banking offices includes eight counties in Indiana. This market has a diverse economy driven by healthcare and education industries, service businesses, technology companies and small manufacturing operations.
Our Indiana market area has a total population of approximately 934,000 and total households of approximately 367,000 as of December 31, 2023. The population of this area has remained stable between 2020 and 2024. The median household income for our Indiana market increased 5.6% over the last year to $60,651 as of December 31, 2023, compared to the national median income level of $75,874. As of December 31, 2023, the unemployment rate for our Indiana market was 3.7%, the same as the national average.
As of September 30, 2023, the House Price Index for the last four quarters in our Indiana market area increased by 6.5%, compared to an increase in the national average of 5.5%. As of September 30, 2023, the foreclosure rate for mortgage loans on one-to-four unit residential properties in the state of Indiana was one in every 1,144 housing units, compared to the national average of one in every 1,389 housing units.
Lending Activities
General. Our principal lending activities are the origination of fixed and adjustable-rate loans collateralized by one-to-four-family residential real estate, shorter term consumer loans and loans collateralized by multi-family residential and commercial real estate as well as commercial business loans. Generally, we focus our lending activities in the geographic areas where we maintain offices.
In an effort to manage interest rate risk, we have sought to make our interest-earning assets more interest rate sensitive by originating adjustable-rate loans, such as adjustable-rate residential mortgage loans and home equity lines of credit, and by originating short-term and medium-term fixed-rate consumer loans. In recent years we have emphasized the origination of commercial real estate loans and commercial business loans, which generally have adjustable-rates of interest and shorter maturities than one-to-four-family residential real estate loans. Because we originate a substantial amount of long-term fixed-rate mortgage loans collateralized by one-to-four-family residential real estate, when possible, we originate and underwrite loans according to standards that allow us to sell them into the secondary mortgage market for purposes of managing interest-rate risk and liquidity. The sale of mortgage loans supports our strategy to grow the consumer and commercial loan portfolios faster than our portfolio of long-term fixed-rate residential mortgage loans. We currently sell low-yielding fixed-rate residential mortgage loans with maturities of more than 15 years, and on a more limited basis, those with maturities of 15 years or less, while retaining all adjustable-rate residential mortgage loans. With the build out of our Columbus, Ohio mortgage fulfillment center, our intention is to sell more loans into the secondary market on a servicing released basis. We also retain servicing on some of the mortgage loans we sell which generates monthly service fee income. We generally retain in our portfolio all consumer loans that we originate while we periodically sell participation loans in the multi-family residential, commercial real estate and commercial business loans that we originate in an effort to reduce the concentration of certain individual credits and the risk associated with certain businesses, industries or geographies.
Residential Mortgage Loans. We offer residential mortgage loans with terms typically ranging from 15 to 30 years, with either fixed or adjustable interest rates. Our mortgage loans are amortized on a monthly basis with both principal and interest due monthly. Originations of fixed-rate residential mortgage loans versus adjustable-rate residential mortgage loans are monitored on an ongoing basis. The percentage of adjustable-rate residential mortgage originations to total originations is affected significantly by the level of market interest rates, customer preference, our interest rate sensitivity and liquidity position, as well as loan products offered by our competitors. Therefore, even when our strategy is to increase the origination of adjustable-rate residential mortgage loans, market conditions may be such that there is greater demand for fixed-rate mortgage loans. Adjustable-rate residential mortgage loans totaled $100.2 million, or 0.9%, of our gross loan portfolio at December 31, 2023.
Our fixed-rate residential mortgage loan products offer fixed rates for up to 30 years. Whenever possible, our fixed-rate residential mortgages are originated and underwritten according to secondary mortgage market guidelines in order to manage credit risk, as well as interest rate risk and liquidity risk. Our adjustable-rate residential mortgage loans offer initial interest rate adjustment periods of five, seven, and ten years, terms up to 30 years and adjustments based on changes in designated market indices.
Regulations limit the amount that a bank may lend relative to appraised values of real estate securing the loans, as determined by an appraisal at the time of loan origination. Such regulations permit a maximum loan-to-value of 95% for residential properties and 80% for all other real estate secured loans. We generally limit the maximum loan-to-value on both fixed-rate and adjustable-rate residential mortgage loans without private mortgage insurance, to 80% of the lesser of appraised values or purchase prices of real estate serving as collateral for our mortgage loans. Limited special financing programs allow for insured loans with loan-to-value ratios of up to 97%, and uninsured loans with loan-to-value ratios up to 100%. The appraisal process is managed by the Northwest Appraising Department, and appraisals are performed by our in-house appraiser staff or by appraisers deemed qualified by our Residential Appraising Manager. We require fire and casualty insurance, as well as a title guaranty regarding good title, on all properties securing our residential mortgage loans. We also require flood insurance for loans secured by properties located within special flood hazard areas.
Included in our $3.419 billion portfolio of residential mortgage loans as of December 31, 2023 are construction loans of $26.6 million, or 0.2% of our gross loan portfolio. We offer fixed-rate and adjustable-rate residential construction-to-permanent loans primarily for the construction of owner-occupied one-to four-family residences in our market area to builders or owners who have a contract for construction. Construction loans are originated with terms of up to 30 years with an allowance of up to one year for construction. Advances are made as construction is completed, and interest is charged on the total amount of credit extended. At the end of the construction period, repayment terms convert to fully amortizing payments, with both principal and interest due monthly. Construction lending generally involves a greater degree of credit risk than permanent residential mortgage lending, as repayment of construction loans is often dependent upon the successful completion of construction projects.
Construction delays or the inability of borrowers to sell properties once construction is completed may impair borrowers’ ability to repay loans. Private mortgage insurance is required for construction loans with loan-to-value ratios in excess of 80%, and the maximum loan-to-value ratio for construction loans is 95% of the lower of cost to build or as-completed appraised value.
In addition, we originate loans within our market area that are secured by individual unimproved or improved lots. Land loans for the construction of owner-occupied residential real estate properties are currently offered with fixed-rates for terms of up to ten years. The maximum loan-to-value ratio for these loans is 80% of the as-completed appraised value.
Our residential mortgage loans customarily include due-on-sale clauses, which are provisions giving us the right to declare loans immediately due and payable in the event, among other things, borrowers sell or otherwise dispose of underlying real properties serving as collateral for loans.
Home Equity Loans and Lines of Credit. Generally, our home equity loans are secured by the borrower’s principal residence with a maximum loan-to-value ratio, including the principal balances of both the first and second mortgage loans, of 95% or less. We generally underwrite home equity loans and lines of credit in a manner similar to our underwriting of residential mortgage loans.
Home equity loans are offered on a fixed-rate basis with amortized terms of up to 20 years. Principal and interest is due monthly. At December 31, 2023, our fixed-rate home equity loans totaled $820.0 million, or 7.2% of gross loans.
Home equity lines of credit are offered on an adjustable-rate basis with terms of up to 25 years, including a draw period of 10 years each. Although home equity lines of credit require interest-only payments during draw periods, they are underwritten using amortizing principal and interest payments based on current rates of equivalent fixed-rate products. The disbursed portion of home equity lines of credit totaled $403.1 million, or 3.6% of gross loans, with $701.0 million remaining undistributed as of December 31, 2023.
Other Consumer Loans. The principal types of other consumer loans we offer are direct and indirect automobile loans, sales finance loans, unsecured personal loans, credit card loans, and loans secured by investment accounts. These loans are typically offered with maturities of ten years or less.
The underwriting standards we employ for consumer loans include a determination of the applicant’s credit history and an assessment of ability to meet existing obligations and payments on the proposed loan. The stability of the applicant’s monthly income may be determined by verification of gross monthly income from primary employment, and additionally, from any verifiable secondary income. Creditworthiness of the applicant is of primary consideration; however, the underwriting process also includes a comparison of the value of the collateral in relation to the proposed loan amount for secured products.
Consumer loans entail greater credit risk than residential mortgage loans, particularly in the case of consumer loans that are unsecured or secured by assets that depreciate rapidly, such as automobiles, mobile homes, boats, and recreation vehicles. In such cases, repossessed collateral for a defaulted consumer loan may not provide an adequate source of repayment for the outstanding loan and the remaining deficiency often does not warrant further substantial collection efforts against the borrower. In particular, amounts realizable on the sale of repossessed automobiles may be significantly reduced based upon the condition of the automobiles and the lack of demand for used automobiles. At December 31, 2023, other consumer loans totaled $2.066 billion, or 18.2% of gross loans.
Commercial Real Estate Loans. Our multi-family commercial real estate loans are secured by multi-family residences, such as rental properties, student housing, and senior living facilities. Our other commercial real estate loans are secured by nonresidential properties such as hotels, commercial offices, medical buildings, manufacturing facilities and retail establishments. At December 31, 2023, a significant portion of our multi-family commercial real estate and commercial real estate loans were secured by properties located within our market area.
Our largest commercial relationship with an aggregate total exposure of $118.9 million as of December 31, 2023, is comprised of multi-family residential, commercial office, hotel, retail buildings, and student housing, the largest of which is $33.5 million of the total exposure secured by retail buildings. This relationship is also our largest commercial real estate loan relationship as of December 31, 2023, of which $117.2 million is attributed to commercial real estate loans. All of the underlying loans were performing in accordance with their terms as of December 31, 2023.
Multi-family commercial and commercial real estate loans are offered with both adjustable and fixed interest rates. The terms of each multi-family residential and commercial real estate loan are negotiated on a case-by-case basis. We generally originate multi-family commercial and commercial real estate loans in amounts up to 80% of the appraised value of the property collateralizing the loan. At December 31, 2023, commercial real estate loans totaled $2.977 billion, or 26.2% of gross loans.
Loans secured by multi-family commercial and commercial real estate generally involve a greater degree of credit risk than residential mortgage loans and carry larger loan balances. This increased credit risk is a result of several factors, including the concentration of principal in a limited number of loans and borrowers, the effects of general economic conditions on income producing properties, and the increased difficulty of evaluating and monitoring these types of loans. Furthermore, the repayment of loans secured by multi-family commercial and commercial real estate is typically dependent upon the successful operation of the related real estate property. If the cash flow from the project is reduced, the borrower’s ability to repay the loan may be impaired.
Commercial Loans. We offer commercial loans to finance various activities in our market area, some of which are secured in part by additional real estate collateral. At December 31, 2023, our largest commercial loan relationship had an aggregate total exposure of $67.4 million, and operates in the internet, cable and phone space. These loans were performing in accordance with their agreed upon terms as of December 31, 2023.
Commercial business loans are offered with both fixed and adjustable interest rates. Underwriting standards we employ for commercial business loans include a determination of the applicant’s ability to meet existing obligations and payments on the proposed loan from operating cash flows generated by the applicant’s business. The financial strength of each applicant is also assessed through a review of financial statements provided by the applicant.
We originate commercial loans through our network of Small Business and Commercial Loan Officers located in our areas. In addition, our Commercial Finance group originates loans where multiple banks may be involved in the credit facilities. These loans are made to companies operating in our market area. Many of these companies carry public debt ratings.
Commercial loans generally have higher interest rates than residential loans, but they also may involve a higher risk of default since their repayment is generally dependent on the successful operation of the borrower’s business. We strive to obtain personal guarantees from the borrower or a third party as a condition to originating commercial loans. At December 31, 2023, commercial loans totaled $1.661 billion, or 14.6% of gross loans.
Loan Originations, Solicitation, Processing and Commitments. Upon receiving a retail loan application, we obtain a credit report and may verify employment to confirm specific information relating to the applicant’s employment, income, and credit standing. In the case of a real estate loan, either an in-house appraiser, or an approved external appraiser, appraises the real estate intended to secure the proposed loan. For certain home equity loans we may use an approved alternative valuation such as an assessed value or Automated Value Model (AVM). A loan underwriter checks the loan document file for accuracy and completeness and verifies the information provided.
For our personal loans, including residential mortgage loans, home equity loans and lines of credit, automobile loans, credit cards and other unsecured loans, we have implemented a credit approval process based on a laddered individual loan authority system. Real estate secured loans are underwritten centrally by our underwriting team. Non-real estate loans are underwritten by both local loan officers or a centralized underwriting team who are granted various levels of authority based on their lending experience and expertise. These authority levels are reviewed by the Credit Committee on at least an annual basis.
For commercial loans, aggregate credit exposures over $1.0 million are underwritten by Credit Administration. Our commercial loan policy assigns individual lending limits for our various commercial loan officers and dual authority consisting of an individual from Commercial Lending and Credit Administration. Lending authorities are established by the Credit Committee. The Senior Loan Committee meets weekly to approve extensions of credit in excess of the maximum dual authority limits. The Credit Committee meets monthly to review the assigned lending limits and to monitor our lending policies, loan activity, economic conditions, and concentrations of credit.
Our general policy is to make no loans, either individually or in the aggregate to one borrower or single source of repayment, in excess of $30.0 million. For loans originated and managed within the Corporate Finance portfolio the Total Credit Exposure limit is increased to $50.0 million for borrowers with a strong credit profile and a risk rating of 3 or better. The Aggregate Credit Exposure limit is $100.0 million. Criticized/classified loans exceeding $5.0 million or unusual loan requests are reviewed with the Risk Management Committee of the Board of Directors at each quarterly meeting. In addition, the Chief Credit Officer has the authority to require that the Board of Directors review any loan that has been approved by the Senior Loan Committee with which the Chief Credit Officer has specific concerns.
After a loan is approved, a loan commitment letter is promptly issued to the borrower. At December 31, 2023, we had commitments to originate $198.2 million of loans.
Loan Origination Fees and Costs. We defer loan origination fees received from borrowers and costs to originate loans and amortize such amounts as an adjustment of yield over the life of the loan by using the level yield method. Deferred loan fees and costs are recognized as part of interest income immediately upon prepayment or the sale of the related loan. At December 31, 2023, we had $72.1 million of net deferred loan origination fees. Loan origination fees vary with the volume and type of loans and commitments originated and purchased, principal repayments, and competitive conditions in the marketplace.
Loan origination costs were $16.4 million, $18.2 million and $25.1 million for the years ended December 31, 2023, 2022 and 2021, respectively.
Loans-to-One Borrower. As of December 31, 2023, the largest aggregate amount loaned to one borrower, or related borrowers, totaled $118.9 million in exposure and was secured by student housing, retail space, office space and commercial development. Our second largest lending relationship totaled $69.1 million in exposure and was secured by student housing, medical space, senior housing, office space, industrial, aerospace, and transportation engineering and retail space. Our third largest commercial relationship totaled $67.8 million in exposure and was secured by a hotel, retail space, office space, multi-family, a charter school, self-storage, and a restaurant. Our fourth largest commercial relationship totaled $67.4 million in exposure and was secured by accounts receivable, information systems, property, and equipment. Our fifth largest commercial relationship totaled $65.0 million in exposure and was secured by accounts receivable, inventory, manufacturing property and equipment. All of these loans were performing in accordance with their terms at December 31, 2023.
Investment Activities
Our Board of Directors has primary responsibility for establishing and overseeing our investment policy. The Board of Directors has delegated authority to implement the investment policy to our Chief Financial Officer. The investment policy is reviewed at least annually, and any changes to the policy are subject to approval by the Board of Directors. The overall objectives of the investment policy are to maintain a portfolio of high quality and diversified investments, to provide liquidity, and to control interest rate risk while providing an acceptable return. The investment portfolio is also used to provide collateral for qualified deposits and borrowings, to provide additional earnings when loan production is low, and to reduce our tax liability. The policy dictates that investment decisions give consideration to the safety of principal, liquidity requirements and potential returns. All purchase and sale transactions are reported to the Board of Directors on a monthly basis.
Our investment policy does not permit the purchase of complex securities and derivatives as defined in federal banking regulations and other high-risk securities, nor does it permit additional investments in pooled trust preferred securities, or single issuer trust preferred securities.
At the time of purchase, we designate a security as either held-to-maturity or available-for-sale based upon our ability and intentions. Securities available-for-sale are carried at fair value and securities held-to-maturity are carried at amortized cost. On a quarterly basis, we measure expected credit losses on held-to-maturity debt securities on a collective basis by major security type. Available-for-sale debt securities in an unrealized loss position are reviewed for impairment at least quarterly. If impairment exists, credit related impairment losses are recorded through an allowance for credit losses while noncredit related impairment losses are recorded in accumulated other comprehensive income (for available-for-sale securities). The fair values of our securities are based on published or securities dealers’ market values, when available. See Note 4 to the Consolidated Financial Statements for a detailed analysis and description of our investment portfolio and valuation techniques.
We purchase debentures and mortgage-backed securities that generally are issued by the Federal Home Loan Bank (“FHLB”), Fannie Mae (“FNMA”), Freddie Mac (“FHLMC”) or Ginnie Mae (“GNMA”). Historically, we have invested in mortgage-backed securities to achieve positive interest rate spreads with minimal administrative expense and to lower our credit risk as a result of the guarantees provided by FHLMC, FNMA or GNMA.
Sources of Funds
General. Deposits are the primary funding source for lending and other investing purposes. In addition to deposits, we derive funds from the amortization, prepayment and sale of loans and mortgage-backed securities, the maturity of investment securities, operations and, if needed, borrowings. Scheduled loan principal repayments are a relatively stable source of funds, while deposit inflows and outflows and loan prepayments and sales are influenced significantly by general interest rates and market conditions. Borrowings may be used on a short-term basis to compensate for reductions in the availability of funds from other sources or on a longer term basis for general business purposes, including to manage interest rate risk.
Deposits. Personal and business deposits are generated from our market area by offering a broad selection of deposit instruments including checking accounts, savings accounts, money market deposit accounts, term certificate accounts and individual retirement accounts. While we accept deposits of $250,000 or more, we do not offer premium rates for such deposits. We accept brokered deposits through the CDARS program, but generally do not solicit funds outside our market area. As of December 31, 2023, we had deposits through the CDARS program with an aggregate balance of $200,000. In addition, we purchased $483.9 million of brokered certificates of deposit in 2023. Deposit account terms vary according to the minimum balance required, the period of time during which the funds must remain on deposit, and the interest rate, among other factors. We regularly execute changes in our deposit rates based upon general market interest rates, competition, and liquidity requirements. As of December 31, 2023, $1.835 billion, or 15.32%, of total deposits were uninsured as they exceeded the FDIC’s $250,000 limit.
Borrowings. We may utilize borrowings to supplement our supply of lendable funds and to meet deposit withdrawal requirements. Borrowings from the FHLB of Pittsburgh typically are collateralized by a portion of our real estate loans. In addition to the FHLB, we have borrowing facilities with the Federal Reserve Bank, two correspondent banks and we borrow funds, in the form of corporate repurchase agreements, from municipalities, corporations and school districts.
Northwest Bank is a member of the FHLB of Pittsburgh. The FHLB functions as a central bank providing credit for Northwest Bank and other member financial institutions. As a member, Northwest Bank is required to own capital stock in the FHLB of Pittsburgh and is authorized to apply for borrowings on the security of certain of its real estate loans, provided certain standards related to creditworthiness have been met. Borrowings are made pursuant to several different programs. Each credit program has its own interest rate and range of maturities. Depending on the program, limitations on the amount of borrowings are based either on a fixed percentage of a member institution’s net worth or on the FHLB’s assessment of the institution’s creditworthiness.
On September 9, 2020, the Company issued $125.0 million of 4.00% fixed-to-floating rate subordinated notes with a maturity date of September 15, 2030. The subordinated notes, which qualify as Tier 2 capital, bear interest at an annual rate of 4.00%, payable semi-annually in arrears commencing on March 15, 2021, and a floating rate of interest equivalent to the 3-month Term Secured Overnight Financing Rate (“SOFR”) plus 3.89% payable quarterly in arrears commencing on December 15, 2025. During the year-ended December 31, 2023 the Company had $114.8 million of subordinated notes outstanding. The subordinated debt issuance costs of approximately $1.8 million are being amortized over five years on a straight-line basis into interest expense.
Risk Management
Board and Board Committees. Our Board of Directors, as a whole and through its committees, maintains responsibilities for the oversight of risk management, including monitoring the “tone at the top”, our risk appetite, our risk culture and overseeing emerging and strategic risks. While our Board’s Risk Committee has primary responsibility for oversight of enterprise risk management, the Audit, Compensation, Innovation & Technology, Trust and Nominating & Corporate Governance Committees also oversee risks within their respective areas of responsibilities. Each of these Board Committees consists entirely of independent directors and provides regular reports to the full Board regarding matters reviewed at their Committee meetings.
Risk Management Roles and Responsibilities. In addition to our Board and Board Committees, responsibility for risk management also flows to individuals and entities throughout the Company, including various management committees and executive management. Our Enterprise Risk Management (“ERM”) Framework defines our “three lines of defense” risk management model, which includes the following:
•The “first line of defense” is comprised of the business areas that engage in activities that generate revenue or provide operational support or services that introduce risk to the Company. As the business owner, the first line of defense is responsible for, among other things, identifying, owning, managing and controlling key risks associated with their activities, timely addressing issues and remediation, and implementing processes and procedures to strengthen the risk and control environment. The first line of defense identifies and manages key risk indicators and risks and controls consistent with the Company’s risk appetite. The executive officers who serve as leaders in the “first line of defense,” are responsible for ensuring that their respective functions operate within established risk limits, in accordance with our risk appetite. These leaders are also responsible for identifying risks, considering risk when developing strategic plans, budgets and new products, and implementing appropriate controls when pursuing business strategies and objectives. In addition, these leaders are responsible for deploying sufficient financial resources and qualified personnel to manage the risks inherent in our business activities.
•The “second line of defense” includes an independent risk management team charged with oversight and monitoring of risk within the business. The second line of defense is responsible for, among other things, formulating our ERM Framework and related policies and procedures, challenging the first line of defense and identifying, monitoring and reporting on aggregate risks of the business and support functions.
Our risk management team, which is led by our Chief Risk Officer (“CRO”) and includes compliance, provides oversight of our risk profile and is responsible for maintaining a compliance program that includes compliance risk assessment, policy development, testing and reporting activities.
The CRO manages our risk management team and is responsible for establishing and implementing standards for the identification, management, measurement, monitoring and reporting of risk on an Enterprise-wide basis. The CRO is responsible for developing an appropriate risk appetite with corresponding limits that aligns with supervisory expectations and proposing our risk appetite to the Board of Directors. The CRO regularly reports to the Risk Committee as well as the Bank’s Enterprise Risk Management Committee (“ERMC”) on risk management matters.
•The “third line of defense” is comprised of the Internal Audit organization. The third line of defense provides an independent review and objective assessment of the design and operating effectiveness of the first and second lines of defense, governance, policies, procedures, processes and internal controls, and reports its findings to executive management and the Board, through the Audit Committee. Internal Audit is responsible for performing periodic, independent reviews and testing compliance with the Company’s and the Bank’s risk management policies and standards, as well as with regulatory guidance and industry best practices. Internal Audit also assesses the design of the Company’s and the Bank’s policies and standards and validates the effectiveness of risk management controls and reports the results of such reviews to the Audit Committee.
Management Committees. The ERMC is the highest-level management committee at the Bank to oversee risks and is responsible for risk governance, risk oversight and making recommendations on the Banks’ risk appetite. The ERMC monitors compliance with limits and related escalation requirements and oversees implementation of risk policies.
In addition to the ERMC, we maintain the following risk management committees to oversee the risks listed below: Credit Committee; Compliance Risk Management Committee; Operational Risk Management Committee; Model Risk Management Committee; and the Asset & Liability Committee. Each of these Committees is responsible for one or more of the Bank’s seven risk categories, which are described in greater detail below under the heading “Risk Categories”. For its risk category(ies) of responsibility, each Committee provides risk governance, risk oversight and monitoring. Each Committee reviews key risk exposures, trends and significant compliance matters, and provides guidance on steps to monitor, control and escalate significant risks. We include the risk information provided by the ERMC, and these management risk committees, along with additional risk information that is identified at the holding company level in our determination and assessment of the risks that are presented to and discussed with our Board and Board Committees.
Risk Categories. We have divided risk into the following seven categories: credit, market, liquidity, operational, compliance, model and reputational risk. We evaluate the potential impact of a risk event on us (including our subsidiaries) by assessing the customer, partner, financial, reputational, and legal and regulatory impacts.
Credit Risk. Credit Risk is the risk arising from an obligor’s failure to meet the terms of any contract or otherwise perform as agreed. Credit Risk is found in all activities in which settlement or repayment depends on counterparty, issuer, or borrower performance. We are exposed to credit risk on the loans we make to our customers. Our credit risk relates to the risk that our borrowers will not repay their loan balances. To minimize our risk of loan write-offs, we have developed comprehensive policies and procedures outlining our underwriting guidelines across all loan types. The loan policies contain guidance and establish requirements specific to loan types for each line of business. They also establish appropriate and accurate financial information requirements to assist in making loan decisions, which may vary based on loan type, risk profile and secondary investor requirement, if applicable. Loan portfolios of all types are monitored as part of ongoing independent credit review and administration functions which ensure underwriting quality, loan administration, collateral, diversity (by industry, geography, products and borrowers) adhere to policy requirements. The credit risk on our loan portfolio is quantified through our allowance for credit losses which is recorded net within loans on our Consolidated Balance Sheets. Credit risk is overseen and monitored by the Credit Committee.
Market Risk. Market Risk is the risk arising from changes in the financial or economic environment, including movements in interest rates. Interest rate risk results from:
•differences in the timing of interest rate changes related to the Bank’s assets and liabilities (repricing risk);
•changing rate relationships among different yield curves affecting an organization’s activities (basis risk);
•changing rate relationships across the spectrum of maturities (yield curve risk); and
•interest-related options embedded in certain products (optionality risk).
Our principal market risk exposures arise from volatility in interest rates and their impact on earnings and capital. While we use various techniques to analyze, measure, assess and manage the financial impact of changes in interest rates, we believe an interest rate sensitivity analysis best reflects the risk inherent in our business. The interest rate sensitivity analysis calculates the impact on net interest income from instantaneous and sustained increases or decreases in market interest rates.
Due to the mix of fixed and floating rate assets and liabilities on our Consolidated Balance Sheet as of December 31, 2023, a hypothetical instantaneous 100 basis point increase or decrease in interest rates would have an immaterial impact on our net interest income results in the first year. Actual changes in our net interest income will depend on many factors, and therefore may differ from our estimated risk to changes in interest rates. The Asset & Liability Committee assists the Bank’s Board of Directors and Bank Management in overseeing, reviewing, and monitoring market risk.
Treasury Risk. Treasury Risk is the risk arising from either 1) the inappropriate management of liquidity and/or capital, resulting in the Bank’s inability to meet obligations when they come due, whether caused by an inability to access funding sources or manage fluctuations in cash flows; or 2) adverse or poorly implemented business decisions due to misaligned business goals and strategies, a lack of resources, or poor quality of implementation. Treasury Risk can also result from an organization’s failure to recognize and address changes in market conditions or levels of systemic risk.
Operational Risk. Operational Risk is the risk arising from failed internal processes, people, and systems or from adverse external events. Operational losses result from internal fraud; external fraud; business disruption and systems failures; damage to physical assets; failure to secure confidential data; inadequate or inappropriate employment practices and workplace safety; improper design of new products or services; and failures in execution, delivery, and process management.
Operational Risk is inherent in all business activities and can impact us through direct or indirect financial loss, brand damage, customer dissatisfaction, and legal and regulatory penalties. The Company has implemented a comprehensive operational risk framework that is defined in the Operational Risk Management Policy. The Operational Risk Management Committee, chaired by our Chief Operational Risk Officer, oversees and monitors operational risk exposures, including escalating issues and recommending policies, procedures and practices to manage operational risks.
Additionally, we maintain an information and cyber security program, which is led by our Chief Information Security Officer and is designed to protect the confidentiality, integrity, and availability of information and information systems from unauthorized access, use, disclosure, disruption, modification, or destruction. The Program is built upon a foundation of advanced security technology, a well-staffed and highly trained team of experts, and robust operations based on industry best practices recommendations from the National Institute of Standards and Technology (NIST) Cybersecurity Framework, Federal Financial Institutions Examination Council (FFIEC) Guidelines, and Center for Internet Security (CIS) Benchmarks. This consists of controls designed to identify, protect, detect, respond and recover from information and cyber security incidents. We continue to invest in enhancements to cyber security capabilities and engage in industry and government forums to promote advancements to the broader financial services cyber security ecosystem.
Compliance Risk. Compliance Risk is the risk arising from violations of laws or regulations, nonconformance with policies and procedures or ethical standards, or inadequate contractual arrangements. This risk exposes the Bank to regulatory enforcement actions, civil money penalties, statutory or punitive damages. Compliance Risk can result in diminished reputation and lessened expansion potential. Our Compliance organization is responsible for establishing and maintaining our Compliance Risk Management Program. Pursuant to this Program, we seek to manage and mitigate compliance risk by assessing, controlling, monitoring, measuring and reporting the legal and regulatory risks to which we are exposed. The Compliance Risk Management Committee, chaired by the Chief Compliance Officer, oversees the implementation and execution of the Compliance Management System and monitors compliance exposures to manage compliance risks.
Model and Data Risk. Model and Data Risk is the risk arising from decisions based on incorrect or misused model outputs and reports. This risk may result from 1) input errors, including inaccurate data; 2) fundamental design errors resulting in inaccurate calculations, valuations, estimates, or forecasts; or 3) incorrect or improper usage or a misunderstanding about a model’s limitations and assumptions.
We manage model risk through a comprehensive model governance framework, including policies and procedures for model development, maintenance and performance monitoring activities, independent model validation and change management capabilities. We also assess model performance on an ongoing basis. Model and Data Risk oversight and monitoring is conducted by the Model Risk Management Committee.
Reputational Risk. Reputational Risk is the risk arising from negative public opinion. This risk may impair our competitiveness by affecting our ability to establish new relationships or services, or continue servicing existing relationships. Reputational Risk is inherent in all activities and requires us to exercise caution in dealing with stakeholders, such as customers, counterparties, correspondents, investors, regulators, employees, and the community. Executive management is responsible for considering the Reputational Risk implications of business activities and strategies, and ensuring the relevant subject matter experts are engaged as needed.
Subsidiary Activities
Northwest Bancshares, Inc.’s sole direct consolidated subsidiary is Northwest Bank. Northwest Bancshares, Inc. also owns all of the common stock of seven statutory business trusts: Northwest Bancorp Capital Trust III, a Delaware statutory business trust, Northwest Bancorp Statutory Trust IV, a Connecticut statutory business trust, LNB Trust II, a Delaware statutory business trust, Union National Capital Trust I, a Delaware statutory business trust, Union National Capital Trust II, a Delaware statutory business trust, MFBC Statutory Trust I, a Delaware statutory business trust, and Universal Preferred Trust, a Delaware statutory business trust (the “Trusts”). At December 31, 2023, the Trusts have issued a total of $128.9 million of trust preferred securities. The Trusts are not consolidated with Northwest Bancshares, Inc. At December 31, 2023, Northwest Bancshares, Inc.’s investment in the Trusts totaled $4.0 million, and the Trusts had assets of $129.6 million, net of discounts due to fair value adjustments made at the time of acquisition of Union Community Bank and MutualFirst Financial, Inc.
At December 31, 2023, Northwest Bank had three active wholly-owned subsidiaries; Great Northwest Corporation, Northwest Capital Group, Inc., and Mutual Federal Interest Corporation. For financial reporting purposes all of these companies are included in the Consolidated Financial Statements of Northwest Bancshares, Inc.
Great Northwest Corporation holds equity investments in government-assisted, low-income housing projects in various locations throughout our market area. At December 31, 2023, Northwest Bank had an equity investment in Great Northwest Corporation of $14.3 million. For the year ended December 31, 2023, Great Northwest Corporation had net income of $178,000, generated primarily from federal low-income housing tax credits.
Northwest Capital Group, Inc.’s principal activity is to own, operate and ultimately divest of properties that were acquired in foreclosure. At December 31, 2023, Northwest Bank had an equity investment of $11.6 million in Northwest Capital Group, Inc., with a $1,400 net loss reported for the year ended December 31, 2023.
Mutual Federal Interest Corporation, which is a Nevada corporation, holds and manages a portion of the Northwest Bank investment portfolio and consumer closed-end first mortgage loans. At December 31, 2023, Northwest Bank had an equity investment in Mutual Federal Interest Corporation of $1.539 billion. For the year ended December 31, 2023, Mutual Federal Interest Corporation had net income of $28.0 million.
Northwest Bank strategically ceased operating several business lines in prior periods.
Northwest Settlement Agency, LLC (which ceased operations and became inactive during the first quarter of 2023) provided title insurance to borrowers of Northwest Bank and other lenders. At December 31, 2023, Northwest Bank had an equity investment in Northwest Settlement Agency, LLC of $3.7 million. For the year ended December 31, 2023, Northwest Settlement Agency, LLC had a net loss of $52,000.
Allegheny Services, Inc. (which ceased operations and became inactive during the first quarter of 2022), was a Delaware investment company that held mortgage loans originated through our wholesale lending operation as well as municipal bonds. At December 31, 2023, Northwest Bank had an equity investment in Allegheny Services, Inc. of $876.2 million.
The Bert Company (doing business as Northwest Insurance Services), was an employee benefits and property and casualty insurance agency specializing in commercial and personal insurance as well as retirement benefit plans and was sold during the second quarter of 2021. At December 31, 2023, Northwest Bank had an equity investment of $29.2 million in The Bert Company.
Northwest Advisors, Inc., a federally registered investment advisor, which provided investment management programs and investment portfolio planning services, ceased operations and became inactive during 2018. At December 31, 2023, Northwest Bank had an equity investment in Northwest Advisors, Inc. of $819,000.
Northwest Financial Services, Inc. provided retail brokerage services and became inactive during the fourth quarter of 2017. At December 31, 2023, Northwest Bank had an equity investment in Northwest Financial Services of $9.4 million.
On July 14, 2017, Northwest Consumer Discount Company, Inc. became inactive as all consumer finance offices were closed. At December 31, 2023, Northwest Bank had an equity investment in Northwest Consumer Discount Company of $44.3 million.
Federal regulations require insured institutions to provide 30 days advance notice to the Federal Deposit Insurance Corporation (“FDIC”) before establishing or acquiring a subsidiary or conducting a new activity in a subsidiary. The insured institution must also provide the FDIC such information as may be required by applicable regulations and must conduct the activity in accordance with the rules and orders of the FDIC. In addition to other enforcement and supervision powers, the FDIC may determine after notice and opportunity for a hearing that the continuation of a savings bank’s ownership of or relation to a subsidiary constitutes a serious risk to the safety, soundness or stability of the savings bank, or is inconsistent with the purposes of federal banking laws.
Upon the making of such a determination, the FDIC may order the savings bank to divest the subsidiary or take other actions.
Human Capital Management
Workforce Demographics. As of December 31, 2023, we had 2,030 full-time and 135 part-time employees, or 2,098 full-time equivalent employees (“FTEs”). This represents a decrease of 60 FTEs, or 2.8%, from December 31, 2022 when we had 2,088 full-time and 140 part-time employees, or 2,158 FTEs. This decrease is a result of our efforts to optimize our retail network. As a financial institution, approximately 42% of our employee population are employed at our 134 full-service banking offices and eight free-standing drive-through locations across Pennsylvania, New York, Ohio, and Indiana, and approximately 4% are employed at our customer call centers. Our annual turnover rate (voluntary and involuntary) was 32.8% as of December 31, 2023. None of our employees are represented by a collective bargaining group.
As a community-based bank, our reputation is an extremely valuable and important component of our business. We strive to conduct our business in a manner that enhances our reputation. This is done, in part, by recruiting, hiring and retaining employees who share our core values of being an integral part of the communities we serve.
Inclusion and Diversity. At Northwest Bank, we know that in order to succeed, we must create and maintain an environment where all employees, whatever their background or role, can contribute, innovate and thrive. We established the Northwest Inclusion Council to foster a workplace where we all feel accepted, safe, seen and heard. Led by senior advisors and leaders from throughout our company’s footprint, the Inclusion Council is focused on engaging our entire employee population and leveraging their diverse talents and perspectives, most significantly through our newly-formed Employee Resources Groups (ERGs).
Workforce Health and Safety. The health and safety of our employees, their families and the communities we serve is our top priority. In order to maintain safety in the workplace, Northwest Bank has an inclusive Safety Focus Group that includes various levels of positions up through senior leadership. The committee was established in order to encourage employee involvement and highlight the importance of safety in the workplace. The COVID-19 pandemic presented an unpredictable and challenging environment across the globe. Throughout this pandemic, we committed to take every measure and precaution to protect our employees while continuing to serve our customers and being mindful of the fiduciary responsibility we have to our shareholders.
Compensation and Benefits. Our compensation program is designed to attract and retain talented individuals to support our business objectives and achieve our strategic goals. We provide employees with compensation packages that include base salaries, and if eligible, incentive compensation, annual bonuses, and equity incentives. In addition, we also offer employees a 401(k) Plan with an employer match contribution, medical, dental, vision, disability, life, wellness plan, employee assistance plan, flexible work arrangement, paid time off, flexible spending accounts, and voluntary benefits.
SUPERVISION AND REGULATION
General
As a bank holding company, we are required to comply with the rules and regulations of the Board of Governors of the Federal Reserve System (the “Federal Reserve Board”), and are also required to file certain reports with and are subject to examination by the Federal Reserve Board. We are also subject to the rules and regulations of the Securities and Exchange Commission under the federal securities laws.
Northwest Bank is a Pennsylvania-chartered stock savings bank and our deposit accounts are insured up to applicable limits by the FDIC’s Deposit Insurance Fund (the “DIF”). Northwest Bank is subject to extensive regulation by the Department of Banking and Securities of the Commonwealth of Pennsylvania (the “Department of Banking”), as its chartering agency, and by the FDIC, as its primary federal regulator and the insurer of its deposit accounts. Northwest Bank must file reports with the Department of Banking and the FDIC concerning its activities and financial condition in addition to obtaining regulatory approvals prior to entering into certain transactions including acquisitions of other financial institutions. Northwest Bank is examined periodically by the Department of Banking and the FDIC to test Northwest Bank’s compliance with various laws and regulations. This regulation and supervision, as well as federal and state law, establishes a comprehensive framework of activities in which Northwest Bank may engage and is intended primarily for the protection of the DIF and depositors. The regulatory structure also gives the regulatory authorities extensive discretion in connection with their supervisory and enforcement activities and with their examination policies, including policies with respect to the classification of assets and the establishment of adequate credit loss reserves for regulatory purposes. Any change in these laws or regulations, whether by the Department of Banking or the FDIC, could have a material adverse impact on the Company, Northwest Bank and their respective operations. Additionally, when the consolidated assets of a financial institution and its holding company exceed $10 billion, such as is the case with us, the financial institution becomes subject to additional statutory and regulatory requirements that will result in additional costs.
This includes enhanced risk management and corporate governance processes, and examination for compliance with federal financial consumer protection laws by the Consumer Financial Protection Bureau (“CFPB”).
Set forth below is a brief description of certain regulatory requirements that are applicable to Northwest Bank and Northwest Bancshares, Inc. The description below is limited to certain material aspects of the statutes and regulations addressed, and is not intended to be a complete description of such statutes and regulations and their effects on Northwest Bank and Northwest Bancshares, Inc.
Pennsylvania Savings Bank Law
The Pennsylvania Banking Code of 1965, as amended (the “Banking Code”) contains detailed provisions governing the organization, operations, corporate powers, savings and investment authority, branching, and rights and responsibilities of directors, officers and employees of Pennsylvania savings banks. A Pennsylvania savings bank may locate or change the location of its principal place of business and establish an office anywhere in, or adjacent to, Pennsylvania, with the prior approval of the Department of Banking. The Banking Code delegates extensive rule making power and administrative discretion to the Department of Banking in its supervision and regulation of state-chartered savings banks.
Although the Department of Banking may accept the examinations and reports of the FDIC in lieu of its own examination, the current practice is for the Department of Banking to conduct joint examinations with the FDIC. The Department of Banking may order any savings bank to discontinue any violation of law or unsafe or unsound business practice and may direct any director, officer, or employee of a savings bank engaged in a violation of law, unsafe or unsound practice or breach of fiduciary duty to show cause at a hearing before the Department of Banking why such person should not be removed. Legislation enacted in 2012 clarified the Department of Banking’s examination and enforcement authority over subsidiaries of Pennsylvania institutions and authorized the assessment of civil money penalties of up to $25,000 under certain circumstances for violations of laws or orders related to the institution or unsafe or unsound practices or breaches of fiduciary duties. The Department of Banking may also appoint a receiver or conservator for an institution in appropriate cases.
Northwest Bank is subject to capital guidelines of the Department of Banking. Although not adopted in regulation form, the Department of Banking requires 6% leverage capital and 10% risk-based capital. The components of leverage and risk-based capital are substantially the same as those defined by the FDIC, as discussed below.
Loans-to-One Borrower Limitation
In accordance with the Banking Code, a Pennsylvania chartered savings bank, with certain limited exceptions, may lend to a single or related group of borrowers an amount equal to up to 15% of its capital accounts, defined as the aggregate of capital, surplus, undivided profits, capital securities and reserve for credit losses. The Northwest Bank Credit Committee has established an internal lending limit, either individually or in the aggregate to one customer, or a single source of repayment, of $30.0 million, or $50.0 million for loans originated and managed within the Corporate Finance portfolio for borrowers with a strong credit profile and a risk rating of 3 or better, and Aggregate Credit Exposure of $100.0 million. As of December 31, 2023 we had 7 credit relationships that were equal to or exceeded our $30.0 million internal limit for individual borrowers, 4 credit relationships that were equal to or exceeded our $50.0 million internal limit for individual borrowers within the corporate finance portfolio, and one credit relationship that was equal to or exceeded the $100.0 million internal limit for Aggregate Credit Exposure.
Dividends
The Company’s ability to pay dividends depends, to a large extent, upon Northwest Bank’s ability to pay dividends to the Company. The Banking Code states that no dividend may be paid out of surplus without approval of the Department of Banking. Dividends may be paid out of accumulated net earnings. No dividend may generally be paid that would result in Northwest Bank failing to comply with its regulatory capital requirements.
Federal Banking Regulation
Northwest Bank is also subject to extensive regulation, examination and supervision by the FDIC, as its primary federal regulator. Such regulation and supervision:
•Limits the activities and investment authority of Northwest Bank;
•Establishes a continuing and affirmative obligation, consistent with Northwest Bank’s safe and sound operation, to help meet the credit needs of its community, including low- and moderate-income neighborhoods;
•Establishes various capital categories resulting in various levels of regulatory scrutiny applied to the institutions in a particular category; and
•Establishes standards for safety and soundness.
The FDIC is required by law to examine each regulated institution every twelve months. The FDIC has the authority to order any savings bank and its directors, officers, or employees to discontinue any violation of law or unsafe or unsound banking practice.
Insurance of Deposit Accounts
The deposit accounts of Northwest Bank are insured by the DIF to the maximum amount provided by law. The FDIC insures deposits up to the standard maximum deposit insurance amount of $250,000. This insurance is backed by the full faith and credit of the United States Government.
The FDIC charges insured depository institutions premiums to maintain the DIF. Under the FDIC’s risk-based assessment system, insured institutions deemed less risky pay lower FDIC assessments. Assessments for institutions with $10 billion or more of assets are primarily based on a scorecard approach by the FDIC, including factors such as examination ratings and modeling measuring the institution’s ability to withstand asset-related and funding-related stress and potential loss to the DIF should the bank fail. The assessment range (inclusive of possible adjustments specified by the regulations) for institutions with greater than $10 billion of total assets was 2.5 to 42 basis points effective January 1, 2023. On November 29, 2023, the FDIC adopted a final rule to implement a special assessment to recover the loss to the DIF arising from the protection of uninsured depositors following the closures of two regional banks in the spring of 2023; the special assessment will only be paid by banking organizations with $5 billion or more in assets.
Insurance of deposits may be terminated by the FDIC upon a finding that the institution has engaged or is engaging in unsafe and unsound practices, is in an unsafe or unsound condition to continue operations or has violated any applicable law, regulation, rule, order or condition imposed by the FDIC or written agreement entered into with the FDIC. The management of Northwest Bank does not know of any practice, condition or violation that might lead to termination of deposit insurance.
Capital Requirements
Federal regulations require federally insured depository institutions to meet several minimum capital standards: a common equity Tier 1 capital to risk-based assets ratio of 4.5%, a Tier 1 capital to risk-based assets ratio of 6.0%, a total capital to risk-based assets ratio of 8.0%, and a Tier 1 capital to total assets leverage ratio of 4.0%.
In determining the amount of risk-weighted assets for purposes of calculating risk-based capital ratios, all assets, including certain off-balance-sheet assets (e.g., recourse obligations, direct credit substitutes, residual interests) are multiplied by a risk weight factor assigned by the regulations based on the risks believed inherent in the type of asset. Higher levels of capital are required for asset categories believed to present greater risk.
Common equity Tier 1 capital is generally defined as common stockholders’ equity and retained earnings. Tier 1 capital is generally defined as common equity Tier 1 and additional Tier 1 capital. Additional Tier 1 capital includes certain noncumulative perpetual preferred stock and related surplus and minority interests in equity accounts of consolidated subsidiaries. Total capital includes Tier 1 capital (common equity Tier 1 capital plus additional Tier 1 capital) and Tier 2 capital. Tier 2 capital is comprised of capital instruments and related surplus, meeting specified requirements, and may include cumulative preferred stock and long-term perpetual preferred stock, mandatory convertible securities, intermediate preferred stock and subordinated debt. Also included in Tier 2 capital is the allowance for credit losses limited to a maximum of 1.25% of risk-weighted assets and, for institutions that have exercised an opt-out election regarding the treatment of Accumulated Other Comprehensive Income, up to 45% of net unrealized gains on available-for-sale equity securities with readily determinable fair market values. Calculation of all types of regulatory capital is subject to deductions and adjustments specified in the regulations. Northwest Bank exercised this opt-out election during the year ended December 31, 2023.
In assessing an institution’s capital adequacy, the FDIC takes into consideration not only these numeric factors but qualitative factors as well, and has the authority to establish higher capital requirements for individual institutions where deemed necessary.
Any institution that fails any of the regulatory capital requirements is subject to enforcement action by the FDIC. Such action may include a capital directive, a cease and desist order, civil money penalties, restrictions on an institution’s operations, termination of federal deposit insurance, and the appointment of a conservator or receiver. Such action, through enforcement proceedings or otherwise, may require a variety of corrective measures.
In addition to establishing the minimum regulatory capital requirements, the regulations limit capital distributions and certain discretionary bonus payments to management if the institution does not hold a “capital conservation buffer” consisting of 2.5% of common equity Tier 1 capital to risk-weighted assets above the amount necessary to meet its minimum risk-based capital requirements.
The following table shows the Basel III regulatory capital levels that must be maintained to avoid limitations on capital distributions and discretionary bonus payments.
|
|
|
|
|
|
|
|
| Common equity Tier 1 ratio plus capital conservation buffer |
7.000 |
% |
| Tier 1 risk-based capital ratio plus capital conservation buffer |
8.500 |
% |
| Total risk-based capital ratio plus capital conservation buffer |
10.500 |
% |
As of December 31, 2023, Northwest Bank’s capital exceeded all applicable regulatory requirements and it had an appropriate capital conservation buffer.
Prompt Corrective Action
Federal law requires, among other things, that federal bank regulators take “prompt corrective action” with respect to institutions that do not meet minimum capital requirements. For this purpose, federal law establishes five capital categories: well capitalized, adequately capitalized, undercapitalized, significantly undercapitalized and critically undercapitalized. Under applicable regulations, an institution is deemed to be “well capitalized” if it has a total risk-based capital ratio of 10.0% or greater, a Tier 1 risk-based capital ratio of 8.0% or greater, a leverage ratio of 5.0% or greater, and a common equity Tier 1 ratio of 6.5% or greater. An institution is deemed to be “adequately capitalized” if it has a total risk-based capital ratio of 8.0% or greater, a Tier 1 risk-based capital ratio of 6.0% or greater, a leverage ratio of 4.0% or greater, or a common equity Tier 1 ratio of 4.5% or greater. An institution is deemed to be “undercapitalized” if it has a total risk-based capital ratio of less than 8.0%, a Tier 1 risk-based capital ratio of less than 6.0%, a leverage ratio of less than 4.0% or a common equity Tier 1 ratio of less than 4.5%. An institution is deemed to be “significantly undercapitalized” if it has a total risk-based capital ratio of less than 6.0%, a Tier 1 risk-based capital ratio of less than 4.0%, a leverage ratio of less than 3.0%, or a common equity Tier 1 ratio of less than 3.0%. An institution is deemed to be “critically undercapitalized” if it has a ratio of tangible equity (as defined in the regulations) to total assets that is equal to or less than 2.0%. Institutions that fall into an “undercapitalized” category are subject to a variety of mandatory and discretionary supervisory actions, including a restriction on capital distributions and the requirement to file a capital restoration plan with the regulators. Performance under the capital restoration plan must be guaranteed by the parent holding company up to the lesser of the amount of the capital deficiency when deemed undercapitalized or 5% of the institution’s total assets. Federal regulations also specify circumstances under which a federal banking agency may reclassify a well capitalized institution as adequately capitalized, and may require an adequately capitalized institution to comply with supervisory actions as if it were in the next lower category (except that the FDIC may not reclassify a significantly undercapitalized institution as critically undercapitalized). As of December 31, 2023, Northwest Bank was well capitalized as defined above.
Transactions with Affiliates
Transactions between Northwest Bank and its affiliates, including the Company, are limited by Sections 23A and 23B of the Federal Reserve Act, applicable to FDIC-insured state nonmember banks by Section 18(j) of the Federal Deposit Insurance Act, and the Federal Reserve Act’s implementing regulation, Regulation W. In general, transactions with affiliates must be on terms and under circumstances that are substantially the same, or at least as favorable to the bank, as comparable transactions with non-affiliates. In addition, certain types of transactions with affiliates are restricted to an aggregate percentage of the bank’s capital stock and surplus. Certain transactions with affiliates are required to be secured by specified collateral.
Activities and Investments of Insured State-Chartered Banks
Federal law generally limits the activities as principal and equity investments of state-chartered banks insured by the FDIC and its subsidiaries to those that are permissible for national banks. Before engaging in a new activity as principal that is not permissible for a national bank or otherwise permissible under federal law or FDIC regulations, an insured savings bank must seek approval from the FDIC to engage in such activity. The FDIC will not approve the activity unless the savings bank meets its minimum capital requirements, and the FDIC determines that the activity does not present a significant risk to the DIF.
Federal Home Loan Bank System
Northwest Bank is a member of the Federal Home Loan Bank System, which consists of 11 regional Federal Home Loan Banks. The Federal Home Loan Bank System provides a central credit facility primarily for member institutions. As a member of the Federal Home Loan Bank of Pittsburgh, Northwest Bank is required to acquire and hold share of capital stock in the Federal Home Loan Bank in specified amounts.
As of December 31, 2023, Northwest Bank was in compliance with this requirement.
The Bank Secrecy Act and USA PATRIOT Act
The Bank Secrecy Act (“BSA”) and the Uniting and Strengthening America by Providing Appropriate Tools Required to Intercept and Obstruct Terrorism Act of 2001 (“USA PATRIOT Act”) require Northwest Bank to implement a compliance program to detect and prevent money laundering, terrorist financing, and illicit crime. Together, the BSA and USA PATRIOT Act require Northwest Bank to implement internal controls, conduct customer due diligence, maintain records, and file reports. The USA PATRIOT Act also required the federal banking agencies to take into consideration the effectiveness of controls designed to combat money laundering activities in determining whether to approve a merger or other acquisition application. Accordingly, if we engage in a merger or other acquisition, our controls designed to combat money laundering would be considered as part of the application process. We have established policies, procedures and systems designed to comply with the BSA, USA PATRIOT Act, and regulations implemented thereunder.
Community Reinvestment Act
All FDIC-insured institutions have a responsibility under the Community Reinvestment Act (“CRA”) and related regulations to help meet the credit needs of their communities, including low- and moderate-income neighborhoods. In connection with its examination of a state-chartered savings bank, the FDIC is required to assess the institution’s record of compliance with the CRA. On October 24, 2023, the FDIC, the Federal Reserve Board, and the Office of the Comptroller of the Currency issued a final rule to strengthen and modernize the CRA regulations. Under the final rule, banks with assets of at least $2 billion as of December 31 in both of the prior two calendar years will be a “large bank.” The agencies will evaluate large banks under four performance tests: the Retail Lending Test, the Retail Services and Products Test, the Community Development Financing Test, and the Community Development Services Test. The applicability date for the majority of the provisions in the CRA regulations is January 1, 2026, and additional requirements will be applicable on January 1, 2027.
Holding Company Regulation
General. As a bank holding company, Northwest Bancshares, Inc. is subject to regulation, examination and supervision by, and periodic reporting to, the Federal Reserve Board. The Federal Reserve Board has enforcement authority over the Company and any non-bank subsidiaries. Among other things, this authority permits the Federal Reserve Board to restrict or prohibit activities that are determined to be a risk to Northwest Bank.
Permissible Activities. The Company’s activities are limited to the activities permissible for bank holding companies, which generally include activities deemed by the Federal Reserve Board to be closely related or a proper incident to banking or managing or controlling banks. A bank holding company that meets certain criteria may elect to be regulated as a financial holding company and thereby engage in a broader array of financial activities, such as underwriting equity securities and insurance. Northwest Bancshares, Inc. has not elected to be regulated as a financial holding company.
Federal law prohibits a bank holding company, including Northwest Bancshares, Inc., from acquiring, directly or indirectly, more than 5% of a class of voting securities of, or all or substantially all of the assets of, another bank or bank holding company, without prior written approval of the Federal Reserve Board. In evaluating applications by bank holding companies to acquire banks, the Federal Reserve Board considers, among other factors, the financial and managerial resources and future prospects of the parties, the effect of the acquisition on the risk to the DIF, the convenience and needs of the community, competitive factors and compliance with anti-money laundering laws.
Capital. Bank holding companies with greater than $3 billion in total consolidated assets are subject to consolidated regulatory capital requirements identical to those applicable to the subsidiary depository institutions. Northwest Bancshares, Inc. was in compliance with the holding company capital requirements and the capital conservation buffer as of December 31, 2023.
Source of Strength Doctrine. The “source of strength doctrine” requires bank holding companies to provide assistance to their subsidiary depository institutions in the event such subsidiary depository institutions experience financial difficulty. The Federal Reserve Board has issued regulations requiring that all bank holding companies serve as a source of financial and managerial strength to their subsidiary depository institutions.
Capital Distributions. The Federal Reserve Board has issued a policy statement regarding the payment of dividends by bank holding companies. In general, the policy provides that dividends should be paid only out of current earnings and only if the prospective rate of earnings retention by the holding company appears consistent with the organization’s capital needs, asset quality and overall supervisory financial condition. Separate regulatory guidance provides for prior consultation with Federal Reserve Bank supervisory staff concerning dividends in certain circumstances, such as where the company’s net income for the past four quarters, net of dividends previously paid over that period, is insufficient to fully fund the dividend, the proposed dividend exceeds earnings for the period for which it is being paid, or the company’s overall rate of earnings retention is inconsistent with the company’s capital needs and overall financial condition. The guidance also provides for prior consultation with supervisory staff for material increases in the amount of a bank holding company’s common stock dividend. The ability of a bank holding company to pay dividends may be restricted if a subsidiary bank becomes undercapitalized.
Federal Reserve Board regulatory guidance also indicates that a bank holding company should inform Federal Reserve Bank staff prior to redeeming or repurchasing common stock or perpetual preferred stock if the bank holding company is experiencing financial weaknesses or the repurchase or redemption would result in a net reduction, at the end of a quarter, in the amount of such equity instruments outstanding compared with the beginning of the quarter in which the redemption or repurchase occurred. Federal Reserve Board regulations require prior approval for a bank holding company to repurchase or redeem its equity securities if the gross consideration, when combined with net consideration paid for all such repurchases or redemptions during the preceding 12 months, will equal 10% or more of the holding company’s consolidated net worth. There is an exception for well-capitalized bank holding companies that meet specified qualitative criteria. Federal Reserve Board guidance provides for prior consultation with supervisory staff and nonobjection under specified circumstances prior to a holding company repurchasing or redeeming regulatory capital instruments, including common stock, regardless of the applicability of the previously referenced notification requirement.
These regulatory policies may affect the ability of Northwest Bancshares, Inc. to pay dividends, repurchase shares of its common stock or otherwise engage in capital distributions.
Acquisition of the Company. Under the Change in Bank Control Act, no person may acquire control of a bank holding company, such as Northwest Bancshares, Inc., unless the Federal Reserve Board has been given 60 days’ prior written notice and has not issued a notice disapproving the proposed acquisition, taking into consideration certain factors, including the financial and managerial resources of the acquirer and the competitive effects of the acquisition. Control, as defined under the Change in Bank Control Act, means ownership, control of or power to vote 25% or more of any class of voting stock. There is a rebuttable presumption of control upon the acquisition of 10% or more of a class of voting stock if the holding company involved has its shares registered under the Securities Exchange Act of 1934, as amended (the “Exchange Act”), or if no other person will own, control or hold the power to vote a greater percentage of that class of voting security after the acquisition.
A company that acquires control of a bank holding company, such as Northwest Bancshares, Inc., must receive prior Federal Reserve Board approval under the Bank Holding Company Act. Control, as defined under the Bank Holding Company Act, means ownership, control or power to vote 25% or more of any class of voting stock, control in any manner over the election of a majority of the company’s directors, or a determination by the regulator that the acquirer has the power to exercise, directly or indirectly, a controlling influence over the management or policies of the company. The Federal Reserve Board adopted a final rule in 2020 that revised its framework for determining whether a company, under the Bank Holding Company Act, exercises a “controlling influence” over a bank or a bank holding company. The Federal Reserve Board’s final rule applies to questions of control under the Bank Holding Company Act but does not extend to the Change in Bank Control Act.
Federal Securities Laws
Our common stock is registered with the SEC under Section 12(b) of the Exchange Act. We are also subject to the proxy rules, tender offer rules, insider trading restrictions, annual and periodic reporting, and other requirements of the Exchange Act.
Sarbanes-Oxley Act of 2002
The Sarbanes-Oxley Act of 2002 was enacted to increase corporate responsibility, to provide for enhanced penalties for accounting and auditing improprieties at publicly traded companies, and to protect investors by improving the accuracy and reliability of corporate disclosures pursuant to the securities laws. The Sarbanes-Oxley Act generally applies to all companies that file or are required to file periodic reports with the Securities and Exchange Commission, under the Exchange Act. The Company has policies, procedures and systems designed to comply with this Act and its implementing regulations.
FEDERAL AND STATE TAXATION
Federal Taxation. For federal income tax purposes, Northwest Bancshares, Inc. files a consolidated federal income tax return with its wholly-owned subsidiaries on a calendar year basis. The applicable federal income tax expense or benefit is properly allocated to each subsidiary based upon taxable income or loss calculated on a separate company basis.
We account for income taxes using the asset and liability method which accounts for deferred income taxes by applying the enacted statutory rates in effect at the balance sheet date to differences between the book basis and the tax basis of assets and liabilities. The resulting deferred tax liabilities and assets are adjusted to reflect changes in tax laws.
Inflation Reduction Act of 2022. The Inflation Reduction Act, which was signed into law on August 16, 2022, among other things, implements a new alternative minimum tax of 15% on corporations with profits in excess of $1 billion, a 1% excise tax on stock repurchases, and several tax incentives to promote clean energy and climate initiatives. These provisions are effective beginning January 1, 2023.
State Taxation. As a Maryland business corporation, Northwest Bancshares, Inc. is required to file annual tax returns with the State of Maryland. In addition, Northwest Bancshares, Inc. is subject to Pennsylvania’s corporate net income tax. Dividends received from Northwest Bank qualify for a 100% dividends received deduction and are not subject to corporate net income tax.
Northwest Bank is subject to Pennsylvania’s mutual thrift institutions tax based on Northwest Bank’s net income determined in accordance with generally accepted accounting principles, with certain adjustments. The tax rate under the mutual thrift institutions tax is 11.5%. Interest on Pennsylvania and federal obligations is excluded from net income. An allocable portion of interest expense incurred to carry the tax-free obligations is disallowed as a deduction. Northwest Bank is also subject to taxes in the other states in which it conducts business. These taxes are apportioned based upon the volume of business conducted in those states as a percentage of the whole. A majority of Northwest Bank’s affairs are conducted in Pennsylvania; however as the Company’s operational footprint expands, taxes paid to other states, such as New York (with a 7.25% rate) and Indiana (with a 6% rate) have grown slightly in significance.
The subsidiaries of Northwest Bank are subject to a Pennsylvania corporate net income tax and are also subject to other applicable taxes in the states where they conduct business.
We are subject to routine audits of our tax returns by the Internal Revenue Service as well as all states in which we conduct business. We are subject to audit by the Internal Revenue Service for the tax periods ended after December 31, 2019 and generally subject to audit by any state in which we conduct business for the tax periods ended after December 31, 2019.
ITEM 1A. RISK FACTORS
In addition to factors discussed in the description of our business and elsewhere in this report, as well as other filings we make with the SEC, the following are factors that could adversely affect our future results of operations and financial condition.
Risks Related to our Lending Activities
Our commercial loan portfolio is increasing and the inherently higher risk of loss may lead to additional provisions for credit losses or charge-offs, which would negatively impact earnings and capital.
Commercial loans generally expose a lender to greater risk of non-payment and loss than one- to four-family residential mortgage loans because repayment of the loans often depends on the successful operation of the business and the income stream of the borrowers. Such loans typically involve larger loan balances to single borrowers or groups of related borrowers compared to one- to four-family residential mortgage loans. Also, many of our commercial borrowers have more than one loan outstanding with us. Consequently, an adverse development with respect to one loan or one credit relationship can expose us to a significantly greater risk of loss compared to an adverse development with respect to a one- to four-family residential mortgage loan. Commercial business loans expose us to additional risk since they typically are dependent on the borrower’s ability to make repayments from the cash flows of the business and are secured by non-real estate collateral that may depreciate over time. Further, our commercial business loans may be secured by collateral other than real estate, such as inventory and accounts receivable, the value of which may be more difficult to appraise, control or collect and may be more susceptible to fluctuation in value at the time of default. In addition, if we foreclose on these loans, our holding period for the collateral may be longer than for a single or multi-family residential property if there are fewer potential purchasers of the collateral.
The level of our commercial real estate loan portfolio may subject us to additional regulatory scrutiny.
The FDIC and the other federal bank regulatory agencies have promulgated joint guidance on sound risk management practices for financial institutions with concentrations in commercial real estate lending. Under the guidance, a financial institution that, like us, is actively involved in commercial real estate lending should perform a risk assessment to identify concentrations. A financial institution may have a concentration in commercial real estate lending if, among other factors, (i) total reported loans for construction, land acquisition and development, and other land represent 100% or more of total capital, or (ii) total reported loans secured by multi-family and non-farm residential properties, loans for construction, land acquisition and development and other land, and loans otherwise sensitive to the general commercial real estate market, including loans to commercial real estate related entities, represent 300% or more of total capital. Based on these factors, we have a concentration in multi-family and commercial real estate lending, as such loans represent 356% of total bank capital as of December 31, 2023. The particular focus of the guidance is on exposure to commercial real estate loans that are dependent on the cash flow from the real estate held as collateral and that are likely to be at greater risk to conditions in the commercial real estate market (as opposed to real estate collateral held as a secondary source of repayment or as an abundance of caution). The purpose of the guidance is to guide banks in developing risk management practices and capital levels commensurate with the level and nature of real estate concentrations. The guidance states that management should employ heightened risk management practices including board and management oversight and strategic planning, development of underwriting standards, risk assessment and monitoring through market analysis and stress testing. While we believe we have implemented policies and procedures with respect to our commercial real estate loan portfolio consistent with this guidance, bank regulators could require us to implement additional policies and procedures consistent with their interpretation of the guidance that may result in additional costs to us or that may result in a curtailment of our multi-family and commercial real estate lending that would adversely affect our loan originations and profitability.
If the allowance for credit losses is not sufficient to cover actual credit losses, our earnings could decrease.
Our customers may not repay their loans according to the original terms, and the collateral, if any, securing the payment of these loans may be insufficient to pay any remaining loan balance. We may experience significant credit losses, which may have a material adverse effect on operating results. We make various assumptions and judgments about the collectability of the loan portfolio, including the creditworthiness of borrowers and the value of the real estate and other assets serving as collateral for the repayment of loans. If our assumptions prove to be incorrect, the allowance for credit losses may not be sufficient to cover losses inherent in our loan portfolio, resulting in additions to the allowance. Material additions to the allowance would materially decrease net income.
Our emphasis on originating commercial real estate and commercial loans is one of the more significant factors in evaluating the allowance for credit losses. As we continue to increase the amount of such loans, increased provisions for credit losses may be necessary, which would decrease our earnings. In addition, any future credit deterioration could require us to increase our allowance for credit losses in the future.
Bank regulators periodically review our allowance for credit losses and may require an increase to the provision for credit losses or further loan charge-offs. Any increase in our allowance for credit losses or loan charge-offs resulting from these reviews may have a material adverse effect on our results of operations or financial condition.
The foreclosure process may adversely impact our recoveries on non-performing loans.
The judicial foreclosure process is protracted, which delays our ability to resolve non-performing loans through the sale of the underlying collateral. The longer timelines have been the result of the economic crisis, additional consumer protection initiatives related to the foreclosure process, increased documentary requirements and judicial scrutiny, and, both voluntary and mandatory programs under which lenders may consider loan modifications or other alternatives to foreclosure. These reasons and the legal and regulatory responses have impacted the foreclosure process and completion time of foreclosures for residential mortgage lenders. This may result in a material adverse effect on collateral values and our ability to minimize its losses.
Risks Related to Laws and Regulations
Changes in laws and regulations and the cost of compliance with new laws and regulations may adversely affect our operations and our income.
The Company and Northwest Bank are subject to extensive regulation, supervision and examination by the Federal Reserve Board, the Department of Banking and the FDIC. These regulatory authorities have extensive discretion in connection with their supervisory and enforcement activities, including the ability to impose restrictions on Northwest Bank’s operations, reclassify assets, determine the adequacy of Northwest Bank’s allowance for credit losses and determine the level of deposit insurance premiums assessed. The laws and regulations applicable to us are subject to frequent change and interpretations. Any change in these regulations and oversight, whether in the form of regulatory policy, new regulations or legislation or additional deposit insurance premiums could have a material impact on our operations.
The potential exists for additional federal or state laws and regulations, or changes in policy, affecting lending and funding practices and liquidity standards. Moreover, bank regulatory agencies have been active in responding to concerns and trends identified in examinations, and have issued many formal enforcement orders requiring capital ratios in excess of regulatory requirements. Bank regulatory agencies, such as the Federal Reserve Board, the Department of Banking, the CFPB and the FDIC, govern the activities in which we may engage, primarily for the protection of depositors, and not for the protection or benefit of potential investors. In addition, new laws and regulations may increase our costs of regulatory compliance and of doing business, and otherwise affect our operations. New laws and regulations may significantly affect the markets in which we do business, the markets for and value of our loans and investments, the fees we can charge and our ongoing operations, costs and profitability.
Non-compliance with the USA PATRIOT Act, Bank Secrecy Act, or other laws and regulations could result in fines or sanctions.
The USA PATRIOT and Bank Secrecy Acts require financial institutions to develop programs to prevent financial institutions from being used for money laundering and terrorist activities. If such activities are detected, financial institutions are obligated to file suspicious activity reports with the U.S. Treasury’s Office of Financial Crimes Enforcement Network. These rules require financial institutions to establish procedures for identifying and verifying the identity of customers seeking to open new financial accounts. Failure to comply with these regulations could result in fines or sanctions or affect our ability to pursue further acquisition opportunities. During the last year, several banking institutions have received large fines for non-compliance with these laws and regulations. While we have developed policies and procedures designed to assist in compliance with these laws and regulations, these policies and procedures may not be effective in preventing violations of these laws and regulations.
We are subject to the Community Reinvestment Act and fair lending laws, and failure to comply with these laws could lead to material penalties.
The Community Reinvestment Act (“CRA”), the Equal Credit Opportunity Act, the Fair Housing Act and other fair lending laws and regulations impose nondiscriminatory lending requirements on financial institutions. A successful regulatory challenge to an institution’s performance under the CRA or fair lending laws and regulations could result in a wide variety of sanctions, including the required payment of damages and civil money penalties, injunctive relief, imposition of restrictions on mergers and acquisitions activity and restrictions on expansion. Private parties may also have the ability to challenge an institution’s performance under fair lending laws in private class action litigation. Such actions could have a material adverse effect on our business, financial condition and results of operations.
We could become subject to more stringent capital requirements, which could adversely impact our return on equity, require us to raise additional capital, or constrain us from paying dividends or repurchasing shares.
Federal regulations establish minimum capital requirements for insured depository institutions, including minimum risk-based capital and leverage ratios, and define “capital” for calculating these ratios. The minimum capital requirements are: (i) a common equity Tier 1 capital ratio of 4.5%; (ii) a Tier 1 to risk-based assets capital ratio of 6%; (iii) a total capital ratio of 8%; and (iv) a Tier 1 leverage ratio of 4%. Unrealized gains and losses on certain “available-for-sale” securities holdings are to be included for purposes of calculating regulatory capital requirements unless a one-time opt-out was exercised. The Bank exercised this one-time opt-out option. The regulations also establish a “capital conservation buffer” of 2.5% and the following minimum ratios: (i) a common equity Tier 1 capital ratio of 7%, (ii) a Tier 1 to risk-based assets capital ratio of 8.5%, and (iii) a total capital ratio of 10.5%. An institution will be subject to limitations on paying dividends, engaging in share repurchases, and paying discretionary bonuses if its capital level falls below the buffer amount. These limitations will establish a maximum percentage of eligible retained income that can be utilized for such actions.
At December 31, 2023, Northwest Bank has met all of these requirements, including the full 2.5% capital conservation buffer.
The application of more stringent capital requirements could, among other things, result in lower returns on equity, require the raising of additional capital, and result in regulatory actions if we were to be unable to comply with such requirements. Implementation of changes to asset risk weightings for risk-based capital calculations, items included or deducted in calculating regulatory capital and/or additional capital conservation buffers could result in management modifying its business strategy, and could limit our ability to make distributions, including paying out dividends or buying back shares. Specifically, Northwest Bank’s ability to pay dividends to stockholders will be limited if it does not have the capital conservation buffer required by the capital rules. Furthermore, the imposition of liquidity requirements in connection with the implementation of Basel III could result in our having to increase our holdings of liquid assets, lengthen the term of our funding, and/or restructure our business model.
The Federal Reserve Board may require us to commit capital resources to support Northwest Bank.
Federal law requires that a holding company act as a source of financial and managerial strength to its subsidiary bank and to commit resources to support such subsidiary bank. Under the “source of strength” doctrine, the Federal Reserve Board may require a holding company to make capital injections into a troubled subsidiary bank and may charge the holding company with engaging in unsafe and unsound practices for failure to commit resources to a subsidiary bank. A capital injection may be required at times when the holding company may not have sufficient resources and therefore may be required to borrow the funds or raise capital. Any borrowing or capital raise could occur at a time that is more difficult and expensive and could have an adverse effect on our business, financial condition, and results of operations.
Future legislative or regulatory actions responding to perceived financial and market problems could impair our ability to foreclose on collateral.
There have been proposals made by members of Congress and others that would reduce the amount distressed borrowers are otherwise contractually obligated to pay under their mortgage loans and limit an institution’s ability to foreclose on mortgage collateral. Were proposals such as these, or other proposals limiting our rights as a creditor, to be implemented, we could experience increased credit losses or increased expense in pursuing our remedies as a creditor.
Legal and regulatory proceedings and related matters could adversely affect us or the financial services industry in general.
We, and other participants in the financial services industry upon whom we rely to operate, have been and may in the future become involved in legal and regulatory proceedings. Most of the proceedings we consider to be in the normal course of our business are typical for the industry; however, it is inherently difficult to assess the outcome of these matters, and other participants in the financial services industry or we may not prevail in any proceeding or litigation. There could be substantial cost and management diversion in such litigation and proceedings, and any adverse determination could have a materially adverse effect on our business, brand or image, or our financial condition and results of our operations.
Monetary policies and regulations of the Federal Reserve Board could adversely affect our business, financial condition and results of operations.
In addition to being affected by general economic conditions, our earnings and growth are affected by the policies of the Federal Reserve Board. An important function of the Federal Reserve Board is to regulate the money supply and credit conditions. Among the instruments used by the Federal Reserve Board to implement these objectives are open market purchases and sales of U.S. government securities, adjustments of the discount rate and changes in banks’ reserve requirements against bank deposits. These instruments are used in varying combinations to influence overall economic growth and the distribution of credit, bank loans, investments and deposits. Their use also affects interest rates charged on loans or paid on deposits.
The monetary policies and regulations of the Federal Reserve Board have had a significant effect on the operating results of financial institutions in the past and are expected to continue to do so in the future. The effects of such policies upon our business, financial condition and results of operations cannot be predicted.
Risks Related to Market Interest Rates
The reversal of the historically low interest rate environment has and may continue to adversely affect our net interest income and profitability.
The Federal Reserve Board decreased benchmark interest rates significantly, to near zero, in response to the COVID-19 pandemic. Beginning in 2022, the Federal Reserve Board reversed its policy of near zero interest rates given its concerns over inflation. Market interest rates have risen significantly in response to the Federal Reserve Board’s rate increases. As discussed below, the increase in market interest rates has had, and may continue to have, an adverse effect on our net interest income and profitability.
Changes in interest rates could adversely affect our results of operations and financial condition.
While we strive to control the impact of changes in interest rates on our net income, our results of operations and financial condition could be significantly affected by changes in interest rates. Our results of operations depend substantially on our net interest income, which is the difference between the interest income we earn on our interest-earning assets, such as loans and investment securities, and the interest expense we pay on our interest-bearing liabilities, such as deposits, borrowings and trust preferred securities. Because it is difficult to perfectly match the maturities and cash flows from our financial assets and liabilities our net income could be adversely impacted by changes in the level of interest rates or the slope of the Treasury yield curve.
Changes in interest rates may also affect the average life of loans and mortgage-related securities. Decreases in interest rates can result in increased prepayments of loans and mortgage-related securities, as borrowers refinance to reduce their borrowing costs. Under these circumstances, we are subject to reinvestment risk to the extent that we are unable to reinvest the cash received from such prepayments at rates that are comparable to the rates on existing loans and investment securities. Additionally, increases in interest rates may decrease loan demand and make it more difficult for borrowers to repay adjustable rate loans. Also, increases in interest rates may extend the life of fixed rate assets, which would restrict our ability to reinvest in higher yielding alternatives, and may result in customers withdrawing certificates of deposit early so long as the early withdrawal penalty is less than the interest they could receive as a result of the higher interest rates.
Changes in interest rates also affect the current fair value of our interest-earning investment securities portfolio. Generally, the value of securities moves inversely with changes in interest rates. At December 31, 2023, the fair value of our investment and mortgage-backed securities portfolio totaled $1.743 billion. Net unrealized losses on these securities totaled $312.0 million at December 31, 2023. During the year ended December 31, 2023, we incurred other comprehensive gains of $7.9 million related to net changes in unrealized holding losses in the available-for-sale investment securities portfolio.
The current level of, or any increases in market interest rates may reduce our mortgage banking income. We generate revenues primarily from gains on the sale of mortgage loans to investors, and from the amortization of deferred mortgage servicing rights. We recognized noninterest income of $2.4 million on mortgage banking activities during the year ended December 31, 2023. We also earn interest on loans held for sale while awaiting delivery to our investors. In a rising or higher interest rate environment, our mortgage loan originations may decrease, resulting in fewer loans that are available for sale. This would result in a decrease in interest income and a decrease in revenues from loan sales. In addition, our results of operations are affected by the amount of noninterest expense associated with mortgage banking activities, such as salaries and employee benefits, occupancy, equipment, data processing and other operating costs. During periods of reduced loan demand, our results of operations may be adversely affected to the extent that we are unable to reduce expenses commensurate with the decline in mortgage loan origination activity.
Hedging against interest rate exposure may adversely affect our earnings.
On occasion we have employed various financial methodologies that limit, or “hedge,” the adverse effects of rising or decreasing interest rates on our loan portfolios and short-term liabilities. We also engage in hedging strategies with respect to arrangements with our customers. Our hedging activity varies based on the level and volatility of interest rates and other changing market conditions. Hedging strategies can be imperfect and may fail to protect us from loss. Moreover, hedging activities could result in costs if the hedge proves to be ineffective. Additionally, hedging activities could fail to protect us or adversely affect us because, among other things:
•available interest rate hedging may not correlate to the risk for which protection is sought;
•the duration of the hedge may not match the duration of the related asset or liability;
•the counterparty in the hedging transaction may default on its obligation to pay;
•the credit quality of the counterparty may degrade to such an extent that it impairs our ability to sell or assign our side of the hedging transaction;
•the value of derivatives used for hedging may be adjusted from time to time in accordance with accounting rules to reflect changes in fair value; and/or
•downward adjustments, or “mark-to-market” losses, would reduce our stockholders’ equity.
Risk Related to the COVID-19 Pandemic
The economic impact of the COVID-19 outbreak could continue to affect our financial condition and results of operations.
Global health concerns relating to the COVID-19 pandemic and related government actions taken to reduce the spread of the virus have continued to affect the macroeconomic environment, both nationally and in the Company’s existing geographic footprint.
Given the ongoing and dynamic nature of the circumstances, it is difficult to predict the full impact of the COVID-19 outbreak on our business. The extent of such impact will depend on future developments, which are highly uncertain, including when the coronavirus can be fully controlled and abated. The COVID-19 pandemic and the related adverse local and national economic consequences could result in a material, adverse effect on our business, financial condition, liquidity, and results of operations.
Risks Related to Economic Conditions
A worsening of economic conditions in our market area could reduce demand for our products and services and/or result in increases in our level of non-performing loans, which could adversely affect our operations, financial condition and earnings.
Our performance is significantly impacted by the general economic conditions in our primary markets in Pennsylvania, New York, Ohio, and Indiana. At December 31, 2023, 38% of our loan portfolio was secured by properties located in Pennsylvania, and 12% of our loan portfolio was secured by properties located in New York, with a large portion of the rest of our loans secured by real estate located in Ohio and Indiana. Local economic conditions have a significant impact on the ability of our borrowers to repay loans and the value of the collateral securing loans.
A deterioration in economic conditions could result in the following consequences, any of which could have a material adverse affect on our business, financial condition, liquidity and results of operations:
•demand for our products and services may decline;
•loan delinquencies, problem assets and foreclosures may increase;
•we may increase our allowance for credit losses;
•collateral for loans, especially real estate, may decline in value, in turn reducing customers’ future borrowing power, and reducing the value of assets and collateral associated with existing loans; and
•the net worth and liquidity of loan guarantors may decline, impairing their ability to honor commitments to us.
In addition, deflationary pressures could have a significant negative effect on our borrowers, especially our business borrowers, and the values of underlying collateral securing loans, which could negatively affect our financial performance.
Inflation can have an adverse impact on our business and on our customers.
Inflation risk is the risk that the value of assets or income from investments will be worth less in the future as inflation decreases the value of money. Inflation generally increases the cost of goods and services we use in our business operations, such as electricity and other utilities, which increases our non-interest expenses. Furthermore, our customers are also affected by inflation and the rising costs of goods and services used in their households and businesses, which could have a negative impact on their ability to repay their loans with us. Sustained higher interest rates by the Federal Reserve Board to tame persistent inflationary price pressures could also push down asset prices and weaken economic activity. A deterioration in economic conditions in the United States and our markets could result in an increase in loan delinquencies and non-performing assets, decreases in loan collateral values and a decrease in demand for our products and services, all of which, in turn, would adversely affect our business, financial condition and results of operations.
Beginning in 2022, in response to a pronounced rise in inflation, the Federal Reserve Board reversed its policy of “near zero” interest rates and has materially increased the target Fed Funds rate. As discussed under “Risks Related to Market Interest Rates - Changes in interest rates could adversely affect our results of operations and financial condition,” as inflation increases and market interest rates rise the value of our investment securities, particularly those with longer maturities, would decrease, although this effect can be less pronounced for floating rate instruments.
We may be negatively impacted by customer and depositor reaction to unrelated bank failures.
On March 9, 2023, Silvergate Bank, La Jolla, California, announced its decision to voluntarily liquidate its assets and wind down operations. On March 10, 2023, Silicon Valley Bank, Santa Clara, California, was closed by the California Department of Financial Protection and Innovation. On March 12, 2023, Signature Bank, New York, New York, was closed by the New York State Department of Financial Services, and on May 1, 2023, First Republic Bank, San Francisco, California, was closed by the California Department of Financial Protection and Innovation. These banks had elevated levels of uninsured deposits, which may be less likely to remain at the bank over time and less stable as a source of funding than insured deposits. These failures led to volatility and declines in the market for bank stocks and questions about depositor confidence in depository institutions.
These bank failures have led to an increased customer and regulatory focus on funding and liquidity at financial institutions, the composition of its deposits, including the amount of uninsured deposits, the amount of accumulated other comprehensive loss, capital levels and interest rate risk management. If we are unable to meet the increased expectations of our customers and regulatory agencies, it may have a material adverse effect on our financial condition and results of operations.
A lack of liquidity could adversely affect the Company’s financial condition and results of operations.
Liquidity is essential to the Company’s business. The Company relies on its ability to generate deposits and effectively manage the repayment of its liabilities to ensure that there is adequate liquidity to fund operations. An inability to raise funds through deposits, borrowings, the sale and maturities of loans and securities and other sources could have a substantial negative effect on liquidity. The Company’s most important source of funds is its deposits. Deposit balances can decrease when customers perceive alternative investments as providing a better risk adjusted return, which are strongly influenced by such external factors as the direction of interest rates, local and national economic conditions and the availability and attractiveness of alternative investments.
Further, the demand for deposits may be reduced due to a variety of factors such as negative trends in the banking sector, the level of and/or composition of our uninsured deposits, demographic patterns, changes in customer preferences, reductions in consumers’ disposable income, the monetary policy of the Federal Reserve or regulatory actions that decrease customer access to particular products. If customers move money out of bank deposits and into other investments such as money market funds, the Company would lose a relatively low-cost source of funds, which would increase its funding costs and reduce net interest income. Any changes made to the rates offered on deposits to remain competitive with other financial institutions may also adversely affect profitability and liquidity. Other primary sources of funds consist of cash flows from operations, maturities and sales of investment securities and/or loans, brokered deposits, borrowings from the FHLB and/or FRB discount window, and unsecured borrowings. The Company also may borrow funds from third-party lenders, such as other financial institutions. The Company’s access to funding sources in amounts adequate to finance or capitalize its activities, or on terms that are acceptable, could be impaired by factors that affect the Company directly or the financial services industry or economy in general, such as disruptions in the financial markets or negative views and expectations about the prospects for the financial services industry, a decrease in the level of the Company’s business activity as a result of a downturn in markets or by one or more adverse regulatory actions against the Company or the financial sector in general. Any decline in available funding could adversely impact the Company’s ability to originate loans, invest in securities, meet expenses, or to fulfill obligations such as meeting deposit withdrawal demands, any of which could have a material adverse impact on its liquidity, business, financial condition and results of operations.
Risks Related to our Business Strategy
Acquisitions may disrupt our business and dilute stockholder value.
We regularly evaluate merger and acquisition opportunities with other financial institutions and financial services companies. As a result, negotiations may take place and future mergers or acquisitions involving cash, debt, or equity securities may occur at any time. We would seek acquisition partners that offer us either significant market presence or the potential to expand our market footprint and improve profitability through economies of scale or expanded services.
Acquiring other banks, businesses, or branches may have an adverse effect on our financial results and may involve various other risks commonly associated with acquisitions, including, among other things:
•difficulty in estimating the value of the target company;
•payment of a premium over book and market values that may dilute our tangible book value and earnings per share in the short and long term;
•potential exposure to unknown or contingent liabilities of the target company;
•exposure to potential asset quality problems of the target company;
•potential volatility in reported income associated with goodwill impairment losses;
•difficulty and expense of integrating the operations and personnel of the target company;
•inability to realize the expected revenue increases, cost savings, increases in geographic or product presence, and/or other projected benefits of the acquisition;
•potential disruption to our business;
•potential diversion of our management’s time and attention;
•the possible loss of key employees and customers of the target company; and
•potential changes in banking or tax laws or regulations that may affect the target company.
Loans that were acquired as part of our acquisitions of other depository institutions were not underwritten or originated in accordance with our credit standards, including environmental matters, and we did not have long-standing relationships with many of these borrowers at the time of acquisition. The acquired loans are re-risked at that date of acquisition based on our credit standards, which can temporarily increase loans classified as special mention and substandard for a period of time until these loans are integrated and conform to our credit standards. Although we reviewed the loan portfolios of each institution acquired as part of the diligence process, and believe that we have established reasonable credit marks with regard to all loans acquired, we may incur losses in excess of the credit marks with regard to these acquired loans, and any such losses, if they occur, may have a material adverse effect on our business, financial condition, and results of operations.
Acquisitions may not enhance our cash flows, business, financial condition, results of operations or prospects as expected and such acquisitions may have an adverse effect on our results of operations, particularly during periods in which the acquisitions are being integrated into our operations.
Our continued pace of growth may require us to raise additional capital during unfavorable market conditions.
We are required by federal regulatory authorities to maintain adequate levels of capital to support our operations. We anticipate that we will have sufficient capital resources to satisfy our capital requirements for the foreseeable future. We may at some point, however, need to raise additional capital to support our continued growth.
If we raise capital through the issuance of additional shares of our common stock or other securities, it would dilute the ownership interests of existing stockholders and may dilute the per share book value of our common stock. New investors may also have rights, preferences and privileges senior to our current stockholders, which may adversely impact our current stockholders. Also, the need to raise additional capital may force our management to spend more time in managerial and financing-related activities than in operational activities.
Our ability to raise additional capital, if needed, will depend on conditions in the capital markets at that time, which are outside of our control, and on our financial performance. Accordingly, we may not be able to raise additional capital, if needed, with favorable terms. If we cannot raise additional capital when needed, our ability to further expand our operations through internal growth and acquisitions could be materially impaired.
New lines of business or new products and services may subject us to additional risks.
From time to time, we may implement new lines of business or offer new products and services within existing lines of business. In addition, we will continue to make investments in research, development, and marketing for new products and services. There are substantial risks and uncertainties associated with these efforts, particularly in instances where the markets are not fully developed. In developing and marketing new lines of business and/or new products and services we may invest significant time and resources. Initial timetables for the development and introduction of new lines of business and/or new products or services may not be achieved and price and profitability targets may not prove feasible. Furthermore, if customers do not perceive our new offerings as providing significant value, they may fail to accept our new products and services. External factors, such as compliance with regulations, competitive alternatives, and shifting market preferences, may also impact the successful implementation of a new line of business or a new product or service. Furthermore, the burden on management and our information technology of introducing any new line of business and/or new product or service could have a significant impact on the effectiveness of our system of internal controls. Failure to successfully manage these risks in the development and implementation of new lines of business or new products or services could have a material adverse effect on our business, financial condition and results of operations.
Our business strategy includes growth, and our financial condition and results of operations could be negatively affected if we fail to grow or fail to manage our growth effectively.
Our business strategy includes growth in assets, deposits and the scale of our operations. Achieving our growth targets will require us to attract customers that currently bank at other financial institutions in our market, thereby increasing our share of the market. Our ability to successfully grow will depend on a variety of factors, including our ability to attract and retain experienced bankers, the continued availability of desirable business opportunities, the competitive responses from other financial institutions in our market area and our ability to manage our growth. In order to successfully manage our growth, the Company may need to adopt and effectively implement new or revise existing policies, procedures, and controls, as well as hire additional employees or pay higher salaries to retain existing employees, to maintain credit quality, control costs and oversee the Company’s operations. Growth opportunities may not be available or we may not be able to manage our growth successfully. If we do not manage our growth effectively, our financial condition and operating results could be negatively affected.
Uncertainties associated with increased loan originations may result in errors in our judgment of collectability, which may lead to additional provisions for credit losses or charge-offs, which would negatively affect our operations.
Increasing loan originations would likely require us to lend to borrowers with which we have limited experience. Accordingly, we would not have a significant payment history pattern with which to judge future collectability. Further, newly originated loans have not been subjected to unfavorable economic conditions. As a result, it may be difficult to predict the future performance of newly originated loans. These loans may have delinquency or charge-off levels above our recent historical experience, which could adversely affect our future performance.
Risk Related to Competitive Matters
Strong competition may limit growth and profitability.
Competition in the banking and financial services industry is intense. We compete with commercial banks, savings institutions, mortgage brokerage firms, credit unions, finance companies, fintech companies, mutual funds, insurance companies, and brokerage and investment banking firms operating locally and elsewhere. Many of these competitors (whether regional or national institutions) have substantially greater resources and lending limits than we have and may offer certain services that we do not or cannot provide. In addition, some have competitive advantages such as the credit union exemption from paying federal income tax. Competitive factors driven by consumer sentiment or otherwise can also reduce our ability to generate fee income, such as through overdraft fees. Our profitability depends upon our ability to successfully compete in our market areas.
Risks Related to Operational Matters
Risks associated with system failures, interruptions, or breaches of security could negatively affect our earnings.
Information technology systems are critical to our business. We use various technology systems to manage our customer relationships, general ledger, deposits, and loans. We have established policies and procedures to prevent or limit the impact of system failures, interruptions, and security breaches, but such events may still occur or may not be adequately addressed if they do occur. In addition, any compromise of our systems could deter customers from using our products and services. Although we rely on security systems to provide security and authentication necessary to effect the secure transmission of data, these precautions may not protect our systems from compromises or breaches of security.
Our business is subject to the Gramm-Leach-Bliley Act which, among other things: (i) imposes certain limitations on our ability to share nonpublic personal information about our customers with nonaffiliated third parties; (ii) requires that we provide certain disclosures to customers about our information collection, sharing and security practices and afford customers the right to “opt out” of any information sharing by us with nonaffiliated third parties (with certain exceptions); and (iii) requires that we develop, implement and maintain a written comprehensive information security program containing appropriate safeguards based on our size and complexity, the nature and scope of our activities, and the sensitivity of customer information we process, as well as plans for responding to data security breaches. Ensuring that our collection, use, transfer and storage of personal information complies with all applicable laws and regulations can increase our costs. Despite the defensive measures we take to manage our internal technological and operational infrastructure, threats may originate externally from third parties such as foreign governments, organized crime and other hackers, and outsource or infrastructure-support providers and application developers, or may originate internally from within our organization. Furthermore, we may not be able to ensure that all of our clients, suppliers, counterparties and other third parties have appropriate controls in place to protect the confidentiality of the information that they exchange with us, particularly where such information is transmitted by electronic means. Our heavy reliance on information technology systems exposes us to operational risks, which include the risk of malfeasance by employees or persons outside of our organization, errors relating to transaction processing and technology, systems failures or interruptions, failures to properly implement systems upgrades, breaches of our internal control systems and compliance requirements, and business continuation and disaster recovery.
In addition, we outsource a significant amount of our data processing to certain third-party providers. If these third-party providers encounter difficulties, or if we have difficulty communicating with them, our ability to adequately process and account for transactions could be affected, and our business operations could be adversely affected. Threats to information security also exist in the processing of customer information through various other vendors and their personnel.
The occurrence of any system failures, interruption, or breach of security could damage our reputation and result in a loss of customers and business, could subject us to additional regulatory scrutiny, or could expose us to litigation and possible financial liability. Any of these events could have a material adverse effect on our financial condition and results of operations.
Our risk management framework may not be effective in mitigating risk and reducing the potential for significant losses.
Our risk management framework is designed to minimize risk and loss to us. We seek to identify, measure, monitor, report and control our exposure to risk, including strategic, market, liquidity, credit, interest rate, compliance and operational risks. While we use a broad and diversified set of risk monitoring and mitigation techniques, these techniques are inherently limited because they cannot anticipate the existence or future development of currently unanticipated or unknown risks. Recent economic conditions and heightened legislative and regulatory scrutiny of the financial services industry, among other developments, have increased our level of risk. Accordingly, we could suffer losses as a result of our failure to properly anticipate and manage these risks.
Our board of directors relies to a large degree on management and outside consultants in overseeing cybersecurity risk management.
The Board of the Company has an Innovation and Technology Sub-Committee, consisting of wholly independent directors chartered, among other items, with a focus on cybersecurity risk. Additionally, the Company’s Board has a designated Risk Management Sub-Committee with the responsibility of monitoring enterprise level risks, including those related to cybersecurity. Furthermore, management of the Company has both an Enterprise Risk Management Committee and an Information Technology Steering Committee (ITSC), both of which are comprised of the most senior members of management, including the Chief Executive Officer, Chief Information Officer, and Chief Operating Officer. The ITSC meets monthly, or more frequently if needed, and the ERMC meets quarterly, or more frequently if needed. Material items related to cybersecurity are reported to the Innovation and Technology and Risk Management Sub-Committees. The Company also engages outside consultants to support its cybersecurity efforts. The directors of the Company do not have significant experience in cybersecurity risk management in other business entities comparable to the Company and rely on members of management, including, but not limited to, the Chief Information Security Officer, Chief Information Security Officer, Chief Technology Officer and Chief Data Officer, for cybersecurity guidance.
Our business may be adversely affected by an increasing prevalence of fraud and other financial crimes.
Our loans to businesses and individuals and our deposit relationships and related transactions are subject to exposure to the risk of loss due to fraud and other financial crimes. Nationally, reported incidents of fraud and other financial crimes have increased. We have also experienced losses due to apparent fraud and other financial crimes. While we have policies and procedures designed to prevent such losses, losses may still occur.
We could be adversely affected by the soundness of other financial institutions and other third parties we rely on.
Financial services institutions are interrelated as a result of trading, clearing, counterparty or other relationships. We have exposure to many different industries and counterparties, and routinely execute transactions with counterparties in the financial services industry, including commercial banks, brokers and dealers, investment banks and other institutional customers. Many of these transactions expose us to credit risk in the event of a default by a counterparty or client. In addition, our credit risk may be exacerbated when our collateral cannot be foreclosed upon or is liquidated at prices not sufficient to recover the full amount of the credit or derivative exposure due. Furthermore, successful operation of our debit card and cash management solutions business depends on the soundness of third party processors, clearing agents and others that we rely on to conduct our merchant business. Any losses resulting from such third parties could adversely affect our business, financial condition and results of operations.
Risks Related to Environmental and Other Global Matters
We are subject to environmental liability risk associated with lending activities.
A significant portion of our loan portfolio is secured by real estate, and we could become subject to environmental liabilities with respect to one or more of these properties. During the ordinary course of business, we may foreclose on and take title to properties securing defaulted loans. In doing so, there is a risk that hazardous or toxic substances could be found on these properties. If hazardous conditions or toxic substances are found on these properties, we may be liable for remediation costs, as well as for personal injury and property damage, civil fines and criminal penalties regardless of when the hazardous conditions or toxic substances first affected any particular property. Environmental laws may require us to incur substantial expenses to address unknown liabilities and may materially reduce the affected property’s value or limit our ability to use or sell the affected property. In addition, future laws or regulations or more stringent interpretations or enforcement policies with respect to existing laws and regulations may increase our exposure to environmental liability, and heightened pressure from investors and other stakeholders may require to incur additional expenses with respect to environmental matters. Although we have policies and procedures to perform an environmental review before initiating any foreclosure action on nonresidential real property, these reviews may not be sufficient to detect all potential environmental hazards. The remediation costs and any other financial liabilities associated with an environmental hazard could have a material adverse effect on us.
Societal responses to climate change could adversely affect our business and performance, including indirectly through impacts on our customers.
Concerns over the long-term impacts of climate change have led and will continue to lead to governmental efforts around the world to mitigate those impacts. Consumers and businesses also may change their behavior on their own as a result of these concerns. We and our customers will need to respond to new laws and regulations as well as consumer and business preferences resulting from climate change concerns. We and our customers may face cost increases, asset value reductions, operating process changes and other issues. The impact on our customers will likely vary depending on their specific attributes, including reliance on role in carbon intensive activities, among the impacts to us could be a drop in demand for our products and services, particularly in certain sectors. In addition, we could face reductions in creditworthiness on the part of some customers or in the value of asset securing loans. Our efforts to take these risks into account in making lending and other decisions, including by increasing our business with climate-friendly companies, may not be effective in protecting us from the negative impact of new laws and regulations or changes in consumer or business behavior.
Our business, financial condition, and results of operations could be adversely affected by natural disasters, health epidemics, and other catastrophic events.
We could be adversely affected if key personnel or a significant number of employees were to become unavailable due to a pandemic, natural disaster, war, act of terrorism, accident, or other reason. Any of these events could result in the temporary reduction of operations, employees, and customers, which could limit our ability to provide services. Additionally, many of our borrowers may suffer property damage, experience interruption of their businesses or lose their jobs after such events. Those borrowers might not be able to repay their loans, and the collateral for such loans may decline significantly in value.
Risks Related to Accounting Matters
If our intangible assets, including goodwill, are either partially or fully impaired in the future, it would decrease earnings.
We are required to test our goodwill and other identifiable intangible assets for impairment on an annual basis and more regularly if indicators of impairment exist. The impairment testing process considers a variety of factors, including the current market price of our common stock, the estimated net present value of our assets and liabilities and information concerning the terminal valuation of similar insured depository institutions. Future impairment testing may result in a partial or full impairment of the value of our goodwill or other identifiable intangible assets, or both. If an impairment determination is made in a future reporting period, our earnings and the book value of these intangible assets will be reduced by the amount of the impairment. However, the recording of such an impairment loss would have no impact on the tangible book value of our shares of common stock or our regulatory capital levels.
Changes in management’s estimates and assumptions may have a material impact on our Consolidated Financial Statements and our financial condition or operating results.
In preparing this annual report as well as periodic reports we are required to file under the Securities Exchange Act of 1934, including our Consolidated Financial Statements, our management is and will be required under applicable rules and regulations to make estimates and assumptions as of a specified date. These estimates and assumptions are based on management’s best estimates and experience as of that date and are subject to substantial risk and uncertainty. Materially different results may occur as circumstances change and additional information becomes known. Areas requiring significant estimates and assumptions by management include our evaluation of the adequacy of our allowance for credit losses.
Risks Related to Investment Activities
We could record future losses on our investment securities portfolio.
A number of factors or combinations of factors could require us to conclude in one or more future reporting periods that an unrealized loss that exists with respect to these and other securities constitutes a credit related impairment, which could result in material losses to us. These factors include, but are not limited to, failure by the issuer to make scheduled interest payments, the issuer of the securities and their creditworthiness, any changes to the rating of the security and any adverse conditions specifically related to the security that would render us unable to forecast a full recovery in value. In addition, the fair values of securities could decline if the overall economy and the financial condition of some of the issuers deteriorates and there remains limited liquidity for these securities. During the year ended December 31, 2023, we incurred other comprehensive gains of $7.9 million related to net changes in unrealized holding losses in the available-for-sale investment securities portfolio.
See “Item 7. Management’s Discussion and Analysis of Financial Condition and Results of Operations-Balance Sheet Analysis-Securities” for a discussion of our securities portfolio and the unrealized losses related to the portfolio, as well as the “Marketable Securities” and “Disclosures about Fair Value of Financial Instruments” footnotes to the audited financial statements.
Our exposure to municipalities may lead to operating losses.
Our municipal bond portfolio may be impacted by the effects of economic stress on state and local governments. At December 31, 2023, we had $85.8 million invested in debt obligations of states, municipalities and political subdivisions (collectively referred to as our municipal bond portfolio). We also had $194.3 million of loans outstanding to municipalities and political subdivisions. State and local governments may experience financial stress due to: (i) declining revenues; (ii) large unfunded liabilities to government workers; and (iii) entrenched cost structures. Additionally, the debt-to-gross domestic product ratios for the majority of states have been deteriorating due to, among other factors, declines in federal monetary assistance. These challenges have led to speculation about the potential for a significant deterioration in the municipal bond market, which could materially affect our results of operations, financial condition and liquidity. We may not be able to mitigate the exposure in our municipal portfolio if state and local governments are unable to fulfill their obligations. The risk of widespread issuer defaults may also increase if there are changes in legislation that permit states, or additional municipalities and political subdivisions, to file for bankruptcy protection or if there are judicial interpretations that, in a bankruptcy or other proceeding, lessen the value of any structural protections.
The financial services sector represents a significant concentration within our investment portfolio.
Within our investment portfolio, we have a significant amount of corporate debt and mortgage-backed securities issued by companies in the financial services sector. Given current market conditions, this sector has an enhanced level of credit risk.
Potential downgrades of U.S. government securities by one or more of the credit ratings agencies could have a material adverse effect on our operations, earnings and financial condition.
A possible downgrade of the sovereign credit ratings of the U.S. government and a decline in the perceived creditworthiness of U.S. government-related obligations could impact the value of our investments, and the availability and pricing of funding transactions collateralized by those instruments. We cannot predict if, when or how any changes to the credit ratings or perceived creditworthiness of these organizations will affect economic conditions. Such ratings actions could result in a significant adverse impact on us. Among other things, a downgrade in the U.S. government’s credit rating could adversely impact the value of our securities portfolio and may trigger requirements that we post additional collateral for trades relative to these securities. A downgrade of the sovereign credit ratings of the U.S. government or the credit ratings of related institutions, agencies or instruments would significantly exacerbate the other risks to which we are subject and any related adverse effects on the business, financial condition and results of operations.
Risks Related to Our Debit and Credit Activities
Changes in card network rules or standards could adversely affect our business.
In order to provide our debit card and cash management solutions, we are members of the Visa network. As such, we are subject to card network rules that could subject us to a variety of fines or penalties that may be assessed on us. The termination of our membership or any changes in card network rules or standards, including interpretation and implementation of existing rules or standards, could increase the cost of operating our merchant services business or limit our ability to provide debit card and cash management solutions to or through our customers, and could have a material adverse effect on our business, financial condition and results of operations.
Changes in card network fees could impact our operations.
From time to time, the card networks increase the fees (known as interchange fees) that they charge to acquirers and that we charge to our merchants. It is possible that competitive pressures will result in us absorbing a portion of such increases in the future, which would increase our costs, reduce our profit margin and adversely affect our business and financial condition. In addition, the card networks require certain capital requirements. An increase in the required capital level would further limit our use of capital for other purposes.
Our business could suffer if there is a decline in the use of debit cards as a payment mechanism or if there are adverse developments with respect to the financial services industry in general.
As the financial services industry evolves, consumers may find debit financial services to be less attractive than traditional or other financial services. Consumers might not use debit card financial services for any number of reasons, including the general perception of our industry. If consumers do not continue or increase their usage of debit cards, including making changes in the way debit cards are loaded, our operating revenues and debit card deposits may remain at current levels or decline. Any projected growth for the industry may not occur or may occur more slowly than estimated. If consumer acceptance of debit financial services does not continue to develop or develops more slowly than expected or if there is a shift in the mix of payment forms, such as cash, credit cards, and debit cards, away from our products and services, it could have a material adverse effect on our financial position and results of operations.
Other Risks Related to Our Business
The corporate governance provisions in our articles of incorporation and bylaws, and the corporate governance provisions under Maryland law, may prevent or impede the holders of our common stock from obtaining representation on our Board of Directors and may impede takeovers of the Company that our board might conclude are not in the best interest of us or our stockholders.
Provisions in our articles of incorporation and bylaws may prevent or impede holders of our common stock from obtaining representation on our Board of Directors and may make takeovers of Northwest Bancshares, Inc. more difficult. As a result, our stockholders may not have the opportunity to participate in such a transaction, which could provide a premium over the prevailing price of our common stock. The provisions that may discourage takeover attempts or make them more difficult include that our Board of Directors is divided into three staggered classes. A classified board makes it more difficult for stockholders to change a majority of the directors because it generally takes at least two annual elections of directors for this to occur. Our articles of incorporation include a provision that no person will be entitled to vote any shares of our common stock in excess of 10% of our outstanding shares of common stock. This limitation does not apply to the purchase of shares by a tax-qualified employee stock benefit plan established by us. In addition, our articles of incorporation and bylaws restrict who may call special meetings of stockholders and how directors may be removed from office.
Additionally, in certain instances, the Maryland General Corporation Law requires a supermajority vote of our stockholders to approve a merger or other business combination with a large stockholder, if the proposed transaction is not approved by a majority of our directors.
We are a community bank and our ability to maintain our reputation is critical to the success of our business and the failure to do so may materially adversely affect our performance.
We are a community bank, and our reputation is one of the most valuable components of our business. A key component of our business strategy is to rely on our reputation for customer service and knowledge of local markets to expand our presence by capturing new business opportunities from existing and prospective customers in our current market and contiguous areas. As such, we strive to conduct our business in a manner that enhances our reputation. This is done, in part, by recruiting, hiring and retaining employees who share our core values of being an integral part of the communities we serve, delivering superior service to our customers and caring about our customers and associates. If our reputation is negatively affected by the actions of our employees, by our inability to conduct our operations in a manner that is appealing to current or prospective customers, or otherwise, our business and operating results may be adversely affected.
If our government banking deposits were lost within a short period of time, this could negatively impact our liquidity and earnings.
As of December 31, 2023, we held $602.3 million of deposits from municipalities throughout Pennsylvania, New York, Ohio, and Indiana. These deposits may be more volatile than other deposits. If a significant amount of these deposits were withdrawn within a short period of time, it could have a negative impact on our short-term liquidity and have an adverse impact on our earnings.
Our funding sources may prove insufficient to replace deposits at maturity and support our future growth.
We must maintain sufficient liquidity to respond to the needs of depositors and borrowers. As such, we utilize a diverse set of funding sources in addition to core deposits. As we continue to grow, we are likely to become more dependent on these sources, which may include FHLB advances, proceeds from the sale of loans, federal funds purchased and brokered certificates of deposit. Adverse operating results or changes in industry conditions could lead to difficulty or an inability to maintain timely access to these additional funding sources. Our financial flexibility will be materially constrained if we are unable to maintain our access to funding or if adequate financing is not available to accommodate future growth at acceptable interest rates. If we are required to rely more heavily on more expensive funding sources to support future growth, our revenues may not increase proportionately to cover our costs. In this case, our operating margins and profitability would be adversely affected.
A protracted government shutdown may result in reduced loan originations and related gains on sale and could negatively affect our financial condition and results of operations.
During any protracted federal government shutdown, we may not be able to close certain loans and we may not be able to recognize non-interest income on the sale of loans. Some of the loans we originate are sold directly to government agencies, and some of these sales may be unable to be consummated during the shutdown. In addition, we believe that some borrowers may determine not to proceed with their home purchase and not close on their loans, which would result in a permanent loss of the related non-interest income. A federal government shutdown could also result in reduced income for government employees or employees of companies that engage in business with the federal government, which could result in greater loan delinquencies, increases in our nonperforming, criticized and classified assets and a decline in demand for our products and services.
Our inability to tailor our retail delivery model to respond to consumer preferences in banking may negatively affect earnings.
We have expanded our market presence through acquisitions and growth. Our branch network continues to be a very significant source of new business generation, however, consumers continue to migrate much of their routine banking to self-service channels. In recognition of this shift in consumer patterns, we regularly review our branch network, which has resulted in branch consolidation accompanied by the enhancement of our capabilities to serve its customers through alternate delivery channels. The benefits of this strategy will depend on our ability to realize expected expense reductions without experiencing significant customer attrition.
ITEM 1B. UNRESOLVED STAFF COMMENTS
Not applicable.
ITEM 1C. CYBERSECURITY
Risk Management and Strategy
Our risk management program is designed to identify, assess, and mitigate risks across various aspects of our company, including credit, market, treasury, operational, compliance, model and data, and reputational. Cybersecurity is a critical component of this program, given the increasing reliance on technology and potential for a cybersecurity incident to occur, which could disrupt business operations or compromise sensitive data. Our Chief Information Security Officer (“CISO”) is primarily responsible for this cybersecurity component and is a key member of the organization, reporting directly to the Chief Information Officer and, as discussed below, periodically to the Innovation and Technology Committee of our board of directors. To date, the Company has not, to its knowledge, experienced an incident materially affecting or reasonably likely to materially affect the Company.
To prepare and respond to incidents, the Company has implemented a multi-layered cybersecurity program that is intended to comply with Gramm-Leach-Bliley Act (GLBA) 12 CFR 364, Appendix B, integrating people, technology, and processes. This includes employee training, the use of innovative technologies, and the implementation of policies and procedures in the areas of Information Security, Data Governance, Business Continuity and Disaster Recovery, Privacy, Third-Party Risk Management, and Incident Response. Our objective for managing cybersecurity risk is to avoid or minimize the impacts of external threat events or other efforts to penetrate, disrupt or misuse our systems or information. The cybersecurity program is built upon a foundation of advanced security technology, our internal employee team, and operations based on industry best practices recommendations from the National Institute of Standards and Technology (NIST) Cybersecurity Framework, Federal Financial Institutions Examination Council (FFIEC) Guidelines, and Center for Internet Security (CIS) Benchmarks. This consists of controls designed to identify, protect, detect, respond and recover from information and cyber security incidents. Our Chief Information Security Officer and our Chief Information Officer, who reports directly to our Chief Executive Officer, along with key members of their teams, regularly collaborate with peer banks, industry groups, and policymakers to discuss cybersecurity trends and issues and identify best practices. The information security program is periodically reviewed by such personnel with the goal of addressing changing threats and conditions.
We also employ a variety of preventative and detective tools designed to monitor, block, and provide alerts regarding suspicious activity, as well as to report on suspected advanced persistent threats. We have established processes and systems designed to mitigate cyber risk, including regular and on-going education and training for employees, preparedness simulations and tabletop exercises, and recovery and resilience tests. We engage in regular assessments of our infrastructure, software systems, and network architecture, using internal cybersecurity experts and third-party specialists. We also actively monitor our email gateways for malicious phishing email campaigns and monitor remote connections as a significant portion of our workforce has the option to work remotely.
The Company relies on third-party vendor solutions to support its operations. Many of these vendors, especially in the financial services industry, have access to sensitive and proprietary information. To mitigate the operational, informational and other risks associated with the use of vendors, the Company maintains a Third-Party Risk Management Program, which is implemented through a Third-Party Risk Management Policy and includes a detailed onboarding process and periodic reviews of vendors with access to sensitive Company data. The Third-Party Risk Management Policy applies to any business arrangement between the Company and another individual or entity, by contract or otherwise, in compliance with the Interagency Guidance on Third-Party Relationships: Risk Management. The Third-Party Risk Management Program is audited periodically in accordance with our Board approved Internal Audit plan.
We leverage internal and external auditors and independent external partners to periodically review our processes, systems, and controls, including with respect to our information security program, to assess their design and operating effectiveness and make recommendations to strengthen our information security and risk management programs. Regular internal monitoring is integral to the Company’s risk assessment process, which includes regular testing of internal key controls, systems, and procedures. In addition, independent third-party penetration testing of the effectiveness of security controls and preparedness measures is conducted at least annually or more often, if warranted by the risk assessment or other external factors. Management determines the scope and objectives of the penetration analysis.
We maintain both an Incident Response Plan and a Crisis Management Plan (the “Plans”) that provide a documented framework for responding to actual or potential cybersecurity incidents, including timely notification of and escalation to the appropriate Board-approved management committees, as discussed further below, and to the Innovation and Technology Committee of our board of directors. The Plans are coordinated through the Business Resiliency Manager and Major Incident Manager, who ultimately report to the Chief Information Officer, and key members of management are embedded into the Plans by their design.
The Plans facilitate coordination across multiple parts of our organization and are evaluated at least annually.
Integral elements of the Plans related to the Company’s response to security vulnerabilities include the following.
•Identifying the appropriate team and any appropriate sub-teams to address specific information and/or cyber security incidents, or categories of information and/or cyber security incidents.
•Coordinating Incident or Crisis Management activities, including developing, maintaining, and following appropriate procedures to respond to and document identified information and/or cyber security incidents.
•Conducting post-incident reviews to gather feedback on information and/or cyber security incident response procedures and address any identified gaps in security measures.
•Providing training and conducting periodic exercises to promote employee and stakeholder preparedness and awareness of the Plans.
•Reviewing the Plans at least annually, or whenever there is a material change in the Company’s business practices that may reasonably affect its cyber incident response procedures.
Notwithstanding our defensive measures and processes, the threat posed by cyber-attacks is severe. Our internal systems, processes, and controls are designed to mitigate loss from cyber-attacks and, while we have experienced cybersecurity incidents in the past, to date, risks from cybersecurity threats have not materially affected our company. For further discussion of risks from cybersecurity threats, see the section captioned “Risks Related to Operational Matters” in Item 1A. Risk Factors.
Governance
Our Chief Information Security Officer is accountable for managing our enterprise information security department and delivering our information security program. The responsibilities of this department include cybersecurity risk assessment, defense operations, cyber incident response, vulnerability assessment, threat intelligence, identity access governance, and the evaluation of third-party risk management and business resilience as it relates to the cybersecurity program.
The foregoing responsibilities are covered on a day-to-day basis by our Chief Information Security Officer and their team. The department consists of information security professionals with varying degrees of education and experience. Individuals within the department are generally subject to professional education and certification requirements. Our Chief Information Security Officer has substantial relevant expertise and formal training in the areas of information security and cybersecurity risk management, including 20 years of cybersecurity experience, 12 of which was spent at the Company.
Our Operational Risk Management group provides guidance, oversight, monitoring and challenge of the first line’s activities. The second line of defense function is separated from the first line of defense function through organizational structure and ultimately reports directly to the Chief Risk Officer.
Our board of directors has established management committees including the Information Technology Steering Committee, which focuses on technology and business impact, and the Operational Risk Management Committee, which focuses on the identification, monitoring, assessment, and management of risk associated with our cyber and information security programs. These committees provide oversight and governance of the technology program and the information security program and are chaired by the Chief Information Officer and Chief Operational Risk Management Officer, respectively, and include the Chief Information Security Officer and other key departmental managers from throughout the entire company. The Information Technology Steering Committee meets monthly and the Operational Risk Management Committee meets at least quarterly to provide oversight of the risk management strategy, standards, policies, practices, controls, and mitigation and prevention efforts employed to manage security risks. More frequent meetings occur from time to time in accordance with the Incident Response Plan to facilitate timely informing and monitoring efforts. The Chief Information Security Officer reports summaries of key issues, including significant cybersecurity incidents, discussed at committee meetings and the actions taken to the Innovation and Technology Committee of our board of directors on a quarterly basis (or more frequently as may be required by the Incident Response Plan).
The Innovation and Technology Committee of our board of directors is responsible for overseeing our information security and technology programs, including management’s actions to identify, assess, mitigate, and remediate or prevent material cybersecurity issues and risks. Our Chief Information Security Officer and our Chief Information Officer provide quarterly reports to the Innovation and Technology Committee of our board of directors regarding the information security program and the technology program, key enterprise cybersecurity initiatives, and other matters relating to cybersecurity processes. The Innovation and Technology Committee of our board of directors reviews and approves our information security and technology budgets and strategies annually. Additionally, the Risk Committee of our board of directors reviews key metrics summarizing our cyber security risk profile on a quarterly basis. The Innovation and Technology Committee and Risk Committee of our board of directors each provide a report of their activities to the full board of directors at each board meeting.
Lastly, at least annually, the CISO reports directly to the Board the overall status of the Information Security Program and the Company’s compliance with the Interagency Guidelines for Safeguarding Customer Information. Any material findings related to the risk assessment, risk management and control decisions, service provider arrangements, results of testing, security breaches or violations are discussed as are management’s responses and any recommendations for program changes.
ITEM 2. PROPERTIES
As of December 31, 2023, we conducted our business through our main office located in Warren, Pennsylvania, 77 other full-service offices and six free-standing drive-through locations throughout our market area in central and western Pennsylvania, 27 full-service offices and one free-standing drive-through location in western New York, 10 full-service offices and one free-standing drive-through location in eastern Ohio, and 20 full-service office locations in Indiana. At December 31, 2023, our premises and equipment had an aggregate net book value of approximately $138.8 million.
ITEM 3. LEGAL PROCEEDINGS
Northwest Bancshares, Inc. and its subsidiaries are subject to various legal actions arising in the normal course of business. In the opinion of management, the resolution of these legal actions is not expected to have a material adverse effect on our financial condition and/or results of operations. See Note 19 in the notes to the Consolidated Financial Statements.
ITEM 4. MINE SAFETY DISCLOSURES
Not applicable.
PART II
ITEM 5. MARKET FOR REGISTRANT’S COMMON EQUITY, RELATED STOCKHOLDER MATTERS AND ISSUER PURCHASES OF EQUITY SECURITIES
Our common stock is listed on the NASDAQ Global Select Market under the symbol “NWBI”. As of February 20, 2024, we had 22 registered market makers, 9,433 stockholders of record (excluding the number of persons or entities holding stock in street name through various brokerage firms), and 127,112,705 shares outstanding.
Payment of dividends on our shares of common stock is subject to determination and declaration by the Board of Directors and will depend upon a number of factors, including capital requirements, regulatory limitations on the payment of dividends, our results of operations and financial condition, tax considerations and general economic conditions. No assurance can be given that dividends will continue to be declared or, if declared, what the amount of dividends will be. See “Item 1. Business Supervision and Regulation — Holding Company Regulation — Source of Strength/Capital Distributions” for additional information regarding our ability to pay dividends.
There were no sales of unregistered securities during the quarter ended December 31, 2023.
On December 13, 2012, the Board of Directors approved a program that authorizes the repurchase of approximately 5,000,000 shares of common stock. This program does not have expiration date. During the year ended December 31, 2023, we did not repurchase any shares and there are a maximum of 2,261,130 remaining shares that can be purchased under the current repurchase program.
Stock Performance Graph
The following stock performance graph compares (a) the cumulative total return on our common stock between December 31, 2018 and December 31, 2023, (b) the cumulative total return on stocks included in the Total Return Index for the NASDAQ Stock Market (US) over such period, and (c) the cumulative total return on stocks included in the NASDAQ Bank Index over such period. Cumulative return assumes the reinvestment of dividends, and is expressed in dollars based on an assumed investment of $100.
There can be no assurance that our stock performance will continue in the future with the same or similar trend depicted in the graph. We will not make or endorse any predictions as to future stock performance.
COMPARISON OF 5 YEAR CUMULATIVE TOTAL RETURN
Among Northwest Bancshares, Inc., the NASDAQ Composite Index, and the NASDAQ Bank Index
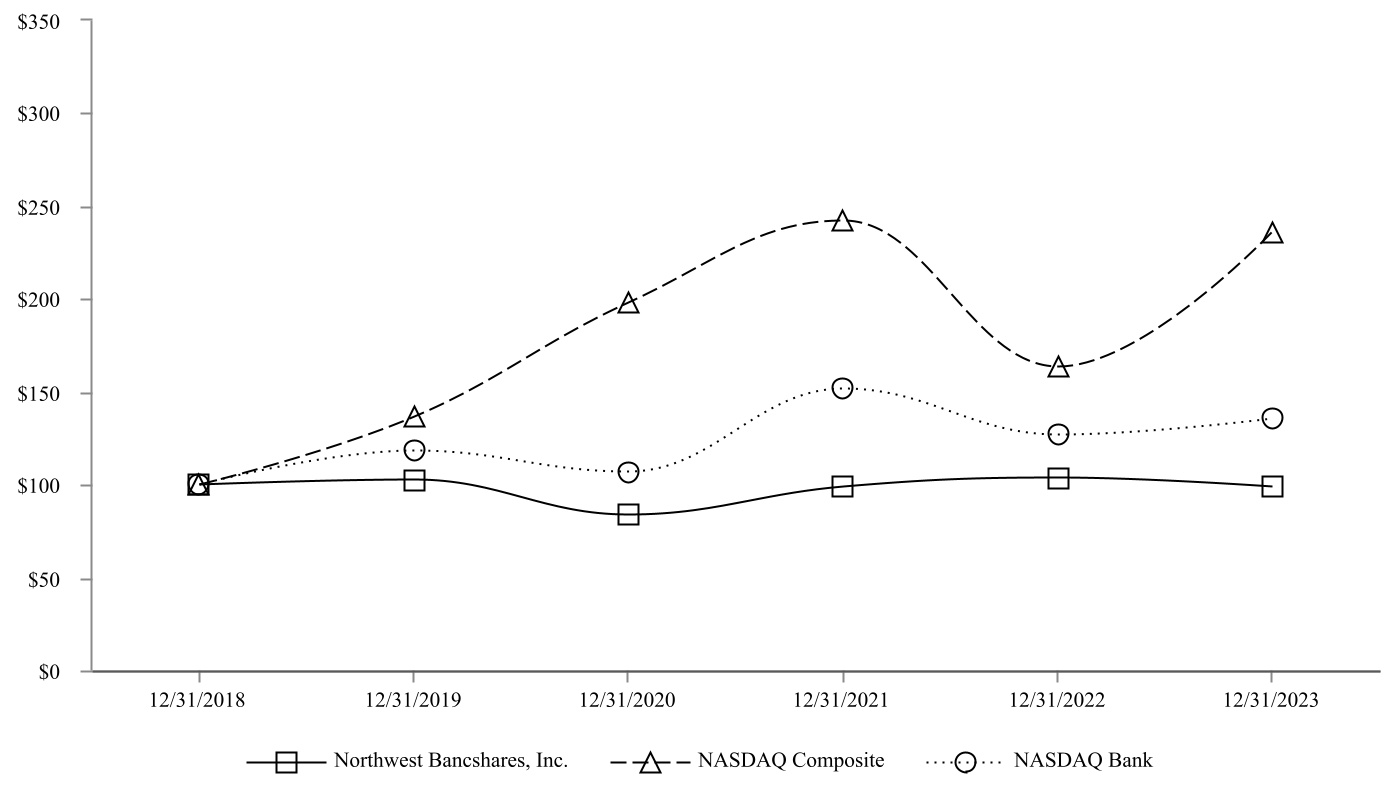
|
|
|
|
|
|
|
|
|
|
|
|
|
|
|
|
|
|
|
|
|
|
|
|
|
|
|
|
|
|
|
|
|
|
|
|
|
At December 31, |
| |
2018 |
|
2019 |
|
2020 |
|
2021 |
|
2022 |
|
2023 |
| Northwest Bancshares, Inc. |
100.00 |
|
|
102.35 |
|
|
83.94 |
|
|
98.89 |
|
|
103.43 |
|
|
98.90 |
|
| NASDAQ Composite |
100.00 |
|
|
136.69 |
|
|
198.10 |
|
|
242.03 |
|
|
163.28 |
|
|
236.17 |
|
| NASDAQ Bank |
100.00 |
|
|
117.98 |
|
|
107.14 |
|
|
151.35 |
|
|
126.88 |
|
|
135.67 |
|
ITEM 6. [RESERVED]
ITEM 7. MANAGEMENT’S DISCUSSION AND ANALYSIS OF FINANCIAL CONDITION AND RESULTS OF OPERATIONS
Our principal business consists of collecting deposits and making loans primarily secured by various types of collateral, including real estate and other assets in the markets in which we are located. Attracting and maintaining deposits is affected by a number of factors, including interest rates paid on competing deposits and other investments offered by other financial and non-financial institutions, account maturities, fee structures, and levels of personal income and savings. Lending activities are affected by the demand for funds and thus are influenced by interest rates, the number and quality of alternative lenders and regional economic conditions. Sources of funds for lending activities include deposits, borrowings, repayments on loans, cash flows from investment and mortgage-backed securities and income provided from operations.
Our earnings depend primarily on net interest income, which is the difference between interest earned on our interest-earning assets, consisting primarily of loans and investment securities, and the interest paid on interest-bearing liabilities, consisting primarily of deposits, borrowed funds, and trust-preferred securities. Net interest income is a function of our interest rate spread, which is the difference between the average yield earned on our interest-earning assets and the average rate paid on our interest-bearing liabilities, as well as a function of the average balance of interest-earning assets compared to the average balance of interest-bearing liabilities. Also contributing to our earnings is noninterest income, which consists primarily of service charges and fees on loan and deposit products and services, fees related to investment management and trust services, net gains and losses on the sale of assets, including SBA loans, and mortgage banking income. Net interest income and noninterest income are offset by provisions for credit losses, general administrative and other expenses, including employee compensation and benefits, occupancy expense and processing costs, as well as by state and federal income tax expense.
Our net income was $135.0 million, or $1.06 per diluted share, for the year ended December 31, 2023 compared to $133.7 million, or $1.05 per diluted share, for the year ended December 31, 2022, and $154.3 million, or $1.21 per diluted share, for the year ended December 31, 2021. The provision for credit losses was $22.9 million for the year ended December 31, 2023 compared to $28.3 million for the year ended December 31, 2022, and a provision credit of $15.8 million for the year ended December 31, 2021.
Selected Financial and Other Data
The summary financial information presented below is derived in part from the Company’s Consolidated Financial Statements. The following is only a summary and should be read in conjunction with the Consolidated Financial Statements and notes included elsewhere in this document. The information at December 31, 2023 and 2022 and for the years ended December 31, 2023, 2022 and 2021 is derived in part from the audited Consolidated Financial Statements that appear in this document.
|
|
|
|
|
|
|
|
|
|
|
|
|
|
|
|
|
|
| |
At December 31, |
| |
2023 |
|
2022 |
|
|
|
|
|
|
| |
(In thousands) |
| Selected Consolidated Financial Data: |
|
|
|
|
|
|
|
|
|
| Total assets |
$ |
14,419,105 |
|
|
14,113,324 |
|
|
|
|
|
|
|
| Cash and cash equivalents |
122,260 |
|
|
139,365 |
|
|
|
|
|
|
|
| Marketable securities held-to-maturity |
124,458 |
|
|
124,455 |
|
|
|
|
|
|
|
| Marketable securities available-for-sale |
182,068 |
|
|
224,537 |
|
|
|
|
|
|
|
| Mortgage-backed securities held-to-maturity |
690,381 |
|
|
756,794 |
|
|
|
|
|
|
|
| Mortgage-backed securities available-for-sale |
861,291 |
|
|
993,571 |
|
|
|
|
|
|
|
| Loans receivable, net of allowance for credit losses: |
|
|
|
|
|
|
|
|
|
| Residential mortgage loans held-for-sale |
8,768 |
|
|
9,913 |
|
|
|
|
|
|
|
| Residential mortgage loans |
3,401,224 |
|
|
3,469,425 |
|
|
|
|
|
|
|
| Home equity loans |
1,222,455 |
|
|
1,291,772 |
|
|
|
|
|
|
|
| Consumer loans |
2,097,917 |
|
|
2,144,931 |
|
|
|
|
|
|
|
| Commercial real estate loans |
2,918,968 |
|
|
2,775,045 |
|
|
|
|
|
|
|
| Commercial loans |
1,640,234 |
|
|
1,111,330 |
|
|
|
|
|
|
|
| Total loans receivable, net |
11,289,566 |
|
|
10,802,416 |
|
|
|
|
|
|
|
| Deposits |
11,979,902 |
|
|
11,464,548 |
|
|
|
|
|
|
|
| Borrowed funds |
398,895 |
|
|
681,166 |
|
|
|
|
|
|
|
| Subordinated debt |
114,189 |
|
|
113,840 |
|
|
|
|
|
|
|
| Shareholders’ equity |
1,551,317 |
|
|
1,491,486 |
|
|
|
|
|
|
|
|
|
|
|
|
|
|
|
|
|
|
|
|
|
|
|
|
|
|
|
|
|
| |
For the years ended December 31, |
| |
2023 |
|
2022 |
|
2021 |
|
|
|
|
| |
(In thousands except per share data) |
| Selected Consolidated Operating Data: |
|
|
|
|
|
|
|
|
|
| Total interest income |
$ |
587,922 |
|
|
448,798 |
|
|
418,508 |
|
|
|
|
|
| Total interest expense |
152,239 |
|
|
28,117 |
|
|
27,246 |
|
|
|
|
|
| Net interest income |
435,683 |
|
|
420,681 |
|
|
391,262 |
|
|
|
|
|
| Provision for credit losses |
22,874 |
|
|
28,315 |
|
|
(15,788) |
|
|
|
|
|
| Net interest income after provision for credit losses |
412,809 |
|
|
392,366 |
|
|
407,050 |
|
|
|
|
|
| Noninterest income |
113,823 |
|
|
110,849 |
|
|
142,889 |
|
|
|
|
|
| Noninterest expense |
351,554 |
|
|
329,523 |
|
|
348,815 |
|
|
|
|
|
| Income before income taxes |
175,078 |
|
|
173,692 |
|
|
201,124 |
|
|
|
|
|
| Income tax expense |
40,121 |
|
|
40,026 |
|
|
46,801 |
|
|
|
|
|
| Net income |
$ |
134,957 |
|
|
133,666 |
|
|
154,323 |
|
|
|
|
|
| Earnings per share: |
|
|
|
|
|
|
|
|
|
| Basic |
$ |
1.06 |
|
|
1.05 |
|
|
1.22 |
|
|
|
|
|
| Diluted |
$ |
1.06 |
|
|
1.05 |
|
|
1.21 |
|
|
|
|
|
|
|
|
|
|
|
|
|
|
|
|
|
|
|
|
|
|
|
|
|
|
|
| |
At or for the year ended December 31, |
| |
2023 |
|
2022 |
|
2021 |
|
|
|
|
| Selected Financial Ratios and Other Data: |
|
|
|
|
|
|
|
|
|
| Return on average assets (1), (6), (7), (8), (9) |
0.95 |
% |
|
0.94 |
% |
|
1.08 |
% |
|
|
|
|
| Return on average equity (2), (6), (7), (8), (9) |
8.94 |
% |
|
8.80 |
% |
|
9.91 |
% |
|
|
|
|
| Average capital to average assets |
10.58 |
% |
|
10.71 |
% |
|
10.89 |
% |
|
|
|
|
| Capital to total assets |
10.76 |
% |
|
10.57 |
% |
|
10.92 |
% |
|
|
|
|
| Tangible common equity to tangible assets (10) |
8.30 |
% |
|
8.03 |
% |
|
8.43 |
% |
|
|
|
|
| Net interest rate spread (3) |
2.86 |
% |
|
3.11 |
% |
|
2.89 |
% |
|
|
|
|
| Net interest margin (4) |
3.28 |
% |
|
3.20 |
% |
|
2.98 |
% |
|
|
|
|
| Noninterest expense to average assets (5), (6), (8), (9) |
2.46 |
% |
|
2.32 |
% |
|
2.44 |
% |
|
|
|
|
| Efficiency ratio (5), (6), (7), (8), (9) |
63.98 |
% |
|
62.00 |
% |
|
65.30 |
% |
|
|
|
|
| Noninterest income to average assets (7) |
0.80 |
% |
|
0.78 |
% |
|
1.00 |
% |
|
|
|
|
| Net interest income to noninterest expense (5), (6), (8), (9) |
1.24x |
|
1.28x |
|
1.12x |
|
|
|
|
| Dividend payout ratio |
75.47 |
% |
|
76.19 |
% |
|
65.29 |
% |
|
|
|
|
| Nonperforming loans to net loans receivable |
0.86 |
% |
|
0.76 |
% |
|
1.60 |
% |
|
|
|
|
| Nonperforming assets to total assets |
0.67 |
% |
|
0.58 |
% |
|
1.10 |
% |
|
|
|
|
| Allowance for credit losses to nonperforming loans |
129.01 |
% |
|
143.98 |
% |
|
64.38 |
% |
|
|
|
|
| Allowance for credit losses to loans receivable |
1.10 |
% |
|
1.08 |
% |
|
1.02 |
% |
|
|
|
|
| Average interest-earning assets to average interest-bearing liabilities |
1.37x |
|
1.41x |
|
1.39x |
|
|
|
|
| Number of banking offices |
142 |
|
|
150 |
|
|
170 |
|
|
|
|
|
|
|
|
|
|
|
|
|
|
|
(1)Represents net income divided by average assets.
(2)Represents net income divided by average equity.
(3)Represents average yield on interest-earning assets less average cost of interest-bearing liabilities (shown on a fully taxable equivalent (“FTE”) basis).
(4)Represents net interest income as a percentage of average interest-earning assets (shown on a FTE basis).
(5)Provision for unfunded commitments was reclassified from other expenses for periods prior to December 31, 2023. Respective ratios were updated to reflect the reclassification.
(6) 2021 includes $3.5 million in merger, asset disposition and restructuring expense.
(7) 2021 includes $25.3 million gain on sale of insurance business.
(8) 2022 includes $5.6 million in merger, asset disposition and restructuring expense.
(9) 2023 includes $6.7 million in merger, asset disposition and restructuring expense.
(10) Excludes goodwill and other intangible assets (non-GAAP).
The following non-GAAP financial measures used by the Company provide information useful to investors in understanding our operating performance and trends, and facilitate comparisons with the performance of our peers. The following table summarizes the non-GAAP financial measures derived from amounts reported in the Company’s Consolidated Statements of Financial Condition.
|
|
|
|
|
|
|
|
|
|
|
|
|
|
|
|
|
|
|
December 31,
2023 |
|
December 31,
2022 |
|
December 31,
2021 |
| Tangible common equity to assets |
|
|
|
|
|
| Total shareholders’ equity |
$ |
1,551,317 |
|
|
1,491,486 |
|
|
1,583,571 |
|
| Less: goodwill and intangible assets |
(386,287) |
|
|
(389,557) |
|
|
(393,833) |
|
| Tangible common equity |
$ |
1,165,030 |
|
|
1,101,929 |
|
|
1,189,738 |
|
|
|
|
|
|
|
| Total assets |
$ |
14,419,105 |
|
|
14,113,324 |
|
|
14,501,508 |
|
| Less: goodwill and intangible assets |
(386,287) |
|
|
(389,557) |
|
|
(393,833) |
|
| Tangible assets |
$ |
14,032,818 |
|
|
13,723,767 |
|
|
14,107,675 |
|
|
|
|
|
|
|
| Tangible common equity to tangible assets |
8.30 |
% |
|
8.03 |
% |
|
8.43 |
% |
Critical Accounting Estimates
Our significant accounting policies are described in Note 1 of the notes to the Consolidated Financial Statements. Certain accounting policies are important to the understanding of our financial condition, since they require management to make difficult, complex or subjective judgments, some of which may relate to matters that are inherently uncertain. Estimates associated with these policies are susceptible to material changes as a result of changes in facts and circumstances, including, but without limitation, changes in interest rates, performance of the economy, financial condition of borrowers and laws and regulations. The following is the accounting estimate we believe is critical.
Allowance for Credit Losses. We recognize that losses will be experienced on assets and that the risk of loss varies with the type of asset, the creditworthiness of a borrower, general economic conditions and the quality of the collateral, if any. We maintain an allowance for expected lifetime losses in the loan portfolio. The allowance for credit losses represents management’s estimate of lifetime expected losses based on all available information. The allowance for credit losses is based on management’s evaluation of relevant available information, from internal and external sources, relating to past events, current conditions and reasonable and supportable forecasts. The loan portfolio is reviewed regularly by management in its determination of the allowance for credit losses. The methodology for assessing the appropriateness of the allowance includes a review of historical losses, peer group comparisons, industry data and economic conditions. As an integral part of their examination process, regulatory agencies periodically review our allowance for credit losses and may require us to make additional provisions for estimated losses based upon judgments different from those of management. In establishing the allowance for credit losses, a combination of statistical models are applied to various pools of outstanding loans. We use a 24 month forecasting period and revert to historical average loss rates thereafter. Credit relationships that have been classified as substandard or doubtful and are greater than or equal to $1.0 million are reviewed by the Credit Administration department to determine if they no longer continue to demonstrate similar risk characteristics to their loan pool. If a loan no longer demonstrates similar risk characteristics to their loan pool they are removed from the pool and an individual assessment is performed. The allowance calculation is also supplemented with qualitative reserves that take into consideration the current portfolio and specific risk characteristics, such as changes in underwriting standards, portfolio mix, delinquency level, or term, as well as changes in environmental conditions, among other factors, that have occurred but are not yet reflected in the quantitative model component.
Our allowance for credit losses is sensitive to a number of inputs, most notably the macroeconomic forecast assumptions as well as the reasonable and supportable forecasting periods that are incorporated in our estimate of credit losses. Therefore, as the macroeconomic environment and related forecasts change or decisions are made to shorten or lengthen the forecasting period, the allowance for credit losses may change materially. The following sensitivity analyses do not represent management’s expectations of the deterioration of our portfolios or the economic environment, but are provided as hypothetical scenarios to assess the sensitivity of the allowance for credit losses to changes in key inputs. We utilized a multi-scenario based macroeconomic forecast in determining the December 31, 2023 allowance for credit losses, which included a weighting of three scenarios: an upside scenario, a baseline scenario and a downside scenario. We placed the most weight on the baseline scenario, with the remaining weight split evenly between the upside and downside scenarios. If we placed 100% weighting on the baseline scenario, the quantitative allowance for credit losses would have been approximately $15.3 million lower. These forecasts revert to our long-term historical average loss rate after a 24 month forecasting period. If we shortened the forecasting period to twelve months and reverted to our long-term historical loss rate thereafter, the quantitative allowance for credit losses would have been approximately $5.2 million lower.
Although management believes that it uses the best information available to establish the allowance for credit losses, future adjustments to the allowance for credit losses may be necessary and results of operations could be adversely affected if circumstances differ substantially from the assumptions used in making the determinations. Because future events affecting borrowers and collateral cannot be predicted with certainty, there can be no assurance that the existing allowance for credit losses is adequate or that increases will not be necessary should the quality of assets deteriorate as a result of the factors discussed previously. Any material increase in the allowance for credit losses may adversely affect our financial condition and results of operations. The allowance is based on information known at the time of the review. Changes in factors underlying the assessment could have a material impact on the amount of the allowance that is necessary and the amount of provision to be charged against earnings. Such changes could impact future results. For further information related to our allowance for credit losses, see Note 1(f) of the notes to the Consolidated Financial Statements.
Recently Issued Accounting Standards
The following Accounting Standard Updates (“ASU”) issued by the Financial Accounting Standards Board (“FASB”) have not yet been adopted.
In October 2023, the FASB issued ASU No. 2023-06, “Disclosure Improvements.” This ASU includes amendments on several subtopics in the FASB Accounting Standards Codification (“Codification”) to incorporate certain disclosures and presentation requirements currently residing in SEC Regulations S-X and S-K. The adoption of this ASU may lead to certain disclosure being relocated into the financial statements. The effective date for each amendment will be the date on which the SEC’s removal of that related disclosure from Regulation S-X or Regulation S-K becomes effective, with early adoption prohibited. These amendments are to be applied prospectively. If the SEC has not removed the applicable requirements from Regulation S-X or Regulation S-K by June 30, 2027, the pending content of the related amendment will be removed from the Codification and will not become effective for any entity. We do not believe this guidance will have a material impact on the Company’s financial statements.
In December 2023, the FASB issued ASU No. 2023-09, “Improvements to Income Tax Disclosures.” This ASU requires additional disaggregated disclosures on entity’s effective tax rate reconciliation and additional details on income taxes paid. This guidance is effective for annual periods beginning after December 15, 2025, with early adoption permitted. This ASU is applied prospectively with the option to apply the ASU retrospectively. We do not believe this guidance will have a material impact on the Company’s financial statements.
Assets. Total assets at December 31, 2023 were $14.419 billion, an increase of $305.8 million, or 2.2%, from $14.113 billion at December 31, 2022. This increase in assets was driven by an increase in total loans receivable. A discussion of significant changes follows.
Cash and cash equivalents. Cash and cash equivalents decreased by $17.1 million, or 12.3%, to $122.3 million at December 31, 2023, from $139.4 million at December 31, 2022. This decrease was primarily to fund organic loan growth, described in further detail below.
Marketable securities. Marketable securities decreased by $241.2 million, or 11.5%, to $1.858 billion at December 31, 2023, from $2.099 billion at December 31, 2022. Held-to-maturity securities decreased $66.4 million, and available-for-sale marketable securities decreased $174.7 million. These decreases were driven by the maturity and regular monthly cash flows, in addition to the sale of approximately $110.0 million of available-for-sale securities during the year in order to reallocate these funds into higher interest-earning products.
The following table sets forth certain information regarding the amortized cost and fair value of our available-for-sale marketable securities portfolio and mortgage-backed securities portfolio at the dates indicated.
|
|
|
|
|
|
|
|
|
|
|
|
|
|
|
|
|
|
|
|
|
|
|
|
|
|
|
|
| |
At December 31, |
| |
2023 |
|
2022 |
|
|
| |
Amortized
cost |
|
Fair
value |
|
Amortized
cost |
|
Fair
value |
|
|
|
|
| |
(In thousands) |
| Residential mortgage-backed securities available-for-sale: |
|
|
|
|
|
|
|
|
|
|
|
| Fixed rate pass-through |
$ |
209,069 |
|
|
183,874 |
|
|
227,122 |
|
|
195,986 |
|
|
|
|
|
| Variable rate pass-through |
7,140 |
|
|
7,080 |
|
|
8,837 |
|
|
8,663 |
|
|
|
|
|
|
|
|
|
|
|
|
|
|
|
|
|
| Fixed rate agency CMOs |
789,842 |
|
|
646,787 |
|
|
906,962 |
|
|
761,678 |
|
|
|
|
|
| Variable rate agency CMOs |
23,965 |
|
|
23,550 |
|
|
27,853 |
|
|
27,244 |
|
|
|
|
|
| Total residential mortgage-backed securities available-for-sale |
1,030,016 |
|
|
861,291 |
|
|
1,170,774 |
|
|
993,571 |
|
|
|
|
|
| Marketable securities available-for-sale: |
|
|
|
|
|
|
|
|
|
|
|
| U.S. Government, agency and GSEs |
115,755 |
|
|
98,911 |
|
|
119,959 |
|
|
99,793 |
|
|
|
|
|
| Municipal securities |
85,766 |
|
|
75,469 |
|
|
127,455 |
|
|
111,766 |
|
|
|
|
|
| Corporate debt issues |
8,466 |
|
|
7,688 |
|
|
13,540 |
|
|
12,978 |
|
|
|
|
|
|
|
|
|
|
|
|
|
|
|
|
|
| Total marketable securities available-for-sale |
$ |
1,240,003 |
|
|
1,043,359 |
|
|
1,431,728 |
|
|
1,218,108 |
|
|
|
|
|
The following table sets forth certain information regarding the amortized cost and fair value of our held-to-maturity marketable securities portfolio and mortgage-backed securities portfolio at the dates indicated.
|
|
|
|
|
|
|
|
|
|
|
|
|
|
|
|
|
|
|
|
|
|
|
|
|
|
|
|
| |
At December 31, |
| |
2023 |
|
2022 |
|
|
| |
Amortized
cost |
|
Fair
value |
|
Amortized
cost |
|
Fair
value |
|
|
|
|
| |
(In thousands) |
| Residential mortgage-backed securities held-to-maturity: |
|
|
|
|
|
|
|
|
|
|
|
| Fixed rate pass-through |
$ |
147,874 |
|
|
127,040 |
|
|
163,196 |
|
|
138,512 |
|
|
|
|
|
| Variable rate pass-through |
449 |
|
|
450 |
|
|
542 |
|
|
530 |
|
|
|
|
|
| Fixed rate agency CMOs |
541,529 |
|
|
463,835 |
|
|
592,527 |
|
|
509,202 |
|
|
|
|
|
| Variable rate agency CMOs |
529 |
|
|
523 |
|
|
529 |
|
|
518 |
|
|
|
|
|
| Total residential mortgage-backed securities held-to-maturity |
690,381 |
|
|
591,848 |
|
|
756,794 |
|
|
648,762 |
|
|
|
|
|
| Marketable securities held-to-maturity: |
|
|
|
|
|
|
|
|
|
|
|
| U.S. Government and agencies |
124,458 |
|
|
107,658 |
|
|
124,455 |
|
|
102,622 |
|
|
|
|
|
| Total marketable securities held-to-maturity |
$ |
814,839 |
|
|
699,506 |
|
|
881,249 |
|
|
751,384 |
|
|
|
|
|
The following table sets forth information regarding the issuers and the carrying value of our mortgage-backed securities at the dates indicated.
|
|
|
|
|
|
|
|
|
|
|
|
|
|
| |
At December 31, |
| |
2023 |
|
2022 |
|
|
| |
(In thousands) |
| Residential mortgage-backed securities: |
|
|
|
|
|
| FNMA |
$ |
568,160 |
|
|
651,404 |
|
|
|
| GNMA |
407,441 |
|
|
438,193 |
|
|
|
| FHLMC |
576,066 |
|
|
660,762 |
|
|
|
|
|
|
|
|
|
| Other (including non-agency) |
5 |
|
|
6 |
|
|
|
| Total residential mortgage-backed securities |
$ |
1,551,672 |
|
|
1,750,365 |
|
|
|
Marketable Securities Portfolio Maturities and Yields. The following table sets forth the scheduled maturities, carrying values, amortized cost, market values and weighted average yields for our marketable securities and mortgage-backed securities portfolios at December 31, 2023. The annualized weighted average yields are calculated by taking the interest of the marketable securities divided by the amortized cost. Adjustable-rate mortgage-backed securities are included in the period in which interest rates are next scheduled to adjust.
|
|
|
|
|
|
|
|
|
|
|
|
|
|
|
|
|
|
|
|
|
|
|
|
|
|
|
|
|
|
|
|
|
|
|
|
|
|
|
|
|
|
|
|
|
|
|
|
|
|
|
|
|
|
|
|
|
|
|
|
|
|
|
|
|
|
| |
One year or less |
|
More than one year
to five years |
|
More than five years
to ten years |
|
More than ten years |
|
Total |
| |
Amortized
cost |
|
Annualized
weighted
average
yield (1) |
|
Amortized
cost |
|
Annualized
weighted
average
yield (1) |
|
Amortized
cost |
|
Annualized
weighted
average
yield (1) |
|
Amortized
cost |
|
Annualized
weighted
average
yield (1) |
|
Amortized
cost |
|
Fair
value |
|
Annualized
weighted
average
yield (1) |
| |
(Dollars in thousands) |
Marketable securities
available-for-sale: |
|
|
|
|
|
|
|
|
|
|
|
|
|
|
|
|
|
|
|
|
|
| Government sponsored entities |
$ |
— |
|
|
— |
% |
|
$ |
45,986 |
|
|
1.07 |
% |
|
$ |
386 |
|
|
2.11 |
% |
|
$ |
— |
|
|
— |
% |
|
$ |
46,372 |
|
|
40,597 |
|
|
1.08 |
% |
U.S. Government and
agency obligations |
— |
|
|
— |
% |
|
20,000 |
|
|
1.75 |
% |
|
— |
|
|
— |
% |
|
49,383 |
|
|
1.27 |
% |
|
69,383 |
|
|
58,314 |
|
|
1.41 |
% |
| Municipal securities |
— |
|
|
— |
% |
|
4,278 |
|
|
1.73 |
% |
|
20,725 |
|
|
2.58 |
% |
|
60,763 |
|
|
2.20 |
% |
|
85,766 |
|
|
75,469 |
|
|
2.26 |
% |
| Corporate debt issues |
— |
|
|
— |
% |
|
— |
|
|
— |
% |
|
8,466 |
|
|
4.49 |
% |
|
— |
|
|
— |
% |
|
8,466 |
|
|
7,688 |
|
|
4.49 |
% |
|
|
|
|
|
|
|
|
|
|
|
|
|
|
|
|
|
|
|
|
|
|
| Total marketable securities available-for-sale |
— |
|
|
— |
% |
|
70,264 |
|
|
1.30 |
% |
|
29,577 |
|
|
3.12 |
% |
|
110,146 |
|
|
1.78 |
% |
|
209,987 |
|
|
182,068 |
|
|
1.81 |
% |
| Residential mortgage-backed securities available-for-sale: |
|
|
|
|
|
|
|
|
|
|
|
|
|
|
|
|
|
|
|
|
|
| Pass-through certificates |
7,283 |
|
|
4.05 |
% |
|
15,781 |
|
|
1.07 |
% |
|
9,791 |
|
|
2.35 |
% |
|
183,354 |
|
|
2.12 |
% |
|
216,209 |
|
|
190,954 |
|
|
2.11 |
% |
| CMOs |
23,965 |
|
|
5.67 |
% |
|
1,258 |
|
|
1.69 |
% |
|
5,878 |
|
|
1.04 |
% |
|
782,706 |
|
|
1.49 |
% |
|
813,807 |
|
|
670,337 |
|
|
1.61 |
% |
Total residential
mortgage-backed securities available-for-sale |
31,248 |
|
|
5.29 |
% |
|
17,039 |
|
|
1.12 |
% |
|
15,669 |
|
|
1.86 |
% |
|
966,060 |
|
|
1.61 |
% |
|
1,030,016 |
|
|
861,291 |
|
|
1.72 |
% |
Marketable securities
held-to-maturity: |
|
|
|
|
|
|
|
|
|
|
|
|
|
|
|
|
|
|
|
|
|
U.S. Government and
agency obligations |
— |
|
|
|
|
69,471 |
|
|
0.98% |
|
54,987 |
|
|
1.03 |
% |
|
— |
|
|
|
|
124,458 |
|
|
107,658 |
|
|
1.00 |
% |
|
|
|
|
|
|
|
|
|
|
|
|
|
|
|
|
|
|
|
|
|
|
|
|
|
|
|
|
|
|
|
|
|
|
|
|
|
|
|
|
|
|
|
|
|
|
|
|
|
|
|
|
|
|
|
|
|
|
|
|
|
|
|
|
|
|
| Total investment securities held-to-maturity |
— |
|
|
— |
% |
|
69,471 |
|
|
0.98% |
|
54,987 |
|
|
1.03 |
% |
|
— |
|
|
— |
% |
|
124,458 |
|
|
107,658 |
|
|
1.00 |
% |
| Residential mortgage-backed securities held-to-maturity: |
|
|
|
|
|
|
|
|
|
|
|
|
|
|
|
|
|
|
|
|
|
| Pass-through certificates |
449 |
|
|
3.39 |
% |
|
197 |
|
|
3.34 |
% |
|
20,217 |
|
|
1.31 |
% |
|
127,460 |
|
|
1.30 |
% |
|
148,323 |
|
|
127,490 |
|
|
1.31 |
% |
| CMOs |
529 |
|
|
6.10 |
% |
|
20,064 |
|
|
0.92 |
% |
|
— |
|
|
— |
% |
|
521,465 |
|
|
2.26 |
% |
|
542,058 |
|
|
464,358 |
|
|
2.22 |
% |
Total residential
mortgage-backed securities held-to-maturity |
978 |
|
|
4.86 |
% |
|
20,261 |
|
|
0.94 |
% |
|
20,217 |
|
|
1.31 |
% |
|
648,925 |
|
|
2.07 |
% |
|
690,381 |
|
|
591,848 |
|
|
2.02 |
% |
| Total marketable securities and mortgage-backed securities |
$ |
32,226 |
|
|
5.28 |
% |
|
$ |
177,035 |
|
|
1.12 |
% |
|
$ |
120,450 |
|
|
1.69 |
% |
|
$ |
1,725,131 |
|
|
1.80 |
% |
|
$ |
2,054,842 |
|
|
1,742,865 |
|
|
1.79 |
% |
Further information and analysis of our investment portfolio, including tables with information related to gross unrealized gains and losses on available-for sale and held-to-maturity marketable securities and tables showing the fair value and gross unrealized losses on marketable securities aggregated by investment category and length of time that the individual securities have been in a continuous unrealized loss position are located in Note 4 of the Notes to the Consolidated Financial Statements.
Loans Receivable. Gross loans receivable increased by $494.4 million, or 4.5%, to $11.415 billion at December 31, 2023, from $10.920 billion at December 31, 2022. This increase was due to organic loan growth. Our business banking portfolio increased by $677.2 million, or 17.1%, to $4.633 billion at December 31, 2023 from $3.956 billion at December 31, 2022, primarily as a result of the new commercial lending verticals that we initiated during the current year. Specifically, our commercial and industrial (C&I) loan portfolio increased by $526.8 million, or 46.5%. The increase in our total business banking was partially offset by a decrease in our personal banking loan portfolio by $182.9 million, or 2.6%, to $6.782 billion at December 31, 2023 from $6.965 billion at December 31, 2022. Cash flows from both our marketable securities portfolio and personal banking portfolio were redirected to partially fund business banking growth.
Set forth below are selected data related to the composition of our loan portfolio by type of loan as of the dates indicated.
|
|
|
|
|
|
|
|
|
|
|
|
|
|
|
|
|
|
|
|
|
|
|
|
|
|
|
|
|
| |
At December 31, |
| |
2023 |
|
2022 |
|
|
|
| |
Amount |
|
Percent |
|
Amount |
|
Percent |
|
|
|
|
|
| |
(Dollars in thousands) |
| Personal Banking: |
|
|
|
|
|
|
|
|
|
|
|
|
| Residential mortgage loans held-for-sale |
$ |
8,768 |
|
|
0.1 |
% |
|
$ |
9,913 |
|
|
0.1 |
% |
|
|
|
|
|
| Residential mortgage loans |
3,419,417 |
|
|
30.0 |
% |
|
3,488,686 |
|
|
31.9 |
% |
|
|
|
|
|
| Home equity loans |
1,227,858 |
|
|
10.8 |
% |
|
1,297,674 |
|
|
11.9 |
% |
|
|
|
|
|
| Vehicle loans |
2,008,601 |
|
|
17.6 |
% |
|
2,056,783 |
|
|
18.8 |
% |
|
|
|
|
|
| Consumer loans (1) |
117,426 |
|
|
1.0 |
% |
|
111,872 |
|
|
1.0 |
% |
|
|
|
|
|
| Total Personal Banking |
6,782,070 |
|
|
59.5 |
% |
|
6,964,928 |
|
|
63.7 |
% |
|
|
|
|
|
|
|
|
|
|
|
|
|
|
|
|
|
|
| Commercial Banking: |
|
|
|
|
|
|
|
|
|
|
|
|
| Commercial real estate |
2,628,457 |
|
|
23.0 |
% |
|
2,448,028 |
|
|
22.5 |
% |
|
|
|
|
|
| Commercial real estate - owner occupied |
345,553 |
|
|
3.0 |
% |
|
375,527 |
|
|
3.4 |
% |
|
|
|
|
|
| Commercial loans |
1,658,729 |
|
|
14.5 |
% |
|
1,131,969 |
|
|
10.4 |
% |
|
|
|
|
|
| Total Commercial Banking |
4,632,739 |
|
|
40.5 |
% |
|
3,955,524 |
|
|
36.3 |
% |
|
|
|
|
|
| Total loans receivable, gross |
11,414,809 |
|
|
100.0 |
% |
|
10,920,452 |
|
|
100.0 |
% |
|
|
|
|
|
|
|
|
|
|
|
|
|
|
|
|
|
|
|
|
|
|
|
|
|
|
|
|
|
|
|
| Total allowance for credit losses |
(125,243) |
|
|
|
|
(118,036) |
|
|
|
|
|
|
|
|
| Total loans receivable, net |
$ |
11,289,566 |
|
|
|
|
$ |
10,802,416 |
|
|
|
|
|
|
|
|
(1) Consists primarily of secured and unsecured personal loans.
The following table sets forth the maturity of our loan portfolio at December 31, 2023. Demand loans and loans having no stated schedule of repayments and no stated maturity are reported as due in one year or less. Adjustable and floating-rate loans are included in the period in which the contractual repayment is due or they contractually mature, if interest only, and fixed-rate loans are included in the period in which the contractual repayment is due.
|
|
|
|
|
|
|
|
|
|
|
|
|
|
|
|
|
|
|
|
|
|
|
|
|
|
|
|
|
|
|
|
|
| At December 31, 2023 (In thousands) |
|
Due in one year or less |
|
Due after
one year
through
five years |
|
Due after
five years
through
fifteen years |
|
Due after fifteen years |
|
Total |
| Personal Banking: |
|
|
|
|
|
|
|
|
|
|
| Residential mortgage loans |
|
$ |
149,194 |
|
|
566,295 |
|
|
1,265,377 |
|
|
1,439,206 |
|
|
$ |
3,420,072 |
|
| Home equity loans |
|
100,004 |
|
|
346,759 |
|
|
566,746 |
|
|
209,653 |
|
|
1,223,162 |
|
| Consumer loans |
|
532,517 |
|
|
1,397,682 |
|
|
135,365 |
|
|
— |
|
|
2,065,564 |
|
| Total Personal Banking |
|
781,715 |
|
|
2,310,736 |
|
|
1,967,488 |
|
|
1,648,859 |
|
|
6,708,798 |
|
|
|
|
|
|
|
|
|
|
|
|
| Commercial Banking: |
|
|
|
|
|
|
|
|
|
|
| Commercial real estate loans |
|
533,988 |
|
|
1,427,774 |
|
|
935,905 |
|
|
79,273 |
|
|
2,976,940 |
|
| Commercial loans |
|
422,217 |
|
|
1,130,256 |
|
|
107,854 |
|
|
404 |
|
|
1,660,731 |
|
| Total Commercial Banking |
|
956,205 |
|
|
2,558,030 |
|
|
1,043,759 |
|
|
79,677 |
|
|
4,637,671 |
|
|
|
|
|
|
|
|
|
|
|
|
| Total Loans |
|
$ |
1,737,920 |
|
|
4,868,766 |
|
|
3,011,247 |
|
|
1,728,536 |
|
|
$ |
11,346,469 |
|
|
|
|
|
|
|
|
|
|
|
|
| Net unearned income and unamortized premiums and discounts |
|
|
|
|
|
|
|
|
|
$ |
68,340 |
|
| Total loans receivable |
|
|
|
|
|
|
|
|
|
$ |
11,414,809 |
|
The following table sets forth at December 31, 2023, the dollar amount of all fixed-rate loans due one year or more after December 31, 2023.
|
|
|
|
|
|
|
|
|
|
|
|
|
|
|
|
|
|
|
|
|
|
|
|
|
|
|
| At December 31, 2023 (In thousands) |
|
Due after
one year
through
five years |
|
Due after
five years
through
fifteen years |
|
Due after fifteen years |
|
Total |
| Personal Banking: |
|
|
|
|
|
|
|
|
| Residential mortgage loans |
|
$ |
555,026 |
|
|
1,235,871 |
|
|
1,382,471 |
|
|
3,173,368 |
|
| Home equity loans |
|
303,400 |
|
|
398,911 |
|
|
28,078 |
|
|
730,389 |
|
| Consumer loans |
|
1,384,481 |
|
|
135,731 |
|
|
— |
|
|
1,520,212 |
|
| Total Personal Banking |
|
2,242,907 |
|
|
1,770,513 |
|
|
1,410,549 |
|
|
5,423,969 |
|
|
|
|
|
|
|
|
|
|
| Commercial Banking: |
|
|
|
|
|
|
|
|
| Commercial real estate loans |
|
595,126 |
|
|
33,107 |
|
|
5 |
|
|
628,238 |
|
| Commercial loans |
|
268,778 |
|
|
32,080 |
|
|
— |
|
|
300,858 |
|
| Total Commercial Banking |
|
863,904 |
|
|
65,187 |
|
|
5 |
|
|
929,096 |
|
|
|
|
|
|
|
|
|
|
| Total Loans |
|
$ |
3,106,811 |
|
|
1,835,700 |
|
|
1,410,554 |
|
|
6,353,065 |
|
The following table sets forth at December 31, 2023, the dollar amount of all adjustable-rate loans due one year or more after December 31, 2023. Adjustable and floating-rate loans are included in the table based on the contractual due date of the loan.
|
|
|
|
|
|
|
|
|
|
|
|
|
|
|
|
|
|
|
|
|
|
|
|
|
|
|
| At December 31, 2023 (In thousands) |
|
Due after
one year
through
five years |
|
Due after
five years
through
fifteen years |
|
Due after fifteen years |
|
Total |
| Personal Banking: |
|
|
|
|
|
|
|
|
| Residential mortgage loans |
|
$ |
11,270 |
|
|
29,507 |
|
|
56,735 |
|
|
97,512 |
|
| Home equity loans |
|
43,358 |
|
|
167,836 |
|
|
181,575 |
|
|
392,769 |
|
| Consumer loans |
|
13,200 |
|
|
— |
|
|
— |
|
|
13,200 |
|
| Total Personal Banking |
|
67,828 |
|
|
197,343 |
|
|
238,310 |
|
|
503,481 |
|
|
|
|
|
|
|
|
|
|
| Commercial Banking: |
|
|
|
|
|
|
|
|
| Commercial real estate loans |
|
832,647 |
|
|
902,798 |
|
|
79,268 |
|
|
1,814,713 |
|
| Commercial loans |
|
861,479 |
|
|
75,774 |
|
|
404 |
|
|
937,657 |
|
| Total Commercial Banking |
|
1,694,126 |
|
|
978,572 |
|
|
79,672 |
|
|
2,752,370 |
|
|
|
|
|
|
|
|
|
|
| Total Loans |
|
$ |
1,761,954 |
|
|
1,175,915 |
|
|
317,982 |
|
|
3,255,851 |
|
The following table provides the various loan sectors in our commercial real estate portfolio at December 31, 2023:
|
|
|
|
|
|
|
|
|
|
|
|
|
December 31, 2023 |
| Property type |
|
|
Percent of portfolio |
| 5 or More Unit Dwelling |
|
|
14.5 |
% |
| Nursing Home |
|
|
12.8 |
|
| Retail Building |
|
|
12.0 |
|
| Commercial Office Building - non-owner occupied |
|
|
9.3 |
|
| Residential acquisition & development - 1-4 family, townhouses and apartments |
|
|
4.8 |
|
| Manufacturing & Industrial Building |
|
|
4.8 |
|
| Multi-use building - commercial, retail and residential |
|
|
4.4 |
|
| Warehouse/Storage Building |
|
|
3.9 |
|
| Commercial office building - owner occupied |
|
|
3.3 |
|
| Multi-use building - office and warehouse |
|
|
3.3 |
|
| Single Family Dwelling |
|
|
2.7 |
|
| Other Medical Facility |
|
|
2.5 |
|
| Student Housing |
|
|
2.2 |
|
| Hotel/Motel |
|
|
2.1 |
|
| 2-4 Family |
|
|
2.1 |
|
| Agricultural Real Estate |
|
|
2.1 |
|
| All Other Types |
|
|
13.2 |
|
| Total |
|
|
100.0 |
% |
The following table describes our commercial real estate portfolio by state at December 31, 2023:
|
|
|
|
|
|
|
|
|
|
|
|
|
December 31, 2023 |
| State |
|
|
Percent of portfolio |
| New York |
|
|
32.4 |
% |
| Pennsylvania |
|
|
30.9 |
|
| Ohio |
|
|
20.0 |
|
| Indiana |
|
|
7.9 |
|
| All other |
|
|
8.8 |
|
| Total |
|
|
100.0 |
% |
Deposits. Total deposits increased by $515.4 million, or 4.5%, to $11.980 billion at December 31, 2023 from $11.465 billion at December 31, 2022. This increase was driven by a $1.551 billion, or 147.4%, increase in time deposits due to customer preferences for this fixed maturity product. Partially offsetting this increase were decreases in savings and money market deposits totaling $659.1 million, or 13.9%, as customers moved balances to higher yielding product alternatives. In addition, demand deposit accounts decreased by $376.1 million, or 6.6%, as we believe customers used funds during this period of higher inflationary costs.
During the year ended December 31, 2023, we purchased $483.9 million of brokered deposits, which made up 18.6% of our time deposits and 4.0% of our total deposit balance at year end. The balance carried an average all-in cost of 5.42% and an average original term of 11.8 months. These purchases were through a registered broker, as part of an Asset/Liability Committee (“ALCO”) strategy to increase and diversify funding sources.
In addition, at year end we had $356.6 million of deposits through our participation in the Intrafi Network Deposits (formerly ICS) program. These deposits are part of a reciprocal program that allows our depositors to receive expanded FDIC coverage by placing multiple interest-bearing demand accounts at other member banks and Northwest receives an equal amount of deposits from other member banks. The balance carried an average cost of 3.43%.
The following table sets forth the dollar amount of deposits in the various types of accounts we offered at the dates indicated.
|
|
|
|
|
|
|
|
|
|
|
|
|
|
|
|
|
|
|
|
|
|
|
|
|
|
|
|
|
|
|
|
|
|
|
|
|
|
|
|
|
|
| |
At December 31, |
| |
2023 |
|
2022 |
|
|
| |
Balance |
|
Percent (1) |
|
Rate (2) |
|
Balance |
|
Percent (1) |
|
Rate (2) |
|
|
|
|
|
|
| |
(Dollars in thousands) |
| Savings deposits |
$ |
2,105,234 |
|
|
17.6 |
% |
|
0.42 |
% |
|
$ |
2,275,020 |
|
|
19.9 |
% |
|
0.10 |
% |
|
|
|
|
|
|
| Demand deposits |
5,303,569 |
|
|
44.3 |
% |
|
0.22 |
% |
|
5,679,674 |
|
|
49.5 |
% |
|
0.03 |
% |
|
|
|
|
|
|
| Money market deposit accounts |
1,968,218 |
|
|
16.4 |
% |
|
1.26 |
% |
|
2,457,569 |
|
|
21.4 |
% |
|
0.14 |
% |
|
|
|
|
|
|
| Time deposits: |
|
|
|
|
|
|
|
|
|
|
|
|
|
|
|
|
|
| Maturing within 1 year |
2,464,022 |
|
|
20.6 |
% |
|
4.44 |
% |
|
754,564 |
|
|
6.6 |
% |
|
1.04 |
% |
|
|
|
|
|
|
| Maturing 1 to 3 years |
98,229 |
|
|
0.8 |
% |
|
0.86 |
% |
|
233,303 |
|
|
2.0 |
% |
|
0.97 |
% |
|
|
|
|
|
|
| Maturing more than 3 years |
40,630 |
|
|
0.3 |
% |
|
0.24 |
% |
|
64,418 |
|
|
0.6 |
% |
|
0.21 |
% |
|
|
|
|
|
|
| Total certificates |
2,602,881 |
|
|
21.7 |
% |
|
2.31 |
% |
|
1,052,285 |
|
|
9.2 |
% |
|
0.65 |
% |
|
|
|
|
|
|
| Total deposits |
$ |
11,979,902 |
|
|
100.0 |
% |
|
0.88 |
% |
|
$ |
11,464,548 |
|
|
100.0 |
% |
|
0.12 |
% |
|
|
|
|
|
|
(1) Represents percentage of total deposits.
(2) Represents weighted average nominal rate at year end.
The following table sets forth the dollar amount of deposits in each state by branch location as of December 31, 2023.
|
|
|
|
|
|
|
|
|
|
|
|
|
|
|
| State |
|
Balance |
|
Percent |
| |
|
(Dollars in thousands) |
| Pennsylvania |
|
$ |
7,375,130 |
|
|
61.5 |
% |
| New York |
|
2,773,706 |
|
|
23.2 |
% |
| Ohio |
|
761,676 |
|
|
6.4 |
% |
| Indiana |
|
1,069,390 |
|
|
8.9 |
% |
| Total |
|
$ |
11,979,902 |
|
|
100.0 |
% |
The following table indicates the amount of our certificates of deposits of $250,000 or more by time remaining until maturity at December 31, 2023.
|
|
|
|
|
|
|
|
|
| Maturity period |
|
Certificates of deposit |
| |
|
(In thousands) |
| Three months or less |
|
$ |
118,990 |
|
| Over three months through six months |
|
156,901 |
|
| Over six months through twelve months |
|
505,596 |
|
| Over twelve months |
|
6,790 |
|
| Total |
|
$ |
788,277 |
|
At December 31, 2023 and 2022, we had total deposits in excess of $250,000 (the limit for FDIC insurance) of $1.835 billion and $4.031 billion, respectively. At those dates, we had no deposits that were uninsured for any other reason. The following table provides details regarding the Company’s uninsured deposits portfolio:
|
|
|
|
|
|
|
|
|
|
|
|
|
|
|
|
|
|
|
|
|
|
|
As of December 31, 2023 |
|
|
|
Balance |
|
Percent of
total deposits |
|
Number of relationships |
|
|
|
|
| Uninsured deposits per the Call Report (1) |
$ |
2,810,966 |
|
|
23.46 |
% |
|
4,924 |
|
|
|
|
|
| Less intercompany deposit accounts |
976,113 |
|
|
8.15 |
% |
|
12 |
|
|
|
|
|
| Less collateralized deposit accounts |
432,443 |
|
|
3.61 |
% |
|
239 |
|
|
|
|
|
| Uninsured deposits excluding intercompany and collateralized accounts |
$ |
1,402,410 |
|
|
11.71 |
% |
|
4,673 |
|
|
|
|
|
|
|
|
|
|
|
|
|
|
|
|
|
|
|
|
|
|
|
|
(1) Uninsured deposits presented may be different from actual amounts due to titling of accounts.
Our largest uninsured depositor, excluding intercompany and collateralized deposit accounts, had an aggregate uninsured deposit balance of $19.0 million, or 0.16% of total deposits, as of December 31, 2023. Our top ten largest uninsured depositors, excluding intercompany and collateralized deposit accounts, had an aggregate uninsured deposit balance of $105.8 million, or 0.88% of total deposits, as of December 31, 2023. The average uninsured deposit account balance, excluding intercompany and collateralized accounts, was $300,000 as of December 31, 2023.
Borrowings. Borrowings decreased by $281.9 million, or 35.5%, to $513.1 million at December 31, 2023 from $795.0 million at December 31, 2022. This decrease was a result of growth in lower cost deposits which enabled the paydown of FHLB advances during the year.
The following table sets forth information concerning our borrowings at the dates and for the periods indicated.
|
|
|
|
|
|
|
|
|
|
|
|
|
|
| |
During the years ended December 31, |
| |
2023 |
|
2022 |
|
|
| |
(Dollars in thousands) |
| FHLB borrowings: |
|
|
|
|
|
| Average balance outstanding |
$ |
568,350 |
|
|
96,358 |
|
|
|
| Maximum outstanding at end of any month during year |
787,300 |
|
|
551,300 |
|
|
|
| Balance outstanding at end of year |
338,500 |
|
|
551,300 |
|
|
|
| Weighted average interest rate during year |
5.37 |
% |
|
4.27 |
% |
|
|
| Weighted average interest rate at end of year |
5.70 |
% |
|
4.54 |
% |
|
|
|
|
|
|
|
|
| Collateralized borrowings: |
|
|
|
|
|
| Average balance outstanding |
$ |
63,694 |
|
|
115,402 |
|
|
|
| Maximum outstanding at end of any month during year |
101,059 |
|
|
135,736 |
|
|
|
| Balance outstanding at end of year |
35,495 |
|
|
105,766 |
|
|
|
| Weighted average interest rate during year |
1.09 |
% |
|
0.19 |
% |
|
|
| Weighted average interest rate at end of year |
1.72 |
% |
|
0.27 |
% |
|
|
|
|
|
|
|
|
| Collateral received: |
|
|
|
|
|
| Average balance outstanding |
$ |
37,942 |
|
|
14,104 |
|
|
|
| Maximum outstanding at end of any month during year |
62,300 |
|
|
42,824 |
|
|
|
| Balance outstanding at end of year |
24,900 |
|
|
24,100 |
|
|
|
| Weighted average interest rate during year |
5.28 |
% |
|
2.62 |
% |
|
|
| Weighted average interest rate at end of year |
5.26 |
% |
|
4.17 |
% |
|
|
|
|
|
|
|
|
| Subordinated borrowings: |
|
|
|
|
|
| Average balance outstanding |
$ |
114,029 |
|
|
116,644 |
|
|
|
| Maximum outstanding at end of any month during year |
114,189 |
|
|
123,638 |
|
|
|
| Balance outstanding at end of year |
114,189 |
|
|
113,840 |
|
|
|
| Weighted average interest rate during year |
4.00 |
% |
|
4.00 |
% |
|
|
| Weighted average interest rate at end of year |
4.00 |
% |
|
4.00 |
% |
|
|
|
|
|
|
|
|
| Total borrowings: |
|
|
|
|
|
| Average balance outstanding |
$ |
784,015 |
|
|
342,508 |
|
|
|
| Maximum outstanding at end of any month during year |
1,009,462 |
|
|
795,006 |
|
|
|
| Balance outstanding at end of year |
513,084 |
|
|
795,006 |
|
|
|
| Weighted average interest rate during year |
4.82 |
% |
|
2.74 |
% |
|
|
| Weighted average interest rate at end of year |
5.02 |
% |
|
3.88 |
% |
|
|
Shareholders’ equity. Total shareholders’ equity at December 31, 2023 was $1.551 billion, or $12.20 per share, an increase of $59.8 million, or 4.0%, from $1.491 billion, or $11.74 per share, at December 31, 2022. This increase was the result of net income of $135.0 million for the year ended December 31, 2023, as well as a decrease in accumulated other comprehensive loss of $21.7 million due primarily to a decrease in unrealized loss in the available-for-sale investment portfolio. These changes were partially offset by $101.7 million of cash dividend payments during the year ended December 31, 2023.
Comparison of Results of Operations for the Years Ended December 31, 2023 and 2022
General. Net income for the year ended December 31, 2023 was $135.0 million, or $1.06 per diluted share, an increase of $1.3 million, or 1.0%, from $133.7 million, or $1.05 per diluted share, for the year ended December 31, 2022. The increase in net income resulted from an increase in net interest income of $15.0 million, or 3.6%, a decrease in the provision for credit losses of $5.4 million, or 19.2%, and an increase in noninterest income of $3.0 million, or 2.7%, partially offset by an increase in noninterest expense of $22.0 million, or 6.7%. Net income for the year ended December 31, 2023 represents a return on average equity and average assets of 8.94% and 0.95%, respectively, compared to 8.80% and 0.94% for the year ended December 31, 2022.
A discussion of significant changes follows.
Interest Income. Total interest income increased by $139.1 million, or 31.0%, to $587.9 million for the year ended December 31, 2023 from $448.8 million for the year ended December 31, 2022. This increase is the result of increases in both the average yield and the average balance of interest-earning assets, as well as the change in our interest-earning asset mix. The average yield earned on interest-earning assets increased to 4.40% for the year ended December 31, 2023 from 3.39% for the year ended December 31, 2022 due to the rising interest rate environment. Additionally, the average balance of interest-earning assets increased by $113.6 million, or 0.9%, to $13.367 billion for the year ended December 31, 2023 from $13.254 billion for the year ended December 31, 2022. The changes in interest-earning asset mix are described further below.
Interest income on loans receivable increased by $135.8 million, or 33.3%, to $543.7 million for the year ended December 31, 2023 from $407.8 million for the year ended December 31, 2022. This increase in interest income on loans receivable is due to increases in both the average yield and average balance of loans receivable. The average yield earned on loans receivable increased to 4.90% for the year ended December 31, 2023 from 3.95% for the year ended December 31, 2022 due to the increase in market interest rates. The average balance of loans receivable increased $781.2 million, or 7.6%, to $11.100 billion for the year ended December 31, 2023 from $10.319 billion for the year ended December 31, 2022 due to organic loan growth in our commercial, residential mortgage, and consumer loan portfolios.
Interest income on mortgage-backed securities increased by $2.1 million, or 6.8%, to $32.9 million for the year ended December 31, 2023 from $30.8 million for the year ended December 31, 2022. This increase is the result of an increase in the average yield on mortgage-backed securities to 1.80% for the year ended December 31, 2023 from 1.56% for the year ended December 31, 2022 due to the purchase of higher yielding mortgage-backed securities in the prior year. Partially offsetting this increase was a decrease in the average balance of mortgage-backed securities of $146.2 million, or 7.4%, to $1.822 billion for the year ended December 31, 2023 from $1.969 billion for the year ended December 31, 2022 due to the sale of available-for-sale securities during the year coupled with regularly scheduled payments and maturities, the cashflows of which were redirected to higher yielding loans.
Interest income on investment securities decreased by $229,000, or 3.9%, to $5.6 million for the year ended December 31, 2023 from $5.8 million for the year ended December 31, 2022. This decrease is the result of a decrease in the average balance of investment securities of $24.1 million, or 6.3%, to $357.4 million for the year ended December 31, 2023 from $381.5 million for the year ended December 31, 2022. Partially offsetting this decrease in average balance was an increase in the average yield on investment securities to 1.57% for the year ended December 31, 2023 from 1.53% for the year ended December 31, 2022.
Dividends on FHLB stock increased by $2.1 million, or 292.9%, to $2.9 million for the year ended December 31, 2023 from $730,000 for the year ended December 31, 2022. This increase is the result of increases in both the average balance and the average yield of FHLB stock. The average balance of FHLB stock increased $22.4 million, or 131.3%, to $39.5 million for the year ended December 31, 2023 from $17.1 million for the year ended December 31, 2022. Required FHLB stock holdings fluctuate with, among other things, the utilization of our borrowing capacity as well as capital requirements established by the FHLB. Additionally, the average yield increased to 7.27% for the year ended December 31, 2023 from 4.27% for the year ended December 31, 2022 due to increases in market interest rates.
Interest income on interest-earning deposits decreased by $698,000, or 19.4%, to $2.9 million for the year ended December 31, 2023 from $3.6 million for the year ended December 31, 2022. This decrease is attributable to a decrease in the average balance of interest-earning deposits by $519.8 million, or 91.6%, to $47.8 million for the year ended December 31, 2023 from $567.6 million for the year ended December 31, 2022 as the Bank deployed funds into higher yielding loans. Partially offsetting this decrease in average balance was an increase in the average yield on interest-earning deposits to 6.07% for the year ended December 31, 2023 from 0.63% for the year ended December 31, 2022, due to the campaign by the Federal Reserve Board over the last year to raise targeted short-term interest rates to combat inflation.
Interest Expense. Interest expense increased by $124.1 million, or 441.4%, to $152.2 million for the year ended December 31, 2023 from $28.1 million for the year ended December 31, 2022 due to increases in both the average cost and average balance of interest-bearing liabilities, as well as the change in liability mix. The average cost of interest-bearing liabilities increased to 1.56% for the year ended December 31, 2023 from 0.30% for the year ended December 31, 2022 resulting primarily from the rising interest rate environment. In addition, customers shifted balances from savings and market deposit accounts into higher yielding time deposits. The average balance of interest-bearing liabilities increased $355.6 million, or 3.8%, to $9.736 billion for the year ended December 31, 2023 from $9.381 billion for the year ended December 31, 2022 driven by an increase in average borrowed funds of $479.6 million, or 226.2%. Wholesale borrowings were utilized to fund loan growth as well as replace the decrease in the average balance of interest-bearing deposits, which declined by $120.6 million, or 1.4%. Lastly, the average balance of noninterest-bearing demand deposits decreased by $285.6 million, or 9.3%, as we believe customers used funds during a period of higher inflationary costs and searched for higher yield alternatives.
Net Interest Income. Net interest income increased by $15.0 million, or 3.6%, to $435.7 million for the year ended December 31, 2023 from $420.7 million for the year ended December 31, 2022. This increase was attributable to the factors discussed above. Our interest rate spread decreased to 2.83% for the year ended December 31, 2023 from 3.09% for the year ended December 31, 2022, and our net interest margin increased to 3.26% for the year ended December 31, 2023 from 3.17% for the year ended December 31, 2022 due to the change in market rates as well as the change in our interest-earning asset and funding mix.
Provision for Credit Losses. We analyze the allowance for credit losses as described in Note 1(f) of the Notes to the Consolidated Financial Statements. The provision for credit losses decreased by $5.4 million, or 19.2%, to 22.9 million for the year ended December 31, 2023 compared to $28.3 million for the year ended December 31, 2022. The current period provision for credit losses includes $18.7 million for credit losses - loans and $4.2 million for credit losses - unfunded commitments. The prior period provision for credit losses includes $17.9 million for credit losses - loans and $10.5 million for credit losses - unfunded commitments. The $804,000 increase in the provision for credit losses - loans was driven by continued growth within our loan portfolio, and the $6.2 million decrease in our provision for credit losses - unfunded commitments was driven by the timing of the origination of loans with current off-balance sheet exposure as our undrawn commitments increased more rapidly during the prior year.
Net charge-offs to average loans increased to 0.11% for the year ended December 31, 2023 from 0.02% for the year ended December 31, 2022 due to several large recoveries during 2022. Total substandard loans declined by $17.8 million, or 7.5%, to $218.5 million, or 1.91% of loans outstanding at December 31, 2023 from $236.2 million, or 2.16% of loans outstanding at December 31, 2022. This decrease was assisted by the note sale of approximately $8.0 million of nonperforming loans for a net gain of approximately $726,000. In addition, delinquencies remain well controlled.
In determining the amount of the current period provision, we considered current economic conditions, including unemployment levels, bankruptcy filings, and changes in collateral values, and assessed the impact of these factors on the quality of our loan portfolio and historical loss experience. We analyze the allowance for credit losses as described in the section entitled “Allowance for Credit Losses”. The provision that is recorded is sufficient, in our judgment, to bring this reserve to a level that reflects the current expected lifetime losses in our loan portfolio relative to loan mix, a reasonable and supportable economic forecast period and historical loss experience at December 31, 2023.
Noninterest Income. Noninterest income increased by $3.0 million, or 2.7%, to $113.8 million for the year ended December 31, 2023 from $110.8 million for the year ended December 31, 2022. This increase was driven by increases in service charges and fees, gains on sales of SBA loans, income from bank owned life insurance, and net gains on sales of real estate owned. Service charges and fees increased $4.0 million, or 7.3%, to $59.2 million for the year ended December 31, 2023 from $55.2 million for the year ended December 31, 2022, driven by commercial loan fees and an increase in deposit related fees based on customer activity in the current year. We also recognized $1.8 million in gains on the sales of SBA loans during the current year due to this newly launched lending vertical. Income from bank owned life insurance increased $1.5 million, or 20.5%, to $8.6 million for the year ended December 31, 2023 from $7.1 million for the year ended December 31, 2022, resulting from death benefits received in the current year. Lastly, the net gain on sales of real estate owned increased $1.4 million, or 232.7%, to $2.0 million for the year ended December 31, 2023 from $603,000 for the year ended December 31, 2022 as a result of gains on foreclosed property sales in the current year. These increases were partially offset by decreases in other operating income and mortgage banking income. Other operating income decreased $3.5 million, or 23.1%, to $11.8 million for the year ended December 31, 2023 from $15.3 million for the year ended December 31, 2022 due to prior year gains on the sales of branch buildings associated with the branch consolidations announced during the prior year. Mortgage banking income decreased $2.4 million, or 50.0%, to $2.4 million for the year ended December 31, 2023 from $4.9 million for the year ended December 31, 2022 due primarily to the volatile interest rate environment causing unfavorable pricing in the secondary market, as well as a slowdown in mortgage loan activity due to higher market interest rates.
In addition, during the current year we sold the mortgage servicing rights on approximately $1.3 billion of one- to four family mortgage loans for an $8.3 million gain, while also selling $110.0 million of investment securities for an equivalent loss, resulting in no impact to capital. However, we were able to reallocate these funds from investments yielding approximately 2.0% into commercial loans yielding over 7.0%.
Noninterest Expense. Noninterest expense increased by $22.0 million, or 6.7%, to $351.6 million for the year ended December 31, 2023 from $329.5 million for the year ended December 31, 2022. This increase was due to increases in almost all expense categories due to both inflationary costs as well as the continued build out of talent and infrastructure necessary to propel the organization to a higher level of performance. In particular, compensation and employee benefits increased $7.3 million, or 3.9%, to $195.7 million for the year ended December 31, 2023 from $188.4 million for the year ended December 31, 2022, driven primarily by the buildout of the commercial business and related credit, risk management, and internal audit support functions over the past twelve months. Processing expenses increased $6.2 million, or 11.8%, to $58.7 million for the year ended December 31, 2023 from $52.5 million for the year ended December 31, 2022 due to the implementation of additional third-party software platforms. FDIC insurance premiums increased $4.5 million, or 94.0%, to $9.3 million for the year ended December 31, 2023 from $4.8 million for the year ended December 31, 2022 due to an increase in the deposit insurance assessment rate beginning in the first quarter of 2023.
Professional services increased $3.1 million, or 21.2%, to $17.8 million for the year ended December 31, 2023 from $14.7 million for the year ended December 31, 2022 primarily due to the use of third-party consulting and staffing support. Merger, asset disposition and restructuring expense increased $1.1 million, or 20.2%, to $6.7 million for the year ended December 31, 2023 from $5.6 million for the year ended December 31, 2022 due to the severance and fixed asset charges related to the branch optimization and personnel reductions previously announced. Lastly, other expenses increased $1.1 million, or 21.7%, to $6.4 million for the year ended December 31, 2023 from $5.2 million for the year ended December 31, 2022 due to an increase in employee relocation and other expenses. Partially offsetting these increases was a $1.0 million, or 23.5%, decrease in amortization of intangible assets to $3.3 million for the year ended December 31, 2023 compared to $4.3 million for the year ended December 31, 2022 due to previously acquired intangible assets being fully amortized in the prior year.
Income Taxes. The provision for income taxes increased by $95,000, or 0.2%, to $40.1 million for the year ended December 31, 2023 from $40.0 million for the year ended December 31, 2022. This increase in income tax expense is primarily due to the $1.4 million, or 0.8%, increase in pretax income to $175.1 million for the year ended December 31, 2023 from $173.7 million for the year ended December 31, 2022. Our effective tax rate for the year ended December 31, 2023 was 22.9% compared to 23.0% for the year ended December 31, 2022.
Comparison of Results of Operations for the Years Ended December 31, 2022 and 2021
General. Net income for the year ended December 31, 2022 was $133.7 million, or $1.05 per diluted share, a decrease of $20.7 million, or 13.4%, from $154.3 million, or $1.21 per diluted share, for the year ended December 31, 2021. The decrease in net income resulted from an increase in the provision for credit losses of $44.1 million, or 279.3%, and a decrease in noninterest income of $32.0 million, or 22.4%. Partially offsetting these unfavorable variances was an increase in net interest income of $29.4 million, or 7.5%, a decrease in income tax expense of $6.8 million, or 14.5%, and a decrease in noninterest expense of $19.3 million, or 5.5%.
Net income for the year ended December 31, 2022 represents returns on average equity and average assets of 8.80% and 0.94%, respectively, compared to 9.91% and 1.08% for the year ended December 31, 2021. A discussion of significant changes follows.
Interest Income. Total interest income increased by $30.3 million, or 7.2%, to $448.8 million for the year ended December 31, 2022 from $418.5 million for the year ended December 31, 2021. This increase is the result of increases in the average yield on interest-earning assets as well as the average balance of interest-earning assets, and specifically the change in our interest-earning asset mix. The average yield earned on interest-earning assets increased to 3.39% for the year ended December 31, 2022 from 3.16% for the year ended December 31, 2021 due to the rising interest rate environment. The average balance of interest-earning assets increased by $17.6 million, or 0.1%, to $13.254 billion for the year ended December 31, 2022 from $13.236 billion for the year ended December 31, 2021.
Interest income on loans receivable increased by $17.5 million, or 4.5%, to $407.8 million for the year ended December 31, 2022 from $390.3 million for the year ended December 31, 2021. This increase in interest income on loans receivable is due to increases in the average yield on loans receivable as well as the average balance of loans receivable. The average yield earned on loans receivable increased to 3.95% for the year ended December 31, 2022 from 3.81% for the year ended December 31, 2021 primarily due to the increase in market interest rates. The average balance of loans receivable increased $79.3 million, or 0.8%, to $10.319 billion for the year ended December 31, 2022 from $10.240 billion for the year ended December 31, 2021 driven mainly by growth in our retail portfolio as commercial Paycheck Protection Program (“PPP”) loans continued to payoff.
Interest income on mortgage-backed securities increased by $9.3 million, or 43.5%, to $30.8 million for the year ended December 31, 2022 from $21.5 million for the year ended December 31, 2021. This increase is attributed to increases in both the average yield of mortgage-backed securities and the average balance. The average yield on mortgage-backed securities increased to 1.56% for the year ended December 31, 2022 from 1.26% for the year ended December 31, 2021 due to the purchase of fixed-rate mortgage-backed securities with yields higher than the existing portfolio. Additionally, the average balance of mortgage-backed securities increased by $264.5 million, or 15.5%, to $1.969 billion for the year ended December 31, 2022 from $1.704 billion for the year ended December 31, 2021. This increase was primarily a result of additional purchases as we deployed interest-earning deposits into higher yielding investments throughout 2022.
Interest income on investment securities increased by $736,000, or 14.4%, to $5.8 million for the year ended December 31, 2022 from $5.1 million for the year ended December 31, 2021. This increase is primarily the result of an increase in the average balance of investment securities of $30.7 million, or 8.8%, to $381.5 million for the year ended December 31, 2022 from $350.8 million for the year ended December 31, 2021. Additionally, the average yield on investment securities increased to 1.53% for the year ended December 31, 2022 from 1.45% for the year ended December 31, 2021.
Dividends on FHLB stock increased by $323,000, or 79.4%, to $730,000 for the year ended December 31, 2022 from $407,000 for the year ended December 31, 2021. This increase is the result of an increase in the average yield on FHLB stock to 4.27% for the year ended December 31, 2022 from 2.01% for the year ended December 31, 2021 as the FHLB of Pittsburgh increased dividend rates on required stock holdings in relation to higher market interest rates. Partially offsetting this increase was a decrease in the average balance of FHLB stock of $3.2 million, or 15.6%, to $17.1 million for the year ended December 31, 2022 from $20.2 million for the year ended December 31, 2021. Required FHLB stock holdings fluctuate with, among other things, the utilization of our borrowing capacity as well as capital requirements established by the FHLB.
Interest income on interest-earning deposits increased by $2.4 million, or 201.4%, to $3.6 million for the year ended December 31, 2022 from $1.2 million for the year ended December 31, 2021. This increase is attributable to an increase in the average yield on interest-earning deposits to 0.63% for the year ended December 31, 2022 from 0.13% for the year ended December 31, 2021, as a result of increases in the targeted federal funds rate by the Federal Reserve. This was partially offset by a decrease in the average balance of interest-earning deposits by $353.8 million, or 38.4%, to $567.6 million for the year ended December 31, 2022 from $921.4 million for the year ended December 31, 2021 as we deployed funds into higher yielding loans and investments.
Interest Expense. Interest expense increased by $871,000, or 3.2%, to $28.1 million for the year ended December 31, 2022 from $27.2 million for the year ended December 31, 2021 due to an increase in the average cost of interest-bearing liabilities to 0.30% for the year ended December 31, 2022 from 0.29% for the year ended December 31, 2021. This increase was due to increases in the interest rates paid on borrowed funds and junior subordinated debentures in response to increases in market interest rates. Partially offsetting these increases was a decrease in the average balance of interest-bearing liabilities of $120.5 million, or 1.3%, to $9.381 billion for the year ended December 31, 2022 from $9.501 billion for the year ended December 31, 2021. This decrease in average balance was driven by a decrease in average deposits by $191.7 million, or 2.1%, as customers utilized funds for higher inflationary purchases and searched for higher alternative yields.
Net Interest Income. Net interest income increased by $29.4 million, or 7.5%, to $420.7 million for the year ended December 31, 2022 from $391.3 million for the year ended December 31, 2021. This increase was attributable to the factors discussed above, specifically the increase in interest income which was partially offset by the increase in interest expense on borrowed funds. Our interest rate spread increased to 3.09% for the year ended December 31, 2022 from 2.88% for the year ended December 31, 2021, and our net interest margin increased to 3.17% for the year ended December 31, 2022 from 2.96% for the year ended December 31, 2021 due to the change in market rates as well as the change in our interest-earning asset mix.
Provision for Credit Losses. We analyze the allowance for credit losses as described in Note 1(f) of the Notes to the Consolidated Financial Statements. The provision for credit losses increased by $44.1 million, or 279.3%, to a total provision expense of $28.3 million for the year ended December 31, 2022 compared to a provision credit of $15.8 million for the year ended December 31, 2021. The provision for the year ended December 31, 2022 includes $17.9 million for credit losses - loans and $10.5 million for credit losses - unfunded commitments. The prior period provision for credit losses includes a credit of 11.9 million for credit losses - loans and a credit of $3.9 million for credit losses - unfunded commitments. The $29.7 million, or 250.3%, increase to provision for credit losses - loans was driven primarily by growth within our loan portfolio, and the $14.4 million, or 367.7%, increase to a provision for credit losses - unfunded commitments was driven primarily by the origination of loans with off-balance sheet exposure. Both increases were also impacted by a deterioration in the most recent economic forecasts reflected in our allowance for credit loss models, including a reduction in home and used vehicle values. The negative provision in the prior year was driven by the improvements in the economic forecasts compared to the uncertainty that existed in 2020 for industries impacted by COVID-19. Total classified loans decreased by $126.9 million, or 34.9%, to $236.2 million at December 31, 2022 from $363.2 million at December 31, 2021. In addition, net charge-offs to average loans decreased to 0.02% for the year ended December 31, 2022 from 0.20% for the year ended December 31, 2021.
In determining the amount of the current period provision, we considered current economic conditions, including unemployment levels, bankruptcy filings, and changes in collateral values, and assessed the impact of these factors on the quality of our loan portfolio and historical loss experience. We analyze the allowance for credit losses as described in the section entitled “Allowance for Credit Losses”. The provision that is recorded is sufficient, in our judgment, to bring this reserve to a level that reflects the current expected lifetime losses in our loan portfolio relative to loan mix, a reasonable and supportable economic forecast period and historical loss experience at December 31, 2022.
Noninterest Income. Noninterest income decreased by $32.0 million, or 22.4%, to $110.8 million for the year ended December 31, 2022 from $142.9 million for the year ended December 31, 2021. This decrease was primarily driven by the sale of our insurance business on April 30, 2021, resulting in a $25.3 million pre-tax gain during the prior year. This insurance business sale in the prior year also resulted in a decrease in insurance commission income of $3.6 million from the year ended December 31, 2021. Also contributing to this decrease was a decrease in mortgage banking income of $11.0 million, or 69.4%, to $4.9 million for the year ended December 31, 2022 from $15.9 million for the year ended December 31, 2021, due primarily to the volatile interest rate environment causing unfavorable pricing in the secondary market, as well as a slowdown in mortgage loan activity in general.
Partially offsetting these decreases were increases in service charges and fees, other operating income, and income from bank-owned life insurance. Service charges and fees increased $3.4 million, or 6.5%, to $55.2 million for the year ended December 31, 2022 from $51.8 million for the year ended December 31, 2021 due to increased customer activity in 2022 after COVID-19 restricted behavior in the prior year. Other operating income increased $3.3 million, or 28.0%, to $15.3 million for the year ended December 31, 2022 from $12.0 million for the year ended December 31, 2022, resulting from gains on the sale of branch buildings associated with the previously announced branch consolidations and improvements in other fee income. Lastly, income from bank-owned life insurance increased $1.1 million, or 17.8%, to $7.1 million for the year ended December 31, 2022 from $6.1 million for the year ended December 31, 2021 due to additional death benefits received during the current year.
Noninterest Expense. Noninterest expense decreased by $19.3 million, or 5.5%, to $329.5 million for the year ended December 31, 2022 from $348.8 million for the year ended December 31, 2021 due to decreases across the majority of expense categories. Other expenses decreased $7.0 million, or 57.3%, to $5.2 million for the year ended December 31, 2022 from $12.3 million for the year ended December 31, 2021 driven by an increase in the discount rate used to calculate our pension liability and related pension expense. Compensation and employee benefits decreased $5.5 million, or 2.9%, to $188.4 million for the year ended December 31, 2022 from $193.9 million for the year ended December 31, 2021, despite recognizing approximately $1.4 million of additional expense related to the acceleration of compensation and stock benefits upon the passing of our former Chief Executive Officer. This decrease in compensation and employee benefits, as well as a $1.5 million, or 4.7%, decrease in premises and occupancy costs, to $29.6 million for the year ended December 31, 2022 from $31.1 million for the year ended December 31, 2021, was driven primarily by the branch consolidations completed in April 2022. Processing expenses decreased $3.3 million, or 5.9%, to $52.5 million for the year ended December 31, 2022 from $55.8 million for the year ended December 31, 2021, due to the prior year investment in technology and infrastructure. Professional services decreased $2.9 million, or 16.6%, to $14.7 million for the year ended December 31, 2022 from $17.6 million for the year ended December 31, 2021 primarily due to the utilization of third-party experts to assist with our digital strategy rollout during the prior year. Lastly, amortization of intangible assets decreased $1.3 million, or 23.0%, to $4.3 million for the year ended December 31, 2022 compared to $5.6 million for the year ended December 31, 2021 due to previously acquired intangible assets being fully amortized. These decreases were partially offset by an increase of $2.2 million, or 62.7%, in merger, asset disposition and restructuring expense to $5.6 million for the year ended December 31, 2022 from $3.5 million for the year ended December 31, 2021 due to severance and fixed asset charges related to the branch and personnel optimization to be completed during the first quarter of 2023.
Income Taxes. The provision for income taxes decreased by $6.8 million, or 14.5%, to $40.0 million for the year ended December 31, 2022 from $46.8 million for the year ended December 31, 2021. This decrease in income tax expense is primarily due to the $27.4 million, or 13.6%, decrease in pretax income to $173.7 million for the year ended December 31, 2022 from $201.1 million for the year ended December 31, 2021. In addition, our effective tax rate for the year ended December 31, 2022 was 23.0% compared to 23.3% for the year ended December 31, 2021.
Asset Quality
We actively manage asset quality through our underwriting practices and collection procedures. Our underwriting practices are focused on balancing risk and return while our collection operations focus on diligently working with delinquent borrowers in an effort to minimize losses.
Collection procedures. Our collection procedures for personal loans generally provide that at 15 days delinquent, a notice of late charges is sent and personal contact efforts are attempted by telephone to strengthen the collection process and obtain reasons for the delinquency. Also, plans to establish a payment program are developed. Personal contact efforts are continued throughout the collection process, as necessary. Generally, if a loan becomes 30 days past due, a collection letter is sent and the loan becomes subject to possible legal action if suitable arrangements for payment have not been made. In addition, the borrower is given information which provides access to consumer counseling services to the extent required by the regulations of the Department of Housing and Urban Development and other applicable authorities. When a loan continues in a delinquent status for 60 days or more, and a payment schedule has not been developed or kept by the borrower, we may send the borrower a notice of intent to foreclose, providing for cure periods of at least 30 days. If not cured, foreclosure proceedings are initiated.
Nonperforming assets. Loans are reviewed on a regular basis and are placed on nonaccrual status when, in the opinion of management, the collection of all contractual principal and/or interest is doubtful. Loans are automatically placed on nonaccrual status when either principal or interest is 90 days or more past due. Interest accrued and unpaid at the time a loan is placed on a nonaccrual status is reversed and charged against interest income.
Real estate acquired as a result of foreclosure or by deed in lieu of foreclosure is classified as real estate owned until such time that it is sold. When real estate is acquired through foreclosure or by deed in lieu of foreclosure, it is recorded at the lower of the related loan balance or its fair value as determined by an appraisal, less estimated costs of disposal. If the value of the property is less than the principal balance, less any related specific credit loss reserve allocations, the difference is charged against the allowance for credit losses.
Any subsequent write-down of real estate owned or loss at the time of disposition is charged against earnings.
Nonaccrual, Past Due, Restructured Loans and Nonperforming Assets. The following table sets forth information with respect to nonperforming assets. Nonaccrual loans are those loans on which the accrual of interest has ceased. Generally, when a loan becomes 90 days past due, we fully reverse all accrued interest thereon and cease to accrue interest thereafter. Exceptions are made for loans that have contractually matured, are in the process of being modified to extend the maturity date and are otherwise current as to principal and interest, and well secured loans that are in process of collection. Loans may also be placed on nonaccrual before they reach 90 days past due if conditions exist that call into question our ability to collect all contractual principal and/or interest. Other nonperforming assets represent property acquired through foreclosure or repossession. Foreclosed property is carried at the lower of its fair value less estimated costs to sell or the principal balance of the related loan.
|
|
|
|
|
|
|
|
|
|
|
|
|
|
|
|
|
|
| |
At December 31, |
| |
2023 |
|
2022 |
|
|
|
|
|
|
| |
(Dollars in thousands) |
| Loans 90 days or more past due: |
|
|
|
|
|
|
|
|
|
| Residential mortgage loans |
$ |
7,995 |
|
|
5,574 |
|
|
|
|
|
|
|
| Home equity loans |
3,126 |
|
|
2,257 |
|
|
|
|
|
|
|
| Vehicle loans |
3,051 |
|
|
2,471 |
|
|
|
|
|
|
|
| Consumer loans |
927 |
|
|
608 |
|
|
|
|
|
|
|
| Commercial real estate loans |
6,535 |
|
|
7,589 |
|
|
|
|
|
|
|
| Commercial real estate loans - owner occupied |
177 |
|
|
278 |
|
|
|
|
|
|
|
| Commercial loans |
2,780 |
|
|
1,829 |
|
|
|
|
|
|
|
| Total loans 90 days or more past due |
$ |
24,591 |
|
|
20,606 |
|
|
|
|
|
|
|
| Total real estate owned (REO) |
$ |
104 |
|
|
413 |
|
|
|
|
|
|
|
| Total loans 90 days or more past due and REO |
24,695 |
|
|
21,019 |
|
|
|
|
|
|
|
| Total loans 90 days or more past due to net loans receivable |
0.22 |
% |
|
0.19 |
% |
|
|
|
|
|
|
| Total loans 90 days or more past due and REO to total assets |
0.17 |
% |
|
0.15 |
% |
|
|
|
|
|
|
| Nonperforming assets: |
|
|
|
|
|
|
|
|
|
| Nonaccrual loans - loans 90 days or more past due |
$ |
21,894 |
|
|
19,861 |
|
|
|
|
|
|
|
| Nonaccrual loans - loans less than 90 days past due |
72,490 |
|
|
61,375 |
|
|
|
|
|
|
|
| Loans 90 days or more past due still accruing |
2,698 |
|
|
744 |
|
|
|
|
|
|
|
| Total nonperforming loans |
97,082 |
|
|
81,980 |
|
|
|
|
|
|
|
| Total nonperforming assets |
$ |
97,186 |
|
|
82,393 |
|
|
|
|
|
|
|
|
|
|
|
|
|
|
|
|
|
|
|
|
|
|
|
|
|
|
|
|
|
|
|
|
|
|
|
|
|
Classification of Assets. Our policies, consistent with regulatory guidelines, provide for the classification of loans, or other assets including other real estate owned, considered to be of lesser quality as “substandard,” “doubtful,” or “loss” assets. An asset is considered “substandard” if it is inadequately protected by the current net worth and paying capacity of the obligor or of the collateral pledged, if any. “Substandard” assets include those characterized by the “distinct possibility” that the financial institution will sustain “some loss” if the deficiencies are not corrected. Assets classified as “doubtful” have all of the weaknesses inherent in those classified “substandard” with the added characteristic that the weaknesses present make “collection or liquidation in full,” on the basis of currently existing facts, conditions, and values, “highly questionable and improbable”. Assets classified as “loss” are those considered “uncollectible” so that their continuance as assets without the establishment of a specific loss reserve is not warranted. Assets that do not expose the savings institution to risk sufficient to warrant classification in one of the aforementioned categories, but which possess some weaknesses, are required to be designated as “special mention”. At December 31, 2023, we had 113 loans, with an aggregate principal balance of $130.8 million, designated as “special mention”.
We regularly review our asset portfolio to determine whether any assets require classification in accordance with applicable regulations. Our largest classified assets generally are also our largest nonperforming assets.
The following table sets forth the aggregate amount of our classified assets at the dates indicated.
|
|
|
|
|
|
|
|
|
|
|
|
|
|
| |
At December 31, |
| |
2023 |
|
2022 |
|
|
| |
(In thousands) |
| Substandard assets |
$ |
218,571 |
|
|
236,653 |
|
|
|
| Doubtful assets |
— |
|
|
— |
|
|
|
| Loss assets |
— |
|
|
— |
|
|
|
| Total classified assets |
$ |
218,571 |
|
|
236,653 |
|
|
|
Allowance for Credit Losses. Our Board of Directors has adopted an “Allowance for Credit Losses” (“ACL”) policy designed to provide management with a systematic methodology for determining and documenting the allowance for credit losses each reporting period. This methodology was developed to provide a consistent process and review procedure to ensure that the allowance for credit losses is in conformity with GAAP, our policies and procedures and other supervisory and regulatory guidelines.
On an ongoing basis, the Credit Administration department, as well as loan officers, branch managers and department heads, review and monitor the loan portfolio for problem loans. This portfolio monitoring includes a review of the monthly delinquency reports as well as historical comparisons and trend analysis. Personal and small business commercial loans are classified primarily by delinquency status. In addition, a meeting is held every quarter with each region to monitor the performance and status of commercial loans on an internal watch list. On an on-going basis, the loan officer, in conjunction with a portfolio manager, grades or classifies problem commercial loans or potential problem commercial loans based upon their knowledge of the lending relationship and other information previously accumulated. This rating is also reviewed independently by our Loan Review department on a periodic basis. Our loan grading system for problem commercial loans is consistent with industry regulatory guidelines which classifies loans as “substandard”, “doubtful” or “loss”. Loans that do not expose us to risk sufficient to warrant classification in one of the previous categories, but which possess some weaknesses, are designated as “special mention”. A “substandard” loan is any loan that is 90 days or more contractually delinquent or is inadequately protected by the current net worth and paying capacity of the obligor or of the collateral pledged, if any. Loans classified as “doubtful” have all the weaknesses inherent in those classified as “substandard” with the added characteristic that the weaknesses present make collection or liquidation in full, on the basis of currently existing facts, conditions or values, highly questionable and improbable. Loans classified as “loss” have all the weakness inherent in those classified as “doubtful” and are considered uncollectible.
Credit relationships that have been classified as substandard or doubtful and are greater than or equal to $1.0 million are reviewed by the Credit Administration department to determine if they no longer continue to demonstrate similar risk characteristics to their loan pool. If a loan no longer demonstrates similar risk characteristics to their loan pool they are removed from the pool and an individual assessment will be performed.
If it is determined that a loan needs to be individually assessed, the Credit Administration department determines the proper measure of fair value for each loan based on one of three methods: (1) the present value of expected future cash flows discounted at the loan’s effective interest rate; (2) the loan’s observable market price; or (3) the fair value of the collateral if the loan is collateral dependent, less costs of sale or disposal. If the measurement of the fair value of the loan is more or less than the amortized cost basis of the loan, the Credit Administration department adjusts the specific allowance associated with that individual loan accordingly.
If a substandard or doubtful loan is not individually assessed, it is grouped with other loans that possess common characteristics for credit losses and analysis. For the purpose of calculating reserves, we have grouped our loans into seven segments: residential mortgage loans, home equity loans, vehicle loans, consumer loans, commercial real estate loans, commercial real estate loans - owner occupied and commercial loans. The allowance for credit losses is measured using a combination of statistical models and qualitative assessments. We use a 24 month forecasting period and revert to historical average loss rates thereafter. Reversion to average loss rates takes place over twelve months. Historical average loss rates are calculated using historical data beginning in October 2009 through the current period.
The credit losses for individually assessed loans along with the estimated loss for each homogeneous pool are consolidated into one summary document. This summary schedule along with the support documentation used to establish this schedule is presented to management’s Allowance for Credit Losses Committee (“ACL Committee”) monthly. The ACL Committee reviews and approves the processes and ACL documentation presented. Based on this review and discussion, the appropriate amount of ACL is estimated and any adjustments to reconcile the actual ACL with this estimate are determined. The ACL Committee also considers if any changes to the methodology are needed. In addition to the ACL Committee’s review and approval, a review is performed by the Risk Management Committee of the Board of Directors on a quarterly basis and annually by internal audit.
In addition to the reviews by management’s ACL Committee and the Board of Directors’ Risk Management Committee, regulators from either the FDIC and/or the Pennsylvania Department of Banking and Securities perform an extensive review on at least an annual basis for the adequacy of the ACL and its conformity with regulatory guidelines and pronouncements. Any recommendations or enhancements from these independent parties are considered by management and the ACL Committee and implemented accordingly.
We acknowledge that this is a dynamic process and consists of factors, many of which are external and out of our control that can change frequently, rapidly and substantially. The adequacy of the ACL is based upon estimates using all the information previously discussed as well as current and known circumstances and events. There is no assurance that actual portfolio losses will not be substantially different than those that were estimated.
We utilize a structured methodology each period when analyzing the adequacy of the allowance for credit losses and the related provision for credit losses, which the ACL Committee assesses regularly for appropriateness. As part of the analysis as of December 31, 2023, we considered the most recent economic conditions and forecasts available. In addition, we considered the overall trends in asset quality, reserves on individually assessed loans, historical loss rates and collateral valuations. The ACL increased by $7.2 million, or 6.1%, to $125.2 million, or 1.10% of gross loans at December 31, 2023 from $118.0 million, or 1.08% of total loans, at December 31, 2022. This increase was the result of organic loan growth, as well as a continued deterioration in economic forecasts, specifically including a reduction in used vehicle prices, as well as increased vacancy rates and decreased rents impacting commercial real estate.
Quarterly, management’s Credit Committee reviews the concentration of credit by industry and customer, lending products and activity, competition and collateral values, as well as economic conditions in general and in each of our market areas. The Credit Committee also reviews and discusses delinquency trends, nonperforming asset amounts and ACL levels and ratios compared to our peer group as well as state and national statistics.
We also consider how the levels of non-accrual loans and historical charge-offs have influenced the required amount of ACL. Nonaccrual loans of $94.4 million, or 0.83% of total gross loans receivable at December 31, 2023, increased by $13.1 million, or 16.2%, from $81.2 million, or 0.74% of total gross loans receivable, at December 31, 2022. This increase was primarily related to current commercial real estate loans. As a percentage of average loans, net charge-offs increased to 0.11% for the year ended December 31, 2023 compared to 0.02% for the year ended December 31, 2022 due to some large recoveries in the prior year.
Analysis of the Allowance for Credit Losses. The following table sets forth the analysis of the allowance for credit losses for the periods indicated.
|
|
|
|
|
|
|
|
|
|
|
|
|
|
|
|
|
|
| |
Years ended December 31, |
| |
2023 |
|
2022 |
|
|
|
|
|
|
| |
(Dollars in thousands) |
| Loans receivable |
$ |
11,414,809 |
|
|
10,920,452 |
|
|
|
|
|
|
|
| Average loans outstanding |
11,100,118 |
|
|
10,318,898 |
|
|
|
|
|
|
|
|
|
|
|
|
|
|
|
|
|
| Allowance for credit losses |
|
|
|
|
|
|
|
|
|
| Balance at beginning of period |
118,036 |
|
|
102,241 |
|
|
|
|
|
|
|
| ASU 2022-02 Adoption |
426 |
|
|
— |
|
|
|
|
|
|
|
|
|
|
|
|
|
|
|
|
|
| Provision for credit losses |
18,664 |
|
|
17,860 |
|
|
|
|
|
|
|
| Charge-offs: |
|
|
|
|
|
|
|
|
|
| Residential mortgage loans |
(1,189) |
|
|
(2,033) |
|
|
|
|
|
|
|
| Home equity loans |
(852) |
|
|
(1,469) |
|
|
|
|
|
|
|
| Vehicle loans |
(6,468) |
|
|
(3,621) |
|
|
|
|
|
|
|
| Consumer loans |
(5,983) |
|
|
(4,785) |
|
|
|
|
|
|
|
| Commercial real estate loans |
(2,298) |
|
|
(7,366) |
|
|
|
|
|
|
|
| Commercial real estate loans - owner occupied |
(68) |
|
|
— |
|
|
|
|
|
|
|
| Commercial loans |
(4,166) |
|
|
(1,657) |
|
|
|
|
|
|
|
| Total charge-offs |
(21,024) |
|
|
(20,931) |
|
|
|
|
|
|
|
| Recoveries: |
|
|
|
|
|
|
|
|
|
| Residential mortgage loans |
1,636 |
|
|
792 |
|
|
|
|
|
|
|
| Home equity loans |
709 |
|
|
1,531 |
|
|
|
|
|
|
|
| Vehicle loans |
2,021 |
|
|
2,334 |
|
|
|
|
|
|
|
| Consumer loans |
1,206 |
|
|
1,553 |
|
|
|
|
|
|
|
| Commercial real estate loans |
2,029 |
|
|
10,364 |
|
|
|
|
|
|
|
| Commercial real estate loans - owner occupied |
66 |
|
|
85 |
|
|
|
|
|
|
|
| Commercial loans |
1,474 |
|
|
2,207 |
|
|
|
|
|
|
|
| Total recoveries |
9,141 |
|
|
18,866 |
|
|
|
|
|
|
|
| Balance at end of period |
$ |
125,243 |
|
|
118,036 |
|
|
|
|
|
|
|
|
|
|
|
|
|
|
|
|
|
| Allowance for credit losses as a percentage of loans receivable |
1.10 |
% |
|
1.08 |
% |
|
|
|
|
|
|
| Net charge-offs as a percentage of average loans outstanding: |
|
|
|
|
|
|
|
|
|
| Residential mortgage loans |
(0.01) |
% |
|
0.04 |
% |
|
|
|
|
|
|
| Home equity loans |
0.01 |
% |
|
— |
% |
|
|
|
|
|
|
| Vehicle loans |
0.22 |
% |
|
0.07 |
% |
|
|
|
|
|
|
| Consumer loans |
4.11 |
% |
|
3.24 |
% |
|
|
|
|
|
|
| Commercial real estate loans |
0.01 |
% |
|
(0.12) |
% |
|
|
|
|
|
|
| Commercial real estate loans - owner occupied |
— |
% |
|
(0.02) |
% |
|
|
|
|
|
|
| Commercial loans |
0.20 |
% |
|
(0.06) |
% |
|
|
|
|
|
|
| Total Average Loans Receivable |
0.11 |
% |
|
0.02 |
% |
|
|
|
|
|
|
| Allowance for credit losses as a percentage of nonperforming loans |
129.01 |
% |
|
143.98 |
% |
|
|
|
|
|
|
| Allowance for credit losses as a percentage of nonperforming assets |
128.87 |
% |
|
143.26 |
% |
|
|
|
|
|
|
Allocation of Allowance for Credit Losses. The following tables set forth the allocation of the allowance for credit losses by loan category at the dates indicated. The allowance for credit losses allocated to each category is not necessarily indicative of future losses in any particular category.
|
|
|
|
|
|
|
|
|
|
|
|
|
|
|
|
|
|
|
|
|
|
|
|
|
|
|
|
| |
At December 31, |
| |
2023 |
|
2022 |
|
|
| |
Amount |
|
% of total
loans (1) |
|
Amount |
|
% of total
loans (1) |
|
|
|
|
| |
(Dollars in thousands) |
| Balance at end of year applicable to: |
|
|
|
|
|
|
|
|
|
|
|
| Residential mortgage loans |
$ |
18,193 |
|
|
30.0 |
% |
|
$ |
19,261 |
|
|
32.0 |
% |
|
|
|
|
| Home equity loans |
5,403 |
|
|
10.8 |
% |
|
5,902 |
|
|
11.9 |
% |
|
|
|
|
| Vehicle loans |
26,911 |
|
|
17.6 |
% |
|
23,059 |
|
|
18.8 |
% |
|
|
|
|
| Consumer loans |
1,199 |
|
|
1.0 |
% |
|
665 |
|
|
1.0 |
% |
|
|
|
|
| Commercial real estate loans |
51,267 |
|
|
23.1 |
% |
|
44,506 |
|
|
22.5 |
% |
|
|
|
|
| Commercial real estate loans - owner occupied |
3,775 |
|
|
3.0 |
% |
|
4,004 |
|
|
3.4 |
% |
|
|
|
|
| Commercial loans |
18,495 |
|
|
14.5 |
% |
|
20,639 |
|
|
10.4 |
% |
|
|
|
|
|
|
|
|
|
|
|
|
|
|
|
|
|
|
|
|
|
|
|
|
|
|
|
|
| Total |
$ |
125,243 |
|
|
100.0 |
% |
|
$ |
118,036 |
|
|
100.0 |
% |
|
|
|
|
(1)Represents percentage of loans in each category to total loans.
Average Balance Sheets
The following table sets forth average balance sheets, average yields, on a fully taxable equivalent (“FTE”) basis, and average costs, and certain other information at and for the periods indicated. All average balances are daily average balances. Non-accrual loans are included in the computation of average balances. The yields set forth below include the effect of deferred fees and discounts and premiums that are amortized or accreted to interest income or expense. The effect of these fees is not considered material. The average yield for loans receivable and investment securities are calculated on a FTE basis. There were no out-of-period adjustments or other exclusions from the amounts presented in the table.
|
|
|
|
|
|
|
|
|
|
|
|
|
|
|
|
|
|
|
|
|
|
|
|
|
|
|
|
|
|
|
|
|
|
|
|
|
|
|
|
|
|
|
|
|
|
|
|
|
|
|
|
|
|
| |
For the years ended December 31, |
| |
2023 |
|
2022 |
|
2021 |
| |
Average
balance |
|
Interest |
|
Average
yield/cost
(11) |
|
Average
balance |
|
Interest |
|
Average
yield/cost
(11) |
|
Average
balance |
|
Interest |
|
Average
yield/cost
(11) |
| |
(Dollars in thousands) |
| Interest-earning assets: |
|
|
|
|
|
|
|
|
|
|
|
|
|
|
|
|
|
| Loans receivable (includes FTE adjustments of $2,477, $1,954, and $1,922, respectively) (1), (2), (3) |
$ |
11,100,118 |
|
|
546,136 |
|
|
4.92 |
% |
|
$ |
10,318,898 |
|
|
409,782 |
|
|
3.97 |
% |
|
$ |
10,239,620 |
|
|
392,265 |
|
|
3.83 |
% |
| Mortgage-backed securities (4) |
1,822,375 |
|
|
32,886 |
|
|
1.80 |
% |
|
1,968,528 |
|
|
30,804 |
|
|
1.56 |
% |
|
1,704,006 |
|
|
21,463 |
|
|
1.26 |
% |
| Investment securities (includes FTE adjustments of $704, $834, and $747, respectively) (4), (5) |
357,436 |
|
|
6,312 |
|
|
1.77 |
% |
|
381,518 |
|
|
6,671 |
|
|
1.75 |
% |
|
350,806 |
|
|
5,848 |
|
|
1.67 |
% |
| FHLB stock, at cost |
39,467 |
|
|
2,868 |
|
|
7.27 |
% |
|
17,065 |
|
|
730 |
|
|
4.27 |
% |
|
20,229 |
|
|
407 |
|
|
2.01 |
% |
| Interest-earning deposits |
47,787 |
|
|
2,901 |
|
|
6.07 |
% |
|
567,609 |
|
|
3,599 |
|
|
0.63 |
% |
|
921,360 |
|
|
1,194 |
|
|
0.13 |
% |
| Total interest-earning assets (includes FTE adjustments of $3,181, $2,788, and $2,669, respectively) |
13,367,183 |
|
|
591,103 |
|
|
4.42 |
% |
|
13,253,618 |
|
|
451,586 |
|
|
3.41 |
% |
|
13,236,021 |
|
|
421,177 |
|
|
3.18 |
% |
| Noninterest-earning assets (6) |
902,626 |
|
|
|
|
|
|
924,080 |
|
|
|
|
|
|
1,072,313 |
|
|
|
|
|
| Total assets |
$ |
14,269,809 |
|
|
|
|
|
|
$ |
14,177,698 |
|
|
|
|
|
|
$ |
14,308,334 |
|
|
|
|
|
| Interest-bearing liabilities: |
|
|
|
|
|
|
|
|
|
|
|
|
|
|
|
|
|
| Savings deposits |
$ |
2,148,127 |
|
|
8,822 |
|
|
0.41 |
% |
|
$ |
2,336,217 |
|
|
2,343 |
|
|
0.10 |
% |
|
$ |
2,232,454 |
|
|
2,440 |
|
|
0.11 |
% |
| Interest-bearing demand deposits |
2,556,281 |
|
|
11,606 |
|
|
0.45 |
% |
|
2,810,889 |
|
|
1,517 |
|
|
0.05 |
% |
|
2,862,677 |
|
|
1,660 |
|
|
0.06 |
% |
| Money market deposit accounts |
2,183,583 |
|
|
24,734 |
|
|
1.13 |
% |
|
2,613,422 |
|
|
3,377 |
|
|
0.13 |
% |
|
2,554,975 |
|
|
2,570 |
|
|
0.10 |
% |
| Time deposits |
1,913,372 |
|
|
60,181 |
|
|
3.15 |
% |
|
1,161,432 |
|
|
6,883 |
|
|
0.59 |
% |
|
1,463,522 |
|
|
12,452 |
|
|
0.85 |
% |
| Borrowed funds (7) |
691,636 |
|
|
32,903 |
|
|
4.76 |
% |
|
212,026 |
|
|
4,531 |
|
|
2.14 |
% |
|
135,285 |
|
|
616 |
|
|
0.46 |
% |
| Subordinated debt |
114,002 |
|
|
4,592 |
|
|
4.03 |
% |
|
117,625 |
|
|
4,750 |
|
|
4.04 |
% |
|
123,457 |
|
|
4,980 |
|
|
4.03 |
% |
| Junior subordinated debentures |
129,434 |
|
|
9,401 |
|
|
7.26 |
% |
|
129,175 |
|
|
4,716 |
|
|
3.60 |
% |
|
128,915 |
|
|
2,528 |
|
|
1.93 |
% |
| Total interest-bearing liabilities |
9,736,435 |
|
|
152,239 |
|
|
1.56 |
% |
|
9,380,786 |
|
|
28,117 |
|
|
0.30 |
% |
|
9,501,285 |
|
|
27,246 |
|
|
0.29 |
% |
| Noninterest-bearing demand deposits (8) |
2,785,279 |
|
|
|
|
|
|
3,070,892 |
|
|
|
|
|
|
2,999,392 |
|
|
|
|
|
| Noninterest-bearing liabilities |
237,810 |
|
|
|
|
|
|
207,316 |
|
|
|
|
|
|
250,075 |
|
|
|
|
|
| Total liabilities |
12,759,524 |
|
|
|
|
|
|
12,658,994 |
|
|
|
|
|
|
12,750,752 |
|
|
|
|
|
| Shareholders’ equity |
1,510,285 |
|
|
|
|
|
|
1,518,704 |
|
|
|
|
|
|
1,557,582 |
|
|
|
|
|
| Total liabilities and shareholders’ equity |
$ |
14,269,809 |
|
|
|
|
|
|
$ |
14,177,698 |
|
|
|
|
|
|
$ |
14,308,334 |
|
|
|
|
|
| Net interest income |
|
|
438,864 |
|
|
|
|
|
|
423,469 |
|
|
|
|
|
|
393,931 |
|
|
|
| Net interest rate spread (9) |
|
|
|
|
2.86 |
% |
|
|
|
|
|
3.11 |
% |
|
|
|
|
|
2.89 |
% |
| Net interest-earning assets/net interest margin (10) |
$ |
3,630,748 |
|
|
|
|
3.28 |
% |
|
$ |
3,872,832 |
|
|
|
|
3.20 |
% |
|
$ |
3,734,736 |
|
|
|
|
2.98 |
% |
| Ratio of average interest-earning assets to average interest-bearing liabilities |
1.37X |
|
|
|
|
|
1.41X |
|
|
|
|
|
1.39X |
|
|
|
|
(1)Average gross loans receivable includes loans held as available-for-sale and loans placed on nonaccrual status.
(2)Interest income includes accretion/amortization of deferred loan fees/expenses, which was not material.
(3)Interest income on tax-free loans is presented on a FTE basis including adjustments, as indicated.
(4)Average balances do not include the effect of unrealized gains or losses on securities held as available-for-sale.
(5)Interest income on tax-free investment securities is presented on a FTE basis including adjustments, as indicated.
(6)Average balances include the effect of unrealized gains or losses on securities held as available-for-sale.
(7)Average balances include FHLB borrowings and collateralized borrowings.
(8)Average cost of deposits was 0.91%, 0.12% and 0.16%, respectively and average cost of interest-bearing deposits were 1.20%, 0.16%, and 0.21%, respectively.
(9)Net interest rate spread represents the difference between the average yield on interest-earning assets and the average cost of interest-bearing liabilities.
(10)Net interest margin represents net interest income as a percentage of average interest-earning assets.
(11)Shown on a FTE basis and in consideration of applicable current federal, state and local tax rates. GAAP basis yields for the years ended December 31, 2023, 2022 and 2021 were - Loans: 4.90%, 3.95%, and 3.81%, respectively, Investment securities: 1.57%, 1.53%, and 1.45%, respectively, Interest-earning assets: 4.40%, 3.39%, and 3.16%, respectively. GAAP basis net interest rate spreads were 2.83%, 3.09%, and 2.88%, respectively, and GAAP basis net interest margins were 3.26%, 3.17%, and 2.96% respectively.
Rate/Volume Analysis
The following table presents, on a FTE basis, the changes in interest income and interest expense for major components of interest-earning assets and interest-bearing liabilities for the year ended December 31, 2023 compared to 2022 and for the year ended December 31, 2022 compared to 2021. For each category of interest-earning assets and interest-bearing liabilities, information is provided on changes attributable to: (1) changes in volume multiplied by the prior year rate; (2) changes in rate multiplied by the prior year volume; and (3) the total increase or decrease. Changes not solely attributable to rate or volume have been allocated proportionately to the change due to volume and the change due to rate. There were no out-of-period adjustments or other exclusions from the amounts presented in the table.
|
|
|
|
|
|
|
|
|
|
|
|
|
|
|
|
|
|
|
|
|
|
|
|
|
|
|
|
|
|
|
|
|
|
|
|
|
Years ended December 31, 2023 vs. 2022 |
|
Years ended December 31, 2022 vs. 2021 |
| |
Increase/(decrease)
due to |
|
Total
increase/(decrease) |
Increase/(decrease)
due to |
|
Total
increase/(decrease) |
| |
| |
Rate |
|
Volume |
Rate |
|
Volume |
| |
(In thousands) |
| Interest-earning assets: |
|
|
|
|
|
|
|
|
|
|
|
| Loans receivable |
$ |
97,916 |
|
|
38,438 |
|
|
136,354 |
|
|
14,458 |
|
|
3,059 |
|
|
17,517 |
|
| Mortgage-backed securities |
4,720 |
|
|
(2,638) |
|
|
2,082 |
|
|
5,194 |
|
|
4,147 |
|
|
9,341 |
|
| Investment securities |
67 |
|
|
(426) |
|
|
(359) |
|
|
275 |
|
|
548 |
|
|
823 |
|
| FHLB stock, at cost |
510 |
|
|
1,628 |
|
|
2,138 |
|
|
458 |
|
|
(135) |
|
|
323 |
|
| Interest-earning deposits |
30,861 |
|
|
(31,559) |
|
|
(698) |
|
|
4,564 |
|
|
(2,159) |
|
|
2,405 |
|
| Total interest-earning assets |
134,074 |
|
|
5,443 |
|
|
139,517 |
|
|
24,949 |
|
|
5,460 |
|
|
30,409 |
|
|
|
|
|
|
|
|
|
|
|
|
|
| Interest-bearing liabilities: |
|
|
|
|
|
|
|
|
|
|
|
| Savings deposits |
7,251 |
|
|
(772) |
|
|
6,479 |
|
|
(217) |
|
|
120 |
|
|
(97) |
|
| Interest-bearing demand deposits |
11,245 |
|
|
(1,156) |
|
|
10,089 |
|
|
(172) |
|
|
29 |
|
|
(143) |
|
| Money market deposit accounts |
26,226 |
|
|
(4,869) |
|
|
21,357 |
|
|
746 |
|
|
61 |
|
|
807 |
|
| Time deposits |
29,647 |
|
|
23,651 |
|
|
53,298 |
|
|
(3,767) |
|
|
(1,802) |
|
|
(5,569) |
|
| Borrowed funds |
5,555 |
|
|
22,817 |
|
|
28,372 |
|
|
2,269 |
|
|
1,646 |
|
|
3,915 |
|
| Subordinated debt |
(12) |
|
|
(146) |
|
|
(158) |
|
|
10 |
|
|
(240) |
|
|
(230) |
|
| Junior subordinated debentures |
4,667 |
|
|
18 |
|
|
4,685 |
|
|
2,184 |
|
|
4 |
|
|
2,188 |
|
| Total interest-bearing liabilities |
84,579 |
|
|
39,543 |
|
|
124,122 |
|
|
1,053 |
|
|
(182) |
|
|
871 |
|
| Net change in net interest income |
$ |
49,495 |
|
|
(34,100) |
|
|
15,395 |
|
|
23,896 |
|
|
5,642 |
|
|
29,538 |
|
Liquidity and Capital Resources
Northwest Bank is required to maintain a sufficient level of liquid assets, as determined by management and defined and reviewed for adequacy by the FDIC during their regular examinations. The FDIC, however, does not prescribe by regulation a minimum amount or percentage of liquid assets. The FDIC allows us to consider any unencumbered, available-for-sale marketable security, whose sale would not impair our capital adequacy, to be eligible for liquidity. Liquidity is monitored through the use of a standard liquidity ratio of liquid assets to borrowings plus deposits. Using this formula, Northwest Bank’s liquidity ratio was 9.51% as of December 31, 2023. We adjust our liquidity level in order to meet funding needs of deposit outflows, repayment of borrowings and loan commitments. We also adjust liquidity as appropriate to meet our asset and liability management objectives. Liquidity needs can also be met by temporarily drawing upon lines-of-credit established for such reasons.
Following the first quarter of 2023 bank failures, the Federal Reserve Board (“FRB”) established the Bank Term Funding Program (“BTFP”) as an additional source of available liquidity to support depository institutions through pledging qualifying assets as collateral. The Bank has taken steps to support readiness but has not participated through December 31, 2023. In January 2024, the FRB announced it will stop extending loans under the BTFP after March 11, 2024. At December 31, 2023, Northwest Bank had $3.286 billion of additional borrowing capacity available with the FHLB of Pittsburgh, including a $250.0 million overnight line of credit, which had a balance of $163.5 million at December 31, 2023, as well as $297.5 million of borrowing capacity available with the Federal Reserve Bank and $105.0 million with two correspondent banks. We believe the Bank has sufficient liquidity and capital resources to meet its cash flow obligations over the next 12 months and for the foreseeable future.
In addition to deposits, our primary sources of funds are the amortization and repayment of loans and mortgage-backed securities, maturities of investment securities and other short-term investments, and earnings and funds provided from operations. While scheduled principal repayments on loans and mortgage-backed securities are a relatively predictable source of funds, deposit flows and loan prepayments are greatly influenced by general interest rate levels, economic conditions, and competition. We manage the pricing of our deposits to maintain a desired deposit balance. In addition, we invest excess funds in short-term interest earning and other assets, which provide liquidity to meet lending requirements.
Short-term interest-earning deposits amounted to $35.9 million at December 31, 2023. For additional information about our cash flows from operating, financing, and investing activities, see the Consolidated Statements of Cash Flows included in the Consolidated Financial Statements.
A portion of our liquidity consists of cash and cash equivalents, which are a product of our operating, investing, and financing activities. The primary sources of cash during the current year were net income, principal repayments on loans and mortgage-backed securities and net increase in deposits.
Liquidity management is both a daily and long-term function of business management. If we require funds beyond our ability to generate them internally, borrowing agreements exist with the FHLB of Pittsburgh and the Federal Reserve Bank of Cleveland, which provide an additional source of funds. At December 31, 2023, Northwest Bank had an outstanding balance of $338.5 million with the FHLB of Pittsburgh. We borrow from these sources to reduce interest rate risk and to provide liquidity when necessary.
At December 31, 2023, our customers had $1.186 billion of unused lines of credit available and $198.2 million in loan commitments. This amount does not include the unfunded portion of loans in process. Time deposits scheduled to mature in less than one year at December 31, 2023, totaled $2.464 billion. We believe that a significant portion of such deposits will remain with us.
Deposits are our primary source of externally generated funds. The level of deposit inflows during any given period is heavily influenced by factors outside of our control, such as consumer savings tendencies, the general level of short-term and long-term market interest rates, as well as higher alternative yields that investors may obtain on competing investments such as money market mutual funds. Financial institutions, such as Northwest Bank, are also subject to deposit outflows. Our net deposits increased by $515.4 million for the year ended December 31, 2023, decreased by $836.6 million for the year ended December 31, 2022, and increased by $701.9 million for the year ended December 31, 2021.
Similarly, the amount of principal repayments on loans and the amount of new loan originations is heavily influenced by the general level of market interest rates, consumer confidence and consumer spending. Funds received from loan maturities and principal payments on loans for the years ended December 31, 2023, 2022 and 2021 were $3.447 billion, $4.047 billion, and $4.490 billion, respectively. Loan originations for the years ended December 31, 2023, 2022 and 2021 were $4.162 billion, $4.948 billion, and $4.715 billion, respectively. We also sell a portion of the loans we originate as part of our mortgage banking operations, and the cash flows from such sales for the years ended December 31, 2023, 2022 and 2021 were $203.7 million, $383.9 million, and $804.7 million, respectively.
We experience significant cash flows from our portfolio of marketable securities as principal payments are received on mortgage-backed securities and as investment securities mature or are called. Cash flows from the repayment of principal and the maturity or call of marketable securities for the years ended December 31, 2023, 2022 and 2021 were $169.0 million, $330.4 million, and $517.9 million, respectively.
When necessary, we utilize borrowings as a source of liquidity and as a source of funds for long-term investment when market conditions permit. The net cash flow from the receipt and repayment of borrowings was a net decrease of $282.3 million, a net increase of $532.0 million, and a net decrease of $20.7 million for the years ended December 31, 2023, 2022 and 2021, respectively.
Northwest Bancshares, Inc. is a separate legal entity from Northwest Bank and must provide for its own liquidity to pay dividends to shareholders, to repurchase its common stock and for other corporate purposes. Northwest Bancshares’ primary source of liquidity is the dividend payments it receives from Northwest Bank. During 2020, Northwest Bancshares, Inc. issued $125.0 million of subordinated debt. At December 31, 2023, Northwest Bancshares, Inc. (on an unconsolidated basis) had liquid assets of $276.0 million.
Other activity with respect to cash flow was the payment of cash dividends on common stock in the amount of $101.7 million, $101.5 million, and $100.3 million for years the ended December 31, 2023, 2022 and 2021, respectively.
At December 31, 2023, stockholders’ equity totaled $1.551 billion. During 2023, our Board of Directors declared regular quarterly cash dividends totaling $0.80 per share of common stock.
We monitor the capital levels of Northwest Bank to provide for current and future business opportunities and to meet regulatory guidelines for “well capitalized” institutions. Northwest Bank is required by the Pennsylvania Department of Banking and Securities and the FDIC to meet minimum capital adequacy requirements. At December 31, 2023, Northwest Bank exceeded all regulatory minimum capital requirements and is considered to be “well capitalized”. In addition, as of December 31, 2023, we were not aware of any recommendation by a regulatory authority that, if it were implemented, would have a material effect on liquidity, capital resources or operations.
Regulatory Capital Requirements. Northwest Bank is subject to minimum capital requirements established by the FDIC. See “Item 1. Business Supervision and Regulation — Capital Requirements and Prompt Corrective Action”. The following table summarizes Northwest Bank’s total shareholders’ equity, regulatory capital, total risk-based assets, and leverage and risk-based capital ratios at the dates indicated.
|
|
|
|
|
|
|
|
|
|
|
|
| |
At December 31, |
| |
2023 |
|
2022 |
| |
(Dollars in thousands) |
Total shareholders’equity (GAAP capital) |
$ |
1,516,850 |
|
|
1,562,610 |
|
| Add: Accumulated other comprehensive loss |
137,847 |
|
|
159,511 |
|
| Less: non-qualifying intangible assets |
(265,889) |
|
|
(269,159) |
|
| CET 1 capital |
1,388,808 |
|
|
1,452,962 |
|
| Additions to Tier 1 capital |
— |
|
|
— |
|
| Leverage or Tier 1 capital |
1,388,808 |
|
|
1,452,962 |
|
| Add: Tier 2 capital (1) |
131,928 |
|
|
115,240 |
|
| Total risk-based capital |
$ |
1,520,736 |
|
|
1,568,202 |
|
| Average assets for leverage ratio |
$ |
14,322,564 |
|
|
14,017,646 |
|
| Net risk-weighted assets including off-balance-sheet items |
$ |
11,211,971 |
|
|
10,659,180 |
|
|
|
|
|
| CET 1 capital ratio |
12.387 |
% |
|
13.631 |
% |
| Minimum requirement |
4.500 |
% |
|
4.500 |
% |
|
|
|
|
| Leverage capital ratio |
9.697 |
% |
|
10.365 |
% |
| Minimum requirement |
4.000 |
% |
|
4.000 |
% |
|
|
|
|
| Total risk-based capital ratio |
13.564 |
% |
|
14.712 |
% |
| Minimum requirement |
8.000 |
% |
|
8.000 |
% |
(1)Tier 2 capital consists of the allowance for credit losses, which is limited to 1.25% of total risk-weighted assets as detailed under the regulations of the FDIC, and 45% of pre-tax net unrealized gains on securities available-for-sale.
Northwest Bank is also subject to capital guidelines of the Pennsylvania Department of Banking. Although not adopted in regulation form, the Department of Banking requires 6% leverage capital and 10% total risk-based capital. See “Item 1. Business — Supervision and Regulation — Capital Requirements and Prompt Corrective Action”.
Contractual Obligations. We are obligated to make future payments according to various contracts. The following table presents the expected future payments of the contractual obligations aggregated by obligation type at December 31, 2023.
|
|
|
|
|
|
|
|
|
|
|
|
|
|
|
|
|
|
|
|
|
|
|
|
|
|
|
|
|
|
| |
Payments due |
| |
Less than
one year |
|
One year to
less than
three years |
|
Three years
to less than
five years |
|
Five years
or greater |
|
Total |
| |
(In thousands) |
| Supplemental Executive Retirement Plan (1) |
$ |
— |
|
|
— |
|
|
— |
|
|
1,021 |
|
|
1,021 |
|
| Term notes payable to the FHLB of Pittsburgh (2) |
338,500 |
|
|
— |
|
|
— |
|
|
— |
|
|
338,500 |
|
| Collateralized borrowings (2) |
35,495 |
|
|
— |
|
|
— |
|
|
— |
|
|
35,495 |
|
| Collateral received (2) |
24,900 |
|
|
— |
|
|
— |
|
|
— |
|
|
24,900 |
|
| Subordinated debentures (2) |
— |
|
|
— |
|
|
— |
|
|
114,800 |
|
|
114,800 |
|
| Junior subordinated debentures (2) |
— |
|
|
— |
|
|
— |
|
|
129,574 |
|
|
129,574 |
|
| Operating leases (3) |
6,153 |
|
|
11,768 |
|
|
11,572 |
|
|
63,147 |
|
|
92,640 |
|
| Total |
$ |
405,048 |
|
|
11,768 |
|
|
11,572 |
|
|
308,542 |
|
|
736,930 |
|
| Commitments to extend credit |
$ |
198,166 |
|
|
— |
|
|
— |
|
|
— |
|
|
198,166 |
|
(1)See Note 15 to the Consolidated Financial Statements, Employee Benefit Plans, for additional information.
(2)See Note 11 to the Consolidated Financial Statements, Borrowed Funds, for additional information.
(3)See Note 3 to the Consolidated Financial Statements, Leases, for additional information.
Impact of Inflation and Changing Prices. The Consolidated Financial Statements and notes thereto, presented elsewhere herein, have been prepared in accordance with United States generally accepted accounting principles, which require the measurement of financial position and operating results in terms of historical dollars without considering the change in the relative purchasing power of money over time and due to inflation. The impact of inflation is reflected in the increased cost of our operations. Unlike most industrial companies, nearly all of our assets and liabilities are monetary. As a result, interest rates have a greater impact on our performance than do the effects of general levels of inflation. Interest rates do not necessarily move in the same direction or to the same extent as the price of goods and services.
Off-Balance-Sheet Arrangements. As a financial services provider, we are routinely a party to various financial instruments with off-balance-sheet risks, such as commitments to extend credit and unused lines of credit. While these contractual obligations represent our future cash requirements, a significant portion of commitments to extend credit may expire without being drawn upon. Such commitments are subject to the same credit policies and approval process accorded to loans we make. In addition, we routinely enter into commitments to purchase and sell residential mortgage loans.
ITEM 7A. QUANTITATIVE AND QUALITATIVE DISCLOSURES ABOUT MARKET RISK
Market Risk Management
The matching of assets and liabilities may be analyzed by examining the extent to which such assets and liabilities are “interest rate sensitive” and by monitoring an institution’s interest rate sensitivity “gap”. An asset or liability is said to be interest rate sensitive within a specific time period if it will mature or re-price within that time period. The interest rate sensitivity gap is defined as the difference between the amount of interest-earning assets maturing or re-pricing within a specific time period and the amount of interest-bearing liabilities maturing or re-pricing within that same time period. A gap is considered positive when the amount of interest rate sensitive assets exceeds the amount of interest rate sensitive liabilities. A gap is considered negative when the amount of interest rate sensitive liabilities exceeds the amount of interest rate sensitive assets. During a period of rising interest rates, a negative gap would tend to adversely affect net interest income while a positive gap would tend to positively affect net interest income. Similarly, during a period of falling interest rates, a negative gap would tend to positively affect net interest income while a positive gap would tend to adversely affect net interest income.
Our practice is to reduce our exposure to interest rate risk generally by matching the maturities of our interest rate sensitive assets and liabilities and by increasing the interest rate sensitivity of our interest-earning assets. We purchase adjustable-rate investment securities and mortgage-backed securities, which at December 31, 2023, totaled $39.7 million, and originate adjustable-rate loans, which at December 31, 2023, totaled $4.032 billion or 35.5% of our gross loan portfolio. Of our $13.283 billion of interest-earning assets at December 31, 2023, $4.072 billion, or 30.7%, consisted of assets with adjustable rates of interest. When open market conditions are favorable, we also attempt to reduce interest rate risk by lengthening the maturities of our interest-bearing liabilities by using FHLB advances as a source of long-term fixed-rate funds, if necessary, and by promoting longer-term certificates of deposit. At times, the Company may also use derivatives to adjust our interest rate risk profile. As of December 31, 2023 we had $175 million of cash flow hedges.
At December 31, 2023, total interest-earning liabilities maturing or re-pricing within one year exceeded total interest-bearing assets maturing or re-pricing in the same period by $565.9 million, representing a negative one-year gap ratio of 3.92%.
The following table sets forth, on a carrying value basis, the amounts of interest-earning assets and interest-bearing liabilities outstanding at December 31, 2023, which are expected to re-price or mature, based upon certain assumptions, in each of the future time periods shown. Except as stated below, the amounts of assets and liabilities shown that re-price or mature during a particular period were determined in accordance with the earlier of the term of re-pricing or the contractual term of the asset or liability. We believe that these assumptions approximate the standards used in the financial services industry and consider them appropriate and reasonable.
|
|
|
|
|
|
|
|
|
|
|
|
|
|
|
|
|
|
|
|
|
|
|
|
|
|
|
|
|
|
|
|
|
|
|
|
| |
Amounts maturing or re-pricing |
| |
Within
1 year |
|
Over
1-3 years |
|
Over
3-5 years |
|
Over
5-10 years |
|
Over 10 years |
|
Total |
| |
(Dollars in thousands) |
| Rate-sensitive assets: |
|
|
|
|
|
|
|
|
|
|
|
| Interest-earning deposits |
$ |
78,689 |
|
|
— |
|
|
— |
|
|
— |
|
|
— |
|
|
78,689 |
|
| Mortgage-backed securities: |
|
|
|
|
|
|
|
|
|
|
|
| Fixed-rate |
208,684 |
|
|
340,821 |
|
|
282,156 |
|
|
443,672 |
|
|
246,467 |
|
|
1,521,800 |
|
| Variable-rate |
29,872 |
|
|
— |
|
|
— |
|
|
— |
|
|
— |
|
|
29,872 |
|
| Investment securities |
8,655 |
|
|
50,563 |
|
|
113,268 |
|
|
107,436 |
|
|
26,604 |
|
|
306,526 |
|
| Mortgage loans: |
|
|
|
|
|
|
|
|
|
|
|
| Adjustable-rate |
36,973 |
|
|
15,327 |
|
|
33,026 |
|
|
14,735 |
|
|
138 |
|
|
100,199 |
|
| Fixed-rate |
398,133 |
|
|
689,205 |
|
|
572,425 |
|
|
1,034,657 |
|
|
625,453 |
|
|
3,319,873 |
|
| Home equity loans: |
|
|
|
|
|
|
|
|
|
|
|
| Adjustable-rate |
403,123 |
|
|
— |
|
|
— |
|
|
— |
|
|
— |
|
|
403,123 |
|
| Fixed-rate |
125,323 |
|
|
215,899 |
|
|
178,363 |
|
|
262,420 |
|
|
38,034 |
|
|
820,039 |
|
| Consumer loans |
675,156 |
|
|
982,060 |
|
|
370,114 |
|
|
23,165 |
|
|
15,069 |
|
|
2,065,564 |
|
| Commercial real estate loans |
1,904,597 |
|
|
698,336 |
|
|
314,031 |
|
|
26,459 |
|
|
33,517 |
|
|
2,976,940 |
|
| Commercial loans |
1,062,508 |
|
|
389,577 |
|
|
175,187 |
|
|
14,761 |
|
|
18,698 |
|
|
1,660,731 |
|
| Total rate-sensitive assets |
4,931,713 |
|
|
3,381,788 |
|
|
2,038,570 |
|
|
1,927,305 |
|
|
1,003,980 |
|
|
13,283,356 |
|
|
|
|
|
|
|
|
|
|
|
|
|
| Rate-sensitive liabilities: |
|
|
|
|
|
|
|
|
|
|
|
| Time deposits |
2,465,478 |
|
|
97,076 |
|
|
37,142 |
|
|
2,922 |
|
|
263 |
|
|
2,602,881 |
|
| Money market demand accounts |
1,631,852 |
|
|
— |
|
|
— |
|
|
— |
|
|
336,366 |
|
|
1,968,218 |
|
| Savings deposits |
429,344 |
|
|
515,956 |
|
|
515,956 |
|
|
643,978 |
|
|
— |
|
|
2,105,234 |
|
| Interest-bearing demand deposits |
617,807 |
|
|
394,121 |
|
|
394,121 |
|
|
985,303 |
|
|
243,194 |
|
|
2,634,546 |
|
| FHLB Advances |
163,500 |
|
|
25,000 |
|
|
150,000 |
|
|
— |
|
|
— |
|
|
338,500 |
|
| Collateral |
24,900 |
|
|
— |
|
|
— |
|
|
— |
|
|
— |
|
|
24,900 |
|
| Other borrowings |
35,495 |
|
|
— |
|
|
— |
|
|
— |
|
|
— |
|
|
35,495 |
|
| Trust Preferred Securities |
129,574 |
|
|
— |
|
|
— |
|
|
— |
|
|
— |
|
|
129,574 |
|
| Subordinated debt |
(349) |
|
|
114,538 |
|
|
— |
|
|
— |
|
|
— |
|
|
114,189 |
|
| Total rate-sensitive liabilities |
$ |
5,497,601 |
|
|
1,146,691 |
|
|
1,097,219 |
|
|
1,632,203 |
|
|
579,823 |
|
|
9,953,537 |
|
|
|
|
|
|
|
|
|
|
|
|
|
| Cumulative interest sensitivity gap |
$ |
(565,888) |
|
|
1,669,209 |
|
|
2,610,560 |
|
|
2,905,662 |
|
|
3,329,819 |
|
|
3,329,819 |
|
|
|
|
|
|
|
|
|
|
|
|
|
Cumulative interest sensitivity gap as a
percentage of total assets |
(3.92) |
% |
|
11.58 |
% |
|
18.10 |
% |
|
20.15 |
% |
|
23.09 |
% |
|
23.09 |
% |
| Cumulative interest-earning assets as a percent of cumulative interest-bearing liabilities |
89.71 |
% |
|
125.12 |
% |
|
133.72 |
% |
|
131.00 |
% |
|
133.45 |
% |
|
133.45 |
% |
At December 31, 2022, we had a cumulative interest sensitivity gap as a percentage of total assets of 25.41%. We have an Asset/Liability Committee, consisting of members of management, which meets monthly to review market interest rates, economic conditions, the pricing of interest earning assets and interest bearing liabilities and our balance sheet structure. On a quarterly basis, this committee also reviews our interest rate risk position and our cash flow projections.
Our Board of Directors has a Risk Management Committee, which meets quarterly, and reviews interest rate risks and trends, our interest sensitivity position, our liquidity position and the market risk inherent in our investment portfolio.
In an effort to assess interest rate risk, we use a simulation model to determine the effect of immediate incremental increases and decreases in interest rates on net interest income, net income and the market value of our equity. Certain assumptions are made regarding loan prepayments and decay rates of savings and interest-bearing demand deposit accounts. Because it is difficult to accurately project the market reaction of depositors and borrowers, the effect of actual changes in interest rates on these assumptions may differ from simulated results.
We have established the following guidelines for assessing interest rate risk:
Net Interest Income Simulation. Given a parallel shift of 100 basis points (“bps”), 200 bps, and 300 bps in interest rates, the estimated net interest income may not decrease by more than 5%, 10%, and 15%, respectively, within a one-year period.
Net Income Simulation. Given a parallel shift of 100 bps, 200 bps, and 300 bps in interest rates, the estimated net income may not decrease by more than 10%, 20%, and 30%, respectively, within a one-year period.
Market Value of Equity Simulation. The market value of our equity is the present value of our assets and liabilities. Given a parallel shift of 100 bps, 200 bps, and 300 bps in interest rates, the market value of equity may not decrease by more than 15%, 30%, and 35%, respectively, from the computed economic value at current interest rate levels.
The following table illustrates the simulated impact of a parallel 100 bps, 200 bps or 300 bps upward or 100 bps, 200 bps, or 300 bps downward movement in interest rates on net interest income, net income, return on average equity, earnings per share, and market value of equity. These analyses were prepared assuming that total interest-earning asset and interest-bearing liability levels at December 31, 2023 remain constant. The impact of the rate movements was computed by simulating the effect of an immediate and sustained shift in interest rates over a twelve-month period from December 31, 2023 levels.
|
|
|
|
|
|
|
|
|
|
|
|
|
|
|
|
|
|
|
|
|
|
|
|
|
|
|
|
|
|
|
|
|
|
|
|
|
|
|
| |
|
Increase |
|
Decrease |
| Parallel shift in interest rates over the next 12 months |
|
100 bps |
|
200 bps |
|
300 bps |
|
100 bps |
|
200 bps |
|
300 bps |
| Projected percentage increase/(decrease) in net interest income |
|
(1.4) |
% |
|
(3.1) |
% |
|
(4.9) |
% |
|
(0.1) |
% |
|
(5.2) |
% |
|
(11.2) |
% |
| Projected percentage increase/(decrease) in net income |
|
(3.3) |
% |
|
(7.4) |
% |
|
(11.5) |
% |
|
(0.3) |
% |
|
(12.7) |
% |
|
(27.0) |
% |
| Projected increase/(decrease) in return on average equity |
|
(3.1) |
% |
|
(7.1) |
% |
|
(11.1) |
% |
|
(0.2) |
% |
|
(12.2) |
% |
|
(26.1) |
% |
| Projected increase/(decrease) in earnings per share |
|
$ |
(0.04) |
|
|
$ |
(0.08) |
|
|
$ |
(0.13) |
|
|
$ |
— |
|
|
$ |
(0.14) |
|
|
$ |
(0.29) |
|
| Projected percentage increase/(decrease) in market value of equity |
|
(8.6) |
% |
|
(17.2) |
% |
|
(25.3) |
% |
|
8.6 |
% |
|
10.8 |
% |
|
9.4 |
% |
The following table illustrates the simulated impact of a parallel 100 bps, 200 bps or 300 bps upward or 100 bps downward movement in interest rates on net interest income, net income, return on average equity, earnings per share, and market value of equity. These analyses were prepared assuming that total interest-earning asset and interest-bearing liability levels at December 31, 2022 remain constant. The impact of the rate movements was computed by simulating the effect of an immediate and sustained shift in interest rates over a twelve-month period from December 31, 2022 levels.
|
|
|
|
|
|
|
|
|
|
|
|
|
|
|
|
|
|
|
|
|
|
|
|
|
|
|
|
|
|
|
|
|
|
|
|
|
|
|
| |
|
Increase |
|
Decrease |
| Parallel shift in interest rates over the next 12 months |
|
100 bps |
|
200 bps |
|
300 bps |
|
100 bps |
|
200 bps |
|
300 bps |
| Projected percentage decrease in net interest income |
|
(1.3) |
% |
|
(2.7) |
% |
|
(4.3) |
% |
|
(5.0) |
% |
|
(10.8) |
% |
|
(16.9) |
% |
| Projected percentage decrease in net income |
|
(2.8) |
% |
|
(5.9) |
% |
|
(9.3) |
% |
|
(11.8) |
% |
|
(25.0) |
% |
|
(39.2) |
% |
| Projected decrease in return on average equity |
|
(2.6) |
% |
|
(5.6) |
% |
|
(8.9) |
% |
|
(11.2) |
% |
|
(24.0) |
% |
|
(37.9) |
% |
| Projected decrease in earnings per share |
|
$ |
(0.03) |
|
|
$ |
(0.07) |
|
|
$ |
(0.11) |
|
|
$ |
(0.14) |
|
|
$ |
(0.30) |
|
|
$ |
(0.48) |
|
| Projected percentage decrease in market value of equity |
|
(8.1) |
% |
|
(16.3) |
% |
|
(26.2) |
% |
|
2.6 |
% |
|
6.3 |
% |
|
7.1 |
% |
The figures included in the tables above represent projections that were computed based upon certain assumptions including loan prepayment rates and deposit decay rates. These assumptions are inherently uncertain and, as a result, we cannot precisely predict the impact of changes in interest rates. Actual results may differ significantly due to timing, magnitude and frequency of interest rate changes and changes in market conditions.
When assessing our interest rate sensitivity, analysis of historical trends indicates that loans will prepay at various speeds (or annual rates) depending on the variance between the weighted average portfolio rates and the current market rates. In preparing the table above, the following assumptions were used: (i) adjustable-rate mortgage loans will prepay at an annual rate of 8% to 23%; (ii) fixed-rate mortgage loans will prepay at an annual rate of 6% to 70%, depending on the type of loan; (iii) commercial loans will prepay at an annual rate of 10% to 30%; and (iv) consumer loans held by Northwest Bank will prepay at an annual rate of 13% to 23%. In regards to our deposits, it has been assumed that (i) fixed maturity deposits will not be withdrawn prior to maturity; (ii) a significant majority of money market accounts will re-price immediately; (iii) savings accounts will gradually re-price over three years; and (iv) checking accounts will re-price either when the rates on such accounts re-price as interest rate levels change, or when deposit holders withdraw funds from such accounts and select other types of deposit accounts, such as certificate accounts, which may have higher interest rates. For purposes of this analysis, management has estimated, based on historical trends, that $617.8 million, or 23.5%, of our interest-bearing demand accounts and $429.3 million, or 20.4%, of our savings deposits are interest sensitive and may re-price in one year or less, and that the remainder may re-price over longer time periods.
The above assumptions are annual percentages based on remaining balances and should not be regarded as indicative of the actual prepayments and withdrawals that we may experience. Moreover, certain shortcomings are inherent in the analysis presented by the foregoing table. For example, although certain assets and liabilities may have similar maturities or periods to re-pricing, they may react in different degrees to changes in market interest rates. Also, interest rates on certain types of assets and liabilities may fluctuate in advance of or lag behind changes in market interest rates. Additionally, certain assets, such as some adjustable-rate loans, have features that restrict changes in interest rates on a short-term basis and over the life of the asset. Moreover, in the event of a change in interest rates, prepayment and early withdrawal levels would likely deviate significantly from those assumed in preparing the table.
In addition, we regularly measure and monitor the market value of our net assets and the changes therein. While fluctuations are expected because of changes in interest rates, we have established policy limits for various interest rate scenarios. Given interest rate shocks of +100 to +300 bps and -100 to -300 bps the market value of net assets is not expected to decrease by more than 15% to 35%.
ITEM 8. FINANCIAL STATEMENTS AND SUPPLEMENTARY DATA
Management’s Report on Internal Control Over Financial Reporting
Management is responsible for establishing and maintaining adequate internal control over financial reporting, as such term is defined in Rule 13a-15(f) under the Securities Exchange Act of 1934.
Management, including the principal executive officer and principal financial officer, has assessed the effectiveness of the Company’s internal control over financial reporting as of December 31, 2023. In making this assessment, management used the criteria set forth by the Committee of Sponsoring Organizations of the Treadway Commission in Internal Control — Integrated Framework (2013). Based on such assessment, management concluded that, as of December 31, 2023, the Company’s internal control over financial reporting is effective based upon those criteria.
KPMG LLP, an independent registered public accounting firm, has audited the Consolidated Financial Statements included in this Report and has issued a report with respect to the effectiveness of the Company’s internal control over financial reporting.
|
|
|
|
|
|
|
|
|
| /s/ Louis J. Torchio |
|
/s/ William W. Harvey, Jr. |
| Louis J. Torchio, President and Chief Executive Officer (Principal Executive Officer) |
|
William W. Harvey, Jr., Senior Executive Vice President, Chief Operating Officer and Chief Financial Officer (Principal Financial Officer) |
Report of Independent Registered Public Accounting Firm
To the Shareholders and Board of Directors
Northwest Bancshares, Inc.:
Opinion on Internal Control Over Financial Reporting
We have audited Northwest Bancshares, Inc. and subsidiaries’ (the Company) internal control over financial reporting as of December 31, 2023, based on criteria established in Internal Control – Integrated Framework (2013) issued by the Committee of Sponsoring Organizations of the Treadway Commission. In our opinion, the Company maintained, in all material respects, effective internal control over financial reporting as of December 31, 2023, based on criteria established in Internal Control – Integrated Framework (2013) issued by the Committee of Sponsoring Organizations of the Treadway Commission.
We also have audited, in accordance with the standards of the Public Company Accounting Oversight Board (United States) (PCAOB), the consolidated statements of financial condition of the Company as of December 31, 2023 and 2022, the related consolidated statements of income, comprehensive income, changes in shareholders’ equity, and cash flows for each of the years in the three-year period ended December 31, 2023, and the related notes (collectively, the consolidated financial statements), and our report dated February 23, 2024 expressed an unqualified opinion on those consolidated financial statements.
Basis for Opinion
The Company’s management is responsible for maintaining effective internal control over financial reporting and for its assessment of the effectiveness of internal control over financial reporting, included in the accompanying Management’s Report on Internal Control Over Financial Reporting. Our responsibility is to express an opinion on the Company’s internal control over financial reporting based on our audit. We are a public accounting firm registered with the PCAOB and are required to be independent with respect to the Company in accordance with the U.S. federal securities laws and the applicable rules and regulations of the Securities and Exchange Commission and the PCAOB.
We conducted our audit in accordance with the standards of the PCAOB. Those standards require that we plan and perform the audit to obtain reasonable assurance about whether effective internal control over financial reporting was maintained in all material respects. Our audit of internal control over financial reporting included obtaining an understanding of internal control over financial reporting, assessing the risk that a material weakness exists, and testing and evaluating the design and operating effectiveness of internal control based on the assessed risk. Our audit also included performing such other procedures as we considered necessary in the circumstances. We believe that our audit provides a reasonable basis for our opinion.
Definition and Limitations of Internal Control Over Financial Reporting
A company’s internal control over financial reporting is a process designed to provide reasonable assurance regarding the reliability of financial reporting and the preparation of financial statements for external purposes in accordance with generally accepted accounting principles. A company’s internal control over financial reporting includes those policies and procedures that (1) pertain to the maintenance of records that, in reasonable detail, accurately and fairly reflect the transactions and dispositions of the assets of the company; (2) provide reasonable assurance that transactions are recorded as necessary to permit preparation of financial statements in accordance with generally accepted accounting principles, and that receipts and expenditures of the company are being made only in accordance with authorizations of management and directors of the company; and (3) provide reasonable assurance regarding prevention or timely detection of unauthorized acquisition, use, or disposition of the company’s assets that could have a material effect on the financial statements.
Because of its inherent limitations, internal control over financial reporting may not prevent or detect misstatements. Also, projections of any evaluation of effectiveness to future periods are subject to the risk that controls may become inadequate because of changes in conditions, or that the degree of compliance with the policies or procedures may deteriorate.
/s/ KPMG LLP
Pittsburgh, Pennsylvania
February 23, 2024
Report of Independent Registered Public Accounting Firm
To the Shareholders and Board of Directors
Northwest Bancshares, Inc.:
Opinion on the Consolidated Financial Statements
We have audited the accompanying consolidated statements of financial condition of Northwest Bancshares, Inc. and subsidiaries (the Company) as of December 31, 2023 and 2022, the related consolidated statements of income, comprehensive income, changes in shareholders’ equity, and cash flows for each of the years in the three-year period ended December 31, 2023, and the related notes (collectively, the consolidated financial statements). In our opinion, the consolidated financial statements present fairly, in all material respects, the financial position of the Company as of December 31, 2023 and 2022, and the results of its operations and its cash flows for each of the years in the three-year period ended December 31, 2023, in conformity with U.S. generally accepted accounting principles.
We also have audited, in accordance with the standards of the Public Company Accounting Oversight Board (United States) (PCAOB), the Company’s internal control over financial reporting as of December 31, 2023, based on criteria established in Internal Control – Integrated Framework (2013) issued by the Committee of Sponsoring Organizations of the Treadway Commission, and our report dated February 23, 2024 expressed an unqualified opinion on the effectiveness of the Company’s internal control over financial reporting.
Basis for Opinion
These consolidated financial statements are the responsibility of the Company’s management. Our responsibility is to express an opinion on these consolidated financial statements based on our audits. We are a public accounting firm registered with the PCAOB and are required to be independent with respect to the Company in accordance with the U.S. federal securities laws and the applicable rules and regulations of the Securities and Exchange Commission and the PCAOB.
We conducted our audits in accordance with the standards of the PCAOB. Those standards require that we plan and perform the audit to obtain reasonable assurance about whether the consolidated financial statements are free of material misstatement, whether due to error or fraud. Our audits included performing procedures to assess the risks of material misstatement of the consolidated financial statements, whether due to error or fraud, and performing procedures that respond to those risks. Such procedures included examining, on a test basis, evidence regarding the amounts and disclosures in the consolidated financial statements. Our audits also included evaluating the accounting principles used and significant estimates made by management, as well as evaluating the overall presentation of the consolidated financial statements. We believe that our audits provide a reasonable basis for our opinion.
Critical Audit Matter
The critical audit matter communicated below is a matter arising from the current period audit of the consolidated financial statements that was communicated or required to be communicated to the audit committee and that: (1) relates to accounts or disclosures that are material to the consolidated financial statements and (2) involved our especially challenging, subjective, or complex judgments. The communication of a critical audit matter does not alter in any way our opinion on the consolidated financial statements, taken as a whole, and we are not, by communicating the critical audit matter below, providing a separate opinion on the critical audit matter or on the accounts or disclosures to which it relates.
Allowance for credit losses for loans evaluated on a collective basis
As discussed in Notes 1 and 5 to the consolidated financial statements, the Company’s allowance for credit losses for loans held for investment was $125.2 million as of December 31, 2023, a portion of which included the measurement of expected credit losses on a collective (pool) basis for those loans that share similar risk characteristics. The expected credit loss methodologies incorporate probability of default (PD) and loss given default (LGD) models to determine a PD and LGD loss assumption which is applied to loan level exposures on an undiscounted basis over the contractual term of the loans, adjusted for prepayments, certain of which use a prepayment model. The Company uses a twenty-four month reasonable and supportable forecast period, which is based on a probability-weighted multiple macroeconomic forecast approach (macroeconomic forecasts) and reverts to historical average loss rates over a twelve-month period for the remaining life of the loans. The following methodologies were developed for each significant loan portfolio segment: (1) the allowance for credit losses within the residential mortgage and home equity loan portfolios are calculated using a PD, LGD and prepayment model adjusted for asset specific characteristics at the loan-level using projected default rates, prepayment rates, and severity rates as well as macroeconomic forecasts determined at the pool level; (2) the allowance for credit losses within the vehicle loan portfolio is calculated using a PD, LGD and prepayment model adjusted for asset specific characteristics at the loan-level using projected default rates and prepayment rates, as well as macroeconomic forecasts determined at the pool level; (3) the allowance for credit losses for commercial real estate small business and commercial small business loan portfolios are calculated using PD and LGD models at the borrower-level using both a regression model and a fractional logit model, as well as macroeconomic forecasts and expected prepayment rates at the pool level; and (4) the allowance for credit losses for the commercial real estate and commercial loan portfolios are calculated using PD and LGD models at the pool-level using projected default and severity rates as well as macroeconomic forecasts and expected prepayment rates determined at the pool level.
A portion of the collective ACL is comprised of adjustments to historical loss information for asset-specific risk characteristics to reflect the extent they do not exist in the historical loss information. These adjustments are based on qualitative factors not reflected in the quantitative models but are likely to impact the measurement of estimated credit losses.
We identified the assessment of the expected credit losses on a collective basis for all loans, except for consumer loans (the collective ACL) as a critical audit matter. A high degree of audit effort, including specialized skills and knowledge, and subjective and complex auditor judgment was involved in the assessment of the collective ACL due to significant measurement uncertainty. Specifically, the assessment encompassed the evaluation of the collective ACL methodologies, including the (1) PD, LGD and prepayment models and their significant assumptions, including the selection and weighting of the macroeconomic forecasts, and the reasonable and supportable forecast period, (2) adjustment for asset specific risk characteristics for residential mortgage, home equity and vehicle loans and (3) the qualitative factors and their significant assumptions. The assessment also included an evaluation of the conceptual soundness and performance of the models. In addition, auditor judgment was required to evaluate the sufficiency of audit evidence obtained.
The following are the primary procedures we performed to address this critical audit matter. We evaluated the design and tested the operating effectiveness of certain internal controls related to the Company’s collective ACL estimate, including controls over the:
•development of the collective ACL methodologies
•development of the small business banking PD, LGD and prepayment models
•continued use and conceptual soundness of the PD, LGD and prepayment models
•performance monitoring of the models
•determination and measurement of the significant assumptions used in the models
•determination of the qualitative factors, including the significant assumptions used in the measurement of the qualitative factors
•analysis of the collective ACL results, trends, and ratios.
We evaluated the Company’s process to develop the collective ACL estimate by testing certain sources of data, factors, and assumptions that the Company used, and considered the relevance and reliability of such data, factors, and assumptions. In addition, we involved credit risk professionals with specialized skills and knowledge, who assisted in:
•evaluating the Company’s collective ACL methodologies for compliance with U.S. generally accepted accounting principles
•evaluating judgments made by the Company relative to the development and performance testing of the model assumptions, inclusive of the metrics used for asset-specific risk characteristics for the mortgage, home equity, and vehicle models, by comparing them to relevant Company-specific metrics and trends and the applicable industry and regulatory practices
•assessing the conceptual soundness and performance testing of the model assumptions by inspecting the model documentation to determine whether the models are suitable for their intended use
•evaluating the selection and weighting of the macroeconomic forecasts, by comparing it to the Company’s business environment and relevant industry practices
•evaluating the length of the reasonable and supportable forecast period by comparing it to specific portfolio risk characteristics and trends
•evaluating the methodology used to develop the qualitative factors and the effect of certain factors on the collective ACL compared with relevant credit risk factors and consistency with credit trends.
We also assessed the sufficiency of the audit evidence obtained related to the collective ACL estimate by evaluating the cumulative results of the audit procedures, qualitative aspects of the Company’s accounting practices, and potential bias in the accounting estimate.
/s/ KPMG LLP
We have served as the Company’s auditor since 1963.
Pittsburgh, Pennsylvania
February 23, 2024
NORTHWEST BANCSHARES, INC. AND SUBSIDIARIES
CONSOLIDATED STATEMENTS OF FINANCIAL CONDITION
(in thousands, excluding share data)
|
|
|
|
|
|
|
|
|
|
|
|
| |
December 31, |
| |
2023 |
|
2022 |
| Assets |
|
|
|
| Cash and cash equivalents |
$ |
122,260 |
|
|
139,365 |
|
Marketable securities available-for-sale (amortized cost of $1,240,003 and $1,431,728, respectively) |
1,043,359 |
|
|
1,218,108 |
|
Marketable securities held-to-maturity (fair value of $699,506 and $751,384, respectively) |
814,839 |
|
|
881,249 |
|
| Total cash and cash equivalents and marketable securities |
1,980,458 |
|
|
2,238,722 |
|
|
|
|
|
| Loans held-for-sale |
8,768 |
|
|
9,913 |
|
| Loans held for investment |
11,406,041 |
|
|
10,910,539 |
|
| Allowance for credit losses |
(125,243) |
|
|
(118,036) |
|
| Loans receivable, net |
11,289,566 |
|
|
10,802,416 |
|
|
|
|
|
| FHLB stock, at cost |
30,146 |
|
|
40,143 |
|
| Accrued interest receivable |
47,353 |
|
|
35,528 |
|
| Real estate owned, net |
104 |
|
|
413 |
|
| Premises and equipment, net |
138,838 |
|
|
145,909 |
|
| Bank-owned life insurance |
251,895 |
|
|
255,062 |
|
| Goodwill |
380,997 |
|
|
380,997 |
|
| Other intangible assets, net |
5,290 |
|
|
8,560 |
|
| Other assets |
294,458 |
|
|
205,574 |
|
| Total assets |
$ |
14,419,105 |
|
|
14,113,324 |
|
|
|
|
|
| Liabilities and shareholders’ equity |
|
|
|
| Liabilities: |
|
|
|
| Deposits |
$ |
11,979,902 |
|
|
11,464,548 |
|
| Borrowed funds |
398,895 |
|
|
681,166 |
|
| Subordinated debt |
114,189 |
|
|
113,840 |
|
| Junior subordinated debentures |
129,574 |
|
|
129,314 |
|
| Advances by borrowers for taxes and insurance |
45,253 |
|
|
47,613 |
|
| Accrued interest payable |
13,669 |
|
|
3,231 |
|
| Other liabilities |
186,306 |
|
|
182,126 |
|
| Total liabilities |
12,867,788 |
|
|
12,621,838 |
|
|
|
|
|
| Shareholders’ equity: |
|
|
|
Preferred stock, $0.01 par value: 50,000,000 authorized, no shares issued |
— |
|
|
— |
|
Common stock, $0.01 par value: 500,000,000 shares authorized, 127,110,453 and 127,028,848 shares issued and outstanding, respectively |
1,271 |
|
|
1,270 |
|
| Additional paid-in capital |
1,024,852 |
|
|
1,019,647 |
|
| Retained earnings |
674,686 |
|
|
641,727 |
|
| Accumulated other comprehensive loss |
(149,492) |
|
|
(171,158) |
|
| Total shareholders’ equity |
1,551,317 |
|
|
1,491,486 |
|
| Total liabilities and shareholders’ equity |
$ |
14,419,105 |
|
|
14,113,324 |
|
See accompanying notes to Consolidated Financial Statements.
NORTHWEST BANCSHARES, INC. AND SUBSIDIARIES
CONSOLIDATED STATEMENTS OF INCOME
(in thousands, excluding share data)
|
|
|
|
|
|
|
|
|
|
|
|
|
|
|
|
|
|
| |
Years ended December 31, |
| |
2023 |
|
2022 |
|
2021 |
| Interest income: |
|
|
|
|
|
| Loans receivable |
$ |
543,659 |
|
|
407,828 |
|
|
390,343 |
|
| Mortgage-backed securities |
32,886 |
|
|
30,804 |
|
|
21,463 |
|
| Taxable investment securities |
3,258 |
|
|
3,070 |
|
|
2,616 |
|
| Tax-free investment securities |
2,350 |
|
|
2,767 |
|
|
2,485 |
|
| FHLB stock dividends |
2,868 |
|
|
730 |
|
|
407 |
|
| Interest-earning deposits |
2,901 |
|
|
3,599 |
|
|
1,194 |
|
| Total interest income |
587,922 |
|
|
448,798 |
|
|
418,508 |
|
| Interest expense: |
|
|
|
|
|
| Deposits |
105,343 |
|
|
14,120 |
|
|
19,122 |
|
| Borrowed funds |
46,896 |
|
|
13,997 |
|
|
8,124 |
|
| Total interest expense |
152,239 |
|
|
28,117 |
|
|
27,246 |
|
| Net interest income |
435,683 |
|
|
420,681 |
|
|
391,262 |
|
| Provision for credit losses - loans |
18,664 |
|
|
17,860 |
|
|
(11,883) |
|
| Provision for credit losses - unfunded commitments (1) |
4,210 |
|
|
10,455 |
|
|
(3,905) |
|
| Net interest income after provision for credit losses |
412,809 |
|
|
392,366 |
|
|
407,050 |
|
| Noninterest income: |
|
|
|
|
|
|
|
|
|
|
|
|
|
|
|
|
|
| Loss on sale of investments |
(8,307) |
|
|
(8) |
|
|
(176) |
|
| Gain on sale of mortgage servicing rights |
8,305 |
|
|
— |
|
|
— |
|
| Gain on sale of SBA loans |
1,800 |
|
|
— |
|
|
— |
|
| Gain on sale of loans |
726 |
|
|
— |
|
|
— |
|
| Service charges and fees |
59,214 |
|
|
55,188 |
|
|
51,837 |
|
| Trust and other financial services income |
27,284 |
|
|
27,765 |
|
|
27,921 |
|
| Insurance commission income |
— |
|
|
— |
|
|
3,633 |
|
| Gain on real estate owned, net |
2,006 |
|
|
603 |
|
|
442 |
|
| Income from bank-owned life insurance |
8,588 |
|
|
7,129 |
|
|
6,050 |
|
| Mortgage banking income |
2,431 |
|
|
4,865 |
|
|
15,892 |
|
| Gain on sale of insurance business |
— |
|
|
— |
|
|
25,327 |
|
| Other operating income |
11,776 |
|
|
15,307 |
|
|
11,963 |
|
| Total noninterest income |
113,823 |
|
|
110,849 |
|
|
142,889 |
|
| Noninterest expense: |
|
|
|
|
|
| Compensation and employee benefits |
195,691 |
|
|
188,359 |
|
|
193,887 |
|
| Premises and occupancy costs |
29,151 |
|
|
29,618 |
|
|
31,073 |
|
| Office operations |
12,955 |
|
|
13,318 |
|
|
13,769 |
|
| Collections expense |
1,695 |
|
|
1,808 |
|
|
1,932 |
|
| Processing expenses |
58,687 |
|
|
52,496 |
|
|
55,763 |
|
| Marketing expenses |
9,444 |
|
|
9,095 |
|
|
8,237 |
|
| Federal deposit insurance premiums |
9,271 |
|
|
4,778 |
|
|
4,975 |
|
| Professional services |
17,819 |
|
|
14,703 |
|
|
17,621 |
|
| Amortization of intangible assets |
3,270 |
|
|
4,277 |
|
|
5,553 |
|
| Real estate owned expense |
456 |
|
|
223 |
|
|
298 |
|
| Merger, asset disposition and restructuring expense |
6,749 |
|
|
5,617 |
|
|
3,453 |
|
|
|
|
|
|
|
| Other expenses |
6,366 |
|
|
5,231 |
|
|
12,254 |
|
| Total noninterest expense |
351,554 |
|
|
329,523 |
|
|
348,815 |
|
| Income before income taxes |
175,078 |
|
|
173,692 |
|
|
201,124 |
|
| Provision for income taxes: |
|
|
|
|
|
| Federal |
31,332 |
|
|
30,910 |
|
|
35,306 |
|
| State |
8,789 |
|
|
9,116 |
|
|
11,495 |
|
| Total provision for income taxes |
40,121 |
|
|
40,026 |
|
|
46,801 |
|
| Net income |
$ |
134,957 |
|
|
133,666 |
|
|
154,323 |
|
| Basic earnings per share |
$ |
1.06 |
|
|
1.05 |
|
|
1.22 |
|
| Diluted earnings per share |
$ |
1.06 |
|
|
1.05 |
|
|
1.21 |
|
(1) Reclassified from other expenses for periods prior to December 31, 2023
See accompanying notes to Consolidated Financial Statements.
NORTHWEST BANCSHARES, INC. AND SUBSIDIARIES
CONSOLIDATED STATEMENTS OF COMPREHENSIVE INCOME
(in thousands)
|
|
|
|
|
|
|
|
|
|
|
|
|
|
|
|
|
|
| |
Years ended December 31, |
| |
2023 |
|
2022 |
|
2021 |
| Net income |
$ |
134,957 |
|
|
133,666 |
|
|
154,323 |
|
| Other comprehensive income net of tax: |
|
|
|
|
|
| Net unrealized holding gains/(losses) on marketable securities: |
|
|
|
|
|
Unrealized holding gains/(losses), net of tax of $(3,429), $45,321, and $10,333, respectively |
7,875 |
|
|
(151,888) |
|
|
(28,873) |
|
Reclassification adjustment for losses/(gains) included in net income, net of tax of ($1,700), $0, and $92, respectively |
5,672 |
|
|
(1) |
|
|
(287) |
|
| Net unrealized holding gains/(losses) on marketable securities |
13,547 |
|
|
(151,889) |
|
|
(29,160) |
|
|
|
|
|
|
|
Change in fair value of interest rate swaps, net of tax of $110, $0, and $0, respectively |
(374) |
|
|
— |
|
|
— |
|
|
|
|
|
|
|
| Defined benefit plan: |
|
|
|
|
|
Net gain, net of tax $(3,961), $(7,182), $(9,144), respectively |
10,019 |
|
|
18,884 |
|
|
23,748 |
|
Reclassification adjustments for prior period service costs and actuarial (gains)/losses included in net income, net of tax of $607, $202, and $(515), respectively |
(1,526) |
|
|
(524) |
|
|
1,332 |
|
| Net gain on defined benefit plans |
8,493 |
|
|
18,360 |
|
|
25,080 |
|
|
|
|
|
|
|
| Other comprehensive income/(loss) |
21,666 |
|
|
(133,529) |
|
|
(4,080) |
|
|
|
|
|
|
|
| Total comprehensive income |
$ |
156,623 |
|
|
137 |
|
|
150,243 |
|
See accompanying notes to Consolidated Financial Statements.
NORTHWEST BANCSHARES, INC. AND SUBSIDIARIES
CONSOLIDATED STATEMENTS OF CHANGES IN SHAREHOLDERS’ EQUITY
(in thousands, excluding per share data)
|
|
|
|
|
|
|
|
|
|
|
|
|
|
|
|
|
|
|
|
|
|
|
|
|
|
|
|
|
|
|
|
|
Common
stock |
|
Additional paid-in
capital |
|
Retained
earnings |
|
Accumulated
other
comprehensive
income/(loss) |
|
|
|
Total
shareholders’
equity |
| Balance at December 31, 2020 |
$ |
1,270 |
|
|
1,015,502 |
|
|
555,480 |
|
|
(33,549) |
|
|
|
|
1,538,703 |
|
Comprehensive income: |
|
|
|
|
|
|
|
|
|
|
|
| Net income |
— |
|
|
— |
|
|
154,323 |
|
|
— |
|
|
|
|
154,323 |
|
Other comprehensive income, net of tax of $766 |
— |
|
|
— |
|
|
— |
|
|
(4,080) |
|
|
|
|
(4,080) |
|
| Total comprehensive income |
— |
|
|
— |
|
|
154,323 |
|
|
(4,080) |
|
|
|
|
150,243 |
|
|
|
|
|
|
|
|
|
|
|
|
|
|
|
|
|
|
|
|
|
|
|
|
|
| Exercise of stock options |
12 |
|
|
13,999 |
|
|
— |
|
|
— |
|
|
|
|
14,011 |
|
| Share repurchases |
(18) |
|
|
(23,836) |
|
|
— |
|
|
— |
|
|
|
|
(23,854) |
|
| Stock-based compensation expense |
3 |
|
|
4,739 |
|
|
— |
|
|
— |
|
|
|
|
4,742 |
|
| Stock-based compensation forfeited |
(1) |
|
|
1 |
|
|
— |
|
|
— |
|
|
|
|
— |
|
|
|
|
|
|
|
|
|
|
|
|
|
Dividends paid ($0.79 per share) |
— |
|
|
— |
|
|
(100,274) |
|
|
— |
|
|
|
|
(100,274) |
|
| Balance at December 31, 2021 |
1,266 |
|
|
1,010,405 |
|
|
609,529 |
|
|
(37,629) |
|
|
|
|
1,583,571 |
|
Comprehensive income: |
|
|
|
|
|
|
|
|
|
|
|
| Net income |
— |
|
|
— |
|
|
133,666 |
|
|
— |
|
|
|
|
133,666 |
|
Other comprehensive income, net of tax of $38,341 |
— |
|
|
— |
|
|
— |
|
|
(133,529) |
|
|
|
|
(133,529) |
|
| Total comprehensive income |
— |
|
|
— |
|
|
133,666 |
|
|
(133,529) |
|
|
|
|
137 |
|
|
|
|
|
|
|
|
|
|
|
|
|
|
|
|
|
|
|
|
|
|
|
|
|
| Exercise of stock options |
4 |
|
|
5,169 |
|
|
— |
|
|
— |
|
|
|
|
5,173 |
|
|
|
|
|
|
|
|
|
|
|
|
|
| Stock-based compensation expense |
1 |
|
|
4,073 |
|
|
— |
|
|
— |
|
|
|
|
4,074 |
|
| Stock-based compensation forfeited |
(1) |
|
|
— |
|
|
— |
|
|
— |
|
|
|
|
(1) |
|
|
|
|
|
|
|
|
|
|
|
|
|
Dividends paid ($0.80 per share) |
— |
|
|
— |
|
|
(101,468) |
|
|
— |
|
|
|
|
(101,468) |
|
| Balance at December 31, 2022 |
1,270 |
|
|
1,019,647 |
|
|
641,727 |
|
|
(171,158) |
|
|
|
|
1,491,486 |
|
Comprehensive income: |
|
|
|
|
|
|
|
|
|
|
|
| Net income |
— |
|
|
— |
|
|
134,957 |
|
|
— |
|
|
|
|
134,957 |
|
Other comprehensive income, net of tax of ($8,373) |
— |
|
|
— |
|
|
— |
|
|
21,666 |
|
|
|
|
21,666 |
|
| Total comprehensive income |
— |
|
|
— |
|
|
134,957 |
|
|
21,666 |
|
|
|
|
156,623 |
|
|
|
|
|
|
|
|
|
|
|
|
|
| Adoption of ASU No. 2022-02 |
— |
|
|
— |
|
|
(329) |
|
|
— |
|
|
|
|
(329) |
|
| Exercise of stock options |
1 |
|
|
629 |
|
|
— |
|
|
— |
|
|
|
|
630 |
|
|
|
|
|
|
|
|
|
|
|
|
|
| Stock-based compensation expense |
1 |
|
|
4,575 |
|
|
— |
|
|
— |
|
|
|
|
4,576 |
|
| Stock-based compensation forfeited |
(1) |
|
|
1 |
|
|
— |
|
|
— |
|
|
|
|
— |
|
|
|
|
|
|
|
|
|
|
|
|
|
Dividends paid ($0.80 per share) |
— |
|
|
— |
|
|
(101,669) |
|
|
— |
|
|
|
|
(101,669) |
|
| Balance at December 31, 2023 |
$ |
1,271 |
|
|
1,024,852 |
|
|
674,686 |
|
|
(149,492) |
|
|
|
|
1,551,317 |
|
See accompanying notes to Consolidated Financial Statements.
NORTHWEST BANCSHARES, INC. AND SUBSIDIARIES
CONSOLIDATED STATEMENTS OF CASH FLOWS
(in thousands)
|
|
|
|
|
|
|
|
|
|
|
|
|
|
|
|
|
|
| |
Years ended December 31, |
| |
2023 |
|
2022 |
|
2021 |
| Operating activities: |
|
|
|
|
|
| Net income |
$ |
134,957 |
|
|
133,666 |
|
|
154,323 |
|
| Adjustments to reconcile net income to net cash provided by operating activities: |
|
|
|
|
|
| Provision for credit losses |
22,874 |
|
|
28,315 |
|
|
(15,788) |
|
| Loss on sale of investments |
8,307 |
|
|
— |
|
|
— |
|
| Net loss/(gain) on sale of assets |
2,117 |
|
|
42 |
|
|
(1,201) |
|
| Mortgage banking activity |
(895) |
|
|
(3,512) |
|
|
(20,120) |
|
| Gain on sale of SBA loans |
(1,754) |
|
|
— |
|
|
— |
|
| Gain on sale of mortgage servicing rights |
(8,305) |
|
|
— |
|
|
— |
|
| Gain on sale of loans |
(726) |
|
|
— |
|
|
— |
|
| Gain on sale of insurance business |
— |
|
|
— |
|
|
(25,327) |
|
| Net depreciation, amortization and accretion |
24,497 |
|
|
6,448 |
|
|
6,633 |
|
| (Increase)/decrease in other assets |
(117,813) |
|
|
(33,751) |
|
|
22,163 |
|
| Increase in other liabilities |
21,771 |
|
|
19,775 |
|
|
7,930 |
|
| Net amortization on marketable securities |
3,090 |
|
|
4,808 |
|
|
7,757 |
|
| Noncash compensation expense related to stock benefit plans |
4,576 |
|
|
4,074 |
|
|
4,742 |
|
| Noncash write-down of real estate owned |
100 |
|
|
54 |
|
|
173 |
|
| Deferred income tax (benefit)/expense |
(4,920) |
|
|
(5,504) |
|
|
12,314 |
|
| Origination of loans held-for-sale |
(198,637) |
|
|
(362,867) |
|
|
(752,831) |
|
| Proceeds from sale of loans held-for-sale |
203,651 |
|
|
383,883 |
|
|
804,690 |
|
| Net cash provided by operating activities |
92,890 |
|
|
175,431 |
|
|
205,458 |
|
|
|
|
|
|
|
| Investing activities: |
|
|
|
|
|
| Purchase of marketable securities held-to-maturity |
— |
|
|
(212,892) |
|
|
(658,817) |
|
| Purchase of marketable securities available-for-sale |
(23,502) |
|
|
(102,178) |
|
|
(705,146) |
|
Proceeds from maturities and principal reductions of marketable securities
held-to-maturity |
65,588 |
|
|
98,701 |
|
|
68,495 |
|
Proceeds from maturities and principal reductions of marketable securities
available-for-sale |
103,424 |
|
|
231,728 |
|
|
449,372 |
|
| Proceeds from sale of marketable securities available-for-sale |
101,229 |
|
|
— |
|
|
59,579 |
|
| Proceeds from bank-owned life insurance |
13,307 |
|
|
5,096 |
|
|
3,984 |
|
| Proceeds from sale of mortgage servicing rights |
13,118 |
|
|
— |
|
|
— |
|
| Loan originations |
(3,963,743) |
|
|
(4,585,563) |
|
|
(3,961,816) |
|
| Loan purchases |
— |
|
|
(371,121) |
|
|
— |
|
| Proceeds from loan maturities and principal reductions |
3,446,731 |
|
|
4,047,147 |
|
|
4,490,089 |
|
|
|
|
|
|
|
| Net redemptions/(proceeds) of FHLB stock |
9,997 |
|
|
(25,959) |
|
|
7,564 |
|
| Proceeds from sale of real estate owned |
2,735 |
|
|
1,633 |
|
|
2,700 |
|
| Proceeds from sale of real estate owned for investment, net |
— |
|
|
305 |
|
|
305 |
|
| Purchases of premises and equipment |
(8,564) |
|
|
(4,320) |
|
|
(17,517) |
|
| Proceeds from sale of insurance business |
— |
|
|
— |
|
|
28,238 |
|
|
|
|
|
|
|
| Net cash used in investing activities |
(239,680) |
|
|
(917,423) |
|
|
(232,970) |
|
NORTHWEST BANCSHARES, INC.
CONSOLIDATED STATEMENTS OF CASH FLOWS
(in thousands)
|
|
|
|
|
|
|
|
|
|
|
|
|
|
|
|
|
|
| |
Years ended December 31, |
| |
2023 |
|
2022 |
|
2021 |
| Financing activities: |
|
|
|
|
|
| Net increase/(decrease) in deposits |
$ |
515,354 |
|
|
(836,617) |
|
|
701,932 |
|
|
|
|
|
|
|
| Repayments of long-term borrowings |
— |
|
|
(10,094) |
|
|
(22,105) |
|
| Net (decrease)/increase in short-term borrowings |
(282,270) |
|
|
542,073 |
|
|
1,432 |
|
| (Decrease)/increase in advances by borrowers for taxes and insurance |
(2,360) |
|
|
3,031 |
|
|
(648) |
|
|
|
|
|
|
|
|
|
|
|
|
|
| Cash dividends paid on common stock |
(101,669) |
|
|
(101,468) |
|
|
(100,274) |
|
| Proceeds from stock options exercised |
630 |
|
|
5,173 |
|
|
14,011 |
|
| Purchase of common stock for retirement |
— |
|
|
— |
|
|
(23,854) |
|
| Net cash provided by/(used in) financing activities |
129,685 |
|
|
(397,902) |
|
|
570,494 |
|
| Net (decrease)/increase in cash and cash equivalents |
$ |
(17,105) |
|
|
(1,139,894) |
|
|
542,982 |
|
|
|
|
|
|
|
| Cash and cash equivalents at beginning of period |
$ |
139,365 |
|
|
1,279,259 |
|
|
736,277 |
|
| Net (decrease)/increase in cash and cash equivalents |
(17,105) |
|
|
(1,139,894) |
|
|
542,982 |
|
| Cash and cash equivalents at end of period |
$ |
122,260 |
|
|
139,365 |
|
|
1,279,259 |
|
|
|
|
|
|
|
|
|
|
|
|
|
|
|
|
|
|
|
|
|
|
|
|
|
|
|
|
|
|
|
|
|
|
|
|
|
|
|
|
|
|
|
| Cash paid during the period for: |
|
|
|
|
|
Interest on deposits and borrowings (including interest credited to deposit accounts of $86,316, $13,399, and $18,711, respectively) |
$ |
141,801 |
|
|
26,690 |
|
|
27,496 |
|
| Income taxes |
47,996 |
|
|
39,365 |
|
|
33,576 |
|
|
|
|
|
|
|
|
|
|
|
|
|
|
|
|
|
|
|
|
|
|
|
|
|
|
|
|
|
|
|
|
|
|
|
|
|
|
|
|
|
|
|
| Noncash activities: |
|
|
|
|
|
| Loan foreclosures and repossessions |
$ |
4,055 |
|
|
4,076 |
|
|
4,897 |
|
| Sale of real estate owned financed by the Company |
70 |
|
|
175 |
|
|
54 |
|
See accompanying notes to Consolidated Financial Statements.
NORTHWEST BANCSHARES, INC. AND SUBSIDIARIES
NOTES TO CONSOLIDATED FINANCIAL STATEMENTS
December 31, 2023, 2022 and 2021
(1) Summary of Significant Accounting Policies
(a) Nature of Operations
Northwest Bancshares, Inc., a Maryland corporation headquartered in Columbus, Ohio, is the bank holding company for its wholly owned subsidiary, Northwest Bank. Northwest Bank, a Pennsylvania chartered savings bank, offers a complete line of business and personal banking products, as well as treasury management solutions and wealth management services through its 142 banking locations in Pennsylvania, New York, Ohio, and Indiana. We have determined that we have one reportable business segment.
(b) Principles of Consolidation
The Consolidated Financial Statements include the accounts of the Company and its wholly owned subsidiaries after elimination of all intercompany accounts and transactions.
(c) Cash and Cash Equivalents
For purposes of the statements of financial condition and cash flows, cash and cash equivalents include cash and amounts due from banks, interest-bearing deposits in other financial institutions, federal funds sold, and other short-term investments with original maturities of three months or less.
(d) Marketable Securities
We classify marketable securities at the time of purchase as held-to-maturity, available-for-sale, or trading. Securities for which management has the intent and ability to hold until maturity are classified as held-to-maturity and are carried at cost, adjusted for amortization of premiums and accretion of discounts on a level yield basis (amortized cost). If it is management’s intent at the time of purchase to hold securities for an indefinite period of time and/or to use such securities as part of its asset/liability management strategy, the securities are classified as available-for-sale and are carried at fair value, with unrealized gains and losses reported as accumulated other comprehensive income/(loss), a separate component of shareholders’ equity, net of tax. Securities classified as available-for-sale include securities that may be sold in response to changes in interest rates, resultant prepayment risk, or other market factors. Securities that are bought and held principally for the purpose of selling them in the near term are classified as trading and are reported at fair value, with changes in fair value included in earnings. The cost of securities sold is determined on a specific identification basis. We held no securities classified as trading at or during the years ended December 31, 2023 and 2022. Fair values are determined as described in Note 16. Throughout the year we validate the prices received from third parties by comparing them to prices provided by a different independent pricing service. We have reviewed the detailed valuation methodologies provided to us by our pricing services.
On a quarterly basis, we measure expected credit losses on held-to-maturity debt securities on a collective basis by major security type and all of our held-to-maturity debt securities are residential mortgage-backed securities. Accrued interest receivable on held-to-maturity debt securities totaled $2.5 million and $2.8 million at December 31, 2023 and December 31, 2022, respectively, and is excluded from estimated credit losses. All of our residential mortgage-backed securities are issued by U.S. government entities and agencies. These securities are either explicitly or implicitly guaranteed by the U.S. government, are highly rated by major rating agencies and have a long history of no credit losses.
For available-for-sale debt securities in an unrealized loss position, on at least a quarterly basis, we review our investments for impairment. An investment security is deemed impaired if the fair value of the investment is less than its amortized cost. We consider both our intent to sell and the likelihood that we will not have to sell the investment securities before recovery of their amortized cost basis during our evaluation. If we intend to sell the investment security or if it is more likely than not that we will be required to sell the investment security, the entire impairment is recorded in earnings. For available-for-sale debt securities that do not meet this criteria, we evaluate whether the decline in fair value has resulted from credit losses or other factors. In making this assessment we consider the issuer of the securities and their creditworthiness, any changes to the rating of the security and any adverse conditions specifically related to the security, among other factors. Also, we may evaluate the business and financial outlook of the issuer, as well as broader economic performance indicators. If this assessment indicates that a credit loss exists, the present value of cash flows expected to be collected from the security is compared to the amortized cost basis of the security. If the present value of cash flows expected to be collected is less than the amortized cost basis, a credit loss exists and an allowance for credit losses is recorded for the credit loss, limited by the amount that the fair value is less than amortized cost.
NORTHWEST BANCSHARES, INC. AND SUBSIDIARIES
NOTES TO CONSOLIDATED FINANCIAL STATEMENTS
December 31, 2023, 2022 and 2021
Any impairment that has not been recorded through an allowance for credit losses is recognized in other comprehensive income.
Changes in the allowance for credit losses are recorded as provision for (or reversal of) credit loss expense. Losses are charged against the allowance when we believe the uncollectibility of an available-for-sale security is confirmed or when there is an intent or requirement to sell the security.
Accrued interest receivable on available-for-sale debt securities totaled $1.6 million and $2.0 million at December 31, 2023 and December 31, 2022, respectively, and is excluded from the estimate of credit losses.
A debt security is placed on nonaccrual status at the time any principal or interest payments become 90 days past due. The receivable for interest income that is accrued but not collected is reversed against interest income when the debt security is placed on nonaccrual status. No debt securities were on nonaccrual status as of December 31, 2023 and December 31, 2022.
(e) Loans Receivable
Our portfolio segments are based on the class of financing receivable. Additionally, the class of financing receivables are based on several factors including the method for monitoring and assessing credit risk and the risk characteristics of the financing receivables. Based on evaluation of the nature of our financing receivables, along with the nature and extent of exposure to credit risk arising from these receivables, our portfolio segments were determined to be Personal Banking and Business Banking loans.
•Personal Banking loans consist of the following classes of financing receivables:
◦Residential mortgage loans - fixed and adjustable rate mortgage loans
◦Home equity loans - first and second mortgage loans and home equity lines of credit
◦Vehicle loans - direct and indirect automobile and motorcycle loans
◦Consumer loans - unsecured lines of credit, credit card loans, and other consumer loans
•Business Banking loans consist of the following classes of financing receivables:
◦Commercial real estate - multi-family commercial real estate loans are secured by multi-family residences, such as rental properties and loans secured by nonresidential properties such as hotels, commercial offices, medical buildings, manufacturing facilities and retail establishments, excluding owner-occupied loans, and including small business commercial real estate loans
◦Commercial real estate - owner-occupied loans - commercial real estate loans secured by residential or non-residential properties
◦Commercial loans - other commercial loans, including small business commercial loans and equipment finance loans
Loans are reported at amortized cost. Amortized cost is the principal balance outstanding, net of any deferred purchased premiums and discounts, deferred origination fees or costs and the allowance for credit losses. Accrued interest receivable totaled $42.2 million and $30.4 million at December 31, 2023 and December 31, 2022, respectively, and was reported in accrued interest receivable on the Consolidated Statements of Financial Condition. Accrued interest receivable is excluded from the amortized cost basis of loans and from the estimate of allowance for credit losses. Interest income on loans is credited to income as earned. Interest earned on loans for which no payments were received during the month is accrued at month end.
Generally, accrued interest on loans more than 90 days delinquent is reversed and such loans are placed on nonaccrual status, except for credit card loans which are not placed in nonaccrual status based on delinquency. All loans are placed on nonaccrual status when principal or interest is 90 days or more delinquent or when there is reasonable doubt that interest or principal will not be collected in accordance with the contractual terms. Interest receipts on all nonaccrual loans are recognized as interest income when it has been determined that all principal and interest will be collected or are applied to principal when collectability of contractual principal is in doubt. Nonaccrual loans generally are restored to an accrual basis when principal and interest become current and a period of performance has been established in accordance with the contractual terms, typically six months.
Occasionally, the Company modifies loans to borrowers in financial distress by providing principal forgiveness, term extensions, an other-than-insignificant payment delay, or interest rate reduction. When principal forgiveness is provided, the amount of forgiveness is charged off against the allowance for credit losses.
NORTHWEST BANCSHARES, INC. AND SUBSIDIARIES
NOTES TO CONSOLIDATED FINANCIAL STATEMENTS
December 31, 2023, 2022 and 2021
Loan delinquency is measured based on the number of days since the payment due date. Past due status is measured using the loan’s contractual maturity date.
Personal Banking loans are charged-off or charged down when they become 180 days delinquent, unless the borrower has filed for bankruptcy. Business Banking loans are charged-off or charged down when, in our opinion, they are no longer collectible or when it has been determined that the collateral value no longer supports the carrying value of the loan for loans that are collateral dependent.
Loan fees and certain direct loan origination costs are deferred and the net deferred fee or cost is then recognized using the level-yield method over the contractual life of the loan as an adjustment to interest income.
We identify certain residential mortgage loans and small business administration guaranteed loans which will be sold prior to maturity, as loans held-for-sale. These loans are recorded at fair value less estimated cost to sell. At December 31, 2023 and 2022, there were $8.8 million and $9.9 million of loans classified as held-for-sale, respectively.
Acquired loans that are not considered purchased with credit deterioration (“PCD”) are initially measured at fair value with no carryover of the related allowance for credit losses. Determining the fair value of the loans involves estimating the amount and timing of principal and interest cash flows expected to be collected on the loans and discounting those cash flows at a market rate of interest.
Acquired loans may be classified as PCD loans upon acquisition if they have experienced more than insignificant credit deterioration since origination. Loans are considered to have experienced more than insignificant credit deterioration if they are greater than 30 days past due, classified special mention or worse or on nonaccrual status. An allowance for credit losses on day 1 is determined using the same methodology as other loans held for investment. The initial allowance for credit losses determined on a collective basis is allocated to individual loans. The allowance is recognized on day 1 by adding it to the fair value of the loan, which is the “Day 1 amortized cost”. There is no credit loss expense recognized on PCD loans because the initial allowance is established by grossing-up the amortized cost of the PCD loan. The difference between the initial amortized cost basis and the par value of the loan is a noncredit discount or premium, which is amortized into interest income over the life of the loan. Subsequent changes to the allowance for credit losses are recorded through provision expense.
(f) Allowance for Credit Losses and Provision for Credit Losses
The allowance for credit losses is deducted from, or added to, the loan’s amortized cost basis to present the net amount expected to be collected on our lending portfolios. We estimate the allowance balance using relevant available information, from internal and external sources, relating to past events, current conditions and reasonable and supportable forecasts. Loans are charged off against the allowance when we believe that a loan balance is confirmed to be uncollectible. Expected recoveries do not exceed the aggregate of amounts previously charged-off and expected to be charged-off.
Expected credit losses are estimated over the contractual term of the loans, adjusted for prepayments. The contractual term excludes expected extensions, renewals and modifications or the extension or renewal option is included in the contract and is not unconditionally cancellable by the Company.
Credit card receivables do not have stated maturities. In determining the estimated life of a credit card receivable, we first estimate the future cash flows expected to be received and then apply those expected future cash flows to the credit card balance.
The allowance for credit losses is measured on a collective (“pool”) basis when similar risk characteristics exist. For the purpose of calculating portfolio-level reserves, we have grouped our loans into seven segments: residential mortgage loans, home equity loans, vehicle loans, consumer loans, commercial real estate loans, commercial real estate owner-occupied and commercial loans. The allowance for credit losses is measured at the pool level utilizing loan-level inputs wherever possible. We use a twenty-four month forecasting period and revert to historical average loss rates thereafter. The reasonable and supportable forecast is based on a probability-weighted multiple macroeconomic forecast approach and obtained from a third party vendor. Reversion to the mean takes place over a twelve-month period. Our loss rate models utilize a linear reversion method. For our probability of default (“PD”)/loss given default (“LGD”) models we revert the PD utilizing exponential reversion, which is an accelerated method, and the LGD utilizing a linear reversion method. Historical average loss rates are calculated using historical data beginning in 2009 through the current period. As part of the analysis as of December 31, 2023, we considered the most recent macroeconomic forecasts available.
NORTHWEST BANCSHARES, INC. AND SUBSIDIARIES
NOTES TO CONSOLIDATED FINANCIAL STATEMENTS
December 31, 2023, 2022 and 2021
Mortgage and Home Equity Loans
The allowance for credit losses within the mortgage and home equity loan pools is calculated using a non-discounted cash flow method through a PD, LGD, and prepayment model developed by an external third-party and adjusted for asset specific characteristics. These classes are further divided into smaller pools of loans with similar risk characteristics such as: lines versus loans, fixed versus variable, senior lien position versus junior lien position, among other things.
For each pool, the models project default rates, prepayment rates, and severity rates. The models accept as inputs key risk drivers such as: current balance, original credit bureau score, original loan-to-value ratio, type of collateral, location of collateral, delinquency status, loan age, among other characteristics. They also utilize macroeconomic forecasts of home price indices, unemployment rates, gross domestic product, and others.
Vehicle Loans
The allowance for credit losses within the vehicle loan pool is calculated using a non-discounted cash flow model through a PD, LGD, and prepayment model developed by an external third-party and adjusted for asset specific risk characteristics. These classes are further divided into smaller pools of loans with similar risk characteristics such as: cars, trucks and powersport vehicles and recreational vehicles. Monthly probabilities of default and prepayments are estimated for each loan, along with estimates of exposure at default and loss given default. The model accepts as inputs key risk drivers such as loan, borrower, and collateral characteristics. It also uses macroeconomic forecasts of used car price indices, gross domestic product, unemployment rates and others.
Consumer Loans
The allowance for credit losses within the consumer loan portfolio is calculated at the portfolio-level using a non-discounted cash flow method through a suite of loss rate models developed internally with the assistance of an external third-party. This class of financing receivables is further divided into credit cards, unsecured lines of credit and other consumer loans.
The allowance for credit losses for credit cards and unsecured lines of credit is calculated using two transition matrix models to project portfolio-level net charge-off rates. Both models use current balance and delinquency status as key risk drivers. These models are not natively sensitive to macroeconomic forecasts. The necessary adjustments to account for current and expected macroeconomic conditions is captured via our qualitative adjustment framework.
For other consumer loans, a regression model is used to project portfolio-level net charge-off rates. This model uses borrower information and macroeconomic forecasts as key inputs.
Commercial Real Estate Loans
The commercial real estate loan class is further segmented into smaller pools of loans with similar risk characteristics, commercial real estate loans and small business commercial real estate loans.
The allowance for credit losses for the commercial real estate loan portfolio is calculated at the pool level using a non-discounted cash flow method through a PD/LGD model developed by an external third-party. This model projects default and severity rates. The model accepts as inputs key risk drivers such as: current balance, original loan-to-value-ratio, type of collateral, location of collateral, delinquency status, loan age, obligor financial statement information, and expected prepayment rates, among other characteristics. It also utilizes macroeconomic forecasts of commercial real estate price indices, unemployment rates, gross domestic product and others.
The allowance for credit losses for commercial real estate small business portfolio is calculated at a borrower-level with a PD/LGD model. Separate models were built by industry segment. Each model was built with a logistic regression model except for the U.S. Small Business Administration (SBA) and Agriculture sub-portfolios. For SBA, a portfolio-level fractional logit model was developed; the small Agriculture segment uses a simple long-run average loss rate. The LGD model is assumption-based and assigns varying LGDs by industry segment. The models’ overall key inputs are borrower and collateral characteristics and macroeconomic forecasts including real GDP, unemployment, home price appreciation, and real disposable personal income.
NORTHWEST BANCSHARES, INC. AND SUBSIDIARIES
NOTES TO CONSOLIDATED FINANCIAL STATEMENTS
December 31, 2023, 2022 and 2021
Commercial Loans and Commercial Real Estate - Owner Occupied Loans
The commercial loan class is further segmented into smaller pools of loans with similar risk characteristics, commercial loans and commercial small business loans, including equipment finance loans.
The allowance for credit losses for the commercial loan portfolio and the commercial real estate - owner occupied loan portfolio is calculated at the pool level using a non-discounted cash flow method through a PD/LGD model developed by an external third-party. The commercial loan portfolio and the commercial real estate owner occupied loan portfolio models project default and severity rates. The model accepts as inputs key risk drivers such as the obligor financial statement information, collateral type, the obligor’s primary industry, expected prepayment rates, among other characteristics. It also utilizes macroeconomic forecasts of unemployment rates, gross domestic product, corporate bond spreads, and others.
The allowance for credit losses for commercial small business loans is calculated at a borrower-level with a PD/LGD model. Separate models were built by industry segment. Each model was built with a logistic regression model except for the U.S. Small Business Administration (SBA) and Agriculture sub-portfolios. For SBA, a portfolio-level fractional logit model was developed; the small Agriculture segment uses a simple long-run average loss rate. The LGD model is assumption-based and assigns varying LGDs by industry segment. The models’ overall key inputs are borrower and collateral characteristics and macroeconomic forecasts including real GDP, unemployment, home price appreciation, and real disposable personal income.
Loans that do not share risk characteristics are evaluated on an individual basis. Loans evaluated individually are not also included in the collective evaluation. When we determine that foreclosure is probable or when the borrower is experiencing financial difficulty at the reporting date and repayment is expected to be provided substantially through the operation or sale of the collateral, expected credit losses are based on the fair value of the collateral at the reporting date, adjusted for selling costs. If this criteria is not met, a discounted cash flow method is used to determine the allowance for credit losses. All changes in the discounted cash flow method over time are reported in the allowance for credit losses.
The allowance calculation is also supplemented with qualitative reserves that takes into consideration the current portfolio and specific risk characteristics, such as changes in underwriting standards, portfolio mix, delinquency level, or term, as well as changes in environmental conditions, among other factors, that have occurred but are not yet reflected in the quantitative model component.
The modifications to borrowers experiencing financial distress are included in their respective portfolio segment and the current loan balance and updated loan terms are run through their respective allowance models to arrive at the quantitative portion of the allowance for credit losses. Subsequent performance of the loans will be measured by delinquency status and will be captured through our models or our qualitative factor assessment, as deemed appropriate. If we no longer believe the loan demonstrates similar risks to their respective portfolio segment, an individual assessment will be performed. Upon the Company’s determination that a modified loan (or portion of a loan) has subsequently been deemed uncollectible, the loan (or a portion of the loan) is written off. Therefore, the amortized cost basis of the loan is reduced by the uncollectible amount and the allowance for credit losses is adjusted by the same amount.
For off-balance-sheet credit exposures, we estimate expected credit losses over the contractual period in which we are exposed to credit risk via a contractual obligation to extend credit, unless that obligation is unconditionally cancellable. The liability for credit losses on off-balance-sheet credit exposures is adjusted through a provision for credit loss - unfunded commitments expense on the Consolidated Statements of Income. We estimate the liability balance using relevant available information, from internal and external sources, relating to past events, current conditions and reasonable and supportable forecasts. The estimate includes a consideration of the likelihood that funding will occur and an estimate of expected credit losses on commitments expected to be funded over its estimated life. Off-balance-sheet exposures that are not unconditionally cancellable have been identified for the mortgage, home equity, commercial real estate, and commercial loan portfolios.
(g) Real Estate Owned
Real estate owned is comprised of property either acquired through foreclosure or voluntarily conveyed by borrowers. These assets are recorded on the date acquired at the lower of the loan balance or fair value of the collateral, less estimated disposition costs, with the fair value being determined by an appraisal. Any initial write-down is charged to the allowance for credit losses. Subsequently, foreclosed assets are valued at the lower of the amount recorded at acquisition date or the current fair value, less estimated disposition costs.
NORTHWEST BANCSHARES, INC. AND SUBSIDIARIES
NOTES TO CONSOLIDATED FINANCIAL STATEMENTS
December 31, 2023, 2022 and 2021
Any subsequent write-down or gains or losses realized from the disposition of such property are credited or charged to noninterest income.
(h) Restricted Investment in FHLB Stock
Federal law requires a member institution of the FHLB system to hold stock of its district FHLB according to a predetermined formula. FHLB stock is carried at cost and evaluated for impairment based on the ultimate recoverability of the par value. FHLB stock can only be purchased, redeemed and transferred at par value. Dividends are reported in interest income in the Consolidated Statements of Income.
(i) Premises and Equipment
Premises and equipment are carried at cost, less accumulated depreciation and amortization. Depreciation is accumulated on a straight-line basis over the estimated useful lives of the related assets. Estimated lives range from three to 39 years. Amortization of leasehold improvements is accumulated on a straight-line basis over the terms of the related leases or the useful lives of the related assets, whichever is shorter.
(j) Goodwill
Goodwill is generated from the premium paid for an acquisition and is allocated to reporting units, which are either our reportable segments or one level below. Reporting units are identified based upon analyzing each individual operating segment. A reporting unit is defined as a distinct, separately identifiable component of an operating segment for which complete, discrete financial information is available that management regularly reviews.
Goodwill is not subject to amortization but is tested for impairment at least annually and possibly more frequently if certain events occur or changes in circumstances arise. In testing goodwill for impairment, we have the option to first assess qualitative factors to determine whether it is more likely than not that the fair value of a reporting unit is less than its carrying value. If, after assessing all events and circumstances, we determine it is not more likely than not that the fair value of a reporting unit is less than its carrying value, then performing the two-step impairment test would be unnecessary. However, if we conclude otherwise, it would then be required to perform the first step of the goodwill impairment test and continue to the second step, if necessary. Step 1 requires the fair value of each reporting unit be compared to its carrying amount, including goodwill. Determining the fair value of a reporting unit requires a high degree of subjective judgment, including developing cash flow projections, selecting appropriate discount rates, identifying relevant market comparables, incorporating general economic and market conditions and selecting an appropriate control premium. We have established June 30 of each year as the date for conducting our annual goodwill impairment assessment. Quarterly, we evaluate if there are any triggering events that would require an update to our previous assessment.
We conducted our annual impairment assessment as of June 30, 2023 by first performing a qualitative assessment of goodwill to determine if it was more likely than not that the fair value was less than the carrying value. In performing a qualitative analysis, factors considered include, but are not limited to, macroeconomic conditions, industry and market conditions and overall financial performance. The results of the qualitative assessment for 2023 indicated that it was not more likely than not that the fair value of the reporting unit was less than the carrying value. Consequently, no additional quantitative impairment test was required and no impairment was recorded in 2023. Future events could cause us to conclude that goodwill has become impaired, which would result in recording an impairment loss. There were no events or changes in circumstance in our operations that would cause us to update the assessment performed as of June 30, 2023 and 2022. Accordingly, we have determined that goodwill is not impaired as of December 31, 2023 and 2022.
(k) Core Deposit and Other Identifiable Intangibles
Through the assistance of an independent third party, we analyze and prepare a core deposit study for all bank acquisitions or other identifiable intangible asset study, such as customer lists, for all non-bank acquisitions. The core deposit study reflects the cumulative present value benefit of acquiring deposits versus an alternative source of funding. The other identifiable intangible asset study reflects the cumulative present value benefit of acquiring the income stream from an existing customer base versus developing new business relationships. Based upon analysis, the amount of the premium related to the core deposits or other identifiable intangibles of the business purchased is calculated along with the estimated life of the intangible. The intangible, which is recorded in other intangible assets, is then amortized to expense on an accelerated basis over an approximate life of typically between seven to eleven years.
NORTHWEST BANCSHARES, INC. AND SUBSIDIARIES
NOTES TO CONSOLIDATED FINANCIAL STATEMENTS
December 31, 2023, 2022 and 2021
(l) Bank-Owned Life Insurance
We own insurance on the lives of a certain group of current and former employees and directors. The policies were purchased to help offset the increase in the costs of various benefit plans, including healthcare, as well as the directors deferred compensation plan. The cash surrender value of these policies is included as an asset on the Consolidated Statements of Financial Condition and any increases in the cash surrender value are recorded as tax-free noninterest income on the Consolidated Statements of Income. In the event of the death of an insured individual covered by these policies, after distribution to the insured’s beneficiaries, if any, we receive a tax-free death benefit, which is recorded as noninterest income.
(m) Deposits
Interest on deposits is accrued and charged to expense monthly and is paid or credited in accordance with the terms of the accounts.
(n) Revenue Recognition
Revenue that is not associated with our financial assets and financial liabilities is recognized when performance obligations under the terms of a contract with our customers are satisfied. Revenue is measured as the amount of consideration we expect to receive in exchange for transferring goods or providing services. The majority of our revenue continues to be recognized at the point in time when the services are provided to our customers.
(o) Pension Plans
We maintain multiple noncontributory defined benefit pension plans (“Pension Plan”) for substantially all of our employees. The net periodic pension cost has been calculated using service cost, interest cost, expected returns on plan assets and net amortization. The other components of the net periodic benefit cost are included in other expense on the Consolidated Statement of Income and are reported separately from the service costs.
Pension expense and obligations depend on assumptions used in calculating such amounts. These assumptions include discount rates, anticipated salary increases, interest costs, expected return on plan assets, mortality rates, and other factors. In determining the projected benefit obligations for pension benefits at December 31, 2023 and 2022, we used a discount rate of 4.79% and 4.99%, respectively. We use the FTSE (previously Citigroup) Pension Liability Index rates matching the duration of our benefit payments as of the measurement date, December 31, to determine the discount rate.
(p) Income Taxes
We join with our wholly owned subsidiaries in filing a consolidated federal income tax return. In accordance with an intercompany tax allocation agreement, the applicable federal income tax expense or benefit is allocated to each subsidiary based upon taxable income or loss calculated on a separate company basis. Each subsidiary is responsible for payment of its own federal income tax liability or receives reimbursement of federal income tax benefit. In addition, deferred taxes are calculated and maintained on a separate company basis.
We account for income taxes under the asset and liability method. The objective of the asset and liability method is to establish deferred tax assets and liabilities for temporary differences between the financial reporting and tax basis of our assets and liabilities based on the tax rates expected to be in effect when such amounts are realized or settled. The effect on deferred tax assets and liabilities with regard to a change in tax rates is recognized in the tax provision in the period the change is enacted. If current available information raises doubt as to the realization of the deferred tax assets, a valuation allowance is established.
(q) Stock-Related Compensation
Stock-based compensation awards granted, comprised of performance and time-based restricted stock units, stock options, and restricted stock awards, are valued at fair value and compensation cost is recognized on a straight-line basis over the requisite service or performance period of each award. For service-based awards compensation will be recognized pro rata over the periods in which the shares vest. For performance-based awards, compensation expense is recognized evenly over the performance period, based on the probability of the achievements of the performance conditions set forth in the plans. Forfeitures are recognized as they occur. For restricted stock awards, the recipients are entitled to all shareholder rights, except that the shares may not be sold, pledged, or otherwise disposed of and are required to be held in a trust.
NORTHWEST BANCSHARES, INC. AND SUBSIDIARIES
NOTES TO CONSOLIDATED FINANCIAL STATEMENTS
December 31, 2023, 2022 and 2021
For restricted stock units and performance stock units, the recipients are not entitled to any of the shareholder rights.
We determine the fair value of each option award, estimated on the grant date, using the Black-Scholes-Merton option-pricing model. The Black-Scholes-Merton option-pricing model uses variables including expected volatilities, expected term, risk-free discount rate and annual rate of quarterly dividends. Expected volatilities are based on historical volatility of the Company’s stock. The expected terms are based upon actual exercise and forfeiture experience of previous option grants. The risk-free rate is based on yields on U.S. Treasury securities of a similar maturity to the expected term of the options. During the years ended December 31, 2023 and 2022 we awarded no stock options to employees or directors. New shares are issued when options are exercised. Option awards are generally granted with an exercise price equal to the closing market price of the Company’s stock on the day before the grant date.
Stock-based employee compensation expense related to common share awards of $4.3 million, $2.8 million and $4.1 million was included in income before income taxes during the years ended December 31, 2023, 2022 and 2021, respectively. The effect on net income for the years ended December 31, 2023, 2022 and 2021 was a reduction of $3.1 million, $2.0 million and $2.9 million, respectively. Total compensation expense for unvested stock options of $332,000 has yet to be recognized as of December 31, 2023. The weighted average period over which this remaining stock option expense will be recognized is approximately 3.08 years. For additional information regarding grants of stock options and common shares, see Note 15.
(r) Derivative Financial Instruments
We recognize all derivative financial instruments as either assets or liabilities in the balance sheet and measure those instruments at fair value. The accounting for changes in the fair value of a derivative depends on the intended use of the derivative and the resulting designation. To qualify for hedge accounting rules, a hedging relationship must be highly effective in offsetting the risk designation as being hedge. The hedging relationship must be formally documented at inception and assess the hedging relationship at least on a quarterly basis to ensure the hedging instrument continues to be highly effective over the life of the hedging relationship. Those methods must be consistent with our approach to managing risk.
At times, we utilize interest rate swap agreements as part of the management of interest rate risk to hedge the interest rate risk on floating rate borrowings. Amounts receivable or payable are recognized as accrued under the terms of the agreements and the differential is recorded as an adjustment to interest expense. The interest rate swaps are designated as cash flow hedges, with the derivative’s unrealized gain or loss recorded as a component of other comprehensive income which is subsequently reclassified into earnings in the period that the hedged forecasted transaction affects earnings. A hedging relationship that is determined to not be highly effective no longer qualifies for hedge accounting and must be de-designated. Any gain or loss is recognized immediately in earnings.
We act as an interest rate or foreign exchange swap counterparty for certain commercial borrowers in the normal course of servicing our customers, which are accounted for at fair value. We manage our exposure to such interest rate or foreign exchange swaps by entering into corresponding and offsetting interest rate swaps with third parties that mirror the terms of the swaps we have with the commercial borrowers. These positions (referred to as “customer swaps”) directly offset each other and our exposure is the fair value of the derivatives due to changes in credit risk of our commercial borrowers and third parties. Customer swaps are recorded within other assets or other liabilities on the consolidated statement of financial condition at their estimated fair value. Changes to the fair value of assets and liabilities arising from these derivatives are included, net, in other operating income in the Consolidated Statement of Income.
(s) Off-Balance-Sheet Instruments
In the normal course of business, we extend credit in the form of loan commitments, undisbursed lines of credit, and standby letters of credit. These off-balance-sheet instruments involve, to various degrees, elements of credit and interest rate risk not reported in the Consolidated Statements of Financial Condition. We utilize the same underwriting standards for these instruments as other extensions of credit.
(t) Leases
At inception, the Company determines if an arrangement contains a lease and whether that lease meets the classification of a finance or operating lease. Operating lease right of use (“ROU”) assets represent our right to use an underlying asset during the lease term and operating lease liabilities represent our obligation to make lease payments arising from the lease. ROU assets and operating lease liabilities are recognized at lease commencement based on the present value of the remaining lease payments.
NORTHWEST BANCSHARES, INC. AND SUBSIDIARIES
NOTES TO CONSOLIDATED FINANCIAL STATEMENTS
December 31, 2023, 2022 and 2021
ROU assets are further adjusted for lease incentives and initial direct costs.
The Company has operating leases for certain branch and office facilities or land with lease terms up to 35 years. These leases generally contain renewal options for periods ranging from one to ten years. These options are included in the lease term when it is reasonably certain that the options will be exercised.
Some of the Company’s lease arrangements contain lease components (e.g., minimum rent payments) and non-lease components (e.g., common area maintenance, taxes, etc.). For all leases, the Company elected the option of not separating lease and non-lease components and instead we account for them as a single lease component.
Certain lease agreements include rental payments that are adjusted periodically for an index or rate. The leases are initially measured using the projected adjustment for the index or rate in effect at the commencement date. The Company’s lease agreements do not contain any material residual value guarantees or material restrictive covenants.
Generally, the Company cannot practically determine the interest rate implicit in the lease. Therefore, the Company uses its incremental borrowing rate as the discount rate for the lease. The Company’s incremental borrowing rate for a lease is the rate of interest it would have to pay on a collateralized basis to borrow an amount equal to the lease payments under similar terms.
(u) Use of Estimates
The preparation of financial statements, in conformity with accounting principles generally accepted in the United States of America, requires management to make estimates and assumptions that affect the reported amounts of assets and liabilities, disclosure of contingent assets and liabilities at the date of the financial statements, and the reported amount of revenues and expenses during the reporting period. The estimate and assumptions that we deem important to our financial statements relate to the allowance for credit losses. This estimate and assumptions are based on management’s best estimates and judgment and we evaluate them using historical experience and other factors, including the current economic environment. We adjust our estimates and assumptions when facts and circumstances dictate. As future events cannot be determined, actual results could differ significantly from our estimates.
(v) Reclassification of Prior Years’ Statements
Certain items previously reported have been reclassified to conform with the current year’s reporting format. These reclassifications had no effect on the reported results of operations. An adjustment has been made to the Consolidated Statements of Income and Consolidated Statements of Cash Flows for the years ended December 31, 2022 and December 31, 2021, to reclassify the provision for credit losses - unfunded commitments, previously presented in other expense, to provide additional transparency to financial statement users.
(2) Recently Adopted Accounting Standards
In March 2022, the Financial Accounting Standards Board (“FASB”) issued Accounting Standards Update (“ASU”) No. 2022-02, “Financial Instruments - Credit Losses (Topic 326): Troubled Debt Restructurings and Vintage Disclosure.” This ASU eliminates the accounting guidance for troubled debt restructurings (“TDRs”), while enhancing disclosure requirements for certain loan modifications when a borrower is experiencing financial difficulty. This ASU also requires the disclosure of current period gross write-offs by year for origination for financing receivables. This guidance is effective for annual periods beginning after December 15, 2022, including interim periods within those years, with early adoption permitted. This ASU is applied prospectively to modifications and write-offs beginning on the first day of the fiscal year of adoption. An entity may elect to adopt a modified retrospective transition method on the recognition and measurement of the TDR guidance.
We adopted ASU 2022-02 using a modified retrospective transition approach related to the recognition and measurement of the TDR guidance and on a prospective basis for modification and write-offs. As a result, the Company was not required to adjust its comparative period financial information for effects of the standard or make the new required ASU 2022-02 disclosure for periods before the date of adoption (i.e. January 1, 2023). This change did not have a material effect on our consolidated financial statements.
In March 2020, the FASB issued ASU No. 2020-04, “Facilitation of the Effects of Reference Rate Reform on Financial Reporting.” This ASU provides temporary optional guidance on contract modifications and hedge accounting to ease the financial reporting burdens of the expected market transition from LIBOR and other interbank offered rates to alternative reference rates. The guidance provides expedients and exceptions for applying GAAP to transactions affected by reference rate reform if certain criteria are met.
NORTHWEST BANCSHARES, INC. AND SUBSIDIARIES
NOTES TO CONSOLIDATED FINANCIAL STATEMENTS
December 31, 2023, 2022 and 2021
The amendments primarily include contract modifications and hedge accounting, as well as providing a one-time election for the sale or transfer of debt securities classified as held-to-maturity. This guidance was effective as of March 12, 2020 through December 31, 2022. In December 2022, the FASB issued ASU No. 2022-06, “Reference Rate Reform (Topic 848): Deferral of the Sunset Date to Topic 848”. This guidance extends the guidance of ASU 2022-04 from December 31, 2022 to December 31, 2024. In January 2021, the FASB issued ASU No. 2021-01, “Reference Rate Reform.” This ASU provides amendments, which are elective, and apply to all entities that have derivative instruments that use an interest rate for margining, discounting or contract price alignment of certain derivative instruments that are modified as a result of the reference rate reform. This ASU is effective upon issuance through December 31, 2024, and can be adopted at any time during this period.
During the current year, we completed our LIBOR transition plan and modified the Company’s loan and other financial instrument contracts that are impacted by the transition. The Company chose the Secured Overnight Financing Rate (“SOFR”) as its alternative replacement for LIBOR on both back-to-back swaps and variable rate loans. There was no material impact to the Company’s financial statements as a result of the transition.
(3) Leases
Lease expense for these leases is recognized on a straight-line basis over the lease term, with variable lease payments recognized in the period those payments are incurred. The components of lease cost recognized within our Consolidated Statements of Income were as follows:
|
|
|
|
|
|
|
|
|
|
|
|
|
|
|
|
|
|
|
|
|
| |
|
For the years ended December 31, |
|
|
2023 |
|
2022 |
|
2021 |
| Operating lease costs (office operations) |
|
$ |
6,529 |
|
|
6,201 |
|
5,802 |
| Variable lease costs (office operations) |
|
863 |
|
|
677 |
|
662 |
| Total operating lease costs |
|
$ |
7,392 |
|
|
6,878 |
|
6,464 |
Amounts reported in the Consolidated Statements of Financial Condition were as follows:
|
|
|
|
|
|
|
|
|
|
|
|
|
|
|
|
|
For the years ended December 31, |
|
|
2023 |
|
2022 |
| Operating leases: |
|
|
|
|
| Operating lease ROU assets (other assets) |
|
$ |
61,727 |
|
|
54,925 |
| Operating lease liabilities (other liabilities) |
|
64,723 |
|
|
57,737 |
|
Other information related to leases were as follows:
|
|
|
|
|
|
|
|
|
|
|
|
|
|
|
|
|
For the years ended December 31, |
|
|
2023 |
|
2022 |
| Supplemental cash flow information |
|
|
|
|
| Cash paid for amounts included in the measurement of lease liabilities: |
|
|
|
|
| Operating cash flow from operating leases |
|
$ |
5,941 |
|
6,207 |
| ROU assets obtained in exchange for lease obligations |
|
13,736 |
|
5,588 |
| Weighted average remaining lease term |
|
16.6 years |
|
15.6 years |
| Weighted average discount rate |
|
4.2 |
% |
|
3.2 |
% |
NORTHWEST BANCSHARES, INC. AND SUBSIDIARIES
NOTES TO CONSOLIDATED FINANCIAL STATEMENTS
December 31, 2023, 2022 and 2021
Amounts disclosed for ROU assets obtained in exchange for lease obligations include amounts added to the carrying amount of ROU assets resulting from lease modifications and reassessments.
Maturities of lease liabilities by fiscal year for our operating leases are as follows:
|
|
|
|
|
|
|
|
|
|
|
As of December 31, 2023 |
| 2024 |
|
$ |
6,153 |
|
| 2025 |
|
5,912 |
|
| 2026 |
|
5,856 |
|
| 2027 |
|
5,786 |
|
| 2028 |
|
5,786 |
|
| Thereafter |
|
63,147 |
|
| Total lease payments |
|
92,640 |
|
| Less amount of lease payments representing interest |
|
27,917 |
|
| Total present value of lease payments |
|
$ |
64,723 |
|
Rental expense for the years ended December 31, 2023, 2022 and 2021 was $7.4 million, $6.9 million and $6.5 million, respectively.
(4) Marketable Securities
Marketable securities available-for-sale at December 31, 2023 are as follows:
|
|
|
|
|
|
|
|
|
|
|
|
|
|
|
|
|
|
|
|
|
|
|
|
|
Amortized cost |
|
Gross unrealized
holding gains |
|
Gross unrealized
holding losses |
|
Fair value |
| Debt issued by the U.S. government and agencies: |
|
|
|
|
|
|
|
| Due after one year through five years |
$ |
20,000 |
|
|
— |
|
|
(1,135) |
|
|
18,865 |
|
| Due after ten years |
49,383 |
|
|
— |
|
|
(9,934) |
|
|
39,449 |
|
|
|
|
|
|
|
|
|
| Debt issued by government-sponsored enterprises: |
|
|
|
|
|
|
|
|
|
|
|
|
|
|
|
| Due after one year through five years |
45,986 |
|
|
— |
|
|
(5,763) |
|
|
40,223 |
|
| Due after five years through ten years |
386 |
|
|
— |
|
|
(12) |
|
|
374 |
|
|
|
|
|
|
|
|
|
|
|
|
|
|
|
|
|
|
|
|
|
|
|
|
|
|
|
|
|
|
|
|
|
| Municipal securities: |
|
|
|
|
|
|
|
|
|
|
|
|
|
|
|
| Due after one year through five years |
4,279 |
|
|
22 |
|
|
(427) |
|
|
3,874 |
|
| Due after five years through ten years |
20,725 |
|
|
— |
|
|
(1,437) |
|
|
19,288 |
|
| Due after ten years |
60,762 |
|
|
125 |
|
|
(8,580) |
|
|
52,307 |
|
|
|
|
|
|
|
|
|
| Corporate debt issues: |
|
|
|
|
|
|
|
| Due after five years through ten years |
8,466 |
|
|
— |
|
|
(778) |
|
|
7,688 |
|
|
|
|
|
|
|
|
|
| Residential mortgage-backed securities: |
|
|
|
|
|
|
|
| Fixed rate pass-through |
209,069 |
|
|
27 |
|
|
(25,222) |
|
|
183,874 |
|
| Variable rate pass-through |
7,140 |
|
|
11 |
|
|
(71) |
|
|
7,080 |
|
|
|
|
|
|
|
|
|
| Fixed rate agency CMOs |
789,842 |
|
|
— |
|
|
(143,055) |
|
|
646,787 |
|
| Variable rate agency CMOs |
23,965 |
|
|
38 |
|
|
(453) |
|
|
23,550 |
|
| Total residential mortgage-backed securities |
1,030,016 |
|
|
76 |
|
|
(168,801) |
|
|
861,291 |
|
| Total marketable securities available-for-sale |
$ |
1,240,003 |
|
|
223 |
|
|
(196,867) |
|
|
1,043,359 |
|
NORTHWEST BANCSHARES, INC. AND SUBSIDIARIES
NOTES TO CONSOLIDATED FINANCIAL STATEMENTS
December 31, 2023, 2022 and 2021
Marketable securities held-to-maturity at December 31, 2023 are as follows:
|
|
|
|
|
|
|
|
|
|
|
|
|
|
|
|
|
|
|
|
|
|
|
|
|
Amortized cost |
|
Gross unrealized
holding gains |
|
Gross unrealized
holding losses |
|
Fair value |
| Debt issued by government-sponsored enterprises: |
|
|
|
|
|
|
|
| Due after one year through five years |
$ |
69,471 |
|
|
— |
|
|
(8,100) |
|
|
61,371 |
|
| Due after five years through ten years |
54,987 |
|
|
— |
|
|
(8,700) |
|
|
46,287 |
|
|
|
|
|
|
|
|
|
| Residential mortgage-backed securities: |
|
|
|
|
|
|
|
| Fixed rate pass-through |
147,874 |
|
|
— |
|
|
(20,834) |
|
|
127,040 |
|
| Variable rate pass-through |
449 |
|
|
1 |
|
|
— |
|
|
450 |
|
| Fixed rate agency CMOs |
541,529 |
|
|
— |
|
|
(77,694) |
|
|
463,835 |
|
| Variable rate agency CMOs |
529 |
|
|
— |
|
|
(6) |
|
|
523 |
|
| Total residential mortgage-backed securities |
690,381 |
|
|
1 |
|
|
(98,534) |
|
|
591,848 |
|
| Total marketable securities held-to-maturity |
$ |
814,839 |
|
|
1 |
|
|
(115,334) |
|
|
699,506 |
|
Marketable securities available-for-sale at December 31, 2022 are as follows:
|
|
|
|
|
|
|
|
|
|
|
|
|
|
|
|
|
|
|
|
|
|
|
|
|
|
|
|
|
|
|
Amortized cost |
|
Gross unrealized
holding gains |
|
Gross unrealized
holding losses |
|
Fair value |
|
|
| Debt issued by the U.S. government and agencies: |
|
|
|
|
|
|
|
|
|
| Due after one year through five years |
$ |
20,000 |
|
|
— |
|
|
(1,799) |
|
|
18,201 |
|
|
|
| Due after ten years |
53,152 |
|
|
— |
|
|
(10,761) |
|
|
42,391 |
|
|
|
|
|
|
|
|
|
|
|
|
|
| Debt issued by government-sponsored enterprises: |
|
|
|
|
|
|
|
|
|
|
|
|
|
|
|
|
|
|
|
| Due after one year through five years |
993 |
|
|
— |
|
|
(49) |
|
|
944 |
|
|
|
| Due after five years through ten years |
45,814 |
|
|
— |
|
|
(7,557) |
|
|
38,257 |
|
|
|
|
|
|
|
|
|
|
|
|
|
|
|
|
|
|
|
|
|
|
|
|
|
|
|
|
|
|
|
|
|
|
|
|
|
|
|
|
|
|
|
| Municipal securities: |
|
|
|
|
|
|
|
|
|
| Due within one year |
506 |
|
|
— |
|
|
(1) |
|
|
505 |
|
|
|
| Due after one year through five years |
986 |
|
|
21 |
|
|
(13) |
|
|
994 |
|
|
|
| Due after five years through ten years |
36,332 |
|
|
— |
|
|
(2,290) |
|
|
34,042 |
|
|
|
| Due after ten years |
89,631 |
|
|
8 |
|
|
(13,414) |
|
|
76,225 |
|
|
|
|
|
|
|
|
|
|
|
|
|
| Corporate debt issues: |
|
|
|
|
|
|
|
|
|
| Due after five years through ten years |
13,540 |
|
|
— |
|
|
(562) |
|
|
12,978 |
|
|
|
|
|
|
|
|
|
|
|
|
|
| Residential mortgage-backed securities: |
|
|
|
|
|
|
|
|
|
| Fixed rate pass-through |
227,122 |
|
|
35 |
|
|
(31,171) |
|
|
195,986 |
|
|
|
| Variable rate pass-through |
8,837 |
|
|
10 |
|
|
(184) |
|
|
8,663 |
|
|
|
|
|
|
|
|
|
|
|
|
|
| Fixed rate agency CMOs |
906,962 |
|
|
— |
|
|
(145,284) |
|
|
761,678 |
|
|
|
| Variable rate agency CMOs |
27,853 |
|
|
31 |
|
|
(640) |
|
|
27,244 |
|
|
|
| Total residential mortgage-backed securities |
1,170,774 |
|
|
76 |
|
|
(177,279) |
|
|
993,571 |
|
|
|
| Total marketable securities available-for-sale |
$ |
1,431,728 |
|
|
105 |
|
|
(213,725) |
|
|
1,218,108 |
|
|
|
NORTHWEST BANCSHARES, INC. AND SUBSIDIARIES
NOTES TO CONSOLIDATED FINANCIAL STATEMENTS
December 31, 2023, 2022 and 2021
Marketable securities held-to-maturity at December 31, 2022 are as follows:
|
|
|
|
|
|
|
|
|
|
|
|
|
|
|
|
|
|
|
|
|
|
|
|
|
Amortized cost |
|
Gross unrealized
holding gains |
|
Gross unrealized
holding losses |
|
Fair value |
| Debt issued by the U.S. government and agencies: |
|
|
|
|
|
|
|
| Due after one year through five years |
$ |
29,478 |
|
|
— |
|
|
(3,676) |
|
|
25,802 |
|
| Due after five years through ten years |
94,977 |
|
|
— |
|
|
(18,157) |
|
|
76,820 |
|
|
|
|
|
|
|
|
|
| Residential mortgage-backed securities: |
|
|
|
|
|
|
|
| Fixed rate pass-through |
163,196 |
|
|
— |
|
|
(24,684) |
|
|
138,512 |
|
| Variable rate pass-through |
542 |
|
|
— |
|
|
(12) |
|
|
530 |
|
| Fixed rate agency CMOs |
592,527 |
|
|
— |
|
|
(83,325) |
|
|
509,202 |
|
| Variable rate agency CMOs |
529 |
|
|
— |
|
|
(11) |
|
|
518 |
|
| Total residential mortgage-backed securities |
756,794 |
|
|
— |
|
|
(108,032) |
|
|
648,762 |
|
| Total marketable securities held-to-maturity |
$ |
881,249 |
|
|
— |
|
|
(129,865) |
|
|
751,384 |
|
The following table shows the contractual maturity of our residential mortgage-backed securities available-for-sale at December 31, 2023:
|
|
|
|
|
|
|
|
|
|
|
|
|
Amortized cost |
|
Fair value |
| Residential mortgage-backed securities: |
|
|
|
| Due within one year |
$ |
167 |
|
|
166 |
|
| Due after one year through five years |
23,946 |
|
|
22,391 |
|
| Due after five years through ten years |
27,806 |
|
|
26,111 |
|
| Due after ten years |
978,097 |
|
|
812,623 |
|
| Total residential mortgage-backed securities |
$ |
1,030,016 |
|
|
861,291 |
|
The following table shows the contractual maturity of our residential mortgage-backed securities held-to-maturity at December 31, 2023:
|
|
|
|
|
|
|
|
|
|
|
|
|
Amortized cost |
|
Fair value |
| Residential mortgage-backed securities: |
|
|
|
| Due after one year through five years |
$ |
20,261 |
|
|
17,861 |
|
| Due after five years through ten years |
20,217 |
|
|
16,308 |
|
| Due after ten years |
649,903 |
|
|
557,679 |
|
| Total residential mortgage-backed securities |
$ |
690,381 |
|
|
591,848 |
|
The following table presents information regarding the issuers and the carrying values of our residential mortgage-backed securities at December 31, 2023 and 2022:
|
|
|
|
|
|
|
|
|
|
|
|
| |
December 31, |
| |
2023 |
|
2022 |
| Residential mortgage-backed securities: |
|
|
|
| FNMA |
$ |
568,160 |
|
|
651,404 |
|
| GNMA |
407,441 |
|
|
438,193 |
|
| FHLMC |
576,066 |
|
|
660,762 |
|
|
|
|
|
| Other (including non-agency) |
5 |
|
|
6 |
|
| Total residential mortgage-backed securities |
$ |
1,551,672 |
|
|
1,750,365 |
|
Marketable securities having a carrying value of $368.5 million at December 31, 2023 were pledged under collateral agreements. During the year ended December 31, 2023, we sold marketable securities classified as available-for-sale for $101.2 million, with gross realized gains of $9,000 and gross realized losses of $8.3 million. During the year ended December 31, 2022, there were no sales of marketable securities classified as available-for-sale. During the year ended December 31, 2021, we sold marketable securities classified as available-for-sale for $59.6 million, with gross realized gains of $410,000 and gross realized losses of $396,000. During the years ended December 31, 2023, 2022, and 2021, we did not recognize an allowance for credit losses in our investment portfolio.
NORTHWEST BANCSHARES, INC. AND SUBSIDIARIES
NOTES TO CONSOLIDATED FINANCIAL STATEMENTS
December 31, 2023, 2022 and 2021
The following table shows the fair value and gross unrealized losses on available for sale investment securities and held to maturity investment securities, for which an allowance for credit losses has not been recorded, aggregated by investment category and length of time that the individual securities have been in a continuous unrealized loss position at December 31, 2023:
|
|
|
|
|
|
|
|
|
|
|
|
|
|
|
|
|
|
|
|
|
|
|
|
|
|
|
|
|
|
|
|
|
|
|
|
| |
Less than 12 months |
|
12 months or more |
|
Total |
| |
Fair value |
|
Unrealized
loss |
|
Fair value |
|
Unrealized
loss |
|
Fair value |
|
Unrealized
loss |
| U.S. government-sponsored enterprises |
$ |
— |
|
|
— |
|
|
206,569 |
|
|
(33,644) |
|
|
206,569 |
|
|
(33,644) |
|
| Corporate debt issues |
— |
|
|
— |
|
|
7,688 |
|
|
(778) |
|
|
7,688 |
|
|
(778) |
|
|
|
|
|
|
|
|
|
|
|
|
|
| Municipal securities |
2,753 |
|
|
(81) |
|
|
66,046 |
|
|
(10,363) |
|
|
68,799 |
|
|
(10,444) |
|
| Residential mortgage-backed securities - agency |
17,976 |
|
|
(242) |
|
|
1,423,707 |
|
|
(267,093) |
|
|
1,441,683 |
|
|
(267,335) |
|
|
|
|
|
|
|
|
|
|
|
|
|
| Total temporarily impaired securities |
$ |
20,729 |
|
|
(323) |
|
|
1,704,010 |
|
|
(311,878) |
|
|
1,724,739 |
|
|
(312,201) |
|
The following table shows the fair value and gross unrealized losses on investment securities available for sale investment securities and held to maturity investment securities, for which an allowance for credit losses has not been recorded, aggregated by investment category and length of time that the individual securities have been in a continuous unrealized loss position at December 31, 2022:
|
|
|
|
|
|
|
|
|
|
|
|
|
|
|
|
|
|
|
|
|
|
|
|
|
|
|
|
|
|
|
|
|
|
|
|
| |
Less than 12 months |
|
12 months or more |
|
Total |
| |
Fair value |
|
Unrealized
loss |
|
Fair value |
|
Unrealized
loss |
|
Fair value |
|
Unrealized
loss |
| U.S. government-sponsored enterprises |
$ |
1,735 |
|
|
(82) |
|
|
200,679 |
|
|
(41,917) |
|
|
202,414 |
|
|
(41,999) |
|
| Corporate debt issues |
12,979 |
|
|
(562) |
|
|
— |
|
|
— |
|
|
12,979 |
|
|
(562) |
|
|
|
|
|
|
|
|
|
|
|
|
|
| Municipal securities |
60,676 |
|
|
(4,047) |
|
|
44,493 |
|
|
(11,671) |
|
|
105,169 |
|
|
(15,718) |
|
| Residential mortgage-backed securities - agency |
373,186 |
|
|
(22,796) |
|
|
1,264,042 |
|
|
(262,515) |
|
|
1,637,228 |
|
|
(285,311) |
|
|
|
|
|
|
|
|
|
|
|
|
|
| Total temporarily impaired securities |
$ |
448,576 |
|
|
(27,487) |
|
|
1,509,214 |
|
|
(316,103) |
|
|
1,957,790 |
|
|
(343,590) |
|
The Company does not believe that the available-for-sale debt securities that were in an unrealized loss position as of December 31, 2023, which were comprised of 488 individual securities, represents a credit loss impairment. All of these securities were issued by U.S. government agencies, U.S. government-sponsored enterprises, local municipalities, or represent corporate debt. The securities issued by the U.S. government agencies or U.S. government-sponsored enterprises are either explicitly or implicitly guaranteed by the U.S. government, are highly rated by major rating agencies and have a long history of no credit losses. The corporate debt issues and securities issued by local municipalities were all highly rated by major rating agencies and have no history of credit losses. The unrealized losses were primarily attributable to changes in the interest rate environment and not due to the credit quality of these investment securities. The Company does not have the intent to sell these investment securities and it is likely that we will not be required to sell these securities before their anticipated recovery, which may be at maturity.
All of the Company’s held-to-maturity debt securities are issued by U.S. government-sponsored agencies or U.S. government-sponsored enterprises. These securities are either explicitly or implicitly guaranteed by the U.S. government, are highly rated by major rating agencies and have a long history of no credit losses. The decline in fair value of the held-to-maturity debt securities were primarily attributable to changes in the interest rate environment and not due to the credit quality of these investment securities, therefore, the Company did not record an allowance for credit losses for these securities as of December 31, 2023.
The following table presents the credit quality for our held-to-maturity securities, based on the latest information available as of December 31, 2023 (in thousands). The credit ratings are sourced from nationally recognized rating agencies, which include Moody’s and S&P, they are presented based on asset type. All of our held-to-maturity securities were current in their payment of principal and interest as of December 31, 2023.
|
|
|
|
|
|
|
|
|
|
|
|
|
AA+ |
|
Total |
| Held-to-maturity securities: |
|
|
|
| Debt issued by the U.S. government-sponsored agencies |
$ |
124,458 |
|
|
124,458 |
|
| Residential mortgage-backed securities |
690,381 |
|
|
690,381 |
|
| Total marketable securities held-to-maturity |
$ |
814,839 |
|
|
814,839 |
|
NORTHWEST BANCSHARES, INC. AND SUBSIDIARIES
NOTES TO CONSOLIDATED FINANCIAL STATEMENTS
December 31, 2023, 2022 and 2021
(5) Loans Receivable
The following table shows a summary of our loans receivable at amortized cost basis at December 31, 2023 and December 31, 2022 (in thousands):
|
|
|
|
|
|
|
|
|
|
|
|
|
|
|
|
|
|
|
|
|
|
|
|
|
|
|
|
|
|
|
|
|
|
|
|
|
December 31, 2023 |
|
December 31, 2022 |
| |
Originated (1) |
|
Acquired (2) |
|
Total |
|
Originated (1) |
|
Acquired (2) |
|
Total |
| Personal Banking: |
|
|
|
|
|
|
|
|
|
|
|
|
|
|
|
|
|
|
|
|
|
|
|
| Residential mortgage loans (3) |
$ |
3,283,299 |
|
|
144,886 |
|
|
3,428,185 |
|
|
3,327,879 |
|
|
170,720 |
|
|
3,498,599 |
|
| Home equity loans |
1,103,410 |
|
|
124,448 |
|
|
1,227,858 |
|
|
1,131,641 |
|
|
166,033 |
|
|
1,297,674 |
|
| Vehicle loans |
1,943,540 |
|
|
65,061 |
|
|
2,008,601 |
|
|
1,965,385 |
|
|
91,398 |
|
|
2,056,783 |
|
| Consumer loans |
111,446 |
|
|
5,980 |
|
|
117,426 |
|
|
104,284 |
|
|
7,588 |
|
|
111,872 |
|
| Total Personal Banking |
6,441,695 |
|
|
340,375 |
|
|
6,782,070 |
|
|
6,529,189 |
|
|
435,739 |
|
|
6,964,928 |
|
|
|
|
|
|
|
|
|
|
|
|
|
| Commercial Banking: |
|
|
|
|
|
|
|
|
|
|
|
| Commercial real estate loans |
2,389,537 |
|
|
238,920 |
|
|
2,628,457 |
|
|
2,135,607 |
|
|
312,421 |
|
|
2,448,028 |
|
| Commercial real estate loans - owner occupied |
319,195 |
|
|
26,358 |
|
|
345,553 |
|
|
341,704 |
|
|
33,823 |
|
|
375,527 |
|
| Commercial loans |
1,623,481 |
|
|
35,248 |
|
|
1,658,729 |
|
|
1,082,914 |
|
|
49,055 |
|
|
1,131,969 |
|
| Total Commercial Banking |
4,332,213 |
|
|
300,526 |
|
|
4,632,739 |
|
|
3,560,225 |
|
|
395,299 |
|
|
3,955,524 |
|
| Total loans receivable, gross |
10,773,908 |
|
|
640,901 |
|
|
11,414,809 |
|
|
10,089,414 |
|
|
831,038 |
|
|
10,920,452 |
|
|
|
|
|
|
|
|
|
|
|
|
|
| Allowance for credit losses |
(118,079) |
|
|
(7,164) |
|
|
(125,243) |
|
|
(107,379) |
|
|
(10,657) |
|
|
(118,036) |
|
| Total loans receivable, net (4) |
$ |
10,655,829 |
|
|
633,737 |
|
|
11,289,566 |
|
|
9,982,035 |
|
|
820,381 |
|
|
10,802,416 |
|
(1)Includes originated and purchased loan pools purchased in an asset acquisition.
(2)Includes loans subject to purchase accounting in a business combination.
(3)Includes $8.8 million and $9.9 million of loans held-for-sale at December 31, 2023 and December 31, 2022, respectively.
(4)Includes $68.3 million and $76.1 million of net unearned income, unamortized premiums and discounts and deferred fees and costs at December 31, 2023 and December 31, 2022, respectively.
During the year ended December 31, 2022, the Company purchased a total of $182.8 million small business equipment finance loan pools and a total of $188.3 million one- to four-family jumbo mortgage loan pools. No loans were purchased during the year ended December 31, 2023.
As of December 31, 2023 and 2022, we serviced loans for others approximating $230.8 million and $1.549 billion, respectively. These loans serviced for others are not our assets and are not included in our financial statements.
As of December 31, 2023 and 2022, approximately 38% and 41% of our loan portfolio was secured by properties located in Pennsylvania. We do not believe we have significant concentrations of credit risk to any one group of borrowers given our underwriting and collateral requirements.
Loans receivable as of December 31, 2023 and 2022 include $4.032 billion and $3.333 billion, respectively, of adjustable rate loans and $7.314 billion and $7.511 billion, respectively, of fixed rate loans.
NORTHWEST BANCSHARES, INC. AND SUBSIDIARIES
NOTES TO CONSOLIDATED FINANCIAL STATEMENTS
December 31, 2023, 2022 and 2021
The following table provides information related to the allowance for credit losses by portfolio segment and by class of financing receivable for the year ended December 31, 2023 (in thousands):
|
|
|
|
|
|
|
|
|
|
|
|
|
|
|
|
|
|
|
|
|
|
|
|
|
|
|
|
|
|
|
|
|
|
|
|
|
Balance as of December 31, 2023 |
|
Current
period provision |
|
Charge-offs |
|
Recoveries |
|
ASU 2022-02 Adoption |
|
Balance as of December 31, 2022 |
| Allowance for Credit Losses |
|
|
|
|
|
|
|
|
|
|
|
| Personal Banking: |
|
|
|
|
|
|
|
|
|
|
|
| Residential mortgage loans |
$ |
18,193 |
|
|
(1,515) |
|
|
(1,189) |
|
|
1,636 |
|
|
— |
|
|
19,261 |
|
| Home equity loans |
5,403 |
|
|
(356) |
|
|
(852) |
|
|
709 |
|
|
— |
|
|
5,902 |
|
| Vehicle loans |
26,911 |
|
|
8,299 |
|
|
(6,468) |
|
|
2,021 |
|
|
— |
|
|
23,059 |
|
| Consumer loans |
1,199 |
|
|
5,311 |
|
|
(5,983) |
|
|
1,206 |
|
|
— |
|
|
665 |
|
| Total Personal Banking |
51,706 |
|
|
11,739 |
|
|
(14,492) |
|
|
5,572 |
|
|
— |
|
|
48,887 |
|
|
|
|
|
|
|
|
|
|
|
|
|
| Commercial Banking: |
|
|
|
|
|
|
|
|
|
|
|
| Commercial real estate loans |
51,267 |
|
|
6,604 |
|
|
(2,298) |
|
|
2,029 |
|
|
426 |
|
|
44,506 |
|
Commercial real estate loans -
owner occupied |
3,775 |
|
|
(227) |
|
|
(68) |
|
|
66 |
|
|
— |
|
|
4,004 |
|
| Commercial loans |
18,495 |
|
|
548 |
|
|
(4,166) |
|
|
1,474 |
|
|
— |
|
|
20,639 |
|
| Total Commercial Banking |
73,537 |
|
|
6,925 |
|
|
(6,532) |
|
|
3,569 |
|
|
426 |
|
|
69,149 |
|
| Total |
$ |
125,243 |
|
|
18,664 |
|
|
(21,024) |
|
|
9,141 |
|
|
426 |
|
|
118,036 |
|
|
|
|
|
|
|
|
|
|
|
|
|
Allowance for Credit Losses -
off-balance-sheet exposure (1) |
|
|
|
|
|
|
|
|
|
|
|
| Personal Banking: |
|
|
|
|
|
|
|
|
|
|
|
|
|
|
|
|
|
|
|
|
|
|
|
| Residential mortgage loans |
$ |
2 |
|
|
(2) |
|
|
— |
|
|
— |
|
|
— |
|
|
4 |
|
| Home equity loans |
65 |
|
|
(9) |
|
|
— |
|
|
— |
|
|
— |
|
|
74 |
|
|
|
|
|
|
|
|
|
|
|
|
|
| Total Personal Banking |
67 |
|
|
(11) |
|
|
— |
|
|
— |
|
|
— |
|
|
78 |
|
|
|
|
|
|
|
|
|
|
|
|
|
| Commercial Banking: |
|
|
|
|
|
|
|
|
|
|
|
| Commercial real estate loans |
6,147 |
|
|
772 |
|
|
— |
|
|
— |
|
|
— |
|
|
5,375 |
|
Commercial real estate loans -
owner occupied |
173 |
|
|
(206) |
|
|
— |
|
|
— |
|
|
— |
|
|
379 |
|
| Commercial loans |
10,736 |
|
|
3,655 |
|
|
— |
|
|
— |
|
|
— |
|
|
7,081 |
|
| Total Commercial Banking |
17,056 |
|
|
4,221 |
|
|
— |
|
|
— |
|
|
— |
|
|
12,835 |
|
| Total off-balance-sheet exposure |
$ |
17,123 |
|
|
4,210 |
|
|
— |
|
|
— |
|
|
— |
|
|
12,913 |
|
(1) The table above has been revised to reflect the correct ending balance for total off-balance-sheet exposure at December 31, 2022. We evaluated the effect of the revision, both qualitatively and quantitatively, and concluded that the impact of the revision was not material.
During the year ended December 31, 2023, we sold $8.0 million of loans that were classified as held-for-investment, for a gain of $726,000, which is reported in gain on sale of loans on the Consolidated Statements of Income.
NORTHWEST BANCSHARES, INC. AND SUBSIDIARIES
NOTES TO CONSOLIDATED FINANCIAL STATEMENTS
December 31, 2023, 2022 and 2021
The following table provides information related to the allowance for credit losses by portfolio segment and by class of financing receivable for the year ended December 31, 2022 (in thousands):
|
|
|
|
|
|
|
|
|
|
|
|
|
|
|
|
|
|
|
|
|
|
|
|
|
|
|
|
|
|
|
Balance as of December 31, 2022 |
|
Current
period provision |
|
Charge-offs |
|
Recoveries |
|
Balance as of December 31, 2021 |
| Allowance for Credit Losses |
|
|
|
|
|
|
|
|
|
| Personal Banking: |
|
|
|
|
|
|
|
|
|
| Residential mortgage loans |
$ |
19,261 |
|
|
13,129 |
|
|
(2,033) |
|
|
792 |
|
|
7,373 |
|
| Home equity loans |
5,902 |
|
|
540 |
|
|
(1,469) |
|
|
1,531 |
|
|
5,300 |
|
| Vehicle loans |
23,059 |
|
|
8,863 |
|
|
(3,621) |
|
|
2,334 |
|
|
15,483 |
|
| Consumer loans |
665 |
|
|
1,013 |
|
|
(4,785) |
|
|
1,553 |
|
|
2,884 |
|
| Total Personal Banking |
48,887 |
|
|
23,545 |
|
|
(11,908) |
|
|
6,210 |
|
|
31,040 |
|
|
|
|
|
|
|
|
|
|
|
| Commercial Banking: |
|
|
|
|
|
|
|
|
|
| Commercial real estate loans |
44,506 |
|
|
(12,633) |
|
|
(7,366) |
|
|
10,364 |
|
|
54,141 |
|
| Commercial real estate loans - owner occupied |
4,004 |
|
|
36 |
|
|
— |
|
|
85 |
|
|
3,883 |
|
| Commercial loans |
20,639 |
|
|
6,912 |
|
|
(1,657) |
|
|
2,207 |
|
|
13,177 |
|
| Total Commercial Banking |
69,149 |
|
|
(5,685) |
|
|
(9,023) |
|
|
12,656 |
|
|
71,201 |
|
| Total |
$ |
118,036 |
|
|
17,860 |
|
|
(20,931) |
|
|
18,866 |
|
|
102,241 |
|
|
|
|
|
|
|
|
|
|
|
Allowance for Credit Losses -
off-balance-sheet exposure (1) |
|
|
|
|
|
|
|
|
|
| Personal Banking: |
|
|
|
|
|
|
|
|
|
|
|
|
|
|
|
|
|
|
|
| Residential mortgage loans |
$ |
4 |
|
|
2 |
|
|
— |
|
|
— |
|
|
2 |
|
| Home equity loans |
74 |
|
|
35 |
|
|
— |
|
|
— |
|
|
39 |
|
|
|
|
|
|
|
|
|
|
|
| Total Personal Banking |
78 |
|
|
37 |
|
|
— |
|
|
— |
|
|
41 |
|
|
|
|
|
|
|
|
|
|
|
| Commercial Banking: |
|
|
|
|
|
|
|
|
|
| Commercial real estate loans |
5,375 |
|
|
4,494 |
|
|
— |
|
|
— |
|
|
881 |
|
| Commercial real estate loans - owner occupied |
379 |
|
|
237 |
|
|
— |
|
|
— |
|
|
142 |
|
| Commercial loans |
7,081 |
|
|
5,687 |
|
|
— |
|
|
— |
|
|
1,394 |
|
| Total Commercial Banking |
12,835 |
|
|
10,418 |
|
|
— |
|
|
— |
|
|
2,417 |
|
| Total off-balance-sheet exposure |
$ |
12,913 |
|
|
10,455 |
|
|
— |
|
|
— |
|
|
2,458 |
|
(1) The table above has been revised to reflect the correct ending balance for total off-balance-sheet exposure at December 31, 2022. We evaluated the effect of the revision, both qualitatively and quantitatively, and concluded that the impact of the revision was not material.
NORTHWEST BANCSHARES, INC. AND SUBSIDIARIES
NOTES TO CONSOLIDATED FINANCIAL STATEMENTS
December 31, 2023, 2022 and 2021
The following table provides information related to the allowance for credit losses by portfolio segment and by class of financing receivable for the year ended December 31, 2021 (in thousands):
|
|
|
|
|
|
|
|
|
|
|
|
|
|
|
|
|
|
|
|
|
|
|
|
|
|
|
|
|
|
| |
Balance as of December 31, 2021 |
|
Current
period provision |
|
Charge-offs |
|
Recoveries |
|
Balance as of December 31, 2020 |
| Allowance for Credit Losses |
|
|
|
|
|
|
|
|
|
| Personal Banking: |
|
|
|
|
|
|
|
|
|
| Residential mortgage loans |
$ |
7,373 |
|
|
2,844 |
|
|
(3,672) |
|
|
935 |
|
|
7,266 |
|
| Home equity loans |
5,300 |
|
|
1,788 |
|
|
(3,380) |
|
|
900 |
|
|
5,992 |
|
| Vehicle loans |
15,483 |
|
|
2,754 |
|
|
(4,632) |
|
|
2,536 |
|
|
14,825 |
|
| Consumer loans |
2,884 |
|
|
3,070 |
|
|
(5,417) |
|
|
2,360 |
|
|
2,871 |
|
| Total Personal Banking |
31,040 |
|
|
10,456 |
|
|
(17,101) |
|
|
6,731 |
|
|
30,954 |
|
|
|
|
|
|
|
|
|
|
|
| Commercial Banking: |
|
|
|
|
|
|
|
|
|
| Commercial real estate loans |
54,141 |
|
|
(15,496) |
|
|
(11,933) |
|
|
2,189 |
|
|
79,381 |
|
| Commercial real estate loans - owner occupied |
3,883 |
|
|
(5,852) |
|
|
(890) |
|
|
107 |
|
|
10,518 |
|
| Commercial loans |
13,177 |
|
|
(991) |
|
|
(4,213) |
|
|
4,807 |
|
|
13,574 |
|
| Total Commercial Banking |
71,201 |
|
|
(22,339) |
|
|
(17,036) |
|
|
7,103 |
|
|
103,473 |
|
| Total |
$ |
102,241 |
|
|
(11,883) |
|
|
(34,137) |
|
|
13,834 |
|
|
134,427 |
|
|
|
|
|
|
|
|
|
|
|
Allowance for Credit Losses -
off-balance-sheet exposure |
|
|
|
|
|
|
|
|
|
| Personal Banking: |
|
|
|
|
|
|
|
|
|
| Residential mortgage loans |
$ |
2 |
|
|
— |
|
|
— |
|
|
— |
|
|
2 |
|
| Home equity loans |
39 |
|
|
4 |
|
|
— |
|
|
— |
|
|
35 |
|
|
|
|
|
|
|
|
|
|
|
| Total Personal Banking |
41 |
|
|
4 |
|
|
— |
|
|
— |
|
|
37 |
|
|
|
|
|
|
|
|
|
|
|
| Commercial Banking: |
|
|
|
|
|
|
|
|
|
| Commercial real estate loans |
881 |
|
|
(2,568) |
|
|
— |
|
|
— |
|
|
3,449 |
|
| Commercial real estate loans - owner occupied |
142 |
|
|
(184) |
|
|
— |
|
|
— |
|
|
326 |
|
| Commercial loans |
1,394 |
|
|
(1,157) |
|
|
— |
|
|
— |
|
|
2,551 |
|
| Total Commercial Banking |
2,417 |
|
|
(3,909) |
|
|
— |
|
|
— |
|
|
6,326 |
|
| Total off-balance sheet exposure |
$ |
2,458 |
|
|
(3,905) |
|
|
— |
|
|
— |
|
|
6,363 |
|
NORTHWEST BANCSHARES, INC. AND SUBSIDIARIES
NOTES TO CONSOLIDATED FINANCIAL STATEMENTS
December 31, 2023, 2022 and 2021
The following table provides information related to the loan portfolio by portfolio segment and by class of financing receivable at December 31, 2023 (in thousands):
|
|
|
|
|
|
|
|
|
|
|
|
|
|
|
|
|
|
|
|
|
|
|
|
| |
Total loans
receivable |
|
Allowance for
credit losses |
|
Nonaccrual
loans |
|
Loans 90 days past due and accruing |
| Personal Banking: |
|
|
|
|
|
|
|
| Residential mortgage loans |
$ |
3,428,185 |
|
|
18,193 |
|
|
8,727 |
|
|
1,671 |
|
| Home equity loans |
1,227,858 |
|
|
5,403 |
|
|
4,492 |
|
|
26 |
|
| Vehicle loans |
2,008,601 |
|
|
26,911 |
|
|
4,816 |
|
|
44 |
|
| Consumer loans |
117,426 |
|
|
1,199 |
|
|
229 |
|
|
722 |
|
| Total Personal Banking |
6,782,070 |
|
|
51,706 |
|
|
18,264 |
|
|
2,463 |
|
|
|
|
|
|
|
|
|
| Commercial Banking: |
|
|
|
|
|
|
|
| Commercial real estate loans |
2,628,457 |
|
|
51,267 |
|
|
71,297 |
|
|
225 |
|
| Commercial real estate loans - owner occupied |
345,553 |
|
|
3,775 |
|
|
676 |
|
|
— |
|
| Commercial loans |
1,658,729 |
|
|
18,495 |
|
|
4,147 |
|
|
10 |
|
| Total Commercial Banking |
4,632,739 |
|
|
73,537 |
|
|
76,120 |
|
|
235 |
|
|
|
|
|
|
|
|
|
| Total |
$ |
11,414,809 |
|
|
125,243 |
|
|
94,384 |
|
|
2,698 |
|
The following table provides information related to the loan portfolio by portfolio segment and by class of financing receivable at December 31, 2022, prior to the adoption of ASU 2022-02 (in thousands):
|
|
|
|
|
|
|
|
|
|
|
|
|
|
|
|
|
|
|
|
|
|
|
|
|
|
|
|
|
|
|
|
|
|
|
|
|
|
|
|
|
|
| |
Total loans
receivable |
|
Allowance for
credit losses |
|
Nonaccrual
loans (1) |
|
Loans 90 days past due and accruing |
|
TDRs |
|
Allowance
related to
TDRs |
|
Additional
commitments
to customers
with loans
classified as
TDRs |
| Personal Banking: |
|
|
|
|
|
|
|
|
|
|
|
|
|
| Residential mortgage loans |
$ |
3,498,599 |
|
|
19,261 |
|
|
7,574 |
|
|
— |
|
|
6,279 |
|
|
1,069 |
|
|
— |
|
| Home equity loans |
1,297,674 |
|
|
5,902 |
|
|
4,145 |
|
|
— |
|
|
1,470 |
|
|
546 |
|
|
— |
|
| Vehicle loans |
2,056,783 |
|
|
23,059 |
|
|
3,771 |
|
|
2 |
|
|
— |
|
|
— |
|
|
— |
|
| Consumer loans |
111,872 |
|
|
665 |
|
|
256 |
|
|
405 |
|
|
— |
|
|
— |
|
|
— |
|
| Total Personal Banking |
6,964,928 |
|
|
48,887 |
|
|
15,746 |
|
|
407 |
|
|
7,749 |
|
|
1,615 |
|
|
— |
|
|
|
|
|
|
|
|
|
|
|
|
|
|
|
| Commercial Banking: |
|
|
|
|
|
|
|
|
|
|
|
|
|
| Commercial real estate loans |
2,448,028 |
|
|
44,506 |
|
|
62,239 |
|
|
— |
|
|
31,980 |
|
|
638 |
|
|
400 |
|
| Commercial real estate loans - owner occupied |
375,527 |
|
|
4,004 |
|
|
624 |
|
|
— |
|
|
94 |
|
|
31 |
|
|
— |
|
| Commercial loans |
1,131,969 |
|
|
20,639 |
|
|
2,627 |
|
|
337 |
|
|
858 |
|
|
116 |
|
|
4 |
|
| Total Commercial Banking |
3,955,524 |
|
|
69,149 |
|
|
65,490 |
|
|
337 |
|
|
32,932 |
|
|
785 |
|
|
404 |
|
|
|
|
|
|
|
|
|
|
|
|
|
|
|
| Total |
$ |
10,920,452 |
|
|
118,036 |
|
|
81,236 |
|
|
744 |
|
|
40,681 |
|
|
2,400 |
|
|
404 |
|
(1)Includes $29.2 million of nonaccrual TDRs.
NORTHWEST BANCSHARES, INC. AND SUBSIDIARIES
NOTES TO CONSOLIDATED FINANCIAL STATEMENTS
December 31, 2023, 2022 and 2021
We present the amortized cost of our loans on nonaccrual status including such loans with no allowance. The following table presents the amortized cost of our loans on nonaccrual status as of the beginning and end of the year ended December 31, 2023 (in thousands):
|
|
|
|
|
|
|
|
|
|
|
|
|
|
|
|
|
|
|
|
|
|
|
|
|
|
|
|
|
|
|
|
|
Nonaccrual
loans at
January 1, 2023 |
|
December 31, 2023 |
|
|
| |
|
Nonaccrual loans with an allowance |
|
Nonaccrual
loans with
no allowance |
|
Total nonaccrual
loans at the end of the period |
|
Loans 90 days
past due
and accruing |
|
|
| Personal Banking: |
|
|
|
|
|
|
|
|
|
|
|
| Residential mortgage loans |
$ |
7,574 |
|
|
8,304 |
|
|
423 |
|
|
8,727 |
|
|
1,671 |
|
|
|
| Home equity loans |
4,145 |
|
|
4,084 |
|
|
408 |
|
|
4,492 |
|
|
26 |
|
|
|
| Vehicle loans |
3,771 |
|
|
4,187 |
|
|
629 |
|
|
4,816 |
|
|
44 |
|
|
|
| Consumer loans |
256 |
|
|
229 |
|
|
— |
|
|
229 |
|
|
722 |
|
|
|
| Total Personal Banking |
15,746 |
|
|
16,804 |
|
|
1,460 |
|
|
18,264 |
|
|
2,463 |
|
|
|
|
|
|
|
|
|
|
|
|
|
|
|
| Commercial Banking: |
|
|
|
|
|
|
|
|
|
|
|
| Commercial real estate loans |
62,239 |
|
|
47,359 |
|
|
23,938 |
|
|
71,297 |
|
|
225 |
|
|
|
| Commercial real estate loans - owner occupied |
624 |
|
|
676 |
|
|
— |
|
|
676 |
|
|
— |
|
|
|
| Commercial loans |
2,627 |
|
|
3,996 |
|
|
151 |
|
|
4,147 |
|
|
10 |
|
|
|
| Total Commercial Banking |
65,490 |
|
|
52,031 |
|
|
24,089 |
|
|
76,120 |
|
|
235 |
|
|
|
|
|
|
|
|
|
|
|
|
|
|
|
| Total |
$ |
81,236 |
|
|
68,835 |
|
|
25,549 |
|
|
94,384 |
|
|
2,698 |
|
|
|
During the year ended December 31, 2023, we did not recognize any interest income on nonaccrual loans.
The following table presents the amortized cost of our loans on nonaccrual status as of the beginning and end of the year ended December 31, 2022, (in thousands):
|
|
|
|
|
|
|
|
|
|
|
|
|
|
|
|
|
|
|
|
|
|
|
|
|
|
|
|
|
|
|
Nonaccrual loans at January 1, 2022 |
|
December 31, 2022 |
| |
|
Nonaccrual loans with an allowance |
|
Nonaccrual loans with no allowance |
|
Total nonaccrual
loans at the end of the period |
|
Loans 90 days past and accruing |
| Personal Banking: |
|
|
|
|
|
|
|
|
|
| Residential mortgage loans |
$ |
10,402 |
|
|
7,574 |
|
|
— |
|
|
7,574 |
|
|
— |
|
| Home equity loans |
5,758 |
|
|
3,887 |
|
|
258 |
|
|
4,145 |
|
|
— |
|
| Vehicle loans |
3,263 |
|
|
2,175 |
|
|
1,596 |
|
|
3,771 |
|
|
2 |
|
| Consumer loans |
675 |
|
|
256 |
|
|
— |
|
|
256 |
|
|
405 |
|
| Total Personal Banking |
20,098 |
|
|
13,892 |
|
|
1,854 |
|
|
15,746 |
|
|
407 |
|
|
|
|
|
|
|
|
|
|
|
| Commercial Banking: |
|
|
|
|
|
|
|
|
|
| Commercial real estate loans |
129,666 |
|
|
22,182 |
|
|
40,057 |
|
|
62,239 |
|
|
— |
|
| Commercial real estate loans - owner occupied |
1,233 |
|
|
624 |
|
|
— |
|
|
624 |
|
|
— |
|
| Commercial loans |
7,474 |
|
|
2,024 |
|
|
603 |
|
|
2,627 |
|
|
337 |
|
| Total Commercial Banking |
138,373 |
|
|
24,830 |
|
|
40,660 |
|
|
65,490 |
|
|
337 |
|
|
|
|
|
|
|
|
|
|
|
| Total |
$ |
158,471 |
|
|
38,722 |
|
|
42,514 |
|
|
81,236 |
|
|
744 |
|
During the year ended December 31, 2022, we recognized $678,000 of interest income on nonaccrual and troubled debt restructuring loans.
NORTHWEST BANCSHARES, INC. AND SUBSIDIARIES
NOTES TO CONSOLIDATED FINANCIAL STATEMENTS
December 31, 2023, 2022 and 2021
A loan is considered to be collateral dependent when the borrower is experiencing financial difficulty and repayment is expected to be provided substantially through the sale or operation of the collateral. The following table presents the amortized cost basis of collateral-dependent loans by class of loans as of December 31, 2023 (in thousands):
|
|
|
|
|
|
|
|
|
|
|
|
|
|
|
|
|
|
| |
Real estate |
|
|
|
|
|
Total |
|
|
|
|
|
|
|
|
|
|
|
|
|
|
|
|
|
|
|
|
|
|
|
|
|
|
|
|
|
|
|
|
|
|
|
|
|
|
|
|
|
|
|
|
|
|
|
|
|
|
|
|
|
|
|
|
|
|
|
|
|
|
|
|
|
|
|
|
|
|
|
|
| Commercial Banking: |
|
|
|
|
|
|
|
|
|
| Commercial real estate loans |
$ |
66,934 |
|
|
|
|
|
|
66,934 |
|
|
|
|
|
|
|
|
|
|
|
|
|
| Commercial loans |
150 |
|
|
|
|
|
|
150 |
|
|
|
| Total Commercial Banking |
67,084 |
|
|
|
|
|
|
67,084 |
|
|
|
|
|
|
|
|
|
|
|
|
|
| Total |
$ |
67,084 |
|
|
|
|
|
|
67,084 |
|
|
|
The following table presents the amortized cost basis of collateral-dependent loans by class of loans as of December 31, 2022 (in thousands):
|
|
|
|
|
|
|
|
|
|
|
|
|
|
|
|
|
|
|
|
| |
Real estate |
|
Equipment |
|
|
|
Total |
| Personal Banking: |
|
|
|
|
|
|
|
| Residential mortgage loans |
$ |
569 |
|
|
— |
|
|
|
|
569 |
|
| Home equity loans |
100 |
|
|
— |
|
|
|
|
100 |
|
|
|
|
|
|
|
|
|
| Total Personal Banking |
669 |
|
|
— |
|
|
|
|
669 |
|
|
|
|
|
|
|
|
|
| Commercial Banking: |
|
|
|
|
|
|
|
| Commercial real estate loans |
57,056 |
|
|
— |
|
|
|
|
57,056 |
|
| Commercial loans |
175 |
|
|
210 |
|
|
|
|
385 |
|
| Total Commercial Banking |
57,231 |
|
|
210 |
|
|
|
|
57,441 |
|
|
|
|
|
|
|
|
|
| Total |
$ |
57,900 |
|
|
210 |
|
|
|
|
58,110 |
|
Occasionally, the Company modifies loans to borrowers in financial distress by providing principal forgiveness, term extensions, an other-than-insignificant payment delay, or interest rate reduction. When principal forgiveness is provided, the amount of forgiveness is charged off against the allowance for credit losses.
In some cases, the Company provides multiple types of concessions to one loan. Typically, one type of concession, such as a term extension, is granted initially. If the borrower continues to experience financial difficulty, another concession, such as principal forgiveness, may be granted. For loans included in the “combination” columns below, multiple types of modifications have been made on the same loan within the current reporting period. The combination is at least two of the following: a term extension, principal forgiveness, an other-than-insignificant payment delay, and/or an interest rate reduction.
The following table presents the amortized cost basis of loans as of December 31, 2023 that were both experiencing financial difficulty and modified during the periods indicated, by class and by type of modification. The percentage of the amortized cost basis of loans that were modified to borrowers in financial distress as compared to the amortized cost basis of each class of financial receivable is also presented below (dollars in thousands).
NORTHWEST BANCSHARES, INC. AND SUBSIDIARIES
NOTES TO CONSOLIDATED FINANCIAL STATEMENTS
December 31, 2023, 2022 and 2021
|
|
|
|
|
|
|
|
|
|
|
|
|
|
|
|
|
|
|
|
|
|
|
|
|
|
|
|
|
|
|
|
|
Payment delay |
|
Term extension |
|
|
|
|
|
Combination term extension and interest rate reduction |
|
Total class of financing receivable |
| Personal Banking: |
|
|
|
|
|
|
|
|
|
|
|
|
|
Residential mortgage loans |
|
|
$ |
363 |
|
|
499 |
|
|
|
|
|
|
— |
|
|
0.03 |
% |
| Home equity loans |
|
|
— |
|
|
403 |
|
|
|
|
|
|
84 |
|
|
0.04 |
% |
|
|
|
|
|
|
|
|
|
|
|
|
|
|
Consumer loans |
|
|
— |
|
|
— |
|
|
|
|
|
|
3 |
|
|
— |
% |
| Total Personal Banking |
|
|
363 |
|
|
902 |
|
|
|
|
|
|
87 |
|
|
0.02 |
% |
|
|
|
|
|
|
|
|
|
|
|
|
|
|
| Commercial Banking: |
|
|
|
|
|
|
|
|
|
|
|
|
|
| Commercial real estate loans |
|
|
— |
|
|
71 |
|
|
|
|
|
|
— |
|
|
— |
% |
|
|
|
|
|
|
|
|
|
|
|
|
|
|
| Commercial loans |
|
|
— |
|
|
11 |
|
|
|
|
|
|
— |
|
|
— |
% |
| Total Commercial Banking |
|
|
— |
|
|
82 |
|
|
|
|
|
|
— |
|
|
— |
% |
|
|
|
|
|
|
|
|
|
|
|
|
|
|
| Total |
|
|
$ |
363 |
|
|
984 |
|
|
|
|
|
|
87 |
|
|
0.01 |
% |
The Company has committed to lend additional amounts totaling $31,000 to the borrowers included in the previous table.
The following table presents the effect of the loan modifications presented above to borrowers experiencing financial difficulty for the year ended December 31, 2023:
|
|
|
|
|
|
|
|
|
|
|
|
|
|
|
|
|
|
|
|
| |
|
|
Weighted-average interest rate reduction |
|
Weighted-average term extension in months |
|
Payment deferral (Years) |
| Personal Banking: |
|
|
|
|
|
|
|
| Residential mortgage loans |
|
|
— |
|
|
142 |
|
0.50 |
| Home equity loans |
|
|
5 |
% |
|
92 |
|
— |
|
|
|
|
|
|
|
|
|
| Consumer loans |
|
|
12 |
% |
|
356 |
|
— |
|
| Total Personal Banking |
|
|
17 |
% |
|
118 |
|
0.50 |
|
|
|
|
|
|
|
|
| Commercial Banking: |
|
|
|
|
|
|
|
| Commercial real estate loans |
|
|
— |
|
|
57 |
|
— |
|
|
|
|
|
|
|
|
|
| Commercial loans |
|
|
— |
|
|
23 |
|
— |
|
| Total Commercial Banking |
|
|
— |
|
|
52 |
|
— |
|
| Total loans |
|
|
17 |
% |
|
113 |
|
0.50 |
The Company closely monitors the performance of loans that are modified to borrowers experiencing financial difficulty to understand the effectiveness of its modification efforts. The following table presents the performance of loans that such loans have been modified since the adoption of ASU 2022-02 (in thousands):
|
|
|
|
|
|
|
|
|
|
|
|
|
|
|
|
|
|
|
|
|
|
|
|
|
|
|
|
| |
|
|
|
|
Current |
|
30-59 days
delinquent |
|
60-89 days
delinquent |
|
90 days or
greater
delinquent |
| Personal Banking: |
|
|
|
|
|
|
|
|
|
|
|
| Residential mortgage loans |
|
|
|
|
$ |
148 |
|
|
342 |
|
|
8 |
|
|
363 |
|
| Home equity loans |
|
|
|
|
465 |
|
|
23 |
|
|
— |
|
|
— |
|
|
|
|
|
|
|
|
|
|
|
|
|
| Consumer loans |
|
|
|
|
3 |
|
|
— |
|
|
— |
|
|
— |
|
| Total Personal Banking |
|
|
|
|
616 |
|
|
365 |
|
|
8 |
|
|
363 |
|
|
|
|
|
|
|
|
|
|
|
|
|
| Commercial Banking: |
|
|
|
|
|
|
|
|
|
|
|
| Commercial real estate loans |
|
|
|
|
71 |
|
|
— |
|
|
— |
|
|
— |
|
|
|
|
|
|
|
|
|
|
|
|
|
| Commercial loans |
|
|
|
|
11 |
|
|
— |
|
|
— |
|
|
— |
|
| Total Commercial Banking |
|
|
|
|
82 |
|
|
— |
|
|
— |
|
|
— |
|
| Total loans |
|
|
|
|
$ |
698 |
|
|
365 |
|
|
8 |
|
|
363 |
|
NORTHWEST BANCSHARES, INC. AND SUBSIDIARIES
NOTES TO CONSOLIDATED FINANCIAL STATEMENTS
December 31, 2023, 2022 and 2021
A modification is considered to be in default when the loan is 90 days or more past due. The following table provides the amortized cost basis of financing receivables that had a payment default during the period and were modified since the adoption of ASU 2022-02 to borrowers experiencing financial difficulty (in thousands):
|
|
|
|
|
|
|
|
|
|
|
|
|
|
|
|
|
|
|
|
Payment delay |
|
|
|
|
|
|
|
|
|
| Personal Banking: |
|
|
|
|
|
|
|
|
|
|
|
|
| Residential mortgage loans |
|
|
$ |
363 |
|
|
|
|
|
|
|
|
|
|
|
|
|
|
|
|
|
|
|
|
|
|
|
|
|
|
|
|
|
|
|
|
|
|
|
|
|
|
|
|
|
|
|
|
|
|
|
|
|
| Total Personal Banking |
|
|
363 |
|
|
|
|
|
|
|
|
|
|
|
|
|
|
|
|
|
|
|
|
|
|
|
|
|
|
|
|
|
|
|
|
|
|
|
|
|
|
|
|
|
|
|
|
|
|
|
|
|
|
|
|
|
|
|
|
|
|
|
|
|
|
|
|
|
|
|
|
|
|
|
|
|
|
|
|
|
|
|
|
|
|
|
|
|
|
|
|
|
|
|
|
|
|
|
|
|
|
|
|
| Total |
|
|
$ |
363 |
|
|
|
|
|
|
|
|
|
|
The modifications to borrowers experiencing financial distress are included in their respective portfolio segment and the current loan balance and updated loan terms are run through their respective ACL models to arrive at the quantitative portion of the ACL. Subsequent performance of the loans will be measured by delinquency status and will be captured through our ACL models or our qualitative factor assessment, as deemed appropriate. If we no longer believe the loan demonstrates similar risks to their respective portfolio segment an individual assessment will be performed. Upon the Company’s determination that a modified loan (or portion of a loan) has subsequently been deemed uncollectible, the loan (or a portion of the loan) is written off. Therefore, the amortized cost basis of the loan is reduced by the uncollectible amount and the allowance for credit losses is adjusted by the same amount.
The following table provides a roll forward of troubled debt restructurings for the period indicated, prior to the adoption of ASU 2022-02 (dollars in thousands):
|
|
|
|
|
|
|
|
|
|
|
|
|
For the year ended December 31, 2022 |
|
Number of
contracts |
|
Amount |
| Beginning TDR balance: |
134 |
|
|
$ |
30,288 |
|
| New TDRs |
14 |
|
|
30,894 |
|
| Re-modified TDRs |
11 |
|
|
8,391 |
|
| Net paydowns |
— |
|
|
(11,870) |
|
| Charge-offs: |
|
|
|
| Residential mortgage loans |
2 |
|
|
(63) |
|
|
|
|
|
|
|
|
|
| Commercial real estate loans |
1 |
|
|
(150) |
|
|
|
|
|
| Commercial loans |
1 |
|
|
(130) |
|
| Paid-off loans: |
|
|
|
| Residential mortgage loans |
4 |
|
|
(361) |
|
| Home equity loans |
3 |
|
|
(89) |
|
|
|
|
|
| Commercial real estate loans |
6 |
|
|
(4,324) |
|
| Commercial real estate loans - owner occupied |
1 |
|
|
(44) |
|
| Commercial loans |
7 |
|
|
(3,470) |
|
| Ending TDR balance: |
123 |
|
|
$ |
40,681 |
|
| Accruing TDRs |
|
|
$ |
11,442 |
|
| Nonaccrual TDRs |
|
|
29,239 |
|
NORTHWEST BANCSHARES, INC. AND SUBSIDIARIES
NOTES TO CONSOLIDATED FINANCIAL STATEMENTS
December 31, 2023, 2022 and 2021
The following tables provide information related to TDRs (including re-modified TDRs) by portfolio segment and by class of financing receivable during the periods indicated, prior to the adoption of ASU 2022-02 (dollars in thousands):
|
|
|
|
|
|
|
|
|
|
|
|
|
|
|
|
|
|
|
|
|
|
|
|
|
|
|
| |
|
For the year ended December 31, 2022 |
| |
|
Number of
contracts |
|
Recorded
investment
at the time of
modification |
|
Current
recorded
investment |
|
Current
allowance |
| Personal Banking: |
|
|
|
|
|
|
|
|
| Residential mortgage loans |
|
4 |
|
|
$ |
530 |
|
|
522 |
|
|
37 |
|
| Home equity loans |
|
6 |
|
|
183 |
|
|
171 |
|
|
42 |
|
|
|
|
|
|
|
|
|
|
|
|
|
|
|
|
|
|
|
| Total Personal Banking |
|
10 |
|
|
713 |
|
|
693 |
|
|
79 |
|
|
|
|
|
|
|
|
|
|
| Commercial Banking: |
|
|
|
|
|
|
|
|
| Commercial real estate loans |
|
9 |
|
|
34,716 |
|
|
20,954 |
|
|
66 |
|
|
|
|
|
|
|
|
|
|
| Commercial loans |
|
6 |
|
|
3,856 |
|
|
263 |
|
|
20 |
|
| Total Commercial Banking |
|
15 |
|
|
38,572 |
|
|
21,217 |
|
|
86 |
|
|
|
|
|
|
|
|
|
|
| Total |
|
25 |
|
|
$ |
39,285 |
|
|
21,910 |
|
|
165 |
|
|
|
|
|
|
|
|
|
|
|
|
|
|
|
|
|
|
|
|
|
|
|
|
|
|
|
|
|
|
|
|
|
|
|
|
|
|
|
|
|
|
|
|
|
|
|
|
|
|
|
|
|
|
|
|
|
|
|
|
|
|
|
|
|
|
|
|
|
|
|
|
|
|
|
|
|
|
|
|
|
|
|
|
|
|
|
|
|
|
|
|
|
|
|
|
|
|
|
|
|
|
|
|
|
|
|
|
|
|
|
|
|
|
|
|
|
|
|
|
|
|
|
|
|
|
|
|
|
|
|
|
|
|
|
|
|
|
|
|
|
|
|
|
|
|
|
|
|
|
|
|
|
|
|
|
For the year ended December 31, 2021 |
|
|
Number of
contracts |
|
Recorded
investment
at the time of
modification |
|
Current
recorded
investment |
|
Current
allowance |
| Personal Banking: |
|
|
|
|
|
|
|
|
| Residential mortgage loans |
|
1 |
|
|
$ |
125 |
|
|
114 |
|
|
15 |
|
| Home equity loans |
|
3 |
|
|
155 |
|
|
34 |
|
|
34 |
|
| Total Personal Banking |
|
4 |
|
|
280 |
|
|
148 |
|
|
49 |
|
|
|
|
|
|
|
|
|
|
| Commercial Banking: |
|
|
|
|
|
|
|
|
| Commercial real estate loans |
|
8 |
|
|
12,006 |
|
|
10,572 |
|
|
1,453 |
|
|
|
|
|
|
|
|
|
|
| Commercial loans |
|
6 |
|
|
4,147 |
|
|
3,903 |
|
|
451 |
|
| Total Commercial Banking |
|
14 |
|
|
16,153 |
|
|
14,475 |
|
|
1,904 |
|
|
|
|
|
|
|
|
|
|
| Total |
|
18 |
|
|
$ |
16,433 |
|
|
14,623 |
|
|
1,953 |
|
The following table provides information as of December 31, 2022 for TDRs (including re-modified TDRs) by type of modification, by portfolio segment and class of financing receivable for modifications during the year ended December 31, 2022, prior to the adoption of ASU 2022-02 (dollars in thousands):
|
|
|
|
|
|
|
|
|
|
|
|
|
|
|
|
|
|
|
|
|
|
|
|
|
|
|
|
|
|
|
|
| |
|
|
Type of modification |
|
|
| |
Number of contracts |
|
Rate |
|
Payment |
|
Maturity date |
|
|
|
Total |
| Personal Banking: |
|
|
|
|
|
|
|
|
|
|
|
| Residential mortgage loans |
4 |
|
|
$ |
— |
|
|
379 |
|
|
143 |
|
|
|
|
522 |
|
| Home equity loans |
6 |
|
|
— |
|
|
23 |
|
|
148 |
|
|
|
|
171 |
|
|
|
|
|
|
|
|
|
|
|
|
|
|
|
|
|
|
|
|
|
|
|
|
|
| Total Personal Banking |
10 |
|
|
— |
|
|
402 |
|
|
291 |
|
|
|
|
693 |
|
|
|
|
|
|
|
|
|
|
|
|
|
| Commercial Banking: |
|
|
|
|
|
|
|
|
|
|
|
| Commercial real estate loans |
9 |
|
|
129 |
|
|
98 |
|
|
20,727 |
|
|
|
|
20,954 |
|
|
|
|
|
|
|
|
|
|
|
|
|
| Commercial loans |
6 |
|
|
— |
|
|
— |
|
|
263 |
|
|
|
|
263 |
|
| Total Commercial Banking |
15 |
|
|
129 |
|
|
98 |
|
|
20,990 |
|
|
|
|
21,217 |
|
|
|
|
|
|
|
|
|
|
|
|
|
| Total |
25 |
|
|
$ |
129 |
|
|
500 |
|
|
21,281 |
|
|
|
|
21,910 |
|
NORTHWEST BANCSHARES, INC. AND SUBSIDIARIES
NOTES TO CONSOLIDATED FINANCIAL STATEMENTS
December 31, 2023, 2022 and 2021
The following table provides information as of December 31, 2021 for TDRs (including re-modified TDRs) by type of modification, by portfolio segment and class of financing receivable for modifications during the year ended December 31, 2021, prior to the adoption of ASU 2022-02 (dollars in thousands):
|
|
|
|
|
|
|
|
|
|
|
|
|
|
|
|
|
|
|
|
|
|
|
|
|
|
|
|
|
|
|
|
|
|
|
|
|
|
|
Type of modification |
|
|
|
Number of contracts |
|
Rate |
|
Payment |
|
Maturity date |
|
Other |
|
Total |
| Personal Banking: |
|
|
|
|
|
|
|
|
|
|
|
Residential mortgage loans |
1 |
|
|
$ |
114 |
|
|
— |
|
|
— |
|
|
— |
|
|
114 |
|
Home equity loans |
3 |
|
|
— |
|
|
30 |
|
|
4 |
|
|
— |
|
|
34 |
|
| Total Personal Banking |
4 |
|
|
114 |
|
|
30 |
|
|
4 |
|
|
— |
|
|
148 |
|
|
|
|
|
|
|
|
|
|
|
|
|
| Commercial Banking: |
|
|
|
|
|
|
|
|
|
|
|
Commercial real estate loans |
8 |
|
|
2,077 |
|
|
— |
|
|
8,424 |
|
|
71 |
|
|
10,572 |
|
|
|
|
|
|
|
|
|
|
|
|
|
Commercial loans |
6 |
|
|
171 |
|
|
— |
|
|
3,732 |
|
|
— |
|
|
3,903 |
|
| Total Commercial Banking |
14 |
|
|
2,248 |
|
|
— |
|
|
12,156 |
|
|
71 |
|
|
14,475 |
|
|
|
|
|
|
|
|
|
|
|
|
|
| Total |
18 |
|
|
$ |
2,362 |
|
|
30 |
|
|
12,160 |
|
|
71 |
|
|
14,623 |
|
The following table provides information related to re-modified trouble debt restructurings by portfolio segment and class of financing receivable for modifications during the year ended December 31, 2022, prior to the adoption of ASU 2022-02 (dollars in thousands):
|
|
|
|
|
|
|
|
|
|
|
|
|
|
|
|
|
|
|
|
|
|
|
|
|
|
|
|
|
|
|
|
Type of re-modification |
|
|
|
Number of
re-modified TDRs |
|
|
|
Payment |
|
Maturity date |
|
|
|
Total |
| Personal Banking: |
|
|
|
|
|
|
|
|
|
|
|
Residential mortgage loans |
1 |
|
|
|
|
$ |
— |
|
|
129 |
|
|
|
|
129 |
|
Home equity loans |
1 |
|
|
|
|
— |
|
|
— |
|
|
|
|
— |
|
|
|
|
|
|
|
|
|
|
|
|
|
|
|
|
|
|
|
|
|
|
|
|
|
| Total Personal Banking |
2 |
|
|
|
|
— |
|
|
129 |
|
|
|
|
129 |
|
|
|
|
|
|
|
|
|
|
|
|
|
| Commercial Banking: |
|
|
|
|
|
|
|
|
|
|
|
Commercial real estate loans |
4 |
|
|
|
|
53 |
|
|
196 |
|
|
|
|
249 |
|
|
|
|
|
|
|
|
|
|
|
|
|
Commercial loans |
5 |
|
|
|
|
— |
|
|
210 |
|
|
|
|
210 |
|
| Total Commercial Banking |
9 |
|
|
|
|
53 |
|
|
406 |
|
|
|
|
459 |
|
|
|
|
|
|
|
|
|
|
|
|
|
| Total |
11 |
|
|
|
|
$ |
53 |
|
|
535 |
|
|
|
|
588 |
|
The following table provides information related to re-modified trouble debt restructurings by portfolio segment and class of financing receivable for modifications during the year ended December 31, 2021, prior to the adoption of ASU 2022-02 (dollars in thousands):
|
|
|
|
|
|
|
|
|
|
|
|
|
|
|
|
|
|
|
|
|
|
|
|
|
|
|
|
|
|
|
|
|
|
|
Type of re-modification |
|
|
|
Number of
re-modified TDRs |
|
Rate |
|
|
|
Maturity date |
|
Other |
|
Total |
| Personal Banking: |
|
|
|
|
|
|
|
|
|
|
|
Residential mortgage loans |
1 |
|
|
$ |
114 |
|
|
|
|
— |
|
|
— |
|
|
114 |
|
Home equity loans |
1 |
|
|
— |
|
|
|
|
— |
|
|
— |
|
|
— |
|
| Total Personal Banking |
2 |
|
|
114 |
|
|
|
|
— |
|
|
— |
|
|
114 |
|
|
|
|
|
|
|
|
|
|
|
|
|
| Commercial Banking: |
|
|
|
|
|
|
|
|
|
|
|
Commercial real estate loans |
7 |
|
|
2,077 |
|
|
|
|
5,108 |
|
|
71 |
|
|
7,256 |
|
|
|
|
|
|
|
|
|
|
|
|
|
|
|
|
|
|
|
|
|
|
|
|
|
| Total Commercial Banking |
7 |
|
|
2,077 |
|
|
|
|
5,108 |
|
|
71 |
|
|
7,256 |
|
|
|
|
|
|
|
|
|
|
|
|
|
| Total |
9 |
|
|
$ |
2,191 |
|
|
|
|
5,108 |
|
|
71 |
|
|
7,370 |
|
NORTHWEST BANCSHARES, INC. AND SUBSIDIARIES
NOTES TO CONSOLIDATED FINANCIAL STATEMENTS
December 31, 2023, 2022 and 2021
No TDRs modified within the previous twelve months of December 31, 2022 subsequently defaulted.
The following table provides information related to troubled debt restructurings modified within the previous twelve months of December 31, 2021 that subsequently defaulted (prior to the adoption of ASU 2022-02):
|
|
|
|
|
|
|
|
|
|
|
|
|
|
|
|
|
|
|
|
|
|
|
|
|
|
|
|
|
Number of
contracts |
|
Recorded
investment
at the time of
modification |
|
Current
recorded
investment |
|
Current
allowance |
|
|
|
|
|
|
|
|
|
|
|
|
|
|
|
|
|
|
|
|
|
|
|
|
|
|
|
|
|
|
|
|
|
|
|
|
|
|
|
|
|
|
|
|
|
|
|
|
|
|
|
|
|
|
| Commercial Banking: |
|
|
|
|
|
|
|
|
| Commercial real estate loans |
|
1 |
|
$ |
4,167 |
|
3,823 |
|
— |
|
|
|
|
|
|
|
|
|
| Total Commercial Banking |
|
1 |
|
4,167 |
|
3,823 |
|
— |
|
|
|
|
|
|
|
|
|
|
| Total |
|
1 |
|
$ |
4,167 |
|
3,823 |
|
— |
The following table provides information related to the amortized cost basis of loan payment delinquencies at December 31, 2023 (in thousands):
|
|
|
|
|
|
|
|
|
|
|
|
|
|
|
|
|
|
|
|
|
|
|
|
|
|
|
|
|
|
|
|
|
|
|
|
|
|
|
|
|
|
| |
30-59 days
delinquent |
|
60-89 days
delinquent |
|
90 days or
greater
delinquent |
|
Total
delinquency |
|
Current |
|
Total loans
receivable |
|
90 days or
greater
delinquent
and accruing |
|
|
|
|
|
|
|
|
|
|
|
|
|
|
| Personal Banking: |
|
|
|
|
|
|
|
|
|
|
|
|
|
Residential mortgage loans |
$ |
30,041 |
|
|
7,796 |
|
|
7,995 |
|
|
45,832 |
|
|
3,382,353 |
|
|
3,428,185 |
|
|
1,671 |
|
Home equity loans |
5,761 |
|
|
982 |
|
|
3,126 |
|
|
9,869 |
|
|
1,217,989 |
|
|
1,227,858 |
|
|
26 |
|
Vehicle loans |
10,382 |
|
|
3,326 |
|
|
3,051 |
|
|
16,759 |
|
|
1,991,842 |
|
|
2,008,601 |
|
|
44 |
|
Consumer loans |
829 |
|
|
428 |
|
|
927 |
|
|
2,184 |
|
|
115,242 |
|
|
117,426 |
|
|
722 |
|
| Total Personal Banking |
47,013 |
|
|
12,532 |
|
|
15,099 |
|
|
74,644 |
|
|
6,707,426 |
|
|
6,782,070 |
|
|
2,463 |
|
|
|
|
|
|
|
|
|
|
|
|
|
|
|
| Commercial Banking: |
|
|
|
|
|
|
|
|
|
|
|
|
|
Commercial real estate loans |
2,010 |
|
|
1,031 |
|
|
6,535 |
|
|
9,576 |
|
|
2,618,881 |
|
|
2,628,457 |
|
|
225 |
|
Commercial real estate loans - owner occupied |
1,194 |
|
|
— |
|
|
177 |
|
|
1,371 |
|
|
344,182 |
|
|
345,553 |
|
|
— |
|
Commercial loans |
4,196 |
|
|
703 |
|
|
2,780 |
|
|
7,679 |
|
|
1,651,050 |
|
|
1,658,729 |
|
|
10 |
|
| Total Commercial Banking |
7,400 |
|
|
1,734 |
|
|
9,492 |
|
|
18,626 |
|
|
4,614,113 |
|
|
4,632,739 |
|
|
235 |
|
|
|
|
|
|
|
|
|
|
|
|
|
|
|
|
|
|
|
|
|
|
|
|
|
|
|
|
|
|
|
|
|
|
|
|
|
|
|
|
|
|
|
|
|
|
|
|
|
|
|
|
|
|
|
|
|
|
|
|
|
|
|
|
|
|
|
|
|
|
|
|
|
|
|
|
|
|
|
|
|
|
|
|
|
|
|
|
|
|
|
|
|
|
|
|
|
|
|
|
|
|
|
|
|
|
|
|
|
|
|
|
|
|
|
|
|
|
|
|
|
|
|
|
|
|
|
|
|
|
|
|
|
|
|
|
|
|
|
|
|
|
|
|
|
|
|
|
|
|
|
|
|
|
|
|
|
|
|
|
|
|
|
|
|
|
|
|
|
|
|
|
|
|
|
|
|
|
|
|
|
|
|
|
|
|
|
|
|
|
|
|
|
|
|
|
|
|
|
|
|
|
|
|
|
|
|
|
|
|
|
| Total loans |
$ |
54,413 |
|
|
14,266 |
|
|
24,591 |
|
|
93,270 |
|
|
11,321,539 |
|
|
11,414,809 |
|
|
2,698 |
|
The following table provides information related to the amortized cost basis loan payment delinquencies at December 31, 2022 (in thousands):
|
|
|
|
|
|
|
|
|
|
|
|
|
|
|
|
|
|
|
|
|
|
|
|
|
|
|
|
|
|
|
|
|
|
|
|
|
|
|
|
|
|
| |
30-59 days
delinquent |
|
60-89 days
delinquent |
|
90 days or
greater
delinquent |
|
Total
delinquency |
|
Current |
|
Total loans
receivable |
|
90 days or
greater
delinquent
and accruing |
| Personal Banking: |
|
|
|
|
|
|
|
|
|
|
|
|
|
| Residential mortgage loans |
$ |
29,487 |
|
|
5,563 |
|
|
5,574 |
|
|
40,624 |
|
|
3,457,975 |
|
|
3,498,599 |
|
|
— |
|
| Home equity loans |
6,657 |
|
|
975 |
|
|
2,257 |
|
|
9,889 |
|
|
1,287,785 |
|
|
1,297,674 |
|
|
— |
|
| Vehicle loans |
8,677 |
|
|
2,770 |
|
|
2,471 |
|
|
13,918 |
|
|
2,042,865 |
|
|
2,056,783 |
|
|
2 |
|
| Consumer loans |
758 |
|
|
300 |
|
|
608 |
|
|
1,666 |
|
|
110,206 |
|
|
111,872 |
|
|
405 |
|
| Total Personal Banking |
45,579 |
|
|
9,608 |
|
|
10,910 |
|
|
66,097 |
|
|
6,898,831 |
|
|
6,964,928 |
|
|
407 |
|
|
|
|
|
|
|
|
|
|
|
|
|
|
|
| Commercial Banking: |
|
|
|
|
|
|
|
|
|
|
|
|
|
Commercial real estate loans |
3,947 |
|
|
2,377 |
|
|
7,589 |
|
|
13,913 |
|
|
2,434,115 |
|
|
2,448,028 |
|
|
— |
|
| Commercial real estate loans - owner occupied |
61 |
|
|
— |
|
|
278 |
|
|
339 |
|
|
375,188 |
|
|
375,527 |
|
|
— |
|
| Commercial loans |
2,648 |
|
|
1,115 |
|
|
1,829 |
|
|
5,592 |
|
|
1,126,377 |
|
|
1,131,969 |
|
|
337 |
|
| Total Commercial Banking |
6,656 |
|
|
3,492 |
|
|
9,696 |
|
|
19,844 |
|
|
3,935,680 |
|
|
3,955,524 |
|
|
337 |
|
| Total loans |
$ |
52,235 |
|
|
13,100 |
|
|
20,606 |
|
|
85,941 |
|
|
10,834,511 |
|
|
10,920,452 |
|
|
744 |
|
NORTHWEST BANCSHARES, INC. AND SUBSIDIARIES
NOTES TO CONSOLIDATED FINANCIAL STATEMENTS
December 31, 2023, 2022 and 2021
Credit Quality Indicators: For Commercial Banking loans we categorize loans into risk categories based on relevant information about the ability of borrowers to service their debt such as: current financial information, historical payment experience, credit documentation, public information, and current economic trends, among other factors. We analyze loans individually by classifying the loans by credit risk. Credit relationships greater than or equal to $1.0 million classified as special mention or substandard are reviewed quarterly for deterioration or improvement to determine if the loan is appropriately classified. We use the following definitions for risk ratings other than pass:
Special Mention — Loans designated as special mention have specific, well-defined risk issues, which create a high level of uncertainty regarding the long-term viability of the business. Loans in this class are considered to have high-risk characteristics. A special mention loan exhibits material negative financial trends due to company-specific or systemic conditions. If these potential weaknesses are not mitigated, they threaten the borrower’s capacity to meet its debt obligations. Special mention loans still demonstrate sufficient financial flexibility to react to and positively address the root cause of the adverse financial trends without significant deviations from their current business strategy. Their potential weaknesses deserve our close attention and warrant enhanced monitoring.
Substandard — Loans classified as substandard are inadequately protected by the current net worth and payment capacity of the obligor or of the collateral pledged, if any. Loans so classified have a well-defined weakness or weaknesses that jeopardize the liquidation of the debt. They are characterized by the distinct possibility that we will sustain some loss if the deficiencies are not corrected.
Doubtful — Loans classified as doubtful have all the weaknesses inherent in those classified as substandard. In addition, those weaknesses make collection or liquidation in full highly questionable and improbable. A loan classified as doubtful exhibits discernible loss potential, but a complete loss seems very unlikely. The possibility of a loss on a doubtful loan is high, but because of certain important and reasonably specific pending factors that may strengthen the loan, its classification as an estimated loss is deferred until a more exact status can be determined.
Loss — Loans classified as loss are considered uncollectible and of such value that the continuance as a loan is not warranted. A loss classification does not mean that the loan has no recovery or salvage value; instead, it means that it is not practical or desirable to defer writing off all or a portion of a basically worthless loan even though partial recovery may be possible in the future.
For Personal Banking loans a pass risk rating is maintained until they are greater than 90 days past due, and risk rating reclassification is based primarily on past due status of the loan. The risk rating categories can generally be described by the following groupings:
Pass — Loans classified as pass are homogeneous loans that are less than 90 days past due from the required payment date at month-end.
Substandard — Loans classified as substandard are homogeneous loans that are greater than 90 days past due from the required payment date at month-end, loans classified as TDRs, or homogenous retail loans that are greater than 180 days past due from the requirement payment date at month-end that has been written down to the value of underlying collateral, less costs to sell.
Doubtful — Loans classified as doubtful are homogeneous loans that are greater than 180 days past due from the required payment date at month-end and not written down to the value of underlying collateral. These loans are generally charged-off in the month in which the 180 day period elapses.
NORTHWEST BANCSHARES, INC. AND SUBSIDIARIES
NOTES TO CONSOLIDATED FINANCIAL STATEMENTS
December 31, 2023, 2022 and 2021
The following table presents the amortized cost basis of our loan portfolio by year of origination and credit quality indicator and the current period charge-offs by year of origination for each portfolio segment as of December 31, 2023 (in thousands):
|
|
|
|
|
|
|
|
|
|
|
|
|
|
|
|
|
|
|
|
|
|
|
|
|
|
|
|
|
|
|
|
|
|
|
|
|
|
|
|
|
|
|
|
|
|
|
|
|
|
|
|
|
|
|
|
2023 |
|
2022 |
|
2021 |
|
2020 |
|
2019 |
|
Prior |
|
Revolving loans |
|
Revolving loans converted to term loans |
|
Total loans
receivable |
|
| Personal Banking: |
|
|
|
|
|
|
|
|
|
|
|
|
|
|
|
|
|
|
| Residential mortgage loans |
|
|
|
|
|
|
|
|
|
|
|
|
|
|
|
|
|
|
| Pass |
$ |
186,081 |
|
|
665,379 |
|
|
792,488 |
|
|
506,068 |
|
|
244,678 |
|
|
1,019,152 |
|
|
— |
|
|
— |
|
|
3,413,846 |
|
|
| Substandard |
— |
|
|
1,581 |
|
|
— |
|
|
1,252 |
|
|
311 |
|
|
11,195 |
|
|
— |
|
|
— |
|
|
14,339 |
|
|
| Total residential mortgage loans |
186,081 |
|
|
666,960 |
|
|
792,488 |
|
|
507,320 |
|
|
244,989 |
|
|
1,030,347 |
|
|
— |
|
|
— |
|
|
3,428,185 |
|
|
| Residential mortgage current period charge-offs |
— |
|
|
(9) |
|
|
(5) |
|
|
(130) |
|
|
(23) |
|
|
(1,023) |
|
|
— |
|
|
— |
|
|
(1,189) |
|
|
| Home equity loans |
|
|
|
|
|
|
|
|
|
|
|
|
|
|
|
|
|
|
| Pass |
71,497 |
|
|
100,639 |
|
|
106,043 |
|
|
146,121 |
|
|
94,144 |
|
|
197,259 |
|
|
463,868 |
|
|
43,526 |
|
|
1,223,097 |
|
|
| Substandard |
— |
|
|
236 |
|
|
54 |
|
|
197 |
|
|
35 |
|
|
1,733 |
|
|
1,447 |
|
|
1,059 |
|
|
4,761 |
|
|
| Total home equity loans |
71,497 |
|
|
100,875 |
|
|
106,097 |
|
|
146,318 |
|
|
94,179 |
|
|
198,992 |
|
|
465,315 |
|
|
44,585 |
|
|
1,227,858 |
|
|
| Home equity current period charge-offs |
— |
|
|
(53) |
|
|
(46) |
|
|
— |
|
|
(48) |
|
|
(352) |
|
|
(144) |
|
|
(209) |
|
|
(852) |
|
|
| Vehicle loans |
|
|
|
|
|
|
|
|
|
|
|
|
|
|
|
|
|
|
| Pass |
664,876 |
|
|
682,275 |
|
|
397,809 |
|
|
132,775 |
|
|
67,853 |
|
|
58,153 |
|
|
— |
|
|
— |
|
|
2,003,741 |
|
|
| Substandard |
646 |
|
|
1,418 |
|
|
1,453 |
|
|
299 |
|
|
556 |
|
|
488 |
|
|
— |
|
|
— |
|
|
4,860 |
|
|
| Total vehicle loans |
665,522 |
|
|
683,693 |
|
|
399,262 |
|
|
133,074 |
|
|
68,409 |
|
|
58,641 |
|
|
— |
|
|
— |
|
|
2,008,601 |
|
|
| Vehicle current period charge-offs |
(678) |
|
|
(1,844) |
|
|
(1,967) |
|
|
(475) |
|
|
(652) |
|
|
(853) |
|
|
— |
|
|
— |
|
|
(6,468) |
|
|
| Consumer loans |
|
|
|
|
|
|
|
|
|
|
|
|
|
|
|
|
|
|
| Pass |
24,277 |
|
|
11,582 |
|
|
5,552 |
|
|
2,072 |
|
|
1,355 |
|
|
6,603 |
|
|
64,214 |
|
|
820 |
|
|
116,475 |
|
|
| Substandard |
55 |
|
|
43 |
|
|
19 |
|
|
6 |
|
|
6 |
|
|
46 |
|
|
726 |
|
|
50 |
|
|
951 |
|
|
| Total consumer loans |
24,332 |
|
|
11,625 |
|
|
5,571 |
|
|
2,078 |
|
|
1,361 |
|
|
6,649 |
|
|
64,940 |
|
|
870 |
|
|
117,426 |
|
|
| Consumer loan current period charge-offs |
(3,412) |
|
|
(511) |
|
|
(390) |
|
|
(157) |
|
|
(177) |
|
|
(980) |
|
|
(317) |
|
|
(38) |
|
|
(5,983) |
|
|
| Total Personal Banking |
947,432 |
|
|
1,463,153 |
|
|
1,303,418 |
|
|
788,790 |
|
|
408,938 |
|
|
1,294,629 |
|
|
530,255 |
|
|
45,455 |
|
|
6,782,070 |
|
|
| Business Banking: |
|
|
|
|
|
|
|
|
|
|
|
|
|
|
|
|
|
|
| Commercial real estate loans |
|
|
|
|
|
|
|
|
|
|
|
|
|
|
|
|
|
|
| Pass |
223,335 |
|
|
470,762 |
|
|
303,873 |
|
|
332,620 |
|
|
228,382 |
|
|
745,244 |
|
|
27,583 |
|
|
24,804 |
|
|
2,356,603 |
|
|
| Special Mention |
2,819 |
|
|
24,735 |
|
|
27,871 |
|
|
5,365 |
|
|
4,053 |
|
|
38,665 |
|
|
711 |
|
|
— |
|
|
104,219 |
|
|
| Substandard |
1,920 |
|
|
750 |
|
|
26,850 |
|
|
18,167 |
|
|
37,044 |
|
|
82,717 |
|
|
79 |
|
|
108 |
|
|
167,635 |
|
|
|
|
|
|
|
|
|
|
|
|
|
|
|
|
|
|
|
|
|
|
|
|
|
|
|
|
|
|
|
|
|
|
|
|
|
|
|
|
| Total commercial real estate loans |
228,074 |
|
|
496,247 |
|
|
358,594 |
|
|
356,152 |
|
|
269,479 |
|
|
866,626 |
|
|
28,373 |
|
|
24,912 |
|
|
2,628,457 |
|
|
Commercial real estate current period
charge-offs |
(14) |
|
|
— |
|
|
(492) |
|
|
— |
|
|
(51) |
|
|
(1,741) |
|
|
— |
|
|
— |
|
|
(2,298) |
|
|
Commercial real estate loans -
owner occupied |
|
|
|
|
|
|
|
|
|
|
|
|
|
|
|
|
|
|
| Pass |
24,725 |
|
|
51,986 |
|
|
47,655 |
|
|
15,984 |
|
|
28,614 |
|
|
140,175 |
|
|
2,378 |
|
|
2,390 |
|
|
313,907 |
|
|
| Special Mention |
1,221 |
|
|
120 |
|
|
1,218 |
|
|
— |
|
|
14,386 |
|
|
2,952 |
|
|
— |
|
|
— |
|
|
19,897 |
|
|
| Substandard |
— |
|
|
— |
|
|
118 |
|
|
1,666 |
|
|
4,646 |
|
|
4,641 |
|
|
— |
|
|
678 |
|
|
11,749 |
|
|
|
|
|
|
|
|
|
|
|
|
|
|
|
|
|
|
|
|
|
|
|
|
|
|
|
|
|
|
|
|
|
|
|
|
|
|
|
|
Total commercial real estate loans -
owner occupied |
25,946 |
|
|
52,106 |
|
|
48,991 |
|
|
17,650 |
|
|
47,646 |
|
|
147,768 |
|
|
2,378 |
|
|
3,068 |
|
|
345,553 |
|
|
| Commercial real estate - owner occupied current period charge-offs |
— |
|
|
— |
|
|
— |
|
|
— |
|
|
— |
|
|
(68) |
|
|
— |
|
|
— |
|
|
(68) |
|
|
| Commercial loans |
|
|
|
|
|
|
|
|
|
|
|
|
|
|
|
|
|
|
| Pass |
482,605 |
|
|
430,378 |
|
|
73,469 |
|
|
26,868 |
|
|
34,090 |
|
|
54,617 |
|
|
531,742 |
|
|
4,110 |
|
|
1,637,879 |
|
|
| Special Mention |
508 |
|
|
3,671 |
|
|
52 |
|
|
299 |
|
|
240 |
|
|
26 |
|
|
1,882 |
|
|
— |
|
|
6,678 |
|
|
| Substandard |
— |
|
|
3,015 |
|
|
872 |
|
|
356 |
|
|
2,361 |
|
|
840 |
|
|
4,729 |
|
|
1,999 |
|
|
14,172 |
|
|
|
|
|
|
|
|
|
|
|
|
|
|
|
|
|
|
|
|
|
|
|
|
|
|
|
|
|
|
|
|
|
|
|
|
|
|
|
|
| Total commercial loans |
483,113 |
|
|
437,064 |
|
|
74,393 |
|
|
27,523 |
|
|
36,691 |
|
|
55,483 |
|
|
538,353 |
|
|
6,109 |
|
|
1,658,729 |
|
|
Commercial loans current period
charge-offs |
(35) |
|
|
(2,072) |
|
|
(517) |
|
|
(430) |
|
|
(205) |
|
|
(845) |
|
|
(60) |
|
|
(2) |
|
|
(4,166) |
|
|
| Total Business Banking |
737,133 |
|
|
985,417 |
|
|
481,978 |
|
|
401,325 |
|
|
353,816 |
|
|
1,069,877 |
|
|
569,104 |
|
|
34,089 |
|
|
4,632,739 |
|
|
|
|
|
|
|
|
|
|
|
|
|
|
|
|
|
|
|
|
|
| Total loans |
$ |
1,684,565 |
|
|
2,448,570 |
|
|
1,785,396 |
|
|
1,190,115 |
|
|
762,754 |
|
|
2,364,506 |
|
|
1,099,359 |
|
|
79,544 |
|
|
11,414,809 |
|
|
For the year ended December 31, 2023, $18.9 million of revolving loans were converted to term loans.
NORTHWEST BANCSHARES, INC. AND SUBSIDIARIES
NOTES TO CONSOLIDATED FINANCIAL STATEMENTS
December 31, 2023, 2022 and 2021
The following table summarizes amortized cost basis loan balances by year of origination, class of loans, and risk category as of December 31, 2022 (in thousands):
|
|
|
|
|
|
|
|
|
|
|
|
|
|
|
|
|
|
|
|
|
|
|
|
|
|
|
|
|
|
|
|
|
|
|
|
|
|
|
|
|
|
|
|
|
|
|
|
|
|
|
|
|
|
| |
2022 |
|
2021 |
|
2020 |
|
2019 |
|
2018 |
|
Prior |
|
Revolving loans |
|
Revolving loans converted to term loans |
|
Total loans receivable |
| Personal Banking: |
|
|
|
|
|
|
|
|
|
|
|
|
|
|
|
|
|
| Residential mortgage loans |
|
|
|
|
|
|
|
|
|
|
|
|
|
|
|
|
|
| Pass |
$ |
659,930 |
|
|
837,823 |
|
|
546,604 |
|
|
265,520 |
|
|
131,599 |
|
|
1,043,394 |
|
|
— |
|
|
— |
|
|
3,484,870 |
|
| Substandard |
422 |
|
|
187 |
|
|
474 |
|
|
796 |
|
|
531 |
|
|
11,319 |
|
|
— |
|
|
— |
|
|
13,729 |
|
| Total residential mortgage loans |
660,352 |
|
|
838,010 |
|
|
547,078 |
|
|
266,316 |
|
|
132,130 |
|
|
1,054,713 |
|
|
— |
|
|
— |
|
|
3,498,599 |
|
| Home equity loans |
|
|
|
|
|
|
|
|
|
|
|
|
|
|
|
|
|
| Pass |
114,598 |
|
|
126,608 |
|
|
173,044 |
|
|
110,495 |
|
|
50,314 |
|
|
198,971 |
|
|
475,229 |
|
|
42,887 |
|
|
1,292,146 |
|
| Substandard |
— |
|
|
46 |
|
|
— |
|
|
127 |
|
324 |
|
|
3,066 |
|
683 |
|
1,282 |
|
5,528 |
|
| Total home equity loans |
114,598 |
|
|
126,654 |
|
|
173,044 |
|
|
110,622 |
|
|
50,638 |
|
|
202,037 |
|
|
475,912 |
|
|
44,169 |
|
|
1,297,674 |
|
| Vehicle loans |
|
|
|
|
|
|
|
|
|
|
|
|
|
|
|
|
|
| Pass |
966,432 |
|
|
611,310 |
|
|
227,897 |
|
|
135,134 |
|
|
70,071 |
|
|
42,166 |
|
|
— |
|
|
— |
|
|
2,053,010 |
|
| Substandard |
292 |
|
|
1,096 |
|
|
667 |
|
|
689 |
|
|
657 |
|
|
372 |
|
|
— |
|
|
— |
|
|
3,773 |
|
| Total vehicle loans |
966,724 |
|
|
612,406 |
|
|
228,564 |
|
|
135,823 |
|
|
70,728 |
|
|
42,538 |
|
|
— |
|
|
— |
|
|
2,056,783 |
|
| Consumer loans |
|
|
|
|
|
|
|
|
|
|
|
|
|
|
|
|
|
| Pass |
19,302 |
|
9,874 |
|
4,327 |
|
|
3,557 |
|
2,409 |
|
|
5,094 |
|
65,610 |
|
1,037 |
|
111,210 |
|
| Substandard |
24 |
|
9 |
|
37 |
|
|
9 |
|
3 |
|
|
48 |
|
432 |
|
100 |
|
662 |
|
| Total consumer loans |
19,326 |
|
|
9,883 |
|
|
4,364 |
|
|
3,566 |
|
|
2,412 |
|
|
5,142 |
|
|
66,042 |
|
|
1,137 |
|
|
111,872 |
|
| Total Personal Banking |
1,761,000 |
|
|
1,586,953 |
|
|
953,050 |
|
|
516,327 |
|
|
255,908 |
|
|
1,304,430 |
|
|
541,954 |
|
|
45,306 |
|
|
6,964,928 |
|
| Business Banking: |
|
|
|
|
|
|
|
|
|
|
|
|
|
|
|
|
|
| Commercial real estate loans |
|
|
|
|
|
|
|
|
|
|
|
|
|
|
|
|
|
| Pass |
322,050 |
|
|
346,355 |
|
|
369,868 |
|
|
244,188 |
|
|
209,500 |
|
|
696,628 |
|
|
24,954 |
|
|
13,314 |
|
|
2,226,857 |
|
| Special Mention |
— |
|
|
17,216 |
|
|
16,782 |
|
|
87 |
|
|
1,000 |
|
|
15,887 |
|
|
157 |
|
|
15 |
|
|
51,144 |
|
| Substandard |
— |
|
|
4,561 |
|
|
3,617 |
|
|
48,879 |
|
|
41,521 |
|
|
70,384 |
|
|
459 |
|
|
606 |
|
|
170,027 |
|
| Total commercial real estate loans |
322,050 |
|
|
368,132 |
|
|
390,267 |
|
|
293,154 |
|
|
252,021 |
|
|
782,899 |
|
|
25,570 |
|
|
13,935 |
|
|
2,448,028 |
|
| Commercial real estate loans - owner occupied |
|
|
|
|
|
|
|
|
|
|
|
|
|
|
|
|
|
| Pass |
62,905 |
|
|
51,673 |
|
|
17,989 |
|
|
49,600 |
|
|
43,570 |
|
|
123,278 |
|
|
2,477 |
|
|
1,460 |
|
|
352,952 |
|
| Special Mention |
126 |
|
|
— |
|
|
18 |
|
|
— |
|
|
2,297 |
|
|
1,106 |
|
|
385 |
|
|
— |
|
|
3,932 |
|
| Substandard |
— |
|
|
— |
|
|
— |
|
|
5,085 |
|
|
2,440 |
|
|
9,250 |
|
|
— |
|
|
1,868 |
|
|
18,643 |
|
| Total commercial real estate loans - owner occupied |
63,031 |
|
|
51,673 |
|
|
18,007 |
|
|
54,685 |
|
|
48,307 |
|
|
133,634 |
|
|
2,862 |
|
|
3,328 |
|
|
375,527 |
|
| Commercial loans |
|
|
|
|
|
|
|
|
|
|
|
|
|
|
|
|
|
| Pass |
481,797 |
|
|
90,320 |
|
|
52,833 |
|
|
46,966 |
|
|
17,250 |
|
|
53,107 |
|
|
354,402 |
|
|
4,032 |
|
|
1,100,707 |
|
| Special Mention |
628 |
|
|
2,190 |
|
|
506 |
|
|
1,704 |
|
|
227 |
|
|
— |
|
|
2,129 |
|
|
— |
|
|
7,384 |
|
| Substandard |
1,833 |
|
|
603 |
|
|
908 |
|
|
2,097 |
|
|
1,605 |
|
|
735 |
|
|
12,941 |
|
|
3,156 |
|
|
23,878 |
|
| Total commercial loans |
484,258 |
|
|
93,113 |
|
|
54,247 |
|
|
50,767 |
|
|
19,082 |
|
|
53,842 |
|
|
369,472 |
|
|
7,188 |
|
|
1,131,969 |
|
| Total Business Banking |
869,339 |
|
|
512,918 |
|
|
462,521 |
|
|
398,606 |
|
|
319,410 |
|
|
970,375 |
|
|
397,904 |
|
|
24,451 |
|
|
3,955,524 |
|
|
|
|
|
|
|
|
|
|
|
|
|
|
|
|
|
|
|
| Total loans |
$ |
2,630,339 |
|
|
2,099,871 |
|
|
1,415,571 |
|
|
914,933 |
|
|
575,318 |
|
|
2,274,805 |
|
|
939,858 |
|
|
69,757 |
|
|
10,920,452 |
|
For the year ended December 31, 2022, $20.7 million of revolving loans were converted to term loans.
NORTHWEST BANCSHARES, INC. AND SUBSIDIARIES
NOTES TO CONSOLIDATED FINANCIAL STATEMENTS
December 31, 2023, 2022 and 2021
Our exposure to credit loss in the event of nonperformance by the other party to off-balance-sheet financial instruments is represented by the contract amount of the financial instrument. We use the same credit policies in making commitments for off- balance-sheet financial instruments as we do for on-balance-sheet instruments. Financial instruments with off-balance-sheet risk as of December 31, 2023 and 2022 are presented in the following table:
|
|
|
|
|
|
|
|
|
|
|
|
|
|
|
|
|
Years ended December 31, |
|
|
2023 |
|
2022 |
| Loans commitments |
|
$ |
198,166 |
|
|
248,636 |
|
| Undisbursed lines of credit |
|
1,185,709 |
|
|
1,094,535 |
|
| Standby letters of credit |
|
46,900 |
|
|
45,140 |
|
| Total |
|
$ |
1,430,775 |
|
|
1,388,311 |
|
Commitments to extend credit are agreements to lend to a customer as long as there is no violation of any condition established in the contract. Commitments generally have fixed expiration dates or other termination clauses and may require payment of a fee. We evaluate each customer’s creditworthiness on a case-by-case basis. The amount of collateral we obtain upon extension of credit is based on management’s credit evaluation of the counterparty. Collateral held varies but generally may include cash, marketable securities, real estate and other property.
Outstanding loan commitments at December 31, 2023 for fixed rate loans were $78.1 million. The interest rates on these commitments approximate market rates at December 31, 2023. Outstanding loan commitments at December 31, 2023 for adjustable rate loans were $120.1 million. The fair values of these commitments are affected by fluctuations in market rates of interest.
We issue standby letters of credit in the normal course of business. Standby letters of credit are conditional commitments issued to guarantee the performance of a customer to a third party. Standby letters of credit generally are contingent upon the failure of the customer to perform according to the terms of the underlying contract with the third party. We are required to perform under a standby letter of credit when drawn upon by the guaranteed third party in the case of nonperformance by our customer. The credit risk associated with standby letters of credit is essentially the same as that involved in extending loans to customers and is subject to normal credit policies. Collateral may be obtained based on management’s credit assessment of the customer. As of December 31, 2023, the maximum potential amount of future payments we could be required to make under these standby letters of credit is $46.9 million, of which $29.7 million is fully collateralized. A liability (which represents deferred income) of $1.1 million and $792,000 has been recognized for the obligations as of December 31, 2023 and 2022, respectively, and there are no recourse provisions that would enable us to recover any amounts from third parties.
In addition, we maintain a $10.0 million credit limit with a correspondent bank for private label credit card facilities for certain existing commercial clients of the Bank, of which $6.9 million of the credit limit was allocated to credit cards that have been issued. These issued credit cards had an outstanding balance of $632,000 at December 31, 2023. The clients of the Bank are responsible for repaying any balances due on these credit cards directly to the correspondent bank; however, if the customer fails to repay their balance, the Bank could be required to satisfy the obligation to the correspondent bank and initiate collection from our customer as part of the existing credit facility of that customer.
Mortgage servicing assets are recognized as separate assets when servicing rights are created through loan originations and the underlying loan is sold. Upon sale, the mortgage servicing right (“MSR”) is established, which represents the then-fair value of future net cash flows expected to be realized for performing the servicing activities. The fair value of the MSRs are estimated by calculating the present value of estimated future net servicing cash flows, taking into consideration actual and expected mortgage loan prepayment rates, discount rates, servicing costs and other economic factors, which are determined based on current market conditions. In determining the fair value of the MSRs, stochastic modeling is performed using variables such as the forward yield curve, prepayment rates, annual service cost, average life expectancy and option adjusted spreads. MSRs are amortized against mortgage banking income in proportion to, and over the period of, the estimated future net servicing income of the underlying mortgage loans. MSRs are recorded in other assets on the Consolidated Statements of Financial Condition.
Capitalized MSRs are evaluated quarterly for impairment based on the estimated fair value of those rights. The MSRs are stratified by certain risk characteristics, primarily loan term and note rate. If impairment exists within a risk stratification tranche, a valuation allowance is established through a charge to income equal to the amount by which the carrying value exceeds the fair value. If it is later determined all or a portion of the temporary impairment no longer exists for a particular tranche, the valuation allowance is reduced or eliminated. We do not directly hedge against realized or potential future impairment losses on our MSRs.
NORTHWEST BANCSHARES, INC. AND SUBSIDIARIES
NOTES TO CONSOLIDATED FINANCIAL STATEMENTS
December 31, 2023, 2022 and 2021
The following table shows changes in MSRs as of and for the years ended December 31, 2023 and 2022:
|
|
|
|
|
|
|
|
|
|
|
|
|
|
|
|
|
|
|
|
|
|
|
Servicing rights |
|
Valuation allowance |
|
Net carrying
value and fair value |
Balance at December 31, 2021 |
|
$ |
10,166 |
|
|
(11) |
|
|
10,155 |
|
| Additions |
|
1,282 |
|
|
4 |
|
|
1,286 |
|
| Amortization |
|
(3,646) |
|
|
— |
|
|
(3,646) |
|
Balance at December 31, 2022 |
|
7,802 |
|
|
(7) |
|
|
7,795 |
|
| Additions |
|
788 |
|
|
(1) |
|
|
787 |
|
| MSR sale |
|
(5,930) |
|
|
— |
|
|
(5,930) |
|
| Amortization |
|
(1,551) |
|
|
— |
|
|
(1,551) |
|
Balance at December 31, 2023 |
|
$ |
1,109 |
|
|
(8) |
|
|
1,101 |
|
(6) Accrued Interest Receivable
Accrued interest receivable as of December 31, 2023 and 2022 is presented in the following table:
|
|
|
|
|
|
|
|
|
|
|
|
| |
December 31, |
| |
2023 |
|
2022 |
| Investment securities |
$ |
1,795 |
|
|
1,722 |
|
| FHLB dividends |
637 |
|
|
391 |
|
| Mortgage-backed securities |
2,743 |
|
|
3,020 |
|
| Loans receivable |
42,178 |
|
|
30,395 |
|
| Total |
$ |
47,353 |
|
|
35,528 |
|
(7) FHLB Stock
Northwest Bank is a member of the FHLB of Pittsburgh and a former member of the FHLB of Indianapolis. As a member of the FHLB of Pittsburgh, we are required to maintain an investment in the capital stock of the FHLB of Pittsburgh in accordance with their 2015 Capital Plan, at cost, in two subclasses based on the following ranges: Membership stock purchase (Subclass B-1) ranging from 0.05% to 1.0% of the member asset value as defined by the FHLB, currently at 0.10%; and Activity-based stock purchase (Subclass B-2) ranging from 2.0% to 6.0% of outstanding advances, currently at 4.0%; 0.0% to 6.0% of acquired member assets, currently at 4.0%; 0.0% to 4.0% of certain letters of credit, currently at 0.75%; and 0.0% to 6.0% of outstanding advance commitments settling more than 30 days after trade, currently at 0.0%.
As a former member of the FHLB of Indianapolis, we are required to maintain an investment in the capital stock of the FHLB of Indianapolis in accordance with their capital plan that became effective on September 26, 2020. This plan requires the Company, as a former member, to maintain its activity-based stock requirements (B-2 stock) ranging from 1.0% to 6.0% of advances, currently at 4.5%; 1.0% to 6.0% for lines of credit, currently at 4.5%; 0.10% to 6.0% for letters of credit, currently at 0.10%; 1.0% to 6.0% of derivative contracts, currently at 4.5%; 0.0% to 6.0% for mandatory Mortgage Purchase Program (when servicing rights are created through loan originations and the underlying loan is sold). Upon sale, the mortgage servicing right (“MPP”), currently at 0.0%, 0.0% to 6.0% for optional MPP, currently at 4.5%; and 1.0% to 6.0% for Community Investment Program (when servicing rights are created through loan originations and the underlying loan is sold). Upon sale, the mortgage servicing right (“CIP”) advances, currently at 4.5%. Class B stock may be redeemed upon five year’s prior written notice from the member in accordance with Section VI.B of the capital plan. Class B stock is also subject to repurchase by the FHLB of Indianapolis, in its discretion, whether or not requested by the member. Our class B shares are scheduled to be redeemed on April 24, 2025 unless they are repurchased by the FHLB of Indianapolis prior to that date.
Our investment in the capital stock of the FHLB of Pittsburgh at December 31, 2023 and December 31, 2022 was $27.0 million and $37.0 million, respectively. In addition, our investment of capital stock of the FHLB of Indianapolis at December 31, 2023 and December 31, 2022 was $3.1 million. We received dividends on capital stock during the years ended December 31, 2023 and 2022 of $2.9 million and $730,000, respectively. Future dividends may be established at different rates for the two subclasses of capital stock.
NORTHWEST BANCSHARES, INC. AND SUBSIDIARIES
NOTES TO CONSOLIDATED FINANCIAL STATEMENTS
December 31, 2023, 2022 and 2021
(8) Premises and Equipment
Premises and equipment at December 31, 2023 and 2022 are summarized by major classification in the following table:
|
|
|
|
|
|
|
|
|
|
|
|
| |
December 31, |
| |
2023 |
|
2022 |
| Land and land improvements |
$ |
23,905 |
|
|
24,368 |
|
| Office buildings and improvements |
140,443 |
|
|
139,180 |
|
| Furniture, fixtures and equipment |
133,513 |
|
|
138,590 |
|
| Leasehold improvements |
23,547 |
|
|
23,559 |
|
| Total, at cost |
321,408 |
|
|
325,697 |
|
| Less accumulated depreciation and amortization |
(182,570) |
|
|
(179,788) |
|
| Premises and equipment, net |
$ |
138,838 |
|
|
145,909 |
|
Depreciation and amortization expense for the years ended December 31, 2023, 2022, and 2021 was $11.5 million, $11.6 million, and $12.1 million, respectively.
(9) Goodwill and Other Intangible Assets
The following table provides information for intangible assets subject to amortization for the years ended December 31, 2023 and 2022:
|
|
|
|
|
|
|
|
|
|
|
|
| |
December 31, |
| |
2023 |
|
2022 |
| Amortizable intangible assets: |
|
|
|
| Core deposit intangibles - gross |
$ |
74,899 |
|
|
74,899 |
|
|
|
|
|
| Less: accumulated amortization |
(69,609) |
|
|
(66,367) |
|
| Core deposit intangibles - net |
$ |
5,290 |
|
|
8,532 |
|
|
|
|
|
| Customer and Contract intangible assets - gross |
$ |
12,775 |
|
|
12,775 |
|
|
|
|
|
| Less: accumulated amortization |
(12,775) |
|
|
(12,747) |
|
| Customer and Contract intangible assets - net |
— |
|
|
28 |
|
| Total intangible assets - net |
$ |
5,290 |
|
|
8,560 |
|
The following information shows the actual aggregate amortization expense for the years ended December 31, 2023, 2022 and 2021 as well as the estimated aggregate amortization expense, based upon current levels of intangible assets, for each of the five succeeding fiscal years:
|
|
|
|
|
|
| For the year ended December 31, 2021 |
$ |
5,553 |
|
| For the year ended December 31, 2022 |
4,277 |
|
| For the year ended December 31, 2023 |
3,270 |
|
| For the year ending December 31, 2024 |
2,452 |
|
| For the year ending December 31, 2025 |
1,662 |
|
| For the year ending December 31, 2026 |
871 |
|
| For the year ending December 31, 2027 |
305 |
|
|
|
The following table provides information for the changes in the carrying amount of goodwill:
|
|
|
|
|
|
|
|
|
|
|
|
|
|
|
|
|
Total |
|
|
|
|
|
|
|
|
|
|
|
|
|
|
|
|
|
|
| Balance at December 31, 2022 |
|
|
|
|
$ |
380,997 |
|
|
|
|
|
|
|
|
|
|
|
|
|
| Balance at December 31, 2023 |
|
|
|
|
$ |
380,997 |
|
We performed our annual goodwill impairment test as of June 30, 2023 2022, and 2021 in accordance with ASC 350, Intangibles - Goodwill and Other, and concluded that goodwill was not impaired. As of December 31, 2023, 2022 and 2021, there were no events or changes in circumstances that would cause us to update that year’s goodwill impairment test and we concluded there was no impairment of goodwill as of such dates.
NORTHWEST BANCSHARES, INC. AND SUBSIDIARIES
NOTES TO CONSOLIDATED FINANCIAL STATEMENTS
December 31, 2023, 2022 and 2021
(10) Deposits
Deposit balances at December 31, 2023 and 2022 are shown in the table below:
|
|
|
|
|
|
|
|
|
|
|
|
| |
December 31, |
| |
2023 |
|
2022 |
| Noninterest-bearing demand deposits |
$ |
2,669,023 |
|
|
2,993,243 |
|
| Interest-bearing demand deposits |
2,634,546 |
|
|
2,686,431 |
|
| Money market deposit accounts |
1,968,218 |
|
|
2,457,569 |
|
| Savings deposits |
2,105,234 |
|
|
2,275,020 |
|
| Time deposits (1) |
2,602,881 |
|
|
1,052,285 |
|
| Total deposits |
$ |
11,979,902 |
|
|
11,464,548 |
|
(1)Includes $483.9 million and $0 of brokered deposits at December 31, 2023 and 2022.
The aggregate amount of time deposits with a minimum denomination of $100,000 at December 31, 2023 and 2022 was $950.3 million and $355.0 million, respectively.
Generally, deposits in excess of $250,000 are not federally insured. At December 31, 2023 and 2022, we had $1.835 billion and $4.031 billion of deposits in accounts exceeding $250,000, respectively.
The following table summarizes the contractual maturity of time deposits at December 31, 2023 and 2022:
|
|
|
|
|
|
|
|
|
|
|
|
| |
December 31, |
| |
2023 |
|
2022 |
| Due within 12 months |
$ |
2,464,022 |
|
|
754,564 |
|
| Due between 12 and 24 months |
70,679 |
|
|
186,803 |
|
| Due between 24 and 36 months |
27,550 |
|
|
46,500 |
|
| Due between 36 and 48 months |
23,590 |
|
|
26,734 |
|
| Due between 48 and 60 months |
13,997 |
|
|
33,691 |
|
| After 60 months |
3,043 |
|
|
3,993 |
|
| Total time deposits |
$ |
2,602,881 |
|
|
1,052,285 |
|
The following table summarizes the interest expense incurred on the respective deposits for the years ended December 31, 2023, 2022 and 2021:
|
|
|
|
|
|
|
|
|
|
|
|
|
|
|
|
|
|
| |
Years ended December 31, |
| |
2023 |
|
2022 |
|
2021 |
| Interest-bearing demand deposits |
$ |
11,606 |
|
|
1,517 |
|
|
1,660 |
|
| Money market deposit accounts |
24,734 |
|
|
3,381 |
|
|
2,597 |
|
| Savings deposits |
8,822 |
|
|
2,339 |
|
|
2,413 |
|
| Time deposits (1) |
60,181 |
|
|
6,883 |
|
|
12,452 |
|
| Total interest expense on deposits |
$ |
105,343 |
|
|
14,120 |
|
|
19,122 |
|
(1)Includes $7.8 million, $0, and $0 of interest expense on brokered deposits at December 31, 2023, 2022, and 2021.
NORTHWEST BANCSHARES, INC. AND SUBSIDIARIES
NOTES TO CONSOLIDATED FINANCIAL STATEMENTS
December 31, 2023, 2022 and 2021
(11) Borrowed Funds
(a) Borrowings
Borrowed funds at December 31, 2023 and 2022 are presented in the following table:
|
|
|
|
|
|
|
|
|
|
|
|
|
|
|
|
|
|
|
|
|
|
|
|
| |
December 31, |
| |
2023 |
|
2022 |
| |
Amount |
|
Average rate |
|
Amount |
|
Average rate |
|
|
|
|
|
|
|
|
|
|
|
|
|
|
|
|
|
|
|
|
|
|
|
|
| Term notes payable to the FHLB of Pittsburgh, due within one year |
$ |
175,000 |
|
|
5.71 |
% |
|
$ |
500,000 |
|
|
4.55 |
% |
| Notes payable to the FHLB of Pittsburgh, due within one year |
163,500 |
|
|
5.70 |
% |
|
51,300 |
|
|
4.45 |
% |
| Collateralized borrowings, due within one year |
35,495 |
|
|
1.72 |
% |
|
105,766 |
|
|
0.27 |
% |
| Collateral received, due within one year |
24,900 |
|
|
5.26 |
% |
|
24,100 |
|
|
4.17 |
% |
| Total borrowed funds |
$ |
398,895 |
|
|
|
|
$ |
681,166 |
|
|
|
Borrowings from the Federal Home Loan Banks (“FHLB”) of Pittsburgh, if any, are secured by our residential first mortgage and other qualifying loans. At December 31, 2023, the carrying value of these loans was $6.022 billion. Certain of these borrowings are subject to restrictions or penalties in the event of prepayment.
The revolving line of credit with the FHLB of Pittsburgh carries a commitment of $250.0 million. The rate is adjusted daily by the FHLB of Pittsburgh, and any borrowings on this line may be repaid at any time without penalty. At December 31, 2023 and December 31, 2022, the balance of the revolving line of credit was $163.5 million and $51.3 million, respectively.
At December 31, 2023 and December 31, 2022, collateralized borrowings due within one year were $35.5 million and $105.8 million, respectively. These borrowings are collateralized by cash or various securities held in safekeeping by the FHLB. At December 31, 2023, the carrying value of the cash and securities used as collateral was $92.0 million.
At December 31, 2023 and December 31, 2022, collateral received was $24.9 million and $24.1 million, respectively. This represents collateral posted to us from our derivative counterparties.
At December 31, 2023 and December 31, 2022, term notes payable to the FHLB of Pittsburgh due within one year were $175.0 million and $500.0 million, respectively. The December 31, 2023 total is made up of seven advances: $25.0 million at 5.76% maturing January 26, 2024; $25.0 million at 5.77% maturing January 31, 2024; $25.0 million at 5.73% maturing February 9, 2024; $25.0 million at 5.68% maturing February 13, 2024; $25.0 million at 5.70% maturing February 12, 2024; $25.0 million at 5.67% maturing February 20, 2024 and $25.0 million at 5.67% maturing February 29, 2024.
On September 9, 2020, the Company issued $125.0 million of 4.00% fixed-to-floating rate subordinated notes with a maturity date of September 15, 2030. The subordinated notes, which qualify as Tier 2 capital, bear interest at an annual rate of 4.00%, payable semi-annually in arrears commencing on March 15, 2021, and a floating rate of interest equivalent to the 3-month Secured Overnight Financing Rate (“SOFR”) plus 3.89% payable quarterly in arrears commencing on December 15, 2025. During the year-ended December 31, 2022 the Company repurchased $10.2 million of subordinated notes leaving $114.8 million of subordinated notes outstanding as of December 31, 2023. The subordinated debt issuance costs of approximately $1.8 million are being amortized over five years on a straight-line basis into interest expense. At December 31, 2023 and December 31, 2022, subordinated debentures, net of issuance costs, were $114.2 million and $113.8 million, respectively. For the years ended December 31, 2023, December 31, 2022, and December 31, 2021 total interest expense paid on the subordinate notes was $4.9 million, $5.1 million, and $5.3 million, respectively.
(b) Trust Preferred Securities
The Company has seven statutory business trusts: Northwest Bancorp Capital Trust III, a Delaware statutory business trust, Northwest Bancorp Statutory Trust IV, a Connecticut statutory business trust, LNB Trust II, a Delaware statutory business trust, Union National Capital Trust I (“UNCT I”), a Delaware statutory business trust, Union National Capital Trust II (“UNCT II”), a Delaware statutory business trust, MFBC Statutory Trust I, a Delaware statutory trust, and Universal Preferred Trust, a Delaware statutory trust (the “Trusts”). The Trusts exist solely to issue preferred securities to third parties for cash, issue common securities to the Company in exchange for capitalization of the Trusts, invest the proceeds from the sale of trust securities in an equivalent amount of debentures of the Company, and engage in other activities that are incidental to those previously listed.
NORTHWEST BANCSHARES, INC. AND SUBSIDIARIES
NOTES TO CONSOLIDATED FINANCIAL STATEMENTS
December 31, 2023, 2022 and 2021
The Trusts have invested the proceeds of the offerings in junior subordinated deferrable interest debentures issued by the Company. The structure of these debentures mirrors the structure of the trust-preferred securities. These subordinated debentures are the sole assets of the Trusts. As the shareholders of the trust preferred securities are the primary beneficiaries of the Trusts, the Trusts are not consolidated in our financial statements.
The following table sets forth a summary of the cumulative trust preferred securities and the junior subordinated debt held by the Trust as of December 31, 2023 and 2022.
|
|
|
|
|
|
|
|
|
|
|
|
|
|
|
|
|
|
|
|
|
|
|
|
|
|
|
|
|
|
|
|
|
Maturity date |
|
Interest rate |
|
|
|
Capital debt
securities |
|
December 31, |
|
|
|
|
|
2023 |
|
2022 |
| Northwest Bancorp Capital Trust III |
December 30, 2035 |
|
3-month SOFR plus 1.38% |
|
|
|
$ |
50,000 |
|
|
51,547 |
|
|
51,547 |
|
| Northwest Bancorp Statutory Trust IV |
December 15, 2035 |
|
3-month SOFR plus 1.38% |
|
|
|
50,000 |
|
|
51,547 |
|
|
51,547 |
|
| LNB Trust II |
June 15, 2037 |
|
3-month SOFR plus 1.48% |
|
|
|
7,875 |
|
|
8,119 |
|
|
8,119 |
|
| Union National Capital Trust I (1) |
January 23, 2034 |
|
3-month SOFR plus 2.85% |
|
|
|
8,000 |
|
|
7,999 |
|
|
7,975 |
|
| Union National Capital Trust II (1) |
November 23, 2034 |
|
3-month SOFR plus 2.00% |
|
|
|
3,000 |
|
|
2,796 |
|
|
2,768 |
|
| MFBC Statutory Trust I (1) |
September 15, 2035 |
|
3-month SOFR plus 1.70% |
|
|
|
5,000 |
|
|
3,788 |
|
|
3,684 |
|
| Universal Preferred Trust (1) |
October 7, 2035 |
|
3-month SOFR plus 1.69% |
|
|
|
5,000 |
|
|
3,778 |
|
|
3,674 |
|
|
|
|
|
|
|
|
$ |
128,875 |
|
|
129,574 |
|
|
129,314 |
|
(1) Net of discounts due to the fair value adjustment made at the time of acquisition.
Cash distributions on the trust securities are made on a quarterly basis to the extent interest on the debentures is received by the Trusts. We have the right to defer payment of interest on the subordinated debentures at any time, or from time-to-time, for periods not exceeding five years. If interest payments on the subordinated debentures are deferred, the distributions on the trust securities also are deferred. To date there have been no interest deferrals. Interest on the subordinated debentures and distributions on the trust securities is cumulative. Our obligation constitutes a full, irrevocable, and unconditional guarantee on a subordinated basis of the obligations of the trust under the preferred securities. For the years ended December 31, 2023, December 31, 2022, and December 31, 2021, total interest expense paid on the trust preferred securities was $9.4 million, $4.7 million, and $2.5 million respectively.
The Trusts must redeem the preferred securities when the debentures are paid at maturity or upon an earlier redemption of the debentures to the extent the debentures are redeemed. All or part of the debentures may be redeemed at any time. Also, the debentures may be redeemed at any time if existing laws or regulations, or the interpretation or application of these laws or regulations, change causing:
•the interest on the debentures to no longer be deductible by the Company for federal income tax purposes;
•the trust to become subject to federal income tax or to certain other taxes or governmental charges;
•the trust to register as an investment company; or
•the preferred securities do not qualify as Tier I capital.
We may, at any time, dissolve any of the Trusts and distribute the debentures to the trust security holders, subject to receipt of any required regulatory approvals.
NORTHWEST BANCSHARES, INC. AND SUBSIDIARIES
NOTES TO CONSOLIDATED FINANCIAL STATEMENTS
December 31, 2023, 2022 and 2021
(12) Income Taxes
Total income tax was allocated for the years ended December 31, 2023, 2022 and 2021 as follows:
|
|
|
|
|
|
|
|
|
|
|
|
|
|
|
|
|
|
| |
Years ended December 31, |
| |
2023 |
|
2022 |
|
2021 |
| Income tax expense |
$ |
40,121 |
|
|
40,026 |
|
|
46,801 |
|
| Shareholders’ equity for unrealized gain/(loss) on securities available-for-sale |
3,429 |
|
|
(45,321) |
|
|
(10,425) |
|
|
|
|
|
|
|
| Shareholders’ equity for pension adjustment |
3,354 |
|
|
6,980 |
|
|
9,659 |
|
| Shareholders’ equity for swap fair value adjustment |
(110) |
|
|
— |
|
|
— |
|
|
|
|
|
|
|
| Unallocated income tax |
$ |
46,794 |
|
|
1,685 |
|
|
46,035 |
|
Income tax expense applicable to income before taxes consists of:
|
|
|
|
|
|
|
|
|
|
|
|
|
|
|
|
|
|
| |
Years ended December 31, |
| |
2023 |
|
2022 |
|
2021 |
| Current tax provision/(benefit): |
|
|
|
|
|
| Federal |
$ |
36,599 |
|
|
36,235 |
|
|
24,554 |
|
| State |
8,442 |
|
|
9,295 |
|
|
9,933 |
|
| Total current tax provision/(benefit) |
45,041 |
|
|
45,530 |
|
|
34,487 |
|
| Deferred tax provision/(benefit): |
|
|
|
|
|
| Federal |
(5,267) |
|
|
(5,325) |
|
|
10,752 |
|
| State |
347 |
|
|
(179) |
|
|
1,562 |
|
| Total deferred tax provision/(benefit) |
(4,920) |
|
|
(5,504) |
|
|
12,314 |
|
| Total income tax expense |
$ |
40,121 |
|
|
40,026 |
|
|
46,801 |
|
A reconciliation of the expected federal statutory income tax rate to the effective rate, expressed as a percentage of pretax income for the years ended December 31, 2023, 2022 and 2021, is as follows:
|
|
|
|
|
|
|
|
|
|
|
|
|
|
|
|
|
|
| |
Years ended December 31, |
| |
2023 |
|
2022 |
|
2021 |
| Expected tax rate |
21.0 |
% |
|
21.0 |
% |
|
21.0 |
% |
| Tax-exempt interest income |
(1.2) |
% |
|
(1.1) |
% |
|
(0.9) |
% |
| State income tax, net of federal benefit |
4.0 |
% |
|
4.0 |
% |
|
4.5 |
% |
| Bank-owned life insurance |
(1.0) |
% |
|
(0.9) |
% |
|
(0.6) |
% |
| Stock-based compensation |
— |
% |
|
0.1 |
% |
|
(0.1) |
% |
| Dividends on stock plans |
(0.4) |
% |
|
(0.5) |
% |
|
(0.4) |
% |
| Low income housing and historic tax credits |
— |
% |
|
(0.2) |
% |
|
(0.2) |
% |
|
|
|
|
|
|
|
|
|
|
|
|
|
|
|
|
|
|
| Other |
0.5 |
% |
|
0.6 |
% |
|
— |
% |
| Effective tax rate |
22.9 |
% |
|
23.0 |
% |
|
23.3 |
% |
NORTHWEST BANCSHARES, INC. AND SUBSIDIARIES
NOTES TO CONSOLIDATED FINANCIAL STATEMENTS
December 31, 2023, 2022 and 2021
The tax effects of temporary differences that give rise to significant portions of the deferred tax assets and deferred tax liabilities at December 31, 2023 and 2022 are presented below:
|
|
|
|
|
|
|
|
|
|
|
|
| |
December 31, |
|
2023 |
|
2022 |
| Deferred tax assets: |
|
|
|
|
|
|
|
| Deferred compensation expense |
$ |
5,001 |
|
|
4,804 |
|
|
|
|
|
| Bad debts |
28,483 |
|
|
27,105 |
|
| Other reserves |
4,511 |
|
|
3,554 |
|
| Accrued post-retirement benefit cost |
477 |
|
|
502 |
|
| Stock benefit plans |
1,134 |
|
|
652 |
|
|
|
|
|
|
|
|
|
|
|
|
|
| Pension and post-retirement benefits |
— |
|
|
2,767 |
|
|
|
|
|
| Unrealized loss on the fair value of securities available-for-sale |
45,985 |
|
|
49,414 |
|
|
|
|
|
|
|
|
|
| Deferred income |
35 |
|
|
95 |
|
| Lease liability |
14,593 |
|
|
13,101 |
|
| Purchase accounting |
698 |
|
|
696 |
|
| Net operating loss |
1,058 |
|
|
1,592 |
|
| Other |
2,431 |
|
|
1,877 |
|
| Total deferred tax assets |
104,406 |
|
|
106,159 |
|
| Deferred tax liabilities: |
|
|
|
| Pension expense |
6,543 |
|
|
6,231 |
|
|
|
|
|
|
|
|
|
| Intangible assets |
18,041 |
|
|
17,400 |
|
|
|
|
|
| Mortgage servicing rights |
242 |
|
|
1,768 |
|
| Fixed assets |
5,567 |
|
|
6,518 |
|
| Net deferred loan costs |
2,412 |
|
|
3,055 |
|
| Right of use asset |
13,917 |
|
|
12,463 |
|
| Pension and post-retirement benefits |
587 |
|
|
— |
|
| Interest rate derivatives |
134 |
|
|
123 |
|
| Other |
2,388 |
|
|
2,369 |
|
| Total deferred tax liabilities |
49,831 |
|
|
49,927 |
|
| Net deferred tax asset |
$ |
54,575 |
|
|
56,232 |
|
We have $1.5 million of federal net operating loss carryovers subject to the annual limitation under Internal Revenue Code Section 382 at December 31, 2023. The carryovers begin to expire in 2031 and are expected to be fully realized. We have $25.9 million of Indiana net operating loss carryovers subject to annual limitation as Indiana conforms to the Internal Revenue Code Section 382 at December 31, 2023. The carryovers begin to expire in 2025. Due to limitation, we do not currently expect to realize $7.6 million of the Indiana net operating loss carryover. This is netted against the net operating loss deferred tax asset in the preceding table.
We recorded a valuation allowance against state deferred tax assets of a Northwest subsidiary since the subsidiary is not expected to utilize its deferred tax assets in the foreseeable future. This valuation allowance is netted against other deferred tax assets in the preceding table.
Other than stated above, we have determined that no valuation allowance is necessary for the deferred tax assets because it is more likely than not that these assets will be realized through future reversals of existing temporary differences and through future taxable income. We will continue to review the criteria related to the recognition of deferred tax assets on a regular basis.
We utilize a comprehensive approach to recognize, measure, present and disclose in our financial statements uncertain tax positions that the company has taken or expects to take on a tax return. We recognize interest accrued and penalties (if any) related to unrecognized tax benefits in income tax expense. The accrual for interest and penalties was not material for all years presented.
NORTHWEST BANCSHARES, INC. AND SUBSIDIARIES
NOTES TO CONSOLIDATED FINANCIAL STATEMENTS
December 31, 2023, 2022 and 2021
The following table presents changes in unrecognized tax benefits at December 31, 2023, 2022 and 2021:
|
|
|
|
|
|
|
|
|
|
|
|
|
|
|
|
|
|
|
Year ended December 31, |
|
2023 |
|
2022 |
|
2021 |
| Unrecognized tax benefits: |
|
|
|
|
|
| Balance, beginning of year |
$ |
473 |
|
|
241 |
|
|
331 |
|
| Increases related to prior year tax positions |
623 |
|
|
252 |
|
|
37 |
|
| Decreases related to prior year tax positions |
(74) |
|
|
(28) |
|
|
(173) |
|
| Increases related to current year tax positions |
58 |
|
|
8 |
|
|
46 |
|
|
|
|
|
|
|
|
|
|
|
|
|
| Balance, end of year |
$ |
1,080 |
|
|
473 |
|
|
241 |
|
It is reasonably possible that over the next twelve months the amount of unrecognized tax benefits may change from the reevaluation of uncertain tax positions arising in examinations, in appeals, or in the courts, or from the closure of tax statutes. We do not expect any significant changes in unrecognized tax benefits during the next twelve months.
We are subject to routine audits of our tax returns by the Internal Revenue Service as well as all states in which we conduct business. We are subject to audit by the Internal Revenue Service for the tax periods ended after December 31, 2019 and generally subject to audit by any state in which we conduct business for the tax periods ended after December 31, 2019.
(13) Shareholders’ Equity
Retained earnings are partially restricted in connection with regulations related to the insurance of deposit accounts, which requires Northwest to maintain certain statutory reserves. Northwest may not pay dividends on or repurchase any of its common stock if the effect thereof would reduce retained earnings below the level of adequate capitalization as defined by federal and state regulators.
In tax years prior to fiscal 1997, Northwest was permitted, under the Internal Revenue Code (“IRC”), to deduct an annual addition to a reserve for bad debts in determining taxable income, subject to certain limitations. Bad debt deductions for income tax purposes are included in taxable income of later years only if the bad debt reserve is used subsequently for purposes other than to absorb bad debt losses. Because Northwest does not intend to use the reserve for purposes other than to absorb losses, no deferred income taxes have been provided prior to fiscal 1987. Retained earnings at December 31, 2023 and 2022 include approximately $39.1 million representing such bad debt deductions for which no deferred income taxes have been provided.
(14) Earnings Per Share
Basic earnings per common share (“EPS”) is computed by dividing net income available to common shareholders by the weighted average number of common shares outstanding for the period, without considering any dilutive items. Diluted EPS reflects the potential dilution that could occur if securities or other contracts to issue common stock were exercised or converted into common stock or resulted in the issuance of common stock that then shared in the earnings of the Company. During the year ended December 31, 2023, 2,814,207 stock options were not included in the computation of diluted earnings per share because the stock options’ exercise price was more than the average market price of the common shares of $11.75. During the year ended December 31, 2022, 1,950,847 stock options were not included in the computation of diluted earnings per share because the stock options’ exercise price was more than the average market price of the common shares of $13.79. During the year ended December 31, 2021, 2,146,897 stock options were not included in the computation of diluted earnings per share because the stock options’ exercise price was more than the average market price of the common shares of $13.80.
NORTHWEST BANCSHARES, INC. AND SUBSIDIARIES
NOTES TO CONSOLIDATED FINANCIAL STATEMENTS
December 31, 2023, 2022 and 2021
The following table sets forth the computation of basic and diluted earnings per share for the years ended December 31, 2023, 2022 and 2021.
|
|
|
|
|
|
|
|
|
|
|
|
|
|
|
|
|
|
| |
Years ended December 31, |
| |
2023 |
|
2022 |
|
2021 |
| Net income |
$ |
134,957 |
|
|
133,666 |
|
|
154,323 |
|
| Less: Dividends and undistributed earnings allocated to participating securities |
339 |
|
|
585 |
|
|
1,010 |
|
| Net income available to common shareholders |
$ |
134,618 |
|
|
133,081 |
|
|
153,313 |
|
|
|
|
|
|
|
| Weighted average common shares outstanding (1) |
126,668,671 |
|
|
126,167,892 |
|
|
126,181,586 |
|
| Add: Participating shares outstanding (1) |
319,501 |
|
|
556,201 |
|
|
828,251 |
|
| Total weighted average common shares and dilutive potential shares (1) |
126,988,172 |
|
|
126,724,093 |
|
|
127,009,837 |
|
|
|
|
|
|
|
| Basic earnings per share (1) |
$ |
1.06 |
|
|
1.05 |
|
|
1.22 |
|
|
|
|
|
|
|
| Diluted earnings per share (1) |
$ |
1.06 |
|
|
1.05 |
|
|
1.21 |
|
(1) Not in thousands.
(15) Employee Benefit Plans
(a) Pension Plans
We maintain noncontributory defined benefit pension plans covering substantially all employees and members of our board of directors. Retirement benefits are based on certain compensation levels, age, and length of service. Contributions are based on an actuarially determined amount to fund not only benefits attributed to service to date but also for those expected to be earned in the future. In addition, we have an unfunded Supplemental Executive Retirement Plan (“SERP”) to compensate those executive participants eligible for the defined benefit pension plan whose benefits are limited by Section 415 of the IRC.
We also sponsor a retirement savings plan in which substantially all employees participate. We provide a matching contribution of 100% of each employee’s contribution to a maximum of 4% of the employee’s compensation.
Effective August 1, 2020, the Pension Plan was amended to include a soft freeze. The soft freeze will allow those employees in an eligible position that were hired, rehired, or acquired on or before July 31, 2020, to continue to vest and accrue additional benefits for each year they are credited with 1,000 hours or more. Employees that are hired, rehired, acquired, or transfer to an eligible job classification on or after August 1, 2020 are not eligible to participate in the Pension Plan.
Total expense for the defined contribution retirement savings plan was $4.4 million, $3.6 million, and $4.6 million for the years ended December 31, 2023, 2022 and 2021, and net periodic pension expense for the defined benefit pension plan was a benefit of $1.1 million for the year ended December 31, 2023 and a total cost of $893,000 and $5.5 million for the years ended 2022 and 2021, respectively.
NORTHWEST BANCSHARES, INC. AND SUBSIDIARIES
NOTES TO CONSOLIDATED FINANCIAL STATEMENTS
December 31, 2023, 2022 and 2021
Components of net periodic pension cost and other amounts recognized in other comprehensive income:
The following table sets forth components of net periodic pension cost and other amounts recognized in other comprehensive income for the years ended December 31, 2023, 2022 and 2021.
|
|
|
|
|
|
|
|
|
|
|
|
|
|
|
|
|
|
| |
Years ended December 31, |
|
2023 |
|
2022 |
|
2021 |
| Defined benefit pension plan: |
|
|
|
|
|
| Service cost |
$ |
6,241 |
|
|
10,396 |
|
|
11,440 |
|
| Interest cost |
9,009 |
|
|
6,683 |
|
|
6,070 |
|
| Expected return on plan assets |
(13,915) |
|
|
(15,454) |
|
|
(13,859) |
|
| Amortization of prior service cost |
(2,254) |
|
|
(2,257) |
|
|
(2,322) |
|
| Amortization of the net loss |
(219) |
|
|
1,525 |
|
|
4,156 |
|
| Net periodic pension cost, defined benefit pension plans |
(1,138) |
|
|
893 |
|
|
5,485 |
|
|
|
|
|
|
|
| Other changes in defined benefit pension plan recognized in other comprehensive income: |
|
|
|
|
|
| Net gain |
(14,066) |
|
|
(28,222) |
|
|
(36,552) |
|
|
|
|
|
|
|
| Amortization of prior service cost |
2,254 |
|
|
2,257 |
|
|
2,322 |
|
| Total recognized in other comprehensive income |
(11,812) |
|
|
(25,965) |
|
|
(34,230) |
|
| Total recognized in net periodic pension cost and other comprehensive income |
$ |
(12,950) |
|
|
(25,072) |
|
|
(28,745) |
|
The estimated net gain and prior service credit for the defined benefit pension plan that will be amortized from accumulated other comprehensive income into net periodic cost ending December 31, 2024 is $71,000 and $2.3 million, respectively.
The following table sets forth information for the defined benefit pension plans’ funded status at December 31, 2023 and 2022:
|
|
|
|
|
|
|
|
|
|
|
|
| |
December 31, |
| |
2023 |
|
2022 |
| Change in benefit obligation: |
|
|
|
| Benefit obligation at beginning of year |
$ |
184,759 |
|
|
246,934 |
|
| Service cost |
6,241 |
|
|
10,396 |
|
| Interest cost |
9,009 |
|
|
6,683 |
|
|
|
|
|
| Actuarial gain |
935 |
|
|
(70,121) |
|
| Benefits paid |
(15,748) |
|
|
(9,133) |
|
| Benefit obligation at end of year |
185,196 |
|
|
184,759 |
|
|
|
|
|
| Change in plan assets: |
|
|
|
| Fair value of plan assets at beginning of year |
202,791 |
|
|
239,438 |
|
| Actual return on plan assets |
29,135 |
|
|
(27,970) |
|
| Employer contributions |
418 |
|
|
456 |
|
|
|
|
|
| Benefits paid |
(15,748) |
|
|
(9,133) |
|
| Fair value of plan assets at end of period |
216,596 |
|
|
202,791 |
|
| Funded status at end of year |
$ |
31,400 |
|
|
18,032 |
|
The following table sets forth the assumptions used to develop the net periodic pension cost:
|
|
|
|
|
|
|
|
|
|
|
|
|
|
|
|
|
|
| |
Years ended December 31, |
| |
2023 |
|
2022 |
|
2021 |
| Discount rate |
4.99 |
% |
|
2.75 |
% |
|
2.39 |
% |
| Expected long-term rate of return on assets |
7.00 |
% |
|
6.50 |
% |
|
6.50 |
% |
| Rate of increase in compensation levels |
3.00 |
% |
|
3.00 |
% |
|
3.00 |
% |
NORTHWEST BANCSHARES, INC. AND SUBSIDIARIES
NOTES TO CONSOLIDATED FINANCIAL STATEMENTS
December 31, 2023, 2022 and 2021
The following table sets forth the assumptions used to determine benefit obligations at the end of each period:
|
|
|
|
|
|
|
|
|
|
|
|
|
|
|
|
|
|
| |
Years ended December 31, |
| |
2023 |
|
2022 |
|
2021 |
| Discount rate |
4.79 |
% |
|
4.99 |
% |
|
2.75 |
% |
| Expected long-term rate of return on assets |
7.00 |
% |
|
6.50 |
% |
|
6.50 |
% |
| Rate of increase in compensation levels |
3.00 |
% |
|
3.00 |
% |
|
3.00 |
% |
The expected long-term rate of return on assets is based on the expected return of each of the asset categories, weighted based on the median of the target allocation for each category. We use the FTSE (previously Citigroup) Pension Liability Index rates matching the duration of our benefit payments as of the measurement date to determine the discount rate.
The accumulated benefit obligation for the funded defined benefit pension plan was $183.1 million, $182.3 million, and $243.6 million at December 31, 2023, 2022 and 2021, respectively. The accumulated benefit obligation for all unfunded defined benefit plans was $2.1 million, $2.5 million, and $3.3 million at December 31, 2023, 2022 and 2021, respectively.
The following table sets forth certain information related to our pension plans:
|
|
|
|
|
|
|
|
|
|
|
|
| |
December 31, |
| |
2023 |
|
2022 |
| Projected benefit obligation |
$ |
185,196 |
|
|
184,759 |
|
| Accumulated benefit obligation |
185,196 |
|
|
184,759 |
|
| Fair value of plan assets |
216,596 |
|
|
202,791 |
|
Because of the current funding status, we do not anticipate a funding requirement during the year ending December 31, 2024.
The investment policy as established by the Plan Administrative Committee, to be followed by the Trustee, is to invest assets based on the target allocations shown in the table below. To meet target allocation ranges set forth by the Plan Administrative Committee, periodically, the assets are reallocated by the Trustee. The investment policy is reviewed periodically to determine if the policy should be changed. Pension assets are conservatively invested with the goal of providing market or better returns with below market risks. Assets are invested in a balanced portfolio composed primarily of equities, fixed income, and cash or cash equivalent investments. The Trustee tries to maintain an approximate asset mix position of 20% to 50% bonds and 30% to 60% equities.
A maximum of 10% may be invested in any one stock, including the stock of Northwest Bancshares, Inc. The objective of holding equity securities is to provide capital appreciation consistent with the ownership of the common stocks of medium to large companies. Acceptable bond investments are direct or agency obligations of the U.S. Government or investment grade corporate bonds. The average maturity of the bond portfolio shall not exceed ten years.
The following table sets forth the weighted average asset allocation of defined benefit plans:
|
|
|
|
|
|
|
|
|
|
|
|
|
|
|
|
|
|
| |
|
|
December 31, |
| |
Target allocation |
|
2023 |
|
2022 |
| Debt securities |
20 – 50% |
|
25 |
% |
|
26 |
% |
| Equity securities |
30 – 60% |
|
69 |
% |
|
65 |
% |
| Other |
5 – 50% |
|
6 |
% |
|
9 |
% |
| Total |
|
|
100 |
% |
|
100 |
% |
NORTHWEST BANCSHARES, INC. AND SUBSIDIARIES
NOTES TO CONSOLIDATED FINANCIAL STATEMENTS
December 31, 2023, 2022 and 2021
All of the assets held by the defined benefit pension plan are measured and recorded at estimated fair value on our balance sheet on a recurring basis as Level 1 assets, as defined by the fair value hierarchy defined in Note 16. The following table sets forth the pension plan assets as of December 31, 2023 and 2022.
|
|
|
|
|
|
|
|
|
|
|
|
|
|
|
|
| |
December 31, |
| |
2023 |
|
2022 |
|
|
|
|
| Defined benefit pension assets: |
|
|
|
|
|
|
|
| Common stock |
$ |
71,192 |
|
|
61,552 |
|
|
|
|
|
| Mutual funds |
131,921 |
|
|
121,826 |
|
|
|
|
|
| Money market funds |
2,150 |
|
|
9,208 |
|
|
|
|
|
| Other |
11,333 |
|
|
10,205 |
|
|
|
|
|
| Total defined benefit pension plan assets (1) |
$ |
216,596 |
|
|
202,791 |
|
|
|
|
|
(1) The defined benefit pension plan statement of net assets also includes accrued interest and dividends resulting in net assets available for benefits of $217.0 million and $203.0 million, respectfully.
The benefits expected to be paid in each year from 2024 to 2028 are $9.0 million, $9.5 million, $9.7 million, $10.1 million and $10.5 million, respectively. The aggregate benefits expected to be paid in the five years from 2029 to 2033 are $60.4 million. The expected benefits to be paid are based on the same assumptions used to measure our benefit obligations at December 31, 2023 and include estimated future employee service.
(b) Post-retirement Healthcare Plan
In addition to pension benefits, we provide post-retirement healthcare benefits for certain employees who were employed as of October 1, 1993 and were at least 55 years of age on that date. We use the accrual method of accounting for post-retirement benefits other than pensions.
Components of net periodic benefit cost and other amounts recognized in other comprehensive income:
The following table sets forth the net periodic benefit cost for the post-retirement healthcare benefits plan for the years ended December 31, 2023, 2022 and 2021:
|
|
|
|
|
|
|
|
|
|
|
|
|
|
|
|
|
|
| |
Years ended December 31, |
| |
2023 |
|
2022 |
|
2021 |
|
|
|
|
|
|
| Interest cost |
$ |
71 |
|
|
40 |
|
|
42 |
|
| Amortization of net loss |
39 |
|
|
6 |
|
|
14 |
|
| Net period benefit cost |
$ |
110 |
|
|
46 |
|
|
56 |
|
The following table sets forth other changes in the post-retirement healthcare plan’s plan assets and benefit obligations recognized in other comprehensive income:
|
|
|
|
|
|
|
|
|
|
|
|
|
|
|
|
|
|
| |
Years ended December 31, |
| |
2023 |
|
2022 |
|
2021 |
| Net (gain)/loss |
$ |
(35) |
|
|
183 |
|
|
(66) |
|
| Total recognized in other comprehensive income |
$ |
(35) |
|
|
183 |
|
|
(66) |
|
| Total recognized in net periodic benefit cost and other comprehensive income |
$ |
74 |
|
|
229 |
|
|
(10) |
|
The estimated net loss for the post-retirement healthcare benefit plan that will be amortized from accumulated other comprehensive income into net periodic benefit cost over the year ending December 31, 2024 is $38,000.
NORTHWEST BANCSHARES, INC. AND SUBSIDIARIES
NOTES TO CONSOLIDATED FINANCIAL STATEMENTS
December 31, 2023, 2022 and 2021
The following table sets forth the funded status of the post-retirement healthcare benefit plan at December 31, 2023 and 2022:
|
|
|
|
|
|
|
|
|
|
|
|
| |
December 31, |
| |
2023 |
|
2022 |
| Change in benefit obligation: |
|
|
|
| Benefit obligation at beginning of year |
$ |
1,521 |
|
|
1,560 |
|
|
|
|
|
| Interest cost |
71 |
|
|
40 |
|
| Actuarial loss |
3 |
|
|
189 |
|
| Benefits paid |
(209) |
|
|
(268) |
|
|
|
|
|
| Benefit obligation at end of year |
$ |
1,386 |
|
|
1,521 |
|
|
|
|
|
| Change in plan assets: |
|
|
|
|
|
|
|
| Employer contributions |
$ |
209 |
|
|
268 |
|
| Benefits paid |
(209) |
|
|
(268) |
|
|
|
|
|
| Funded status at year end |
$ |
(1,386) |
|
|
(1,521) |
|
The assumptions used to develop the preceding information for post-retirement healthcare benefits are as follows:
|
|
|
|
|
|
|
|
|
|
|
|
|
|
|
|
|
|
| |
Years ended December 31, |
| |
2023 |
|
2022 |
|
2021 |
| Discount rate |
4.99 |
% |
|
2.75 |
% |
|
2.39 |
% |
| Monthly cost of healthcare insurance per beneficiary (1) |
$ |
916 |
|
|
415 |
|
|
343 |
|
| Annual rate of increase in healthcare costs |
5.00 |
% |
|
5.00 |
% |
|
5.00 |
% |
(1) Not in thousands.
If the assumed rate of increase in healthcare costs was increased by one percentage point to 6% from the level presented above, the interest cost component of net periodic post-retirement healthcare benefit cost would increase by $3,300 and the accumulated post-retirement benefit obligation for healthcare benefits would increase by $66,200.
The following table sets forth information for plans with an accumulated benefit obligation in excess of plan assets:
|
|
|
|
|
|
|
|
|
|
|
|
| |
December 31, |
| |
2023 |
|
2022 |
| Projected benefit obligation |
$ |
1,386 |
|
|
1,521 |
|
| Accumulated benefit obligation |
1,386 |
|
|
1,521 |
|
|
|
|
|
(c) Common Stock Awards
On April 18, 2018, shareholders approved the Northwest Bancshares, Inc. 2018 Equity Incentive Plan with 1,500,000 common shares authorized for award. From this plan, we awarded employees 293,755 common shares and outside directors 27,000 common shares with a grant date fair value of $13.68 per share (total market value of $4.4 million at issuance) on May 25, 2021. Also during 2021, we awarded discretionary grants of 13,452 common shares with a weighted average grant date fair value of $13.76. During 2022, we awarded discretionary grants of 12,521 common shares with a weighted average grant date fair value of $13.98. These shares vest over a five or seven years period, depending on the date of grant, with the first vesting occurring on the date of grant. Total common shares forfeited from the 2018 plan were 265,176, of which 40,362 shares were forfeited during the year ended December 31, 2023. Forfeited shares may be awarded to other eligible recipients in future grants until the plan termination date in 2028. At December 31, 2023, there was compensation expense of $2.1 million to be recognized for unvested restricted common shares, with an expense recognition period remaining of three years.
On May 18, 2022, shareholders approved the Northwest Bancshares, Inc. 2022 Equity Incentive Plan with 3,500,000 shares authorized for award. From this plan we can awarded employees or directors restricted stock units (“RSUs”). The RSUs vest over a specified time period with the first vesting occurring one year from the grant date. We also award restricted stock awards (“RSAs”) which fully vest one-year from the grant date. We also award performance share units (“PSUs”). The number of PSUs earned will be based on attainment of certain performance criteria over a three-year period, with the actual number of shares issuable ranging between 0% and 150% of the number of PSUs granted. The PSUs have a three-year cliff vesting, from the date of grant, and any PSU’s earned will be issued after the vesting period.
NORTHWEST BANCSHARES, INC. AND SUBSIDIARIES
NOTES TO CONSOLIDATED FINANCIAL STATEMENTS
December 31, 2023, 2022 and 2021
During the years ended December 31, 2022 and 2023, we granted the following awards (amounts in this table are not in thousands):
|
|
|
|
|
|
|
|
|
|
|
|
|
|
|
|
|
|
|
|
|
|
|
|
|
|
|
|
|
|
|
|
|
|
|
|
|
|
|
|
|
|
|
|
|
| Year-ended |
|
Grant date |
|
Award to |
|
Shares |
|
Grant type |
|
Weighted average grant date fair value |
|
Total
market value |
|
Vesting period |
| December 31, 2022 |
|
|
|
|
|
|
|
|
|
|
|
|
|
|
|
|
5/18/2022 |
|
Employees |
|
150,027 |
|
|
RSU |
|
$11.00 |
|
$1.7 million |
|
3 years |
|
|
5/18/2022 |
|
Employees |
|
150,027 |
|
|
PSU |
|
10.26 |
|
|
$1.5 million |
|
3 years |
|
|
5/18/2022 |
|
Directors |
|
41,206 |
|
|
RSA |
|
12.55 |
|
|
$517,000 |
|
1 year |
|
|
Various |
|
Employees |
|
13,115 |
|
|
RSU |
|
12.69 |
|
|
$166,000 |
|
3 years |
|
|
|
|
|
|
|
|
|
|
|
|
|
|
|
| December 31, 2023 |
|
|
|
|
|
|
|
|
|
|
|
|
|
|
|
|
3/15/2023 |
|
Employees |
|
176,623 |
|
|
RSU |
|
11.28 |
|
|
$2.0 million |
|
3 years |
|
|
3/15/2023 |
|
Employees |
|
176,623 |
|
|
PSU |
|
10.54 |
|
|
$1.9 million |
|
3 years |
|
|
3/15/2023 |
|
Directors |
|
33,048 |
|
|
RSA |
|
12.80 |
|
|
$423,000 |
|
1 year |
|
|
3/27/2023 |
|
Employees |
|
80,980 |
|
|
RSU |
|
11.20 |
|
|
$907,000 |
|
2 years |
|
|
Various |
|
Employees |
|
128148 |
|
RSU |
|
10.30 |
|
|
$1.3 million |
|
3 years |
|
|
|
|
|
|
|
|
|
|
|
|
|
|
|
Total shares forfeited from the 2022 plan were 71,073 of which 44,791 shares were forfeited during the year ended December 31, 2023. At December 31, 2023, there was compensation expense of $4.0 million to be recognized for awarded but unvested RSUs and $1.8 million to be recognized for awarded but unvested PSUs, with an expense recognition period remaining of 2.5 years. At December 31, 2023, there was compensation expense of $88,000 to be recognized for awarded but unvested RSAs, with an expense recognition period remaining of one year.
(d) Stock Option Plans
The Northwest Bancshares, Inc. 2018 Equity Incentive Plan also authorized the granting of 3,500,000 stock options authorized for award. On May 25, 2021, we granted employees 621,972 stock options and outside directors 72,000 stock options with an exercise price of $13.68 per share. There were no stock options granted during the years-ended December 31, 2022 and December 31, 2023. These awarded stock options vest over a five-year period with the first vesting occurring on the grant date with a ten-year exercise period from the grant date.
The following table summarizes the activity in our option plans during the years ended December 31, 2023, 2022 and 2021 (amounts in this table are not in thousands):
|
|
|
|
|
|
|
|
|
|
|
|
|
|
|
|
|
|
|
|
|
|
|
|
|
|
|
|
|
|
|
|
|
|
|
|
| |
Years ended December 31, |
| |
2023 |
|
2022 |
|
2021 |
| |
Number |
|
Weighted average
exercise price |
|
Number |
|
Weighted average
exercise price |
|
Number |
|
Weighted average
exercise price |
| Balance at beginning of year |
3,657,580 |
|
|
$ |
14.25 |
|
|
4,380,310 |
|
|
$ |
14.05 |
|
|
5,243,172 |
|
|
$ |
13.72 |
|
| Granted (1) |
— |
|
|
— |
|
|
— |
|
|
— |
|
|
693,972 |
|
|
13.68 |
|
| Exercised (2) |
(63,315) |
|
|
11.46 |
|
|
(465,920) |
|
|
12.14 |
|
|
(1,219,581) |
|
|
12.28 |
|
| Forfeited/expired |
(385,260) |
|
|
13.80 |
|
|
(256,810) |
|
|
14.64 |
|
|
(337,253) |
|
|
14.59 |
|
| Balance at end of year |
3,209,005 |
|
|
14.36 |
|
|
3,657,580 |
|
|
14.25 |
|
|
4,380,310 |
|
|
14.05 |
|
| Exercisable at end of year |
2,601,367 |
|
|
14.52 |
|
|
2,556,235 |
|
|
14.43 |
|
|
2,618,733 |
|
|
14.15 |
|
(1)Weighted average fair value of options at grant date: N/A, N/A and $0.64, respectively.
(2)The total intrinsic value of options exercised was $115,000, $839,000 and $2.3 million, respectively.
NORTHWEST BANCSHARES, INC. AND SUBSIDIARIES
NOTES TO CONSOLIDATED FINANCIAL STATEMENTS
December 31, 2023, 2022 and 2021
The aggregate intrinsic value of all options expected to vest and fully vested options at December 31, 2023 is ($748,000) and ($5.3) million, respectively. The following table summarizes the number of options outstanding, number of options exercisable, and weighted average remaining life of all option grants as of December 31, 2023 (amounts in this table are not in thousands):
|
|
|
|
|
|
|
|
|
|
|
|
|
|
|
|
|
|
|
|
|
|
|
|
| |
Exercise price
$9.71
|
|
Exercise price
$12.37
|
|
Exercise price
$13.15
|
|
Exercise price
$13.68
|
| Options outstanding: |
|
|
|
|
|
|
|
| Number of options |
394,798 |
|
|
249,306 |
|
|
217,863 |
|
|
542,124 |
|
| Weighted average remaining contract life (years) |
6.5 |
|
1.5 |
|
0.5 |
|
7.5 |
| Options exercisable: |
|
|
|
|
|
|
|
| Number of options |
249,193 |
|
|
233,622 |
|
|
217,863 |
|
|
354,612 |
|
| Weighted average remaining term - vested (years) |
6.5 |
|
1.5 |
|
0.5 |
|
7.5 |
|
|
|
|
|
|
|
|
|
|
|
|
|
|
|
|
|
|
|
|
|
|
|
|
|
|
|
|
|
|
|
|
| |
Exercise price
$14.15
|
|
Exercise price
$15.57
|
|
Exercise price
$16.59
|
|
Exercise price
$17.27
|
|
Total average
$14.36
|
|
|
| Options outstanding: |
|
|
|
|
|
|
|
|
|
|
|
| Number of options |
359,473 |
|
|
449,417 |
|
|
578,361 |
|
|
417,663 |
|
|
3,209,005 |
|
|
|
| Weighted average remaining contract life (years) |
2.5 |
|
3.5 |
|
4.5 |
|
5.5 |
|
4.4 |
|
|
| Options exercisable: |
|
|
|
|
|
|
|
|
|
|
|
| Number of options |
315,615 |
|
|
366,920 |
|
|
527,197 |
|
|
336,345 |
|
|
2,601,367 |
|
|
|
| Weighted average remaining term - vested (years) |
2.5 |
|
3.5 |
|
4.5 |
|
5.5 |
|
3.1 |
|
|
(16) Disclosures About Fair Value of Financial Instruments
We are required to disclose fair value information about financial instruments whether or not recognized in the Consolidated Statement of Financial Condition. Fair value information of certain financial instruments and all nonfinancial instruments is not required to be disclosed. Accordingly, the aggregate fair value amounts presented do not represent the underlying value of the Company.
Financial assets and liabilities recognized or disclosed at fair value on a recurring basis and certain financial assets and liabilities on a non-recurring basis are accounted for using a three-level hierarchy of valuation techniques based on whether the inputs to those valuation techniques are observable or unobservable. This hierarchy gives the highest priority to quoted prices with readily available independent data in active markets for identical assets or liabilities (Level 1) and the lowest priority to unobservable market inputs (Level 3). When various inputs for measurement fall within different levels of the fair value hierarchy, the lowest level input that has a significant impact on fair value measurement is used.
Financial assets and liabilities are categorized based upon the following characteristics or inputs to the valuation techniques:
•Level 1 - Financial assets and liabilities for which inputs are observable and are obtained from reliable quoted prices for identical assets or liabilities in actively traded markets. This is the most reliable fair value measurement and includes, for example, active exchange-traded equity securities.
•Level 2 - Financial assets and liabilities for which values are based on quoted prices in markets that are not active or for which values are based on similar assets or liabilities that are actively traded. Level 2 also includes pricing models in which the inputs are corroborated by market data, for example, matrix pricing.
•Level 3 - Financial assets and liabilities for which values are based on prices or valuation techniques that require inputs that are both unobservable and significant to the overall fair value measurement. Level 3 inputs include the following:
•Quotes from brokers or other external sources that are not considered binding;
•Quotes from brokers or other external sources where it cannot be determined that market participants would in fact transact for the asset or liability at the quoted price; and
•Quotes and other information from brokers or other external sources where the inputs are not deemed observable.
NORTHWEST BANCSHARES, INC. AND SUBSIDIARIES
NOTES TO CONSOLIDATED FINANCIAL STATEMENTS
December 31, 2023, 2022 and 2021
We are responsible for the valuation process and as part of this process may use data from outside sources in establishing fair value. We perform due diligence to understand the inputs used or how the data was calculated or derived. We also corroborate the reasonableness of external inputs in the valuation process.
The carrying amounts reported in the Consolidated Statement of Financial Condition approximate fair value for the following financial instruments: cash and cash equivalents, marketable securities available-for-sale, residential mortgage loans held-for-sale, accrued interest receivable, interest rate lock commitments, forward commitments, interest rate swaps, savings and checking deposits, foreign exchange swaps, risk participation agreements, and accrued interest payable.
Marketable Securities
Where available, market values are based on quoted market prices, dealer quotes, and prices obtained from independent pricing services.
Debt securities — available-for-sale - Generally, debt securities are valued using pricing for similar securities, recently executed transactions and other pricing models utilizing observable inputs. The valuation for most debt securities is classified as Level 2. Securities within Level 2 include corporate bonds, municipal bonds, mortgage-backed securities and U.S. government obligations. Certain debt securities which were AAA rated at purchase do not have an active market, and as such we have used an alternative method to determine the fair value of these securities. The fair value has been determined using a discounted cash flow model using market assumptions, which generally include cash flow, collateral and other market assumptions. As such, securities which otherwise would have been classified as Level 2 securities if an active market for those assets or similar assets existed are included herein as Level 3 assets.
Debt securities — held-to-maturity - The fair value of debt securities held-to-maturity is determined in the same manner as debt securities available-for-sale.
Loans Receivable
Loans with comparable characteristics including collateral and re-pricing structures are segregated for valuation purposes. Each loan pool is separately valued utilizing a discounted cash flow analysis. Projected monthly cash flows are discounted to present value using a market rate for comparable loans, which is not considered an exit price. Characteristics of comparable loans include remaining term, coupon interest, and estimated prepayment speeds. Delinquent loans are separately evaluated given the impact delinquency has on the projected future cash flow of the loan including the approximate discount or market rate, which is not considered an exit price.
Loans Held-for-Sale
The estimated fair value of loans held-for-sale is based on market bids obtained from potential buyers.
FHLB Stock
Due to the restrictions placed on the transferability of FHLB stock, it is not practical to determine the fair value. FHLB stock is recorded at cost.
Deposit Liabilities
The estimated fair value of deposits with no stated maturity, which includes demand deposits, money market, and other savings accounts, is the amount payable on demand. Although market premiums paid for depository institutions reflect an additional value for these low-cost deposits, adjusting fair value for any value expected to be derived from retaining those deposits for a future period of time or from the benefit that results from the ability to fund interest-earning assets with these deposit liabilities is prohibited. The fair value estimates of deposit liabilities do not include the benefit that results from the low-cost funding provided by these deposits compared to the cost of borrowing funds in the market. Fair values for time deposits are estimated using a discounted cash flow calculation that applies contractual cost currently being offered in the existing portfolio to current market rates being offered locally for deposits of similar remaining maturities. The valuation adjustment for the portfolio consists of the present value of the difference of these two cash flows, discounted at the assumed market rate of the corresponding maturity.
NORTHWEST BANCSHARES, INC. AND SUBSIDIARIES
NOTES TO CONSOLIDATED FINANCIAL STATEMENTS
December 31, 2023, 2022 and 2021
Borrowed Funds
Fixed rate advances are valued by comparing their contractual cost to the prevailing market cost. The carrying amount of repurchase agreements approximates their fair value.
Subordinated Debentures
The fair value of our subordinated debentures is calculated using the discounted cash flows at rates observable for other similarly traded liabilities.
Junior Subordinated Debentures
The fair value of junior subordinated debentures is calculated using the discounted cash flows at the prevailing rate of interest.
Interest Rate Lock Commitments and Forward Commitments
The fair value of interest rate lock commitments is based on the value of underlying loans held-for-sale which is based on quoted prices for similar loans in the secondary market. This value is then adjusted based on the probability of the loan closing (i.e., the “pull-through” amount, a significant unobservable input). The fair value of forward sale commitments is based on quoted prices from the secondary market based on the settlement date of the contracts.
Cash Flow Hedges, Interest Rate and Foreign Exchange Swap Agreements and Risk Participation Agreements
The fair value of interest rate swaps is based upon the present value of the expected future cash flows using the SOFR discount curve, the basis for the underlying interest rate. To price interest rate swaps, cash flows are first projected for each payment date using the fixed rate for the fixed side of the swap and the forward rates for the floating side of the swap. These swap cash flows are then discounted to time zero using SOFR zero-coupon interest rates. The sum of the present value of both legs is the fair market value of the interest rate swap. These valuations have been derived from our third party vendor’s proprietary models rather than actual market quotations. The proprietary models are based upon financial principles and assumptions that we believe to be reasonable. The fair value of the foreign exchange swap is derived from proprietary models rather than actual market quotations. The proprietary models are based upon financial principles and assumptions we believe to be reasonable. Risk participation agreements are entered into when Northwest purchases a portion of a commercial loan that has an interest rate swap. Northwest assumes credit risk on its portion of the interest rate swap should the borrower fail to pay as agreed. The value of risk participation agreements is determined based on the value of the swap after considering the credit quality, probability of default, and loss given default of the borrower.
Off-Balance Sheet Financial Instruments
These financial instruments generally are not sold or traded, and estimated fair values are not readily available. However, the fair value of commitments to extend credit and standby letters of credit is estimated using the fees currently charged to enter into similar agreements. Commitments to extend credit are generally short-term in nature and, if drawn upon, are issued under current market terms. At December 31, 2023 and 2022, there was no significant unrealized appreciation or depreciation on these financial instruments.
NORTHWEST BANCSHARES, INC. AND SUBSIDIARIES
NOTES TO CONSOLIDATED FINANCIAL STATEMENTS
December 31, 2023, 2022 and 2021
The following table sets forth the carrying amount and estimated fair value of our financial instruments included in the Consolidated Statement of Financial Condition at December 31, 2023 and 2022:
|
|
|
|
|
|
|
|
|
|
|
|
|
|
|
|
|
|
|
|
|
|
|
|
|
|
|
|
|
|
| |
December 31, 2023 |
| |
Carrying amount |
|
Estimated fair value |
|
Level 1 |
|
Level 2 |
|
Level 3 |
| Financial assets: |
|
|
|
|
|
|
|
|
|
| Cash and cash equivalents |
$ |
122,260 |
|
|
122,260 |
|
|
122,260 |
|
|
— |
|
|
— |
|
| Securities available-for-sale |
1,043,359 |
|
|
1,043,359 |
|
|
— |
|
|
1,043,359 |
|
|
— |
|
| Securities held-to-maturity |
814,839 |
|
|
699,506 |
|
|
— |
|
|
699,506 |
|
|
— |
|
| Loans receivable, net |
11,280,798 |
|
|
10,274,593 |
|
|
— |
|
|
— |
|
|
10,274,593 |
|
| Residential mortgage loans held-for-sale |
8,768 |
|
|
8,768 |
|
|
— |
|
|
— |
|
|
8,768 |
|
| Accrued interest receivable |
47,353 |
|
|
47,353 |
|
|
47,353 |
|
|
— |
|
|
— |
|
| Interest rate lock commitments |
641 |
|
|
641 |
|
|
— |
|
|
— |
|
|
641 |
|
| Forward commitments |
12 |
|
|
12 |
|
|
— |
|
|
12 |
|
|
— |
|
| Interest rate swaps designated as hedging instruments |
713 |
|
|
713 |
|
|
— |
|
|
713 |
|
|
— |
|
| Interest rate swaps not designated as hedging instruments |
41,406 |
|
|
41,406 |
|
|
— |
|
|
41,406 |
|
|
— |
|
| FHLB stock |
30,146 |
|
|
30,146 |
|
|
— |
|
|
— |
|
|
— |
|
|
|
|
|
|
|
|
|
|
|
| Total financial assets |
$ |
13,390,295 |
|
|
12,268,757 |
|
|
169,613 |
|
|
1,784,996 |
|
|
10,284,002 |
|
|
|
|
|
|
|
|
|
|
|
| Financial liabilities: |
|
|
|
|
|
|
|
|
|
| Savings and checking deposits |
$ |
9,377,021 |
|
|
9,377,021 |
|
|
9,377,021 |
|
|
— |
|
|
— |
|
| Time deposits |
2,602,881 |
|
|
2,113,177 |
|
|
— |
|
|
— |
|
|
2,113,177 |
|
| Borrowed funds |
398,895 |
|
|
386,446 |
|
|
386,446 |
|
|
— |
|
|
— |
|
| Subordinated debt |
114,189 |
|
|
109,471 |
|
|
— |
|
|
109,471 |
|
|
— |
|
| Junior subordinated debentures |
129,574 |
|
|
112,159 |
|
|
— |
|
|
— |
|
|
112,159 |
|
| Foreign exchange swaps |
291 |
|
|
291 |
|
|
— |
|
|
291 |
|
|
— |
|
| Interest rate swaps designated as hedging instruments |
1,198 |
|
|
1,198 |
|
|
— |
|
|
1,198 |
|
|
— |
|
| Interest rate swaps not designated as hedging instruments |
41,437 |
|
|
41,437 |
|
|
— |
|
|
41,437 |
|
|
— |
|
| Risk participation agreements |
14 |
|
|
14 |
|
|
— |
|
|
14 |
|
|
— |
|
| Accrued interest payable |
13,669 |
|
|
13,669 |
|
|
13,669 |
|
|
— |
|
|
— |
|
| Total financial liabilities |
$ |
12,679,169 |
|
|
12,154,883 |
|
|
9,777,136 |
|
|
152,411 |
|
|
2,225,336 |
|
NORTHWEST BANCSHARES, INC. AND SUBSIDIARIES
NOTES TO CONSOLIDATED FINANCIAL STATEMENTS
December 31, 2023, 2022 and 2021
|
|
|
|
|
|
|
|
|
|
|
|
|
|
|
|
|
|
|
|
|
|
|
|
|
|
|
|
|
|
| |
December 31, 2022 |
| |
Carrying amount |
|
Estimated fair value |
|
Level 1 |
|
Level 2 |
|
Level 3 |
| Financial assets: |
|
|
|
|
|
|
|
|
|
| Cash and cash equivalents |
$ |
139,365 |
|
|
139,365 |
|
|
139,365 |
|
|
— |
|
|
— |
|
| Securities available-for-sale |
1,218,108 |
|
|
1,218,108 |
|
|
— |
|
|
1,218,108 |
|
|
— |
|
| Securities held-to-maturity |
881,249 |
|
|
751,384 |
|
|
— |
|
|
751,384 |
|
|
— |
|
| Loans receivable, net |
10,792,503 |
|
|
9,910,852 |
|
|
— |
|
|
— |
|
|
9,910,852 |
|
| Residential mortgage loans held-for-sale |
9,913 |
|
|
9,913 |
|
|
— |
|
|
— |
|
|
9,913 |
|
| Accrued interest receivable |
35,528 |
|
|
35,528 |
|
|
35,528 |
|
|
— |
|
|
— |
|
| Interest rate lock commitments |
559 |
|
559 |
|
— |
|
|
— |
|
|
559 |
| Forward commitments |
128 |
|
128 |
|
— |
|
|
128 |
|
— |
|
| Interest rate swaps not designated as hedging instruments |
26,642 |
|
|
26,642 |
|
|
— |
|
|
26,642 |
|
|
— |
|
| FHLB stock |
40,143 |
|
|
40,143 |
|
|
— |
|
|
— |
|
|
— |
|
|
|
|
|
|
|
|
|
|
|
| Total financial assets |
$ |
13,144,138 |
|
|
12,132,622 |
|
|
174,893 |
|
|
1,996,262 |
|
|
9,921,324 |
|
|
|
|
|
|
|
|
|
|
|
| Financial liabilities: |
|
|
|
|
|
|
|
|
|
| Savings and checking accounts |
$ |
10,412,263 |
|
|
10,412,263 |
|
|
10,412,263 |
|
|
— |
|
|
— |
|
| Time deposits |
1,052,285 |
|
|
1,059,790 |
|
|
— |
|
|
— |
|
|
1,059,790 |
|
| Borrowed funds |
681,166 |
|
|
680,996 |
|
|
680,996 |
|
|
— |
|
|
— |
|
| Subordinated debt |
113,840 |
|
|
102,554 |
|
|
— |
|
|
102,554 |
|
|
— |
|
| Junior subordinated debentures |
129,314 |
|
|
133,546 |
|
|
— |
|
|
— |
|
|
133,546 |
|
| Foreign exchange swaps |
23 |
|
|
23 |
|
|
— |
|
|
23 |
|
|
— |
|
| Interest rate swaps not designated as hedging instruments |
45,464 |
|
|
45,464 |
|
|
— |
|
|
45,464 |
|
|
— |
|
| Risk participation agreements |
18 |
|
|
18 |
|
|
— |
|
|
18 |
|
|
— |
|
| Accrued interest payable |
3,231 |
|
|
3,231 |
|
|
3,231 |
|
|
— |
|
|
— |
|
| Total financial liabilities |
$ |
12,437,604 |
|
|
12,437,885 |
|
|
11,096,490 |
|
|
148,059 |
|
|
1,193,336 |
|
Fair value estimates are made at a point-in-time, based on relevant market data and information about the instrument. The preceding methods and assumptions were used in estimating the fair value of financial instruments at December 31, 2023 and 2022.
NORTHWEST BANCSHARES, INC. AND SUBSIDIARIES
NOTES TO CONSOLIDATED FINANCIAL STATEMENTS
December 31, 2023, 2022 and 2021
The following table represents assets and liabilities measured at fair value on a recurring basis as of December 31, 2023:
|
|
|
|
|
|
|
|
|
|
|
|
|
|
|
|
|
|
|
|
|
|
|
|
|
Level 1 |
|
Level 2 |
|
Level 3 |
|
Total at
fair value |
|
|
|
|
|
|
|
|
|
|
|
|
|
|
|
|
| Debt securities: |
|
|
|
|
|
|
|
| U.S. government and agencies |
$ |
— |
|
|
58,314 |
|
|
— |
|
|
58,314 |
|
| Government sponsored enterprises |
— |
|
|
40,597 |
|
|
— |
|
|
40,597 |
|
| States and political subdivisions |
— |
|
|
75,469 |
|
|
— |
|
|
75,469 |
|
| Corporate |
— |
|
|
7,688 |
|
|
— |
|
|
7,688 |
|
| Total debt securities |
— |
|
|
182,068 |
|
|
— |
|
|
182,068 |
|
|
|
|
|
|
|
|
|
| Residential mortgage-backed securities: |
|
|
|
|
|
|
|
| GNMA |
— |
|
|
17,441 |
|
|
— |
|
|
17,441 |
|
| FNMA |
— |
|
|
102,678 |
|
|
— |
|
|
102,678 |
|
| FHLMC |
— |
|
|
70,830 |
|
|
— |
|
|
70,830 |
|
| Non-agency |
— |
|
|
5 |
|
|
— |
|
|
5 |
|
| Collateralized mortgage obligations: |
|
|
|
|
|
|
|
| GNMA |
— |
|
|
331,784 |
|
|
— |
|
|
331,784 |
|
| FNMA |
— |
|
|
148,892 |
|
|
— |
|
|
148,892 |
|
| FHLMC |
— |
|
|
189,661 |
|
|
— |
|
|
189,661 |
|
|
|
|
|
|
|
|
|
|
|
|
|
|
|
|
|
| Total mortgage-backed securities |
— |
|
|
861,291 |
|
|
— |
|
|
861,291 |
|
|
|
|
|
|
|
|
|
| Interest rate lock commitments |
— |
|
|
— |
|
|
641 |
|
|
641 |
|
| Forward commitments |
— |
|
|
12 |
|
|
— |
|
|
12 |
|
|
|
|
|
|
|
|
|
| Interest rate swaps designated as hedging instruments |
— |
|
|
713 |
|
|
— |
|
|
713 |
|
| Interest rate swaps not designated as hedging instruments |
— |
|
|
41,406 |
|
|
— |
|
|
41,406 |
|
| Total assets |
$ |
— |
|
|
1,085,490 |
|
|
641 |
|
|
1,086,131 |
|
|
|
|
|
|
|
|
|
|
|
|
|
|
|
|
|
| Foreign exchange swaps |
$ |
— |
|
|
291 |
|
|
— |
|
|
291 |
|
| Interest rate swaps designated as hedging instruments |
— |
|
|
1,198 |
|
|
— |
|
|
1,198 |
|
| Interest rate swaps not designated as hedging instruments |
— |
|
|
41,437 |
|
|
— |
|
|
41,437 |
|
| Risk participation agreements |
— |
|
|
14 |
|
|
— |
|
|
14 |
|
| Total liabilities |
$ |
— |
|
|
42,940 |
|
|
— |
|
|
42,940 |
|
NORTHWEST BANCSHARES, INC. AND SUBSIDIARIES
NOTES TO CONSOLIDATED FINANCIAL STATEMENTS
December 31, 2023, 2022 and 2021
The following table represents assets and liabilities measured at fair value on a recurring basis as of December 31, 2022:
|
|
|
|
|
|
|
|
|
|
|
|
|
|
|
|
|
|
|
|
|
|
|
|
|
Level 1 |
|
Level 2 |
|
Level 3 |
|
Total at
fair value |
|
|
|
|
|
|
|
|
|
|
|
|
|
|
|
|
| Debt securities: |
|
|
|
|
|
|
|
| U.S. government and agencies |
$ |
— |
|
|
60,592 |
|
|
— |
|
|
60,592 |
|
| Government sponsored enterprises |
— |
|
|
39,201 |
|
|
— |
|
|
39,201 |
|
| States and political subdivisions |
— |
|
|
111,766 |
|
|
— |
|
|
111,766 |
|
| Corporate |
— |
|
|
12,978 |
|
|
— |
|
|
12,978 |
|
| Total debt securities |
— |
|
|
224,537 |
|
|
— |
|
|
224,537 |
|
|
|
|
|
|
|
|
|
| Residential mortgage-backed securities: |
|
|
|
|
|
|
|
| GNMA |
— |
|
|
12,434 |
|
|
— |
|
|
12,434 |
|
| FNMA |
— |
|
|
117,218 |
|
|
— |
|
|
117,218 |
|
| FHLMC |
— |
|
|
74,991 |
|
|
— |
|
|
74,991 |
|
| Non-agency |
— |
|
|
6 |
|
|
— |
|
|
6 |
|
| Collateralized mortgage obligations: |
|
|
|
|
|
|
|
| GNMA |
— |
|
|
364,553 |
|
|
— |
|
|
364,553 |
|
| FNMA |
— |
|
|
185,588 |
|
|
— |
|
|
185,588 |
|
| FHLMC |
— |
|
|
238,781 |
|
|
— |
|
|
238,781 |
|
|
|
|
|
|
|
|
|
|
|
|
|
|
|
|
|
| Total mortgage-backed securities |
— |
|
|
993,571 |
|
|
— |
|
|
993,571 |
|
|
|
|
|
|
|
|
|
| Interest rate lock commitments |
— |
|
|
— |
|
|
559 |
|
|
559 |
|
| Forward commitments |
— |
|
|
128 |
|
|
— |
|
|
128 |
|
|
|
|
|
|
|
|
|
| Interest rate swaps not designated as hedging instruments |
— |
|
|
26,642 |
|
|
— |
|
|
26,642 |
|
| Total assets |
$ |
— |
|
|
1,244,878 |
|
|
559 |
|
|
1,245,437 |
|
|
|
|
|
|
|
|
|
|
|
|
|
|
|
|
|
| Foreign exchange swaps |
$ |
— |
|
|
23 |
|
|
— |
|
|
23 |
|
| Interest rate swaps not designated as hedging instruments |
— |
|
|
45,464 |
|
|
— |
|
|
45,464 |
|
| Risk participation agreements |
— |
|
|
18 |
|
|
— |
|
|
18 |
|
| Total liabilities |
$ |
— |
|
|
45,505 |
|
|
— |
|
|
45,505 |
|
The following table presents the changes in Level 3 assets and liabilities measured at fair value on a recurring basis for the year ended December 31, 2023 and 2022:
|
|
|
|
|
|
|
|
|
|
|
|
|
|
|
|
| |
|
|
Years ended December 31, |
| |
|
|
2023 |
|
|
|
2022 |
| Beginning balance January 1, |
|
|
$ |
559 |
|
|
|
|
1,684 |
|
|
|
|
|
|
|
|
|
|
|
|
|
|
|
|
|
|
|
|
|
|
|
|
|
|
|
|
|
|
|
|
|
|
|
|
|
|
|
|
|
| Net activity |
|
|
82 |
|
|
|
|
(1,125) |
|
|
|
|
|
|
|
|
|
|
|
|
|
|
|
|
|
|
|
|
|
|
|
|
|
|
|
|
|
|
|
|
|
| Ending balance December 31, |
|
|
$ |
641 |
|
|
|
|
559 |
|
Certain assets and liabilities are measured at fair value on a nonrecurring basis after initial recognition such as loans individually assessed, real estate owned, and MSRs.
The following table represents the fair market measurement for only those nonrecurring assets that had a fair market value below the carrying amount as of December 31, 2023:
|
|
|
|
|
|
|
|
|
|
|
|
|
|
|
|
|
|
|
|
|
|
|
|
|
Level 1 |
|
Level 2 |
|
Level 3 |
|
Total assets
at fair value |
| Loans individually assessed |
$ |
— |
|
|
— |
|
|
36,747 |
|
|
36,747 |
|
| Mortgage servicing rights |
— |
|
|
— |
|
|
133 |
|
|
133 |
|
| Real estate owned, net |
— |
|
|
— |
|
|
104 |
|
|
104 |
|
|
|
|
|
|
|
|
|
| Total assets |
$ |
— |
|
|
— |
|
|
36,984 |
|
|
36,984 |
|
NORTHWEST BANCSHARES, INC. AND SUBSIDIARIES
NOTES TO CONSOLIDATED FINANCIAL STATEMENTS
December 31, 2023, 2022 and 2021
The following table represents the fair market measurement for only those nonrecurring assets that had a fair market value below the carrying amount as of December 31, 2022:
|
|
|
|
|
|
|
|
|
|
|
|
|
|
|
|
|
|
|
|
|
|
|
|
|
Level 1 |
|
Level 2 |
|
Level 3 |
|
Total assets
at fair value |
| Loans individually assessed |
$ |
— |
|
|
— |
|
|
15,416 |
|
|
15,416 |
|
| Mortgage servicing rights |
— |
|
|
— |
|
|
95 |
|
|
95 |
|
| Real estate owned, net |
— |
|
|
— |
|
|
413 |
|
|
413 |
|
|
|
|
|
|
|
|
|
| Total assets |
$ |
— |
|
|
— |
|
|
15,924 |
|
|
15,924 |
|
Individually Assessed Loans - A loan is considered to be individually assessed as described in Note 1(f). We classify loans individually assessed as nonrecurring Level 3.
Mortgage servicing rights - Mortgage servicing rights represent the value of servicing residential mortgage loans, when the mortgage loans have been sold into the secondary market and the associated servicing has been retained. The value is determined through a discounted cash flow analysis, which uses interest rates, prepayment speeds and delinquency rate assumptions as inputs. All of these assumptions require a significant degree of management judgment. Servicing rights and the related mortgage loans are segregated into categories or homogeneous pools based upon common characteristics. Adjustments are only made when the estimated discounted future cash flows are less than the carrying value, as determined by individual pool. As such, mortgage servicing rights are classified as nonrecurring Level 3.
Real Estate Owned - Real estate owned is comprised of property acquired through foreclosure or voluntarily conveyed by borrowers. These assets are recorded on the date acquired at the lower of the related loan balance or fair value, less estimated disposition costs, with the fair value being determined by appraisal. Subsequently, foreclosed assets are valued at the lower of the amount recorded at acquisition date or fair value, less estimated disposition costs. We classify real estate owned as nonrecurring Level 3.
The following table presents additional quantitative information about assets measured at fair value on a recurring and nonrecurring basis and for which we have utilized Level 3 inputs to determine fair value at December 31, 2023:
|
|
|
|
|
|
|
|
|
|
|
|
|
|
|
|
|
|
|
|
|
|
|
|
| |
Fair value ($) |
|
Valuation
techniques |
|
Significant
unobservable inputs |
|
Range
(weighted average) |
|
|
|
|
|
|
|
|
|
|
|
|
|
|
|
|
|
|
|
|
|
|
|
|
|
|
|
|
|
|
|
|
| Loans individually assessed |
36,747 |
|
Appraisal value (1) |
|
Estimated cost to sell |
|
10% |
|
|
|
|
|
|
|
|
|
|
|
|
|
|
|
|
| Mortgage servicing rights |
133 |
|
Discounted cash flow |
|
Annual service cost |
|
$91 |
|
|
|
|
|
Prepayment rate |
|
6.6% to 16.9% (10.0%) |
|
|
|
|
|
Expected life (months) |
|
52.7 to 103.7 (74.8) |
|
|
|
|
|
Option adjusted spread |
|
731 basis points |
|
|
|
|
|
Forward yield curve |
|
5.46% to 5.38% |
|
|
|
|
|
|
|
|
| Real estate owned, net |
104 |
|
Appraisal value (1) |
|
Estimated cost to sell |
|
15% |
|
|
|
|
|
|
|
|
| Loans held for sale |
8,768 |
|
Quoted prices for similar loans in active markets adjusted by an expected pull-through rate |
|
Estimated pull-through rate |
|
100% |
(1) Fair value is generally determined through independent appraisals of the underlying collateral, which may include Level 3 inputs that are not identifiable.
(17) Regulatory Capital Requirements
We and our banking subsidiary are subject to various regulatory capital requirements administered by the federal and state banking agencies. Failure to meet minimum capital requirements can initiate certain mandatory, and possibly additional discretionary actions by the regulators that, if undertaken, could have a direct material effect on our financial statements. Under capital adequacy guidelines and the regulatory framework for prompt corrective action, specific capital guidelines that involve quantitative measures of assets, liabilities, and certain off-balance-sheet items as calculated under regulatory accounting practices must be met. The capital amounts and classification are also subject to qualitative judgments by the regulators about components, risk weightings, and other factors.
NORTHWEST BANCSHARES, INC. AND SUBSIDIARIES
NOTES TO CONSOLIDATED FINANCIAL STATEMENTS
December 31, 2023, 2022 and 2021
Applicable regulations limit an organization’s capital distributions and certain discretionary bonus payments if the organization does not hold a “capital conservation buffer” consisting of 2.5% of Total Tier 1 and Common Equity Tier 1 (“CET1”) capital to risk-weighted assets in addition to the amount necessary to meet its minimum risk-based capital requirements.
Quantitative measures established by regulation to ensure capital adequacy require us and our banking subsidiary to maintain minimum amounts and ratios (set forth in the table below) of Total, Tier 1, and CET1 capital (as defined in the regulations) to risk-weighted assets (as defined) and of Tier I capital to average assets (as defined). As of December 31, 2023 and 2022, we and our banking subsidiary exceeded all capital adequacy requirements to which we were subject.
We have elected to phase the estimated impact of CECL into regulatory capital in accordance with the interim final rule of the Board of Governors of the Federal Reserve System (FRB) and other U.S. banking agencies that became effective on March 31, 2020. As a result, we delayed recognizing the estimated impact of CECL on regulatory capital until after a two-year deferral period, which for us extended through December 31, 2021. Beginning on January 1, 2022, we were required to phase in 75% of the previously deferred estimated capital impact of CECL, with 50% to be phased in at the beginning of 2023, and 25% at the beginning of 2024, until fully phased in by the first quarter of 2025. Under the interim final rule, the estimated impact of CECL on regulatory capital that we will defer and later phase in is calculated as the entire day-one impact at adoption plus 25% of the subsequent change in allowance during the two-year deferral period.
As of December 15, 2023, the most recent assessment from FDIC, Northwest Bank exceeded all regulatory capital requirements and their regulatory capital ratios were above the minimum levels required to be considered “well-capitalized” for regulatory purposes. To be considered as “well capitalized,” Northwest Bank must maintain total risk-based, Tier 1 risk-based, CET 1 risk-based, and Tier 1 leverage ratios as set forth in the table. There are no conditions or events since that notification that management believes have changed the bank’s categories.
The actual, required, and well capitalized levels as of December 31, 2023 and 2022 were as follows:
|
|
|
|
|
|
|
|
|
|
|
|
|
|
|
|
|
|
|
|
|
|
|
|
|
|
|
|
|
|
|
|
|
|
|
|
| |
At December 31, 2023 |
| |
Actual |
|
Minimum capital
requirements (1) |
|
Well capitalized
requirements |
| |
Amount |
|
Ratio |
|
Amount |
|
Ratio |
|
Amount |
|
Ratio |
| Total capital (to risk weighted assets) |
|
|
|
|
|
|
|
|
|
|
|
| Northwest Bancshares, Inc. |
$ |
1,799,883 |
|
|
16.040 |
% |
|
$ |
1,178,234 |
|
|
10.500 |
% |
|
$ |
1,122,128 |
|
|
10.000 |
% |
| Northwest Bank |
1,520,736 |
|
|
13.564 |
% |
|
1,177,257 |
|
|
10.500 |
% |
|
1,121,197 |
|
|
10.000 |
% |
|
|
|
|
|
|
|
|
|
|
|
|
| Tier 1 capital (to risk weighted assets) |
|
|
|
|
|
|
|
|
|
|
|
| Northwest Bancshares, Inc. |
1,553,766 |
|
|
13.847 |
% |
|
953,809 |
|
|
8.500 |
% |
|
897,702 |
|
|
8.000 |
% |
| Northwest Bank |
1,388,808 |
|
|
12.387 |
% |
|
953,018 |
|
|
8.500 |
% |
|
896,958 |
|
|
8.000 |
% |
|
|
|
|
|
|
|
|
|
|
|
|
| CET 1 capital (to risk weighted assets) |
|
|
|
|
|
|
|
|
|
|
|
| Northwest Bancshares, Inc. |
1,428,181 |
|
|
12.727 |
% |
|
785,489 |
|
|
7.000 |
% |
|
729,383 |
|
|
6.500 |
% |
| Northwest Bank |
1,388,808 |
|
|
12.387 |
% |
|
784,838 |
|
|
7.000 |
% |
|
728,778 |
|
|
6.500 |
% |
|
|
|
|
|
|
|
|
|
|
|
|
| Tier 1 capital (leverage to average assets) |
|
|
|
|
|
|
|
|
|
|
|
| Northwest Bancshares, Inc. |
1,553,766 |
|
|
10.841 |
% |
|
573,290 |
|
|
4.000 |
% |
|
716,612 |
|
|
5.000 |
% |
| Northwest Bank |
1,388,808 |
|
|
9.697 |
% |
|
572,903 |
|
|
4.000 |
% |
|
716,128 |
|
|
5.000 |
% |
(1) Amounts and ratios include the 2023 capital conservation buffer of 2.5% with the exception of Tier 1 capital to average assets. For further information related to the capital conservation buffer, see “Item 1. Business - Supervision and Regulation”.
NORTHWEST BANCSHARES, INC. AND SUBSIDIARIES
NOTES TO CONSOLIDATED FINANCIAL STATEMENTS
December 31, 2023, 2022 and 2021
|
|
|
|
|
|
|
|
|
|
|
|
|
|
|
|
|
|
|
|
|
|
|
|
|
|
|
|
|
|
|
|
|
|
|
|
| |
At December 31, 2022 |
| |
Actual |
|
Minimum capital
requirements (1) |
|
Well capitalized
requirements |
| |
Amount |
|
Ratio |
|
Amount |
|
Ratio |
|
Amount |
|
Ratio |
| Total capital (to risk weighted assets) |
|
|
|
|
|
|
|
|
|
|
|
| Northwest Bancshares, Inc. |
$ |
1,745,701 |
|
|
16.363 |
% |
|
$ |
1,120,216 |
|
|
10.500 |
% |
|
$ |
1,066,872 |
|
|
10.000 |
% |
| Northwest Bank |
1,568,202 |
|
|
14.712 |
% |
|
1,119,214 |
|
|
10.500 |
% |
|
1,065,918 |
|
|
10.000 |
% |
|
|
|
|
|
|
|
|
|
|
|
|
| Tier 1 capital (to risk weighted assets) |
|
|
|
|
|
|
|
|
|
|
|
| Northwest Bancshares, Inc. |
1,516,621 |
|
|
14.216 |
% |
|
906,841 |
|
|
8.500 |
% |
|
853,498 |
|
|
8.000 |
% |
| Northwest Bank |
1,452,962 |
|
|
13.631 |
% |
|
906,030 |
|
|
8.500 |
% |
|
852,734 |
|
|
8.000 |
% |
|
|
|
|
|
|
|
|
|
|
|
|
| CET 1 capital (to risk weighted assets) |
|
|
|
|
|
|
|
|
|
|
|
| Northwest Bancshares, Inc. |
1,391,296 |
|
|
13.041 |
% |
|
746,810 |
|
|
7.000 |
% |
|
693,467 |
|
|
6.500 |
% |
| Northwest Bank |
1,452,962 |
|
|
13.631 |
% |
|
746,143 |
|
|
7.000 |
% |
|
692,847 |
|
|
6.500 |
% |
|
|
|
|
|
|
|
|
|
|
|
|
| Tier 1 capital (leverage to average assets) |
|
|
|
|
|
|
|
|
|
|
|
| Northwest Bancshares, Inc. |
1,516,621 |
|
|
10.817 |
% |
|
560,816 |
|
|
4.000 |
% |
|
701,020 |
|
|
5.000 |
% |
| Northwest Bank |
1,452,962 |
|
|
10.365 |
% |
|
560,706 |
|
|
4.000 |
% |
|
700,882 |
|
|
5.000 |
% |
(1) Amounts and ratios include the 2022 capital conservation buffer of 2.5% with the exception of Tier 1 capital to average assets. For further information related to the capital conservation buffer, see Item 1. Business - “Supervision and Regulation”.
(18) Contingent Liabilities
We and our subsidiaries are subject to a number of asserted and unasserted claims encountered in the normal course of business. Management believes that the aggregate liability, if any, that may result from such potential litigation will not have a material adverse effect on our financial statements. However, we cannot presently determine whether or not any claims against us will have a material adverse effect on our results of operations in any future reporting period.
(19) Legal Proceedings
We establish accruals for legal proceedings when information related to the loss contingencies represented by those matters indicates both that a loss is probable and that the amount of loss can be reasonably estimated. As of December 31, 2023, we do not anticipate that the aggregate ultimate liability arising out of any pending or threatened legal proceedings will be material to our Consolidated Financial Statements. Any such accruals are adjusted thereafter as appropriate to reflect changes in circumstances. Due to the inherent subjectivity of assessments and unpredictability of outcomes of legal proceedings, any amounts accrued may not represent the ultimate loss to us from legal proceedings.
(20) Components of Accumulated Other Comprehensive Income
The following table sets forth the components of accumulated other comprehensive loss as of December 31, 2023 and 2022:
|
|
|
|
|
|
|
|
|
|
|
|
| |
December 31, |
| |
2023 |
|
2022 |
| Unrealized loss on marketable securities available-for-sale |
$ |
(150,659) |
|
|
(164,206) |
|
| Fair value of interest rate swaps |
(374) |
|
|
— |
|
| Defined benefit pension plans |
1,541 |
|
|
(6,952) |
|
| Accumulated other comprehensive loss |
$ |
(149,492) |
|
|
(171,158) |
|
NORTHWEST BANCSHARES, INC. AND SUBSIDIARIES
NOTES TO CONSOLIDATED FINANCIAL STATEMENTS
December 31, 2023, 2022 and 2021
The following table shows the changes in accumulated other comprehensive loss by component for the year ended December 31, 2023:
|
|
|
|
|
|
|
|
|
|
|
|
|
|
|
|
|
|
|
|
|
|
|
|
| |
Unrealized gains and losses on securities
available-for-sale |
|
Change in
fair value of
interest rate
swaps |
|
Change in defined
benefit pension plans |
|
Total |
| Balance as of January 1, |
$ |
(164,206) |
|
|
— |
|
|
(6,952) |
|
|
(171,158) |
|
|
|
|
|
|
|
|
|
| Other comprehensive income/(loss) before reclassification adjustments (1) (2) (3) |
7,875 |
|
|
(374) |
|
|
10,019 |
|
|
17,520 |
|
| Amounts reclassified from accumulated other comprehensive income (4) (5) |
5,672 |
|
|
— |
|
|
(1,526) |
|
|
4,146 |
|
| Net other comprehensive income/(loss) |
13,547 |
|
|
(374) |
|
|
8,493 |
|
|
21,666 |
|
| Balance as of December 31, |
$ |
(150,659) |
|
|
(374) |
|
|
1,541 |
|
|
(149,492) |
|
(1)Consists of unrealized holding gains, net of tax of $(3,429).
(2)Change in fair value of interest rate swaps, net of tax of $110.
(3)Consists of unrealized gains, net of tax of $(3,961).
(4)Consists of realized losses, net of tax of $(1,700).
(5)Consists of realized gains, net of tax of $607.
The following table shows the changes in accumulated other comprehensive loss by component for the year ended December 31, 2022:
|
|
|
|
|
|
|
|
|
|
|
|
|
|
|
|
|
|
|
|
| |
Unrealized gains and losses on securities available-for-sale |
|
|
|
Change in defined
benefit pension plans |
|
Total |
| Balance as of January 1, |
$ |
(12,317) |
|
|
|
|
(25,312) |
|
|
(37,629) |
|
|
|
|
|
|
|
|
|
| Other comprehensive (loss)/income before reclassification adjustments (1) (2) |
(151,888) |
|
|
|
|
18,884 |
|
|
(133,004) |
|
| Amounts reclassified from accumulated other comprehensive income (3) (4) |
(1) |
|
|
|
|
(524) |
|
|
(525) |
|
| Net other comprehensive (loss)/income |
(151,889) |
|
|
|
|
18,360 |
|
|
(133,529) |
|
| Balance as of December 31, |
$ |
(164,206) |
|
|
|
|
(6,952) |
|
|
(171,158) |
|
(1)Consists of unrealized holding losses, net of tax of $45,321.
(2)Consists of unrealized gains, net of tax of $(7,182).
(3)Consists of realized gains, net of tax of $0.
(4)Consists of realized gains, net of tax of $202.
The following table shows the changes in accumulated other comprehensive loss by component for the year ended December 31, 2021:
|
|
|
|
|
|
|
|
|
|
|
|
|
|
|
|
|
|
|
|
|
|
| |
Unrealized gains and losses on securities
available-for-sale |
|
|
|
Change in defined benefit pension plans |
|
Total |
| Balance as of January 1, |
$ |
16,843 |
|
|
|
|
(50,392) |
|
|
(33,549) |
|
|
|
|
|
|
|
|
|
| Other comprehensive (loss)/income before reclassification adjustments (1) (2) |
(28,873) |
|
|
|
|
23,748 |
|
|
(5,125) |
|
| Amounts reclassified from accumulated other comprehensive income (3) (4) |
(287) |
|
|
|
|
1,332 |
|
|
1,045 |
|
| Net other comprehensive (loss)/income |
(29,160) |
|
|
|
|
25,080 |
|
|
(4,080) |
|
| Balance as of December 31, |
$ |
(12,317) |
|
|
|
|
(25,312) |
|
|
(37,629) |
|
(1)Consists of unrealized holding losses, net of tax of $10,333.
(2)Consists of unrealized gains, net of tax of $(9,144).
(3)Consists of realized gains, net of tax of $92.
(4)Consists of realized losses, net of tax of $(515).
NORTHWEST BANCSHARES, INC. AND SUBSIDIARIES
NOTES TO CONSOLIDATED FINANCIAL STATEMENTS
December 31, 2023, 2022 and 2021
(21) Parent Company Only Financial Statements - Condensed
Statements of Financial Condition
|
|
|
|
|
|
|
|
|
|
|
|
| |
December 31, |
| |
2023 |
|
2022 |
| Assets |
|
|
|
| Cash and cash equivalents |
$ |
276,026 |
|
|
174,102 |
|
|
|
|
|
| Investment in bank subsidiary |
1,588,711 |
|
|
1,656,159 |
|
| Other assets |
9,405 |
|
|
9,490 |
|
| Total assets |
$ |
1,874,142 |
|
|
1,839,751 |
|
|
|
|
|
| Liabilities and shareholders’ equity |
|
|
|
| Liabilities: |
|
|
|
| Debentures payable |
$ |
243,763 |
|
|
243,154 |
|
| Other liabilities |
2,302 |
|
|
2,109 |
|
| Total liabilities |
246,065 |
|
|
245,263 |
|
| Shareholders’ equity |
1,628,077 |
|
|
1,594,488 |
|
| Total liabilities and shareholders’ equity |
$ |
1,874,142 |
|
|
1,839,751 |
|
Statements of Income
|
|
|
|
|
|
|
|
|
|
|
|
|
|
|
|
|
|
| |
Years ended December 31, |
| |
2023 |
|
2022 |
|
2021 |
| Income: |
|
|
|
|
|
| Interest income |
$ |
187 |
|
|
140 |
|
|
87 |
|
| Other income |
729 |
|
|
805 |
|
|
527 |
|
| Dividends from bank subsidiary |
215,000 |
|
|
161,000 |
|
|
73,000 |
|
| Undistributed earnings from equity investment in bank subsidiary |
(67,106) |
|
|
(18,187) |
|
|
88,944 |
|
| Total income |
148,810 |
|
|
143,758 |
|
|
162,558 |
|
| Expense: |
|
|
|
|
|
| Compensation and employee benefits |
1,906 |
|
|
1,656 |
|
|
1,358 |
|
| Other expenses |
1,044 |
|
|
1,042 |
|
|
1,033 |
|
| Interest expense |
14,342 |
|
|
9,825 |
|
|
7,870 |
|
| Total expense |
17,292 |
|
|
12,523 |
|
|
10,261 |
|
| Income before income taxes |
131,518 |
|
|
131,235 |
|
|
152,297 |
|
| Income tax benefit |
(3,439) |
|
|
(2,431) |
|
|
(2,026) |
|
| Net income |
$ |
134,957 |
|
|
133,666 |
|
|
154,323 |
|
NORTHWEST BANCSHARES, INC. AND SUBSIDIARIES
NOTES TO CONSOLIDATED FINANCIAL STATEMENTS
December 31, 2023, 2022 and 2021
Statements of Cash Flows
|
|
|
|
|
|
|
|
|
|
|
|
|
|
|
|
|
|
| |
Years ended December 31, |
| |
2023 |
|
2022 |
|
2021 |
| Operating activities: |
|
|
|
|
|
| Net income |
$ |
134,957 |
|
|
133,666 |
|
|
154,323 |
|
| Adjustments to reconcile net income to net cash provided by operating activities: |
|
|
|
|
|
| Undistributed earnings of subsidiary |
67,106 |
|
|
18,187 |
|
|
(88,944) |
|
|
|
|
|
|
|
|
|
|
|
|
|
| Net change in other assets and liabilities |
900 |
|
|
(9,457) |
|
|
597 |
|
| Net cash provided by operating activities |
202,963 |
|
|
142,396 |
|
|
65,976 |
|
|
|
|
|
|
|
| Investing activities: |
|
|
|
|
|
|
|
|
|
|
|
|
|
|
|
|
|
| Net cash used in investing activities |
— |
|
|
— |
|
|
— |
|
|
|
|
|
|
|
| Financing activities: |
|
|
|
|
|
| Cash dividends paid on common stock |
(101,669) |
|
|
(101,468) |
|
|
(100,274) |
|
| Repurchase of Northwest stock |
— |
|
|
— |
|
|
(23,854) |
|
|
|
|
|
|
|
|
|
|
|
|
|
|
|
|
|
|
|
| Proceeds from stock options exercised |
630 |
|
|
5,173 |
|
|
14,011 |
|
| Net cash used in financing activities |
(101,039) |
|
|
(96,295) |
|
|
(110,117) |
|
| Net increase/(decrease) in cash and cash equivalents |
$ |
101,924 |
|
|
46,101 |
|
|
(44,141) |
|
|
|
|
|
|
|
| Cash and cash equivalents at beginning of period |
$ |
174,102 |
|
|
128,001 |
|
|
172,142 |
|
| Net increase/(decrease) in cash and cash equivalents |
101,924 |
|
|
46,101 |
|
|
(44,141) |
|
| Cash and cash equivalents at end of period |
$ |
276,026 |
|
|
174,102 |
|
|
128,001 |
|
NORTHWEST BANCSHARES, INC. AND SUBSIDIARIES
NOTES TO CONSOLIDATED FINANCIAL STATEMENTS
December 31, 2023, 2022 and 2021
(22) Derivative Financial Instruments
We are a party to derivative financial instruments in the normal course of business to manage our own exposure to fluctuations in interest rates and to meet the needs of our customers. The primary derivatives that we use are interest rate swaps and caps and foreign exchange contracts, which are entered into with counterparties that meet established credit standards. We believe that the credit risk inherent in all of our derivative contracts is minimal based on our credit standards and the netting and collateral provisions of the interest rate swap agreements.
Derivatives Designated as Hedging Instruments
As of December 31, 2023, the Company had entered into seven separate pay-fixed interest rate swaps in order to synthetically convert short-term three month FHLB advances to fixed-rate term funding with an aggregate value of $175 million with maturities ranging from three to five years. Our risk management objective and strategy for these interest rate swaps at such time was to reduce our exposure to variability in interest-related cash outflows attributable to changes in the USD-SOFR swap rate, the designated benchmark interest rate being hedged. Based upon our contemporaneous quantitative analysis at the inception of each interest rate swap, we have determined these interest rate swaps qualified for hedge accounting in accordance with ASC 815, Derivatives and Hedging. Our cash flow hedges are recorded within other assets on the Consolidated Statement of Financial Condition at their estimated fair value.
As long as the hedge remains highly effective, the changes in the fair value of derivatives designated and that qualify as cash flow hedges are recorded in accumulated other comprehensive income and are subsequently reclassified into earnings in the period that the hedged forecasted transaction affects earnings. A hedging relationship that is determined to not be highly effective no longer qualifies for hedge accounting and any gain or loss is recognized immediately in earnings. Amounts reclassified into earnings are included in interest expense in the Consolidated Statement of Income.
Derivatives Not Designated as Hedging Instruments
We act as an interest rate or foreign exchange swap counterparty for certain commercial borrowers in the normal course of servicing our customers, which are accounted for at fair value. We manage our exposure to such interest rate or foreign exchange swaps by entering into corresponding and offsetting interest rate swaps with third parties that mirror the terms of the swaps we have with the commercial borrowers. These positions (referred to as “customer swaps”) directly offset each other and our exposure is the fair value of the derivatives due to changes in credit risk of our commercial borrowers and third parties. Customer swaps are recorded within other assets or other liabilities on the consolidated statement of financial condition at their estimated fair value. Changes to the fair value of assets and liabilities arising from these derivatives are included, net, in other operating income in the Consolidated Statement of Income.
We enter into interest rate lock commitments for residential mortgage loans which commit us to lend funds to a potential borrower at a specific interest rate within a specified period of time. Interest rate lock commitments that relate to the origination of mortgage loans that will be held-for-sale are considered derivative financial instruments under applicable accounting guidance. Interest rate lock commitments on loans held-for-sale are carried at fair value in other assets on the consolidated statement of financial condition. Northwest sells loans to the secondary market on a mandatory or best efforts basis. The loans sold on a mandatory basis commit us to deliver a specific principal amount of mortgage loans to an investor at a specified price, by a specified date, or the commitment must be paired off. These forward commitments entered into on a mandatory delivery basis meet the definition of a derivative financial instrument. All closed loans to be sold on a mandatory delivery basis are classified as held-for-sale on the Consolidated Statement of Financial Condition. Changes to the fair value of the interest rate lock commitments and the forward commitments are recorded in mortgage banking income in the Consolidated Statements of Income.
We enter into risk participation agreements with financial institution counterparties for interest rate swaps related to loans in which we are a participant. The risk participation agreements provide credit protection to the financial institution should the borrower fail to perform on its interest rate derivative contract with the financial institution. These risk participation agreements are recorded within other liabilities on the Consolidated Statement of Financial Condition at their estimated fair value. Changes to the fair value of the the risk participation agreements are included in other operating income in the Consolidated Statement of Income.
NORTHWEST BANCSHARES, INC. AND SUBSIDIARIES
NOTES TO CONSOLIDATED FINANCIAL STATEMENTS
December 31, 2023, 2022 and 2021
The following table presents information regarding our derivative financial instruments at the dates indicated:
|
|
|
|
|
|
|
|
|
|
|
|
|
|
|
|
|
|
|
|
|
|
|
|
|
|
|
| |
|
Asset derivatives |
|
Liability derivatives |
|
|
Notional amount |
|
Fair value |
|
Notional amount |
|
Fair value |
| At December 31, 2023 |
|
|
|
|
|
|
|
|
| Derivatives designated as hedging instruments: |
|
|
|
|
|
|
|
|
| Interest rate swap agreements |
|
$ |
75,000 |
|
|
713 |
|
|
100,000 |
|
|
1,198 |
|
| Derivatives not designated as hedging instruments: |
|
|
|
|
|
|
|
|
| Interest rate swap agreements |
|
725,139 |
|
|
41,406 |
|
|
725,139 |
|
|
41,437 |
|
| Foreign exchange swap agreements |
|
— |
|
|
— |
|
|
12,278 |
|
|
291 |
|
| Interest rate lock commitments |
|
21,857 |
|
|
641 |
|
|
— |
|
|
— |
|
| Forward commitments |
|
281 |
|
|
12 |
|
|
— |
|
|
— |
|
| Risk participation agreements |
|
— |
|
|
— |
|
|
101,727 |
|
|
14 |
|
| Total derivatives |
|
$ |
822,277 |
|
|
42,772 |
|
|
939,144 |
|
|
42,940 |
|
|
|
|
|
|
|
|
|
|
| At December 31, 2022 |
|
|
|
|
|
|
|
|
| Derivatives not designated as hedging instruments: |
|
|
|
|
|
|
|
|
| Interest rate swap agreements |
|
$ |
651,114 |
|
|
26,642 |
|
|
651,114 |
|
|
45,464 |
|
| Foreign exchange swap agreements |
|
— |
|
|
— |
|
|
2,328 |
|
|
23 |
|
| Interest rate lock commitments |
|
19,727 |
|
|
559 |
|
|
— |
|
|
— |
|
| Forward commitments |
|
4,909 |
|
128 |
|
|
— |
|
|
— |
|
| Risk participation agreements |
|
— |
|
|
— |
|
|
114,159 |
|
|
18 |
|
| Total derivatives |
|
$ |
675,750 |
|
|
27,329 |
|
|
767,601 |
|
|
45,505 |
|
The following table presents income or expenses recognized on derivatives for the periods indicated:
|
|
|
|
|
|
|
|
|
|
|
|
|
|
|
|
|
|
|
|
|
|
|
For the years ended December 31, |
|
|
2023 |
|
2022 |
|
2021 |
| Hedging derivatives: |
|
|
|
|
|
|
| Decrease in interest expense |
|
$ |
1,573 |
|
|
— |
|
|
— |
|
|
|
|
|
|
|
|
| Non-hedging swap derivatives: |
|
|
|
|
|
|
| (Decrease)/increase in other income |
|
(613) |
|
|
(83) |
|
|
1,033 |
|
| (Decrease)/increase in mortgage banking income |
|
(34) |
|
|
1,368 |
|
|
5,515 |
|
|
|
|
|
|
|
|
The following table presents information regarding our derivative financial instruments designated as hedging for the year ended December 31, 2023 (dollars in thousands):
|
|
|
|
|
|
|
|
|
|
|
|
|
|
|
|
|
|
|
|
|
|
|
|
|
|
|
|
|
|
|
Notional amount |
|
Effective rate |
|
Estimated decrease to interest expense
in the next
twelve months |
|
Maturity date |
|
Remaining term
(in months) |
| Interest rate products: |
|
|
|
|
|
|
|
|
|
| Issued May 11, 2023 |
$ |
25,000 |
|
|
3.48 |
% |
|
$ |
(556) |
|
|
5/11/2027 |
|
40 |
| Issued May 12, 2023 |
25,000 |
|
|
3.52 |
% |
|
(544) |
|
|
5/12/2028 |
|
52 |
| Issued May 19, 2023 |
25,000 |
|
|
3.79 |
% |
|
(470) |
|
|
11/19/2027 |
|
47 |
| Issued May 31, 2023 |
25,000 |
|
|
4.01 |
% |
|
(415) |
|
|
11/30/2026 |
|
35 |
| Issued July 26, 2023 |
25,000 |
|
|
4.29 |
% |
|
(369) |
|
|
7/26/2028 |
|
55 |
| Issued July 31, 2023 |
25,000 |
|
|
4.36 |
% |
|
(346) |
|
|
1/31/2028 |
|
49 |
| Issued August 9, 2023 |
25,000 |
|
|
4.33 |
% |
|
(350) |
|
|
8/9/2027 |
|
43 |
| Total |
$ |
175,000 |
|
|
|
|
$ |
(3,050) |
|
|
|
|
|
ITEM 9. CHANGES IN AND DISAGREEMENTS WITH ACCOUNTANTS ON ACCOUNTING AND FINANCIAL DISCLOSURE
Not applicable.
ITEM 9A. CONTROLS AND PROCEDURES
Under the supervision and with the participation of our management, including our principal executive officer and principal financial officer, we evaluated the effectiveness of the design and operation of our disclosure controls and procedures (as defined in Rule 13a-15(e) and 15d-15(e) under the Exchange Act) as of the end of the period covered by this report. Based upon that evaluation, the principal executive officer and principal financial officer concluded that, as of the end of the period covered by this report, our disclosure controls and procedures were effective.
There were no changes made in our internal controls during the quarter ended December 31, 2023 that have materially affected, or are reasonably likely to materially affect, the Company’s internal control over financial reporting.
See Management’s Report On Internal Control Over Financial Reporting - filed herewith under Part II, Item 8. “Financial Statements and Supplementary Data”.
ITEM 9B. OTHER INFORMATION
Not applicable.
ITEM 9C. DISCLOSURE REGARDING FOREIGN JURISDICTIONS THAT PREVENT INSPECTIONS
Not applicable.
PART III
ITEM 10. DIRECTORS, EXECUTIVE OFFICERS AND CORPORATE GOVERNANCE
Directors
The “Proposal I-Election of Directors” section of the Company’s definitive proxy statement for the Company’s 2024 Annual Meeting of Stockholders (the “2024 Proxy Statement”) is incorporated herein by reference.
Executive Officers
The “Proposal I-Election of Directors-Executive Officers who are not Directors” section of the 2024 Proxy Statement is incorporated herein by reference.
Compliance with Section 16(a) of the Exchange Act
The “Proposal I-Election of Directors-Section 16(a) Beneficial Ownership Reporting Compliance” section of the 2024 Proxy Statement is incorporated herein by reference.
Code of Ethics
The “Proposal I-Election of Directors-Code of Ethics” section of the 2024 Proxy Statement is incorporated herein by reference. A copy of the Code of Ethics is available to shareholders on the “Governance Documents” portion of the Investor Relations’ section on the Company’s website at www.northwest.com.
Corporate Governance
Information regarding the audit committee and its composition and the audit committee’s financial expert required by this item is incorporated herein by reference to the section captioned “Proposal I-Election of Directors-Meetings and Committees of the Board of Directors-Audit Committee” section of the 2024 Proxy Statement.
ITEM 11. EXECUTIVE COMPENSATION
The “Proposal I-Election of Directors-Meetings and Committees of the Board of Directors-Compensation Committee,” “-Compensation Committee Interlocks and Insider Participation,” “-Compensation Discussion and Analysis - Compensation Committee Report,” -Compensation Discussion and Analysis,” “-Executive Compensation,” “-Employment Agreements/Change in Control Agreements,” “-Potential Payments to Named Executive Officers,” “-Defined Benefit Plan,” “-Supplemental Executive Retirement Plan,” “-Life Insurance Coverage” and “-Director Compensation” sections of the Company’s 2024 Proxy Statement are incorporated herein by reference.
ITEM 12. SECURITY OWNERSHIP OF CERTAIN BENEFICIAL OWNERS AND MANAGEMENT AND RELATED STOCKHOLDER MATTERS
The “Proposal I-Election of Directors” section of the Company’s 2024 Proxy Statement is incorporated herein by reference.
The Company does not have any equity compensation program that was not approved by stockholders.
Set forth below is certain information as of December 31, 2023 regarding equity compensation plans that have been approved by stockholders.
|
|
|
|
|
|
|
|
|
|
|
|
|
|
|
|
|
|
|
|
|
| Equity compensation plans approved by stockholders |
|
Number of securities to be issued upon exercise of outstanding options,
warrants and rights |
|
Weighted average
exercise price (1) |
|
Number of securities
remaining available for
issuance under plan |
|
|
|
|
|
|
|
|
|
|
|
|
|
|
|
|
|
|
|
|
|
| Northwest Bancshares, Inc. 2011 Equity Incentive Plan |
|
1,276,059 |
|
|
$ |
14.13 |
|
|
— |
|
| Northwest Bancshares, Inc. 2018 Equity Incentive Plan |
|
1,932,946 |
|
|
14.52 |
|
|
— |
|
| Northwest Bancshares, Inc. 2022 Equity Incentive Plan |
|
— |
|
|
— |
|
|
2,386,878 |
|
| Total |
|
3,209,005 |
|
|
$ |
14.36 |
|
|
2,386,878 |
|
(1)Reflects exercise price of options only.
ITEM 13. CERTAIN RELATIONSHIPS AND RELATED TRANSACTIONS, AND DIRECTOR INDEPENDENCE
The “Proposal I-Election of Directors-Board Independence” and “Proposal I-Election of Directors-Transactions with Certain Related Persons” sections of the Company’s 2024 Proxy Statement are incorporated herein by reference.
ITEM 14. PRINCIPAL ACCOUNTANT FEES AND SERVICES
Our independent registered public accounting firm is KPMG LLP, Pittsburgh, PA, Auditor Firm ID: 185.
The “Proposal II-Ratification of Appointment of Independent Registered Public Accounting Firm” section of the Company’s 2024 Proxy Statement is incorporated herein by reference.
PART IV
ITEM 15. EXHIBITS AND FINANCIAL STATEMENT SCHEDULES
(a)(1) Financial Statements
The following documents are filed as part of this Form 10-K.
(A)Management’s Report on Internal Control Over Financial Reporting
(B)Report of Independent Registered Public Accounting Firm on Internal Control Over Financial Reporting
(C)Report of Independent Registered Public Accounting Firm
(D)Consolidated Statements of Financial Condition at December 31, 2023 and 2022
(E)Consolidated Statements of Income for the Years ended December 31, 2023, 2022 and 2021
(F)Consolidated Statements of Comprehensive Income for the Years ended December 31, 2023, 2022 and 2021
(G)Consolidated Statements of Changes in Shareholders’ Equity for the Years ended December 31, 2023, 2022 and 2021
(H)Consolidated Statements of Cash Flows for the Years ended December 31, 2023, 2022 and 2021
(I)Notes to the Consolidated Financial Statements
(a)(2) Financial Statement Schedules
None.
(a)(3) Exhibits
|
|
|
|
|
|
|
|
|
|
|
|
|
|
|
Regulation S-K
exhibit number |
|
Document |
|
Reference to prior filing
or exhibit number attached hereto |
| |
|
|
|
|
|
|
Articles of Incorporation |
|
Incorporated by reference to the Company’s Registration Statement on Form S-1 (File No. 333-161805), filed with the SEC on September 9, 2009. |
|
|
|
|
|
|
|
Articles of Amendment to Articles of Incorporation |
|
Incorporated by reference to the Company’s Registration Statement on Form S-1 (File No. 333-161805), filed with the SEC on September 9, 2009. |
| |
|
|
|
|
|
|
Amended and Restated Bylaws of Northwest Bancshares, Inc. |
|
Incorporated by reference to the Company’s Registration Statement on Form S-1 (File No. 333-161805), filed with the SEC on September 9, 2009. |
|
|
|
|
|
|
|
Form of Common Stock Certificate |
|
Incorporated by reference to the Company’s Registration Statement on Form S-1 (File No. 333-161805), filed with the SEC on September 9, 2009. |
| |
|
|
|
|
|
|
Description of Registrant’s Securities |
|
Filed herewith as Exhibit 4.2 |
|
|
|
|
|
|
|
Amendment and Restatement of Deferred Compensation Plan for Outside Directors Of Northwest Savings Bank and Eligible Affiliates |
|
Incorporated by reference to the Company’s Annual Report on Form 10-K (File No. 000-23817), filed with the SEC on March 4, 2009. |
| |
|
|
|
|
|
|
Retirement Plan for Outside Directors of Northwest Savings Bank and Eligible Affiliates |
|
Incorporated by reference to the Company’s Annual Report on Form 10-K (File No. 000-23817), filed with the SEC on March 4, 2009. |
| |
|
|
|
|
|
|
Amended and Restated Northwest Savings Bank Nonqualified Supplemental Retirement Plan |
|
Incorporated by reference to the Company’s Annual Report on Form 10-K (File No. 000-23817), filed with the SEC on March 4, 2009. |
| |
|
|
|
|
|
|
Annual Performance Award Plan |
|
Incorporated by reference to the Current Report on
Form 8-K (File No. 001-34582), filed with the SEC on September 16, 2020. |
| |
|
|
|
|
|
|
Northwest Bancorp, Inc. 2008 Stock Option Plan |
|
Incorporated by reference to the Definitive
Proxy Statement for the 2008 Annual Meeting of Shareholders (File No. 000-23817), filed with the
SEC on April 11, 2008. |
| |
|
|
|
|
|
|
Amended and Restated Northwest Savings Bank and Affiliates Upper Managers Bonus Deferred Compensation Plan |
|
Incorporated by reference to the Company’s Annual Report on Form 10-K (File No. 000-23817), filed with the SEC on March 4, 2009. |
| |
|
|
|
|
| 10.7 |
|
Intentionally Omitted |
|
|
| |
|
|
|
|
| 10.8 |
|
Intentionally Omitted |
|
|
| |
|
|
|
|
|
|
Employment Agreement for John J. Golding |
|
Incorporated by reference to the Current Report on Form 8-K (File No. 001-34582), filed with the SEC on April 4, 2020. |
| |
|
|
|
|
|
|
|
|
|
|
|
|
|
|
|
|
|
|
|
|
|
Employment Agreement for Mark T. Reitzes |
|
Incorporated by reference to the Company’s Annual Report on Form 10-K (File No. 001-34582), filed with the SEC on February 26, 2020. |
| |
|
|
|
|
| 10.11 |
|
Intentionally Omitted |
|
|
| |
|
|
|
|
|
|
Northwest Bancshares, Inc. 2011 Equity Incentive Plan |
|
Incorporated by reference to the Company’s Annual Report on Form 10-K (File No. 001-34582), filed with the SEC on March 1, 2011. |
|
|
|
|
|
|
|
|
|
|
|
|
|
|
|
| 10.13 |
|
Intentionally Omitted |
|
|
|
|
|
|
|
|
|
Northwest Bancshares, Inc. 2018 Equity Incentive Plan |
|
Incorporated by reference to Appendix A to the Definitive Proxy Statement for the 2018 Annual Meeting of Shareholders (File no. 001-34582), filed with the SEC on March 7, 2018. |
|
|
|
|
|
|
|
Form of Non-Qualified Stock Option Award Agreement under the 2018 Equity Incentive Plan |
|
Incorporated by reference to the Current Report on
Form 8-K (File No. 001-34582), filed with the SEC on July 2, 2020. |
|
|
|
|
|
|
|
Form of Incentive Stock Option Award Agreement under the 2018 Equity Incentive Plan |
|
Incorporated by reference to the Current Report on
Form 8-K (File No. 001-34582), filed with the SEC on July 2, 2020. |
|
|
|
|
|
|
|
Form of Restricted Stock Award Agreement under the
2018 Equity Incentive Plan |
|
Incorporated by reference to the Current Report on
Form 8-K (File No. 001-34582), filed with the SEC on May 14, 2018. |
|
|
|
|
|
|
|
Form of Amendment to Employee Agreement |
|
Incorporated by reference to the Current Report on
Form 8-K (File No. 001-34582), filed with the SEC on November 16, 2021. |
|
|
|
|
|
|
|
Employment Agreement by and between Northwest Bank, Northwest Bancshares, Inc. and Louis J. Torchio |
|
Incorporated by reference to the Current Report on
Form 8-K (File No. 001-34582), filed with the SEC on August 17, 2022. |
|
|
|
|
|
|
|
Employment Agreement by and between Northwest Bank, Northwest Bancshares, Inc. and William W. Harvey Jr. |
|
Incorporated by reference to the Current Report on
Form 8-K (File No. 001-34582), filed with the SEC on August 17, 2022. |
| |
|
|
|
|
|
|
Northwest Bank Annual Performance Award Plan |
|
Incorporated by reference to the Current Report on Form 8-K (File No. 001-34582), filed with the SEC on April 22, 2022. |
|
|
|
|
|
|
|
Northwest Bank and Northwest Bancshares, Inc. Change in Control Agreement for Scott Watson |
|
Filed herewith as Exhibit 10.22 |
|
|
|
|
|
|
|
Northwest Bank and Northwest Bancshares, Inc. Change in Control Agreement for Greg Betchkal |
|
Filed herewith as Exhibit 10.23 |
|
|
|
|
|
|
|
Retirement Agreement by and between William W. Harvey, Jr., Northwest Bancshares, Inc. and Northwest Bank |
|
Incorporated by reference to the Current Report on Form 8-K (File No. 001-34582), filed with the SEC on September 21, 2023. |
|
|
|
|
|
|
|
Independent Contractor Consulting Agreement by and between William W. Harvey, Jr., Northwest Bancshares, Inc. and Northwest Bank |
|
Incorporated by reference to the Current Report on Form 8-K (File No. 001-34582), filed with the SEC on September 21, 2023. |
|
|
|
|
|
| 12 |
|
Statement re: computation of ratios |
|
Not required |
| |
|
|
|
|
|
|
Subsidiaries of Registrant |
|
Filed herewith as Exhibit 21 |
| |
|
|
|
|
|
|
|
|
|
|
|
|
|
|
|
|
|
|
|
|
|
Consent of experts and counsel |
|
Filed herewith as Exhibit 23 |
| |
|
|
|
|
| 24 |
|
Power of Attorney |
|
Not required |
| |
|
|
|
|
|
|
Certification pursuant to Rule 13a-14 of the Securities Exchange Act of 1934, as Amended, as adopted pursuant to Section 302 of the Sarbanes-Oxley Act of 2002 |
|
Filed herewith as Exhibit 31.1 |
| |
|
|
|
|
|
|
Certification pursuant to Rule 13a-14 of the Securities Exchange Act of 1934, as Amended, as adopted pursuant to Section 302 of the Sarbanes-Oxley Act of 2002 |
|
Filed herewith as Exhibit 31.2 |
| |
|
|
|
|
|
|
Certification pursuant to 18 U.S.C. Section 1350, as adopted pursuant to Section 906 of the Sarbanes-Oxley Act of 2002 |
|
Filed herewith as Exhibit 32 |
|
|
|
|
|
|
|
Policy Relating to Recovery of Extraneously Awarded Compensation |
|
Filed herewith as Exhibit 97 |
|
|
|
|
|
| 101 |
|
Interactive Data File (XBRL) |
|
Filed herewith as Exhibit 101 |
|
|
|
|
|
| 104 |
|
Interactive Data File (XBRL) |
|
Filed herewith as Exhibit 104 |
ITEM 16. FORM 10-K SUMMARY Pursuant to the requirements of Section 13 or 15(d) of the Securities Exchange Act of 1934, the Registrant has duly caused this report to be signed on its behalf by the undersigned, thereunto duly authorized.
Not applicable.
SIGNATURES
NORTHWEST BANCSHARES, INC.
|
|
|
|
|
|
|
|
|
|
|
|
| Date: February 23, 2024 |
|
By: |
/s/ Louis J. Torchio |
| |
|
|
Louis J. Torchio, President and Chief Executive Officer |
| |
|
|
(Principal Executive Officer) |
Pursuant to the requirements of the Securities Exchange of 1934, this report has been signed below by the following persons on behalf of the Registrant and in the capacities and on the dates indicated.
|
|
|
|
|
|
|
|
|
|
|
|
| Date: February 23, 2024 |
|
By: |
/s/ Louis J. Torchio |
| |
|
|
Louis J. Torchio, President and Chief Executive Officer |
| |
|
|
(Principal Executive Officer) |
| |
|
|
|
| Date: February 23, 2024 |
|
By: |
/s/ William W. Harvey, Jr. |
| |
|
|
William W. Harvey, Jr., Senior Executive Vice President, |
|
|
|
Chief Operating Officer, and |
|
|
|
Chief Financial Officer (Principal Financial Officer) |
|
|
|
|
| Date: February 23, 2024 |
|
By: |
/s/ Jeffrey J. Maddigan |
|
|
|
Jeffrey J. Maddigan, Executive Vice President, Finance, Accounting |
| |
|
|
and Corporate Treasurer (Principal Accounting Officer) |
|
|
|
|
| Date: February 23, 2024 |
|
By: |
/s/ Timothy B. Fannin |
|
|
|
Timothy B. Fannin, Chairman and Director |
|
|
|
|
| Date: February 23, 2024 |
|
By: |
/s/ Robert M. Campana |
| |
|
|
Robert M. Campana, Director |
| |
|
|
|
| Date: February 23, 2024 |
|
By: |
/s/ Deborah J. Chadsey |
|
|
|
Deborah J. Chadsey, Director |
|
|
|
|
| Date: February 23, 2024 |
|
By: |
/s/ Wilbur R. Davis |
| |
|
|
Wilbur R. Davis, Director |
|
|
|
|
| Date: February 23, 2024 |
|
By: |
/s/ Timothy M. Hunter |
|
|
|
Timothy M. Hunter, Director |
| |
|
|
|
| Date: February 23, 2024 |
|
By: |
/s/ John P. Meegan |
| |
|
|
John P. Meegan, Director |
|
|
|
|
| Date: February 23, 2024 |
|
By: |
/s/ Mark A. Paup |
|
|
|
Mark A. Paup, Director |
| |
|
|
|
| Date: February 23, 2024 |
|
By: |
/s/ David M. Tullio |
|
|
|
David M. Tullio, Director |
| |
|
|
|
| Date: February 23, 2024 |
|
By: |
/s/ Pablo A. Vegas |
| |
|
|
Pablo A. Vegas, Director |
|
|
|
|
| Date: February 23, 2024 |
|
By: |
/s/ Amber L. Williams |
|
|
|
Amber L. Williams, Director |
EX-4.2
2
nwbi-12312023xexx42.htm
EX-4.2
Document
Exhibit 4.2
Description of Registrant’s Securities
Unless otherwise indicated or the context otherwise requires, references in this Exhibit 4.2 to “we, “us” and “our” refer collectively to Northwest Bancshares, Inc. and Northwest Bank or to any of those entities, depending on the context. In addition, we may refer to Northwest Bancshares, Inc. as “Northwest Bancshares”.
General
We are authorized to issue up to 500,000,000 shares of common stock, par value $0.01 per share, and 50,000,000 shares of preferred stock, par value $0.01 per share. Our articles of incorporation permit our board of directors, without action by the stockholders, to amend the articles of incorporation to increase or decrease the aggregate number of shares of common stock and preferred stock.
Common Stock
Voting Rights. Holders of common stock of Northwest Bancshares have exclusive voting rights in Northwest Bancshares. They elect Northwest Bancshares’ board of directors and act on other matters that are required to be presented to them under Maryland law or that are otherwise presented to them by the board of directors. Each holder of common stock is entitled to one vote per share and does not have any right to cumulate votes in the election of directors. However, any person who beneficially owns more than 10% of the then-outstanding shares of Northwest Bancshares’ common stock is not entitled or permitted to vote any shares of common stock held in excess of the 10% limit. If Northwest Bancshares issues shares of preferred stock, holders of the preferred stock may also possess voting rights. Certain matters require the approval of 80% of Northwest Bancshares’ outstanding common stock.
Dividends. Northwest Bancshares generally may pay dividends on its common stock if, after giving effect to such distribution, (i) it would be able to pay its indebtedness as the indebtedness comes due in the usual course of business or (ii) its total assets exceed the sum of its liabilities and the amount needed, if Northwest Bancshares were to be dissolved at the time of the distribution, to satisfy the preferential rights upon dissolution of any holders of capital stock who have a preference in the event of dissolution. The holders of common stock of Northwest Bancshares are entitled to receive and share equally in dividends as may be declared by Northwest Bancshares’ board of directors out of funds legally available therefor. If Northwest Bancshares issues shares of preferred stock, the holders thereof may have a priority over the holders of the common stock with respect to dividends. The payment of dividends by Northwest Bancshares is also subject to limitations that are imposed by federal law, regulation and policy.
The Federal Reserve has issued a policy statement providing that dividends should be paid only out of current earnings and only if the holding company’s prospective rate of earnings retention is consistent with its capital needs, asset quality and overall financial condition. Federal regulatory guidance also provides for prior regulatory consultation with respect to capital distributions in certain circumstances such as where the holding company’s net income for the past four quarters, net of dividends previously paid over that period, is insufficient to fully fund the dividend or the holding company’s overall rate or earnings retention is inconsistent with its capital needs and overall financial condition.
Liquidation. In the event of liquidation, dissolution or winding up of Northwest Bancshares, the holders of its common stock would be entitled to receive, after payment or provision for payment of all its debts and liabilities (including payments with respect to its liquidation account), all of the assets of Northwest Bancshares available for distribution. If preferred stock is issued, the holders thereof may have a priority over the holders of the common stock in the event of liquidation or dissolution.
Preemptive Rights. Holders of the common stock of Northwest Bancshares are not entitled to preemptive rights with respect to any shares that may be issued. Our common stock is not subject to redemption.
Preferred Stock
Our articles of incorporation permit our board of directors to authorize the issuance of preferred stock in one or more series, without additional approval of the holders of our common stock or preferred stock. The board of directors can establish the number of shares to be included in each such series, and fix the preferences, conversion and other rights, voting powers, restrictions, limitations as to dividends, qualifications and terms and conditions of redemption of the shares of each such series.
Certain Anti-Takeover Provisions
Our articles of incorporation and bylaws contain several provisions that may be deemed to have the effect of discouraging or delaying attempts to gain control of us. Such provisions include, among other things, the requirement of a super majority vote of stockholders or directors to approve certain business combinations and other corporate actions, special procedural rules regarding nomination for election to the board of directors or the introduction of new business at meetings of stockholders, allowing the board to give due consideration to constituencies other than our stockholders in evaluating acquisition or merger proposals, providing that a director may be removed prior to the expiration of his or her term only for cause, upon the vote of a majority of the shares entitled to be voted in the election of directors, a staggered board of directors, prohibiting cumulative voting for any purpose and a vote limitation on shares owned in excess of 10% of Northwest Bancshares’ outstanding shares. The foregoing provisions could impede a change of control. In particular, classification of the board of directors has the effect of decreasing the number of directors that could be elected in a single year by any person who seeks to elect its designees to a majority of the seats on the board. Furthermore, allowing the board to consider non-stockholder constituencies may have the effect of increasing the board’s discretion to reject acquisition or merger proposals.
Additionally, in certain instances, the issuance of authorized but unissued shares of common stock or preferred stock may have an anti-takeover effect. The authority of the board of directors to issue preferred stock with rights and privileges, including voting rights, as it may deem appropriate, may enable the board to prevent a change of control despite a shift in ownership of our common stock. In addition, the board’s authority to issue additional shares of common stock may help deter or delay a change of control by increasing the number of shares needed to gain control.
Northwest Bancshares, Inc.’s Articles of Incorporation and Bylaws
Directors. The board of directors is divided into three classes. The members of each class are elected for a term of three years and only one class of directors will be elected annually. Thus, it would take at least two annual elections to replace a majority of our board of directors. Further, the bylaws impose notice and information requirements in connection with the nomination by stockholders of candidates for election to the board of directors or the proposal by stockholders of business to be acted upon at an annual meeting of stockholders.
Restrictions on Call of Special Meetings. The articles of incorporation and bylaws provide that special meetings of stockholders can be called by the President, by a majority of the whole board of directors or upon the written request of stockholders entitled to cast at least a majority of all votes entitled to vote at the meeting.
Prohibition of Cumulative Voting. The articles of incorporation prohibit cumulative voting for the election of directors.
Limitation of Voting Rights. The articles of incorporation provide that in no event will any person who beneficially owns more than 10% of the outstanding shares of common stock be entitled or permitted to vote any of the shares of common stock held in excess of the 10% limit.
Restrictions on Removing Directors from Office. The articles of incorporation provide that directors may be removed only for cause, and only by the affirmative vote of the holders of at least a majority of the voting power of all of our then-outstanding common stock entitled to vote (after giving effect to the limitation on voting rights discussed above in “-Limitation of Voting Rights.”)
Authorized but Unissued Shares. Northwest Bancshares has authorized but unissued shares of common and preferred stock. The articles of incorporation authorize 50,000,000 shares of serial preferred stock. Northwest Bancshares is authorized to issue preferred stock from time to time in one or more series subject to applicable provisions of law, and the board of directors is authorized to fix the designations, and relative preferences, limitations, voting rights, if any, including without limitation, offering rights of such shares (which could be multiple or as a separate class).
In the event of a proposed merger, tender offer or other attempt to gain control of Northwest Bancshares that the board of directors does not approve, it might be possible for the board of directors to authorize the issuance of a series of preferred stock with rights and preferences that would impede the completion of the transaction. An effect of the possible issuance of preferred stock therefore may be to deter a future attempt to gain control of Northwest Bancshares.
Amendments to Articles of Incorporation and Bylaws. Amendments to the articles of incorporation must be approved by our board of directors and also by at least a majority of the outstanding shares of our voting stock; provided, however, that approval by at least 80% of the outstanding voting stock is generally required to amend certain provisions.
The articles of incorporation also provide that the bylaws may be amended by the affirmative vote of a majority of Northwest Bancshares, Inc.’s directors or by the stockholders by the affirmative vote of at least 80% of the total votes eligible to be voted at a duly constituted meeting of stockholders. Any amendment of this super-majority requirement for amendment of the bylaws would also require the approval of 80% of the outstanding voting stock.
Business Combinations with Interested Stockholders. Under Maryland law, “business combinations” between Northwest Bancshares, Inc. and an interested stockholder or an affiliate of an interested stockholder are prohibited for five years after the most recent date on which the interested stockholder becomes an interested stockholder. These business combinations include a merger, consolidation, statutory share exchange or, in circumstances specified in the statute, certain transfers of assets, certain stock issuances and transfers, liquidation plans and reclassifications involving interested stockholders and their affiliates or issuance or reclassification of equity securities. Maryland law defines an interested stockholder as: (i) any person who beneficially owns 10% or more of the voting power of Northwest Bancshares, Inc.’s voting stock after the date on which Northwest Bancshares, Inc. had 100 or more beneficial owners of its stock; or (ii) an affiliate or associate of Northwest Bancshares, Inc. at any time after the date on which Northwest Bancshares, Inc. had 100 or more beneficial owners of its stock who, within the two-year period prior to the date in question, was the beneficial owner of 10% or more of the voting power of the then-outstanding voting stock of Northwest Bancshares, Inc. A person is not an interested stockholder under the statute if the board of directors approved in advance the transaction by which the person otherwise would have become an interested stockholder. However, in approving a transaction, the board of directors may provide that its approval is subject to compliance, at or after the time of approval, with any terms and conditions determined by the board.
After the five-year prohibition, any business combination between Northwest Bancshares, Inc. and an interested stockholder generally must be recommended by the board of directors of Northwest Bancshares, Inc. and approved by the affirmative vote of at least: (i) 80% of the votes entitled to be cast by holders of outstanding shares of voting stock of Northwest Bancshares, Inc. and (ii) two-thirds of the votes entitled to be cast by holders of voting stock of Northwest Bancshares, Inc. other than shares held by the interested stockholder with whom or with whose affiliate the business combination is to be effected or held by an affiliate or associate of the interested stockholder. These super-majority vote requirements do not apply if Northwest Bancshares, Inc.’s common stockholders receive a minimum price, as defined under Maryland law, for their shares in the form of cash or other consideration in the same form as previously paid by the interested stockholder for its shares.
Evaluation of Offers. The articles of incorporation of Northwest Bancshares, Inc. provide that its board of directors, when evaluating a transaction that would or may involve a change in control of Northwest Bancshares, Inc. (whether by purchases of its securities, merger, consolidation, share exchange, dissolution, liquidation, sale of all or substantially all of its assets, proxy solicitation or otherwise), may, in connection with the exercise of its business judgment in determining what is in the best interests of Northwest Bancshares, Inc. and its stockholders and in making any recommendation to the stockholders, give due consideration to all relevant factors, including, but not limited to:
•the economic effect, both immediate and long-term, upon Northwest Bancshares, Inc.’s stockholders, including stockholders, if any, who do not participate in the transaction;
•the social and economic effect on the present and future employees, creditors and customers of, and others dealing with, Northwest Bancshares, Inc. and its subsidiaries and on the communities in which Northwest Bancshares, Inc. and its subsidiaries operate or are located;
•whether the proposal is acceptable based on the historical, current or projected future operating results or financial condition of Northwest Bancshares, Inc.;
•whether a more favorable price could be obtained for Northwest Bancshares, Inc.’s stock or other securities in the future;
•the reputation and business practices of the other entity to be involved in the transaction and its management and affiliates as they would affect the employees of Northwest Bancshares, Inc. and its subsidiaries;
•the future value of the stock or any other securities of Northwest Bancshares, Inc. or the other entity to be involved in the proposed transaction;
•any antitrust or other legal and regulatory issues that are raised by the proposal;
•the business and historical, current or expected future financial condition or operating results of the other entity to be involved in the transaction, including, but not limited to, debt service and other existing financial obligations, financial obligations to be incurred in connection with the proposed transaction, and other likely financial obligations of the other entity to be involved in the proposed transaction; and
•the ability of Northwest Bancshares, Inc. to fulfill its objectives as a financial institution holding company and on the ability of its subsidiary financial institution(s) to fulfill the objectives of a federally insured financial institution under applicable statutes and regulations.
If the board of directors determines that any proposed transaction should be rejected, it may take any lawful action to defeat such transaction.
Purpose and Anti-Takeover Effects of Northwest Bancshares, Inc.’s Articles of Incorporation and Bylaws. Our board of directors believes that the provisions described above are prudent and reduce our vulnerability to takeover attempts and certain other transactions that have not been negotiated with and approved by our board of directors. Our board of directors believes these provisions are in the best interests of Northwest Bancshares, Inc. and its stockholders. Our board of directors believes that it is in the best position to determine the true value of Northwest Bancshares, Inc. and to negotiate more effectively for what may be in the best interests of its stockholders. Accordingly, our board of directors believes that it is in the best interests of Northwest Bancshares, Inc. and its stockholders to encourage potential acquirers to negotiate directly with the board of directors and that these provisions will encourage such negotiations and discourage hostile takeover attempts. It is also the view of our board of directors that these provisions should not discourage persons from proposing a merger or other transaction at a price reflective of the true value of Northwest Bancshares, Inc. and that is in the best interests of all stockholders.
Takeover attempts that have not been negotiated with and approved by our board of directors present the risk of a takeover on terms that may be less favorable than might otherwise be available. A transaction that is negotiated and approved by our board of directors, on the other hand, can be carefully planned and undertaken at an opportune time in order to obtain maximum value of Northwest Bancshares, Inc. for our stockholders, with due consideration given to matters such as the management and business of the acquiring corporation and maximum strategic development of Northwest Bancshares, Inc.’s assets.
Although a tender offer or other takeover attempt may be made at a price substantially above the current market price, such offers are sometimes made for less than all of the outstanding shares of a target company. As a result, stockholders may be presented with the alternative of partially liquidating their investment at a time that may be disadvantageous, or retaining their investment in an enterprise that is under different management and whose objectives may not be similar to those of the remaining stockholders.
Despite our belief as to the benefits to stockholders of these provisions of Northwest Bancshares, Inc.’s articles of incorporation and bylaws, these provisions may also have the effect of discouraging a future takeover attempt that would not be approved by our board of directors, but pursuant to which stockholders may receive a substantial premium for their shares over then current market prices. As a result, stockholders who might desire to participate in such a transaction may not have any opportunity to do so. Such provisions will also make it more difficult to remove our board of directors and management. Our board of directors, however, has concluded that the potential benefits outweigh the possible disadvantages.
The cumulative effect of the restrictions on acquisition of Northwest Bancshares, Inc. contained in our articles of incorporation and bylaws and in Maryland law may be to discourage potential takeover attempts and perpetuate incumbent management, even though certain stockholders of Northwest Bancshares, Inc. may deem a potential acquisition to be in their best interests, or deem existing management not to be acting in their best interests.
Change in Control Regulations
Under the Change in Bank Control Act, no person may acquire control of an insured savings association or its parent holding company unless the Federal Reserve Board has been given 60 days’ prior written notice and has not issued a notice disapproving the proposed acquisition. The Federal Reserve Board takes into consideration certain factors, including the financial and managerial resources of the acquirer and the competitive effects of the acquisition. In addition, federal regulations provide that no company may acquire control of a savings association without the prior approval of the Federal Reserve Board. Any company that acquires such control becomes a “savings and loan holding company” subject to registration, examination and regulation by the Federal Reserve Board.
Control, as defined under federal law, means ownership, control of or holding irrevocable proxies representing more than 25% of any class of voting stock, control in any manner of the election of a majority of the company’s directors, or a determination by the Federal Reserve Board that the acquirer has the power to direct, or directly or indirectly exercise a controlling influence over, the management or policies of the institution.
Acquisition of more than 10% of any class of a savings and loan holding company’s voting stock constitutes a rebuttable determination of control under the regulations under certain circumstances including where, as is the case with Northwest Bancshares, the issuer has registered securities under Section 12 of the Securities Exchange Act of 1934. Federal Reserve Board regulations provide that parties seeking to rebut control will be provided an opportunity to do so in writing.
Benefit Plans
In addition to the provisions of Northwest Bancshares’ articles of incorporation and bylaws described above, benefit plans of Northwest Bancshares and Northwest Bank that may authorize the issuance of equity to its board of directors, officers and employees adopted in connection with or following the offering contain or may contain provisions which also may discourage hostile takeover attempts which the board of directors of Northwest Bank might conclude are not in the best interests of Northwest Bancshares and Northwest Bank or Northwest Bancshares’ stockholders.
EX-10.22
3
exhibit1022.htm
EX-10.22
exhibit1022
EX-10.23
4
exhibit1023.htm
EX-10.23
exhibit1023

{Clients/1059/00214203.DOC/ } NORTHWEST BANK AND NORTHWEST BANCSHARES, INC. CHANGE IN CONTROL AGREEMENT FOR GREGORY J. BETCHKAL, EVP This Change in Control Agreement (the “Agreement”) is made effective upon commencement of employment (the “Effective Date”) by and between Northwest Bank, a Pennsylvania-chartered stock savings bank (the “Bank”), and Gregory J. Betchkal (the “Executive”). Any reference to “Company” herein shall mean Northwest Bancshares, Inc., or any successor thereto. NOW, THEREFORE, in consideration of the mutual covenants herein contained, and upon the other terms and conditions hereinafter provided, the parties hereby agree as follows: 1. TERM OF AGREEMENT; BASE SALARY (a) The period of the Executive’s employment under this Agreement shall begin as of the Effective Date and shall continue until November 1st of the current year as set forth herein. Commencing on November 1st of each subsequent year (“Anniversary Date”) and continuing on each Anniversary Date thereafter, this Agreement shall renew for an additional twelve (12) months such that the remaining term shall be twelve (12) months from the applicable November 1, unless written notice of non-renewal (“Non- Renewal Notice”) is provided by the Compensation Committee (“Committee”) of the Board of Directors (“Board”) of the Bank to the Executive at least thirty (30) days and not more than sixty (60) days prior to any such Anniversary Date, that this Agreement shall not be renewed. If a Non-Renewal Notice is given, the Agreement shall expire on the Anniversary Date immediately following the date the Non-Renewal Notice is given to the Executive. (b) Prior to each notice period for non-renewal, the Committee will conduct a comprehensive performance evaluation and review of the Executive for purposes of determining whether to extend the Agreement, and the results thereof shall be included in the Committee’s minutes. The Bank shall pay the Executive as compensation a salary of not less than $556,000 per year (“Base Salary”). Such Base Salary shall be payable biweekly. During the period of this Agreement, the Executive’s Base Salary shall be reviewed at least annually. Such review shall be conducted by the Committee, and the Committee may increase, but not decrease, the Executive’s Base Salary other than pursuant to an employer-wide reduction of compensation of all officers of the Bank and not in excess of the average percentage of the employer-wide reduction (any increase in Base Salary shall become the “Base Salary” for purposes of this Agreement). (c) The failure of Committee to take the actions set forth herein before any Anniversary Date will result in the automatic non-renewal of this Agreement. If the Committee fails to inform the Executive of its determination regarding the renewal or non- DocuSign Envelope ID: 47012C4E-E530-40B5-BFC7-F6E01B6A8D40

2 renewal of this Agreement, the Executive may make a written request asking for the Committee’s decision and the Committee shall provide a written response to the Executive within thirty (30) days of the receipt of such request. Reference herein to the term of this Agreement shall refer to both such initial term and such extended terms. (d) Upon the expiration or termination of the Agreement, the Executive shall be an “at will” employee unless the Committee has informed the Executive that the Executive’s employment with the Bank will terminate when the Agreement terminates. (e) Notwithstanding the preceding, in the event a Change in Control (as defined in Section 2.3) occurs, this Agreement shall continue in full force and effect, and shall not terminate or expire until the later of (i) twenty-four (24) months after the Change in Control occurs, or (ii) payment in full of the severance payment under Section 2 hereof (the “Severance Payment”) to the Executive. 2. SEVERANCE PAYMENT 2.1 Right to Severance Payment Upon the occurrence of a Change in Control of the Bank or the Company followed, within twenty-four (24) months thereafter, by the termination of Executive’s employment for a reason specified in Section 2.2 below, the Executive shall be entitled to the Severance Payment provided under Section 2.5. In the event termination occurs by reason of death, voluntary termination other than for reasons specified in Section 2.2, Disability, or for Just Cause, the Executive shall not be entitled to a Severance Payment. Notwithstanding the foregoing, the Executive shall not be entitled to any payments or benefits under this Agreement unless and until the Executive executes a release of claims against the Bank, the Company and any affiliate, and their officers, directors, successors and assigns, releasing said persons from any and all claims, rights, demands, causes of action, suits, arbitrations or grievances relating to the employment relationship, including claims under the Age Discrimination in Employment Act (“ADEA”), but not including claims for benefits under tax-qualified plans or other benefit plans in which the Executive is vested, claims for benefits required by applicable law or claims with respect to obligations set forth in this Agreement that survive the termination of this Agreement. In order to comply with the requirements of Code Section 409A and the ADEA, the release shall be provided to the Executive no later than the date of the Executive’s Separation from Service and the Executive shall have no fewer than twenty-one (21) days to consider the release, and following the Executive’s execution of the release, the Executive shall have seven (7) days to revoke said release. 2.2 Reasons for Termination Following a Change in Control, Executive shall be entitled to a Severance Payment if Executive terminates employment with the Bank within twenty-four (24) months after such Change in Control for any one or more of the following reasons: DocuSign Envelope ID: 47012C4E-E530-40B5-BFC7-F6E01B6A8D40

3 (a) The Bank involuntarily terminates the employment of Executive upon or after a Change in Control other than for Just Cause. (b) A reduction in the Executive’s Base Salary or benefits and perquisites provided to the Executive from those being provided as of the Effective Date of this Agreement. (c) A change in the Executive’s function, duties, or responsibilities, which change would cause the Executive’s position to become one of lesser responsibility, importance or scope. (d) A relocation of the Executive’s principal place of employment by more than thirty (30) miles from its location as of the Effective Date of this Agreement. (e) Liquidation or dissolution of the Bank or the Company other than reorganizations that do not affect the status of the Executive. (f) Breach of the Agreement by the Bank or the Company. Upon the occurrence of any event described in clauses (b), (c), (d), (e) or (f) above (“Good Reason”), the Executive shall have the right to elect to terminate the Executive’s employment under this Agreement by resignation upon not less than thirty (30) days prior written notice given within a reasonable period of time not to exceed ninety (90) days after the initial event giving rise to said right to elect. The Bank shall have at least thirty (30) days to remedy any Good Reason condition, provided, however, that the Bank shall be entitled to waive such cure period and make an immediate payment hereunder. 2.3 Change in Control A Change in Control of the Bank or the Company shall mean a change in control of a nature that: (a) would be required to be reported in response to Item 5.01 of the current report on Form 8-K, as in effect on the date hereof, pursuant to Section 13 or 15(d) of the Securities Exchange Act of 1934 (the “Exchange Act”); or (b) results in a Change in Control of, the Bank or the Company within the meaning of the Home Owners’ Loan Act, as amended, and applicable rules and regulations promulgated thereunder, as in effect at the time of the Change in Control (collectively, the “HOLA”); or (c) a Change in Control shall be deemed to have occurred at such time as: (i) any “person” (as the term is used in Sections 13(d) and 14(d) of the Exchange Act) is or becomes the “beneficial owner” (as defined in Rule 13d-3 under the Exchange Act), DocuSign Envelope ID: 47012C4E-E530-40B5-BFC7-F6E01B6A8D40

4 directly or indirectly, of securities of the Company representing 25% or more of the combined voting power of Company’s outstanding securities except for any securities purchased by the Bank’s employee stock ownership plan or trust; or (ii) individuals who constitute the Board on the date hereof (the “Incumbent Board”) cease for any reason to constitute at least a majority thereof, provided that any person becoming a director subsequent to the date hereof whose election was approved by a vote of at least three quarters of the directors comprising the Incumbent Board, or whose nomination for election by the Company’s stockholders was approved by the same Nominating Committee serving under an Incumbent Board, shall be, for purposes of this clause (b), considered as though he were a member of the Incumbent Board; or (iii) a plan of reorganization, merger, consolidation, sale of all or substantially all the assets of the Bank or the Company or similar transaction in which the Bank or Company is not the surviving institution occurs; or (iv) a proxy statement soliciting proxies from stockholders of the Company, by someone other than the current management of the Company, seeking stockholder approval of a plan of reorganization, merger or consolidation of the Company or similar transaction with one or more corporations or financial institutions, and as a result of such proxy solicitation, a plan of reorganization, merger consolidation or similar transaction involving the Company is approved by the Company’s Board of Directors or the requisite vote of the Company’s stockholders; or (v) a tender offer is made for 25% or more of the voting securities of the Company and the shareholders owning beneficially or of record 25% or more of the outstanding securities of the Company have tendered or offered to sell their shares pursuant to such tender offer and such tendered shares have been accepted by the tender offeror. 2.4 Termination for Just Cause The Executive shall not have the right to receive a Severance Payment pursuant to Section 2.5 upon Termination for Just Cause. “Termination for Just Cause” shall mean DocuSign Envelope ID: 47012C4E-E530-40B5-BFC7-F6E01B6A8D40

5 termination because of the Executive’s personal dishonesty, willful misconduct, any breach of fiduciary duty involving personal profit, intentional failure to perform stated duties, willful violation of any law, rule, or regulation (other than traffic violations or similar offenses) or final cease-and-desist order, or material breach of any provision of this Agreement. In determining incompetence, the acts or omissions shall be measured against standards generally prevailing in the banking industry. For purposes of this paragraph, no act or failure to act on the part of the Executive shall be considered “willful” unless done, or omitted to be done, by the Executive not in good faith and without reasonable belief that the Executive’s action or omission was in the best interest of the Bank or the Company. 2.5 Amount and Time and Form of Severance Payment In the event the Executive becomes entitled to a Severance Payment under the Agreement, the Bank shall pay the Executive, or in the event of the Executive’s subsequent death, the Executive’s estate, the following as a Severance Payment: (a) The Bank shall play the Executive a cash lump sum equal to the sum of (i) two (2) times the Executive’s highest rate of base salary plus (ii) two (2) times the highest rate of cash bonus paid to the Executive during the prior two (2) years, paid within thirty (30) days following the Separation from Service or, if the Executive is a Specified Employee (within the meaning of Treasury Regulations §1.409A-1(i)), to the extent required to avoid penalties under Code Section 409A, on the first business day of the seventh month following the Separation from Service. Such payment shall not be reduced in the event the Executive obtains other employment following a Separation from Service. (b) In addition to the cash lump sum, the Bank shall provide the Executive with continued non-taxable medical and dental coverage substantially identical to the coverage maintained by the Bank for the Executive and his eligible dependents prior to the date of the Executive’s Separation from Service. Such coverage shall continue for a period of twenty-four (24) months after the date of Separation from Service unless the Executive obtains other employment following Separation from Service under which substantially similar benefits are provided and in which the Executive and his eligible dependents are eligible to participate. Notwithstanding anything herein contained to the contrary, if applicable law (including, but not limited to, laws prohibiting discriminating in favor of highly compensated employees), or, if participation by the Executive and his eligible dependents is not permitted under the terms of the applicable health plans, or if providing such benefits would subject the Bank to penalties, then the Bank shall pay the Executive a cash lump sum payment reasonably estimated to be equal to the value of such non-taxable medical and dental benefits, with such payment to be made by lump sum within thirty (30) business days after the Separation from Service, or if later, the date on which the Bank determines that such insurance coverage (or the remainder of such insurance coverage) cannot be provided for the foregoing reasons. DocuSign Envelope ID: 47012C4E-E530-40B5-BFC7-F6E01B6A8D40

6 (c) Notwithstanding the provisions of (a) and (b) above, if the Executive is a “Disqualified Individual” within the meaning of Code Section 280G and the Severance Payment is in an amount which includes an “Excess Parachute Payment” within the meaning of Code Section 280G, the Severance Payment hereunder to Executive shall be reduced to the maximum amount which does not include an Excess Parachute Payment. In the event any change in the Code or regulations thereunder should reduce the amount of payments permissible under Code Section 280G on the Effective Date, then the Severance Payment that is payable shall be determined as if such change in the Code or regulations had not been made. The allocation of the reduction of any aggregate payments or benefits of this Section 2 shall be determined by the Executive, provided, however, that if it is determined that such election by the Executive shall be in violation of Code Section 409A, the allocation of the required reduction shall be pro-rata. (d) Notwithstanding the provisions of (a) and (b) above, no payments shall be made hereunder if the Bank is not in compliance with its minimum capital requirements or if such payments would cause the Bank’s capital to be reduced below its minimum capital requirements. 2.6 Separation from Service For purposes of this Section 2, “termination of employment” shall be construed to mean “Separation from Service” as defined in Code Section 409A and the Treasury regulations promulgated thereunder, provided, however, that the Bank and the Executive reasonably anticipate that the level of bona-fide services the Executive would perform after termination would permanently decrease to a level that is less than 50% of the average level of bona fide services performed (whether as an employee or an independent contractor) over the immediately preceding 36-month period. 3. DEATH AND DISABILITY BENEFITS (a) “Disability” or “Disabled” shall be construed to comply with Code Section 409A and shall be deemed to have occurred, with or without a Change in Control, if: (i) the Executive is unable to engage in any substantial gainful activity by reason of any medically determinable physical or mental impairment that can be expected to result in death, or last for a continuous period of not less than twelve (12) months; (ii) by reason of any medically determinable physical or mental impairment that can be expected to result in death, or last for continuous period of not less than twelve (12) months, the Executive is receiving income replacement benefits for a period of not less than three months under an accident and health plan covering employees of the Bank; or (iii) the Executive is determined to be totally disabled by the Social Security Administration. In the event of Disability, the Executive shall be entitled to receive benefits under any short or long-term disability plan maintained by the Bank. To extent that such benefits are less than the Executive’s Base Salary at the rate in effect at the time of the Executive’s Disability, the Bank shall pay the Executive a cash lump sum equal to the difference between such disability plan benefits and the amount of the Executive’s Base Salary for one year following the termination of his employment due to Disability (regardless of DocuSign Envelope ID: 47012C4E-E530-40B5-BFC7-F6E01B6A8D40

7 whether a Change in Control has occurred). Any payment required hereunder shall be made no later than two and one-half (2.5) months after the end of calendar year in which the Disability occurred. (b) In the event of the Executive’s death during the term of the Agreement, with or without a Change in Control, his estate shall be paid a cash lump sum equal to one times the Executive’s Base Salary at the rate in effect at the time of the Executive’s death. Such payment shall be made within thirty (30) days after the Executive’s date of death. In addition, the Bank will continue to provide non-taxable medical and dental benefits as were previously provided for the Executive’s eligible dependents for three (3) years after the Executive’s death. Notwithstanding anything herein contained to the contrary, if applicable law (including, but not limited to, laws prohibiting discriminating in favor of highly compensated employees), or, if participation by the Executive’s eligible dependents is not permitted under the terms of the applicable health plans, or if providing such benefits would subject the Bank to penalties, then the Bank shall pay the Executive’s surviving eligible dependents a cash lump sum payment reasonably estimated to be equal to the value of such non-taxable medical and dental benefits, with such payment to be made by lump sum within thirty (30) business days of the Executive’s death, or if later, the date on which the Bank determines that such insurance coverage (or the remainder of such insurance coverage) cannot be provided for the foregoing reasons. 4. NOTICE OF TERMINATION (a) Any purported termination by the Bank or by the Executive shall be communicated by Notice of Termination to the other party hereto. For purposes of this Agreement, a “Notice of Termination” shall mean a written notice which shall indicate the specific termination provision in this Agreement relied upon and shall set forth in reasonable detail the facts and circumstances claimed to provide a basis for termination of the Executive’s employment under the provision so indicated. (b) “Date of Termination” shall mean the date specified in the Notice of Termination (which, in the case of a Termination for Just Cause, shall be immediate). Except as set forth below in paragraph (c), in no event shall the Date of Termination exceed thirty (30) days from the date Notice of Termination is given. (c) If, within thirty (30) days after any Notice of Termination is given, the party receiving such Notice of Termination notifies the other party that a dispute exists concerning the termination, except upon the occurrence of a Change in Control and voluntary termination by Executive, in which case the Date of Termination shall be the date specified in the Notice, the Date of Termination shall be the date on which the dispute is finally determined, either by mutual written agreement of the parties, by a binding arbitration award, or by a final judgment, order or decree of a court of competent jurisdiction (the time for appeal therefrom having expired and no appeal having been perfected) and provided further that the Date of Termination shall be extended by a notice of dispute only if such notice is given in good faith and the party giving such notice pursues the resolution of such dispute with reasonable diligence. Notwithstanding the pendency DocuSign Envelope ID: 47012C4E-E530-40B5-BFC7-F6E01B6A8D40

8 of any such dispute, the Bank will continue to pay the Executive his full compensation in effect when the notice giving rise to the dispute was given (including, but not limited to, Base Salary) and continue the Executive as a participant in all compensation, benefit and insurance plans in which the Executive was participating when the notice of dispute was given, until the earlier of one hundred and twenty (120) days from the date of the Notice of Termination or the date upon which the dispute is finally resolved in accordance with this Agreement. Amounts paid under this Section are in addition to all other amounts due under this Agreement and shall not be offset against or reduce any other amounts due under this Agreement. Notwithstanding the foregoing, no compensation or benefits shall be paid to the Executive in the event the Executive is terminated for Just Cause. In the event that such Termination for Just Cause is found to have been wrongful or such dispute is otherwise decided in Executive’s favor, the Executive shall be entitled to receive the Severance Payment set forth in Section 2.5 as if the Executive had suffered a termination of employment under Section 2.2. 5. SOURCE OF PAYMENTS It is intended by the parties hereto that all Severance Payments provided in this Agreement shall be paid in cash, check or direct deposit from the general funds of the Bank or the Company. The Company, however, guarantees payment and provision of all amounts and benefits due hereunder to the Executive and, if such amounts and benefits due from the Bank are not timely paid or provided by the Bank, such amounts and benefits shall be paid or provided by the Company. 6. EFFECT ON PRIOR AGREEMENTS AND EXISTING BENEFIT PLANS This Agreement contains the entire understanding between the parties hereto and supersedes any prior agreement between the Bank and the Executive, except that this Agreement shall not affect or operate to reduce any benefit or compensation inuring to the Executive of a kind elsewhere provided. No provision of this Agreement shall be interpreted to mean that the Executive is subject to receiving fewer benefits than those available to him without reference to this Agreement. 7. NO ATTACHMENT (a) Except as required by law, no right to receive payments under this Agreement shall be subject to anticipation, commutation, alienation, sale, assignment, encumbrance, charge, pledge, or hypothecation, or to execution, attachment, levy, or similar process or assignment by operation of law, and any attempt, voluntary or involuntary, to affect any such action shall be null, void, and of no effect. (b) This Agreement shall be binding upon, and inure to the benefit of, the Executive, the Bank and their respective successors and assigns. 8. AMENDMENT, TERMINATION AND WAIVER DocuSign Envelope ID: 47012C4E-E530-40B5-BFC7-F6E01B6A8D40

9 (a) During the term of the Agreement, the Agreement may be terminated or amended in any respect by an instrument in writing signed by the Executive and the Bank, unless a Change in Control has previously occurred. If a Change in Control occurs, the Agreement no longer shall be subject to amendment, change, substitution, deletion, revocation or termination in any respect whatsoever. (b) No term or condition of this Agreement shall be deemed to have been waived, nor shall there be any estoppel against the enforcement of any provision of this Agreement, except by written instrument of the party charged with such waiver or estoppel. No such written waiver shall be deemed a continuing waiver unless specifically stated therein, and each such waiver shall operate only as to the specific term or condition waived and shall not constitute a waiver of such term or condition for the future or as to any act other than that specifically waived. 9. POST-TERMINATION OBLIGATIONS (a) All payments and benefits to the Executive under this Agreement shall be subject to the Executive’s compliance with paragraph (b) of this Section 9 during the term of this Agreement and for two (2) full years after the expiration or termination hereof. (b) The Executive shall, upon reasonable notice, furnish such information and assistance to the Bank as may reasonably be required by the Bank in connection with any litigation in which it or any of its subsidiaries or affiliates is, or may become, a party. 10. CONFIDENTIALITY The Executive recognizes and acknowledges that the knowledge of the business activities and plans for business activities of the Bank, the Company and affiliates thereof, as it may exist from time to time, is a valuable, special and unique asset of the business of the Bank and the Company. The Executive will not, during or after the term of his employment, disclose any knowledge of the past, present, planned or considered business activities of the Bank, the Company or affiliates thereof to any person, firm, corporation, or other entity for any reason or purpose whatsoever (except for such disclosure as may be required to be provided to any federal banking agency with jurisdiction over the Bank, the Company or the Executive). Notwithstanding the foregoing, the Executive may disclose any knowledge of banking, financial and/or economic principles, concepts or ideas which are not solely and exclusively derived from the business plans and activities of the Bank or the Company, and the Executive may disclose any information regarding the Bank or the Company which is otherwise publicly available. In the event of a breach or threatened breach by the Executive of the provisions of this Section 9, the Bank and/or the Company will be entitled to an injunction restraining the Executive from disclosing, in whole or in part, the knowledge of the past, present, planned or considered business activities of the Bank, the Company or affiliates thereof, or from rendering any services to any person, firm, corporation, other entity to whom such knowledge, in whole or in part, has been disclosed or is threatened to be disclosed. Nothing herein will be construed as prohibiting the Bank or the Company from pursuing DocuSign Envelope ID: 47012C4E-E530-40B5-BFC7-F6E01B6A8D40

10 any other remedies available to the Bank or the Company for such breach or threatened breach, including the recovery of damages from the Executive. 11. OTHER RIGHTS AND BENEFITS NOT AFFECTED 11.1 Other Benefits Except to the extent the Executive shall voluntarily agree otherwise, neither the provisions of this Agreement nor the Severance Payments provided for hereunder shall reduce any amounts otherwise payable, or in any way diminish the Executive’s rights as an employee of the Bank, whether existing now or hereafter, under any benefit, incentive, retirement, stock benefit, stock bonus, stock ownership or any employment agreement or other plan or arrangement. 11.2 Employment Status This Agreement does not constitute a contract of employment or impose on the Executive or the Bank any obligation to retain the Executive as an employee, to change the status of the Executive’s employment, or to change the Bank or the Company’s policies regarding termination of employment. 12. HEADINGS FOR REFERENCE ONLY The headings of sections and paragraphs herein are included solely for convenience of reference and shall not control the meaning or interpretation of any of the provisions of this Agreement. 13. LEGAL FEES AND EXPENSES All legal fees incurred by the Executive pursuant to any dispute or question of interpretation relating to this Agreement shall be the responsibility of and paid by the Executive. 14. ARBITRATION Any dispute or controversy arising under or in connection with the Agreement shall be settled by arbitration, conducted before a panel of three arbitrators sitting in a location selected by the Executive within one hundred (100) miles from the location of the Bank, in accordance with rules of the American Arbitration Association then in effect. Judgment may be entered on the award of the arbitrator in any court having jurisdiction. All expenses of such arbitration, including the reasonable fees and expenses of the counsel for the Executive, shall be borne by the Bank or the Company. 15. APPLICABLE LAW AND SEVERABILITY DocuSign Envelope ID: 47012C4E-E530-40B5-BFC7-F6E01B6A8D40

11 To the extent not preempted by the laws of the United States, the laws of the Commonwealth of Pennsylvania shall be the controlling law in all matters relating to the Agreement. If a provision of this Agreement shall be held illegal or invalid, the illegality or invalidity shall not affect the remaining parts of the Agreement and the Agreement shall be construed and enforced as if the illegal or invalid provision had not been included. 16. SUCCESSOR TO THE BANK The Bank shall require any successor or assignee, whether direct or indirect, by purchase, merger, consolidation or otherwise, to all or substantially all the business or assets of the Bank, expressly and unconditionally to assume and agree to perform the Bank’s obligations under this Agreement, in the same manner and to the same extent that the Bank would be required to perform if no such succession or assignment had taken place. 17. REQUIRED PROVISION Notwithstanding anything herein contained to the contrary, any payments to the Executive by the Bank, whether pursuant to this Agreement or otherwise, are subject to and conditioned upon their compliance with Section 18(k) of the Federal Deposit Insurance Act, 12 U.S.C. § 1828(k), and the regulations promulgated thereunder in 12 C.F.R. Part 359. DocuSign Envelope ID: 47012C4E-E530-40B5-BFC7-F6E01B6A8D40

12 SIGNATURES IN WITNESS WHEREOF, the Bank has caused this Agreement to be executed by its duly authorized officer, and the Executive has signed this Agreement, on the dates set forth below. NORTHWEST BANK _______ By: Date Kyle P. Kane, Executive Vice President, Human Resources NORTHWEST BANCSHARES, INC. _________ By: Date Kyle P. Kane, Executive Vice President, Human Resources EXECUTIVE _________ Date Gregory J. Betchkal DocuSign Envelope ID: 47012C4E-E530-40B5-BFC7-F6E01B6A8D40 03/01/2023 | 2:45 PM PST 03/03/2023 | 5:14 AM PST 03/03/2023 | 5:14 AM PST
EX-21
5
exhibit21.htm
EX-21
exhibit21

Exhibit 21 Subsidiaries of Northwest Bancshares, Inc. • Northwest Bank, a Pennsylvania-chartered savings bank • Northwest Bancorp Capital Trust III, a Delaware statutory business trust • Northwest Bancorp Statutory Trust IV, a Connecticut statutory business trust • LNB Trust II, a Delaware statutory business trust • Union National Capital Trust I, a Delaware statutory business trust • Union National Capital Trust II, a Delaware statutory business trust • MFBC Statutory Trust I, a Delaware statutory business trust • Universal Preferred Trust, a Delaware statutory business trust Subsidiaries of Northwest Bank • Great Northwest Corporation, a Pennsylvania corporation • Northwest Capital Group, Inc., a Pennsylvania corporation • Mutual Federal Interest Corporation, a Nevada corporation • Northwest Settlement Agency, LLC., a Pennsylvania corporation
EX-23
6
nwbi-12312023xexx23.htm
EX-23
Document
Exhibit 23
Consent of Independent Registered Public Accounting Firm
We consent to the incorporation by reference in the registration statements (Nos. 333-261224 and 333-230145) on Form S-3 and in the registration statements (Nos. 333-265056, 333-224910, 333-178077 and 333-170624) on Form S-8 of our reports dated February 23, 2024, with respect to the consolidated financial statements of Northwest Bancshares, Inc. and the effectiveness of internal control over financial reporting.
|
|
|
|
|
|
| /s/ KPMG LLP |
|
| Pittsburgh, Pennsylvania |
|
| February 23, 2024 |
|
EX-31.1
7
nwbi-12312023xexx311.htm
EX-31.1
Document
EXHIBIT 31.1
Certification pursuant to Rule 13a-14
Of the Securities Exchange Act of 1934, as Amended,
As adopted pursuant to
Section 302 of the Sarbanes-Oxley Act of 2002
I, Louis J. Torchio, certify that:
1. I have reviewed this Annual Report on Form 10-K of Northwest Bancshares, Inc.;
2. Based on my knowledge, this report does not contain any untrue statement of a material fact or omit to state a material fact necessary to make the statements made, in light of the circumstances under which such statements were made, not misleading with respect to the period covered by this report;
3. Based on my knowledge, the financial statements, and other financial information included in this report, fairly present in all material respects the financial condition, results of operations and cash flows of the registrant as of, and for, the periods presented in this report;
4. The registrant’s other certifying officer(s) and I are responsible for establishing and maintaining disclosure controls and procedures (as defined in Exchange Act Rules 13a-15(e) and 15d-15(e)) and internal control over financial reporting (as defined in Exchange Act Rules 13a-15(f) and 15d-15(f)) for the registrant and have:
(a) Designed such disclosure controls and procedures, or caused such disclosure controls and procedures to be designed under our supervision, to ensure that material information relating to the registrant, including its consolidated subsidiaries, is made known to us by others within those entities, particularly during the period in which this report is being prepared;
(b) Designed such internal control over financial reporting, or caused such internal control over financial reporting to be designed under our supervision, to provide reasonable assurance regarding the reliability of financial reporting and the preparation of financial statements for external purposes in accordance with generally accepted accounting principles;
(c) Evaluated the effectiveness of the registrant’s disclosure controls and procedures and presented in this report our conclusions about the effectiveness of the disclosure controls and procedures, as of the end of the period covered by this report based on such evaluation; and
(d) Disclosed in this report any change in the registrant’s internal control over financial reporting that occurred during the registrant’s most recent fiscal quarter (the registrant’s fourth fiscal quarter in the case of an annual report) that has materially affected, or is reasonably likely to materially affect, the registrant’s internal control over financial reporting; and
5. The registrant’s other certifying officer(s) and I have disclosed, based on our most recent evaluation of internal control over financial reporting, to the registrant’s auditors and the audit committee of the registrant’s board of directors (or persons performing the equivalent functions):
(a) All significant deficiencies and material weaknesses in the design or operation of internal control over financial reporting which are reasonably likely to adversely affect the registrant’s ability to record, process, summarize and report financial information; and
(b) Any fraud, whether or not material, that involves management or other employees who have a significant role in the registrant’s internal control over financial reporting.
|
|
|
|
|
|
|
|
|
| February 23, 2024 |
|
/s/ Louis J. Torchio |
| Date |
Louis J. Torchio |
| |
President and Chief Executive Officer |
EX-31.2
8
nwbi-12312023xexx312.htm
EX-31.2
Document
EXHIBIT 31.2
Certification pursuant to Rule 13a-14
Of the Securities Exchange Act of 1934, as amended,
As adopted pursuant to
Section 302 of the Sarbanes-Oxley Act of 2002
I, William W. Harvey, Jr., certify that:
1. I have reviewed this Annual Report on Form 10-K of Northwest Bancshares, Inc.;
2. Based on my knowledge, this report does not contain any untrue statement of a material fact or omit to state a material fact necessary to make the statements made, in light of the circumstances under which such statements were made, not misleading with respect to the period covered by this report;
3. Based on my knowledge, the financial statements, and other financial information included in this report, fairly present in all material respects the financial condition, results of operations and cash flows of the registrant as of, and for, the periods presented in this report;
4. The registrant’s other certifying officer(s) and I are responsible for establishing and maintaining disclosure controls and procedures (as defined in Exchange Act Rules 13a-15(e) and 15d-15(e)) and internal control over financial reporting (as defined in Exchange Act Rules 13a-15(f) and 15d-15(f)) for the registrant and have:
(a) Designed such disclosure controls and procedures, or caused such disclosure controls and procedures to be designed under our supervision, to ensure that material information relating to the registrant, including its consolidated subsidiaries, is made known to us by others within those entities, particularly during the period in which this report is being prepared;
(b) Designed such internal control over financial reporting, or caused such internal control over financial reporting to be designed under our supervision, to provide reasonable assurance regarding the reliability of financial reporting and the preparation of financial statements for external purposes in accordance with generally accepted accounting principles;
(c) Evaluated the effectiveness of the registrant’s disclosure controls and procedures and presented in this report our conclusions about the effectiveness of the disclosure controls and procedures, as of the end of the period covered by this report based on such evaluation; and
(d) Disclosed in this report any change in the registrant’s internal control over financial reporting that occurred during the registrant’s most recent fiscal quarter (the registrant’s fourth fiscal quarter in the case of an annual report) that has materially affected, or is reasonably likely to materially affect, the registrant’s internal control over financial reporting; and
5. The registrant’s other certifying officer(s) and I have disclosed, based on our most recent evaluation of internal control over financial reporting, to the registrant’s auditors and the audit committee of the registrant’s board of directors (or persons performing the equivalent functions):
(a) All significant deficiencies and material weaknesses in the design or operation of internal control over financial reporting which are reasonably likely to adversely affect the registrant’s ability to record, process, summarize and report financial information; and
(b) Any fraud, whether or not material, that involves management or other employees who have a significant role in the registrant’s internal control over financial reporting.
|
|
|
|
|
|
|
|
|
| February 23, 2024 |
|
/s/ William W. Harvey, Jr. |
| Date |
William W. Harvey, Jr. |
| |
Senior Executive Vice President, Chief Operating Officer |
| |
and Chief Financial Officer |
EX-32
9
nwbi-12312023xexx32.htm
EX-32
Document
EXHIBIT 32
Certification pursuant to
18 U.S.C. Section 1350,
as adopted pursuant to
Section 906 of the Sarbanes-Oxley Act of 2002
The undersigned officers of Northwest Bancshares, Inc. (the “Company”) hereby certify that, to the best of their knowledge:
1. the Company’s Annual Report on Form 10-K for the Year Ended December 31, 2023 (the “Report”) fully complies with the requirements of Section 13(a) or 15(d) of the Securities Exchange Act of 1934, and
2. that as of the date of this Certification, the information contained in the Report fairly presents, in all material respects, the financial condition and results of operations of the Company.
|
|
|
|
|
|
|
|
|
| February 23, 2024 |
|
/s/ Louis J. Torchio |
| Date |
Louis J. Torchio |
| |
President and Chief Executive Officer |
| |
|
| |
|
| February 23, 2024 |
|
/s/ William W. Harvey, Jr. |
| Date |
William W. Harvey, Jr. |
| |
Senior Executive Vice President, Chief Operating Officer |
| |
and Chief Financial Officer |
The purpose of this statement is solely to comply with Title 18, Chapter 63, Section 1350 of the United States Code, as amended by Section 906 of the Sarbanes-Oxley Act of 2002.
A signed original of this written statement required by Section 906 has been provided to Northwest Bancshares, Inc. and will be retained by Northwest Bancshares, Inc. and furnished to the Securities and Exchange Commission or its staff upon request.
EX-97
10
exhibit97.htm
EX-97
exhibit97

NORTHWEST BANCSHARES, INC. __________________________________________________________ Resolutions of the Board of Directors __________________________________________________________ WHEREAS, the United States Securities and Exchange Commission (“SEC”) has approved the clawback listing standards proposed by The Nasdaq Stock Market (“Nasdaq”), as required by SEC Rule 10D-1 in accordance with the Dodd–Frank Wall Street Reform and Consumer Protection Act; WHEREAS, Nasdaq has amended its listing standards to provide that listed companies must adopt and implement a compliant clawback policy no later than December 1, 2023, and such clawback policy applies to incentive awards received on or after October 2, 2023; and WHEREAS, the Board of Directors of Northwest Bancshares, Inc. (the “Board”) wishes to formally adopt and implement a compliant clawback policy, which requires public companies to recover erroneously awarded incentive-based compensation from current and former executive officers in the event of an accounting restatement. NOW THEREFORE BE IT RESOLVED, that the Board hereby adopts the Northwest Bancshares, Inc. Clawback Policy in substantially the form attached hereto (the “Clawback Policy”); FURTHER RESOLVED, the Clawback Policy will be filed as an exhibit to the Company’s annual report as required by the listing standards; FURTHER RESOLVED, that the appropriate officers of the Company are hereby authorized and directed to perform any and all acts as they deem necessary or advisable in order to carry out the intent and purposes of these resolutions. CORPORATE SECRETARY’S CERTIFICATE I, Richard Laws, Corporate Secretary of Northwest Bancshares, Inc., do hereby certify that the above resolutions were adopted by the Board of Directors at a meeting duly held on November 15, 2023. ________________________ Corporate Secretary DocuSign Envelope ID: E840AFF2-5816-4336-8C53-4105AEB6FB25

{Clients/1059/00435925.DOCX/ } DocuSign Envelope ID: E840AFF2-5816-4336-8C53-4105AEB6FB25