Trading update FY24 & 4Q24 f Jat • STRONG DELIVERY IN 2024 • DIGITAL DRIVING GROWTH FULL YEAR AND FOURTH QUARTER 2024 TRADING UPDATE
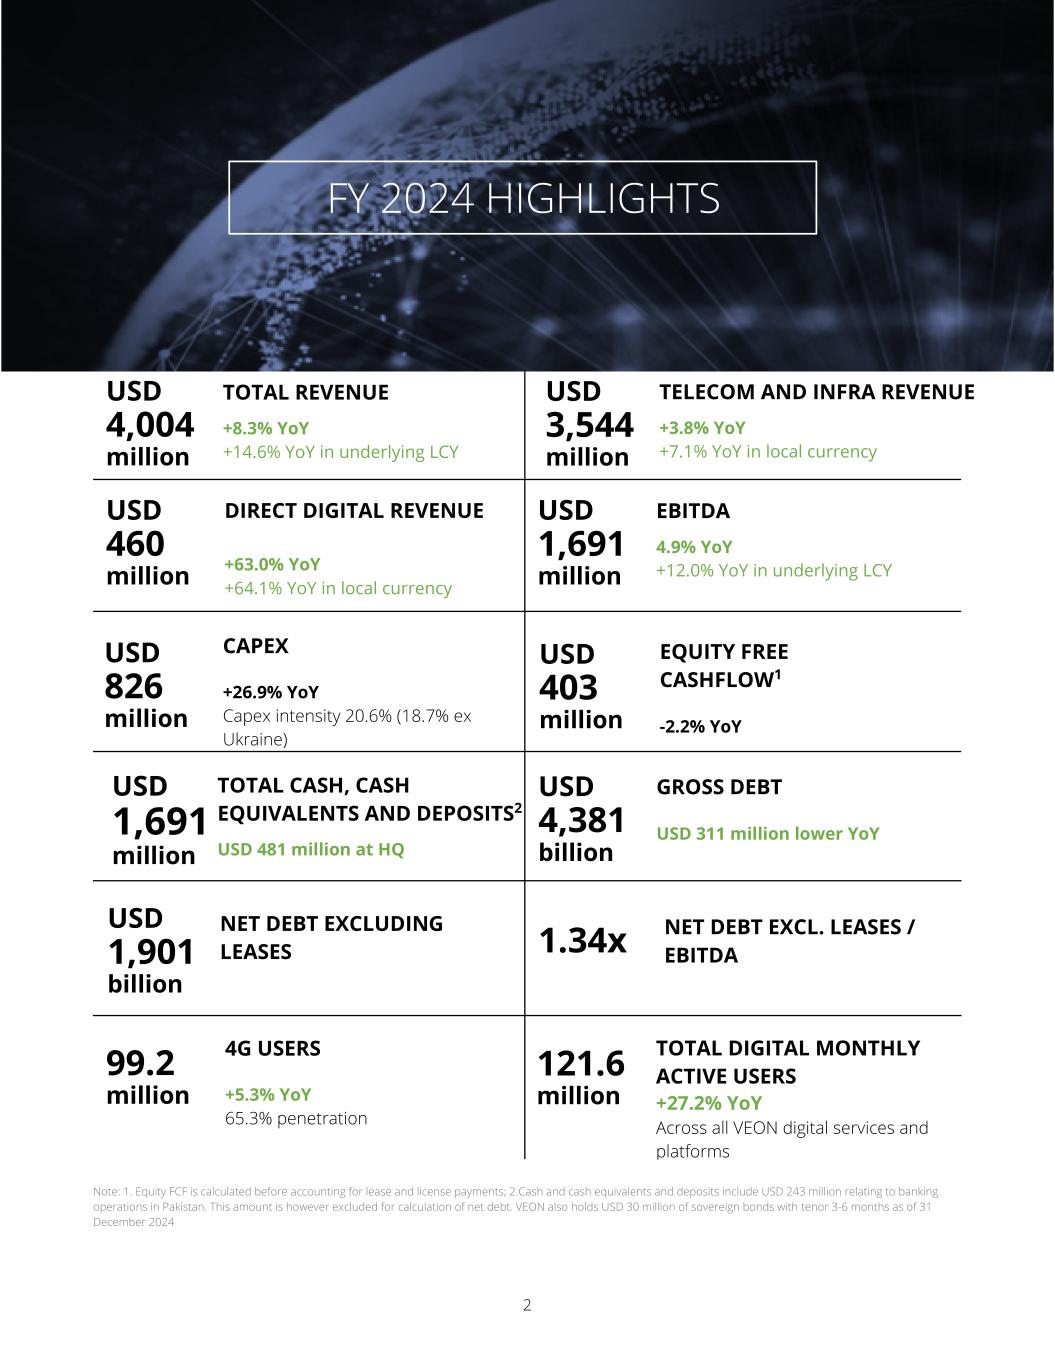
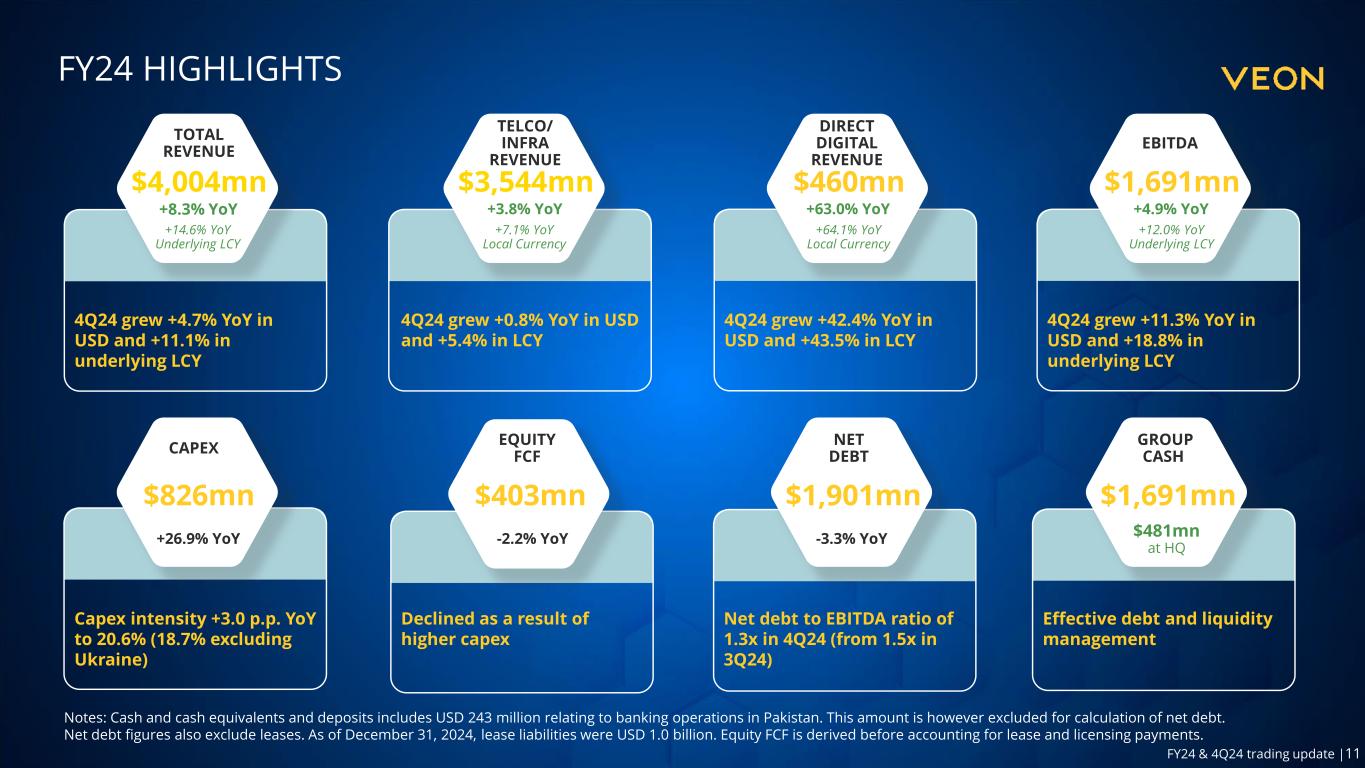
Trading update FY24 & 4Q24 2 1.34x NET DEBT EXCLUDING LEASES USD 1,901 billion NET DEBT EXCL. LEASES / EBITDA Note: 1. Equity FCF is calculated before accounting for lease and license payments; 2.Cash and cash equivalents and deposits include USD 243 million relating to banking operations in Pakistan. This amount is however excluded for calculation of net debt. VEON also holds USD 30 million of sovereign bonds with tenor 3-6 months as of 31 December 2024 99.2 million USD 403 million USD 826 million CAPEX +26.9% YoY Capex intensity 20.6% (18.7% ex Ukraine) EQUITY FREE CASHFLOW1 -2.2% YoY USD 4,004 million TOTAL REVENUE +8.3% YoY +14.6% YoY in underlying LCY TOTAL CASH, CASH EQUIVALENTS AND DEPOSITS2 USD 481 million at HQ USD 1,691 million 4G USERS +5.3% YoY 65.3% penetration TOTAL DIGITAL MONTHLY ACTIVE USERS +27.2% YoY Across all VEON digital services and platforms GROSS DEBT USD 311 million lower YoY USD 4,381 billion DIRECT DIGITAL REVENUE +63.0% YoY +64.1% YoY in local currency USD 460 million 121.6 million USD 3,544 million USD 1,691 million TELECOM AND INFRA REVENUE +3.8% YoY +7.1% YoY in local currency EBITDA 4.9% YoY +12.0% YoY in underlying LCY FY 2024 HIGHLIGHTS

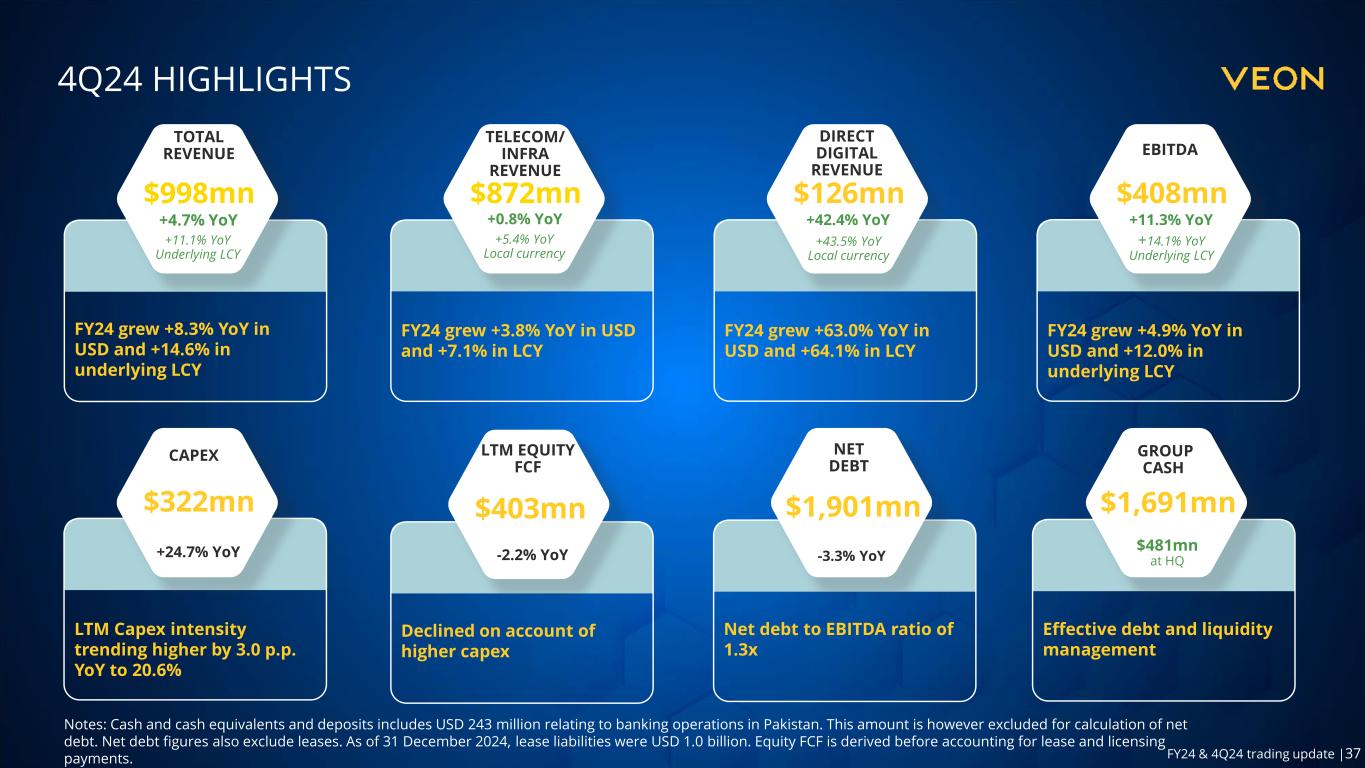
Trading update FY24 & 4Q24 3 1.34x NET DEBT EXCLUDING LEASES USD 1,901 billion NET DEBT EXCL. LEASES / EBITDA3 Note: 1. Denotes last-twelve-months (LTM) Equity FCF is calculated before accounting for lease and license payments ; 2.Cash and cash equivalents and deposits include USD 243 million relating to banking operations in Pakistan. This amount is however excluded for calculation of net debt. VEON also holds USD 30 million of sovereign bonds with tenor 3-6 months as of 31 December 2024. 3. Denotes last-twelve-months (LTM) EBITDA 99.2 million USD 403 million USD 322 million CAPEX +24.7% YoY LTM capex intensity 20.6% (18.7% ex Ukraine) LTM EQUITY FREE CASHFLOW1 -2.2% YoY USD 998 million TOTAL REVENUE +4.7% YoY +11.1% YoY in underlying LCY TOTAL CASH, CASH EQUIVALENTS AND DEPOSITS2 USD 481 million at HQ USD 1,691 million 4G USERS +5.3% YoY 65.3% penetration TOTAL DIGITAL MONTHLY ACTIVE USERS +27.2% YoY Across all VEON digital services and platforms GROSS DEBT USD 311 million lower YoY USD 4,381 billion DIRECT DIGITAL REVENUE +42.4% YoY +43.5% YoY in local currency USD 126 million 121.6 million USD 872 million USD 408 million TELECOM AND INFRA REVENUE +0.8% YoY +5.4% YoY in local currency EBITDA 11.3% YoY +14.1% YoY in underlying LCY 4Q 2024 HIGHLIGHTS
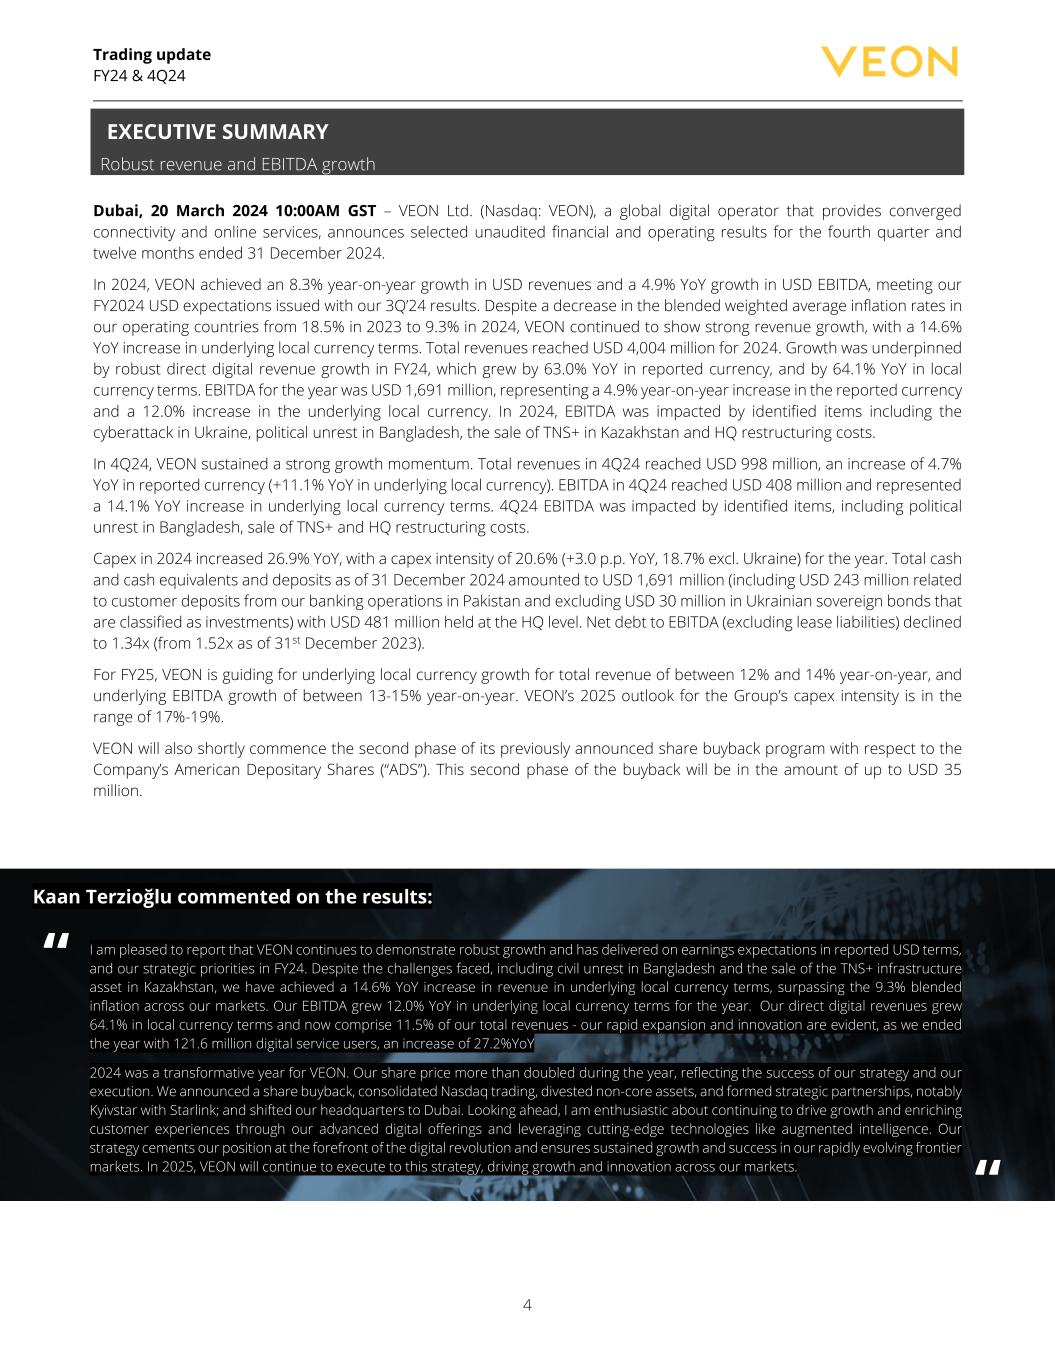
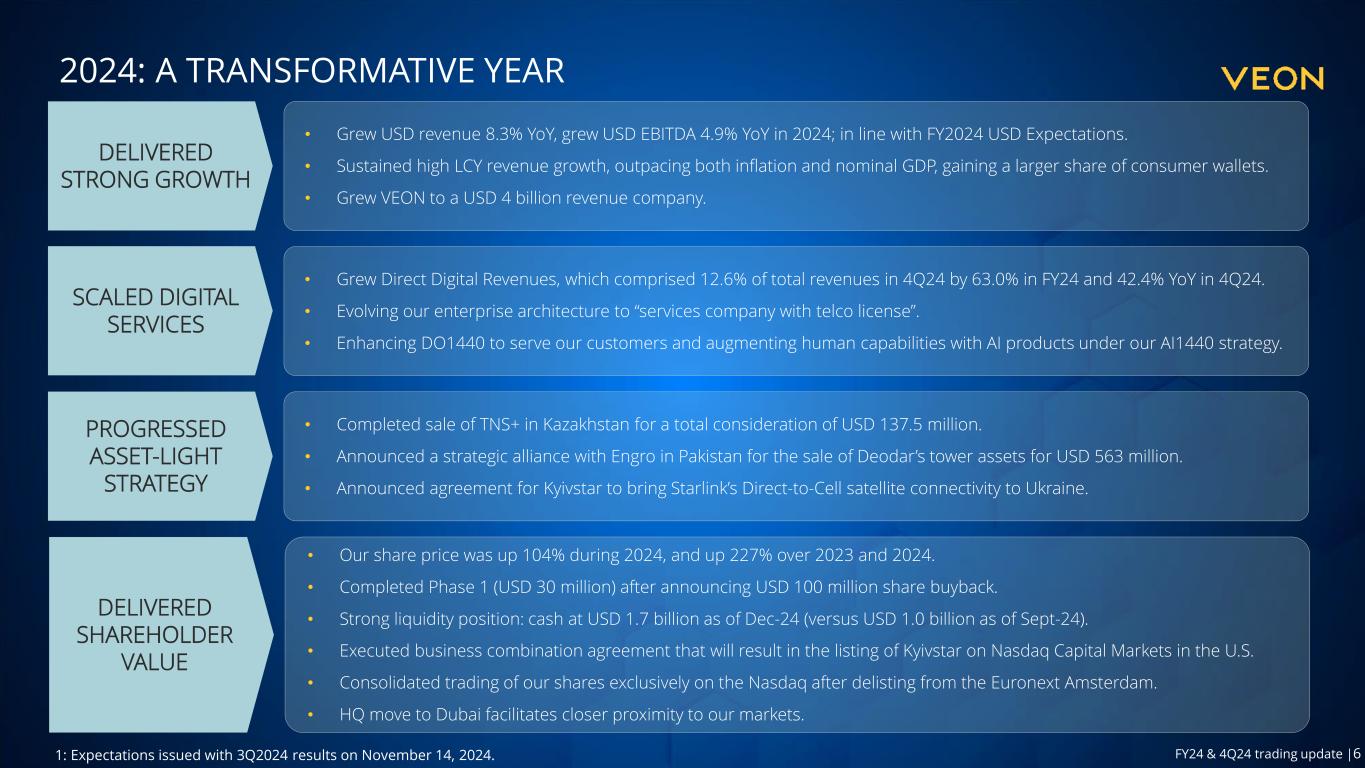
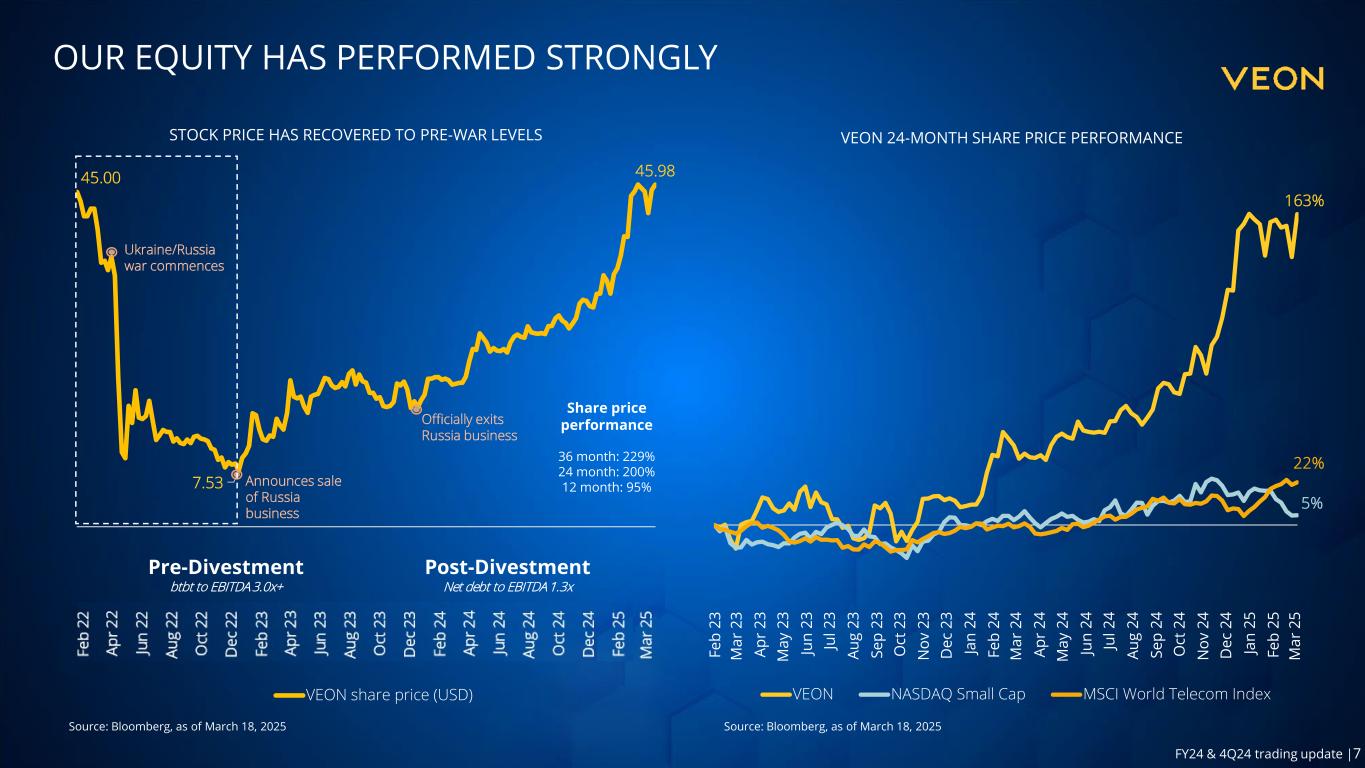
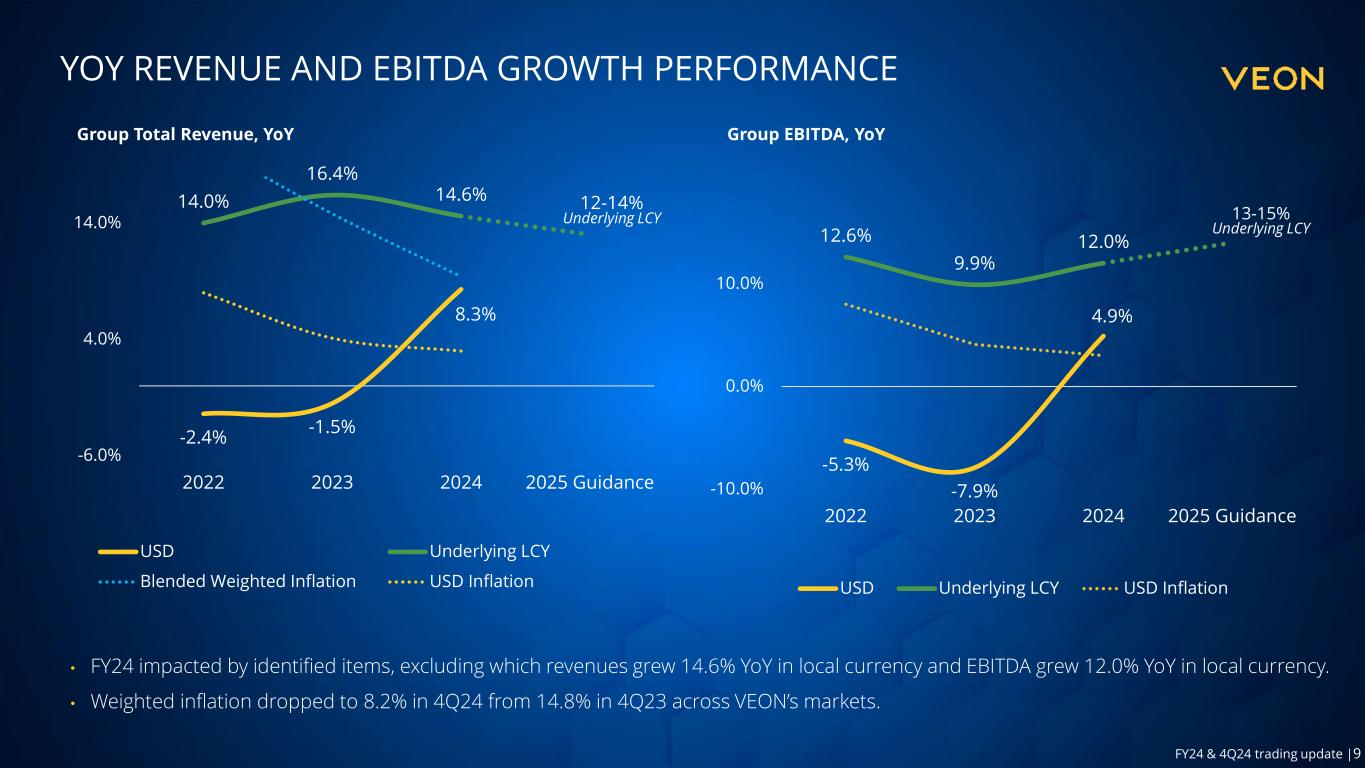
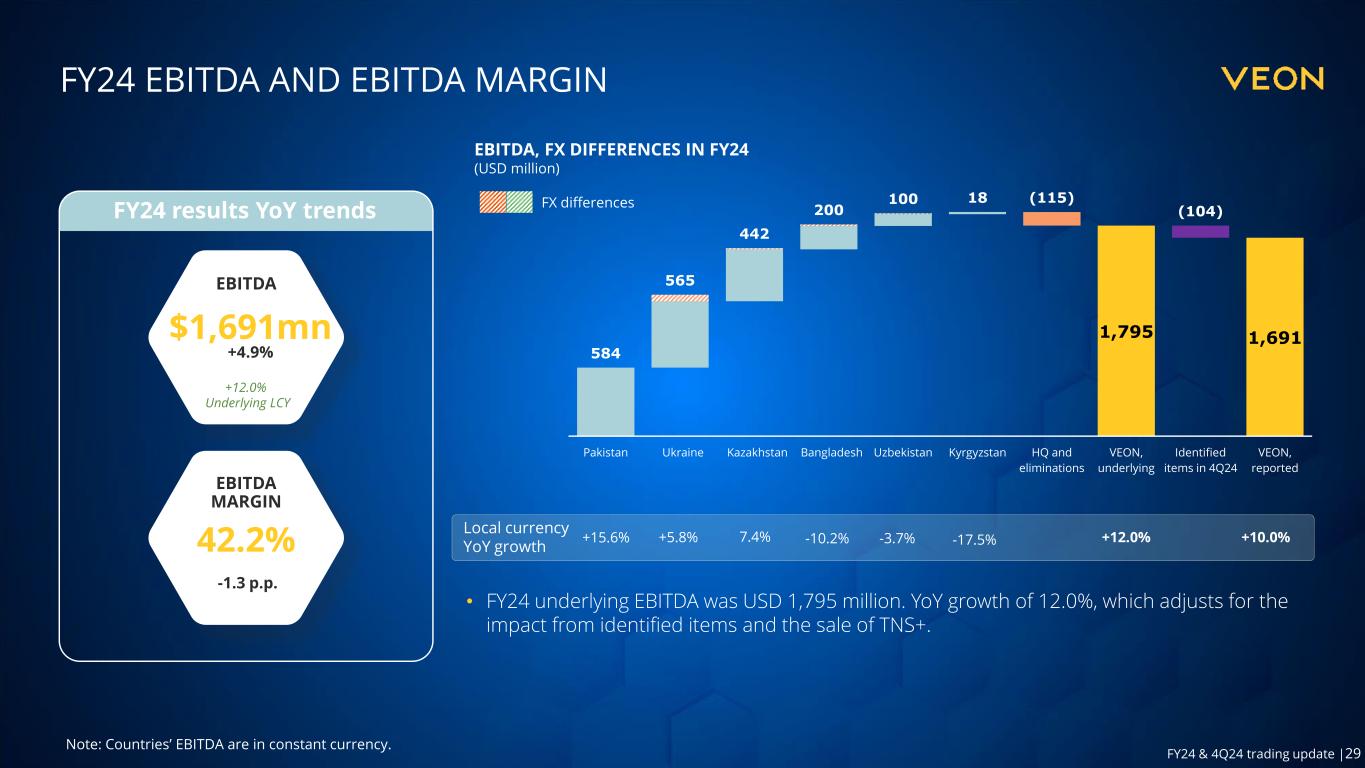
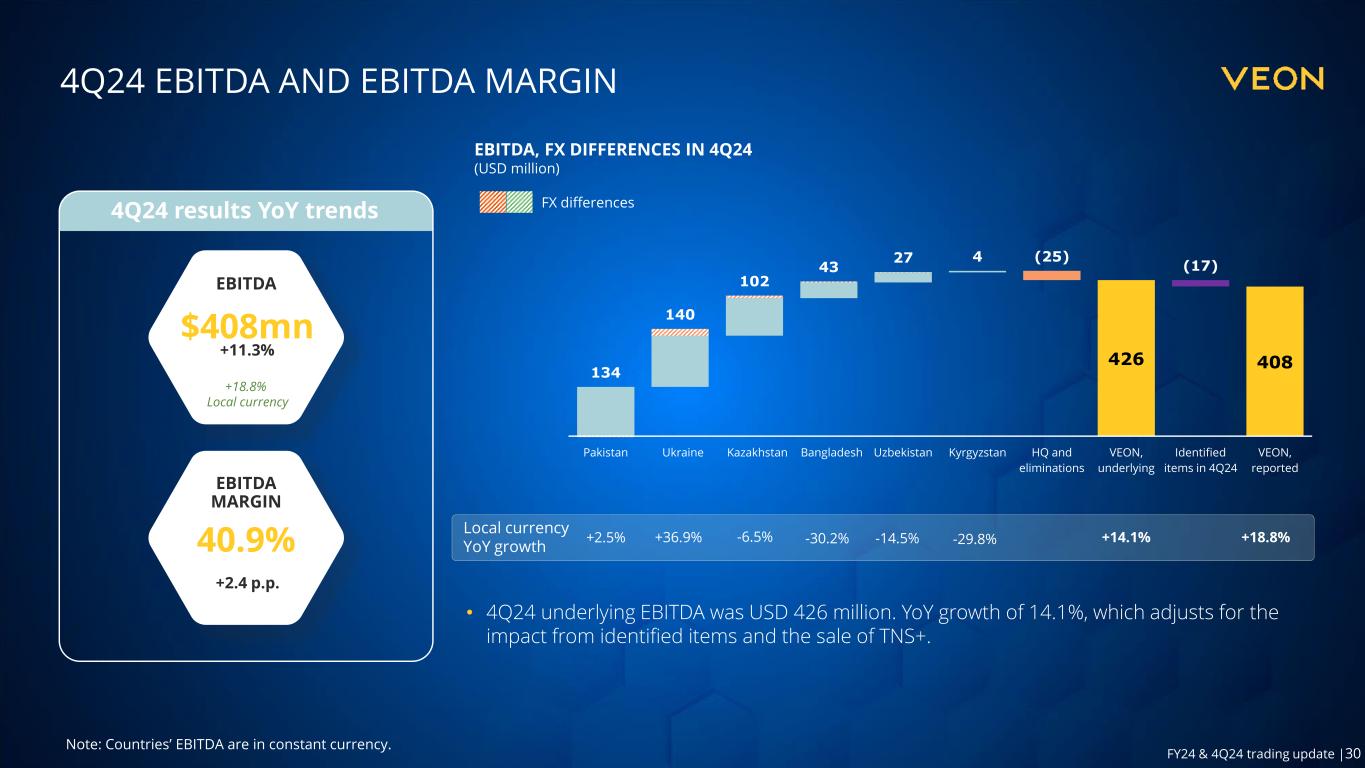
Trading update FY24 & 4Q24 4 Robust revenue and EBITDA growth Dubai, 20 March 2024 10:00AM GST – VEON Ltd. (Nasdaq: VEON), a global digital operator that provides converged connectivity and online services, announces selected unaudited financial and operating results for the fourth quarter and twelve months ended 31 December 2024. In 2024, VEON achieved an 8.3% year-on-year growth in USD revenues and a 4.9% YoY growth in USD EBITDA, meeting our FY2024 USD expectations issued with our 3Q’24 results. Despite a decrease in the blended weighted average inflation rates in our operating countries from 18.5% in 2023 to 9.3% in 2024, VEON continued to show strong revenue growth, with a 14.6% YoY increase in underlying local currency terms. Total revenues reached USD 4,004 million for 2024. Growth was underpinned by robust direct digital revenue growth in FY24, which grew by 63.0% YoY in reported currency, and by 64.1% YoY in local currency terms. EBITDA for the year was USD 1,691 million, representing a 4.9% year-on-year increase in the reported currency and a 12.0% increase in the underlying local currency. In 2024, EBITDA was impacted by identified items including the cyberattack in Ukraine, political unrest in Bangladesh, the sale of TNS+ in Kazakhstan and HQ restructuring costs. In 4Q24, VEON sustained a strong growth momentum. Total revenues in 4Q24 reached USD 998 million, an increase of 4.7% YoY in reported currency (+11.1% YoY in underlying local currency). EBITDA in 4Q24 reached USD 408 million and represented a 14.1% YoY increase in underlying local currency terms. 4Q24 EBITDA was impacted by identified items, including political unrest in Bangladesh, sale of TNS+ and HQ restructuring costs. Capex in 2024 increased 26.9% YoY, with a capex intensity of 20.6% (+3.0 p.p. YoY, 18.7% excl. Ukraine) for the year. Total cash and cash equivalents and deposits as of 31 December 2024 amounted to USD 1,691 million (including USD 243 million related to customer deposits from our banking operations in Pakistan and excluding USD 30 million in Ukrainian sovereign bonds that are classified as investments) with USD 481 million held at the HQ level. Net debt to EBITDA (excluding lease liabilities) declined to 1.34x (from 1.52x as of 31st December 2023). For FY25, VEON is guiding for underlying local currency growth for total revenue of between 12% and 14% year-on-year, and underlying EBITDA growth of between 13-15% year-on-year. VEON’s 2025 outlook for the Group’s capex intensity is in the range of 17%-19%. VEON will also shortly commence the second phase of its previously announced share buyback program with respect to the Company’s American Depositary Shares (“ADS”). This second phase of the buyback will be in the amount of up to USD 35 million. EXECUTIVE SUMMARY I am pleased to report that VEON continues to demonstrate robust growth and has delivered on earnings expectations in reported USD terms, and our strategic priorities in FY24. Despite the challenges faced, including civil unrest in Bangladesh and the sale of the TNS+ infrastructure asset in Kazakhstan, we have achieved a 14.6% YoY increase in revenue in underlying local currency terms, surpassing the 9.3% blended inflation across our markets. Our EBITDA grew 12.0% YoY in underlying local currency terms for the year. Our direct digital revenues grew 64.1% in local currency terms and now comprise 11.5% of our total revenues - our rapid expansion and innovation are evident, as we ended the year with 121.6 million digital service users, an increase of 27.2%YoY 2024 was a transformative year for VEON. Our share price more than doubled during the year, reflecting the success of our strategy and our execution. We announced a share buyback, consolidated Nasdaq trading, divested non-core assets, and formed strategic partnerships, notably Kyivstar with Starlink; and shifted our headquarters to Dubai. Looking ahead, I am enthusiastic about continuing to drive growth and enriching customer experiences through our advanced digital offerings and leveraging cutting-edge technologies like augmented intelligence. Our strategy cements our position at the forefront of the digital revolution and ensures sustained growth and success in our rapidly evolving frontier markets. In 2025, VEON will continue to execute to this strategy, driving growth and innovation across our markets. “ Kaan Terzioğlu commented on the results: “
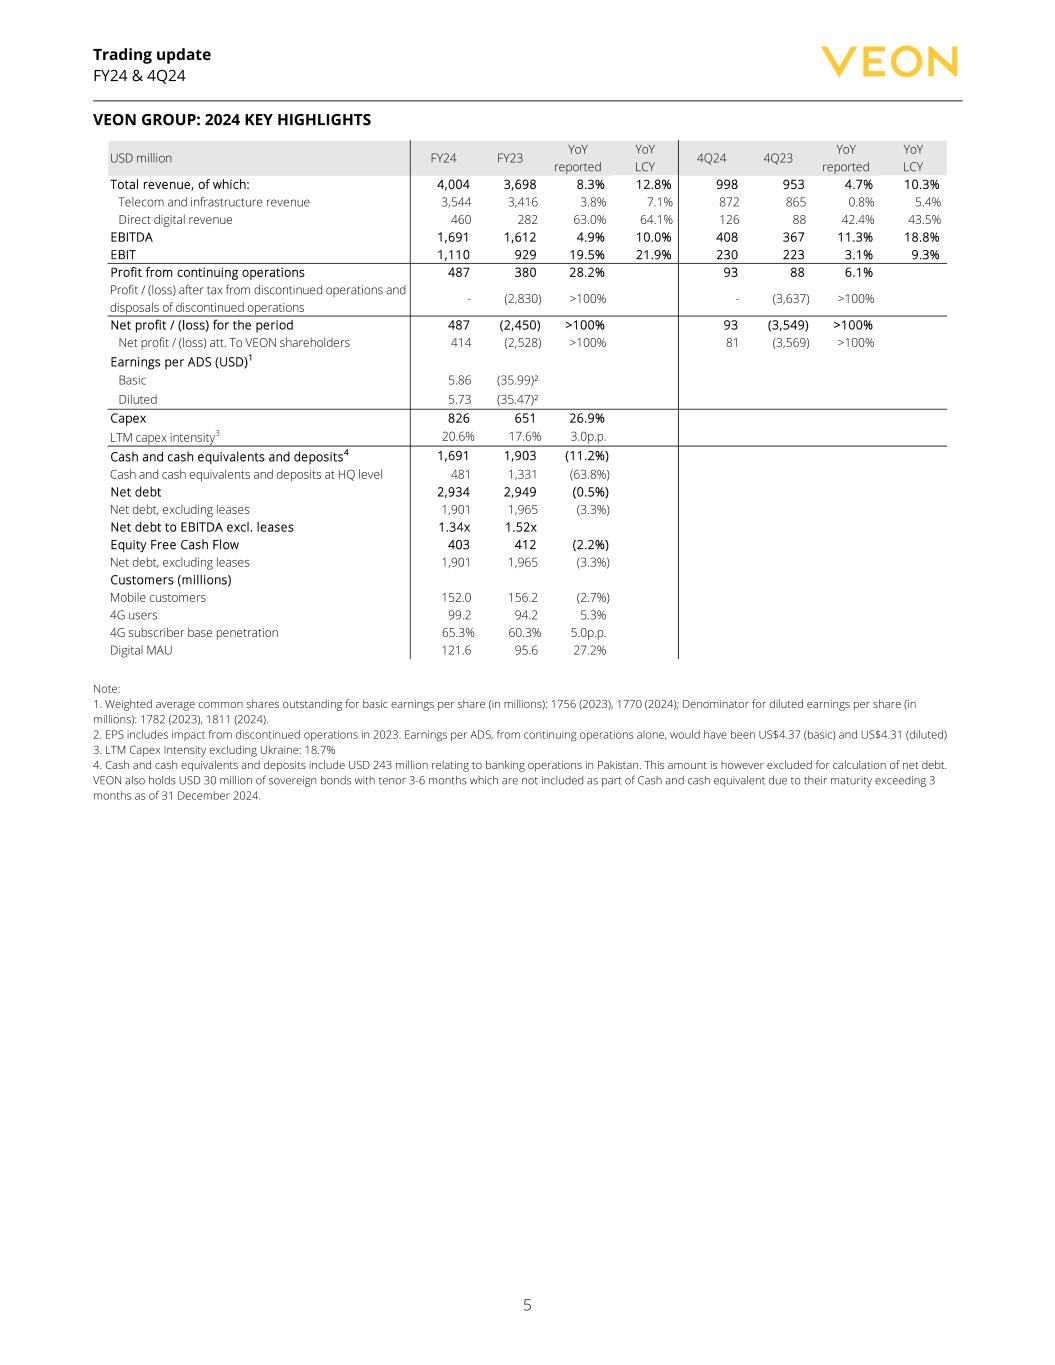
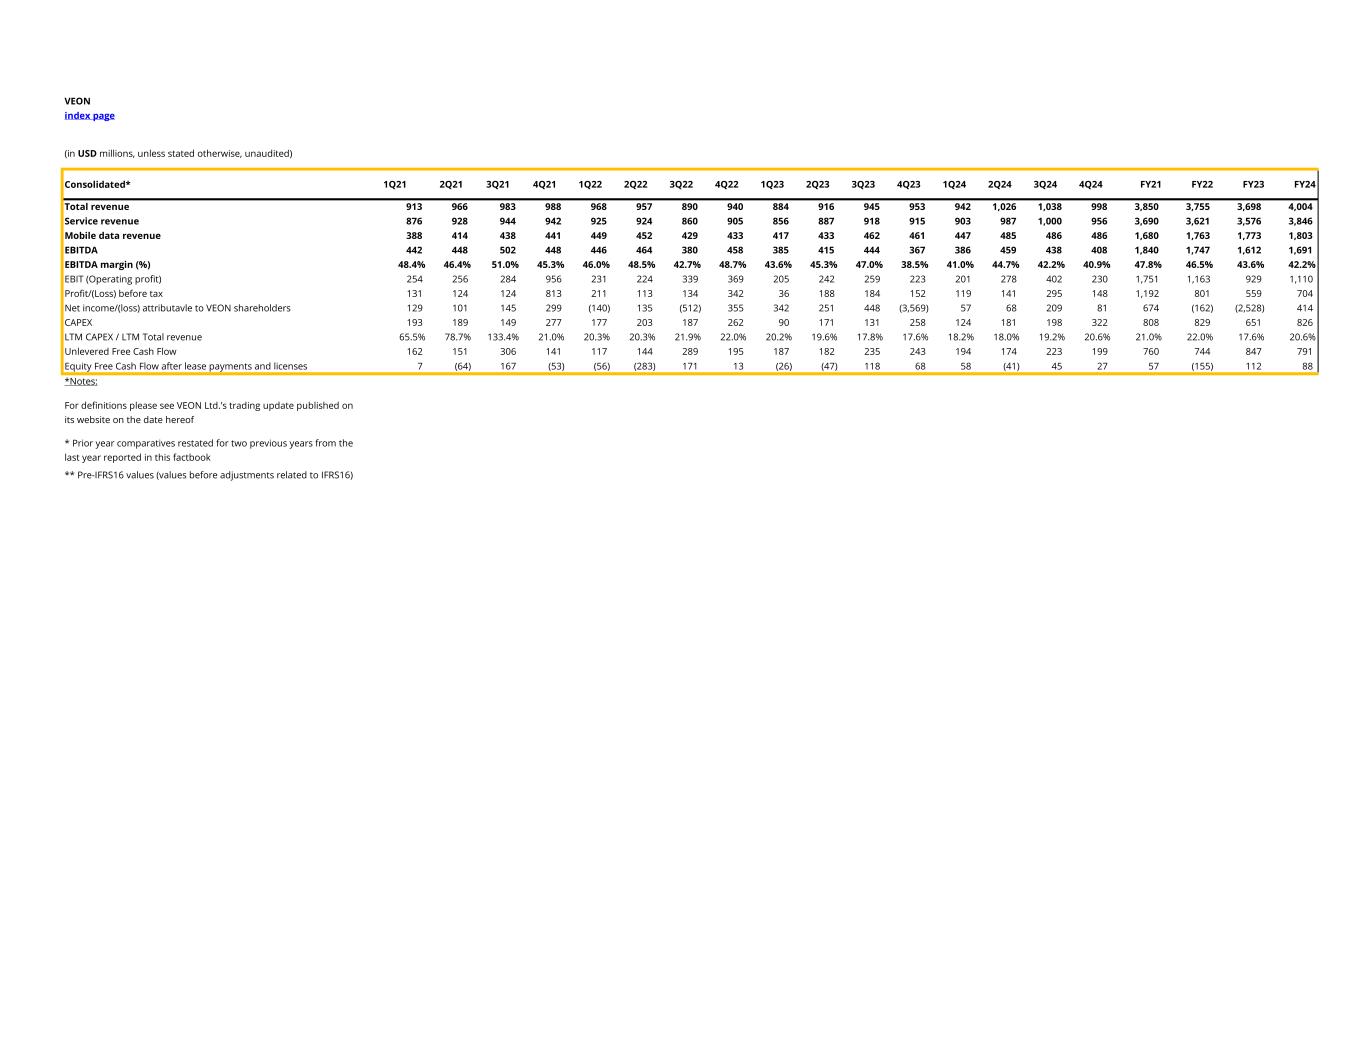
Trading update FY24 & 4Q24 5 VEON GROUP: 2024 KEY HIGHLIGHTS USD million FY24 FY23 YoY reported YoY LCY 4Q24 4Q23 YoY reported YoY LCY Total revenue, of which: 4,004 3,698 8.3% 12.8% 998 953 4.7% 10.3% Telecom and infrastructure revenue 3,544 3,416 3.8% 7.1% 872 865 0.8% 5.4% Direct digital revenue 460 282 63.0% 64.1% 126 88 42.4% 43.5% EBITDA 1,691 1,612 4.9% 10.0% 408 367 11.3% 18.8% EBIT 1,110 929 19.5% 21.9% 230 223 3.1% 9.3% Profit from continuing operations 487 380 28.2% 93 88 6.1% Profit / (loss) after tax from discontinued operations and disposals of discontinued operations - (2,830) >100% - (3,637) >100% Net profit / (loss) for the period 487 (2,450) >100% 93 (3,549) >100% Net profit / (loss) att. To VEON shareholders 414 (2,528) >100% 81 (3,569) >100% Earnings per ADS (USD)1 Basic 5.86 (35.99)² Diluted 5.73 (35.47)² Capex 826 651 26.9% LTM capex intensity3 20.6% 17.6% 3.0p.p. Cash and cash equivalents and deposits4 1,691 1,903 (11.2%) Cash and cash equivalents and deposits at HQ level 481 1,331 (63.8%) Net debt 2,934 2,949 (0.5%) Net debt, excluding leases 1,901 1,965 (3.3%) Net debt to EBITDA excl. leases 1.34x 1.52x Equity Free Cash Flow 403 412 (2.2%) Net debt, excluding leases 1,901 1,965 (3.3%) Customers (millions) Mobile customers 152.0 156.2 (2.7%) 4G users 99.2 94.2 5.3% 4G subscriber base penetration 65.3% 60.3% 5.0p.p. Digital MAU 121.6 95.6 27.2% Note: 1. Weighted average common shares outstanding for basic earnings per share (in millions): 1756 (2023), 1770 (2024); Denominator for diluted earnings per share (in millions): 1782 (2023), 1811 (2024). 2. EPS includes impact from discontinued operations in 2023. Earnings per ADS, from continuing operations alone, would have been US$4.37 (basic) and US$4.31 (diluted) 3. LTM Capex Intensity excluding Ukraine: 18.7% 4. Cash and cash equivalents and deposits include USD 243 million relating to banking operations in Pakistan. This amount is however excluded for calculation of net debt. VEON also holds USD 30 million of sovereign bonds with tenor 3-6 months which are not included as part of Cash and cash equivalent due to their maturity exceeding 3 months as of 31 December 2024.

Trading update FY24 & 4Q24 FY24 & 4Q24 GROUP PERFORMANCE 7 PRESENTATION OF FINANCIAL RESULTS 10 COUNTRY OVERVIEW 14 KEY RECENT DEVELOPMENTS 20 ATTACHMENTS 24 DISCLAIMER NOTICE TO READERS 34 CONTENTS
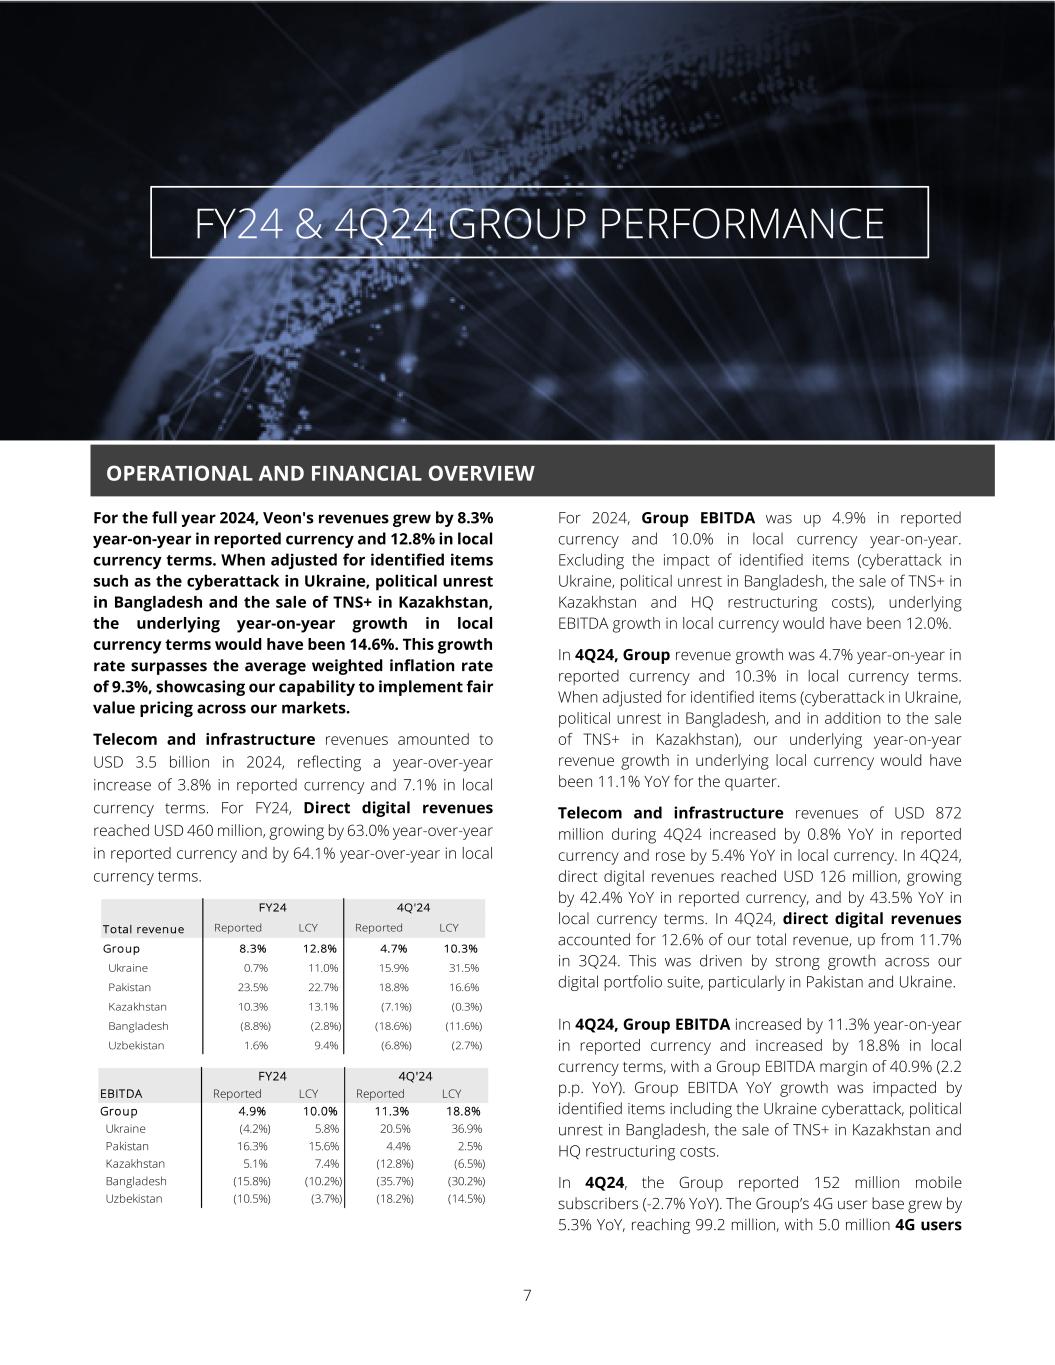
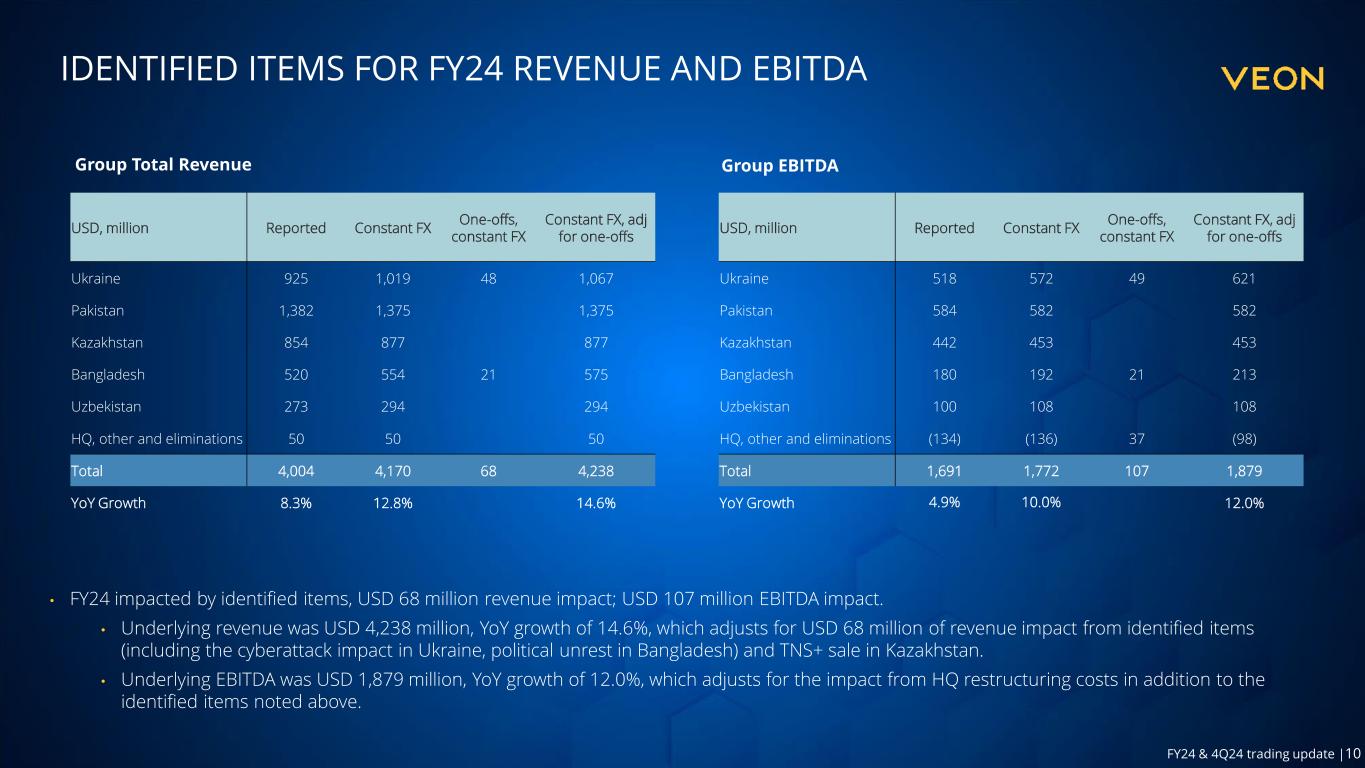
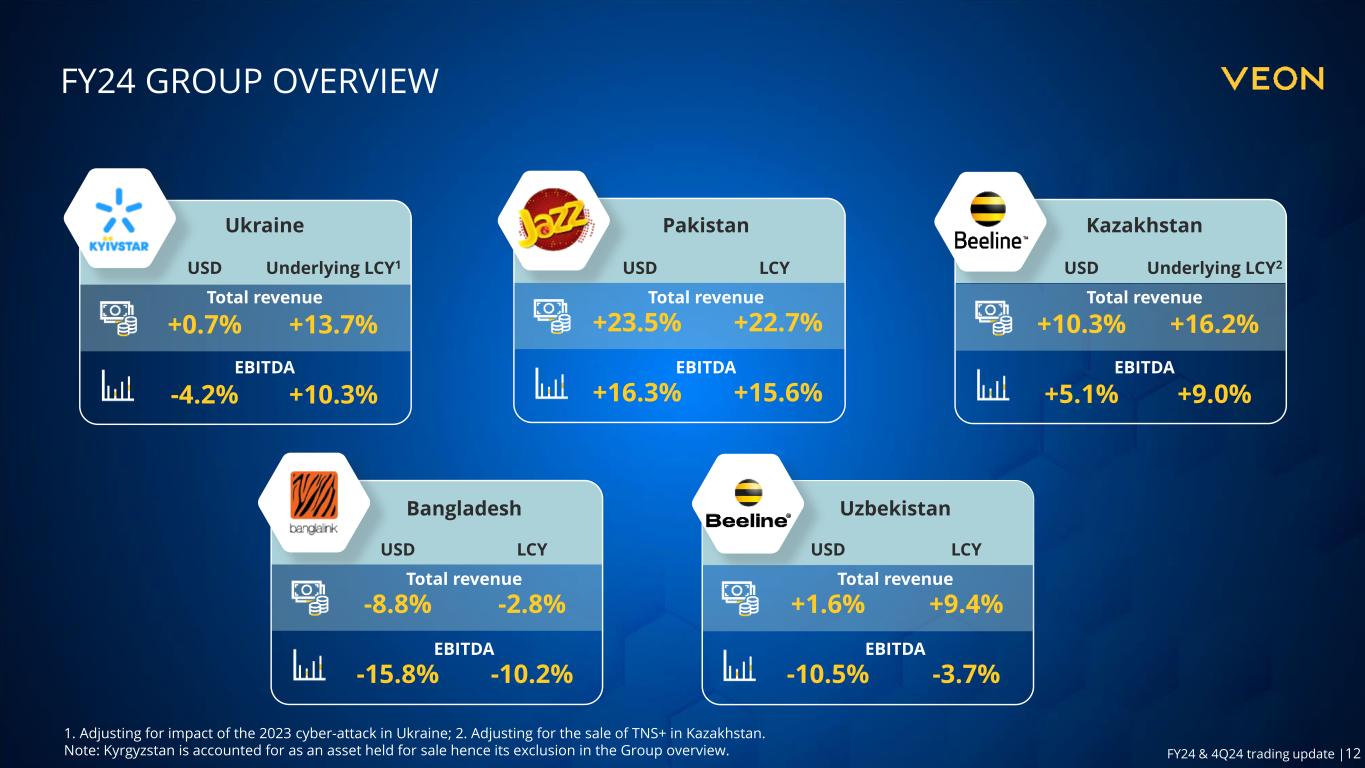
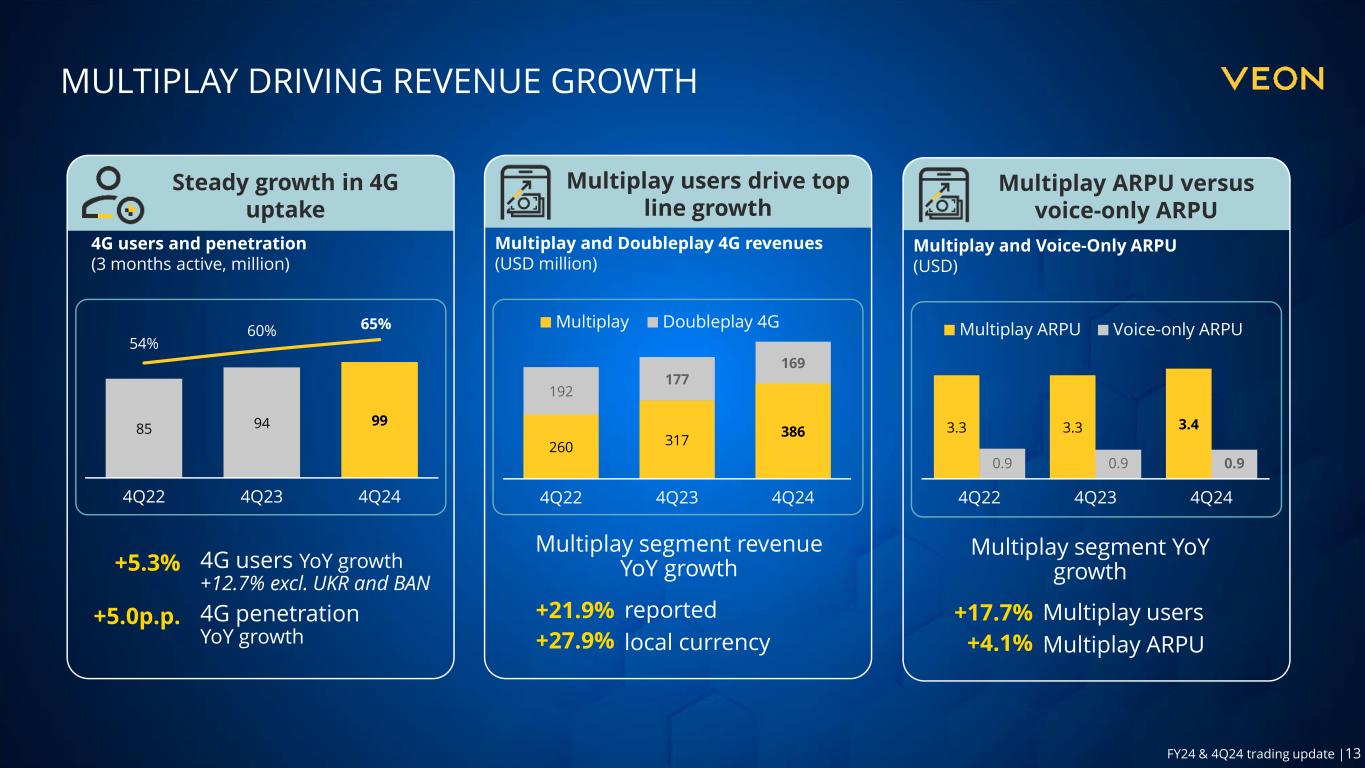
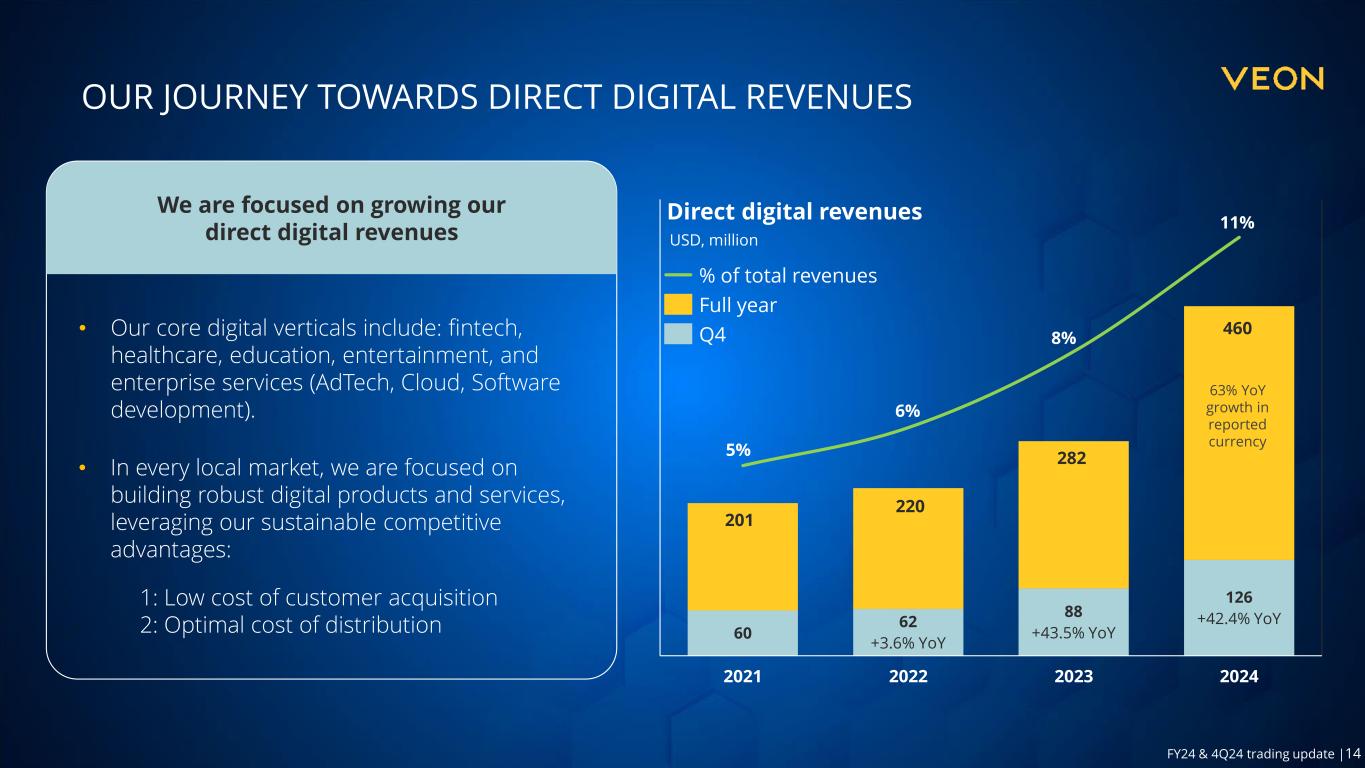
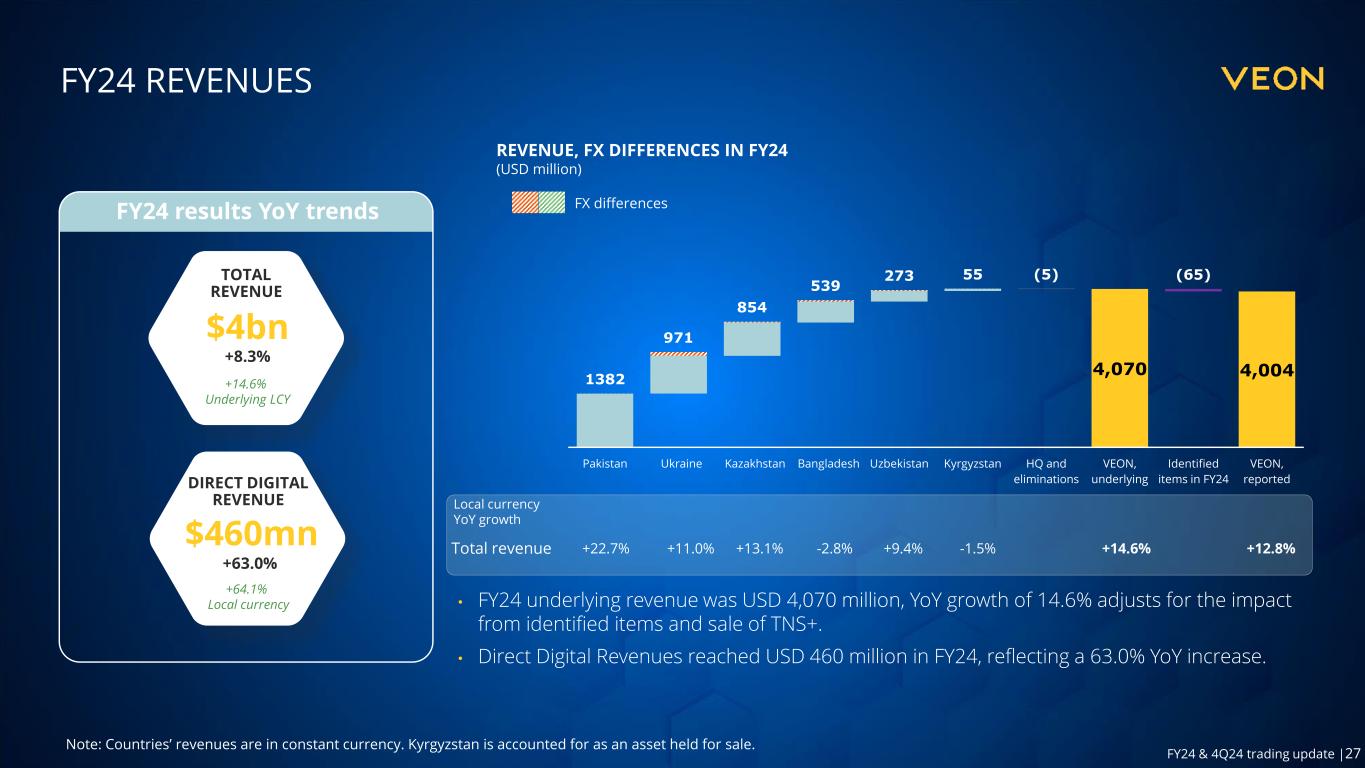
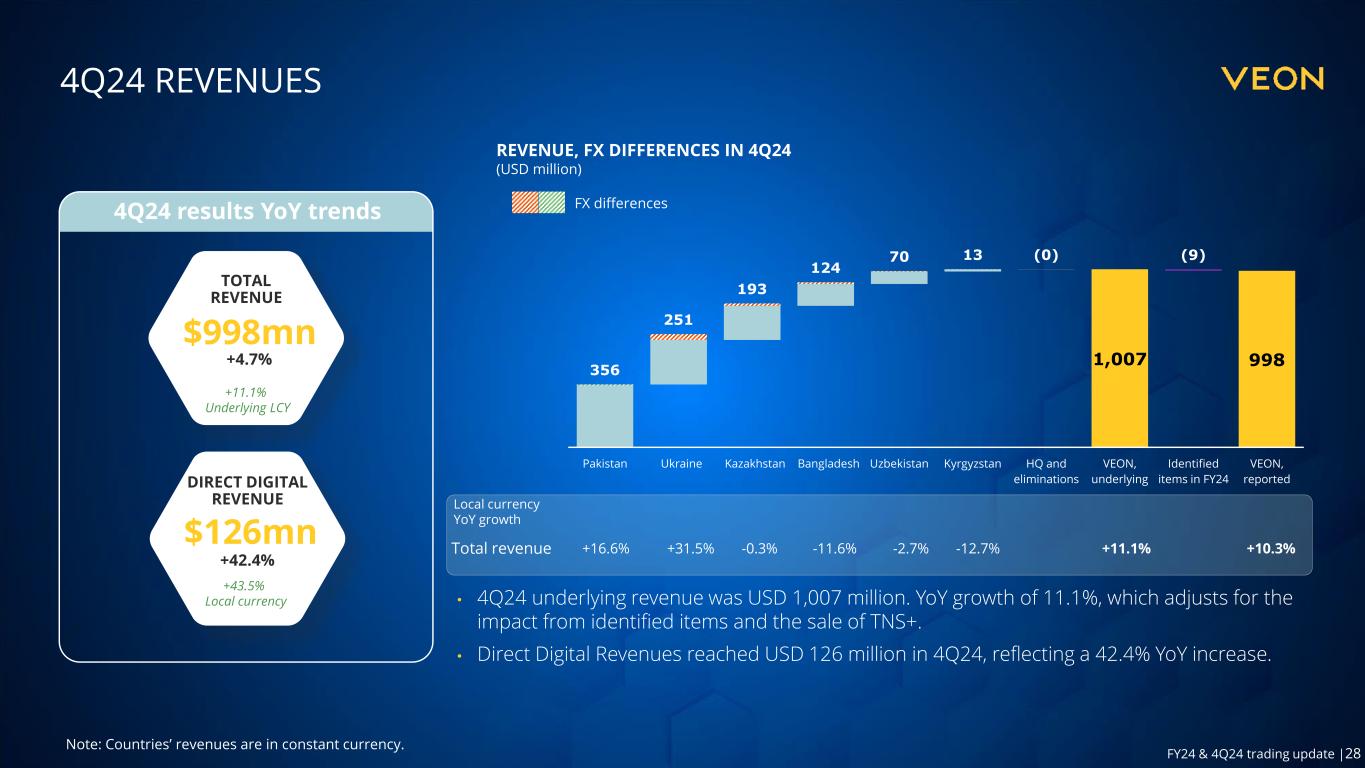
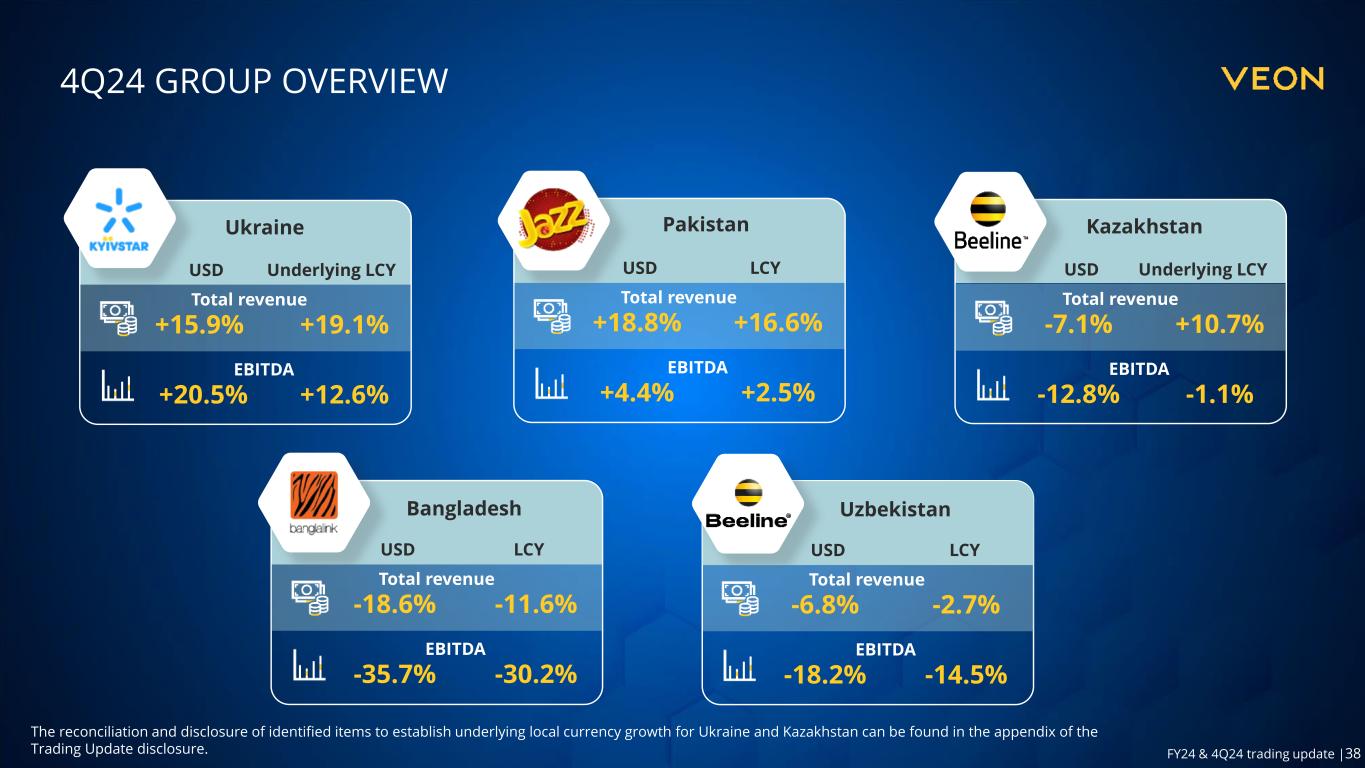
Trading update FY24 & 4Q24 7 For the full year 2024, Veon's revenues grew by 8.3% year-on-year in reported currency and 12.8% in local currency terms. When adjusted for identified items such as the cyberattack in Ukraine, political unrest in Bangladesh and the sale of TNS+ in Kazakhstan, the underlying year-on-year growth in local currency terms would have been 14.6%. This growth rate surpasses the average weighted inflation rate of 9.3%, showcasing our capability to implement fair value pricing across our markets. Telecom and infrastructure revenues amounted to USD 3.5 billion in 2024, reflecting a year-over-year increase of 3.8% in reported currency and 7.1% in local currency terms. For FY24, Direct digital revenues reached USD 460 million, growing by 63.0% year-over-year in reported currency and by 64.1% year-over-year in local currency terms. Total revenue Reported LCY Reported LCY Group 8.3% 12.8% 4.7% 10.3% Ukraine 0.7% 11.0% 15.9% 31.5% Pakistan 23.5% 22.7% 18.8% 16.6% Kazakhstan 10.3% 13.1% (7.1%) (0.3%) Bangladesh (8.8%) (2.8%) (18.6%) (11.6%) Uzbekistan 1.6% 9.4% (6.8%) (2.7%) FY24 4Q'24 EBITDA Reported LCY Reported LCY Group 4.9% 10.0% 11.3% 18.8% Ukraine (4.2%) 5.8% 20.5% 36.9% Pakistan 16.3% 15.6% 4.4% 2.5% Kazakhstan 5.1% 7.4% (12.8%) (6.5%) Bangladesh (15.8%) (10.2%) (35.7%) (30.2%) Uzbekistan (10.5%) (3.7%) (18.2%) (14.5%) FY24 4Q'24 For 2024, Group EBITDA was up 4.9% in reported currency and 10.0% in local currency year-on-year. Excluding the impact of identified items (cyberattack in Ukraine, political unrest in Bangladesh, the sale of TNS+ in Kazakhstan and HQ restructuring costs), underlying EBITDA growth in local currency would have been 12.0%. In 4Q24, Group revenue growth was 4.7% year-on-year in reported currency and 10.3% in local currency terms. When adjusted for identified items (cyberattack in Ukraine, political unrest in Bangladesh, and in addition to the sale of TNS+ in Kazakhstan), our underlying year-on-year revenue growth in underlying local currency would have been 11.1% YoY for the quarter. Telecom and infrastructure revenues of USD 872 million during 4Q24 increased by 0.8% YoY in reported currency and rose by 5.4% YoY in local currency. In 4Q24, direct digital revenues reached USD 126 million, growing by 42.4% YoY in reported currency, and by 43.5% YoY in local currency terms. In 4Q24, direct digital revenues accounted for 12.6% of our total revenue, up from 11.7% in 3Q24. This was driven by strong growth across our digital portfolio suite, particularly in Pakistan and Ukraine. In 4Q24, Group EBITDA increased by 11.3% year-on-year in reported currency and increased by 18.8% in local currency terms, with a Group EBITDA margin of 40.9% (2.2 p.p. YoY). Group EBITDA YoY growth was impacted by identified items including the Ukraine cyberattack, political unrest in Bangladesh, the sale of TNS+ in Kazakhstan and HQ restructuring costs. In 4Q24, the Group reported 152 million mobile subscribers (-2.7% YoY). The Group’s 4G user base grew by 5.3% YoY, reaching 99.2 million, with 5.0 million 4G users OPERATIONAL AND FINANCIAL OVERVIEW FY24 & 4Q24 GROUP PERFORMANCE

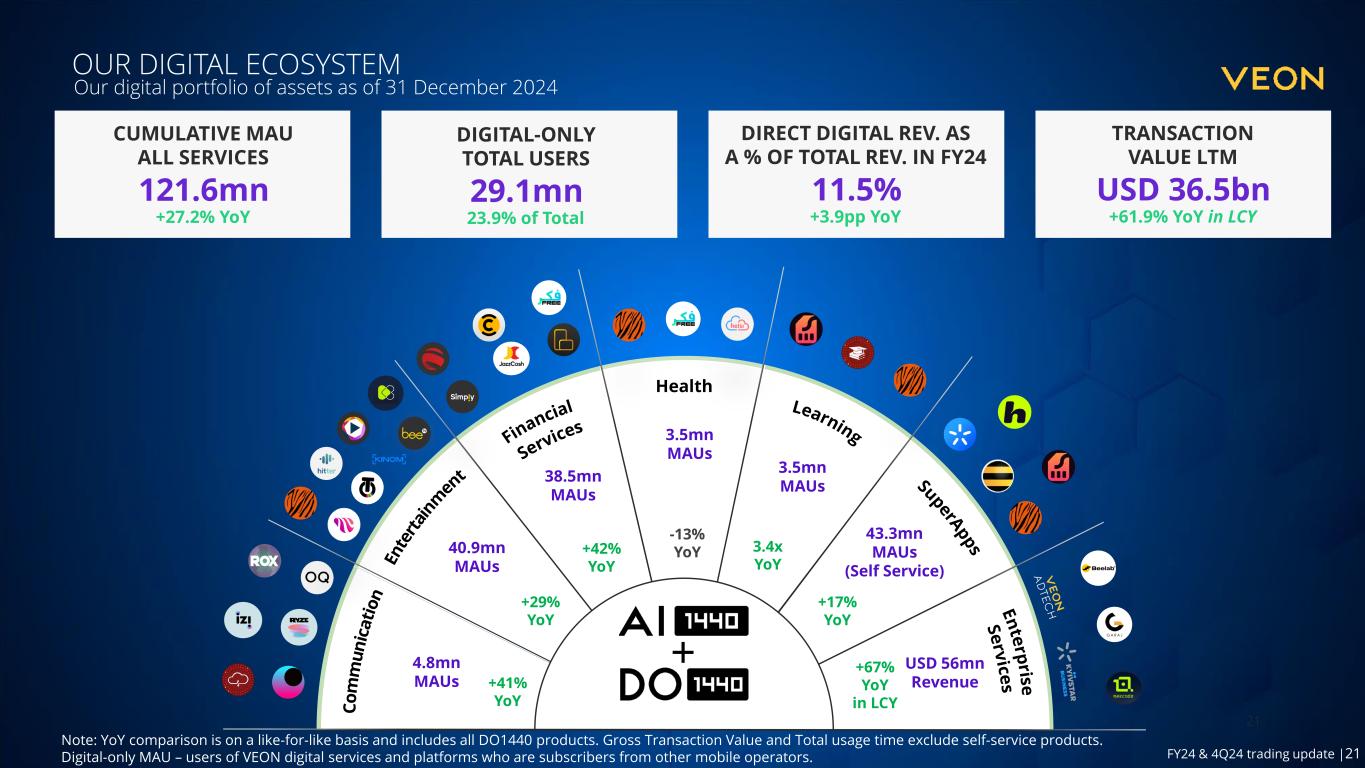
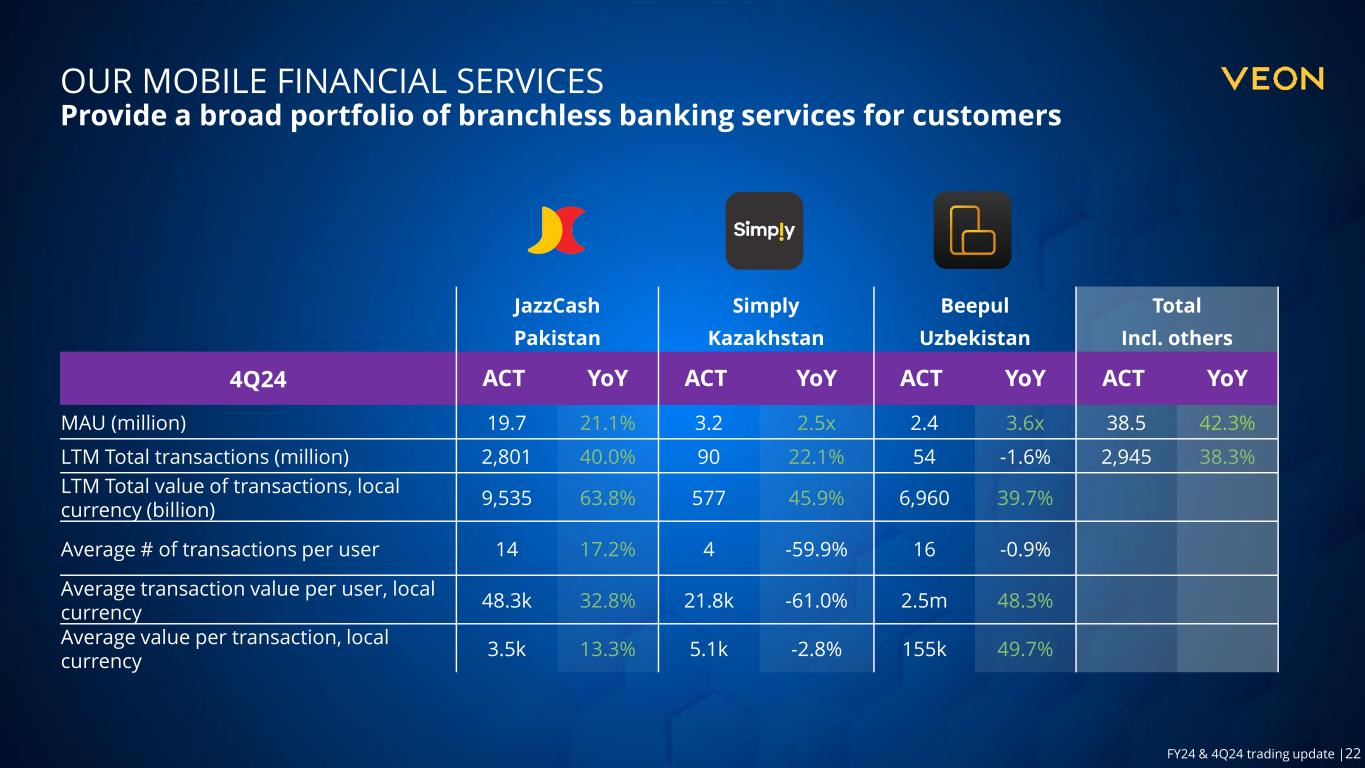
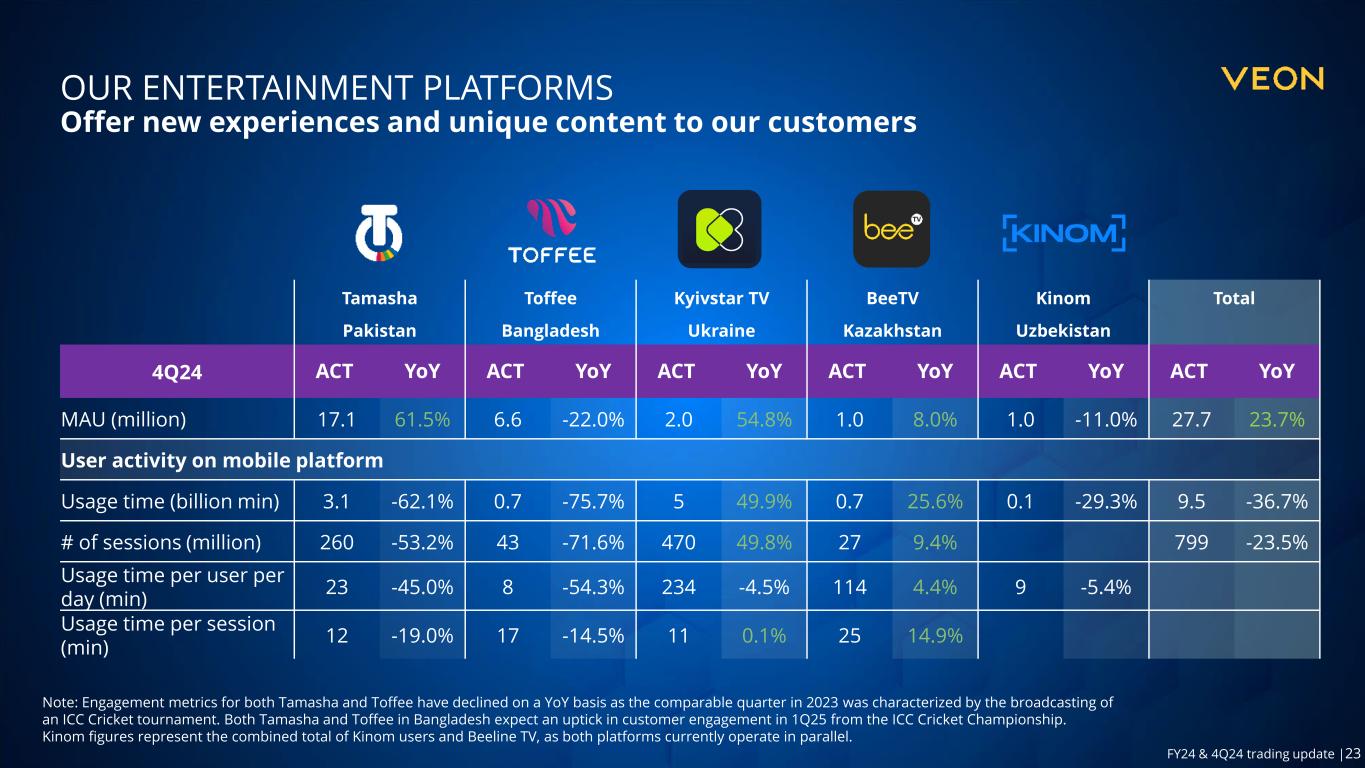
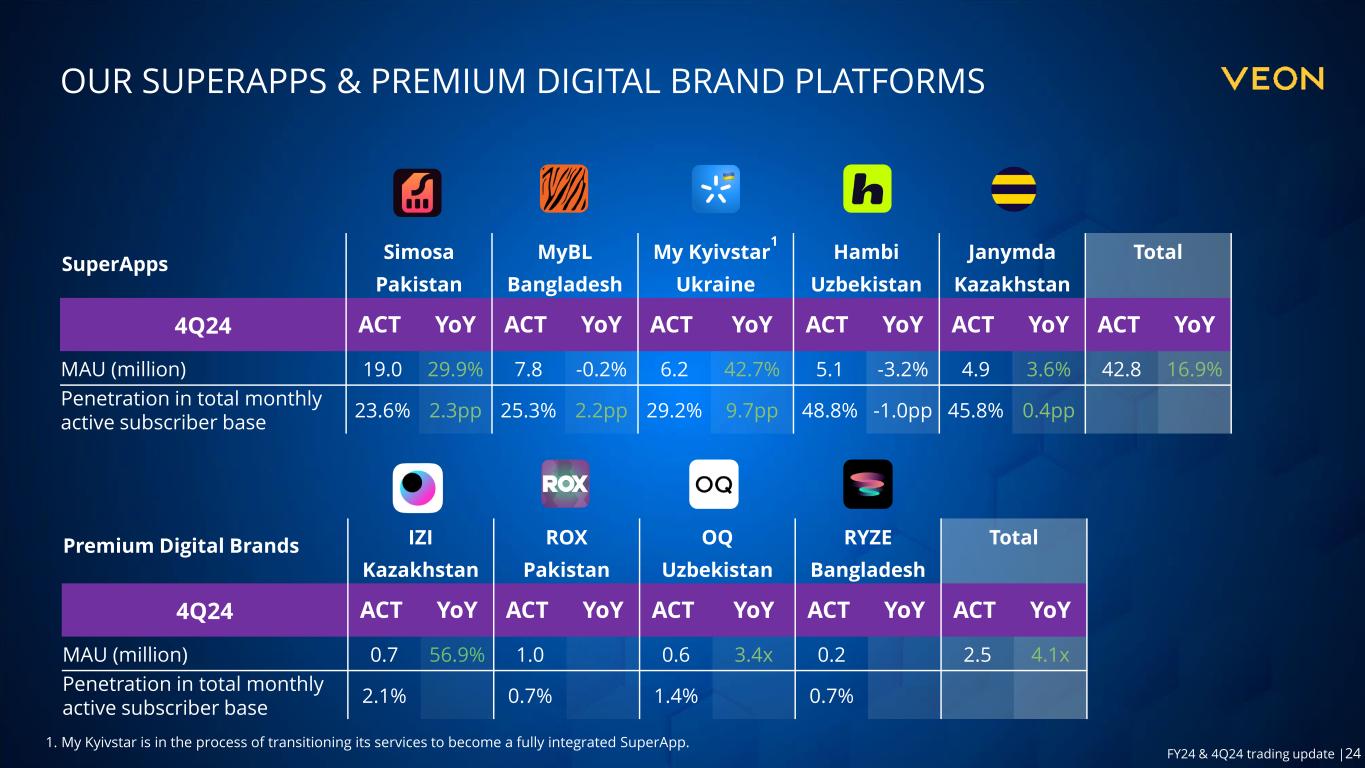
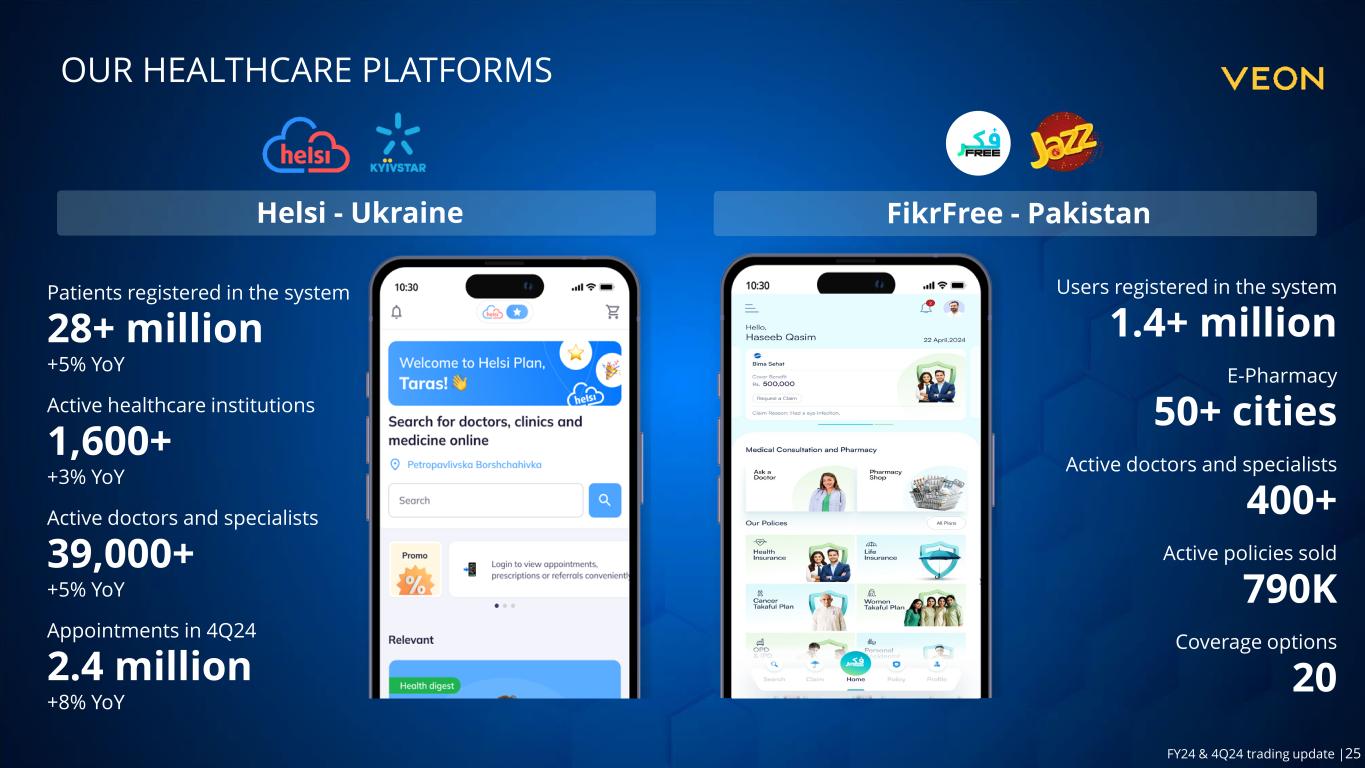
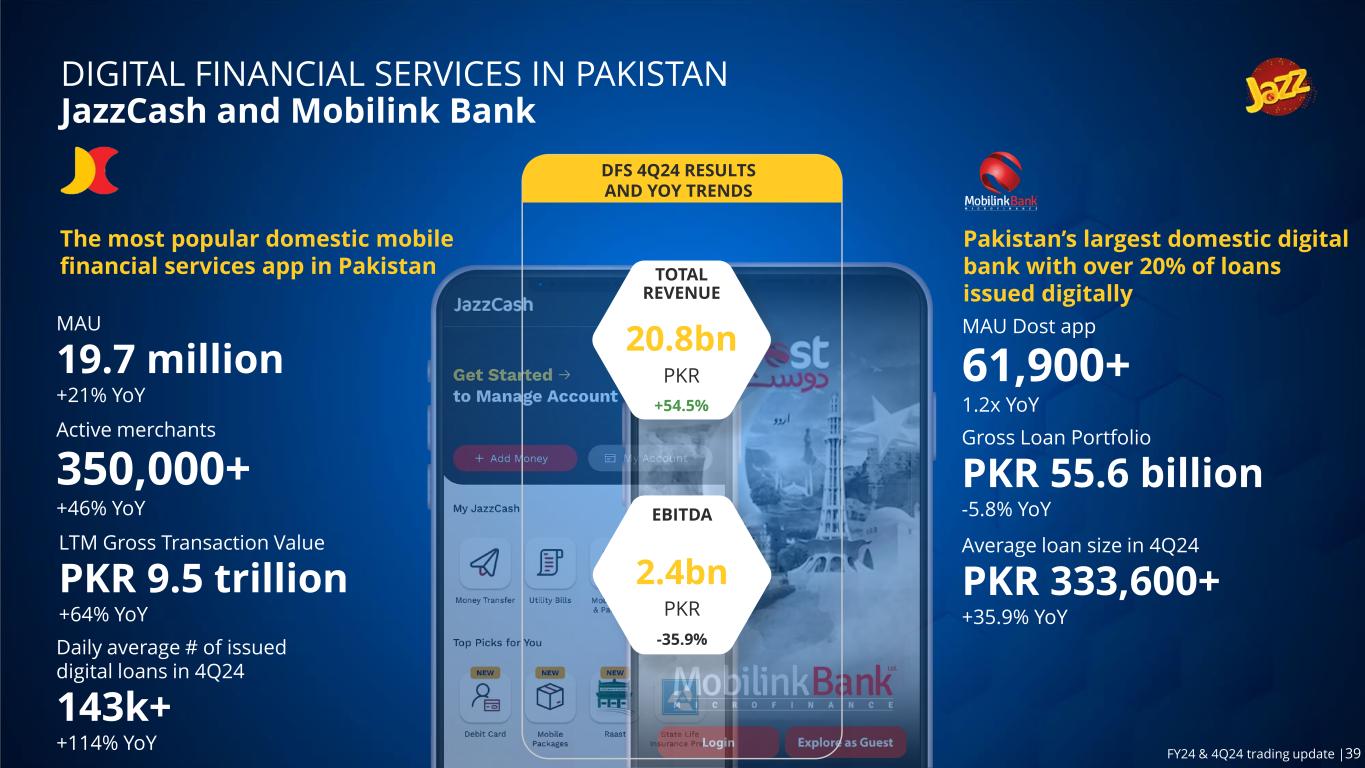
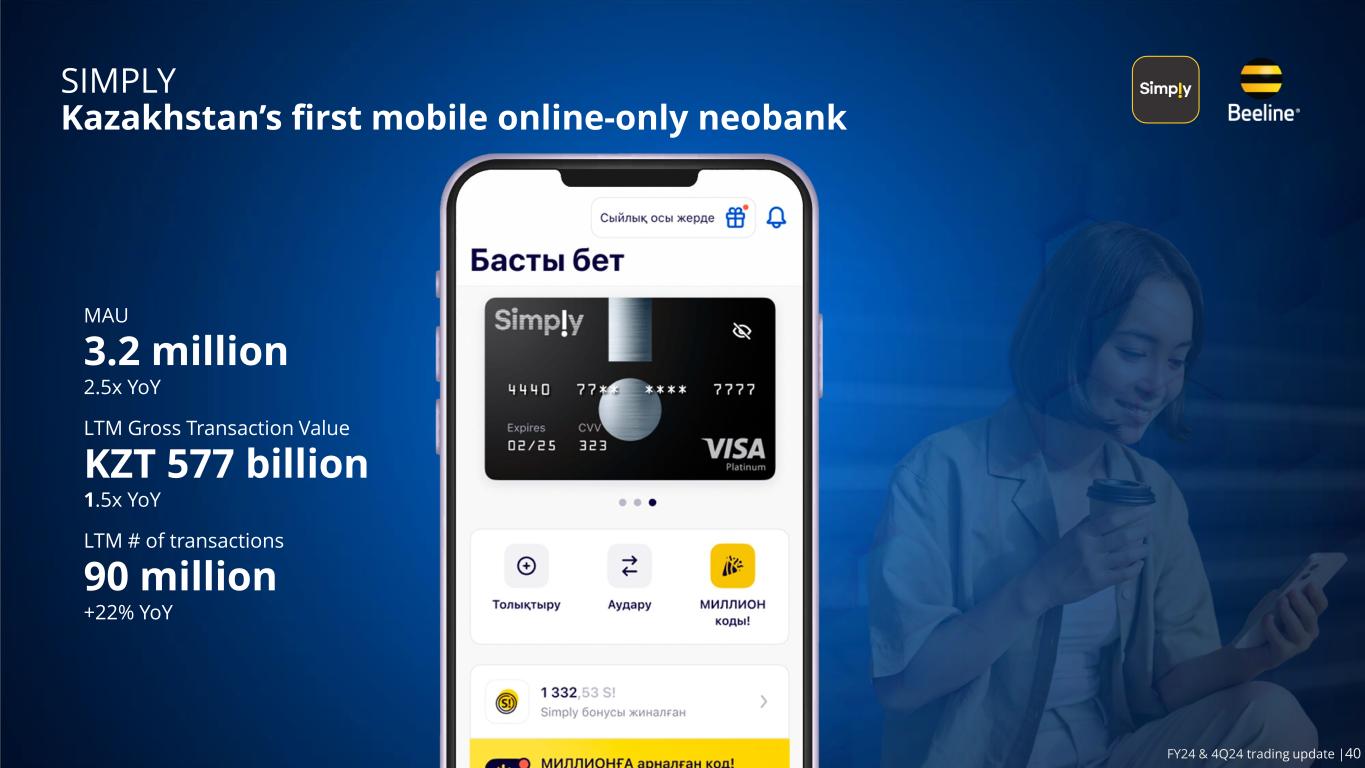
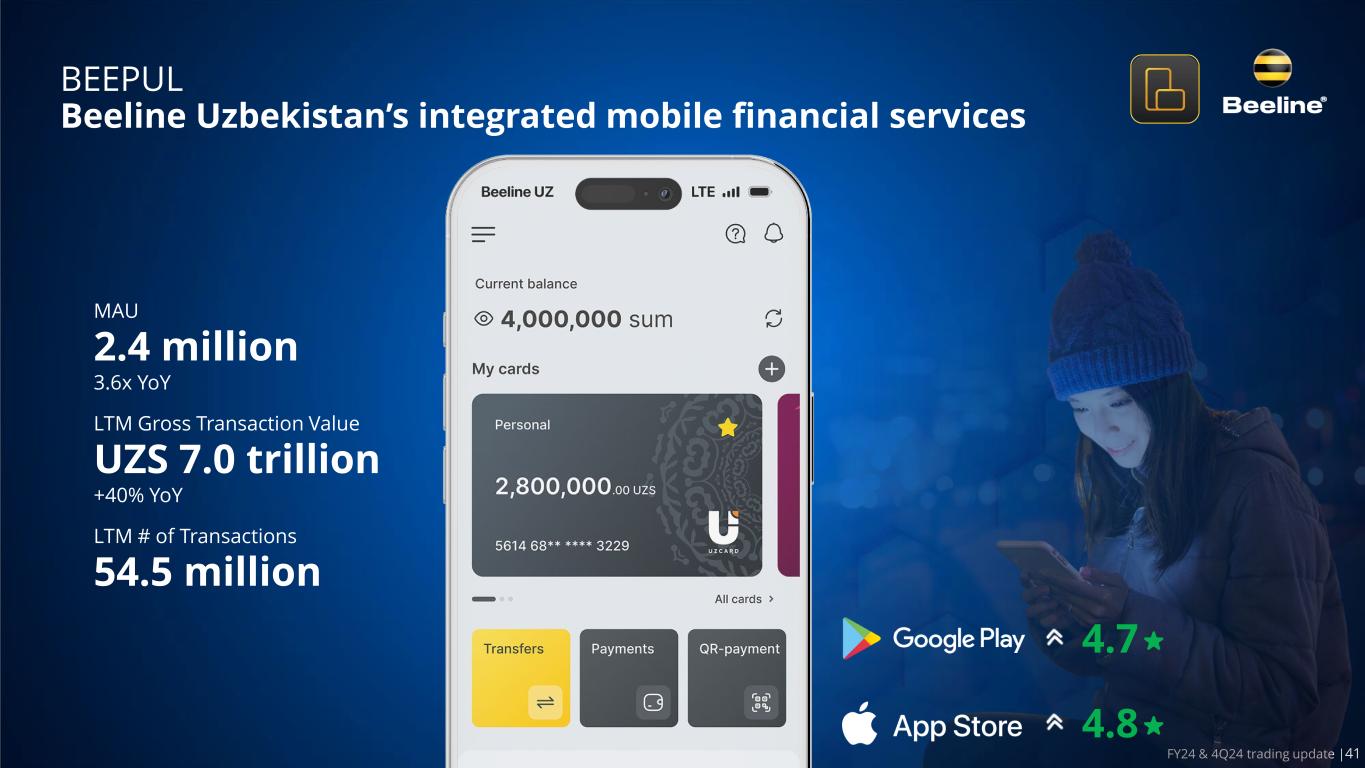
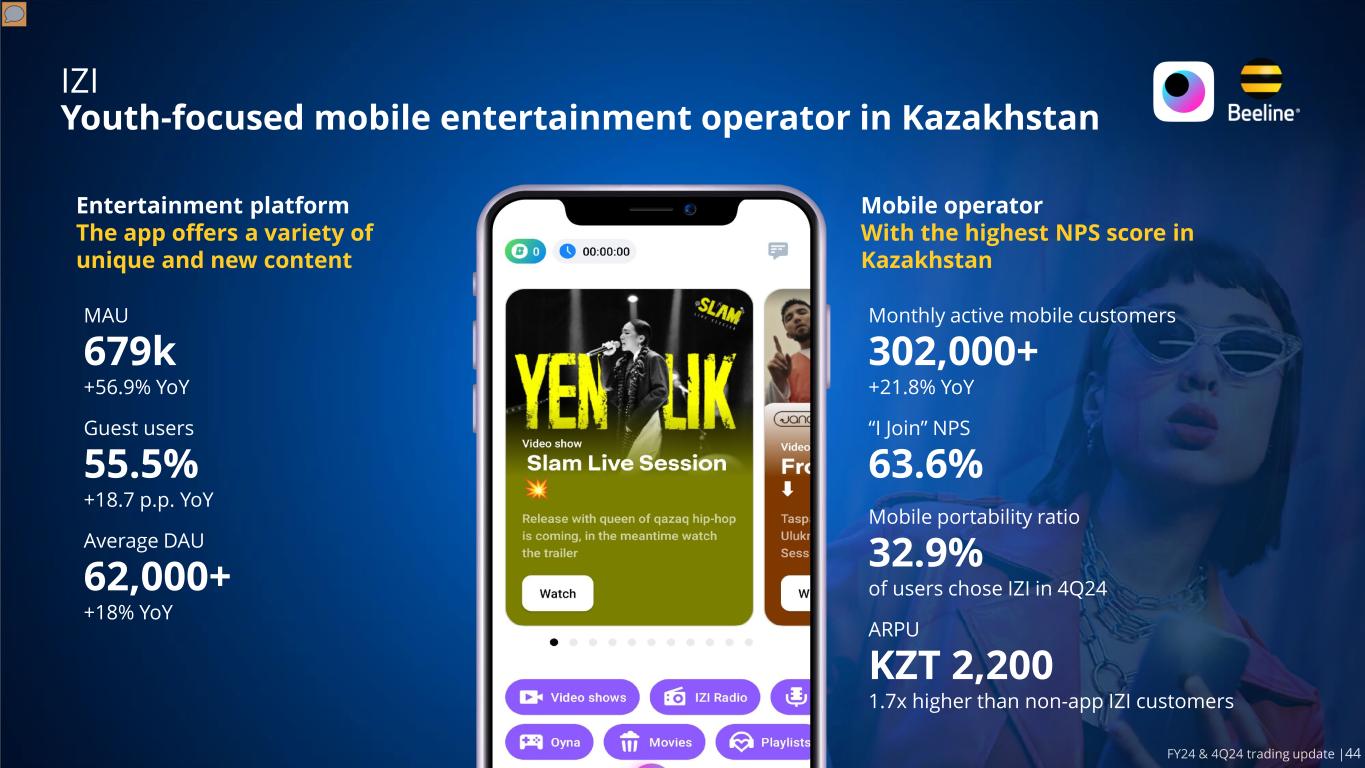
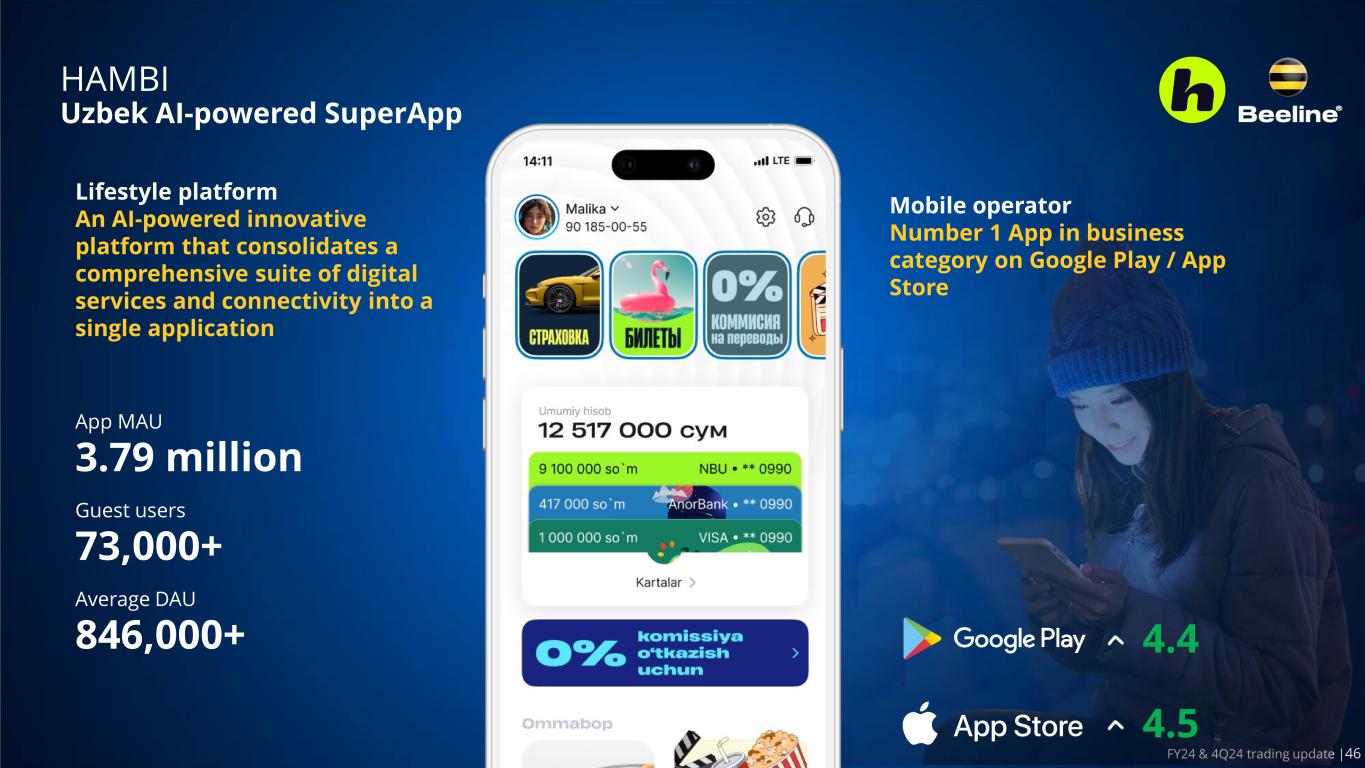
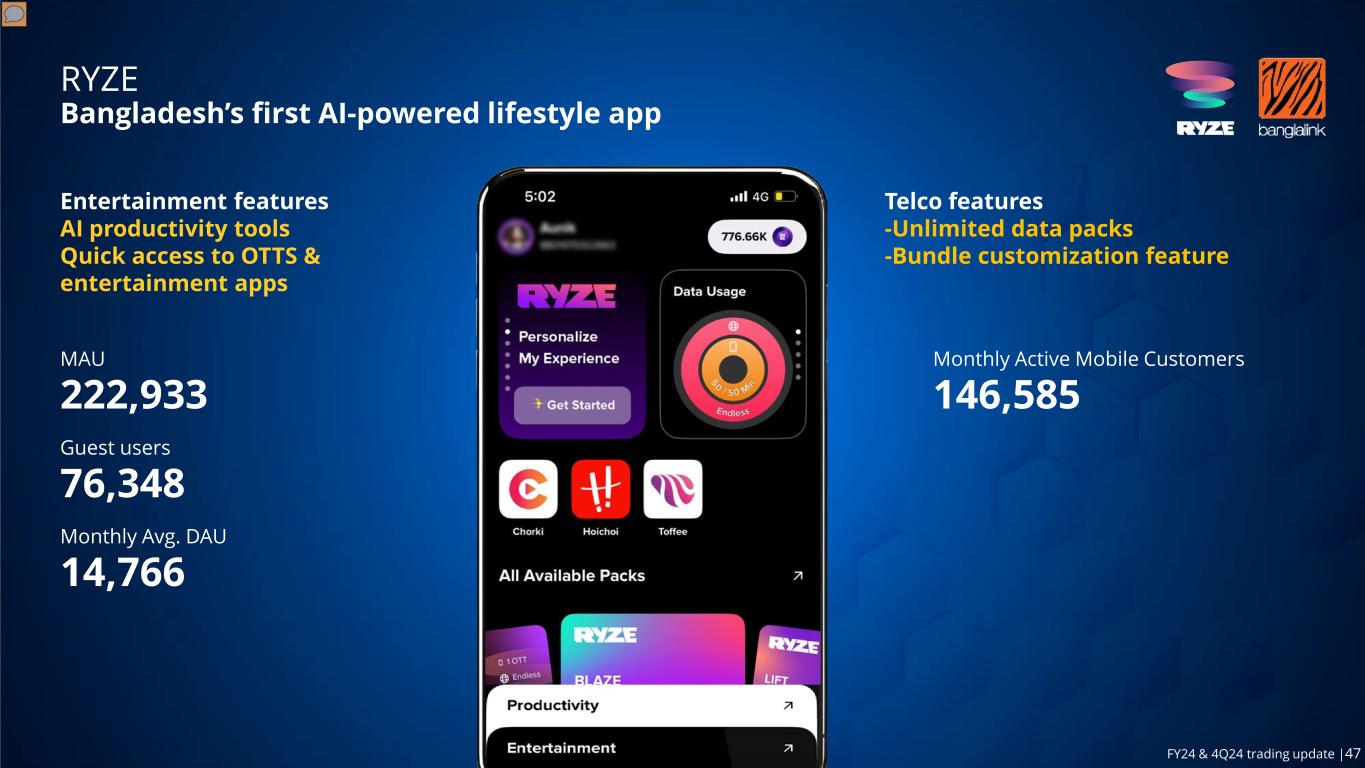
Trading update FY24 & 4Q24 8 added over the last 12 months. As of the end of 4Q24, 4G users now account for 65.3% of our total subscriber base, increasing 4G penetration by 5.0 p.p. from a year earlier, and further supporting the conversion of our subscribers into multiplay users who use at least one of our digital platforms and services in addition to 4G data and voice. VEON has been making significant strides with its "DO1440" Digital Operator strategy since 2021, by expanding and tailoring its digital applications and services to meet the unique needs of each market. In 2024, we focused on AI with a clear focus on augmenting human capabilities and launched our ‘AI1440’ strategy. We accelerated the integration of AI-powered features in our digital applications, bringing AI to our customers in their native languages going beyond using it for process optimization. VEON is committed to strongly delivering on an effective DO1440 + AI1440 strategy, ensuring that every minute of the day is enriched by our services for our customers. Powered by our cutting-edge network, we are transforming lives with innovative solutions in financial services, digital entertainment, health, learning, and enterprise applications. Our locally relevant digital services are designed to resonate deeply with our users. With 121.6 million monthly active users in December 2024, VEON is not just driving digital and financial inclusion; we are empowering individuals and businesses to thrive in a connected world. Our multiplay customers (those who make use of at least one of our digital services on top of our voice and 4G data services) increased by 17.7% YoY to 40.3 million as of December 2024, representing 30.7% of the total user base and supported 21.9% YoY growth in multiplay revenues for the full year (+27.9% YoY in underlying local currency) accounting for 40.4% of VEON’s revenues. Multiplay customer ARPU is 3.7x higher, and churn is 2.3x lower than for voice-only customers. The Group's digital operators leverage digital entertainment applications to cater to the growing demand for locally relevant content in their markets, ensuring it is delivered with enhanced digital experience. These applications support not only local content creators but also increasingly provide viable avenues for advertisers who want to reach the young and digitally savvy audiences of the Group’s digital applications. In financial services for 4Q24, JazzCash in Pakistan, reported 19.7 million MAUs (+21.1% YoY) and increased its 12-month total transactional value by 64% YoY. The total value of the transactions on the JazzCash platform for 2024 was the equivalent of 9.0% of Pakistan’s GDP. In Kazakhstan, Simply, in Kazakhstan, continues to scale strongly with 145.2% rise in MAUs, which reached 3.2 million. Beepul’s revenue grew almost 2.3x in 2024 and MAU increased 3.6x reaching 2.4 million users as of December 2024. In the entertainment vertical, Tamasha in Pakistan grew MAUs 61.5% YoY to 17.1 million. Both Tamasha and Toffee in Bangladesh expect an uptick in customer engagement in 1Q25 from the ICC Cricket Championship. Kyivstar TV in Ukraine reached 2 million MAU (+54.8% YoY). The BeeTV multiplatform entertainment service reached ~1 million MAUs (+8% YoY), with 69% of customers using the mobile version of the service. Kinom, a digital entertainment platform was launched in Uzbekistan in October. In the health vertical, Helsi in Ukraine continued its rapid growth with 28 million registered patients (+5% YoY) as of end 2024. FikrFree, our digital insurance and health platform launched in Pakistan in October 2024, ended the year with 1.4 million MAUs providing over 20 insurance products. It is rapidly gaining traction in engagement, with increasing policy sales and claims processed. Our premium digital brands continue to gain momentum with ROX in Pakistan reaching 1.0 million MAUs since launch in March. IZI, in Kazakhstan, saw MAUs increasing 56.9% YoY to nearly 680K users. In Uzbekistan, OQ reached nearly 600K MAUs at the end of 4Q24, a 3.4x YoY growth, and was rated #1 in the “Business” category in Uzbekistan on the App Store and Google Play. Ryze launched in Bangladesh in November and is off to a strong start with MAUs of 223K as of December 24, just a month into launch. Amongst our SuperApps, Banglalink’s MyBL SuperApp had 7.8 million MAUs as of December and now offers real- time access to local and global news, powered by The Business Standard. In Pakistan, SIMOSA reached ~19m MAUs, +29.9%YoY. In Uzbekistan, Beeline introduced its new SuperApp, Hambi, which has already attracted 5.1 million MAUs (3.8m MAUs are via the mobile app) as of December 2024 and was ranked as the top app on Google Play in the country. Amongst our business digital verticals, QazCode, in collaboration with Kazakh research institutions, launched KazLLM, an open-source Kazakh-language large language model; and has introduced several AI products. Beeline Kazakhstan rolled out VEON AdTech capabilities across three of its products – the SuperApp, BeeTV and IZI – and served ads to customers using VEON AdTech capabilities. Garaj, Jazz’s cloud platform, now has 500+ enterprise customers as it grew its business 74%+ in 2024.
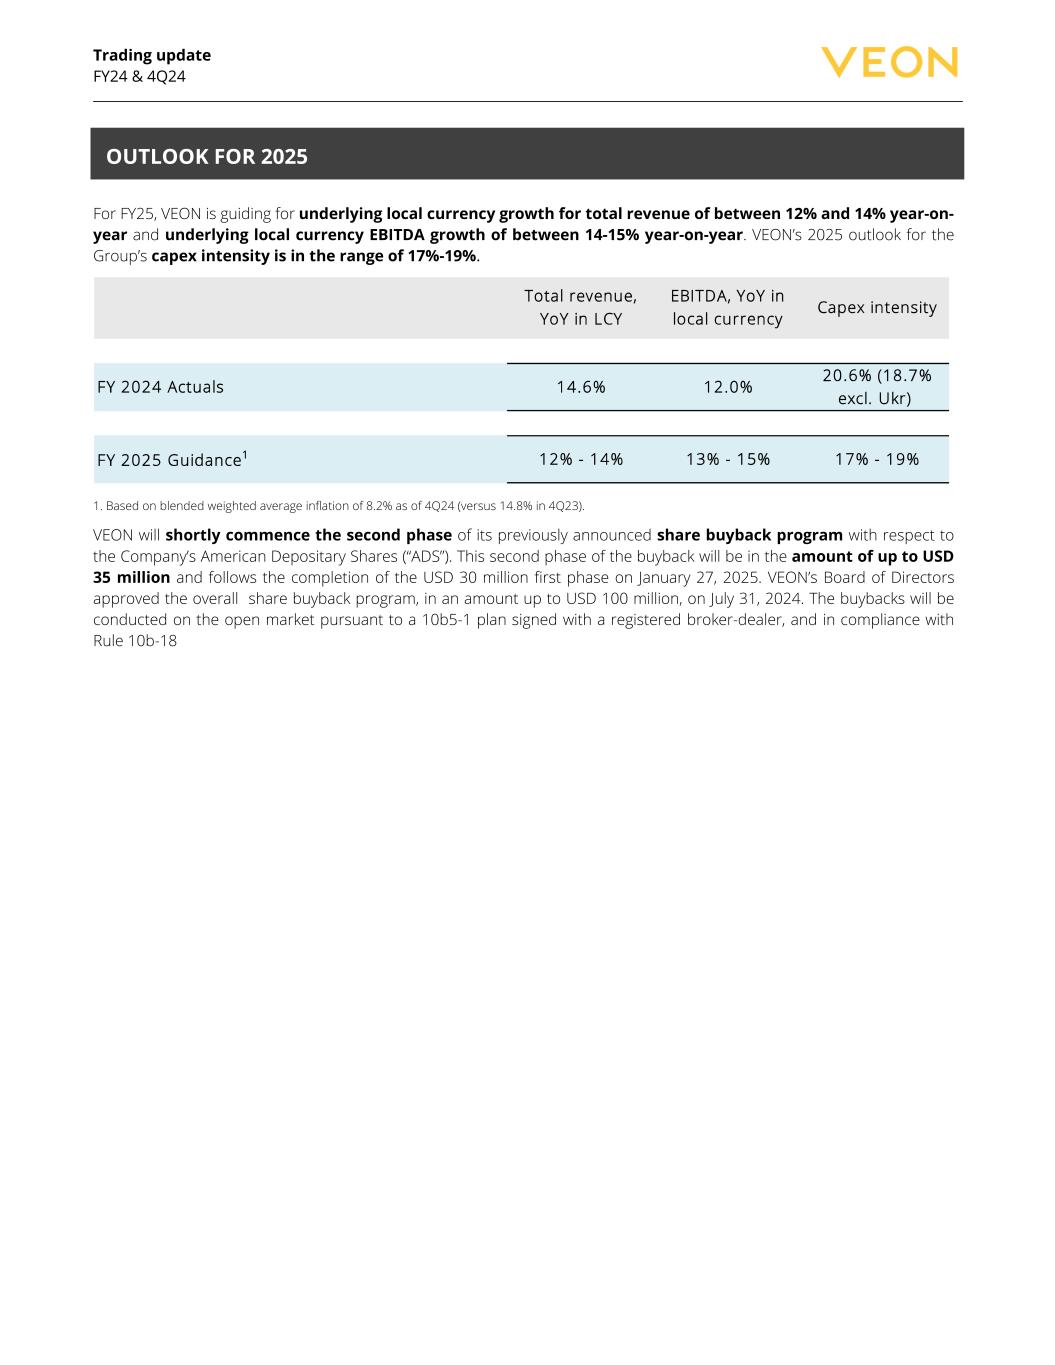
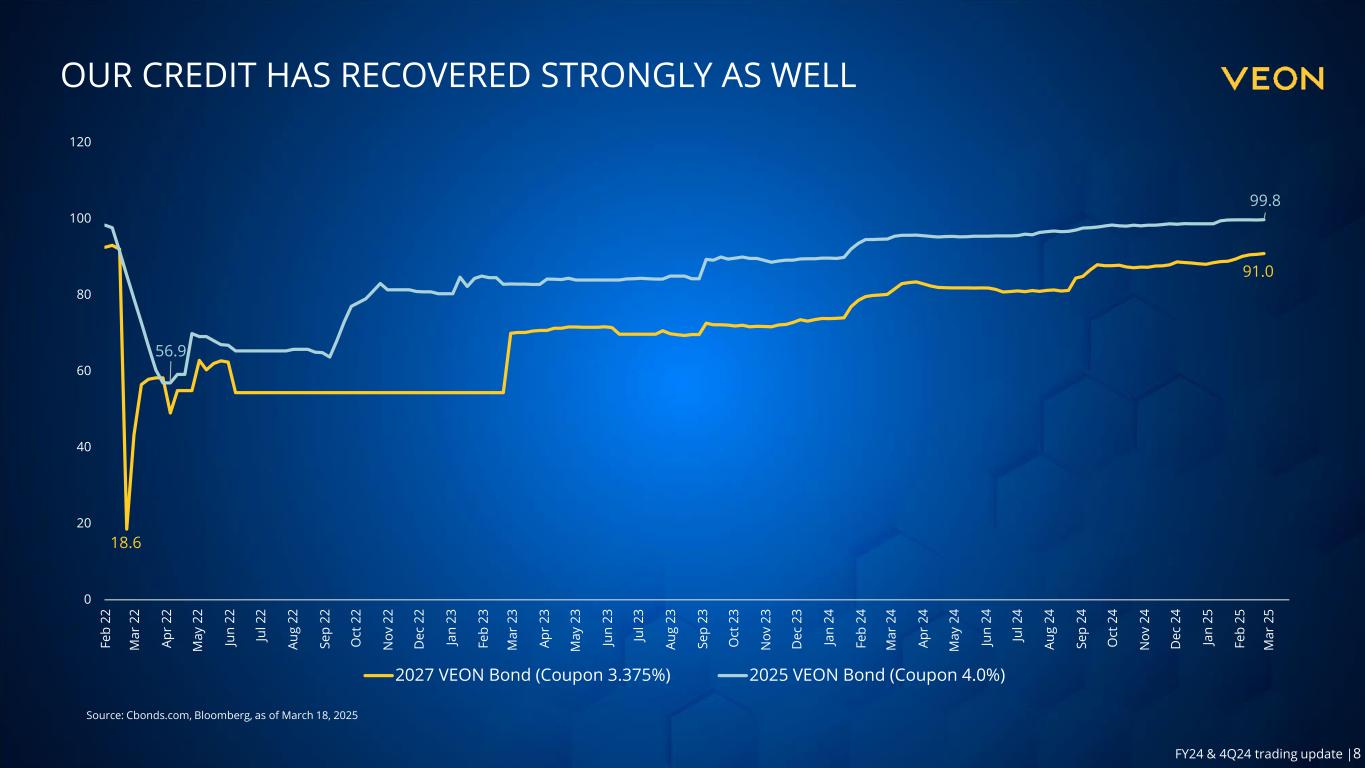
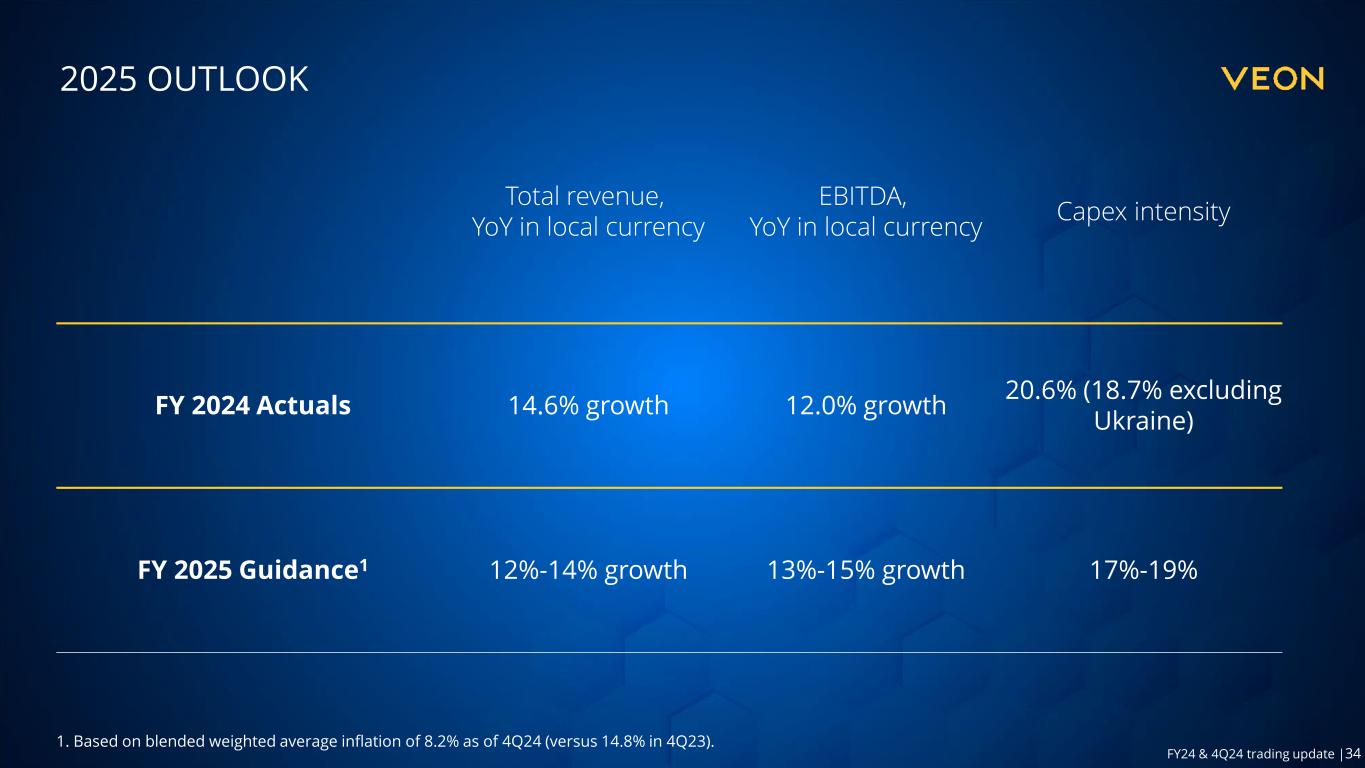
Trading update FY24 & 4Q24 For FY25, VEON is guiding for underlying local currency growth for total revenue of between 12% and 14% year-on- year and underlying local currency EBITDA growth of between 14-15% year-on-year. VEON’s 2025 outlook for the Group’s capex intensity is in the range of 17%-19%. Total revenue, YoY in LCY EBITDA, YoY in local currency Capex intensity FY 2024 Actuals 14.6% 12.0% 20.6% (18.7% excl. Ukr) FY 2025 Guidance1 12% - 14% 13% - 15% 17% - 19% 1. Based on blended weighted average inflation of 8.2% as of 4Q24 (versus 14.8% in 4Q23). VEON will shortly commence the second phase of its previously announced share buyback program with respect to the Company’s American Depositary Shares (“ADS”). This second phase of the buyback will be in the amount of up to USD 35 million and follows the completion of the USD 30 million first phase on January 27, 2025. VEON’s Board of Directors approved the overall share buyback program, in an amount up to USD 100 million, on July 31, 2024. The buybacks will be conducted on the open market pursuant to a 10b5-1 plan signed with a registered broker-dealer, and in compliance with Rule 10b-18 OUTLOOK FOR 2025
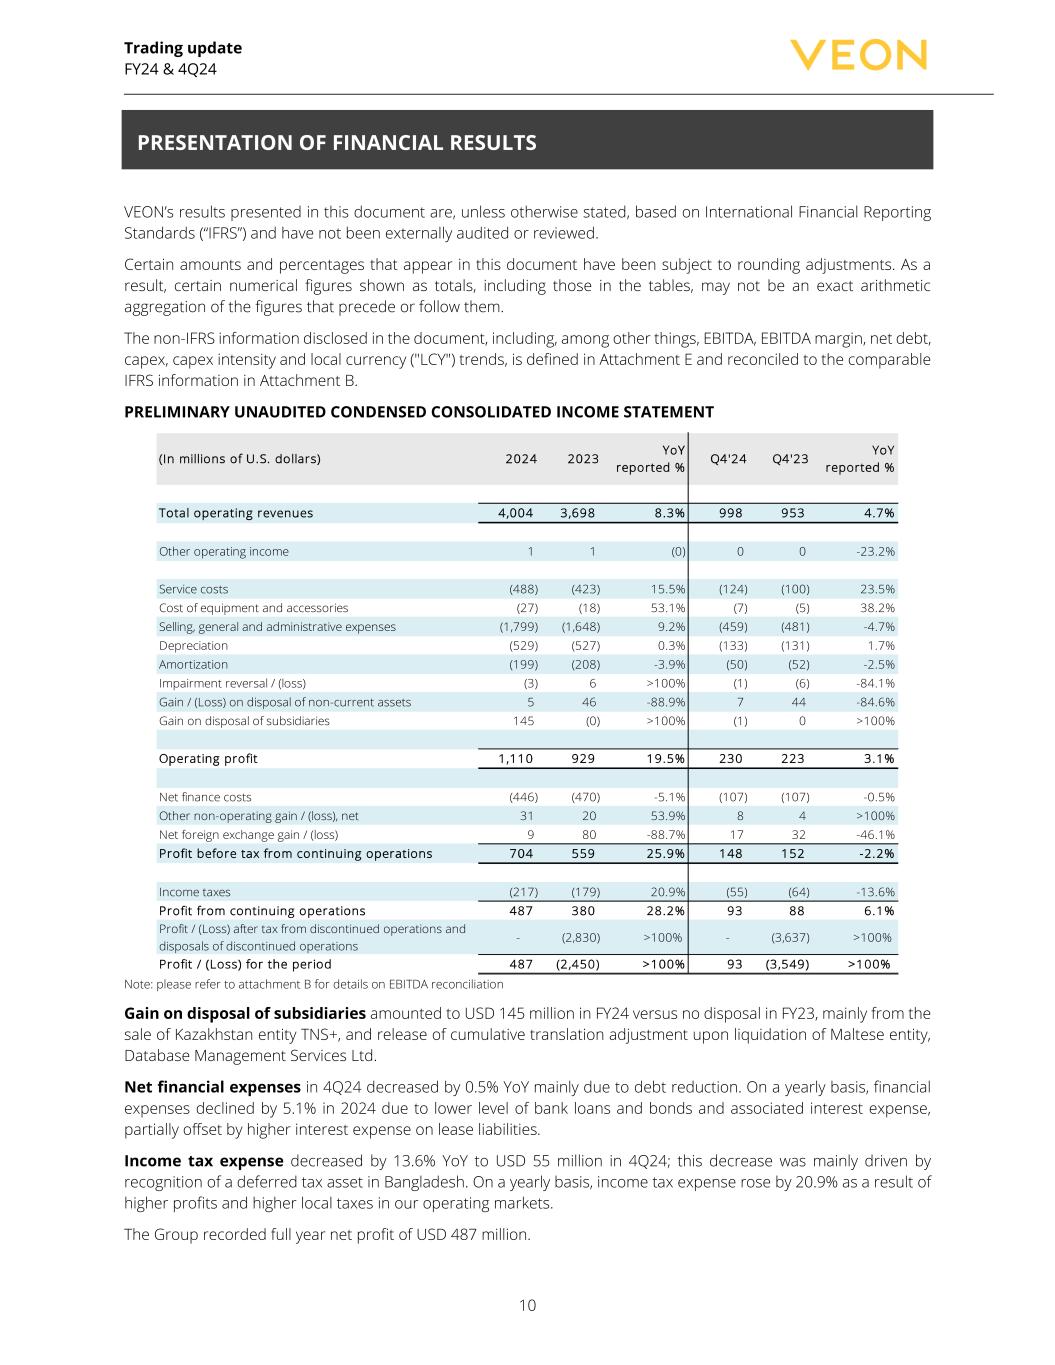
Trading update FY24 & 4Q24 10 VEON’s results presented in this document are, unless otherwise stated, based on International Financial Reporting Standards (“IFRS”) and have not been externally audited or reviewed. Certain amounts and percentages that appear in this document have been subject to rounding adjustments. As a result, certain numerical figures shown as totals, including those in the tables, may not be an exact arithmetic aggregation of the figures that precede or follow them. The non-IFRS information disclosed in the document, including, among other things, EBITDA, EBITDA margin, net debt, capex, capex intensity and local currency ("LCY") trends, is defined in Attachment E and reconciled to the comparable IFRS information in Attachment B. PRELIMINARY UNAUDITED CONDENSED CONSOLIDATED INCOME STATEMENT (In millions of U.S. dollars) 2024 2023 YoY reported % Q4'24 Q4'23 YoY reported % Total operating revenues 4,004 3 ,698 8.3% 998 953 4.7% Other operating income 1 1 (0) 0 0 -23.2% Service costs (488) (423) 15.5% (124) (100) 23.5% Cost of equipment and accessories (27) (18) 53.1% (7) (5) 38.2% Selling, general and administrative expenses (1,799) (1,648) 9.2% (459) (481) -4.7% Depreciation (529) (527) 0.3% (133) (131) 1.7% Amortization (199) (208) -3.9% (50) (52) -2.5% Impairment reversal / (loss) (3) 6 >100% (1) (6) -84.1% Gain / (Loss) on disposal of non-current assets 5 46 -88.9% 7 44 -84.6% Gain on disposal of subsidiaries 145 (0) >100% (1) 0 >100% Operating profit 1,110 929 19.5% 230 223 3.1% Net finance costs (446) (470) -5.1% (107) (107) -0.5% Other non-operating gain / (loss), net 31 20 53.9% 8 4 >100% Net foreign exchange gain / (loss) 9 80 -88.7% 17 32 -46.1% Profit before tax from continuing operations 704 559 25.9% 148 152 -2.2% Income taxes (217) (179) 20.9% (55) (64) -13.6% Profit from continuing operations 487 380 28.2% 93 88 6.1% Profit / (Loss) after tax from discontinued operations and disposals of discontinued operations - (2,830) >100% - (3,637) >100% Profit / (Loss) for the period 487 (2 ,450) >100% 93 (3 ,549) >100% Note: please refer to attachment B for details on EBITDA reconciliation Gain on disposal of subsidiaries amounted to USD 145 million in FY24 versus no disposal in FY23, mainly from the sale of Kazakhstan entity TNS+, and release of cumulative translation adjustment upon liquidation of Maltese entity, Database Management Services Ltd. Net financial expenses in 4Q24 decreased by 0.5% YoY mainly due to debt reduction. On a yearly basis, financial expenses declined by 5.1% in 2024 due to lower level of bank loans and bonds and associated interest expense, partially offset by higher interest expense on lease liabilities. Income tax expense decreased by 13.6% YoY to USD 55 million in 4Q24; this decrease was mainly driven by recognition of a deferred tax asset in Bangladesh. On a yearly basis, income tax expense rose by 20.9% as a result of higher profits and higher local taxes in our operating markets. The Group recorded full year net profit of USD 487 million. PRESENTATION OF FINANCIAL RESULTS

Trading update FY24 & 4Q24 11 PRELIMINARY UNAUDITED CONDENSED CONSOLIDATED CASH FLOW STATEMENT (In millions of U.S. dollars) 2024 2023 YoY reported % Operating activities Net cash flows from operating activities from continuing operations 1,149 1,160 -0.9% Net cash flows from operating activities from discontinued operations - 951 >100% Investing activities Net cash flows used in investing activities from continuing operations (776) (1,020) -23.8% Net cash flows used in investing activities from discontinued operations - (1,217) >100% Financing activities Net cash flows from / (used in) financing activities from continuing operations (550) (919) -40.1% Net cash flows from / (used in) financing activities from discontinued operations - (226) >100% Net increase / (decrease) in cash and cash equivalents (177) (1,271) -86.0% Net foreign exchange difference (21) (80) -73.4% Cash and cash equivalents classified as discontinued operations/held for sale at the beginning of the period 0 146 >100% Cash and cash equivalents classified as discontinued operations/held for sale at the end of the period (14) (0) >100% Cash and cash equivalents at beginning of period 1,901 3,107 -38.8% Cash and cash equivalents at end of period 1,689 1,902 -11.2% Note: please refer to attachment B for details on FCF reconciliation

Trading update FY24 & 4Q24 12 PRELIMINARY UNAUDITED CONDENSED CONSOLIDATED BALANCE SHEET ( In mill ions of U.S. dollars) 2024 2023 YoY reported % Assets Non-current assets Property and equipment 3,016 2,898 4.1% Intangible assets 1,510 1,619 -6.8% Other non-current assets 610 543 12.3% Total non-current assets 5,136 5,060 1.5% Current assets Cash and cash equivalents 1,689 1,902 -11.2% Trade and other receivables 463 543 -14.6% Other current assets 676 713 -5.2% Total current assets 2,828 3,158 -10.4% Assets classified as held for sale 72 0 >100% Total assets 8,036 8,218 -2.2% Equity and l iabil ities Total equity 1,257 1,071 17.4% Non-current l iabil ities Debt and derivatives 3,028 3,464 -12.6% Other non-current liabilities 97 99 -1.5% Total non-current l iabil ities 3,125 3,563 -12.3% Current l iabil ities Trade and other payables 1,276 1,200 6.3% Debt and derivatives 1,666 1,692 -1.6% Other current liabilities 685 692 -1.1% Total current l iabil ities 3,626 3,584 1.2% Liabilities associated with assets held for sale 28 (0) 0.0% Total equity and l iabil ities 8,036 8,218 -2.2%

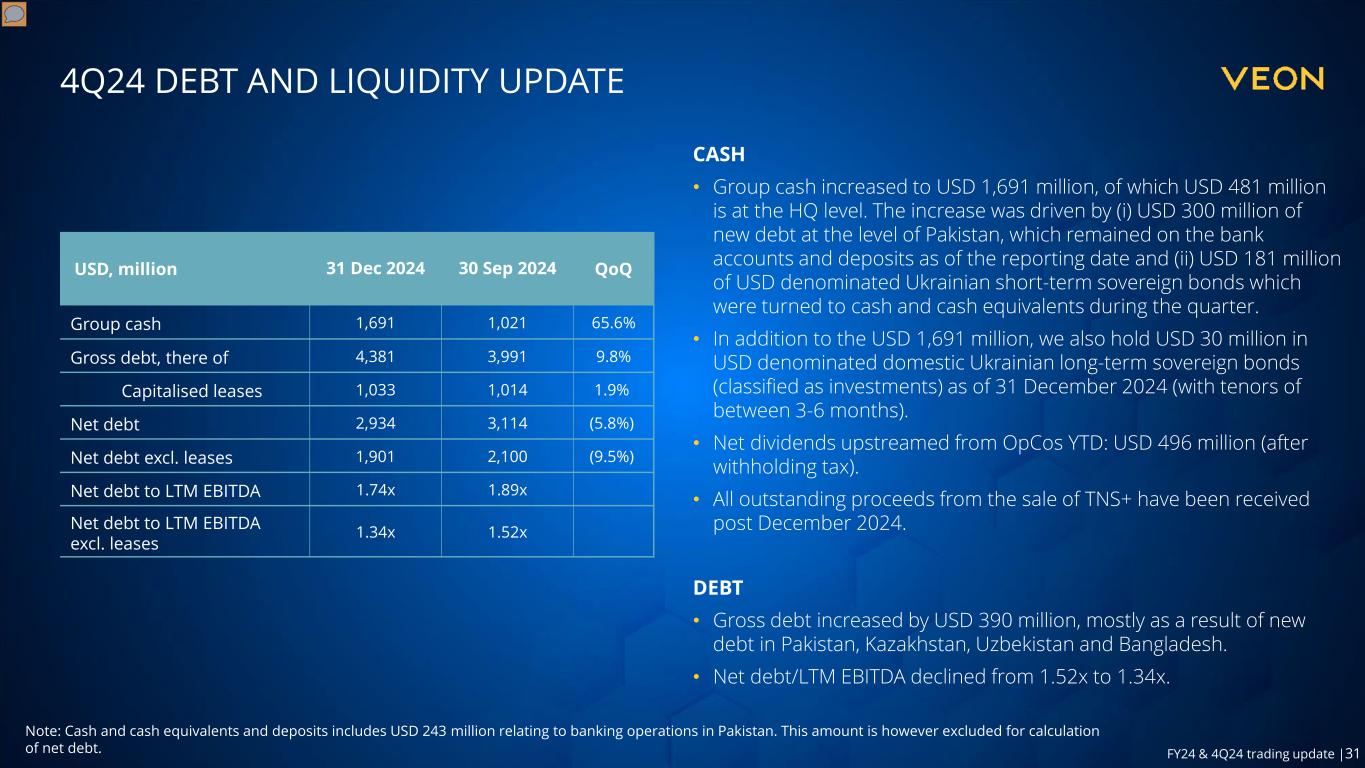
Trading update FY24 & 4Q24 13 LIQUIDITY AND CAPITAL STRUCTURE Note: Cash and cash equivalents and deposits includes amounts relating to banking operations in Pakistan: USD 243 million in 4Q24, USD 144 million in 3Q24 and USD159 million in 4Q23. Long-term accounts payable relate to arrangements with vendors for financing network equipment. Total cash and cash equivalents and deposits increased in Q4 2024 to approximately USD 1,691 million compared to Q3 2024 USD 1,021 million. This increase was driven by USD 300 million of new debt at the level of Pakistan, which was still held on bank accounts and deposits at reporting date, as well as USD 181 million of USD denominated short-term Ukrainian sovereign bonds which were turned to cash and cash equivalents during the quarter. The HQ-level cash and cash equivalents and deposits are held in bank accounts, money market funds and on-demand deposits at a diversified group of international banks. During the twelve months of 2024, operating companies up-streamed USD 496 million in dividends (after withholding tax). In addition to the USD 1,691 million in cash and cash equivalents and deposits, VEON also holds of USD 30 million of USD denominated domestic Ukrainian sovereign bonds with tenor 3-6 months (classified as investments) as of December 31, 2024. Net dividends up streamed from OpCos year-to-date: USD 496 million (after withholding tax). All remaining proceeds from the sale of TNS+ were received after December 2024. Gross debt increased to USD 4.4 billion in Q4 2024, compared to USD 4 billion in Q3 2024. The increase in gross debt was driven mainly as a result of new debt in Pakistan (USD 300 million) and Kazakhstan (USD 40 million) and a small increase in the lease liabilities (USD 19 million). Lease liabilities increased marginally to USD 1,033 million at the end of 4Q24 compared to USD 1,014 million in 3Q24 Net debt decreased to USD 2.9 billion at the end of 4Q24 (USD 3.1 billion at the end of 3Q24) and Net debt excluding leases decreased to USD 1.9 billion (USD 2.1 billion at the end of 3Q24) as the above-mentioned increase in cash exceeded the increase in gross debt. This resulted in lower net debt/EBITDA of 1.74x and 1.34x (if leases were to be excluded). Our leverage calculations and ratios do not take the US$243m relating to banking operations in Pakistan into account. We continually monitor the capital markets and our capital structure, and we expect that in the future we will undertake debt capital markets offerings or other financing transactions if market conditions become favorable. USD million 31 Dec 2024 30 Sep 2024 QoQ 31 Dec 2023 YoY Cash and cash equivalents and deposits 1,691 1,021 65.6% 1,903 (11.2%) Marketable securities 30 211 (85.8%) 150 (80.0%) Gross debt, of which 4,381 3,991 9.8% 4,693 (6.6%) Bonds and loans - principal 3,265 2,896 12.7% 3,631 (10.1%) Lease liabilities - principal 1,033 1,014 1.9% 985 4.9% Long-term accounts payable and other 83 81 2.5% 77 7.8% Net debt 2,934 3,114 (5.8%) 2,949 (0.5%) Net debt / LTM EBITDA 1.74x 1.89x 1.83x Net debt excluding leases 1,901 2,100 (9.5%) 1,965 (3.3%) Net debt excluding leases / LTM EBITDA 1.34x 1.52x 1.41x
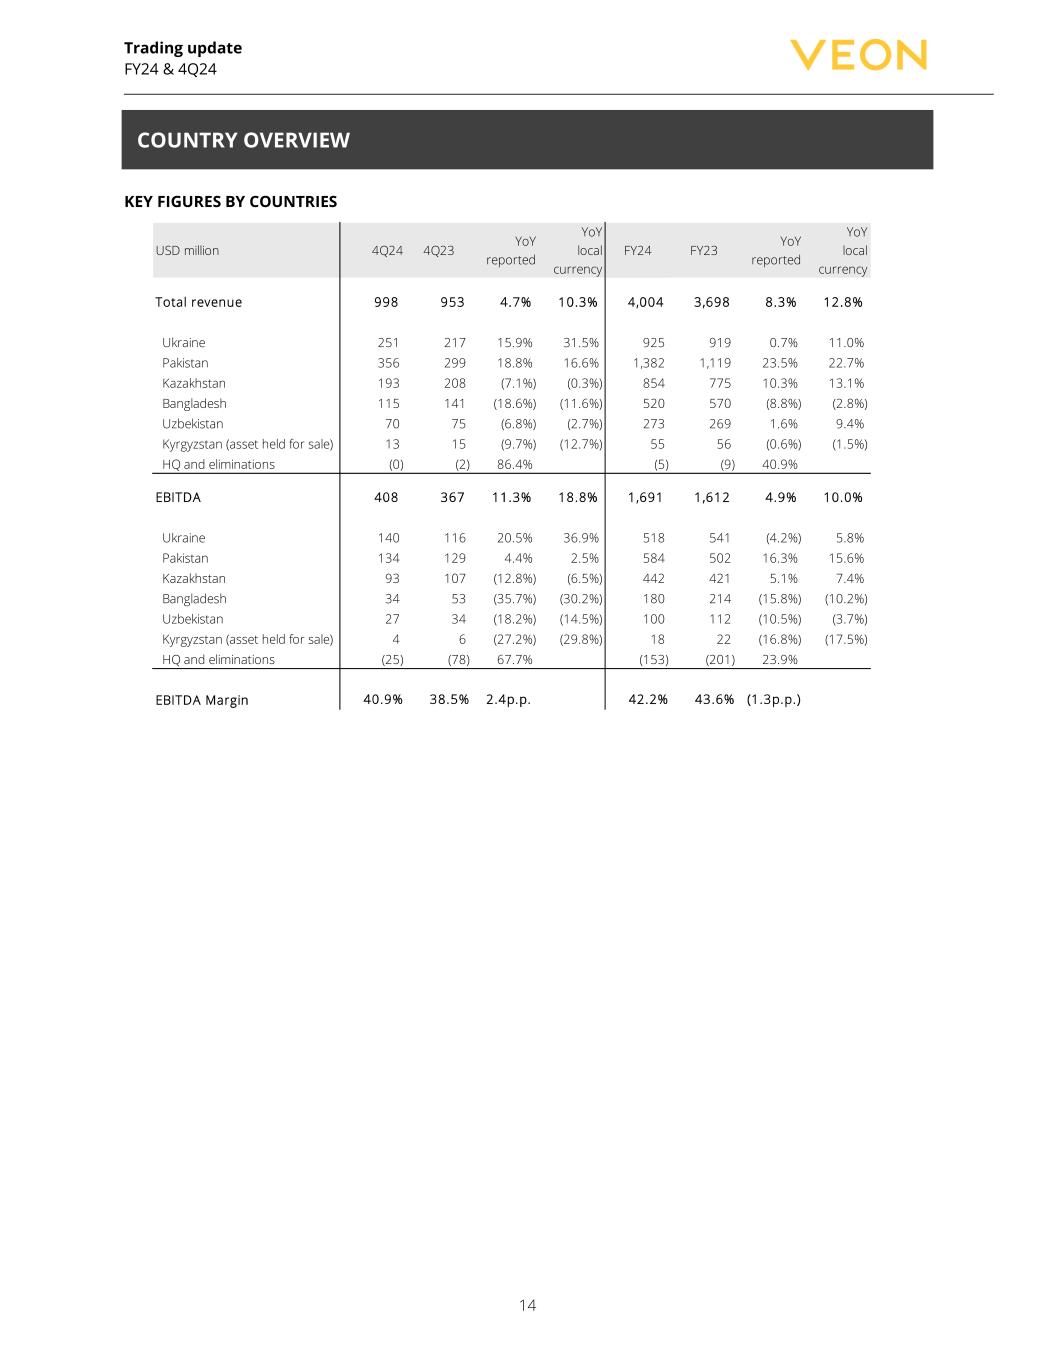
Trading update FY24 & 4Q24 14 KEY FIGURES BY COUNTRIES USD million 4Q24 4Q23 YoY reported YoY local currency FY24 FY23 YoY reported YoY local currency Total revenue 998 953 4.7% 10.3% 4,004 3 ,698 8.3% 12.8% Ukraine 251 217 15.9% 31.5% 925 919 0.7% 11.0% Pakistan 356 299 18.8% 16.6% 1,382 1,119 23.5% 22.7% Kazakhstan 193 208 (7.1%) (0.3%) 854 775 10.3% 13.1% Bangladesh 115 141 (18.6%) (11.6%) 520 570 (8.8%) (2.8%) Uzbekistan 70 75 (6.8%) (2.7%) 273 269 1.6% 9.4% Kyrgyzstan (asset held for sale) 13 15 (9.7%) (12.7%) 55 56 (0.6%) (1.5%) HQ and eliminations (0) (2) 86.4% (5) (9) 40.9% EBITDA 408 367 11.3% 18.8% 1,691 1 ,612 4.9% 10.0% Ukraine 140 116 20.5% 36.9% 518 541 (4.2%) 5.8% Pakistan 134 129 4.4% 2.5% 584 502 16.3% 15.6% Kazakhstan 93 107 (12.8%) (6.5%) 442 421 5.1% 7.4% Bangladesh 34 53 (35.7%) (30.2%) 180 214 (15.8%) (10.2%) Uzbekistan 27 34 (18.2%) (14.5%) 100 112 (10.5%) (3.7%) Kyrgyzstan (asset held for sale) 4 6 (27.2%) (29.8%) 18 22 (16.8%) (17.5%) HQ and eliminations (25) (78) 67.7% (153) (201) 23.9% EBITDA Margin 40.9% 38.5% 2.4p.p. 42.2% 43.6% (1.3p.p.) COUNTRY OVERVIEW
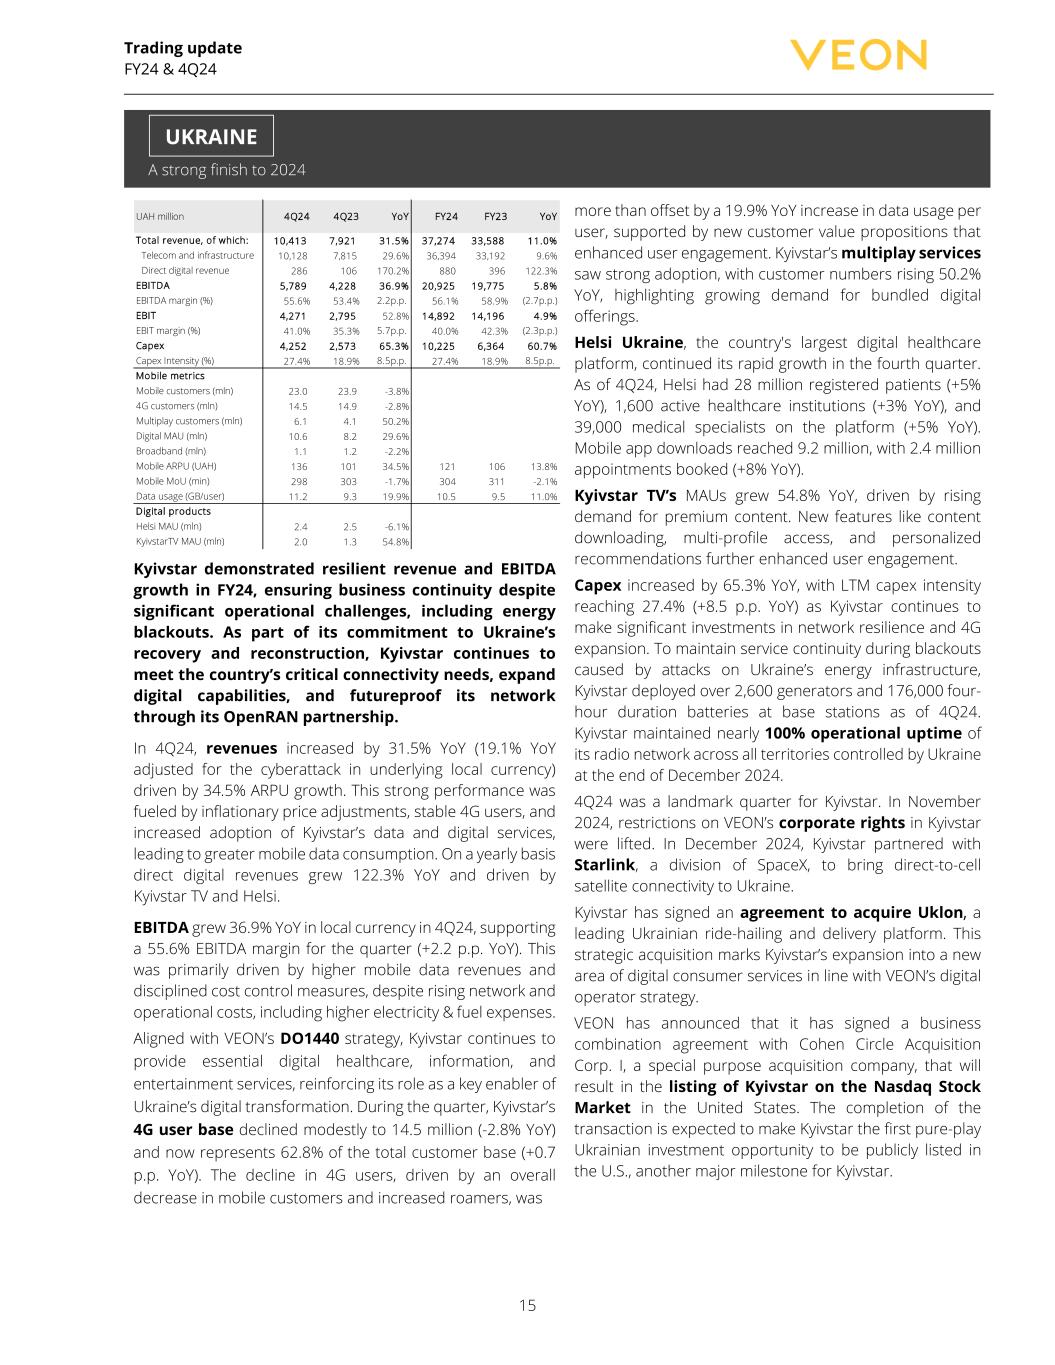
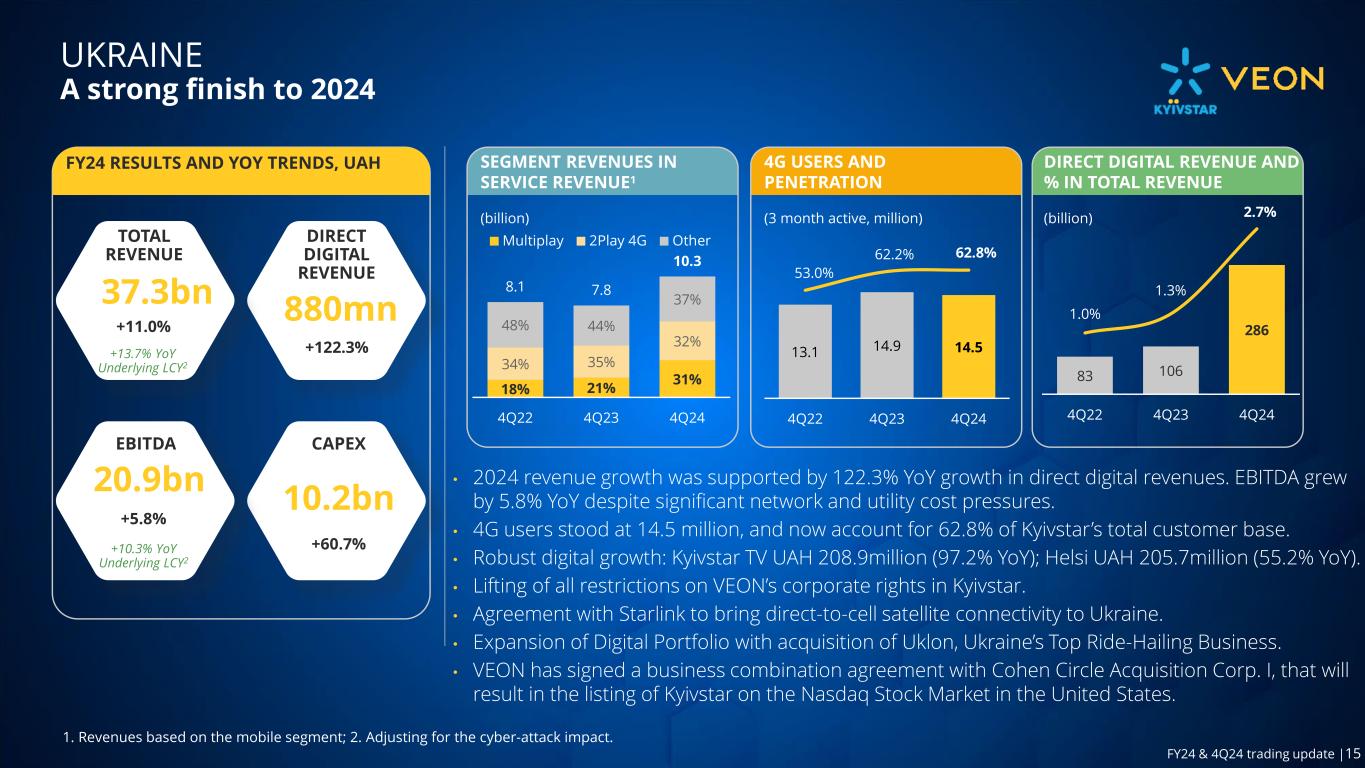
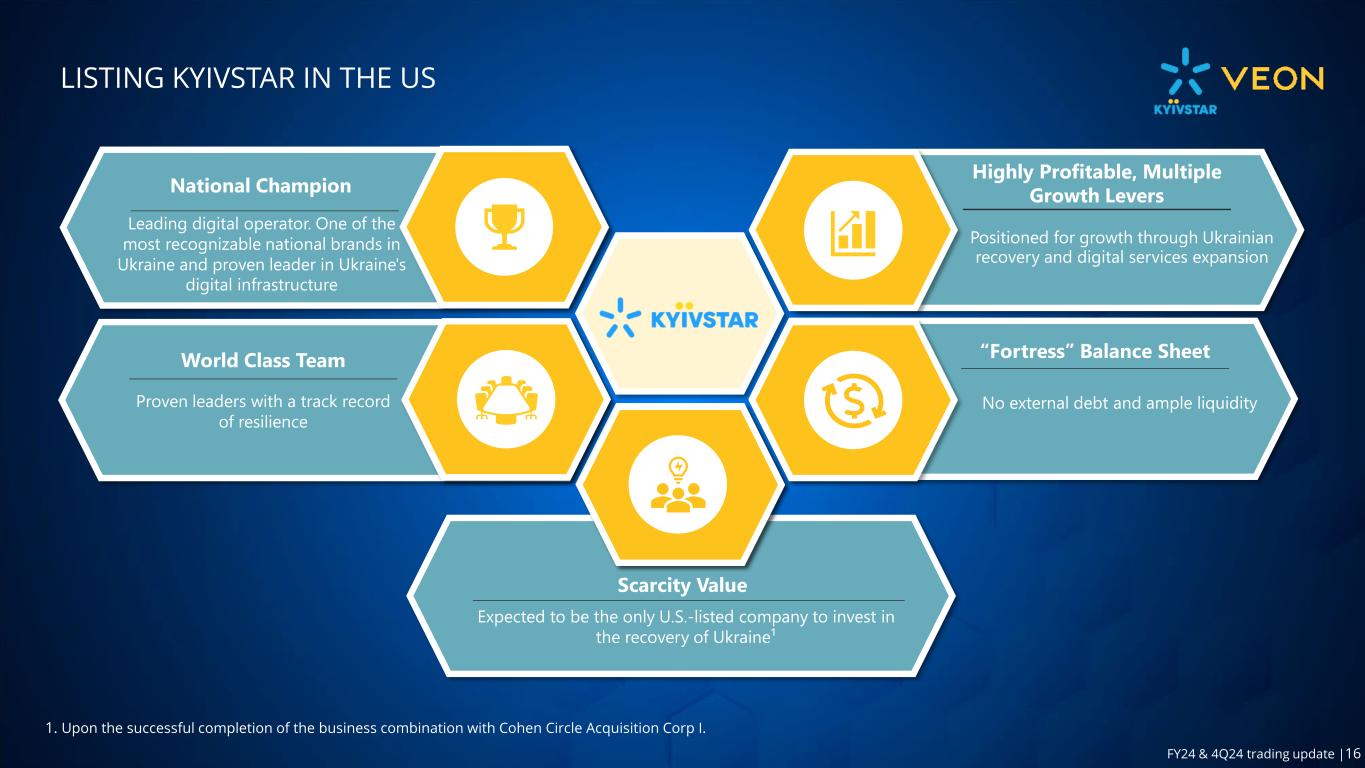
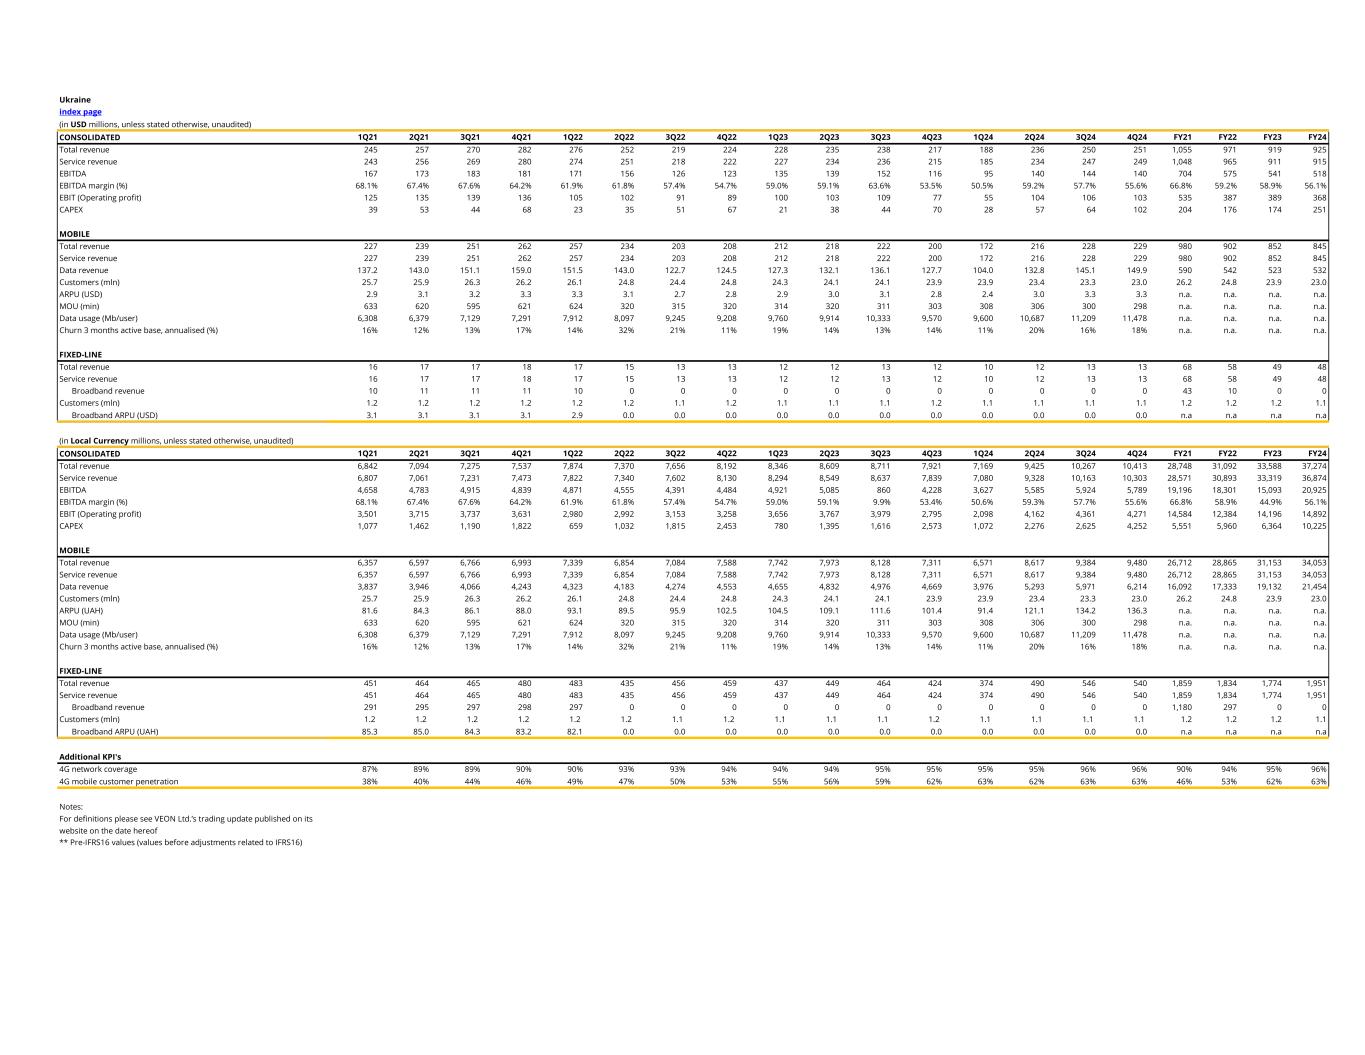
Trading update FY24 & 4Q24 15 A strong finish to 2024 UAH million 4Q24 4Q23 YoY FY24 FY23 YoY Total revenue, of which: 10,413 7,921 31.5% 37,274 33,588 11.0% Telecom and infrastructure 10,128 7,815 29.6% 36,394 33,192 9.6% Direct digital revenue 286 106 170.2% 880 396 122.3% EBITDA 5,789 4 ,228 36.9% 20,925 19,775 5.8% EBITDA margin (%) 55.6% 53.4% 2.2p.p. 56.1% 58.9% (2.7p.p.) EBIT 4,271 2 ,795 52.8% 14,892 14,196 4.9% EBIT margin (%) 41.0% 35.3% 5.7p.p. 40.0% 42.3% (2.3p.p.) Capex 4,252 2 ,573 65.3% 10,225 6,364 60.7% Capex Intensity (%) 27.4% 18.9% 8.5p.p. 27.4% 18.9% 8.5p.p. Mobile metrics Mobile customers (mln) 23.0 23.9 -3.8% 4G customers (mln) 14.5 14.9 -2.8% Multiplay customers (mln) 6.1 4.1 50.2% Digital MAU (mln) 10.6 8.2 29.6% Broadband (mln) 1.1 1.2 -2.2% Mobile ARPU (UAH) 136 101 34.5% 121 106 13.8% Mobile MoU (min) 298 303 -1.7% 304 311 -2.1% Data usage (GB/user) 11.2 9.3 19.9% 10.5 9.5 11.0% Digital products Helsi MAU (mln) 2.4 2.5 -6.1% KyivstarTV MAU (mln) 2.0 1.3 54.8% Kyivstar demonstrated resilient revenue and EBITDA growth in FY24, ensuring business continuity despite significant operational challenges, including energy blackouts. As part of its commitment to Ukraine’s recovery and reconstruction, Kyivstar continues to meet the country’s critical connectivity needs, expand digital capabilities, and futureproof its network through its OpenRAN partnership. In 4Q24, revenues increased by 31.5% YoY (19.1% YoY adjusted for the cyberattack in underlying local currency) driven by 34.5% ARPU growth. This strong performance was fueled by inflationary price adjustments, stable 4G users, and increased adoption of Kyivstar’s data and digital services, leading to greater mobile data consumption. On a yearly basis direct digital revenues grew 122.3% YoY and driven by Kyivstar TV and Helsi. EBITDA grew 36.9% YoY in local currency in 4Q24, supporting a 55.6% EBITDA margin for the quarter (+2.2 p.p. YoY). This was primarily driven by higher mobile data revenues and disciplined cost control measures, despite rising network and operational costs, including higher electricity & fuel expenses. Aligned with VEON’s DO1440 strategy, Kyivstar continues to provide essential digital healthcare, information, and entertainment services, reinforcing its role as a key enabler of Ukraine’s digital transformation. During the quarter, Kyivstar’s 4G user base declined modestly to 14.5 million (-2.8% YoY) and now represents 62.8% of the total customer base (+0.7 p.p. YoY). The decline in 4G users, driven by an overall decrease in mobile customers and increased roamers, was more than offset by a 19.9% YoY increase in data usage per user, supported by new customer value propositions that enhanced user engagement. Kyivstar’s multiplay services saw strong adoption, with customer numbers rising 50.2% YoY, highlighting growing demand for bundled digital offerings. Helsi Ukraine, the country's largest digital healthcare platform, continued its rapid growth in the fourth quarter. As of 4Q24, Helsi had 28 million registered patients (+5% YoY), 1,600 active healthcare institutions (+3% YoY), and 39,000 medical specialists on the platform (+5% YoY). Mobile app downloads reached 9.2 million, with 2.4 million appointments booked (+8% YoY). Kyivstar TV’s MAUs grew 54.8% YoY, driven by rising demand for premium content. New features like content downloading, multi-profile access, and personalized recommendations further enhanced user engagement. Capex increased by 65.3% YoY, with LTM capex intensity reaching 27.4% (+8.5 p.p. YoY) as Kyivstar continues to make significant investments in network resilience and 4G expansion. To maintain service continuity during blackouts caused by attacks on Ukraine’s energy infrastructure, Kyivstar deployed over 2,600 generators and 176,000 four- hour duration batteries at base stations as of 4Q24. Kyivstar maintained nearly 100% operational uptime of its radio network across all territories controlled by Ukraine at the end of December 2024. 4Q24 was a landmark quarter for Kyivstar. In November 2024, restrictions on VEON’s corporate rights in Kyivstar were lifted. In December 2024, Kyivstar partnered with Starlink, a division of SpaceX, to bring direct-to-cell satellite connectivity to Ukraine. Kyivstar has signed an agreement to acquire Uklon, a leading Ukrainian ride-hailing and delivery platform. This strategic acquisition marks Kyivstar’s expansion into a new area of digital consumer services in line with VEON’s digital operator strategy. VEON has announced that it has signed a business combination agreement with Cohen Circle Acquisition Corp. I, a special purpose acquisition company, that will result in the listing of Kyivstar on the Nasdaq Stock Market in the United States. The completion of the transaction is expected to make Kyivstar the first pure-play Ukrainian investment opportunity to be publicly listed in the U.S., another major milestone for Kyivstar. UKRAINE
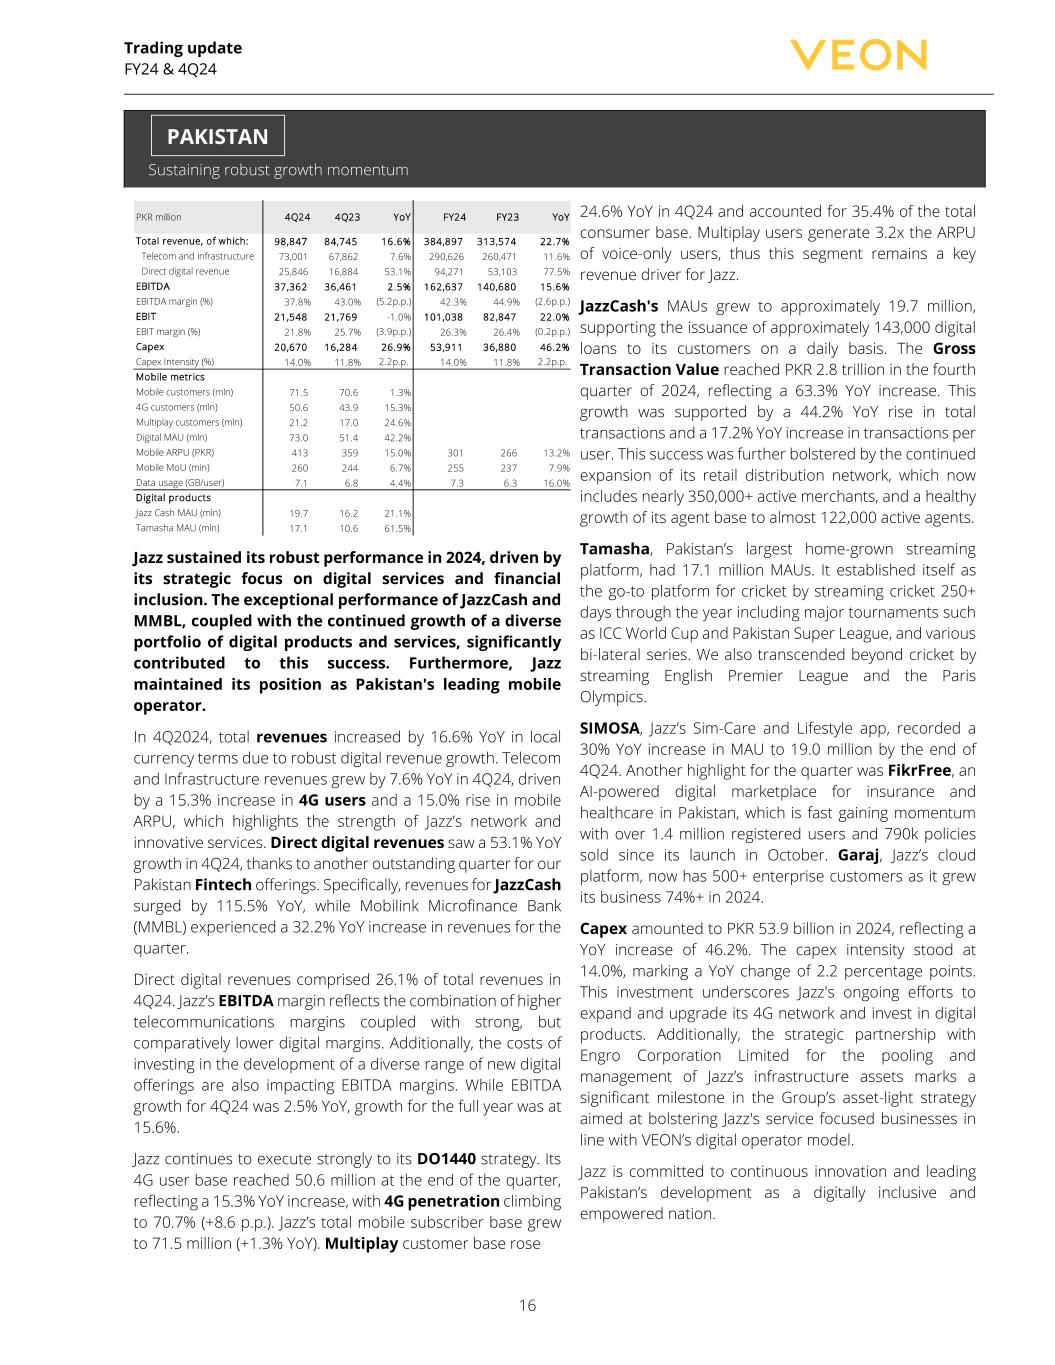
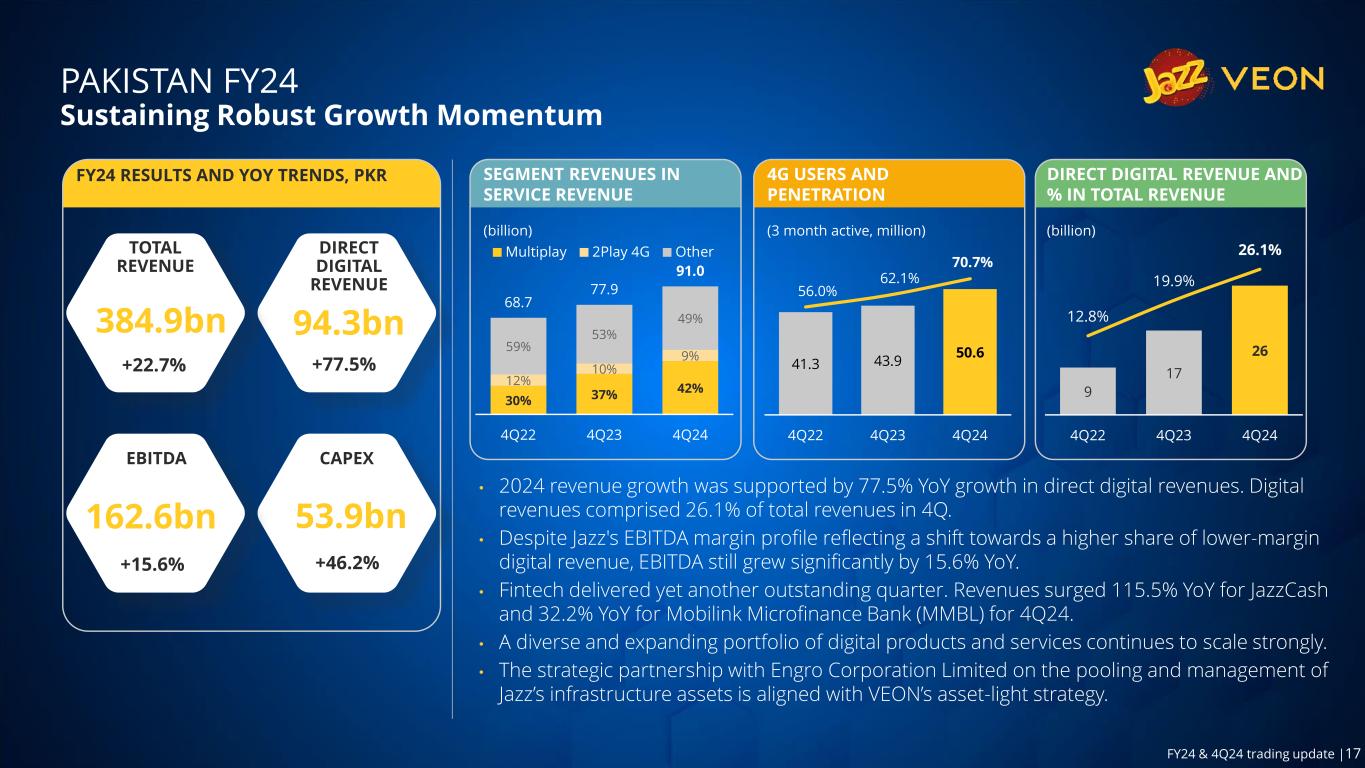
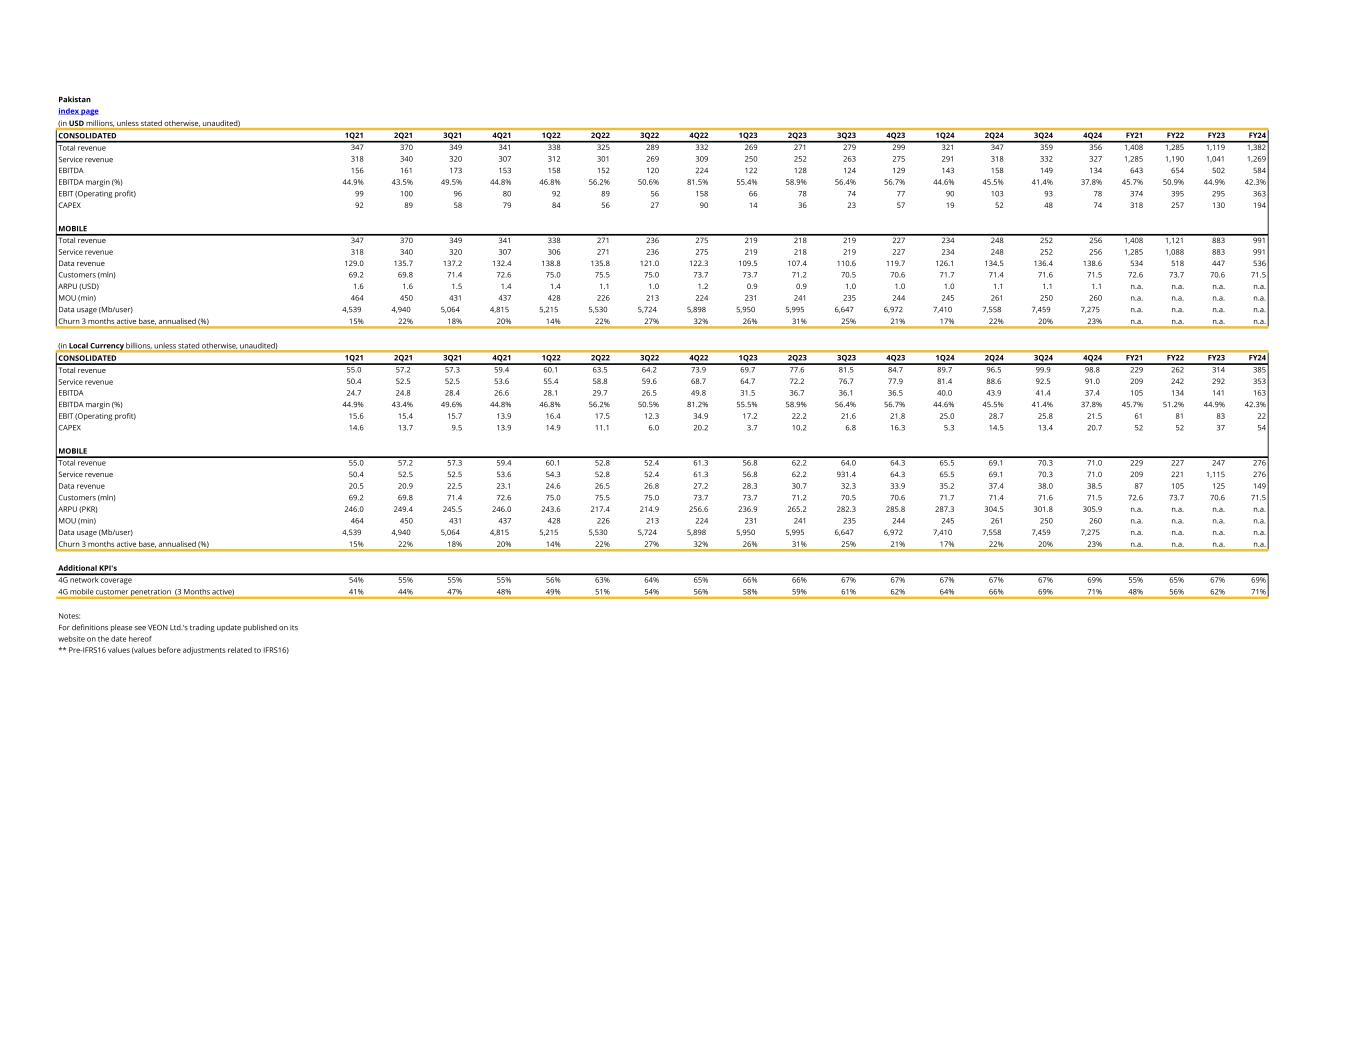
Trading update FY24 & 4Q24 16 Sustaining robust growth momentum PKR million 4Q24 4Q23 YoY FY24 FY23 YoY Total revenue, of which: 98,847 84,745 16.6% 384,897 313,574 22.7% Telecom and infrastructure 73,001 67,862 7.6% 290,626 260,471 11.6% Direct digital revenue 25,846 16,884 53.1% 94,271 53,103 77.5% EBITDA 37,362 36,461 2.5% 162,637 140,680 15.6% EBITDA margin (%) 37.8% 43.0% (5.2p.p.) 42.3% 44.9% (2.6p.p.) EBIT 21,548 21,769 -1.0% 101,038 82,847 22.0% EBIT margin (%) 21.8% 25.7% (3.9p.p.) 26.3% 26.4% (0.2p.p.) Capex 20,670 16,284 26.9% 53,911 36,880 46.2% Capex Intensity (%) 14.0% 11.8% 2.2p.p. 14.0% 11.8% 2.2p.p. Mobile metrics Mobile customers (mln) 71.5 70.6 1.3% 4G customers (mln) 50.6 43.9 15.3% Multiplay customers (mln) 21.2 17.0 24.6% Digital MAU (mln) 73.0 51.4 42.2% Mobile ARPU (PKR) 413 359 15.0% 301 266 13.2% Mobile MoU (min) 260 244 6.7% 255 237 7.9% Data usage (GB/user) 7.1 6.8 4.4% 7.3 6.3 16.0% Digital products Jazz Cash MAU (mln) 19.7 16.2 21.1% Tamasha MAU (mln) 17.1 10.6 61.5% Jazz sustained its robust performance in 2024, driven by its strategic focus on digital services and financial inclusion. The exceptional performance of JazzCash and MMBL, coupled with the continued growth of a diverse portfolio of digital products and services, significantly contributed to this success. Furthermore, Jazz maintained its position as Pakistan's leading mobile operator. In 4Q2024, total revenues increased by 16.6% YoY in local currency terms due to robust digital revenue growth. Telecom and Infrastructure revenues grew by 7.6% YoY in 4Q24, driven by a 15.3% increase in 4G users and a 15.0% rise in mobile ARPU, which highlights the strength of Jazz’s network and innovative services. Direct digital revenues saw a 53.1% YoY growth in 4Q24, thanks to another outstanding quarter for our Pakistan Fintech offerings. Specifically, revenues for JazzCash surged by 115.5% YoY, while Mobilink Microfinance Bank (MMBL) experienced a 32.2% YoY increase in revenues for the quarter. Direct digital revenues comprised 26.1% of total revenues in 4Q24. Jazz’s EBITDA margin reflects the combination of higher telecommunications margins coupled with strong, but comparatively lower digital margins. Additionally, the costs of investing in the development of a diverse range of new digital offerings are also impacting EBITDA margins. While EBITDA growth for 4Q24 was 2.5% YoY, growth for the full year was at 15.6%. Jazz continues to execute strongly to its DO1440 strategy. Its 4G user base reached 50.6 million at the end of the quarter, reflecting a 15.3% YoY increase, with 4G penetration climbing to 70.7% (+8.6 p.p.). Jazz’s total mobile subscriber base grew to 71.5 million (+1.3% YoY). Multiplay customer base rose 24.6% YoY in 4Q24 and accounted for 35.4% of the total consumer base. Multiplay users generate 3.2x the ARPU of voice-only users, thus this segment remains a key revenue driver for Jazz. JazzCash's MAUs grew to approximately 19.7 million, supporting the issuance of approximately 143,000 digital loans to its customers on a daily basis. The Gross Transaction Value reached PKR 2.8 trillion in the fourth quarter of 2024, reflecting a 63.3% YoY increase. This growth was supported by a 44.2% YoY rise in total transactions and a 17.2% YoY increase in transactions per user. This success was further bolstered by the continued expansion of its retail distribution network, which now includes nearly 350,000+ active merchants, and a healthy growth of its agent base to almost 122,000 active agents. Tamasha, Pakistan’s largest home-grown streaming platform, had 17.1 million MAUs. It established itself as the go-to platform for cricket by streaming cricket 250+ days through the year including major tournaments such as ICC World Cup and Pakistan Super League, and various bi-lateral series. We also transcended beyond cricket by streaming English Premier League and the Paris Olympics. SIMOSA, Jazz’s Sim-Care and Lifestyle app, recorded a 30% YoY increase in MAU to 19.0 million by the end of 4Q24. Another highlight for the quarter was FikrFree, an AI-powered digital marketplace for insurance and healthcare in Pakistan, which is fast gaining momentum with over 1.4 million registered users and 790k policies sold since its launch in October. Garaj, Jazz’s cloud platform, now has 500+ enterprise customers as it grew its business 74%+ in 2024. Capex amounted to PKR 53.9 billion in 2024, reflecting a YoY increase of 46.2%. The capex intensity stood at 14.0%, marking a YoY change of 2.2 percentage points. This investment underscores Jazz's ongoing efforts to expand and upgrade its 4G network and invest in digital products. Additionally, the strategic partnership with Engro Corporation Limited for the pooling and management of Jazz’s infrastructure assets marks a significant milestone in the Group’s asset-light strategy aimed at bolstering Jazz's service focused businesses in line with VEON’s digital operator model. Jazz is committed to continuous innovation and leading Pakistan’s development as a digitally inclusive and empowered nation. PAKISTAN

Trading update FY24 & 4Q24 17 Robust momentum maintained KZT million 4Q24 4Q23 YoY FY24 FY23 YoY Total revenue, of which: 96,347 96,667 -0.3% 399,889 353,562 13.1% Telecom and infrastructure 85,421 86,912 -1.7% 360,104 321,868 11.9% Direct digital revenue 10,927 9,755 12.0% 39,785 31,694 25.5% EBITDA 46,582 49,815 -6.5% 206,368 192,067 7.4% EBITDA margin (%) 48.3% 51.5% (3.2p.p.) 51.6% 54.3% (2.7p.p.) EBIT 32,936 37,892 -13.1% 154,837 148,243 4.4% EBIT margin (%) 34.2% 39.2% (5.0p.p.) 38.7% 41.9% (3.2p.p.) Capex 36,543 42,205 -13.4% 85,686 75,927 12.9% Capex Intensity (%) 21.4% 21.5% (0.0p.p.) 21.4% 21.5% (0.0p.p.) Mobile metrics Mobile customers (mln) 11.6 11.1 5.2% 4G customers (mln) 8.8 8.1 9.1% Multiplay customers (mln) 4.2 4.0 4.4% Digital MAU (mln) 13.3 11.0 20.6% Broadband (mln) 0.7 0.7 7.8% Mobile ARPU (KZT) 2,211 2,167 2.0% 2,222 2,014 10.4% Mobile MoU (min) 121 141 -14.0% 130 145 -10.7% Data usage (GB/user) 19.5 18.1 7.9% 18.8 17.3 8.8% Digital products Simply MAU (mln) 3.2 1.3 145.2% IZI MAU (mln) 0.7 0.4 56.9% Beeline Kazakhstan delivered strong financial and operational performance in 2024 as it strengthened its market leadership and continued its digital transformation initiatives. A key highlight of the year was the progress on the asset-light strategy, exemplified by the divestment of TNS+. Following the sale of TNS+, its contributions are no longer included in Beeline Kazakhstan’s accounts effective 4Q24. While total revenues for 4Q24 declined -0.3%YoY, the increase is 10.7% YoY when adjusted for TNS+’ contributions in 4Q24. Excluding TNS+ contributions, telecom and infrastructure revenues grew 15.3% YoY, reflecting a 5.2% YoY increase in mobile subscribers and 2.0% YoY growth in mobile ARPU. Beeline’s growing market share and traction is testament to the success of its 4.9G rollout, which has adequately offset the decision to forego 5G license/spectrum. Direct digital revenues grew 12.0% in the quarter, comprising 11.3% of total revenues and reflecting the robust uptake of Beeline’s digital services suite. 4Q24 EBITDA decreased by 6.5% YoY but was stable (-1.1% YoY) when adjusted for TNS+’ contributions in 4Q24. Total subscribers grew 5.2% YoY to 11.6million in 4Q24. The 4G user base in Kazakhstan rose 9.1% YoY in 4Q24 to 8.8 million and now represents 76.0% of the total customer base. Multiplay customers reached 4.2 million, up 4.4% YoY in 4Q24, and contributed 49.7% to total service revenues in 4Q24. Beeline Kazakhstan continued to expand its digital portfolio in line with the DO1440 strategy. The BeeTV multiplatform entertainment service reached ~1 million MAUs (+8% YoY), with 69% of customers using the mobile version of the service. Simply, Kazakhstan’s first domestic mobile-only online neobank continues to scale strongly with 145.2% rise in MAUs, which reached 3.2 million. Beeline Kazakhstan’s sub-brand IZI continued to deliver strong growth with MAUs of the IZI app increasing 56.9% YoY to nearly 680,000. IZI is also expanding regionally and has recently launched in Kyrgyzstan. QazCode has been at the forefront of developing cutting- edge digital products. In December 2024, QazCode, in collaboration with Kazakh research institutions, launched Kaz-LLM, an open-source Kazakh-language large language model with 8 billion and 70 billion parameter versions. Beeline and QazCode have already launched several AI products developed in-house, including the open-source LLM Kaz-RoBERTA-conversational model, which is currently being used for customer service interactions on Beeline Kazakhstan’s digital platforms. Capex for 2024 increased by 12.9% YoY, with LTM capex intensity reaching 21.4% (-0.05x p.p. YoY). Beeline Kazakhstan is prioritizing its capex budget towards the deployment of MIMO (massive multiple-input multiple- output) technology and 4.9G wireless technology roll-outs. KAZAKHSTAN

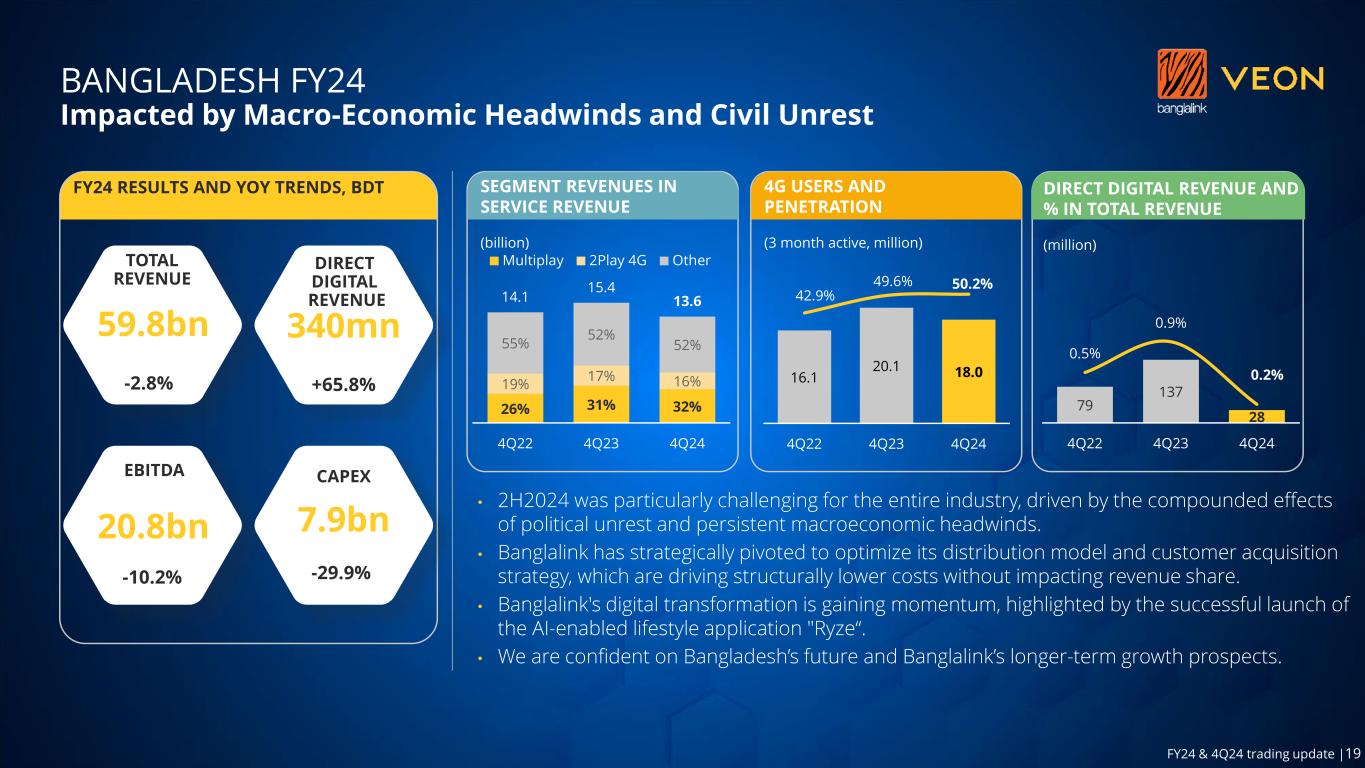
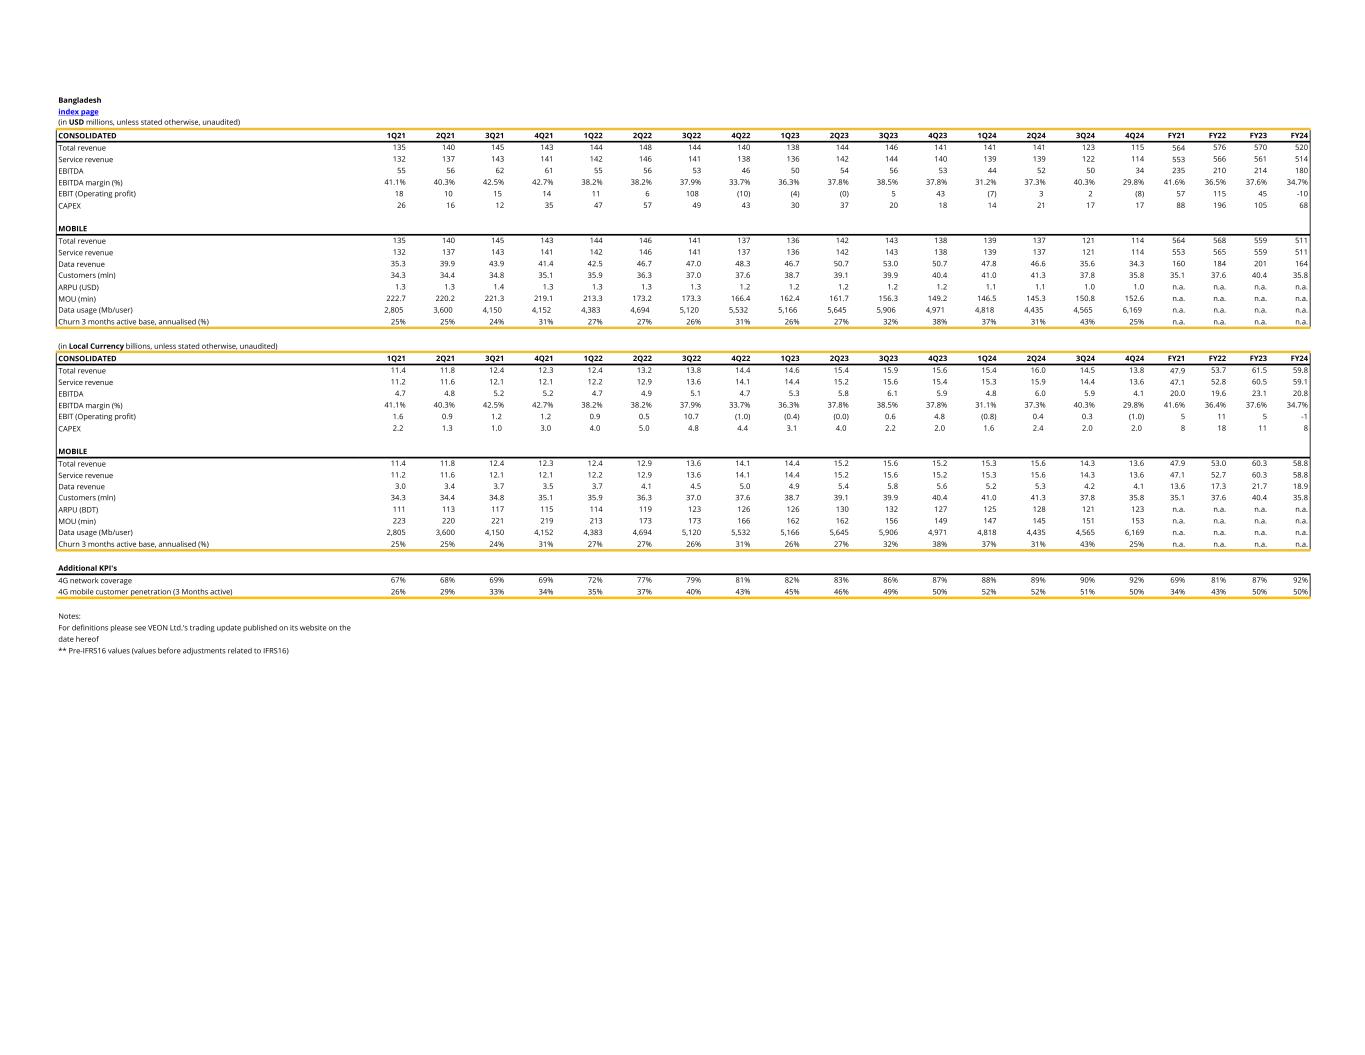
Trading update FY24 & 4Q24 18 Impacted by macro-economic headwinds and civil unrest BDT million 4Q24 4Q23 YoY FY24 FY23 YoY Total revenue, of which: 13,765 15,579 -11.6% 59,780 61,490 -2.8% Telecom and infrastructure re 13,737 15,442 -11.0% 59,440 61,285 -3.0% Direct digital revenue 28 137 -79.7% 340 205 65.8% EBITDA 4,106 5 ,883 -30.2% 20,755 23,113 -10.2% EBITDA margin (%) 29.8% 37.8% (7.9p.p.) 34.7% 37.6% (2.9p.p.) EBIT (982) 4 ,771 -120.6% (1,134) 4 ,915 -123.1% EBIT margin (%) -7.1% 30.6% (37.8p.p.) -1.9% 8.0% (9.9p.p.) Capex 1,980 1 ,977 0.1% 7,899 11,268 -29.9% Capex Intensity (%) 13.2% 18.3% (5.1p.p.) 13.2% 18.3% (5.1p.p.) Mobile metrics Mobile customers (mln) 35.8 40.4 -11.3% 4G customers (mln) 18.0 20.1 -10.4% Multiplay customers (mln) 4.8 5.2 -7.2% Digital MAU (mln) 14.8 16.7 -11.8% Mobile ARPU (BDT) 123 127 -3.4% 129 129 -0.2% Mobile MoU (min) 153 149 2.3% 154 158 -2.4% Data usage (GB/user) 6.0 4.9 24.1% 5.1 5.4 -4.2% Digital products Toffee MAU (mln) 6.6 8.4 -22.0% My BL MAU (mln) 7.8 7.8 -0.2% 2024 was a year of two distinct halves, with the second half being particularly challenging across industries in Bangladesh due to political unrest and macroeconomic headwinds. In response to these challenges, Banglalink strategically pivoted by optimizing its operations and accelerating its digital transformation. Looking ahead, Banglalink is cautiously optimistic that the worst of the macroeconomic impact is in the past and the company is well-positioned to drive sustainable long-term growth. In 4Q24, Banglalink's total revenues declined by 11.6% YoY in local currency terms. Telecom and Infrastructure revenues fell by 11.0% YoY, impacted by a decrease in the subscriber base (- 11.3% YoY) and a drop in mobile ARPU by 3.4% YoY. Digital revenues saw a -79.7% YoY decline, mainly due to seasonality around cricket content and its impact on Toffee's viewership, specifically the comparable quarter last year benefited from the ICC tournament being held over that period. Total EBITDA decreased by 30.2% YoY in 4Q24, primarily due to lower revenue and a one-off VAT provision. In response, Banglalink has strategically pivoted to optimize its distribution model and customer acquisition strategy, which is beginning to structurally lower costs without affecting revenue share. Despite the challenges faced in the second half of 2024, Banglalink remains committed to its Digital Operator 1440 including a strategic focus on increasing 4G penetration. As of the fourth quarter, its 4G user base stood at 18.0 million, reflecting a -10.4% YoY decline in 4Q24, which mirrors the overall subscriber base decline. This translates to a 4G penetration rate of 50.2%, marking a 0.5p.p YoY increase. The multiplay customer base declined by 7.2% YoY, while multiplay revenues declined by 9.8% YoY and now comprise 32.0% of the revenue base. Banglalink’s Toffee is the leading entertainment application and OTT platform in Bangladesh, offering audio and video streaming services to users of all mobile operators in the country. By the end of 4Q24, Toffee had 6.6 million MAUs and recorded over 700 million minutes of usage. Toffee has reinstated linear TV channels by partnering directly with international broadcasters, making it the largest OTT platform in Bangladesh to offer linear TV. Additionally, Banglalink holds exclusive streaming rights for ICC world events across Bangladesh until the end of 2025. This initiative is expected to continue driving Toffee’s growth into 2025. The successful launch of the AI-enabled lifestyle application 'Ryze' in November 2024, targeting the youth segment, is yet another example of an innovative digital service driving digital adoption and growth. Market reception has been very positive, with Ryze recording 222,000+ MAUs by December 2024, just a month after its launch. Additionally, transaction volumes on MyBanglalink ('MyBL'), a pioneering telecommunications super app, maintaining stable MAUs at 7.8 million. Capex in 2024 was BDT 7.9 billion (-29.9% YoY); with capex intensity for 2024 at 13.2%. Banglalink’s nationwide 4G footprint provides a solid foundation for future growth. BANGLADESH
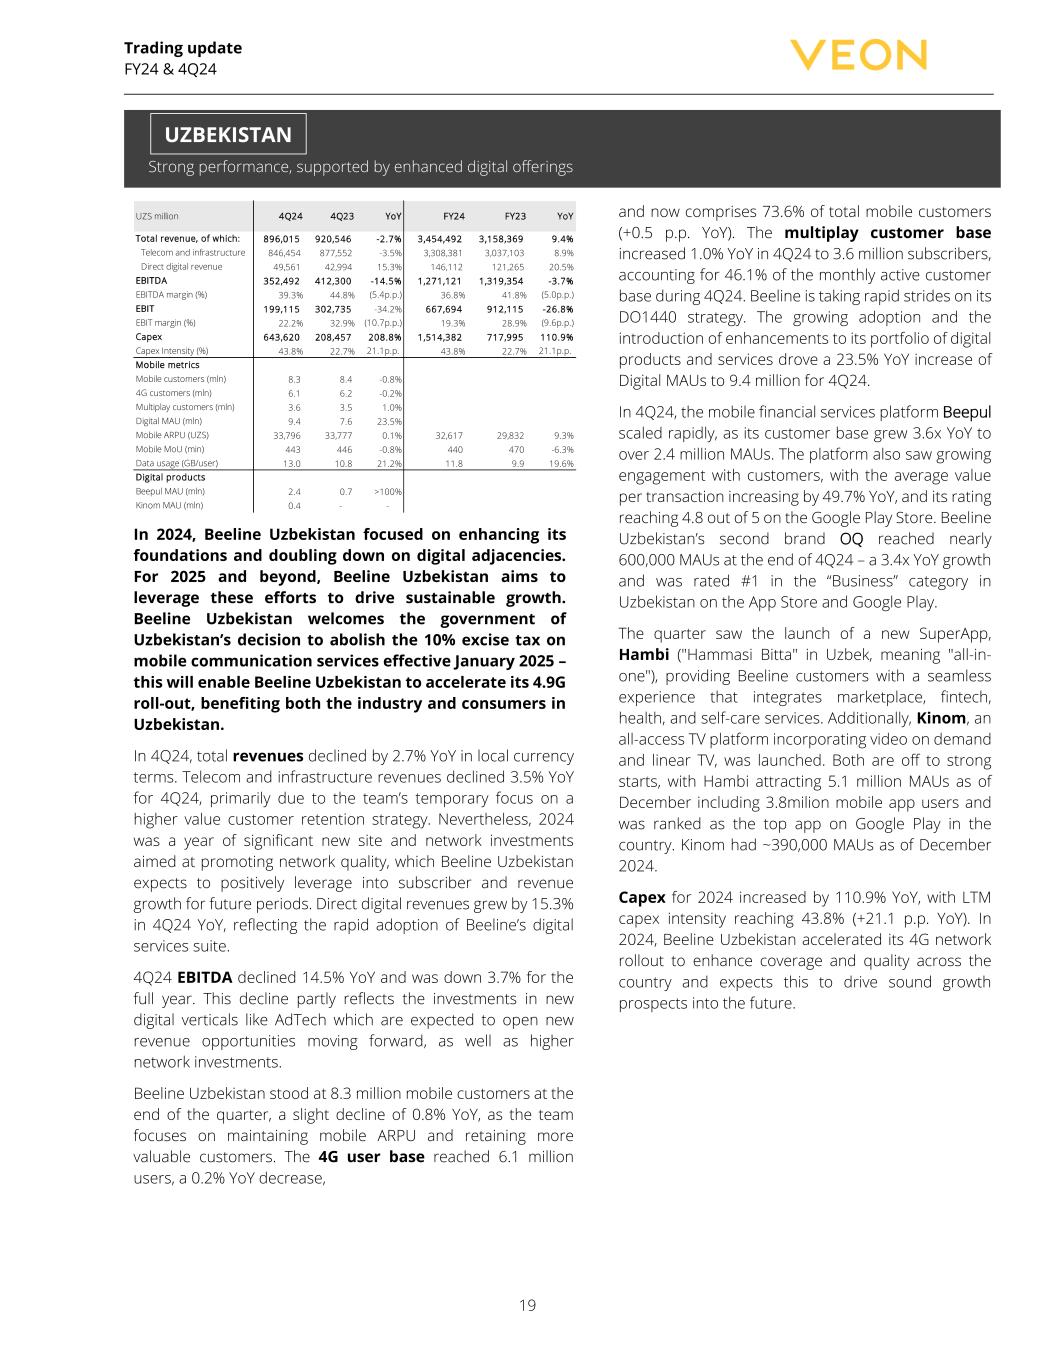
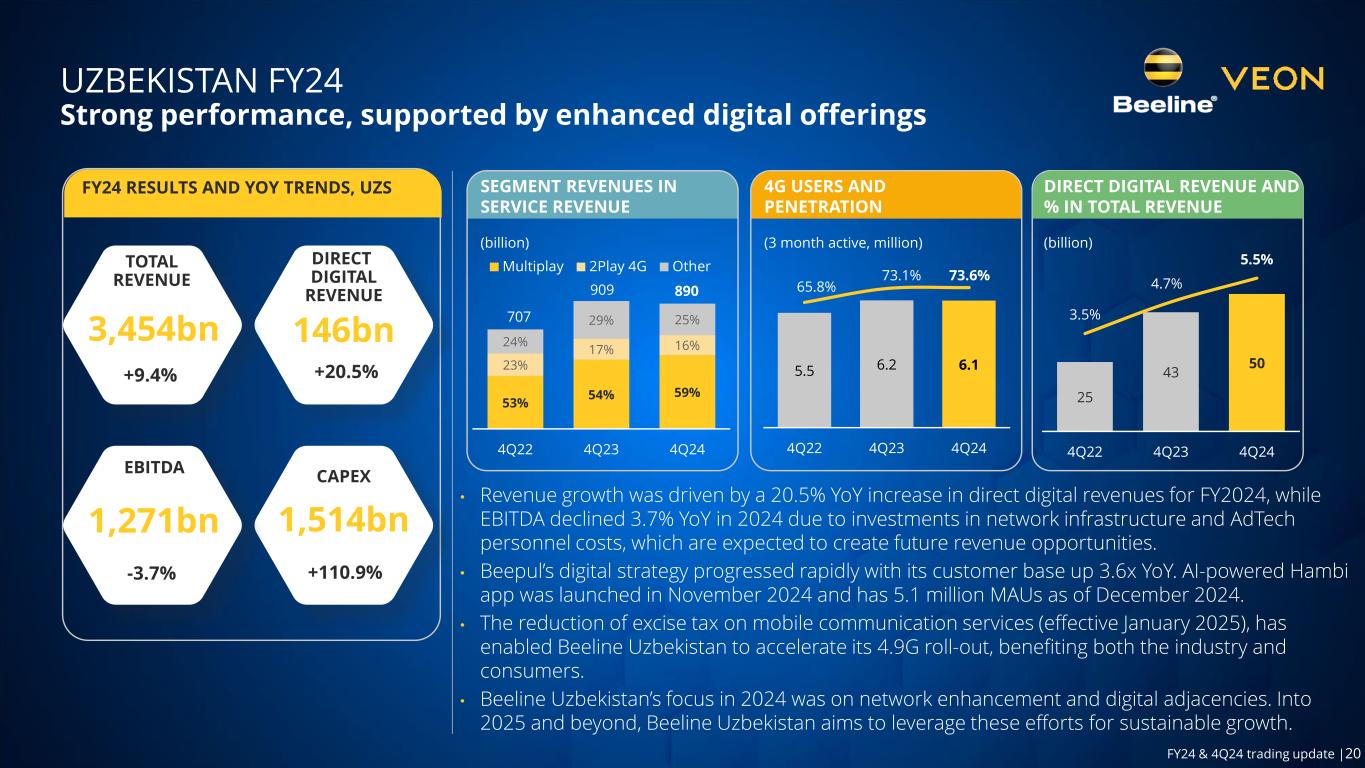
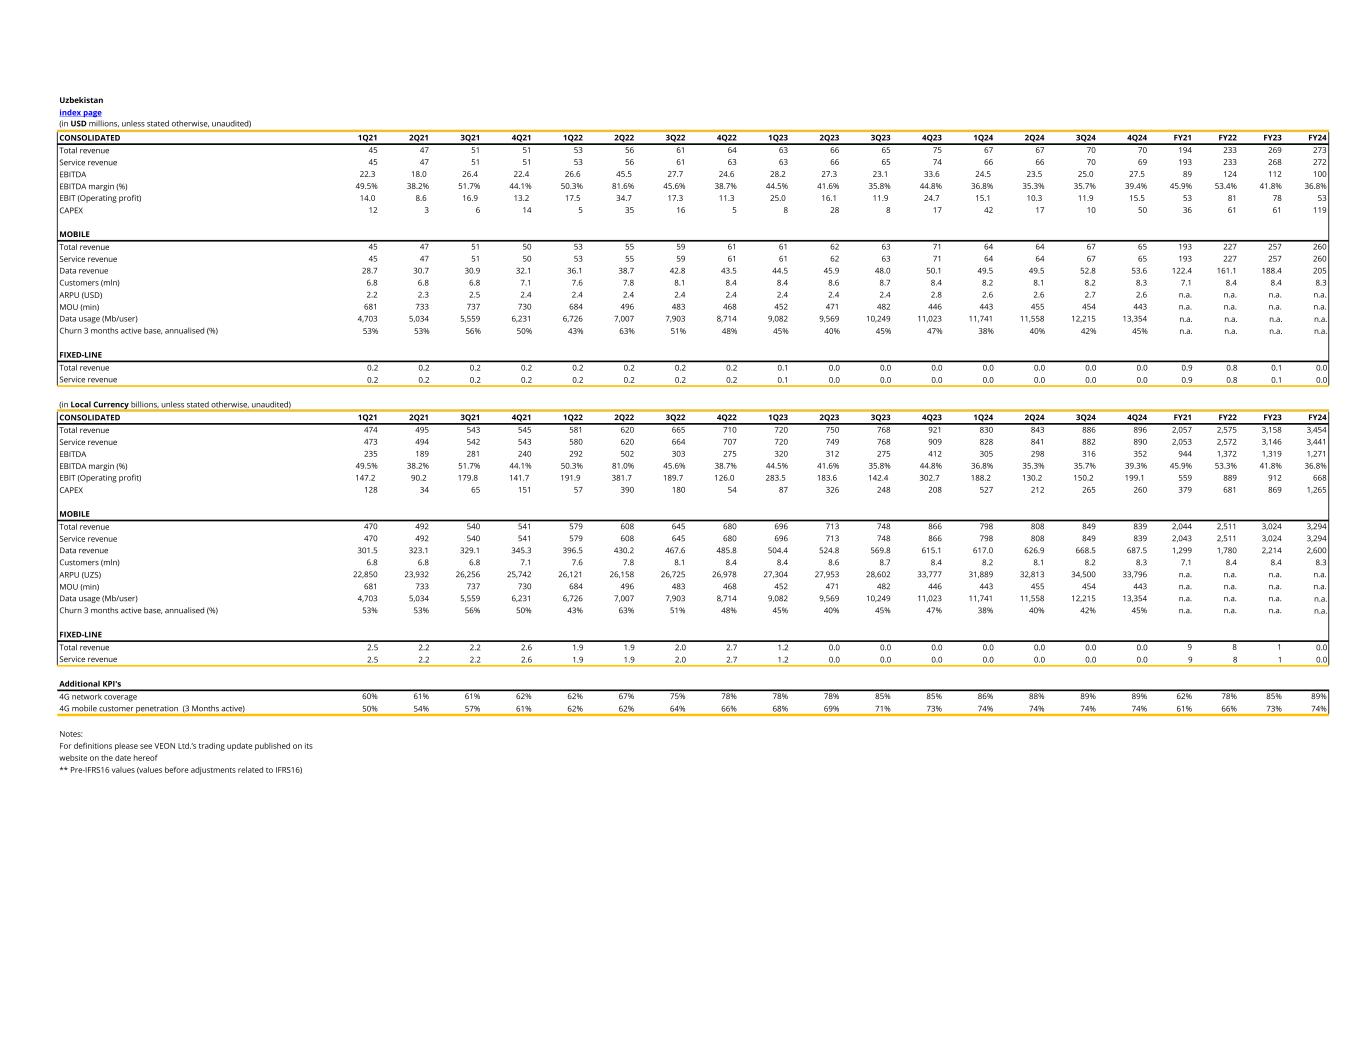
Trading update FY24 & 4Q24 19 Strong performance, supported by enhanced digital offerings UZS million 4Q24 4Q23 YoY FY24 FY23 YoY Total revenue, of which: 896,015 920,546 -2.7% 3,454,492 3 ,158,369 9.4% Telecom and infrastructure 846,454 877,552 -3.5% 3,308,381 3,037,103 8.9% Direct digital revenue 49,561 42,994 15.3% 146,112 121,265 20.5% EBITDA 352,492 412,300 -14.5% 1,271,121 1 ,319,354 -3.7% EBITDA margin (%) 39.3% 44.8% (5.4p.p.) 36.8% 41.8% (5.0p.p.) EBIT 199,115 302,735 -34.2% 667,694 912,115 -26.8% EBIT margin (%) 22.2% 32.9% (10.7p.p.) 19.3% 28.9% (9.6p.p.) Capex 643,620 208,457 208.8% 1,514,382 717,995 110.9% Capex Intensity (%) 43.8% 22.7% 21.1p.p. 43.8% 22.7% 21.1p.p. Mobile metrics Mobile customers (mln) 8.3 8.4 -0.8% 4G customers (mln) 6.1 6.2 -0.2% Multiplay customers (mln) 3.6 3.5 1.0% Digital MAU (mln) 9.4 7.6 23.5% Mobile ARPU (UZS) 33,796 33,777 0.1% 32,617 29,832 9.3% Mobile MoU (min) 443 446 -0.8% 440 470 -6.3% Data usage (GB/user) 13.0 10.8 21.2% 11.8 9.9 19.6% Digital products Beepul MAU (mln) 2.4 0.7 >100% Kinom MAU (mln) 0.4 - - In 2024, Beeline Uzbekistan focused on enhancing its foundations and doubling down on digital adjacencies. For 2025 and beyond, Beeline Uzbekistan aims to leverage these efforts to drive sustainable growth. Beeline Uzbekistan welcomes the government of Uzbekistan’s decision to abolish the 10% excise tax on mobile communication services effective January 2025 – this will enable Beeline Uzbekistan to accelerate its 4.9G roll-out, benefiting both the industry and consumers in Uzbekistan. In 4Q24, total revenues declined by 2.7% YoY in local currency terms. Telecom and infrastructure revenues declined 3.5% YoY for 4Q24, primarily due to the team’s temporary focus on a higher value customer retention strategy. Nevertheless, 2024 was a year of significant new site and network investments aimed at promoting network quality, which Beeline Uzbekistan expects to positively leverage into subscriber and revenue growth for future periods. Direct digital revenues grew by 15.3% in 4Q24 YoY, reflecting the rapid adoption of Beeline’s digital services suite. 4Q24 EBITDA declined 14.5% YoY and was down 3.7% for the full year. This decline partly reflects the investments in new digital verticals like AdTech which are expected to open new revenue opportunities moving forward, as well as higher network investments. Beeline Uzbekistan stood at 8.3 million mobile customers at the end of the quarter, a slight decline of 0.8% YoY, as the team focuses on maintaining mobile ARPU and retaining more valuable customers. The 4G user base reached 6.1 million users, a 0.2% YoY decrease, and now comprises 73.6% of total mobile customers (+0.5 p.p. YoY). The multiplay customer base increased 1.0% YoY in 4Q24 to 3.6 million subscribers, accounting for 46.1% of the monthly active customer base during 4Q24. Beeline is taking rapid strides on its DO1440 strategy. The growing adoption and the introduction of enhancements to its portfolio of digital products and services drove a 23.5% YoY increase of Digital MAUs to 9.4 million for 4Q24. In 4Q24, the mobile financial services platform Beepul scaled rapidly, as its customer base grew 3.6x YoY to over 2.4 million MAUs. The platform also saw growing engagement with customers, with the average value per transaction increasing by 49.7% YoY, and its rating reaching 4.8 out of 5 on the Google Play Store. Beeline Uzbekistan’s second brand OQ reached nearly 600,000 MAUs at the end of 4Q24 – a 3.4x YoY growth and was rated #1 in the “Business” category in Uzbekistan on the App Store and Google Play. The quarter saw the launch of a new SuperApp, Hambi ("Hammasi Bitta" in Uzbek, meaning "all-in- one"), providing Beeline customers with a seamless experience that integrates marketplace, fintech, health, and self-care services. Additionally, Kinom, an all-access TV platform incorporating video on demand and linear TV, was launched. Both are off to strong starts, with Hambi attracting 5.1 million MAUs as of December including 3.8milion mobile app users and was ranked as the top app on Google Play in the country. Kinom had ~390,000 MAUs as of December 2024. Capex for 2024 increased by 110.9% YoY, with LTM capex intensity reaching 43.8% (+21.1 p.p. YoY). In 2024, Beeline Uzbekistan accelerated its 4G network rollout to enhance coverage and quality across the country and expects this to drive sound growth prospects into the future. UZBEKISTAN

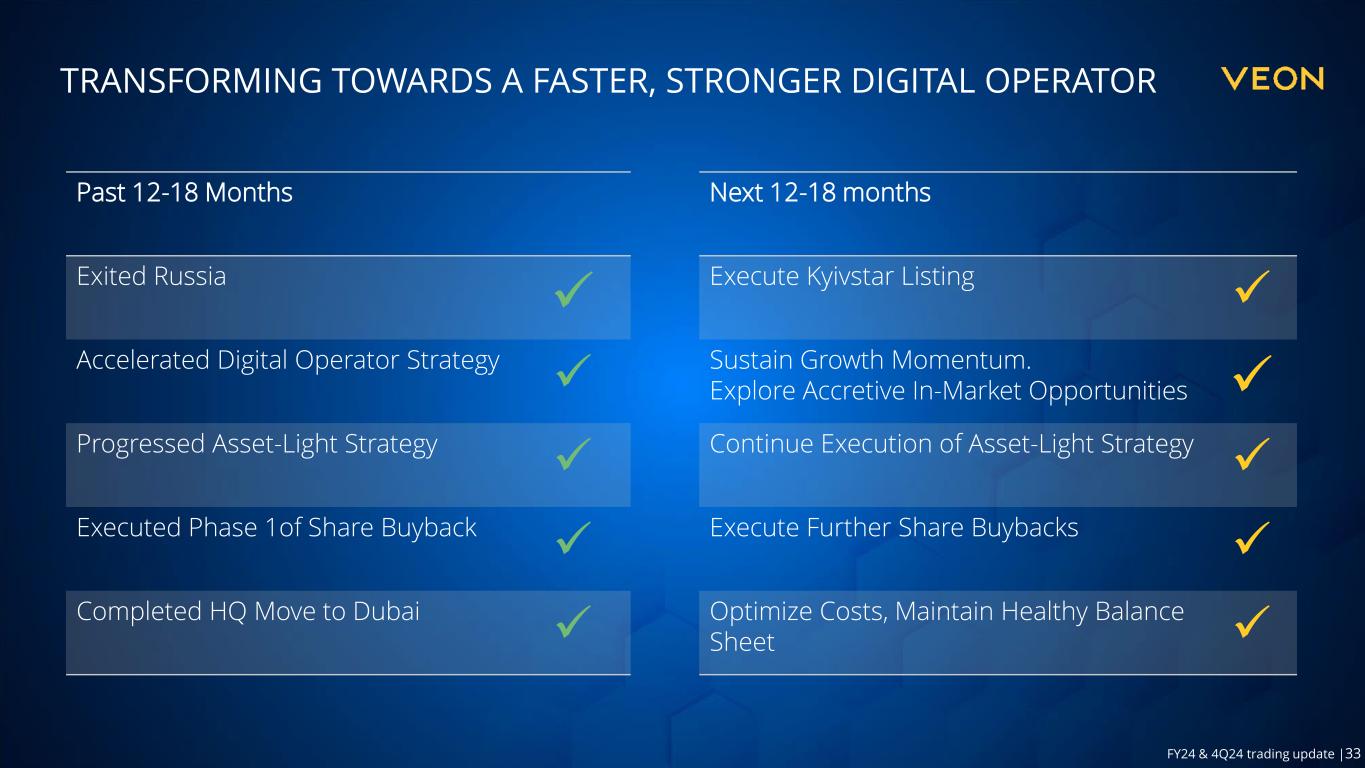
Trading update FY24 & 4Q24 20 VEON’s Kyivstar Expands Digital Portfolio with Acquisition of Uklon, Ukraine’s Top Ride-Hailing Business On March 19, 2025, VEON announced its wholly-owned subsidiary JSC Kyivstar (“Kyivstar”) has signed an agreement to acquire Uklon group (“Uklon”), a leading Ukrainian ride-hailing and delivery platform. This strategic acquisition marks Kyivstar’s expansion into a new area of digital consumer services in line with VEON’s digital operator strategy. Uklon operates in 27 cities across Ukraine and unites more than 100 thousand driver-partners on the platform. The company facilitated over 100 million rides and more than 3 million deliveries in 2024. In 2023, Uklon entered the deliveries business and expanded its operations into Uzbekistan, where VEON’s Beeline Uzbekistan also operates as the country’s leading digital operator. Upon closing of the deal, Kyivstar will acquire 97% of Uklon shares for a total consideration of USD 155.2 million. Uklon CEO Serhii Hryshkov is expected to remain in his position, where he will continue developing the company's products and services in Ukraine and other geographies. The agreement is subject to customary closing conditions and approvals. VEON moves forward with Kyivstar’s Landmark Nasdaq Listing On March 18, 2025, VEON and Cohen Circle Acquisition Corporation, a special purpose acquisition company (Nasdaq: CCIRU), today announced the signing of a business combination agreement (the “BCA”) that will result in the listing of JSC Kyivstar (“Kyivstar”), the leading digital operator in Ukraine, on the Nasdaq Stock Market (“Nasdaq”) in the United States. Following the completion of the business combination (the “Business Combination”), Kyivstar Group Ltd. (“Kyivstar Group”), the parent company of Kyivstar, will be listed on Nasdaq under the ticker symbol KYIV. VEON will own a minimum of 80% of the issued and outstanding equity of Kyivstar Group immediately following the closing of the Business Combination, which is expected to occur in Q3 2025 and is subject to the approval of Cohen Circle’s shareholders and other customary closing conditions. VEON appoints Johan Buse as the Incoming CEO of Banglalink On March 17, 2025, VEON announced that Johan Buse has been appointed as the Chief Executive Officer of Banglalink, VEON’s digital operator in Bangladesh, effective 6th April 2025. Johan joins Banglalink from StarHub in Singapore where he led the Consumer Business Group focusing on strategy and business transformation. Prior to that, Johan has had decades of experience in the telecom industry across Europe, Asia and the Middle East. He previously served as the Chief Commercial Officer of Ooredoo Oman and held senior positions at Deutsche Telekom Croatia, AXIS and Singtel. Johan will succeed Erik Aas who has made the decision to move on from Banglalink after nine successful years. KEY RECENT DEVELOPMENTS
Trading update FY24 & 4Q24 21 Mobilink Bank Wins GLOMO Award for Invisible Heirs Campaign On March 06, 2025, VEON proudly announced that its subsidiary, Mobilink Microfinance Bank, had been awarded the ‘CMO Marketing Campaign’ Award at the GSMA Global Mobile (GLOMO) Awards during Mobile World Congress 2025. The award recognizes Mobilink Bank’s Invisible Heirs campaign, which addresses the systemic issue of women being denied their rightful inheritance and empowers them with tools to claim what is lawfully theirs. The Invisible Heirs campaign aims to tackle gender-based financial inequality in Pakistan. At its core is an inheritance calculator, integrated into Mobilink Bank’s Dost mobile app, which allows women to easily calculate their rightful share of inheritance. VEON Gets Unanimous Support from Noteholders Voting in Consent Solicitation to Facilitate Indirect Listing of Kyivstar on Nasdaq On January 30, 2025, VEON announced the successful completion of a bond consent solicitation process (the ”Consent Solicitation”) undertaken by VEON Holdings B.V. (the "Issuer"), with unanimous support from voting noteholders to substitute a new VEON subsidiary for the Issuer and to make certain other amendments to the terms and conditions of the Issuer’s Senior Unsecured Notes due 25 November 2027. VEON Appoints New Members to the Group Executive Committee On January 16, 2025, VEON announced additional appointments to its Group Executive Committee (“GEC”) by appointing two operating company CEOs. Aamir Ibrahim, CEO of Jazz and the Chair of Mobilink Bank in Pakistan, and Evgeniy Nastradin, CEO of Beeline Kazakhstan, have joined the GEC effective 1 January 2025, in addition to their country CEO responsibilities. These appointments to the GEC will further strengthen VEON’s strategic alignment to its markets and enable Aamir and Evgeniy to further contribute to the Group’s ambitious digital services-driven growth plans while also highlighting the investor value potential of its key digital services and capabilities. VEON to List Kyivstar on Nasdaq in New York, Signs Letter of Intent with Cohen Circle On January 13, 2025, VEON and Cohen Circle Acquisition Corporation, a special purpose acquisition company, today announced the signing of a letter of intent (“LOI”) to enter into a business combination with the aim of indirectly listing Kyivstar, VEON’s digital operator in Ukraine, on the Nasdaq Stock Market LLC in the United States. Completion of this transaction would make Kyivstar the first purely Ukrainian investment opportunity to be publicly listed on a U.S. stock exchange, enabling U.S. and other international investors to participate more directly in Kyivstar’s growth and the broader recovery of the Ukrainian economy. VEON appoints Burak Ozer as Group Chief Financial Officer On January 09, 2025, VEON announced the appointment of Burak Ozer as Group Chief Financial Officer (Group CFO), effective 9 January 2025. Burak will succeed Joop Brakenhoff, who will continue to serve VEON as an Advisor to the Group CEO. VEON and Starlink to Bring Starlink Direct-to-Cell Satellite Connectivity to Kyivstar Customers On December 30, 2024, VEON announced that Kyivstar, its digital operator in Ukraine, has signed an agreement with Starlink, a division of SpaceX, to introduce groundbreaking direct-to-cell satellite connectivity in Ukraine. Upon its launch, the service will make Ukraine one of the first countries to have the game-changing Starlink direct-to-cell service, enhancing the resilience of the country’s connectivity landscape. Kyivstar anticipates launching Starlink direct- to-cell services with SMS and OTT messaging functionality in the fourth quarter of 2025 for Kyivstar customers and plans to expand to voice and data in later stages. VEON Completes the Move of its Headquarters to Dubai On December 19, 2024, VEON completed the move of its Group headquarters from Amsterdam to Dubai, United Arab Emirates. With the move of its Group headquarters to Dubai, VEON is now the largest Nasdaq-listed company with its Group headquarters in Dubai, which is also home to Nasdaq Dubai. VEON discloses its unaudited interim condensed consolidated financial statements for 3Q and 9M 2024 On December 13, 2024, VEON following the release of its 3Q24 trading update on 14 November 2024, disclosed its unaudited interim condensed consolidated financial statements for the three-month and nine-month periods ended 30 September 2024 for VEON Ltd. The Financial Statements are available on the VEON Group website.
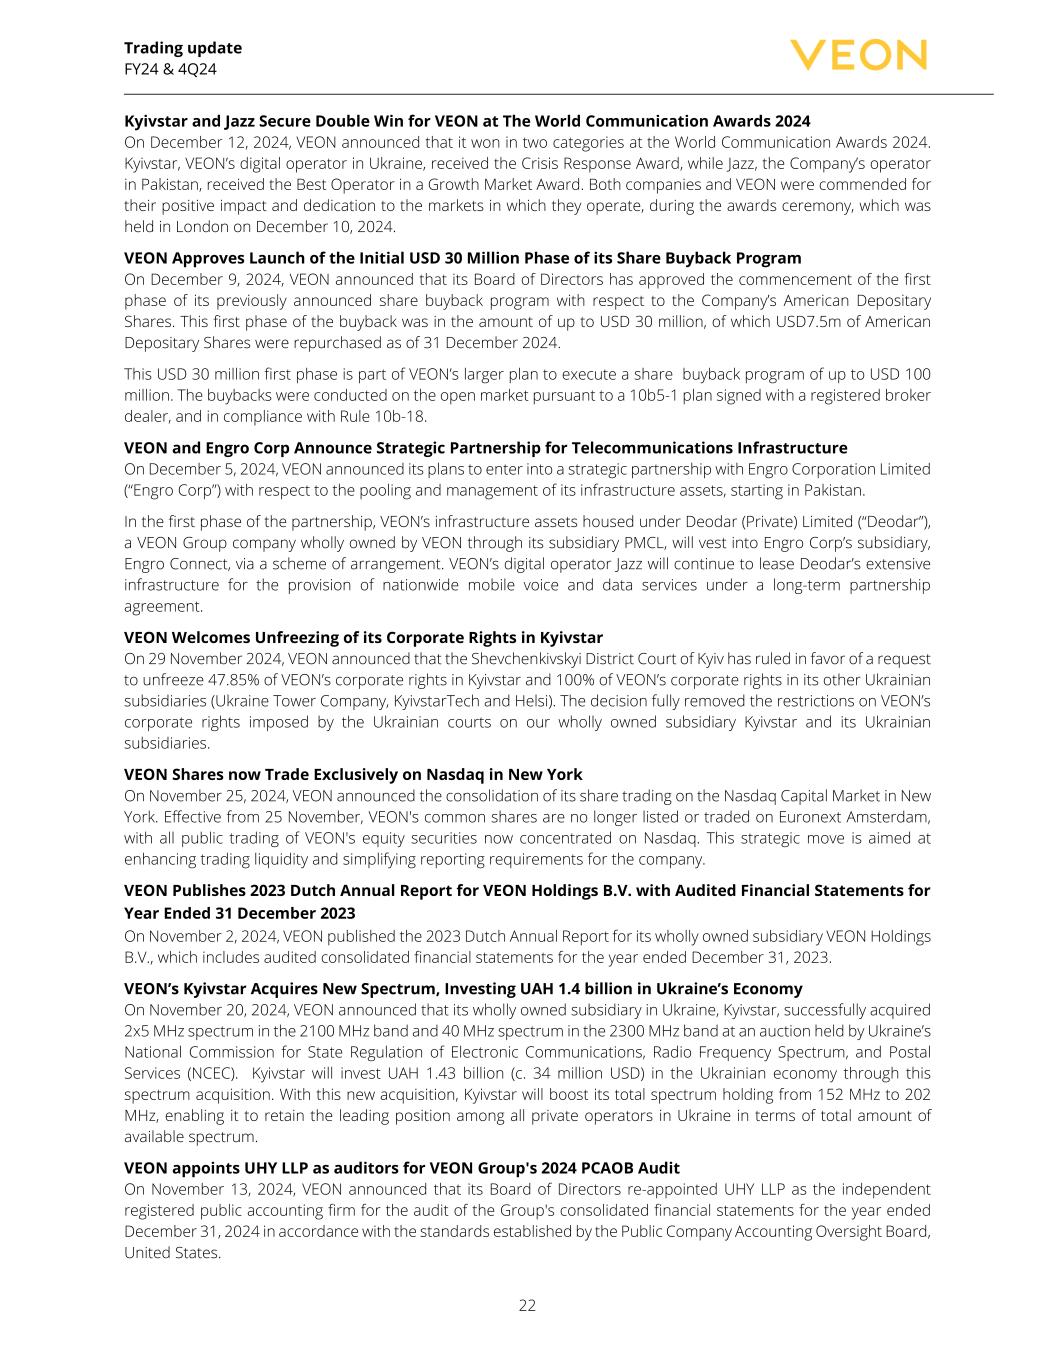
Trading update FY24 & 4Q24 22 Kyivstar and Jazz Secure Double Win for VEON at The World Communication Awards 2024 On December 12, 2024, VEON announced that it won in two categories at the World Communication Awards 2024. Kyivstar, VEON’s digital operator in Ukraine, received the Crisis Response Award, while Jazz, the Company’s operator in Pakistan, received the Best Operator in a Growth Market Award. Both companies and VEON were commended for their positive impact and dedication to the markets in which they operate, during the awards ceremony, which was held in London on December 10, 2024. VEON Approves Launch of the Initial USD 30 Million Phase of its Share Buyback Program On December 9, 2024, VEON announced that its Board of Directors has approved the commencement of the first phase of its previously announced share buyback program with respect to the Company’s American Depositary Shares. This first phase of the buyback was in the amount of up to USD 30 million, of which USD7.5m of American Depositary Shares were repurchased as of 31 December 2024. This USD 30 million first phase is part of VEON’s larger plan to execute a share buyback program of up to USD 100 million. The buybacks were conducted on the open market pursuant to a 10b5-1 plan signed with a registered broker dealer, and in compliance with Rule 10b-18. VEON and Engro Corp Announce Strategic Partnership for Telecommunications Infrastructure On December 5, 2024, VEON announced its plans to enter into a strategic partnership with Engro Corporation Limited (“Engro Corp”) with respect to the pooling and management of its infrastructure assets, starting in Pakistan. In the first phase of the partnership, VEON’s infrastructure assets housed under Deodar (Private) Limited (“Deodar”), a VEON Group company wholly owned by VEON through its subsidiary PMCL, will vest into Engro Corp’s subsidiary, Engro Connect, via a scheme of arrangement. VEON’s digital operator Jazz will continue to lease Deodar’s extensive infrastructure for the provision of nationwide mobile voice and data services under a long-term partnership agreement. VEON Welcomes Unfreezing of its Corporate Rights in Kyivstar On 29 November 2024, VEON announced that the Shevchenkivskyi District Court of Kyiv has ruled in favor of a request to unfreeze 47.85% of VEON’s corporate rights in Kyivstar and 100% of VEON’s corporate rights in its other Ukrainian subsidiaries (Ukraine Tower Company, KyivstarTech and Helsi). The decision fully removed the restrictions on VEON’s corporate rights imposed by the Ukrainian courts on our wholly owned subsidiary Kyivstar and its Ukrainian subsidiaries. VEON Shares now Trade Exclusively on Nasdaq in New York On November 25, 2024, VEON announced the consolidation of its share trading on the Nasdaq Capital Market in New York. Effective from 25 November, VEON's common shares are no longer listed or traded on Euronext Amsterdam, with all public trading of VEON's equity securities now concentrated on Nasdaq. This strategic move is aimed at enhancing trading liquidity and simplifying reporting requirements for the company. VEON Publishes 2023 Dutch Annual Report for VEON Holdings B.V. with Audited Financial Statements for Year Ended 31 December 2023 On November 2, 2024, VEON published the 2023 Dutch Annual Report for its wholly owned subsidiary VEON Holdings B.V., which includes audited consolidated financial statements for the year ended December 31, 2023. VEON’s Kyivstar Acquires New Spectrum, Investing UAH 1.4 billion in Ukraine’s Economy On November 20, 2024, VEON announced that its wholly owned subsidiary in Ukraine, Kyivstar, successfully acquired 2x5 MHz spectrum in the 2100 MHz band and 40 MHz spectrum in the 2300 MHz band at an auction held by Ukraine’s National Commission for State Regulation of Electronic Communications, Radio Frequency Spectrum, and Postal Services (NCEC). Kyivstar will invest UAH 1.43 billion (c. 34 million USD) in the Ukrainian economy through this spectrum acquisition. With this new acquisition, Kyivstar will boost its total spectrum holding from 152 MHz to 202 MHz, enabling it to retain the leading position among all private operators in Ukraine in terms of total amount of available spectrum. VEON appoints UHY LLP as auditors for VEON Group's 2024 PCAOB Audit On November 13, 2024, VEON announced that its Board of Directors re-appointed UHY LLP as the independent registered public accounting firm for the audit of the Group's consolidated financial statements for the year ended December 31, 2024 in accordance with the standards established by the Public Company Accounting Oversight Board, United States.

Trading update FY24 & 4Q24 23 VEON held Special General Meeting for the Laying of the 2023 Audited Financials Before Shareholders On December 12, 2024 VEON’s Board of Directors convened a special general meeting of its shareholders (the “SGM”) solely for the purpose of laying the audited financial statements for the period ending December 31, 2023 shareholders. The SGM was announced on November 12, 2024. VEON Launches AI-Powered Super App Hambi in Uzbekistan On November 1, 2024, VEON launched the Hambi super app, an AI-powered innovative platform that consolidates a comprehensive suite of digital services and connectivity into a single application, which is now accessible to all mobile users in Uzbekistan.
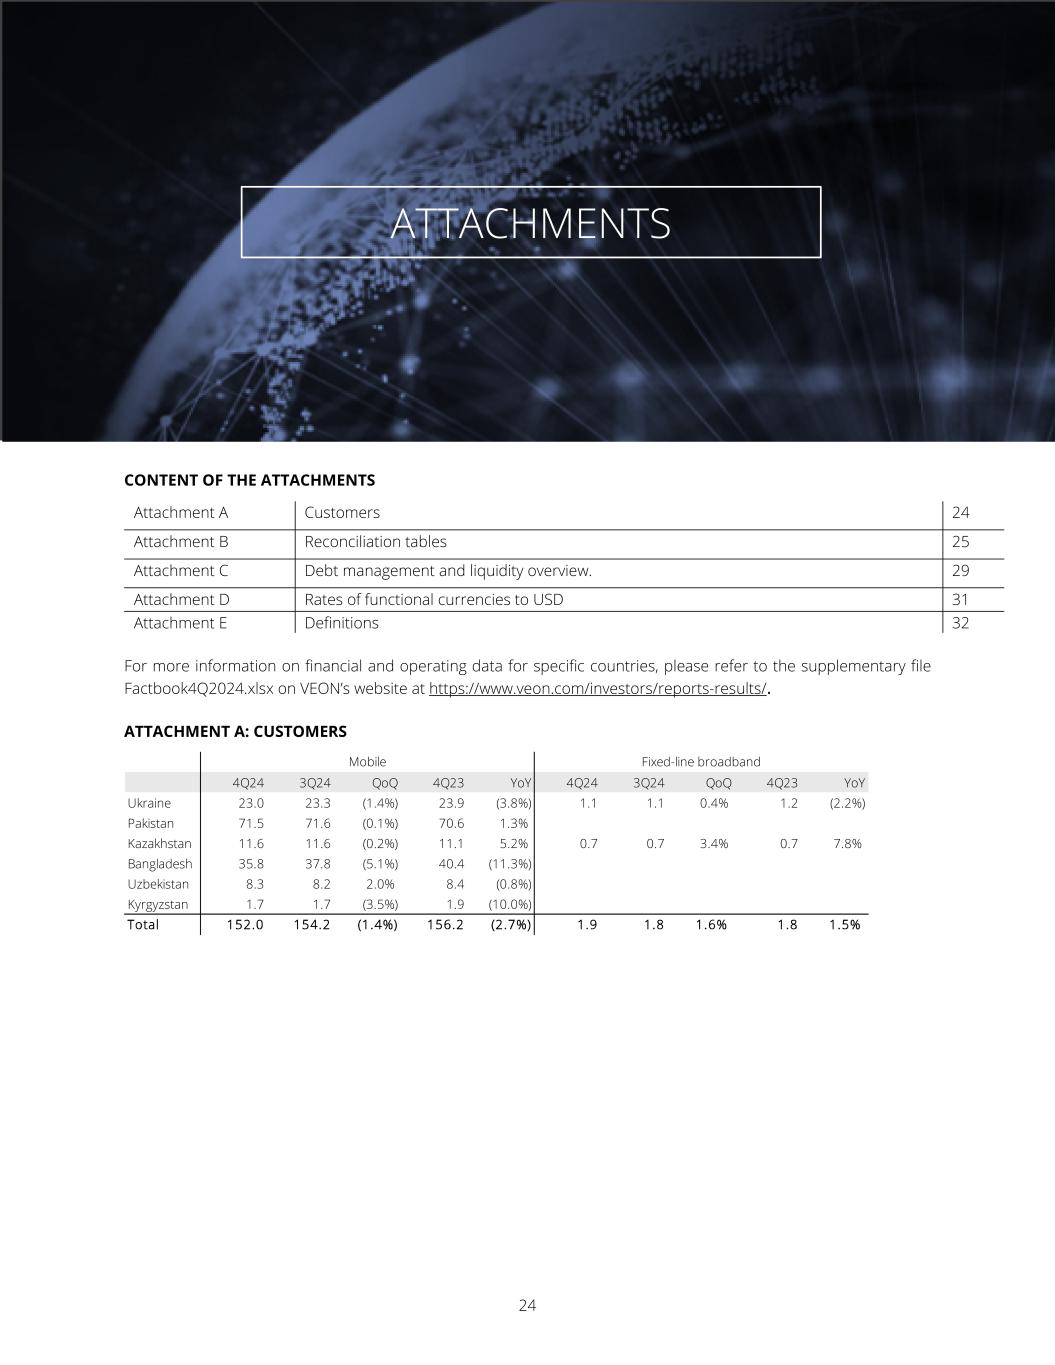
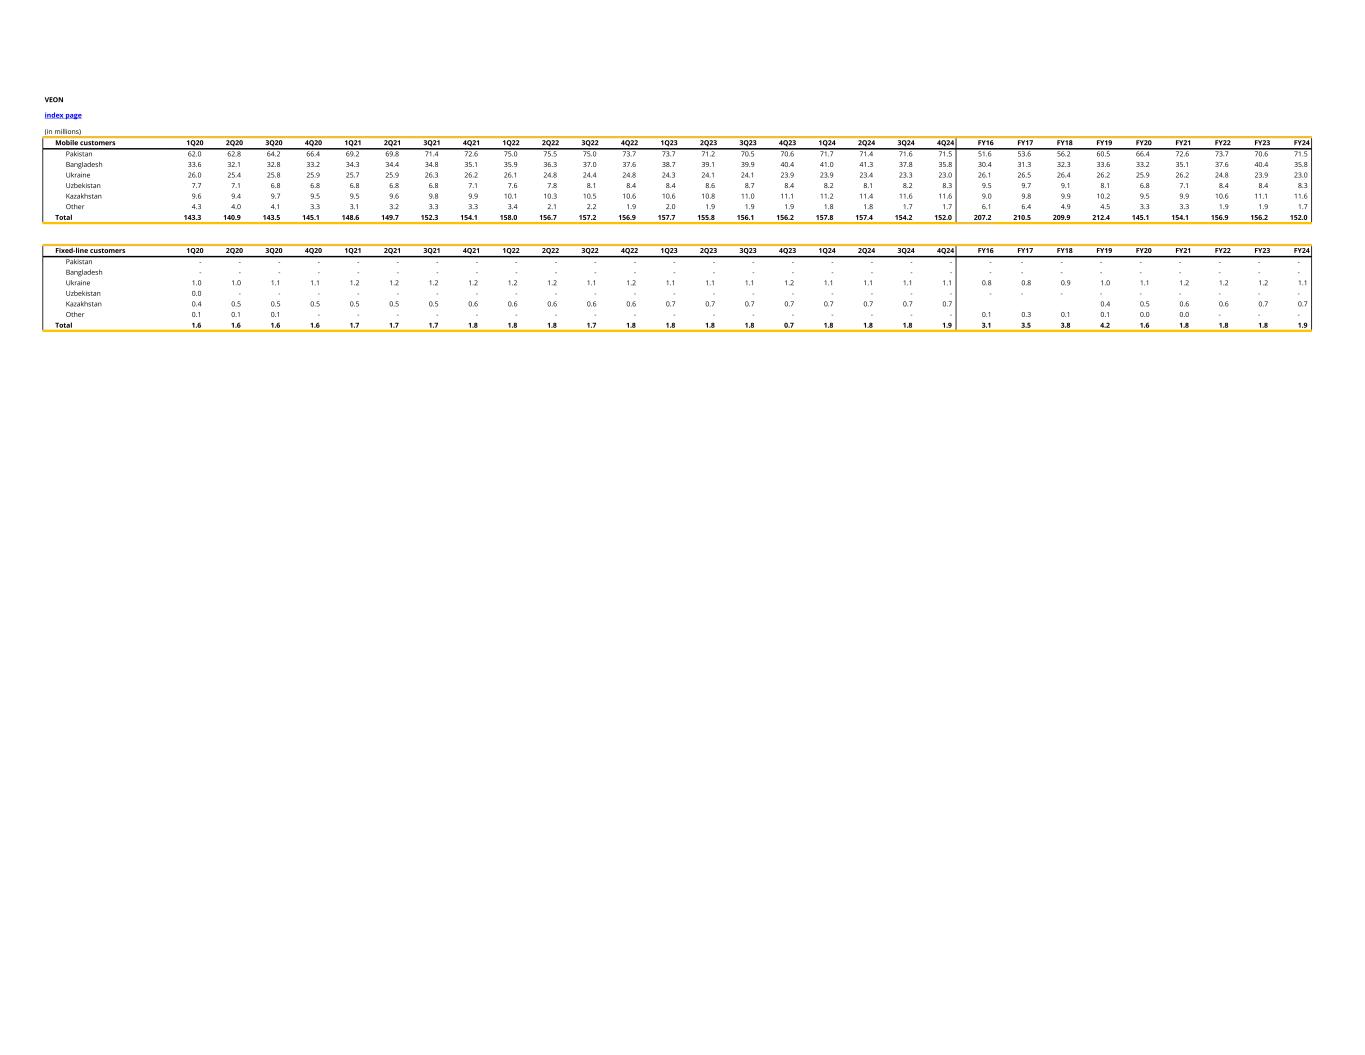
Trading update FY24 & 4Q24 24 CONTENT OF THE ATTACHMENTS Attachment A Customers 24 Attachment B Reconciliation tables 25 Attachment C Debt management and liquidity overview. 29 Attachment D Rates of functional currencies to USD 31 Attachment E Definitions 32 For more information on financial and operating data for specific countries, please refer to the supplementary file Factbook4Q2024.xlsx on VEON’s website at https://www.veon.com/investors/reports-results/. ATTACHMENT A: CUSTOMERS 4Q24 3Q24 QoQ 4Q23 YoY 4Q24 3Q24 QoQ 4Q23 YoY Ukraine 23.0 23.3 (1.4%) 23.9 (3.8%) 1.1 1.1 0.4% 1.2 (2.2%) Pakistan 71.5 71.6 (0.1%) 70.6 1.3% Kazakhstan 11.6 11.6 (0.2%) 11.1 5.2% 0.7 0.7 3.4% 0.7 7.8% Bangladesh 35.8 37.8 (5.1%) 40.4 (11.3%) Uzbekistan 8.3 8.2 2.0% 8.4 (0.8%) Kyrgyzstan 1.7 1.7 (3.5%) 1.9 (10.0%) Total 152.0 154.2 (1.4%) 156.2 (2.7%) 1.9 1.8 1.6% 1.8 1.5% Mobile Fixed-line broadband ATTACHMENTS

Trading update FY24 & 4Q24 25 ATTACHMENT B: RECONCILIATION TABLES RECONCILIATION OF CONSOLIDATED EBITDA TO PROFIT/(LOSS) FOR THE PERIOD USD million Unaudited 4Q24 4Q23 FY24 FY23 EBITDA 408 367 1,691 1,612 Depreciation (133) (131) (529) (527) Amortization (50) (52) (199) (208) Impairment (loss) / gain (1) (6) (3) 6 Gain/(loss) on disposals of non-current assets 7 44 5 46 (Loss) /gain on disposals of subsidiaries (1) 0 145 (0) Operating profit 230 223 1,110 929 Financial income and expenses, of which: (107) (107) (446) (470) - Financial income 17 11 49 60 - Financial expenses (123) (119) (495) (531) Net foreign exchange gain /(loss) and others, of which: 25 36 40 100 - Other non-operating gains/(losses) 8 4 31 20 - Net foreign exchange gain / (loss) 17 32 9 80 Profit before tax from continuing operations 148 152 704 559 Income tax expense (55) (64) (217) (179) Profit continuing operations 93 88 487 380 Profit / (loss) from discontinued operations - (3,637) - (2,830) Profit for the period 93 (3,549) 487 (2,450) Profit attributable to non-controlling interest 13 19 72 78 Profit attributable to VEON shareholders 81 (3,569) 414 (2,528) RECONCILIATION OF CAPEX USD million 4Q24 4Q23 FY24 FY23 Capex excluding l icense and capitalised leases 322 258 826 651 Adding back purchase of licenses (31) (61) (188) (169) Difference in timing between accrual and payment for capital expenditures (65) (43) 270 284 Cash paid for capital expenditures 226 154 907 766
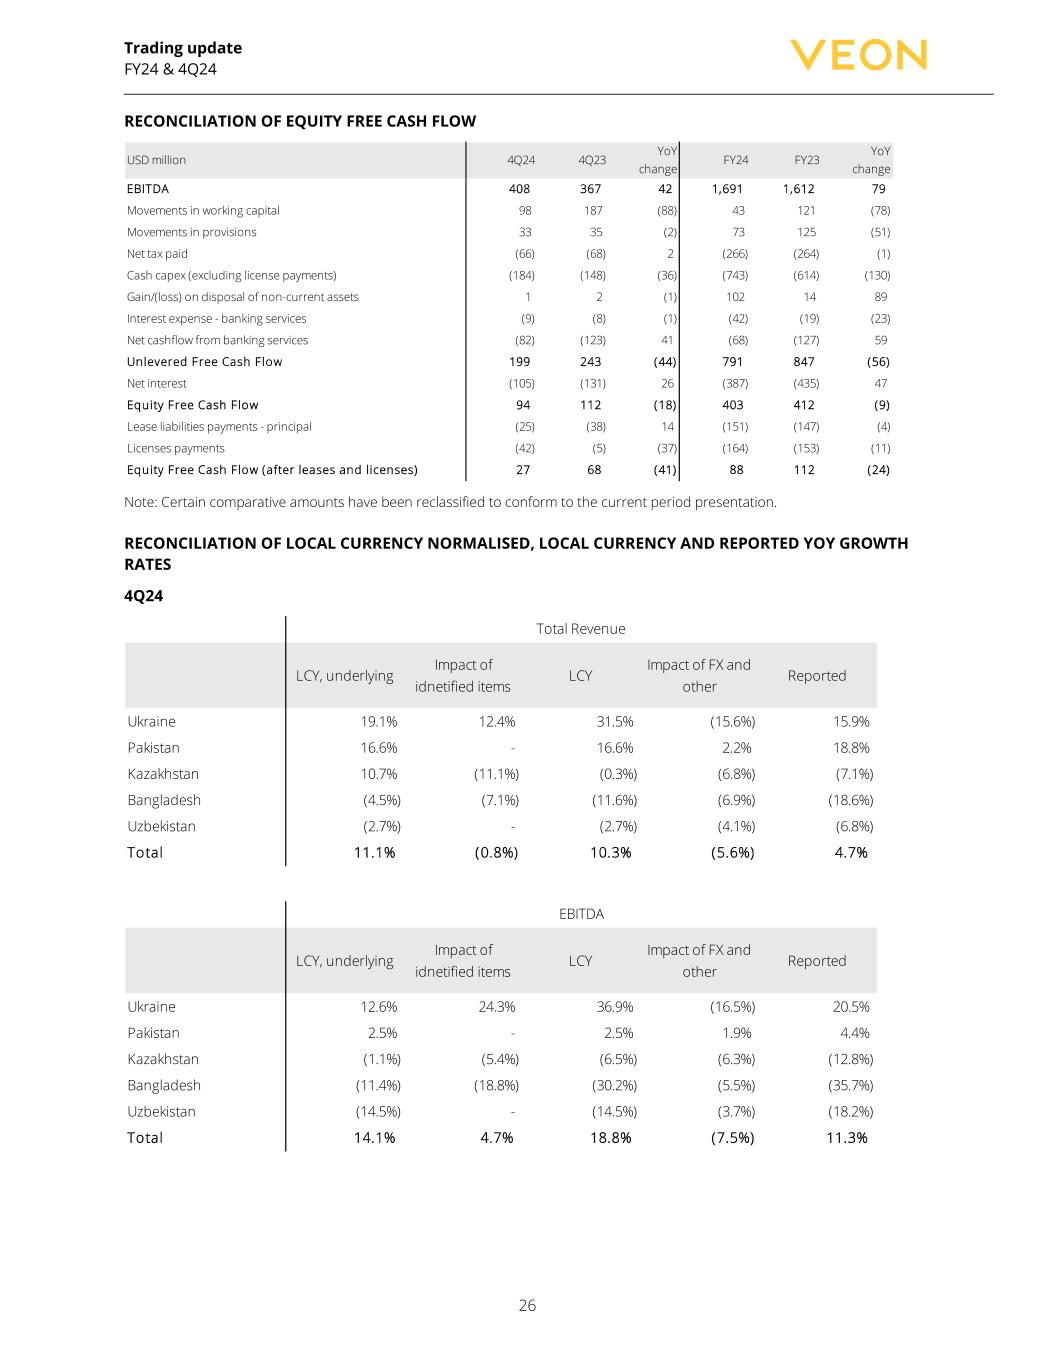
Trading update FY24 & 4Q24 26 RECONCILIATION OF EQUITY FREE CASH FLOW USD million 4Q24 4Q23 YoY change FY24 FY23 YoY change EBITDA 408 367 42 1,691 1,612 79 Movements in working capital 98 187 (88) 43 121 (78) Movements in provisions 33 35 (2) 73 125 (51) Net tax paid (66) (68) 2 (266) (264) (1) Cash capex (excluding license payments) (184) (148) (36) (743) (614) (130) Gain/(loss) on disposal of non-current assets 1 2 (1) 102 14 89 Interest expense - banking services (9) (8) (1) (42) (19) (23) Net cashflow from banking services (82) (123) 41 (68) (127) 59 Unlevered Free Cash F low 199 243 (44) 791 847 (56) Net interest (105) (131) 26 (387) (435) 47 Equity Free Cash F low 94 112 (18) 403 412 (9) Lease liabilities payments - principal (25) (38) 14 (151) (147) (4) Licenses payments (42) (5) (37) (164) (153) (11) Equity Free Cash F low (after leases and l icenses) 27 68 (41) 88 112 (24) Note: Certain comparative amounts have been reclassified to conform to the current period presentation. RECONCILIATION OF LOCAL CURRENCY NORMALISED, LOCAL CURRENCY AND REPORTED YOY GROWTH RATES 4Q24 LCY, underlying Impact of idnetified items LCY Impact of FX and other Reported Ukraine 19.1% 12.4% 31.5% (15.6%) 15.9% Pakistan 16.6% - 16.6% 2.2% 18.8% Kazakhstan 10.7% (11.1%) (0.3%) (6.8%) (7.1%) Bangladesh (4.5%) (7.1%) (11.6%) (6.9%) (18.6%) Uzbekistan (2.7%) - (2.7%) (4.1%) (6.8%) Total 11.1% (0.8%) 10.3% (5.6%) 4.7% Total Revenue LCY, underlying Impact of idnetified items LCY Impact of FX and other Reported Ukraine 12.6% 24.3% 36.9% (16.5%) 20.5% Pakistan 2.5% - 2.5% 1.9% 4.4% Kazakhstan (1.1%) (5.4%) (6.5%) (6.3%) (12.8%) Bangladesh (11.4%) (18.8%) (30.2%) (5.5%) (35.7%) Uzbekistan (14.5%) - (14.5%) (3.7%) (18.2%) Total 14.1% 4.7% 18.8% (7.5%) 11.3% EBITDA

Trading update FY24 & 4Q24 27 FY24 LCY, underlying Impact of idnetified items LCY Impact of FX and other Reported Ukraine 13.7% (2.7%) 11.0% (10.3%) 0.7% Pakistan 22.7% - 22.7% 0.7% 23.5% Kazakhstan 16.2% (3.1%) 13.1% (2.8%) 10.3% Bangladesh 0.8% (3.6%) (2.8%) (6.0%) (8.8%) Uzbekistan 9.4% - 9.4% (7.7%) 1.6% Total 14.6% (1.8%) 12.8% (4.5%) 8.3% Total Revenue LCY, underlying Impact of idnetified items LCY Impact of FX and other Reported Ukraine 10.3% (4.5%) 5.8% (10.0%) (4.2%) Pakistan 15.6% - 15.6% 0.7% 16.3% Kazakhstan 9.0% (1.5%) 7.4% (2.3%) 5.1% Bangladesh (0.6%) (9.6%) (10.2%) (5.6%) (15.8%) Uzbekistan (3.7%) - (3.7%) (6.9%) (10.5%) Total 12.0% (2.0%) 10.0% (5.0%) 4.9% EBITDA RECONCILIATION OF AMOUNTS: REPORTED, IN CONSTANT CURRENCY AND IN CONSTANT CURRENCY ADJUSTED FOR IDENTIFIED ITEMS 4Q24 USD, million Reported Constant FX Identified items, constant FX Underlying constant FX Total revenue Ukraine 251 285 285 Pakistan 356 349 349 Kazakhstan 193 207 207 Bangladesh 115 125 10 135 Uzbekistan 70 73 73 HQ, other and eliminations 13 13 13 Total 998 1,051 10 1,061 USD, million Reported Constant FX Identified items, constant FX Underlying constant FX EBITDA Ukraine 140 158 158 Pakistan 134 132 132 Kazakhstan 93 100 100 Bangladesh 34 37 10 47 Uzbekistan 27 29 29 HQ, other and eliminations (21) (21) 8 (12) Total 408 436 18 454
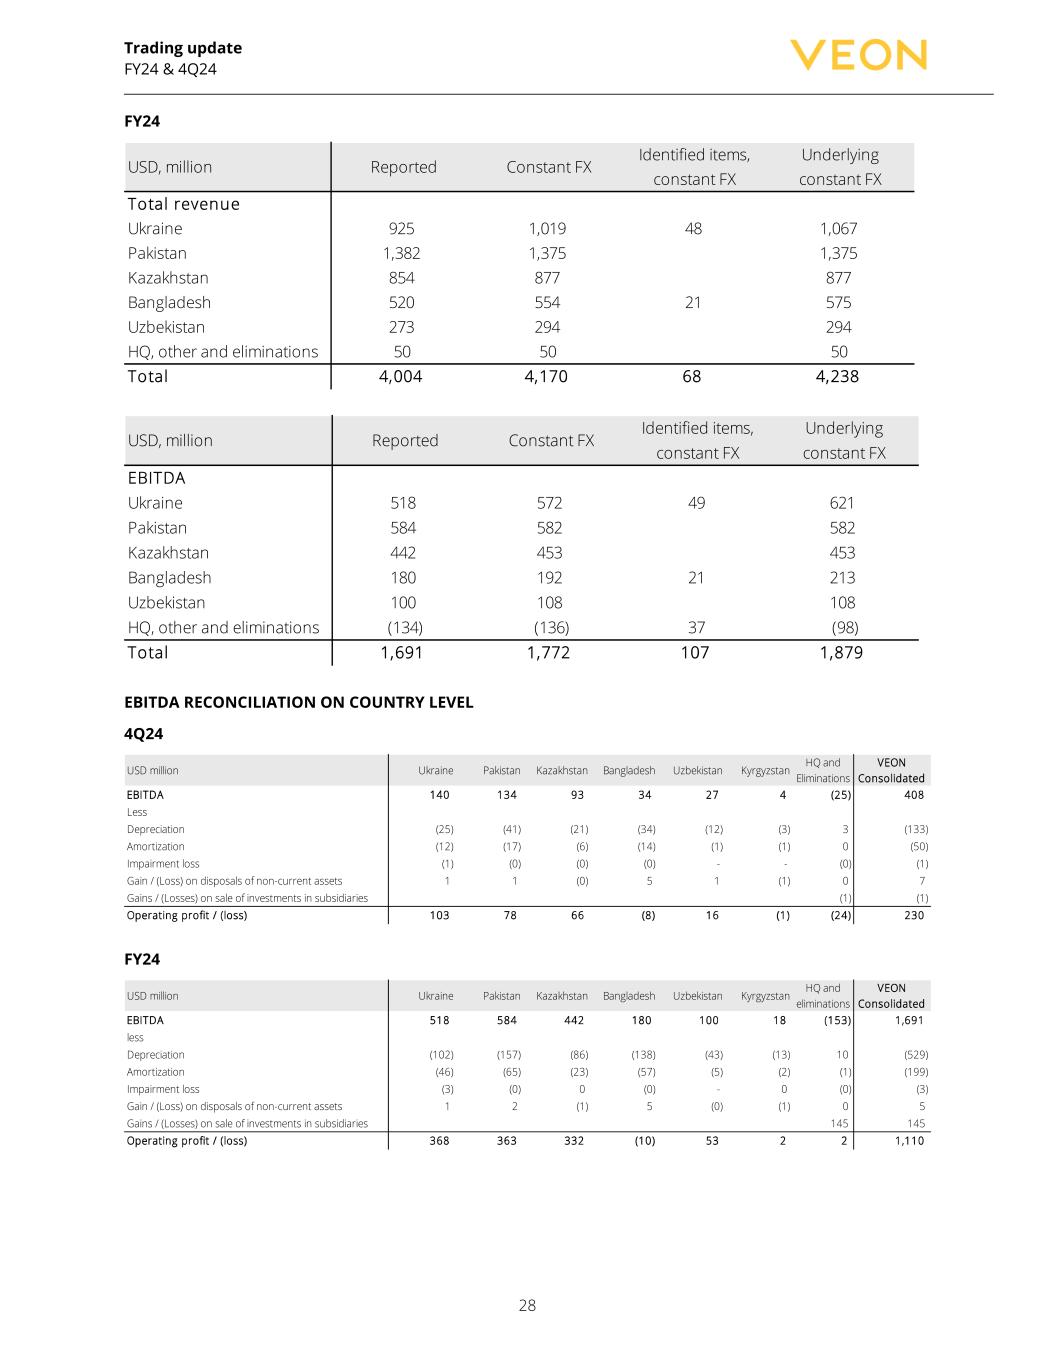
Trading update FY24 & 4Q24 28 FY24 USD, million Reported Constant FX Identified items, constant FX Underlying constant FX Total revenue Ukraine 925 1,019 48 1,067 Pakistan 1,382 1,375 1,375 Kazakhstan 854 877 877 Bangladesh 520 554 21 575 Uzbekistan 273 294 294 HQ, other and eliminations 50 50 50 Total 4,004 4,170 68 4,238 USD, million Reported Constant FX Identified items, constant FX Underlying constant FX EBITDA Ukraine 518 572 49 621 Pakistan 584 582 582 Kazakhstan 442 453 453 Bangladesh 180 192 21 213 Uzbekistan 100 108 108 HQ, other and eliminations (134) (136) 37 (98) Total 1,691 1,772 107 1,879 EBITDA RECONCILIATION ON COUNTRY LEVEL 4Q24 USD million Ukraine Pakistan Kazakhstan Bangladesh Uzbekistan Kyrgyzstan HQ and Eliminations VEON Consolidated EBITDA 140 134 93 34 27 4 (25) 408 Less Depreciation (25) (41) (21) (34) (12) (3) 3 (133) Amortization (12) (17) (6) (14) (1) (1) 0 (50) Impairment loss (1) (0) (0) (0) - - (0) (1) Gain / (Loss) on disposals of non-current assets 1 1 (0) 5 1 (1) 0 7 Gains / (Losses) on sale of investments in subsidiaries (1) (1) Operating profit / (loss) 103 78 66 (8) 16 (1) (24) 230 FY24 USD million Ukraine Pakistan Kazakhstan Bangladesh Uzbekistan Kyrgyzstan HQ and eliminations VEON Consolidated EBITDA 518 584 442 180 100 18 (153) 1 ,691 less Depreciation (102) (157) (86) (138) (43) (13) 10 (529) Amortization (46) (65) (23) (57) (5) (2) (1) (199) Impairment loss (3) (0) 0 (0) - 0 (0) (3) Gain / (Loss) on disposals of non-current assets 1 2 (1) 5 (0) (1) 0 5 Gains / (Losses) on sale of investments in subsidiaries 145 145 Operating profit / (loss) 368 363 332 (10) 53 2 2 1 ,110

Trading update FY24 & 4Q24 29 ATTACHMENT C: DEBT MANAGEMENT AND LIQUIDITY OVERVIEW. RECONCILIATION OF NET DEBT USD million 31 Dec 2024 30 Sep 2024 30 Jun 2024 31 Mar 2024 31 Dec 2023 Net debt, excluding leases and banking operations in Pakistan 1,901 2,100 2,226 2,040 1,970 Lease liabilities - principal 1,033 1,014 1,011 1,024 985 Net debt, excluding banking operations in Pakistan 2,934 3,114 3,237 3,064 2,955 Cash and cash equivalents 1,689 1,019 862 832 1,902 Deposits in MMBL and JazzCash in Pakistan (243) (144) (140) (200) (165) Long-term and short-term deposits 2 2 2 3 1 Gross debt 4,381 3,991 3,961 3,699 4,693 Interest accrued related to financial liabilities 54 87 69 85 75 Other unamortised adjustments to financial liabilities (fees, discounts etc.) (14) (13) (13) (8) (6) Derivatives not designated as hedges 9 (0) (0) (0) (0) Derivatives designed as hedges (0) (0) 0 0 1 Other financial liabilities (0) (0) (0) (0) (0) Total financial liabilities 4,430 4 ,064 4 ,018 3 ,775 4 ,762 GROUP DEBT AND LIQUIDITY CURRENCY MIX * Note: Cash and cash deposits includes USD 243m relating to banking operations in Pakistan. This amount is however excluded for calculation of net debt. OUTSTANDING DEBT BY ENTITY As of 31 December 2024 USD equivalent, millions Gross debt Capitalised leases Gross debt excluding leases Cash, cash equivalents and deposits Net debt* excluding leases USD 1,694 2 1,692 652 1,040 RUB 89 - 89 - 89 PKR 1,455 321 1,134 610 767 BDT 568 364 204 45 159 UAH 166 166 - 36 (36) Other 409 180 229 348 (118) Total 4,381 1 ,033 3 ,348 1 ,691 1 ,901 Entity Bonds Loans Overdrafts and vendor financing Total outstanding debt VEON Holdings B.V.1 1,668 - - 1,668 Pakistan Mobile Communications Ltd. 54 1,061 9 1,124 Banglalink Digital Communications Ltd. - 204 10 214 Unitel LLC. - 45 76 121 KaR-Tel LLP. - 67 60 127 Other 7 3 1 11 Total bonds, loans, overdrafts and other 1,729 1,380 156 3,265 Long term payables and other 83 Gross debt excluding leases 3,348
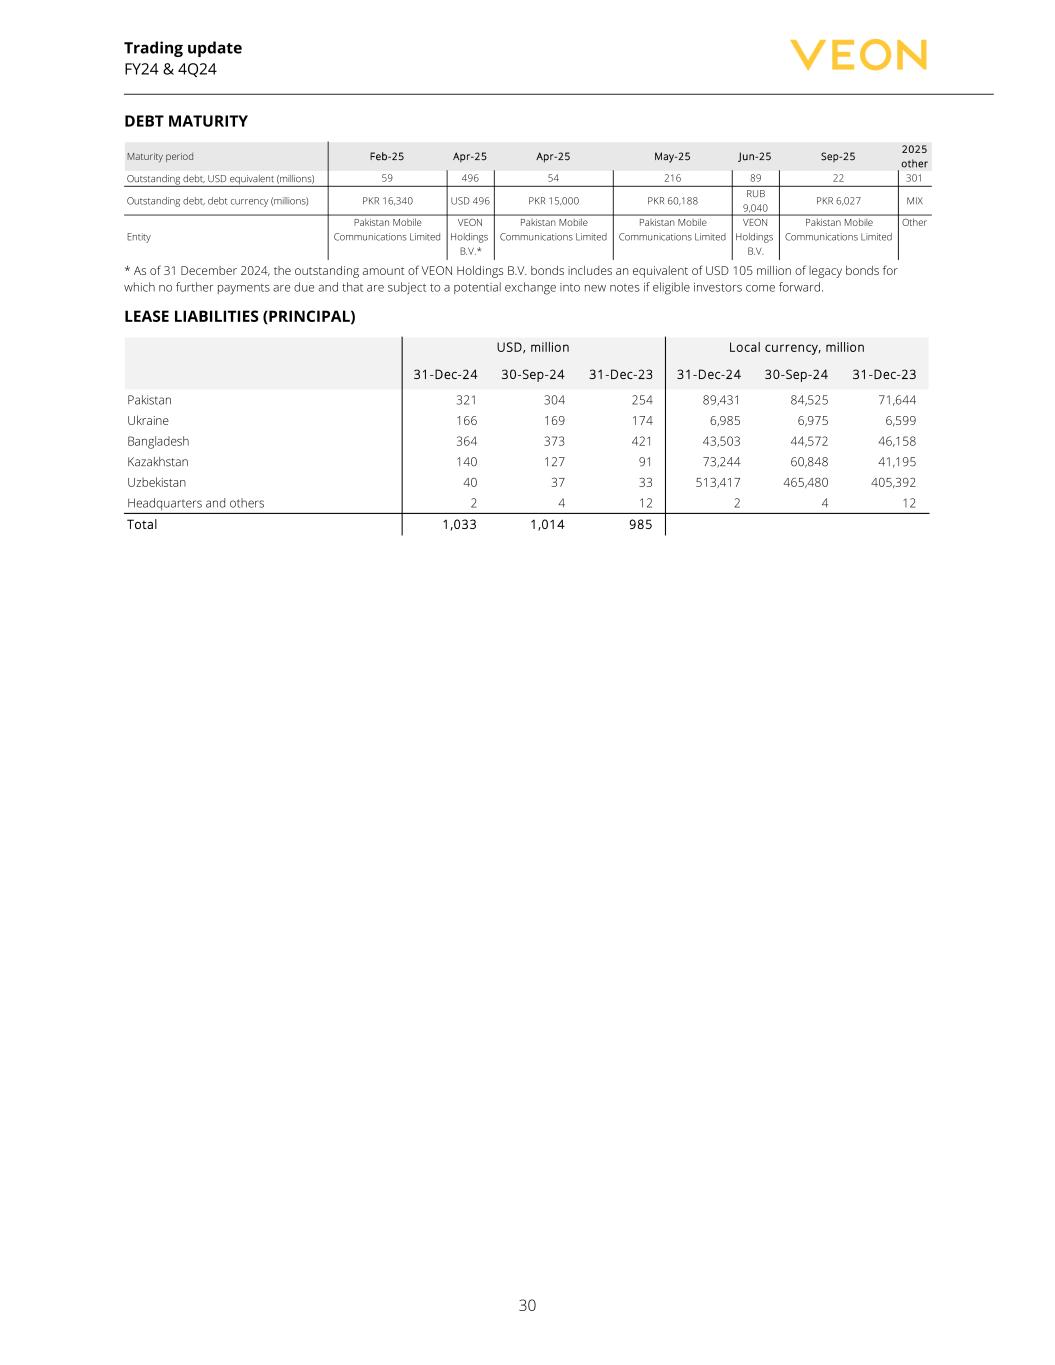
Trading update FY24 & 4Q24 30 DEBT MATURITY Maturity period Feb-25 Apr-25 Apr-25 May-25 Jun-25 Sep-25 2025 other Outstanding debt, USD equivalent (millions) 59 496 54 216 89 22 301 Outstanding debt, debt currency (millions) PKR 16,340 USD 496 PKR 15,000 PKR 60,188 RUB 9,040 PKR 6,027 MIX VEON Holdings VEON Holdings B.V.* B.V. Entity Pakistan Mobile Communications Limited Pakistan Mobile Communications Limited Pakistan Mobile Communications Limited Pakistan Mobile Communications Limited Other * As of 31 December 2024, the outstanding amount of VEON Holdings B.V. bonds includes an equivalent of USD 105 million of legacy bonds for which no further payments are due and that are subject to a potential exchange into new notes if eligible investors come forward. LEASE LIABILITIES (PRINCIPAL) 31-Dec-24 30-Sep-24 31-Dec-23 31-Dec-24 30-Sep-24 31-Dec-23 Pakistan 321 304 254 89,431 84,525 71,644 Ukraine 166 169 174 6,985 6,975 6,599 Bangladesh 364 373 421 43,503 44,572 46,158 Kazakhstan 140 127 91 73,244 60,848 41,195 Uzbekistan 40 37 33 513,417 465,480 405,392 Headquarters and others 2 4 12 2 4 12 Total 1,033 1,014 985 USD, million Local currency, million

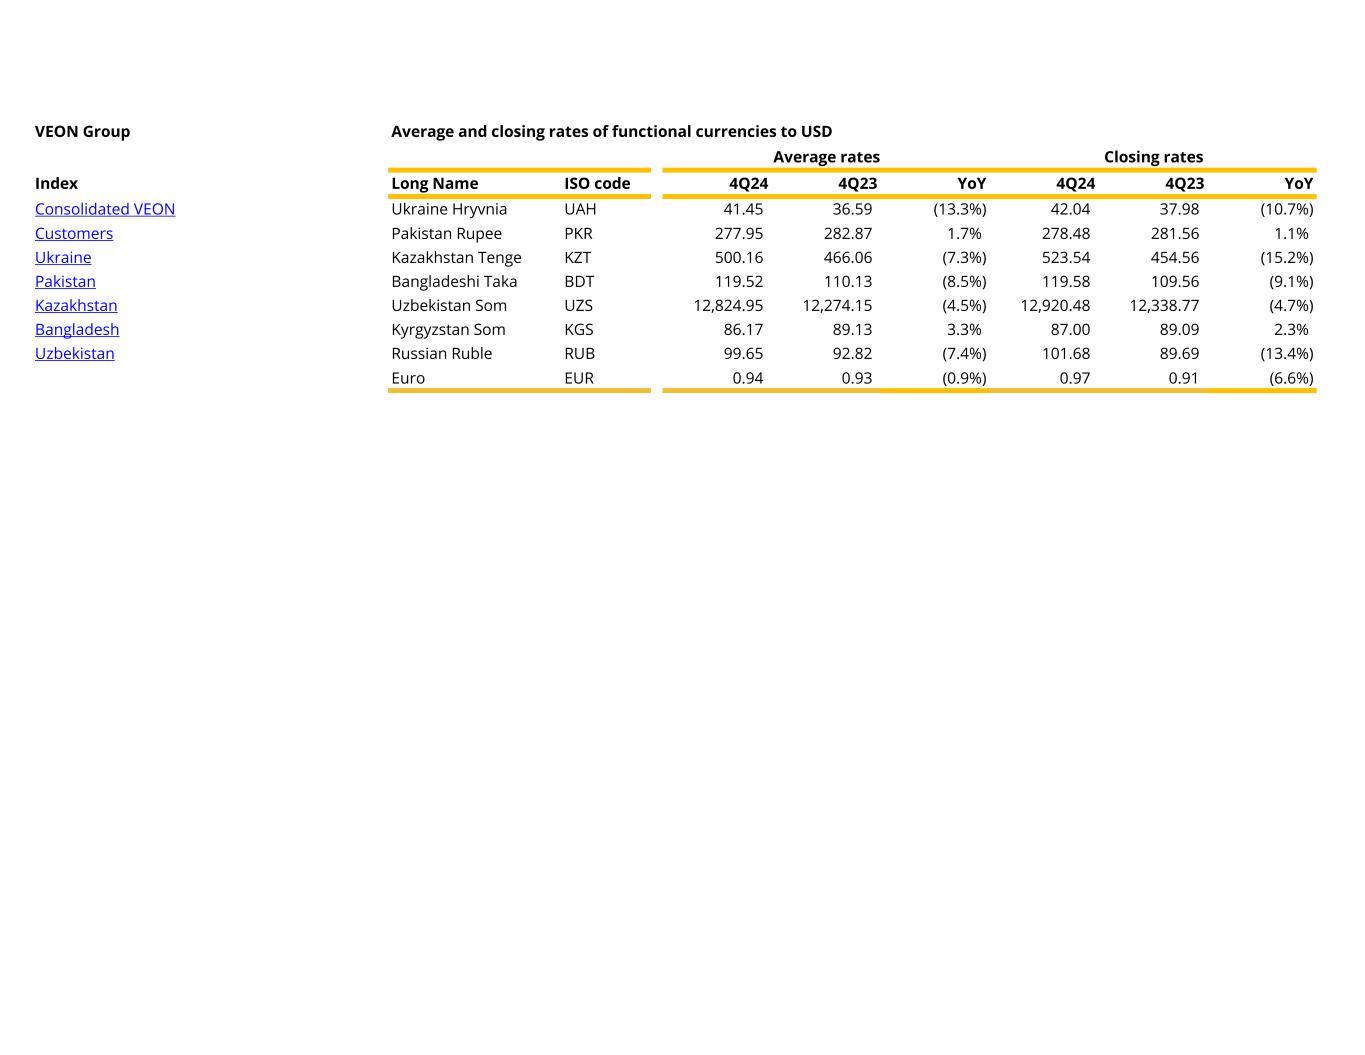
Trading update FY24 & 4Q24 31 ATTACHMENT D: RATES OF FUNCTIONAL CURRENCIES TO USD 4Q24 4Q23 YoY 4Q24 4Q23 YoY Ukraine Hryvnia 41.45 36.59 (13.3%) 42.04 37.98 (10.7%) Pakistan Rupee 277.95 282.87 1.7% 278.48 281.56 1.1% Kazakhstan Tenge 500.16 466.06 (7.3%) 523.54 454.56 (15.2%) Bangladeshi Taka 119.52 110.13 (8.5%) 119.58 109.56 (9.1%) Uzbekistan Som 12,824.95 12,274.15 (4.5%) 12,920.48 12,338.77 (4.7%) Kyrgyzstan Som 86.17 89.13 3.3% 87.00 89.09 2.3% Russian Ruble 99.65 92.82 (7.4%) 101.68 89.69 (13.4%) Euro 0.94 0.93 (0.9%) 0.97 0.91 (6.6%) Closing ratesAverage rates
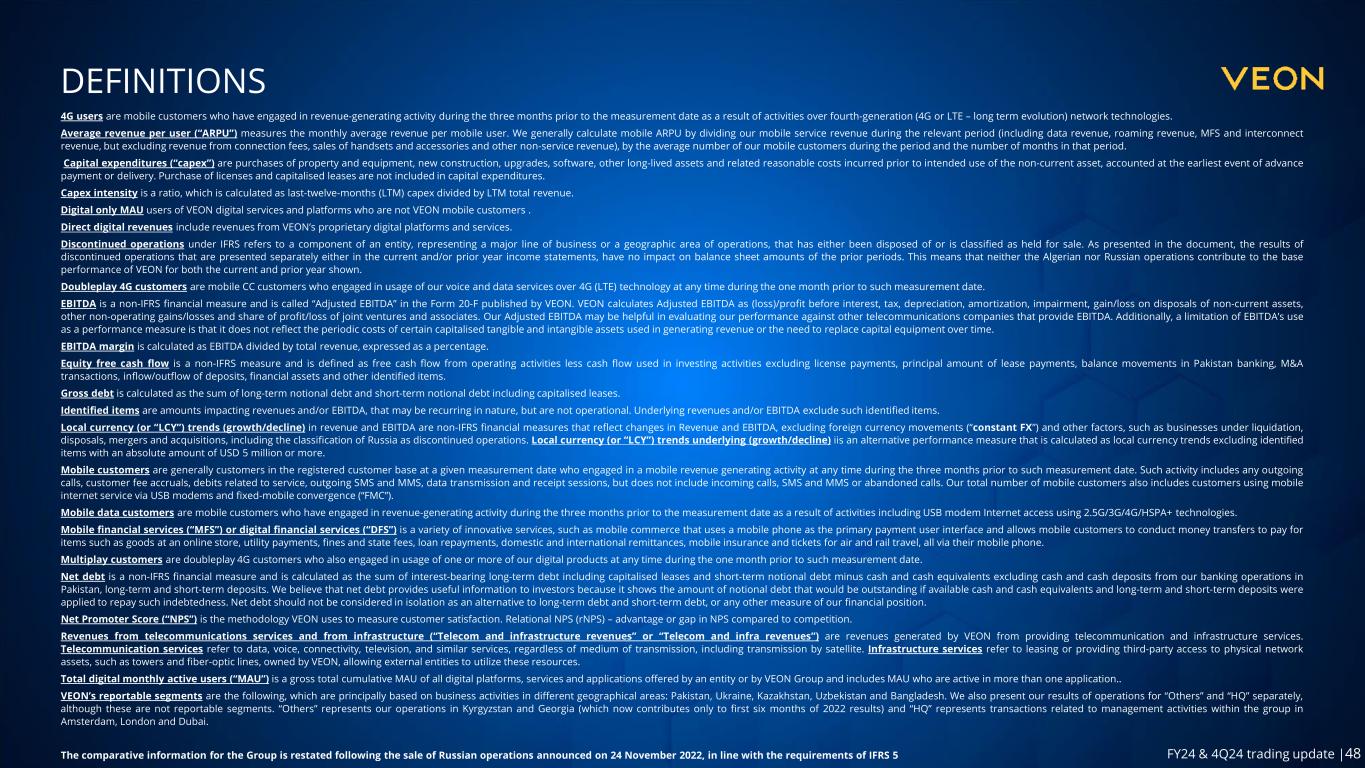
Trading update FY24 & 4Q24 32 ATTACHMENT E: DEFINITIONS 4G users are mobile customers who have engaged in revenue-generating activity during the three months prior to the measurement date as a result of activities over fourth-generation (4G or LTE – long term evolution) network technologies. ARPU (average revenue per user) measures the monthly average revenue per mobile user. We generally calculate mobile ARPU by dividing our mobile service revenue during the relevant period (including data revenue, roaming revenue, MFS and interconnect revenue, but excluding revenue from connection fees, sales of handsets and accessories and other non-service revenue) by the average number of our mobile customers during the period and the number of months in that period. Capital expenditures (capex) are purchases of property and equipment, new construction, upgrades, software, other long-lived assets and related reasonable costs incurred prior to the intended use of the non-current asset, accounted at the earliest event of advance payment or delivery. Purchases of licenses and capitalized leases are not included in capital expenditures. Capex intensity is a ratio, which is calculated as last-twelve-months (LTM) capex divided by LTM total revenue. Direct digital revenues include revenues from VEON’s proprietary digital platforms and services. Discontinued operations under IFRS refers to a component of an entity, representing a major line of business or a geographic area of operations, that has either been disposed of or is classified as held for sale. As presented in the document, the results of discontinued operations that are presented separately, either in the current and/or prior year income statements, have no impact on balance sheet amounts of the prior periods. This means Russian operations contribute to the base performance of VEON for prior year shown. Doubleplay 4G customers are mobile customers who engaged in usage of our voice and data services over 4G (LTE) technology at any time during the one month prior to such measurement date. EBITDA is a non-IFRS financial measure and is called Adjusted EBITDA in the 2023 Form 20-F published by VEON. Adjusted EBITDA should not be considered in isolation or as a substitute for analyses of the results as reported under IFRS. We calculate Adjusted EBITDA as profit / (loss) before tax from continuing operations, before depreciation, amortization, loss from disposal of non-current assets and impairment loss, financial expenses and costs, net foreign exchange gain/(loss) and share of profit /(loss) of associates and joint ventures. EBITDA margin is calculated as EBITDA (as defined above) divided by total revenue, expressed as a percentage. Equity free cash flow is a non-IFRS measure and is defined as free cash flow from operating activities less cash flow used in investing activities, excluding license payments, principal amount of lease payments, balance movements in Pakistan banking, M&A transactions, inflow/outflow of deposits, financial assets and other one-off items. Gross debt is calculated as the sum of long-term notional debt and short-term notional debt, including capitalized leases. Identified items are amounts impacting revenues and/or EBITDA, that may be recurring in nature but are not operational. Underlying revenues and/or EBITDA exclude such identified items. Local currency (or “LCY”) trends (growth/decline) in revenue and EBITDA are non-IFRS financial measures that reflect changes in Revenue and EBITDA, excluding foreign currency movements (“constant FX”). LCY trends underlying (growth/decline) is an alternative performance measure that is calculated as local currency trends excluding identified items and other factors, such as businesses under liquidation, disposals, mergers and acquisitions with an absolute amount of USD 5 million or more. Mobile customers (also - mobile subscribers) are generally customers in the registered customer base at a given measurement date who engaged in a mobile revenue generating activity at any time during the three months prior to such measurement date. Such activity includes any outgoing calls, customer fee accruals, debits related to service, outgoing SMS and MMS, data transmission and receipt sessions, but does not include incoming calls, SMS and MMS or abandoned calls. Our total number of mobile customers also includes customers using mobile internet service via USB modems and fixed-mobile convergence (“FMC”).
Trading update FY24 & 4Q24 33 Mobile data customers (also – mobile data subscribers) are mobile customers who have engaged in revenue- generating activity during the three months prior to the measurement date as a result of activities including USB modem Internet access using 2.5G/3G/4G/HSPA+ technologies. Mobile financial services (“MFS”) or digital financial services (“DFS”) are a variety of innovative services, such as mobile commerce, which uses a mobile phone as the primary payment user interface and allows mobile customers to conduct money transfers to pay for items such as goods at an online store, utility payments, fines and state fees, loan repayments, domestic and international remittances, mobile insurance and tickets for air and rail travel, all via their mobile phone. Multiplay customers are doubleplay 4G customers who also engaged in usage of one or more of our digital products at any time during the one month prior to such measurement date. Net debt is a non-IFRS financial measure and is calculated as the sum of interest-bearing long-term debt, including capitalized leases (unless specifically excluded) and short-term notional debt minus cash and cash equivalents and deposits, excluding cash and cash deposits from our banking operations in Pakistan, long-term and short-term deposits. We believe that net debt provides useful information to investors because it shows the amount of notional debt that would be outstanding if available cash and cash equivalents and deposits and long-term and short-term deposits were applied to repay such indebtedness. Net debt should not be considered in isolation as an alternative to long-term debt and short-term debt, or any other measure of our financial position. Net Promoter Score (“NPS”) is the methodology VEON uses to measure customer satisfaction. Relative NPS (rNPS) – advantage or gap in NPS when compared to competition. Revenues from telecommunications services and from infrastructure (“Telecom and infrastructure revenues” or “Telecom and infra revenues”) are revenues generated by VEON from providing telecommunication and infrastructure services. Telecommunication services refer to data, voice, connectivity, television, and similar services, regardless of medium of transmission, including transmission by satellite. Infrastructure services refer to leasing or providing third-party access to physical network assets, such as towers and fiber-optic lines, owned by VEON, allowing external entities to utilize these resources. Total digital monthly active users (“MAU”) is a gross total cumulative MAU of all digital platforms, services and applications offered by an entity or by the Group and includes MAU who are active in more than one application. VEON’s reportable segments are the following, which are principally based on business activities in different geographical areas: Pakistan, Ukraine, Kazakhstan, Bangladesh and Uzbekistan. We also present our results of operations for “Others” and “HQ” separately, although these are not reportable segments. “Others” represents our operations in Kyrgyzstan and “HQ” represents transactions related to management activities within the group in Amsterdam, London and Dubai.
Trading update FY24 & 4Q24 34 DISCLAIMER VEON's results and other financial information presented in this document are, unless otherwise stated, prepared in accordance with International Financial Reporting Standards ("IFRS") and have not been externally reviewed and/or audited. The financial information included in this document is preliminary and is based on a number of assumptions that are subject to inherent uncertainties and subject to change. The financial information presented herein is based on internal management accounts, is the responsibility of management and is subject to financial closing procedures which have not yet been completed and have not been audited, reviewed or verified. Certain amounts and percentages that appear in this document have been subject to rounding adjustments. As a result, certain numerical figures shown as totals, including those in the tables, may not be an exact arithmetic aggregation of the figures that precede or follow them. Although we believe the information to be reasonable, actual results may vary from the information contained above and such variations could be material. As such, you should not place undue reliance on this information. This information may not be indicative of the actual results for the current period or any future period. Certain other factors that could cause actual results to differ materially from those discussed in any forward-looking statements include the risk factors described in VEON’s 2023 Form 20-F for the year ended 31 December 2023 filed with the U.S. Securities and Exchange Commission (the “SEC”) on 17 October 2024 and other public filings made from time to time by VEON with the SEC. Other unknown or unpredictable factors also could harm our future results. New risk factors and uncertainties emerge from time to time, and it is not possible for our management to predict all risk factors and uncertainties, nor can we assess the impact of all factors on our business or the extent to which any factor, or combination of factors, may cause actual results to differ materially from those contained in any forward- looking statements. Under no circumstances should the inclusion of such forward-looking statements in this document be regarded as a representation or warranty by us or any other person with respect to the achievement of results set out in such statements or that the underlying assumptions used will in fact be the case. Therefore, you are cautioned not to place undue reliance on these forward-looking statements. The forward-looking statements speak only as of the date hereof. We cannot assure you that any projected results or events will be achieved. Except to the extent required by law, we disclaim any obligation to update or revise any of these forward-looking statements, whether as a result of new information, future events or otherwise, after the date on which the statements are made, or to reflect the occurrence of unanticipated events. NOTICE TO READERS: FINANCIAL INFORMATION PRESENTED VEON's results and other financial information presented in this document are, unless otherwise stated, prepared in accordance with International Financial Reporting Standards ("IFRS") based on internal management reporting, are the responsibility of management and have not been externally audited, reviewed, or verified. As such, you should not place undue reliance on this information. This information may not be indicative of the actual results for any future period. DISCLAIMER AND NOTICE TO READERS
Trading update FY24 & 4Q24 35 NOTICE TO READERS: IMPACT OF THE WAR IN UKRAINE The ongoing war in Ukraine and the resulting sanctions adopted by the United States, member states of the European Union, the European Union itself, the United Kingdom, Ukraine and certain other nations, countersanctions and other legal and regulatory responses, as well as responses by our service providers, partners, suppliers and other counterparties, and the other indirect and direct consequences of the war have impacted and, if the war, such responses and other consequences continue or escalate, may significantly impact our results and aspects of our operations in Ukraine and may significantly affect our results and aspects of our operations in the other countries in which we operate. We are closely monitoring events in Ukraine, as well as the possibility of the imposition of further legal and regulatory restrictions in connection with the ongoing war in Ukraine and any potential impact the war may have on our results, whether directly or indirectly. Our operations in Ukraine continue to be affected by the war. We are doing everything we can to protect the safety of our employees, while continuing to ensure the uninterrupted operation of our communications, financial and digital services.


