•RAISING FULL-YEAR REVENUE AND EBITDA GUIDANCE •RETURN TO USD REVENUE GROWTH •EXIT FROM RUSSIA COMPLETED THIRD QUARTER 2023 TRADING UPDATE
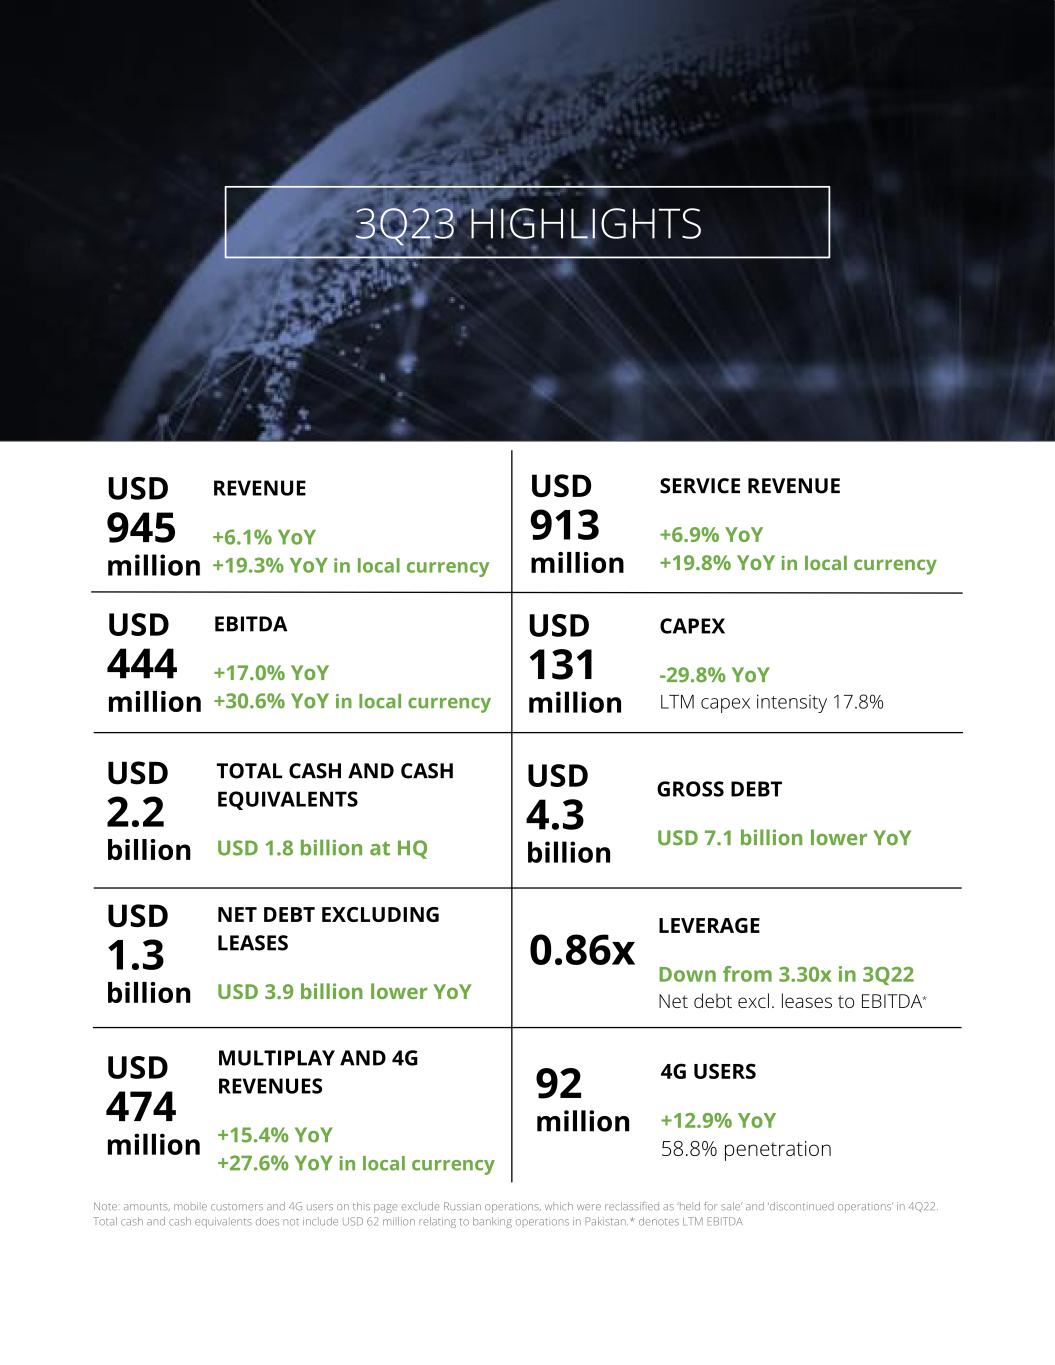
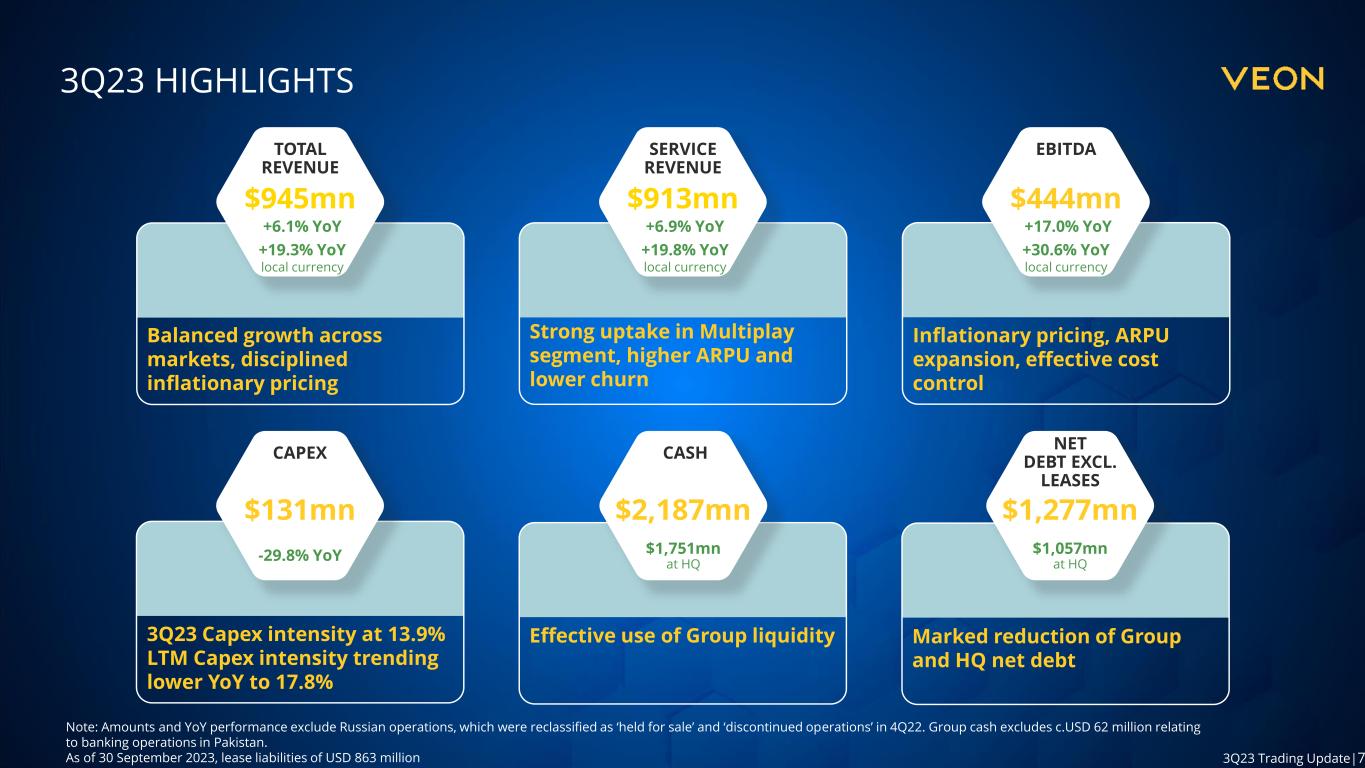
Trading update 3Q23 2 Note: amounts, mobile customers and 4G users on this page exclude Russian operations, which were reclassified as ‘held for sale’ and ‘discontinued operations’ in 4Q22. Total cash and cash equivalents does not include USD 62 million relating to banking operations in Pakistan.* denotes LTM EBITDA USD 945 million REVENUE +6.1% YoY +19.3% YoY in local currency SERVICE REVENUE +6.9% YoY +19.8% YoY in local currency USD 913 million TOTAL CASH AND CASH EQUIVALENTS USD 1.8 billion at HQ USD 2.2 billion EBITDA +17.0% YoY +30.6% YoY in local currency USD 444 million USD 131 million 4G USERS +12.9% YoY 58.8% penetration 92 million LEVERAGE Down from 3.30x in 3Q22 Net debt excl. leases to EBITDA* 0.86x 3Q23 HIGHLIGHTS GROSS DEBT USD 7.1 billion lower YoY USD 4.3 billion NET DEBT EXCLUDING LEASES USD 3.9 billion lower YoY USD 1.3 billion MULTIPLAY AND 4G REVENUES +15.4% YoY +27.6% YoY in local currency USD 474 million CAPEX -29.8% YoY LTM capex intensity 17.8%
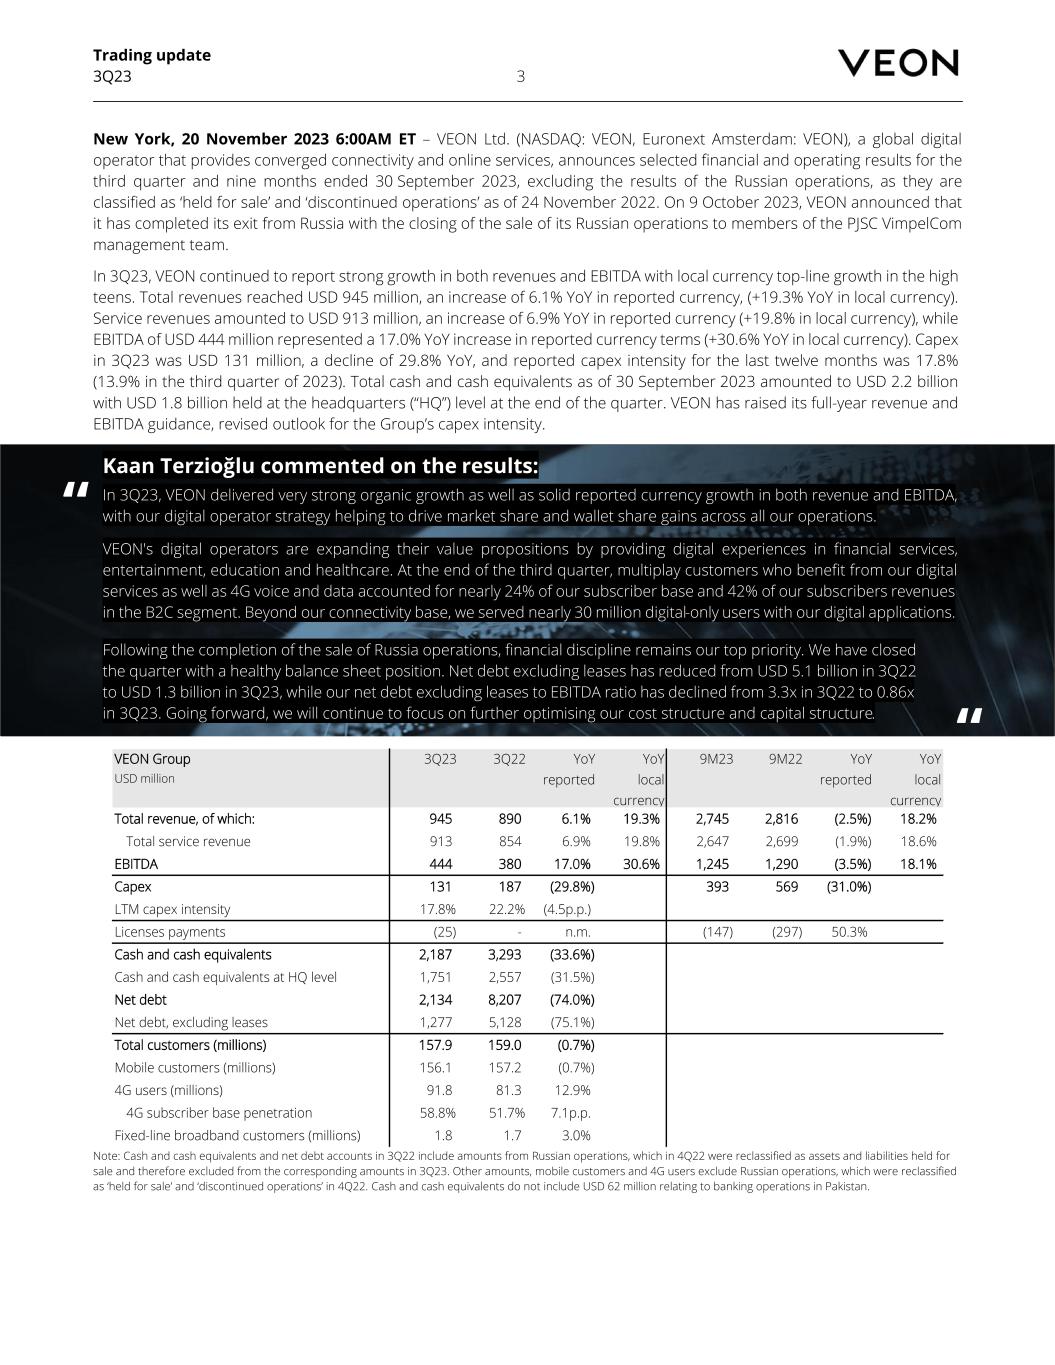
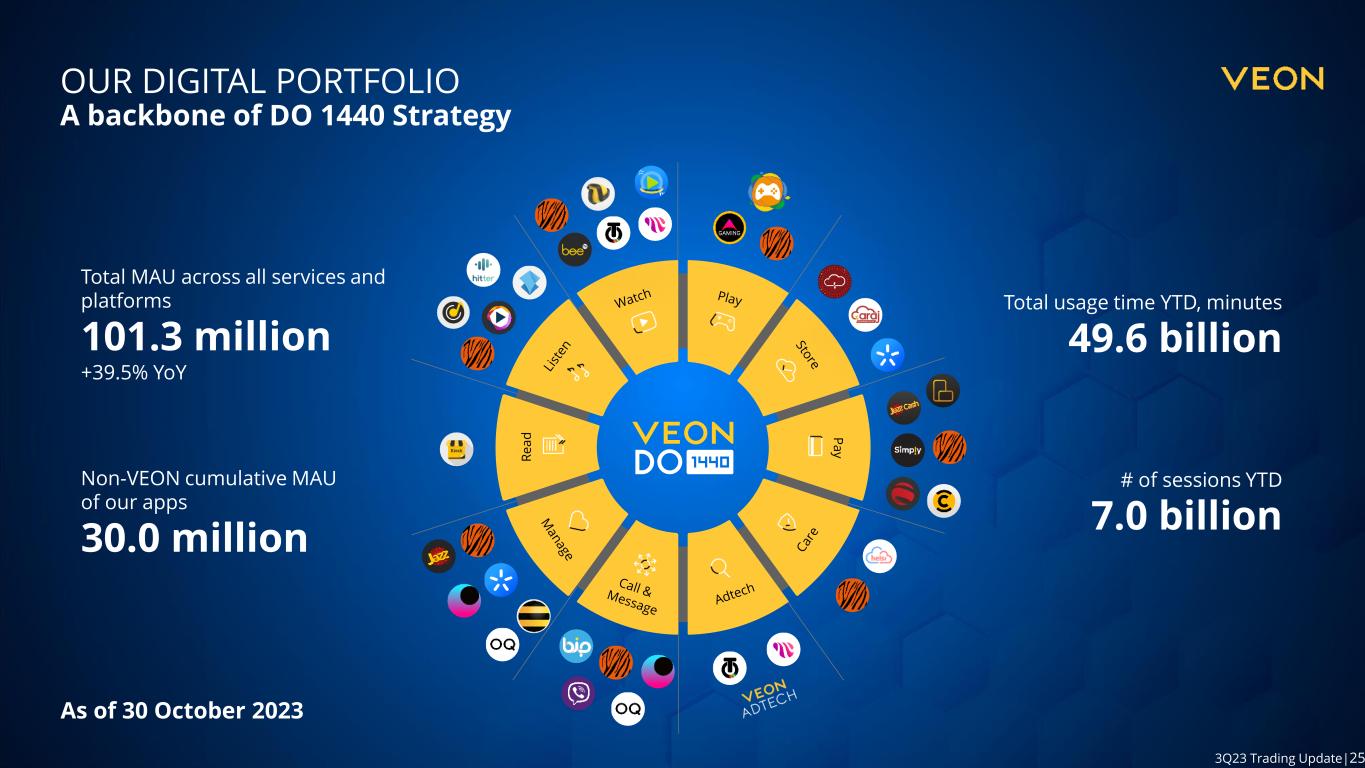
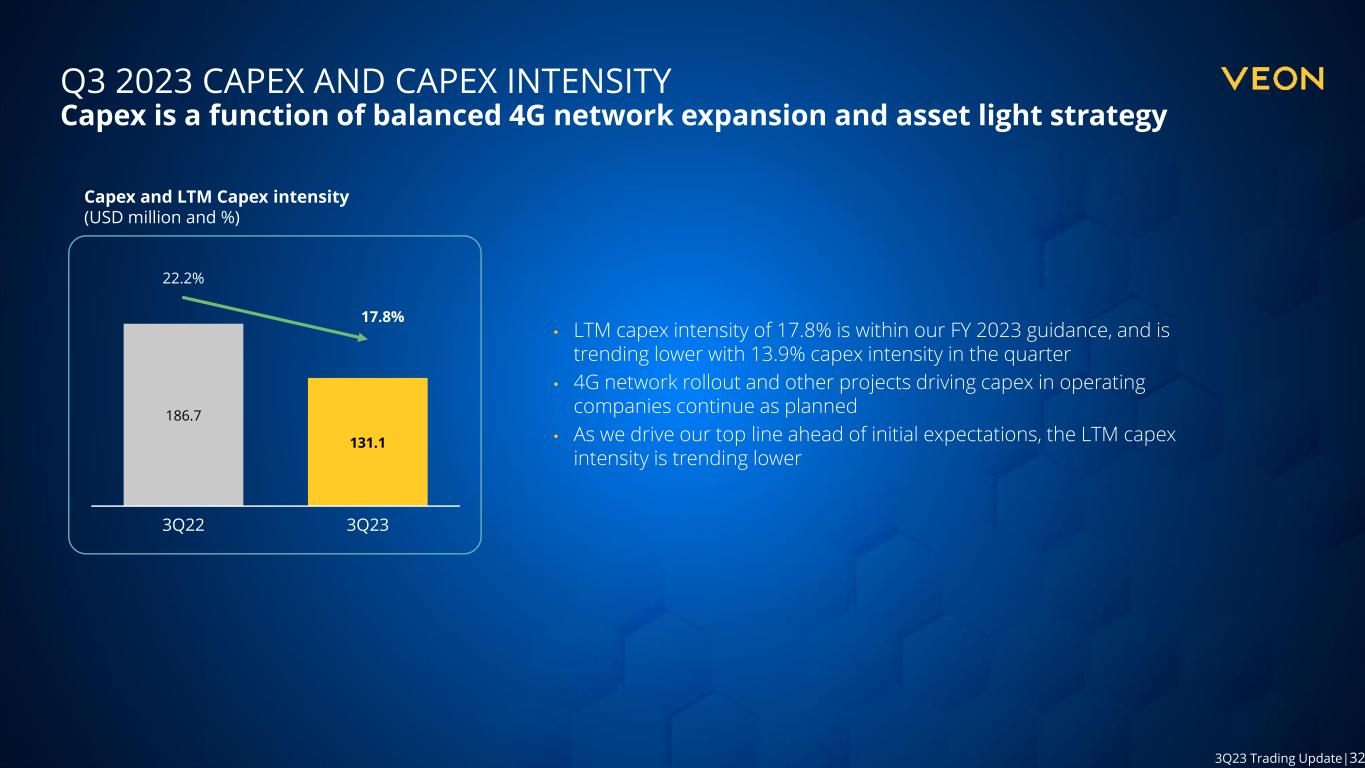
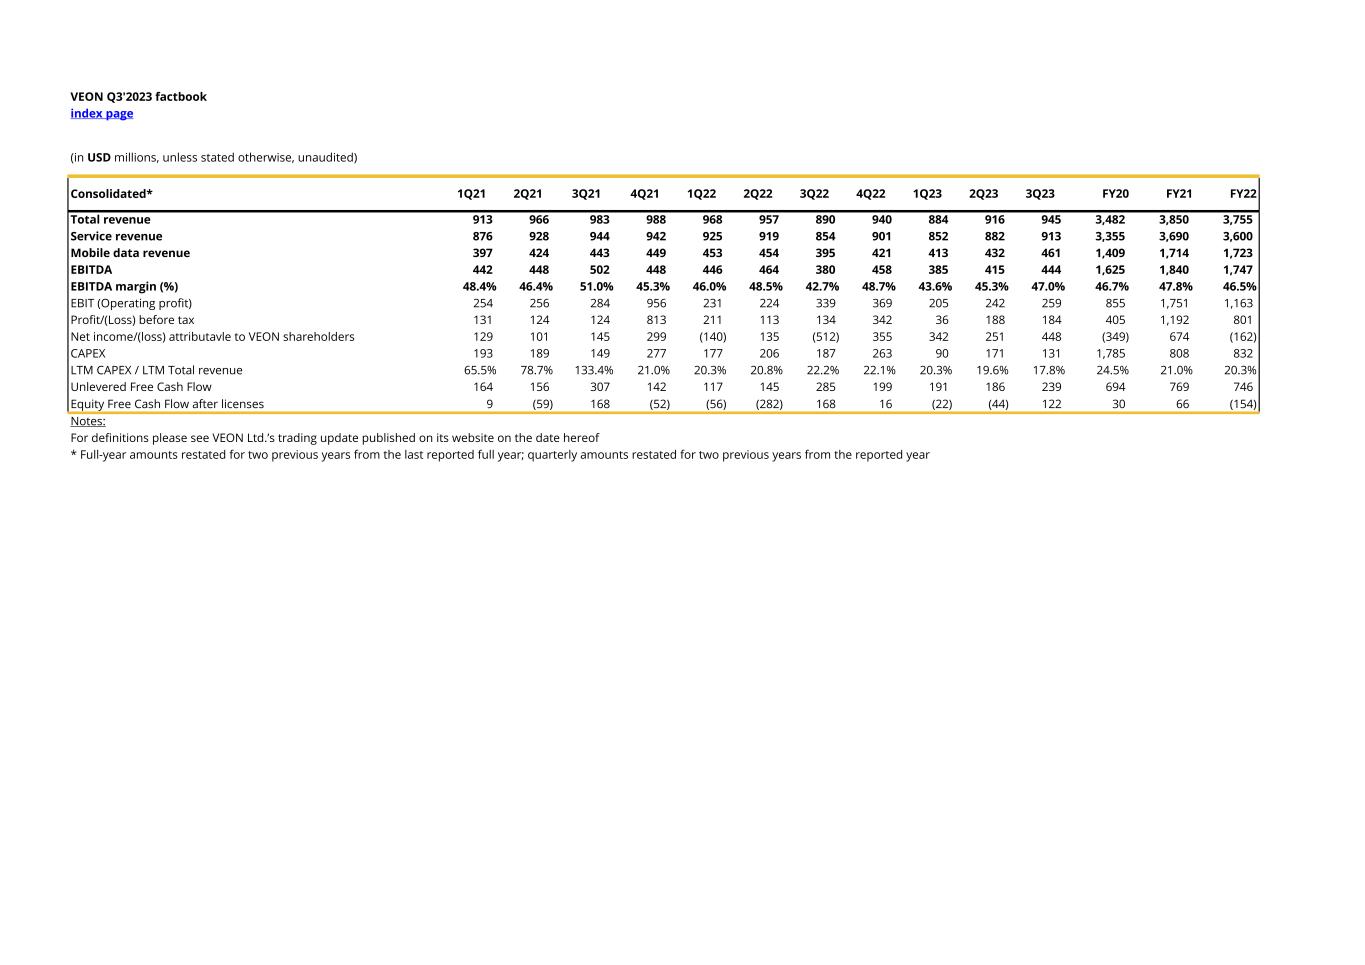
Trading update 3Q23 3 New York, 20 November 2023 6:00AM ET – VEON Ltd. (NASDAQ: VEON, Euronext Amsterdam: VEON), a global digital operator that provides converged connectivity and online services, announces selected financial and operating results for the third quarter and nine months ended 30 September 2023, excluding the results of the Russian operations, as they are classified as ‘held for sale’ and ‘discontinued operations’ as of 24 November 2022. On 9 October 2023, VEON announced that it has completed its exit from Russia with the closing of the sale of its Russian operations to members of the PJSC VimpelCom management team. In 3Q23, VEON continued to report strong growth in both revenues and EBITDA with local currency top-line growth in the high teens. Total revenues reached USD 945 million, an increase of 6.1% YoY in reported currency, (+19.3% YoY in local currency). Service revenues amounted to USD 913 million, an increase of 6.9% YoY in reported currency (+19.8% in local currency), while EBITDA of USD 444 million represented a 17.0% YoY increase in reported currency terms (+30.6% YoY in local currency). Capex in 3Q23 was USD 131 million, a decline of 29.8% YoY, and reported capex intensity for the last twelve months was 17.8% (13.9% in the third quarter of 2023). Total cash and cash equivalents as of 30 September 2023 amounted to USD 2.2 billion with USD 1.8 billion held at the headquarters (“HQ”) level at the end of the quarter. VEON has raised its full-year revenue and EBITDA guidance, revised outlook for the Group’s capex intensity. VEON Group USD million 3Q23 3Q22 YoY reported YoY local currency 9M23 9M22 YoY reported YoY local currency Total revenue, of which: 945 890 6.1% 19.3% 2,745 2,816 (2.5%) 18.2% Total service revenue 913 854 6.9% 19.8% 2,647 2,699 (1.9%) 18.6% EBITDA 444 380 17.0% 30.6% 1,245 1,290 (3.5%) 18.1% Capex 131 187 (29.8%) 393 569 (31.0%) LTM capex intensity 17.8% 22.2% (4.5p.p.) Licenses payments (25) - n.m. (147) (297) 50.3% Cash and cash equivalents 2,187 3,293 (33.6%) Cash and cash equivalents at HQ level 1,751 2,557 (31.5%) Net debt 2,134 8,207 (74.0%) Net debt, excluding leases 1,277 5,128 (75.1%) Total customers (millions) 157.9 159.0 (0.7%) Mobile customers (millions) 156.1 157.2 (0.7%) 4G users (millions) 91.8 81.3 12.9% 4G subscriber base penetration 58.8% 51.7% 7.1p.p. Fixed-line broadband customers (millions) 1.8 1.7 3.0% Note: Cash and cash equivalents and net debt accounts in 3Q22 include amounts from Russian operations, which in 4Q22 were reclassified as assets and liabilities held for sale and therefore excluded from the corresponding amounts in 3Q23. Other amounts, mobile customers and 4G users exclude Russian operations, which were reclassified as ‘held for sale’ and ‘discontinued operations’ in 4Q22. Cash and cash equivalents do not include USD 62 million relating to banking operations in Pakistan. In 3Q23, VEON delivered very strong organic growth as well as solid reported currency growth in both revenue and EBITDA, with our digital operator strategy helping to drive market share and wallet share gains across all our operations. VEON's digital operators are expanding their value propositions by providing digital experiences in financial services, entertainment, education and healthcare. At the end of the third quarter, multiplay customers who benefit from our digital services as well as 4G voice and data accounted for nearly 24% of our subscriber base and 42% of our subscribers revenues in the B2C segment. Beyond our connectivity base, we served nearly 30 million digital-only users with our digital applications. Following the completion of the sale of Russia operations, financial discipline remains our top priority. We have closed the quarter with a healthy balance sheet position. Net debt excluding leases has reduced from USD 5.1 billion in 3Q22 to USD 1.3 billion in 3Q23, while our net debt excluding leases to EBITDA ratio has declined from 3.3x in 3Q22 to 0.86x in 3Q23. Going forward, we will continue to focus on further optimising our cost structure and capital structure. Kaan Terzioğlu commented on the results: “ “
3Q23 TRADING UPDATE 5 KEY RECENT DEVELOPMENTS 8 LIQUIDITY AND CAPITAL STRUCTURE 10 COUNTRY PERFORMANCE 12 CONFERENCE CALL INFORMATION 19 PRESENTATION OF FINANCIAL RESULTS AND NONRECURRING ITEMS 20 DISCLAIMER AND NOTICE TO READERS 21 ATTACHMENTS 23 CONTENTS

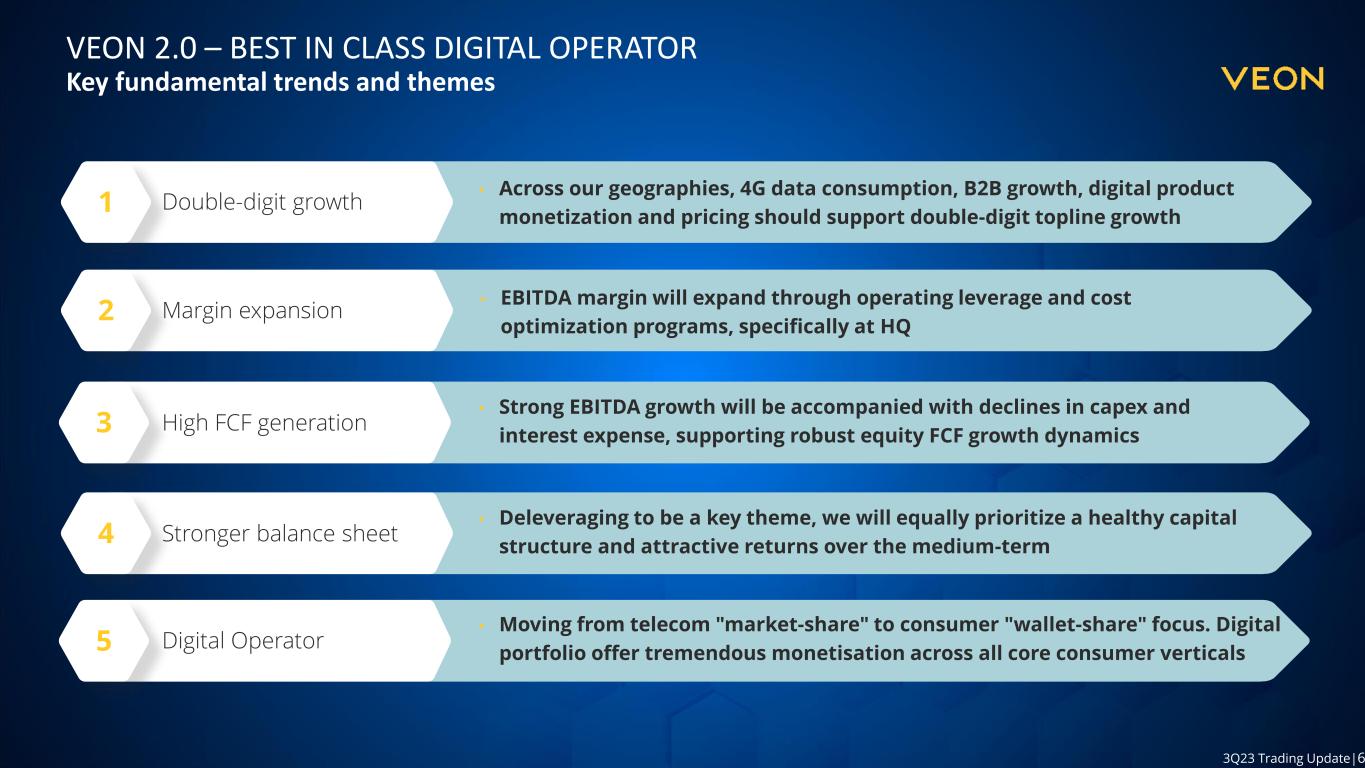
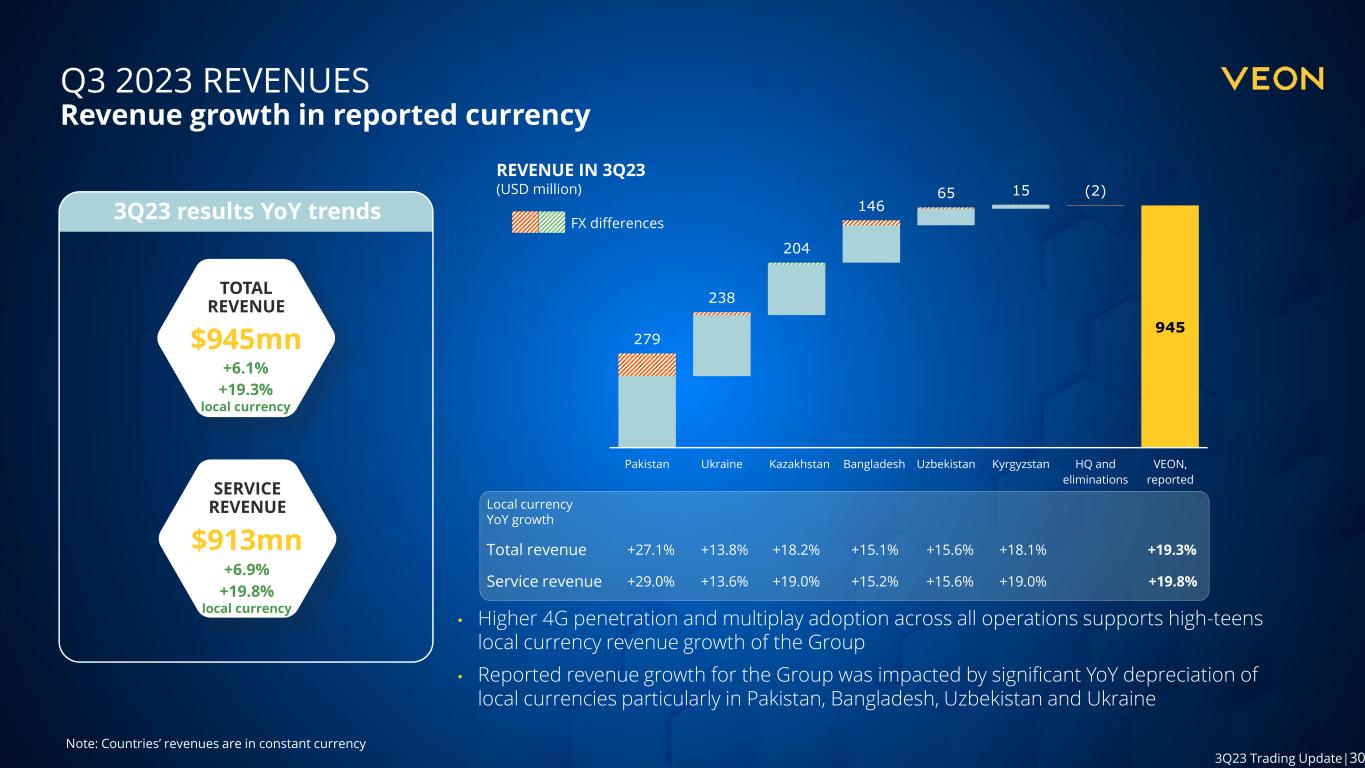
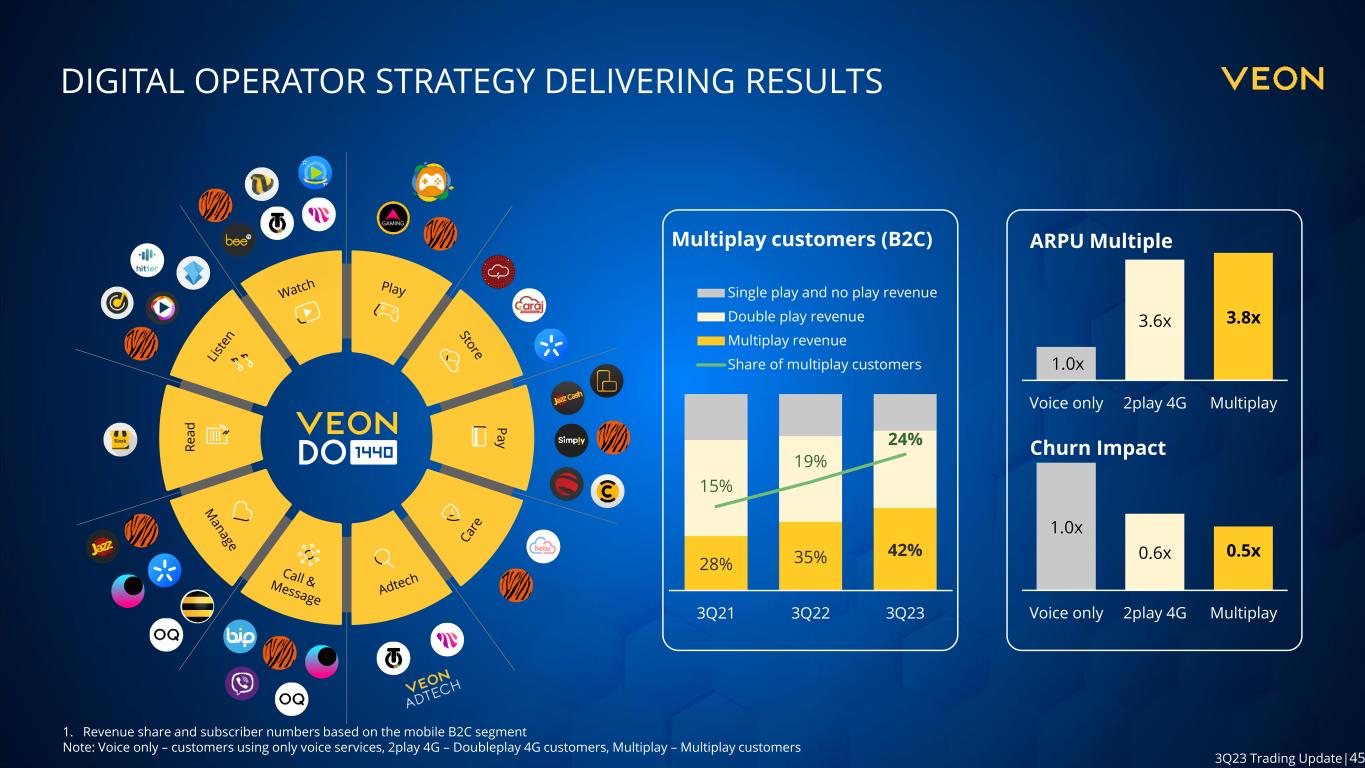
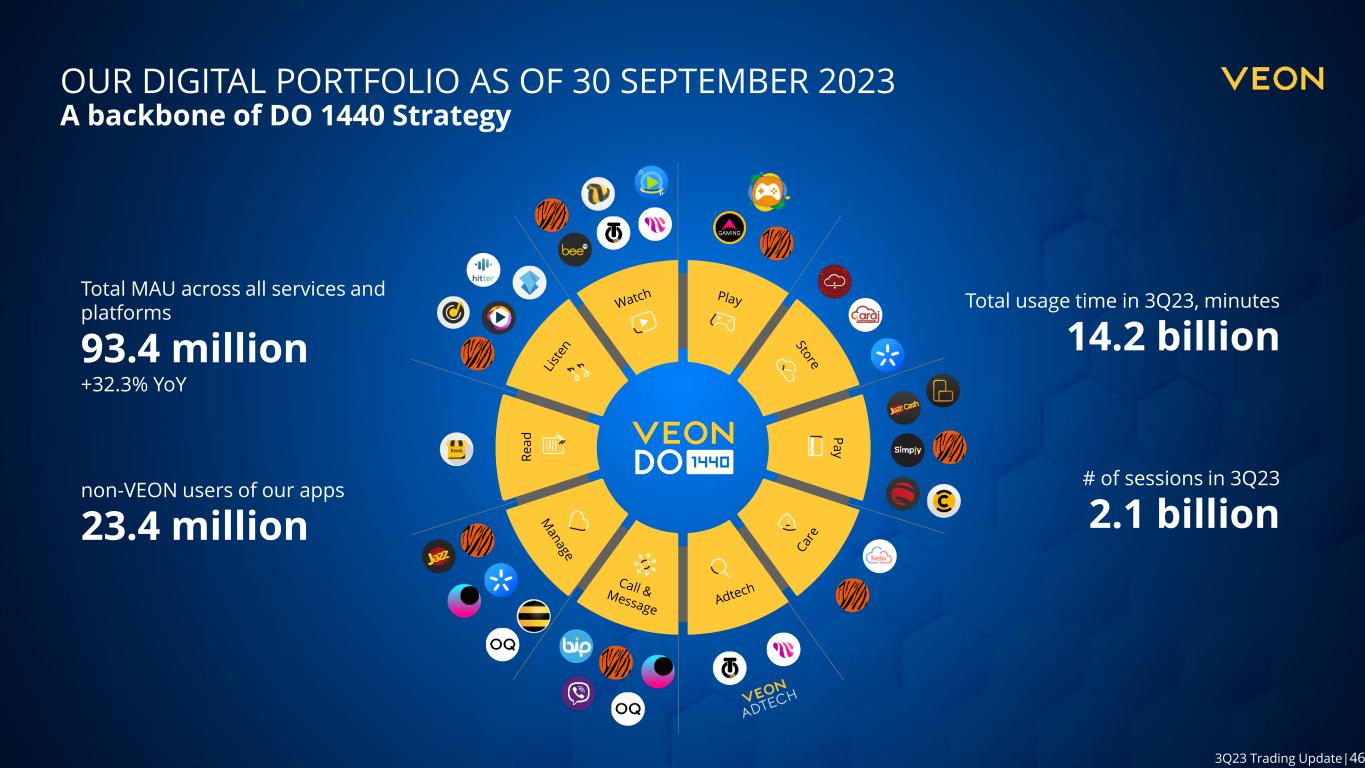
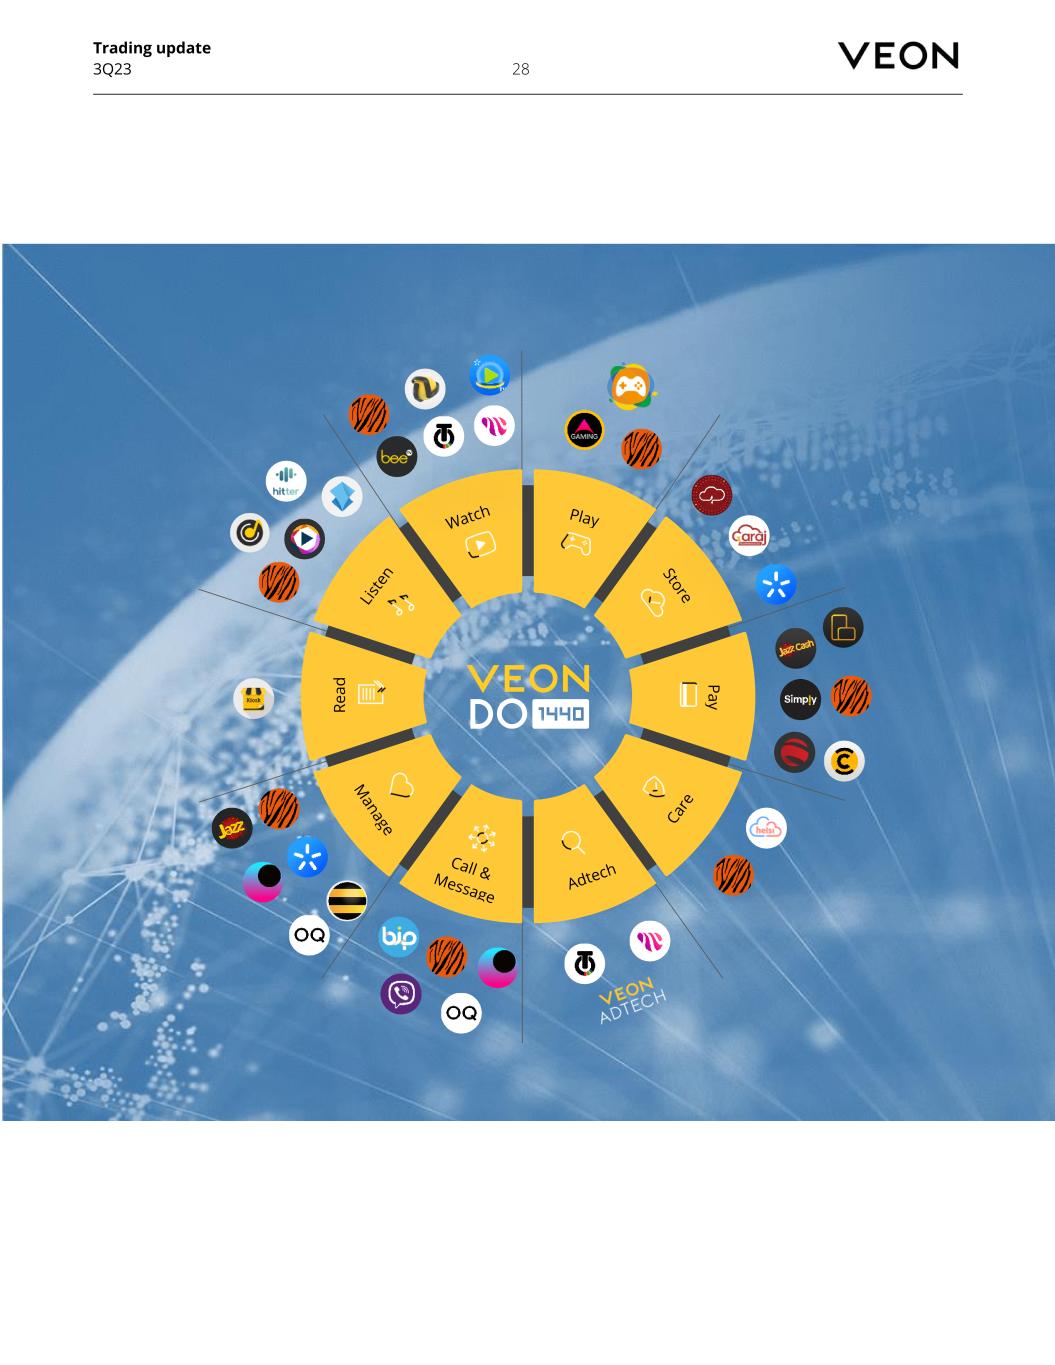
Trading update 3Q23 5 VEON delivered 6.1% growth in reported currency and 19.3% digit growth in local currency revenues and EBITDA in 3Q23, driven by further execution of our Digital Operator strategy. The Group’s liquidity position remains healthy with Group cash and cash equivalents at USD 2.2 billion. Group revenues increased by 6.1% YoY during 3Q23 in reported currency and by 19.3% YoY in local currency terms. 3Q23 Revenue Growth YoY Reported Local currency Total revenue 6.1% 19.3% Ukraine 8.6% 13.8% Pakistan (3.5%) 27.1% Kazakhstan 23.5% 18.2% Bangladesh 1.6% 15.1% Uzbekistan 6.3% 15.6% Kyrgyzstan 9.0% 18.1% Five operating companies reported growth in reported currency, while all our operating companies, including Ukraine, achieved double-digit local currency revenue growth. We continued to expand market share across all our countries of operation. Service revenues increased by 6.9% YoY in reported currency and rose by 19.8% YoY in local currency. In 3Q23, Group EBITDA grew by 17.0% YoY in reported currency and by 30.6% in local currency terms, with Group EBITDA margin at 47.0% (+4.4 p.p. YoY). The Group’s YoY EBITDA performance was affected by extraordinary non-recurring items in Ukraine in 3Q22 and 3Q23, in Kazakhstan in 3Q23 and in Uzbekistan in 3Q22 and 3Q23 as detailed in the Country Performance section. Group EBITDA was also impacted by extraordinary costs associated with the resizing of HQ and situation management of c.USD 8.9 million. Excluding these extraordinary HQ costs, underlying Group EBITDA would be c.USD 453 million. In the nine months ended 30 September 2023, extraordinary costs associated with the resizing of VEON HQ and situation management were c.USD 34 million. Excluding extradorinary non-recurring items, underlying EBITDA growth was 27.6%. In 3Q23, we reported 156.1 million mobile subscribers (- 0.7% YoY). The Group’s 4G user base grew by 12.9% YoY, reaching 91.8 million, with 10.5 million 4G users added over the past 12 months. 4G users now account for 58.8% of our total subscriber base, up 7.1 p.p. from a year earlier, supporting further conversion of subscribers into multiplay users who use at least one of our digital services in addition to 4G data and voice. VEON launched its Digital Operator strategy (“DO1440”) in 2021 and has been building portfolios of digital applications and services tailored for each of our markets. We aim to deliver digital experiences for every minute of the day through services powered by our 4G network across our key adjacent markets, spanning areas including financial services, digital entertainment (TV, music, gaming, and more), digital health, digital learning, business-to-business solutions and industrial applications, as well as providing locally relevant digital experiences. The total number of monthly active users of VEON’s operating companies’ digital services amounted to 93.4 3Q23 TRADING UPDATE IGHLIGHTS:

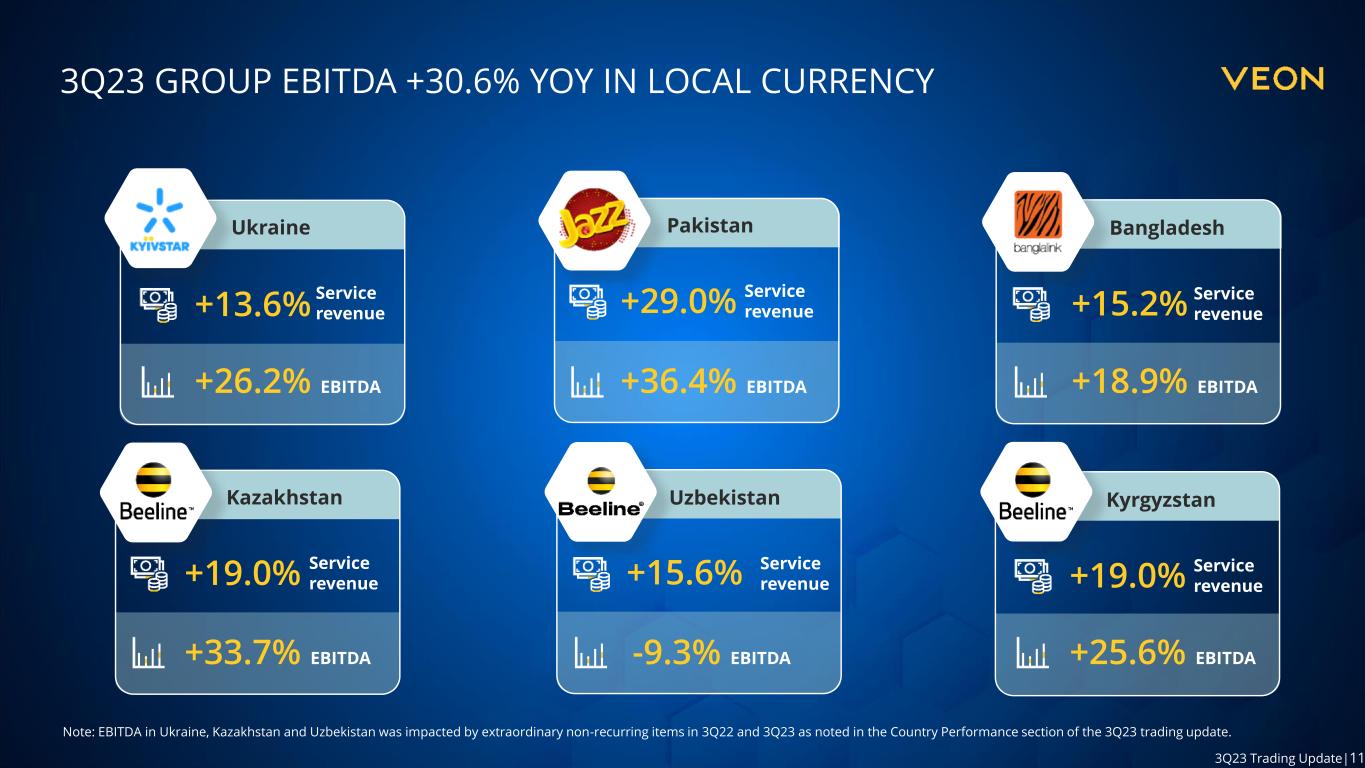
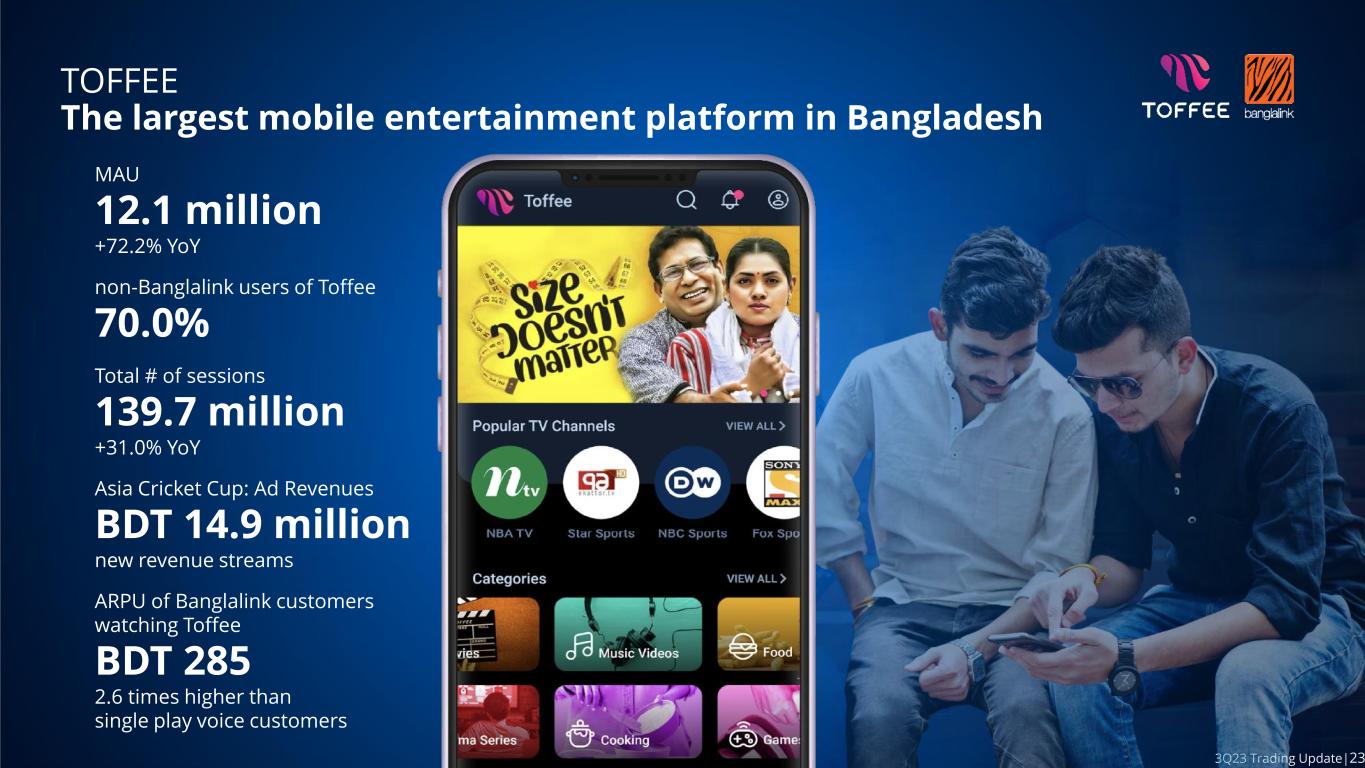
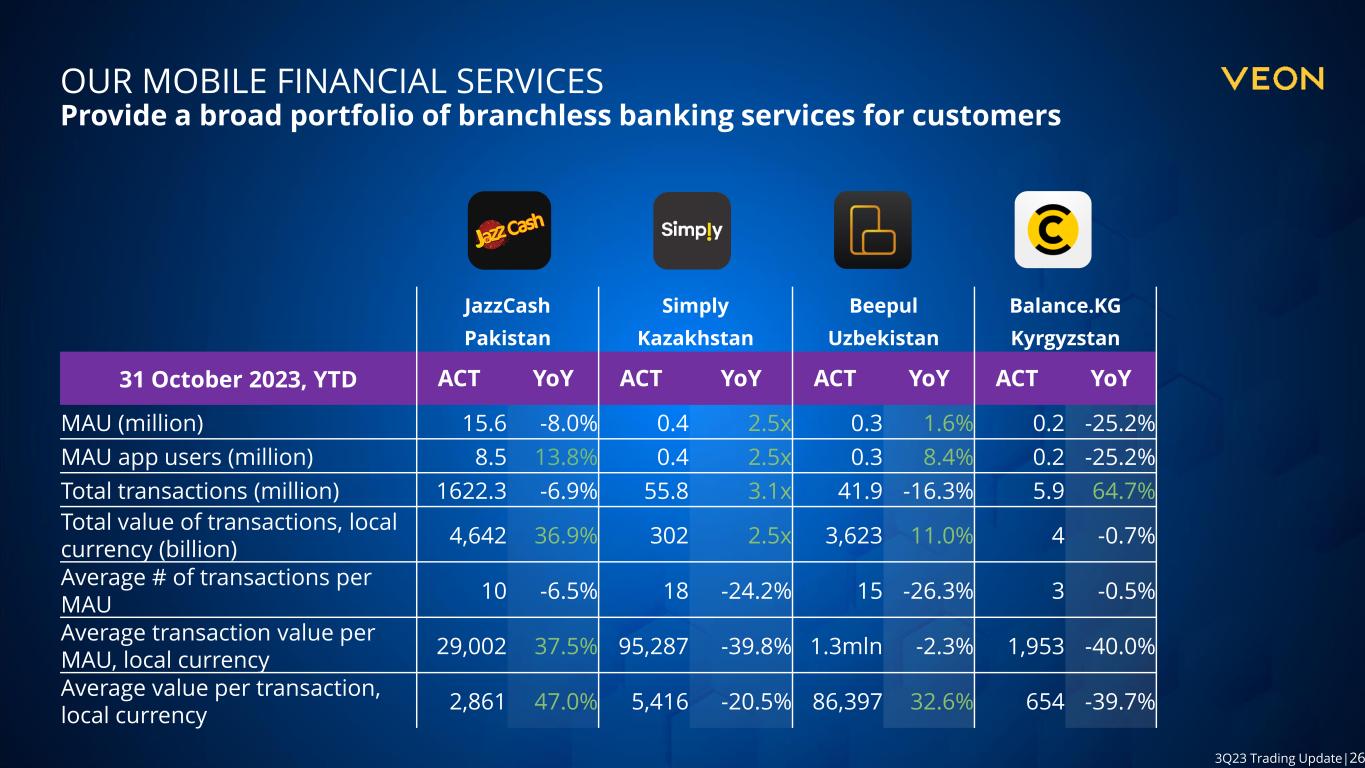
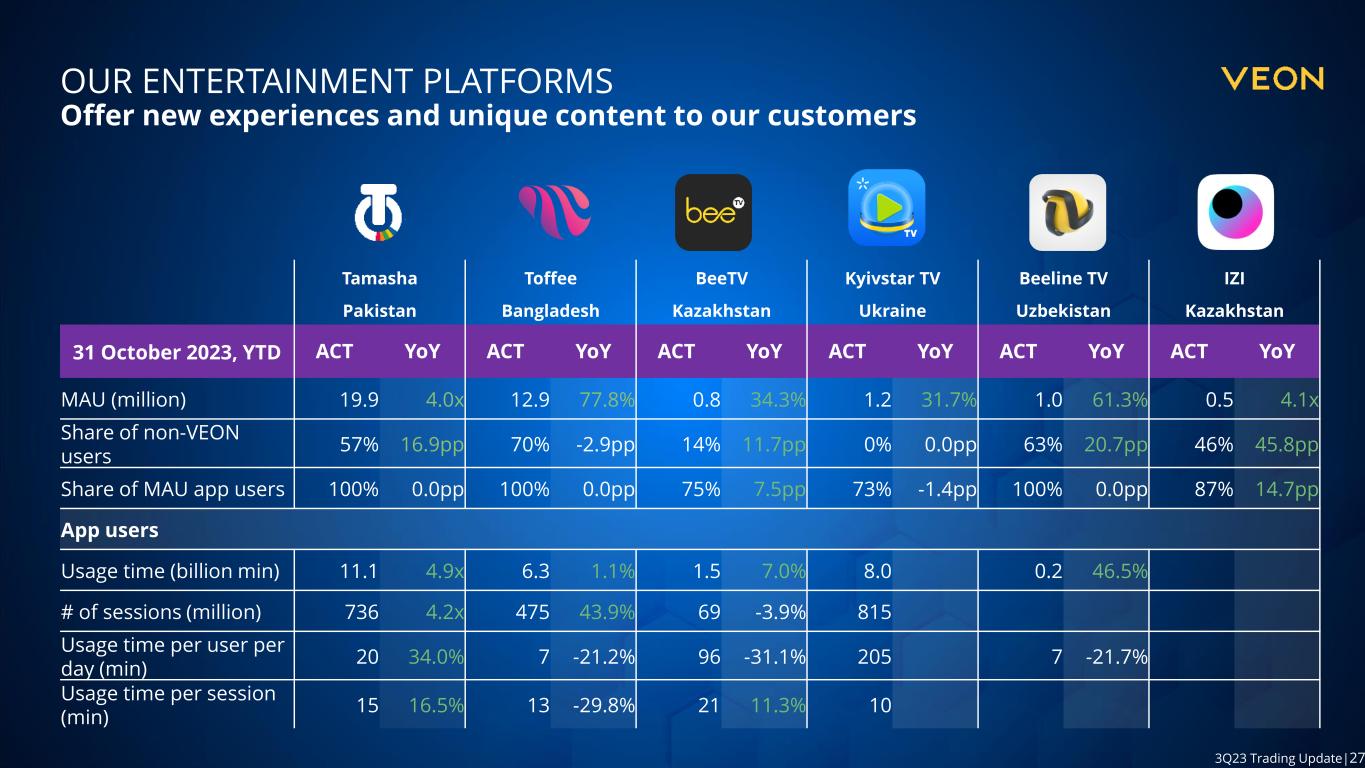
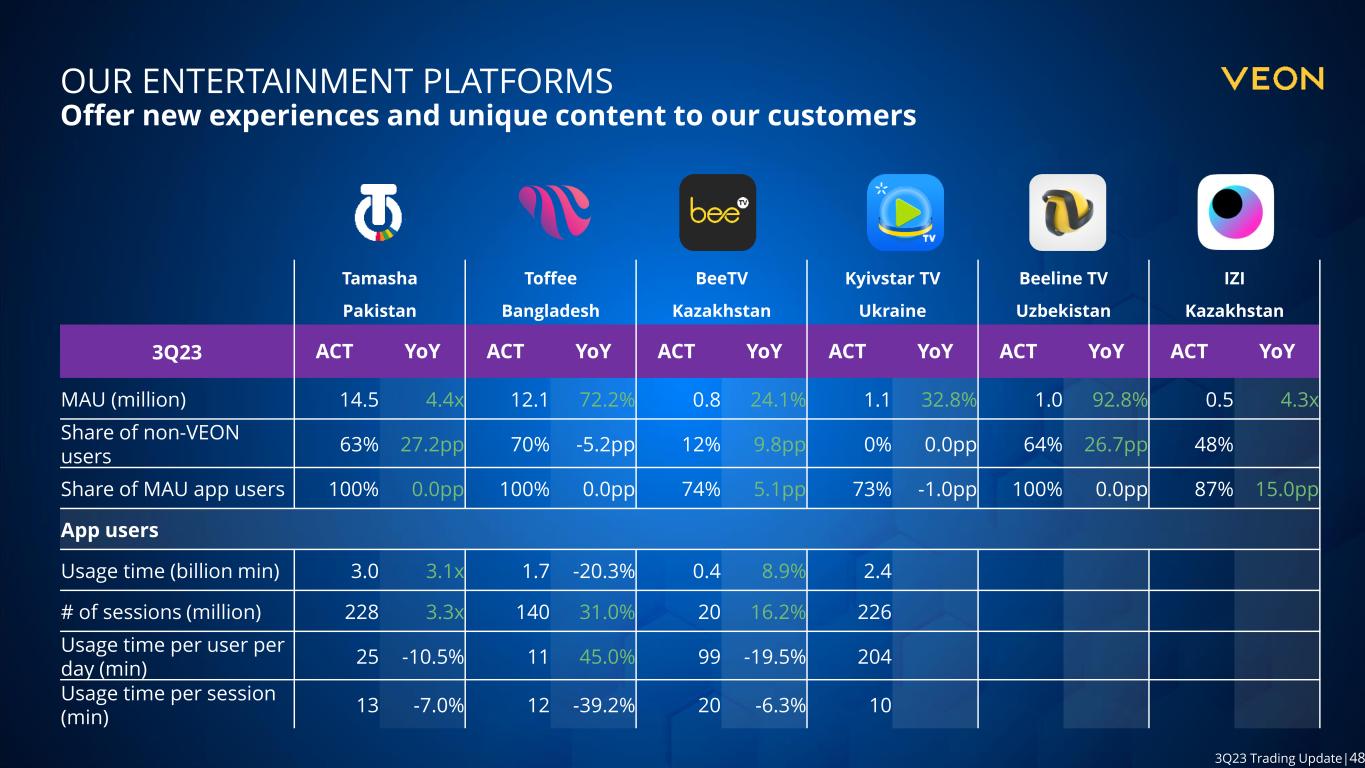
Trading update 3Q23 6 million in September 2023, supporting digital inclusion and local talent development in the digital space. Our multiplay B2C customers (those who make use of at least one of our digital services on top of our voice and data services) increased by 23.1% YoY to 29.8 million, representing 23.6% of the user base and accounting for 42.0% of VEON’s B2C revenues. Multiplay B2C customer ARPU is 3.8x higher, and churn is 2.1x lower, than for voice-only B2C customers. With a higher share of multiplay customers, ARPU levels in each of our operating companies also increased at rates ranging from 6.2% to 37.4% YoY in 3Q23. Through digital entertainment applications, VEON Group’s digital operators aim to meet the rising demand in their respective markets for locally relevant content, delivered with a superior digital experience. These applications support not only local content creators but also increasingly provide viable avenues for advertisers who want to reach the young and digitally savvy audiences of VEON Group companies’ digital applications. Our media streaming services, including Toffee in Bangladesh and Tamasha in Pakistan, remain important drivers for growth in our multiplay customer base. Toffee reached 12.1 million monthly active users (“MAUs”), a 72.2% YoY increase, while Tamasha in Pakistan reached 14.5 million MAUs, representing a 4.4-fold YoY increase. Our digital financial services business in Pakistan, JazzCash, reported 15.4 million MAUs and increased its 12-month total transaction volume by 35.9% YoY. In 3Q23, Group capex was USD 131.1 million (-29.8% YoY) with capex intensity for the last twelve months of 17.8% (- 4.5 p.p. YoY) and 13.9% in the current quarter. We closed the third quarter with total cash and cash equivalents of USD 2.2 billion, excluding banking operations in Pakistan, with USD 1.8 billion at the HQ level. Our local operations remain self-funding. In Ukraine, the team continued to focus on keeping the country connected while also delivering double digit growth in both revenue and EBITDA. Around 94% of our radio network remained operational at the end of the quarter. Kyivstar’s revenues increased 13.8% YoY in local currency (+8.6% YoY in reported currency). Kyivstar’s 4G customer base grew 13.1% YoY, with data usage rising 17.7% YoY. EBITDA increased by 26.2% YoY in local currency terms (+20.4% YoY in reported currency) in 3Q23 despite ongoing operational cost pressures, including electricity and fuel costs, and continued charitable donations, as well as staff and customer support programs. Excluding extraordinary one-off items in 3Q22 and 3Q23, underlying EBITDA grew 19.9% YoY in local currency. Pakistan revenues rose 27.1% YoY in local currency (- 3.5% YoY in reported currency), a strong result given a challenging macroeconomic environment. A further devaluation of around c.30% YoY in the Pakistani Rupee in the quarter negatively impacted financial performance in reported currency terms. Jazz grew its 4G users (+6.4% YoY), ARPU (+37.4% YoY) and data usage (+16.1% YoY) in 3Q23. EBITDA rose by 36.4% YoY in local currency terms (+3.3% YoY in reported currency) on the back of higher service revenues and effective cost control despite higher energy and fuel prices compared to 3Q22. In Kazakhstan, revenues increased 18.2% YoY in local currency terms (+23.5% YoY in reported currency). This was driven by the further expansion of our mobile customer base (+4.6% YoY) and 4G users (+10.4% YoY), higher ARPU (+19.6% YoY) and data usage (+10.8% YoY) and inflationary pricing. EBITDA rose by 33.7% YoY in local currency terms (+39.4% YoY in reported currency). Excluding an extraordinary one-off item in 3Q23, underlying EBITDA grew 24.5% YoY in local currency. In Bangladesh, Banglalink’s revenues increased 15.1% YoY in local currency (+1.6% YoY in reported currency) supported by balanced growth of its customer base and ARPU. This was Banglalink’s sixth consecutive quarter of double-digit YoY local currency revenue growth. The operator’s nationwide network expansion supported 31.1% YoY growth in 4G users. Banglalink continued to deliver joint growth in its subscriber base, which increased +7.9% YoY, as well as ARPU, which grew +6.8% YoY. EBITDA rose by 18.9% YoY in local currency (+4.8% YoY in reported currency). In Uzbekistan, revenues increased by 15.6% YoY in local currency (+6.3% YoY in reported currency), a ninth consecutive quarter of double-digit YoY revenue growth. This was driven by a 17.8% YoY expansion of the 4G subscriber base and robust growth in data revenues. EBITDA declined by 9.3% YoY in local currency (-16.5% YoY in reported currency) impacted by certain extraordinary one-offs in 3Q22 and 3Q23 and higher regulatory fees in 3Q23. Excluding these one-off items, underlying EBITDA was 10.0% higher YoY in local currency.

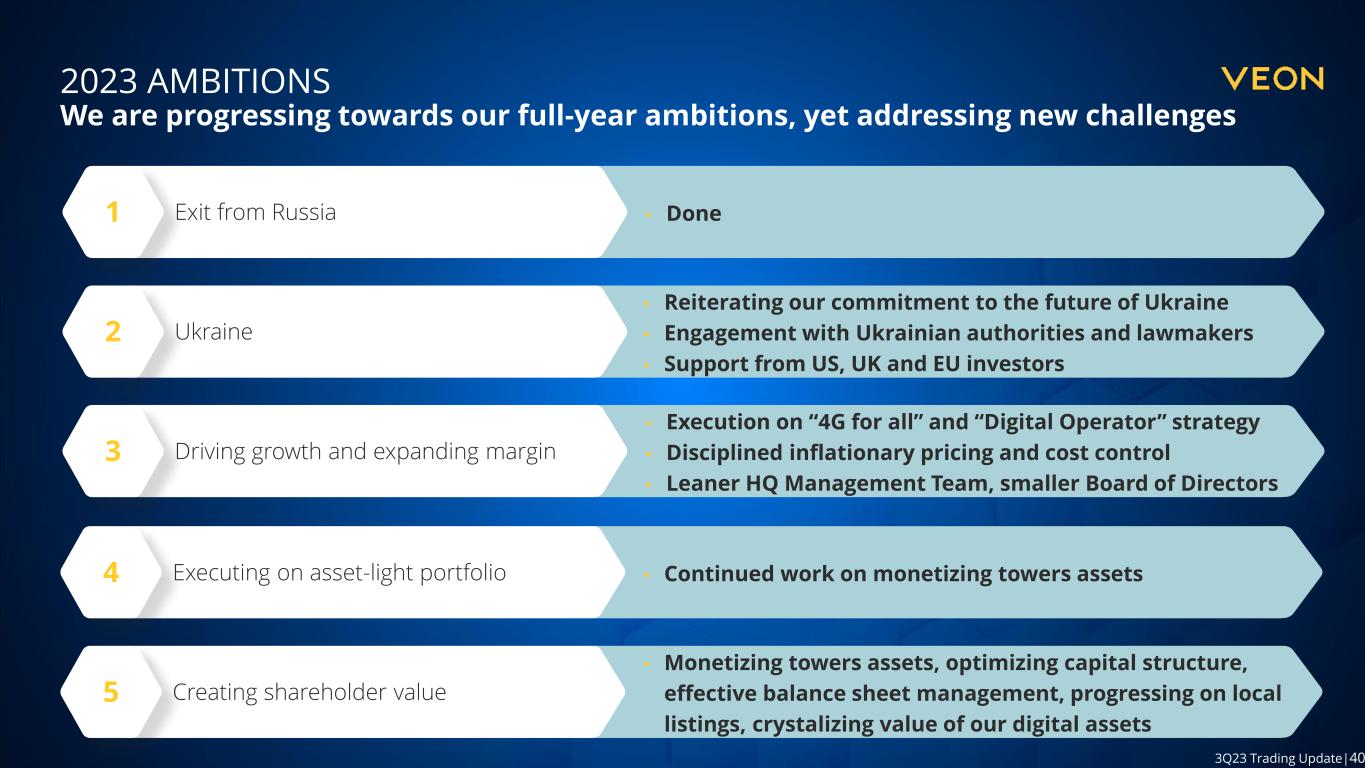
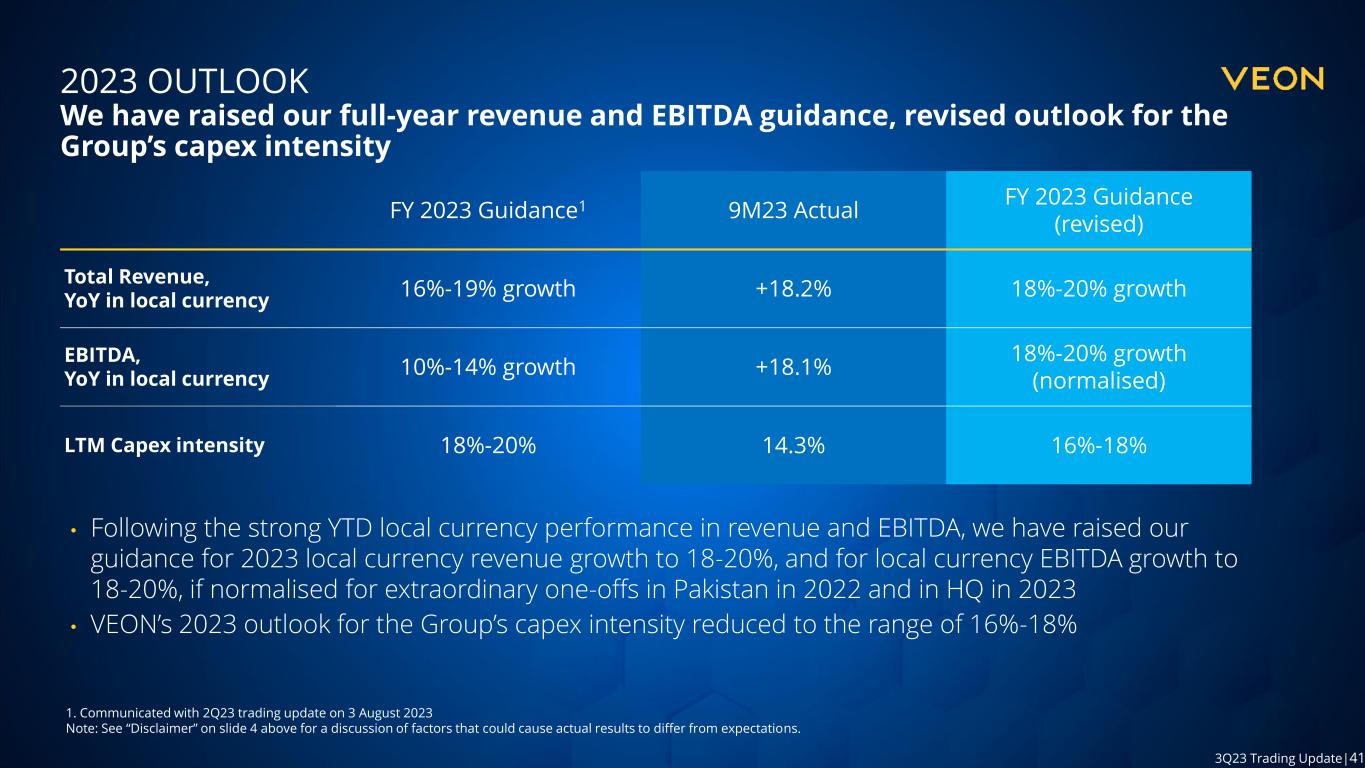
Trading update 3Q23 7 As we deliver on our Digital Operator strategy targets across the Group, we have raised our guidance for 2023 local currency revenue growth to 18%-20%, and for 2023 local currency EBITDA growth to 18%-20%, if normalised for extraordinary one-offs in Pakistan and in HQ in 2022 and 2023. VEON’s 2023 outlook for the Group’s capex intensity reduced to the range of 16%-18%. Previous Guidance FY23 Revised Guidance FY23 Total revenue growth 16-19% 18-20% YoY local currency EBITDA growth 10-14% 18-20% YoY local currency (normalised) LTM Capex Intensity 18-20% 16-18%
Trading update 3Q23 8 LATEST DEVELOPMENTS IN BANGLADESH Banglalink local syndicate loan facility On 16 November 2023, Banglalink signed an agreement with seven banks to secure a five-year syndicated term loan of BDT 8 billion (USD 70 million). The funds will be utilized in network expansion, regulatory payments, and other corporate purposes. Going asset-light: VEON and Summit reach USD 100M deal for partial sale of Bangladesh towers portfolio On 15 November 2023, VEON announced that its wholly owned subsidiary Banglalink has entered into an agreement to sell part of its tower portfolio in Bangladesh to Summit Towers Ltd for BDT 11 billion – an equivalent of roughly USD 100 million. The deal includes a long-term service partnership with Summit Towers. Upon closing of the deal, more than 2,000 towers – about one-third of Banglalink’s towers portfolio – will be transferred to Summit Towers, a company majority-owned by Summit Communications Group, a leading Bangladeshi infrastructure group. BTRC regulatory audit matter Despite having objections to the audit findings, in compliance with the instruction given by the Bangladesh Telecommunication Regulatory Commission (the “BTRC”) on 5 November 2023 to pay the principal amount of the BTRC’s audit demand within 10 working days, Banglalink has deposited BDT 1,657 million (USD 16 million) to the BTRC on 19 November 2023. The remaining elements of the BTRC’s audit, including the late fee, are not yet resolved. LATEST DEVELOPMENTS IN UKRAINE VEON Welcomes Former U.S. Secretary of State Mike Pompeo to Kyivstar Board of Directors On 14 November 2023, VEON announced that former U.S. Secretary of State Michael R. Pompeo will join the Board of Directors of VEON’s wholly-owned Ukrainian subsidiary Kyivstar as an independent non-executive director in his capacity as a Partner of Impact Investments, a newly established US-based strategic and financial advisory and investment firm which seeks to develop long-term partnerships with the world’s leading companies across a range of industries and geographies. In addition, VEON Group CEO Kaan Terzioglu has been appointed as Chair of the Kyivstar Board of Directors. VEON files motion with Kyiv Court challenging the freezing of corporate rights in Kyivstar On 30 October 2023, VEON announced that VEON Ltd. and VEON Holdings B.V. have filed two motions with the relevant Kyiv district court, challenging the freezing of the corporate rights in Kyivstar, which was initially announced on the website of the Security Services of Ukraine (SSU) on 6 October 2023. Noting that corporate rights in Kyivstar belong exclusively to VEON, and that their full or partial seizure directly violates the rights of VEON and its international debt and equity investors, VEON requested the lifting of the freezing of its corporate rights in Kyivstar. On 23 October 2023, VEON announced that it sent a senior delegation to Ukraine consisting of members of the VEON Board and Management. The delegation visited Kyiv and Lviv, meeting with Kyivstar employees, Kyivstar’s community support projects, government officials and representatives of diplomatic missions. The delegation’s visit follows VEON’s announcement on 9 October 2023 that it has closed the sale of its Russia operations and completed its exit from Russia – one of the most significant KEY RECENT DEVELOPMENTS IGHLIGHTS:
Trading update 3Q23 9 corporate exits given VEON’s public listing and the relative size of the asset. VEON had committed USD 600 million to Ukraine’s recovery and reconstruction over the next years during the “Ukraine Recovery Conference” in London in June. VEON is the sole and rightful owner of Kyivstar On 12 October 2023, VEON issued a clarification regarding certain developments in Ukraine, in response to recent press reports and in order to address questions raised by VEON’s international debt and equity investors. On 6 October 2023, the Security Services of Ukraine (SSU) announced that the Ukrainian courts are seizing all “corporate rights” of Mikhail Fridman, Peter Aven and Andrei Kosogov in 20 Ukrainian companies that these individuals beneficially own, while criminal proceedings, unrelated to Kyivstar or VEON, are in progress. This announcement was incorrectly characterized by some Ukrainian media as a “seizure” or “freezing” of “Kyivstar’s assets”. On 9 October 2023, Ukrainian media further reported, with a headline which incorrectly mentions Kyivstar, that the Ministry of Justice of Ukraine is separately finalizing a lawsuit in the Ukraine High Anti-Corruption Court to confiscate any Ukrainian assets of M. Fridman. To date, neither VEON nor Kyivstar had received any official communication from the Ukrainian authorities or courts regarding these matters. The only information that VEON has at the moment is from its share registrar in Ukraine, which confirms that any ownership changes to Kyivstar are currently not permitted. While VEON does not comment on unconfirmed reports in principle, the Company clarifies that VEON is and remains Kyivstar’s sole and rightful owner. None of the individuals mentioned in the SSU announcement referenced above own any shares in VEON or Kyivstar. VEON has no controlling or majority shareholder. The individuals mentioned in the SSU announcement cannot exercise any rights regarding VEON or Kyivstar, are not a part of either company’s governance mechanisms, including boards, nor do they have the ability to control or influence decisions made by VEON or Kyivstar. They do not derive benefits from VEON or any of its operating companies. Management believes that any actions aimed at the rights, benefits or funds of the aforementioned individuals cannot legitimately be directed toward Kyivstar or VEON. Kyivstar Raises UAH100 million to Support Ukraine’s Demining On 20 September 2023, VEON announced that its Ukrainian digital operator, Kyivstar, raised over UAH 100 million (c.USD 2.7 million) to support de-mining operations in the country. The funds will be used to provide specialist de-mining equipment for mine-clearing teams and support the safety of the civilian population. In line with its commitment to the reconstruction and recovery of Ukraine, Kyivstar launched a campaign to support the de-mining initiative “We Live Here”, donating directly to the initiative and further facilitating donations from its customers. The fundraising campaign continues with a target to raise UAH 175 million (c.USD 4.7 million). VEON CLOSES THE SALE OF ITS RUSSIA OPERATIONS, COMPLETES ITS EXIT FROM RUSSIA On 9 October 2023, VEON announced that it completed its exit from Russia with the closing of the sale of its Russian operations to a group of senior members of the PJSC VimpelCom management team. As previously announced, the transaction does not provide for any buy-back arrangements and signifies a complete exit from the Russian market for VEON. VEON COMPLETES EARLY PAYMENT OF ITS 2023 AND 2024 NOTES On 13 September 2023, VEON’s subsidiary, VEON Holdings B.V. (“VEON Holdings”), issued two redemption notices for the early payment of VEON Holdings’ bonds maturing in December 2023 and June 2024. VEON Holdings redeemed in full its senior notes due in December 2023 and June 2024, outstanding as of the redemption date of 27 September 2023. VEON Holdings’ bonds maturing in October 2023 were paid on 13 October upon their maturity. VEON GROUP ANNOUNCES VESTING OF SHARE AWARD FOR THE GROUP CEO On 7 September 2023, VEON announced vesting of management share awards to the Group Chief Executive Officer, Kaan Terzioglu. The vesting of this share award is the second and final tranche of VEON’s Group CEO share award, which was detailed in the press release dated 23 September 2022. A total of 146,490 American Depositary Shares (“ADS”) vested as part of VEON’s Deferred Share Plan, where each ADS represents 25 underlying common shares. The ADSs will be transferred to Mr. Kaan Terzioglu in due course. Following the vesting and transfer of the ADSs, the total number of ADSs held by Kaan Terzioglu is 292,522 and the number of common shares held by Kaan Terzioglu is 100,000.

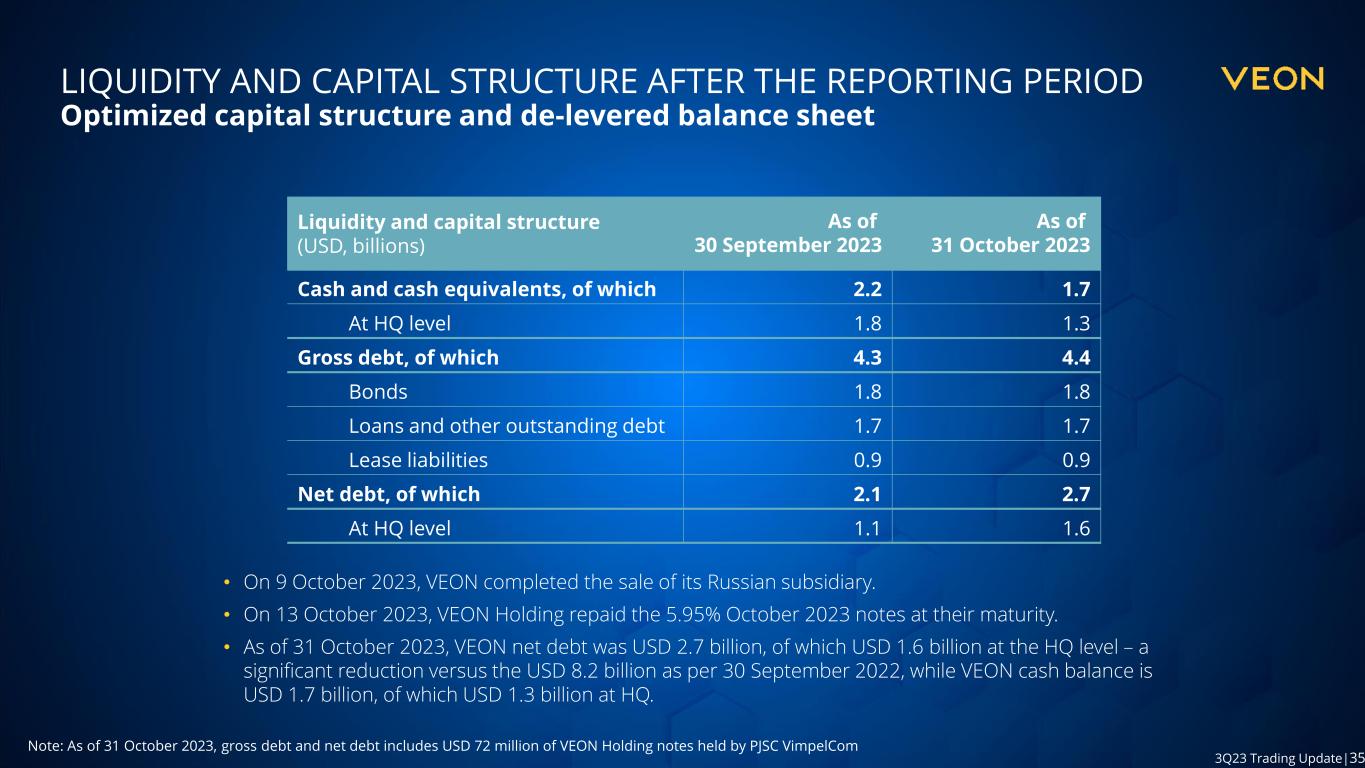
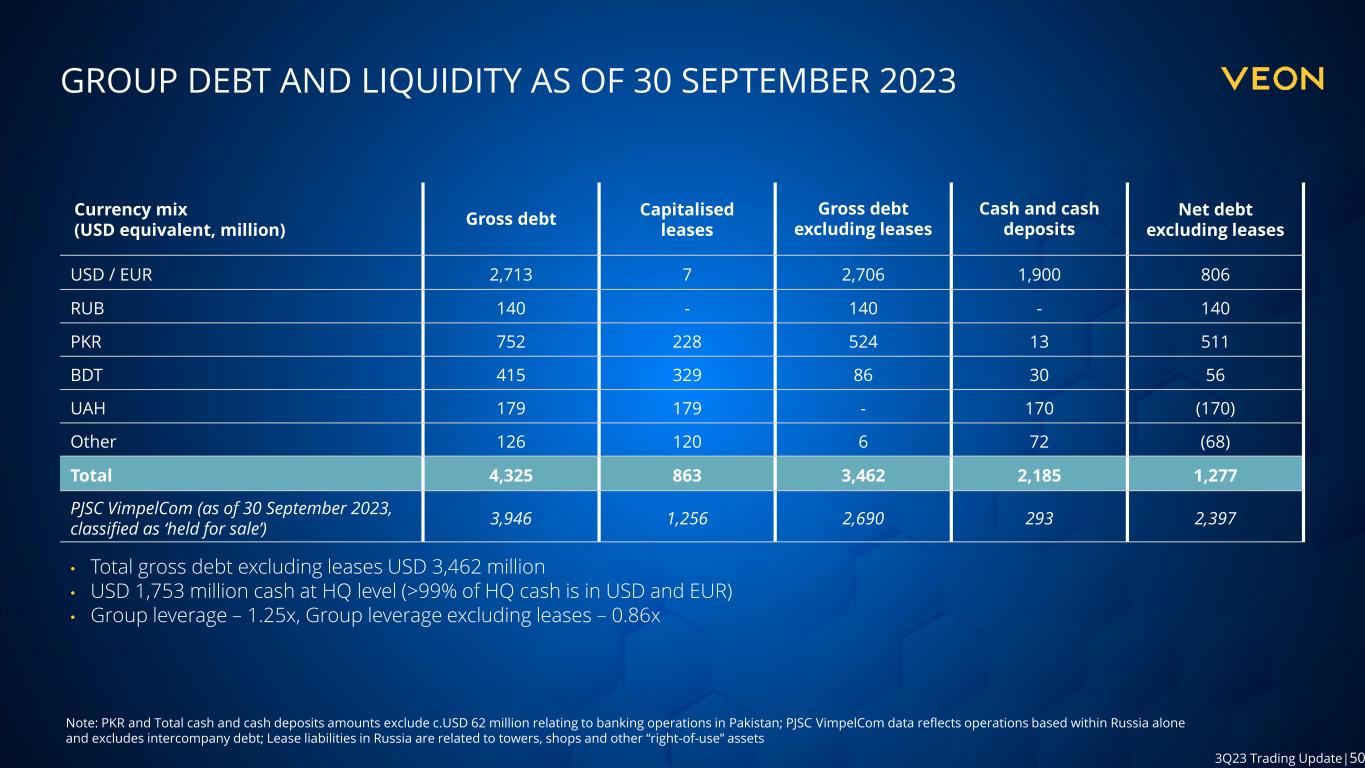
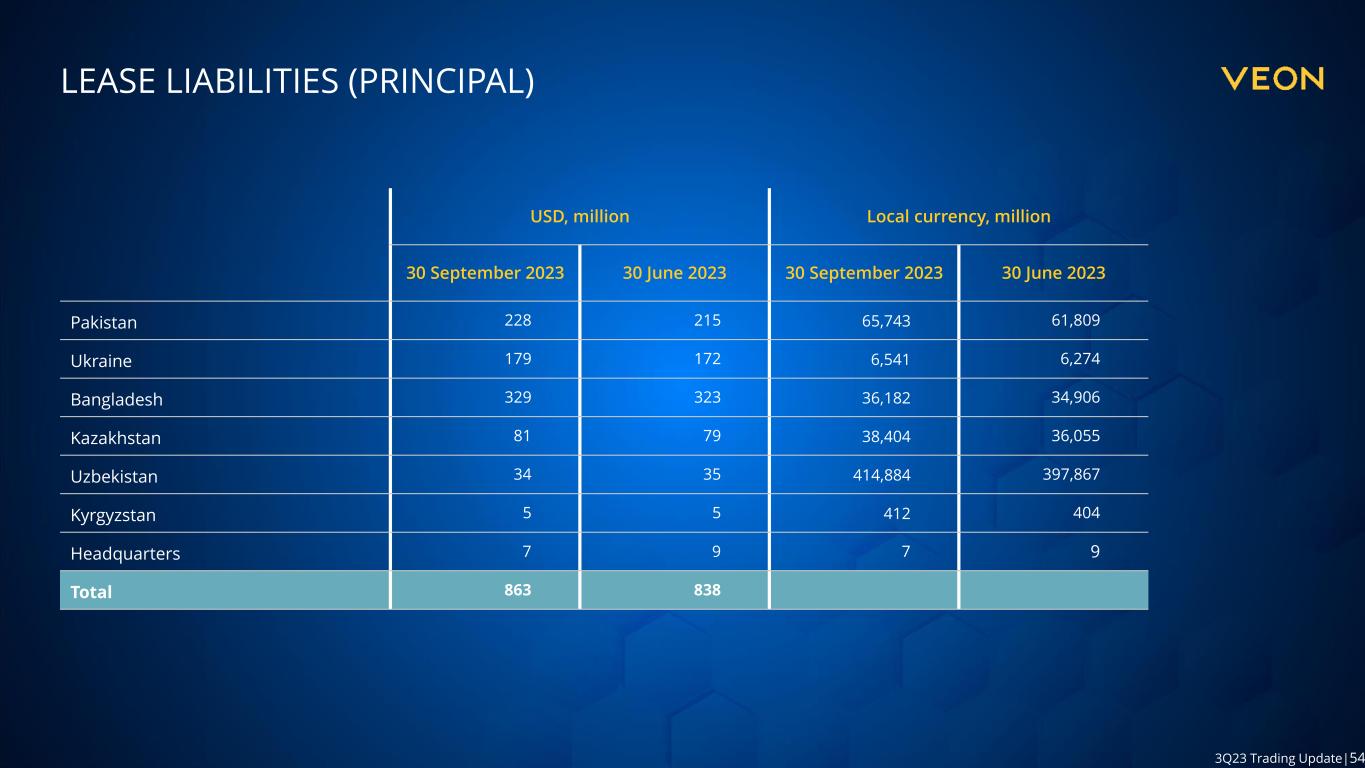
Trading update 3Q23 10 KEY DATA USD million 30 September 2023 30 June 2023 QoQ 30 September 2022 YoY Cash and cash equivalents 2,187 2,403 (8.9%) 3,293 (33.6%) Gross debt, of which 4,326 5,161 (16.2%) 11,449 (62.2%) Lease liabilities 863 838 3.1% 3,092 (72.1%) Net debt 2,134 2,753 (22.5%) 8,207 (74.0%) Net debt / LTM EBITDA 1.25x 1.68x 4.72x Net debt excluding leases 1,277 1,923 (33.6%) 5,128 (75.1%) Net debt excluding leases / LTM EBITDA 0.86x 1.34x 3.30x Note: Certain comparative amounts have been reclassified to conform to the current period presentation. Accounts as at 30 September 2022 include amounts from Russian operations, which in 4Q22 were reclassified as assets and liabilities held for sale and therefore excluded from the corresponding amounts as at 30 June 2023 and as at 30 September 2023. Cash and cash equivalents exclude amounts relating to banking operations in Pakistan. Total cash and cash equivalents decreased in the third quarter to approximately USD 2.2 billion (USD 2.4 billion as at 30 June 2023), excluding USD 62 million relating to banking operations in Pakistan, mostly due to the early redemption of the VEON Holdings’ December 2023 and June 2024 notes in September 2023. Of this, USD 1.8 billion in cash and cash equivalents is held by VEON’s HQ in Amsterdam denominated in US dollars and euro, including USD 1.06 billion drawn under the Revolving Credit Facility (“RCF”). The HQ-level cash and cash equivalents are held in bank accounts, money market funds and on-demand deposits at a diversified group of international banks. Gross debt decreased to USD 4.3 billion as of 30 September 2023, compared with USD 5.2 billion at the end of Q2 2023. The decrease in gross debt was largely driven by the early redemption of December 2023 and June 2024 VEON Holdings’ notes, further reclassification of VEON Holdings B.V. notes purchased by PJSC VimpelCom Russia to Intercompany debt, and by the QoQ depreciation of the Russian ruble and Pakistani rupee against the US dollar. Combined with debt repayments by operating companies, this resulted in lower reported levels of bank loans and bonds. Lease liabilities increased to USD 863 million at the end of 3Q23 from USD 838 million as of 30 June 2023, which was primarily impacted by network expansion in Pakistan, Ukraine, Bangladesh, Kazakhstan and Uzbekistan. Net debt decreased to USD 2.1 billion in 3Q23, and cash generation at operating companies exceeding debt repayments. Net debt excluding leases decreased to USD 1.3 billion. This resulted in improved net debt/EBITDA ratios of 1.25x and 0.86x, respectively. LIQUIDITY AND CAPITAL STRUCTURE

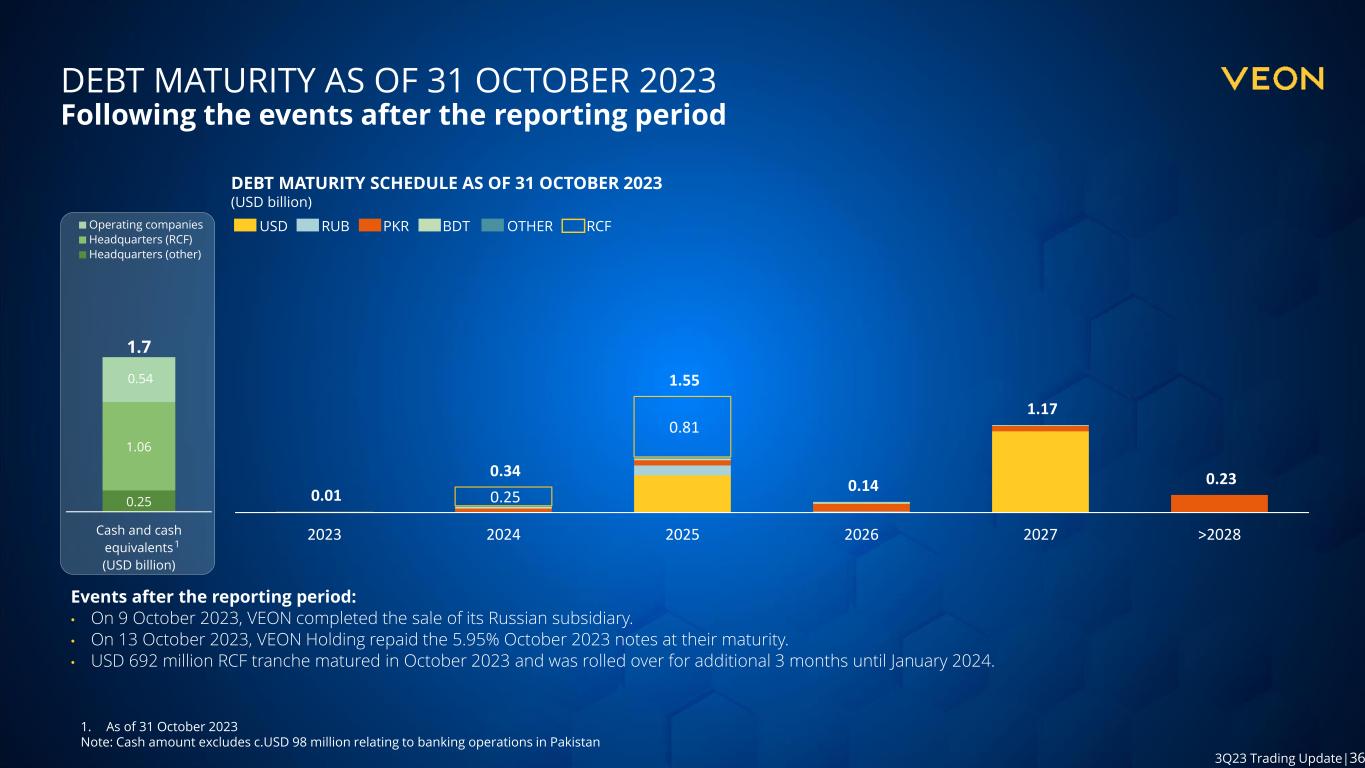
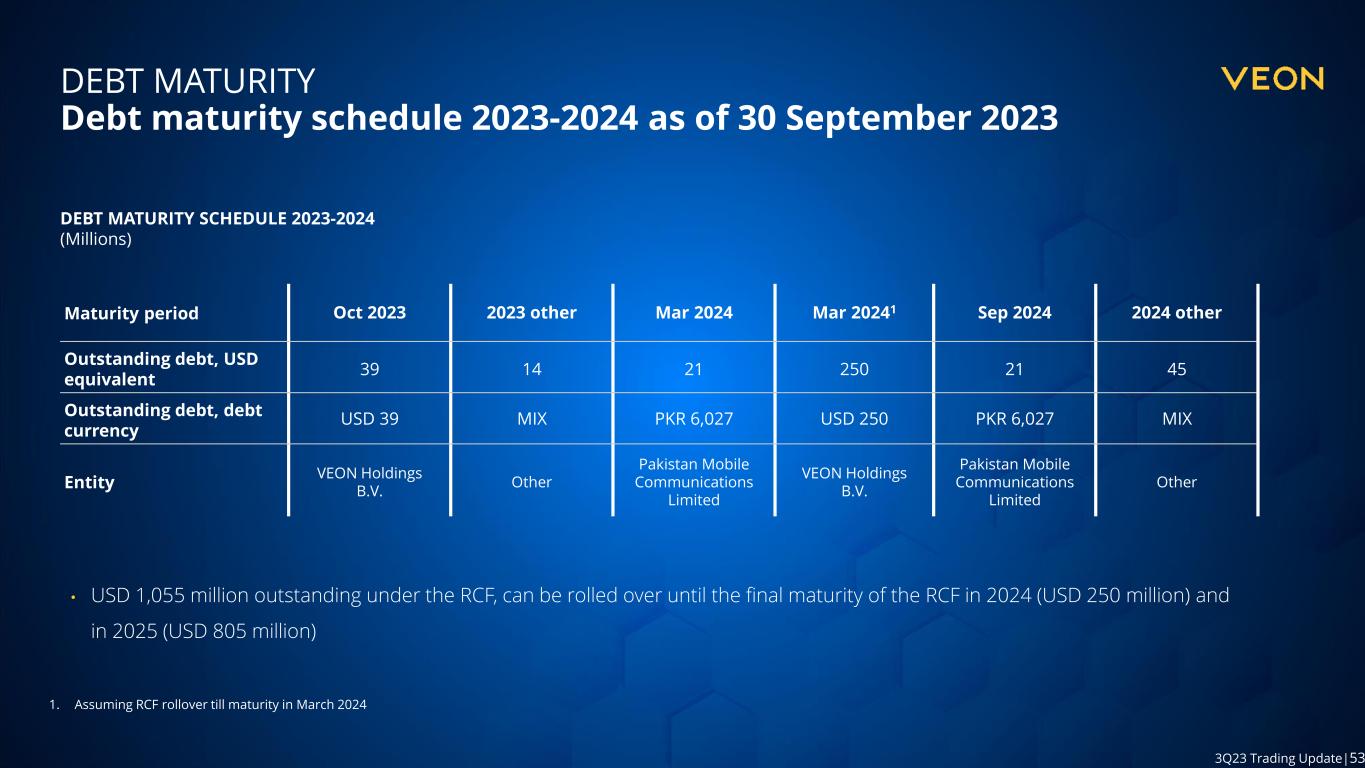
Trading update 3Q23 11 Debt maturities at HQ level, USD (million) equivalent Year Debt RCF Total 2023 39 - 39 2024 - 250 250 Beyond 2024 1,718 805 2,523 Note: the amounts exclude accrued interest costs For the USD 1.1 billion RCF, USD 250 million can be rolled over until final maturity in March 2024 and USD 805 million can be rolled over until final maturity in March 2025. Despite the unprecedented challenges posed by the conflict between Russia and Ukraine and the current sanctions environment, VEON is optimistic that following the completion of the sale of its Russian operations on 9 October 2023 it can return to international capital markets, including the debt capital markets that the company has traditionally relied on to refinance maturing debt. The ability to upstream cash to HQ level to meet obligations is currently impaired by currency controls in Ukraine and other geopolitical and FX pressures affecting emerging markets. VEON remains committed to monetizing assets to enhance liquidity at the HQ level and is taking steps to regain access to capital markets. VEON is confident in its ability to navigate these challenges and continue to provide converged connectivity and online services to its customers globally. LIQUIDITY AND CAPITAL STRUCTURE AS AT 31 OCTOBER 2023 After taking into account VEON’s exit from Russia announced on 9 October 2023, and the payment of October 2023 VEON Holdings notes in October 2023, our Group debt and cash position as of 31 October 2023 was as follows: • Gross debt of USD 4.4 billion (USD 3.5 billion, excluding leases); • Cash and cash equivalents of USD 1.7 billion, of which USD 1.3 billion is at HQ level; and • Net debt of USD 2.7 billion (USD 1.8 billion, excluding leases), of which USD 1.6 billion is at HQ level. This represents a significant reduction from Group net debt of USD 8.2 billion (USD 5.1 billion, excluding leases) as of 30 September 2022. As of 31 October 2023, our Group weighted average cost of debt, excluding leases, is approximately 8% with a Group weighted average maturity of approximately 2.3 years. Pro-forma externally outstanding VEON Holdings notes as at 31 October 2023 ISIN Date of Issuance Maturity date Amount issued Amount outstanding US92334VAA35 (144A) XS2058691663 (REGS) October 9, 2019 tap: January 22, 2020 April 9, 2025 USD 1,000 million USD 556 million XS2184900269 (144A) XS2184900186 (REGS) June 18, 2020 June 18, 2025 RUB 20,000 million RUB 9,187 million XS2226712995 (144A) XS2226716392 (REGS) September 11, 2020 September 11, 2025 RUB 10,000 million RUB 3,274 million XS2343534462 (144A) XS2343532508 (REGS) September 16, 2021 September 16, 2026 RUB 20,000 million RUB 1,357 million US91823N2A05 (144A) XS2252958751 (REGS) November 25, 2020 November 25, 2027 USD 1,250 million USD 1,093 million Note: takes into account VEON's exit from Russia and the redemption upon maturity of VEON Holdings' October 2023 notes; excludes VEON Holdings' notes held by the Group.

Trading update 3Q23 12 KEY FIGURES BY COUNTRIES USD million 3Q23 3Q22 YoY reported YoY local currency 9M23 9M22 YoY reported YoY local currency Total revenue 945 890 6.1% 19.3% 2,745 2,816 (2.5%) 18.2% Ukraine 238 219 8.6% 13.8% 702 747 (6.0%) 12.1% Pakistan 279 289 (3.5%) 27.1% 820 953 (14.0%) 21.9% Kazakhstan 204 166 23.5% 18.2% 567 467 21.5% 20.1% Bangladesh 146 144 1.6% 15.1% 428 436 (1.9%) 16.6% Uzbekistan 65 61 6.3% 15.6% 194 169 14.3% 20.0% Kyrgyzstan 15 13 9.0% 18.1% 41 36 14.5% 19.7% Georgia - - n.m. n.m. - 17 (100.0%) (100.0%) HQ and eliminations (2) (2) (12.0%) (7) (11) 34.2% Service revenue 913 854 6.9% 19.8% 2,647 2,699 (1.9%) 18.6% Ukraine 236 218 8.4% 13.6% 697 743 (6.2%) 11.9% Pakistan 258 263 (2.1%) 29.0% 751 865 (13.2%) 23.1% Kazakhstan 199 160 24.4% 19.0% 550 450 22.2% 20.7% Bangladesh 144 141 1.7% 15.2% 421 429 (1.7%) 16.8% Uzbekistan 65 61 6.3% 15.6% 194 169 14.3% 20.0% Kyrgyzstan 15 13 9.8% 19.0% 41 36 14.9% 20.0% Georgia - - n.m. n.m. - 17 (100.0%) (100.0%) HQ and eliminations (2) (2) (19.5%) (7) (11) 34.1% EBITDA 444 380 17.0% 30.6% 1,245 1,290 (3.5%) 18.1% Ukraine 152 126 20.4% 26.2% 425 452 (6.0%) 12.5% Pakistan 124 120 3.3% 36.4% 373 430 (13.2%) 23.7% Kazakhstan 118 85 39.4% 33.7% 314 239 31.5% 29.9% Bangladesh 56 53 4.8% 18.9% 161 164 (2.3%) 16.3% Uzbekistan 23 28 (16.5%) (9.3%) 79 100 (21.2%) (17.3%) Kyrgyzstan 6 5 16.0% 25.6% 16 14 12.4% 17.5% Georgia - - n.m. n.m. - 7 (100.0%) (100.0%) HQ and eliminations (34) (37) 8.2% (123) (118) (4.5%) EBITDA margin 47.0% 42.7% 4.4p.p. 45.4% 45.8% (0.4p.p.) COUNTRY PERFORMANCE

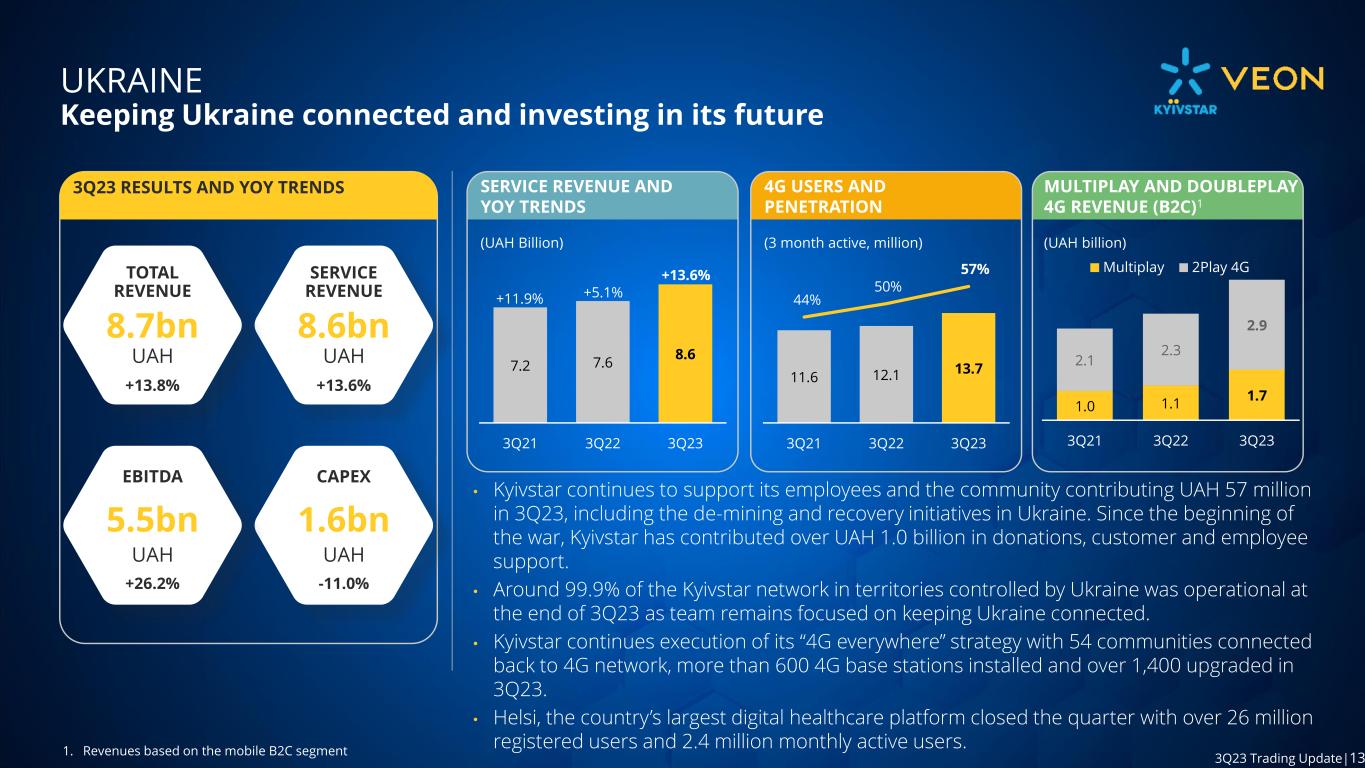
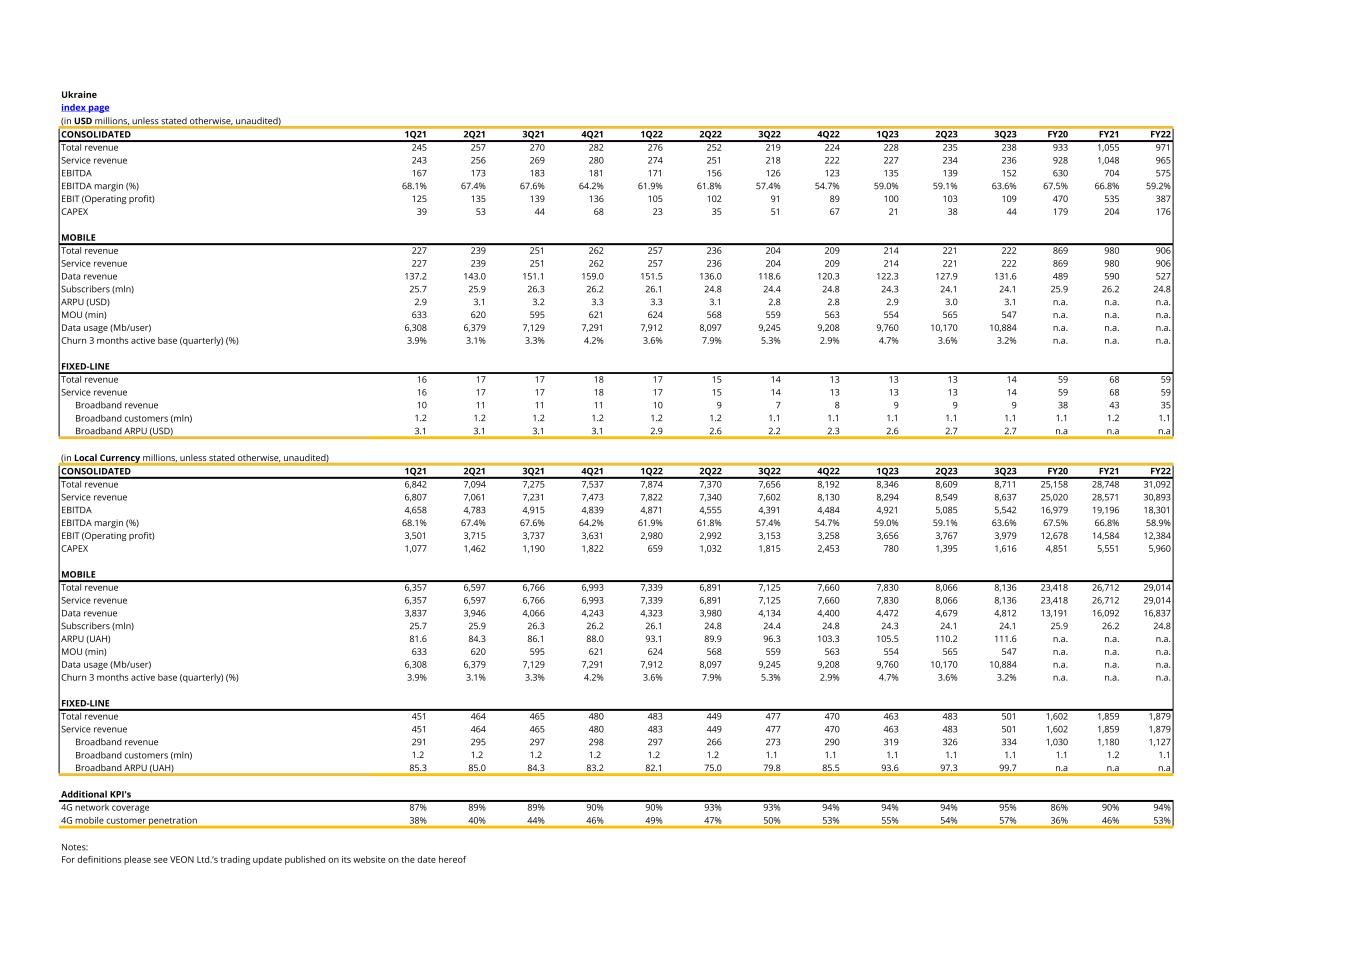
Trading update 3Q23 13 Keeping Ukraine connected and investing in its future UAH million 3Q23 3Q22 Y oY 9M23 9M22 Y oY Total rev enue 8,711 7,656 13.8% 25,667 22,900 12.1% Service revenue 8,637 7,602 13.6% 25,480 22,763 11.9% EBITDA 5,542 4,391 26.2% 15,547 13,817 12.5% EBIT DA margin 63.6% 57.4% 6.3p.p. 60.6% 60.3% 0.2p.p. Capex 1,616 1,815 (11.0%) 3,791 3,507 8.1% Capex intensity 18.4% 17.5% 0.9p.p. Mobile T otal operating revenue 8,136 7,125 14.2% 24,033 21,354 12.5% Service revenue 8,136 7,125 14.2% 24,033 21,354 12.5% Data revenue 4,812 4,134 16.4% 13,963 12,437 12.3% Customers (mln) 24.1 24.4 (1.1%) Data users (mln) 17.1 16.8 1.8% 4G users (mln) 13.7 12.1 13.1% ARPU (UAH) 112 96 15.8% MOU (min) 547 559 (2.2%) Data usage (GB/user) 10.6 9.0 17.7% 4G coverage 94.7% 93.0% 1.7p.p. F ixed-line T otal operating revenue 501 477 5.0% 1,447 1,409 2.6% Service revenue 501 477 5.0% 1,447 1,409 2.6% Broadband revenue 334 273 22.6% 979 836 17.0% Broadband customers (mln) 1.1 1.1 0.6% Broadband ARPU (UAH) 100 80 25.0% Kyivstar’s revenues and EBITDA growth accelerated in the quarter, despite the challenging operating environment. The team remains fully committed to the reconstruction and recovery of Ukraine. Total revenues increased by 13.8% YoY in 3Q23, with mobile service revenues rising by 14.2% YoY, supported by a 15.8% YoY increase in ARPU and higher roaming revenues. EBITDA rose by 26.2% YoY, corresponding to an EBITDA margin of 63.6%. In 3Q22 and 3Q23, EBITDA was affected by UAH 279 million and UAH 57 million respectively in charitable donations, as well as staff and customer support programs, as Kyivstar continues to assist its employees and local communities, including de-mining and recovery initiatives in Ukraine. Excluding these one-off items, EBITDA grew 19.9% YoY in local currency despite high annual increases in utility tariffs. Kyivstar’s 4G user base reached 13.7 million (+13.1% YoY), and now accounts for 56.7% of the total customer base (+7.1 p.p. YoY). The growth in 4G users together with new value propositions supported a 17.7% YoY growth in data consumption. Kyivstar’s mobile subscriber base was down 1.1% YoY as the number of Ukrainians living outside of Ukraine continued to impact the subscriber base. With an enhanced focus on VEON’s DO1440 strategy, Kyivstar supported access to key services including digital healthcare, information and entertainment services. Kyivstar’s multiplay customers increased by 21.4% YoY and generated growth of 45.4% YoY in multiplay revenues. Helsi Ukraine, the country’s largest digital healthcare platform, continues to power digital medicine in Ukraine, with more than 26 million registered patients. Helsi mobile app downloads increased by 8.3% YoY and reached 17.2 million in the third quarter helping our clients to book some 1.9 million appointments through the platform during the reported period. The media streaming service, Kyivstar TV closed the quarter with more than 1.1 million MAUs, representing a 32.8% YoY increase. In 3Q23, 2,900 users of Kyivstar TV enjoyed its recently introduced “Children’s Profile”, a dedicated portfolio of content for children, and around 20,000 customers benefited from educational content available on the platform for free. In line with its “4G everywhere” strategy, Kyivstar re- connected 54 more communities to its 4G network, added more than 600 new 4G base stations and upgraded over 1,400 base stations to 4G standard in 3Q23 as Kyivstar continued to support essential connectivity in the country and sustain business resilience and continuity. Capex was 11.0% lower YoY due to phasing of projects. Over the course of the past 21 months, Kyivstar has focused extensively on resilience, building multiple redundancies into its core network and investing in the energy infrastructure of its sites with power generators and batteries. Despite significant impacts on its network and doubling of the intensity of DDoS attacks, Kyivstar maintains operational nearly 99.9% of the radio network on territories controlled by Ukraine at the end of September and supports Ukraine’s cybersecurity. Given our strong commitment to the reconstruction and recovery of Ukraine, Kyivstar launched a campaign to support the de-mining campaign “We Live Here”, donating directly to the initiative and further facilitating donations from its customers. In the year to date, Kyivstar has raised over UAH 120 million and donated UAH 20 million to support de-mining operations in the country. The funds will be used to provide specialist de-mining equipment for mine- clearing teams and support the safety of the civilian population. The fundraising campaign continues with a target to raise UAH 175 million. UKRAINE
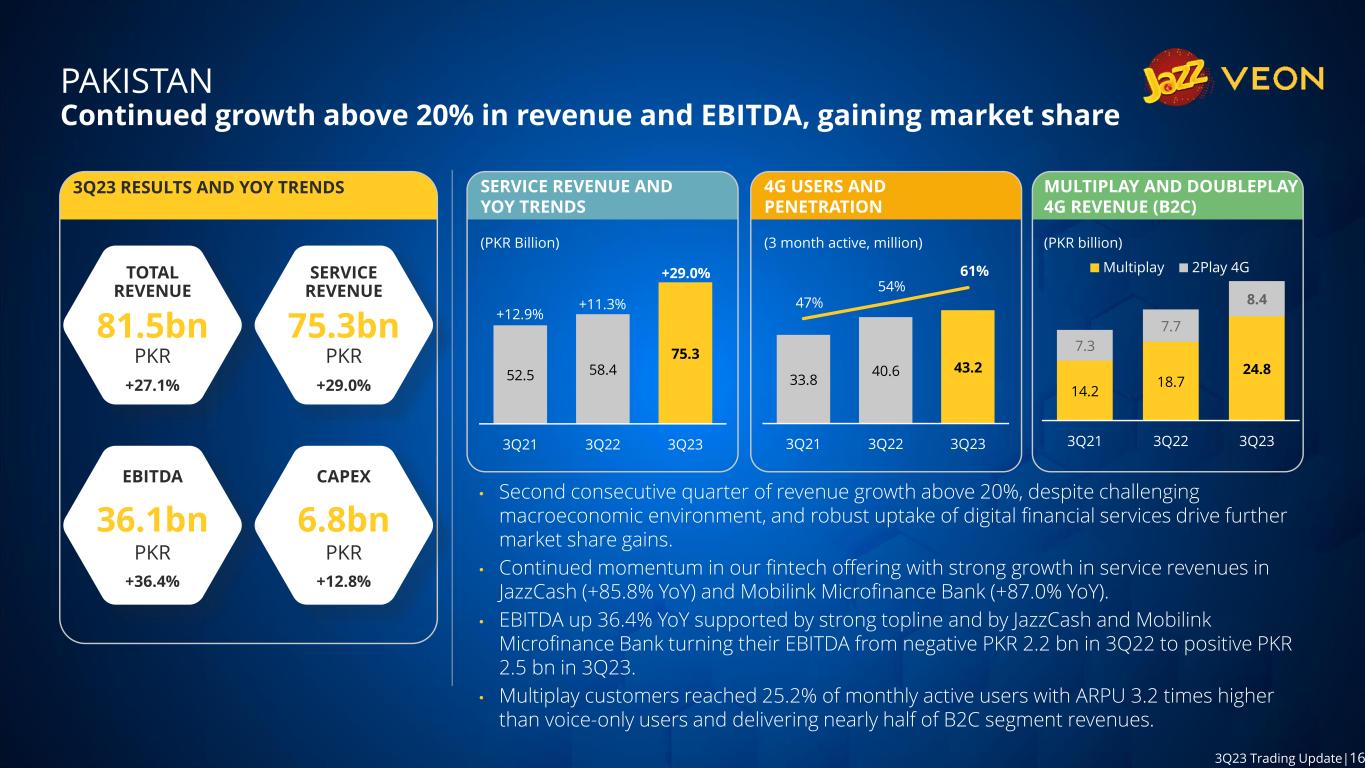
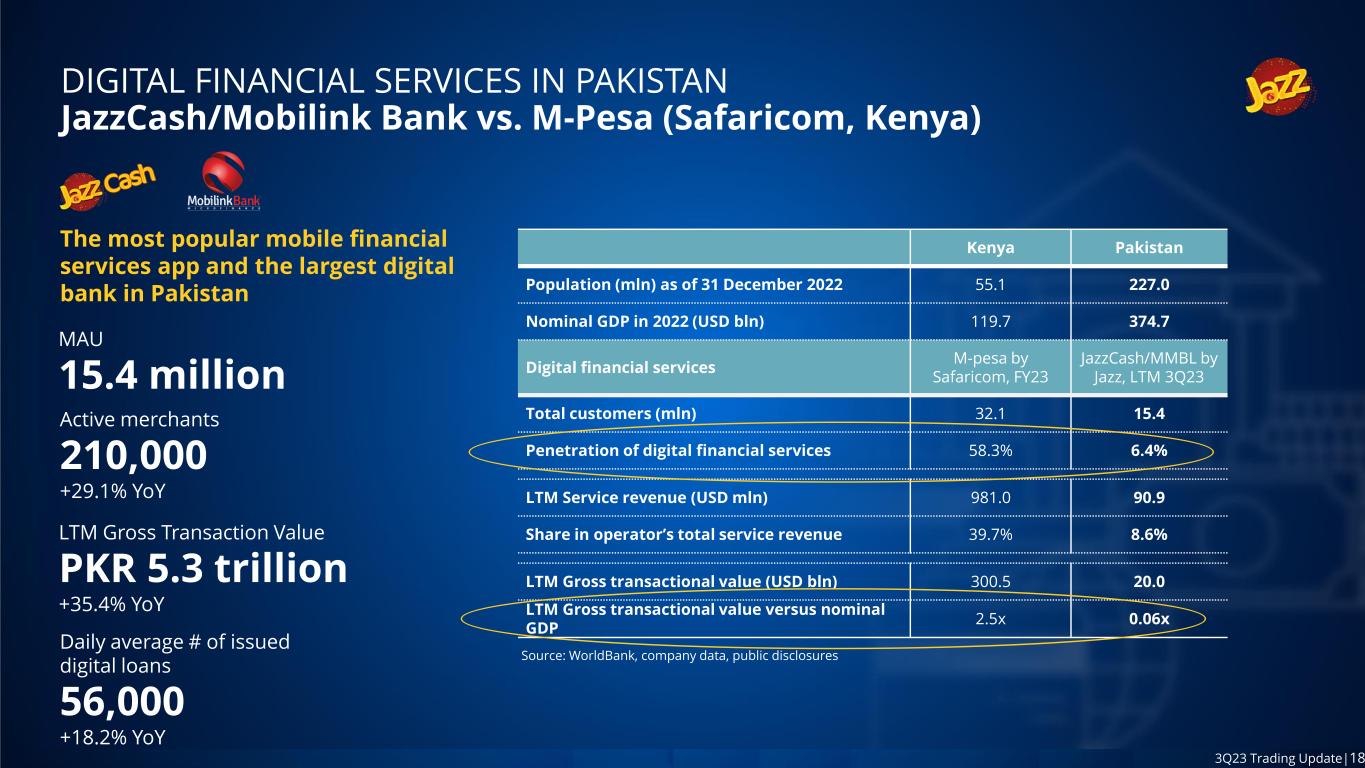
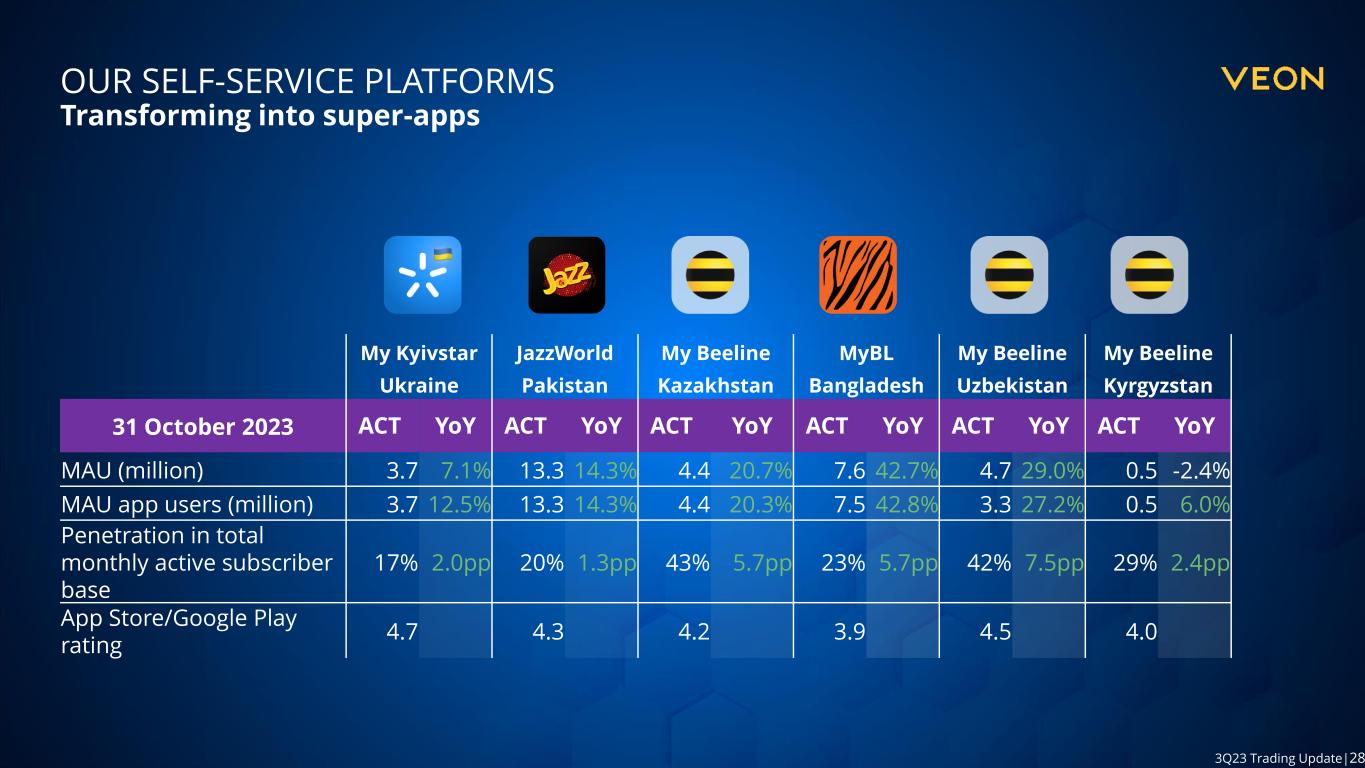
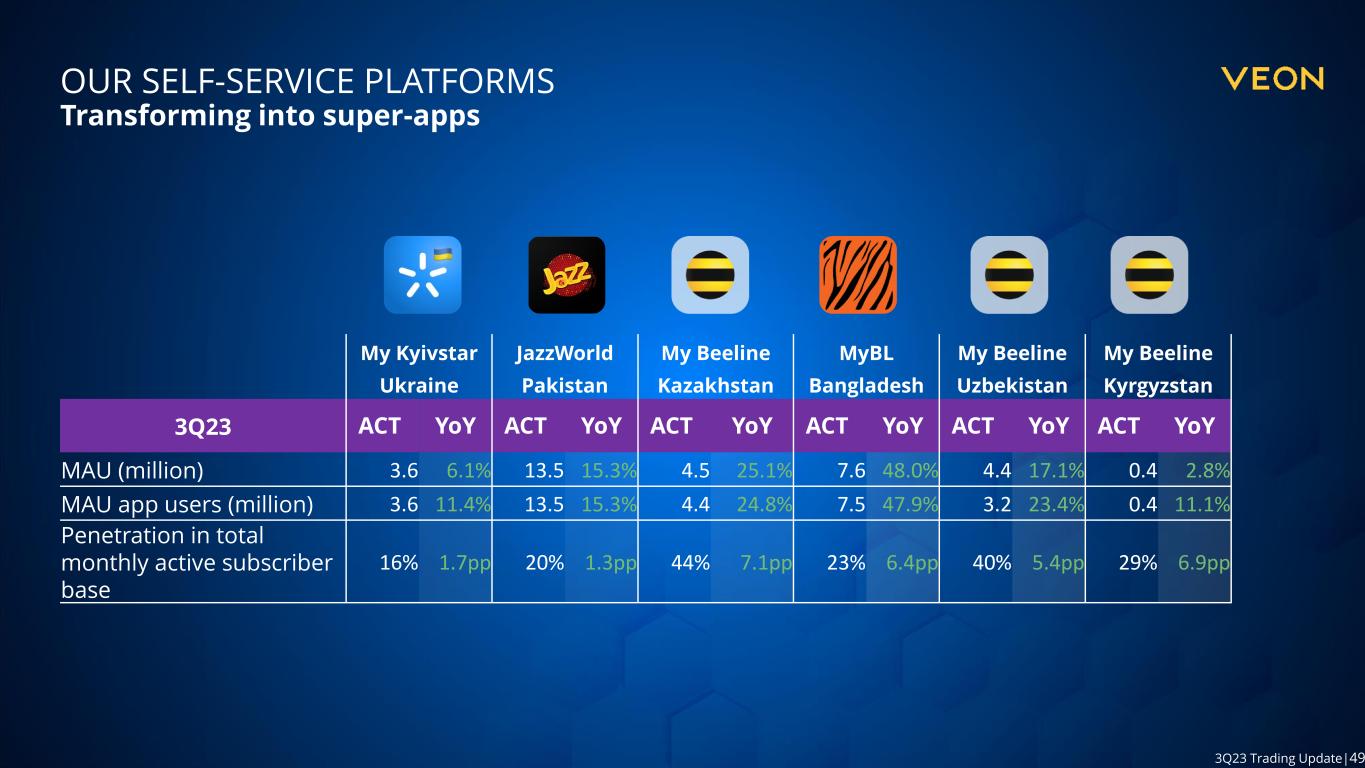
Trading update 3Q23 14 Continued growth above 20% YoY in revenue and EBITDA, gaining market share PKR million 3Q23 3Q22 Y oY 9M23 9M22 Y oY Total rev enue 81,538 64,150 27.1% 228,829 187,738 21.9% Service revenue 75,287 58,383 29.0% 209,742 170,416 23.1% EBITDA 36,071 26,454 36.4% 104,219 84,282 23.7% EBIT DA margin 44.2% 41.2% 3.0p.p. 45.5% 44.9% 0.7p.p. Capex 6,753 5,989 12.8% 20,595 32,059 (35.8%) Capex intensity 13.5% 18.6% (5.1p.p.) Mobile T otal operating revenue 81,538 64,150 27.1% 228,829 187,738 21.9% Service revenue 75,287 58,383 29.0% 209,742 170,416 23.1% Data revenue 33,788 27,068 24.8% 93,422 78,444 19.1% Customers (mln) 70.5 75.0 (6.0%) Data users (mln) 53.5 53.6 (0.2%) 4G users (mln) 43.2 40.6 6.4% ARPU (PKR ) 352 256 37.4% MOU (min) 427 396 7.8% Data usage (GB/user) 6.5 5.6 16.1% 4G coverage 67.0% 63.8% 3.2p.p. With a robust portfolio of digital offerings and double- digit growth in multiplay customers, Jazz delivered its second consecutive quarter of local currency revenue and EBITDA growth above 20% and gained further market share despite a challenging macroeconomic environment. Total revenues rose by 27.1% YoY in 3Q23 reflecting strong volume growth and disciplined inflationary pricing. ARPU grew 37.4% YoY as Jazz’s strong portfolio of DO1440 services continues to scale up. Jazz’s fintech offerings stood out in this quarter, with robust increases in service revenues for both JazzCash (+85.8% YoY) and Mobilink Microfinance Bank (+87.0% YoY). EBITDA rose by 36.4% YoY on the back of high-twenties growth in revenues, which was further supported by EBITDA margin expansions at both JazzCash and Mobilink Microfinance Bank. JazzCash and Mobilink Microfinance Bank turned their EBITDA from negative PKR 2.2 billion in 3Q22 to positive PKR 2.5 billion in 3Q23. Reported currency performance was substantially impacted by c.30% YoY currency depreciation, an 8.25 p.p. YoY increase in interest rates and average annual inflation at c.29% in 3Q23. In 3Q23, the 4G user base reached 43.2 million, a YoY increase of 6.4%, with 4G penetration of 61.2% (+7.2 p.p.). Jazz reported 70.5 million mobile subscribers (-6.0% YoY) as the team focuses on accelerated top-line growth, improving mobile ARPU and retaining more valuable customers. With the continued execution of its DO1440 strategy, Jazz recorded 15.2% YoY growth in multiplay customers who benefit from digital services such as JazzCash, the self-care app JazzWorld and the entertainment platform Tamasha. In 3Q23 multiplay customers accounted for 25.2% of the monthly active consumer base. With 3.2x the ARPU of voice- only users, Jazz’s multiplay customers generated 48.4% of the operator’s revenues in the B2C segment (+6.7 p.p. YoY). JazzCash, the most popular mobile fintech application in Pakistan, had 15.4 million MAUs and served 1.3 million customers with digital loans (+5.8% YoY). Total revenue grew by 77.3% YoY with LTM Gross Transaction Value of PKR 5.3 trillion, a 35.4% YoY increase. This was supported by the continued expansion in retail presence, reaching almost 210,000 active merchants (+29.1% YoY) while optimizing its agent base with more than 119,000 active agents at the end of the quarter (-4.3% YoY). The growing popularity of branchless banking services among Pakistani users remains thematic, and it is estimated by the State Bank of Pakistan that c.92% of all branchless banking transactions are carried out through mobile wallets/apps like JazzCash. This highlights the convenience, trust and safety these platforms provide to the citizens of Pakistan, boosting the country’s economy. The self-care app JazzWorld saw MAUs increase by 15.3% YoY, reaching 13.5 million at the end of 3Q23. In 3Q23, Pakistan’s leading entertainment platform Tamasha reached 14.5 million MAUs (up 4.4x YoY), and average daily active users rose 4.7x YoY to reach more than 2.3 million at the end of the quarter. Tamasha served 14.4 million unique viewers during the 2023 Cricket Asia Cup games, the highest-ever audience figures on a digital video platform for a sporting event in Pakistan. In the nail-biting match between Pakistan and Sri Lanka, Tamasha served 4.8 million concurrent users demonstrating its leading technology and platform architecture. Tamasha ranked as the number one downloaded app on both the Apple App Store and Google Play during the Asia Cup. Capex was PKR 6.8 billion in 3Q23, with LTM capex intensity of 13.5% (-5.1 p.p. YoY) impacted by the regulator’s currency control measures. However, Jazz continued to expand and upgrade its 4G network, with almost 1,000 new 4G sites YoY. PAKISTAN
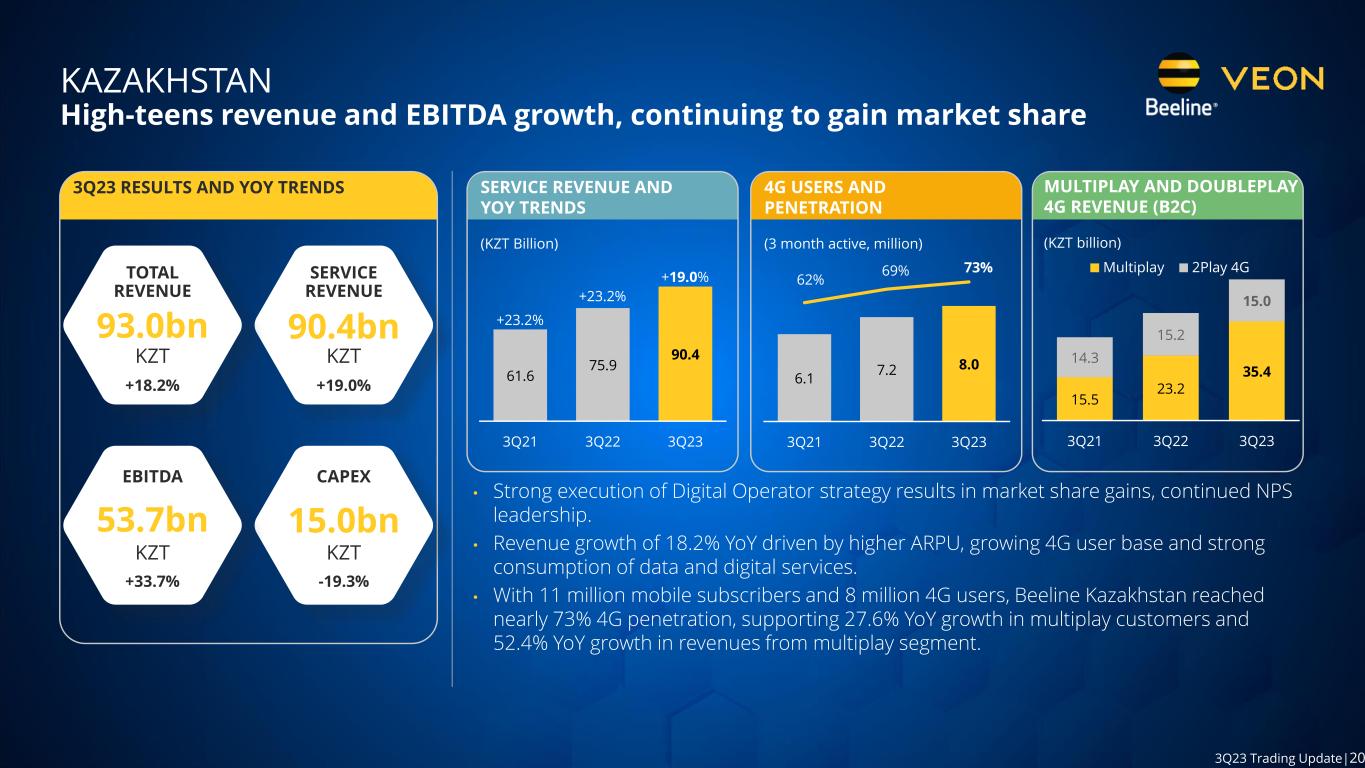
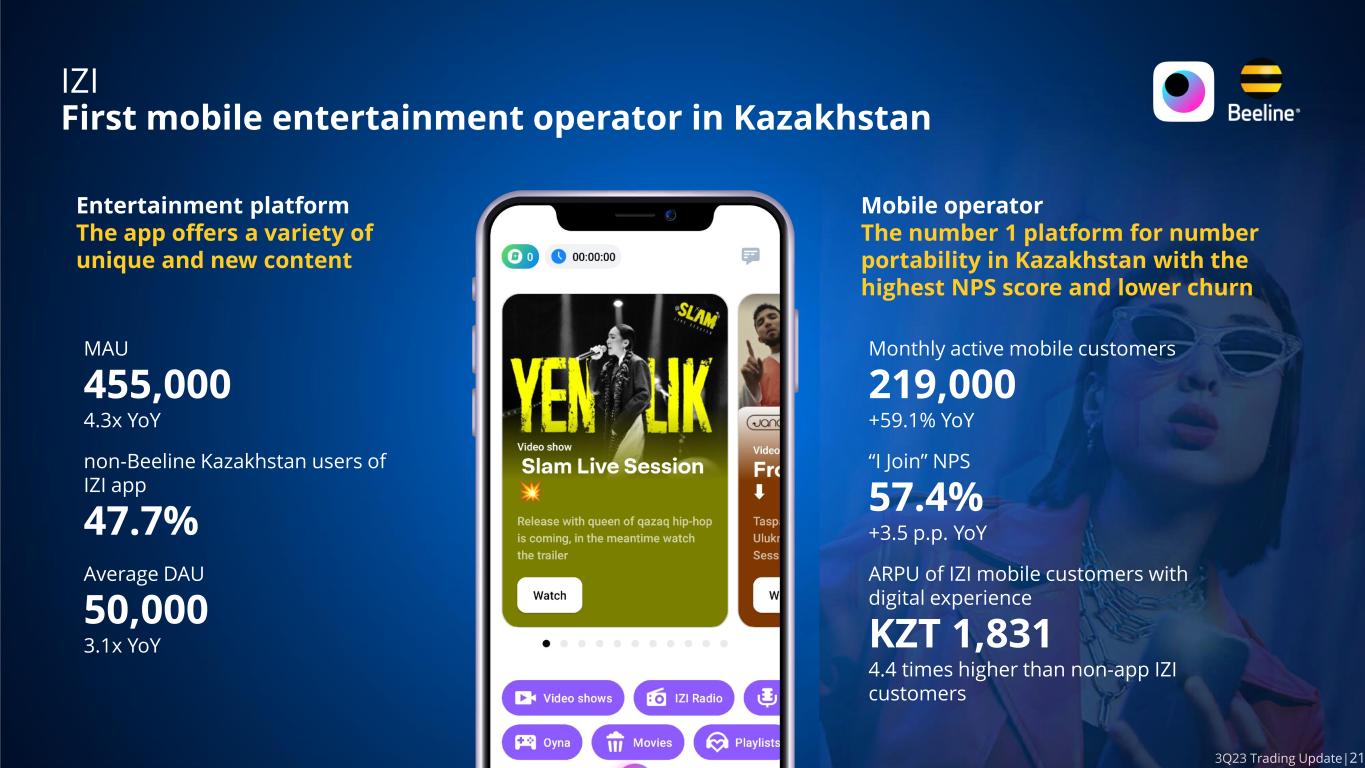
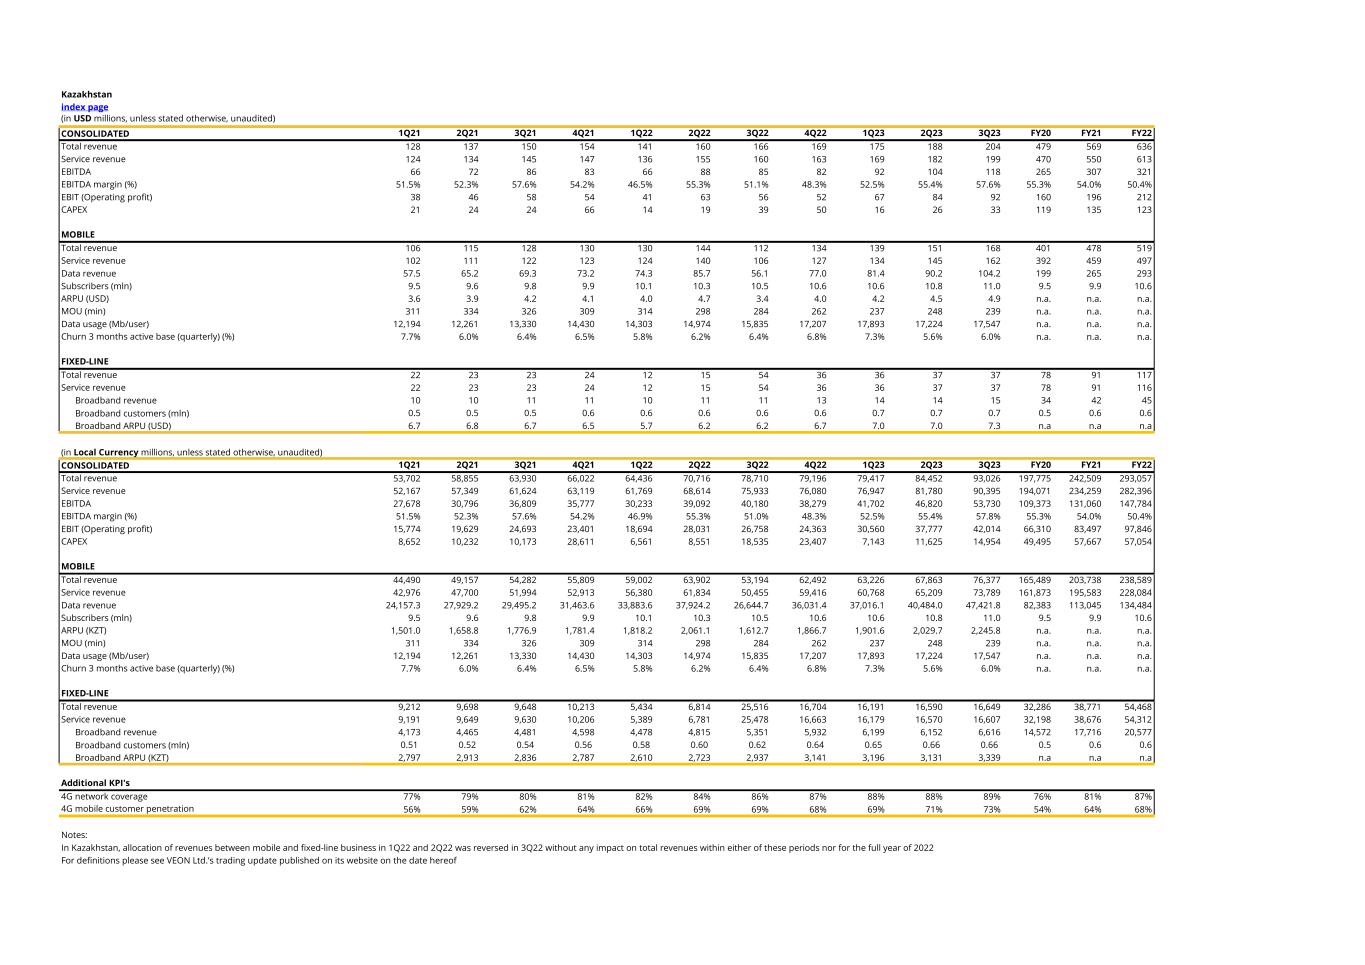
Trading update 3Q23 15 High-teens revenue and EBITDA growth, continuing to gain market share KZT million 3Q23 3Q22 Y oY 9M23 9M22 Y oY Total rev enue 93,026 78,710 18.2% 256,895 213,861 20.1% Service revenue 90,395 75,933 19.0% 249,122 206,316 20.7% EBITDA 53,730 40,180 33.7% 142,252 109,506 29.9% EBIT DA margin 57.8% 51.0% 6.7p.p. 55.4% 51.2% 4.2p.p. Capex 14,954 18,535 (19.3%) 33,722 33,647 0.2% Capex intensity 17.0% 22.2% (5.2p.p.) Mobile T otal operating revenue 76,377 64,084 19.2% 207,466 176,097 17.8% Service revenue 73,789 61,345 20.3% 199,766 168,668 18.4% Data revenue 47,422 35,165 34.9% 124,922 98,452 26.9% Customers (mln) 11.0 10.5 4.6% Data users (mln) 9.3 8.6 7.6% 4G users (mln) 8.0 7.2 10.4% ARPU (KZT ) 2,246 1,878 19.6% MOU (min) 239 284 (15.8%) Data usage (GB/user) 17.1 15.5 10.8% 4G coverage 88.6% 85.8% 2.8p.p. F ixed-line T otal operating revenue 16,649 14,626 13.8% 49,430 37,764 30.9% Service revenue 16,607 14,588 13.8% 49,357 37,648 31.1% Broadband revenue 6,616 5,351 23.6% 18,968 14,644 29.5% Broadband customers (mln) 0.7 0.6 7.3% Broadband ARPU (KZT ) 3,480 2,977 16.9% Beeline Kazakhstan continued to gain market share in 3Q2023, with high-teens YoY local currency growth in revenues and EBITDA. Beeline Kazakhstan has reached 11 million mobile subscribers and Multiplay customers rose 27.6% YoY. Total revenues rose by 18.2% YoY, while service revenues increased by 19.0% YoY, supported by growth in both the mobile and fixed line businesses as well as from digital offerings. EBITDA increased by 33.7% YoY in 3Q23, impacted by a one- off radio frequency tax benefit of KZT 3.7 billion. Excluding this one-off item, EBITDA grew 24.5% YoY in local currency, supported by the solid topline YoY growth driven by price increases, a growing customer base and rising consumption of data and digital services. Beeline Kazakhstan expanded its 4G user base to nearly 8.0 million, up 10.4% YoY at the end of 3Q23, and reached 72.6% 4G penetration of the total customer base. Beeline Kazakhstan continued to expand its digital portfolio in line with the DO1440 strategy. Multiplay customers who used services such as izi, Simply, My Beeline and BeeTV reached 3.8 million, up 27.6% YoY. With higher ARPU and lower churn, these customers contributed 59.5% of the revenues in the B2C segment. The MyBeeline self-care platform increased its MAUs by 25.1% YoY, reaching the 4.5 million users. The BeeTV multiplatform entertainment service reached more than 787,000 MAUs (+24.1% YoY), with 73.9% of customers using the mobile version of the service. BeeTV has acquired broadcasting rights for 125 games of UEFA Champions League 2023/24. Moreover, 24 of them will be aired exclusively on BeeTV. The 2023/24 UEFA Champions League group stage began on 19 September 2023 and will end on 1 June 2024. Beeline Kazakhstan’s sub-brand izi continued to deliver significant growth with MAUs of the izi app increasing 4.3x YoY to some 455,000. At the end of the third quarter, izi recorded 219,000 monthly active subscribers using izi sim card, a 59.0% increase YoY. Total ARPU of izi platform users increased by 22.1% YoY on the back of its expanded value proposition as the platform offers a variety of unique new content and actively promotes Kazakh celebrities. Simply, Kazakhstan’s first mobile online-only neobank, saw a 2.0x YoY increase in MAUs, which reached more than 320,000 at the end of 3Q23. Capex was KZT 15.0 billion during the quarter, representing a capex intensity of 17.0%. Capex budgets continue to be allocated to the 250+ project, which focuses on expanding the 4G network and connecting remote and rural areas, as Beeline Kazakhstan connected 96 settlements to its network and added over 180 new 4G base stations in 3Q23. KAZAKHSTAN
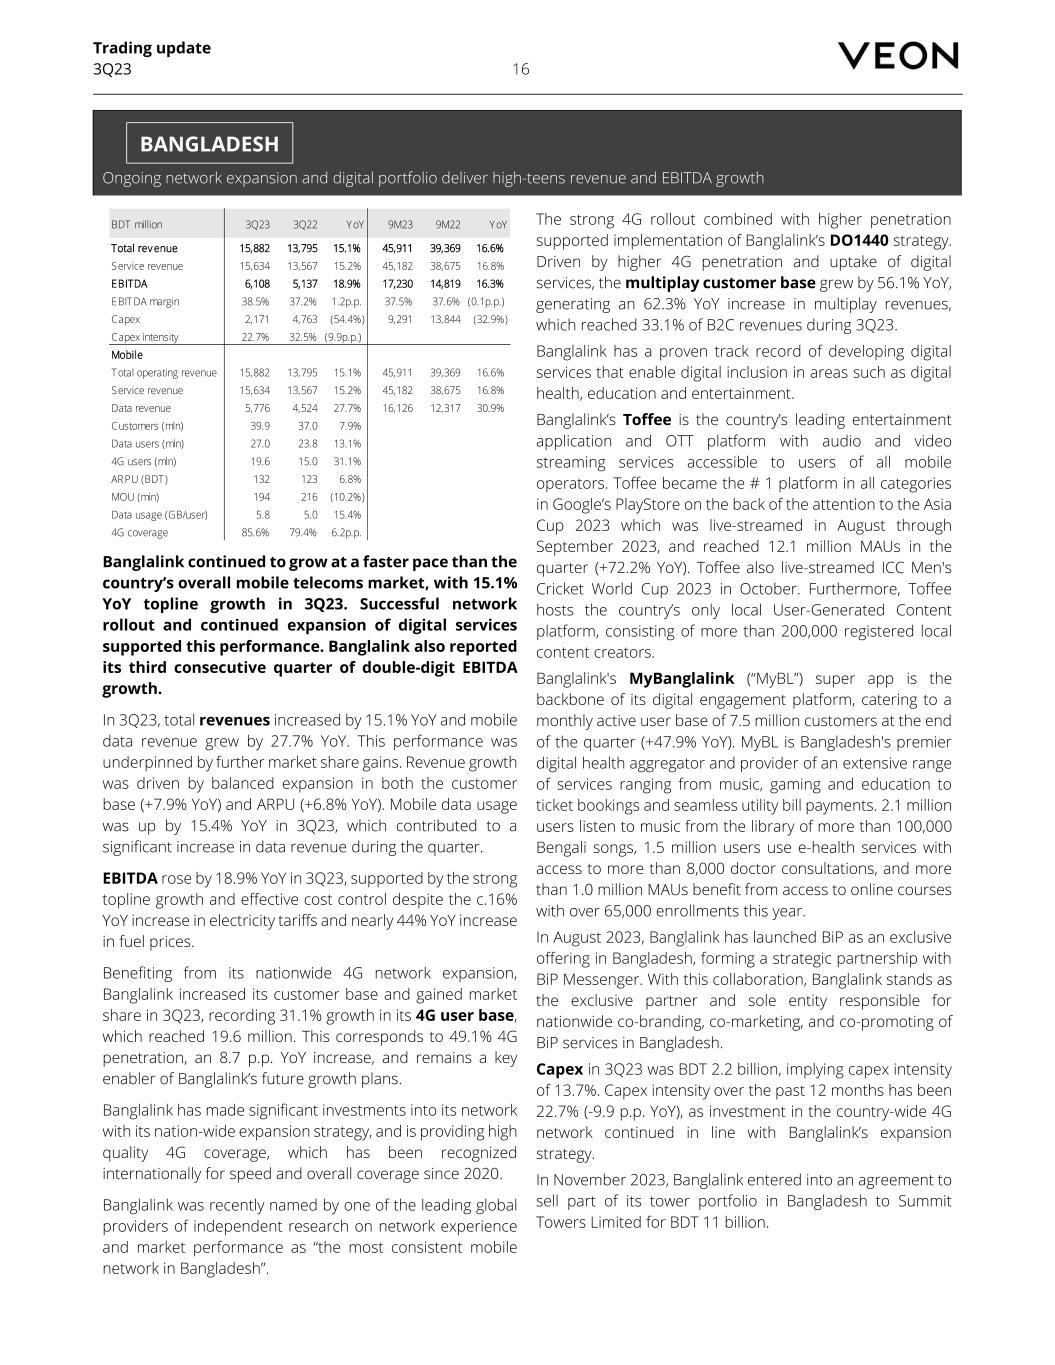
Trading update 3Q23 16 Ongoing network expansion and digital portfolio deliver high-teens revenue and EBITDA growth BDT million 3Q23 3Q22 Y oY 9M23 9M22 Y oY Total rev enue 15,882 13,795 15.1% 45,911 39,369 16.6% Service revenue 15,634 13,567 15.2% 45,182 38,675 16.8% EBITDA 6,108 5,137 18.9% 17,230 14,819 16.3% EBIT DA margin 38.5% 37.2% 1.2p.p. 37.5% 37.6% (0.1p.p.) Capex 2,171 4,763 (54.4%) 9,291 13,844 (32.9%) Capex intensity 22.7% 32.5% (9.9p.p.) Mobile T otal operating revenue 15,882 13,795 15.1% 45,911 39,369 16.6% Service revenue 15,634 13,567 15.2% 45,182 38,675 16.8% Data revenue 5,776 4,524 27.7% 16,126 12,317 30.9% Customers (mln) 39.9 37.0 7.9% Data users (mln) 27.0 23.8 13.1% 4G users (mln) 19.6 15.0 31.1% ARPU (BDT ) 132 123 6.8% MOU (min) 194 216 (10.2%) Data usage (GB/user) 5.8 5.0 15.4% 4G coverage 85.6% 79.4% 6.2p.p. Banglalink continued to grow at a faster pace than the country’s overall mobile telecoms market, with 15.1% YoY topline growth in 3Q23. Successful network rollout and continued expansion of digital services supported this performance. Banglalink also reported its third consecutive quarter of double-digit EBITDA growth. In 3Q23, total revenues increased by 15.1% YoY and mobile data revenue grew by 27.7% YoY. This performance was underpinned by further market share gains. Revenue growth was driven by balanced expansion in both the customer base (+7.9% YoY) and ARPU (+6.8% YoY). Mobile data usage was up by 15.4% YoY in 3Q23, which contributed to a significant increase in data revenue during the quarter. EBITDA rose by 18.9% YoY in 3Q23, supported by the strong topline growth and effective cost control despite the c.16% YoY increase in electricity tariffs and nearly 44% YoY increase in fuel prices. Benefiting from its nationwide 4G network expansion, Banglalink increased its customer base and gained market share in 3Q23, recording 31.1% growth in its 4G user base, which reached 19.6 million. This corresponds to 49.1% 4G penetration, an 8.7 p.p. YoY increase, and remains a key enabler of Banglalink’s future growth plans. Banglalink has made significant investments into its network with its nation-wide expansion strategy, and is providing high quality 4G coverage, which has been recognized internationally for speed and overall coverage since 2020. Banglalink was recently named by one of the leading global providers of independent research on network experience and market performance as “the most consistent mobile network in Bangladesh”. The strong 4G rollout combined with higher penetration supported implementation of Banglalink’s DO1440 strategy. Driven by higher 4G penetration and uptake of digital services, the multiplay customer base grew by 56.1% YoY, generating an 62.3% YoY increase in multiplay revenues, which reached 33.1% of B2C revenues during 3Q23. Banglalink has a proven track record of developing digital services that enable digital inclusion in areas such as digital health, education and entertainment. Banglalink’s Toffee is the country’s leading entertainment application and OTT platform with audio and video streaming services accessible to users of all mobile operators. Toffee became the # 1 platform in all categories in Google’s PlayStore on the back of the attention to the Asia Cup 2023 which was live-streamed in August through September 2023, and reached 12.1 million MAUs in the quarter (+72.2% YoY). Toffee also live-streamed ICC Men's Cricket World Cup 2023 in October. Furthermore, Toffee hosts the country’s only local User-Generated Content platform, consisting of more than 200,000 registered local content creators. Banglalink's MyBanglalink (“MyBL”) super app is the backbone of its digital engagement platform, catering to a monthly active user base of 7.5 million customers at the end of the quarter (+47.9% YoY). MyBL is Bangladesh's premier digital health aggregator and provider of an extensive range of services ranging from music, gaming and education to ticket bookings and seamless utility bill payments. 2.1 million users listen to music from the library of more than 100,000 Bengali songs, 1.5 million users use e-health services with access to more than 8,000 doctor consultations, and more than 1.0 million MAUs benefit from access to online courses with over 65,000 enrollments this year. In August 2023, Banglalink has launched BiP as an exclusive offering in Bangladesh, forming a strategic partnership with BiP Messenger. With this collaboration, Banglalink stands as the exclusive partner and sole entity responsible for nationwide co-branding, co-marketing, and co-promoting of BiP services in Bangladesh. Capex in 3Q23 was BDT 2.2 billion, implying capex intensity of 13.7%. Capex intensity over the past 12 months has been 22.7% (-9.9 p.p. YoY), as investment in the country-wide 4G network continued in line with Banglalink’s expansion strategy. In November 2023, Banglalink entered into an agreement to sell part of its tower portfolio in Bangladesh to Summit Towers Limited for BDT 11 billion. BANGLADESH
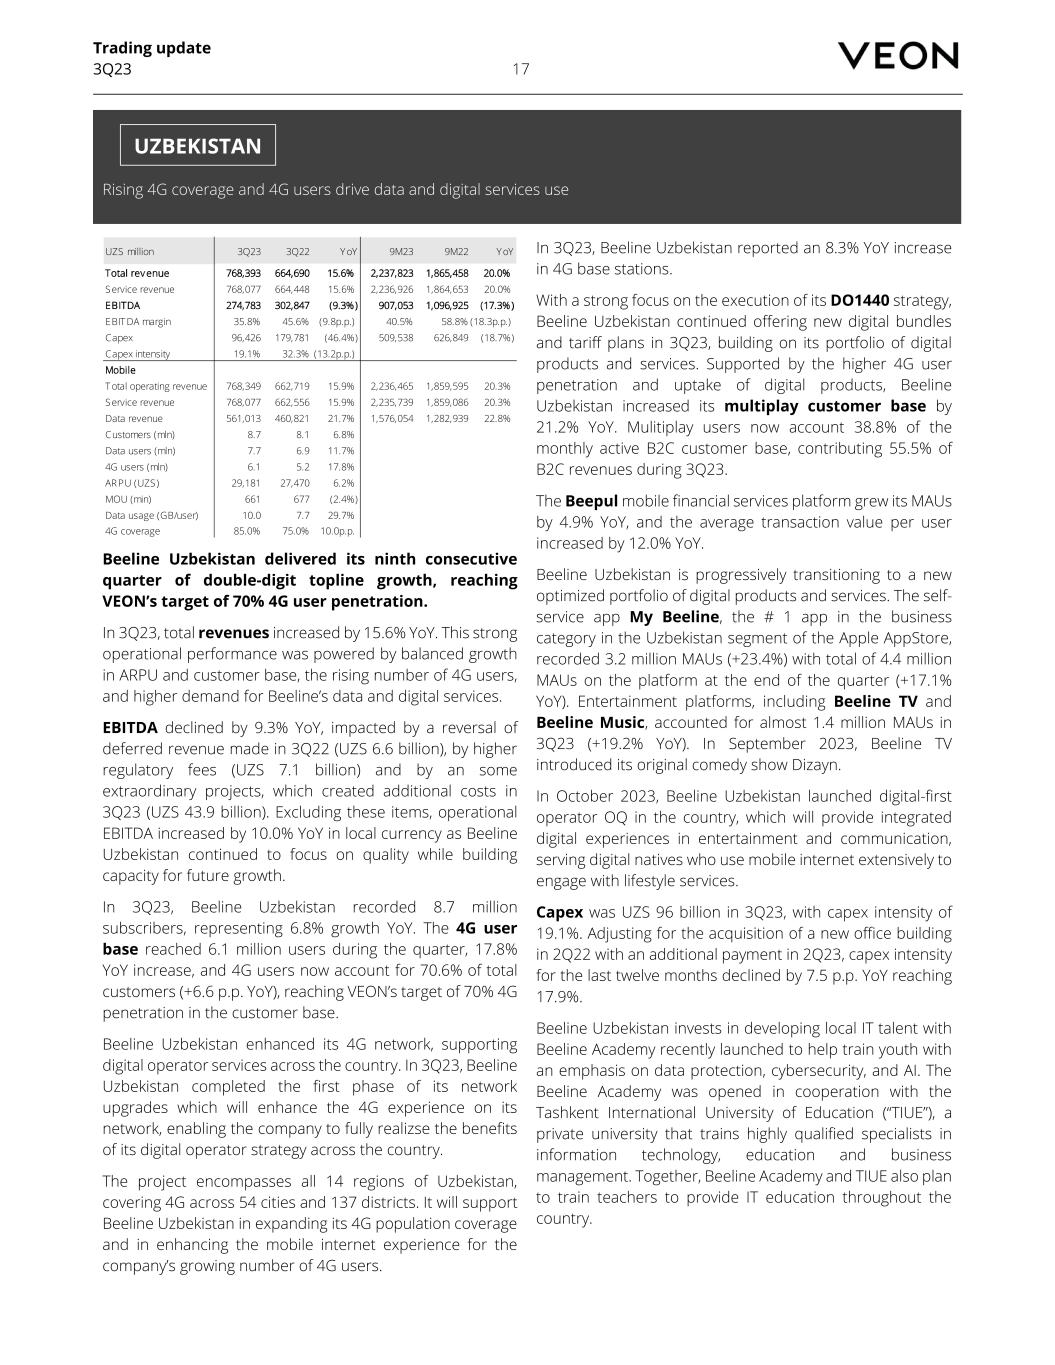
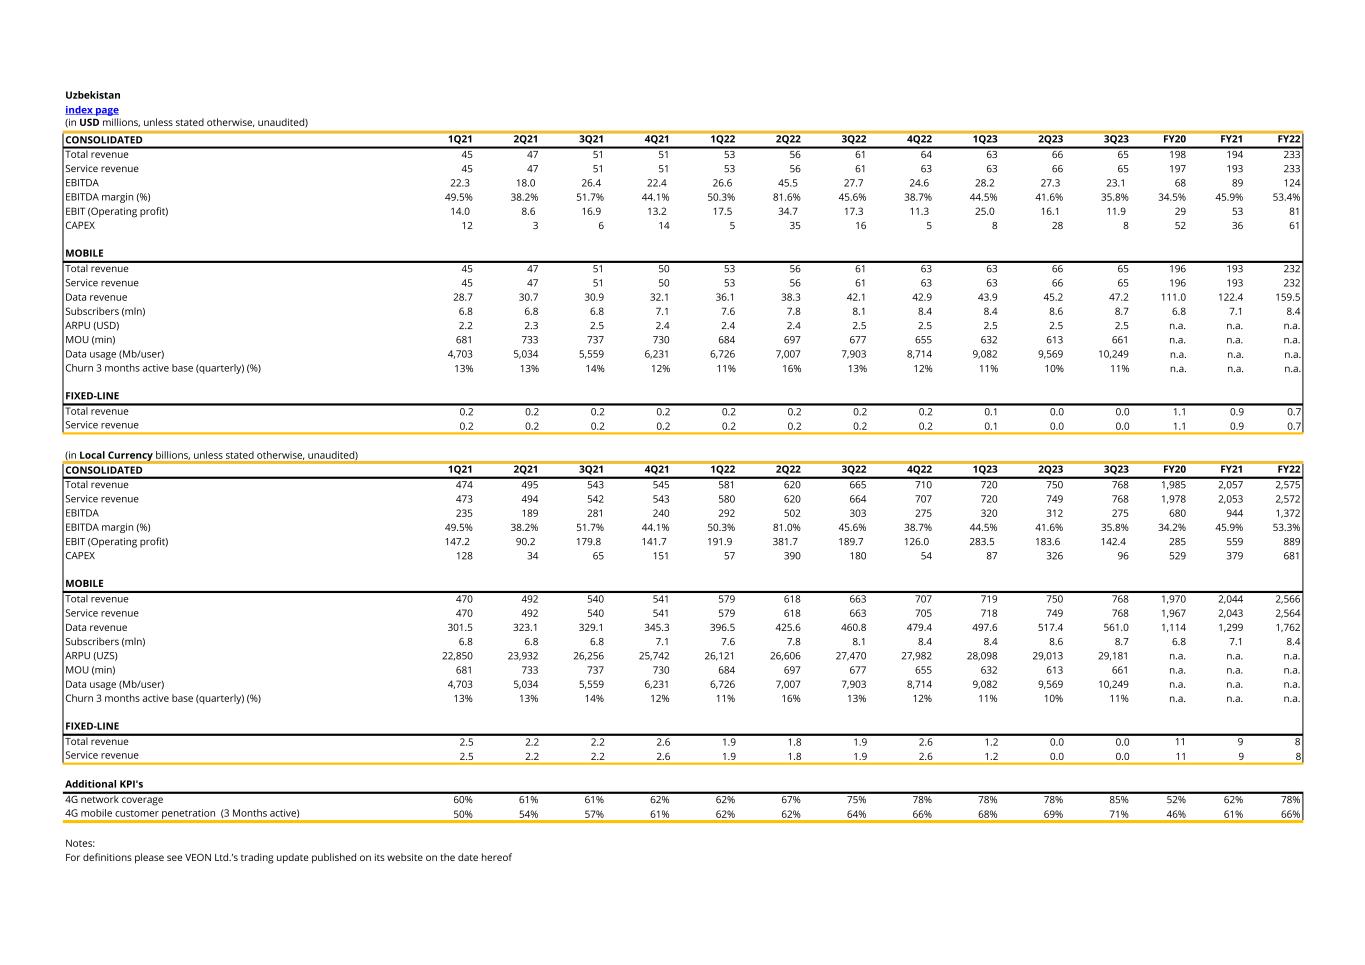
Trading update 3Q23 17 Rising 4G coverage and 4G users drive data and digital services use UZS million 3Q23 3Q22 Y oY 9M23 9M22 Y oY Total rev enue 768,393 664,690 15.6% 2,237,823 1,865,458 20.0% Service revenue 768,077 664,448 15.6% 2,236,926 1,864,653 20.0% EBITDA 274,783 302,847 (9.3% ) 907,053 1,096,925 (17.3% ) EBIT DA margin 35.8% 45.6% (9.8p.p.) 40.5% 58.8% (18.3p.p.) Capex 96,426 179,781 (46.4%) 509,538 626,849 (18.7%) Capex intensity 19.1% 32.3% (13.2p.p.) Mobile T otal operating revenue 768,349 662,719 15.9% 2,236,465 1,859,595 20.3% Service revenue 768,077 662,556 15.9% 2,235,739 1,859,086 20.3% Data revenue 561,013 460,821 21.7% 1,576,054 1,282,939 22.8% Customers (mln) 8.7 8.1 6.8% Data users (mln) 7.7 6.9 11.7% 4G users (mln) 6.1 5.2 17.8% ARPU (UZS) 29,181 27,470 6.2% MOU (min) 661 677 (2.4%) Data usage (GB/user) 10.0 7.7 29.7% 4G coverage 85.0% 75.0% 10.0p.p. Beeline Uzbekistan delivered its ninth consecutive quarter of double-digit topline growth, reaching VEON’s target of 70% 4G user penetration. In 3Q23, total revenues increased by 15.6% YoY. This strong operational performance was powered by balanced growth in ARPU and customer base, the rising number of 4G users, and higher demand for Beeline’s data and digital services. EBITDA declined by 9.3% YoY, impacted by a reversal of deferred revenue made in 3Q22 (UZS 6.6 billion), by higher regulatory fees (UZS 7.1 billion) and by an some extraordinary projects, which created additional costs in 3Q23 (UZS 43.9 billion). Excluding these items, operational EBITDA increased by 10.0% YoY in local currency as Beeline Uzbekistan continued to focus on quality while building capacity for future growth. In 3Q23, Beeline Uzbekistan recorded 8.7 million subscribers, representing 6.8% growth YoY. The 4G user base reached 6.1 million users during the quarter, 17.8% YoY increase, and 4G users now account for 70.6% of total customers (+6.6 p.p. YoY), reaching VEON’s target of 70% 4G penetration in the customer base. Beeline Uzbekistan enhanced its 4G network, supporting digital operator services across the country. In 3Q23, Beeline Uzbekistan completed the first phase of its network upgrades which will enhance the 4G experience on its network, enabling the company to fully realizse the benefits of its digital operator strategy across the country. The project encompasses all 14 regions of Uzbekistan, covering 4G across 54 cities and 137 districts. It will support Beeline Uzbekistan in expanding its 4G population coverage and in enhancing the mobile internet experience for the company’s growing number of 4G users. In 3Q23, Beeline Uzbekistan reported an 8.3% YoY increase in 4G base stations. With a strong focus on the execution of its DO1440 strategy, Beeline Uzbekistan continued offering new digital bundles and tariff plans in 3Q23, building on its portfolio of digital products and services. Supported by the higher 4G user penetration and uptake of digital products, Beeline Uzbekistan increased its multiplay customer base by 21.2% YoY. Mulitiplay users now account 38.8% of the monthly active B2C customer base, contributing 55.5% of B2C revenues during 3Q23. The Beepul mobile financial services platform grew its MAUs by 4.9% YoY, and the average transaction value per user increased by 12.0% YoY. Beeline Uzbekistan is progressively transitioning to a new optimized portfolio of digital products and services. The self- service app My Beeline, the # 1 app in the business category in the Uzbekistan segment of the Apple AppStore, recorded 3.2 million MAUs (+23.4%) with total of 4.4 million MAUs on the platform at the end of the quarter (+17.1% YoY). Entertainment platforms, including Beeline TV and Beeline Music, accounted for almost 1.4 million MAUs in 3Q23 (+19.2% YoY). In September 2023, Beeline TV introduced its original comedy show Dizayn. In October 2023, Beeline Uzbekistan launched digital-first operator OQ in the country, which will provide integrated digital experiences in entertainment and communication, serving digital natives who use mobile internet extensively to engage with lifestyle services. Capex was UZS 96 billion in 3Q23, with capex intensity of 19.1%. Adjusting for the acquisition of a new office building in 2Q22 with an additional payment in 2Q23, capex intensity for the last twelve months declined by 7.5 p.p. YoY reaching 17.9%. Beeline Uzbekistan invests in developing local IT talent with Beeline Academy recently launched to help train youth with an emphasis on data protection, cybersecurity, and AI. The Beeline Academy was opened in cooperation with the Tashkent International University of Education (“TIUE”), a private university that trains highly qualified specialists in information technology, education and business management. Together, Beeline Academy and TIUE also plan to train teachers to provide IT education throughout the country. UZBEKISTAN

Trading update 3Q23 18 SALE OF RUSSIAN OPERATIONS On 24 November 2022, VEON Ltd. announced that following a competitive process, it had entered into an agreement to sell its Russian operations. Upon execution of the agreement, the Russian business has been classified as ‘held for sale’ and ‘discontinued operations’, and accounted for as such, in line with the requirements of IFRS 5. The result is that the Russian operations do not contribute to VEON’s comparison base or actual reported results in this press release (except as specifically noted), however, this classification has no impact on balance sheet amounts in prior periods. On 9 October 2023, VEON Ltd. announced that it completed its exit from Russia with the closing of the sale of its Russian operations to a group of senior members of the PJSC VimpelCom management team. The table below represents revenue and EBITDA amounts, excluding intercompany, that would have been included into VEON Group results, had the Russian operations not been classified as ‘held for sale’ and ‘discontinued operations’. Russia RUB million 3Q23 3Q22 YoY 9M23 9M22 YoY Total revenue 77,095 70,615 9.2% 221,102 211,549 4.5% Service revenue 70,076 66,291 5.7% 202,839 193,242 5.0% EBITDA 33,357 30,273 10.2% 95,265 87,234 9.2% EBITDA margin 43.3% 42.9% 0.4p.p. 43.1% 41.2% 1.9p.p. Capex 13,155 12,902 2.0% 36,624 41,425 (11.6%) Capex intensity 18.4% 21.6% (3.2p.p.) Mobile Total operating revenue 65,246 60,207 8.4% 186,871 180,764 3.4% Service revenue 58,358 55,918 4.4% 169,004 162,559 4.0% Customers (mln) 44.1 46.0 (4.0%) Data users (mln) 31.7 32.2 (1.8%) 4G users (mln) 26.0 25.7 1.0% ARPU (RUB) 439 399 10.1% MOU (min) 303 313 (3.2%) Data usage (GB/user) 19.8 16.2 22.1% 4G coverage 91.0% 90.0% 1.0p.p. Fixed-line Total operating revenue 11,849 10,408 13.8% 34,231 30,785 11.2% Service revenue 11,718 10,373 13.0% 33,835 30,683 10.3% Broadband revenue 3,447 3,173 8.6% 10,168 9,465 7.4% Broadband customers (mln) 2.9 2.9 (1.4%) Broadband ARPU (RUB) 397 360 10.3%
Trading update 3Q23 19 On 20 November 2023, VEON will host a conference call with senior management at 8:00AM EST (13:00 GMT, 14:00 CET), which will be made available through the webcast and over the phone. Webcast To register for and then access the webcast please click here or copy and paste this link to the address bar of your browser: https://edge.media-server.com/mmc/p/38c9oa3y Once registered, you will be prompted to the webcast page. Dial-in We strongly encourage you to watch the webcast, but if you prefer to dial in, then please click here or copy and paste this link to the address bar of your browser to register for and then access the dial-in options: https://register.vevent.com/register/BIc58eced36cc842808dae1e6bb5de498f Once registered, you will be prompted to the page with the dial-in details and will receive registration confirmation on the email address mentioned during registration. Q&A Kindly note, that Q&A session will be facilitated via “Q&A” function in the webcast. You can also submit your questions prior the event to VEON Investor Relations at ir@veon.com. The conference call replay and the slide presentation webcast will be available for 12 months after the end of the event at the same link as the live webcast. The slide presentation and a transcript of the conference call will also be available for download from VEON’s website. CONTACT INFORMATION Investor Relations Faisal Ghori ir@veon.com CONFERENCE CALL INFORMATION
Trading update 3Q23 20 VEON’s results presented in this document are, unless otherwise stated, based on IFRS and have not been externally audited or reviewed. Certain amounts and percentages that appear in this document have been subject to rounding adjustments. As a result, certain numerical figures shown as totals, including those in the tables, may not be an exact arithmetic aggregation of the figures that precede or follow them. The non-IFRS information disclosed in the document, including, among other things, EBITDA, EBITDA margin, net debt, capex, capex intensity, local currency trends, and ARPU, is defined in Attachment A. ITEMS THAT AFFECT YEAR-ON-YEAR COMPARISONS FOR REVENUE AND EBITDA On 8 June 2022, VEON announced completion of the sale of VEON Georgia LLC, VEON’s operating subsidiary in Georgia. Georgia results were deconsolidated from VEON Group numbers following the date of sale. The Georgian operations also do not contribute to either the comparison base or the actual reported numbers of customer base, 4G users and 4G penetration. Following the exercise of the put option for our stake in Algeria on 1 July 2021, the Algerian business, in line with the requirements of IFRS 5, became a discontinued operation, and was accounted for as ‘held for sale’. On 5 August 2022, VEON completed the sale of the Algerian business. The result is that the Algerian operations do not contribute to the base performance of VEON for both the current and prior year in this press release, and from the balance sheet perspective, it was measured at the lower of (i) the carrying amount of the discontinued business; and (ii) its fair market value, less costs to sell. Any deviation from this value in respect of the final valuation resulted in a gain/loss, which was accounted for as a profit/loss from discontinued operations. On 24 November 2022, VEON Ltd. announced that following a competitive process, it had entered into an agreement to sell its Russian operations. Following the execution of the agreement, the Russian business was classified as ‘held for sale’ and ‘discontinued operations’, and accounted for as such, in line with the requirements of IFRS 5. On 9 October 2023, VEON announced that it has completed its exit from Russia with the closing of the sale of its Russian operations to a group of senior members of the PJSC VimpelCom management team, led by VimpelCom CEO Alexander Torbakhov. The result is that the Russian operations do not contribute to VEON’s comparison base or actual reported results in this press release (except as specifically noted and except with respect to Net debt excluding leases as of 3Q22), however, this classification has no impact on balance sheet amounts in prior periods. PRESENTATION OF FINANCIAL RESULTS AND NON-RECURRING ITEMS
Trading update 3Q23 21 DISCLAIMER VEON's results and other financial information presented in this document are, unless otherwise stated, prepared in accordance with International Financial Reporting Standards ("IFRS") and have not been externally reviewed and audited. The financial information included in this document is preliminary and is based on a number of assumptions that are subject to inherent uncertainties and subject to change. The financial information presented herein is based on internal management accounts, is the responsibility of management and is subject to financial closing procedures which have not yet been completed and has not been audited, reviewed or verified. Certain amounts and percentages that appear in this document have been subject to rounding adjustments. As a result, certain numerical figures shown as totals, including those in the tables, may not be an exact arithmetic aggregation of the figures that precede or follow them. Although we believe the information to be reasonable, actual results may vary from the information contained above and such variations could be material. As such, you should not place undue reliance on this information. This information may not be indicative of the actual results for the current period or any future period. This document contains “forward-looking statements”, as the phrase is defined in Section 27A of the U.S. Securities Act of 1933, as amended, and Section 21E of the U.S. Securities Exchange Act of 1934, as amended. These forward-looking statements may be identified by words such as “may,” “might,” “will,” “could,” “would,” “should,” “expect,” “plan,” “anticipate,” “intend,” “seek,” “believe,” “estimate,” “predict,” “potential,” “continue,” “contemplate,” “possible” and other similar words. Forward-looking statements include statements relating to, among other things, VEON’s plans to implement its strategic priorities, including operating model and development plans; anticipated performance, including VEON’s ability to generate sufficient cash flow; VEON’s assessment of the impact of the conflict surrounding Russia and Ukraine, including related sanctions and counter- sanctions, on its current and future operations and financial condition; future market developments and trends; operational and network development and network investment, including expectations regarding the roll-out and benefits of 3G/4G/LTE networks, as applicable; spectrum acquisitions and renewals; the effect of the acquisition of additional spectrum on customer experience; VEON’s ability to realize the acquisition and disposition of any of its businesses and assets and to execute its strategic transactions in the timeframes anticipated, or at all; VEON’s ability to realize financial improvements, including an expected reduction of net pro-forma leverage ratio following the successful completion of certain dispositions and acquisitions; our dividends; and VEON’s ability to realize its targets and commercial initiatives in its various countries of operation. The forward-looking statements included in this document are based on management’s best assessment of VEON’s strategic and financial position and of future market conditions, trends and other potential developments. These discussions involve risks and uncertainties. The actual outcome may differ materially from these statements as a result of, among other things: further escalation in the conflict surrounding Russia and Ukraine, including further sanctions and counter-sanctions and any related involuntary deconsolidation of our Ukrainian operations; demand for and market acceptance of VEON’s products and services; our plans regarding our dividend payments and policies, as well as our ability to receive dividends, distributions, loans, transfers or other payments or guarantees from our subsidiaries; continued volatility in the economies in VEON’s markets; governmental regulation of the telecommunications industries; general political uncertainties in VEON’s markets; government investigations or other regulatory actions; litigation or disputes with third parties or regulatory authorities or other negative DISCLAIMER AND NOTICE TO READERS
Trading update 3Q23 22 developments regarding such parties; the impact of export controls and laws affecting trade and investment on our and important third-party suppliers' ability to procure goods, software or technology necessary for the services we provide to our customers; risks associated with our material weakness in internal control over financial reporting; risks associated with data protection or cyber security, other risks beyond the parties’ control or a failure to meet expectations regarding various strategic priorities, the effect of foreign currency fluctuations, increased competition in the markets in which VEON operates and the effect of consumer taxes on the purchasing activities of consumers of VEON’s services. Certain other factors that could cause actual results to differ materially from those discussed in any forward-looking statements include the risk factors described in VEON’s Annual Report on Form 20-F for the year ended 31 December 2022 filed with the U.S. Securities and Exchange Commission (the “SEC”) on 24 July 2023 and other public filings made from time to time by VEON with the SEC. Other unknown or unpredictable factors also could harm our future results. New risk factors and uncertainties emerge from time to time and it is not possible for our management to predict all risk factors and uncertainties, nor can we assess the impact of all factors on our business or the extent to which any factor, or combination of factors, may cause actual results to differ materially from those contained in any forward-looking statements. Under no circumstances should the inclusion of such forward-looking statements in this document be regarded as a representation or warranty by us or any other person with respect to the achievement of results set out in such statements or that the underlying assumptions used will in fact be the case. Therefore, you are cautioned not to place undue reliance on these forward-looking statements. The forward- looking statements speak only as of the date hereof. We cannot assure you that any projected results or events will be achieved. Except to the extent required by law, we disclaim any obligation to update or revise any of these forward-looking statements, whether as a result of new information, future events or otherwise, after the date on which the statements are made, or to reflect the occurrence of unanticipated events. Furthermore, elements of this document contain or may contain, “inside information” as defined under the Market Abuse Regulation (EU) No. 596/2014. NOTICE TO READERS: FINANCIAL INFORMATION PRESENTED VEON's results and other financial information presented in these financial statements are, unless otherwise stated, prepared in accordance with International Financial Reporting Standards ("IFRS") based on internal management reporting, are the responsibility of management, and have not been externally audited, reviewed, or verified. As such, you should not place undue reliance on this information. This information may not be indicative of the actual results for any future period. NOTICE TO READERS: IMPACT OF THE WAR IN UKRAINE The ongoing war between Russia and Ukraine and the sanctions imposed by the United States, member states of the European Union, the European Union itself, the United Kingdom, Ukraine and certain other nations, counter-sanctions by Russia and other legal and regulatory responses, as well as responses by our service providers, partners, suppliers and other counterparties, and the consequences of all of the foregoing have impacted and, if the war, sanctions and such responses continue or escalate, may significantly impact our results and aspects of our operations in Ukraine, and may significantly affect our results and aspects of our operations in the other countries in which we operate. We are closely monitoring events in Russia and Ukraine, as well as the possibility of the imposition of further sanctions in connection with the ongoing war between Russia and Ukraine and any resulting further rise in tensions between Russia and the United States, the United Kingdom and/or the European Union. Although we have completed our exit from Russia, our operations in Ukraine continue to be affected by the war. We are doing everything we can to protect the safety of our employees, while continuing to ensure the uninterrupted operation of our communications, financial and digital services.

Trading update 3Q23 23 CONTENT OF THE ATTACHMENTS Attachment A Definitions 24 Attachment B Customers 26 Attachment C Reconciliation of local currency and reported trends 26 Attachment D Rates of functional currencies to USD 27 For more information on financial and operating data for specific countries, please refer to the supplementary file Factbook2Q2023.xlsx on VEON’s website at https://www.veon.com/investors/reports-results/ ATTACHMENTS

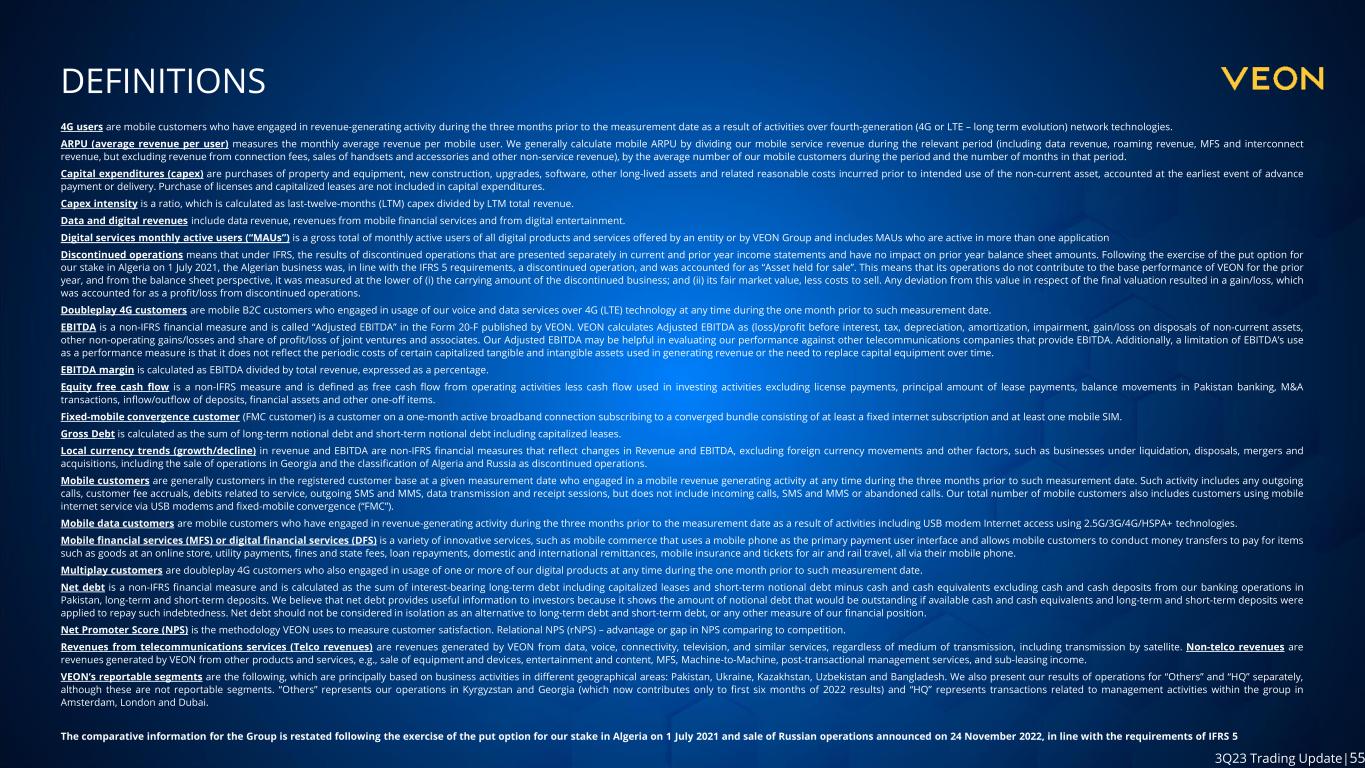
Trading update 3Q23 24 ATTACHMENT A: DEFINITIONS 4G users are mobile customers who have engaged in revenue-generating activity during the three months prior to the measurement date as a result of activities over fourth-generation (4G or LTE – long term evolution) network technologies. ARPU (average revenue per user) measures the monthly average revenue per mobile user. We generally calculate mobile ARPU by dividing our mobile service revenue during the relevant period (including data revenue, roaming revenue, MFS and interconnect revenue, but excluding revenue from connection fees, sales of handsets and accessories and other non-service revenue), by the average number of our mobile customers during the period and the number of months in that period. Capital expenditures (capex) are purchases of property and equipment, new construction, upgrades, software, other long- lived assets and related reasonable costs incurred prior to intended use of the non-current asset, accounted at the earliest event of advance payment or delivery. Purchase of licenses and capitalized leases are not included in capital expenditures. Capex intensity is a ratio, which is calculated as last-twelve-months (LTM) capex divided by LTM total revenue. Data and digital revenues include data revenue, revenues from mobile financial services and from digital entertainment. Digital services monthly active users (“MAUs”) is a gross total of monthly active users of all digital products and services offered by an entity or by VEON Group and includes MAUs who are active in more than one application. Discontinued operations means that under IFRS, the results of discontinued operations that are presented separately in current and prior year income statements and have no impact on balance sheet amounts of prior periods. This means that neither Algerian nor Russian operations do not contribute to the base performance of VEON for both the current and prior year. Doubleplay 4G customers are mobile customers who engaged in usage of our voice and data services over 4G (LTE) technology at any time during the one month prior to such measurement date. EBITDA is a non-IFRS financial measure and is called Adjusted EBITDA in the Form 20-F published by VEON. VEON calculates Adjusted EBITDA as (loss)/profit before interest, tax, depreciation, amortization, impairment, gain/loss on disposals of non- current assets, other non-operating gains/losses and share of profit/loss of joint ventures and associates. Our Adjusted EBITDA may be helpful in evaluating our performance against other telecommunications companies that provide EBITDA. Additionally, a limitation of EBITDA’s use as a performance measure is that it does not reflect the periodic costs of certain capitalized tangible and intangible assets used in generating revenue or the need to replace capital equipment over time. EBITDA margin is calculated as EBITDA divided by total revenue, expressed as a percentage. Equity free cash flow is a non-IFRS measure and is defined as free cash flow from operating activities less cash flow used in investing activities excluding license payments, principal amount of lease payments, balance movements in Pakistan banking, M&A transactions, inflow/outflow of deposits, financial assets and other one-off items. Fixed-mobile convergence customer (FMC customer) is a customer on a one-month active broadband connection subscribing to a converged bundle consisting of at least a fixed internet subscription and at least one mobile SIM. Gross Debt is calculated as the sum of long-term notional debt and short-term notional debt including capitalized leases. Local currency trends (growth/decline) in revenue and EBITDA are non-IFRS financial measures that reflect changes in Revenue and EBITDA, excluding foreign currency movements and other factors, such as businesses under liquidation, disposals, mergers and acquisitions, including the sale of operations in Georgia and the classification of Algeria and Russia as ‘discontinued operations’. Mobile customers are generally customers in the registered customer base at a given measurement date who engaged in a mobile revenue generating activity at any time during the three months prior to such measurement date. Such activity includes any outgoing calls, customer fee accruals, debits related to service, outgoing SMS and MMS, data transmission and receipt
Trading update 3Q23 25 sessions, but does not include incoming calls, SMS and MMS or abandoned calls. Our total number of mobile customers also includes customers using mobile internet service via USB modems and fixed-mobile convergence (“FMC”). Mobile data customers are mobile customers who have engaged in revenue-generating activity during the three months prior to the measurement date as a result of activities including USB modem Internet access using 2.5G/3G/4G/HSPA+ technologies. Mobile financial services (MFS) or digital financial services (DFS) is a variety of innovative services, such as mobile commerce that uses a mobile phone as the primary payment user interface and allows mobile customers to conduct money transfers to pay for items such as goods at an online store, utility payments, fines and state fees, loan repayments, domestic and international remittances, mobile insurance and tickets for air and rail travel, all via their mobile phone. Multiplay customers are doubleplay 4G customers who also engaged in usage of one or more of our digital products at any time during the one month prior to such measurement date. Net debt is a non-IFRS financial measure and is calculated as the sum of interest-bearing long-term debt including capitalized leases (unless specifically excluded) and short-term notional debt minus cash and cash equivalents excluding cash and cash deposits from our banking operations in Pakistan, long-term and short-term deposits. We believe that net debt provides useful information to investors because it shows the amount of notional debt that would be outstanding if available cash and cash equivalents and long-term and short-term deposits were applied to repay such indebtedness. Net debt should not be considered in isolation as an alternative to long-term debt and short-term debt, or any other measure of our financial position. Net Promoter Score (NPS) is the methodology VEON uses to measure customer satisfaction. Relative NPS (rNPS) – advantage or gap in NPS when comparing to competition. VEON’s reportable segments are the following, which are principally based on business activities in different geographical areas: Pakistan, Ukraine, Kazakhstan, Bangladesh and Uzbekistan. We also present our results of operations for “Others” and “HQ” separately, although these are not reportable segments. “Others” represents our operations in Kyrgyzstan and Georgia (included until the sale thereof on 8 June 2022) and “HQ” represents transactions related to management activities within the group in Amsterdam, London and Dubai.

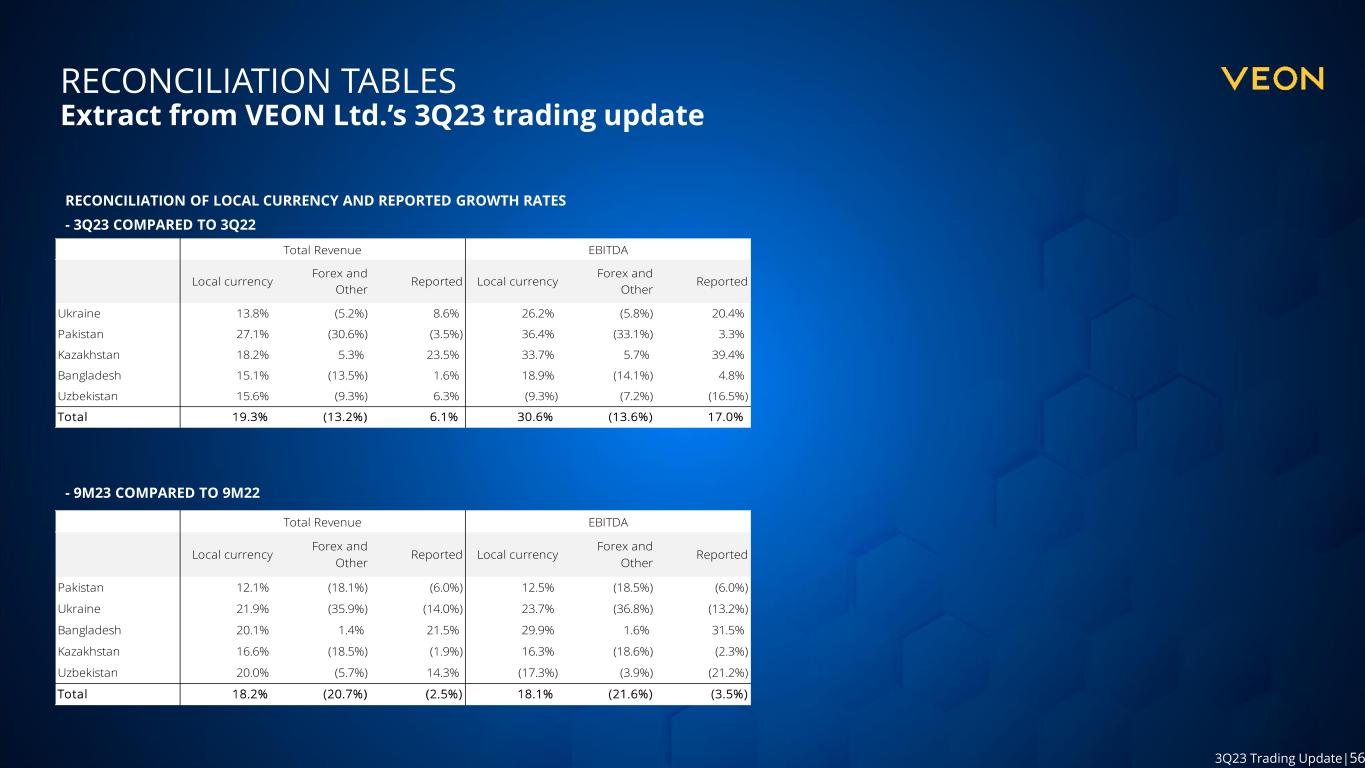
Trading update 3Q23 26 ATTACHMENT B: CUSTOMERS 3Q23 2Q23 QoQ 3Q22 Y oY 3Q23 2Q23 QoQ 3Q22 Y oY Pakistan 70.5 71.2 (1.0%) 75.0 (6.0%) Ukraine 24.1 24.1 - 24.4 (1.1%) 1.1 1.1 1.8% 1.1 0.6% Bangladesh 39.9 39.1 2.0% 37.0 7.9% Kazakhstan 11.0 10.8 2.1% 10.5 4.6% 0.7 0.7 0.8% 0.6 7.3% Uzbekistan 8.7 8.6 1.0% 8.1 6.8% Kyrgyzstan 1.9 1.9 (1.7%) 2.2 (14.2%) Total 156.1 155.8 0.2% 157.2 (0.7% ) 1.8 1.8 1.4% 1.7 3.0% Mobile F ixed-line broadband Note: The Russian and Algerian operations do not contribute to both the comparison base and the actual reported numbers. ATTACHMENT C: RECONCILIATION OF LOCAL CURRENCY AND REPORTED GROWTH RATES 3Q23 COMPARED TO 3Q22 Local currency Forex and Other Reported Local currency Forex and Other Reported Ukraine 13.8% (5.2%) 8.6% 26.2% (5.8%) 20.4% Pakistan 27.1% (30.6%) (3.5%) 36.4% (33.1%) 3.3% Kazakhstan 18.2% 5.3% 23.5% 33.7% 5.7% 39.4% Bangladesh 15.1% (13.5%) 1.6% 18.9% (14.1%) 4.8% Uzbekistan 15.6% (9.3%) 6.3% (9.3%) (7.2%) (16.5%) Total 19.3% (13.2%) 6.1% 30.6% (13.6%) 17.0% Total Revenue EBITDA 9M23 COMPARED TO 9M22 Local currency Forex and Other Reported Local currency Forex and Other Reported Pakistan 12.1% (18.1%) (6.0%) 12.5% (18.5%) (6.0%) Ukraine 21.9% (35.9%) (14.0%) 23.7% (36.8%) (13.2%) Bangladesh 20.1% 1.4% 21.5% 29.9% 1.6% 31.5% Kazakhstan 16.6% (18.5%) (1.9%) 16.3% (18.6%) (2.3%) Uzbekistan 20.0% (5.7%) 14.3% (17.3%) (3.9%) (21.2%) Total 18.2% (20.7%) (2.5%) 18.1% (21.6%) (3.5%) Total Revenue EBITDA

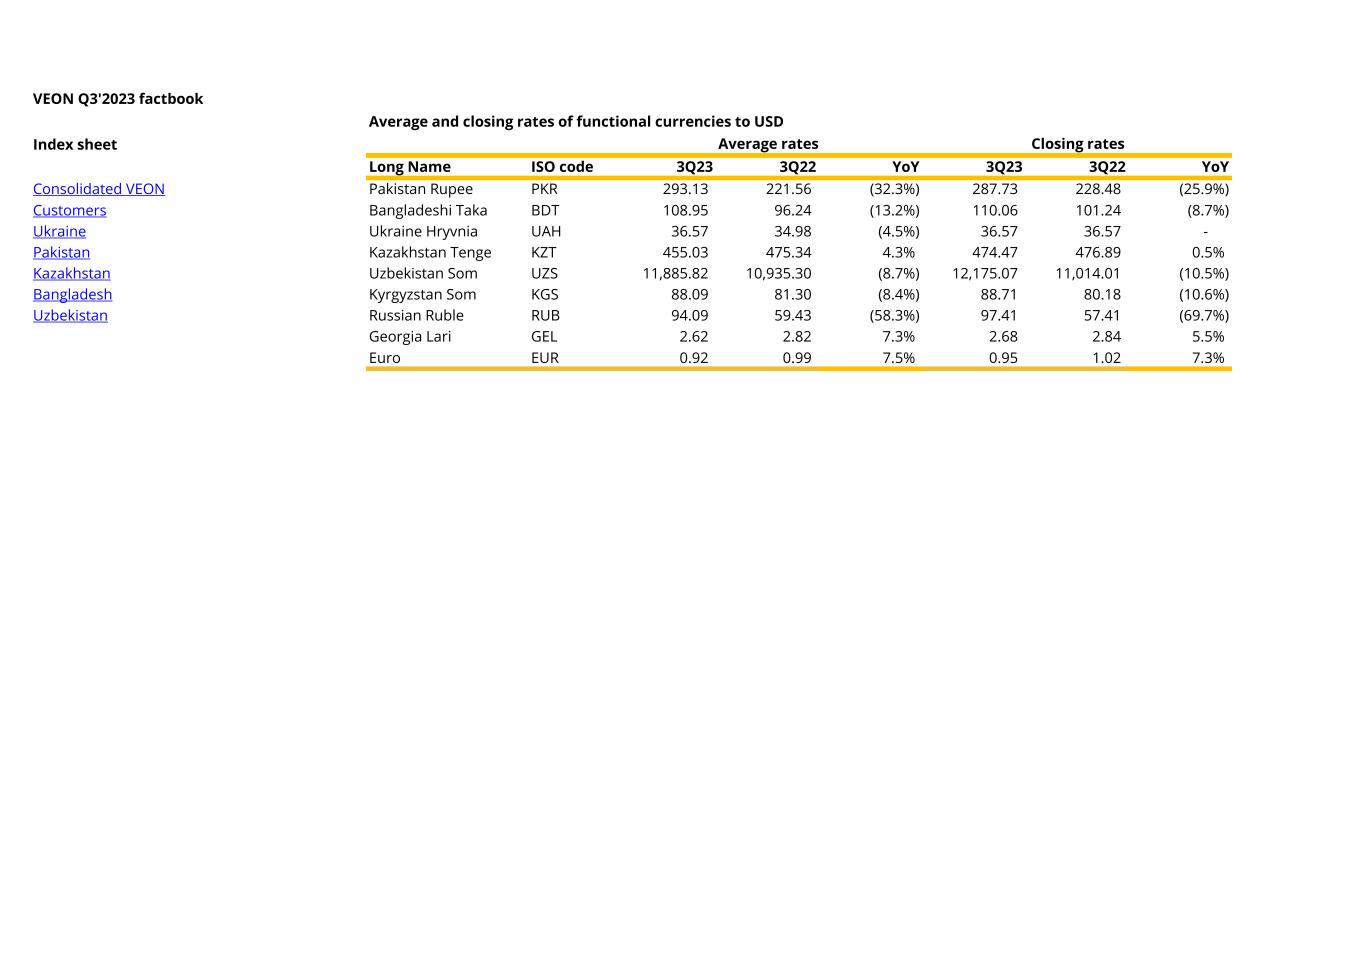
Trading update 3Q23 27 ATTACHMENT D: RATES OF FUNCTIONAL CURRENCIES TO USD 3Q23 3Q22 YoY 3Q23 3Q22 YoY Pakistan Rupee 293.13 221.56 (32.3%) 287.73 228.48 (25.9%) Bangladeshi Taka 108.95 96.24 (13.2%) 110.06 101.24 (8.7%) Ukraine Hryvnia 36.57 34.98 (4.5%) 36.57 36.57 - Kazakhstan Tenge 455.03 475.34 4.3% 474.47 476.89 0.5% Uzbekistan Som 11,885.82 10,935.30 (8.7%) 12,175.07 11,014.01 (10.5%) Kyrgyzstan Som 88.09 81.30 (8.4%) 88.71 80.18 (10.6%) Russian Ruble 94.09 59.43 (58.3%) 97.41 57.41 (69.7%) Closing ratesAverage rates
Trading update 3Q23 28 R e a d P a y


