UNITED STATES
SECURITIES AND EXCHANGE COMMISSION
WASHINGTON, D.C. 20549
______________________
FORM 8-K
______________________
CURRENT REPORT
Pursuant to Section 13 or 15(d) of the Securities Exchange Act of 1934
Date of Report (Date of earliest event reported): January 12, 2026
______________________
Heartflow, Inc.
(Exact name of Registrant as Specified in Its Charter)
______________________
|
|
|
Delaware |
001-42790 |
26-0506743 |
|
(State or Other Jurisdiction of Incorporation) |
(Commission File Number) |
(IRS Employer Identification No.) |
331 E. Evelyn Avenue
Mountain View, California 94041
(Address of Principal Executive Offices) (Zip Code)
(650) 241-1221
(Registrant’s Telephone Number, Including Area Code)
N/A
(Former Name or Former Address, if Changed Since Last Report)
______________________
Check the appropriate box below if the Form 8-K filing is intended to simultaneously satisfy the filing obligation of the registrant under any of the following provisions:
|
|
¨ |
Written communications pursuant to Rule 425 under the Securities Act (17 CFR 230.425) |
¨ |
Soliciting material pursuant to Rule 14a-12 under the Exchange Act (17 CFR 240.14a-12) |
¨ |
Pre-commencement communications pursuant to Rule 14d-2(b) under the Exchange Act (17 CFR 240.14d-2(b)) |
¨ |
Pre-commencement communications pursuant to Rule 13e-4(c) under the Exchange Act (17 CFR 240.13e-4(c)) |
Securities registered pursuant to Section 12(b) of the Act:
|
|
|
|
|
Title of each class |
|
Trading Symbol(s) |
|
Name of each exchange on which registered |
Common Stock, $0.001 par value per share |
|
HTFL |
|
The Nasdaq Stock Market LLC (Nasdaq Global Select Market) |
Indicate by check mark whether the registrant is an emerging growth company as defined in Rule 405 of the Securities Act of 1933 (§ 230.405 of this chapter) or Rule 12b-2 of the Securities Exchange Act of 1934 (§ 240.12b-2 of this chapter).
Emerging growth company x
If an emerging growth company, indicate by check mark if the registrant has elected not to use the extended transition period for complying with any new or revised financial accounting standards provided pursuant to Section 13(a) of the Exchange Act. ¨
Item 7.01 Regulation FD Disclosure.
On January 12, 2026, Heartflow, Inc. (the “Company”) is posting an investor presentation to the Company’s website (www.heartflow.com) in advance of management’s presentation at an investor conference. A copy of this investor presentation is furnished as Exhibit 99.1 to this Current Report on Form 8-K and is incorporated herein by reference.
By filing this Current Report on Form 8-K and furnishing the information contained herein, the Company makes no admission as to the materiality of any information in this report that is required to be disclosed solely by reason of Regulation FD.
Item 9.01 Financial Statements and Exhibits.
(d)Exhibits.
|
|
|
Exhibit No. |
|
Description |
99.1 |
|
Investor Presentation of Heartflow, Inc. dated January 12, 2026 |
104 |
|
Cover Page Interactive Data File (embedded within the Inline XBRL document) |
The information contained in Items 7.01 and 9.01 to this Current Report on Form 8-K shall not be deemed to be “filed” for purposes of Section 18 of the Securities Exchange Act of 1934, as amended (the “Exchange Act”), or otherwise subject to the liabilities of that section, nor shall such information be deemed to be incorporated by reference into any filing of the Company under the Securities Act of 1933, as amended, or the Exchange Act, except as expressly set forth by specific reference in such a filing.
SIGNATURES
Pursuant to the requirements of the Securities Exchange Act of 1934, the registrant has duly caused this report to be signed on its behalf by the undersigned hereunto duly authorized.
|
|
|
|
HEARTFLOW, INC. |
|
|
|
|
Date: January 12, 2026 |
By: |
/s/ Vikram Verghese |
|
|
Vikram Verghese |
|
|
Chief Financial Officer |
Exhibit 99.1

Heartflow
Investor Presentation
January 2026

Disclaimers Forward-Looking Statements This presentation includes express or implied forward-looking statements within the meaning of the Private Securities Litigation Reform Act of 1995 that involve substantial risks and uncertainties. All statements other than statements of historical facts contained in this presentation, including statements regarding our strategy, future financial condition, future operations, projected costs, prospects, plans, objectives of management, and expected market growth, are forward-looking statements. In some cases, you can identify forward-looking statements by words such as “may,” “will,” “shall,” “should,” “expects,” “plans,” “anticipates,” “could,” “intends,” “target,” “projects,” “contemplates,” “believes,” “estimates,” “predicts,” “potential,” “goal,” “objective,” “seeks,” or “continue” or the negative of these words or other similar terms or expressions that concern our expectations, strategy, plans, or intentions. Forward-looking statements contained in this presentation include, but are not limited to, statements about: our business model and strategic plans for our products, technologies and business, including our implementation thereof; our expectations regarding the potential addressable market size for our products; and our expectation about market trends. You should not rely on forward-looking statements as predictions of future events. We have based the forward-looking statements contained in this presentation primarily on our current expectations, estimates, forecasts, and projections about future events and trends that we believe may affect our business, financial condition, results of operations, and prospects. Although we believe that we have a reasonable basis for each forward-looking statement contained in this presentation, we cannot guarantee that the future results, levels of activity, performance, or events and circumstances reflected in
the forward-looking statements will be achieved or occur at all. Forward-looking statements involve known and unknown risks and uncertainties and are subject to other important factors that may cause our actual results, performance or achievements to be materially different from any future results, performance or achievements expressed or implied by the forward-looking statements, including, but not limited to, our ability to achieve or sustain profitability; our dependence on the success of our one product, Heartflow FFRCT Analysis; the willingness of healthcare providers to change their standard practice regarding the evaluation of coronary artery disease; the impact on the adoption of the Heartflow Platform by healthcare providers if third-party payors, including government payors, do not cover or provide adequate reimbursement; the concentration of our customer base; the significant competition we face in an environment of rapid technological change; the nascent nature of the commercialization of Heartflow Plaque Analysis; our use and development of artificial intelligence models; our ability to properly manage our future growth; disruption by catastrophic events; damage to or disruption of our information technology systems; security breaches that we cannot anticipate or successfully defend; extensive regulatory requirements we face to bring our products to market; risks that third parties could develop commercial technology and products similar or identical to ours; our ability to obtain and maintain sufficient intellectual property protection for our products or avoid claims of infringement; additional capital might not be available on terms favorable to us, or at all; and the additional factors discussed in our Quarterly Report on Form 10-Q for the quarter ended September 30, 2025, as such risks and uncertainties may be amended, supplemented or superseded from time to time by our subsequent periodic reports on Form 10-Q and Form 10-K we file with the United States Securities and Exchange Commission. We qualify all of our forward-looking statements by these cautionary statements. Moreover, we operate in a very competitive and rapidly changing environment. New risks and uncertainties emerge from time to time, and it is not possible for us to predict all risks and uncertainties that could have an impact on the forward-looking statements contained in this presentation. The forward-looking statements made in this presentation relate only to events as of the date on which the statements are made. We undertake no obligation to update any forward-looking statements made in this presentation to reflect events or circumstances after the date of this presentation or to reflect new information or the occurrence of unanticipated events, except as required by law. We may not actually achieve the plans, intentions, or expectations disclosed in our forward-looking statements, and you should not place undue reliance on our forward-looking statements.
Industry Data This presentation also contains market data and industry forecasts from certain third-party sources of information, including publicly available industry publications and subscription-based publications. None of such data and forecasts was prepared specifically for us. No third-party source that has prepared such information has reviewed or passed upon our use of the information in this presentation, and no third-party source is quoted or summarized in this presentation as an expert. We believe these data are reliable, but we have not independently verified the accuracy of this information. In addition, projections, assumptions and estimates of our future performance and the future performance of the markets in which we operate are necessarily subject to a high degree of uncertainty and risk.
Non-GAAP Measures This presentation includes references to Non-GAAP financial measures. Reconciliations of the differences between the Non-GAAP measures provided in this presentation to the most comparable GAAP financial measures are included in the Appendix. 2
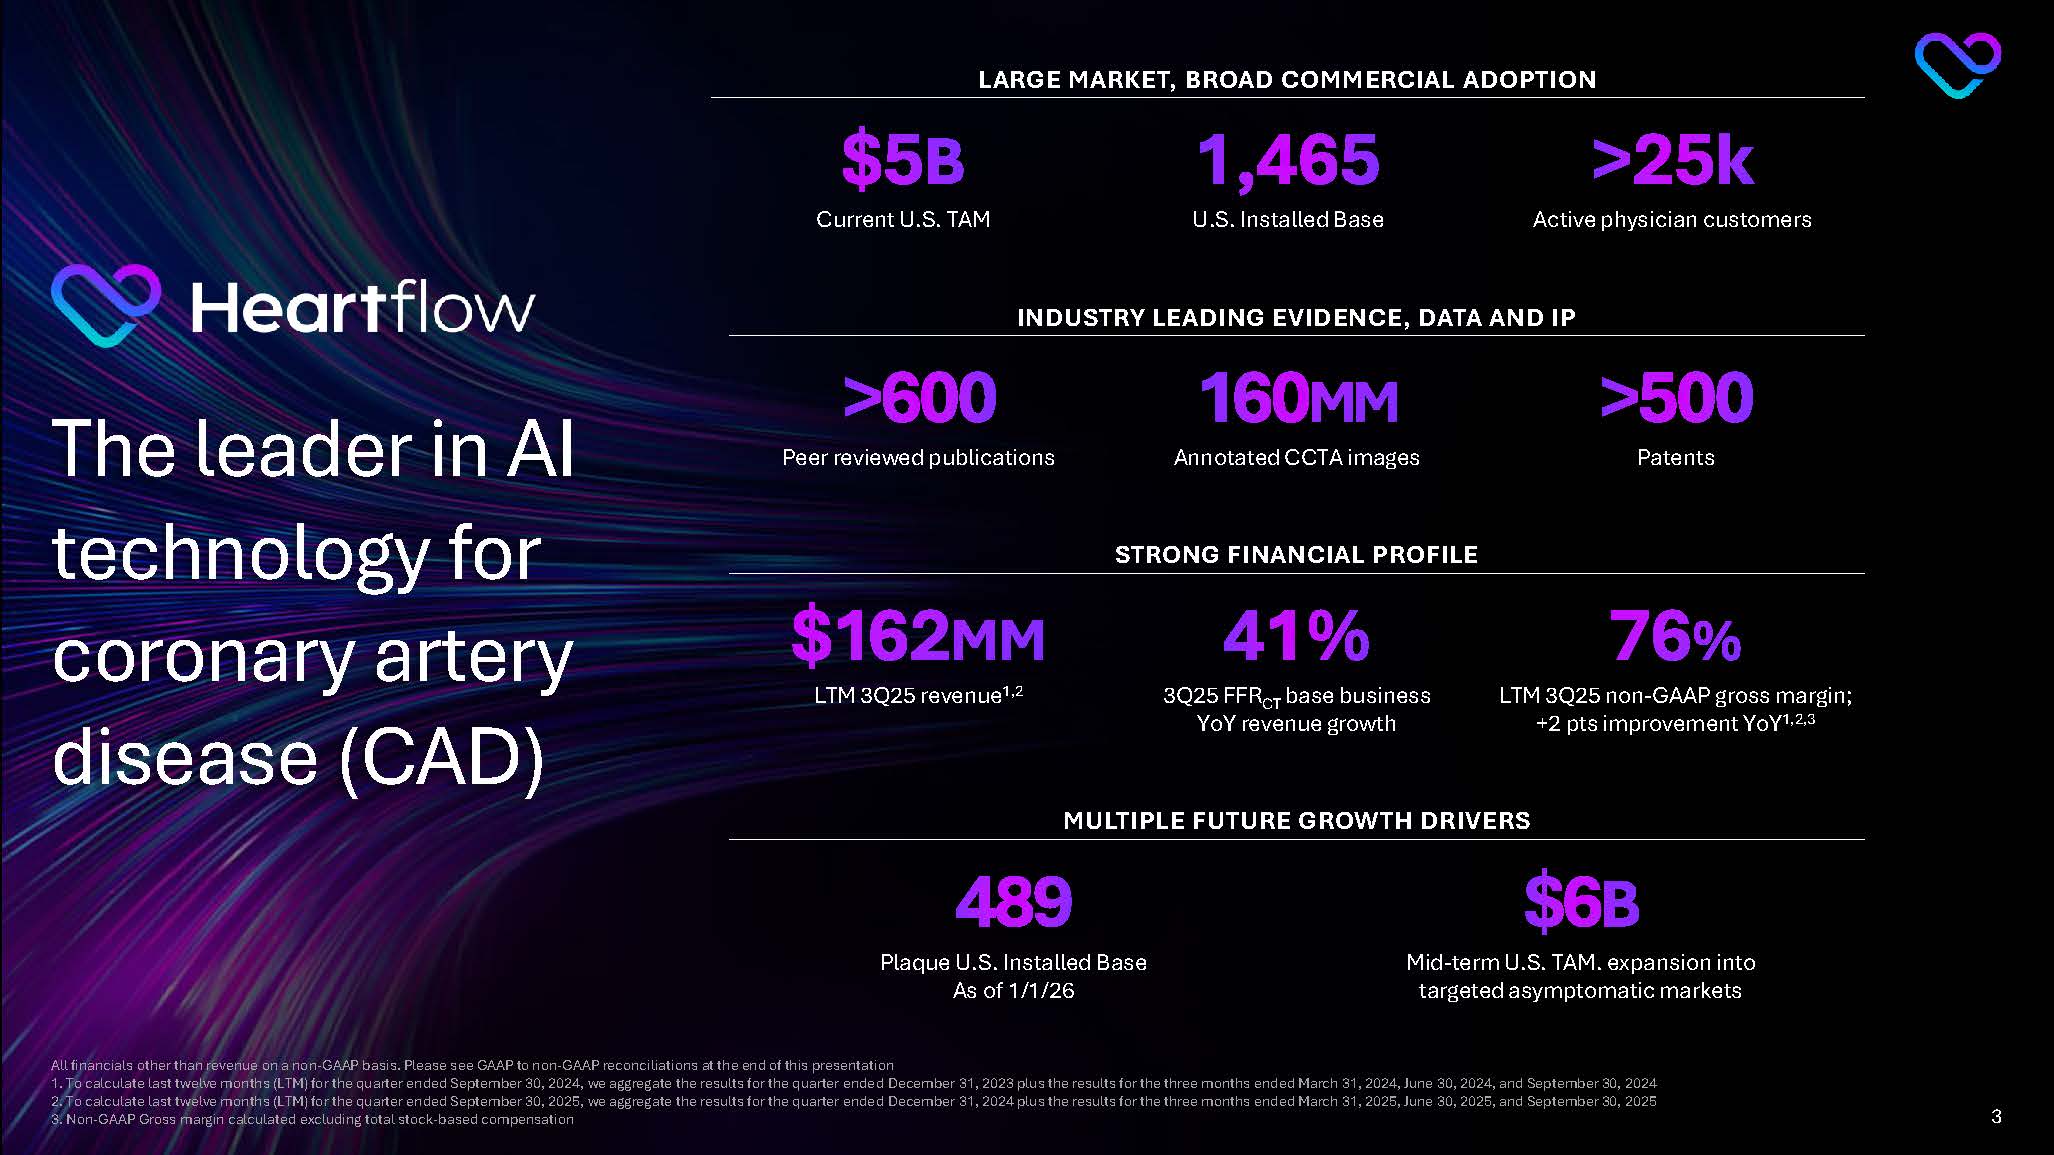
Heartflow The leader in AI technology for coronary artery disease (CAD) LARGE MARKET, BROAD COMMERCIAL ADOPTION $5B Current U.S. TAM 1,465 U.S. Installed Base >25k Active physician customers STRONG FINANCIAL PROFILE $162MM LTM 3Q25 revenue1,2 41% 3Q25 FFRCT base business YoY revenue growth 76% LTM 3Q25 non-GAAP gross margin; +2 pts improvement YoY1,2,3 All financials other than revenue on a non-GAAP basis. Please see GAAP to non-GAAP reconciliations at the end of this presentation 1. To calculate last twelve months (LTM) for the quarter ended September 30, 2024, we aggregate the results for the quarter ended December 31, 2023 plus the results for the three months ended March 31, 2024, June 30, 2024, and September 30, 2024 2. To calculate last twelve months (LTM) for the quarter ended September 30, 2025, we aggregate the results for the quarter ended December 31, 2024 plus the results for the three months ended March 31, 2025, June 30, 2025, and September 30, 2025 3. Non-GAAP Gross margin calculated excluding total stock-based compensation 3
INDUSTRY LEADING EVIDENCE, DATA AND IP >600 Peer reviewed publications 160MM Annotated CCTA images >500 Patents MULTIPLE FUTURE GROWTH DRIVERS 489 Plaque U.S. Installed Base As of 1/1/26 $6B Mid-term U.S. TAM. expansion into targeted asymptomatic markets
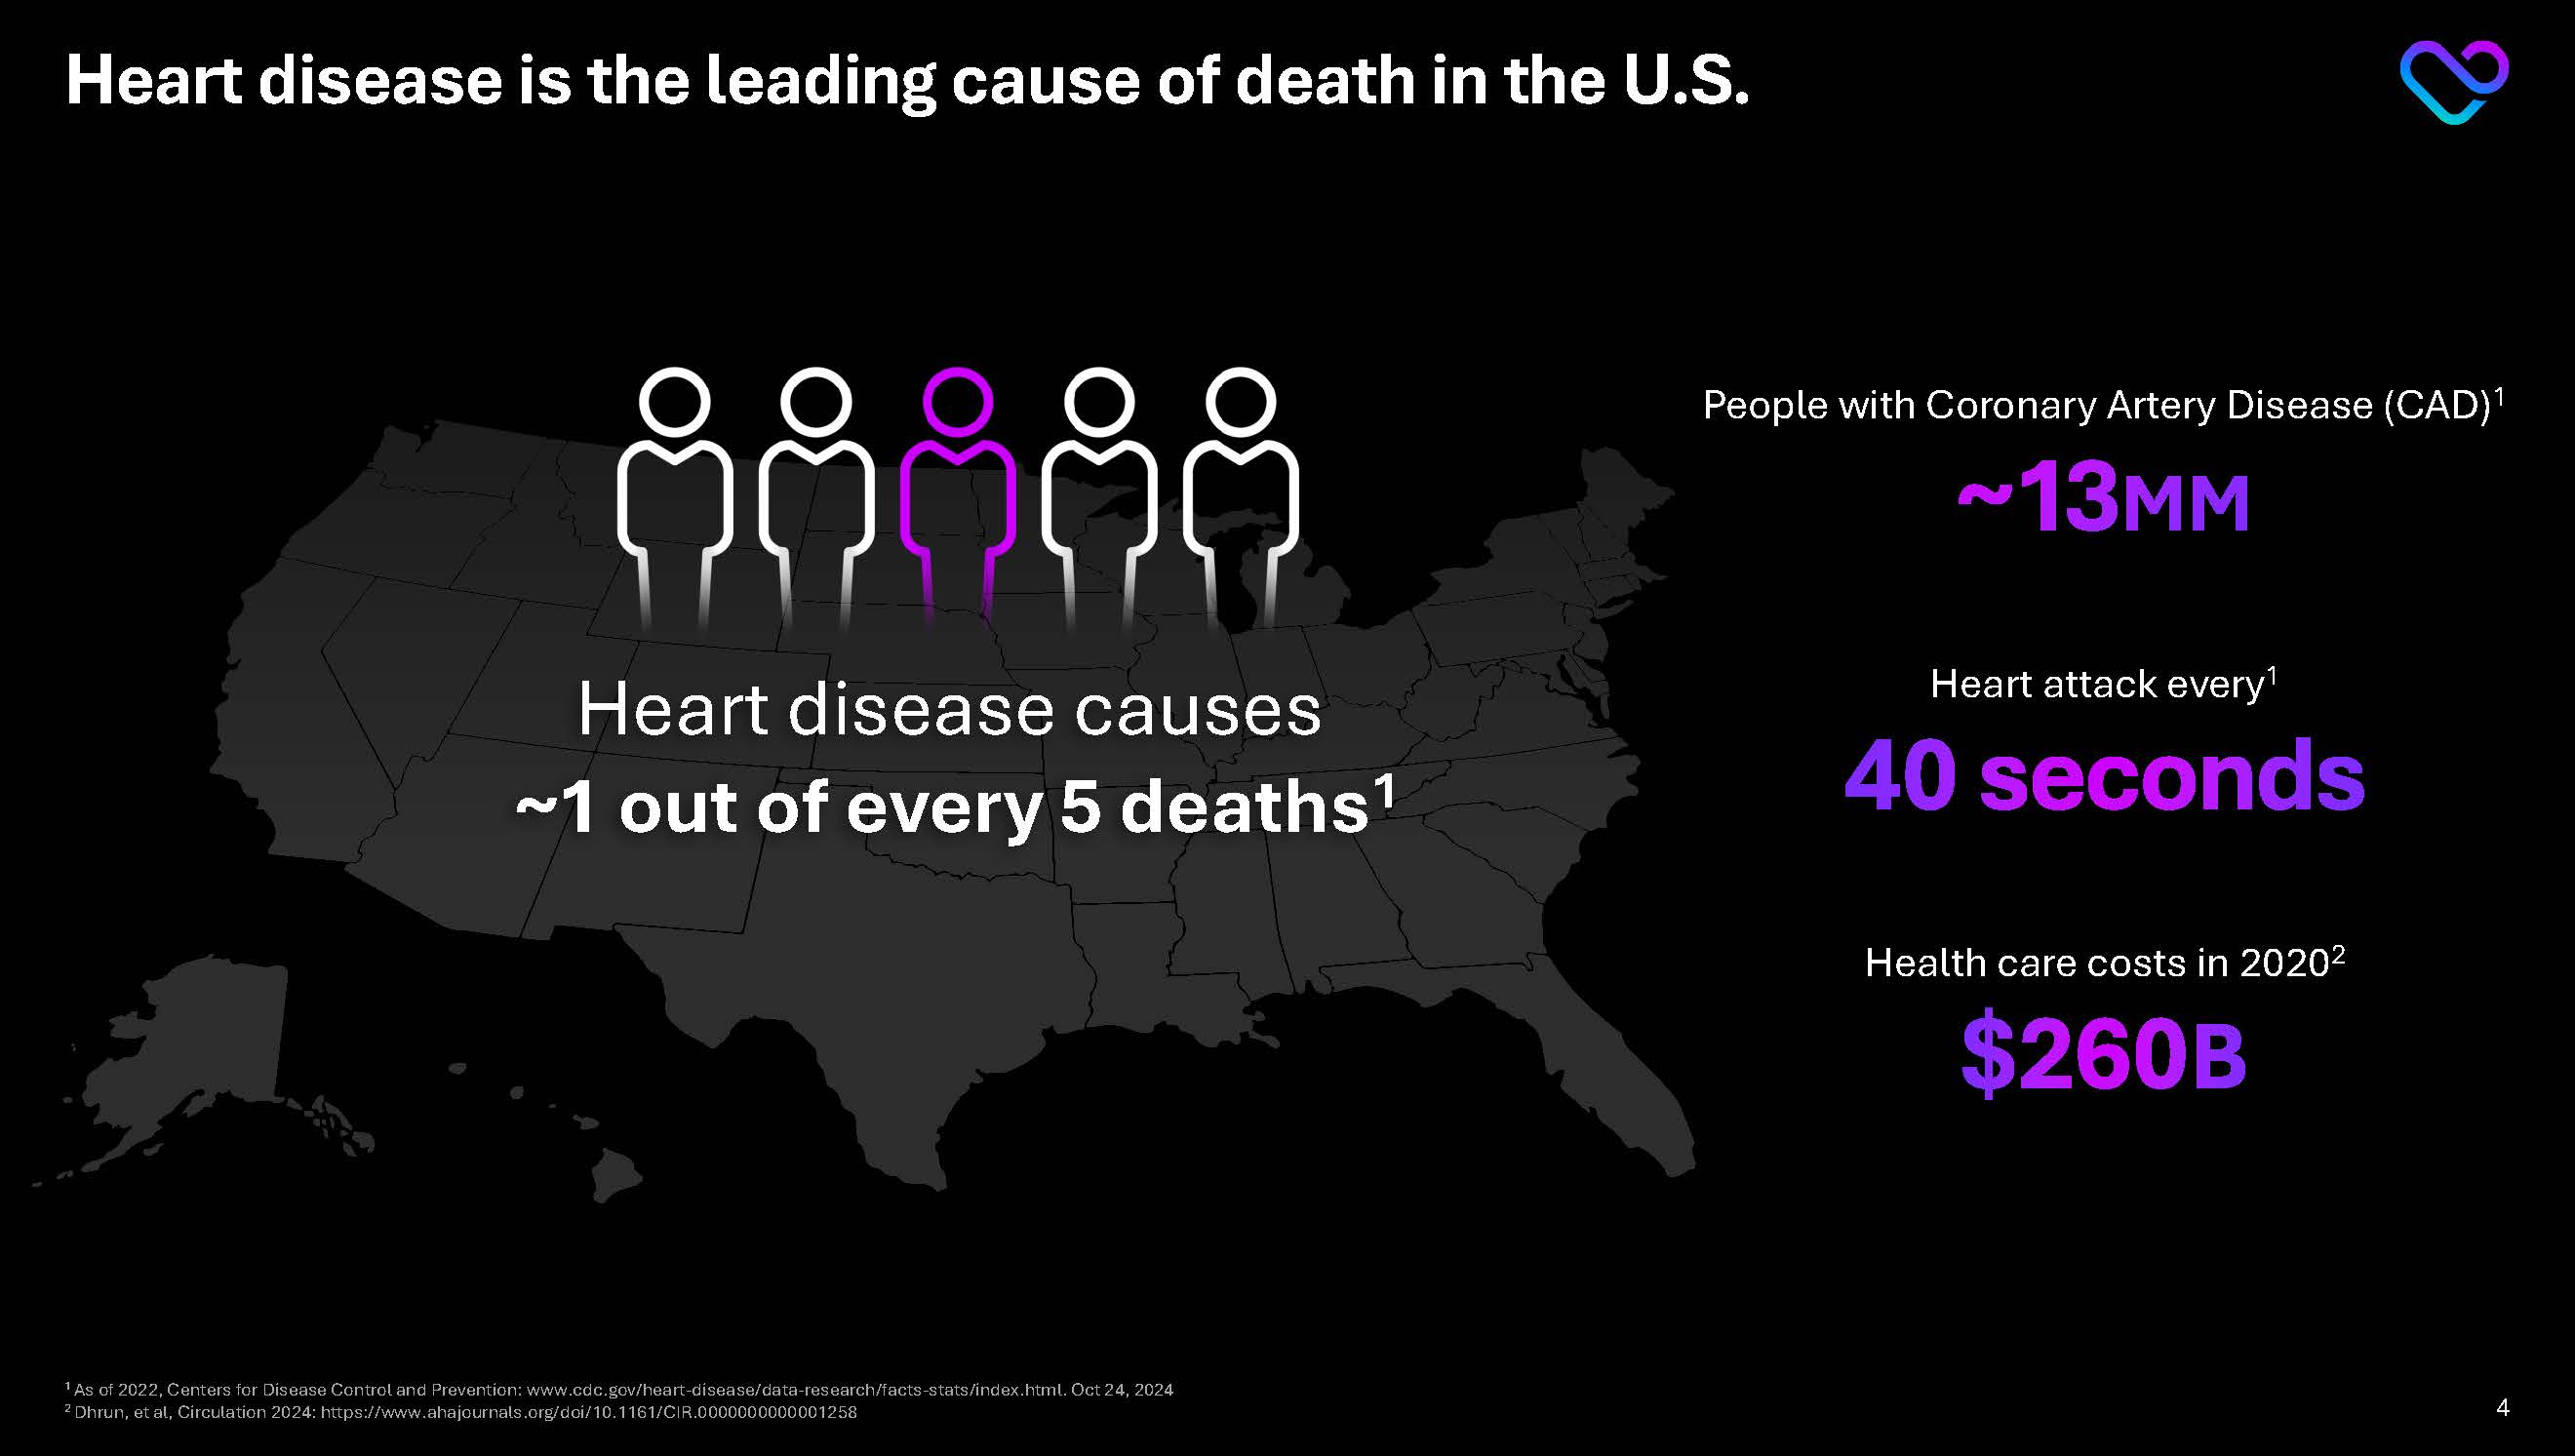
Heart disease is the leading cause of death in the U.S. Heart disease causes ~1 out of every 5 deaths1 People with Coronary Artery Disease (CAD)1 ~13 MM Heart attack every1 40 seconds Health care costs in 20202 $260B
1 As of 2022, Centers for Disease Control and Prevention: www.cdc.gov/heart-disease/data-research/facts-stats/index.html. Oct 24, 2024 2 Dhrun, et al, Circulation 2024: https://www.ahajournals.org/doi/10.1161/CIR.0000000000001258 4 4 SCOT-HEART Investigators, NEJM 2018 7
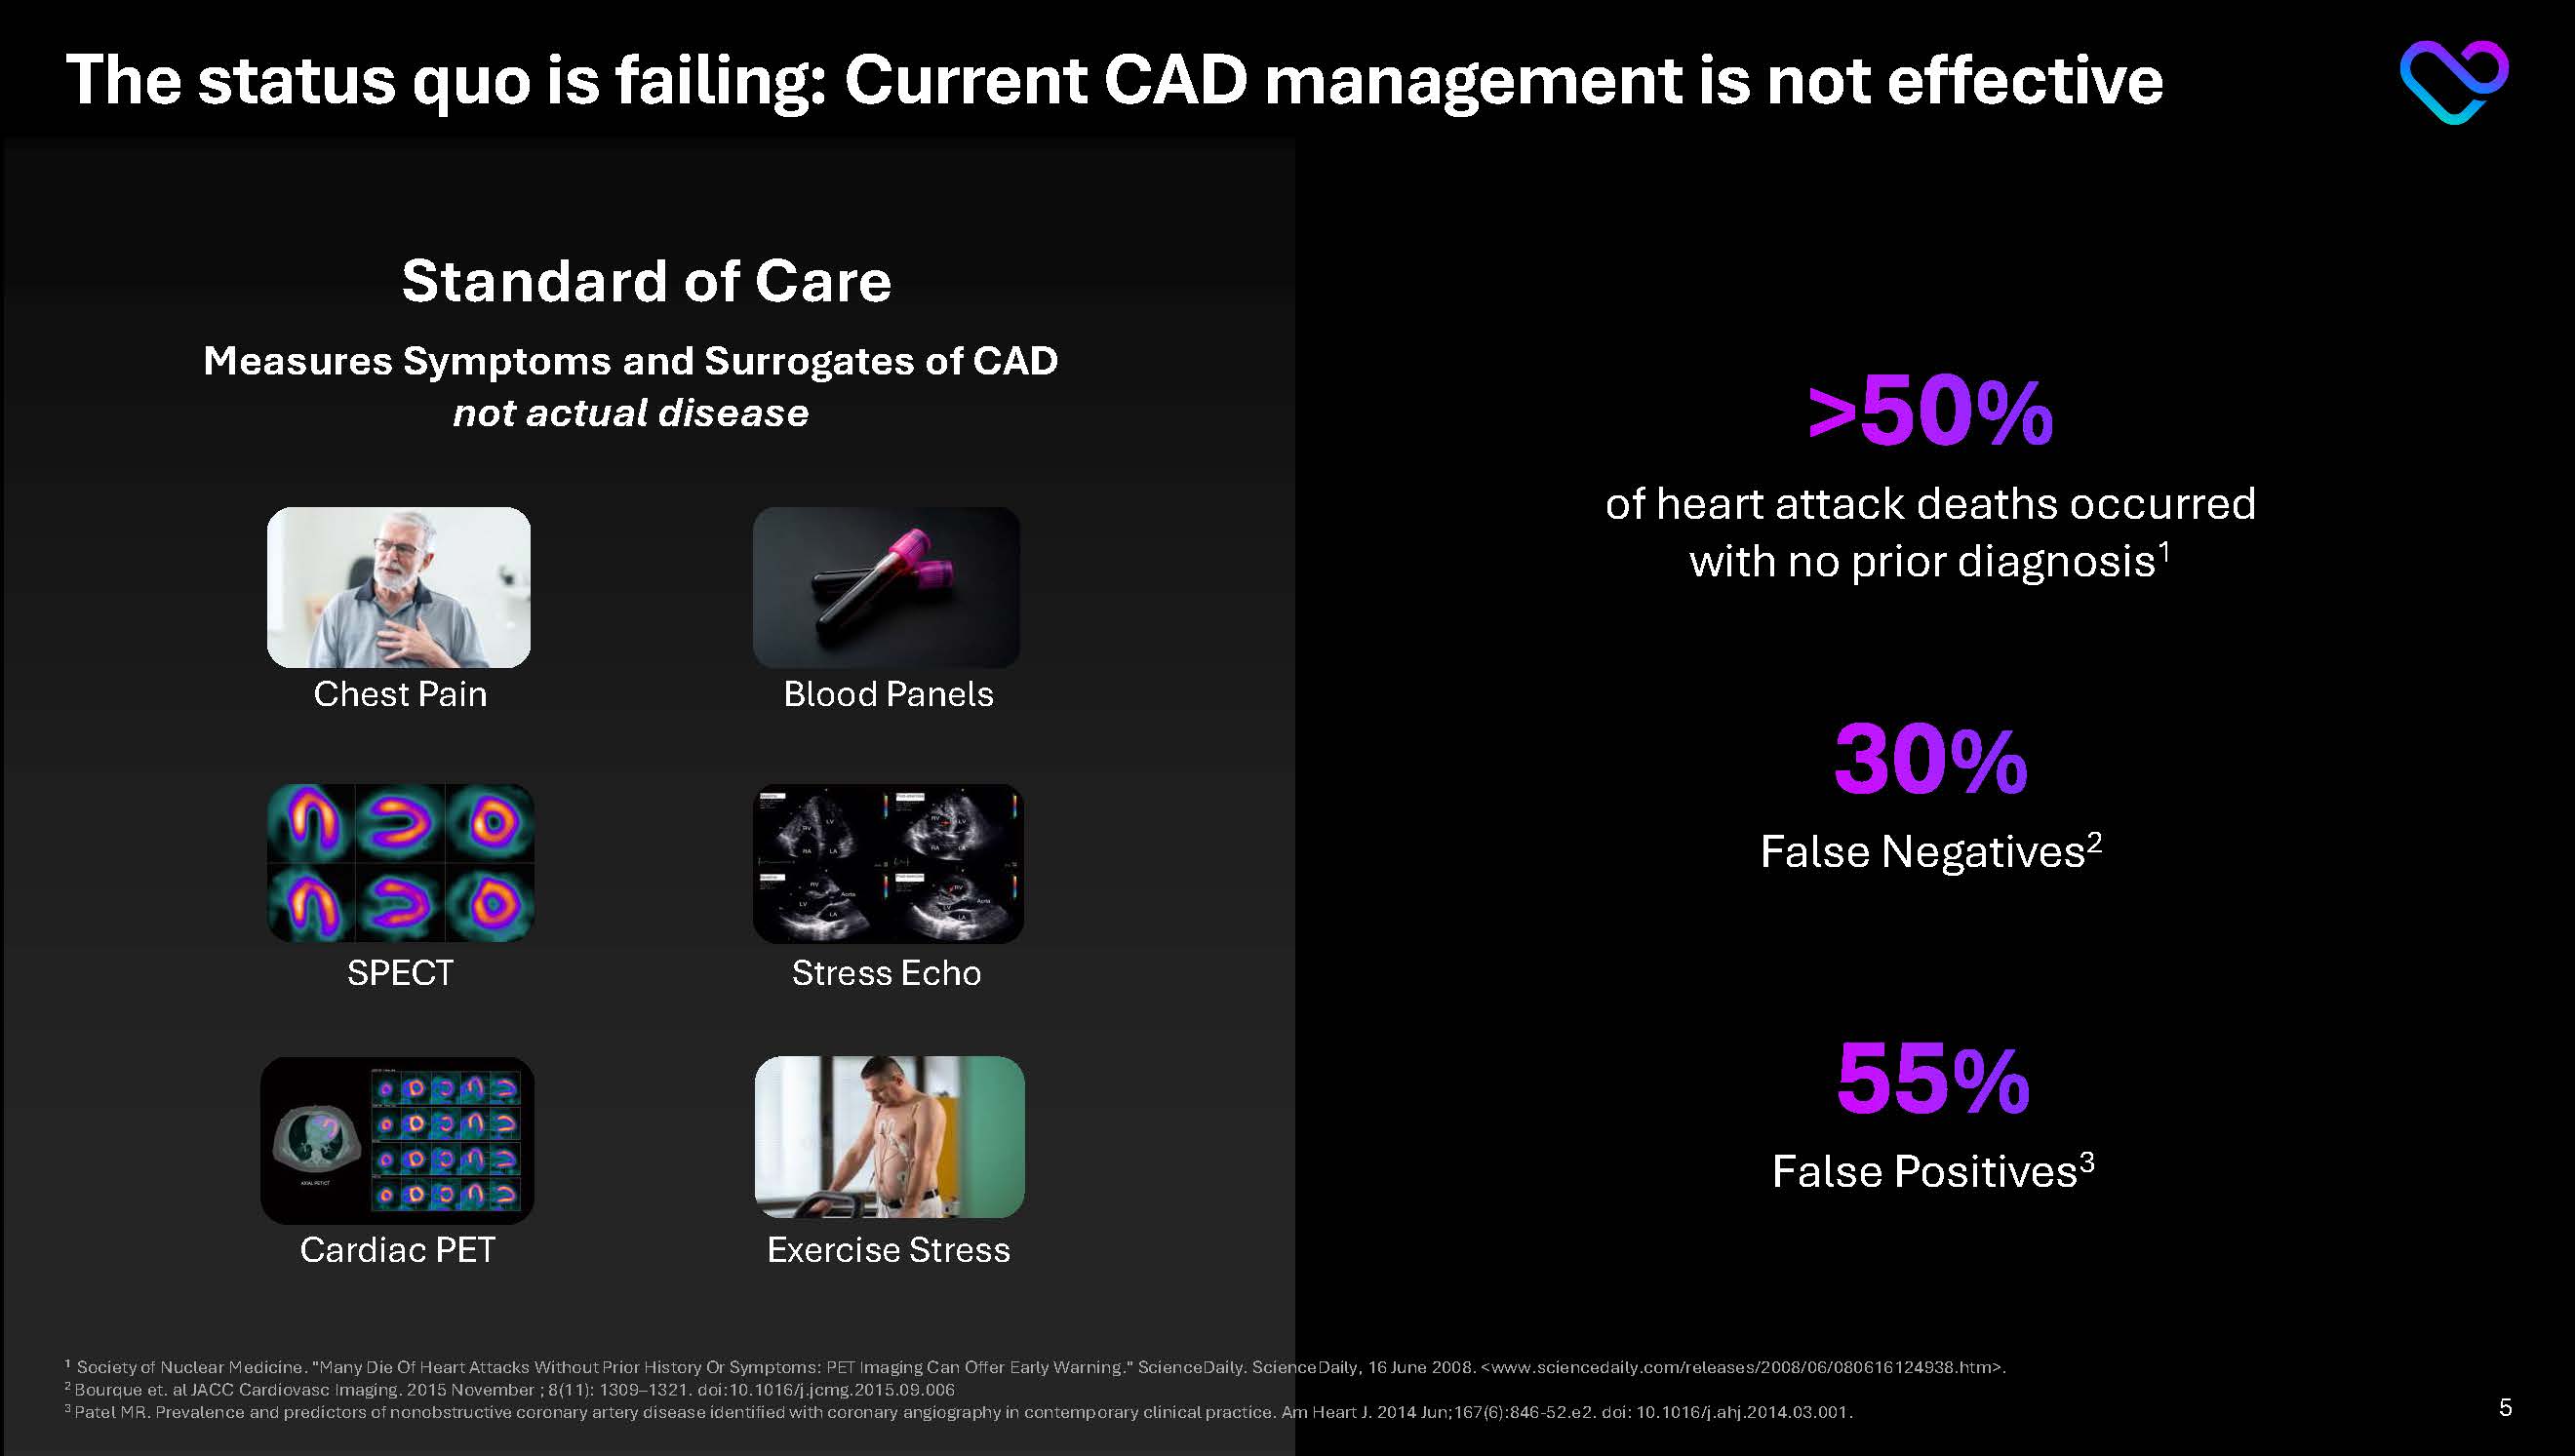
The status quo is failing: Current CAD management is not effective Standard of Care >50% of heart attack deaths occurred with no prior diagnosis1 30% False Negatives2 55% False Positives3 Measures Symptoms and Surrogates of CAD not actual disease Chest Pain Blood Panels SPECT Stress Echo Exercise Stress
1 Society of Nuclear Medicine. "Many Die Of Heart Attacks Without Prior History Or Symptoms: PET Imaging Can Offer Early Warning." ScienceDaily. ScienceDaily, 16 June 2008. <www.sciencedaily.com/releases/2008/06/080616124938.htm>.
2 Bourque et. al JACC Cardiovasc Imaging. 2015 November ; 8(11): 1309–1321. doi:10.1016/j.jcmg.2015.09.006
3 Patel MR. Prevalence and predictors of nonobstructive coronary artery disease identified with coronary angiography in contemporary clinical practice. Am Heart J. 2014 Jun;167(6):846-52.e2. doi: 10.1016/j.ahj.2014.03.001. 5
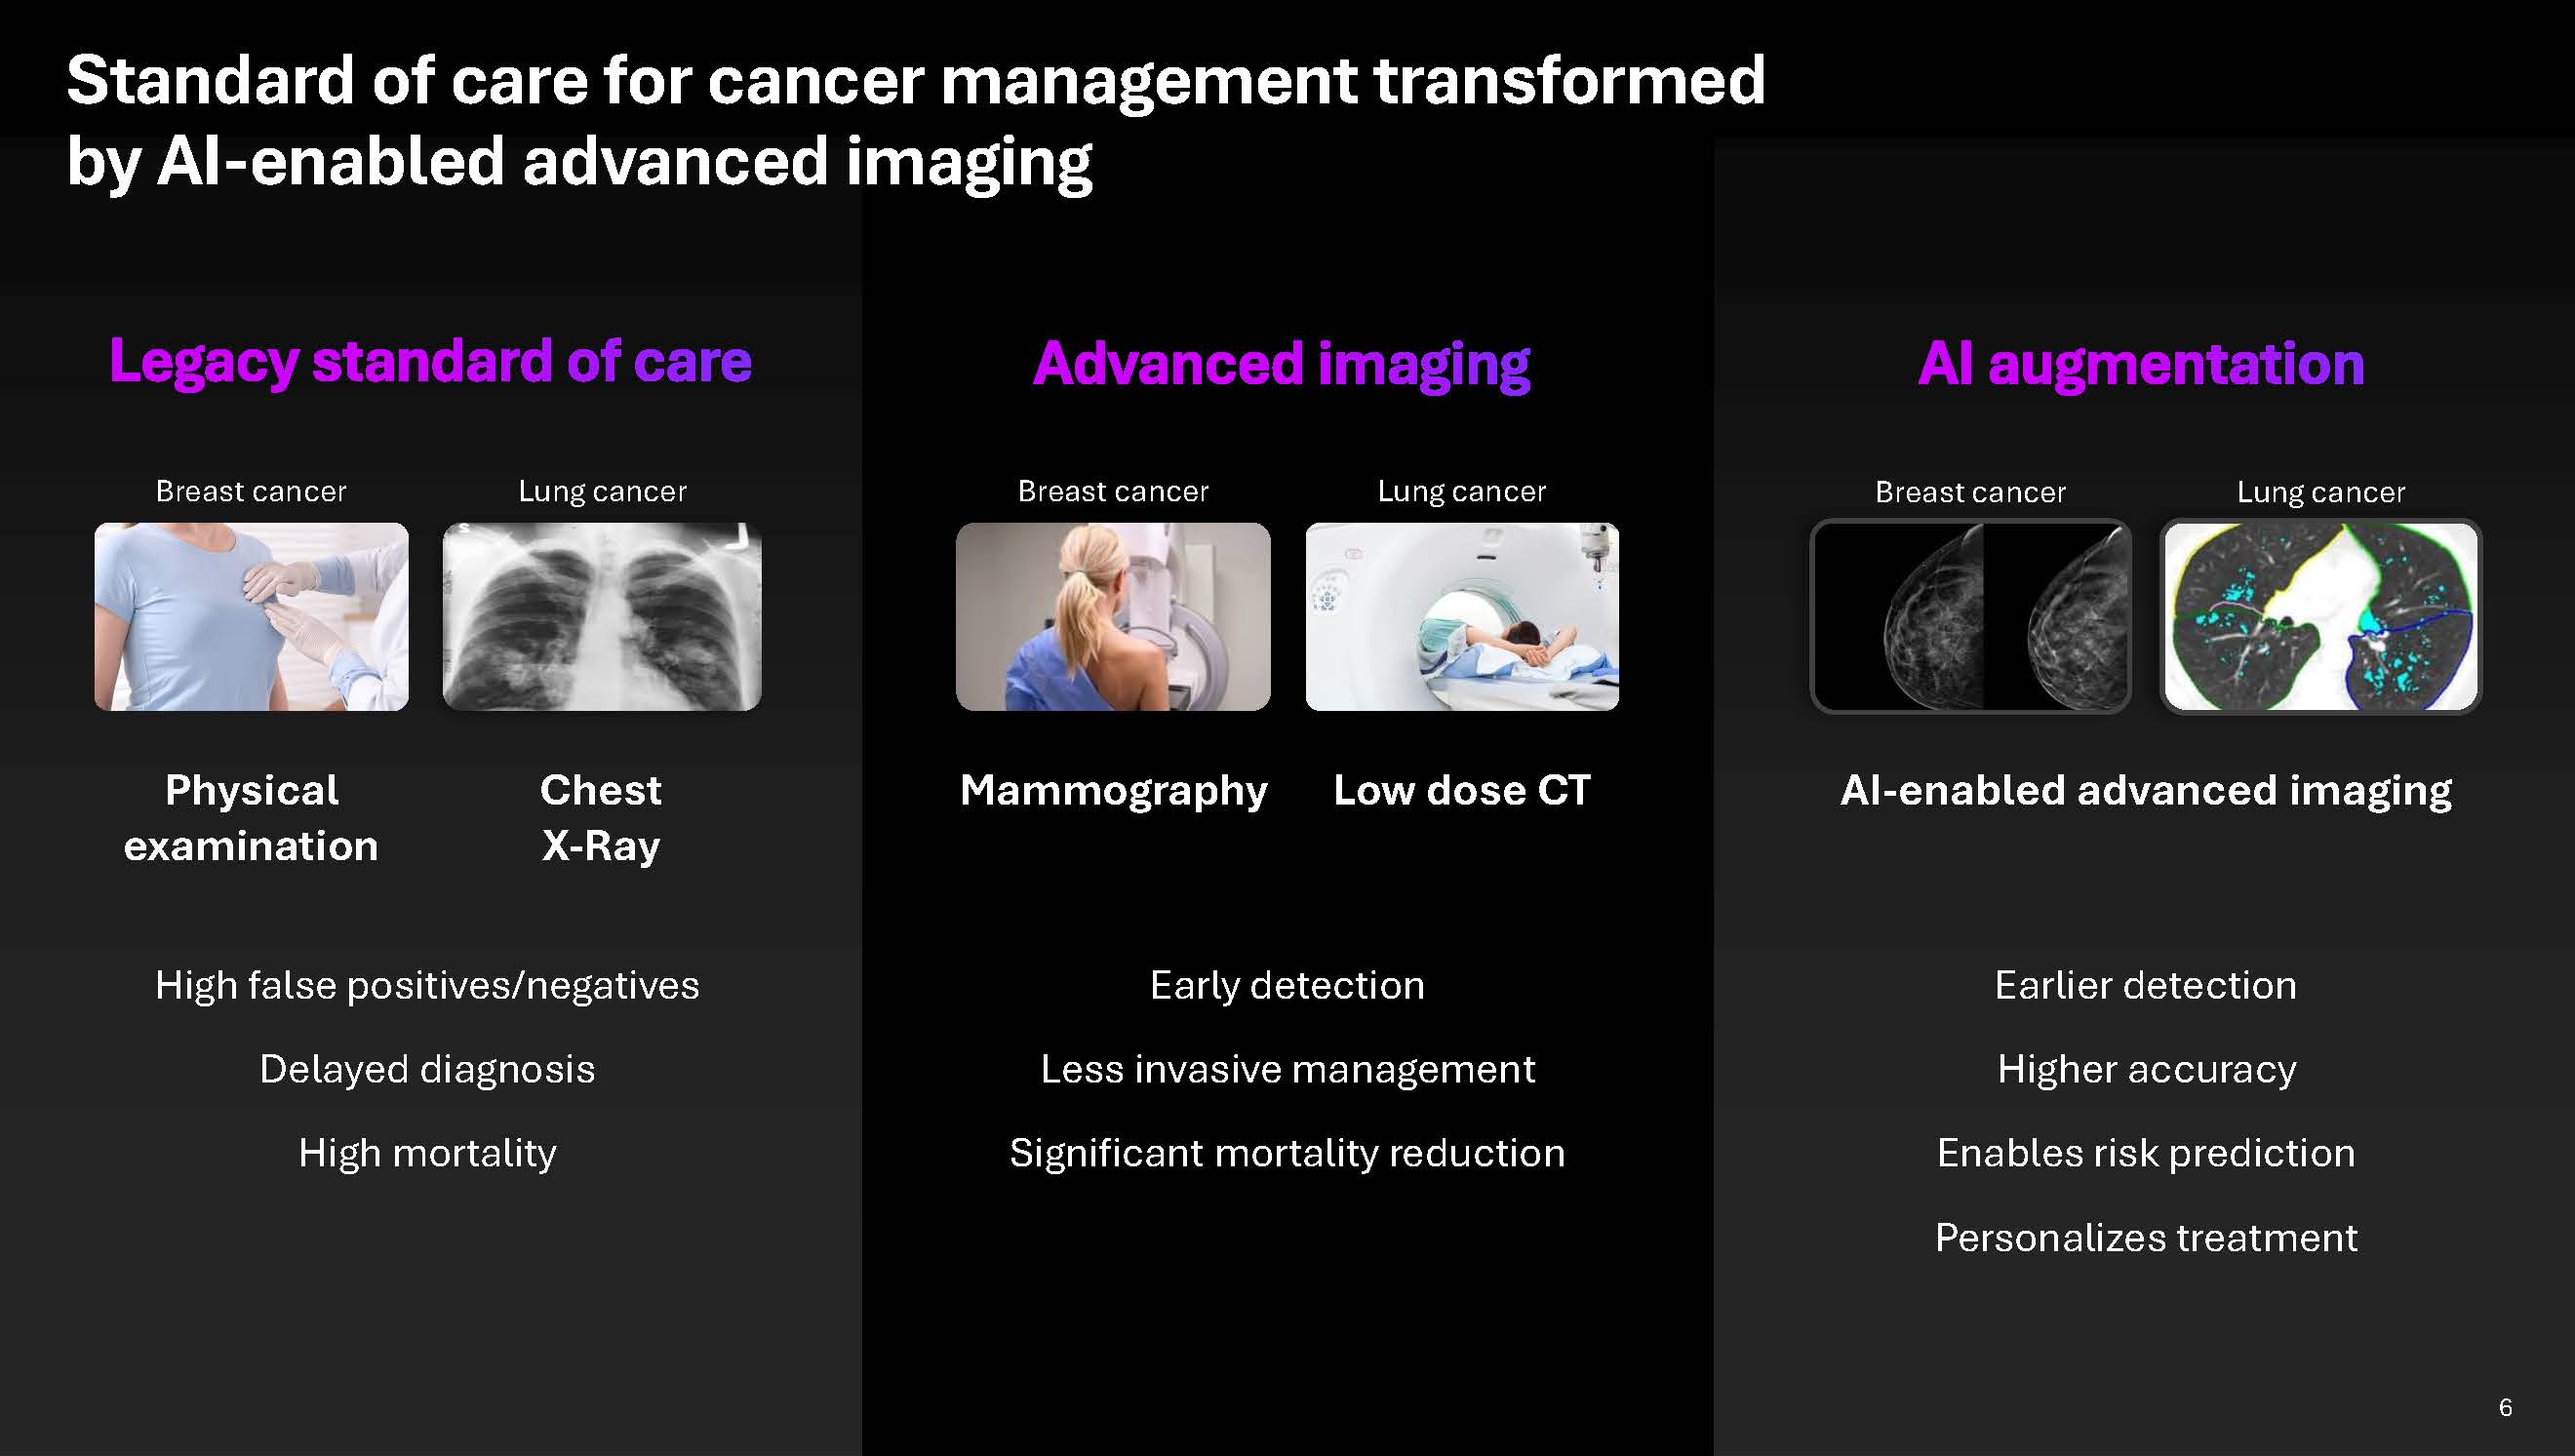
Standard of care for cancer management transformed by AI-enabled advanced imaging Legacy standard of care Physical examination High false positives/negatives Delayed diagnosis High mortality Mammography Early detection Less invasive management Significant mortality reduction AI-enabled advanced imaging Earlier detection Higher accuracy Enables risk prediction Personalizes treatment Breast cancer Lung cancer Breast cancer
Lung cancer Breast cancer Lung cancer Low dose CT AI augmentation 6
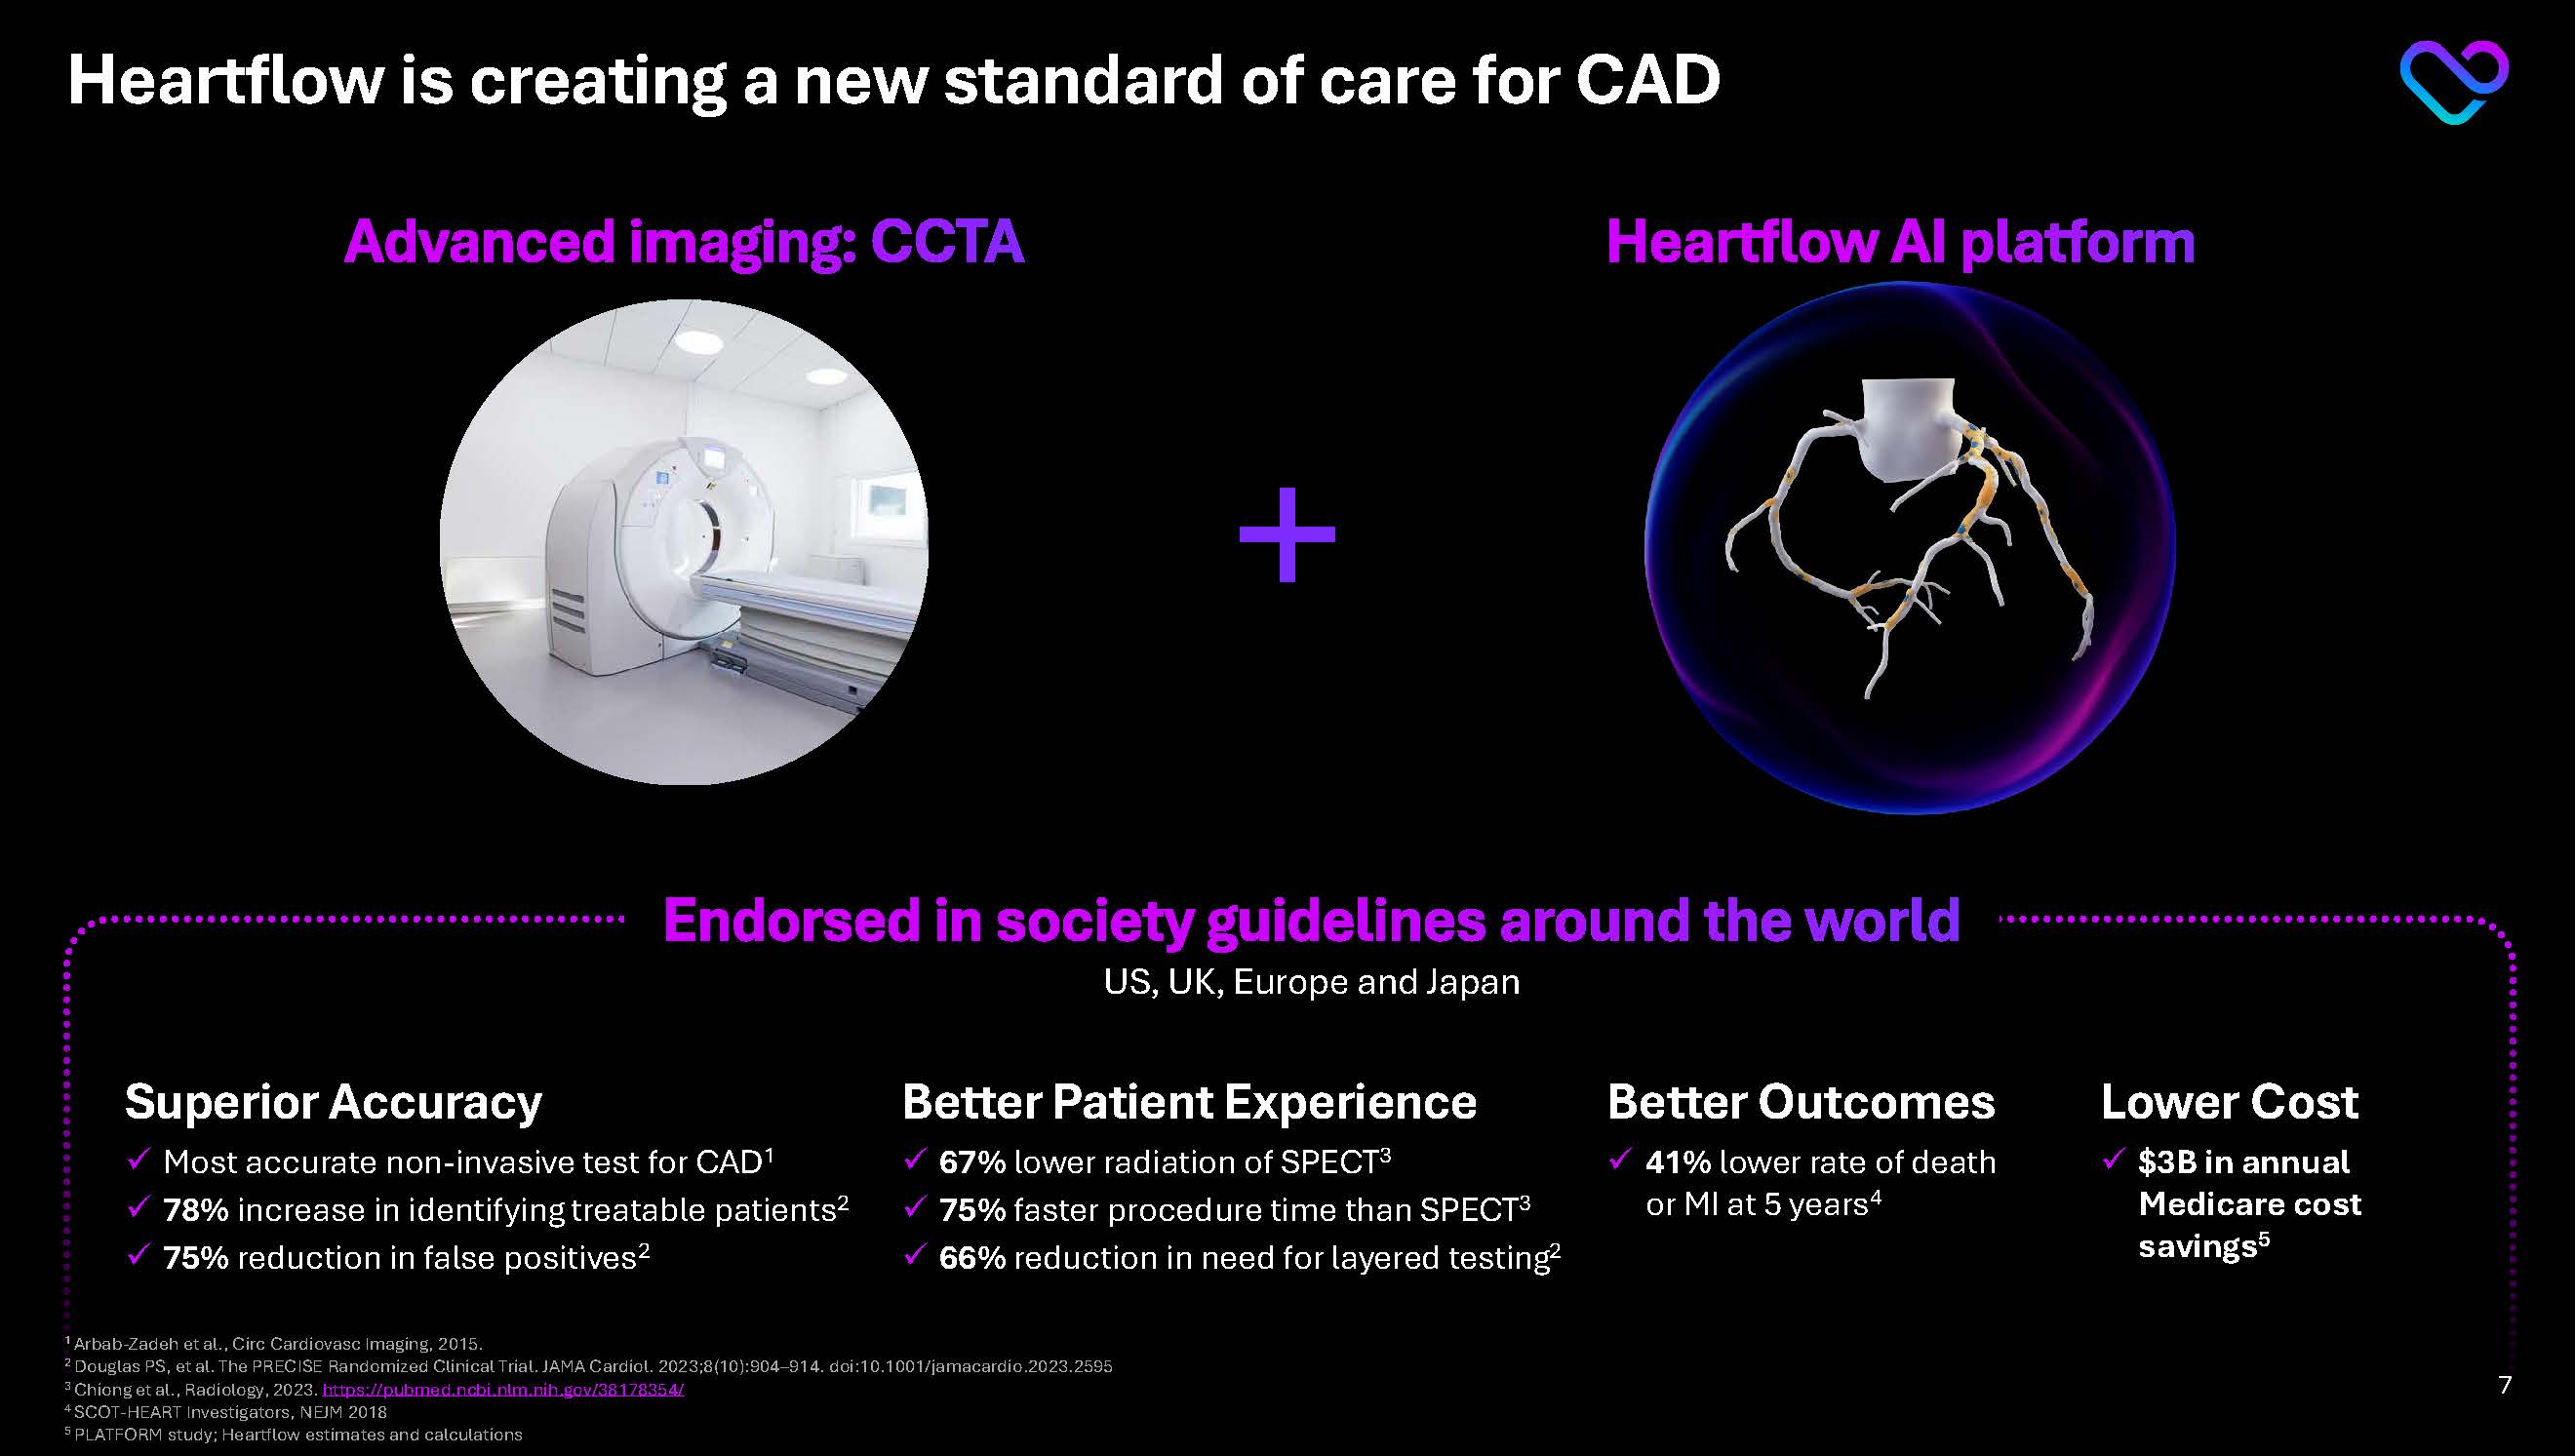
Heartflow is creating a new standard of care for CAD A cardiac CT angiography (CCTA) scan is a noninvasive test that uses X-ray to take Better Patient Experience 67% lower radiation of SPECT3 75% faster procedure time than SPECT3 66% reduction in need for layered testing2 Endorsed in society guidelines around the world US, UK, Europe and Japan Better Outcomes 41% lower rate of death or MI at 5 years4 Superior Accuracy Most accurate non-invasive test for CAD1 78% increase in identifying treatable patients2 75% reduction in false positives2 Lower Cost $3B in annual Medicare cost savings5 Advanced imaging: CCTA Heartflow AI platform
1 Arbab-Zadeh et al., Circ Cardiovasc Imaging, 2015.
2 Douglas PS, et al. The PRECISE Randomized Clinical Trial. JAMA Cardiol. 2023;8(10):904–914. doi:10.1001/jamacardio.2023.2595
3 Chiong et al., Radiology, 2023. https://pubmed.ncbi.nlm.nih.gov/38178354/
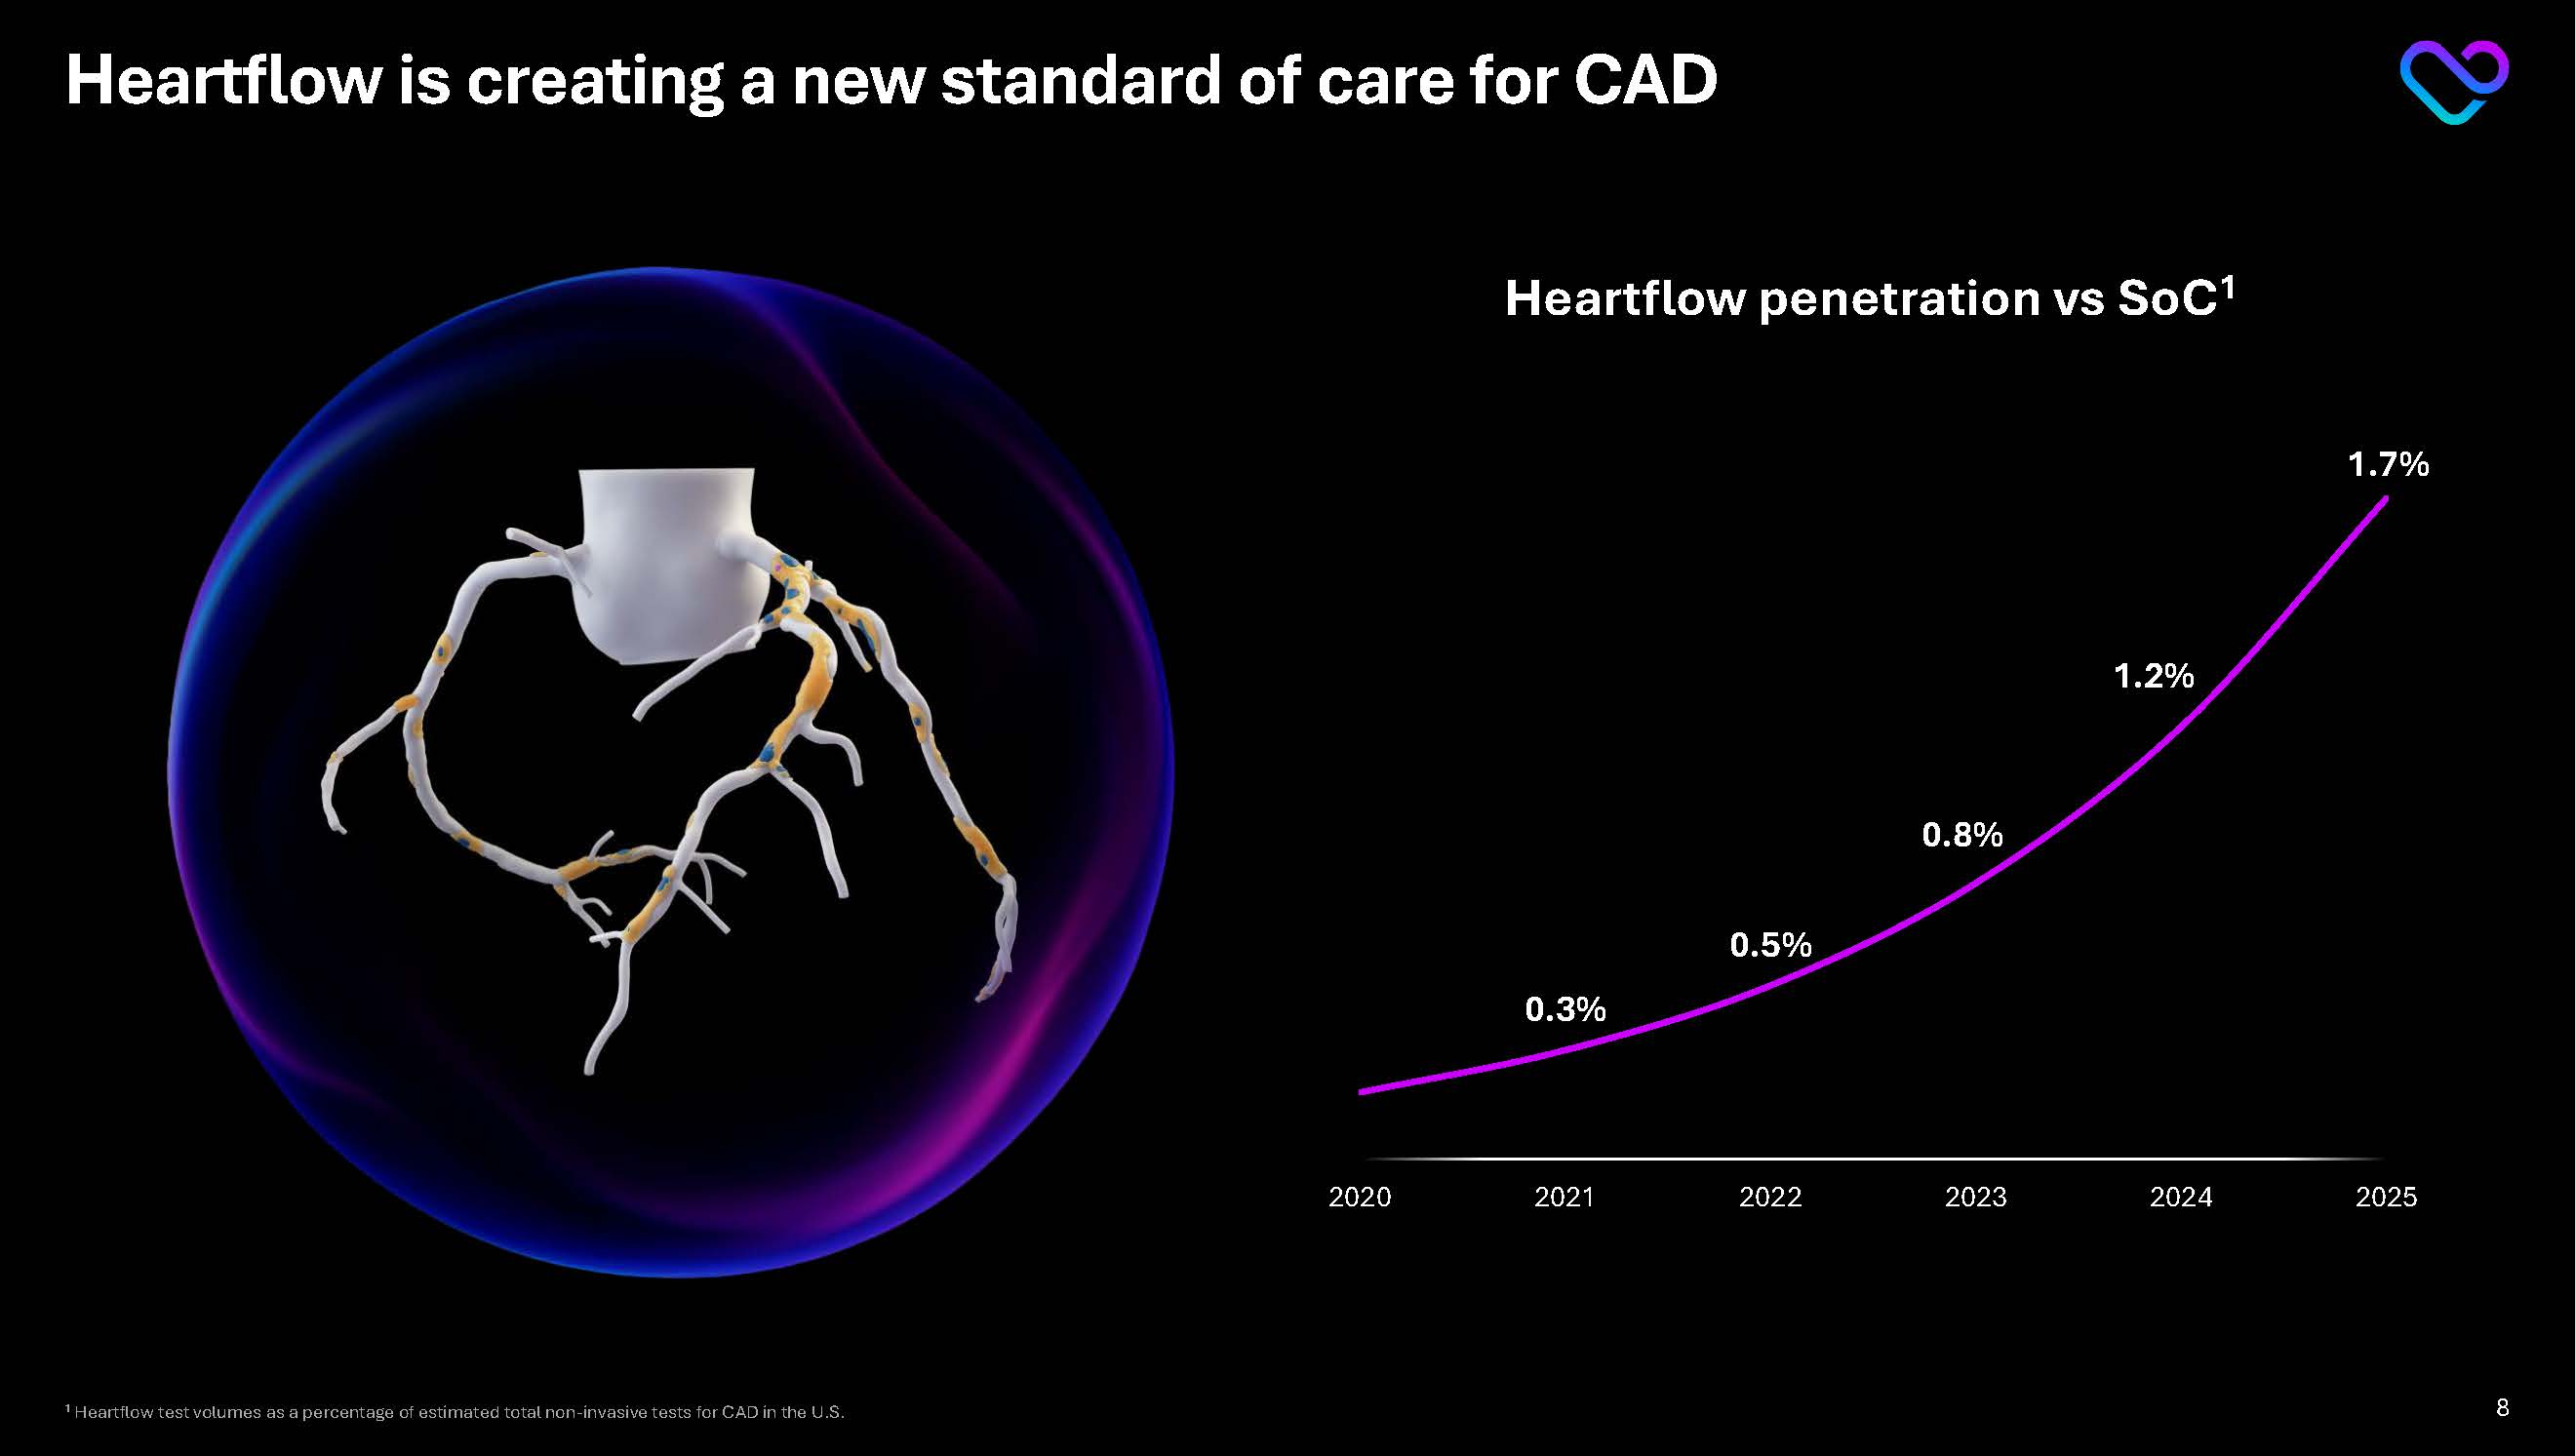
Heartflow is creating a new standard of care for CAD Heartflow penetration vs SoC1 0.3% 0.5% 0.8% 1.2% 1.7% 2020 2021 2022 2023 2024 2025 1 Heartflow test volumes as a percentage of estimated total non-invasive tests for CAD in the U.S. 8
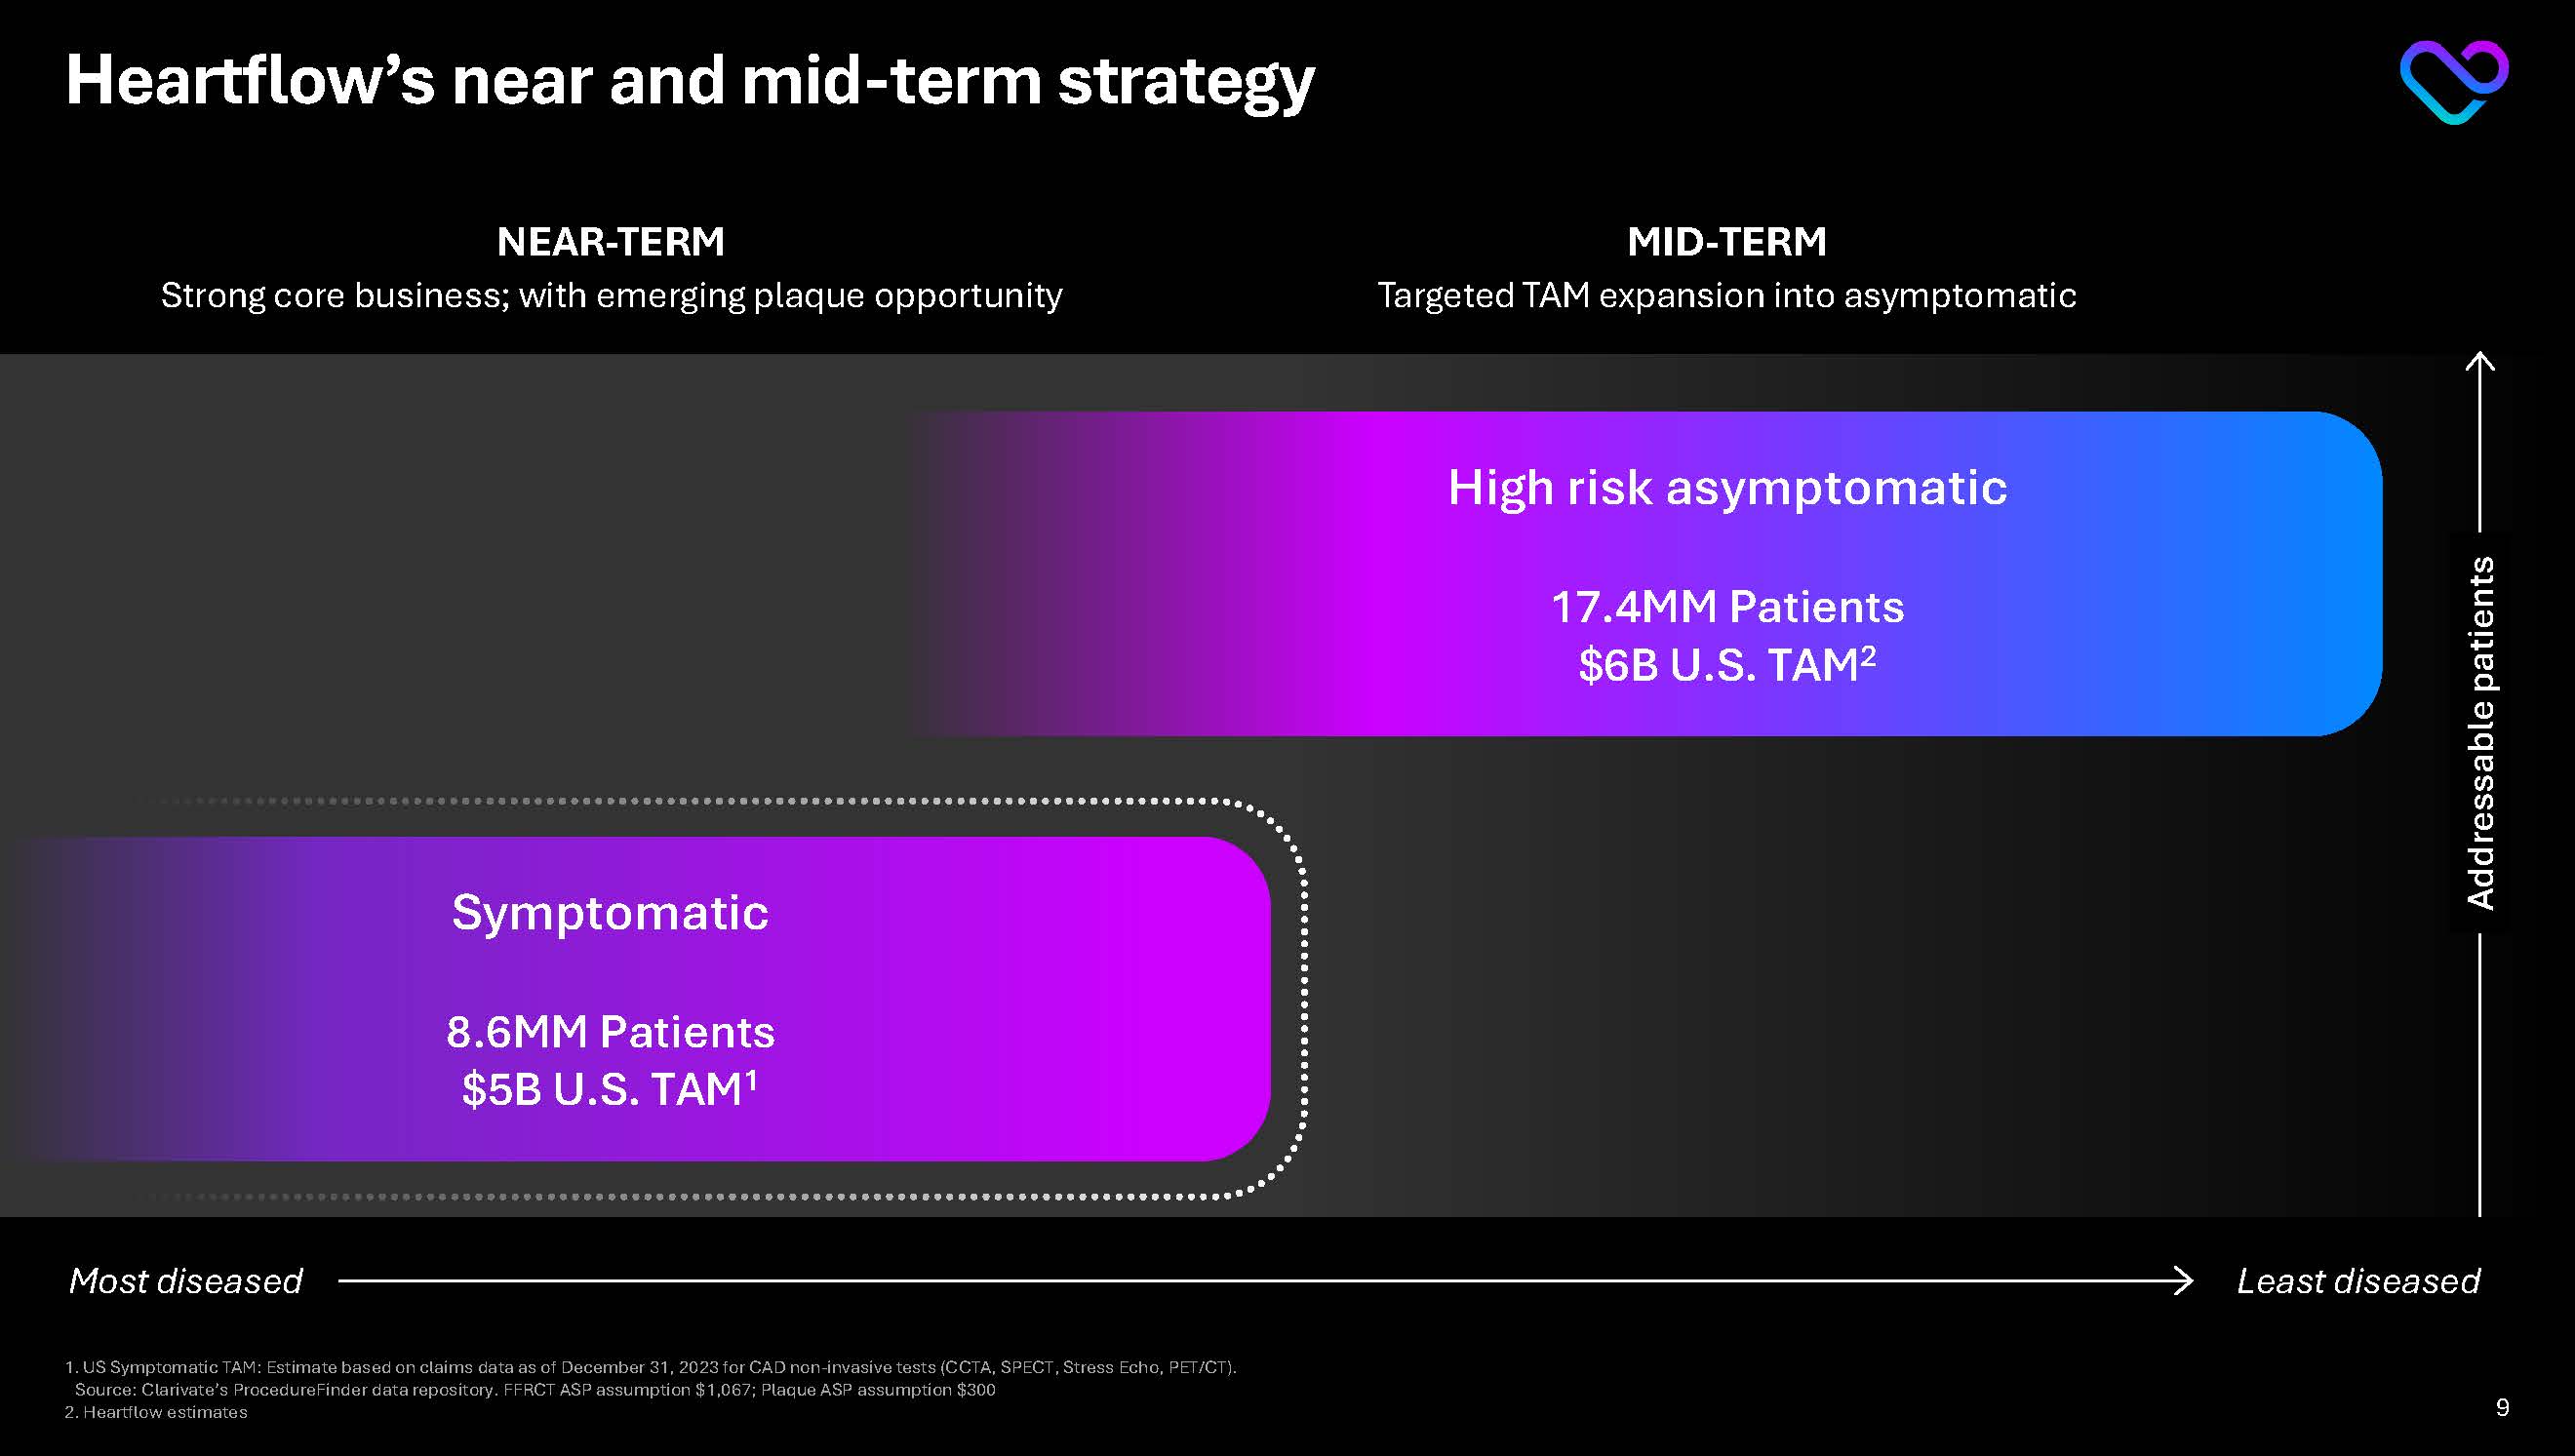
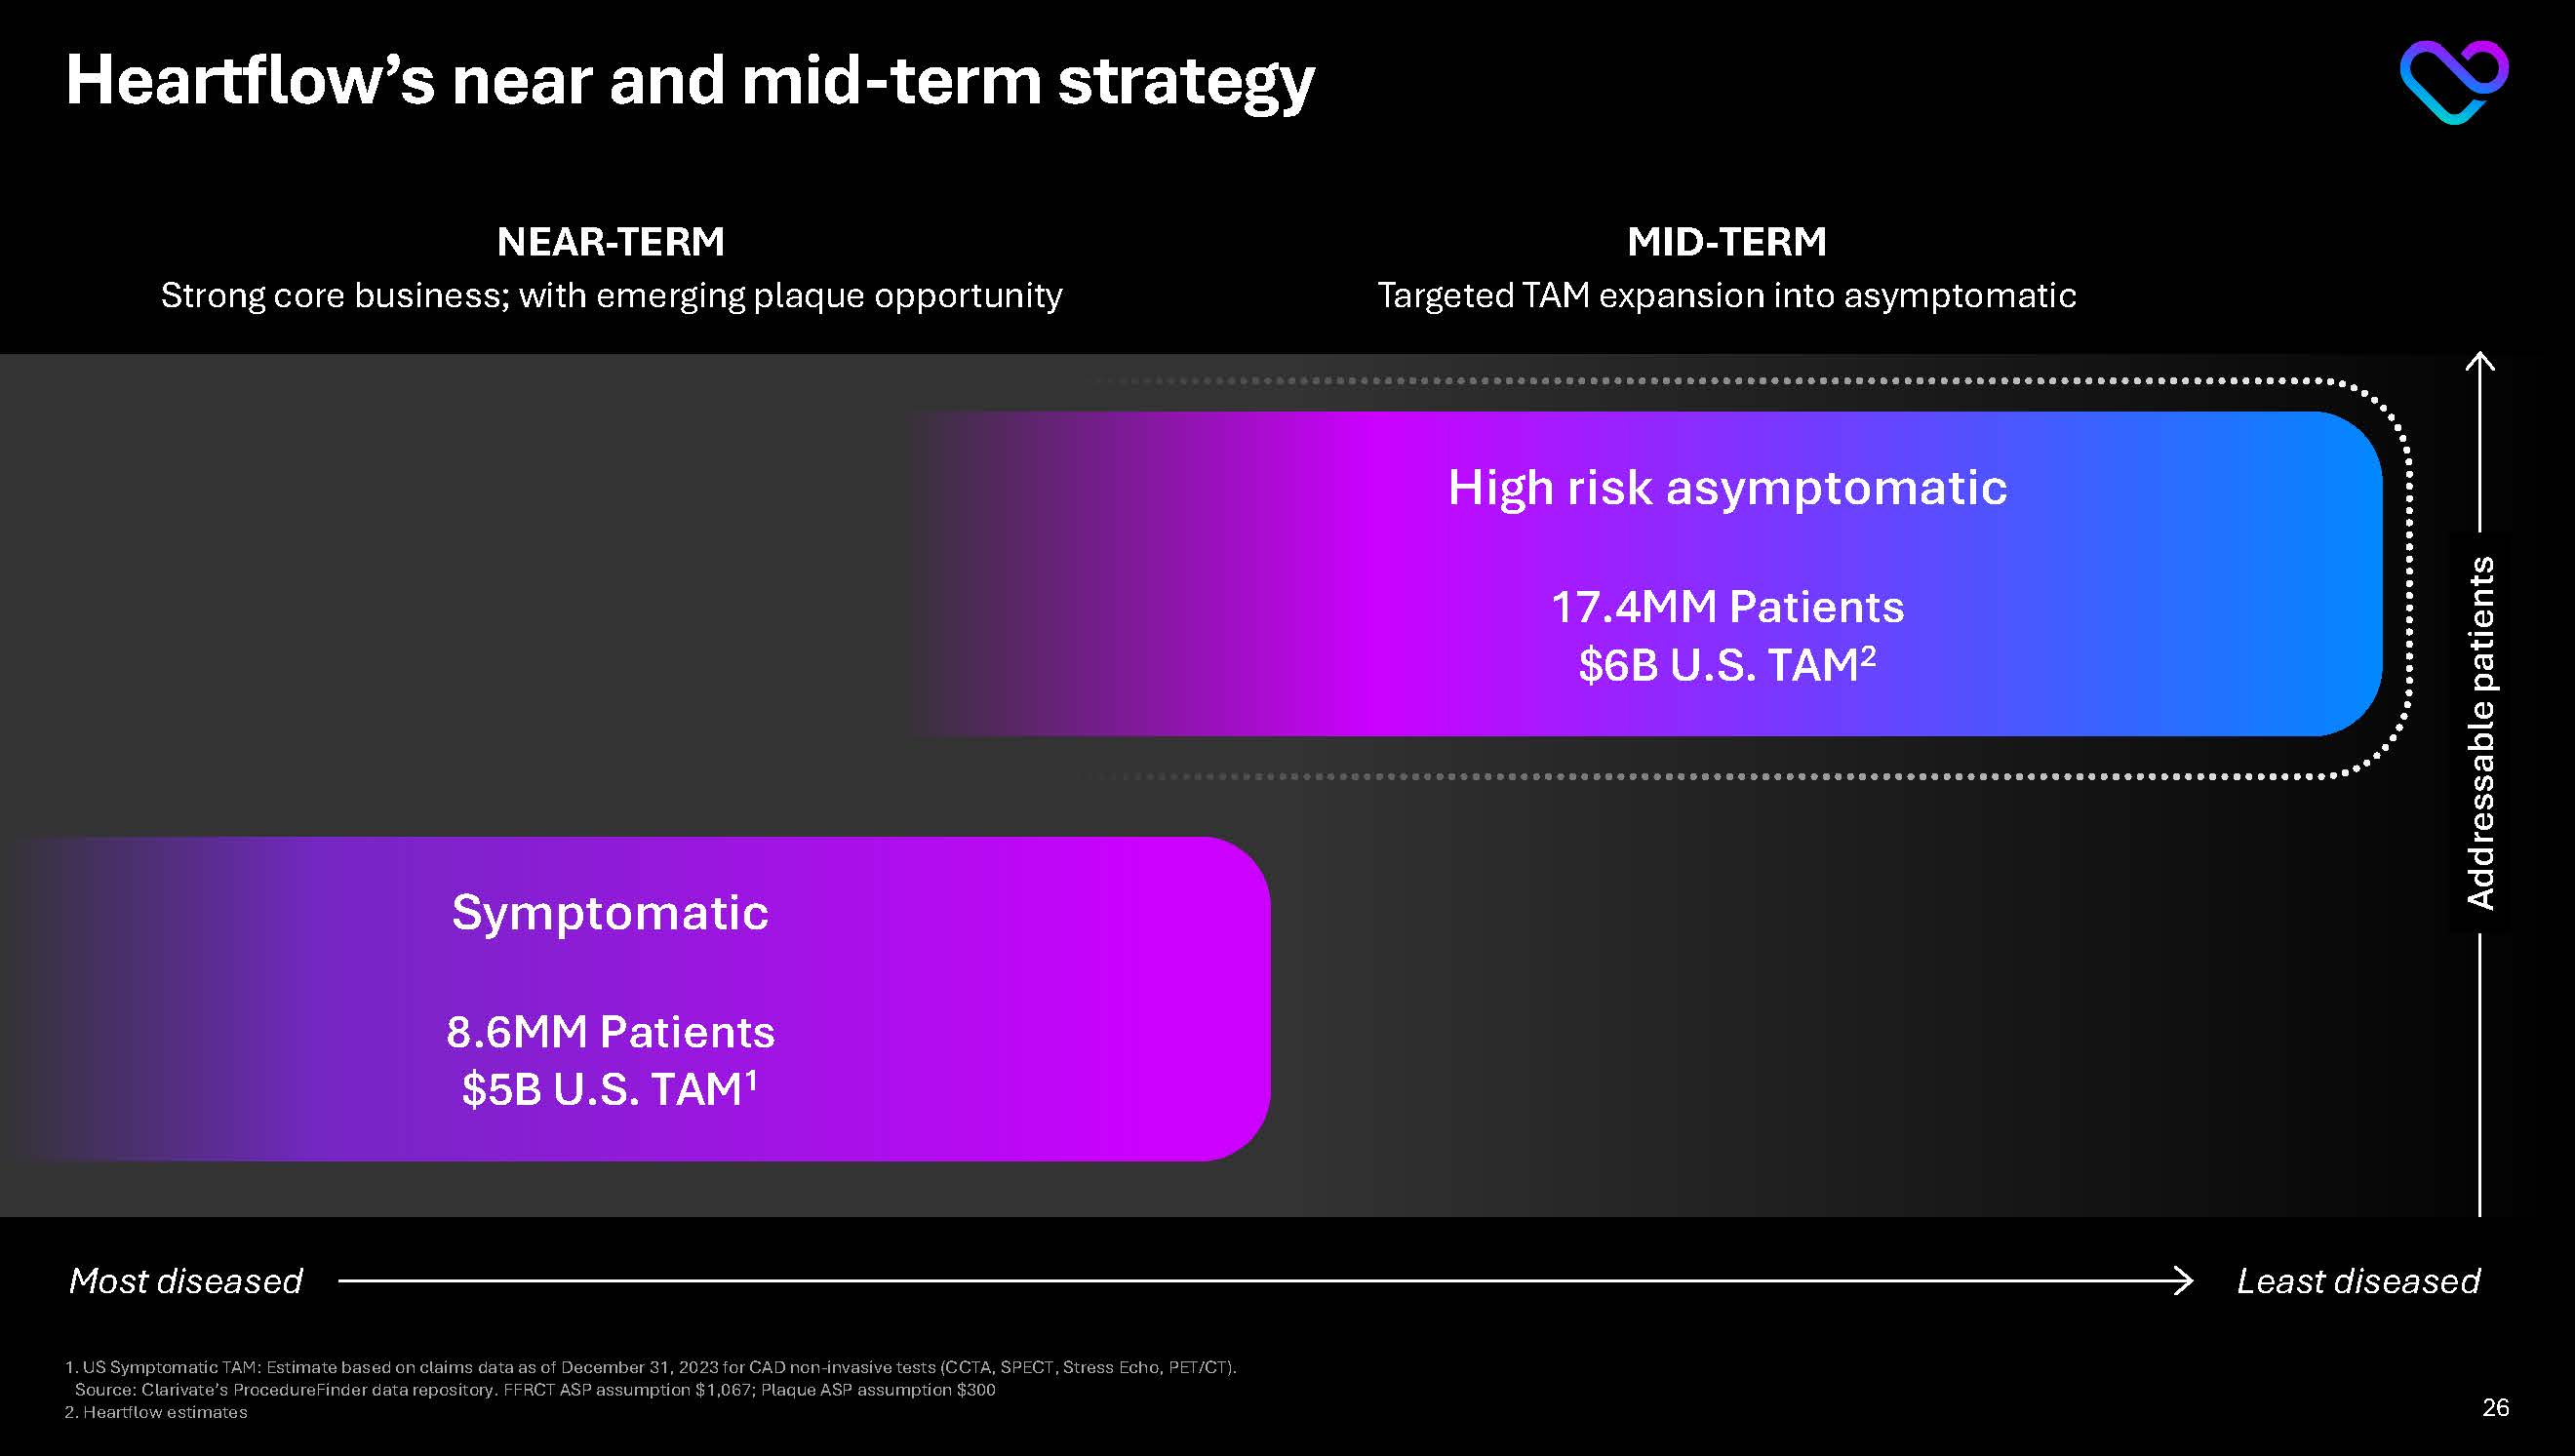
Heartflow’s near and mid-term strategy Addressable patients Least diseased Most diseased NEAR-TERM Strong core business; with emerging plaque opportunity MID-TERM Targeted TAM expansion into asymptomatic Symptomatic
8.6MM Patients $5B U.S. TAM1 High risk asymptomatic 17.4MM Patients $6B U.S. TAM2 1.US Symptomatic TAM: Estimate based on claims data as of December 31, 2023 for CAD non-invasive tests (CCTA, SPECT, Stress Echo, PET/CT). Source: Clarivate’s ProcedureFinder data repository. FFRCT ASP assumption $1,067; Plaque ASP assumption $300 2.Heartflow estimates 9
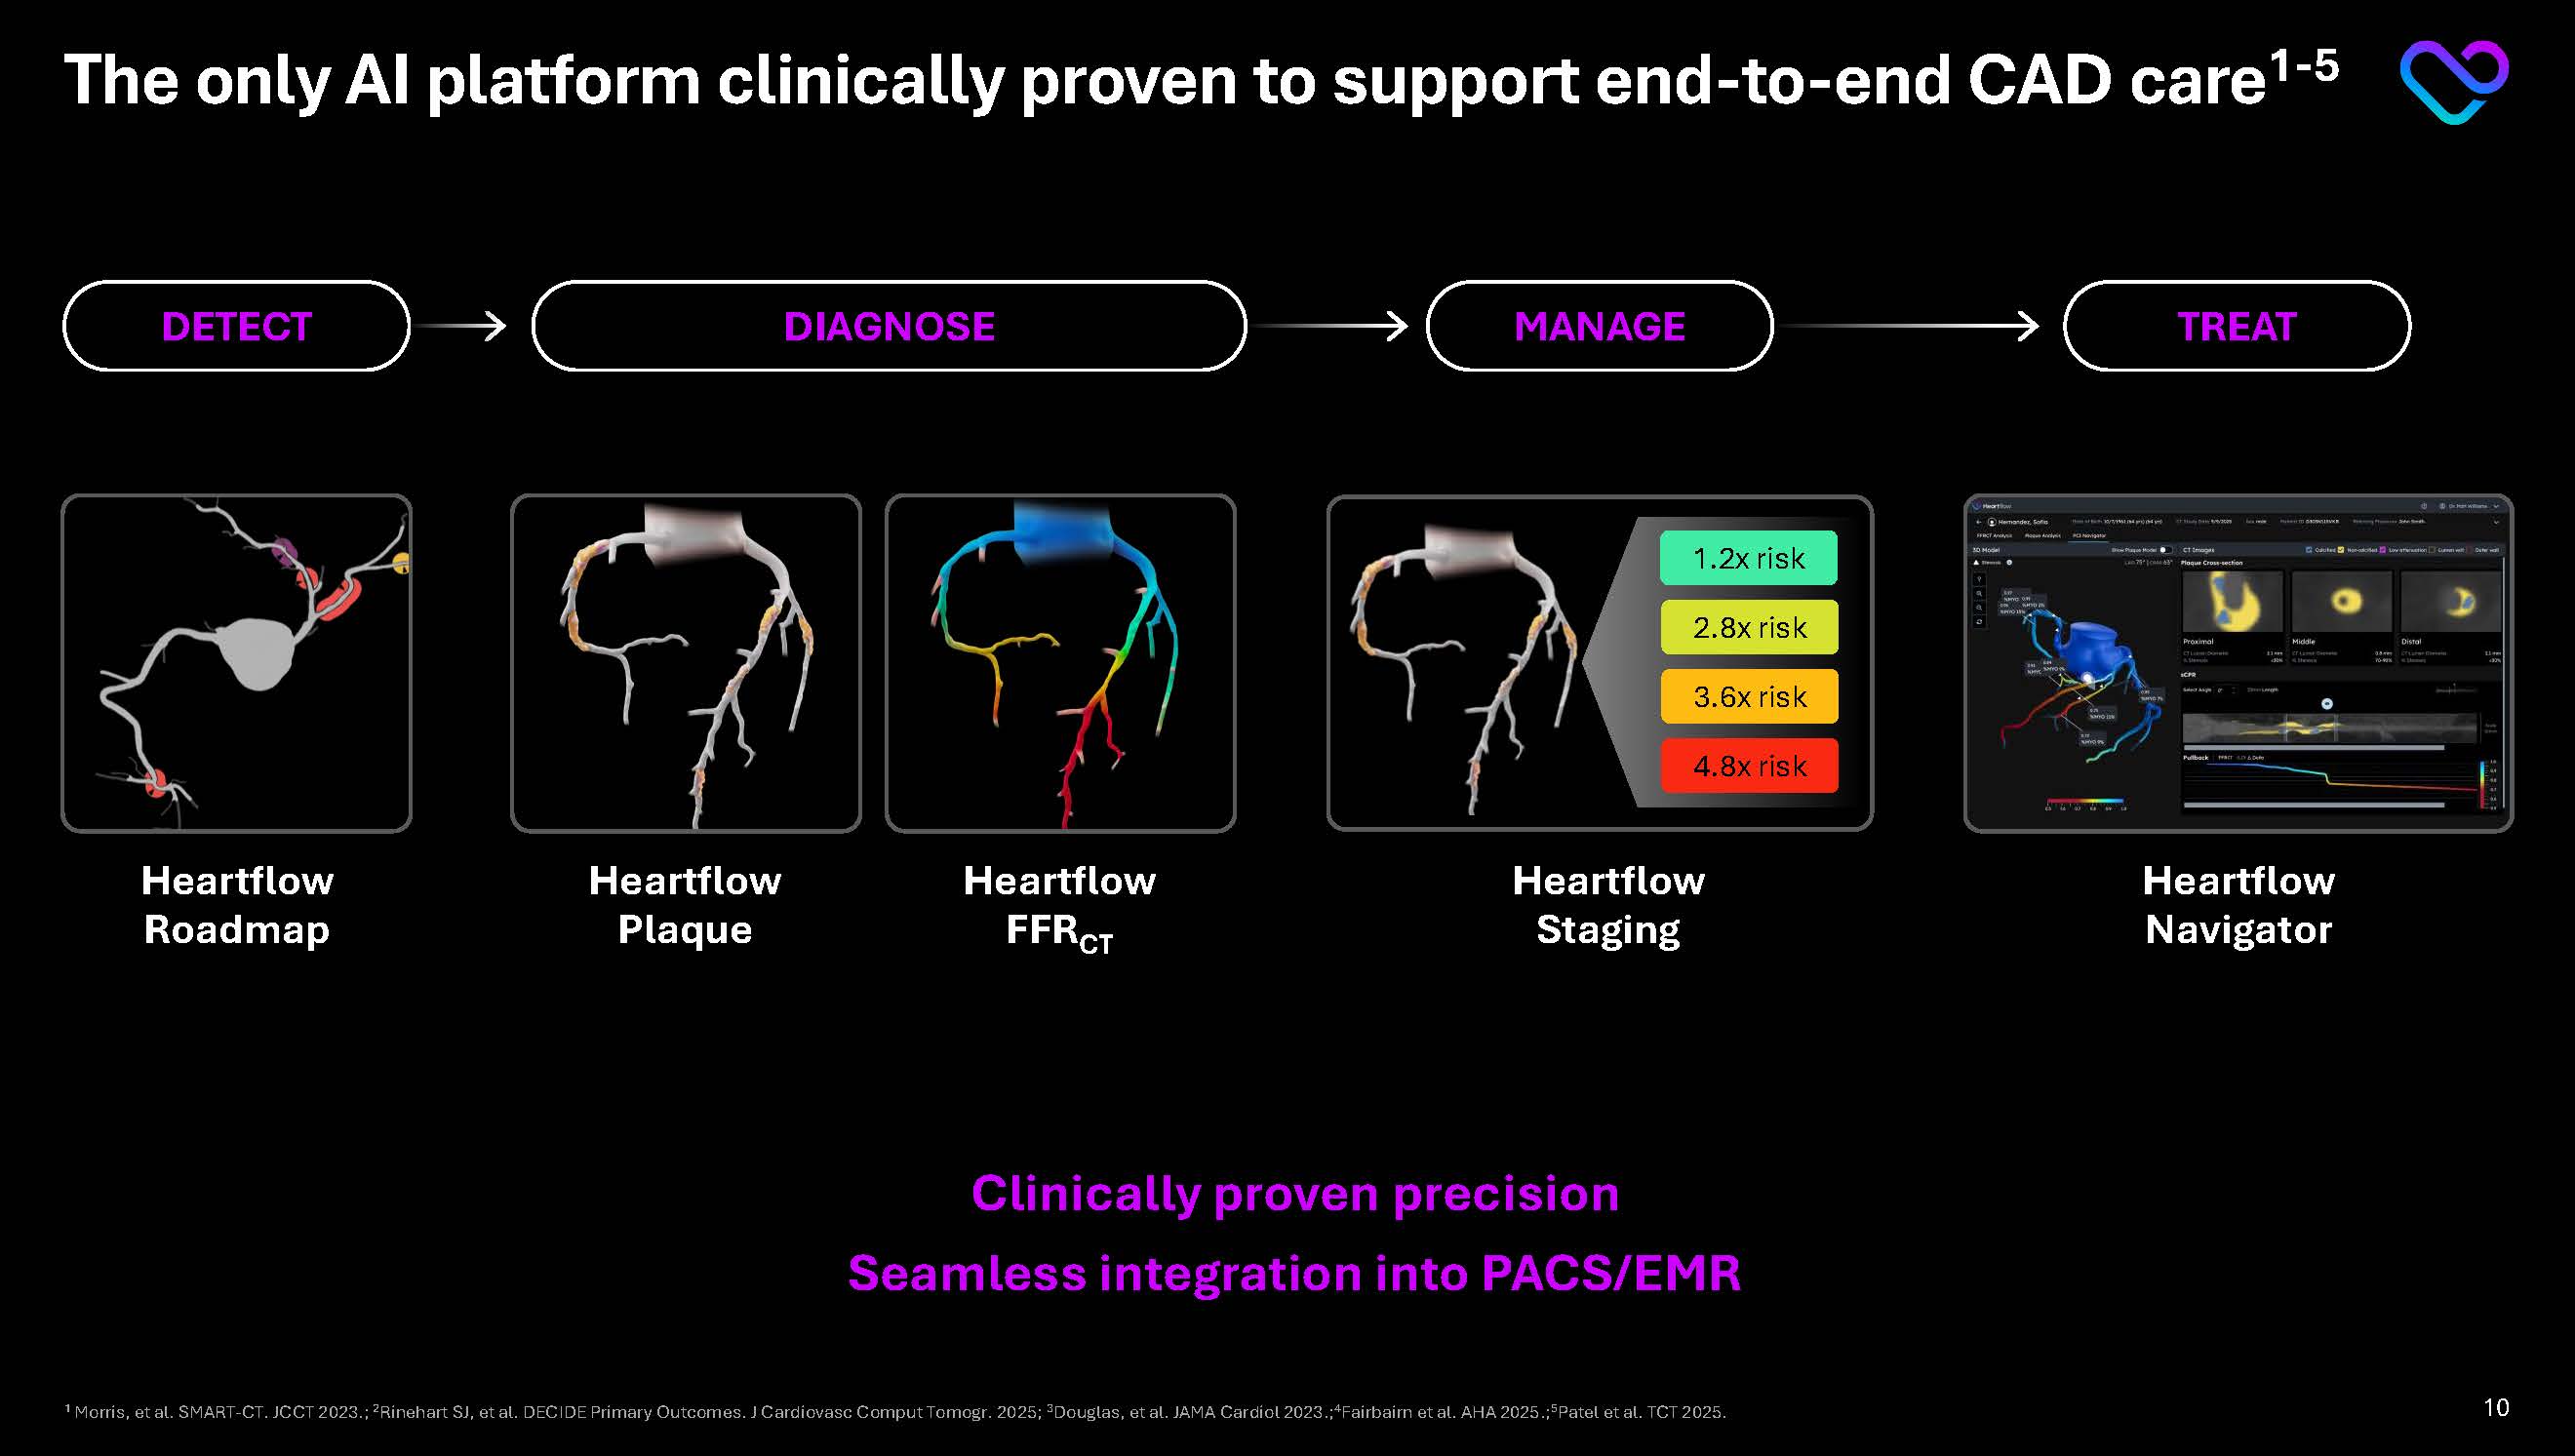
The only AI platform clinically proven to support end-to-end CAD care1-5 DETECT Heartflow Roadmap DIAGNOSE Heartflow Plaque Heartflow FFRCTA MANAGE TREAT Heartflow Staging Heartflow Navigator 1.2x risk 2.8x risk 3.6x risk 4.8x risk Clinically proven precision Seamless integration into PACS/EMR 1 Morris, et al. SMART-CT. JCCT 2023.; 2Rinehart SJ, et al. DECIDE Primary Outcomes. J Cardiovasc Comput Tomogr. 2025; 3Douglas, et al. JAMA Cardiol 2023.;4Fairbairn et al. AHA 2025.;5Patel et al. TCT 2025. 10

Heartflow Roadmap 1. Morris, et al. A Study to Measure the Ability of AI-CSQ to Support The Busy CCTA Reader: SMART-CT. JCCT 2023. 2. Presented at SCCT, July 2023 “A Study To Measure the Ability of AI-CSQ to Support The Busy CCTA Reader: SMART-CT” 3. Morris, et al. A Study to Measure the Ability of AI-CSQ to Support The Busy CCTA Reader: SMART-CT. JCCT 2023. DETECT First and only disease detection tool available on 100% of CCTAs
Prospectively proven to increase… CCTA reader efficiency by 26% 1 CCTA inter-reader consistency by 41% 1,2 CCTA reader confidence by 25%3 11
1. Ihdayhid A, et al. Radiol Cardiothorac Imaging. 2024. doi: 10.1148/ryct.230312 and internal bridging study with ICC correlation between first generation and second generation Plaque Analysis algorithm 2.
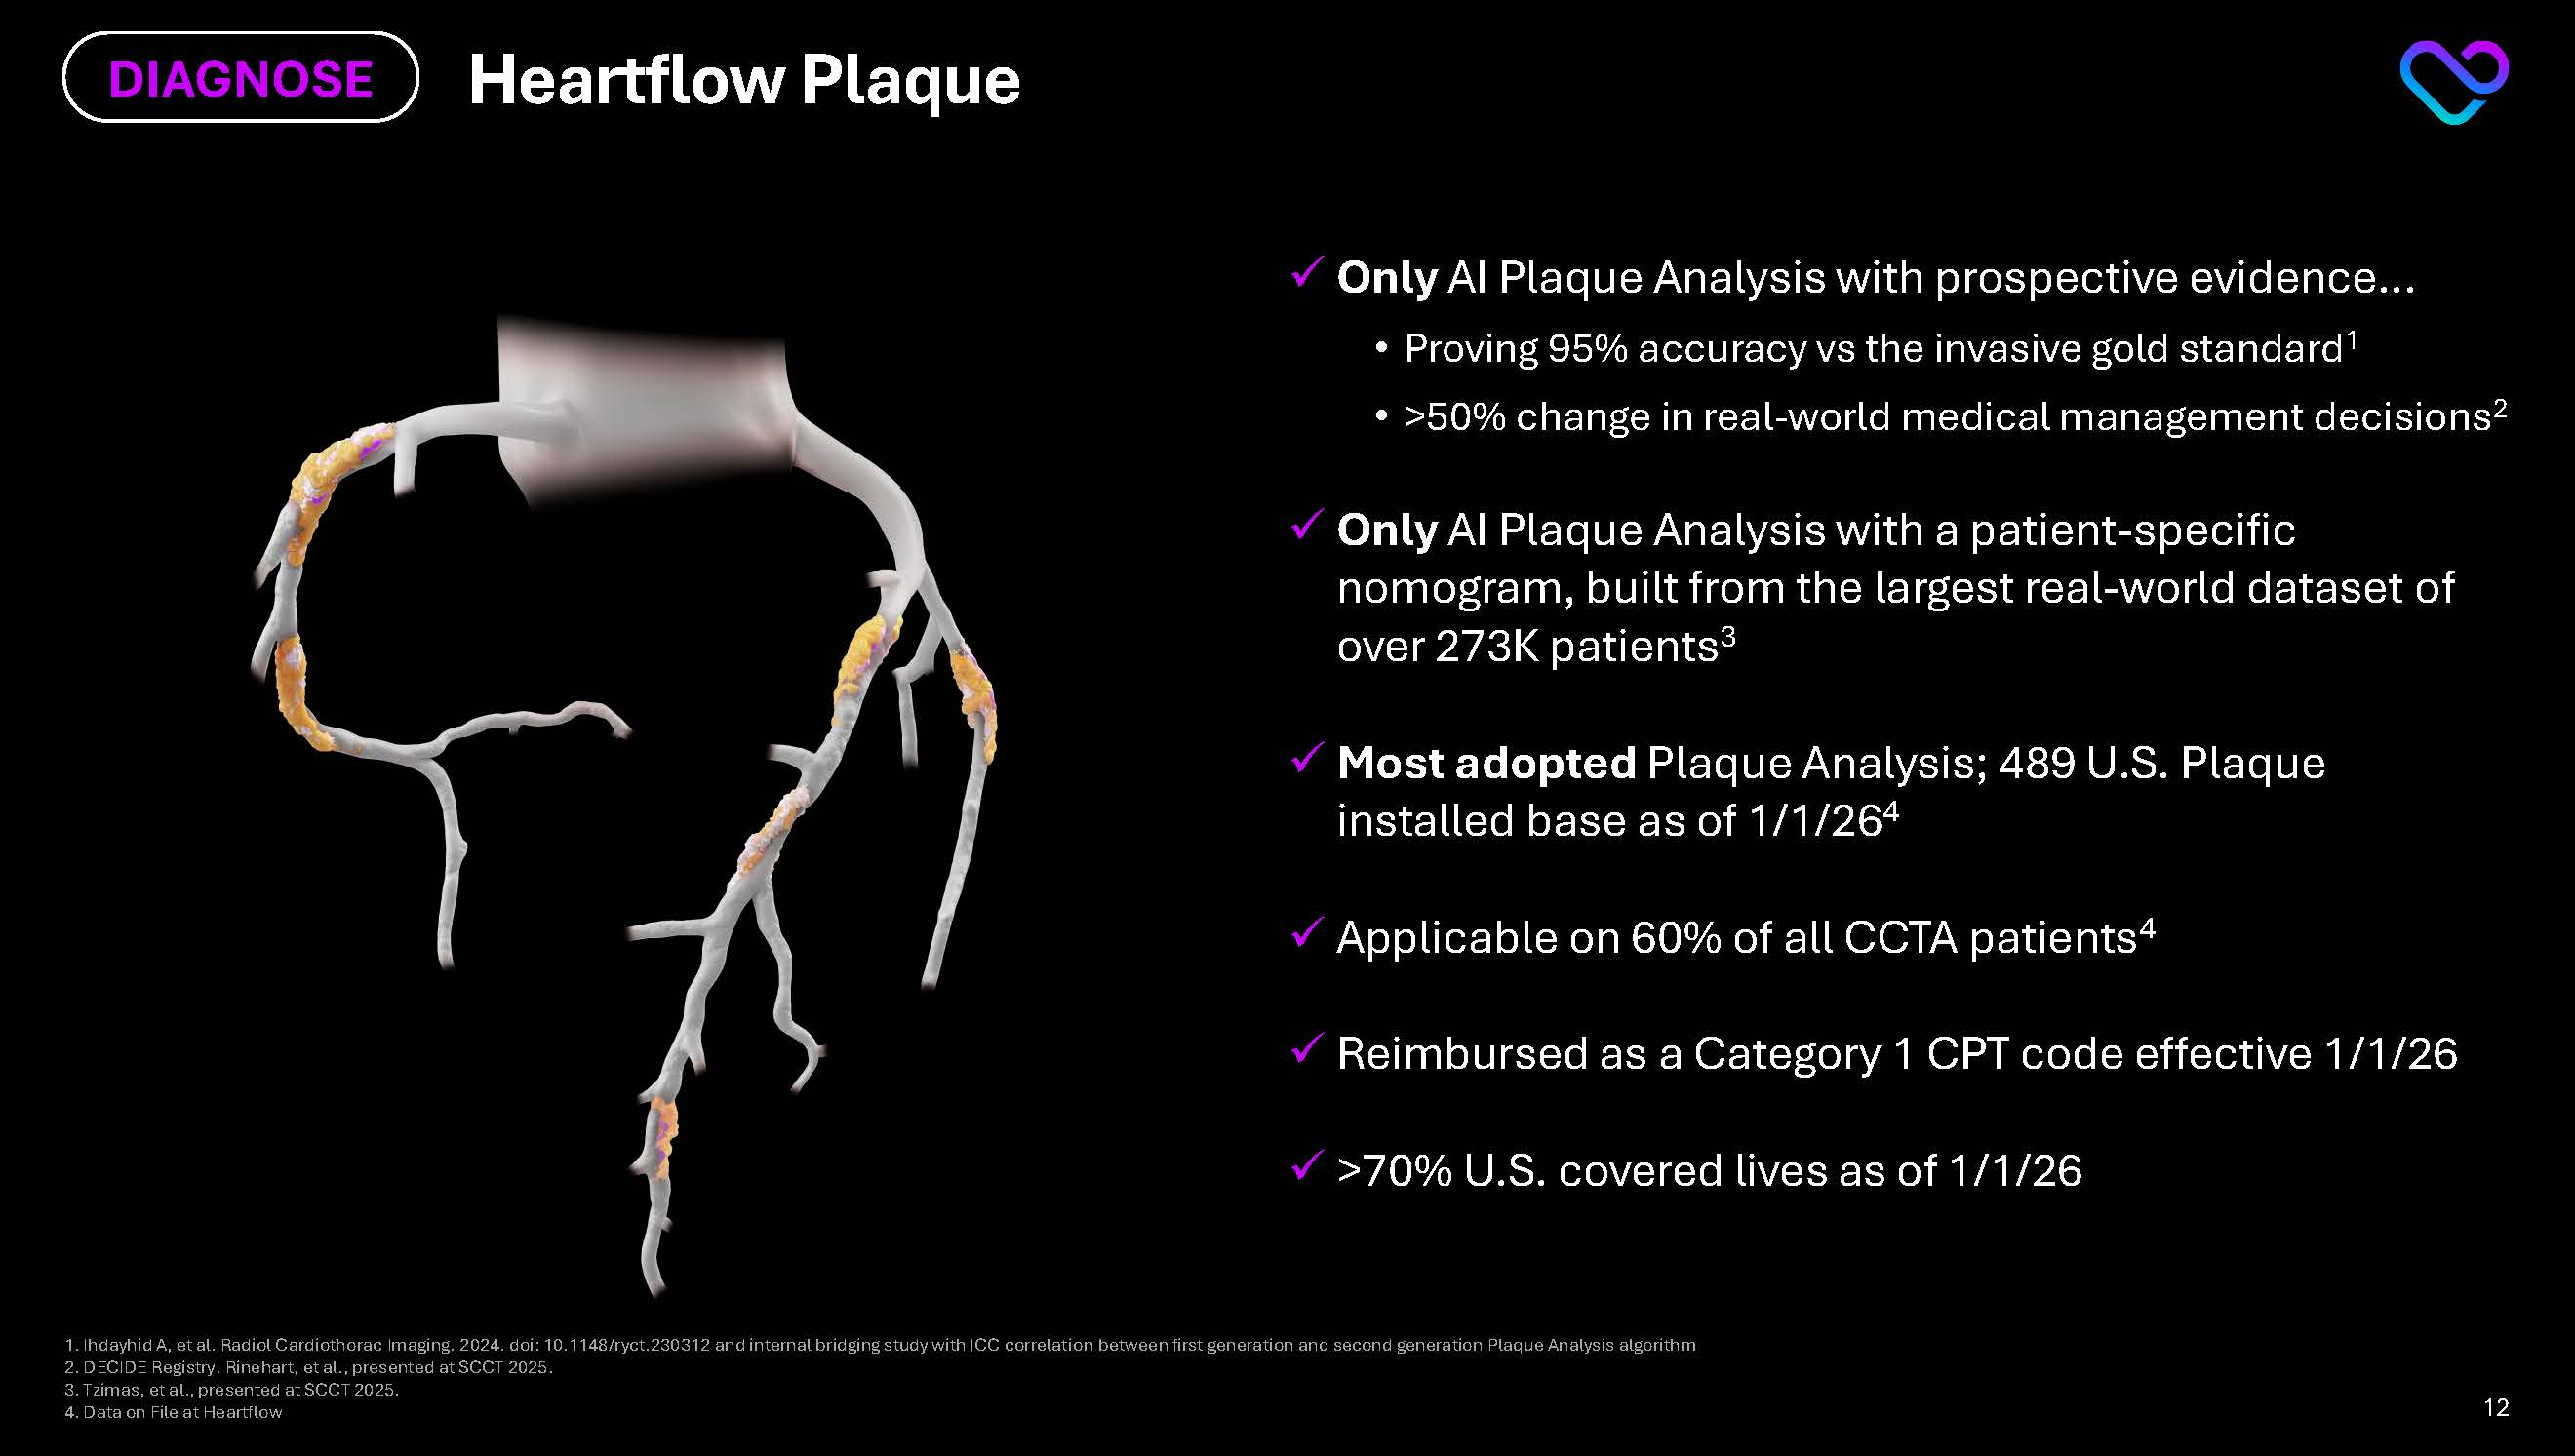
DECIDE Registry. Rinehart, et al., presented at SCCT 2025. 3.Tzimas, et al., presented at SCCT 2025. 4. Data on File at Heartflow Heartflow Plaque DIAGNOSE Only AI Plaque Analysis with prospective evidence… Proving 95% accuracy vs the invasive gold standard1 >50% change in real-world medical management decisions2 Only AI Plaque Analysis with a patient-specific nomogram, built from the largest real-world dataset of over 273K patients3 Most adopted Plaque Analysis; 489 U.S. Plaque installed base as of 1/1/264 Applicable on 60% of all CCTA patients4 Reimbursed as a Category 1 CPT code effective 1/1/26 >70% U.S. covered lives as of 1/1/26 12
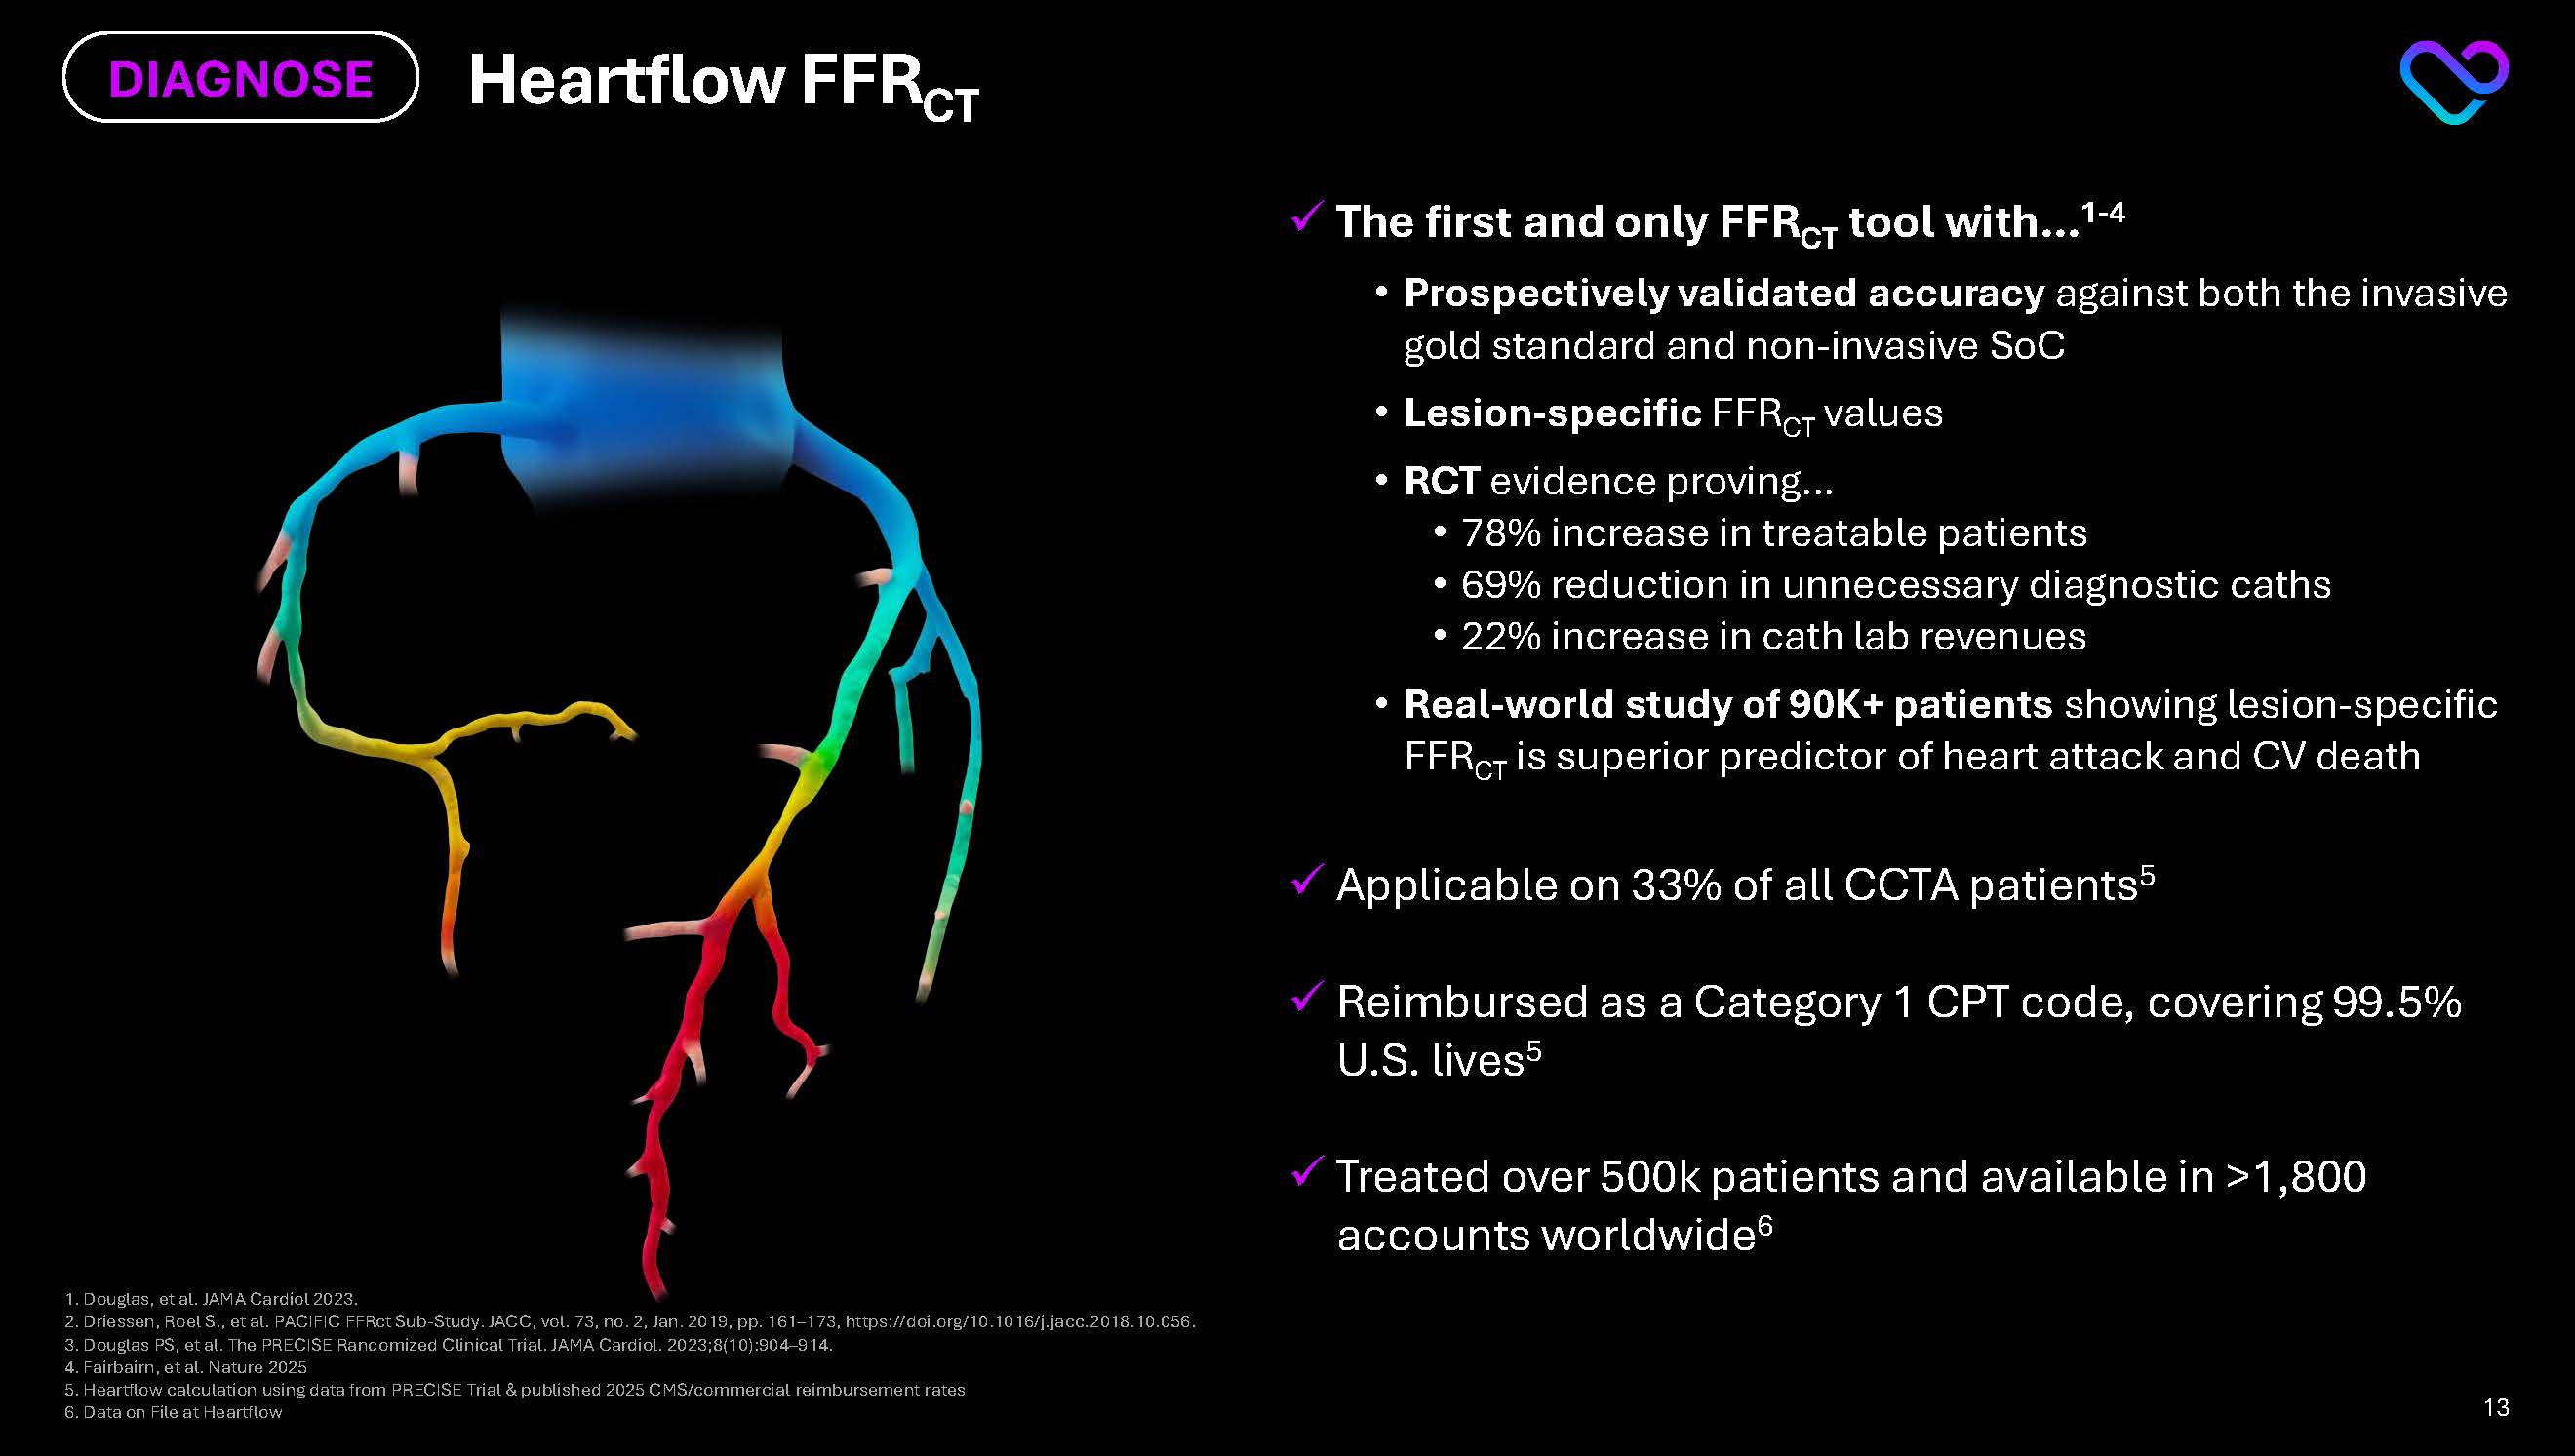
1.Douglas, et al. JAMA Cardiol 2023.2. Driessen, Roel S., et al. PACIFIC FFRct Sub-Study. JACC, vol. 73, no. 2, Jan. 2019, pp. 161–173, https://doi.org/10.1016/j.jacc.2018.10.056. 3. Douglas PS, et al. The PRECISE Randomized Clinical Trial. JAMA Cardiol. 2023;8(10):904–914. 4. Fairbairn, et al. Nature 2025 5.Heartflow calculation using data from PRECISE Trial & published 2025 CMS/commercial reimbursement rates 6.Data on File at Heartflow Heartflow FFRCT DIAGNOSE The first and only FFRCT tool with…1-4 Prospectively validated accuracy against both the invasive gold standard and non-invasive SoC Lesion-specific FFRCT values RCT evidence proving… 78% increase in treatable patients 69% reduction in unnecessary diagnostic caths 22% increase in cath lab revenues Real-world study of 90K+ patients showing lesion-specific FFRCT is superior predictor of heart attack and CV death Applicable on 33% of all CCTA patients5 Reimbursed as a Category 1 CPT code, covering 99.5% U.S. lives5 Treated over 500k patients and available in >1,800 accounts worldwide6 13
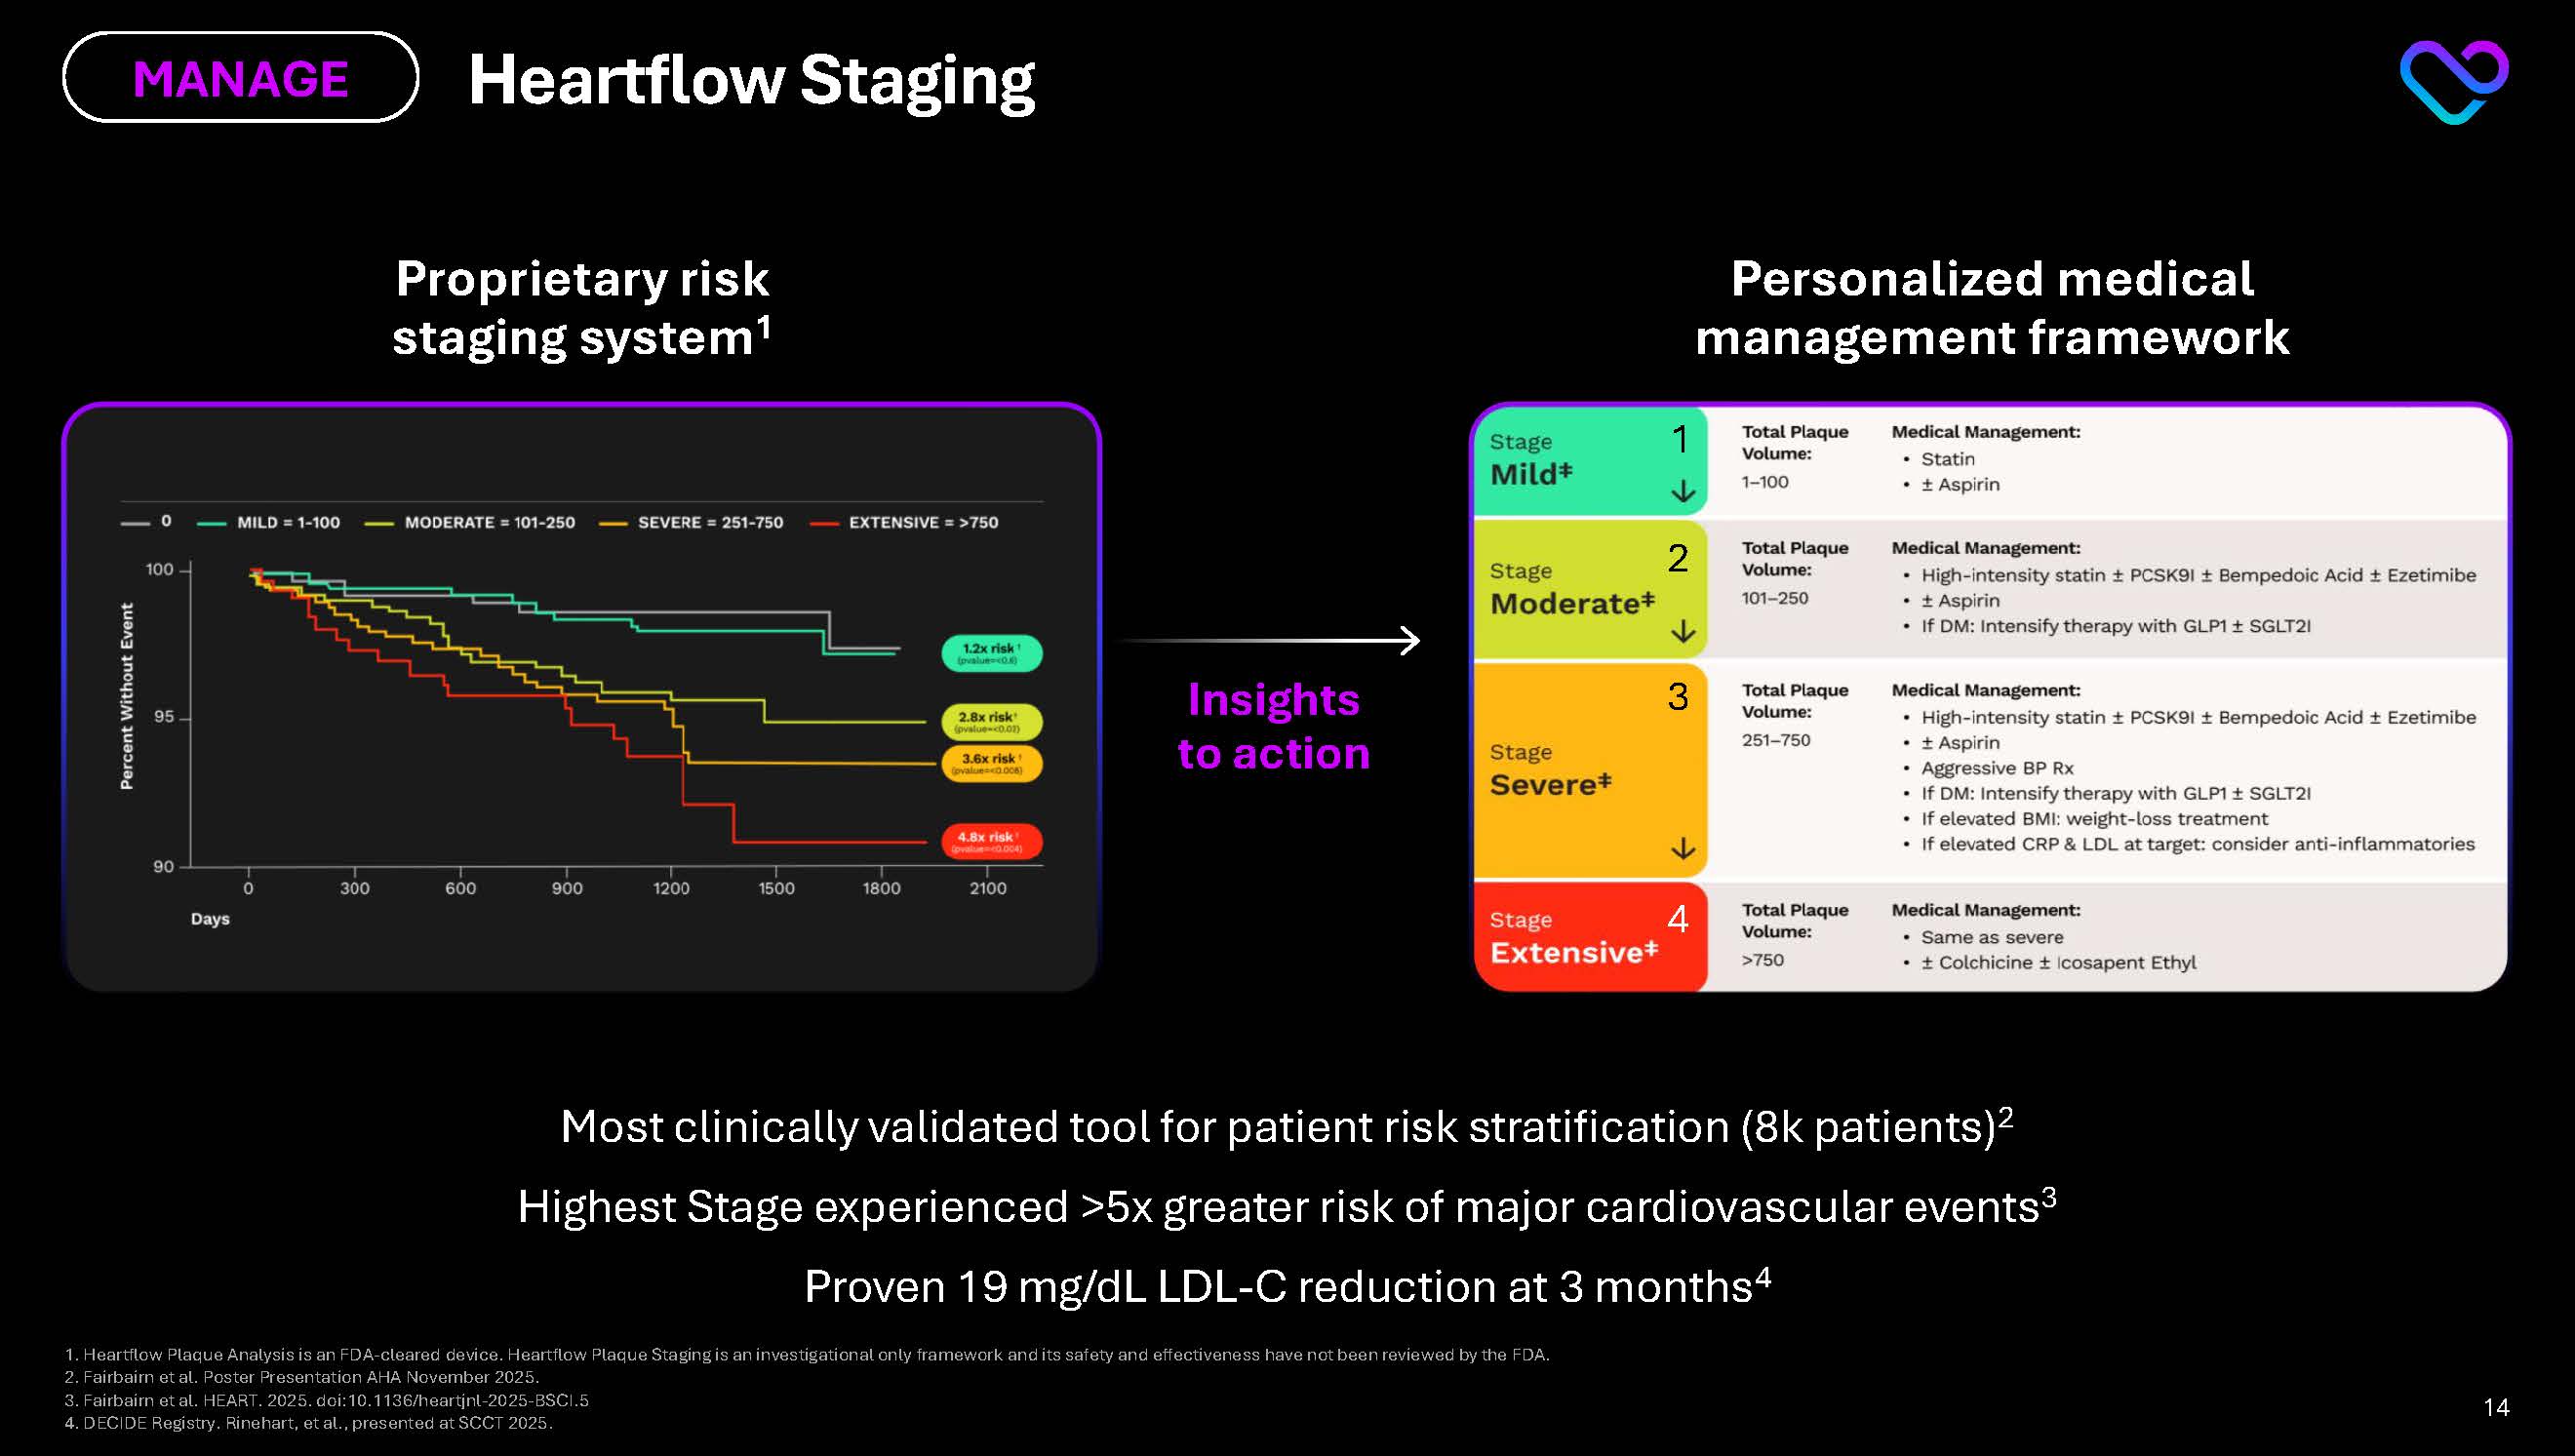
Proprietary risk staging system1 Personalized medical management framework Most clinically validated tool for patient risk stratification (8k patients)2 Highest Stage experienced >5x greater risk of major cardiovascular events3 Proven 19 mg/dL LDL-C reduction at 3 months4 Insights to action Heartflow Staging MANAGE 1 2 3 4 1. Heartflow Plaque Analysis is an FDA-cleared device. Heartflow Plaque Staging is an investigational only framework and its safety and effectiveness have not been reviewed by the FDA. 2. Fairbairn et al. Poster Presentation AHA November 2025. 3. Fairbairn et al. HEART. 2025. doi:10.1136/heartjnl-2025-BSCI.5 4. DECIDE Registry. Rinehart, et al., presented at SCCT 2025. Stage Mild Moderate Severe Extensive 0 1-100 101-250 251-750 >750 Percent Without Event Days 100 95 90 0 300 600 900 1200 1500 1800 2100 Total Plaque Volume: Medical Management: Statin Aspirin High-Intensity statin PCSK9I Bempedoic Acid Ezetimibe If DM: Intensify therapy with GLP1 SGLT2I Aggressive BP Rx If elevated BMI: weight-loss treatment If elevated CRP & LDL at target: consider anti inflammatories Same as severe Colchicine Icosapent Ethyl 14

Heartflow Navigator TREAT 1. Patel et al. PLAN-CALCIUM. Presented at TCT 2025. First and only planning tool founded on the most accurate and prospectively validated FFRCT and Plaque analyses1 Available for 100% of FFRCT patients Initiating ~5,000 pts NAVIGATE-PCI Registry in 1H ‘26 Expected launch in ‘26 P4 Study (1,104 patient RCT) Primary Endpoint 2H ‘26 15
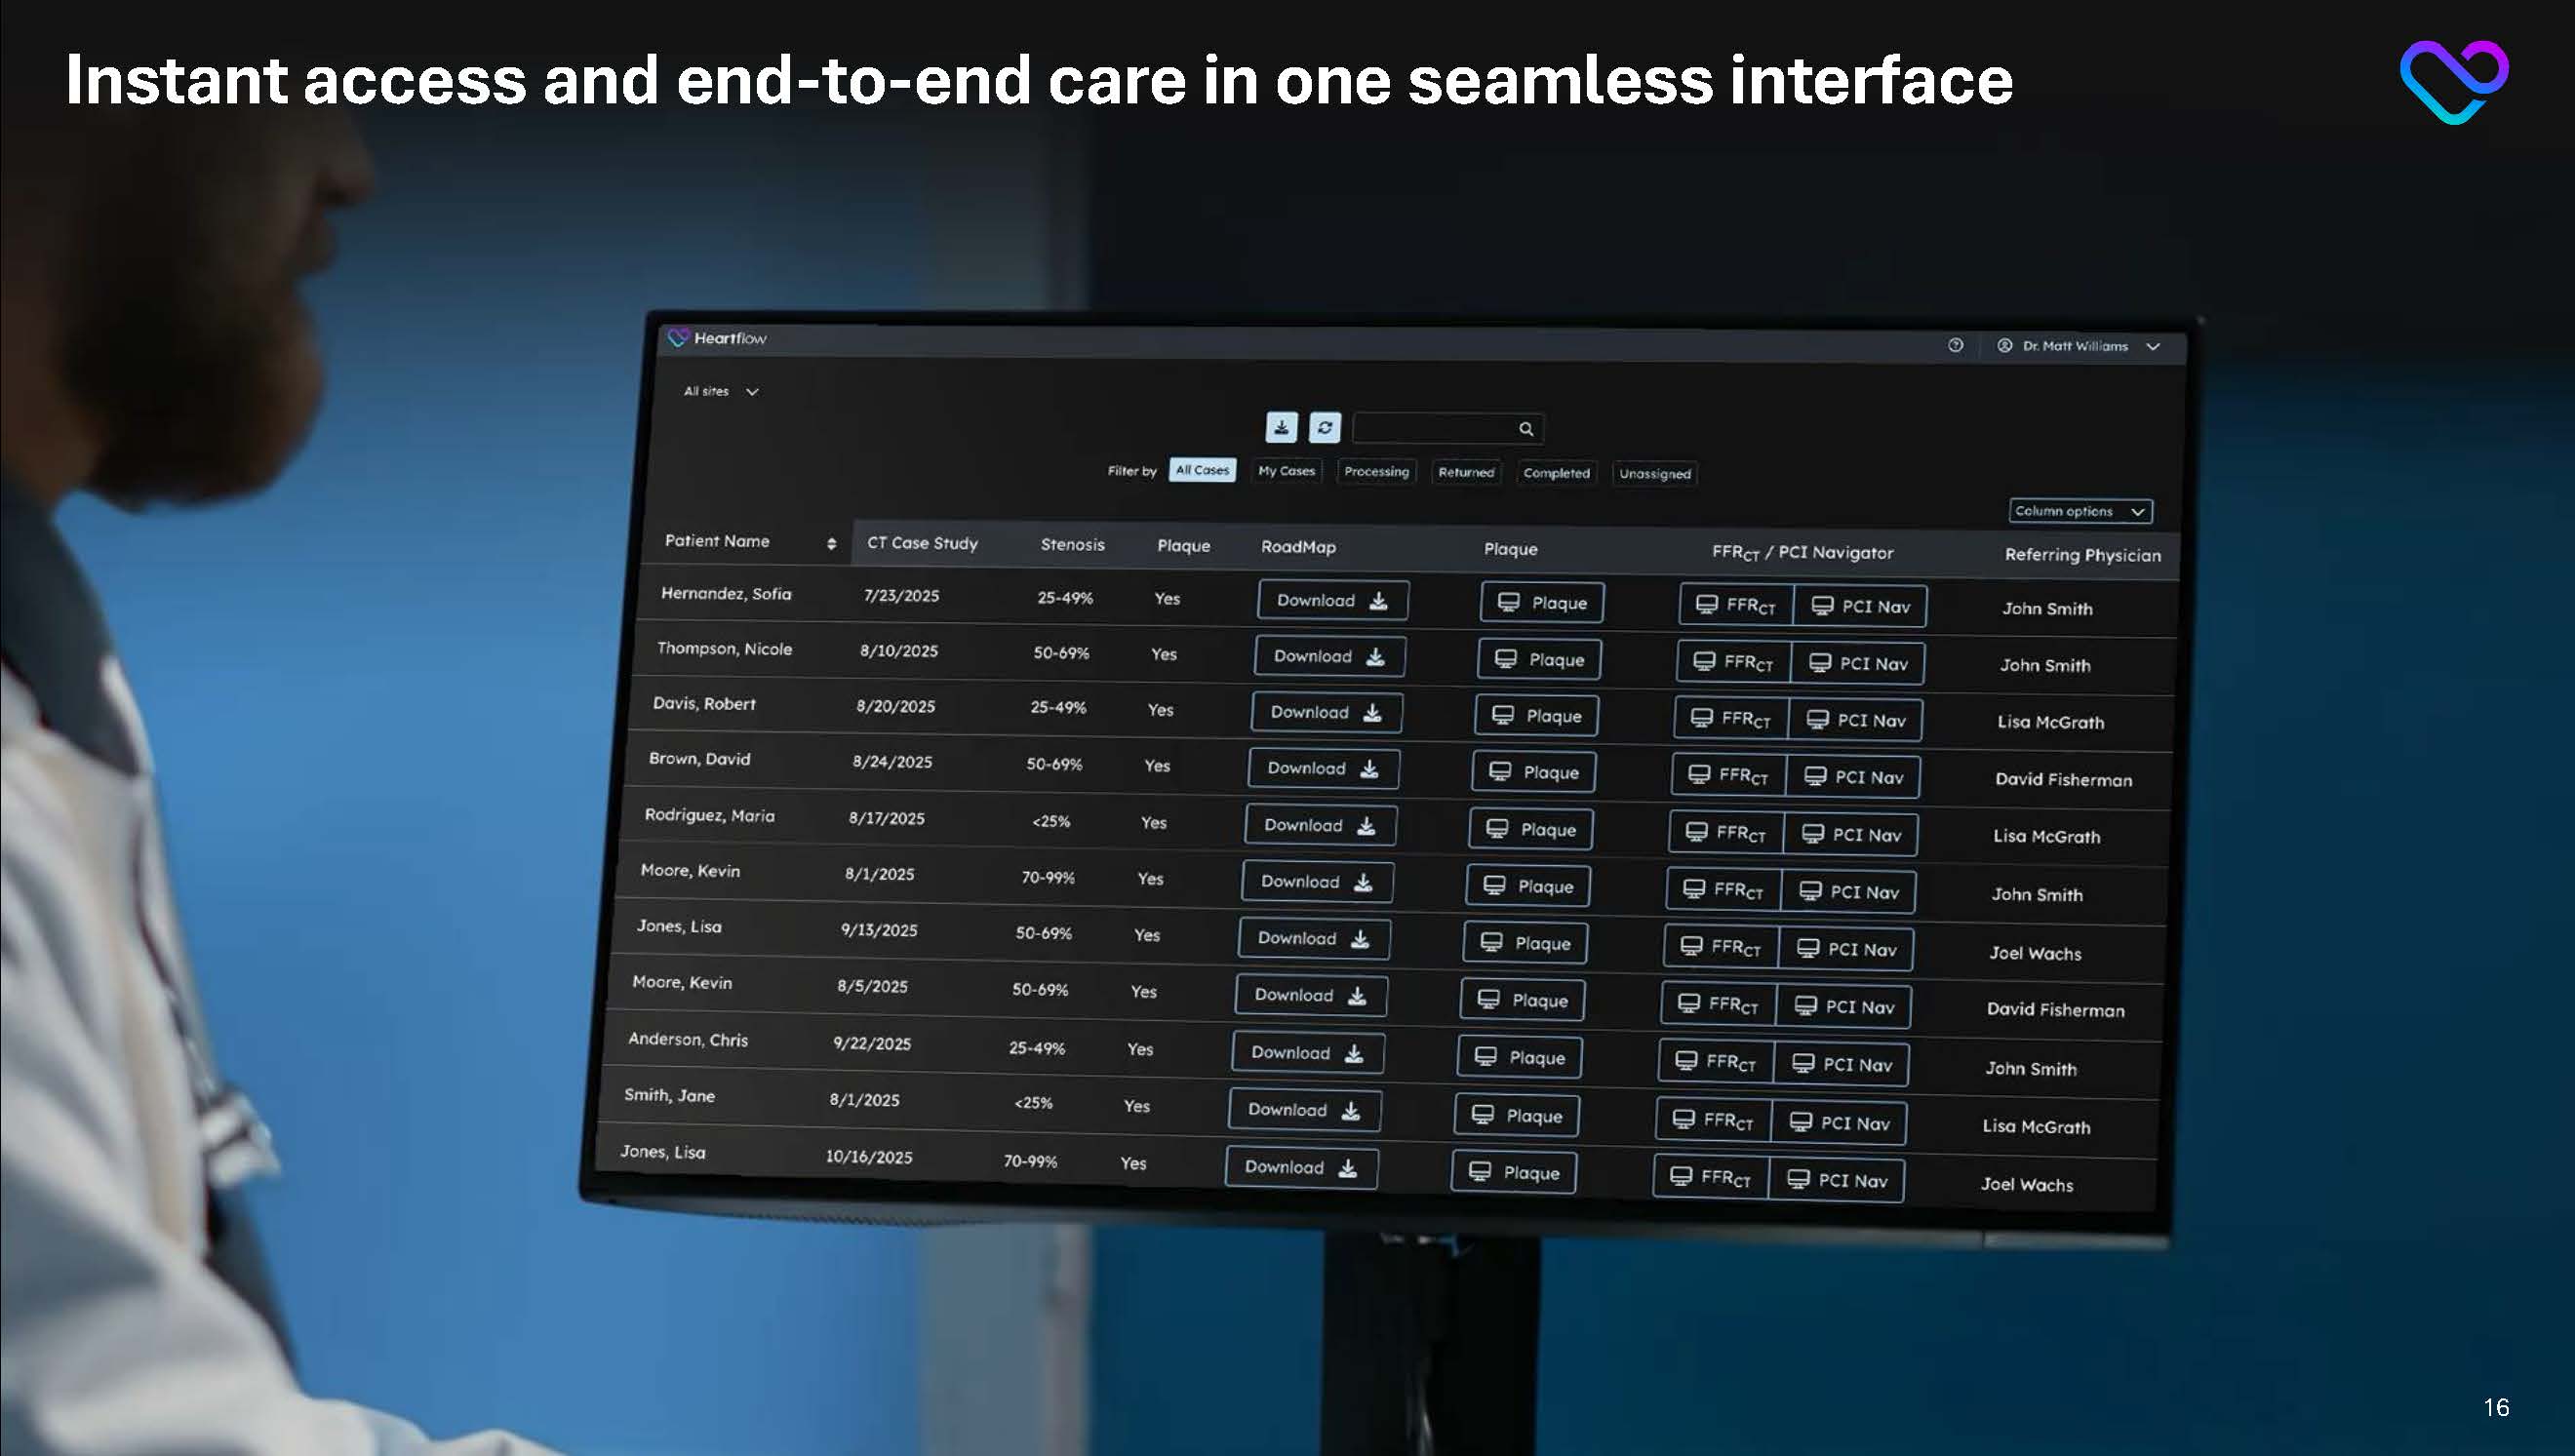
Instant access and end-to-end care in one seamless interface 16
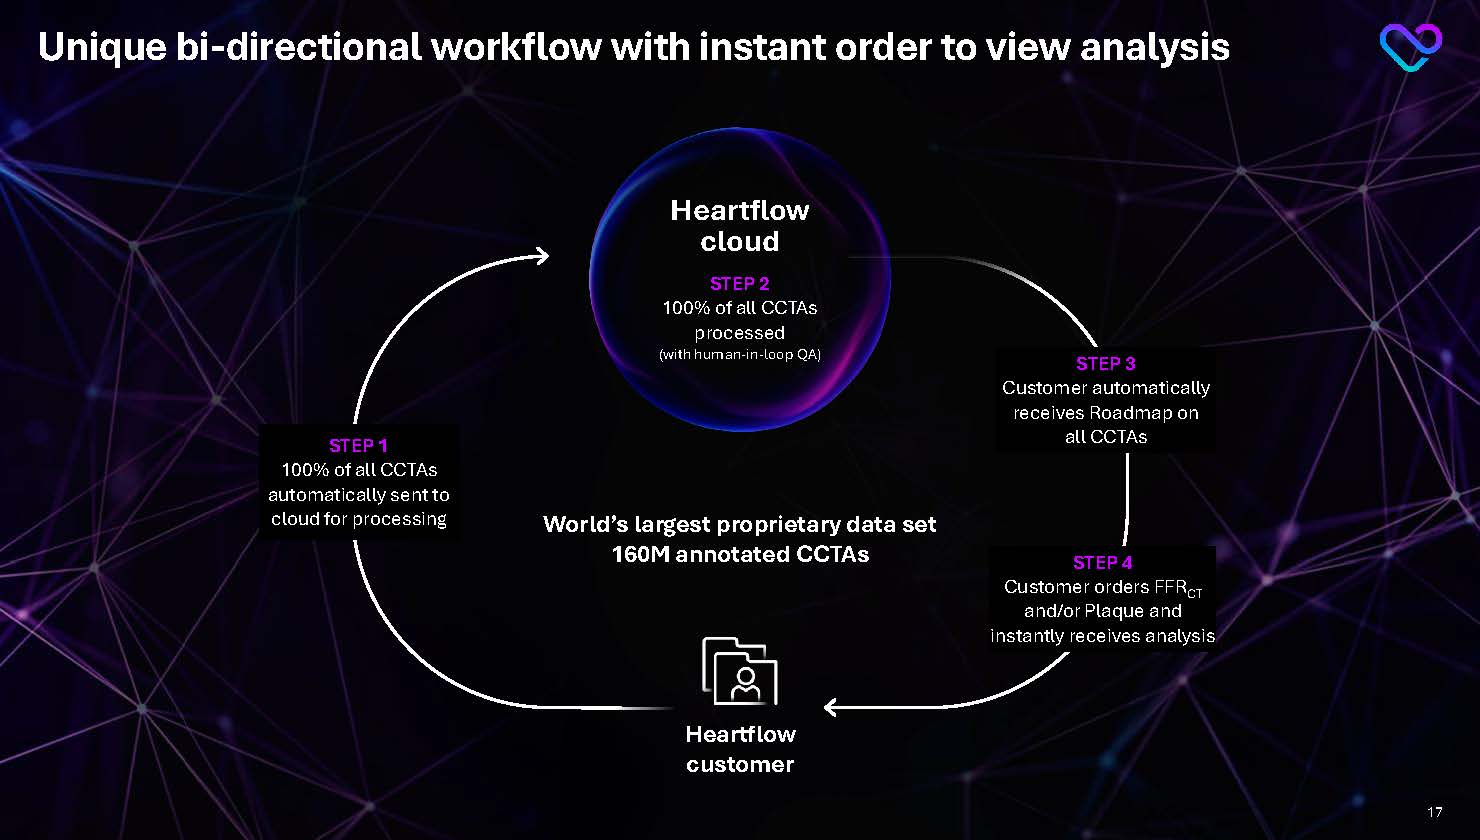
Unique bi-directional workflow with instant order to view analysis Heartflow cloud STEP 2 100% of all CCTAs processed (with human-in-loop QA) Heartflow customer World’s largest proprietary data set
160M annotated CCTAs STEP 1 100% of all CCTAs automatically sent to cloud for processing STEP 3 Customer automatically receives Roadmap on all CCTAs STEP 4 Customer orders FFRCT and/or Plaque and instantly receives analysis 17
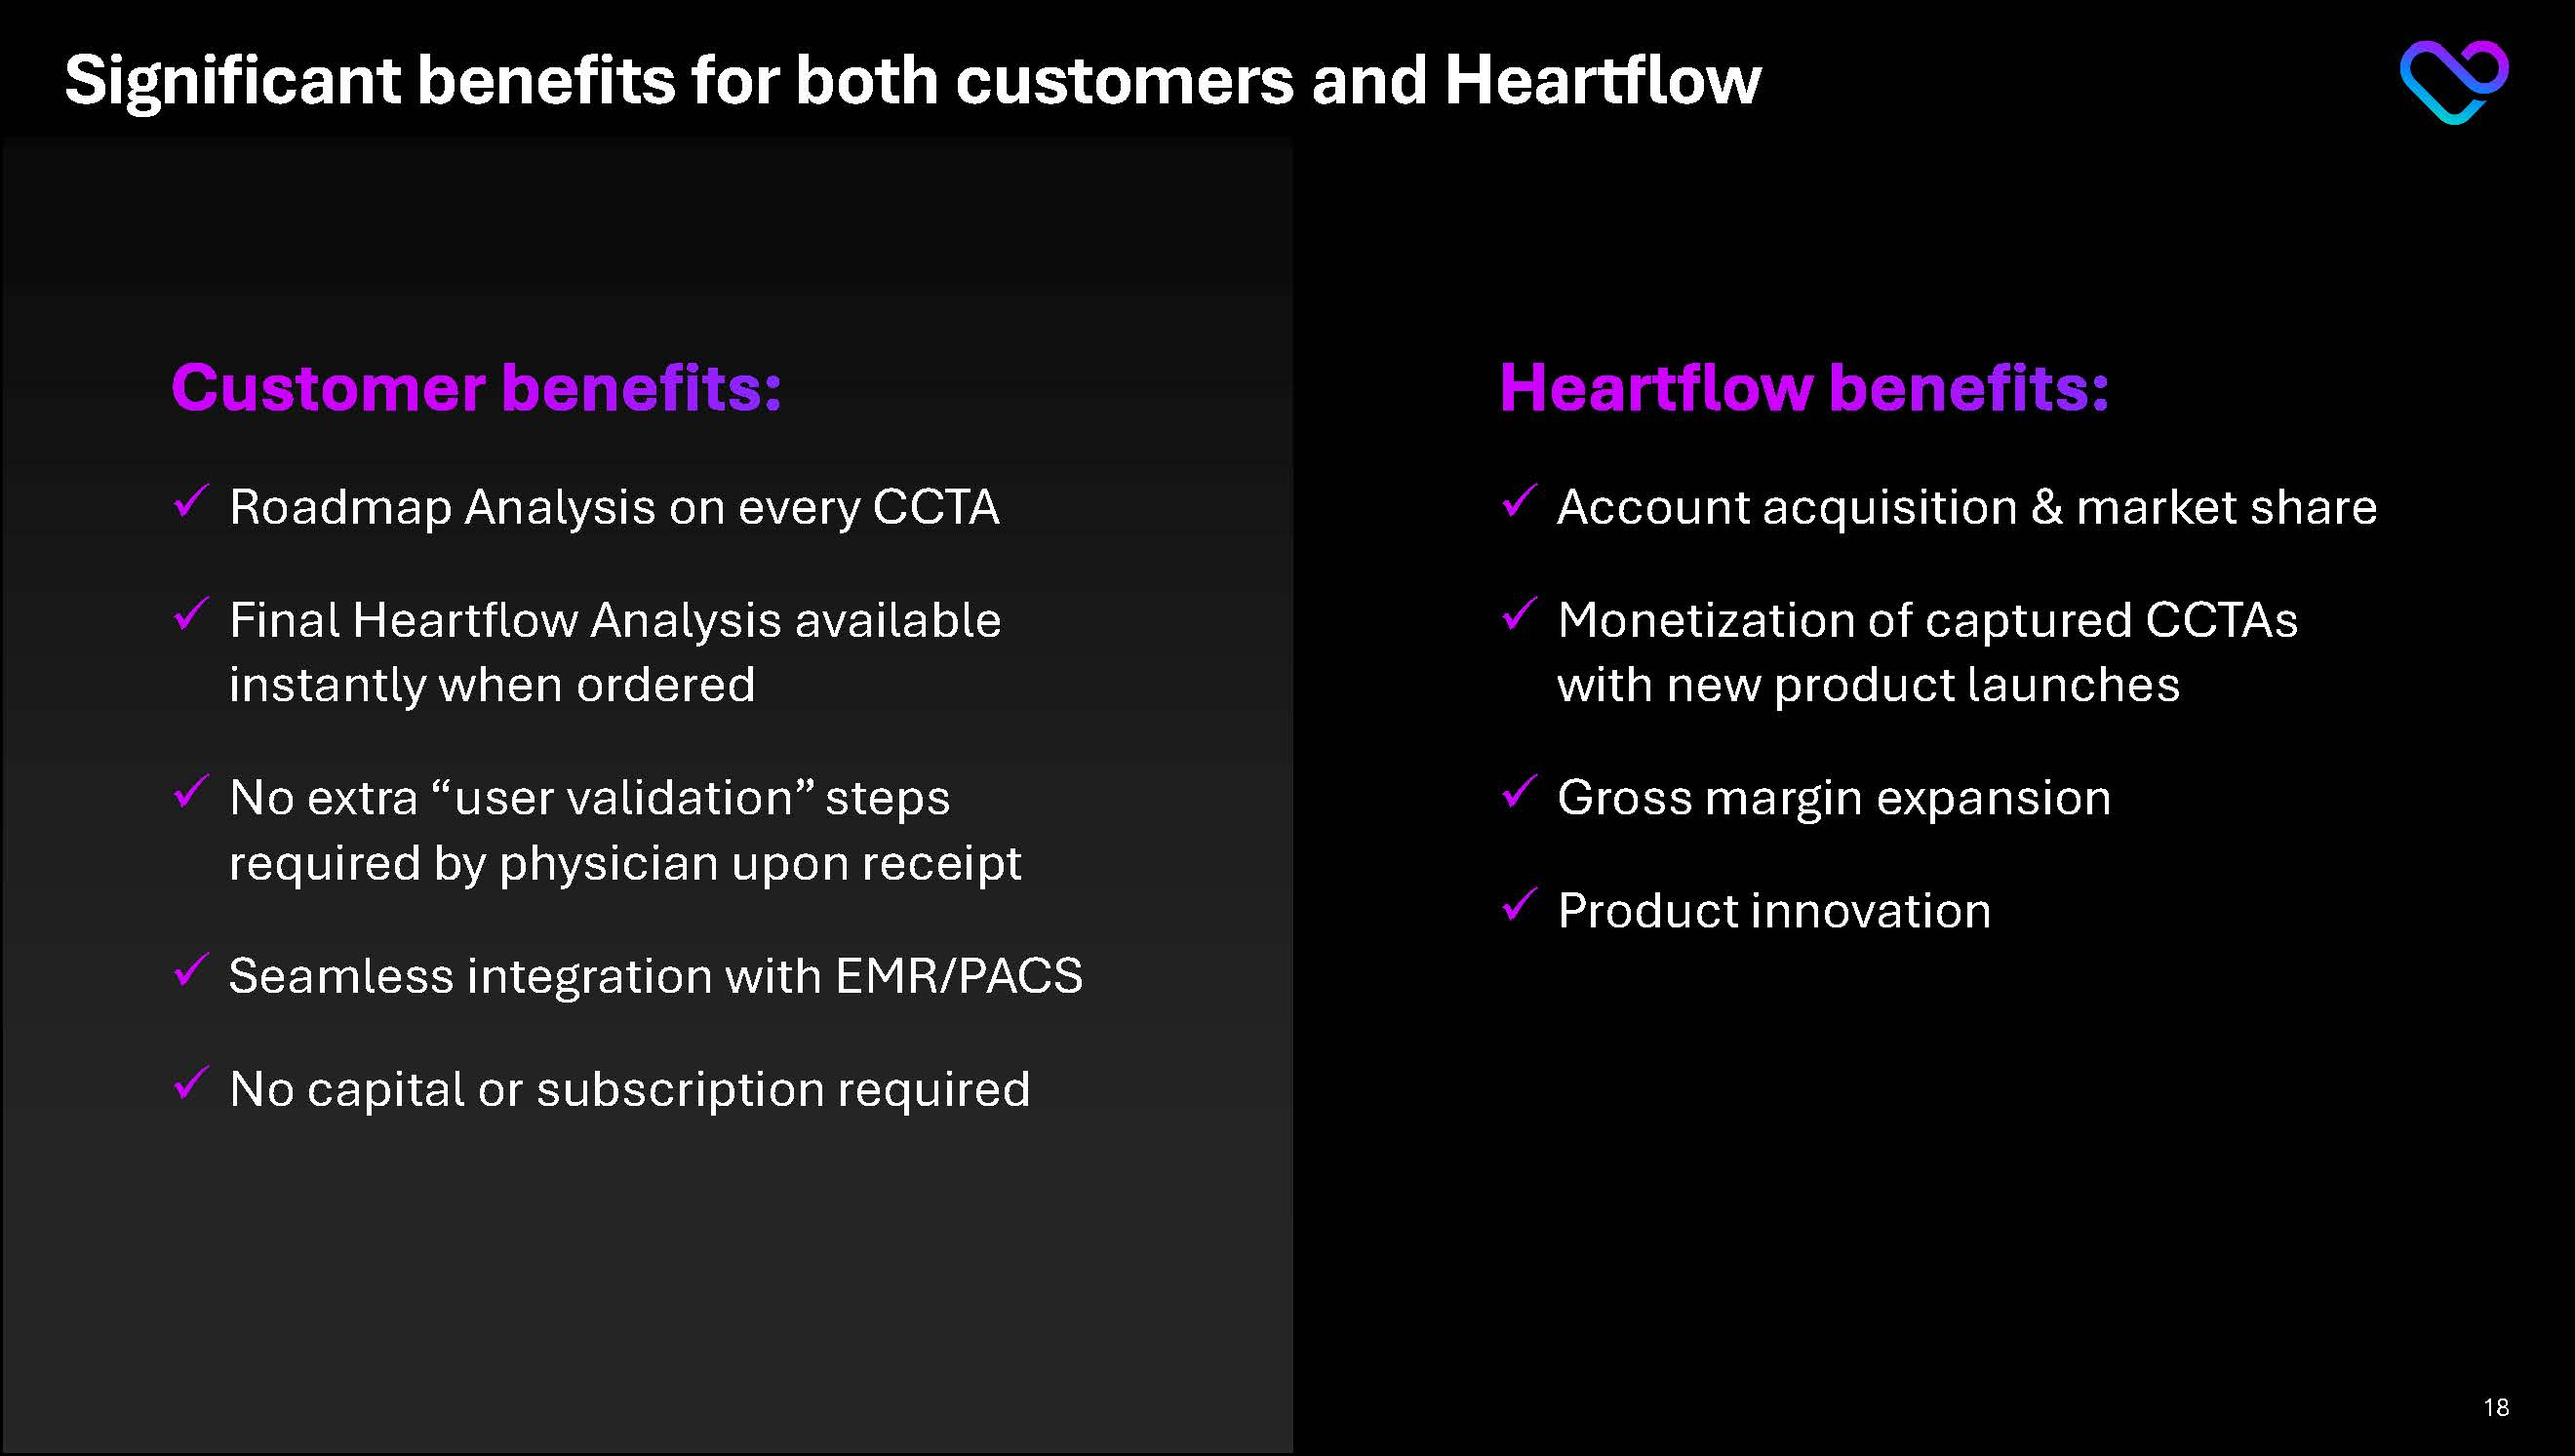
Significant benefits for both customers and Heartflow Customer benefits:Roadmap Analysis on every CCTA Final Heartflow Analysis available instantly when ordered No extra “user validation” steps required by physician upon receipt Seamless integration with EMR/PACS No capital or subscription required Heartflow benefits: Account acquisition & market share Monetization of captured CCTAs with new product launches Gross margin expansion Product innovation 18
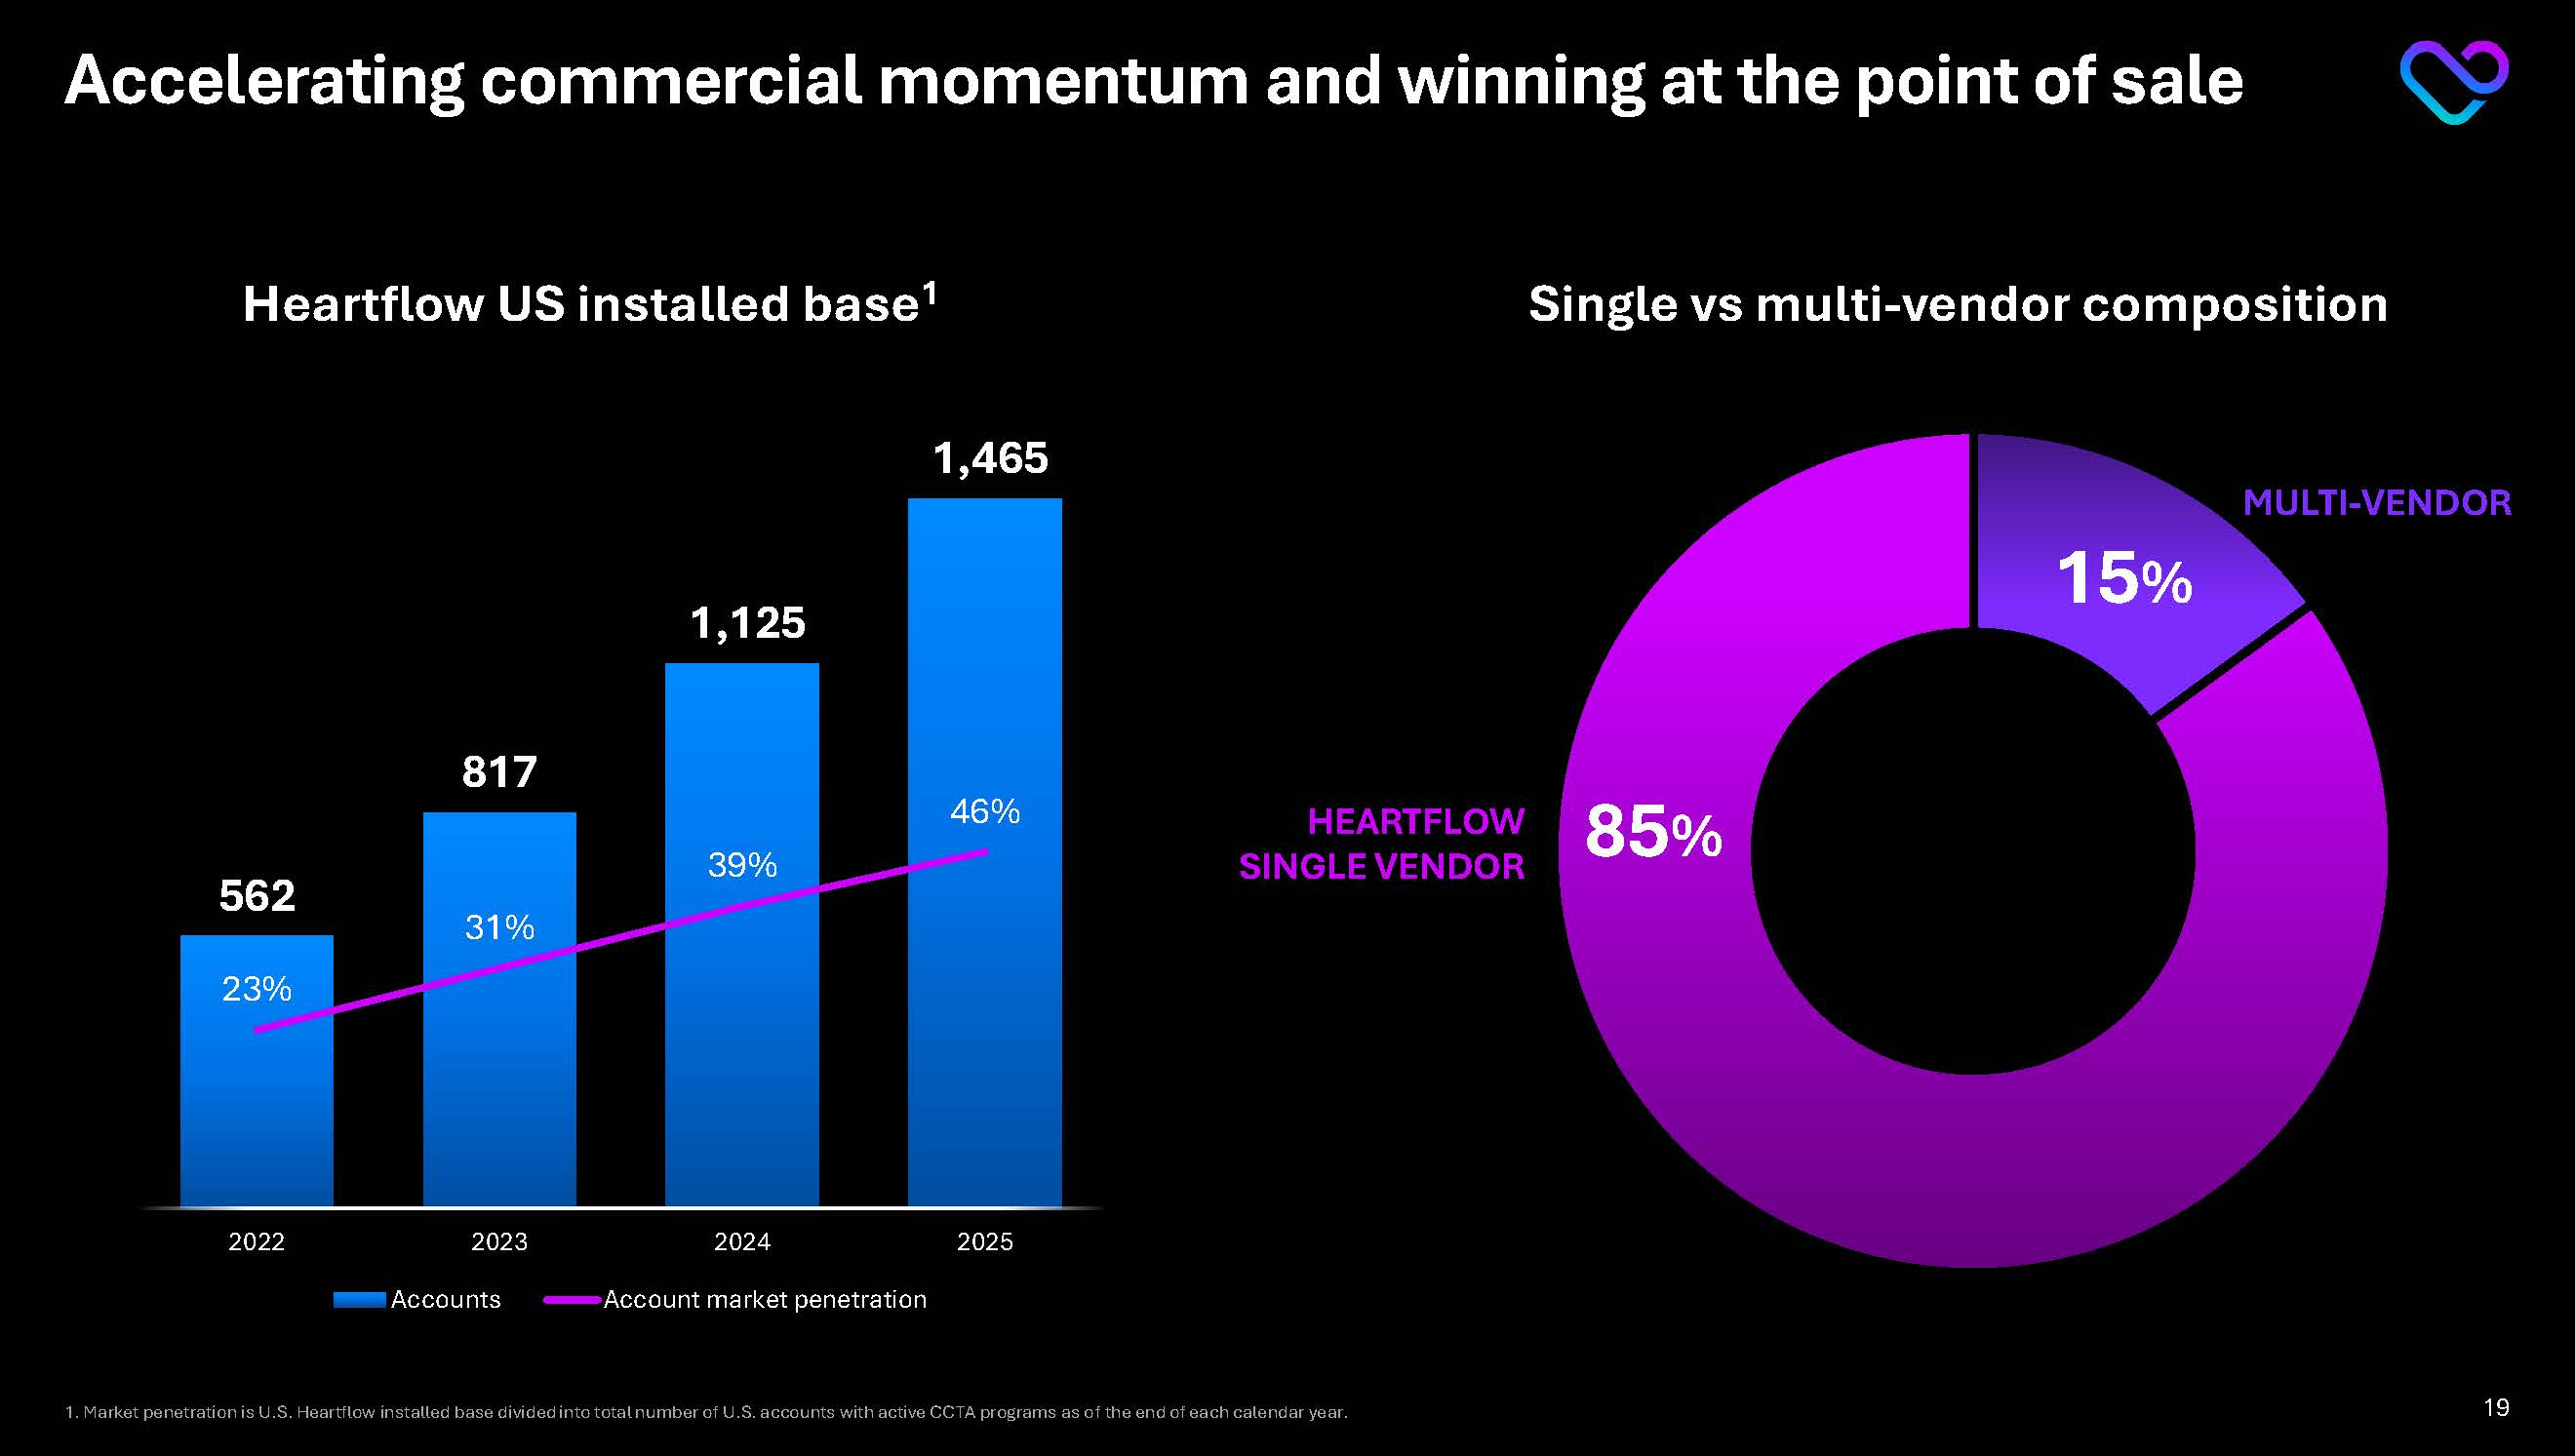
Accelerating commercial momentum and winning at the point of sale Heartflow US installed base1 15% 85% Single vs multi-vendor composition MULTI-VENDOR HEARTFLOW SINGLE VENDOR 1. Market penetration is U.S. Heartflow installed base divided into total number of U.S. accounts with active CCTA programs as of the end of each calendar year.562 817 1,125 1,465 23% 31% 39% 46% 2022 2023 2024 2025 Accounts Account market penetration 19
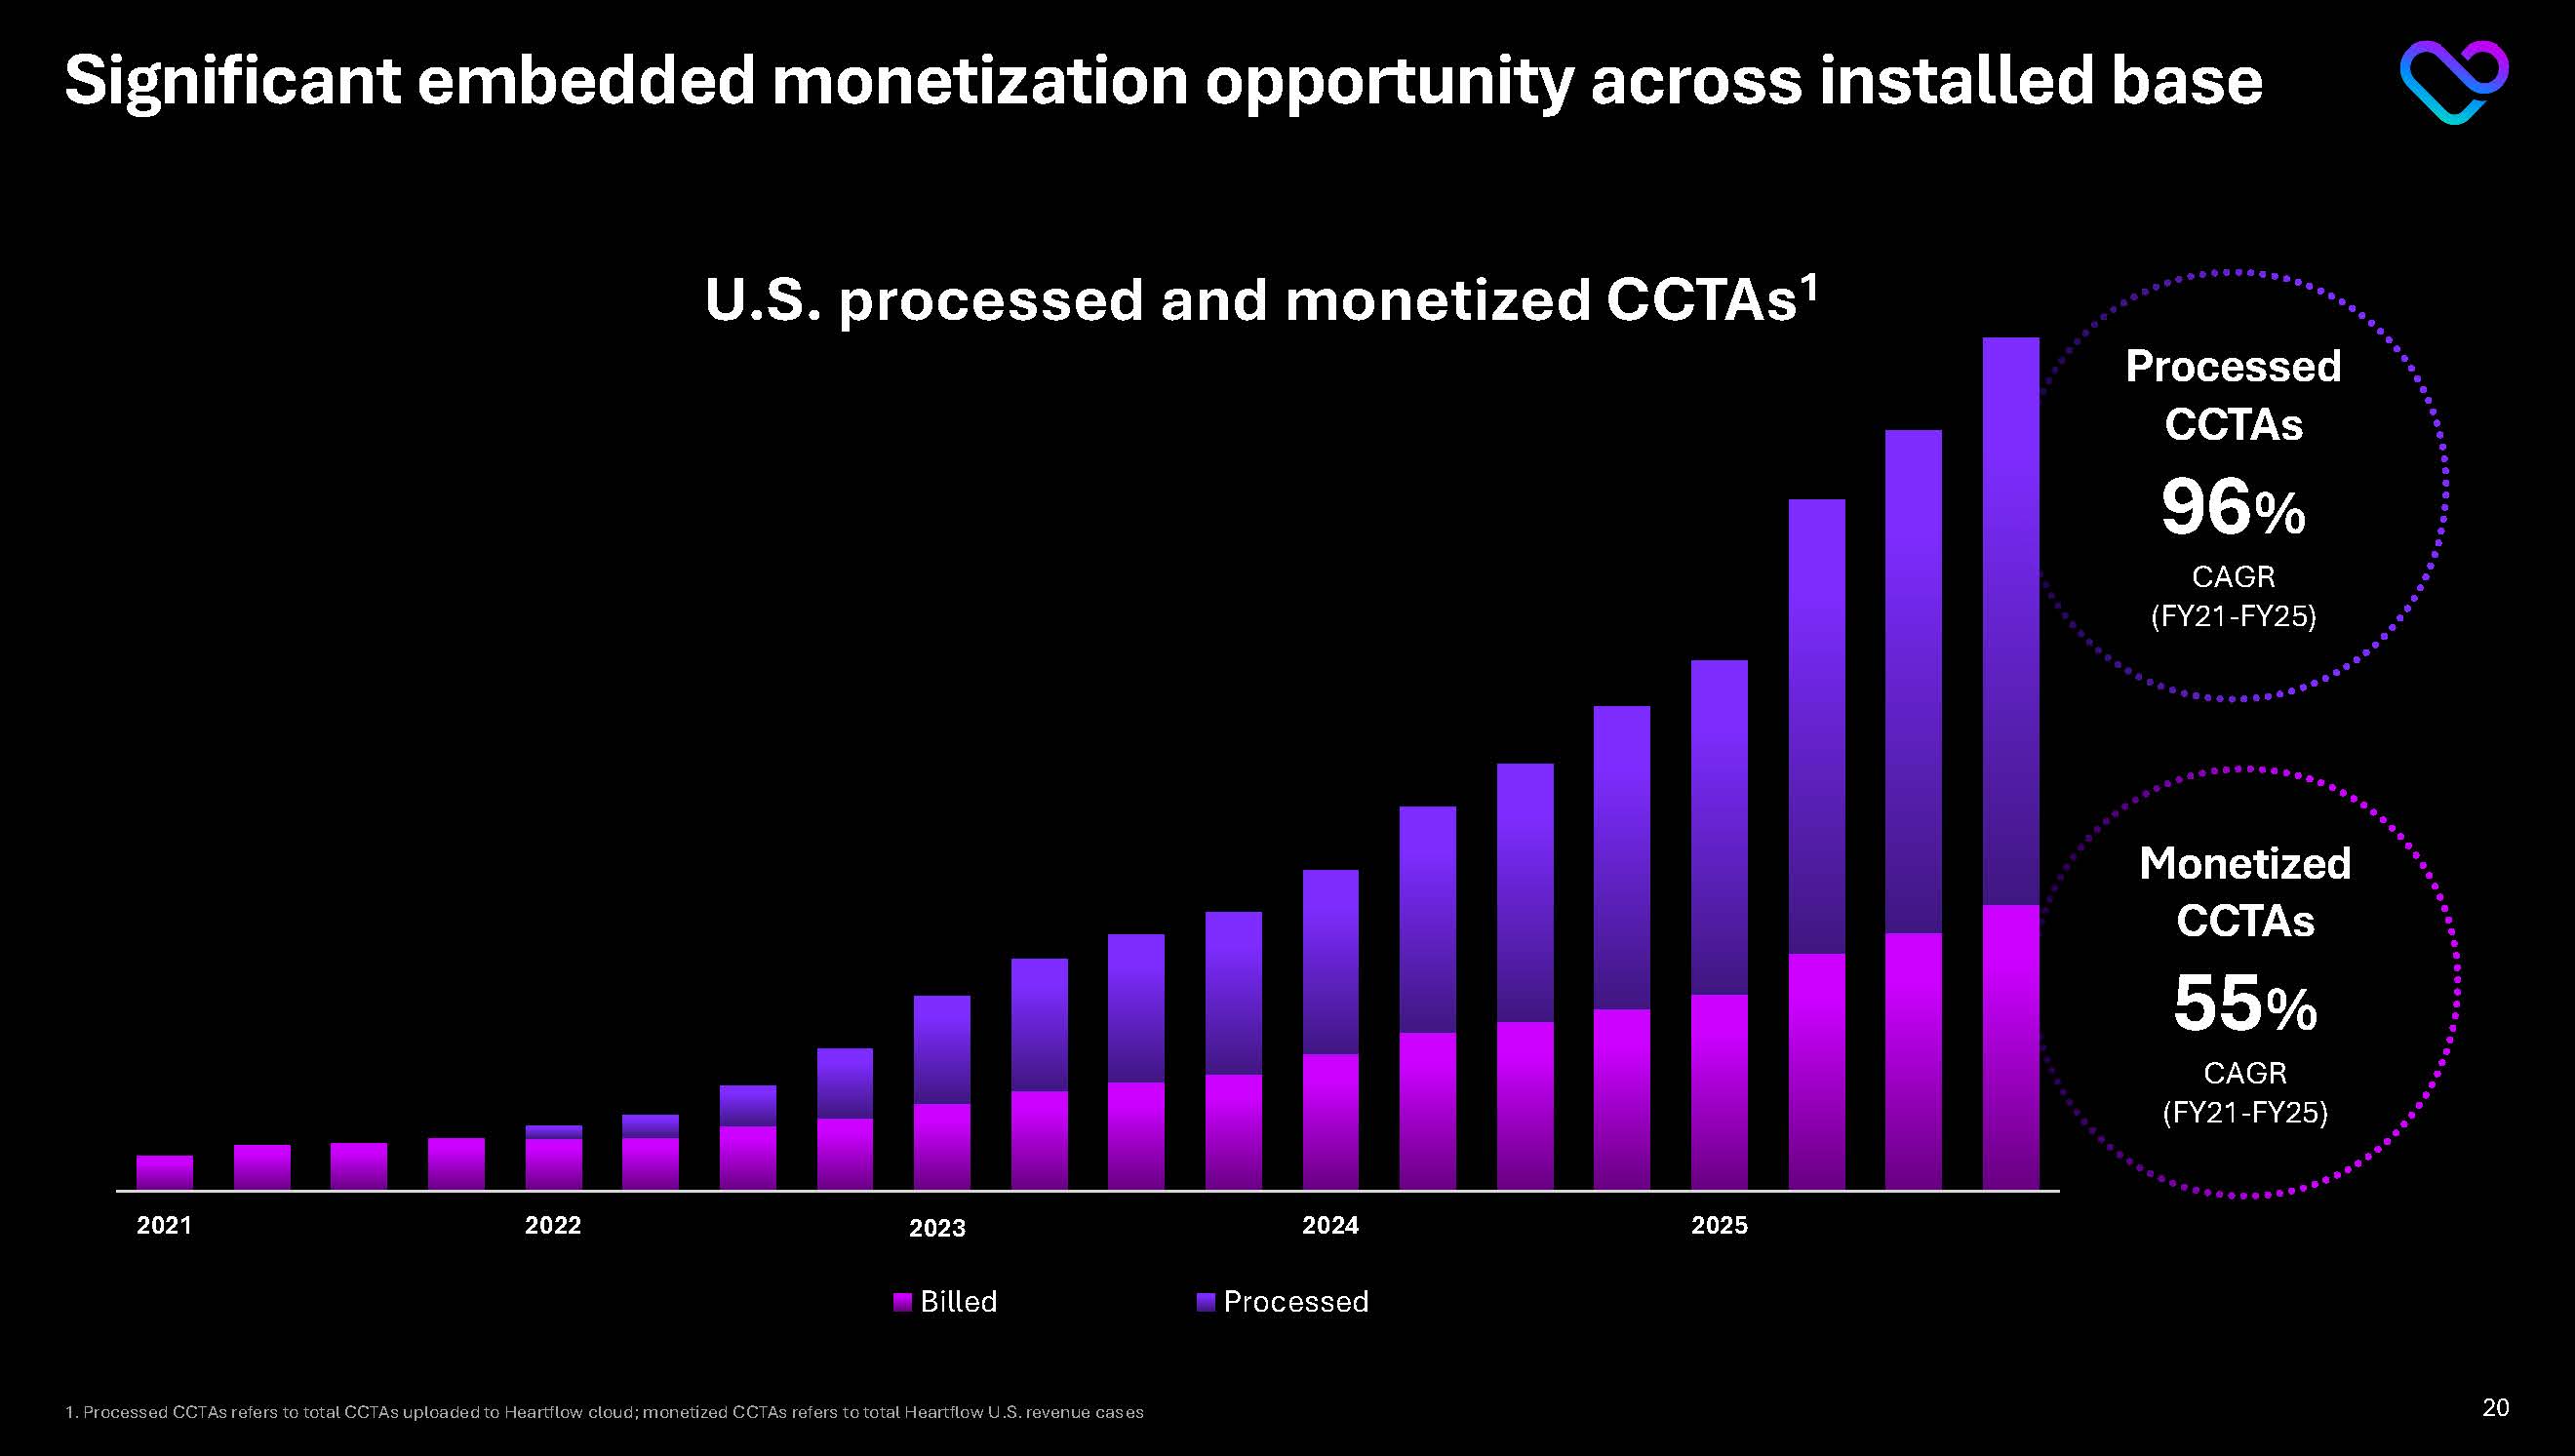
Significant embedded monetization opportunity across installed base Monetized CCTAs 55% CAGR(FY21-FY25) Processed CCTAs 96% CAGR(FY21-FY25) 2021 2022 2023 2024 2025 U.S. processed and monetized CCTAs1
1. Processed CCTAs refers to total CCTAs uploaded to Heartflow cloud; monetized CCTAs refers to total Heartflow U.S. revenue cases 20
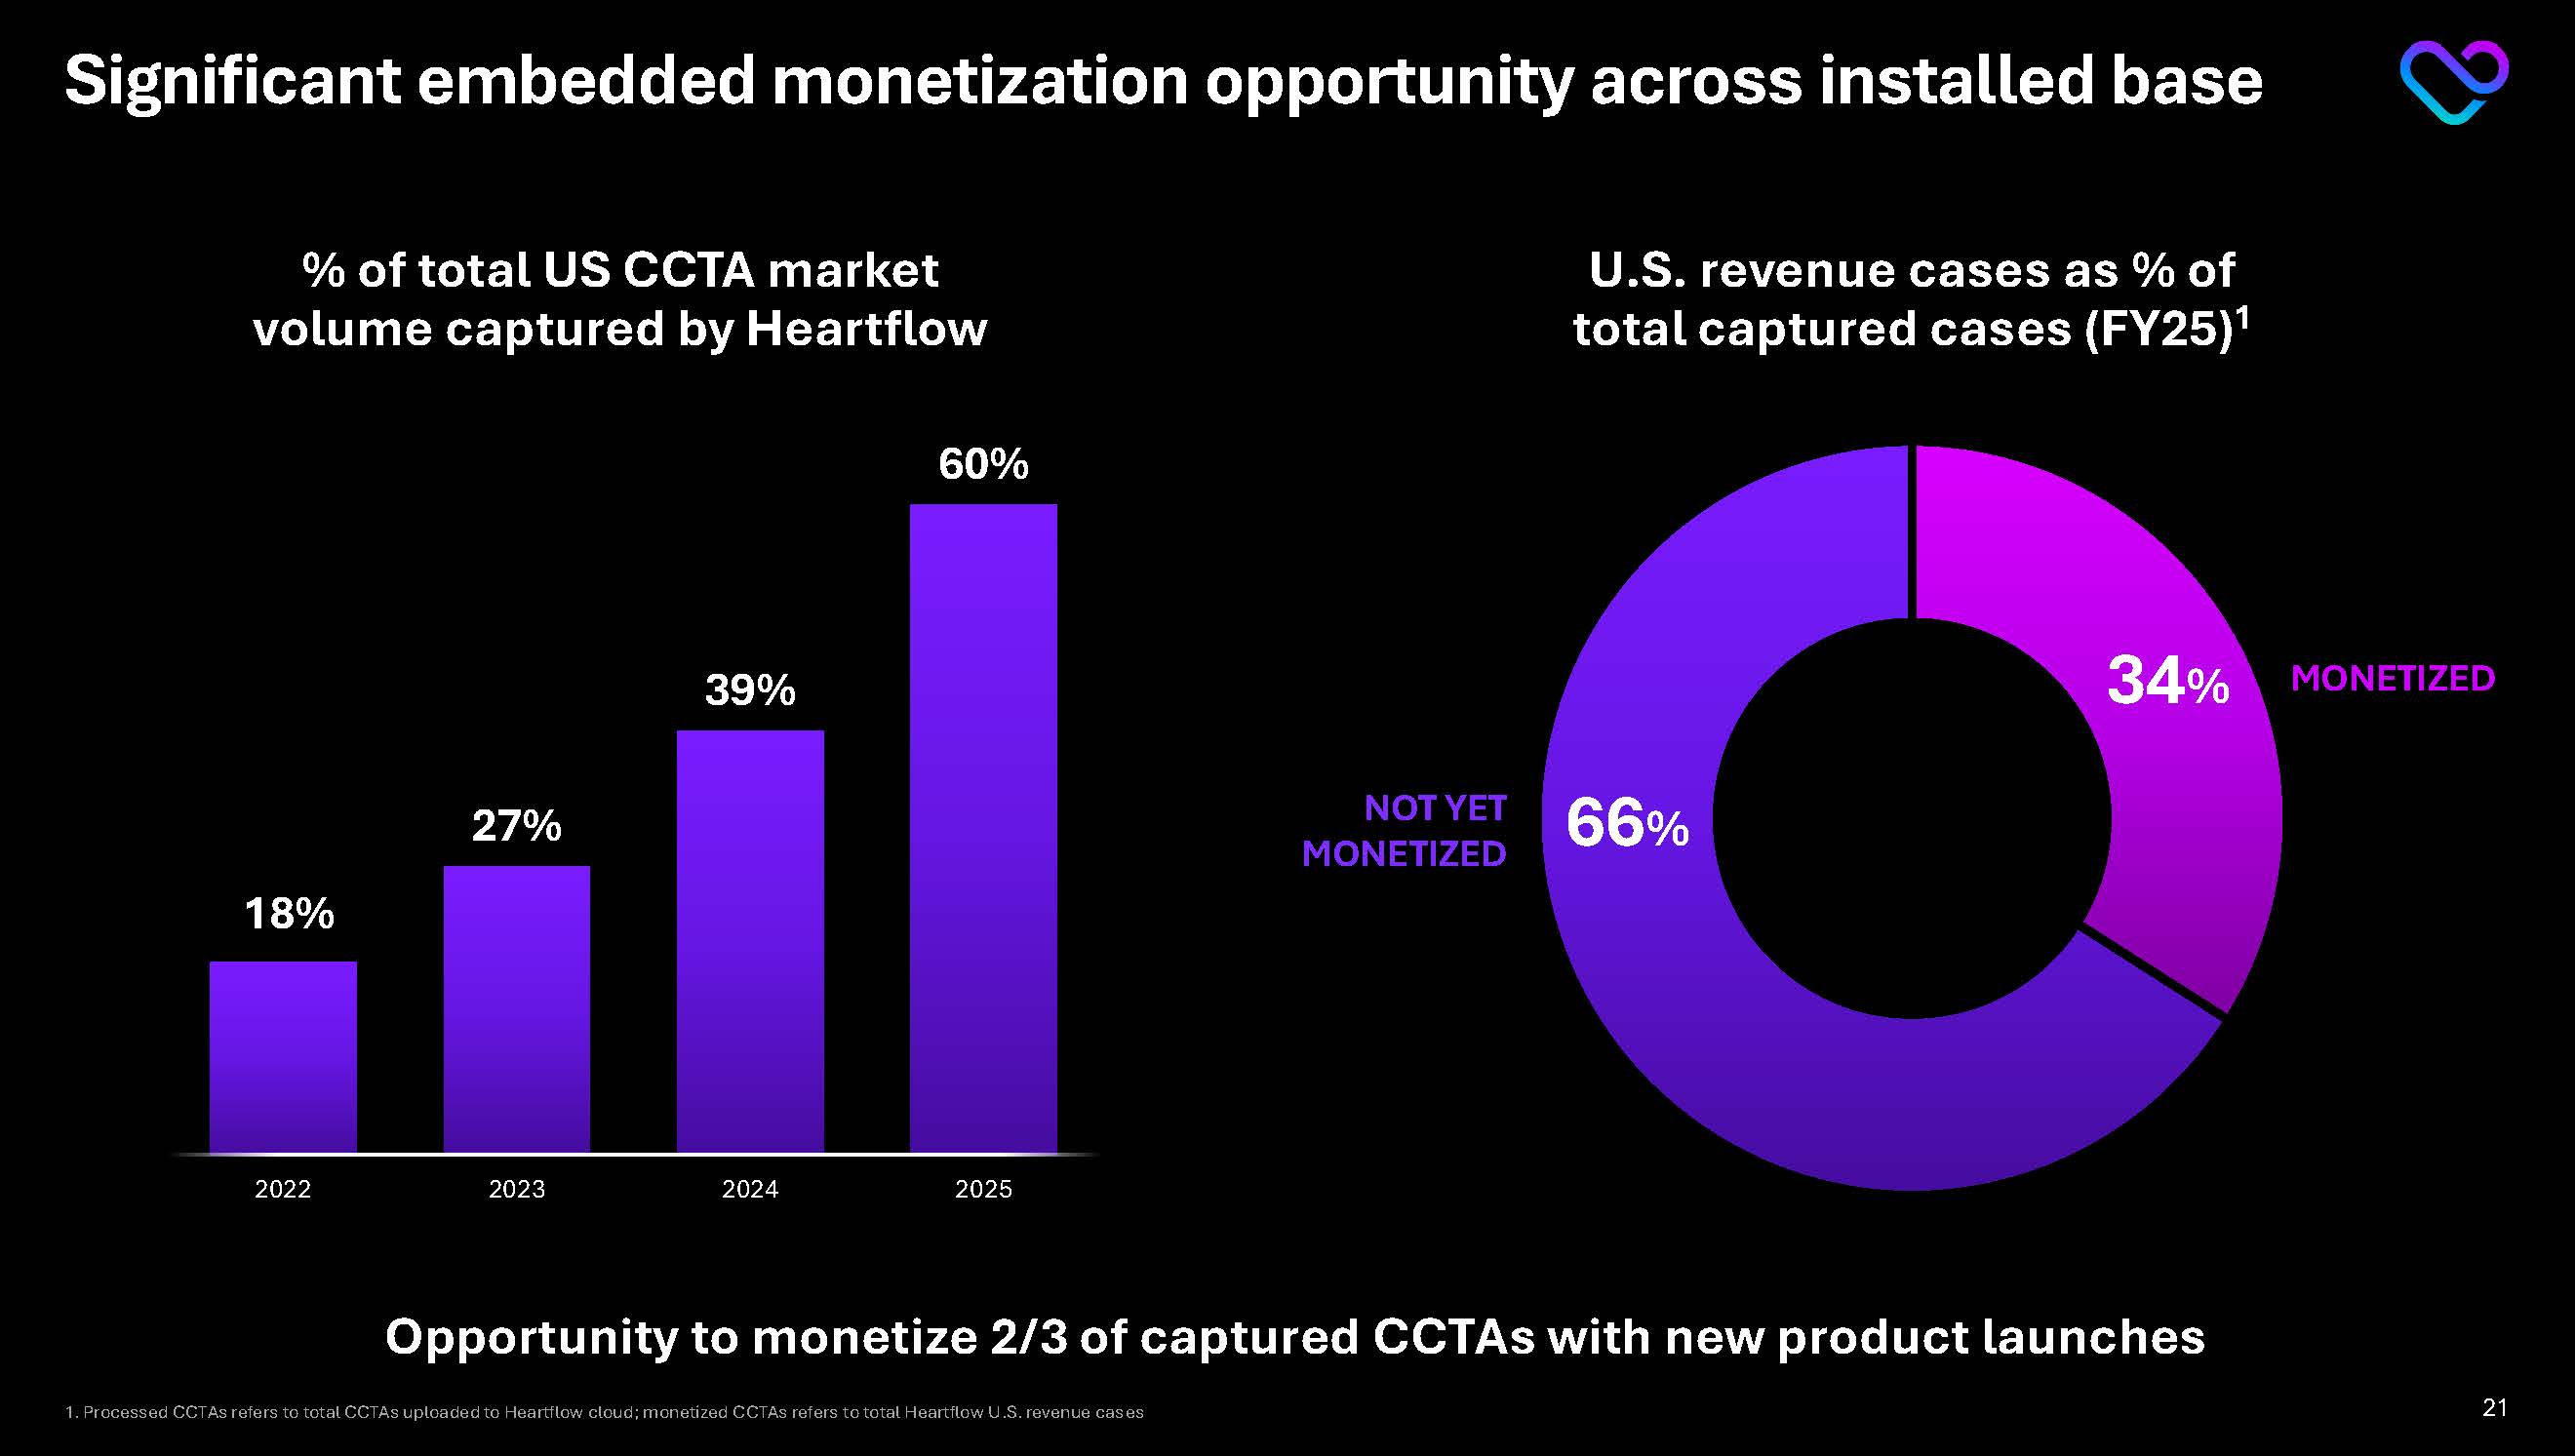
Significant embedded monetization opportunity across installed base Opportunity to monetize 2/3 of captured CCTAs with new product launches % of total US CCTA market volume captured by Heartflow 34% 66% U.S. revenue cases as % of total captured cases (FY25)1 MONETIZED NOT YET MONETIZED 1. Processed CCTAs refers to total CCTAs uploaded to Heartflow cloud; monetized CCTAs refers to total Heartflow U.S. revenue cases18% 27% 39% 60% 2022 2023 2024 2025 21
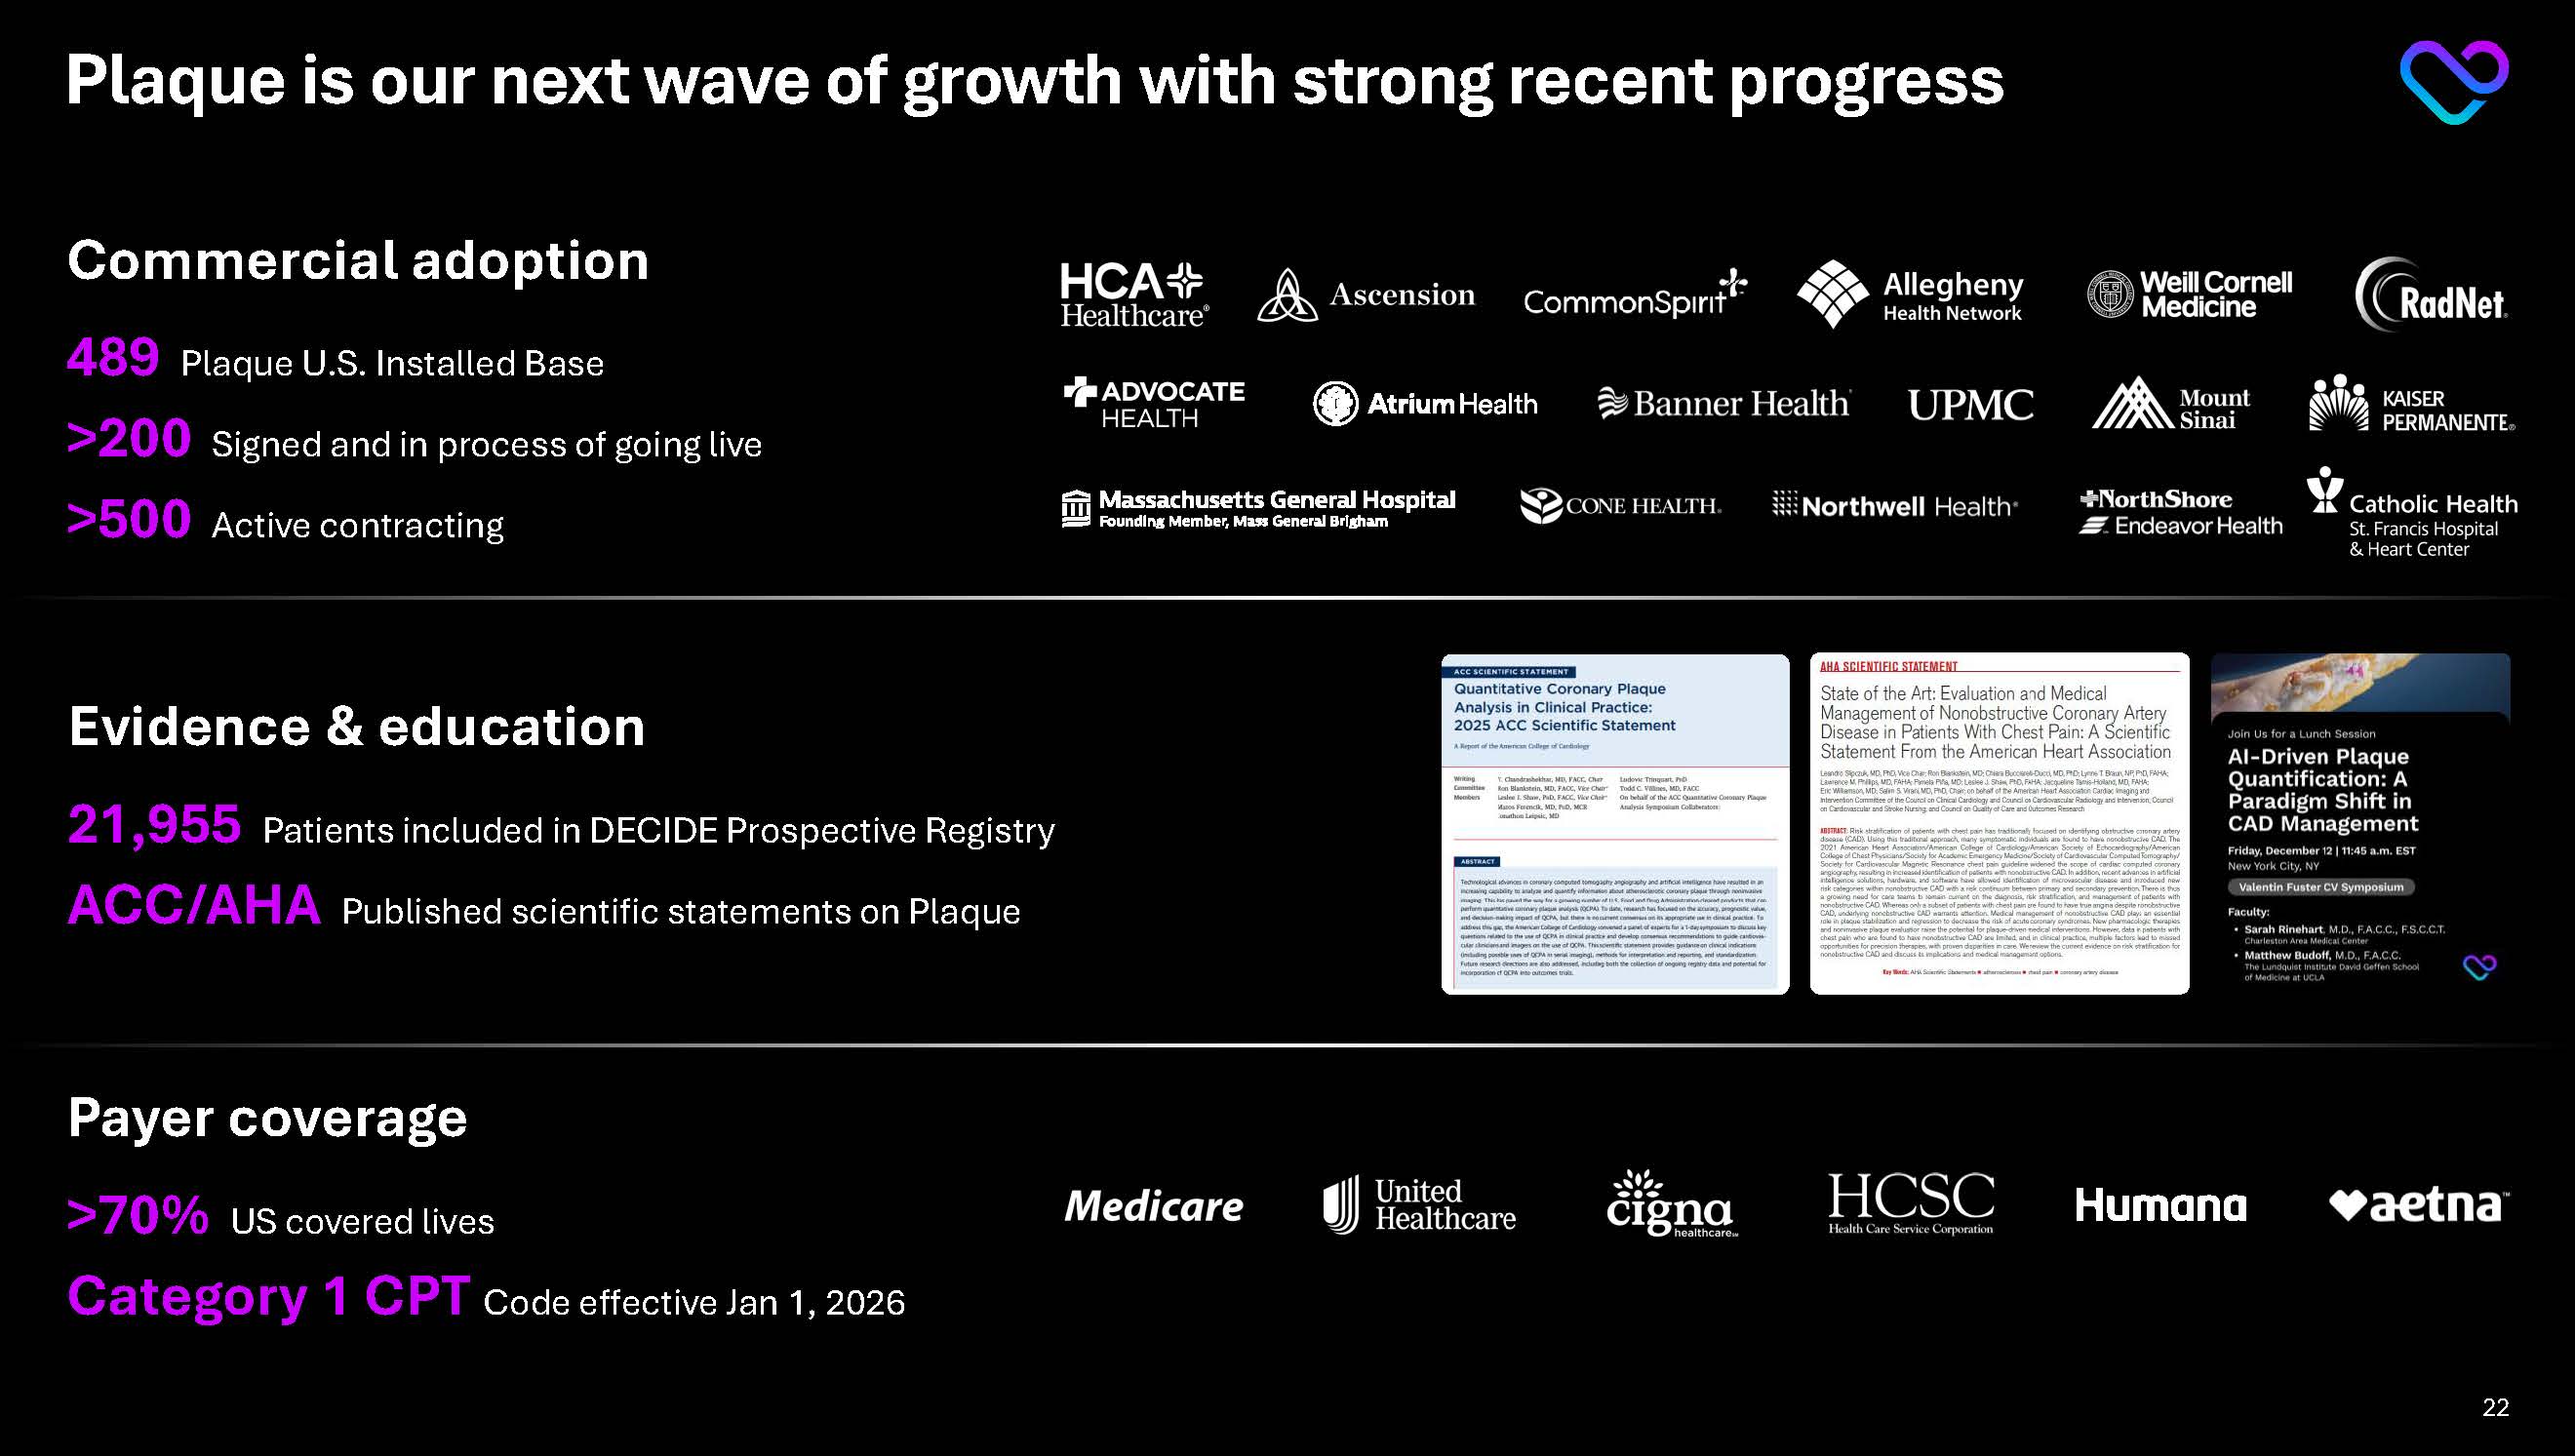
Plaque is our next wave of growth with strong recent progress Commercial adoption 489 Plaque U.S. Installed Base >200 Signed and in process of going live >500 Active contracting HCA Healthcare Ascension CommonSpirit Allegheny Health Networks Weill Cornell Medicine RadNet Midwest Advocate Health Atrium Health Banner Health UPMC Mount Sinai Kaiser Permanente Massachusetts General Hospital CONE Health Northwell Health NorthShore Catholic Health Medicare United Health Cigna HCSC Humana Aetna
Evidence & education
21,955Patients included in DECIDE Prospective Registry
ACC/AHA Published scientific statements on Plaque
Payer coverage
>70% US covered lives
Category 1 CPT Code effective Jan 1, 2026 22

Durable long-term non-GAAP gross margin expansion 1 Improved automation and non-GAAP gross margin expansion Gross margin levers
Improved automation and production team efficiency Higher case volumes Plaque revenues(no incremental COGS) > 80% Long term non-GAAP gross margin target 80% 70% 60% 50% 40% 30% 80 70 60 50 40 30 20 10 2021 2022 2023 2024 23Q25 Analyst processing time (in minutes) Gross margin (%) 1. Please see GAAP to non-GAAP reconciliations at the end of this presentation 23
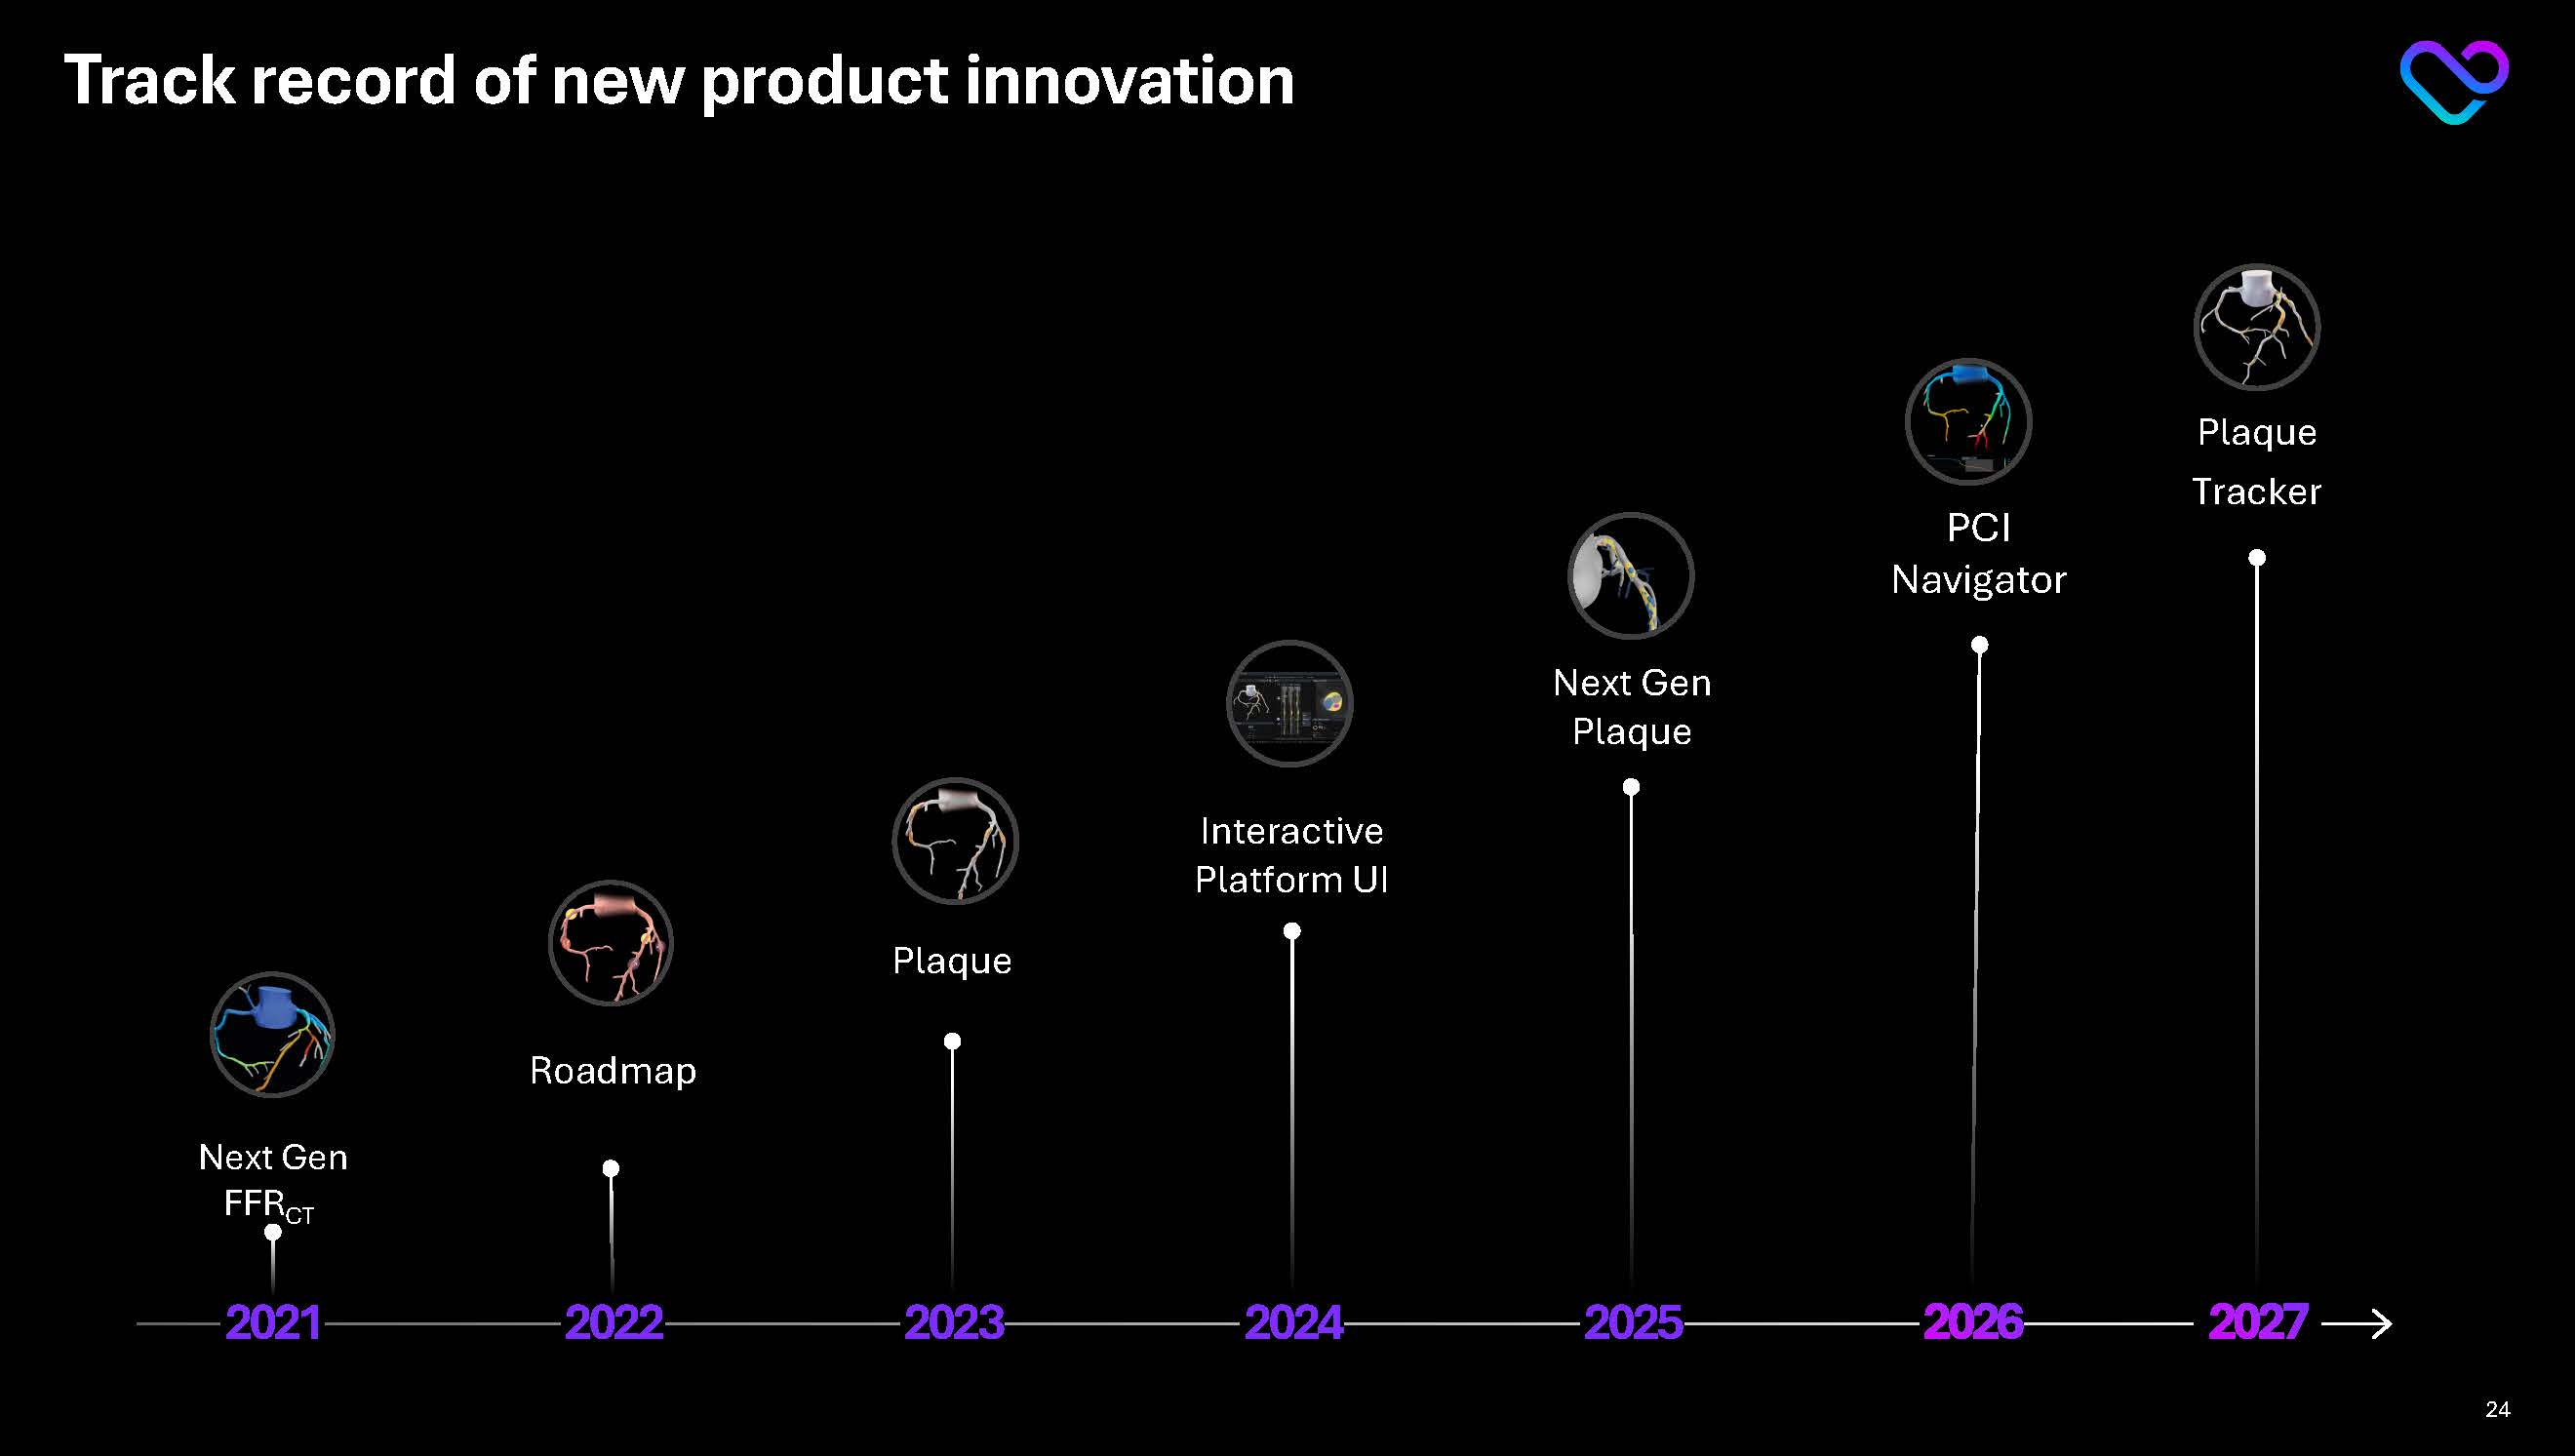
Plaque Tracker Track record of new product innovation 2021 2027 2022 2023 2024 2025 2026 Next Gen FFRCT Roadmap Plaque Interactive Platform UI Next Gen Plaque PCI Navigator 24
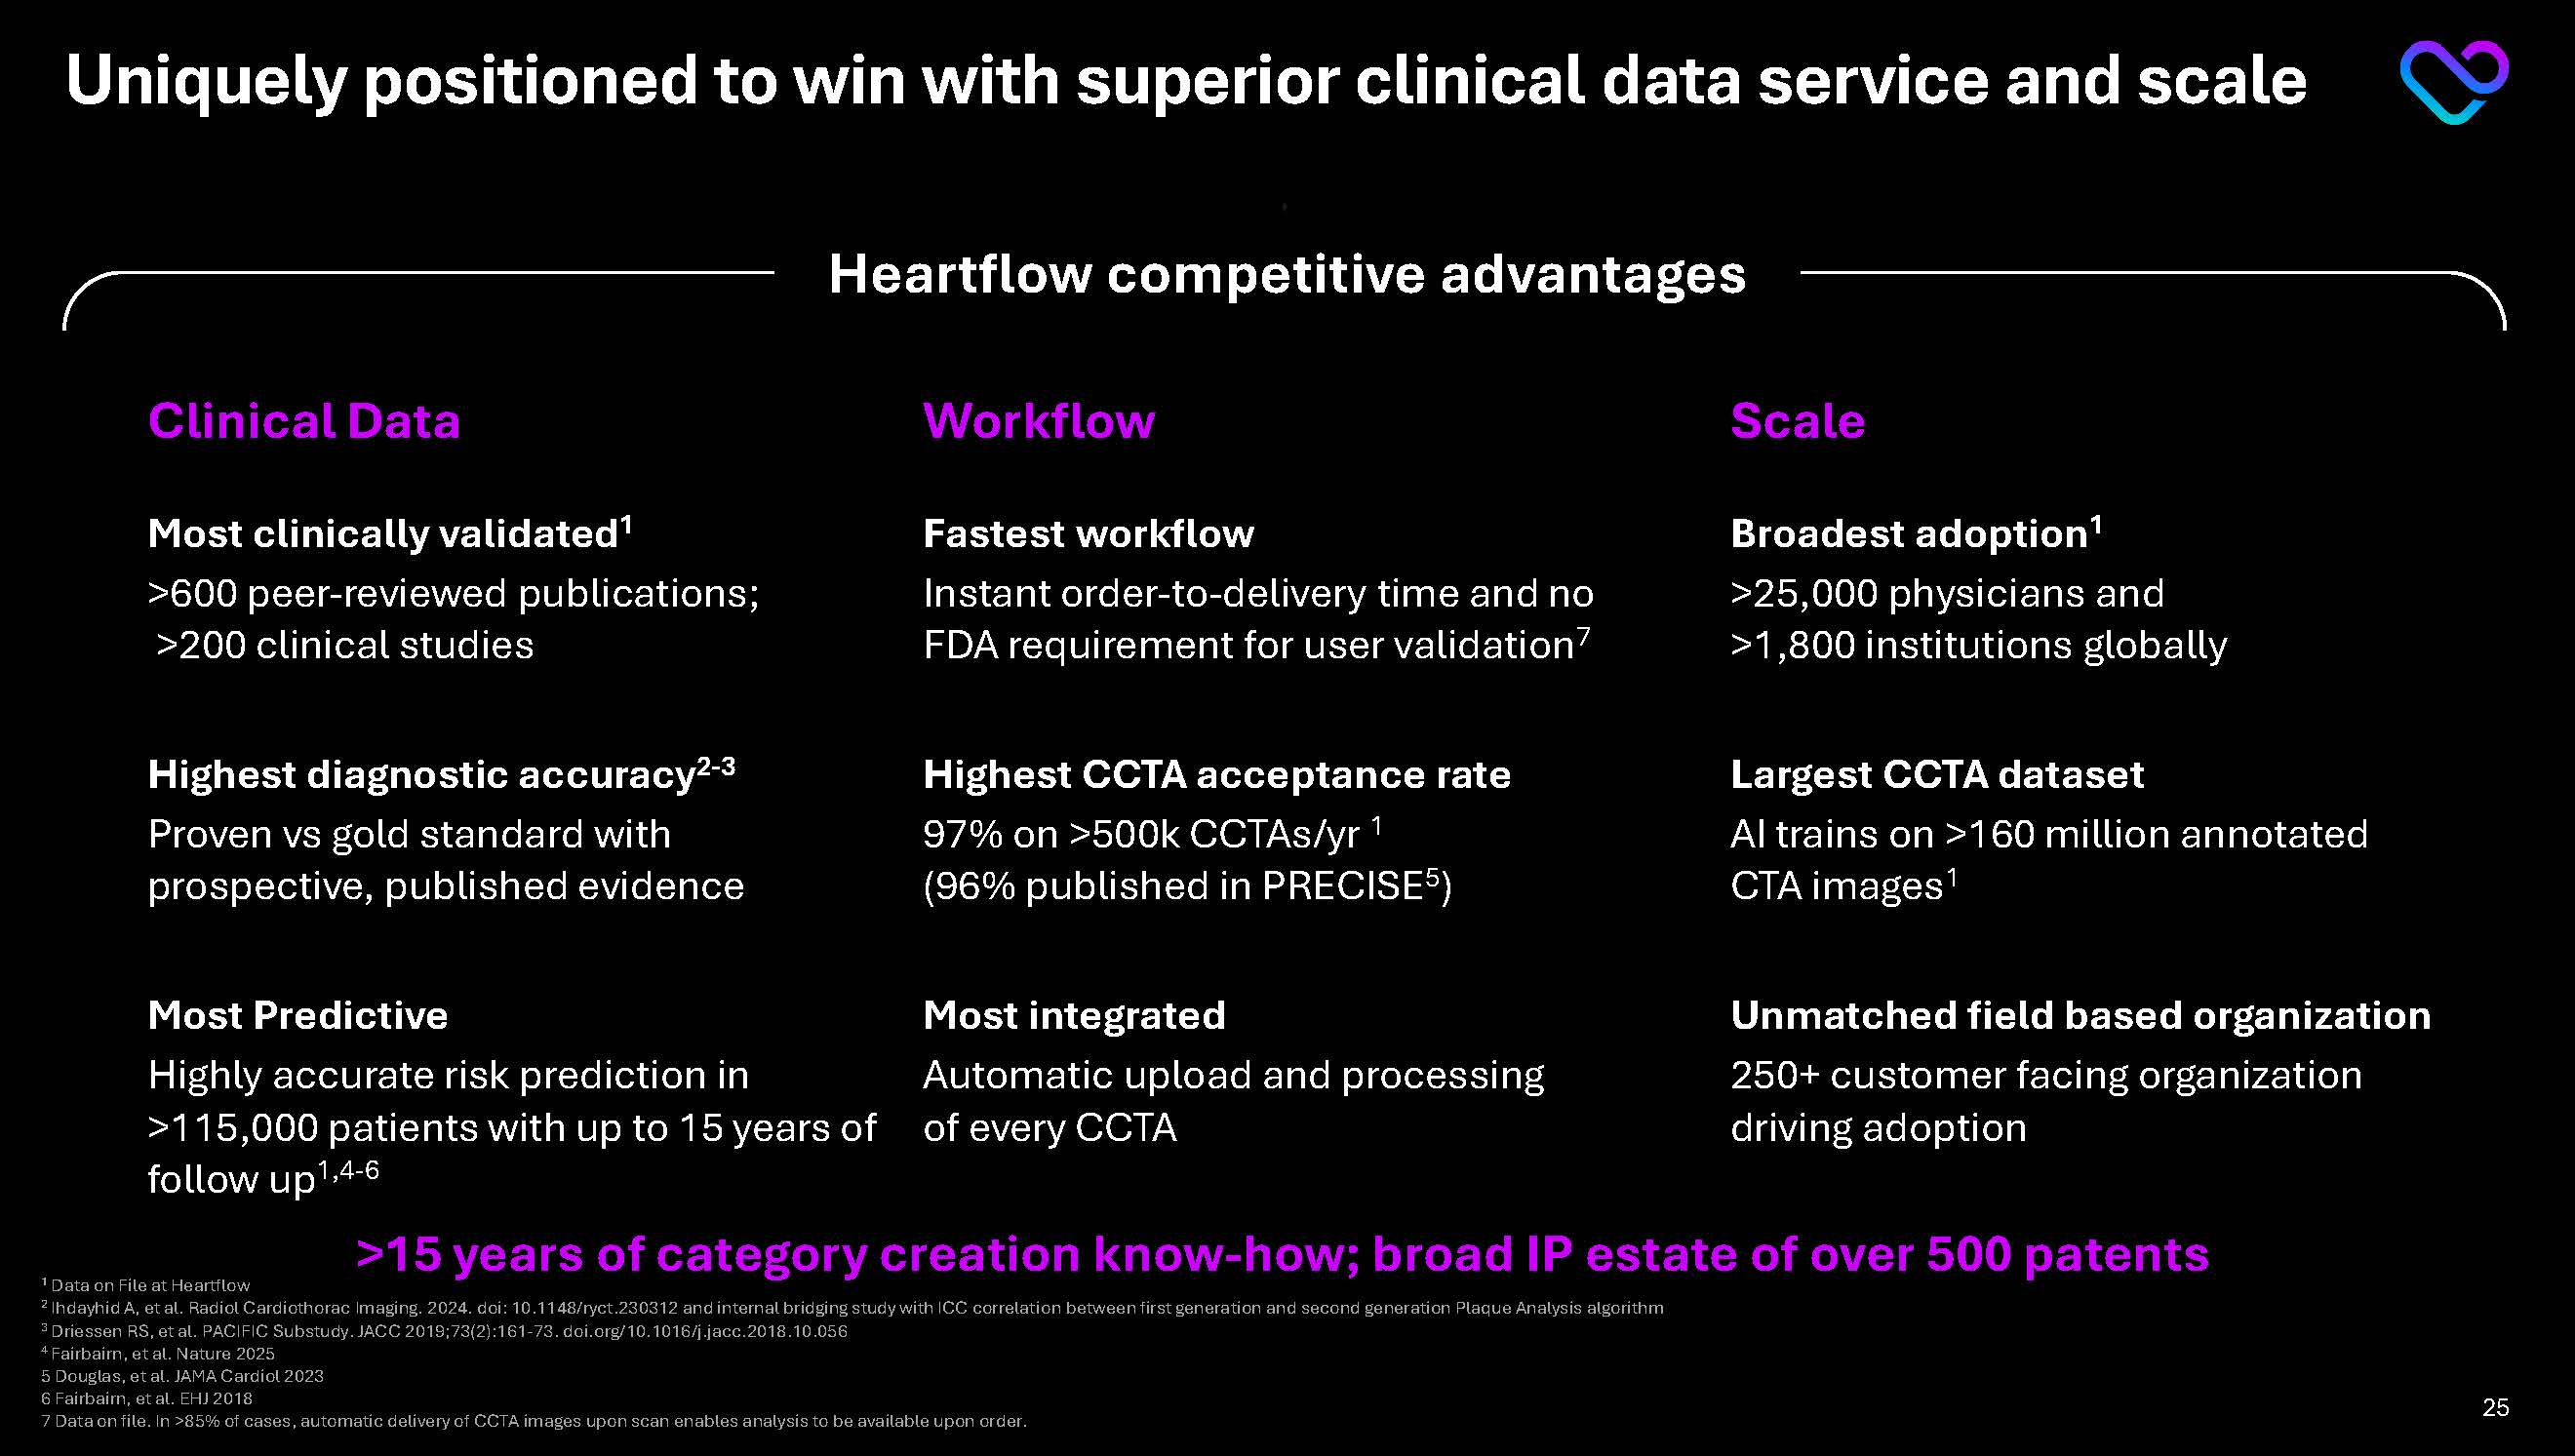
Clinical Data Workflow Scale Most clinically validated1 >600 peer-reviewed publications; >200 clinical studies Fastest workflow Instant order-to-delivery time and no FDA requirement for user validation7 Broadest adoption1 >25,000 physicians and >1,800 institutions globally Highest diagnostic accuracy2-3 Proven vs gold standard with prospective, published evidence Highest CCTA acceptance rate 97% on >500k CCTAs/yr 1(96% published in PRECISE5) Largest CCTA dataset AI trains on >160 million annotated CTA images1 Most Predictive Highly accurate risk prediction in >115,000 patients with up to 15 years of follow up1,4-6 Most integrated Automatic upload and processing of every CCTA Unmatched field based organization 250+ customer facing organization driving adoption >15 years of category creation know-how; broad IP estate of over 500 patents Uniquely positioned to win with superior clinical data service and scale Heartflow competitive advantages 1 Data on File at Heartflow 2 Ihdayhid A, et al. Radiol Cardiothorac Imaging. 2024. doi: 10.1148/ryct.230312 and internal bridging study with ICC correlation between first generation and second generation Plaque Analysis algorithm 3 Driessen RS, et al. PACIFIC Substudy. JACC 2019;73(2):161-73. doi.org/10.1016/j.jacc.2018.10.056 4 Fairbairn, et al. Nature 2025 5 Douglas, et al. JAMA Cardiol 2023 6 Fairbairn, et al. EHJ 2018 7 Data on file. In >85% of cases, automatic delivery of CCTA images upon scan enables analysis to be available upon order. 25
Heartflow’s near and mid-term strategy Addressable patients Least diseased Most diseased NEAR-TERM
Strong core business; with emerging plaque opportunity MID-TERM Targeted TAM expansion into asymptomatic Symptomatic 8.6MM Patients $5B U.S. TAM1
High risk asymptomatic 17.4MM Patients $6B U.S. TAM2 1. US Symptomatic TAM: Estimate based on claims data as of December 31, 2023 for CAD non-invasive tests (CCTA, SPECT, Stress Echo, PET/CT).
Source: Clarivate’s ProcedureFinder data repository. FFRCT ASP assumption $1,067; Plaque ASP assumption $300
2. Heartflow estimates 26
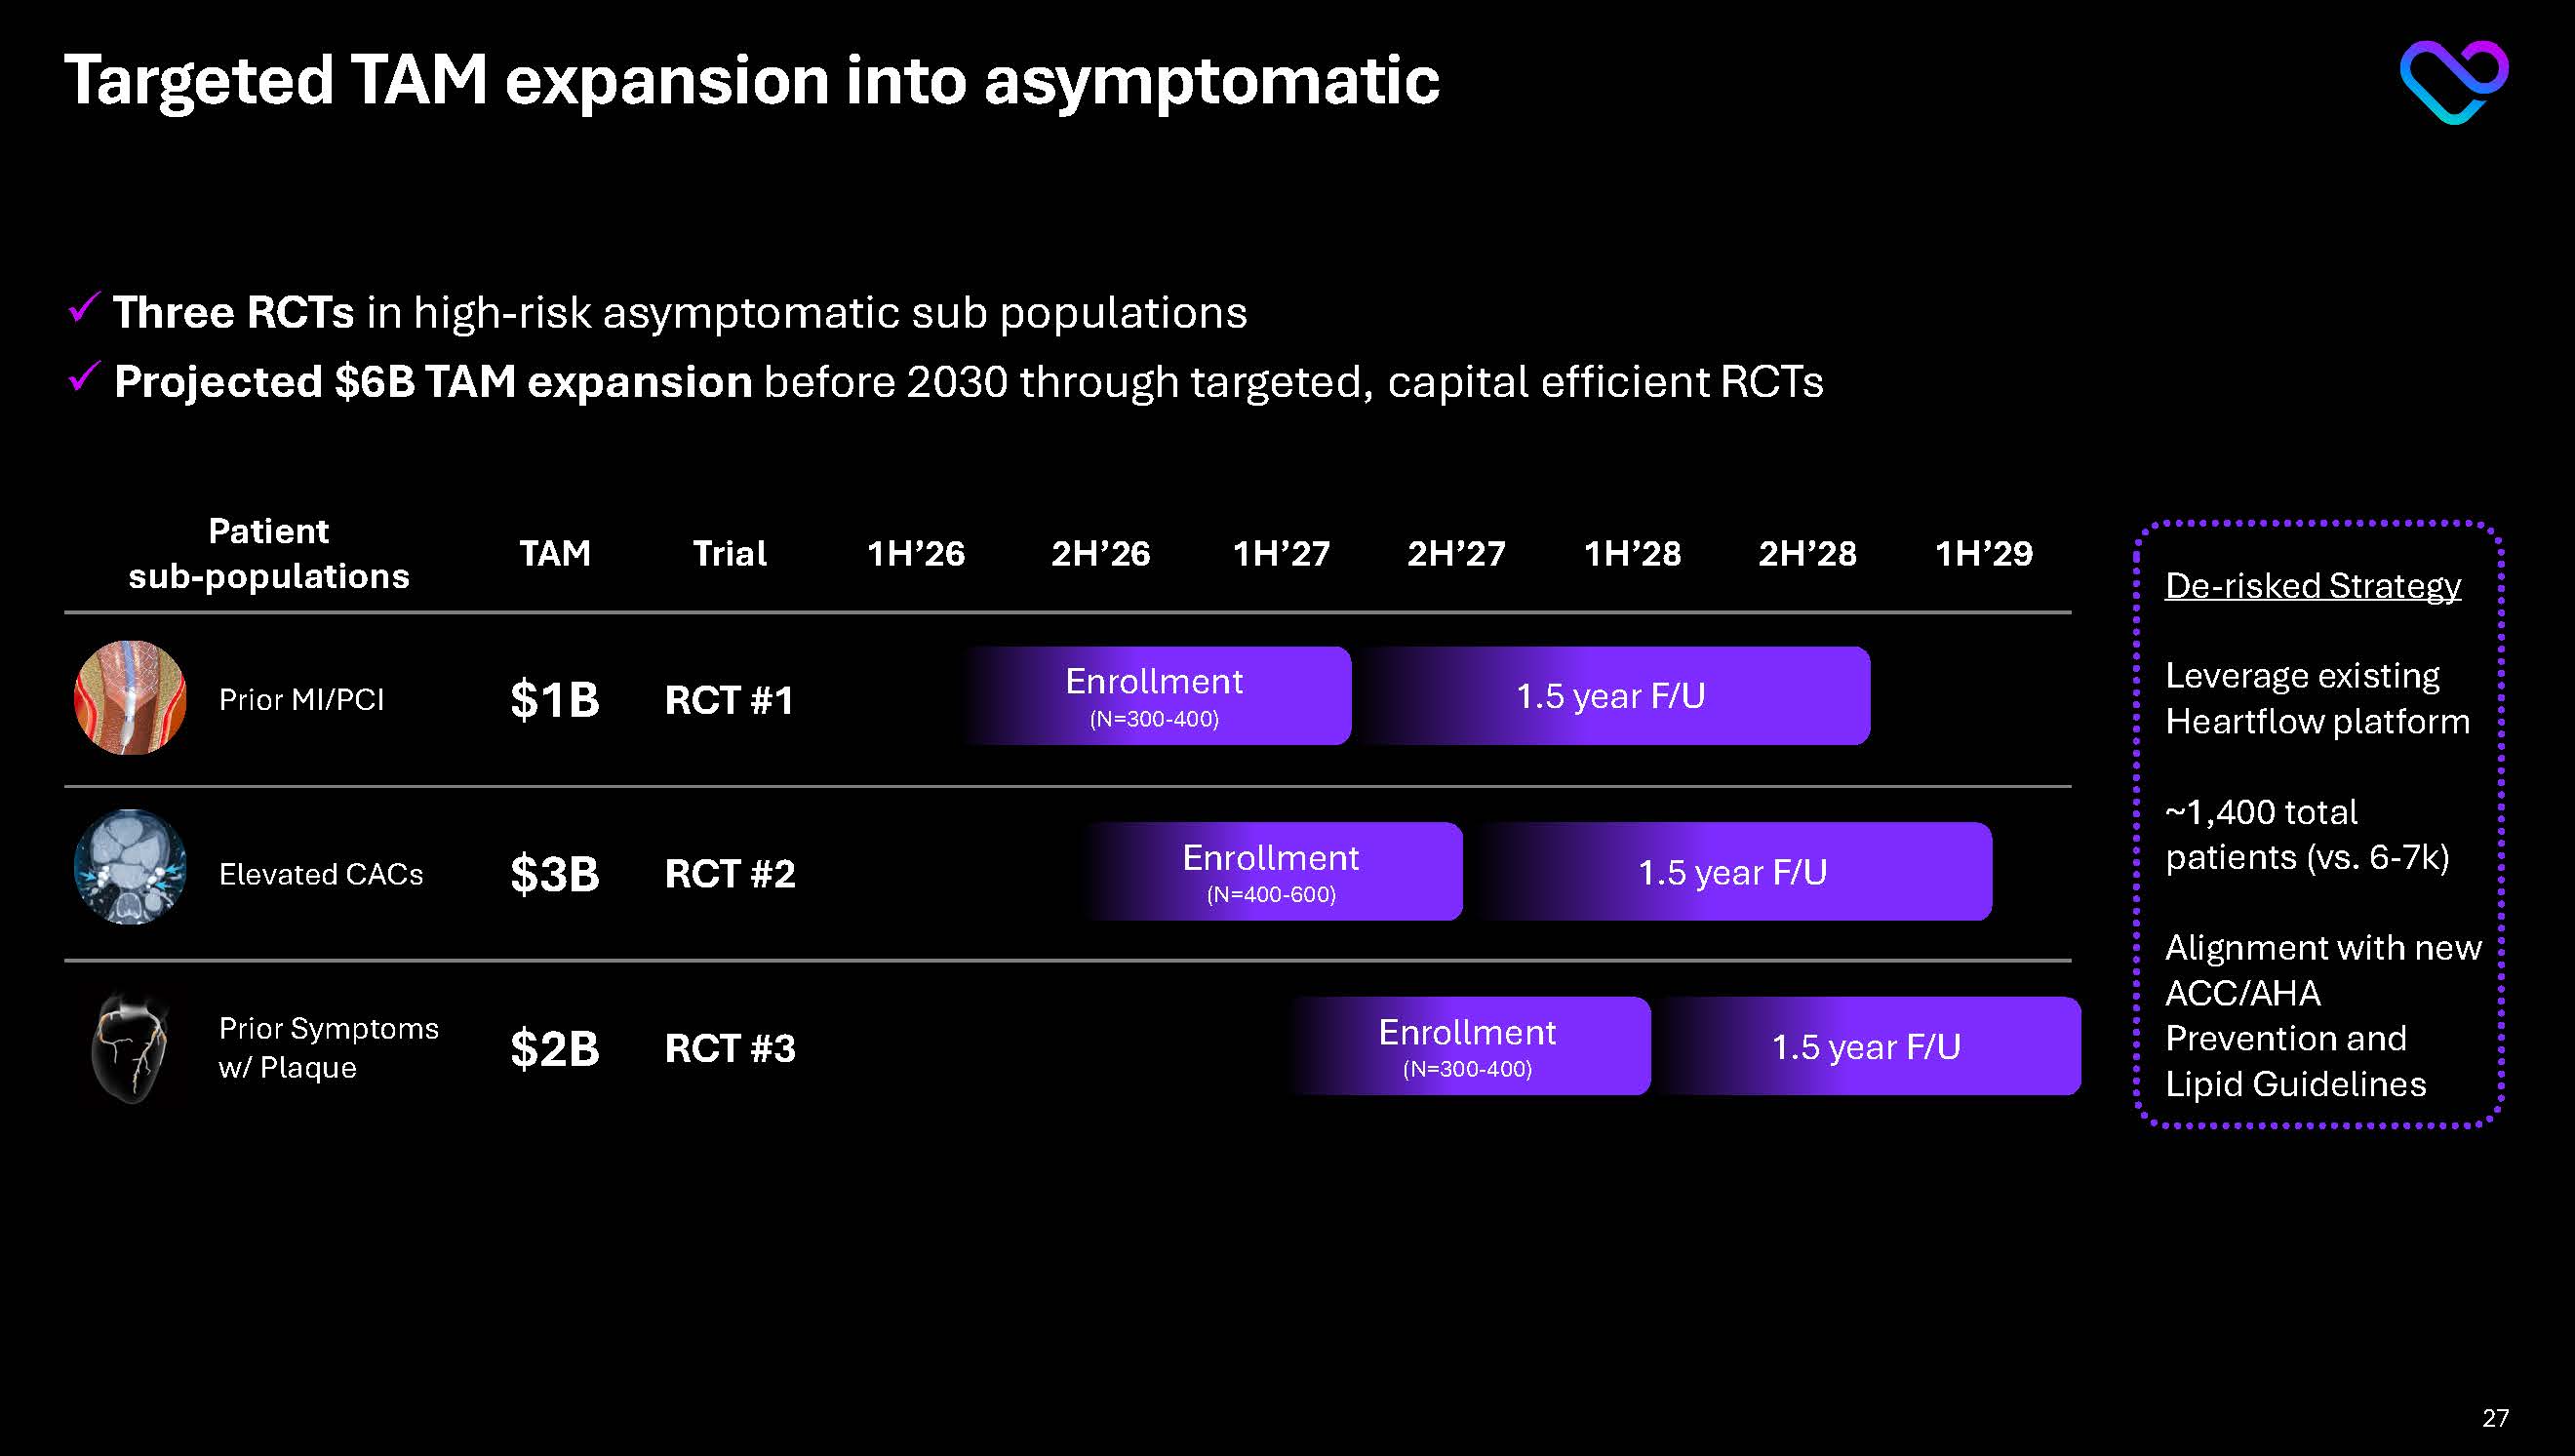
Targeted TAM expansion into asymptomatic Three RCTsin high-risk asymptomatic sub populations Projected $6B TAM expansion before 2030 through targeted, capital efficient RCTs
Patient TAM Trial 1H’26 2H’26 1H’27 2H’27 1H’28 2H’28 1H’29 Prior MI/PCI $1B RCT #1 Elevated CACs $3B RCT #2 Prior Symptoms w/ Plaque $2B RCT #3 Percutaneous Coronary Intervention (PCI ...
Enrollment(N=300-400) 1.5 year F/U Enrollment(N=400-600) 1.5 year F/U Enrollment(N=300-400) 1.5 year F/U
De-risked Strategy Leverage existing Heartflow platform
~1,400 total patients (vs. 6-7k) Alignment with new ACC/AHA Prevention and Lipid Guidelines 27
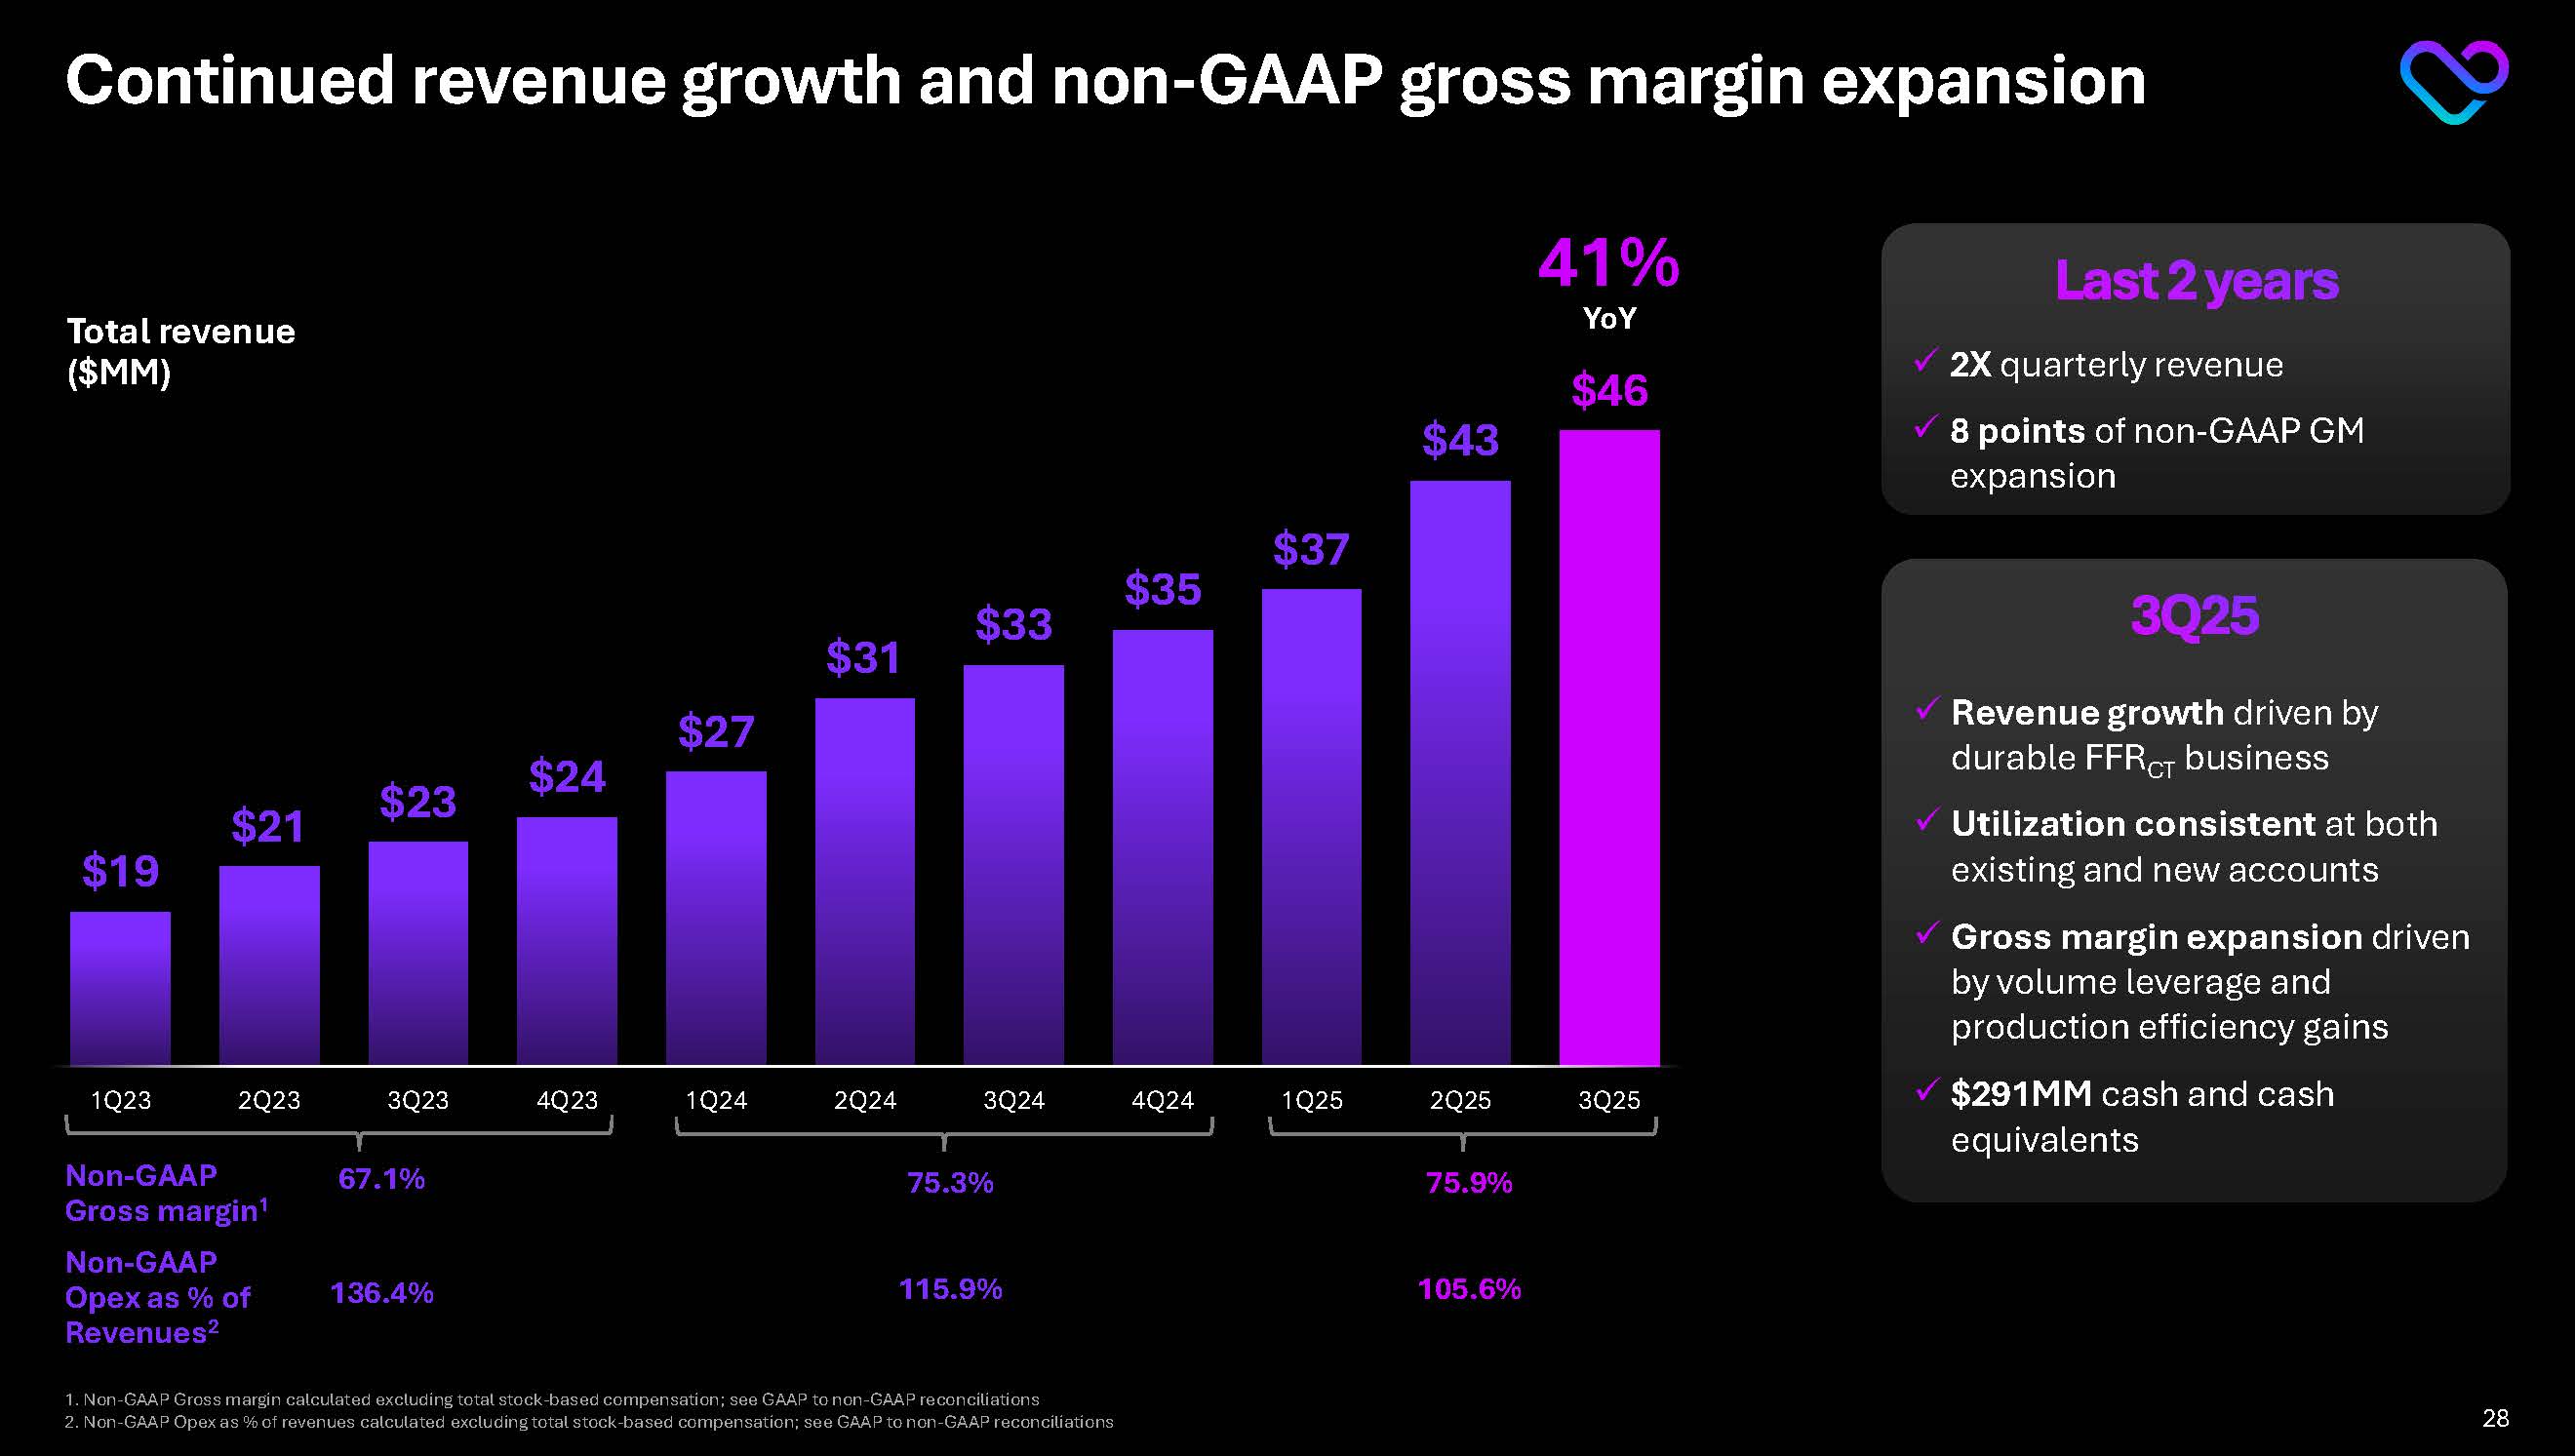
Continued revenue growth and non-GAAP gross margin expansion 41% YoY Total revenue ($MM) Non-GAAP Gross margin1 67.1% 75.3% Non-GAAP Opex as % of Revenues2 136.4% 115.9% 75.9% 105.6% Last 2 years 2X quarterly revenue
8 points of non-GAAP GM expansion 3Q25 Revenue growth driven by durable FFRCT business Utilization consistent at both existing and new accounts Gross margin expansion driven by volume leverage and production efficiency gains $291MM cash and cash equivalents 1. Non-GAAP Gross margin calculated excluding total stock-based compensation; see GAAP to non-GAAP reconciliations 2. Non-GAAP Opex as % of revenues calculated excluding total stock-based compensation; see GAAP to non-GAAP reconciliations $19 $21 $23 $24 $27 $31 $33 $35 $37 $43 $46 1Q23 2Q23 3Q23 4Q23 1Q24 2Q24 3Q24 4Q24 1Q25 2Q25 3Q25 28

Experienced leadership driving continued success JOHN FARQUHAR President & CEO Medtronic VIKRAM VERGHESE, CFA Chief Financial Officer Google Life Sciences, Medtronic DR. CAMPBELL ROGERS Chief Medical Officer Brigham & Women's Hospital, Johnson & Johnson JUSTIN CAMBRA Chief Technology Officer iRhythm Technologies KATHLEEN CAREY Senior Vice President, Operations Alto Pharmacy NATHAN CHAN Senior Vice President, U.S. Sales
Medtronic CARA SANTILLO Senior Vice President, Market Access and Reimbursement Elekta SHIVANTH BHASKARAN Senior Vice President, Marketing Medtronic MAZI KIANI Senior Vice President, Quality and Regulatory Inari Medical MANISH KAPOOR Chief Product Officer Vantive, Johnson & Johnson ANGELA AHMAD Chief Legal and Compliance Officer Inari, CoreLogic, Latham and Watkins 29

Thanks you

GAAP to non-GAAP reconciliation: 3mo ended September 30 Three Months Ended September 30, 2025 Three Months Ended September 30, 2024 GAAP Adjustments Non-GAAP GAAP Adjustments Non-GAAP Gross profit $35,415 $127 (a) $35,542 $24,937 $71 (a) $25,008 Gross margin 76.5% 0.3% 76.8% 75.7% 0.2% 75.9% Operating Expenses: Research and development $17,297 $(959) (a) $16,338 $11,863 $ (563) (a) $11,300 Selling, general and administrative $33,217 $(2,874) (a) $30,343 $28,003 $(1,702) (a) $26,301 Total operating expenses $50,514 $(3,833) $46,681 $39,866 $(2,265) $37,601 Loss from operations $(15,099) $3,960 $(11,139) $(14,929) $2,336 $(12,593) Net loss $(50,855) $37,619 (b) $(13,236) $(19,140) $2,921 (c) $(16,219) Net loss per share, basic and diluted $(1.04) $0.77 $(0.27) $(3.43) $0.53 $(2.90)a. Represents adjustments related to stock-based compensation expense b. Represents adjustments for: (i) stock-based compensation expense of $4.0 million; (ii) change in fair value of common stock warrant liability of $32.1 million; (iii) change in fair value of derivative liability of $4.8 million; and (iv) loss on extinguishment of debt of $6.4 million
c. Represents adjustments for: (i) stock-based compensation expense of $2.3 million; and (ii) change in fair value of common stock warrant liability of $0.6 million 31
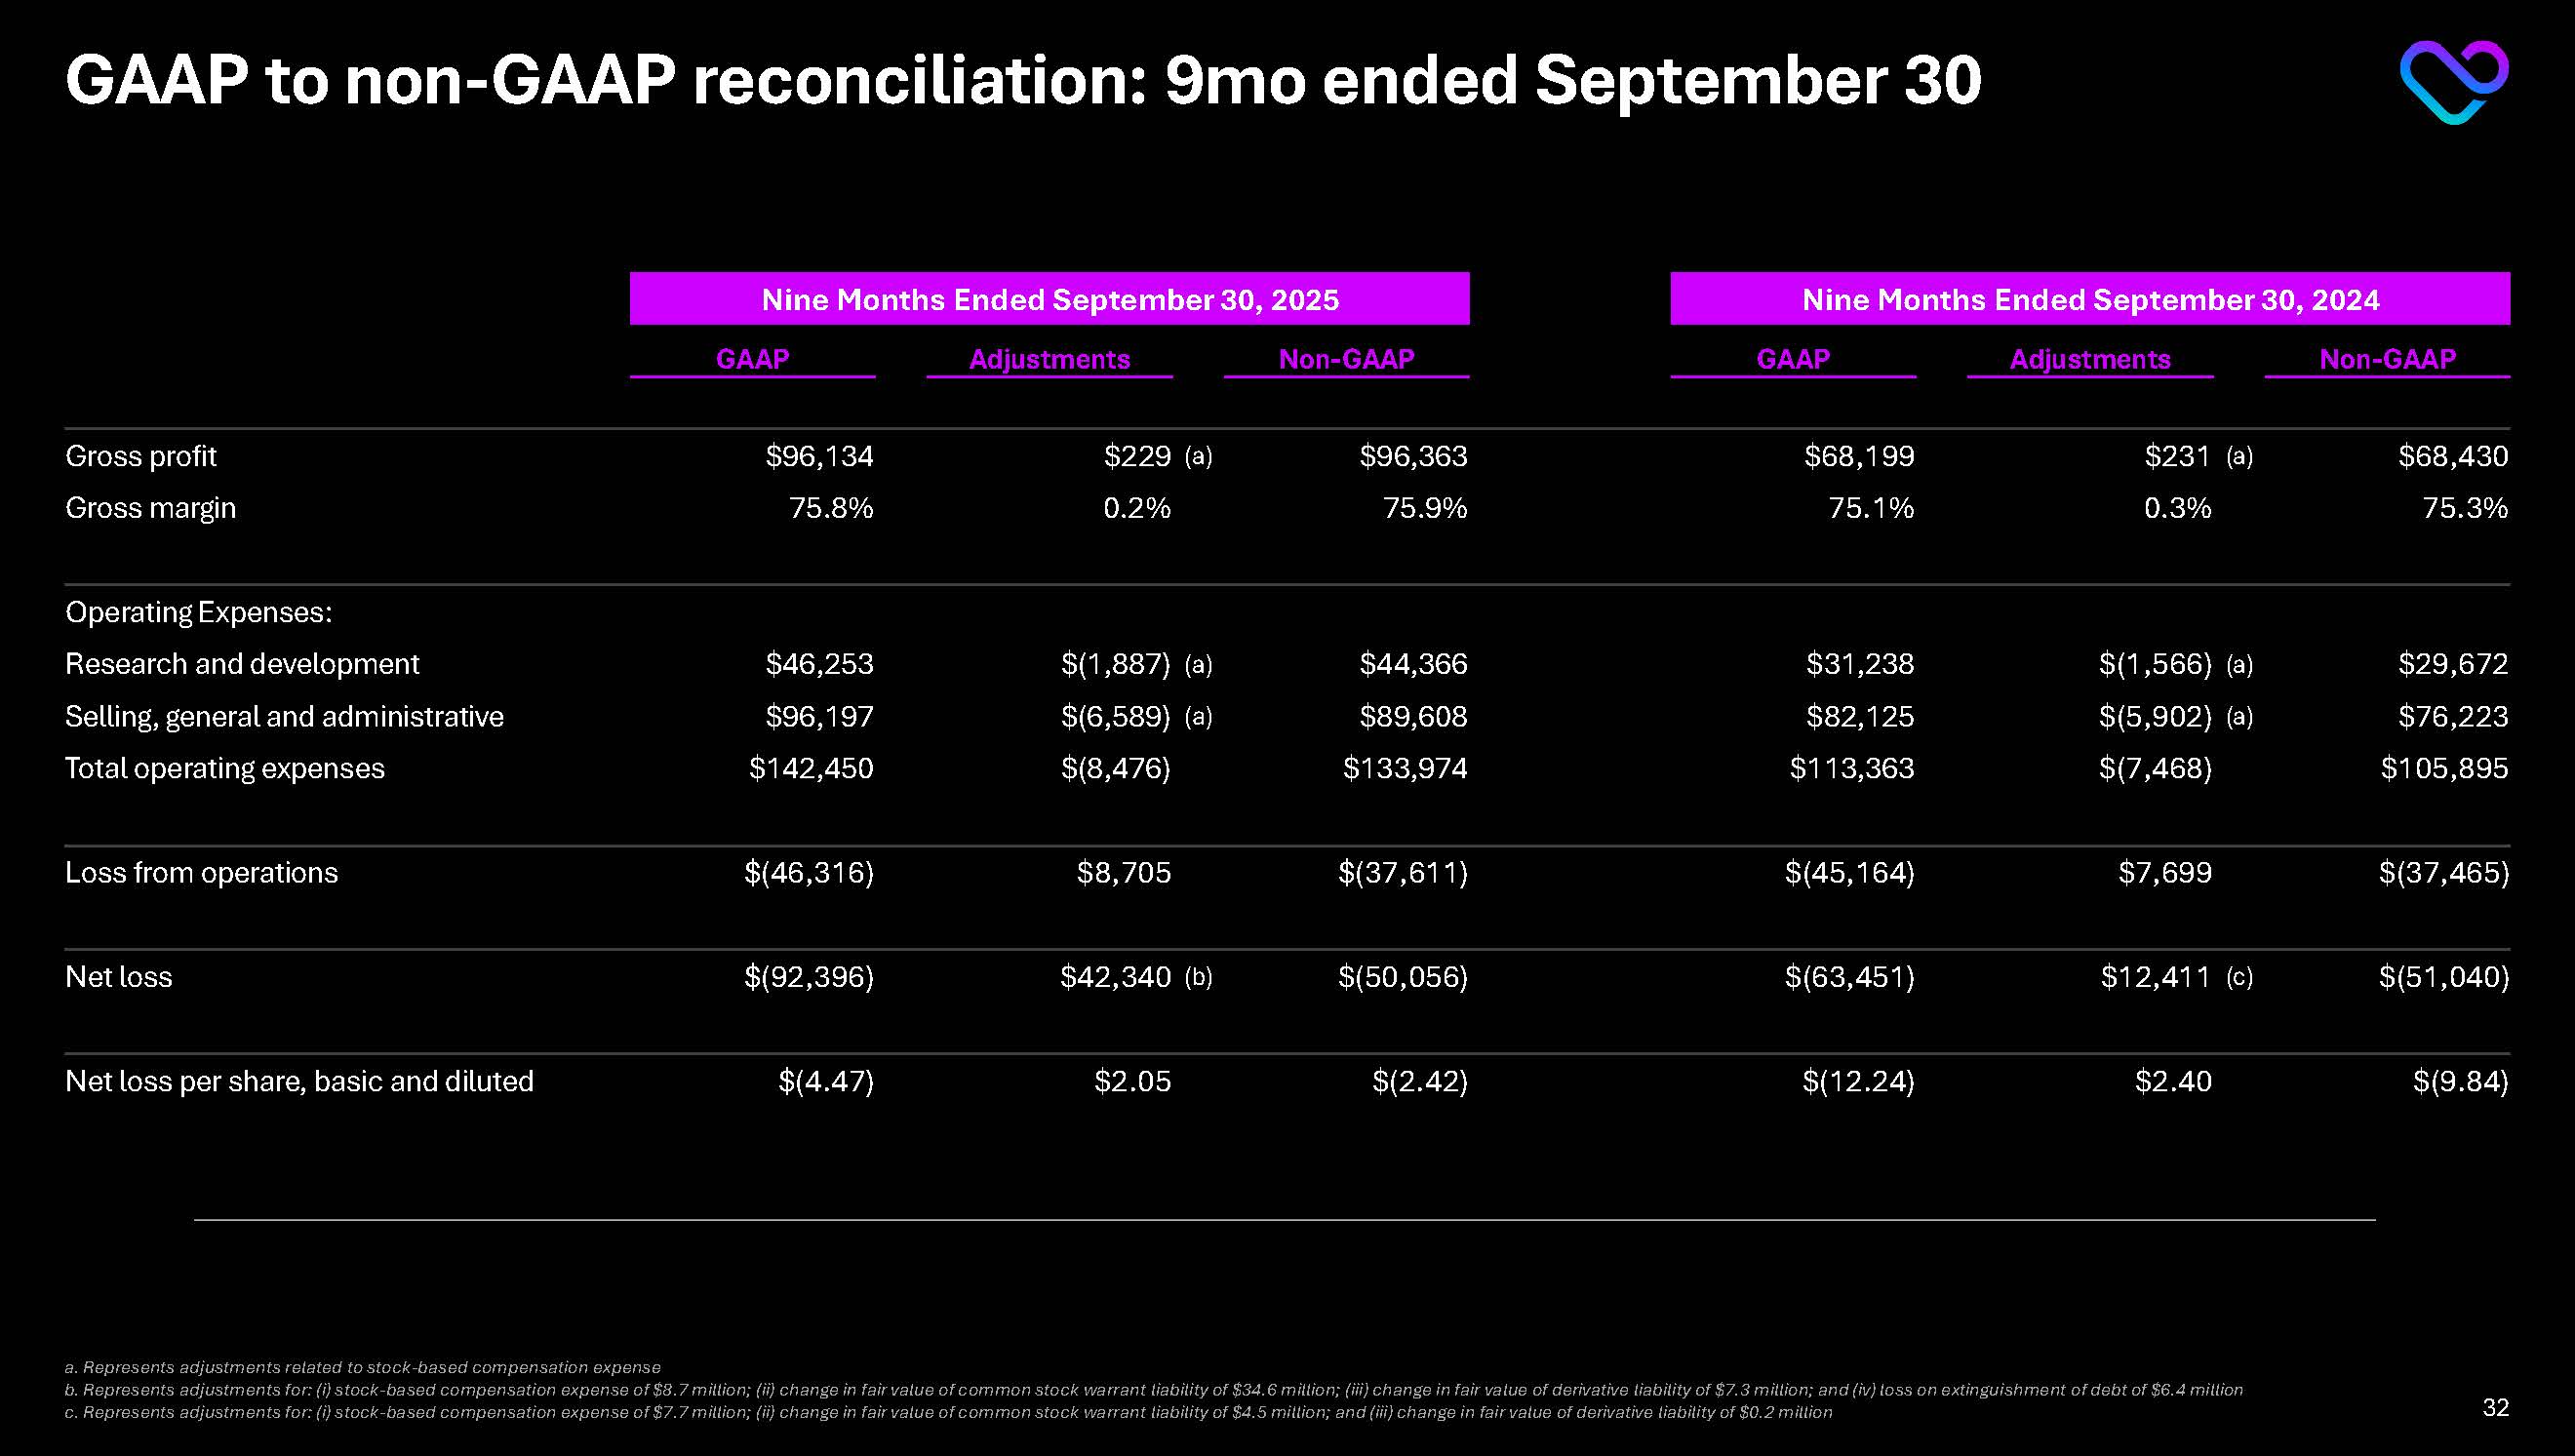
GAAP to non-GAAP reconciliation: 9mo ended September 30 Nine Months Ended September 30, 2025 Nine Months Ended September 30, 2024 GAAP Adjustments Non-GAAP GAAP Adjustments Non-GAAP
Gross profit $96,134 $229 (a) $96,363 $68,199 $231 (a) $68,430 Gross margin 75.8% 0.2% 75.9% 75.1% 0.3% 75.3% Operating Expenses: Research and development $46,253 $(1,887) (a) $44,366 $31,238 $(1,566) (a) $29,672
Selling, general and administrative $96,197 $(6,589) (a) $89,608 $82,125 $(5,902) (a) $76,223 Total operating expenses $142,450 $(8,476) $133,974 $113,363 $(7,468) $105,895 Loss from operations $(46,316) $8,705
$(37,611) $(45,164) $7,699 $(37,465) Net loss $(92,396) $42,340 (b) $(50,056) $(63,451) $12,411 (c) $(51,040) Net loss per share, basic and diluted $(4.47) $2.05 $(2.42) $(12.24) $2.40 $(9.84) a. Represents adjustments related to stock-based compensation expense b. Represents adjustments for: (i) stock-based compensation expense of $8.7 million; (ii) change in fair value of common stock warrant liability of $34.6 million; (iii) change in fair value of derivative liability of $7.3 million; and (iv) loss on extinguishment of debt of $6.4 million
c. Represents adjustments for: (i) stock-based compensation expense of $7.7 million; (ii) change in fair value of common stock warrant liability of $4.5 million; and (iii) change in fair value of derivative liability of $0.2 million 32
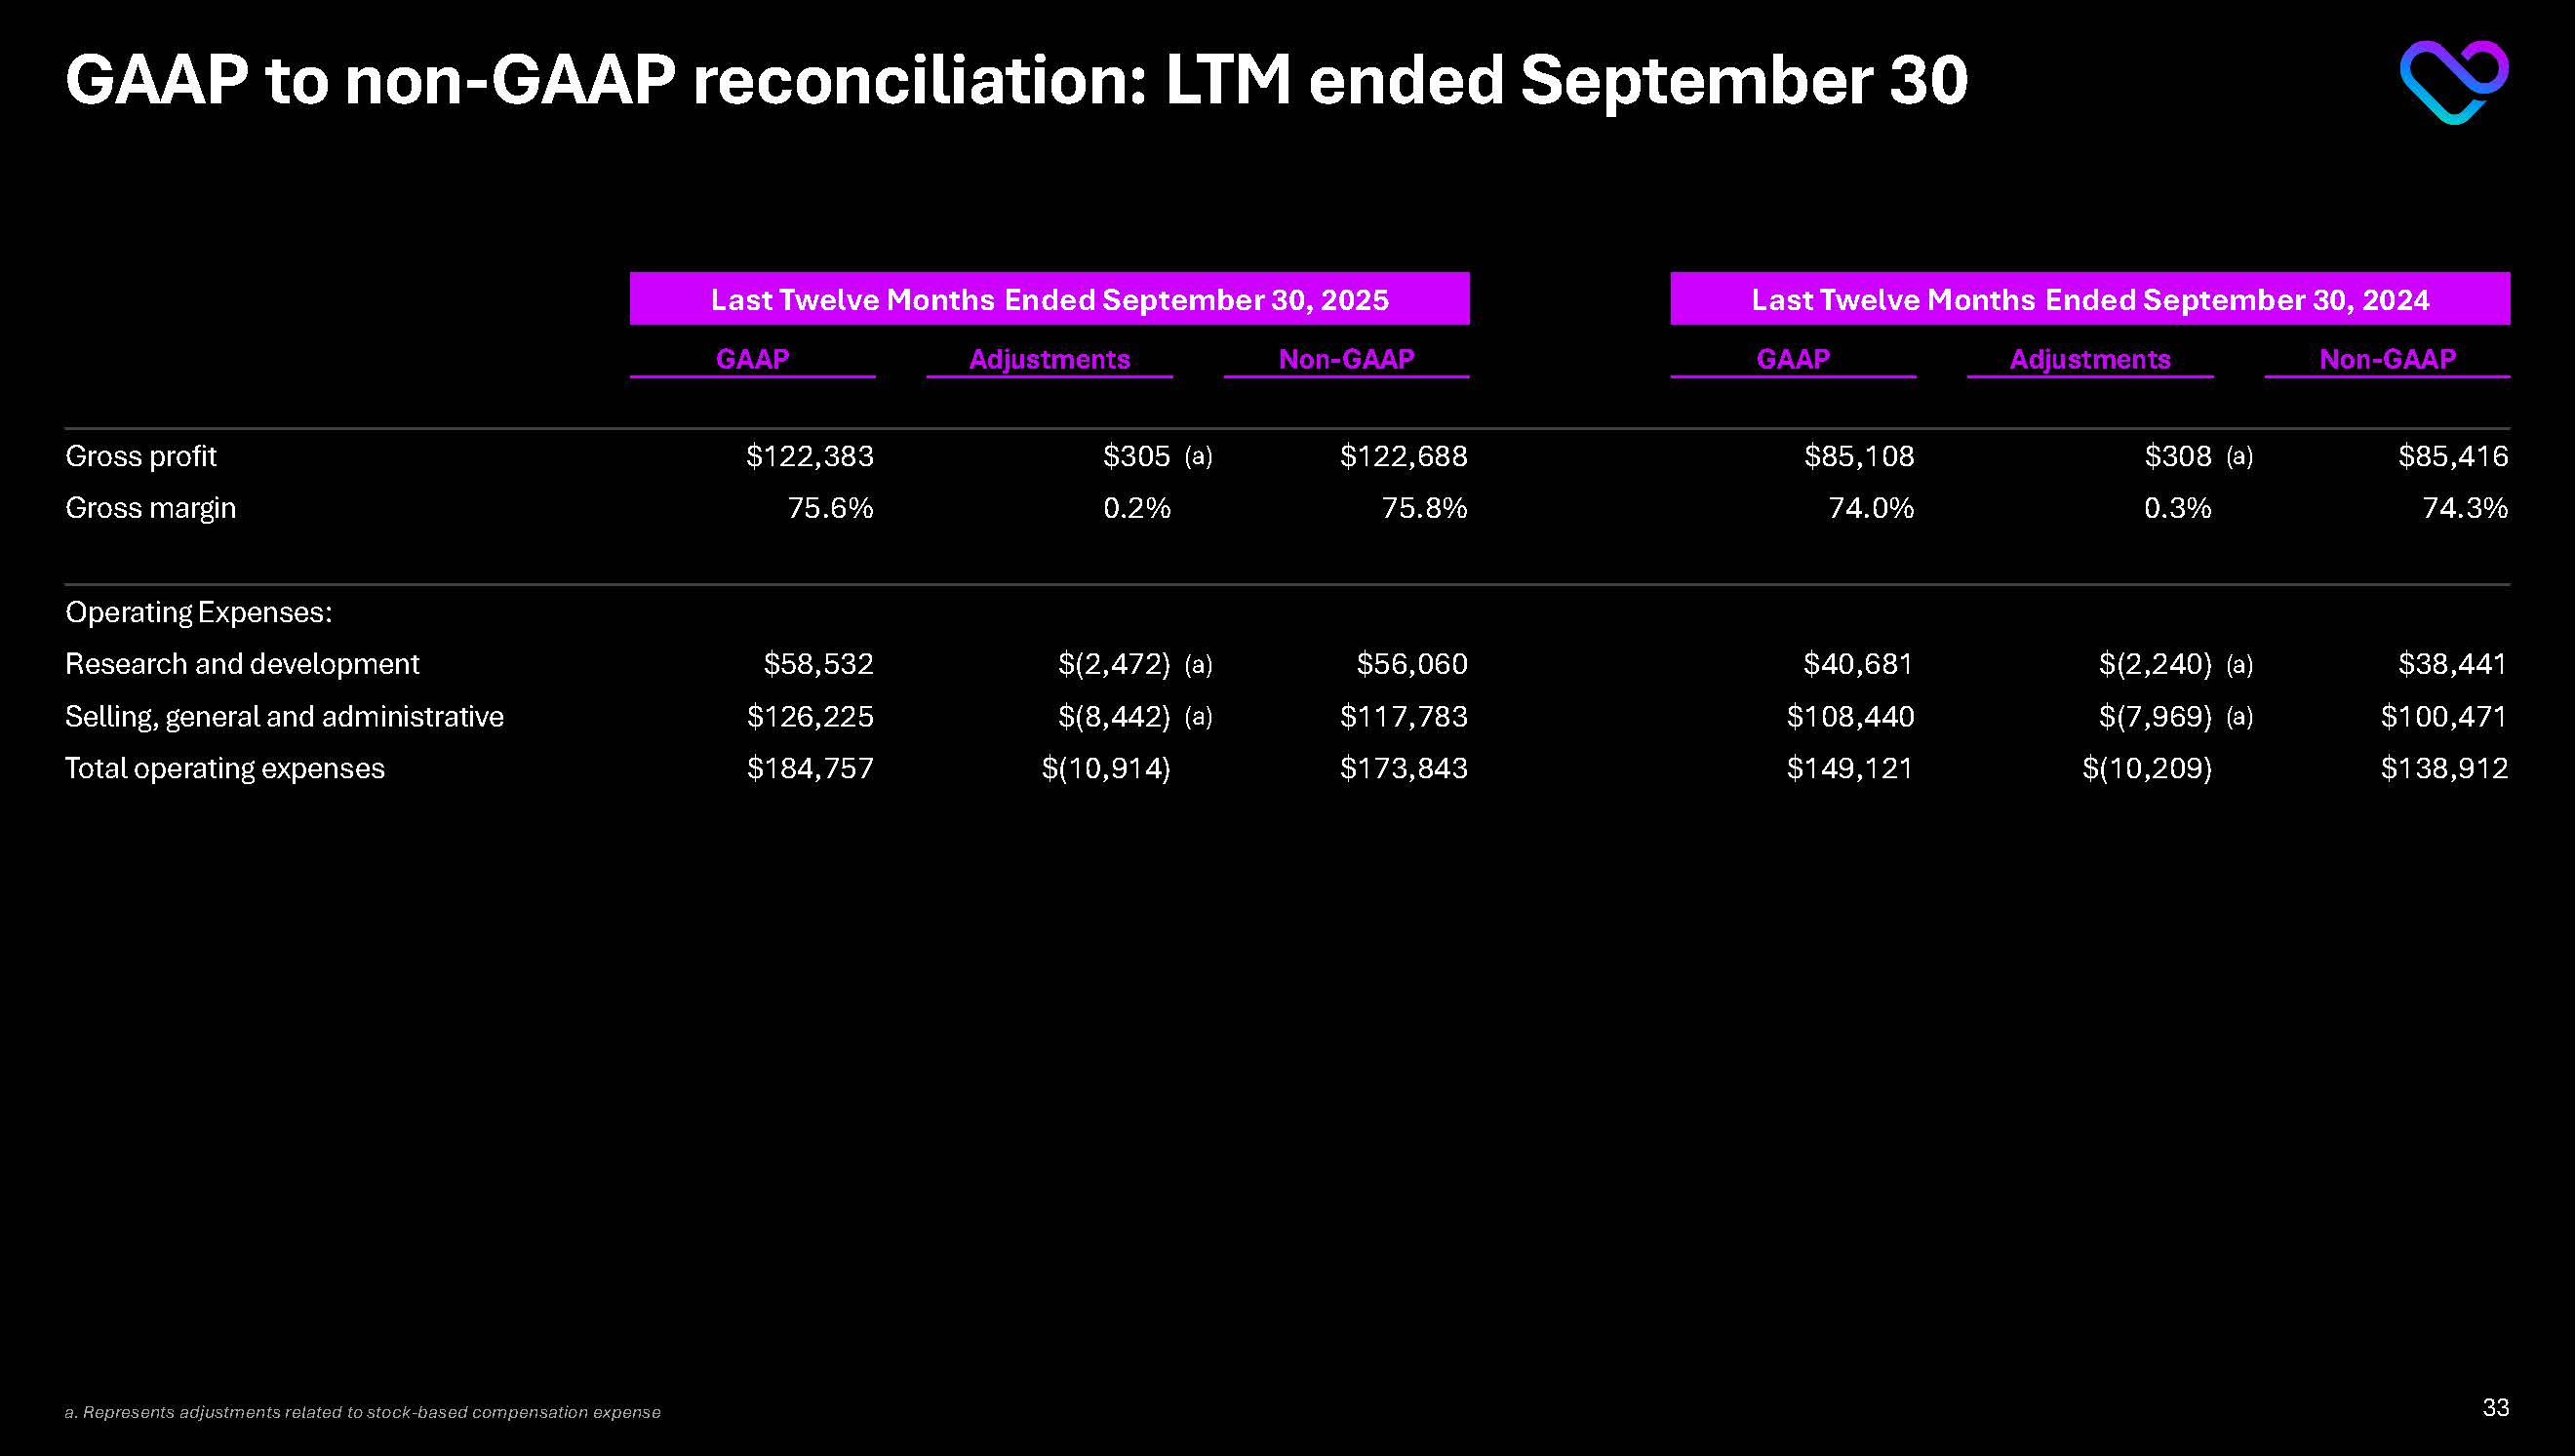
GAAP to non-GAAP reconciliation: LTM ended September 30 Last Twelve Months Ended September 30, 2025 Last Twelve Months Ended September 30, 2024 GAAP Adjustments Non-GAAP GAAP Adjustments Non-GAAP Gross profit
$122,383 $305 (a) $122,688 $85,108 $308 (a) $85,416 Gross margin 75.6% 0.2% 75.8% 74.0% 0.3% 74.3% Operating Expenses: Research and development $58,532 $(2,472) (a) $56,060 $40,681 $(2,240) (a) $38,441
Selling, general and administrative $126,225 $(8,442) (a) $117,783 $108,440 $(7,969) (a) $100,471 Total operating expenses $184,757 $(10,914) $173,843 $149,121 $(10,209) $138,912 a. Represents adjustments related to stock-based compensation expense 33
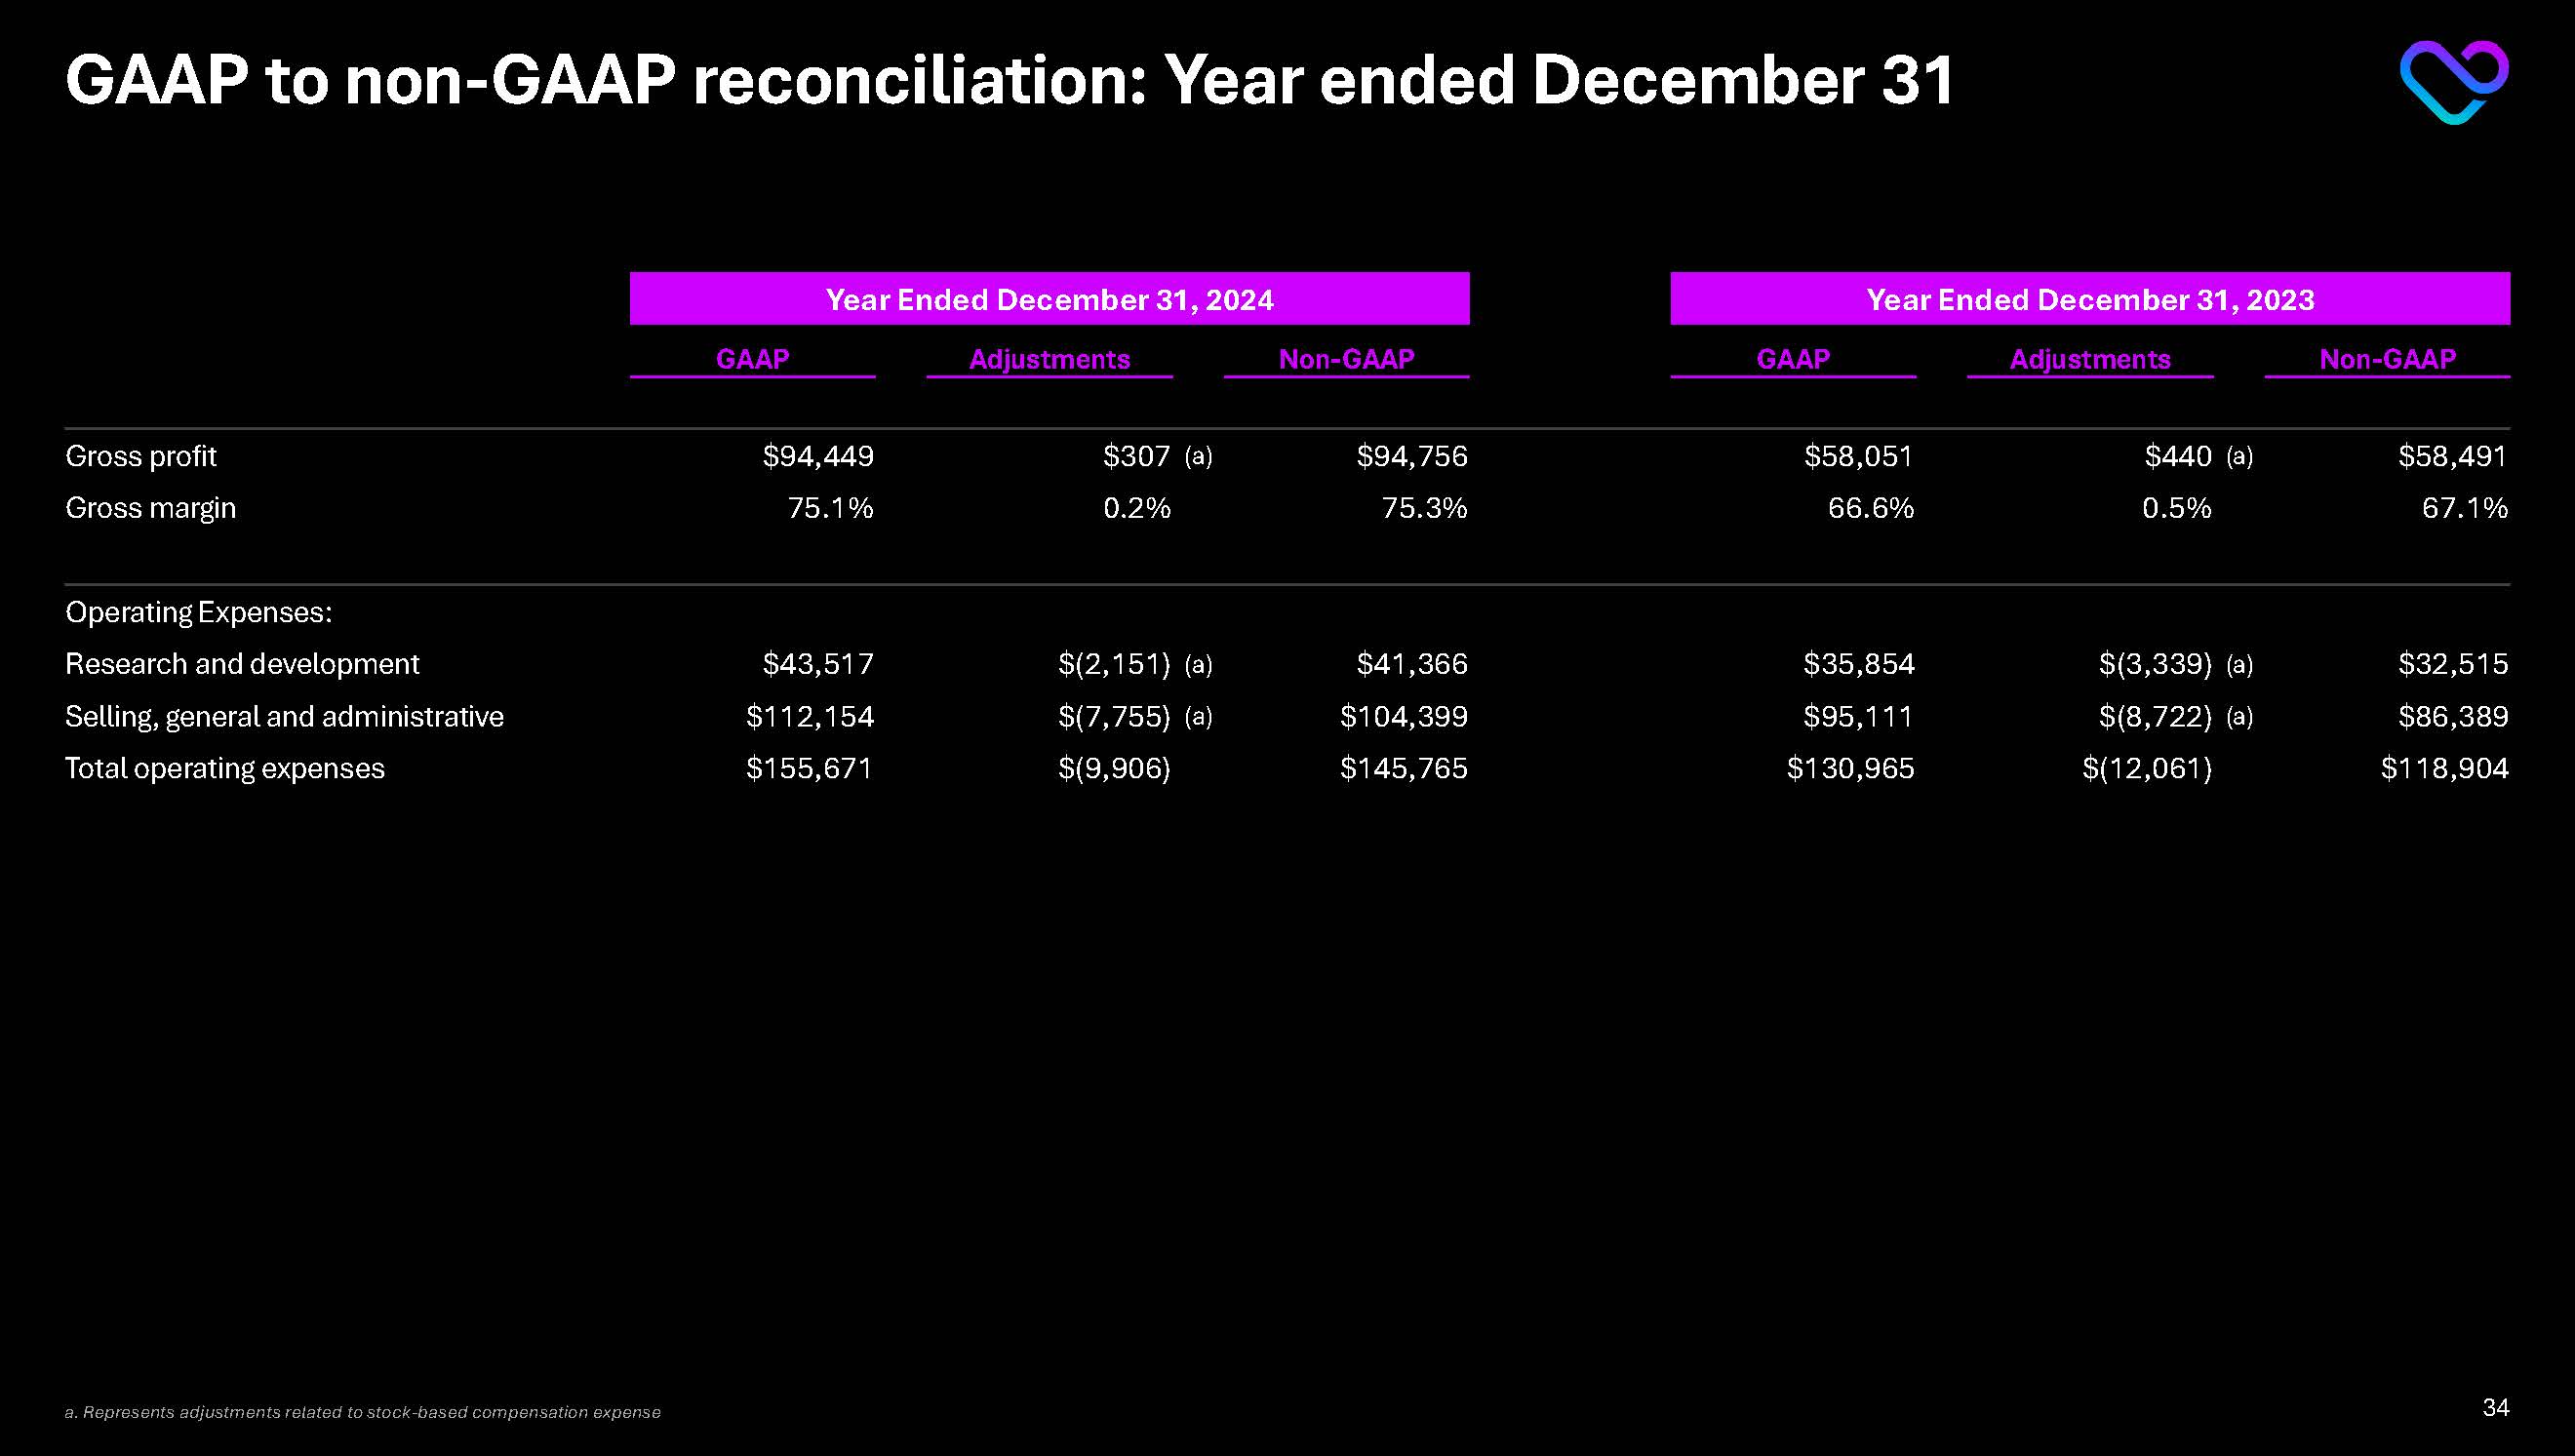
GAAP to non-GAAP reconciliation: Year ended December 31 Year Ended December 31, 2024 Year Ended December 31, 2023 GAAP Adjustments Non-GAAP GAAP Adjustments Non-GAAP Gross profit $94,449 $307 (a) $94,756 $58,051
$440 (a) $58,491 Gross margin 75.1% 0.2% 75.3% 66.6% 0.5% 67.1% Operating Expenses: Research and development $43,517 $(2,151) (a) $41,366 $35,854 $(3,339) (a) $32,515 Selling, general and administrative $112,154
$(7,755) (a) $104,399 $95,111 $(8,722) (a) $86,389 Total operating expenses $155,671 $(9,906) $145,765 $130,965 $(12,061) $118,904 a. Represents adjustments related to stock-based compensation expense 34