I N VE S T O R P R E S E N T AT I ON ALTISOURCE M A Y 2 0 2 3
© 2023 Altisource All Rights Reserved. DISCLAIMER 2 CAUTIONARY STATEMENT REGARDING FORWARD LOOKING STATEMENTS This corporate presentation includes certain forward-looking statements within the meaning of Section 21E of the Securities Exchange Act of 1934, as amended, and the Private Securities Litigation Reform Act of 1995. These forward-looking statements include, but are not limited to, statements regarding the intent, belief or current expectations of Altisource Portfolio Solutions S.A. ("we," "us," "our," the "Company" or "Altisource") and our management team. These forward-looking statements involve known and unknown risks, uncertainties and other important factors that may cause the actual results, performance or achievements of the Company to be materially different from any future results, performance or achievements expressed or implied by the forward-looking statements. This presentation contains forward-looking statements that involve a number of risks and uncertainties. These forward-looking statements include all statements that are not historical fact, including statements that relate to, among other things, future events or our future performance or financial condition. These statements may be identified by words such as “anticipate,” “intend,” “expect,” “may,” “could,” “should,” “would,” “plan,” “estimate,” “seek,” “believe,” “potential” or “continue” or the negative of these terms and comparable terminology. Such statements are based on expectations as to the future and are not statements of historical fact. Furthermore, forward-looking statements are not guarantees of future performance and involve a number of assumptions, risks and uncertainties that could cause actual results to differ materially. We caution you not to place undue reliance on these forward-looking statements which reflect our view only as of the date of this report. We are under no obligation (and expressly disclaim any obligation) to update or alter any forward- looking statements contained herein to reflect any change in our expectations with regard thereto or change in events, conditions or circumstances on which any such statement is based. The risks and uncertainties to which forward-looking statements are subject include, but are not limited to, risks related to the COVID-19 pandemic, customer concentration, the timing of the anticipated increase in default related referrals following the expiration of foreclosure and eviction moratoriums and forbearance programs, the timing of the expiration of such moratoriums and programs, and any other delays occasioned by government, investor or servicer actions, the use and success of our products and services, our ability to retain existing customers and attract new customers and the potential for expansion or changes in our customer relationships, technology disruptions, our compliance with applicable data requirements, our use of third party vendors and contractors, our ability to effectively manage potential conflicts of interest, macro-economic and industry specific conditions, our ability to effectively manage our regulatory and contractual obligations, the adequacy of our financial resources, including our sources of liquidity and ability to repay borrowings and comply with our Credit Agreement, including the financial and other covenants contained therein, as well as Altisource’s ability to retain key executives or employees, behavior of customers, suppliers and/or competitors, technological developments, governmental regulations, taxes and policies. The forward-looking statements should not be unduly relied upon. Nothing in this presentation and our other SEC filings should be regarded as a representation by any person that these statements will be achieved, and the Company undertakes no obligation to update these statements as a result of a change in circumstances, new information or future events. For additional information about factors that could cause actual results to differ materially from those described in the forward-looking statements, please refer to the Company’s filings with the Securities and Exchange Commission, including the risk factors contained in the Company’s Annual Report on Form 10-K for the year ended December 31, 2022 and the Company’s Quarterly Report on Form 10-Q for the quarter ended March 31, 2023. This corporate presentation shall not constitute an offer to sell, or a solicitation of an offer to buy, nor will there be any sale of these securities in any state or other jurisdiction in which such an offer, solicitation or sale would be unlawful prior to the registration or qualification under the securities laws of any such state or other jurisdiction.

© 2023 Altisource All Rights Reserved. OVERVIEW OF ALT ISOURCE 3 1 Comprehensive suite of solutions 1 Full time employees, excluding contractors, as of May 15, 2023 2 Service revenue presented herein excludes reimbursable expenses and non-controlling interests 3 Market Capitalization (“Market Cap”) as of May 19, 2023. Enterprise Value (“EV”) reflects Market Cap as of May 19, 2023 plus Net Debt as of March 31, 2023 K E Y B U S I N E S S H I G H L I G H T S LUXEMBOURG Headquarters UNITED STATES INDIA URUGUAY 1,295 Employees1 $144 MM 2022 Service revenue2 $96 MM Market Cap3 $280 MM Enterprise Value3 NASDAQ Exchange ASPS Ticker Symbol Strong and growing customer base 2 Compelling growth catalysts 3 Path to positive cash flow4 K E Y F A C T S S U I T E O F S O L U T I O N S BUY Marketplace to buy homes SERVICE / MANAGE Suite of solutions for residential loan servicers and real estate investors SELL Marketplace to sell homes LEND Suite of solutions for small and mid-sized residential loan originators Comprehensive suite of solutions that support the default servicing, real estate and origination lifecycles
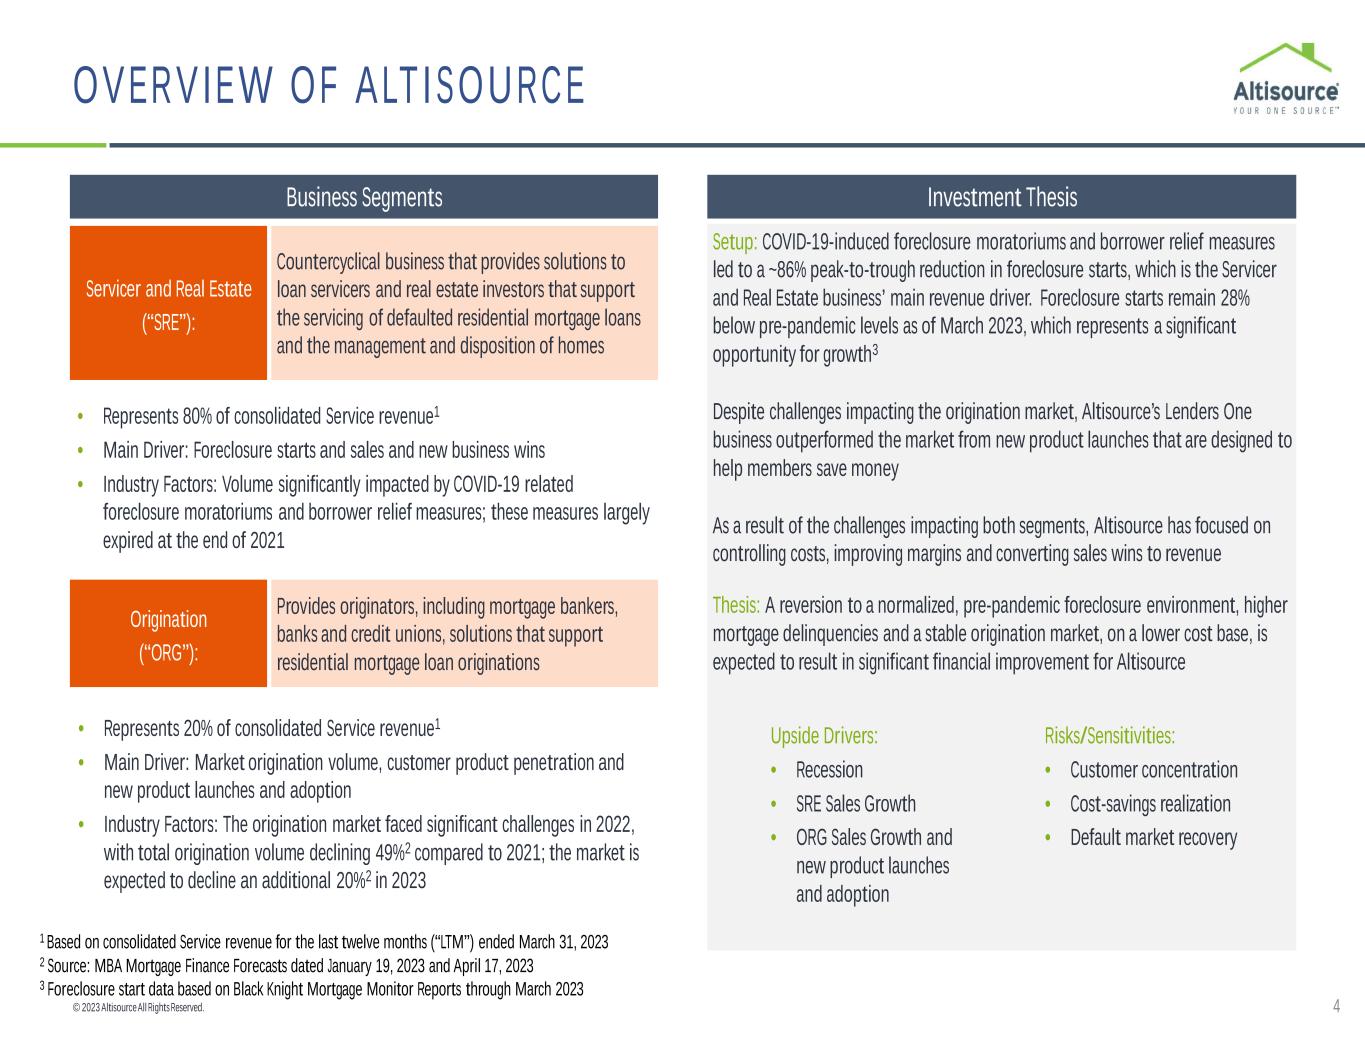
© 2023 Altisource All Rights Reserved. Setup: COVID-19-induced foreclosure moratoriums and borrower relief measures led to a ~86% peak-to-trough reduction in foreclosure starts, which is the Servicer and Real Estate business’ main revenue driver. Foreclosure starts remain 28% below pre-pandemic levels as of March 2023, which represents a significant opportunity for growth3 Despite challenges impacting the origination market, Altisource’s Lenders One business outperformed the market from new product launches that are designed to help members save money As a result of the challenges impacting both segments, Altisource has focused on controlling costs, improving margins and converting sales wins to revenue Thesis: A reversion to a normalized, pre-pandemic foreclosure environment, higher mortgage delinquencies and a stable origination market, on a lower cost base, is expected to result in significant financial improvement for Altisource OVERVIEW OF ALT ISOURCE 4 • Represents 20% of consolidated Service revenue1 • Main Driver: Market origination volume, customer product penetration and new product launches and adoption • Industry Factors: The origination market faced significant challenges in 2022, with total origination volume declining 49%2 compared to 2021; the market is expected to decline an additional 20%2 in 2023 Investment Thesis Servicer and Real Estate (“SRE”): Origination (“ORG”): Countercyclical business that provides solutions to loan servicers and real estate investors that support the servicing of defaulted residential mortgage loans and the management and disposition of homes Provides originators, including mortgage bankers, banks and credit unions, solutions that support residential mortgage loan originations Business Segments • Represents 80% of consolidated Service revenue1 • Main Driver: Foreclosure starts and sales and new business wins • Industry Factors: Volume significantly impacted by COVID-19 related foreclosure moratoriums and borrower relief measures; these measures largely expired at the end of 2021 Upside Drivers: • Recession • SRE Sales Growth • ORG Sales Growth and new product launches and adoption Risks/Sensitivities: • Customer concentration • Cost-savings realization • Default market recovery 1 Based on consolidated Service revenue for the last twelve months (“LTM”) ended March 31, 2023 2 Source: MBA Mortgage Finance Forecasts dated January 19, 2023 and April 17, 2023 3 Foreclosure start data based on Black Knight Mortgage Monitor Reports through March 2023
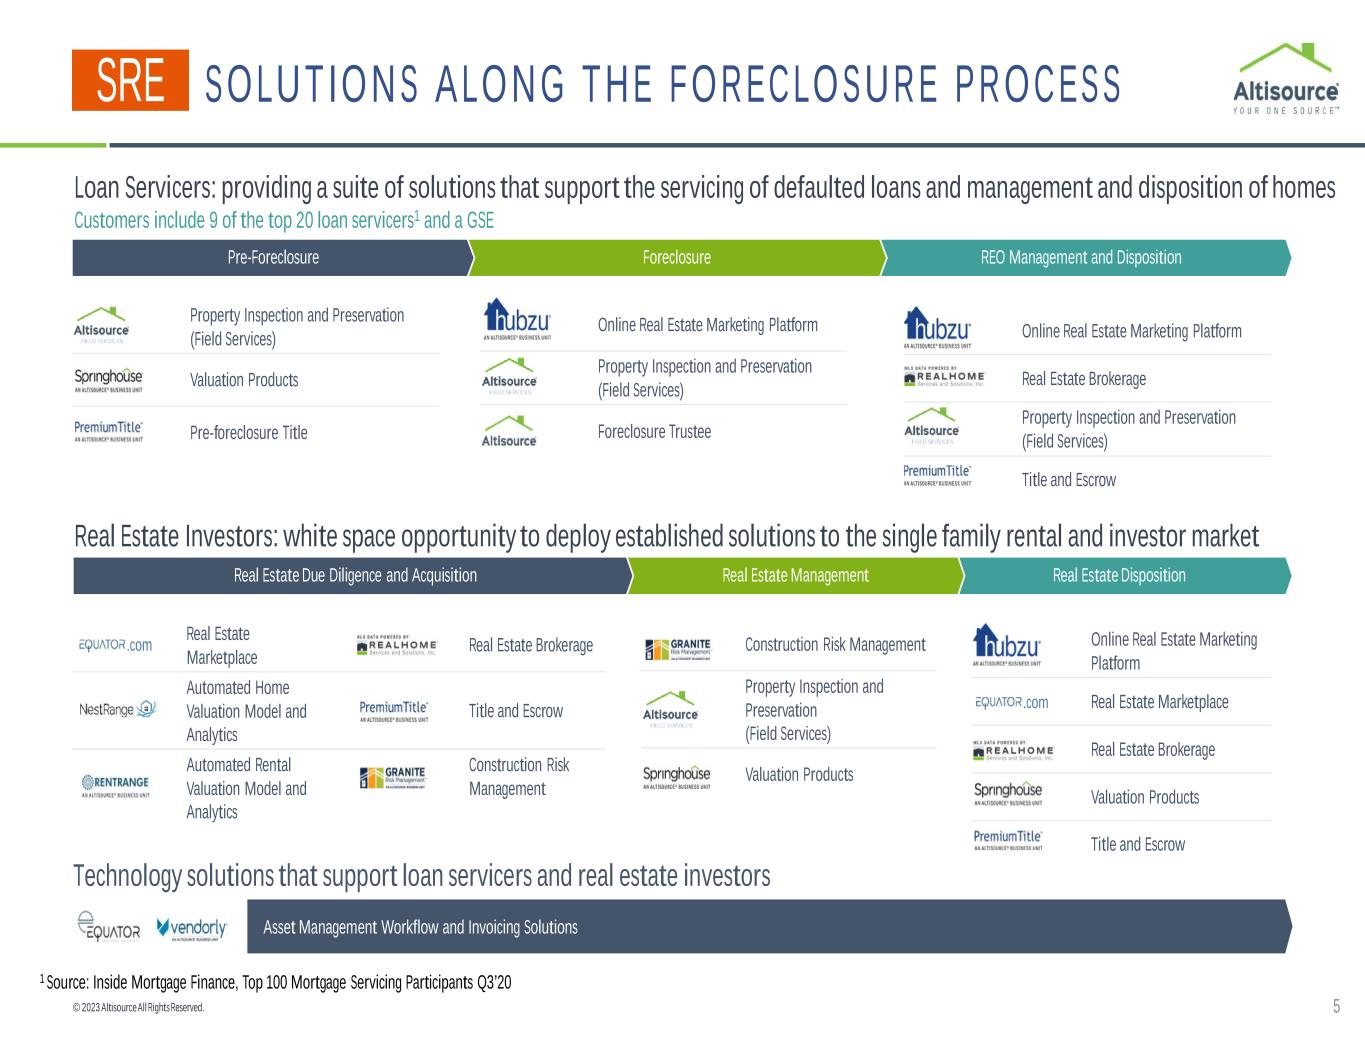
© 2023 Altisource All Rights Reserved. 5 SOLUTIONS ALONG THE FORECLOSURE PROCESS Asset Management Workflow and Invoicing Solutions Technology solutions that support loan servicers and real estate investors Online Real Estate Marketing Platform Real Estate Marketplace Real Estate Brokerage Valuation Products Title and Escrow Construction Risk Management Property Inspection and Preservation (Field Services) Valuation Products Real Estate Marketplace Real Estate Brokerage Automated Home Valuation Model and Analytics Title and Escrow Automated Rental Valuation Model and Analytics Construction Risk Management Online Real Estate Marketing Platform Real Estate Brokerage Property Inspection and Preservation (Field Services) Title and Escrow Online Real Estate Marketing Platform Property Inspection and Preservation (Field Services) Foreclosure Trustee Property Inspection and Preservation (Field Services) Valuation Products Pre-foreclosure Title Pre-Foreclosure REO Management and DispositionPre-Foreclosure Foreclosure Real Estate DispositionReal Estate Due Diligence and Acquisition Real Estate Management .com .com Loan Servicers: providing a suite of solutions that support the servicing of defaulted loans and management and disposition of homes Customers include 9 of the top 20 loan servicers1 and a GSE Real Estate Investors: white space opportunity to deploy established solutions to the single family rental and investor market 1 Source: Inside Mortgage Finance, Top 100 Mortgage Servicing Participants Q3’20 SRE
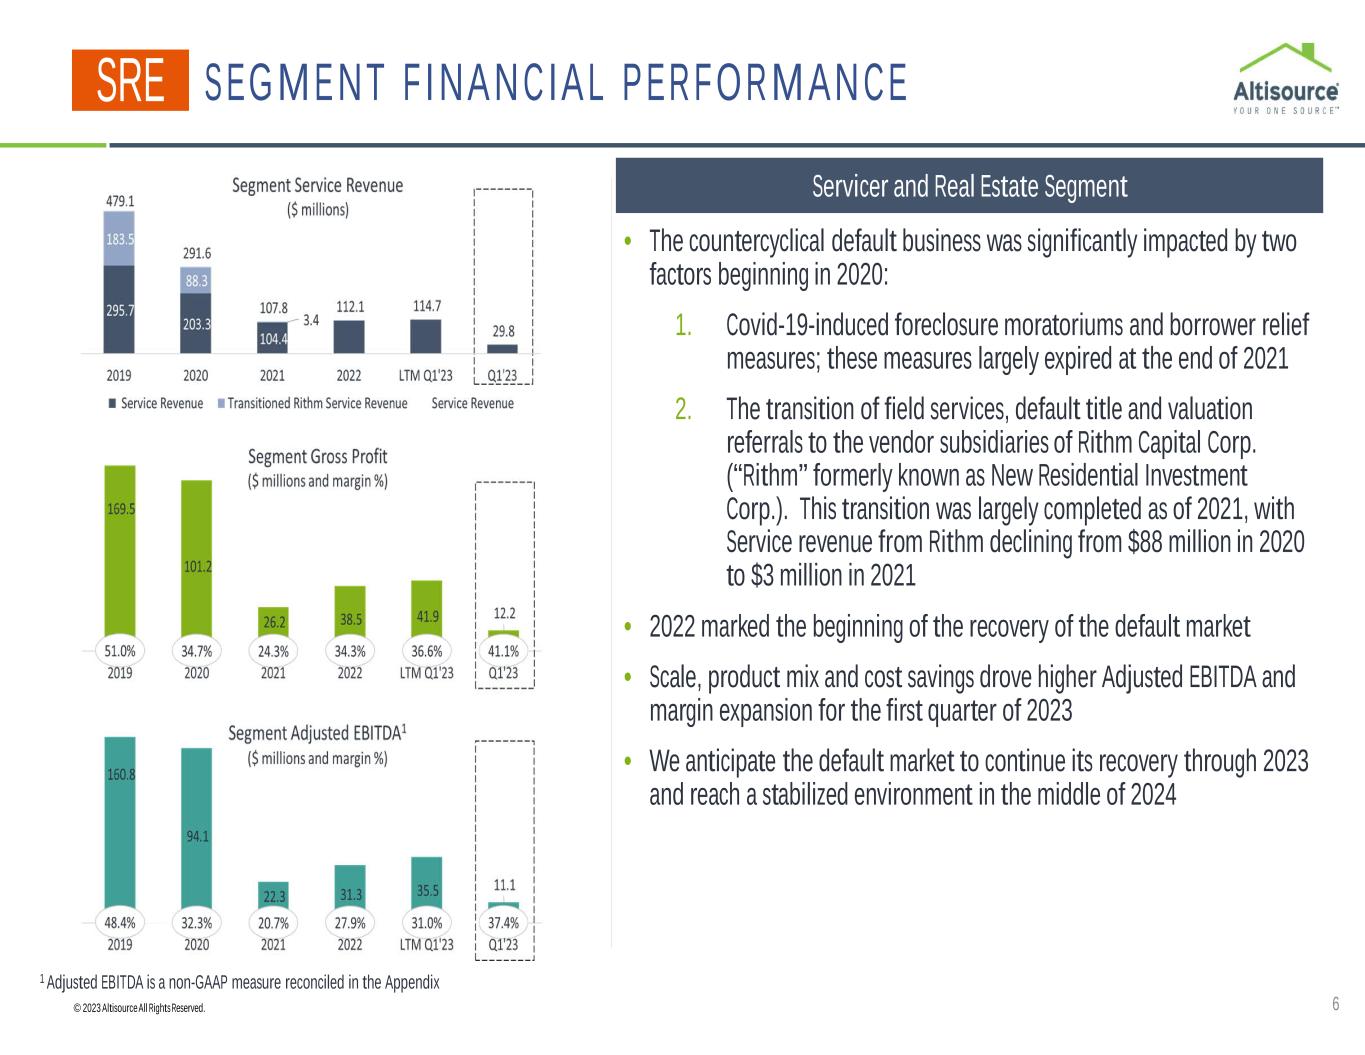
© 2023 Altisource All Rights Reserved. SEGMENT F INANCIAL PERFORMANCE 6 • The countercyclical default business was significantly impacted by two factors beginning in 2020: 1. Covid-19-induced foreclosure moratoriums and borrower relief measures; these measures largely expired at the end of 2021 2. The transition of field services, default title and valuation referrals to the vendor subsidiaries of Rithm Capital Corp. (“Rithm” formerly known as New Residential Investment Corp.). This transition was largely completed as of 2021, with Service revenue from Rithm declining from $88 million in 2020 to $3 million in 2021 • 2022 marked the beginning of the recovery of the default market • Scale, product mix and cost savings drove higher Adjusted EBITDA and margin expansion for the first quarter of 2023 • We anticipate the default market to continue its recovery through 2023 and reach a stabilized environment in the middle of 2024 Servicer and Real Estate Segment SRE 1 Adjusted EBITDA is a non-GAAP measure reconciled in the Appendix

© 2023 Altisource All Rights Reserved. MARKET FACTORS THAT DRIVE REVENUE GROWTH 7 Foreclosure Starts and Timing Foreclosure Starts Days • 2022 foreclosure starts were 325% higher than 2021 • The 2022 increase in foreclosure starts drove higher referrals for our pre-foreclosure solutions including title, valuation, trustee and field services for the past three quarters • 2022 foreclosure starts were 28% lower than 2019; similarly, Q1’23 foreclosure starts were 28% lower than Q1’19. We believe this: • is due to (a) the timing for servicers to initiate foreclosures on delinquent loans following the expiration of the moratoriums, (b) certain limited 2022 GSE foreclosure suspension directives1 and (c) borrower equity following strong home price appreciation beginning during the pandemic • represents a significant opportunity for revenue growth should the market return to pre-pandemic foreclosure start levels • In today’s environment, we estimate it typically takes an average of two years to convert foreclosure starts to foreclosure sales and another six months to market and sell the resulting REO Shaded area represents period of borrower relief measures Source: Data based on Black Knight Mortgage Monitor Reports from January 2018 through March 2023 1 In April 2022, the Federal Housing Finance Authority (FHFA) required servicers of GSE loans to suspend foreclosure activities for up to 60 days if the servicer has been notified that a borrower has applied for assistance under the Department of Treasury’s Homeowner Assistance Fund (HAF) SRE
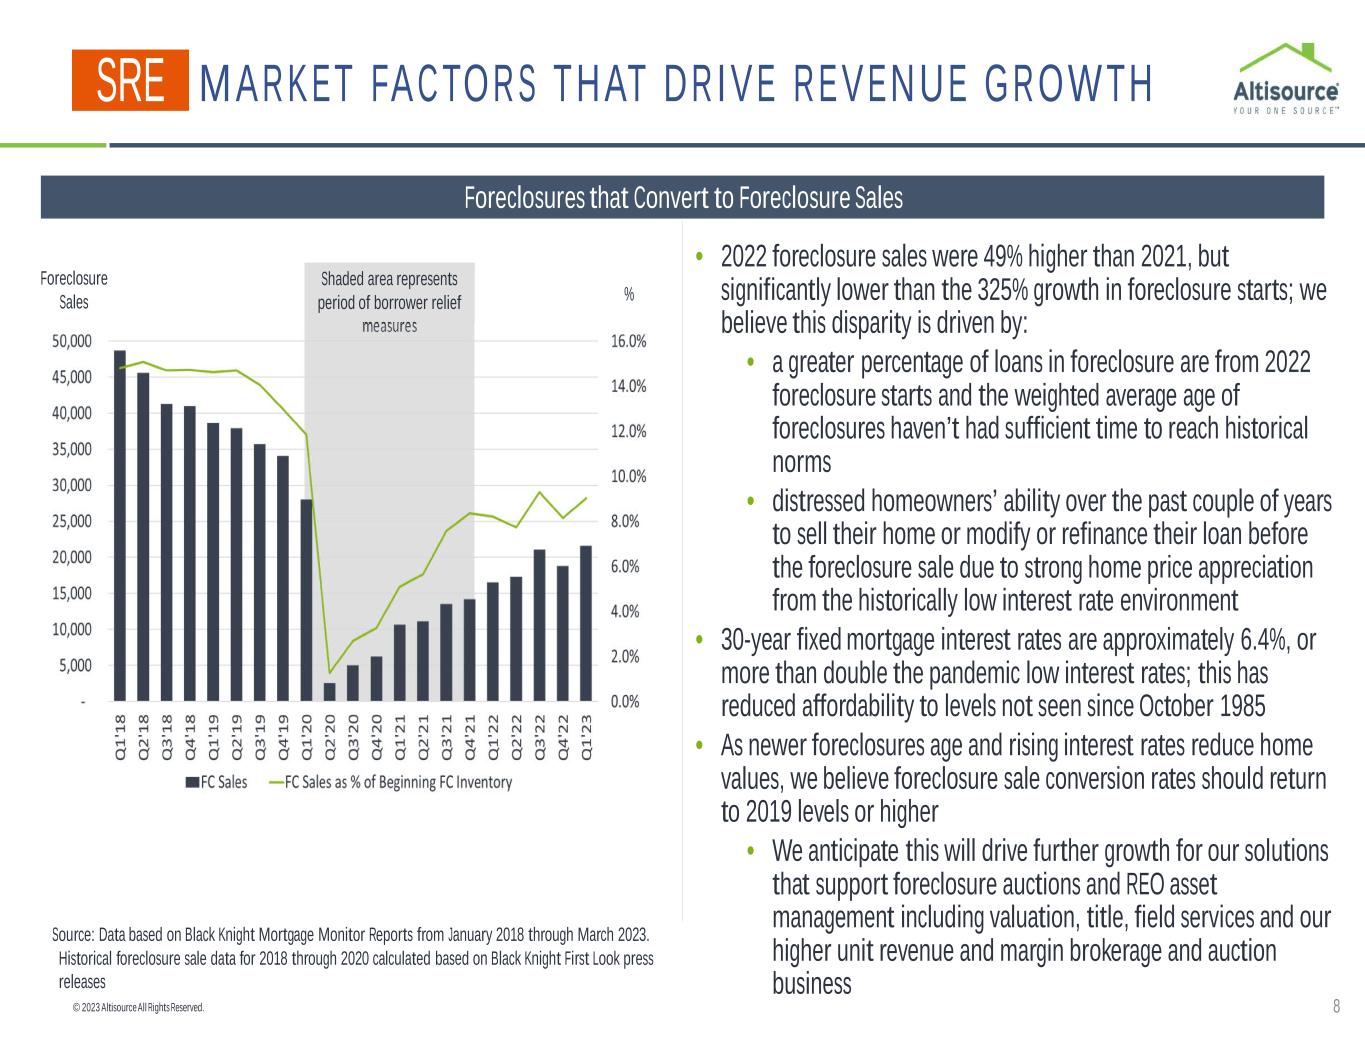
© 2023 Altisource All Rights Reserved. MARKET FACTORS THAT DRIVE REVENUE GROWTH 8 Foreclosures that Convert to Foreclosure Sales Foreclosure Sales % • 2022 foreclosure sales were 49% higher than 2021, but significantly lower than the 325% growth in foreclosure starts; we believe this disparity is driven by: • a greater percentage of loans in foreclosure are from 2022 foreclosure starts and the weighted average age of foreclosures haven’t had sufficient time to reach historical norms • distressed homeowners’ ability over the past couple of years to sell their home or modify or refinance their loan before the foreclosure sale due to strong home price appreciation from the historically low interest rate environment • 30-year fixed mortgage interest rates are approximately 6.4%, or more than double the pandemic low interest rates; this has reduced affordability to levels not seen since October 1985 • As newer foreclosures age and rising interest rates reduce home values, we believe foreclosure sale conversion rates should return to 2019 levels or higher • We anticipate this will drive further growth for our solutions that support foreclosure auctions and REO asset management including valuation, title, field services and our higher unit revenue and margin brokerage and auction business Shaded area represents period of borrower relief measures Source: Data based on Black Knight Mortgage Monitor Reports from January 2018 through March 2023. Historical foreclosure sale data for 2018 through 2020 calculated based on Black Knight First Look press releases SRE
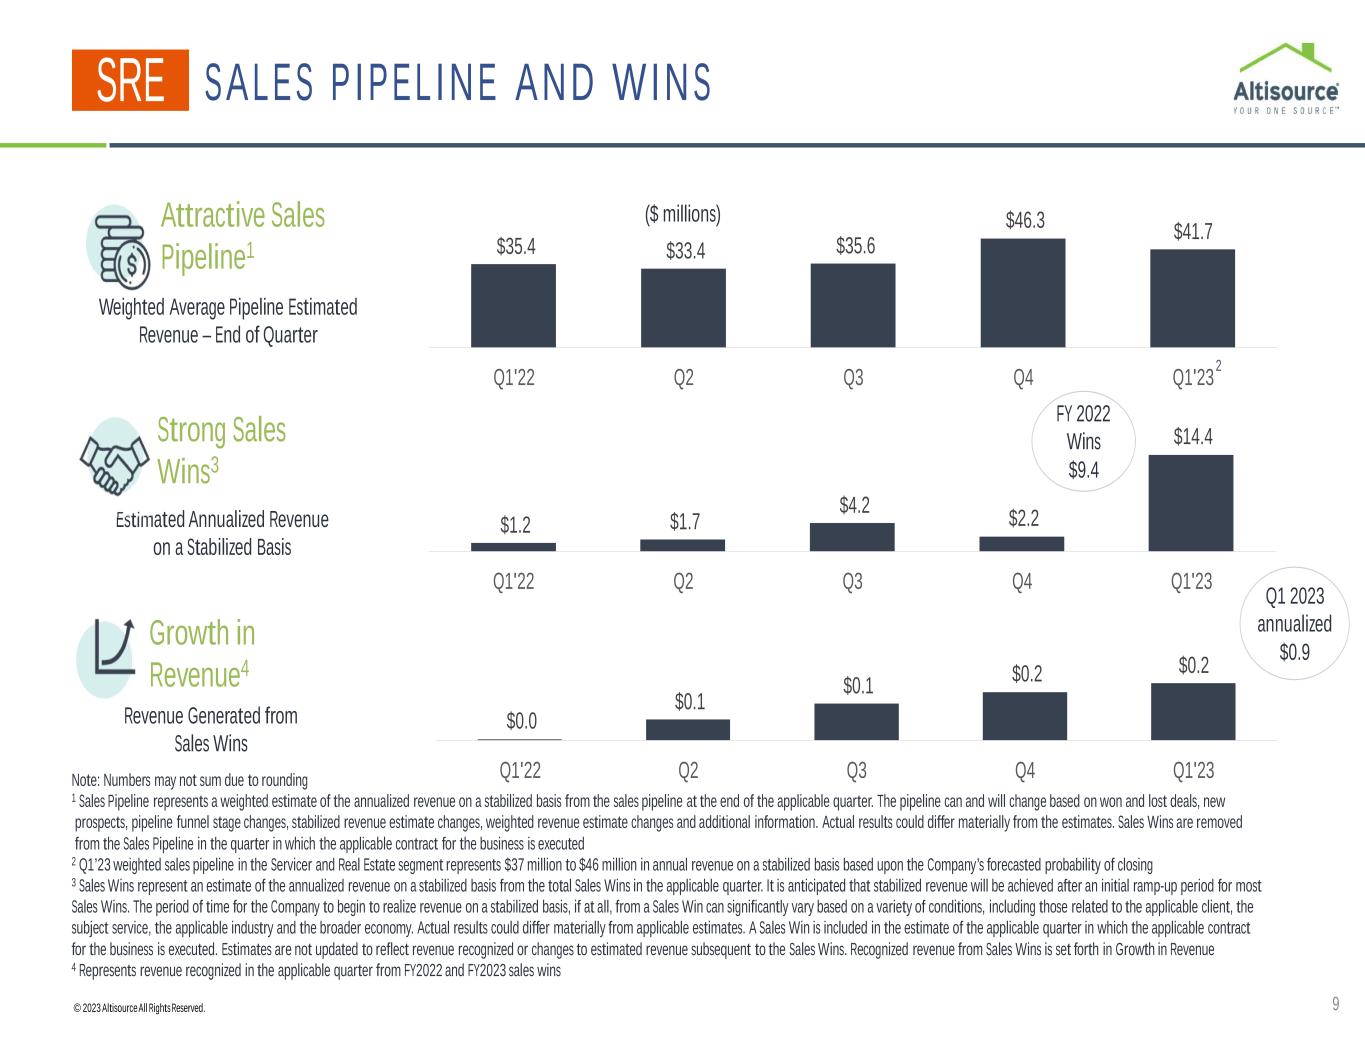
© 2023 Altisource All Rights Reserved. SALES P IPEL INE AND WINS 9 $35.4 $33.4 $35.6 $46.3 $41.7 Q1'22 Q2 Q3 Q4 Q1'23 $1.2 $1.7 $4.2 $2.2 $14.4 Q1'22 Q2 Q3 Q4 Q1'23 $0.0 $0.1 $0.1 $0.2 $0.2 Q1'22 Q2 Q3 Q4 Q1'23 Attractive Sales Pipeline1 Weighted Average Pipeline Estimated Revenue – End of Quarter ($ millions) Note: Numbers may not sum due to rounding 1 Sales Pipeline represents a weighted estimate of the annualized revenue on a stabilized basis from the sales pipeline at the end of the applicable quarter. The pipeline can and will change based on won and lost deals, new prospects, pipeline funnel stage changes, stabilized revenue estimate changes, weighted revenue estimate changes and additional information. Actual results could differ materially from the estimates. Sales Wins are removed from the Sales Pipeline in the quarter in which the applicable contract for the business is executed 2 Q1’23 weighted sales pipeline in the Servicer and Real Estate segment represents $37 million to $46 million in annual revenue on a stabilized basis based upon the Company’s forecasted probability of closing 3 Sales Wins represent an estimate of the annualized revenue on a stabilized basis from the total Sales Wins in the applicable quarter. It is anticipated that stabilized revenue will be achieved after an initial ramp-up period for most Sales Wins. The period of time for the Company to begin to realize revenue on a stabilized basis, if at all, from a Sales Win can significantly vary based on a variety of conditions, including those related to the applicable client, the subject service, the applicable industry and the broader economy. Actual results could differ materially from applicable estimates. A Sales Win is included in the estimate of the applicable quarter in which the applicable contract for the business is executed. Estimates are not updated to reflect revenue recognized or changes to estimated revenue subsequent to the Sales Wins. Recognized revenue from Sales Wins is set forth in Growth in Revenue 4 Represents revenue recognized in the applicable quarter from FY2022 and FY2023 sales wins FY 2022 Wins $9.4 Q1 2023 annualized $0.9 Strong Sales Wins3 Estimated Annualized Revenue on a Stabilized Basis Growth in Revenue4 Revenue Generated from Sales Wins 2 SRE
© 2023 Altisource All Rights Reserved. • Indicators that consumers are becoming increasingly financially stressed which could be precursors to a rise in mortgage delinquency rates: • High inflation eroding consumer purchasing power • Rapid rise in Fed Funds Rate driving mortgage interest rates to almost double from pandemic lows • Home affordability reduced to historic lows in Q4 2022 • Average personal savings rate declined to 5.1% in March 2023, compared to 26.3% in March 20211 • Auto loan delinquencies near record high levels • Federal student loan payments slated to resume • Outstanding credit card debt reached a record high in December 2022 and continued to climb at a robust pace in January 2023 • Credit card delinquencies rose sharply through 2022; two large credit card lenders reported rising delinquencies in February 2023 compared to January MACROECONOMIC ENVIRONMENT 10 1 Source: Economic Research Division of Federal Reserve Bank of St. Louis; Personal Saving Rate
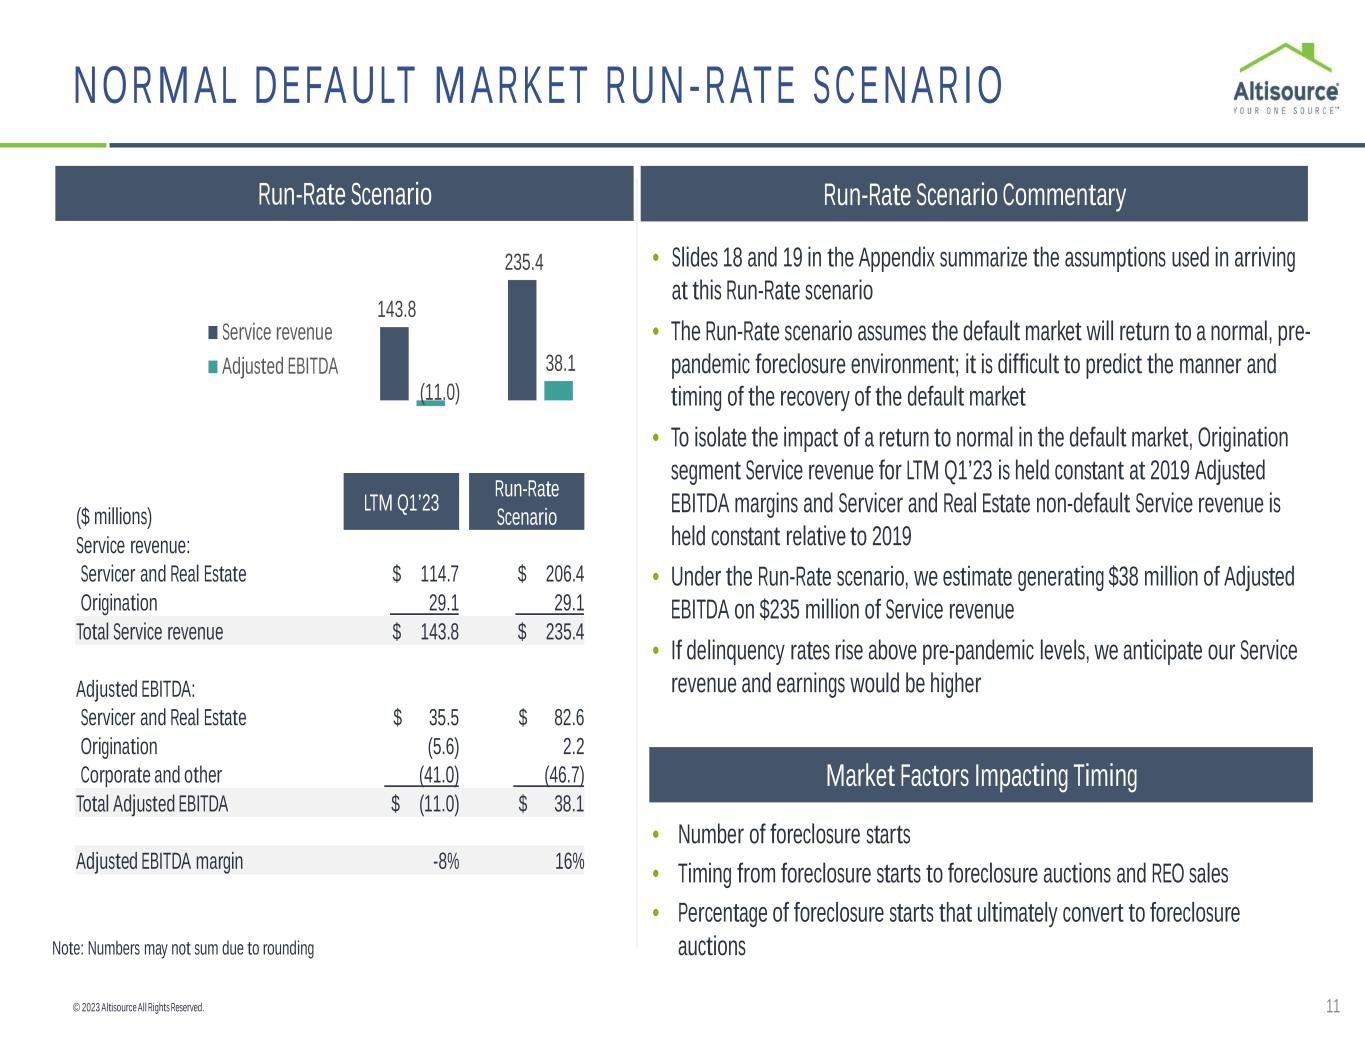
© 2023 Altisource All Rights Reserved. NORMAL DEFAULT MARKET RUN-RATE SCENARIO 11 • Slides 18 and 19 in the Appendix summarize the assumptions used in arriving at this Run-Rate scenario • The Run-Rate scenario assumes the default market will return to a normal, pre- pandemic foreclosure environment; it is difficult to predict the manner and timing of the recovery of the default market • To isolate the impact of a return to normal in the default market, Origination segment Service revenue for LTM Q1’23 is held constant at 2019 Adjusted EBITDA margins and Servicer and Real Estate non-default Service revenue is held constant relative to 2019 • Under the Run-Rate scenario, we estimate generating $38 million of Adjusted EBITDA on $235 million of Service revenue • If delinquency rates rise above pre-pandemic levels, we anticipate our Service revenue and earnings would be higher • Number of foreclosure starts • Timing from foreclosure starts to foreclosure auctions and REO sales • Percentage of foreclosure starts that ultimately convert to foreclosure auctions Run-Rate Scenario Commentary Note: Numbers may not sum due to rounding Run-Rate Scenario ($ millions) LTM Q1’23 Run-Rate Scenario Service revenue: Servicer and Real Estate $ 114.7 $ 206.4 Origination 29.1 29.1 Total Service revenue $ 143.8 $ 235.4 Adjusted EBITDA: Servicer and Real Estate $ 35.5 $ 82.6 Origination (5.6) 2.2 Corporate and other (41.0) (46.7) Total Adjusted EBITDA $ (11.0) $ 38.1 Adjusted EBITDA margin -8% 16% Market Factors Impacting Timing 143.8 235.4 (11.0) 38.1 Service revenue Adjusted EBITDA
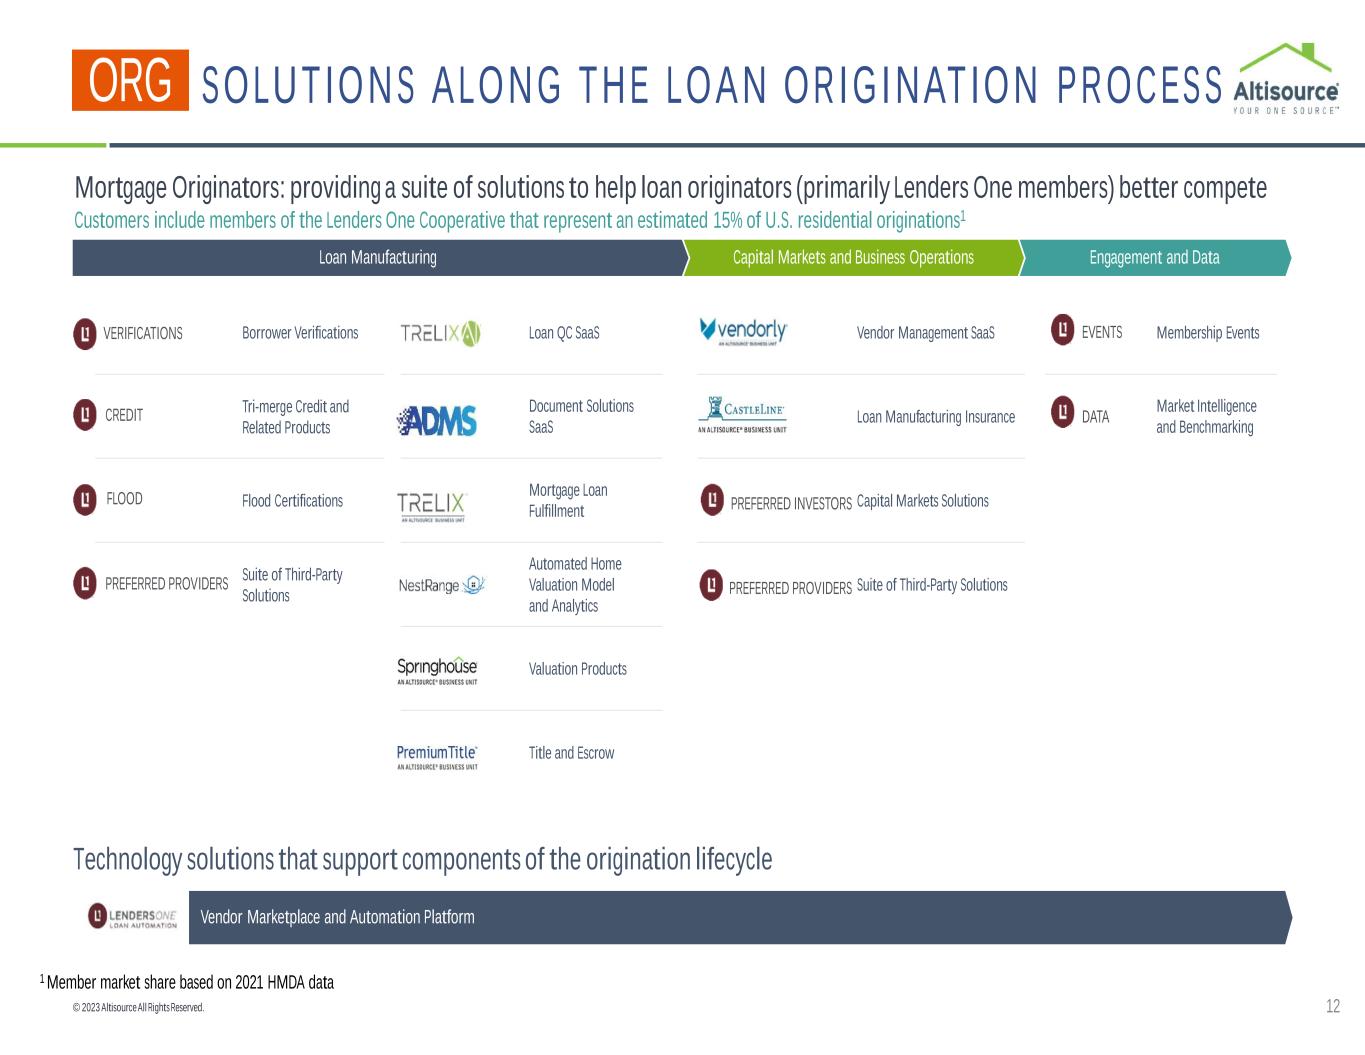
© 2023 Altisource All Rights Reserved. SOLUTIONS ALONG THE LOAN ORIGINATION PROCESS Membership Events Market Intelligence and Benchmarking Vendor Management SaaS Loan Manufacturing Insurance Capital Markets Solutions Suite of Third-Party Solutions Borrower Verifications Tri-merge Credit and Related Products Flood Certifications Suite of Third-Party Solutions Loan QC SaaS Document Solutions SaaS Mortgage Loan Fulfillment Automated Home Valuation Model and Analytics Valuation Products Title and Escrow 12 Engagement and DataLoan Manufacturing Capital Markets and Business Operations VERIFICATIONS CREDIT PREFERRED INVESTORS EVENTS DATA PREFERRED PROVIDERSPREFERRED PROVIDERS FLOOD Vendor Marketplace and Automation Platform Technology solutions that support components of the origination lifecycle Mortgage Originators: providing a suite of solutions to help loan originators (primarily Lenders One members) better compete Customers include members of the Lenders One Cooperative that represent an estimated 15% of U.S. residential originations1 1 Member market share based on 2021 HMDA data ORG
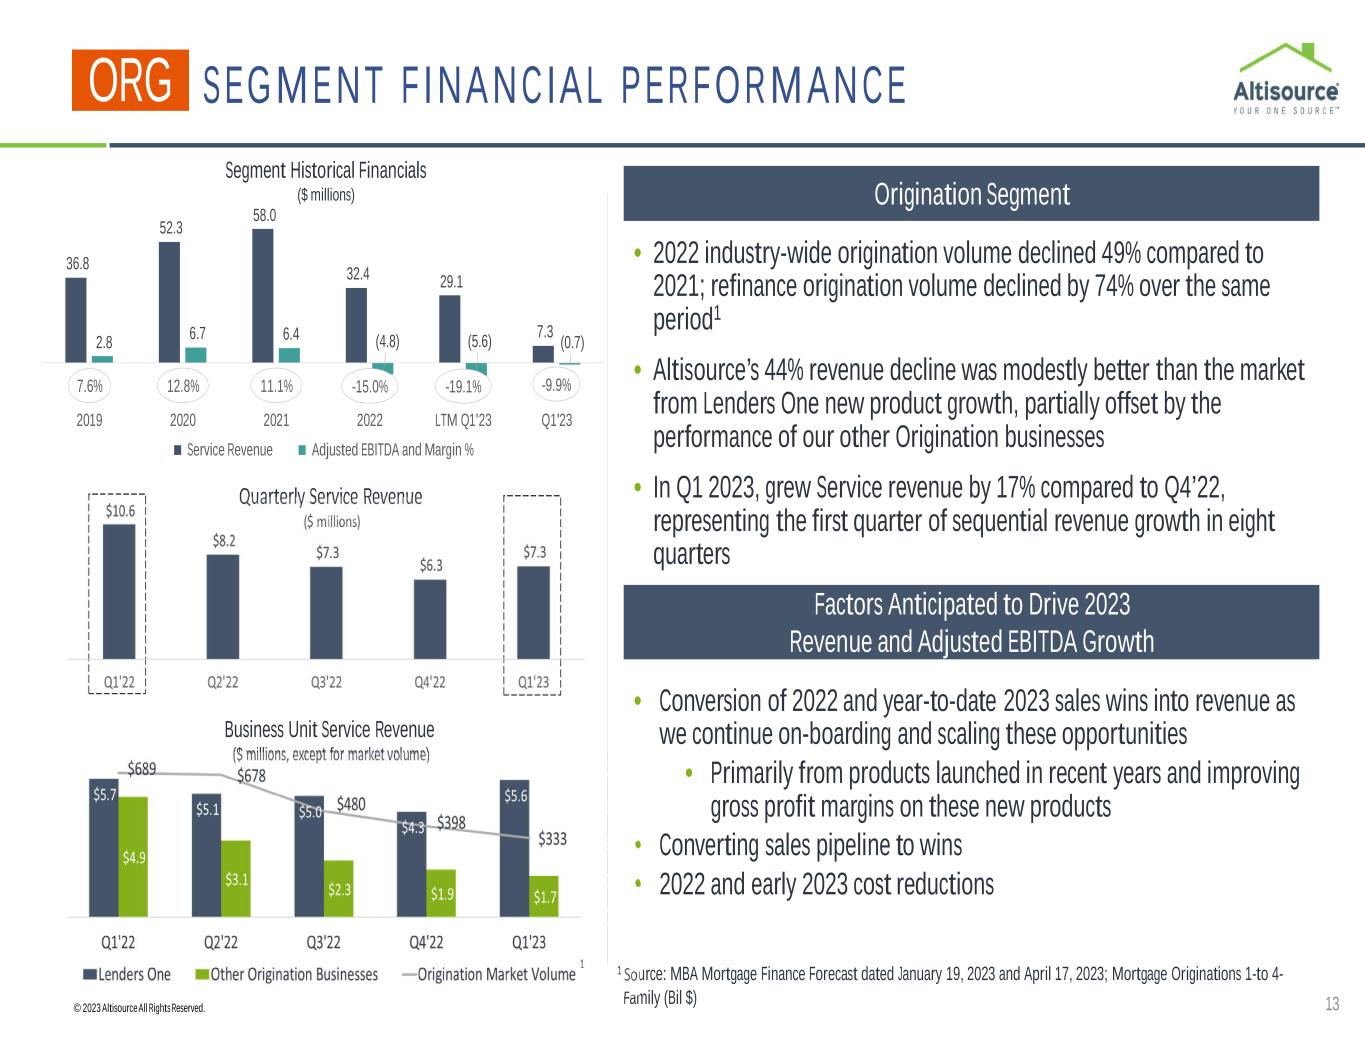
© 2023 Altisource All Rights Reserved. SEGMENT F INANCIAL PERFORMANCE 13 • 2022 industry-wide origination volume declined 49% compared to 2021; refinance origination volume declined by 74% over the same period1 • Altisource’s 44% revenue decline was modestly better than the market from Lenders One new product growth, partially offset by the performance of our other Origination businesses • In Q1 2023, grew Service revenue by 17% compared to Q4’22, representing the first quarter of sequential revenue growth in eight quarters • Conversion of 2022 and year-to-date 2023 sales wins into revenue as we continue on-boarding and scaling these opportunities • Primarily from products launched in recent years and improving gross profit margins on these new products • Converting sales pipeline to wins • 2022 and early 2023 cost reductions Origination Segment Quarterly Service Revenue ($ millions) 1 Source: MBA Mortgage Finance Forecast dated January 19, 2023 and April 17, 2023; Mortgage Originations 1-to 4- Family (Bil $) Business Unit Service Revenue ($ millions, except for market volume) 1 ORG Factors Anticipated to Drive 2023 Revenue and Adjusted EBITDA Growth Segment Historical Financials ($ millions) 36.8 52.3 58.0 32.4 29.1 7.32.8 6.7 6.4 (4.8) (5.6) (0.7) 7.6% 12.8% 11.1% -15.0% -19.1% -9.9% 2019 2020 2021 2022 LTM Q1'23 Q1'23 Service Revenue Adjusted EBITDA and Margin %

© 2023 Altisource All Rights Reserved. $20.8 $31.9 $23.4 $22.6 $20.8 Q1'22 Q2 Q3 Q4 Q1'23 $1.7 $7.9 $10.2 $1.8 $3.4 Q1'22 Q2 Q3 Q4 Q1'23 $0.2 $0.4 $0.8 $1.0 $2.3 Q1'22 Q2 Q3 Q4 Q1'23 SALES P IPEL INE AND WINS 14 Strong Sales Wins3 Growth in Revenue4 Estimated Annualized Revenue on a Stabilized Basis Revenue Generated from Sales Wins Attractive Sales Pipeline1 Weighted Average Pipeline Estimated Revenue – End of Quarter ($ millions) 2 2 Note: Numbers may not sum due to rounding 1 Sales Pipeline represents a weighted estimate of the annualized revenue on a stabilized basis from the sales pipeline at the end of the applicable quarter. The pipeline can and will change based on won and lost deals, new prospects, pipeline funnel stage changes, stabilized revenue estimate changes, weighted revenue estimate changes and additional information. Actual results could differ materially from the estimates. Sales Wins are removed from the Sales Pipeline in the quarter in which the applicable contract for the business is executed 2 Q1’23 weighted sales pipeline in the Origination segment represents $18 million to $23 million in annual revenue on a stabilized basis based upon the Company’s forecasted probability of closing 3 Sales Wins represent an estimate of the annualized revenue on a stabilized basis from the total Sales Wins in the applicable quarter. It is anticipated that stabilized revenue will be achieved after an initial ramp-up period for most Sales Wins. The period of time for the Company to begin to realize revenue on a stabilized basis, if at all, from a Sales Win can significantly vary based on a variety of conditions, including those related to the applicable client, the subject service, the applicable industry and the broader economy. Actual results could differ materially from applicable estimates. A Sales Win is included in the estimate of the applicable quarter in which the applicable contract for the business is executed. Estimates are not updated to reflect revenue recognized or changes to estimated revenue subsequent to the Sales Wins. Recognized revenue from Sales Wins is set forth in Growth in Revenue 4 Represents revenue recognized in the applicable quarter from FY2022 and FY2023 sales wins FY 2022 Wins $21.6 Q1 2023 annualized $9.4 ORG
© 2023 Altisource All Rights Reserved. • Generated $1.5 million in Adjusted EBITDA, representing a $5.6 million improvement over the first quarter of 20221 • Improved company-wide gross profit margins to 23% compared to 15% in the first quarter of 20221 • In the Servicer and Real Estate segment, grew Service revenue by 10% to $29.8 million and Adjusted EBITDA by 63% to $11.1 million compared to Q1’22 • In a difficult origination environment, grew Origination segment Service revenue 17% compared to the fourth quarter of 2022 • 31% year-over-year revenue decline in the Origination segment was better than the 52%2 market-wide decline in origination volume for the same period • Continued to maintain cost discipline with respect to Corporate costs • Strengthened the balance sheet in February 2023 by extending the maturity dates of our Senior Secured Term Loans and Revolver and raising equity • Maintained a robust sales pipeline and won and onboarded significant new business in both segments IMPROVING F INANCIAL PERFORMA NCE IN Q1 2023 15 1 Refer to the Appendix for historical financial summary 2 Source: MBA Mortgage Finance Forecast dated April 17, 2023; Mortgage Originations 1-to 4-Family (Bil $)

A P P E N D I X

© 2023 Altisource All Rights Reserved. HISTORICAL FINANCIALS 17 Altisource was significantly impacted by COVID-19 related borrower relief measures beginning in 2020. Following the expiration of these measures in late 2021, along with efficiency measures implemented, the Company’s performance began to improve Note: 2019 through 2021 includes Service revenue totaling $106M, $3M and $5M, respectively, from businesses that have been sold or discontinued
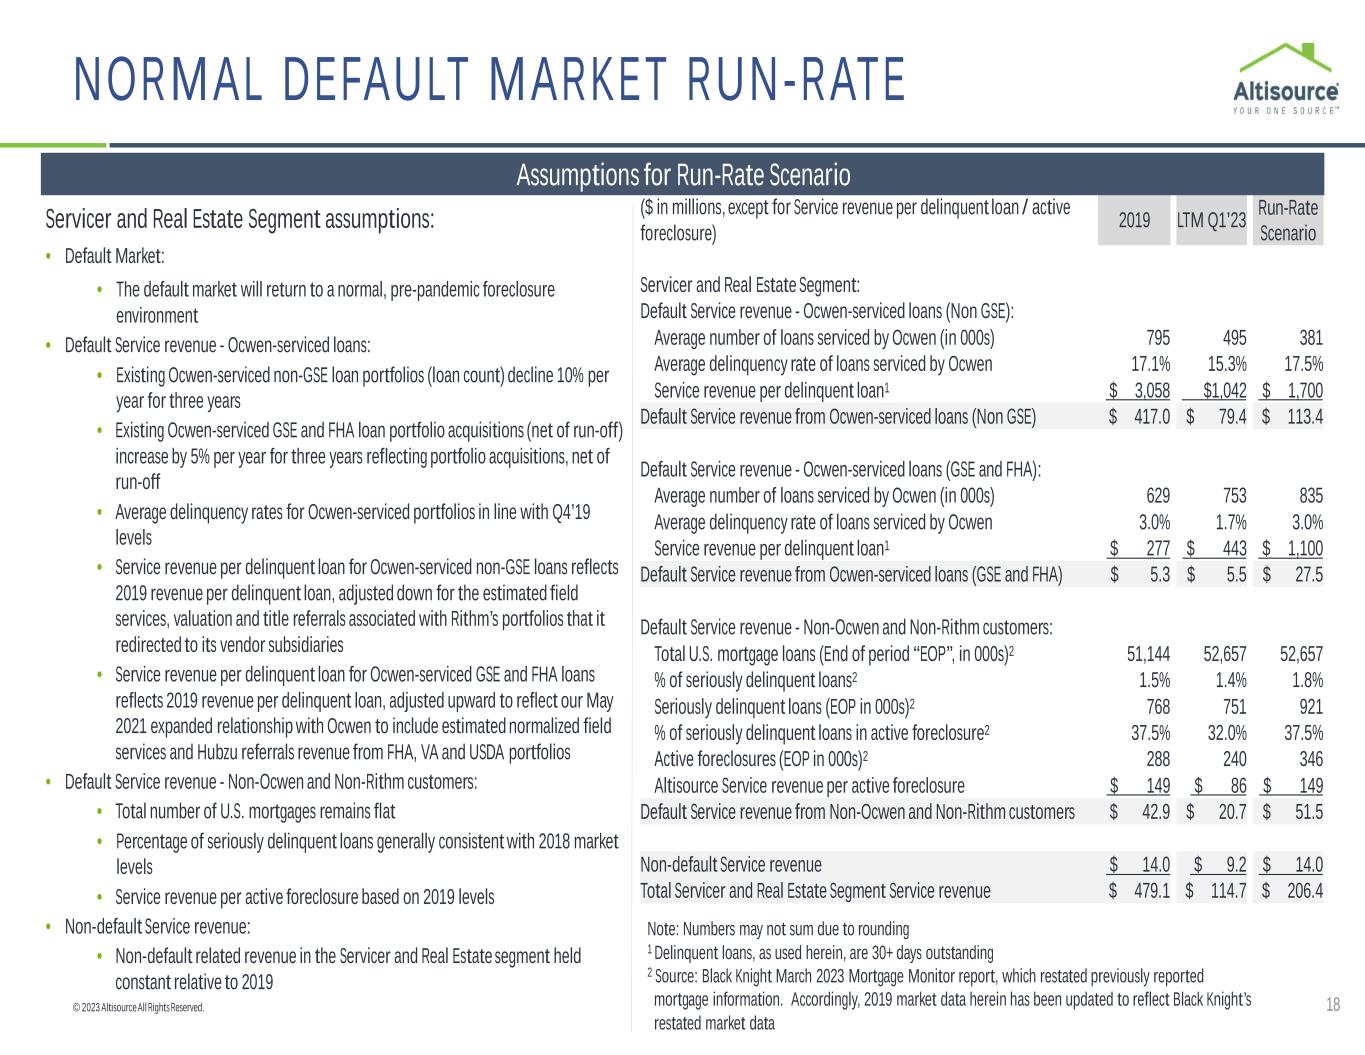
© 2023 Altisource All Rights Reserved. ($ in millions, except for Service revenue per delinquent loan / active foreclosure) 2019 LTM Q1’23 Run-Rate Scenario Servicer and Real Estate Segment: Default Service revenue - Ocwen-serviced loans (Non GSE): Average number of loans serviced by Ocwen (in 000s) 795 495 381 Average delinquency rate of loans serviced by Ocwen 17.1% 15.3% 17.5% Service revenue per delinquent loan1 $ 3,058 $1,042 $ 1,700 Default Service revenue from Ocwen-serviced loans (Non GSE) $ 417.0 $ 79.4 $ 113.4 Default Service revenue - Ocwen-serviced loans (GSE and FHA): Average number of loans serviced by Ocwen (in 000s) 629 753 835 Average delinquency rate of loans serviced by Ocwen 3.0% 1.7% 3.0% Service revenue per delinquent loan1 $ 277 $ 443 $ 1,100 Default Service revenue from Ocwen-serviced loans (GSE and FHA) $ 5.3 $ 5.5 $ 27.5 Default Service revenue - Non-Ocwen and Non-Rithm customers: Total U.S. mortgage loans (End of period “EOP”, in 000s)2 51,144 52,657 52,657 % of seriously delinquent loans2 1.5% 1.4% 1.8% Seriously delinquent loans (EOP in 000s)2 768 751 921 % of seriously delinquent loans in active foreclosure2 37.5% 32.0% 37.5% Active foreclosures (EOP in 000s)2 288 240 346 Altisource Service revenue per active foreclosure $ 149 $ 86 $ 149 Default Service revenue from Non-Ocwen and Non-Rithm customers $ 42.9 $ 20.7 $ 51.5 Non-default Service revenue $ 14.0 $ 9.2 $ 14.0 Total Servicer and Real Estate Segment Service revenue $ 479.1 $ 114.7 $ 206.4 NORMAL DEFAULT MARKET RUN-RATE 18 Assumptions for Run-Rate Scenario Note: Numbers may not sum due to rounding 1 Delinquent loans, as used herein, are 30+ days outstanding 2 Source: Black Knight March 2023 Mortgage Monitor report, which restated previously reported mortgage information. Accordingly, 2019 market data herein has been updated to reflect Black Knight’s restated market data Servicer and Real Estate Segment assumptions: • Default Market: • The default market will return to a normal, pre-pandemic foreclosure environment • Default Service revenue - Ocwen-serviced loans: • Existing Ocwen-serviced non-GSE loan portfolios (loan count) decline 10% per year for three years • Existing Ocwen-serviced GSE and FHA loan portfolio acquisitions (net of run-off) increase by 5% per year for three years reflecting portfolio acquisitions, net of run-off • Average delinquency rates for Ocwen-serviced portfolios in line with Q4’19 levels • Service revenue per delinquent loan for Ocwen-serviced non-GSE loans reflects 2019 revenue per delinquent loan, adjusted down for the estimated field services, valuation and title referrals associated with Rithm’s portfolios that it redirected to its vendor subsidiaries • Service revenue per delinquent loan for Ocwen-serviced GSE and FHA loans reflects 2019 revenue per delinquent loan, adjusted upward to reflect our May 2021 expanded relationship with Ocwen to include estimated normalized field services and Hubzu referrals revenue from FHA, VA and USDA portfolios • Default Service revenue - Non-Ocwen and Non-Rithm customers: • Total number of U.S. mortgages remains flat • Percentage of seriously delinquent loans generally consistent with 2018 market levels • Service revenue per active foreclosure based on 2019 levels • Non-default Service revenue: • Non-default related revenue in the Servicer and Real Estate segment held constant relative to 2019

© 2023 Altisource All Rights Reserved. ($ in millions, except for Service revenue per delinquent loan / active foreclosure) 2019 LTM Q1’23 Run-Rate Scenario Origination Segment: Total Origination segment Service revenue $ 36.8 $ 29.1 $ 29.1 Corporate and Others Segment: Total Corporate and Others Service revenue $ 105.9 $ - $ - Consolidated Service revenue $ 621.9 $ 143.8 $ 235.4 Adjusted EBITDA: Servicer and Real Estate $ 160.8 $ 35.5 $ 82.6 Origination 2.8 (5.6) 2.2 Corporate and Others (92.8) (41.0) (46.7) Consolidated Adjusted EBITDA $ 70.8 $ (11.0) $ 38.1 Adjusted EBITDA Margins: Servicer and Real Estate 34% 31% 40% Origination 8% -19% 8% Consolidated Adjusted EBITDA Margin 11% -8% 16% NORMAL DEFAULT MARKET RUN-RATE 19 Assumptions for Run-Rate Scenario Origination Segment Assumptions: • Origination revenue held constant relative to LTM Q1’23 based on current interest rate environment Corporate and Others Segment Assumptions: • Note: 2019 Service revenue and Adjusted EBITDA in Corporate and Others includes businesses that have been sold or discontinued; no Service revenue for Corporate and Others is assumed in the Run-Rate scenario Adjusted EBITDA Margins and Corporate and Other costs: • Servicer and Real Estate segment Adjusted EBITDA margins are improving from revenue growth, product mix and efficiency initiatives • Origination segment Adjusted EBITDA margins are equal to 2019 Origination Adjusted EBITDA margins • Corporate and Other costs reflect cost reduction measures that the Company has implemented since 2019 Note: Numbers may not sum due to rounding

© 2023 Altisource All Rights Reserved. RECONCILIATIO N OF NON-GAAP MEASURES 20 Reconciliation of Net (Loss) Income Attributable to Altisource to Adjusted EBITDA ($ in MM) 2019 2020 2021 2022 LTM Q1'23 Q1'22 Q1'23 Net (Loss) Income Attributable to Altisource (308.0)$ (67.2)$ 11.8$ (53.4)$ (54.2)$ (12.2)$ (12.9)$ Income Tax Provision 318.3 8.6 3.2 5.3 5.9 0.9 1.5 Interest Expense, Net of Interest Income 21.1 17.6 14.6 16.0 18.8 3.5 6.3 Depreciation and Amortization 18.5 14.9 4.6 3.4 3.2 1.0 0.7 Intangible Asset Amortization Expense 19.0 14.7 9.5 5.1 5.1 1.3 1.3 Share-based Compensation Expense 11.9 7.8 2.8 5.0 5.2 1.3 1.4 Cost of Cost Savings Initiatives and Other 14.1 12.7 3.6 1.7 2.2 0.1 0.6 Debt Amendment Costs - - - - 3.2 - 3.2 Unrealized Gain on Warrant Liability - - - - (0.7) - (0.7) Pointillist Losses - 7.8 7.2 - - - - (Gain) Loss on Sale of Business (17.8) - (88.9) 0.2 0.2 - - Unrealized Gain on Investment in Equity Securities (14.4) (4.0) - - - - - Sales Tax Accrual 0.3 (2.7) - - - - - Loss on BRS Portfolio Sale 1.8 - - - - - - Goodwill and Intangible and Other Assets Write-off from Business Exits 6.1 - - - - - - Adjusted EBITDA 70.8$ 10.2$ (31.7)$ (16.6)$ (11.0)$ (4.1)$ 1.5$


