株探米国株
英語
エドガーで原本を確認する

UNITED STATES
SECURITIES AND EXCHANGE COMMISSION
Washington, D.C. 20549
____________________
FORM 40-F
Registration statement pursuant to Section 12 of the Securities Exchange Act of 1934
or
Annual report pursuant to Section 13(a) or 15(d) of the Securities Exchange Act of 1934
For the fiscal year ended:
December 31, 2023 Commission File Number:  000-53543
____________________
Ballard Power Systems Inc.
(Exact name of registrant as specified in its charter)
British Columbia, Canada 3620 Not Applicable
(Province or Other Jurisdiction of (Primary Standard Industrial Classification (I.R.S. Employer
Incorporation or Organization) Code Number) Identification No.)
9000 Glenlyon Parkway
Burnaby, BC
Canada V5J 5J8
(604) 454-0900
(Address and telephone number of registrant’s principal executive offices)
____________________
CORPORATION SERVICE COMPANY (CSC)
19 West 44th street, Suite 200
New York, NY 1000510036
(800) 927-9800
(Name, address (including zip code) and telephone number (including area code) of agent for service in the United States)
____________________
Securities registered or to be registered pursuant to Section 12(b) of the Act:
Title of Each Class: Trading Symbol Name of Each Exchange On Which Registered:
Common Shares BLDP NASDAQ Global Market
Securities registered or to be registered pursuant to Section 12(g) of the Act: Not applicable
Securities for which there is a reporting obligation pursuant to Section 15(d) of the Act: Not applicable
For annual reports, indicate by check mark the information filed with this form:
☒ Annual Information Form
☒  Audited Annual Financial Statements
Indicate the number of outstanding shares of each of the registrant’s classes of capital or common stock as of the close of the period covered by the annual report: As of December 31, 2023, there were 298,935,706 common shares outstanding.
Indicate by check mark whether the Registrant (1) has filed all reports required to be filed by Section 13 or 15(d) of the Exchange Act during the preceding 12 months (or for such shorter period that the Registrant was required to file such reports) and (2) has been subject to such filing requirements for the past 90 days. ☒  Yes ☐  No
Indicate by check mark whether the Registrant has submitted electronically every Interactive Data File required to be submitted pursuant to Rule 405 of Regulation S-T (§232.405 of this chapter) during the preceding 12 months (or such shorter period that the Registrant was required to submit such files). ☒  Yes ☐  No
Indicate by check mark whether the registrant is an emerging growth company as defined in Rule 12b-2 of the Exchange Act.
Emerging growth company ☐

If an emerging growth company that prepares its financial statements in accordance with U.S. GAAP, indicate by check mark if the registrant has elected not to use the extended transition period for complying with any new or revised financial accounting standards provided pursuant to Section 13(a) of the Exchange Act. ☐

Indicate by check mark whether the registrant has filed a report on and attestation to its management’s assessment of the effectiveness of its internal control over financial reporting under Section 404(b) of the Sarbanes-Oxley Act (15 U.S.C. 7262(b)) by the registered public accounting firm that prepared or issued its audit report. ☒ 

If securities are registered pursuant to Section 12(b) of the Act, indicate by check mark whether the financial statements of the registrant included in the filing reflect the correction of an error to previously issued financial statements.
Indicate by check mark whether any of those error corrections are restatements that required a recovery analysis of incentive-based compensation received by any of the registrant’s executive officers during the relevant recovery period pursuant to §240.10D-1(b). ☐


This Annual Report (this “Annual Report”) on Form 40-F shall be incorporated by reference into or as an exhibit to, as applicable, the following Registration Statements of the Registrant filed under the Securities Act of 1933: Form S-8 (File Nos. 333-225494 and 333-161807); and Form F-10/A (File No. 333-271758).

DOCUMENTS INCORPORATED BY REFERENCE
The following documents of Ballard Power Systems Inc. (the “Registrant” or the “Company”) are filed as exhibits to this Annual Report and are hereby incorporated by reference herein:
the Registrant’s Annual Information Form for the year ended December 31, 2023;
the Registrant’s Audited Consolidated Financial Statements as at and for the years ended December 31, 2023 and 2022, including the notes thereto, together with the report of the independent registered public accounting firm thereon; and
the Registrant’s Management’s Discussion and Analysis for the year ended December 31, 2023.
EXPLANATORY NOTE
The Company is a Canadian issuer eligible to file its annual report pursuant to Section 13 of the United States Securities Exchange Act of 1934, as amended (the “Exchange Act”) on Form 40-F. The Company is a “foreign private issuer” as defined in Rule 3b-4 under the Exchange Act and Rule 405 under the Securities Act of 1933, as amended. Accordingly, the Company’s equity securities are exempt from Sections 14(a), 14(b), 14(c), 14(f) and 16 of the Exchange Act pursuant to Rule 3a12-3.
The Company is permitted, under a multi-jurisdictional disclosure system adopted by the United States, to prepare this Annual Report on Form 40-F in accordance with Canadian disclosure requirements, which are different from those of the United States.
The Company prepares its financial statements in accordance with International Financial Reporting Standards as issued by the International Financial Accounting Boards, and they may be subject to Canadian auditing and auditor independence standards. Accordingly, the financial statements of the Company incorporated by reference in this Annual Report may not be comparable to financial statements of United States companies.
CAUTIONARY STATEMENT REGARDING FORWARD LOOKING STATEMENTS
This Annual Report contains forward-looking statements concerning anticipated developments in the operations of the Company in future periods, planned development activities, the adequacy of the Company’s financial resources and other events or conditions that may occur in the future. Forward-looking statements are frequently, but not always, identified by words such as “estimate”, “project”, “believe”, “anticipate”, “intend”, “expect”, “plan”, “predict”, “may”, “should”, “will” and similar expressions, or by statements that events, conditions or results “will,” “may,” “could” or “should” occur or be achieved. Forward-looking statements are statements about the future and are inherently uncertain, and actual achievements of the Company or other future events or conditions may differ materially from those reflected in the forward-looking statements due to a variety of risks, uncertainties and other factors, including, without limitation, those described in the Annual Information Form incorporated by reference in this Annual Report.


The Company’s forward-looking statements are based on the beliefs, expectations and opinions of management on the date the statements are made and the Company assumes no obligation to update such forward-looking statements in the future. For the reasons set forth above, investors should not place undue reliance on forward-looking statements.
DISCLOSURE CONTROLS AND PROCEDURES
The required disclosure is included in Management’s Discussion and Analysis, which is incorporated herein by reference to Exhibit 99.2.
MANAGEMENT’S ANNUAL REPORT ON INTERNAL CONTROL OVER FINANCIAL REPORTING
The required disclosure is included in Management’s Discussion and Analysis, which is incorporated herein by reference to Exhibit 99.2.
ATTESTATION REPORT OF THE REGISTERED PUBLIC ACCOUNTING FIRM
The Registrant’s independent registered public accounting firm, KPMG LLP, independently assessed the effectiveness of the Registrant’s internal control over financial reporting. KPMG LLP’s attestation is located in the Report of Independent Registered Public Accounting Firm included in the Registrant’s Audited Consolidated Financial Statements, which is incorporated herein by reference to Exhibit 99.1.
CHANGES IN INTERNAL CONTROLS OVER FINANCIAL REPORTING
During the period covered by this Annual Report, no changes occurred in the Company’s internal control over financial reporting that has materially affected, or is reasonably likely to materially affect, the Company’s internal control over financial reporting.
NOTICES PURSUANT TO REGULATION BTR
There were no notices required by Rule 104 of Regulation BTR that the Company sent during the year ended December 31, 2023 concerning any equity security subject to a blackout period under Rule 101 of Regulation BTR.
AUDIT COMMITTEE AND AUDIT COMMITTEE FINANCIAL EXPERT
The Board has a separately designated standing audit committee (the “Audit Committee”) established for the purpose of overseeing the accounting and financial reporting processes of the Company and audits of the financial statements of the Company in accordance with Section 3(a)(58)(A) of the Exchange Act. As of the date of this Annual Report, the Company’s Audit Committee is comprised of Douglas P. Hayhurst, Janet Woodruff, James Roche and Kathleen Bayless, each of whom the Board has determined is independent, as that term is defined in the listing standards of the NASDAQ Global Market (“Nasdaq”) and Rule 10A-3 of the Exchange Act.
The Registrant’s Board of Directors has determined that the Audit Committee has at least three members, Douglas P. Hayhurst, Janet Woodruff and Kathleen Bayless, who qualify as an audit committee financial expert under as defined in paragraph (8)(b) of General Instruction B of Form 40-F, and is independent, as defined in the listing standards of Nasdaq. A description of Mr. Hayhurst’s, Ms. Woodruff's and Ms. Bayless' qualifications are included in the Annual Information Form, under the heading “Audit Committee Matters”, which is incorporated herein by reference to Exhibit 99.3.
CODE OF ETHICS
The Registrant has adopted a code of ethics that applies to all members of its Board of Directors, as well as its officers and employees. A copy of the code of ethics is posted on the Registrant’s Internet website at www.ballard.com, and is available in print to any person without charge, upon written request to the corporate secretary of the Registrant at the principal executive offices of the Registrant provided above. If there are any amendments to the code of ethics, the Registrant intends to provide a brief description of the amendment and a copy of the amendment via its website. No waivers of the code of ethics have been granted to any principal officer of the Registrant or any person performing similar functions during the year ended December 31, 2023.
PRINCIPAL ACCOUNTANT FEES AND SERVICES
The required disclosure is included in the Annual Information Form, under the heading “Audit Committee Matters,” which is incorporated herein by reference to Exhibit 99.3.


OFF-BALANCE SHEET ARRANGEMENTS
The required disclosure is included under the heading “Off-Balance Sheet Arrangements & Contractual Obligations” in Management’s Discussion and Analysis, which is incorporated herein by reference to Exhibit 99.2.
CONTRACTUAL OBLIGATIONS
The required disclosure is included under the heading “Off-Balance Sheet Arrangements & Contractual Obligations” in Management’s Discussion and Analysis, which is incorporated herein by reference to Exhibit 99.2.
NASDAQ CORPORATE GOVERNANCE
The Registrant’s common shares are listed on Nasdaq. Nasdaq Marketplace Rule 5615(a)(3) permits a foreign private issuer, such as the Registrant, to follow its home country practice in lieu of most of the requirements of the 5600 Series of the Nasdaq Marketplace Rules. For a discussion of the significant differences between our corporate governance practices and those required to be followed by U.S. domestic issuers under Nasdaq’s corporate governance requirements, please refer to our website at www.ballard.com.

FOREIGN JURISDICTIONS THAT PREVENT INSPECTIONS
Not applicable.

RECOVERY OF ERRONEOUSLY AWARDED COMPENSATION
Not applicable.

CERTAIN U.S. FEDERAL INCOME TAX CONSIDERATIONS

The following is a general summary of certain material U.S. federal income tax considerations relevant to a U.S. Holder (as defined below) arising from and relating to the acquisition, ownership, and disposition of common shares.

This summary is for general information purposes only and does not purport to be a complete analysis or listing of all potential U.S. federal income tax consequences that may apply to a U.S. Holder arising from and relating to the acquisition, ownership, and disposition of common shares. In addition, this summary does not take into account the individual facts and circumstances of any particular U.S. Holder that may affect the U.S. federal income tax consequences to such U.S. Holder including, without limitation, specific tax consequences to a U.S. Holder under an applicable income tax treaty. Accordingly, this summary is not intended to be, and should not be construed as, legal or U.S. federal income tax advice with respect to any U.S. Holder. Except as discussed below, this summary does not discuss applicable income tax reporting requirements. This summary does not address the U.S. federal alternative minimum, U.S. federal net investment income, U.S. federal estate and gift, U.S. state and local, and non‑U.S. tax consequences to U.S. Holders of the acquisition, ownership, and disposition of common shares. Each U.S. Holder should consult its own tax advisor regarding the U.S. federal, U.S. federal alternative minimum, U.S. federal net investment income, U.S. federal estate and gift, U.S. state and local, and non-U.S. tax consequences relating to the acquisition, ownership, and disposition of common shares.

No legal opinion from U.S. legal counsel or ruling from the Internal Revenue Service (the “IRS”) has been requested, or will be obtained, regarding the U.S. federal income tax consequences of the acquisition, ownership, and disposition of common shares. This summary is not binding on the IRS, and the IRS is not precluded from taking a position that is different from, and contrary to, the positions taken in this summary. In addition, because the authorities on which this summary is based are subject to various interpretations, the IRS and the U.S. courts could disagree with one or more of the conclusions described in this summary.


Scope of this Summary

Authorities

This summary is based on the Internal Revenue Code of 1986, as amended (the “Code”), Treasury Regulations (whether final, temporary, or proposed), published rulings of the IRS, published administrative positions of the IRS, the Convention Between Canada and the United States of America with Respect to Taxes on Income and on Capital, signed September 26, 1980, as amended (the “Canada-U.S. Tax Convention”), and U.S. court decisions that are applicable and, in each case, as in effect and available, as of the date of this document. Any of the authorities on which this summary is based could be changed in a material and adverse manner at any time, and any such change could be applied on a retroactive or prospective basis. This summary does not discuss the potential effects, whether adverse or beneficial, of any proposed legislation that, if enacted, could be applied on a retroactive or prospective basis.


U.S. Holders

For purposes of this summary, the term “U.S. Holder” means a beneficial owner of common shares that is for U.S. federal income tax purposes:

a.an individual who is a citizen or resident of the U.S.;
b.a corporation (or other entity treated as a corporation for U.S. federal income tax purposes) organized under the laws of the U.S., any state thereof or the District of Columbia;
c.an estate whose income is subject to U.S. federal income taxation regardless of its source; or
d.a trust that (a) is subject to the primary supervision of a court within the U.S. and the control of one or more U.S. persons for all substantial decisions or (b) has a valid election in effect under applicable Treasury Regulations to be treated as a U.S. person.

Non-U.S. Holders

For purposes of this summary, a “non-U.S. Holder” is a beneficial owner of common shares that is not a U.S. Holder and is not a partnership for U.S. federal income tax purposes. This summary does not address the U.S. federal income tax consequences to non-U.S. Holders arising from and relating to the acquisition, ownership, and disposition of common shares. Accordingly, a non-U.S. Holder should consult its own tax advisor regarding the U.S. federal, U.S. federal alternative minimum, U.S. federal estate and gift, U.S. state and local, and non-U.S. tax consequences (including the potential application of and operation of any income tax treaties) relating to the acquisition, ownership, and disposition of common shares.

U.S. Holders Subject to Special U.S. Federal Income Tax Rules Not Addressed

This summary does not address the U.S. federal income tax considerations applicable to U.S. Holders that are subject to special provisions under the Code, including, but not limited to, U.S. Holders that: (a) are tax-exempt organizations, qualified retirement plans, individual retirement accounts, or other tax-deferred accounts; (b) are financial institutions, underwriters, insurance companies, real estate investment trusts, or regulated investment companies; (c) are broker-dealers, dealers, or traders in securities or currencies that elect to apply a mark-to-market accounting method; (d) have a “functional currency” other than the U.S. dollar; (e) own common shares as part of a straddle, hedging transaction, conversion transaction, constructive sale, or other integrated transaction; (f) acquired common shares in connection with the exercise of employee stock options or otherwise as compensation for services; (g) hold common shares other than as a capital asset within the meaning of Section 1221 of the Code (generally, property held for investment purposes); (h) are partnerships or other flow-through entities (and partners or other owners thereof); (i) are S corporations (and shareholders thereof); (j) are U.S. expatriates or former long-term residents of the United States; (k) hold common shares in connection with a trade or business, permanent establishment, or fixed base outside the U.S.; (l) are subject to special tax accounting rules; (m) are subject to the alternative minimum tax; or (n) own, have owned or will own (directly, indirectly, or by attribution) 10% or more of the total combined voting power or value of the outstanding shares of the Company. U.S. Holders that are subject to special provisions under the Code, including, but not limited to, U.S. Holders described immediately above, should consult their own tax advisor regarding the U.S. federal, U.S. federal alternative minimum, U.S. federal net investment income, U.S. federal estate and gift, U.S. state and local, and non-U.S. tax consequences relating to the acquisition, ownership and disposition of common shares.

If an entity or arrangement that is classified as a partnership (or other “pass-through” entity) for U.S. federal income tax purposes holds common shares, the U.S. federal income tax consequences to such entity and the partners (or other owners) of such partnership generally will depend on the activities of the partnership and the status of such partners (or other owners). This summary does not address the tax consequences to any such partner (or owner). Partners (or other owners) of entities or arrangements that are classified as partnerships for U.S. federal income tax purposes should consult their own tax advisors regarding the U.S. federal income tax consequences arising from and relating to the acquisition, ownership, and disposition of common shares.


Ownership and Disposition of Common Shares

The following discussion is subject in its entirety to the rules described below under the heading “Passive Foreign Investment Company Rules.”

Taxation of Distributions

A U.S. Holder that receives a distribution, including a constructive distribution, with respect to a common share will be required to include the amount of such distribution in gross income as a dividend (without reduction for any foreign income tax withheld from such distribution) to the extent of the current or accumulated “earnings and profits” of the Company, as computed for U.S. federal income tax purposes. To the extent that a distribution exceeds the current and accumulated “earnings and profits” of the Company, such distribution will be treated first as a tax-free return of capital to the extent of a U.S. Holder’s tax basis in the common shares and thereafter as gain from the sale or exchange of such common shares (see “Sale or Other Taxable Disposition of Common Shares” below). However, the Company may not maintain the calculations of its earnings and profits in accordance with U.S. federal income tax principles, and each U.S. Holder should therefore assume that any distribution by the Company with respect to the common shares will constitute ordinary dividend income. Dividends received on common shares by corporate U.S. Holders generally will not be eligible for the “dividends received deduction” allowed to corporations under the Code with respect to dividends received from domestic corporations.

Subject to applicable limitations and provided the Company is eligible for the benefits of the Canada-U.S. Tax Convention or the common shares are readily tradable on a United States securities market, dividends paid by the Company to non-corporate U.S. Holders, including individuals, generally will be eligible for the preferential tax rates applicable to long-term capital gains for dividends provided certain holding period and other conditions are satisfied, including that the Company not be classified as a PFIC (as defined below) in the tax year of distribution or in the preceding tax year. The dividend rules are complex, and each U.S. Holder should consult its own tax advisor regarding the application of such rules.

Sale or Other Taxable Disposition of Common Shares

A U.S. Holder will generally recognize gain or loss on the sale or other taxable disposition of common shares in an amount equal to the difference, if any, between (a) the amount of cash plus the fair market value of any property received and (b) such U.S. Holder’s tax basis in such common shares sold or otherwise disposed of. Any such gain or loss generally will be capital gain or loss, which will be long-term capital gain or loss if, at the time of the sale or other disposition, such common shares are held for more than one year.

Preferential tax rates apply to long-term capital gains of a U.S. Holder that is an individual, estate, or trust. There are currently no preferential tax rates for long-term capital gains of a U.S. Holder that is a corporation. Deductions for capital losses are subject to significant limitations under the Code.

Passive Foreign Investment Company Rules

If the Company were to constitute a “passive foreign investment company” or “PFIC” for any year during a U.S. Holder’s holding period, then certain potentially adverse rules would affect the U.S. federal income tax consequences to a U.S. Holder resulting from the acquisition, ownership and disposition of common shares. The Company believes that it was a PFIC for its most recently completed tax year. No determination has been made by the Company with respect to its anticipated PFIC status for its current tax year or any future tax year.No opinion of legal counsel or ruling from the IRS concerning the status of the Company as a PFIC has been obtained or is currently planned to be requested. The determination of whether any corporation was, or will be, a PFIC for a tax year depends, in part, on the application of complex U.S. federal income tax rules, which are subject to differing interpretations. In addition, whether any corporation will be a PFIC for any tax year depends on the assets and income of such corporation over the course of each such tax year and, as a result, cannot be predicted with certainty as of the date of this document. The Company’s PFIC classification for its current or future tax years may depend on, among other things, the manner in which, and how quickly, the Company utilizes its cash on hand, the income generated by it and its subsidiaries, as well as on changes in the market value of common shares. Accordingly, there can be no assurance that the IRS will not challenge any determination made by the Company (or any subsidiary of the Company) concerning its PFIC status. Each U.S. Holder should consult its own tax advisors regarding the PFIC status of the Company and each subsidiary of the Company.


In any year in which the Company is classified as a PFIC, a U.S. Holder will be required to file an annual report with the IRS containing such information as Treasury Regulations and/or other IRS guidance may require. In addition to penalties, a failure to satisfy such reporting requirements may result in an extension of the time period during which the IRS can assess a tax.


U.S. Holders should consult their own tax advisors regarding the requirements of filing such information returns under these rules, including the requirement to file an IRS Form 8621 annually.

The Company generally will be a PFIC if, for a tax year, (a) 75% or more of the gross income of the Company is passive income (the “PFIC income test”) or (b) 50% or more of the value of the Company’s assets either produce passive income or are held for the production of passive income, based on the quarterly average of the fair market value of such assets (the “PFIC asset test”). “Gross income” generally includes all sales revenues less the cost of goods sold, plus income from investments and from incidental or outside operations or sources, and “passive income” generally includes, for example, dividends, interest, certain rents and royalties, certain gains from the sale of stock and securities, and certain gains from commodities transactions. Active business gains arising from the sale of commodities generally are excluded from passive income if substantially all of a foreign corporation’s commodities are stock in trade or inventory, depreciable property used in a trade or business, or supplies regularly used or consumed in the ordinary course of its trade or business, and certain other requirements are satisfied.
For purposes of the PFIC income test and PFIC asset test described above, if the Company owns, directly or indirectly, 25% or more of the total value of the outstanding shares of another corporation, the Company will be treated as if the Company (a) held a proportionate share of the assets of such other corporation and (b) received directly a proportionate share of the income of such other corporation. In addition, for purposes of the PFIC income test and PFIC asset test described above, and assuming certain other requirements are met, “passive income” does not include certain interest, dividends, rents, or royalties that are received or accrued by the Company from certain “related persons” (as defined in Section 954(d)(3) of the Code) also organized in Canada, to the extent such items are properly allocable to the income of such related person that is not passive income.

Under certain attribution rules, if the Company is a PFIC, U.S. Holders will generally be deemed to own their proportionate share of the Company’s direct or indirect equity interest in any company that is also a PFIC (a “Subsidiary PFIC”), and will generally be subject to U.S. federal income tax on their proportionate share of (a) any “excess distributions,” as described below, on the stock of a Subsidiary PFIC and (b) a disposition or deemed disposition of the stock of a Subsidiary PFIC by the Company or another Subsidiary PFIC, both as if such U.S. Holders directly held the shares of such Subsidiary PFIC. In addition, U.S. Holders may be subject to U.S. federal income tax on any indirect gain realized on the stock of a Subsidiary PFIC on the sale or disposition of common shares. Accordingly, U.S. Holders should be aware that they could be subject to tax under the PFIC rules even if no distributions are received and no redemptions or other dispositions of common shares are made.

Default PFIC Rules Under Section 1291 of the Code

If the Company is a PFIC for any tax year during which a U.S. Holder owns common shares, the U.S. federal income tax consequences to such U.S. Holder of the acquisition, ownership, and disposition of common shares will depend on whether and when such U.S. Holder makes an election to treat the Company and each Subsidiary PFIC, if any, as a “qualified electing fund” or “QEF” under Section 1295 of the Code (a “QEF Election”) or makes a mark-to-market election under Section 1296 of the Code (a “Mark-to-Market Election”). A U.S. Holder that does not make either a QEF Election or a Mark-to-Market Election will be referred to in this summary as a “Non-Electing U.S. Holder.”

A Non-Electing U.S. Holder will be subject to the rules of Section 1291 of the Code (described below) with respect to: (a) any gain recognized on the sale or other taxable disposition of common shares; and (b) any “excess distribution” received on the common shares. A distribution generally will be an “excess distribution” to the extent that such distribution (together with all other distributions received in the current tax year) exceeds 125% of the average distributions received during the three preceding tax years (or during a U.S. Holder’s holding period for the common shares, if shorter).

Under Section 1291 of the Code, any gain recognized on the sale or other taxable disposition of common shares (including an indirect disposition of the stock of any Subsidiary PFIC), and any “excess distribution” received on common shares or with respect to the stock of a Subsidiary PFIC, must be ratably allocated to each day in a Non-Electing U.S. Holder’s holding period for the respective common shares. The amount of any such gain or excess distribution allocated to the tax year of disposition or distribution of the excess distribution and to years before the entity became a PFIC, if any, would be taxed as ordinary income (and not eligible for certain preferred rates). The amounts allocated to any other tax year would be subject to U.S. federal income tax at the highest tax rate applicable to ordinary income in each such year, and an interest charge would be imposed on the tax liability for each such year, calculated as if such tax liability had been due in each such year. A Non-Electing U.S. Holder that is not a corporation must treat any such interest paid as “personal interest,” which is not deductible.
If the Company is a PFIC for any tax year during which a Non-Electing U.S. Holder holds common shares, the Company will continue to be treated as a PFIC with respect to such Non-Electing U.S. Holder, regardless of whether the Company ceases to be a PFIC in one or more subsequent tax years.


A Non-Electing U.S. Holder may terminate this deemed PFIC status by electing to recognize gain (which will be taxed under the rules of Section 1291 of the Code discussed above), but not loss, as if such common shares were sold on the last day of the last tax year for which the Company was a PFIC.

QEF Election    

A U.S. Holder that makes a timely and effective QEF Election for the first tax year in which the holding period of its common shares begins generally will not be subject to the rules of Section 1291 of the Code discussed above with respect to its common shares. A U.S. Holder that makes a timely and effective QEF Election will be subject to U.S. federal income tax on such U.S. Holder’s pro rata share of (a) the net capital gain of the Company, which will be taxed as long-term capital gain to such U.S. Holder, and (b) the ordinary earnings of the Company, which will be taxed as ordinary income to such U.S. Holder. Generally, “net capital gain” is the excess of (a) net long-term capital gain over (b) net short-term capital loss, and “ordinary earnings” are the excess of (a) “earnings and profits” over (b) net capital gain. A U.S. Holder that makes a QEF Election will be subject to U.S. federal income tax on such amounts for each tax year in which the Company is a PFIC, regardless of whether such amounts are actually distributed to such U.S. Holder by the Company. However, for any tax year in which the Company is a PFIC and has no net income or gain, U.S. Holders that have made a QEF Election would not have any income inclusions as a result of the QEF Election. If a U.S. Holder that made a QEF Election has an income inclusion, such a U.S. Holder may, subject to certain limitations, elect to defer payment of current U.S. federal income tax on such amounts, subject to an interest charge. If such U.S. Holder is not a corporation, any such interest paid will be treated as “personal interest,” which is not deductible.

A U.S. Holder that makes a timely and effective QEF Election with respect to the Company generally (a) may receive a tax-free distribution from the Company to the extent that such distribution represents “earnings and profits” of the Company that were previously included in income by the U.S. Holder because of such QEF Election and (b) will adjust such U.S. Holder’s tax basis in the common shares to reflect the amount included in income or allowed as a tax-free distribution because of such QEF Election. In addition, a U.S. Holder that makes a QEF Election generally will recognize capital gain or loss on the sale or other taxable disposition of common shares.
The procedure for making a QEF Election, and the U.S. federal income tax consequences of making a QEF Election, will depend on whether such QEF Election is timely. A QEF Election will be treated as “timely” if such QEF Election is made for the first year in the U.S. Holder’s holding period for the common shares in which the Company was a PFIC. A U.S. Holder may make a timely QEF Election by filing the appropriate QEF Election documents at the time such U.S. Holder files a U.S. federal income tax return for such year. If a U.S. Holder does not make a timely and effective QEF Election for the first year in the U.S. Holder’s holding period for the common shares, the U.S. Holder may still be able to make a timely and effective QEF Election in a subsequent year if such U.S. Holder meets certain requirements and makes a “purging” election to recognize gain (which will be taxed under the rules of Section 1291 of the Code discussed above) as if such common shares were sold for their fair market value on the day the QEF Election is effective. If a U.S. Holder makes a QEF Election but does not make a “purging” election to recognize gain as discussed in the preceding sentence, then such U.S. Holder shall be subject to the QEF Election rules and shall continue to be subject to tax under the rules of Section 1291 discussed above with respect to its common shares. If a U.S. Holder owns PFIC stock indirectly through another PFIC, separate QEF Elections must be made for the PFIC in which the U.S. Holder is a direct shareholder and the Subsidiary PFIC for the QEF rules to apply to both PFICs.

A QEF Election will apply to the tax year for which such QEF Election is timely made and to all subsequent tax years, unless such QEF Election is invalidated or terminated or the IRS consents to revocation of such QEF Election. If a U.S. Holder makes a QEF Election and, in a subsequent tax year, the Company ceases to be a PFIC, the QEF Election will remain in effect (although it will not be applicable) during those tax years in which the Company is not a PFIC. Accordingly, if the Company becomes a PFIC in another subsequent tax year, the QEF Election will be effective and the U.S. Holder will be subject to the QEF rules described above during any subsequent tax year in which the Company qualifies as a PFIC.

For each tax year that the Company qualifies as a PFIC, the Company: (a) intends to make publicly available to U.S. Holders, upon their written request, a “PFIC Annual Information Statement” for the Company as described in Treasury Regulation Section 1.1295-1(g) (or any successor Treasury Regulation) and (b) upon written request, intends to use commercially reasonable efforts to provide such additional information that such U.S. Holder is reasonably required to obtain in connection with maintaining such QEF Election with regard to the Company. The Company may elect to provide such information on the Company’s website. However, U.S. Holders should be aware that the Company can provide no assurances that the Company will provide any such information relating to any Subsidiary PFIC and as a result, a QEF Election may not be available with respect to any Subsidiary PFIC. Because the Company may own shares in one or more Subsidiary PFICs at any time, U.S. Holders will continue to be subject to the rules discussed above with respect to the taxation of gains and excess distributions with respect to any Subsidiary PFIC for which the U.S. Holders do not obtain such required information.Each U.S. Holder should consult its own tax advisors regarding the availability of, and procedure for making, a QEF Election with respect to the Company and any Subsidiary PFIC.


A U.S. Holder makes a QEF Election by attaching a completed IRS Form 8621, including a PFIC Annual Information Statement, to a timely filed United States federal income tax return. However, if the Company does not provide the required information with regard to the Company or any of its Subsidiary PFICs, U.S. Holders will not be able to make a QEF Election for such entity and will continue to be subject to the rules of Section 1291 of the Code discussed above that apply to Non-Electing U.S. Holders with respect to the taxation of gains and excess distributions.

Mark-to-Market Election

A U.S. Holder may make a Mark-to-Market Election only if the common shares are marketable stock. The common shares generally will be “marketable stock” if the common shares are regularly traded on (a) a national securities exchange that is registered with the SEC, (b) the national market system established pursuant to section 11A of the Exchange Act, or (c) a foreign securities exchange that is regulated or supervised by a governmental authority of the country in which the market is located, provided that (i) such foreign exchange has trading volume, listing, financial disclosure, and surveillance requirements, and meets other requirements and the laws of the country in which such foreign exchange is located, together with the rules of such foreign exchange, ensure that such requirements are actually enforced and (ii) the rules of such foreign exchange effectively promote active trading of listed stocks. If such stock is traded on such a qualified exchange or other market, such stock generally will be “regularly traded” for any calendar year during which such stock is traded, other than in de minimis quantities, on at least 15 days during each calendar quarter. Each U.S. Holder should consult its own tax advisor in this matter.
A U.S. Holder that makes a Mark-to-Market Election with respect to its common shares generally will not be subject to the rules of Section 1291 of the Code discussed above with respect to such common shares. However, if a U.S. Holder does not make a Mark-to-Market Election beginning in the first tax year of such U.S. Holder’s holding period for the common shares for which the Company is a PFIC and such U.S. Holder has not made a timely QEF Election, the rules of Section 1291 of the Code discussed above will apply to certain dispositions of, and distributions on, the common shares.

A U.S. Holder that makes a Mark-to-Market Election will include in ordinary income, for each tax year in which the Company is a PFIC, an amount equal to the excess, if any, of (a) the fair market value of the common shares, as of the close of such tax year over (b) such U.S. Holder’s adjusted tax basis in such common shares. A U.S. Holder that makes a Mark-to-Market Election will be allowed a deduction in an amount equal to the excess, if any, of (a) such U.S. Holder’s adjusted tax basis in the common shares, over (b) the fair market value of such common shares (but only to the extent of the net amount of previously included income as a result of the Mark-to-Market Election for prior tax years).

A U.S. Holder that makes a Mark-to-Market Election generally also will adjust such U.S. Holder’s tax basis in the common shares to reflect the amount included in gross income or allowed as a deduction because of such Mark-to-Market Election. In addition, upon a sale or other taxable disposition of common shares, a U.S. Holder that makes a Mark-to-Market Election will recognize ordinary income or ordinary loss (not to exceed the excess, if any, of (a) the amount included in ordinary income because of such Mark-to-Market Election for prior tax years over (b) the amount allowed as a deduction because of such Mark-to-Market Election for prior tax years). Losses that exceed this limitation are subject to the rules generally applicable to losses provided in the Code and Treasury Regulations.
A U.S. Holder makes a Mark-to-Market Election by attaching a completed IRS Form 8621 to a timely filed United States federal income tax return. A Mark-to-Market Election applies to the tax year in which such Mark-to-Market Election is made and to each subsequent tax year, unless the common shares cease to be “marketable stock” or the IRS consents to revocation of such election. Each U.S. Holder should consult its own tax advisors regarding the availability of, and procedure for making, a Mark-to-Market Election.

Although a U.S. Holder may be eligible to make a Mark-to-Market Election with respect to the common shares, no such election may be made with respect to the stock of any Subsidiary PFIC that a U.S. Holder is treated as owning, because such stock is not marketable. Hence, the Mark-to-Market Election will not be effective to avoid the application of the default rules of Section 1291 of the Code described above with respect to deemed dispositions of Subsidiary PFIC stock or excess distributions from a Subsidiary PFIC to its shareholder.


Other PFIC Rules

Under Section 1291(f) of the Code, the IRS has issued proposed Treasury Regulations that, subject to certain exceptions, would cause a U.S. Holder that had not made a timely QEF Election to recognize gain (but not loss) upon certain transfers of common shares that would otherwise be tax-deferred (e.g., gifts and exchanges pursuant to corporate reorganizations). However, the specific U.S. federal income tax consequences to a U.S. Holder may vary based on the manner in which common shares are transferred.

Certain additional adverse rules may apply with respect to a U.S. Holder if the Company is a PFIC, regardless of whether such U.S. Holder makes a QEF Election. For example, under Section 1298(b)(6) of the Code, a U.S. Holder that uses common shares as security for a loan will, except as may be provided in Treasury Regulations, be treated as having made a taxable disposition of such common shares.

In addition, a U.S. Holder who acquires common shares from a decedent will not receive a “step up” in tax basis of such common shares to fair market value unless such decedent had a timely and effective QEF Election in place.

Special rules also apply to the amount of foreign tax credit that a U.S. Holder may claim on a distribution from a PFIC. Subject to such special rules, foreign taxes paid with respect to any distribution in respect of stock in a PFIC are generally eligible for the foreign tax credit. The rules relating to distributions by a PFIC and their eligibility for the foreign tax credit are complicated, and a U.S. Holder should consult with its own tax advisors regarding the availability of the foreign tax credit with respect to distributions by a PFIC.

The PFIC rules are complex, and each U.S. Holder should consult its own tax advisors regarding the PFIC rules and how the PFIC rules may affect the U.S. federal income tax consequences of the acquisition, ownership, and disposition of common shares.

Certain additional adverse rules may apply with respect to a U.S. Holder if the Company is a PFIC, regardless of whether the U.S. Holder makes a QEF Election. These rules include special rules that apply to the amount of foreign tax credit that a U.S. Holder may claim on a distribution from a PFIC. Subject to these special rules, foreign taxes paid with respect to any distribution in respect of stock in a PFIC are generally eligible for the foreign tax credit. U.S. Holders are urged to consult their own tax advisors regarding the potential application of the PFIC rules to the ownership and disposition of common shares, and the availability of certain U.S. tax elections under the PFIC rules.


Additional Considerations

Receipt of Foreign Currency

The amount of any distribution paid to a U.S. Holder in foreign currency, or on the sale, exchange or other taxable disposition of common shares, generally will be equal to the U.S. dollar value of such foreign currency based on the exchange rate applicable on the date of receipt (regardless of whether such foreign currency is converted into U.S. dollars at that time). If the foreign currency received is not converted into U.S. dollars on the date of receipt, a U.S. Holder will have a basis in the foreign currency equal to its U.S. dollar value on the date of receipt. Any U.S. Holder who receives payment in foreign currency and engages in subsequent conversion or other disposition of the foreign currency after the date of receipt may have a foreign currency exchange gain or loss that would be treated as ordinary income or loss, and generally will be U.S. source income or loss for foreign tax credit purposes. Different rules apply to U.S. Holders who use the accrual method of tax accounting. Each U.S. Holder should consult its own U.S. tax advisor regarding the U.S. federal income tax consequences of receiving, owning, and disposing of foreign currency.

Foreign Tax Credit

Dividends paid on the common shares will be treated as foreign-source income, and generally will be treated as “passive category income” or “general category income” for U.S. foreign tax credit purposes.Any gain or loss recognized on a sale or other disposition of common shares generally will be United States source gain or loss. Certain U.S. Holders that are eligible for the benefits of Canada-U.S. Tax Convention may elect to treat such gain or loss as Canadian source gain or loss for U.S. foreign tax credit purposes.The Code applies various complex limitations on the amount of foreign taxes that may be claimed as a credit by U.S. taxpayers. In addition, Treasury Regulations that apply to taxes paid or accrued (the “Foreign Tax Credit Regulations”) impose additional requirements for Canadian withholding taxes to be eligible for a foreign tax credit, and there can be no assurance that those requirements will be satisfied.The Treasury Department has recently released guidance temporarily pausing the application of certain of the Foreign Tax Credit Regulations.


Subject to the PFIC rules and the Foreign Tax Credit Regulations, each as discussed above, a U.S. Holder that pays (whether directly or through withholding) Canadian income tax with respect to dividends paid on the common shares generally will be entitled, at the election of such U.S. Holder, to receive either a deduction or a credit for such Canadian income tax paid. Generally, a credit will reduce a U.S. Holder’s U.S. federal income tax liability on a dollar-for-dollar basis, whereas a deduction will reduce a U.S. Holder’s income subject to U.S. federal income tax. This election is made on a year-by-year basis and applies to all foreign taxes paid (whether directly or through withholding) by a U.S. Holder during a year.

The foreign tax credit rules are complex, and involve the application of rules that depend on a U.S. Holder’s particular circumstances. Accordingly, each U.S. Holder should consult its own U.S. tax advisor regarding the foreign tax credit rules.

Backup Withholding and Information Reporting

Under U.S. federal income tax law and Treasury Regulations, certain categories of U.S. Holders must file information returns with respect to their investment in, or involvement in, a foreign corporation. For example, U.S. return disclosure obligations (and related penalties) are imposed on U.S. Holders that hold certain specified foreign financial assets in excess of certain threshold amounts. The definition of specified foreign financial assets includes not only financial accounts maintained in foreign financial institutions, but also, unless held in accounts maintained by a financial institution, any stock or security issued by a non-U.S. person, any financial instrument or contract held for investment that has an issuer or counterparty other than a U.S. person and any interest in a foreign entity. U.S. Holders may be subject to these reporting requirements unless their common shares are held in an account at certain financial institutions. Penalties for failure to file certain of these information returns are substantial. U.S. Holders should consult with their own tax advisors regarding the requirements of filing information returns, including the requirement to file an IRS Form 8938.

Payments made within the U.S. or by a U.S. pay or or U.S. middleman, of dividends on, and proceeds arising from the sale or other taxable disposition of, common shares will generally be subject to information reporting and backup withholding tax, (currently at the rate of 24%), if a U.S. Holder (a) fails to furnish such U.S. Holder’s correct U.S. taxpayer identification number (generally on Form W-9), (b) furnishes an incorrect U.S. taxpayer identification number, (c) is notified by the IRS that such U.S. Holder has previously failed to properly report items subject to backup withholding tax, or (d) fails to certify, under penalty of perjury, that such U.S. Holder has furnished its correct U.S. taxpayer identification number and that the IRS has not notified such U.S. Holder that it is subject to backup withholding tax. However, certain exempt persons generally are excluded from these information reporting and backup withholding rules. Backup withholding is not an additional tax. Any amounts withheld under the U.S. backup withholding tax rules generally will be allowed as a credit against a U.S. Holder’s U.S. federal income tax liability, if any, or will be refunded, if such U.S. Holder furnishes required information to the IRS in a timely manner.

The discussion of reporting requirements set forth above is not intended to constitute an exhaustive description of all reporting requirements that may apply to a U.S. Holder. A failure to satisfy certain reporting requirements may result in an extension of the time period during which the IRS can assess a tax, and under certain circumstances, such an extension may apply to assessments of amounts unrelated to any unsatisfied reporting requirements. Each U.S. Holder should consult its own tax advisor regarding the information reporting and backup withholding rules.

THE FOREGOING DISCUSSION IS NOT INTENDED TO CONSTITUTE A COMPLETE ANALYSIS OF ALL U.S. TAX MATTERS THAT MAY BE IMPORTANT TO U.S. HOLDERS WITH RESPECT TO THE ACQUISITION, OWNERSHIP AND DISPOSITION OF THE COMMON SHARES. PROSPECTIVE U.S. HOLDERS ARE STRONGLY ENCOURAGED TO CONSULT THEIR OWN TAX ADVISORS REGARDING THE TAX CONSIDERATIONS APPLICABLE TO THEM IN LIGHT OF THEIR OWN PARTICULAR CIRCUMSTANCES.


UNDERTAKING
The Company undertakes to make available, in person or by telephone, representatives to respond to inquiries made by the Commission staff, and to furnish promptly, when requested to do so by the Commission staff, information relating to: the securities registered pursuant to Form 40-F; the securities in relation to which the obligation to file an annual report on Form 40-F arises; or transactions in said securities.


CONSENT TO SERVICE OF PROCESS
The Company has previously filed with the Commission a written consent to service of process on Form F-X. Any change to the name or address of the Company’s agent for service shall be communicated promptly to the Commission by amendment to the Form F-X referencing the file number of the Company.

EXHIBIT INDEX
The following documents are being filed with the Commission as exhibits to this Annual Report on Form 40-F.
Exhibit Description
101 Interactive Data File, formatted as Inline XBRL
104 Cover Page from this Annual Report on Form 40-F, formatted as Inline XBRL

SIGNATURES
Pursuant to the requirements of the Exchange Act, the Registrant certifies that it meets all of the requirements for filing on Form 40-F and has duly caused this Annual Report to be signed on its behalf by the undersigned, thereto duly authorized.
BALLARD POWER SYSTEMS INC.
Date: March 11, 2024 By: /s/ Paul Dobson
Name: Paul Dobson
Title: Vice President and Chief Financial Officer


EX-97.1 2 ballardex971to_26cxcompens.htm EX-97.1 Document
Ballard Clawback Policy (October 2, 2023)


Policy and Objective
Effective October 2, 2023, the NYSE and Nasdaq amended their listing standards related to recovery of erroneously awarded executive compensation as required by SEC Rule 10D-1. These rules are required by the Dodd-Frank Wall Street Reform and Consumer Protection Act and SEC Exchange Act Rule 10D-1.  Under Rule 10D-1 and Nasdaq rules, recovery of erroneously awarded incentive-based compensation is required from current and former executive officers who received incentive-based compensation during the three fiscal years preceding the date on which a company is required to prepare an accounting restatement to correct a material error. Failure to adopt a compliant compensation recovery policy, disclose the policy in accordance with SEC rules, or comply with the policy’s recovery provisions can result in delisting of the company from the exchange.
The Board of Directors (the “Board”) of Ballard Power Systems Inc. (the “Corporation”) has adopted this policy (the “Policy”) to govern the recovery of incentive-based compensation from executive officers in connection with a restatement of the financial results of the Corporation.
Interpretation and application
Application
This Policy applies to the Corporation’s current and former executive officers who received incentive-based compensation during the three fiscal years preceding the date on which a company is required to prepare an accounting restatement to correct a material error. This Policy applies to incentive-based compensation received by an executive officer (a) after beginning services as an executive officer; (b) if that person served as an executive officer at any time during the performance period for such incentive-based compensation; and (c) while the Corporation had a listed class of securities on a national securities exchange. Recovery of erroneously awarded compensation is on a “no fault” basis, without regard to whether any misconduct occurred or an executive officer’s responsibility for the erroneous financial statements.
Types of Restatements
A restatement due to material noncompliance with any financial reporting requirement under the securities laws triggers application of this Policy. Recovery for restatements that correct errors that are material to previously issued financial statements (“Big R” restatements), as well as for restatements that correct errors that are not material to previously issued financial statements but would result in a material misstatement if the errors were left uncorrected in the current report or the error correction was recognized in the current period (“little r” restatements).
In determining the materiality of an error, the Board shall have regard to the facts and circumstances and existing judicial and administrative interpretations.
Look-Back Period
Incentive-based compensation received during the three completed fiscal years (including any transition periods resulting from a change in the Corporation’s fiscal year as provided in Rule 10D-1) immediately preceding the date that a restatement is required is subject to this Policy. The date that a restatement is required is the earlier of:
a)the date the Company’s board of directors, a committee of the board of directors, or the officer or officers of the Company authorized to take such action if board action is not required, concludes, or reasonably should have concluded, that the Company is required to prepare an accounting restatement; or
b)the date a court, regulator, or other legally authorized body directs the Company to prepare the accounting restatement.
Notwithstanding the foregoing, this Policy only applies to incentive-based compensation received on or after the effective date. The Corporation’s former policy will apply to incentive-based compensation received before the effective date.
Recovery Amount Determination


- 2 -

The erroneously awarded incentive-based compensation subject to recovery is the amount of incentive-based compensation received that exceeds the amount of incentive-based compensation that otherwise would have been received had it been determined based on the restated amounts, calculated on a pre-tax basis.
For equity awards that are incentive-based compensation, if the shares, share units or options are still held at the time of recovery, the recoverable amount is the number of shares, share units or options received in excess of the number that should have been received after applying the restated financial reporting measure. If options have been exercised, but the underlying shares have not been sold, the recoverable amount is the number of shares underlying the excess options applying the restated financial measure.
For incentive-based compensation based on stock price or total shareholder return, where the amount of erroneously awarded compensation is not subject to mathematical recalculation based on the information in an accounting restatement, the recoverable amount must be determined based on a reasonable, documented estimate of the effect of the accounting restatement on the applicable measure. The Corporation shall maintain documentation of the determination of that reasonable estimate and provide such documentation to Nasdaq.
Recovery of Amounts Paid
The Corporation shall recover erroneously awarded incentive-based compensation in compliance with this Policy, except to the extent that the Board has determined that pursuit of recovery would be impracticable because:
1.the direct expense paid to a third party to assist in enforcing the policy would exceed the amount to be recovered;
2.it would violate home country law, where that law was adopted prior to November 28, 2022, based on an opinion of counsel acceptable to Nasdaq; or
3.it would cause a retirement plan, under which benefits are broadly available to employees of the Corporation, to fail to meet the requirements of 26 U.S.C. 401(a)(13) or 26 U.S.C. 411(a) and regulations thereunder.
Before concluding that pursuit is impracticable, the Corporation must first make a reasonable attempt to recover the incentive-based compensation, document such reasonable attempt(s) to recover, and provide that documentation to Nasdaq.
The Corporation is prohibited from indemnifying any current or former executive officer for recovered compensation.
Disclosure Requirements
The Corporation shall file this Policy as an exhibit to its Form 40-F filed with the SEC.
In addition, the Corporation shall file all disclosures required by securities laws if, during the prior fiscal year, either a triggering restatement occurred or any balance of excess incentive-based compensation was outstanding. (See Appendix for current disclosure requirements.)
Definitions
For the purposes of this Policy:
1.“effective date” means October 2, 2023.
2.“executive officer” means the Corporation’s president, principal financial officer, principal accounting officer (or if there is no such accounting officer, the controller), any vice-president of the Corporation in charge of a principal business unit, division, or function (such as sales, administration, or finance), any other officer who performs a policy-making function, or any other person who performs similar policymaking functions for the Corporation. Executive officers of the Corporation’s parent(s) or subsidiaries are deemed executive officers of the Corporation if they perform such policy making functions for the Corporation. Policy-making function is not intended to include policy-making functions that are not significant.


- 3 -

3.“financial reporting measures” are measures that are determined and presented in accordance with the accounting principles used in preparing the Corporation’s financial statements, and any measures that are derived wholly or in part from such measures. Stock price and total shareholder return are also financial reporting measures. A financial reporting measure need not be presented within the financial statements or included in a regulatory filing.
4.“incentive-based compensation” is any compensation that is granted, earned, or vested based wholly or in part upon the attainment of a financial reporting measure. Incentive-based compensation includes, but is not limited to:
Non-equity incentive plan awards that are earned based wholly or in part on satisfying a financial reporting measure performance goal;
Bonuses paid from a “bonus pool,” the size of which is determined based wholly or in part on satisfying a financial reporting measure performance goal;
Other cash awards based on satisfaction of a financial reporting measure performance goal;
Restricted stock, restricted stock units, performance share units, stock options, and stock appreciation rights that are granted or become vested based wholly or in part on satisfying a financial reporting measure performance goal; and
Proceeds received upon the sale of shares acquired through an incentive plan that were granted or vested based wholly or in part on satisfying a financial reporting measure performance goal.
Equity awards that vest exclusively upon completion of a specified employment period, without any performance condition, and bonus awards that are discretionary or based on subjective goals or goals unrelated to financial reporting measures, do not constitute incentive-based compensation. 
5. “received” Incentive-based compensation is deemed received in the Corporation’s fiscal period during which the financial reporting measure specified in the incentive-based compensation award is attained, even if the payment or grant of the incentive-based compensation occurs after the end of that period.
General
The Board is authorized to interpret and construe this Policy and to make all determinations necessary, appropriate or advisable for the administration of this Policy and may delegate any or all of its duties and responsibilities under this Policy to the Audit Committee and/or People & Compensation Committee, in which case any reference to the “Board” in this Policy shall be to such committees.
This Policy shall not be deemed to contradict the existing terms of any outstanding agreements, plans, programs or other arrangements pursuant to which performance-based compensation may be awarded or paid by the Corporation and shall supersede any such agreements, plans, programs or other arrangements to the extent of any inconsistency with this Policy.
The remedies available under this Policy shall not be exhaustive and nothing herein shall preclude the Corporation from taking any disciplinary actions in respect of the acts or conduct of an executive officer as the Corporation deems appropriate in the circumstances, up to and including termination of employment, as well as any other remedies or recourses available to the Corporation. The provisions of this Policy are in addition to (and not in lieu of) any rights to repayment the Corporation may have under Section 304 of the Sarbanes-Oxley Act of 2002 and other applicable laws.
This Policy may be amended or restated by the Board from time to time to ensure compliance with applicable securities regulations and exchange rules and policies, and it may be supplemented by, among other things, more specific procedures and standards as well as amendments to the applicable compensation agreements, plans, programs or other arrangements of the Corporation.


- 4 -

This Policy was approved by the Board of Directors of the Corporation on September 6, 2023.


- 5 -

Appendix
SEC rules require disclosure pursuant to Item 402 of Regulation S-K of the following items, among others, if, during the prior fiscal year, either a triggering restatement occurred or any balance of excess incentive-based compensation was outstanding:
•The date on which the listed issuer was required to prepare an accounting restatement and the aggregate dollar amount of erroneously awarded compensation attributable to such accounting restatement (including an analysis of how the recoverable amount was calculated) or, if the amount has not yet been determined, an explanation of the reasons and disclosure of the amount and related disclosures in the next filing that is subject to Item 402 of Regulation S-K;
•The aggregate dollar amount of erroneously awarded compensation that remains outstanding at the end of its last completed fiscal year;
•If the financial reporting measure related to a stock price or total shareholder return metric, the estimates used to determine the amount of erroneously awarded compensation attributable to such accounting restatement and an explanation of the methodology used for such estimates;
•If recovery would be impracticable, for each current and former named executive officer and for all other current and former executive officers as a group, disclose the amount of recovery forgone and a brief description of the reason the listed registrant decided in each case not to pursue recovery; and
•For each current and former named executive officer, disclose the amount of erroneously awarded compensation still owed that had been outstanding for 180 days or longer since the date the issuer determined the amount owed.


0.33330.33330.33330001453015FY2024FALSE00014530152023-01-012023-12-3100014530152023-12-31iso4217:USD00014530152022-12-3100014530152022-01-012022-12-31iso4217:USDxbrli:sharesxbrli:shares0001453015ifrs-full:IssuedCapitalMember2021-12-310001453015ifrs-full:AdditionalPaidinCapitalMember2021-12-310001453015ifrs-full:RetainedEarningsMember2021-12-310001453015ifrs-full:ReserveOfExchangeDifferencesOnTranslationMember2021-12-3100014530152021-12-310001453015ifrs-full:RetainedEarningsMember2022-01-012022-12-310001453015ifrs-full:IssuedCapitalMember2022-01-012022-12-310001453015ifrs-full:AdditionalPaidinCapitalMember2022-01-012022-12-310001453015ifrs-full:IssuedCapitalMemberbldp:DeferredShareUnitsMember2022-01-012022-12-310001453015ifrs-full:AdditionalPaidinCapitalMemberbldp:DeferredShareUnitsMember2022-01-012022-12-310001453015bldp:DeferredShareUnitsMember2022-01-012022-12-310001453015ifrs-full:IssuedCapitalMemberbldp:RestrictedShareUnitsRSUMember2022-01-012022-12-310001453015bldp:RestrictedShareUnitsRSUMemberifrs-full:AdditionalPaidinCapitalMember2022-01-012022-12-310001453015bldp:RestrictedShareUnitsRSUMember2022-01-012022-12-310001453015ifrs-full:ReserveOfExchangeDifferencesOnTranslationMember2022-01-012022-12-310001453015ifrs-full:IssuedCapitalMemberifrs-full:OpeningBalanceAfterAdjustmentCumulativeEffectAtDateOfInitialApplicationMember2022-12-310001453015ifrs-full:OpeningBalanceAfterAdjustmentCumulativeEffectAtDateOfInitialApplicationMemberifrs-full:AdditionalPaidinCapitalMember2022-12-310001453015ifrs-full:OpeningBalanceAfterAdjustmentCumulativeEffectAtDateOfInitialApplicationMemberifrs-full:RetainedEarningsMember2022-12-310001453015ifrs-full:ReserveOfExchangeDifferencesOnTranslationMemberifrs-full:OpeningBalanceAfterAdjustmentCumulativeEffectAtDateOfInitialApplicationMember2022-12-310001453015ifrs-full:OpeningBalanceAfterAdjustmentCumulativeEffectAtDateOfInitialApplicationMember2022-12-310001453015ifrs-full:RetainedEarningsMember2023-01-012023-12-310001453015ifrs-full:IssuedCapitalMember2023-01-012023-12-310001453015ifrs-full:AdditionalPaidinCapitalMember2023-01-012023-12-310001453015ifrs-full:IssuedCapitalMemberbldp:DeferredShareUnitsMember2023-01-012023-12-310001453015ifrs-full:AdditionalPaidinCapitalMemberbldp:DeferredShareUnitsMember2023-01-012023-12-310001453015bldp:DeferredShareUnitsMember2023-01-012023-12-310001453015ifrs-full:IssuedCapitalMemberbldp:RestrictedShareUnitsRSUMember2023-01-012023-12-310001453015bldp:RestrictedShareUnitsRSUMemberifrs-full:AdditionalPaidinCapitalMember2023-01-012023-12-310001453015bldp:RestrictedShareUnitsRSUMember2023-01-012023-12-310001453015ifrs-full:ReserveOfExchangeDifferencesOnTranslationMember2023-01-012023-12-310001453015ifrs-full:IssuedCapitalMember2023-12-310001453015ifrs-full:AdditionalPaidinCapitalMember2023-12-310001453015ifrs-full:RetainedEarningsMember2023-12-310001453015ifrs-full:ReserveOfExchangeDifferencesOnTranslationMember2023-12-310001453015bldp:BallardMotiveSolutionsMember2023-01-012023-12-31xbrli:pure0001453015bldp:BallardMotiveSolutionsMember2022-01-012022-12-310001453015bldp:GuangzhouBallardPowerSystemsIncMember2023-01-012023-12-310001453015bldp:GuangzhouBallardPowerSystemsIncMember2022-01-012022-12-310001453015bldp:BallardPowerSystemsEuropeMember2023-01-012023-12-310001453015bldp:BallardPowerSystemsEuropeMember2022-01-012022-12-310001453015bldp:BallardHongKongLtd.Member2023-01-012023-12-310001453015bldp:BallardHongKongLtd.Member2022-01-012022-12-310001453015bldp:BallardUnmannedSystemsMember2023-01-012023-12-310001453015bldp:BallardUnmannedSystemsMember2022-01-012022-12-310001453015bldp:BallardServicesinc.Member2023-01-012023-12-310001453015bldp:BallardServicesinc.Member2022-01-012022-12-310001453015bldp:BallardFuelCellSystemIncMember2023-01-012023-12-310001453015bldp:BallardFuelCellSystemIncMember2022-01-012022-12-310001453015bldp:BallardPowerCorporationMember2023-01-012023-12-310001453015bldp:BallardPowerCorporationMember2022-01-012022-12-310001453015bldp:WeichaiBallardJVMember2023-01-012023-12-310001453015bldp:WeichaiBallardJVMember2022-01-012022-12-310001453015bldp:SynergyJVMember2023-01-012023-12-310001453015bldp:SynergyJVMember2023-01-012023-12-310001453015ifrs-full:BottomOfRangeMemberifrs-full:ComputerEquipmentMember2023-01-012023-12-310001453015ifrs-full:TopOfRangeMemberifrs-full:ComputerEquipmentMember2023-01-012023-12-310001453015ifrs-full:FixturesAndFittingsMemberifrs-full:BottomOfRangeMember2023-01-012023-12-310001453015ifrs-full:FixturesAndFittingsMemberifrs-full:TopOfRangeMember2023-01-012023-12-310001453015ifrs-full:BottomOfRangeMemberifrs-full:MachineryMember2023-01-012023-12-310001453015ifrs-full:TopOfRangeMemberifrs-full:MachineryMember2023-01-012023-12-310001453015ifrs-full:BottomOfRangeMemberifrs-full:LandAndBuildingsMember2023-01-012023-12-310001453015ifrs-full:TopOfRangeMemberifrs-full:LandAndBuildingsMember2023-01-012023-12-310001453015ifrs-full:BottomOfRangeMemberifrs-full:OfficeEquipmentMember2023-01-012023-12-310001453015ifrs-full:TopOfRangeMemberifrs-full:OfficeEquipmentMember2023-01-012023-12-310001453015ifrs-full:BottomOfRangeMemberifrs-full:VehiclesMember2023-01-012023-12-310001453015ifrs-full:TopOfRangeMemberifrs-full:VehiclesMember2023-01-012023-12-310001453015ifrs-full:BottomOfRangeMemberifrs-full:CopyrightsPatentsAndOtherIndustrialPropertyRightsServiceAndOperatingRightsMember2023-01-012023-12-310001453015ifrs-full:TopOfRangeMemberifrs-full:CopyrightsPatentsAndOtherIndustrialPropertyRightsServiceAndOperatingRightsMember2023-01-012023-12-310001453015ifrs-full:BottomOfRangeMemberbldp:ERPmanagementreportingsoftwaresystemMember2023-01-012023-12-310001453015ifrs-full:TopOfRangeMemberbldp:ERPmanagementreportingsoftwaresystemMember2023-01-012023-12-310001453015ifrs-full:BottomOfRangeMemberifrs-full:CustomerrelatedIntangibleAssetsMember2023-01-012023-12-310001453015ifrs-full:TopOfRangeMemberifrs-full:CustomerrelatedIntangibleAssetsMember2023-01-012023-12-310001453015ifrs-full:BottomOfRangeMemberbldp:NoncompeteAgreements1Member2023-01-012023-12-310001453015ifrs-full:TopOfRangeMemberbldp:NoncompeteAgreements1Member2023-01-012023-12-310001453015bldp:DomainNamesMember2023-01-012023-12-310001453015bldp:TrademarksandServicemarksMember2023-01-012023-12-310001453015ifrs-full:BottomOfRangeMemberbldp:InternallygeneratedfuelcellMember2023-01-012023-12-310001453015ifrs-full:TopOfRangeMemberbldp:InternallygeneratedfuelcellMember2023-01-012023-12-310001453015bldp:ArcolaEnergyLimitedMember2021-11-110001453015ifrs-full:TopOfRangeMemberbldp:ArcolaEnergyLimitedMember2021-11-110001453015bldp:ArcolaEnergyLimitedMember2023-12-310001453015bldp:ArcolaEnergyLimitedMember2021-11-112021-11-110001453015bldp:ArcolaEnergyLimitedMember2021-11-112023-12-310001453015bldp:BallardMotiveSolutionsMember2022-01-012022-12-310001453015bldp:ArcolaEnergyLimitedMember2022-01-012022-12-310001453015bldp:BallardMotiveSolutionsMember2022-12-310001453015ifrs-full:AccumulatedDepreciationAmortisationAndImpairmentMember2023-01-012023-12-310001453015ifrs-full:AccumulatedDepreciationAmortisationAndImpairmentMember2022-01-012022-12-310001453015bldp:BallardMotiveSolutionsMemberifrs-full:GrossCarryingAmountMemberifrs-full:TechnologybasedIntangibleAssetsMember2023-12-310001453015bldp:BallardMotiveSolutionsMemberifrs-full:TechnologybasedIntangibleAssetsMemberifrs-full:AccumulatedDepreciationAmortisationAndImpairmentMember2023-12-310001453015bldp:BallardMotiveSolutionsMemberifrs-full:TechnologybasedIntangibleAssetsMemberbldp:CarryingAmountExcludingImpairmentMember2023-12-310001453015bldp:BallardMotiveSolutionsMemberifrs-full:TechnologybasedIntangibleAssetsMemberifrs-full:AccumulatedImpairmentMember2023-12-310001453015bldp:BallardMotiveSolutionsMemberifrs-full:TechnologybasedIntangibleAssetsMember2023-12-310001453015bldp:BallardMotiveSolutionsMemberifrs-full:GrossCarryingAmountMember2023-12-310001453015bldp:BallardMotiveSolutionsMemberifrs-full:AccumulatedDepreciationAmortisationAndImpairmentMember2023-12-310001453015bldp:BallardMotiveSolutionsMemberbldp:CarryingAmountExcludingImpairmentMember2023-12-310001453015bldp:BallardMotiveSolutionsMemberifrs-full:AccumulatedImpairmentMember2023-12-310001453015bldp:BallardMotiveSolutionsMember2023-12-310001453015bldp:BallardMotiveSolutionsMemberifrs-full:GrossCarryingAmountMemberifrs-full:TechnologybasedIntangibleAssetsMember2022-12-310001453015bldp:BallardMotiveSolutionsMemberifrs-full:TechnologybasedIntangibleAssetsMemberifrs-full:AccumulatedDepreciationAmortisationAndImpairmentMember2022-12-310001453015bldp:BallardMotiveSolutionsMemberifrs-full:TechnologybasedIntangibleAssetsMemberbldp:CarryingAmountExcludingImpairmentMember2022-12-310001453015bldp:BallardMotiveSolutionsMemberifrs-full:TechnologybasedIntangibleAssetsMemberifrs-full:AccumulatedImpairmentMember2022-12-310001453015bldp:BallardMotiveSolutionsMemberifrs-full:TechnologybasedIntangibleAssetsMember2022-12-310001453015ifrs-full:CustomerrelatedIntangibleAssetsMemberbldp:BallardMotiveSolutionsMemberifrs-full:GrossCarryingAmountMember2022-12-310001453015ifrs-full:CustomerrelatedIntangibleAssetsMemberbldp:BallardMotiveSolutionsMemberifrs-full:AccumulatedDepreciationAmortisationAndImpairmentMember2022-12-310001453015ifrs-full:CustomerrelatedIntangibleAssetsMemberbldp:BallardMotiveSolutionsMemberbldp:CarryingAmountExcludingImpairmentMember2022-12-310001453015ifrs-full:CustomerrelatedIntangibleAssetsMemberbldp:BallardMotiveSolutionsMemberifrs-full:AccumulatedImpairmentMember2022-12-310001453015ifrs-full:CustomerrelatedIntangibleAssetsMemberbldp:BallardMotiveSolutionsMember2022-12-310001453015bldp:BallardMotiveSolutionsMemberifrs-full:GrossCarryingAmountMemberbldp:NonCompeteAgreementMember2022-12-310001453015bldp:BallardMotiveSolutionsMemberbldp:NonCompeteAgreementMemberifrs-full:AccumulatedDepreciationAmortisationAndImpairmentMember2022-12-310001453015bldp:BallardMotiveSolutionsMemberbldp:NonCompeteAgreementMemberbldp:CarryingAmountExcludingImpairmentMember2022-12-310001453015bldp:BallardMotiveSolutionsMemberbldp:NonCompeteAgreementMemberifrs-full:AccumulatedImpairmentMember2022-12-310001453015bldp:BallardMotiveSolutionsMemberbldp:NonCompeteAgreementMember2022-12-310001453015bldp:BallardMotiveSolutionsMemberifrs-full:GrossCarryingAmountMember2022-12-310001453015bldp:BallardMotiveSolutionsMemberifrs-full:AccumulatedDepreciationAmortisationAndImpairmentMember2022-12-310001453015bldp:BallardMotiveSolutionsMemberbldp:CarryingAmountExcludingImpairmentMember2022-12-310001453015bldp:BallardMotiveSolutionsMemberifrs-full:AccumulatedImpairmentMember2022-12-310001453015bldp:OwnedPropertyPlantAndEquipmentMember2023-12-310001453015bldp:OwnedPropertyPlantAndEquipmentMember2022-12-310001453015ifrs-full:RightofuseAssetsMember2023-12-310001453015ifrs-full:RightofuseAssetsMember2022-12-310001453015ifrs-full:ComputerEquipmentMember2023-12-310001453015ifrs-full:ComputerEquipmentMember2022-12-310001453015ifrs-full:FixturesAndFittingsMember2023-12-310001453015ifrs-full:FixturesAndFittingsMember2022-12-310001453015ifrs-full:LeaseholdImprovementsMember2023-12-310001453015ifrs-full:LeaseholdImprovementsMember2022-12-310001453015ifrs-full:MachineryMember2023-12-310001453015ifrs-full:MachineryMember2022-12-310001453015ifrs-full:GrossCarryingAmountMemberifrs-full:BuildingsMember2022-12-310001453015ifrs-full:GrossCarryingAmountMemberifrs-full:BuildingsMember2023-01-012023-12-310001453015ifrs-full:GrossCarryingAmountMemberifrs-full:BuildingsMember2023-12-310001453015ifrs-full:GrossCarryingAmountMemberifrs-full:ComputerEquipmentMember2022-12-310001453015ifrs-full:GrossCarryingAmountMemberifrs-full:ComputerEquipmentMember2023-01-012023-12-310001453015ifrs-full:GrossCarryingAmountMemberifrs-full:ComputerEquipmentMember2023-12-310001453015ifrs-full:FixturesAndFittingsMemberifrs-full:GrossCarryingAmountMember2022-12-310001453015ifrs-full:FixturesAndFittingsMemberifrs-full:GrossCarryingAmountMember2023-01-012023-12-310001453015ifrs-full:FixturesAndFittingsMemberifrs-full:GrossCarryingAmountMember2023-12-310001453015ifrs-full:GrossCarryingAmountMemberifrs-full:LeaseholdImprovementsMember2022-12-310001453015ifrs-full:GrossCarryingAmountMemberifrs-full:LeaseholdImprovementsMember2023-01-012023-12-310001453015ifrs-full:GrossCarryingAmountMemberifrs-full:LeaseholdImprovementsMember2023-12-310001453015ifrs-full:GrossCarryingAmountMemberifrs-full:MachineryMember2022-12-310001453015ifrs-full:GrossCarryingAmountMemberifrs-full:MachineryMember2023-01-012023-12-310001453015ifrs-full:GrossCarryingAmountMemberifrs-full:MachineryMember2023-12-310001453015ifrs-full:GrossCarryingAmountMember2022-12-310001453015ifrs-full:GrossCarryingAmountMember2023-01-012023-12-310001453015ifrs-full:GrossCarryingAmountMember2023-12-310001453015ifrs-full:AccumulatedDepreciationAmortisationAndImpairmentMemberifrs-full:BuildingsMember2022-12-310001453015ifrs-full:AccumulatedDepreciationAmortisationAndImpairmentMemberifrs-full:BuildingsMember2023-01-012023-12-310001453015ifrs-full:AccumulatedDepreciationAmortisationAndImpairmentMemberifrs-full:BuildingsMember2023-12-310001453015ifrs-full:AccumulatedDepreciationAmortisationAndImpairmentMemberifrs-full:ComputerEquipmentMember2022-12-310001453015ifrs-full:AccumulatedDepreciationAmortisationAndImpairmentMemberifrs-full:ComputerEquipmentMember2023-01-012023-12-310001453015ifrs-full:AccumulatedDepreciationAmortisationAndImpairmentMemberifrs-full:ComputerEquipmentMember2023-12-310001453015ifrs-full:FixturesAndFittingsMemberifrs-full:AccumulatedDepreciationAmortisationAndImpairmentMember2022-12-310001453015ifrs-full:FixturesAndFittingsMemberifrs-full:AccumulatedDepreciationAmortisationAndImpairmentMember2023-01-012023-12-310001453015ifrs-full:FixturesAndFittingsMemberifrs-full:AccumulatedDepreciationAmortisationAndImpairmentMember2023-12-310001453015ifrs-full:LeaseholdImprovementsMemberifrs-full:AccumulatedDepreciationAmortisationAndImpairmentMember2022-12-310001453015ifrs-full:LeaseholdImprovementsMemberifrs-full:AccumulatedDepreciationAmortisationAndImpairmentMember2023-01-012023-12-310001453015ifrs-full:LeaseholdImprovementsMemberifrs-full:AccumulatedDepreciationAmortisationAndImpairmentMember2023-12-310001453015ifrs-full:MachineryMemberifrs-full:AccumulatedDepreciationAmortisationAndImpairmentMember2022-12-310001453015ifrs-full:MachineryMemberifrs-full:AccumulatedDepreciationAmortisationAndImpairmentMember2023-01-012023-12-310001453015ifrs-full:MachineryMemberifrs-full:AccumulatedDepreciationAmortisationAndImpairmentMember2023-12-310001453015ifrs-full:AccumulatedDepreciationAmortisationAndImpairmentMember2022-12-310001453015ifrs-full:AccumulatedDepreciationAmortisationAndImpairmentMember2023-12-310001453015bldp:ProductionAndTestEquipmentMember2022-01-012022-12-310001453015country:CN2023-01-012023-12-310001453015country:CN2022-01-012022-12-310001453015bldp:ProductionAndTestEquipmentMember2023-01-012023-12-310001453015ifrs-full:GrossCarryingAmountMemberifrs-full:ComputerEquipmentMember2021-12-310001453015ifrs-full:GrossCarryingAmountMemberifrs-full:ComputerEquipmentMember2022-01-012022-12-310001453015ifrs-full:FixturesAndFittingsMemberifrs-full:GrossCarryingAmountMember2021-12-310001453015ifrs-full:FixturesAndFittingsMemberifrs-full:GrossCarryingAmountMember2022-01-012022-12-310001453015ifrs-full:GrossCarryingAmountMemberifrs-full:LeaseholdImprovementsMember2021-12-310001453015ifrs-full:GrossCarryingAmountMemberifrs-full:LeaseholdImprovementsMember2022-01-012022-12-310001453015ifrs-full:GrossCarryingAmountMemberifrs-full:MachineryMember2021-12-310001453015ifrs-full:GrossCarryingAmountMemberifrs-full:MachineryMember2022-01-012022-12-310001453015ifrs-full:GrossCarryingAmountMember2021-12-310001453015ifrs-full:GrossCarryingAmountMember2022-01-012022-12-310001453015ifrs-full:AccumulatedDepreciationAmortisationAndImpairmentMemberifrs-full:ComputerEquipmentMember2021-12-310001453015ifrs-full:AccumulatedDepreciationAmortisationAndImpairmentMemberifrs-full:ComputerEquipmentMember2022-01-012022-12-310001453015ifrs-full:FixturesAndFittingsMemberifrs-full:AccumulatedDepreciationAmortisationAndImpairmentMember2021-12-310001453015ifrs-full:FixturesAndFittingsMemberifrs-full:AccumulatedDepreciationAmortisationAndImpairmentMember2022-01-012022-12-310001453015ifrs-full:LeaseholdImprovementsMemberifrs-full:AccumulatedDepreciationAmortisationAndImpairmentMember2021-12-310001453015ifrs-full:LeaseholdImprovementsMemberifrs-full:AccumulatedDepreciationAmortisationAndImpairmentMember2022-01-012022-12-310001453015ifrs-full:MachineryMemberifrs-full:AccumulatedDepreciationAmortisationAndImpairmentMember2021-12-310001453015ifrs-full:MachineryMemberifrs-full:AccumulatedDepreciationAmortisationAndImpairmentMember2022-01-012022-12-310001453015ifrs-full:AccumulatedDepreciationAmortisationAndImpairmentMember2021-12-310001453015ifrs-full:LandAndBuildingsMember2023-12-310001453015ifrs-full:LandAndBuildingsMember2022-12-310001453015ifrs-full:OfficeEquipmentMember2023-12-310001453015ifrs-full:OfficeEquipmentMember2022-12-310001453015ifrs-full:VehiclesMember2023-12-310001453015ifrs-full:VehiclesMember2022-12-310001453015ifrs-full:GrossCarryingAmountMemberifrs-full:LandAndBuildingsMember2022-12-310001453015ifrs-full:GrossCarryingAmountMemberifrs-full:LandAndBuildingsMember2023-01-012023-12-310001453015ifrs-full:GrossCarryingAmountMemberifrs-full:LandAndBuildingsMember2023-12-310001453015ifrs-full:GrossCarryingAmountMemberifrs-full:OfficeEquipmentMember2022-12-310001453015ifrs-full:GrossCarryingAmountMemberifrs-full:OfficeEquipmentMember2023-01-012023-12-310001453015ifrs-full:GrossCarryingAmountMemberifrs-full:OfficeEquipmentMember2023-12-310001453015ifrs-full:GrossCarryingAmountMemberifrs-full:VehiclesMember2022-12-310001453015ifrs-full:GrossCarryingAmountMemberifrs-full:VehiclesMember2023-01-012023-12-310001453015ifrs-full:GrossCarryingAmountMemberifrs-full:VehiclesMember2023-12-310001453015ifrs-full:LandAndBuildingsMemberifrs-full:AccumulatedDepreciationAndAmortisationMember2022-12-310001453015ifrs-full:LandAndBuildingsMemberifrs-full:AccumulatedDepreciationAndAmortisationMember2023-01-012023-12-310001453015ifrs-full:LandAndBuildingsMemberifrs-full:AccumulatedDepreciationAndAmortisationMember2023-12-310001453015ifrs-full:OfficeEquipmentMemberifrs-full:AccumulatedDepreciationAndAmortisationMember2022-12-310001453015ifrs-full:OfficeEquipmentMemberifrs-full:AccumulatedDepreciationAndAmortisationMember2023-01-012023-12-310001453015ifrs-full:OfficeEquipmentMemberifrs-full:AccumulatedDepreciationAndAmortisationMember2023-12-310001453015ifrs-full:VehiclesMemberifrs-full:AccumulatedDepreciationAndAmortisationMember2022-12-310001453015ifrs-full:VehiclesMemberifrs-full:AccumulatedDepreciationAndAmortisationMember2023-01-012023-12-310001453015ifrs-full:VehiclesMemberifrs-full:AccumulatedDepreciationAndAmortisationMember2023-12-310001453015ifrs-full:AccumulatedDepreciationAndAmortisationMember2022-12-310001453015ifrs-full:AccumulatedDepreciationAndAmortisationMember2023-01-012023-12-310001453015ifrs-full:AccumulatedDepreciationAndAmortisationMember2023-12-310001453015ifrs-full:GrossCarryingAmountMemberifrs-full:LandAndBuildingsMember2021-12-310001453015ifrs-full:GrossCarryingAmountMemberifrs-full:LandAndBuildingsMember2022-01-012022-12-310001453015ifrs-full:GrossCarryingAmountMemberifrs-full:OfficeEquipmentMember2021-12-310001453015ifrs-full:GrossCarryingAmountMemberifrs-full:OfficeEquipmentMember2022-01-012022-12-310001453015ifrs-full:GrossCarryingAmountMemberifrs-full:VehiclesMember2021-12-310001453015ifrs-full:GrossCarryingAmountMemberifrs-full:VehiclesMember2022-01-012022-12-310001453015ifrs-full:LandAndBuildingsMemberifrs-full:AccumulatedDepreciationAndAmortisationMember2021-12-310001453015ifrs-full:LandAndBuildingsMemberifrs-full:AccumulatedDepreciationAndAmortisationMember2022-01-012022-12-310001453015ifrs-full:OfficeEquipmentMemberifrs-full:AccumulatedDepreciationAndAmortisationMember2021-12-310001453015ifrs-full:OfficeEquipmentMemberifrs-full:AccumulatedDepreciationAndAmortisationMember2022-01-012022-12-310001453015ifrs-full:VehiclesMemberifrs-full:AccumulatedDepreciationAndAmortisationMember2021-12-310001453015ifrs-full:VehiclesMemberifrs-full:AccumulatedDepreciationAndAmortisationMember2022-01-012022-12-310001453015ifrs-full:AccumulatedDepreciationAndAmortisationMember2021-12-310001453015ifrs-full:AccumulatedDepreciationAndAmortisationMember2022-01-012022-12-310001453015bldp:ERPmanagementreportingsoftwaresystemMember2023-12-310001453015bldp:ERPmanagementreportingsoftwaresystemMember2022-12-310001453015ifrs-full:CopyrightsPatentsAndOtherIndustrialPropertyRightsServiceAndOperatingRightsMemberbldp:ArcolaEnergyLimitedMember2023-12-310001453015ifrs-full:CopyrightsPatentsAndOtherIndustrialPropertyRightsServiceAndOperatingRightsMemberbldp:ArcolaEnergyLimitedMember2022-12-310001453015bldp:ArcolaEnergyLimitedMember2023-01-012023-12-310001453015bldp:FuelCellProductsAndServicesMember2023-01-012023-12-310001453015bldp:FuelCellProductsAndServicesMember2022-01-012022-12-310001453015bldp:SynergyJVMember2022-01-012022-12-310001453015bldp:WeichaiBallardJVMember2022-12-310001453015bldp:WeichaiBallardJVMember2021-12-310001453015bldp:WeichaiBallardJVMember2023-12-31iso4217:CNY0001453015bldp:WeichaiBallardJVMemberbldp:WeichaiBallardJVMember2023-12-310001453015bldp:WeichaiBallardJVMemberbldp:WeichaiBallardJVMember2022-12-310001453015bldp:WeichaiBallardJVMemberbldp:WeichaiBallardJVMember2023-01-012023-12-310001453015bldp:WeichaiBallardJVMemberbldp:WeichaiBallardJVMember2022-01-012022-12-310001453015bldp:SynergyJVMember2022-12-310001453015bldp:SynergyJVMember2021-12-310001453015bldp:SynergyJVMember2023-12-310001453015bldp:SynergyJVMember2023-09-012023-09-300001453015bldp:LongTermInvestmentMemberbldp:ForseePowerMember2022-12-310001453015bldp:LongTermInvestmentMemberbldp:ForseePowerMember2023-01-012023-12-310001453015bldp:LongTermInvestmentMemberbldp:ForseePowerMember2023-12-310001453015bldp:WisdomMotorMemberbldp:LongTermInvestmentMember2022-12-310001453015bldp:WisdomMotorMemberbldp:LongTermInvestmentMember2023-01-012023-12-310001453015bldp:WisdomMotorMemberbldp:LongTermInvestmentMember2023-12-310001453015bldp:LongTermInvestmentMemberbldp:QuantronAGMember2022-12-310001453015bldp:LongTermInvestmentMemberbldp:QuantronAGMember2023-01-012023-12-310001453015bldp:LongTermInvestmentMemberbldp:QuantronAGMember2023-12-310001453015bldp:HyCapFundMemberbldp:LongTermInvestmentMember2022-12-310001453015bldp:HyCapFundMemberbldp:LongTermInvestmentMember2023-01-012023-12-310001453015bldp:HyCapFundMemberbldp:LongTermInvestmentMember2023-12-310001453015bldp:CleanH2FundMemberbldp:LongTermInvestmentMember2022-12-310001453015bldp:CleanH2FundMemberbldp:LongTermInvestmentMember2023-01-012023-12-310001453015bldp:CleanH2FundMemberbldp:LongTermInvestmentMember2023-12-310001453015bldp:LongTermFinancialInvestmentsMember2022-12-310001453015bldp:LongTermFinancialInvestmentsMember2023-01-012023-12-310001453015bldp:LongTermFinancialInvestmentsMember2023-12-310001453015bldp:LongTermInvestmentMemberbldp:ForseePowerMember2021-12-310001453015bldp:LongTermInvestmentMemberbldp:ForseePowerMember2022-01-012022-12-310001453015bldp:WisdomMotorMemberbldp:LongTermFinancialInvestmentsMember2021-12-310001453015bldp:WisdomMotorMemberbldp:LongTermFinancialInvestmentsMember2022-01-012022-12-310001453015bldp:WisdomMotorMemberbldp:LongTermFinancialInvestmentsMember2022-12-310001453015bldp:LongTermFinancialInvestmentsMemberbldp:QuantronAGMember2021-12-310001453015bldp:LongTermFinancialInvestmentsMemberbldp:QuantronAGMember2022-01-012022-12-310001453015bldp:LongTermFinancialInvestmentsMemberbldp:QuantronAGMember2022-12-310001453015bldp:HyCapFundMemberbldp:LongTermInvestmentMember2021-12-310001453015bldp:HyCapFundMemberbldp:LongTermInvestmentMember2022-01-012022-12-310001453015bldp:CleanH2FundMemberbldp:LongTermInvestmentMember2021-12-310001453015bldp:CleanH2FundMemberbldp:LongTermInvestmentMember2022-01-012022-12-310001453015bldp:LongTermInvestmentMember2021-12-310001453015bldp:LongTermInvestmentMember2022-01-012022-12-310001453015bldp:LongTermInvestmentMember2022-12-310001453015srt:ScenarioForecastMemberbldp:TemplewaterMember2024-03-310001453015bldp:ForseePowerMember2021-10-012021-10-310001453015bldp:ForseePowerMember2023-01-012023-12-310001453015bldp:ForseePowerMember2022-01-012022-12-310001453015bldp:SubsequentContributionMemberbldp:ForseePowerMember2023-12-310001453015bldp:SubsequentContributionMemberbldp:ForseePowerMember2022-12-310001453015bldp:WisdomMotorMember2022-06-300001453015bldp:WisdomMotorMember2022-06-012022-06-300001453015bldp:WisdomMotorMember2023-01-012023-12-310001453015bldp:SubsequentContributionMemberbldp:WisdomMotorMember2023-12-310001453015bldp:SubsequentContributionMemberbldp:WisdomMotorMember2022-12-310001453015bldp:QuantronAGMember2022-09-30iso4217:EUR0001453015bldp:QuantronAGMember2022-09-012022-09-300001453015bldp:QuantronAGMember2023-01-012023-12-31iso4217:GBP0001453015bldp:QuantronAGMember2022-01-012022-12-310001453015bldp:SubsequentContributionMemberbldp:QuantronAGMember2023-12-310001453015bldp:SubsequentContributionMemberbldp:QuantronAGMember2022-12-310001453015bldp:InitialContributionMemberbldp:HyCapFundMember2023-01-012023-12-310001453015bldp:InitialContributionMemberbldp:HyCapFundMember2022-01-012022-12-310001453015bldp:HyCapFundMember2021-08-012021-08-310001453015bldp:SubsequentContributionMemberbldp:HyCapFundMember2023-01-012023-12-310001453015bldp:SubsequentContributionMemberbldp:HyCapFundMember2022-01-012022-12-310001453015bldp:SubsequentContributionMemberbldp:HyCapFundMember2023-12-310001453015bldp:SubsequentContributionMemberbldp:HyCapFundMember2022-12-310001453015bldp:CleanH2FundMemberbldp:InitialContributionMember2023-01-012023-12-310001453015bldp:CleanH2FundMemberbldp:InitialContributionMember2022-01-012022-12-310001453015bldp:CleanH2FundMember2021-12-012021-12-310001453015bldp:HydrogenFundsMember2023-01-012023-12-310001453015bldp:HydrogenFundsMember2022-01-012022-12-310001453015bldp:SubsequentContributionMemberbldp:CleanH2FundMember2023-12-310001453015bldp:SubsequentContributionMemberbldp:CleanH2FundMember2022-12-310001453015bldp:BankOperatingLineMember2023-12-31iso4217:CAD0001453015bldp:EncoreFXFacilityMember2023-12-310001453015ifrs-full:CurrencyRiskMember2023-12-310001453015ifrs-full:CurrencyRiskMember2022-12-310001453015ifrs-full:RestructuringProvisionMember2021-12-310001453015ifrs-full:WarrantyProvisionMember2021-12-310001453015ifrs-full:OnerousContractsProvisionMember2021-12-310001453015bldp:ContingentConsiderationProvisionMember2021-12-310001453015ifrs-full:LegalProceedingsProvisionMember2021-12-310001453015ifrs-full:RestructuringProvisionMember2022-01-012022-12-310001453015ifrs-full:WarrantyProvisionMember2022-01-012022-12-310001453015ifrs-full:OnerousContractsProvisionMember2022-01-012022-12-310001453015bldp:ContingentConsiderationProvisionMember2022-01-012022-12-310001453015ifrs-full:LegalProceedingsProvisionMember2022-01-012022-12-310001453015ifrs-full:RestructuringProvisionMember2022-12-310001453015ifrs-full:WarrantyProvisionMember2022-12-310001453015ifrs-full:OnerousContractsProvisionMember2022-12-310001453015bldp:ContingentConsiderationProvisionMember2022-12-310001453015ifrs-full:LegalProceedingsProvisionMember2022-12-310001453015ifrs-full:RestructuringProvisionMember2023-01-012023-12-310001453015ifrs-full:WarrantyProvisionMember2023-01-012023-12-310001453015ifrs-full:OnerousContractsProvisionMember2023-01-012023-12-310001453015bldp:ContingentConsiderationProvisionMember2023-01-012023-12-310001453015ifrs-full:LegalProceedingsProvisionMember2023-01-012023-12-310001453015ifrs-full:RestructuringProvisionMember2023-12-310001453015ifrs-full:WarrantyProvisionMember2023-12-310001453015ifrs-full:OnerousContractsProvisionMember2023-12-310001453015bldp:ContingentConsiderationProvisionMember2023-12-310001453015ifrs-full:LegalProceedingsProvisionMember2023-12-310001453015srt:CumulativeEffectPeriodOfAdoptionAdjustmentMemberifrs-full:OnerousContractsCostOfFulfillingContractMember2022-01-010001453015ifrs-full:BottomOfRangeMember2023-12-310001453015ifrs-full:TopOfRangeMember2023-12-310001453015ifrs-full:LandAndBuildingsMember2023-12-310001453015ifrs-full:LandAndBuildingsMember2022-12-310001453015ifrs-full:OfficeEquipmentMember2023-12-310001453015ifrs-full:OfficeEquipmentMember2022-12-310001453015ifrs-full:VehiclesMember2023-12-310001453015ifrs-full:VehiclesMember2022-12-310001453015ifrs-full:NotLaterThanOneYearMember2023-12-310001453015ifrs-full:LaterThanOneYearAndNotLaterThanFiveYearsMember2023-12-310001453015ifrs-full:LaterThanFiveYearsMember2023-12-310001453015ifrs-full:ProvisionForDecommissioningRestorationAndRehabilitationCostsMember2023-12-310001453015ifrs-full:ProvisionForDecommissioningRestorationAndRehabilitationCostsMember2022-12-310001453015ifrs-full:ProvisionForDecommissioningRestorationAndRehabilitationCostsMember2022-01-012022-12-310001453015ifrs-full:ProvisionForDecommissioningRestorationAndRehabilitationCostsMember2023-01-012023-12-310001453015bldp:PensionPlanMember2023-12-310001453015bldp:PensionPlanMember2022-12-310001453015bldp:OtherPostretirementBenefitsPlanMember2023-12-310001453015bldp:OtherPostretirementBenefitsPlanMember2022-12-310001453015bldp:PensionPlanMemberifrs-full:PlanAssetsMember2023-01-012023-12-31bldp:plan0001453015ifrs-full:PresentValueOfDefinedBenefitObligationMemberbldp:PensionPlanMember2022-12-310001453015ifrs-full:PresentValueOfDefinedBenefitObligationMemberbldp:PensionPlanMember2021-12-310001453015bldp:PensionPlanMemberifrs-full:PlanAssetsMember2022-12-310001453015bldp:PensionPlanMemberifrs-full:PlanAssetsMember2021-12-310001453015bldp:PensionPlanMember2021-12-310001453015ifrs-full:PresentValueOfDefinedBenefitObligationMemberbldp:PensionPlanMember2023-01-012023-12-310001453015ifrs-full:PresentValueOfDefinedBenefitObligationMemberbldp:PensionPlanMember2022-01-012022-12-310001453015bldp:PensionPlanMemberifrs-full:PlanAssetsMember2022-01-012022-12-310001453015bldp:PensionPlanMember2023-01-012023-12-310001453015bldp:PensionPlanMember2022-01-012022-12-310001453015ifrs-full:PresentValueOfDefinedBenefitObligationMemberbldp:PensionPlanMember2023-12-310001453015bldp:PensionPlanMemberifrs-full:PlanAssetsMember2023-12-310001453015bldp:OtherPostretirementBenefitsPlanMemberifrs-full:PresentValueOfDefinedBenefitObligationMember2022-12-310001453015bldp:OtherPostretirementBenefitsPlanMemberifrs-full:PresentValueOfDefinedBenefitObligationMember2021-12-310001453015bldp:OtherPostretirementBenefitsPlanMemberifrs-full:PlanAssetsMember2022-12-310001453015bldp:OtherPostretirementBenefitsPlanMemberifrs-full:PlanAssetsMember2021-12-310001453015bldp:OtherPostretirementBenefitsPlanMember2021-12-310001453015bldp:OtherPostretirementBenefitsPlanMemberifrs-full:PresentValueOfDefinedBenefitObligationMember2023-01-012023-12-310001453015bldp:OtherPostretirementBenefitsPlanMemberifrs-full:PresentValueOfDefinedBenefitObligationMember2022-01-012022-12-310001453015bldp:OtherPostretirementBenefitsPlanMemberifrs-full:PlanAssetsMember2023-01-012023-12-310001453015bldp:OtherPostretirementBenefitsPlanMemberifrs-full:PlanAssetsMember2022-01-012022-12-310001453015bldp:OtherPostretirementBenefitsPlanMember2023-01-012023-12-310001453015bldp:OtherPostretirementBenefitsPlanMember2022-01-012022-12-310001453015bldp:OtherPostretirementBenefitsPlanMemberifrs-full:PresentValueOfDefinedBenefitObligationMember2023-12-310001453015bldp:OtherPostretirementBenefitsPlanMemberifrs-full:PlanAssetsMember2023-12-310001453015ifrs-full:ActuarialAssumptionOfMedicalCostTrendRatesMember2023-12-310001453015bldp:EmployeeStockOption1Member2023-01-012023-12-310001453015bldp:EmployeeStockOption1Member2022-01-012022-12-310001453015ifrs-full:DiscontinuedOperationsMember2023-01-012023-12-310001453015bldp:BallardMotiveSolutionsMember2021-11-30bldp:tranche0001453015bldp:BallardMotiveSolutionsMember2021-11-012021-11-300001453015bldp:ProspectusMember2021-03-310001453015bldp:ProspectusMember2023-01-012023-12-310001453015ifrs-full:BottomOfRangeMemberbldp:ExercisePriceRangeOneMember2023-12-310001453015ifrs-full:TopOfRangeMemberbldp:ExercisePriceRangeOneMember2023-12-310001453015bldp:ExercisePriceRangeOneMember2023-12-310001453015bldp:ExercisePriceRangeOneMember2023-01-012023-12-310001453015ifrs-full:BottomOfRangeMemberbldp:ExercisePriceRangeTwoMember2023-12-310001453015ifrs-full:TopOfRangeMemberbldp:ExercisePriceRangeTwoMember2023-12-310001453015bldp:ExercisePriceRangeTwoMember2023-12-310001453015bldp:ExercisePriceRangeTwoMember2023-01-012023-12-310001453015ifrs-full:BottomOfRangeMemberbldp:ExercisePriceRangeThreeMember2023-12-310001453015ifrs-full:TopOfRangeMemberbldp:ExercisePriceRangeThreeMember2023-12-310001453015bldp:ExercisePriceRangeThreeMember2023-12-310001453015bldp:ExercisePriceRangeThreeMember2023-01-012023-12-310001453015ifrs-full:BottomOfRangeMemberbldp:ExercisePriceRangeSixMember2023-12-310001453015bldp:ExercisePriceRangeSixMemberifrs-full:TopOfRangeMember2023-12-310001453015bldp:ExercisePriceRangeSixMember2023-12-310001453015bldp:ExercisePriceRangeSixMember2023-01-012023-12-310001453015ifrs-full:OrdinarySharesMember2023-01-012023-12-310001453015ifrs-full:OrdinarySharesMember2022-01-012022-12-310001453015bldp:ShareDistributionPlanMember2022-12-310001453015bldp:ShareDistributionPlanMember2023-12-310001453015bldp:ShareDistributionPlanMember2023-01-012023-12-310001453015bldp:ShareDistributionPlanMember2022-01-012022-12-310001453015bldp:DeferredShareUnitsMember2021-12-310001453015bldp:DeferredShareUnitsMember2022-12-310001453015bldp:DeferredShareUnitsMember2023-12-310001453015bldp:RestrictedShareUnitsRSUMember2021-12-310001453015bldp:RestrictedShareUnitsRSUMember2022-12-310001453015bldp:RestrictedShareUnitsRSUMember2023-12-310001453015bldp:EmployeeStockOption1Memberbldp:ShareBasedCompensationAwardFirstTrancheMember2023-01-012023-12-310001453015bldp:ShareBasedCompensationAwardSecondTrancheMemberbldp:EmployeeStockOption1Member2023-01-012023-12-310001453015bldp:ShareBasedCompensationAwardThirdTrancheMemberbldp:EmployeeStockOption1Member2023-01-012023-12-31bldp:investment0001453015bldp:InitialContributionMemberbldp:HyCapFundMember2023-12-310001453015bldp:HyCapFundMember2023-01-012023-12-310001453015bldp:CleanH2FundMemberbldp:InitialContributionMember2023-12-310001453015bldp:CleanH2FundMember2023-01-012023-12-310001453015bldp:InitialContributionMemberbldp:TemplewaterMember2023-12-310001453015bldp:TemplewaterMember2023-01-012023-12-310001453015bldp:ProvisionRelatedToIntellectualPropertyPurchaseMember2023-01-012023-12-310001453015bldp:ProvisionRelatedToIntellectualPropertyPurchaseMember2022-01-012022-12-310001453015bldp:ProvisionRelatedToIntellectualPropertyPurchaseMember2023-12-310001453015ifrs-full:MiscellaneousOtherProvisionsMember2023-01-012023-12-310001453015ifrs-full:MiscellaneousOtherProvisionsMember2023-12-310001453015country:CN2023-01-012023-12-310001453015country:CN2022-01-012022-12-310001453015bldp:EUROPE1Member2023-01-012023-12-310001453015bldp:EUROPE1Member2022-01-012022-12-310001453015bldp:NorthAmerica1Member2023-01-012023-12-310001453015bldp:NorthAmerica1Member2022-01-012022-12-310001453015bldp:OtherGeographicalAreasMember2023-01-012023-12-310001453015bldp:OtherGeographicalAreasMember2022-01-012022-12-310001453015bldp:BusMember2023-01-012023-12-310001453015bldp:BusMember2022-01-012022-12-310001453015bldp:TruckMember2023-01-012023-12-310001453015bldp:TruckMember2022-01-012022-12-310001453015bldp:RailMember2023-01-012023-12-310001453015bldp:RailMember2022-01-012022-12-310001453015bldp:MarineMember2023-01-012023-12-310001453015bldp:MarineMember2022-01-012022-12-310001453015bldp:HDMobilitySubtotalMember2023-01-012023-12-310001453015bldp:HDMobilitySubtotalMember2022-01-012022-12-310001453015bldp:StationaryMember2023-01-012023-12-310001453015bldp:StationaryMember2022-01-012022-12-310001453015bldp:EmergingMarketsAndOtherMember2023-01-012023-12-310001453015bldp:EmergingMarketsAndOtherMember2022-01-012022-12-310001453015ifrs-full:GoodsOrServicesTransferredAtPointInTimeMember2023-01-012023-12-310001453015ifrs-full:GoodsOrServicesTransferredAtPointInTimeMember2022-01-012022-12-310001453015ifrs-full:GoodsOrServicesTransferredOverTimeMember2023-01-012023-12-310001453015ifrs-full:GoodsOrServicesTransferredOverTimeMember2022-01-012022-12-310001453015bldp:ScientificResearchExpendituresMember2023-12-310001453015bldp:ScientificResearchExpendituresMember2022-12-310001453015bldp:InvestmentsMember2023-12-310001453015bldp:InvestmentsMember2022-12-310001453015bldp:ShareIssuanceCostsMember2023-12-310001453015bldp:ShareIssuanceCostsMember2022-12-310001453015ifrs-full:UnusedTaxLossesMember2023-12-310001453015ifrs-full:UnusedTaxLossesMember2022-12-310001453015bldp:CapitalLossesCarriedForwardMember2023-12-310001453015bldp:CapitalLossesCarriedForwardMember2022-12-310001453015ifrs-full:UnusedTaxCreditsMember2023-12-310001453015ifrs-full:UnusedTaxCreditsMember2022-12-310001453015bldp:PropertyPlantandEquipmentAndIntangibleAssetsMember2023-12-310001453015bldp:PropertyPlantandEquipmentAndIntangibleAssetsMember2022-12-310001453015country:CAbldp:ScientificResearchExpendituresMember2023-12-310001453015country:CAbldp:ScientificResearchExpendituresMember2022-12-310001453015ifrs-full:UnusedTaxLossesMembercountry:CA2023-12-310001453015ifrs-full:UnusedTaxLossesMembercountry:CA2022-12-310001453015country:CAbldp:CapitalLossesCarriedForwardMember2023-12-310001453015country:CAbldp:CapitalLossesCarriedForwardMember2022-12-310001453015country:CAifrs-full:UnusedTaxCreditsMember2023-12-310001453015country:CAifrs-full:UnusedTaxCreditsMember2022-12-310001453015country:DEifrs-full:UnusedTaxLossesMember2023-12-310001453015country:DEifrs-full:UnusedTaxLossesMember2022-12-310001453015country:USifrs-full:UnusedTaxLossesMember2023-12-310001453015country:USifrs-full:UnusedTaxLossesMember2022-12-310001453015ifrs-full:UnusedTaxLossesMembercountry:DK2023-12-310001453015ifrs-full:UnusedTaxLossesMembercountry:DK2022-12-310001453015country:HKifrs-full:UnusedTaxLossesMember2023-12-310001453015country:HKifrs-full:UnusedTaxLossesMember2022-12-310001453015ifrs-full:UnusedTaxLossesMembercountry:GB2023-12-310001453015ifrs-full:UnusedTaxLossesMembercountry:GB2022-12-310001453015bldp:ResearchAndDevelopmentTaxCreditsMembercountry:GB2023-12-310001453015bldp:ResearchAndDevelopmentTaxCreditsMembercountry:GB2022-12-310001453015bldp:WeichaiBallardJVMemberifrs-full:AssociatesMember2023-12-310001453015bldp:WeichaiBallardJVMemberifrs-full:AssociatesMember2022-12-310001453015bldp:WeichaiBallardJVMemberifrs-full:AssociatesMember2023-01-012023-12-310001453015bldp:WeichaiBallardJVMemberifrs-full:AssociatesMember2022-01-012022-12-310001453015srt:MaximumMember2023-01-012023-12-31bldp:customer0001453015bldp:CustomerOneMember2023-01-012023-12-310001453015bldp:CustomerOneMember2022-01-012022-12-310001453015bldp:CustomerTwoMember2022-01-012022-12-310001453015country:US2023-01-012023-12-310001453015country:US2022-01-012022-12-310001453015country:DE2023-01-012023-12-310001453015country:DE2022-01-012022-12-310001453015country:CA2023-01-012023-12-310001453015country:CA2022-01-012022-12-310001453015country:PL2023-01-012023-12-310001453015country:PL2022-01-012022-12-310001453015country:GB2023-01-012023-12-310001453015country:GB2022-01-012022-12-310001453015country:NL2023-01-012023-12-310001453015country:NL2022-01-012022-12-310001453015country:FR2023-01-012023-12-310001453015country:FR2022-01-012022-12-310001453015country:DK2023-01-012023-12-310001453015country:DK2022-01-012022-12-310001453015country:BE2023-01-012023-12-310001453015country:BE2022-01-012022-12-310001453015country:IN2023-01-012023-12-310001453015country:IN2022-01-012022-12-310001453015country:TW2023-01-012023-12-310001453015country:TW2022-01-012022-12-310001453015country:ES2023-01-012023-12-310001453015country:ES2022-01-012022-12-310001453015country:NO2023-01-012023-12-310001453015country:NO2022-01-012022-12-310001453015country:AU2023-01-012023-12-310001453015country:AU2022-01-012022-12-310001453015country:JP2023-01-012023-12-310001453015country:JP2022-01-012022-12-310001453015bldp:OtherCountriesMember2023-01-012023-12-310001453015bldp:OtherCountriesMember2022-01-012022-12-310001453015country:CA2023-12-310001453015country:CA2022-12-310001453015country:CN2023-12-310001453015country:CN2022-12-310001453015country:US2023-12-310001453015country:US2022-12-310001453015country:DK2023-12-310001453015country:DK2022-12-310001453015country:GB2023-12-310001453015country:GB2022-12-310001453015bldp:GreenHydrogenMemberbldp:BallardPowerSystemsEuropeMember2022-01-012022-12-310001453015bldp:GreenHydrogenMember2023-01-012023-12-310001453015bldp:GreenHydrogenMember2022-01-012022-12-310001453015bldp:ForseePowerMember2023-01-012023-12-310001453015bldp:ForseePowerMember2022-01-012022-12-310001453015bldp:WisdomMotorMember2023-01-012023-12-310001453015bldp:WisdomMotorMember2022-01-012022-12-310001453015bldp:QuantronAGMember2023-01-012023-12-310001453015bldp:QuantronAGMember2022-01-012022-12-310001453015bldp:HyCapFundMember2023-01-012023-12-310001453015bldp:HyCapFundMember2022-01-012022-12-310001453015bldp:CleanH2FundMember2023-01-012023-12-310001453015bldp:CleanH2FundMember2022-01-012022-12-310001453015ifrs-full:CurrencyRiskMember2023-01-012023-12-310001453015bldp:CashAndCashEquivalents1Memberifrs-full:CurrencyRiskMember2023-12-310001453015ifrs-full:CurrencyRiskMemberifrs-full:CurrencySwapContractMember2023-12-31iso4217:CADiso4217:USDiso4217:USDiso4217:CAD0001453015ifrs-full:InterestRateRiskMember2023-12-310001453015dei:BusinessContactMember2023-01-012023-12-31


Consolidated Financial Statements
(Expressed in U.S. dollars)

BALLARD POWER SYSTEMS INC.

Years ended December 31, 2023 and 2022


MANAGEMENT’S REPORT
Management’s Responsibility for the Financial Statements and Report on Internal Control over Financial Reporting
The consolidated financial statements contained in this Annual Report have been prepared by management in accordance with International Financial Reporting Standards (“IFRS”) as issued by the International Accounting Standards Board. The integrity and objectivity of the data in these consolidated financial statements are management’s responsibility. Management is also responsible for all other information in the Annual Report and for ensuring that this information is consistent, where appropriate, with the information and data contained in the consolidated financial statements.
Management is responsible for establishing and maintaining adequate internal control over financial reporting. Internal control over financial reporting is a process designed to provide reasonable assurance regarding the reliability of financial reporting and the preparation of consolidated financial statements for external reporting purposes in accordance with IFRS. Internal control over financial reporting may not prevent or detect fraud or misstatements because of limitations inherent in any system of internal control. Management has assessed the effectiveness of the Corporation’s internal control over financial reporting based on the framework in Internal Control – Integrated Framework (2013) issued by the Committee of Sponsoring Organizations of the Treadway Commission, and concluded that the Corporation’s internal control over financial reporting was effective as of December 31, 2023. Some of the assets and liabilities include amounts, which are based on estimates and judgments, as their final determination is dependent on future events.
The Board of Directors oversees management’s responsibilities for financial reporting through the Audit Committee, which consists of eight directors who are independent and not involved in the daily operations of the Corporation. The Audit Committee meets on a regular basis with management and the external and internal auditors to discuss internal controls over the financial reporting process, auditing matters and financial reporting issues. The Audit Committee is responsible for appointing the external auditors (subject to shareholder approval), and reviewing and approving all financial disclosure contained in our public documents and related party transactions.
The external auditors, KPMG LLP, have audited the financial statements and expressed an unqualified opinion thereon. KPMG has also expressed an unqualified opinion on the effective operation of the internal controls over financial reporting as of December 31, 2023. The external auditors have full access to management and the Audit Committee with respect to their findings concerning the fairness of financial reporting and the adequacy of internal controls.

“RANDALL MACEWEN” “PAUL DOBSON”
 
 
RANDALL MACEWEN PAUL DOBSON
President and Vice President and
Chief Executive Officer Chief Financial Officer
March 8, 2024 March 8, 2024


Report of Independent Registered Public Accounting Firm

To the Shareholders and Board of Directors
Ballard Power Systems Inc.:

Opinion on the Consolidated Financial Statements

We have audited the accompanying consolidated statements of financial position of Ballard Power Systems Inc. and subsidiaries (the Corporation) as of December 31, 2023 and 2022, the related consolidated statements of loss and comprehensive income (loss), changes in equity, and cash flows for each of the years then ended, and the related notes (collectively, the consolidated financial statements). In our opinion, the consolidated financial statements present fairly, in all material respects, the financial position of the Corporation as of December 31, 2023 and 2022, and the results of its operations and its cash flows for each of the years then ended, in conformity with International Financial Reporting Standards as issued by the International Accounting Standards Board.

We also have audited, in accordance with the standards of the Public Company Accounting Oversight Board (United States) (PCAOB), the Corporation’s internal control over financial reporting as of December 31, 2023, based on criteria established in Internal Control – Integrated Framework (2013) issued by the Committee of Sponsoring Organizations of the Treadway Commission, and our report dated March 8, 2024 expressed an unqualified opinion on the effectiveness of the Corporation’s internal control over financial reporting.

Basis for Opinion

These consolidated financial statements are the responsibility of the Corporation’s management. Our responsibility is to express an opinion on these consolidated financial statements based on our audits. We are a public accounting firm registered with the PCAOB and are required to be independent with respect to the Corporation in accordance with the U.S. federal securities laws and the applicable rules and regulations of the Securities and Exchange Commission and the PCAOB.

We conducted our audits in accordance with the standards of the PCAOB. Those standards require that we plan and perform the audit to obtain reasonable assurance about whether the consolidated financial statements are free of material misstatement, whether due to error or fraud. Our audits included performing procedures to assess the risks of material misstatement of the consolidated financial statements, whether due to error or fraud, and performing procedures that respond to those risks. Such procedures included examining, on a test basis, evidence regarding the amounts and disclosures in the consolidated financial statements. Our audits also included evaluating the accounting principles used and significant estimates made by management, as well as evaluating the overall presentation of the consolidated financial statements. We believe that our audits provide a reasonable basis for our opinion.


KPMG LLP is a Canadian limited liability partnership and a member firm of the KPMG network of independent member firms affiliated with KPMG International Cooperative (“KPMG International”), a Swiss entity. KPMG Canada provides services to KPMG LLP.


Critical Audit Matter

The critical audit matter communicated below is the matter arising from the current period audit of the consolidated financial statements that were communicated or required to be communicated to the audit committee and that: (1) relate to accounts or disclosures that are material to the consolidated financial statements and (2) involved our especially challenging, subjective, or complex judgments. The communication of critical audit matter does not alter in any way our opinion on the consolidated financial statements, taken as a whole, and we are not, by communicating the critical audit matter below, providing separate opinions on the critical audit matter or on the accounts or disclosures to which they relate.

Estimated costs to complete engineering and technology transfer services for long-term fixed-price contracts

As discussed in Notes 4(j) and 5(a) to the consolidated financial statements, the Corporation recognizes engineering and technology transfer service revenues from long-term fixed-price contracts over time by multiplying the expected consideration from the contract by the ratio of the cost incurred to date to estimated costs to complete the contract. Engineering and technology transfer service revenues from long-term fixed-price contracts are inherently uncertain in that total revenue from these contracts is fixed while the amount recognized to a period end requires estimates of costs to complete these contracts which estimates are subject to significant variability. As discussed in Note 23 to the consolidated financial statements, engineering and technology transfer service revenues from long-term fixed-price contracts totaled $23,599 thousand for the year ended December 31, 2023. We identified the evaluation of the estimate of costs to complete engineering and technology transfer services for long-term fixed-price contracts as a critical audit matter. A higher degree of auditor judgment was required to evaluate the significant assumptions used to estimate costs to complete the contracts, including the estimated labour hours and cost of materials to complete the contracts.

The following are the primary procedures we performed to address this critical audit matter. We evaluated the design and tested the operating effectiveness of internal controls related to the Corporation’s determination of estimated costs to complete long-term fixed-price contracts, including the determination of significant assumptions. For a selection of long-term fixed-price contracts we compared the Corporation’s historical estimated costs to complete contracts to actual labour hours and cost of materials incurred to assess the Corporation’s ability to accurately forecast. We evaluated the estimated costs to completion for a selection of customer contracts, by (1) inspecting contractual documents with customers to understand the timing of services; (2) interviewing operational personnel of the Corporation to evaluate progress to date, the estimate of costs to complete contracts, and factors impacting the estimated labour hours and cost of material to complete the contracts; (3) evaluating contract progress by inspecting correspondence between the Corporation and the customer; (4) evaluating the cost to complete the contracts for consistency with the status of delivery and the underlying contractual terms; (5) comparing the Corporation’s current estimate of costs to complete the contracts to those estimated in prior periods and investigating changes during the period; and (6) comparing labour hours and cost of materials incurred subsequent to the Corporation’s year-end date to assess the consistency with the estimated costs for the period.


/s/ KPMG LLP

Chartered Professional Accountants
We have served as the Corporation’s auditor since 1999.

Vancouver, Canada
March 8, 2024


KPMG LLP is a Canadian limited liability partnership and a member firm of the KPMG network of independent member firms affiliated with KPMG International Cooperative (“KPMG International”), a Swiss entity. KPMG Canada provides services to KPMG LLP.


Report of Independent Registered Public Accounting Firm

To the Shareholders and Board of Directors
Ballard Power Systems Inc.:

Opinion on Internal Control Over Financial Reporting

We have audited Ballard Power Systems Inc.’s and subsidiaries’ (the Corporation) internal control over financial reporting as of December 31, 2023, based on criteria established in Internal Control – Integrated Framework (2013) issued by the Committee of Sponsoring Organizations of the Treadway Commission. In our opinion, the Corporation maintained, in all material respects, effective internal control over financial reporting as of December 31, 2023, based on criteria established in Internal Control – Integrated Framework (2013) issued by the Committee of Sponsoring Organizations of the Treadway Commission.

We also have audited, in accordance with the standards of the Public Company Accounting Oversight Board (United States) (PCAOB), the consolidated statements of financial position of the Corporation as of December 31, 2023 and 2022, the related consolidated statements of loss and comprehensive income (loss), changes in equity, and cash flows for each of the years then ended, and the related notes (collectively, the consolidated financial statements), and our report dated March 8, 2024 expressed an unqualified opinion on those consolidated financial statements.

Basis for Opinion
The Corporation’s management is responsible for maintaining effective internal control over financial reporting and for its assessment of the effectiveness of internal control over financial reporting, included in the accompanying Management’s Responsibility for the Financial Statements and Report on Internal Control over Financial Reporting. Our responsibility is to express an opinion on the Corporation’s internal control over financial reporting based on our audit. We are a public accounting firm registered with the PCAOB and are required to be independent with respect to the Corporation in accordance with the U.S. federal securities laws and the applicable rules and regulations of the Securities and Exchange Commission and the PCAOB.

We conducted our audit in accordance with the standards of the PCAOB. Those standards require that we plan and perform the audit to obtain reasonable assurance about whether effective internal control over financial reporting was maintained in all material respects. Our audit of internal control over financial reporting included obtaining an understanding of internal control over financial reporting, assessing the risk that a material weakness exists, and testing and evaluating the design and operating effectiveness of internal control based on the assessed risk. Our audit also included performing such other procedures as we considered necessary in the circumstances. We believe that our audit provides a reasonable basis for our opinion.


KPMG LLP is a Canadian limited liability partnership and a member firm of the KPMG network of independent member firms affiliated with KPMG International Cooperative (“KPMG International”), a Swiss entity.


Definition and Limitations of Internal Control Over Financial Reporting

KPMG Canada provides services to KPMG LLP A company’s internal control over financial reporting is a process designed to provide reasonable assurance regarding the reliability of financial reporting and the preparation of financial statements for external purposes in accordance with generally accepted accounting principles. A company’s internal control over financial reporting includes those policies and procedures that (1) pertain to the maintenance of records that, in reasonable detail, accurately and fairly reflect the transactions and dispositions of the assets of the company; (2) provide reasonable assurance that transactions are recorded as necessary to permit preparation of financial statements in accordance with generally accepted accounting principles, and that receipts and expenditures of the company are being made only in accordance with authorizations of management and directors of the company; and (3) provide reasonable assurance regarding prevention or timely detection of unauthorized acquisition, use, or disposition of the company’s assets that could have a material effect on the financial statements.

Because of its inherent limitations, internal control over financial reporting may not prevent or detect misstatements. Also, projections of any evaluation of effectiveness to future periods are subject to the risk that controls may become inadequate because of changes in conditions, or that the degree of compliance with the policies or procedures may deteriorate.


/s/ KPMG LLP

Chartered Professional Accountants

Vancouver, Canada
March 8, 2024


KPMG LLP is a Canadian limited liability partnership and a member firm of the KPMG network of independent member firms affiliated with KPMG International Cooperative (“KPMG International”), a Swiss entity. KPMG Canada provides services to KPMG LLP.


BALLARD POWER SYSTEMS INC.
Consolidated Statements of Financial Position
(Expressed in thousands of U.S. dollars)
Note December 31, 2023 December 31, 2022
Assets  
Current assets:    
Cash and cash equivalents $ 751,130  $ 913,730 
Short-term investments 2,113  2,011 
Trade and other receivables 8 58,565  48,696 
Inventories 9 45,870  58,050 
Prepaid expenses and other current assets 7,063  6,020 
Total current assets 864,741  1,028,507 
Non-current assets:
Property, plant and equipment 10 116,325  82,361 
Intangible assets 11 1,406  5,214 
Goodwill 12 40,277  64,268 
Equity-accounted investments 13 13,901  24,026 
Long-term financial investments 14 40,345  42,331 
Other long-term assets 547  370 
Total assets $ 1,077,542  $ 1,247,077 
Liabilities and Equity
Current liabilities:
Trade and other payables 16 $ 39,696  $ 40,333 
Deferred revenue 17 4,588  8,030 
Provisions and other current liabilities 18 21,797  20,910 
Current lease liabilities 19 4,505  3,895 
Total current liabilities 70,586  73,168 
Non-current liabilities:
Non-current lease liabilities 19 13,393  11,836 
Deferred gain on finance lease liability 19 485  902 
Other non-current liabilities and employee future benefits 20 1,862  2,260 
Total liabilities 86,326  88,166 
Equity:
Share capital 21 2,425,641  2,420,396 
Contributed surplus 21 306,042  300,764 
Accumulated deficit (1,737,505) (1,560,759)
Foreign currency reserve (2,962) (1,490)
Total equity 991,216  1,158,911 
Total liabilities and equity $ 1,077,542  $ 1,247,077 
See accompanying notes to consolidated financial statements.
Approved on behalf of the Board:
“Doug Hayhurst” “Jim Roche”
Director Director


BALLARD POWER SYSTEMS INC.
Consolidated Statements of Loss and Comprehensive Income (Loss)
For the years ended December 31
(Expressed in thousands of U.S. dollars, except per share amounts and number of shares)
Note 2023 2022
Restated *
Revenues:
Product and service revenues 23 & 31 $ 102,368  $ 81,860 
Cost of product and service revenues 124,199  95,168 
Gross margin (21,831) (13,308)
Operating expenses:
Research and product development 98,306  89,715 
General and administrative 23,874  26,355 
Sales and marketing 15,110  12,538 
Other expense 25 3,783  3,412 
Total operating expenses   141,073  132,020 
Results from operating activities (162,904) (145,328)
Finance income (loss) and other 26 31,055  (2,112)
Finance expense 26 (1,105) (1,265)
Net finance income (loss) 29,950  (3,377)
Equity in loss of investment in joint venture and associates 13 & 29 (10,131) (11,617)
Impairment charges on property, plant and equipment 10 & 27 (967) (7)
Loss before income taxes (144,052) (160,329)
Income tax expense 28 (158) (42)
Net loss from continued operations (144,210) (160,371)
Net loss from discontinued operations 7 (33,506) (13,123)
Net loss $ (177,716) $ (173,494)
Other comprehensive income (loss):
Items that will not be reclassified to profit or loss:
Actuarial gain on defined benefit plans 20 970  1,514 
970  1,514 
Items that may be reclassified subsequently to profit or loss:
Foreign currency translation differences (1,472) (3,211)
(1,472) (3,211)
Other comprehensive loss, net of tax (502) (1,697)
Total comprehensive loss $ (178,218) $ (175,191)
Basic and diluted loss per share
Continued operations $ (0.48) $ (0.54)
Discontinued operations $ (0.11) $ (0.04)
Loss per share $ (0.59) $ (0.58)
Weighted average number of common shares outstanding 298,661,041  298,093,270 
* Comparative information has been restated due to a discontinued operation (note 7).
See accompanying notes to consolidated financial statements.


BALLARD POWER SYSTEMS INC.
Consolidated Statements of Changes in Equity
(Expressed in thousands of U.S. dollars except number of shares)
Number of
shares
Share
capital
Contributed
surplus
Accumulated
deficit
Foreign
currency
reserve
Total
equity
Balance, December 31, 2021 297,700,295  $ 2,416,256  $ 297,819  $ (1,388,779) $ 1,721  $ 1,327,017 
Net loss —  —  —  (173,494) —  (173,494)
Deferred share consideration related to acquisition (notes 7 & 21) 112,451  1,762  (1,782) —  —  (20)
DSUs redeemed (note 21) 58,990  244  (997) —  —  (753)
RSUs redeemed (note 21) 217,832  785  (3,251) —  —  (2,466)
Options exercised (note 21) 304,635  1,349  (433) —  —  916 
Share-based compensation (note 21) —  —  9,408  —  —  9,408 
Other comprehensive income (loss):
Defined benefit plan actuarial gain (note 20) —  —  —  1,514  —  1,514 
Foreign currency translation for foreign operations —  —  —  —  (3,211) (3,211)
Balance, December 31, 2022 298,394,203  $ 2,420,396  $ 300,764  $ (1,560,759) $ (1,490) $ 1,158,911 
Net loss —  —  —  (177,716) —  (177,716)
Deferred share consideration related to acquisition (notes 7 & 21) 224,902  3,053  (3,068) —  —  (15)
DSUs redeemed (note 21) 31,736  194  (365) —  —  (171)
RSUs redeemed (note 21) 132,745  1,494  (2,079) —  —  (585)
Options exercised (note 21) 152,120  504  (169) —  —  335 
Share-based compensation (note 21) —  —  10,959  —  —  10,959 
Other comprehensive income (loss):
Defined benefit plan actuarial gain (note 20) —  —  —  970  —  970 
Foreign currency translation for foreign operations —  —  —  —  (1,472) (1,472)
Balance, December 31, 2023 298,935,706  $ 2,425,641  $ 306,042  $ (1,737,505) $ (2,962) $ 991,216 

See accompanying notes to consolidated financial statements.


BALLARD POWER SYSTEMS INC.
Consolidated Statements of Cash Flows
For the years ended December 31
(Expressed in thousands of U.S. dollars)
Note 2023 2022
Cash provided by (used in):    
Operating activities:
Net loss for the year $ (177,716) $ (173,494)
Adjustments for:
Depreciation and amortization 13,527  13,773 
Deferred gain amortization (417) (416)
Impairment loss on trade receivables 25 1,537  73 
Inventory impairment and onerous contracts provision adjustments 9 & 18 14,978  7,513 
Unrealized (gain) loss on forward contracts (1,296) 862 
Equity in loss of investment in joint venture and associates 13 & 29 10,131  11,617 
Net decrease in fair value of investments 14 & 32 12,897  16,877 
De-recognition of lease 10 120  — 
Impairment charges on property, plant and equipment 10 & 27 967 
Impairment charges on intangible assets 7 & 11 2,266  13,017 
Impairment charges on Goodwill 7 & 12 23,991  — 
Recovery on settlement of contingent consideration 7 & 18 —  (9,891)
Accretion (dilution) on decommissioning liabilities 20 532  (73)
Employee future benefits 20 48  82 
Employee future benefits plan contributions 20 (8) (7)
Share-based compensation 21 10,959  9,408 
Deferred income tax recovery 7 —  (3,578)
(87,484) (114,230)
Changes in non-cash working capital:
Trade and other receivables (12,913) (2,945)
Inventories (898) (11,145)
Prepaid expenses and other current assets 76  (1,668)
Trade and other payables (3,580) (718)
Deferred revenue (3,442) (4,079)
Warranty provision 3,671  2,614 
(17,086) (17,941)
Cash used in operating activities (104,570) (132,171)
Investing activities:
         Net decrease in short-term investments 32 —  1,010 
         Contributions to long-term investments 14 (11,911) (17,913)
         Recovery of contributions to long-term investments 14 1,000  — 
         Additions to property, plant and equipment 10 (41,214) (33,932)
         Investment in intangible assets 11 (154) (550)
         Investment in joint venture and associates 13 —  (9,272)
         Consideration paid related to acquisition 7 & 18 (2,000) (14,900)
Cash used in investing activities (54,279) (75,557)
Financing activities:
         Principal payments of lease liabilities 19 (4,013) (3,322)
         Net proceeds on issuance of share capital from share option exercises 21 335  916 
Cash used in financing activities (3,678) (2,406)
Effect of exchange rate fluctuations on cash and cash equivalents held (73) (31)
Decrease in cash and cash equivalents (162,600) (210,165)
Cash and cash equivalents, beginning of year 913,730  1,123,895 
Cash and cash equivalents, end of year $ 751,130  $ 913,730 
Supplemental disclosure of cash flow information (note 30). See accompanying notes to consolidated financial statements.


BALLARD POWER SYSTEMS INC.
Notes to Consolidated Financial Statements
Years ended December 31, 2023, and 2022
(Tabular amounts expressed in thousands of U.S. dollars, except per share amounts and numbers of shares)

1.     Reporting entity:
The principal business of Ballard Power Systems Inc. (the “Corporation”) is the design, development, manufacture, sale and service of proton exchange membrane ("PEM") fuel cell products for a variety of applications, focusing on power products for bus, truck, rail, marine, stationary and emerging market (material handling, off-road and other) applications, as well as the delivery of services, including technology solutions, after sales services and training. A fuel cell is an environmentally clean electrochemical device that combines hydrogen fuel with oxygen (from the air) to produce electricity.

The Corporation is a company domiciled in Canada and its registered office is located at 9000 Glenlyon Parkway, Burnaby, British Columbia, Canada, V5J 5J8. The consolidated financial statements of the Corporation as at and for the years ended December 31, 2023 and 2022 comprise the Corporation and its subsidiaries (note 4(a)).

2.     Basis of preparation:
(a)    Statement of compliance:
These consolidated financial statements of the Corporation have been prepared in accordance with International Financial Reporting Standards (“IFRS”) accounting standards as issued by the International Accounting Standards Board (“IASB”).
The consolidated financial statements were authorized for issue by the Board of Directors on March 8, 2024.
Details of the Corporation's material accounting policies are included in note 4.
(b)    Basis of measurement:
The consolidated financial statements have been prepared on the historical cost basis except for the following material items in the statement of financial position:
•Financial assets classified as measured at fair value through profit or loss (FVTPL); and
•Employee future benefits liability is recognized as the net of the present value of the defined benefit obligation, less the fair value of plan assets.
(c)    Functional and presentation currency:
These consolidated financial statements are presented in U.S. dollars, which is the Corporation’s functional currency.
(d)    Use of estimates:
The preparation of the consolidated financial statements in conformity with IFRS accounting standards requires the Corporation’s management to make estimates and assumptions that affect the application of accounting policies and the reported amounts of assets, liabilities, income and expenses. Actual results may differ from these estimates.
Estimates and underlying assumptions are reviewed on an ongoing basis. Revisions to accounting estimates are recognized in the period in which the estimates are revised and in any future periods affected.
Significant areas having estimation uncertainty include revenue recognition, asset impairment, warranty provision, inventory and onerous contract provision, and fair value measurement (including investments). These estimates and judgments are discussed further in note 5.


11

BALLARD POWER SYSTEMS INC.
Notes to Consolidated Financial Statements
Years ended December 31, 2023, and 2022
(Tabular amounts expressed in thousands of U.S. dollars, except per share amounts and numbers of shares)
2.     Basis of preparation (cont'd):
(e)    Future operations:
The Corporation is required to assess its ability to continue as a going concern or whether substantial doubt exists as to the Corporation’s ability to continue as a going concern into the foreseeable future. The Corporation has forecast its cash flows for the foreseeable future and despite the ongoing volatility and uncertainties inherent in the business, the Corporation believes it has adequate liquidity in cash and working capital to achieve its liquidity objective. The Corporation’s ability to continue as a going concern and realize its assets and discharge its liabilities and commitments in the normal course of business is dependent upon the Corporation having adequate liquidity and achieving profitable operations that are sustainable.
The Corporation’s strategy to mitigate this uncertainty is to continue its drive to attain profitable operations that are sustainable by executing a business plan that continues to focus on revenue growth, improving overall gross margins, maintaining discipline over cash operating expenses, managing working capital and capital expenditure requirements, and securing additional financing to fund operations as needed until the Corporation does achieve profitable operations that are sustainable. Failure to implement this plan could have a material adverse effect on the Corporation’s financial condition and or results of operations.

3.     Changes in accounting policies:
The Corporation has consistently applied the accounting policies set out in note 4 to all periods presented in these consolidated financial statements.
A number of new standards and interpretations became effective from January 1, 2023 however, they did not have a material impact on the Corporation's consolidated financial statements.

4.     Material accounting policies:
The accounting policies set out below have been applied consistently to all periods presented in these consolidated financial statements, unless otherwise indicated.
(a)    Basis of consolidation:
The consolidated financial statements include the accounts of the Corporation and its principal subsidiaries as follows:
Percentage ownership
2023 2022
Ballard Motive Solutions 100  % 100  %
Guangzhou Ballard Power Systems Co., Ltd. 100  % 100  %
Ballard Power Systems Europe A/S 100  % 100  %
Ballard Hong Kong Ltd. 100  % 100  %
Ballard US Inc. 100  % 100  %
Ballard Services Inc. 100  % 100  %
Ballard Fuel Cell Systems Inc. 100  % 100  %
Ballard Power Corporation 100  % 100  %
Subsidiary Entities
Subsidiaries are entities controlled by the Corporation. The Corporation controls an entity when it is exposed to, or has rights to, variable returns from its involvement with the entity and has the ability to affect those returns though its power over the entity. The financial statements of subsidiaries are included in the consolidated financial statements from the date that control commences until the date that control ceases. Intercompany balances and transactions are eliminated in the consolidated financial statements.
12

BALLARD POWER SYSTEMS INC.
Notes to Consolidated Financial Statements
Years ended December 31, 2023, and 2022
(Tabular amounts expressed in thousands of U.S. dollars, except per share amounts and numbers of shares)
4.     Material accounting policies (cont'd):
(a)    Basis of consolidation (cont'd):
Subsidiary Entities (cont'd)
During the year ended December 31, 2023, the Corporation completed a further restructuring of operations at Ballard Motive Solutions ("BMS") and effectively closed the operation. As such, the historic operating results of the BMS business for both 2023 and 2022 have been removed from continuing operating results and are instead presented separately in the statement of comprehensive income (loss) as loss from discontinued operations.
Equity Investment Entities
The Corporation also has a non-controlling, 49% interest (2022 - 49%), in Weichai Ballard Hy-Energy Technologies Co., Ltd ("Weichai Ballard JV"). This associated company is accounted for using the equity method of accounting.
On completion of an Equity Transfer Agreement in October 2023, the Corporation disposed of its 10% investment in Guangdong Synergy Hydrogen Power Co., Ltd. ("Synergy Ballard JVCo") valued at $nil as of December 31, 2023.
(b)    Foreign currency:
(i)    Foreign currency transactions
Transactions in foreign currencies are translated to the respective functional currencies of the Corporation and its subsidiaries at the exchange rate in effect at the transaction date. Monetary assets and liabilities denominated in other than the functional currency are translated at the exchange rates in effect at the statement of financial position date. The resulting exchange gains and losses are recognized in earnings. Non-monetary assets and liabilities denominated in other than the functional currency that are measured at fair value are translated to the functional currency at the exchange rate at the date that the fair value was determined. Non-monetary items that are measured in terms of historical cost in other than the functional currency are translated using the exchange rate at the date of the transaction.
(ii)    Foreign operations
The assets and liabilities of foreign operations are translated to the presentation currency using exchange rates at the reporting date. The income and expenses of foreign operations are translated to the presentation currency using exchange rates at the dates of the transactions. Foreign currency differences are recognized in other comprehensive income (loss).
(c)    Financial instruments:
(i)    Financial assets
The Corporation initially recognizes loans and receivables and deposits on the date that they originated and all other financial assets on the trade date at which the Corporation becomes a party to the contractual provisions of the instrument. The Corporation de-recognizes a financial asset when the contractual rights to the cash flows from the asset expire, or when it transfers substantially all the risks and rewards of ownership of the financial asset.


13

BALLARD POWER SYSTEMS INC.
Notes to Consolidated Financial Statements
Years ended December 31, 2023, and 2022
(Tabular amounts expressed in thousands of U.S. dollars, except per share amounts and numbers of shares)
4.     Material accounting policies (cont'd):
(c)    Financial instruments (cont'd):
(i)    Financial assets (cont'd)
Financial assets are classified as measured at: amortized cost; fair value through other comprehensive income ("FVOCI") or fair value through profit or loss ("FVTPL"). The classification of financial assets is generally based on the business model in which a financial asset is managed and its contractual cash flow characteristics. Derivatives embedded in contracts where the host is a financial asset in the scope of the standard are never separated. Instead, the hybrid financial instrument as a whole is assessed for classification. The Corporation's financial assets which consist primarily of cash and cash equivalents, short-term investments, trade and other receivables, contract assets and long-term financial investments are classified at amortized cost.
The Corporation also periodically enters into foreign exchange forward contracts to limit its exposure to foreign currency rate fluctuations. These derivatives are recognized initially at fair value and are recorded as either assets or liabilities based on their fair value. Subsequent to initial recognition, these derivatives are measured at fair value and changes to their value are recorded through profit or loss.
(ii)    Financial liabilities
Financial liabilities comprise the Corporation’s trade and other payables. The financial liabilities are initially recognized on the date they are originated and are derecognized when the contractual obligations are discharged or cancelled or expire. These financial liabilities are recognized initially at fair value and subsequently are measured at amortized cost using the effective interest method, when materially different from the initial amount. Fair value is determined based on the present value of future cash flows, discounted at the market rate of interest.
(d)    Inventories:
Inventories are recorded at the lower of cost and net realizable value. The cost of inventories is based on the first-in first-out principle, and includes expenditures incurred in acquiring the inventories, production or conversion costs and other costs incurred in bringing them to their existing location and condition. In the case of manufactured inventories and work in progress, cost includes materials, labor and appropriate share of production overhead based on normal operating capacity. Costs of materials are determined on an average per unit basis.
Net realizable value is the estimated selling price in the ordinary course of business, less the estimated costs of completion and selling expenses. In establishing any impairment of inventory, management estimates the likelihood that inventory carrying values will be affected by changes in market demand, technology and design, which would impair the value of inventory on hand.
(e)     Property, plant and equipment:
(i)    Recognition and measurement
Items of property, plant and equipment are measured at cost less accumulated depreciation and any accumulated impairment losses. The cost of self-constructed assets includes the cost of materials, costs directly attributable to bringing the assets to a working condition for their intended use, and the costs of dismantling and removing items and restoring the site on which they are located. If significant parts of an item of property, plant and equipment have different useful lives, then they are accounted for as separate items (major components) of property, plant and equipment.
Any gain or loss on disposal of an item of property, plant and equipment is recognized in profit or loss.


14

BALLARD POWER SYSTEMS INC.
Notes to Consolidated Financial Statements
Years ended December 31, 2023, and 2022
(Tabular amounts expressed in thousands of U.S. dollars, except per share amounts and numbers of shares)
4.     Material accounting policies (cont'd):
(e)     Property, plant and equipment (cont'd):
(ii)    Depreciation (cont'd)
Depreciation is calculated to write-off the cost of items of property, plant and equipment less their estimated residual values using the straight-line method over their estimated useful lives, and is recognized in profit or loss.
The estimated useful lives of property, plant and equipment for current and comparative periods are as follows:
Computer equipment
3 to 10 years
Furniture and fixtures
5 to 10 years
Leasehold improvements The shorter of initial term of the respective lease and
estimated useful life
Production and test equipment
4 to 15 years
Leased assets are depreciated over the shorter of the lease term or their useful lives unless it is reasonably certain that the Corporation will obtain ownership by the end of the lease term.
Right-of-use asset - Property
1 to 15 years
Right-of-use asset - Office equipment
4 to 7 years
Right-of-use asset - Vehicles
1 to 5 years
Depreciation methods, useful lives and residual values are reviewed at each reporting date and adjusted if appropriate.
(f)    Leases:
IFRS 16 Leases introduced a single, on-balance sheet accounting model for lessees. As a result, the Corporation, as a lessee, has recognized right-of-use assets representing its rights to use the underlying assets, and lease liabilities representing its obligation to make lease payments. Lessor accounting remains similar to previous accounting policies.
At inception of a contract, the Corporation assesses whether a contract is, or contains, a lease. A contract is, or contains, a lease if the contract conveys the right to control the use of an identified asset for a period of time in exchange for consideration.
i.    As a Lessee
The Corporation recognizes a right-of-use asset and a lease liability at the lease commencement date. The right-of-use asset is initially measured at cost, which comprises the initial amount of the lease liability adjusted for any lease payments made at or before the commencement date, plus any initial direct costs incurred and an estimate of costs to dismantle and remove the underlying asset or to restore the underlying asset or the site on which it is located, less any lease incentives received.
The right-of-use asset is subsequently depreciated using the straight-line method from the commencement date to the earlier of the end of the useful life of the right-of-use asset or the end of the lease term. The estimated useful lives of right-of-use assets are determined on the same basis as those of property and equipment. In addition, the right-of-use asset is periodically reduced by impairment losses, if any, and adjusted for certain remeasurements of the lease liability.
The lease liability is initially measured at the present value of the lease payments that are not paid at the commencement date, discounted using the interest rate implicit in the lease or, if that rate cannot be readily determined, the Corporation’s incremental borrowing rate. Generally, the Corporation uses its incremental borrowing rate as the discount rate.
15

BALLARD POWER SYSTEMS INC.
Notes to Consolidated Financial Statements
Years ended December 31, 2023, and 2022
(Tabular amounts expressed in thousands of U.S. dollars, except per share amounts and numbers of shares)
4.     Material accounting policies (cont'd):
(f)    Leases (cont'd):
i.    As a Lessee (cont'd)
The lease liability is subsequently measured at amortized cost using the effective interest method. It is remeasured when there is a change in future lease payments arising from a change in an index or rate, if there is a change in the Corporation’s estimate of the amount expected to be payable under a residual value guarantee or if the Corporation changes its assessment of whether it will exercise a purchase, extension or termination option. When the lease liability is remeasured in this way, a corresponding adjustment is made to the carrying amount of the right-of-use asset, or is recorded in profit or loss if the carrying amount of the right-of-use asset has been reduced to zero.
The Corporation presents right-of-use assets in ‘Property, plant and equipment’ and lease liabilities in ‘Lease liability’ in the statement of financial position.
The Corporation has elected not to recognize right-of-use assets and lease liabilities for short-term leases of properties, equipment and vehicles that have a lease term of 12 months or less. The Corporation has elected not to recognize right-of-use assets and lease liabilities for low value leases that have initial values of less than $5,000. The Corporation recognizes the lease payments associated with these leases as an operating expense on a straight-line basis over the lease term.
(g)    Goodwill and intangible assets:
(i)    Recognition and measurement
Goodwill Goodwill arising on the acquisition of subsidiaries is measured at cost less accumulated impairment losses.
Research and development Expenditure on research activities is recognized in profit or loss as incurred.
Development expenditure is capitalized only if the expenditure can be measured reliably, the product or process is technically and commercially feasible, future economic benefits are probable and the Corporation intends to and has sufficient resources to complete development and to use or sell the asset. Otherwise, it is recognized in profit or loss as incurred. Subsequent to initial recognition, development expenditure is measured at cost less accumulated amortization and any accumulated impairment losses.
Intangible assets Intangible assets, including patents, know-how, in-process research and development, trademarks and service marks, customer contracts and relationships, non-compete agreements, and software systems that are acquired or developed by the Corporation and have finite useful lives are measured at cost less accumulated amortization and any accumulated impairment losses.
(ii)    Amortization
Amortization is calculated to write-off the cost of intangible assets less their estimated residual values using the straight-line method over their estimated useful lives, and is recognized in profit or loss. Goodwill is not amortized.
The estimated useful lives for current and comparative periods are as follows:
Acquired patents, know-how and in-process research & development
5 to 20 years
ERP management reporting software system
5 to 10 years
Acquired customer contracts and relationships
7 to 10 years
Acquired non-compete agreements
1 to 3 years
Domain names
15 years
Acquired trademarks and service marks
15 years
Internally generated fuel cell intangible assets
3 to 5 years
Amortization methods, useful lives and residual values are reviewed at each reporting date and adjusted if appropriate.
16

BALLARD POWER SYSTEMS INC.
Notes to Consolidated Financial Statements
Years ended December 31, 2023, and 2022
(Tabular amounts expressed in thousands of U.S. dollars, except per share amounts and numbers of shares)
4.     Material accounting policies (cont'd):
(h)    Impairment:
(i)    Financial assets
An ‘expected credit loss’ ("ECL") model applies to financial assets measured at amortized cost and debt investments at FVOCI, but not to investments in equity instruments. The Corporation's financial assets measured at amortized cost and subject to the ECL model consist primarily of trade receivables and contract assets.
In applying the ECL model, loss allowances are measured on either of the following bases:
•12-month ECLs: these are ECLs that result from possible default events within the 12 months after the reporting date; and
•lifetime ECLs: these are ECLs that result from all possible default events over the expected life of a financial instrument.

The Corporation measures loss allowances for trade receivables and contract assets at an amount equal to lifetime ECLs.
When determining whether the credit risk of a financial asset has increased significantly since initial recognition and when estimating ECLs, the Corporation considers reasonable and supportable information that is relevant and available without undue cost or effort. This includes both quantitative and qualitative information and analysis, based on historical experience and informed credit assessment and including forward-looking information.
(ii) Non-financial assets
The carrying amounts of the Corporation’s non-financial assets other than inventories are reviewed at each reporting date to determine whether there is any indication of impairment. If any such indication exists, then the asset’s recoverable amount is estimated. For goodwill and intangible assets that have indefinite useful lives, the recoverable amount is estimated annually or whenever events or circumstances indicate that the carrying amount may not be recoverable.
The recoverable amount of an asset or cash-generating unit is the greater of its value in use and its fair value less costs to sell. In assessing value in use, the estimated future cash flows are discounted to their present value using a pre-tax discount rate that reflects current market assessments of the time value of money and the risks specific to the asset. Fair value less costs to sell is defined as the estimated price that would be received on the sale of the asset in an orderly transaction between market participants at the measurement date. For the purposes of impairment testing, assets that cannot be tested individually are grouped together into the smallest group of assets that generates cash inflows from continuing use that are largely independent of the cash inflows of other groups of assets.
The allocation of goodwill to cash-generating units reflects the lowest level at which goodwill is monitored for internal reporting purposes.
An impairment loss is recognized if the carrying amount of an asset or its cash-generating unit exceeds its estimated recoverable amount. Impairment losses are recognized in profit or loss. Impairment losses recognized in respect of the cash generating units are allocated first to reduce the carrying amount of any goodwill allocated to the units, and then to reduce the carrying amounts of the other assets in the unit on a pro-rata basis.


17

BALLARD POWER SYSTEMS INC.
Notes to Consolidated Financial Statements
Years ended December 31, 2023, and 2022
(Tabular amounts expressed in thousands of U.S. dollars, except per share amounts and numbers of shares)
4.     Material accounting policies (cont'd):
(h)    Impairment (cont'd):
(ii) Non-financial assets (cont'd)
An impairment loss in respect of goodwill is not reversed. In respect of other assets, impairment losses recognized in prior periods are assessed at each reporting date for any indications that the loss has decreased or no longer exists. An impairment loss is reversed only to the extent that the asset’s carrying amount does not exceed the carrying amount that would have been determined, net of depreciation or amortization, if no impairment loss had been recognized.
(i)    Provisions:
A provision is recognized if, as a result of a past event, the Corporation has a present legal or constructive obligation that can be estimated reliably, and it is probable that an outflow of economic benefits will be required to settle the obligation. Provisions are determined by discounting the expected future cash flows at a pre-tax rate that reflects current market assessments of the time value of money and the risk specific to the liability. The unwinding of the discount is recognized as a finance expense.
Warranty provision
A provision for warranty costs is recorded on product sales at the time the sale is recognized. In establishing the warranty provision, management estimates the likelihood that products sold will experience warranty claims and the estimated cost to resolve claims received, taking into account the nature of the contract and past and projected experience with the products.
Decommissioning liabilities
Legal obligations to retire tangible long-lived assets are recorded at the net present value of the expected costs of settlement at acquisition with a corresponding increase in asset value. These include assets leased under operating leases. The liability is accreted over the life of the asset to the ultimate settlement amount and the increase in asset value is depreciated over the remaining useful life of the asset.
(j)    Revenue recognition:
The Corporation generates revenues primarily from product sales, the license and sale of intellectual property and fundamental knowledge, and the provision of engineering services and technology transfer services. Product revenues are derived primarily from standard product sales contracts and from long-term fixed price contracts. Intellectual property and fundamental knowledge license revenues are derived primarily from standard licensing and technology transfer agreements. Engineering service and technology transfer services revenues are derived primarily from cost-plus reimbursable contracts and from long-term fixed price contracts.
Revenue is recognized when a customer obtains control of the goods or services. Determining the timing of the transfer of control, at a point in time or over time, requires judgment. On standard product sales contracts, revenues are recognized when customers obtain control of the product, that is when transfer of title and risks and rewards of ownership of goods have passed and when obligation to pay is considered certain. Invoices are generated and revenue is recognized at that point in time. Provisions for warranties are made at the time of sale.
On standard licensing and technology transfer agreements, revenues are recognized on the transfer of rights to a licensee, when it is determined to be distinct from other performance obligations, and if the customer can direct the use of, and obtain substantially all of the remaining benefits from the license as it exists at the time of transfer. In other cases, the proceeds are considered to relate to the right to use the asset over the license period and the revenue is recognized over that period. If it is determined that the license is not distinct from other performance obligations, revenue is recognized over time as the customer simultaneously receives and consumes the benefit.

18

BALLARD POWER SYSTEMS INC.
Notes to Consolidated Financial Statements
Years ended December 31, 2023, and 2022
(Tabular amounts expressed in thousands of U.S. dollars, except per share amounts and numbers of shares)
4.     Material accounting policies (cont'd):
(j)    Revenue recognition (cont'd):
On cost-plus reimbursable contracts, revenues are recognized as costs are incurred, and include applicable fees earned as services are provided.
On long-term fixed price contracts, the customer controls all of the work in progress as the services are being provided. This is because under these contracts, the deliverables are made to a customer’s specification, and if a contract is terminated by the customer, then the Corporation is entitled to reimbursement of the costs incurred to date plus the applicable gross margin. Therefore, revenue from these contracts and the associated costs are recognized as the costs are incurred over time.
On long-term fixed price contracts, revenues are recognized over time using cumulative costs incurred to date relative to total estimated costs at completion to measure progress towards satisfying performance obligations. Generally, revenue is recognized by multiplying the expected consideration by the ratio of cumulative costs incurred to date to the sum of incurred and estimated costs for completing the performance obligation. The cumulative effect of changes to estimated revenues and estimated costs for completing a contract are recognized in the period in which the revisions are identified. In the event that the estimated costs for completing the contract exceed the expected revenues on a contract, such loss is recognized in its entirety in the period it becomes known.
Deferred revenue (i.e. contract liabilities) represents cash received from customers in excess of revenue recognized on uncompleted contracts.
(k)    Finance income and expense:
Finance income comprises interest income on funds invested, gains (losses) on the disposal of available-for-sale financial assets, foreign exchange gains (losses), and changes in the fair value of financial assets at fair value through profit or loss, pension administration expense, and employee future benefit plan expense. Interest income is recognized as it accrues in income, using the effective interest method.
Finance expense comprises interest expense on leases and the unwinding of the discount on provisions.
(l)    Income taxes:
The Corporation follows the asset and liability method of accounting for income taxes. Under this method, deferred income taxes are recognized for the deferred income tax consequences attributable to differences between the financial statement carrying values of assets and liabilities and their respective income tax bases (temporary differences) and for loss carry forwards. The resulting changes in the net deferred tax asset or liability are included in income.
Deferred tax assets and liabilities are measured using enacted, or substantively enacted, tax rates expected to apply to taxable income in the years in which temporary differences are expected to be recovered or settled. The effect on deferred income tax assets and liabilities, of a change in tax rates, is included in income in the period that includes the substantive enactment date. Deferred income tax assets are reviewed at each reporting date and are reduced to the extent that it is no longer probable that the related tax benefit will be realized.


19

BALLARD POWER SYSTEMS INC.
Notes to Consolidated Financial Statements
Years ended December 31, 2023, and 2022
(Tabular amounts expressed in thousands of U.S. dollars, except per share amounts and numbers of shares)
4.     Material accounting policies (cont'd):
(m)    Employee benefits:
Defined benefit plans
A defined benefit plan is a post-employment pension plan other than a defined contribution plan. The Corporation’s net obligation in respect of defined benefit pension plans is calculated separately for each plan by estimating the amount of future benefit that employees have earned in return for their service in the current and prior periods; that benefit is discounted to determine its present value. Any unrecognized past service costs and the fair value of any plan assets are deducted. The discount rate is the yield at the reporting date on AA credit-rated bonds that have maturity dates approximating the terms of the Corporation’s obligations and that are denominated in the same currency in which the benefits are expected to be paid. The calculation is performed annually by a qualified actuary using the projected unit credit method.
When the calculation results in a benefit to the Corporation, the recognized asset is limited to the total of any unrecognized past service costs and the present value of economic benefits available in the form of any future refunds from the plan or reductions in future contributions to the plan. In order to calculate the present value of economic benefits, consideration is given to any minimum funding requirements that apply to any plan in the Corporation. An economic benefit is available to the Corporation if it is realizable during the life of the plan, or on settlement of the plan liabilities.
The Corporation recognizes all remeasurements arising from defined benefit plans, which comprise actuarial gains and losses, immediately in other comprehensive income (loss). Remeasurements recognized in other comprehensive income (loss) are not recycled through profit or loss in subsequent periods.
Other long-term employee benefits
The Corporation’s net obligation in respect of long-term employee benefits other than pension plans is the amount of future benefit that employees have earned in return for their service in the current and prior periods; that benefit is discounted to determine its present value, and the fair value of any related assets is deducted. The discount rate is the yield at the reporting date on AA credit-rated bonds that have maturity dates approximating the terms of the Corporation’s obligations. The calculation is performed using the projected unit credit method. Any actuarial gains and losses are recognized in other comprehensive income or loss in the period in which they arise.
Termination benefits
Termination benefits are recognized as an expense (restructuring expense recorded in other operating expense) when the Corporation is committed demonstrably, without realistic possibility of withdrawal, to a formal detailed plan to either terminate employment before the normal retirement date, or to provide termination benefits as a result of an offer made to encourage voluntary redundancy. Termination benefits for voluntary redundancies are recognized as an expense if the Corporation has made an offer of voluntary redundancy, it is probable that the offer will be accepted, and the number of acceptances can be estimated reliably. If benefits are payable more than 12 months after the reporting period, then they are discounted to their present value.
Short-term employee benefits
Short-term employee benefit obligations are measured on an undiscounted basis and are expensed as the related service is provided.
A liability is recognized for the amount expected to be paid under short-term cash bonus or profit sharing plans if the Corporation has a present legal or constructive obligation to pay this amount as a result of past service provided by the employee, and the obligation can be estimated reliably.


20

BALLARD POWER SYSTEMS INC.
Notes to Consolidated Financial Statements
Years ended December 31, 2023, and 2022
(Tabular amounts expressed in thousands of U.S. dollars, except per share amounts and numbers of shares)
4.     Material accounting policies (cont'd):
(n)    Share-based compensation plans:
The Corporation uses the fair-value based method of accounting for share-based compensation for all awards of shares, share options, restricted share units, and deferred share units granted. The resulting compensation expense, based on the fair value of the awards granted, excluding the impact of any non-market service and performance vesting conditions, is charged to income over the period that the employees unconditionally become entitled to the award, with a corresponding increase to contributed surplus.
Fair values of share options are calculated using the Black-Scholes valuation method as of the grant date and adjusted for estimated forfeitures. Restricted share units and deferred share units are valued at the fair-value price at grant date. For awards with graded vesting, the fair value of each tranche is calculated separately and recognized over its respective vesting period. Non-market vesting conditions are considered in making assumptions about the number of awards that are expected to vest. At each reporting date, the Corporation reassesses its estimates of the number of awards that are expected to vest and recognizes the impact of any revision in the income statement with a corresponding adjustment to contributed surplus. For awards with market conditions, the fair value is determined at grant date using a complex financial simulation model and there is no subsequent true-up to actual.
The Corporation issues shares, share options, restricted share units, and deferred share units under its share-based compensation plans as described in note 21. Any consideration paid by employees on exercise of share options or purchase of shares, together with the amount initially recorded in contributed surplus, is credited to share capital. The redemption of restricted share units and deferred share units are non-cash transactions that are recorded in contributed surplus and share capital.
(o)    Earnings (loss) per share:
Basic earnings (loss) per share is computed using the weighted average number of common shares outstanding during the period, adjusted for treasury shares. Diluted earnings per share is calculated using the treasury stock method.
Under the treasury stock method, the dilution is calculated based upon the number of common shares issued should deferred share units (“DSUs”), restricted share units (“RSUs”), and “in the money” options, if any, be exercised. When the effects of outstanding stock-based compensation arrangements would be anti-dilutive, diluted loss per share is not shown separately.
(p)    Segment reporting:
An operating segment is a component of the Corporation that engages in business activities from which it may earn revenues and incur expenses, including revenues and expenses that relate to transactions with any of the Corporation’s other components. Segment results include items directly attributable to a segment as well as those that can be allocated on a reasonable basis. Unallocated items comprise mainly corporate assets, head office expenses, and income tax assets and liabilities.

5.Critical judgments in applying accounting policies and key sources of estimation uncertainty:
Critical judgments in applying accounting policies:
Critical judgments that management has made in the process of applying the Corporation’s accounting policies and that have the most significant effect on the amounts recognized in the consolidated financial statements are limited to management’s assessment of the Corporation’s ability to continue as a going concern (note 2(e)).
Key sources of estimation uncertainty:
The following are key assumptions concerning the future and other key sources of estimation uncertainty that have significant risk of resulting in a material adjustment to the reported amount of assets, liabilities, income and expenses within the next financial year.
21

BALLARD POWER SYSTEMS INC.
Notes to Consolidated Financial Statements
Years ended December 31, 2023, and 2022
(Tabular amounts expressed in thousands of U.S. dollars, except per share amounts and numbers of shares)
5.Critical judgments in applying accounting policies and key sources of estimation uncertainty (cont'd):
Key sources of estimation uncertainty (cont'd):
(a)Revenue recognition:
On long-term fixed price contracts, revenues are recorded over time using costs incurred to date relative to total estimated costs at completion to measure progress towards satisfying performance obligations. Revenue is recognized by multiplying the expected consideration by the ratio of cumulative costs incurred to date to the sum of incurred and estimated costs for completing the performance obligation. The cumulative effect of changes to expected revenues and expected costs for completing a contract are recognized in the period in which the revisions are identified. If the expected costs exceed the expected revenues on a contract, such loss is recognized in its entirety in the period it becomes known.
(i)    The determination of expected costs for completing a contract is based on estimates that can be affected by a variety of factors such as variances in the timeline to completion, the cost of materials, the availability and cost of labour, as well as productivity.
(ii)    The determination of potential revenues includes the contractually agreed amount and may be adjusted based on the estimate of the Corporation’s attainment on achieving certain defined contractual milestones. Management’s estimation is required in determining the amount of consideration to which the Corporation expects to be entitled and in determining when a performance obligation has been met.
Estimates used to determine revenues and costs of long-term fixed price contracts involve uncertainties that ultimately depend on the outcome of future events and are periodically revised as projects progress. There is a risk that a customer may ultimately disagree with management’s assessment of the progress achieved against milestones, or that the Corporation's estimates of the work required to complete a contract may change.
(b) Asset impairment:
Many of the factors used in assessing fair value are outside the control of management and it is reasonably likely that assumptions and estimates will change from period to period.
These changes may result in future impairments. For example, the revenue growth rate could be lower than projected due to economic, industry or competitive factors, or the discount rate used in the value in use model could increase due to a change in market interest rates. In addition, future goodwill impairment charges may be necessary if the market capitalization decreased due to a decline in the trading price of the Corporation’s common stock, which could negatively impact the fair value of the Corporation’s cash generating units.
(c)Warranty provision:
A provision for warranty costs is recorded on product sales at the time of shipment. In establishing the warranty provision, management estimates the likelihood that products sold will experience warranty claims and the cost to resolve claims received. In making such determinations, the Corporation uses estimates based on the nature of the contract and past and projected experience with the products. Should these estimates prove to be incorrect, the Corporation may incur costs different from those provided for in the warranty provision. Management reviews warranty assumptions and makes adjustments to the provision at each reporting date based on the latest information available, including the expiry of contractual obligations. Adjustments to the warranty provision are recorded in cost of product and service revenues.


22

BALLARD POWER SYSTEMS INC.
Notes to Consolidated Financial Statements
Years ended December 31, 2023, and 2022
(Tabular amounts expressed in thousands of U.S. dollars, except per share amounts and numbers of shares)
5.Critical judgments in applying accounting policies and key sources of estimation uncertainty (cont'd):
Key sources of estimation uncertainty (cont'd):
(d)Inventory and onerous contracts provision:
In determining the lower of cost and net realizable value of inventory and in establishing the appropriate provision for inventory obsolescence, management estimates the likelihood that inventory carrying values will be affected by changes in market pricing or demand for the products and by changes in technology or design which could make inventory on hand obsolete or recoverable at less than the recorded value. Management performs regular reviews to assess the impact of changes in technology and design, sales trends and other changes on the carrying value of inventory. Where it is determined that such changes have occurred and will have a negative impact on the value of inventory on hand, appropriate provisions are made.
If there is a subsequent increase in the value of inventory on hand, reversals of previous write-downs to net realizable value are made. Unforeseen changes in these factors could result in additional inventory provisions, or reversals of previous provisions, being required.
A provision for onerous contracts is also assessed and measured at the present value of the lower of the expected cost of terminating the contract and the expected net cost of continuing with the contract, which is determined based on the incremental costs of fulfilling the obligation under the contract and an allocation of other costs directly related to fulfilling the contract. Before an onerous contract provision is established, the Corporation recognizes any impairment loss on the assets (including through an inventory provision) associated with that contract.
(e)    Fair value measurement (including investments):
A number of the Corporation’s accounting policies and disclosures require the measurement of fair values, for both financial and non-financial assets and liabilities.
When one is available, the Corporation measures the fair value of an instrument using the quoted price in an active market for that instrument. A market is regarded as “active” if transactions for the asset or liability take place with sufficient frequency and volume to provide pricing information on an ongoing basis. If there is no quoted price in an active market, then the Corporation uses valuation techniques that maximize the use of relevant observable inputs and minimize the use of unobservable inputs. This involves developing estimates and assumptions consistent with how market participants would price the instrument. Management bases its assumptions on observable data as far as possible, but this is not always available. In that case, management uses the best information available. Where they are available, the fair value of investments is based on observable market transactions. Estimated fair values may vary from the actual prices that would be achieved in an arm’s length transaction at the reporting date.
The best evidence of the fair value of a financial instrument (including investments) on initial recognition is usually the transaction price – i.e., the fair value of the consideration given or received. If the Corporation determines that the fair value on initial recognition differs from the transaction price and the fair value is evidenced neither by a quoted price in an active market for an identical asset or liability nor based on a valuation technique for which any unobservable inputs are judged to be insignificant in relation to the measurement, then the financial instrument is initially measured at fair value, adjusted to defer the difference between the fair value on initial recognition and the transaction price. Subsequently, that difference is recognized in profit or loss on an appropriate basis over the life of the instrument but no later than when the valuation is wholly supported by observable data, or the transaction is closed out.


23

BALLARD POWER SYSTEMS INC.
Notes to Consolidated Financial Statements
Years ended December 31, 2023, and 2022
(Tabular amounts expressed in thousands of U.S. dollars, except per share amounts and numbers of shares)
6.     Recent accounting pronouncements and future accounting policy changes:
The following is an overview of accounting standard changes that the Corporation will be required to adopt in future years. The Corporation expects to adopt these standards as at their effective dates and will continue to evaluate the impact of these standards on the consolidated financial statements.
    Classification of Liabilities as Current or Non-current (Amendments to IAS 1)
On January 23, 2020, the IASB issued amendments to IAS 1 Presentation of Financial Statements (the "2020 amendments"), to clarify the classification of liabilities as current or non-current. On October 31, 2022, the IASB issued Non-current Liabilities with Covenants (Amendments to IAS 1) (the “2022 amendments”), to improve the information a company provides about long-term debt with covenants.
For the purposes of non-current classification, the 2020 amendments and the 2022 amendments (collectively "the amendments") removed the requirement for a right to defer settlement or roll over of a liability for at least twelve months to be unconditional. Instead, such a right must have substance and exist at the end of the reporting period.
The amendments reconfirmed that only covenants with which a company must comply on or before the reporting date affect the classification of a liability as current or non-current. Covenants with which a company must comply after the reporting date do not affect a liability’s classification at that date. The amendments also clarify how a company classifies a liability that includes a counterparty conversion option. The amendments state that:
•settlement of a liability includes transferring a company’s own equity instruments to the counterparty, and
•when classifying liabilities as current or non-current a company can ignore only those conversion options that are recognized as equity.
The amendments are effective for annual periods beginning on or after January 1, 2024. Early adoption is permitted. A company that applies the 2020 amendments early is required to also apply the 2022 amendments. The adoption of the Amendments to IAS 1 is not expected to have a material impact on the Corporation's financial statements.

7.    Discontinued operations:
On November 11, 2021, the Corporation acquired BMS (formerly Arcola Energy Limited), a UK-based systems engineering company specializing in hydrogen fuel cell systems and powertrain integration. The Corporation acquired 100% of Arcola for total consideration of up to $40,000,000, consisting of up-front net cash consideration of $7,157,000, and including 337,353 shares of the Corporation with an acquisition date fair value of approximately $4,851,000 (all shares have been issued as of December 31, 2023) vesting over a two year period from the acquisition date, and $26,258,000 in earn-out cash contingent consideration based on the achievement of certain performance milestones over an up to three year period from the acquisition date.
Subsequent to the acquisition, the Corporation re-evaluated the business model of BMS and during the year ended December 31, 2022, the Corporation decided to exit the vehicle integration business of BMS and made certain restructuring changes to its operations. As a result of the post-acquisition restructuring of BMS' operations during the year ended December 31, 2022, the Corporation recognized a net charge to restructuring costs of $4,835,000 consisting primarily of contract exit and modification costs, grant adjustment charges, personnel change costs, and legal and advisory costs, net of expected recoveries; recovery on settlement of contingent consideration of $9,891,000 related to the cancellation of certain contingent and outstanding cash milestones no longer payable; and intangible asset impairment of $13,017,000 consisting of a write-down of acquired technology, customer contracts, and non-compete intangible assets to their estimated fair value of $2,500,000.


24

BALLARD POWER SYSTEMS INC.
Notes to Consolidated Financial Statements
Years ended December 31, 2023, and 2022
(Tabular amounts expressed in thousands of U.S. dollars, except per share amounts and numbers of shares)
7.    Discontinued operations (cont'd):
During the year ended December 31, 2023, the Corporation completed a further restructuring of operations at BMS and effectively closed the operation. As such, the historic operating results of the BMS business for both 2023 and 2022 have been removed from continuing operating results and are instead presented separately in the statement of loss and comprehensive income (loss) as loss from discontinued operations.
The Corporation reviewed its remaining BMS related intangible assets and goodwill for impairment indicators and concluded that impairment indicators on certain assets did exist as of December 31, 2023. During the year ended December 31, 2023, the Corporation recorded impairment charges of $2,266,000 (2022 - $13,017,000) on intangible assets (note 11) and impairment charges of $23,991,000 (2022 - $nil) on goodwill (note 12) related to the closure of operations at BMS. As a result of the impairment charges, intangible assets and goodwill for BMS were both written down to $nil as of December 31, 2023.
Acquired Accumulated Net carrying Ending
intangible assets December 31, 2023 Cost amortization amount Impairment Balance
Technology $ 2,500  $ 234  $ 2,266  $ 2,266  $ — 
$ 2,500  $ 234  $ 2,266  $ 2,266  $ — 
Acquired Accumulated Net carrying Ending
intangible assets at December 31, 2022 Cost amortization amount Impairment Balance
Technology $ 15,976  $ 1,498  $ 14,478  $ 11,978  $ 2,500 
Customer contracts and relationships 1,048  168  880  880 
Non-compete agreement 255  96  159  159 
$ 17,279  $ 1,762  $ 15,517  $ 13,017  $ 2,500 
Net loss from discontinued operations for the years ended December 31, 2023 and 2022 is comprised of the following:
2023 2022
Product and service revenues $ 934  $ 1,926 
Cost of product and service revenues 607  1,713 
Gross margin 327  213 
Total operating expense (7,913) (13,784)
Finance income and other 337  (4)
Impairment charges on intangible assets (2,266) (13,017)
Impairment charges on goodwill (23,991) — 
Recovery on settlement of contingent consideration —  9,891 
Income tax recovery —  3,578 
Net loss from discontinued operations $ (33,506) $ (13,123)

Net cash flows from discontinued operations for the years ended December 31, 2023 and 2022 is as follows:

2023 2022
Cash used in operating activities $ (3,601) $ (12,259)
Cash provided by (used in) investing activities 47  (78)
Cash used in financing activities (234) (210)
Cash used in discontinued operations $ (3,788) $ (12,547)


25

BALLARD POWER SYSTEMS INC.
Notes to Consolidated Financial Statements
Years ended December 31, 2023, and 2022
(Tabular amounts expressed in thousands of U.S. dollars, except per share amounts and numbers of shares)
8.     Trade and other receivables:
December 31, 2023 December 31, 2022
Trade accounts receivable $ 37,490  $ 25,812 
Other receivables 7,806  10,103 
Contract assets 13,269  12,781 
$ 58,565  $ 48,696 
Contract assets
Contract assets primarily relate to the Corporation's rights to consideration for work completed but not billed as at December 31, 2023 for engineering services and technology transfer services.
Contract assets December 31, 2023
At January 1, 2023 $ 12,781 
Additions to contract assets 8,435 
Invoiced during the year (7,947)
At December 31, 2023 $ 13,269 

Information about the Corporation's exposure to credit and market risks, and impairment losses for trade receivables and contract assets is included in note 32.

9.     Inventories:
December 31, 2023 December 31, 2022
Raw materials and consumables $ 15,085  $ 29,016 
Work-in-progress 15,041  17,171 
Finished goods 7,169  8,502 
Service inventory 8,575  3,361 
$ 45,870  $ 58,050 
In 2023, the amount of raw materials and consumables, finished goods and work-in-progress recognized as cost of product and service revenues amounted to $103,850,000 (2022 - $68,870,000).
In 2023, the Corporation recorded negative inventory impairment and onerous contract provision adjustments of $17,181,000 (2022 - $8,702,000) and reversed previously recorded adjustments of $2,203,000 (2022 - $1,189,000), resulting in net negative inventory impairment and onerous contract provision adjustments of $14,978,000 (2022 - $7,513,000). Write-downs and reversals are included in either cost of product and service revenues, or research and product development expense, depending on the nature of inventory.

10.    Property, plant and equipment:
December 31, 2023 December 31, 2022
Property, plant and equipment owned $ 102,206  $ 70,344 
Right-of-use assets 14,119  12,017 
$ 116,325  $ 82,361 


26

BALLARD POWER SYSTEMS INC.
Notes to Consolidated Financial Statements
Years ended December 31, 2023, and 2022
(Tabular amounts expressed in thousands of U.S. dollars, except per share amounts and numbers of shares)
10.    Property, plant and equipment (cont'd):
Property, plant and equipment owned
Net carrying amounts December 31, 2023 December 31, 2022
Computer equipment $ 1,405  $ 1,207 
Furniture and fixtures 1,436  1,323 
Leasehold improvements 2,245  1,550 
Production and test equipment 97,120  66,264 
$ 102,206  $ 70,344 
Cost December 31, 2022 Additions Disposals Transfers Effect of movements in exchange rates December 31, 2023
Building $ —  $ 936  $ —  $ —  $ —  $ 936 
Computer equipment 6,741  745  —  (130) —  7,356 
Furniture and fixtures 2,406  328  —  —  30  2,764 
Leasehold improvements 9,650  1,103  —  —  27  10,780 
Production and test equipment 109,202  38,102  (111) (1,041) (55) 146,097 
$ 127,999  $ 41,214  $ (111) $ (1,171) $ $ 167,933 
Accumulated depreciation December 31, 2022 Depreciation Disposals Impairment Transfers Effect of movements in exchange rates December 31, 2023
Building $ —  $ —  —  $ 936  $ —  $ —  $ 936 
Computer equipment 5,534  491  —  —  (73) (1) 5,951 
Furniture and fixtures 1,083  245  —  —  (12) 12  1,328 
Leasehold improvements 8,100  431  —  —  —  8,535 
Production and test equipment 42,938  7,132  (23) 31  (1,090) (11) 48,977 
$ 57,655  $ 8,299  $ (23) $ 967  $ (1,171) $ —  $ 65,727 
During the year ended December 31, 2023, impairment charges of $967,000 (2022 - $7,000) consist primarily of a write-down of assets of $936,000 (2022 - $nil), as the Corporation has decided to suspend investment in a planned facility in China (note 27), and an impairment loss of $31,000 (2022 - $7,000) for production and test equipment.
Cost December 31, 2021 Additions Impairment Transfers Effect of movements in exchange rates December 31, 2022
Computer equipment $ 6,852  $ 181  $ —  $ (290) $ (2) $ 6,741 
Furniture and fixtures 1,914  700  —  (208) —  2,406 
Leasehold improvements 9,450  388  —  (185) (3) 9,650 
Production and test equipment 77,644  32,663  (7) (1,109) 11  109,202 
$ 95,860  $ 33,932  $ (7) $ (1,792) $ $ 127,999 


27

BALLARD POWER SYSTEMS INC.
Notes to Consolidated Financial Statements
Years ended December 31, 2023, and 2022
(Tabular amounts expressed in thousands of U.S. dollars, except per share amounts and numbers of shares)
10.    Property, plant and equipment (cont'd):
Property, plant and equipment owned (cont'd)
Accumulated depreciation December 31, 2021 Depreciation Transfers Effect of movements in exchange rates December 31, 2022
Computer equipment $ 5,253  $ 574  $ (290) $ (3) $ 5,534 
Furniture and fixtures 1,152  139  (208) —  1,083 
Leasehold improvements 7,932  353  (185) —  8,100 
Production and test equipment 37,668  6,368  (1,109) 11  42,938 
$ 52,005  $ 7,434  $ (1,792) $ $ 57,655 
Right-of-use assets
The Corporation leases certain assets under lease agreements, comprising primarily of leases of land and buildings, office equipment and vehicles (note 19).
Net carrying amounts included in property, plant and equipment December 31, 2023 December 31, 2022
Property $ 13,691  $ 11,487 
Equipment 70  116 
Vehicle 358  414 
$ 14,119  $ 12,017 
Cost December 31, 2022 Additions De-recognition Effect of movements in exchange rates December 31, 2023
Property $ 28,844  $ 5,676  $ (73) $ —  $ 34,447 
Equipment 188  —  (11) (1) 176 
Vehicle 637  150  (135) (15) 637 
$ 29,669  $ 5,826  $ (219) $ (16) $ 35,260 
Accumulated depreciation December 31, 2022 Depreciation De-recognition Effect of movements in exchange rates December 31, 2023
Property $ 17,357  $ 3,382  $ (3) $ 21  $ 20,757 
Equipment 72  41  (7) —  106 
Vehicle 223  109  (58) 278 
$ 17,652  $ 3,532  $ (68) $ 25  $ 21,141 
Cost December 31, 2021 Additions De-recognition Transfer Effect of movements in exchange rates December 31, 2022
Property $ 26,427  $ 2,746  $ —  $ (341) $ 12  $ 28,844 
Equipment 175  13  —  —  —  188 
Vehicle 372  290  (25) —  —  637 
$ 26,974  $ 3,049  $ (25) $ (341) $ 12  $ 29,669 


28

BALLARD POWER SYSTEMS INC.
Notes to Consolidated Financial Statements
Years ended December 31, 2023, and 2022
(Tabular amounts expressed in thousands of U.S. dollars, except per share amounts and numbers of shares)
10.    Property, plant and equipment (cont'd):
Right-of-use assets (cont'd)
Accumulated depreciation December 31, 2021 Depreciation De-recognition Transfer Effect of movements in exchange rates December 31, 2022
Property $ 14,590  $ 3,108  $ —  $ (341) $ —  $ 17,357 
Equipment 36  36  —  —  —  72 
Vehicle 142  87  (6) —  —  223 
$ 14,768  $ 3,231  $ (6) $ (341) $ —  $ 17,652 

11.     Intangible assets:
December 31, 2023 December 31, 2022
ERP management reporting software system $ 1,406  $ 2,714 
Intellectual property acquired from Ballard Motive Solutions (note 7) —  2,500 
$ 1,406  $ 5,214 
Accumulated Net carrying
Cost amortization amount
At January 1, 2022 $ 78,677  $ 57,889  $ 20,788 
Additions to intangible assets 550  —  550 
Amortization expense —  3,107  (3,107)
Impairment on intangible assets (note 7) —  13,017  (13,017)
At December 31, 2022 79,227  74,013  5,214 
Additions to intangible assets 154  —  154 
Amortization expense —  1,696  (1,696)
Impairment on intangible assets (note 7) —  2,266  (2,266)
At December 31, 2023 $ 79,381  $ 77,975  $ 1,406 
During the year ended December 31, 2023, impairment charges on intangible assets of $2,266,000 (2022 - $13,017,000) were recognized primarily as a result of the post-acquisition restructuring of operations and ultimate closure of BMS (note 7).
Additions to intangible assets in 2023 of $154,000 (2022 - $550,000) consist primarily of costs to enhance the capabilities of the ERP management reporting software system.
Amortization expense on intangible assets is allocated to research and product development expense or general and administration expense depending upon the nature of the underlying assets. During the year ended December 31, 2023, amortization of $1,696,000 (2022 - $3,107,000) was recorded.

12. Goodwill:
For the purpose of impairment testing, goodwill is allocated to the Corporation’s cash-generating units which represent the lowest level within the Corporation at which the goodwill is monitored for internal management purposes, which is not higher than the Corporation’s operating segments (note 31).
As of December 31, 2023, the aggregate carrying amount of the Corporation’s goodwill is $40,277,000 (2022 - $64,268,000). The impairment of goodwill related to the closure of BMS of $23,991,000 (2022 - $nil) was recorded before the impairment test effective December 31, 2023.

29

BALLARD POWER SYSTEMS INC.
Notes to Consolidated Financial Statements
Years ended December 31, 2023, and 2022
(Tabular amounts expressed in thousands of U.S. dollars, except per share amounts and numbers of shares)
12. Goodwill (cont'd):
The goodwill impairment testing requires a comparison of the carrying value of the asset to the higher of (i) value in use; and (ii) fair value less costs to sell. Value in use is defined as the present value of future cash flows expected to be derived from the asset in its current state. The Corporation’s fair value less costs to sell test is a modified market capitalization assessment, whereby the fair value of the Fuel Cell Products and Services segment is determined by first calculating the value of the Corporation at December 31, 2023 based on the average closing share price in the month of December, adding a reasonable estimated control premium to determine the Corporation’s enterprise value on a controlling basis after adjusting for excess cash balances, deducting the fair value of long-term financial investments, and then deducting the estimated costs to sell to arrive at the fair value of the Fuel Cell Products and Services segment. Based on the fair value less costs to sell test, the Corporation has determined that the fair value of the Fuel Cell Products and Services segment exceeds its carrying value as of December 31, 2023, indicating that no goodwill impairment charge is required for 2023 ($nil in 2022).

13.    Equity-accounted Investments:
For the year ended December 31, 2023, the Corporation recorded $10,131,000 (2022 - $11,617,000) in equity loss of investment in JV and associates, consisting of equity loss in Weichai Ballard JV of $9,931,000 (2022 - $11,599,000) and equity loss in Synergy Ballard JVCo of $200,000 (2022 - $18,000).
Investment in Weichai Ballard JV
Investment in Weichai Ballard JV December 31,
2023
December 31,
2022
Beginning balance $ 24,026  $ 28,982 
Capital contribution to JV —  9,272 
Recognition of 49% profit on inventory not yet sold to third party, net
1,205  549 
Equity in loss (9,931) (11,599)
Cumulative translation adjustment due to foreign exchange (1,399) (3,178)
Ending balance $ 13,901  $ 24,026 
Weichai Ballard JV is an associate in which the Corporation has significant influence and a 49% ownership interest. During the year ended December 31, 2023, the Corporation made committed capital contributions of $nil (2022 - $9,272,000 (RMB 62,475,000 equivalent)) to Weichai Ballard JV. At December 31, 2023, as specified in the Equity Joint Venture Agreement, the Corporation has fulfilled its capital contribution commitments to Weichai Ballard JV.
The following tables summarize the financial information of Weichai Ballard JV as included in its own financial statements as of December 31, 2023, adjusted for foreign exchange differences, the application of the Corporation's accounting policies, and the Corporation's incorporation costs.
December 31,
2023
December 31, 2022
Percentage ownership interest (49%)
Current assets $ 63,023  $ 80,088 
Non-current assets 132  2,618 
Current liabilities (29,265) (23,460)
Non-current liabilities —  (2,314)
Net assets (100%) 33,890  56,932 
Corporation's share of net assets (49%)
16,607  27,895 
Incorporation costs 324  324 
Elimination of unrealized profit on downstream sales, net of sale to third party (3,030) (4,193)
Carrying amount of investment in Weichai Ballard JV $ 13,901  $ 24,026 

30

BALLARD POWER SYSTEMS INC.
Notes to Consolidated Financial Statements
Years ended December 31, 2023, and 2022
(Tabular amounts expressed in thousands of U.S. dollars, except per share amounts and numbers of shares)
13.    Equity-accounted Investments (cont'd):
Investment in Weichai Ballard JV (cont'd)
December 31, December 31,
2023 2022
Revenue (100%) $ 12,705  $ 6,476 
Net loss (100%) 20,268  23,672 
Corporation's share of net loss (49%)
$ 9,931  $ 11,599 
Investment in Synergy Ballard JVCo
Investment in Synergy Ballard JVCo December 31,
2023
December 31,
2022
Beginning balance $ —  $ — 
Recognition of 10% profit on inventory sold to third party, net
200  18 
Equity in loss (200) (18)
Ending balance $ —  $ — 
On completion of an Equity Transfer Agreement in October 2023, the Corporation disposed of its 10% investment in Synergy Ballard JVCo valued at $nil as of December 31, 2023. All remaining deferred revenue and profit on past downstream transactions totalling $736,000 were fully recognized in the year ended December 31, 2023 .

14.    Long-term financial investments:
In addition to the above equity-accounted investments, the Corporation has also acquired ownership interest in various other investments.
Net carrying value December 31, 2022 Contributions (Proceeds) Change in Fair Value December 31, 2023
Long-term investment - Forsee Power $ 18,470  $ —  $ (3,501) $ 14,969 
Long-term investment - Wisdom Motor 10,000  (1,000) (4,900) 4,100 
Long-term investment - Quantron AG 5,333  3,304  (4,237) 4,400 
Long-term investment - HyCap Fund 7,963  4,624  214  12,801 
Long-term investment - Clean H2 Fund 565  3,983  (473) 4,075 
$ 42,331  $ 10,911  $ (12,897) $ 40,345 
Net carrying value December 31, 2021 Contributions (Proceeds) Change in Fair Value December 31, 2022
Long-term investment - Forsee Power $ 33,335  $ —  $ (14,865) $ 18,470 
Long-term investment - Wisdom Motor —  10,000  —  10,000 
Long-term investment - Quantron AG —  5,183  150  5,333 
Long-term investment - HyCap Fund 7,636  1,924  (1,597) 7,963 
Long-term investment - Clean H2 Fund 339  806  (580) 565 
$ 41,310  $ 17,913  $ (16,892) $ 42,331 
During the year ended December 31, 2023, changes in fair value and foreign exchange adjustments for long -term investments totalling $12,897,000 (2022 - $16,877,000) were comprised of decreases in long-term investments of $12,897,000 (2022 - $16,892,000) offset by increases in short-term investments of $nil (2022 - $15,000) and were recognized as an unrealized loss in the consolidated statements of loss and comprehensive income (loss) and included in finance loss and other (notes 26 and 32).


31

BALLARD POWER SYSTEMS INC.
Notes to Consolidated Financial Statements
Years ended December 31, 2023, and 2022
(Tabular amounts expressed in thousands of U.S. dollars, except per share amounts and numbers of shares)
14.    Long-term financial investments (cont'd):
During the first three months of 2024, the Corporation invested in a decarbonization and climate technology and growth equity fund by acquiring a 2% interest in Templewater Decarbonization I, L.P. (“Templewater”), a limited partnership registered in Cayman Islands, for an initial investment of $495,000 on a total commitment of $1,000,000.

Investment in Forsee Power
In October 2021, the Corporation acquired a non-controlling 9.8% equity interest in Forsee Power SA ("Forsee Power"), a publicly traded French company specializing in the design, development, manufacture, commercialization, and financing of smart battery systems for sustainable electric transport.
During the year ended December 31, 2023, changes in fair value and foreign exchange adjustments totalling $(3,501,000) (2022 - $(14,865,000)) were recognized as an unrealized loss in the consolidated statements of loss and comprehensive income (loss) and included in finance loss and other (notes 26 and 32), resulting in net fair value investment in Forsee Power of $14,969,000 as of December 31, 2023 (2022 - $18,470,000), now representing a non-controlling 7.3% equity interest.
Investment in Wisdom Motor
In June 2022, the Corporation invested $10,000,000 and acquired a non-controlling 7.2% interest in Wisdom Group Holdings Ltd. ("Wisdom Motor"), a privately held Cayman Island holding company with operating subsidiaries whose business includes the design and manufacture of vehicles, including zero emission fuel cell electric buses, trucks, and battery-electric vehicles. During the year ended December 31, 2023, the Corporation assigned its option held to purchase additional Series A Preferred Shares in Wisdom for consideration of $1,000,000, resulting in recovery of contributions of $1,000,000. The exercise of this option by the acquiring counterparties, diluted the Corporation's ownership interest from 7.2% to 6.7% as of December 31, 2023.
During the year ended December 31, 2023, changes in fair value totalling $(4,900,000) (2022 - $nil) were recognized as an unrealized loss in the consolidated statements of loss and comprehensive income (loss) and included in finance loss and other (notes 26 and 32), resulting in net fair value investment in Wisdom Motor of $4,100,000 as of December 31, 2023 (2022 - $10,000,000).
Investment in Quantron AG
In September 2022, the Corporation invested €5,000,000 ($5,183,000) and acquired a non-controlling 1.9% equity interest in Quantron AG, a global electric vehicle integrator and an emerging specialty OEM to accelerate fuel cell truck adoption. During the year ended December 31, 2023, the Corporation made a committed additional contribution of €3,000,000 ($3,304,000) to exercise its option to purchase an additional 793 shares, resulting in a non-controlling ownership interest of 3.0% in Quantron AG as of December 31, 2023.
During the year ended December 31, 2023, changes in fair value and foreign exchange adjustments totalling $(4,237,000) (2022 -$150,000) were recognized as an unrealized loss in the consolidated statements of loss and comprehensive income (loss) and included in finance loss and other (notes 26 and 32), resulting in net fair value investment in Quantron AG of $4,400,000 as of December 31, 2023 (2022 - $5,333,000).
Investment in Hydrogen Funds
HyCap Fund
In August 2021, the Corporation invested in HyCap Fund I SCSp (“HyCap”), a special limited partnership registered in Luxembourg. During the year ended December 31, 2023, the Corporation made additional contributions of £3,771,000 ($4,624,000) (2022 - £1,550,000 ($1,924,000)) for total contributions of £10,987,000 ($14,210,000).


32

BALLARD POWER SYSTEMS INC.
Notes to Consolidated Financial Statements
Years ended December 31, 2023, and 2022
(Tabular amounts expressed in thousands of U.S. dollars, except per share amounts and numbers of shares)
14.    Long-term financial investments (cont'd):
Investment in Hydrogen Funds (cont'd)
HyCap Fund (cont'd)
During the year ended December 31, 2023, changes in fair value and foreign exchange adjustments totalling $214,000 (2022 - $(1,597,000)) were recognized as an unrealized gain in the consolidated statements of loss and comprehensive income (loss) and included in finance loss and other (notes 26 and 32), resulting in net fair value investment in HyCap of $12,801,000 as of December 31, 2023 (2022 - $7,963,000).
Clean H2 Infrastructure Fund
In December 2021, the Corporation invested in Clean H2 Infrastructure Fund I ("Clean H2"), a special limited partnership registered in France. During the year ended December 31, 2023, the Corporation made additional contributions of €3,705,000 ($3,983,000) (2022 - €696,000 ($806,000)) for total contributions of €4,701,000 ($5,146,000).
During the year ended December 31, 2023, changes in fair value and foreign exchange adjustments totalling $(473,000) (2022 - $(580,000)) were recognized as an unrealized loss in the consolidated statements of loss and comprehensive income (loss) and included in finance loss and other (notes 26 and 32), resulting in net fair value investment in Clean H2 of $4,075,000 as of December 31, 2023 (2022 - $565,000).

15.    Bank facilities:
The Corporation has the following bank facilities available to it.
Letter of Guarantee Facility
The Corporation has a Letter of Guarantee Facility (“LG Facility”), enabling the bank to issue letters of guarantees, standby letters of credit, performance bonds, counter guarantees, counter standby letters of credit or similar credits on the Corporation's behalf from time to time up to a maximum of $2,000,000.
At December 31, 2023, EUR 979,000 (CDN $1,433,000) (2022 - $nil) was outstanding on the LG Facility.
Foreign Exchange Facility
The Corporation also has a $25,000,000 Foreign Exchange Facility (“FX Facility”) that enables the Corporation to enter into foreign exchange currency contracts (at face value amounts in excess of the FX facility) secured by a guarantee from Export Development Canada.
At December 31, 2023, the Corporation had outstanding foreign exchange currency contracts to purchase a total of CDN $31,500,000 (2022 – CDN $38,000,000) at an average rate of 1.35 CDN per U.S. dollar, resulting in an unrealized gain of CDN $542,000 at December 31, 2023 (2022 – CDN $(1,201,000)). The unrealized gain on forward foreign exchange contracts is presented in prepaid expenses and other current assets on the statement of financial position.

16.    Trade and other payables:
December 31, 2023 December 31, 2022
Trade accounts payable $ 13,724  $ 20,440 
Compensation payable 19,235  13,248 
Other liabilities 5,628  6,059 
Taxes payable 1,109  586 
$ 39,696  $ 40,333 

33

BALLARD POWER SYSTEMS INC.
Notes to Consolidated Financial Statements
Years ended December 31, 2023, and 2022
(Tabular amounts expressed in thousands of U.S. dollars, except per share amounts and numbers of shares)
17.    Deferred revenue:
Deferred revenue (i.e. contract liabilities) represents cash received from customers in excess of revenue recognized on uncompleted contracts.
Deferred revenue December 31, 2023 December 31, 2022
Beginning Balance $ 8,030  $ 12,109 
Additions to deferred revenue 21,790  21,650 
Revenue recognized during the year (25,232) (25,729)
Ending Balance $ 4,588  $ 8,030 


18.    Provisions:

Restructuring Warranty Onerous Contingent Legal
Balance provision provision contracts consideration provision Total
At January 1, 2022 $ $ 8,712  $ 300  $ 26,258  $ —  $ 35,275 
Opening retained earnings adjustment —  —  1,200  —  —  1,200 
Provisions made during year 455  5,851  2,900  —  2,968  12,174 
Provisions used/paid during year (320) (2,391) —  (14,900) —  (17,611)
Provisions reversed/expired during year —  (860) —  (9,280) —  (10,140)
Effect of movements in exchange rates (3) 15  —  —  —  12 
At December 31, 2022 137  11,327  4,400  2,078  2,968  20,910 
Provisions made during year 1,459  7,210  2,600  —  —  11,269 
Provisions used/paid during year (1,176) (2,652) —  (2,000) (2,968) (8,796)
Provisions reversed/expired during year —  (910) (700) —  —  (1,610)
Effect of movements in exchange rates 22  —  —  —  24 
At December 31, 2023 $ 422  $ 14,997  $ 6,300  $ 78  $ —  $ 21,797 
Restructuring provision
Restructuring charges primarily relate to certain cost cutting measures and primarily include employee termination benefits. Restructuring charges are recognized in other operating expense. As of December 31, 2023, restructuring costs totalling $422,000 remain accrued.
Warranty provision
The Corporation recorded warranty provisions of $7,210,000 (2022 - $5,851,000), comprised of $5,916,000 (2022 - $4,580,000) related to new product sales and $1,294,000 (2022 - $1,271,000) related to upward warranty adjustments. This was offset by warranty expenditures of $2,652,000 (2022 - $2,391,000) and downward warranty adjustments of $910,000 (2022 - $860,000), due primarily to contractual expirations and changes in estimated and actual costs to repair. As of December 31, 2023, total warranty provision of $14,997,000 has been accrued in provisions and other current liabilities.
Onerous Contracts
The Corporation adopted a new standard for onerous contracts on January 1, 2022 which resulted in an increase in the onerous contract provisions of $1,200,000. On completion of a review of the Corporation's "open" contracts as of December 31, 2023, total onerous contract costs of $6,300,000 have been accrued in provisions and other current liabilities.
The Corporation will continue to review open contracts on a quarterly basis to determine if any ongoing or new contracts become onerous, and if any of the underlying conditions or assumptions change which would require an adjustment to the accrued provision.
34

BALLARD POWER SYSTEMS INC.
Notes to Consolidated Financial Statements
Years ended December 31, 2023, and 2022
(Tabular amounts expressed in thousands of U.S. dollars, except per share amounts and numbers of shares)
18.    Provisions (cont'd):
Contingent Consideration
As part of the acquisition of BMS in November 2021 (note 7), total consideration included earn-out cash consideration payable by the Corporation, based on the achievement of certain performance milestones over a three year period from the acquisition date. As part of the post-acquisition restructuring of operations at Ballard Motive Solutions in the UK in 2022, there was a change in estimate in the fair value of contingent consideration due to changes in expectation of achieving milestones. This resulted in a recovery on settlement of contingent consideration of $9,891,000 related to the cancellation of certain contingent and outstanding cash milestones no longer payable. The contingent consideration provision now comprises the last remaining milestone at its estimated value of $78,000.
During the year ended December 31, 2023, cash payments of $2,000,000 (2022 - $14,900,000) were made by the Corporation upon successful achievement of certain performance milestones.
Legal provision
As part of the post-acquisition restructuring of operations at BMS in 2022 (note 7), the Corporation recorded a legal provision for various contract exit and modification costs, grant adjustment charges, and legal and advisory costs, net of expected recoveries. As at December 31, 2023, costs totalling $nil remain accrued.

19.     Lease liability:
The Corporation leases certain assets under lease agreements. The lease liability consists primarily of leases of land and buildings, office equipment and vehicles. The leases have interest rates ranging from 2.95% to 8.56% per annum and expire between January 2024 and October 2033.
December 31, 2023 December 31, 2022
Property $ 4,368  $ 3,743 
Equipment 38  39 
Vehicle 99  113 
Lease Liability, Current $ 4,505  $ 3,895 
Property $ 13,078  $ 11,505 
Equipment 32  73 
Vehicle 283  258 
Lease Liability, Non-current $ 13,393  $ 11,836 
Lease Liability $ 17,898  $ 15,731 
The Corporation is committed to minimum lease payments as follows:
Maturity Analysis December 31, 2023
Less than one year $ 5,667 
Between one and five years 11,757 
More than five years 4,837 
Total undiscounted lease liabilities $ 22,261 
During the year ended December 31, 2023, the Corporation made principal payments on its lease liabilities of $4,013,000 (2022 - $3,322,000).
Deferred gains were also recorded on closing of the finance lease agreement and are amortized over the lease term. At December 31, 2023, the outstanding deferred gain was $485,000 (2022 – $902,000).

35

BALLARD POWER SYSTEMS INC.
Notes to Consolidated Financial Statements
Years ended December 31, 2023, and 2022
(Tabular amounts expressed in thousands of U.S. dollars, except per share amounts and numbers of shares)
20.     Other non-current liabilities and employee future benefits:
December 31, 2023 December 31, 2022
Other non-current liabilities $ 2,337  $ 1,805 
Employee future benefits (475) 455 
Other non-current liabilities and employee future benefits $ 1,862  $ 2,260 
Other non-current liabilities: Decommissioning liabilities
A provision for decommissioning liabilities has been recorded for the Corporation’s head office building in Burnaby, British Columbia and is related to estimated site restoration obligations at the end of the lease term. The Corporation has made certain modifications to the leased building to facilitate the manufacturing and testing of its fuel cell products. Consequently, the site restoration obligations relate primarily to dismantling and removing various manufacturing and test equipment and restoring the infrastructure of the leased building to its original state of when the lease was entered into.
Due to the long-term nature of the liability, the most significant uncertainty in estimating the provision is the costs that will be incurred. The Corporation has determined a range of reasonably possible outcomes of the total costs for the head office building. In determining the fair value of the decommissioning liabilities, the estimated future cash flows have been discounted at 3.17% per annum (2022 – 3.41%).
The Corporation performed an assessment of the estimated cash flows required to settle the obligations for the building as of December 31, 2023. Based on the assessment, an increase of $449,000 in the provision (2022 - $nil) was recorded against decommissioning liabilities, in addition to accretion costs of $43,000 (2022 - $44,000) and the effect of movements in exchange rates of $40,000 (2022 - $(117,000)).
The net discounted amount of estimated cash flows required to settle the obligation for the building as of December 31, 2023 is $2,337,000 (2022 - $1,805,000) which is expected to be settled at the end of the lease term in 2025.
Employee future benefits
December 31, 2023 December 31, 2022
Net defined benefit pension plan liability $ (582) $ 348 
Net other post-retirement benefit plan liability 107  107 
Employee future benefits $ (475) $ 455 
The Corporation maintained a defined benefit pension plan covering existing and former employees in the United States. The benefits under the pension plan were based on years of service and salary levels accrued as of December 31, 2009. In 2009, amendments were made to the defined benefit pension plan to freeze benefits accruing to employees at their respective years of service and salary levels obtained as of December 31, 2009.
During the year ended December 31, 2023, the Corporation completed a settlement agreement with an external party to transfer 100% of its liability for the plan retiree population of the plan. On final settlement, $7,326,000 of the plan assets were distributed to this external party who then assumed the full liability of the retiree group. The Corporation also filed formal plan termination documents and once formal approval is obtained later in 2024, the Corporation anticipates settling the remaining plan liability through cash settlement and annuity purchases from the remaining plan assets.
Certain employees in the United States are also eligible for post-retirement healthcare, life insurance, and other benefits.
The Corporation accrues the present value of its obligations under employee future benefit plans and related costs, net of the present value of plan assets.

36

BALLARD POWER SYSTEMS INC.
Notes to Consolidated Financial Statements
Years ended December 31, 2023, and 2022
(Tabular amounts expressed in thousands of U.S. dollars, except per share amounts and numbers of shares)
20.     Other non-current liabilities and employee future benefits (cont'd):
Employee future benefits (cont'd)
The measurement date used to determine pension and other post-retirement benefit obligations and expense is December 31 of each year. The most recent actuarial valuation of the employee future benefit plans for funding purposes was as of January 1, 2023. The next actuarial valuation of the employee future benefit plans for funding purposes is expected to be performed as of January 1, 2024.
The Corporation expects contributions of $nil to be paid to its defined benefit plans in 2024.
The following tables reconcile the opening balances to the closing balances for the net defined benefit liability and its components for the two plans. The expense recognized in statement of loss and comprehensive income (loss) is recorded in finance loss and other (note 26).    
Defined benefit obligation Fair value of plan assets Net defined benefit liability
Defined benefit pension plan 2023 2022 2023 2022 2023 2022
Balance at January 1 $ 14,402  $ 19,187  $ (14,054) $ (17,373) $ 348  $ 1,814 
Included in profit or loss
Current service cost 26  30  —  —  26  30 
Interest cost (income) 700  518  (683) (468) 17  50 
Benefits payable —  —  —  —  —  — 
726  548  (683) (468) 43  80 
Included in other comprehensive income (loss)
Remeasurements loss (gain):
Actuarial loss (gain) arising from:
Demographic assumptions —  —  —  —  —  — 
Financial assumptions 113  (4,547) —  —  113  (4,547)
Experience adjustment (600) (91) —  —  (600) (91)
Return on plan assets excluding interest —  —  (486) 3,092  (486) 3,092 
income
Plan expenses (54) (24) 54  24  —  — 
Settlements (7,326) —  7,326  —  —  — 
(7,867) (4,662) 6,894  3,116  (973) (1,546)
Other
Contributions paid by the employer —  —  —  —  —  — 
Benefits paid (558) (671) 558  671  —  — 
(558) (671) 558  671  —  — 
Balance at December 31 $ 6,703  $ 14,402  $ (7,285) $ (14,054) $ (582) $ 348 


37

BALLARD POWER SYSTEMS INC.
Notes to Consolidated Financial Statements
Years ended December 31, 2023, and 2022
(Tabular amounts expressed in thousands of U.S. dollars, except per share amounts and numbers of shares)
20.     Other non-current liabilities and employee future benefits (cont'd):
Employee future benefits (cont'd)
Defined benefit obligation Fair value of plan assets Net defined benefit liability
Other post-retirement benefit plan 2023 2022 2023 2022 2023 2022
Balance at January 1 $ 107  $ 80  $ —  $ —  $ 107  $ 80 
Included in profit or loss
Interest cost (income) —  — 
—  — 
Included in other comprehensive income (loss)
Remeasurements loss (gain):
Actuarial loss (gain) arising from:
Demographic assumptions —  —  —  —  —  — 
Financial assumptions (23) —  —  (23)
Experience adjustment 55  —  —  55 
32  —  —  32 
Other
Contributions paid by the employer —  —  (8) (7) (8) (7)
Benefits paid (8) (7) —  — 
(8) (7) —  —  (8) (7)
Balance at December 31 $ 107  $ 107  $ —  $ —  $ 107  $ 107 
Included in other comprehensive income (loss) December 31, 2023 December 31, 2022
Defined benefit pension plan actuarial gain $ 973  $ 1,546 
Other post-retirement benefit plan actuarial loss (3) (32)
$ 970  $ 1,514 
Pension plan assets comprise:
2023 2022
Cash and cash equivalents 100  % %
Equity securities —  % 60  %
Debt securities —  % 37  %
Total 100  % 100  %
The significant actuarial assumptions adopted in measuring the fair value of benefit obligations at December 31 were as follows:
2023 2022
Pension plan Other benefit plan Pension plan Other benefit plan
Discount rate 4.88  % 4.67  % 5.00  % 4.89  %
Rate of compensation increase n/a n/a n/a n/a


38

BALLARD POWER SYSTEMS INC.
Notes to Consolidated Financial Statements
Years ended December 31, 2023, and 2022
(Tabular amounts expressed in thousands of U.S. dollars, except per share amounts and numbers of shares)
20.     Other non-current liabilities and employee future benefits (cont'd):
Employee future benefits (cont'd)
The significant actuarial assumptions adopted in determining net expense for the years ended December 31 were as follows:
2023 2022
Pension plan Other benefit plan Pension plan Other benefit plan
Discount rate 5.00  % 4.67  % 2.76  % 4.89  %
Rate of compensation increase n/a n/a n/a n/a
Impacts of assumed health care cost trend rates applicable to the other post-retirement benefit plan at December 31, 2023 including a one-percentage-point change in assumed health care cost trend rates would not have a material impact on the Corporation’s financial statements.

21.     Equity:

Share-based compensation December 31, 2023 December 31, 2022
Option Expense $ 3,035  $ 5,931 
DSU Expense 397  529 
RSU Expense 7,288  2,479 
Total share-based compensation for continuing operations (per statement of loss) $ 10,720  $ 8,939 
Discontinued operations 239  469 
Total share-based compensation (per statement of equity) $ 10,959  $ 9,408 
(a)Share capital:
Upon acquisition of BMS in November 2021 (note 7), part of the total consideration paid included the issuance of 337,353 shares of the Corporation in three future tranches at a fair value of $18.30 per share discounted for the timing delay in receiving the shares using an Asian put option pricing model, or $4,851,000.
During the year ended December 31, 2023, the Corporation issued the second and final third tranches of 224,902 (2022 - 112,451) common shares with a fair value of $3,068,000 (2022 - $1,782,000) as per the acquisition date, offset by miscellaneous deferred financing costs of $15,000 (2022 - $20,000).
During March 2021, the Corporation filed a short form base Shelf Prospectus, which provides the flexibility to make offerings of securities up to an aggregate initial offering price of $1,500,000,000 during the effective period of the Prospectus, until April 2023. This was renewed in May 2023 for a period of two years until April 2025.
At December 31, 2023, 298,935,706 ( 2022 - 298,394,203) common shares were issued and outstanding.
(b)    Share options:
The Corporation has options outstanding under a consolidated share option plan. All directors, officers and employees of the Corporation, and its subsidiaries, are eligible to participate in the share option plans although as a matter of policy, options are currently not issued to directors. Option exercise prices are denominated in either Canadian or U.S. dollars, depending on the residency of the recipient. Canadian dollar denominated options have been converted to U.S. dollars using the year-end exchange rate for presentation purposes.
All options have a term of seven years from the date of grant unless otherwise determined by the board of directors. One-third of the options vest and may be exercised, at the beginning of each of the second, third, and fourth years after granting.

39

BALLARD POWER SYSTEMS INC.
Notes to Consolidated Financial Statements
Years ended December 31, 2023, and 2022
(Tabular amounts expressed in thousands of U.S. dollars, except per share amounts and numbers of shares)
21.     Equity (cont'd):
(b)    Share options (cont'd):
As at December 31, options outstanding from the consolidated share option plan were as follows:
Balance Options for common shares Weighted average exercise price
At January 1, 2022 4,041,567  $ 8.70 
Options granted 1,263,685  8.97 
Options exercised (304,635) 2.87 
Options forfeited (184,496) 12.75 
Options expired (8,501) 2.20 
At December 31, 2022 4,807,620  9.19 
Options exercised (152,120) 2.25 
Options forfeited (263,253) 10.39 
Options expired (2,025) 1.36 
At December 31, 2023 4,390,222  $ 9.36 
The following table summarizes information about the Corporation’s share options outstanding as at December 31, 2023:
Options outstanding Options exercisable
Number Weighted average
remaining
contractual life
Weighted
average
exercise
Number Weighted
average
Range of exercise price outstanding (years) price exercisable exercise price
$1.33 - $3.08
1,038,671  1.7 $ 2.84  1,038,671  $ 2.84 
$3.64 - $5.62
440,140  2.1 4.05  393,037  3.86 
$7.07 - $10.73
2,043,418  4.2 10.14  1,403,784  10.43 
$12.91 - $26.13
867,993  4.1 18.02  729,625  17.43 
4,390,222  3.4 $ 9.36  3,565,117  $ 8.93 
During 2023, compensation expense of $3,035,000 (2022 – $5,931,000) was recorded in net loss based on the grant date fair value of the awards recognized over the vesting period.
During 2023, 152,120 (2022 - 304,635) options were exercised for an equal amount of common shares for proceeds of $335,000 (2022 -$916,000).
During 2023, options to purchase nil common shares were granted with a weighted average fair value of $nil (2022 – 1,263,685 options and $4.92 fair value). The granted options vest annually over three years.
As at December 31, 2023, options to purchase 4,390,222 common shares were outstanding (2022 – 4,807,620).
(c)    Share distribution plan:
The Corporation has a consolidated share distribution plan that permits the issuance of common shares for no cash consideration to employees of the Corporation to recognize their past contribution and to encourage future contribution to the Corporation. At December 31, 2023, there were 17,140,498 (2022 – 18,844,127) shares available to be issued under this plan.
During 2022 and 2023, no shares were issued under this plan and therefore no compensation expense was recorded against profit or loss.


40

BALLARD POWER SYSTEMS INC.
Notes to Consolidated Financial Statements
Years ended December 31, 2023, and 2022
(Tabular amounts expressed in thousands of U.S. dollars, except per share amounts and numbers of shares)
21.     Equity (cont'd):
(d)    Deferred share units:
Deferred share units (“DSUs”) are granted to the board of directors and executives. Eligible directors must elect to receive at least half of their annual retainers and executives may elect to receive all or part of their annual bonuses in DSUs. Each DSU is redeemable for one common share in the capital of the Corporation after the director or executive ceases to provide services to the Corporation. Shares will be issued from the Corporation’s share distribution plan.
Balance DSUs for common shares
At January 1, 2022 756,223 
DSUs granted 80,319 
DSUs exercised (126,862)
At December 31, 2022 709,680 
DSUs granted 93,188 
DSUs exercised (65,499)
At December 31, 2023 737,369 
During 2023, compensation expense of $397,000 (2022 - $529,000) was recorded in net loss relating to 93,188 DSUs (2022 - 80,319) granted during the year.
During 2023, 65,499 DSUs (2022 – 126,862) were exercised, net of applicable taxes, which resulted in the issuance of 31,736 common shares (2022 – 58,990), resulting in an impact on equity of $171,000 (2022 - $753,000).
As at December 31, 2023, 737,369 deferred share units were outstanding (2022 – 709,680).
(e)    Restricted share units:
Restricted share units (“RSUs”) are granted to employees and executives. Each RSU is convertible into one common share. The RSUs vest after a specified number of years from the date of issuance, and under certain circumstances, are contingent on achieving specified performance criteria. A performance factor adjustment is made if there is an over-achievement (or under-achievement) of specified performance criteria, resulting in additional (or fewer) RSUs being converted. Certain RSUs granted in 2023 include an additional market criteria with weighted vesting over three years.
The Corporation has two plans under which RSUs may be granted, the consolidated share distribution plan and the market purchase RSU plan. Awards under the consolidated share distribution plan are satisfied by the issuance of treasury shares on maturity.
Balance RSUs for common shares
At January 1, 2022 966,220 
RSUs granted 567,693 
RSU performance factor adjustment (29,004)
RSUs exercised (460,681)
RSUs forfeited (42,148)
At December 31, 2022 1,002,080 
RSUs granted 2,996,387 
RSUs exercised (279,668)
RSUs forfeited (577,353)
At December 31, 2023 3,141,446 


41

BALLARD POWER SYSTEMS INC.
Notes to Consolidated Financial Statements
Years ended December 31, 2023, and 2022
(Tabular amounts expressed in thousands of U.S. dollars, except per share amounts and numbers of shares)
21.     Equity (cont'd):
(e)    Restricted share units (cont'd):
During 2023, compensation expense of $7,288,000 (2022 - $2,479,000) was recorded in net loss.
During 2023, 2,996,387 RSUs were issued (2022 – 567,693). The fair value of RSU grants is measured based on the stock price of the shares underlying the RSU on the date of grant or by using a complex simulation model, depending on the type of RSU.
During 2023, 279,668 RSUs (2022 – 460,681) were exercised, net of applicable taxes, which resulted in the issuance of 132,745 common shares (2022 – 217,832), resulting in an impact on equity of $585,000 (2022 - $2,466,000).
As at December 31, 2023, 3,141,446 RSUs were outstanding (2022 – 1,002,080).

22.     Commitments and contingencies:
As at December 31, 2023, the Corporation is committed to minimum lease payments (note 19).
Long-term investments include two investments committing the Corporation to be a limited partner in hydrogen infrastructure and growth equity funds (note 14). The Corporation has committed to investing £25,000,000 (including £10,986,000 invested as of December 31, 2023) into HyCap. The Corporation has committed to investing €30,000,000 (including €4,701,000 invested as of December 31, 2023) into Clean H2. Long-term investments also include an investment committing the Corporation to be a limited partner in Templewater, a decarbonization climate technology and growth equity fund. The Corporation has committed to investing $1,000,000 (including $nil invested as of December 31, 2023) in Templewater.

As at December 31, 2023, the Corporation has outstanding commitments aggregating up to a maximum of $22,031,000 relating primarily to purchases of property, plant and equipment.
In connection with the acquisition of intellectual property from UTC in April 2014, the Corporation retains a royalty obligation in certain circumstances to pay UTC a portion of any future intellectual property sale and licensing income generated from certain of the Corporation's intellectual property portfolio for a period of 15 years expiring in April 2029. No royalties were paid to UTC in the years ended December 31, 2023 and December 31, 2022.
The Corporation retains a previous funding obligation to pay royalties of 2% of revenues, to a maximum of $4,613,000 (CDN $5,351,000), on sales of certain fuel cell products for commercial distributed utility applications. As of December 31, 2023, no royalties have been incurred to date for this agreement.
The Corporation also retains a previous funding obligation to pay royalties of 2% of revenues, to a maximum of $1,896,000 (CDN $2,200,000), on sales of certain fuel cell products for commercial transit applications. As of December 31, 2023, no royalties have been incurred to date for this agreement.
In the ordinary course of business or as required by certain acquisition or disposition agreements, the Corporation is periodically required to provide certain indemnities to other parties. As of December 31, 2023, the Corporation has not accrued any significant amount owing, or receivable, due to any indemnity agreements undertaken in the ordinary course of business.

23. Disaggregation of revenue:
The Corporation's operations and main revenue streams are the same as those described in note 4. The Corporation's revenue is derived from contracts with customers.


42

BALLARD POWER SYSTEMS INC.
Notes to Consolidated Financial Statements
Years ended December 31, 2023, and 2022
(Tabular amounts expressed in thousands of U.S. dollars, except per share amounts and numbers of shares)
23. Disaggregation of revenue (cont'd):
In the following table, revenue is disaggregated by geographical market, by market application, and by timing of revenue recognition.
December 31, December 31,
2023 2022
Geographical markets
China $ 11,980  $ 9,127 
Europe 48,958  38,444 
North America 37,736  28,572 
Other 3,694  5,717 
$ 102,368  $ 81,860 
Application
Bus $ 29,265  $ 24,917 
Truck 10,961  11,472 
Rail 19,100  5,106 
Marine 7,331  2,184 
HD Mobility subtotal 66,657  43,679 
Stationary 21,707  18,872 
Emerging Markets and Other 14,004  19,309 
$ 102,368  $ 81,860 
Timing of revenue recognition
Products transferred at a point in time $ 78,769  $ 52,749 
Products and services transferred over time 23,599  29,111 
$ 102,368  $ 81,860 

24. Personnel expenses:
Personnel expenses are included in cost of product and service revenues, research and product development expense, general and administrative expense, sales and marketing expense, and other expense.
December 31, 2023 December 31, 2022
Salaries and employee benefits $ 103,868  $ 92,743 
Share-based compensation (note 21) 10,720  8,939 
$ 114,588  $ 101,682 

25. Other operating expense:
December 31, 2023 December 31, 2022
Net impairment loss on trade receivables $ 1,498  $ 73 
Restructuring and related costs 1,512  482 
Acquisition related costs 773  2,857 
$ 3,783  $ 3,412 
During the year ended December 31, 2023, the Corporation recorded a net impairment loss on trade receivables of $1,498,000 (2022 - $73,000), consisting primarily of various receivables no longer deemed collectible. In the event that the Corporation recovers any amounts previously recorded as impairment losses, the recovered amount will be recognized as a reversal of the impairment loss in the period of recovery.

43

BALLARD POWER SYSTEMS INC.
Notes to Consolidated Financial Statements
Years ended December 31, 2023, and 2022
(Tabular amounts expressed in thousands of U.S. dollars, except per share amounts and numbers of shares)
25. Other operating expense (cont'd):
During the year ended December 31, 2023, total restructuring and related charges of $1,512,000 (2022 - $482,000) relate primarily to certain cost cutting measures and related personnel costs.
Acquisition related costs of $773,000 (2022 - $2,857,000) for the year ended December 31, 2023 consist primarily of other legal, advisory, and transaction related costs incurred due to corporate development activities.

26. Finance income and expense:

2023 2022
Employee future benefit plan expense (note 20) $ (109) $ (189)
Investment income 43,340  19,606 
Mark to market and foreign exchange loss on financial assets (notes 14 & 32) (12,897) (16,877)
Foreign exchange gain (loss) 821  (4,552)
Government levies (100) (100)
Finance income (loss) and other $ 31,055  $ (2,112)
Finance expense $ (1,105) $ (1,265)

27. Impairment charges on property, plant, and equipment:

During the year ended December 31, 2023, the Corporation recognized impairment charges on property, plant, and equipment of $967,000 (2022 - $7,000).
During the year ended December 31, 2023, the Corporation decided to suspend investment in a planned facility in China . As a result of this decision, the Corporation will not be able to recover any costs totalling $936,000 as the plant was still in the design phase and the costs incurred are not directly transferable to any other planned location. Consequently, the Corporation recognized property, plant and equipment impairment charges of $936,000 during the year ended December 31, 2023.

During the year ended December 31, 2023, the Corporation also recorded an impairment loss of $31,000 (2022 - $7,000) for production and test equipment that was never placed in service and was determined not required to support the Corporation's future manufacturing or testing capabilities.

28.     Income taxes:
(a)Current tax expense:
The components of income tax benefit (expense) included in the determination of the profit (loss) from continuing operations comprise of:


44

BALLARD POWER SYSTEMS INC.
Notes to Consolidated Financial Statements
Years ended December 31, 2023, and 2022
(Tabular amounts expressed in thousands of U.S. dollars, except per share amounts and numbers of shares)
28.     Income taxes (cont'd):
(a)Current tax expense (cont'd):
2023 2022
Current tax expense
Current period income tax $ 64  $ 39 
Withholding tax 94 
Total current tax expense $ 158  $ 42 
Deferred tax expense
Origination and reversal of temporary differences $ (45,050) $ (12,264)
Adjustments for prior periods 2,174  277 
Change in unrecognized deductible temporary differences 42,876  11,987 
Total deferred tax expense $ —  $ — 
Total income tax expense from continuing operations $ 158  $ 42 
The Corporation’s effective income tax rate differs from the combined Canadian federal and provincial statutory income tax rate for companies. The principal factors causing the difference are as follows:
2023 2022
Net loss before income taxes (from continuing operations) $ (144,052) $ (160,329)
Expected tax recovery at 27.00% (2022 – 27.00% )
$ (38,894) $ (43,289)
Increase (reduction) in income taxes resulting from:
Non-deductible expenses (non-taxable income) (993) 12,712 
Expiry of losses and ITC 96  1,515 
Investment tax credits earned (4,009) (3,782)
Foreign tax rate and tax rate differences 4,165  4,636 
Change in unrecognized deductible temporary differences 39,674  28,247 
Other 119 
Income taxes from continuing operations $ 158  $ 42 
(b)    Unrecognized deferred tax asset:
At December 31, 2023, the Corporation did not recognize any deferred tax assets resulting from the following deductible temporary differences for financial statement and income tax purposes.
2023 2022
Scientific research expenditures $ 143,663  $ 127,482 
Investments 36,315  21,463 
Share issuance costs 14,145  23,588 
Losses from operations carried forward 394,599  284,468 
Capital losses carried forward 10,703  — 
Investment tax credits 46,810  43,451 
Property, plant and equipment and intangible assets 221,365  208,991 
$ 867,600  $ 709,443 
Deferred tax assets have not been recognized in respect of these deductible temporary differences because it is not currently probable that future taxable profit will be available against which the Corporation can utilize the benefits.


45

BALLARD POWER SYSTEMS INC.
Notes to Consolidated Financial Statements
Years ended December 31, 2023, and 2022
(Tabular amounts expressed in thousands of U.S. dollars, except per share amounts and numbers of shares)
28.     Income taxes (cont'd):
(b)    Unrecognized deferred tax asset (cont'd):
The Corporation has available to carry forward the following as at December 31:
2023 2022
Canadian scientific research expenditures $ 143,663  $ 127,482 
Canadian losses from operations 262,887  165,647 
Canadian capital losses from operations 12,958  — 
Canadian investment tax credits 46,810  40,877 
German losses from operations for corporate tax purposes 46  501 
US federal losses from operations 46,784  49,237 
Denmark losses from operations 65,786  50,495 
Hong Kong losses from operations 116  61 
UK losses from operations 13,085  14,304 
UK research and development tax credits 122  115 
The Canadian scientific research expenditures may be carried forward indefinitely. The Canadian losses from operations may be used to offset future Canadian taxable income and expire over the period from 2033 to 2043.
The German, Hong Kong, Denmark and UK losses from operations may be used to offset future taxable income in Germany, Hong Kong, Denmark and UK for corporate tax and trade tax purposes and may be carried forward indefinitely.
The US federal losses from operations incurred prior to January 1, 2018 may be used to offset future US taxable income and expire over the period from 2023 to 2037 and may be carried forward indefinitely for losses incurred after January 1, 2018.
The Canadian investment tax credits may be used to offset future Canadian income taxes otherwise payable and expire over the period from 2023 to 2043. The UK scientific research and development tax credits may be carried forward indefinitely.

29.    Related party transactions:
Related parties include shareholders with a significant ownership interest in the Corporation, including its subsidiaries and affiliates, and the Corporation’s equity accounted investees: Weichai Ballard JV and Synergy Ballard JVCo (note 13).
For the year ended December 31, 2023 and 2022, related party transactions and balances with the Corporation's 49% owned equity accounted investee, Weichai Ballard JV, were as follows:
Balances with related party - Weichai Ballard JV 2023 2022
Trade and other receivables $ 13,697  $ 13,320 
Investments 13,901  24,026 
Deferred revenue 1,904  2,095 
Transactions during the year with related party - Weichai Ballard JV 2023 2022
Revenues $ 8,099  $ 8,115 
Cost of goods sold and operating expense 1,996  3,225 


46

BALLARD POWER SYSTEMS INC.
Notes to Consolidated Financial Statements
Years ended December 31, 2023, and 2022
(Tabular amounts expressed in thousands of U.S. dollars, except per share amounts and numbers of shares)
29.    Related party transactions (cont'd):
On completion of an Equity Transfer Agreement in October 2023, the Corporation disposed of its 10% investment in Synergy Ballard JVCo valued at $nil as of December 31, 2023.
Corporation Directors and Executive Officers
The Corporation provides key management personnel, being board directors and executive officers, certain benefits, in addition to their salaries. Key management personnel also participate in the Corporation’s share-based compensation plans (note 21).
In addition to cash and equity compensation, the Corporation provides the executive officers with certain personal benefits, including car allowance, medical benefit program, long and short-term disability coverage, life insurance and an annual medical, financial planning allowance and relocation allowances and services as necessary.
The employment agreements for the executive officers are substantially the same with slight variations by individual. The maximum obligation that is required to be provided in the event of termination is notice of 12 months plus one month for every year of employment completed with the Corporation (to a maximum of 24 months), or payment in lieu of such notice, consisting of the salary, bonus and other benefits that would have been earned during such notice period. If there is a change of control, and if the executive officer’s employment is terminated, including a constructive dismissal, within 2 years following the date of a change of control, the executive officer is entitled to a payment equivalent to payment in lieu of a 24 month notice period. The minimum obligation that is required is limited to that required by employment standards legislation plus one day for every full month of employment since hire date, with no distinction made for a change of control situation.
Key management personnel compensation is comprised of:
2023 2022
Salaries and employee benefits $ 3,817  $ 3,416 
Post-employment retirement benefits 65  61 
Termination benefits —  247 
Share-based compensation (note 21) 2,622  1,793 
$ 6,504  $ 5,517 

30. Supplemental disclosure of cash flow information:

Non-cash financing and investing activities: 2023 2022
Compensatory shares $ 1,688  $ 1,029 

31.    Operating segments:
The Corporation operates in a single segment, Fuel Cell Products and Services, which consists of the design, development, manufacture, sale and service of PEM fuel cell products for a variety of applications, focusing on power products for bus, truck, rail, marine, stationary and emerging market (material handling, off-road and other) applications, as well as the delivery of services, including technology solutions, after sales services and training.
In 2023, revenues included sales to one individual customer of $10,882,000 which exceeded 10% of total revenue. In 2022, revenues included sales to two individual customers of $9,426,000 and $8,115,000, respectively, which exceeded 10% of total revenue.


47

BALLARD POWER SYSTEMS INC.
Notes to Consolidated Financial Statements
Years ended December 31, 2023, and 2022
(Tabular amounts expressed in thousands of U.S. dollars, except per share amounts and numbers of shares)
31.    Operating segments (cont'd):
Revenues from continuing operations by geographic area, which are attributed to countries based on customer location for the years ended December 31, are as follows:
Revenues 2023 2022
United States $ 25,702  $ 24,052 
Germany 14,490  13,685 
Canada 12,034  4,520 
China 11,980  9,127 
Poland 11,262  1,769 
United Kingdom 8,178  7,967 
Netherlands 4,812  103
France 3,307  6,903 
Denmark 2,240  2,529 
Belgium 2,089  3,430 
India 2,034  656 
Taiwan 1,381  640 
Spain 857  763 
Norway 779  591 
Australia 51  3,711 
Japan 76  541 
Other countries 1,096  873 
$ 102,368  $ 81,860 
Non-current assets by geographic area are as follows:
December 31, December 31,
Non-current assets 2023 2022
Canada $ 186,109  $ 180,421 
China 13,916  24,047 
United States 8,600  6,791 
Denmark 4,176  4,398 
United Kingdom —  2,913 
$ 212,801  $ 218,570 

32.    Financial instruments:
(a)Fair value:
The Corporation’s financial instruments consist of cash and cash equivalents, short-term investments, trade and other receivables, long-term financial investments, and trade and other payables. The fair values of cash and cash equivalents, trade and other receivables, and trade and other payables approximate their carrying values because of the short-term nature of these instruments.
Short-term investments comprise term deposits with terms of greater than 90 days and a previously held investment in a Danish public company held by Ballard Power Systems Europe ("BPSE"). During the year ended December 31, 2022, the Corporation sold its remaining Green Hydrogen shares for net proceeds of $1,010,000.


48

BALLARD POWER SYSTEMS INC.
Notes to Consolidated Financial Statements
Years ended December 31, 2023, and 2022
(Tabular amounts expressed in thousands of U.S. dollars, except per share amounts and numbers of shares)
32.    Financial instruments (cont'd):
(a)Fair value (cont'd):
Long-term financial investments (note 14) comprise newly-created hydrogen infrastructure and growth equity funds: HyCap Fund and Clean H2 Fund, and an investment in Forsee Power, Wisdom Motor, and Quantron AG, as well as equity-accounted investments. Changes in fair value and foreign exchange adjustments are recognized as gains or losses in the consolidated statements of loss and comprehensive income (loss) and included in finance loss and other (note 26). During the year ended December 31, 2023, the Corporation recognized net mark to market and foreign exchange losses of $12,897,000 (2022 - $16,877,000).
Increase (decrease) in fair value due to MTM and foreign exchange December 31, 2023 December 31, 2022
Short-term investment - Green Hydrogen $ —  $ 15 
Long-term investment - Forsee Power (3,501) (14,865)
Long-term investment - Wisdom Motor (4,900) — 
Long-term investment - Quantron AG (4,237) 150 
Long-term investment - HyCap Fund 214  (1,597)
Long-term investment - Clean H2 Fund (473) (580)
Decrease in fair value of investments $ (12,897) $ (16,877)
Fair value measurements recognized in the statement of financial position must be categorized in accordance with the following levels:
(i)    Level 1: Quoted prices (unadjusted) in active markets for identical assets or liabilities;
(ii)    Level 2: Inputs other than quoted prices included in Level 1 that are observable for the asset or liability,     either directly (i.e. as prices) or indirectly (i.e. derived from prices);
(iii)    Level 3: Inputs for the asset or liability that are not based on observable market data (unobservable inputs).
The Corporation's above-mentioned investment in Forsee Power is categorized as Level 1 whereas the other investments are all categorized as Level 3.
(b)    Financial risk management:
The Corporation primarily has exposure to foreign currency exchange rate risk, commodity risk, interest rate risk, and credit risk.
Foreign currency exchange rate risk
Foreign currency exchange rate risk is the risk that the fair value of deferred cash flows of a financial instrument will fluctuate because of changes in foreign exchange rates. The Corporation is exposed to currency risks primarily due to its holdings of Canadian dollar denominated cash equivalents and its Canadian dollar denominated purchases and accounts payable. Substantially all receivables are denominated in U.S. dollars.
Periodically, the Corporation uses foreign exchange currency contracts to manage exposure to currency rate fluctuations. These contracts are recorded at their fair value as either assets or liabilities on the statement of financial position. Any changes in fair value are either (i) recorded in the statement of comprehensive income (loss) if formally designated and qualified under hedge accounting criteria; or (ii) recorded in the statements of loss and comprehensive income (loss) if either not designated, or not qualified, under hedge accounting criteria.The outstanding foreign exchange currency contracts are not qualified under hedge accounting.


49

BALLARD POWER SYSTEMS INC.
Notes to Consolidated Financial Statements
Years ended December 31, 2023, and 2022
(Tabular amounts expressed in thousands of U.S. dollars, except per share amounts and numbers of shares)
32.    Financial instruments (cont'd):
(b)    Financial risk management (cont'd):
Foreign currency exchange rate risk (cont'd)
The Corporation limits its exposure to foreign currency risk by holding Canadian denominated cash and cash equivalents in amounts up to 100% of forecasted twelve month Canadian dollar net expenditures and up to 50% of the following twelve months of forecasted Canadian dollar net expenditures, thereby creating an economic hedge. Periodically, the Corporation also enters into forward foreign exchange contracts to further limit its exposure. At December 31, 2023, the Corporation held Canadian dollar denominated cash and cash equivalents of CDN $64,383,000 and outstanding forward foreign exchange contracts to buy a total of CDN $31,500,000 in 2023 at an average rate of CDN $1.35 to US $1.00.
The following exchange rates applied during the year ended December 31, 2023:
$US to $1.00 CDN $CDN to $1.00 US
January 1, 2023 Opening rate $0.784 $1.354
December 31, 2023 Closing rate $0.755 $1.325
Fiscal 2023 Average rate $0.741 $1.350
Based on cash and cash equivalents and forward foreign exchange contracts held at December 31, 2023, a 10% increase in the Canadian dollar against the U.S. dollar, with all other variables held constant, would result in an increase in foreign exchange gains of approximately $7,236,000 recorded against net income.
If the Canadian dollar weakened 10% against the US dollar, there would be an equal, and opposite impact, on net income. This sensitivity analysis includes foreign currency denominated monetary items, and adjusts their translation at year-end, for a 10% change in foreign currency rates.
Commodity risk
Commodity risk is the risk of financial loss due to fluctuations in commodity prices, in particular, for the price of platinum and palladium, which are key components of the Corporation’s fuel cell products. Platinum and palladium are scarce natural resources and therefore the Corporation is dependent upon a sufficient supply of these commodities. To manage its exposure to commodity price fluctuations, the Corporation may include platinum and or palladium pricing adjustments directly into certain significant customer contracts.
Interest rate risk
Interest rate risk is the risk that the fair value of deferred cash flows of a financial instrument will fluctuate because of changes in market interest rates. The Corporation is exposed to interest rate risk arising primarily from fluctuations in interest rates on its cash and cash equivalents. The Corporation limits its exposure to interest rate risk by continually monitoring and adjusting portfolio duration to align to forecasted cash requirements and anticipated changes in interest rates.
Based on cash and cash equivalents at December 31, 2023, a 1.0% decline in interest rates, with all other variables held constant, would result in a decrease in investment income of $7,511,000. If interest rates had been 1.0% higher, there would be an equal and opposite impact on net income.
Credit risk
Credit risk is the risk of financial loss to the Corporation if a customer or counterparty to a financial instrument fails to meet its contractual obligations, and arises principally from the Corporation’s receivables from customers.


50

BALLARD POWER SYSTEMS INC.
Notes to Consolidated Financial Statements
Years ended December 31, 2023, and 2022
(Tabular amounts expressed in thousands of U.S. dollars, except per share amounts and numbers of shares)
32.    Financial instruments (cont'd):
(b)    Financial risk management (cont'd):
Credit risk (cont'd)
IFRS 9 Financial Instruments requires impairment losses to be recognized based on “expected losses” that will occur in the future, incorporating forward looking information relating to defaults and applies a single ECL impairment model that applies to all financial assets within scope. ECLs are a probability-weighted estimate of credit losses. Credit losses are measured as the present value of all cash shortfalls (i.e. the difference between the cash flows due to the Corporation in accordance with the contract and the cash flows that the Corporation expects to receive). Under IFRS 9, at each reporting date the Corporation is required to assess whether financial assets carried at amortized cost are credit-impaired.
As a result of this review for the year ended December 31, 2023, the Corporation did not recognize any additional estimated ECL impairment losses.

51
EX-99.2 4 bldp123123-ex992mda.htm EX-99.2 Document

image.jpg
image_21.jpg Page 1 of 49


CAUTION REGARDING FORWARD-LOOKING STATEMENTS
This document contains forward-looking statements about expected events and the financial and operating performance of Ballard Power Systems Inc. (“Ballard”, “the Company”, “we”, “us” or “our”). Forward-looking statements include any statements that do not refer to historical facts. Forward-looking statements are based on the beliefs of management and reflect our current expectations as contemplated under the safe harbor provisions of Section 21E of the United States Securities Exchange Act of 1934, as amended. Words such as "estimate", "project", "believe", "anticipate", "intend", "expect", "plan", "predict", "may", "should", "will", the negatives of these words or other variations thereof and comparable terminology are intended to identify forward-looking statements. Such statements include, but are not limited to, statements with respect to our objectives, goals, liquidity, sources and uses of capital, including statements that describe any anticipated offering of securities under our Shelf Prospectus and Registration Statement or the filing of a Prospectus supplement, outlook including our estimated revenue and gross margins, cash flow from operations, Cash Operating Costs, EBITDA and Adjusted EBITDA (see Non-GAAP measures), strategy, order backlog, order book of expected deliveries, future product roadmap costs and selling prices, future product sales, future production capacities and volumes, the markets for our products, expenses / costs, contributions and cash requirements to and from joint venture operations and research and development activities, as well as statements with respect to our beliefs, plans, objectives, expectations, anticipations, estimates and intentions. These statements are not guarantees of future performance and involve assumptions, risks and uncertainties that are difficult to predict. In particular, these forward-looking statements are based on certain factors and assumptions relating to our expectations with respect to new and existing customer and partner relationships, the generation of new sales, producing, delivering, and selling the expected product and service volumes at the expected prices and controlling our costs. They are also based on a variety of general factors and assumptions including, but not limited to, our expectations regarding technology and product development efforts, manufacturing capacity and cost, product and service pricing, market demand, and the availability and prices of raw materials, labour, and supplies. These assumptions have been derived from information available to the Company including information obtained by the Company from third parties. These assumptions may prove to be incorrect in whole or in part. In addition, actual results may differ materially from those expressed, implied, or forecasted in such forward-looking statements. Factors that could cause our actual results or outcomes to differ materially from the results expressed, implied or forecasted in such forward-looking statements include, but are not limited to: challenges or delays in our technology and product development activities; changes in the availability or price of raw materials, labour, supplies and shipping; costs of integration, and the integration failing to achieve the expected benefits of the transaction; our ability to attract and retain business partners, suppliers, employees and customers; our ability to extract value from joint venture operations; global economic trends and geopolitical risks (such as conflicts in Ukraine and the Middle East), including changes in the rates of investment, inflation or economic growth in our key markets, or an escalation of trade tensions such as those between the U.S. and China; investment in hydrogen fueling infrastructure and competitive pricing of hydrogen fuel; the relative strength of the value proposition that we offer our customers with our products or services; changes in competitive technologies, including internal combustion engine, battery and fuel cell technologies; challenges or delays in our technology and product development activities; changes in our customers’ requirements, the competitive environment and/or related market conditions; product safety, liability or warranty issues; warranty claims, product performance guarantees, or indemnification claims; changes in product or service pricing or cost; market developments or customer actions that may affect levels of demand and/or the financial performance of the major industries, regions and customers we serve, such as secular, cyclical and competitive pressures in the bus, truck, rail, marine and stationary sectors; the rate of mass adoption of our products or related ecosystem, including the availability of cost-effective hydrogen; cybersecurity threats; our ability to protect our intellectual property; climate risk; changing government or environmental regulations, including subsidies or incentives associated with the adoption of clean energy products, including hydrogen and fuel cells; currency fluctuations, including the magnitude of the rate of change of the Canadian dollar versus the U.S. dollar; our access to funding and our ability to provide the capital required for product development, operations and marketing efforts, working capital requirements, and joint venture capital contributions; changes in U.S. tax laws and tax status related to “passive foreign investment company” designation; the severity, magnitude and duration of the on-going COVID-19 pandemic, including impacts of the pandemic and of businesses’ and governments’ responses to the pandemic on our operations, personnel and joint venture operations, and on commercial activity and demand across our and our customers’, partners’ and joint venture businesses, and on global supply chains; potential merger and acquisition activities, including risks related to integration, loss of key personnel and disruptions to operations; and the general assumption that none of the risks identified in the Risks and Uncertainties section of this document or in our most recent Annual Information Form will materialize. Readers should not place undue reliance on Ballard's forward-looking statements. The forward-looking statements contained in this document speak only as of the date of this Management Discussion and Analysis (“MD&A”). Except as required by applicable legislation, Ballard does not undertake any obligation to release publicly any updates or revisions to these forward-looking statements to reflect events or circumstances after the date of this MD&A including the occurrence of unanticipated events.
image_21.jpg Page 2 of 49


MANAGEMENT’S DISCUSSION AND ANALYSIS
March 8, 2024
Section Description
1.     Introduction
 1.1 Preparation of the MD&A
 1.2 Management’s Report on Disclosure Controls and Procedures and Internal Controls over Financial Reporting
 1.3 Risks and Uncertainties
 2. Core Strategy and Business
2.1 Core Business
2.2 Strategic Imperatives
 3.    Select Annual Financial Information
and 2024 Business Outlook
3.1 Select Annual Financial Information
 3.2 2023 Performance Compared to 2023 Business Outlook
 3.3 2024 Business Outlook
4.    Recent Developments
(Including Contractual Updates)
4.1 Corporate
4.2 Europe
4.3 North America and Rest of World
4.4 China
5.    Results of Operations
5.1 Operating Segments
5.2 Summary of Key Financial Metrics –
Three months ended December 31, 2023
5.3 Summary of Key Financial Metrics –
Year ended December 31, 2023
5.4 Operating Expenses and Other Items –
Three months and year ended December 31, 2023
5.5 Summary of Quarterly Results
6.    Cash Flow, Liquidity and Capital
              Resources
6.1 Summary of Cash Flows
6.2 Cash Provided by (Used by) Operating Activities
6.3 Cash Provided by (Used by) Investing Activities
6.4 Cash Provided by (Used by) Financing Activities
6.5 Liquidity and Capital Resources
7.    Other Financial Matters
7.1 Off Balance Sheet Arrangements and Contractual Obligations
7.2 Related Party Transactions
7.3 Outstanding Share and Equity Information
8.    Use of Proceeds
8.1 Reconciliation of Use of Proceeds from Previous Financings
9.    Accounting Matters
9.1 Overview
9.2 Critical Judgments in Applying Accounting Policies
9.3 Key Sources of Estimation Uncertainty
9.4 Recently Adopted Accounting Policy Changes
9.5 Future Accounting Policy Changes
10.    Supplemental Non-GAAP Measures
            and Reconciliations
10.1 Overview
10.2 Cash Operating Costs
10.3 EBITDA and Adjusted EBITDA

image_21.jpg Page 3 of 49


1. INTRODUCTION
1.1 Preparation of the MD&A
This discussion and analysis of financial condition and results of operations of Ballard Power Systems Inc. (“Ballard”, “the Company”, “we”, “us” or “our”) is prepared as of March 8, 2024 and should be read in conjunction with our audited consolidated financial statements and accompanying notes for the year ended December 31, 2023. The results reported herein are presented in U.S. dollars unless otherwise stated and have been prepared in accordance with International Financial Reporting Standards (“IFRS”) as issued by the International Accounting Standards Board. Additional information relating to the Company, including our Annual Information Form, is filed with Canadian (www.sedarplus.ca) and U.S. securities regulatory authorities (www.sec.gov) and is also available on our website at www.ballard.com.
1.2 Management’s Report on Disclosure Controls and Procedures and Internal Controls over Financial Reporting
Disclosure controls and procedures
Our disclosure controls and procedures are designed to provide reasonable assurance that relevant information is gathered and reported to senior management, including the Chief Executive Officer (“CEO”) and the Chief Financial Officer (“CFO”), on a timely basis so that appropriate decisions can be made regarding public disclosures.
As of the end of the period covered by this report, we evaluated, under the supervision and with the participation of management, including the CEO and the CFO, the effectiveness of the design and operation of our disclosure controls and procedures, as defined in Rules 13a–15(e) and 15d-15(e) of the Securities Exchange Act of 1934 (“Exchange Act”). The CEO and CFO have concluded that as of December 31, 2023, our disclosure controls and procedures were effective to ensure that information required to be disclosed in reports we file or submit under the Exchange Act is recorded, processed, summarized, and reported within the time periods specified therein, and accumulated and reported to management to allow timely discussions regarding required disclosure.
Internal control over financial reporting
The CEO and CFO, together with other members of management, are responsible for establishing and maintaining adequate internal control over the Company’s financial reporting. Internal control over financial reporting is designed under our supervision, and overseen by the Company’s board of directors, management, and other personnel, to provide reasonable assurance regarding the reliability of financial reporting and the preparation of financial statements for external purposes in accordance with IFRS.
There are inherent limitations in the effectiveness of internal control over financial reporting, including the possibility that misstatements may not be prevented or detected. Accordingly, even effective internal controls over financial reporting can provide only reasonable assurance with respect to financial statement preparation. Furthermore, the effectiveness of internal controls can change with circumstances.
Management, including the CEO and CFO, have evaluated the effectiveness of internal control over financial reporting, as defined in Rules 13a–15(f) of the Exchange Act, in relation to criteria described in Internal Control–Integrated Framework (2013) issued by the Committee of Sponsoring Organizations of the Treadway Commission (“COSO”).
image_21.jpg Page 4 of 49


Based on this evaluation, management has determined that internal control over financial reporting was effective as of December 31, 2023.
KPMG LLP, our independent registered public accounting firm, has audited our consolidated financial statements and expressed an unqualified opinion thereon. KPMG LLP has also expressed an unqualified opinion on the effectiveness of our internal control over financial reporting as of December 31, 2023.
Changes in internal control over financial reporting
During the year ended December 31, 2023, there were no changes in internal control over financial reporting that have materially affected, or are reasonably likely to materially affect, the Company’s internal control over financial reporting. Our design of disclosure controls and procedures and internal controls over financial reporting includes controls, policies and procedures covering our subsidiaries including Ballard Power Systems Europe A/S, Ballard Fuel Cell Systems Inc., and Guangzhou Ballard Power Systems Co., Ltd.
1.3 Risks and Uncertainties
An investment in our common shares involves risk. Investors should carefully consider the risks and uncertainties described below and in our Annual Information Form. The risks and uncertainties described in our Annual Information Form are not the only ones that we face. Additional risks and uncertainties, including those that we do not know about now or that we currently deem immaterial, may also adversely affect our business. For a more complete discussion of the risks and uncertainties which apply to our business and our operating results, please see our Annual Information Form and other filings with Canadian (www.sedarplus.ca) and U.S. (www.sec.gov) securities regulatory authorities.
A summary of our identified risks and uncertainties are as follows:
•We may not be able to successfully execute our business plan.
•We depend on a limited number of customers for the majority of our revenues and are subject to risks associated with early-stage market activities related to fuel cell bus, truck, rail, marine and stationary applications.
•We are dependent on third party suppliers for the supply of key materials and components for our products and services and may be subject to supply chain disruption.
•We are dependent upon Original Equipment Manufacturers and Systems Integrators to purchase certain of our products.
•In China, a significant amount of operations are conducted by a joint venture that we do not control. In addition, we provide most of our technology solutions services to that joint venture.
•We have limited experience manufacturing fuel cell products on a commercial basis and our experience has been limited to relatively low production volumes.
•We are subject to risks inherent in international operations, including restrictions on the conversion of currencies and restrictions on repatriation of funds, including out of China.
image_21.jpg Page 5 of 49


•Certain of our customer supply agreements are subject to certain conditions or risks, including achievement of certain product performance milestones, completion of product development programs, or customer cancellation provisions.
•Public policy and regulatory changes, including regulations relating to perfluoroalkyl and polyfluoroalkyl substances (“PFAS”) used in our products, could hurt the market for our products and services.
•Global macro-economic conditions are beyond our control and may have an adverse impact on our business, our joint venture, our key suppliers, and/or customers, and our ability to raise capital.
•Adequate investment in hydrogen fueling infrastructure and competitive pricing of hydrogen fuel is beyond our control.
•Geopolitical conditions are beyond our control and may have an adverse impact on our business, our joint venture, our key suppliers, and/or customers.
•We currently face inflationary pressures.
•We currently face and will continue to face significant competition, and many current and future competitors may have significantly more resources.
•We could be adversely affected by risks associated with capital investments and new business processes.
•Our technology and products may not meet the market requirements, including requirements relating to performance, integration and / or cost.
•We may not be able to sell our products on a commercially viable basis on the timetable we anticipate, or at all.
•We could lose or fail to attract the personnel necessary to operate our business.
•Warranty claims, product performance guarantees, or indemnification claims could negatively impact our gross margins and financial performance.
•We expect our cash reserves will be reduced due to future operating losses, working capital requirements, capital expenditures, and potential acquisitions and other investments by our business, including in certain hydrogen infrastructure and growth equity funds, and we cannot provide certainty as to how long our cash reserves will last or that we will be able to access additional capital when necessary.
•Potential fluctuations in our financial and business results make forecasting difficult and may restrict our access to funding for our commercialization plan.
•A mass market for our products may never develop or may take longer to develop than we anticipate.
•We may experience cybersecurity threats to our information technology infrastructure and systems, and unauthorized attempts to gain access to our proprietary or confidential information, as may our customers, suppliers and/or partners.
•We depend on our intellectual property, and our failure to protect that intellectual property could adversely affect our expected future growth and success.
image_21.jpg Page 6 of 49


•Climate change risks may adversely affect our operations, or the operations of our suppliers, customers and/or partners.
•Regulatory agencies could require us to modify or terminate existing investments, acquisitions or joint ventures and could delay or prevent future opportunities.
•Additional issuance of securities by Ballard may dilute existing securityholders, reduce some or all of Ballard’s financial measures on a per share basis, reduce the trading price of the Common Shares or other Ballard securities or impede Ballard’s ability to raise future capital.
•Proposed legislation in the U.S. Congress, including changes in U.S. tax law, and the Inflation Reduction Act of 2022 may adversely impact Ballard and the value of common shares.
•Exchange rate fluctuations are beyond our control and may have a material adverse effect on our business, operating results, financial condition and profitability.
•Commodity price fluctuations are beyond our control and may have a material adverse effect on our business, operating results, financial condition and profitability.
•Our products use flammable fuels and some generate high voltages, which could subject our business to product safety, product liability or other claims.
•We could be liable for environmental damages resulting from our research, development or manufacturing operations.
•Ballard believes that it was a “passive foreign investment company” (“PFIC”) for our most recently completed tax year, which may have adverse U.S. federal income tax consequences for U.S. Holders.
•Emerging diseases, like COVID-19, may adversely affect our operations (including our joint venture in China), our suppliers, our customers and/or partners.
•We could be adversely affected by risks associated with mergers and acquisitions.
2. CORE BUSINESS AND STRATEGY
2.1 Core Business
At Ballard, our vision is to deliver fuel cell power for a sustainable planet. We are recognized as a world leader in proton exchange membrane (“PEM”) fuel cell power system development and commercialization.
Our principal business is the design, development, manufacture, sale and service of PEM fuel cell products for a variety of applications, focusing on power products for bus, truck, rail, marine, stationary and emerging market (material handling, off-road and other) applications, as well as the delivery of services, including technology solutions, after sales services and training.
A fuel cell is an environmentally clean electrochemical device that combines hydrogen fuel with oxygen (from the air) to produce electricity. The hydrogen fuel can be obtained from natural gas, kerosene, methanol, ammonia, or other hydrocarbon fuels, or from water through electrolysis. Ballard’s PEM fuel cell products are typically designed to feature high fuel efficiency, relatively low operating temperature, high durability, low noise and vibration, compact size, quick response to changes in electrical demand, and modular design. Embedded in each Ballard fuel cell product lies a stack of unit cells designed with our proprietary PEM fuel cell technology.
image_21.jpg Page 7 of 49


This technology includes membrane electrode assemblies, catalysts, plates, and other key components, and draw on intellectual property from our patent portfolio, together with our extensive experience and know-how, in key areas of PEM fuel cell stack design, operation, production processes and systems integration.
We are based in Canada, with head office, research, technology and product development, engineering services, testing, manufacturing and after-sale service facilities in Burnaby, British Columbia. We also have sales, assembly, research and development, certain engineering services and after-sale service facilities in Hobro, Denmark, a module assembly facility in Bend, Oregon, and a sales, quality, supply chain, and after-sales service office in Guangzhou, Guangdong Province, China.
We also have a non-controlling, 49% interest in Weichai Ballard Hy-Energy Technologies Co., Ltd. (“Weichai Ballard JV”), located in Weifang, Shandong Province, China. Weichai Ballard JV’s business is to manufacture certain fuel cell products utilizing Ballard’s LCS fuel cell stack and LCS-based power modules for bus, commercial truck, and forklift applications with certain exclusive rights in China.
Furthermore, we have certain non-controlling and non-equity accounted investments: (i) a 3% equity interest in Quantron AG (“Quantron”), a global electric vehicle integrator and an emerging specialty OEM, to accelerate fuel cell truck adoption; (ii) a 6.7% equity interest in Wisdom Group Holdings Ltd. (“Wisdom”), a Cayman Island holding company with operating subsidiaries whose business includes the design and manufacture of vehicles, including zero emission fuel cell electric buses, trucks, and battery-electric vehicles; and (iii) a 7.3% equity interest in Forsee Power SA (“Forsee Power”), a French company specializing in the design, development, manufacture, commercialization, and financing of smart battery systems for sustainable electric transport. We have also invested in two hydrogen infrastructure and growth equity funds: (i) a 10.4% interest in the HyCap Fund I SCSP (“HyCap”), a special limited partnership registered in Luxembourg; and (ii) a 1.5% interest in Clean H2 Infra Fund (“Clean H2”), a special limited partnership registered in France. During the first quarter of 2024, we invested in a decarbonization and climate technology and growth equity fund by acquiring a 2% interest in Templewater Decarbonization I, L.P., a limited partnership registered in Cayman Islands, for an initial investment of $0.5 million on a total commitment of $1.0 million.
2.2Strategic Imperatives
We strive to build value for our shareholders by developing, manufacturing, selling, and servicing zero-emission, industry-leading PEM fuel cell technology products and services to meet the needs of our customers in target markets. More specifically, our business plan is to leverage our core competencies of PEM fuel cell stack technology and engine development and manufacturing, our investments in advanced manufacturing and production capacity, and our product portfolio by marketing our products and services across select large and attractive addressable market applications and select geographic regions.
We typically select our target market applications based on use cases where the comparative user value proposition for PEM fuel cells powered by hydrogen are strongest – such as where operators value low emission vehicles that require high utilization, long driving range, heavy payload, fast refueling, and similar user experiences to legacy diesel vehicles – and where the barriers to entry for hydrogen refueling infrastructure are lowest – such as use cases where fuel cell vehicles typically return to a depot or hydrogen hub for centralized refueling and don’t require a distributed hydrogen refueling network.
image_21.jpg Page 8 of 49


Our current target markets include certain medium- and heavy-duty mobility applications for bus, truck, rail, and marine, along with certain off-road mobility and stationary power applications.
We select our target geographic markets based on a variety of factors, including addressable market sizes of the target market applications in the geographic markets, historic deployments and expected market adoption rates for hydrogen and fuel cells, supportive government policies, existing and potential partner, customer, and end user relationships, and competitive dynamics. Our current target markets are the geographic regions of Europe, North America, and China.
While we recognize addressing multiple market applications and geographic markets in parallel increases our near-term cost structure and investments, we believe offering the same core PEM fuel cell technologies and substantially similar derivative PEM fuel cell products across multiple mobility and power market applications and select geographic regions will significantly expand and strengthen our long-term business prospects by increasing volume scaling in our operations, enabling lower product and production costs for the benefit of all markets, improving our competitive positioning and market share, enabling richly diversified revenue streams and profit pools, and improving our return on investment in our technology and product development programs and our investments in manufacturing.
Our strategy is built on four key themes:
•Double down in the fuel cell stack & module: invest in leading PEM fuel cell technology and products to provide leading value to our customers and end users on a total cost of ownership basis;
•Accelerate market development: deepen and create new partnerships to accelerate hydrogen and fuel cell market adoption and grow volumes for product sales;
•Win in key regions: prioritize investments in North America and Europe, and monitor China before materially deepening our investment in China; and
•Here for Life: deliver a compelling environmental, social and governance (“ESG”) proposition for our stakeholders.
In 2020 and 2021, we materially strengthened our financial position through equity financings, thereby providing additional flexibility to fund our growth strategy. Following these financings, given strong indicators of long-term market adoption of hydrogen and zero-emission mobility, given growing customer interest in our fuel cell products, given a growing opportunity set, and given an increasingly competitive environment, we strategically decided to significantly increase and accelerate our investments ahead of the adoption curve. As a result, over the past three years, we increased and accelerated our investments in technology and product innovation, product cost reduction, production capacity expansion and localization, strategic pricing for select customer demonstration programs, and customer experience. Our increased investments include: next generation products and technology, including our proprietary membrane electrode assemblies (“MEAs”), bipolar plates, stacks, and modules; advanced manufacturing processes, technologies, equipment, and production capacity expansion activities primarily in Canada, Europe and the United States; and technology and product cost reduction.
image_21.jpg Page 9 of 49


Given challenging and dynamic macroeconomic and geopolitical conditions, given continued delays in hydrogen and fuel cell market adoption, and given changes in investor sentiment towards pre-profitability clean energy companies with long-duration investment horizons, we sharpened our focus in 2023 to protect our balance sheet. While we continue to invest against our long-term strategy, we rationalized our product portfolio, reduced the number of active product development programs, dropped new corporate development investments, and discontinued certain legacy products and non-core activities, including Ballard Motive Solutions in the U.K. We also suspended our proposed $130 million investment for the localization of a new MEA production facility in China.
3. SELECT ANNUAL FINANCIAL INFORMATION AND 2024 BUSINESS OUTLOOK
3.1 Select Annual Financial Information
Results of Operations Year ended,
(Expressed in thousands of U.S. dollars, except per share amounts and gross margin %) 2023
2022
2021
Revenues $    102,368 $    81,860 $    104,367
Gross margin $    (21,831) $    (13,308) $    14,066
Gross margin % (21%) (16%) 13%
Total Operating Expenses $    141,073 $    132,020 $    100,731
Cash Operating Costs (1)
$    119,327 $    111,992 $    82,630
Adjusted EBITDA (1)
$    (150,088) $    (132,635) $    (80,981)
Net loss from continuing operations $    (144,210) $    (160,371) $    (113,282)
Net loss from continuing operations per share $    (0.48) $    (0.54) $    (0.38)
Financial Position
At December 31,
(expressed in thousands of U.S. dollars) 2023
2022
2021
Total assets $    1,077,542 $    1,247,077 $    1,440,943
Total non-current liabilities $    15,740 $    14,998 $    29,567
Cash, cash equivalents and short-term investments $    753,243 $    915,741 $    1,126,899
Cash Operating Costs and Adjusted EBITDA are non-GAAP measures. We use certain Non-GAAP measures to assist in assessing our financial performance. Non-GAAP measures do not have any standardized meaning prescribed by GAAP and are therefore unlikely to be comparable to similar measures presented by other companies. See reconciliation to GAAP in the Supplemental Non-GAAP Measures section.
3.2 2023 Performance compared to 2023 Business Outlook
Consistent with the Company’s past practice, and in view of the early stage of hydrogen fuel cell market development and adoption, we did not provide specific revenue or net income (loss) guidance for 2023. We did however provide certain quantitative and qualitative outlook expectations for 2023 as we continued our plan to increase investments in the business, including extensive research and product development, expanding our product offerings, and investments in manufacturing capabilities. In particular:
•Total Operating Expenses: 2023 outlook range of $135 million to $155 million – Total Operating Expenses in fiscal 2023 of $149.0 million (including $7.9 million of operating expenses from discontinued operations) were at the higher end of our outlook range of between $135 million and $155 million (compared to $145.8 million in fiscal 2022 including $13.8 million of operating expenses from discontinued operations) as we continued to invest in research and product development by advancing new technology, product cost reduction, product innovation, and development across bus, truck, rail, marine, and stationary power markets, including next-generation MEAs, plates, stacks, and modules.
image_21.jpg Page 10 of 49


•Capital Expenditures: 2023 outlook range of $40 million to $60 million – Total Capital Expenditures (being additions to property, plant and equipment and investment in other intangible assets) in fiscal 2023 of $41.4 million were at the lower end of our outlook range of between $40 million and $60 million (compared to $34.5 million in fiscal 2022) as we continued to invest in testing, advanced manufacturing, and production. Capital allocation in 2023 included increasing testing and prototyping capabilities, including new advanced test station equipment and refurbishments of existing testing equipment, advanced manufacturing equipment in Canada for next-generation bipolar plates, and positioning our manufacturing capabilities in Canada, Denmark, and the United States to support anticipated scale in key markets. We also continued to look at opportunities to expand our presence in growing markets.
3.3    2024 Business Outlook
Consistent with the Company’s past practice, and in view of the early stage of hydrogen fuel cell market development and adoption, we are not providing specific revenue or net income (loss) guidance for 2024. In 2024, we plan to continue investments in next generation products, advanced manufacturing, and production capacity expansion. We also expect revenue in 2024 will be back-half weighted, with roughly 30% in the first half and 70% in the second half, similar to 2023. Our 2024 outlook includes:
•Total Operating Expenses: 2024 outlook range of $145 million to $165 million – We expect total Operating Expenses (excluding discontinued operations) for fiscal 2024 to be between $145 million and $165 million (compared to $141.1 million in fiscal 2023) as we continue to invest in research and product development across our markets, including rationalization of our product portfolio, accelerating product cost reduction initiatives, and increased investment to accelerate development of our next-generation core products including MEAs, plates, stacks, and modules.
•Capital Expenditures: 2024 outlook range of $50 million to $70 million – We expect total Capital Expenditures (being additions to property, plant and equipment and investment in other intangible assets) for fiscal 2024 to be between $50 million and $70 million (compared to $41.4 million in fiscal 2023) as we continue to expand our production manufacturing capacity in support of our ‘local for local’ strategy, including planned investments in testing, advanced manufacturing and production.
Our expectations for 2024 are in part supported by our 12-month Order Book of approximately $66.6 million which is derived from our Order Backlog of approximately $130.5 million as of December 31, 2023 (during the fourth quarter of 2024, we removed approximately $22 million from the Order Backlog for a specific customer experiencing liquidity issues and resulting program delays). Our Order Backlog represents the estimated aggregate value of orders at a given time for which customers have made contractual commitments and our 12-month Order Book represents the aggregate expected value of that portion of the Order Backlog that the Company expects to deliver in the subsequent 12-month period.
image_21.jpg Page 11 of 49


Our expectations are based on our internal forecast which reflects an assessment of overall business conditions and takes into account actual sales, operating expenses, capital expenditures, and financial results in the first two months of 2024; sales orders received for units and services expected to be delivered in the remainder of 2024; purchase and cost commitments currently in existence for fiscal 2024; an estimate with respect to the generation of new sales and the timing of deliveries in each of our markets for the balance of 2024; an estimate of purchase and cost commitments to be generated in each of our locations for the balance of 2024; and assumes an average U.S. dollar exchange rate in the mid $0.70’s in relation to the Canadian dollar for 2024.
The primary risk factors to our business expectations for 2024 are customer, production, or program delays or cancellations in delivering against existing power products and technology solutions orders and delays from forecast in terms of closing and delivering expected sales; adverse macro-economic and political conditions including trade and other geopolitical risks; changes in government subsidy and incentive programs; inadequate investment in hydrogen infrastructure and / or excessive hydrogen fuel costs, all of which could negatively impact our customers’ access to capital and the success of their program plans which could adversely impact our business including potential changes, delays or accelerations in our expected operating and capital equipment requirements; disruptions due to delays of supply of key materials and components from third party suppliers; disruptions as a result of our reliance on a limited number of technology service customers including Weichai Ballard JV, which are reliant on their internal commercialization plans and budget requirements; disruptions as a result of delays in achieving technology solutions program milestones; disruptions as a result of our reliance on a limited number of customers and certain of those customer’s internal stack development and commercialization plans; and fluctuations in the Canadian dollar relative to the U.S. dollar, as a significant portion of our operating expense commitments and capital expenditure commitments are priced in Canadian dollars.
Our Order Backlog and our 12-month Order Book are currently comprised of a relatively limited number of contracts and a relatively limited number of customers. Given the relative immaturity of our industry and customer deployment programs, our Order Backlog and 12-month Order Book are potentially vulnerable to risk of cancellation, deferral or non-performance by our customers for a variety of reasons, including: risks related to continued customer commitment to a fuel cell program; risks related to customer liquidity; credit risks; risks related to changes, reductions or eliminations in government policies, subsidies and incentives; risks related to macro-economic and political conditions including trade, public health, and other geopolitical risks; risks related to slower market adoption; risks related to vehicle integration challenges; risks related to the development of effective hydrogen refueling infrastructure; risks related to the ability of our products to meet evolving market requirements; and supplier-related risks. Certain of our customer supply agreements are also subject to certain conditions or risks, including achievement of certain product performance milestones, completion of product development programs, or customer cancellation provisions, and it is likely that some future supply agreements will also be subject to similar conditions and risks. There can be no assurance that we will achieve or satisfy such conditions or that customers will not cancel their orders. In addition, our supply agreements may include various pricing structures or reduced pricing tiers based on various factors, including volumes and the timing of deliveries. In setting these reduced pricing tiers, we may assume certain future product cost reductions which are subject to execution risk, including future commodity costs, supply chain costs, and production costs, and we may not be successful in achieving the planned cost reductions.
image_21.jpg Page 12 of 49


In such circumstances, these agreements may become future onerous contracts if our gross margins become negative and the value of carried inventory to support product delivery under such contracts may also be adversely impacted.
Furthermore, potential fluctuations in our financial results make financial forecasting difficult. In addition, due to the early stage of development of the market for hydrogen fuel cell products, it is difficult to accurately predict future revenues, operating expenses, cash flows, or results of operations on a quarterly basis. The Company’s revenues, operating expenses, cash flows, and other operating results can vary significantly from quarter to quarter. As a result, quarter-to-quarter comparisons of revenues, operating expenses, cash flows, and other operating results may not be meaningful; instead, we believe our operating performance should be assessed over a number of quarters and years. It is likely that in one or more future quarters, financial results will fall below the expectations of securities analysts and investors and the trading price of the Company's shares may be materially and adversely affected.
4.RECENT DEVELOPMENTS (Including Contractual Updates)
4.1     Corporate
Update on global manufacturing strategy
On September 30, 2022, we announced our strategy ‘local for local’ where we summarized our plan to deepen our global manufacturing footprint in Europe, the United States, and China to support expected global market demand growth through 2030. As part of this strategy, we entered into an investment agreement with the Government of Anting in Shanghai’s Jiading District to establish our new China headquarters, MEA manufacturing facility, and an R&D center, at a site strategically located at the Jiading Hydrogen Port, located in one of China’s leading automotive industry clusters, with the plan to invest approximately $130 million over the next three years.
However, as a result of the increasingly constructive hydrogen policy landscape and increased market activity in the U.S. and Europe; and given the continued hydrogen and fuel cell policy uncertainties and market delays in China, as well as geopolitical risks, we decided to suspend our MEA localization plan in China while we continue with a comparative analysis on manufacturing capacity expansion options and possible sequencing prioritization in the U.S. and/or European markets. We expect to conclude this review in 2024.
4.2     Europe
15 MW order for stationary power products in Europe
On March 5, 2024, we announced an order for 15 megawatts (MW) of fuel cell systems from a UK-based company specializing in renewable off-grid power generation. We expect to deliver 150 FCmove®-HD+ 100 kW systems beginning in late 2024 and continuing through 2025.
The current order of 15 MW of fuel cell systems follows prior cumulative orders for roughly 5 MW of fuel cell systems from this customer. The purchase order is the first order under a new multi-year supply agreement.
image_21.jpg Page 13 of 49


The agreement also provides the customer an option to purchase up to an additional 296 systems by March 2026, which, if fully exercised, would bring the total number of systems ordered to 446.
Orders from Solaris for over 62 hydrogen fuel cell engines to power buses in Europe
On November 6, 2023, we announced multiple purchase orders totaling 62 hydrogen fuel cell engines from long-standing customer Solaris Bus & Coach sp. z o.o. (“Solaris”), a leading European bus manufacturer deploying hydrogen-powered city buses across the continent. Ballard expects delivery of the majority of the fuel cell engines to occur in 2024.
The hydrogen fuel cell engines will power buses in Germany and Poland. The number of engines ordered by Solaris in 2024 approximate 350, representing substantial growth over the more than 140 fuel cell city buses that Solaris has deployed with customers in Europe to date.
Orders from Solaris for over 170 hydrogen fuel cell engines to power buses in Europe
On October 10, 2023, we announced multiple purchase orders totaling 177 hydrogen fuel cell engines from long-standing customer Solaris. Ballard commenced deliveries of these orders in late 2023 and expect the remainder to ship in 2024 and 2025.
The orders include the supply of fuel cell engines to support the largest announced deployment of a fleet of fuel cell city buses in Europe, with 127 Solaris fuel cell buses to be deployed in Bologna, Italy. Ballard also received orders for a further 50 modules to power Solaris fuel cell buses in Germany and Italy.
4.3     North America and Rest of World
Long-Term Supply Agreement with NFI Group and purchase order for 100 fuel cell engines for bus deployments in North America
On January 3, 2024, we announced the signing of a new Long-Term Supply Agreement (“LTSA”) with NFI Group Inc. (“NFI”), a leading independent bus and coach manufacturer and a leader in electric mass mobility solutions in North America and Europe. The agreement marks a new phase in the established partnership between Ballard and NFI, focused on deployment-level volumes of fuel cell powered buses across all of NFI’s major brands including New Flyer, Alexander Dennis, and MCI.
As part of the LTSA, NFI has placed its first purchase order under the agreement for a minimum of 100 FCmove®-HD+ modules for planned delivery in 2024. The modules will primarily be produced in Ballard’s Bend, Oregon facility with Buy America compliance, and will power New Flyer’s next generation Xcelsior CHARGE FC™ hydrogen fuel cell buses for deployment across the US and Canada, including California, Manitoba, Nevada, New York, Ohio, and Pennsylvania.
Canadian Pacific Kansas City places follow-on order for 2.4 MW of Ballard fuel cell engines for active service locomotives
On November 6, 2023, we announced an order for 2.4 MW of additional fuel cell engines from Canadian Pacific Kansas City (“CPKC”). These twelve, 200 kW fuel cell engines were delivered in 2023 as expected and will support the development of CPKC’s additional hydrogen-powered locomotives planned for regular switching and local freight service applications in Alberta.
image_21.jpg Page 14 of 49


The additional locomotives will be partially funded through the Emissions Reduction Alberta (“ERA”) program that helps the province deliver on its environmental and economic goals and will in turn support the decarbonization of rail transport by funding hydrogen production and refueling infrastructure along with hydrogen-powered locomotives.
Over the past two years, Ballard has supplied CPKC with 38 fuel cell engines for use in its hydrogen locomotives, with combined fuel cell power of 7.6 MW. The additional locomotives are expected to enter service in late 2024.
4.4     China
Weichai Power Co., Ltd. and Weichai Ballard Hy-Energy Technologies Co., Ltd.
On November 13, 2018, we announced the closing of a strategic collaboration transaction with Weichai. Ballard’s strategic collaboration with Weichai included:
•Equity Investment – an equity investment in Ballard made by Weichai representing a 19.9% interest in the Company at that time. Weichai currently holds an approximate 15.4% interest in Ballard.
Ballard entered into an investor rights agreement with Weichai under which: (a) so long as Weichai directly or indirectly holds at least 10% of Ballard’s outstanding shares, it has an anti-dilution right entitling it to maintain its percentage ownership in Ballard by subscribing for Common Shares from treasury at the same price as Ballard distributes Common Shares to other investors (to date, Weichai’s anti-dilution rights with respect to all previous offerings of the Company have expired unexercised); (b) for so long as Weichai directly or indirectly holds at least 15% of Ballard’s outstanding Common Shares, it has the right to nominate two directors to Ballard’s board of directors; and (c) if there is a third-party offer to buy Ballard, Weichai has the right to make a superior proposal or otherwise it must vote its Common Shares in accordance with the recommendation of Ballard’s board of directors.
•China Joint Venture and Technology Transfer Agreement – Weichai and Ballard have established a joint venture company in Shandong Province to support China’s Fuel Cell Electric Vehicle market, with Weichai holding a controlling ownership interest of 51% and Ballard holding a 49% ownership position. Weichai Ballard JV was established in the fourth quarter of 2018. During fiscal 2018 through fiscal 2022, Weichai made its committed capital contributions totaling RMB 561.0 million and Ballard made its committed capital contributions totaling RMB 539.0 million (equivalent to $79.4 million). Weichai holds three of five Weichai Ballard JV board seats and Ballard holds two, with Ballard having certain shareholder protection provisions.
The Weichai Ballard JV develops and manufactures fuel cell modules and components including Ballard’s LCS bi-polar plates, fuel cell stacks and FCgen®-LCS-based power modules for bus, commercial truck, and forklift applications with exclusive rights (subject to certain conditions) in China and is to pay Ballard a total of $90 million under a program to develop and transfer technology to Weichai Ballard JV in order to enable these manufacturing activities.
image_21.jpg Page 15 of 49


Revenue earned from the $90 million Weichai Ballard JV technology transfer agreement ($2.3 million in the fourth quarter of 2023; $0.9 million in the fourth quarter of 2022; $4.9 million in fiscal 2023; $6.0 million in fiscal 2022; $18.2 million in fiscal 2021; $6.0 million in fiscal 2022; $18.2 million in fiscal 2021; $21.2 million in fiscal 2020; $22.5 million in fiscal 2019; $1.2 million in fiscal 2018) is recorded primarily as technology solutions revenues in our Heavy-Duty Mobility Truck market. During the fourth quarter of 2018, we received an initial 10% or $9.0 million prepayment from Weichai Ballard JV for this program with additional amounts paid to us as program milestones are successfully completed. We retain an exclusive right to the developed technologies outside China, subject to certain restrictions on sublicensing outside China. The Weichai Ballard JV will also purchase MEAs for FCgen®-LCS fuel cell stacks exclusively from Ballard under a long-term supply agreement.
•Fuel Cell Sales – On December 16, 2019, we announced the receipt of a purchase order from Weichai Ballard JV for the delivery of MEAs valued at approximately $19 million under a long-term MEA supply agreement. Revenue earned from this agreement ($1.5 million in the fourth quarter of 2023; $0.2 million in the fourth quarter of 2022; $2.1 million in fiscal 2023; $1.0 million in fiscal 2022) is recorded primarily as product revenue in our Heavy-Duty Mobility Truck market. As of December 31, 2023, an additional $5.1 million of revenue associated with shipments on this order to Weichai Ballard JV remain unrecognized until these products are ultimately sold by Weichai Ballard JV.
The Weichai Ballard JV operation, located in Weifang, Shandong Province, China, has commenced production activities of LCS bi-polar plates, LCS fuel cell stacks and LCS-based modules to power bus and truck FCEVs for the China market. The Weichai Ballard JV is expected to have annual production capacity of 40,000 fuel cell stacks and 20,000 engines.
5.     RESULTS OF OPERATIONS
5.1     Operating Segments
We report our results in the single operating segment of Fuel Cell Products and Services. For 2023, we have made certain changes in the presentation of revenues by application comprising our Fuel Cell Products and Services operating segment. Our Fuel Cell Products and Services segment consists of the sale of PEM fuel cell products and services for a variety of applications, including Heavy-Duty Mobility (consisting of bus, truck, rail, and marine applications), Stationary Power, and Emerging and Other Markets (consisting of material handling, off-road, and other applications). Revenues from the delivery of Services, including technology solutions, after sales services and training, are included in each of the respective markets.
During the fourth quarter of 2023, we completed a restructuring of operations at Ballard Motive Solutions in the U.K. and effectively closed the operation. As such, the historic operating results (including revenue and operating expenses) of the Ballard Motive Solutions business for both 2023 and 2022 have been removed from continuing operating results and are instead presented separately in the statement of comprehensive income (loss) as loss from discontinued operations.


image_21.jpg Page 16 of 49


5.2     Summary of Key Financial Metrics – Three Months Ended December 31, 2023
Revenue and Gross Margin
(Expressed in thousands of U.S. dollars) Three months ended December 31,
2023 2022 $ Change % Change
Heavy-Duty Mobility $ 29,004 $ 9,079 $ 19,925 219%
Bus 11,978 2,718 9,260 341%
Truck 5,991 2,544 3,447 135%
Rail 7,039 2,676 4,363 163%
Marine 3,996 1,141 2,855 250%
Stationary 12,805 6,234 6,571 105%
Emerging and Other 4,942 4,870 72 1%
Revenues $ 46,751 $ 20,183 $ 26,568 132%
China $ 5,496 $ 2,009 $ 3,487 174%
Europe 24,907 9,080 15,827 174%
North America 15,106 8,168 6,938 85%
Rest of World 1,242 926 316 34%
Revenues 46,751 20,183 26,568 132%
Cost of goods sold 56,918 26,276 30,642 117%
Gross Margin $ (10,167) $ (6,093) $ (4,074) 67%
Gross Margin % (22%) (30%) n/a 8 pts
Fuel Cell Products and Services Revenues of $46.8 million for the fourth quarter of 2023 increased 132%, or $26.6 million, compared to the fourth quarter of 2022. The 132% increase was driven by higher Heavy-Duty Mobility and Stationary market revenues as Emerging and Other and Stationary market revenues were effectively flat. Revenue increased in each region with the largest increases in Europe and North America followed by China and Rest of World.
Heavy-Duty Mobility revenues of $29.0 million in the fourth quarter of 2023 increased $20.0 million, or 219%, due to higher sales of fuel cell products in each of our sub-markets of bus, rail, truck and marine. Heavy-Duty Mobility revenues on a quarter-to-quarter basis are impacted by product mix due to varying customer requirements and various fuel cell products, including numerous power configurations required by our customers (and the resulting impact on selling price) of our fuel cell modules, fuel cell stacks, MEAs, and related component and parts kits. Heavy-Duty Mobility revenues of $29.0 million in the fourth quarter of 2023 includes service revenues of $2.3 million earned on the Weichai Ballard JV technology transfer program; $2.3 million from Weichai Ballard JV for the supply of a mix of certain fuel cell products and components that will be used in the assembly of modules to power zero-emission FCEVs in China; and $24.4 million from a variety of customers in Europe, North America, China, and the rest of the world, primarily for shipments of FCwave™, FCmove™-HD+, FCmove™-HD FCmove™-XD, and FCveloCity®-HD7 fuel cell modules and related components for their respective bus, truck, rail and marine programs.
Heavy-Duty Mobility revenues of $9.0 million in the fourth quarter of 2022 includes service revenues of $0.9 million earned on the Weichai Ballard JV technology transfer program; $0.3 million to Weichai Ballard JV for the supply of a mix of certain fuel cell products and components that will be used in the assembly of modules to power zero-emission FCEVs in China; and $7.8 million to a variety of customers in North America, Europe, and Other areas, primarily for shipments of FCveloCity®-HD7 and FCveloCity®-HDv8 fuel cell modules and related components for their respective bus and train programs.
image_21.jpg Page 17 of 49


Stationary revenues of $12.8 million increased $6.6 million, or 105%, due to higher sales of stationary power generation fuel cell modules, stacks, products and services primarily in Europe and North America. Stationary revenues also include technology solutions program revenues from a variety of customer programs for stationary applications.
Emerging and Other market revenues of $4.9 million increased $0.1 million, or 1%, due primarily to higher sales of fuel cell modules primarily for mining applications, partially offset by lower fuel cell stack shipments and lower service revenues. Emerging and Other market revenues include technology solutions program revenues on the completed Audi program of nil in the fourth quarter of 2023, compared to $1.0 million in the fourth quarter of 2022.
Fuel Cell Products and Services gross margins were ($10.2) million, or (22%) of revenues, for the fourth quarter of 2023, compared to ($6.1) million, or (30%) of revenues, for the fourth quarter of 2022. The negative gross margin in the fourth quarter of 2023 was driven primarily by significantly higher inventory impairment and onerous contract provisions, and by a shift to lower overall product margin and service revenue mix including the impacts of pricing strategy, higher fixed overhead costs due primarily to the expansion of manufacturing capacity, and increases in supply costs.
Gross margin in the fourth quarter of 2023 was negatively impacted by net increases in inventory impairment and onerous contract provision adjustments of ($10.7) million, and positively impacted by net warranty adjustments of $0.3 million. Negative inventory and related impairment adjustments of ($10.7) million in the fourth quarter of 2023 were primarily due to (i) customer specific heavy-duty mobility inventory no longer expected to be utilized due to a certain customer’s liquidity issues and resulting program delays; (ii) excess and slow moving small stationary inventory located primarily in Europe due to product rationalization and potential divestiture activities; and (iii) excess and slow moving legacy and customer service inventory no longer expected to be utilized. Gross margin in the fourth quarter of 2022 was negatively impacted by net inventory and onerous contract provision adjustments of ($4.1) million due primarily to excess and impaired service inventory; and positively impacted by net warranty adjustments of $0.5 million.
image_21.jpg Page 18 of 49


Operating Expenses and Cash Operating Costs
(Expressed in thousands of U.S. dollars)
Three months ended December 31,
2023 2022 $ Change % Change
Research and Product
  Development
$ 24,459 $ 21,506 $ 2,953
    14%
General and Administrative 5,042 4,982 60
     1%
Sales and Marketing 3,716 3,295 421
    13%
Operating Expenses $ 33,217 $ 29,783 $ 3,434
    12%


Research and Product
  Development (cash operating cost)
$ 21,337 $ 20,586 $ 751
    4%
General and Administrative
 (cash operating cost)
4,233 5,361 (1,128)
     (21%)
Sales and Marketing (cash operating cost) 3,380 3,091 289
    9%
Cash Operating Costs $ 28,950 $ 29,038 $ (88)
    (0%)
Cash Operating Costs and its components of Research and Product Development (cash operating cost), General and Administrative (cash operating cost), and Sales and Marketing (cash operating cost) are non-GAAP measures. We use certain Non-GAAP measures to assist in assessing our financial performance. Non-GAAP measures do not have any standardized meaning prescribed by GAAP and are therefore unlikely to be comparable to similar measures presented by other companies. See the reconciliation of Cash Operating Costs to GAAP in the Supplemental Non-GAAP Measures and Reconciliations section and the reconciliation of Research and Product Development (cash operating cost), General and Administrative (cash operating cost), and Sales and Marketing (cash operating cost) to GAAP in the Operating Expense section. Cash Operating Costs adjusts operating expenses for stock-based compensation expense, depreciation and amortization, impairment losses on trade receivables, restructuring charges, the impact of unrealized gains or losses on foreign exchange contracts, acquisition related costs, and financing charges.
Total Operating Expenses (excluding Other operating expenses) for the fourth quarter of 2023 were $33.2 million, an increase of $3.4 million, or 12%, compared to the fourth quarter of 2022. The increase was driven by higher research and product development expenses of $3.0 million and higher sales and marketing expenses of $0.4 million.
Cash Operating Costs (see Supplemental Non-GAAP Measures and Reconciliations) for the fourth quarter of 2023 were $29.0 million, a decrease of ($0.1) million, or (0%), compared to the fourth quarter of 2022. The minor decrease was driven by lower general and administrative cash operating costs of ($1.1) million, partially offset by higher research and product development cash operating costs of $0.8 million, and higher sales and marketing cash operating costs of $0.3 million.
The minor decrease in cash operating costs in the fourth quarter of 2023 was driven primarily by lower general and administrative costs due to lower contractor services, recruiting, and insurance costs. These cost reductions were partially offset by increased expenditure on technology and product development activities, including the design and development of next generation fuel cell stacks and engines for bus, truck, rail, marine and stationary applications, and continuation engineering investment in our existing fuel cell products, including activities related to product cost reduction. Program investment includes expenditures related to our FCmove™-HD+ and FCmove XD fuel cell modules designed for buses and medium and heavy-duty trucks, our FCgen®-HPS High-Power Density Fuel Cell Stack for light-medium-and heavy-duty vehicles, our FCwave™ Fuel Cell Module for marine applications, and on the ongoing improvement of all of our fuel cell products including our high performance fuel cell module, the FCmove™-HD, and our high performance liquid-cooled fuel cell stack, the FCgen®-LCS.
Adjusted EBITDA
(Expressed in thousands of U.S. dollars) Three months ended December 31,
2023 2022 $ Change % Change
Adjusted EBITDA $ (44,083) $ (40,148) $ (3,935)
                      (10%)
    EBITDA and Adjusted EBITDA are non-GAAP measures. We use certain Non-GAAP measures to assist in assessing our financial performance. Non-GAAP measures do not have any standardized meaning prescribed by GAAP and are therefore unlikely to be comparable to similar measures presented by other companies. See reconciliation of Adjusted EBITDA to GAAP in the Supplemental Non-GAAP Measures and Reconciliations section. Adjusted EBITDA adjusts EBITDA for stock-based compensation expense, transactional gains and losses, acquisition related costs, finance and other income, recovery on settlement of contingent consideration, asset impairment charges, and the impact of unrealized gains and losses on foreign exchange contracts.
image_21.jpg Page 19 of 49


Adjusted EBITDA (see Supplemental Non-GAAP Measures and Reconciliations) for the fourth quarter of 2023 was ($44.1) million, compared to ($40.1) million for the fourth quarter of 2022. The increase in Adjusted EBITDA loss of ($3.9) million was driven primarily by the increase in gross margin loss of ($4.1) million, higher impairment loss on trade receivables of ($1.4) million, and higher restructuring expenses of ($0.2) million, partially offset by the decrease in Cash Operating Costs of $0.1 million, and lower equity in loss of investment in joint venture and associates of $2.4 million attributed to the operations of Weichai Ballard JV.
Net Loss from Continuing Operations
(Expressed in thousands of U.S. dollars) Three months ended December 31,
2023 2022 $ Change % Change
Net loss from Continuing Operations $ (48,889) $ (27,572) $ (21,317) (77)%
Net loss from continuing operations for the fourth quarter of 2023 was ($48.9) million, or ($0.16) per share, compared to a net loss from continuing operations of ($27.6) million, or ($0.09) per share, in the fourth quarter of 2022. The ($21.3) million increase in net loss in the fourth quarter of 2023 was driven primarily by the increase in Adjusted EBITDA loss of ($3.9) million and by lower finance and other income of ($13.9) million.
Net Loss from Discontinued Operations
(Expressed in thousands of U.S. dollars) Three months ended December 31,
2023 2022 $ Change % Change
Revenues $ 323 $ 281 $ 42 15%
Cost of goods sold 108 107 1 1%
Gross margin 215 174 41 24%
Operating expenses (2,699) (6,938) 4,239 61%
Finance and other (income) loss 125 (3) 128 4267%
Impairment charges on intangible assets (13,017) 13,017 100%
Recovery on settlement of contingent consideration 9,891 (9,891) (100)%
Income tax recovery (expense) 3,038 (3,038) (100)%
Net loss from discontinued operations $ (2,359) $ (6,855) $ 4,496 66%
Net loss from discontinued operations for the fourth quarter of 2023 was ($2.4) million, or ($0.01) per share, compared to ($6.9) million, or ($0.02) per share, in the fourth quarter of 2022.
During the fourth quarter of 2023, we completed a restructuring of operations at Ballard Motive Solutions in the U.K. and effectively closed the operation. As such, the historic operating results of the Ballard Motive Solutions business for both 2023 and 2022 have been removed from continuing operating results and are instead presented separately in the statement of comprehensive income (loss) as loss from discontinued operations.


image_21.jpg Page 20 of 49


5.3     Summary of Key Financial Metrics – Year Ended December 31, 2023
Revenue and Gross Margin
(Expressed in thousands of U.S. dollars) Year ended December 31,
2023 2022 $ Change % Change
Heavy-Duty Mobility $ 66,657 $ 43,679 $ 22,978 53%
Bus 29,265 24,917 4,348 17%
Truck 10,961 11,472 (511) (4%)
Rail 19,100 5,106 13,994 274%
Marine 7,331 2,184 5,147 236%
Stationary 21,707 18,872 2,835 15%
Emerging and Other 14,004 19,309 (5,305) (27%)
Revenues $ 102,368 $ 81,860 $ 20,508 25%
China $ 11,980 $ 9,127 $ 2,853 31%
Europe 48,958 38,444 10,514 27%
North America 37,736 28,572 9,164 32%
Rest of World 3,694 5,717 (2,023) (35%)
Revenues 102,368 81,860 20,508 25%
Cost of goods sold 124,199 95,168 29,031 31%
Gross Margin $ (21,831) $ (13,308) $ (8,523) (64%)
Gross Margin % (21%) (16%) n/a (5 pts)
Fuel Cell Products and Services Revenues of $102.4 million for 2023 increased 25%, or $20.5 million, compared to 2022. The 25% increase was driven by higher Heavy-Duty Mobility and Stationary market revenues, partially offset by lower Emerging and Other market revenues. Revenue increases in Europe, North America and China, were partially offset by lower revenues in Rest of World.
Heavy-Duty Mobility revenues of $66.7 million in 2023 increased $23.0 million, or 53%, due primarily to higher sales of rail, marine, and bus fuel cell products. Heavy-Duty Mobility revenues on a quarter-to-quarter basis are impacted by product mix due to varying customer requirements and various fuel cell products, including numerous power configurations required by our customers (and the resulting impact on selling price) of our fuel cell modules, fuel cell stacks, MEAs, and related component and parts kits. Heavy-Duty Mobility revenues of $66.7 million in 2023 includes service revenue of $4.9 million earned on the Weichai Ballard JV technology transfer program; $3.2 million from Weichai Ballard JV for the supply of a mix of certain fuel cell products and components that will be used in the assembly of modules to power zero-emission FCEVs in China; $1.7 million of product and service revenues from Synergy Ballard JVCo; and $56.9 million from a variety of customers in Europe, North America, China, and the rest of the world, primarily for shipments of FCmove™-HD, FCmove™-HD+, FCmove™-XD, FCwave™, and FCveloCity®-HD7, and FCmove™-MD fuel cell modules and related components for their respective bus, truck, rail and marine programs.
Heavy-Duty Mobility revenues of $43.7 million in 2022 includes service revenues of $6.0 million earned on the Weichai Ballard JV technology transfer program; $2.1 million to Weichai Ballard JV for the supply of a mix of certain fuel cell products and components that will be used in the assembly of modules to power zero-emission FCEVs in China; and $35.6 million to a variety of customers in North America, Europe, and Other areas, primarily for shipments of FCveloCity®-HD7 and FCveloCity®-HDv8 fuel cell modules and related components for their respective bus and train programs.
image_21.jpg Page 21 of 49


Stationary revenues of $21.7 million increased $2.8 million, or 15%, due to higher sales of stationary power generation fuel cell modules, stacks, products and services primarily in Europe and North America. Stationary revenues also include technology solutions program revenues from a variety of customer programs for stationary applications.
Emerging and Other market revenues of $14.0 million decreased ($5.3) million, or (27%), due primarily to lower service revenues and lower fuel cell stack shipments, partially offset by higher sales of fuel cell modules for mining applications. Emerging and Other market revenues include technology solutions program revenues on the complete Audi program of $0.3 million in 2023, compared to $5.6 million earned in 2022.
Fuel Cell Products and Services gross margins were ($21.8) million, or (21%) of revenues, for 2023, compared to ($13.3) million, or (16%) of revenues, for 2022. The negative gross margin in 2023 was driven primarily by significantly higher inventory impairment and onerous contract provisions, and by a shift to lower overall product margin and service revenue mix including the impacts of pricing strategy, higher fixed overhead costs due primarily to the expansion of manufacturing capacity, and increases in supply costs.
Gross margin in 2023 was negatively impacted by net increases in inventory impairment and onerous contract provision adjustments of ($15.0) million, and negatively impacted by net warranty adjustments of ($0.3 million). Negative inventory and related impairment adjustments of ($15.0) million in 2023 were primarily due to (i) customer specific heavy-duty mobility inventory no longer expected to be utilized due to a certain customer’s liquidity issues and resulting program delays; (ii) excess and slow moving small stationary inventory located primarily in Europe due to product rationalization and potential divestiture activities; (iii) excess stationary and heavy-duty mobility product inventory; and (iv) excess and slow moving legacy and customer service inventory no longer expected to be utilized. Gross margin in 2022 was negatively impacted by net inventory and onerous contract provision adjustments of ($7.5) million due primarily to excess and impaired heavy-duty mobility product and service inventory; and negatively impacted by net warranty adjustments of ($0.4) million related primarily to increased service costs.
image_21.jpg Page 22 of 49


Operating Expenses and Cash Operating Costs
(Expressed in thousands of U.S. dollars)
Year ended December 31,
2023 2022 $ Change % Change
Research and Product
  Development
$ 98,306 $ 89,715 $ 8,591 10%
General and Administrative 23,874 26,355 (2,481) (9)%
Sales and Marketing 15,110 12,538 2,572 21%
Operating Expenses $ 137,290 $ 128,608 $ 8,682 7%


Research and Product
  Development (cash operating cost)
$ 86,248 $ 79,806 $ 6,442 8%
General and Administrative
 (cash operating cost)
19,513 20,842 (1,329) (6)%
Sales and Marketing (cash operating cost) 13,566 11,344 2,222 20%
Cash Operating Costs $ 119,327 $ 111,992 $ 7,335 7%
Cash Operating Costs and its components of Research and Product Development (cash operating cost), General and Administrative (cash operating cost), and Sales and Marketing (cash operating cost) are non-GAAP measures. We use certain Non-GAAP measures to assist in assessing our financial performance. Non-GAAP measures do not have any standardized meaning prescribed by GAAP and are therefore unlikely to be comparable to similar measures presented by other companies. See the reconciliation of Cash Operating Costs to GAAP in the Supplemental Non-GAAP Measures and Reconciliations section and the reconciliation of Research and Product Development (cash operating cost), General and Administrative (cash operating cost), and Sales and Marketing (cash operating cost) to GAAP in the Operating Expense section. Cash Operating Costs adjusts operating expenses for stock-based compensation expense, depreciation and amortization, impairment losses on trade receivables, restructuring charges, the impact of unrealized gains or losses on foreign exchange contracts, acquisition related costs, and financing charges.
Total Operating Expenses (excluding Other operating expenses) for 2023 was $137.3 million, an increase of $8.7 million, or 7%, compared to 2022. The increase was driven by higher research and product development expenses of $8.6 million and higher sales and marketing expenses of $2.6 million, partially offset by lower general and administrative expenses of ($2.5) million.
Cash Operating Costs (see Supplemental Non-GAAP Measures and Reconciliations) for 2023 were $119.3 million, an increase of $7.3 million, or 7%, compared to 2022. The increase was driven by higher research and product development cash operating costs of $6.4 million and by higher sales and marketing cash operating costs of $2.2 million, partially offset by lower general and administrative cash operating costs of ($1.3) million.
The increase in operating expenses and cash operating costs in 2023 was driven primarily by increased expenditure on technology and product development activities including the design and development of next generation fuel cell stacks and engines for bus, truck, rail, marine and stationary applications, and continuation engineering investment in our existing fuel cell products, including activities related to product cost reduction. Program investment includes expenditures related to our FCmove™-HD+ and FCmove XD fuel cell modules designed for buses and medium and heavy-duty trucks, our FCgen®-HPS High-Power Density Fuel Cell Stack for light-medium-and heavy-duty vehicles, our FCwave™ Fuel Cell Module for marine applications, and on the ongoing improvement of all of our fuel cell products including our high performance fuel cell module, the FCmove™-HD, and our high performance liquid-cooled fuel cell stack, the FCgen®-LCS. In addition, sales and marketing costs increased due to increased commercial expenditures and staffing primarily in Europe and North America.
Operating expenses also include the impact of inflationary wage pressures. These operating expense increases were partially offset by relatively lower labour costs in Canada in 2023 on our Canadian operating cost base as the Canadian dollar, relative to the U.S. dollar, was approximately (4%) lower in 2023, compared to 2022.


image_21.jpg Page 23 of 49


Adjusted EBITDA
(Expressed in thousands of U.S. dollars) Year ended December 31,
2023 2022 $ Change % Change
Adjusted EBITDA $ (150,088) $ (132,635) $ (17,453)
                      (13%)
    EBITDA and Adjusted EBITDA are non-GAAP measures. We use certain Non-GAAP measures to assist in assessing our financial performance. Non-GAAP measures do not have any standardized meaning prescribed by GAAP and are therefore unlikely to be comparable to similar measures presented by other companies. See reconciliation of Adjusted EBITDA to GAAP in the Supplemental Non-GAAP Measures and Reconciliations section. Adjusted EBITDA adjusts EBITDA for stock-based compensation expense, transactional gains and losses, acquisition related costs, finance and other income, recovery on settlement of contingent consideration, asset impairment charges, and the impact of unrealized gains and losses on foreign exchange contracts.
Adjusted EBITDA (see Supplemental Non-GAAP Measures and Reconciliations) for 2023 was ($151.1) million, compared to ($132.6) million for 2022. The ($17.5) million increase in Adjusted EBITDA loss was driven primarily by the decrease in gross margin of ($8.5), the increase in Cash Operating Costs of ($7.3) million, higher impairment loss on trade receivables of ($1.4) million, and higher restructuring expenses of ($1.0) million, partially offset and lower equity in loss of investment in joint venture and associates of $1.5 million attributed to the operations of Weichai Ballard JV.
Net Loss from Continuing Operations
(Expressed in thousands of U.S. dollars) Year ended December 31,
2023 2022 $ Change % Change
Net loss from Continuing Operations $ (144,210) $ (160,371) $ 16,161
    10%
Net loss from continuing operations for 2023 was ($144.2) million, or ($0.48) per share, compared to a net loss from continuing operations of ($160.4) million, or ($0.54) per share, in 2022. The $16.2 million decrease in net loss in 2023 was driven primarily by higher finance and other income of $33.2 million due to primarily to increased investment income of $23.7 million, improved mark to market and foreign exchange impacts of $4.0 million on our long-term investments including Forsee Power, Wisdom, Quantron, and hydrogen infrastructure and growth equity funds, and by higher foreign exchange gains on net monetary assets of $5.4 million. These net loss improvements were partially offset by the increase in Adjusted EBITDA loss of ($17.5) million.
In addition, operating margins, and costs in 2023 were also impacted by the positive impact of a weaker Canadian dollar, relative to the U.S. dollar, as compared to 2022. As a significant amount of our net operating costs (primarily labour) are denominated in Canadian dollars, gross margin, operating expenses, Adjusted EBITDA, and net loss are impacted by changes in the Canadian dollar relative to the U.S. dollar. As the Canadian dollar relative to the U.S. dollar was approximately (4%), or (300) basis points, lower in 2023 as compared to 2022, positive foreign exchange impacts on our Canadian operating margins and cost base were approximately $3.9 million. A $0.01 decrease in the Canadian dollar, relative to the U.S. dollar, positively impacts annual operating margins and costs by approximately $1.3 million.


image_21.jpg Page 24 of 49


Net Loss from Discontinued Operations
(Expressed in thousands of U.S. dollars) Year ended December 31,
2023 2022 $ Change % Change
Revenues $ 934 $ 1,926 $ (992) (52%)
Cost of goods sold 607 1,713 (1,106) (65%)
Gross margin 327 213 114 54%
Operating expenses (7,913) (13,784) 5,871 43%
Finance and other (income) loss 337 (4) 341 8525%
Impairment charges on intangible assets (2,266) (13,017) 10,751 83%
Impairment charges on goodwill (23,991) (23,991) (100%)
Recovery on settlement of contingent consideration 9,891 (9,891) (100%)
Income tax recovery (expense) 3,578 (3,578) (100%)
Net loss from discontinued operations $ (33,506) $ (13,123) $ (20,383) (155%)
Net loss from discontinued operations for 2023 was ($33.5) million, or ($0.11) per share, compared to ($13.1) million, or ($0.04) per share, in 2022.
During the fourth quarter of 2023, we completed a restructuring of operations at Ballard Motive Solutions in the U.K. and effectively closed the operation. As such, the historic operating results of the Ballard Motive Solutions business for both 2023 and 2022 have been removed from continuing operating results and are instead presented separately in the statement of comprehensive income (loss) as loss from discontinued operations.
5.4     Operating Expenses and Other Items – Three Months and Year ended December 31, 2023
Research and product development expenses
(Expressed in thousands of U.S. dollars)
Three months ended December 31,
Research and product development 2023 2022 $ Change % Change
Research and product development expense $ 24,459 $ 21,506 $ 2,953 14%
Less: Depreciation and amortization expense $ (1,832) $ 18 $ (1,850) (1,278%)
Less: Stock-based compensation expense $ (1,290) $ (938) $ (352) (38%)
Research and Product Development (cash operating cost) $ 21,337 $ 20,586 $ 751 4%
(Expressed in thousands of U.S. dollars)
Year ended December 31,
Research and product development 2023 2022 $ Change % Change
Research and product development expense $ 98,306 $ 89,715 $ 8,591 10%
Less: Depreciation and amortization expense $ (6,538) $ (4,894) $ 1,644 34%
Less: Stock-based compensation expense $ (5,520) $ (5,015) $ (505) (10%)
Research and Product Development (cash operating cost) $ 86,248 $ 79,806 $ 6,442 8%
Research and Product Development (cash operating cost) is a non-GAAP measure. We use certain Non-GAAP measures to assist in assessing our financial performance. Non-GAAP measures do not have any standardized meaning prescribed by GAAP and are therefore unlikely to be comparable to similar measures presented by other companies. Research and Product Development (cash operating cost) adjusts Research and product development expense for depreciation and amortization expense and stock-based compensation expense. See the reconciliation of the adjustments to Research and product development expense in the table above.
Research and product development expenses for the three months ended December 31, 2023, were $24.5 million, an increase of $3.0 million, or 14%, compared to the corresponding period of 2022. Excluding depreciation and amortization expense and stock-based compensation expense, research, and product development cash operating costs (see Supplemental Non-GAAP Measures and Reconciliations) were $21.3 million in the fourth quarter of 2023, an increase of $0.8 million, or 4%, compared to the fourth quarter of 2022.
Research and product development expenses for the year ended December 31, 2023, were $98.3 million, an increase of $8.6 million, or 10%, compared to the corresponding period of 2022.
image_21.jpg Page 25 of 49


Excluding depreciation and amortization expense and stock-based compensation expense, research and product development cash operating costs (see Supplemental Non-GAAP Measures and Reconciliations) were $86.2 million in 2023, an increase of $6.4 million, or 8%, compared to 2022.
The respective $0.8 million, or 4%, and $6.4 million, or 8%, increases in research and development cash operating costs (see Supplemental Non-GAAP Measures and Reconciliations) in the fourth quarter and fiscal year of 2023, as compared to the fourth quarter and fiscal year of 2022, was driven primarily by increased expenditure on technology and product development activities including the design and development of next generation fuel cell stacks and engines for bus, truck, rail, marine and stationary applications, and continuation engineering investment in our existing fuel cell products, including activities related to product cost reduction. Program investment includes expenditures related to our FCmove™-HD+ and FCmove XD fuel cell modules designed for buses and medium and heavy-duty trucks, our FCgen®-HPS High-Power Density Fuel Cell Stack for light-medium-and heavy-duty vehicles, our FCwave™ Fuel Cell Module for marine applications, and on the ongoing improvement of all of our fuel cell products including our high performance fuel cell module, the FCmove™-HD, and our high performance liquid-cooled fuel cell stack, the FCgen®-LCS.
Research and product development expenses also include the impact of inflationary wage pressures. These operating expense increases were partially offset by relatively lower labour costs in Canada in 2023 on our Canadian operating cost base as the Canadian dollar, relative to the U.S. dollar, was approximately (4%) lower in 2023, compared to 2022.
Depreciation and amortization expense included in research and product development expense for the three months and year ended December 31, 2023, was $1.8 million and $6.5 million, respectively, compared to nominal amounts and $4.9 million, respectively, for the corresponding periods of 2022. Depreciation and amortization expense relate primarily to amortization expense on our intangible assets and depreciation expense on our research and product development facilities and equipment.
Stock-based compensation expense included in research and product development expense for the three months and year ended December 31, 2023, was $1.3 million and $5.5 million, respectively, compared to $0.9 million and $5.0 million, respectively, for the corresponding periods of 2022. The increase in 2023 was due primarily to new equity awards granted to a wider employee base and to help retain key personnel.
General and administrative expenses
(Expressed in thousands of U.S. dollars)
Three months ended December 31,
General and administrative 2023 2022 $ Change % Change
General and administrative expense $ 5,042 $ 4,982 $ 60 1%
Less: Depreciation and amortization expense $ (556) $ (449) $ (107) (24%)
Less: Stock-based compensation expense $ (949) $ (229) $ (720) (314%)
Add: Impact of unrealized gains (losses) on foreign exchange contracts $ 696 $ 1,057 $ (361) (34%)
General and Administrative (cash operating cost) $ 4,233 $ 5,361 $ (1,128) (21%)

image_21.jpg Page 26 of 49


(Expressed in thousands of U.S. dollars)
Year ended December 31,
General and administrative 2023 2022 $ Change % Change
General and administrative expense $ 23,874 $ 26,355 $ (2,481) (9%)
Less: Depreciation and amortization expense $ (1,997) $ (1,915) $ (82) (4%)
Less: Stock-based compensation expense $ (3,660) $ (2,736) $ (924) (34%)
Add: Impact of unrealized gains (losses) on foreign exchange contracts $ 1,296 $ (862) $ 2,158 250%
General and Administrative (cash operating cost) $ 19,513 $ 20,842 $ (1,329) (6%)
General and Administrative (cash operating cost) is a non-GAAP measure. We use certain Non-GAAP measures to assist in assessing our financial performance. Non-GAAP measures do not have any standardized meaning prescribed by GAAP and are therefore unlikely to be comparable to similar measures presented by other companies. General and Administrative (cash operating cost) adjusts General and administrative expense for depreciation and amortization expense, stock-based compensation expense and the impact of unrealized gains or losses on foreign exchange contracts. See the reconciliation of the adjustments to General and administrative expense in the table above.
General and administrative expenses for the three months ended December 31, 2023, were $5.0 million, an increase of $0.1 million, or 1%, compared to the corresponding period of 2022. Excluding depreciation and amortization expense, stock-based compensation expense, and the impact of unrealized gains (losses) on foreign exchange contracts, general and administrative cash operating costs (see Supplemental Non-GAAP Measures and Reconciliations) were $4.2 million in the fourth quarter of 2023, a decrease of ($1.1) million, or (21%), compared to the fourth quarter of 2022.
General and administrative expenses for the year ended December 31, 2023, were $23.9 million, a decrease of ($2.5) million, or (9%), compared to the corresponding period of 2022. Excluding depreciation and amortization expense, stock-based compensation expense, and the impact of unrealized gains (losses) on foreign exchange contracts, general and administrative cash operating costs (see Supplemental Non-GAAP Measures and Reconciliations) were $19.5 million in 2023, a decrease of ($1.3) million, or (6%), compared to 2022.
The respective ($1.1) million, or (21%), and ($1.3) million, or (6%), decreases in general and administrative cash operating costs (see Supplemental Non-GAAP Measures and Reconciliations) in the fourth quarter and fiscal year of 2023, as compared to the fourth quarter and fiscal year of 2022, was due primarily to lower contractor services, recruiting, and insurance costs. The impact of inflationary wage pressures were offset by relatively lower labour costs in Canada in 2023 on our Canadian operating cost base as the Canadian dollar, relative to the U.S. dollar, was approximately (4%) lower in 2023, compared to 2022.
Depreciation and amortization expense included in general and administrative expense for the three months and year ended December 31, 2023, was $0.6 million and $2.0 million, respectively, relatively consistent with the corresponding periods of 2022. Depreciation and amortization expense relate primarily to our office and information technology intangible assets including our ongoing investment in our ERP system.
Stock-based compensation expense included in general and administrative expense for the three months and year ended December 31, 2023, was $0.9 million and $3.7 million, respectively, compared to $0.2 million and $2.7 million, respectively, for the corresponding periods of 2022. The increase in 2023 was due primarily to new equity awards granted to a wider employee base and to help retain key personnel.
The impact of unrealized gains (losses) on foreign exchange contracts included in general and administrative expense for the three months and year ended December 31, 2023, was $0.7 million and $1.3 million, respectively, compared to $1.1 million and ($0.9) million, respectively, for the corresponding periods of 2022. We use forward foreign exchange contracts to help manage our exposure to currency rate fluctuations. We record these contracts at their fair value as of the balance sheet date as either assets or liabilities with any changes in fair value in the period recorded in profit or loss (general and administrative expense) as these contracts are not designated or qualified under hedge accounting criteria.
image_21.jpg Page 27 of 49


Sales and marketing expenses
(Expressed in thousands of U.S. dollars)
Three months ended December 31,
Sales and marketing 2023 2022 $ Change % Change
Sales and marketing expense $ 3,716 $ 3,295 $ 421 13%
Less: Depreciation and amortization expense $ $ (4) $ 4 100%
Less: Stock-based compensation expense $ (336) $ (200) $ (136) (68%)
Sales and Marketing (cash operating cost) $ 3,380 $ 3,091 $ 289 9%

(Expressed in thousands of U.S. dollars)
Year ended December 31,
Sales and marketing 2023 2022 $ Change % Change
Sales and marketing expense $ 15,110 $ 12,538 $ 2,572 21%
Less: Depreciation and amortization expense $ (4) $ (6) $ 2 33%
Less: Stock-based compensation expense $ (1,540) $ (1,188) $ (352) (30%)
Sales and Marketing (cash operating cost) $ 13,566 $ 11,344 $ 2,222 20%
Sales and Marketing (cash operating cost) is a non-GAAP measure. We use certain Non-GAAP measures to assist in assessing our financial performance. Non-GAAP measures do not have any standardized meaning prescribed by GAAP and are therefore unlikely to be comparable to similar measures presented by other companies. Sales and Marketing (cash operating cost) adjusts Sales and marketing expense for depreciation and amortization expense and stock-based compensation expense. See the reconciliation of the adjustments to Sales and marketing expense in the table above.
Sales and marketing expenses for the three months ended December 31, 2023, were $3.7 million, an increase of $0.4 million, or 13%, compared to the corresponding period of 2022. Excluding stock-based compensation expense, sales and marketing cash operating costs (see Supplemental Non-GAAP Measures and Reconciliations) was $3.4 million in the fourth quarter of 2023, an increase of $0.3 million, or 9%, compared to the fourth quarter of 2022.
Sales and marketing expenses for the year ended December 31, 2023, were $15.1 million, an increase of $2.6 million, or 21%, compared to the corresponding period of 2022. Excluding stock-based compensation expense, sales and marketing cash operating costs (see Supplemental Non-GAAP Measures and Reconciliations) was $13.6 million in 2023, an increase of $2.2 million, or 20%, compared to 2022.
The respective $0.3 million, or 9%, and $2.2 million, or 20%, increases in general and administrative cash operating costs (see Supplemental Non-GAAP Measures and Reconciliations) in the fourth quarter and fiscal year of 2023, as compared to the fourth quarter and fiscal year 2022, was due primarily to increased commercial expenditures and staffing primarily in Europe and North America.
Stock-based compensation expense included in sales and marketing expense for the three months and year ended December 31, 2023, was $0.3 million and $1.5 million, respectively, compared to $0.2 million and $1.2 million, respectively, for the corresponding periods of 2022. The increase in 2023 was due primarily to new equity awards granted to a wider employee base and to help retain key personnel.
Other operating expenses for the three months and year ended December 31, 2023, was $1.8 million and $3.8 million, respectively, compared to $0.3 million and $3.4 million, respectively, for the corresponding periods of 2022. The following table provides a breakdown of other operating expense for the reported periods:
image_21.jpg Page 28 of 49


(Expressed in thousands of U.S. dollars)
Three months ended December 31,
2023 2022 $ Change % Change
Impairment loss on trade receivables $ 1,436 $ 73 $ 1,363 1,867%
Restructuring and related costs (recovery) 322 137 185 135%
Acquisition related costs (3) 106 (109) (103%)
Other expenses (recovery) $ 1,755 $ 316 $ 1,439 455%

(Expressed in thousands of U.S. dollars)
Year ended December 31,
2023 2022 $ Change % Change
Impairment loss on trade receivables $ 1,498 $ 73 $ 1,425 1,952%
Restructuring and related costs (recovery) 1,512 482 1,030 214%
Acquisition related costs 773 2,857 (2,084) 73%
Other expenses (recovery) $ 3,783 $ 3,412 $ 371 11%
Impairment loss (recovery) on trade receivables for the three months and year ended December 31, 2023 were $1.4 million and $1.5 million, respectively, compared to nominal amounts in 2022. If we recover on an impaired trade receivable through legal or other means, the recovered amount is recognized in the period of recovery as a reversal of the impairment loss.
Restructuring and related costs (recovery) for the three months and year ended December 31, 2023 were $0.3 million and $1.5 million, respectively, compared to $0.1 million and $0.5 million for each of the corresponding periods of 2022, and consist of certain cost cutting measures and related personnel change costs.
Acquisition related costs for the three months and year ended December 31, 2023 were nominal and $0.8 million, respectively, compared to $0.1 million and $2.9 million, respectively, for the corresponding periods of 2022, and consist primarily of legal, advisory, and transaction related costs incurred due to corporate development activities.
Finance income (loss) and other for the three months and year ended December 31, 2023 was $1.9 million and $31.1 million, respectively, compared to $15.7 million and ($2.1) million for the corresponding periods of 2022. The following table provides a breakdown of finance and other income (loss) for the reported periods:
(Expressed in thousands of U.S. dollars)
Three months ended December 31,
2023 2022 $ Change % Change
Employee future benefit plan expense $ (15) $ (22) $ 7 32%
Investment and other income (loss) 10,906 9,791 1,115 11%
Mark to Market gain (loss) on financial assets (10,329) 2,900 (13,229) (456%)
Foreign exchange gain (loss) 1,309 3,059 (1,750) (57%)
Government levies -%
Finance income (loss) and other $ 1,871 $ 15,728 $ (13,857) (88%)

image_21.jpg Page 29 of 49


(Expressed in thousands of U.S. dollars)
Year ended December 31,
2023 2022 $ Change % Change
Employee future benefit plan expense $ (109) $ (189) $ 80 42%
Investment and other income (loss) 43,340 19,606 23,734 121%
Mark to Market gain (loss) on financial assets (12,897) (16,877) 3,980 24%
Foreign exchange gain (loss) 821 (4,552) 5,373 118%
Government levies (100) (100) -%
Finance income (loss) and other $ 31,055 $ (2,112) $ 33,167 1,570%
Employee future benefit plan expense for the three months and year ended December 31, 2023 and 2022 were nominal and consist primarily of interest cost on plan obligations over the expected return on plan assets on a curtailed defined benefit pension plan for certain former United States employees.
Investment and other income for the three months and year ended December 31, 2023 was $10.9 million and $43.3 million, respectively, compared to $9.8 million and $19.6 million, respectively, for the corresponding periods of 2022. Amounts were earned on our cash, cash equivalents and short-term investments and have changed proportionately with the overall increase in market interest rates during 2023 and the relative change in our overall average monthly cash balances.
Mark to market gain (loss) on financial assets for the three months and year ended December 31, 2023, was ($10.3) million and ($12.9) million, respectively, compared to $2.9 million and ($16.9) million, respectively, for the corresponding periods of 2022. Mark to market gain (loss) consist primarily of changes in the fair value of our long-term financial investments including Forsee Power, Wisdom, Quantron, and hydrogen infrastructure and growth equity funds. Mark to market gains and losses are also impacted by the conversion of these long-term financial assets from their respective European Euro or Great British pound denominated investment to the U.S. dollar.
Foreign exchange gains (losses) for the three months and year ended December 31, 2023 were $1.3 million and $0.8 million, respectively, compared to $3.1 million and ($4.6) million, respectively, for the corresponding periods of 2022. Foreign exchange gains and losses are attributable primarily to the effect of changes in the value of the Canadian dollar, relative to the U.S. dollar, on our Canadian dollar-denominated net monetary position. Foreign exchange gains and losses are also impacted by the conversion of Ballard Power Systems Europe A/S’ assets and liabilities from the Danish Kroner to the U.S. dollar at exchange rates in effect at each reporting date which are recorded in other comprehensive income (loss).
Government levies for the year ended December 31, 2023 was ($0.1) million, consistent with the corresponding period of 2022. Government levies relate primarily to withholding taxes deducted from proceeds earned on certain commercial contracts.
Finance expense for the three months and year ended December 31, 2023 was ($0.3) million and ($1.1) million, respectively, compared to ($0.3) million and ($1.3) million, respectively, for the corresponding periods of 2022. Finance expense represents the interest expense incurred on our right-of-use assets with a lease term of greater than 12-months, including our head office building, manufacturing facility, and related storage facilities in Burnaby, British Columbia, as well as similar right-of-use assets in all of our subsidiaries.
image_21.jpg Page 30 of 49


Equity in income (loss) of investment in joint venture and associates for the three months and year ended December 31, 2023, was ($4.3) million and ($10.1) million, respectively, compared to ($6.8) million and ($11.6) million, respectively, for the corresponding periods of 2022. Equity in loss of investment in joint venture and associates relates to the pickup of 49% of the net income (loss) of Weichai Ballard JV in China due to our 49% ownership position which is accounted for using the equity method of accounting.
The loss of investment in joint venture and associates in the operations of Weichai Ballard JV includes research and product development expenses in the periods consisting primarily of amounts expended on the ongoing $90 million technology transfer agreement with Ballard as Weichai Ballard JV continues to establish operations. Weichai Ballard JV manufactures Ballard’s next-generation LCS bi-polar plates, fuel cell stacks and LCS-based power modules for bus, commercial truck, and forklift applications with certain exclusive rights in China.
Impairment charges on property, plant and equipment for the three months and year ended December 31, 2023 was ($1.0) million in each of the periods and consists primarily of a write-down of assets in China as we have decided to suspend investment in our previously announced MEA localization facility in China while we continue with a comparative analysis on manufacturing capacity expansion options and possible sequencing prioritization in the U.S. and/or European markets.
5.5     Summary of Quarterly Results
The following table provides summary financial data for our last eight quarters:
(Expressed in thousands of U.S. dollars, except per share amounts and weighted average shares outstanding which are expressed in thousands)
Quarter ended,
Dec 31,
 2023
Sep 30,
 2023
Jun 30,
 2023
Mar 31,
 2023
Revenues $ 46,751 $ 27,060 $ 15,314 $ 13,243
Net loss from continuing operations $ (48,889) $ (34,720) $ (28,213) $ (32,388)
Net loss from continuing operations per share, basic and diluted $ (0.16) $ (0.12) $ (0.09) $ (0.11)
Weighted average common shares outstanding 298,826 298,705 298,679 298,429
Dec 31,
 2022
Sep 30,
 2022
Jun 30,
 2022
Mar 31,
 2022
Revenues $ 20,183 $ 21,155 $ 20,666 $ 19,856
Net loss from continuing operations $ (27,572) $ (41,295) $ (51,795) $ (39,709)
Net loss from continuing operations per share, basic and diluted $ (0.09) $ (0.14) $ (0.17) $ (0.13)
Weighted average common shares outstanding 298,324 298,181 298,155 297,825

Summary of Quarterly Results: There were no significant seasonal variations in our quarterly results. Variations in our net loss for the above periods were affected primarily by the following factors:
•Revenues: Variations in fuel cell product and service revenues reflect the demand and timing of our customers’ fuel cell vehicle, bus, and fuel cell product deployments as well as the demand and timing of their engineering services projects. Variations in fuel cell product and service revenues also reflect the timing of work performed and the achievements of milestones under long-term fixed price contracts.
image_21.jpg Page 31 of 49


•Operating expenses: Operating expenses include the impact of changes in the value of the Canadian dollar, versus the U.S. dollar, on our Canadian dollar denominated operating expenses.
•Net loss from continuing operations: Net loss from continuing operations is impacted by the above noted impacts on Revenues and Operating expenses. Net loss in the fourth quarter of 2023, third quarter of 2023, second quarter of 2023, first quarter of 2023, the fourth quarter of 2022, the third quarter of 2022, the second quarter of 2022, and the first quarter of 2022, was also impacted by mark to market gains (losses) on financial assets of ($10.3) million, ($2.5) million, $0.3 million, ($0.5) million, $2.9 million, $1.7 million, ($12.9) million, and ($8.6) million, respectively, related primarily to our investments in Forsee Power, Wisdom, Quantron, and hydrogen infrastructure and growth equity funds.
6.CASH FLOWS, LIQUIDITY AND CAPITAL RESOURCES
6.1     Summary of Cash Flows
Cash and cash equivalents were $751.1 million as of December 31, 2023, compared to $913.7 million as of December 31, 2022. The ($162.6) million decrease in cash and cash equivalents in 2023 was driven primarily by net cash operating losses (excluding non-cash items) of ($87.5) million, net working capital outflows of ($17.1) million, purchases of property, plant and equipment and intangible assets of ($41.4) million, subsequent milestone cash acquisition investment payments for Ballard Motive Solutions of ($2.0) million, long-term net financial investments of ($10.9) million consisting of new investments in Quantron and hydrogen infrastructure and growth equity funds, and by finance lease repayments of ($4.0) million.
6.2     Cash Provided by (Used by) Operating Activities
(Expressed in thousands of U.S. dollars) Three months ended December 31,
2023
     2022
$ Change
Cash Operating Loss $ (17,485) $ (22,956) $ 5,472
Change in Working Capital:
Trade and other receivables (16,271) 654 (16,925)
Inventory 14,986 (744) 15,730
Prepaid expenses and other current assets 3,522 (142) 3,664
Trade and other payables (954) 4,982 (5,936)
Deferred revenue (4,030) (2,677) (1,353)
Warranty provision 1,893 (300) 2,193
(854) 1,773 (2,627)
Cash Used by Operating Activities $ (18,339) $ (21,183) $ 2,844
For the three months ended December 31, 2023, cash used by operating activities was ($18.3) million, compared to ($21.2) million for the three months ended December 31, 2022. The $2.8 million decrease in cash used by operating activities in the fourth quarter of 2023, as compared to the fourth quarter of 2022, was driven by the relative decrease in cash operating losses of $5.5 million, partially offset by the increase in working capital requirements of ($2.6) million.
image_21.jpg Page 32 of 49


The relative $5.5 million decrease in cash operating losses in the fourth quarter of 2023 was driven primarily by the increase in Adjusted EBITDA loss of ($3.9) million and by several items included in cash operating losses but excluded from Adjusted EBITDA loss or vice-versa including: lower loss from discontinued operations (excluding the impact of impairment related charges) of $3.5 million, higher impairment loss on trade receivables of $1.4 million, higher inventory impairment and onerous contracts provisions adjustment of $6.6 million, higher restructuring expenses of $0.2 million, lower finance and other income (excluding mark to market fair value changes on investments) of ($0.6) million, lower equity investment losses in joint venture and associates of ($2.4) million.
The total change in working capital of ($0.9) million in the fourth quarter of 2023 was driven by lower inventory of $15.0 million due primarily to higher product shipments in the period, lower prepaid expenses of $3.5 million primarily due to the timing of annual insurance renewals, and by higher warranty provisions of $1.9 million. These fourth quarter of 2023 inflows were partially offset by higher accounts and contract receivables of ($16.3) million primarily due to the timing of revenues and the related customer collections, and lower deferred revenue of ($4.0) million as pre-payments on certain product and service contracts were recognized.
The total change in working capital of $1.8 million in the fourth quarter of 2022 was driven by higher accounts payable and accrued liabilities of $5.0 million primarily due to the timing of supplier payments, by lower accounts and contract receivables of $0.7 million primarily due to the timing of revenues and the related customer collections. These fourth quarter of 2022 inflows were partially offset by lower deferred revenue of ($2.7) million as pre-payments on certain product and service contracts were recognized, and higher inventory of ($0.7) million.
(Expressed in thousands of U.S. dollars) Year ended December 31,
2023
     2022
$ Change
Cash Operating Loss $ (87,484) $ (114,230) $ 26,747
Change in Working Capital:
Trade and other receivables (12,913) (2,945) (9,968)
Inventory (898) (11,145) 10,247
Prepaid expenses and other current assets 76 (1,668) 1,744
Trade and other payables (3,580) (718) (2,862)
Deferred revenue (3,442) (4,079) 637
Warranty provision 3,671 2,614 1,057
(17,086) (17,941) 855
Cash Used by Operating Activities $ (104,570) $ (132,171) $ 27,602
For the year ended December 31, 2023, cash used by operating activities was ($104.6) million compared to ($132.2) million for 2022. The $27.6 million decrease in cash used by operating activities in 2023, as compared to 2022, was driven by the relative decrease in cash operating losses of $26.7 million, and by the relative decrease in working capital requirements of $0.9 million.
The relative $26.7 million decrease in cash operating losses in 2023 was driven primarily by the increase in Adjusted EBITDA loss of ($17.5) million which was more than offset by several items included in cash operating losses but excluded from Adjusted EBITDA loss or vice-versa including: lower loss from discontinued operations (excluding the impact of impairment related charges) of $3.3 million higher finance and other income (excluding mark to market fair value changes on investments) of $29.1 million, lower equity investment losses in joint venture and associates of ($1.5) million, higher impairment of trade receivables of $1.5 million, higher inventory impairment and onerous contracts provisions adjustment of $7.5 million, higher restructuring expenses of $1.0 million, and lower acquisition related costs of $2.1 million.
image_21.jpg Page 33 of 49


The total change in working capital of ($17.1) million in 2023 was driven by higher accounts and contract receivables of ($12.9) million primarily due to the timing of revenues and the related customer collections, lower accounts payable and accrued liabilities of ($3.6) million primarily as a result of the timing of supplier payments and annual compensation awards, lower deferred revenue of ($3.4) million as pre-payments on certain product and service contracts were recognized, and higher inventory of ($0.9) million. These 2023 outflows were partially offset by higher warranty provisions of $3.7 million.
The total change in working capital of ($17.9) million in 2022 was driven by higher inventory of ($11.1) million primarily to support expected product shipments in 2023 and to help mitigate ongoing supply chain disruptions, by lower deferred revenue of ($4.1) million as pre-payments on certain product and service contracts were recognized, by higher accounts and contract receivables of ($2.9) million primarily as a result of the timing of revenues and the related customer collections, and by higher prepaid expenses of ($1.7) million primarily due to the timing of annual insurance renewals. These 2022 outflows were partially offset by higher warranty provisions of $2.6 million.
6.3     Cash Provided by (Used by) Investing Activities
Investing activities resulted in net cash outflows of ($10.8) million and ($54.3) million, respectively, for the three months and year ended December 31, 2023, compared to net cash outflows of ($20.1) million and ($75.6) million, respectively, for the corresponding periods of 2022.
Investing activities in the fourth quarter of 2023 of ($10.8) million consist of capital expenditures of ($7.4) million incurred primarily for production and test equipment and certain intangible assets, and additional long-term investments in the HyCap and Clean H2 hydrogen infrastructure and growth equity funds of ($3.5) million.
Investing activities in the fourth quarter of 2022 of ($20.1) million consist of additional long-term investments in Quantron of ($5.2) million and in certain hydrogen infrastructure and growth equity funds of ($0.1) million, and by capital expenditures of ($14.8) million incurred primarily for production and test equipment and certain intangible assets.
Investing activities in 2023 of ($54.3) million consist of capital expenditures of ($41.4) million incurred primarily for production and test equipment and certain intangible assets, additional long-term investments in Quantron of ($3.3) million, additional investment in the HyCap and Clean H2 hydrogen infrastructure and growth equity funds of ($8.6) million, and subsequent milestone attainment cash acquisition investment in Ballard Motive Solutions of ($2.0) million. These 2023 cash outflows were partially offset by a recovery of contributions in our long-term investment in Wisdom of $1.0 million.
Investing activities in 2022 of ($75.6) million consist of additional long-term investments in Quantron, Wisdom, and in certain hydrogen infrastructure and growth equity funds of ($17.9) million, subsequent Milestone cash acquisition investment payments for Ballard Motive Solutions of ($14.9) million, investments in associated companies of ($9.3) million for the twelfth, thirteenth and fourteenth and final contracted equity contributions in our 49% investment in Weichai Ballard JV, and by capital expenditures of ($34.5) million incurred primarily for production and test equipment and certain intangible assets, partially offset by proceeds received on the sale of short-term investments of $1.0 million.

image_21.jpg Page 34 of 49


6.4     Cash Provided by (Used by) Financing Activities
Financing activities resulted in net cash outflows of ($1.1) million and ($3.7) million, respectively, for the three months and year ended December 31, 2023, compared to net cash outflows of ($0.8) million and ($2.4) million, respectively, for the corresponding periods of 2022.
Financing activities in the fourth quarter of 2023 of ($1.1) million consist of finance lease payments of ($1.2) million, partially offset by proceeds from the exercise of share purchase options of $0.1 million. Financing activities in the fourth quarter of 2022 of ($0.8) million consist of finance lease payments of ($1.0) million, partially offset by proceeds from the exercise of share purchase options of $0.1 million.
Financing activities in 2023 of ($3.7) million consist of finance lease payments of ($4.0) million, partially offset by proceeds from the exercise of share purchase options of $0.3 million. Financing activities in 2022 of ($2.4) million consist of finance lease payments of ($3.3) million, partially offset by proceeds from the exercise of share purchase options of $0.9 million.
6.5     Liquidity and Capital Resources
As of December 31, 2023, we had total liquidity of $753.2 million. We measure liquidity as our net cash and short-term investment position, consisting of the sum of our cash, cash equivalents and short-term investments of $753.2 million, as we have no bank debt.
We have a Letter of Guarantee Facility (the “LG Facility”) enabling our bank to issue letters of guarantees, standby letters of credit, performance bonds, counter guarantees, counter standby letter of credit or similar credits on our behalf to from time to time up to a maximum of $2.0 million. As of December 31, 2023, issued letters of credit of euro 1.0 million were outstanding under the LG Facility. We also have a $25 million Foreign Exchange Facility (the “FX Facility”) enabling us to enter into foreign exchange currency contracts (at face value amounts in excess of the FX Facility) secured by a guarantee from Export Development Canada. As of December 31, 2023, we had outstanding foreign exchange currency contracts to purchase a total of Canadian $31.5 million under the FX Facility.
Our liquidity objective is to maintain cash balances sufficient to fund at least six quarters of forecasted cash used by operating activities and contractual commitments. Our strategy to attain this objective is to continue our drive to attain profitable operations that are sustainable by executing a business plan that continues to focus on Fuel Cell Products and Services revenue growth, improving overall gross margins, maintaining discipline over Cash Operating Costs, managing working capital and capital expenditure requirements, and securing additional financing to fund our operations as needed until we do achieve profitable operations that are sustainable. We believe that we have adequate liquidity in cash and working capital to achieve our liquidity objective.
Failure to achieve or maintain this liquidity objective could have a material adverse effect on our financial condition and results of operations including our ability to continue as a going concern. There are also various risks and uncertainties affecting our ability to achieve this liquidity objective including, but not limited to, the market acceptance and rate of commercialization of our products, the ability to successfully execute our business plan, and general global economic conditions, certain of which are beyond our control.
image_21.jpg Page 35 of 49


While we continue to make significant investments in product development and market development activities necessary to commercialize our products, make increased investments in working capital and capital expenditures as we grow our business, and make ongoing capital contributions in support of our investment in certain hydrogen infrastructure and growth equity funds, our actual liquidity requirements will also vary and will be impacted by future acquisitions and strategic partnerships and investments, our relationships with our lead customers and strategic partners including their ability to successfully finance and fund their operations and programs and agreements with us, our success in developing new channels to market and relationships with customers, our success in generating revenue growth from near-term product, service and licensing opportunities, our success in managing our operating expense and working capital requirements, foreign exchange fluctuations, and the progress and results of our research, development and demonstration programs.
We may also choose to pursue additional liquidity through the issuance of debt or equity in private or public market financings. To enable the timely issuance of equity securities in the public market, we renewed our Base Shelf Prospectus on file with the securities regulators in Canada on May 9, 2023. The Base Shelf Prospectus, which is effective for 25-months ending in June 2025, was filed in each of the provinces and territories of Canada, and a corresponding shelf registration statement on Form F-10 was also filed with the United States Securities and Exchange Commission. These filings will enable offerings of securities at any time during the 25-month period that the Base Shelf Prospectus remains effective. No offerings of securities under this Base Shelf Prospectus have been issued to date.
No assurance can be given that any such additional liquidity will be available or that, if available, it can be obtained on terms favorable to the Company. If any securities are offered under the Base Shelf Prospectus, the terms of any such securities and the intended use of the net proceeds resulting from such offering would be established at the time of any offering and would be described in a supplement to the Base Shelf Prospectus filed with applicable Canadian securities regulators and/or the SEC, respectively, at the time of such an offering.
7.OTHER FINANCIAL MATTERS
7.1     Off-Balance Sheet Arrangements and Contractual Obligations
Periodically, we use forward foreign exchange contracts to manage our exposure to currency rate fluctuations. We record these contracts at their fair value as either assets or liabilities on our statement of financial position. Any changes in fair value are either (i) recorded in other comprehensive income if formally designated and qualified under hedge accounting criteria; or (ii) recorded in profit or loss (general and administrative expense) if either not designated, or not qualified, under hedge accounting criteria. As of December 31, 2023, we had outstanding foreign exchange currency contracts to purchase a total of Canadian $31.5 million at an average rate of 1.3457 Canadian per U.S. dollar, resulting in an unrealized gain of Canadian $0.5 million as of December 31, 2023. The outstanding foreign exchange currency contracts have not been designated under hedge accounting.
image_21.jpg Page 36 of 49


As of December 31, 2023, we did not have any other material obligations under guarantee contracts, retained or contingent interests in transferred assets, outstanding derivative instruments, or non-consolidated variable interests.
As of December 31, 2023, we had the following contractual obligations and commercial commitments calculated on a non-discounted basis (with the exception of Finance leases):
(Expressed in thousands of U.S. dollars) Payments due by period,
Contractual Obligations Total Less than one year 1-3 years 4-5 years After 5 years
Finance leases $     22,261 $       5,667 $       7,551 $     4,206 $       4,837
Asset retirement obligations          2,407                -          2,407                -                -
Long-term investment (HyCap)        17,818        17,818                -                -                -
Long-term investment (Clean H2)        27,955          6,630        21,325           -                -
Total contractual obligations $     70,441 $     30,115 $     31,283 $     4,206 $       4,837
Long-term investments include an investment committing us to be a limited partner in HyCap, a hydrogen infrastructure and growth equity fund. HyCap is to invest in a combination of hydrogen infrastructure projects and investments in companies along the hydrogen value chain. We have committed to investing £25.0 million (including £11.0 million invested as of December 31, 2023) into HyCap.
Long-term investments also include an investment committing us to be a limited partner in Clean H2, another hydrogen infrastructure and growth equity fund. Clean H2 is to invest in a combination of hydrogen infrastructure projects and investments in companies along the hydrogen value chain. We have committed to investing €30.0 million (including €4.7 million invested as of December 31, 2023) into Clean H2.
Long-term investments also include an investment committing us to be a limited partner in Templewater, a decarbonization climate technology and growth equity fund. We have committed to investing $1.0 million (including nil invested as of December 31, 2023) in Templewater.
In addition, we have outstanding commitments of $22.0 million as of December 31, 2023, related primarily to purchases of property, plant, and equipment. Capital expenditures and expenditures on other intangible assets pertain to our regular operations and are expected to be funded through cash on hand.
In connection with the acquisition of intellectual property from UTC in 2014, we have a royalty obligation in certain circumstances to pay UTC a portion of any future intellectual property sale and licensing income generated from certain of our intellectual property portfolio for a period of 15-years expiring in April 2029. No royalties were paid to UTC for the years ended December 31, 2023 and 2022.
As of December 31, 2023, we retain a previous funding obligation to pay royalties of 2% of revenues (to a maximum of Canadian $5.4 million) on sales of certain fuel cell products for commercial distributed utility applications. No royalties have been incurred to date due to this agreement.
We also retain a previous funding obligation to pay royalties of 2% of revenues (to a maximum of Canadian $2.2 million) on sales of certain fuel cell products for commercial transit applications. No royalties have been incurred to date due to this agreement.
image_21.jpg Page 37 of 49


In the ordinary course of business or as required by certain acquisition or disposition agreements, we are periodically required to provide certain indemnities to other parties. As of December 31, 2023, we have not accrued any significant amount owing, or receivable, due to any indemnity agreements undertaken in the ordinary course of business.
7.2     Related Party Transactions
Related parties now only include our 49% owned equity accounted investee, Weichai Ballard JV, as we disposed of our 10% owned equity accounted investee, Synergy Ballard JVCo, in 2023. Transactions between us and our subsidiaries are eliminated on consolidation. For the three months and year ended December 31, 2023, and 2022, related party transactions and balances with Weichai Ballard JV are as follows:
(Expressed in thousands of U.S. dollars) Three Months Ended December 31,
Transactions with related parties
2023 2022
Revenues $    4,655 $    1,178
Cost of goods sold and operating expense $    583 $    1,253

(Expressed in thousands of U.S. dollars) Year Ended December 31,
Transactions with related parties
2023 2022
Revenues $    8,099 $    8,115
Cost of goods sold and operating expense $    1,996 $    3,225

(Expressed in thousands of U.S. dollars) As at Dec 31, As at Dec 31,
Balances with related parties
2023 2022
Accounts receivable $    13,697 $    13,320
Investments $    13,901 $    24,026
Deferred revenue $    (1,904) $    (2,095)
We also provide key management personnel, being board directors and executive officers, certain benefits, in addition to their salaries. Key management personnel also participate in the Company’s share-based compensation plans. Key management personnel compensation is summarized in note 29 to our annual consolidated financial statements for the year ended December 31, 2023.
7.3     Outstanding Share and Equity Information
As of March 8, 2024
Common share outstanding 299,036,564
Options outstanding 4,263,427
DSUs outstanding 737,369
RSUs / PSUs outstanding (subject to vesting and performance criteria) 3,134,099
8.USE OF PROCEEDS
8.1     Reconciliation of Use of Proceeds from Previous Financings
During 2021 and 2020, we completed the following offerings of our common shares (“Common Shares”):
image_21.jpg Page 38 of 49


•On February 23, 2021, we closed a bought deal offering of 14.87 million Common Shares at a price of $37.00 per Common Share for gross proceeds of $550.2 million and net proceeds of $527.3 million (the “2021 Offering”).
•On November 27, 2020, we closed a bought deal offering of 20.9 million Common Shares at a price of $19.25 per Common Share for gross proceeds of $402.5 million and net proceeds of $385.8 million (the “2020 Offering”).
•On September 1, 2020, we announced an at-the-market equity program to issue a total of 16.45 million Common Shares from treasury (the “$250 million ATM Program”). The 16.45 million Common Shares issued under the $250 million ATM Program were sold in the third and fourth quarters of 2020 at prevailing market prices at the time of sale for total gross proceeds of $250 million and total net proceeds of $244.1 million.
•On March 10, 2020, we announced an at-the-market equity program to allow the issuance of up to $75 million of Common Shares from treasury (the “$75 million ATM Program” and together with the $250 million ATM Program, the “2020 ATM Programs”). The 8.2 million Common Shares issued under the $75 million ATM Program were sold in the first half of 2020 at prevailing market prices at the time of sale for total gross proceeds of $66.7 million and total net proceeds of $64.7 million.
The net proceeds from the 2021 Offering and the 2020 Offering of $527.3 million and $385.8 million, respectively, were intended to be used to further strengthen the Company’s financial position, thereby providing additional flexibility to fund growth strategies, including through activities such as product innovation, investments in production capacity expansion and localization, future acquisitions and strategic partnerships and investments. The net proceeds from the 2020 ATM Programs of $308.8 million were intended to be used for general corporate purposes. Pending their use, we disclosed our intention to invest the net proceeds from the 2021 Offering and the 2020 Offering in short-term, investment grade, interest bearing instruments or to hold them as cash and cash equivalents.
The following tables sets out a comparison of the Company’s disclosed expected use of net proceeds from the 2020 Offering, the 2021 Offering, and the 2020 ATM Programs to the actual use of such net proceeds to December 31, 2023. As of December 31, 2023, the residual net proceeds from the 2021 Offering and the 2020 ATM Programs were held in interest bearing cash accounts. The net proceeds of $385.8 million from the 2020 Offering have now been fully expended.
image_21.jpg Page 39 of 49


2020 Offering Net Proceeds $385.8M (fully expended)
Intended Use of Net Proceeds: Further strengthen the Company’s balance sheet, thereby providing additional flexibility to fund growth strategies, including through activities such as product innovation, investments in production capacity expansion and localization, future acquisitions and strategic partnerships and investments.
Actual Use of Net Proceeds (expressed in thousands of U.S. dollars)
Variance – (Over)/Under Expenditures Explanation of Variance
Research and Product Development (cash Operating cost) expenditures including product development of next generation fuel cell stacks and modules $182,227 N/A N/A
Investments in property, plant and equipment and other intangible assets including production capacity expansion and localization $83,174 N/A N/A
Ballard Motive Solutions acquisition (initial and subsequent cash costs) and acquisition related expenses $26,768 N/A N/A
Strategic partnerships and investments including Quantron, Wisdom, Forsee Power, HyCap, Clean H2, Weichai Ballard JVCo, and acquisition related expenses $93,631 N/A N/A
Total expended to December 31, 2023 $385,800

2021 Offering Net Proceeds $527.3M
Intended Use of Net Proceeds: Further strengthen the Company’s balance sheet, thereby providing additional flexibility to fund growth strategies, including through activities such as product innovation, investments in production capacity expansion and localization, future acquisitions and strategic partnerships and investments.
Actual Use of Net Proceeds (expressed in thousands of U.S. dollars)
Variance – (Over)/Under Expenditures Explanation of Variance
Research and Product Development (cash Operating cost) expenditures including product development of next generation fuel cell stacks and modules $9,477 N/A N/A
Investments in property, plant and equipment and other intangible assets including production capacity expansion and localization $7,380 N/A N/A
Strategic partnerships and investments including Quantron, Wisdom, Forsee Power, HyCap, Clean H2, Weichai Ballard JVCo, and acquisition related expenses $3,467 N/A N/A
Total expended to December 31, 2023 $20,324

2020 ATM Programs Net Proceeds $308.8M
Intended Use of Net Proceeds: General Corporate Purposes
Actual Use of Net Proceeds (expressed in thousands of U.S. dollars)
Variance – (Over)/Under Expenditures Explanation of Variance
Gross Margin loss expenditures (net of inventory impairment charges) $19,733 N/A N/A
General and Administration (cash Operating cost) expenditures $50,667 N/A N/A
Sales and Marketing (cash Operating cost) expenditures $28,370 N/A N/A
Restructuring related expenditures $8,399 N/A N/A
Working capital requirements $30,414 N/A N/A
Lease liability principal repayments $8,068 N/A N/A
Total expended to December 31, 2023 $145,651

image_21.jpg Page 40 of 49


9.ACCOUNTING MATTERS
9.1     Overview
Our consolidated financial statements are prepared in accordance with IFRS, which require us to make estimates and assumptions that affect the application of accounting policies and the reported amounts of assets, liabilities, income, and expenses. Actual results may differ from those estimates. Estimates and underlying assumptions are reviewed on an ongoing basis. Revisions to accounting estimates are recognized in the period in which the estimates are revised and in any future periods affected.
9.2     Critical Judgments in Applying Accounting Policies
Critical judgments that we have made in the process of applying our accounting policies and that have the most significant effect on the amounts recognized in the consolidated financial statements is limited to our assessment of our ability to continue as a going concern (See Note 2 (e) to our annual consolidated financial statements).
Our material accounting policies are detailed in note 4 to our annual consolidated financial statements for the year ended December 31, 2023. Effective January 1, 2023, we adopted a number of new standards and interpretations, but they did not have a material impact on our financial statements.
9.3     Key Sources of Estimation Uncertainty
The following are key assumptions concerning the future and other key sources of estimation uncertainty that have a significant risk of resulting in a material adjustment to the reported amount of assets, liabilities, income, and expenses within the next financial year.
REVENUE RECOGNITION
Revenues are generated primarily from product sales, the license and sale of intellectual property and fundamental knowledge, and the provision of engineering services and technology transfer services. Product revenues are derived primarily from standard product sales contracts and from long-term fixed price contracts. Intellectual property and fundamental knowledge license revenues are derived primarily from standard licensing and technology transfer agreements. Engineering service and technology transfer service revenues are derived primarily from cost-plus reimbursable contracts and from long-term fixed price contracts.
Revenue is recognized when a customer obtains control of the goods or services. Determining the timing of the transfer of control, at a point in time or over time, requires judgment.
On standard product sales contracts, revenues are recognized when customers obtain control of the product, which is when transfer of title and risks and rewards of ownership of goods have passed, and when obligation to pay is considered certain. Invoices are generated and revenue is recognized at that point in time. Provisions for warranties are made at the time of sale. Revenue recognition for standard product sales contracts does not usually involve significant estimates.
On standard licensing and technology transfer agreements, revenues are recognized on the transfer of rights to a licensee, when it is determined to be distinct from other performance obligations, and if the customer can direct the use of, and obtain substantially all of the remaining benefits from the license as it exists at the time of transfer.
image_21.jpg Page 41 of 49


In other cases, the proceeds are considered to relate to the right to use the asset over the license period and the revenue is recognized over that period. If it is determined that the license is not distinct from other performance obligations, revenue is recognized over time as the customer simultaneously receives and consumes the benefit. Revenue recognition for standard license and sale agreements does not usually involve significant estimates.
On cost-plus reimbursable contracts, revenues are recognized as costs are incurred, and include applicable fees earned as services are provided. Revenue recognition for cost-plus reimbursable contracts does not usually involve significant estimates.
On long-term fixed price contracts, the customer controls all of the work in progress as the services are being provided. This is because under these contracts, the deliverables are made to a customer’s specification, and if a contract is terminated by the customer, then the Company is entitled to reimbursement of the costs incurred to date plus the applicable gross margin. Therefore, revenue from these contracts and the associated costs are recognized as the costs are incurred over time. On long-term fixed price contracts, revenues are recognized over time using cumulative costs incurred to date relative to total estimated costs at completion to measure progress towards satisfying performance obligations. Generally, revenue is recognized by multiplying the expected consideration by the ratio of cumulative costs incurred to date to the sum of incurred and estimated costs for completing the performance obligation. The cumulative effect of changes to estimated revenues and estimated costs for completing a contract are recognized in the period in which the revisions are identified. If the estimated costs for completing the contract exceed the expected revenues on a contract, such loss is recognized in its entirety in the period it becomes known. Deferred revenue (i.e., contract liabilities) represents cash received from customers in excess of revenue recognized on uncompleted contracts.
•The determination of expected costs for completing a contract is based on estimates that can be affected by a variety of factors such as variances in the timeline to completion, the cost of materials, the availability and cost of labour, as well as productivity.
•The determination of potential revenues includes the contractually agreed amount and may be adjusted based on the estimate of our attainment on achieving certain defined contractual milestones. Management’s estimation is required in determining the amount of consideration for which the Company expects to be entitled and in determining when a performance obligation has been met.
Estimates used to determine revenues and costs of long-term fixed price contracts involve uncertainties that ultimately depend on the outcome of future events and are periodically revised as projects progress. There is a risk that a customer may ultimately disagree with management’s assessment of the progress achieved against milestones, or that our estimates of the work required to complete a contract may change.
During the three months and year ended December 31, 2023, and 2022, there were no significant adjustments to revenues relating to revenue recognized in a prior period.
image_21.jpg Page 42 of 49


ASSET IMPAIRMENT
The carrying amounts of our non-financial assets other than inventories are reviewed at each reporting date to determine whether there is any indication of impairment. If any such indication exists, then the asset’s recoverable amount is estimated. For goodwill and intangible assets that have indefinite useful lives, the recoverable amount is estimated annually, or whenever events or circumstances indicate that the carrying amount may not be recoverable.
The recoverable amount of an asset or cash-generating unit is the greater of its value in use and its fair value less costs to sell. In assessing value in use, the estimated future cash flows are discounted to their present value using a pre-tax discount rate that reflects current market assessments of the time value of money and the risks specific to the asset. In assessing fair value less costs to sell, the price that would be received on the sale of an asset in an orderly transaction between market participants at the measurement date is estimated. For the purposes of impairment testing, assets that cannot be tested individually are grouped together into the smallest group of assets that generates cash inflows from continuing use that are largely independent of the cash inflows of other groups of assets. The allocation of goodwill to cash-generating units reflects the lowest level at which goodwill is monitored for internal reporting purposes. Many of the factors used in assessing fair value are outside the control of management and it is reasonably likely that assumptions and estimates will change from period to period. These changes may result in future impairments. For example, our revenue growth rate could be lower than projected due to economic, industry or competitive factors, or the discount rate used in our value in use model could increase due to a change in market interest rates. In addition, future goodwill impairment charges may be necessary if our market capitalization declines due to a decrease in the trading price of our common stock, which could negatively impact the fair value of our business.
An impairment loss is recognized if the carrying amount of an asset or its cash-generating unit exceeds its estimated recoverable amount. Impairment losses are recognized in net loss. Impairment losses recognized in respect of the cash-generating units are allocated first to reduce the carrying amount of any goodwill allocated to the units, and then to reduce the carrying amounts of the other assets in the unit on a pro-rata basis.
An impairment loss in respect of goodwill is not reversed. In respect of other assets, impairment losses recognized in prior periods are assessed at each reporting date for any indications that the cumulative loss has decreased or no longer exists. An impairment loss is reversed only to the extent that the asset’s carrying amount does not exceed the carrying amount that would have been determined, net of depreciation or amortization, if no impairment loss had been recognized.
As of December 31, 2023, our consolidated goodwill balance of $40.3 million relates solely to our Fuel Cell Products and Services segment. We perform the annual review of goodwill as at December 31 of each year, more often if events or changes in circumstances indicate that it might be impaired. Under IFRS, the annual review of goodwill requires a comparison of the carrying value of the asset to the higher of (i) value in use; and (ii) fair value less costs to sell. Value in use is defined as the present value of future cash flows expected to be derived from the asset in its current state. Our fair value less costs to sell test is in effect a modified market capitalization assessment, whereby we calculate the fair value of the Fuel Cell Products and Services segment by first calculating the value of the Company at December 31, 2023 based on the average closing share price in the month of December, add a reasonable estimated control premium to determine the Company’s enterprise value on a controlling basis after adjusting for excess cash balances, deducting the fair value of long-term financial investments, and then deducting the estimated costs to sell from this enterprise value to arrive at the fair value of the Fuel Cell Products and Services segment.
image_21.jpg Page 43 of 49


As a result of this assessment, we have determined that the fair value of the Fuel Cell Products and Services segment exceeds its carrying value as of December 31, 2023, indicating that no goodwill impairment charge is required for 2023.
In addition to the above goodwill impairment test, we perform a quarterly assessment of the carrying amounts of our non-financial assets (other than inventories) to determine whether there is any indication of impairment. During the three months and year ended December 31, 2023, impairment charges of ($1.0) million were recognized on our non-financial assets (other than inventories) related to impaired property, plant and equipment in China as we have decided to suspend our previously announced MEA localization plan in China.
WARRANTY PROVISION
A provision for warranty costs is recorded on product sales at the time of shipment. In establishing the accrued warranty liabilities, we estimate the likelihood that products sold will experience warranty claims and the cost to resolve claims received.
In making such determinations, we use estimates based on the nature of the contract and past and projected experience with the products. Should these estimates prove to be incorrect, we may incur costs different from those provided for in our warranty provisions. During the three months and year ended December 31, 2023, we recorded provisions to accrued warranty liabilities of $2.5 million and $6.0 million, respectively, for new product sales, compared to $0.9 million and $4.6 million, respectively, for the three months and year ended December 31, 2022.
We review our warranty assumptions and make adjustments to accrued warranty liabilities quarterly based on the latest information available and to reflect the expiry of contractual obligations. Adjustments to accrued warranty liabilities are recorded in cost of product and service revenues. As a result of these reviews and the resulting adjustments, our warranty provision and cost of revenues for the three months and year ended December 31, 2023, were adjusted downwards (upwards) by $0.3 million and ($0.4) million, respectively, compared to adjustments of $0.5 million and ($0.4) million, respectively, for the three months and year ended December 31, 2022.
INVENTORY AND ONEROUS CONTRACT PROVISIONS
In determining the lower of cost and net realizable value of our inventory and establishing the appropriate provision for inventory obsolescence, we estimate the likelihood that inventory carrying values will be affected by changes in market pricing or demand for our products and by changes in technology or design which could make inventory on hand obsolete or recoverable at less than cost. We perform regular reviews to assess the impact of changes in technology and design, sales trends, and other changes on the carrying value of inventory. Where we determine that such changes have occurred and will have a negative impact on the value of inventory on hand, appropriate provisions are made. If there is a subsequent increase in the value of inventory on hand, reversals of previous write-downs to net realizable value are made. Unforeseen changes in these factors could result in additional inventory provisions, or reversals of previous provisions, being required.
image_21.jpg Page 44 of 49


A provision for onerous contracts is also assessed and measured at the present value of the lower of the expected cost of terminating the contract and the expected net cost of continuing with the contract, which is determined based on the incremental costs of fulfilling the obligation under the contract and an allocation of other costs directly related to fulfilling the contract. Before an onerous contract provision is established, we recognize any impairment loss on the assets (including through an inventory provision) associated with that contract.
During the three months and year ended December 31, 2023, negative inventory impairment and onerous contract provision adjustments of ($10.7) million and ($15.0) million, respectively, were recorded as a charge to cost of product and service revenues, compared to negative inventory impairment and onerous contract provision adjustments of ($4.1) million and ($7.5) million, respectively, in the three months and year ended December 31, 2022.
FAIR VALUE MEASUREMENT (INCLUDING INVESTMENTS)
Fair value is the price that would be received to sell an asset or paid to transfer a liability in an orderly transaction between market participants at the measurement date in the principal or, in its absence, the most advantageous market to which the Company has access at that date. The fair value of a liability reflects its non-performance risk. A number of the Company’s accounting policies and disclosures require the measurement of fair values, for both financial and non-financial assets and liabilities.
When one is available, the Company measures the fair value of an instrument using the quoted price in an active market for that instrument. A market is regarded as “active” if transactions for the asset or liability take place with sufficient frequency and volume to provide pricing information on an ongoing basis. If there is no quoted price in an active market, then the Company uses valuation techniques that maximize the use of relevant observable inputs and minimize the use of unobservable inputs. This involves developing estimates and assumptions consistent with how market participants would price the instrument. Management bases its assumptions on observable data as far as possible, but this is not always available. In that case, management uses the best information available. Where they are available, the fair value of investments is based on observable market transactions. Estimated fair values may vary from the actual prices that would be achieved in an arm’s length transaction at the reporting date.
The best evidence of the fair value of a financial instrument (including investments) on initial recognition is usually the transaction price – i.e., the fair value of the consideration given or received. If the Company determines that the fair value on initial recognition differs from the transaction price and the fair value is evidenced neither by a quoted price in an active market for an identical asset or liability nor based on a valuation technique for which any unobservable inputs are judged to be insignificant in relation to the measurement, then the financial instrument is initially measured at fair value, adjusted to defer the difference between the fair value on initial recognition and the transaction price. Subsequently, that difference is recognized in profit or loss on an appropriate basis over the life of the instrument but no later than when the valuation is wholly supported by observable data, or the transaction is closed out. During the three months and year ended December 31, 2023, we recognized mark to market gain (loss) on financial assets of ($10.3) million and ($12.9) million, respectively, compared to $2.9 million and ($16.9) million, respectively, for the three months and year ended December 31, 2022.
image_21.jpg Page 45 of 49


Mark to market gain (loss) in 2023 and 2022 consist primarily of changes in the fair value of our long-term financial investments including Forsee Power, Wisdom, Quantron, and in our HyCap and Clean H2 hydrogen infrastructure and growth equity funds.
9.4     Recently Adopted Accounting Policy Changes
Effective January 1, 2023, we adopted a number of new standards and interpretations, but they did not have a material impact on our financial statements.
9.5 Future Accounting Policy Changes
The following is an overview of accounting standard changes that we will be required to adopt in future years. We do not expect to adopt any of these standards before their effective dates and we continue to evaluate the impact of these standards on our consolidated financial statements.
Classification of Liabilities as Current or Non-Current (Amendments to IAS 1)
On January 23, 2020, the IASB issued amendments to IAS 1 Presentation of Financial Statements (the “2020 Amendments”), to clarify the classification of liabilities as current or non-current. On October 31, 2022, the IASB issued Non-current Liabilities with Covenants (Amendments to IAS 1) (the “2022 Amendments”), to improve the information a company provides about long-term debt with covenants.
For the purposes of non-current classification, the 2020 Amendments and the 2022 Amendments (collectively “the Amendments”) removed the requirement for a right to defer settlement or roll over of a liability for at least twelve months to be unconditional. Instead, such a right must exist at the end of the reporting period and have substance.
The Amendments reconfirmed that only covenants with which a company must comply on or before the reporting date affect the classification of a liability as current or non-current. Covenants with which a company must comply after the reporting date do not affect a liability’s classification at that date. The Amendments also clarify how a company classifies a liability that includes a counterparty conversion option. The Amendments state that:
•settlement of a liability includes transferring a company’s own equity instruments to the counterparty, and
•when classifying liabilities as current or non-current a company can ignore only those conversion options that are recognized as equity.
The Amendments are effective for annual periods beginning on or after January 1, 2024. The adoption of the amendments to IAS 1 are not expected to have a material impact on the Company’s financial statements.
10.SUPPLEMENTAL NON-GAAP MEASURES AND RECONCILIATIONS
10.1 Overview
In addition to providing measures prepared in accordance with GAAP, we present certain supplemental non-GAAP measures. These measures are Cash Operating Costs (including its components of research and product development (operating cost), general and administrative (operating cost) and sales and marketing (operating cost)), EBITDA and Adjusted EBITDA. These non-GAAP measures do not have any standardized meaning prescribed by GAAP and therefore are unlikely to be comparable to similar measures presented by other companies.
image_21.jpg Page 46 of 49


We believe these measures are useful in evaluating the operating performance of the Company’s ongoing business. These measures should be considered in addition to, and not as a substitute for, operating expenses, net income, cash flows and other measures of financial performance and liquidity reported in accordance with GAAP. The calculation of these non-GAAP measures has been made on a consistent basis for all periods presented.
10.2 Cash Operating Costs
This supplemental non-GAAP measure is provided to assist readers in determining our operating costs on an ongoing cash basis. We believe this measure is useful in assessing performance and highlighting trends on an overall basis.
We also believe Cash Operating Costs is frequently used by securities analysts and investors when comparing our results with those of other companies. Cash Operating Costs differs from the most comparable GAAP measure, total operating expenses, primarily because it does not include stock-based compensation expense, depreciation and amortization, impairment losses or recoveries on trade receivables, restructuring and related costs, acquisition related costs, the impact of unrealized gains and losses on foreign exchange contracts, and financing charges. The following tables show a reconciliation of total operating expenses to Cash Operating Costs for the three months and year ended December 31, 2023, and 2022:
(Expressed in thousands of U.S. dollars) Three months ended December 31,
Cash Operating Costs 2023 2022 $ Change
Total Operating Expenses $ 34,972 $ 30,099 $ 4,873
Stock-based compensation expense (2,575) (1,367) (1,208)
Impairment recovery (losses) on trade receivables (1,436) (73) (1,363)
Acquisition related costs 3 (106) 109
Restructuring and related (costs) recovery (322) (137) (185)
Impact of unrealized gains (losses) on foreign exchange contracts 696 1,057 (361)
Depreciation and amortization (2,388) (435) (1,953)
Cash Operating Costs $ 28,950 $ 29,038 $ (88)


(Expressed in thousands of U.S. dollars) Year ended December 31,
Cash Operating Costs 2023 2022 $ Change
Total Operating Expenses $ 141,073 $ 132,022 $ 9,053
Stock-based compensation expense (10,720) (8,939) (1,781)
Impairment recovery (losses) on trade receivables (1,498) (73) (1,425)
Acquisition related costs (773) (2,857) 2,084
Restructuring and related (costs) recovery (1,512) (482) (1,030)
Impact of unrealized gains (losses) on foreign exchange contracts 1,296 (862) 2,158
Depreciation and amortization (8,539) (6,815) (1,724)
Cash Operating Costs $ 119,327 $ 111,992 $ 7,335
The components of Cash Operating Costs of research and product development (cash operating cost), general and administrative (cash operating cost), and sales and marketing (cash operating cost) differ from their respective most comparable GAAP measure of research and product development expense, general and administrative expense, and sales and marketing expense, primarily because they do not include stock-based compensation expense, depreciation and amortization expense, and acquisition related costs.
image_21.jpg Page 47 of 49


A reconciliation of these respective operating expenses to the respective components of Cash Operating Costs for the three months and year ended December 31, 2023, and 2022 is included in Section 5.4 Operating Expenses and Other Items.
A breakdown of total stock-based compensation expense for the three months and year ended December 31, 2023, and 2022 are as follows:
(Expressed in thousands of U.S. dollars) Three months ended December 31,
Stock-based compensation expense 2023 2022 $ Change
Total stock-based compensation expense recorded as follows:
Cost of goods sold $ $ $
Research and product development expense 1,290 938 352
General and administrative expense 949 229 720
Sales and marketing expense (recovery) 336 200 136
Stock-based compensation expense $ 2,575 $ 1,367 $ 1,208

(Expressed in thousands of U.S. dollars) Year ended December 31,
Stock-based compensation expense 2023 2022 $ Change
Total stock-based compensation expense recorded as follows:
Cost of goods sold $ $ $
Research and product development expense 5,520 5,015 505
General and administrative expense 3,660 2,736 924
Sales and marketing expense (recovery) 1,540 1,188 352
Stock-based compensation expense $ 10,720 $ 8,939 $ 1,781
A breakdown of total depreciation and amortization expense for the three months and year ended December 31, 2023, and 2022 are as follows:
(Expressed in thousands of U.S. dollars) Three months ended December 31,
Depreciation and amortization expense 2023 2022 $ Change
Total depreciation and amortization expense recorded as follows:
Cost of goods sold $ 1,136 $ 1,966 $ (830)
Research and product development expense 1,832 (18) 1,850
General and administrative expense 556 449 107
Sales and marketing expense 4 (4)
Depreciation and amortization expense $ 3,524 $ 2,401 $ 1,123

(Expressed in thousands of U.S. dollars) Year ended December 31,
Depreciation and amortization expense 2023 2022 $ Change
Total depreciation and amortization expense recorded as follows:
Cost of goods sold $ 4,211 $ 4,837 $ (626)
Research and product development expense 6,538 4,894 1,644
General and administrative expense 1,997 1,915 82
Sales and marketing expense 4 6 (2)
Depreciation and amortization expense $ 12,750 $ 11,652 $ (1,098)
10.3 EBITDA and Adjusted EBITDA
These supplemental non-GAAP measures are provided to assist readers in determining our operating performance. We believe this measure is useful in assessing performance and highlighting trends on an overall basis. We also believe EBITDA and Adjusted EBITDA are frequently used by securities analysts and investors when comparing our results with those of other companies. EBITDA differs from the most comparable GAAP measure, net loss from continuing operations, primarily because it does not include finance expense, income taxes, depreciation of property, plant and equipment, and amortization of intangible assets.
image_21.jpg Page 48 of 49


Adjusted EBITDA adjusts EBITDA for stock-based compensation expense, transactional gains and losses, acquisition related costs, finance and other income, recovery on settlement of contingent consideration, asset impairment charges, and the impact of unrealized gains and losses on foreign exchange contracts. The following tables show a reconciliation of net loss to EBITDA and Adjusted EBITDA for the three months and year ended December 31, 2023, and 2022:

(Expressed in thousands of U.S. dollars) Three months ended December 31,
EBITDA and Adjusted EBITDA 2023 2022 $ Change
Net loss from continuing operations $ (48,889) $ (27,572) $ (21,317)
Depreciation and amortization 3,524 2,401 1,123
Finance expense 270 294 (24)
Income taxes (recovery) 40 34
                   6
EBITDA $ (45,055) $ (24,843) $ (20,212)
Stock-based compensation expense 2,575 1,367 1,208
Acquisition related costs (3) 106 (109)
Finance and other (income) loss (1,871) (15,728) 13,857
Impairment charge on property, plant and equipment 967 7 960
Impact of unrealized (gains) losses on foreign exchange contracts (696) (1,057) 361
Adjusted EBITDA $ (44,083) $ (40,148) $ (3,935)
(Expressed in thousands of U.S. dollars) Year ended December 31,
EBITDA and Adjusted EBITDA 2023 2022 $ Change
Net loss from continuing operations $ (144,210) $ (160,371) $ 16,161
Depreciation and amortization 12,750 11,652 1,098
Finance expense 1,105 1,265 (160)
Income taxes (recovery) 158 42
                116
EBITDA $ (130,197) $ (147,412) $ 17,215
Stock-based compensation expense 10,720 8,939 1,781
Acquisition related costs 773 2,857 (2,084)
Finance and other (income) loss (31,055) 2,112 (33,167)
Impairment charge on property, plant and equipment 967 7 960
Impact of unrealized (gains) losses on foreign exchange contracts (1,296) 862 (2,158)
Adjusted EBITDA $ (150,088) $ (132,635) $ (17,453)

image_21.jpg Page 49 of 49
EX-99.3 5 ballard993123123annualinfo.htm EX-99.3 Document


image_0.jpg

BALLARD POWER SYSTEMS INC.
ANNUAL INFORMATION FORM
For the year ended December 31, 2023

Dated March 8, 2024


image_2.jpg

TABLE OF CONTENTS
2

image_2.jpg


3

image_2.jpg
This Annual Information Form and the documents incorporated by reference herein contain forward-looking statements that are based on the beliefs of management and reflect our current expectations as contemplated under the safe harbor provisions of Section 21E of the United States Securities Exchange Act of 1934, as amended. When used in this Annual Information Form, the words “estimate”, “project”, “believe”, “anticipate”, “intend”, “expect”, “plan”, “predict”, “may”, “could”, “should”, “will”, the negatives of these words or other variations thereof and comparable terminology are intended to identify forward-looking statements. Such statements include, but are not limited to, statements with respect to our objectives, goals, liquidity, sources and uses of capital, outlook, strategy, order backlog, order book of expected deliveries, future product roadmap costs and selling prices, future product sales, future production capacities and volumes, the markets for our products, expenses / costs, contributions and cash requirements to and from joint venture operations and research and development activities, as well as statements with respect to our beliefs, plans, objectives, expectations, anticipations, estimates and intentions. These statements are not guarantees of future performance and involve assumptions, risks and uncertainties that are difficult to predict. In particular, these forward-looking statements are based on certain factors and assumptions relating to our expectations with respect to new and existing customer and partner relationships, the generation of new sales, producing, delivering, and selling the expected product and service volumes at the expected prices and controlling our costs. They are also based on a variety of general factors and assumptions including, but not limited to, our expectations regarding technology and product development efforts, manufacturing capacity and cost, product and service pricing, market demand, and the availability and prices of raw materials, labour, and supplies. These assumptions have been derived from information available to the Company including information obtained by the Company from third parties. These assumptions may prove to be incorrect in whole or in part. In addition, actual results may differ materially from those expressed, implied, or forecasted in such forward-looking statements. Factors that could cause our actual results or outcomes to differ materially from the results expressed, implied or forecasted in such forward-looking statements include, but are not limited to: challenges or delays in our technology and product development activities; changes in the availability or price of raw materials, labour, supplies and shipping; costs of integration, and the integration failing to achieve the expected benefits of the transaction; our ability to attract and retain business partners, suppliers, employees and customers; our ability to extract value from joint venture operations; global economic trends and geopolitical risks (such as conflicts in Ukraine and the Middle East), including changes in the rates of investment, inflation or economic growth in our key markets, or an escalation of trade tensions such as those between the U.S. and China; investment in hydrogen fueling infrastructure and competitive pricing of hydrogen fuel; the relative strength of the value proposition that we offer our customers with our products or services; changes in competitive technologies, including internal combustion engine, battery and fuel cell technologies;
4

image_2.jpg
challenges or delays in our technology and product development activities; changes in our customers’ requirements, the competitive environment and/or related market conditions; product safety, liability or warranty issues; warranty claims, product performance guarantees, or indemnification claims; changes in product or service pricing or cost; market developments or customer actions that may affect levels of demand and/or the financial performance of the major industries, regions and customers we serve, such as secular, cyclical and competitive pressures in the bus, truck, rail, marine and stationary sectors; the rate of mass adoption of our products or related ecosystem, including the availability of cost-effective hydrogen; cybersecurity threats; our ability to protect our intellectual property; climate risk; changing government or environmental regulations, including subsidies or incentives associated with the adoption of clean energy products, including hydrogen and fuel cells; currency fluctuations, including the magnitude of the rate of change of the Canadian dollar versus the U.S. dollar; our access to funding and our ability to provide the capital required for product development, operations and marketing efforts, working capital requirements, and joint venture capital contributions; changes in U.S. tax laws and tax status related to “passive foreign investment company” designation; the severity, magnitude and duration of the on-going COVID-19 pandemic, including impacts of the pandemic and of businesses’ and governments’ responses to the pandemic on our operations, personnel and joint venture operations, and on commercial activity and demand across our and our customers’, partners’ and joint venture businesses, and on global supply chains; potential merger and acquisition activities, including risks related to integration, loss of key personnel and disruptions to operations; and the general assumption that none of the risks noted in the “Risk Factors” section of this Annual Information Form will materialize.
The forward-looking statements contained in this Annual Information Form speak only as of the date of this Annual Information Form. Except as required by applicable legislation, Ballard does not undertake any obligation to release publicly any revisions to these forward-looking statements to reflect events or circumstances after the date of this Annual Information Form, including the occurrence of unanticipated events.
In this Annual Information Form, references to “Corporation”, “Company”, “Ballard”, “we”, “us” and “our” refer to Ballard Power Systems Inc. and, as applicable, its subsidiaries. All dollar amounts are in United States dollars unless otherwise indicated. Canadian dollars are indicated by the symbol “C$”, and euros by the symbol “€”.
Except where otherwise indicated, all information presented is as of December 31, 2023.
5

image_2.jpg
CORPORATE STRUCTURE
Name, Address and Incorporation
Ballard was incorporated on November 12, 2008 under the Canada Business Corporations Act (Canada), under the name “7076991 Canada Inc.” Ballard changed its name to “Ballard Power Systems Inc.” on December 31, 2008. On August 24, 2016, Ballard continued into British Columbia under the Business Corporations Act (British Columbia). Ballard’s head office is located at 9000 Glenlyon Parkway, Burnaby, British Columbia, Canada V5J 5J8, and its registered office is located at Suite 1700, 666 Burrard Street, Vancouver, British Columbia, Canada V6C 2X8.
Previously, Ballard Power Systems Inc. was a British Columbia company incorporated on May 30, 1989. The original predecessor to Ballard was founded in 1979 under the name Ballard Research Inc. to conduct research and development on high-energy lithium batteries. In the course of investigating environmentally clean energy systems with commercial potential, we began to develop fuel cells and have been developing fuel cell products since 1983.
Our Vision, Mission and Values
Our vision is to deliver fuel cell power for a sustainable planet. Our mission is to use our fuel cell expertise to deliver valuable and innovative solutions to our customers globally, create rewarding opportunities for our team, provide extraordinary value to our shareholders and power the hydrogen society.
Our values represent our core beliefs and underpin how we carry on our business. In addition to our value pillars of safety and innovation, we have five key cultural values:
•Listen and Deliver – We listen to our customers, understand their business and deliver innovative and valuable solutions for lasting partnerships;
•Quality Always – We deliver quality in everything we do;
•Inspire Excellence – We live with integrity, passion, urgency, agility and humility;
•Row Together – We achieve success through respect, trust and collaboration; and
•Own It – We step up, take ownership for our results and trust others to do the same.
Intercorporate Relationships
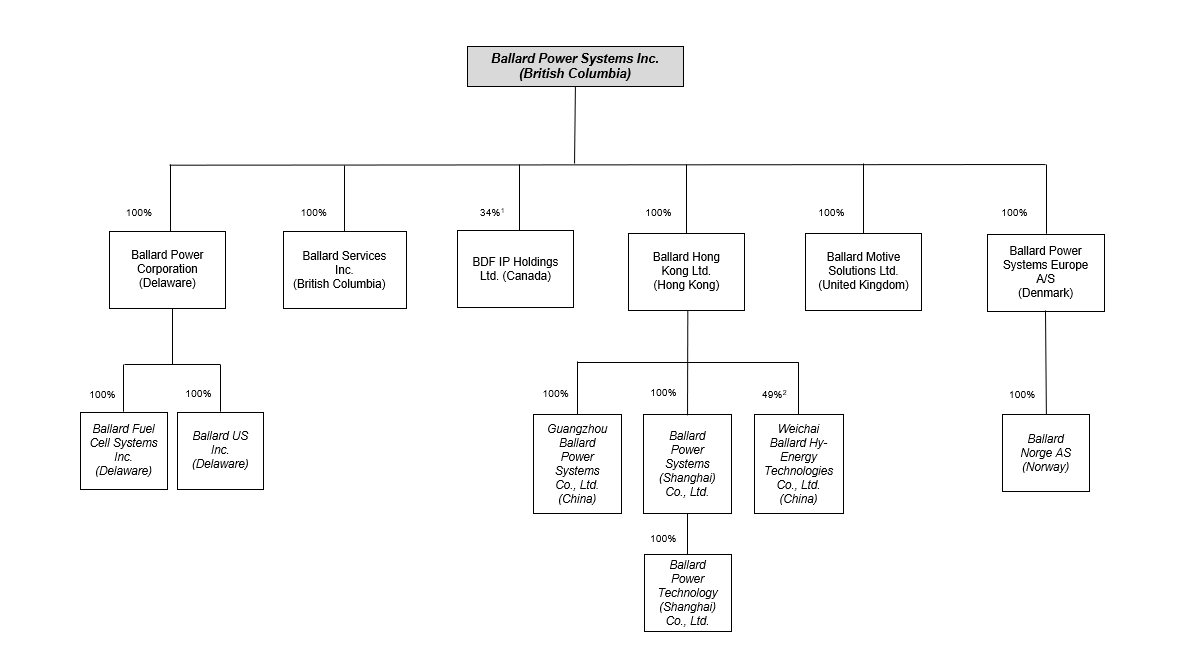
We have eleven subsidiaries and affiliates: (i) Ballard Power Corporation, a Delaware corporation that is a holding company; (ii) Ballard Fuel Cell Systems, Inc., a Delaware corporation that does certain development and manufacturing work, and provides certain services to customers; (iii) Ballard US Inc.
6

image_2.jpg
(formerly Ballard Unmanned Systems Inc.), a Delaware corporation that is a dormant holding company; (iv) Ballard Power Systems Europe A/S (formerly Dantherm Power A/S) (“Ballard Denmark”), a Danish corporation that provides certain sales, assembly, manufacturing, commissioning, research and development, engineering services and after-sales service; (v) Ballard Norge AS, a Norwegian company that provides certain sales and after-sales services; (vi) BDF IP Holdings Ltd., a Canadian corporation that holds certain intellectual property assets; (vii) Ballard Services Inc., a British Columbia company that provides certain engineering services; (viii) Ballard Hong Kong Limited, a holding company for certain assets in China; (ix) Guangzhou Ballard Power Systems Co., Ltd., a Chinese wholly foreign-owned entity, that provides certain sales, quality, supply chain and after-sales services; (x) Ballard Power Systems (China) Co. Ltd., a Chinese wholly foreign-owned entity that is a holding company; and (xi) Ballard Motive Solutions Ltd. (formerly Arcola Energy Ltd.) (“BMS”), a United Kingdom company which was restructured in the fourth quarter of 2023 and discontinued.
We have a non-controlling 49% interest in Weichai Ballard Hy-Energy Technologies Co., Ltd. (“Weichai-Ballard JV”), located in Weifang, Shandong Province, China, with Weichai Power Co., Ltd. (“Weichai”) holding a 51% interest. The Weichai-Ballard JV’s business is to manufacture Ballard’s FCgen®-LCS fuel cell bipolar plates, stacks and power modules for bus, commercial truck and forklift applications with certain exclusive rights in China.
7

image_2.jpg
The following chart shows these subsidiaries and affiliates, their respective jurisdictions of incorporation and our percentage of share ownership in each of them, all as of March 8, 2024:
image_3.jpg
Notes:
1. Ballard holds 100% of the non-voting, participating shares of BDF IP Holdings Ltd. and 34% of the voting, non-participating shares, along with each of Mercedes-Benz AG (33%) and Ford Motor Company (33%).
2. Ballard indirectly holds a 49% interest in Weichai Ballard Hy-Energy Technologies Co., Ltd. together with Weichai Power Co., Ltd. (51%).

Recent History
Over the past three years, we have continued to focus on building and commercializing our proton exchange membrane (“PEM”) fuel cell business for select mobility and stationary power applications. The following are key developments during that period:
15 MW order for stationary power products in Europe
On March 5, 2024, we announced an order for 15 megawatts (MW) of fuel cell systems from a UK-based company specializing in renewable off-grid power generation. We expect to deliver 150 FCmove®-HD+ 100 kW systems beginning in late 2024 and continuing through 2025.
The current order of 15 MW of fuel cell systems follows prior cumulative orders for roughly 5 MW of fuel cell systems from this customer. The purchase order is the first order under a new multi-year supply agreement.
8

image_2.jpg
The agreement also provides the customer an option to purchase up to an additional 296 systems by March 2026, which, if fully exercised, would bring the total number of systems ordered to 446.
Long-Term Supply Agreement with NFI Group Inc. (“NFI”) and purchase order for 100 fuel cell engines for bus deployments in North America
On January 3, 2024, we announced the signing of a new Long-Term Supply Agreement (“LTSA”) with NFI Group, a leading independent bus and coach manufacturer and a leader in electric mass mobility solutions in North America and Europe. The LTSA marks a new phase in the established partnership between Ballard and NFI, focused on deployment-level volumes of fuel cell powered buses across all of NFI’s major brands including New Flyer, Alexander Dennis, and MCI.
As part of the LTSA, NFI has placed its first purchase order under the LTSA for a minimum of 100 FCmove®-HD+ modules for planned delivery in 2024. The modules will primarily be produced in our Bend, Oregon facility with Buy America compliance, and will power New Flyer’s next generation Xcelsior CHARGE FC™ hydrogen fuel cell buses for deployment across the US and Canada, including California, Manitoba, Nevada, New York, Ohio, and Pennsylvania.
Guangdong Synergy Ballard Hydrogen Power Co., Ltd. (“Synergy Ballard JVCo”)
During 2017, Synergy Ballard JVCo commenced operations utilizing Ballard’s FCveloCity®-9SSL fuel cell stack technology in the city of Yunfu in China’s Guangdong Province. Ballard held a non-controlling 10% interest in the joint venture, Synergy Ballard JVCo, together with Guangdong Nation Synergy Hydrogen Power Technology Co., Ltd. (a member of the “Synergy Group”) who held a 90% interest. Ballard contributed $1.0 million for its 10% interest in Synergy Ballard JVCo. The fuel cell stacks manufactured by Synergy Ballard JVCo were expected to be used primarily in fuel cell engines assembled in China to provide propulsion power for zero-emission fuel cell electric buses and commercial vehicles in China.
Synergy Ballard JVCo had an exclusive license to manufacture and sell FCveloCity®-9SSL stacks in China until September 30, 2026.
On October 18, 2023, we completed an equity transfer agreement to sell our 10% interest (fair valued at nil) in Synergy Ballard JVCo to the Synergy Group for nominal consideration. As we no longer have significant influence over the operating activities of Synergy Ballard JVCo, the equity method of accounting for this investment was discontinued as of September 30, 2023. Ballard, Synergy Group and Synergy Ballard JVCo signed mutual releases and the exclusive license to Synergy Ballard JVCo was terminated.
9

image_2.jpg
LOI with Ford Trucks for fuel cell powered heavy-duty trucks & initial order
On August 3, 2023, we announced the signing of a letter of intent (“LOI”) with Ford Trucks to supply a fuel cell system as part of the development of a hydrogen fuel cell powered vehicle prototype. We also received an initial purchase order for 2 FCmove™-XD 120 kW fuel cell engines that were delivered by Ballard to Ford Trucks in the fourth quarter of 2023.
Ford Trucks, the global brand of Ford Otosan, plans to develop a FCEV F-MAX as part of the project. The 120 kW FCmove™-XD fuel cell engines will be integrated into Ford Trucks’ F-MAX 44-ton long-haul tractor truck. Ford Trucks plans to build and assemble the fuel cell-powered F-MAX in Turkey and aims to commence European Ten-T corridor demonstrations in 2025 as part of the European Union’s Horizon Europe ZEFES (Zero Emission Freight EcoSystem) project goals. As per the LOI, upon the successful completion of the development program and subject to certain other conditions, Ballard may be named as the preferred supplier for the serial production of the fuel cell-powered F-MAX.
Ballard Fuel Cells to Power CPKC Hydrogen Locomotive Program
On March 9, 2021, we announced that Canadian Pacific (“CP”), now Canadian Pacific Kansas City (“CPKC”) will employ Ballard fuel cell modules for CP’s pioneering Hydrogen Locomotive Program to develop North America’s first hydrogen-powered line-haul freight locomotive by retrofitting a formerly diesel-powered locomotive with Ballard’s 200 kW hydrogen fuel cell modules.
On January 19, 2022, we announced receipt of an order for six of an additional eight fuel cell modules to support CP’s expansion of the Hydrogen Locomotive Program. In total, Ballard will provide a total of 14 fuel cell modules, each module with a rated power output of 200 kW, to support this program.
On July 27, 2023, we announced an order for fuel cell engines from CPKC. These eighteen, 200 kW fuel cell engines were delivered in 2023 and will support the expansion of CPKC’s Hydrogen Locomotive Program.
On November 6, 2023, we announced an order for 2.4 MW of additional fuel cell engines from CPKC. These twelve, 200 kW fuel cell engines are planned for delivery in 2023 and will support the development of CPKC’s additional hydrogen-powered locomotives planned for regular switching and local freight service applications in Alberta.
Over the past two years, Ballard has supplied CPKC with 38 fuel cell engines for use in its hydrogen locomotives, with combined fuel cell power of 7.6 MW. The additional locomotives are expected to enter service in late 2024.
10

image_2.jpg
Order from First Mode for 30 additional hydrogen fuels for diesel-free mining trucks
On March 1, 2023, we announced a purchase order to supply First Mode with 30 hydrogen fuel cell modules – totaling 3 MW – to power several hybrid hydrogen and battery ultra-class mining haul trucks. This is the equivalent of approximately 4,000 horsepower.
The 30 Ballard hydrogen fuel cell modules are to be integrated into clean energy powerplants built in Seattle, Washington and installed into ultra-class haul trucks to be operated at First Mode’s Proving Grounds in Centralia, Washington. These trucks are estimated to save 2,600 tons of diesel fuel each year.
Order from CrossWind for stationary power project
On January 23, 2023, we announced an order for a fuel cell system from CrossWind, a joint venture between Shell and Eneco. The Ballard fuel cell system will be integrated in the Hollandse Kust Noord offshore wind project. The Hollandse Kust Noord offshore wind project, located off the coast of the Netherlands, will have a capacity of 759 MW to generate at least 3.3 TWh per year. Ballard will supply a containerized fuel cell power solution with a peak power capacity of 1 MW, with delivery expected in 2024.
Update on global manufacturing strategy
On September 30, 2022, we announced our strategy ‘local for local’ where we summarized our plan to deepen our global manufacturing footprint in Europe, the United States, and China to support expected global market demand growth through 2030. As part of this strategy, we entered into an investment agreement with the Government of Anting in Shanghai’s Jiading District to establish our new China headquarters, membrane electrode assembly (“MEA”) manufacturing facility, and a research and development (“R&D”) center, at a site strategically located at the Jiading Hydrogen Port, located in one of China’s leading automotive industry clusters, with the plan to invest approximately $130 million over the next three years.
However, as a result of the increasingly constructive hydrogen policy landscape and increased market activity in the U.S. and Europe; and given the continued hydrogen and fuel cell policy uncertainties and market delays in China, as well as geopolitical risks, we decided to suspend our MEA localization plan in China while we continue with a comparative analysis on manufacturing capacity expansion options and possible sequencing prioritization in the U.S. and/or European markets. We expect to conclude this review in 2024.
Ballard signs contract with Stadler to supply fuel cell engines to power first hydrogen train in United States
On September 26, 2022, we announced an order from Stadler Rail AG (“Stadler”), a leading manufacturer of rolling stock, for the supply of six 100 kW FCmoveTM-HD+ fuel cell engines to power the first hydrogen train in the United States.
11

image_2.jpg
The contract to provide the hydrogen-powered train was awarded to Stadler by San Bernardino County Transportation Authority (SBCTA), with the option of additional trains in the future. The train is expected to be in service in San Bernardino, California in 2024 and is expected to seat over 100 passengers.
Ballard to power India’s first hydrogen trains
On September 6, 2022, we announced a fuel cell module order from Medha Servo Drives (“Medha”), a leading rail system integrator, who has been contracted by Indian Railways to develop India’s first hydrogen powered trains. The two retrofitted diesel-electric commuter trains will integrate 8 units of 100 kW FCmoveTM-HD+, Ballard’s latest fuel cell technology, which offers improved efficiency and power density than previous module generations. The contract to provide the hydrogen-powered trains was awarded to Medha as a first step in Indian Railways’ path to achieve their net zero ambitions. The fuel cell modules were shipped in 2023, with trains scheduled to go into service in 2024, with potential for additional retrofits following the initial deployment.
Ballard partners with Wisdom Motor Company
On May 9, 2022, we announced a strategic collaboration with Wisdom (Fujian) Motor Company Limited (“Wisdom”), Templewater Group (“Templewater”), and Bravo Transport Services Limited (“Bravo”) to accelerate the adoption of commercial fuel cell electric vehicles (“FCEVs”) in Hong Kong.
Templewater, an alternative asset management firm and parent company of Bravo, Hong Kong island’s largest transit operator, together with Ballard, co-invested in a Series A funding for Wisdom, a technology company that designs and manufactures zero emission commercial vehicles. The Series A funds (including Ballard’s $10.0 million equity ownership contribution in the second quarter of 2022) will support Wisdom’s organizational growth, R&D, and manufacturing platforms, including the expansion and development of its hydrogen zero emission fuel cell truck, bus, and specialty vehicle offerings for international markets.
Wisdom’s hydrogen vehicle product lines are expected to exclusively deploy Ballard’s world leading PEM fuel cell technology, with modules supplied by the Weichai-Ballard JV in China. On August 8, 2022, Ballard entered into a joint development agreement with Wisdom to advance the integration and optimization of its fuel cell electric powertrain designs and control strategies.
Ballard granted Type Approval by DNV for the FCwaveTM marine fuel cell module
On April 6, 2022, we announced the receipt of Europe’s industry first Type Approval by DNV, one of the world’s leading classification and certification bodies, for our marine fuel cell module FCwaveTM. The Type Approval marks an important step in commercializing Ballard’s fuel cell technology for marine applications and is key to including fuel cells as part of zero- emission solutions for the marine industry.
12

image_2.jpg
The FCwaveTM module is a flexible solution that can support the energy needs of various vessel types as well as onshore power. The scalable 200 kW power module offers a plug-and-play replacement for conventional diesel engines. The Type Approval certification confirms the design meets certain safety, functional, design and documentation requirements necessary for global marine commercialization.
Project with Adani for Hydrogen Fuel Cells in India
On February 22, 2022, we announced the signing of a non-binding Memorandum of Understanding (“MOU”) with the Adani Group (“Adani Group”) to evaluate a joint investment case for the commercialization of fuel cells in various mobility and industrial applications in India.
On January 17, 2023, we announced the signing of an agreement to launch a pilot project to develop a hydrogen fuel cell electric truck (“FCET”) for mining logistics and transportation with Adani Enterprises Limited (“AEL”), part of the diversified Adani portfolio of companies, and Ashok Leyland.
This collaboration marks Asia’s first planned hydrogen powered mining truck. The demonstration project will be led by AEL, a company focused on both mining operations and developing green hydrogen projects for sourcing, transporting, and building out hydrogen refueling infrastructure. Ballard, an industry leading PEM fuel cell engine manufacturer, will supply the FCmoveTM fuel cell engine for the hydrogen truck and Ashok Leyland, one of the largest manufacturers of buses in the world, will provide the vehicle platform and technical support. The FCET launched in India in 2023.
Ballard fuel cells installed onboard the world’s first liquid hydrogen-powered ferry
On February 2, 2022, we announced the delivery of two, 200 kilowatt (kW) FCwaveTM modules to Norled A/S, one of Norway’s largest ferry and express boat operators. The fuel cell modules power the world’s first liquid hydrogen-powered ferry, the MF Hydra.
Orders for 31 fuel cell engines to a leading global construction, electric power & off-road equipment manufacturer
On January 13, 2022, we announced orders for 31 modules, totaling 3 MW of hydrogen fuel cell power, to a leading global construction, electric power, and off-road equipment manufacturer for testing and deployment in a variety of end-use applications. The modules were delivered, and have been undergoing various testing programs.
Acquisition of Arcola
On November 11, 2021, we announced the acquisition of Arcola Energy Ltd. (“Arcola”) (now BMS), a UK-based systems engineering company, specializing in hydrogen fuel cell powertrain and vehicle systems integration.
13

image_2.jpg
Ballard acquired Arcola for total consideration of up to US$40 million, including 337,353 Ballard shares (with an approximate valuation of US$6 million at acquisition) that vest over two years, and up to US$34 million in upfront and earn-out cash consideration based on the achievement of certain performance conditions over a two-year period.
During the fourth quarter of 2022, we completed a post-acquisition restructuring of the operations at BMS and recognized impairment charges on intangible assets of approximately $13 million and restructuring related operating expenses of approximately $5 million which included contract exit and modification costs, grant adjustment charges, personnel change costs, and legal and advisory costs, net of expected recoveries. Pursuant to this restructuring of operations, it was agreed to reduce the earn-out consideration by approximately $10 million which resulted in a corresponding recovery on settlement of contingent consideration payable.
During the fourth quarter of 2023, we completed a restructuring of operations at BMS and operations have been effectively closed and discontinued.
Infrastructure Funds
In 2021, we invested in two hydrogen infrastructure and growth equity funds whereby we acquired a 12% interest in the HyCap Fund I SCSP (“HyCap”), a special limited partnership registered in Luxembourg; and a 1% interest in the Clean H2 Infra Fund (“Clean H2”), a special limited partnership registered in France.
HyCap is a newly created hydrogen infrastructure and growth equity fund. HyCap is to invest in a combination of hydrogen infrastructure projects and investments in companies along the hydrogen value chain. We have committed to investing £25.0 million (including £11 million invested as of December 31, 2023) into HyCap.
Clean H2 is another newly created hydrogen infrastructure and growth equity fund. Clean H2 is to invest in a combination of hydrogen infrastructure projects and investments in companies along the hydrogen value chain. We have committed to investing €30.0 million (including €4.7 million invested as of December 31, 2023) into Clean H2.
During the first quarter of 2024, we invested in a decarbonization and climate technology and growth equity fund by acquiring a 2% interest in Templewater Decarbonization I, L.P., a limited partnership registered in Cayman Islands, for an initial investment of $0.5 million on a total commitment of $1.0 million.
Ballard and Forsee Power SA (“Forsee Power”) enter Long-Term Strategic Partnership to Develop & Commercialize Integrated Fuel Cell and Battery Solutions for Heavy-Duty Hydrogen Mobility
On October 18, 2021, we announced the signing of an MOU for a strategic partnership with Forsee Power to develop fully integrated fuel cell and battery solutions, optimized for performance, cost and installation for heavy-duty hydrogen mobility applications.
14

image_2.jpg
As part of the strategic relationship, in October 2021, Ballard participated as a cornerstone lead investor in Forsee Power’s initial public offering on Euronext in Paris, France. We made a contribution of €37.7 million (approximately $43.8 million), resulting in an ownership interest of 9.77% in Forsee Power at that time. In connection with our investment, Ballard has the right to appoint a nominee to the Forsee Power board of directors. Ballard appointed a nominee effective as of the closing of the initial public offering.
The MOU was superseded by a Collaboration Agreement between the parties, dated December 14, 2022, pursuant to which the parties agreed to jointly approach new and existing customers with an integrated fuel cell and battery solution. Both companies have started to promote integrated solutions to a number of customers.
Ballard and Quantron AG Announce a Strategic Partnership for the Development of Hydrogen Fuel Cell Electric Trucks
On September 7, 2021, we announced a strategic partnership with Quantron AG (“Quantron”) expected to accelerate deployment and market adoption of fuel cell technologies. Initial collaboration will focus on the integration of Ballard’s FCmove™ family of heavy-duty fuel cell power modules into Quantron’s electric drivetrain and vehicles.
On September 19, 2022, we announced a minority equity investment in Quantron. As part of Quantron’s financing round of up to €50 million, Ballard’s investment proceeds (€5 million was contributed in the fourth quarter of 2022), are to be used by Quantron to develop their truck fuel cell vehicle platforms, under the terms of a Joint Development Agreement. Ballard is to be the exclusive fuel cell supplier to Quantron for these platforms.
In connection with our investment, Ballard has the right to appoint a nominee to the Quantron AG board of directors.
In 2023, Ballard made an additional investment in Quantron of €3 million after the satisfaction of certain investment conditions.
As part of the strategic partnership, Quantron committed to purchase 140 FCmove™ modules totaling approximately 17 MW, with an option to purchase an additional 50 units. Subsequent to the initial order, Quantron committed to purchase an additional 72 FCmove™ modules totaling approximately 3 MW. All of the ordered 212 fuel cell modules were expected to be delivered in 2023 and 2024. While a small number of modules were delivered in 2023, further deliveries have been postponed due to financing and related vehicle program delays at Quantron.
The zero-emission fuel cell electric vehicle platforms developed by Quantron are to integrate Ballard fuel cell products for various truck applications in Europe.
15

image_2.jpg
Ballard and Linamar Form Strategic Alliance to Develop Fuel Cell Solutions for Light-Duty Vehicles
On May 3, 2021, we announced the formation of a strategic alliance with Linamar Corporation (“Linamar”) for the co-development and sale of fuel cell powertrains and components for class 1 and 2 vehicles, weighing up to 5 tons, initially in North America and Europe.
On May 9, 2022, Ballard announced with Linamar the unveiling of its concept hydrogen fuel cell powered class 2 truck chassis with FCmove™ product. The technology demonstration platform was showcased at the ACT Expo displayed in a RAM 2500 truck chassis.
Ballard and Linamar are currently working on development of a new fuel cell commercial vehicle platform to be announced in 2024.
Orders for Fuel Cell Modules to Power Buses
On November 4, 2021, we announced orders for a total of 40 FCmoveTM-HD (70kW) modules for planned deployment in hydrogen fuel cell electric buses (“FCEBs”) across Europe in 2022. As of March 2023, the announced FCmoveTM-HD sales have been deployed in FCEBs across Europe.
On June 22, 2021, we announced a follow-on purchase order from New Flyer for 20 fuel cell modules to power 20 New Flyer Xcelsior® model FCEBs, planned for deployment with Alameda-Contra Costa Transit District (AC Transit) in Oakland, California.
On March 9, 2021, we announced follow-on purchase orders from Wrightbus for a total of 50 fuel cell modules to power FCEBs planned for deployment in a number of UK cities.
Ballard Receives Orders to Power Siemens Mireo Plus H Passenger Trains and signs LOI for up to an additional 200 modules over the next six years
On July 15, 2021, we announced a purchase order for two of our 200 kW fuel cell modules from Siemens Mobility GmbH to power a 2-car Mireo Plus H passenger train through a trial operation in Bavaria, Germany.
On September 22, 2022, we announced an order for 14 x 200 kW fuel cell modules from Siemens Mobility GmbH, to power a fleet of seven Mireo Plus H passenger trains. Delivery of The 14 fuel cell modules were delivered 2023 with the fleet planned to be in service in Berlin-Brandenburg region in late 2024.
In addition to the initial order of 14 fuel cell modules, Siemens Mobility also signed a letter of intent with Ballard for the supply of 200 fuel cell modules totaling 40 MW over the next six years, including a firm commitment on 100 of the fuel cell modules totaling 20 MW. The modules will be used for Siemen’s Mireo Plus H trains.
16

image_2.jpg
February 2021 Bought Deal Offering of Common Shares
On February 23, 2021, we announced the closing of a bought deal offering of 14,870,000 common shares of Ballard at a price of $37.00 per common share for gross proceeds of $550,190,000.
Ballard and AUDI Sign Agreements Regarding Use of the High-Power Density Fuel Cell Stack for Vehicle Propulsion
As part of the planned completion of the AUDI program, on October 29, 2020, we announced that we had signed definitive agreements – in the form of an amendment to the existing Technology Development Agreement and a Patent License Agreement – with AUDI AG (“AUDI”) expanding Ballard’s right to use the FCgen®-HPS product, a high-performance, zero-emission, PEM fuel cell stack in all applications, including commercial trucks and passenger cars. The amendments allowed AUDI to reduce the size of the remaining Technology Solutions program to the lower end of the range previously disclosed, and in return Ballard acquired expanded rights to use the FCgen®-HPS product, subject to certain royalty obligations. The FCgen®-HPS fuel cell stack provides propulsion for a range of Light-, Medium- and Heavy-Duty vehicles with a high volumetric power density of 4.3 kilowatts per liter (4.3 kW/L).
Ballard and MAHLE to Collaborate on Fuel Cell Propulsion Systems for Heavy- and Medium-Duty Trucks
On September 28, 2020, we announced an agreement to collaborate with MAHLE International GmbH (“MAHLE”), a leading international development partner and Tier 1 supplier to the commercial vehicle and automotive industry, on the development of zero-emission fuel cell systems to provide primary propulsion power in various classes of commercial trucks. The definitive agreement defining the collaboration was entered in October 2020.
During the initial development phase, Ballard has prime responsibility for fuel cell system design, while MAHLE’s scope of responsibility includes some of the balance-of-plant components, thermal management and power electronics development and testing.
Solaris Bus & Coach S.A. Orders
On April 27, 2020, we announced a purchase order from Solaris Bus & Coach S.A. (“Solaris”), a leading European bus and trolleybus manufacturer headquartered in Bolechowo, Poland, for 20 of Ballard’s new 70 kW heavy-duty FCmove™-HD fuel cell modules. These modules will power 20 Solaris Urbino 12 hydrogen buses planned for deployment The Netherlands, under the Joint Initiative For Hydrogen Vehicles Across Europe (“JIVE 2”) funding program. The buses will be operated by Connexxion, which provides transport services for South Holland province.
On March 12, 2020, we announced a purchase order from Solaris for 25 70 kW heavy-duty FCmove™-HD fuel cell modules. These 25 modules will power 15 Solaris Urbino 12 hydrogen buses planned for deployment in Cologne, Germany and 10 Urbino 12 hydrogen buses planned for deployment in Wuppertal, Germany, all under the JIVE 2 funding program.
17

image_2.jpg
On November 17, 2022, we announced another purchase order from Solaris for a further 25 70 kW heavy-duty FCmove™-HD fuel cell modules. These modules will be installed in Solaris’ Urbino 12 hydrogen buses for deployment to Polish public transport operator MPK Poznań and were delivered in the second half of 2023. The buses are to be partially funded by the National Fund for Environmental Protection and Water Management’s Green Public Transport program. MPK Poznań requires 30% of its fleet to be zero-emission by 2028. These 25 hydrogen fuel cell buses will increase its zero-emission fleet from 18% to 25%.
On October 10, 2023, we announced multiple purchase orders totaling 177 hydrogen fuel cell engines from Solaris. Ballard started deliveries of these fuel cells in 2023 and we expect t the remainder to ship in 2024 and 2025. The orders include the supply of fuel cell engines to support the largest announced deployment of a fleet of fuel cell city buses in Europe, with 127 Solaris fuel cell buses to be deployed in Bologna, Italy. Ballard also received orders for a further 50 modules to power Solaris fuel cell buses in Germany and Italy.
On November 6, 2023 we announced multiple purchase orders totaling 62 hydrogen fuel cells engines from Solaris. The hydrogen fuel cell engines will power buses in Germany and Poland. The number of engines ordered by Solaris year-to-date is now 365, representing substantial growth over the close to 200 fuel cell city buses that Solaris has deployed with customers in Europe to date.
Ballard and HDF Energy Sign Development Agreement for Multi-Megawatt Fuel Cell Systems
On December 9, 2019, we signed a Product Development Agreement with Hydrogène de France (“HDF Energy”) for the development and integration of a multi-megawatt (“MW”) scale PEM fuel cell system into HDF Energy’s Renewstable® power plant designed for stationary power applications.
HDF Energy’s Renewstable® power plant is a multi-MW baseload system enabling large-scale storage of intermittent renewable wind or solar energy in the form of hydrogen – through the process of electrolysis – as well as electricity generation using that hydrogen feedstock together with a fuel cell system.
Subject to certain conditions, the collaboration contemplates a future technology transfer of Ballard’s new MW-scale containerized PEM fuel cell system to HDF Energy with an exclusive royalty-bearing, non-transferable, multi-year global license for the manufacture and sale of MW-scale fuel cell systems for Renewstable® power plant systems. The collaboration also contemplates Ballard supplying FCgen®-LCS fuel cell stacks for these systems based on an exclusive long-term supply agreement.
18

image_2.jpg
The initial HDF Energy project is an installation planned in French Guiana, an overseas region of France located off the northern Atlantic coast of South America, under the Centrale Electricité de l’Ouest Guyanais (“CEOG”) project. The project includes the supply of 2 x 1.55 MW fuel cell systems built by Ballard in 2023. Systems will be installed and commissioned on site in 2024.
Strategic Collaboration with Weichai
On November 13, 2018, we closed a strategic collaboration transaction with Weichai. The strategic collaboration included an equity investment by Weichai in Ballard, formation of a joint venture company and a development program.
Weichai and Ballard established the Weichai-Ballard JV on November 26, 2018 in Shandong Province to support China’s fuel cell electric vehicle market. Ballard holds a 49% ownership position and Weichai holds a 51% ownership position. Weichai holds three of five Weichai-Ballard JV board seats and Ballard holds two, with Ballard having certain minority shareholder protections.
The Weichai-Ballard JV develops and manufactures fuel cell modules and components including Ballard’s LCS bipolar plates, fuel cell stacks and FCgen®-LCS-based power modules for bus, commercial truck, and forklift applications with exclusive rights (subject to certain conditions) in China and is to pay Ballard a total of $90 million under a Research and Development Agreement to develop and transfer technology to Weichai-Ballard JV in order to enable these manufacturing activities. Ballard retains an exclusive right to the developed technologies outside China, subject to certain restrictions on sublicensing outside China. The Weichai-Ballard JV will also purchase MEAs for FCgen®-LCS fuel cell stacks exclusively from Ballard under a long-term supply agreement.
The Weichai-Ballard JV operation, located in Weifang, Shandong Province, China, has commenced production activities of LCS bipolar plates, LCS fuel cell stacks and LCS-based modules to power bus and truck FCEVs for the China market. After recent production automation projects, the Weichai-Ballard JV is expected to have annual production capacity of 40,000 fuel cell stacks which equates to approximately 20,000 engines.
OUR BUSINESS
At Ballard, our vision is to deliver fuel cell power for a sustainable planet. We are recognized as a world leader in PEM fuel cell and power system development and commercialization.
Our principal business is the design, development, manufacture, sale and service of PEM fuel cell products for a variety of applications, focusing on our market verticals of bus, truck, rail, marine, stationary power, and emerging markets, as well as offering engineering services, product and systems integration services, and related technology transfer for a variety of PEM fuel cell applications.
19

image_2.jpg
A fuel cell is an environmentally clean electrochemical device that combines hydrogen fuel with oxygen (from the air) to produce electricity. The hydrogen fuel can be obtained from natural gas, kerosene, methanol or other hydrocarbon fuels, or from water through electrolysis. Ballard’s PEM fuel cell products feature high fuel efficiency, low operating temperature, low noise and vibration, compact size, quick response to changes in electrical demand and modular design. Embedded in each Ballard PEM fuel cell product lies a stack of unit cells designed with Ballard’s proprietary technology, which include membrane electrode assemblies, catalysts, plates, and other key components, and which draw on intellectual property from our patent portfolio together with our extensive experience and know-how, in key areas of PEM fuel cell stack design, operation, production processes and system integration.
Strategy
We strive to build value for our shareholders by developing, manufacturing, selling, and servicing zero-emission, industry-leading PEM fuel cell technology products and services to meet the needs of our customers in target markets. More specifically, our business plan is to leverage our core competencies of PEM fuel cell stack technology and engine development and manufacturing, our investments in advanced manufacturing and production capacity, and our product portfolio by marketing our products and services across select large and attractive addressable market applications and select geographic regions.
We typically select our target market applications based on use cases where the comparative user value proposition for PEM fuel cells powered by hydrogen are strongest – such as where operators value low emission vehicles that require high utilization, long driving range, heavy payload, fast refueling, and similar user experiences to legacy diesel vehicles – and where the barriers to entry for hydrogen refueling infrastructure are lowest – such as use cases where fuel cell vehicles typically return to a depot or hydrogen hub for centralized refueling and don’t require a distributed hydrogen refueling network. Our current target markets include certain medium- and heavy-duty mobility applications for bus, truck, rail, and marine, along with certain off-road mobility and stationary power applications.
We select our target geographic markets based on a variety of factors, including addressable market sizes of the target market applications in the geographic markets, historic deployments and expected market adoption rates for hydrogen and fuel cells, supportive government policies, existing and potential partner, customer, and end user relationships, and competitive dynamics. Our current target markets are the geographic regions of Europe, North America, and China.
While we recognize addressing multiple market applications and geographic markets in parallel increases our near-term cost structure and investments, we believe offering the same core PEM fuel cell technologies and substantially similar derivative PEM fuel cell products across multiple mobility and power market applications and select geographic regions will significantly expand and strengthen our long-term business prospects by increasing volume scaling in our operations, enabling lower product and production costs for the benefit of all markets, improving our competitive positioning and market share, enabling richly diversified revenue streams and profit pools, and improving our return on investment in our technology and product development programs and our investments in manufacturing.
20

image_2.jpg
Our strategy is built on four key themes:
1.Double down in the fuel cell stack & module: invest in leading PEM fuel cell technology and products to provide leading value to our customers and end users on a total cost of ownership basis;
2.Accelerate market development: deepen and create new partnerships to accelerate hydrogen and fuel cell market adoption and grow volumes for product sales;
3.Win in key regions: prioritize investments in North America and Europe, and monitor China before materially deepening our investment in China; and
4.Here for Life: deliver a compelling environmental, social and governance (“ESG”) proposition for our stakeholders.
In 2020 and 2021, we materially strengthened our financial position through equity financings, thereby providing additional flexibility to fund our growth strategy. Following these financings, given strong indicators of long-term market adoption of hydrogen and zero-emission mobility, given growing customer interest in our fuel cell products, given a growing opportunity set, and given an increasingly competitive environment, we strategically decided to significantly increase and accelerate our investments ahead of the adoption curve. As a result, over the past three years, we increased and accelerated our investments in technology and product innovation, product cost reduction, production capacity expansion and localization, strategic pricing for select customer demonstration programs, and customer experience. Our increased investments include: next generation products and technology, including our proprietary membrane electrode assemblies (“MEAs”), bipolar plates, stacks, and modules; advanced manufacturing processes, technologies, equipment, and production capacity expansion activities primarily in Canada, Europe and the United States; and technology and product cost reduction.
Given challenging and dynamic macroeconomic and geopolitical conditions, given continued delays in hydrogen and fuel cell market adoption, and given changes in investor sentiment towards pre-profitability clean energy companies with long-duration investment horizons, we sharpened our focus in 2023 to protect our balance sheet. While we continue to invest against our long-term strategy, we rationalized our product portfolio, reduced the number of active product development programs, dropped new corporate development investments, and discontinued certain legacy products and non-core activities, including Ballard Motive Solutions in the U.K. We also discontinued our proposed $130 million investment for the localization of a new MEA production facility in China.
21

image_2.jpg
Revenues from Market Segments
We report our results in the single operating segment of Fuel Cell Products and Services. Our Fuel Cell Products and Services segments consist of the sale and service of PEM fuel cell products and the delivery of Technology Solutions, including engineering services for our target markets of bus, truck, rail, marine, stationary power, and emerging markets.
During the fourth quarter of 2023, we completed a restructuring of operations at BMS and operations have been effectively closed. As such, the historic operating results (including revenue and operating expenses) of the BMS business for both 2023 and 2022 have been removed from continuing operating results and are instead presented separately in the statement of comprehensive income (loss) as loss from discontinued operations.
The following chart shows the percentage of total revenues which arises from sales to investees and sales of products and services to other customers, for the years 2023 and 2022:
2023 2022
Revenues from Fuel Cell Products and Services
Percentage of total revenues
100% 100%
Portion representing sales to investees (1)
8.0% 10.0%
Portion representing sales to customers other than investees
92.0% 90.0%
Notes:
1. In this table, “investees” means Weichai Ballard Hy-Energy Technologies Co., Ltd., a joint venture formed in China, of which we hold a 49% equity interest.

Our Markets, Products and Services
Product & Service Overview
Ballard’s product offering provides for a cost effective and flexible set of fuel cell power solutions. Ballard provides products in four distinct product classes and two separate categories of services:
1.MEAs: We provide our proprietary MEAs to the Weichai-Ballard JV that use the MEAs to produce our proprietary FCgen®-LCS fuel cell stacks, respectively.
2.Fuel cell stacks: We provide our proprietary FCgen® and FCveloCity® fuel cell stacks to OEM customers and system integrators that use the stacks to produce fuel cell systems for power solutions. As the fuel cell stack provider, we are the power inside the system.
3.Fuel cell modules: We design and build, including specifying and procuring balance of plant components, self-contained FCmoveTM motive modules using our fuel cell stacks that are plug-and-play into commercial vehicle powertrains. We also design and build self-contained FCwave™ modules designed for marine applications and FCrail™ for rail applications. As a fuel cell module provider, we make it easier for OEMs and system integrators to create fuel cell powertrains.
22

image_2.jpg
4.Fuel cell systems: We also build complete fuel cell systems, FCgen®-H2PM and CleargenTM products, for stationary power markets that are designed to solve certain power needs of our customers, including back-up for critical infrastructure and MW distributed power generation.
5.Technology Solutions: We offer engineering services to our customers for specialized integration of our products or, specific to partnerships, custom fuel cell product development.
6.After Sales Services: We offer our customers after sales services including in and out of warranty support, service contracts, spare part management, fleet monitoring and training.
23

image_2.jpg
The following table lists the key fuel cell and non-fuel cell products we currently produce, offer for sale, have under development or are testing:
Fuel Cell Product Family:
Product Name Application Status
FCgen®-LCS MEA
Fuel cell stacks for buses, commercial vehicles, light rail, and material handling Sales to licensee (Weichai-Ballard JV)
FCgen®-HPS stacks
Light-duty and heavy-duty commercial vehicles and passenger car Sales to OEMs and system integrators
FCgen®-LCS stacks
Buses, commercial vehicles, light rail, and material handling Sales to OEMs and system integrators
FCveloCity®-9SSL stacks
Buses, commercial vehicles, light rail, and material handling Sales to OEMs and system integrators
FCgen®-1020ACS stacks
Material handling and backup power Sales to OEMs and system integrators
FCmove™ modules Buses, commercial vehicles, and light rail (legacy product range) Sales to OEMs and system integrators
FCwave™ modules Marine, rail (freight locomotives) and stationary Sales to OEMs and system integrators
FCrail™ Passenger rail application Sales to OEMs and system integrators
FCgen®-1020ACS Backup power Sales to OEMs and system integrators
FCgen®-H2PM
Backup power systems Sales to customers
ClearGen®
Distributed generation systems Sales to customers and Integrators


Fuel Cell Products and Services
Our primary business is the sale of Power Products, consisting of fuel cell modules and fuel cell stacks offered to customers in our target market verticals of bus, truck, rail, marine, stationary power, and emerging markets.
24

image_2.jpg
Fuel cell electric vehicles and power generation systems in these applications rely on centralized fueling depots that simplify the hydrogen infrastructure requirements and are typically government-subsidized, thus enabling the purchase of pre-commercial fleets.
In addition to our fuel product, we also provide engineering services to customers in our target markets under our Technology Solutions offering. Our engineering services help customers solve difficult technical and business challenges in the commercialization of their PEM fuel cell products or address new business opportunities and markets. We offer customized, bundled technology solutions, including specialized PEM fuel cell engineering services, access to our intellectual property portfolio and know-how, as well as specialized integration support for our products in various applications across all of our market verticals.
We design and manufacture fuel cell modules and stack products capable of delivering 50 kW to 200 kW of power. These modules and stacks can be combined to provide power output in excess of 1 MW for certain applications. We supply the fuel cell modules to a combination of vehicle OEMs and system integrators to deliver to end users. The demand for zero-emission vehicles is driven in many jurisdictions by the requirement to reduce greenhouse gases and other harmful emissions.
In 2019, we launched our eighth-generation high-performance fuel cell module, the FCmove™-HD. The FCmove™ family of products is designed to power medium- and heavy-duty commercial vehicles such as buses and trucks. The FCmove™-HD 70kW version is being delivered to customers in China and Europe and has been integrated into vehicles. The FCmove™-HD+ 100kW version was launched in 2021 and we are starting delivery of the first modules to customers for integration into their new vehicle platforms in 2022. We presented at the IAA Show in September 2022 the concept unit for FCmoveTM-XD (120/240kW) product which was developed for heavy duty trucks (>19t and class 6-8) and became commercially available in 2023.
In 2020, we introduced the FCwaveTM, a fuel cell module designed for certain marine applications. The FCwaveTM fuel cell module is a 200 kW modular unit that can be scaled in series up to the multi-megawatt (MW) power level. The FCwaveTM product provides primary propulsion power for marine vessels – such as passenger and car ferries, river push boats, and fishing boats – as well as stationary electrical power to support hotel and auxiliary loads on cruise ships and other vessels while docked at port (also known as ‘cold ironing’). In 2021, we also started to sell FCwave™ products for stationary and rail applications. In 2022, our FCwaveTM fuel cell module was granted the industry-first Type Approval by DNV, one of the world’s leading marine classification and certification bodies.
Our Technology Solutions efforts support expanding our key market verticals. In 2023, we completed the development of the 200kW FCrailTM fuel cell engine to power Siemens’ Mireo light rail train pursuant to the Development Agreement entered into with Siemens in 2017.
25

image_2.jpg
Related to the bus and truck verticals we continued the execution of the Research and Development Agreement to develop and transfer technology to the Weichai-Ballard JV to enable manufacturing of Ballard’s FCgen®-LCS fuel cell stack and FCgen®-LCS-based power modules for bus, commercial truck and forklift applications with exclusive rights in China. We also completed several large scale stationary installations in the 1-1.5 MW range for various customers and have several more planned for 2024.
Market Verticals
Bus
We supply Power Products and Technology Solutions to bus manufacturers primarily in Europe and North America. The bus market is the most mature of our markets as measured by the length of time Ballard has been active in the market and by the number of products sold to customers in the market. Hydrogen fuel cell buses offer long range, the ability to complete demanding routes, and short refueling times for bus operators. Target applications for our bus vertical include transit buses and intercity coach buses.
Truck
We supply Power Products and Technology Solutions to truck manufacturers and truck integrators in Europe and North America. Our Power Products and Technology Solutions revenues from Weichai-Ballard JV are also recorded in this vertical. The hydrogen fuel cell truck market is at a nascent phase typified by demonstration projects to prove the capabilities of the technology in the real world. For truck applications, hydrogen fuel cell power offers long range, high payloads, short refueling times, and high fuel efficiency. Target applications for our truck vertical include heavy-duty long haul trucks, rubbish collection vehicles or garbage trucks, and medium-duty trucks or delivery vans.
Rail
We supply Power Products and Technology Solutions to train OEMs and railway operators in Europe and North America. Our technology offers a compelling value proposition to railway operators seeking to eliminate carbon emissions on railway lines that lack overhead catenary power infrastructure, as hydrogen fuel cells eliminate the need to build the overhead infrastructure by utilizing refueling depots that mirror current practice for diesel locomotives. Target applications for our rail vertical include passenger rail and freight locomotive applications.
Marine
We supply Power Products and Technology Solutions to ship operators and shipyards in Europe and North America. Fuel cell power provides marine vessel operators with ships that have long range and short refueling times.
26

image_2.jpg
Target applications in our marine vertical include river transport, barges, short sea container ships, and ferries.
Stationary Power
We supply Power Products and Technology Solutions to OEMs and system integrators of power generation products. Our products allow users to generate zero emission power in remote locations that lack access to electrical grid infrastructure or generate back-up power for up to several days. Given the expected growth in electricity demand and the difficulties of expanding the electrical distribution network, we see an opportunity for fuel cell products to support demand for incremental power generation. Target applications include EV charging, TV and film production sites, grid balancing, and data centers.
Emerging Markets
Our Emerging Markets vertical encompasses two distinct markets: Materials Handling and Off-Highway. We supply Power Products and Technology Solutions to customers in both market verticals.
The material handling market includes industrial vehicles such as forklifts, automated guided vehicles and ground support equipment. Our initial focus is on battery-powered Class 1 counterbalance lift trucks, Class 2 reach trucks and Class 3 pallet forklifts. Ballard is currently supplying fuel cell stacks to a limited number of system integrators in North America and Europe.
The off-highway market includes industrial vehicles such as ultra-class mining haul trucks, excavators, construction equipment and farming equipment. Fuel cell products enable customers to operate their vehicles with high up-times, and are able to meet high power demands in heavy-duty applications.
Competition
Diesel-powered buses and commercial trucks currently dominate the market today. Compressed natural gas and diesel electric hybrid powertrains are lower-emission alternatives to diesel engines but are in limited service today. Electric trolley buses provide a zero-emission alternative; however, their purchase price is high and the overhead catenary power infrastructure is expensive to maintain and is considered aesthetically undesirable in many urban centres. The recent developments in battery-powered powertrain vehicles have created a zero-emission alternative to fuel cell buses in the form of battery electric buses and commercial trucks, as well as electrified trains and battery-powered marine vessels. These battery-powered heavy-duty vehicles will continue to offer a competitive zero emission mobility solution for zero-emission mobility applications.
We believe that fuel cell electric vehicles are the best zero-emission alternative for medium-duty and heavy-duty applications in certain use cases in bus, truck, train, marine and off-highway. In comparison to battery electric vehicles, we believe fuel cell electric vehicles in medium-duty and heavy-duty applications: are able to operate over a longer range and on more demanding routes; offer higher energy density to maximize payload; and are capable of refueling quickly, ensuring the vehicle is on the road generating revenue for the fleet operator.
27

image_2.jpg
We also believe that in certain cases hydrogen refueling infrastructure has certain scaling cost and logistics advantages compared to battery recharging for large fleets.
Companies developing fuel cell systems for heavy-duty applications include Beijing Sinohytec Co. Ltd., cellcentric GmbH & Co. KG (a joint venture of Daimler Truck AG and the Volvo Group), Cummins Inc., EKPO Fuel Cell Technologies GmbH (a joint venture of ElringKlinger and Plastic Omnium), Hyzon Fuel Cell Technologies Pte. Ltd., Sino-Synergy Hydrogen Energy Technology (Jiaxing) Co., Ltd., Hyundai Motor Company, Nikola Motor Company, Plug Power, Inc., Powercell Sweden AB, Robert Bosch GmbH, Shanghai Re-Fire Technology Co., Ltd., Symbio SAS (a joint venture of Michelin, Forvia and Stellantis), and Toyota Motor Corporation.
We are also seeing the emergence of product offerings for hydrogen internal combustion engines developed by companies like Cummins Inc. and J C Bamford Excavators Ltd. Numerous engine and vehicle manufacturers are interested in development programs. This technology is seen as a potential bridge between legacy internal combustion engines and hydrogen fuel cell mobility. Through modification of existing diesel engines, it allows the use of hydrogen as a fuel leading to CO2 emission reduction. However, the technology is not expected to meet zero emission requirements (such as NOx emissions) and is expected to have significantly lower efficiency compared to fuel cells .
The stationary power generation market is currently dominated by diesel generators and batteries. Advanced battery technology continues to make modest progress in the backup power generation market. However, advanced battery technologies still require lengthy recharging and, in many cases, cannot meet desired run times without requiring substantial space. We believe that PEM fuel cell products are superior to batteries in some applications, because of their ability to provide extended run time without frequent or lengthy recharging, as well as their ability to offer lower life cycle costs, given that batteries require periodic replacement.
For certain applications and markets we believe fuel cell power generators offer a value proposition against diesel generators with lower operating cost, extended run time, low emission and noise, and less risk of theft.
Hydrogen fueled gas turbines are also being developed and could be an alternative to diesel generators. Compared with fuel cell systems, however, H-ICEs and gas turbines produce nitrous oxide emissions and are considered to be less power efficient.
Companies developing PEM fuel cell systems for stationary power generation applications include CHEM, Plug Power, Inc., SFC Energy, Powercell, and Nedstack. We seek to gain competitive advantage through fuel cell designs that provide zero emissions, superior performance, reliability, durability and cost.
28

image_2.jpg
We believe that we are well positioned to compete with our competitors based on our talented workforce, intellectual property portfolio, technology, number of product offerings, manufacturing capabilities, vertical integration, customers, partners, brand, financial strength, and extensive operating hours in real world heavy-duty operations.
Impact of Regulations and Public Policy
In the course of carrying on our business we believe we have become aware of government regulation and public policies that may be supportive of our business, the fuel cell industry in general or zero-emission vehicles. The statements below in this section are based on our understanding of the regulations and public policies in place in the particular jurisdiction as of the date of this Annual Information Form that we believe to be correct. While we believe the statements below in this section to be correct, regulation and public policy may change without notice and our understanding of regulations and public policies may be incorrect.
Approximately 75 countries have announced targets to achieve net-zero emissions strategies for 2050 or pledged to be carbon neutral by 2050. As of June 7, 2023, 35 countries representing approximately 90% of global GDP have specific hydrogen strategies according to the industry association “Hydrogen Europe”. The main drivers of such policies include GHG emission reduction goals, energy security, the integration of renewables, as well as the opportunity for economic growth and green recovery plans. Interest and investment in hydrogen is increasing globally, as governments across the globe continue to adopt national hydrogen strategies. The Hydrogen Council reported in 2023 that over 1,400 large-scale hydrogen project proposals worth $570 billion have been announced.
On November 15, 2021, President Biden signed into law the Infrastructure Investment and Jobs Act. The bill allocates over $62 billion to the Department of Energy to advance clean energy technologies, including: (1) $8 billion to support the development of at least four clean hydrogen hubs across the United States in order to further development with respect to the production, processing, delivery, storage, and end-use of clean hydrogen; and (2) $1 billion to support the demonstration, commercialization, and deployment of electrolyzer systems, in order to decrease the cost of clean hydrogen production. On October 13, 2023, the Department of Energy announced that seven Hydrogen Hubs across the United Status have been awarded $7 billion in funding to support the development of clean hydrogen production, delivery, and end-use.
In 2023, nearly $1.7 billion was allocated through the Federal Transit Administration’s (the “FTA”) Low and No Emission Grants and the Bus and Bus Facilities Grants; this funding supported investment in 150 transit fleets and facilities throughout the United States with more than 1,700 vehicles being zero-emission.
29

image_2.jpg
The Inflation Reduction Act was signed into law by President Biden in August 2022, and represents a $369 billion investment in the modernization of the American energy system. Among other things, the broad bill includes a hydrogen production tax credit (up to $3/kg of hydrogen produced at a given facility, based on the carbon intensity of production ). It is intended to make technologies, like green hydrogen and carbon capture, profitable in large scale improving business case for hydrogen mobility and deployment of fuel cell applications.
The California Air and Resource Board (“CARB”) Low Carbon Transportation and Air Quality Improvement Program programs provide mobile source incentives to reduce GHG emissions, criteria pollutants, and air toxics through the development of advanced technology and clean transportation in California. The ICT Regulation was adopted in December 2018 and requires all public transit agencies to gradually transition to a 100 percent zero‑emission bus (“ZEB”) fleet. Beginning in 2029, all new transit bus purchases by California transit agencies must be ZEBs, with a goal for full transition by 2040. In 2020, the CARB unanimously adopted the world’s first zero-emission commercial truck requirement, the Advanced Clean Trucks rule. Beginning in 2024, truck manufacturers must increase their zero-emission truck sales to between 30-50 percent by 2030 and 40-75 percent by 2035 depending on the class of truck. The CARB requirements are expected to be key drivers of the growing demand in California for fuel cell trucks and buses. In 2023, the CARB passed the In-Use Locomotive Regulation to reduce emissions from locomotives operating in the state. Under the rules, switch, industrial and passenger locomotives built in 2030 or after will be required to operate in zero-emissions configurations while in California, and in 2023 for freight line haul.
Significant funding is invested in hydrogen production, distribution and use, throughout the EU. In 2020, multiple countries in Europe announced ambitious hydrogen strategies supported by significant funding (for example, €9 billion in Germany and €7 billion in France). In 2023, the European Commission launched a €800 million auction for hydrogen production subsidies in November 2023. The Netherlands, Germany, Denmark and the UK also launched support schemes for hydrogen (and derivatives) production.
The European Commission’s “Fit for 55 package”, announced in July 2021, includes 19 legislative proposals to help the European Union reach its climate goals of reducing GHG emissions by 55% by 2030 and achieving carbon-neutrality by 2050. As of December 31, 2023, 14 pieces of legislation tabled under this package have been adopted, several of which could support growth of the European Union’s hydrogen economy. For instance, the Alternative Fuels Infrastructure Regulation (EU 2023/1804) mandates the deployment of hydrogen refueling stations at least every 200 km along the main EU highways (“TEN-T network”) for compressed hydrogen by 2030. The revised Renewable Energy Directive (2023/2413) that came into force on November 20, 2023, mandates fuel suppliers to supply enough hydrogen and derivatives (Renewable Fuels of Non-Biological Origin “RFNBOs”) to cover at least 1% of the energy used in transport by 2030.
30

image_2.jpg
The revised CO2 emission standards for heavy-duty vehicles presented by the European Commission on February 14, 2023, are also expected to drive adoption of zero-emission trucks, buses and coaches by setting emission reduction targets for all major OEMs. As of end 2023, the European Institutions have reached a preliminary agreement to mandate CO2 emission reduction of 45% by 2030, 65% by 2035 and 90% by 2040 for trucks above 7.5 tons. All city buses are also expected to be zero-emission by 2035. In November 2021, the European Commission launched the Clean Hydrogen Partnership, taking over the activities of the existing Fuel Cell and Hydrogen Joint Undertaking. The Partnership will support hydrogen technologies R&D with €1 billion of funding for the period 2021-2027, complemented by at least an equivalent amount of private investment (from the private members of the partnership).
Other relevant EU legislative initiatives for the hydrogen and fuel cell sector include the, the new Fuel EU Maritime, the revised EU emission trading scheme, the Energy Efficiency Directive, the revision of the EU gas directive and EU gas regulation, the revised Weights and Dimensions directive and the Net Zero Industry Act.
In December 2020, Canada announced its Hydrogen Strategy setting an ambitious framework to cement hydrogen as a key part of Canada’s path to net-zero carbon emissions by 2050 and make Canada a global leader in hydrogen technologies. In 2021, Natural Resources Canada set up a framework for the execution of Canadian Hydrogen Strategy including development of hydrogen hubs and have released first call for proposal for production at scale of green hydrogen to be used for fuel for zero emission vehicles. In August 2021, the Canadian government announced the creation of the Zero Emission Transit Fund, which will allocate $2.75 billion to ZEBs over five years with a goal of deploying 5,000 ZEBs. In 2022 and 2023 the Canadian Government has been working on the implementation of the hydrogen strategy with focus on a number of hydrogen hubs.
The Clean Hydrogen Investment Tax Credit (ITC), first announced in the 2022 Fall Economic Statement and described in Budget 2023, will provide a 15 to 40 per cent refundable tax credit for investments in projects that produce all, or substantially all, hydrogen through their production process. Projects with less than 0.75kg of carbon dioxide-equivalent (CO2e) per kilogram of hydrogen produced will receive the full 40% rate.
In September 2020, the Government of China announced a new 4-year policy framework replacing existing subsidy programs with awards. While previous policies in China to support zero-emission vehicle makers (sometimes referred to as new-energy vehicles) had offered subsidies on sales, the new policy framework will require local governments and companies to build a more mature supply chain and business model for the new-energy vehicle industry. The Government of China is expected to provide financial incentives to demonstration regions that meet requirements based on:
•Completeness of industry base with leading enterprises;
31

image_2.jpg
•Competitive hydrogen energy supply and economics;
•Prior fleet demonstration of FCEV applications; and
•Guaranteed local policy to support FCEV industry.
In 2021, the Government of China announced the first demonstration city clusters in Beijing, Shanghai and Guangdong. In early 2022, the Government of China announced Henan and Hebei as the second demonstration city clusters.
In March 2022, the National Development and Reform Commission (NDRC) and National Energy Administration (NEA) jointly released the country’s first mid to long-term plan for implementing and developing hydrogen usage in China, stretching until 2035. According to the plan, the projected volume for renewable-based hydrogen is aimed to reach within the range 100,000-200,000 tons annually by 2025.
Workforce
As of December 31, 2023, we had 1,173 employees in Canada, the United States, the European Union, the United Kingdom and China, representing such diverse disciplines as electrochemistry, polymer chemistry, chemical, mechanical, electronic and electrical engineering, manufacturing, quality, supply chain management, advanced manufacturing, marketing, sales, service, business development, legal, finance, accounting, people & culture, information technology and business management. Our employees are not represented by any labour union. Each employee must agree to confidentiality provisions as part of the terms of his or her employment, and certain employees have also executed non-competition agreements with Ballard.
Sustainability and ESG
Strategy and Oversight
Our strategic theme of Here for Life™ connotes our purpose to decarbonize mobility and accelerate the impact of a low carbon energy transition. Our strategy continues to be based on our fundamental commitment to managing our risks, capitalizing on opportunities, and conducting our operations in an environmentally and socially responsible manner. By focusing on sustainable ESG practices and transparency, Ballard strives to ensure that we, our customers, partners and suppliers continue to maximize our positive impact on the world around us.
The Sustainability and Governance Committee (“S&G Committee”) of the Board has the responsibility of overseeing our environmental, social and governance performance. This includes overseeing policies and practices relating to ESG. The S&G Committee is composed of independent directors and reports regularly to the Board. The SGC Committee mandate can be found on Ballard’s website (www.ballard.com/investors/governance).
32

image_2.jpg
Recent Developments
In late 2021, we completed our first three-year ESG strategy and conducted our first stakeholder-informed materiality assessment. This assessment helped us understand and prioritize the ESG topics most impactful to our business and to our stakeholders. These topics remained unchanged for 2023 and our top seven include: (1) energy transition impact, (2) climate and greenhouse gas emissions, (3) employee attraction, engagement, and retention, (4) health and safety, (5) diversity, equity, and inclusion, (6) ethics and anti-corruption, and (7) corporate governance.
In March 2023, we signed as participants to the United Nations Global Compact, a voluntary leadership platform for the development, implementation, and disclosure of responsible business practices. We are planning to submit our first Communications on Progress (CoP) report in 2024.
During 2023, we continued to pursue our “Mission Carbon Zero” initiative; a multi-year approach to reduce our environmental impact and achieve carbon neutrality by 2030. Through this initiative we continued to execute against our Carbon Neutral Plan (“CNP”), a roadmap which contains six primary goals focused on the material initiatives that will support a reduced carbon footprint and accelerate the avoidance of emissions as our business grows. More information on our CNP activities can be found in our annual ESG report.
In 2023, we revised our previous Diversity and Inclusion Policy to become our Diversity, Equity, and Inclusion Policy, recognizing the important role equity plays in building an inclusive culture. We also conducted a diversity census and inclusivity sentiment survey to understand the demography of our organization. This led to forming our first ever DEI Council, made up of leaders and employees across our organization, to lead the development and implementation of our DEI strategy.
2022 ESG Report
In June 2023, we issued our 2022 ESG Report, our fourth annual ESG report, and the first report aligned with the reporting requirements of the Global Reporting Initiative (GRI) and the Sustainability Accounting Standards Board (SASB).
The report captures the first year of focused action resulting from our ESG strategy and the pursuit of Ballard’s sustainability commitments and supporting initiatives. Highlights from the 2022 ESG Report include:
•Continued improvement in overall ESG research ratings;
•In 2022, Ballard fuel cell technology prevented the consumption of ~53 million gallons of diesel, avoiding ~540,000 tCO2e;
•20% emissions intensity decline since 2019 across reported scope 1, scope 2, and scope 3 emissions;
•Outline of Ballard’s carbon neutral by 2030 plan, including key goals for driving decarbonization of corporate emissions;
33

image_2.jpg
•88% annual employee retention rate;
•Increased women representation at the senior leadership level by 14% since 2019;
•Taught more than 125,000 students hydrogen fuel cell technology through Ballard’s Hydrogen Challenge Education Program;
•63% decrease in lost-time injury rate year over year; and
•93% of total operating waste was recycled.
A copy of our 2022 ESG Report is available on our website (www.ballard.com/about-ballard/our-sustainability).
Environmental Policy
Ballard is committed to supporting the delivery of fuel cell solutions while seeking to mitigate our negative environmental impact and ensuring compliance with applicable regulatory requirements. Consequently, we have implemented comprehensive environmental management programs with half of our operating sites (including our most material production facilities), third-party certified under ISO 14001, and plans to certify the remaining. We strive to contribute to the protection of the environment by integrating environmental priorities into our overall business plan and through the specific monitoring and measurement of such priorities against historical performance and, in some cases, specific targets.
Social Policies
Ballard maintains a (i) comprehensive Code of Ethics, (ii) a Diversity, Equity and Inclusion Policy, and (iii) a Harassment, Workplace Bullying and Anti-discrimination Policy. These policies affirm Ballard’s commitment to preventing harassment and discrimination against any employee or applicant based on grounds of religion, race, sex, nationality, disability or any other basis protected by law, ordinance or regulation. The policies extend to recruitment, selection and compensation practices, as well as to working conditions and the work environment. Internal complaint resolution procedures have been established whereby any person covered by these policies can contact their people and culture business partner or manager who will address their complaint. We encourage our employees to report any situation that appears to involve a breach of the company’s ethical or legal obligations and have engaged a third-party to receive anonymous reports or allegations of wrongdoing, and they can be contacted on a confidential basis.
Facilities
We currently have facilities in Canada, Denmark, USA, and China, including the following facilities: (a) 260,024 ft² (24,157 m²) of leased facilities in Burnaby, British Columbia that house our corporate headquarters and our fuel cell development, manufacturing, assembly and testing activities; (b) 18,202 ft² (1,691 m²) of leased facilities in Hobro, Denmark that house certain engineering, manufacturing, sales and service activities; and (c) 26,000 ft² (2,415 m²) of leased facilities in Bend, Oregon that house certain of our assembly and testing facilities. The Weichai-Ballard JV’s operations in Weifang, Shandong Province, China are conducted in an approximately 150,000 ft² (14,000 m²) facility.
34

image_2.jpg
As noted in the Recent History section, Ballard is undertaking a comparative analysis on manufacturing capacity expansion options and possible sequencing prioritization in the U.S. and/or European markets. We expect to conclude this review in 2024.
As per our Quality Statement, we are committed to ensuring that each of these facilities is operated in full compliance with all applicable laws, as well as all applicable health, safety, and regulatory standards.
Manufacturing
Our PEM fuel cell products are produced in five facilities – three in Burnaby, British Columbia, Canada, one in Hobro, Denmark, and one in Bend, Oregon, USA. Along with these facilities, the Weichai-Ballard JV, of which Ballard has a 49% interest, manufactures Ballard’s FCgen®-LCS fuel cell stack and FCgen®-LCS-based power modules for bus, truck and forklift applications in Weifang, Shandong Province, China. The Burnaby facilities are focused on our core fuel cell competencies, which include the production of MEAs, the production of bipolar plates, integration and testing of fuel cell stacks, assembly and testing of motive modules, assembly and testing of stationary systems, as well as support of other products required through our engineering services contracts. Ballard Denmark develops, tests, and manufactures FCwave™ marine power modules, FCgen® stationary power modules and backup power systems in Hobro, Denmark. The Bend facility manufactures and tests certain motive modules primarily for the US market.
As a part of our expansion strategy, we continue to make investments in our manufacturing processes, equipment, capabilities and business processes to increase our production.
Certain materials and components used in the production of MEAs, bipolar plates, fuel cell stacks, and balance of plant are proprietary in nature and have been developed in joint collaboration between Ballard and our key supply base. Strategic supply agreements have been executed with these suppliers to ensure security of supply, protection of our intellectual property, and adherence to our strict quality and reliability standards.
Safety
Our products are designed and manufactured with the safety of our employees, customers, and end-users in mind. All equipment and processes that are introduced into our working environment are evaluated using a rigorous Preliminary Hazard Assessment procedure to ensure they are safe to use.
In 2023, we continued to work diligently to continue to strengthen the culture of safety across our entire global footprint. We have enhanced the robustness of our safety protocols in the areas of Hazard Identification and Control, Accident Investigations, Training and Instruction, Emergency Preparedness, Workplace Inspections, and Industry Specific Programs.
35

image_2.jpg
Conformance to these systems is ensured through our Integrated Management System.
We continued to meet the requirements of ISO 45001 – Occupational Health and Safety certification in certain of our Burnaby facilities.
Quality
Quality is an integral part of the Ballard culture. We measure our success through the satisfaction of our customers and other quality metrics.
Our processes and systems are focused on ensuring that every product that is shipped to our customers conforms to their expectations and contractual requirements while being produced in a safe and environmentally conscious manner. We adhere to our Quality Policy Statement, which reads, “At Ballard, Quality is intrinsic to our identity. Our team is empowered to do things right – the first time – to satisfy customer needs and deliver on our promise.”
We are certified to automotive standard IATF16949 while maintaining ISO9001:2015 in our Burnaby facilities. Conformance to these quality systems is ensured through our Integrated Management System. We also strive for continuous improvements in our manufacturing processes through such practices as Lean Manufacturing, 5-S and Six Sigma. The Weichai-Ballard JV in Weifang, Shandong Province, China carries the IATF16949 certification. Our Hobro facility carries the ISO9001:2015 certification.
Research and Product Development
Ballard’s research activities are primarily focused on the MEA and its sub-components, aimed at improving the overall cost, performance, durability, and reliability of our products. Material development for other unit cell components, such as bipolar plates, frames, seals and adhesives, are areas of additional research focus. Product development activities have been primarily directed at stack design and module development and cost reduction. Progress is driven by leveraging stack component designs, materials, and manufacturing processes across multiple product platforms.
Intellectual Property
Ballard’s technical strengths lay in our proprietary MEA design, combined with our extensive stack and system integration capabilities, which enables development of complete end-user systems that meet or exceed customer specifications, across a wide range of market applications.
Our intellectual property covers multiple aspects of our technology, including: materials and components; cell, stack and systems architecture; stack/system operation and control; and manufacturing processes. Our intellectual property portfolio is not limited to our patents and patent applications; it also includes know-how and trade secrets developed over more than 30 years of research, product development and production.
36

image_2.jpg
As of March 8, 2024, Ballard owns or controls: 35 United States granted patents; 97 non-United States granted patents; 2 United States published patent applications; and 12 published non-United States patent applications. Our patents will expire between May 2024 and April 2043.
We hold licence rights to additional intellectual property from a number of third parties. We have a royalty-free license to approximately 870 issued patents and pending patent applications from AUDI for bus and non-automotive applications and a royalty-bearing license for all other applications. In addition, these licences include non-exclusive, royalty-free access to all of the intellectual property rights held by NuCellSys GmbH, a Daimler subsidiary, and to all of the intellectual property rights relating to fuel cells developed by Daimler, Ford and their subsidiaries (either directly or through AFCC), including any intellectual property rights developed by them to January 31, 2013. As of March 8, 2024, approximately 80 of the patents and patent applications that were included in these licenses, are currently granted or pending.
Cybersecurity
Ballard is committed to maintaining strong security controls, including encryption, to protect our information and the information our customers and partners entrust to us. We maintain administrative, technical, and organizational security measures to protect information from loss, misuse, and unauthorized access or disclosure. These measures are based on industry security practices and take into account the sensitivity of the information we collect, the current state of technology, the cost effectiveness of implementation, and the scope of the data processing we engage in. To our knowledge, Ballard has not experienced an information security breach in the last three years.
Ballard implements and maintains a cybersecurity framework to manage cyber risk, control, and compliance-based activities. We are certified under the ISO 27001:2013 standard (International Organization for Standardization) and Ballard also maintains robust cyber insurance coverage. Ballard employees receive cybersecurity training during onboarding and on an ongoing basis.
The Audit Committee is responsible for overseeing our cybersecurity risk program and monitoring cybersecurity policies and procedures within our organization. Management briefs the Audit Committee on cybersecurity matters quarterly.
SHARE CAPITAL AND MARKET FOR SECURITIES
Our authorized share capital consists of an unlimited number of common shares and an unlimited number of preferred shares. As of March 8, 2024, our issued share capital consisted of 299,036,564 common shares. Our common shares are listed and trade on the Toronto Stock Exchange (“TSX”) and on the National Association of Securities Dealers Automated Quotation Global Market (“NASDAQ”) and trade under the symbol “BLDP” on both exchanges.
37

image_2.jpg
The following table shows the monthly trading activity for our common shares on the TSX and NASDAQ during 2023:
TSX NASDAQ
Price Range
(C$)
Average Daily Volume
(#)
Price Range
(US$)
Average Daily Volume
(#)
January $6.40 - $8.77 737,243 $4.67 - $6.59 3,080,873
February $7.42 - $9.45 1,103,368 $5.44 - $7.10 2,207,935
March $6.55 - $8.24 433,595 $4.77 - $6.06 2,998,609
April $5.76 - $7.54 555,429 $4.22 - $5.61 2,030,190
May $5.41 - $6.40 637,724 $3.98 - $4.81 3,127,579
June $5.41 - $7.57 652,249 $4.06 - $5.68 4,077,426
July $5.40 - $6.38 151,054 $4.05 - $4.84 3,139,650
August $5.29 - $6.86 584,982 $3.90 - $5.11 2,620,303
September $4.67 - $5.87 467,043 $3.46 - $4.34 1,926,078
October $4.32 - $5.29 517,668 $3.13 - $3.90 2,420,459
November $4.35 - $5.17 762,483 $3.14 - $3.79 2,813,659
December $4.61 - $5.38 571,532 $3.40 - $4.02 1,537,395
The holders of our common shares are entitled to one vote for each share held on all matters to be voted on by such shareholders and, subject to the rights and priorities of the holders of preferred shares, are entitled to receive such dividends as may be declared by our Board out of funds legally available therefor and, in the event of liquidation, wind-up or dissolution, to receive our remaining property, after the satisfaction of all outstanding liabilities.
Our preferred shares are issuable in series and our Board is entitled to determine the designation, preferences, rights, conditions, restrictions, limitations and prohibitions to be attached to each series of such shares. The Board represents that it will not, without prior shareholder approval, issue or use preferred stock for any defensive or anti-takeover purpose or for the purpose of implementing any shareholder rights plan. Currently there are no preferred shares outstanding.
DIVIDEND RECORD AND POLICY
To date, we have not paid any dividends on our shares and, because it is anticipated that all available cash will be needed to implement our business plans, we have no plans to pay dividends in the foreseeable future.
ESCROWED SECURITIES AND SECURITIES SUBJECT TO CONTRACTUAL RESTRICTIONS ON TRANSFER
There are no securities of Ballard in escrow or subject to contractual restrictions on transfer.


38

image_2.jpg
DIRECTORS AND OFFICERS
Board of Directors
The following chart provides the following information as of December 31, 2023: the name and province or state of residence of each of our directors, each director’s respective positions and offices held with Ballard, their principal occupation during the past five years and, the period of time each has served as a director.
Name and Province/State of Residence(1)
Office Principal Occupations and Positions During the Last Five Years Director Since
Kathy Bayless

California, USA
Director
Ms. Bayless’ principal occupation is corporate director. Ms. Bayless is a member of the Board and Audit Committee Chair of Veeco Instruments Inc. (electronics manufacturing equipment) and Amprius Technologies, Inc. (lithium-ion battery manufacturing). Previously Ms. Bayless held various executive roles at public technology companies, including SVP Chief Financial Officer and Treasurer at Synaptics, Incorporated as well as Komag, Incorporated. Ms. Bayless is a Certified Public Accountant in California.
2021
Douglas P. Hayhurst

British Columbia, Canada
Director
Mr. Hayhurst’s principal occupation is corporate director. Previously, Mr. Hayhurst was a Global Industry Leader with IBM Canada Business Consulting Services (consulting services) and with PricewaterhouseCoopers Management Consultants (consulting services). Prior to that, Mr. Hayhurst held various senior executive management roles with Price Waterhouse Canada including National Deputy Managing Partner (Toronto) and Managing Partner for British Columbia (Vancouver). Mr. Hayhurst received a Fellowship (FCA) from the Institutes of Chartered Accountants of British Columbia and of Ontario. He has completed the Directors Education Program of the Institute of Corporate Directors and has received his ICD.D designation.
2012
Kui (Kevin) Jiang(2)

Shandong, China
Director
Mr. Jiang is President of Shandong Heavy Industry Group Co., Ltd. (heavy machinery manufacturing). He is also a non-executive director of Weichai Power Co., Ltd, (diesel engine, powertrain and hydraulic products manufacturing), a supervisor of KION Group AG (intralogistics, warehouse solutions and industrial trucks), and a director of Shantui Construction Machinery Co., Ltd. (heavy machinery manufacturing). Previously, Mr. Jiang was deputy general manager of Shandong Bulldozer General Factory (heavy machinery manufacturing); deputy general manager of Shantui Construction Machinery Import and Export Company (heavy machinery); a director and senior officer of Shantui Engineering Machinery Co., Ltd. (heavy machinery); deputy general manager of Shandong Engineering Machinery Group Co., Ltd. (heavy machinery); executive deputy general manager and vice chairman of Weichai Group Holdings Limited, (diesel engine manufacturing); and chairman of Shanzhong Jianji Co., Ltd. (heavy machinery). He is an engineer and holds an MBA degree.
2019
R. Randall (Randy) MacEwen

British Columbia, Canada
Director, President & Chief Executive Officer
Mr. MacEwen is President and Chief Executive Officer of Ballard, a position he has held since 2014. Previously, Mr. MacEwen was the founder and Managing Partner at NextCleanTech LLC (consulting services) from 2010 to 2014; and President & CEO and Executive Vice President, Corporate Development at Solar Integrated Technologies, Inc. (solar) from 2006 to 2009 and 2005 to 2006, respectively. Prior to that, Mr. MacEwen was Executive Vice President, Corporate Development at Stuart Energy Systems Corporation (electrolysers) from 2001 to 2005; and an associate at Torys LLP (law firm) from 1997 to 2001.
2014
39

image_2.jpg
Hubertus M. Muehlhaeuser

Switzerland
Director
Mr. Muehlhaeuser is Chairman & CEO of Pontem Corporation (special purpose acquisition company) Chairman of Kelvion Holding Ltd. (heat exchangers); and Chairman of FläktGroup Ltd. (air handling technology solutions). Previously Mr. Muehlhaeuser was CEO and Executive Director at CNH Industrial N.V. (agricultural equipment), CEO and Executive Director at Welbilt Inc. (food and beverage equipment) and Sr. Vice President and General Manager at AGCO Corporation (agricultural equipment).
2021
Marty Neese

California, USA
Director
Mr. Neese is CEO of Verdagy Inc. (electrolysis and hydrogen production). He is also co-founder of Nuvosil AS (silicon recycling). Previously, he was Chief Operating Officer of Velodyne LiDAR, Inc. (autonomous vehicles) from February 2017 to October 2017. Prior to that, Mr. Neese was Chief Operating Officer of SunPower Corporation (solar power equipment and services) from 2008 to 2017; responsible for Global Operations at Flextronics (electronics manufacturing services) from 2007 to 2008 following its acquisition of Solectron Corporation (electronics manufacturing services) where he was Executive Vice President from 2004 to 2007.
2015
James Roche

Ontario, Canada
Director
Mr. Roche is founder, President & CEO of Stratford Group (management consulting services), a position he has held since 2008, and Chair & CEO of ThinkRF Corp. (communications equipment manufacturer), a position he has held since 2016. Prior to that, Mr. Roche was co-founder, President & CEO of Tundra Semiconductor (semiconductor component manufacturer) from 1995 to 2006 and founding member and executive at Newbridge Networks (communications equipment manufacturer) from 1986 to 1995.
2015
Shaojun (Sherman) Sun(2)

Shandong, China
Director
Mr. Sun is an Executive Director and Executive President of Weichai Power Co., Ltd. (diesel engine, powertrain and hydraulic products manufacturing), a director of Weichai Group Holdings Limited (diesel engine manufacturing), Vice Chair of Power Solutions International Inc. (cleantech engine and powertrain manufacturing), and an executive director of Sinotruck (Hong Kong) Limited (heavy-duty truck manufacturing). Previously, Mr. Sun was supervisor and chief engineer at Weifang Diesel Engine Factory (diesel engine manufacturing) and director of Torch Automobile Group Co., Ltd. (heavy machinery and automotive manufacturing). He holds doctorate degree in engineering.
2019
Janet Woodruff

British Columbia, Canada
Director
Ms. Woodruff’s principal occupation is corporate director. Previously, Ms. Woodruff served as acting CEO to the Transportation Investment Corporation (transportation infrastructure management) from 2014 to 2015, advisor to the board (2013-2014) and interim Chief Financial Officer (2012-2013). Prior to that, she was Vice President and Special Advisor to BC Hydro (public utility) from 2010 to 2011; Interim President (2009-2010) and Vice President, Corporate Services and Chief Financial Officer (2007-2008) of BC Transmission Corporation (electricity transmission infrastructure); and Chief Financial Officer and Vice President, Systems Development and Performance of Vancouver Coastal Health (regional health authority) from 2003 to 2007.
2017
Notes
1.The information as to place of residence, principal occupation, business or employment of, and shares beneficially owned, or controlled or directed, directly or indirectly, by a director is not within the knowledge of our management and has been furnished by the director.
2.Mr. Kui (Kevin) Jiang and Mr. Shaojun (Sherman) Sun each retired from the Ballard Board of Directors effective December 31, 2023. Mr. Jiang and Mr. Sun had been directors since 2019 and served as nominees of Weichai. Effective January 1, 2024, Mr. Jiang and Mr. Sun have been replaced by Mr. Michael Chen and Mr. Yingbo Wang.
Mr. Chen currently serves as the CEO of Weichai Ballard Hy-energy Technologies Co. Ltd. and Vice General Manager of Weichai Holding Group Co., Ltd. (diesel engine manufacturing). He has served in various engineering and management roles at Weichai Power Co., Ltd, (diesel engine, powertrain and hydraulic products manufacturing) since 2010. Mr. Chen earned a PhD in Power Engineering and Engineering Thermophysics from Tsinghua University.
40

image_2.jpg
Mr. Wang is the CEO of Weichai New Energy Power Technology Co. Ltd. (holding company), Director of the Wuhan New Energy Research Institute (clean energy research), and Assistant GM at Weichai Power. He has held engineering and management roles at Weichai Power Co., Ltd, (diesel engine, powertrain and hydraulic products manufacturing) since 2012. Mr. Wang earned a Master of Mechatronics Engineering at Southwest Jiaotong University.
Directors are elected yearly at our annual shareholders’ meeting and serve on the Board until the following annual shareholders’ meeting, at which time, they either stand for re-election or leave the Board. If no meeting is held, each director serves until his or her successor is elected or appointed, unless the director resigns earlier.
The Board currently has four standing committees: (1) the Audit Committee; (2) the People & Compensation Committee (PCC); (3) the Sustainability & Governance Committee (SGC); and (4) the Commercial Committee.
The following chart sets out the members of our standing committees in 2023:

Audit Committee
People & Compensation Committee
Sustainability & Governance Committee
Commercial Committee
Kathy Bayless
Douglas P. Hayhurst
(Chair)
Hubertus M. Muehlhaeuser
(Chair)
Marty Neese
(Chair)
James Roche
Janet Woodruff
(Chair)
The members of these committees are all independent. Management directors and directors who are appointed by shareholders pursuant to agreements with Ballard are not eligible to serve on board committees. As a result, Weichai nominees do not serve on any committees.
Conflicts of Interest
Previously, Mr. Jiang, and Mr. Sun, and currently, Mr. Chen and Mr. Wang are directors and officers of Weichai or affiliates of Weichai, and as a result they may have potential material conflicts of interest with Ballard given the contractual relationships between and amongst Ballard, Weichai and the Weichai-Ballard JV as discussed above in the Recent History section and below in the Material Contracts section of this Annual Information Form.
41

image_2.jpg
Executive Officers
As of March 8, 2024, we have eight executive officers. The name and province or state of residence of each executive officer, the offices held by each officer and each officer’s principal occupation during the last five years are as follows:
Name and Province/State of Residence Position Principal Occupation
Mark Biznek
British Columbia, Canada
Chief Operating Officer
Executive officer of Ballard.
Formerly General Manager of Marine & Electronic Solutions (2020-2022), and Vice President – Strategic Operations (2018-2020) at Kohler Power Systems.
Kevin Colbow
British Columbia, Canada
Senior Vice President and Chief Technology Officer Executive officer of Ballard.
Paul Dobson
Florida, USA
Senior Vice President and Chief Financial Officer
Executive officer of Ballard.
Formerly Interim CEO and Chief Financial Officer at Hydro One (2018 to 2019).
Mircea Gradu
British Columbia, Canada
Senior Vice President and Chief Engineering Officer
Executive officer of Ballard.
Formerly Senior Vice President Automotive Programs, Product and Quality at Velodyne Lidar, Inc. (2017-2022)
R. Randall (Randy) MacEwen
British Columbia, Canada
President and Chief Executive Officer Executive officer of Ballard.
David Mucciacciaro
Michigan, USA
Senior Vice President and Chief Commercial Officer
Executive officer of Ballard.
Formerly Vice President Global Sales, Strategy and Product Line at Magna International, Magna Electronics (2018-2022)
Sarbjot (Jyoti) Sidhu
British Columbia, Canada
Senior Vice President and Chief People Officer
Executive officer of Ballard.
Formerly Senior Vice President, Operations of Ballard.
Lee Sweetland(1)
British Columbia, Canada
Senior Vice President and Chief Transformation Officer
Executive officer of Ballard.
Formerly Vice President Advanced Manufacturing of Ballard and Director, Advanced Manufacturing


Notes
1.Lee Sweetland was appointed SVP and Chief Transformation Officer in January 2024

Shareholdings of Directors and Executive Officers
As of March 8, 2024, our directors and executive officers, as a group, beneficially owned, or controlled or directed, directly or indirectly, 473,805 of our common shares, being less than 1% of our issued and outstanding common shares.
Cease Trade Orders, Bankruptcies, Penalties or Sanctions
For the 10 years ended March 8, 2024, other than as disclosed below we are not aware that any current director or executive officer of Ballard had been a director or executive officer of any issuer which, while that person was acting in that capacity, or within a year of that person ceasing to act in that capacity, became bankrupt or made a proposal under any legislation relating to bankruptcy or insolvency or was subject to or instituted any proceedings, arrangement or compromise with creditors or had a receiver, receiver manager or trustee appointed to hold its assets.
42

image_2.jpg
Mr. Roche was Chair of Aonix Advanced Materials Corp. (a private company) when a bankruptcy order was issued against it under the Bankruptcy and Insolvency Act (Canada) on October 13, 2017.
For the 10 years ended March 8, 2024, we are not aware that any current director or executive officer of Ballard had been a director, chief executive officer or chief financial officer of any issuer which was the subject of a cease trade order, an order similar to a cease trade order or an order that denied such issuer access to any exemption under securities legislation, and that was in effect for a period of more than 30 consecutive days, (in each such case, an “Order”) while that person was acting in that capacity, or was subject to such an Order issued after the director or executive officer ceased to be a director, chief executive officer or chief financial officer and resulted from an event that occurred while that person was acting in that capacity.
INTEREST OF MANAGEMENT AND OTHERS IN MATERIAL TRANSACTIONS
The Weichai-Ballard JV is 51% owned by Weichai, and as of March 8, 2024, Weichai beneficially owns (through its wholly owned subsidiary, Weichai Power Hong Kong International Development Co., Limited (“Weichai HK”)) owns approximately 15.4% of Ballard’s common shares.
The Weichai-Ballard JV has exclusive rights to manufacturer Ballard’s next generation LCS fuel cell stack and LCS-based modules for bus, commercial truck and forklift markets in China.
As noted above, two of Ballard’s directors, Mr. Chen and Mr. Wang, are directors and officers of Weichai or affiliates of Weichai.
Except as described above, none of our insiders, directors or executive officers, nor any associate or affiliate of such persons, has had any material interest, direct or indirect, in any transaction of ours within our three most recently completed financial years, nor in any transaction or proposed transaction within our current financial year that has materially affected or would materially affect us or any of our subsidiaries.
AUDIT COMMITTEE MATTERS
Audit Committee Mandate
The Audit Committee operates under a mandate that is approved by the Board and which outlines the responsibilities of the Audit Committee. A copy of the Audit Committee’s mandate is attached as Appendix “A” and posted on our website. This mandate is reviewed annually and the Audit Committee’s performance is assessed.
43

image_2.jpg
Composition of the Audit Committee
The following table sets forth the name of each of the current members of the Audit Committee, whether such member is independent, whether such member is financially literate and the relevant education and experience of such member.
Name Independent? Financially Literate? Relevant Education and Experience
Kathy Bayless Yes Yes Ms. Bayless is a member of the Board and Audit Committee Chair of Veeco Instruments Inc., and a member of the Board and Audit Committee of Energous Corporation. Previously Ms. Bayless held various executive roles at public technology companies including Chief Financial Officer and Treasurer at Synaptics, Incorporated and Komag, Incorporated. Ms. Bayless is a Certified Public Accountant in California.
Douglas P. Hayhurst (Chair) Yes Yes Mr. Hayhurst was an executive with IBM Canada Business Consulting Services and a Partner with PricewaterhouseCoopers Management Consultants. Prior to that, Mr. Hayhurst held various senior executive management roles with Price Waterhouse including National Deputy Managing Partner (Toronto) and Managing Partner for British Columbia (Vancouver). Mr. Hayhurst received a Fellowship (FCA) from the Institutes of Chartered Accountants of British Columbia and of Ontario. He has completed the Directors Education Program of the Institute of Corporate Directors and has received his ICD.D designation.
James Roche Yes Yes Corporate Director of Ballard. Mr. Roche is currently President and CEO of Stratford Managers Corporation and was a founding member and executive at Newbridge Networks Corporation. He subsequently co-founded Tundra Semiconductor Corporation, and was President and CEO of the publicly traded company. Mr. Roche has also served as President and CEO of CMC Microsystems and ThinkRF Corp.
Janet Woodruff Yes Yes Ms. Woodruff was acting CEO to the Transportation Investment Corporation from 2014 to 2015, advisor to the board (2013-2014) and interim Chief Financial Officer (2012-2013). Formerly Vice President and Special Advisor to BC Hydro from 2010 to 2011; Interim President (2009-2010) and Vice President, Corporate Services and Chief Financial Officer (2007-2008) of BC Transmission Corporation. Formerly, Chief Financial Officer and Vice President, Systems Development and Performance of Vancouver Coastal Health from 2003 to 2007.
The Audit Committee is responsible for recommending the appointment of our external auditors (for shareholder approval at our annual general meeting), monitoring the external auditors’ qualifications and independence, and determining the appropriate level of remuneration for the external auditors. The external auditors report directly to the Audit Committee.
The Audit Committee also approves in advance, on a case-by-case basis, any services to be provided by the external auditors that are not related to the audit. The following table shows the costs incurred with KPMG LLP in 2023 and 2022 for audit and non-audit related work, all of which were approved by the Audit Committee:
Type of Audit Fees 2023 (C$) 2022 (C$)
Audit
$953,530
$934,330 (1)
Audit-Related Fees
Nil Nil
Tax Fees
Nil Nil
All Other Fees
$6,475 $5,700
44

image_2.jpg
Notes:
1.Restated to separate out KPMG Denmark XBRL tagging to “All Other Fees” and to disclose late KPMG Denmark invoice not accrued.
Audit Fees
Audit fees were for professional services rendered by KPMG LLP for the audit of the annual financial statements, quarterly reviews and services provided in connection with statutory and regulatory filings or engagements relating to prospectuses and other offering documents.
Audit-Related Fees
Audit-related fees would be for assurance and related services reasonably related to the performance of the audit or review of financial statements or other services traditionally performed by the auditor but are not reported under the heading audit fees above. There were no fees paid to KPMG LLP that would be considered “Audit-Related Fees” in 2023 and 2022.
Tax Fees
There were no fees paid to KPMG LLP that would be considered “Tax Fees” in 2023 or 2022.
All Other Fees
All other fees to be disclosed under this category would be for products and services other than those described under the headings audit fees, audit-related fees and tax fees above. There were no fees paid to KPMG LLP that would be considered “All Other Fees” in 2023. The “All Other Fees” in 2023 and 2022 consisted of KPMG Denmark XBRL tagging services.
LEGAL PROCEEDINGS
From time to time, we may be involved in litigation relating to claims arising out of our operations in the normal course of business.
TRANSFER AGENT AND REGISTRAR
Our transfer agent and registrar is Computershare Trust Company of Canada, 100 University Avenue, 9th Floor, Toronto, Ontario, M5J 2Y1.
MATERIAL CONTRACTS
Particulars of every contract that is material to Ballard, other than a contract entered into in the ordinary course of business that is not required to be disclosed under National Instrument 51-102 – Continuous Disclosure Obligations, and that was entered into within the most recently completed financial year, or before the most recently completed financial year but is still in effect, are listed below.
45

image_2.jpg
AUDI Patent License and Intellectual Property Exploitation Agreement
On October 29, 2020, we entered into a Patent License and Intellectual Property Exploitation Agreement (the “License Agreement”) with AUDI expanding Ballard’s right to use the FCgen®-HPS product, a high-performance, zero-emission, proton exchange membrane (PEM) fuel cell stack in all applications, including commercial trucks and passenger cars. The License Agreement modifies many of the provisions of TDA-3 related to the parties’ respective intellectual property rights. Concurrently with the signing of the License Agreement Ballard and AUDI entered into an amendment to TDA-3.
Pursuant to the License Agreement AUDI grants to Ballard for use in all applications a non-exclusive, royalty-bearing license to the intellectual property developed for AUDI pursuant to TDA-3, the prior Technology Development Agreement dated as of March 1, 2013 entered into between Ballard and Volkswagen AG, as amended and assigned to AUDI, and the Transfer and License Agreement dated February 11, 2015 between Ballard and AUDI.
Pursuant to the License Agreement Ballard grants to AUDI for use in all applications a non-exclusive, royalty-bearing license to use Ballard’s background and sideground intellectual property incorporated, forming a part of, or covering work or deliverables performed in connection with TDA-3.
The License Agreement established the royalty payable by each party. The term of the License Agreement continues until the last of the relevant patents expire.
We filed the License Agreement on SEDAR on November 6, 2020.
Weichai Strategic Collaboration Transaction
On November 13, 2018, we entered into a strategic collaboration transaction with Weichai that included the following material agreements:
1.A Subscription Agreement between Weichai and Ballard dated August 29, 2018. The Subscription Agreement resulted in an equity investment in Ballard by Weichai in the amount of approximately $163.6 million, representing 19.9% of the outstanding common shares of the capital of Ballard at that time.
2.An Investor Rights Agreement between Weichai HK and Ballard dated November 13, 2018. The key terms of the Investor Rights Agreement are set out in the Recent History section of this Annual Information Form.
3.A Joint Venture Agreement between Weichai and Ballard HK dated November 13, 2018. The key terms of the Joint Venture Agreement are set out in the Recent History section of this Annual Information Form.
The Subscription Agreement was filed on SEDAR on September 3, 2018 and the Investor Rights Agreement and Joint Venture Agreement were filed on SEDAR on November 23, 2018.
46

image_2.jpg
INTERESTS OF EXPERTS
KPMG LLP, our independent auditors, has audited our consolidated financial statements for the years ended December 31, 2023 and 2022. As at the date hereof, KPMG LLP has confirmed that they are independent with respect to the Corporation within the meaning of the relevant rules and related interpretations prescribed by the relevant professional bodies in Canada and any applicable legislation or regulations and also that they are independent accountants with respect to the Corporation under all relevant U.S. professional and regulatory standards.
RISK FACTORS
An investment in our common shares involves risk. Investors should carefully consider the risks and uncertainties described below and the other information contained in, and incorporated into, this Annual Information Form, including “Management’s Discussion and Analysis” and our financial statements for the year ended December 31, 2023. The risks and uncertainties described below are not the only ones we face. Additional risks and uncertainties, including those that we do not know about now or that we currently deem immaterial, may also adversely affect our business.
We may not be able to successfully execute our business plan.
The execution of our business plan poses many challenges and is based on a number of assumptions. We may not be able to successfully execute our business plan. If we experience significant cost overruns on our programs, or if our business plan is more costly than we anticipate, certain research and development activities may be delayed or eliminated, resulting in changes or delays to our commercialization plans, or we may be compelled to secure additional funding (which may or may not be available) to execute our business plan. We cannot predict with certainty our future revenues or results from our operations. If the assumptions on which our revenue or expenditure forecasts are based change, the benefits of our business plan may change as well. In addition, we may consider expanding our business beyond what is currently contemplated in our business plan. Depending on the financing requirements of a potential acquisition or new product opportunity, we may be required to raise additional capital through the issuance of equity or debt. If we are unable to raise additional capital on acceptable terms, we may be unable to pursue a potential acquisition or new product opportunity.
We depend on a limited number of customers for the majority of our revenues and are subject to risks associated with early-stage market activities related to fuel cell bus, truck, rail, marine and stationary applications.
We depend on a limited number of customers for the majority of our revenues and are subject to risks associated with early stage market activities related to fuel cell bus, truck, rail, marine and stationary applications. While we continually seek to expand our customer base, we expect the limited number of customers will continue for the next several years.
47

image_2.jpg
Our future success is dependent upon the continued purchases of our products by these customers. Any fluctuations in anticipated demand from these customers may negatively impact on our business, financial condition and results of operations.
If we are unable to broaden our customer base and expand relationships with other potential customers, our business in these markets will continue to be impacted by unanticipated demand fluctuations due to our dependence on these customers. Unanticipated demand fluctuations may have a negative impact on our revenues and business, and an adverse effect on our business, financial condition and results of operations.
In addition, our dependence on a small number of customers in our markets exposes us to numerous other risks, including: (i) a slowdown or delay in the customers’ deployment of our products could significantly reduce demand for our products as well as increase pricing pressure on our products due to increased purchasing leverage; (ii) customer-specific factors resulting in a choice to pursue an alternative technology or supplier; (iii) reductions in a few customers’ forecasts and demand could result in excess inventories; (iv) the current or future economic conditions could negatively affect our major customers and cause them to significantly reduce operations or file for bankruptcy; (v) concentration of accounts receivable credit risk, which could have a material adverse effect on our liquidity and financial condition if one of our major customers declared bankruptcy or delayed payment of their receivables; and (vi) changes in government support for zero-emission vehicles could adversely affect the end-user cost of vehicles incorporating our heavy-duty mobility products.
We are dependent on third party suppliers for the supply of key materials and components for our products and services and may be subject to supply chain disruption.
We have established relationships with third party suppliers, on whom we rely to provide materials and components for our products. A supplier’s failure to supply materials or components in a timely manner, or to supply materials and components that meet our quality, quantity or cost requirements, or our inability to obtain substitute sources for these materials and components in a timely manner or on terms acceptable to us, could harm our ability to manufacture and deliver our products. Ballard depends on third-party carriers to ship our products to customers around the world. Any interruption or inefficiency in the shipping process could cause delays, damage, or loss of products. In addition, to the extent that our product development plans rely on development of supplied materials or components, we cannot guarantee that we will be able to leverage our relationships with suppliers to support these plans. To the extent that the processes that our suppliers use to manufacture the materials and components are proprietary, we may be unable to obtain comparable materials or components from alternative suppliers, which could adversely affect our ability to produce viable fuel cell products or significantly raise our cost of producing such products.
48

image_2.jpg
While supply chain disruptions that occurred globally as a result of the COVID-19 pandemic did not materially impact our business or operations, supply chains could be further disrupted in the future by factors beyond our control. This could include: a reduction in the supply or availability of commodities or parts required to manufacture our products; lockdowns and workforce disruptions caused by epidemics and pandemics; the impacts of climate change on transportation networks and suppliers manufacturing facilities; and economic sanctions or embargoes.
We are dependent upon Original Equipment Manufacturers (“OEMs”) and Systems Integrators to purchase certain of our products.
To be commercially useful, our fuel cell products must be integrated into products manufactured by Systems Integrators and OEMs. We can offer no guarantee that Systems Integrators or OEMs will manufacture appropriate, durable or safe products or, if they do manufacture such products, that they will choose to use our fuel cell products. Any integration, design, manufacturing or marketing problems encountered by Systems Integrators or OEMs could adversely affect the market for our fuel cell products and our financial results.
We, directly or through our joint venture, sell a significant portion of our products in the Heavy-Duty Mobility market in China and to relatively small System Integrator customers with limited experience developing fuel cell system products on a commercial basis. We do not know whether these customers will be able to successfully develop, manufacture or market products to their customers. In addition, our dependence on such customers in this market increases the risks of difficulties in integration, design, manufacturing or marketing of their products; and that current or future macro-economic conditions in China could negatively affect them and cause them to significantly reduce operations or file for bankruptcy.
In China a significant amount of operations are conducted by the joint venture that we do not control. In addition, we provide most of our technology solutions services to the joint venture.
A key part of our strategy is based on the localization of stack and module production with joint venture partners, where we do not control the joint venture. We share ownership and management of the Weichai-Ballard JV with one or more parties who may not have the same goals, strategies, priorities or resources as we do and may compete with us outside the joint venture.
Joint ventures are intended to be operated for the equal benefit of all co-owners, rather than for our exclusive benefit. Operating a business as a joint venture often requires additional organizational formalities as well as time-consuming procedures for sharing information and making decisions. If a co-owner changes or relationships deteriorate, our success in the joint venture may be materially adversely affected. In addition, because we have a minority share ownership, we have limited control over the actions of the Weichai-Ballard JV. As a result, we may be unable to prevent misconduct or other violations of applicable laws by the Weichai-Ballard JV. To the extent another party makes decisions that negatively impact the Weichai-Ballard JV or internal control issues arise within either joint venture, we may have to take responsive or other action or we may be subject to penalties, fines or other related actions for these activities.
49

image_2.jpg
In addition, we provide most of our technology solutions services to the Weichai-Ballard JV. Any decline in or loss of demand for any reason may have a negative impact on our revenues, and an adverse effect on our business, financial condition and results of operations. Our dependence on a limited number of customers in this market exposes us to numerous other risks, including current or future economic conditions could negatively affect the joint venture and cause them to significantly reduce or cease operations or file for bankruptcy.
We have limited experience manufacturing fuel cell products on a commercial basis and our experience has been limited to relatively low production volumes.
To date, we have limited experience manufacturing fuel cell products on a commercial basis and our experience has been limited to relatively low production volumes. We have limited experience developing and manufacturing products that meet regulatory and commercial requirements in our target markets.
We cannot be sure that we will be able to develop efficient, low-cost, high-volume automated processes that will enable us to meet our cost goals and profitability projections. While we currently have sufficient production capacity to fulfill customer orders in the near term, we expect that we will increase our production capacity based on market demand. We cannot be sure that we will be able to achieve any planned increases in production capacity or that unforeseen problems relating to our manufacturing processes will not occur. Even if we are successful in developing high-volume automated processes and achieving planned increases in production capacity, we cannot be sure that we will do so in time to meet our product commercialization schedule or to satisfy customer demand. If our business does not grow as quickly as anticipated, our existing and planned manufacturing facilities would, in part, represent excess capacity for which we may not recover the cost, in which case our revenues may be inadequate to support our committed costs and planned growth, and our gross margins and business strategy would be adversely affected. Any of these factors could have a material adverse effect on our business, results of operations and financial performance.
We are subject to risks inherent in international operations, including restrictions on the conversion of currencies and restrictions on repatriation of funds, including out of China.
We face numerous challenges in our international business activities, including restrictions on the conversion of currencies; restrictions on repatriation of funds; nationalization and expropriation; war, insurrection, civil unrest, strikes and other political risks; negotiation of contracts with government entities; unexpected changes in regulatory and other legal requirements; delays or inability to obtain permits; fluctuations in exchange rates; longer accounts receivable requirements and collections; difficulties in managing international operations; potentially adverse tax consequences; and added risks and uncertainties due to different economic, cultural and political environments.
50

image_2.jpg
Trade disputes and trade barriers, whether tariff or non-tariff, could prevent us from selling our products in key geographical markets, make our products uncompetitive with local competitors, and prevent us from sourcing key components of our products.
Any of the above factors could have a material adverse effect on our business, results of operations and financial performance.
Certain of our customer supply agreements are subject to certain conditions or risks, including achievement of certain product performance milestones, completion of product development programs, or customer cancellation provisions.
Certain of our customer supply agreements are subject to certain conditions or risks, including achievement of certain product performance milestones, completion of product development programs, or customer cancellation provisions, and it is likely that some future supply agreements will also be subject to similar conditions and risks. There can be no assurance that we will achieve or satisfy the conditions or that customers will not cancel their orders. In addition, our supply agreements may include various pricing structures or reduced pricing tiers based on various factors, including volumes and timing. In setting these reduced pricing tiers, we may assume certain future product cost reductions which are subject to execution risk, including future commodity costs, supply chain costs, and production costs, and we may not be successful in achieving the planned cost reductions. In such circumstances, these agreements may become future onerous contracts if our gross margins become negative, and the value of carried inventory to support product delivery under such contracts may also be adversely impacted. This could have a material and adverse effect on our business operations, financial reporting, financial condition and results of operations.
Public policy and regulatory changes, including regulations relating to perfluoroalkyl and polyfluoroalkyl substances (“PFAS”) used in our products, could hurt the market for our products and services.
Changes in existing government regulations and the emergence of new regulations with respect to fuel cell products may hurt the market for our products and services. Environmental laws and regulations have driven interest in fuel cells. We cannot guarantee that these laws and policies, including subsidies or incentives associated with the adoption of clean energy products, will not change. Changes in these laws and other laws and policies, or the failure of these laws and policies to become more widespread, could result in manufacturers abandoning their interest in fuel cell products or favoring alternative technologies. In addition, as fuel cell products are introduced into our target markets, governments may impose burdensome requirements and restrictions on the use of fuel cell products that could reduce or eliminate demand for some or all of our products and services.
51

image_2.jpg
Like many industries, the hydrogen and fuel cell industries use perfluoroalkyl and polyfluoroalkyl substances (“PFAS”) in products, including materials and components of PEM fuel cells and electrolyzers. There are accelerating regulatory trends in markets where we operate focused on reducing or eliminating the presence of PFAS in the environment, including a proposed ban on PFAS for fuel cells in Europe by 2031. While we are working with our supply base to eliminate the use of PFAS in materials and components used in our fuel cell products, including our membrane electrode assemblies, there can be no assurance that our suppliers would be able to successfully achieve reductions of PFAS if required to comply with future regulatory requirements.
Government budgetary constraints could reduce the demand for our products by restricting the funding available for green hydrogen production and/or zero-emission products like those that we produce. We cannot guarantee that current government direct and indirect financial support for our products will continue.
Global macro-economic conditions are beyond our control and may have an adverse impact on our business, our joint venture, our key suppliers, and/or customers and our ability to raise capital.
Macro-economic conditions, including volatility in capital markets, global and regional expectations with respect to the rate of inflation, may adversely affect the development of sales of our products, and thereby delay the commercialization of our products. Customers and/or suppliers may not be able to successfully execute our business plans; product development activities may be delayed or eliminated; new product introduction may be delayed or eliminated; end-user demand may decrease; and some companies may not continue to be commercially viable.
The inability to raise capital on favorable terms, particularly during times of high interest rates and inflation, and uncertainty or reduced liquidity in the capital markets, could negatively affect Ballard ability to maintain and to expand our businesses. Factors beyond Ballard’s control may create uncertainty that could increase its cost of capital or impair its ability to access the capital markets. These factors include depressed economic conditions, a recession, increasing interest rates, inflation, sanctions, trade restrictions, political instability, war, terrorism, and extreme volatility in the debt, equity, or credit markets. If Ballard are unable to access capital markets on terms that are reasonable, we may have to delay raising capital, issue shorter-term securities, and/or bear an unfavorable cost of capital, which, in turn, could impact our ability to grow our businesses, decrease earnings, and/or significantly reduce financial flexibility.
Any significant economic slowdown, or change in government policies and practices around subsidies for zero-emission vehicles or hydrogen fueling infrastructure, in any of the regions in which we operate could have an adverse impact on our business, financial condition and results of operations.
52

image_2.jpg
Adequate investment in hydrogen fueling infrastructure and competitive pricing of hydrogen fuel is beyond our control.
The successful large-scale deployment of zero-emission vehicles will require adequate investment in hydrogen fueling infrastructure and competitive pricing of hydrogen fuel. Inadequate hydrogen fueling infrastructure and/or excessive hydrogen fuel costs could negatively impact deployment of fuel cell powered zero-emission vehicles and may negatively impact the business, financial condition and results of operations for us, our joint venture, key suppliers and/or customers.
Geopolitical conditions are beyond our control and may have an adverse impact on our business, our joint venture, our key suppliers, and/or customers.
While our operations have not been, and are unlikely to be, directly impacted by the current conflicts in Ukraine and the Middle East, the conflicts and international response have, and may continue to have, wide-ranging impacts to the global economy and markets. The duration and outcome of these conflicts remains uncertain, and could continue to fuel, or exacerbate global tensions, energy and other commodity shortages, supply chain disruptions, inflationary pressures, weakening sentiment and growth prospects, market volatility, cyberattacks, and the proliferation of sanctions and trade measures.
The implications of the conflicts in Ukraine and the Middle East are difficult to predict with any certainty at this time and there remains uncertainty relating to the potential impact of the conflicts on our business, our joint venture, our key suppliers, and/or customers, and it could have a material and adverse effect on our business operations, financial reporting, financial condition and results of operations. Depending on the extent, duration, and severity of the conflicts, it may have the effect of heightening many of the other risks described herein.
We are subject to geopolitical risk in all jurisdictions in which we operate. There are risks of political instability in several of the jurisdictions in which we operate, including, from such factors as political conflict, economic sanctions or embargoes, tariffs and corruption. Tensions remain elevated between China and the U.S. and its allies over a number of issues, and the prospect of closer relations between China and Russia add further global and economic uncertainty. Political tensions and potential conflict could contribute to global economic uncertainty and could significantly disrupt the flow of goods, services and people. Such conditions could have a destabilizing effect on our markets and/or increase the costs of conducting business in affected jurisdictions. The materialization of one or more of these risks could have an adverse effect on our business operations, financial reporting, financial condition and results of operations.
53

image_2.jpg
We currently face inflationary pressures.
We currently face inflationary pressures in all markets in which we operate, with higher commodities, energy, labor, freight and other production input pricing expected to persist throughout 2024. While many of these input price increases will likely moderate over time, the increases may have a longer-term effect on our cost structure. Additionally, we may continue to experience price increases or surcharges from suppliers in connection with the inflationary pressures they face. The inability to offset inflationary price increases through price increases to or cost recoveries from our customers, modifications to our products, continuous improvement actions or otherwise, could have a material adverse effect on our business operations, financial reporting, financial condition and results of operations.
We currently face and will continue to face significant competition, and many current and future competitors may have significantly more resources.
As fuel cell products have the potential to replace existing power products, competition for our products will come from current power technologies, from improvements to current power technologies, and from new alternative energy technologies, including other types of fuel cells. Each of our target markets is currently serviced by existing manufacturers with existing customers and suppliers. These manufacturers use proven and widely accepted technologies such as internal combustion engines and batteries as well as coal, oil and nuclear-powered generators.
Additionally, there are competitors working on developing technologies other than PEM fuel cells (such as other types of fuel cells and advanced batteries) in each of our targeted markets. Some of these technologies are as capable of fulfilling existing and proposed regulatory requirements as the PEM fuel cell.
Within the PEM fuel cell market, we also have a large number of competitors. Across the world, corporations, national laboratories and universities are actively engaged in the development and manufacture of PEM fuel cell products and components. Each of these competitors has the potential to capture market share in each of our target markets.
Many of our competitors have substantial financial resources, customer bases, manufacturing, marketing and sales capabilities, and businesses or other resources, which give them significant competitive advantages over us.
We could be adversely affected by risks associated with capital investments and new business processes.
We may, in the future, seek to expand our business through investments in capital equipment and new business processes.
While necessary for the growth of our business, investments in capital equipment and new business processes involve allocating resources based on future expectations that may or may not be correct.
54

image_2.jpg
Investments in capital equipment and new business processes may not address the requirements of the targeted markets in the future and may result in lower-than-expected returns on such investments.
The above risks and difficulties, if they materialize, could disrupt our ongoing business, distract management, result in the loss of key personnel, increase expenses and otherwise have a material adverse effect on our business, results of operations and financial performance.
Our technology and products may not meet the market requirements, including requirements relating to performance, integration and/or cost.
The market requirements for our products and, by extension, our technology change rapidly. Our existing and planned products may not meet the market requirements for any number of characteristics, including performance, integration characteristics, cost, freeze-protection, ingress protection, and durability.
We may not be able to sell our products on a commercially viable basis on the timetable we anticipate, or at all.
We cannot guarantee that we will be able to develop commercially viable fuel cell products on the timetable we anticipate, or at all. Selling our fuel cell products on a commercially viable basis requires technological advances to improve the durability, reliability and performance of these products, and to develop commercial volume manufacturing processes for these products. It also depends upon our ability to reduce the costs of these products, since they are currently more expensive than products based on existing technologies, such as internal combustion engines and batteries. We may not be able to sufficiently reduce the cost of these products without reducing their performance, reliability and durability, which would adversely affect the willingness of consumers to buy our products. We cannot guarantee that we will be able to internally develop the technology necessary to sell our fuel cell products on a commercially viable basis or that we will be able to acquire or license the required technology from third parties.
In addition, before we release any product to market, we subject it to numerous field tests. These field tests may encounter problems and delays for a number of reasons, many of which are beyond our control. If these field tests reveal technical defects or reveal that our products do not meet performance goals, our anticipated timeline for selling our products on a commercially viable basis could be delayed, and potential purchasers may decline to purchase our products.
We could lose or fail to attract the personnel necessary to operate our business.
Our success depends in large part on our ability to attract and retain key management, engineering, scientific, marketing, manufacturing and operating personnel. As we develop additional manufacturing capabilities and expand the scope of our operations, we will require more skilled personnel. Recruiting personnel for the fuel cell industry is highly competitive. We may not be able to continue to attract and retain the qualified executive, managerial and technical personnel needed for our business.
55

image_2.jpg
Our failure to attract or retain qualified personnel could have a material adverse effect on our business.
Warranty claims, product performance guarantees, or indemnification claims could negatively impact on our gross margins and financial performance.
There is a risk that our warranty accrual estimates are not sufficient and we may recognize additional expenses, including those related to litigation, as a result of warranty claims in excess of our current expectations. Such warranty claims may necessitate changes to our products or manufacturing processes and/or a product recall, all of which could hurt our reputation and the reputation of our products and may have an adverse impact on our financial performance and/or on future sales. While we attempt to mitigate these risks through product development, quality assurance and customer support and service processes, there can be no assurance that these processes are adequate. Even in the absence of any warranty claims, a product deficiency such as a design or manufacturing defect could be identified, necessitating a product recall or other corrective measures, which could hurt our reputation and the reputation of our products and may have an adverse impact on our financial performance and/or on future sales.
New products may have different performance characteristics from previous products. In addition, we have limited field experience with existing commercial products from which to make our warranty accrual estimates.
We expect our cash reserves will be reduced due to future operating losses, working capital requirements, capital expenditures, and potential acquisitions and other investments by our business, including in certain hydrogen infrastructure and growth equity funds, and we cannot provide certainty as to how long our cash reserves will last or that we will be able to access additional capital when necessary.
We have a history of losses and negative cash flows and expect to incur continued losses and generate negative cash flow until we can produce sufficient revenues to cover our costs. We expect to incur continued losses and generate negative cash flow until we can produce sufficient revenues to cover our costs. Further, we are obligated to fund HyCap and Clean H2 to our agreed upon contribution amount. We may never become profitable. Even if we do achieve profitability, we may be unable to sustain or increase our profitability in the future. There are substantial uncertainties associated with our achieving and sustaining profitability. We expect our cash reserves will be reduced due to future operating losses, working capital requirements, and we cannot provide certainty as to how long our cash reserves will last or that we will be able to access additional capital if and when necessary.
56

image_2.jpg
Potential fluctuations in our financial and business results make forecasting difficult and may restrict our access to funding for our commercialization plan.
We expect our revenues and operating results to vary significantly from quarter to quarter. As a result, quarter-to-quarter comparisons of our revenues and operating results may not be meaningful. Due to the stage of development of our business, it is difficult to predict our future revenues or results of operations accurately. We are also subject to normal operating risks such as credit risks, foreign currency risks and fluctuations in commodity prices. As a result, it is possible that in one or more future quarters, our operating results may fall below the expectations of investors and securities analysts. Not meeting investor and security analyst expectations may materially and adversely impact the trading price of our common shares and restrict our ability to secure the required funding to pursue our commercialization plans.
A mass market for our products may never develop or may take longer to develop than we anticipate.
Our fuel cell products represent emerging markets, and we do not know whether end-users will want to use them in commercial volumes. In such emerging markets, demand and market acceptance for recently introduced products and services are subject to a high level of uncertainty and risk. The development of a mass market for our fuel cell products may be affected by many factors, some of which are beyond our control, including the emergence of newer, more competitive technologies and products, the cost of fuels used by our products, regulatory requirements, consumer perceptions of the safety of our products and related fuels, and end-user reluctance to buy a new product.
If a mass market fails to develop, or develops more slowly than we anticipate, we may never achieve profitability. In addition, we cannot guarantee that we will continue to develop, manufacture or market our products if sales levels do not support the continuation of the product.
We may experience cybersecurity threats to our information technology infrastructure and systems, and unauthorized attempts to gain access to our proprietary or confidential information, as may our customers, suppliers and/or partners.
We depend on information technology infrastructure and systems (“IT Systems”), hosted internally and outsourced, to process, transmit and store electronic data and financial information (including proprietary or confidential information), and manage business operations. Our business requires the appropriate and secure utilization of sensitive, confidential or personal data or information belonging to our employees, customers and partners. In addition, Ballard proprietary or confidential information may be stored on IT Systems of our suppliers, customers and partners. Increased global cybersecurity vulnerabilities, threats and more sophisticated and targets cyber-related attacks pose a risk to the security of Ballard’s and its customers’, partners’, suppliers’ and third-party service providers’ IT Systems and the confidentiality, availability and integrity of Ballard’s and its customers’ and partners’ data or information.
57

image_2.jpg
We may be subject to cybersecurity risks or other breaches of our IT Systems intended to obtain unauthorized access to our information and that of our business partners, destroy data or disable, degrade or sabotage our IT Systems through the introductions of computer viruses, fraudulent emails, cyber attached and other means, and such breaches could originate from a variety of sources including our own employees or unknown third parties. While we have made investments seeking to address these threats, including monitoring of networks and systems, hiring of experts, employee training and security policies for employees, we may face difficulties in anticipating and implementing adequate preventative measures and remain potentially vulnerable. We must rely on our own safeguards as well as the safeguards put in place by our suppliers, customers and partners to mitigate the threats. Our internal systems are audited for cybersecurity vulnerabilities by third party security firms to ensure we are prepared for new and emerging threats. Our suppliers, customers and partners have varying levels of cybersecurity expertise and safeguards, most have yearly compliance audits that are available upon request.
An IT System failure or non-availability, cyber-attack or breach of systems security could disrupt our operations, cause financial loss, a loss of business opportunities, misappropriation or unauthorized release of confidential/proprietary or personal information, damage to our systems and those with whom we do business, violation of privacy laws, litigation, regulatory penalties and remediation and restoration costs, as well as increased costs to maintain our IT Systems. Cybersecurity breaches or failures of our IT Systems could have an adverse effect on our business operations, financial reporting, financial condition and results of operations, and result in reputational damage. Furthermore, given the highly evolving nature of cybersecurity threats or disruptions and their increased frequency, the impact of any future incident cannot be easily predicted or mitigated, and the costs related to such threats or disruptions may not be fully insured or indemnified by other means.
We depend on our intellectual property, and our failure to protect that intellectual property could adversely affect our expected future growth and success.
Failure to protect our existing intellectual property rights may result in the loss of our exclusivity regarding, or the right to use, our technologies. If we do not adequately ensure our freedom to use certain technology, we may have to pay others for the rights to use their intellectual property, pay damages for infringement or misappropriation, or be enjoined from using such intellectual property. We rely on patent, trade secret, trademark and copyright laws to protect our intellectual property. Some of our intellectual property is not covered by any patent or patent application, and the patents to which we currently have rights expire between 2021 and 2040. Our present or future-issued patents may not protect our technological leadership, and our patent portfolio may not continue to grow at the same rate as it has in the past. Moreover, our patent position is subject to complex factual and legal issues that may give rise to uncertainty as to the validity, scope and enforceability of a particular patent. Accordingly, there is no assurance that: (i) any of the patents owned by us or other patents that third parties license to us will not be invalidated, circumvented, challenged, rendered unenforceable or licensed to others; or (ii) any of our pending or future patent applications will be issued with the breadth of claim coverage sought by us, if issued at all.
58

image_2.jpg
In addition, effective patent, trade secret, trademark and copyright protection may be unavailable, limited or not applied for in certain countries.
We also seek to protect our proprietary intellectual property, including intellectual property that may not be patented or patentable, in part by confidentiality agreements and, if applicable, inventors’ rights agreements with our strategic partners and employees. We can provide no assurance that these agreements will not be breached, that we will have adequate remedies for any breach, or that such persons or institutions will not assert rights to intellectual property arising out of these relationships.
Certain of our intellectual property have been licensed to us on a non-exclusive basis from third parties who may also license such intellectual property to others, including our competitors. If necessary or desirable, we may seek further licences under the patents or other intellectual property rights of others. However, we may not be able to obtain such licences or the terms of any offered licences may not be acceptable to us. The failure to obtain a licence from a third party for intellectual property we use could cause us to incur substantial liabilities and to suspend the manufacture or shipment of products or our use of processes requiring the use of such intellectual property.
We may become subject to lawsuits in which it is alleged that we have infringed the intellectual property rights of others or commence lawsuits against others who we believe are infringing upon our rights. Our involvement in intellectual property litigation could result in significant expense to us, adversely affecting the development of sales of the challenged product or intellectual property and diverting the efforts of our technical and management personnel, whether or not such litigation is resolved in our favour.

Climate change risks may adversely affect our operations, or the operations of our suppliers, customers and/or partners.
Our business interruption risk is exacerbated by an increasing number of extreme weather events related to climate change. Extreme weather events such as floods and fires caused or exacerbated by climate change could impair our ability to carry on business. For example, extreme weather events could cause catastrophic destruction to some of our or our supplier’s and/or customer’s facilities, which could in turn disrupt our production and/or prevent us from supplying products to our customers.
Transitioning to a lower-carbon economy creates opportunities for us and may increase demand for zero-emission products like those that we produce. However, we may also become subject to potential negative impacts of new environmental regulations, laws, and policies that could result in increased costs of carrying on our business.
59

image_2.jpg
Our financial condition may be negatively impacted by costs associated with changes in environmental laws and regulations and regulatory enforcement.

Regulatory agencies could require us to modify or terminate existing investments, acquisitions or joint ventures and could delay or prevent future opportunities.
Our current and future investment, acquisition and joint venture opportunities are, or may be, subject to the jurisdiction of the Department of Innovation, Science and Economic Development (“ISED”) under the Investment Canada Act (the “ICA”), the U.S. Federal Trade Commission (“FTC”) and Department of Justice (“DOJ”) under the Hart-Scott-Rodino Antitrust Improvements Act of 1976 (the “HSR Act”) and related legislation and regulations, the Committee on Foreign Investment in the United States (“CFIUS”) and other similar regulatory schemes. The ICA regulates the acquisition of control of a Canadian business by a non-Canadian and requires that certain transactions be reviewed by ISED before they are permitted to close. The HSR Act regulates certain transactions that affect U.S. commerce and requires that certain transactions be reported to the FTC and DOJ before they are permitted to close. CFIUS has jurisdiction over investments in “U.S. businesses” by non-U.S. persons that involve U.S. national security concerns, which concerns may change or evolve over time in response to political, economic or other events. Unlike the ICA and the HSR Act, CFIUS may intervene in the transaction before or after the closing if the parties to a transaction do not make a voluntary or required filing with CFIUS.
Because we are a British Columbia-based company with operations and assets in the United States, Europe, the UK and China, as well as a joint venture and significant shareholders in China, from time to time we have received and responded to inquiries from these agencies. We may receive additional inquiries from, or be required to make filings with, these agencies in the future. Any of these agencies could delay or prevent us from participating in future investment, acquisition or joint venture opportunities, or could require us to take steps to address concerns identified by the regulatory agency with respect to existing investments or joint ventures. Each of these regulatory agencies has broad discretion to investigate and intervene in transactions that fall within the scope of their respective regulatory authority. In addition, CFIUS could intervene in our previously completed transactions and require us to modify or amend the terms of those transactions, or terminate or unwind all or part of the transactions, if CFIUS determines that it is necessary to address U.S. national security concerns, without regard to whether the transaction was completed and operated in accordance with applicable law. If these regulatory agencies modify, delay, prevent or terminate our participation in these investments, acquisitions and joint ventures, the results of our operations or financial condition may be adversely impacted.
60

image_2.jpg
Additional issuance of securities by Ballard may dilute existing securityholders, reduce some or all of Ballard’s financial measures on a per share basis, reduce the trading price of the Common Shares or other Ballard securities or impede Ballard’s ability to raise future capital
Ballard may issue additional securities in the future in connection with acquisitions, strategic transactions, financings or for other purposes. To the extent additional securities are issued, Ballard’s existing securityholders could be diluted and some or all of Ballard’s financial measures could be reduced on a per share basis. Additionally, Ballard securities issued in connection with a transaction may not be subject to resale restrictions and, as such, the market price of Ballard’s securities may decline if certain large holders of Ballard securities or recipients of Ballard securities in connection with an acquisition, sell all or a significant portion of such securities or are perceived by the market as intending to sell such securities. In addition, such issuances of securities may impede Ballard’s ability to raise capital through the sale of additional equity securities in the future.
Proposed legislation in the U.S. Congress, including changes in U.S. tax law, and the Inflation Reduction Act of 2022 may adversely impact Ballard and the value of common shares.
Changes to U.S. tax laws (which changes may have retroactive application) could adversely affect Ballard or holders of common shares. In recent years, many changes to U.S. federal income tax laws have been proposed and made, and additional changes to U.S. federal income tax laws are likely to continue to occur in the future.
The U.S. Congress is currently considering numerous items of legislation which may be enacted prospectively or with retroactive effect, which legislation could adversely impact the Company’s financial performance and the value of common shares. Additionally, states in which Ballard operates or owns assets may impose new or increased taxes. If enacted, most of the proposals would be effective for the current or later years. The proposed legislation remains subject to change, and its impact on Ballard and holders of common shares is uncertain.
In addition, the Inflation Reduction Act of 2022 includes provisions that impact the U.S. federal income taxation of corporations. Among other items, this legislation includes provisions that impose a minimum tax on the book income of certain large corporations and an excise tax on certain corporate stock repurchases that are imposed on the corporation purchasing such stock. It is unclear how this legislation will be implemented by the U.S. Department of the Treasury and Ballard cannot predict how this legislation or any future changes in tax laws might affect Ballard or holders of common shares.
61

image_2.jpg
Exchange rate fluctuations are beyond our control and may have a material adverse effect on our business, operating results, financial condition and profitability.
We report our financial results in United States dollars. Our operating expenditures are particularly affected by fluctuations in the exchange rate between the Canadian dollar and the United States dollar. We generate the majority of our revenues in United States dollars while the majority of our operating expenditures are incurred in Canadian dollars. As a result, any increase in the value of the Canadian dollar, relative to the United States dollar, increases the amount of reported operating expenditures in excess of any corresponding increase in revenues and gross margins. Exchange rate fluctuations are beyond our control, and the Canadian dollar may appreciate against the United States dollar in the future, which would result in higher operating expenditures and lower net income. In order to reduce the potential negative effect of a strengthening Canadian dollar, we occasionally enter into various hedging programs. Regardless, if the Canadian dollar increases in value, it will negatively affect our financial results and our competitive position compared to other fuel cell product manufacturers in jurisdictions where operating costs are lower.
Commodity price fluctuations are beyond our control and may have a material adverse effect on our business, operating results, financial condition and profitability.
Commodity prices, in particular the price of platinum and palladium, affect our costs. Platinum and palladium are key components of our fuel cell products. Platinum and palladium are scarce natural resources and we are dependent upon a sufficient supply of these commodities. While we do not anticipate significant near or long-term shortages in the supply of platinum or palladium, such shortages could adversely affect our ability to produce commercially viable fuel cell products or significantly raise our cost of producing such products. In order to reduce the impact of platinum price fluctuations, we occasionally enter into various hedging programs.
Our products use flammable fuels and some generate high voltages, which could subject our business to product safety, product liability or other claims.
Our business exposes us to potential product safety, product liability and similar claims that are inherent in electrical products, and in products that use hydrogen or hydrogen-rich reformate fuels. High-voltage electricity poses potential shock hazards, and hydrogen is a flammable gas and therefore a potentially dangerous fuel. Any accidents involving our products or other hydrogen-based products could materially impede widespread market acceptance and demand for our fuel cell products. Involvement in litigation could result in significant expense to us, adversely affecting the development and sales of our products, and diverting the efforts of our technical and management personnel, whether or not the litigation is resolved in our favour. In addition, we may be held responsible for damages beyond the scope of our insurance coverage. We also cannot predict whether we will be able to maintain our insurance coverage on acceptable terms.
62

image_2.jpg
We could be liable for environmental damages resulting from our research, development or manufacturing operations.
Our business exposes us to the risk of harmful substances escaping into the environment, resulting in personal injury or loss of life, damage to or destruction of property, and natural resource damage. Depending on the nature of the claim, our current insurance policies may not adequately reimburse us for costs incurred in settling environmental damage claims, and in some instances, we may not be reimbursed at all. Our business is subject to numerous laws and regulations that govern environmental protection and human health and safety. These laws and regulations have changed frequently in the past and it is reasonable to expect additional and more stringent changes in the future. Our operations may not comply with future laws and regulations, and we may be required to make significant unanticipated capital and operating expenditures. If we fail to comply with applicable environmental laws and regulations, governmental authorities may seek to impose fines and penalties on us, or to revoke or deny the issuance or renewal of operating permits, and private parties may seek damages from us. Under those circumstances, we might be required to curtail or cease operations, conduct site remediation or other corrective action, or pay substantial damage claims.
Ballard believes that it was a “passive foreign investment company” (“PFIC”) for our most recently completed tax year, which may have adverse U.S. federal income tax consequences for U.S. Holders (as defined below).
Ballard believes that it was a PFIC for its most recently completed tax year. No determination has been made by Ballard with respect to its anticipated PFIC status for its current tax year or any future tax year. Ballard’s PFIC classification for its current or future tax years may depend on, among other things, the manner in which, and how quickly, Ballard utilizes its cash on hand, the income generated by it and its subsidiaries, as well as on changes in the market value of common shares. If Ballard is a PFIC for any year during a U.S. Holder’s holding period of common shares, then such U.S. Holder generally will be required to treat any gain realized upon a disposition of the common shares or any so-called “excess distribution” received on its common shares as ordinary income, and to pay an interest charge on a portion of such gain or distribution. In certain circumstances, the sum of the tax and the interest charge may exceed the total amount of proceeds realized on the disposition, or the amount of excess distribution received, by the U.S. Holder. Subject to certain limitations, these tax consequences may be mitigated if a U.S. Holder makes a timely and effective QEF Election (as defined herein) or a Mark-to-Market Election (as defined herein). Subject to certain limitations, such elections may be made with respect to the common shares. A U.S. Holder who makes a timely and effective QEF Election generally must report on a current basis its share of Ballard’s net capital gain and ordinary earnings for any year in which the Company is a PFIC, whether or not Ballard distributes any amounts with respect to the common shares. A U.S.
63

image_2.jpg
Holder who makes the Mark-to-Market Election generally must include as ordinary income each year the excess of the fair market value of the common shares over the U.S. Holder’s basis therein. This paragraph is qualified in its entirety by the discussion under the heading “Certain U.S. Federal Income Tax Considerations” in Ballard’s Annual Report on Form 40-F, which has been filed with the SEC and can be found on the SEC’s website at www.sec.gov. Each U.S. Holder should consult its own tax advisor regarding the tax consequences of the PFIC rules and the acquisition, ownership, and disposition of the common shares.
Emerging diseases, like COVID-19, may adversely affect our operations (including our joint venture in China), our suppliers, our customers and/or partners.
Emerging diseases, like COVID-19, and government actions to address them, may adversely affect our operations, our suppliers, our customers, or our joint venture.
A local, regional, national or international epidemic, including the COVID-19 pandemic, may prevent, or cause delays in, acquiring components of our products, producing our products, delivering our services, completing sales of our products or services whether by direct impacts to our operations, or impacts to the operations of our suppliers, customers or to the financial markets. Our joint venture may similarly be affected.
The continued magnitude, outcome and duration of epidemics and pandemics are difficult to accurately assess, but their impacts could:
•worsen economic conditions, which could negatively impact levels of investment in fuel cell technology deployments by governments and/or our customers;
•impact our production levels, including as a result of full or partial shutdowns of our manufacturing facilities;
•impact our customers’ or joint venture’s production volume levels, including as a result of prolonged unscheduled facility shutdowns;
•cause potential shortages of employees to staff our facilities, or the facilities of our customers, suppliers or joint venture;
•lead to prolonged disruptions of critical components, including because of the bankruptcy/insolvency of one or more suppliers; or
•result in governmental regulation adversely impacting our business,
all of which could have a material adverse effect on our business, financial condition and results of operations, which could be rapid and unexpected.
We could be adversely affected by risks associated with mergers and acquisitions.
We may, in the future, seek to expand our business through acquisitions and investments.
Acquisitions will be in part dependent on management’s ability to identify, acquire and develop suitable acquisition targets in both new and existing markets. In certain circumstances, acceptable acquisition targets might not be available.
64

image_2.jpg
Acquisitions involve a number of risks, including: (i) the possibility that we, as successor owner, may be legally and financially responsible for liabilities of prior owners; (ii) the possibility that we may pay more than the acquired company or assets are worth; (iii) the additional expenses associated with completing an acquisition and amortizing any acquired intangible assets; (iv) the difficulty of integrating the operations and personnel of an acquired business; (v) the challenge of implementing uniform standards, controls, procedures and policies throughout an acquired business; (vi) the inability to integrate, train, retrain and motivate key personnel of an acquired business; (vii) the potential disruption of our ongoing business and the distraction of management from our day-to-day operations; and (viii) an inability to realize the full extent of, or any of, the anticipated benefits of a merger or acquisition transaction, including failure to realize projected revenue gains or achieve expected cost savings within the assumed timeframe.
The above risks and difficulties, if they materialize, could disrupt our ongoing business, distract management, result in the loss of key personnel, increase expenses and otherwise have a material adverse effect on our business, results of operations and financial performance.
ADDITIONAL INFORMATION
Additional information regarding Ballard may be found on the Canadian Securities Administrator’s SEDAR website at www.sedar.com and on the United States Securities and Exchange Commission’s EDGAR website at www.sec.gov. In particular, additional information regarding directors’ and officers’ remuneration and indebtedness, principal holders of our securities and securities authorized for issuance under security compensation plans is contained in our information circular for our most recent annual meeting of securityholders that involved the election of directors. Additional financial information is provided in our financial statements and Management’s Discussion and Analysis for the most recently completed financial year.
Copies of this Annual Information Form and the documents incorporated by reference herein, our comparative financial statements (including the auditors’ report) for the year ended December 31, 2023, each interim financial statement issued after December 31, 2023, our management proxy circular and our Annual Report may be obtained upon request from our Corporate Secretary, 9000 Glenlyon Parkway, Burnaby, British Columbia, V5J 5J8, or on our website at www.ballard.com.
65

image_2.jpg
APPENDIX “A”
AUDIT COMMITTEE MANDATE
The Board has established an Audit Committee (the “Committee”) to assist the Board in fulfilling its oversight responsibilities regarding the integrity of the Corporation’s accounting and financial reporting, the Corporation’s systems of internal controls over financial reporting, the independence and performance of the Corporation’s external and internal auditors, the identification and management of the Corporation’s risks, the Corporation’s Whistleblower Reporting processes, the Corporation’s financial policies and the review and approval of related party transactions, as further described below.
In this Mandate, the “Corporation” means Ballard Power Systems Inc. and a “director” means a member of the Corporation’s board of directors (the “Board”). “SGC” means the Corporation’s Sustainability & Governance Committee.
Composition and Eligibility
A)    The Committee will have a minimum of three members, including the chair of the Committee. Following each annual meeting of shareholders of the Corporation the Board, upon the recommendation of the SGC, will appoint the members of the Committee, including the Committee chair. Any member may be removed or replaced at any time by the Board and will cease to be a member upon ceasing to be a director of the Corporation. Each member will hold office until the close of the next annual meeting of shareholders of the Corporation or until the member resigns or is replaced, whichever occurs first.
B)    Each member of the Committee will be an independent director as set out in applicable securities laws, rules and regulations, and standards of the stock exchanges on which the Corporation’s securities are listed.
C)    All members of the Committee will be financially literate, as defined in accordance with applicable securities laws, rules and regulations, and standards of the stock exchanges on which the Corporation’s securities are listed.
D)    At least one member of the Committee must be an audit committee “financial expert” as defined by applicable securities laws, rules and regulations.
E)    Any member of the Committee who serves on more than three public company audit committees must inform the Chair of the Board, so that the Board may consider and discuss with such member any issues related to his or her effectiveness and time commitment.
Meetings & Quorum
A)    The Committee will meet at least quarterly and otherwise as necessary. Any member of the Committee may request additional meetings.
66

image_2.jpg
B)    Notice of the time and place of each meeting will be given to each member of the Committee either by telephone or other electronic means not less than 1 week before the time of the meeting. Meetings may be held at any time if all Committee members have waived or are deemed to have waived notice of the meeting. A Committee member participating in a meeting will be deemed to have waived notice of the meeting.
C)    The Board Chair will attend meetings of the Committee as an ex officio member. The Board Chair will be considered as a Committee member for purposes of establishing quorum and will be entitled to vote on matters considered at the meeting. Unless the Committee chair determines otherwise, any other directors who are not members of the Committee will not be allowed to attend meetings of the Committee.
D)    The CEO, CFO, Controller and internal auditor will have direct access to the Committee and any of them may request a meeting of the Committee be called by notifying the chair of the Committee. They will receive notice of every meeting of the Committee and will normally be requested to attend, other than in cases where the Committee wishes to meet in-camera. Other executives or employees of the Corporation will attend at the request of the Committee Chair.
E)    Meetings will be chaired by the Chair of the Committee, or if the Chair is absent, by a member chosen by the Committee from among themselves.
F)    A majority of Committee members constitute a quorum necessary for the transaction of business at Committee meetings. A quorum once established is maintained even if members of the Committee leave the meeting prior to conclusion.
G)    The Corporate Secretary or his or her nominee will act as Secretary to the Committee.
H)    All decisions made by the Committee may be made at a Committee meeting or evidenced in writing and signed by all Committee members, which will be fully effective as if it had been made or passed at a Committee meeting.
I)    As part of every regularly-scheduled meeting, the Committee will hold in-camera sessions with: (1) the external auditors and the internal auditors; (2) with the external auditors only; and (3) of the Committee itself, without management or management directors present. The Committee may also hold other in-camera sessions with such members of management present as the Committee deems appropriate.
J)    The Committee will report to the Board on its meetings and each member of the Board will have access to the minutes of the Committee’s meetings, regardless of whether the director is a member of the Committee.
67

image_2.jpg
Duties and Responsibilities
A)Financial Reporting Control Systems
The Committee is responsible for monitoring the quality and integrity of the Corporation’s accounting and financial reporting process through discussions with management, the external auditors and the internal auditors.
In discharging this responsibility, the Committee will review:
(i)    with management and the external auditors, the Company’s significant accounting policies, including the impact of alternative accounting policies, and any proposed changes thereto; and key management estimates, risks and judgments that could materially affect the financial results;
(ii)    emerging accounting issues and their potential impact on the Company’s financial reporting;
(iii)    with management any significant changes in financial risks facing the Corporation;
(iv)    management’s report assessing the adequacy and effectiveness of the Corporation’s disclosure controls and procedures and systems of internal control; and
(v)    the evaluation by either the internal or external auditors of management’s internal control systems, and management’s responses to any identified deficiencies or weaknesses.
Prior to public disclosure, the Committee will review and approve (where authority has been delegated by Board to the Committee) or recommend to the Board for approval:
(i)    the audited annual consolidated financial statements and unaudited interim condensed consolidated financial statements of the Corporation;
(ii)    the interim and annual management’s discussion and analysis of financial condition and results of operations (MD&A) of the Corporation; and
(iii)    all other material financial public disclosure documents of the Company and those of its subsidiaries that are reporting issuers, including prospectuses, material press releases with financial results, the Annual Information Form and management information circular.
B)External Auditors
The external auditors will report directly to the Committee and the Committee will:
(i)    recommend to the Board and the Corporation’s shareholders the appointment of external auditors; determine their compensation; and monitor and evaluate their qualifications, resources, performance and independence;
68

image_2.jpg
(ii)    oversee the work of the external auditors and review and approve the annual audit plan of the external auditors, including the scope of the audit to be performed, and performance against the audit plan;
(iii)    pre-approve all audit, audit-related and non-audit services to be provided to the Corporation or any of its subsidiaries, by the external auditors (and its affiliates), in accordance with applicable securities laws, rules and regulations;
(iv)    discuss with the external auditors the quality and acceptability of the Corporation’s accounting policies, including:
a)    all critical accounting policies and practices;
b)    all alternative treatments of financial information that have been discussed with management, implications of their use and the external auditors’ “preferred treatment”;
c)    any other material written communications between the external auditors and management;
(v)    review reports of the external auditors;
(vi)    review the quarterly and annual representation letters given by management to the external auditors;
(vii)    at least annually, obtain and review a report by the external auditors describing:
a)    the firm’s internal quality-control procedures;
b)    any material issues raised by the most recent internal quality control review, or peer review of the firm, or by any inquiry or investigation by governmental, regulatory or professional authorities, within the preceding five years, respecting one or more independent audits carried out by the firm, and any steps taken to deal with such issues; and
c)    all relationships between the external auditors and the Company;
(viii)    annually assess and confirm the independence of the external auditors and require the external auditors to deliver an annual report to the Committee regarding its independence, and hold discussions with the external auditors as to any relationship or services that may impact their objectivity or independence;
(ix)    ensure that the audit partners representing the external auditors meet the rotation requirements set out by applicable securities laws, rules and regulations, and standards of the stock exchanges on which the Corporation’s securities are listed; and
69

image_2.jpg
(x)    review and approve hiring policies regarding partners, employees and former partners and employees of current and former external auditors in accordance with applicable securities laws, rules and regulations and the Corporation’s policies.
C)Monitoring Internal Auditors
The internal auditors will report quarterly to the Committee on the results of internal audit activities and will also have direct access to the chair of the Committee when the internal auditors determine it is necessary. The Committee will:
(i)    annually approve the appointment of the internal auditor (or persons responsible for the function);
(ii)    review the scope of responsibilities and effectiveness of the internal audit team, its reporting relationships, activities, organizational structure and resources, its independence from management and its working relationship with the external auditors;
(iii)    oversee the work of the internal auditors including reviewing and approving the annual internal audit plan and updates thereto; and
(iv)    review the reports of the internal auditors on the status of significant internal audit findings, recommendations and management’s responses and review any other reports of the internal auditors.
D)Financial Management
The Committee will at least annually:
(i)    review with management and approve, or make recommendations to the Board to approve, the Corporation’s capital structure strategy; financial policies and investment policies, including debt and equity components; current and expected financial leverage, interest rate and foreign exchange exposures; taking in consideration current and future business needs (including the Annual Operating Plan), capital markets and the Corporation’s credit rating; and
(ii)    review compliance with financial policies.
E)    Cybersecurity
The Committee will:
(i)    oversee policies, procedures, plans and execution intended to provide security, confidentiality, availability and integrity of the Corporation’s data, including personal information and customer and other third party confidential information in the Corporation’s possession or custody;
70

image_2.jpg
(ii)    oversee the effectiveness of the Corporation’s policies and procedures with respect to its information technology systems, including enterprise cybersecurity and privacy;
(iii)    oversee policies and procedures of the Corporation in preparation for responding to any material incidents;
(iv)    oversee the Corporation’s compliance with applicable information security and data protection laws and industry standards, and oversee any internal audits of the Corporation’s information technology systems and processes;
(v)    review the Corporation’s cyber insurance policies to ensure appropriate coverage;
F)    Risk Management and Internal Controls
The Committee will:
(i)    at least annually, review the Corporation’s risk assessment and risk management policies, including the Corporation’s insurance coverage, and management’s compliance with them;
(ii)    review with management, the external auditors and legal counsel, as necessary, any litigation, claim or other contingency, including any tax assessment, that could have a material effect upon the financial position or operating results of the Corporation and the appropriateness of the disclosure thereof in the documents reviewed by the Committee;
(iii)    review and recommend to the Board for approval of the Corporation’s delegation of financial authority;
(iv)    while ensuring confidentiality and anonymity, ensure management has established procedures for the receipt, retention and treatment of complaints received by the Corporation regarding accounting, internal accounting controls or auditing matters or employee concerns regarding accounting or auditing matters or breaches of the Corporation’s ethics policies (“Whistleblower Reporting”);
(v)    review quarterly reports on any Whistleblower Reporting complaints received by the Corporation;
(vi)    review management’s approach for safeguarding corporate assets, data and information systems, the adequacy of staffing of key financial functions (including succession plans for the Corporation’s CFO and Controller) and their plans for improvements;
(vii)    review the appointment of the financial senior executives of the Corporation, prior to recommendation by the SGC to the Board;
71

image_2.jpg
(viii)    assist the Board with the oversight of the Corporation’s compliance with applicable legal and regulatory requirements; and
(ix)    review other risk management matters from time to time as the Committee may consider suitable or the Board may specifically direct.
G)     Related Party Transactions
A related party transaction is defined as a transaction or a series of transactions in which the Corporation or any of its subsidiaries is to be a party, which involves an amount exceeding U.S. $120,000 in aggregate and in which any of the following persons have a direct or indirect material interest:
•a director or executive officer of the Corporation;
•any nominee for election as a director of the Corporation;
•any security holder of the Corporation known by the Corporation to own (of record or beneficially) more than 5% of any class of the Corporation’s voting securities; and
•any member of the immediate family of any of the foregoing persons.
In carrying out its responsibilities in reviewing and approving related party transactions, the Committee will:
(i)    receive details of all related party transactions proposed by the Corporation, and actual and potential conflicts of interest relating thereto, to verify their propriety and that disclosure is appropriate;
(ii)    if a valuation or fairness opinion is required by any applicable statutes or regulations, supervise the preparation of such valuation or fairness opinion; and
(iii)    if approval of the Board of directors is necessary, provide a recommendation to the Board of directors with respect to the related party transaction.
H)     Other
The Committee will:
(i)    annually review the audit of the expense reports of the Chair of the Board of Directors and the CEO;
(ii)    review the minutes of the Corporation’s Disclosure Committee; and
(iii)    evaluate, at least annually, the adequacy of this Mandate and the Committee’s performance, and report its evaluation and any recommendations for change to the Board.
72

image_2.jpg
Authority
A)The Committee is authorized to request the presence, at any meeting, of senior management, legal counsel or anyone else who could contribute substantively to the subject of the meeting.
B)The Committee is empowered to investigate any activity of the Corporation and all employees are to co-operate as requested by the Committee. The Committee may retain outside advisors having special expertise to assist it in fulfilling its responsibilities, and determine the appropriate level of remuneration for such outside advisors.
C)The Committee may form and delegate authority to Committee members or subcommittees.
D)Nothing contained in the above mandate is intended to assign to the Audit Committee the Board’s responsibility to ensure the Corporation’s compliance with applicable laws or regulations or to expand applicable standards of liability under statutory or regulatory requirements for the directors or the members of the Audit Committee.
73
EX-99.4 6 ballard994123123soxsection.htm EX-99.4 Document

Certification Pursuant to Section 302 of the Sarbanes-Oxley Act of 2002

I, R. Randall MacEwen, certify that:
1.I have reviewed this annual report on Form 40-F of Ballard Power Systems Inc.;
2.Based on my knowledge, this report does not contain any untrue statement of a material fact or omit to state a material fact necessary to make the statements made, in light of the circumstances under which such statements were made, not misleading with respect to the period covered by this report;
3.Based on my knowledge, the financial statements, and other financial information included in this report, fairly present in all material respects the financial condition, results of operations and cash flows of the issuer as of, and for, the periods presented in this report;
4.The issuer’s other certifying officer and I are responsible for establishing and maintaining disclosure controls and procedures (as defined in Exchange Act Rules 13a-15(e) and 15d-15(e)) and internal control over financial reporting (as defined in Exchange Act Rules 13a-15(f) and 15d-15(f)) for the issuer and have:
a)Designed such disclosure controls and procedures, or caused such disclosure controls and procedures to be designed under our supervision, to ensure that material information relating to the issuer, including its consolidated subsidiaries, is made known to us by others within those entities, particularly during the period in which this report is being prepared;
b)Designed such internal control over financial reporting, or caused such internal control over financial reporting to be designed under our supervision, to provide reasonable assurance regarding the reliability of financial reporting and the preparation of financial statements for external purposes in accordance with generally accepted accounting principles;
c)Evaluated the effectiveness of the issuer’s disclosure controls and procedures and presented in this report our conclusions about the effectiveness of the disclosure controls and procedures, as of the end of the period covered by this report based on such evaluation; and
d)Disclosed in this report any change in the issuer’s internal control over financial reporting that occurred during the period covered by the annual report that has materially affected, or is reasonably likely to materially affect the issuer’s internal control over financial reporting; and
5.The issuer’s other certifying officer and I have disclosed, based on our most recent evaluation of internal control over financial reporting, to the issuer’s auditors and the audit committee of the issuer’s board of directors (or persons performing the equivalent functions):
a)All significant deficiencies and material weaknesses in the design or operation of internal control over financial reporting which are reasonably likely to adversely affect the issuer’s ability to record, process, summarize and report financial information; and
b)Any fraud, whether or not material, that involves management or other employees who have a significant role in the issuer’s internal control over financial reporting.
Date: March 11, 2024
By: /s/ R. Randall MacEwen            
Name: R. Randall MacEwen
President and Chief Executive Officer I, Paul Dobson, certify that:


Certification Pursuant to Section 302 of the Sarbanes-Oxley Act of 2002

1.I have reviewed this annual report on Form 40-F of Ballard Power Systems Inc.;
2.Based on my knowledge, this report does not contain any untrue statement of a material fact or omit to state a material fact necessary to make the statements made, in light of the circumstances under which such statements were made, not misleading with respect to the period covered by this report;
3.Based on my knowledge, the financial statements, and other financial information included in this report, fairly present in all material respects the financial condition, results of operations and cash flows of the issuer as of, and for, the periods presented in this report;
4.The issuer’s other certifying officer and I are responsible for establishing and maintaining disclosure controls and procedures (as defined in Exchange Act Rules 13a-15(e) and 15d-15(e)) and internal control over financial reporting (as defined in Exchange Act Rules 13a-15(f) and 15d-15(f)) for the issuer and have:
a)Designed such disclosure controls and procedures, or caused such disclosure controls and procedures to be designed under our supervision, to ensure that material information relating to the issuer, including its consolidated subsidiaries, is made known to us by others within those entities, particularly during the period in which this report is being prepared;
b)Designed such internal control over financial reporting, or caused such internal control over financial reporting to be designed under our supervision, to provide reasonable assurance regarding the reliability of financial reporting and the preparation of financial statements for external purposes in accordance with generally accepted accounting principles;
c)Evaluated the effectiveness of the issuer’s disclosure controls and procedures and presented in this report our conclusions about the effectiveness of the disclosure controls and procedures, as of the end of the period covered by this report based on such evaluation; and
d)Disclosed in this report any change in the issuer’s internal control over financial reporting that occurred during the period covered by the annual report that has materially affected, or is reasonably likely to materially affect the issuer’s internal control over financial reporting; and
5.The issuer’s other certifying officer and I have disclosed, based on our most recent evaluation of internal control over financial reporting, to the issuer’s auditors and the audit committee of the issuer’s board of directors (or persons performing the equivalent functions):
a)All significant deficiencies and material weaknesses in the design or operation of internal control over financial reporting which are reasonably likely to adversely affect the issuer’s ability to record, process, summarize and report financial information; and
b)Any fraud, whether or not material, that involves management or other employees who have a significant role in the issuer’s internal control over financial reporting.
Date: March 11, 2024
By: /s/ Paul Dobson                
Name: Paul Dobson
Senior Vice President and Chief Financial Officer

EX-99.5 7 ballard995123123soxsection.htm EX-99.5 Document

Section 906 Certification

Certification Pursuant to
18 U.S.C. Section 1350

As Adopted Pursuant to Section 906 of the Sarbanes-Oxley Act of 2002
In connection with the Annual Report on Form 40-F of Ballard Power Systems Inc., a corporation organized under the laws of British Columbia (the “Company”), for the period ending December 31, 2023 as filed with the Securities and Exchange Commission on the date hereof (the “Report”), each of the undersigned officers of the Company certifies, pursuant to 18 U.S.C. Section 1350, as adopted pursuant to Section 906 of the Sarbanes-Oxley Act of 2002, that:
1. The Report fully complies with the requirements of Section 13(a) or 15(d) of the Securities Exchange Act of 1934 (15 U.S.C. 78m(a) or 78o(d)); and
 
2. The information contained in the Report fairly presents, in all material respects, the financial condition and results of operations of the Company.
Dated: March 11, 2024 /s/ R. Randall MacEwen
R. Randall MacEwen
President and Chief Executive Officer (principal executive officer)
 
 
Dated: March 11, 2024 /s/ Paul Dobson
Paul Dobson
Senior Vice President and Chief Financial Officer (principal financial officer)


EX-99.6 8 ballard996123123kpmgcertif.htm EX-99.6 Document
kpmglogo2019.jpg
KPMG LLP
PO Box 10426 777 Dunsmuir Street
Vancouver BC V7Y 1K23
Canada
Telephone (604) 692-3000
Fax (604) 691-3031

Consent of Independent Registered Public Accounting Firm

The Board of Directors

Ballard Power Systems Inc.

We, KPMG LLP, consent to the use of our report dated March 8, 2024, on the consolidated financial
statements of Ballard Power Systems Inc. (the “Entity”), which comprise the consolidated statements of
financial position as at December 31, 2023 and December 31, 2022, the related consolidated statements of
loss and comprehensive income (loss), changes in equity and cash flows for each of the years in the two-year
period ended December 31, 2023, and the related notes, and our report dated March 8, 2024 on the
effectiveness of internal control over financial reporting as of December 31, 2023.
We also consent to the incorporation by reference of such reports in the Registration Statements No. 333-
225494 and No. 333-271785 on Form S-8 and No. 333-271758 on Form F-10 of Ballard Power Systems Inc.

//s// KPMG LLP
March 8, 2024
Vancouver, Canada
KPMG LLP, an Ontario limited liability partnership and member firm of the KPMG global organization of independent member firms affiliated with KPMG International Limited, a private English company limited by guarantee. KPMG Canada provides services to KPMG LLP.