株探米国株
日本語 英語
エドガーで原本を確認する
0001447362FALSE00014473622023-11-022023-11-02

UNITED STATES
SECURITIES AND EXCHANGE COMMISSION
Washington, D.C. 20549

FORM 8-K
CURRENT REPORT
Pursuant to Section 13 or 15(d)
of the Securities Exchange Act of 1934

Date of Report (Date of earliest event reported): November 2, 2023

Castle Biosciences, Inc.
(Exact name of registrant as specified in its charter)
         
Delaware   001-38984   77-0701774
(state or other jurisdiction
of incorporation)
  (Commission
File Number)
  (I.R.S. Employer
Identification No.)
505 S. Friendswood Drive, Suite 401
Friendswood, Texas
77546
(Address of principal executive offices) (Zip Code)

Registrant’s telephone number, including area code: (866) 788-9007

(Former name or former address, if changed since last report.)

Check the appropriate box below if the Form 8-K filing is intended to simultaneously satisfy the filing obligation of the registrant under any of the following provisions: 

☐    Written communications pursuant to Rule 425 under the Securities Act (17 CFR 230.425)
☐    Soliciting material pursuant to Rule 14a-12 under the Exchange Act (17 CFR 240.14a-12) 
☐    Pre-commencement communications pursuant to Rule 14d-2(b) under the Exchange Act (17 CFR 240.14d-2(b)) 
☐    Pre-commencement communications pursuant to Rule 13e-4(c) under the Exchange Act (17 CFR 240.13e-4(c)) 
 
Securities registered pursuant to Section 12(b) of the Act:
Title of each class Trading Symbol(s)   Name of each exchange on which registered
Common Stock, $0.001 par value per share CSTL   The Nasdaq Global Market

Indicate by check mark whether the registrant is an emerging growth company as defined in Rule 405 of the Securities Act of 1933 (§ 230.405 of this chapter) or Rule 12b–2 of the Securities Exchange Act of 1934 (§ 240.12b–2 of this chapter).
Emerging growth company ☐ 
If an emerging growth company, indicate by check mark if the registrant has elected not to use the extended transition period for complying with any new or revised financial accounting standards provided pursuant to Section 13(a) of the Exchange Act. ☐ 


Item 2.02    Results of Operations and Financial Condition.

On November 2, 2023, Castle Biosciences, Inc. (the “Company”) issued a press release announcing its financial results for the third quarter and nine months ended ended September 30, 2023. A copy of the press release is attached hereto as Exhibit 99.1 and incorporated herein by reference.

The information contained or incorporated in this Current Report on Form 8-K, including Exhibit 99.1, shall not be deemed “filed” for purposes of Section 18 of the Securities Exchange Act of 1934, as amended (the “Exchange Act”), or otherwise subject to the liabilities of that section, nor shall it be deemed to be incorporated by reference into any filing under the Exchange Act or the Securities Act of 1933, as amended (the “Securities Act”), except as expressly set forth by specific reference in such filing to this Current Report on Form 8-K.

Item 7.01    Regulation FD Disclosure.

On November 2, 2023, the Company made available the slide presentation attached hereto as Exhibit 99.2. Information from this slide presentation may also be used by the management of the Company in future meetings regarding the Company.

The information contained or incorporated in this Item 7.01 of this Current Report on Form 8-K, including Exhibit 99.2, shall not be deemed “filed” for purposes of Section 18 of the Exchange Act or otherwise subject to the liabilities of that section, nor shall it be deemed to be incorporated by reference into any filing under the Exchange Act or the Securities Act except as expressly set forth by specific reference in such filing to this Current Report on Form 8-K.

Item 9.01    Financial Statements and Exhibits.
(d) Exhibits.
Exhibit
Number Description
99.1
99.2
104 Inline XBRL for the cover page of this Current Report on Form 8-K.


SIGNATURES
Pursuant to the requirements of the Securities Exchange Act of 1934, the registrant has caused this report to be signed on its behalf by the undersigned hereunto duly authorized.
CASTLE BIOSCIENCES, INC.
By: /s/ Frank Stokes
Frank Stokes
Chief Financial Officer
Date: November 2, 2023


EX-99.1 2 exhibit991q32023earningsre.htm EX-99.1 Document

cstllogo01a.jpg
Exhibit 99.1


Castle Biosciences Reports Third Quarter 2023 Results

Q3 2023 revenue increased 66% over Q3 2022 to $61 million
Q3 2023 total test reports increased 52% over Q3 2022
Raising full year 2023 revenue guidance to at least $200 million from at least $180 million
Conference call and webcast today at 4:30 p.m. ET

FRIENDSWOOD, Texas - Nov. 2, 2023--Castle Biosciences, Inc. (Nasdaq: CSTL), a company improving health through innovative tests that guide patient care, today announced its financial results for the third quarter and nine months ended September 30, 2023.

“Our third quarter results were exceptional, demonstrating the strength of our business fundamentals and the innovative test portfolio we’ve built to provide patients and clinicians with actionable information to guide patient care,” said Derek Maetzold, president and chief executive officer of Castle Biosciences. “We delivered another quarter of significant test volume growth and revenue growth, which helped drive positive earnings and positive operating cash flow. Given our consistent performance year-to-date and confidence in our business, we are raising our 2023 revenue guidance to at least $200 million, up from at least $180 million.

“We continue to invest in our strategic growth initiatives across our entire test portfolio, while maintaining our firm focus on financial discipline. We believe our investments will continue to support our long-term value creation plans and the improvement of patient care. Our success is not possible without the continued dedication and efforts of our Castle team, and I would like to express my sincere appreciation for their contributions.”
Third Quarter Ended September 30, 2023, Financial and Operational Highlights
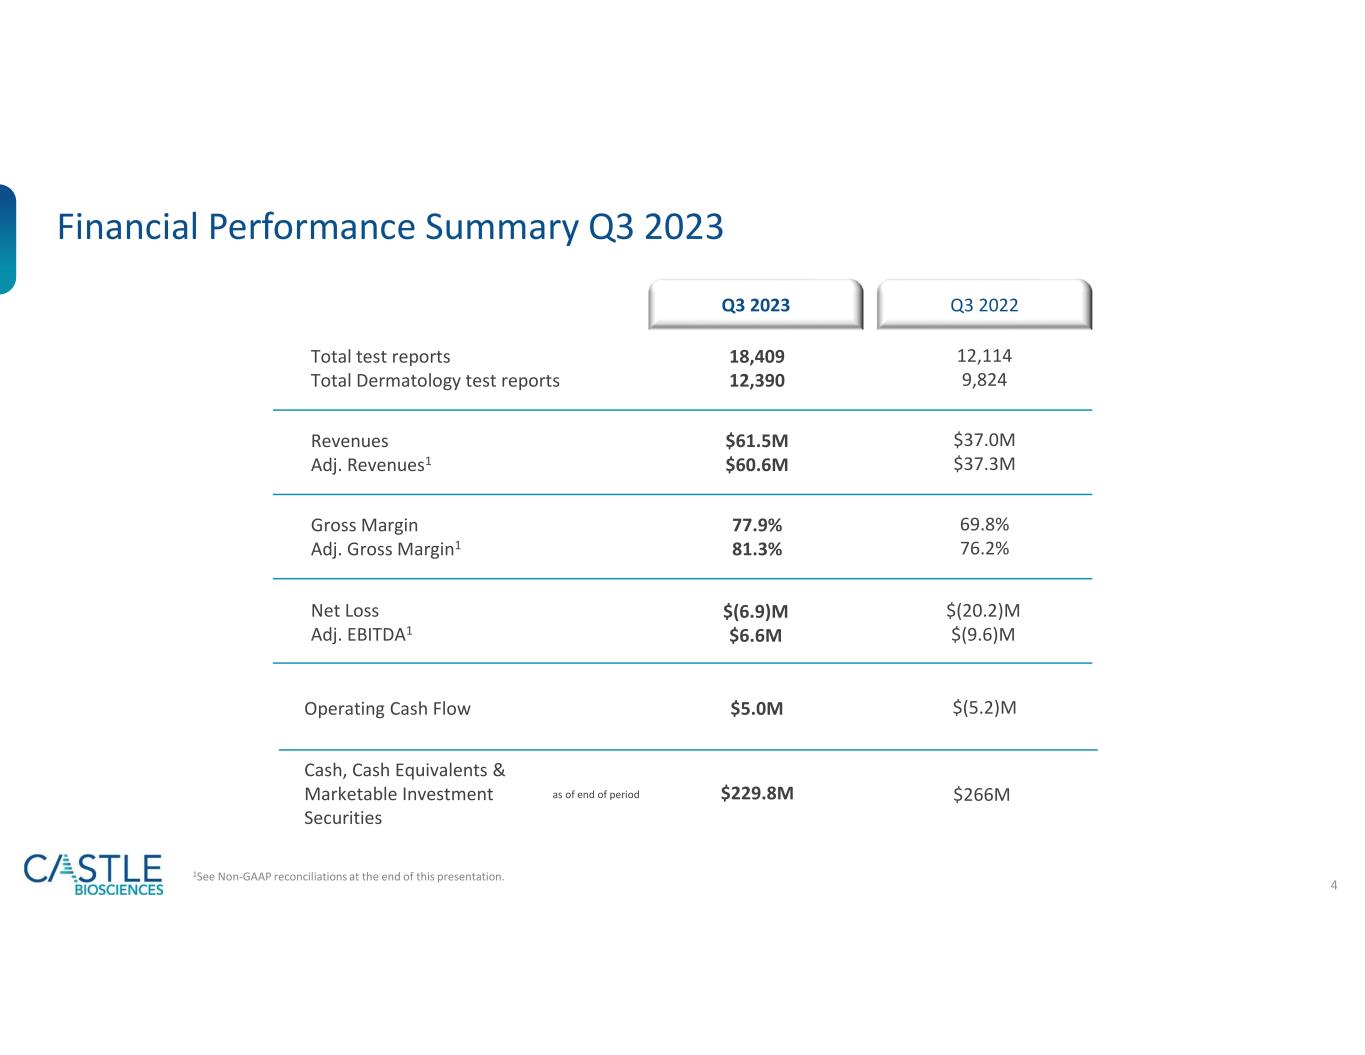
•Revenues were $61.5 million, a 66% increase compared to $37.0 million during the same period in 2022. Included in revenue for the period were revenue adjustments related to tests delivered in prior periods. These prior period revenue adjustments for the quarter ended September 30, 2023, were $0.9 million of net positive revenue adjustments, compared to $(0.3) million of net negative revenue adjustments for the same period in 2022.
•Adjusted revenues, which exclude the effects of revenue adjustments related to tests delivered in prior periods, were $60.6 million, a 63% increase compared to $37.3 million for the same period in 2022.
•Delivered 18,409 total test reports in the third quarter of 2023, an increase of 52% compared to 12,114 in the same period of 2022:
◦DecisionDx®-Melanoma test reports delivered in the quarter were 8,559, compared to 7,354 in the third quarter of 2022, an increase of 16%.
◦DecisionDx®-SCC test reports delivered in the quarter were 2,820, compared to 1,636 in the third quarter of 2022, an increase of 72%.
◦MyPath® Melanoma test reports delivered in the quarter were 1,011, compared to 834 MyPath Melanoma and DiffDx®-Melanoma aggregate test reports in the third quarter of 2022, an increase of 21%.
◦DecisionDx®-UM test reports delivered in the quarter were 399, compared to 392 in the third quarter of 2022, an increase of 2%.
◦TissueCypher® Barrett’s Esophagus test reports delivered in the quarter were 2,829, compared to 690 in the third quarter of 2022, an increase of 310%.
◦IDgenetix® test reports delivered in the quarter were 2,791, compared to 1,208 in the third quarter of 2022, an increase of 131%.
•Gross margin for the quarter ended September 30, 2023, was 78%, and adjusted gross margin was 81%.


•Net cash provided by operations was $5.0 million, compared to net cash used in operations of $5.2 million for the same period in 2022.
•Net loss for the third quarter, which includes non-cash stock-based compensation expense of $13.0 million, was $(6.9) million, compared to a net loss of $(20.2) million for the same period in 2022.
•Adjusted EBITDA for the third quarter was $6.6 million, compared to $(9.6) million for the same period in 2022.

Nine Months Ended September 30, 2023, Financial and Operational Highlights
•Revenues were $153.7 million, a 56% increase compared to $98.7 million during the same period in 2022. Included in revenue for the period were revenue adjustments related to tests delivered in prior periods. These prior period revenue adjustments for the nine months ended September 30, 2023, were $(3.1) million of net negative revenue adjustments, compared to $(1.9) million of net negative revenue adjustments for the same period in 2022.
•Adjusted revenues, which exclude the effects of revenue adjustments related to tests delivered in prior periods, were $156.8 million, a 56% increase compared to $100.6 million for the same period in 2022.
•Delivered 50,145 total test reports in the nine months ended September 30, 2023, an increase of 58% compared to 31,775 in the same period of 2022:
◦DecisionDx-Melanoma test reports delivered in the nine months ended September 30, 2023, were 24,739, compared to 20,502 for the same period in 2022, an increase of 21%.
◦DecisionDx-SCC test reports delivered in the nine months ended September 30, 2023, were 7,912, compared to 4,122 for the same period in 2022, an increase of 92%.
◦MyPath Melanoma test reports delivered in the nine months ended September 30, 2023, were 2,944, compared to 2,739 MyPath Melanoma and DiffDx-Melanoma aggregate test reports for the same period in 2022, an increase of 7%.
◦DecisionDx-UM test reports delivered in the nine months ended September 30, 2023, were 1,269, compared to 1,279 for the same period in 2022, a decrease of 1%.
◦TissueCypher Barrett’s Esophagus test reports delivered in the nine months ended September 30, 2023, were 5,659, compared to 1,098 for the same period in 2022, following our initial offering of the test beginning in December 2021.
◦IDgenetix test reports delivered in the nine months ended September 30, 2023, were 7,622, compared to 2,035 for the same period in 2022, following our initial offering of the test beginning in April 2022.
•Gross margin for the nine months ended September 30, 2023, was 74%, and adjusted gross margin was 79%.
•Net cash used in operations was $24.2 million, compared to $35.7 million for the same period in 2022.
•Net loss for the nine months ended September 30, 2023, which includes non-cash stock-based compensation expense of $39.4 million, was $(54.9) million, compared to $(46.5) million for the same period in 2022.
•Adjusted EBITDA for the nine months ended September 30, 2023, was $(13.8) million, compared to $(32.2) million for the same period in 2022.
Cash, Cash Equivalents and Marketable Investment Securities
As of September 30, 2023, the Company’s cash, cash equivalents and marketable investment securities totaled $229.8 million.
2023 Outlook
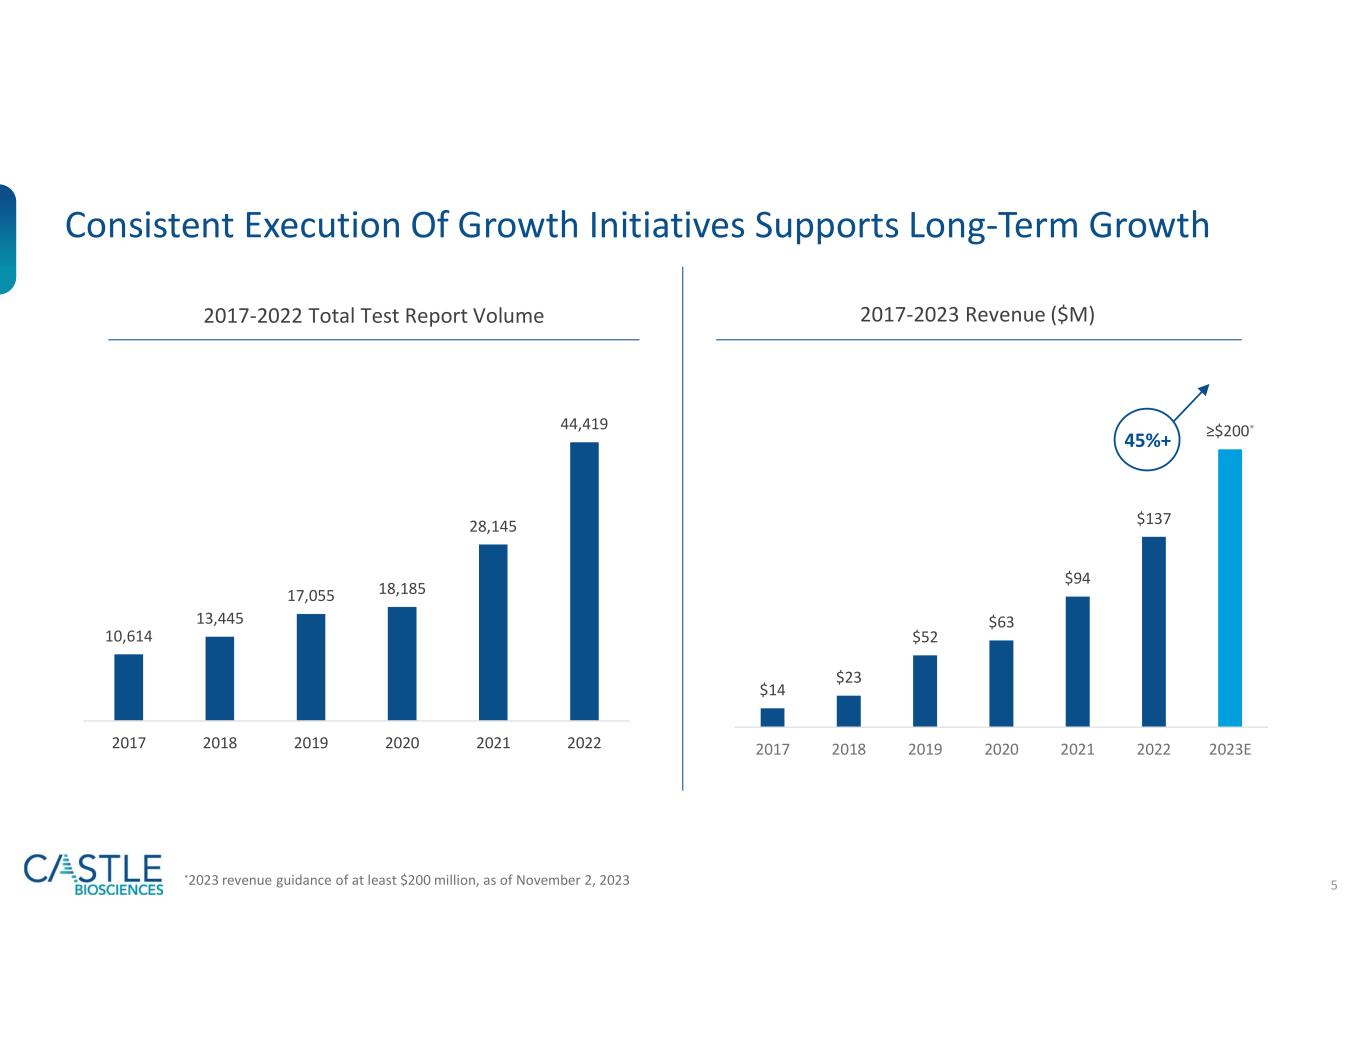
Castle Biosciences is increasing its guidance for anticipated total revenue in 2023. The Company now anticipates generating at least $200 million in total revenue in 2023 compared to the previously provided guidance of at least $180 million.
Third Quarter and Recent Accomplishments and Highlights
Dermatology
•DecisionDx-Melanoma: In October 2023, the Company announced a new study demonstrating DecisionDx-Melanoma outperforms a nomogram developed at the Memorial Sloan Kettering Cancer Center in predicting the risk of sentinel lymph node positivity in patients with cutaneous melanoma. The study can be found here.


•DecisionDx-SCC: In October 2023, the Company shared new data demonstrating the ability of its DecisionDx-SCC test to identify localized high-risk cutaneous squamous cell carcinoma patients at a higher risk of metastasis who may benefit from adjuvant radiation therapy. See the Company’s news release from October 3, 2023, for more information.
Gastroenterology
•In October, the Company announced new data demonstrating the significant clinical utility of its TissueCypher Barrett’s Esophagus test in guiding risk-aligned upstaging of care for patients with non-dysplastic Barrett’s esophagus (BE) at a higher risk of progression to high-grade dysplasia (HGD) or esophageal adenocarcinoma (EAC) than indicated by their clinicopathologic risk factors. See the Company’s news release from October 2, 2023, for more information.
•In September, the Company announced the publication of data demonstrating that the TissueCypher Barrett’s Esophagus test outperformed standard of care pathology review in predicting malignant progression to HGD and EAC in BE patients with an initial diagnosis of low-grade dysplasia (LGD).The study can be found here.
•In September, the Company announced new data demonstrating its TissueCypher Barrett’s Esophagus test can identify patients at a higher or lower risk of developing esophageal cancer than indicated by pathologic diagnoses and clinical risk factors to guide escalated or de-escalated patient management. See the Company’s news release from September 8, 2023, for more information.
•In August, the Company announced a new study published in The American Journal of Gastroenterology showing how use of TissueCypher Barrett’s Esophagus test results can significantly improve management decisions for BE patients with LGD to improve health outcomes. The study can be found here.
Mental Health
•In September, the Company announced data from a study showing the addition of drug-drug interactions and lifestyle factors to drug-gene interactions provided by its IDgenetix test significantly impacted the number of drug recommendations and contributed to improved remission rates for patients with moderate to severe depression. See the Company’s new release from September 9, 2023, for more information.
Corporate
•In September, the Company announced that it had earned a Top Workplaces National Industry Award, ranking third among 84 Top Workplaces in the healthcare industry. Castle has earned several additional Top Workplace awards this year, including Top Workplaces USA and Arizona Top Workplace awards, both for the second consecutive year, as well as the Culture Excellence Awards for Innovation, Work-Life Flexibility, Compensation & Benefits, Leadership and Purpose & Values. See the Company’s news release from September 19, 2023, for more information.
•In September, the Company announced that it had received its Clinical Laboratory Permit from the New York State Department of Health for its laboratory in Pittsburgh. Castle operates clinical laboratories in Pittsburgh and Phoenix. With the recent successful inspection in Pittsburgh, both laboratories are now permitted to provide test services to patients and physicians in the state of New York. Castle’s Phoenix laboratory received its permit in early 2018. See the Company’s news release from September 12, 2023, for more information.
Conference Call and Webcast Details
Castle Biosciences will hold a conference call on Thursday, Nov. 2, 2023, at 4:30 p.m. Eastern time to discuss its third quarter 2023 results and provide a corporate update.

A live webcast of the conference call can be accessed here: https://events.q4inc.com/attendee/479909909 or via the webcast link on the Investor Relations page of the Company’s website, https://ir.castlebiosciences.com/overview/default.aspx. Please access the webcast at least 10 minutes before the conference call start time. An archive of the webcast will be available on the Company’s website until Nov. 23, 2023.

To access the live conference call via phone, please dial 833 470 1428 from the United States, or +1 404 975 4839 internationally, at least 10 minutes prior to the start of the call, using the conference ID 925738.


There will be a brief Question & Answer session following management commentary.
Use of Non-GAAP Financial Measures (UNAUDITED)
In this release, we use the metrics of Adjusted Revenues, Adjusted Gross Margin and Adjusted EBITDA, which are non-GAAP financial measures and are not calculated in accordance with generally accepted accounting principles in the United States (GAAP). Adjusted Revenues and Adjusted Gross Margin reflect adjustments to GAAP net revenues to exclude net positive and/or net negative revenue adjustments recorded in the current period associated with changes in estimated variable consideration related to test reports delivered in previous periods. Adjusted Gross Margin further excludes acquisition-related intangible asset amortization. Adjusted EBITDA excludes from net loss interest income, interest expense, income tax expense (benefit), depreciation and amortization expense, stock-based compensation expense, change in fair value of contingent consideration and acquisition related transaction costs.

We use Adjusted Revenues, Adjusted Gross Margin and Adjusted EBITDA internally because we believe these metrics provide useful supplemental information in assessing our revenue and operating performance reported in accordance with GAAP, respectively. We believe that Adjusted Revenues, when used in conjunction with our test report volume information, facilitates investors’ analysis of our current-period revenue performance and average selling price performance by excluding the effects of revenue adjustments related to test reports delivered in prior periods, since these adjustments may not be indicative of the current or future performance of our business. We believe that providing Adjusted Revenues may also help facilitate comparisons to our historical periods. Adjusted Gross Margin is calculated using Adjusted Revenues and therefore excludes the impact of revenue adjustments related to test reports delivered in prior periods, which we believe is useful to investors as described above. We further exclude acquisition-related intangible asset amortization in the calculation of Adjusted Gross Margin. We believe that excluding acquisition-related intangible asset amortization may facilitate gross margin comparisons to historical periods and may be useful in assessing current-period performance without regard to the historical accounting valuations of intangible assets, which are applicable only to tests we acquired rather than internally developed. We believe Adjusted EBITDA may enhance an evaluation of our operating performance because it excludes the impact of prior decisions made about capital investment, financing, investing and certain expenses we believe are not indicative of our ongoing performance. However, these non-GAAP financial measures may be different from non-GAAP financial measures used by other companies, even when the same or similarly titled terms are used to identify such measures, limiting their usefulness for comparative purposes.

These non-GAAP financial measures are not meant to be considered in isolation or used as substitutes for net revenues, gross margin, or net loss reported in accordance with GAAP; should be considered in conjunction with our financial information presented in accordance with GAAP; have no standardized meaning prescribed by GAAP; are unaudited; and are not prepared under any comprehensive set of accounting rules or principles. In addition, from time to time in the future, there may be other items that we may exclude for purposes of these non-GAAP financial measures, and we may in the future cease to exclude items that we have historically excluded for purposes of these non-GAAP financial measures. Likewise, we may determine to modify the nature of adjustments to arrive at these non-GAAP financial measures. Because of the non-standardized definitions of non-GAAP financial measures, the non-GAAP financial measure as used by us in this press release and the accompanying reconciliation tables have limits in their usefulness to investors and may be calculated differently from, and therefore may not be directly comparable to, similarly titled measures used by other companies. Accordingly, investors should not place undue reliance on non-GAAP financial measures. Reconciliations of these non-GAAP financial measures to the most directly comparable GAAP financial measures are presented in the tables at the end of this release.
About Castle Biosciences
Castle Biosciences (Nasdaq: CSTL) is a leading diagnostics company improving health through innovative tests that guide patient care. The Company aims to transform disease management by keeping people first: patients, clinicians, employees and investors.

Castle’s current portfolio consists of tests for skin cancers, uveal melanoma, Barrett’s esophagus and mental health conditions. Additionally, the Company has active research and development programs for tests in other diseases with high clinical need, including its test in development to help guide systemic therapy selection for patients with moderate-to-severe, atopic dermatitis, psoriasis and related conditions.


To learn more, please visit www.CastleBiosciences.com and connect with us on LinkedIn, Facebook, X and Instagram.

DecisionDx-Melanoma, DecisionDx-CMSeq, DecisionDx-SCC, MyPath Melanoma, DiffDx-Melanoma, DecisionDx-UM, DecisionDx-PRAME, DecisionDx-UMSeq, TissueCypher and IDgenetix are trademarks of Castle Biosciences, Inc.
Forward-Looking Statements
This press release contains forward-looking statements within the meaning of Section 27A of the Securities Act of 1933, as amended, and Section 21E of the Securities Exchange Act of 1934, as amended, which are subject to the “safe harbor” created by those sections. These forward-looking statements include, but are not limited to, statements concerning our expectations regarding: (i) our full year 2023 revenue guidance of at least $200 million; (ii) our continued investment in our strategic growth across our entire test portfolio and the ability of this investment to continue to support our long-term value creation plans and the improvement of patient care; (iii) the potential clinical value and utility of our tests, including with respect to findings in the studies highlighted in this press release; (iv) our belief that the DecisionDx-SCC test can identify localized high-risk cutaneous squamous cell carcinoma patients at a higher risk of metastasis who may benefit from adjuvant radiation therapy; (v) our belief that the TissueCypher Barrett’s Esophagus test can identify patients at a higher or lower risk of developing esophageal cancer and that such test results can significantly improve management decisions for BE patients with LGD to improve health outcomes; and (vi) our belief that the IDgenetix test significantly impacted the number of drug recommendations and contributed to improved remission rates for patients with moderate to severe depression. The words “anticipate,” “can,” “could,” “expect,” “goal,” “may,” “plan” and similar expressions are intended to identify forward-looking statements, although not all forward-looking statements contain these identifying words. We may not actually achieve the plans, intentions, or expectations disclosed in our forward-looking statements and you should not place undue reliance on our forward-looking statements. Actual results or events could differ materially from the plans, intentions and expectations disclosed in the forward-looking statements that we make. These forward-looking statements involve risks and uncertainties that could cause our actual results to differ materially from those in the forward-looking statements, including, without limitation: the accuracy of our assumptions and expectations underlying our fiscal 2023 revenue guidance (including, without limitation, our assumptions or expectations regarding continued reimbursement for our DecisionDx-SCC test at the current rate and reimbursement for our other products and subsequent coverage decisions, our estimated total addressable markets for our products and product candidates and the related expenses, capital requirements and potential needs for additional financing, the anticipated cost, timing and success of our product candidates, and our plans to research, develop and commercialize new tests and our ability to successfully integrate new businesses, assets, products or technologies acquired through acquisitions), the effects of macroeconomic events and conditions, including inflation and monetary supply shifts, labor shortages, liquidity concerns at, and failures of, banks and other financial institutions or other disruptions in the banking system or financing markets and recession risks, supply chain disruptions, outbreaks of contagious diseases (such as the COVID-19 pandemic) and geopolitical events (such as the ongoing Israel-Hamas War and Ukraine-Russia conflict), among others, on our business and our efforts to address its impact on our business; subsequent study or trial results and findings may contradict earlier study or trial results and findings or may not support the results discussed in this press release, including with respect to the tests discussed in this press release; our planned installation of additional equipment and supporting technology infrastructures and implementation of certain process efficiencies may not enable us to increase the future scalability of our TissueCypher Test; actual application of our tests may not provide the aforementioned benefits to patients; our newer gastroenterology and mental health franchises may not contribute to the achievement of our long-term financial targets as anticipated; and the risks set forth under the heading “Risk Factors” in our Annual Report on Form 10-K for the year ended December 31, 2022, our Quarterly Report on Form 10-Q for the three months ended September 30, 2023, each filed or to be filed with the SEC, and in our other filings with the SEC. The forward-looking statements are applicable only as of the date on which they are made, and we do not assume any obligation to update any forward-looking statements, except as may be required by law.

Investor Relations Contact:
Camilla Zuckero
czuckero@castlebiosciences.com


281-906-3868

Media Contact:
Allison Marshall
amarshall@castlebiosciences.com

###


CASTLE BIOSCIENCES, INC.
CONDENSED CONSOLIDATED STATEMENTS OF OPERATIONS
(UNAUDITED)
(in thousands, except per share data)
Three Months Ended
September 30,
Nine Months Ended
September 30,
2023 2022 2023 2022
NET REVENUES $ 61,493  $ 37,011  $ 153,668  $ 98,701 
OPERATING EXPENSES AND OTHER OPERATING INCOME
Cost of sales (exclusive of amortization of acquired intangible assets) 11,319  8,859  32,559  22,489 
Research and development 12,923  10,907  40,624  33,594 
Selling, general and administrative 44,619  36,626  136,062  104,577 
Amortization of acquired intangible assets 2,272  2,306  6,742  6,051 
Change in fair value of contingent consideration —  (151) —  (17,987)
Total operating expenses, net 71,133  58,547  215,987  148,724 
Operating loss (9,640) (21,536) (62,319) (50,023)
Interest income 2,769  1,293  7,504  1,693 
Interest expense (2) (6) (9) (13)
Loss before income taxes (6,873) (20,249) (54,824) (48,343)
Income tax expense (benefit)
32  —  62  (1,823)
Net loss $ (6,905) $ (20,249) $ (54,886) $ (46,520)
Loss per share, basic and diluted $ (0.26) $ (0.77) $ (2.05) $ (1.79)
Weighted-average shares outstanding, basic and diluted 26,834  26,316  26,725  25,938 


Stock-Based Compensation Expense
Stock-based compensation expense is included in the condensed consolidated statements of operations as follows (in thousands):
Three Months Ended
September 30,
Nine Months Ended
September 30,
2023 2022 2023 2022
Cost of sales (exclusive of amortization of acquired intangible assets) $ 1,245  $ 975  $ 3,719  $ 2,725 
Research and development 2,682  1,948  7,755  5,607 
Selling, general and administrative 9,116  6,273  27,943  18,066 
Total stock-based compensation expense $ 13,043  $ 9,196  $ 39,417  $ 26,398 


CASTLE BIOSCIENCES, INC.
CONDENSED CONSOLIDATED STATEMENTS OF COMPREHENSIVE LOSS
(UNAUDITED)
(in thousands)

Three Months Ended
September 30,
Nine Months Ended
September 30,
2023 2022 2023 2022
Net loss $ (6,905) $ (20,249) $ (54,886) $ (46,520)
Other comprehensive income (loss):
Net unrealized gain (loss) on marketable investment securities 73  (189) 310  (189)
Comprehensive loss $ (6,832) $ (20,438) $ (54,576) $ (46,709)


CASTLE BIOSCIENCES, INC.
CONDENSED CONSOLIDATED BALANCE SHEETS
(in thousands)
September 30, 2023 December 31, 2022
ASSETS (unaudited)
Current Assets
Cash and cash equivalents $ 91,223  $ 122,948 
Marketable investment securities 138,530  135,677 
Accounts receivable, net 37,003  23,476 
Inventory 5,769  3,980 
Prepaid expenses and other current assets 7,097  6,207 
Total current assets 279,622  292,288 
Long-term accounts receivable, net 1,338  1,087 
Property and equipment, net 22,273  14,315 
Operating lease assets 11,613  12,181 
Goodwill and other intangible assets, net 119,607  126,348 
Other assets – long-term 1,566  1,110 
Total assets $ 436,019  $ 447,329 
LIABILITIES AND STOCKHOLDERS’ EQUITY
Current Liabilities
Accounts payable $ 6,929  $ 4,731 
Accrued compensation 22,405  24,358 
Operating lease liabilities 1,091  1,777 
Other accrued and current liabilities 5,899  5,262 
Total current liabilities 36,324  36,128 
Noncurrent operating lease liabilities 13,435  11,533 
Deferred tax liability 441  428 
Other liabilities 36  90 
Total liabilities 50,236  48,179 
Stockholders’ Equity
Common stock
27  27 
Additional paid-in capital 601,618  560,409 
Accumulated deficit (215,791) (160,905)
Accumulated other comprehensive loss (71) (381)
Total stockholders’ equity 385,783  399,150 
Total liabilities and stockholders’ equity $ 436,019  $ 447,329 


CASTLE BIOSCIENCES, INC.
CONDENSED CONSOLIDATED STATEMENTS OF CASH FLOWS
(UNAUDITED)
(in thousands)
Nine Months Ended
September 30,
2023 2022
OPERATING ACTIVITIES
Net loss $ (54,886) $ (46,520)
Adjustments to reconcile net loss to net cash used in operating activities:
Depreciation and amortization 9,106  7,702 
Stock-based compensation expense 39,417  26,398 
Change in fair value of contingent consideration —  (17,987)
Deferred income taxes 13  (1,839)
Accretion of discounts on marketable investment securities (3,851) (184)
Other 284  186 
Change in operating assets and liabilities:
Accounts receivable (13,779) (5,678)
Prepaid expenses and other current assets (892) (1,870)
Inventory (1,789) (1,502)
Operating lease assets (590) 694 
Other assets (455) 533 
Accounts payable 2,693  2,155 
Operating lease liabilities 1,093  (559)
Accrued compensation (1,953) 3,669 
Other accrued and current liabilities 1,376  (853)
Net cash used in operating activities (24,213) (35,655)
INVESTING ACTIVITIES
Purchases of property and equipment (9,828) (3,845)
Asset acquisition, adjustment to purchase price —  547 
Acquisition of business, net of cash and cash equivalents acquired —  (26,966)
Proceeds from sale of property and equipment 10 
Purchases of marketable investment securities (136,693) (131,808)
Proceeds from maturities of marketable investment securities 138,000  — 
Net cash used in investing activities (8,511) (162,063)
FINANCING ACTIVITIES
Proceeds from exercise of common stock options 197  675 
Payment of employees’ taxes on vested restricted stock units (1,119) (134)
Proceeds from contributions to the employee stock purchase plan 2,027  1,812 
Repayment of principal portion of finance lease liabilities (106) (88)
Net cash provided by financing activities 999  2,265 
NET CHANGE IN CASH AND CASH EQUIVALENTS (31,725) (195,453)
Beginning of period 122,948  329,633 
End of period $ 91,223  $ 134,180 


CASTLE BIOSCIENCES, INC.
Reconciliation of Non-GAAP Financial Measures (UNAUDITED)
The table below presents the reconciliation of adjusted revenues and adjusted gross margin, which are non-GAAP financial measures. See "Use of Non-GAAP Financial Measures (UNAUDITED)" above for further information regarding the Company's use of non-GAAP financial measures.
Three Months Ended
September 30,
Nine Months Ended
September 30,
2023 2022 2023 2022
(in thousands)
Adjusted revenues
Net revenues (GAAP) $ 61,493  $ 37,011  $ 153,668  $ 98,701 
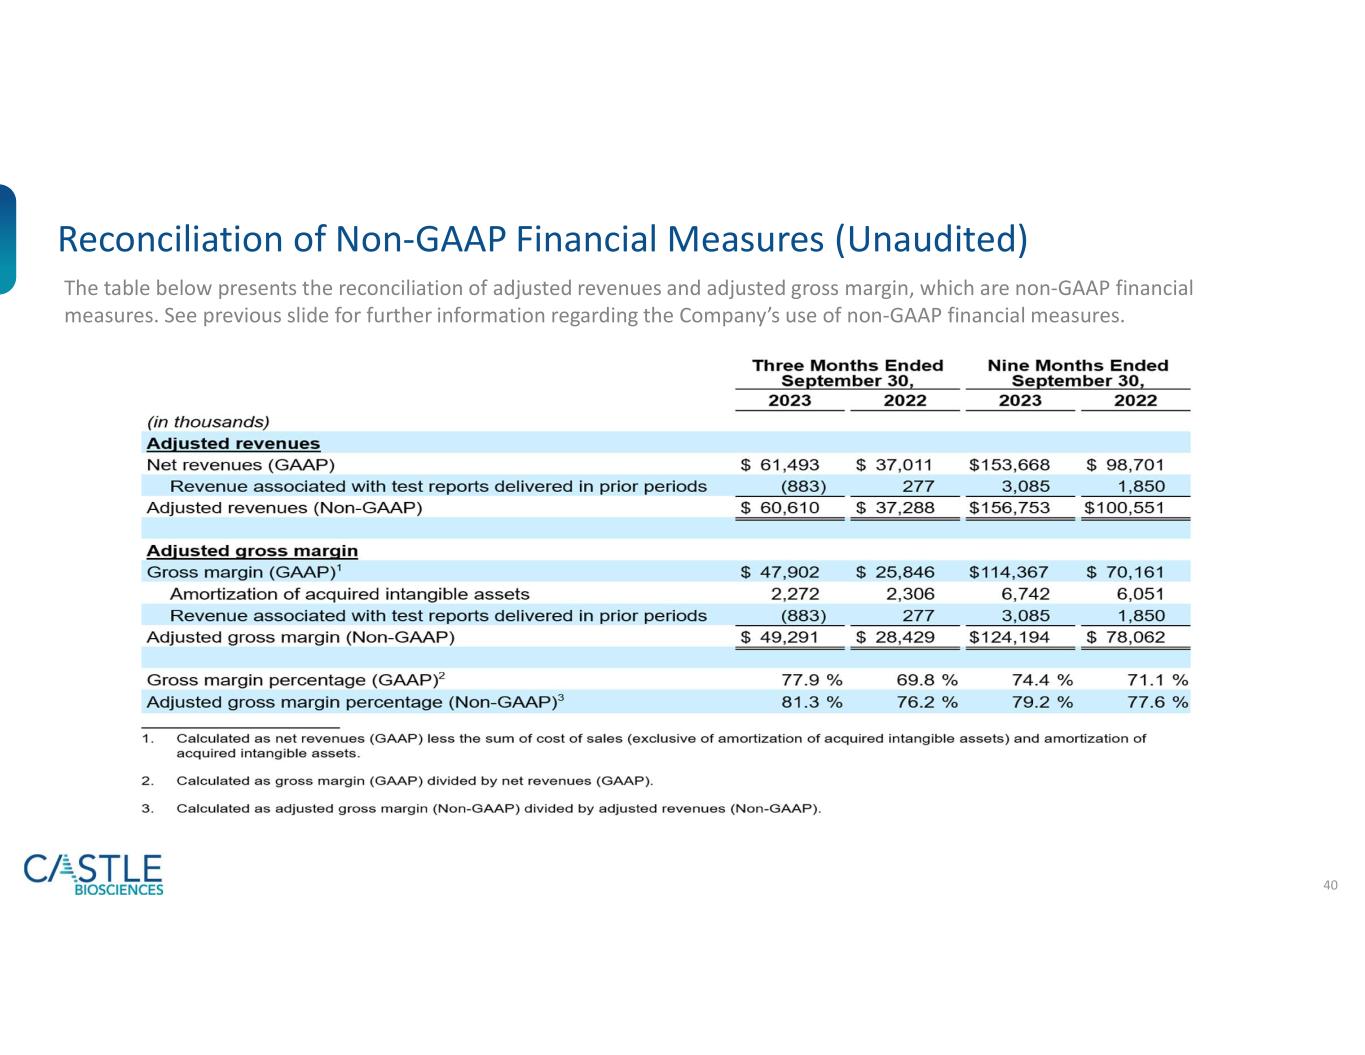
Revenue associated with test reports delivered in prior periods (883) 277  3,085  1,850 
Adjusted revenues (Non-GAAP) $ 60,610  $ 37,288  $ 156,753  $ 100,551 
Adjusted gross margin
Gross margin (GAAP)1
$ 47,902  $ 25,846  $ 114,367  $ 70,161 
Amortization of acquired intangible assets 2,272  2,306  6,742  6,051 
Revenue associated with test reports delivered in prior periods (883) 277  3,085  1,850 
Adjusted gross margin (Non-GAAP) $ 49,291  $ 28,429  $ 124,194  $ 78,062 
Gross margin percentage (GAAP)2
77.9  % 69.8  % 74.4  % 71.1  %
Adjusted gross margin percentage (Non-GAAP)3
81.3  % 76.2  % 79.2  % 77.6  %
1.Calculated as net revenues (GAAP) less the sum of cost of sales (exclusive of amortization of acquired intangible assets) and amortization of acquired intangible assets.
2.Calculated as gross margin (GAAP) divided by net revenues (GAAP).
3.Calculated as adjusted gross margin (Non-GAAP) divided by adjusted revenues (Non-GAAP).

The table below presents the reconciliation of adjusted EBITDA, which is a non-GAAP financial measure. See "Use of Non-GAAP Financial Measures (UNAUDITED)" above for further information regarding the Company's use of non-GAAP financial measures.
Three Months Ended
September 30,
Nine Months Ended
September 30,
2023 2022 2023 2022
(in thousands)
Adjusted EBITDA
Net loss $ (6,905) $ (20,249) $ (54,886) $ (46,520)
Interest income1
(2,769) (1,293) (7,504) (1,693)
Interest expense 13 
Income tax expense (benefit)
32  —  62  (1,823)
Depreciation and amortization expense 3,174  2,923  9,106  7,702 
Stock-based compensation expense 13,043  9,196  39,417  26,398 
Change in fair value of contingent consideration —  (151) —  (17,987)
Acquisition related transaction costs —  —  —  1,711 
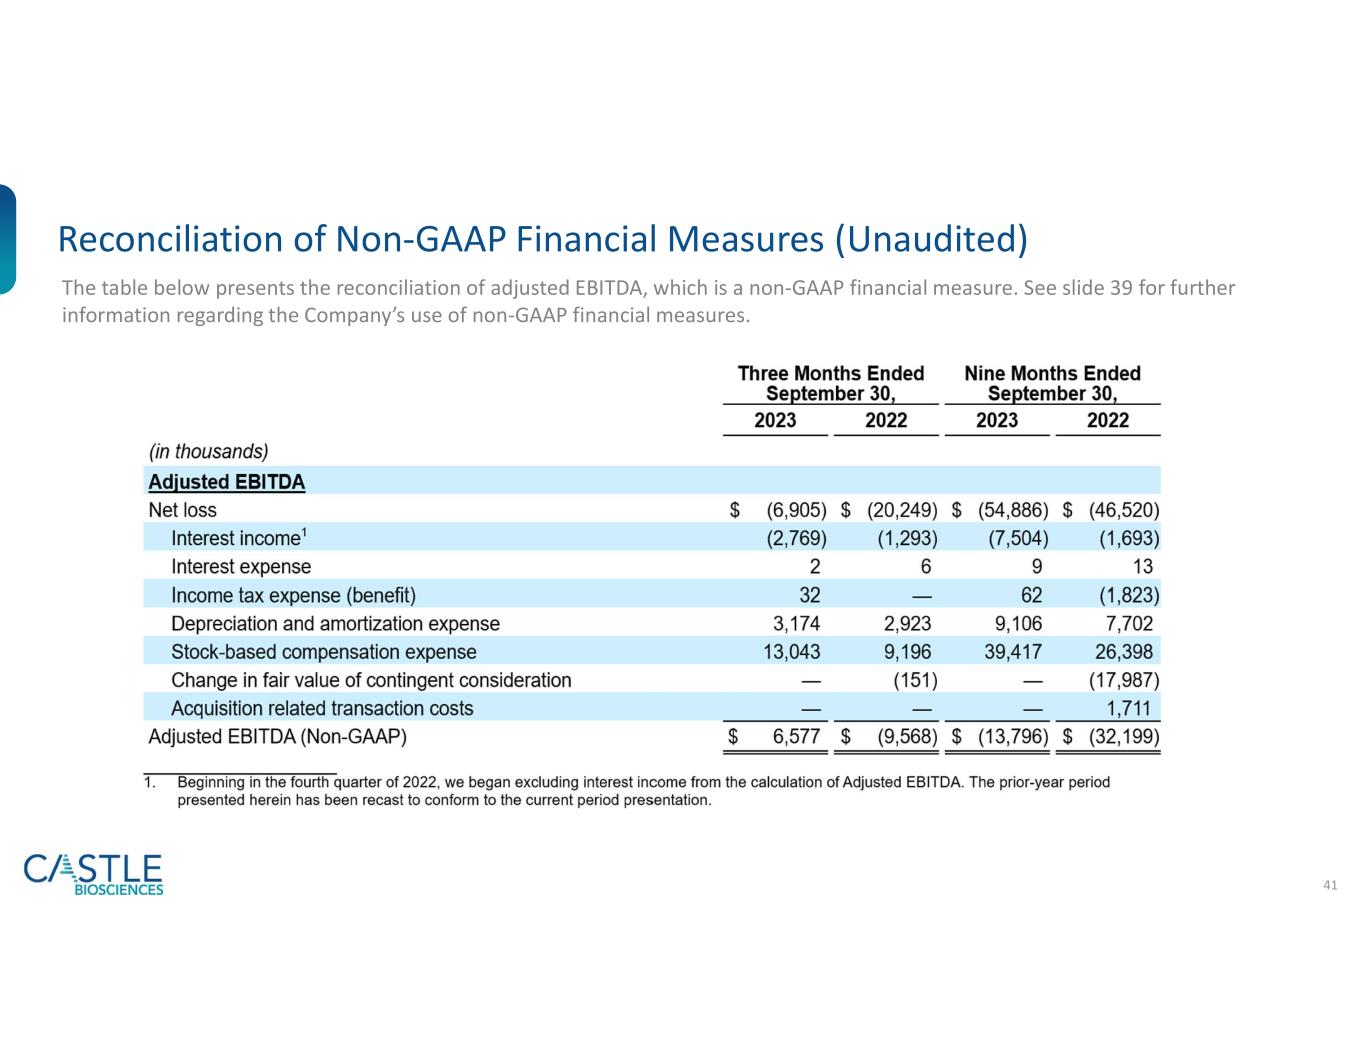
Adjusted EBITDA (Non-GAAP) $ 6,577  $ (9,568) $ (13,796) $ (32,199)
1.    Beginning in the fourth quarter of 2022, we began excluding interest income from the calculation of Adjusted EBITDA. The prior-year period presented herein has been recast to conform to the current period presentation.

EX-99.2 3 exhibit992q323.htm EX-99.2 exhibit992q323
November 2023 Transforming Disease Management


2 Disclaimers This presentation contains forward-looking statements within the meaning of Section 27A of the Securities Act of 1933, as amended, and Section 21E of the Securities Exchange Act of 1934, as amended, which are subject to the “safe harbor” created by those sections. These forward-looking statements include, but are not limited to, statements concerning: our 2023 revenue guidance of at least $200 million; our expected launch of our pipeline expansion by the end of 2025; the potential of DecisionDx-Melanoma test results to help inform more personalized patient management decisions; our belief that DecisionDx-SCC (i) could be used to guide ART the way PNI does in existing guidelines, (ii) may be a benefit to ART when appropriate high-risk patients are identified, (iii) can result in a 40% or greater reduction in risk, (iv) may inform appropriate clinical management decisions related to ART administration in high-risk SCC patients and (v) has the potential for significant cost savings to our healthcare system by helping ensure the appropriate patients receive costly therapies; our mission, vision, strategic guideposts and our strategies for driving long-term growth through strong execution and our operational guideposts; the timing and achievement of program milestones; our estimated U.S. total addressable market for our commercially available tests; our positioning for continued growth; our ongoing studies generating data and their impact on driving adoption of our tests; and study observations and interpretations of study data, including conclusions about the benefits and impact of our tests on treatment decisions and patient outcomes. The words “anticipates,” “can,” “could,” “estimates,” “expects,” “may,” “potential,” “target” and similar expressions are intended to identify forward-looking statements, although not all forward-looking statements contain these identifying words. We may not actually achieve the plans, intentions, or expectations disclosed in our forward-looking statements and you should not place undue reliance on our forward-looking statements. Actual results or events could differ materially from the plans, intentions and expectations disclosed in the forward-looking statements that we make. These forward-looking statements involve risks and uncertainties that could cause our actual results to differ materially from those in the forward-looking statements, including, without limitation: our estimates and assumptions underlying our estimated U.S. total addressable market for our commercially available tests; the accuracy of our assumptions and expectations underlying our fiscal 2023 and three-year revenue and other financial targets and guidance (including, without limitation, our assumptions or expectations regarding continued reimbursement for our DecisionDx-SCC test at the current rate and reimbursement for our other products and subsequent coverage decisions, our estimated total addressable markets for our products and product candidates and the related expenses, capital requirements and potential needs for additional financing, the anticipated cost, timing and success of our product candidates, and our plans to research, develop and commercialize new tests and our ability to successfully integrate new businesses, assets, products or technologies acquired through acquisitions), the effects of macroeconomic events and conditions, including inflation and monetary supply shifts, labor shortages, liquidity concerns at, and failures of, banks and other financial institutions or other disruptions in the banking system or financing markets and recession risks, supply chain disruptions, outbreaks of contagious diseases (such as the COVID-19 pandemic) and geopolitical events (such as the ongoing Israel-Hamas War and Ukraine-Russia conflict), among others, on our business and our efforts to address its impact on our business; subsequent study or trial results and findings may contradict earlier study or trial results and findings or may not support the results discussed in this presentation, including with respect to the diagnostic and prognostic tests discussed in this presentation; actual application of our tests may not provide the anticipated benefits to patients; and the risks set forth under the heading “Risk Factors” in our Annual Report on Form 10-K for the year ended December 31, 2022, and in our other filings with the SEC. The forward-looking statements are applicable only as of the date on which they are made, and we do not assume any obligation to update any forward-looking statements, except as may be required by law. Forward-Looking Statements


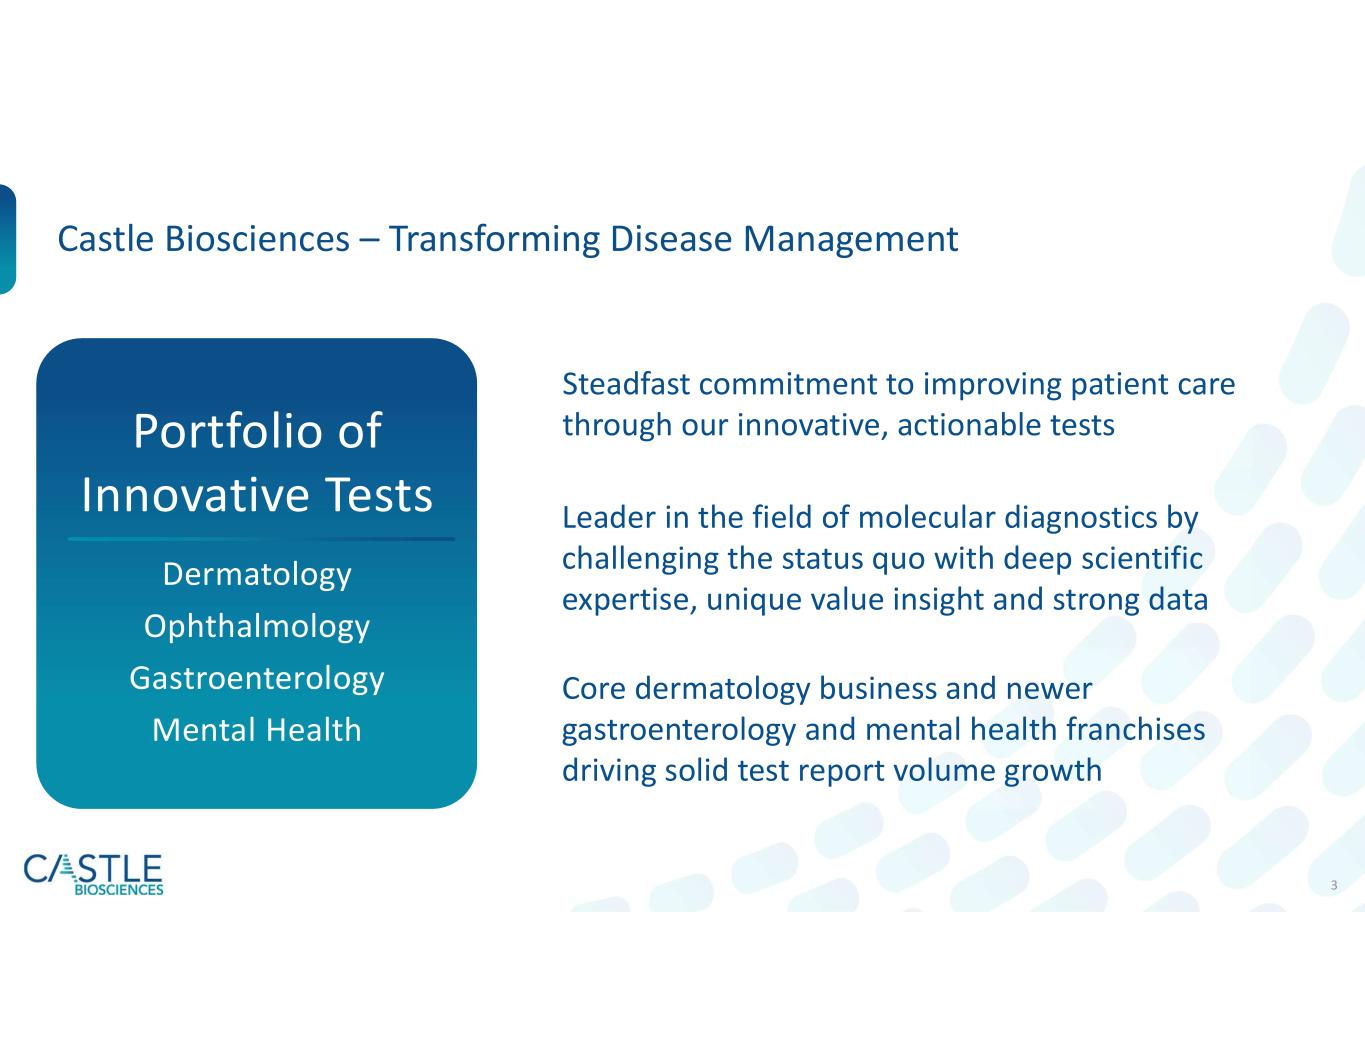
3 Castle Biosciences – Transforming Disease Management Portfolio of Innovative Tests Dermatology Ophthalmology Gastroenterology Mental Health Leader in the field of molecular diagnostics by challenging the status quo with deep scientific expertise, unique value insight and strong data Core dermatology business and newer gastroenterology and mental health franchises driving solid test report volume growth Steadfast commitment to improving patient care through our innovative, actionable tests


4 Financial Performance Summary Q3 2023 18,409 12,390 Total test reports Total Dermatology test reports Q3 2023 Q3 2022 1See Non-GAAP reconciliations at the end of this presentation. $61.5M $60.6M Revenues Adj. Revenues1 77.9% 81.3% Gross Margin Adj. Gross Margin1 12,114 9,824 $37.0M $37.3M 69.8% 76.2% $5.0MOperating Cash Flow $229.8M Cash, Cash Equivalents & Marketable Investment Securities as of end of period $(5.2)M $266M $(6.9)M $6.6M Net Loss Adj. EBITDA1 $(20.2)M $(9.6)M

 
5 Consistent Execution Of Growth Initiatives Supports Long-Term Growth 2017-2023 Revenue ($M) 2017-2022 Total Test Report Volume 1 2 *2023 revenue guidance of at least $200 million, as of November 2, 2023 $14 $23 $52 $63 $94 $137 ≥$200* 2017 2018 2019 2020 2021 2022 2023E 10,614 13,445 17,055 18,185 28,145 44,419 2017 2018 2019 2020 2021 2022 45%+


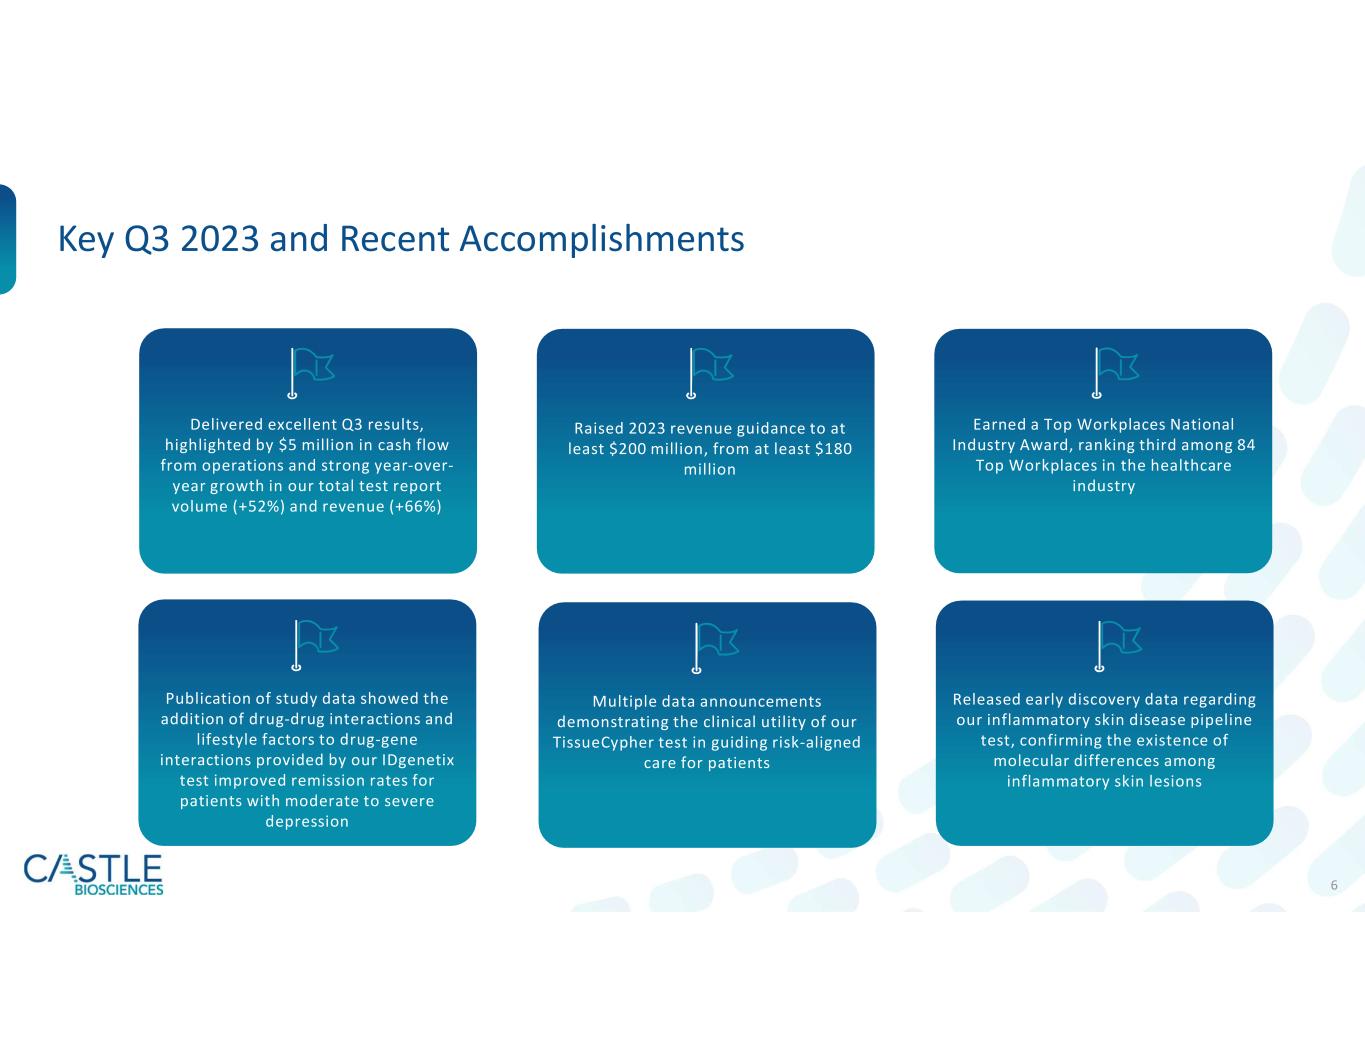
6 Raised 2023 revenue guidance to at least $200 million, from at least $180 million Earned a Top Workplaces National Industry Award, ranking third among 84 Top Workplaces in the healthcare industry Key Q3 2023 and Recent Accomplishments Publication of study data showed the addition of drug-drug interactions and lifestyle factors to drug-gene interactions provided by our IDgenetix test improved remission rates for patients with moderate to severe depression Released early discovery data regarding our inflammatory skin disease pipeline test, confirming the existence of molecular differences among inflammatory skin lesions Delivered excellent Q3 results, highlighted by $5 million in cash flow from operations and strong year-over- year growth in our total test report volume (+52%) and revenue (+66%) Multiple data announcements demonstrating the clinical utility of our TissueCypher test in guiding risk-aligned care for patients


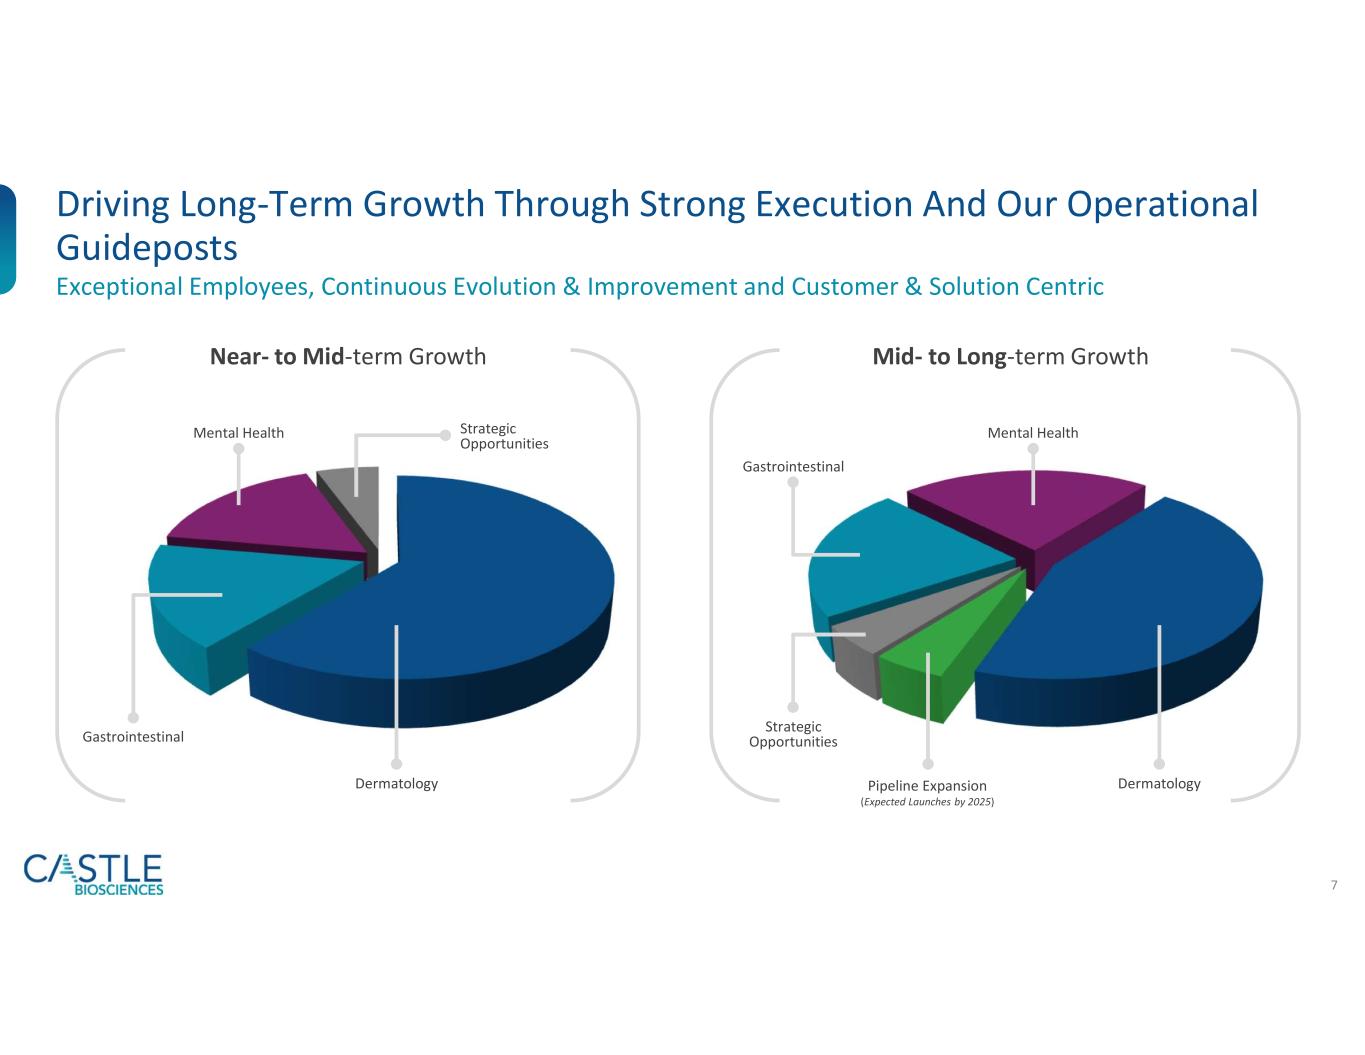
7 Driving Long-Term Growth Through Strong Execution And Our Operational Guideposts Dermatology Mental Health Gastrointestinal Strategic Opportunities Pipeline Expansion (Expected Launches by 2025) Mental Health Gastrointestinal Strategic Opportunities Near- to Mid-term Growth Mid- to Long-term Growth Dermatology Exceptional Employees, Continuous Evolution & Improvement and Customer & Solution Centric


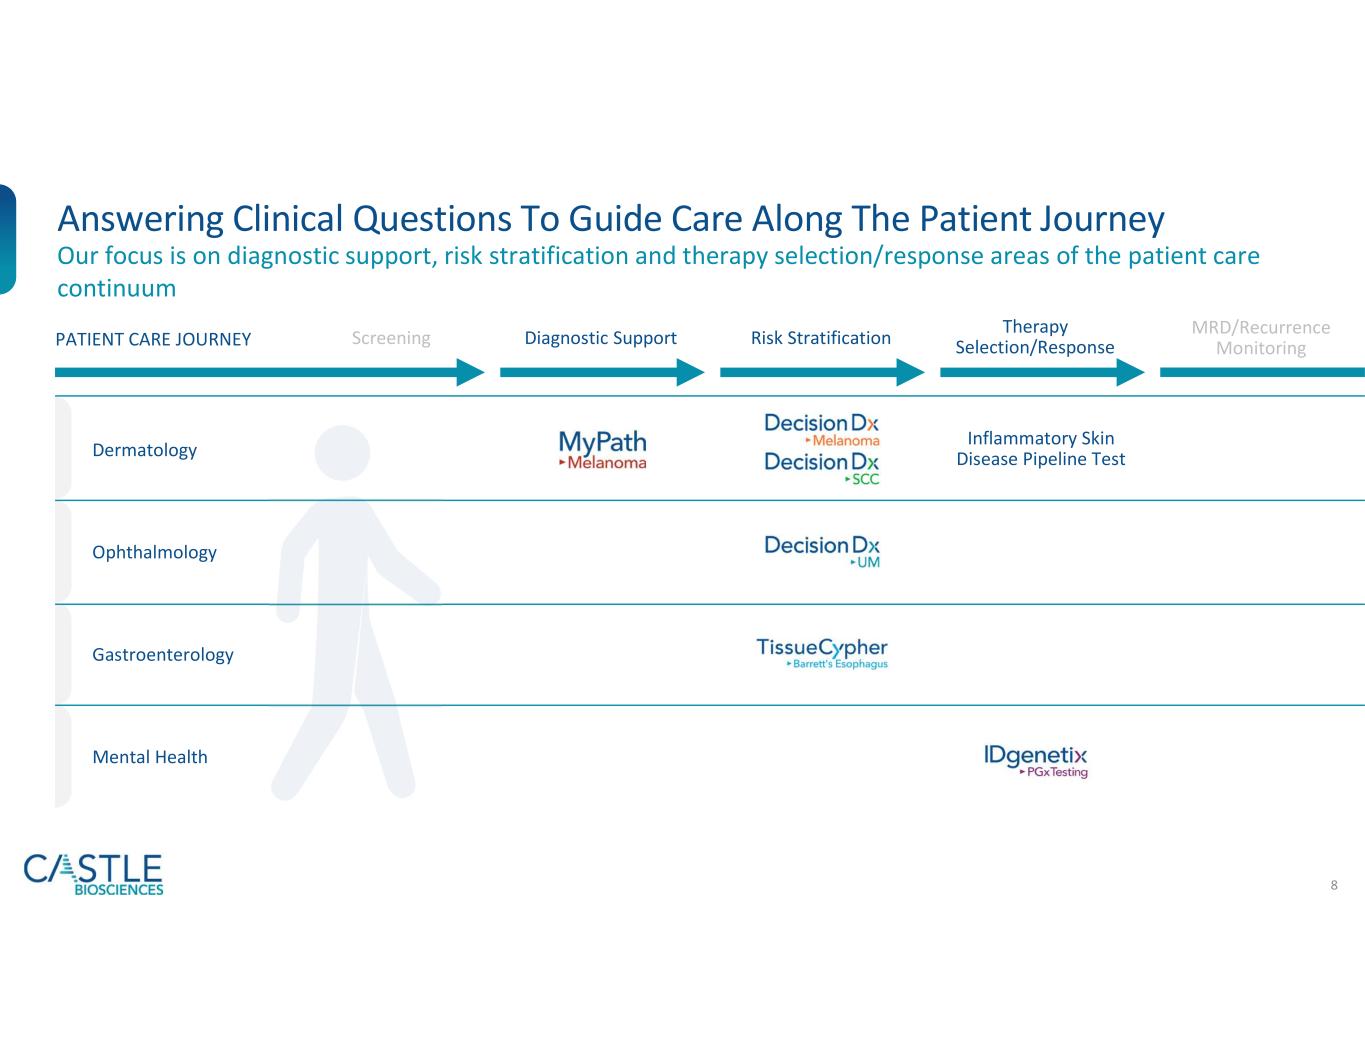
8 Answering Clinical Questions To Guide Care Along The Patient Journey Our focus is on diagnostic support, risk stratification and therapy selection/response areas of the patient care continuum Dermatology Ophthalmology Gastroenterology Mental Health Screening Diagnostic Support Risk Stratification Therapy Selection/Response MRD/Recurrence MonitoringPATIENT CARE JOURNEY Inflammatory Skin Disease Pipeline Test


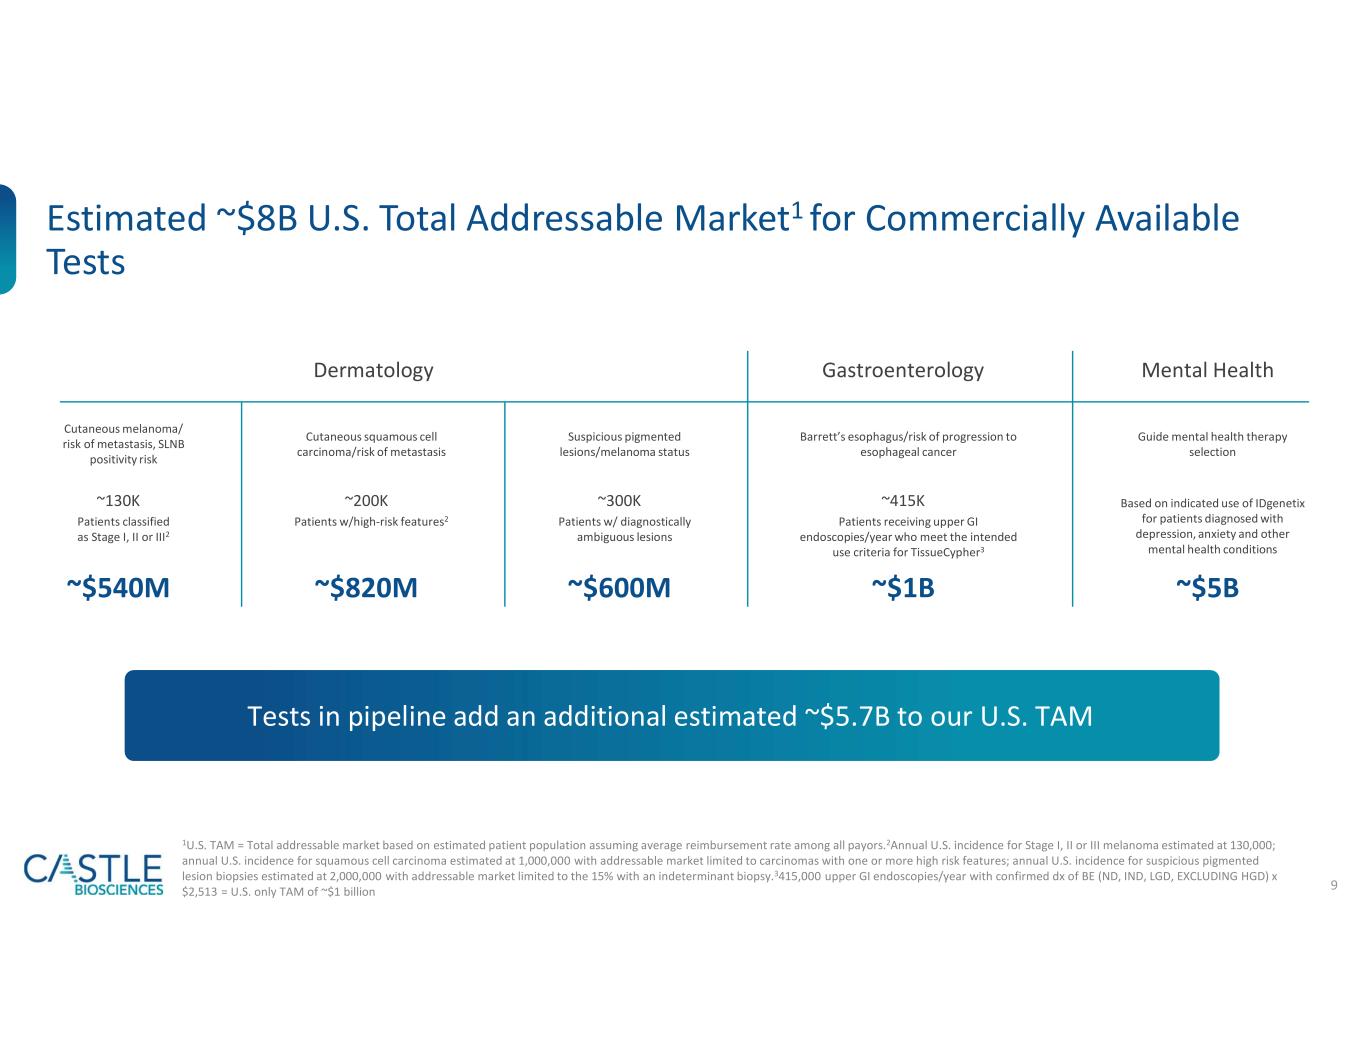
9 Estimated ~$8B U.S. Total Addressable Market1 for Commercially Available Tests Dermatology Gastroenterology Mental Health Cutaneous melanoma/ risk of metastasis, SLNB positivity risk Patients classified as Stage I, II or III2 ~$540M ~130K Cutaneous squamous cell carcinoma/risk of metastasis Patients w/high-risk features2 ~$820M ~200K Suspicious pigmented lesions/melanoma status Patients w/ diagnostically ambiguous lesions ~$600M ~300K Barrett’s esophagus/risk of progression to esophageal cancer Patients receiving upper GI endoscopies/year who meet the intended use criteria for TissueCypher3 ~$1B ~415K Guide mental health therapy selection Based on indicated use of IDgenetix for patients diagnosed with depression, anxiety and other mental health conditions ~$5B Tests in pipeline add an additional estimated ~$5.7B to our U.S. TAM 1U.S. TAM = Total addressable market based on estimated patient population assuming average reimbursement rate among all payors.2Annual U.S. incidence for Stage I, II or III melanoma estimated at 130,000; annual U.S. incidence for squamous cell carcinoma estimated at 1,000,000 with addressable market limited to carcinomas with one or more high risk features; annual U.S. incidence for suspicious pigmented lesion biopsies estimated at 2,000,000 with addressable market limited to the 15% with an indeterminant biopsy.3415,000 upper GI endoscopies/year with confirmed dx of BE (ND, IND, LGD, EXCLUDING HGD) x $2,513 = U.S. only TAM of ~$1 billion


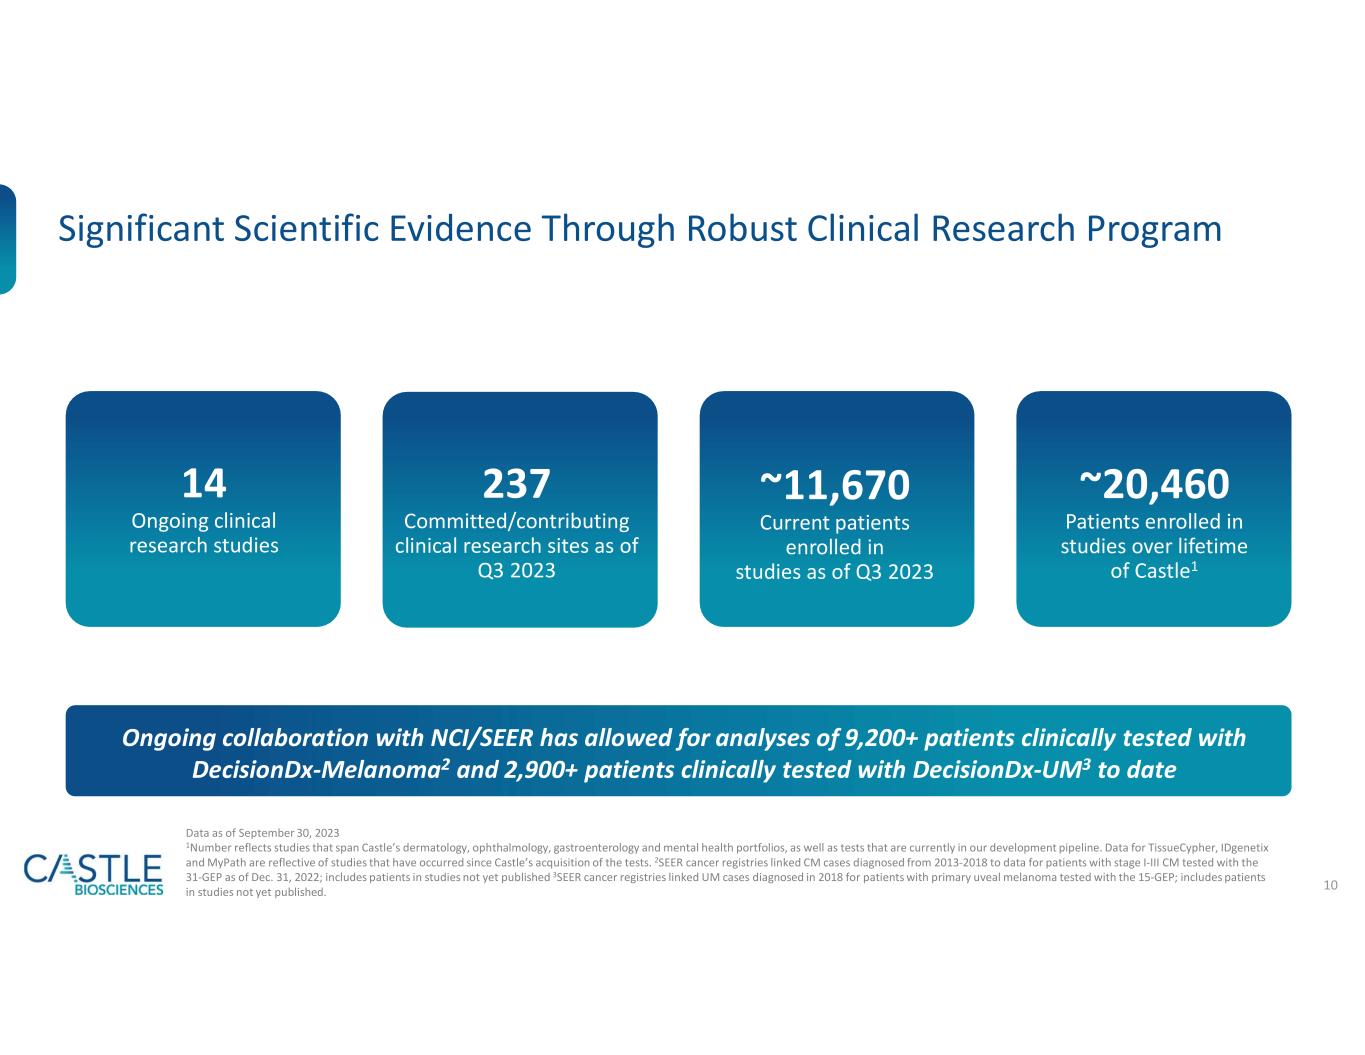
10 Significant Scientific Evidence Through Robust Clinical Research Program 237 Committed/contributing clinical research sites as of Q3 2023 ~20,460 Patients enrolled in studies over lifetime of Castle1 ~11,670 Current patients enrolled in studies as of Q3 2023 Data as of September 30, 2023 1Number reflects studies that span Castle’s dermatology, ophthalmology, gastroenterology and mental health portfolios, as well as tests that are currently in our development pipeline. Data for TissueCypher, IDgenetix and MyPath are reflective of studies that have occurred since Castle’s acquisition of the tests. 2SEER cancer registries linked CM cases diagnosed from 2013-2018 to data for patients with stage I-III CM tested with the 31-GEP as of Dec. 31, 2022; includes patients in studies not yet published 3SEER cancer registries linked UM cases diagnosed in 2018 for patients with primary uveal melanoma tested with the 15-GEP; includes patients in studies not yet published. 14 Ongoing clinical research studies Ongoing collaboration with NCI/SEER has allowed for analyses of 9,200+ patients clinically tested with DecisionDx-Melanoma2 and 2,900+ patients clinically tested with DecisionDx-UM3 to date


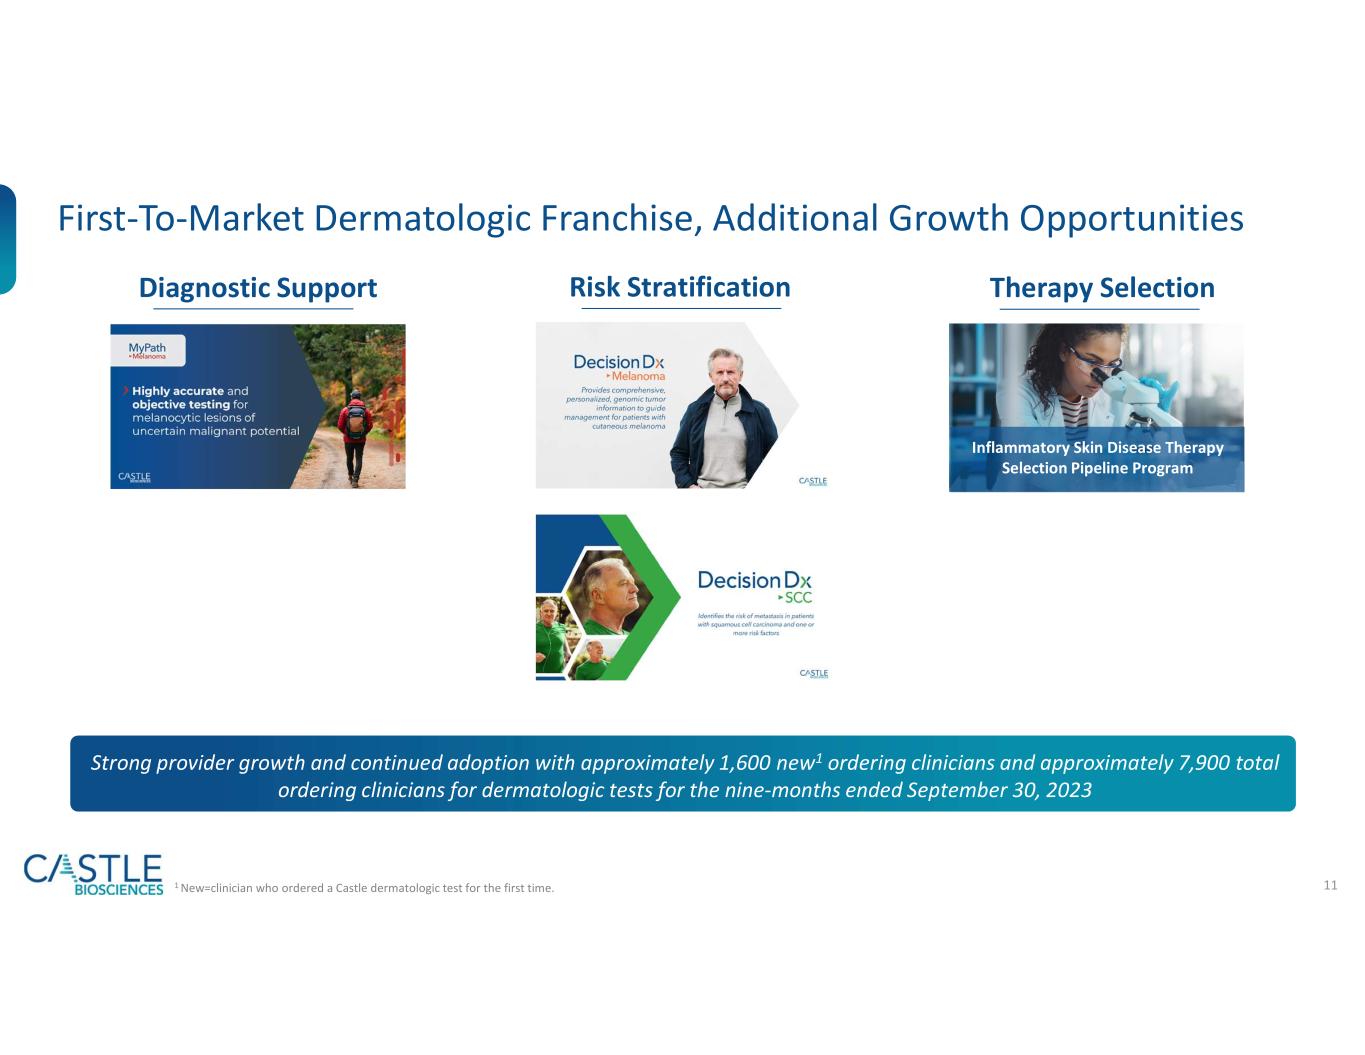
11 First-To-Market Dermatologic Franchise, Additional Growth Opportunities Diagnostic Support Risk Stratification Therapy Selection 1 New=clinician who ordered a Castle dermatologic test for the first time. Inflammatory Skin Disease Therapy Selection Pipeline Program Strong provider growth and continued adoption with approximately 1,600 new1 ordering clinicians and approximately 7,900 total ordering clinicians for dermatologic tests for the nine-months ended September 30, 2023


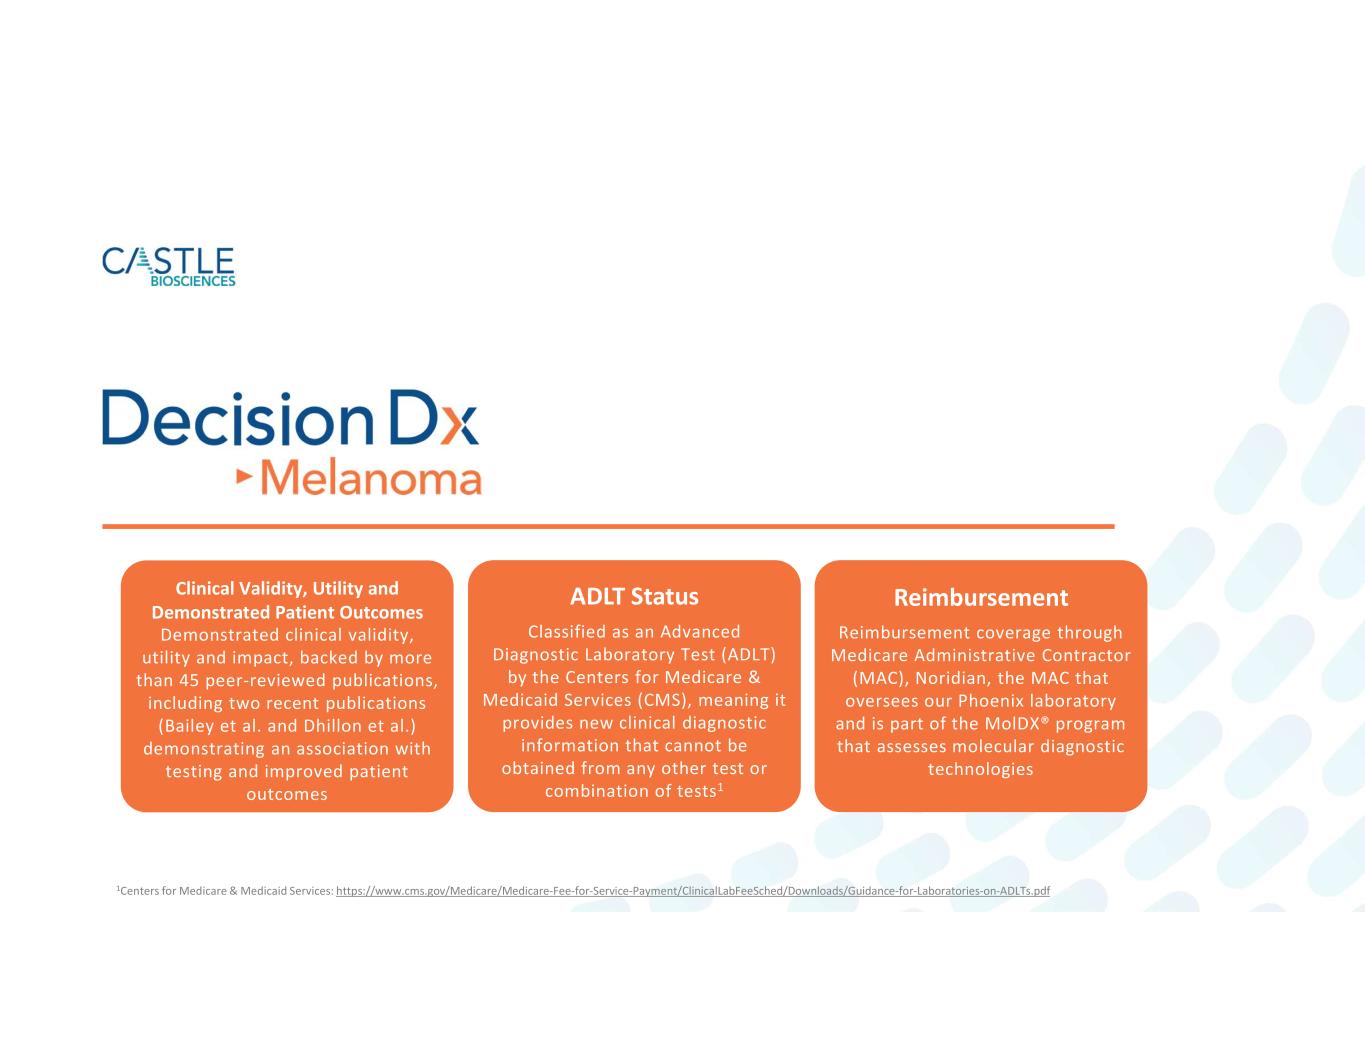
Demonstrated clinical validity, utility and impact, backed by more than 45 peer-reviewed publications, including two recent publications (Bailey et al. and Dhillon et al.) demonstrating an association with testing and improved patient outcomes Classified as an Advanced Diagnostic Laboratory Test (ADLT) by the Centers for Medicare & Medicaid Services (CMS), meaning it provides new clinical diagnostic information that cannot be obtained from any other test or combination of tests1 Reimbursement coverage through Medicare Administrative Contractor (MAC), Noridian, the MAC that oversees our Phoenix laboratory and is part of the MolDX® program that assesses molecular diagnostic technologies ADLT Status Reimbursement 1Centers for Medicare & Medicaid Services: https://www.cms.gov/Medicare/Medicare-Fee-for-Service-Payment/ClinicalLabFeeSched/Downloads/Guidance-for-Laboratories-on-ADLTs.pdf Clinical Validity, Utility and Demonstrated Patient Outcomes


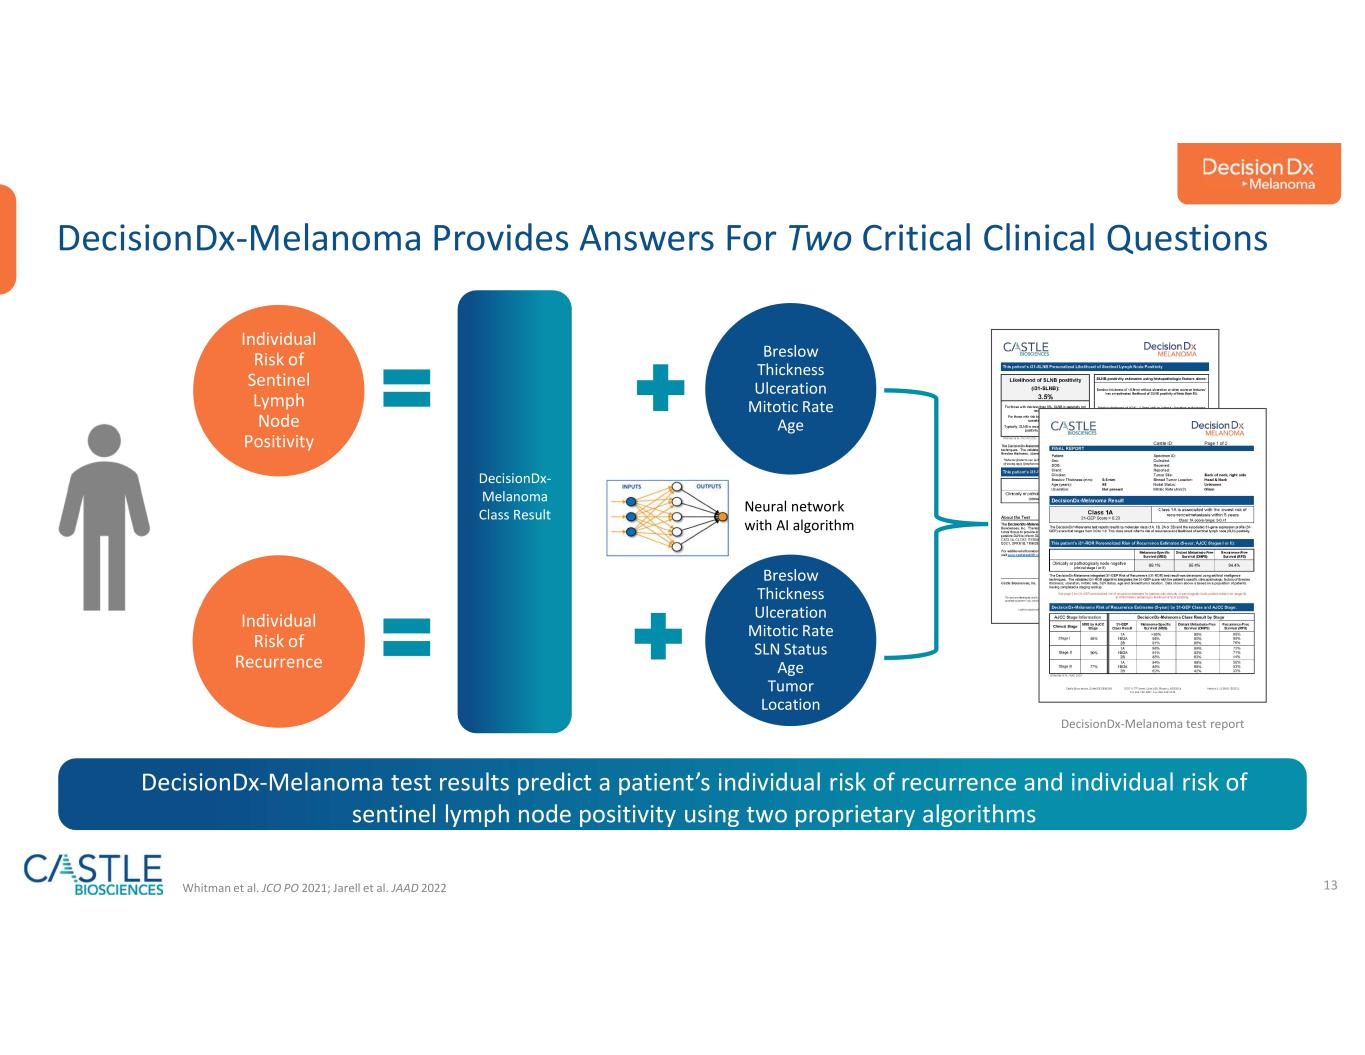
13 DecisionDx- Melanoma Class Result Breslow Thickness Ulceration Mitotic Rate Age Breslow Thickness Ulceration Mitotic Rate SLN Status Age Tumor Location Individual Risk of Sentinel Lymph Node Positivity Individual Risk of Recurrence Whitman et al. JCO PO 2021; Jarell et al. JAAD 2022 Neural network with AI algorithm DecisionDx-Melanoma Provides Answers For Two Critical Clinical Questions DecisionDx-Melanoma test report DecisionDx-Melanoma test results predict a patient’s individual risk of recurrence and individual risk of sentinel lymph node positivity using two proprietary algorithms


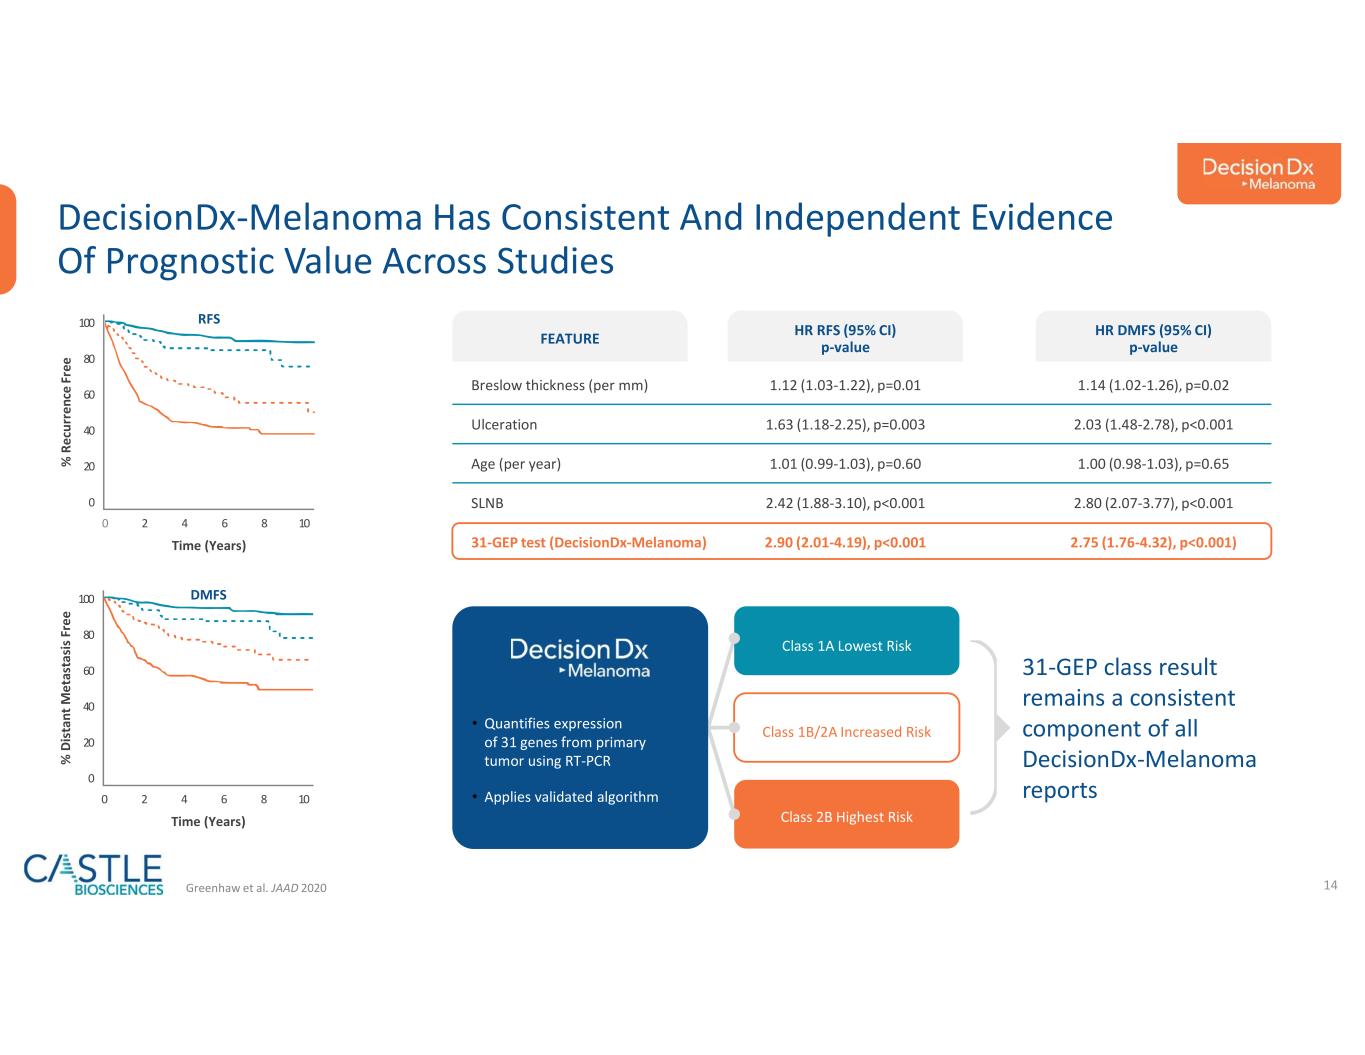
14 DecisionDx-Melanoma Has Consistent And Independent Evidence Of Prognostic Value Across Studies Greenhaw et al. JAAD 2020 1086420 100 80 60 40 20 0 Time (Years) % R ec ur re nc e Fr ee 1086420 100 80 60 40 20 0 Time (Years) % D is ta nt M et as ta si s F re e RFS DMFS Breslow thickness (per mm) 1.12 (1.03-1.22), p=0.01 1.14 (1.02-1.26), p=0.02 Ulceration 1.63 (1.18-2.25), p=0.003 2.03 (1.48-2.78), p<0.001 Age (per year) 1.01 (0.99-1.03), p=0.60 1.00 (0.98-1.03), p=0.65 SLNB 2.42 (1.88-3.10), p<0.001 2.80 (2.07-3.77), p<0.001 31-GEP test (DecisionDx-Melanoma) 2.90 (2.01-4.19), p<0.001 2.75 (1.76-4.32), p<0.001) FEATURE HR RFS (95% CI) p-value HR DMFS (95% CI) p-value Class 1A Lowest Risk Class 1B/2A Increased Risk Class 2B Highest Risk • Quantifies expression of 31 genes from primary tumor using RT-PCR • Applies validated algorithm 31-GEP class result remains a consistent component of all DecisionDx-Melanoma reports


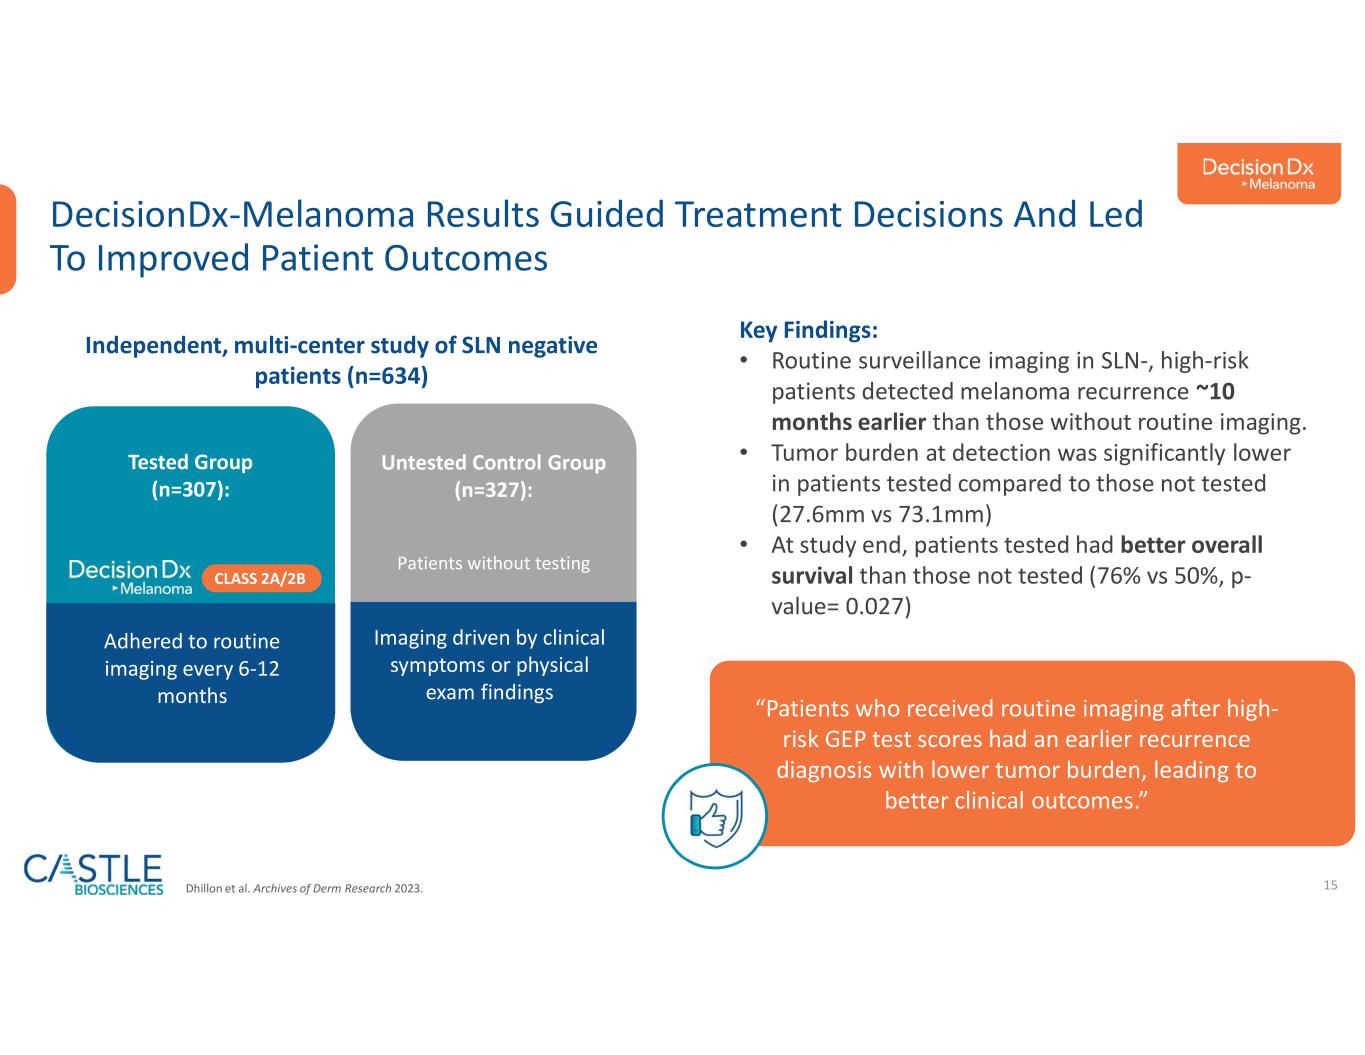
15 DecisionDx-Melanoma Results Guided Treatment Decisions And Led To Improved Patient Outcomes Key Findings: • Routine surveillance imaging in SLN-, high-risk patients detected melanoma recurrence ~10 months earlier than those without routine imaging. • Tumor burden at detection was significantly lower in patients tested compared to those not tested (27.6mm vs 73.1mm) • At study end, patients tested had better overall survival than those not tested (76% vs 50%, p- value= 0.027) Tested Group (n=307): “Patients who received routine imaging after high- risk GEP test scores had an earlier recurrence diagnosis with lower tumor burden, leading to better clinical outcomes.” Dhillon et al. Archives of Derm Research 2023. Independent, multi-center study of SLN negative patients (n=634) Adhered to routine imaging every 6-12 months Untested Control Group (n=327): Patients without testing Imaging driven by clinical symptoms or physical exam findings CLASS 2A/2B


Collaboration with the National Cancer Institute Linking DecisionDx-Melanoma clinical testing with patients captured in the National Cancer Institute’s SEER Program Registries


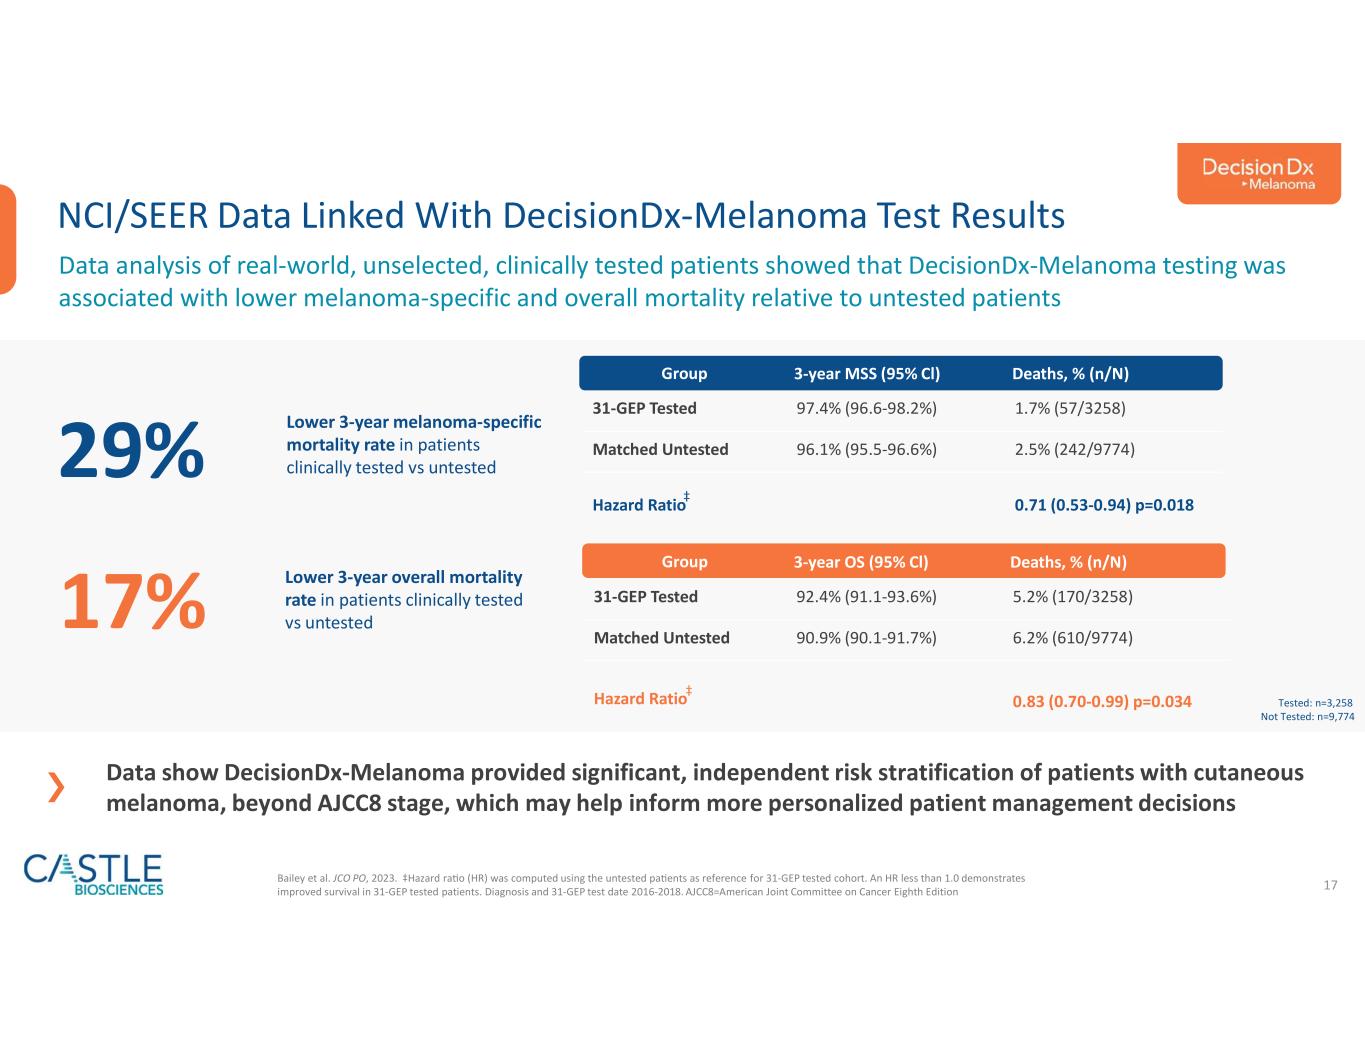
17 NCI/SEER Data Linked With DecisionDx-Melanoma Test Results Data analysis of real-world, unselected, clinically tested patients showed that DecisionDx-Melanoma testing was associated with lower melanoma-specific and overall mortality relative to untested patients Bailey et al. JCO PO, 2023. ‡Hazard ra o (HR) was computed using the untested pa ents as reference for 31-GEP tested cohort. An HR less than 1.0 demonstrates improved survival in 31-GEP tested patients. Diagnosis and 31-GEP test date 2016-2018. AJCC8=American Joint Committee on Cancer Eighth Edition Data show DecisionDx-Melanoma provided significant, independent risk stratification of patients with cutaneous melanoma, beyond AJCC8 stage, which may help inform more personalized patient management decisions Tested: n=3,258 Not Tested: n=9,774 29% 17% Lower 3-year melanoma-specific mortality rate in patients clinically tested vs untested Lower 3-year overall mortality rate in patients clinically tested vs untested Deaths, % (n/N)3-year MSS (95% Cl)Group 1.7% (57/3258)97.4% (96.6-98.2%)31-GEP Tested 2.5% (242/9774)96.1% (95.5-96.6%)Matched Untested 0.71 (0.53-0.94) p=0.018Hazard Ratio Deaths, % (n/N)3-year OS (95% Cl)Group 5.2% (170/3258)92.4% (91.1-93.6%)31-GEP Tested 6.2% (610/9774)90.9% (90.1-91.7%)Matched Untested 0.83 (0.70-0.99) p=0.034Hazard Ratio ‡ ‡


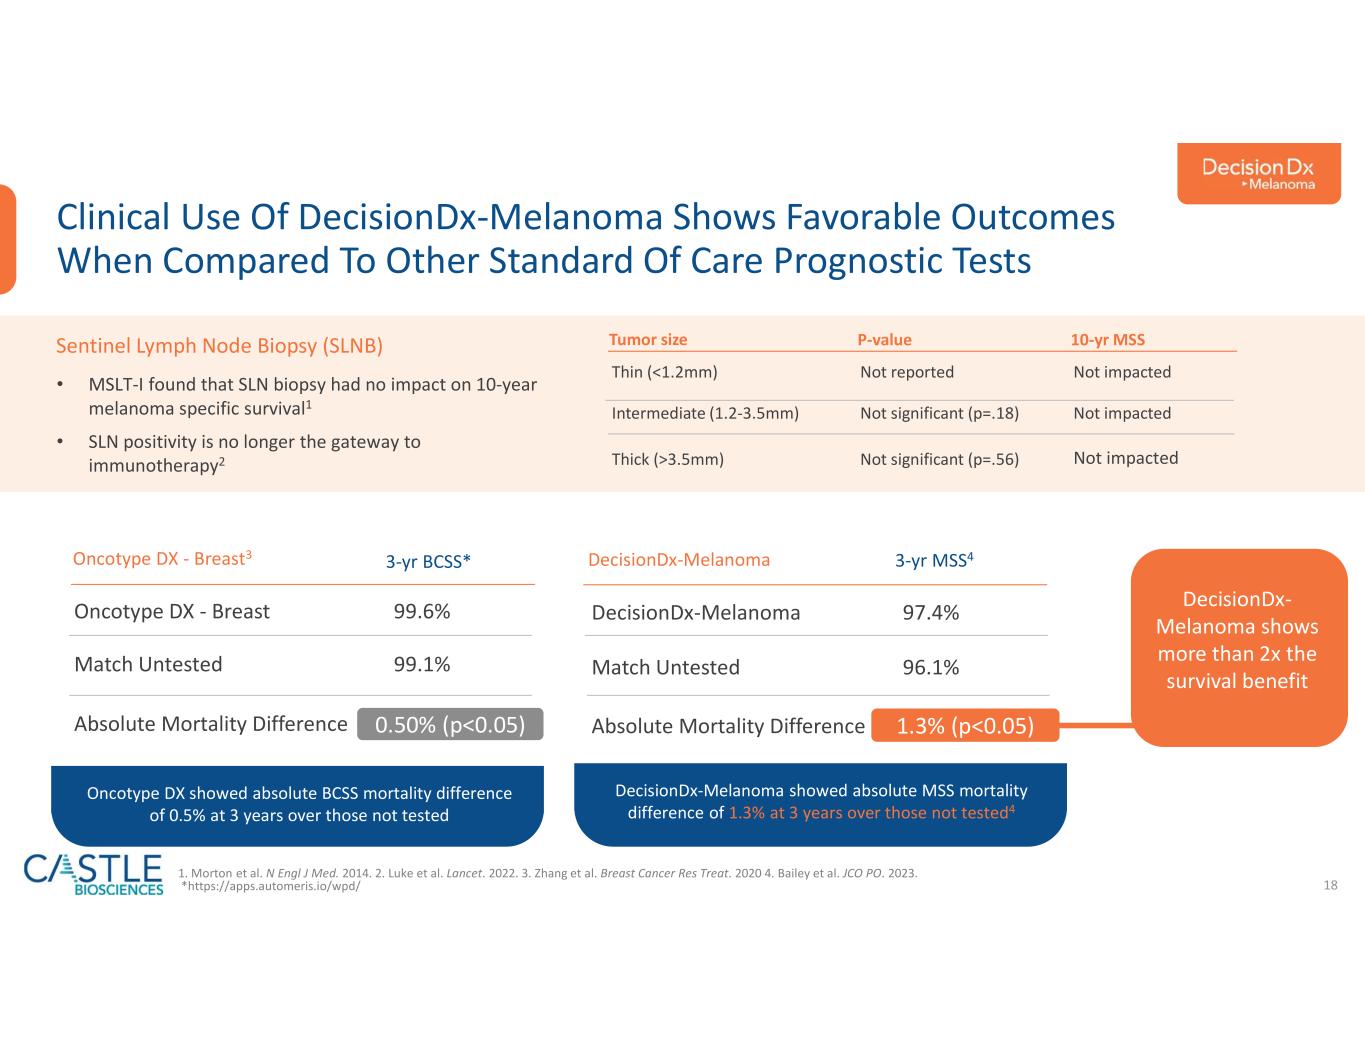
18 97.4%DecisionDx-Melanoma 96.1%Match Untested Absolute Mortality Difference 99.6%Oncotype DX - Breast 99.1%Match Untested Absolute Mortality Difference Clinical Use Of DecisionDx-Melanoma Shows Favorable Outcomes When Compared To Other Standard Of Care Prognostic Tests 1. Morton et al. N Engl J Med. 2014. 2. Luke et al. Lancet. 2022. 3. Zhang et al. Breast Cancer Res Treat. 2020 4. Bailey et al. JCO PO. 2023. *https://apps.automeris.io/wpd/ Sentinel Lymph Node Biopsy (SLNB) • MSLT-I found that SLN biopsy had no impact on 10-year melanoma specific survival1 • SLN positivity is no longer the gateway to immunotherapy2 10-yr MSSP-valueTumor size Not impactedNot reportedThin (<1.2mm) Not impactedNot significant (p=.18)Intermediate (1.2-3.5mm) Not impactedNot significant (p=.56)Thick (>3.5mm) Oncotype DX - Breast3 3-yr BCSS* Oncotype DX showed absolute BCSS mortality difference of 0.5% at 3 years over those not tested 1.3% (p<0.05) 3-yr MSS4 DecisionDx-Melanoma showed absolute MSS mortality difference of 1.3% at 3 years over those not tested4 DecisionDx- Melanoma shows more than 2x the survival benefit DecisionDx-Melanoma 0.50% (p<0.05)


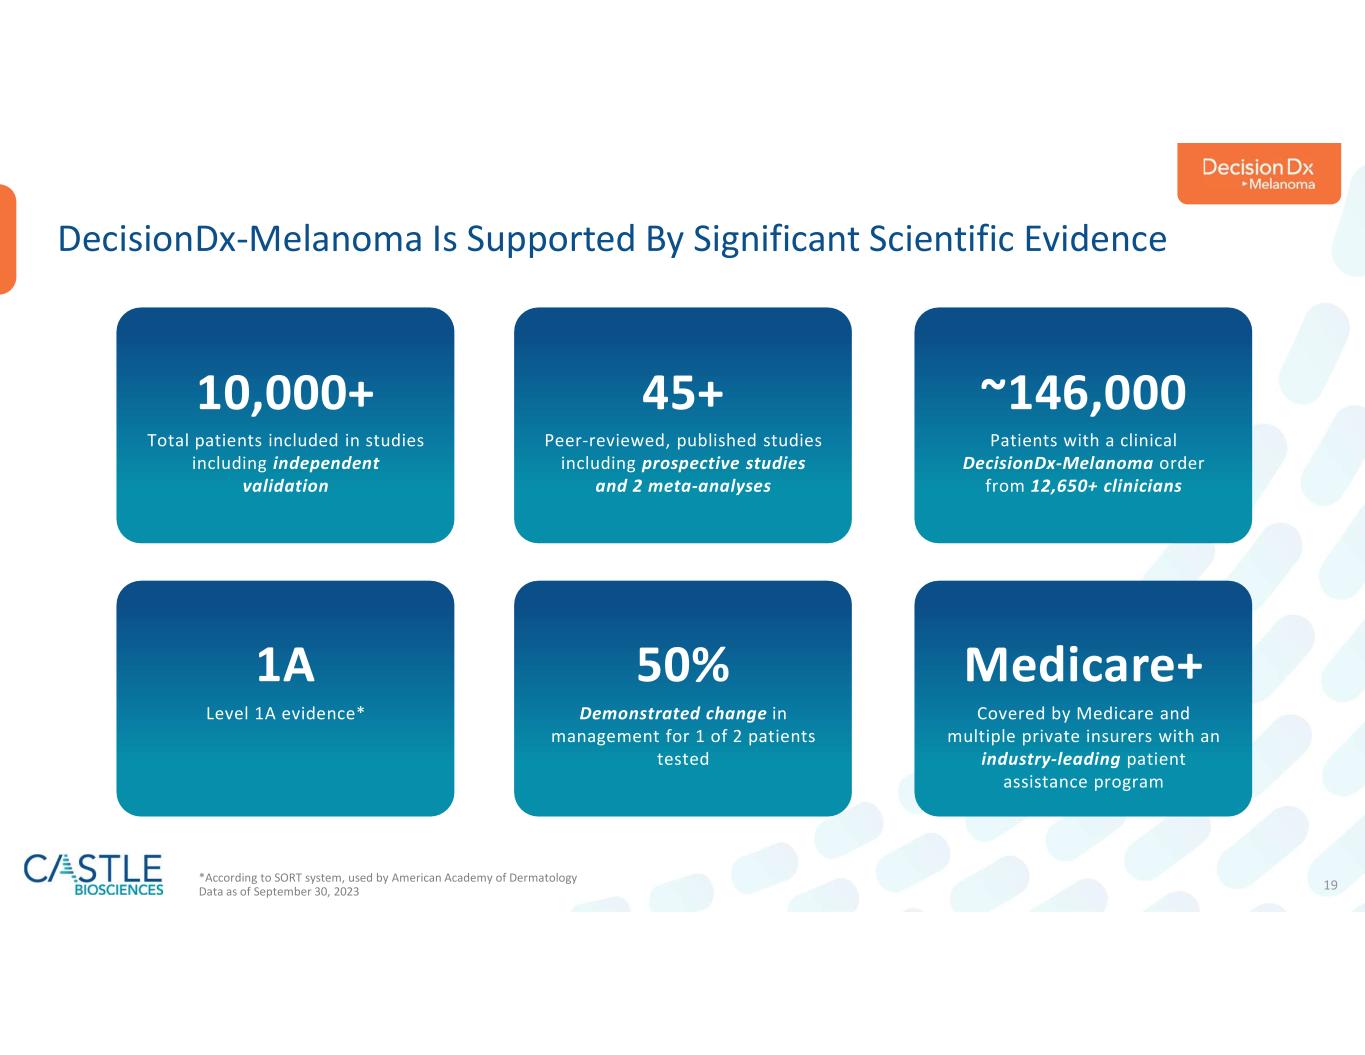
19 DecisionDx-Melanoma Is Supported By Significant Scientific Evidence 10,000+ Total patients included in studies including independent validation 45+ Peer-reviewed, published studies including prospective studies and 2 meta-analyses ~146,000 Patients with a clinical DecisionDx-Melanoma order from 12,650+ clinicians 1A Level 1A evidence* 50% Demonstrated change in management for 1 of 2 patients tested Medicare+ Covered by Medicare and multiple private insurers with an industry-leading patient assistance program *According to SORT system, used by American Academy of Dermatology Data as of September 30, 2023


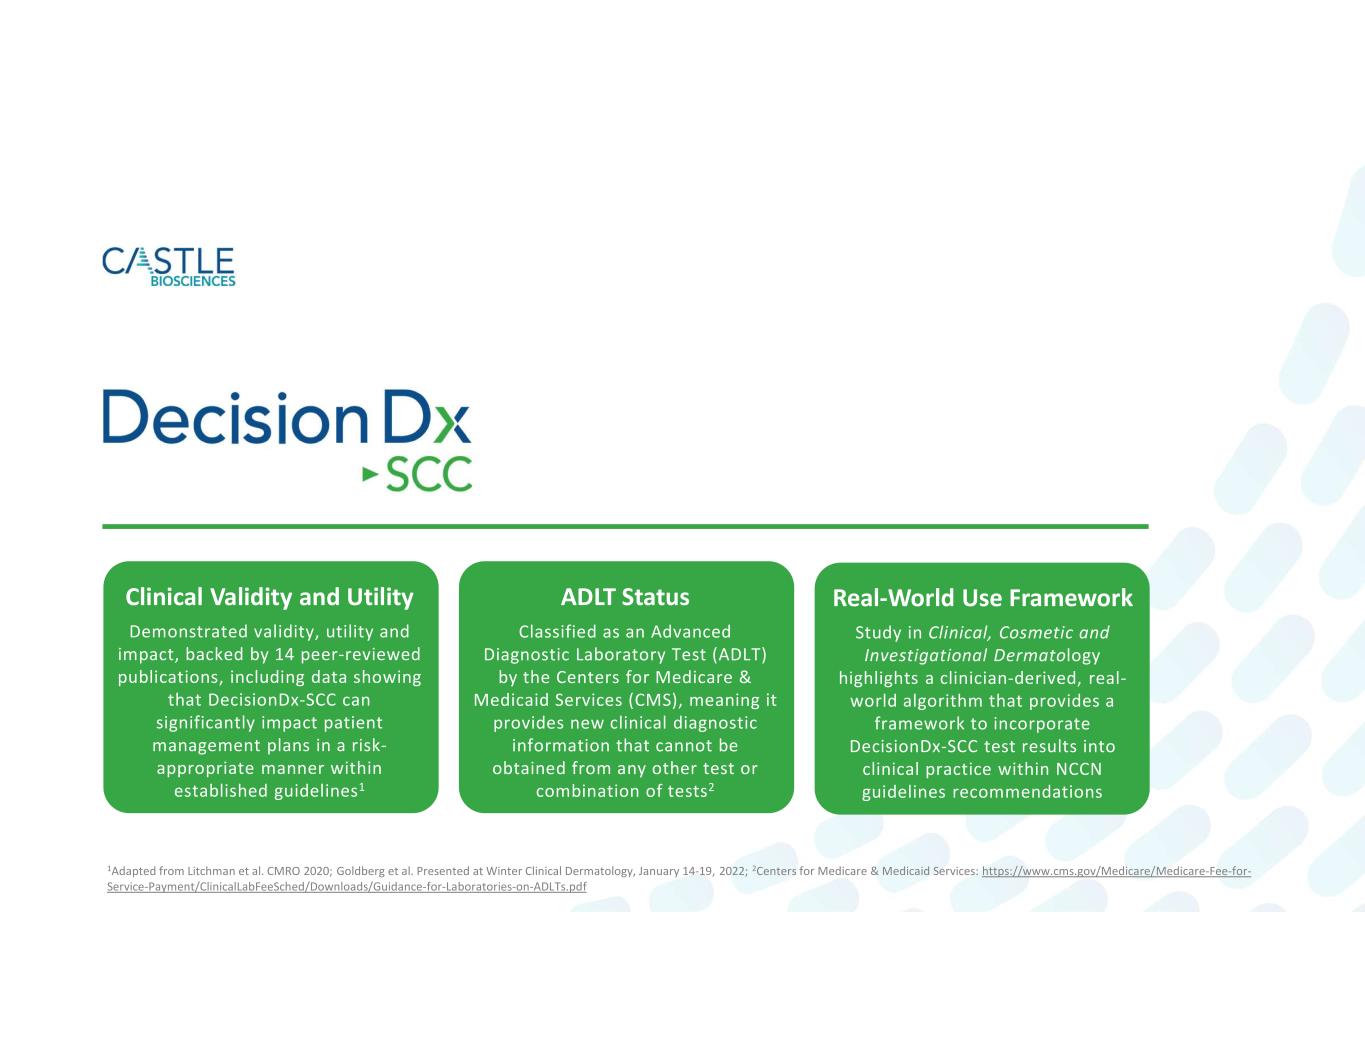
Demonstrated validity, utility and impact, backed by 14 peer-reviewed publications, including data showing that DecisionDx-SCC can significantly impact patient management plans in a risk- appropriate manner within established guidelines1 Classified as an Advanced Diagnostic Laboratory Test (ADLT) by the Centers for Medicare & Medicaid Services (CMS), meaning it provides new clinical diagnostic information that cannot be obtained from any other test or combination of tests2 Study in Clinical, Cosmetic and Investigational Dermatology highlights a clinician-derived, real- world algorithm that provides a framework to incorporate DecisionDx-SCC test results into clinical practice within NCCN guidelines recommendations Clinical Validity and Utility ADLT Status 1Adapted from Litchman et al. CMRO 2020; Goldberg et al. Presented at Winter Clinical Dermatology, January 14-19, 2022; 2Centers for Medicare & Medicaid Services: https://www.cms.gov/Medicare/Medicare-Fee-for- Service-Payment/ClinicalLabFeeSched/Downloads/Guidance-for-Laboratories-on-ADLTs.pdf Real-World Use Framework


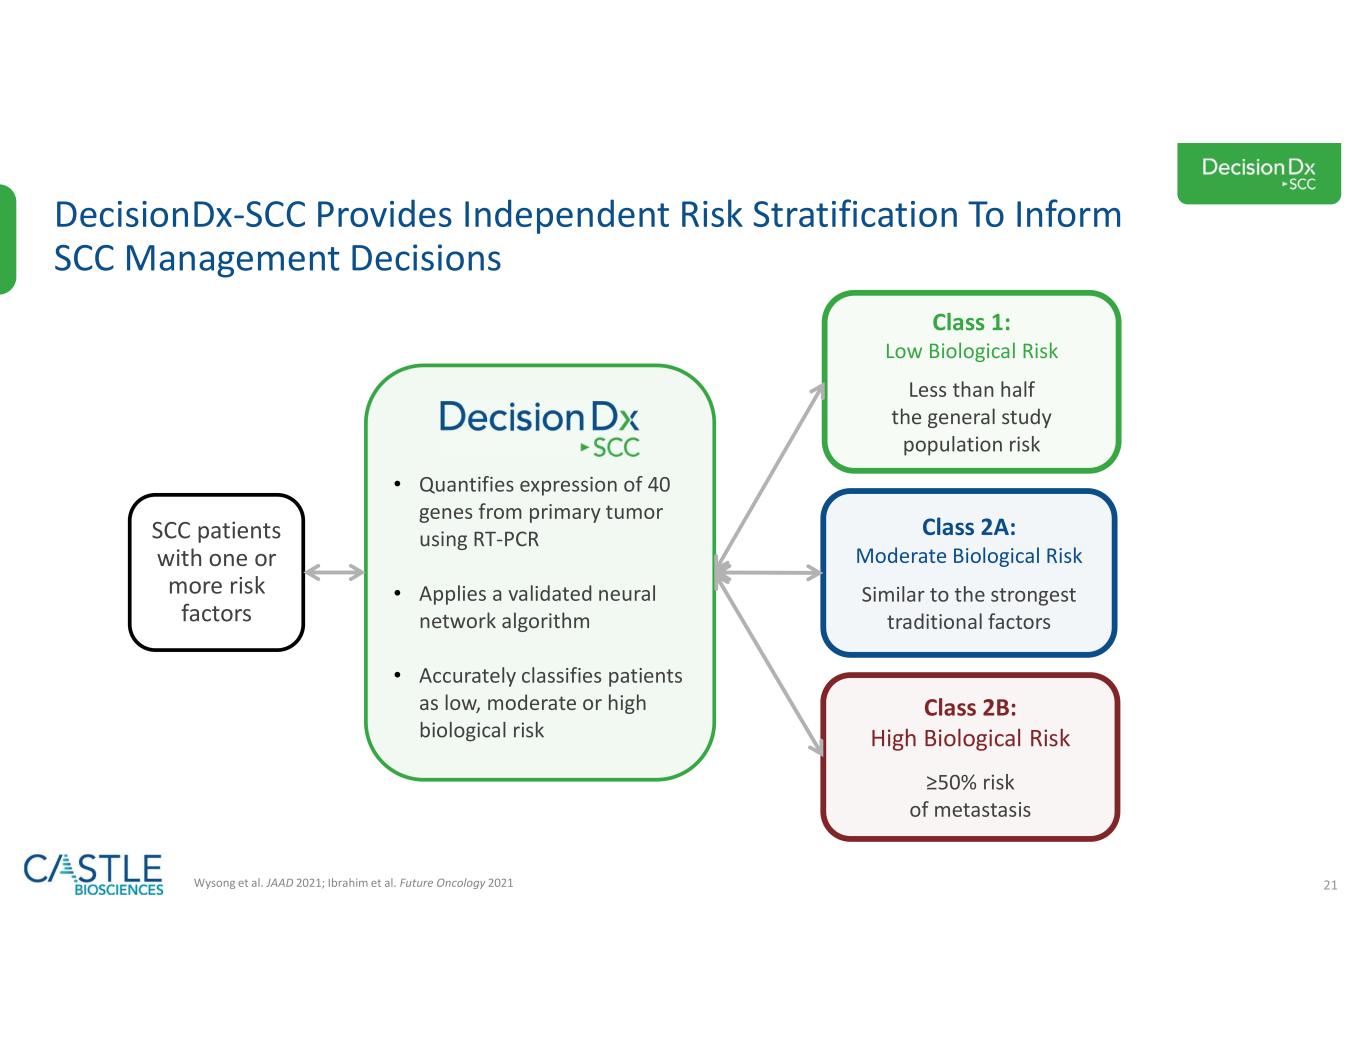
21 DecisionDx-SCC Provides Independent Risk Stratification To Inform SCC Management Decisions Wysong et al. JAAD 2021; Ibrahim et al. Future Oncology 2021 Class 1: Low Biological Risk Less than half the general study population risk • Quantifies expression of 40 genes from primary tumor using RT-PCR • Applies a validated neural network algorithm • Accurately classifies patients as low, moderate or high biological risk Class 2A: Moderate Biological Risk Similar to the strongest traditional factors SCC patients with one or more risk factors Class 2B: High Biological Risk ≥50% risk of metastasis


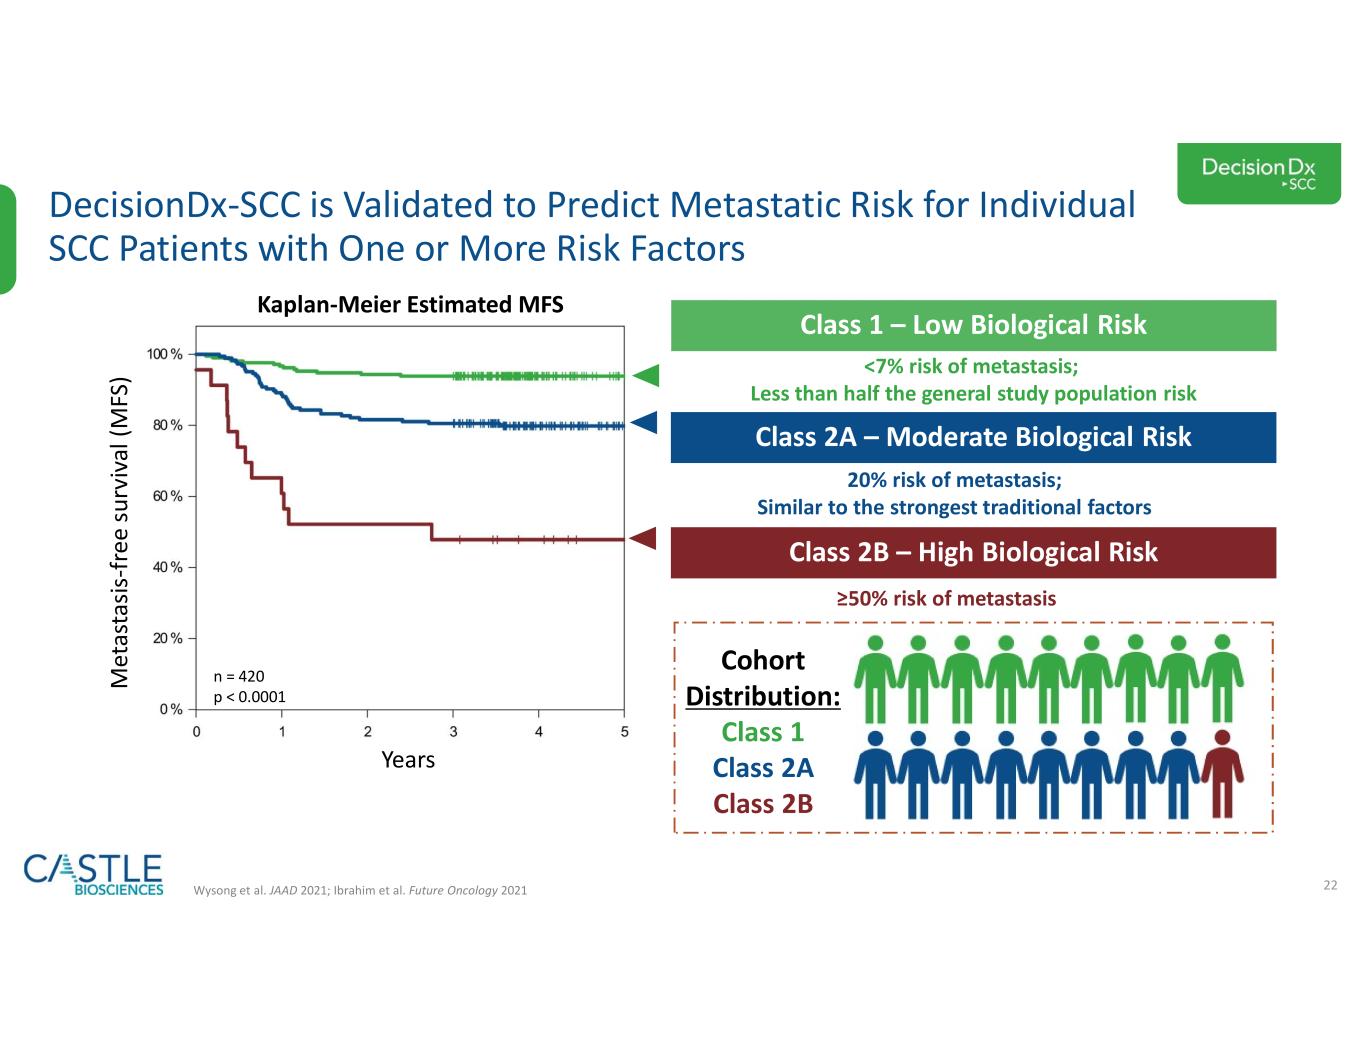
22 DecisionDx-SCC is Validated to Predict Metastatic Risk for Individual SCC Patients with One or More Risk Factors Wysong et al. JAAD 2021; Ibrahim et al. Future Oncology 2021 M et as ta si s- fr ee s ur vi va l ( M FS ) Years n = 420 p < 0.0001 Cohort Distribution: Class 1 Class 2A Class 2B Kaplan-Meier Estimated MFS Class 1 – Low Biological Risk <7% risk of metastasis; Less than half the general study population risk Class 2A – Moderate Biological Risk 20% risk of metastasis; Similar to the strongest traditional factors Class 2B – High Biological Risk ≥50% risk of metastasis


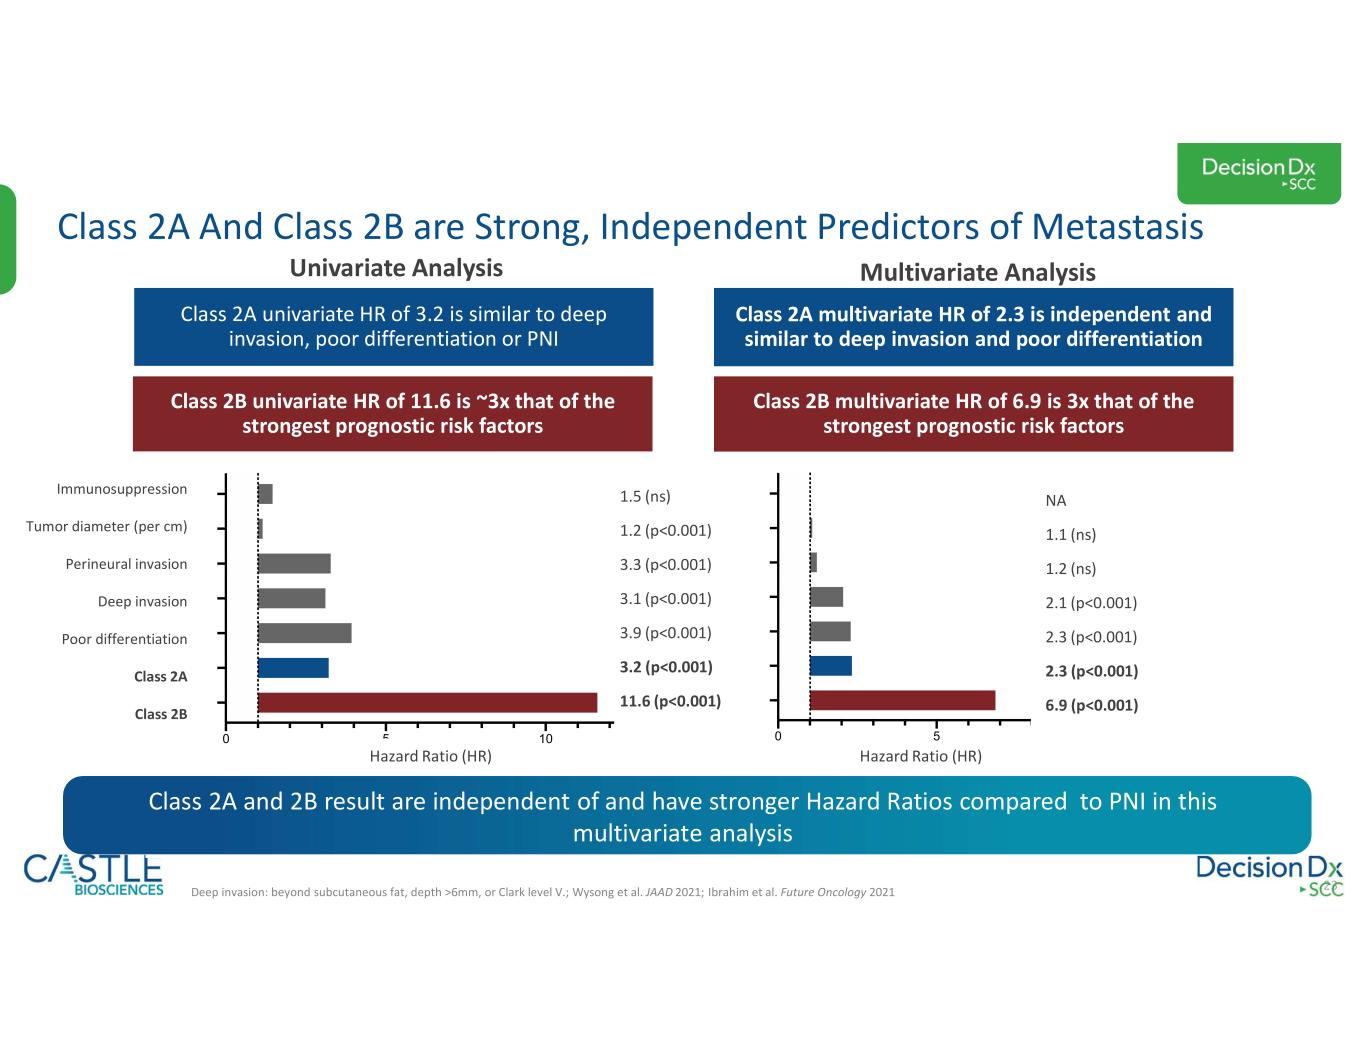
23 Class 2A And Class 2B are Strong, Independent Predictors of Metastasis Class 2B multivariate HR of 6.9 is 3x that of the strongest prognostic risk factors Class 2A multivariate HR of 2.3 is independent and similar to deep invasion and poor differentiation Class 2B univariate HR of 11.6 is ~3x that of the strongest prognostic risk factors Class 2A univariate HR of 3.2 is similar to deep invasion, poor differentiation or PNI 0 5 10 Hazard Ratio 0 5 Hazard Ratio Immunosuppression Tumor diameter (per cm) Perineural invasion Deep invasion Poor differentiation Class 2A Class 2B Univariate Analysis Multivariate Analysis NA 1.1 (ns) 1.2 (ns) 2.1 (p<0.001) 2.3 (p<0.001) 2.3 (p<0.001) 6.9 (p<0.001) 1.5 (ns) 1.2 (p<0.001) 3.3 (p<0.001) 3.1 (p<0.001) 3.9 (p<0.001) 3.2 (p<0.001) 11.6 (p<0.001) Hazard Ratio (HR) Hazard Ratio (HR) Deep invasion: beyond subcutaneous fat, depth >6mm, or Clark level V.; Wysong et al. JAAD 2021; Ibrahim et al. Future Oncology 2021 Class 2A and 2B result are independent of and have stronger Hazard Ratios compared to PNI in this multivariate analysis


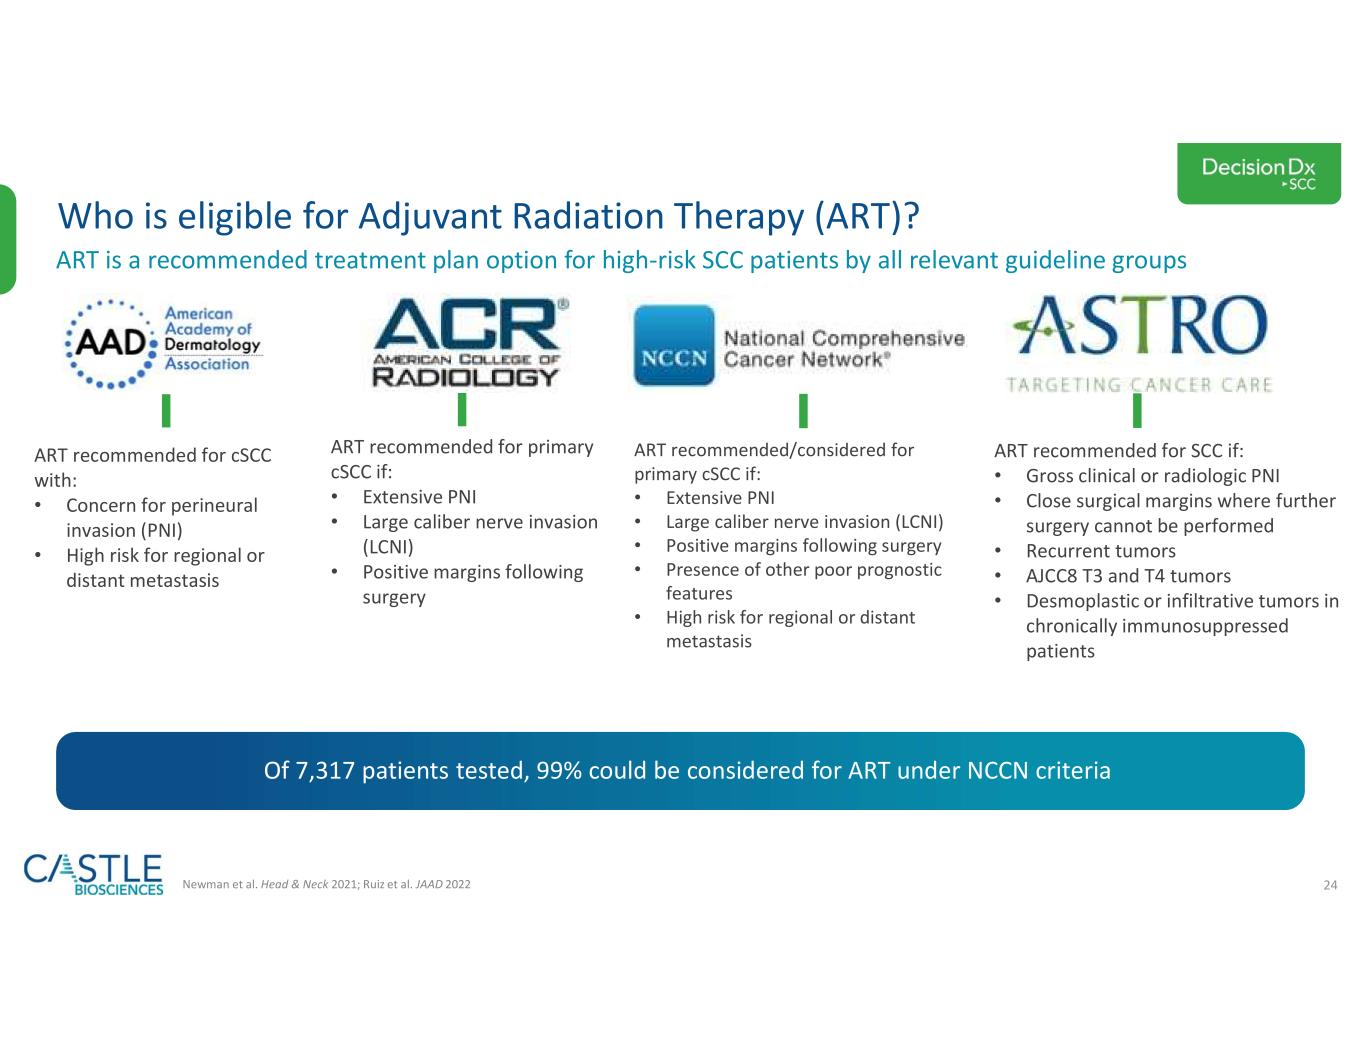
24 Who is eligible for Adjuvant Radiation Therapy (ART)? ART is a recommended treatment plan option for high-risk SCC patients by all relevant guideline groups ART recommended for primary cSCC if: • Extensive PNI • Large caliber nerve invasion (LCNI) • Positive margins following surgery ART recommended for SCC if: • Gross clinical or radiologic PNI • Close surgical margins where further surgery cannot be performed • Recurrent tumors • AJCC8 T3 and T4 tumors • Desmoplastic or infiltrative tumors in chronically immunosuppressed patients ART recommended for cSCC with: • Concern for perineural invasion (PNI) • High risk for regional or distant metastasis Newman et al. Head & Neck 2021; Ruiz et al. JAAD 2022 Of 7,317 patients tested, 99% could be considered for ART under NCCN criteria ART recommended/considered for primary cSCC if: • Extensive PNI • Large caliber nerve invasion (LCNI) • Positive margins following surgery • Presence of other poor prognostic features • High risk for regional or distant metastasis


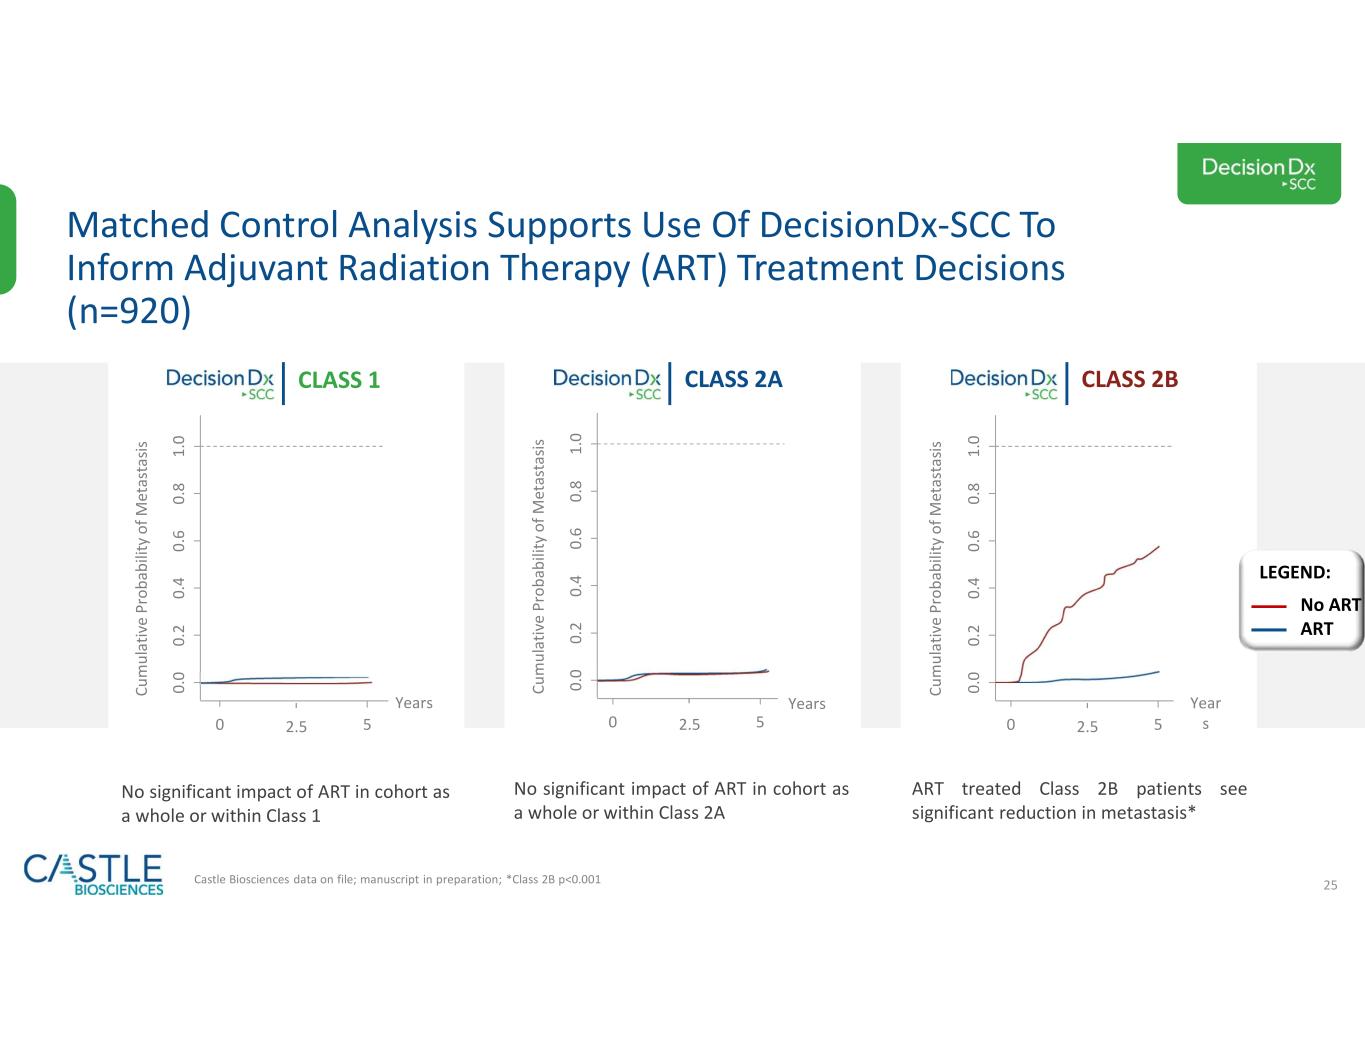
25 No significant impact of ART in cohort as a whole or within Class 1 Matched Control Analysis Supports Use Of DecisionDx-SCC To Inform Adjuvant Radiation Therapy (ART) Treatment Decisions (n=920) Castle Biosciences data on file; manuscript in preparation; *Class 2B p<0.001 CLASS 1 CLASS 2A CLASS 2B ART treated Class 2B patients see significant reduction in metastasis* No significant impact of ART in cohort as a whole or within Class 2A Cu m ul at iv e Pr ob ab ili ty o f M et as ta sis 0. 0 0. 2 0. 4 0. 6 0. 8 1. 0 0 5 Years 2.5 Cu m ul at iv e Pr ob ab ili ty o f M et as ta si s 0. 0 0. 2 0. 4 0. 6 0. 8 1. 0 0 5 Years 2.5 Cu m ul at iv e Pr ob ab ili ty o f M et as ta sis 0. 0 0. 2 0. 4 0. 6 0. 8 1. 0 0 5 Year s2.5 No ART ART LEGEND:


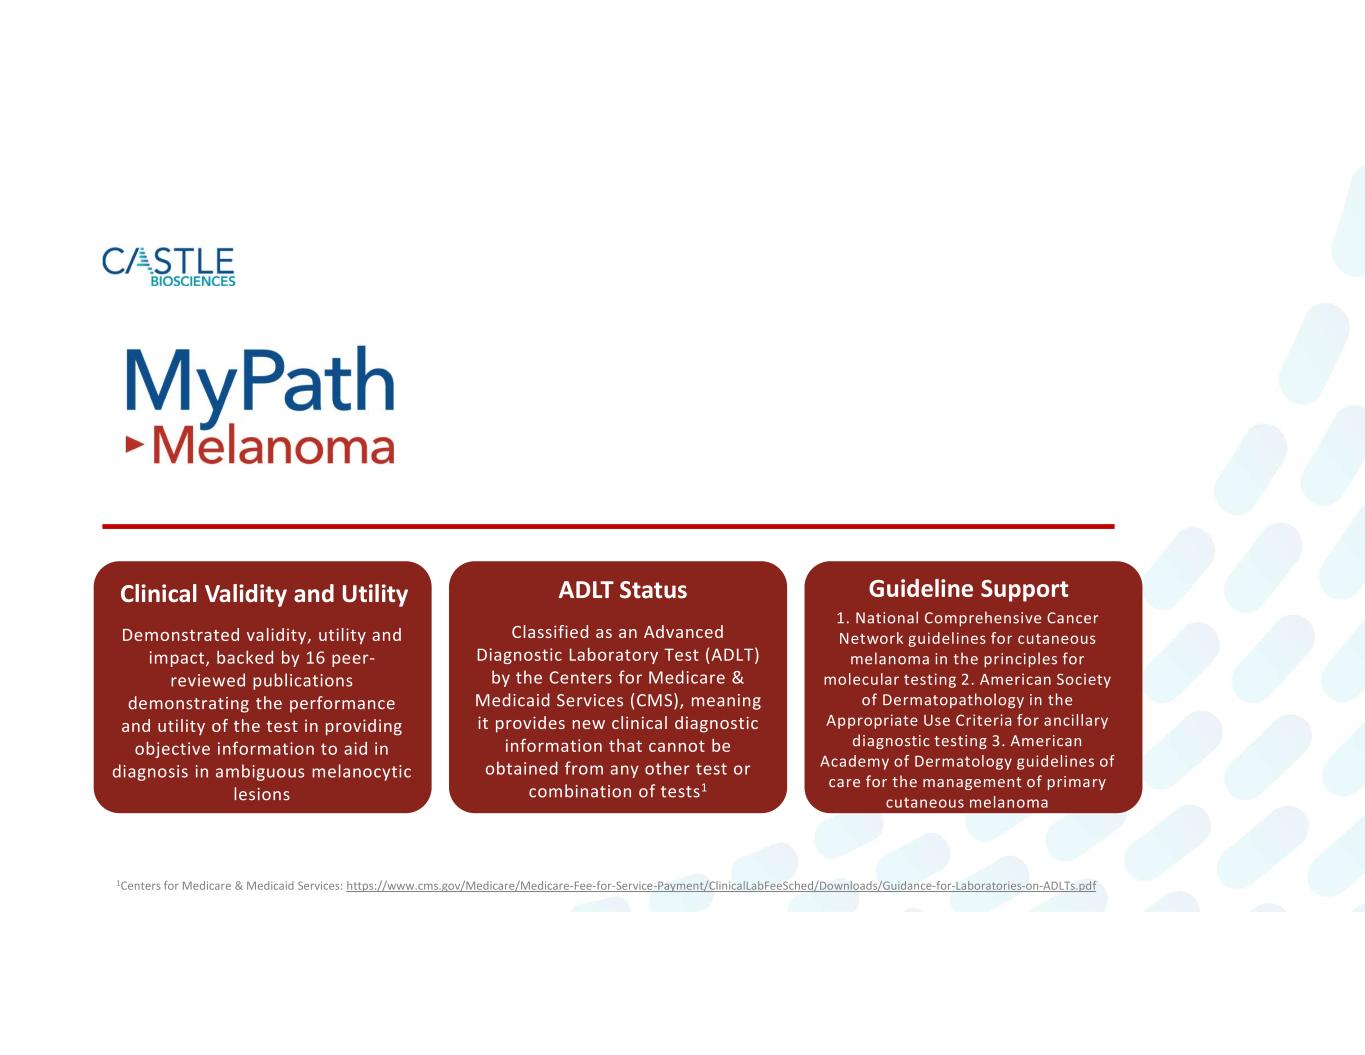
Clinical Validity and Utility ADLT Status Guideline Support Demonstrated validity, utility and impact, backed by 16 peer- reviewed publications demonstrating the performance and utility of the test in providing objective information to aid in diagnosis in ambiguous melanocytic lesions Classified as an Advanced Diagnostic Laboratory Test (ADLT) by the Centers for Medicare & Medicaid Services (CMS), meaning it provides new clinical diagnostic information that cannot be obtained from any other test or combination of tests1 1Centers for Medicare & Medicaid Services: https://www.cms.gov/Medicare/Medicare-Fee-for-Service-Payment/ClinicalLabFeeSched/Downloads/Guidance-for-Laboratories-on-ADLTs.pdf 1. National Comprehensive Cancer Network guidelines for cutaneous melanoma in the principles for molecular testing 2. American Society of Dermatopathology in the Appropriate Use Criteria for ancillary diagnostic testing 3. American Academy of Dermatology guidelines of care for the management of primary cutaneous melanoma


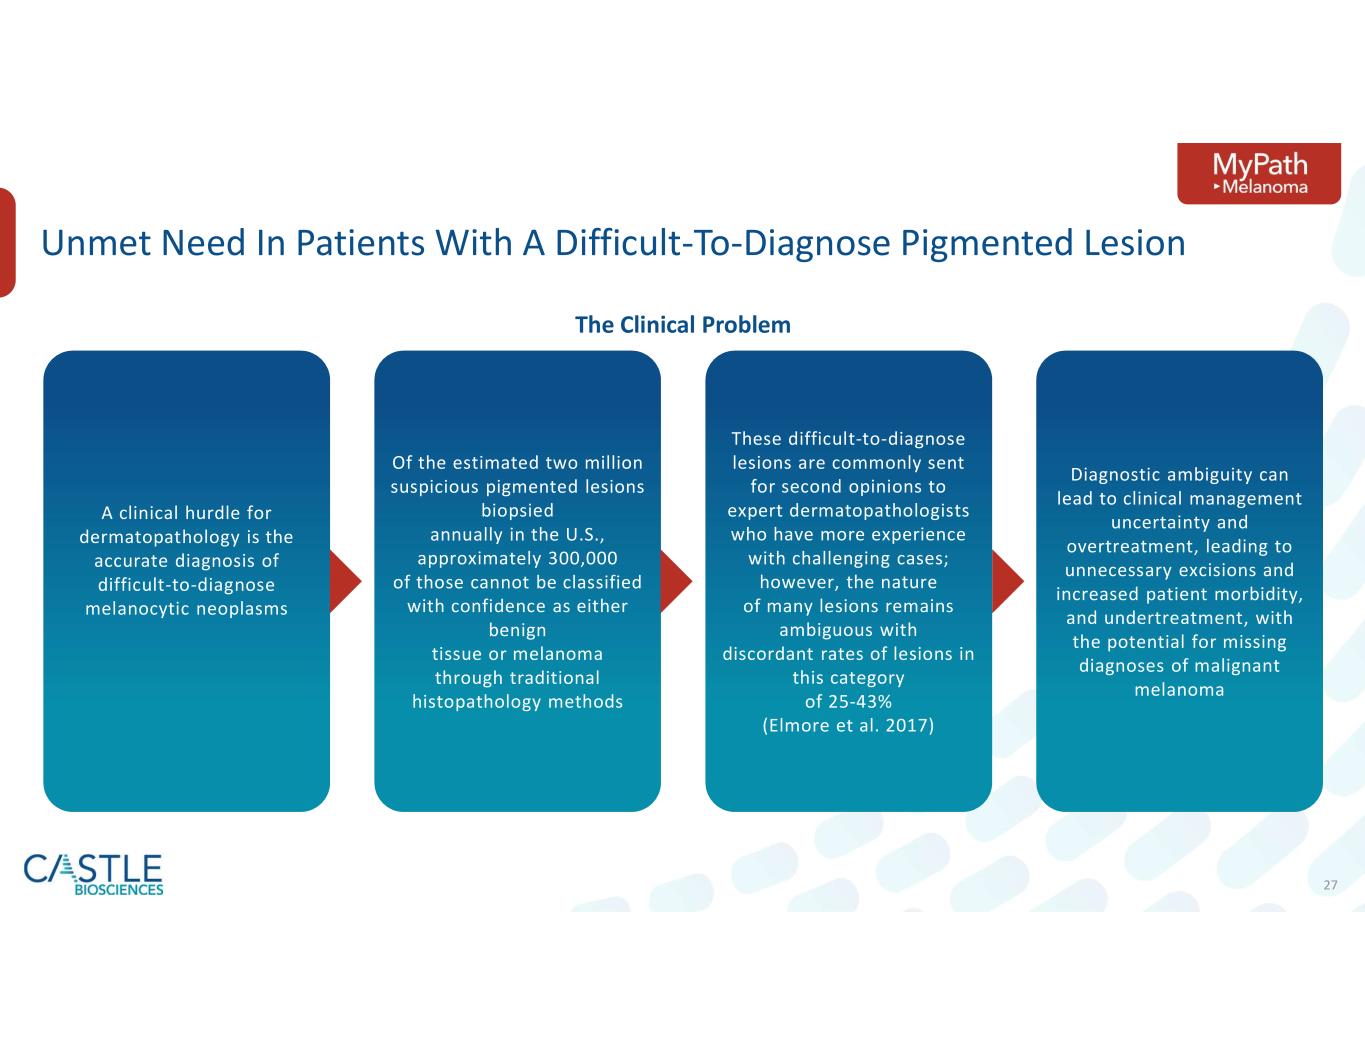
27 A clinical hurdle for dermatopathology is the accurate diagnosis of difficult-to-diagnose melanocytic neoplasms Unmet Need In Patients With A Difficult-To-Diagnose Pigmented Lesion Of the estimated two million suspicious pigmented lesions biopsied annually in the U.S., approximately 300,000 of those cannot be classified with confidence as either benign tissue or melanoma through traditional histopathology methods These difficult-to-diagnose lesions are commonly sent for second opinions to expert dermatopathologists who have more experience with challenging cases; however, the nature of many lesions remains ambiguous with discordant rates of lesions in this category of 25-43% (Elmore et al. 2017) Diagnostic ambiguity can lead to clinical management uncertainty and overtreatment, leading to unnecessary excisions and increased patient morbidity, and undertreatment, with the potential for missing diagnoses of malignant melanoma The Clinical Problem


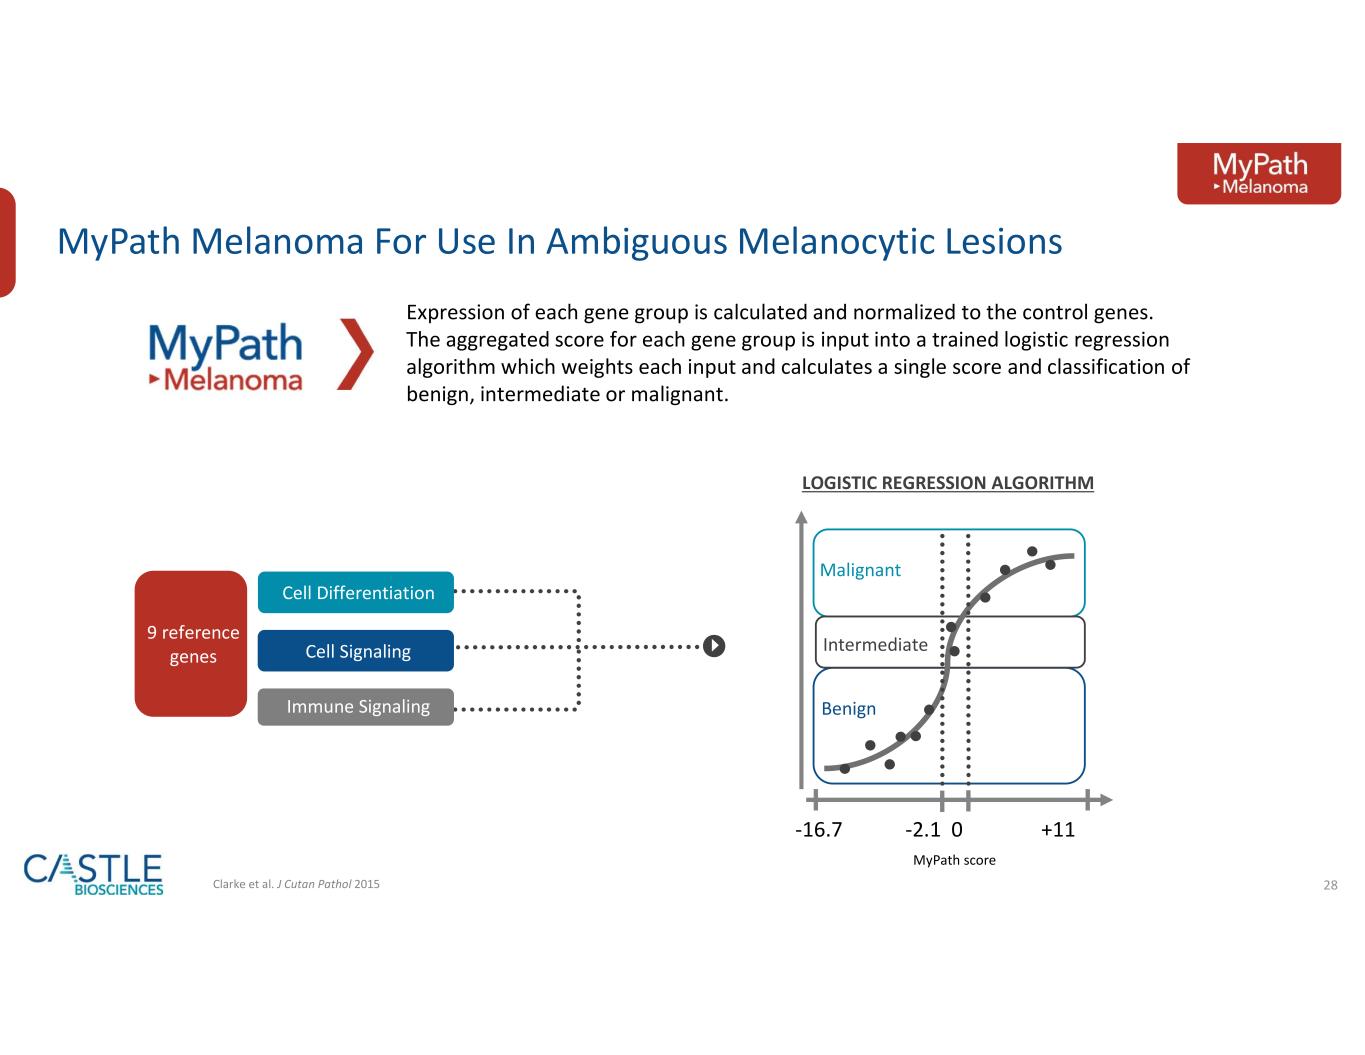
28 MyPath Melanoma For Use In Ambiguous Melanocytic Lesions Cell Signaling Cell Differentiation Immune Signaling LOGISTIC REGRESSION ALGORITHM -16.7 -2.1 0 +11 Benign Intermediate Malignant MyPath score Expression of each gene group is calculated and normalized to the control genes. The aggregated score for each gene group is input into a trained logistic regression algorithm which weights each input and calculates a single score and classification of benign, intermediate or malignant. 9 reference genes Clarke et al. J Cutan Pathol 2015


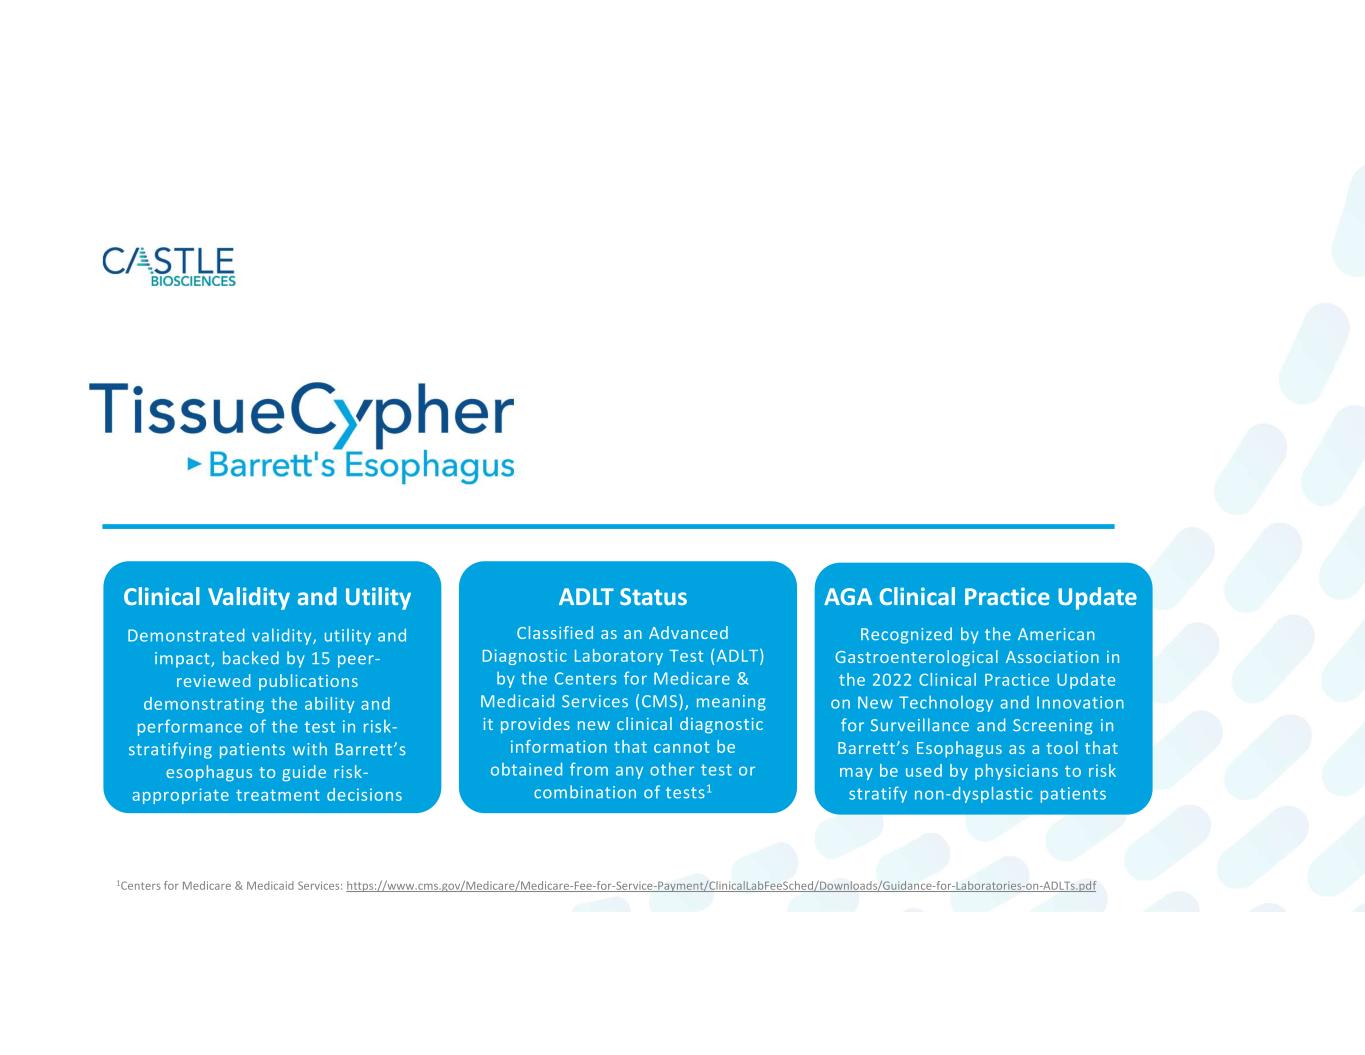
Demonstrated validity, utility and impact, backed by 15 peer- reviewed publications demonstrating the ability and performance of the test in risk- stratifying patients with Barrett’s esophagus to guide risk- appropriate treatment decisions Classified as an Advanced Diagnostic Laboratory Test (ADLT) by the Centers for Medicare & Medicaid Services (CMS), meaning it provides new clinical diagnostic information that cannot be obtained from any other test or combination of tests1 Recognized by the American Gastroenterological Association in the 2022 Clinical Practice Update on New Technology and Innovation for Surveillance and Screening in Barrett’s Esophagus as a tool that may be used by physicians to risk stratify non-dysplastic patients Clinical Validity and Utility ADLT Status AGA Clinical Practice Update 1Centers for Medicare & Medicaid Services: https://www.cms.gov/Medicare/Medicare-Fee-for-Service-Payment/ClinicalLabFeeSched/Downloads/Guidance-for-Laboratories-on-ADLTs.pdf


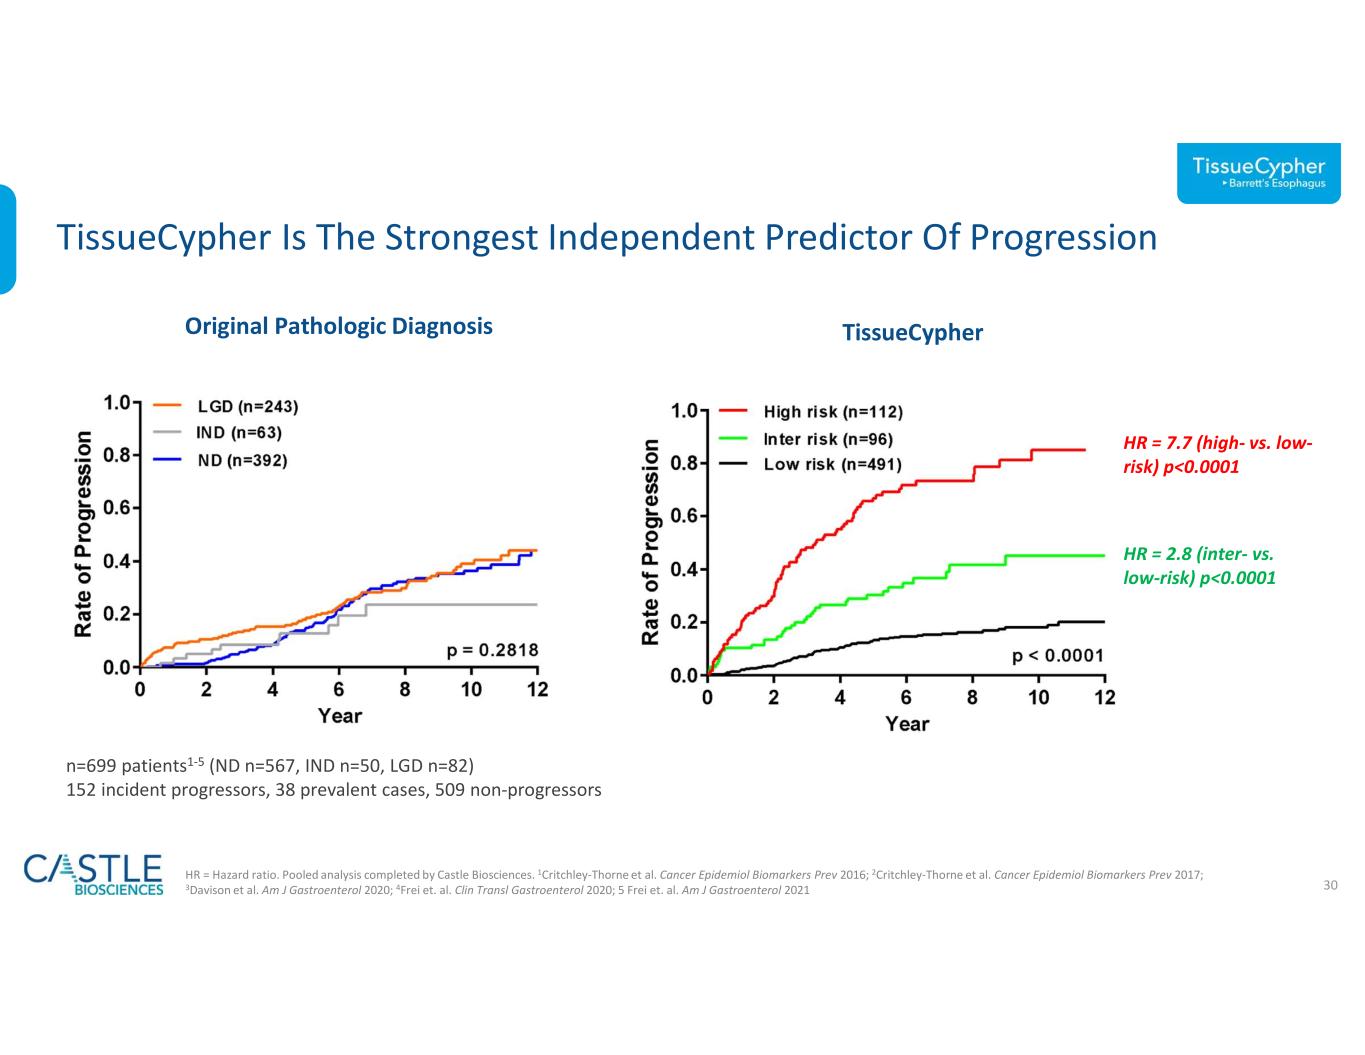
30 TissueCypher Is The Strongest Independent Predictor Of Progression HR = Hazard ratio. Pooled analysis completed by Castle Biosciences. 1Critchley-Thorne et al. Cancer Epidemiol Biomarkers Prev 2016; 2Critchley-Thorne et al. Cancer Epidemiol Biomarkers Prev 2017; 3Davison et al. Am J Gastroenterol 2020; 4Frei et. al. Clin Transl Gastroenterol 2020; 5 Frei et. al. Am J Gastroenterol 2021 n=699 patients1-5 (ND n=567, IND n=50, LGD n=82) 152 incident progressors, 38 prevalent cases, 509 non-progressors Original Pathologic Diagnosis HR = 7.7 (high- vs. low- risk) p<0.0001 HR = 2.8 (inter- vs. low-risk) p<0.0001 TissueCypher


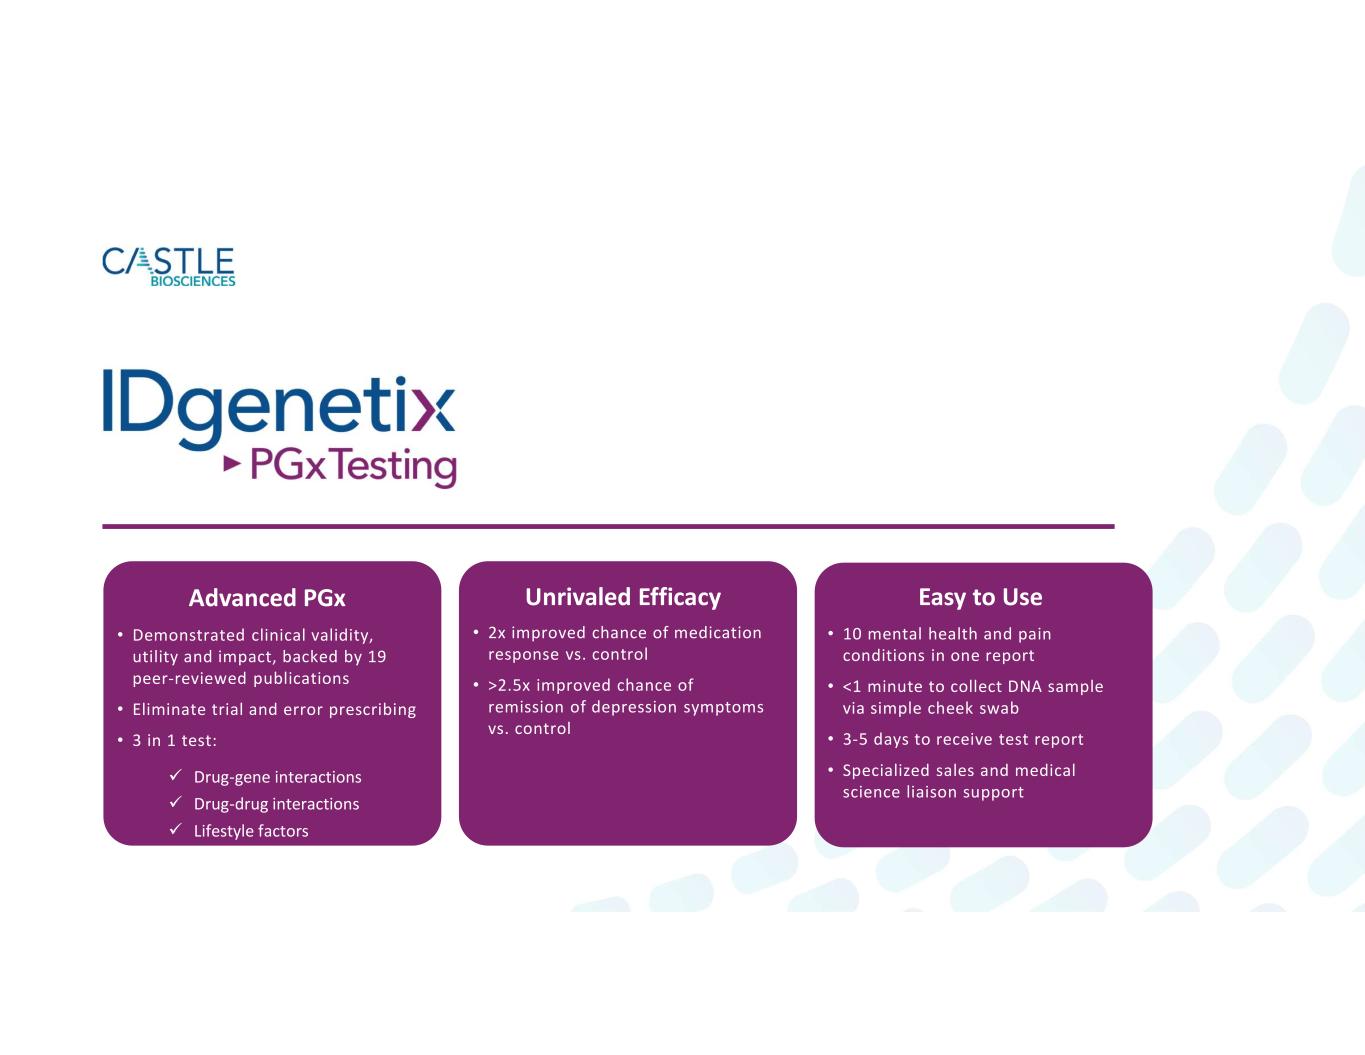
• Demonstrated clinical validity, utility and impact, backed by 19 peer-reviewed publications • Eliminate trial and error prescribing • 3 in 1 test:  Drug-gene interactions  Drug-drug interactions  Lifestyle factors • 2x improved chance of medication response vs. control • >2.5x improved chance of remission of depression symptoms vs. control • 10 mental health and pain conditions in one report • <1 minute to collect DNA sample via simple cheek swab • 3-5 days to receive test report • Specialized sales and medical science liaison support Advanced PGx Unrivaled Efficacy Easy to Use


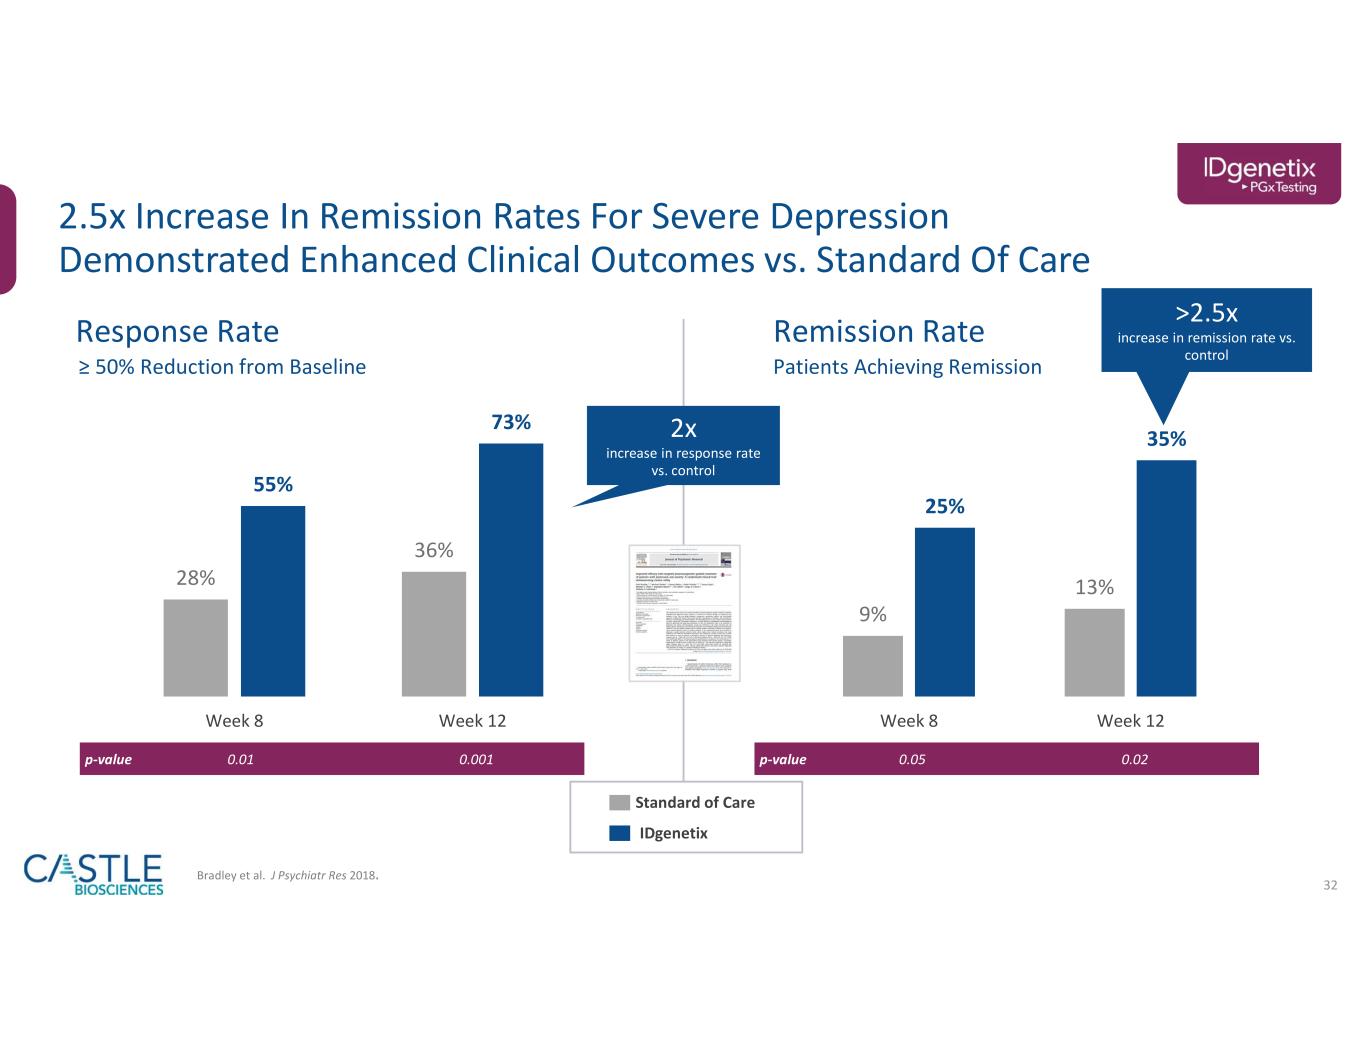
32 2.5x Increase In Remission Rates For Severe Depression Demonstrated Enhanced Clinical Outcomes vs. Standard Of Care Standard of Care IDgenetix Response Rate ≥ 50% Reduction from Baseline Remission Rate Patients Achieving Remission 0.020.05p-value0.0010.01p-value >2.5x increase in remission rate vs. control 2x increase in response rate vs. control Bradley et al. J Psychiatr Res 2018. 28% 36% 55% 73% Week 8 Week 12 9% 13% 25% 35% Week 8 Week 12


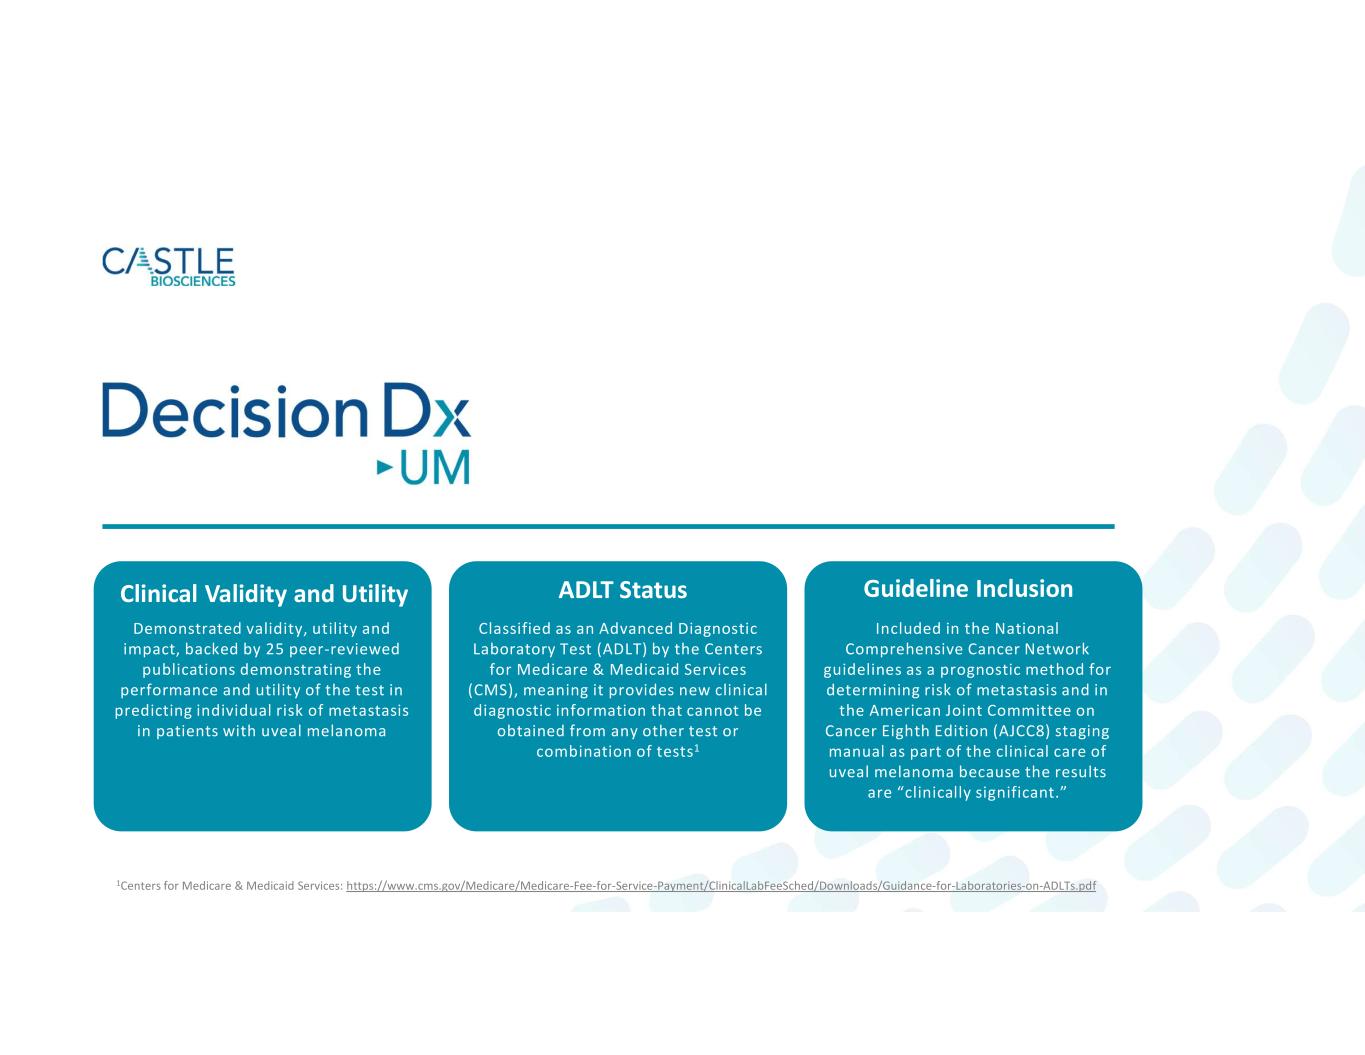
Clinical Validity and Utility ADLT Status Guideline Inclusion Demonstrated validity, utility and impact, backed by 25 peer-reviewed publications demonstrating the performance and utility of the test in predicting individual risk of metastasis in patients with uveal melanoma Classified as an Advanced Diagnostic Laboratory Test (ADLT) by the Centers for Medicare & Medicaid Services (CMS), meaning it provides new clinical diagnostic information that cannot be obtained from any other test or combination of tests1 Included in the National Comprehensive Cancer Network guidelines as a prognostic method for determining risk of metastasis and in the American Joint Committee on Cancer Eighth Edition (AJCC8) staging manual as part of the clinical care of uveal melanoma because the results are “clinically significant.” 1Centers for Medicare & Medicaid Services: https://www.cms.gov/Medicare/Medicare-Fee-for-Service-Payment/ClinicalLabFeeSched/Downloads/Guidance-for-Laboratories-on-ADLTs.pdf


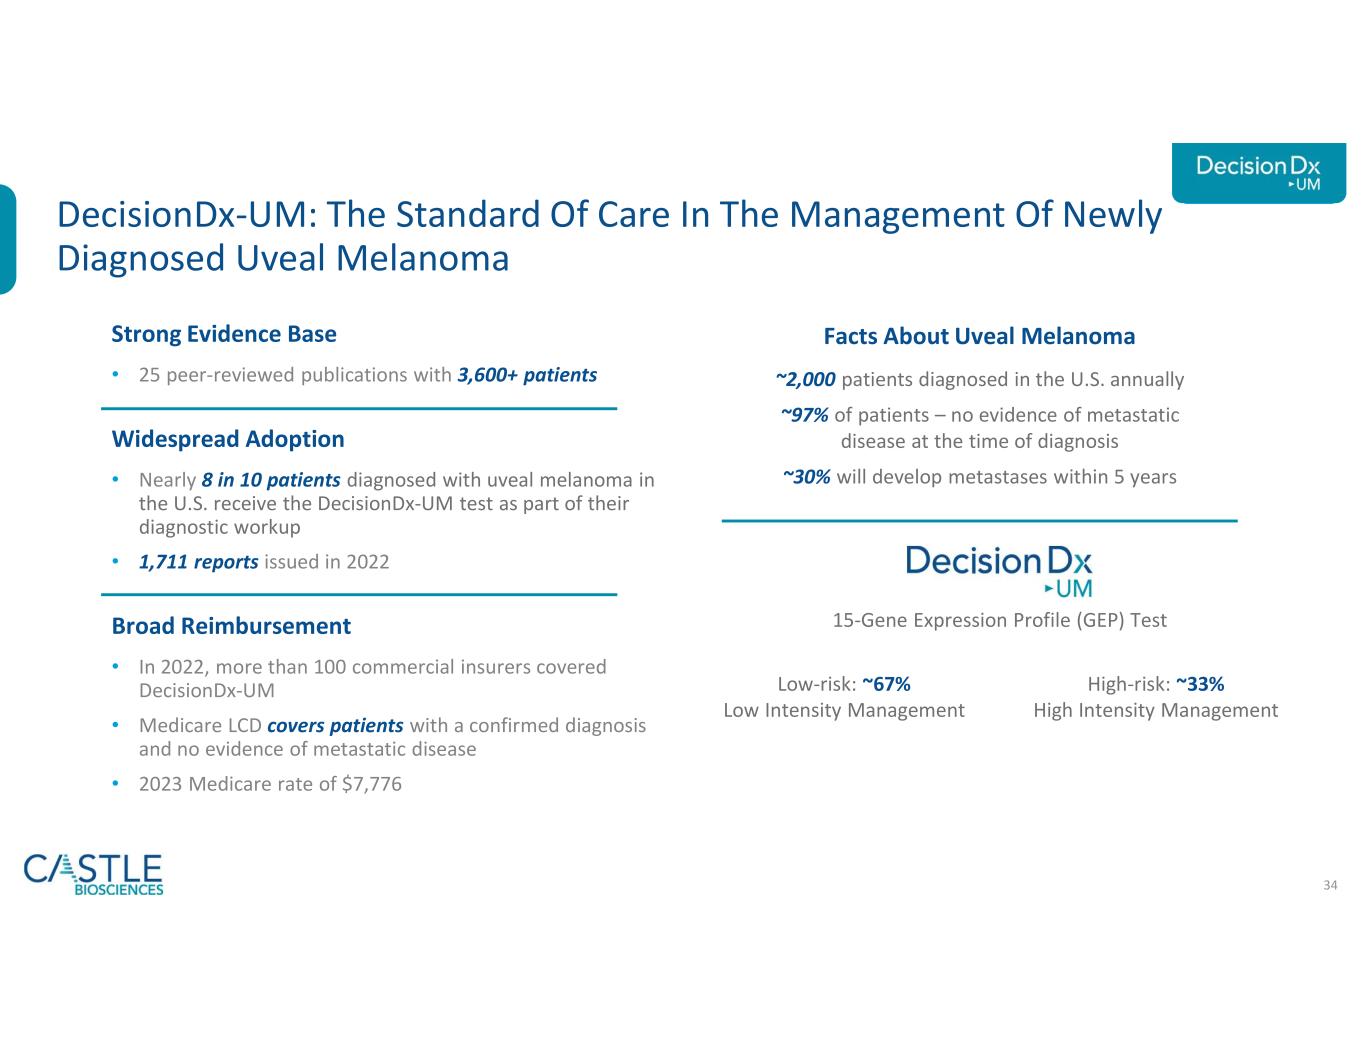
34 Strong Evidence Base • 25 peer-reviewed publications with 3,600+ patients Widespread Adoption • Nearly 8 in 10 patients diagnosed with uveal melanoma in the U.S. receive the DecisionDx-UM test as part of their diagnostic workup • 1,711 reports issued in 2022 Broad Reimbursement • In 2022, more than 100 commercial insurers covered DecisionDx-UM • Medicare LCD covers patients with a confirmed diagnosis and no evidence of metastatic disease • 2023 Medicare rate of $7,776 DecisionDx-UM: The Standard Of Care In The Management Of Newly Diagnosed Uveal Melanoma ~2,000 patients diagnosed in the U.S. annually ~97% of patients – no evidence of metastatic disease at the time of diagnosis ~30% will develop metastases within 5 years Low-risk: ~67% Low Intensity Management High-risk: ~33% High Intensity Management Uveal Melanoma – A Rare Eye Cancer 15-Gene Expression Profile (GEP) Test Facts About Uveal Melanoma


Inflammatory Skin Disease Pipeline program to develop a genomic test aimed at guiding systemic therapy selection for patients with moderate-to-severe atopic dermatitis (AD), psoriasis (PSO) and related conditions


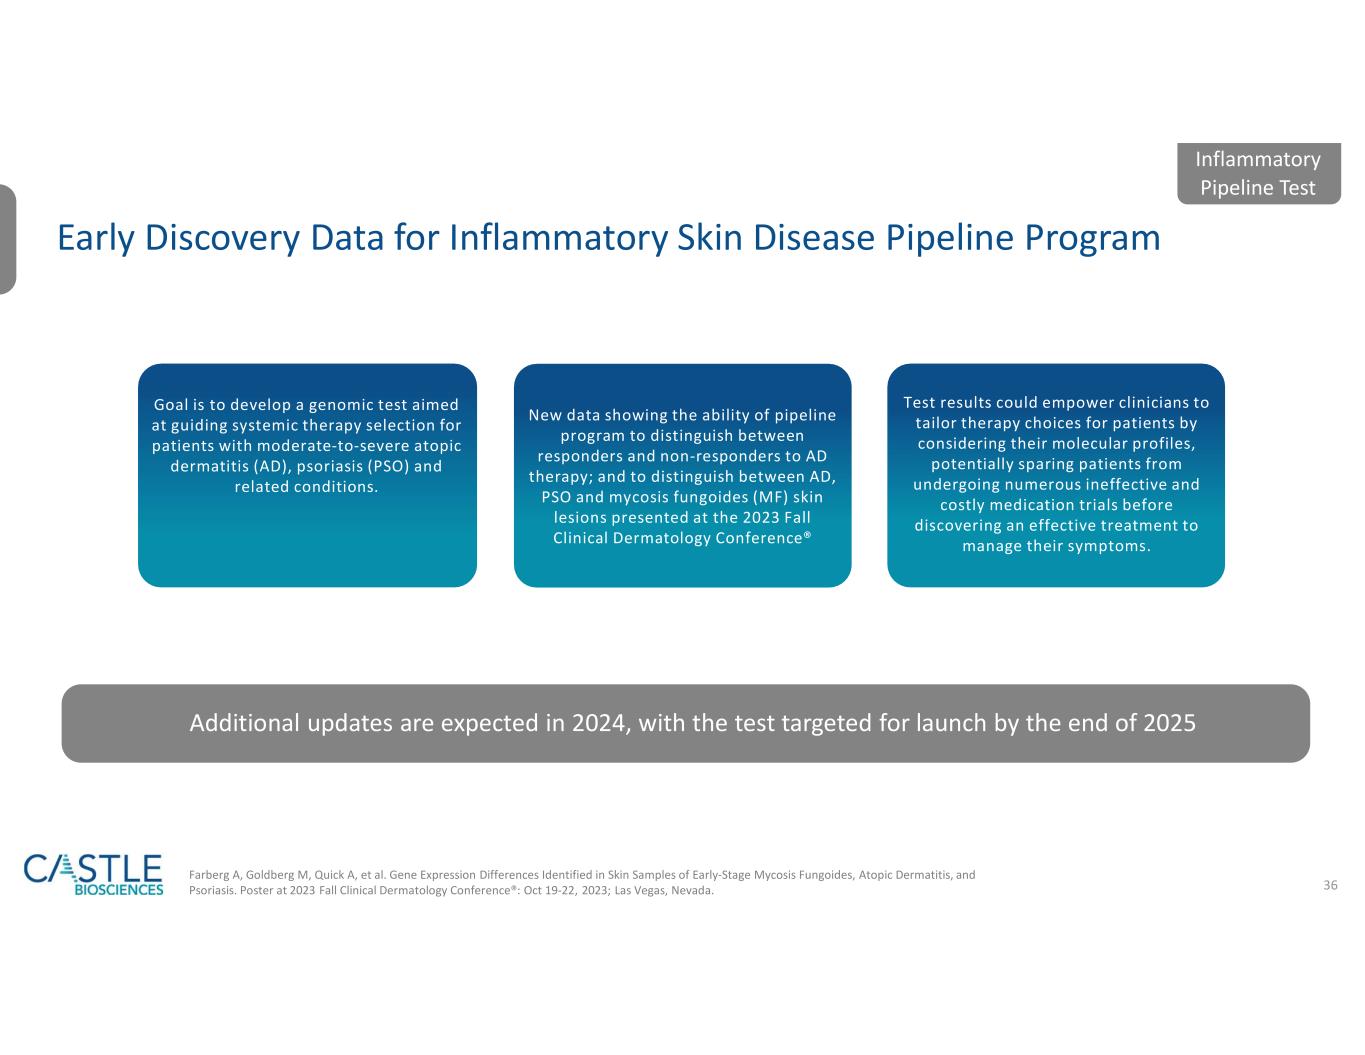
36 Early Discovery Data for Inflammatory Skin Disease Pipeline Program Inflammatory Pipeline Test New data showing the ability of pipeline program to distinguish between responders and non-responders to AD therapy; and to distinguish between AD, PSO and mycosis fungoides (MF) skin lesions presented at the 2023 Fall Clinical Dermatology Conference® Test results could empower clinicians to tailor therapy choices for patients by considering their molecular profiles, potentially sparing patients from undergoing numerous ineffective and costly medication trials before discovering an effective treatment to manage their symptoms. Goal is to develop a genomic test aimed at guiding systemic therapy selection for patients with moderate-to-severe atopic dermatitis (AD), psoriasis (PSO) and related conditions. Farberg A, Goldberg M, Quick A, et al. Gene Expression Differences Identified in Skin Samples of Early-Stage Mycosis Fungoides, Atopic Dermatitis, and Psoriasis. Poster at 2023 Fall Clinical Dermatology Conference®: Oct 19-22, 2023; Las Vegas, Nevada. Additional updates are expected in 2024, with the test targeted for launch by the end of 2025


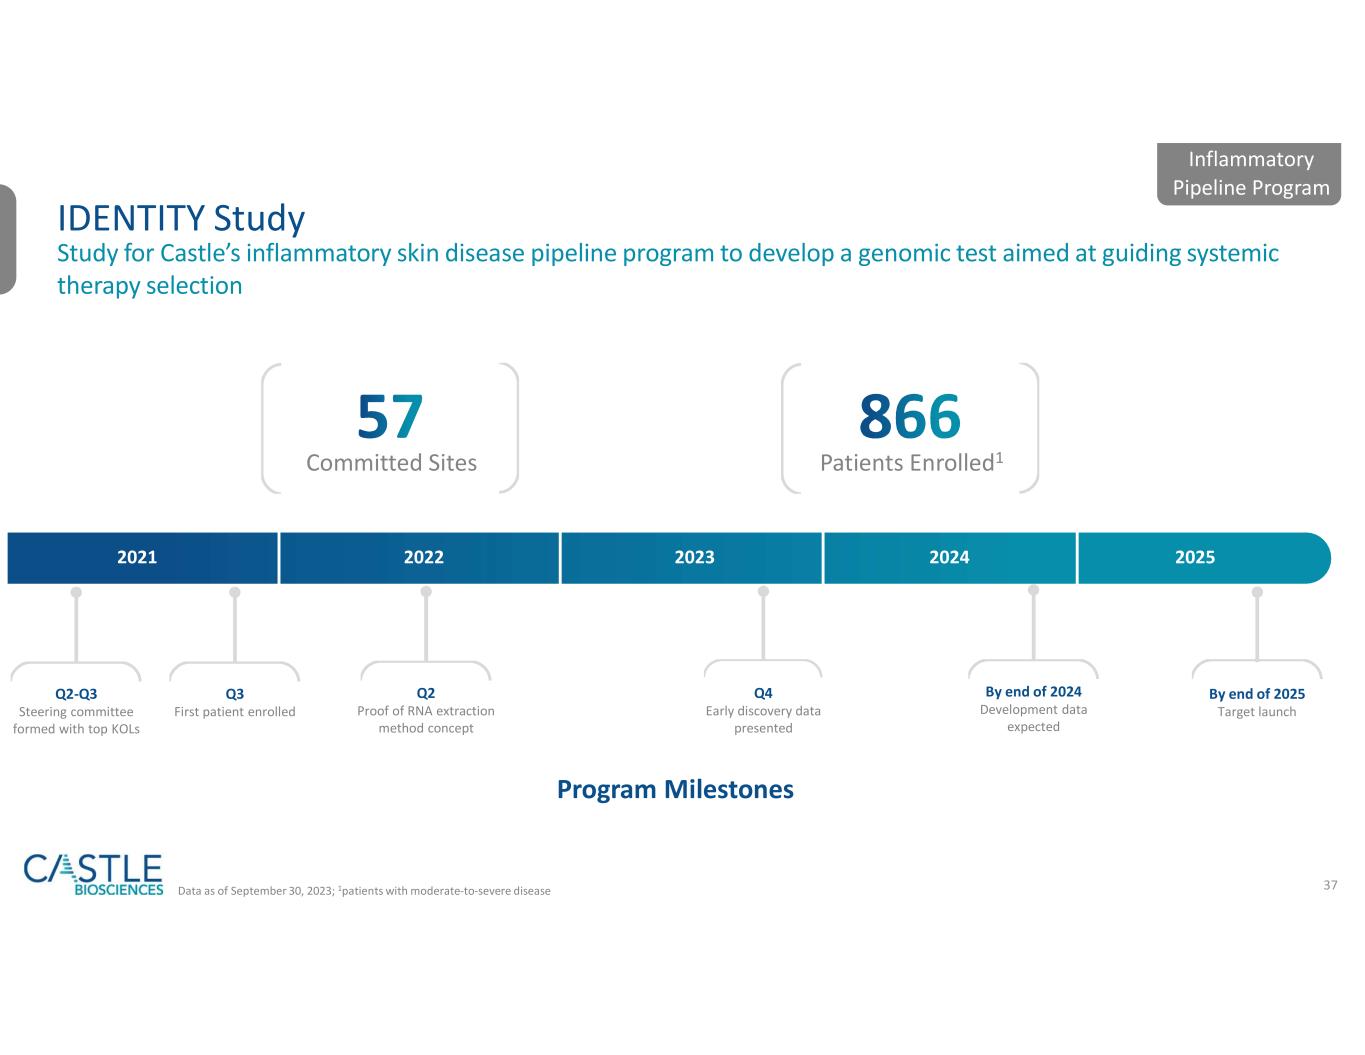
37 IDENTITY Study Study for Castle’s inflammatory skin disease pipeline program to develop a genomic test aimed at guiding systemic therapy selection Q2-Q3 Steering committee formed with top KOLs Q3 First patient enrolled Q2 Proof of RNA extraction method concept Q4 Early discovery data presented By end of 2025 Target launch Committed Sites Patients Enrolled1 Data as of September 30, 2023; 1patients with moderate-to-severe disease Program Milestones Inflammatory Pipeline Program 2021 2022 2023 2024 2025 By end of 2024 Development data expected


Thank you


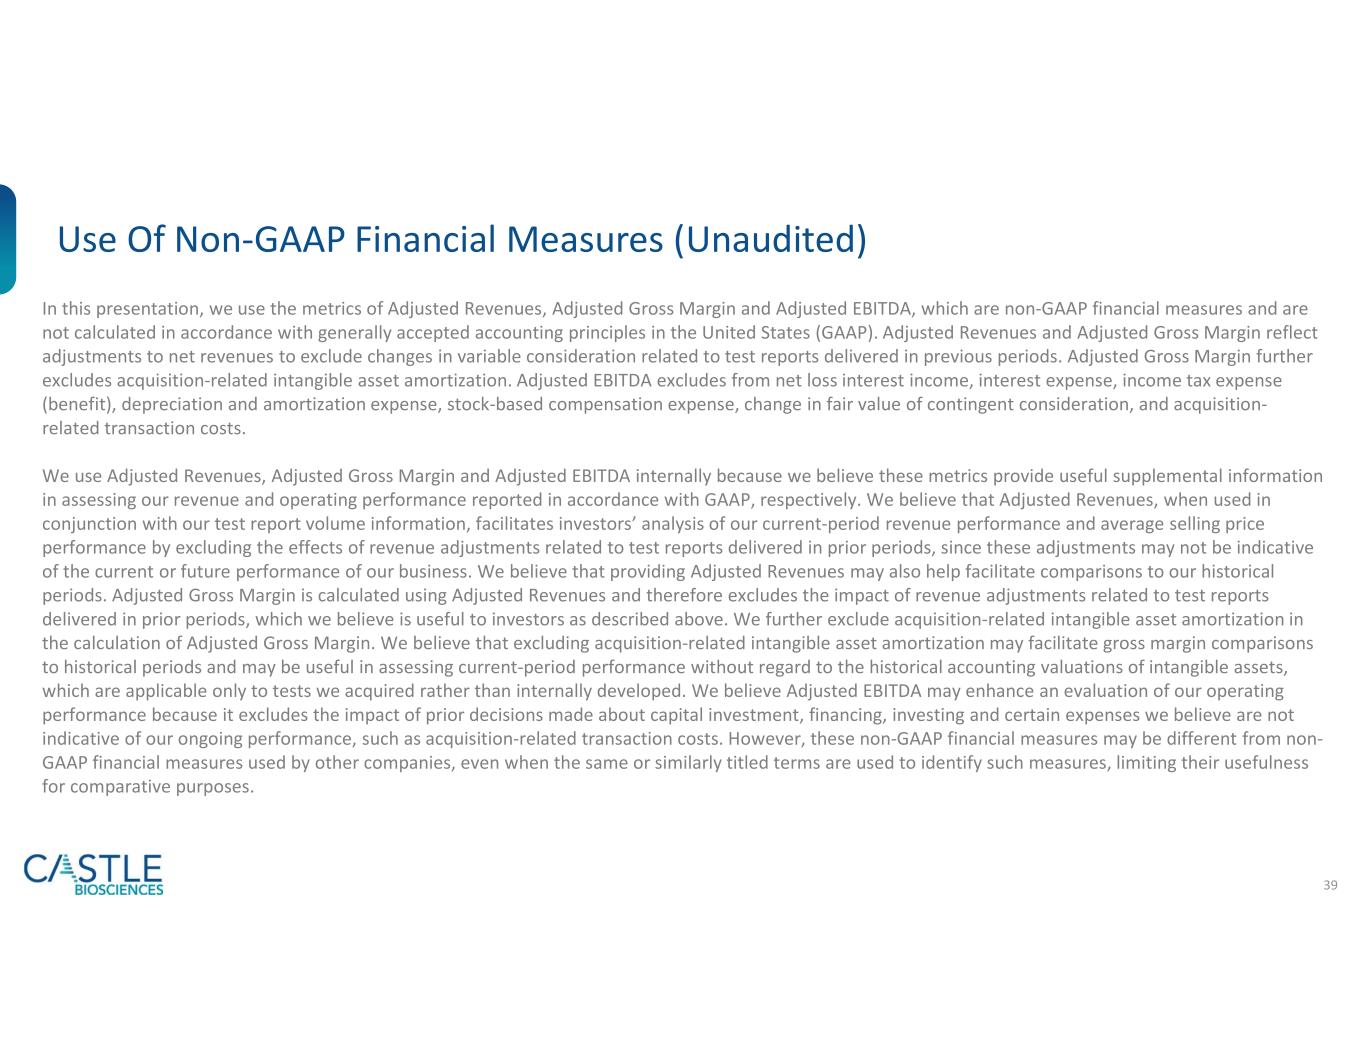
39 Use Of Non-GAAP Financial Measures (Unaudited) In this presentation, we use the metrics of Adjusted Revenues, Adjusted Gross Margin and Adjusted EBITDA, which are non-GAAP financial measures and are not calculated in accordance with generally accepted accounting principles in the United States (GAAP). Adjusted Revenues and Adjusted Gross Margin reflect adjustments to net revenues to exclude changes in variable consideration related to test reports delivered in previous periods. Adjusted Gross Margin further excludes acquisition-related intangible asset amortization. Adjusted EBITDA excludes from net loss interest income, interest expense, income tax expense (benefit), depreciation and amortization expense, stock-based compensation expense, change in fair value of contingent consideration, and acquisition- related transaction costs. We use Adjusted Revenues, Adjusted Gross Margin and Adjusted EBITDA internally because we believe these metrics provide useful supplemental information in assessing our revenue and operating performance reported in accordance with GAAP, respectively. We believe that Adjusted Revenues, when used in conjunction with our test report volume information, facilitates investors’ analysis of our current-period revenue performance and average selling price performance by excluding the effects of revenue adjustments related to test reports delivered in prior periods, since these adjustments may not be indicative of the current or future performance of our business. We believe that providing Adjusted Revenues may also help facilitate comparisons to our historical periods. Adjusted Gross Margin is calculated using Adjusted Revenues and therefore excludes the impact of revenue adjustments related to test reports delivered in prior periods, which we believe is useful to investors as described above. We further exclude acquisition-related intangible asset amortization in the calculation of Adjusted Gross Margin. We believe that excluding acquisition-related intangible asset amortization may facilitate gross margin comparisons to historical periods and may be useful in assessing current-period performance without regard to the historical accounting valuations of intangible assets, which are applicable only to tests we acquired rather than internally developed. We believe Adjusted EBITDA may enhance an evaluation of our operating performance because it excludes the impact of prior decisions made about capital investment, financing, investing and certain expenses we believe are not indicative of our ongoing performance, such as acquisition-related transaction costs. However, these non-GAAP financial measures may be different from non- GAAP financial measures used by other companies, even when the same or similarly titled terms are used to identify such measures, limiting their usefulness for comparative purposes.

 
40 Reconciliation of Non-GAAP Financial Measures (Unaudited) The table below presents the reconciliation of adjusted revenues and adjusted gross margin, which are non-GAAP financial measures. See previous slide for further information regarding the Company’s use of non-GAAP financial measures.


41 Reconciliation of Non-GAAP Financial Measures (Unaudited) The table below presents the reconciliation of adjusted EBITDA, which is a non-GAAP financial measure. See slide 39 for further information regarding the Company’s use of non-GAAP financial measures.


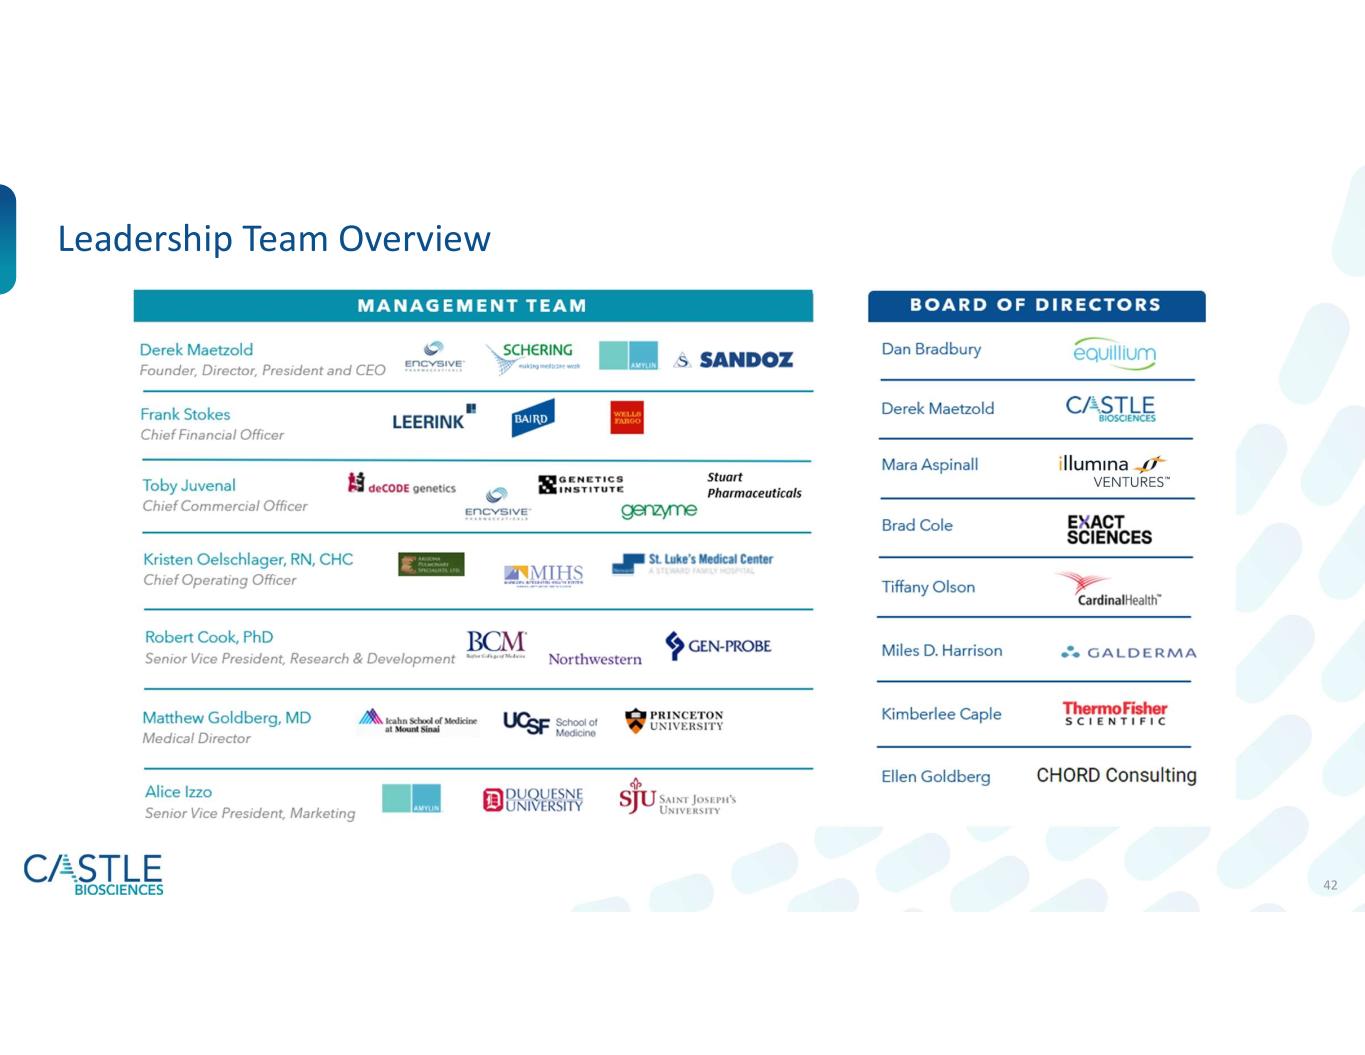
42 Leadership Team Overview