| Ohio | 001-35296 | 34-1371693 |
| (State or other jurisdiction | (Commission | (IRS Employer |
| of incorporation) | File Number) | Identification No.) |
| 20 South Broad Street, P.O. Box 555, Canfield, Ohio | 44406-0555 |
| (Address of principal executive offices) | (Zip Code) |
|
☒
|
Written communication pursuant to Rule 425 under the Securities Act (17 CFR 230.425)
|
|
☐
|
Soliciting material pursuant to Rule 14a-12 under the Exchange Act (17 CFR 240.14a-12)
|
| ☐ |
Pre-commencement communication pursuant to Rule 14d-2(b) under the Exchange Act (17 CFR 240.14d-2(b))
|
|
☐
|
Pre-commencement communication pursuant to Rule 13e-4(c) under the Exchange Act (17 CFR 240.13e-4(c))
|
|
Title of each class
|
Trading
Symbol |
Name of each exchange
on which registered |
||
|
Common Stock, No Par Value
|
FMNB
|
The NASDAQ Stock Market
|
|
Exhibit Number
|
Description
|
|
99.1
|
|
|
99.2
|
|
|
104
|
Cover Page Interactive Data File (embedded within the Inline XBRL document)
|
|
Farmers National Banc Corp.
|
|||
|
By:
|
/s/ Kevin J. Helmick
|
||
|
Kevin J. Helmick
|
|||
|
President and Chief Executive Officer
|
|||
January 28, 2026
Press Release
Source: Farmers National Banc Corp.
Kevin J. Helmick, President and CEO
20 South Broad Street, P.O. Box 555
Canfield, OH 44406
330.533.3341
Email: exec@farmersbankgroup.com
FARMERS NATIONAL BANC CORP. ANNOUNCES EARNINGS FOR FOURTH QUARTER OF 2025
|
● |
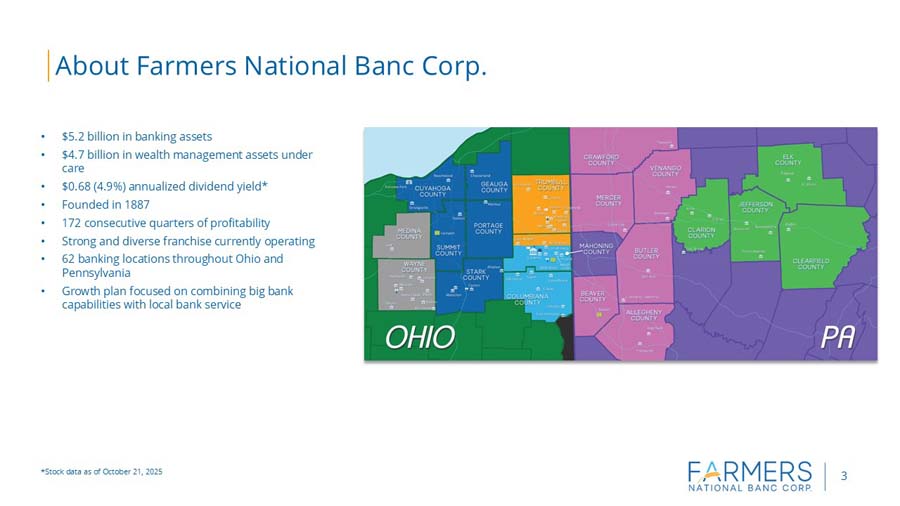
172 consecutive quarters of profitability |
|
● |
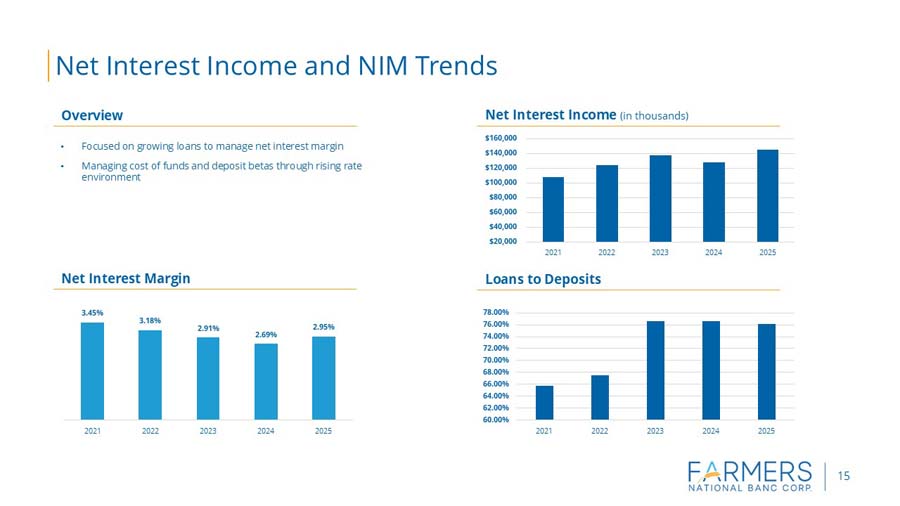
Net interest margin increased to 3.05% in the fourth quarter of 2025 from 3.00% in the third quarter of 2025 and 2.72% in the fourth quarter of 2024 |
|
● |
Efficiency ratio of 57.11% in the fourth quarter of 2025, 55.0% excluding merger/core conversion costs (non-GAAP) |
|
● |
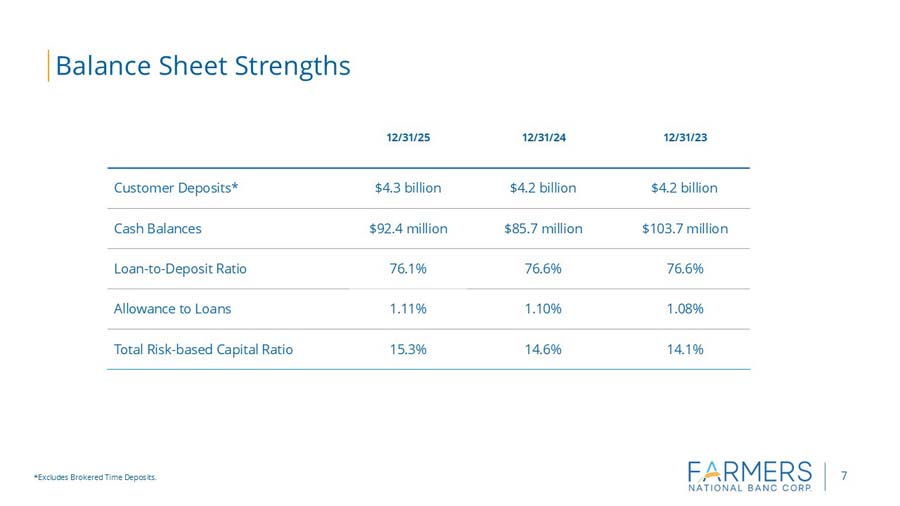
Customer deposit growth (excluding brokered CDs) was $151.0 million in 2025, or 3.6% growth |
|
● |
Nonperforming loans declined to $26.2 million in the fourth quarter 2025 from $35.3 million in third quarter 2025 |
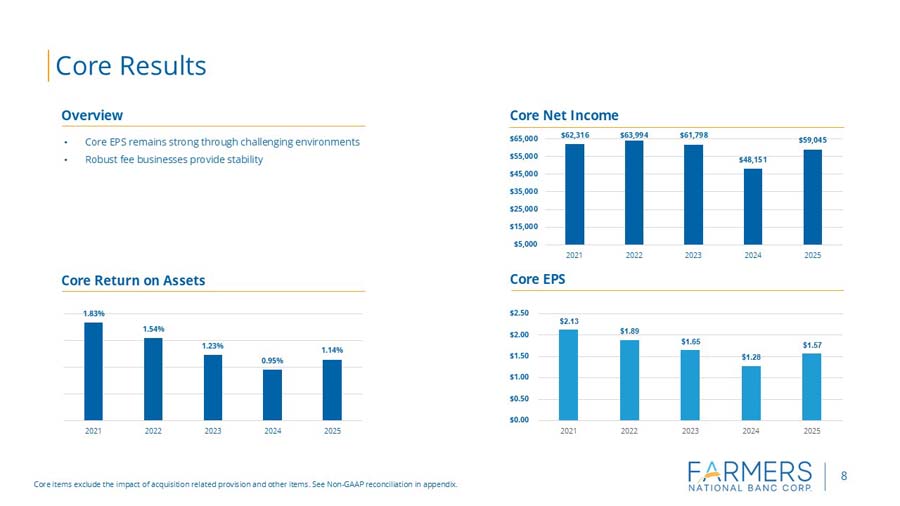
CANFIELD, Ohio (January 28, 2026) – Farmers National Banc Corp. (“Farmers” or the “Company”) (NASDAQ: FMNB) today announced net income of $14.6 million, or $0.39 per diluted share, for the fourth quarter of 2025 compared to $14.4 million, or $0.38 per diluted share, for the fourth quarter of 2024. Net income for the fourth quarter of 2025 included $925,000 related to merger and core conversion costs and $143,000 in pretax losses for the sale of investment securities and other assets. Excluding these items (non-GAAP), net income for the fourth quarter of 2025 was $15.1 million, or $0.40 per diluted share.
Kevin J. Helmick, President and CEO, stated: “I am pleased with our performance for the fourth quarter and full year 2025, reflecting the ongoing strength of the Company’s community banking platform. During the year, we added experienced team members, continued to invest in our platform, and remained focused on disciplined growth and prudent risk management. Most importantly, during the fourth quarter of 2025, we announced the merger with Middlefield Banc Corp., which we expect will close in the first quarter of 2026. I am excited about the direction we are headed and the opportunities ahead to create long-term value for our shareholders in 2026 and beyond.”
Balance Sheet
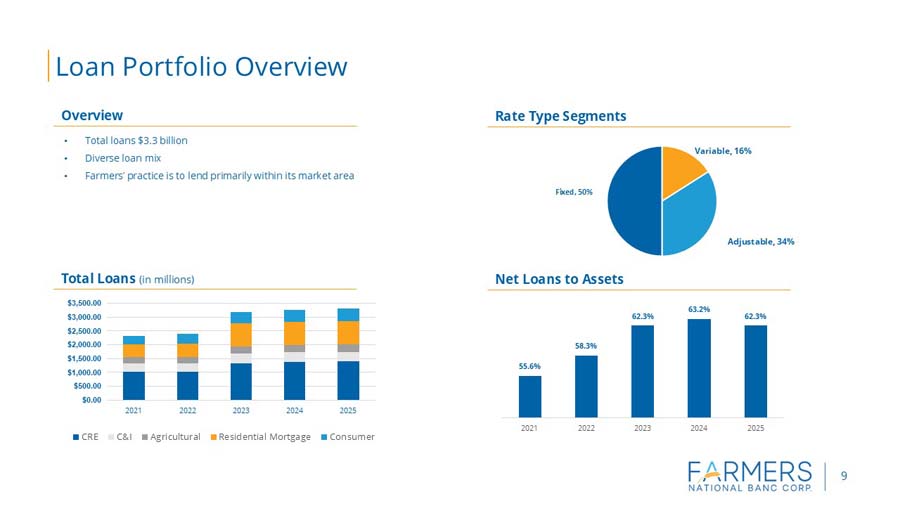
Total assets increased to $5.25 billion in the fourth quarter of 2025 from $5.24 billion at September 30, 2025 and $5.12 billion at December 31, 2024. Loans declined to $3.30 billion at December 31, 2025 from $3.34 billion at September 30, 2025 but were up $36.4 million from $3.27 billion at December 31, 2024. The decrease from the prior quarter was primarily due to greater payoffs seen in this quarter outpacing originations in the commercial portfolio.
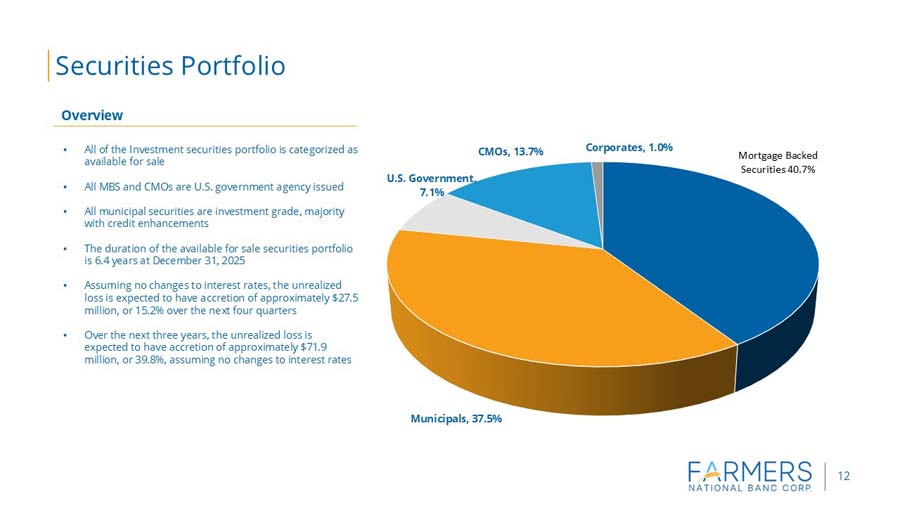
Securities available for sale totaled $1.34 billion at December 31, 2025 compared to $1.30 billion as of September 30, 2025, and $1.27 billion at December 31, 2024. The mark to market adjustment has improved by $62.4 million since the beginning of 2025 as the Fed has resumed cutting interest rates. The Company anticipates continued rate volatility in the bond market in 2026, which will continue to affect the value of the portfolio.
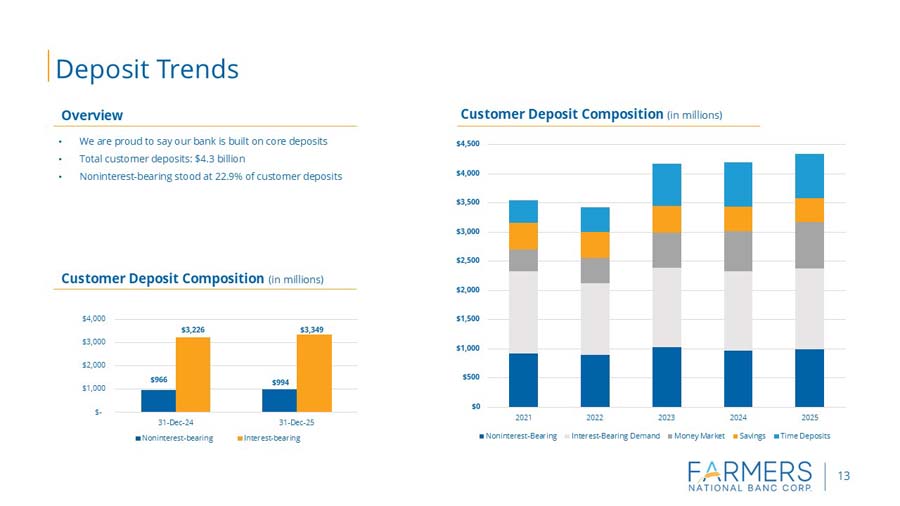
Total deposits declined to $4.34 billion at December 31, 2025, from $4.40 billion at September 30, 2025 but are up $76.0 million since December 31, 2024. During the fourth quarter of 2025, the Company saw seasonal runoff of public funds totaling $93.4 million. Excluding public funds, the fourth quarter of 2025 saw deposit growth of $35.6 million compared to the third quarter of 2025. For the full year of 2025, excluding brokered CDs, the Company experienced strong deposit growth of $151.0 million, or 3.6%.
Total stockholders’ equity increased to $485.7 million at December 31, 2025, from $465.9 million at September 30, 2025, and $406.0 million at December 31, 2024. The increase was primarily due to an improvement in accumulated other comprehensive income along with increased retained earnings.
Credit Quality
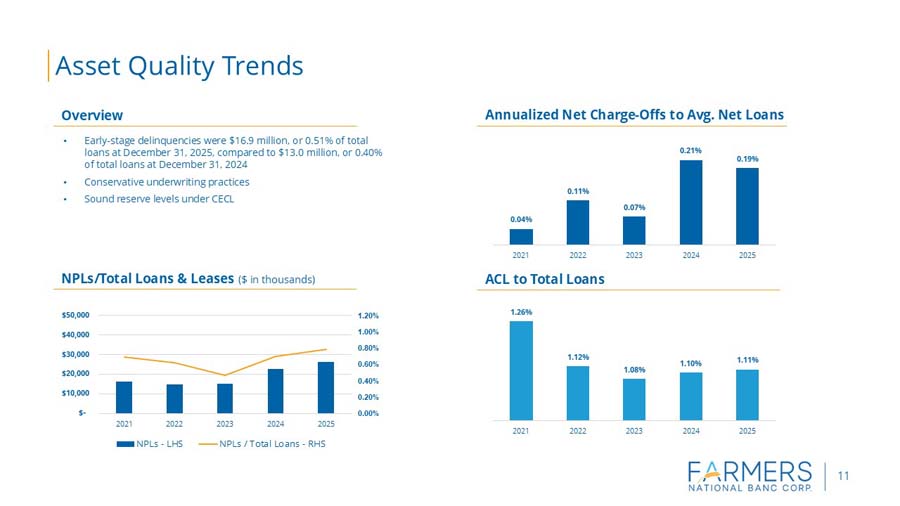
Non-performing loans decreased from $35.3 million at September 30, 2025, to $26.2 million at December 31, 2025, but are up slightly from $22.8 million at December 31, 2024. A single loan relationship totaling $7.3 million that moved into nonaccrual during the third quarter of 2025 paid off during the fourth quarter of 2025. A charge-off of $2.5 million was recognized on the loan prior to the payoff. Nonperforming loans to total loans were 0.79% at December 31, 2025, 1.06% at September 30, 2025, and 0.70% at December 31, 2024. The Company’s loans which were 30-89 days delinquent were $16.9 million at December 31, 2025, or 0.51% of total loans, compared to $16.1 million at September 30, 2025, and $13.0 million at December 31, 2024.
The provision for credit losses and unfunded commitments totaled $2.3 million for the fourth quarter of 2025 compared to $295,000 for the fourth quarter of 2024. The provision in the fourth quarter of 2025 was negatively impacted by the charge-off mentioned above. Annualized net charge-offs as a percentage of average loans were 0.59% for the fourth quarter of 2025, compared to 0.07% for the third quarter of 2025 and 0.08% for the fourth quarter of 2024. In addition to the $2.5 million charge-off discussed previously, the Company had an additional $2.0 million charge-off in the fourth quarter that aided in the workout of another troubled relationship. This $2.0 million figure had been specifically reserved in prior periods. The allowance for credit losses to total loans was 1.11% at December 31, 2025 compared to 1.18% at September 30, 2025, and 1.10% at December 31, 2024.
Net Interest Income
Net interest income was of $37.0 million in the fourth quarter of 2025, compared to $32.7 million in the fourth quarter of 2024. Average interest earning assets increased to $4.94 billion in the fourth quarter of 2025 compared to $4.91 billion in the fourth quarter of 2024. The increase was primarily driven by a $46.4 million increase in average loan balances offset by a decrease in fed funds sold. The net interest margin improved to 3.05% in the fourth quarter of 2025 compared to 3.00% in the third quarter of 2025 and 2.72% in the fourth quarter of 2024. The year-over-year increase in net interest margin was due to higher yields on earning assets and lower funding costs on interest bearing liabilities. The Federal Reserve rate cuts in the back half of 2024 and 2025 have benefitted funding costs, while the lag effects of assets repricing continued to drive earning asset yields higher. The yield on interest earning assets increased from 4.77% in the fourth quarter of 2024 to 4.87% in the fourth quarter of 2025, while the cost of interest-bearing liabilities declined from 2.72% in the fourth quarter of 2024 to 2.43% in the fourth quarter of 2025. With additional cuts to the federal funds rate expected in 2026, the Company expects its net interest margin will continue to expand into 2026 as the Company remains liability sensitive and will benefit from falling interest rates. Excluding acquisition marks and PPP interest, non-GAAP, the Company’s net interest margin was 2.90% in the fourth quarter of 2025, 2.87% in the third quarter of 2025, and 2.56% in the fourth quarter of 2024.
Noninterest Income
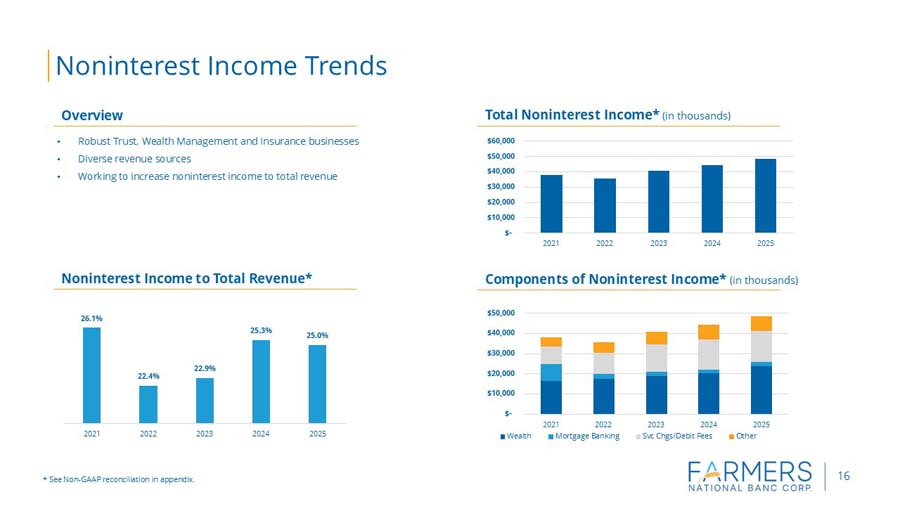
Noninterest income increased to $12.1 million in the fourth quarter of 2025 from $11.4 million in the fourth quarter of 2024. The increase was driven by strong performance across multiple business lines. Bank owned life insurance (BOLI) income increased $278,000 during the fourth quarter of 2025 to $891,000 compared to $613,000 in the fourth quarter of 2024. The Company purchased an additional $15.0 million in policies during the first quarter of 2025 and policy crediting rates have increased over the last twelve months. Trust fees increased by $379,000 to $3.1 million in the fourth quarter of 2025 from $2.7 million in the fourth quarter of 2024. The Company continues to grow this line of business through deeper penetration in its acquired markets. Insurance agency commissions increased from $1.3 million in the fourth quarter of 2024 to $1.6 million in the fourth quarter of 2025. The Company received a one-time commission of $94,000 during the quarter and fixed annuity sales increased $174,000 as strong annuity activity continues. Retirement plan commissions increased to $1.0 million in the fourth quarter of 2025 from $719,000 in the fourth quarter of 2024 primarily due to the acquisition of Crest Retirement Advisors LLC in late December of 2024. Net gains on the sale of loans increased to $436,000 in the fourth quarter of 2025 from $282,000 in the fourth quarter of 2024 due to additional mortgage volume compared to the year ago period. Other mortgage banking income declined $179,000 in the fourth quarter of 2025 compared to the fourth quarter of 2024. This was primarily due to the Company incurring $58,000 mortgage servicing impairment in the fourth quarter of 2025. Debit card income declined $208,000 to $2.0 million in the fourth quarter of 2025 compared to the fourth quarter of 2024 primarily due to slightly lower commission income recognized from Mastercard in 2025 compared to 2024. Other noninterest income declined to $523,000 in the fourth quarter of 2025 compared to $856,000 in the fourth quarter of 2024 due to lower SBIC income.
Noninterest Expense
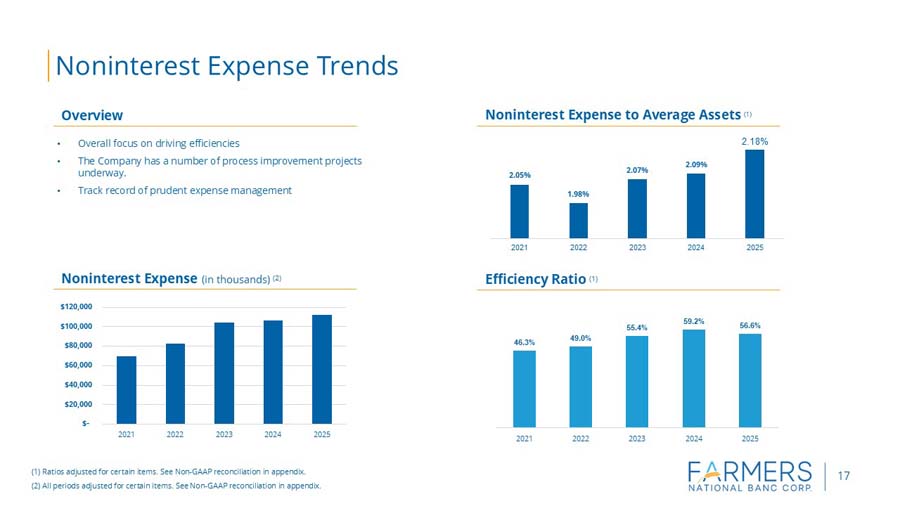
Noninterest expense increased to $29.1 million in the fourth quarter of 2025 from $26.2 million in the fourth quarter of 2024. Salaries and employee benefits increased to $15.4 million in the fourth quarter of 2025 from $14.4 million in the fourth quarter of 2024. The increase was primarily driven by annual raises, the acquisition of Crest Retirement in the fourth quarter of 2024 and higher commission expense from increased revenue in the fee-based businesses. Occupancy and equipment expense increased to $4.5 million in the fourth quarter of 2025 from $4.1 million in the fourth quarter of 2024 due to increased maintenance and software costs in 2025. Professional fees increased to $1.2 million in the fourth quarter of 2025 from $785,000 in the fourth quarter of 2024. Legal expenses were low in the fourth quarter of 2024 due to an accrual adjustment. Merger and core conversion expenses were $925,000 in the fourth quarter of 2025 compared to $92,000 in the fourth quarter of 2025. The Company announced the acquisition of Middlefield Banc Corp. in October of 2025 along with its intention to convert its core system to Jack Henry. The merger expense incurred in 2024 was related to the Company’s acquisition of Crest Retirement Advisors LLC. Advertising and marketing expense was down $257,000 from the figure reported for the quarter ended December 31, 2024, primarily due to accrual reductions in the fourth quarter of 2024. Core processing expense increased to $1.4 million for the quarter ended December 31, 2025, from $1.2 million for the quarter ended December 31, 2024. The increase was due to annual increases and timing differences.
Liquidity
The Company had access to an additional $552.2 million in FHLB borrowing capacity at December 31, 2025, along with $498.5 million in available for sale securities that are available for pledging. The Company’s loan to deposit ratio was 76.1% at December 31, 2025.
About Farmers National Banc Corp.
Founded in 1887, Farmers National Banc Corp. is a diversified financial services company headquartered in Canfield, Ohio, with $5.2 billion in banking assets. Farmers National Banc Corp.’s wholly-owned subsidiaries are comprised of The Farmers National Bank of Canfield, a full-service national bank engaged in commercial and retail banking with 62 banking locations in Mahoning, Trumbull, Columbiana, Portage, Stark, Wayne, Medina, Geauga and Cuyahoga Counties in Ohio and Beaver, Butler, Allegheny, Jefferson, Clarion, Venango, Clearfield, Mercer, Elk and Crawford Counties in Pennsylvania, and Farmers Trust Company, which operates trust offices and offers services in the same geographic markets. Total wealth management assets under care at December 31, 2025 are $4.7 billion. Farmers National Insurance, LLC, a wholly-owned subsidiary of The Farmers National Bank of Canfield, offers a variety of insurance products.
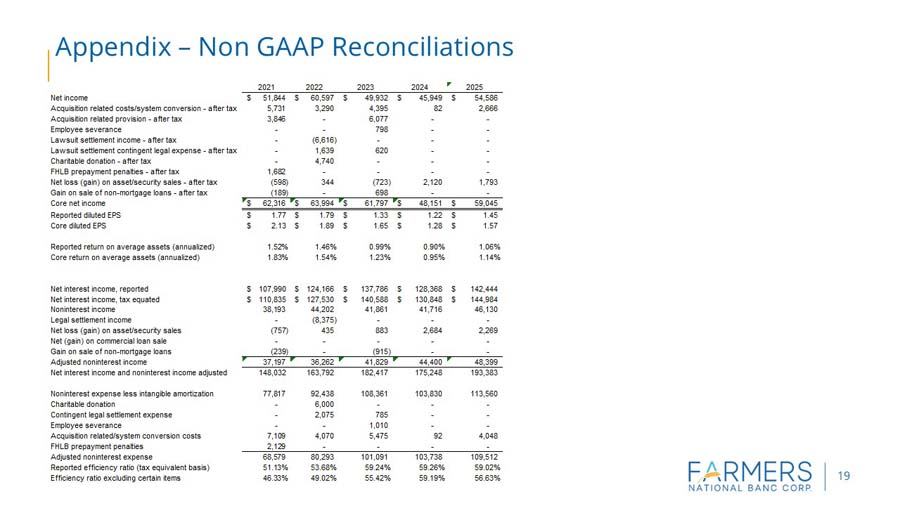
Non-GAAP Disclosure
This press release includes disclosures of Farmers’ tangible common equity ratio, return on average tangible assets, return on average tangible equity, net income excluding costs related to acquisition activities and certain items, return on average assets excluding merger costs and certain items, return on average equity excluding merger costs and certain items, net interest margin excluding acquisition marks and related accretion and PPP interest and fees and efficiency ratio less certain items, which are financial measures not prepared in accordance with generally accepted accounting principles in the United States (GAAP). A non-GAAP financial measure is a numerical measure of historical or future financial performance, financial position or cash flows that excludes or includes amounts that are required to be disclosed by GAAP. Farmers believes that these non-GAAP financial measures provide both management and investors a more complete understanding of the underlying operational results and trends and Farmers’ marketplace performance. The presentation of this additional information is not meant to be considered in isolation or as a substitute for the numbers prepared in accordance with GAAP. The reconciliations of non-GAAP financial measures to their GAAP equivalents are included in the tables following Consolidated Financial Highlights below.
Cautionary Statements Regarding Forward-Looking Statements
We make statements in this news release and our related investor conference call, and we may from time to time make other statements, that are forward-looking statements within the meaning of the Private Securities Litigation Reform Act of 1995, including statements about Farmers’ financial condition, results of operations, asset quality trends and profitability. Forward-looking statements are not historical facts but instead represent only management’s current expectations and forecasts regarding future events, many of which, by their nature, are inherently uncertain and outside of Farmers’ control. Forward-looking statements are preceded by terms such as “expects,” “believes,” “anticipates,” “intends” and similar expressions, as well as any statements related to future expectations of performance or conditional verbs, such as “will,” “would,” “should,” “could” or “may.” Farmers’ actual results and financial condition may differ, possibly materially, from the anticipated results and financial condition indicated in these forward-looking statements. Factors that could cause Farmers’ actual results to differ materially from those described in certain forward-looking statements include significant changes in near-term local, regional, and U.S. economic conditions including those resulting from continued high rates of inflation, tightening monetary policy of the Board of Governors of the Federal Reserve, U.S. and foreign country tariff policies, and possibility of a recession; and the other factors contained in Farmers’ Annual Report on Form 10-K for the year ended December 31, 2024 and subsequent Quarterly Reports on Form 10-Q filed with the Securities and Exchange Commission (SEC) and available on Farmers’ website (www.farmersbankgroup.com) and on the SEC’s website (www.sec.gov). Forward-looking statements are not guarantees of future performance and should not be relied upon as representing management’s views as of any subsequent date. Farmers does not undertake any obligation to update the forward-looking statements to reflect the impact of circumstances or events that may arise after the date of the forward-looking statements.
Important Additional Information
In connection with the proposed merger with Middlefield Banc Corp. (“Middlefield”), the Company has filed relevant materials with the SEC, including a Registration Statement on Form S-4 that contains a definitive joint proxy statement/prospectus of the Company and Middlefield (the “joint proxy statement/prospectus”). The Registration Statement was declared effective on December 15, 2025 and the Company has filed or may file other documents regarding the proposed Merger with the SEC.
INVESTORS AND SECURITY HOLDERS ARE URGED TO READ THE JOINT PROXY STATEMENT/PROSPECTUS AND ANY OTHER RELEVANT DOCUMENTS FILED WITH THE SEC, AS WELL AS ANY AMENDMENTS OR SUPPLEMENTS TO THESE DOCUMENTS, CAREFULLY AND IN THEIR ENTIRETY BECAUSE THEY CONTAIN AND THEY WILL CONTAIN IMPORTANT INFORMATION ABOUT THE COMPANY, MIDDLEFIELD, THE PROPOSED MERGER AND RELATED MATTERS THAT SHAREHOLDERS SHOULD CONSIDER BEFORE MAKING ANY DECISION REGARDING THE PROPOSED MERGER.
The joint proxy statement/prospectus has been mailed to Farmers’ shareholders. The joint proxy statement/prospectus and other documents filed by the Company with the SEC are available free of charge from the SEC’s website at www.sec.gov or through the Company’s website at www.farmersbankgroup.com or Middlefield’s website at www.middlefieldbank.bank. Before making any voting or investment decision, investors and shareholders of the Company are urged to read carefully the entire registration statement and definitive joint proxy statement/prospectus, including any amendments thereto, because they contain important information about the proposed transaction. This communication does not constitute an offer to sell or the solicitation of an offer to buy any securities or a solicitation of any vote or approval, nor shall there be any sale of securities in any jurisdiction in which the offer, solicitation or sale is unlawful before registration or qualification of the securities under the securities laws of the jurisdiction. No offer of securities shall be made except by means of a prospectus satisfying the requirements of Section 10 of the Securities Act of 1933, as amended. This document is not a substitute for the joint proxy statement/prospectus or for any other document that the Company has filed or may file with the SEC in connection with the proposed Merger.
Participants in the Solicitation
The respective directors and executive officers of the Company and Middlefield and other persons may be deemed to be participants in the solicitation of proxies from the Company and Middlefield shareholders with respect to the Merger. Information regarding the directors of the Company is available in its proxy statement filed with the SEC on March 18, 2025 in connection with its 2025 Annual Meeting of Shareholders and information regarding the executive officers of the Company is available in its Form 10-K filed with the SEC on March 6, 2025. Information regarding the directors of Middlefield is available in its proxy statement filed with the SEC on April 4, 2025 in connection with its 2025 Annual Meeting of Shareholders and information regarding the executive officers of Middlefield is available in its Form 10-K filed with the SEC on March 13, 2025. Other information regarding the participants in the solicitation and a description of their direct and indirect interests, by security holdings or otherwise, will be contained in the proxy statement and prospectus to be included in the Registration Statement on Form S-4 and other relevant materials to be filed with the SEC when they become available.
|
Farmers National Banc Corp. and Subsidiaries |
||||||||
|
Consolidated Financial Highlights |
||||||||
|
(Amounts in thousands, except per share results) Unaudited |
||||||||
|
Consolidated Statements of Income |
For the Three Months Ended |
For the Year Ended |
||||||
|
Dec. 31, |
Sept. 30, |
June 30, |
March 31, |
Dec. 31, |
Dec. 31, |
Dec. 31, |
Percent |
|
|
2025 |
2025 |
2025 |
2025 |
2024 |
2025 |
2024 |
Change |
|
|
Total interest income |
$59,418 |
$59,366 |
$57,702 |
$57,305 |
$57,909 |
$233,792 |
$227,732 |
2.7% |
|
Total interest expense |
22,398 |
23,059 |
22,781 |
23,110 |
25,170 |
91,348 |
99,364 |
-8.1% |
|
Net interest income |
37,020 |
36,307 |
34,921 |
34,195 |
32,739 |
142,444 |
128,368 |
11.0% |
|
Provision (credit) for credit losses |
2,306 |
1,419 |
3,548 |
(204) |
295 |
7,069 |
7,966 |
-11.3% |
|
Noninterest income |
12,098 |
11,430 |
12,122 |
10,481 |
11,413 |
46,130 |
41,716 |
10.6% |
|
System conversion / Acquisition related costs |
925 |
3,123 |
0 |
0 |
92 |
4,048 |
92 |
0.0% |
|
Other expense |
28,153 |
28,556 |
27,175 |
28,526 |
26,082 |
112,411 |
106,599 |
5.5% |
|
Income before income taxes |
17,734 |
14,639 |
16,320 |
16,354 |
17,683 |
65,046 |
55,427 |
17.4% |
|
Income taxes |
3,096 |
2,178 |
2,410 |
2,776 |
3,292 |
10,460 |
9,478 |
10.4% |
|
Net income |
$14,638 |
$12,461 |
$13,910 |
$13,578 |
$14,391 |
$54,586 |
$45,949 |
18.8% |
|
Average diluted shares outstanding |
37,705 |
37,677 |
37,622 |
37,626 |
37,616 |
37,633 |
37,512 |
|
|
Basic earnings per share |
0.39 |
0.33 |
0.37 |
0.36 |
0.38 |
1.46 |
1.23 |
|
|
Diluted earnings per share |
0.39 |
0.33 |
0.37 |
0.36 |
0.38 |
1.45 |
1.22 |
|
|
Cash dividends per share |
0.17 |
0.17 |
0.17 |
0.17 |
0.17 |
0.68 |
0.68 |
|
|
Performance Ratios |
||||||||
|
Net Interest Margin (Annualized) |
3.05% |
3.00% |
2.91% |
2.85% |
2.72% |
2.95% |
2.69% |
|
|
Efficiency Ratio (Tax equivalent basis) |
57.11% |
62.66% |
56.66% |
59.60% |
56.42% |
59.02% |
59.26% |
|
|
Efficiency Ratio (Tax equivalent basis) excluding core conversion, acquisition costs and other extraordinary items (b) |
55.00% |
56.43% |
55.66% |
59.57% |
56.10% |
56.63% |
59.19% |
|
|
Return on Average Assets (Annualized) |
1.12% |
0.96% |
1.08% |
1.06% |
1.12% |
1.06% |
0.90% |
|
|
Return on Average Equity (Annualized) |
12.17% |
11.26% |
13.08% |
13.12% |
13.43% |
12.38% |
11.28% |
|
|
Other Performance Ratios (Non-GAAP) |
||||||||
|
Return on Average Tangible Assets |
1.16% |
1.00% |
1.13% |
1.10% |
1.16% |
1.10% |
0.94% |
|
|
Return on Average Tangible Equity |
19.90% |
19.46% |
23.37% |
24.02% |
23.95% |
21.48% |
21.05% |
|
|
Consolidated Statements of Financial Condition |
||||||||
|
Dec. 31, |
Sept. 30, |
June 30, |
March 31, |
Dec. 31, |
||||
|
2025 |
2025 |
2025 |
2025 |
2024 |
||||
|
Assets |
||||||||
|
Cash and cash equivalents |
$92,357 |
$92,345 |
$90,740 |
$113,256 |
$85,738 |
|||
|
Debt securities available for sale |
1,343,457 |
1,301,766 |
1,274,899 |
1,281,413 |
1,266,553 |
|||
|
Other investments |
45,397 |
44,245 |
42,410 |
40,334 |
45,405 |
|||
|
Loans held for sale |
1,516 |
4,975 |
2,174 |
2,973 |
5,005 |
|||
|
Loans |
3,304,713 |
3,337,780 |
3,303,359 |
3,251,391 |
3,268,346 |
|||
|
Less allowance for credit losses |
36,811 |
39,528 |
38,563 |
35,549 |
35,863 |
|||
|
Net Loans |
3,267,902 |
3,298,252 |
3,264,796 |
3,215,842 |
3,232,483 |
|||
|
Other assets |
495,241 |
493,992 |
503,409 |
503,222 |
483,740 |
|||
|
Total Assets |
$5,245,870 |
$5,235,575 |
$5,178,428 |
$5,157,040 |
$5,118,924 |
|||
|
Liabilities and Stockholders' Equity |
||||||||
|
Deposits |
||||||||
|
Noninterest-bearing |
$994,122 |
$994,604 |
$995,865 |
$979,142 |
$965,507 |
|||
|
Interest-bearing |
3,348,656 |
3,405,911 |
3,325,564 |
3,342,182 |
3,226,321 |
|||
|
Brokered time deposits |
0 |
0 |
74,988 |
159,964 |
74,951 |
|||
|
Total deposits |
4,342,778 |
4,400,515 |
4,396,417 |
4,481,288 |
4,266,779 |
|||
|
Other interest-bearing liabilities |
367,733 |
321,581 |
289,428 |
188,275 |
391,150 |
|||
|
Other liabilities |
49,634 |
47,530 |
54,835 |
58,343 |
54,967 |
|||
|
Total liabilities |
4,760,145 |
4,769,626 |
4,740,680 |
4,727,906 |
4,712,896 |
|||
|
Stockholders' Equity |
485,725 |
465,949 |
437,748 |
429,134 |
406,028 |
|||
|
|
||||||||
|
Total Liabilities and Stockholders' Equity |
$5,245,870 |
$5,235,575 |
$5,178,428 |
$5,157,040 |
$5,118,924 |
|||
|
Period-end shares outstanding |
37,653 |
37,647 |
37,642 |
37,615 |
37,586 |
|||
|
Book value per share |
$12.90 |
$12.38 |
$11.63 |
$11.41 |
$10.80 |
|||
|
Tangible book value per share (Non-GAAP)* |
7.98 |
7.44 |
6.67 |
6.42 |
5.80 |
|||
|
* Tangible book value per share is calculated by dividing tangible common equity by outstanding shares |
||||||||
|
|
For the Three Months Ended |
For the Year Ended |
||||||
|
Dec. 31, |
Sept. 30, |
June 30, |
March 31, |
Dec. 31, |
Dec. 31, |
Dec. 31, |
||
|
Capital and Liquidity |
2025 |
2025 |
2025 |
2025 |
2024 |
2025 |
2024 |
|
|
Common Equity Tier 1 Capital Ratio (a) |
11.94% |
11.62% |
11.56% |
11.44% |
11.14% |
|||
|
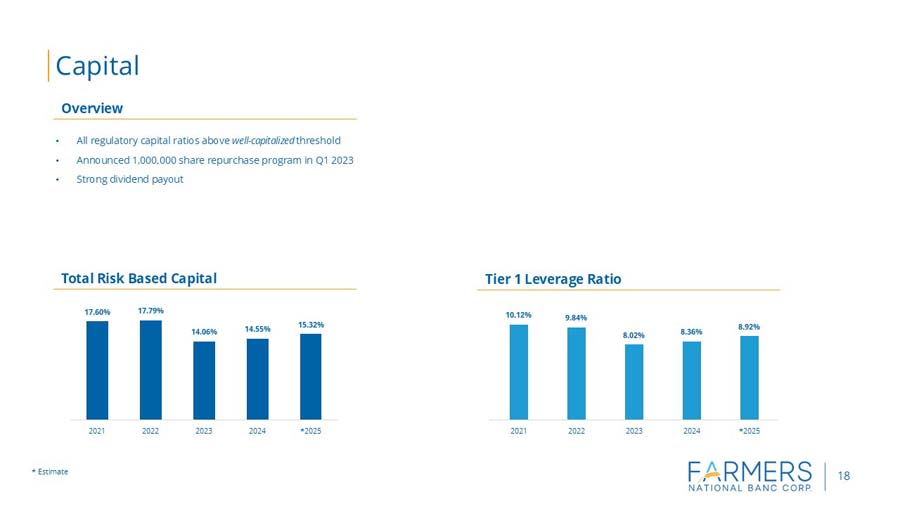
Total Risk Based Capital Ratio (a) |
15.32% |
15.08% |
15.04% |
14.87% |
14.55% |
|||
|
Tier 1 Risk Based Capital Ratio (a) |
12.42% |
12.10% |
12.05% |
11.92% |
11.62% |
|||
|
Tier 1 Leverage Ratio (a) |
8.92% |
8.75% |
8.67% |
8.52% |
8.36% |
|||
|
Equity to Asset Ratio |
9.26% |
8.90% |
8.45% |
8.32% |
7.93% |
|||
|
Tangible Common Equity Ratio (b) |
5.94% |
5.54% |
5.03% |
4.86% |
4.42% |
|||
|
Net Loans to Assets |
62.29% |
63.00% |
63.05% |
62.36% |
63.15% |
|||
|
Loans to Deposits |
76.10% |
75.85% |
75.14% |
72.55% |
76.60% |
|||
|
Asset Quality |
||||||||
|
Non-performing loans |
$26,215 |
$35,344 |
$27,819 |
$20,724 |
$22,818 |
|||
|
Non-performing assets |
26,370 |
35,519 |
28,052 |
20,902 |
22,903 |
|||
|
Loans 30 - 89 days delinquent |
16,947 |
16,083 |
17,727 |
11,192 |
13,032 |
|||
|
Charged-off loans |
5,192 |
869 |
748 |
698 |
928 |
7,507 |
7,987 |
|
|
Recoveries |
295 |
333 |
176 |
362 |
293 |
1,166 |
1,166 |
|
|
Net Charge-offs |
4,897 |
536 |
572 |
336 |
635 |
6,341 |
6,821 |
|
|
Annualized Net Charge-offs to Average Net Loans |
0.59% |
0.07% |
0.07% |
0.04% |
0.08% |
0.19% |
0.21% |
|
|
Allowance for Credit Losses to Total Loans |
1.11% |
1.18% |
1.17% |
1.09% |
1.10% |
|||
|
Non-performing Loans to Total Loans |
0.79% |
1.06% |
0.84% |
0.64% |
0.70% |
|||
|
Loans 30 - 89 Days Delinquent to Total Loans |
0.51% |
0.48% |
0.54% |
0.34% |
0.40% |
|||
|
Allowance to Non-performing Loans |
140.42% |
111.84% |
138.62% |
171.54% |
157.17% |
|||
|
Non-performing Assets to Total Assets |
0.50% |
0.68% |
0.54% |
0.41% |
0.45% |
|||
|
(a) September 30, 2025 ratio is estimated |
||||||||
|
(b) This is a non-GAAP financial measure. A reconciliation to GAAP is shown below |
||||||||
|
For the Three Months Ended |
||||||||
|
Dec. 31, |
Sept. 30, |
June 30, |
March 31, |
Dec. 31, |
||||
|
End of Period Loan Balances |
2025 |
2025 |
2025 |
2025 |
2024 |
|||
|
Commercial real estate |
$1,398,116 |
$1,428,583 |
$1,385,162 |
$1,370,661 |
$1,382,714 |
|||
|
Commercial |
340,224 |
351,213 |
363,009 |
336,600 |
349,966 |
|||
|
Residential real estate |
850,300 |
850,112 |
849,443 |
846,639 |
845,081 |
|||
|
HELOC |
181,544 |
176,609 |
171,312 |
161,991 |
158,014 |
|||
|
Consumer |
257,795 |
251,557 |
253,363 |
257,310 |
259,954 |
|||
|
Agricultural loans |
265,565 |
269,025 |
270,599 |
267,737 |
262,392 |
|||
|
Total, excluding net deferred loan costs |
$3,293,544 |
$3,327,099 |
$3,292,888 |
$3,240,938 |
$3,258,121 |
|||
|
For the Three Months Ended |
||||||||
|
Dec. 31, |
Sept. 30, |
June 30, |
March 31, |
Dec. 31, |
||||
|
End of Period Customer Deposit Balances |
2025 |
2025 |
2025 |
2025 |
2024 |
|||
|
Noninterest-bearing demand |
$994,122 |
$994,604 |
$995,866 |
$979,142 |
$965,507 |
|||
|
Interest-bearing demand |
1,377,520 |
1,443,422 |
1,388,596 |
1,468,424 |
1,366,255 |
|||
|
Money market |
795,631 |
761,788 |
748,770 |
718,083 |
682,558 |
|||
|
Savings |
408,743 |
410,165 |
416,795 |
416,162 |
414,796 |
|||
|
Certificate of deposit |
766,762 |
790,536 |
771,403 |
739,512 |
762,712 |
|||
|
Total customer deposits |
$4,342,778 |
$4,400,515 |
$4,321,430 |
$4,321,323 |
$4,191,828 |
|||
|
Memo: Public funds included in above numbers |
$773,896 |
$867,253 |
$801,561 |
$873,200 |
$766,853 |
|||
|
For the Three Months Ended |
For the Year Ended |
|||||||
|
Dec. 31, |
Sept. 30, |
June 30, |
March 31, |
Dec. 31, |
Dec. 31, |
Dec. 31, |
||
|
Noninterest Income |
2025 |
2025 |
2025 |
2025 |
2024 |
2025 |
2024 |
|
|
Service charges on deposit accounts |
$1,831 |
$1,874 |
$1,749 |
$1,758 |
$1,890 |
$7,212 |
$7,311 |
|
|
Bank owned life insurance income, including death benefits |
891 |
852 |
832 |
810 |
613 |
3,385 |
2,659 |
|
|
Trust fees |
3,079 |
2,745 |
2,596 |
2,641 |
2,700 |
11,061 |
10,099 |
|
|
Insurance agency commissions |
1,567 |
1,395 |
1,828 |
1,741 |
1,273 |
6,531 |
5,472 |
|
|
Security gains (losses), including fair value changes for equity securities |
(7) |
(927) |
36 |
(1,313) |
10 |
(2,211) |
(2,638) |
|
|
Retirement plan consulting fees |
1,009 |
1,060 |
783 |
798 |
719 |
3,650 |
2,637 |
|
|
Investment commissions |
706 |
658 |
721 |
529 |
621 |
2,614 |
2,007 |
|
|
Net gains on sale of loans |
436 |
559 |
329 |
326 |
282 |
1,650 |
1,502 |
|
|
Other mortgage banking fee income (loss), net |
106 |
192 |
27 |
147 |
285 |
472 |
435 |
|
|
Debit card and EFT fees |
1,956 |
2,068 |
2,017 |
1,866 |
2,164 |
7,907 |
7,484 |
|
|
Other noninterest income |
523 |
954 |
1,204 |
1,178 |
856 |
3,859 |
4,748 |
|
|
Total Noninterest Income |
$12,097 |
$11,430 |
$12,122 |
$10,481 |
$11,413 |
$46,130 |
$41,716 |
|
|
For the Three Months Ended |
For the Year Ended |
|||||||
|
Dec. 31, |
Sept. 30, |
June 30, |
March 31, |
Dec. 31, |
Dec. 31, |
Dec. 31, |
||
|
Noninterest Expense |
2025 |
2025 |
2025 |
2025 |
2024 |
2025 |
2024 |
|
|
Salaries and employee benefits |
$15,397 |
$15,992 |
$14,722 |
$16,166 |
$14,424 |
$62,277 |
$58,925 |
|
|
Occupancy and equipment |
4,456 |
4,370 |
4,119 |
4,138 |
4,075 |
17,083 |
15,588 |
|
|
FDIC insurance and state and local taxes |
925 |
1,212 |
1,262 |
1,262 |
1,019 |
4,661 |
5,029 |
|
|
Professional fees |
1,179 |
990 |
1,026 |
1,196 |
785 |
4,391 |
4,317 |
|
|
System conversion / Merger related costs |
925 |
3,123 |
0 |
0 |
92 |
4,048 |
92 |
|
|
Advertising |
449 |
466 |
454 |
456 |
192 |
1,825 |
1,503 |
|
|
Intangible amortization |
711 |
718 |
735 |
735 |
914 |
2,899 |
2,861 |
|
|
Core processing charges |
1,391 |
1,412 |
1,401 |
1,397 |
1,202 |
5,601 |
4,622 |
|
|
Other noninterest expenses |
3,646 |
3,396 |
3,456 |
3,176 |
3,471 |
13,674 |
13,754 |
|
|
Total Noninterest Expense |
$29,079 |
$31,679 |
$27,175 |
$28,526 |
$26,174 |
$116,459 |
$106,691 |
|
|
Average Balance Sheets and Related Yields and Rates |
||||||||
|
(Dollar Amounts in Thousands) |
||||||||
|
Three Months Ended |
Three Months Ended |
|||||||
|
December 31, 2025 |
December 31, 2024 |
|||||||
|
AVERAGE |
YIELD/ |
AVERAGE |
YIELD/ |
|||||
|
BALANCE |
INTEREST (1) |
RATE (1) |
BALANCE |
INTEREST (1) |
RATE (1) |
|||
|
EARNING ASSETS |
||||||||
|
Loans (2) |
$3,317,263 |
$48,750 |
5.88% |
$3,270,825 |
$47,286 |
5.78% |
||
|
Taxable securities |
1,149,570 |
7,546 |
2.63 |
1,119,391 |
6,850 |
2.45 |
||
|
Tax-exempt securities (2) |
361,284 |
2,891 |
3.20 |
379,342 |
2,991 |
3.15 |
||
|
Other investments |
41,956 |
467 |
4.45 |
38,855 |
420 |
4.32 |
||
|
Federal funds sold and other |
66,943 |
397 |
2.37 |
104,289 |
987 |
3.79 |
||
|
Total earning assets |
4,937,016 |
60,051 |
4.87 |
4,912,702 |
58,534 |
4.77 |
||
|
Nonearning assets |
288,481 |
247,199 |
||||||
|
Total assets |
$5,225,497 |
$5,159,901 |
||||||
|
INTEREST-BEARING LIABILITIES |
||||||||
|
Time deposits |
$773,558 |
$6,657 |
3.44% |
$765,674 |
$7,463 |
3.90% |
||
|
Brokered time deposits |
0 |
0 |
0.00 |
74,941 |
822 |
4.39 |
||
|
Savings deposits |
1,195,948 |
4,718 |
1.58 |
1,091,547 |
4,056 |
1.49 |
||
|
Demand deposits - interest bearing |
1,433,266 |
8,074 |
2.25 |
1,419,048 |
8,731 |
2.46 |
||
|
Total interest-bearing deposits |
3,402,772 |
19,449 |
2.29 |
3,351,210 |
21,072 |
2.52 |
||
|
Short term borrowings |
191,054 |
1,957 |
4.10 |
260,369 |
3,105 |
4.77 |
||
|
Long term borrowings |
86,659 |
992 |
4.58 |
86,096 |
993 |
4.61 |
||
|
Total borrowed funds |
277,713 |
2,949 |
4.25 |
346,465 |
4,098 |
4.73 |
||
|
Total interest-bearing liabilities |
3,680,485 |
22,398 |
2.43 |
3,697,675 |
25,170 |
2.72 |
||
|
NONINTEREST-BEARING LIABILITIES AND STOCKHOLDERS' EQUITY |
||||||||
|
Demand deposits - noninterest bearing |
1,014,374 |
973,788 |
||||||
|
Other liabilities |
49,577 |
59,792 |
||||||
|
Stockholders' equity |
481,061 |
428,646 |
||||||
|
TOTAL LIABILITIES AND |
||||||||
|
STOCKHOLDERS' EQUITY |
$5,225,497 |
$5,159,901 |
||||||
|
Net interest income and interest rate spread |
$37,653 |
2.44% |
$33,364 |
2.05% |
||||
|
Net interest margin |
3.05% |
2.72% |
||||||
|
(1) Interest and yields are calculated on a tax-equivalent basis where applicable. |
||||||||
|
(2) For 2025, adjustments of $110,000 and $523,000, respectively, were made to tax equate income on tax exempt loans and tax exempt securities. For 2024, adjustments of $71,000 and $536,000, respectively, were made to tax equate income on tax exempt loans and tax exempt securities. These adjustments were based on a marginal federal income tax rate of 21%, less disallowances. |
||||||||
|
For the Year Ended |
For the Year Ended |
|||||||
|
December 31, 2025 |
December 31, 2024 |
|||||||
|
AVERAGE |
YIELD/ |
AVERAGE |
YIELD/ |
|||||
|
BALANCE |
INTEREST (1) |
RATE (1) |
BALANCE |
INTEREST (1) |
RATE (1) |
|||
|
EARNING ASSETS |
||||||||
|
Loans (2) |
$3,291,482 |
$191,433 |
5.82% |
$3,227,384 |
$186,032 |
5.76% |
||
|
Taxable securities |
1,140,462 |
29,491 |
2.59 |
1,110,905 |
26,838 |
2.42 |
||
|
Tax-exempt securities (2) |
366,464 |
11,676 |
3.19 |
386,643 |
12,165 |
3.15 |
||
|
Other investments |
41,809 |
1,930 |
4.62 |
35,402 |
1,450 |
4.10 |
||
|
Federal funds sold and other |
69,534 |
1,802 |
2.59 |
96,288 |
3,727 |
3.87 |
||
|
Total earning assets |
4,909,751 |
236,332 |
4.81 |
4,856,622 |
230,212 |
4.74 |
||
|
Nonearning assets |
254,563 |
234,297 |
||||||
|
Total assets |
$5,164,314 |
$5,090,919 |
||||||
|
INTEREST-BEARING LIABILITIES |
||||||||
|
Time deposits |
$753,803 |
$26,699 |
3.54% |
$745,945 |
$29,329 |
3.93% |
||
|
Brokered time deposits |
71,529 |
3,112 |
4.35 |
25,389 |
1,108 |
4.36 |
||
|
Savings deposits |
1,158,663 |
17,578 |
1.52 |
1,095,470 |
16,144 |
1.47 |
||
|
Demand deposits - interest bearing |
1,427,654 |
32,389 |
2.27 |
1,396,193 |
34,588 |
2.48 |
||
|
Total interest-bearing deposits |
3,411,649 |
79,778 |
2.34 |
3,262,997 |
81,169 |
2.49 |
||
|
Short term borrowings |
174,170 |
7,591 |
4.36 |
293,488 |
14,105 |
4.81 |
||
|
Long term borrowings |
86,433 |
3,979 |
4.60 |
87,749 |
4,090 |
4.66 |
||
|
Total borrowed funds |
260,603 |
11,570 |
4.44 |
381,237 |
18,195 |
4.77 |
||
|
Total interest-bearing liabilities |
3,672,252 |
91,348 |
2.49 |
3,644,234 |
99,364 |
2.73 |
||
|
NONINTEREST-BEARING LIABILITIES |
||||||||
|
AND STOCKHOLDERS' EQUITY |
||||||||
|
Demand deposits - noninterest bearing |
$998,255 |
981,115 |
||||||
|
Other liabilities |
52,896 |
58,134 |
||||||
|
Stockholders' equity |
440,911 |
407,436 |
||||||
|
TOTAL LIABILITIES AND |
||||||||
|
STOCKHOLDERS' EQUITY |
$5,164,314 |
$5,090,919 |
||||||
|
Net interest income and interest rate spread |
$144,984 |
2.32% |
$130,848 |
2.01% |
||||
|
Net interest margin |
2.95% |
2.69% |
||||||
|
(1) Interest and yields are calculated on a tax-equivalent basis where applicable. |
||||||||
|
(2) For 2025, adjustments of $322,000 and $1.6 million, respectively, were made to tax equate income on tax exempt loans and tax exempt securities. For 2024, adjustments of $228,000 and $1.6 million, respectively, were made to tax equate income on tax exempt loans and tax exempt securities. These adjustments were based on a marginal federal income tax rate of 21%, less disallowances. |
||||||||
|
Reconciliation of Total Assets to Tangible Assets |
For the Three Months Ended |
For the Year Ended |
||||||
|
Dec. 31, |
Sept. 30, |
June 30, |
March 31, |
Dec. 31, |
Dec. 31, |
Dec. 31, |
||
|
2025 |
2025 |
2025 |
2025 |
2024 |
2025 |
2024 |
||
|
Total Assets |
$5,245,870 |
$5,235,575 |
$5,178,428 |
$5,157,040 |
$5,118,924 |
$5,245,870 |
$5,118,924 |
|
|
Less Goodwill and other intangibles |
185,301 |
186,013 |
186,731 |
187,466 |
188,200 |
185,301 |
188,200 |
|
|
Tangible Assets |
$5,060,569 |
$5,049,562 |
$4,991,697 |
$4,969,574 |
$4,930,724 |
$5,060,569 |
$4,930,724 |
|
|
Average Assets |
5,225,497 |
5,178,998 |
5,132,661 |
5,118,767 |
5,159,901 |
5,164,314 |
5,090,919 |
|
|
Less average Goodwill and other intangibles |
186,844 |
186,479 |
187,209 |
187,947 |
188,256 |
186,844 |
189,105 |
|
|
Average Tangible Assets |
$5,038,653 |
$4,992,519 |
$4,945,452 |
$4,930,820 |
$4,971,645 |
$4,977,470 |
$4,901,814 |
|
|
Reconciliation of Common Stockholders' Equity to Tangible Common Equity |
For the Three Months Ended |
For the Year Ended |
||||||
|
Dec. 31, |
Sept. 30, |
June 30, |
March 31, |
Dec. 31, |
Dec. 31, |
Dec. 31, |
||
|
2025 |
2025 |
2025 |
2025 |
2024 |
2025 |
2024 |
||
|
Stockholders' Equity |
$485,725 |
$465,949 |
$437,748 |
$429,134 |
$406,028 |
$485,725 |
$406,028 |
|
|
Less Goodwill and other intangibles |
185,301 |
186,013 |
186,731 |
187,466 |
188,200 |
185,301 |
188,200 |
|
|
Tangible Common Equity |
$300,424 |
$279,936 |
$251,017 |
$241,668 |
$217,828 |
$300,424 |
$217,828 |
|
|
Average Stockholders' Equity |
481,061 |
442,556 |
425,249 |
414,021 |
428,646 |
440,911 |
407,436 |
|
|
Less average Goodwill and other intangibles |
186,844 |
186,479 |
187,209 |
187,947 |
188,256 |
186,844 |
189,105 |
|
|
Average Tangible Common Equity |
$294,217 |
$256,077 |
$238,040 |
$226,074 |
$240,390 |
$254,067 |
$218,331 |
|
|
Reconciliation of Net Income, Less Merger and Certain Items |
For the Three Months Ended |
For the Year Ended |
||||||
|
Dec. 31, |
Sept. 30, |
June 30, |
March 31, |
Dec. 31, |
Dec. 31, |
Dec. 31, |
||
|
2025 |
2025 |
2025 |
2025 |
2024 |
2025 |
2024 |
||
|
Net income |
$14,638 |
$12,461 |
$13,910 |
$13,578 |
$14,391 |
$54,586 |
$45,949 |
|
|
System conversion / Acquisition related costs - after tax |
398 |
2,467 |
0 |
0 |
82 |
2,666 |
82 |
|
|
Net loss (gain) on asset/security sales - after tax |
113 |
760 |
(137) |
1,056 |
70 |
1,793 |
2,120 |
|
|
Net income - Adjusted |
$15,149 |
$15,688 |
$13,773 |
$14,634 |
$14,543 |
$59,045 |
$48,151 |
|
|
Diluted EPS excluding merger and certain items |
$0.40 |
$0.42 |
$0.37 |
$0.39 |
$0.39 |
$1.57 |
$1.28 |
|
|
Return on Average Assets excluding system conversion, merger and certain items (Annualized) |
1.16% |
1.21% |
1.07% |
1.14% |
1.13% |
1.14% |
0.95% |
|
|
Return on Average Equity excluding system conversion, merger and certain items (Annualized) |
12.60% |
14.18% |
12.96% |
14.14% |
13.57% |
13.39% |
11.82% |
|
|
Return on Average Tangible Equity excluding system conversion, merger costs and certain items (Annualized) |
20.60% |
24.51% |
23.14% |
25.89% |
24.20% |
23.24% |
22.05% |
|
|
Efficiency ratio excluding certain items |
For the Three Months Ended |
For the Year Ended |
||||||
|
Dec. 31, |
Sept. 30, |
June 30, |
March 31, |
Dec. 31, |
Dec. 31, |
Dec. 31, |
||
|
2025 |
2025 |
2025 |
2025 |
2024 |
2025 |
2024 |
||
|
Net interest income, tax equated |
$37,653 |
$36,940 |
$35,554 |
$34,837 |
$33,364 |
$144,984 |
$130,848 |
|
|
Noninterest income |
12,097 |
11,430 |
12,122 |
10,481 |
11,413 |
46,130 |
41,716 |
|
|
Net loss (gain) on asset/security sales |
143 |
962 |
(173) |
1,337 |
89 |
2,269 |
2,684 |
|
|
Net interest income and noninterest income adjusted |
49,893 |
49,332 |
47,503 |
46,655 |
44,866 |
193,383 |
175,248 |
|
|
Noninterest expense less intangible amortization |
28,368 |
30,961 |
26,440 |
27,791 |
25,260 |
113,560 |
103,830 |
|
|
System conversion / Acquisition related costs |
925 |
3,123 |
0 |
0 |
92 |
4,048 |
92 |
|
|
Noninterest expense adjusted |
27,443 |
27,838 |
26,440 |
27,791 |
25,168 |
109,512 |
103,738 |
|
|
Efficiency ratio excluding certain items |
55.00% |
56.43% |
55.66% |
59.57% |
56.10% |
56.63% |
59.19% |
|
|
Net interest margin excluding acquisition marks and PPP interest and fees |
For the Three Months Ended |
For the Year Ended |
||||||
|
Dec. 31, |
Sept. 30, |
June 30, |
March 31, |
Dec. 31, |
Dec. 31, |
Dec. 31, |
||
|
2025 |
2025 |
2025 |
2025 |
2024 |
2025 |
2024 |
||
|
Net interest income, tax equated |
$ 37,653 |
$ 36,940 |
$ 35,554 |
$ 34,837 |
$ 33,364 |
$ 144,984 |
$ 130,848 |
|
|
Acquisition marks |
1,894 |
1,677 |
1,731 |
2,151 |
1,953 |
7,453 |
8,837 |
|
|
PPP interest and fees |
0 |
0 |
0 |
0 |
0 |
2 |
2 |
|
|
Adjusted and annualized net interest income |
143,036 |
141,052 |
135,292 |
130,744 |
125,644 |
137,529 |
122,009 |
|
|
Average earning assets |
4,937,016 |
4,922,275 |
4,886,771 |
4,892,311 |
4,912,702 |
4,909,751 |
4,856,622 |
|
|
Less PPP average balances |
87 |
89 |
95 |
105 |
112 |
95 |
153 |
|
|
Adjusted average earning assets |
4,936,929 |
4,922,186 |
4,886,676 |
4,892,206 |
4,912,590 |
4,909,656 |
4,856,469 |
|
|
Net interest margin excluding marks and PPP interest and fees |
2.90% |
2.87% |
2.77% |
2.67% |
2.56% |
2.80% |
2.51% |
|
Exhibit 99.2