|
Virginia
|
001-38817
|
81-2871064
|
|
(State or Other Jurisdiction
of Incorporation)
|
(Commission File Number)
|
(IRS Employer
Identification No.)
|
|
10089 Fairfax Boulevard, Fairfax, VA
|
22030
|
|
|
(Address of Principal Executive Offices)
|
(Zip Code)
|
|
☐
|
Written communications pursuant to Rule 425 under the Securities Act (17 CFR 230.425)
|
|
☐
|
Soliciting material pursuant to Rule 14a-12 under the Exchange Act (17 CFR 240.14a-12)
|
|
☐
|
Pre-commencement communications pursuant to Rule 14d-2(b) under the Exchange Act (17 CFR 240.14d-2(b))
|
|
☐
|
Pre-commencement communications pursuant to Rule 13e-4(c) under the Exchange Act (17 CFR 240.13e-4(c))
|
|
Title of each class
|
Trading
Symbol(s)
|
Name of each exchange on which registered
|
||
|
Common Stock
|
MNSB
|
The Nasdaq Stock Market LLC
|
||
|
Depositary Shares (each representing a 1/40th interest in a share of 7.50% Series A Fixed-Rate Non-Cumulative Perpetual Preferred Stock
|
MNSBP
|
The Nasdaq Stock Market LLC
|
|
Exhibit
Number
|
Description
|
|
|
99.1
|
||
| 99.2 | Investor Presentation dated January 26, 2026 | |
|
104
|
Cover Page Interactive Data File (embedded within the Inline XBRL document).
|
|
MAINSTREET BANCSHARES, INC
|
|||
|
Date: January 26, 2026
|
By:
|
/s/ Richard A. Vari
|
|
|
Name: Richard A. Vari
|
|||
|
Title: Chief Financial Officer
|
|||
Exhibit 99.1
|
PRESS RELEASE |
Contact: Billy Freesmeier |
|
|
January 26, 2026 8:00 AM ET |
Chief of Staff |
|
| (703) 481-4579 | ||
MainStreet Bancshares Inc. Reports a Profitable 2025 and remains focused on serving the Washington, DC Metropolitan Community
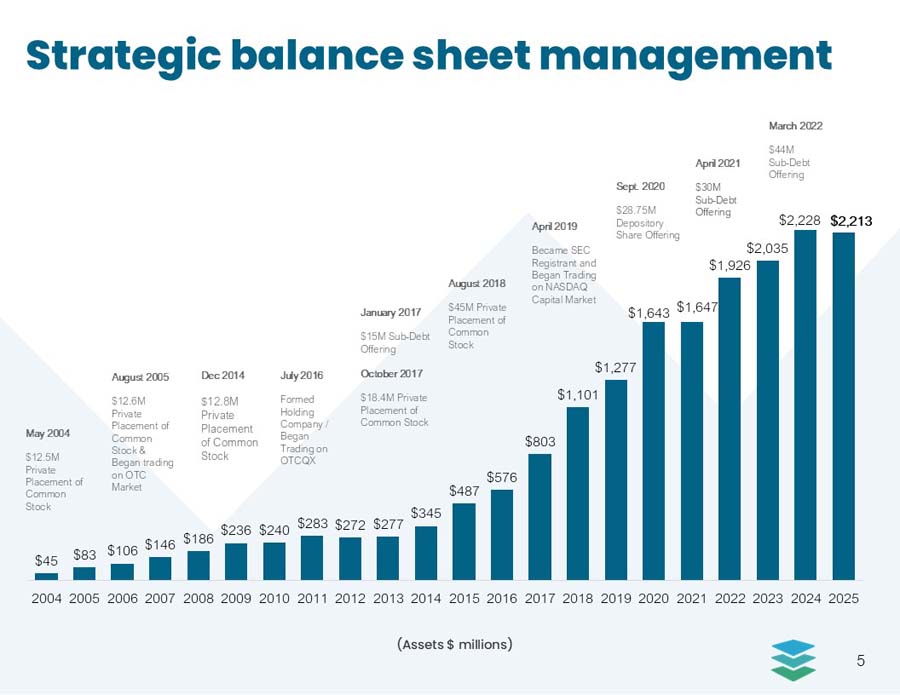
Strategic Balance Sheet Management Yields a Healthy Net Interest Margin
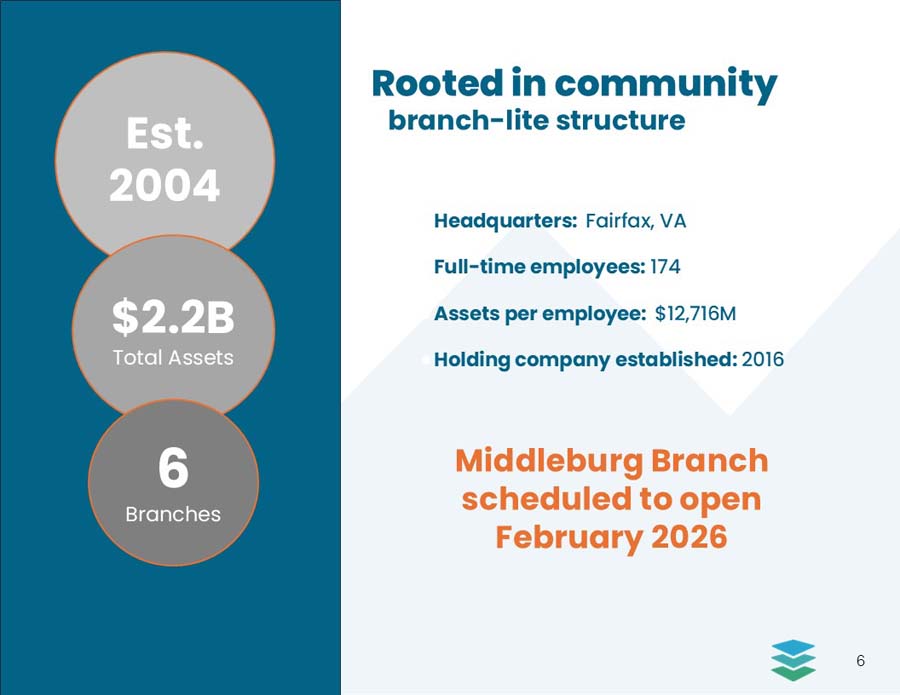
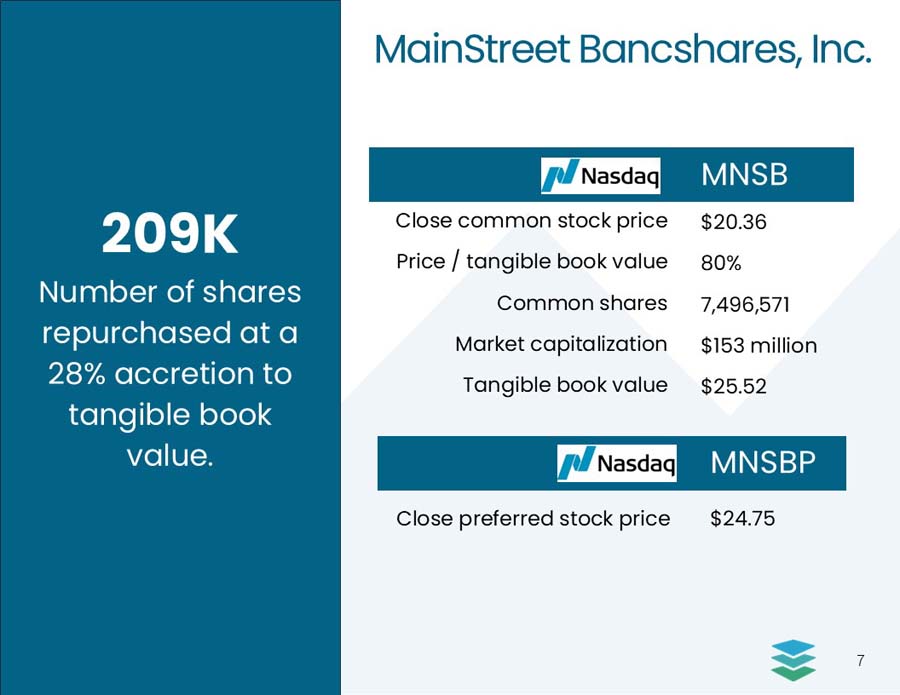
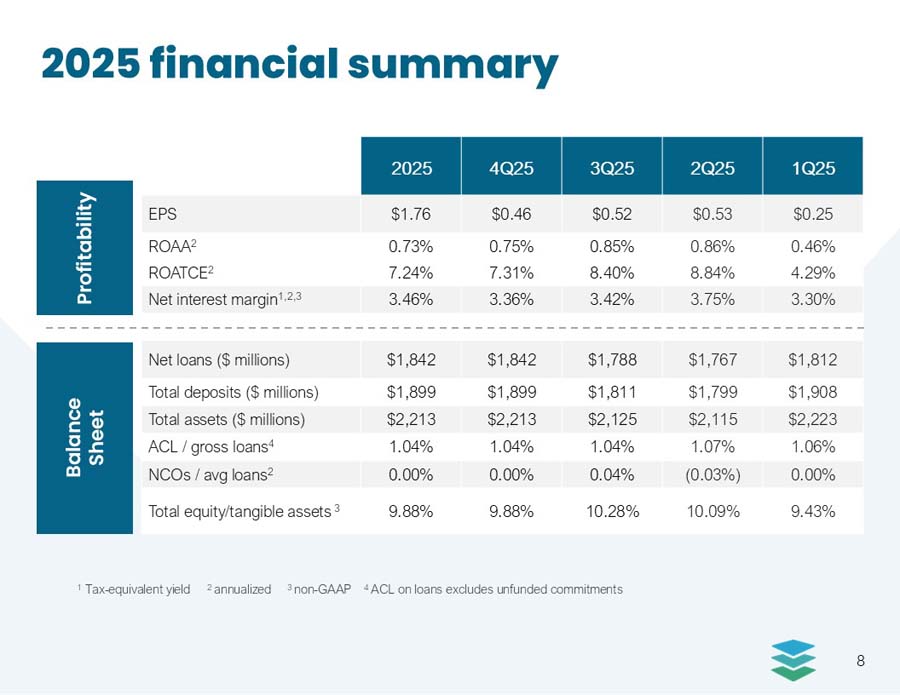
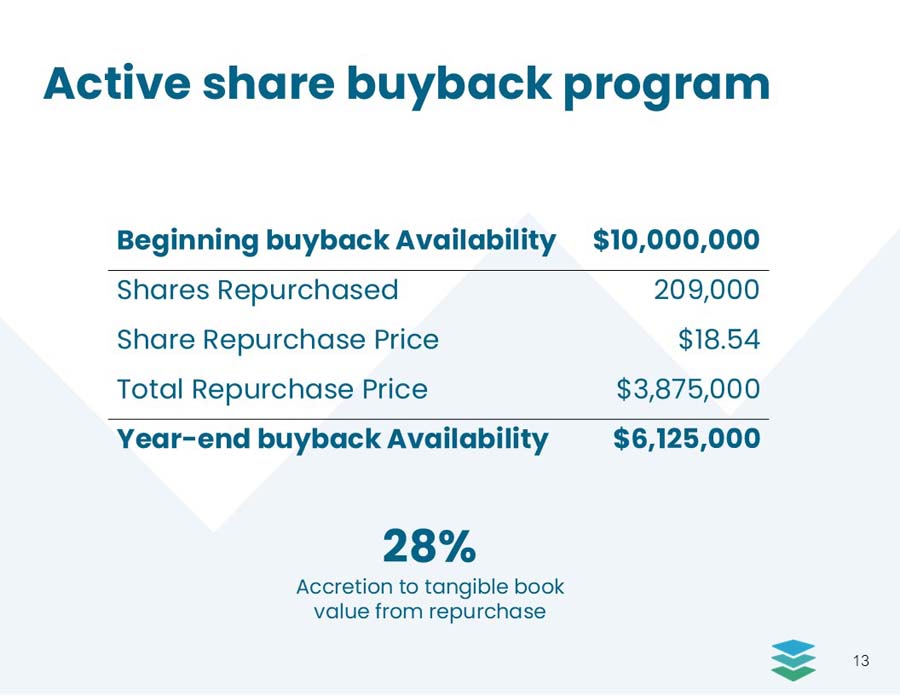
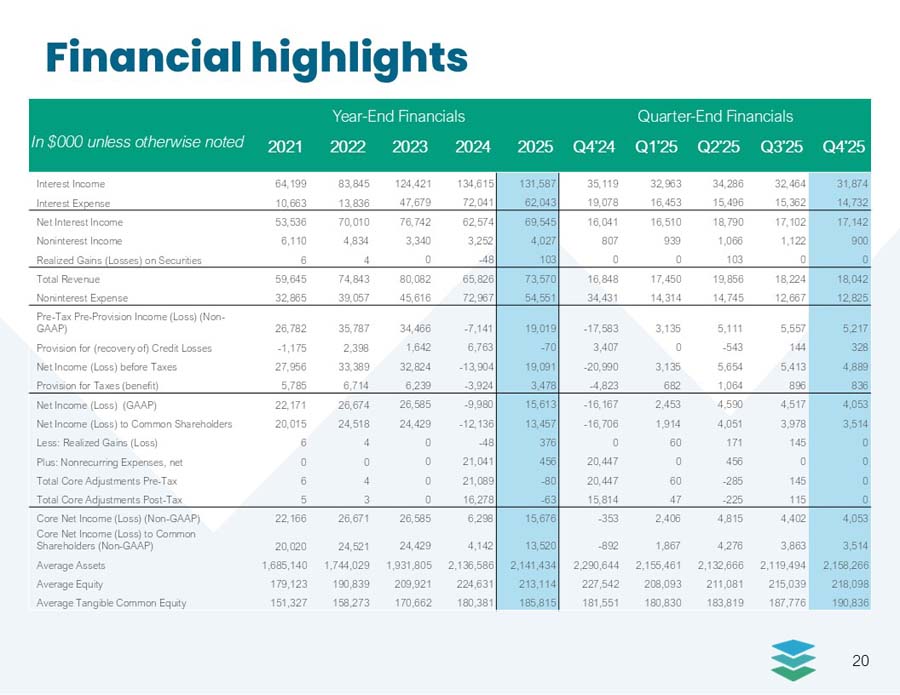
Fairfax, VA., January 26, 2026 – MainStreet Bancshares, Inc. (Nasdaq: MNSB & MNSBP), the financial holding company for MainStreet Bank, reported a net income of $15.6 million for the year-ended December 31, 2025, resulting in earnings per common share of $1.76. The Company executed a buyback of 209,000 shares during the fourth quarter as part of its share buyback plan. The Company and Bank remain strongly capitalized.
“The team delivered quickly on our focused return to core banking,” said Jeff W. Dick, Chairman and CEO of MainStreet Bancshares, Inc. and MainStreet Bank. “We are steadfast in increasing profitability and primed to go forward.”
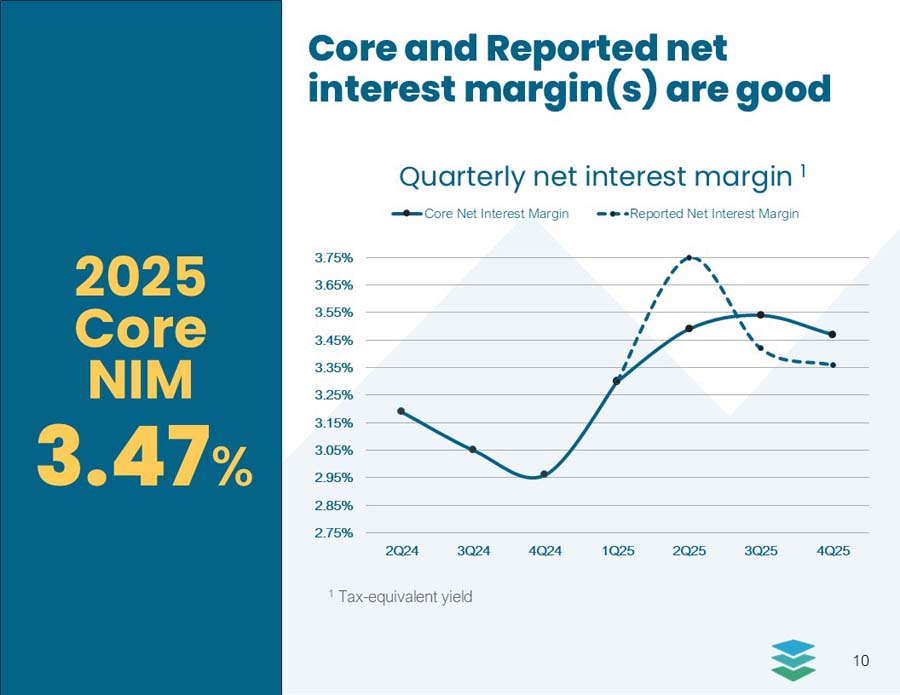
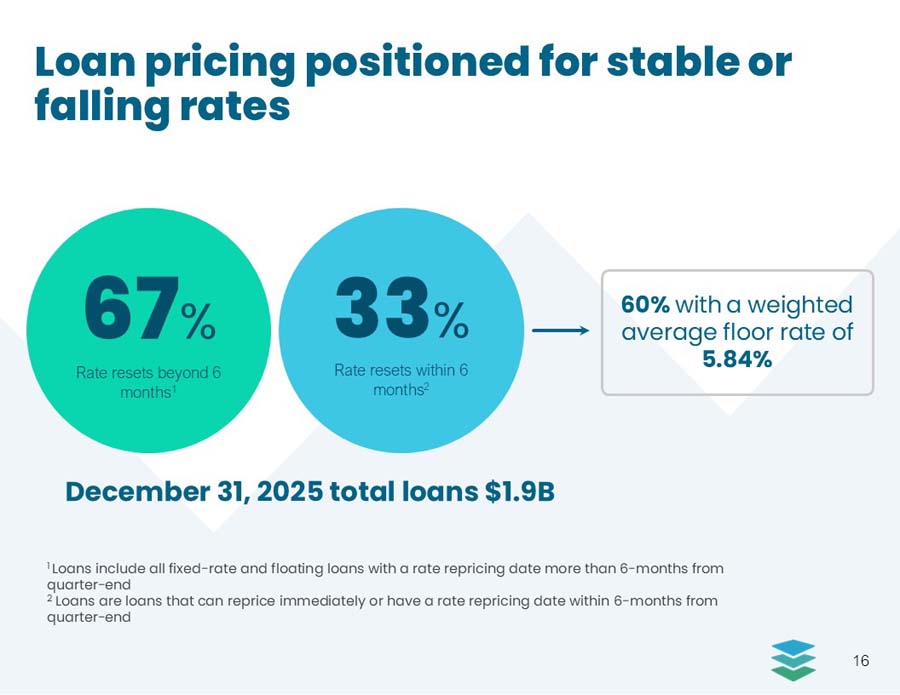
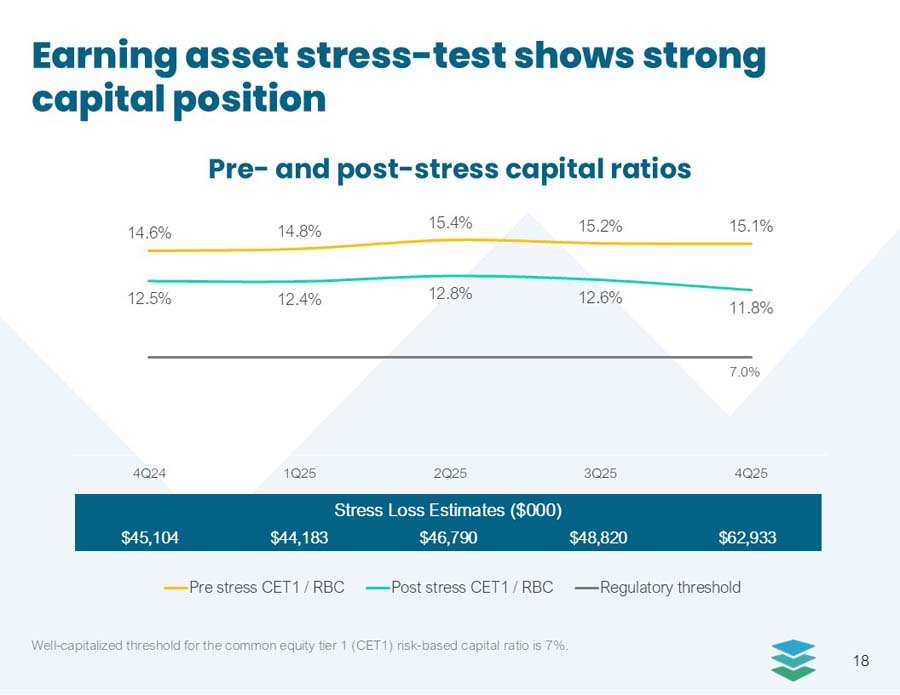
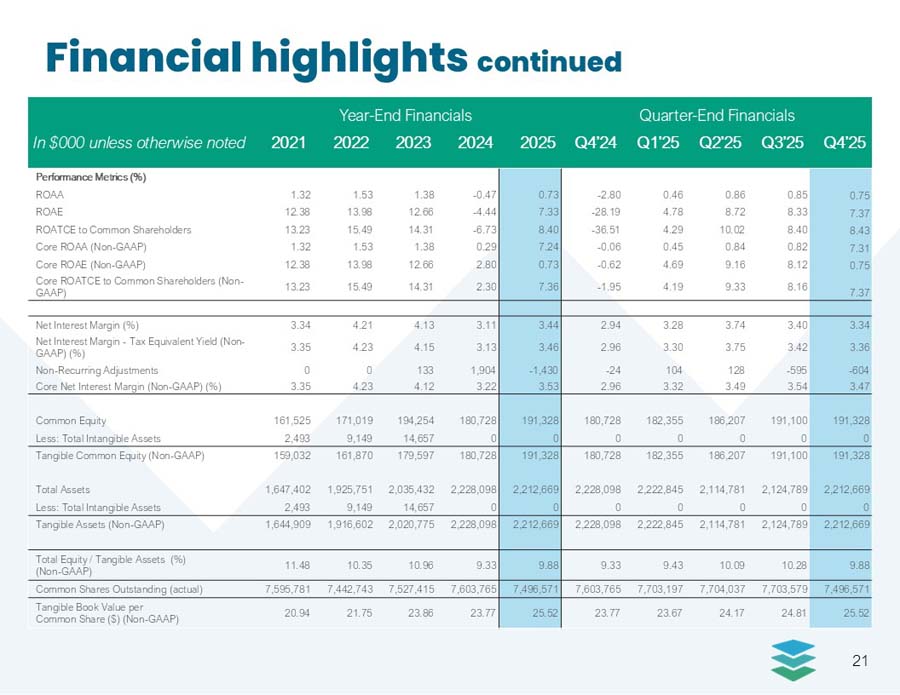
“The net interest margin expanded to 3.46% for 2025, a 33-basis point increase from the previous year,” said Alex Vari, Chief Financial Officer of MainStreet Bancshares, Inc. and MainStreet Bank. “We plan to preserve and grow this strong net interest margin and continue to control our expenses to enhance our future performance. We are laser-focused on building a strong balance sheet and our portfolio is well-positioned for the current and anticipated interest rate environment.”
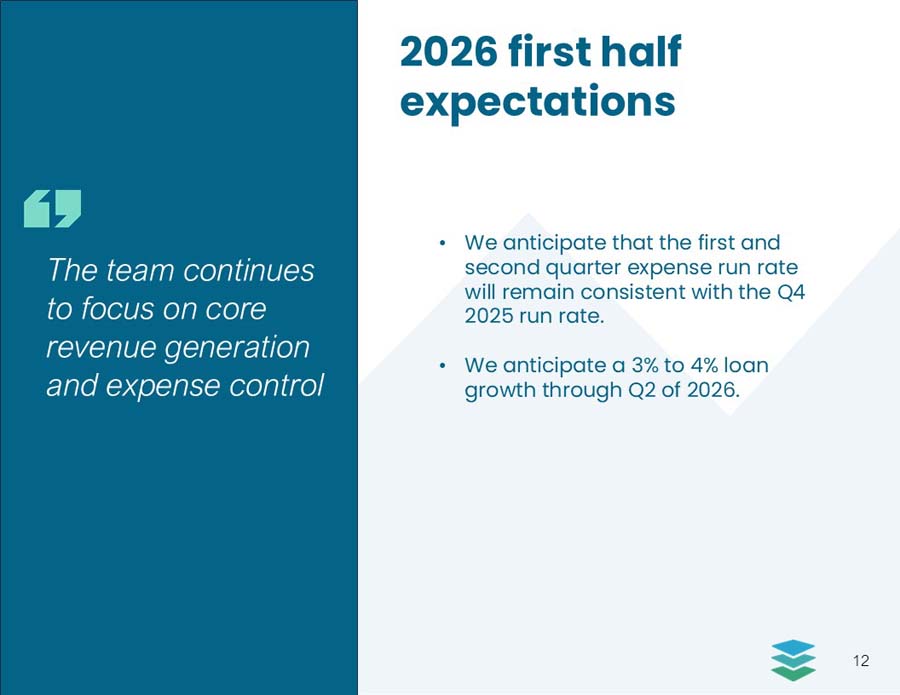
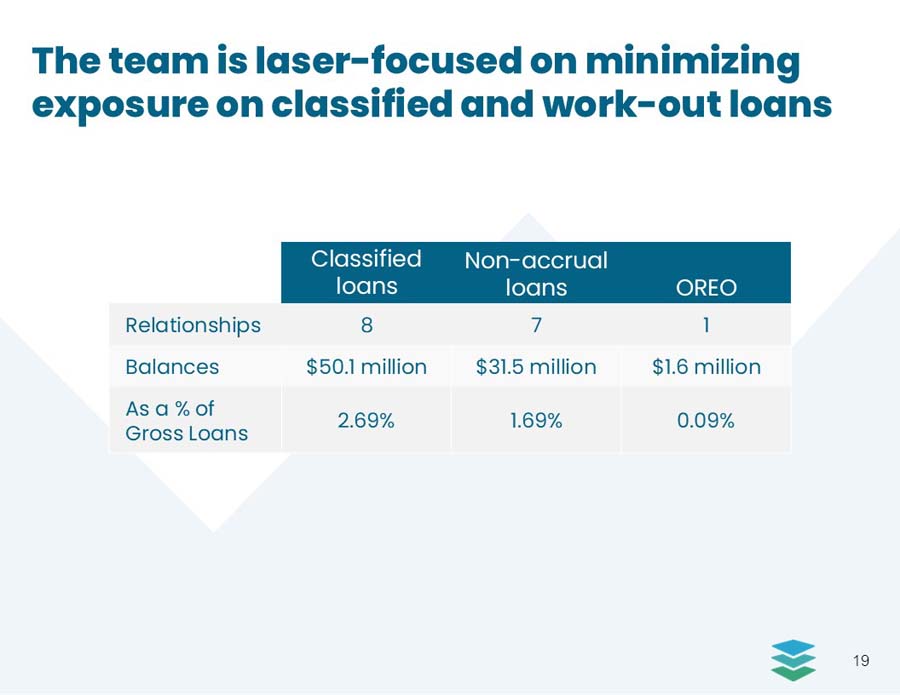
“We continue to prove positive outcomes as we manage our asset quality and grow our loan portfolio,” said Tom Floyd, Chief Lending Officer of MainStreet Bank. “Our team increased gross loans by $54 million in the fourth quarter, and we’re encouraged by the momentum carrying into this year.”
About MainStreet Bank: MainStreet Bank is coming to Middleburg, Virginia in February 2026! Our newest branch will be located at 10 North Pendleton Street, Middleburg, Virginia 20118.
In addition, MainStreet operates six branches in Herndon, Fairfax, McLean, Leesburg, Clarendon, and Washington, D.C. MainStreet Bank has over 55,000 free ATMs and a fully integrated online and mobile banking solution. The Bank is not restricted by a conventional branching system, as it can offer business customers the ability to Put Our Bank in Your Office®. With robust and easy-to-use online business banking technology, MainStreet has "put our bank" in thousands of businesses in the metropolitan area.
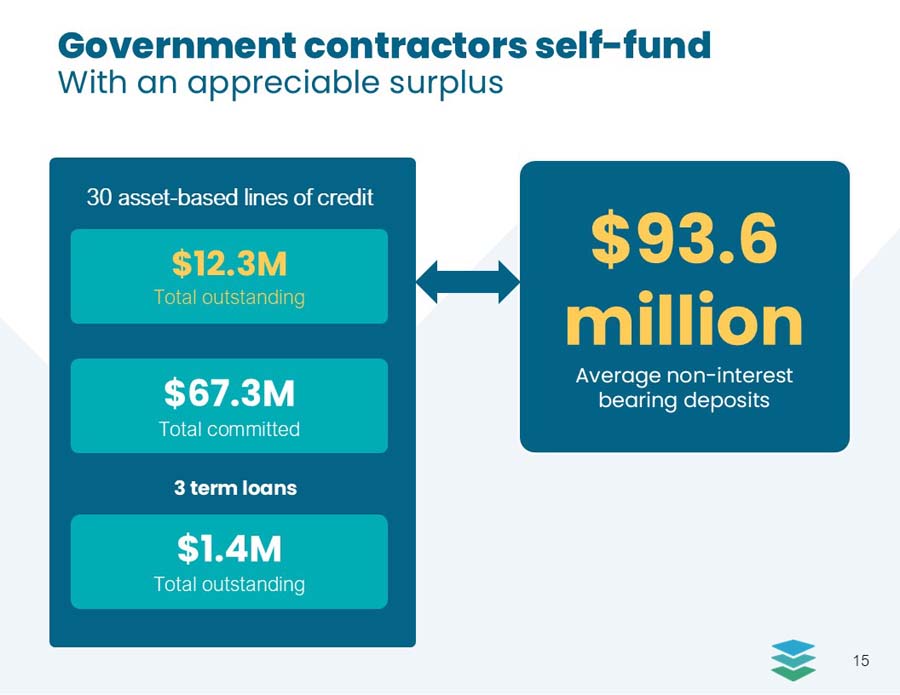
MainStreet Bank has a robust line of business and professional lending products, including government contracting lines of credit, commercial lines and term loans, residential and commercial construction, and commercial real estate. MainStreet also works with the SBA to offer 7A and 504 lending solutions. From sophisticated cash management to enhanced mobile banking and instant-issue Debit cards, MainStreet Bank is always looking for ways to improve our customer's experience.
MainStreet Bank was the first community bank in the Washington, D.C., metropolitan area to offer a full online business banking solution. MainStreet Bank was also the first bank headquartered in the Commonwealth of Virginia to offer CDARS – a solution that provides multi-million-dollar FDIC insurance. Further information on the Bank can be obtained by visiting its website at mstreetbank.com.
This release contains forward-looking statements, including our expectations with respect to future events that are subject to various risks and uncertainties. The statements contained in this release that are not historical facts are forward-looking statements as defined in the Private Securities Litigation Reform Act of 1995. Words such as “may,” “will,” “could,” “should,” “expect,” “plan,” “project,” “intend,” “anticipate,” “believe,” “estimate,” “predict,” “potential,” “pursuant,” “target,” “continue,” and similar expressions are intended to identify such forward-looking statements. Factors that could cause actual results to differ materially from management's projections, forecasts, estimates and expectations include: fluctuation in market rates of interest and loan and deposit pricing, adverse changes in the overall national economy as well as adverse economic conditions in our specific market areas, future impacts of pandemic outbreaks, maintenance and development of well-established and valued client relationships and referral source relationships, and acquisition or loss of key production personnel. We caution readers that the list of factors above is not exclusive. The forward-looking statements are made as of the date of this release, and we may not undertake steps to update the forward-looking statements to reflect the impact of any circumstances or events that arise after the date the forward-looking statements are made. In addition, our past results of operations are not necessarily indicative of future performance.
UNAUDITED CONSOLIDATED BALANCE SHEET INFORMATION
(In thousands)
|
December 31, 2025 |
September 30, 2025 |
June 30, 2025 |
March 31, 2025 |
December 31, 2024* |
||||||||||||||||
|
ASSETS |
||||||||||||||||||||
|
Cash and due from banks |
$ | 25,179 | $ | 23,940 | $ | 20,888 | $ | 18,384 | $ | 21,351 | ||||||||||
|
Interest-bearing deposits at other financial institutions |
1,276 | 1,315 | 864 | 735 | 1,711 | |||||||||||||||
|
Federal funds sold |
136,301 | 102,039 | 111,532 | 183,521 | 184,646 | |||||||||||||||
|
Total cash and cash equivalents |
162,756 | 127,294 | 133,284 | 202,640 | 207,708 | |||||||||||||||
|
Investment securities available for sale (AFS), at fair value |
56,454 | 58,338 | 56,138 | 55,935 | 55,747 | |||||||||||||||
|
Investment securities held to maturity (HTM), at amortized cost, net of allowance for credit losses of $0 for all periods |
15,298 | 14,293 | 14,846 | 15,657 | 16,078 | |||||||||||||||
|
Restricted securities, at amortized cost |
7,005 | 7,005 | 7,005 | 7,005 | 6,873 | |||||||||||||||
|
Loans, net of allowance for credit losses of $19,308, $18,831, $19,057, $19,460, and $19,450, respectively |
1,841,833 | 1,788,243 | 1,767,432 | 1,811,789 | 1,810,556 | |||||||||||||||
|
Premises and equipment, net |
13,530 | 13,212 | 13,344 | 13,020 | 13,287 | |||||||||||||||
|
Other real estate owned, net |
1,697 | — | — | — | — | |||||||||||||||
|
Property held for sale, at fair value |
2,806 | 3,225 | 3,225 | — | — | |||||||||||||||
|
Accrued interest and other receivables |
14,518 | 13,622 | 15,023 | 9,607 | 11,311 | |||||||||||||||
|
Bank owned life insurance |
40,752 | 40,433 | 40,117 | 39,809 | 39,507 | |||||||||||||||
|
Other assets |
56,020 | 59,124 | 64,367 | 67,383 | 67,031 | |||||||||||||||
|
Total Assets |
$ | 2,212,669 | $ | 2,124,789 | $ | 2,114,781 | $ | 2,222,845 | $ | 2,228,098 | ||||||||||
|
LIABILITIES AND STOCKHOLDERS’ EQUITY |
||||||||||||||||||||
|
Liabilities: |
||||||||||||||||||||
|
Non-interest bearing deposits |
$ | 378,694 | $ | 324,717 | $ | 330,045 | $ | 345,319 | $ | 324,307 | ||||||||||
|
Interest-bearing demand deposits |
119,407 | 123,231 | 124,090 | 106,033 | 139,780 | |||||||||||||||
|
Savings and NOW deposits |
121,905 | 125,214 | 116,069 | 124,049 | 64,337 | |||||||||||||||
|
Money market deposits |
499,334 | 458,946 | 463,904 | 511,925 | 560,082 | |||||||||||||||
|
Time deposits |
779,844 | 778,727 | 764,439 | 820,999 | 819,288 | |||||||||||||||
|
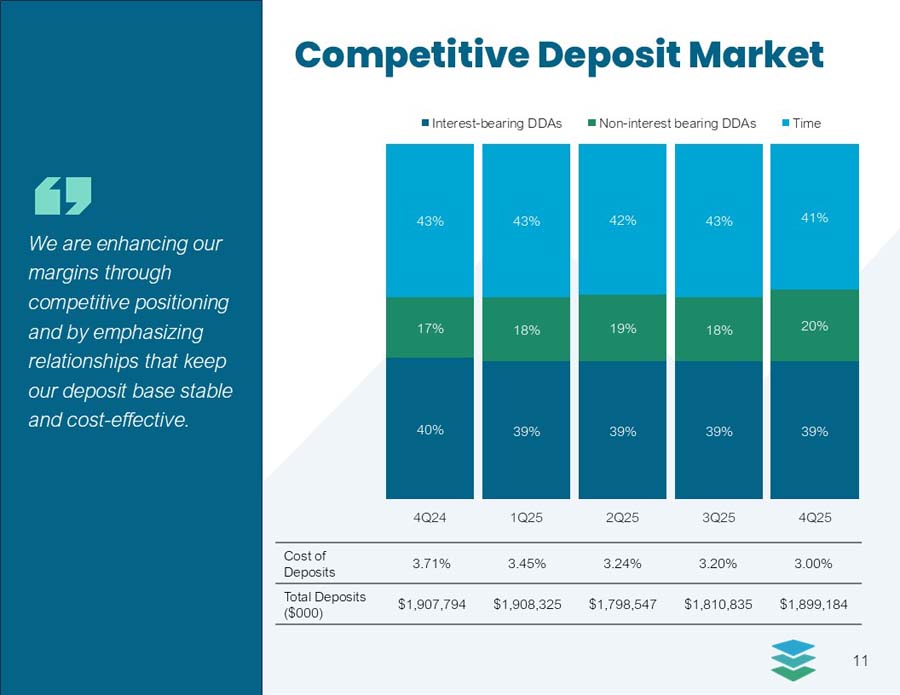
Total deposits |
1,899,184 | 1,810,835 | 1,798,547 | 1,908,325 | 1,907,794 | |||||||||||||||
|
Subordinated debt, net |
69,936 | 69,837 | 71,238 | 72,138 | 73,039 | |||||||||||||||
|
Other liabilities |
24,958 | 25,754 | 31,526 | 32,764 | 39,274 | |||||||||||||||
|
Total Liabilities |
1,994,078 | 1,906,426 | 1,901,311 | 2,013,227 | 2,020,107 | |||||||||||||||
|
Stockholders’ Equity: |
||||||||||||||||||||
|
Preferred stock |
27,263 | 27,263 | 27,263 | 27,263 | 27,263 | |||||||||||||||
|
Common stock |
29,008 | 29,833 | 29,825 | 29,810 | 29,466 | |||||||||||||||
|
Capital surplus |
66,531 | 68,895 | 68,261 | 67,612 | 67,823 | |||||||||||||||
|
Retained earnings |
101,557 | 98,793 | 95,585 | 92,305 | 91,150 | |||||||||||||||
|
Accumulated other comprehensive loss |
(5,768 | ) | (6,421 | ) | (7,464 | ) | (7,372 | ) | (7,711 | ) | ||||||||||
|
Total Stockholders’ Equity |
218,591 | 218,363 | 213,470 | 209,618 | 207,991 | |||||||||||||||
|
Total Liabilities and Stockholders’ Equity |
$ | 2,212,669 | $ | 2,124,789 | $ | 2,114,781 | $ | 2,222,845 | $ | 2,228,098 | ||||||||||
*Derived from audited financial statements
UNAUDITED CONSOLIDATED STATEMENTS OF INCOME (LOSS) INFORMATION
(In thousands, except share and per share data)
|
Year-to-Date |
Three Months Ended |
|||||||||||||||||||||||||||
|
December 31, 2025 |
December 31, 2024* |
December 31, 2025 |
September 30, 2025 |
June 30, 2025 |
March 31, 2025 |
December 31, 2024 |
||||||||||||||||||||||
|
INTEREST INCOME: |
||||||||||||||||||||||||||||
|
Interest and fees on loans |
$ | 124,211 | $ | 125,177 | $ | 29,969 | $ | 30,688 | $ | 32,443 | $ | 31,111 | $ | 31,323 | ||||||||||||||
|
Interest on investment securities |
||||||||||||||||||||||||||||
|
Taxable securities |
1,707 | 1,693 | 421 | 435 | 431 | 420 | 431 | |||||||||||||||||||||
|
Tax-exempt securities |
1,076 | 1,093 | 276 | 270 | 267 | 263 | 262 | |||||||||||||||||||||
|
Interest on interest-bearing deposits at other financial institutions |
54 | 41 | 10 | 11 | 10 | 22 | 15 | |||||||||||||||||||||
|
Interest on federal funds sold |
4,540 | 6,611 | 1,198 | 1,060 | 1,135 | 1,147 | 3,088 | |||||||||||||||||||||
|
Total interest income |
131,588 | 134,615 | 31,874 | 32,464 | 34,286 | 32,963 | 35,119 | |||||||||||||||||||||
|
INTEREST EXPENSE: |
||||||||||||||||||||||||||||
|
Interest on interest-bearing demand deposits |
4,187 | 8,661 | 1,064 | 1,071 | 1,004 | 1,048 | 2,612 | |||||||||||||||||||||
|
Interest on savings and NOW deposits |
1,469 | 754 | 390 | 467 | 391 | 221 | 201 | |||||||||||||||||||||
|
Interest on money market deposits |
18,852 | 21,386 | 4,246 | 4,623 | 4,707 | 5,276 | 5,475 | |||||||||||||||||||||
|
Interest on time deposits |
34,239 | 37,364 | 8,244 | 8,369 | 8,595 | 9,031 | 10,003 | |||||||||||||||||||||
|
Interest on federal funds purchased |
93 | 575 | — | 28 | — | 65 | — | |||||||||||||||||||||
|
Interest on Federal Home Loan Bank advances |
— | 46 | — | — | — | — | — | |||||||||||||||||||||
|
Interest on subordinated debt |
3,203 | 3,255 | 788 | 804 | 799 | 812 | 787 | |||||||||||||||||||||
|
Total interest expense |
62,043 | 72,041 | 14,732 | 15,362 | 15,496 | 16,453 | 19,078 | |||||||||||||||||||||
|
Net interest income |
69,545 | 62,574 | 17,142 | 17,102 | 18,790 | 16,510 | 16,041 | |||||||||||||||||||||
|
Provision for credit losses |
(70 | ) | 6,763 | 328 | 144 | (543 | ) | — | 3,407 | |||||||||||||||||||
|
Net interest income after provision for credit losses |
69,615 | 55,811 | 16,814 | 16,958 | 19,333 | 16,510 | 12,634 | |||||||||||||||||||||
|
NON-INTEREST INCOME: |
||||||||||||||||||||||||||||
|
Deposit account service charges |
2,184 | 1,996 | 559 | 557 | 538 | 530 | 481 | |||||||||||||||||||||
|
Bank owned life insurance income |
1,245 | 1,189 | 319 | 316 | 308 | 302 | 304 | |||||||||||||||||||||
|
Gain on retirement of subordinated debt |
273 | — | — | 145 | 68 | 60 | — | |||||||||||||||||||||
|
Gain on equity securities |
103 | — | — | — | 103 | — | — | |||||||||||||||||||||
|
Net loss on securities called or matured |
— | (48 | ) | — | — | — | — | — | ||||||||||||||||||||
|
Other non-interest income |
222 | 115 | 22 | 104 | 49 | 47 | 22 | |||||||||||||||||||||
|
Total non-interest income |
4,027 | 3,252 | 900 | 1,122 | 1,066 | 939 | 807 | |||||||||||||||||||||
|
NON-INTEREST EXPENSES: |
||||||||||||||||||||||||||||
|
Salaries and employee benefits |
31,587 | 30,475 | 7,557 | 7,366 | 8,279 | 8,385 | 8,253 | |||||||||||||||||||||
|
Furniture and equipment expenses |
3,840 | 3,636 | 884 | 799 | 1,141 | 1,016 | 830 | |||||||||||||||||||||
|
Advertising and marketing |
2,051 | 2,199 | 469 | 571 | 530 | 481 | 600 | |||||||||||||||||||||
|
Occupancy expenses |
1,407 | 1,614 | 293 | 400 | 318 | 396 | 358 | |||||||||||||||||||||
|
Outside services |
3,776 | 3,627 | 688 | 625 | 1,290 | 1,173 | 1,168 | |||||||||||||||||||||
|
Administrative expenses |
996 | 929 | 238 | 259 | 270 | 229 | 243 | |||||||||||||||||||||
|
Computer software intangible impairment |
— | 19,721 | — | — | — | — | 19,721 | |||||||||||||||||||||
|
Other operating expenses |
10,894 | 10,766 | 2,696 | 2,647 | 2,917 | 2,634 | 3,258 | |||||||||||||||||||||
|
Total non-interest expenses |
54,551 | 72,967 | 12,825 | 12,667 | 14,745 | 14,314 | 34,431 | |||||||||||||||||||||
|
Income (loss) before income tax expense (benefit) |
19,091 | (13,904 | ) | 4,889 | 5,413 | 5,654 | 3,135 | (20,990 | ) | |||||||||||||||||||
|
Income tax expense (benefit) |
3,478 | (3,924 | ) | 836 | 896 | 1,064 | 682 | (4,823 | ) | |||||||||||||||||||
|
Net income (loss) |
15,613 | (9,980 | ) | 4,053 | 4,517 | 4,590 | 2,453 | (16,167 | ) | |||||||||||||||||||
|
Preferred stock dividends |
2,156 | 2,156 | 539 | 539 | 539 | 539 | 539 | |||||||||||||||||||||
|
Net income (loss) available to common shareholders |
$ | 13,457 | $ | (12,136 | ) | $ | 3,514 | $ | 3,978 | $ | 4,051 | $ | 1,914 | $ | (16,706 | ) | ||||||||||||
|
Earnings (loss) per common share, basic and diluted |
$ | 1.76 | $ | (1.60 | ) | $ | 0.46 | $ | 0.52 | $ | 0.53 | $ | 0.25 | $ | (2.20 | ) | ||||||||||||
|
Weighted average number of common shares, basic and diluted |
7,652,504 | 7,606,391 | 7,564,723 | 7,704,639 | 7,704,677 | 7,636,191 | 7,603,318 | |||||||||||||||||||||
*Derived from audited financial statements
UNAUDITED LOAN, DEPOSIT AND BORROWING DETAIL
(In thousands)
|
December 31, 2025 |
September 30, 2025 |
December 31, 2024 |
Percentage Change |
|||||||||||||||||||||||||||||
|
$ Amount |
% of Total |
$ Amount |
% of Total |
$ Amount |
% of Total |
Last 3 Mos |
Last 12 Mos |
|||||||||||||||||||||||||
|
LOANS: |
||||||||||||||||||||||||||||||||
|
Construction and land development loans |
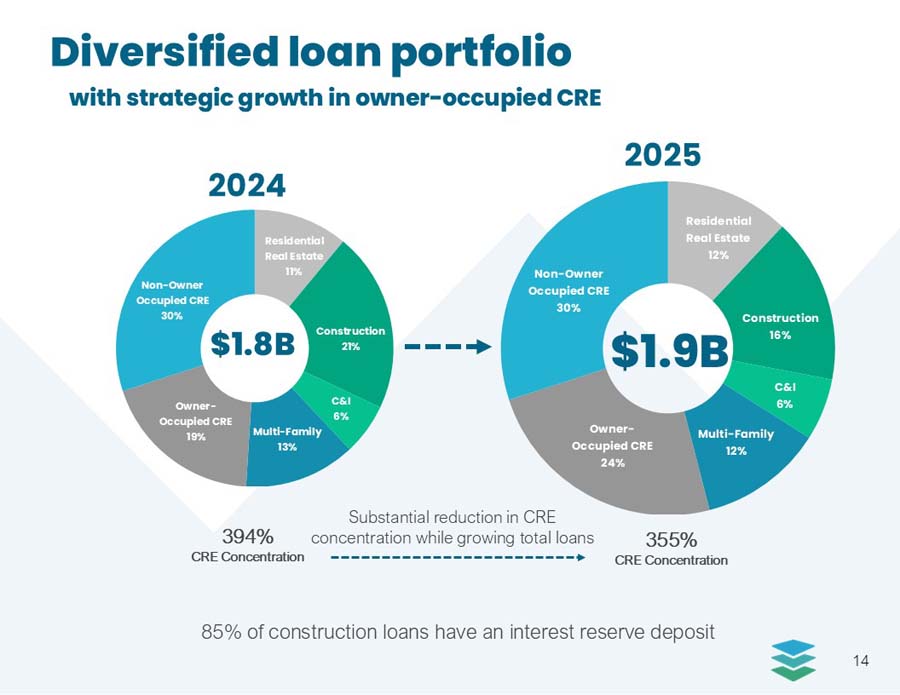
$ | 300,666 | 16.1 | % | $ | 312,318 | 17.2 | % | $ | 391,253 | 21.3 | % | -3.7 | % | -23.2 | % | ||||||||||||||||
|
Residential real estate loans |
441,578 | 23.7 | % | 411,592 | 22.7 | % | 438,745 | 23.9 | % | 7.3 | % | 0.6 | % | |||||||||||||||||||
|
Commercial real estate loans |
1,014,933 | 54.4 | % | 981,091 | 54.2 | % | 898,204 | 48.9 | % | 3.4 | % | 13.0 | % | |||||||||||||||||||
|
Commercial and industrial loans |
106,990 | 5.7 | % | 105,217 | 5.8 | % | 105,212 | 5.7 | % | 1.7 | % | 1.7 | % | |||||||||||||||||||
|
Consumer loans |
1,148 | 0.1 | % | 1,204 | 0.1 | % | 1,574 | 0.2 | % | -4.7 | % | -27.1 | % | |||||||||||||||||||
|
Total Gross Loans |
$ | 1,865,315 | 100.0 | % | $ | 1,811,422 | 100.0 | % | $ | 1,834,988 | 100.0 | % | 3.0 | % | 1.7 | % | ||||||||||||||||
|
Less: Allowance for credit losses |
(19,308 | ) | (18,831 | ) | (19,450 | ) | ||||||||||||||||||||||||||
|
Net deferred loan fees |
(4,174 | ) | (4,348 | ) | (4,982 | ) | ||||||||||||||||||||||||||
|
Net Loans |
$ | 1,841,833 | $ | 1,788,243 | $ | 1,810,556 | ||||||||||||||||||||||||||
|
DEPOSITS: |
||||||||||||||||||||||||||||||||
|
Non-interest bearing deposits |
$ | 378,694 | 20.0 | % | $ | 324,717 | 17.9 | % | $ | 324,307 | 17.0 | % | 16.6 | % | 16.8 | % | ||||||||||||||||
|
Interest-bearing deposits: |
||||||||||||||||||||||||||||||||
|
Demand deposits |
119,407 | 6.3 | % | 123,231 | 6.8 | % | 139,780 | 7.3 | % | -3.1 | % | -14.6 | % | |||||||||||||||||||
|
Savings and NOW deposits |
121,905 | 6.4 | % | 125,214 | 6.9 | % | 64,337 | 3.4 | % | -2.6 | % | 89.5 | % | |||||||||||||||||||
|
Money market deposits |
499,334 | 26.3 | % | 458,946 | 25.3 | % | 560,082 | 29.4 | % | 8.8 | % | -10.8 | % | |||||||||||||||||||
|
Time deposit $250,000 or more |
490,594 | 25.8 | % | 501,332 | 27.8 | % | 535,676 | 28.0 | % | -2.1 | % | -8.4 | % | |||||||||||||||||||
|
Time deposit less than $250,000 |
289,250 | 15.2 | % | 277,395 | 15.3 | % | 283,612 | 14.9 | % | 4.3 | % | 2.0 | % | |||||||||||||||||||
|
Total Deposits |
$ | 1,899,184 | 100.0 | % | $ | 1,810,835 | 100.0 | % | $ | 1,907,794 | 100.0 | % | 4.9 | % | -0.5 | % | ||||||||||||||||
|
BORROWINGS: |
||||||||||||||||||||||||||||||||
|
Subordinated debt, net |
$ | 69,936 | 100.0 | % | $ | 69,837 | 100.0 | % | $ | 73,039 | 100.0 | % | 0.1 | % | -4.2 | % | ||||||||||||||||
|
Total Borrowings |
$ | 69,936 | 100.0 | % | $ | 69,837 | 100.0 | % | $ | 73,039 | 100.0 | % | 0.1 | % | -4.2 | % | ||||||||||||||||
|
Total Deposits and Borrowings |
$ | 1,969,120 | $ | 1,880,672 | $ | 1,980,833 | 4.7 | % | -0.6 | % | ||||||||||||||||||||||
|
Core customer funding sources (1) |
$ | 1,400,678 | 71.1 | % | $ | 1,289,952 | 68.6 | % | $ | 1,439,657 | 72.7 | % | 8.6 | % | -2.7 | % | ||||||||||||||||
|
Brokered and listing service sources (2) |
498,506 | 25.3 | % | 520,883 | 27.7 | % | 468,137 | 23.6 | % | -4.3 | % | 6.5 | % | |||||||||||||||||||
|
Subordinated debt, net (3) |
69,936 | 3.6 | % | 69,837 | 3.7 | % | 73,039 | 3.7 | % | 0.1 | % | -4.2 | % | |||||||||||||||||||
|
Total Funding Sources |
$ | 1,969,120 | 100.0 | % | $ | 1,880,672 | 100.0 | % | $ | 1,980,833 | 100.0 | % | 4.7 | % | -0.6 | % | ||||||||||||||||
|
(1) |
Includes ICS, CDARS, and reciprocal deposits maintained by customers, which represent sweep accounts tied to customer operating accounts. |
|
(2) |
Consists of certificates of deposit (CD) through multiple listing services and multiple brokered deposit services, as well as ICS and CDARS one-way certificates of deposit and regional money market accounts. Excludes $145.2 million in core deposits placed in reciprocal networks for FDIC insurance coverage that will be classified as brokered deposits on the call report in pursuant to rule 12 CFR 337.6(e) as of December 31, 2025. |
|
(3) |
Subordinated debt obligation qualifies as Tier 2 capital at the holding company and Tier 1 capital at the Bank. |
UNAUDITED AVERAGE BALANCE SHEETS, INTEREST AND RATES
(In thousands)
|
For the three months ended December 31, 2025 |
For the three months ended December 31, 2024 |
|||||||||||||||||||||||
|
Average Balance |
Interest Income/ Expense (3)(4) |
Average Yields/ Rate (annualized) (3)(4) |
Average Balance |
Interest Income/ Expense (3)(4) |
Average Yields/ Rate (annualized) (3)(4) |
|||||||||||||||||||
|
ASSETS: |
||||||||||||||||||||||||
|
Interest-earning assets: |
||||||||||||||||||||||||
|
Loans (1)(2) |
$ | 1,819,614 | $ | 29,969 | 6.53 | % | $ | 1,808,894 | $ | 31,323 | 6.87 | % | ||||||||||||
|
Securities: |
||||||||||||||||||||||||
|
Taxable |
50,844 | 421 | 3.29 | % | 53,566 | 431 | 3.19 | % | ||||||||||||||||
|
Tax-exempt |
35,631 | 349 | 3.89 | % | 35,512 | 332 | 3.71 | % | ||||||||||||||||
|
Interest-bearing deposits at other financial institutions |
1,044 | 10 | 3.80 | % | 1,272 | 15 | 4.68 | % | ||||||||||||||||
|
Federal funds sold |
127,376 | 1,198 | 3.73 | % | 262,323 | 3,088 | 4.67 | % | ||||||||||||||||
|
Total interest-earning assets |
$ | 2,034,509 | $ | 31,947 | 6.23 | % | $ | 2,161,567 | $ | 35,189 | 6.46 | % | ||||||||||||
|
Other assets |
123,757 | 129,077 | ||||||||||||||||||||||
|
Total assets |
$ | 2,158,266 | $ | 2,290,644 | ||||||||||||||||||||
|
Liabilities and Stockholders’ Equity: |
||||||||||||||||||||||||
|
Interest-bearing liabilities: |
||||||||||||||||||||||||
|
Interest-bearing demand deposits |
$ | 125,673 | $ | 1,064 | 3.36 | % | $ | 231,496 | $ | 2,612 | 4.48 | % | ||||||||||||
|
Savings and NOW deposits |
121,401 | 390 | 1.27 | % | 64,112 | 201 | 1.24 | % | ||||||||||||||||
|
Money market deposits |
467,891 | 4,246 | 3.60 | % | 514,235 | 5,475 | 4.22 | % | ||||||||||||||||
|
Time deposits |
786,801 | 8,244 | 4.16 | % | 809,924 | 10,003 | 4.90 | % | ||||||||||||||||
|
Total interest-bearing deposits |
$ | 1,501,766 | $ | 13,944 | 3.68 | % | $ | 1,619,767 | $ | 18,291 | 4.48 | % | ||||||||||||
|
Federal funds purchased |
2 | — | — | 2 | — | — | ||||||||||||||||||
|
Subordinated debt, net |
69,898 | 788 | 4.47 | % | 73,001 | 787 | 4.28 | % | ||||||||||||||||
|
Total interest-bearing liabilities |
$ | 1,571,666 | $ | 14,732 | 3.72 | % | $ | 1,692,770 | $ | 19,078 | 4.47 | % | ||||||||||||
|
Demand deposits and other liabilities |
368,502 | 370,332 | ||||||||||||||||||||||
|
Total liabilities |
$ | 1,940,168 | $ | 2,063,102 | ||||||||||||||||||||
|
Stockholders’ Equity |
218,098 | 227,542 | ||||||||||||||||||||||
|
Total Liabilities and Stockholders’ Equity |
$ | 2,158,266 | $ | 2,290,644 | ||||||||||||||||||||
|
Interest Rate Spread |
2.51 | % | 1.99 | % | ||||||||||||||||||||
|
Net Interest Income |
$ | 17,215 | $ | 16,111 | ||||||||||||||||||||
|
Net Interest Margin |
3.36 | % | 2.96 | % | ||||||||||||||||||||
|
(1) |
Includes loans classified as non-accrual |
|
(2) |
Total loan interest income includes amortization of deferred loan fees, net of deferred loan costs |
| (3) | Income and yields for all periods presented are reported on a tax-equivalent basis using the federal statutory rate of 21% |
|
(4) |
Refer to "Unaudited Reconciliation of Certain Non-GAAP Financial Measures" for reconciliation of non-GAAP measures |
UNAUDITED AVERAGE BALANCE SHEETS, INTEREST AND RATES
(In thousands)
|
For the year ended December 31, 2025 |
For the year ended December 31, 2024 |
|||||||||||||||||||||||
|
Average Balance |
Interest Income/ Expense (3)(4) |
Average Yields/ Rate (annualized) (3)(4) |
Average Balance |
Interest Income/ Expense (3)(4) |
Average Yields/ Rate (annualized) (3)(4) |
|||||||||||||||||||
|
ASSETS: |
||||||||||||||||||||||||
|
Interest-earning assets: |
||||||||||||||||||||||||
|
Loans (1)(2) |
$ | 1,820,481 | $ | 124,211 | 6.82 | % | $ | 1,782,061 | $ | 125,177 | 7.02 | % | ||||||||||||
|
Securities: |
||||||||||||||||||||||||
|
Taxable |
52,401 | 1,707 | 3.26 | % | 54,935 | 1,693 | 3.08 | % | ||||||||||||||||
|
Tax-exempt |
35,382 | 1,362 | 3.85 | % | 36,379 | 1,384 | 3.80 | % | ||||||||||||||||
|
Interest-bearing deposits at other financial institutions |
1,216 | 54 | 4.44 | % | 815 | 41 | 5.03 | % | ||||||||||||||||
|
Federal funds sold |
111,144 | 4,540 | 4.08 | % | 136,258 | 6,611 | 4.85 | % | ||||||||||||||||
|
Total interest-earning assets |
$ | 2,020,624 | $ | 131,874 | 6.53 | % | $ | 2,010,448 | $ | 134,906 | 6.71 | % | ||||||||||||
|
Other assets |
120,810 | 126,138 | ||||||||||||||||||||||
|
Total assets |
$ | 2,141,434 | $ | 2,136,586 | ||||||||||||||||||||
|
Liabilities and Stockholders’ Equity: |
||||||||||||||||||||||||
|
Interest-bearing liabilities: |
||||||||||||||||||||||||
|
Interest-bearing demand deposits |
$ | 117,493 | $ | 4,187 | 3.56 | % | $ | 181,109 | $ | 8,661 | 4.78 | % | ||||||||||||
|
Savings and NOW deposits |
107,151 | 1,469 | 1.37 | % | 54,385 | 754 | 1.39 | % | ||||||||||||||||
|
Money market deposit |
486,945 | 18,852 | 3.87 | % | 464,400 | 21,386 | 4.61 | % | ||||||||||||||||
|
Time deposits |
785,378 | 34,239 | 4.36 | % | 748,938 | 37,364 | 4.99 | % | ||||||||||||||||
|
Total interest-bearing deposits |
$ | 1,496,967 | $ | 58,747 | 3.92 | % | $ | 1,448,832 | $ | 68,165 | 4.70 | % | ||||||||||||
|
Federal funds purchased |
1,973 | 93 | 4.71 | % | 9,941 | 575 | 5.78 | % | ||||||||||||||||
|
FHLB advances |
— | — |
— |
820 | 46 |
5.61 |
% | |||||||||||||||||
|
Subordinated debt, net |
71,223 | 3,203 | 4.50 | % | 72,852 | 3,255 | 4.47 | % | ||||||||||||||||
|
Total interest-bearing liabilities |
$ | 1,570,163 | $ | 62,043 | 3.95 | % | $ | 1,532,445 | $ | 72,041 | 4.70 | % | ||||||||||||
|
Demand deposits and other liabilities |
358,146 | 379,510 | ||||||||||||||||||||||
|
Total liabilities |
$ | 1,928,309 | $ | 1,911,955 | ||||||||||||||||||||
|
Stockholders’ Equity |
213,114 | 224,631 | ||||||||||||||||||||||
|
Total Liabilities and Stockholders’ Equity |
$ | 2,141,423 | $ | 2,136,586 | ||||||||||||||||||||
|
Interest Rate Spread |
2.58 | % | 2.01 | % | ||||||||||||||||||||
|
Net Interest Income |
$ | 69,831 | $ | 62,865 | ||||||||||||||||||||
|
Net Interest Margin |
3.46 | % |
3.13 |
% | ||||||||||||||||||||
|
(1) |
Includes loans classified as non-accrual |
|
(2) |
Total loan interest income includes amortization of deferred loan fees, net of deferred loan costs |
| (3) | Income and yields for all periods presented are reported on a tax-equivalent basis using the federal statutory rate of 21% |
|
(4) |
Refer to "Unaudited Reconciliation of Certain Non-GAAP Financial Measures" for reconciliation of non-GAAP measures |
UNAUDITED SUMMARY FINANCIAL DATA
(Dollars in thousands except per share data)
|
At or For the Three Months Ended |
At or For the Year Ended |
|||||||||||||||
|
December 31, |
December 31, |
|||||||||||||||
|
2025 |
2024 |
2025 |
2024 |
|||||||||||||
|
Per share Data and Shares Outstanding |
||||||||||||||||
|
Earnings (loss) per common share (basic and diluted) |
$ | 0.46 | $ | (2.20 | ) | $ | 1.76 | $ | (1.60 | ) | ||||||
|
Book value per common share |
$ | 25.52 | $ | 23.77 | $ | 25.52 | $ | 23.77 | ||||||||
|
Tangible book value per common share (2) |
$ | 25.52 | $ | 23.77 | $ | 25.52 | $ | 23.77 | ||||||||
|
Weighted average common shares (basic and diluted) |
7,564,723 | 7,603,318 | 7,652,504 | 7,606,391 | ||||||||||||
|
Common shares outstanding at end of period |
7,496,571 | 7,603,765 | 7,496,571 | 7,603,765 | ||||||||||||
|
Performance Ratios |
||||||||||||||||
|
Return on average assets (annualized) |
0.75 | % | (2.80 | )% | 0.73 | % | (0.47 | )% | ||||||||
|
Return on average equity (annualized) |
7.37 | % | (28.19 | )% | 7.33 | % | (4.44 | )% | ||||||||
|
Return on average common equity (annualized) |
7.31 | % | (29.13 | )% | 7.24 | % | (6.15 | )% | ||||||||
|
Yield on earning assets (FTE) (2) (annualized) |
6.23 | % | 6.46 | % | 6.53 | % | 6.71 | % | ||||||||
|
Cost of interest-bearing liabilities (annualized) |
3.72 | % | 4.47 | % | 3.95 | % | 4.70 | % | ||||||||
|
Net interest spread (FTE) (2) (annualized) |
2.51 | % | 1.99 | % | 2.58 | % | 2.01 | % | ||||||||
|
Net interest margin (FTE) (2) (annualized) |
3.36 | % | 2.96 | % | 3.46 | % | 3.13 | % | ||||||||
|
Non-interest income as a percentage of average assets (annualized) |
0.17 | % | 0.14 | % | 0.19 | % | 0.15 | % | ||||||||
|
Non-interest expense to average assets (annualized) |
2.36 | % | 5.96 | % | 2.55 | % | 3.42 | % | ||||||||
|
Efficiency ratio (3) |
71.08 | % | 204.36 | % | 74.15 | % | 110.85 | % | ||||||||
|
Allowance for Credit Losses |
||||||||||||||||
|
Allowance for credit losses (ACL) |
||||||||||||||||
|
Beginning balance, ACL - loans |
$ | 18,831 | $ | 18,327 | $ | 19,450 | $ | 16,506 | ||||||||
|
Add: recoveries |
2 | 9 | 834 | 28 | ||||||||||||
|
Less: charge-offs |
— | (2,151 | ) | (858 | ) | (4,569 | ) | |||||||||
|
Add: provision for credit losses - loans |
475 | 3,265 | (118 | ) | 7,485 | |||||||||||
|
Ending balance, ACL - loans |
$ | 19,308 | $ | 19,450 | $ | 19,308 | $ | 19,450 | ||||||||
|
Beginning balance, reserve for unfunded commitment (RUC) |
$ | 482 | $ | 145 | $ | 287 | $ | 1,009 | ||||||||
|
Provision for unfunded commitments, net |
(147 | ) | 142 | 48 | (722 | ) | ||||||||||
|
Ending balance, RUC |
$ | 335 | $ | 287 | $ | 335 | $ | 287 | ||||||||
|
Total allowance for credit losses |
$ | 19,643 | $ | 19,737 | $ | 19,643 | $ | 19,737 | ||||||||
|
Allowance for credit losses on loans to total gross loans |
1.04 | % | 1.06 | % | 1.04 | % | 1.06 | % | ||||||||
|
Allowance for credit losses on loans to non-performing loans |
58.19 | % | 89.84 | % | 58.19 | % | 89.84 | % | ||||||||
|
Net charge-offs to average gross loans (annualized) |
0.00 | % | 0.46 | % | 0.00 | % | 0.25 | % | ||||||||
|
Concentration Ratios |
||||||||||||||||
|
Commercial real estate loans to total capital (4) |
354.85 | % | 393.79 | % | 354.85 | % | 393.79 | % | ||||||||
|
Construction loans to total capital (5) |
98.06 | % | 131.92 | % | 98.06 | % | 131.92 | % | ||||||||
|
Past due and Non-performing Assets |
||||||||||||||||
|
Loans 30-89 days past due and accruing to total gross loans |
0.98 | % | 0.00 | % | 0.98 | % | 0.00 | % | ||||||||
|
Loans 90 days past due and accruing to total gross loans |
0.00 | % | 0.00 | % | 0.00 | % | 0.00 | % | ||||||||
|
Non-accrual loans to total gross loans |
1.69 | % | 1.18 | % | 1.69 | % | 1.18 | % | ||||||||
|
Other real estate owned, net |
$ | 1,697 | $ | — | $ | 1,697 | $ | — | ||||||||
|
Non-performing loans |
$ | 31,482 | $ | 21,650 | $ | 31,482 | $ | 21,650 | ||||||||
|
Non-performing assets to total assets |
1.50 | % | 0.97 | % | 1.50 | % | 0.97 | % | ||||||||
|
Regulatory Capital Ratios (Bank only) (1) |
||||||||||||||||
|
Total risk-based capital ratio |
16.08 | % | 15.69 | % | 16.08 | % | 15.69 | % | ||||||||
|
Tier 1 risk-based capital ratio |
15.05 | % | 14.64 | % | 15.05 | % | 14.64 | % | ||||||||
|
Leverage ratio |
13.28 | % | 12.08 | % | 13.28 | % | 12.08 | % | ||||||||
|
Common equity tier 1 ratio |
15.05 | % | 14.64 | % | 15.05 | % | 14.64 | % | ||||||||
|
Other information |
||||||||||||||||
|
Common shares closing stock price |
$ | 20.36 | $ | 18.10 | $ | 20.36 | $ | 18.10 | ||||||||
|
Tangible equity / tangible assets |
9.88 | % | 9.33 | % | 9.88 | % | 9.33 | % | ||||||||
|
Average tangible equity / average tangible assets (2) |
10.11 | % | 9.21 | % | 9.95 | % | 9.80 | % | ||||||||
|
Number of full time equivalent employees |
174 | 204 | 174 | 204 | ||||||||||||
|
Number of full service branch offices |
6 | 6 | 6 | 6 | ||||||||||||
|
(1) |
Regulatory capital ratios as of December 31, 2025 are preliminary |
|
(2) |
Refer to "Unaudited Reconciliation of Certain Non-GAAP Financial Measures" for reconciliation of non-GAAP measures |
|
(3) |
Efficiency ratio is calculated as non-interest expense as a percentage of net interest income and non-interest income |
|
(4) |
Commercial real estate includes only non-owner occupied, multifamily, and construction loans as a percentage of Bank capital |
|
(5) |
Construction loans as a percentage of Bank capital |
Unaudited Reconciliation of Certain Non-GAAP Financial Measures
(Dollars In thousands)
|
For the three months ended December 31, |
For the year ended December 31, |
|||||||||||||||
|
2025 |
2024 |
2025 |
2024 |
|||||||||||||
|
Net interest margin (FTE) |
||||||||||||||||
|
Net interest income (GAAP) |
$ | 17,142 | $ | 16,041 | $ | 69,545 | $ | 62,574 | ||||||||
|
FTE adjustment on tax-exempt securities |
73 | 70 | 286 | 291 | ||||||||||||
|
Net interest income (FTE) (non-GAAP) |
17,215 | 16,111 | 69,831 | 62,865 | ||||||||||||
|
Average interest-earning assets |
2,034,509 | 2,161,567 | 2,020,624 | 2,010,448 | ||||||||||||
|
Net interest margin (GAAP) |
3.34 | % | 2.94 | % | 3.44 | % | 3.11 | % | ||||||||
|
Net interest margin (FTE) (non-GAAP) |
3.36 | % | 2.96 | % | 3.46 | % | 3.13 | % | ||||||||
|
For the three months ended December 31, |
For the year ended December 31, |
|||||||||||||||
|
2025 |
2024 |
2025 |
2024 |
|||||||||||||
|
Yield on earning assets (FTE) |
||||||||||||||||
|
Total interest income (GAAP) |
$ | 31,874 | $ | 35,119 | $ | 131,588 | $ | 134,615 | ||||||||
|
FTE adjustment on tax-exempt securities |
73 | 70 | 286 | 291 | ||||||||||||
|
Total interest income (FTE) (non-GAAP) |
31,947 | 35,189 | 131,874 | 134,906 | ||||||||||||
|
Average interest-earning assets |
2,034,509 | 2,161,567 | 2,020,624 | 2,010,448 | ||||||||||||
|
Yield on earning assets (GAAP) |
6.22 | % | 6.45 | % | 6.51 | % | 6.70 | % | ||||||||
|
Yield on earning assets (FTE) (non-GAAP) |
6.23 | % | 6.46 | % | 6.53 | % | 6.71 | % | ||||||||
|
For the three months ended December 31, |
For the year ended December 31, |
|||||||||||||||
|
2025 |
2024 |
2025 |
2024 |
|||||||||||||
|
Net interest spread (FTE) |
||||||||||||||||
|
Yield on earning assets (GAAP) |
6.22 | % | 6.45 | % | 6.51 | % |
6.70 |
% | ||||||||
|
Yield on earning assets (FTE) (non-GAAP) |
6.23 | % | 6.46 | % |
6.53 |
% |
6.71 |
% | ||||||||
|
Yield on interest-bearing liabilities (GAAP) |
3.72 | % | 4.47 | % |
3.95 |
% |
4.70 |
% | ||||||||
|
Net interest spread (GAAP) |
2.50 | % | 1.98 | % |
2.56 |
% | 2.00 | % | ||||||||
|
Net interest spread (FTE) (non-GAAP) |
2.51 | % | 1.99 | % |
2.58 |
% | 2.01 | % | ||||||||
|
For the three months ended December 31, |
For the year ended December 31, |
|||||||||||||||
|
2025 |
2024 |
2025 |
2024 |
|||||||||||||
|
Average tangible stockholders' equity |
||||||||||||||||
|
Total average stockholders' equity (GAAP) |
$ | 218,098 | $ | 227,542 | $ | 213,114 | $ | 224,631 | ||||||||
|
Less: average intangible assets |
— | (18,327 | ) | — | (16,989 | ) | ||||||||||
|
Total average tangible stockholders' equity (non-GAAP) |
218,098 | 209,215 | 213,114 | 207,642 | ||||||||||||
|
For the three months ended December 31, |
For the year ended December 31, |
|||||||||||||||
|
2025 |
2024 |
2025 |
2024 |
|||||||||||||
|
Average tangible assets |
||||||||||||||||
|
Total average assets (GAAP) |
$ | 2,158,266 | $ | 2,290,644 | $ | 2,141,434 | $ | 2,136,586 | ||||||||
|
Less: average intangible assets |
— | (18,327 | ) | — | (16,989 | ) | ||||||||||
|
Total average tangible assets (non-GAAP) |
2,158,266 | 2,272,317 | 2,141,434 | 2,119,597 | ||||||||||||
Exhibit 99.2