| Iowa | 0-32637 | 42-1039071 |
| (State or Other Jurisdiction of | (Commission File Number) | (I.R.S. Employer |
| Incorporation or Organization) | Identification No.) |
|
☐
|
Written communications pursuant to Rule 425 under the Securities Act (17 CFR 230.425)
|
|
☐
|
Soliciting material pursuant to Rule 14a-12 under the Exchange Act (17 CFR 240.14a-12)
|
|
☐
|
Pre-commencement communications pursuant to Rule 14d-2(b) under the Exchange Act (17 CFR 240.14d-2(b))
|
|
☐
|
Pre-commencement communications pursuant to Rule 13e-4(c) under the Exchange Act (17 CFR 240.13e-4(c))
|
|
Title of each class
|
Trading Symbol
|
Name of each exchange on which registered
|
|
Common stock, $2.00 par value
|
ATLO
|
NASDAQ Capital Market
|
| Exhibit No. | Description |
| 99.1 | News Release dated January 23, 2026 |
| 99.2 | Investor Presentation dated January 23, 2026 |
| 104 | Cover Page Interactive Data File (embedded within the Inline XBRL document) |
|
AMES NATIONAL CORPORATION
|
|||
|
Date: January 23, 2026
|
By:
|
/s/ John P. Nelson
|
|
|
John P. Nelson, Chief Executive Officer and President
|
|||
|
Principal Executive Officer
|
|||
EXHIBIT 99.1
| NEWS RELEASE | CONTACT: | JOHN P. NELSON | |
| FOR IMMEDIATE RELEASE | CEO AND PRESIDENT | ||
| (515) 232-6251 | |||
| JANUARY 23, 2026 |

AMES NATIONAL CORPORATION
ANNOUNCES EARNINGS FOR THE FOURTH QUARTER OF 2025
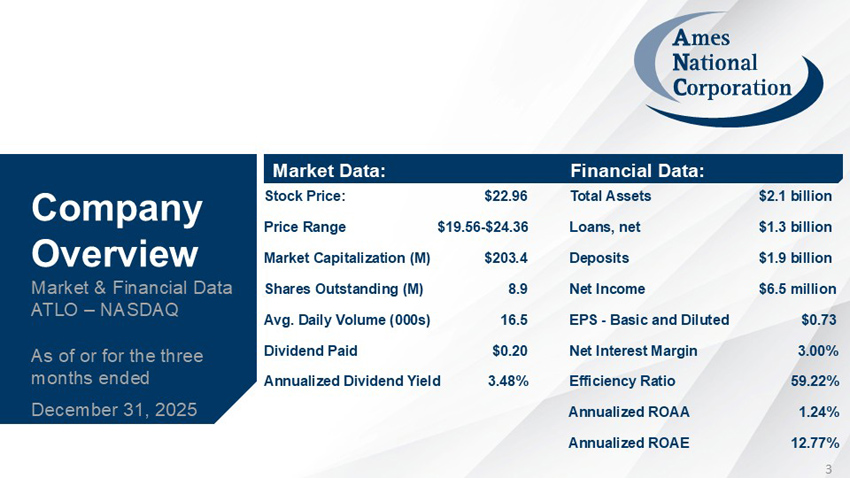
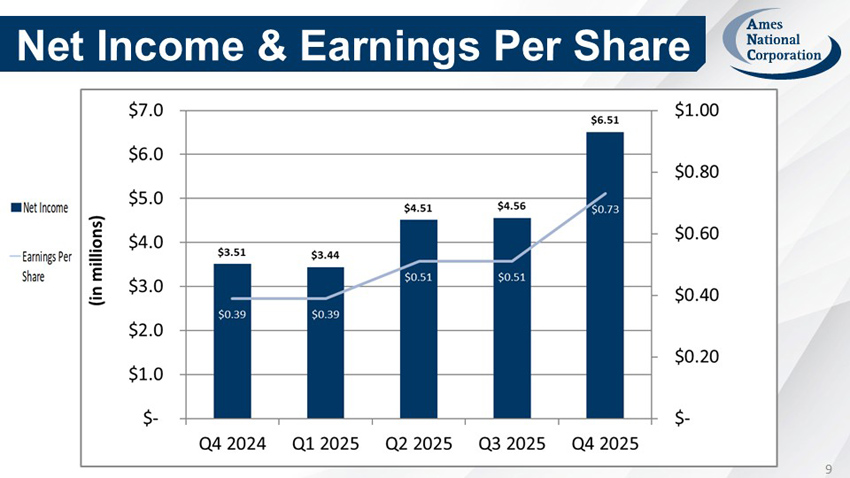
Ames, Iowa – Ames National Corporation (Nasdaq: ATLO; the “Company”) today reported net income for the fourth quarter of 2025 of $6.5 million, or $0.73 per share, compared to $3.5 million, or $0.39 per share, earned in the fourth quarter of 2024. For the year ended December 31, 2025, net income for the Company totaled $19.0 million or $2.14 per share, compared to $10.2 million or $1.14 per share earned in 2024. The increase in earnings is primarily due to an increase in net interest income. Net interest income increased due to higher yields on loans and investments, combined with a lower cost of funds driven by declining market rates and reduced borrowings.
INCOME STATEMENT HIGHLIGHTS (unaudited)
|
Three Months Ended |
Year Ended |
|||||||||||||||
|
December 31, |
December 31, |
|||||||||||||||
|
2025 |
2024 |
2025 |
2024 |
|||||||||||||
|
Net income (in thousands) |
$ | 6,514 | $ | 3,513 | $ | 19,027 | $ | 10,218 | ||||||||
|
Earnings per share - basic and diluted |
$ | 0.73 | $ | 0.39 | $ | 2.14 | $ | 1.14 | ||||||||
|
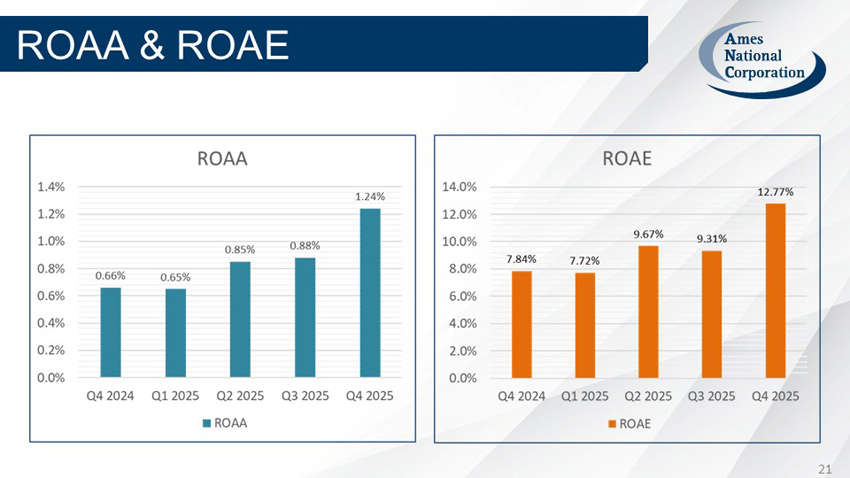
Return on average assets |
1.24 | % | 0.66 | % | 0.90 | % | 0.48 | % | ||||||||
|
Return on average equity |
12.77 | % | 7.84 | % | 9.95 | % | 6.02 | % | ||||||||
|
Efficiency ratio |
59.22 | % | 71.47 | % | 62.74 | % | 76.59 | % | ||||||||
|
Net interest margin |
3.00 | % | 2.38 | % | 2.75 | % | 2.22 | % | ||||||||
COMPANY STOCK HIGHLIGHTS (unaudited)
|
As of or for the |
||||
|
three months ended |
||||
|
December 31, |
||||
|
Company Stock (ATLO) |
2025 |
|||
|
Closing price |
$ | 22.96 | ||
|
Price range |
$ | 19.56 - 24.36 | ||
|
Book value per common share |
$ | 23.47 | ||
|
Cash dividend declared |
$ | 0.20 | ||
|
Dividend yield |
3.48 | % | ||
BALANCE SHEET HIGHLIGHTS (unaudited)
|
December 31, |
||||||||
|
(Dollars in thousands) |
2025 |
2024 |
||||||
|
Assets |
$ | 2,133,540 | $ | 2,133,180 | ||||
|
Loans receivable, net |
1,280,222 | 1,303,917 | ||||||
|
Deposits |
1,854,667 | 1,846,682 | ||||||
|
Stockholders' equity |
207,894 | 174,706 | ||||||
|
Capital ratio |
9.74 | % | 8.19 | % | ||||
Fourth Quarter 2025 Results:
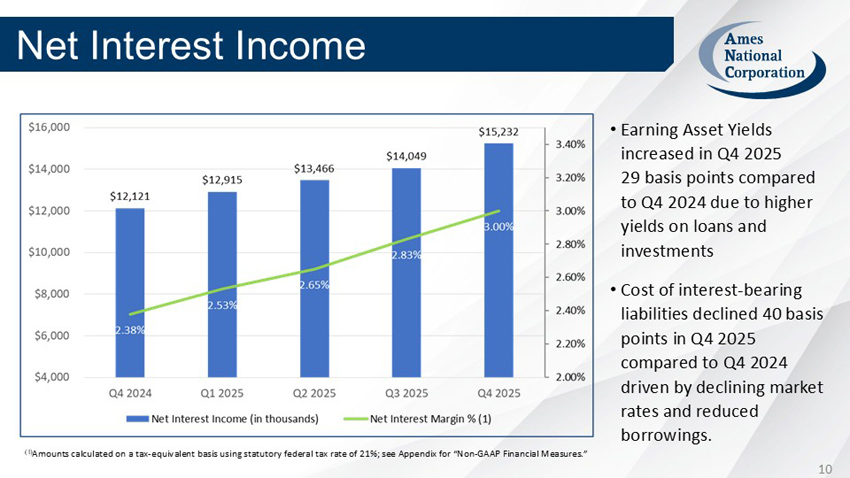
Fourth quarter 2025 loan interest income was $600 thousand higher than fourth quarter 2024 and was primarily due to improved yield on the loan portfolio. Interest income from investment securities increased by $688 thousand during this same period due to maturities reinvested at higher rates. Deposit interest expense decreased $1.1 million during this same period due primarily to decreases in market rates. Other borrowed funds interest expense decreased $650 thousand during the same period due primarily to reduced borrowings. Nonaccrual interest income of $140 thousand was recognized in the fourth quarter of 2025. Fourth quarter 2025 net interest income totaled $15.2 million, an increase of $3.1 million, or 25.7%, compared to the same quarter a year ago. These factors were the primary contributors to the Company’s net interest margin, on a tax-equivalent basis (a non-GAAP measure), improving to 3.00% for the quarter ended December 31, 2025 as compared to 2.38% for the quarter ended December 31, 2024 and 2.83% for the quarter ended September 30, 2025.
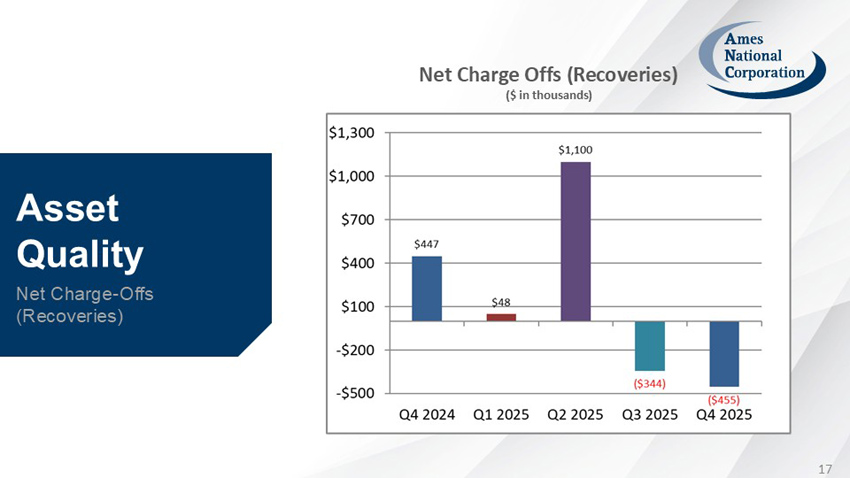
A credit loss benefit of ($660) thousand was recognized in the fourth quarter of 2025 as compared to a credit loss benefit of ($130) thousand in the fourth quarter of 2024. Net loan recoveries totaled $455 thousand for the quarter ended December 31, 2025 compared to net loan charge-offs of $447 thousand for the quarter ended December 31, 2024. The credit loss benefit in 2025 was primarily due to net recoveries in the commercial operating loan portfolio. The credit loss benefit in 2024 was primarily due to a reduction in specific reserves and less outstanding off balance sheet credit exposures.
Noninterest income for the fourth quarter of 2025 totaled $3.4 million as compared to $2.6 million in the fourth quarter of 2024, an increase of 31.2%. The increase is primarily due to an increase in wealth management income and gain on sale of other real estate owned. The increase in wealth management income is primarily due to growth in assets under management and an increase in estate and trust fees. The gain on sale of other real estate resulted from a $2.6 million nonperforming commercial real estate loan that was foreclosed upon and subsequently sold during the quarter.
Noninterest expense for the fourth quarter of 2025 totaled $11.1 million compared to $10.5 million recorded in the fourth quarter of 2024, an increase of 4.9%. The increase reflects higher salaries and benefits, driven by anticipated bonus payouts and an additional one day of paid time off provided to all employees in celebration of the Company's 50th anniversary. The efficiency ratio was 59.22% for the fourth quarter of 2025 as compared to 71.47% in the fourth quarter of 2024. The improved efficiency ratio was primarily due to an increase in net interest income and noninterest income.
Income tax expense for the fourth quarter of 2025 totaled $1.8 million compared to $825 thousand recorded in the fourth quarter of 2024. The effective tax rate was 21% and 19% for the quarters ended December 31, 2025 and 2024, respectively. The lower than expected tax rate in 2025 and 2024 was primarily due to tax-exempt interest income and New Markets Tax Credits.
Year 2025 Results:
For the year ended December 31, 2025 loan interest income was $2.6 million higher than the year ended December 31, 2024. The increase is primarily due to improved yield on the loan portfolio. Interest-bearing deposits with banks and federal funds sold interest income increased by $1.3 million during this same period due to higher average balances. Deposit interest expense decreased $3.1 million during the same period due primarily to decreases in market rates. Other borrowed funds interest expense decreased $3.1 million during the same period due primarily to reduced borrowings. The net interest income for the year ended December 31, 2025 totaled $55.7 million, an increase of $10.7 million, or 23.8%, compared to the same period a year ago. These factors were the primary contributors to the Company’s net interest margin, on a tax-equivalent basis (a non-GAAP measure), improving to 2.75% for the year ended December 31, 2025 as compared to 2.22% for the year ended December 31, 2024.
A credit loss expense of $1.0 million was recognized for the year ended December 31, 2025 as compared to a credit loss expense of $592 thousand for the year ended December 31, 2024. Net loan charge-offs totaled $357 thousand for the year ended December 31, 2025 compared to net loan charge-offs of $453 thousand for the year ended December 31, 2024. The credit loss expense in 2025 was primarily due to an increase in specific reserves in the commercial real estate and operating loan portfolios. The credit loss expense in 2024 was primarily due to growth in the loan portfolio and charge-offs in the commercial loan portfolio.
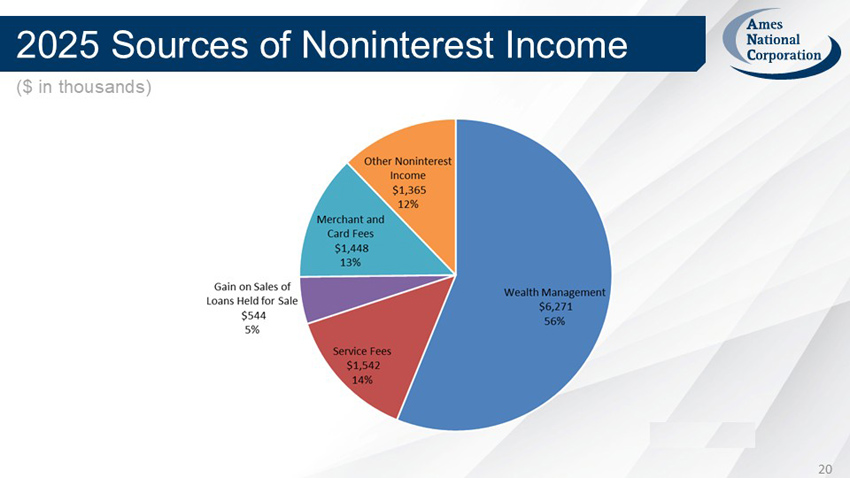
Noninterest income for the year ended December 31, 2025 totaled $11.2 million compared to $9.8 million for the year ended December 31, 2024, an increase of 13.4%. The increase is primarily due to an increase in wealth management income due to growth in assets under management and an increase in estate and trust fees.
Noninterest expense for the year ended December 31, 2025 totaled $41.9 million compared to $42.0 million for the year ended December 31, 2024, a decrease of 0.1%. The decrease in noninterest expense is primarily due to $799 thousand of consultant fees for certain contract negotiations completed in 2024 and cost savings reflected in 2025. The cost savings were offset by an increase in salaries and benefits primarily due to normal raises and anticipated bonus payouts as Company performance thresholds are met. The efficiency ratio was 62.74% and 76.59% for the year ended December 31, 2025 and 2024, respectively.
Income tax expense for the year ended December 31, 2025 and 2024 totaled $4.8 million and $2.0 million, respectively. The effective tax rate was 20% and 17% for the year ended December 31, 2025 and 2024, respectively. The lower than expected tax rate in 2025 and 2024 was due primarily to tax-exempt interest income and New Markets Tax Credits.
Balance Sheet Review:
As of December 31, 2025, total assets were $2.13 billion, an increase of $360 thousand, as compared to December 31, 2024. The increase in assets is primarily due to an increase in interest-bearing deposits in financial institutions, decrease in unrealized losses on securities available-for-sale and partially offset by a decrease in loans receivable.
Securities available-for-sale as of December 31, 2025 increased to $656.0 million from $648.5 million as of December 31, 2024. The increase in securities available-for-sale is primarily due to lower unrealized losses in the investment portfolio. The Company's investment portfolio had an expected duration of 3.0 years as of December 31, 2025. There are $94 million of investments maturing in 2026 at an average yield of approximately 1.4%.
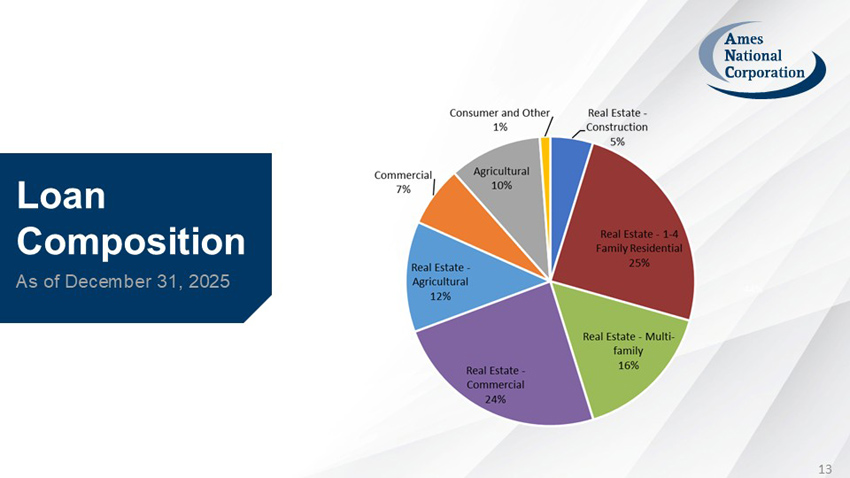
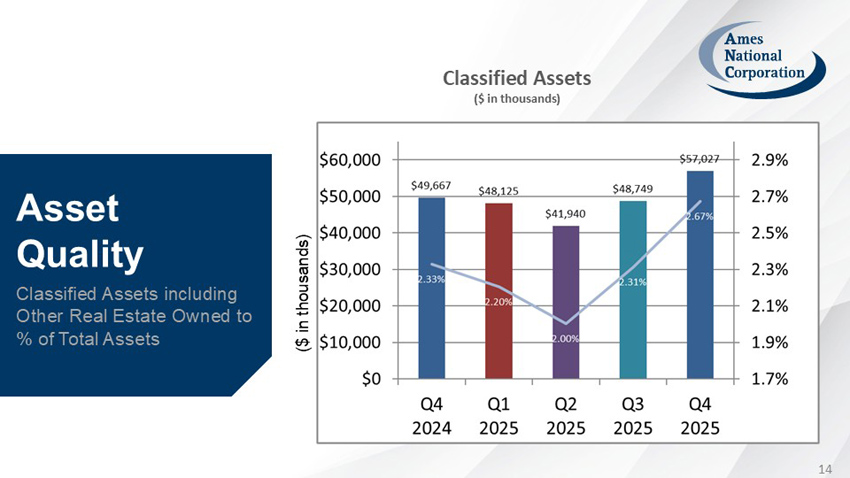
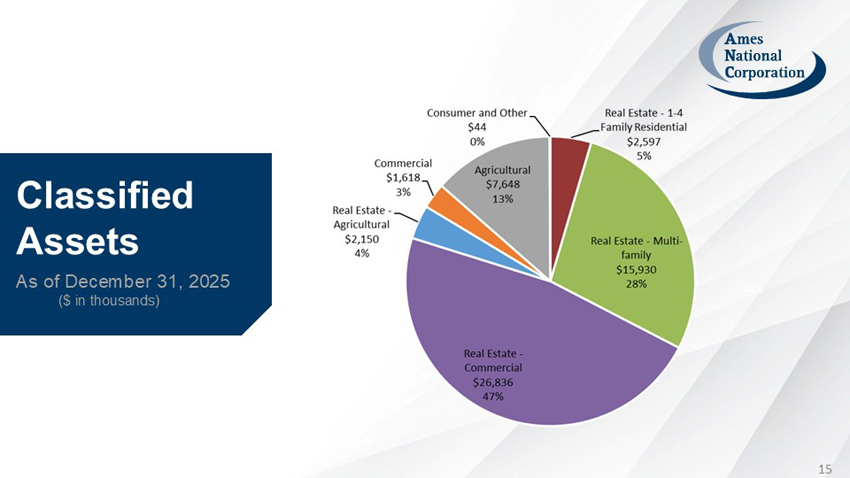
Net loans as of December 31, 2025 decreased to $1.28 billion, as compared to $1.30 billion as of December 31, 2024, a decrease of 1.8%. The decrease was primarily due to a decline in the commercial real estate loan portfolio and partially offset by an increase in the 1 to 4 family residential and multi-family real estate portfolios. Substandard loans were $42.2 million and $35.5 million as of December 31, 2025 and 2024, respectively. Substandard-impaired loans were $14.6 million and $14.2 million as of December 31, 2025 and 2024, respectively. The increase in substandard loans is primarily due to weakening in the multi-family loan portfolio. Some multi-family real estate loans are experiencing a decline in occupancy rates. The increase in substandard-impaired loans is primarily due to one agricultural loan relationship. There are approximately $348 million of loans maturing within one year at an average yield of approximately 5.5%.
The allowance for credit losses on December 31, 2025 totaled $17.7 million, or 1.36% of loans, compared to $17.1 million, or 1.29% of loans, as of December 31, 2024. The increase in the allowance for credit losses is primarily due to an increase in specific reserves.
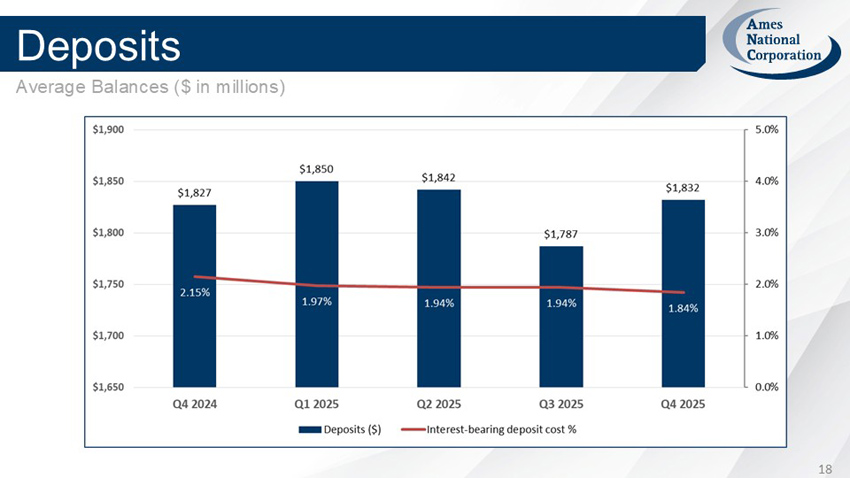
Deposits totaled $1.855 billion as of December 31, 2025, an increase of 0.4%, compared to $1.847 billion recorded as of December 31, 2024. The nominal increase in deposits is primarily due to increases in commercial demand and interest-bearing checking accounts. Securities sold under agreements to repurchase decreased to $38.8 million as of December 31, 2025, compared to $52.4 million as of December 31, 2024. Securities sold under agreements to repurchase and deposit balances fluctuate as customers’ liquidity needs vary and could be impacted by prevailing market interest rates, competition, and economic conditions. Approximately 14% of deposits are tied to external indexes as of December 31, 2025. Deposit interest expense related to these deposits can be more volatile than other deposit products in a changing interest rate environment.
Other borrowings decreased to $21.4 million as of December 31, 2025 compared to $47.0 million as of December 31, 2024. The Company has reduced borrowings throughout 2025 as investments have matured.
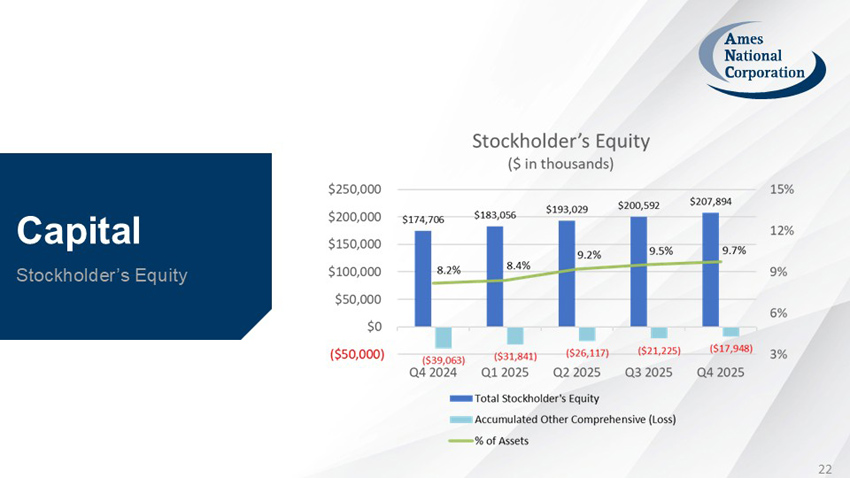
The Company’s stockholders’ equity represented 9.7% of total assets as of December 31, 2025 with all of the Company’s six affiliate banks considered well-capitalized as defined by federal capital regulations. Total stockholders’ equity was $207.9 million as of December 31, 2025, compared to $174.7 million as of December 31, 2024. The increase in stockholders’ equity was primarily the result of a decrease in unrealized losses on the investment portfolio and retention of net income in excess of dividends.
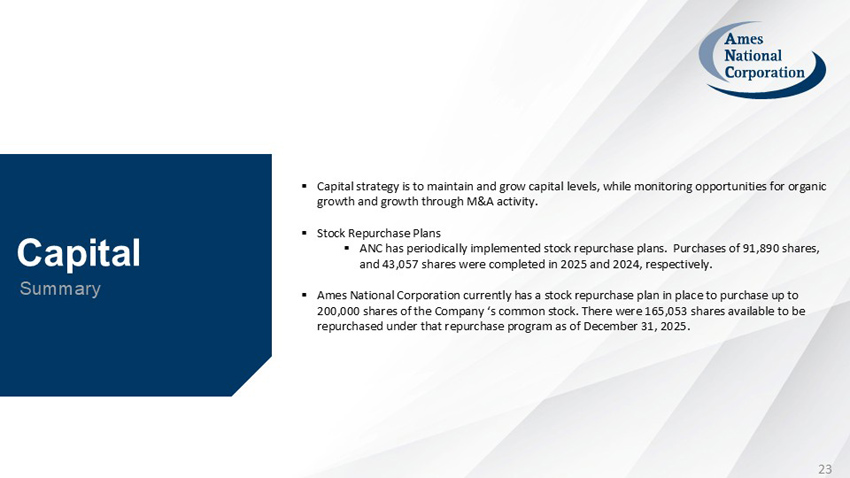
Share Repurchase Program
For the period October 1, 2025 through December 31, 2025, under the repurchase program that was announced in August 2025, which allowed for the repurchase of 200,000 shares of common stock, the Company repurchased 34,947 shares of its common stock at an average price of $20.98 per share and a total cost of $733 thousand. There were 165,053 shares available to be repurchased under that repurchase program as of December 31, 2025.
The weighted average outstanding shares for the three months ended December 31, 2025 and 2024 was 8,869,276 and 8,988,663, respectively. The weighted average outstanding shares for the year ended December 31, 2025 and 2024 was 8,895,197 and 8,991,286, respectively. The Company had no potentially dilutive securities outstanding during the periods presented.
Cash Dividend Announcement
On November 12, 2025, the Company declared a quarterly cash dividend on common stock, payable on December 15, 2025 to stockholders of record as of December 1, 2025, equal to $0.20 per share.
Forecasted Earnings
The Company is forecasting earnings for the year ending December 31, 2026 in the range of $2.70 to $2.80 per share compared to $2.14 per share earned for the year ended December 31, 2025. The increase in forecasted earnings from 2025 actual results is primarily due to an anticipated improvement in net interest margin as lower yielding investments and loans are expected to reprice at higher rates and cost of funds are expected to decrease due to lower market rates.
About Ames National Corporation
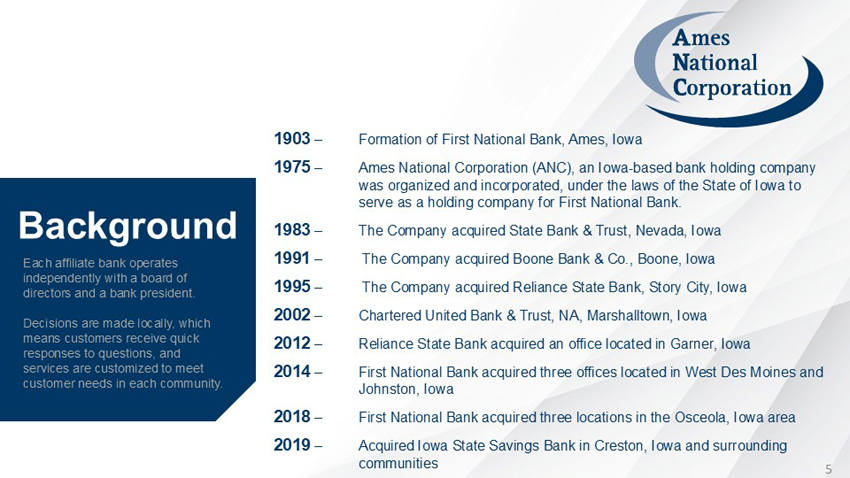
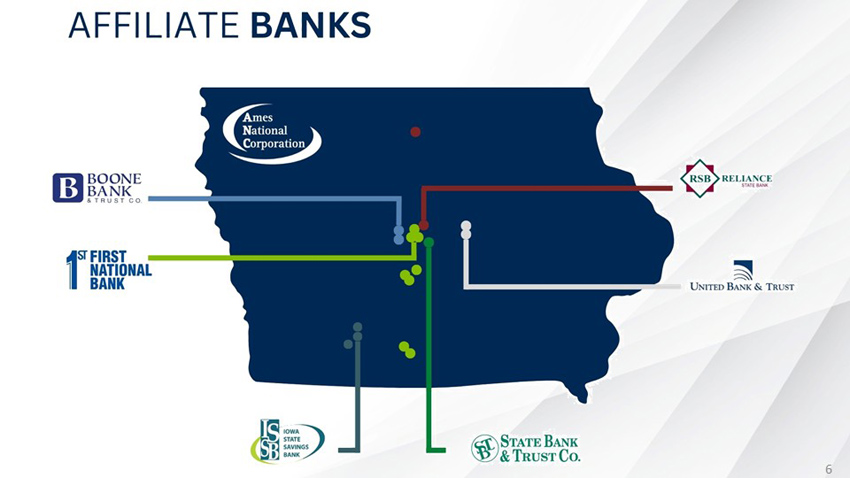
Ames National Corporation affiliate Iowa banks are First National Bank, Ames; Boone Bank & Trust Co., Boone; State Bank & Trust Co., Nevada; Reliance State Bank, Story City; United Bank & Trust Co., Marshalltown; and Iowa State Savings Bank, Creston, Iowa.
The Private Securities Litigation Reform Act of 1995 provides the Company with the opportunity to make cautionary statements regarding forward-looking statements contained in this News Release, including forward-looking statements concerning the Company’s future performance and asset quality. Forward-looking statements contained in this News Release are not historical facts and are based on management’s current beliefs, assumptions, predictions and expectations of future events, including the Company’s future performance, taking into account all information currently available to management. These beliefs, assumptions, predictions and expectations are subject to numerous risks and uncertainties and can change as a result of many possible events or factors, not all of which are known to management and many of which are beyond management’s control. If a change occurs, the Company’s business, financial condition, liquidity, results of operations, asset quality, plans and objectives may vary materially from those expressed in the forward-looking statements. Accordingly, investors are cautioned not to place undue reliance on such forward-looking statements. These statements are often, but not always, made through the use of words or phrases such as “anticipates,” “believes,” “can,” “could,” “may,” “predicts,” “potential,” “should,” “will,” “estimate,” “plans,” “projects,” “forecasts”, “continuing,” “ongoing,” “expects,” “views,” “intends” and similar words or phrases. The risks and uncertainties that may affect the Company’s future performance and asset quality include, but are not limited to, the following: national, regional and local economic conditions and the impact they may have on the Company and its customers; competitive products and pricing available in the marketplace; changes in credit and other risks posed by the Company’s loan and investment portfolios, including declines in commercial or residential real estate values or changes in the allowance for credit losses as dictated by new market conditions or regulatory requirements; changes in local, national and international economic conditions, including rising inflation rates; fiscal and monetary policies of the U.S. government, including the imposition of tariffs on U.S. imports and the imposition of retaliatory tariffs by foreign governments on U.S. exports; changes in governmental regulations affecting financial institutions (including regulatory fees and capital requirements); changes in prevailing interest rates; credit risk management and asset/liability management; the financial and securities markets; the availability of and cost associated with sources of liquidity; and other risks and uncertainties inherent in the Company’s business, including those discussed under the headings “Forward-Looking Statements and Business Risks” and “Risk Factors” in the Company’s Annual Report on Form 10-K for the year-ended December 31, 2024. Any forward-looking statements are qualified in their entirety by the foregoing risks and uncertainties and speak only as of the date on which such statements are made. The Company undertakes no obligation to revise or update such forward-looking statements to reflect events or circumstances after the date on which the statements are made or to reflect the occurrence of unanticipated events.
|
AMES NATIONAL CORPORATION AND SUBSIDIARIES |
|
Consolidated Balance Sheets |
|
(in thousands, except share and per share data) |
|
(unaudited) |
(audited) |
|||||||
|
December 31, |
December 31, |
|||||||
|
2025 |
2024 |
|||||||
|
ASSETS |
||||||||
|
Cash and due from banks |
$ | 20,481 | $ | 19,525 | ||||
|
Interest-bearing deposits in financial institutions and federal funds sold |
106,272 | 81,702 | ||||||
|
Total cash and cash equivalents |
126,753 | 101,227 | ||||||
|
Interest-bearing time deposits |
5,678 | 6,166 | ||||||
|
Securities available-for-sale |
655,954 | 648,513 | ||||||
|
Federal Home Loan Bank (FHLB) and Federal Reserve Bank (FRB) stock, at cost |
2,795 | 3,883 | ||||||
|
Loans receivable, net |
1,280,222 | 1,303,917 | ||||||
|
Loans held for sale |
472 | 342 | ||||||
|
Bank premises and equipment, net |
20,920 | 21,567 | ||||||
|
Accrued income receivable |
14,067 | 13,864 | ||||||
|
Other real estate owned |
204 | - | ||||||
|
Bank-owned life insurance |
3,303 | 3,214 | ||||||
|
Deferred income taxes, net |
7,494 | 14,056 | ||||||
|
Other intangible assets, net |
791 | 1,092 | ||||||
|
Goodwill |
12,424 | 12,424 | ||||||
|
Other assets |
2,463 | 2,915 | ||||||
|
Total assets |
$ | 2,133,540 | $ | 2,133,180 | ||||
|
LIABILITIES AND STOCKHOLDERS' EQUITY |
||||||||
|
LIABILITIES |
||||||||
|
Deposits |
||||||||
|
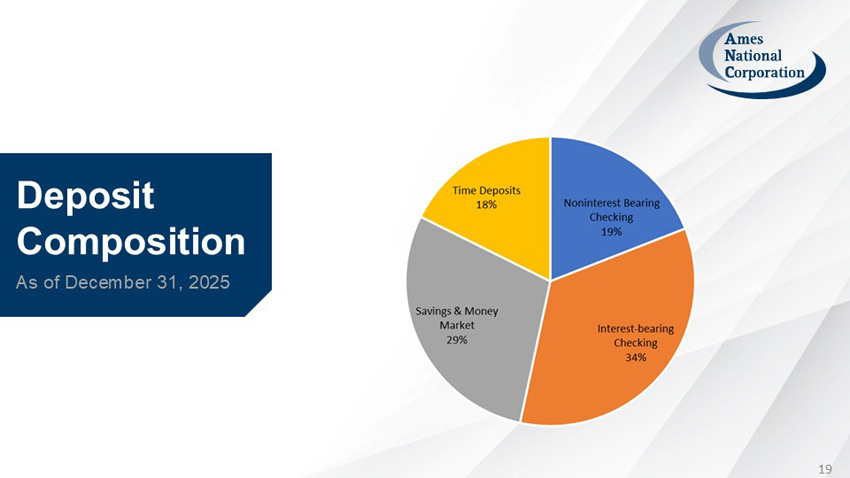
Noninterest-bearing checking |
$ | 353,766 | $ | 358,386 | ||||
|
Interest-bearing checking |
635,885 | 619,951 | ||||||
|
Savings and money market |
537,708 | 540,491 | ||||||
|
Time, $250 and over |
85,799 | 84,996 | ||||||
|
Other time |
241,509 | 242,858 | ||||||
|
Total deposits |
1,854,667 | 1,846,682 | ||||||
|
Securities sold under agreements to repurchase |
38,799 | 52,412 | ||||||
|
Other borrowings |
21,352 | 46,952 | ||||||
|
Dividends payable |
- | 1,790 | ||||||
|
Accrued interest payable |
2,562 | 3,208 | ||||||
|
Accrued expenses and other liabilities |
8,266 | 7,430 | ||||||
|
Total liabilities |
1,925,646 | 1,958,474 | ||||||
|
STOCKHOLDERS' EQUITY |
||||||||
|
Common stock, $2 par value, authorized 18,000,000 shares; issued and outstanding 8,857,220 and 8,949,110 shares as of December 31, 2025 and 2024, respectively |
17,714 | 17,898 | ||||||
|
Additional paid-in capital |
12,135 | 13,635 | ||||||
|
Retained earnings |
195,993 | 182,236 | ||||||
|
Accumulated other comprehensive (loss) |
(17,948 | ) | (39,063 | ) | ||||
|
Total stockholders' equity |
207,894 | 174,706 | ||||||
|
Total liabilities and stockholders' equity |
$ | 2,133,540 | $ | 2,133,180 | ||||
|
AMES NATIONAL CORPORATION AND SUBSIDIARIES |
|
Consolidated Statements of Income |
|
(in thousands, except per share data) |
|
(unaudited) |
(unaudited) |
(unaudited) |
(audited) |
|||||||||||||
|
Three Months Ended |
Year Ended |
|||||||||||||||
|
December 31, |
December 31, |
|||||||||||||||
|
2025 |
2024 |
2025 |
2024 |
|||||||||||||
|
Interest and dividend income: |
||||||||||||||||
|
Loans, including fees |
$ | 17,598 | $ | 16,998 | $ | 68,348 | $ | 65,791 | ||||||||
|
Securities |
||||||||||||||||
|
Taxable |
3,656 | 2,910 | 12,956 | 12,014 | ||||||||||||
|
Tax-exempt |
412 | 470 | 1,726 | 1,994 | ||||||||||||
|
Other interest and dividend income |
971 | 871 | 4,063 | 2,808 | ||||||||||||
|
Total interest and dividend income |
22,637 | 21,249 | 87,093 | 82,607 | ||||||||||||
|
Interest expense: |
||||||||||||||||
|
Deposits |
6,901 | 7,974 | 28,880 | 32,011 | ||||||||||||
|
Other borrowed funds |
504 | 1,154 | 2,551 | 5,620 | ||||||||||||
|
Total interest expense |
7,405 | 9,128 | 31,431 | 37,631 | ||||||||||||
|
Net interest income |
15,232 | 12,121 | 55,662 | 44,976 | ||||||||||||
|
Credit loss expense (benefit) |
(660 | ) | (130 | ) | 1,037 | 592 | ||||||||||
|
Net interest income after credit loss expense (benefit) |
15,892 | 12,251 | 54,625 | 44,384 | ||||||||||||
|
Noninterest income: |
||||||||||||||||
|
Wealth management income |
1,935 | 1,397 | 6,271 | 5,310 | ||||||||||||
|
Service fees |
392 | 388 | 1,542 | 1,450 | ||||||||||||
|
Securities (losses), net |
— | — | — | (165 | ) | |||||||||||
|
Gain on sale of loans held for sale |
149 | 163 | 544 | 524 | ||||||||||||
|
Merchant and card fees |
366 | 429 | 1,448 | 1,640 | ||||||||||||
|
Gain on sale of other real estate owned |
407 | — | 407 | 11 | ||||||||||||
|
Other noninterest income |
199 | 251 | 958 | 1,078 | ||||||||||||
|
Total noninterest income |
3,448 | 2,628 | 11,170 | 9,848 | ||||||||||||
|
Noninterest expense: |
||||||||||||||||
|
Salaries and employee benefits |
6,950 | 6,180 | 26,176 | 25,145 | ||||||||||||
|
Data processing |
1,476 | 1,674 | 5,781 | 6,152 | ||||||||||||
|
Occupancy expenses, net |
738 | 769 | 2,992 | 3,007 | ||||||||||||
|
FDIC insurance assessments |
238 | 286 | 1,026 | 1,164 | ||||||||||||
|
Professional fees |
646 | 415 | 2,083 | 2,605 | ||||||||||||
|
Business development |
490 | 390 | 1,508 | 1,373 | ||||||||||||
|
Intangible asset amortization |
70 | 78 | 301 | 337 | ||||||||||||
|
New markets tax credit projects amortization |
191 | 243 | 766 | 766 | ||||||||||||
|
Other operating expenses, net |
263 | 506 | 1,296 | 1,442 | ||||||||||||
|
Total noninterest expense |
11,062 | 10,541 | 41,929 | 41,991 | ||||||||||||
|
Income before income taxes |
8,278 | 4,338 | 23,866 | 12,241 | ||||||||||||
|
Income tax expense |
1,764 | 825 | 4,839 | 2,023 | ||||||||||||
|
Net income |
$ | 6,514 | $ | 3,513 | $ | 19,027 | $ | 10,218 | ||||||||
|
Basic and diluted earnings per share |
$ | 0.73 | $ | 0.39 | $ | 2.14 | $ | 1.14 | ||||||||
|
Declared dividends per share |
$ | 0.20 | $ | 0.20 | $ | 0.60 | $ | 0.94 | ||||||||
AVERAGE BALANCES AND INTEREST RATES (unaudited)
The following two tables are used to calculate the Company’s non-GAAP net interest margin on a fully taxable equivalent (FTE) basis. The first table includes the Company’s average assets and the related income to determine the average yield on earning assets. The second table includes the average liabilities and related expense to determine the average rate paid on interest-bearing liabilities. The net interest margin is equal to interest income less interest expense divided by average earning assets.
|
AVERAGE BALANCE SHEETS AND INTEREST RATES |
||||||||||||
|
Three Months Ended December 31, |
||||||||||||
|
2025 |
2024 |
|||||||||||
|
Average |
Revenue/ |
Yield/ |
Average |
Revenue/ |
Yield/ |
|||||||
|
balance |
expense |
rate |
balance |
expense |
rate |
|||||||
|
ASSETS |
||||||||||||
|
(dollars in thousands) |
||||||||||||
|
Interest-earning assets |
||||||||||||
|
Loans (1) |
||||||||||||
|
Commercial |
$ 92,031 |
$ 1,520 |
6.61% |
$ 94,981 |
$ 1,480 |
6.23% |
||||||
|
Agricultural |
124,282 |
2,130 |
6.86% |
119,160 |
2,174 |
7.30% |
||||||
|
Real estate |
1,061,923 |
13,746 |
5.18% |
1,082,206 |
13,122 |
4.85% |
||||||
|
Consumer and other |
15,103 |
202 |
5.35% |
17,021 |
222 |
5.22% |
||||||
|
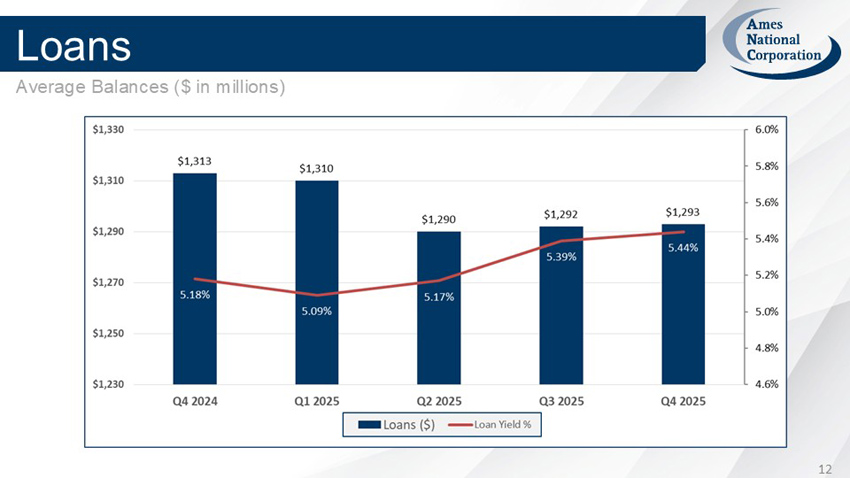
Total loans (including fees) |
1,293,339 |
17,598 |
5.44% |
1,313,368 |
16,998 |
5.18% |
||||||
|
Investment securities |
||||||||||||
|
Taxable |
581,236 |
3,656 |
2.52% |
579,573 |
2,910 |
2.01% |
||||||
|
Tax-exempt (2) |
74,940 |
521 |
2.78% |
88,995 |
595 |
2.68% |
||||||
|
Total investment securities |
656,176 |
4,177 |
2.55% |
668,568 |
3,505 |
2.10% |
||||||
|
Interest-bearing deposits with banks and federal funds sold |
93,637 |
971 |
4.15% |
72,645 |
871 |
4.80% |
||||||
|
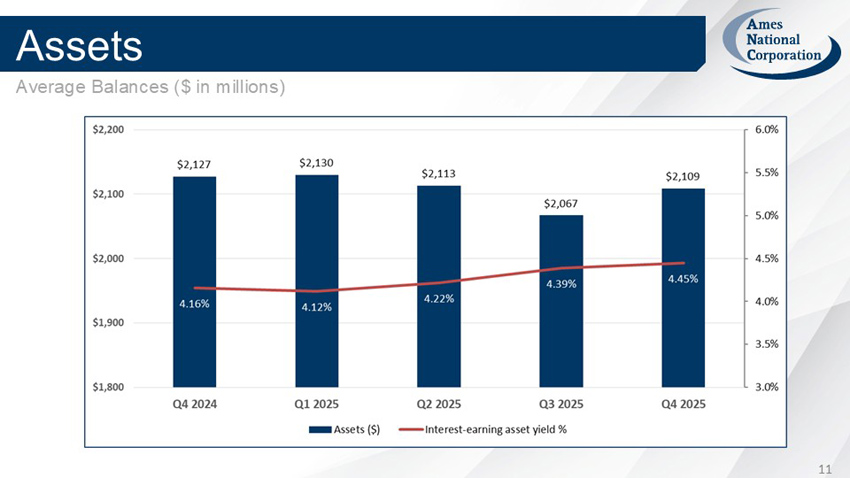
Total interest-earning assets |
2,043,152 |
$ 22,746 |
4.45% |
2,054,581 |
$ 21,374 |
4.16% |
||||||
|
Noninterest-earning assets |
65,798 |
72,483 |
||||||||||
|
TOTAL ASSETS |
$ 2,108,950 |
$ 2,127,064 |
||||||||||
(1) Average loan balances include nonaccrual loans, if any. Interest income collected on nonaccrual loans has been included.
(2) Tax-exempt income has been adjusted to a tax-equivalent basis using an incremental tax rate of 21%.
|
AVERAGE BALANCE SHEETS AND INTEREST RATES |
||||||||||||
|
Three Months Ended December 31, |
||||||||||||
|
2025 |
2024 |
|||||||||||
|
Average |
Revenue/ |
Yield/ |
Average |
Revenue/ |
Yield/ |
|||||||
|
balance |
expense |
rate |
balance |
expense |
rate |
|||||||
|
LIABILITIES AND STOCKHOLDERS' EQUITY |
||||||||||||
|
(dollars in thousands) |
||||||||||||
|
Interest-bearing liabilities |
||||||||||||
|
Deposits |
||||||||||||
|
Interest-bearing checking, savings accounts and money markets |
$ 1,171,186 |
$ 3,853 |
1.32% |
$ 1,164,041 |
$ 4,584 |
1.58% |
||||||
|
Time deposits |
332,064 |
3,048 |
3.67% |
320,866 |
3,390 |
4.23% |
||||||
|
Total deposits |
1,503,250 |
6,901 |
1.84% |
1,484,907 |
7,974 |
2.15% |
||||||
|
Other borrowed funds |
60,700 |
504 |
3.32% |
107,937 |
1,154 |
4.28% |
||||||
|
Total interest-bearing liabilities |
1,563,950 |
7,405 |
1.89% |
1,592,844 |
9,128 |
2.29% |
||||||
|
Noninterest-bearing liabilities |
||||||||||||
|
Noninterest-bearing checking |
328,309 |
342,063 |
||||||||||
|
Other liabilities |
12,644 |
12,838 |
||||||||||
|
Stockholders' equity |
204,047 |
179,319 |
||||||||||
|
TOTAL LIABILITIES AND STOCKHOLDERS' EQUITY |
$ 2,108,950 |
$ 2,127,064 |
||||||||||
|
Net interest income (FTE)(3) |
$ 15,341 |
$ 12,246 |
||||||||||
|
Net interest spread (FTE) |
2.56% |
1.87% |
||||||||||
|
Net interest margin (FTE)(3) |
3.00% |
2.38% |
||||||||||
(3) Net interest income (FTE) is a non-GAAP financial measure.
Non-GAAP Financial Measures
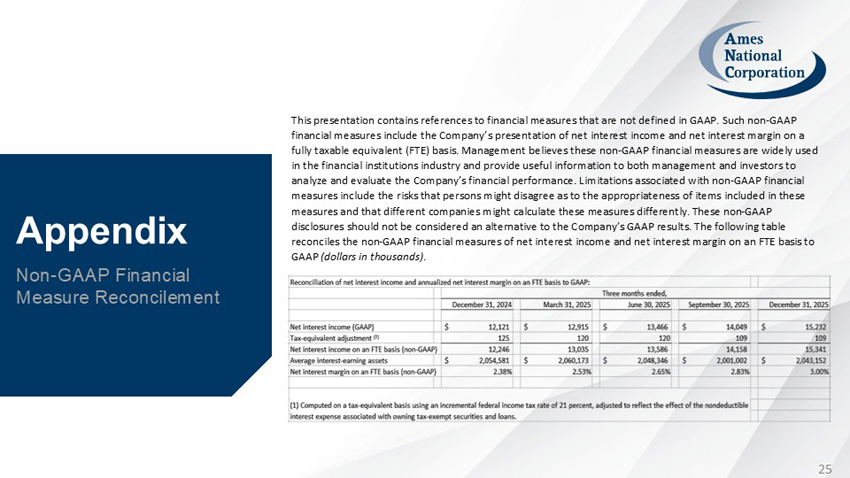
This report contains references to financial measures that are not defined in GAAP. Such non-GAAP financial measures include the Company’s presentation of net interest income and net interest margin on an FTE basis. Management believes these non-GAAP financial measures are widely used in the financial institutions industry and provide useful information to both management and investors to analyze and evaluate the Company’s financial performance. Limitations associated with non-GAAP financial measures include the risks that persons might disagree as to the appropriateness of items included in these measures and that different companies might calculate these measures differently. These non-GAAP disclosures should not be considered an alternative to the Company’s GAAP results. The following table reconciles the non-GAAP financial measures of net interest income and net interest margin on an FTE basis to GAAP (dollars in thousands).
|
Three Months Ended December 31, |
Year Ended December 31, |
|||||||||||||||
|
2025 |
2024 |
2025 |
2024 |
|||||||||||||
|
Reconciliation of net interest income and annualized net interest margin on an FTE basis to GAAP: |
||||||||||||||||
|
Net interest income (GAAP) |
$ | 15,232 | $ | 12,121 | $ | 55,662 | $ | 44,976 | ||||||||
|
Tax-equivalent adjustment (1) |
109 | 125 | 458 | 530 | ||||||||||||
|
Net interest income on an FTE basis (non-GAAP) |
15,341 | 12,246 | 56,120 | 45,506 | ||||||||||||
|
Average interest-earning assets |
$ | 2,043,152 | $ | 2,054,581 | $ | 2,038,021 | $ | 2,052,978 | ||||||||
|
Net interest margin on an FTE basis (non-GAAP) |
3.00 | % | 2.38 | % | 2.75 | % | 2.22 | % | ||||||||
(1) Computed on a tax-equivalent basis using an incremental federal income tax rate of 21 percent, adjusted to reflect the effect of the tax-exempt interest income associated with owning tax-exempt securities and loans.
Exhibit 99.2