|
Louisiana
|
001-36522
|
27-1560715
|
||||||
|
(State or other jurisdiction
of incorporation)
|
(Commission
File Number)
|
(I.R.S. Employer
Identification No.)
|
|
10500 Coursey Blvd.
Baton Rouge, Louisiana 70816
|
||
|
(Address of principal executive offices) (Zip Code)
|
|
☐
|
Written communications pursuant to Rule 425 under the Securities Act (17 CFR 230.425)
|
|
|
☐
|
Soliciting material pursuant to Rule 14a-12 under the Exchange Act (17 CFR 240.14a-12)
|
|
|
☐
|
Pre-commencement communications pursuant to Rule 14d-2(b) under the Exchange Act (17 CFR 240.14d-2(b))
|
|
|
☐
|
Pre-commencement communications pursuant to Rule 13e-4(c) under the Exchange Act (17 CFR 240.13e-4(c))
|
|
Title of each class
|
Trading Symbol(s)
|
Name of each exchange on which registered
|
||||||
|
Common stock, $1.00 par value per share
|
ISTR
|
The Nasdaq Global Market
|
|
Item 2.02
|
Results of Operations and Financial Condition
|
|
Item 9.01
|
Financial Statements and Exhibits
|
|
Exhibit Number
|
Description of Exhibit
|
|||||||
|
99.1
|
||||||||
| 99.2 | Investor presentation dated January 22, 2026 | |||||||
|
104
|
The cover page of Investar Holding Corporation’s Form 8-K is formatted in Inline XBRL
|
|
INVESTAR HOLDING CORPORATION
|
||||||||
|
Date: January 22, 2026
|
By:
|
/s/ John J. D’Angelo
|
||||||
|
John J. D’Angelo
|
||||||||
|
President and Chief Executive Officer
|
||||||||
Exhibit 99.1
For Immediate Release
Investar Holding Corporation Announces 2025 Fourth Quarter Results
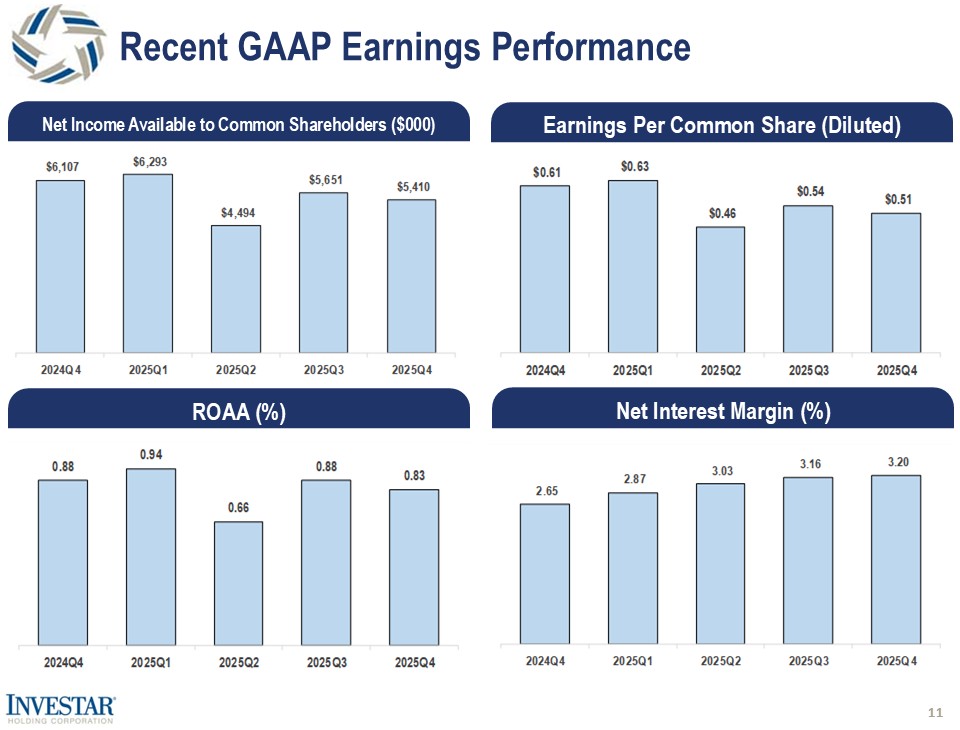
BATON ROUGE, LA / ACCESS Newswire / January 22, 2026 / Investar Holding Corporation (“Investar”) (NASDAQ:ISTR), the holding company for Investar Bank, National Association (the “Bank”), today announced financial results for the quarter ended December 31, 2025. Investar reported net income available to common shareholders of $5.4 million, or $0.51 per diluted common share, for the fourth quarter of 2025, compared to net income available to common shareholders of $5.7 million, or $0.54 per diluted common share, for the quarter ended September 30, 2025, and net income available to common shareholders of $6.1 million, or $0.61 per diluted common share, for the quarter ended December 31, 2024.
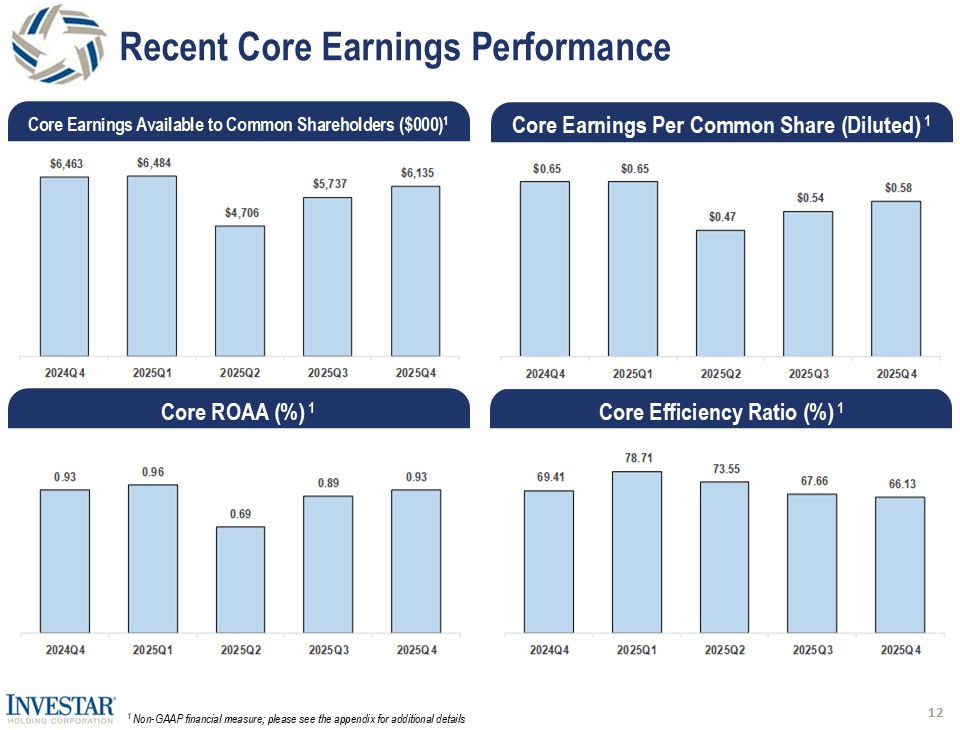
On a non-GAAP basis, core earnings per diluted common share for the fourth quarter of 2025 were $0.58 compared to $0.54 for the third quarter of 2025 and $0.65 for the fourth quarter of 2024. Core earnings available to common shareholders exclude certain items including, but not limited to, (gain) loss on call or sale of investment securities, net; loss on sale or disposition of fixed assets, net; loss (gain) on sale of other real estate owned, net; change in the fair value of equity securities; loss on early extinguishment of subordinated debt; acquisition expense; write down of other real estate owned and severance. Investar’s fourth quarter of 2024 results include $3.1 million in nontaxable noninterest income from bank owned life insurance (“BOLI”) death benefit proceeds, which had a favorable impact on our core metrics for that quarter. Refer to the Reconciliation of Non-GAAP Financial Measures tables for a reconciliation of GAAP to non-GAAP metrics, including the impact of BOLI death benefit proceeds on our core metrics.
Investar’s President and Chief Executive Officer John D’Angelo commented:
“Over the past year, Investar has continued to execute on our strategy of consistent, quality earnings through the optimization of our balance sheet. As a result of this strategy, we were able to grow our net interest margin in each successive quarter of 2025 and improve our core metrics. For the fourth quarter, our net interest margin improved to 3.20%, a four basis point increase compared to the third quarter of 2025 and a massive 55 basis point increase from the fourth quarter of 2024.
Total loans increased 1.2% during the fourth quarter of 2025 (4.8% annualized) as we brought on new business, primarily variable-rate loans, at a blended interest rate of 6.9%, which progressed us towards our goal of an interest rate neutral balance sheet. Our decision over the past year to keep duration short on our liabilities provided us with the flexibility to secure lower cost funding that was accretive to our net interest margin primarily by allowing higher cost brokered time deposits to run off and replacing them with lower cost, non-maturing deposits. We have closely managed our interest-earning assets to optimize yields in a declining rate environment.
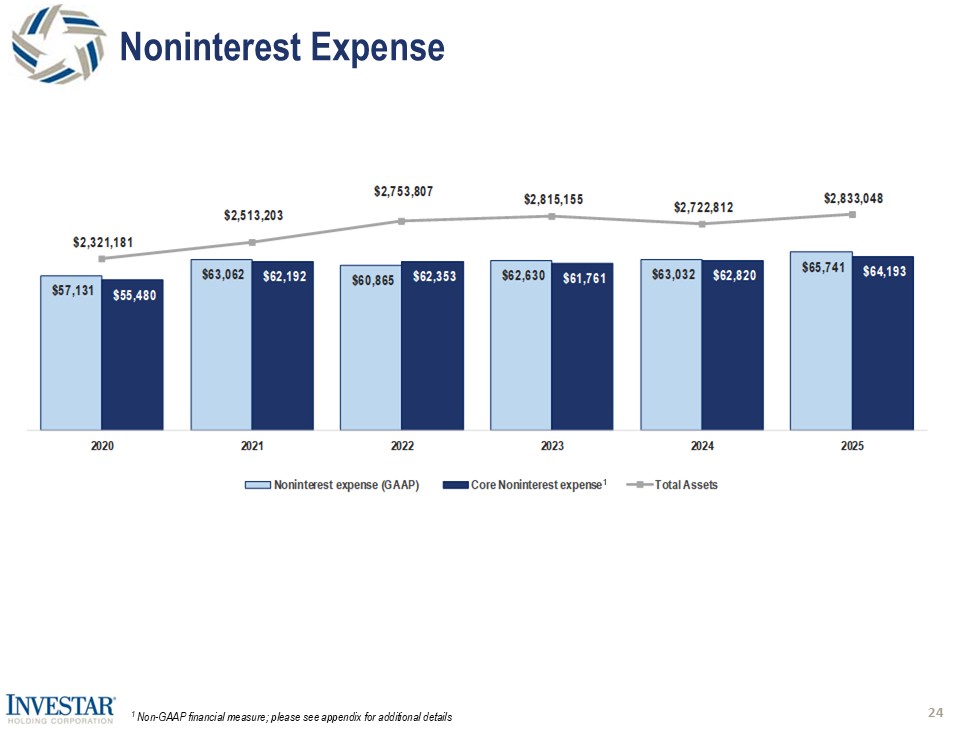
Additionally, noninterest expenses are closely monitored and remain well-controlled. Excluding the impact of acquisition expenses, annual noninterest expense increased only 2.7% in 2025 compared to 2024.
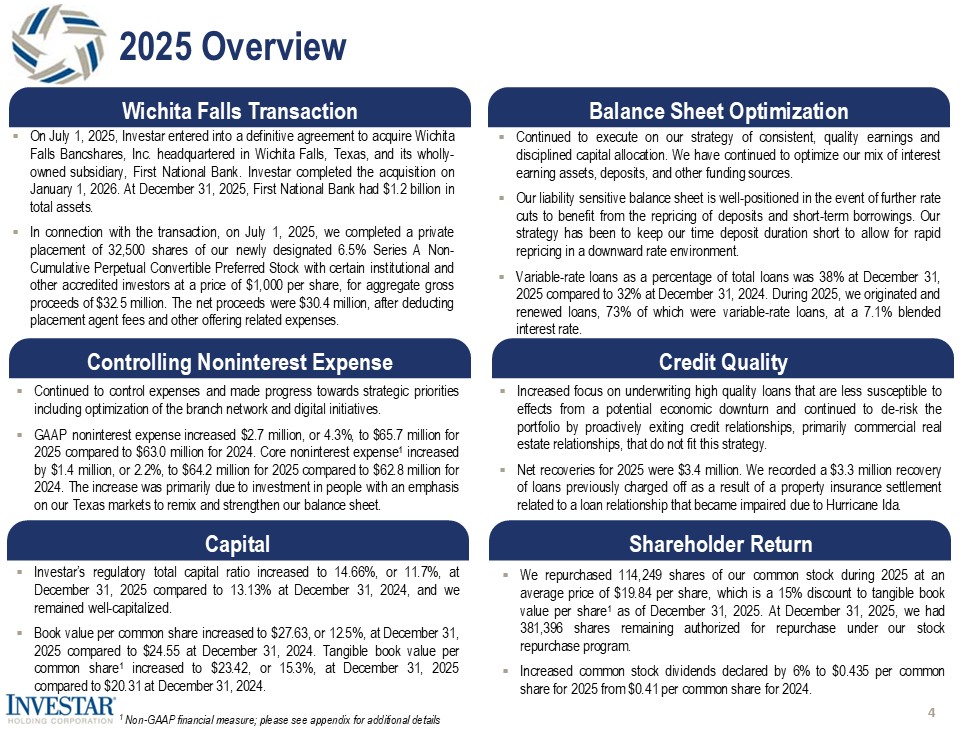
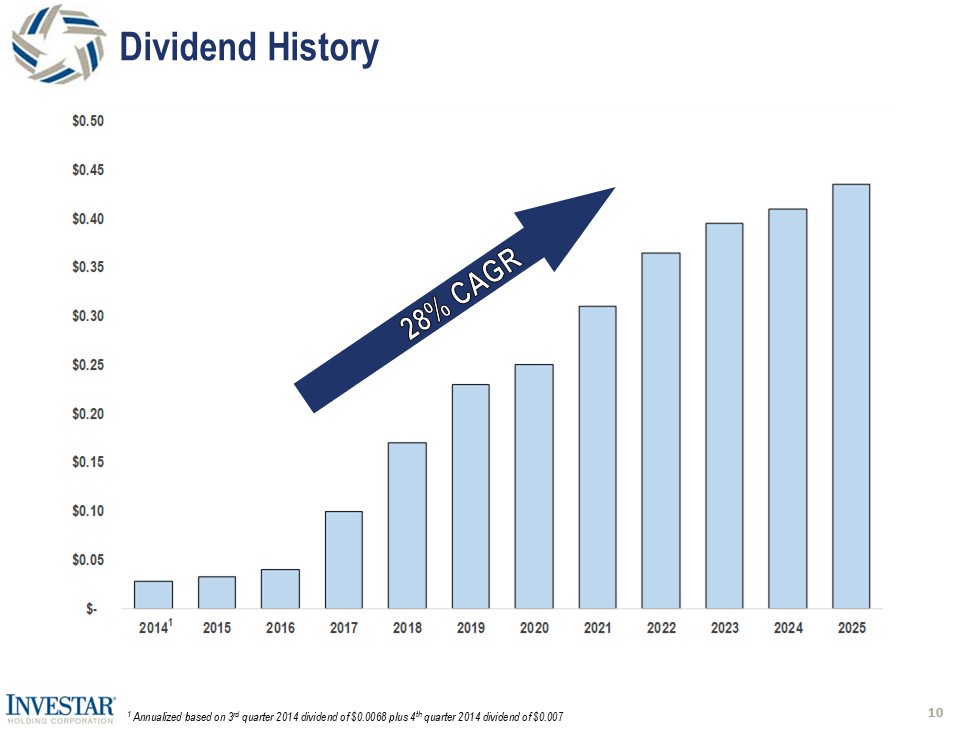
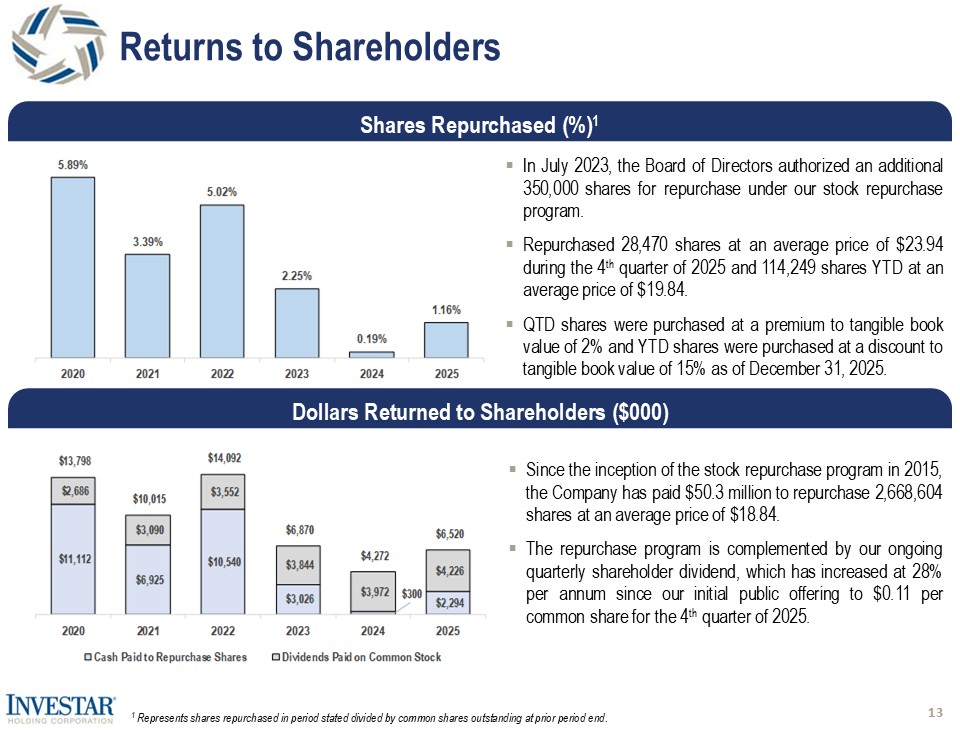
As always, we remain focused on creating shareholder value and returning capital to shareholders. We repurchased 28,470 shares of our common stock during the fourth quarter of 2025 at an average price of $23.94 per share and 114,249 shares of our common stock during the year at an average price of $19.84 per share. Additionally, during the year, we declared quarterly dividends totaling $0.435 per share, which represented a 6.1% increase from the previous year.
Investar has been selected by American Banker and Best Companies Group as a 2025 Best Bank to Work For and a 2025 Best Place to Work in Louisiana. We are honored to be a recipient of these awards. I want to thank all of our employees for their tremendous efforts during 2025 and their commitment to excellence.”
Wichita Falls Bancshares, Inc. Transaction Closing
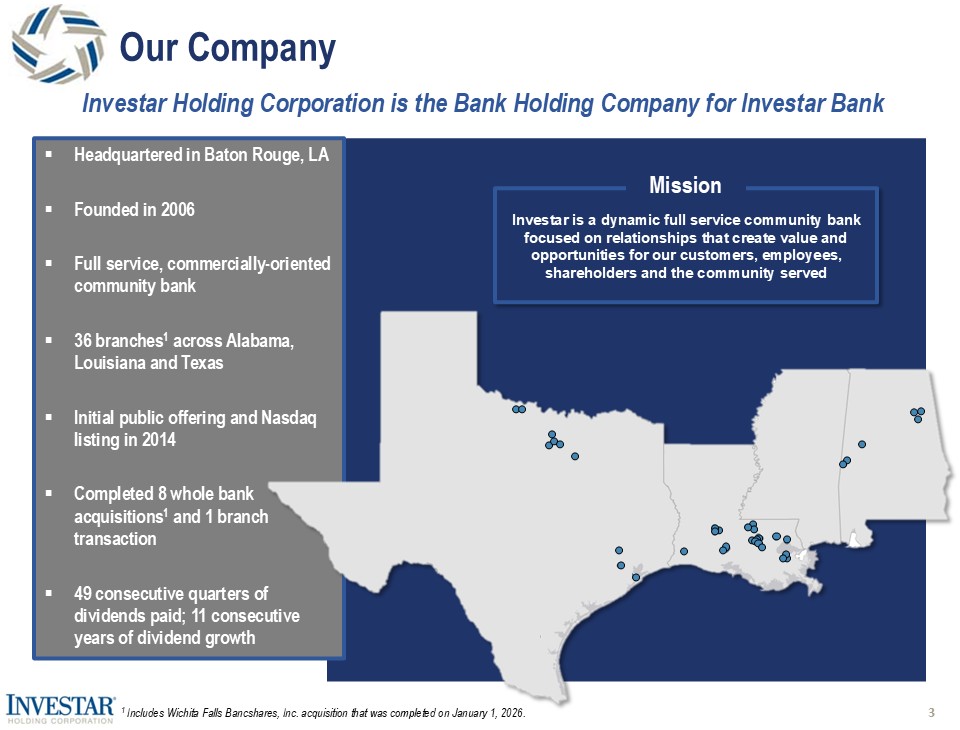
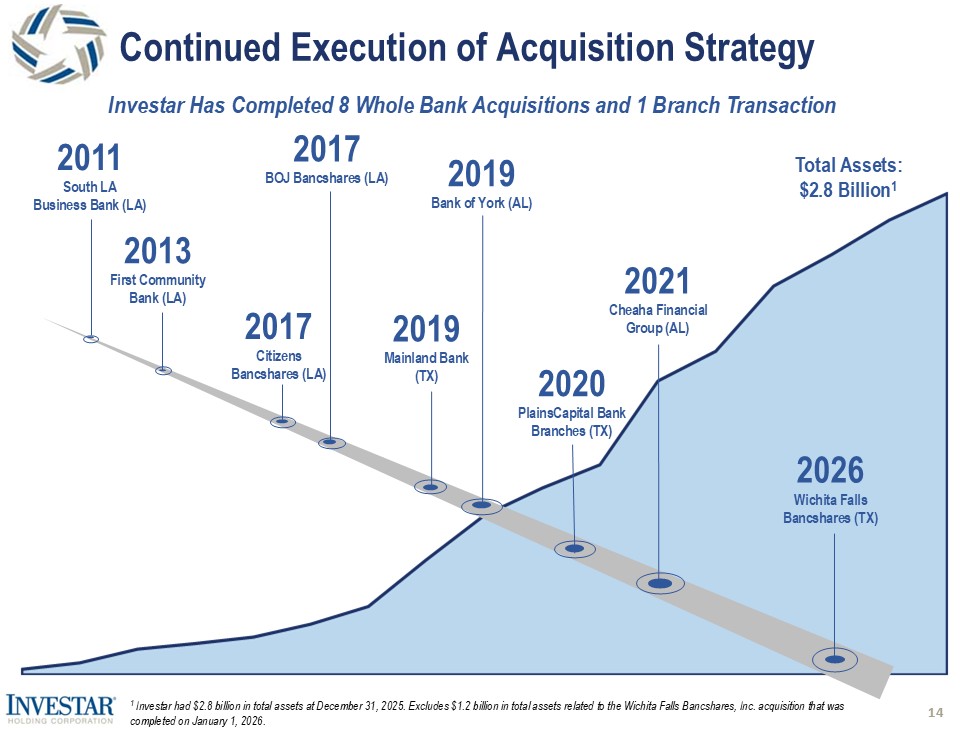
On July 1, 2025, Investar entered into a definitive agreement to acquire Wichita Falls Bancshares, Inc. (“Wichita Falls”), headquartered in Wichita Falls, Texas, and its wholly-owned subsidiary, First National Bank (“FNB”). Investar completed the acquisition on January 1, 2026. All of the issued and outstanding shares of Wichita Falls common stock were converted into aggregate merger consideration consisting of $7.2 million in cash and 3,955,334 shares of Investar common stock for an aggregate transaction value of approximately $112.9 million. This value is based on Investar’s closing stock price on December 31, 2025 of $26.72 per common share.
Mr. D’Angelo commented:
“Investar is excited to expand our footprint into the north Dallas and Wichita Falls markets through the acquisition of First National Bank. This transaction represents the continued execution of our multi-state expansion strategy through the combination of two community banks with a history of service, an alignment of culture and a common commitment to enhancing shareholder value. We are excited about this partnership and look forward to welcoming First National Bank’s customers, shareholders and employees to the Investar family.
Fourth Quarter Highlights
|
• |
Net interest margin improved four basis points to 3.20% for the quarter ended December 31, 2025 compared to 3.16% for the quarter ended September 30, 2025. |
|
• |
The overall cost of funds for the quarter ended December 31, 2025 decreased 13 basis points to 2.98% compared to 3.11% for the quarter ended September 30, 2025. The cost of deposits decreased 13 basis points to 2.91% for the quarter ended December 31, 2025 compared to 3.04% for the quarter ended September 30, 2025. |
|
• |
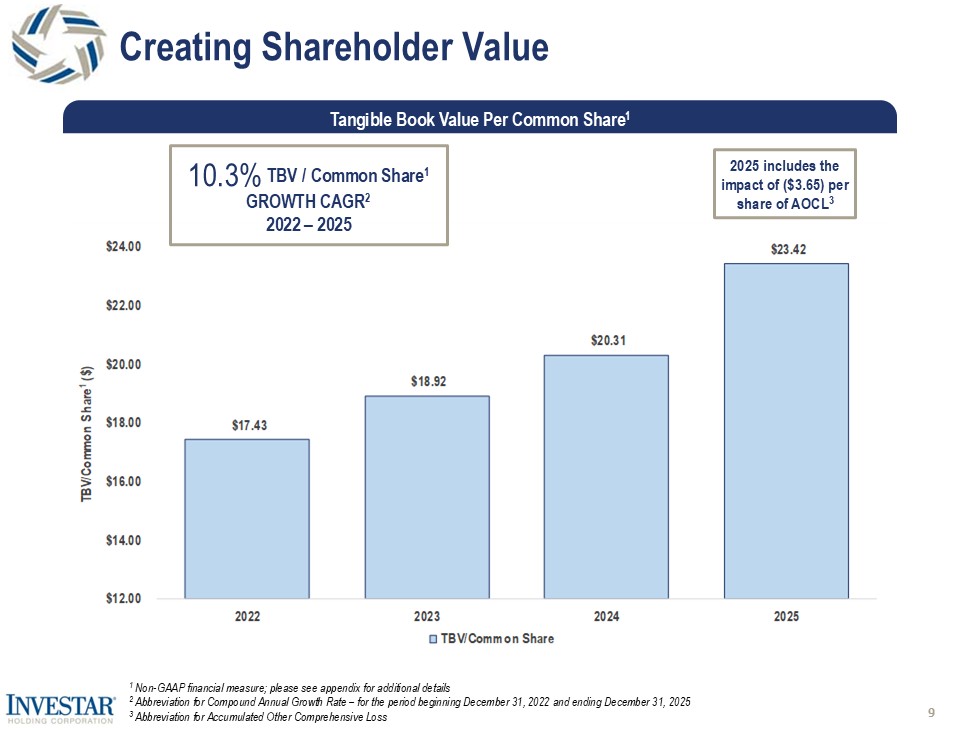
Book value per common share increased to $27.63 at December 31, 2025, or 2.5% (10.0% annualized), compared to $26.96 at September 30, 2025. Tangible book value per common share increased to $23.42 at December 31, 2025, or 2.9% (11.6% annualized), compared to $22.76 at September 30, 2025. |
|
• |
Noninterest expense decreased $0.2 million to $16.3 million for the quarter ended December 31, 2025 compared to $16.5 million for the quarter ended September 30, 2025. Core noninterest expense decreased $0.3 million to $15.8 million for the quarter ended December 31, 2025 compared to $16.1 million for the quarter ended September 30, 2025. |
|
• |
Total loans increased $25.5 million, or 1.2% (4.8% annualized) to $2.18 billion at December 31, 2025, compared to $2.15 billion at September 30, 2025. |
|
• |
The business lending portfolio, which consists of loans secured by owner-occupied commercial real estate properties and commercial and industrial loans, increased $31.8 million, or 3.1%, to $1.06 billion, at December 31, 2025, compared to $1.02 billion at September 30, 2025. |
|
• |
Variable-rate loans as a percentage of total loans was 38% at December 31, 2025 compared to 36% at September 30, 2025. During the fourth quarter of 2025, we originated and renewed loans, 63% of which were variable-rate loans, at a 6.9% blended interest rate. |
|
• |
Investar repurchased 28,470 shares of its common stock through its stock repurchase program at an average price of $23.94 per share during the quarter ended December 31, 2025, leaving 381,396 shares authorized for repurchase under the program at December 31, 2025. |
Loans
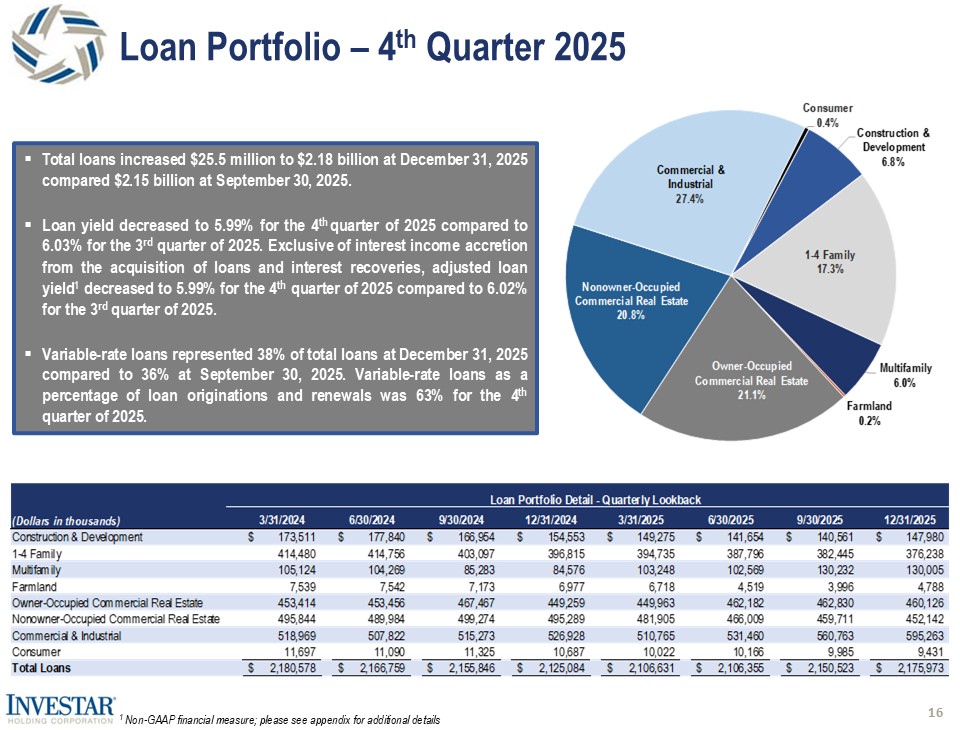
Total loans were $2.18 billion at December 31, 2025, an increase of $25.5 million, or 1.2%, compared to September 30, 2025, and an increase of $50.9 million, or 2.4%, compared to December 31, 2024.
The following table sets forth the composition of the total loan portfolio as of the dates indicated (dollars in thousands).
|
Linked Quarter Change |
Year/Year Change |
Percentage of Total Loans |
||||||||||||||||||||||||||||||||||
|
12/31/2025 |
9/30/2025 |
12/31/2024 |
$ |
% |
$ |
% |
12/31/2025 |
12/31/2024 |
||||||||||||||||||||||||||||
|
Mortgage loans on real estate |
||||||||||||||||||||||||||||||||||||
|
Construction and development |
$ | 147,980 | $ | 140,561 | $ | 154,553 | $ | 7,419 | 5.3 | % | $ | (6,573 | ) | (4.3 | )% | 6.8 | % | 7.3 | % | |||||||||||||||||
|
1-4 Family |
376,238 | 382,445 | 396,815 | (6,207 | ) | (1.6 | ) | (20,577 | ) | (5.2 | ) | 17.3 | 18.7 | |||||||||||||||||||||||
|
Multifamily |
130,005 | 130,232 | 84,576 | (227 | ) | (0.2 | ) | 45,429 | 53.7 | 6.0 | 4.0 | |||||||||||||||||||||||||
|
Farmland |
4,788 | 3,996 | 6,977 | 792 | 19.8 | (2,189 | ) | (31.4 | ) | 0.2 | 0.3 | |||||||||||||||||||||||||
|
Commercial real estate |
||||||||||||||||||||||||||||||||||||
|
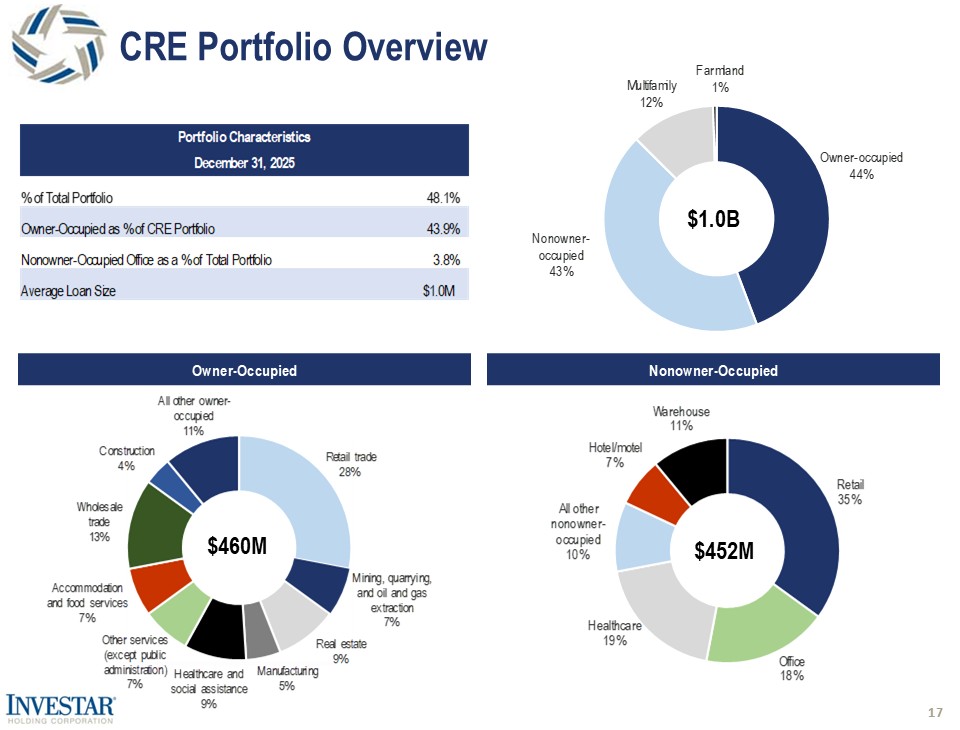
Owner-occupied |
460,126 | 462,830 | 449,259 | (2,704 | ) | (0.6 | ) | 10,867 | 2.4 | 21.1 | 21.1 | |||||||||||||||||||||||||
|
Nonowner-occupied |
452,142 | 459,711 | 495,289 | (7,569 | ) | (1.6 | ) | (43,147 | ) | (8.7 | ) | 20.8 | 23.3 | |||||||||||||||||||||||
|
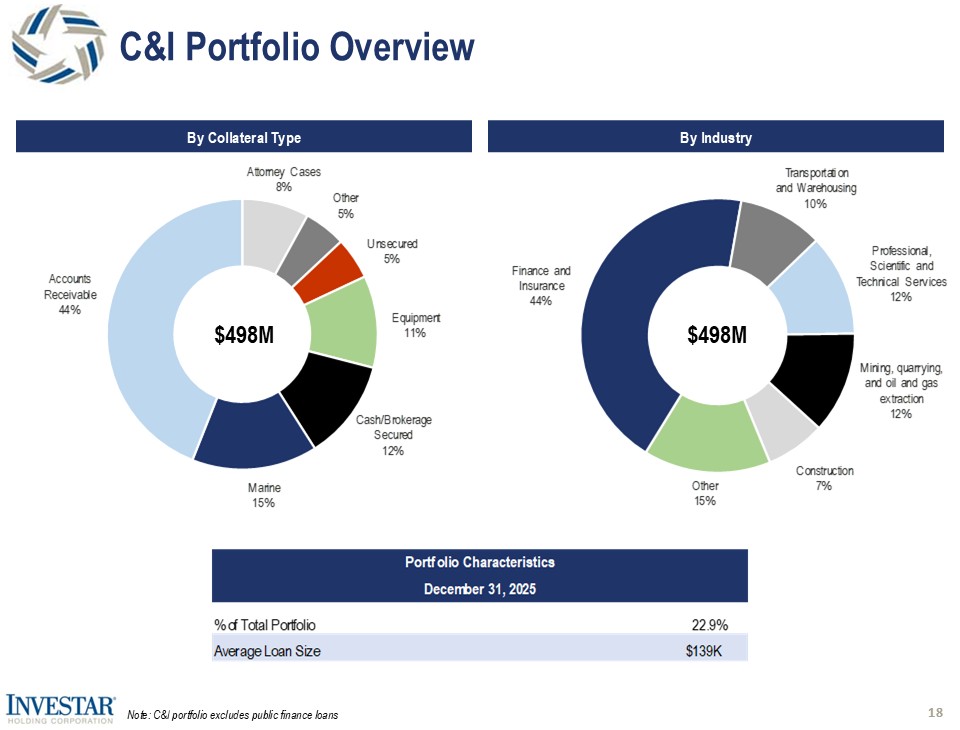
Commercial and industrial |
595,263 | 560,763 | 526,928 | 34,500 | 6.2 | 68,335 | 13.0 | 27.4 | 24.8 | |||||||||||||||||||||||||||
|
Consumer |
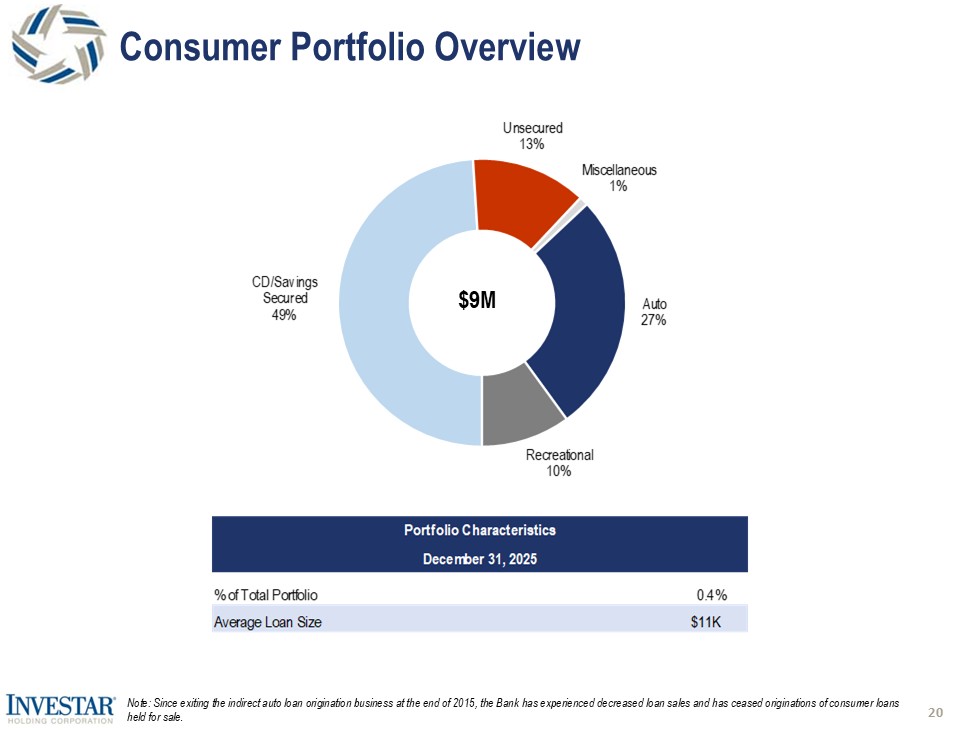
9,431 | 9,985 | 10,687 | (554 | ) | (5.5 | ) | (1,256 | ) | (11.8 | ) | 0.4 | 0.5 | |||||||||||||||||||||||
|
Total loans |
$ | 2,175,973 | $ | 2,150,523 | $ | 2,125,084 | $ | 25,450 | 1.2 | % | $ | 50,889 | 2.4 | % | 100 | % | 100 | % | ||||||||||||||||||
At December 31, 2025, Investar’s total business lending portfolio, which consists of loans secured by owner-occupied commercial real estate properties and commercial and industrial loans, was $1.06 billion, an increase of $31.8 million, or 3.1%, compared to the business lending portfolio of $1.02 billion at September 30, 2025, and an increase of $79.2 million, or 8.1%, compared to the business lending portfolio of $976.2 million at December 31, 2024. The increase in the business lending portfolio compared to September 30, 2025 and December 31, 2024 was primarily driven by increased commercial and industrial loan production.
Nonowner-occupied loans totaled $452.1 million at December 31, 2025, a decrease of $7.6 million, or 1.6%, compared to $459.7 million at September 30, 2025, and a decrease of $43.1 million, or 8.7%, compared to $495.3 million at December 31, 2024. The decrease in nonowner-occupied loans compared to September 30, 2025 and December 31, 2024 was primarily due to loan amortization and payoffs that aligned with our continued strategy to optimize and de-risk the mix of the portfolio.
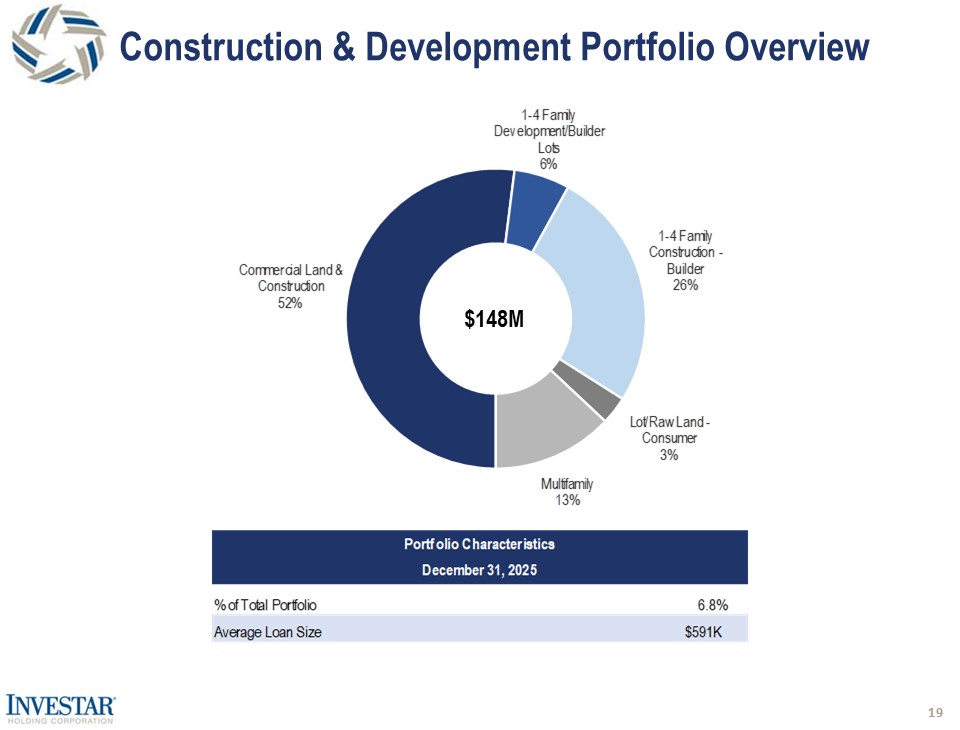
Construction and development loans totaled $148.0 million at December 31, 2025, an increase of $7.4 million, or 5.3%, compared to $140.6 million at September 30, 2025, and a decrease of $6.6 million, or 4.3%, compared to $154.6 million at December 31, 2024. The increase in construction and development loans compared to September 30, 2025 was primarily due to organic growth. The decrease in construction and development loans compared to December 31, 2024 was primarily due to conversions to permanent loans upon completion of construction.
Credit Quality
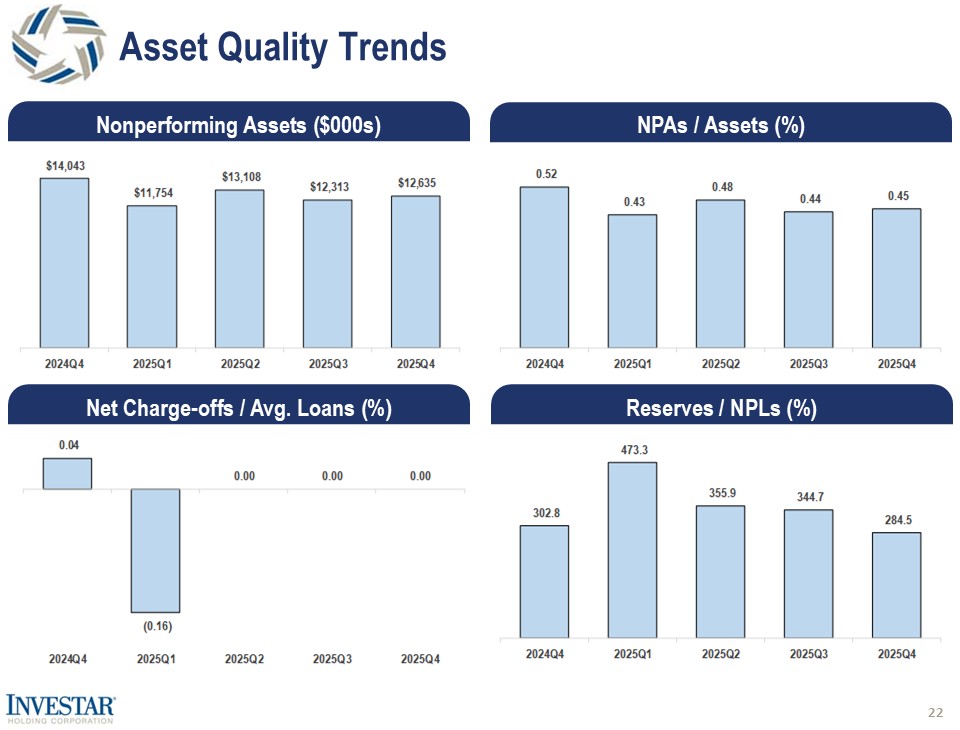
Nonperforming loans were $9.3 million, or 0.43% of total loans, at December 31, 2025, an increase of $1.6 million compared to $7.7 million, or 0.36% of total loans, at September 30, 2025, and an increase of $0.5 million compared to $8.8 million, or 0.42% of total loans, at December 31, 2024. The increase in nonperforming loans compared to September 30, 2025 was mainly attributable to 1-4 family loan relationships totaling $2.1 million partially offset by paydowns.
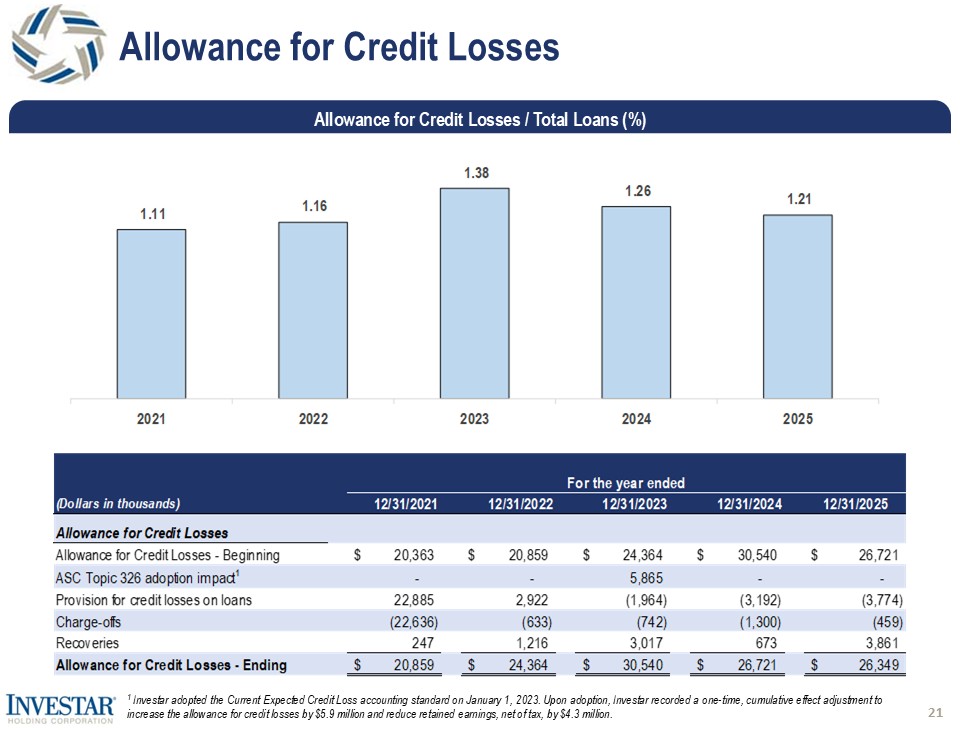
The allowance for credit losses was $26.3 million, or 284.5% and 1.21% of nonperforming and total loans, respectively, at December 31, 2025, compared to $26.5 million, or 344.7% and 1.23% of nonperforming and total loans, respectively, at September 30, 2025, and $26.7 million, or 302.8% and 1.26% of nonperforming and total loans, respectively, at December 31, 2024.
Investar recorded a negative provision for credit losses of $0.1 million for the quarter ended December 31, 2025 compared to a provision for credit losses of $0.1 million and a negative provision for credit losses of $0.7 million for the quarters ended September 30, 2025 and December 31, 2024, respectively. The negative provision for credit losses in the quarter ended December 31, 2025 was primarily attributable to changes in the economic forecast and loan mix. The provision for credit losses in the quarter ended September 30, 2025 was primarily due to loan growth partially offset by changes in the economic forecast and loan mix. The negative provision for credit losses for the quarter ended December 31, 2024 was primarily attributable to a decrease in total loans, aging of existing loans and an improvement in the economic forecast.
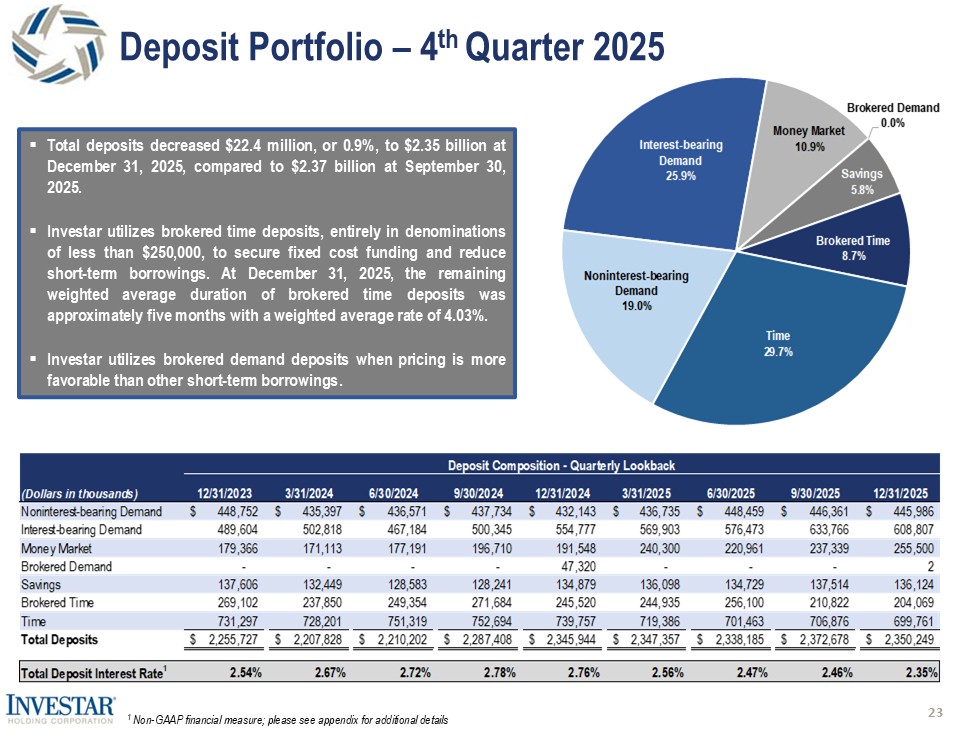
Total deposits at December 31, 2025 were $2.35 billion, a decrease of $22.4 million, or 0.9%, compared to $2.37 billion at September 30, 2025, and an increase of $4.3 million, or 0.2%, compared to $2.35 billion at December 31, 2024.
The following table sets forth the composition of deposits as of the dates indicated (dollars in thousands).
|
Linked Quarter Change |
Year/Year Change |
Percentage of Total Deposits |
||||||||||||||||||||||||||||||||||
|
12/31/2025 |
9/30/2025 |
12/31/2024 |
$ |
% |
$ |
% |
12/31/2025 |
12/31/2024 |
||||||||||||||||||||||||||||
|
Noninterest-bearing demand deposits |
$ | 445,986 | $ | 446,361 | $ | 432,143 | $ | (375 | ) | (0.1 | )% | $ | 13,843 | 3.2 | % | 19.0 | % | 18.4 | % | |||||||||||||||||
|
Interest-bearing demand deposits |
608,807 | 633,766 | 554,777 | (24,959 | ) | (3.9 | ) | 54,030 | 9.7 | 25.9 | 23.7 | |||||||||||||||||||||||||
|
Money market deposits |
255,500 | 237,339 | 191,548 | 18,161 | 7.7 | 63,952 | 33.4 | 10.9 | 8.2 | |||||||||||||||||||||||||||
|
Brokered demand deposits |
2 | — | 47,320 | 2 | — | (47,318 | ) | (100.0 | ) | — | 2.0 | |||||||||||||||||||||||||
|
Savings deposits |
136,124 | 137,514 | 134,879 | (1,390 | ) | (1.0 | ) | 1,245 | 0.9 | 5.8 | 5.7 | |||||||||||||||||||||||||
|
Brokered time deposits |
204,069 | 210,822 | 245,520 | (6,753 | ) | (3.2 | ) | (41,451 | ) | (16.9 | ) | 8.7 | 10.5 | |||||||||||||||||||||||
|
Time deposits |
699,761 | 706,876 | 739,757 | (7,115 | ) | (1.0 | ) | (39,996 | ) | (5.4 | ) | 29.7 | 31.5 | |||||||||||||||||||||||
|
Total deposits |
$ | 2,350,249 | $ | 2,372,678 | $ | 2,345,944 | $ | (22,429 | ) | (0.9 | )% | $ | 4,305 | 0.2 | % | 100 | % | 100 | % | |||||||||||||||||
The decrease in interest-bearing demand deposits at December 31, 2025 compared to September 30, 2025 was primarily due to customers drawing down on their existing deposit accounts. The increase in money market deposits at December 31, 2025 compared to September 30, 2025 was primarily the result of organic growth. Brokered time deposits decreased to $204.1 million at December 31, 2025 from $210.8 million at September 30, 2025. Investar utilizes brokered time deposits, entirely in denominations of less than $250,000, to secure fixed cost funding and reduce short-term borrowings. At December 31, 2025, the balance of brokered time deposits remained below 10% of total assets, and the remaining weighted average duration was approximately five months with a weighted average rate of 4.03%. Investar utilizes brokered demand deposits when pricing is more favorable than other short-term borrowings.
Stockholders’ Equity
On July 1, 2025, Investar completed a private placement of 32,500 shares of its newly designated 6.5% Series A Non-Cumulative Perpetual Convertible Preferred Stock (“Series A Preferred Stock”) with selected institutional and other accredited investors at a price of $1,000 per share, for aggregate gross proceeds of $32.5 million. The net proceeds were $30.4 million, after deducting placement agent fees and other offering related expenses. Investar used a portion of the net proceeds from the offering to support the acquisition of Wichita Falls and will use the remainder for general corporate purposes, including organic growth and other potential acquisitions.
Stockholders’ equity was $301.1 million at December 31, 2025, an increase of $5.8 million, or 2.0%, compared to September 30, 2025, and an increase of $59.8 million, or 24.8%, compared to December 31, 2024. The increase in stockholders’ equity compared to September 30, 2025 was primarily attributable to net income for the quarter and a decrease in accumulated other comprehensive loss due to an increase in the fair value of the Bank’s available for sale securities portfolio. The increase in stockholders’ equity compared to December 31, 2024 was primarily attributable to the issuance of the Series A Preferred Stock, net income for the twelve months ended December 31, 2025, and a decrease in accumulated other comprehensive loss due to an increase in the fair value of the Bank’s available for sale securities portfolio.
Net Interest Income
Net interest income for the fourth quarter of 2025 totaled $21.6 million, an increase of $0.5 million, or 2.3%, compared to the third quarter of 2025, and an increase of $4.1 million, or 23.7%, compared to the fourth quarter of 2024. Total interest income was $37.1 million, $37.1 million and $35.5 million for the quarters ended December 31, 2025, September 30, 2025 and December 31, 2024, respectively. Total interest expense was $15.5 million, $15.9 million and $18.0 million for the corresponding periods. Included in net interest income for the quarters ended December 31, 2025, September 30, 2025 and December 31, 2024 is $6,000, $6,000, and $11,000, respectively, of interest income accretion from the acquisition of loans. Also included in net interest income for the quarters ended December 31, 2025, September 30, 2025 and December 31, 2024 are interest recoveries of $1,000, $64,000 and $11,000, respectively.
Investar’s net interest margin was 3.20% for the quarter ended December 31, 2025, compared to 3.16% for the quarter ended September 30, 2025 and 2.65% for the quarter ended December 31, 2024. The increase in net interest margin for the quarter ended December 31, 2025 compared to the quarter ended September 30, 2025 was driven by a 13 basis point decrease in the overall cost of funds partially offset by a four basis point decrease in the yield on interest-earning assets. The increase in net interest margin for the quarter ended December 31, 2025 compared to the quarter ended December 31, 2024 was driven by a 51 basis point decrease in the overall cost of funds, primarily brokered time deposits, time deposits and short-term borrowings, and an 11 basis point increase in the yield on interest-earning assets.
The yield on interest-earning assets was 5.49% for the quarter ended December 31, 2025, compared to 5.53% for the quarter ended September 30, 2025 and 5.38% for the quarter ended December 31, 2024. The decrease in the yield on interest-earning assets compared to the quarter ended September 30, 2025 was driven by a four basis point decrease in the yield on our loan portfolio. The increase in the yield on interest-earning assets compared to the quarter ended December 31, 2024 was driven by a 12 basis point increase in the yield on our loan portfolio.
Exclusive of the interest income accretion from the acquisition of loans and interest recoveries, discussed above, adjusted net interest margin increased to 3.20% for the quarter ended December 31, 2025, compared to 3.15% for the quarter ended September 30, 2025 and 2.64% for the quarter ended December 31, 2024. The adjusted yield on interest-earning assets was 5.49% for the quarter ended December 31, 2025 compared to 5.52% and 5.37% for the quarters ended September 30, 2025 and December 31, 2024, respectively. Refer to the Reconciliation of Non-GAAP Financial Measures tables for a reconciliation of GAAP to non-GAAP metrics.
The cost of deposits decreased 13 basis points to 2.91% for the quarter ended December 31, 2025 compared to 3.04% for the quarter ended September 30, 2025 and decreased 49 basis points compared to 3.40% for the quarter ended December 31, 2024. The decrease in the cost of deposits compared to the quarter ended September 30, 2025 resulted primarily from both a lower average balance of, and a decrease in rates paid on, brokered time deposits. The decrease in the cost of deposits compared to the quarter ended December 31, 2024 resulted primarily from both a lower average balance of, and a decrease in rates paid on, brokered time deposits and time deposits, partially offset by a higher average balance of interest-bearing demand deposits.
The cost of short-term borrowings increased eight basis points to 3.01% for the quarter ended December 31, 2025 compared to 2.93% for the quarter ended September 30, 2025 and decreased 90 basis points compared to 3.91% for the quarter ended December 31, 2024. The increase in the cost of short-term borrowings compared to the quarter ended September 30, 2025 resulted primarily from increased utilization of short-term Federal Home Loan Bank (“FHLB”) advances during the fourth quarter of 2025. Beginning in the second quarter of 2023, the Bank began utilizing the Bank Term Funding Program (“BTFP”) to secure fixed rate funding for up to a one-year term and reduce short-term FHLB advances, which are priced daily. The Bank utilized this source of funding due to its lower rate as compared to FHLB advances, the ability to prepay the obligations without penalty, and as a means to lock in funding. During the fourth quarter of 2024, the Bank repaid all of the remaining $109.0 million in borrowings under the BTFP, which had a weighted average rate of 4.76%. The decrease in the cost of short-term borrowings compared to the quarter ended December 31, 2024 resulted primarily from lower average borrowings due primarily to the paydown of borrowings under the BTFP and a lower current rate on short-term FHLB advances compared to borrowings under the BTFP.
The overall cost of funds for the quarter ended December 31, 2025 decreased 13 basis points to 2.98% compared to 3.11% for the quarter ended September 30, 2025 and decreased 51 basis points compared to 3.49% for the quarter ended December 31, 2024. The decrease in the cost of funds for the quarter ended December 31, 2025 compared to the quarter ended September 30, 2025 resulted from a decrease in the cost of deposits, partially offset by both an increase in the average balance of, and an increase in the cost of, short-term borrowings, as discussed above. The decrease in the cost of funds for the quarter ended December 31, 2025 compared to the quarter ended December 31, 2024 resulted primarily from a decrease in the cost of deposits and both a decrease in the average balance of, and a decrease in the cost of, short-term borrowings, partially offset by a higher average balance of deposits, as discussed above.
Noninterest Income
Noninterest income for the fourth quarter of 2025 totaled $1.8 million, a decrease of $1.1 million, or 38.3%, compared to the third quarter of 2025 and a decrease of $3.3 million, or 64.3%, compared to the fourth quarter of 2024.
The decrease in noninterest income compared to the quarter ended September 30, 2025 was driven by a $0.9 million decrease in other operating income, a $0.2 million increase in loss on sale of other real estate owned, and a $0.1 million decrease in the change in fair value of equity securities, partially offset by a $0.1 million increase in income from BOLI. The decrease in other operating income was primarily attributable to a $0.4 million decrease in distributions from other investments and a $0.4 million decrease in the change in net asset value of other investments.
The decrease in noninterest income compared to the quarter ended December 31, 2024 was driven by $3.6 million in income from BOLI recorded in the fourth quarter of 2024 compared to $0.6 million recorded in the fourth quarter of 2025, a $0.6 million decrease in other operating income, and a $0.1 million increase in loss on sale of other real estate owned, partially offset by a $0.4 million increase in gain on call or sale of investment securities. During the fourth quarter of 2024, the Bank received BOLI death benefit proceeds totaling $5.5 million and recorded $3.1 million in income from BOLI. The decrease in other operating income was primarily attributable to a $0.4 million decrease in the change in net asset value of other investments and a $0.2 million decrease in distributions from other investments.
Noninterest Expense
Noninterest expense for the fourth quarter of 2025 totaled $16.3 million, a decrease of $0.2 million, or 1.5%, compared to the third quarter of 2025, and an increase of $0.2 million, or 1.2%, compared to the fourth quarter of 2024.
The decrease in noninterest expense for the quarter ended December 31, 2025 compared to the quarter ended September 30, 2025 was driven by a $0.2 million decrease in salaries and employee benefits and a $0.2 million decrease in other operating expenses, partially offset by a $0.2 million increase in acquisition expense. The decrease in salaries and employee benefits was primarily due to a decrease in incentive-based compensation. The decrease in other operating expenses was primarily due to a $0.1 million decrease in Federal Deposit Insurance Corporation (“FDIC”) assessments and a $0.1 million decrease in write down of other real estate owned. The increase in acquisition expense was related to the Wichita Falls transaction.
The increase in noninterest expense for the quarter ended December 31, 2025 compared to the quarter ended December 31, 2024 was driven by a $0.4 million increase in acquisition expense and a $0.3 million increase in salaries and employee benefits, partially offset by a $0.3 million decrease in other operating expenses and a $0.2 million decrease in loss on early extinguishment of subordinated debt. The increase in salaries and employee benefits was primarily due to investment in people with an emphasis on our Texas markets to remix and strengthen our balance sheet. The decrease in other operating expenses was primarily due to a $0.1 million decrease in FDIC assessments, a $0.1 million decrease in charitable contributions, and a $0.1 million decrease in branch services expense. During the fourth quarter of 2024, Investar redeemed $20.0 million in principal amount of our 2029 Notes and recognized a loss on early extinguishment of subordinated debt of $0.2 million primarily consisting of unamortized deferred financing costs.
Taxes
Investar recorded income tax expense of $1.3 million for the quarter ended December 31, 2025, which equates to an effective tax rate of 18.3%, an increase from the effective tax rate of 17.3% for the quarter ended September 30, 2025 and an increase from the effect tax rate of 16.0% for the quarter ended December 31, 2024.
Basic and Diluted Earnings Per Common Share
Investar reported basic and diluted earnings per common share of $0.55 and $0.51, respectively, for the quarter ended December 31, 2025, compared to basic and diluted earnings per common share of $0.57 and $0.54, respectively for the quarter ended September 30, 2025, and basic and diluted earnings per common share of $0.62 and $0.61, respectively, for the quarter ended December 31, 2024.
About Investar Holding Corporation
Investar, headquartered in Baton Rouge, Louisiana, provides full banking services, excluding trust services, through its wholly-owned banking subsidiary, Investar Bank, National Association. The Bank currently operates 36 branch locations serving Louisiana, Texas, and Alabama. At December 31, 2025, the Bank had 323 full-time equivalent employees and total assets of $2.8 billion.
Non-GAAP Financial Measures
This press release contains financial information determined by methods other than in accordance with generally accepted accounting principles in the United States of America, or GAAP. These measures and ratios include “tangible common equity,” “tangible assets,” “tangible common equity to tangible assets,” “tangible book value per common share,” “core noninterest income,” “core earnings before noninterest expense,” “core noninterest expense,” “core earnings before income tax expense,” “core income tax expense,” “core earnings,” “core earnings available to common shareholders,” “core efficiency ratio,” “core return on average assets,” “core return on average common equity,” “core basic earnings per common share” and “core diluted earnings per common share.” We also present certain average loan, yield, net interest income and net interest margin data adjusted to show the effects of excluding interest recoveries and interest income accretion from the acquisition of loans. Management believes these non-GAAP financial measures provide information useful to investors in understanding Investar’s financial results, and Investar believes that its presentation, together with the accompanying reconciliations, provide a more complete understanding of factors and trends affecting Investar’s business and allow investors to view performance in a manner similar to management, the entire financial services sector, bank stock analysts and bank regulators. These non-GAAP measures should not be considered a substitute for GAAP basis measures and results, and Investar strongly encourages investors to review its consolidated financial statements in their entirety and not to rely on any single financial measure. Because non-GAAP financial measures are not standardized, it may not be possible to compare these financial measures with other companies’ non-GAAP financial measures having the same or similar names. A reconciliation of the non-GAAP financial measures disclosed in this press release to the comparable GAAP financial measures is included at the end of the financial statement tables.
Forward-Looking and Cautionary Statements
This press release contains forward-looking statements within the meaning of the Private Securities Litigation Reform Act of 1995 that reflect Investar’s current views with respect to, among other things, future events and financial performance. Investar generally identifies forward-looking statements by terminology such as “outlook,” “believes,” “expects,” “potential,” “continues,” “may,” “will,” “could,” “should,” “seeks,” “approximately,” “predicts,” “intends,” “plans,” “estimates,” “anticipates” or the negative version of those words or other comparable words.
Any forward-looking statements contained in this press release are based on the historical performance of Investar and its subsidiaries or on Investar’s current plans, estimates and expectations. The inclusion of this forward-looking information should not be regarded as a representation by Investar that the future plans, estimates or expectations by Investar will be achieved. Such forward-looking statements are subject to various risks and uncertainties and assumptions relating to Investar’s operations, financial results, financial condition, business prospects, growth strategy and liquidity. If one or more of these or other risks or uncertainties materialize, or if Investar’s underlying assumptions prove to be incorrect, Investar’s actual results may vary materially from those indicated in these statements. Investar does not undertake any obligation to publicly update or revise any forward-looking statement, whether as a result of new information, future developments or otherwise. A number of important factors could cause actual results to differ materially from those indicated by the forward-looking statements. These factors include, but are not limited to, the following, any one or more of which could materially affect the outcome of future events:
|
• |
the significant risks and uncertainties for our business, results of operations and financial condition, as well as our regulatory capital and liquidity ratios and other regulatory requirements caused by business and economic conditions generally and in the financial services industry in particular, whether nationally, regionally or in the markets in which we operate, including heightened uncertainties resulting from recent changing trade and tariff policies that could have an adverse impact on inflation and economic growth at least in the near term; |
|
• |
changes in inflation, interest rates, yield curves and interest rate spread relationships that affect our loan and deposit pricing; |
|
• |
our ability to successfully execute our strategy focused on consistent, quality earnings through the optimization of our balance sheet, and our ability to successfully execute a long-term growth strategy; |
|
• |
our ability to achieve organic loan and deposit growth, and the composition of that growth; |
|
• |
our ability to identify and enter into agreements to combine with attractive acquisition candidates, finance acquisitions, complete acquisitions after definitive agreements are entered into, and successfully integrate and grow acquired operations; |
|
• |
our potential growth, including our entrance or expansion into new markets, and the need for sufficient capital to support that growth; |
|
• |
a reduction in liquidity, including as a result of a reduction in the amount of deposits we hold or other sources of liquidity, which may be caused by, among other things, disruptions in the banking industry similar to those that occurred in early 2023 that caused bank depositors to move uninsured deposits to other banks or alternative investments outside the banking industry; |
|
• |
inaccuracy of the assumptions and estimates we make in establishing reserves for credit losses and other estimates; |
|
• |
changes in the quality or composition of our loan portfolio, including adverse developments in borrower industries or in the repayment ability of individual borrowers; |
|
• |
changes in the quality and composition of, and changes in unrealized losses in, our investment portfolio, including whether we may have to sell securities before their recovery of amortized cost basis and realize losses; |
|
• |
the extent of continuing client demand for the high level of personalized service that is a key element of our banking approach as well as our ability to execute our strategy generally; |
|
• |
our dependence on our management team, and our ability to attract and retain qualified personnel; |
|
|
• | the concentration of our business within our geographic areas of operation in Louisiana, Texas and Alabama; |
|
• |
risks to holders of our common stock relating to our Series A Preferred Stock, including, but not limited to, dividend preferences to holders of the preferred stock, other conditions with respect to the payment of dividends on our common stock, potential dilution upon conversion of the preferred stock, and liquidation preferences to holders of the preferred stock; |
|
• |
increasing costs of complying with new and potential future regulations; |
|
• |
new or increasing geopolitical tensions, including resulting from wars in Ukraine and Israel and surrounding areas; |
|
• |
the emergence or worsening of widespread public health challenges or pandemics; |
|
• |
concentration of credit exposure; |
|
• |
any deterioration in asset quality and higher loan charge-offs, and the time and effort necessary to resolve problem assets; |
|
• |
fluctuations in the price of oil and natural gas; |
|
• |
data processing system failures and errors; |
|
• |
risks associated with our digital transformation process, including increased risks of cyberattacks and other security breaches and challenges associated with addressing the increased prevalence of artificial intelligence; |
|
• |
risks of losses resulting from increased fraud attacks against us and others in the financial services industry; |
|
• |
potential impairment of our goodwill and other intangible assets; |
|
• |
the impact of litigation and other legal proceedings to which we become subject; |
|
• |
competitive pressures in the commercial finance, retail banking, mortgage lending and consumer finance industries, as well as the financial resources of, and products offered by, competitors; |
|
• |
the impact of changes in laws and regulations applicable to us, including banking, securities and tax laws and regulations and accounting standards, as well as changes in the interpretation of such laws and regulations by our regulators; |
|
• |
changes in the scope and costs of FDIC insurance and other coverages; |
|
• |
governmental monetary and fiscal policies; and |
|
• |
hurricanes, tropical storms, tropical depressions, floods, winter storms, droughts and other adverse weather events, all of which have affected Investar’s market areas from time to time; other natural disasters; oil spills and other man-made disasters; acts of terrorism; other international or domestic calamities; acts of God; and other matters beyond our control. |
These factors should not be construed as exhaustive. Additional information on these and other risk factors can be found in Part I Item 1A. “Risk Factors” and in the “Cautionary Note Regarding Forward-Looking Statements” in Part II Item 7. “Management’s Discussion and Analysis of Financial Condition and Results of Operations” in Investar’s Annual Report on Form 10-K for the year ended December 31, 2024 filed with the Securities and Exchange Commission.
For further information contact:
Investar Holding Corporation
Corey Moore
Executive Vice President and Deputy Chief Financial Officer
(225) 227-2348
Corey.Moore@investarbank.com
|
INVESTAR HOLDING CORPORATION |
|
SUMMARY FINANCIAL INFORMATION |
|
(Amounts in thousands, except share and per share data) |
|
(Unaudited) |
|
As of and for the three months ended |
||||||||||||||||||||
|
12/31/2025 |
9/30/2025 |
12/31/2024 |
Linked Quarter |
Year/Year |
||||||||||||||||
|
EARNINGS DATA |
||||||||||||||||||||
|
Total interest income |
$ | 37,128 | $ | 37,095 | $ | 35,505 | 0.1 | % | 4.6 | % | ||||||||||
|
Total interest expense |
15,497 | 15,942 | 18,022 | (2.8 | ) | (14.0 | ) | |||||||||||||
|
Net interest income |
21,631 | 21,153 | 17,483 | 2.3 | 23.7 | |||||||||||||||
|
Provision for credit losses |
(75 | ) | 139 | (701 | ) | (154.0 | ) | 89.3 | ||||||||||||
|
Total noninterest income |
1,842 | 2,984 | 5,163 | (38.3 | ) | (64.3 | ) | |||||||||||||
|
Total noninterest expense |
16,277 | 16,526 | 16,079 | (1.5 | ) | 1.2 | ||||||||||||||
|
Income before income tax expense |
7,271 | 7,472 | 7,268 | (2.7 | ) | 0.0 | ||||||||||||||
|
Income tax expense |
1,333 | 1,293 | 1,161 | 3.1 | 14.8 | |||||||||||||||
|
Net income |
5,938 | 6,179 | 6,107 | (3.9 | ) | (2.8 | ) | |||||||||||||
|
Preferred stock dividends declared |
528 | 528 | — | — | — | |||||||||||||||
|
Net income available to common shareholders |
$ | 5,410 | $ | 5,651 | $ | 6,107 | (4.3 | ) | (11.4 | ) | ||||||||||
|
AVERAGE BALANCE SHEET DATA |
||||||||||||||||||||
|
Total assets |
$ | 2,836,916 | $ | 2,797,338 | $ | 2,763,734 | 1.4 | % | 2.6 | % | ||||||||||
|
Total interest-earning assets |
2,683,658 | 2,659,306 | 2,626,533 | 0.9 | 2.2 | |||||||||||||||
|
Total loans |
2,150,980 | 2,141,280 | 2,129,388 | 0.5 | 1.0 | |||||||||||||||
|
Total interest-bearing deposits |
1,917,020 | 1,919,377 | 1,881,297 | (0.1 | ) | 1.9 | ||||||||||||||
|
Total interest-bearing liabilities |
2,060,430 | 2,033,350 | 2,054,561 | 1.3 | 0.3 | |||||||||||||||
|
Total deposits |
2,370,480 | 2,370,406 | 2,315,730 | 0.0 | 2.4 | |||||||||||||||
|
Total common stockholders’ equity |
271,241 | 260,799 | 247,230 | 4.0 | 9.7 | |||||||||||||||
|
PER COMMON SHARE DATA |
||||||||||||||||||||
|
Earnings: |
||||||||||||||||||||
|
Basic earnings per common share |
$ | 0.55 | $ | 0.57 | $ | 0.62 | (3.5 | )% | (11.3 | )% | ||||||||||
|
Diluted earnings per common share |
0.51 | 0.54 | 0.61 | (5.6 | ) | (16.4 | ) | |||||||||||||
|
Core earnings:(1) |
||||||||||||||||||||
|
Core basic earnings per common share(1) |
0.63 | 0.58 | 0.66 | 8.6 | (4.5 | ) | ||||||||||||||
|
Core diluted earnings per common share(1) |
0.58 | 0.54 | 0.65 | 7.4 | (10.8 | ) | ||||||||||||||
|
Book value per common share |
27.63 | 26.96 | 24.55 | 2.5 | 12.5 | |||||||||||||||
|
Tangible book value per common share(1) |
23.42 | 22.76 | 20.31 | 2.9 | 15.3 | |||||||||||||||
|
Common shares outstanding |
9,798,948 | 9,825,883 | 9,828,413 | (0.3 | ) | (0.3 | ) | |||||||||||||
|
Weighted average common shares outstanding - basic |
9,806,683 | 9,830,387 | 9,828,146 | (0.2 | ) | (0.2 | ) | |||||||||||||
|
Weighted average common shares outstanding - diluted |
11,554,939 | 11,527,876 | 9,993,790 | 0.2 | 15.6 | |||||||||||||||
|
PERFORMANCE RATIOS |
||||||||||||||||||||
|
Return on average assets |
0.83 | % | 0.88 | % | 0.88 | % | (5.7 | )% | (5.7 | )% | ||||||||||
|
Core return on average assets(1) |
0.93 | 0.89 | 0.93 | 4.5 | — | |||||||||||||||
|
Return on average common equity |
7.91 | 8.60 | 9.83 | (8.0 | ) | (19.5 | ) | |||||||||||||
|
Core return on average common equity(1) |
9.75 | 8.73 | 10.40 | 11.7 | (6.3 | ) | ||||||||||||||
|
Net interest margin |
3.20 | 3.16 | 2.65 | 1.3 | 20.8 | |||||||||||||||
|
Net interest income to average assets |
3.03 | 3.00 | 2.52 | 1.0 | 20.2 | |||||||||||||||
|
Noninterest expense to average assets |
2.28 | 2.34 | 2.31 | (2.6 | ) | (1.3 | ) | |||||||||||||
|
Efficiency ratio(2) |
69.34 | 68.47 | 71.00 | 1.3 | (2.3 | ) | ||||||||||||||
|
Core efficiency ratio(1) |
66.13 | 67.66 | 69.41 | (2.3 | ) | (4.7 | ) | |||||||||||||
|
Dividend payout ratio |
20.00 | 19.30 | 16.94 | 3.6 | 18.1 | |||||||||||||||
|
Net charge-offs (recoveries) to average loans |
— | — | 0.04 | — | (100.0 | ) | ||||||||||||||
|
(1) Non-GAAP financial measure. See reconciliation. |
|
(2) Efficiency ratio represents noninterest expense divided by the sum of net interest income (before provision for credit losses) and noninterest income. |
|
INVESTAR HOLDING CORPORATION |
|
SUMMARY FINANCIAL INFORMATION |
|
(Unaudited) |
|
As of and for the three months ended |
||||||||||||||||||||
|
12/31/2025 |
9/30/2025 |
12/31/2024 |
Linked Quarter |
Year/Year |
||||||||||||||||
|
ASSET QUALITY RATIOS |
||||||||||||||||||||
|
Nonperforming assets to total assets |
0.45 | % | 0.44 | % | 0.52 | % | 2.3 | % | (13.5 | )% | ||||||||||
|
Nonperforming loans to total loans |
0.43 | 0.36 | 0.42 | 19.4 | 2.4 | |||||||||||||||
|
Allowance for credit losses to total loans |
1.21 | 1.23 | 1.26 | (1.6 | ) | (4.0 | ) | |||||||||||||
|
Allowance for credit losses to nonperforming loans |
284.50 | 344.66 | 302.77 | (17.5 | ) | (6.0 | ) | |||||||||||||
|
CAPITAL RATIOS |
||||||||||||||||||||
|
Investar Holding Corporation: |
||||||||||||||||||||
|
Total common equity to total assets |
9.56 | % | 9.46 | % | 8.86 | % | 1.1 | % | 7.9 | % | ||||||||||
|
Tangible common equity to tangible assets(1) |
8.22 | 8.10 | 7.44 | 1.4 | 10.4 | |||||||||||||||
|
Tier 1 leverage capital |
10.73 | 10.70 | 9.27 | 0.3 | 15.7 | |||||||||||||||
|
Common equity tier 1 capital(2) |
11.17 | 11.12 | 10.84 | 0.4 | 3.0 | |||||||||||||||
|
Tier 1 capital(2) |
12.85 | 12.82 | 11.25 | 0.2 | 14.2 | |||||||||||||||
|
Total capital(2) |
14.66 | 14.65 | 13.13 | 0.1 | 11.7 | |||||||||||||||
|
Investar Bank: |
||||||||||||||||||||
|
Tier 1 leverage capital |
10.85 | 10.88 | 9.70 | (0.3 | ) | 11.9 | ||||||||||||||
|
Common equity tier 1 capital(2) |
13.00 | 13.05 | 11.77 | (0.4 | ) | 10.5 | ||||||||||||||
|
Tier 1 capital(2) |
13.00 | 13.05 | 11.77 | (0.4 | ) | 10.5 | ||||||||||||||
|
Total capital(2) |
14.11 | 14.17 | 12.92 | (0.4 | ) | 9.2 | ||||||||||||||
|
(1) Non-GAAP financial measure. See reconciliation. |
|
(2) Estimated for December 31, 2025. |
|
INVESTAR HOLDING CORPORATION |
||||||
|
CONSOLIDATED BALANCE SHEETS |
||||||
|
(Amounts in thousands, except share data) |
||||||
|
(Unaudited) |
|
December 31, 2025 |
September 30, 2025 |
December 31, 2024 |
||||||||||
|
ASSETS |
||||||||||||
|
Cash and due from banks |
$ | 26,606 | $ | 32,564 | $ | 26,623 | ||||||
|
Interest-bearing balances due from other banks |
14,899 | 2,809 | 1,299 | |||||||||
|
Cash and cash equivalents |
41,505 | 35,373 | 27,922 | |||||||||
|
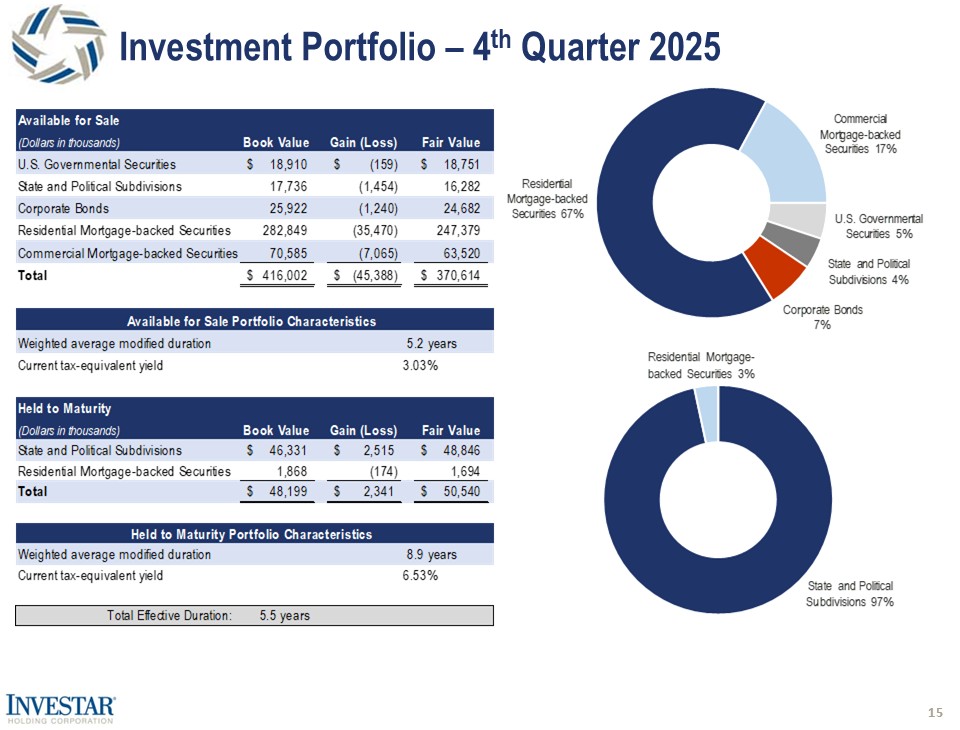
Available for sale securities at fair value (amortized cost of $416,002, $417,729, and $392,564, respectively) |
370,614 | 370,251 | 331,121 | |||||||||
|
Held to maturity securities at amortized cost (estimated fair value of $50,540, $50,576, and $42,144, respectively) |
48,199 | 47,834 | 42,687 | |||||||||
|
Loans |
2,175,973 | 2,150,523 | 2,125,084 | |||||||||
|
Less: allowance for credit losses |
(26,349 | ) | (26,470 | ) | (26,721 | ) | ||||||
|
Loans, net |
2,149,624 | 2,124,053 | 2,098,363 | |||||||||
|
Equity securities at fair value |
3,354 | 3,270 | 2,593 | |||||||||
|
Nonmarketable equity securities |
17,021 | 15,255 | 16,502 | |||||||||
|
Bank premises and equipment, net of accumulated depreciation of $23,836, $23,297, and $21,853, respectively |
39,534 | 39,732 | 40,705 | |||||||||
|
Other real estate owned, net |
3,374 | 4,633 | 5,218 | |||||||||
|
Accrued interest receivable |
14,289 | 14,858 | 14,423 | |||||||||
|
Deferred tax asset |
14,050 | 14,362 | 17,120 | |||||||||
|
Goodwill and other intangible assets, net |
41,184 | 41,303 | 41,696 | |||||||||
|
Bank-owned life insurance |
69,188 | 68,612 | 59,703 | |||||||||
|
Other assets |
21,112 | 21,092 | 24,759 | |||||||||
|
Total assets |
$ | 2,833,048 | $ | 2,800,628 | $ | 2,722,812 | ||||||
|
LIABILITIES |
||||||||||||
|
Deposits |
||||||||||||
|
Noninterest-bearing |
$ | 445,986 | $ | 446,361 | $ | 432,143 | ||||||
|
Interest-bearing |
1,904,263 | 1,926,317 | 1,913,801 | |||||||||
|
Total deposits |
2,350,249 | 2,372,678 | 2,345,944 | |||||||||
|
Advances from Federal Home Loan Bank |
116,000 | 60,000 | 67,215 | |||||||||
|
Repurchase agreements |
11,183 | 15,066 | 8,376 | |||||||||
|
Subordinated debt, net of unamortized issuance costs |
16,738 | 16,728 | 16,697 | |||||||||
|
Junior subordinated debt |
8,830 | 8,806 | 8,733 | |||||||||
|
Accrued taxes and other liabilities |
28,975 | 32,055 | 34,551 | |||||||||
|
Total liabilities |
2,531,975 | 2,505,333 | 2,481,516 | |||||||||
|
STOCKHOLDERS’ EQUITY |
||||||||||||
|
Preferred stock, no par value per share; 5,000,000 shares authorized; 6.5% Series A Non-Cumulative Perpetual Convertible Preferred Stock; 32,500 shares ($1,000 liquidation preference) issued and outstanding at December 31, 2025 and September 30, 2025 and none issued and outstanding at December 31, 2024 |
30,353 | 30,353 | — | |||||||||
|
Common stock, $1.00 par value per share; 40,000,000 shares authorized; 9,798,948, 9,825,883, and 9,828,413 shares issued and outstanding, respectively |
9,799 | 9,826 | 9,828 | |||||||||
|
Surplus |
146,133 | 146,304 | 146,890 | |||||||||
|
Retained earnings |
150,510 | 146,178 | 132,935 | |||||||||
|
Accumulated other comprehensive loss |
(35,722 | ) | (37,366 | ) | (48,357 | ) | ||||||
|
Total stockholders’ equity |
301,073 | 295,295 | 241,296 | |||||||||
|
Total liabilities and stockholders’ equity |
$ | 2,833,048 | $ | 2,800,628 | $ | 2,722,812 | ||||||
|
INVESTAR HOLDING CORPORATION |
|
CONSOLIDATED STATEMENTS OF INCOME |
|
(Amounts in thousands, except per share data) |
|
(Unaudited) |
|
For the three months ended |
For the twelve months ended |
|||||||||||||||||||
| December 31, 2025 | September 30, 2025 | December 31, 2024 | December 31, 2025 | December 31, 2024 | ||||||||||||||||
|
INTEREST INCOME |
||||||||||||||||||||
|
Interest and fees on loans |
$ | 32,477 | $ | 32,563 | $ | 31,438 | $ | 126,732 | $ | 128,498 | ||||||||||
|
Interest on investment securities |
||||||||||||||||||||
|
Taxable |
3,204 | 3,096 | 2,709 | 11,940 | 11,047 | |||||||||||||||
|
Tax-exempt |
718 | 689 | 569 | 2,743 | 1,249 | |||||||||||||||
|
Other interest income |
729 | 747 | 789 | 2,601 | 3,071 | |||||||||||||||
|
Total interest income |
37,128 | 37,095 | 35,505 | 144,016 | 143,865 | |||||||||||||||
|
INTEREST EXPENSE |
||||||||||||||||||||
|
Interest on deposits |
14,046 | 14,726 | 16,071 | 57,868 | 61,510 | |||||||||||||||
|
Interest on borrowings |
1,451 | 1,216 | 1,951 | 5,375 | 12,602 | |||||||||||||||
|
Total interest expense |
15,497 | 15,942 | 18,022 | 63,243 | 74,112 | |||||||||||||||
|
Net interest income |
21,631 | 21,153 | 17,483 | 80,773 | 69,753 | |||||||||||||||
|
Provision for credit losses |
(75 | ) | 139 | (701 | ) | (3,391 | ) | (3,480 | ) | |||||||||||
|
Net interest income after provision for credit losses |
21,706 | 21,014 | 18,184 | 84,164 | 73,233 | |||||||||||||||
|
NONINTEREST INCOME |
||||||||||||||||||||
|
Service charges on deposit accounts |
841 | 832 | 804 | 3,256 | 3,241 | |||||||||||||||
|
Gain (loss) on call or sale of investment securities, net |
16 | 2 | (371 | ) | 18 | (753 | ) | |||||||||||||
|
(Loss) gain on sale or disposition of fixed assets, net |
— | (5 | ) | — | (8 | ) | 427 | |||||||||||||
|
(Loss) gain on sale of other real estate owned, net |
(94 | ) | 94 | (25 | ) | 29 | 683 | |||||||||||||
|
Interchange fees |
389 | 394 | 407 | 1,574 | 1,615 | |||||||||||||||
|
Income from bank owned life insurance |
576 | 485 | 3,576 | 1,985 | 4,886 | |||||||||||||||
|
Change in the fair value of equity securities |
84 | 200 | 159 | 261 | 413 | |||||||||||||||
|
Income from legal settlement |
— | — | — | — | 1,122 | |||||||||||||||
|
Other operating income |
30 | 982 | 613 | 2,348 | 2,571 | |||||||||||||||
|
Total noninterest income |
1,842 | 2,984 | 5,163 | 9,463 | 14,205 | |||||||||||||||
|
Income before noninterest expense |
23,548 | 23,998 | 23,347 | 93,627 | 87,438 | |||||||||||||||
|
NONINTEREST EXPENSE |
||||||||||||||||||||
|
Depreciation and amortization |
678 | 683 | 736 | 2,792 | 3,095 | |||||||||||||||
|
Salaries and employee benefits |
10,066 | 10,302 | 9,792 | 40,228 | 38,615 | |||||||||||||||
|
Occupancy |
672 | 679 | 647 | 2,667 | 2,576 | |||||||||||||||
|
Data processing |
814 | 831 | 901 | 3,456 | 3,611 | |||||||||||||||
|
Marketing |
105 | 101 | 136 | 429 | 370 | |||||||||||||||
|
Professional fees |
521 | 496 | 434 | 2,076 | 1,797 | |||||||||||||||
|
Loss (gain) on early extinguishment of subordinated debt |
— | — | 210 | — | (292 | ) | ||||||||||||||
|
Acquisition expense |
449 | 246 | — | 1,036 | — | |||||||||||||||
|
Other operating expenses |
2,972 | 3,188 | 3,223 | 13,057 | 13,260 | |||||||||||||||
|
Total noninterest expense |
16,277 | 16,526 | 16,079 | 65,741 | 63,032 | |||||||||||||||
|
Income before income tax expense |
7,271 | 7,472 | 7,268 | 27,886 | 24,406 | |||||||||||||||
|
Income tax expense |
1,333 | 1,293 | 1,161 | 4,982 | 4,154 | |||||||||||||||
|
Net income |
5,938 | 6,179 | 6,107 | 22,904 | 20,252 | |||||||||||||||
|
Preferred stock dividends declared |
528 | 528 | — | 1,056 | — | |||||||||||||||
|
Net income available to common shareholders |
$ | 5,410 | $ | 5,651 | $ | 6,107 | $ | 21,848 | $ | 20,252 | ||||||||||
|
EARNINGS PER COMMON SHARE |
||||||||||||||||||||
|
Basic earnings per common share |
$ | 0.55 | $ | 0.57 | $ | 0.62 | $ | 2.22 | $ | 2.06 | ||||||||||
|
Diluted earnings per common share |
0.51 | 0.54 | 0.61 | 2.13 | 2.04 | |||||||||||||||
|
Cash dividends declared per common share |
0.11 | 0.11 | 0.105 | 0.435 | 0.41 | |||||||||||||||
|
INVESTAR HOLDING CORPORATION |
|
CONSOLIDATED AVERAGE BALANCE SHEET, INTEREST EARNED AND YIELD ANALYSIS |
|
(Amounts in thousands) |
|
(Unaudited) |
|
For the three months ended |
||||||||||||||||||||||||||||||||||||
|
December 31, 2025 |
September 30, 2025 |
December 31, 2024 |
||||||||||||||||||||||||||||||||||
|
Interest |
Interest |
Interest |
||||||||||||||||||||||||||||||||||
|
Average |
Income/ |
Average |
Income/ |
Average |
Income/ |
|||||||||||||||||||||||||||||||
|
Balance |
Expense |
Yield/ Rate |
Balance |
Expense |
Yield/ Rate |
Balance |
Expense |
Yield/ Rate |
||||||||||||||||||||||||||||
|
Assets |
||||||||||||||||||||||||||||||||||||
|
Interest-earning assets: |
||||||||||||||||||||||||||||||||||||
|
Loans |
$ | 2,150,980 | $ | 32,477 | 5.99 | % | $ | 2,141,280 | $ | 32,563 | 6.03 | % | $ | 2,129,388 | $ | 31,438 | 5.87 | % | ||||||||||||||||||
|
Securities: |
||||||||||||||||||||||||||||||||||||
|
Taxable |
412,959 | 3,204 | 3.08 | 406,153 | 3,096 | 3.02 | 389,170 | 2,709 | 2.77 | |||||||||||||||||||||||||||
|
Tax-exempt |
54,667 | 718 | 5.21 | 51,442 | 689 | 5.31 | 44,544 | 569 | 5.08 | |||||||||||||||||||||||||||
|
Interest-bearing balances with banks |
65,052 | 729 | 4.44 | 60,431 | 747 | 4.90 | 63,431 | 789 | 4.95 | |||||||||||||||||||||||||||
|
Total interest-earning assets |
2,683,658 | 37,128 | 5.49 | 2,659,306 | 37,095 | 5.53 | 2,626,533 | 35,505 | 5.38 | |||||||||||||||||||||||||||
|
Cash and due from banks |
28,990 | 27,102 | 25,222 | |||||||||||||||||||||||||||||||||
|
Intangible assets |
41,246 | 41,370 | 41,775 | |||||||||||||||||||||||||||||||||
|
Other assets |
109,445 | 96,704 | 98,057 | |||||||||||||||||||||||||||||||||
|
Allowance for credit losses |
(26,423 | ) | (27,144 | ) | (27,853 | ) | ||||||||||||||||||||||||||||||
|
Total assets |
$ | 2,836,916 | $ | 2,797,338 | $ | 2,763,734 | ||||||||||||||||||||||||||||||
|
Liabilities and stockholders’ equity |
||||||||||||||||||||||||||||||||||||
|
Interest-bearing liabilities: |
||||||||||||||||||||||||||||||||||||
|
Deposits: |
||||||||||||||||||||||||||||||||||||
|
Interest-bearing demand deposits |
$ | 873,065 | $ | 4,912 | 2.23 | % | $ | 836,137 | $ | 4,802 | 2.28 | % | $ | 753,477 | $ | 4,342 | 2.29 | % | ||||||||||||||||||
|
Brokered demand deposits |
369 | 3 | 3.68 | 109 | 1 | 4.59 | 1,312 | 15 | 4.43 | |||||||||||||||||||||||||||
|
Savings deposits |
136,712 | 366 | 1.06 | 136,314 | 380 | 1.11 | 130,896 | 371 | 1.13 | |||||||||||||||||||||||||||
|
Brokered time deposits |
199,823 | 2,109 | 4.19 | 242,224 | 2,842 | 4.66 | 246,104 | 3,103 | 5.02 | |||||||||||||||||||||||||||
|
Time deposits |
707,051 | 6,656 | 3.73 | 704,593 | 6,701 | 3.77 | 749,508 | 8,240 | 4.37 | |||||||||||||||||||||||||||
|
Total interest-bearing deposits |
1,917,020 | 14,046 | 2.91 | 1,919,377 | 14,726 | 3.04 | 1,881,297 | 16,071 | 3.40 | |||||||||||||||||||||||||||
|
Short-term borrowings |
48,941 | 372 | 3.01 | 28,452 | 210 | 2.93 | 68,237 | 671 | 3.91 | |||||||||||||||||||||||||||
|
Long-term debt |
94,469 | 1,079 | 4.53 | 85,521 | 1,006 | 4.66 | 105,027 | 1,280 | 4.85 | |||||||||||||||||||||||||||
|
Total interest-bearing liabilities |
2,060,430 | 15,497 | 2.98 | 2,033,350 | 15,942 | 3.11 | 2,054,561 | 18,022 | 3.49 | |||||||||||||||||||||||||||
|
Noninterest-bearing deposits |
453,460 | 451,029 | 434,433 | |||||||||||||||||||||||||||||||||
|
Other liabilities |
21,432 | 21,786 | 27,510 | |||||||||||||||||||||||||||||||||
|
Stockholders’ equity |
301,594 | 291,173 | 247,230 | |||||||||||||||||||||||||||||||||
|
Total liability and stockholders’ equity |
$ | 2,836,916 | $ | 2,797,338 | $ | 2,763,734 | ||||||||||||||||||||||||||||||
|
Net interest income/net interest margin |
$ | 21,631 | 3.20 | % | $ | 21,153 | 3.16 | % | $ | 17,483 | 2.65 | % | ||||||||||||||||||||||||
|
INVESTAR HOLDING CORPORATION |
|
CONSOLIDATED AVERAGE BALANCE SHEET, INTEREST EARNED AND YIELD ANALYSIS |
|
(Amounts in thousands) |
|
(Unaudited) |
|
For the twelve months ended |
||||||||||||||||||||||||
|
December 31, 2025 |
December 31, 2024 |
|||||||||||||||||||||||
|
Interest |
Interest |
|||||||||||||||||||||||
|
Average |
Income/ |
Average |
Income/ |
|||||||||||||||||||||
|
Balance |
Expense |
Yield/ Rate |
Balance |
Expense |
Yield/ Rate |
|||||||||||||||||||
|
Assets |
||||||||||||||||||||||||
|
Interest-earning assets: |
||||||||||||||||||||||||
|
Loans |
$ | 2,126,514 | $ | 126,732 | 5.96 | % | $ | 2,163,161 | $ | 128,498 | 5.94 | % | ||||||||||||
|
Securities: |
||||||||||||||||||||||||
|
Taxable |
402,353 | 11,940 | 2.97 | 399,855 | 11,047 | 2.76 | ||||||||||||||||||
|
Tax-exempt |
51,648 | 2,743 | 5.31 | 29,930 | 1,249 | 4.17 | ||||||||||||||||||
|
Interest-bearing balances with banks |
54,308 | 2,601 | 4.79 | 56,851 | 3,071 | 5.40 | ||||||||||||||||||
|
Total interest-earning assets |
2,634,823 | 144,016 | 5.47 | 2,649,797 | 143,865 | 5.43 | ||||||||||||||||||
|
Cash and due from banks |
27,109 | 25,890 | ||||||||||||||||||||||
|
Intangible assets |
41,434 | 42,006 | ||||||||||||||||||||||
|
Other assets |
98,856 | 95,391 | ||||||||||||||||||||||
|
Allowance for credit losses |
(26,746 | ) | (28,933 | ) | ||||||||||||||||||||
|
Total assets |
$ | 2,775,476 | $ | 2,784,151 | ||||||||||||||||||||
|
Liabilities and stockholders’ equity |
||||||||||||||||||||||||
|
Interest-bearing liabilities: |
||||||||||||||||||||||||
|
Deposits: |
||||||||||||||||||||||||
|
Interest-bearing demand deposits |
$ | 819,182 | $ | 18,188 | 2.22 | % | $ | 692,390 | $ | 14,024 | 2.03 | % | ||||||||||||
|
Brokered demand deposits |
2,464 | 109 | 4.44 | 455 | 22 | 4.76 | ||||||||||||||||||
|
Savings deposits |
135,716 | 1,447 | 1.07 | 130,553 | 1,418 | 1.09 | ||||||||||||||||||
|
Brokered time deposits |
237,294 | 10,983 | 4.63 | 249,668 | 12,878 | 5.16 | ||||||||||||||||||
|
Time deposits |
710,610 | 27,141 | 3.82 | 745,002 | 33,168 | 4.45 | ||||||||||||||||||
|
Total interest-bearing deposits |
1,905,266 | 57,868 | 3.04 | 1,818,068 | 61,510 | 3.38 | ||||||||||||||||||
|
Short-term borrowings |
40,118 | 1,282 | 3.19 | 189,912 | 8,699 | 4.58 | ||||||||||||||||||
|
Long-term debt |
87,751 | 4,093 | 4.66 | 81,152 | 3,903 | 4.81 | ||||||||||||||||||
|
Total interest-bearing liabilities |
2,033,135 | 63,243 | 3.11 | 2,089,132 | 74,112 | 3.55 | ||||||||||||||||||
|
Noninterest-bearing deposits |
445,929 | 430,433 | ||||||||||||||||||||||
|
Other liabilities |
22,407 | 28,986 | ||||||||||||||||||||||
|
Stockholders’ equity |
274,005 | 235,600 | ||||||||||||||||||||||
|
Total liability and stockholders’ equity |
$ | 2,775,476 | $ | 2,784,151 | ||||||||||||||||||||
|
Net interest income/net interest margin |
$ | 80,773 | 3.07 | % | $ | 69,753 | 2.63 | % | ||||||||||||||||
| INVESTAR HOLDING CORPORATION | ||||||||||||||||||||
|
RECONCILIATION OF NON-GAAP FINANCIAL MEASURES |
||||||||||||||||||||
| INTEREST EARNED AND YIELD ANALYSIS ADJUSTED FOR INTEREST RECOVERIES AND ACCRETION | ||||||||||||||||||||
| (Amounts in thousands) | ||||||||||||||||||||
| (Unaudited) | ||||||||||||||||||||
|
For the three months ended |
||||||||||||||||||||||||||||||||||||
|
December 31, 2025 |
September 30, 2025 |
December 31, 2024 |
||||||||||||||||||||||||||||||||||
|
Interest |
Interest |
Interest |
||||||||||||||||||||||||||||||||||
|
Average |
Income/ |
Average |
Income/ |
Average |
Income/ |
|||||||||||||||||||||||||||||||
|
Balance |
Expense |
Yield/ Rate |
Balance |
Expense |
Yield/ Rate |
Balance |
Expense |
Yield/ Rate |
||||||||||||||||||||||||||||
|
Interest-earning assets: |
||||||||||||||||||||||||||||||||||||
|
Loans |
$ | 2,150,980 | $ | 32,477 | 5.99 | % | $ | 2,141,280 | $ | 32,563 | 6.03 | % | $ | 2,129,388 | $ | 31,438 | 5.87 | % | ||||||||||||||||||
|
Adjustments: |
||||||||||||||||||||||||||||||||||||
|
Interest recoveries |
1 | 64 | 11 | |||||||||||||||||||||||||||||||||
|
Accretion |
6 | 6 | 11 | |||||||||||||||||||||||||||||||||
|
Adjusted loans |
2,150,980 | 32,470 | 5.99 | 2,141,280 | 32,493 | 6.02 | 2,129,388 | 31,416 | 5.87 | |||||||||||||||||||||||||||
|
Securities: |
||||||||||||||||||||||||||||||||||||
|
Taxable |
412,959 | 3,204 | 3.08 | 406,153 | 3,096 | 3.02 | 389,170 | 2,709 | 2.77 | |||||||||||||||||||||||||||
|
Tax-exempt |
54,667 | 718 | 5.21 | 51,442 | 689 | 5.31 | 44,544 | 569 | 5.08 | |||||||||||||||||||||||||||
|
Interest-bearing balances with banks |
65,052 | 729 | 4.44 | 60,431 | 747 | 4.90 | 63,431 | 789 | 4.95 | |||||||||||||||||||||||||||
|
Adjusted interest-earning assets |
2,683,658 | 37,121 | 5.49 | 2,659,306 | 37,025 | 5.52 | 2,626,533 | 35,483 | 5.37 | |||||||||||||||||||||||||||
|
Total interest-bearing liabilities |
2,060,430 | 15,497 | 2.98 | 2,033,350 | 15,942 | 3.11 | 2,054,561 | 18,022 | 3.49 | |||||||||||||||||||||||||||
|
Adjusted net interest income/adjusted net interest margin |
$ | 21,624 | 3.20 | % | $ | 21,083 | 3.15 | % | $ | 17,461 | 2.64 | % | ||||||||||||||||||||||||
|
INVESTAR HOLDING CORPORATION |
||||||||||||||||||||
|
RECONCILIATION OF NON-GAAP FINANCIAL MEASURES |
||||||||||||||||||||
|
(Amounts in thousands, except share data) |
||||||||||||||||||||
|
(Unaudited) |
|
December 31, 2025 |
September 30, 2025 |
December 31, 2024 |
||||||||||
|
Tangible common equity |
||||||||||||
|
Total stockholders’ equity |
$ | 301,073 | $ | 295,295 | $ | 241,296 | ||||||
|
Less: preferred stock |
30,353 | 30,353 | — | |||||||||
|
Total common equity |
270,720 | 264,942 | 241,296 | |||||||||
|
Adjustments: |
||||||||||||
|
Goodwill |
40,088 | 40,088 | 40,088 | |||||||||
|
Core deposit intangible |
996 | 1,115 | 1,508 | |||||||||
|
Trademark intangible |
100 | 100 | 100 | |||||||||
|
Tangible common equity |
$ | 229,536 | $ | 223,639 | $ | 199,600 | ||||||
|
Tangible assets |
||||||||||||
|
Total assets |
$ | 2,833,048 | $ | 2,800,628 | $ | 2,722,812 | ||||||
|
Adjustments: |
||||||||||||
|
Goodwill |
40,088 | 40,088 | 40,088 | |||||||||
|
Core deposit intangible |
996 | 1,115 | 1,508 | |||||||||
|
Trademark intangible |
100 | 100 | 100 | |||||||||
|
Tangible assets |
$ | 2,791,864 | $ | 2,759,325 | $ | 2,681,116 | ||||||
|
Common shares outstanding |
9,798,948 | 9,825,883 | 9,828,413 | |||||||||
|
Tangible common equity to tangible assets |
8.22 | % | 8.10 | % | 7.44 | % | ||||||
|
Book value per common share |
$ | 27.63 | $ | 26.96 | $ | 24.55 | ||||||
|
Tangible book value per common share |
23.42 | 22.76 | 20.31 | |||||||||
|
INVESTAR HOLDING CORPORATION |
||||||||||||||||||||
|
RECONCILIATION OF NON-GAAP FINANCIAL MEASURES |
||||||||||||||||||||
|
(Amounts in thousands, except share data) |
||||||||||||||||||||
|
(Unaudited) |
|
For the three months ended |
|||||||||||||
|
December 31, 2025 |
September 30, 2025 |
December 31, 2024 |
|||||||||||
|
Net interest income |
(a) |
$ | 21,631 | $ | 21,153 | $ | 17,483 | ||||||
|
Provision for credit losses |
(75 | ) | 139 | (701 | ) | ||||||||
|
Net interest income after provision for credit losses |
21,706 | 21,014 | 18,184 | ||||||||||
|
Noninterest income |
(b) |
1,842 | 2,984 | 5,163 | |||||||||
|
(Gain) loss on call or sale of investment securities, net |
(16 | ) | (2 | ) | 371 | ||||||||
|
Loss on sale or disposition of fixed assets, net |
— | 5 | — | ||||||||||
|
Loss (gain) on sale of other real estate owned, net |
94 | (94 | ) | 25 | |||||||||
|
Change in the fair value of equity securities |
(84 | ) | (200 | ) | (159 | ) | |||||||
|
Change in the net asset value of other investments(1) |
389 | 11 | (25 | ) | |||||||||
|
Core noninterest income(2) |
(d) |
2,225 | 2,704 | 5,375 | |||||||||
|
Core earnings before noninterest expense(2) |
23,931 | 23,718 | 23,559 | ||||||||||
|
Total noninterest expense |
(c) |
16,277 | 16,526 | 16,079 | |||||||||
|
Loss on early extinguishment of subordinated debt |
— | — | (210 | ) | |||||||||
|
Acquisition expense |
(449 | ) | (246 | ) | — | ||||||||
|
Write down of other real estate owned(3) |
— | (138 | ) | — | |||||||||
|
Severance(4) |
(52 | ) | — | (4 | ) | ||||||||
|
Core noninterest expense |
(f) |
15,776 | 16,142 | 15,865 | |||||||||
|
Core earnings before income tax expense(2) |
8,155 | 7,576 | 7,694 | ||||||||||
|
Core income tax expense(5) |
1,492 | 1,311 | 1,231 | ||||||||||
|
Core earnings(2) |
6,663 | 6,265 | 6,463 | ||||||||||
|
Preferred stock dividends declared |
528 | 528 | — | ||||||||||
|
Core earnings available to common shareholders |
$ | 6,135 | $ | 5,737 | $ | 6,463 | |||||||
|
Core basic earnings per common share(2) |
0.63 | 0.58 | 0.66 | ||||||||||
|
Diluted earnings per common share (GAAP) |
$ | 0.51 | $ | 0.54 | $ | 0.61 | |||||||
|
(Gain) loss on call or sale of investment securities, net |
— | — | 0.03 | ||||||||||
|
Loss on sale or disposition of fixed assets, net |
— | — | — | ||||||||||
|
Loss (gain) on sale of other real estate owned, net |
0.01 | (0.01 | ) | — | |||||||||
|
Change in the fair value of equity securities |
(0.01 | ) | (0.02 | ) | (0.01 | ) | |||||||
|
Change in the net asset value of other investments(1) |
0.03 | — | — | ||||||||||
|
Loss on early extinguishment of subordinated debt |
— | — | 0.02 | ||||||||||
|
Acquisition expense |
0.03 | 0.02 | — | ||||||||||
|
Write down of other real estate owned(3) |
— | 0.01 | — | ||||||||||
|
Severance(4) |
0.01 | — | — | ||||||||||
|
Core diluted earnings per common share(2) |
$ | 0.58 | $ | 0.54 | $ | 0.65 | |||||||
|
Efficiency ratio |
(c) / (a+b) |
69.34 | % | 68.47 | % | 71.00 | % | ||||||
|
Core efficiency ratio(2) |
(f) / (a+d) |
66.13 | 67.66 | 69.41 | |||||||||
|
Core return on average assets(2)(6) |
0.93 | 0.89 | 0.93 | ||||||||||
|
Core return on average common equity(2)(6) |
9.75 | 8.73 | 10.40 | ||||||||||
|
Total average assets |
$ | 2,836,916 | $ | 2,797,338 | $ | 2,763,734 | |||||||
|
Total average common stockholders’ equity |
271,241 | 260,799 | 247,230 | ||||||||||
| (1) | Change in the net asset value of other investments represents unrealized gains or losses on Investar’s investments in Small Business Investment Companies and other investment funds and is included in other operating income in the accompanying consolidated statements of income. |
| (2) | Core noninterest income, core earnings before noninterest expense, core earnings before income tax expense and core earnings include $3.1 million in nontaxable noninterest income from BOLI death benefit proceeds recorded during the quarter ended December 31, 2024. Excluding this income, core basic earnings per common share, core diluted earnings per common share, core efficiency ratio, core return on average assets and core return on average equity are $0.39, $0.39, 80.35%, 0.55%, and 6.19%, respectively, for the quarter ended December 31, 2024. |
| (3) | Reflects an adjustment to noninterest expense for provision for estimated losses on other real estate owned when fair value is determined to be less than carrying values, which is included in other operating expenses in the accompanying consolidated statements of income. |
| (4) | Severance is included in salaries and employee benefits in the accompanying consolidated statements of income. |
| (5) | Core income tax expense is calculated using the effective tax rates of 18.3%, 17.3% and 16.0% for the quarters ended December 31, 2025, September 30, 2025 and December 31, 2024, respectively. |
| (6) | Core earnings used in calculation. No adjustments were made to average assets or average equity. |
Exhibit 99.2