|
Delaware
|
001-31830
|
95-4274680
|
|
(State or other jurisdiction
of incorporation)
|
(Commission
File Number)
|
(IRS Employer Identification No.)
|
|
☐
|
Written communications pursuant to Rule 425 under the Securities Act (17 CFR 230.425)
|
|
☐
|
Soliciting material pursuant to Rule 14a-12 under the Exchange Act (17 CFR 240.14a-12)
|
|
☐
|
Pre-commencement communications pursuant to Rule 14d-2(b) under the Exchange Act (17 CFR 240.14d-2(b))
|
|
☐
|
Pre-commencement communications pursuant to Rule 13e-4(c) under the Exchange Act (17 CFR 240.13e-4(c))
|
|
Title of each class
|
Trading Symbol(s)
|
Name of each exchange on which registered
|
|
Common stock
|
CATY
|
Nasdaq Global Select Market
|
|
Item 2.02
|
Results of Operations and Financial Condition.
|
|
Item 7.01.
|
Regulation FD Disclosure
|
|
Item 9.01
|
Financial Statements and Exhibits.
|
|
(d)
|
Exhibits
|
|
99.1
|
|
99.2
|
|
104
|
Cover Page Interactive Data File (embedded within the Inline XBRL document)
|
| Date: January 22, 2026 | |||
| CATHAY GENERAL BANCORP | |||
| By: | /s/ Heng W. Chen | ||
| Heng W. Chen | |||
| Executive Vice President and | |||
| Chief Financial Officer | |||
Exhibit 99.1
FOR IMMEDIATE RELEASE
|
For: |
Cathay General Bancorp |
Contact: |
Heng W. Chen |
|
777 N. Broadway |
(626) 279-3652 |
||
|
Los Angeles, CA 90012 |
Cathay General Bancorp Announces Fourth Quarter and Full Year 2025 Results
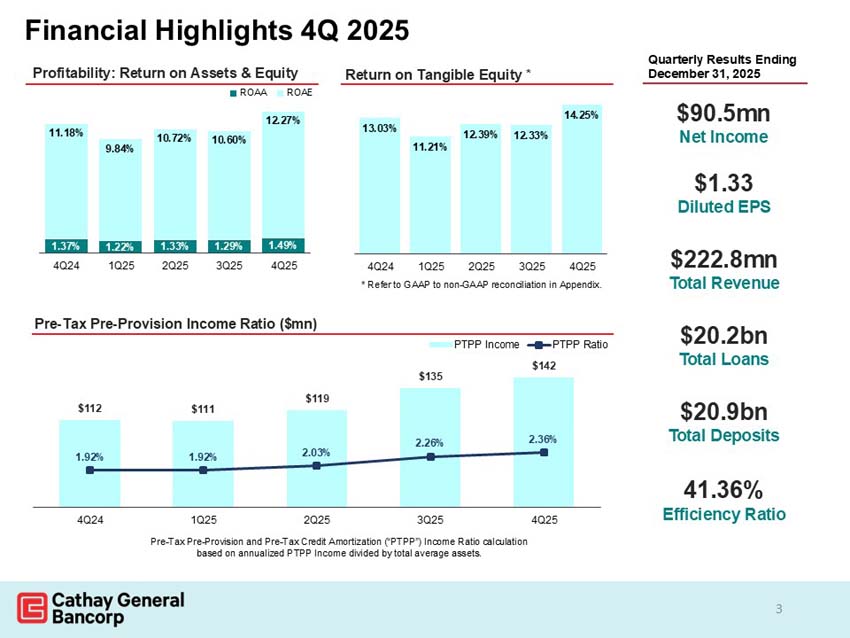
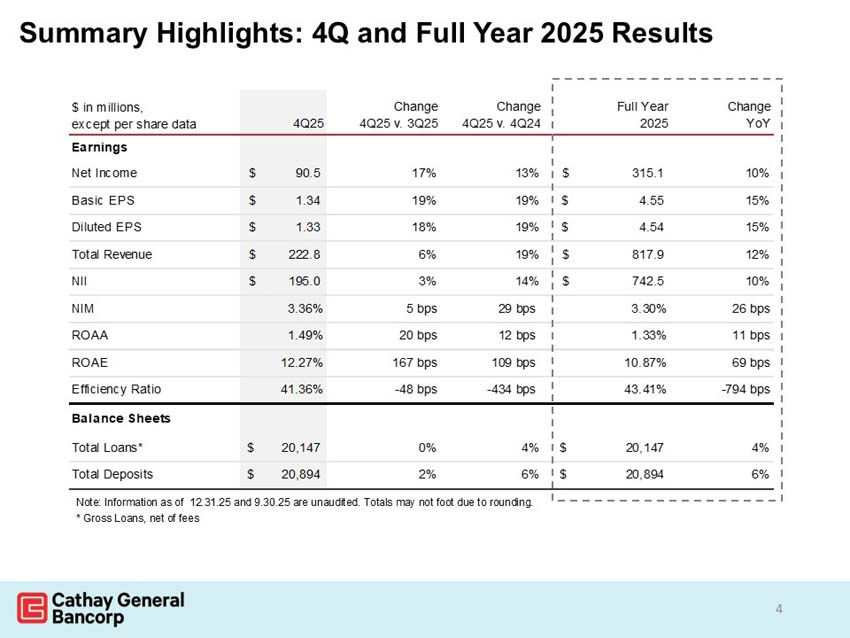
Los Angeles, Calif., January 22, 2026: Cathay General Bancorp (the “Company”, “we”, “us”, or “our”) (Nasdaq: CATY), the holding company for Cathay Bank, today announced its unaudited financial results for the quarter and year ended December 31, 2025. The Company reported net income of $315.1 million, or $4.54 per diluted share, for the year ended December 31, 2025 and net income of $90.5 million, or $1.33 per diluted share, for the fourth quarter of 2025.
FINANCIAL PERFORMANCE
|
Three months ended |
Year ended December 31, |
|||||||||||||||||||
|
(unaudited) |
December 31, 2025 |
September 30, 2025 |
December 31, 2024 |
2025 |
2024 |
|||||||||||||||
|
Net income (in millions) |
$ |
90.5 |
$ |
77.7 |
$ |
80.2 |
$ |
315.1 |
$ |
286.0 | ||||||||||
|
Basic earnings per common share |
$ | 1.34 | $ | 1.13 | $ | 1.13 | $ | 4.55 | $ | 3.97 | ||||||||||
|
Diluted earnings per common share |
$ | 1.33 | $ | 1.13 | $ | 1.12 | $ | 4.54 | $ | 3.95 | ||||||||||
|
Return on average assets |
1.49 | % | 1.29 | % | 1.37 | % | 1.33 | % | 1.22 | % | ||||||||||
|
Return on average total stockholders' equity |
12.27 | % | 10.60 | % | 11.18 | % | 10.87 | % | 10.18 | % | ||||||||||
|
Efficiency ratio |
41.36 | % | 41.84 | % | 45.70 | % | 43.41 | % | 51.35 | % | ||||||||||
HIGHLIGHTS
|
● |
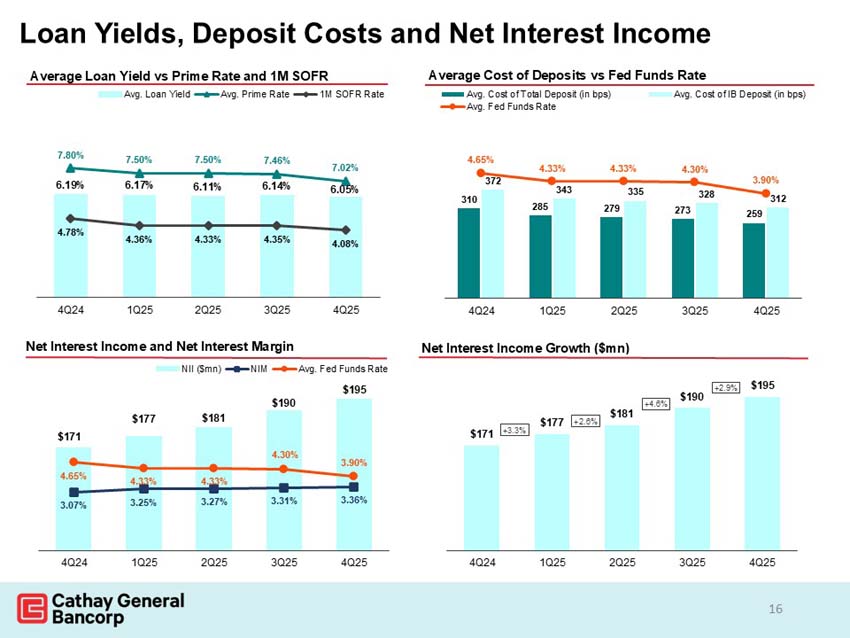
Net interest margin increased to 3.36% during the fourth quarter from 3.31% in the third quarter. |
|
● |
Total loans, excluding loans held for sale, increased to $20.15 billion, or 4.0%, from $19.38 billion in 2024. |
|
● |
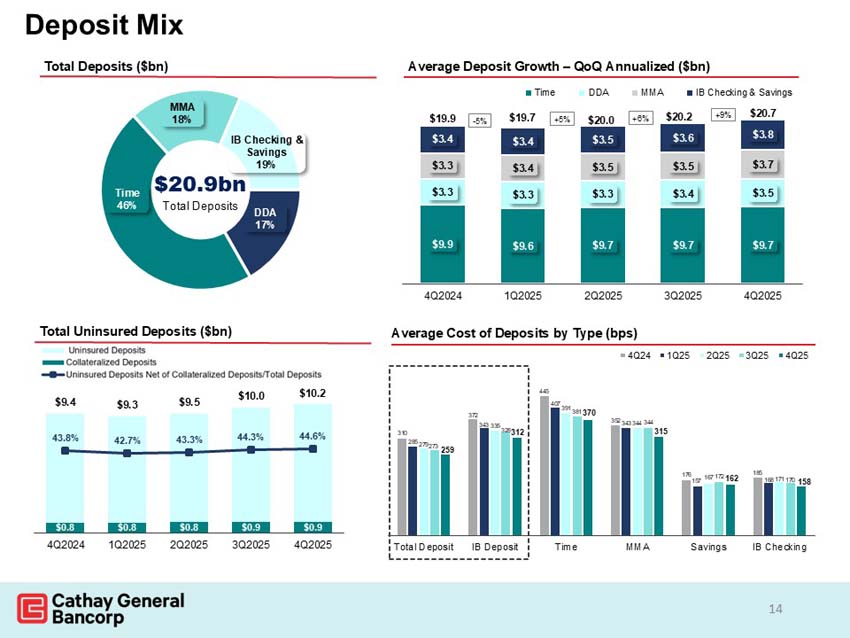
Total deposits increased $1.20 billion, or 6.1%, to $20.89 billion in 2025, from $19.69 billion in 2024. |
|
|
“We are pleased by the continued increase in the net interest margin compared to the third quarter of 2025 and fourth quarter of 2024. During the fourth quarter of 2025, we repurchased 1,099,803 shares at an average cost of $47.15 per share for a total of $51.9 million”, commented Chang M. Liu, President and Chief Executive Officer of the Company. |
INCOME STATEMENT REVIEW
FOURTH QUARTER 2025 COMPARED TO THE THIRD QUARTER 2025
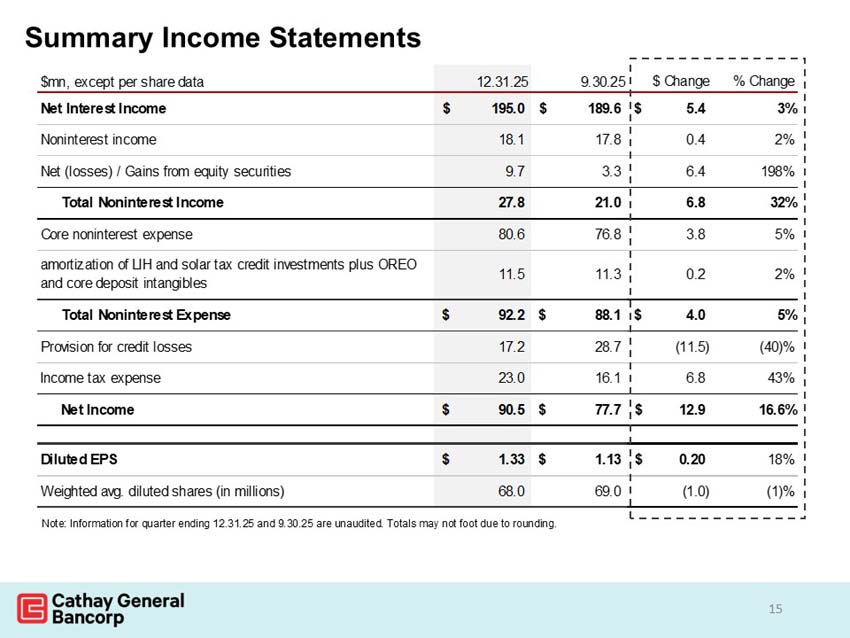
Net income for the quarter ended December 31, 2025, was $90.5 million, an increase of $12.8 million, or 16.5%, compared to net income of $77.7 million for the third quarter of 2025. Diluted earnings per share for the fourth quarter of 2025 was $1.33 per share compared to $1.13 per share for the third quarter of 2025.
Return on average stockholders’ equity was 12.27% and return on average assets was 1.49% for the quarter ended December 31, 2025, compared to a return on average stockholders’ equity of 10.60% and a return on average assets of 1.29% in the third quarter of 2025.
Net interest income before provision for credit losses
Net interest income before provision for credit losses increased $5.4 million, or 2.9%, to $195.0 million during the fourth quarter of 2025, compared to $189.6 million in the third quarter of 2025. The increase was due primarily to a decrease in interest deposit expense, partially offset by a decrease in interest income from loans and securities.
The net interest margin was 3.36% for the fourth quarter of 2025 compared to 3.31% for the third quarter of 2025.
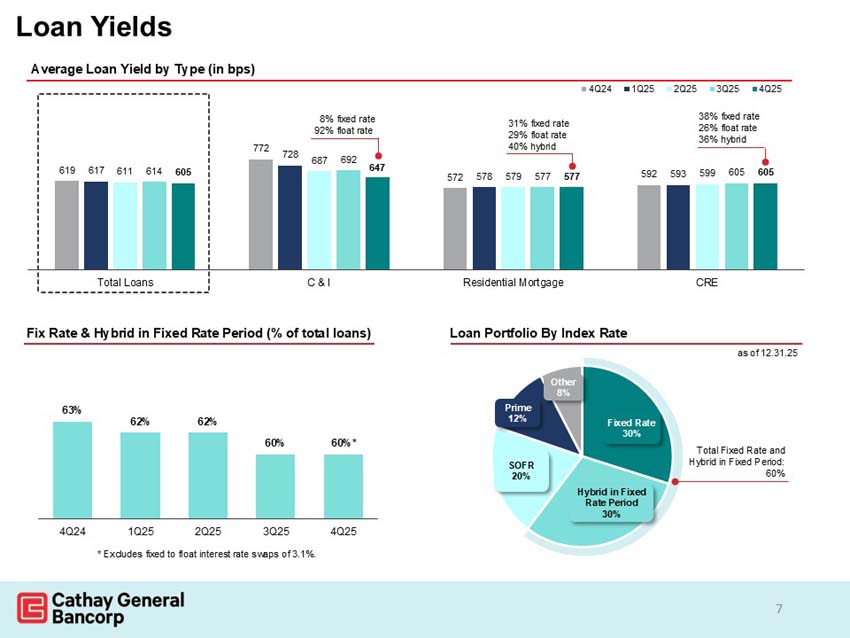
For the fourth quarter of 2025, the yield on average interest-earning assets was 5.74%, the cost of funds on average interest-bearing liabilities was 3.14%, and the cost of average interest-bearing deposits was 3.12%. In comparison, for the third quarter of 2025, the yield on average interest-earning assets was 5.84%, the cost of funds on average interest-bearing liabilities was 3.32%, and the cost of average interest-bearing deposits was 3.28%. The decrease in the yield on average interest-bearing liabilities resulted mainly from lower interest rates on deposits driven by the lower repricing of maturing time deposits in the fourth quarter. The decrease in the yield on average interest-earning assets resulted mainly from lower interest rates on loans due to the decreasing rate environment. The net interest spread, defined as the difference between the yield on average interest-earning assets and the cost of funds on average interest-bearing liabilities, was 2.60% for the fourth quarter of 2025, compared to 2.52% for the third quarter of 2025.
Provision for credit losses
The Company recorded a provision for credit losses of $17.2 million in the fourth quarter of 2025 compared to $28.7 million in the third quarter of 2025. As of December 31, 2025, the allowance for credit losses increased by $11.9 million to $208.4 million, or 1.03% of gross loans, compared to $196.5 million, or 0.98% of gross loans as of September 30, 2025.
The following table sets forth the charge-offs and recoveries for the periods indicated:
|
Three months ended |
Year ended December 31, |
|||||||||||||||||||
|
December 31, 2025 |
September 30, 2025 |
December 31, 2024 |
2025 |
2024 |
||||||||||||||||
|
($ In thousands) (Unaudited) |
||||||||||||||||||||
|
Charge-offs: |
||||||||||||||||||||
|
Commercial loans |
$ | 5,467 | $ | 16,173 | $ | 14,064 | $ | 33,101 | $ | 26,926 | ||||||||||
|
Construction loans |
— | — | — | — | — | |||||||||||||||
|
Real estate loans (1) |
409 | 314 | 2,472 | 4,636 | 4,531 | |||||||||||||||
|
Installment and other loans |
— | — | 7 | — | 15 | |||||||||||||||
|
Total charge-offs |
5,876 | 16,487 | 16,543 | 37,737 | 31,472 | |||||||||||||||
|
Recoveries: |
||||||||||||||||||||
|
Commercial loans |
517 | 547 | 75 | 1,529 | 1,102 | |||||||||||||||
|
Construction loans |
— | 5 | — | 6 | — | |||||||||||||||
|
Real estate loans (1) |
3 | 289 | 133 | 482 | 694 | |||||||||||||||
|
Installment and other loans |
— | — | 2 | — | 2 | |||||||||||||||
|
Total recoveries |
520 | 841 | 210 | 2,017 | 1,798 | |||||||||||||||
|
Net charge-offs/(recoveries) |
$ | 5,356 | $ | 15,646 | $ | 16,333 | $ | 35,720 | $ | 29,674 | ||||||||||
|
(1) Real estate loans include commercial mortgage loans, residential mortgage loans and equity lines. |
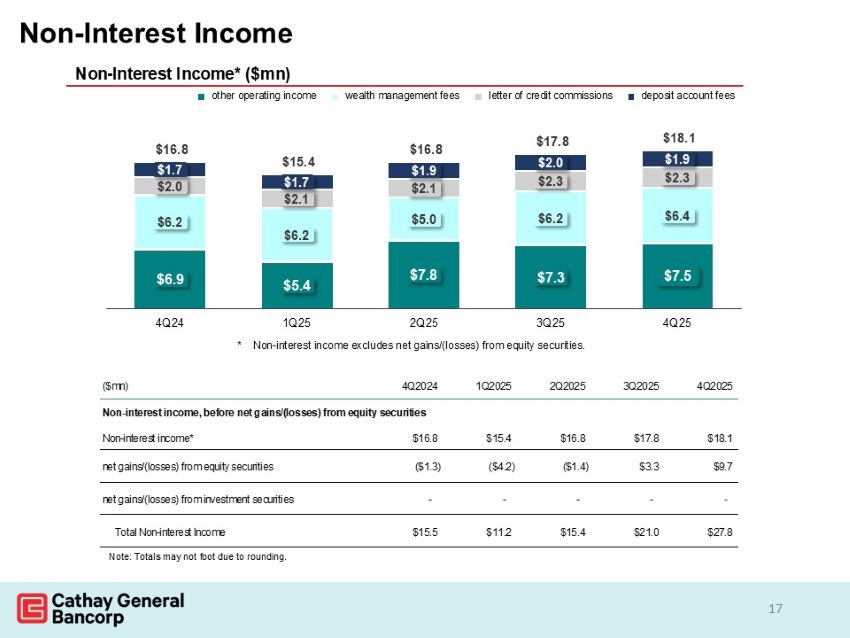
Non-interest income
Non-interest income, which includes revenues from depository service fees, letters of credit commissions, securities gains (losses), wealth management fees, and other sources of fee income, was $27.8 million for the fourth quarter of 2025, an increase of $6.8 million, or 32.2%, compared to $21.0 million for the third quarter of 2025. The increase was primarily due to an increase of $6.4 million in unrealized gains on equity securities, when compared to the third quarter of 2025.
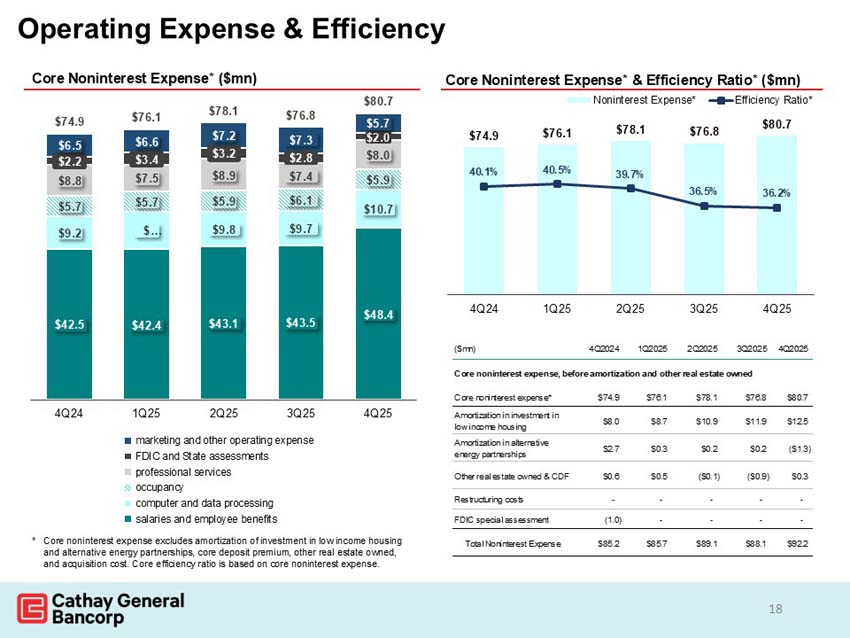
Non-interest expense
Non-interest expense increased $4.1 million, or 4.6%, to $92.2 million in the fourth quarter of 2025 compared to $88.1 million in the third quarter of 2025. The increase was primarily due to an increase in salaries and employee benefits costs driven by higher performance-based incentive accruals. The efficiency ratio, defined as non-interest expense divided by the sum of net interest income before provision for loan losses plus non-interest income, was 41.36% in the fourth quarter of 2025 compared to 41.84% for the third quarter of 2025.
Income taxes
The effective tax rate for the fourth quarter of 2025 was 20.23% compared to 17.18% for the third quarter of 2025. The effective tax rate for the third and fourth quarter of 2025 includes the impact of low-income housing tax credits.
BALANCE SHEET REVIEW
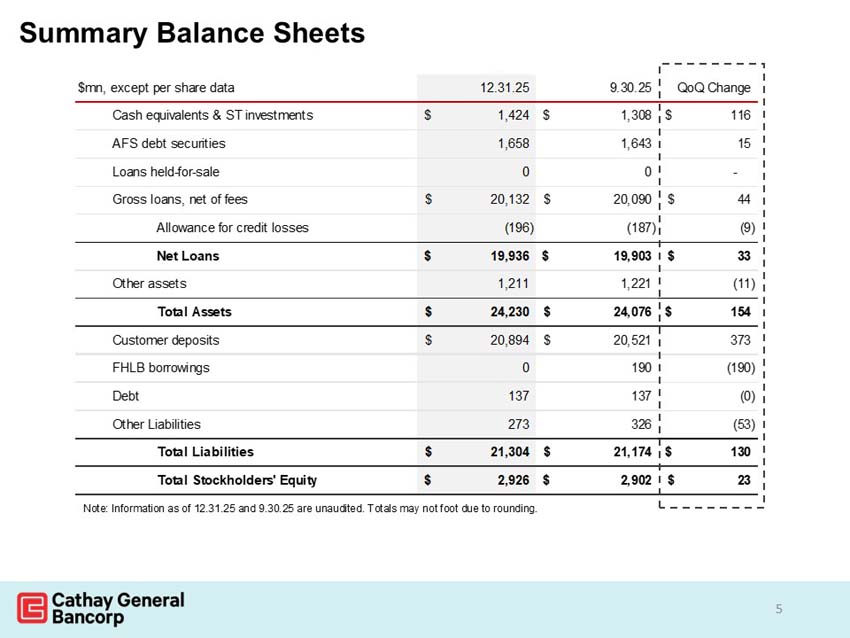
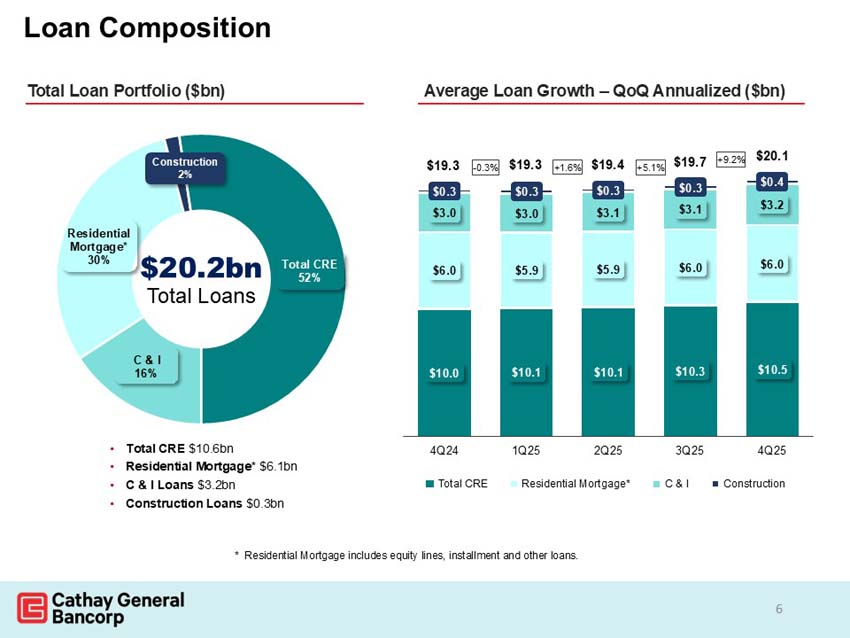
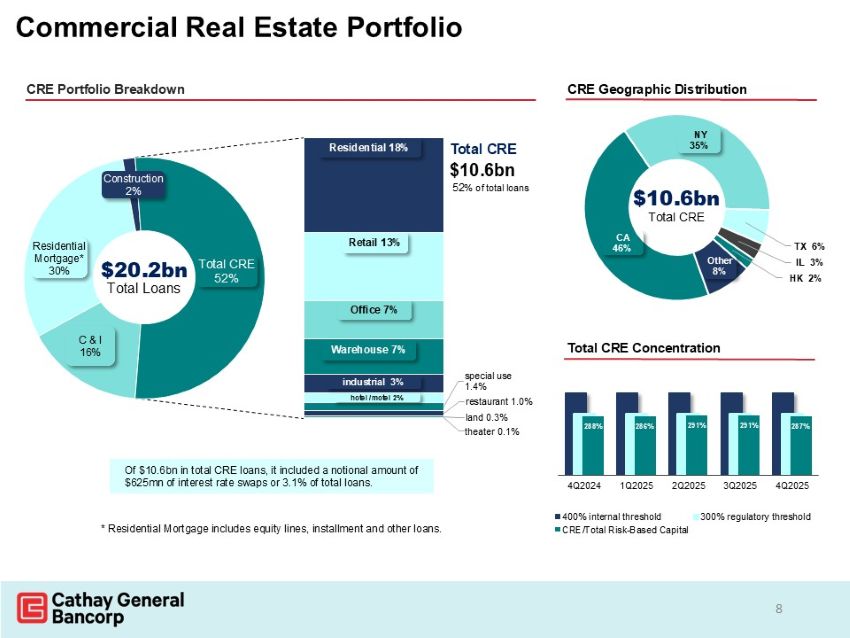
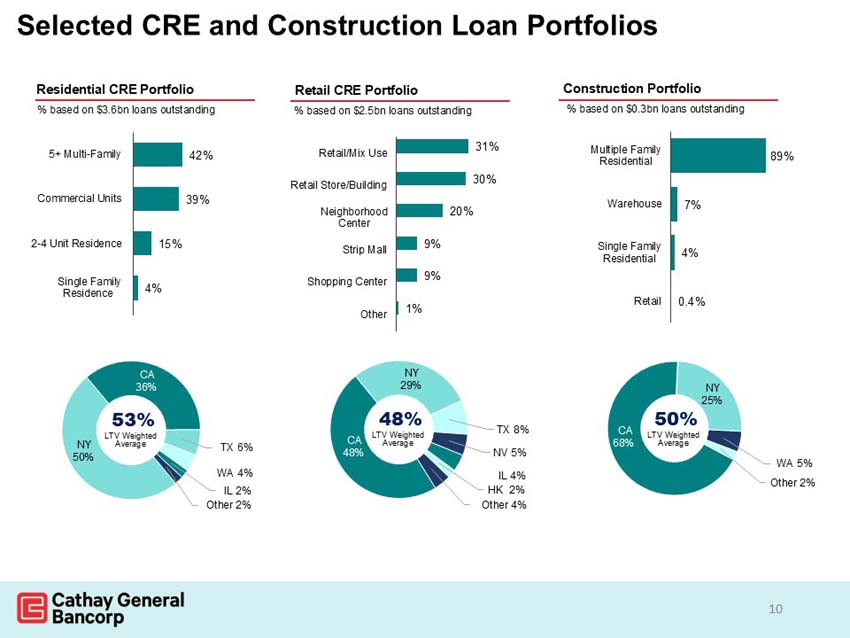
Gross loans were $20.15 billion as of December 31, 2025, an increase of $771.2 million, or 4.0%, from $19.38 billion as of December 31, 2024. The increase was primarily due to increases of $530.9 million, or 5.3%, in commercial real estate loans, $143.0 million, or 2.5%, in residential mortgage loans, $86.6 million, or 2.8%, in commercial loans and $17.9 million, or 5.6%, in construction loans offset by a decrease of $3.6 million, or 1.5%, in home equity loans. For the fourth quarter of 2025, gross loans increased by $42.5 million, or 0.9% annualized.
The loan balances and composition as of December 31, 2025, compared to September 30, 2025, and December 31, 2024, are presented below:
|
December 31, 2025 |
September 30, 2025 |
December 31, 2024 |
||||||||||
|
($ In thousands) (Unaudited) |
||||||||||||
|
Commercial loans |
$ | 3,184,556 | $ | 3,212,907 | $ | 3,098,004 | ||||||
|
Construction loans |
337,550 | 356,215 | 319,649 | |||||||||
|
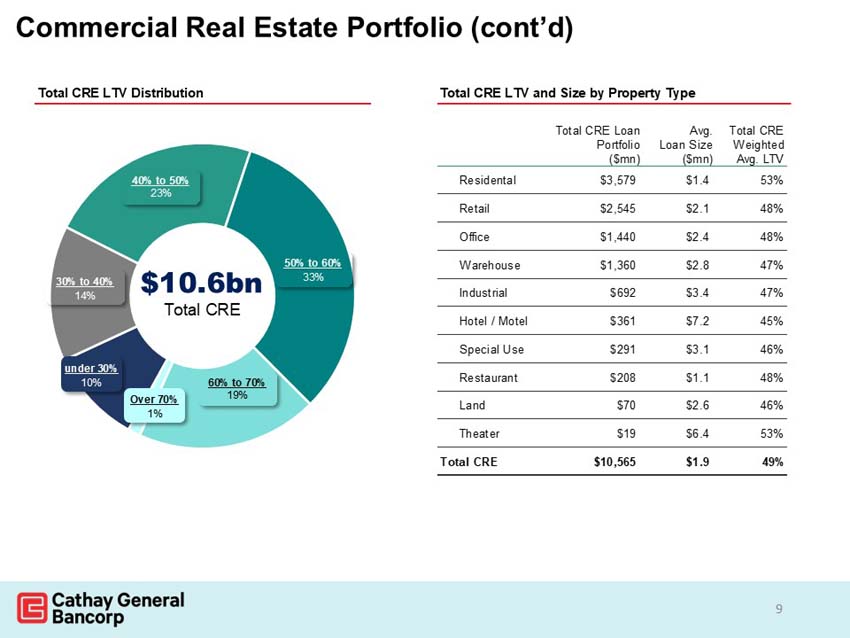
Commercial real estate loans |
10,564,744 | 10,484,939 | 10,033,830 | |||||||||
|
Residential mortgage loans |
5,832,094 | 5,815,140 | 5,689,097 | |||||||||
|
Equity lines |
226,444 | 232,254 | 229,995 | |||||||||
|
Installment and other loans |
1,814 | 3,261 | 5,380 | |||||||||
|
Gross loans |
$ | 20,147,202 | $ | 20,104,716 | $ | 19,375,955 | ||||||
|
Allowance for loan losses |
(195,911 | ) | (186,647 | ) | (161,765 | ) | ||||||
|
Unamortized deferred loan fees |
(14,903 | ) | (14,987 | ) | (10,541 | ) | ||||||
|
Total loans held for investment, net |
$ | 19,936,388 | $ | 19,903,082 | $ | 19,203,649 | ||||||
|
Loans held for sale |
$ | — | $ | — | $ | — | ||||||
Total deposits were $20.89 billion as of December 31, 2025, an increase of $1.20 billion, or 6.1%, from $19.69 billion as of December 31, 2024.
The deposit balances and composition as of December 31, 2025, compared to September 30, 2025, and December 31, 2024, are presented below:
|
December 31, 2025 |
September 30, 2025 |
December 31, 2024 |
||||||||||
|
($ In thousands) (Unaudited) |
||||||||||||
|
Non-interest-bearing demand deposits |
$ | 3,505,606 | $ | 3,574,567 | $ | 3,284,342 | ||||||
|
NOW deposits |
2,370,047 | 2,226,182 | 2,205,695 | |||||||||
|
Money market deposits |
3,800,471 | 3,586,301 | 3,372,773 | |||||||||
|
Savings deposits |
1,500,890 | 1,424,243 | 1,252,788 | |||||||||
|
Time deposits |
9,717,153 | 9,709,856 | 9,570,601 | |||||||||
|
Total deposits |
$ | 20,894,167 | $ | 20,521,149 | $ | 19,686,199 | ||||||
ASSET QUALITY REVIEW
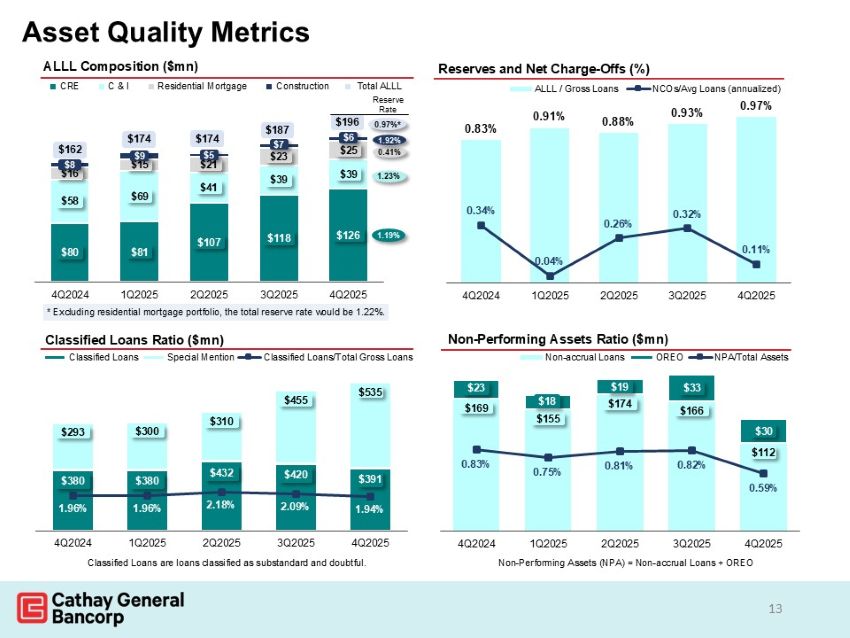
As of December 31, 2025, total non-accrual loans were $112.4 million, a decrease of $56.8 million, or 33.6%, from $169.2 million as of December 31, 2024, and a decrease of $53.2 million, or 32.1%, from $165.6 million as of September 30, 2025.
The allowance for loan losses was $195.9 million and the allowance for off-balance sheet unfunded credit commitments was $12.4 million as of December 31, 2025. The allowances represent the amount estimated by management to be appropriate to absorb expected credit losses inherent in the loan portfolio, including unfunded credit commitments. The allowance for loan losses represented 0.97% of period-end gross loans, and 172.82% of non-performing loans as of December 31, 2025. The comparable ratios were 0.83% of period-end gross loans, and 93.39% of non-performing loans as of December 31, 2024.
The changes in non-performing assets and accruing loan modifications to borrowers experiencing financial difficulty as of December 31, 2025, compared to December 31, 2024, and September 30, 2025, are presented below:
|
($ In thousands) (Unaudited) |
December 31, 2025 |
December 31, 2024 |
% Change |
September 30, 2025 |
% Change |
|||||||||||||||
|
Non-performing assets |
||||||||||||||||||||
|
Accruing loans past due 90 days or more |
$ | 1,000 | $ | 4,050 | (75 | ) | $ | 110 | 809 | |||||||||||
|
Non-accrual loans: |
||||||||||||||||||||
|
Construction loans |
— | — | — | — | — | |||||||||||||||
|
Commercial real estate loans |
59,511 | 83,128 | (28 | ) | 103,158 | (42 | ) | |||||||||||||
|
Commercial loans |
21,498 | 59,767 | (64 | ) | 33,690 | (36 | ) | |||||||||||||
|
Residential mortgage loans |
31,354 | 26,266 | 19 | 28,784 | 9 | |||||||||||||||
|
Total non-accrual loans: |
$ | 112,363 | $ | 169,161 | (34 | ) | $ | 165,632 | (32 | ) | ||||||||||
|
Total non-performing loans |
113,363 | 173,211 | (35 | ) | 165,742 | (32 | ) | |||||||||||||
|
Other real estate owned |
30,336 | 23,071 | 31 | 32,983 | (8 | ) | ||||||||||||||
|
Total non-performing assets |
$ | 143,699 | $ | 196,282 | (27 | ) | $ | 198,725 | (28 | ) | ||||||||||
|
Accruing loan modifications to borrowers experiencing financial difficulties |
$ | 78,148 | $ | — | — | $ | 63,355 | 23 | ||||||||||||
|
Allowance for loan losses |
$ | 195,911 | $ | 161,765 | 21 | $ | 186,647 | 5 | ||||||||||||
|
Total gross loans outstanding, at period-end |
$ | 20,147,202 | $ | 19,375,955 | 4 | $ | 20,104,716 | 0 | ||||||||||||
|
Allowance for loan losses to non-performing loans, at period-end |
172.82 | % | 93.39 | % | 112.61 | % | ||||||||||||||
|
Allowance for loan losses to gross loans, at period-end |
0.97 | % | 0.83 | % | 0.93 | % | ||||||||||||||
The ratio of non-performing assets to total assets was 0.59% as of December 31, 2025, compared to 0.85% as of December 31, 2024. Total non-performing assets decreased $52.6 million, or 26.8%, to $143.7 million as of December 31, 2025, compared to $196.3 million as of December 31, 2024, primarily due to a decrease of $56.8 million, or 33.6%, in non-accrual loans, and $3.1 million, or 75.3%, in accruing loans past due 90 days or more, offset by an increase of $7.3 million, or 31.5%, in other real estate owned.
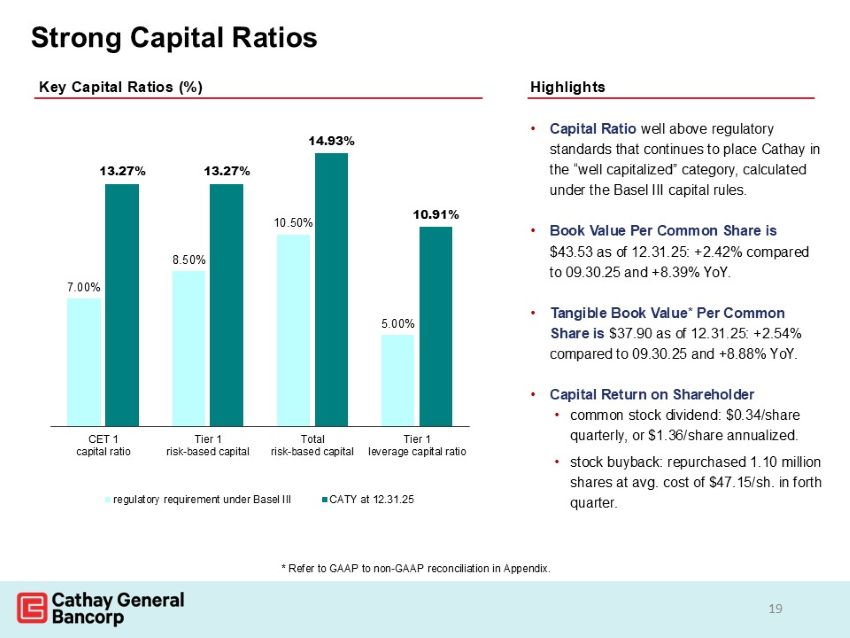
CAPITAL ADEQUACY REVIEW
As of December 31, 2025, the Company’s Tier 1 risk-based capital ratio of 13.27%, total risk-based capital ratio of 14.93%, and Tier 1 leverage capital ratio of 10.91%, calculated under the Basel III capital rules, continue to place the Company in the “well capitalized” category for regulatory purposes, which is defined as institutions with a Tier 1 risk-based capital ratio equal to or greater than 8%, a total risk-based capital ratio equal to or greater than 10%, and a Tier 1 leverage capital ratio equal to or greater than 5%. As of December 31, 2024, the Company’s Tier 1 risk-based capital ratio was 13.54%, total risk-based capital ratio was 15.08%, and Tier 1 leverage capital ratio was 10.96%.
FULL YEAR REVIEW
Net income for the year ended December 31, 2025, was $315.1 million, an increase of $29.1 million, or 10.2%, compared to net income of $286.0 million for the year ended December 31, 2024. Diluted earnings per share for the year ended December 31, 2025, was $4.54 compared to $3.95 per share for the year ended December 31, 2024. The net interest margin for the year ended December 31, 2025, was 3.30% compared to 3.04% for the year ended December 31, 2024.
Return on average stockholders’ equity was 10.87% and return on average assets was 1.33% for the year ended December 31, 2025, compared to a return on average stockholders’ equity of 10.18% and a return on average assets of 1.22% for the year ended December 31, 2024. The efficiency ratio for the year ended December 31, 2025, was 43.41% compared to 51.35% for the year ended December 31, 2024.
CONFERENCE CALL
Cathay General Bancorp will host a conference call to discuss its fourth quarter and year-end 2025 financial results this afternoon, Thursday, January 22, 2026, at 3:00 p.m., Pacific Time. Analysts and investors may dial in and participate in the question-and-answer session. To access the call, please dial 1-833-816-1377 and enter Conference ID 10205620. The presentation accompanying this call and access to the live webcast is available on our site at www.cathaygeneralbancorp.com and a replay of the webcast will be archived for one year within 24 hours after the event.
ABOUT CATHAY GENERAL BANCORP
Cathay General Bancorp is a publicly traded company (Nasdaq: CATY) and is the holding company for Cathay Bank, a California state-chartered bank. Founded in 1962, Cathay Bank offers a wide range of financial services and currently operate over 60 branches across the United States in California, New York, Washington, Texas, Illinois, Massachusetts, Maryland, Nevada, and New Jersey. Overseas, it has a branch outlet in Hong Kong, and representative offices in Beijing, Shanghai, and Taipei. To learn more about Cathay Bank, please visit www.cathaybank.com. Cathay General Bancorp’s website is at www.cathaygeneralbancorp.com. Information set forth on such websites is not incorporated into this press release.
FORWARD-LOOKING STATEMENTS
Statements made in this press release, other than statements of historical fact, are forward-looking statements within the meaning of the applicable provisions of the Private Securities Litigation Reform Act of 1995 regarding management’s beliefs, projections, and assumptions concerning future results and events. These forward-looking statements may include, but are not limited to, such words as “aims,” “anticipates,” “believes,” “can,” “continue,” “could,” “estimates,” “expects,” “hopes,” “intends,” “may,” “plans,” “projects,” “predicts,” “potential,” “possible,” “optimistic,” “seeks,” “shall,” “should,” “will,” and variations of these words and similar expressions. Forward-looking statements are based on estimates, beliefs, projections, and assumptions of management and are not guarantees of future performance. These forward-looking statements are subject to certain risks and uncertainties that could cause actual results to differ materially from our historical experience and our present expectations or projections. Such risks and uncertainties and other factors include, but are not limited to, adverse developments or conditions related to or arising from local, regional, national and international business, market and economic conditions and events, the potential for new and increase tariffs, trade restrictions or geopolitical tensions that could affect economic activity or specific industry sectors and the impact they may have on us, our customers and our operations, assets and liabilities; possible additional provisions for loan losses and charge-offs; credit risks of lending activities and deterioration in asset or credit quality; extensive laws and regulations and supervision that we are subject to including potential future supervisory action by bank supervisory authorities; increased costs of compliance and other risks associated with changes in regulation; higher capital requirements from the implementation of the Basel III capital standards; compliance with the Bank Secrecy Act and other money laundering statutes and regulations; potential goodwill impairment; liquidity risk; fluctuations in interest rates; risks associated with acquisitions and the expansion of our business into new markets; inflation and deflation; real estate market conditions and the value of real estate collateral; our ability to generate anticipated returns on our investments and financings, including in tax-advantaged projects; environmental liabilities; our ability to compete with larger competitors; our ability to retain key personnel; successful management of reputational risk; natural disasters, public health crises and geopolitical events; general economic or business conditions in Asia, and other regions where Cathay Bank has operations; failures, interruptions, or security breaches of our information systems; our ability to adapt our systems to technological changes; risk management processes and strategies; adverse results in legal proceedings; certain provisions in our charter and bylaws that may affect acquisition of the Company; changes in accounting standards or tax laws and regulations; market disruption and volatility; restrictions on dividends and other distributions by laws and regulations and by our regulators and our capital structure; issuance of preferred stock; successfully raising additional capital, if needed, and the resulting dilution of interests of holders of our common stock; the soundness of other financial institutions; and general competitive, economic, political, and market conditions and fluctuations.
These and other factors are further described in Cathay General Bancorp’s Annual Report on Form 10-K for the year ended December 31, 2024 (Item 1A in particular), other reports filed with the Securities and Exchange Commission (“SEC”), and other filings Cathay General Bancorp makes with the SEC from time to time. Actual results in any future period may also vary from the past results discussed in this press release. Given these risks and uncertainties, readers are cautioned not to place undue reliance on any forward-looking statements. Any forward-looking statement speaks only as of the date on which it is made, and, except as required by law, we undertake no obligation to update or review any forward-looking statement to reflect circumstances, developments or events occurring after the date on which the statement is made or to reflect the occurrence of unanticipated events.
CATHAY GENERAL BANCORP
CONSOLIDATED FINANCIAL HIGHLIGHTS
(Unaudited)
|
Three months ended |
Year ended December 31, |
|||||||||||||||||||
|
($ In thousands, except per share data) |
December 31, 2025 |
September 30, 2025 |
December 31, 2024 |
2025 |
2024 |
|||||||||||||||
|
Financial performance |
||||||||||||||||||||
|
Net interest income before provision for credit losses |
$ | 195,013 | $ | 189,587 | $ | 171,012 | $ | 742,460 | $ | 674,055 | ||||||||||
|
Provision for credit losses |
17,200 | 28,731 | 14,500 | 72,631 | 37,500 | |||||||||||||||
|
Net interest income after provision for credit losses |
177,813 | 160,856 | 156,512 | 669,829 | 636,555 | |||||||||||||||
|
Non-interest income |
27,816 | 21,021 | 15,473 | 75,432 | 55,664 | |||||||||||||||
|
Non-interest expense |
92,156 | 88,117 | 85,219 | 355,063 | 374,677 | |||||||||||||||
|
Income before income tax expense |
113,473 | 93,760 | 86,766 | 390,198 | 317,542 | |||||||||||||||
|
Income tax expense |
22,956 | 16,109 | 6,565 | 75,074 | 31,563 | |||||||||||||||
|
Net income |
$ | 90,517 | $ | 77,651 | $ | 80,201 | $ | 315,124 | $ | 285,979 | ||||||||||
|
Net income per common share: |
||||||||||||||||||||
|
Basic |
$ | 1.34 | $ | 1.13 | $ | 1.13 | $ | 4.55 | $ | 3.97 | ||||||||||
|
Diluted |
$ | 1.33 | $ | 1.13 | $ | 1.12 | $ | 4.54 | $ | 3.95 | ||||||||||
|
Cash dividends paid per common share |
$ | 0.34 | $ | 0.34 | $ | 0.34 | $ | 1.36 | $ | 1.36 | ||||||||||
|
Selected ratios |
||||||||||||||||||||
|
Return on average assets |
1.49 | % | 1.29 | % | 1.37 | % | 1.33 | % | 1.22 | % | ||||||||||
|
Return on average total stockholders’ equity |
12.27 | % | 10.60 | % | 11.18 | % | 10.87 | % | 10.18 | % | ||||||||||
|
Efficiency ratio |
41.36 | % | 41.84 | % | 45.70 | % | 43.41 | % | 51.35 | % | ||||||||||
|
Dividend payout ratio |
25.28 | % | 29.93 | % | 29.95 | % | 29.77 | % | 34.26 | % | ||||||||||
|
Yield analysis (Fully taxable equivalent) |
||||||||||||||||||||
|
Total interest-earning assets |
5.74 | % | 5.84 | % | 5.92 | % | 5.82 | % | 6.02 | % | ||||||||||
|
Total interest-bearing liabilities |
3.14 | % | 3.32 | % | 3.75 | % | 3.32 | % | 3.90 | % | ||||||||||
|
Net interest spread |
2.60 | % | 2.52 | % | 2.17 | % | 2.50 | % | 2.12 | % | ||||||||||
|
Net interest margin |
3.36 | % | 3.31 | % | 3.07 | % | 3.30 | % | 3.04 | % | ||||||||||
|
Capital ratios |
December 31, 2025 |
September 30, 2025 |
December 31, 2024 |
|||||||||
|
Tier 1 risk-based capital ratio |
13.27 | % | 13.17 | % | 13.54 | % | ||||||
|
Total risk-based capital ratio |
14.93 | % | 14.78 | % | 15.08 | % | ||||||
|
Tier 1 leverage capital ratio |
10.91 | % | 10.90 | % | 10.96 | % | ||||||
CATHAY GENERAL BANCORP
CONDENSED CONSOLIDATED BALANCE SHEETS
(Unaudited)
|
($ In thousands, except share and per share data) |
December 31, 2025 |
September 30, 2025 |
December 31, 2024 |
|||||||||
|
Assets |
||||||||||||
|
Cash and due from banks |
$ | 146,320 | $ | 166,167 | $ | 157,167 | ||||||
|
Short-term investments and interest bearing deposits |
1,278,089 | 1,141,886 | 882,353 | |||||||||
|
Securities available-for-sale (amortized cost of $1,735,451 at December 31, 2025, $1,728,199 at September 30, 2025 and $1,668,661 at December 31, 2024) |
1,658,223 | 1,643,450 | 1,547,128 | |||||||||
|
Loans |
20,147,202 | 20,104,716 | 19,375,955 | |||||||||
|
Less: Allowance for loan losses |
(195,911 | ) | (186,647 | ) | (161,765 | ) | ||||||
|
Unamortized deferred loan fees, net |
(14,903 | ) | (14,987 | ) | (10,541 | ) | ||||||
|
Loans, net |
19,936,388 | 19,903,082 | 19,203,649 | |||||||||
|
Equity securities |
44,821 | 32,111 | 34,429 | |||||||||
|
Federal Home Loan Bank stock |
17,250 | 17,250 | 17,250 | |||||||||
|
Other real estate owned, net |
30,336 | 32,983 | 23,071 | |||||||||
|
Affordable housing investments and alternative energy partnerships, net |
287,182 | 292,672 | 289,611 | |||||||||
|
Premises and equipment, net |
87,579 | 88,552 | 88,676 | |||||||||
|
Customers’ liability on acceptances |
4,385 | 7,730 | 14,061 | |||||||||
|
Accrued interest receivable |
96,993 | 96,055 | 97,779 | |||||||||
|
Goodwill |
375,696 | 375,696 | 375,696 | |||||||||
|
Other intangible assets, net |
2,683 | 2,667 | 3,335 | |||||||||
|
Right-of-use assets- operating leases |
34,187 | 31,086 | 28,645 | |||||||||
|
Other assets |
229,443 | 244,257 | 291,831 | |||||||||
|
Total assets |
$ | 24,229,575 | $ | 24,075,644 | $ | 23,054,681 | ||||||
|
Liabilities and Stockholders’ Equity |
||||||||||||
|
Deposits: |
||||||||||||
|
Non-interest-bearing demand deposits |
$ | 3,505,606 | $ | 3,574,567 | $ | 3,284,342 | ||||||
|
Interest-bearing deposits: |
||||||||||||
|
NOW deposits |
2,370,047 | 2,226,182 | 2,205,695 | |||||||||
|
Money market deposits |
3,800,471 | 3,586,301 | 3,372,773 | |||||||||
|
Savings deposits |
1,500,890 | 1,424,243 | 1,252,788 | |||||||||
|
Time deposits |
9,717,153 | 9,709,856 | 9,570,601 | |||||||||
|
Total deposits |
20,894,167 | 20,521,149 | 19,686,199 | |||||||||
|
Advances from the Federal Home Loan Bank |
— | 190,000 | 60,000 | |||||||||
|
Other borrowings for affordable housing investments |
17,582 | 17,628 | 17,740 | |||||||||
|
Long-term debt |
119,136 | 119,136 | 119,136 | |||||||||
|
Acceptances outstanding |
4,385 | 7,730 | 14,061 | |||||||||
|
Lease liabilities - operating leases |
36,102 | 33,079 | 30,851 | |||||||||
|
Other liabilities |
232,815 | 284,646 | 280,990 | |||||||||
|
Total liabilities |
21,304,187 | 21,173,368 | 20,208,977 | |||||||||
|
Stockholders' equity |
2,925,388 | 2,902,276 | 2,845,704 | |||||||||
|
Total liabilities and equity |
$ | 24,229,575 | $ | 24,075,644 | $ | 23,054,681 | ||||||
|
Book value per common share |
$ | 43.53 | $ | 42.50 | $ | 40.16 | ||||||
|
Number of common shares outstanding |
67,200,126 | 68,286,591 | 70,863,324 | |||||||||
CATHAY GENERAL BANCORP
CONDENSED CONSOLIDATED STATEMENTS OF OPERATIONS
(Unaudited)
|
Three months ended |
Year ended December 31, |
|||||||||||||||||||
|
December 31, 2025 |
September 30, 2025 |
December 31, 2024 |
2025 |
2024 |
||||||||||||||||
|
($ In thousands, except share and per share data) |
||||||||||||||||||||
|
Interest and Dividend Income |
||||||||||||||||||||
|
Loan receivable, including loan fees |
$ | 306,761 | $ | 308,945 | $ | 300,991 | $ | 1,206,547 | $ | 1,217,166 | ||||||||||
|
Investment securities |
13,505 | 12,690 | 13,587 | 51,964 | 59,307 | |||||||||||||||
|
Federal Home Loan Bank stock |
380 | 376 | 379 | 1,508 | 1,684 | |||||||||||||||
|
Deposits with banks |
12,106 | 12,184 | 15,025 | 49,241 | 56,818 | |||||||||||||||
|
Total interest and dividend income |
332,752 | 334,195 | 329,982 | 1,309,260 | 1,334,975 | |||||||||||||||
|
Interest Expense |
||||||||||||||||||||
|
Time deposits |
90,715 | 93,087 | 111,082 | 374,232 | 458,490 | |||||||||||||||
|
Other deposits |
44,514 | 46,300 | 44,557 | 177,618 | 177,775 | |||||||||||||||
|
Advances from Federal Home Loan Bank |
527 | 3,075 | 766 | 6,248 | 14,283 | |||||||||||||||
|
Long-term debt |
1,956 | 2,043 | 2,194 | 8,048 | 8,129 | |||||||||||||||
|
Short-term borrowings |
27 | 103 | 371 | 654 | 2,243 | |||||||||||||||
|
Total interest expense |
137,739 | 144,608 | 158,970 | 566,800 | 660,920 | |||||||||||||||
|
Net interest income before provision for credit losses |
195,013 | 189,587 | 171,012 | 742,460 | 674,055 | |||||||||||||||
|
Provision for credit losses |
17,200 | 28,731 | 14,500 | 72,631 | 37,500 | |||||||||||||||
|
Net interest income after provision for credit losses |
177,813 | 160,856 | 156,512 | 669,829 | 636,555 | |||||||||||||||
|
Non-Interest Income |
||||||||||||||||||||
|
Net (losses)/gains from equity securities |
9,710 | 3,263 | (1,312 | ) | 7,392 | (7,516 | ) | |||||||||||||
|
Debt securities losses, net |
— | — | — | — | 1,107 | |||||||||||||||
|
Letters of credit commissions |
2,332 | 2,256 | 2,063 | 8,799 | 7,749 | |||||||||||||||
|
Depository service fees |
1,885 | 2,011 | 1,674 | 7,573 | 6,574 | |||||||||||||||
|
Wealth management fees |
6,364 | 6,219 | 6,194 | 23,688 | 24,055 | |||||||||||||||
|
Other operating income |
7,525 | 7,272 | 6,854 | 27,980 | 23,695 | |||||||||||||||
|
Total non-interest income |
27,816 | 21,021 | 15,473 | 75,432 | 55,664 | |||||||||||||||
|
Non-Interest Expense |
||||||||||||||||||||
|
Salaries and employee benefits |
48,415 | 43,462 | 42,526 | 177,427 | 167,376 | |||||||||||||||
|
Occupancy expense |
5,866 | 6,104 | 5,724 | 23,657 | 23,281 | |||||||||||||||
|
Computer and equipment expense |
6,260 | 5,760 | 4,923 | 23,234 | 20,135 | |||||||||||||||
|
Professional services expense |
7,996 | 7,360 | 8,761 | 31,692 | 30,986 | |||||||||||||||
|
Data processing service expense |
4,438 | 3,991 | 4,234 | 17,466 | 16,370 | |||||||||||||||
|
FDIC and State assessments |
2,023 | 2,783 | 1,198 | 11,382 | 14,279 | |||||||||||||||
|
Marketing expense |
1,518 | 1,494 | 1,518 | 6,003 | 6,520 | |||||||||||||||
|
Other real estate owned expense/(income) |
59 | (1,078 | ) | 368 | (1,152 | ) | 2,699 | |||||||||||||
|
Amortization of investments in low income housing and alternative energy partnerships |
11,232 | 12,149 | 10,728 | 43,614 | 72,633 | |||||||||||||||
|
Amortization of core deposit intangibles |
217 | 229 | 250 | 946 | 1,098 | |||||||||||||||
|
Other operating expense |
4,132 | 5,863 | 4,989 | 20,794 | 19,300 | |||||||||||||||
|
Total non-interest expense |
92,156 | 88,117 | 85,219 | 355,063 | 374,677 | |||||||||||||||
|
Income before income tax expense |
113,473 | 93,760 | 86,766 | 390,198 | 317,542 | |||||||||||||||
|
Income tax expense |
22,956 | 16,109 | 6,565 | 75,074 | 31,563 | |||||||||||||||
|
Net income |
$ | 90,517 | $ | 77,651 | $ | 80,201 | $ | 315,124 | $ | 285,979 | ||||||||||
|
Net income per common share: |
||||||||||||||||||||
|
Basic |
$ | 1.34 | $ | 1.13 | $ | 1.13 | $ | 4.55 | $ | 3.97 | ||||||||||
|
Diluted |
$ | 1.33 | $ | 1.13 | $ | 1.12 | $ | 4.54 | $ | 3.95 | ||||||||||
|
Cash dividends paid per common share |
$ | 0.34 | $ | 0.34 | $ | 0.34 | $ | 1.36 | $ | 1.36 | ||||||||||
|
Basic average common shares outstanding |
67,681,571 | 68,727,390 | 71,168,983 | 69,184,832 | 72,068,850 | |||||||||||||||
|
Diluted average common shares outstanding |
67,988,945 | 68,990,648 | 71,491,518 | 69,452,220 | 72,327,017 | |||||||||||||||
CATHAY GENERAL BANCORP
AVERAGE BALANCES – SELECTED CONSOLIDATED FINANCIAL INFORMATION
(Unaudited)
|
Three months ended |
||||||||||||||||||||||||
|
($ In thousands)(Unaudited) |
December 31, 2025 |
September 30, 2025 |
December 31, 2024 |
|||||||||||||||||||||
|
Average Balance |
Average Yield/Rate (1) |
Average Balance |
Average Yield/Rate (1) |
Average Balance |
Average Yield/Rate (1) |
|||||||||||||||||||
| Interest-earning assets: | ||||||||||||||||||||||||
|
Loans (1) |
$ | 20,103,677 | 6.05 | % | $ | 19,951,853 | 6.14 | % | $ | 19,345,616 | 6.19 | % | ||||||||||||
|
Taxable investment securities |
1,653,908 | 3.24 | % | 1,634,248 | 3.08 | % | 1,542,577 | 3.50 | % | |||||||||||||||
|
FHLB stock |
17,250 | 8.75 | % | 17,250 | 8.65 | % | 17,250 | 8.75 | % | |||||||||||||||
|
Deposits with banks |
1,229,444 | 3.91 | % | 1,113,274 | 4.34 | % | 1,265,496 | 4.72 | % | |||||||||||||||
|
Total interest-earning assets |
$ | 23,004,279 | 5.74 | % | $ | 22,716,625 | 5.84 | % | $ | 22,170,939 | 5.92 | % | ||||||||||||
|
Interest-bearing liabilities: |
||||||||||||||||||||||||
|
Interest-bearing demand deposits |
$ | 2,305,316 | 1.58 | % | $ | 2,189,376 | 1.70 | % | $ | 2,131,978 | 1.85 | % | ||||||||||||
|
Money market deposits |
3,668,083 | 3.15 | % | 3,556,374 | 3.44 | % | 3,259,771 | 3.52 | % | |||||||||||||||
|
Savings deposits |
1,518,094 | 1.62 | % | 1,419,953 | 1.72 | % | 1,306,584 | 1.76 | % | |||||||||||||||
|
Time deposits |
9,727,542 | 3.70 | % | 9,698,744 | 3.81 | % | 9,932,776 | 4.45 | % | |||||||||||||||
|
Total interest-bearing deposits |
$ | 17,219,035 | 3.12 | % | $ | 16,864,447 | 3.28 | % | $ | 16,631,109 | 3.72 | % | ||||||||||||
|
Other borrowed funds |
71,474 | 3.07 | % | 295,892 | 4.26 | % | 111,142 | 4.07 | % | |||||||||||||||
|
Long-term debt |
119,136 | 6.51 | % | 119,136 | 6.80 | % | 119,136 | 7.33 | % | |||||||||||||||
|
Total interest-bearing liabilities |
17,409,645 | 3.14 | % | 17,279,475 | 3.32 | % | 16,861,387 | 3.75 | % | |||||||||||||||
|
Non-interest-bearing demand deposits |
3,484,027 | 3,384,141 | 3,318,350 | |||||||||||||||||||||
|
Total deposits and other borrowed funds |
$ | 20,893,672 | $ | 20,663,616 | $ | 20,179,737 | ||||||||||||||||||
|
Total average assets |
$ | 24,089,037 | $ | 23,843,380 | $ | 23,332,869 | ||||||||||||||||||
|
Total average equity |
$ | 2,927,541 | $ | 2,907,596 | $ | 2,854,994 | ||||||||||||||||||
|
Year ended |
||||||||||||||||
|
($ In thousands)(Unaudited) |
December 31, 2025 |
December 31, 2024 |
||||||||||||||
|
Average Balance |
Average Yield/Rate (1) |
Average Balance |
Average Yield/Rate (1) |
|||||||||||||
| Interest-earning assets: | ||||||||||||||||
|
Loans (1) |
$ | 19,722,436 | 6.12 | % | $ | 19,434,614 | 6.26 | % | ||||||||
|
Taxable investment securities |
1,592,700 | 3.26 | % | 1,621,477 | 3.66 | % | ||||||||||
|
FHLB stock |
17,250 | 8.74 | % | 18,681 | 9.02 | % | ||||||||||
|
Deposits with banks |
1,161,842 | 4.24 | % | 1,098,488 | 5.17 | % | ||||||||||
|
Total interest-earning assets |
$ | 22,494,228 | 5.82 | % | $ | 22,173,260 | 6.02 | % | ||||||||
|
Interest-bearing liabilities: |
||||||||||||||||
|
Interest-bearing demand deposits |
$ | 2,193,139 | 1.66 | % | $ | 2,186,726 | 2.05 | % | ||||||||
|
Money market deposits |
3,518,747 | 3.36 | % | 3,166,318 | 3.65 | % | ||||||||||
|
Savings deposits |
1,393,380 | 1.65 | % | 1,151,427 | 1.52 | % | ||||||||||
|
Time deposits |
9,675,753 | 3.87 | % | 10,022,826 | 4.57 | % | ||||||||||
|
Total interest-bearing deposits |
$ | 16,781,019 | 3.29 | % | $ | 16,527,297 | 3.85 | % | ||||||||
|
Other borrowed funds |
171,309 | 4.03 | % | 315,086 | 5.24 | % | ||||||||||
|
Long-term debt |
119,136 | 6.76 | % | 119,136 | 6.82 | % | ||||||||||
|
Total interest-bearing liabilities |
17,071,464 | 3.32 | % | 16,961,519 | 3.90 | % | ||||||||||
|
Non-interest-bearing demand deposits |
3,376,699 | 3,283,586 | ||||||||||||||
|
Total deposits and other borrowed funds |
$ | 20,448,163 | $ | 20,245,105 | ||||||||||||
|
Total average assets |
$ | 23,620,645 | $ | 23,368,429 | ||||||||||||
|
Total average equity |
$ | 2,899,898 | $ | 2,809,620 | ||||||||||||
|
(1) Yields and interest earned include net loan fees. Non-accrual loans are included in the average balance. |
CATHAY GENERAL BANCORP
GAAP to NON-GAAP RECONCILIATION
SELECTED CONSOLIDATED FINANCIAL INFORMATION
(Unaudited)
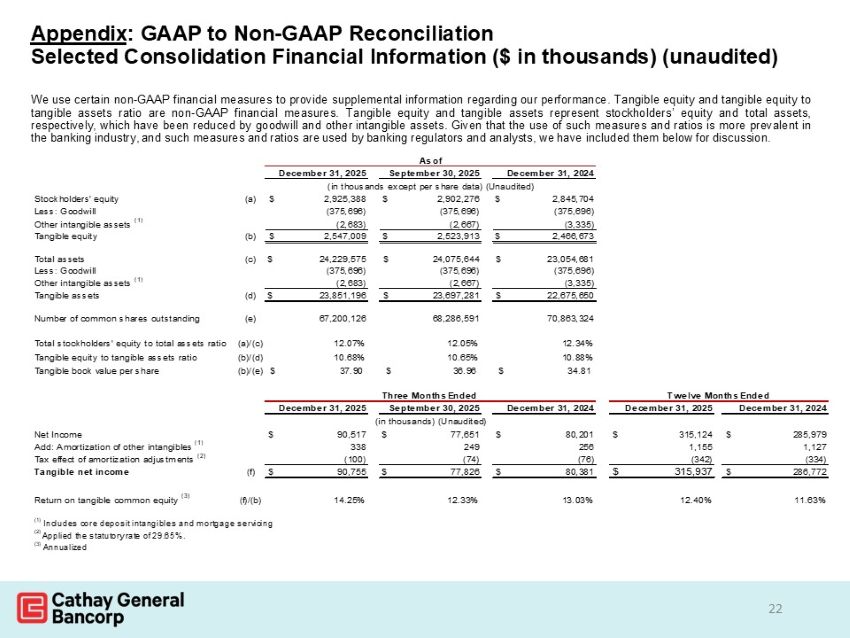
The Company uses certain non-GAAP financial measures to provide supplemental information regarding the Company’s performance. Tangible equity and tangible equity to tangible assets ratio are non-GAAP financial measures. Tangible equity and tangible assets represent stockholders’ equity and total assets, respectively, which have been reduced by goodwill and other intangible assets. Given that the use of such measures and ratios is prevalent in the banking industry, and such measures and ratios are used by banking regulators and analysts, the Company has included them below for discussion.
|
As of |
|||||||||||||
|
December 31, 2025 |
September 30, 2025 |
December 31, 2024 |
|||||||||||
|
($ In thousands except per share data) (Unaudited) |
|||||||||||||
|
Stockholders' equity |
(a) |
$ | 2,925,388 | $ | 2,902,276 | $ | 2,845,704 | ||||||
|
Less: Goodwill |
(375,696 | ) | (375,696 | ) | (375,696 | ) | |||||||
|
Other intangible assets (1) |
(2,683 | ) | (2,667 | ) | (3,335 | ) | |||||||
|
Tangible equity |
(b) |
$ | 2,547,009 | $ | 2,523,913 | $ | 2,466,673 | ||||||
|
Total assets |
(c) |
$ | 24,229,575 | $ | 24,075,644 | $ | 23,054,681 | ||||||
|
Less: Goodwill |
(375,696 | ) | (375,696 | ) | (375,696 | ) | |||||||
|
Other intangible assets (1) |
(2,683 | ) | (2,667 | ) | (3,335 | ) | |||||||
|
Tangible assets |
(d) |
$ | 23,851,196 | $ | 23,697,281 | $ | 22,675,650 | ||||||
|
Number of common shares outstanding |
(e) |
67,200,126 | 68,286,591 | 70,863,324 | |||||||||
|
Total stockholders' equity to total assets ratio |
(a)/(c) |
12.07 | % | 12.05 | % | 12.34 | % | ||||||
|
Tangible equity to tangible assets ratio |
(b)/(d) |
10.68 | % | 10.65 | % | 10.88 | % | ||||||
|
Tangible book value per share |
(b)/(e) |
$ | 37.90 | $ | 36.96 | $ | 34.81 | ||||||
|
Three Months Ended |
Twelve Months Ended |
||||||||||||||||||||
|
December 31, 2025 |
September 30, 2025 |
December 31, 2024 |
December 31, 2025 |
December 31, 2024 |
|||||||||||||||||
|
($ In thousands) (Unaudited) |
|||||||||||||||||||||
|
Net Income |
$ | 90,517 | $ | 77,651 | $ | 80,201 | $ | 315,124 | $ | 285,979 | |||||||||||
|
Add: Amortization of other intangibles (1) |
338 | 249 | 256 | 1,155 | 1,127 | ||||||||||||||||
|
Tax effect of amortization adjustments (2) |
(100 | ) | (74 | ) | (76 | ) | (342 | ) | (334 | ) | |||||||||||
|
Tangible net income |
(f) |
$ | 90,755 | $ | 77,826 | $ | 80,381 | $ | 315,937 | $ | 286,772 | ||||||||||
|
Return on tangible common equity (3) |
(f)/(b) |
14.25 | % | 12.33 | % | 13.03 | % | 12.40 | % | 11.63 | % | ||||||||||
|
(1) Includes core deposit intangibles and mortgage servicing |
|
(2) Applied the statutory rate of 29.65%. |
|
(3) Annualized |
Exhibit 99.2