UNITED STATES
SECURITIES AND EXCHANGE COMMISSION
Washington, D.C. 20549
FORM 10-K
|
☒ |
Annual Report Pursuant to Section 13 or 15(d) of the Securities Exchange Act of 1934 |
|
|
For the fiscal year ended September 27, 2025 |
or
|
☐ |
Transition Report Pursuant to Section 13 or 15(d) of the Securities Exchange Act of 1934 |
|
|
For the transition period from _____ to _____ |
Commission File No. 000-14616
J&J SNACK FOODS CORP.
(Exact name of registrant as specified in its charter)
| New Jersey | 22-1935537 |
| (State or other jurisdiction of | (I.R.S. Employer Identification No.) |
| incorporation or organization) | |
| 350 Fellowship Road, | 08054 |
| Mt. Laurel, New Jersey | (Zip code) |
| (Address of principal executive offices) |
(856) 665-9533
(Registrant’s telephone number, including area code)
Securities Registered Pursuant to Section 12(b) of the Act:
|
Title of Each Class |
Trading Symbol |
Name of Each Exchange on Which Registered |
|
Common Stock, no par value |
JJSF |
The Nasdaq Global Select Market |
Securities Registered Pursuant to Section 12(g) of the Act: None
Indicate by check mark if the registrant is a well-known seasoned issuer, as defined in Rule 405 of the Securities Act. Yes ☒ No ☐
Indicate by check mark if the registrant is not required to file reports pursuant to Section 13 or 15(d) of the Act. Yes ☐ No ☒
Indicate by check mark whether the registrant (1) has filed all reports required to be filed by Section 13 or 15(d) of the Securities Exchange Act of 1934 during the preceding 12 months (or such shorter period that the registrant was required to file such reports), and (2) has been subject to such filing requirements for the past 90 days. Yes ☒ No ☐
Indicate by check mark whether the registrant has submitted electronically every Interactive Data File required to be submitted pursuant to Rule 405 of Regulation S-T (§232.405 of this chapter) during the preceding 12 months (or for such shorter period that the registrant was required to submit such files). Yes ☒ No ☐
Indicate by check mark whether the registrant is a large accelerated filer, an accelerated filer, a non-accelerated filer, smaller reporting company, or an emerging growth company. See the definition of “large accelerated filer,” “accelerated filer,” “smaller reporting company,” and “emerging growth company” in Rule 12b-2 of the Exchange Act.
|
Large accelerated filer |
☒ |
Accelerated filer |
☐ |
|
Non-accelerated filer |
☐ |
Smaller reporting company |
☐ |
|
|
Emerging growth company | ☐ |
If an emerging growth company, indicate by check mark if the registrant has elected not to use the extended transition period for complying with any new or revised financial accounting standards provided pursuant to Section 13(a) of the Exchange Act. ☐
Indicate by check mark whether the registrant has filed a report on and attestation to its management’s assessment of the effectiveness of its internal control over financial reporting under Section 404(b) of the Sarbanes-Oxley Act (15 U.S.C. 7262(b)) by the registered public accounting firm that prepared or issued its audit report. Yes ☒ No ☐
Indicate by check mark whether the registrant is a shell company (as defined in Rule 12b-2 of the Exchange Act). Yes ☐ No ☒
March 28, 2025 was the last business day of the registrant’s most recently completed second fiscal quarter. The aggregate market value of the registrant’s common stock held by non-affiliates was $1,968,027,965 based on the last sale price on March 28, 2025 of $130.14 per share.
Indicate the number of shares outstanding of each of the issuer’s classes of common stock, as of the latest practicable date.
|
Class |
Outstanding as of November 21, 2025 |
|
Common Stock, no par value |
19,343,158 shares |
DOCUMENTS INCORPORATED BY REFERENCE
Portions of the registrant’s definitive proxy statement for its Annual Meeting of Shareholders scheduled for February 12, 2026 are incorporated by reference into Part III of this report.
J & J SNACK FOODS CORP.
2025 FORM 10-K ANNUAL REPORT
TABLE OF CONTENTS
| Page | ||
|
PART I |
||
|
Note About Forward-Looking Statements |
1 |
|
|
Item 1 |
Business |
1 |
|
Item 1A |
Risk Factors |
8 |
|
Item 1B |
Unresolved Staff Comments |
14 |
|
Item 1C |
Cybersecurity |
14 |
|
Item 2 |
Properties |
15 |
|
Item 3 |
Legal Proceedings |
15 |
|
Item 4 |
Mine Safety Disclosures |
15 |
|
PART II |
||
|
Item 5 |
Market For Registrant’s Common Equity, Related Stockholder Matters And Issuer Purchases Of Equity Securities |
16 |
|
Item 6 |
[Reserved] |
17 |
|
Item 7 |
Management’s Discussion And Analysis Of Financial Condition And Results Of Operations |
17 |
|
Item 7A |
Quantitative And Qualitative Disclosures About Market Risk |
30 |
|
Item 8 |
Financial Statements And Supplementary Data |
30 |
|
Item 9 |
Changes In And Disagreements With Accountants On Accounting And Financial Disclosure |
30 |
|
Item 9A |
Controls and Procedures |
30 |
|
Item 9B |
Other Information |
32 |
|
Item 9C |
Disclosure Regarding Foreign Jurisdictions That Prevent Inspections |
32 |
|
PART III |
||
|
Item 10 |
Directors, Executive Officers and Corporate Governance |
32 |
|
Item 11 |
Executive Compensation |
33 |
|
Item 12 |
Security Ownership Of Certain Beneficial Owners And Management And Related Stockholder Matters |
33 |
|
Item 13 |
Certain Relationships And Related Transactions, and Director Independence |
33 |
|
Item 14 |
Principal Accountant Fees and Service |
33 |
|
PART IV |
||
|
Item 15 |
Exhibits, Financial Statement Schedules |
33 |
|
Item 16 |
Form 10-K Summary |
33 |
Note About Forward-Looking Statements
This annual report on Form 10-K contains forward-looking statements. Statements that are not historic or current facts are “forward-looking statements” made pursuant to the safe harbor provisions of Section 27A of the Securities Act of 1933, as amended (the “Securities Act”), and Section 21E of the Securities Exchange Act of 1934, as amended (the “Exchange Act”). These statements discuss goals, intentions, and expectations as to future trends, plans, events, results of operations or financial condition, or state other information relating to us, based on our current beliefs as well as assumptions made by us and information currently available to us. Forward-looking statements generally will be accompanied by words such as "anticipate," "if," "may," "believe," "plan,", "goals," "estimate," "expect," "project," "continue," "forecast," "intend," "may," "could," "should," "will," and other similar expressions. Statements addressing our future operating performance and statements addressing events and developments that we expect or anticipate will occur are also considered as forward-looking statements. This includes, without limitation, our statements and expectations regarding any current or future recovery in our industry (or the industries of our customers), the success of new product innovations, the impact of tariffs and other government regulations, and the future impact of our expense reduction and supply chain efficiency projects, including facility optimization projects and investments in additional production capacity and logistics and warehousing operations. Such forward-looking statements are inherently uncertain, and readers must recognize that actual results may differ materially from the expectations of management. We intend that such forward-looking statements be subject to the safe harbor provisions of the Securities Act and the Exchange Act. Important factors that could cause actual results to differ materially from the forward-looking statements include, without limitation: the risks described in Item 1A and in Item 7A of this annual report on Form 10-K.
We wish to caution readers not to place undue reliance on any such forward-looking statements, which speak as of the date made. Any forward-looking statements represent management’s best judgment as to what may occur in the future. However, forward-looking statements are subject to risks, uncertainties, and important factors beyond our control that could cause actual results and events to differ materially from historical results of operations and events and those presently anticipated or projected. We disclaim any obligation to subsequently revise, update, add or to otherwise correct, any forward-looking statements to reflect events or circumstances after the date of such statement or to reflect the occurrence of anticipated or unanticipated events. Furthermore, all subsequent written and oral forward-looking statements attributable to us or persons acting on our behalf are expressly qualified in their entirety by the cautionary statements contained in this report. The discussion and analysis of our financial condition and results of operations included in Item 7 - Management’s Discussion and Analysis of Financial Condition and Results of Operations should be read in conjunction with our consolidated financial statements and related notes included in Item 8 of this Form 10-K.
PART I
Item 1. Business
General
J & J Snack Foods Corp. (the “Company” or “J & J”) manufactures snack foods and distributes frozen beverages which it markets nationally to the foodservice and retail supermarket industries. The Company’s principal snack food products are soft pretzels marketed primarily under the brand names SUPERPRETZEL, BRAUHAUS, FEDERAL PRETZEL, and BAVARIAN BAKERY, frozen novelties marketed primarily under the DIPPIN’ DOTS, LUIGI’S, WHOLE FRUIT, ICEE, DOGSTERS, PHILLY SWIRL and MINUTE MAID* brand names, churros marketed primarily under the ¡HOLA! brand name, and bakery products sold primarily under the READI-BAKE, COUNTRY HOME, MARY B’S, DADDY RAY’S and HILL & VALLEY brand names as well as for private label and contract packing. We believe we are the largest manufacturer of soft pretzels in the United States. Other snack food products include funnel cake sold under THE FUNNEL CAKE FACTORY brand and handheld products sold under smaller brands. The Company’s principal frozen beverage products are the ICEE brand frozen carbonated beverage and the SLUSH PUPPIE brand frozen non-carbonated beverage.
The Company’s Food Service and Frozen Beverages sales are made primarily to foodservice customers including snack bar and food stand locations in leading chain, department, discount, warehouse club and convenience stores; malls and shopping centers; fast food and casual dining restaurants; stadiums and sports arenas; leisure and theme parks; movie theatres; independent retailers; and schools, colleges, and other institutions. The Company’s retail supermarket customers are primarily supermarket chains.
* Minute Maid is a registered trademark of the Coca-Cola Company
The Company was incorporated in 1971 under the laws of the State of New Jersey.
The Company operates in three business segments: Food Service, Retail Supermarkets and Frozen Beverages. These segments are described below.
The Chief Operating Decision Maker for Food Service, Retail Supermarkets and Frozen Beverages reviews detailed operating income statements and sales reports in order to assess performance and allocate resources to each individual segment. Sales and operating income are key variables monitored by the Chief Operating Decision Maker and management when determining each segment’s and the Company’s financial condition and operating performance. In addition, the Chief Operating Decision Maker reviews and evaluates capital spending of each segment on a quarterly basis to monitor cash flow and asset needs of each segment (see Item 7 – Management’s Discussion and Analysis of Financial Condition and Results of Operations and Item 8 – Financial Statements and Supplementary Data for financial information about segments).
Food Service
The primary products sold by the Food Service segment are soft pretzels, frozen novelties, churros, handheld products, and baked goods. Our customers in the Food Service segment include snack bars and food stands in chain, department, and discount stores; malls and shopping centers; fast food and casual dining restaurants; stadiums and sports arenas; leisure and theme parks; convenience stores; movie theatres; warehouse club stores; schools, colleges and other institutions. Within the food service industry, our products are purchased by the consumer primarily for consumption at the point-of-sale or for take-away.
Retail Supermarkets
The primary products sold to the retail supermarket channel are soft pretzel products – including SUPERPRETZEL, frozen novelties including LUIGI’S Real Italian Ice, MINUTE MAID Juice Bars and Soft Frozen Lemonade, WHOLE FRUIT frozen fruit bars and sorbet, DOGSTERS ice cream style treats for dogs, PHILLY SWIRL cups and sticks, ICEE Squeeze-Up Tubes and handheld products. Within the retail supermarket channel, our frozen and prepackaged products are purchased by the consumer for consumption at home.
Frozen Beverages
We sell frozen beverages to the foodservice industry primarily under the names ICEE, SLUSH PUPPIE and PARROT ICE in the United States, Mexico, and Canada. We also provide repair and maintenance services to customers for customer-owned equipment.
Products
Soft Pretzels
The Company’s soft pretzels are sold under many brand names; some of which are: SUPERPRETZEL, SUPERPRETZEL BAVARIAN, NEW YORK PRETZEL, FEDERAL PRETZEL, AND BRAUHAUS; and, to a lesser extent, under private labels.
Soft pretzels are sold in the Food Service and Retail Supermarket segments. Soft pretzel sales amounted to 18% of the Company’s revenue in fiscal year 2025, 18% in fiscal year 2024, and 19% in fiscal year 2023.
Certain of the Company’s soft pretzels (whole grain) qualify under USDA regulations as the nutritional equivalent of grains for purposes of the USDA school nutrition program, thereby enabling a participating school to obtain partial reimbursement for the cost of the Company’s soft pretzels from the USDA.
The Company’s soft pretzels are manufactured according to a proprietary formula, ranging in size from one to twenty-four ounces in weight. A portion of the Company’s soft pretzels are shaped and formed by the Company’s twister machines. These soft pretzel tying machines are automated, high-speed machines for twisting dough into the traditional pretzel shape. Additionally, we make soft pretzels which are extruded or shaped by hand. Soft pretzels, after baking, are quick-frozen and packaged for delivery.
The Company’s principal marketing program in the Food Service segment includes supplying ovens, mobile merchandisers, display cases, warmers, and similar merchandising equipment to the retailer to prepare and promote the sale of soft pretzels. Some of this equipment is proprietary, including combination warmer and display cases that re-bake frozen soft pretzels while displaying them, thus eliminating the need for an oven. The Company retains ownership of the equipment placed in customer locations, and as a result, customers are not required to make an investment in equipment.
Frozen Novelties
The Company’s frozen novelties are marketed primarily under the DIPPIN’DOTS, LUIGI’S, WHOLE FRUIT, DOGSTERS, PHILLY SWIRL, ICEE and MINUTE MAID brand names. Frozen novelties are sold in the Food Service and Retail Supermarkets segments. Frozen novelties sales were 16% of the Company’s revenue in fiscal year 2025, 17% in fiscal year 2024, and 17% in fiscal year 2023.
The Company’s LUIGI’S and WHOLE FRUIT frozen juice cups for schools are produced in various flavors and contain one half of a cup of fruit equivalent made of 100% juice with no added sugar and in accordance with USDA guidelines.
The Company’s DIPPIN’ DOTS’ frozen novelty products are cryogenically frozen beads, created using liquid nitrogen at -320 degrees Fahrenheit. Product variations include ice cream (milk and cream based), flavored ice (water based) and frozen yogurt branded YODOTS. The product is served to consumers by the cup, or via individual serving packages.
The balance of the Company’s frozen novelties products are manufactured from water, sweeteners and fruit juice concentrates in various flavors and packaging including cups, tubes, and sticks. Several of the products contain ice cream and WHOLE FRUIT bars contains real fruit.
Churros
The Company’s churros are sold primarily under the ¡HOLA! brand name. Churros are sold to the Food Service and Retail Supermarkets segments. Churro sales were 6% of the Company’s sales in fiscal year 2025, 7% in fiscal year 2024, and 7% in fiscal year 2023. Churros are pastries in stick form which the Company produces in several sizes according to a proprietary formula. The churros are deep fried, frozen, and packaged. At food service point-of-sale they are reheated and topped with a cinnamon sugar mixture. The Company also sells chocolate-filled, fruit-filled, and crème-filled churros. The Company supplies churro merchandising equipment similar to that used for its soft pretzels.
Handheld Products
The Company's handheld products are sold primarily under private label names. Handheld products are sold to the Food Service and Retail Supermarket segments. Handheld product sales amounted to 7% of the Company’s sales in fiscal year 2025, 7% in fiscal year 2024, and 6% in fiscal year 2023.
Bakery Products
The Company’s bakery products are marketed under the MRS. GOODCOOKIE, READI-BAKE, COUNTRY HOME, MARY B’S, DADDY RAY’S and HILL & VALLEY brand names, and under private labels. Bakery products include primarily fig and fruit bars, cookies, breads, rolls, crumb, muffins, and donuts. Bakery products are sold to the Food Service segment. Bakery products sales amounted to 27% of the Company’s sales in fiscal year 2025, 26% in fiscal year 2024, and 26% in fiscal year 2023.
Frozen Beverages
The Company markets frozen beverages primarily under the names ICEE, SLUSH PUPPIE and PARROT ICE which are sold primarily in the United States, Mexico, and Canada. Frozen beverages are reported in the Frozen Beverages segment.
Frozen beverage sales amounted to 14% of the Company’s revenue in fiscal year 2025, 15% in fiscal year 2024, and 14% in fiscal year 2023.
Under the Company’s principal marketing program for frozen carbonated beverages, it installs frozen beverage dispensers for its ICEE brand at customer locations and thereafter services the machines, arranges to supply customers with ingredients required for production of the frozen beverages, and supports customer retail sales efforts with in-store promotions and point-of-sale materials. The Company sells frozen non-carbonated beverages under the SLUSH PUPPIE and PARROT ICE brands through a distributor network and through its own distribution network. The Company also provides repair and maintenance service to customers for customer-owned equipment and sells equipment in its Frozen Beverages segment. Revenue from equipment sales and repair and maintenance services totaled 9% of the Company’s sales in each of the fiscal years 2025, 2024, and 2023.
Each new frozen carbonated customer location requires a frozen beverage dispenser supplied by the Company or by the customer. Company-supplied frozen carbonated dispensers are purchased from outside vendors or rebuilt by the Company.
The Company provides managed service and/or products to approximately 132,000 Company-owned and customer-owned dispensers.
Other Products
Other products sold by the Company include funnel cakes sold under the FUNNEL CAKE FACTORY brand name and smaller amounts of various other food products. These products are sold in the Food Service and Frozen Beverages segments.
Customers
The Company sells its products to two principal channels: foodservice and retail supermarkets. The primary products sold to the foodservice channel are soft pretzels, frozen beverages, frozen novelties, churros, handheld products and baked goods. The primary products sold to the retail supermarket channel are soft pretzels, frozen novelties and handheld products.
We have several large customers that account for a significant portion of our sales. Our top ten customers accounted for 46%, 45% and 43% of our sales during fiscal years 2025, 2024, and 2023, respectively, with our largest customer accounting for 10% of our sales in fiscal 2025, 9% of our sales in fiscal 2024, and 9% of our sales in fiscal 2023. Five of the ten customers in 2025 are food distributors who sell our product to many end users. The loss of one or more of our large customers could adversely affect our results of operations. These customers typically do not enter long-term contracts and make purchase decisions based on a combination of price, product quality, consumer demand and customer service performance. If our sales to one or more of these customers are reduced, this reduction may adversely affect our business. If receivables from one or more of these customers become uncollectible, our operating income would be adversely impacted.
The Food Service and the Frozen Beverages segments sell primarily to foodservice channels. The Retail Supermarkets segment sells primarily to the retail supermarket channel.
The Company’s customers in the Food Service segment include snack bars and food stands in chain, department and mass merchandising stores, malls and shopping centers, fast food and casual dining restaurants, stadiums and sports arenas, leisure and theme parks, convenience stores, movie theatres, warehouse club stores, schools, colleges and other institutions, and independent retailers. Machines and machine parts are sold to other food and beverage companies. Within the food service industry, the Company’s products are purchased by the consumer primarily for consumption at the point-of-sale.
The Company sells its products to a large majority of supermarkets in the United States. Products sold to retail supermarket customers are primarily soft pretzel products, including SUPERPRETZEL, frozen novelties including LUIGI’S Real Italian Ice, MINUTE MAID Juice Bars and Soft Frozen Lemonade, WHOLE FRUIT frozen fruit bars, WHOLE FRUIT Sorbet, PHILLY SWIRL cups and sticks, MARY B’S biscuits and dumplings, DADDY RAY’S fig and fruit bars, HILL & VALLEY baked goods, and ICEE Squeeze-Up Tubes. Within the retail supermarket industry, the Company’s frozen and prepackaged products are purchased by the consumer for consumption at home.
Marketing and Distribution
The Company supports its portfolio of brands with national and regional marketing programs. For the Food Service and Frozen Beverages segments’ customers, these marketing programs include providing ovens, mobile merchandisers, display cases, freezers, kiosks, warmers, frozen beverage dispensers and other merchandising equipment for the individual customer requirements and point-of-sale materials as well as participating in trade shows and in-store demonstrations. The Company’s ongoing advertising and promotional campaigns for its Retail Supermarket segment’s products include consumer advertising campaigns across traditional and digital channels, and print/digital media with value added shopper offers and promotions.
The Company develops and introduces new products on a routine basis. The Company evaluates the success of new product introductions on the basis of sales and profit levels.
The Company’s products are sold through a network of food brokers, independent sales distributors, and the Company’s own direct sales force. For its snack food products, the Company maintains warehouse and distribution facilities in Pennsauken, Bellmawr, Bridgeport, and Woolwich, New Jersey; Vernon (Los Angeles), California; Brooklyn, New York; Scranton and Hatfield, Pennsylvania; Carrollton (Dallas) and Terrell, Texas; Moscow Mills (St. Louis), Missouri; Tampa, Florida; Weston, Oregon; Rock Island, Illinois; Glendale, Arizona; and Paducah, Kentucky. Frozen beverages and machine parts are distributed from 172 Company managed warehouse and distribution facilities located in 45 states, Mexico, and Canada, which allow the Company to directly service its customers in the surrounding areas. The Company’s products are shipped in frozen form from the Company’s manufacturing and warehouse facilities on a fleet of Company operated tractor-trailers, trucks, and vans, as well as by independent carriers.
Seasonality
The Company’s sales are seasonal because frozen beverage sales and frozen novelties sales are generally higher during warmer months.
Trademarks and Patents
The Company has a significant trademark portfolio, the most important of which are SUPERPRETZEL, TEXAS TWIST, NEW YORK PRETZEL, BAVARIAN BAKERY, SOFTSTIX, and BRAUHAUS for its pretzel products; DIPPIN’ DOTS, SHAPE-UPS, WHOLE FRUIT, PHILLY SWIRL, and LUIGI’S for its frozen novelties; ¡HOLA!, and CALIFORNIA CHURROS for its churros; ICEE, ARCTIC BLAST, SLUSH PUPPIE, and PARROT ICE for its frozen beverages; FUNNEL CAKE FACTORY for its funnel cake products; and MRS. GOODCOOKIE, READI-BAKE, COUNTRY HOME, CAMDEN CREEK, MARY B’S, DADDY RAY’S, and HILL & VALLEY for its bakery products.
The Company markets frozen beverages under the trademark ICEE in all the United States and in Mexico and Canada.
The trademarks, when renewed and continuously used, have an indefinite term and are considered important to the Company as a means of identifying its products. The Company considers its trademarks important to the success of its business.
The Company has numerous patents related to the manufacturing and marketing of its products.
Suppliers
The Company’s manufactured products are produced from raw materials which are readily available from numerous sources. With the exception of the Company’s churro production equipment, funnel cake production equipment and soft pretzel twisting equipment, all of which are made for the Company by independent third parties, and certain specialized packaging equipment, the Company’s manufacturing equipment is readily available from various sources. Syrup for frozen beverages is purchased primarily from The Coca-Cola Company, Keurig Dr. Pepper, Inc., the Pepsi Cola Company, and Jogue, Inc. Cups. Straws and lids are readily available from various suppliers. Parts for frozen beverage dispensing machines are purchased from several sources.
Competition
Snack food and bakery products markets are highly competitive. The Company’s principal products compete against similar and different food products manufactured and sold by numerous other companies, some of which are substantially larger and have greater resources than the Company. As the soft pretzel, frozen novelties, bakery products and related markets evolve, additional competitors and new competing products may enter the markets. Competitive factors in these markets include product quality, innovation, customer service, taste, price, identity and brand name awareness, method of distribution and sales promotions.
The Company believes it is one of the only national distributors of soft pretzels. However, there are numerous regional and local manufacturers of food service and retail supermarket soft pretzels as well as several chains of retail pretzel stores.
In Frozen Beverages, the Company competes directly with other frozen beverage companies. There are many other regional frozen beverage competitors throughout the country and one large retail chain which uses its own frozen beverage brand.
The Company competes with large soft drink manufacturers for counter and floor space for its frozen beverage dispensing machines at retail locations and with products which are more widely known than the ICEE, SLUSH PUPPIE and PARROT ICE frozen beverages.
The Company competes with several other companies in the frozen novelties and bakery products markets.
Risks Associated with Foreign Operations
Foreign operations can involve greater risk than doing business in the United States. Foreign economies differ favorably or unfavorably from the United States’ economy in such respects as the level of inflation and debt, which may result in fluctuations in the value of the country’s currency and real property. Sales from our foreign operations were $69.6 million, $73.4 million and $70.2 million in fiscal years 2025, 2024, and 2023, respectively. At September 27, 2025, the total assets in our foreign operations were $79.1 million or 5.7% of total assets. At September 28, 2024, the total assets in our foreign operations were $67.6 million or 5.0% of total assets.
Government Regulation and Food Safety
Our business operations are subject to regulation by various federal, state and local government entities and agencies. As a producer of food products for human consumption, our operations are subject to stringent production, packaging, quality, labeling and distribution standards, including regulations promulgated under the Federal Food, Drug and Cosmetic Act and the Food Safety Modernization Act. We are also subject to various federal, state, and local environmental protection laws. Based upon available information, the cost of compliance with these laws and regulations did not have a material effect upon the level of capital expenditures, earnings, or competitive position in fiscal 2025 and is not expected to have a material impact in fiscal 2026.
Our Food Safety & Quality (FSQA) personnel within our Compliance Department have broad, diverse academic and experience credentials and oversee all aspects of product safety & quality assurance across the Company. Our facilities are Global Food Safety Initiative (GFSI) certified and are audited annually by third-party certification bodies. Our “Food Safety & Quality Plans” are validated and verified to ensure product safety and quality. We have implemented Corporate Standards which are aligned with GFSI and Regulatory standards and routinely conduct audits to ensure compliance. We provide bi-weekly support calls and mentorship programs for FSQA and Plant Leadership and annual Food Safety Summit Meetings to develop and strengthen our facility teams. As part of the onboarding process, and throughout their careers, employees are engaged in food safety discussions and trainings to provide safe, high-quality products to customers and consumers.
Human Capital Management
Employees and Labor Relations
The Company has approximately 4,600 full and part-time employees and approximately 600 workers employed by staffing agencies as of September 27, 2025. About 1,400 production and distribution employees throughout the Company are covered by collective bargaining agreements. The Company considers its culture and employee relations to be positive.
Employee Safety
We maintain a safety culture grounded on the premise of eliminating workplace incidents, risks and hazards. We have a team of dedicated Employee Health & Safety professionals within our Compliance Department who oversee all aspects of employee safety across the company. We keep our employees safe by ensuring all employees receive ongoing support and training. We have developed and implemented processes to identify and eliminate safety incidents by reducing their frequency and severity. We also closely review and monitor our safety performance. According to data from the U.S Bureau of Labor Statistics, the Company’s Total Recordable Incident Rate (“TRIR”) and Days Away, Restricted or Transferred (“DART”) incident rates were lower than food manufacturing averages. Our goal is to reduce Occupational Safety and Health Administration (“OSHA”) recordable incidents year-over-year.
Professional Development
We deploy a variety of training programs throughout the organization and go to great lengths to make learning and knowledge available to our employees. Programs such as tuition reimbursement, mentorships, internships, and internal trainings are some of the ways in which we invest in our people and their knowledge. We know that these investments are not only beneficial for our employees, but they are also important for the future success of our business. We continue to see increases in internal promotions across all levels of the organization.
Diversity and Inclusion
We believe that having an inclusive and diverse culture strengthens our ability to recruit and develop talent and allows our employees to thrive and succeed. Diversity of input and perspectives is an essential part of our strategic plan to build a winning team and culture. We believe that one key to success is attracting and retaining a diverse workforce that reflects our consumers of today and tomorrow, and we strive to do so. We also strive to foster an inclusive and diverse workplace culture where colleagues feel a sense of belonging and are included in discussions and valued for their contributions.
Compensation
We believe in equal pay for equal work and that compensation should match talent, experience and skill set of a person.
Available Information
The Company’s internet address is www.jjsnack.com. On the investor relations section of its website, the Company provides free access to its annual report on Form 10-K, quarterly reports on Form 10-Q, current reports on Form 8-K and any amendments to these reports, as soon as reasonably practicable after such materials are electronically filed with, or furnished to, the Securities and Exchange Commission (“SEC”). The information on the website listed above is not and should not be considered part of this annual report on Form 10-K and is not incorporated by reference in this document.
Item 1A. Risk Factors
Our business is subject to numerous risks and uncertainties. You should carefully consider the risks described below, together with all the other information included in this report, in considering our business and prospects. The risks and uncertainties described below are not the only ones facing us. Additional risks and uncertainties not presently known to us or that we currently deem insignificant or immaterial may also materially and adversely affect our business, financial condition, results of operations or prospects. The following is a discussion of known potentially significant risks which could result in harm to our business, financial condition, or results of operations.
General Economic Risk
The willingness of our customers and consumers to purchase our products may depend in part on economic conditions. Worsening economic conditions or future challenges to economic growth could have a negative impact on consumer demand, which could adversely affect our business. Deterioration of national and global economic conditions could cause consumers to forego certain purchases during economic downturns that could result in decreased demand for our business. The economic uncertainty may limit our ability to increase or maintain prices and reduce sales of higher margin products. In addition, changes in tax or interest rates, current or future governmental policies or regulations, which include the imposition of tariffs, efforts to combat inflation, financial and credit market disruptions or other reasons, could negatively impact us.
Risks of Shortages or Increased Cost of Raw Materials and Packaging
We are exposed to market risks arising from adverse changes in commodity prices, affecting the cost of our raw materials and energy. The raw materials and energy which we use for the production and distribution of our products are largely commodities that are subject to price volatility and fluctuations in availability caused by changes in global supply and demand, weather conditions, agricultural uncertainty, or governmental policies and regulations, which can include the imposition of tariffs. We purchase these materials and energy mainly in the open market. Our procurement practices are intended to reduce the risk of future price increases, but also may potentially limit the ability to benefit from possible price decreases. If commodity price changes result in increases in raw materials and energy costs, we may not be able to increase our prices to offset these increased costs without suffering reduced revenue and operating income. These increased costs, if not offset, may have a significant impact on our profits.
U.S. trade policies, including the imposition of tariffs, and potential related actions by other countries are outside of our control and may affect our results of operations. Recently, the United States announced tariffs on imports from a broad range of countries which we anticipate will cause inflationary pressures, possible retaliatory tariffs and higher costs on certain of our raw materials and packaging imported from the affected countries. If maintained, the announced U.S. tariffs, as well as related measures that could be taken by other countries, could affect our results of operations.
Risks Relating to Pandemics, Epidemics, or Other Disease Outbreaks
Pandemics, epidemics, or other disease outbreaks could significantly change consumption patterns for our products. These changes could force us to rapidly adapt to those new patterns, and, if we do not, our business could be materially and adversely affected. Additionally, pandemics, epidemics or other disease outbreaks may depress or otherwise impact demand for our products because quarantines may inhibit consumption. Restrictions on public gatherings or interactions may also limit the opportunity for our customers and consumers to purchase our products, especially in certain of our sales channels, such as food service. Any economic downturn caused by any pandemic, epidemic, or other disease outbreak may also cause substantial changes in consumer behavior and our supply chain operations, some of which may materially affect our operations and results of operations.
General Risks of the Food Industry
We are subject to the risks of adverse changes in general economic conditions; evolving consumer preferences and nutritional and health-related concerns; changes in food distribution channels; federal, state and local food processing controls or other mandates; changes in federal, state, local and international laws and regulations, or in the application of such laws and regulations; consumer product labeling and liability claims; risks of product tampering and contamination; and negative publicity surrounding actual or perceived product safety deficiencies. The increased buying power of large supermarket chains, other retail outlets and wholesale food vendors could result in greater resistance to price increases and could alter customer inventory levels and access to shelf space.
Federal or state actions targeting specific food ingredients (including bans or phase-outs of certain dyes, preservatives or processing aids) – or actions that incentivize removal of those ingredients – could require us to reformulate existing products, incur higher ingredient or manufacturing costs, reduce shelf life, or change product functionality and taste. These changes could result in lost sales, customer dissatisfaction, increased recall risk or material expenses. Further, new rules requiring front-of-pack nutrition labels, warnings, or expanded ingredient disclosures may require redesign of packaging, increase unit costs, and influence consumer purchase decisions. These requirements may restrict certain claims we make and could lead to product delisting or store exclusion in some channels.
Our business, results of operations, and financial condition could be materially and adversely affected by changes in consumer behavior arising from the increased use of prescription weight-loss therapies, including GLP-1 and related drugs. These therapies can suppress appetite and change food preferences and consumption patterns, which could reduce demand for food categories we sell. This reduction in demand could adversely affect our results of operations and growth prospects.
Risks of Shortages or Increased Costs of Labor
Our businesses operate in highly competitive markets. The labor market in the United States is very competitive. We depend on the skills, working relationships, and continued services of employees, including our experienced management team. We must hire, train, and develop effective employees. We compete with other companies both within and outside of our industry for talented employees, and we may lose key personnel or fail to attract, train, and retain other talented personnel. In addition, our ability to achieve our operating goals depends on our ability to identify, hire, train, and retain qualified individuals. Any such loss or failure could adversely affect our product sales, financial condition, and operating results. Additionally, a shortage in the labor pool and other general inflationary pressures or changes, and applicable laws and regulations could increase labor costs, which could have a material adverse effect on our consolidated operating results or financial condition.
In addition, some of our associates are covered by collective bargaining agreements, and other associates may seek to be covered by collective bargaining agreements. Strikes or work stoppages or other business interruptions could occur if we are unable to renew these agreements on satisfactory terms or enter into new agreements on satisfactory terms or if we are unable to otherwise manage changes in, or that affect, our workforce, which could impair manufacturing or distribution of our products or result in a loss of sales, which could adversely impact our business, financial condition, or results of operations. The terms and conditions of existing, renegotiated, or new collective bargaining agreements could also increase our costs or otherwise affect our ability to fully implement future operational changes to enhance our efficiency or adapt to changing business needs or strategy.
Environmental Risks
The disposal of solid and liquid waste material and the discharge of airborne pollutants resulting from the preparation and processing of foods is subject to various federal, state, and local laws and regulations relating to the protection of the environment. Such laws and regulations have a substantial effect on the food processing industry as a whole, requiring substantially all firms in the industry to incur material expenditures for modification of existing processing facilities and for construction of upgraded or new waste treatment facilities.
We cannot predict what environmental legislation or regulations will be enacted in the future, how existing or future laws or regulations will be administered or interpreted or what environmental conditions may be found to exist. Enactment of more stringent laws or regulations or more strict interpretation of existing laws and regulations may require additional expenditure by us, some of which could have a negative impact on our operations and financial condition. Additionally, the failure by any one or more of our suppliers to comply with applicable federal, state, and local laws and regulations relating to the protection of the environment, or allegations of non-compliance, may disrupt their operations and could result in accompanying disruptions to our operations.
Risks Resulting from Customer Concentration
We have several large customers that account for a significant portion of our sales. Our top ten customers accounted for 46% of our sales during fiscal year 2025, 45% of our sales during fiscal year 2024 and 43% of our sales during fiscal year 2023, with our largest customer accounting for 10% of our sales in 2025, 9% of our sales in 2024, and 9% of our sales in 2023.
Five of the ten customers are food distributors who sell our product to many end users. The loss of one or more of our large customers could adversely affect our results of operations. These customers typically do not enter into long-term contracts and make purchase decisions based on a combination of price, product quality, consumer demand and customer service performance. If our sales to one or more of these customers are reduced, this reduction may adversely affect our business. If receivables from one or more of these customers become uncollectible, our operating income would be adversely impacted.
Risks Relating to Competition
Our businesses operate in highly competitive markets. We compete against national and regional manufacturers and distributors on the basis of price, quality, product variety, brand recognition and loyalty, and effective distribution. Many of our major competitors in the market are larger and have greater financial and marketing resources than we do. Increased competition from our competitors could lead to downward pressure on prices and/or a decline in our market share, either of which could adversely affect our results. See “Competition” in Item 1 for more information about our competitors.
Risks Relating to Manufacturing and Distribution
Our ability to purchase, manufacture and distribute products is critical to our success. Because we source certain products from single manufacturing sites, it is possible that we could experience a production disruption that results in a reduction or elimination of the availability of some of our products. If we are not able to obtain alternate production capability in a timely manner, or on favorable terms, it could have a negative impact on our business, results of operations, financial condition, and cash flows, including the potential for long-term loss of product placement with various customers. We are also subject to risks of other business disruptions associated with our dependence on production facilities and distribution systems. Natural disasters, terrorist activity, cyberattacks or other unforeseen events could interrupt production or distribution and have a material adverse effect on our business, results of operations, financial condition, and cash flows, including the potential for long-term loss of product placement with our customers. For example, on August 19, 2024, we experienced a fire at our Holly Ridge plant in North Carolina. The building was damaged as a result of the fire, and plant operations were interrupted.
Risks Relating to the Availability and Costs of Transportation
Our ability to obtain adequate and reasonably priced methods of transportation to distribute our products, including refrigerated trailers for many of our products, is a key factor to our success. Delays in transportation, including weather-related delays, and carrier capacity limitations, could have a material adverse effect on our business and results of operations. Further, higher fuel costs and increased line haul costs due to industry capacity constraints, customer delivery requirements and a more restrictive regulatory environment could also negatively impact our financial results. We pay fuel surcharges that fluctuate with the price of diesel fuel to third-party transporters of our products, and such surcharges can be substantial. Any sudden or dramatic increases in the price of diesel fuel would serve to increase our fuel surcharges and our cost of goods sold. These higher costs could have a material adverse effect on our business, results of operations, financial condition, and cash flows.
Risks Relating to Manufacturing Capacity Constraints
Our current manufacturing resources may be inadequate to meet significantly increased demand for some of our products. Our ability to increase our manufacturing capacity depends on many factors, including the costs and availability of equipment, the equipment delivery and construction lead-times, installation, qualification, regulatory permitting, and regulatory requirements. A lack of sufficient manufacturing capacity to meet demand could cause our customer service levels to decrease, which may negatively affect customer demand for our products and customer relations generally, which in turn could have a material adverse effect on our business, results of operations, financial condition, and cash flows. In addition, operating facilities at or near capacity may also increase production and distribution costs and negatively affect relations with our employees or contractors, which could result in disruptions in our operations.
Risks Relating to Acquisition Integration
From time to time, the Company undertakes acquisitions or divestitures. The success of any acquisition or divestiture depends on the Company’s ability to identify opportunities that help the Company meet its strategic objectives, consummate a transaction on favorable contractual terms, and achieve expected returns and other financial benefits.
Acquisitions, require us to efficiently integrate the acquired business or businesses, which involves a significant degree of difficulty, including the following:
|
● |
integrating the operations and business cultures of the acquired businesses; |
|
|
● |
the possibility of faulty assumptions underlying our expectations regarding the prospects of the acquired businesses; |
|
|
● |
attracting and retaining the necessary personnel associated with the acquisitions; |
|
|
● |
creating uniform standards, controls, procedures, policies, and information systems and controlling the costs associated with such matters; and |
|
|
● |
expectations about the performance of acquired trademarks and brands and the fair value of such trademarks and brands. |
Divestitures have operational risks that may include impairment charges. Divestitures also present unique financial and operational risks, including diverting management attention from the existing core business, separating personnel and financial data and other systems, and adversely affecting existing business relationships with suppliers and customers.
In situations where acquisitions and divestitures are not successfully implemented or completed, or the expected benefits of such acquisitions or divestitures are not otherwise realized, the Company’s business or financial results could be negatively impacted.
New Jersey Law and Provisions of Our Amended and Restated Certificate of Incorporation and Bylaws May Inhibit a Change In Control
The New Jersey Shareholders' Protection Act, N.J.S.A. 14A:10A-1, et seq., may delay, deter or prevent a change in control by prohibiting the Company from engaging in a business combination transaction with an interested shareholder for a period of five years after the person becomes an interested stockholder, even if a majority of our shareholders believe a change in control would be in the best interests of the Company and its shareholders. In addition, our Amended and Restated Certificate of Incorporation and Bylaws contain provisions that may delay, deter or prevent a future acquisition of J & J Snack Foods Corp. not approved by our Board of Directors. This could occur even if our shareholders are offered an attractive value for their shares or if a substantial number or even a majority of our shareholders believe the takeover is in their best interest. These provisions are intended to encourage any person interested in acquiring us to negotiate with and obtain the approval of our Board of Directors in connection with the transaction. Provisions of our Amended and Restated Certificate of Incorporation and Bylaws that could delay, deter or prevent a future acquisition include the following:
|
● |
a classified Board of Directors; |
|
|
● |
the requirement that our shareholders may only remove Directors for cause; |
|
|
● |
limitations on share holdings and voting of certain persons who exceed the “Voting Threshold” specified in the Amended and Restated Certificate of Incorporation; |
|
|
● |
special Director voting rights are granted to certain “Experienced Directors” only in the event of a “hostile change of Board control,” as such terms are defined in the Amended and Restated Certificate of Incorporation; |
|
|
● |
the ability of the Board of Directors to consider the interests of various constituencies, including our employees, customers, suppliers, creditors and the local communities in which we operate; |
|
|
● |
shareholders do not generally have the right to call special meetings or to act by written consent; |
|
|
● |
our Bylaws contain advance notice procedures for nominations of Directors or submission of shareholder proposals at an annual meeting; and |
|
|
● |
our Bylaws contain a forum selection clause providing that certain litigation against the Company can only be brought in New Jersey state or federal courts. |
Risk Related to Increases in our Health Insurance Costs
The costs of employee health care insurance have been increasing in recent years due to rising health care costs, legislative changes, and general economic conditions. Because of the breadth and complexity of health care regulations as well as other health care reform legislation considered by Congress and state legislatures, we cannot predict with certainty the future effect of these laws on us. A continued increase in health care costs or additional costs incurred as a result of new or existing health care reform laws or changes in enforcement policies could have a negative impact on our financial position and results of operations.
Risk Related to Product Changes
There are risks in the marketplace related to trade and consumer acceptance of product improvements, packaging initiatives and new product introductions. We cannot be sure if our new products, product improvements, or packaging initiatives will be accepted by customers.
Risks Associated with Foreign Operations
Foreign economies may differ favorably or unfavorably from the United States’ economy in such respects as the level of inflation and debt, which may result in fluctuations in the value of the country’s currency. Further, there may be less government regulation in various countries, and we may face difficulty in enforcing our legal rights outside the United States. Additionally, in some foreign countries, there is the possibility of expropriation or confiscatory taxation limitations on the removal of property or other assets, political or social instability or diplomatic developments which could affect the operations and assets of U.S. companies doing business in that country. Any such difficulties noted above could affect our business. Sales of our foreign operations were $69.6 million, $73.4 million, and $70.2 million in fiscal years 2025, 2024, and 2023, respectively. At September 27, 2025, the total assets of our foreign operations were approximately $79.1 million or 5.7% of total assets. At September 28, 2024, the total assets of our foreign operations were $67.6 million or 5.0% of total assets.
Risks Associated with our Information Technology Systems
The efficient operation of our business depends on our information technology systems. We rely on our information technology systems to effectively manage our business data, communications, supply chain, manufacturing, order entry and fulfillment, and other business processes. The failure of our information technology systems (including those provided to us by third parties) to perform as we anticipate could disrupt our business and could result in production, billing, collecting, and ordering errors, processing inefficiencies, and the loss of sales and customers, causing our business and results of operations to suffer.
Our information technology systems may be vulnerable to damage or interruption from circumstances beyond our control, including fire, natural disasters, systems failures, security breaches or intrusions (including those against our third-party providers and theft of customer, consumer, or other confidential data), and viruses. Although we continue to monitor our information technology networks, if we are unable to prevent physical and electronic break-ins, cyber-attacks, and other information security breaches, we may suffer material financial and reputational damage, be subject to litigation or incur significant remediation costs or penalties.
Risks Associated with Real or Perceived Safety Issues Regarding our Food Products
We sell food products for human consumption, which involves risks such as product contamination or spoilage, product tampering, other adulteration of food products, mislabeling, and misbranding. We can be impacted by both real and unfounded claims regarding the safety of our operations, or concerns regarding mislabeled, adulterated, contaminated, or spoiled food products. Any of these circumstances could necessitate a voluntary or mandatory recall, a need to change a product’s labeling or other consumer safety concerns. A pervasive product recall may result in significant loss due to the costs of a recall, related legal claims, including claims arising from bodily injury or illness caused by our products, the destruction of product inventory, or lost sales due to product unavailability or negative publicity. A highly publicized product recall, whether involving us or any related products made by third parties, also could result in a loss of customers or an unfavorable change in consumer sentiment regarding our products or any category in which we operate. In addition, an allegation of noncompliance with federal or state food laws and regulations could force us to cease production, stop selling our products or create significant adverse publicity that could harm our credibility and decrease market demand for our products. Any of these events could have a material adverse effect on our business, results of operations, financial condition, and cash flows.
Risks Associated with our Intellectual Property Rights
We consider our intellectual property rights, particularly our trademarks, to be a significant and valuable aspect of our business. We protect our intellectual property rights through a combination of trademark, patent, copyright and trade secret protection, contractual agreements, and policing of third-party misuses of our intellectual property in traditional retail and digital environments. Our failure to obtain or adequately protect our intellectual property or any change in law that lessens or removes the current legal protections of our intellectual property may diminish our competitiveness and adversely affect our business and financial results.
Competing intellectual property claims that impact our brands or products may arise unexpectedly. Any litigation or disputes regarding intellectual property may be costly and time consuming and may divert the attention of our management and key personnel from our business operations. We may also be subject to significant damages or injunctions against development, launch and sale of certain products. Any of these occurrences may harm our business and financial results.
Risks Associated with the Favorable Perception of our Brands
We have a number of iconic brands with significant value. Maintaining and continually enhancing the value of these brands is critical to the success of our business. Brand value is primarily based on consumer perceptions. Success in promoting and enhancing brand value depends in large part on our ability to provide high-quality products. Brand value could diminish significantly due to a number of factors, including consumer perception that we have acted in an irresponsible manner, adverse publicity about our products, packaging, ingredients, our environmental, social, human capital or governance practices, our failure to maintain the quality of our products, the failure of our products to deliver consistently positive consumer experiences, or the products becoming unavailable to consumers. The growing use of social and digital media by consumers increases the speed and extent that information and opinions can be shared. Negative posts or comments about us, our brands, products, or packaging on social or digital media could seriously damage our brands and reputation. In addition, we might fail to appropriately target our marketing efforts, anticipate consumer preferences, or invest sufficiently in maintaining our brand image. If we do not maintain the favorable perception of our brands, our financial results could be adversely impacted.
Risk Associated with Generating Anticipated Cost Savings and/or Operating Efficiencies Associated with our Strategic Initiatives
Our future success and earnings growth depend in part on our ability to achieve the appropriate cost structure and operate efficiently in the highly competitive food industry, particularly in an environment of volatile cost inputs. We continuously pursue initiatives to reduce costs and increase effectiveness. We also regularly pursue cost productivity initiatives in procurement, manufacturing, and logistics. Any failure or delay in implementing our initiatives in accordance with our plans could adversely affect our ability to meet our long-term growth and profitability expectations and could adversely affect our business. If we do not continue to effectively manage costs and achieve additional efficiencies, our competitiveness and profitability could decrease.
Seasonality and Quarterly Fluctuations
Our sales are affected by the seasonal demand for our products. Demand is greater during the summer months primarily as a result of the warm weather demand for our ICEE and frozen novelties products. Because of seasonal fluctuations, there can be no assurance that the results of any particular quarter will be indicative of results for the full year or for future years.
Item 1B. Unresolved Staff Comments
We have no unresolved SEC staff comments to report.
Item 1C. Cybersecurity
Cybersecurity Risk Management and Strategy
Our enterprise risk management process includes an evaluation of cybersecurity risk together with other company risks. The Company has established a cybersecurity risk management program (the “program”) designed to assess, identify, and manage material cybersecurity risks. Our program is designed based on industry best practices and is aligned with the core components of frameworks established by the National Institute of Standards and Technology (NIST), Center for Internet Security (CIS) and International Organization for Standardization (ISO).
An annual risk assessment is performed to identify internal and external cybersecurity threats and vulnerabilities, assess the likelihood and potential impact of such threats and vulnerabilities, and prioritize the risks from such threats and vulnerabilities. The results of the risk assessment, along with professional judgment, are used to develop and implement cybersecurity risk mitigation strategies and controls.
Our program includes:
|
● |
A cybersecurity incident response plan that outlines a structured approach to investigating, containing, documenting, and mitigating cybersecurity incidents, including reporting findings and keeping senior management, the Audit Committee, and other key stakeholders informed and involved as appropriate; |
|
● |
Annual external penetration testing to identify vulnerabilities, assess perimeter security, improve incident response, and strengthen security policies and procedures; |
|
● |
Regular phishing, social engineering, and cybersecurity awareness training for employees with access to the Company’s information technology environment; |
|
● |
Annual tabletop exercises to test incident response plans, improve communication and coordination between relevant employees, and identify gaps to inform needed adjustments to plans; |
|
● |
Ongoing risk assessments of third-party service providers designed to ensure they meet the Company’s standards for reliability, security, compliance, and performance. |
Third-party service providers are used in various capacities as part of our cybersecurity risk management program, including performing risk mitigation controls and providing cloud-based cybersecurity services and platforms. For example, third-party service providers are used to conduct our external penetration testing, as well as assist the Company in detecting, responding, and mitigating cybersecurity incidents. The Company uses a variety of processes to oversee and identify material risks from cybersecurity threats associated with the use of third-party service providers. Third-party service providers are required to complete a detailed questionnaire, which is used to identify and assess material cybersecurity risks. In addition, the Company performs an annual review of independent attestation reports of the third-party service providers’ control environments designed to ensure that the controls meet Company security requirements and that any identified issues in the independent attestation reports do not present material cybersecurity risks to the Company.
To date, we have not identified any cybersecurity threats or incidents which have materially affected, or are reasonably likely to materially affect, the Company, including its business strategy, results of operations or financial condition; however, there is no guarantee that we will not be the subject of future successful cybersecurity threats or incidents that may materially and adversely affect the Company, including its business strategy, financial condition, results of operations or prospects. Additional information on cybersecurity-related risks is discussed under the heading “Risks Associated with our Information Technology Systems” under Item 1A, which should be read in conjunction with Item 1C.
Cybersecurity Governance
Our Board of Directors has delegated oversight responsibilities for enterprise risk, including cybersecurity risk, to the Audit Committee. The Chief Information Officer (“CIO”) and Chief Information Security Officer (“CISO”) provide periodic updates to the Audit Committee regarding the Company's cybersecurity risk management program. The Company has a cybersecurity incident response plan that includes a process to evaluate cybersecurity incidents for materiality. The escalation protocol includes reporting potentially material cybersecurity incidents to senior members of management for further evaluation. Any cybersecurity incident determined to have a material impact on the Company is timely reported to the Audit Committee.
The CISO has primary responsibility for the development, operation, and maintenance of our cybersecurity risk management program. Our CISO has 25 years of experience in information technology and cybersecurity generally, which has been gained from a combination of education, including relevant degrees, and prior work experience.
Item 2. Properties
|
Location |
Reporting Segment |
Facility Type |
Products Manufactured |
Owned Square Footage |
Leased Square Footage |
Total Square Footage |
|||||||||
|
Pennsauken, NJ |
Food Service/Retail Supermarket |
Manufacturing |
Soft Pretzels, Churros, Bakery Products |
70,000 | - | 70,000 | |||||||||
|
Pennsauken, NJ |
Food Service/Retail Supermarket |
Warehousing/Distribution |
N/A | 171,000 | - | 171,000 | |||||||||
|
Mt. Laurel, NJ |
Food Service/Retail Supermarket/Frozen Beverages |
Office |
N/A | - | 30,000 | 30,000 | |||||||||
|
Bellmawr, NJ |
Food Service/Retail Supermarket |
Manufacturing |
Soft Pretzels, Bakery Products |
150,000 | - | 150,000 | |||||||||
|
Vernon, CA |
Food Service |
Manufacturing |
Soft Pretzels, Churros, Bakery Products |
- | 107,000 | 107,000 | |||||||||
|
Vernon, CA |
Food Service |
Warehousing/Distribution |
N/A | - | 30,000 | 30,000 | |||||||||
|
Vernon, CA |
Food Service |
Office/Warehousing |
N/A | - | 80,000 | 80,000 | |||||||||
|
Brooklyn, NY |
Food Service |
Manufacturing |
Soft Pretzels |
- | 20,000 | 20,000 | |||||||||
|
Colton, CA |
Food Service |
Manufacturing |
Churros, Bakery Products |
- | 45,000 | 45,000 | |||||||||
|
Atlanta, GA |
Food Service/Retail Supermarket |
Manufacturing |
Bakery Products |
- | 85,000 | 85,000 | |||||||||
|
Rock Island, IL |
Food Service |
Manufacturing |
Bakery Products |
- | 129,000 | 129,000 | |||||||||
|
Scranton, PA |
Food Service/Retail Supermarket |
Manufacturing |
Frozen Novelties |
46,000 | - | 46,000 | |||||||||
|
Scranton, PA |
Food Service/Retail Supermarket |
Warehousing |
N/A | 42,000 | - | 42,000 | |||||||||
|
Hatfield, PA |
Food Service |
Manufacturing |
Soft Pretzels |
- | 30,000 | 30,000 | |||||||||
|
Carrollton, TX |
Food Service |
Manufacturing |
Soft Pretzels |
- | 48,000 | 48,000 | |||||||||
|
Carrollton, TX |
Food Service |
Warehousing |
N/A | - | 7,000 | 7,000 | |||||||||
|
Bridgeport, NJ |
Food Service |
Manufacturing |
Bakery Products |
- | 133,000 | 133,000 | |||||||||
|
Moscow Mills, MO |
Food Service |
Manufacturing |
Bakery Products |
165,000 | - | 165,000 | |||||||||
|
Holly Ridge, NC |
Food Service/Retail Supermarket |
Manufacturing |
Handheld Products |
84,000 | - | 84,000 | |||||||||
|
Weston, OR |
Food Service/Retail Supermarket |
Manufacturing |
Handheld Products |
- | 70,000 | 70,000 | |||||||||
|
Weston, OR |
Food Service/Retail Supermarket |
Warehousing |
N/A | - | 11,000 | 11,000 | |||||||||
|
Little Rock, AR |
Food Service |
Office |
N/A | - | 3,000 | 3,000 | |||||||||
|
Paducah, KY |
Food Service |
Manufacturing |
Frozen Novelties |
130,000 | - | 183,000 | |||||||||
|
Paducah, KY |
Food Service |
Office |
N/A | - | 59,000 | 59,000 | |||||||||
|
Lancaster, CA |
Food Service |
Warehousing |
N/A | - | 23,000 | 23,000 | |||||||||
|
Tampa, FL |
Retail Supermarket |
Manufacturing |
Frozen Novelties |
- | 67,000 | 67,000 | |||||||||
|
LaVergne, TN |
Frozen Beverages |
Office |
N/A | - | 84,000 | 84,000 | |||||||||
|
Terrell, TX |
Food Service/Retail Supermarket |
Warehousing |
N/A | - | 117,000 | 117,000 | |||||||||
|
Woolwich, NJ |
Food Service/Retail Supermarket |
Warehousing |
N/A | - | 201,000 | 201,000 | |||||||||
|
Glendale, AZ |
Food Service/Retail Supermarket |
Warehousing |
N/A | - | 87,000 | 87,000 | |||||||||
| 858,000 | 1,466,000 | 2,324,000 | |||||||||||||
The Company also leases approximately 170 smaller warehouse and distribution facilities in 45 states, Mexico, Canada, Australia, and China.
Item 3. Legal Proceedings
The Company has no material pending legal proceedings, other than ordinary routine litigation incidental to the business, to which the Company or any of its subsidiaries is a party or of which any of their property is subject.
Item 4. Mine Safety Disclosures
Not Applicable
PART II
Item 5. Market For Registrant’s Common Equity, Related Stockholder Matters And Issuer Purchases Of Equity Securities
We have, issued and outstanding, one class of capital stock, Common Stock. Holders of Common Stock are generally entitled to one vote per share on matters submitted to shareholders for approval. As of September 27, 2025, we had approximately 66 stockholders of record of our common stock.
Market Information
The Company’s common stock is traded on the NASDAQ Global Select Market under the symbol “JJSF.”
Issuer Purchases of Equity Securities
The following tables sets forth repurchases of our common stock during the fourth quarter of 2025:
|
Total number of shares |
Approximate dollar value |
|||||||||||||||
|
Total number |
Average |
purchased as part of |
of shares that may yet |
|||||||||||||
|
of shares |
price paid |
publicly announced |
be purchased under |
|||||||||||||
|
Period |
purchased (1) |
per share |
plans or programs (2) |
plans or programs (2) |
||||||||||||
|
(in thousands) |
||||||||||||||||
|
June 29, 2025 to July 26, 2025 |
- | - | - | $ | 45,000 | |||||||||||
|
July 27, 2025 to August 23, 2025 |
27,715 | $ | 108.24 | 27,715 | 42,000 | |||||||||||
|
August 24, 2025 to September 27, 2025 |
- | - | - | 42,000 | ||||||||||||
|
Three months ended September 27, 2025 |
27,715 | 108.24 | 27,715 | 42,000 | ||||||||||||
|
(1) |
There were 27,715 shares repurchased as part of our publicly announced share repurchase program during the quarter ended September 27, 2025. |
|
(2) |
On February 3, 2025, the Company announced that the Board of Directors authorized a share repurchase program (the 2025 Share Repurchase Program) pursuant to which the Company could repurchase up to $50.0 million of the Company’s common stock, exclusive of any fees, commissions, and other expenses related to such repurchases. As of September 27, 2025, there remains $42.0 million of share repurchase availability under the 2025 Share Repurchase Program. |
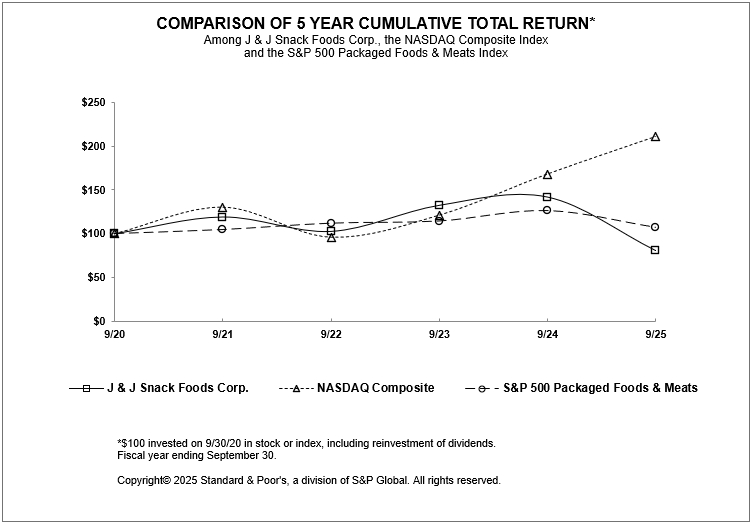
Performance Graph
The following graph shows a five-year comparison of cumulative total returns for our stock, the Nasdaq Composite Index and our peer group, the Standard & Poor’s (“S&P”) Packaged Foods & Meats Index.
Item 6. [ RESERVED ]
Item 7. Management’s Discussion And Analysis Of Financial Condition And Results Of Operations
Objective
This Management’s Discussion and Analysis of Financial Condition and Results of Operations (“MD&A”) is intended to provide a reader of our financial statements with a narrative from the perspective of our management regarding our financial condition and results of operations, liquidity and certain other factors that may affect our future results. The following discussion should be read in conjunction with the consolidated financial statements and accompanying notes included in Item 8 of this Form 10-K. Refer to the Company’s Annual Report on Form 10-K for the fiscal year ended September 28, 2024 for additional information related to the discussion and analysis of our financial condition and results of operations for the fiscal year ended September 28, 2024 compared to the fiscal year ended September 30, 2023.
Business Overview
The Company manufactures snack foods and distributes frozen beverages which it markets nationally to the foodservice and retail supermarket industries. The Company’s principal snack food products are soft pretzels, frozen novelties, churros and bakery products. We are the largest manufacturer of soft pretzels in the United States. Other snack food products include funnel cake and handheld products. The Company’s principal frozen beverage products are the ICEE brand frozen carbonated beverage and the SLUSH PUPPIE brand frozen non-carbonated beverage.
The Company’s Food Service and Frozen Beverages sales are made primarily to foodservice customers including snack bar and food stand locations in leading chain, department, discount, warehouse club and convenience stores; malls and shopping centers; fast food and casual dining restaurants; stadiums and sports arenas; leisure and theme parks; movie theatres; independent retailers; and schools, colleges and other institutions. The Company’s retail supermarket customers are primarily supermarket chains.
Business Trends and Strategy
Our results are impacted by macroeconomic and demographic trends and changes in consumer behavior. The U.S. economy has experienced economic volatility and uncertainty in recent years, which has had, and we expect might continue to have, an impact on consumer behavior. Consumer spending may continue to be impacted by levels of discretionary income and the impact of that on the consumer’s decision making around their purchases. In addition, inflation continues to impact our business, and fluctuating raw material input costs may continue to impact the costs of our products.
In fiscal year 2025, we encountered significant headwinds associated with certain cost inputs, most notably, rising cocoa costs. Record high cocoa costs were fueled by supply deficits, led by significant production declines among the largest producers. Despite an anticipated supply recovery, cocoa market prices continued to remain volatile, and touched record highs in fiscal 2025. These rising costs pressured margins, primarily during the first half of our fiscal year, as they outweighed pricing actions up to that point in time.
While overall packaging and raw material inflation, inclusive of the cocoa market, appears to be moderating for fiscal 2026, uncertainty within the supply chain surrounding impacts from the U.S. government’s tariffs on imports could be a potential headwind for the Company in fiscal 2026. Tariffs may increase the cost of certain raw materials and packaging that we use in our business, and our financial performance may be adversely impacted if we are unable to pass on the cost increases in the form of price increases to our customers. Additionally, the ultimate impact of tariffs may be difficult to predict as tariff rates and duration remain uncertain, which can make our planning process more challenging.
To help combat these potential headwinds, we continue to pursue operational improvements, as well as expand growth opportunities across our various channels and customers. Some recent examples of implementing these strategies include:
|
● |
Our recently completed strategic supply chain transformation in which we opened three regional distribution centers which is projected to drive cost reductions around warehousing and distribution. |
|
● |
The recent addition of six new production lines which has significantly expanded our capacity and allowed us to meet growth opportunities across our core products such as pretzels, churros and frozen novelties. |
|
● |
Implementation of a new ERP system in fiscal 2022 which has helped to create efficiencies and streamline internal processes. |
|
● |
Many examples of successful cross-selling and leveraging our brands across customer channels, including our recent expansion of Dippin’ Dots brand into retail and further into the theater channel. |
|
● |
Further expansion of our SuperPretzel brand across the retail market through the launch of Bavarian Sticks. |
|
● |
Our fiscal year 2023 rollout of our new Hola! Churro brand. |
|
● |
Our recently announced transformation program, “Project Apollo,” which is anticipated to generate sustainable efficiencies and cost savings across the enterprise. |
The above-referenced Project Apollo is expected to generate at least $20 million of run-rate operating income for the initiatives that are expected to be implemented by fiscal 2026. The initial focus of the project is the consolidation and optimization of our manufacturing network. During the fourth quarter of fiscal 2025, we announced the closure of two manufacturing facilities, our plant in Holly Ridge, North Carolina, and our plant in Atlanta, Georgia. In October 2025, we subsequently announced the closure of a third manufacturing facility, our plant in Colton, California. Production from these facilities will either be consolidated into various other facilities across our network, or it will be discontinued as part of our ongoing sales portfolio optimization. This consolidation was enabled by the investments we have made in our plants to modernize and expand capacity for our core products, as well as our investments made to build out our three regional distribution centers. In connection with the closing of our three facilities, we recorded plant closure costs of approximately $24 million in the fourth quarter of fiscal 2025, which primarily related to non-cash write-downs and write-offs related to inventory and to property, plant and equipment, as well as severance and benefit costs. We expect to continue to incur non-recurring costs related to this optimization of our manufacturing network into fiscal 2026.
In addition to plant consolidation, as part of the first phase of Project Apollo, we are expecting to optimally reposition production within our network, which we are expecting to generate additional freight savings in fiscal 2026 and beyond, and to streamline our corporate functions, which is expected to generate general and administrative expense savings in fiscal 2026 and beyond.
Fiscal Period
The Company’s fiscal year is the 52- or 53- week period that ends on the last Saturday of September. An additional week is included in the last fiscal quarter every five or six years to realign the Company’s fiscal quarters with calendar quarters, which occurred in the Company’s fourth quarter of fiscal 2023. The Company’s fiscal years 2025 and 2024 spanned 52 weeks each, whereas fiscal year 2023 spanned 53 weeks.
RESULTS OF OPERATIONS:
Fiscal Year 2025 Compared to Fiscal Year 2024
Results of Consolidated Operations
The following discussion provides a review of results for the fiscal year ended September 27, 2025 as compared with the fiscal year ended September 28, 2024.
|
Summary of Results |
Fiscal year ended |
|||||||||||
|
September 27, |
September 28, |
|||||||||||
|
2025 |
2024 |
|||||||||||
|
(52 weeks) |
(52 weeks) |
% Change |
||||||||||
|
(in thousands) |
||||||||||||
|
Net Sales |
$ | 1,583,233 | $ | 1,574,755 | 0.5 | % | ||||||
|
Cost of goods sold |
1,113,351 | 1,088,630 | 2.3 | % | ||||||||
|
Gross Profit |
469,882 | 486,125 | (3.3 | )% | ||||||||
|
Operating expenses |
||||||||||||
|
Marketing |
123,606 | 118,805 | 4.0 | % | ||||||||
|
Distribution |
168,305 | 175,601 | (4.2 | )% | ||||||||
|
Administrative |
77,787 | 74,771 | 4.0 | % | ||||||||
|
Intangible asset impairment charges |
2,257 | - | 100.0 | % | ||||||||
|
Gain on insurance proceeds received for damage to property, plant, and equipment |
(10,622 | ) | - | 100.0 | % | |||||||
|
Plant closure expense |
24,073 | - | 100.0 | % | ||||||||
|
Other general expense |
150 | (597 | ) | (125.1 | )% | |||||||
|
Total Operating Expenses |
385,556 | 368,580 | 4.6 | % | ||||||||
|
Operating Income |
84,326 | 117,545 | (28.3 | )% | ||||||||
|
Other income (expense) |
||||||||||||
|
Investment income |
3,596 | 3,228 | 11.4 | % | ||||||||
|
Interest expense |
(1,493 | ) | (1,826 | ) | (18.2 | )% | ||||||
|
Earnings before income taxes |
86,429 | 118,947 | (27.3 | )% | ||||||||
|
Income tax expense |
20,834 | 32,396 | (35.7 | )% | ||||||||
|
NET EARNINGS |
$ | 65,595 | $ | 86,551 | (24.2 | )% | ||||||
|
Comparisons as a Percentage of Net Sales |
Fiscal year ended |
|||||||||||
|
September 27, |
September 28, |
|||||||||||
|
2025 |
2024 |
Basis Pt Chg |
||||||||||
|
Gross profit |
29.7 | % | 30.9 | % | (120 | ) | ||||||
|
Marketing |
7.8 | % | 7.5 | % | 30 | |||||||
|
Distribution |
10.6 | % | 11.2 | % | (60 | ) | ||||||
|
Administrative |
4.9 | % | 4.7 | % | 20 | |||||||
|
Operating income |
5.3 | % | 7.5 | % | (220 | ) | ||||||
|
Earnings before income taxes |
5.5 | % | 7.6 | % | (210 | ) | ||||||
|
Net earnings |
4.1 | % | 5.5 | % | (140 | ) | ||||||
NET SALES
Net sales increased by $8.5 million, or 1%, to $1,583.2 million in fiscal 2025, with the increase led by sales growth in our foodservice segment, somewhat offset by a decrease in our retail supermarket segment.
GROSS PROFIT
Gross profit decreased by $16.3 million, or 3%, to $469.8 million in fiscal 2025. Gross profit as a percentage of sales decreased to 29.7% in fiscal 2025 from 30.9% in fiscal 2024. This decrease primarily reflected the negative margin impacts from comparatively rising raw material costs and other inflationary pressures that had outweighed pricing actions through the first half of our fiscal year. Additionally, the loss of some limited time offer churro volumes from prior year, the impact of mix and foreign exchange related headwinds in our frozen beverages segment, and mix changes within our bakery business negatively impacted current period gross profit when compared to prior year.
OPERATING EXPENSES
Total operating expenses increased by $17.0 million, or 5%, to $385.6 million in fiscal 2025 and increased as a percentage of sales to 24.4% in fiscal 2025, compared to 23.4% in fiscal 2024. In fiscal 2025, operating expenses included $24.1 million of plant closure expense, $2.3 million of intangible asset impairment charges, and a partly offsetting $10.6 million gain on insurance proceeds received for damage to property, plant, and equipment. The net impact of these items increased operating expenses as a percentage of sales by approximately 100 bps.
Marketing and selling expenses as a percentage of sales increased from 7.5% in fiscal 2024 to 7.8% in fiscal 2025, with the increase primarily driven by the higher promotional marketing spend and sponsorships. Distribution expenses as a percentage of sales decreased to 10.6% in fiscal 2025 from 11.2% in fiscal 2024, with the decrease driven by the continued benefits of our strategic initiatives to improve logistics management and increase efficiency across our distribution network and supply chain, as well as approximately $5 million of non-recurring start-up costs related to the opening of regional distribution centers in fiscal 2024. Administrative expenses as a percentage of sales increased slightly from 4.7% in fiscal 2024 to 4.9% in fiscal 2025, with the increase largely attributable to higher compensation costs.
OTHER INCOME AND EXPENSE
Investment income increased by $0.4 million, or 11%, to $3.6 million in fiscal 2025 due to higher average cash balances during the year.
Interest expense decreased by $0.3 million, or 18%, to $1.5 million in fiscal 2025 due to the reduction in the Company’s average outstanding borrowings under the Amended Credit Agreement throughout the fiscal year.
INCOME TAX EXPENSE
Our effective tax rate in fiscal 2025 was 24.1%. Our effective tax rate in fiscal 2024 was 27.2%. The decrease in rate between periods was primarily attributable to a change in estimate on blended state tax rate and the impact on the valuation of net deferred tax liabilities.
NET EARNINGS
Net earnings decreased by $21.0 million, or 24%, in fiscal 2025 to $65.6 million, or $3.36 per diluted share, from $86.6 million or $4.45 per diluted share, in fiscal 2024 as a result of the aforementioned items.
There are many factors which can impact our net earnings from year to year, among which are the supply and cost of raw materials and labor, insurance costs, factors impacting sales as noted above, the continuing consolidation of our customers, our ability to manage our manufacturing, marketing and distribution activities, our ability to make and integrate acquisitions and changes in tax laws and interest rates.
Results of Operations – Segments
We have three reportable segments, as disclosed in the accompanying notes to the consolidated financial statements: Food Service, Retail Supermarkets and Frozen Beverages.
The Chief Operating Decision Maker for Food Service, Retail Supermarkets and Frozen Beverages reviews monthly detailed operating income statements and sales reports to assess performance and allocate resources to each individual segment. Sales and operating income are the key variables monitored by the Chief Operating Decision Maker when determining each segment and the Company’s financial condition and operating performance. In addition, the Chief Operating Decision Maker reviews and evaluates capital spending of each segment on a quarterly basis to monitor cash flow and asset needs of each segment.
To align with how our Chief Operating Decision Maker currently reviews the monthly detailed operating income statements, we have reclassified certain corporate expenses that are not allocated to our three reportable segments. This change in presentation resulted in an increase to our Food Service segment operating income of $24.8 million, to our Retail segment operating income of $2.6 million and to our Frozen Beverages segment of $1.5 million in fiscal 2024, respectively.
The following table is a summary of sales and operating income, which is how we measure segment profit.
|
Fiscal year ended |
||||||||||||
|
September 27, |
September 28, |
|||||||||||
|
2025 |
2024 |
|||||||||||
|
(52 weeks) |
(52 weeks) |
% Change |
||||||||||
|
(in thousands) |
||||||||||||
|
Net Sales |
||||||||||||
|
Food Service |
$ | 1,001,361 | $ | 985,195 | 1.6 | % | ||||||
|
Retail Supermarket |
213,809 | 221,308 | (3.4 | )% | ||||||||
|
Frozen Beverages |
368,063 | 368,252 | (0.1 | )% | ||||||||
|
Total Sales |
$ | 1,583,233 | $ | 1,574,755 | 0.5 | % | ||||||
|
Fiscal year ended |
||||||||||||
|
September 27, |
September 28, |
|||||||||||
|
2025 |
2024 |
|||||||||||
|
(52 weeks) |
(52 weeks) |
% Change |
||||||||||
|
(in thousands) |
||||||||||||
|
Operating Income |
||||||||||||
|
Food Service |
$ | 64,794 | $ | 74,214 | (12.7 | )% | ||||||
|
Retail Supermarket |
13,318 | 19,192 | (30.6 | )% | ||||||||
|
Frozen Beverages |
49,529 | 52,996 | (6.5 | )% | ||||||||
|
General corporate expenses |
(29,864 | ) | (28,857 | ) | 3.5 | % | ||||||
| Gain on insurance proceeds received for damage to property, plant, and equipment | 10,622 | - | 100.0 | % | ||||||||
|
Plant closure expense |
(24,073 | ) | - | 100.0 | % | |||||||
|
Total Operating Income |
$ | 84,326 | $ | 117,545 | (28.3 | )% | ||||||
FOOD SERVICE SEGMENT RESULTS
|
Fiscal year ended |
||||||||||||
|
September 27, |
September 28, |
|||||||||||
|
2025 |
2024 |
|||||||||||
|
(52 weeks) |
(52 weeks) |
% Change |
||||||||||
|
(in thousands) |
||||||||||||
|
Food Service Sales to External Customers |
||||||||||||
|
Soft pretzels |
$ | 230,070 | $ | 222,237 | 3.5 | % | ||||||
|
Frozen novelties |
149,884 | 147,995 | 1.3 | % | ||||||||
|
Churros |
97,867 | 114,306 | (14.4 | )% | ||||||||
|
Handhelds |
92,018 | 86,053 | 6.9 | % | ||||||||
|
Bakery |
405,909 | 387,129 | 4.9 | % | ||||||||
|
Other |
25,613 | 27,475 | (6.8 | )% | ||||||||
|
Total Food Service |
$ | 1,001,361 | $ | 985,195 | 1.6 | % | ||||||
|
Food Service Operating Income |
$ | 64,794 | $ | 74,214 | (12.7 | )% | ||||||
Sales to food service customers increased $16.2 million, or 1.6%, to $1,001.4 million in fiscal 2025. Soft pretzel sales to the food service market increased 4% to $230.1 million for the year, with the increase largely driven by strong second-half of the fiscal year volume increases across many of our pretzel products and brands, most notably our Bavarian pretzels, with a secondary benefit of price increases. Frozen novelties sales increased $1.9 million, or 1%, to $149.9 million for the year, with the increase driven by an approximate 3% increase in Dippin’ Dots sales. Churro sales to food service customers were down 14% to $97.9 million for the year with the decrease largely driven by the lapping of the benefit of limited time offer churro volumes with a major customer in the prior year period which did not recur in the current year period. Sales of bakery products increased $18.8 million, or 5%, to $405.9 million for the year, with the increase attributable to contractual pricing true-up on costing on certain raw material ingredients, as well as some targeted, non-contractual price increases taken to offset the rising costs on certain raw material ingredients, offset somewhat by volume declines, most notably in our first fiscal quarter related to our pie portfolio and the loss of some seasonal business with a declining margin profile that we bid on, but did not retain. Handheld sales to food service customers increased 7% to $92.0 million in fiscal 2025, with the increase largely attributable to a combination of strong volume increases across our core food service handhelds as well as pricing increases related to the contractual pricing true-up of costing on certain raw material ingredients.
Sales of new products in the first twelve months since their introduction were approximately $3.9 million for the fiscal year, driven primarily by the addition of churros to the menu of a major fast-food customer. Sales in the fiscal year benefited from the impact of mid-single digit percentage price increases, with those price increases primarily related to the contractual pricing true-up of costing on certain raw material ingredients, as well as some targeted, non-contractual price increases taken in an attempt to offset the rising costs on certain raw material ingredients. The revenue increase attributable to price increases was somewhat offset by declining volumes, most noticeably in our churro portfolio due to the lapping of the benefit of limited time offer churro volumes with a major customer in the prior fiscal year, as well as in our bakery portfolio, due to the volume declines in our pie business in the first fiscal quarter related to the loss of some seasonal business with declining profit margin profile that we bid on, but did not retain.
Operating income in our Food Service segment decreased $9.4 million or 13% to $64.8 million in fiscal 2025, with the decrease primarily driven by the impact of gross margin pressures due to rising raw material costs and other inflationary pressures which outweighed the benefits from price increases in the first half of our fiscal year, as well as the impact of the lapping of the benefit of limited time offer churro volumes with a major customer in fiscal 2024.
RETAIL SUPERMARKETS SEGMENT RESULTS
|
Fiscal year ended |
||||||||||||
|
September 27, |
September 28, |
|||||||||||
|
2025 |
2024 |
|||||||||||
|
(52 weeks) |
(52 weeks) |
% Change |
||||||||||
|
(in thousands) |
||||||||||||
|
Retail Supermarket Sales to External Customers |
||||||||||||
|
Soft pretzels |
$ | 61,713 | $ | 61,744 | (0.1 | )% | ||||||
|
Frozen novelties |
110,286 | 112,192 | (1.7 | )% | ||||||||
|
Biscuits |
23,123 | 24,229 | (4.6 | )% | ||||||||
|
Handhelds |
21,578 | 26,253 | (17.8 | )% | ||||||||
|
Coupon redemption |
(2,707 | ) | (3,162 | ) | (14.4 | )% | ||||||
|
Other |
(184 | ) | 52 | (453.8 | )% | |||||||
|
Total Retail Supermarket |
$ | 213,809 | $ | 221,308 | (3.4 | )% | ||||||
|
Retail Supermarket Operating Income |
$ | 13,318 | $ | 19,192 | (30.6 | )% | ||||||
Sales of products to retail supermarkets decreased $7.5 million, or 3%, to $213.8 million in fiscal year 2025. Soft pretzel sales to retail supermarkets remained materially flat at $61.7 million, with a strong fiscal fourth quarter offsetting some declines earlier in the fiscal year. Sales of frozen novelties decreased $1.9 million, or 2%, to $110.3 million in fiscal 2025, with the decrease mostly attributable to volume declines seen in the second half of our fiscal year. Sales of biscuits and dumplings decreased 5% to $23.1 million and handheld sales to retail supermarket customers decreased 18% to $21.6 million in fiscal 2025, with the decrease in handheld sales primarily attributable to the impact of capacity constraints related to the fire at our Holly Ridge facility.
Sales of new products in retail supermarkets were approximately $5.0 million, driven primarily by the launch of Dippin’ Dots sundaes. Sales in the fiscal year benefited from the impact of low-single digit percentage price increases, with those increases more than offset by volume decreases that were primarily noted within the third and fourth fiscal quarters.
Operating income in our Retail Supermarkets segment decreased $5.9 million or 31% to $13.3 million in fiscal 2025, with the decrease primarily driven by the declining frozen novelties volumes seen in the second half of our fiscal year.
FROZEN BEVERAGES SEGMENT RESULTS
|
Fiscal year ended |
||||||||||||
|
September 27, |
September 28, |
|||||||||||
|
2025 |
2024 |
|||||||||||
|
(52 weeks) |
(52 weeks) |
% Change |
||||||||||
|
(in thousands) |
||||||||||||
|
Frozen Beverages |
||||||||||||
|
Beverages |
$ | 219,312 | $ | 230,030 | (4.7 | )% | ||||||
|
Repair and maintenance service |
97,392 | 96,589 | 0.8 | % | ||||||||
|
Machines revenue |
47,807 | 38,188 | 25.2 | % | ||||||||
|
Other |
3,552 | 3,445 | 3.1 | % | ||||||||
|
Total Frozen Beverages |
$ | 368,063 | $ | 368,252 | (0.1 | )% | ||||||
|
Frozen Beverages Operating Income |
$ | 49,529 | $ | 52,996 | (6.5 | )% | ||||||
Total frozen beverage segment sales decreased slightly by $0.2 million, to $368.0 in fiscal 2025. Beverage-related sales decreased 5%, or $10.7 million, in fiscal 2025, with the decrease primarily reflecting weakness in certain channels, as well as the unfavorable foreign exchange impacts from a weaker Mexican Peso, somewhat offset by comparative strength noted within the theater channel. Gallon sales decreased 4% from the prior fiscal year. Service revenue increased 1% to $97.4 million in fiscal 2025 and machines revenue, primarily sales of frozen beverage machines, increased 25% to $47.8 million in fiscal 2025, primarily driven by strong growth from theater and convenience customers.
The estimated number of Company-owned frozen beverage dispensers was 24,000 at both September 27, 2025 and September 28, 2024. Operating income in our Frozen Beverage segment decreased 7%, or $3.5 million, in fiscal 2025, primarily due to the impact of unfavorable mix and the unfavorable foreign exchange related headwinds.
RESULTS OF OPERATIONS:
Fiscal Year 2024 (52 weeks) Compared to Fiscal Year 2023 (53 weeks)
The discussion of our results of operations for Fiscal Year 2024 (52 weeks) compared to Fiscal Year 2023 (53 weeks) can be found in Part II, Item 7, “Management’s Discussion and Analysis of Financial Condition and Results of Operations” in the Company’s Annual Report on Form 10-K for the year ended September 28, 2024 and such discussion is incorporated by reference herein.
ACQUISITIONS
Thinsters Acquisition
On April 8, 2024, J & J Snack Foods Corp. completed the acquisition of the Thinsters cookie business from Hain Celestial Group. The purchase price was approximately $7.0 million, consisting entirely of cash.
The acquisition was accounted for under the purchase method of accounting, and its operations are included in the accompanying consolidated financial statements from their respective acquisition dates.
LIQUIDITY AND CAPITAL RESOURCES
Although there are many factors that could impact our operating cash flow, most notably net earnings, we believe that our future operating cash flow, along with our borrowing capacity, our current cash and cash equivalent balances and our investment securities is sufficient to satisfy our cash requirements over the next twelve months and beyond, as well as fund future growth and expansion.
Fiscal 2025 Compared to Fiscal 2024
|
September 27, |
September 28, |
|||||||
|
2025 |
2024 |
|||||||
|
(in thousands) |
||||||||
|
Cash flows from operating activities |
||||||||
|
Net earnings |
$ | 65,595 | $ | 86,551 | ||||
|
Non-cash items in net income: |
||||||||
|
Depreciation of fixed assets |
66,018 | 63,411 | ||||||
|
Amortization of intangibles and deferred costs |
7,314 | 7,190 | ||||||
|
Intangible asset impairment charges |
2,257 | - | ||||||
|
Losses from disposals of property & equipment |
320 | 11 | ||||||
|
Non-cash plant shutdown expenses |
20,845 | - | ||||||
|
Share-based compensation |
6,320 | 6,220 | ||||||
|
Deferred income taxes |
3,949 | 6,434 | ||||||
|
Gain on insurance proceeds received for damage to property, plant, and equipment |
(10,622 | ) | - | |||||
|
Gain on insurance proceeds received in excess of operating losses recognized |
(799 | ) | - | |||||
|
Other |
95 | (199 | ) | |||||
|
Changes in assets and liabilities, net of effects from purchase of companies |
3,834 | 3,448 | ||||||
|
Net cash provided by operating activities |
$ | 165,126 | $ | 173,066 | ||||
|
● |
Non-cash plant shutdown costs relate to the write-down and write-off of assets in connection with the Company’s shutdown of its Holly Ridge, NC, Atlanta, GA, and Colton, CA manufacturing plants. |
|
● |
Gain on insurance proceeds received related to insurance recoveries related to the Holly Ridge fire and totaled approximately $11.4 million. |
|
● |
Cash flows associated with changes in assets and liabilities, net effects from purchase of companies, generated approximately $3.8 million of cash in fiscal 2025 compared with $3.4 million of cash in fiscal 2024. |
|
September 27, |
September 28, |
|||||||
|
2025 |
2024 |
|||||||
|
(in thousands) |
||||||||
|
Cash flows from investing activities |
||||||||
|
Payments for purchases of companies, net of cash acquired |
- | (7,014 | ) | |||||
|
Purchases of property, plant and equipment |
(82,873 | ) | (73,569 | ) | ||||
|
Proceeds from disposal of property and equipment |
1,401 | 699 | ||||||
|
Proceeds from insurance for fixed assets |
11,421 | 2,218 | ||||||
|
Net cash (used in) investing activities |
$ | (70,051 | ) | $ | (77,666 | ) | ||
|
● |
The payments for purchases of companies, net of cash acquired, in fiscal 2024 related to the Thinsters acquisition. |
|
● |
Purchases of property, plant and equipment include spending for production growth, in addition to acquiring new equipment, infrastructure replacements, and upgrades to maintain competitive standing and position us for future opportunities. |
|
● |
Proceeds from insurance for fixed assets related to insurance recoveries related to the Holly Ridge fire. |
|
September 27, |
September 28, |
|||||||
|
2025 |
2024 |
|||||||
|
(in thousands) |
||||||||
|
Cash flows from financing activities |
||||||||
|
Payments to repurchase common stock |
(8,000 | ) | - | |||||
|
Proceeds from issuance of stock |
4,282 | 15,740 | ||||||
|
Borrowings under credit facility |
50,000 | 71,000 | ||||||
|
Repayment of borrowings under credit facility |
(50,000 | ) | (98,000 | ) | ||||
|
Payments on finance lease obligations |
(238 | ) | (151 | ) | ||||
|
Payment of cash dividends |
(60,751 | ) | (56,957 | ) | ||||
|
Net cash (used in) financing activities |
$ | (64,707 | ) | $ | (68,368 | ) | ||
|
● |
In fiscal 2025, the Company repurchased 66,776 shares of common stock of the Company at an average price of $119.80 per share on the open market, pursuant to the share repurchase program. |
|
● |
Proceeds from issuance of stock decreased in fiscal 2025 as the quantity of stock options being exercised continues to decline as the Company began to issue service share units and performance units as forms of stock-based compensation in recent years. |
|
● |
Borrowings under the credit facility and repayment of borrowings under the credit facility relate to the Company’s cash draws and repayments made to primarily fund working capital needs and represent the continued net pay-down of borrowings outstanding across both fiscal periods. |
|
● |
Dividends paid during fiscal 2025 increased as our quarterly dividend was raised during fiscal 2025. |
Liquidity
As of September 27, 2025, we had $105.9 million of cash and cash equivalents.
In December 2021, the Company entered into an amended and restated loan agreement (the “Credit Agreement”) with our existing banks which provided for up to a $50 million revolving credit facility repayable in December 2026.
On June 21, 2022, the Company entered into an amendment to the Credit Agreement, the “Amended Credit Agreement” which provided for an incremental increase of $175 million in available borrowings. The Amended Credit Agreement also includes an option to increase the size of the revolving credit facility by up to an amount not to exceed in the aggregate the greater of $225 million or, $50 million plus the Consolidated EBITDA of the Borrowers, subject to the satisfaction of certain terms and conditions.
Interest accrues, at the Company’s election at (i) the SOFR Rate (as defined in the Credit Agreement), plus an applicable margin, based upon the Consolidated Net Leverage Ratio, as defined in the Credit Agreement, or (ii) the Alternate Base Rate (a rate based on the higher of (a) the prime rate announced from time-to-time by the Administrative Agent, (b) the Federal Reserve System’s federal funds rate, plus 0.50% or (c) the Daily SOFR Rate, plus an applicable margin). The Alternate Base Rate is defined in the Credit Agreement.
The Credit Agreement requires the Company to comply with various affirmative and negative covenants, including without limitation (i) covenants to maintain a minimum specified interest coverage ratio and maximum specified net leverage ratio, and (ii) subject to certain exceptions, covenants that prevent or restrict the Company’s ability to pay dividends, engage in certain mergers or acquisitions, make certain investments or loans, incur future indebtedness, alter its capital structure or line of business, prepay subordinated indebtedness, engage in certain transactions with affiliates, or amend its organizational documents. As of September 27, 2025, the Company is in compliance with all financial covenants of the Credit Agreement.
As of September 27, 2025, we had no outstanding borrowings drawn on the Amended Credit Agreement. As of September 27, 2025, we had $210.2 million of additional borrowing capacity, after giving effect to the $14.8 million of letters of credit outstanding.
The Company’s material cash requirements include the following contractual and other obligations:
Purchase Commitments
Our most significant raw material requirements include flour, packaging, shortening, corn syrup, sugar, juice, cheese, chocolate, and a variety of nuts. We attempt to minimize the effect of future price fluctuations related to the purchase of raw materials primarily through forward purchasing to cover future manufacturing requirements, generally for periods from 1 to 12 months. As of September 27, 2025, we have approximately $133 million of such commitments. The purchase commitments do not exceed our projected requirements over the related terms and are in the normal course of business.
Leases
We have operating leases with initial noncancelable lease terms in excess of one year covering the rental of various facilities and equipment. Our operating leases include leases for real estate from some of our office, distribution and manufacturing facilities as well as manufacturing and non-manufacturing equipment used in our business. As of September 27, 2025, we have operating lease payment obligations of $161.6 million, with $21.6 million payable within 12 months.
Off –Balance Sheet Arrangements
The Company has off-balance sheet arrangements for purchase commitments as of September 27, 2025.
Critical Accounting Policies, Judgments and Estimates
We prepare our financial statements in conformity with accounting principles generally accepted in the United States of America. The preparation of such financial statements requires management to make estimates and assumptions that affect the reported amounts of assets and liabilities and disclosures of contingent assets and liabilities at the date of those financial statements and the reported amounts of revenues and expenses during the reporting period. Actual results could differ from those estimates.
The Company discloses its significant accounting policies in the accompanying notes to its audited consolidated financial statements.
Judgments and estimates of uncertainties are required in applying the Company’s accounting policies in certain areas. Following are some of the areas requiring significant judgments and estimates: revenue recognition, allowance for estimated credit losses, valuation of goodwill and long-lived and intangible assets, insurance reserves, and income taxes and business combinations.
Revenue Recognition
The performance obligations of our customer contracts for product and machine sales are determined by each individual purchase order and the respective products ordered, with revenue being recognized at a point-in-time when the obligation under the terms of the agreement is satisfied and product control is transferred to our customer. Specifically, control transfers to our customers when the product is delivered to, installed, or picked up by our customers based upon applicable shipping terms, which is when our customers can direct the use and obtain substantially all of the remaining benefits from the product. The performance obligations in our customer contracts for product are generally satisfied within 30 days.
The singular performance obligation of our customer contracts for time and material repair and maintenance equipment service is the performance of the repair and maintenance with revenue being recognized at a point-in-time when the repair and maintenance is completed.
The singular performance obligation of our customer repair and maintenance equipment service contracts is the performance of the repair and maintenance with revenue being recognized over the time the service is expected to be performed. Our customers are billed for service contracts in advance of performance and therefore we have contract liability on our balance sheet.
Revenue is measured by the transaction price, which is defined as the amount of consideration we expect to receive in exchange for satisfying the performance obligations noted above. The transaction price is adjusted for estimates of known or expected variable consideration which includes sales discounts, trade promotions and certain other sales and customer incentives, including rebates and coupon redemptions. Variable consideration related to these programs is recorded as a reduction to revenue when the related revenue is recognized, and is recorded using the most likely amount method, with updates to estimates and related accruals of variable consideration occurring each period based on historical experience, changes in circumstances and other factors, including review of contractual pricing and rebate arrangements with customers.
We do not believe that there is a reasonable likelihood that there will be material change in the estimates or assumptions used to recognize revenue. As noted above, estimates are made based on historical experience and other factors. However, if the level of redemption rates or performance was to vary significantly from estimates, we may be exposed to gains or losses that could be material. We have not made any material changes in the accounting methodology used to recognize revenue during the past three fiscal years.
Allowance for Estimated Credit Losses
We provide an allowance for estimated credit losses after taking into consideration historical experience and other factors. On September 27, 2020, the Company adopted guidance issued by the FASB in ASU 2016-13 Measurement of Credit Losses on Financial Instruments, which requires companies to recognize an allowance that reflects a current estimate of credit losses expected to be incurred over the life of the asset. The Company continuously monitors collections and payments from its customers and maintains a provision for estimated credit losses. The allowance for estimated credit losses considers a number of factors including the age of receivable balances, the history of losses, expectations of future credit losses and the customers’ ability to pay off obligations.
We do not believe that there is a reasonable likelihood that there will be a material change in the estimates or assumptions used to value our accounts receivable. Since adoption of the new guidance on September 27, 2020, we have not made any material changes in the accounting methodology used to value accounts receivable.
Valuation of Goodwill
We have three reporting units with goodwill. Goodwill is evaluated annually by the Company for impairment. We perform impairment tests at year end for our reporting units, which are also the operating segment levels with recorded goodwill utilizing primarily the discounted cash flow method. This methodology used to estimate the fair value of the total Company and its reporting units requires inputs and assumptions (i.e. revenue growth, operating profit margins, capital spending requirements and discount rates) that reflect current market conditions. The estimated fair value of each reporting unit is compared to the carrying value of the reporting unit. If the carrying value of the reporting unit exceeds its fair value, the goodwill of the reporting unit is potentially impaired, and the Company then determines the implied fair value of goodwill, which is compared to the carrying value of goodwill to determine if impairment exists. Our tests at September 27, 2025 show that the fair value of each of our reporting units with goodwill exceeded its carrying value by at least 50%. Therefore, no further analysis was required.
The inputs and assumptions used involve considerable management judgment and are based upon assumptions about expected future operating performance. Assumptions used in these forecasts are consistent with internal planning. The actual performance of the reporting units could differ from management’s estimates due to changes in business conditions, operating performance, economic conditions, competition, and consumer preferences. We have not made any material changes in the accounting methodology used to value goodwill during the past three fiscal years.
Valuation of Long-Lived Assets and Other Intangible Assets
We record an impairment charge to property, plant and equipment and amortizing intangible assets in accordance with the applicable accounting standards, when, based on certain indicators of impairment, we believe such assets have experienced a decline in value that is other than temporary. Future adverse changes in market conditions or poor operating results of these underlying assets could result in losses or an inability to recover the carrying value of the asset that may not be reflected in the asset’s current carrying value, thereby possibly requiring impairment charges in the future.
Indefinite lived intangibles are reviewed annually for impairment. The fair value of our indefinite lived intangible assets is calculated using either a relief from royalty valuation approach, or the excess earnings method. We are required to make estimates and assumptions about sales growth, royalty rates, and discount rates based on budgets, business plans, economic projections, and marketplace data. Our impairment analysis contains uncertainties due to uncontrollable events that could positively or negatively impact the future economic and operating conditions.
We have not made any material changes in the accounting methodology used to evaluate impairment of long-lived assets and other intangibles during the last three fiscal years. While we believe we have made reasonable estimates and assumptions to calculate fair value of these assets, it is possible a material change could occur. If our actual results are not consistent with our estimates and assumptions used to calculate fair value, it could result in a material impairment of our long-lived assets and other intangibles.
Insurance Reserves
We have a self-insured medical plan which covers approximately 1,800 of our employees. We record a liability for incurred but not yet reported or paid claims based on our historical experience of claims payments and a calculated lag time. Considering that we have stop loss coverage of $300,000 for each individual plan subscriber, the general consistency of claims payments and the short time lag, we believe that there is not a material exposure for this liability.
We self-insure, up to loss limits, workers’ compensation, automobile and general liability claims. Insurance reserves are calculated on a combination of an undiscounted basis based on actual claims data and estimates of incurred but not reported claims developed utilizing historical claims trends. Projected settlements of incurred but not reported claims are estimated based on pending claims, historical trends, industry trends related to expected losses and actual reported losses, and key assumptions, including loss development factors and expected loss rates.
We have not made any material changes in the accounting methodology used to establish our self-insurance liability during the past three fiscal years. We do not believe that there is a reasonable likelihood that there will be a material change in the estimate or assumptions used to calculate our self-insurance liability. However, if actual results are not consistent with our estimates or assumptions, we may be exposed to gains or losses that could be material.
Income Taxes
The annual tax rate is based on our income and statutory tax rates. Changes in statutory rates and tax laws in jurisdictions in which we operate may have a material effect on our annual tax rate. The effect of these changes, if any, would be recognized as a discrete item upon enactment.
Deferred income taxes arise from temporary differences between the tax and financial statement recognition of revenues and expenses. Deferred tax assets and liabilities are measured based on the enacted tax rates that will apply in the years in which the temporary differences are expected to be recovered or paid.
We have not made any material changes in the accounting methodology used to account for income taxes during the past three fiscal years. Changes in tax laws and rates could affect recorded deferred tax assets and liabilities in the future. Other than those potential impacts, we do not believe there is a reasonable likelihood that there will be a material change in tax related balances.
Business Combinations
We use assumptions and estimates in determining the fair value of assets acquired and liabilities assumed in a business combination. We use various models to value assets acquired and liabilities assumed, such as the net realizable value method to value inventory, and the cost method and market approach to value property, plant and equipment. The determination of the fair value of intangible assets, which can represent a significant portion of the purchase price of our acquisitions, requires the use of significant judgement with regard to the fair value, and whether such intangibles are amortizable or non-amortizable and, if the former, the period and method by which the intangible will be amortized. We estimate the fair value of acquisition-related intangibles either through the relief of royalty method or multi-period excess earnings method, or based on projections of cash flows that will arise from identifiable intangible assets of acquired businesses, which includes estimate of customer attrition. The projected cash flows are discounted to determine the present value of the assets at the date of acquisition. For significant acquisitions, we may use independent third-party valuation specialists to assist us in determining the fair value of assets acquired and liabilities assumed.
We have not made any material changes in the accounting methodology used to account for business combinations during the past three fiscal years. We do not believe that there is a reasonable likelihood that there will be a material change in the estimate or assumptions used to determine the fair value of assets acquired or liabilities assumed in a business combination. However, if actual results are not consistent with our estimates or assumptions, we may be exposed to impairment charges that could be material.
Item 7A. Quantitative And Qualitative Disclosures About Market Risk
The following is the Company’s quantitative and qualitative analysis of its financial market risk:
Interest Rate Sensitivity
The Company has in the past entered into interest rate swaps to limit its exposure to interest rate risk and may do so in the future if the Board of Directors feels that such non-trading hedging is in the best interest of the Company and its shareholders. As of September 27, 2025, the Company had no interest rate swap contracts.
Interest Rate Risk
At September 27, 2025, the Company had no debt outstanding.
Purchasing Risk
The Company’s most significant raw material requirements include flour, shortening, corn syrup, sugar, juice, cheese, chocolate, and a variety of nuts. The Company attempts to minimize the effect of future price fluctuations related to the purchase of raw materials primarily through forward purchasing to cover future manufacturing requirements, generally for periods from 1 to 12 months. Future contracts are not used in combination with forward purchasing of these raw materials. The Company’s procurement practices are intended to reduce the risk of future price increases, but also may potentially limit the ability to benefit from possible price decreases.
Foreign Exchange Rate Risk
The Company has not entered into any forward exchange contracts to hedge its foreign currency rate risk as of September 27, 2025, because it does not believe its foreign exchange exposure is significant.
Item 8. Financial Statements And Supplementary Data
The financial statements of the Company are filed under this Item 8, beginning on page F-1 of this report.
Item 9. Changes In And Disagreements With Accountants On Accounting And Financial Disclosure
None.
Item 9A. Controls And Procedures
Disclosure Controls and Procedures
We carried out an evaluation under the supervision and with the participation of our management, including our chief executive officer and chief financial officer, of the effectiveness of the design and operation of our disclosure controls and procedures, as such term is defined under Rule 13a-15(e) promulgated under the Exchange Act for financial reporting, as of September 27, 2025. Based on that evaluation, our chief executive officer and chief financial officer have concluded that these controls and procedures are effective at a reasonable assurance level.
Our disclosure controls and procedures are designed to provide reasonable assurance that information required to be disclosed by us in the reports that we file or submit under the Exchange Act is recorded, processed, summarized, and reported, within the time periods specified in the rules and forms of the SEC. These disclosure controls and procedures include, among other things, controls and procedures designed to provide reasonable assurance that information required to be disclosed by us in the reports that we file under the Exchange Act is accumulated and communicated to our management, including our chief executive officer and chief financial officer, as appropriate to allow timely decisions regarding required disclosure.
Management’s Report on Internal Control over Financial Reporting
Our management is responsible for establishing and maintaining adequate internal control over financial reporting. Internal control over financial reporting is defined in Rule 13a-15(f) and 15d-15(f) under the Exchange Act as a process designed by, or under the supervision of, the chief executive officer and chief financial officer and effected by the board of directors and management to provide reasonable assurance regarding the reliability of financial reporting and the preparation of financial statements for external purposes in accordance with generally accepted accounting principles and includes those policies and procedures that:
|
● |
Pertain to the maintenance of records that in reasonable detail accurately and fairly reflect the transactions and dispositions of our assets; |
|
● |
Provide reasonable assurance that transactions are recorded as necessary to permit preparation of financial statements in accordance with generally accepted accounting principles, and that receipts and expenditures of the company are being made only in accordance with authorizations of our management and board of directors; |
|
● |
Provide reasonable assurance regarding prevention or timely detection of unauthorized acquisition, use or disposition of our assets that could have a material effect on the financial statements. |
Because of its inherent limitations, internal control over financial reporting may not prevent or detect misstatements. Projections of any evaluation of effectiveness to future periods are subject to the risks that controls may become inadequate because of changes in conditions, or that the degree of compliance with the policies or procedures may deteriorate.
Our management assessed the effectiveness of our internal control over financial reporting as of September 28, 2024. In making this assessment, our management used the criteria set forth by the Committee of Sponsoring Organizations of the Treadway Commission (COSO) in the 2013 Internal Control-Integrated Framework.
Based on our assessment as of September 28, 2024, our management identified a material weakness related to ineffective information technology general controls (ITGCs), including certain controls over logical access and change management. As a result, certain business process controls that are dependent on the ineffective ITGCs, or rely on the data produced from systems impacted by the ineffective ITGCs, were also deemed ineffective. Management concluded that, as of September 28, 2024, the Company’s internal control over financial reporting was not effective.
The material weakness did not result in any material misstatements to our previously issued financial statements as of September 28, 2024.
Throughout fiscal 2025, the Company conducted a remediation plan that ensured that change management and user access controls were performed timely and included (i) enhancing our processes around reviewing privileged access to key financial systems; (ii) strengthening change management procedures, (iii) expanding the management and governance over ITGCs (iv) enhancing existing access management procedures and ownership.
As of September 27, 2025, management conducted an evaluation and assessed the effectiveness of the Company’s internal control over financial reporting, including the enhanced controls around change management and user access. Based on its evaluation, management concluded that the Company’s internal control over financial reporting was effective as of September 27, 2025.
Our independent registered public accounting firm, Grant Thornton LLP, audited our internal control over financial reporting as of September 27, 2025. Their report, dated November 26, 2025, expressed an unqualified opinion on the effectiveness of the Company’s internal control over financial reporting. That report appears in Item 15 of Part IV of this Annual Report on Form 10-K and is incorporated by reference to this Item 9A.
Item 9B. Other Information
None of our directors or executive officers adopted, modified or terminated any contract, instruction or written plan for the purchase or sale of our securities that was intended to satisfy the affirmative defense conditions of Rule 10b5-1(c) or any “non-Rule 10b5-1 trading arrangement” as defined in Item 408(c) of Regulation S-K.
There was no information required on Form 8-K during the quarter that was not reported.
Item 9C. Disclosure Regarding Foreign Jurisdictions that Prevent Inspections
Not applicable.
PART III
Item 10. Directors, Executive Officers, and Corporate Governance
The information required relating to directors, director nominees and executive officers of the registrant is incorporated by reference from the information under the captions “Election of Directors,” “Biographical Information about the Nominees and Directors,” “Board Committees” and “Executive Officers” contained in our Proxy Statement for our Annual Meeting of Shareholders to be held on February 12, 2026 (the “Proxy Statement”).
The information relating to the identification of the audit committee, audit committee financial expert and director nomination procedures of the registrant is incorporated by reference from the information under the captions “The Audit Committee” and “The Nominating Committee” contained in the Proxy Statement.
The information concerning Section 16(a) Compliance appearing under the caption “Delinquent Section 16(a) Reports” in the Proxy Statement is incorporated herein by reference.
The Company has adopted insider trading policies and procedures applicable to our directors, officers, and employees, and have implemented processes for the company, that we believe are reasonably designed to promote compliance with insider trading laws, rules, and regulations, and the Nasdaq Stock Market LLC listing standards.
Our Insider Trading Policy prohibits our employees and related persons and entities from trading in securities of J & J Snack Foods Corp. and other companies while in possession of material, nonpublic information. Our Insider Trading Policy also prohibits our employees from disclosing material, nonpublic information of J & J Snack Foods Corp., or another publicly traded company, to others who may trade on the basis of that information. A copy of our Insider Trading Policy is filed as Exhibit 19.1 to this Form 10-K.
The Company has adopted a Code of Ethics pursuant to Section 406 of the Sarbanes-Oxley Act of 2002, which applies to the Company’s principal executive officer and senior financial officers. The Company has also adopted a Code of Business Conduct and Ethics which applies to all employees. The Company will furnish any person, without charge, a copy of the Code of Ethics upon written request to J & J Snack Foods Corp., 350 Fellowship Rd., Mt. Laurel, New Jersey 08054, Attn: Secretary. A copy of the Code of Ethics can also be found on our website at www.jjsnack.com. Any waiver of any provision of the Code of Ethics granted to the principal executive officer or senior financial officer may only be granted by a majority of the Company’s disinterested directors. If a waiver is granted, information concerning the waiver will be posted on our website www.jjsnack.com for a period of 12 months.
Item 11. Executive Compensation
Information concerning executive compensation appearing in the Proxy Statement under the caption “Executive Compensation” is incorporated herein by reference.
Item 12. Security Ownership Of Certain Beneficial Owners And Management And Related Stockholder Matters
Information concerning the security ownership of certain beneficial owners and management and the information concerning equity compensation plans appearing in the Proxy Statement under the captions “Security Ownership of Certain Beneficial Owners and Management” and “Equity Compensation Plan Information” is incorporated herein by reference.
Item 13. Certain Relationships And Related Transactions, and Director Independence
The information set forth in the Proxy Statement under the captions “Certain Relationships” and “Director Independence” is incorporated herein by reference.
Item 14. Principal Accountant Fees And Services
The information set forth in the Proxy Statement under the captions “Ratification of Independent Registered Public Accounting Firm” and “Fees of Independent Registered Public Accounting Firm” is incorporated herein by reference.
PART IV
Item 15. Exhibits, Financial Statement Schedules
|
a) |
The following documents are filed as part of this Report: |
|
(1) |
Financial Statements |
The financial statements filed as part of this report are listed on the Index to Consolidated Financial Statements and Financial Statements Schedule on page F-1.
|
(2) |
Financial Statement Schedule – Page S-1 |
Schedule II – Valuation and Qualifying Accounts
All other schedules are omitted either because they are not applicable or because the information required is contained in the financial statements or notes thereto.
|
b) |
Exhibits |
2.1
3.1
3.2
3.3
4.6
4.7
4.8
10.4*
10.5*
10.6*
10.7*
10.8*
10.9*
19.1
21.1**
Subsidiaries of J & J Snack Foods Corp.
23.1**
Consent of Independent Registered Public Accounting Firm.
31.1**
Certification Pursuant to Section 302 of the Sarbanes-Oxley Act of 2002.
31.2**
Certification Pursuant to Section 302 of the Sarbanes-Oxley Act of 2002.
32.1**
32.2**
97.1
101**
The following financial information from J&J Snack Foods Corp.'s Form 10-K for the year ended September 27, 2025, formatted in iXBRL (Inline extensible Business Reporting Language):
|
(i) |
Consolidated Balance Sheets, |
|
(ii) |
Consolidated Statements of Earnings, |
|
(iii) |
Consolidated Statements of Comprehensive Income, |
|
(iv) |
Consolidated Statements of Cash Flows, |
|
(v) |
Consolidated Statement of Changes in Stockholders' Equity and |
|
(vi) |
The Notes to the Consolidated Financial Statements |
104
Cover Page Interactive Data File (formatted as Inline XBRL and contained in Exhibit 101).
*Compensatory Plan
**Filed Herewith
Item 16. Form 10-K Summary
Not applicable.
SIGNATURES
Pursuant to the requirements of Section 13(a) or 15(d) of the Securities Exchange Act of 1934, the Registrant has duly caused report to be signed on its behalf by the undersigned, thereunto duly authorized.
J & J SNACK FOODS CORP.
|
November 26, 2025 |
By: |
/s/ Dan Fachner | |
|
|
Dan Fachner, |
||
|
|
Chairman, President and |
||
|
|
Chief Executive Officer |
||
|
|
(Principal Executive Officer) |
||
Pursuant to the requirements of the Securities Exchange Act of 1934, this report has been signed below by the following persons on behalf of the Registrant and in the capacities and on the dates indicated.
|
November 26, 2025 |
/s/ Dan Fachner |
|
|
|
Dan Fachner, |
|
|
|
Chairman, President and |
|
|
|
Chief Executive Officer |
|
|
|
(Principal Executive Officer) |
|
|
November 26, 2025 |
/s/ Shawn Munsell |
|
|
|
Shawn Munsell, Senior Vice |
|
|
|
President and Chief Financial |
|
|
|
Officer |
|
|
|
(Principal Financial Officer) |
|
|
|
(Principal Accounting Officer) |
|
|
November 26, 2025 |
/s/ Sidney R. Brown |
|
|
|
Sidney R. Brown, Director |
|
|
November 26, 2025 |
/s/ Peter G. Stanley |
|
|
|
Peter G. Stanley, Director |
|
|
November 26, 2025 |
/s/ Vincent A. Melchiorre |
|
|
|
Vincent A. Melchiorre, Director |
|
|
November 26, 2025 |
/s/ Marjorie S. Roshkoff |
|
|
|
Marjorie S. Roshkoff, Director |
|
|
November 26, 2025 |
/s/ Roy C. Jackson |
|
|
|
Roy C. Jackson, Director |
|
|
November 26, 2025 |
/s/ Mary M. Meder |
|
| Mary M. Meder, Director | ||
| November 26, 2025 | /s/ Kathleen E. Ciaramello | |
| Kathleen E. Ciaramello, Director | ||
J & J SNACK FOODS CORP.
INDEX TO CONSOLIDATED FINANCIAL STATEMENTS
AND FINANCIAL STATEMENT SCHEDULE
|
Financial Statements: |
|
|
Report of Independent Registered Public Accounting Firm (PCAOB ID 248) |
F-2 |
|
Report of Independent Registered Public Accounting Firm on Internal Control over Financial Reporting |
F-4 |
|
Consolidated Balance Sheets as of September 27, 2025 and September 28, 2024 |
F-6 |
|
Consolidated Statements of Earnings for the fiscal years ended September 27, 2025, September 28, 2024, and September 30, 2023 |
F-7 |
|
Consolidated Statements of Comprehensive Income for the fiscal years ended September 27, 2025, September 28, 2024, and September 30, 2023 |
F-8 |
|
Consolidated Statement of Changes in Stockholders’ Equity for the fiscal years ended September 27, 2025, September 28, 2024, and September 30, 2023 |
F-9 |
|
Consolidated Statements of Cash Flows for the fiscal years ended September 27, 2025, September 28, 2024, and September 30, 2023 |
F-10 |
|
Notes to Consolidated Financial Statements |
F-11 |
|
Financial Statement Schedule: |
|
|
Schedule II – Valuation and Qualifying Accounts |
S-1 |
REPORT OF INDEPENDENT REGISTERED PUBLIC ACCOUNTING FIRM
Board of Directors and Shareholders
J&J Snack Foods Corp. and Subsidiaries
Opinion on the financial statements
We have audited the accompanying consolidated balance sheets of J & J Snack Foods Corp. (a New Jersey Corporation) and subsidiaries (the “Company”) as of September 27, 2025 and September 28, 2024, the related consolidated statements of earnings, comprehensive income, changes in stockholders' equity, and cash flows for each of the three years in the period ended September 27, 2025, and the related notes and financial statement schedule included under Item 15(a) (collectively referred to as the “consolidated financial statements”). In our opinion, the consolidated financial statements present fairly, in all material respects, the financial position of the Company as of September 27, 2025 and September 28, 2024, and the results of its operations and its cash flows for each of the three years in the period ended September 27, 2025, in conformity with accounting principles generally accepted in the United States of America.
We also have audited, in accordance with the standards of the Public Company Accounting Oversight Board (United States) (“PCAOB”), the Company’s internal control over financial reporting as of September 27, 2025, based on criteria established in the 2013 Internal Control—Integrated Framework issued by the Committee of Sponsoring Organizations of the Treadway Commission (“COSO”), and our report dated November 26, 2025 expressed an unqualified opinion.
Basis for opinion
These consolidated financial statements are the responsibility of the Company’s management. Our responsibility is to express an opinion on the Company’s consolidated financial statements based on our audits. We are a public accounting firm registered with the PCAOB and are required to be independent with respect to the Company in accordance with the U.S. federal securities laws and the applicable rules and regulations of the Securities and Exchange Commission and the PCAOB.
We conducted our audits in accordance with the standards of the PCAOB. Those standards require that we plan and perform the audit to obtain reasonable assurance about whether the financial statements are free of material misstatement, whether due to error or fraud. Our audits included performing procedures to assess the risks of material misstatement of the financial statements, whether due to error or fraud, and performing procedures that respond to those risks. Such procedures included examining, on a test basis, evidence regarding the amounts and disclosures in the financial statements. Our audits also included evaluating the accounting principles used and significant estimates made by management, as well as evaluating the overall presentation of the financial statements. We believe that our audits provide a reasonable basis for our opinion.
Critical audit matter
The critical audit matter communicated below is a matter arising from the current period audit of the financial statements that was communicated or required to be communicated to the audit committee and that: (1) relates to accounts or disclosures that are material to the financial statements and (2) involved our especially challenging, subjective, or complex judgments. The communication of critical audit matters does not alter in any way our opinion on the financial statements, taken as a whole, and we are not, by communicating the critical audit matter below, providing a separate opinion on the critical audit matter or on the accounts or disclosures to which it relates.
Net Revenue Adjustments
As described further in Note A to the consolidated financial statements, contracts with customers at certain subsidiaries include some form of variable consideration, including sales discounts, trade promotions and certain other sales and consumer incentives, including rebates and coupon redemptions. Variable consideration is treated as a reduction in revenue when the related revenue is recognized, and is recorded using the most likely amount method, with updates to estimates and related accruals of variable consideration occurring each period based on historical experience and changes in circumstances. We identified the estimation of certain subsidiaries’ reserves for these net revenue adjustments by management as a critical audit matter.
The principal considerations for our determination that the estimation of certain subsidiaries’ reserves for these net revenue adjustments is a critical audit matter are that the inputs and assumptions utilized by management in estimating these reserves, including consistency of historical data and estimates of future customer credits, require significant judgment and create a high degree of estimation uncertainty. Consequently, auditing these assumptions require subjective auditor judgment.
Our audit procedures related to the estimation of the reserves included the following, among others:
|
● |
We obtained an understanding, evaluated the design, and tested the operating effectiveness of key controls relating to management’s calculation of the reserves for net revenue adjustments, including understanding relevant inputs and assumptions of key management review controls over the period-end accrual of allowances and customer pricing adjustments. |
|
● |
We re-performed management’s process for calculating the reserves for net revenue adjustments |
|
● |
We evaluated key inputs relevant to the net revenue adjustments, including contractual pricing and rebate arrangements with customers and historical allowance data, which were compared to source documents and historical data. We evaluated key assumptions relevant to net revenue adjustments, including the consistency of historical data and estimates of future customer credits. |
|
● |
We evaluated transactions subsequent to year end, which involved inspecting customer credits and relevant source documents submitted by customers related to the allowance, including end-user pricing adjustments. |
/s/GRANT THORNTON LLP
We have served as the Company’s auditor since 1984.
Philadelphia, Pennsylvania
November 26, 2025
REPORT OF INDEPENDENT REGISTERED PUBLIC ACCOUNTING FIRM
Board of Directors and Shareholders
J&J Snack Foods Corp. and Subsidiaries
Opinion on internal control over financial reporting
We have audited the internal control over financial reporting of J & J Snack Foods Corp. (a New Jersey corporation) and subsidiaries (the “Company”) as of September 27, 2025, based on criteria established in the 2013 Internal Control—Integrated Framework issued by the Committee of Sponsoring Organizations of the Treadway Commission (“COSO”). In our opinion, the Company maintained, in all material respects, effective internal control over financial reporting as of September 27, 2025, based on criteria established in the 2013 Internal Control—Integrated Framework issued by COSO.
We also have audited, in accordance with the standards of the Public Company Accounting Oversight Board (United States) (“PCAOB”), the consolidated financial statements of the Company as of and for the year ended September 27, 2025, and our report dated November 26, 2025 expressed an unqualified opinion on those financial statements.
Basis for opinion
The Company’s management is responsible for maintaining effective internal control over financial reporting and for its assessment of the effectiveness of internal control over financial reporting, included in the accompanying Management's Report on Internal Control over Financial Reporting. Our responsibility is to express an opinion on the Company’s internal control over financial reporting based on our audit. We are a public accounting firm registered with the PCAOB and are required to be independent with respect to the Company in accordance with the U.S. federal securities laws and the applicable rules and regulations of the Securities and Exchange Commission and the PCAOB.
We conducted our audit in accordance with the standards of the PCAOB. Those standards require that we plan and perform the audit to obtain reasonable assurance about whether effective internal control over financial reporting was maintained in all material respects. Our audit included obtaining an understanding of internal control over financial reporting, assessing the risk that a material weakness exists, testing and evaluating the design and operating effectiveness of internal control based on the assessed risk, and performing such other procedures as we considered necessary in the circumstances. We believe that our audit provides a reasonable basis for our opinion.
Definition and limitations of internal control over financial reporting
A company’s internal control over financial reporting is a process designed to provide reasonable assurance regarding the reliability of financial reporting and the preparation of financial statements for external purposes in accordance with generally accepted accounting principles. A company’s internal control over financial reporting includes those policies and procedures that (1) pertain to the maintenance of records that, in reasonable detail, accurately and fairly reflect the transactions and dispositions of the assets of the company; (2) provide reasonable assurance that transactions are recorded as necessary to permit preparation of financial statements in accordance with generally accepted accounting principles, and that receipts and expenditures of the company are being made only in accordance with authorizations of management and directors of the company; and (3) provide reasonable assurance regarding prevention or timely detection of unauthorized acquisition, use, or disposition of the company’s assets that could have a material effect on the financial statements.
Because of its inherent limitations, internal control over financial reporting may not prevent or detect misstatements. Also, projections of any evaluation of effectiveness to future periods are subject to the risk that controls may become inadequate because of changes in conditions, or that the degree of compliance with the policies or procedures may deteriorate.
/s/ GRANT THORNTON LLP
Philadelphia, Pennsylvania
November 26, 2025
Item 8. Financial Statements And Supplementary Data
|
J & J SNACK FOODS CORP. AND SUBSIDIARIES |
|
CONSOLIDATED BALANCE SHEETS |
|
(in thousands, except share amounts) |
|
September 27, |
September 28, |
|||||||
|
2025 |
2024 |
|||||||
|
Assets |
||||||||
|
Current assets |
||||||||
|
Cash and cash equivalents |
$ | 105,893 | $ | 73,394 | ||||
|
Accounts receivable, net of allowances for estimated credit losses of $3,274 and $3,227, respectively |
184,069 | 189,233 | ||||||
|
Inventories |
175,173 | 173,141 | ||||||
|
Prepaid expenses and other |
13,197 | 14,646 | ||||||
|
Total current assets |
478,332 | 450,414 | ||||||
|
Property, plant and equipment, at cost |
1,009,463 | 1,012,043 | ||||||
|
Less accumulated depreciation and amortization |
619,310 | 620,858 | ||||||
|
Property, plant and equipment, net |
390,153 | 391,185 | ||||||
|
Other assets |
||||||||
|
Goodwill |
185,070 | 185,070 | ||||||
|
Trade name intangible assets, net |
105,920 | 109,695 | ||||||
|
Other intangible assets, net |
66,730 | 72,561 | ||||||
|
Operating lease right-of-use assets |
151,538 | 152,383 | ||||||
|
Other |
3,758 | 3,793 | ||||||
|
Total other assets |
513,016 | 523,502 | ||||||
|
Total Assets |
$ | 1,381,501 | $ | 1,365,101 | ||||
|
Liabilities and Stockholders' Equity |
||||||||
|
Current Liabilities |
||||||||
|
Current finance lease liabilities |
$ | 563 | $ | 243 | ||||
|
Accounts payable |
82,405 | 89,268 | ||||||
|
Accrued insurance liability |
16,441 | 16,933 | ||||||
|
Accrued liabilities |
12,606 | 10,063 | ||||||
|
Current operating lease liabilities |
21,624 | 19,063 | ||||||
|
Accrued compensation expense |
26,475 | 23,325 | ||||||
|
Dividends payable |
15,552 | 15,178 | ||||||
|
Total current liabilities |
175,666 | 174,073 | ||||||
|
Long-term debt |
- | - | ||||||
|
Noncurrent finance lease liabilities |
1,355 | 445 | ||||||
|
Noncurrent operating lease liabilities |
140,021 | 140,751 | ||||||
|
Deferred income taxes |
91,703 | 87,824 | ||||||
|
Other long-term liabilities |
6,061 | 5,038 | ||||||
|
Commitments and contingencies (Note H) |
||||||||
|
Stockholders' Equity |
||||||||
|
Preferred stock, $1 par value; authorized 10,000,000 shares; none issued |
- | - | ||||||
|
Common stock, no par value; authorized, 50,000,000 shares; issued and outstanding 19,440,000 and 19,460,000 respectively |
139,118 | 136,516 | ||||||
|
Accumulated other comprehensive loss |
(12,647 | ) | (15,299 | ) | ||||
|
Retained Earnings |
840,224 | 835,753 | ||||||
|
Total stockholders' equity |
966,695 | 956,970 | ||||||
|
Total Liabilities and Stockholders' Equity |
$ | 1,381,501 | $ | 1,365,101 | ||||
The accompanying notes are an integral part of these statements.
|
J & J SNACK FOODS CORP. AND SUBSIDIARIES |
|
CONSOLIDATED STATEMENTS OF EARNINGS |
|
(in thousands, except per share information) |
|
Fiscal year ended |
||||||||||||
|
September 27, |
September 28, |
September 30, |
||||||||||
|
2025 |
2024 |
2023 |
||||||||||
|
(52 weeks) |
(52 weeks) |
(53 weeks) |
||||||||||
|
Net Sales |
$ | 1,583,233 | $ | 1,574,755 | $ | 1,558,829 | ||||||
|
Cost of goods sold |
1,113,351 | 1,088,630 | 1,088,964 | |||||||||
|
Gross Profit |
469,882 | 486,125 | 469,865 | |||||||||
|
Operating expenses |
||||||||||||
|
Marketing and selling |
123,606 | 118,805 | 110,258 | |||||||||
|
Distribution |
168,305 | 175,601 | 172,804 | |||||||||
|
Administrative |
77,787 | 74,771 | 75,425 | |||||||||
|
Intangible asset impairment charges |
2,257 | - | 1,678 | |||||||||
|
Gain on insurance proceeds received for damage to property, plant, and equipment |
(10,622 | ) | - | - | ||||||||
|
Plant closure expense |
24,073 | - | - | |||||||||
|
Other general expense |
150 | (597 | ) | 182 | ||||||||
|
Total operating expenses |
385,556 | 368,580 | 360,347 | |||||||||
|
Operating Income |
84,326 | 117,545 | 109,518 | |||||||||
|
Other income (expenses) |
||||||||||||
|
Investment income |
3,596 | 3,228 | 2,743 | |||||||||
|
Interest expense |
(1,493 | ) | (1,826 | ) | (4,747 | ) | ||||||
|
Earnings before income taxes |
86,429 | 118,947 | 107,514 | |||||||||
|
Income taxes |
20,834 | 32,396 | 28,608 | |||||||||
|
NET EARNINGS |
$ | 65,595 | $ | 86,551 | $ | 78,906 | ||||||
|
Earnings per diluted share |
$ | 3.36 | $ | 4.45 | $ | 4.08 | ||||||
|
Weighted average number of diluted shares |
19,548 | 19,449 | 19,324 | |||||||||
|
Earnings per basic share |
$ | 3.37 | $ | 4.46 | $ | 4.10 | ||||||
|
Weighted average number of basic shares |
19,467 | 19,389 | 19,257 | |||||||||
The accompanying notes are an integral part of these statements.
|
J&J SNACK FOODS CORP. AND SUBSIDIARIES |
|
CONSOLIDATED STATEMENTS OF COMPREHENSIVE INCOME |
|
(in thousands) |
|
Fiscal year ended |
||||||||||||
|
September 27, |
September 28, |
September 30, |
||||||||||
|
2025 |
2024 |
2023 |
||||||||||
|
(52 weeks) |
(52 weeks) |
(53 weeks) |
||||||||||
|
Net Earnings |
$ | 65,595 | $ | 86,551 | $ | 78,906 | ||||||
|
Foreign currency translation adjustments |
2,652 | (5,133 | ) | 3,547 | ||||||||
|
Total other comprehensive income (loss), net of tax |
2,652 | (5,133 | ) | 3,547 | ||||||||
|
Comprehensive Income |
$ | 68,247 | $ | 81,418 | $ | 82,453 | ||||||
The accompanying notes are an integral part of these statements.
|
J & J SNACK FOODS CORP. AND SUBSIDIARIES |
|
CONSOLIDATED STATEMENTS OF CHANGES IN STOCKHOLDERS' EQUITY |
|
(in thousands) |
|
Accumulated |
||||||||||||||||||||
|
Other |
||||||||||||||||||||
|
Common Stock |
Comprehensive |
Retained |
||||||||||||||||||
|
Shares |
Amount |
Loss |
Earnings |
Total |
||||||||||||||||
|
Balance as September 24, 2022 |
19,219 | $ | 94,026 | $ | (13,713 | ) | $ | 782,856 | $ | 863,169 | ||||||||||
|
Common stock issued upon exercise of stock options, net of shares withheld for taxes |
94 | 13,111 | - | - | 13,111 | |||||||||||||||
|
Common stock issued upon vesting of service share units, net of shares withheld for taxes |
2 | - | - | - | - | |||||||||||||||
|
Common stock issued for employee stock purchase plan, net of shares withheld for taxes |
17 | 2,101 | - | - | 2,101 | |||||||||||||||
|
Foreign currency translation adjustment |
- | - | 3,547 | - | 3,547 | |||||||||||||||
|
Dividends declared ($0.74 per share) |
- | - | - | (54,634 | ) | (54,634 | ) | |||||||||||||
|
Share-based compensation |
- | 5,318 | - | - | 5,318 | |||||||||||||||
|
Net earnings |
- | - | - | 78,906 | 78,906 | |||||||||||||||
|
Balance as September 30, 2023 |
19,332 | $ | 114,556 | $ | (10,166 | ) | $ | 807,128 | $ | 911,518 | ||||||||||
|
Common stock issued upon exercise of stock options, net of shares withheld for taxes |
106 | 13,231 | - | - | 13,231 | |||||||||||||||
|
Common stock issued upon vesting of service share units, net of shares withheld for taxes |
4 | - | - | - | - | |||||||||||||||
|
Common stock issued for employee stock purchase plan, net of shares withheld for taxes |
18 | 2,509 | - | - | 2,509 | |||||||||||||||
|
Foreign currency translation adjustment |
- | - | (5,133 | ) | - | (5,133 | ) | |||||||||||||
|
Dividends declared ($0.78 per share) |
- | - | - | (57,926 | ) | (57,926 | ) | |||||||||||||
|
Share-based compensation |
- | 6,220 | - | - | 6,220 | |||||||||||||||
|
Net earnings |
- | - | - | 86,551 | 86,551 | |||||||||||||||
|
Balance as September 28, 2024 |
19,460 | $ | 136,516 | $ | (15,299 | ) | $ | 835,753 | $ | 956,970 | ||||||||||
|
Common stock issued upon exercise of stock options, net of shares withheld for taxes |
16 | 2,327 | - | - | 2,327 | |||||||||||||||
|
Common stock issued upon vesting of service share units, net of shares withheld for taxes |
8 | (552 | ) | - | - | (552 | ) | |||||||||||||
|
Common stock issued for employee stock purchase plan, net of shares withheld for taxes |
23 | 2,507 | - | - | 2,507 | |||||||||||||||
|
Repurchase of common stock |
(67 | ) | (8,000 | ) | - | - | (8,000 | ) | ||||||||||||
|
Foreign currency translation adjustment |
- | - | 2,652 | - | 2,652 | |||||||||||||||
|
Dividends declared ($0.80 per share) |
- | - | - | (61,124 | ) | (61,124 | ) | |||||||||||||
|
Share-based compensation |
- | 6,320 | - | - | 6,320 | |||||||||||||||
|
Net earnings |
- | - | - | 65,595 | 65,595 | |||||||||||||||
|
Balance as September 27, 2025 |
19,440 | $ | 139,118 | $ | (12,647 | ) | $ | 840,224 | $ | 966,695 | ||||||||||
The accompanying notes are an integral part of these statements.
|
J & J SNACK FOODS CORP. AND SUBSIDIARIES |
|
CONSOLIDATED STATEMENTS OF CASH FLOWS |
|
(in thousands) |
|
Fiscal year ended |
||||||||||||
|
September 25, |
September 28, |
September 30, |
||||||||||
|
2025 |
2024 |
2023 |
||||||||||
|
(52 weeks) |
(52 weeks) |
(53 weeks) |
||||||||||
|
Operating activities: |
||||||||||||
|
Net earnings |
$ | 65,595 | $ | 86,551 | $ | 78,906 | ||||||
|
Adjustments to reconcile net earnings to net cash provided by operating activities |
||||||||||||
|
Depreciation of fixed assets |
66,018 | 63,411 | 56,616 | |||||||||
|
Amortization of intangibles and deferred costs |
7,314 | 7,190 | 6,525 | |||||||||
|
Intangible asset impairment charges |
2,257 | - | 1,678 | |||||||||
| Losses (Gains) from disposals of property & equipment | 320 | 11 | (409 | ) | ||||||||
| Non-cash plant shutdown expenses | 20,845 | - | - | |||||||||
|
Share-based compensation |
6,320 | 6,220 | 5,318 | |||||||||
|
Deferred income taxes |
3,949 | 6,434 | 10,935 | |||||||||
|
Gain on insurance proceeds received for damage to property, plant, and equipment |
(10,622 | ) | - | - | ||||||||
|
Gain on insurance proceeds received in excess of operating losses recognized |
(799 | ) | - | - | ||||||||
|
(Gain) Loss on marketable securities |
- | - | (8 | ) | ||||||||
|
Other |
95 | (199 | ) | 323 | ||||||||
|
Changes in assets and liabilities, net of effects from purchase of companies |
||||||||||||
|
Decrease in accounts receivable |
5,502 | 7,931 | 11,399 | |||||||||
|
(Increase) Decrease in inventories |
(2,322 | ) | (1,006 | ) | 9,475 | |||||||
|
Net changes in other operating assets and liabilities |
654 | (3,477 | ) | (8,479 | ) | |||||||
|
Net cash provided by operating activities |
165,126 | 173,066 | 172,279 | |||||||||
|
Investing activities: |
||||||||||||
|
Payments for purchases of companies, net of cash acquired |
- | (7,014 | ) | - | ||||||||
|
Purchases of property, plant and equipment |
(82,873 | ) | (73,569 | ) | (104,737 | ) | ||||||
|
Proceeds from redemption and sales of marketable securities |
- | - | 9,716 | |||||||||
|
Proceeds from disposal of property and equipment |
1,401 | 699 | 1,781 | |||||||||
|
Proceeds from insurance for fixed assets |
11,421 | 2,218 | - | |||||||||
|
Net cash (used in) investing activities |
(70,051 | ) | (77,666 | ) | (93,240 | ) | ||||||
|
Financing activities: |
||||||||||||
|
Payments to repurchase common stock |
(8,000 | ) | - | - | ||||||||
|
Proceeds from issuance of stock |
4,282 | 15,740 | 15,212 | |||||||||
|
Borrowings under credit facility |
50,000 | 71,000 | 114,000 | |||||||||
|
Repayment of borrowings under credit facility |
(50,000 | ) | (98,000 | ) | (142,000 | ) | ||||||
|
Payments on finance lease obligations |
(238 | ) | (151 | ) | (180 | ) | ||||||
|
Payment of cash dividend |
(60,751 | ) | (56,957 | ) | (53,877 | ) | ||||||
|
Net cash (used in) financing activities |
(64,707 | ) | (68,368 | ) | (66,845 | ) | ||||||
|
Effect of exchange rates on cash and cash equivalents |
2,131 | (3,219 | ) | 2,206 | ||||||||
|
Net increase in cash and cash equivalents |
32,499 | 23,813 | 14,400 | |||||||||
|
Cash and cash equivalents at beginning of period |
73,394 | 49,581 | 35,181 | |||||||||
|
Cash and cash equivalents at end of period |
$ | 105,893 | $ | 73,394 | $ | 49,581 | ||||||
The accompanying notes are an integral part of these statements.
J & J SNACK FOODS CORP. AND SUBSIDIARIES
NOTES TO CONSOLIDATED FINANCIAL STATEMENTS
NOTE A – SUMMARY OF SIGNIFICANT ACCOUNTING POLICIES
J & J Snack Foods Corp. and Subsidiaries (“the Company”) manufactures, markets and distributes a variety of nutritional snack foods and beverages to the foodservice and retail supermarket industries. A summary of the significant accounting policies consistently applied in the preparation of the accompanying consolidated financial statements follows. Our 2025, 2024, and 2023 fiscal years comprised 52 weeks, 52 weeks, and 53 weeks, respectively.
|
1. |
Principles of Consolidation |
The consolidated financial statements were prepared in accordance with U.S. GAAP. These financial statements include the accounts of J & J Snack Foods Corp. and its wholly-owned subsidiaries. Intercompany balances and transactions have been eliminated in the consolidated financial statements.
|
2. |
Revenue Recognition |
We recognize revenue in accordance with ASC 606, “Revenue from Contracts with Customers.” Revenue-related taxes collected on behalf of customers and remitted to taxing authorities, principally sales and use taxes, are not included in revenues.
When Performance Obligations Are Satisfied
A performance obligation is a promise in a contract to transfer a distinct good or service to the customer and is the unit of account for revenue recognition. A contract’s transaction price is allocated to each distinct performance obligation and recognized as revenue when, or as, the performance obligation is satisfied.
The performance obligations of our customer contracts for product and machine sales is determined by each individual purchase order and the respective products ordered, with revenue being recognized at a point-in-time when the obligation under the terms of the agreement is satisfied and product control is transferred to our customer. Specifically, control transfers to our customers when the product is delivered to, installed or picked up by our customers based upon applicable shipping terms, as our customers can direct the use and obtain substantially all of the remaining benefits from the product at this point in time. The performance obligations in our customer contracts for product are generally satisfied within 30 days.
The singular performance obligation of our customer contracts for time and material repair and maintenance equipment service is the performance of the repair and maintenance with revenue being recognized at a point-in-time when the repair and maintenance is completed.
The singular performance obligation of our customer repair and maintenance equipment service contracts is the performance of the repair and maintenance with revenue being recognized over the time the service is expected to be performed. Our customers are billed for service contracts in advance of performance and therefore we have contract liability on our balance sheet.
Significant Payment Terms
In general, within our customer contracts, the purchase order identifies the product, quantity, price, pick-up allowances, payment terms and final delivery terms. Although some payment terms may be more extended, presently, the majority of our payment terms are 30 days. As a result, we have used the available practical expedient and, consequently, do not adjust our revenues for the effects of a significant financing component.
Shipping
All amounts billed to customers related to shipping and handling are classified as revenues; therefore, we recognize revenue for shipping and handling fees at the time the products are shipped or when services are performed. The cost of shipping products to the customer is recognized at the time the products are shipped to the customer and our policy is to classify them as Distribution expenses.
Variable Consideration
In addition to fixed contract consideration, our contracts include some form of variable consideration, including sales discounts, trade promotions and certain other sales and consumer incentives, including rebates and coupon redemptions. In general, variable consideration is treated as a reduction in revenue when the related revenue is recognized. Depending on the specific type of variable consideration, we use the most likely amount method to determine the variable consideration. We believe there will be no significant changes to our estimates of variable consideration when any related uncertainties are resolved with our customers. We review and update our estimates and related accruals of variable consideration each period based on historical experience. Our recorded liability for allowances, end-user pricing adjustments and trade spending was approximately $22.3 million at September 27, 2025 and $21.9 million at September 28, 2024.
Warranties & Returns
We provide all customers with a standard or assurance type warranty. Either stated or implied, we provide assurance the related products will comply with all agreed-upon specifications and other warranties provided under the law. No services beyond an assurance warranty are provided to our customers.
We do not grant a general right of return. However, customers may return defective or non-conforming products. Customer remedies may include either a cash refund or an exchange of the product. We do not estimate a right of return and related refund liability as returns of our products are rare.
Contract Balances
Our customers are billed for service contracts in advance of performance and therefore we have a contract liability on our balance sheet as follows:
|
Fiscal year ended |
||||||||
|
September 27, |
September 28, |
|||||||
|
2025 |
2024 |
|||||||
|
(in thousands) |
||||||||
|
Beginning Balance |
$ | 4,798 | $ | 5,306 | ||||
|
Additions to contract liability |
6,447 | 6,763 | ||||||
|
Amounts recognized as revenue |
(7,356 | ) | (7,271 | ) | ||||
|
Ending Balance |
$ | 3,889 | $ | 4,798 | ||||
Disaggregation of Revenue
See Note M for disaggregation of our net sales by class of similar product and type of customer.
Allowance for Estimated Credit Losses
The Company continuously monitors collections and payments from its customers and maintains a provision for estimated credit losses. The allowance for estimated credit losses considers a number of factors including the age of receivable balances, the history of losses, expectations of future credit losses and the customers’ ability to pay off obligations. The allowance for estimated credit losses was $3.3 million at September 27, 2025 and $3.2 million at September 28, 2024.
|
3. |
Foreign Currency |
Assets and liabilities in foreign currencies are translated into U.S. dollars at the rate of exchange prevailing at the balance sheet date. Revenues and expenses are translated at the average rate of exchange for the period. The cumulative translation adjustment is recorded as a separate component of stockholders’ equity and changes to such are included in comprehensive income.
|
4. |
Use of Estimates |
In preparing financial statements in conformity with accounting principles generally accepted in the United States of America, management is required to make estimates and assumptions that affect the reported amounts of assets and liabilities, the disclosure of contingent assets and liabilities at the date of the financial statements, and the reported amounts of revenues and expenses during the reporting period. Actual results could differ from those estimates.
|
5. |
Cash Equivalents |
Cash equivalents are short-term, highly liquid investments with original maturities of three months or less.
|
6. |
Concentrations and related risks |
We maintain cash balances at financial institutions located in various states and internationally. We maintain cash balances at multiple domestic banks totaling approximately $47 million, and at banks in multiple foreign jurisdictions totaling approximately $56 million, that is in excess of domestic and international federally insured limits.
Financial instruments that could potentially subject us to concentrations of credit risk are trade accounts receivable; however, such risks are limited due to the large number of customers comprising our customer base and their dispersion across geographic regions. We have approximately 21 customers with accounts receivable balances of between $1 million and $10 million and five customers with a balance greater than $10 million, with the largest being approximately $25 million.
We have several large customers that account for a significant portion of our sales. Our top ten customers accounted for 46%, 45% and 43% of our sales during fiscal years 2025, 2024, and 2023, respectively, with our largest customer accounting for 10% of our sales in 2025, 9% of our sales in 2024, and 9% of our sales in 2023. Five of the ten customers are food distributors who sell our product to many end users.
About 28% of our employees are covered by collective bargaining agreements.
None of our vendors supplied more than 10% of our ingredients and packaging in 2025, 2024 or 2023.
Virtually all of our accounts receivable are due from trade customers. Credit is extended based on evaluation of our customers’ financial condition and collateral is typically not required. Accounts receivable payment terms vary and are stated in the financial statements at amounts due from customers net of an allowance for estimated credit losses. At September 27, 2025, September 28, 2024, and September 30, 2023, our accounts receivables were $184.1 million, $189.2 million, and $198.1 million, net of an allowance for estimated credit losses of $3.3 million, $3.2 million, and $3.2 million. Accounts receivable outstanding longer than the payment terms are considered past due. We determine our allowance by considering a number of factors, including the length of time trade accounts receivable are past due, our previous loss history, customers’ current ability to pay their obligations to us, and the condition of the general economy and the industry as a whole. We write off accounts receivable when they become uncollectible, and payments subsequently received on such receivables are credited to the allowance for estimated credit losses.
|
7. |
Inventories |
Inventories are valued at the lower of cost (determined by the first-in, first-out method) or net realizable value. We recognize abnormal amounts of idle facilities, freight, handling costs, and spoilage as charges of the current period. Additionally, we allocate fixed production overhead to inventories based on the normal capacity of our production facilities. We calculate normal capacity as the production expected to be achieved over several periods or seasons under normal circumstances, taking into account the loss of capacity resulting from planned maintenance. This requires us to use judgment to determine when production is outside the range of expected variation in production (either abnormally low or abnormally high). In periods of abnormally low production (for example, periods in which there is significantly lower demand, labor and material shortages exist, or there is unplanned equipment downtime) the amount of fixed overhead allocated to each unit of production is not increased. However, in periods of abnormally high production the amount of fixed overhead allocated to each unit of production is decreased to assure inventories are not measured above cost.
|
8. |
Investment Securities |
We classify our investment securities in one of three categories: held to maturity, trading, or available for sale. We held no investment securities at September 27, 2025 or September 28, 2024.
|
9. |
Depreciation and Amortization |
Depreciation of equipment and buildings is provided for by the straight-line method over the assets’ estimated useful lives. We review our equipment and buildings to ensure that they provide economic benefit and are not impaired.
Amortization of leasehold improvements is provided for by the straight-line method over the term of the lease or the assets’ estimated useful lives, whichever is shorter. Licenses and rights, customer relationships, technology, non-compete agreements, and franchise agreements and certain tradenames are being amortized by the straight-line method over periods ranging from 2 to 20 years and amortization expense is reflected throughout operating expenses.
Long-lived assets, including fixed assets and amortizing intangibles, are reviewed for impairment as events or changes in circumstances occur indicating that the carrying amount of the asset may not be recoverable. Indefinite lived intangibles are reviewed annually for impairment. Cash flow and sales analyses are used to assess impairment. The estimates of future cash flows and sales involve considerable management judgment and are based upon assumptions about expected future operating performance. Assumptions used in these forecasts are consistent with internal planning. The actual cash flows and sales could differ from management’s estimates due to changes in business conditions, operating performance, economic conditions, competition, and consumer preferences.
|
10. |
Fair Value of Financial Instruments |
We follow the provisions of ASC 820-10, Fair Value Measurements and Disclosure Topic, or ASC 820-10, for our financial assets and liabilities. ASC 820-10 provides a framework for measuring fair value under GAAP and requires expanded disclosures regarding fair value measurements. ASC 820-10 defines fair value as the exchange price that would be received for an asset or paid to transfer a liability (an exit price) in the principal or most advantageous market for the asset or liability in an orderly transaction between market participants on the measurement date. ASC 820-10 also establishes a fair value hierarchy, which requires an entity to maximize the use of observable inputs, where available, and minimize the use of unobservable inputs when measuring fair value. The three levels of inputs used to measure fair value are as follows:
Level 1 – Quoted prices in active markets for identical assets or liabilities.
Level 2 – Observable inputs other than quoted process included in Level 1, such as quoted prices for similar assets and liabilities in active markets.
Level 3 – Unobservable inputs that are supported by little or no market activity and that are significant to the fair value of the assets or liabilities, including certain pricing models, discounted cash flow methodologies and similar techniques that use significant unobservable inputs.
Our certificates of deposits are measured using Level 2 inputs and are based on indicative third-party price quotations. We held $5.2 million of certificates of deposits as of September 27, 2025, and as of September 28, 2024, respectively. Certificates of deposits are included within cash and cash equivalents on our Consolidated Balance Sheets.
The carrying value of our short-term financial instruments, such as accounts receivables and accounts payable, approximate their fair values, based on the short-term maturities of these instruments.
|
11. |
Income Taxes |
We account for our income taxes in accordance with the asset and liability method. Deferred tax assets and liabilities are recognized for future tax consequences attributable to temporary differences between the consolidated financial statements carrying amounts of existing assets and liabilities and their respective tax bases, as well as for operating loss and tax credit carryforwards. Deferred tax amounts are determined by using the enacted tax rates expected to be in effect when the temporary differences are expected to be recovered or settled. The effect on deferred tax assets and liabilities of a change in tax rates is recognized in income in the period that includes the enactment date. A valuation allowance reduces the deferred tax assets to the amount that is more likely than not to be realized.
Additionally, we recognize a liability for income taxes and associated penalties and interest for tax positions taken or expected to be taken in a tax return which are more likely than not to be overturned by taxing authorities (“uncertain tax positions”). We have not recognized a tax benefit in our financial statements for these uncertain tax positions.
As of September 27, 2025, and September 28, 2024, the total amount of gross unrecognized tax benefits was $0.3 million and $0.3 million, respectively, all of which would impact our effective tax rate over time, if recognized. We recognize interest and penalties related to income tax matters as a part of the provision for income taxes. As of September 27, 2025 and September 28, 2024, we had $0.3 million of accrued interest and penalties. A reconciliation of the beginning and ending amount of unrecognized tax benefits is as follows:
|
(in thousands) |
||||
|
Balance at September 28, 2024 |
$ | 343 | ||
|
Additions based on tax positions related to the current year |
- | |||
|
Reductions for tax positions of prior years |
- | |||
|
Settlements |
- | |||
|
Balance at September 27, 2025 |
$ | 343 | ||
In addition to our federal tax return and tax returns for Mexico and Canada, we file tax returns in all states that have a corporate income tax. Virtually all the returns noted above are open for examination for three to four years.
Our effective tax rate in fiscal 2025 was 24.1%. Our effective tax rate in our fiscal 2024 year was 27.2% and in fiscal 2023 was 26.6%.
|
12. |
Earnings Per Common Share |
Basic earnings per common share (“EPS”) excludes dilution and is computed by dividing income available to common shareholders by the weighted average common shares outstanding during the period. Diluted EPS takes into consideration the potential dilution that could occur if securities (stock options, service share units (“RSU”)’s and performance share units (“PSU”)’s) or other contracts to issue common stock were exercised and converted into common stock.
Our calculation of EPS is as follows:
|
Fiscal year ended September 27, 2025 |
||||||||||||
|
Income |
Shares |
Per Share |
||||||||||
|
(Numerator) |
(Denominator) |
Amount |
||||||||||
|
(in thousands, except per share amounts) |
||||||||||||
|
Basic EPS |
||||||||||||
|
Net earnings available to common stockholders |
$ | 65,595 | 19,467 | $ | 3.37 | |||||||
|
Effect of dilutive securities |
||||||||||||
|
RSU's, PSU's and options |
$ | - | 81 | (0.01 | ) | |||||||
|
Diluted EPS |
||||||||||||
|
Net earnings available to common stockholders plus assumed conversions |
$ | 65,595 | 19,548 | $ | 3.36 | |||||||
207,171 anti-dilutive shares have been excluded in the computation of fiscal year 2025 diluted EPS.
|
Fiscal year ended September 28, 2024 |
||||||||||||
|
Income |
Shares |
Per Share |
||||||||||
|
(Numerator) |
(Denominator) |
Amount |
||||||||||
|
(in thousands, except per share amounts) |
||||||||||||
|
Basic EPS |
||||||||||||
|
Net earnings available to common stockholders |
$ | 86,551 | 19,389 | $ | 4.46 | |||||||
|
Effect of dilutive securities |
||||||||||||
|
RSU's, PSU's and options |
$ | - | 60 | (0.01 | ) | |||||||
|
Diluted EPS |
||||||||||||
|
Net earnings available to common stockholders plus assumed conversions |
$ | 86,551 | 19,449 | $ | 4.45 | |||||||
152,381 anti-dilutive shares have been excluded in the computation of fiscal year 2024 diluted EPS.
|
Fiscal year ended September 30, 2023 |
||||||||||||
|
Income |
Shares |
Per Share |
||||||||||
|
(Numerator) |
(Denominator) |
Amount |
||||||||||
|
(in thousands, except per share amounts) |
||||||||||||
|
Basic EPS |
||||||||||||
|
Net earnings available to common stockholders |
$ | 78,906 | 19,257 | $ | 4.10 | |||||||
|
Effect of dilutive securities |
||||||||||||
|
RSU's, PSU's and options |
$ | - | 67 | (0.02 | ) | |||||||
|
Diluted EPS |
||||||||||||
|
Net earnings available to common stockholders plus assumed conversions |
$ | 78,906 | 19,324 | $ | 4.08 | |||||||
252,044 anti-dilutive shares have been excluded in the computation of fiscal year 2023 diluted EPS.
|
13. |
Accounting for Stock-Based Compensation |
At September 27, 2025, the Company has two stock-based employee compensation plans. Pre-tax share-based compensation was recognized as follows:
|
Fiscal year ended |
||||||||||||
|
September 27, |
September 28, |
September 30, |
||||||||||
|
2025 |
2024 |
2023 |
||||||||||
|
(in thousands) |
||||||||||||
|
Stock options |
$ | 416 | $ | 1,281 | $ | 2,321 | ||||||
|
Stock purchase plan |
434 | 508 | 555 | |||||||||
|
Stock issued to outside directors |
140 | 188 | 145 | |||||||||
|
Service share units issued to employees |
3,887 | 2,565 | 1,440 | |||||||||
|
Performance share units issued to employees |
1,443 | 1,678 | 857 | |||||||||
|
Total share-based compensation |
$ | 6,320 | $ | 6,220 | $ | 5,318 | ||||||
|
Tax benefits |
$ | 1,584 | $ | 1,538 | $ | 1,099 | ||||||
The fair value of each option grant is estimated on the date of grant using the Black-Scholes options-pricing model. No grants of options were made in fiscal 2025, 2024 or 2023. The following weighted average assumptions were used for grants in fiscal 2022: expected volatility of 25.8%; weighted average risk-free interest rates of 0.8%; dividend rate of 1.6%; and expected lives ranging between 4 and 10 years.
Expected volatility is based on the historical volatility of the price of our common shares over the past 51 months for 5-year options and 10 years for 10-year options. We use historical information to estimate expected life and forfeitures within the valuation model. The expected term of awards represents the period of time that options granted are expected to be outstanding. The risk-free rate for periods within the expected life of the option is based on the U.S. Treasury yield curve in effect at the time of grant. Compensation cost is recognized using a straight-line method over the vesting or service period and is net of estimated forfeitures.
The Company issued 34,868 service share units (“RSU”)’s in fiscal 2025, 25,957 in fiscal 2024, and 21,864 in fiscal 2023. Each RSU entitles the awardee to one share of common stock upon vesting. The fair value of the RSU’s was determined based upon the closing price of the Company’s common stock on the date of grant.
The Company also issued 17,500 performance share units (“PSU”)’s in fiscal 2025, 14,506 in fiscal 2024 and 21,260 in fiscal 2023. Each PSU may result in the issuance of up to two shares of common stock upon vesting, dependent upon the level of achievement of the applicable performance goal. The fair value of the PSU’s was determined based upon the closing price of the Company’s common stock on the date of grant. Additionally, the Company applies a quarterly probability assessment in computing this non-cash compensation expense, and any change in estimate is reflected as a cumulative adjustment to expense in the quarter of the change.
|
14. |
Advertising Costs |
Advertising costs are expensed as incurred. Total advertising expense was $11.9 million, $11.1 million, and $9.7 million for the fiscal years 2025, 2024, and 2023, respectively.
|
15. |
Commodity Price Risk Management |
Our most significant raw material requirements include flour, packaging, shortening, corn syrup, sugar, juice, cheese, chocolate, and a variety of nuts. We attempt to minimize the effect of future price fluctuations related to the purchase of raw materials primarily through forward purchasing to cover future manufacturing requirements, generally for periods from 1 to 12 months. As of September 27, 2025, we have approximately $133 million of such commitments. Futures contracts are not used in combination with forward purchasing of these raw materials. Our procurement practices are intended to reduce the risk of future price increases, but also may potentially limit the ability to benefit from possible price decreases. At each of the last three fiscal year ends, we did not have any material losses on our purchase commitments.
|
16. |
Research and Development Costs |
Research and development costs are expensed as incurred. Total research and development expense was $1.4 million, $1.2 million, and $1.2 million for the fiscal years 2025, 2024, and 2023, respectively.
|
17. |
Recent Accounting Pronouncements |
In November 2023, the FASB issued ASU No. 2023-07 “Segment Reporting (Topic 280): Improvements to Reportable Segment Disclosures.” This guidance requires all public entities to provide enhanced disclosures about significant segment expenses. The amendments in this ASU are to be applied retrospectively and are effective for fiscal years beginning after December 15, 2023 and for interim periods within fiscal years beginning after December 15, 2024. We adopted this guidance and included the required disclosure in the notes to our annual consolidated financial statements for fiscal year ended September 27, 2025. This guidance will become effective for our interim period disclosures beginning in fiscal 2026.
In December 2023, the FASB issued ASU No. 2023-09 “Income Taxes (Topic 740): Improvements to Income Tax Disclosures.” This guidance enhances the transparency around income tax information through improvements to income tax disclosures, primarily related to the effective rate reconciliation and income taxes paid, to improve the overall effectiveness of income tax disclosures. The amendments in the ASU are effective for fiscal years beginning after December 15, 2024, with early adoption permitted. We are currently assessing the impact of the guidance on our consolidated financial statements and disclosures.
In November 2024, the FASB issued ASU No. 2024-03 “Income Statement – Reporting Comprehensive Income – Expense Disaggregation Disclosures.” This guidance improves disclosure requirements and provides more detailed information around an entity’s expenses, specifically amounts related to purchases of inventory, employee compensation, depreciation, intangible asset amortization, and selling expenses, along with qualitative descriptions of certain other types of expenses. This guidance is effective for fiscal years beginning after December 15, 2027, with early adoption permitted. We are currently assessing the impact of the guidance on our consolidated financial statements and disclosures.
In July 2025, the FASB issued ASU No. 2025-05 “Financial Instruments – Credit Losses (Topic 326).” This guidance introduces a practical expedient for all entities with qualifying assets to assume that current conditions remain unchanged for the remaining life of the asset with estimated credit losses. The amendments in the ASU are effective for fiscal years beginning after December 15, 2025, with early adoption permitted. We are currently assessing the impact of the guidance on our consolidated financial statements and disclosures.
In September 2025, the FASB issued ASU No. 2025-06 “Intangibles – Goodwill and Other – Internal-Use Software (Subtopic 350-40).” This authoritative guidance modernizes the accounting for internal-use software costs including the elimination of the stage-based capitalization model and updated disclosure requirements. The guidance is effective for annual reporting periods beginning after December 15, 2027, and interim reporting periods within those annual reporting periods. Amendments can be applied using a prospective transition approach, a modified transition approach, or a retrospective transition approach. We are currently assessing the impact of the guidance on our consolidated financial statements and disclosures.
|
18. |
Reclassifications |
Certain prior year financial statement amounts have been reclassified to be consistent with the presentation for the current year.
NOTE B – ACQUISITIONS
Thinsters
On April 8, 2024, J & J Snack Foods Corp. completed the acquisition of the Thinsters cookie business from Hain Celestial Group as part of our growth strategy to increase our product portfolio. The purchase price was approximately $7.0 million, consisting entirely of cash.
The allocation of the purchase price to major classes of assets and liabilities was completed as of September 28, 2024. The purchase price allocation includes $1.1 million of Inventory acquired and $5.9 million of Intangible assets. Intangible assets include an indefinite lived Trade name with a fair value of $5.3 million, and an amortizing Customer relationship intangible asset with a fair value of $0.7 million. The Customer relationship intangible asset will amortize over a useful life of 10 years. The acquisition of Thinsters was accounted for using the acquisition method of accounting.
The financial results of Thinsters have been included in our consolidated financial statements since the date of the acquisition. Sales and net earnings of Thinsters were not deemed to be material for the year ended September 27, 2025 or September 28, 2024. Thinsters is reported as part of our Food Service segment. Acquisition costs of $0.3 million were included within Administrative expenses for the year ended September 28, 2024.
NOTE C – INVENTORIES
Inventories consist of the following:
|
September 27, |
September 28, |
|||||||
|
2025 |
2024 |
|||||||
|
(in thousands) |
||||||||
|
Finished goods |
$ | 89,512 | $ | 86,470 | ||||
|
Raw materials |
32,259 | 29,830 | ||||||
|
Packaging materials |
11,122 | 12,649 | ||||||
|
Equipment parts and other |
42,280 | 44,192 | ||||||
|
Total inventories |
$ | 175,173 | $ | 173,141 | ||||
NOTE D– PROPERTY, PLANT AND EQUIPMENT
Property, plant and equipment consist of the following:
|
September 27, 2025 |
September 28, 2024 |
Estimated useful lives (in years) |
|||||||||||
|
(in thousands) |
|||||||||||||
|
Land |
$ | 3,684 | $ | 3,684 | - | ||||||||
|
Buildings & Improvements |
127,022 | 122,919 | 5 | - | 39.5 | ||||||||
|
Plant machinery and equipment |
488,771 | 475,194 | 5 | - | 20 | ||||||||
|
Marketing equipment |
309,371 | 317,269 | 5 | - | 7 | ||||||||
|
Transportation equipment |
16,720 | 15,796 | 5 | ||||||||||
|
Office equipment |
49,996 | 48,589 | 3 | - | 5 | ||||||||
|
Construction in Progress |
13,899 | 28,592 | - | ||||||||||
| 1,009,463 | 1,012,043 | ||||||||||||
|
Less accumulated depreciation |
619,310 | 620,858 | |||||||||||
|
Property, plant and equipment, net |
$ | 390,153 | $ | 391,185 | |||||||||
Depreciation expense was $66.0 million, $63.4 million, and $56.6 million for fiscal years 2025, 2024, and 2023, respectively.
Property, plant and equipment purchased by the Company is valued at cost. Property, plant and equipment acquired through acquisition is valued at fair value.
NOTE E – GOODWILL AND INTANGIBLE ASSETS
Our reportable segments are Food Service, Retail Supermarket, and Frozen Beverages.
Intangible Assets
The carrying amount of acquired intangible assets for the reportable segments are as follows:
| September 27, 2025 |
September 28, 2024 |
|||||||||||||||
|
Gross |
Gross |
|||||||||||||||
|
Carrying |
Accumulated |
Carrying |
Accumulated |
|||||||||||||
|
Amount |
Amortization |
Amount |
Amortization |
|||||||||||||
|
FOOD SERVICE |
||||||||||||||||
|
Indefinite lived intangible assets |
||||||||||||||||
|
Trade names |
$ | 85,424 | $ | - | $ | 85,424 | $ | - | ||||||||
|
Amortized intangible assets |
||||||||||||||||
|
Trade names |
2,515 | 2,515 | 4,024 | 1,006 | ||||||||||||
|
Franchise agreements |
8,500 | 2,763 | 8,500 | 1,913 | ||||||||||||
|
Customer relationships |
23,550 | 14,749 | 23,550 | 12,369 | ||||||||||||
|
Technology |
23,110 | 7,493 | 23,110 | 5,170 | ||||||||||||
|
License and rights |
1,690 | 1,734 | 1,690 | 1,650 | ||||||||||||
|
TOTAL FOOD SERVICE |
$ | 144,789 | $ | 29,254 | $ | 146,298 | $ | 22,108 | ||||||||
|
RETAIL SUPERMARKETS |
||||||||||||||||
|
Indefinite lived intangible assets |
||||||||||||||||
|
Trade names |
$ | 11,181 | $ | - | $ | 11,938 | $ | - | ||||||||
|
TOTAL RETAIL SUPERMARKETS |
$ | 11,181 | $ | - | $ | 11,938 | $ | - | ||||||||
|
FROZEN BEVERAGES |
||||||||||||||||
|
Indefinite lived intangible assets |
||||||||||||||||
|
Trade names |
$ | 9,315 | $ | - | $ | 9,315 | $ | - | ||||||||
|
Distribution rights |
36,100 | - | 36,100 | - | ||||||||||||
|
Amortized intangible assets |
||||||||||||||||
|
Customer relationships |
1,439 | 968 | 1,439 | 844 | ||||||||||||
|
Licenses and rights |
1,400 | 1,352 | 1,400 | 1,282 | ||||||||||||
|
TOTAL FROZEN BEVERAGES |
$ | 48,254 | $ | 2,320 | $ | 48,254 | $ | 2,126 | ||||||||
|
CONSOLIDATED |
$ | 204,224 | $ | 31,574 | $ | 206,490 | $ | 24,234 | ||||||||
The gross carrying amount of intangible assets is determined by applying a discounted cash flow model to the future sales and earnings associated with each intangible asset or is set by contract cost. The amortization period used for definite lived intangible assets is set by contract period or by the period over which the bulk of the discounted cash flow is expected to be generated. We currently believe that we will receive the benefit from the use of the trade names and distribution rights classified as indefinite lived intangible assets indefinitely and they are therefore not amortized.
Licenses and rights, customer relationships, franchise agreements, technology, certain trade names, and non-compete agreements are being amortized by the straight-line method over periods ranging from 10 to 20 years and amortization expense is reflected throughout operating expenses.
Amortizing and indefinite lived intangibles are reviewed for impairment as events or changes in circumstances occur indicating that the carrying amount of the asset may not be recoverable.
In connection with our quarterly triggering event analyses conducted during fiscal year 2025, we determined that the carrying amounts of one of our indefinite trade names exceeded its fair value as of September 27, 2025. As a result, the Company recorded an intangible asset impairment charge of $0.8 million in the fourth quarter of fiscal 2025. The intangible asset impairment charge is reflected in Intangible asset impairment charges in the Consolidated Statements of Earnings. The $0.8 million intangible asset impairment charge related to a trade name in the Retail Supermarket segment.
Additionally, we determined that the carrying amount of one of our amortizing trade names exceeded its fair value as of June 28, 2025. As a result, the Company recorded an intangible asset impairment charge of $1.5 million in the third quarter of fiscal 2025. The intangible asset impairment charge is reflected in Intangible asset impairment charges in the Consolidated Statements of Earnings. The $1.5 million intangible asset impairment charge related to trade names in the Food Service segment.
In connection with our annual impairment assessment conducted during the fourth quarter of 2023, we determined that the carrying amounts of three trade names exceeded their fair value as of September 30, 2023. As a result, the Company recorded an indefinite lived intangible asset impairment charge of $1.7 million in the fourth quarter of 2023. The intangible asset impairment charge is reflected in Intangible asset impairment charges in the Consolidated Statements of Earnings. The $1.7 million intangible asset impairment charge related to trade names in the Food Service segment.
There were no impairment charges recorded in fiscal 2024.
In fiscal year 2024, intangible assets of $5.9 million were added in the food service segment from the acquisition of the Thinsters business. There were no intangible assets acquired in the fiscal years 2025 or 2023. The acquisition included an indefinite lived Trade name intangible asset with a fair value of $5.3 million, and an amortizing Customer relationship intangible asset with a fair value of $0.7 million. The Customer relationship intangible asset will amortize over a useful life of 10 years.
Aggregate amortization expense of intangible assets for the fiscal years 2025, 2024, and 2023 was $7.3 million, $7.2 million, and $6.5 million, respectively.
Estimated amortization expense for the next five fiscal years is approximately $5.6 million in 2026, $4.7 million in 2027, $4.3 million in 2028 and 2029, and $4.2 million in 2030.
The weighted amortization period of the intangible assets, in total, is 10.0 years. The weighted amortization period by intangible asset class is 10 years for Technology, 10 years for Customer relationships, 20 years for Licenses & rights, and 10 years for Franchise agreements.
Goodwill
The carrying amounts of goodwill for the reportable segments are as follows:
|
September 27, |
September 28, |
|||||||
|
2025 |
2024 |
|||||||
|
(in thousands) |
||||||||
|
Food Service |
$ | 124,426 | $ | 124,426 | ||||
|
Retail Supermarket |
4,146 | 4,146 | ||||||
|
Frozen Beverages |
56,498 | 56,498 | ||||||
|
Total goodwill |
$ | 185,070 | $ | 185,070 | ||||
The carrying value of goodwill is determined based on the excess of the purchase price of acquisitions over the estimated fair value of tangible and intangible assets. Goodwill is not amortized but is evaluated annually at year end by management for impairment. Our impairment analysis for fiscal years 2025, 2024, and 2023 was based on a combination of the income approach, which estimates the fair value of reporting units based on discounted cash flows, and the market approach, which estimates the fair value of reporting units based on comparable market prices and multiples. Under the income approach the Company used a discounted cash flow which requires Level 3 inputs such as: annual growth rates, discount rates based upon the weighted average cost of capital and terminal values based upon current stock market multiples. There were no impairment charges to goodwill in fiscal years 2025, 2024, or 2023.
No goodwill was acquired in fiscal year 2025 or 2024. In fiscal year 2023, goodwill of $0.7 million was added in the food service segment from measurement period adjustments related to the prior year acquisition of Dippin’ Dots.
NOTE F – LONG-TERM DEBT
In December 2021, the Company entered into an amended and restated loan agreement (the “Credit Agreement”) with our existing banks which provided for up to a $50 million revolving credit facility repayable in December 2026.
Interest accrues, at the Company’s election at (i) the SOFR Rate (as defined in the Credit Agreement), plus an applicable margin, based upon the Consolidated Net Leverage Ratio, as defined in the Credit Agreement, or (ii) the Alternate Base Rate (a rate based on the higher of (a) the prime rate announced from time-to-time by the Administrative Agent, (b) the Federal Reserve System’s federal funds rate, plus 0.50% or (c) the Daily SOFR Rate, plus an applicable margin). The Alternate Base Rate is defined in the Credit Agreement.
The Credit Agreement requires the Company to comply with various affirmative and negative covenants, including without limitation (i) covenants to maintain a minimum specified interest coverage ratio and maximum specified net leverage ratio, and (ii) subject to certain exceptions, covenants that prevent or restrict the Company’s ability to pay dividends, engage in certain mergers or acquisitions, make certain investments or loans, incur future indebtedness, alter its capital structure or line of business, prepay subordinated indebtedness, engage in certain transactions with affiliates, or amend its organizational documents. As of September 27, 2025, the Company is in compliance with all financial covenants of the Credit Agreement.
On June 21, 2022, the Company entered into an amendment to the Credit Agreement, the “Amended Credit Agreement” which provided for an incremental increase of $175 million in available borrowings. The Amended Credit Agreement also includes an option to increase the size of the revolving credit facility by up to an amount not to exceed in the aggregate the greater of $225 million or, $50 million plus the Consolidated EBITDA of the Borrowers, subject to the satisfaction of certain terms and conditions.
As of September 27, 2025, and as of September 28, 2024, there were no outstanding balances under the Amended Credit Agreement. As of September 27, 2025, the amount available under the Amended Credit Agreement was $210.2 million, after giving effect to the outstanding letters of credit of $14.8 million. As of September 28, 2024, the amount available under the Amended Agreement was $212.7 million, after giving effect to the outstanding letters of credit of $12.3 million.
NOTE G – INCOME TAXES
Income tax expense (benefit) is as follows:
|
Fiscal year ended |
||||||||||||
|
September 27, |
September 28, |
September 30, |
||||||||||
|
2025 |
2024 |
2023 |
||||||||||
|
(in thousands) |
||||||||||||
|
Current |
||||||||||||
|
U.S. Federal |
$ | 12,440 | $ | 17,532 | $ | 6,447 | ||||||
|
Foreign |
3,293 | 1,983 | 6,149 | |||||||||
|
State |
2,412 | 6,447 | 4,349 | |||||||||
|
Total current expense |
18,145 | 25,962 | 16,945 | |||||||||
|
Deferred |
||||||||||||
|
U.S. Federal |
$ | 3,453 | $ | 5,028 | $ | 12,134 | ||||||
|
Foreign |
113 | 238 | 232 | |||||||||
|
State |
(877 | ) | 1,168 | (703 | ) | |||||||
|
Total deferred expense (benefit) |
2,689 | 6,434 | 11,663 | |||||||||
|
Total expense |
$ | 20,834 | $ | 32,396 | $ | 28,608 | ||||||
The provisions for income taxes differ from the amounts computed by applying the statutory federal income tax rate of 21% for the fiscal years ended 2025, 2024 and 2023 to earnings before income taxes for the following reasons:
|
Fiscal year ended |
||||||||||||
|
September 27, |
September 28, |
September 30, |
||||||||||
|
2025 |
2024 |
2023 |
||||||||||
|
(in thousands) |
||||||||||||
|
Income taxes at federal statutory rates |
$ | 18,150 | $ | 24,979 | $ | 22,578 | ||||||
|
Increase (decrease) in taxes resulting from: |
||||||||||||
|
State income taxes, net of federal income tax benefit |
2,716 | 6,261 | 2,732 | |||||||||
|
Tax effect in jurisdictions where rates differ from statutory rate |
841 | 1,195 | 1,837 | |||||||||
|
Other, net |
(873 | ) | (39 | ) | 1,461 | |||||||
|
Income tax expense |
$ | 20,834 | $ | 32,396 | $ | 28,608 | ||||||
Our effective tax rate in fiscal 2025 was 24.1%. Our effective tax rate in our fiscal 2024 year was 27.2% and our effective tax rate in fiscal 2023 was 26.6%.
Deferred tax assets and liabilities consist of the following:
|
Fiscal year ended |
||||||||
|
September 27, |
September 28, |
|||||||
|
2025 |
2024 |
|||||||
|
(in thousands) |
||||||||
|
Deferred tax assets: |
||||||||
|
Vacation accrual |
$ | 1,075 | $ | 1,037 | ||||
|
Capital loss carry forwards |
221 | 229 | ||||||
|
Unrealized gains/losses |
286 | 298 | ||||||
|
Accrued insurance liability |
2,961 | 4,071 | ||||||
|
Operating lease liabilities |
40,337 | 42,542 | ||||||
|
Deferred income |
17 | 30 | ||||||
|
Allowances |
2,752 | 2,805 | ||||||
|
Inventory capitalization |
691 | 1,850 | ||||||
|
Share-based compensation |
2,348 | 1,960 | ||||||
|
Net operating loss |
1,301 | 2,112 | ||||||
|
Bonus accrual |
1,796 | 2,497 | ||||||
|
Foreign tax credit |
160 | 185 | ||||||
|
Total deferred tax assets |
53,945 | 59,616 | ||||||
|
Valuation allowance |
(507 | ) | (527 | ) | ||||
|
Total deferred tax assets, net |
53,438 | 59,089 | ||||||
|
Deferred tax liabilities: |
||||||||
|
Amortization of goodwill and other intangible assets |
39,716 | 38,842 | ||||||
|
Depreciation of property, plant and equipment |
67,680 | 67,073 | ||||||
|
Right-of-use assets |
37,745 | 40,563 | ||||||
|
Accounting method change 481(a) |
- | 435 | ||||||
|
Total deferred tax liabilities |
145,141 | 146,913 | ||||||
|
Total deferred tax liabilities, net |
$ | 91,703 | $ | 87,824 | ||||
As of September 27, 2025, we have a federal net operating loss carry forward of approximately $1.4 million from the PHILLY SWIRL acquisition. These carry forwards are subject to an annual limitation under Code Section 382 of approximately $0.4 million and will expire in 2033. We have determined there are no limitations to the total use of this tax asset and accordingly, have not recorded a valuation allowance for this deferred tax asset. Additionally, as of September 27, 2025, we have federal and state capital loss carryforwards of approximately $0.8 million primarily from the sale of marketable securities in fiscal year 2017 and unrealized losses incurred in fiscal years 2019 and 2020. These carry forwards began to expire in 2021. Except for current year usage, we have no foreseeable capital gains that would allow us to use this asset. Accordingly, we have recorded a valuation allowance for the full amount of this deferred tax asset.
We have undistributed earnings of our Mexican and Canadian subsidiaries. We are no longer permanently reinvested in earnings of our foreign subsidiaries for any year. No material amount of additional U.S. federal income taxes is anticipated if our undistributed earnings in our Mexican and Canadian subsidiaries were repatriated to the U.S. However, if such funds were repatriated, it would not be a material amount, as a substantial amount, if not all of the earnings, are expected to be used in the respective foreign jurisdiction for business operations. The portion of funds that may be repatriated may be subject to a minimal amount of applicable federal and state income taxes and non-U.S. income and withholding taxes. The amount of unrecognized deferred income tax liabilities related to potential federal and state income taxes and foreign withholding taxes is immaterial.
We have closely monitored the development of Pillar Two – Global Minimum Tax – introduced by the Organization for Economic Co-operation and Development (“OECD”) and the impact on the Company’s effective tax rate. While we do not currently estimate a material impact on our consolidated financial statements, we will continue to monitor the impact as countries implement legislation and the OECD provides additional guidance.
On August 16, 2022, the Inflation Reduction Act of 2022 (“IRA”) was signed into law. The IRA made several changes to the U.S. tax code effective after December 31, 2022, including, but not limited to, a 15% minimum tax on large corporations with average annual financial statement income of more than $1 billion for a three tax-year period and a 1% excise tax on public company stock buybacks, which will be accounted for in treasury stock. We do not expect these changes to have a material impact on our provision for income taxes or financial statements.
On July 4, 2025, the United States government enacted into law the One Big Beautiful Act (the “OBBBA”). The OBBBA includes a broad range of tax reform provisions affecting businesses. The legislation has multiple effective dates, with certain provisions effective in 2025 and others implemented through 2027. The legislation did not have a material impact on fiscal 2025 effective rate or consolidated financial statements. We will continue to review the OBBBA tax provisions to assess impacts to our consolidated financial statements.
NOTE H ‑ COMMITMENTS AND CONTINGENCIES
We are a party to litigation which has arisen in the normal course of business which management currently believes will not have a material adverse effect on our financial condition or results of operations.
We self-insure, up to loss limits, certain insurable risks such as workers’ compensation, automobile, and general liability claims. Accruals for claims under our self-insurance program are recorded on a claims incurred basis. Our total recorded liability for all years’ claims incurred but not yet paid was $14.4 million and $15.3 million at September 27, 2025 and September 28, 2024, respectively. In connection with certain self-insurance agreements, we customarily enter into letters of credit arrangements with our insurers. At both September 27, 2025, and September 28, 2024, we had outstanding letters of credit totaling $14.8 million, and $12.3 million, respectively.
We have a self-insured medical plan which covers approximately 1,800 of our employees. We record a liability for incurred but not yet reported or paid claims based on our historical experience of claims payments and a calculated lag time. Our recorded liability at September 27, 2025 and September 28, 2024 was $2.2 million and $1.6 million, respectively.
On August 19, 2024, we experienced a fire at our Holly Ridge plant in North Carolina. The building was damaged as a result of the fire, and plant operations were interrupted. We maintain property, general liability and business interruption insurance coverage. Based on the provisions of our insurance policies, we record estimated insurance recoveries for fire related costs for which recovery is deemed to be probable.
In the fiscal year ended September 28, 2024, we recorded $6.8 million of fire related costs, for all of which recovery was deemed to be probable, and we received $5.0 million of insurance proceeds for inventory, fixed asset losses, and other fire related costs. Additionally, we recorded an insurance receivable, net of advance proceeds received, for other fire related costs for which recovery was deemed probable of $1.8 million, which was recorded in prepaid expenses and other, in the Consolidated Balance Sheet as of September 28, 2024.
In the fiscal year ended September 27, 2025, we recorded an additional $10.4 million of fire related costs, respectively, for all of which recovery was deemed to be probable. In the fiscal year ended September 27, 2025, we received $26.6 million of insurance proceeds, respectively, for inventory, fixed asset replacement costs, and business interruption losses.
Cumulative fire related costs through September 27, 2025 were $17.2 million, for all of which insurance proceeds have been received. Cumulative Insurance proceeds as of September 27, 2025 were $31.6 million for inventory, fixed asset replacement costs, and business interruption losses. Of the $31.6 million insurance proceeds received through September 27, 2025, $10.6 million was recognized in the fiscal year ended September 27, 2025, representing gains on insurance proceeds received for damage to property, plant, and equipment. Additionally, for the fiscal year ended September 27, 2025, we recorded a gain of $3.7 million in cost of goods sold in the Consolidated Statement of Earnings representing the proceeds received in excess of operating losses recognized. There was no insurance receivable, net of advance proceeds received, for other fire related costs for which recovery was deemed probable in the Consolidated Balance Sheet as of September 27, 2025.
NOTE I – EQUITY
Capital Stock
We have, issued and outstanding, one class of capital stock, Common Stock. Holders of Common Stock are generally entitled to one vote per share on matters submitted to shareholders for approval. As of September 27, 2025, we had approximately 66 stockholders of record of our common stock.
Share Repurchases
On February 3, 2025, the Company announced that the Board of Directors authorized a share repurchase program (the “2025 Share Repurchase Program”) pursuant to which the Company could repurchase up to $50.0 million of the Company’s common stock, exclusive of any fees, commissions, and other expenses related to such repurchases. Under the 2025 Share Repurchase Program, the Company may repurchase its common stock from time to time, in amounts, at prices, and at such times as the Company deems appropriate, subject to market conditions, legal requirements, and other considerations. The Company’s repurchases may be executed using open market purchases, unsolicited or solicited privately negotiated transactions, or other transactions, and may be affected pursuant to trading plans intended to qualify under Rule 10b5-1 of the Securities Exchange Act of 1934, as amended. The 2025 Share Repurchase Program is effective for two years; however, the 2025 Share Repurchase Program does not obligate the Company to repurchase any specific number of shares and may be suspended, modified or terminated at any time without prior notice.
In fiscal year 2025, the Company repurchased 66,776 shares of common stock of the Company at an average price of $119.80 per share on the open market, pursuant to the share repurchase program. As of the date of the repurchase, the repurchased shares were retired and returned to the status of authorized but unissued shares of common stock.
|
Fiscal year ended |
||||||||||||
|
September 27, |
September 28, |
September 30, |
||||||||||
|
2025 |
2024 |
2023 |
||||||||||
|
Shares repurchased (in thousands) |
67 | - | - | |||||||||
|
Average price per share |
$ | 119.80 | $ | - | $ | - | ||||||
|
Total investment (in thousands) |
$ | 8,000 | $ | - | $ | - | ||||||
As a result of the Company’s stock repurchases, there remains $42.0 million of share repurchase availability under the 2025 Share Repurchase Program as of September 27, 2025.
NOTE J – STOCK-BASED COMPENSATION
We have a Long-Term Incentive Plan (the “Plan”). Pursuant to the Plan, stock options, which qualify as incentive stock options as well as stock options which are nonqualified, restricted stock units, and performance awards may be granted to officers and our key employees.
The exercise price of incentive stock options is at least the fair market value of the common stock on the date of grant. The exercise price for nonqualified options is determined by a committee of the Board of Directors. The options are generally exercisable after three years and expire no later than ten years from date of grant. The fair value of each option grant is estimated on the date of grant using the Black-Scholes options-pricing model. Forfeitures are recognized as they occur.
Performance awards may include (i) specific dollar-value target awards, (ii) performance units, or (iii) performance shares. The vesting of performance-based awards, if any, is dependent upon the achievement of certain performance targets. If the performance standards are not achieved, all unvested units will expire, and any accrued expense will be reversed. The fair value of the grant is determined based upon the closing price of the Company’s stock on the date of grant.
There are approximately 509,000 shares reserved under the Plan for which options, restricted stock units, and performance awards have not yet been issued. There are options that were issued under prior option plans that have since been replaced that are still outstanding.
We have an Employee Stock Purchase Plan (“ESPP”) whereby employees purchase stock by making contributions through payroll deductions for six-month periods. The purchase price of the stock is 85% of the lower of the market price of the stock at the beginning of the six-month period or the end of the six-month period. In fiscal years 2025, 2024, and 2023 employees purchased 22,295, 18,243 and 17,231 shares at average purchase prices of $110.22, $140.15, and $121.53, respectively. ESPP expense of $0.4 million, $0.5 million, and $0.6 million was recognized for fiscal years 2025, 2024, and 2023, respectively.
Stock Options
A summary of the status of our stock option plans as of fiscal years 2025, 2024, and 2023 and the changes during the years ended on those dates is represented below:
|
Incentive Stock Options |
Nonqualified Stock Options |
|||||||||||||||
|
Weighted- |
Weighted- |
|||||||||||||||
|
Stock |
Average |
Stock |
Average |
|||||||||||||
|
Options |
Exercise |
Options |
Exercise |
|||||||||||||
|
Outstanding |
Price |
Outstanding |
Price |
|||||||||||||
|
Balance, September 24, 2022 |
433,359 | 146.98 | 228,318 | 132.29 | ||||||||||||
|
Granted |
- | - | - | - | ||||||||||||
|
Exercised |
(83,401 | ) | 140.30 | (11,294 | ) | 137.81 | ||||||||||
|
Canceled |
(78,137 | ) | 143.96 | (5,646 | ) | 153.04 | ||||||||||
|
Balance, September 30, 2023 |
271,821 | 147.45 | 211,378 | 140.79 | ||||||||||||
|
Granted |
- | - | - | - | ||||||||||||
|
Exercised |
(53,300 | ) | 144.24 | (50,247 | ) | 122.16 | ||||||||||
|
Canceled |
(58,470 | ) | 158.50 | (15,158 | ) | 161.87 | ||||||||||
|
Balance, September 28, 2024 |
160,051 | 144.49 | 145,973 | 145.01 | ||||||||||||
|
Granted |
- | - | - | - | ||||||||||||
|
Exercised |
(12,348 | ) | 145.39 | (5,720 | ) | 142.47 | ||||||||||
|
Canceled |
(28,082 | ) | 137.25 | (21,597 | ) | 120.24 | ||||||||||
|
Balance, September 27, 2025 |
119,621 | 146.10 | 118,656 | 149.64 | ||||||||||||
|
Exercisable Options September 27, 2025 |
119,621 | 146.10 | 118,656 | 149.64 | ||||||||||||
There were no incentive stock option grants in fiscal years 2025, 2024 or 2023. There were no non-qualified stock options grants in fiscal years 2025, 2024 or 2023. The total intrinsic value of stock options exercised was $0.4 million, $3.4 million and $2.1 million in fiscal years 2025, 2024, and 2023, respectively. Exercisable options as of September 27, 2025 had no intrinsic value.
The total cash received from these option exercises was $2.3 million, $13.2 million and $13.1 million in fiscal years 2025, 2024, and 2023, respectively; and the actual tax benefit realized from the tax deductions from these option exercises was $0.1 million, $0.6 million and $0.1 million in fiscal years 2025, 2024, and 2023, respectively.
At September 27, 2025, the Company does not have any unrecognized compensation expense related to stock options to be recognized over the next fiscal year.
The following table summarizes information about incentive stock options outstanding as of September 27, 2025:
|
Options Outstanding |
Options Exercisable |
||||||||||||||||||||||||
|
Number |
Weighted- |
Number |
Weighted- |
||||||||||||||||||||||
|
Outstanding |
Average |
Weighted- |
Outstanding |
Average |
Weighted- |
||||||||||||||||||||
|
at |
Remaining |
Average |
at |
Remaining |
Average |
||||||||||||||||||||
|
Range of |
September 27, |
Contractual |
Exercise |
September 27, |
Contractual |
Exercise |
|||||||||||||||||||
|
Exercise Prices |
2025 |
Life |
Price |
2025 |
Life |
Price |
|||||||||||||||||||
| $132.38 | - | $165.56 | 119,621 | 1.3 | $ | 146.10 | 119,621 | 1.3 | $ | 146.10 | |||||||||||||||
|
Total options |
119,621 | 119,621 | 146.10 | ||||||||||||||||||||||
The following table summarizes information about nonqualified stock options outstanding as of September 27, 2025:
|
Options Outstanding |
Options Exercisable |
||||||||||||||||||||||||
|
Number |
Weighted- |
Number |
Weighted- |
||||||||||||||||||||||
|
Outstanding |
Average |
Weighted- |
Outstanding |
Average |
Weighted- |
||||||||||||||||||||
|
at |
Remaining |
Average |
at |
Remaining |
Average |
||||||||||||||||||||
|
Range of |
September 27, |
Contractual |
Exercise |
September 27, |
Contractual |
Exercise |
|||||||||||||||||||
|
Exercise Prices |
2025 |
Life |
Price |
2025 |
Life |
Price |
|||||||||||||||||||
| $119.44 | - | $132.38 | 48,030 | 1.5 | $ | 126.54 | 48,030 | 1.5 | $ | 126.54 | |||||||||||||||
| $150.89 | - | $191.40 | 70,626 | 0.3 | $ | 165.35 | 70,626 | 0.3 | $ | 165.35 | |||||||||||||||
|
Total options |
118,656 | 118,656 | 149.64 | ||||||||||||||||||||||
Restricted Stock Units
A summary of our service share units (“RSU”)’s as of fiscal years 2025, 2024, and 2023 and the changes during the years ended on those dates is represented below.
|
Weighted- |
||||||||||||||||
|
Average |
||||||||||||||||
|
Number of |
Grant-Date |
Weighted- |
||||||||||||||
|
Restricted |
Fair Value |
Average Remaining |
Aggregate |
|||||||||||||
|
Stock Units |
Per Share |
Contractual Life |
Intrinsic Value |
|||||||||||||
|
(in thousands) |
||||||||||||||||
|
Nonvested at September 24, 2022 |
9,200 | 154.85 | 2.1 | |||||||||||||
|
Granted |
21,864 | 154.32 | ||||||||||||||
|
Vested |
(3,165 | ) | 154.94 | |||||||||||||
|
Canceled |
- | - | ||||||||||||||
|
Nonvested at September 30, 2023 |
27,899 | 154.46 | 2.2 | |||||||||||||
|
Granted |
25,957 | 166.10 | ||||||||||||||
|
Vested |
(6,390 |
) |
155.26 | |||||||||||||
|
Canceled |
(2,270 | ) | 158.14 | |||||||||||||
|
Nonvested at September 28, 2024 |
45,196 | 157.32 | 1.9 | |||||||||||||
|
Granted |
34,868 | 139.97 | ||||||||||||||
|
Vested |
(12,748 | ) | 161.92 | |||||||||||||
|
Canceled |
(4,118 | ) | 158.57 | |||||||||||||
|
Nonvested at September 27, 2025 |
63,198 | 150.33 | 1.8 | 6,042 | ||||||||||||
As of September 27, 2025, the Company has unrecognized compensation expense of approximately $4.3 million related to the RSU’s.
Performance Share Units
A summary of our performance share units (“PSU”)’s as of fiscal years 2025, 2024, and 2023 and the changes during the years ended on those dates is represented below. The shares are represented at the target award amounts based upon the respective performance share agreements. Actual shares that will vest depend on the level of attainment of the performance-based criteria.
|
Weighted- |
||||||||||||||||
|
Average |
||||||||||||||||
|
Number of |
Grant-Date |
Weighted- |
||||||||||||||
|
Performance |
Fair Value |
Average Remaining |
Aggregate |
|||||||||||||
|
Share Units |
Per Share |
Contractual Life |
Intrinsic Value |
|||||||||||||
|
(in thousands) |
||||||||||||||||
|
Nonvested at September 24, 2022 |
8,868 | 155.01 | 2.1 | |||||||||||||
|
Granted |
21,260 | 155.29 | ||||||||||||||
|
Vested |
- | - | ||||||||||||||
|
Canceled |
(8,868 | ) | - | |||||||||||||
|
Nonvested at September 30, 2023 |
21,260 | 155.29 | 2.2 | |||||||||||||
|
Granted |
14,476 | 167.44 | ||||||||||||||
|
Vested |
- | - | ||||||||||||||
|
Canceled (1) |
(4,752 |
) |
163.28 | |||||||||||||
|
Nonvested at September 28, 2024 |
30,984 | 160.47 | 1.6 | |||||||||||||
|
Granted |
17,500 | 157.01 | ||||||||||||||
|
Vested |
- | - | ||||||||||||||
|
Canceled (1) |
(12,827 | ) | 159.41 | |||||||||||||
|
Nonvested at September 27, 2025 |
35,657 | 159.17 | 1.1 | 3,409 | ||||||||||||
|
(1) Includes adjustments for performance achievement. |
As of September 27, 2025, the Company has unrecognized compensation expense of approximately $1.6 million related to the PSU’s.
NOTE K – 401(k) PROFIT‑SHARING PLAN
We maintain a 401(k) profit-sharing plan for our employees. Under this plan, we may make discretionary profit sharing and matching 401(k) contributions. Contributions of $3.2 million, $3.2 million, and $2.8 million were made in fiscal years 2025, 2024, and 2023, respectively.
NOTE L – CASH FLOW INFORMATION
The following is supplemental cash flow information:
|
Fiscal year ended |
||||||||||||
|
September 27, |
September 28, |
September 30, |
||||||||||
|
2025 |
2024 |
2023 |
||||||||||
|
(in thousands) |
||||||||||||
|
Cash paid for: |
||||||||||||
|
Interest |
$ | 1,496 | $ | 1,787 | $ | 4,745 | ||||||
|
Income taxes |
17,991 | 26,923 | 8,617 | |||||||||
|
Non cash items: |
||||||||||||
|
Obtaining a right-of-use asset in exchange for a lease liability |
$ | 28,969 | $ | 84,565 | $ | 54,050 | ||||||
NOTE M – SEGMENT REPORTING
Our financial results are presented as three reportable segments: Food Service, Retail Supermarkets and Frozen Beverages. These segments are described below:
Food Service
The primary products sold by the Food Service segment are soft pretzels, frozen novelties, churros, handheld products and baked goods. Our customers in the Food Service segment include snack bars and food stands in chain, department and discount stores; malls and shopping centers; casual dining restaurants; fast food and casual dining restaurants; stadiums and sports arenas; leisure and theme parks; convenience stores; movie theatres; warehouse club stores; schools, colleges and other institutions. Within the food service industry, our products are purchased by the consumer primarily for consumption at the point-of-sale or for take-away.
Retail Supermarkets
The primary products sold to the retail supermarket channel are soft pretzel products – including SUPERPRETZEL and AUNTIE ANNE’S, frozen novelties including LUIGI’S Real Italian Ice, MINUTE MAID Juice Bars and Soft Frozen Lemonade, WHOLE FRUIT frozen fruit bars and sorbet, DOGSTERS ice cream style treats for dogs, PHILLY SWIRL cups and sticks, ICEE Squeeze-Up Tubes and handheld products.
Frozen Beverages
We sell frozen beverages to the foodservice industry primarily under the names ICEE, SLUSH PUPPIE and PARROT ICE in the United States, Mexico and Canada. We also provide repair and maintenance services to customers for customer-owned equipment.
We principally sell our products to the food service and retail supermarket industries. Sales and results of our frozen beverages business are monitored separately from the balance of our food service business because of different distribution and capital requirements. We maintain separate and discrete financial information for the three operating segments mentioned above which is available to our Chief Operating Decision Maker, who is our Chief Executive Officer. We have applied no aggregation criteria to any of these operating segments in order to determine reportable segments. All inter-segment net sales and expenses have been eliminated in computing net sales and operating income.
Our Chief Operating Decision Maker reviews monthly detailed operating income statements and sales reports in order to assess performance and allocate resources to each individual segment. Sales and operating income are key variables monitored by the Chief Operating Decision Maker when determining each segment and the company’s financial condition and operating performance.
Significant expenses are expenses which are regularly provided to the Chief Operating Decision Maker and are included in segment operating income. These consist of cost of sales, marketing and selling expenses, distribution expenses, administrative expenses, intangible asset impairment charges, and other general expenses. Cost of sales includes raw materials, direct labor and plant overhead costs. Distribution expenses include costs associated with the transportation of our product to customers. Marketing and selling expenses include costs to execute sales to customers, and costs related to the selling, marketing, advertising and promotional activities. Administrative expenses include costs that are not directly tied to the manufacturing, distribution, or marketing and selling of our products.
Costs that are directly attributable to our Food Service, Retail Supermarkets, or Frozen Beverages segments are charged directly to the appropriate segment. Costs that are deemed to be indirect, excluding unallocated corporate expenses and other unusual significant transactions such as gain on insurance proceeds received for damage to property, plant and equipment, and plant closure expenses, are allocated to the three reportable segments using a reasonable methodology that is consistently applied.
To align with how our Chief Operating Decision Maker currently reviews the monthly detailed operating income statements, we have reclassified certain corporate expenses that are not allocated to our three reportable segments. This change in presentation resulted in an increase to our Food Service segment operating income of $24.8 million, to our Retail segment operating income of $2.6 million, and to our Frozen Beverages segment of $1.5 million in fiscal 2024, respectively, and an increase to our Food Service segment operating income of $23.0 million, to our Retail segment operating income of $2.4 million, and to our Frozen Beverages segment of $1.5 million in fiscal 2023, respectively, with the corresponding impacts of the presentation change seen within General corporate expenses in the table below.
In addition, the Chief Operating Decision Maker reviews and evaluates capital spending of each segment on a quarterly basis to monitor cash flow and asset needs of each segment. Additionally, our Chief Operating Decision Maker considers variances of actual performance to our annual operating plan and periodic forecasts when making decisions.
Information regarding the operations in these three reportable segments is as follows:
|
For the year ended September 27, 2025 |
||||||||||||||||
|
(in thousands) |
||||||||||||||||
|
Food |
Retail |
Frozen |
||||||||||||||
|
Service |
Supermarket |
Beverages |
Total |
|||||||||||||
|
Net sales to external customers |
$ | 1,001,361 | $ | 213,809 | $ | 368,063 | $ | 1,583,233 | ||||||||
|
Less: |
||||||||||||||||
|
Cost of goods sold |
718,075 | 152,953 | 242,323 | 1,113,351 | ||||||||||||
|
Segment gross profit |
283,286 | 60,856 | 125,740 | 469,882 | ||||||||||||
|
Marketing and selling |
67,695 | 18,607 | 37,304 | 123,606 | ||||||||||||
|
Distribution |
117,874 | 25,246 | 25,185 | 168,305 | ||||||||||||
|
Administrative |
31,313 | 2,928 | 13,682 | 47,923 | ||||||||||||
| Intangible asset impairment charges | 1,500 | 757 | - | 2,257 | ||||||||||||
|
Other general expense |
110 | - | 40 | 150 | ||||||||||||
|
Segment operating income |
64,794 | 13,318 | 49,529 | 127,641 | ||||||||||||
|
General corporate expenses |
29,864 | |||||||||||||||
|
Gain on insurance proceeds received for damage to property, plant, and equipment |
(10,622 | ) | ||||||||||||||
|
Plant closure expense |
24,073 | |||||||||||||||
|
Operating income |
$ | 84,326 | ||||||||||||||
|
For the year ended September 28, 2024 |
||||||||||||||||
|
(in thousands) |
||||||||||||||||
|
Food |
Retail |
Frozen |
||||||||||||||
|
Service |
Supermarket |
Beverages |
Total |
|||||||||||||
|
Net sales to external customers |
$ | 985,195 | $ | 221,308 | $ | 368,252 | $ | 1,574,755 | ||||||||
|
Less: |
||||||||||||||||
|
Cost of goods sold |
696,139 | 155,580 | 236,911 | 1,088,630 | ||||||||||||
|
Segment gross profit |
289,056 | 65,728 | 131,341 | 486,125 | ||||||||||||
|
Marketing and selling |
64,070 | 18,622 | 36,113 | 118,805 | ||||||||||||
|
Distribution |
123,373 | 25,718 | 26,510 | 175,601 | ||||||||||||
|
Administrative |
27,851 | 2,196 | 15,867 | 45,914 | ||||||||||||
| Intangible asset impairment charges | - | - | - | - | ||||||||||||
|
Other general expense |
(452 | ) | - | (145 | ) | (597 | ) | |||||||||
|
Segment operating income |
74,214 | 19,192 | 52,996 | 146,402 | ||||||||||||
|
General corporate expenses |
28,857 | |||||||||||||||
|
Gain on insurance proceeds received for damage to property, plant, and equipment |
- | |||||||||||||||
|
Plant closure expense |
- | |||||||||||||||
|
Operating income |
$ | 117,545 | ||||||||||||||
|
For the year ended September 30, 2023 |
||||||||||||||||
|
(in thousands) |
||||||||||||||||
|
Food |
Retail |
Frozen |
||||||||||||||
|
Service |
Supermarket |
Beverages |
Total |
|||||||||||||
|
Net sales to external customers |
$ | 981,840 | $ | 215,428 | $ | 361,561 | $ | 1,558,829 | ||||||||
|
Less: |
||||||||||||||||
|
Cost of goods sold |
698,603 | 154,504 | 235,857 | 1,088,964 | ||||||||||||
|
Segment gross profit |
283,237 | 60,924 | 125,704 | 469,865 | ||||||||||||
|
Marketing and selling |
55,929 | 18,523 | 35,806 | 110,258 | ||||||||||||
|
Distribution |
120,106 | 28,164 | 24,534 | 172,804 | ||||||||||||
|
Administrative |
32,662 | 2,354 | 13,480 | 48,496 | ||||||||||||
| Intangible asset impairment charges | 1,678 | - | - | 1,678 | ||||||||||||
|
Other general expense |
53 | 88 | 41 | 182 | ||||||||||||
|
Segment operating income |
72,809 | 11,795 | 51,843 | 136,447 | ||||||||||||
|
General corporate expenses |
26,929 | |||||||||||||||
|
Gain on insurance proceeds received for damage to property, plant, and equipment |
- | |||||||||||||||
|
Plant closure expense |
- | |||||||||||||||
|
Operating income |
$ | 109,518 | ||||||||||||||
Total depreciation and amortization expense, capital expenditures, and total assets by segment, reflecting our current segment structure for all periods presented, were:
|
September 27, |
September 28, |
September 30, |
||||||||||
|
2025 |
2024 |
2023 |
||||||||||
|
(52 weeks) |
(52 weeks) |
(53 weeks) |
||||||||||
|
(in thousands) |
||||||||||||
|
Depreciation and amortization: |
||||||||||||
|
Food Service |
$ | 48,099 | $ | 44,280 | $ | 37,777 | ||||||
|
Retail Supermarket |
1,145 | 1,736 | 1,966 | |||||||||
|
Frozen Beverages |
22,244 | 22,734 | 21,417 | |||||||||
|
Corporate |
1,844 | 1,851 | 1,981 | |||||||||
|
Total depreciation and amortization |
$ | 73,332 | $ | 70,601 | $ | 63,141 | ||||||
|
Capital expenditures: |
||||||||||||
|
Food Service |
$ | 59,321 | $ | 45,535 | $ | 78,829 | ||||||
|
Retail Supermarket |
303 | 21 | 1,824 | |||||||||
|
Frozen Beverages |
23,176 | 27,421 | 23,525 | |||||||||
|
Corporate |
73 | 592 | 559 | |||||||||
|
Total capital expenditures |
$ | 82,873 | $ | 73,569 | $ | 104,737 | ||||||
|
Assets: |
||||||||||||
|
Food Service |
$ | 961,092 | $ | 954,747 | $ | 885,017 | ||||||
|
Retail Supermarket |
30,327 | 34,609 | 34,232 | |||||||||
|
Frozen Beverages |
364,473 | 358,892 | 339,486 | |||||||||
|
Corporate |
25,609 | 16,853 | 18,501 | |||||||||
|
Total assets |
$ | 1,381,501 | $ | 1,365,101 | $ | 1,277,236 | ||||||
Geographic data for net sales (recognized in the countries where products were sold from) and total assets were:
|
September 27, |
September 28, |
September 30, |
||||||||||
|
2025 |
2024 |
2023 |
||||||||||
|
(52 weeks) |
(52 weeks) |
(53 weeks) |
||||||||||
|
(in thousands) |
||||||||||||
|
Net sales to external customers: |
||||||||||||
|
United States |
$ | 1,513,585 | $ | 1,501,326 | $ | 1,488,622 | ||||||
|
Other |
69,648 | 73,429 | 70,207 | |||||||||
|
Total net sales to external customers |
$ | 1,583,233 | $ | 1,574,755 | $ | 1,558,829 | ||||||
|
Assets: |
||||||||||||
|
United States |
$ | 1,302,387 | $ | 1,297,531 | $ | 1,215,744 | ||||||
|
Other |
79,114 | 67,570 | 61,492 | |||||||||
|
Total assets |
$ | 1,381,501 | $ | 1,365,101 | $ | 1,277,236 | ||||||
Net sales by product category, reflecting our current segment structure for all periods presented, were:
|
September 27, |
September 28, |
September 30, |
||||||||||
|
2025 |
2024 |
2023 |
||||||||||
|
(52 weeks) |
(52 weeks) |
(53 weeks) |
||||||||||
|
(in thousands) |
||||||||||||
|
Sales to external customers: |
||||||||||||
|
Food Service |
||||||||||||
|
Soft pretzels |
$ | 230,070 | $ | 222,237 | $ | 235,572 | ||||||
|
Frozen novelties |
149,884 | 147,995 | 145,425 | |||||||||
|
Churros |
97,867 | 114,306 | 108,927 | |||||||||
|
Handhelds |
92,018 | 86,053 | 82,292 | |||||||||
|
Bakery |
405,909 | 387,129 | 378,149 | |||||||||
|
Other |
25,613 | 27,475 | 31,475 | |||||||||
|
Total Food Service |
$ | 1,001,361 | $ | 985,195 | $ | 981,840 | ||||||
|
Retail Supermarket |
||||||||||||
|
Soft pretzels |
$ | 61,713 | $ | 61,744 | $ | 60,272 | ||||||
|
Frozen novelties |
110,286 | 112,192 | 115,807 | |||||||||
|
Biscuits |
23,123 | 24,229 | 25,074 | |||||||||
|
Handhelds |
21,578 | 26,253 | 16,655 | |||||||||
|
Coupon redemption |
(2,707 | ) | (3,162 | ) | (2,561 | ) | ||||||
|
Other |
(184 | ) | 52 | 181 | ||||||||
|
Total Retail Supermarket |
$ | 213,809 | $ | 221,308 | $ | 215,428 | ||||||
|
Frozen Beverages |
||||||||||||
|
Beverages |
$ | 219,312 | $ | 230,030 | $ | 224,655 | ||||||
|
Repair and maintenance service |
97,392 | 96,589 | 95,941 | |||||||||
|
Machines revenue |
47,807 | 38,188 | 37,933 | |||||||||
|
Other |
3,552 | 3,445 | 3,032 | |||||||||
|
Total Frozen Beverages |
$ | 368,063 | $ | 368,252 | $ | 361,561 | ||||||
|
Consolidated sales |
$ | 1,583,233 | $ | 1,574,755 | $ | 1,558,829 | ||||||
NOTE N - ACCUMULATED OTHER COMPREHENSIVE LOSS
Changes to the components of accumulated other comprehensive loss are as follows:
|
Fiscal year ended |
||||||||
|
September 27, |
September 28, |
|||||||
|
2025 |
2024 |
|||||||
|
(in thousands) |
||||||||
|
Foreign currency translation adjustments |
||||||||
|
Beginning balance |
$ | (15,299 | ) | $ | (10,166 | ) | ||
|
Foreign currency translation adjustment gain (loss) |
2,652 | (5,133 | ) | |||||
|
Ending balance |
$ | (12,647 | ) | $ | (15,299 | ) | ||
|
Accumulated other comprehensive loss |
$ | (12,647 | ) | $ | (15,299 | ) | ||
NOTE O – LEASES
General Lease Description
We have operating leases with initial noncancelable lease terms in excess of one year covering the rental of various facilities and equipment. Certain of these leases contain renewal options and some provide options to purchase during the lease term. Our operating leases include leases for real estate from some of our office, warehouse, and manufacturing facilities as well as manufacturing and non-manufacturing equipment used in our business. The remaining lease terms for these operating leases range from 1 month to 18 years.
We have finance leases with initial noncancelable lease terms in excess of one year covering the rental of various equipment. These leases are generally for manufacturing and non-manufacturing equipment used in our business. The remaining lease terms for these finance leases range from 1 year to 6 years.
Significant Assumptions and Judgments
Contract Contains a Lease
In evaluating our contracts to determine whether a contract is or contains a lease, we considered the following:
|
● |
Whether explicitly or implicitly identified assets have been deployed in the contract; and |
|
● |
Whether we obtain substantially all of the economic benefits from the use of that underlying asset and whether we can direct how and for what purpose the asset is used during the term of the contract. |
Allocation of Consideration
In determining how to allocate consideration between lease and non-lease components in a contract that was deemed to contain a lease, we used judgment and consistent application of assumptions to reasonably allocate the consideration.
Options to Extend or Terminate Leases
We have leases which contain options to extend or terminate the leases. On a lease-by-lease basis, we have determined if the extension should be considered reasonably certain to be exercised and thus a right-of-use asset and a lease liability should be recorded.
Discount Rate
The discount rate for leases, if not explicitly stated in the lease, is the incremental borrowing rate, which is the rate of interest that a lessee would have to pay to borrow on a collateralized basis over a similar term an amount equal to the lease payments in a similar economic environment.
We used a discount rate to calculate the present value of the lease liability at the date of adoption. In the development of the discount rate, we considered our internal borrowing rate, treasury security rates, collateral, and credit risk specific to us, and our lease portfolio characteristics.
As of September 27, 2025, the weighted-average discount rate of our operating and finance leases was 5.2% and 4.1%, respectively. As of September 28, 2024, the weighted-average discount rate of our operating and finance leases was 5.2% and 4.0%, respectively.
Amounts Recognized in the Financial Statements
The components of lease expense were as follows (in thousands):
|
Fiscal year ended |
Fiscal year ended |
|||||||
|
September 27, 2025 |
September 28, 2024 |
|||||||
|
Operating lease cost in Cost of goods sold and Operating expenses |
$ | 31,354 | $ | 27,646 | ||||
|
Finance lease cost: |
||||||||
|
Amortization of assets in Cost of goods sold and Operating expenses |
$ | 204 | $ | 159 | ||||
|
Interest on lease liabilities in Interest expense & other |
85 | 30 | ||||||
|
Total finance lease cost |
$ | 289 | $ | 189 | ||||
|
Short-term lease cost in Cost of goods sold and Operating expenses |
- | - | ||||||
|
Total net lease cost |
$ | 31,643 | $ | 27,835 | ||||
Supplemental balance sheet information related to leases is as follows (in thousands):
|
September 27, 2025 |
September 28, 2024 |
|||||||
|
Operating Leases |
||||||||
|
Operating lease right-of-use assets |
$ | 151,538 | $ | 152,383 | ||||
|
Current operating lease liabilities |
$ | 21,624 | $ | 19,063 | ||||
|
Noncurrent operating lease liabilities |
140,021 | 140,751 | ||||||
|
Total operating lease liabilities |
$ | 161,645 | $ | 159,814 | ||||
|
Finance Leases |
||||||||
|
Finance lease right-of-use assets in Property, plant and equipment, net |
$ | 2,493 | $ | 601 | ||||
|
Current finance lease liabilities |
$ | 563 | $ | 243 | ||||
|
Noncurrent finance lease liabilities |
1,355 | 445 | ||||||
|
Total finance lease liabilities |
$ | 1,918 | $ | 688 | ||||
Supplemental cash flow information related to leases is as follows (in thousands):
|
Fiscal year ended |
Fiscal year ended |
|||||||
|
September 27, 2025 |
September 28, 2024 |
|||||||
|
Cash paid for amounts included in the measurement of lease liabilities: |
||||||||
|
Operating cash flows from operating leases |
$ | 30,115 | $ | 25,784 | ||||
|
Operating cash flows from finance leases |
$ | 85 | $ | 30 | ||||
|
Financing cash flows from finance leases |
$ | 238 | $ | 151 | ||||
|
Supplemental noncash information on lease liabilities arising from obtaining right-of-use assets |
$ | 28,969 | $ | 84,565 | ||||
|
Supplemental noncash information on lease liabilities removed due to purchase of leased asset |
$ | - | $ | - | ||||
As of September 27, 2025, the maturities of lease liabilities were as follows (in thousands):
|
Operating Leases |
Finance Leases |
|||||||
|
2026 |
$ | 28,931 | $ | 591 | ||||
|
2027 |
27,740 | 562 | ||||||
|
2028 |
23,698 | 379 | ||||||
|
2029 |
18,367 | 255 | ||||||
|
2030 |
12,962 | 239 | ||||||
|
Thereafter |
109,257 | 65 | ||||||
|
Total minimum payments |
220,955 | 2,091 | ||||||
|
Less amount representing interest |
(59,310 | ) | (173 | ) | ||||
|
Present value of lease obligations |
$ | 161,645 | $ | 1,918 | ||||
As of September 27, 2025 the weighted-average remaining term of our operating and finance leases was 11.4 years and 4.1 years, respectively.
As of September 28, 2024, the weighted-average remaining term of our operating and finance leases was 12.6 years and 3.6 years, respectively.
NOTE P – RELATED PARTIES
NFI Industries, Inc.
We have related party expenses for distribution and shipping related costs with NFI Industries, Inc. and its affiliated entities (“NFI”). Our director, Sidney R. Brown, is CEO and an owner of NFI Industries, Inc.
The payments to NFI were as follows:
|
Fiscal year ended |
||||||||||||
|
September 27, |
September 28, |
September 30, |
||||||||||
|
2025 |
2024 |
2023 |
||||||||||
|
(in millions) |
||||||||||||
|
Transportation management services payments (1) |
$ | 0.9 | $ | 1.0 | $ | 0.8 | ||||||
|
Labor management services payments (2) |
16.2 | 10.5 | 0.8 | |||||||||
|
Lease payments (3) |
1.9 | 1.8 | 0.2 | |||||||||
|
Pass through payments to third parties (4) |
52.4 | 55.7 | 54.1 | |||||||||
|
Total payment amount distributed to NFI |
$ | 71.4 | $ | 69.0 | $ | 55.9 | ||||||
|
(1) |
The Company is contracted with NFI for transportation management services, which involves the arrangement for the distribution of the Company's goods. This amount represents the payments for management fees associated with this service. |
|
(2) |
The Company is entered into a master service agreement with NFI for the operations and labor management of our three regional distribution centers. This amount represents the payments to NFI for services rendered under this contract. |
|
(3) |
In June 2023, the Company began leasing a regional distribution center in Terrell, Texas that was constructed by, and is owned by, a subsidiary of NFI. This amount represents the lease payments associated with the lease arrangement. At the lease commencement date, $28.7 million was recorded as an operating right-of-use asset, $0.2 million was recorded as a current operating lease liability, and $28.5 million was recorded as a non-current operating lease liability. As of September 27, 2025, $26.5 million was recorded as an operating right-of-use asset, $0.7 million was recorded as a current operating lease liability, and $27.4 million was recorded as a non-current operating lease liability. As of September 28, 2024, $27.4 million was recorded as an operating right-of-use asset, $0.6 million was recorded as a current operating lease liability, and $28.0 million was recorded as a non-current operating lease liability. |
|
(4) |
This amount represents passed through payments to third-party distribution and shipping vendors that are managed on the Company's behalf by NFI. |
As of September 27, 2025, and September 28, 2024, related party trade payables of approximately $3.2 million and $0.6 million, respectively, were recorded as accounts payable.
All agreements with NFI include terms that are consistent with those that we believe would have been negotiated at an arm’s length with an independent party.
AMC Global
We incur related party expenses for attitudinal and research services with AMC Global, a global marketing research company. The husband of our director, Marjorie Roshkoff, is CEO and owner of AMC Global. In the fiscal year ended September 27, 2025, the Company did not incur any expenses with AMC Global, and in the fiscal years ended September 28, 2024 and September 30, 2023, the Company paid AMC Global $76,500 and $113,500, respectively, for services.
Additionally, the Company pays board advisory consulting fees to the husband of our director, Marjorie Roshkoff. In each of the fiscal years 2025, 2024, and 2023, the Company paid $50,000 for these board advisory consulting fees.
NOTE Q – MANUFACTURING FACILITY CLOSURES AND DISPOSALS
During the fourth quarter of fiscal 2025, we announced the closure of two manufacturing facilities, our plant in Holly Ridge, North Carolina, and our plant in Atlanta, Georgia. In October 2025, we subsequently announced the closure of a third manufacturing facility, our plant in Colton, California. Production from these facilities will either be consolidated into various other facilities across our network, or it will be discontinued as part of our ongoing sales portfolio optimization. This consolidation was enabled by the investments we have made in our plants to modernize and expand capacity for our core products, as well as our investments made to build out our three regional distribution centers.
As a result of the plant closures, we recorded charges of $24.1 million in fiscal 2025. There were no plant closure expenses in fiscal 2024 or fiscal 2023. These costs are reported in the plant closure expense item within the Operating expenses section of the Consolidated Statements of Income. Included in the results for fiscal 2025 are $3.2 million of charges that have resulted or will result in cash outflows and $20.9 million in non-cash charges.
The manufacturing facility in Holly Ridge, NC produced handheld products for our Food Service and Retail Supermarket segments and ceased production on July 31, 2025. The closure costs for the facility totaled $14.9 million in fiscal 2025, including long-lived asset impairment charges of $14.4 million, severance and benefits costs of $0.3 million, and other exit and disposal costs of $0.2 million. These costs are reported in the plant closure expense item of the Consolidated Statements of Earnings. The long-lived asset impairment charges included a charge to write-down the value of a production line to its estimated fair value of $1.8 million. The estimate of fair value is categorized as level 3 within the fair value hierarchy. The key assumption used in the estimate of fair value was a third party offer to purchase the equipment, less estimated immaterial selling costs.
The manufacturing facility in Atlanta, GA produced bakery and biscuit products for our Food Service and Retail Supermarket segments and ceased production on September 27, 2025. The closure costs for the facility totaled $6.6 million in fiscal 2025, including long-lived asset impairment charges of $3.2 million, severance and benefit costs of $2.6 million, inventory write-offs of $0.6 million, and other exit and disposal costs of $0.2 million. These costs are reported in the plant closure expense item of the Consolidated Statements of Earnings.
The manufacturing facility in Colton, CA produces churro products for our Food Service and Retail Supermarket segments and will cease production in the first quarter of fiscal 2026. The closure costs for the plant totaled $2.6 million in fiscal 2025, including $1.2 million of long-lived asset impairment charges and $1.4 million of ROU impairment charges. These costs are reported in the plant closure expense item of the Consolidated Statements of Earnings.
The following table reflects our liability related to manufacturing facility closures as of September 27, 2025 (in thousands):
|
September 28, |
Plant closure |
Plant closure |
September 27, |
|||||||||||||
|
2024 |
expenses |
payments |
2025 |
|||||||||||||
|
Severance and benefits costs |
$ | - | $ | 2,918 | $ | (384 | ) | $ | 2,534 | |||||||
|
Other exit and disposal costs |
- | 300 | (182 | ) | 118 | |||||||||||
|
Total |
$ | - | $ | 3,218 | $ | (566 | ) | $ | 2,652 | |||||||
NOTE R – SUBSEQUENT EVENTS
In October 2025, we announced the closure of our manufacturing plant in Colton, California. The closure costs for the plant totaled $2.6 million in fiscal 2025, including $1.2 million of long-lived asset impairment charges and $1.4 million of ROU impairment charges. These costs are reported in the plant closure expense item of the Consolidated Statements of Earnings.
J & J SNACK FOODS CORP. AND SUBSIDIARIES
SCHEDULE II – VALUATION AND QUALIFYING ACCOUNTS
(in thousands)
|
Opening |
Charged to |
Closing |
||||||||||||||||
|
Year |
Description |
Balance |
Expense |
Deductions |
Balance |
|||||||||||||
|
2025 |
Allowance for estimated credit losses |
$ | 3,227 | $ | 485 | $ | 438 | (1) | $ | 3,274 | ||||||||
|
2024 |
Allowance for estimated credit losses |
$ | 3,182 | $ | 659 | $ | 614 | (1) | $ | 3,227 | ||||||||
|
2023 |
Allowance for estimated credit losses |
$ | 2,158 | $ | 1,428 | $ | 404 | (1) | $ | 3,182 | ||||||||
(1) Write-offs of uncollectible accounts receivable.
EXHIBIT 21.1 – SUBSIDIARIES OF J & J SNACK FOODS CORP.
|
Place of |
|
|
Incorporation |
|
|
J & J Snack Foods Investment Corp. |
Delaware |
|
The ICEE Company |
Delaware |
|
J & J Snack Foods Corp. of California |
California |
|
J & J Snack Foods Corp./Mia |
Pennsylvania |
|
J & J Snack Foods Corp. of Pennsylvania |
Pennsylvania |
|
J & J Snack Foods Sales Corp. |
New Jersey |
|
J & J Snack Foods Transport Corp. |
New Jersey |
|
ICEE-Canada, Inc. |
Canada |
|
ICEE de Mexico, S.A. De C.V. |
Mexico |
|
Bakers Best Snack Food Corp. |
Pennsylvania |
|
Pretzels, Inc. |
Texas |
|
Country Home Bakers, LLC |
Georgia |
|
ICEE of Hawaii, Inc. |
Hawaii |
|
DADDY RAY’S , Inc. |
Missouri |
|
J & J Snack Foods Handhelds Corp. |
Ohio |
|
New York Pretzel, LLC |
New York |
|
Philly’s Famous Water Ice, Inc. |
Florida |
EXHIBIT 21.1–SUBSIDIARIES OF J & J SNACK FOODS CORP - continued
|
Hill & Valley, Inc. |
Illinois |
|
ICEE International, B.V. |
Netherlands |
|
DD Acquisition Holdings, LLC |
Delaware |
|
Dippin’ Dots Holding, LLC |
Oklahoma |
|
Dippin’ Dots, LLC |
Oklahoma |
|
Dippin’ Dots Franchising, LLC |
Oklahoma |
|
Doc Popcorn Franchising, LLC |
Oklahoma |
|
Dippin’ Dots Australia |
Australia |
|
Dippin’ Dots International, LLC |
Australia |
|
Doc Popcorn, LLC |
Oklahoma |
|
Dippin’ Dots Worldwide Holding Company, LLC |
Delaware |
|
Dippin’ Dots Hong Kong Limited |
Hong Kong |
|
DDP South America, LLC |
Delaware |
|
Dippin’ Dots Trading Shanghai |
China |
Exhibit 23.1
CONSENT OF INDEPENDENT REGISTERED PUBLIC ACCOUNTING FIRM
We have issued our reports dated November 26, 2025, with respect to the consolidated financial statements and internal control over financial reporting included in the Annual Report of J&J Snack Foods Corp. on Form 10-K for the year ended September 27, 2025. We consent to the incorporation by reference of said reports in the Registration Statements of J&J Snack Foods Corp. on Forms S-8 (File No. 333-269805, File No. 333-258298, File No. 333-221782, File No. 333-178379, File No. 333-111292, File No. 333-03833, File No. 333-283558, and File No. 333-283493).
/s/ GRANT THORNTON LLP
Philadelphia, Pennsylvania
November 26, 2025
EXHIBIT 31.1
CERTIFICATION PURSUANT TO
SECTION 302
OF THE SARBANES-OXLEY ACT OF 2002
I, Dan Fachner, certify that:
|
1. |
I have reviewed this report on Form 10-K of J & J Snack Foods Corp.; |
|
2. |
Based on my knowledge, this report does not contain any untrue statement of a material fact or omit to state a material fact necessary to make the statements made, in light of the circumstances under which such statements were made, not misleading with respect to the period covered by this report; |
|
3. |
Based on my knowledge, the financial statements, and other financial information included in this report, fairly present in all material respects the financial condition, results of operations and cash flows of the registrant as of, and for, the periods presented in this report; |
|
4. |
The registrant’s other certifying officers and I are responsible for establishing and maintaining disclosure controls and procedures (as defined in Exchange Act Rules 13a-15(e) and 15d-15(e)) and internal controls and procedures for financial reporting (as defined in Exchange Act Rules 13a-15(f) and 15d-15(f)) for the registrant and have: |
|
a) |
designed such disclosure controls and procedures, or caused such disclosure controls and procedures to be designed under our supervision, to ensure that material information relating to the Registrant, including its consolidated subsidiaries, is made known to us by others within those entities, particularly during the period in which this report is being prepared; |
|
b) |
designed such internal control over financial reporting, or caused such internal control over financial reporting to be designed under our supervision, to provide reasonable assurance regarding the reliability of financial reporting and the preparation of financial statements for external purposes in accordance with generally accepted accounting principles; |
|
c) |
evaluated the effectiveness of the registrant’s disclosure controls and procedures and presented in this report our conclusions about the effectiveness of the disclosure controls and procedures, as of the end of the period covered by this report based on such evaluation; and |
|
d) |
disclosed in this report any change in the registrant’s internal control over financial reporting that occurred during the registrant’s fourth fiscal quarter that has materially affected, or is reasonably likely to materially affect, the registrant’s internal control over financial reporting. |
|
5. |
The registrant’s other certifying officers and I have disclosed, based on our most recent evaluation of internal control over financial reporting, to the registrant’s auditors and the audit committee of registrant’s board of directors (or persons performing the equivalent functions): |
|
a) |
all significant deficiencies and material weaknesses in the design or operation of internal control over financial reporting which are reasonably likely to adversely affect the registrant's ability to record, process, summarize and report financial information; and |
|
b) |
any fraud, whether or not material, that involves management or other employees who have a significant role in the registrant's internal controls over financial reporting. |
Date: November 26, 2025
|
|
|
|
|
|
/s/ Dan Fachner |
|
|
|
Dan Fachner |
|
|
|
Chairman, President and Chief Executive Officer |
|
| (Principal Executive Officer) |
EXHIBIT 31.2
CERTIFICATION PURSUANT TO
SECTION 302
OF THE SARBANES-OXLEY ACT OF 2002
I, Shawn Munsell, certify that:
|
1. |
have reviewed this report on Form 10-K of J & J Snack Foods Corp.; |
|
2. |
Based on my knowledge, this report does not contain any untrue statement of a material fact or omit to state a material fact necessary to make the statements made, in light of the circumstances under which such statements were made, not misleading with respect to the period covered by this report; |
|
3. |
Based on my knowledge, the financial statements, and other financial information included in this report, fairly present in all material respects the financial condition, results of operations and cash flows of the registrant as of, and for, the periods presented in this report; |
|
4. |
The registrant’s other certifying officers and I are responsible for establishing and maintaining disclosure controls and procedures (as defined in Exchange Act Rules 13a-15(e) and 15d-15(e)) and internal controls and procedures for financial reporting (as defined in Exchange Act Rules 13a-15(f) and 15d-15(f)) for the registrant and have: |
|
a) |
designed such disclosure controls and procedures, or caused such disclosure controls and procedures to be designed under our supervision, to ensure that material information relating to the Registrant, including its consolidated subsidiaries, is made known to us by others within those entities, particularly during the period in which this report is being prepared; |
|
b) |
designed such internal control over financial reporting, or caused such internal control over financial reporting to be designed under our supervision, to provide reasonable assurance regarding the reliability of financial reporting and the preparation of financial statements for external purposes in accordance with generally accepted accounting principles; |
|
c) |
evaluated the effectiveness of the registrant’s disclosure controls and procedures and presented in this report our conclusions about the effectiveness of the disclosure controls and procedures, as of the end of the period covered by this report based on such evaluation; and |
|
d) |
disclosed in this report any change in the registrant’s internal control over financial reporting that occurred during the registrant’s fourth fiscal quarter that has materially affected, or is reasonably likely to materially affect, the registrant’s internal control over financial reporting. |
|
5. |
The registrant’s other certifying officers and I have disclosed, based on our most recent evaluation of internal control over financial reporting, to the registrant’s auditors and the audit committee of registrant’s board of directors (or persons performing the equivalent functions): |
|
a) |
all significant deficiencies and material weaknesses in the design or operation of internal control over financial reporting which are reasonably likely to adversely affect the registrant’s ability to record, process, summarize and report financial information; and |
|
b) |
any fraud, whether or not material, that involves management or other employees who have a significant role in the registrant's internal controls over financial reporting. |
Date: November 26, 2025
|
|
|
|
|
|
/s/ Shawn Munsell |
|
|
|
Shawn Munsell |
|
|
|
Senior Vice President and |
|
| Chief Financial Officer | ||
| (Principal Financial Officer) | ||
| (Principal Accounting Officer) |
Exhibit 32.1
CERTIFICATION PURSUANT TO
18 U.S.C. SECTION 1350,
AS ADOPTED PURSUANT TO
SECTION 906 OF THE SARBANES-OXLEY ACT OF 2002
Pursuant to Section 906 of the Sarbanes-Oxley Act of 2002 (Section 1350 of Chapter 63 of Title 18 of the United States Code), the undersigned officer of J & J Snack Foods Corp. (the “Company”), does hereby certify with respect to the Annual Report of the Company on Form 10-K for the year ended September 27, 2025 (the “Report”) that:
|
(1) |
The Report fully complies with the requirements of Section 13(a) or 15(d) of the Securities Exchange Act of 1934; and |
|
(2) |
The information contained in the Report fairly presents, in all material respects, the financial condition and results of operations of the Company. |
Dated: November 26, 2025
|
|
|
|
|
|
/s/ Dan Fachner |
|
|
|
Dan Fachner |
|
|
|
Chairman, President and Chief Executive Officer |
|
| (Principal Executive Officer) |
Exhibit 32.2
CERTIFICATION PURSUANT TO
18 U.S.C. SECTION 1350,
AS ADOPTED PURSUANT TO
SECTION 906 OF THE SARBANES-OXLEY ACT OF 2002
Pursuant to Section 906 of the Sarbanes-Oxley Act of 2002 (Section 1350 of Chapter 63 of Title 18 of the United States Code), the undersigned officer of J & J Snack Foods Corp. (the “Company”), does hereby certify with respect to the Annual Report of the Company on Form 10-K for the year ended September 27, 2025 (the “Report”) that:
|
(1) |
The Report fully complies with the requirements of Section 13(a) or 15(d) of the Securities Exchange Act of 1934; and |
|
(2) |
The information contained in the Report fairly presents, in all material respects, the financial condition and results of operations of the Company. |
Dated: November 26, 2025
|
|
|
|
|
|
/s/ Shawn Munsell |
|
|
|
Shawn Munsell |
|
|
|
Senior Vice President and |
|
| Chief Financial Officer | ||
| (Principal Financial Officer) | ||
| (Principal Accounting Officer) |