UNITED STATES
SECURITIES AND EXCHANGE COMMISSION
Washington, D.C. 20549
FORM 6-K
Report of Foreign Private Issuer
Pursuant to Rule 13a-16 or 15d-16 of
the Securities Exchange Act of 1934
For the month of November 2025
Commission File No. 001-42797
BULLISH
Office 101, 103, 105 Suite 70202, Unit 7A-2B, 2nd Floor
Building A, Block 7, 60 Nexus Way, Camana Bay,
George Town, Grand Cayman, Cayman Islands, KY1-9005
(Address of principal executive office)
Indicate by check mark whether the registrant files or will file annual reports under cover of Form 20-F or Form 40-F.
Form 20-F ☒ Form 40-F ☐
INFORMATION CONTAINED IN THIS REPORT ON FORM 6-K
On November 19, 2025, Bullish issued a press release titled “Bullish Reports Third Quarter 2025 Results.” A copy of the press release, the unaudited third quarter 2025 results and the earnings presentation are furnished as Exhibits 99.1, 99.2 and 99.3, respectively, to this report on Form 6-K.
Incorporation By Reference
The unaudited condensed consolidated statements of profit or loss and other comprehensive income/(loss), unaudited condensed consolidated balance sheets, unaudited condensed consolidated statements of changes in equity and unaudited condensed consolidated statements of cash flows attached as Exhibit 99.2 to this report on Form 6-K are hereby incorporated by reference into Bullish’s registration statement on Form S-8 (Registration No. 333- 289553) (including any prospectuses forming a part of such registration statement), to be a part thereof from the date on which this report is submitted, to the extent not superseded by documents or reports subsequently filed or furnished.
INDEX TO EXHIBITS
|
Exhibit No. |
Description |
|
99.1 |
|
|
99.2 |
Third Quarter 2025 Unaudited Condensed Consolidated Financial Statements |
|
99.3 |
SIGNATURES
Pursuant to the requirements of the Securities Exchange Act of 1934, the registrant has duly caused this report to be signed on its behalf by the undersigned, thereunto duly authorized.
|
BULLISH |
||
|
Date: November 19, 2025 |
By: |
/s/ Jose A. Torres |
|
Jose A. Torres |
||
|
Chief Accounting Officer |
||
Exhibit 99.1
Bullish Reports Third Quarter 2025 Results
|
● |
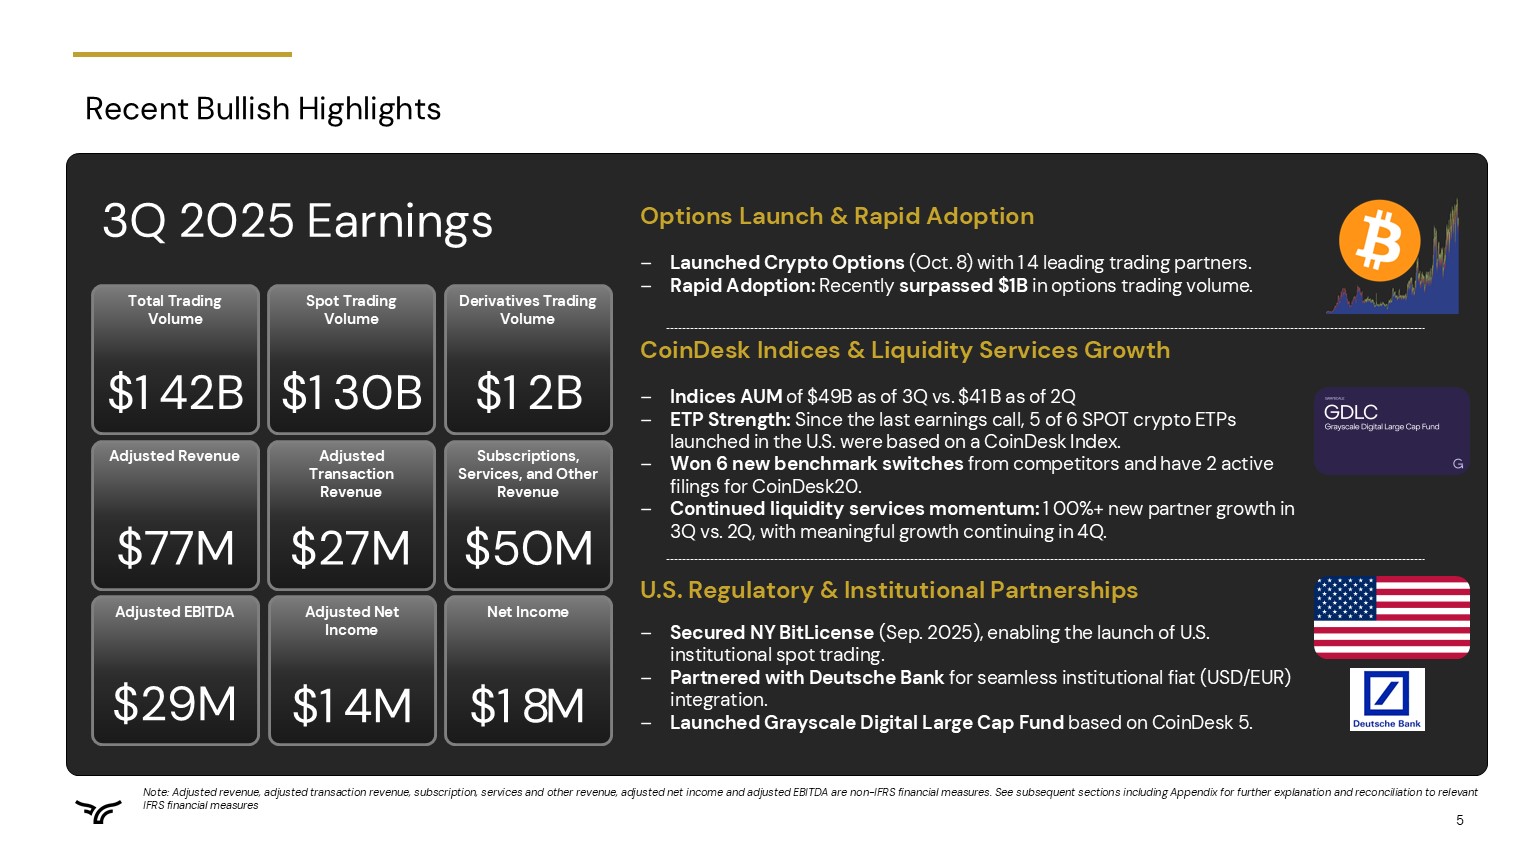
Bullish posts record Adjusted Revenue, Adjusted EBITDA, and Adjusted Net Income for Q3’2025 |
|
● |
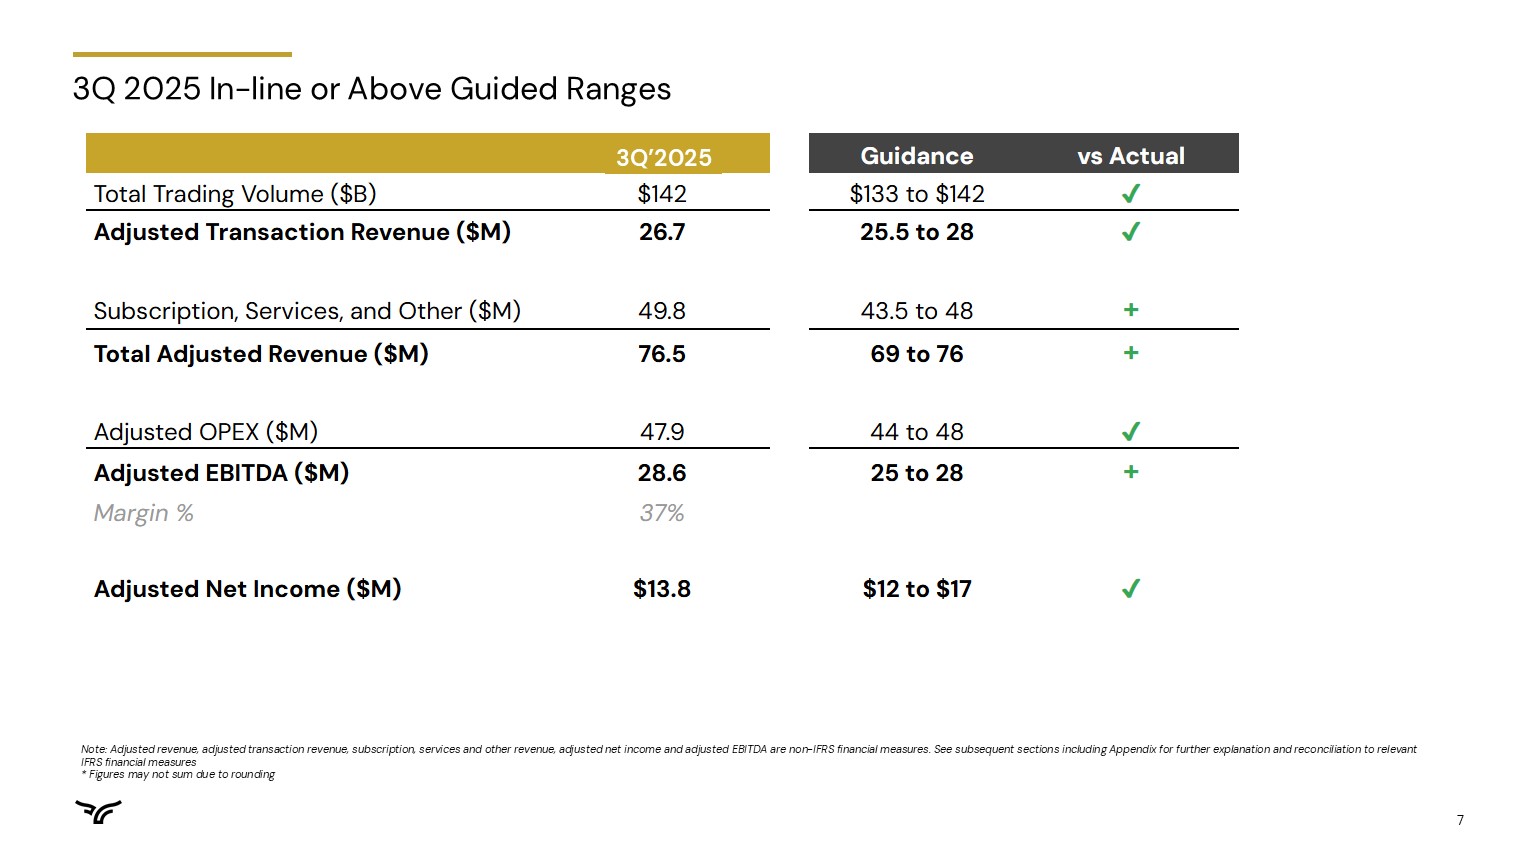
Bullish beats guided ranges on Subscription, Services, & Other (SS&O) Revenue, Total Adjusted Revenue, and Adjusted EBITDA in Q3’2025 |
|
● |
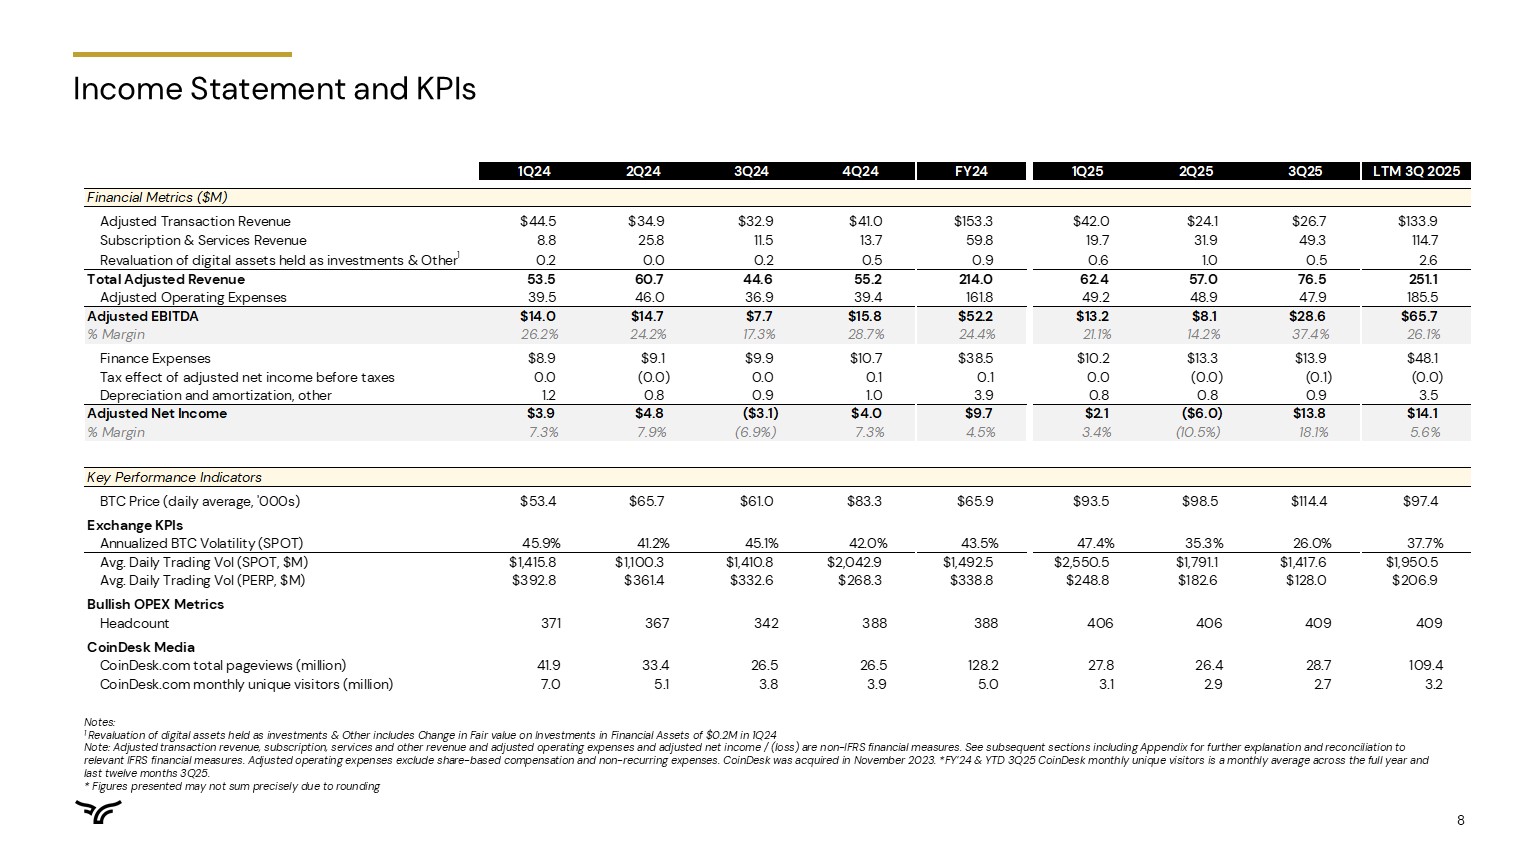
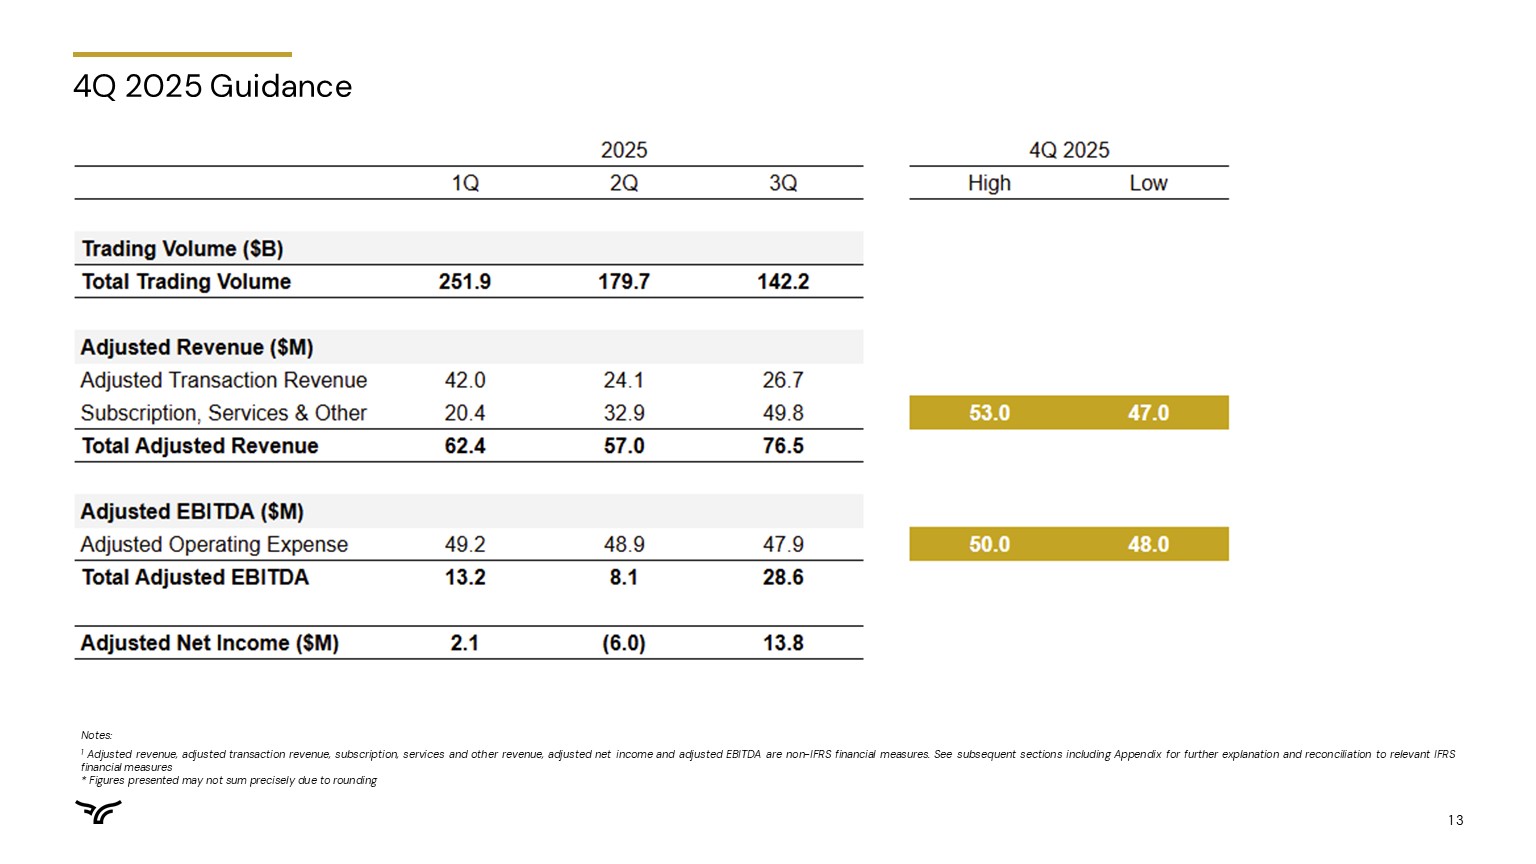
Q3’2025 Adjusted Revenue of $76.5 million and Adjusted EBITDA of $28.6 million |
|
|
|
||
|
● |
Bullish launches options trading and surpasses $1B in options trading volume |
Cayman Islands, November 19, 2025 – Bullish (NYSE: BLSH), an institutionally focused global digital asset platform that provides market infrastructure and information services, today announced financial results for the third quarter ended September 30, 2025.
Tom Farley, CEO: “Bullish had a highly successful third quarter. We launched our crypto options trading and U.S. spot trading businesses, signed notable institutional clients, gained indices traction, and expanded our liquidity services partners meaningfully. We believe Bullish is positioned at the intersection of trends driving crypto evolution: regulatory clarity, institutional adoption, and real-world asset tokenization.”
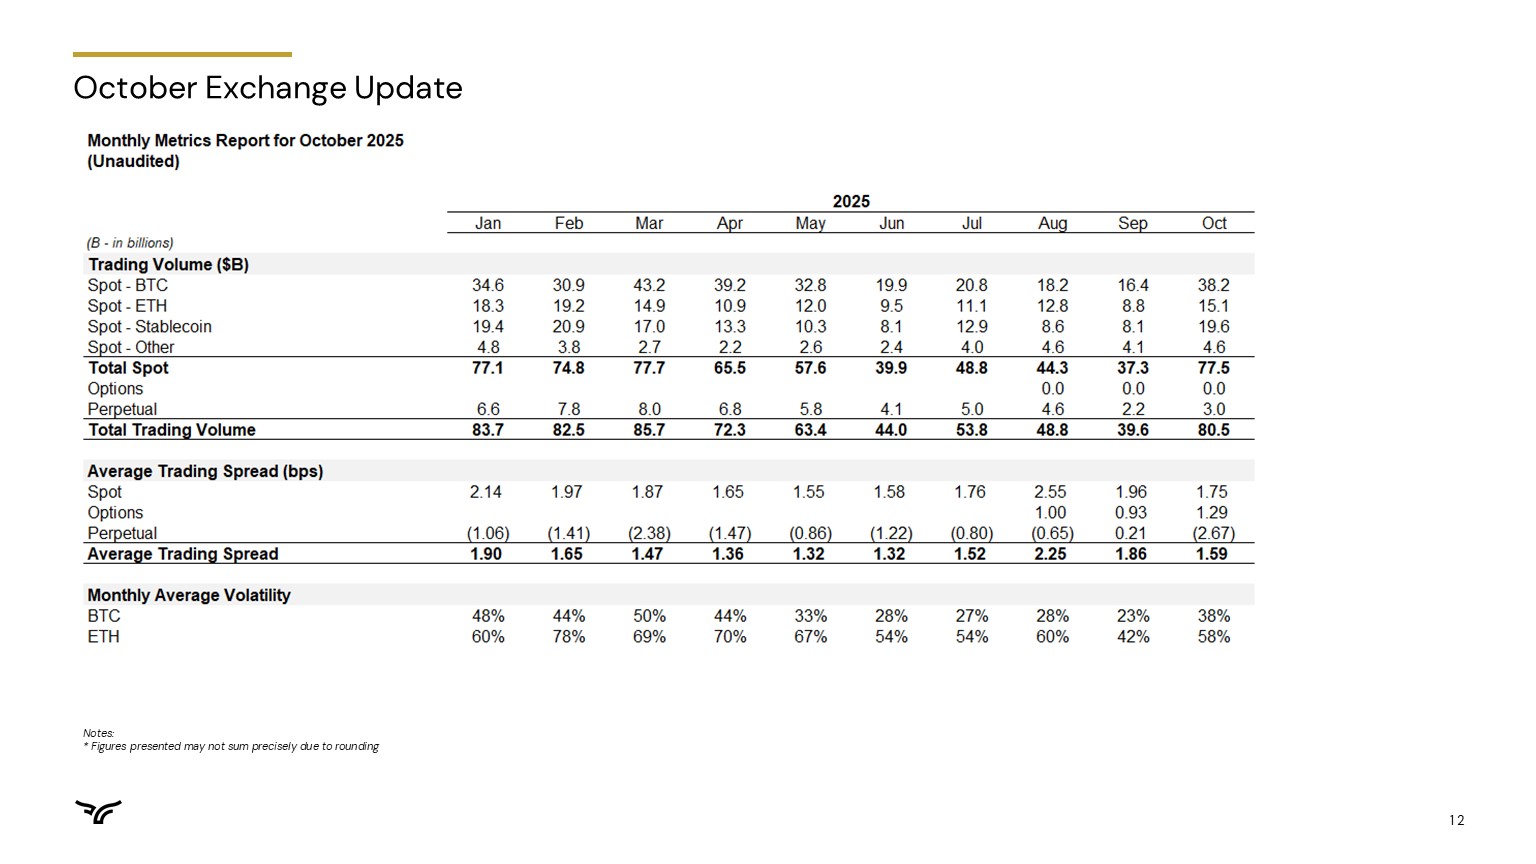
David Bonanno, CFO: "Bullish continues to win. After posting record SS&O revenue and record profitability in the third quarter, we are continuing to see strong momentum in the fourth quarter. Our recently launched options product has already surpassed $1B in trading volume and quarter-to-date spot trading volume is up 77% from Q3. We continue to expand our liquidity services ecosystem and feel confident that our diversified business model will deliver sustained, profitable growth."
Q3 2025 Financial Highlights
All amounts compared to Q3 2024
|
- |
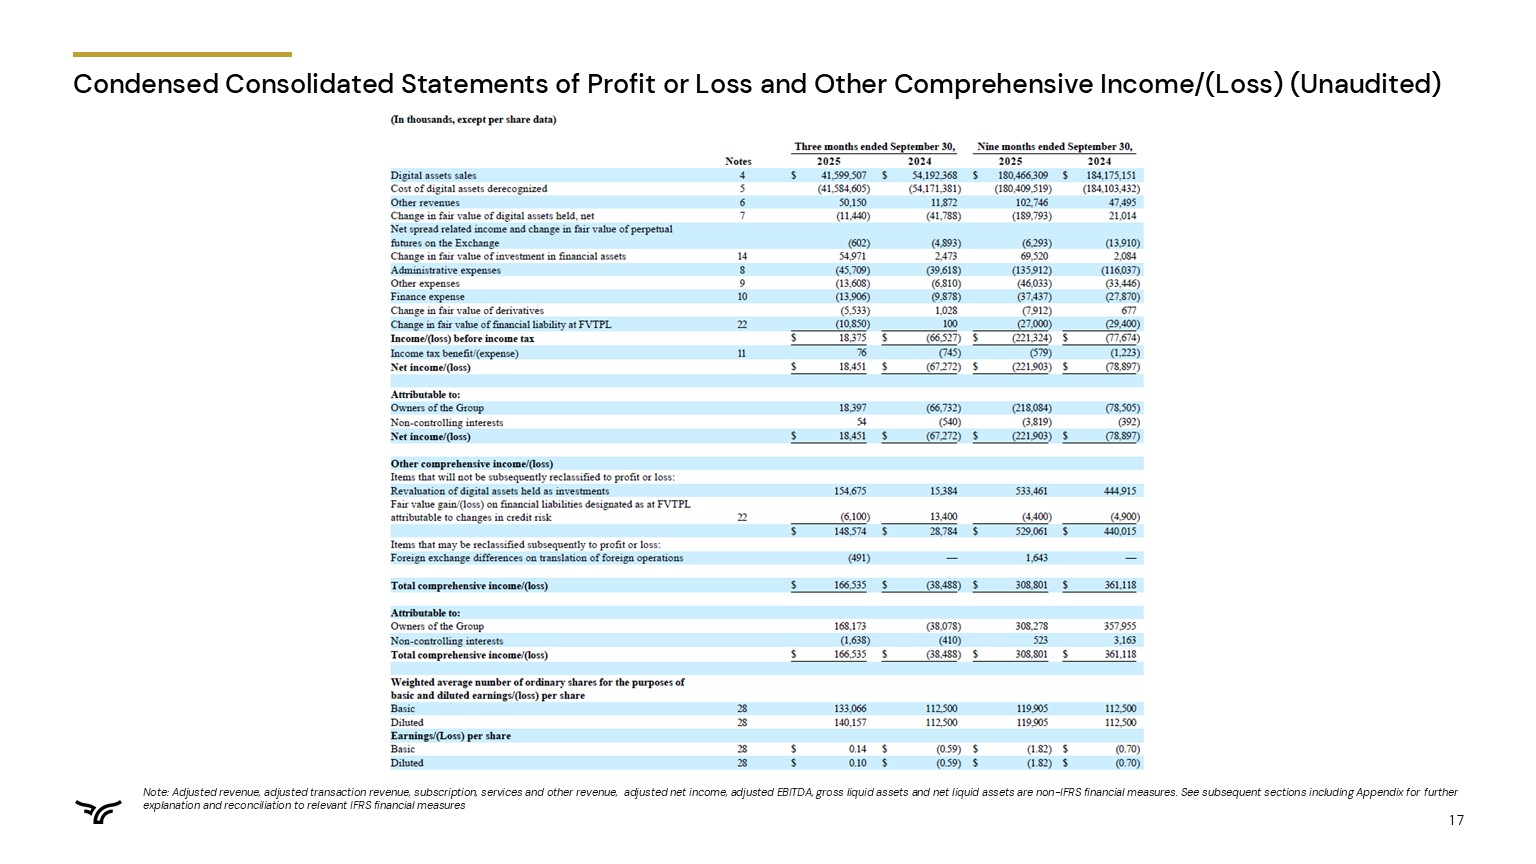
Digital asset sales were $41.6 billion vs. $54.2 billion |
|
- |
Net income (loss) was $18.5 million or $0.10 per diluted share vs. $(67.3) million or $(0.59) per diluted share |
|
- |
Adjusted revenue (non-IFRS) was $76.5 million vs. $44.6 million |
|
- |
Adjusted transaction revenue (non-IFRS) was $26.7 million vs. $32.9 million |
|
- |
Adjusted net income (non-IFRS) was $13.8 million vs. $(3.1) million |
|
- |
Adjusted EBITDA (non-IFRS) was $28.6 million vs. $7.7 million |
Q3 2025 Key Business Metrics
Business Highlights
|
- |
Launched Crypto Options with 14 leading trading partners and recently surpassed $1B in trading volume. |
|
- |
ETP Strength: In the last two months, 5 of 6 spot crypto ETPs launched in the U.S. were based on a CoinDesk Index and the business won 6 benchmark switches from competitors. |
|
- |
Liquidity Services Expansion: New partnerships more than doubled in Q3 compared to Q2, with meaningful growth continuing in Q4. |
|
- |
U.S. Launch: Launched U.S. spot trading following NY BitLicense approval from the New York State Department of Financial Services in September 2025. |
Q4 2025 Guidance
To give investors insight into our business and expectations, management is providing the following guidance for the fourth quarter 2025:
|
- |
Subscription, Services & Other Revenue (non-IFRS) of $47.0 million to $53.0 million |
|
- |
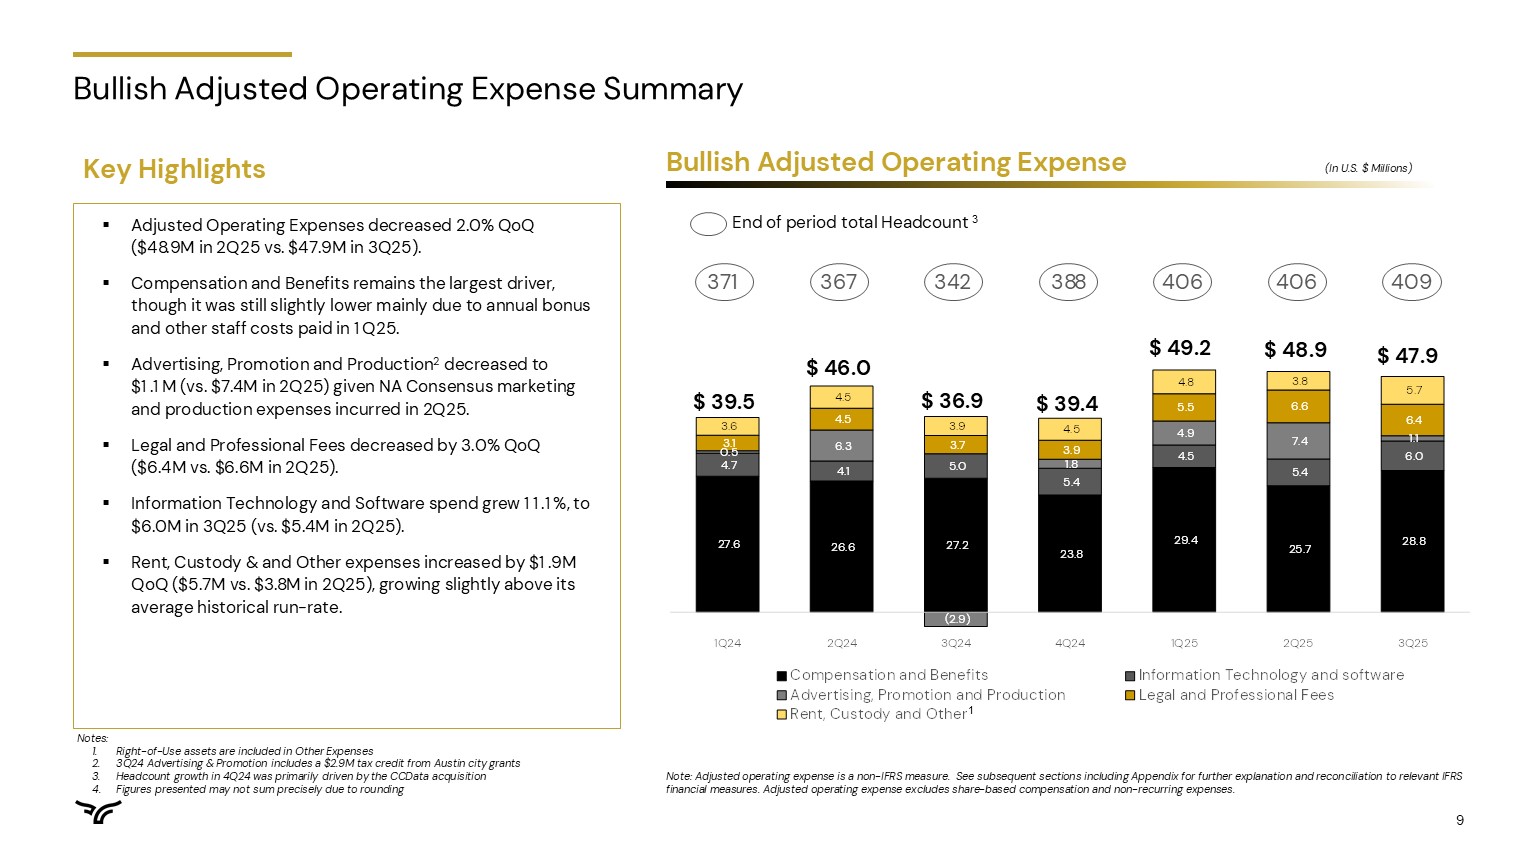
Adjusted Operating Expenses (non-IFRS) of $48.0 million to $50.0 million |
Conference Call Webcast and Q&A Information
Bullish will host a call to discuss its results at 8:30 a.m. ET on November 19, 2025. The live webcast can be accessed at investors.bullish.com, along with supplemental slides. Following the call, a replay and transcript will be available at investors.bullish.com.
About Bullish
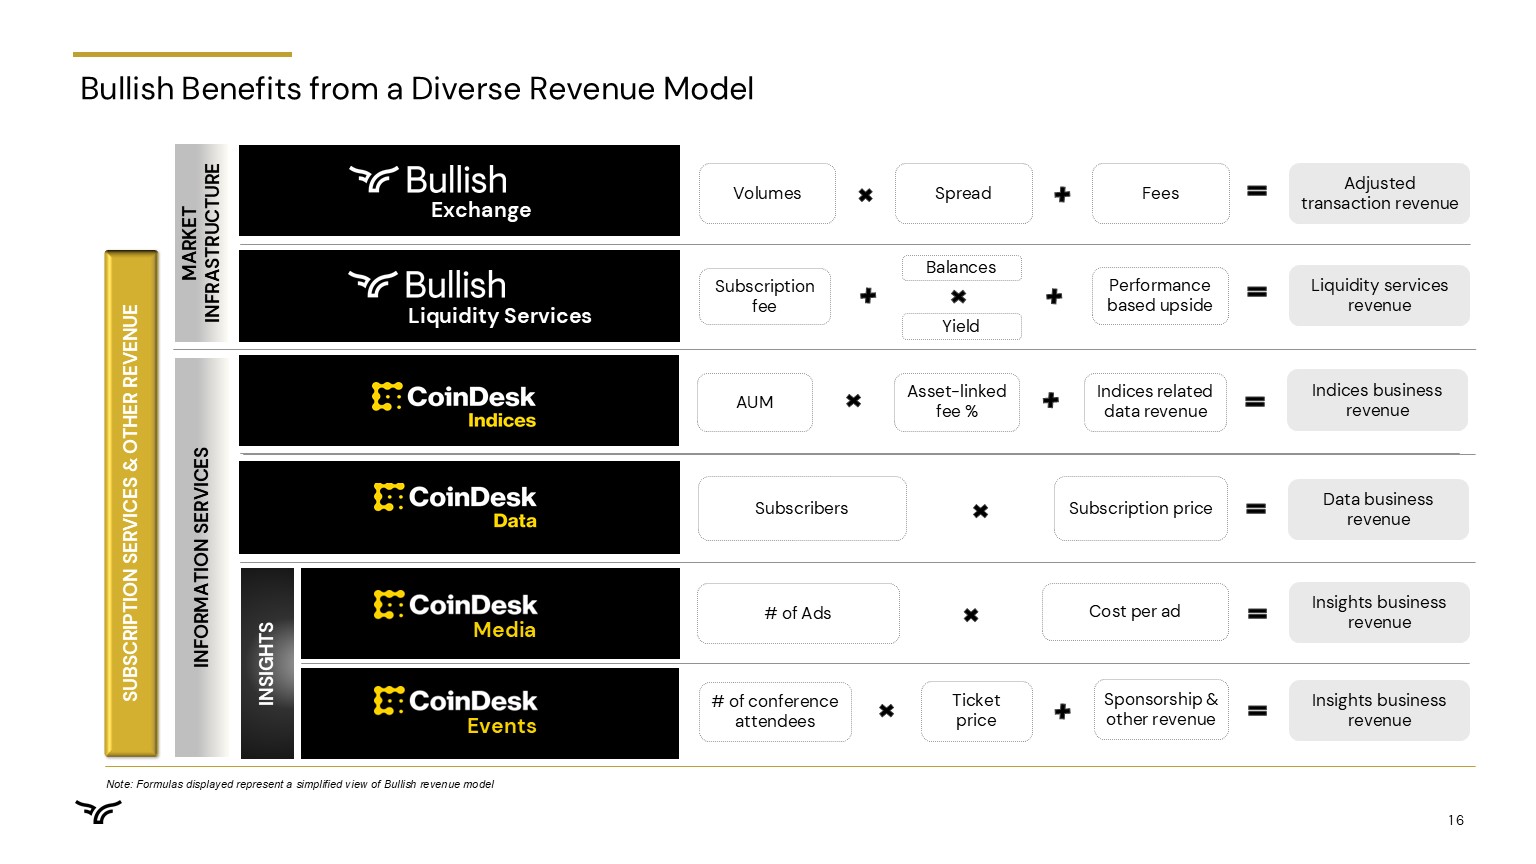
Bullish (NYSE:BLSH) is an institutionally focused global digital asset platform that provides market infrastructure and information services. Bullish services are regulated in the United States, European Union, United Kingdom, Hong Kong, and Gibraltar. These include: Bullish Exchange – a regulated and institutionally focused digital assets spot and derivatives exchange, integrating a high-performance central limit order book matching engine with automated market making to provide deep and predictable liquidity. CoinDesk Indices – a collection of tradable proprietary and single-asset benchmarks and indices that track the performance of digital assets for global institutions in the digital assets and traditional finance industries. CoinDesk Data – a broad suite of digital assets market data and analytics, providing real-time insights into prices, trends, and market dynamics. CoinDesk Insights – a digital asset media and events provider and operator of coindesk.com, a digital media platform that covers news and insights about digital assets, the underlying markets, policy, and blockchain technology.
For more information, please visit bullish.com and follow LinkedIn and X.
Use of Websites to Distribute Material Company Information
We use the Bullish Investor Relations website (investors.bullish.com) and our X account (x.com/bullish) to publicize information relevant to investors, including information that may be deemed material, in addition to filings we make with the U.S. Securities and Exchange Commission (SEC) and press releases. We encourage investors to regularly review the information posted on our website and X account in addition to our SEC filings and press releases to be informed of the latest developments.
Contacts
Media: media@bullish.com
Investor Relations: investors@bullish.com
Source: Bullish
Non-IFRS financial measures and key performance indicators
This communication includes certain financial measures that are not recognized by the International Financial Reporting Standards (“IFRS”). These non-IFRS financial measures are “adjusted transaction revenue,” “subscription, services and other revenue,” “adjusted revenue,” “adjusted net income / (loss)” and “adjusted EBITDA,” “gross liquid assets” and “net liquid assets”, and “adjusted operating expense.” These non-IFRS financial measures should not be considered in isolation or as an alternative to net income, cash flows from operations or other measures of profitability, liquidity or performance under IFRS. We believe these non-IFRS financial measures provide useful information to management and investors regarding certain financial and business trends. These non-IFRS financial measures are subject to inherent limitations as they reflect the exercise of judgments about which items of expense and income are excluded or included in determining these non-IFRS financial measures. Refer to the section “Reconciliation of Non-IFRS Measures” for further details and a reconciliation of the non-IFRS financial measures presented to their most directly comparable IFRS financial measures.
This communication also provides our forward-looking “adjusted transaction revenue,” “subscription, services & other revenue,” “adjusted revenue,” “adjusted operating expense,” “adjusted EBITDA,” and “adjusted net income” guidance for the upcoming fiscal quarter. Information reconciling upcoming fiscal quarter “adjusted transaction revenue,” “subscription, services & other revenue,” “adjusted revenue,” “adjusted operating expense,” “adjusted EBITDA,” and “adjusted net income” to their most directly comparable IFRS financial measures is unavailable to us without unreasonable effort due to the high variability, complexity and lack of visibility in making accurate forecasts and projections to certain reconciling items. These items cannot be reasonably and accurately predicated without the investment of undue time, costs and other resources, and accordingly, no reconciliation of the forward-looking non-IFRS financial measures is included. These reconciling items could be material to our actual results for the period.
In addition, management is providing forward-looking guidance on the following key performance indicator, Trading Volume, for the upcoming fiscal quarter. Refer to the section “Definitions of Certain Metrics” in this communication for definitions of key performance indicators.
Forward-Looking Statements
This communication contains “forward-looking statements” within the meaning of the Private Securities Litigation Reform Act of 1995. Sentences containing words such as “believe,” “intend,” “plan,” “may,” “expect,” “should,” “could,” “anticipate,” “estimate,” “predict,” “project,” or their negatives, or other similar expressions of a future or forward-looking nature generally should be considered forward-looking statements. Such statements include, without limitation, statements relating to our expected financial or operating performance, including for the upcoming fiscal quarter; our business strategy and potential market opportunities; current and prospective products, services or acquisitions; trends in, demand for, and growth and market size of, the digital assets industry; expectations regarding relationships with clients and third-party business partners and overall business momentum; our plans and expectations related to tokenization; competition in our industry; the regulatory and legal environment, including regulatory proceedings or approvals; and general economic and business conditions. Such forward-looking statements are based upon estimates and assumptions that, while considered reasonable by us, are inherently uncertain and are subject to risks, uncertainties, and other factors which could cause actual results to differ materially from those expressed or implied by such forward-looking statements. Factors that may cause results to differ from those expressed in our forward-looking statements include, but are not limited to intense competition in our industry, including from unregulated and less-regulated entities and platforms; our ability to execute our business strategy and grow our business and operations, including in new geographic locations; our ability to develop, launch and improve our products and services and their adoption; our ability to attract and retain customers; the evolving rules and regulations applicable to digital assets and our products and services; our ability to obtain and maintain regulatory approvals and stay in compliance with laws and regulations, and the costs of doing so; evolution and adoption of digital assets; interest rate fluctuations and digital asset price volatility; changes in, or unexpected, costs to operate our business; cybersecurity risks, including with respect to digital assets custody; disruptions to information and technology systems, blockchain networks and third-party services on which we rely; changes in general market, political or economic conditions; and other risks and uncertainties set forth in the section entitled “Risk Factors” in our final prospectus dated August 12, 2025 filed with the Securities and Exchange Commission (“SEC”), as well as potential risks and uncertainties disclosed in our other filings with the SEC. We may not actually achieve the performance, plans, or expectations disclosed in our forward-looking statements. Nothing in this communication should be regarded as a representation by any person that the forward-looking statements set forth therein will be achieved or that any of the contemplated results of such forward-looking statements will be achieved. You should not place undue reliance on forward-looking statements, which speak only as of the date they are made. We do not undertake any duty to update forward-looking statements.
Definitions of Certain Metrics
|
● |
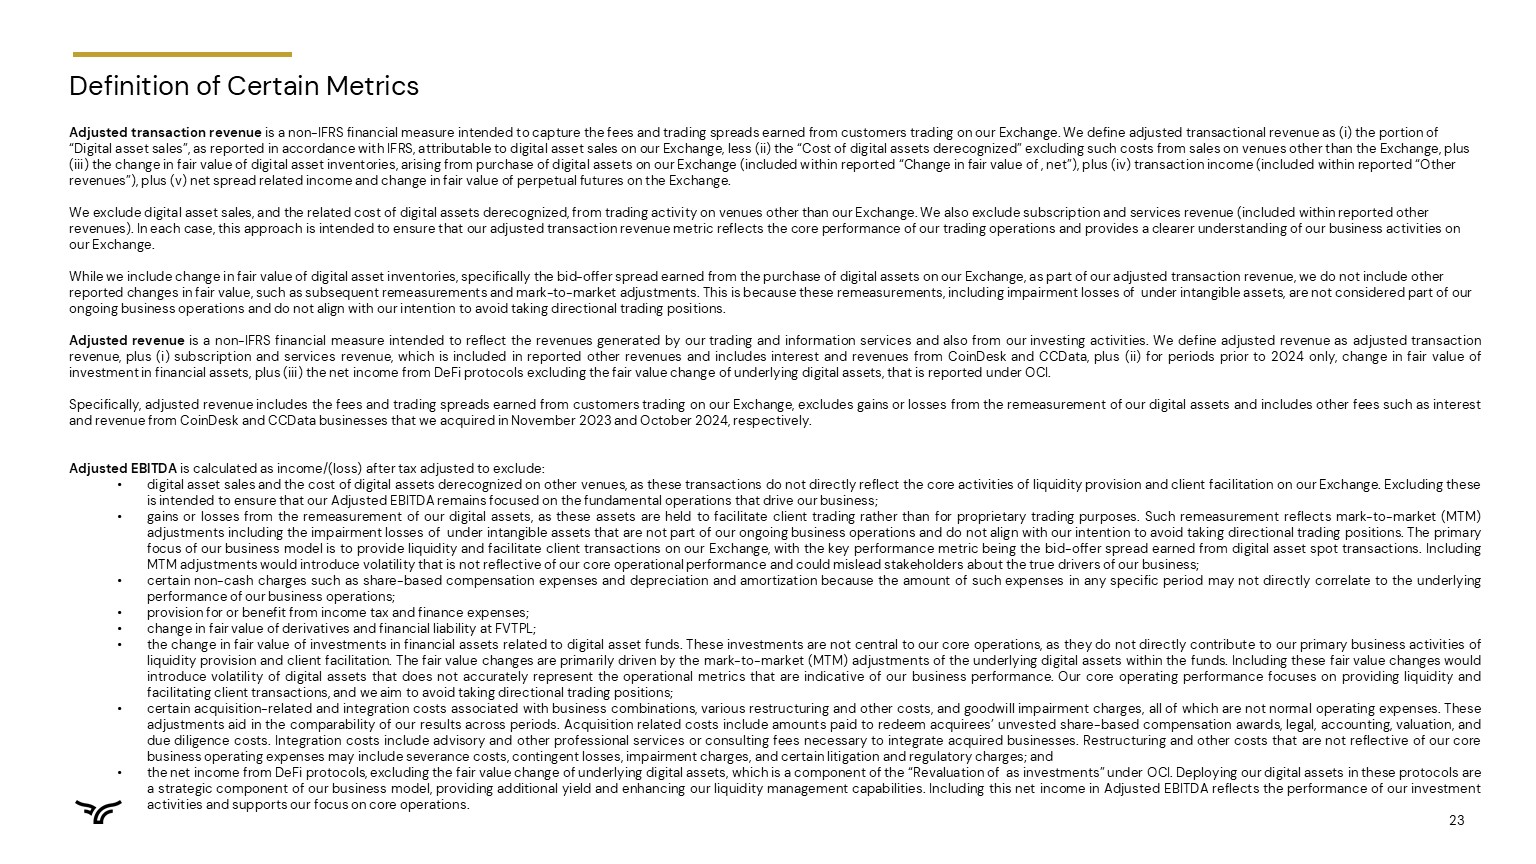
Adjusted transaction revenue is a non-IFRS financial measure intended to capture the fees and trading spreads earned from customers trading on our Exchange. We define adjusted transactional revenue as (i) the portion of “Digital asset sales”, as reported in accordance with IFRS, attributable to digital asset sales on our Exchange, less (ii) the “Cost of digital assets derecognized” excluding such costs from sales on venues other than the Exchange, plus (iii) the change in fair value of digital asset inventories, arising from purchase of digital assets on our Exchange (included within reported “Change in fair value of digital assets held, net”), plus (iv) transaction income (included within reported “Other revenues”), plus (v) net spread related income and change in fair value of perpetual futures on the Exchange. |
|
|
|
||
|
We exclude digital asset sales, and the related cost of digital assets derecognized, from trading activity on venues other than our Exchange. We also exclude subscription and services revenue (included within reported other revenues). In each case, this approach is intended to ensure that our adjusted transaction revenue metric reflects the core performance of our trading operations and provides a clearer understanding of our business activities on our Exchange. |
||
|
|
||
|
While we include change in fair value of digital asset inventories, specifically the bid-offer spread earned from the purchase of digital assets on our Exchange, as part of our adjusted transaction revenue, we do not include other reported changes in fair value, such as subsequent remeasurements and mark-to-market adjustments. This is because these remeasurements, including impairment losses of digital assets held under intangible assets, are not considered part of our ongoing business operations and do not align with our intention to avoid taking directional trading positions. |
|
● |
Adjusted revenue is a non-IFRS financial measure intended to reflect the revenues generated by our trading and information services and also from our investing activities. We define adjusted revenue as adjusted transaction revenue, plus (i) subscription and services revenue, which is included in reported other revenues and includes interest and revenues from CoinDesk and CCData, plus (ii) for periods prior to 2024 only, change in fair value of investment in financial assets, plus (iii) the net income from DeFi protocols excluding the fair value change of underlying digital assets, that is reported under OCI. |
|
|
|
||
|
Specifically, adjusted revenue includes the fees and trading spreads earned from customers trading on our Exchange, excludes gains or losses from the remeasurement of our digital assets and includes other fees such as interest and revenue from CoinDesk and CCData businesses that we acquired in November 2023 and October 2024, respectively. |
|
● |
Adjusted EBITDA is calculated as income/(loss) after tax adjusted to exclude: |
|
○ |
digital asset sales and the cost of digital assets derecognized on other venues, as these transactions do not directly reflect the core activities of liquidity provision and client facilitation on our Exchange. Excluding these is intended to ensure that our Adjusted EBITDA remains focused on the fundamental operations that drive our business; |
|
○ |
gains or losses from the remeasurement of our digital assets, as these assets are held to facilitate client trading rather than for proprietary trading purposes. Such remeasurement reflects mark-to-market (MTM) adjustments including the impairment losses of digital assets held under intangible assets that are not part of our ongoing business operations and do not align with our intention to avoid taking directional trading positions. The primary focus of our business model is to provide liquidity and facilitate client transactions on our Exchange, with the key performance metric being the bid-offer spread earned from digital asset spot transactions. Including MTM adjustments would introduce volatility that is not reflective of our core operational performance and could mislead stakeholders about the true drivers of our business; |
|
○ |
certain non-cash charges such as share-based compensation expenses and depreciation and amortization because the amount of such expenses in any specific period may not directly correlate to the underlying performance of our business operations; |
|
○ |
provision for or benefit from income tax and finance expenses; |
|
○ |
change in fair value of derivatives and financial liability at FVTPL; |
|
○ |
the change in fair value of investments in financial assets related to digital asset funds. These investments are not central to our core operations, as they do not directly contribute to our primary business activities of liquidity provision and client facilitation. The fair value changes are primarily driven by the mark-to-market (MTM) adjustments of the underlying digital assets within the funds. Including these fair value changes would introduce volatility of digital assets that does not accurately represent the operational metrics that are indicative of our business performance. Our core operating performance focuses on providing liquidity and facilitating client transactions, and we aim to avoid taking directional trading positions; |
|
○ |
certain acquisition-related and integration costs associated with business combinations, various restructuring and other costs, and goodwill impairment charges, all of which are not normal operating expenses. These adjustments aid in the comparability of our results across periods. Acquisition related costs include amounts paid to redeem acquirees’ unvested share-based compensation awards, legal, accounting, valuation, and due diligence costs. Integration costs include advisory and other professional services or consulting fees necessary to integrate acquired businesses. Restructuring and other costs that are not reflective of our core business operating expenses may include severance costs, contingent losses, impairment charges, and certain litigation and regulatory charges; and |
|
○ |
the net income from DeFi protocols, excluding the fair value change of underlying digital assets, which is a component of the “Revaluation of digital assets held as investments” under OCI. Deploying our digital assets in these protocols are a strategic component of our business model, providing additional yield and enhancing our liquidity management capabilities. Including this net income in Adjusted EBITDA reflects the performance of our investment activities and supports our focus on core operations. |
|
● |
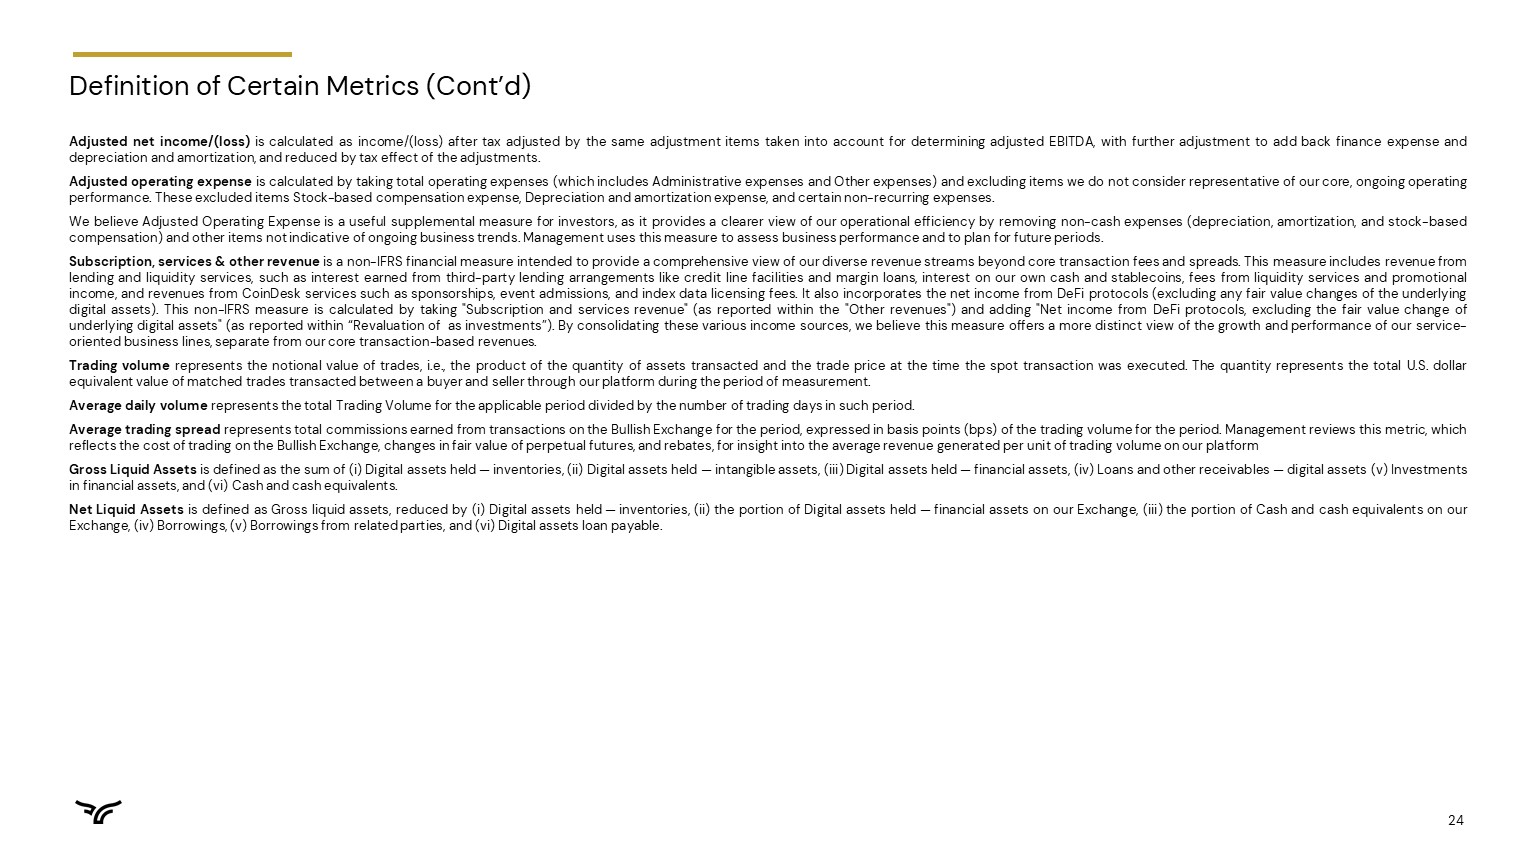
Adjusted net income/(loss) is calculated as income/(loss) after tax adjusted by the same adjustment items taken into account for determining adjusted EBITDA, with further adjustment to add back finance expense and depreciation and amortization, and reduced by tax effect of the adjustments. |
|
● |
Adjusted operating expense is calculated by taking total operating expenses (which includes Administrative expenses and Other expenses) and excluding items we do not consider representative of our core, ongoing operating performance. These excluded items Stock-based compensation expense, Depreciation and amortization expense, and certain non-recurring expenses. |
|
|
|
||
|
We believe Adjusted Operating Expense is a useful supplemental measure for investors, as it provides a clearer view of our operational efficiency by removing non-cash expenses (depreciation, amortization, and stock-based compensation) and other items not indicative of ongoing business trends. Management uses this measure to assess business performance and to plan for future periods. |
|
● |
Subscription, services & other revenue is a non-IFRS financial measure intended to provide a comprehensive view of our diverse revenue streams beyond core transaction fees and spreads. This measure includes revenue from lending and liquidity services, such as interest earned from third-party lending arrangements like credit line facilities and margin loans, interest on our own cash and stablecoins, fees from liquidity services and promotional income, and revenues from CoinDesk services such as sponsorships, event admissions, and index data licensing fees. It also incorporates the net income from DeFi protocols (excluding any fair value changes of the underlying digital assets). This non-IFRS measure is calculated by taking "Subscription and services revenue" (as reported within the "Other revenues") and adding "Net income from DeFi protocols, excluding the fair value change of underlying digital assets" (as reported within “Revaluation of digital assets held as investments”). By consolidating these various income sources, we believe this measure offers a more distinct view of the growth and performance of our service-oriented business lines, separate from our core transaction-based revenues. |
|
● |
Trading volume represents the notional value of trades, i.e., the product of the quantity of assets transacted and the trade price at the time the spot transaction was executed. The quantity represents the total U.S. dollar equivalent value of matched trades transacted between a buyer and seller through our platform during the period of measurement. |
|
● |
Average daily volume represents the total Trading Volume for the applicable period divided by the number of trading days in such period. |
|
● |
Average trading spread represents total commissions earned from transactions on the Bullish Exchange for the period, expressed in basis points (bps) of the trading volume for the period. Management reviews this metric, which reflects the cost of trading on the Bullish Exchange, changes in fair value of perpetual futures, and rebates, for insight into the average revenue generated per unit of trading volume on our platform. |
|
|
|
||
|
● |
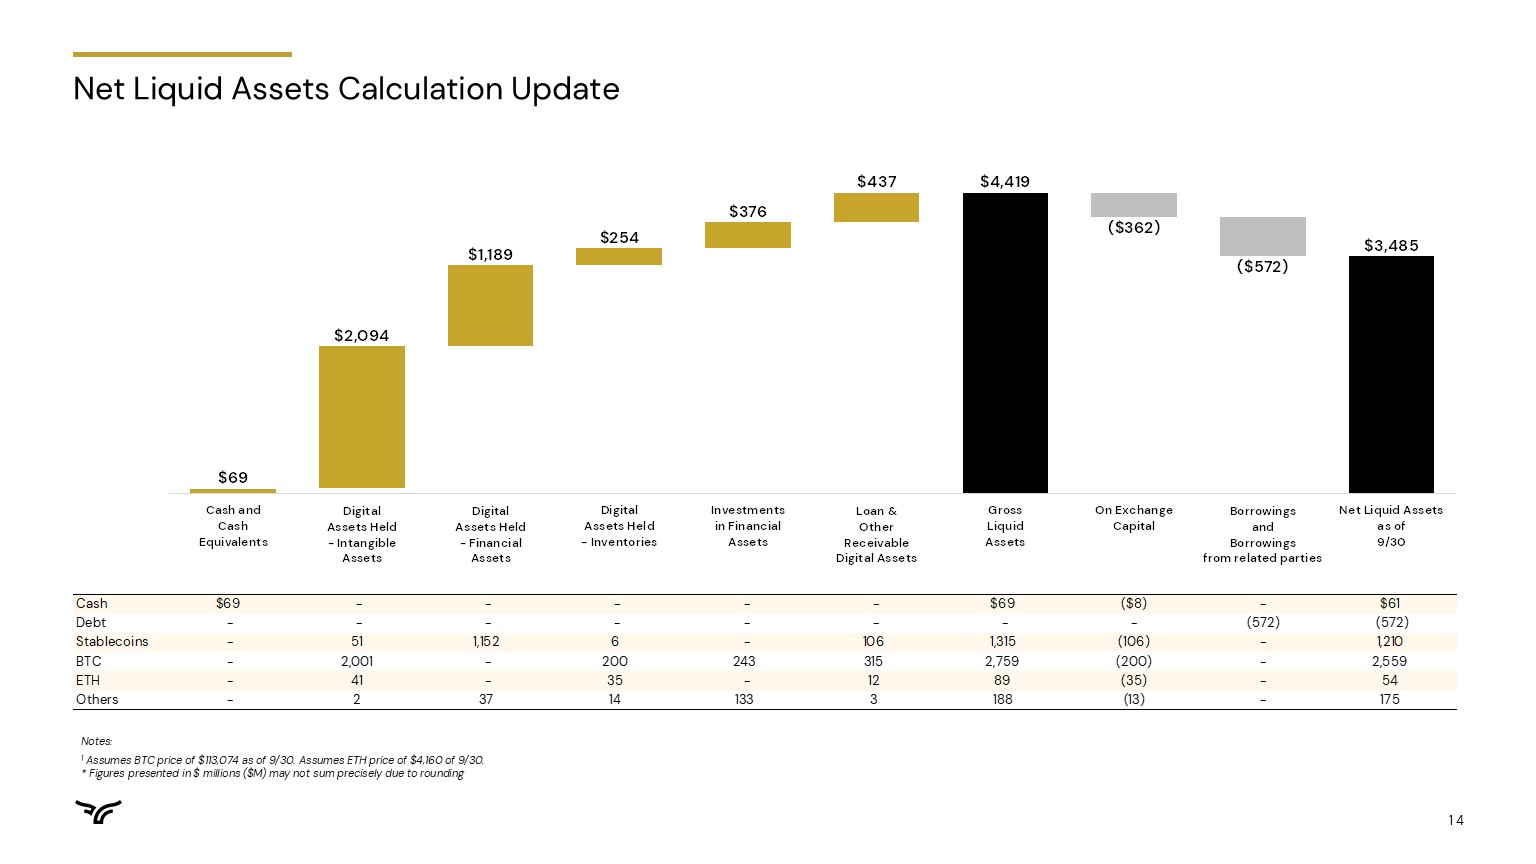
Gross liquid assets is defined as the sum of (i) Digital assets held — inventories, (ii) Digital assets held — intangible assets, (iii) Digital assets held — financial assets, (iv) Loans and other receivables — digital assets, (v) Investments in financial assets, and (vi) Cash and cash equivalents. |
|
| ● | Net liquid assets is defined as Gross liquid assets, reduced by (i) Digital assets held — inventories, (ii) the portion of Digital assets held — financial assets on our Exchange, (iii) the portion of Cash and cash equivalents on our Exchange, (iv) Borrowings, (v) Borrowings from related parties, and (iv) Digital assets loan payable. |
BULLISH
CONDENSED CONSOLIDATED STATEMENTS OF PROFIT OR LOSS AND OTHER COMPREHENSIVE INCOME/(LOSS) (UNAUDITED)
FOR THE THREE AND NINE MONTHS ENDED SEPTEMBER 30, 2025 AND 2024
(In thousands, except per share data)
|
Three months ended September 30, |
Nine months ended September 30, |
|||||||||||||||
|
2025 |
2024 |
2025 |
2024 |
|||||||||||||
|
Digital assets sales |
$ | 41,599,507 | $ | 54,192,368 | $ | 180,466,309 | $ | 184,175,151 | ||||||||
|
Cost of digital assets derecognized |
(41,584,605 | ) | (54,171,381 | ) | (180,409,519 | ) | (184,103,432 | ) | ||||||||
|
Other revenues |
50,150 | 11,872 | 102,746 | 47,495 | ||||||||||||
|
Change in fair value of digital assets held, net |
(11,440 | ) | (41,788 | ) | (189,793 | ) | 21,014 | |||||||||
|
Net spread related income and change in fair value of perpetual futures on the Exchange |
(602 | ) | (4,893 | ) | (6,293 | ) | (13,910 | ) | ||||||||
|
Change in fair value of investment in financial assets |
54,971 | 2,473 | 69,520 | 2,084 | ||||||||||||
|
Administrative expenses |
(45,709 | ) | (39,618 | ) | (135,912 | ) | (116,037 | ) | ||||||||
|
Other expenses |
(13,608 | ) | (6,810 | ) | (46,033 | ) | (33,446 | ) | ||||||||
|
Finance expense |
(13,906 | ) | (9,878 | ) | (37,437 | ) | (27,870 | ) | ||||||||
|
Change in fair value of derivatives |
(5,533 | ) | 1,028 | (7,912 | ) | 677 | ||||||||||
|
Change in fair value of financial liability at FVTPL |
(10,850 | ) | 100 | (27,000 | ) | (29,400 | ) | |||||||||
|
Income/(loss) before income tax |
$ | 18,375 | $ | (66,527 | ) | $ | (221,324 | ) | $ | (77,674 | ) | |||||
|
Income tax benefit/(expense) |
76 | (745 | ) | (579 | ) | (1,223 | ) | |||||||||
|
Net income/(loss) |
$ | 18,451 | $ | (67,272 | ) | $ | (221,903 | ) | $ | (78,897 | ) | |||||
|
Attributable to: |
||||||||||||||||
|
Owners of the Group |
18,397 | (66,732 | ) | (218,084 | ) | (78,505 | ) | |||||||||
|
Non-controlling interests |
54 | (540 | ) | (3,819 | ) | (392 | ) | |||||||||
|
Net income/(loss) |
$ | 18,451 | $ | (67,272 | ) | $ | (221,903 | ) | $ | (78,897 | ) | |||||
|
Other comprehensive income/(loss) |
||||||||||||||||
|
Items that will not be subsequently reclassified to profit or loss: |
||||||||||||||||
|
Revaluation of digital assets held as investments |
154,675 | 15,384 | 533,461 | 444,915 | ||||||||||||
|
Fair value gain/(loss) on financial liabilities designated as at FVTPL attributable to changes in credit risk |
(6,100 | ) | 13,400 | (4,400 | ) | (4,900 | ) | |||||||||
| $ | 148,574 | $ | 28,784 | $ | 529,061 | $ | 440,015 | |||||||||
|
Items that may be reclassified subsequently to profit or loss: |
||||||||||||||||
|
Foreign exchange differences on translation of foreign operations |
(491 | ) | — | 1,643 | — | |||||||||||
|
Total comprehensive income/(loss) |
$ | 166,535 | $ | (38,488 | ) | $ | 308,801 | $ | 361,118 | |||||||
|
Attributable to: |
||||||||||||||||
|
Owners of the Group |
168,173 | (38,078 | ) | 308,278 | 357,955 | |||||||||||
|
Non-controlling interests |
(1,638 | ) | (410 | ) | 523 | 3,163 | ||||||||||
|
Total comprehensive income/(loss) |
$ | 166,535 | $ | (38,488 | ) | $ | 308,801 | $ | 361,118 | |||||||
|
Weighted average number of ordinary shares for the purposes of basic and diluted earnings/(loss) per share |
||||||||||||||||
|
Basic |
133,066 | 112,500 | 119,905 | 112,500 | ||||||||||||
|
Diluted |
140,157 | 112,500 | 119,905 | 112,500 | ||||||||||||
|
Earnings/(Loss) per share |
||||||||||||||||
|
Basic |
$ | 0.14 | $ | (0.59 | ) | $ | (1.82 | ) | $ | (0.70 | ) | |||||
|
Diluted |
$ | 0.10 | $ | (0.59 | ) | $ | (1.82 | ) | $ | (0.70 | ) | |||||
BULLISH
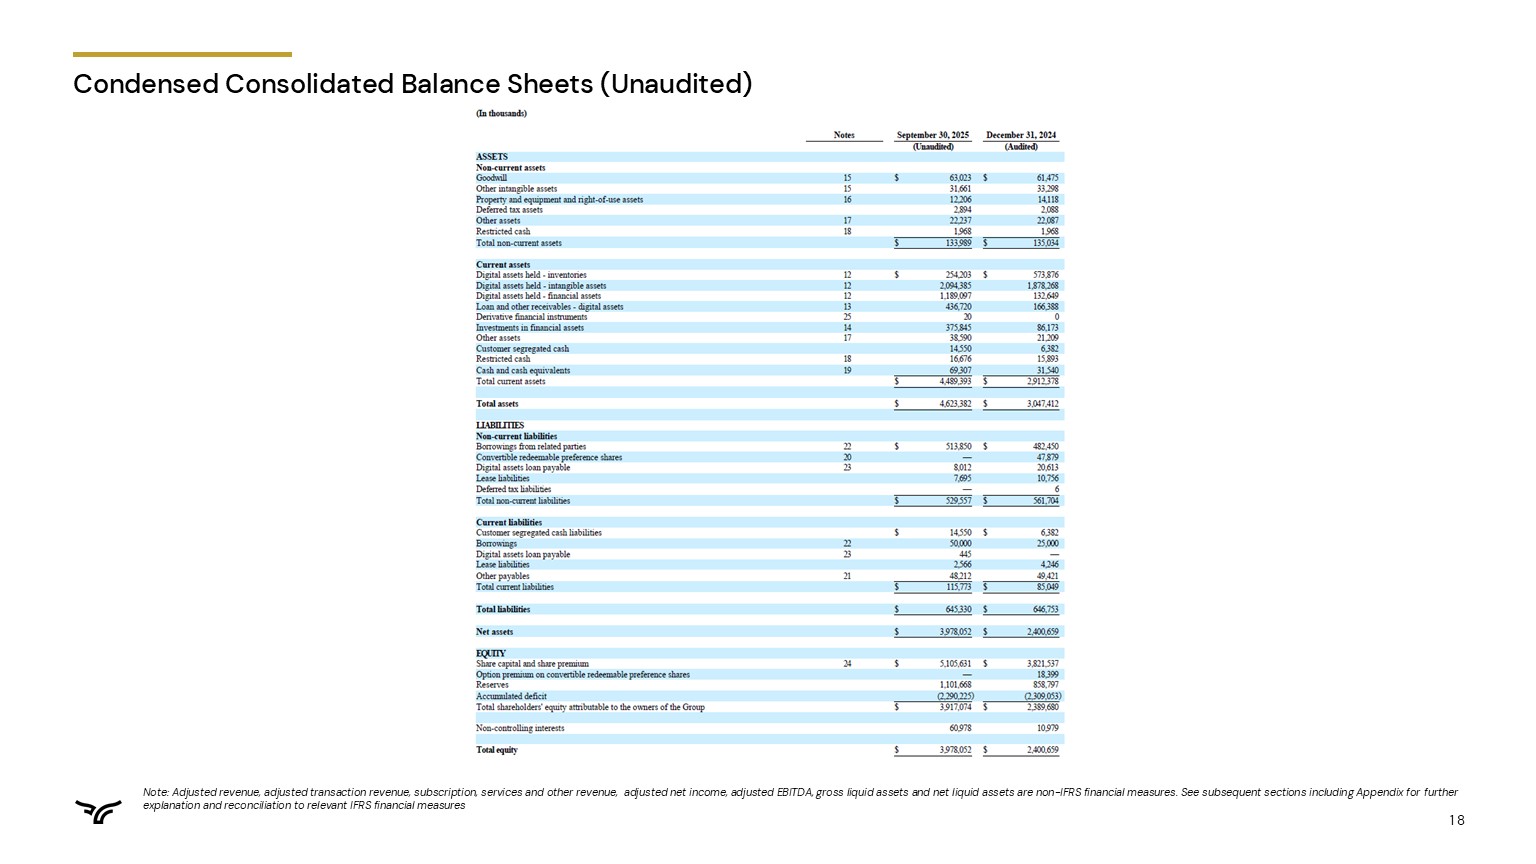
CONDENSED CONSOLIDATED BALANCE SHEETS (UNAUDITED)
AS OF SEPTEMBER 30, 2025 AND DECEMBER 31, 2024
(In thousands)
|
September 30, 2025 |
December 31, 2024 |
|||||||
|
(Unaudited) |
(Audited) |
|||||||
|
ASSETS |
||||||||
|
Non-current assets |
||||||||
|
Goodwill |
$ | 63,023 | $ | 61,475 | ||||
|
Other intangible assets |
31,661 | 33,298 | ||||||
|
Property and equipment and right-of-use assets |
12,206 | 14,118 | ||||||
|
Deferred tax assets |
2,894 | 2,088 | ||||||
|
Other assets |
22,237 | 22,087 | ||||||
|
Restricted cash |
1,968 | 1,968 | ||||||
|
Total non-current assets |
$ | 133,989 | $ | 135,034 | ||||
|
Current assets |
||||||||
|
Digital assets held - inventories |
$ | 254,203 | $ | 573,876 | ||||
|
Digital assets held - intangible assets |
2,094,385 | 1,878,268 | ||||||
|
Digital assets held - financial assets |
1,189,097 | 132,649 | ||||||
|
Loan and other receivables - digital assets |
436,720 | 166,388 | ||||||
|
Derivative financial instruments |
20 | 0 | ||||||
|
Investments in financial assets |
375,845 | 86,173 | ||||||
|
Other assets |
38,590 | 21,209 | ||||||
|
Customer segregated cash |
14,550 | 6,382 | ||||||
|
Restricted cash |
16,676 | 15,893 | ||||||
|
Cash and cash equivalents |
69,307 | 31,540 | ||||||
|
Total current assets |
$ | 4,489,393 | $ | 2,912,378 | ||||
|
Total assets |
$ | 4,623,382 | $ | 3,047,412 | ||||
|
LIABILITIES |
||||||||
|
Non-current liabilities |
||||||||
|
Borrowings from related parties |
$ | 513,850 | $ | 482,450 | ||||
|
Convertible redeemable preference shares |
— | 47,879 | ||||||
|
Digital assets loan payable |
8,012 | 20,613 | ||||||
|
Lease liabilities |
7,695 | 10,756 | ||||||
|
Deferred tax liabilities |
— | 6 | ||||||
|
Total non-current liabilities |
$ | 529,557 | $ | 561,704 | ||||
|
Current liabilities |
||||||||
|
Customer segregated cash liabilities |
$ | 14,550 | $ | 6,382 | ||||
|
Borrowings |
50,000 | 25,000 | ||||||
|
Digital assets loan payable |
445 | — | ||||||
|
Lease liabilities |
2,566 | 4,246 | ||||||
|
Other payables |
48,212 | 49,421 | ||||||
|
Total current liabilities |
$ | 115,773 | $ | 85,049 | ||||
|
Total liabilities |
$ | 645,330 | $ | 646,753 | ||||
|
Net assets |
$ | 3,978,052 | $ | 2,400,659 | ||||
|
EQUITY |
||||||||
|
Share capital and share premium |
$ | 5,105,631 | $ | 3,821,537 | ||||
|
Option premium on convertible redeemable preference shares |
— | 18,399 | ||||||
|
Reserves |
1,101,668 | 858,797 | ||||||
|
Accumulated deficit |
(2,290,225 | ) | (2,309,053 | ) | ||||
|
Total shareholders' equity attributable to the owners of the Group |
$ | 3,917,074 | $ | 2,389,680 | ||||
|
Non-controlling interests |
60,978 | 10,979 | ||||||
|
Total equity |
$ | 3,978,052 | $ | 2,400,659 | ||||
BULLISH
CONDENSED CONSOLIDATED STATEMENTS OF CASH FLOWS (UNAUDITED)
FOR THE THREE AND NINE MONTHS ENDED SEPTEMBER 30, 2025 AND 2024
(In thousands)
|
Three months ended |
Nine months ended |
|||||||||||||||
|
September 30, |
September 30, |
|||||||||||||||
|
2025 |
2024 |
2025 |
2024 |
|||||||||||||
|
Cash flows from operating activities |
||||||||||||||||
|
Net income/(loss) |
$ | 18,451 | $ | (67,272 | ) | $ | (221,903 | ) | $ | (78,897 | ) | |||||
|
Adjustments for: |
||||||||||||||||
|
Interest income |
(4,303 | ) | (2,080 | ) | (10,329 | ) | (5,219 | ) | ||||||||
|
Debt interest expense |
13,654 | 9,599 | 36,654 | 27,072 | ||||||||||||
|
Lease interest expense |
252 | 279 | 783 | 798 | ||||||||||||
|
Net foreign exchange loss |
44 | 29 | — | 80 | ||||||||||||
|
Share-based payments expenses |
3,130 | 5,698 | 11,519 | 17,888 | ||||||||||||
|
Depreciation of property and equipment and right-of-use assets |
1,301 | 1,502 | 4,431 | 4,773 | ||||||||||||
|
Amortization of other intangible assets |
514 | 542 | 1,687 | 1,626 | ||||||||||||
|
Impairment of right-of-use asset |
— | — | — | 956 | ||||||||||||
|
(Gain)/loss from revaluation of digital assets and investments in financial assets at FVTPL, net |
(67,414 | ) | 17,100 | (50,050 | ) | (49,830 | ) | |||||||||
|
Derecognition of lease |
(416 | ) | — | (416 | ) | — | ||||||||||
|
Change in fair value of financial liability at FVTPL |
10,850 | (100 | ) | 27,000 | 29,400 | |||||||||||
|
Impairment losses of digital assets |
29,415 | 21,187 | 178,234 | 26,055 | ||||||||||||
|
Operating cash flows before changes in operating assets and liabilities |
5,478 | (13,516 | ) | (22,390 | ) | (25,298 | ) | |||||||||
|
Increase in other assets |
(18,166 | ) | (710 | ) | (15,147 | ) | (4,736 | ) | ||||||||
|
Increase in deferred tax assets |
(375 | ) | (373 | ) | (806 | ) | (1,589 | ) | ||||||||
|
(Increase)/decrease in digital assets held - inventories |
(11,606 | ) | 26,788 | 261,774 | 26,750 | |||||||||||
|
Increase in digital assets held - financial assets |
(1,820,415 | ) | (30,607 | ) | (2,645,719 | ) | (58,037 | ) | ||||||||
|
(Increase)/decrease in loan and other receivables - digital assets |
1,782,229 | (4,411 | ) | 2,375,485 | (15,098 | ) | ||||||||||
|
Increase/(decrease) in other payables |
3,466 | 9,540 | (1,807 | ) | (2,808 | ) | ||||||||||
|
Increase in customer segregated cash liabilities |
10,412 | 1,436 | 8,168 | 6,962 | ||||||||||||
|
Decrease in deferred tax liabilities |
(12 | ) | (2 | ) | (6 | ) | (14 | ) | ||||||||
|
Interest received |
2,366 | 2,080 | 7,251 | 5,219 | ||||||||||||
|
Net cash provided by/(used in) operating activities |
$ | (46,623 | ) | $ | (9,775 | ) | $ | (33,197 | ) | $ | (68,649 | ) | ||||
|
Cash flows from investing activities |
||||||||||||||||
|
Purchase of investment in financial assets |
$ | (3,345 | ) | $ | — | $ | (4,620 | ) | $ | — | ||||||
|
Proceeds on investment in financial assets |
48,213 | 6 | 48,213 | 167 | ||||||||||||
|
Purchase of investment in derivative financial instruments |
— | 1,462 | — | 1,128 | ||||||||||||
|
Purchase of property and equipment |
(2,094 | ) | (92 | ) | (2,344 | ) | (313 | ) | ||||||||
|
Purchase of digital assets held - intangible assets |
(2 | ) | (80 | ) | (41,666 | ) | (243 | ) | ||||||||
|
Prepayment on intangible assets |
— | — | — | (10,001 | ) | |||||||||||
|
Proceeds on disposal of digital assets held - intangible assets |
101 | — | 30,549 | — | ||||||||||||
|
Net cash provided by/(used in) investing activities |
$ | 42,873 | $ | 1,296 | $ | 30,132 | $ | (9,262 | ) | |||||||
|
Cash flows from financing activities |
||||||||||||||||
|
Proceeds from issuance of Ordinary shares |
$ | 59,194 | $ | — | $ | 59,194 | $ | — | ||||||||
|
Interest paid |
(9,915 | ) | (9,878 | ) | (30,554 | ) | (19,105 | ) | ||||||||
|
Proceeds from borrowings |
— | — | 174,300 | 25,000 | ||||||||||||
|
Repayment of borrowings |
— | — | (149,300 | ) | — | |||||||||||
|
Repayment on lease liabilities |
(1,201 | ) | (1,458 | ) | (4,065 | ) | (3,579 | ) | ||||||||
|
Net cash provided by/(used in) financing activities |
$ | 48,078 | $ | (11,336 | ) | $ | 49,575 | $ | 2,316 | |||||||
|
Net increase/(decrease) in cash and cash equivalents, customer segregated cash and restricted cash |
44,328 | (19,815 | ) | 46,510 | (75,595 | ) | ||||||||||
|
Cash and cash equivalents, customer segregated cash and restricted cash at beginning of the period |
57,859 | 75,746 | 55,783 | 131,526 | ||||||||||||
|
Effects of exchange rate changes on cash and cash equivalents, customer segregated cash and restricted cash |
315 | — | 208 | — | ||||||||||||
|
Cash and cash equivalents, customer segregated cash and restricted cash at end of the period |
$ | 102,502 | $ | 55,931 | $ | 102,501 | $ | 55,931 | ||||||||
|
Cash and cash equivalents, customer segregated cash and restricted cash consisted of the following: |
||||||||||||||||
|
Customer segregated cash |
14,550 | 7,024 | 14,550 | 7,024 | ||||||||||||
|
Restricted cash |
18,644 | 19,475 | 18,644 | 19,475 | ||||||||||||
|
Cash and cash equivalents |
69,307 | 29,432 | 69,307 | 29,432 | ||||||||||||
|
Total cash and cash equivalents, customer segregated cash and restricted cash |
$ | 102,502 | $ | 55,931 | $ | 102,501 | $ | 55,931 | ||||||||
|
Supplemental schedule of non-cash investing and financing activities |
||||||||||||||||
|
Recognition of right-of-use assets against lease liabilities |
$ | (3,103 | ) | $ | — | $ | 364 | $ | 8,445 | |||||||
|
Purchase of digital assets held - intangible assets |
(3,788,863 | ) | (2,883,690 | ) | (39,553,706 | ) | (2,949,909 | ) | ||||||||
|
Proceeds on disposal of digital assets held - intangible assets |
3,793,109 | 2,783,584 | 39,271,654 | 2,817,681 | ||||||||||||
|
Digital asset loan receivables made, net |
163,362 | 5,095 | 191,499 | 63,356 | ||||||||||||
|
Digital asset pledged as collateral posted/(returned), net |
(53,103 | ) | 7,510 | 26,871 | 60,061 | |||||||||||
|
Purchase of investment in financial assets via USDC |
— | (26,566 | ) | (10,116 | ) | (31,168 | ) | |||||||||
|
Prepayment on intangible assets made, net |
(2,114 | ) | — | (78 | ) | (8,043 | ) | |||||||||
|
Interest paid in digital assets |
(3,990 | ) | — | (6,882 | ) | — | ||||||||||
|
Proceeds from borrowings via digital assets |
858,864 | — | 3,185,184 | — | ||||||||||||
|
Repayment from borrowings via digital assets |
(882,037 | ) | — | (3,185,184 | ) | — | ||||||||||
|
Proceeds from digital assets loan payable via digital assets |
176,810 | — | 393,553 | — | ||||||||||||
|
Repayments from digital assets loan payable via digital assets |
(178,071 | ) | — | (408,568 | ) | — | ||||||||||
|
Proceeds from issuance of Ordinary shares |
1,150,000 | — | 1,150,000 | — | ||||||||||||
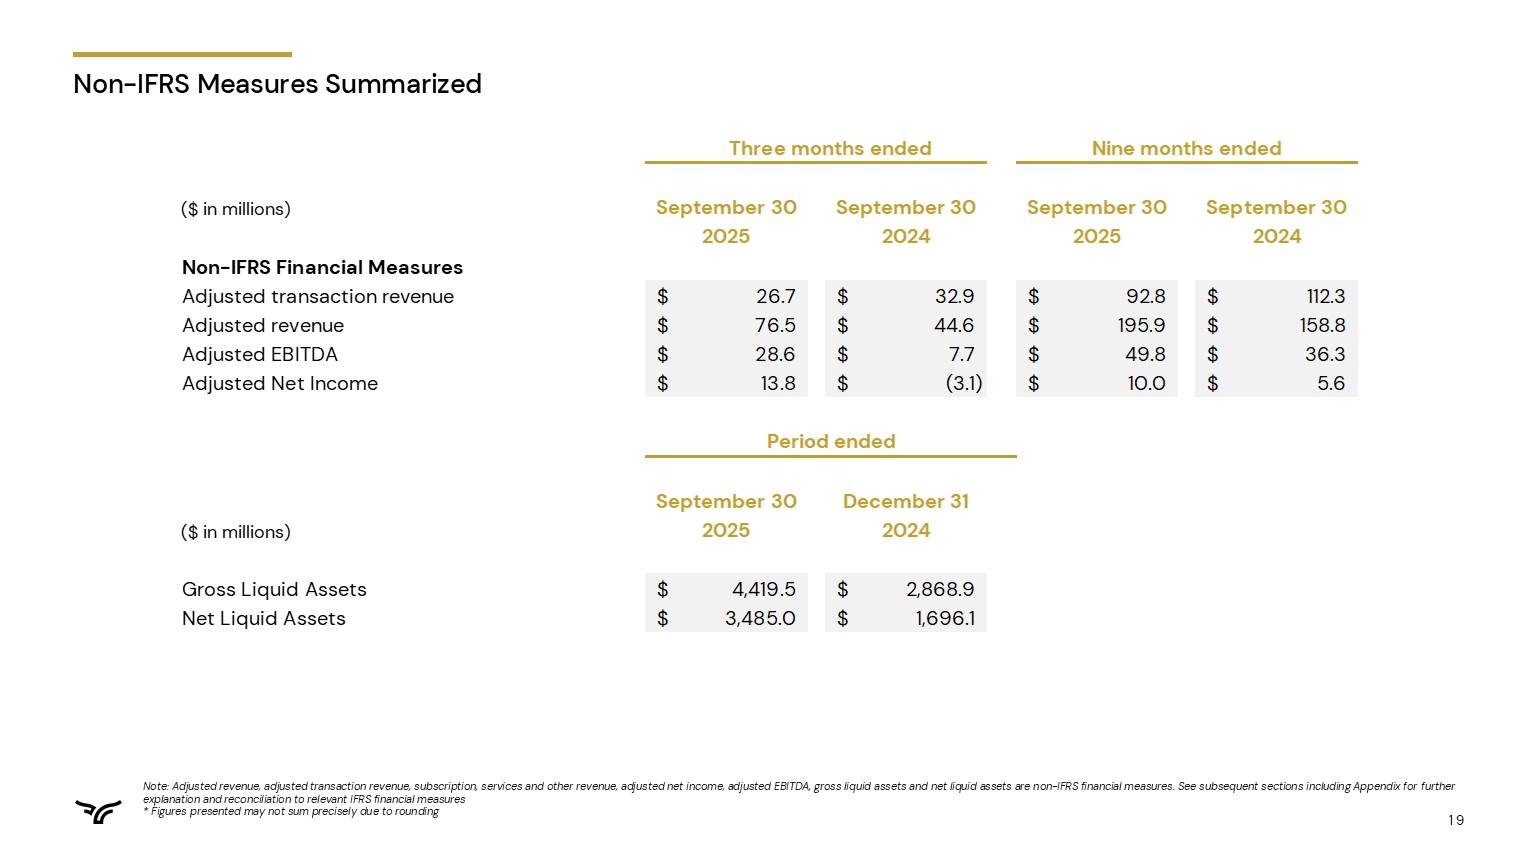
Non-IFRS Measures Summarized
In US$ millions
|
Three months ended |
Nine months ended |
|||||||||||||||
|
September 30, |
September 30, |
September 30, |
September 30, |
|||||||||||||
|
($ in millions) |
2025 |
2024 |
2025 |
2024 |
||||||||||||
|
Non-IFRS Financial Measures |
||||||||||||||||
|
Adjusted transaction revenue |
$ | 26.7 | $ | 32.9 | $ | 92.8 | $ | 112.3 | ||||||||
|
Adjusted revenue |
$ | 76.5 | $ | 44.6 | $ | 195.9 | $ | 158.8 | ||||||||
|
Adjusted EBITDA |
$ | 28.6 | $ | 7.7 | $ | 49.8 | $ | 36.3 | ||||||||
|
Adjusted Net Income |
$ | 13.8 | $ | (3.1 | ) | $ | 10.0 | $ | 5.6 | |||||||
|
Period ended |
||||||||
|
September 30, |
December 31, |
|||||||
|
($ in millions) |
2025 |
2024 |
||||||
|
Gross Liquid Assets |
$ | 4,419.5 | $ | 2,868.9 | ||||
|
Net Liquid Assets |
$ | 3,485.0 | $ | 1,696.1 | ||||
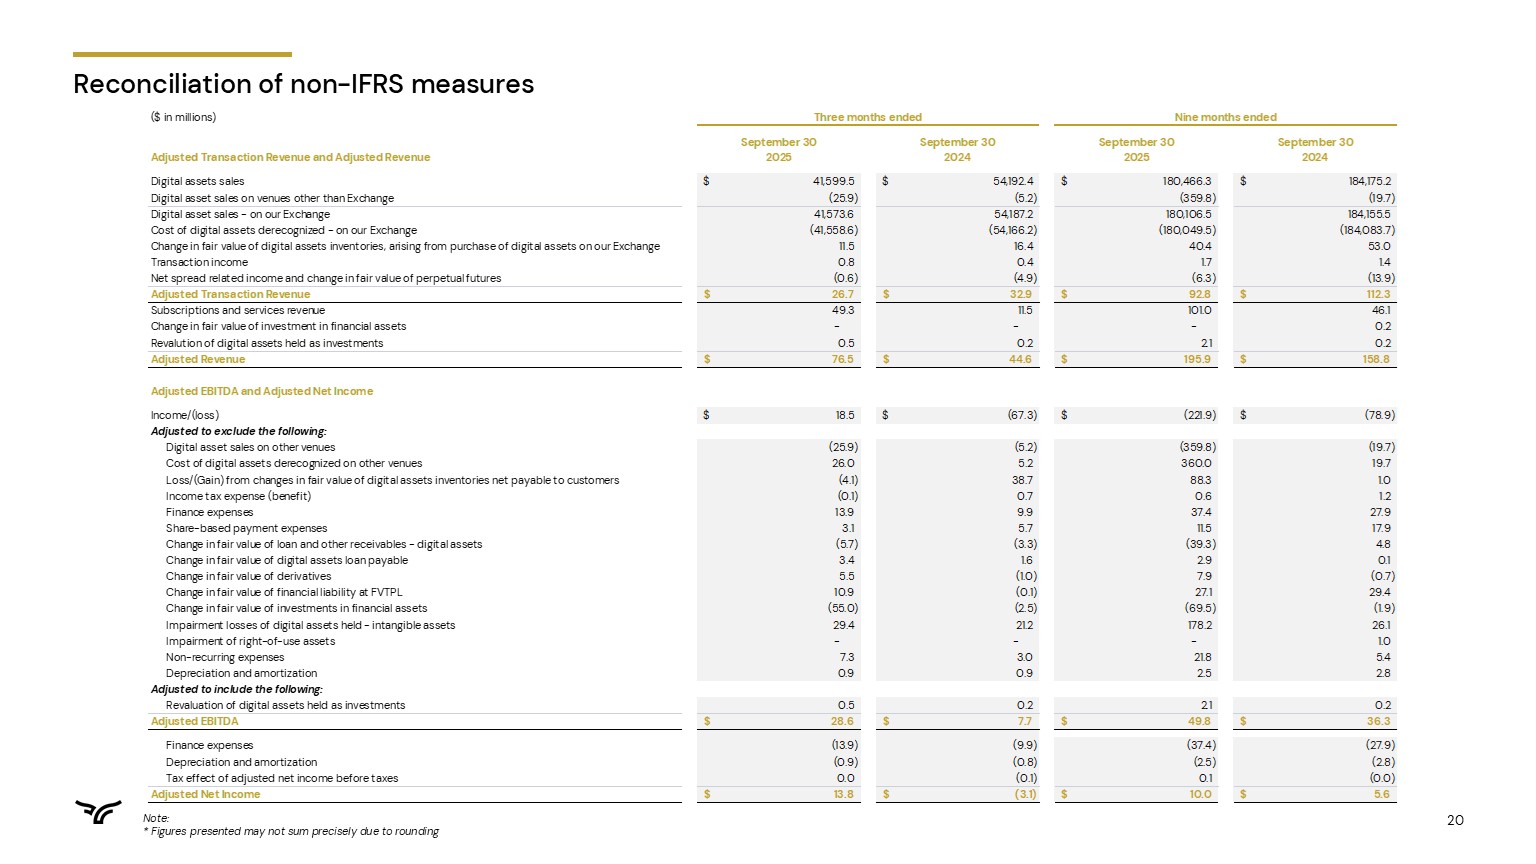
Reconciliation of Non-IFRS Measures
In US$ millions
|
($ in millions) |
Three months ended |
Nine months ended |
||||||||||||||
|
September 30, |
September 30, |
September 30, |
September 30, |
|||||||||||||
|
Adjusted Transaction Revenue and Adjusted Revenue |
2025 |
2024 |
2025 |
2024 |
||||||||||||
|
Digital assets sales |
$ | 41,599.5 | $ | 54,192.4 | $ | 180,466.3 | $ | 184,175.2 | ||||||||
|
Digital asset sales on venues other than Exchange |
(25.9 | ) | (5.2 | ) | (359.8 | ) | (19.7 | ) | ||||||||
|
Digital asset sales - on our Exchange |
$ | 41,573.6 | $ | 54,187.2 | $ | 180,106.5 | $ | 184,155.5 | ||||||||
|
Cost of digital assets derecognized - on our Exchange |
(41,558.6 | ) | (54,166.2 | ) | (180,049.5 | ) | (184,083.7 | ) | ||||||||
|
Change in fair value of digital assets inventories, arising from purchase of digital assets on our Exchange |
11.5 | 16.4 | 40.4 | 53.0 | ||||||||||||
|
Transaction income |
0.8 | 0.4 | 1.7 | 1.4 | ||||||||||||
|
Net spread related income and change in fair value of perpetual futures |
(0.6 | ) | (4.9 | ) | (6.3 | ) | (13.9 | ) | ||||||||
|
Adjusted Transaction Revenue |
$ | 26.7 | $ | 32.9 | $ | 92.8 | $ | 112.3 | ||||||||
|
Subscriptions and services revenue |
49.3 | 11.5 | 101.0 | 46.1 | ||||||||||||
|
Change in fair value of investment in financial assets |
— | — | — | 0.2 | ||||||||||||
|
Revaluation of digital assets held as investments |
0.5 | 0.2 | 2.1 | 0.2 | ||||||||||||
|
Adjusted Revenue |
$ | 76.5 | $ | 44.6 | $ | 195.9 | $ | 158.8 | ||||||||
|
Adjusted EBITDA and Adjusted Net Income |
||||||||||||||||
|
Income/(loss) |
$ | 18.5 | $ | (67.3 | ) | $ | (221.9 | ) | $ | (78.9 | ) | |||||
|
Adjusted to exclude the following: |
||||||||||||||||
|
Digital asset sales on other venues |
(25.9 | ) | (5.2 | ) | (359.8 | ) | (19.7 | ) | ||||||||
|
Cost of digital assets derecognized on other venues |
26.0 | 5.2 | 360.0 | 19.7 | ||||||||||||
|
Loss/(Gain) from changes in fair value of digital assets inventories net payable to customers |
(4.1 | ) | 38.7 | 88.3 | 1.0 | |||||||||||
|
Income tax expense |
(0.1 | ) | 0.7 | 0.6 | 1.2 | |||||||||||
|
Finance expenses |
13.9 | 9.9 | 37.4 | 27.9 | ||||||||||||
|
Share-based payment expenses |
3.1 | 5.7 | 11.5 | 17.9 | ||||||||||||
|
Change in fair value of loan and other receivables - digital assets |
(5.7 | ) | (3.3 | ) | (39.3 | ) | 4.8 | |||||||||
|
Change in fair value of digital assets loan payable |
3.4 | 1.6 | 2.9 | 0.1 | ||||||||||||
|
Change in fair value of derivatives |
5.5 | (1.0 | ) | 7.9 | (0.7 | ) | ||||||||||
|
Change in fair value of financial liability at FVTPL |
10.9 | (0.1 | ) | 27.1 | 29.4 | |||||||||||
|
Change in fair value of investments in financial assets |
(55.0 | ) | (2.5 | ) | (69.5 | ) | (1.9 | ) | ||||||||
|
Impairment losses of digital assets held - intangible assets |
29.4 | 21.2 | 178.2 | 26.1 | ||||||||||||
|
Impairment of right-of-use assets |
— | — | — | 1.0 | ||||||||||||
|
Non-recurring expenses |
7.3 | 3.0 | 21.8 | 5.4 | ||||||||||||
|
Depreciation and amortization |
0.9 | 0.9 | 2.5 | 2.8 | ||||||||||||
|
Adjusted to include the following: |
||||||||||||||||
|
Revaluation of digital assets held as investments |
0.5 | 0.2 | 2.1 | 0.2 | ||||||||||||
|
Adjusted EBITDA |
$ | 28.6 | $ | 7.7 | $ | 49.8 | $ | 36.3 | ||||||||
|
Finance expenses |
(13.9 | ) | (9.9 | ) | (37.4 | ) | (27.9 | ) | ||||||||
|
Depreciation and amortization |
(0.9 | ) | (0.8 | ) | (2.5 | ) | (2.8 | ) | ||||||||
|
Tax effect of adjusted net income before taxes |
0.0 | (0.1 | ) | 0.1 | (0.0 | ) | ||||||||||
|
Adjusted Net Income |
$ | 13.8 | $ | (3.1 | ) | $ | 10.0 | $ | 5.6 | |||||||
Note - Figures presented may not sum precisely due to rounding.
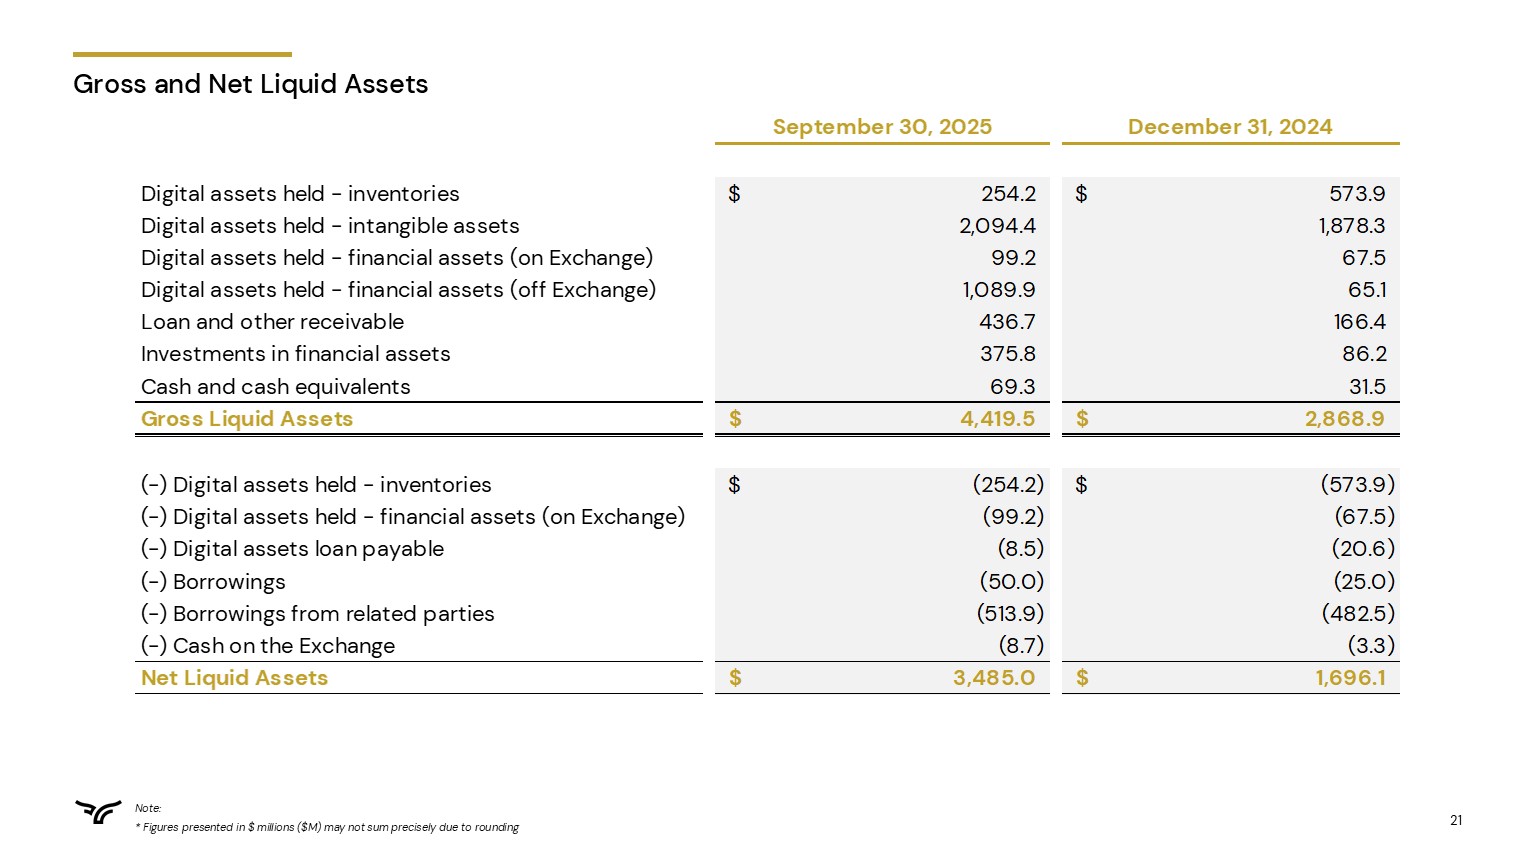
Gross and Net Liquid Assets
In US$ millions
|
September 30, 2025 |
December 31, 2024 |
|||||||
|
Digital assets held - inventories |
$ | 254.2 | $ | 573.9 | ||||
|
Digital assets held - intangible assets |
2,094.4 | 1,878.3 | ||||||
|
Digital assets held - financial assets (on Exchange) |
99.2 | 67.5 | ||||||
|
Digital assets held - financial assets (off Exchange) |
1,089.9 | 65.1 | ||||||
|
Loan and other receivable |
436.7 | 166.4 | ||||||
|
Investments in financial assets |
375.8 | 86.2 | ||||||
|
Cash and cash equivalents |
69.3 | 31.5 | ||||||
|
Gross Liquid Assets |
$ | 4,419.5 | $ | 2,868.9 | ||||
|
(-) Digital assets held - inventories |
$ | (254.2 | ) | $ | (573.9 | ) | ||
|
(-) Digital assets held - financial assets (on Exchange) |
(99.2 | ) | (67.5 | ) | ||||
|
(-) Digital assets loan payable |
(8.5 | ) | (20.6 | ) | ||||
|
(-) Borrowings |
(50.0 | ) | (25.0 | ) | ||||
|
(-) Borrowings from related parties |
(513.9 | ) | (482.5 | ) | ||||
|
(-) Cash on the Exchange |
(8.7 | ) | (3.3 | ) | ||||
|
Net Liquid Assets |
$ | 3,485.0 | $ | 1,696.1 | ||||
Note - Figures presented may not sum precisely due to rounding.
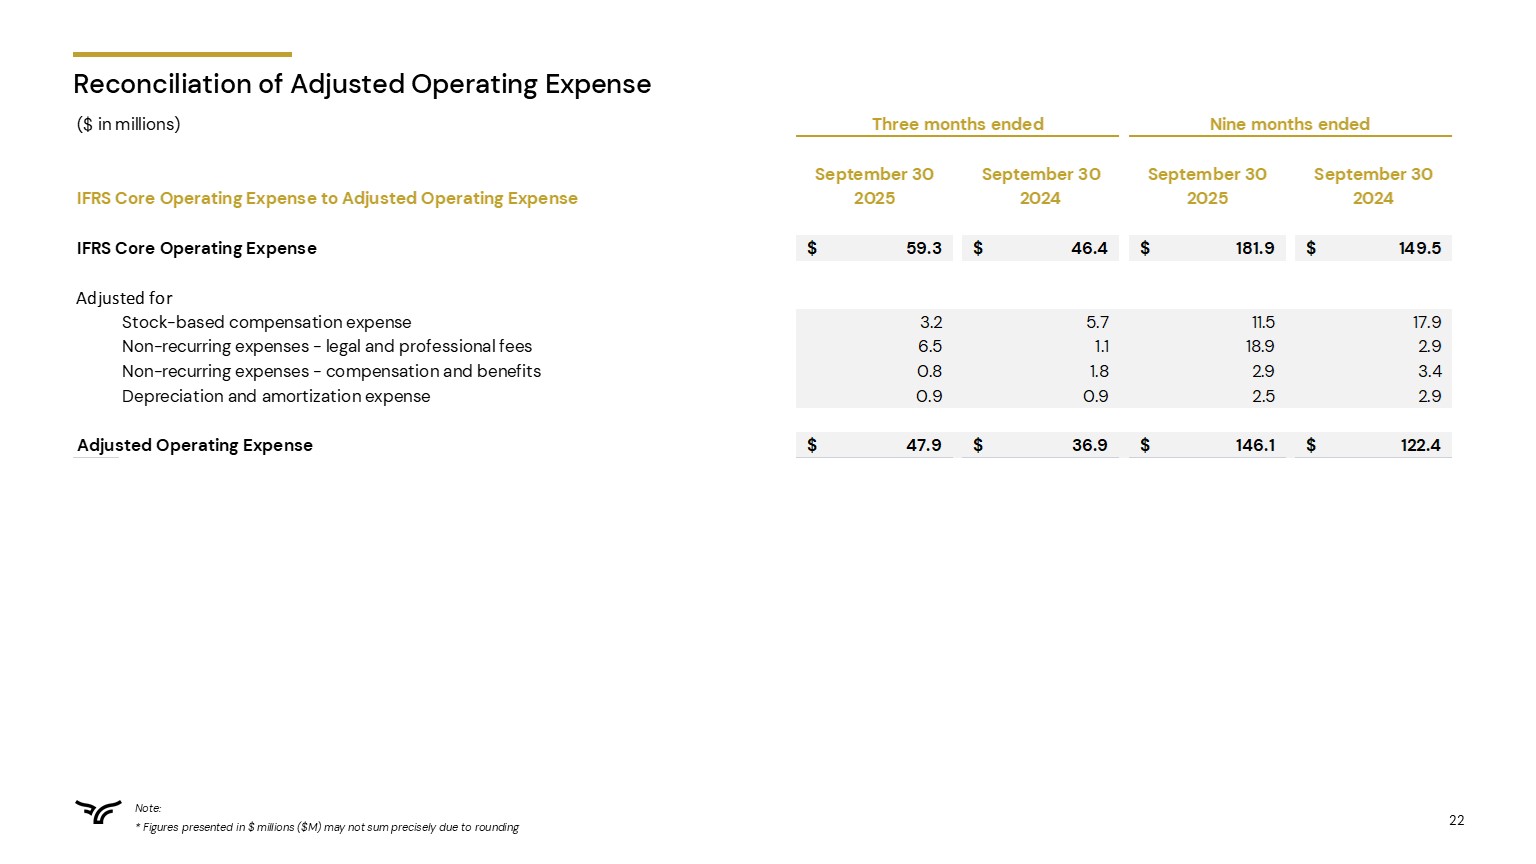
Reconciliation of Adjusted Operating Expense
In US$ millions
|
($ in millions) |
Three months ended |
Nine months ended |
||||||||||||||
|
September 30, |
September 30, |
September 30, |
September 30, |
|||||||||||||
|
IFRS Core Operating Expense to Adjusted Operating Expense |
2025 |
2024 |
2025 |
2024 |
||||||||||||
|
IFRS Core Operating Expense |
$ | 59.3 | $ | 46.4 | $ | 181.9 | $ | 149.5 | ||||||||
|
Adjusted for |
||||||||||||||||
|
Stock-based compensation expense |
3.2 | 5.7 | 11.5 | 17.9 | ||||||||||||
|
Non-recurring expenses - legal and professional fees |
6.5 | 1.1 | 18.9 | 2.9 | ||||||||||||
|
Non-recurring expenses - compensation and benefits |
0.8 | 1.8 | 2.9 | 3.4 | ||||||||||||
|
Depreciation and amortization expense |
0.9 | 0.9 | 2.5 | 2.9 | ||||||||||||
|
Adjusted Operating Expense |
$ | 47.9 | $ | 36.9 | $ | 146.1 | $ | 122.4 | ||||||||
Note - Figures presented may not sum precisely due to rounding.
Exhibit 99.2
|
Page |
|
|
BULLISH — UNAUDITED CONDENSED CONSOLIDATED FINANCIAL STATEMENTS |
|
|
Unaudited Condensed Consolidated Balance Sheets as of September 30, 2025 and December 31, 2024 |
|
|
Notes to the Unaudited Condensed Consolidated Financial Statements |
CONDENSED CONSOLIDATED STATEMENTS OF PROFIT OR LOSS AND OTHER COMPREHENSIVE INCOME/(LOSS) (UNAUDITED)
FOR THE THREE AND NINE MONTHS ENDED SEPTEMBER 30, 2025 AND 2024
(In thousands, except per share data)
Three months ended September 30, |
Nine months ended September 30, |
|||||||||||||||||||
Notes |
2025 |
2024 |
2025 |
2024 |
||||||||||||||||
Digital assets sales |
4 | $ | 41,599,507 | $ | 54,192,368 | $ | 180,466,309 | $ | 184,175,151 | |||||||||||
Cost of digital assets derecognized |
5 | (41,584,605 | ) | (54,171,381 | ) | (180,409,519 | ) | (184,103,432 | ) | |||||||||||
Other revenues |
6 | 50,150 | 11,872 | 102,746 | 47,495 | |||||||||||||||
Change in fair value of digital assets held, net |
7 | (11,440 | ) | (41,788 | ) | (189,793 | ) | 21,014 | ||||||||||||
Net spread related income and change in fair value of perpetual futures on the Exchange |
(602 | ) | (4,893 | ) | (6,293 | ) | (13,910 | ) | ||||||||||||
Change in fair value of investment in financial assets |
14 | 54,971 | 2,473 | 69,520 | 2,084 | |||||||||||||||
Administrative expenses |
8 | (45,709 | ) | (39,618 | ) | (135,912 | ) | (116,037 | ) | |||||||||||
Other expenses |
9 | (13,608 | ) | (6,810 | ) | (46,033 | ) | (33,446 | ) | |||||||||||
Finance expense |
10 | (13,906 | ) | (9,878 | ) | (37,437 | ) | (27,870 | ) | |||||||||||
Change in fair value of derivatives |
(5,533 | ) | 1,028 | (7,912 | ) | 677 | ||||||||||||||
Change in fair value of financial liability at FVTPL |
22 | (10,850 | ) | 100 | (27,000 | ) | (29,400 | ) | ||||||||||||
Income/(loss) before income tax |
$ | 18,375 | $ | (66,527 | ) | $ | (221,324 | ) | $ | (77,674 | ) | |||||||||
Income tax benefit/(expense) |
11 | 76 | (745 | ) | (579 | ) | (1,223 | ) | ||||||||||||
Net income/(loss) |
$ | 18,451 | $ | (67,272 | ) | $ | (221,903 | ) | $ | (78,897 | ) | |||||||||
Attributable to: |
||||||||||||||||||||
Owners of the Group |
18,397 | (66,732 | ) | (218,084 | ) | (78,505 | ) | |||||||||||||
Non-controlling interests |
54 | (540 | ) | (3,819 | ) | (392 | ) | |||||||||||||
Net income/(loss) |
$ | 18,451 | $ | (67,272 | ) | $ | (221,903 | ) | $ | (78,897 | ) | |||||||||
Other comprehensive income/(loss) |
||||||||||||||||||||
Items that will not be subsequently reclassified to profit or loss: |
||||||||||||||||||||
Revaluation of digital assets held as investments |
154,675 | 15,384 | 533,461 | 444,915 | ||||||||||||||||
Fair value gain/(loss) on financial liabilities designated as at FVTPL attributable to changes in credit risk |
22 | (6,100 | ) | 13,400 | (4,400 | ) | (4,900 | ) | ||||||||||||
| $ | 148,574 | $ | 28,784 | $ | 529,061 | $ | 440,015 | |||||||||||||
Items that may be reclassified subsequently to profit or loss: |
||||||||||||||||||||
Foreign exchange differences on translation of foreign operations |
(491 | ) | — | 1,643 | — | |||||||||||||||
Total comprehensive income/(loss) |
$ | 166,535 | $ | (38,488 | ) | $ | 308,801 | $ | 361,118 | |||||||||||
Attributable to: |
||||||||||||||||||||
Owners of the Group |
168,173 | (38,078 | ) | 308,278 | 357,955 | |||||||||||||||
Non-controlling interests |
(1,638 | ) | (410 | ) | 523 | 3,163 | ||||||||||||||
Total comprehensive income/(loss) |
$ | 166,535 | $ | (38,488 | ) | $ | 308,801 | $ | 361,118 | |||||||||||
Weighted average number of ordinary shares for the purposes of basic and diluted earnings/(loss) per share |
||||||||||||||||||||
Basic |
28 | 133,066 | 112,500 | 119,905 | 112,500 | |||||||||||||||
Diluted |
28 | 140,157 | 112,500 | 119,905 | 112,500 | |||||||||||||||
Earnings/(Loss) per share |
||||||||||||||||||||
Basic |
28 | $ | 0.14 | $ | (0.59 | ) | $ | (1.82 | ) | $ | (0.70 | ) | ||||||||
Diluted |
28 | $ | 0.10 | $ | (0.59 | ) | $ | (1.82 | ) | $ | (0.70 | ) | ||||||||
The accompanying notes are an integral part of these condensed consolidated financial statements.
CONDENSED CONSOLIDATED BALANCE SHEETS (UNAUDITED)
AS OF SEPTEMBER 30, 2025 AND DECEMBER 31, 2024
(In thousands)
Notes |
September 30, 2025 |
December 31, 2024 |
||||||||||
(Unaudited) |
(Audited) |
|||||||||||
ASSETS |
||||||||||||
Non-current assets |
||||||||||||
Goodwill |
15 | $ | 63,023 | $ | 61,475 | |||||||
Other intangible assets |
15 | 31,661 | 33,298 | |||||||||
Property and equipment and right-of-use assets |
16 | 12,206 | 14,118 | |||||||||
Deferred tax assets |
2,894 | 2,088 | ||||||||||
Other assets |
17 | 22,237 | 22,087 | |||||||||
Restricted cash |
18 | 1,968 | 1,968 | |||||||||
Total non-current assets |
$ | 133,989 | $ | 135,034 | ||||||||
Current assets |
||||||||||||
Digital assets held - inventories |
12 | $ | 254,203 | $ | 573,876 | |||||||
Digital assets held - intangible assets |
12 | 2,094,385 | 1,878,268 | |||||||||
Digital assets held - financial assets |
12 | 1,189,097 | 132,649 | |||||||||
Loan and other receivables - digital assets |
13 | 436,720 | 166,388 | |||||||||
Derivative financial instruments |
25 | 20 | 0 | |||||||||
Investments in financial assets |
14 | 375,845 | 86,173 | |||||||||
Other assets |
17 | 38,590 | 21,209 | |||||||||
Customer segregated cash |
14,550 | 6,382 | ||||||||||
Restricted cash |
18 | 16,676 | 15,893 | |||||||||
Cash and cash equivalents |
19 | 69,307 | 31,540 | |||||||||
Total current assets |
$ | 4,489,393 | $ | 2,912,378 | ||||||||
Total assets |
$ | 4,623,382 | $ | 3,047,412 | ||||||||
LIABILITIES |
||||||||||||
Non-current liabilities |
||||||||||||
Borrowings from related parties |
22 | $ | 513,850 | $ | 482,450 | |||||||
Convertible redeemable preference shares |
20 | — | 47,879 | |||||||||
Digital assets loan payable |
23 | 8,012 | 20,613 | |||||||||
Lease liabilities |
7,695 | 10,756 | ||||||||||
Deferred tax liabilities |
— | 6 | ||||||||||
Total non-current liabilities |
$ | 529,557 | $ | 561,704 | ||||||||
Current liabilities |
||||||||||||
Customer segregated cash liabilities |
$ | 14,550 | $ | 6,382 | ||||||||
Borrowings |
22 | 50,000 | 25,000 | |||||||||
Digital assets loan payable |
23 | 445 | — | |||||||||
Lease liabilities |
2,566 | 4,246 | ||||||||||
Other payables |
21 | 48,212 | 49,421 | |||||||||
Total current liabilities |
$ | 115,773 | $ | 85,049 | ||||||||
Total liabilities |
$ | 645,330 | $ | 646,753 | ||||||||
Net assets |
$ | 3,978,052 | $ | 2,400,659 | ||||||||
EQUITY |
||||||||||||
Share capital and share premium |
24 | $ | 5,105,631 | $ | 3,821,537 | |||||||
Option premium on convertible redeemable preference shares |
— | 18,399 | ||||||||||
Reserves |
1,101,668 | 858,797 | ||||||||||
Accumulated deficit |
(2,290,225 | ) | (2,309,053 | ) | ||||||||
Total shareholders' equity attributable to the owners of the Group |
$ | 3,917,074 | $ | 2,389,680 | ||||||||
Non-controlling interests |
60,978 | 10,979 | ||||||||||
Total equity |
$ | 3,978,052 | $ | 2,400,659 | ||||||||
The accompanying notes are an integral part of these condensed consolidated financial statements.
CONDENSED CONSOLIDATED STATEMENTS OF CHANGES IN EQUITY (UNAUDITED)
FOR THE THREE MONTHS ENDED SEPTEMBER 30, 2025 AND 2024
(In thousands)
Reserves |
||||||||||||||||||||||||||||||||||||||||
Option |
||||||||||||||||||||||||||||||||||||||||
premium on |
Revaluation |
Total equity |
||||||||||||||||||||||||||||||||||||||
convertible |
Share- |
reserves for |
attributable |
|||||||||||||||||||||||||||||||||||||
redeemable |
based |
digital assets |
to the |
Non- |
||||||||||||||||||||||||||||||||||||
Share |
Share |
preference |
payment |
held as |
Other |
Accumulated |
owners of |
controlling |
Total |
|||||||||||||||||||||||||||||||
capital |
premium |
shares |
reserves |
investments |
reserves |
deficit |
the Group |
interests |
equity |
|||||||||||||||||||||||||||||||
As of July 1, 2024 |
$ | 225 | $ | 3,808,375 | $ | 18,399 | $ | 59,455 | $ | 371,180 | $ | 55,679 | $ | (2,623,644 | ) | $ | 1,689,669 | $ | 4,421 | $ | 1,694,090 | |||||||||||||||||||
Net income/(loss) |
— | — | — | — | — | — | (66,732 | ) | (66,732 | ) | (540 | ) | (67,272 | ) | ||||||||||||||||||||||||||
Other comprehensive income/(loss) for the period |
— | — | — | — | 15,254 | 13,400 | — | 28,654 | 130 | 28,784 | ||||||||||||||||||||||||||||||
Total comprehensive income for the year/period |
— | — | — | — | 15,254 | 13,400 | (66,732 | ) | (38,078 | ) | (410 | ) | (38,488 | ) | ||||||||||||||||||||||||||
Issuance of shares, including exercise of stock options |
— | — | — | — | — | — | — | — | — | — | ||||||||||||||||||||||||||||||
Equity settled share-based payments |
— | — | — | 5,698 | — | — | — | 5,698 | — | 5,698 | ||||||||||||||||||||||||||||||
Transfer of revaluation gain of digital assets held as investments upon disposal |
— | — | — | — | (21,777 | ) | — | 21,777 | — | — | — | |||||||||||||||||||||||||||||
As of September 30, 2024 |
$ | 225 | $ | 3,808,375 | $ | 18,399 | $ | 65,153 | $ | 364,657 | $ | 69,079 | $ | (2,668,599 | ) | $ | 1,657,289 | $ | 4,011 | $ | 1,661,300 | |||||||||||||||||||
As of July 1, 2025 |
$ | 226 | $ | 3,821,311 | $ | 18,399 | $ | 78,250 | $ | 934,756 | $ | 60,857 | $ | (2,375,625 | ) | $ | 2,538,174 | $ | 13,140 | $ | 2,551,314 | |||||||||||||||||||
Net income |
— | — | — | — | — | — | 18,397 | 18,397 | 54 | 18,451 | ||||||||||||||||||||||||||||||
Other comprehensive income/(loss) for the period |
— | — | — | — | 156,164 | (6,388 | ) | — | 149,776 | (1,692 | ) | 148,084 | ||||||||||||||||||||||||||||
Total comprehensive income/(loss) |
— | — | — | — | 156,164 | (6,388 | ) | 18,397 | 168,173 | (1,638 | ) | 166,535 | ||||||||||||||||||||||||||||
Issuance of shares related to IPO |
69 | 1,209,125 | — | — | — | — | — | 1,209,194 | — | 1,209,194 | ||||||||||||||||||||||||||||||
Conversion of redeemable preference shares to share premium |
6 | 66,272 | (18,399 | ) | — | — | — | — | 47,879 | — | 47,879 | |||||||||||||||||||||||||||||
Conversion of Bullish Global shares to Ordinary shares |
— | 8,622 | — | — | 2,291 | (30 | ) | (8,898 | ) | 1,985 | (1,985 | ) | — | |||||||||||||||||||||||||||
Increase in non-controlling interest upon establishment of BMC1 conversion rights to Ordinary shares |
— | — | — | (12,887 | ) | (19,601 | ) | 251 | (19,224 | ) | (51,461 | ) | 51,461 | — | ||||||||||||||||||||||||||
Equity settled share-based payments |
— | — | — | 3,130 | — | — | — | 3,130 | — | 3,130 | ||||||||||||||||||||||||||||||
Transfer of revaluation gain of digital assets held as investments upon disposal |
— | — | — | — | (95,125 | ) | — | 95,125 | — | — | — | |||||||||||||||||||||||||||||
As of September 30, 2025 |
$ | 301 | $ | 5,105,330 | $ | — | $ | 68,493 | $ | 978,485 | $ | 54,690 | $ | (2,290,225 | ) | $ | 3,917,074 | $ | 60,978 | $ | 3,978,052 | |||||||||||||||||||
BULLISH
CONDENSED CONSOLIDATED STATEMENTS OF CHANGES IN EQUITY (UNAUDITED)
FOR THE NINE MONTHS ENDED SEPTEMBER 30, 2025 AND 2024
(In thousands)
Reserves |
||||||||||||||||||||||||||||||||||||||||
Option |
||||||||||||||||||||||||||||||||||||||||
premium on |
Revaluation |
Total equity |
||||||||||||||||||||||||||||||||||||||
convertible |
Share- |
reserves for |
attributable |
|||||||||||||||||||||||||||||||||||||
redeemable |
based |
digital assets |
to the |
Non- |
||||||||||||||||||||||||||||||||||||
Share |
Share |
preference |
payment |
held as |
Other |
Accumulated |
owners of |
controlling |
Total |
|||||||||||||||||||||||||||||||
capital |
premium |
shares |
reserves |
investments |
reserves |
deficit |
the Group |
interests |
equity |
|||||||||||||||||||||||||||||||
As of January 1, 2024 |
$ | 225 | $ | 3,786,883 | $ | 18,399 | $ | 68,757 | $ | — | $ | 73,979 | $ | (2,666,797 | ) | $ | 1,281,446 | $ | 848 | $ | 1,282,294 | |||||||||||||||||||
Net income/(loss) |
— | — | — | — | — | — | (78,505 | ) | (78,505 | ) | (392 | ) | (78,897 | ) | ||||||||||||||||||||||||||
Other comprehensive income/(loss) for the period |
— | — | — | — | 441,360 | (4,900 | ) | — | 436,460 | 3,555 | 440,015 | |||||||||||||||||||||||||||||
Total comprehensive income/(loss) |
— | — | — | — | 441,360 | (4,900 | ) | (78,505 | ) | 357,955 | 3,163 | 361,118 | ||||||||||||||||||||||||||||
Issuance of shares, including exercise of stock options |
— | 21,492 | — | (21,492 | ) | — | — | — | — | — | — | |||||||||||||||||||||||||||||
Equity settled share-based payments |
— | — | — | 17,888 | — | — | — | 17,888 | — | 17,888 | ||||||||||||||||||||||||||||||
Transfer of revaluation gain of digital assets held as investments upon disposal |
— | — | — | — | (76,703 | ) | — | 76,703 | — | — | — | |||||||||||||||||||||||||||||
As of September 30, 2024 |
$ | 225 | $ | 3,808,375 | $ | 18,399 | $ | 65,153 | $ | 364,657 | $ | 69,079 | $ | (2,668,599 | ) | $ | 1,657,289 | $ | 4,011 | $ | 1,661,300 | |||||||||||||||||||
As of January 1, 2025 |
$ | 226 | $ | 3,821,311 | $ | 18,399 | $ | 69,852 | $ | 731,838 | $ | 57,107 | $ | (2,309,053 | ) | $ | 2,389,680 | $ | 10,979 | $ | 2,400,659 | |||||||||||||||||||
Net loss |
— | — | — | — | — | — | (218,084 | ) | (218,084 | ) | (3,819 | ) | (221,903 | ) | ||||||||||||||||||||||||||
Other comprehensive income for the period |
— | — | — | 9 | 528,991 | (2,638 | ) | — | 526,362 | 4,342 | 530,704 | |||||||||||||||||||||||||||||
Total comprehensive income/(loss) |
— | — | — | 9 | 528,991 | (2,638 | ) | (218,084 | ) | 308,278 | 523 | 308,801 | ||||||||||||||||||||||||||||
Issuance of shares related to IPO |
69 | 1,209,125 | — | — | — | — | — | 1,209,194 | — | 1,209,194 | ||||||||||||||||||||||||||||||
Conversion of redeemable preference shares to share premium |
6 | 66,272 | (18,399 | ) | — | — | — | — | 47,879 | — | 47,879 | |||||||||||||||||||||||||||||
Conversion of Bullish Global shares to Ordinary shares |
— | 8,622 | — | — | 2,291 | (30 | ) | (8,898 | ) | 1,985 | (1,985 | ) | — | |||||||||||||||||||||||||||
Increase in non-controlling interest upon establishment of BMC1 conversion rights to Ordinary shares |
— | — | — | (12,887 | ) | (19,601 | ) | 251 | (19,224 | ) | (51,461 | ) | 51,461 | — | ||||||||||||||||||||||||||
Equity settled share-based payments |
— | — | — | 11,519 | — | — | — | 11,519 | — | 11,519 | ||||||||||||||||||||||||||||||
Transfer of revaluation gain of digital assets held as investments upon disposal |
— | — | — | — | (265,034 | ) | — | 265,034 | — | — | — | |||||||||||||||||||||||||||||
As of September 30, 2025 |
$ | 301 | $ | 5,105,330 | $ | — | $ | 68,493 | $ | 978,485 | $ | 54,690 | $ | (2,290,225 | ) | $ | 3,917,074 | $ | 60,978 | $ | 3,978,052 | |||||||||||||||||||
The accompanying notes are an integral part of these condensed consolidated financial statements.
CONDENSED CONSOLIDATED STATEMENTS OF CASH FLOWS (UNAUDITED)
FOR THE NINE MONTHS ENDED SEPTEMBER 30, 2025 AND 2024
(In thousands)
Nine months ended |
||||||||||||
September 30, |
||||||||||||
Notes |
2025 |
2024 |
||||||||||
Cash flows from operating activities |
||||||||||||
Net loss |
$ | (221,903 | ) | $ | (78,897 | ) | ||||||
Adjustments for: |
||||||||||||
Interest income |
6 | (10,329 | ) | (5,219 | ) | |||||||
Debt interest expense |
10 | 36,654 | 27,072 | |||||||||
Lease interest expense |
10 | 783 | 798 | |||||||||
Net foreign exchange loss |
- | 80 | ||||||||||
Share-based payments expenses |
29 | 11,519 | 17,888 | |||||||||
Depreciation of property and equipment and right-of-use assets |
9 | 4,431 | 4,773 | |||||||||
Amortization of other intangible assets |
15 | 1,687 | 1,626 | |||||||||
Impairment of right-of-use asset |
9 | - | 956 | |||||||||
Gain from revaluation of digital assets and investments in financial assets at FVTPL, net |
7 | (50,050 | ) | (49,830 | ) | |||||||
Derecognition of lease |
(416 | ) | — | |||||||||
Change in fair value of financial liability at FVTPL |
22 | 27,000 | 29,400 | |||||||||
Impairment losses of digital assets |
12 | 178,234 | 26,055 | |||||||||
Operating cash flows before changes in operating assets and liabilities |
(22,390 | ) | (25,298 | ) | ||||||||
Increase in other assets |
(15,147 | ) | (4,736 | ) | ||||||||
Decrease in deferred tax assets |
(806 | ) | (1,589 | ) | ||||||||
Decrease in digital assets held - inventories |
261,774 | 26,750 | ||||||||||
Increase in digital assets held - financial assets |
(2,645,719 | ) | (58,037 | ) | ||||||||
Decrease/(increase) in digital assets held - loan receivable |
2,375,485 | (15,098 | ) | |||||||||
Decrease in other payables |
(1,807 | ) | (2,808 | ) | ||||||||
Increase in customer segregated cash liabilities |
8,168 | 6,962 | ||||||||||
Decrease in deferred tax liabilities |
(6 | ) | (14 | ) | ||||||||
Interest received |
7,251 | 5,219 | ||||||||||
Net cash used in operating activities |
$ | (33,197 | ) | $ | (68,649 | ) | ||||||
Cash flows from investing activities |
||||||||||||
Purchase of investment in financial assets |
$ | (4,620 | ) | $ | — | |||||||
Proceeds on investment in financial assets |
48,213 | 167 | ||||||||||
Cash received from investment in derivative financial instruments |
— | 1,128 | ||||||||||
Purchase of property and equipment |
16 | (2,344 | ) | (313 | ) | |||||||
Purchase of digital assets held - intangible assets |
(41,666 | ) | (243 | ) | ||||||||
Prepayment on intangible assets |
— | (10,001 | ) | |||||||||
Proceeds on disposal of digital assets held - intangible assets |
30,549 | — | ||||||||||
Net cash provided by/(used in) investing activities |
$ | 30,132 | $ | (9,262 | ) | |||||||
Cash flows from financing activities |
||||||||||||
Proceeds from issuance of Ordinary shares |
$ | 59,194 | $ | — | ||||||||
Interest paid |
10 | (30,554 | ) | (19,105 | ) | |||||||
Proceeds from borrowings |
174,300 | 25,000 | ||||||||||
Repayment of borrowings |
(149,300 | ) | — | |||||||||
Repayment on lease liabilities |
(4,065 | ) | (3,579 | ) | ||||||||
Net cash provided by financing activities |
$ | 49,575 | $ | 2,316 | ||||||||
Net increase/(decrease) in cash and cash equivalents, customer segregated cash and restricted cash |
46,510 | (75,595 | ) | |||||||||
Cash and cash equivalents, customer segregated cash and restricted cash at beginning of the period |
55,783 | 131,526 | ||||||||||
Effects of exchange rate changes on cash and cash equivalents, customer segregated cash and restricted cash |
208 | — | ||||||||||
Cash and cash equivalents, customer segregated cash and restricted cash at end of the period |
$ | 102,501 | $ | 55,931 | ||||||||
Cash and cash equivalents, customer segregated cash and restricted cash consisted of the following: |
||||||||||||
Customer segregated cash |
14,550 | 7,024 | ||||||||||
Restricted cash |
18 | 18,644 | 19,475 | |||||||||
Cash and cash equivalents |
19 | 69,307 | 29,432 | |||||||||
Total cash and cash equivalents, customer segregated cash and restricted cash |
$ | 102,501 | $ | 55,931 | ||||||||
Supplemental schedule of non-cash investing and financing activities |
||||||||||||
Recognition of right-of-use assets against lease liabilities |
$ | 364 | $ | 8,445 | ||||||||
Purchase of digital assets held - intangible assets |
(39,553,706 | ) | (2,949,909 | ) | ||||||||
Proceeds on disposal of digital assets held - intangible assets |
39,271,654 | 2,817,681 | ||||||||||
Digital asset loan receivables made, net |
191,499 | 63,356 | ||||||||||
Digital asset pledged as collateral posted, net |
26,871 | 60,061 | ||||||||||
Purchase of investment in financial assets via USDC |
(10,116 | ) | (31,168 | ) | ||||||||
Prepayment on intangible assets made, net |
(78 | ) | (8,043 | ) | ||||||||
Interest paid in digital assets |
(6,882 | ) | — | |||||||||
Proceeds from borrowings via digital assets |
3,185,184 | — | ||||||||||
Repayment from borrowings via digital assets |
(3,185,184 | ) | — | |||||||||
Proceeds from digital assets loan payable via digital assets |
393,553 | — | ||||||||||
Repayments from digital assets loan payable via digital assets |
(408,568 | ) | — | |||||||||
Proceeds from issuance of Ordinary shares |
1,150,000 | — | ||||||||||
The accompanying notes are an integral part of these condensed consolidated financial statements.
Bullish (the “Company”) is an exempted company incorporated and domiciled in the Cayman Islands with limited liability. The Company and its subsidiaries are collectively referred to as “the Group.” These Unaudited Condensed Consolidated Interim Financial Statements are as of September 30, 2025 and December 31, 2024 and for the three and nine months ended September 30, 2025 and 2024.
Prior to July 23, 2024, the Company was majority owned by block.one. Effective July 23, 2024 and August 21, 2024, block.one transferred the majority of the Class A common shares in tranches to certain of its shareholders.
The principal activity of the Group is providing infrastructure and information services which includes the operation of a digital asset trading platform (the “Exchange”) and CoinDesk Inc. (“CoinDesk”) which provides digital asset media and information services. On October 9, 2024, the Group completed the acquisition of Crypto Coin Comparison Ltd (“CCData”). Further details on the nature of the Group’s operations and these entities can be found in the Group’s audited consolidated financial statements for the year ended December 31, 2024 (the “Annual Financial Statements”).
The Unaudited Condensed Consolidated Interim Financial Statements are presented in United States dollars, which is the same as the functional currency of the Group.
Operating segments are defined as components of an entity for which separate financial information is available and that are regularly reviewed by the Chief Operating Decision Maker (“CODM”) in deciding how to allocate resources to an individual segment and in assessing performance. For the Group, the Chief Executive Officer (“CEO”) serves as the CODM. The CODM reviews financial information presented on a global consolidated basis for purposes of making operating decisions, allocating resources, and evaluating financial performance. As such, the Group has determined that it operates as one operating segment and one reportable segment.
Initial Public Offering
In August 2025, the Group completed its initial public offering (“IPO”) on the New York Stock Exchange (“NYSE”) under the ticker symbol “BLSH,” in which the Company issued and sold 34,500,000 Ordinary shares to the public, inclusive of the underwriters’ over-allotment option which was exercised in full, at a price of $37.00 per share. The IPO resulted in net proceeds to the Company of $1,212.7 million after deducting the underwriting discounts and commissions and before deducting offering costs of $3.5 million, which were charged to Share premium as a reduction of the net proceeds received from the IPO.
Reverse Stock Split and IPO Reorganization
On July 31, 2025, the Company’s Board of Directors approved a reverse stock split of the Company’s Class A common shares, Class B preference shares, and Class C common shares on a 1-for-2 basis (the “Reverse Split”) which became effective on August 1, 2025. Accordingly, all holders of record of Class A common shares and Class B preference shares on August 1, 2025 (no Class C common shares were outstanding on such date), received respectively one issued and outstanding Class A common share and one issued and outstanding Class B preference share of the Company in exchange for two issued and outstanding Class A common shares and two issued and outstanding Class B preference shares of the Company. No fractional shares were issued in connection with the Reverse Split. All fractional shares created by the Reverse Split were rounded up to the nearest whole number of shares.
All information referencing outstanding shares of the Company, including earnings and loss per share, in the current and comparative periods presented herein give retroactive effect to the Reverse Split.
The following transactions impacting shares, options, and restricted stock units (“RSUs”) in Bullish Global and BMC1 interests occurred in connection with the IPO Reorganization and are adjusted for the effect of the Reverse Split described above.
|
• |
Immediately prior to the completion of the IPO, the Company redesignated Class A shares as Ordinary shares; |
|
• |
Bullish Global RSUs converted into RSUs of Ordinary shares on a 1-for-2 basis; |
|
• |
Bullish Global options converted into options to acquire Ordinary shares on a 1-for-2 basis with the exercise price for each converted option being twice the pre-conversion exercise price (subject to the same vesting conditions); and |
|
• |
Certain conversion rights with respect to the BMC1 equity became effective. These conversion rights, subject to vesting, entitle holders of an aggregate outstanding 13,643,618 units of BMC1 equity to receive 7,075,504 Ordinary shares. |
Immediately prior to the completion of its IPO, and pursuant to the Amended and Restated Memorandum and Articles of Association, the Group was authorized to issue 750,000,000 Ordinary shares of a par value of $0.002, and all of its issued and outstanding Common shares and Preference shares were converted into and re-designated as Ordinary shares of a par value of $0.002 on a one-for-one basis.
Subsequently, as part of the transaction that, collectively with the Reverse Split and the issuance of Ordinary shares to the third party investor in Bullish Global, we refer to as the "IPO Reorganization," the 2,735,938 issued and outstanding Class B preference shares (post Reverse Split) were mandatorily converted into an equal number of Ordinary shares. The accounting for this conversion involved derecognizing the $47.9 million financial liability associated with the Convertible redeemable preference shares and reclassifying the $18.4 million Option premium on convertible redeemable preference shares equity component; both amounts were transferred to Share capital and Share premium.
2 Summary of principal accounting policies
The accounting policies have been consistently applied to the current and prior financial years presented, as are the methods of computation, unless otherwise stated below.
2.1 Basis of preparation
|
(i) |
Compliance with IFRS |
The Unaudited Condensed Consolidated Interim Financial Statements as of September 30, 2025 and December 31, 2024 and for the three and nine months ended September 30, 2025 and December 31, 2024, have been prepared in accordance with International Accounting Standard (“IAS”) 34, Interim Financial Reporting, issued by the International Accounting Standards Board (“IASB”). The financial statements comply with IFRS as issued by the IASB.
These Unaudited Condensed Consolidated Financial Statements do not include all the information and disclosures required in the Annual Financial Statements and should be read in conjunction with the Annual Financial Statements. For details on principal accounting policies, including but not limited to, principles of consolidation, business combinations, revenue recognition, financial instruments, leases, and taxation, refer to the Annual Financial Statements.
The accounting policies adopted in the preparation of these Unaudited Condensed Consolidated Interim Financial Statements are consistent with those followed in the preparation of the Group’s Annual Financial Statements, except for the adoption of new standards and interpretations effective as of January 1, 2025, and as described below.
|
(ii) |
Going concern |
The Directors have, at the time of approving the Unaudited Condensed Consolidated Interim Financial Statements, a reasonable expectation that the Group has adequate resources to continue in operational existence for the foreseeable future. Thus, they continue to adopt the going concern basis of accounting in preparing the Unaudited Condensed Consolidated Financial Statements.
|
(iii) |
Reclassification of digital assets |
Effective January 1, 2024, the Group reclassified certain portfolios of digital assets not allocated for market-making purposes from inventory to indefinite-life intangible assets under IAS 38. This reclassification was applied prospectively. Details of this reclassification were provided in the Annual Financial Statements.
|
(iv) |
New standard and amendments to standards which are not yet effective |
Certain new standards and amendments to IFRS have been issued but are not yet effective for the period ended September 30, 2025, and have not been early adopted by the Group. IFRS 18 “Presentation and Disclosure in Financial Statements” replaces IAS 1 and is effective for annual reporting periods beginning on or after January 1, 2027. The Group is currently assessing the impact of IFRS 18. For other new standards and amendments not yet effective, refer to the Annual Financial Statements.
2.2 Digital assets held - intangible assets and inventories
Prior to December 31, 2023:
Before December 31, 2023, the Group classified all digital assets as inventories under IAS 2, as they were primarily held for the purpose of facilitating market-making activities on the Bullish Exchange. These assets were measured at fair value less costs to sell, with changes in fair value recognized in the Consolidated Statement of Profit or Loss under Change in fair value of digital assets held, net.
Starting from January 1, 2024:
Effective January 1, 2024, the Group reclassified a portion of its existing digital assets, previously classified as inventory measured at fair value less costs to sell, to intangible assets, utilizing the revaluation method as digital assets are traded in active markets. For the purpose of revaluation, fair value is measured by reference to the Company’s principal market at subsequent measurement dates. This change impacts Other comprehensive income/(loss) (“OCI”) as increases in the fair value of these intangible assets are recognized directly in equity under Revaluation reserves for digital assets held as investments. This reserve represents the revaluation adjustment of intangible assets, capturing the change of fair value from their weighted average cost prospectively on or after January 1, 2024. This reclassification is driven by a significant change in the operation of its business, characterized by a substantial reduction in the quantity of digital assets deployed for liquidity provision and market-making activities on the Exchange.
In addition to the reclassification of existing assets, new digital assets acquired from this date are classified as either intangible assets or inventory, reflecting their intended use within the Group’s updated operational business model framework. This strategic realignment ensures that the Group’s financial reporting accurately reflects the change in the nature of its business operations and asset management practices.
For digital assets classified as intangible assets, if the carrying amount of a digital asset increases as a result of revaluation, the increase is recognized in OCI and accumulated in Equity under Reserves. However, if the increase in the carrying amount of the digital asset reverses a previous revaluation decrease recognized in Net income/(loss), it is recognized in Net income/(loss).
Conversely, if the carrying amount decreases due to revaluation, the decrease is recognized in Net income/(loss). However, if there is a credit balance in the Revaluation reserves for that asset, the decrease is recognized in OCI, reducing the equity under the Revaluation reserves heading.
The cumulative Revaluation reserves included in Equity may be transferred directly to Accumulated deficit when the surplus is realized, either upon the retirement or disposal of the asset. Transfers from Revaluation reserves to Accumulated deficit are not recorded through Net income/(loss).
Digital assets held — intangible assets associated with decentralized finance protocols
The Group engages with decentralized finance (“DeFi”) protocols, which are smart contracts designed to perform specific functions, predominantly built on various blockchain platforms. These protocols enable the Group to provide or access liquidity and facilitate the exchange of digital assets directly on the blockchain.
To provide liquidity, the Group deposits or transfers its digital assets to the smart contracts of these DeFi protocols. In return, the Group typically receives protocol-specific digital assets that represent its claims on the underlying digital assets deposited.
Most DeFi protocols have the capability to utilize the Group’s deposited digital assets for various purposes, including lending or trading them with other participants in the DeFi protocol. Upon transferring digital assets to the smart contracts, the Group derecognizes the original digital assets and recognizes the protocol-specific digital assets received in return. Upon redeeming the protocol-specific asset for the underlying digital asset, the protocol-specific digital asset is derecognized and the returned digital asset is recognized.
Digital assets held — financial assets classification
As of September 30, 2025, the Group has updated the listing of assets to be classified as Digital assets held – financial assets to include AUSD, EURAU, EURC, EURCV, RLUSD, USD1, USDCV, and USDG in addition to the assets previously described in the Annual Financial Statements. These assets are stablecoins that are contractually redeemable for fiat currency on demand. In addition to these stablecoins, the Group also classifies certain DeFi protocol tokens funded by these stablecoins as Digital assets held – financial assets.
3 Critical accounting judgments and key sources of estimation uncertainty
In preparing these Unaudited Condensed Consolidated Interim Financial Statements, management has made judgments, estimates, and assumptions that affect the application of accounting policies and the reported amounts of assets and liabilities, income, and expense. Actual results may differ from these estimates.
Refer to the Annual Financial Statements for a comprehensive discussion of critical accounting judgments and key sources of estimation uncertainty.
The significant judgments made by management in applying the Group’s accounting policies and the key sources of estimation uncertainty were the same as those described in the Annual Financial Statements, with the following updates or emphasis for the interim period:
|
(i) |
Fair market value of digital assets held |
The determination of fair value for digital assets continues to require judgment, particularly in identifying principal markets.
|
(ii) |
Goodwill and Other intangible assets impairment |
Management assesses Goodwill for impairment annually or more frequently if indicators exist. Other intangible assets are assessed if indicators of impairment arise. Other intangible assets excludes Digital assets held - intangible assets. No material indicators of impairment were identified during the three and nine months ended September 30, 2025, that were not already considered in the Annual Financial Statements.
4 Digital assets sales
The following tables summarize the disaggregation of Digital assets sales by venue for the three and nine months ended September 30, 2025 and 2024 (in thousands):
Three months ended September 30, |
Nine months ended September 30, |
|||||||||||||||
2025 |
2024 |
2025 |
2024 |
|||||||||||||
On the Exchange |
$ | 41,573,599 | $ | 54,187,137 | $ | 180,106,468 | $ | 184,155,453 | ||||||||
On other venues(i) |
25,908 | 5,231 | 359,841 | 19,698 | ||||||||||||
Total Digital asset sales |
$ | 41,599,507 | $ | 54,192,368 | $ | 180,466,309 | $ | 184,175,151 | ||||||||
|
(i) |
Other venues means other exchanges or over-the-counter brokers that were used to purchase or sell digital assets. |
4 Digital assets sales—(continued)
Below is the table of Digital assets sales on the Exchange disaggregated by major geography, based on domicile of the customers, accounting for 10% or more of total Digital assets sales on the Exchange in any of the periods presented (in thousands):
Three months ended September 30, |
Nine months ended September 30, |
|||||||||||||||
2025 |
2024 |
2025 |
2024 |
|||||||||||||
United Kingdom |
$ | 12,746,179 | $ | 14,936,306 | $ | 52,134,794 | $ | 55,698,609 | ||||||||
British Virgin Islands |
9,921,533 | 10,790,888 | 53,872,513 | 25,550,852 | ||||||||||||
Cayman Islands |
5,970,734 | 832,890 | 10,298,783 | 4,703,996 | ||||||||||||
Singapore |
1,471,354 | 17,715,059 | 14,923,886 | 69,170,310 | ||||||||||||
Rest of the World |
11,463,799 | 9,911,994 | 48,876,492 | 29,031,686 | ||||||||||||
Total Digital asset sales |
$ | 41,573,599 | $ | 54,187,137 | $ | 180,106,468 | $ | 184,155,453 | ||||||||
Below are the tables of Digital assets sales on the Exchange disaggregated by major customers accounting for 10% or more of total Digital assets sales on the Exchange in any of the periods presented (in thousands):
Three months ended September 30, |
Nine months ended September 30, |
|||||||||||||||
2025 |
2024 |
2025 |
2024 |
|||||||||||||
Customer 3 |
$ | 7,296,971 | $ | 12,462,044 | $ | 40,401,766 | $ | 48,230,949 | ||||||||
Customer 7 |
4,500,909 | * | 24,060,114 | * | ||||||||||||
Customer 8 |
5,449,207 | * | * | * | ||||||||||||
Customer 4 |
* | 6,667,135 | * | 19,575,476 | ||||||||||||
Customer 6 |
* | 16,123,949 | * | 64,740,142 | ||||||||||||
* Digital asset sales attributable to the customer during the period did not exceed the 10% threshold.
The customer numbers presented above represent unique customers. The number is non-sequential and is only recycled once a customer has not met the disclosure threshold as a major customer in both the current period and prior comparative periods.
5 Cost of digital assets derecognized
The following table presents the Cost of digital assets derecognized by venue for the three and nine months ended September 30, 2025 and 2024 (in thousands):
Three months ended September 30, |
Nine months ended September 30, |
|||||||||||||||
2025 |
2024 |
2025 |
2024 |
|||||||||||||
On the Exchange |
$ | 41,558,634 | $ | 54,166,182 | $ | 180,049,508 | $ | 184,083,729 | ||||||||
On other venues(i) |
25,971 | 5,199 | 360,011 | 19,703 | ||||||||||||
Total Cost of digital assets derecognized |
$ | 41,584,605 | $ | 54,171,381 | $ | 180,409,519 | $ | 184,103,432 | ||||||||
|
(i) |
Other venues means other exchanges or over-the-counter brokers that were used to purchase or sell digital assets. |
For the three and nine months ended September 30, 2025 and 2024, the Exchange recorded Cost of digital assets derecognized based on the carrying value of the digital assets sold from the Automated Market Making Instructions (“AMMI”) on the Exchange which was the fair value of the digital asset at the time it was disposed.
6 Other revenues
The following table presents Other revenues by category for the three and nine months ended September 30, 2025 and 2024 (in thousands).
Three months ended September 30, |
Nine months ended September 30, |
|||||||||||||||
2025 |
2024 |
2025 |
2024 |
|||||||||||||
Transaction fee income(i) |
$ | 836 | $ | 395 | $ | 1,783 | $ | 1,415 | ||||||||
Subscription and services revenue(ii) |
49,314 | 11,477 | 100,963 | 46,080 | ||||||||||||
Total Other revenues |
$ | 50,150 | $ | 11,872 | $ | 102,746 | $ | 47,495 | ||||||||
|
(i) |
For the three months ended September 30, 2025 and 2024, the Exchange recorded Transaction fee income from peer-to-peer spot trades of $0.7 million and $0.3 million, respectively. For the nine months ended September 30, 2025 and 2024, the Exchange recorded Transaction fee income from peer-to-peer spot trades of $1.6 million and $0.9 million, respectively. |
|
(ii) |
Includes interest income of $4.3 million and $3.4 million for the three months ended September 30, 2025 and 2024, respectively. Includes interest income of $10.3 million and $7.7 million for the nine months ended September 30, 2025 and 2024, respectively. |
7 Change in fair value of digital assets held, net
The following table presents the components of the Change in fair value of digital assets held, net for the three and nine months ended September 30, 2025 and 2024 (in thousands):
Three months ended September 30, |
Nine months ended September 30, |
|||||||||||||||
2025 |
2024 |
2025 |
2024 |
|||||||||||||
Change in fair value of digital asset inventories, arising from purchase of digital assets on the Exchange |
$ | 11,497 | $ | 16,386 | $ | 40,360 | $ | 53,023 | ||||||||
Change in fair value of digital asset inventories and financial assets, net of change in fair value of the payable to customers |
4,094 | (38,683 | ) | (88,336 | ) | (1,009 | ) | |||||||||
Change in fair value of loan and other receivables - digital assets |
5,717 | 3,293 | 39,275 | (4,835 | ) | |||||||||||
Change in fair value of digital asset loan payable |
(3,333 | ) | (1,597 | ) | (2,858 | ) | (110 | ) | ||||||||
Impairment losses of digital asset held - intangible assets |
(29,415 | ) | (21,187 | ) | (178,234 | ) | (26,055 | ) | ||||||||
Total Change in fair value of digital assets held, net |
$ | (11,440 | ) | $ | (41,788 | ) | $ | (189,793 | ) | $ | 21,014 | |||||
8 Administrative expenses
The following table presents the components of Administrative expenses for the three and nine months ended September 30, 2025 and 2024 (in thousands):
Three months ended September 30, |
Nine months ended September 30, |
|||||||||||||||
2025 |
2024 |
2025 |
2024 |
|||||||||||||
Compensation and benefits |
$ | 32,742 | $ | 34,778 | $ | 98,403 | $ | 102,798 | ||||||||
Legal and professional fees |
12,967 | 4,840 | 37,509 | 13,239 | ||||||||||||
Total Administrative expenses |
$ | 45,709 | $ | 39,618 | $ | 135,912 | $ | 116,037 | ||||||||
9 Other expenses
The following table presents the components of Other expenses for the three and nine months ended September 30, 2025 and 2024 (in thousands):
Three months ended September 30, |
Nine months ended September 30, |
|||||||||||||||
2025 |
2024 |
2025 |
2024 |
|||||||||||||
Information technology and software expenses |
$ | 5,978 | $ | 5,001 | $ | 15,947 | $ | 13,763 | ||||||||
Production expenses |
696 | (1,371 | ) | 8,510 | 1,922 | |||||||||||
Advertisement and promotion expenses |
366 | (1,559 | ) | 4,803 | 1,981 | |||||||||||
Depreciation of property and equipment and right-of-use assets |
1,301 | 1,502 | 4,431 | 4,773 | ||||||||||||
Amortization of intangible assets |
514 | 542 | 1,687 | 1,626 | ||||||||||||
Impairment of right-of-use assets |
- | - | - | 956 | ||||||||||||
Custody fees |
408 | 414 | 1,352 | 1,236 | ||||||||||||
Other |
4,345 | 2,281 | 9,303 | 7,189 | ||||||||||||
Total Other expenses |
$ | 13,608 | $ | 6,810 | $ | 46,033 | $ | 33,446 | ||||||||
10 Finance expense
The following table presents the components of Finance expense for the three and nine months ended September 30, 2025 and 2024 (in thousands):
Three months ended September 30, |
Nine months ended September 30, |
|||||||||||||||
2025 |
2024 |
2025 |
2024 |
|||||||||||||
Loan interest expense |
$ | 13,653 | $ | 9,599 | $ | 36,654 | $ | 27,072 | ||||||||
Lease interest expense |
253 | 279 | 783 | 798 | ||||||||||||
Total Finance expense |
$ | 13,906 | $ | 9,878 | $ | 37,437 | $ | 27,870 | ||||||||
Loan interest expense for the three months ended September 30, 2025 and 2024, include expenses related to ongoing financing arrangements detailed in the Annual Financial Statements and the following significant developments in 2025:
Resolution of 2024 loan and new repurchase agreement (February 2025): A loan and security agreement entered into on June 11, 2024 for $25 million matured on February 11, 2025. Subsequently, on February 28, 2025, the Group entered into a repurchase agreement with the same lending entity. This agreement includes monthly interest payments at 9% per annum. See Note 22 for further details.
For details of loan agreements entered into in 2023 with its former ultimate holding company, block.one, where terms are materially unchanged, refer to the Annual Financial Statements and Note 22.
For the three months ended September 30, 2025 and 2024, the Group recognized Loan interest expense of $8.8 million in each period from the loan facility with a related company owned by the major shareholder. For the nine months ended September 30, 2025 and 2024 loan interest expense from the facility totaled $26.0 million and $26.1 million, respectively.
11 Income tax benefit (expense)
The following table presents the components of Income tax benefit) for the three and nine months ended September 30, 2025 and 2024 (in thousands):
|
Three months ended September 30, |
Nine months ended September 30, |
|||||||||||||||
|
2025 |
2024 |
2025 |
2024 |
|||||||||||||
|
Current income tax expense |
$ | (311 | ) | $ | (1,120 | ) | $ | (1,399 | ) | $ | (2,816 | ) | ||||
|
Deferred income tax benefit |
387 | 375 | 820 | 1,593 | ||||||||||||
|
Total Income tax benefit (expense) |
$ | 76 | $ | (745 | ) | $ | (579 | ) | $ | (1,223 | ) | |||||
12 Digital assets held
The tables below present the movement of Digital assets held - inventories and Digital assets held - intangible assets for the three and nine months ended September 30, 2025 and 2024 (in thousands).
Digital |
Digital |
|||||||||||||||
assets held - inventories |
assets held - intangible assets |
|||||||||||||||
2025 |
2024 |
2025 |
2024 |
|||||||||||||
As of June 30, |
$ | 231,870 | $ | 435,057 | $ | 1,957,402 | $ | 1,280,205 | ||||||||
Reclassification of digital assets to financial assets |
(2,154 | ) | — | — | — | |||||||||||
Additions |
41,611,112 | 54,164,859 | 3,788,863 | 2,883,770 | ||||||||||||
Disposals |
(41,599,507 | ) | (54,192,367 | ) | (3,793,109 | ) | (2,783,584 | ) | ||||||||
Loan and other receivables made, net(i) |
1,901 | 720 | (41,563 | ) | (9,608 | ) | ||||||||||
Net settlement of Investments in financial assets |
— | — | 57,533 | (17,585 | ) | |||||||||||
Revaluation |
10,981 | (22,114 | ) | 154,674 | 15,384 | |||||||||||
Impairment losses |
— | — | (29,415 | ) | (21,187 | ) | ||||||||||
As of September 30, |
$ | 254,203 | $ | 386,155 | $ | 2,094,385 | $ | 1,347,395 | ||||||||
Digital |
Digital |
|||||||||||||||
assets held - inventories |
assets held - intangible assets |
|||||||||||||||
2025 |
2024 |
2025 |
2024 |
|||||||||||||
As of January 1, |
$ | 573,876 | $ | 1,289,346 | $ | 1,878,268 | $ | — | ||||||||
Reclassification of digital assets from inventories to intangible assets |
— | (928,691 | ) | — | 928,691 | |||||||||||
Reclassification of digital assets to financial assets |
(2,154 | ) | — | — | — | |||||||||||
Additions |
180,204,535 | 184,149,376 | 39,595,370 | 2,949,989 | ||||||||||||
Disposals |
(180,466,309 | ) | (184,175,151 | ) | (39,302,102 | ) | (2,817,681 | ) | ||||||||
Loan and other receivables made, net(i) |
(3,917 | ) | (1,027 | ) | (160,678 | ) | (110,277 | ) | ||||||||
Net settlement of Investments in financial assets |
— | — | (271,700 | ) | (22,187 | ) | ||||||||||
Revaluation |
(51,828 | ) | 52,302 | 533,461 | 444,915 | |||||||||||
Impairment losses |
— | — | (178,234 | ) | (26,055 | ) | ||||||||||
As of September 30, |
$ | 254,203 | $ | 386,155 | $ | 2,094,385 | $ | 1,347,395 | ||||||||
|
(i) |
The net repayment or proceeds from Loan and other receivables made/(returned), net, accounts for the net amount of collateral pledged or returned, excluding the repayment of interest income recognized during the period. The receipt of interest is recorded under Additions. |
12 Digital assets held—(continued)
The tables below present the movement of Digital assets held - financial assets for the three and nine months ended September 30, 2025 and 2024 (in thousands):
Digital |
||||||||
assets held - financial assets |
||||||||
2025 |
2024 |
|||||||
As of June 30, |
$ | 106,020 | $ | 249,028 | ||||
Reclassification of digital assets to financial assets |
2,154 | - | ||||||
Additions/(disposals), net |
1,790,607 | (56,476 | ) | |||||
Proceeds from issuance of Ordinary shares |
1,150,000 | — | ||||||
Loan and other receivables made, net(i) |
(1,862,643 | ) | (5,133 | ) | ||||
Net settlement of Investments in financial assets |
- | (8,981 | ) | |||||
Net settlement of perpetual contracts |
(1,651 | ) | (7,890 | ) | ||||
Revaluation |
4,610 | (183 | ) | |||||
As of September 30, |
$ | 1,189,097 | $ | 170,365 | ||||
Digital |
||||||||
assets held - financial assets |
||||||||
2025 |
2024 |
|||||||
As of January 1, |
$ | 132,649 | $ | 253,663 | ||||
Reclassification of digital assets to financial assets |
2,154 | - | ||||||
Additions/(disposals), net |
2,343,416 | (36,271 | ) | |||||
Proceeds from issuance of Ordinary shares |
1,150,000 | - | ||||||
Loan and other receivables made, net(i) |
(2,441,948 | ) | (14,124 | ) | ||||
Net settlement of Investments in financial assets |
10,116 | (8,981 | ) | |||||
Net settlement of perpetual contracts |
(11,143 | ) | (23,634 | ) | ||||
Revaluation |
3,853 | (288 | ) | |||||
As of September 30, |
$ | 1,189,097 | $ | 170,365 | ||||
|
(i) |
The net repayment or proceeds from Loan and other receivables accounts for the net amount of collateral pledged or returned, excluding the repayment of interest income recognized during the period. The receipt of interest is recorded under Additions/(disposals), net. |
The table below presents the breakdown of Digital assets held - financial assets by venue (in thousands):
September 30, |
December 31, |
|||||||
2025 |
2024 |
|||||||
Digital financial assets held on the Exchange wallets |
$ | 99,247 | $ | 67,514 | ||||
Digital financial assets held on the non-Exchange wallets |
1,089,850 | 65,135 | ||||||
Total Digital assets held - financial assets |
$ | 1,189,097 | $ | 132,649 | ||||
12 Digital assets held—(continued)
The table below presents the implied units and carrying amount of digital assets, denominated in units and US dollars, for Digital assets held - inventories, Digital assets - intangible assets, and Digital assets - financial assets (in thousands):
September 30, |
December 31, |
|||||||||||||||
2025 |
2024 |
|||||||||||||||
Units |
Fair Value |
Units |
Fair Value |
|||||||||||||
BTC(i) |
19.46 | $ | 2,200,340 | 22.70 | $ | 2,143,529 | ||||||||||
ETH(i) |
18.31 | 76,197 | 61.65 | 208,862 | ||||||||||||
Stablecoins(ii) |
1,208,718 | 206,551 | ||||||||||||||
Others(iii) |
52,430 | 25,851 | ||||||||||||||
Total Digital assets held - inventories, intangible assets, and financial assets |
$ | 3,537,685 | $ | 2,584,793 | ||||||||||||
|
(i) |
BTC and ETH balances presented include tokens that are wrapped such as cbBTC (6,236 units valued at $705.1 million as of September 30, 2025 and none as of December 31, 2024), wBTC (135 units valued at $15.2 million as of September 30, 2025, 247.9 units valued at $23.4 million as of December 31, 2024) and weETH (160.5 units valued at $0.7 million as of September 30, 2025, 48.1 units valued at $0.2 million as of December 31, 2024). |
|
(ii) |
Stablecoins are a digital asset intended to maintain a stable value by tracking a reference asset, such as USD, typically on a one-to-one basis. As of September 30, 2025 individual assets that comprise greater than 5% of the balance include USDC ($720.0 million), USDG ($220.4 million), and PYUSD ($68.2 million). As of December 31, 2024, individual assets that comprise greater than 5% of the balance include USDC ($127.9 million), SUSDE ($51.3 million), and USDT ($19.7 million). No other stablecoins represent greater than 5% of the total balance. |
|
(iii) |
Any digital asset that individually represents less than 5% of the digital asset balance presented is grouped together as Others. |
13 Loan and other receivables - digital assets
The tables below present the movement of Loan and other receivables - digital assets for the three and nine months ended September 30, 2025 and 2024 (in thousands):
Loan and other receivables - digital assets |
||||||||
2025 |
2024 |
|||||||
As of June 30, |
$ | 310,927 | $ | 120,977 | ||||
Digital asset loan receivables made, net |
172,081 | 5,095 | ||||||
Digital asset pledged as collateral made/(repaid), net |
(53,103 | ) | 7,510 | |||||
Interest |
1,098 | 1,414 | ||||||
Revaluation gain/(loss) |
5,717 | 3,293 | ||||||
As of September 30, |
$ | 436,720 | $ | 138,289 | ||||
Loan and other receivables - digital assets |
||||||||
2025 |
2024 |
|||||||
As of January 1, |
$ | 166,388 | $ | 17,696 | ||||
Digital asset loan receivables made, net |
200,217 | 63,356 | ||||||
Digital asset pledged as collateral made, net |
26,871 | 60,061 | ||||||
Interest |
3,969 | 2,011 | ||||||
Revaluation gain/(loss) |
39,275 | (4,835 | ) | |||||
As of September 30, |
$ | 436,720 | $ | 138,289 | ||||
The following table presents Loan and other receivables - digital assets by type of underlying digital asset provided, denominated in units and US dollars, as of September 30, 2025 and December 31, 2024 (in thousands). Amounts totaling less than 5% of the outstanding balance are aggregated in the Others line:
September 30, |
December 31, |
|||||||||||||||
2025 |
2024 |
|||||||||||||||
Units |
Fair Value |
Units |
Fair Value |
|||||||||||||
BTC |
1.72 | $ | 194,466 | 0.80 | $ | 74,901 | ||||||||||
ETH |
1.65 | 6,878 | 0.42 | 1,427 | ||||||||||||
Stablecoins(i) |
103,559 | 20,500 | ||||||||||||||
Others |
2,463 | — | ||||||||||||||
Total Digital assets - credit line facility and other lending arrangements |
$ | 307,366 | $ | 96,828 | ||||||||||||
BTC |
0.03 | $ | 3,076 | 0.00 | $ | 236 | ||||||||||
ETH |
1.30 | 5,409 | 0.58 | 1,977 | ||||||||||||
Stablecoins(i) |
2,826 | 19,446 | ||||||||||||||
Others |
213 | 277 | ||||||||||||||
Total Digital assets - margin lending services |
$ | 11,524 | $ | 21,936 | ||||||||||||
BTC |
1.04 | $ | 117,830 | 0.50 | $ | 47,624 | ||||||||||
Total Digital assets - pledged as collateral |
$ | 117,830 | $ | 47,624 | ||||||||||||
BTC |
2.79 | $ | 315,372 | 1.30 | $ | 122,761 | ||||||||||
ETH |
2.95 | 12,287 | 1.00 | 3,404 | ||||||||||||
Stablecoins(i) |
106,385 | 39,946 | ||||||||||||||
Others |
2,676 | 277 | ||||||||||||||
Total Loan and other receivables - digital assets |
$ | 436,720 | $ | 166,388 | ||||||||||||
|
(i) |
Stablecoins are a digital asset intended to maintain a stable value by tracking a reference asset, such as USD, typically on a one-to-one basis. |
The Group provides collateralized digital asset loans via margin lending services and credit line facilities. The maximum exposure to credit risk is the carrying value. As of September 30, 2025 and December 31, 2024, the net exposure after considering collateral was zero. No significant change in fair value attributable to credit risk was recorded for Loans and other receivables - digital assets for the three and nine months ended September 30, 2025 and 2024.
See Note 26(c) for the fair value hierarchy based on the degree to which the fair value is observable.
14 Investments in financial assets
The table below presents the fair value of Investments in financial assets by investment type (in thousands):
September 30, |
December 31, |
|||||||
2025 |
2024 |
|||||||
BTC funds |
$ | 243,213 | $ | 35,365 | ||||
CD20 funds |
127,948 | 40,598 | ||||||
Other digital assets funds |
- | 10,110 | ||||||
Other Investments in financial assets |
4,684 | 100 | ||||||
Total Investments in financial assets |
$ | 375,845 | $ | 86,173 | ||||
As of September 30, 2025, the Group held digital assets exchange-traded funds and private funds valued at $371.2 million (December 31, 2024: $86.1 million) as well as equity investments valued at $4.7 million (December 31, 2024: $0.1 million). “CD20” is the CoinDesk 20 Index, a cryptocurrency index that is traded on the exchanges, including the Group’s cryptocurrency exchange.
When the Group disposes of Investments in financial assets, a realized gain or loss is calculated as the proceeds received from the sale of the investment less the investment's original cost. The realized gains and losses are recorded on a gross basis. These amounts are presented within Change in fair value of investment in financial assets.
For the three months ended September 30, 2025 and 2024, the Group recognized realized gains on disposition of investments in financial assets of $23.2 million and $0 million, respectively. Realized losses for the same periods totaled $20.6 million and $0 million, respectively.
15 Goodwill and Other intangible assets
The table below presents the carrying value of Goodwill and Other intangible assets (in thousands):
September 30, |
December 31, |
|||||||
2025 |
2024 |
|||||||
Domain |
$ | 1,336 | $ | 1,336 | ||||
Customer relationships(i) |
6,518 | 6,920 | ||||||
Trademarks(i) |
23,807 | 25,042 | ||||||
Total Other intangible assets |
$ | 31,661 | $ | 33,298 | ||||
Goodwill |
$ | 63,023 | $ | 61,475 | ||||
|
(i) |
Customer relationships and Trademarks were acquired as part of business combinations and are amortized on a straight-line based over their estimated useful lives (14 years for Customer relationships, 12 to 16 years for Trademarks). Amortization for the three months ended September 30, 2025 and 2024 was $0.6 million and $0.5 million, respectively. Amortization for the nine months ended September 30, 2025 and 2024 was $1.7 million and $1.6 million, respectively. |
16 Property and equipment and right-of-use assets
The table below presents the carrying value of Property and equipment and right-of-use assets (in thousands):
September 30, |
December 31, |
|||||||
2025 |
2024 |
|||||||
Computers and equipment |
$ | 862 | $ | 735 | ||||
Furniture and fixtures |
725 | 898 | ||||||
Leasehold improvements |
609 | 720 | ||||||
Right-of-use assets (i) |
8,144 | 11,765 | ||||||
Construction in progress |
1,866 | - | ||||||
Total Property and equipment and right-of-use assets |
$ | 12,206 | $ | 14,118 | ||||
|
(i) |
The Group leases office premises with lease terms ranging from 2 to 8 years. Refer to Note 26 for maturity analysis of Lease liabilities. |
17 Other assets
The table below presents the components of non-current and current Other assets (in thousands):
September 30, |
December 31, |
|||||||
2025 |
2024 |
|||||||
Non-current assets |
||||||||
Deposits |
$ | 4,939 | $ | 970 | ||||
Other receivables |
270 | 249 | ||||||
Finance lease receivables |
739 | 824 | ||||||
Prepayments |
16,289 | 20,044 | ||||||
Total Other assets (non-current) |
$ | 22,237 | $ | 22,087 | ||||
Current assets |
||||||||
Accounts receivable |
$ | 19,996 | $ | 9,146 | ||||
Finance lease receivables |
167 | 333 | ||||||
Prepayments |
13,525 | 8,616 | ||||||
Other receivables |
4,902 | 3,114 | ||||||
Total Other assets (current) |
$ | 38,590 | $ | 21,209 | ||||
As of September 30, 2025 and December 31, 2024 the carrying values of current Other assets approximated their fair values.
18 Restricted cash
As of September 30, 2025, current Restricted cash primarily related to deposits for insurance policies of $16.7 million (December 31, 2024: $15.9 million) and non-current Restricted cash primarily related to guarantees for lease agreements of $2.0 million (December 31, 2024: $2.0 million).
19 Cash and cash equivalents
The table below presents the components of Cash and cash equivalents (in thousands):
September 30, |
December 31, |
|||||||
2025 |
2024 |
|||||||
Cash at banks |
$ | 58,740 | $ | 28,231 | ||||
Cash on the Exchange at banks |
8,716 | 3,300 | ||||||
Cash held in brokers |
1,851 | 9 | ||||||
Total Cash and cash equivalents |
$ | 69,307 | $ | 31,540 | ||||
As of September 30, 2025 and December 31, 2024, the carrying values of Cash and cash equivalents approximated their fair values.
20 Convertible redeemable preference shares
As of September 30, 2025, and December 31, 2024 the outstanding Convertible redeemable preference share liability totaled $0 and $47.9 million, respectively. As of December 31, 2024, 2,735,938 shares remained unredeemed.
Effective in August, as part of the IPO Reorganization, all 2,735,938 issued and outstanding Class B preference shares were mandatorily converted into an equal number of Ordinary shares. The accounting for this conversion involved derecognizing the $47.9 million financial liability and reclassifying the $18.4 million equity component. Both amounts were transferred to Share capital and Share premium.
21 Other payables
The table below presents the components of Other payables (in thousands):
September 30, |
December 31, |
|||||||
2025 |
2024 |
|||||||
Accrued compensation and benefits |
$ | 14,428 | $ | 16,072 | ||||
Accrued expenses |
8,589 | 8,153 | ||||||
Other payables |
5,733 | 3,443 | ||||||
Deferred income |
7,973 | 9,504 | ||||||
Tax payables |
1,896 | 1,705 | ||||||
Loan interest payable to the related party(i) |
8,764 | 8,764 | ||||||
Amounts due to related parties(i) |
829 | 1,780 | ||||||
Total Other payables |
$ | 48,212 | $ | 49,421 | ||||
|
(i) |
For additional details regarding transactions with related parties see Note 30. |
As of September 30, 2025 and December 31, 2024, the carrying values of Other payables approximated their fair values.
22 Borrowings from related parties and Borrowings
The table below presents the components of the Borrowings from related parties and Borrowings (in thousands):
September 30, |
December 31, |
|||||||
2025 |
2024 |
|||||||
Unsecured Borrowings from related parties at FVTPL(i) |
$ | 513,850 | $ | 482,450 | ||||
Secured Borrowings at amortized cost |
$ | 50,000 | $ | 25,000 | ||||
Borrowings from related parties (non-current) |
$ | 513,850 | $ | 482,450 | ||||
Borrowings (current) |
$ | 50,000 | $ | 25,000 | ||||
|
(i) |
See Note 30 for additional details. |
Borrowings from related parties
Borrowings from related parties includes an unsecured loan from a related party. Borrowings includes a secured loan, a secured credit facility, and secured borrowings from DeFi protocols. Significant financing activity and facility changes are described in Note 10. For details of facilities existing at December 31, 2024, where terms are materially unchanged, refer to the Annual Financial Statements.
For the three months ended September 30, 2025, the amount of Fair value gain/(loss) on financial liabilities designated as at FVTPL attributable to changes in credit risk associated with the Borrowings from related parties was $(6.1) million (September 30, 2024: $13.4 million) and the remaining Change in fair value of financial liability at FVTPL was $(10.9) million (September 30, 2024: $0.1 million).
For the nine months ended September 30, 2025, the amount of Fair value gain/(loss) on financial liabilities designated as at FVTPL attributable to changes in credit risk associated with the Borrowings from related parties was $(4.4) million (September 30, 2024: $(4.9) million) and the remaining Change in fair value of financial liability at FVTPL was $(27.0) million (September 30, 2024: $(29.4) million).
New credit facility (January 2025): On January 31, 2025, the Group entered into a credit facility agreement with another lending entity. The Group was required to provide USD or digital assets as collateral for the loan. A mandatory top-up event is triggered if the collateral posted falls below the required value, and the Group is required to deposit additional collateral into the collateral account to address the shortfall. On April 22, 2025, $100 million was drawn from this credit facility, the loan was fully repaid on April 23, 2025.
Resolution of 2024 loan and new repurchase agreement (February 2025): On June 11, 2024, the Group entered into the Loan and Security Agreement with a lending entity for a principal amount of $25 million, bearing interest at 10% per annum, with interest paid monthly and the principal due at maturity. Per the agreement, the Group was required to maintain BTC as collateral. If the loan-to-value (LTV) ratio exceeded 60%, a mandatory top-up event would have been triggered, requiring the Group to deposit additional BTC or USD to reduce the LTV ratio to 50% or less. The loan matured on February 11, 2025.
On February 28, 2025, the Group entered into the Repurchase Agreement with the same lending entity. Under this new agreement, the Group transferred a specified amount of BTC with a nominal value of $125 million to the entity for a purchase price of $50 million. This arrangement carries an interest rate of 9% per annum, payable monthly. The Group is obligated to repurchase the BTC on February 28, 2026. If the market value of the transferred BTC falls below a 200% margin, the Group must transfer additional BTC to restore the margin to 200%.
Other borrowings from DeFi protocols
The Group borrows certain stablecoins, which are classified as Digital assets held - financial assets, from DeFi protocols to access liquidity for its operations. These Borrowings are over collateralized by digital assets and are subject to automatic liquidation if the value of the collateral falls below the required maintenance levels. Interest rates are variable and are determined by the algorithmic supply and demand within each protocol.
23 Digital assets loan payable
The table below presents the components of Digital assets loan payable (in thousands):
Three months ended September 30, |
Nine months ended September 30, |
|||||||||||||||
2025 |
2024 |
2025 |
2024 |
|||||||||||||
Unsecured borrowing at FVTPL |
||||||||||||||||
Beginning of period |
$ | 6,111 | $ | 4,677 | $ | 20,613 | $ | 6,164 | ||||||||
Loan repayment |
— | — | (15,135 | ) | — | |||||||||||
Revaluations (gain)/loss |
1,901 | 1,597 | 2,534 | 110 | ||||||||||||
As of end of September 30, |
$ | 8,012 | $ | 6,274 | $ | 8,012 | $ | 6,274 | ||||||||
Secured borrowing at FVTPL |
||||||||||||||||
Beginning of period |
$ | 273 | $ | — | $ | — | $ | — | ||||||||
Loan drawdown |
176,810 | 745 | 393,553 | 745 | ||||||||||||
Loan repayment |
(178,071 | ) | (761 | ) | (393,433 | ) | (761 | ) | ||||||||
Revaluations (gain)/loss |
1,433 | 16 | 325 | 16 | ||||||||||||
As of end of September 30, |
$ | 445 | $ | — | $ | 445 | $ | — | ||||||||
Digital assets loan payable (non-current) |
$ | 8,012 | $ | 6,274 | $ | 8,012 | $ | 6,274 | ||||||||
Digital assets loan payable (current) |
$ | 445 | $ | — | $ | 445 | $ | — | ||||||||
For details of unsecured Digital assets loan payable arrangements existing as of December 31, 2024, where terms are materially unchanged, refer to the Annual Financial Statements.
The Group borrows digital assets and certain stablecoins which may be classified as Digital assets - intangible assets from DeFi protocols to access liquidity for its operations. The Borrowings are secured and over- collateralized by digital assets, and are subject to automatic liquidation if the value of the collateral falls below required maintenance levels. Interest rates are variable and determined by the algorithmic supply and demand within each protocol.
24 Share capital and Share premium
The table below presents the number of authorized shares (in thousands):
| September 30, | December 31, | |||||||
| 2025 | 2024 | |||||||
| Shares | Shares | |||||||
Authorized shares of $0.002 each |
||||||||
Ordinary shares |
750,000 | - | ||||||
Class A common shares |
- | 500,000 | ||||||
Class B preference shares |
- | 125,000 | ||||||
Class C common shares |
- | 125,000 | ||||||
Total |
750,000 | 750,000 | ||||||
The table below presents the number of issued and fully paid shares (in thousands) and the associated Share capital and Share premium recorded (in thousands):
| September 30, | September 30, | |||||
| 2025 | 2025 | |||||
Shares |
$'s |
|||||
Issued and fully paid - Ordinary shares |
||||||
As of June 30, 2025 and December 31, 2024 (post-Reverse Stock Split) |
113,215 | 3,821,537 | ||||
Conversion of Class B Preference shares |
2,736 | 66,278 | ||||
Conversion of Bullish Global shares |
233 | 8,622 | ||||
Issuance of Ordinary shares in connection with initial public offering during the period |
34,500 | 1,209,194 | ||||
As of September 30, 2025 |
150,684 | 5,105,631 |
Immediately prior to the completion of its initial public offering ("IPO"), and pursuant to the Amended and Restated Memorandum and Articles of Association, the Group was authorized to issue 750,000,000 Ordinary shares of a par value of $0.002, and all of its issued and outstanding Common shares and Preference shares were converted into and re-designated as Ordinary shares of a par value of $0.002 on a one-for-one basis.
In August 2025, the Group completed its IPO and issued and sold 34,500,000 Ordinary shares, inclusive of the underwriters’ over-allotment option which was exercised in full, at a price of $37.00 per share. The IPO resulted in net proceeds to the Company of $1,212.7 million after deducting the underwriting discounts and commissions and before deducting offering costs of $3.5 million, which were recorded to Share capital and Share premium as a reduction of the net proceeds received from the IPO.
25 Derivative financial instruments
The table below presents details regarding Derivative financial instruments (in thousands):
September 30, |
December 31, |
|||||||
2025 |
2024 |
|||||||
Derivative financial instruments (assets) |
||||||||
Digital currency perpetual contracts - carrying amount |
$ | 20 | - | |||||
Derivative financial instruments (liabilities) |
||||||||
Digital currency perpetual contracts - carrying amount |
- | - | ||||||
Total notional amount |
||||||||
Digital currency perpetual contracts |
$ | 186,741 | $ | 38,626 | ||||
The notional amount of Derivative financial instruments primarily represents the perpetual futures contracts that the Group offers to eligible customers on the Exchange. Derivative financial instruments are held as trading derivatives that are not designated in hedge accounting relationship.
26 Financial risk management
The Group’s major instruments include Loan and other receivables - digital assets, Borrowings, Borrowings from related parties, Digital assets loan payable, and other amounts due to related parties. Details of the financial instruments are disclosed in their respective notes and in the Annual Financial Statements. The risks associated with these instruments include market risk (currency risk, interest rate risk and other price risk), credit risk, liquidity risk, loss of access risk, irrevocability, hard fork, and air drop risks, and regulatory oversight risk. The approaches on how to mitigate these risks are set out below. The Group manages and monitors these exposures to ensure appropriate measures are implemented in a timely and effective manner.
|
(a) |
Credit risk |
Refer to the Annual Financial Statements for a comprehensive discussion of credit risk. Credit risk primarily arises from Cash and cash equivalents, Loan and other receivables - digital assets, and Other receivables. For Loan and other receivables - digital assets and Other receivables, the Group continues to monitor collateral levels and borrower performance. As of September 30, 2025 and December 31, 2024, the allowance for expected credit losses was not material.
26 Financial risk management—(continued)
|
(b) |
Liquidity risk |
The Group monitors its liquidity requirements to ensure sufficient funds are available. The following tables present the contractual maturity analysis for financial liabilities as of September 30, 2025 and December 31, 2024 (in thousands):
Later than |
||||||||||||||||||||
1 year and |
Total |
Carrying |
||||||||||||||||||
Less than |
not later |
Later than |
undiscounted |
amount as of |
||||||||||||||||
| 1 year | than 5 years | 5 years | cash flow | September 30, 2025 | ||||||||||||||||
September 30, 2025 |
||||||||||||||||||||
Accrued compensation and benefits |
$ | 14,428 | $ | — | $ | — | $ | 14,428 | $ | 14,428 | ||||||||||
Accrued expenses |
8,589 | — | — | 8,589 | 8,589 | |||||||||||||||
Other payables |
5,733 | — | — | 5,733 | 5,733 | |||||||||||||||
Lease liabilities |
4,779 | 6,202 | 465 | 11,446 | 10,260 | |||||||||||||||
Digital assets loan payable |
885 | 8,440 | — | 9,325 | 8,457 | |||||||||||||||
Borrowings from related parties |
34,774 | 572,230 | — | 607,004 | 513,850 | |||||||||||||||
Borrowings |
51,590 | — | — | 51,590 | 50,000 | |||||||||||||||
Customer segregated cash liabilities |
14,551 | — | — | 14,551 | 14,551 | |||||||||||||||
Tax payables |
1,896 | — | — | 1,896 | 1,896 | |||||||||||||||
Amounts due to related parties |
829 | — | — | 829 | 829 | |||||||||||||||
Loan interest payable to the related party |
8,764 | — | — | 8,764 | 8,764 | |||||||||||||||
| $ | 146,818 | $ | 586,872 | $ | 465 | $ | 734,155 | $ | 637,357 | |||||||||||
|
|
26 Financial risk management—(continued)
|
(b) |
Liquidity risk—(continued) |
Later than |
||||||||||||||||||||
1 year and |
Total |
Carrying |
||||||||||||||||||
Less than |
not later |
Later than |
undiscounted |
amount as of |
||||||||||||||||
| 1 year | than 5 years | 5 years | cash flow | December 31, 2024 | ||||||||||||||||
December 31, 2024 |
||||||||||||||||||||
Accrued compensation and benefits |
$ | 16,072 | $ | — | $ | — | $ | 16,072 | $ | 16,072 | ||||||||||
Accrued expenses |
8,153 | — | — | 8,153 | 8,153 | |||||||||||||||
Other payables |
3,443 | — | — | 3,443 | 3,443 | |||||||||||||||
Lease liabilities |
6,180 | 13,455 | 616 | 20,251 | 15,002 | |||||||||||||||
Digital assets loan payable |
1,134 | 22,564 | — | 23,698 | 20,613 | |||||||||||||||
Borrowings |
60,059 | 598,184 | — | 658,243 | 507,450 | |||||||||||||||
Convertible redeemable preference shares(i) |
— | 47,879 | — | 47,879 | 47,879 | |||||||||||||||
Customer segregated cash liabilities |
6,382 | — | — | 6,382 | 6,382 | |||||||||||||||
Tax payables |
1,705 | — | — | 1,705 | 1,705 | |||||||||||||||
Amounts due to related parties |
1,780 | — | — | 1,780 | 1,780 | |||||||||||||||
Loan interest payable to the related party |
8,764 | — | — | 8,764 | 8,764 | |||||||||||||||
| $ | 113,672 | $ | 682,082 | $ | 616 | $ | 796,370 | $ | 637,243 | |||||||||||
|
(i) |
As part of the IPO Reorganization, the Convertible redeemable preference shares were mandatorily converted into Ordinary shares. The accounting for this conversion involved derecognizing the $47.9 million financial liability associated with the Convertible redeemable preference shares. This amount was transferred to Share capital and Share premium. |
26 Financial risk management—(continued)
|
(c) |
Regulatory oversight risk |
Regulatory changes or actions may restrict the use of digital assets or the operation of digital asset networks or exchanges in a manner that adversely affects investments held by the Group. The Group consistently engages with external legal counsel and regulatory advisors to understand any updates on the regulatory landscape that may impact our business.
|
(d) |
Market risk |
Market risk is the potential for loss resulting from unfavorable market movements, which can arise from changes in various market factors as follows:
(i) Price risk of digital assets
The Group is exposed to price risk associated with its holdings of digital assets, primarily BTC and ETH. The prices of digital assets are subject to significant volatility and are influenced by numerous factors. These include, but are not limited to, global supply and demand dynamics, interest and exchange rates, inflation or deflation, and broader political and economic conditions.
The Group's exposure to price risk primarily arises from its direct holdings of digital assets which are measured at fair value. Management actively monitors market conditions and potential exposure to mitigate these risks.
(ii) Interest rate risk
The Group is exposed to interest rate risk, specifically the risk associated with changes in rate on interest bearing financial assets including cash balances deposited at financial institutions. The Group manages its interest rate risk through regular assessments of the existing interest rate environment, the current outlook, and the potential impact of any changes in rate.
The sensitivity analyses below have been determined based on the exposure to interest rates for non-derivative instruments at the reporting date. A 50 basis point increase or decrease represents management's assessment of the reasonable possible change in interest rate.
If interest rates had been 50 basis points higher or lower with all other variables were held constant, the Group's profit for the three months ended September 30, 2025 would have been $4.1 million (September 30, 2024: $0.9 million) lower/higher.
(iii) Currency risk
The Group is exposed to exchange rate fluctuation risk as a result of operating in multiple jurisdictions with different operating currencies. Financial assets and financial liabilities are primarily denominated in the functional currency of the respective company. The Group’s exposure to foreign currency exchange risk is not significant.
26 Financial risk management—(continued)
|
(e) |
Fair value estimation |
The fair value hierarchy levels and valuation techniques are consistent with those applied in the Annual Financial Statements.
The following tables present the Group’s digital assets and financial liabilities that are measured at fair value (in thousands):
Level 1 |
Level 2 |
Level 3 |
Total |
|||||||||||||
As of September 30, 2025 |
||||||||||||||||
Assets |
||||||||||||||||
Investments in financial assets |
$ | — | $ | 375,845 | $ | — | $ | 375,845 | ||||||||
Digital assets held - inventories |
254,203 | — | — | 254,203 | ||||||||||||
Digital assets held - intangible assets |
2,094,385 | — | — | 2,094,385 | ||||||||||||
Digital assets held - financial assets |
1,189,097 | — | — | 1,189,097 | ||||||||||||
Loan and other receivables - digital assets |
— | 436,720 | — | 436,720 | ||||||||||||
Derivative financial instruments |
— | 20 | — | 20 | ||||||||||||
| $ | 3,537,684 | $ | 812,585 | $ | — | $ | 4,350,270 | |||||||||
Liabilities |
||||||||||||||||
Borrowings from related parties |
$ | — | $ | — | $ | 513,850 | $ | 513,850 | ||||||||
Digital assets loan payable - current and non-current |
— | 8,457 | — | 8,457 | ||||||||||||
| $ | — | $ | 8,457 | $ | 513,850 | $ | 522,307 | |||||||||
Level 1 |
Level 2 |
Level 3 |
Total |
|||||||||||||
As of December 31, 2024 |
||||||||||||||||
Assets |
||||||||||||||||
Investments in financial assets |
$ | — | $ | 86,173 | $ | — | $ | 86,173 | ||||||||
Digital assets held - inventories |
573,876 | — | — | 573,876 | ||||||||||||
Digital assets held - intangible assets |
1,878,268 | — | — | 1,878,268 | ||||||||||||
Digital assets held - financial assets |
132,649 | — | — | 132,649 | ||||||||||||
Loan and other receivables - digital assets |
— | 166,388 | — | 166,388 | ||||||||||||
| $ | 2,584,793 | $ | 252,561 | $ | — | $ | 2,837,354 | |||||||||
Liabilities |
||||||||||||||||
Borrowings from related parties |
$ | — | $ | — | $ | 482,450 | $ | 482,450 | ||||||||
Digital assets loan payable |
— | 20,613 | — | 20,613 | ||||||||||||
| $ | — | $ | 20,613 | $ | 482,450 | $ | 503,063 | |||||||||
26 Financial risk management—(continued)
|
(e) |
Fair value estimation—(continued) |
The following table presents a reconciliation of Level 3 fair value measurements of financial instruments (in thousands):
Borrowings from related parties |
||||||||
2025 |
2024 |
|||||||
As of January 1, |
$ | 482,450 | $ | 422,750 | ||||
Fair value change attributable to changes in credit risk |
(6,050 | ) | 16,850 | |||||
Change in fair value of financial liability at FVTPL |
900 | 35,600 | ||||||
As of March 31, |
$ | 477,300 | $ | 475,200 | ||||
Fair value change attributable to changes in credit risk |
4,350 | 1,450 | ||||||
Change in fair value of financial liability at FVTPL |
15,250 | (6,100 | ) | |||||
As of June 30, |
$ | 496,900 | $ | 470,550 | ||||
Fair value change attributable to changes in credit risk |
6,100 | (13,400 | ) | |||||
Change in fair value of financial liability at FVTPL |
10,850 | (100 | ) | |||||
As of September 30, |
$ | 513,850 | $ | 457,050 | ||||
27 Capital risk management
The Group’s objectives, policies, and processes for managing capital are consistent with those disclosed in the Annual Financial Statements.
28 Earnings/(loss) per share
The table below presents the components of the calculation of the basic and diluted earnings/(loss) per share (in thousands):
Three months ended September 30, |
Nine months ended September 30, |
|||||||||||||||
2025 |
2024 |
2025 |
2024 |
|||||||||||||
Earnings/(loss) |
||||||||||||||||
Earnings/(loss) for the purpose of basic earnings per share attributable to owners of the Group |
$ | 18,397 | $ | (66,732 | ) | $ | (218,084 | ) | $ | (78,505 | ) | |||||
Effects of NCI add-back to Net income assuming conversion of BMC1 shares |
(4,495 | ) | - | - | - | |||||||||||
Earnings/(loss) for the purpose of diluted earnings per share attributable to owners of the Group |
$ | 13,902 | $ | (66,732 | ) | $ | (218,084 | ) | $ | (78,505 | ) | |||||
Weighted average shares outstanding |
||||||||||||||||
Weighted average shares outstanding for the purpose of basic earnings/(loss) per share |
133,066 | 112,500 | 119,905 | 112,500 | ||||||||||||
Effects of dilutive Convertible redeemable preference shares |
1,279 | - | - | - | ||||||||||||
Effects of dilutive ESOP shares |
2,084 | - | - | - | ||||||||||||
Effects of dilutive BMC1 shares |
3,728 | - | - | - | ||||||||||||
Weighted average shares outstanding for the purposes of diluted earnings/(loss) per share |
140,157 | 112,500 | 119,905 | 112,500 | ||||||||||||
In periods where the Company has a net loss, no dilutive shares are included in the calculation for Weighted average shares outstanding as they are considered anti-dilutive.
29 Share-based payments
The table below presents the components of Share-based payments (in thousands):
Three months ended September 30, |
Nine months ended September 30, |
|||||||||||||||
2025 |
2024 |
2025 |
2024 |
|||||||||||||
Share-based payments related to employees |
$ | 3,130 | $ | 5,698 | $ | 11,519 | $ | 17,781 | ||||||||
Share-based payments related to advisor |
— | — | — | 107 | ||||||||||||
Total Share-based payments |
$ | 3,130 | $ | 5,698 | $ | 11,519 | $ | 17,888 | ||||||||
Significant activity during the three and nine months ended September 30, 2025 included grants under the 2024 Plan. Refer to the Annual Financial Statements for details of plans existing at December 31, 2024.
In February 2025, the Board of Directors passed a resolution to adopt a new equity incentive plan (the “2024 Plan”). The 2024 Plan allows for the granting of stock options to management, employees, advisors, and other key service providers.
Options under the 2024 Plan may be granted for contractual periods of up to ten years at prices authorized by the Board of Directors. Options granted under the 2024 Plan typically vest ratably on an annual basis over four years and are subject to additional terms and conditions including exercise period, lapse, and forfeiture. In the event of a corporate transaction that results in a change of control or a public listing, the options will be subject to a lock up for a specified period after the triggering event.
29 Share-based payments—(continued)
Equity-settled share plan to employees
The Group granted options to eligible employees of the Group and/or its subsidiaries, employees of block.one and/or its subsidiaries, and other service providers. Options under the 2024 Plan typically vest ratably on an annual basis over four years and are subject to additional terms and conditions including exercise period, lapse, and forfeiture.
The fair value of the employee and consultancy services received in exchange for the grant of the compensatory equity awards is recognized as an expense with a corresponding increase in share based payment reserve. The total amount to be expensed is determined by reference to the fair value of the options granted. The total expense is recognized over the vesting period, which is the period over which all of the specified vesting conditions are to be satisfied.
Options
The tables below present details of the options activity during the three and nine months ended September 30, 2025 and 2024:
Three months ended September 30, |
||||||||||||||||
2025 |
2024 |
|||||||||||||||
Weighted |
Weighted |
|||||||||||||||
average |
average |
|||||||||||||||
Options |
exercise price |
Options |
exercise price |
|||||||||||||
Outstanding at beginning of period |
5,796,544 | $ | 17.75 | 4,746,884 | $ | 16.03 | ||||||||||
Granted during the period |
282,369 | $ | 24.64 | 490,370 | $ | 14.00 | ||||||||||
Forfeited during the period |
(110,453 | ) | $ | 19.55 | (276,914 | ) | $ | 14.20 | ||||||||
Outstanding at the end of period |
5,968,460 | $ | 18.04 | 4,960,340 | $ | 16.03 | ||||||||||
Exercisable at the end of period |
2,455,911 | — | ||||||||||||||
Nine months ended September 30, |
||||||||||||||||
2025 |
2024 |
|||||||||||||||
Weighted |
Weighted |
|||||||||||||||
average |
Number of |
average |
||||||||||||||
Options |
exercise price |
stock options |
exercise price |
|||||||||||||
Outstanding at beginning of period |
4,944,061 | $ | 16.09 | 2,577,467 | $ | 37.98 | ||||||||||
Granted during the period |
1,458,858 | $ | 24.52 | 2,791,317 | $ | 22.14 | ||||||||||
Forfeited during the period |
(434,459 | ) | $ | 17.56 | (408,444 | ) | $ | 16.76 | ||||||||
Outstanding at the end of period |
5,968,460 | $ | 18.04 | 4,960,340 | $ | 16.03 | ||||||||||
Exercisable at the end of period |
2,455,911 | — | ||||||||||||||
The options outstanding as of September 30, 2025 had a weighted average remaining contractual life of 8.1 years.
RSUs
The tables below present details of the RSU activity during the three and nine months ended September 30, 2025 and 2024:
Three months ended September 30, |
||||||||
2025 |
2024 |
|||||||
Outstanding at beginning of the period |
200,046 | 201,074 | ||||||
Forfeited during the period |
— | (1,028 | ) | |||||
Outstanding at end of the period |
200,046 | 200,046 | ||||||
Nine months ended September 30, |
||||||||
2025 |
2024 |
|||||||
Outstanding at beginning of the period |
200,046 | 201,939 | ||||||
Forfeited during the period |
— | (1,893 | ) | |||||
Outstanding at end of the period |
200,046 | 200,046 | ||||||
2023 Equity-settled share plan to senior management
The tables below present details of the Restricted units and Incentive units outstanding during the periods:
Restricted Units relating to Class A of BMC1
Three months ended September 30, |
Nine months ended September 30, |
|||||||||||||||
2025 |
2024 |
2025 |
2024 |
|||||||||||||
Outstanding at beginning of the period |
4,787,234 | 4,787,234 | 4,787,234 | 4,787,234 | ||||||||||||
Shares converted from Class B to Class A during the period |
5,136,703 | — | 5,136,703 | — | ||||||||||||
Outstanding as of period end |
9,923,937 | 4,787,234 | 9,923,937 | 4,787,234 | ||||||||||||
Incentive Units relating to Class B of BMC1
Three months ended September 30, |
Nine months ended September 30, |
|||||||||||||||
2025 |
2024 |
2025 |
2024 |
|||||||||||||
Outstanding at beginning of period |
8,856,384 | 8,856,384 | 8,856,384 | 9,574,468 | ||||||||||||
Shares converted from Class B to Class A during the period |
(5,136,703 | ) | — | (5,136,703 | ) | — | ||||||||||
Cancelled during the period |
— | — | — | (718,084 | ) | |||||||||||
Outstanding at the end of the period |
3,719,681 | 8,856,384 | 3,719,681 | 8,856,384 | ||||||||||||
On August 12, 2025, the Group redesignated 5,136,703 Class B shares as Class A shares of BMC1. The Class A and Class B shares of BMC1 are exchangeable for an aggregate of 7,075,504 Ordinary shares, of which 3,656,923 are vested.
Equity-settled stock option plan to advisor
There were no outstanding advisor options and no activity for the three months ended September 30, 2025 and 2024. A summary of advisor option activity for the nine months ended September 30, 2025 and 2024 is as follows (in thousands except for exercise price):
Nine months ended September 30, 2025 |
Nine months ended September 30, 2024 |
|||||||||||||||
Weighted |
Weighted |
|||||||||||||||
average |
average |
|||||||||||||||
Options |
exercise price |
Options |
exercise price |
|||||||||||||
Outstanding at beginning of period |
— | $ | — | 1,812,500 | $ | 15.97 | ||||||||||
Exercised during the period |
— | $ | — | (1,125,000 | ) | $ | 11.10 | |||||||||
Forfeited during the period |
— | $ | — | (687,500 | ) | $ | 11.10 | |||||||||
Outstanding at the end of period |
— | $ | — | — | $ | — | ||||||||||
Exercisable at the end of period |
— | — | ||||||||||||||
For the three months ended September 30, 2025 and 2024, the Group recognized total expense of $0 and $0, respectively, related to equity-settled share-based payments to advisor.
For the nine months ended September 30, 2025 and 2024, the Group recognized total expense of $0 and $0.1 million, respectively, related to equity-settled share-based payments to advisor.
30 Related party transactions
The table below presents related party transactions entered into during the period (in thousands):
For the three months ended September 30, |
For the nine months ended September 30, |
|||||||||||||||
2025 |
2024 |
2025 |
2024 |
|||||||||||||
Other expenses |
||||||||||||||||
Services fees charged to a related party (i) |
$ | 241 | $ | 93 | $ | 722 | $ | 93 | ||||||||
Finance expense |
||||||||||||||||
Loan interest expense charged by related parties/parent entity (ii) |
$ | 8,764 | $ | 8,764 | $ | 26,007 | $ | 26,102 | ||||||||
The table below presents outstanding balances arising from the above transactions as of September 30, 2025, and December 31, 2024 (in thousands).
September 30, |
December 31, |
|||||||
2025 |
2024 |
|||||||
Other payables |
||||||||
Amounts due to related parties (iii) |
$ | 829 | $ | 1,780 | ||||
Loan interest expense payable to related parties |
8,764 | 8,764 | ||||||
Borrowings from related parties |
||||||||
Loan payable to related parties (ii) |
$ | 513,850 | $ | 482,450 | ||||
|
(i) |
In 2024, the Group entered into a service agreement with a company that is wholly owned by a related party, controlled by the major shareholder and director of the Group, for the use of office spaces and amenities leased by the Group. In July 2025, the Group agreed to assign this office lease in its entirety to an entity controlled by the Group's major shareholder and director, for no consideration. This assignment was subsequently completed, which finalized the termination of the 2024 service agreement and released the Group from its related lease guarantee. |
|
(ii) |
In 2023, the Group entered into a loan agreement with its parent entity block.one. The Group paid interest to block.one at a per annum interest rate of 7% on a quarterly basis. In 2024, block.one transferred all of its rights and obligations under the loan agreement to a subsidiary of block.one. Subsequently, the majority of shares of the subsidiary were transferred to certain major shareholders of the Group, hence the counterparty of the loan became a related party of the Group. See Note 22 for further details. |
|
(iii) |
The outstanding balances with the amounts due to the related parties (formerly the parent entity block.one and its subsidiaries) are unsecured, interest free and repayable on demand. |
31 Commitments and contingencies
The Group entered into loan commitments through the Exchange to provide funds to customers at a future date. These commitments typically have a specified term and may be subject to unconditional cancellation or may remain in effect, contingent upon the satisfaction of all conditions outlined in the related loan agreements. These commitments encompass undrawn credit facilities and represent the Group's intent to provide funds as per the agreed terms and conditions.
The Group entered into two secured revolving credit facility agreements. Interest on borrowings drawn under these facilities accrues daily. These agreements provide for a total facility size of up to 800 BTC (USD equivalent of $90.5 million as of September 30, 2025) and 205 million USDC. Of this total amount, 200 BTC (USD equivalent of $22.6 million as of September 30, 2025) and 40 million USDC are committed. As of December 31, 2024, the Group had a single secured revolving credit facility agreement totaling 50 million USDC, of which 20 million USDC was committed.
The table below presents the outstanding, undrawn, off-balance sheet financial commitments as of September 30, 2025 and December 31, 2024 (in thousands)
September 30, 2025 |
December 31, 2024 |
|||||||
Margin lending services |
108,360 | 86,130 | ||||||
Other lending services(i) |
$ | 295,459 | $ | 50,000 | ||||
Total financial commitments |
403,819 | 136,130 | ||||||
On December 31, 2022, the Group entered into an agreement with a cloud platform services provider to commit to a minimum total of $30 million in order to receive a discount for their cloud platform related services. The commitment is divided into two periods: Commitment Period 1 and Commitment Period 2. Commitment Period 1 is 24 months long or shorter if the agreement is terminated and requires a minimum commitment of $16 million. Commitment Period 2 is 12 months or shorter if the agreement is terminated after the end of Commitment Period 1 and requires a minimum commitment of $14 million. At the end of each commitment period or upon earlier termination, if the Group fails to meet its minimum commitment for a given period, it will need to make up the difference between the minimum commitment and the fees incurred for cloud platform related services during that period. The Group received a service credit of $3 million for using certain applicable services as of December 31, 2024. The Group is entitled to receive an additional $3 million service credit after having met the $15 million milestone as of September 30, 2025. The Group recognizes the service credit over the commitment period on a straight line basis under Information technology and software expenses within Other expense.
32 Subsequent events
The Group has evaluated subsequent events through November 19, 2025, the date the condensed consolidated financial statements were available for issuance. There were no subsequent events that required recognition or disclosure in the financial statements.
|
|
Exhibit 99.3