UNITED STATES
SECURITIES AND EXCHANGE COMMISSION
Washington, D. C. 20549
FORM 10-K
(Mark one)
|
☑ |
ANNUAL REPORT PURSUANT TO SECTION 13 OR 15(d) OF THE SECURITIES EXCHANGE ACT OF 1934 |
For the fiscal year ended March 31, 2025
OR
|
☐ |
TRANSITION REPORT PURSUANT TO SECTION 13 OR 15(d) OF THE SECURITIES EXCHANGE ACT OF 1934 |
For the transition period from ______ to _____
Commission File Number 0-01989
Seneca Foods Corporation
(Exact name of Registrant as specified in its charter)
|
New York |
16-0733425 |
|
(State or other jurisdiction of incorporation or organization) |
(I. R. S. Employer Identification No.) |
|
350 WillowBrook Office Park, Fairport, New York |
14450 |
|
(Address of principal executive offices) |
(Zip Code) |
Registrant’s telephone number, including area code: (585) 495-4100
Securities registered pursuant to Section 12(b) of the Act:
|
Title of Each Class |
Trading Symbol |
Name of Exchange on Which Registered |
|
Common Stock Class A, $0.25 Par |
SENEA |
NASDAQ Global Select Market |
|
Common Stock Class B, $0.25 Par |
SENEB |
NASDAQ Global Select Market |
Securities registered pursuant to Section 12(g) of the Act: None
Indicate by check mark if the registrant is a well-known seasoned issuer, as defined in Rule 405 of the Securities Act. Yes ☐ No ☑
Indicate by check mark if the registrant is not required to file reports pursuant to Section 13 or Section 15(d) of the Act. Yes ☐ No ☑
Indicate by check mark whether the registrant (1) has filed all reports required to be filed by Section 13 or 15(d) of the Securities Exchange Act of 1934 during the preceding 12 months (or for such shorter period that the registrant was required to file such reports), and (2) has been subject to such filing requirements for the past 90 days. Yes ☑ No ☐
Indicate by check mark whether the registrant has submitted electronically, every Interactive Data File required to be submitted pursuant to Rule 405 of Regulation S-T (§232.405 of this chapter) during the preceding 12 months (or for such shorter period that the registrant was required to submit such files). Yes ☑ No ☐
Indicate by check mark whether the registrant is a large accelerated filer, an accelerated filer, a non-accelerated filer, a smaller reporting company or an emerging growth company. See the definitions of "large accelerated filer," "accelerated filer," "smaller reporting company" and “emerging growth company” in Rule 12b-2 of the Exchange Act.
|
Large accelerated filer ☐ |
Accelerated filer ☑ |
Non-accelerated filer ☐ |
Smaller reporting company ☐ |
Emerging growth company ☐ |
If an emerging growth company, indicate by check mark if the registrant has elected not to use the extended transition period for complying with any new or revised financial accounting standards provided pursuant to Section 13(a) of the Exchange Act. ☐
Indicate by check mark whether the registrant has filed a report on and attestation to its management’s assessment of the effectiveness of its internal control over financial reporting under Section 404(b) of the Sarbanes-Oxley Act (15 U.S.C. 7262(b)) by the registered public accounting firm that prepared or issued its audit report. ☑
If securities are registered pursuant to Section 12(b) of the Act, indicate by check mark whether the financial statements of the registrant included in the filing reflect the correction of an error to previously issued financial statements. ☐
Indicate by check mark whether any of those error corrections are restatements that required a recovery analysis of incentive-based compensation received by any of the registrant’s executive officers during the relevant recovery period pursuant to §240.10D-1(b). ☐
Indicate by check mark whether the registrant is a shell company (as defined in Rule 12b-2 of the Exchange Act). Yes ☐ No ☑
The aggregate market value of the voting and non-voting common equity held by non-affiliates of the Registrant as of September 27, 2024, the last business day of the Registrant’s most recently completed second fiscal quarter, was $324,037,648 (based on the closing share price per market reports generated from the NASDAQ Global Select Market System on September 27, 2024).
As of May 23, 2025, there were 5,330,247 shares of Class A common stock and 1,562,163 shares of Class B common stock outstanding.
DOCUMENTS INCORPORATED BY REFERENCE:
Portions of the registrant’s definitive Proxy Statement for the 2025 Annual Meeting of Shareholders to be held hereafter, and the Annual Report to Shareholders of Seneca Foods Corporation for the fiscal year ended March 31, 2025 (the “Annual Report”), included as Exhibit 13 to this Form 10-K, are incorporated by reference in Parts I, II, III, and IV hereof.
ANNUAL REPORT ON FORM 10-K
FOR THE FISCAL YEAR ENDED MARCH 31, 2025
TABLE OF CONTENTS
|
PART I. |
Pages |
|
|
Item 1. |
||
|
Item 1A. |
||
|
Item 1B. |
||
|
Item 1C. |
||
|
Item 2. |
||
|
Item 3. |
||
|
Item 4. |
||
|
PART II. |
||
|
Item 5. |
||
|
Item 6. |
||
|
Item 7. |
Management’s Discussion and Analysis of Financial Condition and Results of Operations |
|
|
Item 7A. |
||
|
Item 8. |
||
|
Item 9. |
Changes in and Disagreements with Accountants on Accounting and Financial Disclosure |
|
|
Item 9A. |
||
|
Item 9B. |
||
|
Item 9C. |
Disclosure Regarding Foreign Jurisdictions that Prevent Inspections |
|
|
PART III. |
||
|
Item 10. |
||
|
Item 11. |
||
|
Item 12. |
Security Ownership of Certain Beneficial Owners and Management and Related Stockholder Matters |
|
|
Item 13. |
Certain Relationships and Related Transactions, and Director Independence |
|
|
Item 14. |
||
|
PART IV. |
||
|
Item 15. |
||
|
Item 16. |
||
Forward-Looking Statements
This Annual Report on Form 10-K contains “forward-looking statements” as that term is used in the Private Securities Litigation Reform Act of 1995. Forward-looking statements can be identified by the fact that they address future events, developments, and results and do not relate strictly to historical facts. Any statements contained herein that are not statements of historical fact may be deemed to be forward-looking statements. Forward-looking statements include, without limitation, any statement that may predict, forecast, indicate, or imply future results, performance, or achievements, and may contain the words "will," "anticipate," "estimate," "expect," "project," "intend," "plan," "believe," "seeks," "should," "likely," "targets," "may", "can" and variations thereof and similar expressions. Forward-looking statements are subject to known and unknown risks, uncertainties, and other important factors that could cause actual results to differ materially from those expressed. We believe important factors that could cause actual results to differ materially from our expectations include, but are not limited to, the following:
|
o |
the effects of rising costs and availability of raw fruit and vegetables, steel, ingredients, packaging, other raw materials, distribution and labor; |
|
|
o |
crude oil prices and their impact on distribution, packaging and energy costs; |
|
|
o |
an overall labor shortage, ability to retain a sufficient seasonal workforce, lack of skilled labor, labor inflation or increased turnover impacting our ability to recruit and retain employees; |
|
|
o |
climate and weather affecting growing conditions and crop yields; |
|
|
o |
our ability to successfully implement sales price increases and cost saving measures to offset cost increases; |
|
|
o |
the loss of significant customers or a substantial reduction in orders from these customers; |
|
|
o |
effectiveness of our marketing and trade promotion programs; |
|
|
o |
competition, changes in consumer preferences, demand for our products and local economic and market conditions; |
|
|
o |
the impact of a pandemic on our business, suppliers, customers, consumers and employees; |
|
|
o |
unanticipated expenses, including, without limitation, litigation or legal settlement expenses; |
|
|
o |
product liability claims; |
|
|
o |
the anticipated needs for, and the availability of, cash; |
|
|
o |
the availability of financing; |
|
|
o |
leverage and the ability to service and reduce debt; |
|
|
o |
foreign currency exchange and interest rate fluctuations; |
|
|
o |
the risks associated with the expansion of our business; |
|
|
o |
the ability to successfully integrate acquisitions into our operations; |
|
|
o |
our ability to protect information systems against, or effectively respond to, a cybersecurity incident or other disruption; |
|
|
o |
other factors that affect the food industry generally, including: |
|
■ |
recalls if products become adulterated or misbranded, liability if product consumption causes injury, ingredient disclosure and labeling laws and regulations and the possibility that consumers could lose confidence in the safety and quality of certain food products; |
|
■ |
competitors’ pricing practices and promotional spending levels; |
|
■ |
fluctuations in the level of our customers’ inventories and credit and other business risks related to our customers operating in a challenging economic and competitive environment; and |
|
■ |
the risks associated with third-party suppliers, including the risk that any failure by one or more of our third-party suppliers to comply with food safety or other laws and regulations may disrupt our supply of raw materials or certain finished goods products or injure our reputation; and |
|
o |
changes in, or the failure or inability to comply with, U.S., foreign and local governmental regulations, including environmental and health and safety regulations. |
Any of these factors, as well as such other factors as discussed in (1) Part I, Item 1A., “Risk Factors” of this Annual Report on Form 10-K, (2) Part II, Item 7, “Management’s Discussion and Analysis of Financial Condition and Results of Operations” and (3) in our other periodic filings with the Securities and Exchange Commission (the “SEC”), could cause our actual results to differ materially from our anticipated results. The information provided in this Form 10-K is based upon the facts and circumstances known as of the date of this report, and any forward-looking statements made by us in this Form 10-K speak only as of the date on which they are made. Except as required by law, we undertake no obligation to update these forward-looking statements after the date of this Form 10-K to reflect events or circumstances after such date, or to reflect the occurrence of unanticipated events.
PART I
Overview
Seneca Foods Corporation (“Seneca” or the “Company”) was founded in 1949 and has evolved through internal growth and strategic acquisitions into a leading provider of packaged fruits and vegetables, with 26 main facilities located throughout the United States. The facilities are comprised of plants for packaging, can manufacturing, seed production, a farming operation and a logistical support network. Food packaging operations are primarily supported by plant locations in New York, Michigan, Oregon, Wisconsin, Washington, Idaho, Illinois, and Minnesota. The Company also maintains warehouses which are generally located adjacent to its packaging plants. The Company is incorporated in New York with its headquarters located at 350 WillowBrook Office Park, Fairport, New York 14450 and its telephone number is (585) 495-4100.
The Company’s business strategies are designed to grow its market share and enhance sales and margins. These strategies include: 1) expand the Company’s leadership in the packaged fruit and vegetable industry; 2) provide low-cost, high-quality fruit and vegetable products to consumers through the elimination of costs from the Company’s supply chain and investment in state-of-the-art production and logistical technology; 3) focus on growth opportunities to capitalize on higher expected returns; and 4) pursue strategic acquisitions that leverage the Company’s core competencies.
Available Information
The Company’s Internet address is www.senecafoods.com. The Company’s annual report on Form 10-K, quarterly reports on Form 10-Q, current reports on Form 8-K and any amendments to those reports filed or furnished pursuant to Section 13(a) or 15(d) of the Securities Exchange Act of 1934, as amended, are available on the Company’s website, as soon as reasonably practicable after they are electronically filed with or furnished to the SEC. All such filings on the Company’s website are available free of charge. Information on our website is not part of the annual report on Form 10-K.
In addition, the Company's website includes items related to corporate governance matters, including charters of various committees of the Board of Directors and the Company's Code of Business Conduct and Ethics. The Company intends to disclose on its website any amendment to or waiver of any provision of the Code of Business Conduct and Ethics that would otherwise be required to be disclosed under the rules of the SEC and NASDAQ.
Financial Information about Industry Segments
The Company manages its business almost entirely on the basis of two reportable food packaging segments: Vegetable and Fruit/Snack. The Other category comprises non-food operations including revenue derived from the sale of cans, ends, seed, and outside revenue from the Company's aircraft operations, and certain corporate items. The Company’s food operations constituted 98% of total net sales in fiscal year 2025. Canned vegetables represented 83%, frozen vegetables represented 8%, fruit products represented 6%, and snack products represented 1% of the total food packaging net sales. Non-food packaging sales represented 2% of the Company's fiscal year 2025 net sales. Refer to the information set forth under the heading “Segment Information” in Note 12 of the Notes to Consolidated Financial Statements in Part II, Item 8, “Financial Statements and Supplementary Data”, for additional discussion about the Company’s segments.
Principal Products and Markets
The Company’s principal product offerings include canned, frozen and jarred produce, and snack chips. The Company manufactures and sells the following:
|
● |
private label products to retailers, such as supermarkets, mass merchandisers, and specialty retailers, for resale under the retailers’ own or controlled labels; |
|
|
● |
private label and branded products to the foodservice industry, including foodservice distributors and national restaurant operators; |
|
|
● |
branded products under national and regional brands that the Company owns or licenses, including Seneca®, Libby’s®, Green Giant®, Aunt Nellie’s®, CherryMan®, Green Valley® and READ®; |
|
|
● |
branded products under co-pack agreements to other major branded companies for their distribution; and |
|
|
● |
products to the Company’s industrial customer base for repackaging in portion control packages and for use as ingredients by other food manufacturers. |
The Company’s fruits and vegetables are sold nationwide by major grocery outlets, including supermarkets, mass merchandisers, limited assortment stores, club stores and dollar stores. The Company also sells its products to foodservice distributors, restaurant chains, industrial markets, other food processors, export customers in approximately 55 countries and federal, state and local governments for school and other food programs. Additionally, the Company packs canned and frozen vegetables under contract packing agreements. The following table summarizes net sales by major product category for fiscal years 2025 and 2024 (in thousands):
|
Fiscal Year: |
|||||||||
|
2025 |
2024 |
||||||||
|
Canned vegetables |
$ | 1,314,315 | $ | 1,204,823 | |||||
|
Frozen vegetables |
124,714 | 120,795 | |||||||
|
Fruit products |
92,378 | 87,435 | |||||||
|
Snack products |
14,995 | 13,400 | |||||||
|
Other |
32,485 | 32,150 | |||||||
| $ | 1,578,887 | $ | 1,458,603 | ||||||
Source and Availability of Raw Materials
The Company’s high-quality products are primarily sourced from more than 1,100 American farms. The Company purchases other raw materials, including steel, ingredients and packaging materials from commodity processors, steel producers and packaging suppliers. Raw materials and other input costs, such as labor, fuel, utilities and transportation, are subject to fluctuations in price attributable to a number of factors. Fluctuations in commodity prices can lead to retail price volatility and can influence consumer and trade buying patterns. The cost of raw materials, fuel, labor, distribution and other costs related to our operations can increase from time to time significantly and unexpectedly.
The Company experienced material cost increases to various production inputs during the last several years due to a number of factors, including but not limited to, supply chain disruptions, steel supply and pricing, raw material shortages, labor shortages, and the conflict between Russia and Ukraine. While the Company has no direct exposure to this foreign conflict, it had a negative impact on the global economy which increased certain of our input costs. While some of the factors mentioned above have started to ease and stabilize during fiscal year 2025, the Company’s costs remain elevated as compared to historical levels.
The Company attempts to manage costs by locking in prices through short-term supply contracts, advance grower purchase agreements, and by implementing cost saving measures. The Company also attempts to offset rising input costs by raising sales prices to its customers. However, increases in the prices the Company charges its customers may lag behind rising input costs. Competitive pressures and pricing methodologies employed in the various sales channels in which the Company competes also may limit its ability to raise prices in response to rising costs. To the extent the Company is unable to avoid or offset any present or future cost increases, its operating results could be materially adversely affected.
United States and International Sales
The following table sets forth United States and international net sales (in thousands, except percentages):
|
Fiscal Year: |
||||||||
|
2025 |
2024 |
|||||||
|
Net sales: |
||||||||
|
United States |
$ | 1,492,266 | $ | 1,374,774 | ||||
|
International |
86,621 | 83,829 | ||||||
|
Total net sales |
$ | 1,578,887 | $ | 1,458,603 | ||||
|
As a percentage of net sales: |
||||||||
|
United States |
94.5 | % | 94.3 | % | ||||
|
International |
5.5 | % | 5.7 | % | ||||
|
Total |
100.0 | % | 100.0 | % | ||||
Intellectual Property
The Company has a license agreement with B&G Foods, Inc., for use of the Green Giant® brand name to manufacture, market, distribute, and sell shelf-stable vegetable products within the United States and its territories, and certain Caribbean islands in perpetuity. The license is royalty free and does not include Green Giant frozen, Green Giant Canada or the Le Sueur brand.
The Company holds the Libby's® brand name pursuant to a trademark license. The license is limited to vegetables which are shelf-stable, frozen, and thermally packaged, and includes the Company's major vegetable varieties – sweet corn, peas and green beans – as well as certain other thermally packaged vegetable varieties and sauerkraut. The license is renewable by the Company every 10 years for an aggregate period expiring in March 2081.
The Company is required to pay an annual royalty to Libby's Brand Holding, Ltd., who may terminate the license for non-payment of royalty, use of the trademark in sales outside the licensed territory, failure to achieve a minimum level of sales under the licensed trademark during any calendar year or a material breach or default by the Company under the agreement (which is not cured within the specified cure period). A total of $0.1 million was paid as a royalty fee for the fiscal year ended March 31, 2025.
The Company also sells canned vegetables, frozen vegetables, jarred fruit, and other food products under several other brands for which the Company has obtained registered trademarks, including, Aunt Nellie’s®, CherryMan®, Green Valley®, READ®, Seneca®, and other regional brands.
Seasonality
The Company’s production cycle begins with planting in the spring followed by harvesting and packaging during the second and third fiscal quarters with sales spanning over the following twelve months. Minimal food packaging occurs in the Company's last fiscal quarter ending March 31, which is the optimal time for maintenance, repairs and equipment changes in its packaging plants. The supply of commodities, current pricing, and expected new crop quantity and quality affect the timing and amount of the Company’s sales and earnings. When the seasonal harvesting periods of the Company's major vegetables are newly completed, inventories for these packaged vegetables are at their highest levels. For peas, the peak inventory time is mid-summer and for sweet corn and green beans, the Company's highest volume vegetables, the peak inventory is in mid-autumn. The seasonal nature of the Company’s production cycle results in inventory and accounts payable typically reaching their lowest point in mid-to-late first quarter prior to the new seasonal pack commencing. As the seasonal pack progresses, these components of working capital both increase until the pack is complete.
The Company’s fruit and vegetable sales exhibit seasonal increases in the third fiscal quarter due to increased retail demand during the holiday season. In addition, the Company sells canned and frozen vegetables to a co-pack customer on a bill and hold basis during the pack cycle, which typically occurs in the second and third quarters. Given the seasonal nature of the Company's sales, the accounts receivable balance typically reaches its highest point at the end of the second fiscal quarter.
These seasonal fluctuations are illustrated in the following table, which presents certain unaudited quarterly financial information for the periods indicated (in thousands):
|
First |
Second Quarter |
Third |
Fourth Quarter |
|||||||||||||
|
Fiscal Year 2025: |
||||||||||||||||
|
Net sales |
$ | 304,727 | $ | 425,465 | $ | 502,856 | $ | 345,839 | ||||||||
|
Gross margin |
42,691 | 42,871 | 49,110 | 15,529 | ||||||||||||
|
Net earnings |
12,661 | 13,303 | 14,659 | 601 | ||||||||||||
| Accounts receivable, net (at quarter end) | 96,448 | 108,533 | 70,829 | 96,330 | ||||||||||||
| Inventories (at quarter end) | 841,847 | 944,887 | 735,682 | 603,955 | ||||||||||||
| Accounts payable (at quarter end) | 62,460 | 213,015 | 70,791 | 43,580 | ||||||||||||
|
Revolver outstanding (at quarter end) |
209,189 | 146,421 | 42,196 | 1,000 | ||||||||||||
|
Fiscal Year 2024: |
||||||||||||||||
|
Net sales |
$ | 298,664 | $ | 407,475 | $ | 444,481 | $ | 307,983 | ||||||||
|
Gross margin |
55,289 | 58,118 | 54,033 | 20,778 | ||||||||||||
|
Net earnings (loss) |
23,111 | 24,779 | 17,675 | (2,247 | ) | |||||||||||
| Accounts receivable, net (at quarter end) | 84,964 | 128,380 | 89,928 | 79,767 | ||||||||||||
| Inventories (at quarter end) | 735,124 | 1,013,447 | 968,889 | 872,692 | ||||||||||||
| Accounts payable (at quarter end) | 117,700 | 321,579 | 125,182 | 40,326 | ||||||||||||
|
Revolver outstanding (at quarter end) |
52,064 | 134,757 | 258,108 | 237,225 | ||||||||||||
Competition
Competition in the packaged food industry is substantial with brand recognition and promotion, quality, service, and pricing being the major determinants in the Company’s relative market position. The Company believes that it is a major producer of canned vegetables, frozen vegetables, and jarred fruit but some producers of these products have sales which exceed the Company's sales. The Company is aware of at least 13 competitors in the United States packaged fruit and vegetable industry, many of which are privately held companies.
Government Regulation
The Company is subject to extensive regulations in the United States by federal, state and local government authorities. In the United States, the federal agencies governing the manufacture, marketing and distribution of our products include, among others, the Federal Trade Commission (“FTC”), the United States Food & Drug Administration (“FDA”), the United States Department of Agriculture (“USDA”), the United States Environmental Protection Agency (“EPA”) and the Occupational Safety and Health Administration (“OSHA”). Under various statutes, these agencies prescribe and establish, among other things, the requirements and standards for quality, safety and representation of the Company’s products to the consumer in labeling and advertising.
Environmental protection is an area that has been worked on diligently at each food packaging facility. In all locations, the Company has cooperated with federal, state, and local environmental protection authorities in developing and maintaining suitable antipollution facilities. In general, we believe our pollution control facilities are equal to or somewhat superior to those of our competitors and are within environmental protection standards. The Company does not expect any capital expenditures out of the ordinary course of business in order to comply with environmental regulations in the near future.
There has been a broad range of proposed and promulgated state, national and international regulations aimed at reducing the effects of climate change. In the United States, there is a possibility that some form of regulation will be forthcoming at the federal level to address the effects of climate change. Such regulation could result in the creation of additional costs in the form of taxes, consultant expenses, the restriction of output, investments of capital to maintain compliance with laws and regulations or required acquisition or trading of emission allowances. Climate change regulation continues to evolve, and while it is not possible to accurately estimate either a timetable for implementation or the Company’s future compliance costs relating to implementation, such regulation could have a material effect on our business, financial condition and results of operations.
Environmental Matters
Seneca publishes an annual Business Responsibility and Sustainability Report which highlights its vision for and approach to corporate sustainability and details key initiatives it is undertaking in the areas of environmental stewardship, social responsibility, and corporate governance. The report is available on our website and is not a part of this Annual Report on Form 10-K.
The Company takes its responsibility to be a good steward of the environment seriously and adopts policies and procedures under the guidance of the Board of Directors that advance our performance. We monitor existing and pending climate legislation and regulation to evaluate any potential impact on our future results of operations, capital expenditures or financial position. The Board of Directors provides oversight as part of their evaluation of business responsibility and sustainability initiatives, and we will continue to monitor emerging developments and assess our performance in this area. We may face additional economic and operational impacts from environmental and climate protection laws and regulations as well as impacts from our suppliers and customers as they adhere to such laws and regulations.
Human Capital
Employment
As of March 31, 2025, Seneca employed approximately 2,885 employees and employed an additional approximately 4,010 seasonal employees during the Company’s peak summer harvest season. 100% of our employees are located in the United States, distributed across the Company’s facilities.
Culture
At Seneca, we work hard every day to feed the world safe and nutritious products, while adhering to our fundamental beliefs (which can be found on our website). These beliefs include acting with integrity in all matters, treating employees with respect, and maintaining the highest standards for protecting our workers. We also believe in promoting from within, which has resulted in many long-tenured employees in leadership positions throughout the Company.
Employee Health and Safety
The health and safety of our employees is a top priority at Seneca. The Company complies with all national and local laws of the jurisdictions in which we operate regarding worker health and safety. In addition, we work to continuously improve our safety record with worker safety training and Seneca’s HERO (“Health Environment Risk Observation”) program, in which employees proactively identify and mitigate potential safety risks. At Seneca, we believe that safety is everyone’s responsibility, and the HERO program reflects that commitment, with close to 100% employee participation.
The Company also conducts regular safety audits at all processing locations to ensure compliance with Seneca and OSHA safety standards. External risk management services are also consulted as part of this process. The Company’s management recognizes plants that achieve at least one million work hours or 1,000 days worked without a lost time injury to employees with the President’s “Bronze Eagle” award, which is prominently displayed at many of our processing facilities.
Employee Training and Development
Seneca believes in developing internal talent and providing employees with an opportunity for education and advancement. In support of this endeavor, we have developed three key programs. SAVES (“Seneca Adding Value Employee System”) focuses on employee empowerment, education, and application of lean manufacturing principles. The Company’s dedicated SAVES instructors and project leaders educate employees and empower them to make process improvements at all of our processing facilities. GROWS (“Get Rid of Waste Systemically”) supports our leadership development efforts through continuous improvement project leadership. LEADS ("Leadership Education and Development at Seneca") is a training program focused on leadership, managing employees in a positive and productive manner, and reinforces many of our fundamental beliefs, such as treating employees with respect.
Culture
Seneca believes that everyone should feel respected and welcome in our workplace. The Company is committed to providing equal opportunity in all aspects of employment, and to applying fair labor practices while respecting the national and local laws of the states and communities where we have operations. The Company does not engage in or tolerate discrimination, intimidation, harassment, or any other unlawful conduct. We believe that a diverse and inclusive workforce provides the Company with the benefits of different viewpoints and perspectives, as well as a talented and innovative employee base.
The following factors as well as factors described elsewhere in this Form 10-K or in other filings by the Company with the SEC, could adversely affect the Company’s consolidated financial position, results of operations or cash flows. Other factors not presently known to us or that we presently believe are not material could also affect our business operations or financial results. The Company refers to itself as “we”, “our” or “us” in this section.
Fruit and Vegetable Industry Risks
Excess capacity in the fruit and vegetable industry has a downward impact on selling price.
If canned vegetable, frozen vegetable, or jarred fruit categories decline, less shelf space will be devoted to these categories in the supermarkets. Fresh and perishable businesses are improving their delivery systems around the world and the availability of fresh produce is impacting the consumer purchasing patterns relating to packaged fruit and vegetables. Our financial performance and growth are related to conditions in the United States’ fruit and vegetable packaging industry which is a mature industry. Our net sales are a function of product availability and market pricing. In the fruit and vegetable packaging industry, product availability and market prices tend to have an inverse relationship: market prices tend to decrease as more product is available and to increase if less product is available. Product availability is a direct result of plantings, growing conditions, crop yields and inventory levels, all of which vary from year to year. These factors may have a significant effect on supply and competition and create downward pressure on prices. In addition, market prices can be affected by the planting and inventory levels and individual pricing decisions of our competitors. Generally, market prices in the fruit and vegetable packaging industry adjust more quickly to variations in product availability than an individual packager can adjust its cost structure; thus, in an oversupply situation, a packager’s margins likely will weaken. We typically have experienced lower margins during times of industry oversupply.
In the past, the fruit and vegetable packaging industry has been characterized by excess capacity, with resulting pressure on our prices and profit margins. We have closed packaging plants in past years in response to the downward pressure on prices. There can be no assurance that our margins will improve in response to favorable market conditions or that we will be able to operate profitably during depressed market conditions.
Growing cycles and adverse weather conditions may decrease our results from operations.
Our operations are affected by the growing cycles of the vegetables we package. When the vegetables are ready to be picked, we must harvest and package them quickly or lose the opportunity to package the impacted vegetables for an entire year. Most of our vegetables are grown by farmers under contract with us. Consequently, we must pay the contract grower for the vegetables even if we cannot or do not harvest or package them. Most of our production occurs during the second quarter (July through September) of our fiscal year, which corresponds with the quarter that the growing season ends for most of the produce packaged by us.
A majority of our sales occur during the second and third quarters of each fiscal year due to seasonal consumption patterns for our products. Accordingly, inventory levels and accounts receivable levels are highest during the second and third quarters. Net sales generated during our second and third fiscal quarters have a significant impact on our results of operations. Because of these seasonal fluctuations, the results of any particular quarter, particularly in the first half of our fiscal year, will not necessarily be indicative of results for the full year or for future years.
We set our planting schedules without knowing the effect of the weather on the crops or on the entire industry’s production. Weather conditions during the course of each vegetable crop’s growing season will affect the volume and growing time of that crop. As most of our vegetables are produced in more than one part of the United States, this somewhat reduces the risk that our entire crop will be subject to disastrous weather. The upper Midwest is the primary growing region for the principal vegetables which we pack, namely peas, green beans and sweet corn, and it is also a substantial source of our competitors’ vegetable production. A sizeable portion of our vegetable production areas are serviced with irrigation systems to help minimize (i) wet conditions for planting and (ii) dry conditions during the growing season. Any adverse effects of weather-related reduced production may be partially mitigated by higher selling prices for the vegetables which are produced.
The commodity materials that we package or otherwise require are subject to price increases that could adversely affect our profitability.
The materials that we use, such as raw fruit and vegetables, steel, ingredients, pouches and other packaging materials as well as the electricity, diesel fuel, and natural gas used in our business, are commodities that may experience price volatility caused by external factors, including but not limited to market fluctuations, availability, currency fluctuations and changes in governmental regulations and agricultural programs. General inventory positions of major commodities, such as field corn, soybeans and wheat, all commodities with which we must compete for acreage, can have dramatic effects on prices for those commodities, which can translate into similar swings in prices needed to be paid for our contracted commodities. These programs and other events can result in reduced supplies of these commodities, higher supply costs or interruptions in our production schedules. If prices of these commodities increase beyond what we can pass along to our customers, our operating income will decrease.
Risks Associated with Our Operations
Changes in economic conditions that impact consumer spending could harm our business.
The food products industry and our financial performance are sensitive to changes in overall economic conditions that impact consumer spending, including but not limited to inflation, economic volatility resulting from a pandemic, and global conflicts. Future economic conditions affecting consumer income such as employment levels, business conditions, interest rates, inflation and tax rates could reduce consumer spending or cause consumers to shift their spending to other products. Historic increases in inflation following the COVID-19 pandemic may cause consumers to be more sensitive to price changes. A general reduction in the level of consumer spending or shifts in consumer spending to other products could have a material adverse effect on our growth, sales, and profitability.
Pandemics or disease outbreaks may disrupt our business, including among other things, our supply chain, our manufacturing operations and customer and consumer demand for our products, and could have a material adverse impact on our business.
The spread of pandemics or disease outbreaks may negatively affect our operations. If a significant percentage of our workforce or the workforce of our third-party business partners is unable to work, including because of illness or travel or government restrictions in connection with a pandemic or disease outbreak, our operations may be negatively impacted. Some of our workforce dwell in company provided housing and therefore any outbreaks would need to be managed, to the extent possible, to meet healthcare protocols. Pandemics or disease outbreaks could result in a widespread health crisis that could adversely affect economies and financial markets, consumer spending and confidence levels resulting in an economic downturn that could affect customer and consumer demand for our products.
Our efforts to manage and mitigate these factors may be unsuccessful, and the effectiveness of these efforts depends on factors beyond our control, including the duration and severity of any pandemic or disease outbreak, as well as third party actions taken to contain its spread and mitigate public health effects.
The ultimate impact of a pandemic on our business will depend on many factors, including, among others, the duration of social distancing and stay-at-home mandates, our ability to continue to operate our manufacturing facilities and maintain the supply chain without material disruption, and the extent to which macroeconomic conditions resulting from the pandemic and the pace of the subsequent recovery may impact consumer eating habits.
We depend upon key customers.
Our products are sold in a highly competitive marketplace, which includes increased concentration and a growing presence of large-format retailers and discounters. Dependence upon key customers could lead to increased pricing pressure by these customers. A relatively limited number of customers account for a large percentage of the Company’s total net sales. The top ten customers represented approximately 53% and 52% of net sales for fiscal years 2025 and 2024, respectively. If we lose a significant customer or if sales to a significant customer materially decrease, our business, financial condition and results of operations may be materially and adversely affected.
If we do not maintain the market shares of our products, our business and revenues may be adversely affected.
All of our products compete with those of other national and regional food packaging companies under highly competitive conditions. The fruit and vegetable products which we sell under our own brand names not only compete with fruit and vegetable products produced by food packaging competitors, but also compete with products we produce and sell under contract packing agreements with other companies who market those products under their own brand names and the vegetables we sell to various retail grocery chains which carry our customers’ own brand names.
The customers who buy our products to sell under their own brand names control the marketing programs for those products. In recent years, many major retail food chains have been increasing their promotions, offerings and shelf space allocations for their own fruit and vegetable brands, to the detriment of fruit and vegetable brands owned by the packagers, including our own brands. We cannot predict the pricing or promotional activities of our customers/competitors or whether they will have a negative effect on us. There are competitive pressures and other factors which could cause our products to lose market share or result in significant price erosion that could materially and adversely affect our business, financial condition and results of operations.
The domestic packaged food industry continues to face import competition. The ramifications include, but are not limited to, market oversaturation, inferior quality of imported products competing in the same market as products sourced from the United States, and potential increased pricing pressure on domestic producers for finished goods. These factors could negatively affect our existing market share and adversely impact the Company’s financial condition and results of operations.
Increases in logistics and other transportation-related costs could materially adversely impact our results of operations.
Our ability to competitively serve our customers depends on the availability of reliable and low-cost transportation. We use multiple forms of transportation to bring our products to market. They include trucks, intermodal, rail cars, and ships. Disruption to the timely supply of these services or increases in the cost of these services for any reason, including availability or cost of fuel, regulations affecting the industry, or labor shortages in the transportation industry, could have an adverse effect on our ability to serve our customers, and could materially and adversely affect our business, financial condition and results of operations.
A recall of our products could have a material adverse effect on our business. In addition, we may be subject to significant liability should the consumption of any of our products cause injury, illness or death.
The sale of food products for human consumption involves the risk of illness or injury to consumers. Such injuries may result from mislabeling, tampering by unauthorized third parties or product contamination or spoilage, including the presence of foreign objects, undeclared allergens, substances, chemicals, other agents or residues introduced during the growing, manufacturing, storage, handling or transportation phases of production. Under certain circumstances, we may be required to recall products, leading to a material adverse effect on our business, financial condition, results of operations or liquidity. Even if a situation does not necessitate a recall, product liability claims might be asserted against us. We have from time to time been involved in product liability lawsuits, none of which have been material to our business. While we are subject to governmental inspection and regulations and believe our facilities comply in all material respects with all applicable laws and regulations, if the consumption of any of our products causes, or is alleged to have caused, a health-related illness in the future, we may become subject to claims or lawsuits relating to such matters. Even if a product liability claim is unsuccessful or is not fully pursued, the negative publicity surrounding any assertion that our products caused injury, illness or death could adversely affect our reputation with existing and potential customers and our corporate and brand image. Moreover, claims or liabilities of this sort might not be covered by our insurance or by any rights of indemnity or contribution that we may have against others. We maintain product liability insurance in an amount we believe to be adequate. However, we cannot assure you that we will not incur claims or liabilities for which we are not insured or that exceed the amount of our insurance coverage. A product liability judgment against us or a product recall or the damage to our reputation resulting therefrom could have a material adverse effect on our business, financial condition, results of operations or liquidity.
Pending and future litigation may lead us to incur significant costs.
We are, or may become, party to various lawsuits and claims arising in the normal course of business, which may include lawsuits or claims relating to contracts, intellectual property, product recalls, product liability, the marketing and labeling of products, employment matters, environmental matters or other aspects of our business. Even when not merited, the defense of these lawsuits may divert our management’s attention, and we may incur significant expenses in defending these lawsuits. In addition, we may be required to pay damage awards or settlements or become subject to injunctions or other equitable remedies, which could have a material adverse effect on our business, financial condition, results of operations or liquidity. The outcome of litigation is often difficult to predict, and the outcome of pending or future litigation may have a material adverse effect on our business, financial condition, results of operations or liquidity.
We face risks associated with our defined benefit pension plan.
We maintain a company-sponsored noncontributory defined benefit pension plan. A deterioration in the value of plan assets resulting from poor market performance, a general financial downturn or otherwise could cause an increase in the amount of contributions we are required to make to these plans. For example, our defined benefit pension plan may from time to time move from an overfunded to underfunded status driven by decreases in plan asset values that may result from changes in long-term interest rates and disruptions in U.S. or global financial markets. For a more detailed description of the pension plan, refer to the information set forth under the heading “Retirement Plans” in Note 9 of the Notes to Consolidated Financial Statements in Part II, Item 8, “Financial Statements and Supplementary Data.” An obligation to make additional, unanticipated contributions to our defined benefit plans could reduce the cash available for working capital and other corporate uses and may have a material adverse effect on our business, financial condition, results of operations and liquidity.
Our business is dependent on our information technology systems and software, and failure to protect against or effectively respond to cyberattacks, security breaches, or other incidents involving those systems, could adversely affect day-to-day operations and decision making processes and have an adverse effect on our performance and reputation.
The efficient operation of our business depends on our information technology systems, which we rely on to effectively manage our business data, communications, logistics, accounting, regulatory and other business processes. If we do not allocate and effectively manage the resources necessary to build and sustain an appropriate technology environment, our business, reputation, or financial results could be negatively impacted. In addition, our information technology systems may be vulnerable to damage or interruption from circumstances beyond our control, including systems failures, natural disasters, terrorist attacks, viruses, ransomware, security breaches or cyber incidents. Cyberattacks are becoming more sophisticated and are increasing in the number of attempts and frequency by groups and individuals with a wide range of motives. A security breach of sensitive information could result in damage to our reputation and our relations with our customers or employees. Any such damage or interruption could have a material adverse effect on our business. Also see “Cybersecurity” included as part of Item 1C. of this Annual Report on Form 10-K.
We generate agricultural food packaging wastes and are subject to substantial environmental regulation.
As a food packager, we regularly dispose of produce wastes (silage) and processing water as well as materials used in plant operation and maintenance. This includes our plant boilers, which generate heat used in packaging and can manufacturing operations, producing generally small emissions into the air. These activities and operations are regulated by federal and state laws and the respective federal and state environmental agencies. Occasionally, we may be required to remediate conditions found by the regulators to be in violation of environmental law or to contribute to the cost of remediating waste disposal sites, which we neither owned nor operated, but in which, we and other companies deposited waste materials, usually through independent waste disposal companies. Future possible costs of environmental remediation, contributions and penalties could materially and adversely affect our business, financial condition and results of operations.
Our production capacity for certain products and commodities is concentrated in a limited number of facilities, exposing us to a material disruption in production in the event that a disaster strikes.
We only have one plant that produces cherry products and one plant that produces pumpkin products. We have two plants that manufacture empty cans, one with substantially more capacity than the other, which are not interchangeable since each plant cannot necessarily produce all the can sizes needed. Although we maintain property and business interruption insurance coverage, there can be no assurance that this level of coverage is adequate in the event of a catastrophe or significant disruption at these or other Company facilities. If such an event occurs, it could materially and adversely affect our business, financial condition and results of operations.
We may undertake acquisitions or product innovations and may have difficulties integrating them or may not realize the anticipated benefits.
In the future, we may undertake acquisitions of other businesses or introduce new products, although there can be no assurances that these will occur. Such undertakings involve numerous risks and significant investments. There can be no assurance that we will be able to identify and acquire acquisition candidates on favorable terms, to profitably manage or to successfully integrate future businesses that we may acquire or new products we may introduce without substantial costs, delays or problems. Any of these outcomes could materially and adversely affect our business, financial condition and results of operations.
We are dependent upon a seasonal workforce and our inability to hire sufficient employees may adversely affect our business.
At the end of March 2025, we had roughly 2,885 employees of which approximately 2,800 were full time and approximately 85 seasonal employees worked in food packaging. During the peak summer harvest period, we employed an additional approximately 4,010 seasonal employees to help package fruit and vegetables. If there is a shortage of seasonal labor, or if there is an increase to minimum wage rates, this could have a negative impact on our cost of operations. Many of our packaging operations are located in rural communities that may not have sufficient labor pools, requiring us to hire employees from other regions. An inability to hire and train sufficient employees during the critical harvest period could materially and adversely affect our business, financial condition and results of operations.
Increases in labor costs or work stoppages or strikes could materially and adversely affect our financial condition and results of operations.
Personnel costs, including the costs of medical and other employee health and welfare benefits, have increased. These costs can vary substantially as a result of an increase in the number, mix and experience of our employees and changes in health care and other employment-related laws. There are no assurances that we will succeed in reducing future increases in such costs. Increases in personnel costs can also be amplified by low unemployment rates, preferences among workers in the labor market and general tight labor market conditions in any of the areas where we operate. Our inability to control such costs could materially and adversely affect our financial condition and results of operations. Although we consider our labor relations to be good, if a significant number of our employees engaged in a work slowdown, or other type of labor unrest, it could in some cases impair our ability to supply our products to customers, which could result in reduced sales, and may distract our management from focusing on our business and strategic priorities. Any of these activities could materially and adversely affect our financial condition and results of operations.
Environmental and other regulation of our business, including climate change regulation, could adversely impact us by increasing our production cost or restricting our ability to import certain products into the United States.
Climate change serves as a risk multiplier increasing both the frequency and severity of natural disasters that may affect our business operations. Moreover, there has been a broad range of proposed and promulgated state, national and international regulation aimed at reducing the effects of climate change. Such regulation could result in additional costs in the form of taxes, consultant costs, the restriction of output, investments of capital to maintain compliance with laws and regulations, or required acquisition or trading of emission allowances. Disclosure requirements imposed by different regulators may not always be uniform, which may result in increased complexity, increased compliance costs, and other compliance-related risks. Climate change regulation continues to evolve, and it is not possible to accurately estimate either a timetable for implementation or our future compliance costs relating to implementation.
There may be increased governmental legislative and regulatory activity in reaction to consumer perception related to enamels.
There has been continued state legislative activity to ban certain enamels used to line cans; such as Bisphenol-A ("BPA"). These legislative decisions are predominantly driven by consumer perception that BPA may be harmful. These actions have been taken despite the scientific evidence and general consensus of United States and international government agencies that BPA is safe and does not pose a risk to human health. The legislative actions combined with growing public perception about food safety may require us to change some of the materials used as linings in our packaging materials. Failure to do so could result in a loss of sales as well as loss in value of the inventory utilizing certain materials. In collaboration with other can makers as well as enamel suppliers, we have aggressively worked to find alternative materials for can linings not manufactured using BPA. We have fully transitioned to BPA Non-Intent (“BPANI”) for our canned product volume. Even though BPANI has been fully approved by the Food and Drug Administration (“FDA”), there could be future legislative or regulatory actions that claim BPANI also poses a risk to human health. Future changes or additional health and safety laws and regulations in connection with our products, packaging or processes may also impose upon us new requirements, costs, and changes to production. Such requirements, changes, liabilities, and costs could materially and adversely affect our business, financial condition and results of operations.
The implementation of the Food Safety Modernization Act of 2011 may affect operations.
The Food Safety Modernization Act ("FSMA") was enacted with the goal of enabling the FDA to better protect public health by strengthening the food safety system. FSMA was designed to focus the efforts of the FDA on preventing food safety problems rather than relying primarily on reacting to problems after they occur. The law also provides the FDA with new enforcement authorities designed to achieve higher rates of compliance with prevention and risk-based food safety standards and to better respond to and contain problems when they do occur. The increased inspections, mandatory recall authority of the FDA, increased scrutiny of foreign sourced or supplied food products, and increased records access may have an impact on our business. As we are already in a highly regulated business, operating under the increased scrutiny of more FDA authority does not appear likely to negatively impact our business. The law also gives the FDA important new tools to hold imported foods to the same standards as domestic foods.
Our results are dependent on successful marketplace initiatives and acceptance by consumers of our products.
Our product introductions and improvements of existing products, along with other marketplace initiatives, are designed to capitalize on new and evolving customer or consumer trends and preferences. Shifts in consumer trends and preferences may result from several factors, including dietary trends, attention to nutritional aspects and concerns (perceived or substantiated) about the health effects of and the sourcing of certain ingredients. For example, the FDA has issued a statement on sodium which referred to an Institute of Medicine statement that too much sodium is a major contributor to high blood pressure. Some of our products contain a moderate amount of sodium per recommended serving, which is based on and aligns with consumer preferences for taste. In addition, there is the potential for increased government regulation of certain color additives which may include additional labeling requirements. Specific products within our portfolio could be impacted resulting in the need to modify our ingredient composition or develop alternative color additives. To remain competitive, we must anticipate and react to these trends and preferences. While we devote significant resources to meeting this goal, we may not be successful in developing new products or appropriate alternative ingredients that are acceptable by customers or consumers and meet the requirements of government regulatory agencies.
Financing Risks
Global economic conditions may materially and adversely affect our business, financial condition and results of operations.
Unfavorable economic conditions, including the impact of recessions in the United States and throughout the world, may negatively affect our business and financial results. These economic conditions could negatively impact (i) consumer demand for our products, (ii) the mix of our products’ sales, (iii) our ability to collect accounts receivable on a timely basis, (iv) the ability of suppliers to provide the materials required in our operations and (v) our ability to obtain financing or to otherwise access the capital markets. The strength of the U.S. dollar versus other world currencies could result in increased competition from imported products and decreased sales to our international customers. A prolonged recession could result in decreased revenue, margins and earnings. Additionally, the economic situation could have an impact on our lenders or customers, causing them to fail to meet their obligations to us. Certain of our raw materials, namely steel, are subject to import tariffs and other restrictions, and the United States government may periodically impose new or revise existing duties, quotas, tariffs or other restrictions to which we are subject. The occurrence of any of these risks could materially and adversely affect our business, financial condition and results of operations.
Our ability to manage our working capital and our Revolving Credit Facility is critical to our success.
As of March 31, 2025, we had a $1.0 million outstanding balance on our revolving credit facility (“Revolver”). During our second and third fiscal quarters, our operations generally require more cash than is available from operations. In these circumstances, it is necessary to borrow under our Revolver. Our ability to obtain financing in the future through credit facilities will be affected by several factors, including our creditworthiness, our ability to operate in a profitable manner and general market and credit conditions. Significant changes in our business or cash outflows from operations could create a need for additional working capital. An inability to obtain additional working capital on terms reasonably acceptable to us or access the Revolver would materially and adversely affect our operations. Additionally, if we need to use a portion of our cash flows to pay principal and interest on our debt, it will reduce the amount of money we have for operations, working capital, capital expenditures, expansions, acquisitions or general corporate or other business activities.
Failure to comply with the requirements of our debt agreements could have a material adverse effect on our business.
Our debt agreements contain financial and other restrictive covenants which, among other things, limit our ability to borrow money, including with respect to the refinancing of existing indebtedness. These provisions may limit our ability to conduct our business, take advantage of business opportunities and respond to changing business, market and economic conditions. In addition, they may place us at a competitive disadvantage relative to other companies that may be subject to fewer, if any, restrictions. Failure to comply with the requirements of our debt agreements could materially and adversely affect our business, financial condition and results of operations. We have pledged our accounts receivable, inventory, equipment, certain facilities, capital stock, or other ownership interests that we own in our subsidiaries to secure certain debt. If a default occurred and was not cured, secured lenders could foreclose on this collateral.
Risks Relating to Our Stock
Our existing shareholders, if acting together, may be able to exert control over matters requiring shareholder approval.
Holders of our Class B common stock are entitled to one vote per share, while holders of our Class A common stock are entitled to one-twentieth of a vote per share. In addition, holders of our 10% Cumulative Convertible Voting Preferred Stock, Series A, our 10% Cumulative Convertible Voting Preferred Stock, Series B and, solely with respect to the election of directors, our 6% Cumulative Voting Preferred Stock, which we refer to as our voting preferred stock, are entitled to one vote per share. As of March 31, 2025, holders of Class B common stock and voting preferred stock held 90.6% of the combined voting power of all shares of capital stock then outstanding and entitled to vote. These shareholders, if acting together, would be in a position to control the election of our directors and to effect or prevent certain corporate transactions that require majority or supermajority approval of the combined classes, including mergers and other business combinations. This may result in us taking corporate actions that shareholders may not consider to be in their best interest and may affect the market price of our common stock.
As of March 31, 2025, our current executive officers and directors beneficially owned 13.37% of our outstanding shares of Class A common stock, 54.79% of our outstanding shares of Class B common stock and 27.12% of our voting preferred stock, or 41.06% of the combined voting power of our outstanding shares of capital stock. This concentration of voting power may inhibit changes in control of the Company and may adversely affect the market price of our common stock.
Our certificate of incorporation and bylaws contain provisions that discourage corporate takeovers.
Certain provisions of our certificate of incorporation and bylaws and provisions of the New York Business Corporation Law may have the effect of delaying or preventing a change in control. Various provisions of our certificate of incorporation and bylaws may inhibit changes in control not approved by our directors and may have the effect of depriving shareholders of any opportunity to receive a premium over the prevailing market price of our common stock in the event of an attempted unsolicited takeover. In addition, the existence of these provisions may adversely affect the market price of our common stock. These provisions include:
|
● |
a classified board of directors; |
|
● |
a requirement that special meetings of shareholders be called only by our directors or holders of 25% of the voting power of all shares outstanding and entitled to vote at the meeting; |
|
● |
our board of directors has the power to classify and reclassify any of our unissued shares of capital stock into shares of capital stock with such preferences, rights, powers and restrictions as the board of directors may determine; |
|
● |
the affirmative vote of two-thirds of the shares present and entitled to vote is required to amend our bylaws or remove a director; and |
|
● |
under the New York Business Corporation Law, in addition to certain restrictions which may apply to “business combinations” involving us and an “interested shareholder”, a plan for our merger or consolidation must be approved by two-thirds of the votes of all outstanding shares entitled to vote thereon. See “Our existing shareholders, if acting together, may be able to exert control over matters requiring shareholder approval.” |
We have not paid dividends on our common stock in the past.
We have not declared or paid any cash dividends on our common stock in the past. In addition, payment of cash dividends on our common stock is not permitted by the terms of our revolving credit facility. This policy may be revisited under the correct circumstances in the future.
Other Risks
Tax legislation could impact future cash flows.
We use the last-in, first-out (“LIFO”) method of inventory accounting. As of March 31, 2025, we had a LIFO reserve of $359.3 million which, at the statutory tax rate of 24.9%, represents approximately $89.5 million of income taxes, payment of which is delayed to future dates based upon changes in inventory costs. From time-to-time, discussions regarding changes in U.S. corporate and state tax laws have included the potential of LIFO being repealed. Should LIFO be repealed, the $89.5 million of postponed taxes, plus any future benefit realized prior to the date of repeal, would likely have to be repaid over some period of time. Repayment of these postponed taxes will reduce the amount of cash that we would have available to fund our operations, working capital, capital expenditures, expansions, acquisitions or general corporate or other business activities. This could materially and adversely affect our business, financial condition and results of operations.
The tax status of our insurance subsidiary could be challenged resulting in an acceleration of income tax payments.
In conjunction with our workers’ compensation program, we operate a wholly owned insurance subsidiary, Dundee Insurance Company, Inc. We recognize this subsidiary as an insurance company for federal income tax purposes with respect to our consolidated federal income tax return. In the event the Internal Revenue Service (“IRS”) were to determine that this subsidiary does not qualify as an insurance company, we could be required to make accelerated income tax payments to the IRS that we otherwise would have deferred until future periods.
Item 1B. Unresolved Staff Comments
None
Risk Management and Strategy
The Company’s cybersecurity risk management program is integrated with its overall enterprise risk management program and shares common methodologies, reporting channels and governance processes that apply across functions to other legal, compliance, strategic, operational, and financial risk areas.
The Company designs and assesses the cybersecurity risk management program based on the National Institute of Standards and Technology Cybersecurity Framework (“NIST CSF”). The Company uses the NIST CSF as a guide to help identify, assess, and manage cybersecurity risks relevant to its business; this does not imply that the Company’s cybersecurity program meets any particular technical standards, specifications, or requirements.
The cybersecurity risk management program is grounded in a zero-trust framework and employs a multi-layered approach, including:
|
● |
Awareness and training for employees, involving phishing campaigns, informational sessions at management meetings, and annual mandatory training with simulations of common cybersecurity threats; |
|
● |
Security tools and technologies, along with control policies and active review procedures which strengthen authentication and access protection; |
|
● |
Third-party risk management process and monitoring procedures for service providers, suppliers, and vendors who have access to critical systems and information; |
|
● |
Risk and vulnerability management encompassing both proactive and predictive defenses which provides opportunities to assess, remediate, and validate; and |
|
● |
Managed detection and incident response, including advanced endpoint protection and data loss prevention. |
In evaluating the risks identified as a part of the annual assessment process, the Company’s information technology team considers the likelihood and severity of the respective risk and the potential impact of the risk on the Company, its customers, and its employees. These risks are then prioritized and monitored by the information technology team.
The Company conducts periodic testing of software, hardware, defensive capabilities, and other information security systems to assess its cybersecurity readiness and maturity of the cybersecurity program. Tests are conducted by the information technology team and reputable third-party consultants and auditors. In developing and evaluating the testing procedures, the Company considers both its individual risks and industry standards.
The cybersecurity risk management program includes an incident response plan with a cross-functional team comprised of designated members of the information technology department, senior management, and other appropriate individuals. The team is responsible for assessing and managing the cybersecurity incident response process, as outlined within the incident response plan, and taking necessary corrective actions to mitigate and eliminate the issue.
As of the date of this report, the Company is not aware of any cybersecurity incidents that have materially affected or are reasonably likely to materially affect the Company, including its business strategy, results of operations, or financial condition that are required to be reported in this Form 10-K. For further discussion of the risks associated with cybersecurity incidents and potential impact to the Company, see the cybersecurity risk factor within “Item 1A. Risk Factors” in this Form 10-K.
Governance
The information technology department, led by the Senior Vice President of Technology and Planning, Chief Information Officer (“CIO”), is responsible for the Company’s cybersecurity program. The CIO, along with the certified Information Security Officer and the VP of Information Technology have significant experience spanning over 20 years in information security, infrastructure, and compliance.
The Board of Directors considers cybersecurity risk as part of its overall risk oversight function. The Board of Directors receives briefings from the CIO regarding the Company’s cybersecurity risk management program at least annually. These briefings include updates on the Company’s cybersecurity risks and threats, the status of projects to strengthen the information security systems, assessments of the information security program, and the emerging cybersecurity threat landscape.
The following table details the Company’s manufacturing plants, warehouses, and corporate offices:
|
Square |
||||||||
|
Footage |
Acres |
|||||||
|
(000s) |
||||||||
|
Food Group |
||||||||
|
Nampa, Idaho |
244 | 16 | ||||||
|
Payette, Idaho |
404 | 43 | ||||||
|
Princeville, Illinois |
278 | 568 | ||||||
|
Hart, Michigan |
368 | 134 | ||||||
|
Traverse City, Michigan |
58 | 43 | ||||||
|
Blue Earth, Minnesota |
287 | 429 | ||||||
|
Glencoe, Minnesota |
699 | 999 | ||||||
|
LeSueur, Minnesota |
81 | 497 | ||||||
|
Montgomery, Minnesota |
572 | 1,172 | ||||||
|
Rochester, Minnesota |
835 | 461 | ||||||
|
Geneva, New York |
762 | 593 | ||||||
|
Leicester, New York |
228 | 91 | ||||||
|
Dayton, Oregon |
82 | 19 | ||||||
|
Dayton, Washington |
250 | 29 | ||||||
|
Yakima, Washington |
122 | 8 | ||||||
|
Baraboo, Wisconsin |
642 | 13 | ||||||
|
Berlin, Wisconsin |
97 | 125 | ||||||
|
Cambria East, Wisconsin |
399 | 401 | ||||||
|
Cambria West, Wisconsin |
365 | 411 | ||||||
|
Clyman, Wisconsin |
447 | 724 | ||||||
|
Cumberland, Wisconsin |
437 | 307 | ||||||
|
Gillett, Wisconsin |
329 | 90 | ||||||
|
Janesville, Wisconsin |
1,299 | 341 | ||||||
|
Mayville, Wisconsin |
239 | 354 | ||||||
|
Oakfield, Wisconsin |
231 | 2,135 | ||||||
|
Ripon, Wisconsin |
647 | 164 | ||||||
|
Non-Food Group |
||||||||
|
Fairport, New York |
13 | |||||||
|
Penn Yan, New York |
27 | 4 | ||||||
|
Total |
10,442 | 10,171 | ||||||
The Company believes that these facilities are suitable and adequate for the purposes for which they are currently intended. All locations, although highly utilized, have the ability to expand as sales requirements justify. Because of the seasonal production cycles, the exact extent of utilization is difficult to measure.
The information set forth under the heading “Legal Proceedings and Other Contingencies” in Note 13 of the Notes to Consolidated Financial Statements in Part II, Item 8 of this Annual Report on Form 10-K is incorporated herein by reference.
Item 4. Mine Safety Disclosures Item 5.
Not Applicable.
PART II
Market for Registrant’s Common Stock, Related Stockholder Matters and Issuer Purchases of Equity Securities
Refer to the information in the 2025 Annual Report, attached as Exhibit 13 to this Annual Report on Form 10-K, under the section “Shareholder Information”, which is incorporated by reference.
Issuer Purchases of Equity Securities
On August 10, 2022, the Board approved an amendment to the Company’s stock repurchase program which increased the maximum number of shares to be repurchased under the program up to 2,000,000 shares of the Company's Class A and/or Class B Common Stock, including the shares of convertible participating preferred stock of the Company (collectively, the “Common Stock”). Under the repurchase program, the Company may purchase shares of Common Stock from time to time in the open market or in privately negotiated transactions in compliance with the applicable rules and regulations of the Securities and Exchange Commission. The Board also authorized the establishment of a stock trading plan pursuant to Rule 10b5-1 under the Securities Exchange Act of 1934, as amended, to make purchases of Common Stock pursuant to the stock repurchase program. The timing and amount of stock repurchases under the program, if any, will be at the discretion of management, and will depend on available cash, market conditions and other considerations. Therefore, we cannot assure you as to the number or aggregate dollar amount of shares, if any, that will be repurchased under the repurchase program. We may discontinue the program at any time.
On August 9, 2023, the Board approved an amendment to the Company’s stock repurchase program which increased the maximum number of shares to be repurchased under the program up to 2,500,000 shares of the Common Stock. The Company’s stock repurchase program does not have an expiration date.
|
Total Number of |
Average Price |
Maximum Number |
||||||||||||||||||||||
|
Shares Purchased |
Paid per Share |
Total Number of Shares |
(or Approximate Dollar Value) |
|||||||||||||||||||||
|
Purchased as Part of |
of Shares that May Yet |
|||||||||||||||||||||||
|
Class A |
Class B |
Class A |
Class B |
Publicly Announced |
Be Purchased Under the |
|||||||||||||||||||
|
Period |
Common |
Common |
Common |
Common |
Plans or Programs |
Plans or Programs |
||||||||||||||||||
|
01/01/2025 – |
||||||||||||||||||||||||
|
01/31/2025 |
- | - | - | - | ||||||||||||||||||||
|
02/01/2025 – |
||||||||||||||||||||||||
|
02/28/2025 (1) |
9,891 | - | $ | 79.53 | - | - | ||||||||||||||||||
|
03/01/2025 – |
||||||||||||||||||||||||
|
03/31/2025 |
- | - | - | - | ||||||||||||||||||||
|
Total |
9,891 | - | $ | 79.53 | - | - | 361,878 | |||||||||||||||||
|
(1) |
Includes 9,891 shares that were purchased from the Seneca Foods Corporation Employees’ Savings Plan to satisfy the cash needs for transfers and payments in connection with the employer stock investment fund under the plan. |
Item 7. Management’s Discussion and Analysis of Financial Condition and Results of Operations
Refer to the information in the 2025 Annual Report, attached as Exhibit 13 to this Annual Report on Form 10-K, under the section “Management’s Discussion and Analysis of Financial Condition and Results of Operations”, which is incorporated by reference.
Item 7A. Quantitative and Qualitative Disclosures about Market Risk
Refer to the information in the 2025 Annual Report, attached as Exhibit 13 to this Annual Report on Form 10-K, under the section “Management’s Discussion and Analysis of Financial Condition and Results of Operations”, which is incorporated by reference.
Item 8. Financial Statements and Supplementary Data
Refer to the information in the 2025 Annual Report, attached as Exhibit 13 to this Annual Report on Form 10-K, which is incorporated herein by reference.
Item 9. Changes in and Disagreements with Accountants on Accounting and Financial Disclosure
None.
Item 9A. Controls and Procedures
Evaluation of Disclosure Controls and Procedures
Our management, with the participation of our Principal Executive Officer and Principal Financial Officer, evaluated the effectiveness of our disclosure controls and procedures (as defined in Rules 13a-15(e) and 15d-15(e) under the Exchange Act), as of March 31, 2025. Based upon this evaluation, our Principal Executive Officer and Principal Financial Officer concluded that, as of March 31, 2025, the Company’s disclosure controls and procedures: (1) were designed to ensure that material information relating to the Company is accumulated and communicated to our management, including our Principal Executive Officer and Principal Financial Officer, particularly during the period in which this report was being prepared, so as to allow timely decisions regarding required disclosure and (2) were effective, in that they provide reasonable assurance that information required to be disclosed by the Company in the reports we file or submit under the Exchange Act is recorded, processed, summarized and reported within the time periods specified in the SEC’s rules and forms.
Management’s Annual Report on Internal Control over Financial Reporting
Our management is responsible for establishing and maintaining adequate internal control over the Company’s financial reporting (as defined in Rules 13a-15(f) and 15d-15(f) under the Exchange Act). Because of its inherent limitations, internal control over financial reporting may not prevent or detect all misstatements. Projections of any evaluation of effectiveness to future periods are subject to the risk that controls may become inadequate because of changes in conditions, or that the degree of compliance with the policies or procedures may deteriorate.
Our management assessed the effectiveness of the Company’s internal control over financial reporting as of March 31, 2025. In making this assessment, our management used the criteria set forth by the Committee of Sponsoring Organizations of the Treadway Commission (“COSO”) in Internal Control-Integrated Framework (2013). Based on our assessment, management believes that, as of March 31, 2025, our internal control over financial reporting is effective based on those criteria. Our independent registered public accounting firm, Deloitte & Touche LLP, has audited the effectiveness of our internal control over financial reporting as of March 31, 2025, as stated in their report, which is included in Part II, Item 8 of this Annual Report on Form 10-K.
Changes in Internal Control over Financial Reporting
There were no changes in our internal control over financial reporting (as defined in rules 13a-15(f) and 15d-15(f) under the Exchange Act) during the quarter ended March 31, 2025 that has materially affected, or is reasonably likely to materially affect, the Company’s internal control over financial reporting.
During the quarterly period ended March 31, 2025, no director or Section 16 officer adopted or terminated any Rule 10b5-1 trading arrangement or non-Rule 10b5-1 trading arrangement (in each case, as defined in Item 408(a) of Regulation S-K).
Item 9C. Disclosure Regarding Foreign Jurisdictions that Prevent Inspections Certain information required by Part III is incorporated by reference from the Company’s Definitive Proxy Statement for its 2025 Annual Meeting of Shareholders to be held on August 7, 2025 (the “Proxy Statement”).
None.
PART III
The Proxy Statement will be filed within 120 days after the end of the Company’s fiscal year ended March 31, 2025.
Item 10. Directors, Executive Officers and Corporate Governance
The following sections of the Proxy Statement are incorporated herein by reference:
|
● |
Information Concerning Directors |
|
|
● |
Executive Officers |
|
|
● |
Delinquent Section 16(a) Reports |
|
|
● |
Board Governance |
|
|
● |
Audit Committee Matters |
Item 11. Executive Compensation
The following sections of the Proxy Statement are incorporated herein by reference:
|
● |
Compensation Discussion and Analysis |
|
|
● |
Summary Compensation Table |
|
|
● |
Grants of Plan-Based Awards in Fiscal Year 2025 |
|
|
● |
Outstanding Equity Awards at 2025 Fiscal Year-End |
|
|
● |
Option Exercises and Stock Vested in Fiscal Year 2025 |
|
|
● |
Pension Benefits |
|
|
● |
Compensation of Directors |
|
|
● |
Compensation Committee Interlocks |
|
|
● |
Pay Versus Performance |
|
|
● |
CEO Pay Ratio |
The information included under the heading “Compensation Committee Report” in the Proxy Statement is also incorporated herein by reference; however, this information shall not be deemed to be “soliciting material” or to be “filed” with the SEC or subject to Regulation 14A or 14C, or to the liabilities of Section 18 of the Exchange Act.
Item 12. Security Ownership of Certain Beneficial Owners and Management and Related Stockholder Matters
Securities Authorized for Issuance Under Equity Compensation Plans
The 2007 Equity Incentive Plan (the “2007 Equity Plan”) was approved by shareholders at the Company’s annual meeting on August 10, 2007 and extended on July 28, 2017. The 2007 Equity Plan expires in August 2027 and originally authorized the issuance of up to 100,000 shares of either Class A Common Stock and Class B Common Stock or a combination of the two classes of stock. During fiscal year 2025, 3,870 shares were awarded under the terms of the 2007 Equity Plan. As of March 31, 2025, there were 36,224 shares available for distribution as part of future awards under the 2007 Equity Plan. No additional shares have been awarded under the 2007 Equity Plan through the date of this Annual Report on Form 10-K. There are no equity compensation plans not approved by the Company’s shareholders.
The following sections of the Proxy Statement are incorporated herein by reference:
|
● |
Security Ownership of Certain Beneficial Owners |
|
|
● |
Security Ownership of Management and Directors |
Item 13. Certain Relationships and Related Transactions, and Director Independence
The following sections of the Proxy Statement are incorporated herein by reference:
|
● |
Independent Directors |
|
|
● |
Certain Transactions and Relationships |
Item 14. Principal Accountant Fees and Services
The following sections of the Proxy Statement are incorporated herein by reference:
|
● |
Principal Accountant Fees and Services |
PART IV
Item 15. Exhibits and Financial Statement Schedule
|
A. |
Exhibits, Financial Statements, and Supplemental Schedule |
|
1. |
Financial Statements – the following consolidated financial statements of the Registrant, included in the 2025 Annual Report to Shareholders, are incorporated by reference in Part II, Item 8 “Financial Statements and Supplementary Data”: |
|
a. |
Consolidated Statements of Net Earnings – Years ended March 31, 2025, 2024, and 2023 |
|
b. |
Consolidated Statements of Comprehensive Income – Years ended March 31, 2025, 2024, and 2023 |
|
c. |
Consolidated Balance Sheets – As of March 31, 2025 and 2024 |
|
d. |
Consolidated Statements of Cash Flows – Years ended March 31, 2025, 2024, and 2023 |
|
e. |
Consolidated Statements of Stockholders’ Equity – Years ended March 31, 2025, 2024, and 2023 |
|
f. |
Notes to Consolidated Financial Statements – Years ended March 31, 2025, 2024, and 2023 |
|
g. |
Reports of Independent Registered Public Accounting Firms (PCAOB ID 34 and PCAOB ID 6581) |
|
2. |
Supplemental Schedule: |
|
a. |
Schedule II—Valuation and Qualifying Accounts |
Other schedules have not been filed because the conditions requiring the filing do not exist or the required information is included in the consolidated financial statements, including the notes thereto.
|
32 |
Certifications pursuant to Section 906 of the Sarbanes-Oxley Act of 2002 (filed herewith) |
|
97 |
|
|
101.INS |
Inline XBRL Instance Document (filed herewith). |
|
101.1.SCH |
Inline XBRL Taxonomy Extension Calculation Schema Document (filed herewith) |
|
101.2.CAL |
Inline XBRL Taxonomy Extension Calculation Linkbase Document (filed herewith) |
|
101.3.DEF |
Inline XBRL Taxonomy Extension Definition Linkbase Document (filed herewith) |
|
101.4.LAB |
Inline XBRL Taxonomy Extension Label Linkbase Document (filed herewith) |
|
101.5.PRE |
Inline XBRL Taxonomy Extension Presentation Linkbase Document (filed herewith) |
|
104 |
Cover page Interactive Data File (formatted as inline XBRL with applicable taxonomy extension information contained in Exhibits 101.*) (filed herewith) |
* Indicates management or compensatory agreement
Item 16. Form 10-K Summary Pursuant to the requirements of Section 13 or 15 (d) of the Exchange Act, the registrant has duly caused this report to be signed on its behalf by the undersigned, thereunto duly authorized.
None
SENECA FOODS CORPORATION
|
By: |
/s/ Michael S. Wolcott |
Michael S. Wolcott
Senior Vice President, Chief Financial Officer and Treasurer
June 12, 2025
Pursuant to the requirements of the Exchange Act, this report has been signed below by the following persons on behalf of the registrant and in the capacities and on the dates indicated:
|
Signature |
Title |
Date |
||
|
/s/ Paul L. Palmby |
President and Chief Executive Officer |
June 12, 2025 |
||
|
Paul L. Palmby |
Director |
|||
|
(Principal Executive Officer) |
||||
|
/s/ Michael S. Wolcott |
Senior Vice President, Chief Financial Officer, |
June 12, 2025 |
||
|
Michael S. Wolcott |
and Treasurer |
|||
|
(Principal Financial Officer) |
||||
|
/s/ Gregory R. Ide |
Vice President, Controller, |
June 12, 2025 |
||
|
Gregory R. Ide |
and Assistant Secretary |
|||
|
(Principal Accounting Officer) |
||||
|
/s/ Kraig H. Kayser |
Director (Chairman) |
June 12, 2025 |
||
|
Kraig H. Kayser |
||||
|
/s/ Kathryn J. Boor |
Director |
June 12, 2025 |
||
|
Kathryn J. Boor |
||||
|
/s/ Peter R. Call |
Director |
June 12, 2025 |
||
|
Peter R. Call |
||||
|
/s/ John P. Gaylord |
Director |
June 12, 2025 |
||
|
John P. Gaylord |
||||
|
/s/ Linda K. Nelson |
Director |
June 12, 2025 |
||
|
Linda K. Nelson |
||||
|
/s/ Donald J. Stuart |
Director |
June 12, 2025 |
||
|
Donald J. Stuart |
||||
|
/s/ Bruce E. Ware |
Director |
June 12, 2025 |
||
|
Bruce E. Ware |
||||
|
/s/ Keith A. Woodward |
Director |
June 12, 2025 |
||
|
Keith A. Woodward |
Exhibit 13
Management’s Discussion and Analysis of Financial Condition and Results of Operations
Our Business
Seneca is a leading provider of packaged fruits and vegetables, with facilities located throughout the United States. Its high quality products are primarily sourced from more than 1,100 American farms. The Company’s product offerings include canned, frozen and jarred produce, and snack chips. Its products are sold under private label as well as national and regional brands that the Company owns or licenses, including Seneca®, Libby’s®, Green Giant®, Aunt Nellie’s®, CherryMan®, Green Valley® and READ®. The Company’s fruits and vegetables are sold nationwide by major grocery outlets, including supermarkets, mass merchandisers, limited assortment stores, club stores and dollar stores. The Company also sells its products to foodservice distributors, restaurant chains, industrial markets, other food processors, export customers in approximately 55 countries and federal, state and local governments for school and other food programs. Additionally, the Company packs canned and frozen vegetables under contract packing agreements.
The Company’s business strategies are designed to grow its market share and enhance sales and margins. These strategies include: 1) expand the Company’s leadership in the packaged fruit and vegetable industry; 2) provide low cost, high quality fruit and vegetable products to consumers through the elimination of costs from the Company’s supply chain and investment in state-of-the-art production and logistical technology; 3) focus on growth opportunities to capitalize on higher expected returns; and 4) pursue strategic acquisitions that leverage the Company’s core competencies.
All references to years are fiscal years ended March 31 unless otherwise indicated.
Fluctuations in Commodity, Production, Distribution and Labor Costs
We purchase raw materials, including raw produce, steel, ingredients and packaging materials from growers, commodity processors, steel producers and packaging suppliers. Raw materials and other input costs, such as labor, fuel, utilities and transportation, are subject to fluctuations in price attributable to a number of factors. Fluctuations in commodity prices can lead to retail price volatility and can influence consumer and trade buying patterns. The cost of raw materials, fuel, labor, distribution and other costs related to our operations can increase from time to time significantly and unexpectedly, the impact of which could increase our cost of products sold and reduce our profitability.
We experienced material cost increases to various production inputs during the last several years due to a number of factors, including but not limited to, supply chain disruptions, steel supply and pricing, raw material shortages, labor shortages, and the conflict between Russia and Ukraine. While we have no direct exposure to this foreign conflict, it had a negative impact on the global economy which increased certain of our input costs. While some of the factors mentioned above have started to ease and stabilize during fiscal year 2025, our costs remain elevated as compared to historical levels.
We attempt to manage costs by locking in prices through short-term supply contracts, advance grower purchase agreements, and by implementing cost saving measures. We also attempt to offset rising input costs by raising sales prices to our customers. However, increases in the prices we charge our customers may lag behind rising input costs. Competitive pressures and pricing methodologies employed in the various sales channels in which we compete may also limit our ability to raise prices in response to rising costs. To the extent we are unable to avoid or offset any present or future cost increases, our operating results could be materially adversely affected.
Results of Operations - Fiscal Year 2025 versus Fiscal Year 2024
The following discussion is a comparison between fiscal year 2025 and fiscal year 2024 results. For a discussion of the Company’s results of operations for the year ended March 31, 2024 compared to the year ended March 31, 2023, please refer to the information under the section “Management’s Discussion and Analysis of Financial Condition and Results of Operations” in the Company’s Annual Report on Form 10-K for the fiscal year ended March 31, 2024, which was filed with the Securities and Exchange Commission (“SEC”) on June 13, 2024.
Net Sales:
The following table presents net sales by product category (in thousands):
|
Fiscal Year: |
||||||||
|
2025 |
2024 |
|||||||
|
Canned vegetables |
$ | 1,314,315 | $ | 1,204,823 | ||||
|
Frozen vegetables |
124,714 | 120,795 | ||||||
|
Fruit products |
92,378 | 87,435 | ||||||
|
Snack products |
14,995 | 13,400 | ||||||
|
Other |
32,485 | 32,150 | ||||||
| $ | 1,578,887 | $ | 1,458,603 | |||||
Net sales for fiscal year 2025 totaled $1,578.9 million as compared to $1,458.6 million for fiscal year 2024. The overall net sales increase of $120.3 million, or 8.2%, was due to higher sales volumes contributing $85.5 million to net sales, complemented by higher selling prices and favorable mix, which provided favorability of $34.8 million, as compared to the prior fiscal year.
Net sales of canned vegetables, frozen vegetables, and fruit products increased over the prior fiscal year as volume in each of these product categories was higher. Elevated pricing necessitated by the material cost increases experienced by the Company also contributed to an increase in net sales for these product categories.
Net sales of snack products increased as compared to the prior fiscal year primarily driven by increased volume.
Operating Income:
The following table sets forth the percentages of net sales represented by selected items for fiscal year 2025 and fiscal year 2024 reflected in our Consolidated Statements of Net Earnings (percentages shown as absolute values):
|
Fiscal Year: |
||||||||
|
2025 |
2024 |
|||||||
|
Gross margin |
9.5 | % | 12.9 | % | ||||
|
Selling, general, and administrative expense |
4.8 | % | 5.6 | % | ||||
|
Other operating income, net |
0.2 | % | 0.0 | % | ||||
|
Operating income |
4.9 | % | 7.4 | % | ||||
|
Interest expense, net |
2.1 | % | 2.3 | % | ||||
|
Other non-operating income |
0.6 | % | 0.7 | % | ||||
|
Income taxes |
0.8 | % | 1.3 | % | ||||
Gross Margin – Gross margin is equal to net sales less cost of products sold. As a percentage of net sales, gross margin was 9.5% for fiscal year 2025 as compared to 12.9% for fiscal year 2024. The decrease in gross margin for fiscal year 2025 was primarily driven by continued elevated costs, which outpaced the increase in net sales as compared to fiscal year 2024. Finished goods sold by the Company during fiscal year 2025 primarily consisted of products produced during either the preceding year or current year seasonal packs; both of which have a higher cost on a per unit basis as compared to previous fiscal years. Refer to the material cash requirements section below for additional discussion of the factors impacting the respective seasonal pack. Additionally, the Company recorded a LIFO charge of $34.5 million in fiscal year 2025 versus a LIFO charge of $22.3 million in fiscal year 2024, which equated to a year-over-year unfavorable impact to gross margin of $12.2 million.
Selling, General and Administrative Expense – Selling, general and administrative expense for fiscal year 2025 decreased $5.8 million from fiscal year 2024. Selling, general and administrative expense was 4.8% of net sales in fiscal year 2025 and 5.6% of net sales in fiscal year 2024. The decrease in selling, general, and administrative expense as a percentage of net sales was mainly due to the increase in net sales during fiscal year 2025 and the fixed nature of certain expenses.
Other Operating Income, net – The Company had net other operating income of $3.0 million in fiscal year 2025, primarily driven by gains of $4.1 million on the sale of land in the Midwest, which was offset by $1.0 million for the disposal of various spare equipment.
The Company had net other operating income of $0.2 million in fiscal year 2024, which was driven primarily by gains on the sale of non-operational assets in the Pacific Northwest, partially offset by transition service fees incurred in connection with an asset acquisition. Refer to Note 15 of the Notes to Consolidated Financial Statements for further details of that transaction.
Non-Operating Income (Expense):
Interest Expense, Net – Interest expense as a percentage of net sales was 2.1% for fiscal year 2025 as compared to 2.3% for fiscal year 2024. Interest expense decreased slightly from $34.0 million in the prior fiscal year to $33.2 million for fiscal year 2025 as a result of lower average borrowings outstanding under the Company’s revolving credit facility in fiscal year 2025 as compared to fiscal year 2024.
Other Non-Operating Income – Other non-operating income totaled $10.0 million and $9.8 million in fiscal years 2025 and 2024, respectively, and is comprised mainly of the non-service related pension amounts that are actuarially determined. The non-service related pension amounts can either be income or expense depending on the results of the actuarial calculations. For details of the calculation of the pension amounts, refer to Note 9 of the Notes to Consolidated Financial Statements. Other non-operating income also includes the patronage distribution associated with the Company’s term loans. The patronage distribution varies each year and there is no guarantee that an amount will be received by the Company; for further details refer to Note 6 of the Notes to Consolidated Financial Statements.
Income Taxes – As a result of the aforementioned factors, pre-tax earnings decreased from $83.0 million in fiscal year 2024 to $54.5 million in fiscal year 2025. Income tax expense totaled $13.3 million and $19.7 million in fiscal years 2025 and 2024, respectively. The Company’s effective tax rate was 24.3% and 23.7% in fiscal years 2025 and 2024, respectively. The main drivers of the increase to the effective tax rate in fiscal year 2025 as compared to fiscal year 2024 resulted from changes in the valuation allowance, state return to accrual adjustments, expirations and other adjustments of state tax credits, and differences in the overall permanent tax adjustments. For additional details of the calculation of the effective tax rate, refer to Note 8 of the Notes to Consolidated Financial Statements.
Earnings per Share:
|
Fiscal Year: |
||||||||
|
2025 |
2024 |
|||||||
|
Basic earnings per common share |
$ | 5.95 | $ | 8.64 | ||||
|
Diluted earnings per common share |
$ | 5.90 | $ | 8.56 | ||||
For details of the calculation of these amounts, refer to Note 3 of the Notes to Consolidated Financial Statements.
Liquidity and Capital Resources:
Material Cash Requirements – The Company’s primary liquidity requirements include debt service, capital expenditures and working capital needs. The Company may also seek strategic acquisitions to leverage existing capabilities and further build upon its existing business. Liquidity requirements are funded primarily through cash generated from operations and external sources of financing, including the revolving credit facility.
During the preceding fiscal years, working capital needs trended higher than previously experienced by the Company in part because of larger annual pack sizes needed to replenish the Company’s post-pandemic inventory levels to meet customer demand, and because of supply chain challenges and inflationary pressure in the steel industry which impacted can manufacturing operations. To successfully navigate the uncertainty driven by inflation and import tariffs, and a desire to diversify its steel supply, the Company employed a strategic approach during those fiscal years and increased steel coil purchases to better position itself for subsequent years. The higher cost of steel coil raw materials translated into an elevated container cost and ultimately resulted in an increased cost per unit for the associated finished good product. Working capital was likewise unfavorably impacted during the preceding fiscal years as the Company experienced material cost increases implemented by suppliers affecting various other production inputs aside from steel. These economic conditions contributed to higher cash outflows and an increased cost per unit for the associated finished good product.
From the standpoint of available inventory, the Company’s larger seasonal pack sizes in fiscal year 2024 driven by favorable growing conditions, coupled with lower sales, resulted in higher inventory levels for finished goods as of March 31, 2024. These higher inventory levels provided the Company with additional availability of products leading into fiscal year 2025, resulting in a lower planned seasonal pack and the opportunity to normalize working capital trends, specifically surrounding inventory.
During fiscal year 2025, the Company has experienced an easing of working capital needs driven by the factors previously mentioned. However, adverse weather conditions during the planting and harvesting seasons had a notable impact, especially in the upper Midwest where the Company has its primary growing region. Challenging growing conditions and reduced crop yields resulted in a seasonal pack that was lower than originally planned. This in turn has resulted in a higher-cost seasonal pack on a per unit basis for fiscal year 2025; however, the overall costs from a cash requirements perspective are favorable as compared to the preceding fiscal years.
The Company believes that its operations along with existing liquidity sources will satisfy its cash requirements for at least the next twelve months. This includes the Company’s expectation with respect to Term Loan A-1 that matures on June 1, 2025, that it will maintain or have access to sufficient liquidity to retire or refinance long-term debt at maturity or otherwise, primarily using cash on hand, as well as access to the capital markets, and its revolving credit facility. The Company has borrowed funds and continues to believe that it has the ability to do so at reasonable interest rates; however additional borrowings would result in increased interest expense. The Company does not have any off-balance sheet financing arrangements.
Summary of Cash Flows – The following table presents a summary of the Company’s cash flows from operating, investing, and financing activities (in thousands):
|
Fiscal Year: |
||||||||
|
2025 |
2024 |
|||||||
|
Cash provided by (used in) operating activities |
$ | 335,475 | $ | (82,963 | ) | |||
|
Cash used in investing activities |
(34,814 | ) | (47,202 | ) | ||||
|
Cash (used in) provided by financing activities |
(262,124 | ) | 129,762 | |||||
|
Net increase (decrease) in cash, cash equivalents and restricted cash |
38,537 | (403 | ) | |||||
|
Cash, cash equivalents and restricted cash, beginning of period |
11,853 | 12,256 | ||||||
|
Cash, cash equivalents and restricted cash, end of period |
$ | 50,390 | $ | 11,853 | ||||
Net Cash Provided by (Used in) Operating Activities – For fiscal year 2025, cash provided by operating activities was $335.5 million, which consisted of $208.1 million from changes in operating assets and liabilities, coupled with net earnings of $41.2 million and non-cash charges of $86.2 million. The non-cash charges were largely driven by $44.8 million of depreciation and amortization, $5.0 million of non-cash lease expense, and a $34.5 million LIFO charge. The change in operating assets and liabilities was favorably impacted by improved working capital needs during the current fiscal year. The Company experienced a lower utilization of cash for inventories resulting from the higher inventory levels carried into the current fiscal year along with a reduced fiscal year 2025 seasonal pack due to adverse weather conditions. This is consistent with the factors discussed above within the material cash requirements section.
For fiscal year 2024, cash used in operating activities was $83.0 million, which consisted of a use of cash of $215.1 million by operating assets and liabilities partially offset by net earnings of $63.3 million, adjusted by non-cash charges of $68.8 million. The non-cash charges were largely driven by $43.5 million of depreciation and amortization, $7.3 million of non-cash lease expense, and a $22.3 million LIFO charge. The change in operating assets and liabilities was largely due to inventories being a use of cash driven by higher finished goods inventory levels and by the material cost inflation to various production inputs. The increase in inventories was also impacted by finished goods acquired in the asset acquisition. Refer to Note 15 of the Notes to Consolidated Financial Statements for further details of that transaction.
The cash requirements of the business fluctuate significantly throughout the year to coincide with the seasonal growing cycles of vegetables. The majority of the inventories are produced during the packing months, from June through November, and are then sold over the following twelve months. Cash flow from operating activities is one of the Company’s main sources of liquidity, excluding usual seasonal working capital swings.
Net Cash Used in Investing Activities – Net cash used in investing activities was $34.8 million for fiscal year 2025 and consisted of cash used for capital expenditures of $37.2 million and $2.7 million paid as deposits to vendors for the installation of a new can manufacturing line. Partially offsetting those amounts, the Company received proceeds from the sale of assets totaling $5.1 million.
Net cash used in investing activities was $47.2 million for fiscal year 2024 and consisted of cash used for capital expenditures of $36.6 million and $18.7 million paid as deposits to vendors for the installation of a new can manufacturing line. Offsetting those amounts, the Company received proceeds from the sale of assets totaling $8.1 million.
Net Cash (Used in) Provided by Financing Activities – Net cash used in financing activities was $262.1 million for fiscal year 2025, driven primarily by a net paydown on the Company’s revolving credit facility of $236.2 million. The Company paid $1.6 million of costs in connection with the refinancing of its revolving credit facility. The Company also made payments totaling $20.3 million on its term loans and finance obligation during fiscal year 2025. Partially offsetting the outflows was a $12.4 million increase in note payable borrowings associated with the Company’s new can manufacturing line which was converted to a finance obligation during the current fiscal year. Additionally, the Company used cash of $11.6 million to purchase treasury stock and made payments of $4.8 million on finance leases.
Net cash provided by financing activities was $129.8 million for fiscal year 2024, driven primarily by a net $114.2 million increase on the Company’s term loan and note payable, as well as an increase in net borrowings on the Company’s revolving credit facility of $56.6 million during fiscal year 2024. Cash used to purchase treasury stock of $33.0 million and to make payments on finance leases of $8.0 million partially offset the cash provided by financing activities.
Debt – The Company’s primary cash requirements are to make payments on the Company’s debt, finance seasonal working capital needs and to fund capital expenditures. Internally generated funds and amounts available under the revolving credit facility are the Company’s primary sources of liquidity, although the Company believes it has the ability to raise additional capital, if it desires.
Note Payable and Finance Obligation – During fiscal year 2024, the Company entered into an unsecured note payable with an individual lender for an interim financing arrangement associated with deposits paid to vendors for the installation of a new can manufacturing line located at one of the Company’s plant facilities. The note payable had a variable interest rate based upon the Secured Overnight Financing Rate (“SOFR”) plus 1.80% with interest payable monthly.
During fiscal year 2025, subsequent to the final installation of the can manufacturing line in September 2024, the Company took title and recorded an addition to property, plant and equipment of $21.3 million and a corresponding reduction of the vendor deposits which were recorded within other assets on the Consolidated Balance Sheet. After taking title to the equipment, the Company and the lender entered into a financing agreement for the can manufacturing line which commenced in September 2024 and is recorded as a finance obligation on the accompanying Consolidated Balance Sheets. In connection with this transaction, the note payable was cancelled. The finance obligation has a maturity date of September 14, 2031 and a monthly payment of $0.3 million which is comprised of principal and interest at a fixed rate of 5.56%.
Future minimum payments under the finance obligation are as follows (in thousands):
|
Fiscal years ending March 31: |
||||
|
2026 |
$ | 3,684 | ||
|
2027 |
3,684 | |||
|
2028 |
3,684 | |||
|
2029 |
3,684 | |||
|
2030 |
3,684 | |||
|
Thereafter |
5,524 | |||
|
Total minimum payment required |
23,944 | |||
|
Less interest |
3,888 | |||
|
Total finance obligation |
20,056 | |||
|
Amount due within one year |
2,635 | |||
|
Finance obligation, less current portion |
$ | 17,421 |
Revolving Credit Facility – On December 23, 2024, the Company entered into a Loan and Security Agreement (the “Agreement”), with Wells Fargo Bank, National Association as agent for the various lenders of a senior revolving credit facility of up to $450.0 million that is seasonally adjusted to a maximum of $400.0 million during the months of April through July (the “Revolver”).
The Agreement refinanced and replaced in its entirety the Fourth Amended and Restated Loan and Security Agreement dated as of March 24, 2021, as amended from time to time, with Bank of America, N.A. as agent, issuing bank, and syndication agent, and BofA Securities, Inc. as lead arranger (the “2021 Agreement”). The Agreement maintains many of the key characteristics of the 2021 Agreement including the variable interest rate based on SOFR plus an applicable margin, type of collateral, borrowing base requirements and financial covenant calculation, if applicable.
The Revolver is secured by substantially all of the Company’s accounts receivable and inventories and contains borrowing base requirements as well as a financial covenant, if certain circumstances apply. The Company utilizes its Revolver for general corporate purposes, including seasonal working capital needs, to pay debt principal and interest obligations, and to fund capital expenditures and acquisitions. Seasonal working capital needs are affected by the growing cycles of the vegetables the Company packages. The majority of vegetable inventories are produced during the months of June through November and are then sold over the following twelve months. Payment terms for vegetable produce are generally three months but may vary and range from approximately one to seven months. Therefore, the Company’s need to draw on the Revolver may fluctuate significantly throughout the year.
The interest rate benchmark for borrowings under the Revolver is based upon SOFR plus an applicable margin, as defined in the Agreement. In order to maintain availability of funds under the revolving credit facility, the Company pays a commitment fee on the unused portion of the Revolver. As of March 31, 2025, the unused portion of the Revolver was $442.0 million. The Revolver has a five-year term and matures on December 24, 2029. Accordingly, the Revolver balance is included in Long-Term Debt on the accompanying Consolidated Balance Sheets.
In connection with the Revolver refinance, certain lenders exited the syndicate and were replaced by new syndicate members. The portion of the transaction in which certain lenders exited was accounted for as an extinguishment resulting in the write-off of an immaterial amount of unamortized deferred costs. The portion of the transaction comprised of lenders that remained in the syndicate was accounted for as a modification, resulting in the Company continuing to defer the remaining unamortized costs over the term of the Revolver. Additionally, the Company incurred $1.6 million of new debt issuance costs which will be deferred over the term of the Revolver and amortized on a straight-line basis. On the closing date, a repayment of $70.0 million was made to satisfy the outstanding revolving credit facility obligations immediately prior to the refinance transaction, and a corresponding Revolver borrowing of the same amount was drawn to fund the payment. The Consolidated Statement of Cash Flows reflects the payment of debt issuance costs and the gross repayment and borrowing amounts for the Revolver within financing activities.
The following table summarizes certain quantitative data for Revolver borrowings during fiscal year 2025 and fiscal year 2024 (in thousands, except for percentages):
|
As of: |
||||||||
|
March 31, |
March 31, |
|||||||
|
2025 |
2024 |
|||||||
|
Outstanding borrowings |
$ | 1,000 | $ | 237,225 | ||||
|
Interest rate |
5.83 | % | 6.93 | % | ||||
|
Fiscal Year: |
||||||||
|
2025 |
2024 |
|||||||
|
Maximum amount of borrowings drawn during the period |
$ | 233,063 | $ | 290,968 | ||||
|
Average outstanding borrowings |
$ | 124,606 | $ | 162,780 | ||||
|
Weighted average interest rate |
6.86 | % | 6.78 | % | ||||
Term Loans – On January 20, 2023, the Company entered into a Second Amended and Restated Loan and Guaranty Agreement with Farm Credit East, ACA (the “Term Loan Agreement”) which governs two term loans, as summarized below:
Term Loan A-1: The Term Loan Agreement provides for the continuation of a $100.0 million unsecured term loan with a maturity date of June 1, 2025 and fixed interest rate of 3.3012%. Quarterly principal payments are $1.0 million on Term Loan A-1. Upon maturity, the Company paid the Term Loan A-1 in full using available cash on hand.
Term Loan A-2: The Term Loan Agreement adds an additional term loan in the amount of $175.0 million that will mature on January 20, 2028, and is secured by a portion of the Company’s property, plant and equipment. Term Loan A-2 bears interest at a variable interest rate based upon SOFR plus an additional margin determined by the Company’s leverage ratio. Quarterly payments of principal outstanding on Term Loan A-2 in the amount of $1.5 million commenced on March 1, 2023. The Company’s historical practice is to hold term debt until maturity. The Company expects to maintain or have access to sufficient liquidity to retire or refinance long-term debt at maturity or otherwise, from operating cash flows, access to the capital markets, and its Revolver. The Company continuously evaluates opportunities to refinance its debt; however, any refinancing is subject to market conditions and other factors, including financing options that may be available to the Company from time to time, and there can be no assurance that the Company will be able to successfully refinance any debt on commercially acceptable terms at all.
On May 23, 2023, the Term Loan Agreement was amended by the Second Amended and Restated Loan and Guaranty Agreement Amendment which amends, restates and replaces in its entirety Term Loan A-2 (the “Amendment”). The Amendment provides a single advance term facility in the principal amount of $125.0 million to be combined with the outstanding principal balance of $173.5 million on Term Loan A-2 into one single $298.5 million term loan (“Amended Term Loan A-2”). Amended Loan Term A-2 is secured by a portion of the Company’s property, plant and equipment and bears interest at a variable interest rate based upon SOFR plus an additional margin determined by the Company’s leverage ratio. Quarterly payments of principal outstanding on Amended Term Loan A-2 in the amount of $3.75 million commenced on June 1, 2023. The Amendment continues all aspects of Term Loan A-1 as defined in the Term Loan Agreement. As of March 31, 2025, the interest rate on Amended Term Loan A-2 was 6.57%.
The Amendment for Term Loan A-1 and Term Loan A-2 (collectively, the “Term Loans”) contains restrictive covenants usual and customary for loans of its type, in addition to financial covenants including minimum EBITDA and minimum tangible net worth which apply to both Terms Loans described above. In connection with the Amended Term Loan A-2, the Company incurred $1.1 million of financing costs which will be deferred and amortized over the life of the term loan.
Debt repayment requirements in each of the five subsequent fiscal years are presented below (in thousands):
|
Fiscal years ending March 31: |
||||
|
2026 |
$ | 96,000 | ||
|
2027 |
15,000 | |||
|
2028 |
238,500 | |||
|
2029 |
- | |||
|
2030 |
1,000 | |||
|
Total |
$ | 350,500 |
The Company believes that its cash flows from operations, availability under its Revolver, and cash and cash equivalents on hand will provide adequate funds for the Company’s working capital needs, planned capital expenditures, operating and administrative expenses, and debt service obligations for at least the next twelve months and the foreseeable future.
Restrictive Covenants – The Company’s debt agreements, including the Revolver and Term Loans, contain customary affirmative and negative covenants that restrict, with specified exceptions, the Company’s ability to incur additional indebtedness, incur liens, pay dividends on the Company’s capital stock, make other restricted payments, including investments, transfer all or substantially all of the Company’s assets, enter into consolidations or mergers, and enter into transactions with affiliates. The Company’s debt agreements also require the Company to meet certain financial covenants including a minimum EBITDA and minimum tangible net worth. The Revolver contains borrowing base requirements related to accounts receivable and inventories and also requires the Company to meet a financial covenant related to a minimum fixed charge coverage ratio if (a) an event of default under the Agreement has occurred or (b) availability on the Revolver is less than the greater of (i) 10% of the commitments then in effect and (ii) $30.0 million. The most restrictive financial covenant in the debt agreements is the minimum EBITDA within the Term Loans which for fiscal year 2025 was greater than $75.0 million in EBITDA. The Company computes its financial covenants as if the Company were on the first-in, first out (“FIFO”) method of inventory accounting. The Company has met all such financial covenants as of March 31, 2025.
The Company's debt agreements limit the payment of dividends and other distributions, subject to availability under the Revolver. There is an annual total distribution limitation of $50,000, less aggregate annual dividend payments totaling $23,181 that the Company presently pays on two outstanding classes of preferred stock. See Note 10 of the Notes to Consolidated Financial Statements for additional information on the Company’s preferred stock.
Standby Letters of Credit – The Company has standby letters of credit for certain insurance-related requirements. The majority of the Company’s standby letters of credit are automatically renewed annually, unless the issuer gives cancellation notice in advance. On March 31, 2025, the Company had $7.0 million in outstanding standby letters of credit. These standby letters of credit are supported by the Company’s Revolver and reduce borrowings available under the Revolver.
Obligations and Commitments:
The Company is party to various contractual obligations involving commitments to make payments to third parties. These obligations impact the Company’s short-term and long-term liquidity and capital resource needs. Certain contractual obligations are reflected on the Consolidated Balance Sheet as of March 31, 2025, while others are considered future obligations. Contractual obligations primarily consist of operating leases, purchase obligations and commitments, principal payments on long-term debt and related interest payments, and income taxes. All of these arrangements require cash payments over varying periods of time. Certain of these arrangements are cancelable on short notice and others require additional payments as part of any early termination. See Notes 6 and 7 of the Notes to Consolidated Financial Statements for information related to the Company’s debt and leases, respectively.
Purchase obligations and commitments consist of open purchase orders to purchase raw materials, including raw produce, steel, ingredients and packaging materials, as well as commitments for products and services used in the normal course of business. The Company expects that the majority of these purchase obligations and commitments will be settled within one year.
The Company’s contractual obligations related to income taxes are primarily related to unrecognized tax benefits. See Note 8 of the Notes to Consolidated Financial Statements for information related to income taxes.
In the normal course of its business, the Company has posted a surety bond and a surety-backed letter of credit which serve as collateral for its workers’ compensation policy. The primary purpose of these instruments is to indemnify the beneficiary should the Company be unable to fulfill its obligations for claims asserted under the workers’ compensation policy. Both the surety bond and the surety-backed letter of credit are automatically renewed annually, unless the issuer gives cancellation notice in advance. As of March 31, 2025, the available undrawn amount of the surety bond and the surety-backed letter of credit was $4.0 million and $13.8 million, respectively. The Company is not aware of any outstanding claims made against either of these instruments.
The Company has no off-balance sheet debt or other unrecorded obligations other than the commitments noted above.
Impact of Seasonality on Financial Position and Results of Operations:
The Company’s production cycle begins with planting in the spring followed by harvesting and packaging during the second and third fiscal quarters with sales spanning over the following twelve months. Minimal food packaging occurs in the Company's last fiscal quarter ending March 31, which is the optimal time for maintenance, repairs and equipment changes in its packaging plants. The supply of commodities, current pricing, and expected new crop quantity and quality affect the timing and amount of the Company’s sales and earnings. When the seasonal harvesting periods of the Company's major vegetables are newly completed, inventories for these packaged vegetables are at their highest levels. For peas, the peak inventory time is mid-summer and for sweet corn and green beans, the Company's highest volume vegetables, the peak inventory is in mid-autumn. The seasonal nature of the Company’s production cycle results in inventory and accounts payable typically reaching their lowest point in mid-to-late first quarter prior to the new seasonal pack commencing. As the seasonal pack progresses, these components of working capital both increase until the pack is complete.
The Company’s fruit and vegetable sales exhibit seasonal increases in the third fiscal quarter due to increased retail demand during the holiday season. In addition, the Company sells canned and frozen vegetables to a co-pack customer on a bill and hold basis during the pack cycle, which typically occurs in the second and third quarters. Given the seasonal nature of the Company’s sales, the accounts receivable balance typically reaches its highest point at the end of the second fiscal quarter.
The following table shows quarterly information for selected financial statement items during fiscal years 2025 and 2024 to illustrate the Company’s seasonal business (in thousands):
|
First |
Second Quarter |
Third |
Fourth Quarter |
|||||||||||||
|
Fiscal Year 2025: |
||||||||||||||||
|
Net sales |
$ | 304,727 | $ | 425,465 | $ | 502,856 | $ | 345,839 | ||||||||
|
Gross margin |
42,691 | 42,871 | 49,110 | 15,529 | ||||||||||||
|
Net earnings |
12,661 | 13,303 | 14,659 | 601 | ||||||||||||
| Accounts receivable, net (at quarter end) | 96,448 | 108,533 | 70,829 | 96,330 | ||||||||||||
| Inventories (at quarter end) | 841,847 | 944,887 | 735,682 | 603,955 | ||||||||||||
| Accounts payable (at quarter end) | 62,460 | 213,015 | 70,791 | 43,580 | ||||||||||||
|
Revolver outstanding (at quarter end) |
209,189 | 146,421 | 42,196 | 1,000 | ||||||||||||
|
Fiscal Year 2024: |
||||||||||||||||
|
Net sales |
$ | 298,664 | $ | 407,475 | $ | 444,481 | $ | 307,983 | ||||||||
|
Gross margin |
55,289 | 58,118 | 54,033 | 20,778 | ||||||||||||
|
Net earnings (loss) |
23,111 | 24,779 | 17,675 | (2,247 | ) | |||||||||||
| Accounts receivable, net (at quarter end) | 84,964 | 128,380 | 89,928 | 79,767 | ||||||||||||
| Inventories (at quarter end) | 735,124 | 1,013,447 | 968,889 | 872,692 | ||||||||||||
| Accounts payable (at quarter end) | 117,700 | 321,579 | 125,182 | 40,326 | ||||||||||||
|
Revolver outstanding (at quarter end) |
52,064 | 134,757 | 258,108 | 237,225 | ||||||||||||
Critical Accounting Estimates:
In certain circumstances, the preparation of the Consolidated Financial Statements in conformity with generally accepted accounting principles in the United States (“GAAP”) requires management to use judgment to make certain estimates and assumptions. Critical accounting estimates are defined as those that involve a significant level of estimation uncertainty and have had, or are reasonably likely to have, a material impact on the financial condition or results of operations of the Company. These estimates affect the reported amounts of assets and liabilities and disclosures of contingent assets and liabilities at the date of the Consolidated Financial Statements and the reported amounts of net sales and expenses during the reporting period. Actual results may differ from these estimates.
Management believes the accounting estimates listed below are those that are most critical to the portrayal of the Company’s financial condition and results of operations, and that require management’s most difficult, subjective, or complex judgments in estimating the effect of inherent uncertainties. Refer to Note 1 of the Notes to Consolidated Financial Statements for a detailed discussion of significant accounting policies.
Trade Promotion Expenses – The Company records both direct and estimated reductions to sales for trade promotions at the time of sale of the respective product. For estimated reductions, the Company maintains an accrual for customer promotional programs, in-store display incentives, and other sales and marketing expenses. This accrual requires management judgment regarding the volume of promotional offers that will be redeemed by the customer and is based on a combination of historical data on performance of similar programs and specific customer program activity. The amounts are subject to fluctuation due to the level of sales and marketing programs, and timing of deductions. Accrued trade promotions were $7.0 million and $10.0 million as of March 31, 2025 and 2024, respectively, and are included in other accrued expenses on the Consolidated Balance Sheets.
Inventories – The Company uses the lower of cost, determined under the last-in, first-out (“LIFO”) method, or market, to value substantially all of its inventories. In the high inflation environment that the Company has been experiencing, the Company believes that the LIFO method is preferable over the first-in, first-out (“FIFO”) method because it better matches the cost of current production to current revenue. An actual valuation of inventory under the LIFO method is made at the end of each fiscal year based on the inventory levels and costs at that time.
Pension Expense – The Company has a defined benefit plan (the “Plan”) which is subject to certain economic and demographic assumptions. The funded status of the Plan is dependent upon key assumptions, including the discount rate, mortality, and the rate of increase in compensation levels. Additionally, the Plan’s funded status is dependent on other factors such as the actual return on plan assets. Certain assumptions reflect the Company's historical experience and management’s best judgment regarding future expectations. Management reviews these assumptions at least annually and uses independent actuaries to assist in formulating assumptions and making estimates.
The discount rate used is determined in conjunction with the Company’s actuary by reference to a current yield curve and by considering the timing and amount of projected future benefit payments. The expected return on plan assets is determined by evaluating the mix of investments that comprise the asset portfolio and external forecasts of future long-term investment returns, along with input from independent pension consultants. With respect to the mortality assumption, the Society of Actuaries’ published mortality tables and projection scales are used in developing the estimates of mortality. Assumptions for increases in the rate of compensation are based on management estimates, which incorporate historical experience and overall compensation trends in the current business environment.
The Plan’s funded status increased $23.3 million during fiscal year 2025 reflecting the actual fair value of plan assets and the projected benefit obligation as of March 31, 2025. This funded status increase was primarily driven by a $19.1 million reduction to the projected benefit obligation, as described in more detail below, and a $4.2 million increase in the fair value of plan assets.
During fiscal year 2025, the actuarial gain in the Plan’s projected benefit obligation was driven by an increase in discount rates and changes in demographic assumptions to better reflect future plan experience, partially offset by the reflection of an assumed salary increase rate for fiscal year 2026 in excess of the long-term rate. Additionally, the Company completed a lump-sum payout during fiscal year 2025 to certain terminated vested Plan participants which resulted in payments of $10.2 million. During fiscal year 2024, the actuarial gain in the Plan’s projected benefit obligation was driven by an increase in discount rates, partially offset by the annual update in plan census data resulting in losses and the reflection of an assumed salary increase rate for fiscal year 2025 in excess of the long-term rate. Plan assets increased from $288.9 million as of March 31, 2024 to $293.1 million as of March 31, 2025 primarily due to favorable return on plan assets which outpaced payments of benefits.
The Plan was amended to freeze accruals to new hires and rehires effective January 1, 2020. Refer to Note 9 of the Notes to Consolidated Financial Statements for the full defined benefit plan disclosures.
Non-GAAP Financial Measures:
Adjusted net earnings, EBITDA, and FIFO EBITDA are non-GAAP financial measures and are provided for informational purposes only. The Company believes these non-GAAP financial measures provide investors with helpful information to evaluate financial performance, perform comparisons from period to period, and compare results against the Company’s industry peers. A non-GAAP financial measure is defined as a numerical measure of the Company’s financial performance that excludes or includes amounts so as to be different from the most directly comparable measure calculated and presented in accordance with GAAP in the Consolidated Balance Sheets and related Consolidated Statements of Net Earnings, Comprehensive Income, Stockholders’ Equity and Cash Flows. The Company does not intend for this information to be considered in isolation or as a substitute for other measures prepared in accordance with GAAP.
Adjusted net earnings are calculated on a FIFO basis which excludes the impact from the application of LIFO. Set forth below is a reconciliation of reported net earnings before income taxes to adjusted net earnings (in thousands):
|
Fiscal Year: |
||||||||
|
2025 |
2024 |
|||||||
|
Earnings before income taxes, as reported |
$ | 54,483 | $ | 82,999 | ||||
|
LIFO charge |
34,474 | 22,342 | ||||||
|
Adjusted earnings before income taxes |
88,957 | 105,341 | ||||||
|
Income taxes (1) |
21,843 | 25,177 | ||||||
|
Adjusted net earnings |
$ | 67,114 | $ | 80,164 | ||||
|
(1) |
For fiscal years 2025 and 2024, income taxes on adjusted earnings before income taxes were calculated using the income tax provision amounts of $13.3 million and $19.7 million, respectively, and applying the statutory rates of 24.9% and 24.6%, respectively, for each of the respective periods to the pre-tax LIFO charge. |
The Company believes EBITDA is often a useful measure of a Company’s operating performance because EBITDA excludes charges for depreciation, amortization, non-cash lease expense, and interest expense as well as the Company’s provision for income tax expense. EBITDA is frequently used as one of the bases for comparing businesses in the Company’s industry. FIFO EBITDA also excludes non-cash charges related to the LIFO inventory valuation method. The Company’s revolving credit facility and term loan agreements use FIFO EBITDA in the financial covenants thereunder.
Set forth below is a reconciliation of reported net earnings to EBITDA and FIFO EBITDA (in thousands):
|
Fiscal Year: |
||||||||
|
2025 |
2024 |
|||||||
|
Net earnings |
$ | 41,224 | $ | 63,318 | ||||
|
Income taxes |
13,259 | 19,681 | ||||||
|
Interest expense, net of interest income |
33,245 | 34,020 | ||||||
|
Depreciation and amortization (1) |
49,795 | 50,729 | ||||||
|
Interest amortization (2) |
(565 | ) | (447 | ) | ||||
|
EBITDA |
136,958 | 167,301 | ||||||
|
LIFO charge |
34,474 | 22,342 | ||||||
|
FIFO EBITDA |
$ | 171,432 | $ | 189,643 | ||||
|
(1) |
Includes non-cash lease expense consistent with financial covenant calculations. |
|
(2) |
Reconciling item needed to exclude debt issuance cost amortization from the amount shown for interest expense. |
Recent Accounting Pronouncements:
The Company evaluates recent accounting pronouncements to determine the potential impact they may have on the consolidated financial statements. Refer to Note 1 of the Notes to Consolidated Financial Statements for additional information and discussion about recently adopted accounting pronouncements and recently issued accounting pronouncements not yet adopted.
QUANTITATIVE AND QUALITATIVE DISCLOSURES ABOUT MARKET RISK
Interest Rate Risk
Our exposure to market risk for changes in interest rates relates primarily to the amount of interest expense we expect to pay with respect to our Revolver and Amended Term Loan A-2 (collectively, “Variable Rate Debt”), which are tied to the variable market rate SOFR. Interest rates on the remainder of our long-term debt, including Amended Term Loan A-1 and the finance obligation, are fixed and not subject to interest rate volatility. The Company uses its Variable Rate Debt for general corporate purposes, including seasonal working capital needs, to pay debt principal and interest obligations, and to fund capital expenditures and acquisitions. With $401.2 million in average Variable Rate Debt during fiscal year 2025, a hypothetical 1% change in interest rates would have had a $4.0 million impact on interest expense.
Commodity Risk
The materials that the Company uses, such as vegetables, fruits, steel, ingredients, and packaging materials, as well as the electricity and natural gas used in the Company’s business are commodities that may experience price volatility caused by external factors including but not limited to, market fluctuations, availability, weather, currency fluctuations, and changes in governmental regulations and agricultural programs. These events may result in reduced supplies of these materials, higher supply costs, or interruptions in the Company’s production schedules. If prices of these raw materials increase and the Company is not able to effectively pass such price increases along to its customers, operating income will decrease.
The principal effect of inflation in both commodity and consumer prices on the Company’s operating results is to increase costs, both for products sold and selling, general and administrative expenses. Although the Company may attempt to offset these cost increases by increasing selling prices for its products, consumers may not have the buying power to cover these increased costs and may reduce their volume of purchases of those products. In that event, selling price increases may not be sufficient to completely offset the Company’s cost increases.
The Company does not currently hedge or otherwise use derivative instruments to manage interest rate or commodity risks.
Consolidated Statements of Net Earnings
Seneca Foods Corporation
(In thousands, except per share amounts)
|
Fiscal Year: |
||||||||||||
|
2025 |
2024 |
2023 |
||||||||||
|
Net sales |
$ | 1,578,887 | $ | 1,458,603 | $ | 1,509,352 | ||||||
|
Costs and expenses: |
||||||||||||
|
Cost of products sold |
1,428,686 | 1,270,385 | 1,405,033 | |||||||||
|
Selling, general, and administrative expense |
75,459 | 81,209 | 81,072 | |||||||||
|
Other operating (income) expense, net |
(3,028 | ) | (222 | ) | 1,888 | |||||||
|
Total costs and expenses |
1,501,117 | 1,351,372 | 1,487,993 | |||||||||
|
Operating income |
77,770 | 107,231 | 21,359 | |||||||||
|
Other income and expenses: |
||||||||||||
|
Interest expense, net of interest income of $967, $699 and $528, respectively |
33,245 | 34,020 | 14,325 | |||||||||
|
Other non-operating income |
(9,958 | ) | (9,788 | ) | (6,759 | ) | ||||||
|
Earnings before income taxes |
54,483 | 82,999 | 13,793 | |||||||||
|
Income taxes |
13,259 | 19,681 | 4,562 | |||||||||
|
Net earnings |
$ | 41,224 | $ | 63,318 | $ | 9,231 | ||||||
|
Earnings per share: |
||||||||||||
|
Basic |
$ | 5.95 | $ | 8.64 | $ | 1.19 | ||||||
|
Diluted |
$ | 5.90 | $ | 8.56 | $ | 1.16 | ||||||
|
Weighted average common shares outstanding: |
||||||||||||
|
Basic |
6,912 | 7,318 | 7,796 | |||||||||
|
Diluted |
6,979 | 7,385 | 7,863 | |||||||||
See Notes to Consolidated Financial Statements.
Consolidated Statements of Comprehensive Income
Seneca Foods Corporation
(In thousands)
|
Fiscal Year: |
||||||||||||
|
2025 |
2024 |
2023 |
||||||||||
|
Comprehensive income: |
||||||||||||
|
Net earnings |
$ | 41,224 | $ | 63,318 | $ | 9,231 | ||||||
|
Change in pension and postretirement benefits, net of tax expense (benefit) of $5,772, ($1,628) and $1,999, respectively |
17,544 | (4,892 | ) | 5,980 | ||||||||
|
Total |
$ | 58,768 | $ | 58,426 | $ | 15,211 | ||||||
See Notes to Consolidated Financial Statements.
Consolidated Balance Sheets
Seneca Foods Corporation
(In thousands)
|
As of: |
||||||||
|
March 31, |
March 31, |
|||||||
|
Assets |
||||||||
|
Current assets: |
||||||||
|
Cash and cash equivalents |
$ | 42,685 | $ | 4,483 | ||||
|
Restricted cash |
7,705 | 7,370 | ||||||
|
Accounts receivable, net of allowance for credit losses of $71 and $53, respectively |
96,330 | 79,767 | ||||||
|
Inventories |
603,955 | 872,692 | ||||||
|
Refundable income taxes |
672 | - | ||||||
|
Other current assets |
4,307 | 2,703 | ||||||
|
Total current assets |
755,654 | 967,015 | ||||||
|
Property, plant and equipment, net |
324,768 | 305,016 | ||||||
|
Right-of-use assets operating, net |
10,004 | 19,705 | ||||||
|
Right-of-use assets finance, net |
13,224 | 20,386 | ||||||
|
Pension assets |
75,733 | 52,442 | ||||||
|
Other assets |
2,046 | 19,433 | ||||||
|
Total assets |
$ | 1,181,429 | $ | 1,383,997 | ||||
|
Liabilities and Stockholders' Equity |
||||||||
|
Current liabilities: |
||||||||
|
Accounts payable |
$ | 43,580 | $ | 40,326 | ||||
|
Note payable |
- | 8,926 | ||||||
|
Deferred revenue |
11,140 | 8,185 | ||||||
|
Accrued vacation |
12,942 | 11,632 | ||||||
|
Accrued payroll |
10,926 | 15,845 | ||||||
|
Income taxes payable |
1,686 | 2,648 | ||||||
|
Other accrued expenses |
28,592 | 33,383 | ||||||
|
Current portion of long-term debt, finance and lease obligations |
105,692 | 30,090 | ||||||
|
Total current liabilities |
214,558 | 151,035 | ||||||
|
Long-term debt |
253,822 | 585,786 | ||||||
|
Operating lease obligations |
6,924 | 13,758 | ||||||
|
Finance lease obligations |
8,377 | 12,259 | ||||||
|
Finance obligation |
17,421 | - | ||||||
|
Deferred income tax liability, net |
32,282 | 24,320 | ||||||
|
Other liabilities |
15,022 | 13,946 | ||||||
|
Total liabilities |
548,406 | 801,104 | ||||||
|
Commitments and contingencies |
||||||||
|
Stockholders' equity: |
||||||||
|
Preferred stock |
346 | 351 | ||||||
|
Common stock |
3,051 | 3,050 | ||||||
|
Additional paid-in capital |
102,376 | 100,425 | ||||||
|
Treasury stock, at cost |
(210,669 | ) | (200,107 | ) | ||||
|
Accumulated other comprehensive loss |
(7,836 | ) | (25,380 | ) | ||||
|
Retained earnings |
745,755 | 704,554 | ||||||
|
Total stockholders' equity |
633,023 | 582,893 | ||||||
|
Total liabilities and stockholders’ equity |
$ | 1,181,429 | $ | 1,383,997 | ||||
See Notes to Consolidated Financial Statements.
Consolidated Statements of Cash Flows
Seneca Foods Corporation
(In thousands)
|
Fiscal Year: |
||||||||||||
|
2025 |
2024 |
2023 |
||||||||||
|
Cash flows from operating activities: |
||||||||||||
|
Net earnings |
$ | 41,224 | $ | 63,318 | $ | 9,231 | ||||||
|
Adjustments to reconcile net earnings to net cash from operating activities: |
||||||||||||
|
Depreciation and amortization |
44,776 | 43,478 | 40,941 | |||||||||
|
Non-cash lease expense |
5,019 | 7,251 | 11,636 | |||||||||
|
LIFO charge |
34,474 | 22,342 | 131,611 | |||||||||
|
Deferred income tax expense |
2,190 | (5,533 | ) | (3,534 | ) | |||||||
|
Gain on the sale of assets |
(3,276 | ) | (2,331 | ) | (2,872 | ) | ||||||
|
Provision for restructuring and impairments |
- | 567 | 4,333 | |||||||||
|
Stock-based compensation expense |
175 | 246 | 76 | |||||||||
|
Pension expense |
26 | 354 | 1,481 | |||||||||
|
401(k) match stock contribution |
2,795 | 2,453 | 1,515 | |||||||||
|
Changes in operating assets and liabilities: |
||||||||||||
|
Accounts receivable |
(16,563 | ) | 17,334 | 22,098 | ||||||||
|
Inventories |
234,263 | (224,136 | ) | (398,514 | ) | |||||||
|
Other assets |
(1,733 | ) | 91 | 2,743 | ||||||||
|
Accounts payable |
3,254 | (29,213 | ) | (18,370 | ) | |||||||
|
Accrued expenses and other |
(9,515 | ) | 11,192 | (13,641 | ) | |||||||
|
Income taxes |
(1,634 | ) | 9,624 | (1,530 | ) | |||||||
|
Net cash provided by (used in) operating activities |
335,475 | (82,963 | ) | (212,796 | ) | |||||||
|
Cash flows from investing activities: |
||||||||||||
|
Additions to property, plant and equipment |
(37,225 | ) | (36,637 | ) | (70,628 | ) | ||||||
|
Proceeds from the sale of assets |
5,077 | 8,089 | 5,751 | |||||||||
|
Increase in non-current deposits |
(2,666 | ) | (18,654 | ) | - | |||||||
|
Net cash used in investing activities |
(34,814 | ) | (47,202 | ) | (64,877 | ) | ||||||
|
Cash flows from financing activities: |
||||||||||||
|
Borrowings under revolving credit facility |
461,455 | 783,650 | 777,083 | |||||||||
|
Repayments under revolving credit facility |
(697,680 | ) | (727,023 | ) | (616,939 | ) | ||||||
|
Borrowings under term loans and note payable |
12,394 | 133,359 | 174,427 | |||||||||
|
Payments on term loans and finance obligation |
(20,264 | ) | (19,215 | ) | (5,500 | ) | ||||||
|
Payments on finance leases |
(4,815 | ) | (7,956 | ) | (8,814 | ) | ||||||
|
Purchase of treasury stock |
(11,591 | ) | (33,030 | ) | (41,209 | ) | ||||||
|
Payment of debt issuance costs |
(1,600 | ) | - | - | ||||||||
|
Preferred stock dividends |
(23 | ) | (23 | ) | (23 | ) | ||||||
|
Net cash (used in) provided by financing activities |
(262,124 | ) | 129,762 | 279,025 | ||||||||
|
Net increase (decrease) in cash, cash equivalents and restricted cash |
38,537 | (403 | ) | 1,352 | ||||||||
|
Cash, cash equivalents and restricted cash, beginning of year |
11,853 | 12,256 | 10,904 | |||||||||
|
Cash, cash equivalents and restricted cash, end of year |
$ | 50,390 | $ | 11,853 | $ | 12,256 | ||||||
|
Supplemental disclosures of cash flow information: |
||||||||||||
|
Cash paid for interest, net of capitalized interest |
$ | 34,276 | $ | 33,100 | $ | 11,218 | ||||||
|
Cash paid for income taxes, net |
$ | 12,657 | $ | 15,105 | $ | 9,084 | ||||||
|
Non-cash transactions: |
||||||||||||
|
Exchange of note payable for finance obligation and non-current deposits for property, plant and equipment |
$ | 21,320 | $ | - | $ | - | ||||||
|
Right-of-use assets obtained in exchange for lease obligations |
$ | 2,980 | $ | 5,746 | $ | 10,187 | ||||||
|
Right-of-use assets derecognized upon early lease termination |
$ | 7,592 | $ | 2,286 | $ | 3,588 | ||||||
|
Assets acquired from exercise of finance lease purchase options, net of accumulated depreciation |
$ | 2,965 | $ | 6,681 | $ | - | ||||||
|
Property, plant and equipment purchased on account |
$ | 38 | $ | 307 | $ | 1,177 | ||||||
See Notes to Consolidated Financial Statements.
Consolidated Statements of Stockholders' Equity
Seneca Foods Corporation
(In thousands, except share amounts)
|
Accumulated |
||||||||||||||||||||||||||||
|
Additional |
Other |
|||||||||||||||||||||||||||
|
Preferred |
Common |
Paid-In |
Treasury |
Comprehensive |
Retained |
|||||||||||||||||||||||
|
Stock |
Stock |
Capital |
Stock |
Loss |
Earnings |
Total |
||||||||||||||||||||||
|
Balance March 31, 2022 |
$ | 644 | $ | 3,041 | $ | 98,641 | $ | (128,879 | ) | $ | (26,468 | ) | $ | 632,051 | $ | 579,030 | ||||||||||||
|
Net earnings |
- | - | - | - | - | 9,231 | 9,231 | |||||||||||||||||||||
|
Cash dividends paid on preferred stock |
- | - | - | - | - | (23 | ) | (23 | ) | |||||||||||||||||||
|
Equity incentive program |
- | - | 150 | - | - | - | 150 | |||||||||||||||||||||
|
Stock issued for profit sharing plan |
- | - | 76 | - | - | - | 76 | |||||||||||||||||||||
|
Contribution of 401(k) match |
- | - | - | 1,515 | - | - | 1,515 | |||||||||||||||||||||
|
Purchase of treasury stock |
- | - | - | (41,209 | ) | - | - | (41,209 | ) | |||||||||||||||||||
|
Preferred stock conversion |
(293 | ) | 8 | 285 | - | - | - | - | ||||||||||||||||||||
|
Change in pension and postretirement benefits adjustment (net of tax $1,999) |
- | - | - | - | 5,980 | - | 5,980 | |||||||||||||||||||||
|
Balance March 31, 2023 |
351 | 3,049 | 99,152 | (168,573 | ) | (20,488 | ) | 641,259 | 554,750 | |||||||||||||||||||
|
Net earnings |
- | - | - | - | - | 63,318 | 63,318 | |||||||||||||||||||||
|
Cash dividends paid on preferred stock |
- | - | - | - | - | (23 | ) | (23 | ) | |||||||||||||||||||
|
Equity incentive program |
- | 1 | 245 | - | - | - | 246 | |||||||||||||||||||||
|
Stock issued for profit sharing plan |
- | - | 71 | - | - | - | 71 | |||||||||||||||||||||
|
Contribution of 401(k) match |
- | - | 957 | 1,496 | - | - | 2,453 | |||||||||||||||||||||
|
Purchase of treasury stock |
- | - | - | (33,030 | ) | - | - | (33,030 | ) | |||||||||||||||||||
|
Change in pension and postretirement benefits adjustment (net of tax $1,628) |
- | - | - | - | (4,892 | ) | - | (4,892 | ) | |||||||||||||||||||
|
Balance March 31, 2024 |
351 | 3,050 | 100,425 | (200,107 | ) | (25,380 | ) | 704,554 | 582,893 | |||||||||||||||||||
|
Net earnings |
- | - | - | - | - | 41,224 | 41,224 | |||||||||||||||||||||
|
Cash dividends paid on preferred stock |
- | - | - | - | - | (23 | ) | (23 | ) | |||||||||||||||||||
|
Equity incentive program |
- | 1 | 174 | - | - | - | 175 | |||||||||||||||||||||
|
Stock issued for profit sharing plan |
- | - | 6 | - | - | - | 6 | |||||||||||||||||||||
|
Contribution of 401(k) match |
- | - | 1,766 | 1,029 | - | - | 2,795 | |||||||||||||||||||||
|
Purchase of treasury stock |
- | - | - | (11,591 | ) | - | - | (11,591 | ) | |||||||||||||||||||
|
Preferred stock conversion |
(5 | ) | - | 5 | - | - | - | - | ||||||||||||||||||||
|
Change in pension and postretirement benefits adjustment (net of tax $5,772) |
- | - | - | - | 17,544 | - | 17,544 | |||||||||||||||||||||
|
Balance March 31, 2025 |
$ | 346 | $ | 3,051 | $ | 102,376 | $ | (210,669 | ) | $ | (7,836 | ) | $ | 745,755 | $ | 633,023 | ||||||||||||
|
Preferred Stock |
Common Stock |
|||||||||||||||||||
|
6% Voting |
10% Voting |
|||||||||||||||||||
|
Cumulative |
Cumulative |
Participating |
Class A |
Class B |
||||||||||||||||
|
Callable |
Convertible |
Convertible |
Common |
Common |
||||||||||||||||
|
Par $0.25 |
Par $0.025 |
Par $0.025 |
Par $0.25 |
Par $0.25 |
||||||||||||||||
|
Shares authorized and designated: |
||||||||||||||||||||
|
March 31, 2025 |
200,000 | 1,400,000 | 7,891 | 20,000,000 | 10,000,000 | |||||||||||||||
|
Shares outstanding: |
||||||||||||||||||||
|
March 31, 2023 |
200,000 | 807,240 | 8,292 | 5,928,424 | 1,707,241 | |||||||||||||||
|
March 31, 2024 |
200,000 | 807,240 | 8,292 | 5,400,429 | 1,659,411 | |||||||||||||||
|
March 31, 2025 |
200,000 | 807,240 | 7,891 | 5,342,172 | 1,562,163 | |||||||||||||||
|
Balance in Equity at March 31, 2025 |
$ | 50 | $ | 202 | $ | 94 | $ | 2,592 | $ | 459 | ||||||||||
See Notes to Consolidated Financial Statements.
1. Summary of Significant Accounting Policies
Nature of Operations — Seneca Foods Corporation (the “Company”) currently has 26 facilities in eight states in support of its main operations. The Company markets private label and branded packaged foods to retailers and institutional food distributors.
Principles of Consolidation — The Consolidated Financial Statements include the accounts of the Company and its wholly-owned subsidiaries. All intercompany accounts and transactions have been eliminated in consolidation.
Use of Estimates in the Preparation of Financial Statements — The preparation of financial statements in conformity with accounting principles generally accepted in the United States ("GAAP") requires management to make estimates and assumptions. Such estimates and assumptions affect the reported amounts of assets and liabilities as well as the disclosure of contingent assets and liabilities at the date of the Consolidated Financial Statements, and the reported amounts of net sales and expenses during the reporting period. The Company evaluates its estimates and assumptions on an ongoing basis using historical experience and other factors that management believes to be reasonable under the circumstances, including the current economic environment. The Company adjusts such estimates and assumptions when facts and circumstances dictate. Actual results could differ materially from those estimates.
Reclassification of Prior Year Balances — Certain prior year amounts have been reclassified for consistency with current year presentation. These reclassifications have no impact on the amount of total assets or liabilities, net sales, or net earnings. Prior to fiscal year 2025, the plant restructuring line item was separately presented on the Consolidated Statements of Net Earnings and is now included in the other operating (income) expense, net line item.
Cash, Cash Equivalents and Restricted Cash — The Company considers all highly liquid instruments purchased with an original maturity of three months or less to be cash and cash equivalents. Cash equivalents are primarily invested in commercial paper and highly rated money market funds. The Company’s workers’ compensation policy requires deposits to be held in escrow related to the Company’s deductible. Accordingly, the Company maintains the required deposit and records the amounts as restricted cash on the Consolidated Balance Sheets. These balances are classified as restricted cash as they are not available for use by the Company to fund operations.
The following table reconciles cash, cash equivalents and restricted cash as reported on the Consolidated Balance Sheets to the total amounts shown in the Company’s Consolidated Statements of Cash Flows (in thousands):
|
As of: |
||||||||
|
March 31, |
March 31, |
|||||||
|
2025 |
2024 |
|||||||
|
Cash and cash equivalents |
$ | 42,685 | $ | 4,483 | ||||
|
Restricted cash |
7,705 | 7,370 | ||||||
|
Total cash, cash equivalents and restricted cash |
$ | 50,390 | $ | 11,853 | ||||
Fair Value of Financial Instruments — The carrying values of cash, cash equivalents and restricted cash, accounts receivable, refundable income taxes, accounts payable, note payable, income taxes payable, and accrued expenses approximate fair value because of the immediate or short-term maturity of these financial instruments. See Note 11, Fair Value of Financial Instruments, for further discussion of the fair value of the Company’s cash equivalents, long-term debt and finance obligation.
The three-tier value hierarchy is utilized to prioritize the inputs used in measuring fair value. The hierarchy gives the highest priority to quoted prices in active markets (Level 1) and the lowest priority to unobserved inputs (Level 3). The three levels are defined as follows:
|
● |
Level 1 - Quoted prices for identical instruments in active markets. |
|
● |
Level 2 - Quoted prices for similar instruments; quoted prices for identical or similar instruments in markets that are not active; and model-derived valuations in which all significant inputs or significant value-drivers are observable. |
|
● |
Level 3 - Model-derived valuations in which one or more inputs or value-drivers are both significant to the fair value measurement and unobservable. |
Accounts Receivable and Doubtful Accounts — Accounts receivable is stated at invoice value, which is net of any off-invoice promotions. In determining the Company’s reserve for credit losses, receivables are assigned an expected loss based on historical information adjusted for forward-looking economic factors. Management believes these provisions are adequate based upon the relevant information presently available.
Inventories — Substantially all inventories are stated at the lower of cost or market with cost determined using the last-in, first-out (“LIFO”) method. An actual valuation of inventory under the LIFO method is made at the end of each fiscal year based on the inventory levels and costs at that time. In contrast, interim LIFO calculations are based on management’s estimates of expected year-end inventory levels, production pack yields, sales and the expected rate of inflation or deflation for the year. The interim LIFO calculations are subject to adjustment in the final year-end LIFO inventory valuation.
Property, Plant and Equipment — Property, plant, and equipment are stated at cost. Interest incurred during the construction of major projects is capitalized. During fiscal year 2025, the Company capitalized a nominal amount of interest and capitalized $0.7 million of interest in fiscal year 2024. For financial reporting, the Company provides for depreciation on the straight-line method at rates based upon the estimated useful lives of the various assets. The estimated useful lives are as follows:
|
Years |
||||||
|
Buildings and improvements |
30 | |||||
|
Land improvements |
10 | - | 20 | |||
|
Machinery and equipment |
5 | - | 15 | |||
|
Office equipment and furniture |
3 | - | 5 | |||
|
Vehicles |
3 | - | 5 | |||
|
Computer software |
3 | - | 5 | |||
Long-Lived Assets — The Company evaluates its long-lived assets for recoverability whenever events or circumstances indicate that the carrying value of such assets may not be fully recoverable. Recoverability is measured by a comparison of the carrying value of an asset to estimated undiscounted future cash flows expected to be generated by the asset. Impairment losses are then evaluated if the estimated future undiscounted cash flows are less than carrying value. A loss is recognized when the carrying value of an asset exceeds its fair value. The Company did not record an impairment loss on long-lived assets during fiscal years 2025, 2024 and 2023.
Deferred Financing Costs — Deferred financing costs incurred in obtaining debt are amortized on a straight-line basis over the term of the debt, which is not materially different than using the effective interest rate method. Amortization of deferred financing costs is recorded as part of interest expense on the Consolidated Statements of Net Earnings. As of March 31, 2025 there were $1.7 million of unamortized financing costs included in other assets related to the Company’s revolving credit facility and $0.7 million of unamortized financing costs related to its term loans that are included as a contra to long-term debt on the Consolidated Balance Sheets.
Revenue Recognition — Revenue recognition is completed for most customers at a point in time basis when product control is transferred to the customer. In general, control transfers to the customer when the product is shipped or delivered to the customer based upon applicable shipping terms, as the customer can direct the use and obtain substantially all of the remaining benefits from the asset at this point in time. The Company does sell certain finished goods inventory for cash on a bill and hold basis. The terms of the bill and hold agreement(s) provide that title to the specified inventory is transferred to the customer(s) prior to shipment and the Company has the right to payment (prior to physical delivery) which results in recorded revenue as determined under the revenue recognition standard. Refer to Note 2, Revenue Recognition, for further discussion of the policy.
Trade Promotions — Trade promotions are an important component of the sales and marketing of the Company’s branded products and are critical to the support of the business. Trade promotions represent a form of variable consideration, which is recorded as a reduction of sales, and include amounts paid to retailers for shelf space, to obtain favorable display positions and to offer temporary price reductions for the sale of our products to consumers. Accruals for trade promotions are recorded primarily at the time of sale to the retailer based on expected levels of performance. Settlement of these liabilities typically occurs in subsequent periods primarily through an authorized process for deductions taken by a retailer from amounts otherwise due to the Company. As a result, the ultimate cost of a trade promotion program is dependent on the relative success of the events and the actions and level of deductions taken by retailers. Final determination of the permissible deductions may take extended periods of time.
Concentration of Credit Risk — Financial instruments that potentially subject the Company to credit risk consist of trade receivables, interest-bearing investments, cash and cash equivalents, and restricted cash. Retailers, distributors, and co-pack customers comprise a significant portion of the trade receivables; collateral is generally not required. A relatively limited number of customers account for a large percentage of the Company’s total net sales. The top ten customers represented approximately 53% and 52% of net sales for fiscal years 2025 and 2024, respectively. The Company closely monitors the credit risk associated with its customers. The Company places substantially all of its interest-bearing investments with financial institutions and monitors credit exposure. Cash and short-term investments in certain accounts exceed the federal insured limit; however, the Company has not experienced any losses in such accounts.
Advertising Costs — Advertising costs are expensed as incurred and totaled $3.5 million in fiscal year 2025, $2.7 million in fiscal year 2024, and $2.2 million in fiscal year 2023.
Income Taxes — The provision for income taxes includes federal and state income taxes currently payable and those deferred because of temporary differences between the financial statement and tax basis of assets and liabilities and tax credit carryforwards. The Company uses the flow-through method to account for its investment tax credits.
The Company evaluates the likelihood of realization of its net deferred income tax assets by assessing its valuation allowance and by adjusting the amount of such allowance, if necessary. The factors used to assess the likelihood of realization are the Company’s forecast of future taxable income, the projected reversal of temporary differences and available tax planning strategies that could be implemented to realize the net deferred income tax assets.
Current rules on the accounting for uncertainty on income taxes prescribe a minimum recognition threshold for a tax position taken or expected to be taken in a tax return that is required to be met before being recognized in the financial statements. Those rules also provide guidance on derecognition, measurement, classification, interest and penalties, accounting in interim periods, disclosure and transition. The Company recognizes interest and penalties accrued on unrecognized tax benefits as well as interest received from favorable settlements within income tax expense.
Earnings per Common Share — The Company has two series of convertible preferred stock, which are deemed to be participating securities that are entitled to participate in any dividend on Class A common stock as if the preferred stock had been converted into common stock immediately prior to the record date for such dividend. Basic earnings per share for common stock is calculated using the “two-class” method by dividing the earnings attributable to common stockholders by the weighted average of common shares outstanding during the period. Restricted stock is included in the basic earnings per share calculation.
Diluted earnings per share is calculated by dividing earnings attributable to common stockholders by the sum of the weighted average common shares outstanding plus the dilutive effect of convertible preferred stock using the “if-converted” method, which treats the contingently-issuable shares of convertible preferred stock as common stock.
Recently Adopted Accounting Pronouncements — In November 2023, the Financial Accounting Standards Board (“FASB”) issued Accounting Standards Update (“ASU”) 2023-07, Segment Reporting (Topic 280): Improvements to Reportable Segment Disclosures (“ASU 2023-07”) to improve reportable segment disclosure requirements, primarily through enhanced disclosures about significant segment expenses. The standard does not change the definition of a segment, the method for determining segments, or the criteria for aggregating operating segments into reportable segments. ASU 2023-07 is effective for annual periods beginning after December 15, 2023, and interim periods within fiscal years beginning after December 15, 2024, and requires retrospective application to all prior periods presented in the financial statements. The Company adopted this guidance during the fiscal year ended March 31, 2025, by providing the additional disclosures as required. Refer to Note 12, Segment Information, for additional information.
Recently Issued Accounting Pronouncements — In November 2024, the FASB issued ASU 2024-03, Income Statement — Reporting Comprehensive Income — Expense Disaggregation Disclosures (Subtopic 220-40): Disaggregation of Income Statement Expenses (“ASU 2024-03”) which requires detailed disclosures in the notes to financial statements disaggregating specific expense categories and certain other disclosures to provide enhanced transparency into the nature and function of expenses. The FASB further clarified the effective date in January 2025 with the issuance of ASU 2025-01, Income Statement — Reporting Comprehensive Income — Expense Disaggregation Disclosures (Subtopic 220-40): Clarifying the Effective Date (“ASU 2025-01”). ASU 2024-03 is effective for annual periods beginning after December 15, 2026, and interim periods within annual reporting periods beginning after December 15, 2027, with early adoption permitted. The requirements should be applied on a prospective basis while retrospective application is permitted. The Company plans to adopt this pronouncement for its fiscal year beginning April 1, 2027, and is in the process of analyzing the impact on its Consolidated Financial Statements.
In December 2023, the FASB issued ASU 2023-09, Income Taxes (Topic 740): Improvements to Income Tax Disclosures (“ASU 2023-09”) related to income tax disclosures. The amendments in this update are intended to enhance the transparency and decision usefulness of income tax disclosures primarily through changes to the rate reconciliation and income taxes paid information. ASU 2023-09 is effective for annual periods beginning after December 15, 2024, though early adoption is permitted. The Company plans to adopt this pronouncement for its fiscal year beginning April 1, 2025, and is in the process of analyzing the impact on its Consolidated Financial Statements.
All other newly issued accounting pronouncements not yet effective have been deemed either not applicable or were related to technical amendments or codification. In addition, the Company did not adopt any other new accounting pronouncements during fiscal year 2025.
Subsequent Events — The Company has evaluated subsequent events for disclosure through the date of issuance of the accompanying Consolidated Financial Statements.
2. Revenue Recognition
The Company applies the provisions of Accounting Standards Codification (“ASC”) 606-10, Revenue from Contracts with Customers, and recognizes revenue under the core principle to depict the transfer of products to customers in an amount reflecting the consideration the Company expects to receive. The Company conducts its business almost entirely in food packaging, which comprised approximately 98% of the Company's fiscal year 2025 net sales.
Nature of Products — The Company’s product offerings include the following:
|
• |
Canned and frozen vegetables which are sold under private label, and national and regional brands that the Company owns or licenses, as well as under contract packing agreements; |
|
• |
Fruit products comprised of jarred and packaged products; |
|
• |
Snack products comprised of packaged fruit chips; |
|
• |
Other non-food operations which are ancillary to the Company’s main product offerings, such as the sale of cans and ends, seed, and outside revenue from the Company’s aircraft operations. |
Disaggregation of Revenue — In the following table, segment revenue is disaggregated by product category groups (in thousands):
|
Fiscal Year: |
||||||||||||
|
2025 |
2024 |
2023 |
||||||||||
|
Canned vegetables |
$ | 1,314,315 | $ | 1,204,823 | $ | 1,253,257 | ||||||
|
Frozen vegetables |
124,714 | 120,795 | 121,211 | |||||||||
|
Fruit products |
92,378 | 87,435 | 91,495 | |||||||||
|
Snack products |
14,995 | 13,400 | 12,661 | |||||||||
|
Other |
32,485 | 32,150 | 30,728 | |||||||||
|
Total |
$ | 1,578,887 | $ | 1,458,603 | $ | 1,509,352 | ||||||
When Performance Obligations Are Satisfied — A performance obligation is a promise in a contract to transfer a distinct good or service to the customer and is the unit of account for revenue recognition. A contract’s transaction price is allocated to each distinct performance obligation and recognized as revenue when, or as, the performance obligation is satisfied. The Company’s primary performance obligation is the production of food products and secondarily case and labeling services and storage services for certain bill and hold sales.
Revenue recognition is completed primarily at a point in time basis when product control is transferred to the customer. In general, control transfers to the customer when the product is shipped or delivered to the customer based upon applicable shipping terms, as the customer can direct the use and obtain substantially all of the remaining benefits from the asset at this point in time.
Customer contracts generally do not include more than one performance obligation. When a contract does contain more than one performance obligation, we allocate the contract’s transaction price to each performance obligation based on its relative standalone selling price. The standalone selling price for each distinct good is generally determined by directly observable data. The performance obligations in our contracts are generally satisfied within one year.
Significant Payment Terms — Our customer contracts identify the product, quantity, price, payment and final delivery terms. Payment terms usually include early pay discounts. We grant payment terms consistent with industry standards. Although some payment terms may be more extended, no terms beyond one year are granted at contract inception. As a result, we apply the available practical expedient and do not adjust the promised amount of consideration for the effects of a significant financing component because the period between our transfer of a promised good or service to a customer and the customer’s payment for that good or service will be generally 30 days or less.
Shipping — All shipping and handling costs associated with outbound freight are accounted for as fulfillment costs and are included in the cost of products sold; this includes shipping and handling costs after control over a product has transferred to a customer.
Variable Consideration — In addition to fixed contract consideration, certain contracts include some form of variable consideration. Trade promotions are an important component of the sales and marketing of the Company’s branded products and are critical to the support of the business. Trade promotion costs, which are recorded as a reduction of gross sales, include amounts paid to retailers for shelf space, to obtain favorable display positions and to offer temporary price reductions for the sale of our products to consumers. Settlement of these liabilities typically occurs in subsequent periods primarily through an authorized process for deductions taken by a retailer from amounts otherwise due to the Company. As a result, the ultimate cost of a trade promotion program is dependent on the relative success of the events and the actions and level of deductions taken by retailers. Final determination of the permissible deductions may take extended periods of time. Accruals for trade promotions are recorded primarily at the time of sale to the retailer based on expected levels of performance. The Company estimates variable consideration using the expected value method to determine the total consideration which the Company expects to be entitled. The Company updates its estimate of variable consideration each reporting period based on available information and the effect is recognized as an adjustment to sales. Accrued trade promotions were $7.0 million and $10.0 million as of March 31, 2025 and 2024, respectively, and are included in other accrued expenses on the Consolidated Balance Sheets.
Contract Balances — The contract asset balances were $1.1 million and $0.4 million as of March 31, 2025 and 2024, respectively, and are recorded as part of other current assets on the Consolidated Balance Sheets. The Company has contract liabilities in the form of deferred revenue representing payments received from certain of its co-pack customers in advance of completion of the Company's respective performance obligations. The majority of the balance is comprised of prepaid case and labeling and storage services which have been collected from bill and hold sales, as well as amounts invoiced in accordance with the terms of a co-pack agreement.
The deferred revenue activity during fiscal years 2025 and 2024 is shown in the following table (in thousands):
|
Fiscal Year: |
||||||||
|
2025 |
2024 |
|||||||
|
Beginning balance |
$ | 8,185 | $ | 9,956 | ||||
|
Deferral of revenue |
18,208 | 19,200 | ||||||
|
Recognition of unearned revenue |
(15,253 | ) | (17,049 | ) | ||||
|
Settlement of liability (1) |
- | (3,922 | ) | |||||
|
Ending balance |
$ | 11,140 | $ | 8,185 | ||||
(1) Represents settlement of a portion of the deferred revenue liability in connection with the asset acquisition discussed in Note 15, Asset Acquisition.
Contract Costs — We have identified certain incremental costs to obtain a contract, primarily sales commissions, that would require capitalization under the standard. The Company applies the available practical expedient to continue expensing these costs as incurred because the amortization period for the costs would have been one year or less. The Company does not incur significant fulfillment costs requiring capitalization.
3. Earnings per Share
Earnings per share for fiscal years 2025, 2024 and 2023 are as follows (in thousands, except per share amounts):
|
Fiscal Year: |
||||||||||||
|
2025 |
2024 |
2023 |
||||||||||
|
Basic |
||||||||||||
|
Net earnings |
$ | 41,224 | $ | 63,318 | $ | 9,231 | ||||||
|
Deduct preferred stock dividends |
23 | 23 | 23 | |||||||||
|
Undistributed net earnings |
41,201 | 63,295 | 9,208 | |||||||||
|
Earnings attributable to participating preferred shareholders |
48 | 72 | 30 | |||||||||
|
Earnings attributable to common shareholders |
$ | 41,153 | $ | 63,223 | $ | 9,178 | ||||||
|
Weighted average common shares outstanding |
6,912 | 7,318 | 7,796 | |||||||||
|
Basic earnings per common share |
$ | 5.95 | $ | 8.64 | $ | 1.19 | ||||||
|
Diluted |
||||||||||||
|
Earnings attributable to common shareholders |
$ | 41,153 | $ | 63,223 | $ | 9,178 | ||||||
|
Add dividends on convertible preferred stock |
20 | 20 | 20 | |||||||||
|
Earnings attributable to common stock on a diluted basis |
$ | 41,173 | $ | 63,243 | $ | 9,198 | ||||||
|
Weighted average common shares outstanding - basic |
6,912 | 7,318 | 7,796 | |||||||||
|
Additional shares to be issued under full conversion of preferred stock |
67 | 67 | 67 | |||||||||
|
Total shares for diluted |
6,979 | 7,385 | 7,863 | |||||||||
|
Diluted earnings per common share |
$ | 5.90 | $ | 8.56 | $ | 1.16 | ||||||
4. Inventories
The Company uses the LIFO method of valuing inventory as it believes this method allows for better matching of current production cost to current revenue. As of March 31, 2025 and 2024, first-in, first-out (“FIFO”) based inventory costs exceeded LIFO based inventory costs, resulting in a LIFO reserve of $359.3 million and $324.8 million, respectively. In order to state inventories at LIFO, the Company recorded an increase to cost of products sold of $34.5 million and $22.3 million for fiscal years 2025 and 2024, respectively.
During fiscal year 2025, the Company experienced a reduction in inventory levels. This decrease resulted in a liquidation of certain LIFO inventory layers that were carried at lower costs prevailing in prior fiscal years as compared with current costs in fiscal year 2025. The effect of the LIFO liquidation decreased cost of products sold by $14.5 million and increased net earnings by $10.9 million, thereby impacting basic earnings per share by $1.58 and diluted earnings by share by $1.56. The LIFO liquidation is included within the net LIFO charge of $34.5 million recorded in fiscal year 2025. There was no LIFO liquidation in fiscal year 2024.
The inventories by category and the impact of using the LIFO method are shown in the following table (in thousands):
|
As of: |
||||||||
|
March 31, |
March 31, |
|||||||
|
2025 |
2024 |
|||||||
|
Finished products |
$ | 619,598 | $ | 795,993 | ||||
|
Work in process |
106,006 | 125,027 | ||||||
|
Raw materials and supplies |
237,607 | 276,454 | ||||||
| 963,211 | 1,197,474 | |||||||
|
Less: excess of FIFO cost over LIFO cost |
(359,256 | ) | (324,782 | ) | ||||
|
Total inventories |
$ | 603,955 | $ | 872,692 | ||||
5. Property, Plant and Equipment
Property, plant and equipment is comprised of the following (in thousands):
|
As of: |
||||||||
|
March 31, |
March 31, |
|||||||
|
2025 |
2024 |
|||||||
|
Land and land improvements |
$ | 52,339 | $ | 49,627 | ||||
|
Buildings and improvements |
238,709 | 236,141 | ||||||
|
Machinery and equipment |
502,223 | 457,433 | ||||||
|
Office equipment, furniture, vehicles and computer software |
15,604 | 14,971 | ||||||
|
Construction in progress |
16,177 | 14,450 | ||||||
|
Property, plant and equipment, cost |
825,052 | 772,622 | ||||||
|
Less: accumulated depreciation |
(500,284 | ) | (467,606 | ) | ||||
|
Property, plant and equipment, net |
$ | 324,768 | $ | 305,016 | ||||
Depreciation expense totaled $40.1 million, $36.8 million, and $33.9 million for fiscal years 2025, 2024, and 2023, respectively.
6. Debt
Note Payable and Finance Obligation — During fiscal year 2024, the Company entered into an unsecured note payable with an individual lender for an interim financing arrangement associated with deposits paid to vendors for the installation of a new can manufacturing line located at one of the Company’s plant facilities. The note payable had a variable interest rate based upon the Secured Overnight Financing Rate (“SOFR”) plus 1.80% with interest payable monthly.
During fiscal year 2025, subsequent to the final installation of the can manufacturing line in September 2024, the Company took title and recorded an addition to property, plant and equipment of $21.3 million and a corresponding reduction of the vendor deposits which were recorded within other assets on the Consolidated Balance Sheet. After taking title to the equipment, the Company and the lender entered into a financing agreement for the can manufacturing line which commenced in September 2024 and is recorded as a finance obligation on the accompanying Consolidated Balance Sheets. In connection with this transaction, the note payable was cancelled. The finance obligation has a maturity date of September 14, 2031 and a monthly payment of $0.3 million which is comprised of principal and interest at a fixed rate of 5.56%.
Future minimum payments under the finance obligation are as follows (in thousands):
|
Fiscal years ending March 31: |
||||
|
2026 |
$ | 3,684 | ||
|
2027 |
3,684 | |||
|
2028 |
3,684 | |||
|
2029 |
3,684 | |||
|
2030 |
3,684 | |||
|
Thereafter |
5,524 | |||
|
Total minimum payment required |
23,944 | |||
|
Less interest |
3,888 | |||
|
Total finance obligation |
20,056 | |||
|
Amount due within one year |
2,635 | |||
|
Finance obligation, less current portion |
$ | 17,421 |
Long-term debt is comprised of the following (in thousands):
|
As of: |
||||||||
|
March 31, |
March 31, |
|||||||
|
2025 |
2024 |
|||||||
|
Revolving credit facility |
$ | 1,000 | $ | 237,225 | ||||
|
Term loans |
||||||||
|
Term Loan A-1 |
||||||||
|
Outstanding principal |
81,000 | 85,000 | ||||||
|
Unamortized debt issuance costs |
(5 | ) | (37 | ) | ||||
|
Term Loan A-1, net |
80,995 | 84,963 | ||||||
|
Term Loan A-2 |
||||||||
|
Outstanding principal |
268,500 | 283,500 | ||||||
|
Unamortized debt issuance costs |
(673 | ) | (902 | ) | ||||
|
Term Loan A-2, net |
267,827 | 282,598 | ||||||
|
Total long-term debt |
349,822 | 604,786 | ||||||
|
Less current portion |
96,000 | 19,000 | ||||||
|
Long-term debt, less current portion |
$ | 253,822 | $ | 585,786 | ||||
Revolving Credit Facility — On December 23, 2024, the Company entered into a Loan and Security Agreement (the “Agreement”), with Wells Fargo Bank, National Association as agent for the various lenders of a senior revolving credit facility of up to $450.0 million that is seasonally adjusted to a maximum of $400.0 million during the months of April through July (the “Revolver”).
The Agreement refinanced and replaced in its entirety the Fourth Amended and Restated Loan and Security Agreement dated as of March 24, 2021, as amended from time to time, with Bank of America, N.A. as agent, issuing bank, and syndication agent, and BofA Securities, Inc. as lead arranger (the “2021 Agreement”). The Agreement maintains many of the key characteristics of the 2021 Agreement including the variable interest rate based on SOFR plus an applicable margin, type of collateral, borrowing base requirements and financial covenant calculation, if applicable.
The Revolver is secured by substantially all of the Company’s accounts receivable and inventories and contains borrowing base requirements as well as a financial covenant, if certain circumstances apply. The Company utilizes its Revolver for general corporate purposes, including seasonal working capital needs, to pay debt principal and interest obligations, and to fund capital expenditures and acquisitions. Seasonal working capital needs are affected by the growing cycles of the vegetables the Company packages. The majority of vegetable inventories are produced during the months of June through November and are then sold over the following twelve months. Payment terms for vegetable produce are generally three months but may vary and range from approximately one to seven months. Therefore, the Company’s need to draw on the Revolver may fluctuate significantly throughout the year.
The interest rate benchmark for borrowings under the Revolver is based upon SOFR plus an applicable margin, as defined in the Agreement. In order to maintain availability of funds under the revolving credit facility, the Company pays a commitment fee on the unused portion of the Revolver. As of March 31, 2025, the unused portion of the Revolver was $442.0 million. The Revolver has a five-year term and matures on December 24, 2029. Accordingly, the Revolver balance is included in Long-Term Debt on the accompanying Consolidated Balance Sheets.
In connection with the Revolver refinance, certain lenders exited the syndicate and were replaced by new syndicate members. The portion of the transaction in which certain lenders exited was accounted for as an extinguishment resulting in the write-off of an immaterial amount of unamortized deferred costs. The portion of the transaction comprised of lenders that remained in the syndicate was accounted for as a modification, resulting in the Company continuing to defer the remaining unamortized costs over the term of the Revolver. Additionally, the Company incurred $1.6 million of new debt issuance costs which will be deferred over the term of the Revolver and amortized on a straight-line basis. On the closing date, a repayment of $70.0 million was made to satisfy the outstanding revolving credit facility obligations immediately prior to the refinance transaction, and a corresponding Revolver borrowing of the same amount was drawn to fund the payment. The Consolidated Statement of Cash Flows reflects the payment of debt issuance costs and the gross repayment and borrowing amounts for the Revolver within financing activities.
The following table summarizes certain quantitative data for Revolver borrowings during fiscal year 2025 and fiscal year 2024 (in thousands, except for percentages):
|
As of: |
||||||||
|
March 31, |
March 31, |
|||||||
|
2025 |
2024 |
|||||||
|
Outstanding borrowings |
$ | 1,000 | $ | 237,225 | ||||
|
Interest rate |
5.83 | % | 6.93 | % | ||||
|
Fiscal Year: |
||||||||
|
2025 |
2024 |
|||||||
|
Maximum amount of borrowings drawn during the period |
$ | 233,063 | $ | 290,968 | ||||
|
Average outstanding borrowings |
$ | 124,606 | $ | 162,780 | ||||
|
Weighted average interest rate |
6.86 | % | 6.78 | % | ||||
Term Loans — On January 20, 2023, the Company entered into a Second Amended and Restated Loan and Guaranty Agreement with Farm Credit East, ACA (the “Term Loan Agreement”) which governs two term loans, as summarized below:
Term Loan A-1: The Term Loan Agreement provides for the continuation of a $100.00 million unsecured term loan with a maturity date of June 1, 2025 and fixed interest rate of 3.3012%. Quarterly principal payments are $1.0 million on Term Loan A-1. Upon maturity, the Company paid the Term Loan A-1 in full using available cash on hand.
Term Loan A-2: The Term Loan Agreement adds an additional term loan in the amount of $175.0 million that will mature on January 20, 2028, and is secured by a portion of the Company’s property, plant and equipment. Term Loan A-2 bears interest at a variable interest rate based upon SOFR plus an additional margin determined by the Company’s leverage ratio. Quarterly payments of principal outstanding on Term Loan A-2 in the amount of $1.5 million commenced on March 1, 2023. The Company’s historical practice is to hold term debt until maturity. The Company expects to maintain or have access to sufficient liquidity to retire or refinance long-term debt at maturity or otherwise, from operating cash flows, access to the capital markets, and its Revolver. The Company continuously evaluates opportunities to refinance its debt; however, any refinancing is subject to market conditions and other factors, including financing options that may be available to the Company from time to time, and there can be no assurance that the Company will be able to successfully refinance any debt on commercially acceptable terms at all.
On May 23, 2023, the Term Loan Agreement was amended by the Second Amended and Restated Loan and Guaranty Agreement Amendment which amends, restates and replaces in its entirety Term Loan A-2 (the “Amendment”). The Amendment provides a single advance term facility in the principal amount of $125.0 million to be combined with the outstanding principal balance of $173.5 million on Term Loan A-2 into one single $298.5 million term loan (“Amended Term Loan A-2”). Amended Loan Term A-2 is secured by a portion of the Company’s property, plant and equipment and bears interest at a variable interest rate based upon SOFR plus an additional margin determined by the Company’s leverage ratio. Quarterly payments of principal outstanding on Amended Term Loan A-2 in the amount of $3.75 million commenced on June 1, 2023. The Amendment continues all aspects of Term Loan A-1 as defined in the Term Loan Agreement. As of March 31, 2025, the interest rate on Amended Term Loan A-2 was 6.57%.
The Amendment for Term Loan A-1 and Term Loan A-2 (collectively, the “Term Loans”) contains restrictive covenants usual and customary for loans of its type, in addition to financial covenants including minimum EBITDA and minimum tangible net worth which apply to both Terms Loans described above. In connection with the Amended Term Loan A-2, the Company incurred $1.1 million of financing costs which will be deferred and amortized over the life of the term loan.
The Term Loans permit the Company to participate in a patronage program. The program allows the Company to receive an annual patronage distribution from Farm Credit East, ACA, which is earned during a given calendar year period based on its eligible borrowings. The distribution is not guaranteed and if declared by Farm Credit East, ACA, the amount will be received by the Company during the fourth quarter of each fiscal year. The Company received $4.2 million, $3.7 million, and $0.9 million of patronage distributions in fiscal years 2025, 2024 and 2023, respectively. For fiscal year 2025 and fiscal year 2024, the patronage distribution is included within other non-operating income in the Consolidated Statements of Net Earnings.
Debt repayment requirements in each of the five subsequent fiscal years are presented below (in thousands):
|
Fiscal years ending March 31: |
||||
|
2026 |
$ | 96,000 | ||
|
2027 |
15,000 | |||
|
2028 |
238,500 | |||
|
2029 |
- | |||
|
2030 |
1,000 | |||
|
Total |
$ | 350,500 |
Covenants and Other Debt Matters — The Company’s debt agreements, including the Revolver and Term Loans, contain customary affirmative and negative covenants that restrict, with specified exceptions, the Company’s ability to incur additional indebtedness, incur liens, pay dividends on the Company’s capital stock, make other restricted payments, including investments, transfer all or substantially all of the Company’s assets, enter into consolidations or mergers, and enter into transactions with affiliates. The Company’s debt agreements also require the Company to meet certain financial covenants including a minimum EBITDA and minimum tangible net worth. The Revolver contains borrowing base requirements related to accounts receivable and inventories and also requires the Company to meet a financial covenant related to a minimum fixed charge coverage ratio if (a) an event of default has occurred or (b) availability on the Revolver is less than the greater of (i) 10% of the commitments then in effect and (ii) $30.0 million. The most restrictive financial covenant in the debt agreements is the minimum EBITDA within the Term Loans which for fiscal year 2025 was greater than $75.0 million. The Company computes its financial covenants as if the Company were on the FIFO method of inventory accounting. The Company has met all such financial covenants as of March 31, 2025.
The Company's debt agreements limit the payment of dividends and other distributions, subject to availability under the Revolver. There is an annual total distribution limitation of $50,000, less aggregate annual dividend payments totaling $23,181 that the Company presently pays on two outstanding classes of preferred stock. The carrying value of assets pledged for secured debt, including the Revolver, Term Loan A-2, and lease obligations, is $804.0 million as of March 31, 2025.
Standby Letters of Credit – The Company has standby letters of credit for certain insurance-related requirements. The majority of the Company’s standby letters of credit are automatically renewed annually, unless the issuer gives cancellation notice in advance. On March 31, 2025, the Company had $7.0 million in outstanding standby letters of credit. These standby letters of credit are supported by the Company’s Revolver and reduce borrowings available under the Revolver.
7. Leases
The Company determines whether an arrangement is a lease at inception of the agreement. Presently, the Company leases land, machinery and equipment under various operating and finance leases.
Right-of-Use (“ROU”) assets represent the Company’s right to use the underlying assets for the lease term and lease obligations represent the net present value of the Company’s obligation to make payments arising from these leases. ROU assets and lease obligations are recognized at commencement date based on the present value of lease payments over the lease term using the implicit lease interest rate or, when unknown, an incremental borrowing rate based on the information available at commencement date or April 1, 2019 for leases that commenced prior to that date. ROU assets and lease obligations for the Company’s operating and finance leases are disclosed separately in the Company’s Consolidated Balance Sheets.
Lease terms may include options to extend or terminate the lease, and the impact of these options are included in the calculation of the ROU asset and lease obligation only when the exercise of the option is at the Company’s sole discretion and it is reasonably certain that the Company will exercise that option. The Company will not separate lease and non-lease components for its leases when it is impractical to separate the two. In addition, the Company has certain leases that have variable payments based solely on output or usage of the leased asset. These variable operating leases are excluded from the Company’s Consolidated Balance Sheet presentation and expensed as incurred. Leases with an initial term of 12 months or less, or short-term leases, are not recorded on the accompanying Consolidated Balance Sheets and are expensed as incurred.
The components of lease cost were as follows (in thousands):
|
Fiscal Year: |
||||||||||||
|
2025 |
2024 |
2023 |
||||||||||
|
Lease cost: |
||||||||||||
|
Amortization of right-of-use assets |
$ | 4,048 | $ | 6,134 | $ | 6,715 | ||||||
|
Interest on lease obligations |
547 | 767 | 959 | |||||||||
|
Finance lease cost |
4,595 | 6,901 | 7,674 | |||||||||
|
Operating lease cost |
5,603 | 8,222 | 13,506 | |||||||||
|
Short-term lease cost |
7,548 | 5,335 | 5,589 | |||||||||
|
Total lease cost |
$ | 17,746 | $ | 20,458 | $ | 26,769 | ||||||
|
Cash paid for amounts included in the measurement of lease obligations: |
||||||||||||
|
Operating cash flows from finance leases |
$ | 547 | $ | 767 | $ | 959 | ||||||
|
Operating cash flows from operating leases |
5,904 | 8,849 | 13,736 | |||||||||
|
Financing cash flows from finance leases |
4,815 | 7,956 | 8,814 | |||||||||
| $ | 11,266 | $ | 17,572 | $ | 23,509 | |||||||
|
Right-of-use assets obtained in exchange for new finance lease obligations |
$ | - | $ | 337 | $ | 5,825 | ||||||
|
Right-of-use assets obtained in exchange for new operating lease obligations |
$ | 2,980 | $ | 5,409 | $ | 4,362 | ||||||
|
Right-of-use assets derecognized upon early termination of finance leases |
$ | 20 | $ | 598 | $ | 78 | ||||||
|
Right-of-use assets derecognized upon early termination of operating leases |
$ | 7,572 | $ | 1,688 | $ | 3,510 | ||||||
|
Weighted-average lease term (years): |
||||||||||||
|
Finance leases |
3.8 | 4.4 | 4.7 | |||||||||
|
Operating leases |
4.2 | 4.3 | 4.6 | |||||||||
|
Weighted-average discount rate (percentage): |
||||||||||||
|
Finance leases |
4.1 | % | 4.0 | % | 3.8 | % | ||||||
|
Operating leases |
5.0 | % | 4.7 | % | 4.4 | % | ||||||
Undiscounted future lease payments under non-cancelable operating and finance leases, along with a reconciliation of undiscounted cash flows to operating and finance lease obligations, respectively, as of March 31, 2025 were as follows (in thousands):
|
Years ending March 31: |
Operating |
Finance |
||||||
|
2026 |
$ | 3,586 | $ | 4,269 | ||||
|
2027 |
2,390 | 3,218 | ||||||
|
2028 |
1,945 | 2,811 | ||||||
|
2029 |
1,276 | 1,659 | ||||||
|
2030 |
934 | 923 | ||||||
|
Thereafter |
1,014 | 383 | ||||||
|
Total minimum payment required |
11,145 | 13,263 | ||||||
|
Less interest |
1,035 | 1,015 | ||||||
|
Present value of minimum lease payments |
10,110 | 12,248 | ||||||
|
Amount due within one year |
3,186 | 3,871 | ||||||
|
Long-term lease obligations |
$ | 6,924 | $ | 8,377 | ||||
8. Income Taxes
The Company files a consolidated federal and various state income tax returns. The provision for income taxes is as follows (in thousands):
|
Fiscal Year: |
||||||||||||
|
2025 |
2024 |
2023 |
||||||||||
|
Current: |
||||||||||||
|
Federal |
$ | 9,236 | $ | 20,850 | $ | 5,819 | ||||||
|
State |
1,833 | 4,364 | 2,277 | |||||||||
|
Total |
11,069 | 25,214 | 8,096 | |||||||||
|
Deferred: |
||||||||||||
|
Federal |
$ | 1,257 | $ | (5,010 | ) | $ | (3,886 | ) | ||||
|
State |
933 | (523 | ) | 352 | ||||||||
|
Total |
2,190 | (5,533 | ) | (3,534 | ) | |||||||
|
Total income taxes |
$ | 13,259 | $ | 19,681 | $ | 4,562 | ||||||
A reconciliation of the expected U.S. statutory rate to the effective rate is as follows:
|
Fiscal Year: |
||||||||||||
|
2025 |
2024 |
2023 |
||||||||||
|
Computed (expected tax rate) |
21.0 | % | 21.0 | % | 21.0 | % | ||||||
|
State income taxes (net of federal tax benefit) |
3.9 | % | 3.6 | % | 4.1 | % | ||||||
|
Federal credits |
-0.8 | % | -0.6 | % | -3.9 | % | ||||||
|
State rate changes |
0.0 | % | -0.2 | % | 2.8 | % | ||||||
|
State credit expiration |
0.9 | % | 0.0 | % | 2.1 | % | ||||||
|
State return to accrual |
1.4 | % | 0.5 | % | -0.6 | % | ||||||
|
Change in valuation allowance |
-2.1 | % | -0.2 | % | 7.8 | % | ||||||
|
Other |
0.0 | % | -0.4 | % | -0.2 | % | ||||||
|
Effective income tax rate |
24.3 | % | 23.7 | % | 33.1 | % | ||||||
The Company’s effective tax rate was 24.3%, 23.7%, and 33.1% in fiscal years 2025, 2024, and 2023, respectively. In fiscal year 2025, there was a change in the valuation allowance resulting from state credits that are not expected to be used before expiration. This change to the existing valuation allowance from the current year, as well as credit expirations and true-ups, decreased the fiscal year 2025 effective tax rate by 2.1%.
In fiscal year 2023, the Company added a valuation allowance against state tax credits as a result of a change in ordering of credit usage for Wisconsin because it was determined that it was more likely than not that the tax credits would not be used prior to expiration. This change to the existing valuation allowance increased the fiscal year 2023 effective tax rate by 7.8%. There was not a similar change in valuation allowance in fiscal year 2024, which provided the effect of reducing the effective tax rate year-over-year.
The following is a summary of the significant components of the Company's deferred income tax assets and liabilities (in thousands):
|
As of: |
||||||||
|
March 31, |
March 31, |
|||||||
|
2025 |
2024 |
|||||||
|
Deferred income tax assets: |
||||||||
|
Future tax credits |
$ | 3,719 | $ | 4,884 | ||||
|
Inventory valuation |
7,294 | 9,951 | ||||||
|
Employee benefits |
3,108 | 2,739 | ||||||
|
Insurance |
878 | 922 | ||||||
|
State depreciation basis differences |
3,152 | 3,344 | ||||||
|
Operating leases |
128 | 190 | ||||||
|
Intangibles |
2,994 | 2,760 | ||||||
|
Pension and post-retirement benefits |
2,877 | 8,734 | ||||||
|
Interest |
34 | 18 | ||||||
| Business interest limitation | 3,194 | - | ||||||
|
Deferred revenue |
164 | 260 | ||||||
|
Net operating loss and other tax attribute carryovers |
278 | 558 | ||||||
|
Other |
467 | 427 | ||||||
|
Total assets |
28,287 | 34,787 | ||||||
|
Valuation allowance - noncurrent |
(3,719 | ) | (4,884 | ) | ||||
|
Total deferred income tax assets, net |
24,568 | 29,903 | ||||||
|
Deferred income tax liabilities: |
||||||||
|
Property basis and depreciation difference |
27,537 | 25,260 | ||||||
|
Inventory reserve |
5,200 | 3,091 | ||||||
|
Right-of-use assets |
2,236 | 3,971 | ||||||
|
Pension |
21,587 | 21,682 | ||||||
|
Other |
290 | 219 | ||||||
|
Total liabilities |
56,850 | 54,223 | ||||||
|
Deferred income tax liability, net |
$ | (32,282 | ) | $ | (24,320 | ) | ||
Net deferred income tax liabilities of $32.3 million and $24.3 million as of March 31, 2025 and 2024, respectively, are recognized as noncurrent liabilities in the Consolidated Balance Sheets.
The Company has State tax credit carryforwards amounting to $1.8 million (California), $1.0 million (New York), and $1.7 million (Wisconsin), which are available to reduce future taxes payable in each respective state through 2025 (California), through 2036 (New York), and through 2038 (Wisconsin). The Company has performed the required assessment regarding the realization of deferred tax assets and as of March 31, 2025, the Company has recorded a valuation allowance amounting to $3.7 million, which relates primarily to tax credit carryforwards which management has concluded it is more likely than not that they will not be realized in the ordinary course of operations. Although realization is not assured, management has concluded that it is more likely than not that the deferred tax assets for which a valuation allowance was determined to be unnecessary will be realized in the ordinary course of operations. The amount of net deferred tax assets considered realizable, however, could be reduced if actual future income or income tax rates are lower than estimated or if there are differences in the timing or amount of future reversals of existing taxable or deductible temporary differences.
Current rules on the accounting for uncertainty on income taxes prescribe a minimum recognition threshold for a tax position taken or expected to be taken in a tax return that is required to be met before being recognized in the consolidated financial statements. Those rules also provide guidance on derecognition, measurement, classification, interest and penalties, accounting in interim periods, disclosure and transition. The Company classifies the liability for uncertain tax positions in other long-term liabilities on the Consolidated Balance Sheets which is reflective of their expected settlement date.
The change in the liability for uncertain tax positions for fiscal years 2025 and 2024 consists of the following (in thousands):
|
As of: |
||||||||
|
March 31, |
March 31, |
|||||||
|
2025 |
2024 |
|||||||
|
Beginning balance |
$ | 830 | $ | 742 | ||||
|
Tax positions related to current year: |
||||||||
|
Additions |
- | 120 | ||||||
|
Tax positions related to prior years: |
||||||||
|
Additions |
82 | - | ||||||
|
Reductions |
- | (19 | ) | |||||
|
Lapses in statues of limitations |
- | (13 | ) | |||||
|
Ending balance |
$ | 912 | $ | 830 | ||||
The liability balances as of March 31, 2025 and 2024 do not include tax positions that are highly certain but for which there is uncertainty about the timing. Because of the impact of deferred tax accounting, other than interest and penalties, the disallowance of these positions would not impact the annual effective tax rate but would accelerate the payment of cash to the tax authority to an earlier period.
The Company recognizes interest and penalties accrued on unrecognized tax benefits as well as interest received from favorable settlements within income tax expense. During fiscal years 2025 and 2024, the accrued interest and penalties balance and change during the respective fiscal years was not significant associated with unrecognized tax benefits.
Although management believes that an adequate position has been made for uncertain tax positions, there is the possibility that the ultimate resolution could have an adverse effect on the net earnings of the Company. Conversely, if resolved favorably in the future, the related provisions would be reduced, thus having a positive impact on net earnings. During fiscal year 2025, there were no lapses in the statute of limitations for existing uncertain tax positions. During the next twelve months there could be a decrease in the uncertain tax positions of approximately $0.5 million due to a lapse in the statute of limitations.
The federal income tax returns for fiscal years after 2022 are subject to examination. The Company is currently involved in one state income tax audit covering fiscal year 2022 and fiscal year 2023. The Company is current on its federal and state tax returns.
9. Retirement Plans
The Company has a noncontributory defined benefit pension plan (the “Plan”) covering most employees who meet certain age-entry requirements and work a stated minimum number of hours per year. The Plan was amended to freeze accruals to new hires and rehires effective January 1, 2020. The Plan was adequately funded as of March 31, 2025 and 2024, respectively, and no contributions were required to meet legal funding requirements.
The following tables provide a reconciliation of the changes in the Plan’s benefit obligation and fair value of plan assets over the two-year period ended March 31, 2025 and a statement of the funded status as of March 31, 2025 and 2024 (in thousands):
|
Fiscal Year: |
||||||||
|
2025 |
2024 |
|||||||
|
Change in benefit obligation |
||||||||
|
Benefit obligation at beginning of year |
$ | 236,507 | $ | 235,038 | ||||
|
Service cost (excluding expenses) |
4,905 | 5,505 | ||||||
|
Interest cost |
11,967 | 11,388 | ||||||
|
Actuarial gain |
(14,616 | ) | (4,674 | ) | ||||
|
Benefit payments |
(21,375 | ) | (10,750 | ) | ||||
|
Benefit obligation at end of year |
$ | 217,388 | $ | 236,507 | ||||
|
Change in plan assets |
||||||||
|
Fair value of plan assets at beginning of year |
$ | 288,949 | $ | 294,342 | ||||
|
Actual return on plan assets |
26,901 | 6,428 | ||||||
|
Benefit payments and expenses |
(22,729 | ) | (11,821 | ) | ||||
|
Fair value of plan assets at end of year |
$ | 293,121 | $ | 288,949 | ||||
|
Funded status |
$ | 75,733 | $ | 52,442 | ||||
The Plan’s funded status increased by $23.3 million during fiscal year 2025 reflecting the actual fair value of plan assets and the projected benefit obligation as of March 31, 2025. This funded status increase was primarily driven by a $19.1 million reduction to the projected benefit obligation, as described in more detail below, and a $4.2 million increase in the fair value of plan assets. The Plan's accumulated benefit obligation was $203.8 million as of March 31, 2025 and $219.3 million as of March 31, 2024.
During fiscal year 2025, the actuarial gain in the Plan’s projected benefit obligation was driven by an increase in discount rates and changes in demographic assumptions to better reflect future plan experience, partially offset by the reflection of an assumed salary increase rate for fiscal year 2026 in excess of the long-term rate. During fiscal year 2024, the actuarial gain in the Plan’s projected benefit obligation was driven by an increase in discount rates, partially offset by the annual update in plan census data resulting in losses and the reflection of an assumed salary increase rate for fiscal year 2025 in excess of the long-term rate. Plan assets increased from $288.9 million as of March 31, 2024 to $293.1 million as of March 31, 2025 primarily due to favorable return on plan assets which outpaced payments of benefits.
During fiscal year 2025, the Company completed a lump-sum payout (“Lump-Sum Payout”) to certain terminated vested participants of the Plan. Under the Lump-Sum Payout, eligible participants were able to voluntarily elect an early payout of their pension benefits in the form of a lump-sum payment equal to the present value of the participant's pension benefits in satisfaction of all benefits payable to the participant under the Plan. The transaction did not trigger settlement accounting. In connection with the Lump-Sum Payout, payments of $10.2 million were distributed from existing plan assets. Payments under the Lump-Sum Payout are reflected as benefit payments in the reconciliation of the change in the Plan’s benefit obligation and fair value of plan assets for fiscal year 2025.
The following table provides the components of the Plan’s accumulated other comprehensive loss, pre-tax (in thousands):
|
Fiscal Year: |
||||||||||||
|
2025 |
2024 |
2023 |
||||||||||
|
Amounts Recognized in Accumulated Other Comprehensive Pre-Tax Loss |
||||||||||||
|
Prior service cost |
$ | (1 | ) | $ | (9 | ) | $ | (75 | ) | |||
|
Net loss |
(11,574 | ) | (34,883 | ) | (28,310 | ) | ||||||
|
Accumulated other comprehensive pre-tax loss |
$ | (11,575 | ) | $ | (34,892 | ) | $ | (28,385 | ) | |||
The following table provides the components of net periodic benefit cost for the Plan for fiscal years 2025, 2024, and 2023 (in thousands):
|
Fiscal Year: |
||||||||||||
|
2025 |
2024 |
2023 |
||||||||||
|
Service cost including administrative expenses |
$ | 5,805 | $ | 6,405 | $ | 8,240 | ||||||
|
Interest cost |
11,967 | 11,388 | 9,254 | |||||||||
|
Expected return on plan assets |
(18,504 | ) | (17,725 | ) | (16,104 | ) | ||||||
|
Amortization of net loss |
750 | 220 | - | |||||||||
|
Amortization of prior service cost |
8 | 66 | 91 | |||||||||
|
Net periodic benefit cost |
$ | 26 | $ | 354 | $ | 1,481 | ||||||
The Company utilizes a full yield curve approach in the estimation of net periodic benefit cost components by applying the specific spot rates along the yield curve used in determination of the benefit obligation to their underlying projected cash flows.
Prior service costs are amortized on a straight-line basis over the average remaining service period of active participants. Gains and losses in excess of 10% of the greater of the benefit obligation and the market-related value of assets are amortized over the average remaining service period of active participants.
The following table provides the components of other changes in plan assets and benefit obligation for fiscal years 2025, 2024, and 2023 (in thousands):
|
Fiscal Year: |
||||||||||||
|
2025 |
2024 |
2023 |
||||||||||
|
Other Changes in Plan Assets and Benefit Obligation Recognized in Other Comprehensive Income |
||||||||||||
|
Net actuarial (gain) loss |
$ | (22,559 | ) | $ | 6,792 | $ | (7,827 | ) | ||||
|
Amortization of: |
||||||||||||
|
Prior service cost |
(8 | ) | (65 | ) | (91 | ) | ||||||
|
Actuarial loss |
(750 | ) | (220 | ) | - | |||||||
|
Total recognized in other comprehensive income |
$ | (23,317 | ) | $ | 6,507 | $ | (7,918 | ) | ||||
The assumptions used to measure the Company’s benefit obligation and pension expense are shown in the following table:
|
Fiscal Year: |
||||||||||||
|
2025 |
2024 |
2023 |
||||||||||
|
Weighted Average Assumptions for Balance Sheet Liability at End of Year: |
||||||||||||
|
Discount rate - projected benefit obligation |
5.63 | % | 5.31 | % | 5.04 | % | ||||||
|
Rate of compensation increase |
3.00 | % | 3.00 | % | 3.00 | % | ||||||
|
Mortality table |
Pri-2012 Blue Collar Generational Table Improvement Scale MP-2021 |
Pri-2012 Blue Collar Generational Table Improvement Scale MP-2021 |
Pri-2012 Blue Collar Generational Table Improvement Scale MP-2021 |
|||||||||
|
Weighted Average Assumptions for Benefit Cost at Beginning of Year: |
||||||||||||
|
Discount rate - benefit obligations |
5.31 | % | 5.04 | % | 3.81 | % | ||||||
|
Discount rate - interest cost |
5.19 | % | 4.90 | % | 3.52 | % | ||||||
|
Discount rate - service cost |
5.40 | % | 5.16 | % | 3.93 | % | ||||||
|
Expected return on plan assets |
6.55 | % | 6.15 | % | 5.00 | % | ||||||
|
Rate of compensation increase |
3.00 | % | 3.00 | % | 3.00 | % | ||||||
Plan Assets
Investment Policy and Strategy — The Company maintains an investment policy that utilizes a liability-driven investments approach to reduce the ongoing volatility of the Plan’s funded status. The Company’s target allocation consists of 30% allocated to a diversified mix of return-seeking investments including equities and alternative investments and 70% allocated to liability-hedging fixed income investments.
The Company’s plan assets consist of the following:
|
Target Allocation for: |
Percentage of Plan |
|||||||||||
|
Fiscal Year |
March 31, 2025 |
March 31, 2024 |
||||||||||
|
Equity securities |
25 | % | 24 | % | 15 | % | ||||||
|
Debt securities |
69 | % | 72 | % | 80 | % | ||||||
|
Real estate |
3 | % | 2 | % | 2 | % | ||||||
|
Cash |
1 | % | 1 | % | 1 | % | ||||||
|
Other |
2 | % | 1 | % | 2 | % | ||||||
|
Total |
100 | % | 100 | % | 100 | % | ||||||
The following tables set forth the Company’s plan assets at fair value, by level within the fair value hierarchy (as defined in Note 1), as of March 31, 2025 and 2024 (in thousands):
|
As of March 31, 2025 |
||||||||||||||||||||
|
Level 1 |
Level 2 and Level 3 |
Subtotal |
Measured |
Total |
||||||||||||||||
|
Equity securities |
$ | 42,767 | $ | - | $ | 42,767 | $ | - | $ | 42,767 | ||||||||||
|
Held in common/collective trusts: |
||||||||||||||||||||
|
Equity securities |
- | - | - | 26,903 | 26,903 | |||||||||||||||
|
Real estate |
- | - | - | 4,451 | 4,451 | |||||||||||||||
|
Debt securities |
- | - | - | 212,162 | 212,162 | |||||||||||||||
|
Cash/short-term investments (2) |
- | - | - | 3,485 | 3,485 | |||||||||||||||
|
Other investments |
- | - | - | 3,353 | 3,353 | |||||||||||||||
|
Fair value of plan assets |
$ | 42,767 | $ | - | $ | 42,767 | $ | 250,354 | $ | 293,121 | ||||||||||
|
As of March 31, 2024 |
||||||||||||||||||||
|
Level 1 |
Level 2 and Level 3 |
Subtotal |
Measured |
Total |
||||||||||||||||
|
Equity securities |
$ | 26,371 | $ | - | $ | 26,371 | $ | - | $ | 26,371 | ||||||||||
|
Held in common/collective trusts: |
||||||||||||||||||||
|
Equity securities |
- | - | - | 17,730 | 17,730 | |||||||||||||||
|
Real estate |
- | - | - | 4,509 | 4,509 | |||||||||||||||
|
Debt securities |
- | - | - | 231,904 | 231,904 | |||||||||||||||
|
Cash/short-term investments (2) |
- | - | - | 3,388 | 3,388 | |||||||||||||||
|
Other investments |
- | - | - | 5,047 | 5,047 | |||||||||||||||
|
Fair value of plan assets |
$ | 26,371 | $ | - | $ | 26,371 | $ | 262,578 | $ | 288,949 | ||||||||||
|
(1) |
Certain investments that are measured at fair value using the net asset value (“NAV”) per share (or its equivalent) practical expedient have not been categorized in the fair value hierarchy but are included to reconcile to the amounts presented in the benefit obligations and funded status table. |
|
(2) |
The cash/short term investments consist of a money market fund that holds individual, high quality, short duration fixed income investments, however the fund does not trade on public markets. The Company elected to consistently apply the practical expedient to all investments within common/collective trusts, and therefore, the fair value of this fund is measured at net asset value per share. |
Expected Return on Plan Assets
For fiscal year 2025, the expected long-term rate of return on Plan assets was 6.55%. For fiscal year 2026, the Company will increase the expected long-term rate of return on Plan assets to 6.95%. The Company expected 6.55% and 6.95% to fall within the 35 to 65 percentile range of returns on investment portfolios with asset diversification similar to that of the Plan's target asset allocation for fiscal years 2025 and 2026, respectively.
Cash Flows
There are no expected employee or employer contributions for the fiscal year ending March 31, 2026.
Estimated future benefit payments reflecting expected future service for the fiscal years ending March 31 (in thousands):
|
2026 |
$ | 11,718 | ||
|
2027 |
12,423 | |||
|
2028 |
12,998 | |||
|
2029 |
13,612 | |||
|
2030 |
14,087 | |||
| 2031-2035 | 75,650 |
401(k) Plan
The Company also has an employees’ savings 401(k) plan covering all employees who meet certain age-entry requirements. Participants may make contributions up to the legal limit. The Company contributes additional amounts in the form of an annual fixed company match. The match is based on whether an individual is an eligible participant in the Company’s defined benefit pension plan. The Company made 401(k) matching contributions of $2.8 million, $2.5 million, and $1.5 million in fiscal years 2025, 2024, and 2023, respectively. In each of the aforementioned fiscal years, the matching contribution was comprised entirely of the Company’s treasury stock. The stock portion of the matching contribution is valued at current market value while the treasury stock is valued at cost.
Unfunded Deferred Compensation Plan
The Company sponsors an unfunded nonqualified deferred compensation plan to permit certain eligible employees to defer receipt of a portion of their compensation to a future date. As of March 31, 2025 and 2024, the Company has recorded a liability of $3.4 million and $2.5 million, respectively, in connection with the unfunded deferred compensation plan.
10. Stockholders’ Equity
Preferred Stock — The Company has authorized three classes of preferred stock: Class A Preferred Stock, 6% Voting Cumulative Preferred Stock, and Preferred Stock Without Par Value.
Class A Preferred Stock — There are 8,200,000 shares of Class A Preferred Stock which have been authorized with a par value of $0.025. The Class A Preferred Stock is designated in series by the Board of Directors, and as of March 31, 2025, there are three designated series.
|
● |
10% Voting Cumulative Convertible Preferred Stock - Series A — There are 1,000,000 shares of 10% Series A Preferred Stock that have been designated by the Board of Directors, with 407,240 shares outstanding as of March 31, 2025. The shares have a par value of $0.025 and a stated value of $0.25 and are convertible into one share of Class A Common Stock and one share of Class B Common Stock for every 20 shares of Series A Preferred Stock. During fiscal years 2025 and 2024, the Company paid dividends of $10,181, equating to $0.025 per share, on the Series A Preferred Stock. |
|
● |
10% Voting Cumulative Convertible Preferred Stock - Series B — There are 400,000 shares of 10% Series B Preferred Stock that have been designated by the Board of Directors, with 400,000 shares outstanding as of March 31, 2025. The shares have a par value of $0.025 and a stated value of $0.25 and are convertible into one share of Class A Common Stock and one share of Class B Common Stock for every 30 shares of Series B Preferred Stock. During fiscal years 2025 and 2024, the Company paid dividends of $10,000, equating to $0.025 per share, on the Series B Preferred Stock. |
|
● |
Participating Convertible Preferred Stock, Series 1998 — The shares of Participating Convertible Preferred Stock, Series 1998 are convertible at the holders’ option on a one-for-one basis into shares of Class A Common Stock, subject to antidilution adjustments. This series of preferred stock has the right to receive dividends and distributions at a rate equal to the amount of any dividends and distributions declared or made on the Class A Common Stock. No dividends were declared or paid on this preferred stock in fiscal year 2025 or 2024. In addition, this series of preferred stock has a liquidation preference equal to the stated value of $12.00 per share or, if greater, the total distribution which a holder would have received if all outstanding shares of this series were converted into shares of Class A Common Stock immediately prior to the date for calculating the total liquidation distribution. There were 7,891 shares of Participating Convertible Preferred Stock, Series 1998 designated and outstanding as of March 31, 2025 and 401 conversions during the fiscal year. Shares of this series may not be reissued by the Company once they have been converted or acquired by the Company, rather they became authorized but unissued shares of Class A Preferred and may be issued as part of another series of Class A Preferred Stock. |
As of March 31, 2025, the Company has an aggregate of 6,792,109 shares of non-designated Class A Preferred Stock authorized for issuance.
6% Voting Cumulative Preferred Stock — There are 200,000 shares of 6% Preferred Stock that are authorized and outstanding as of March 31, 2025. This class of preferred stock is callable at their par value of $0.25 at any time at the option of the Company. The Company paid dividends of $3,000, equating to $0.015 per share, on the 6% Preferred Stock during each of fiscal years 2025 and 2024.
Preferred Stock Without Par Value — There are 30,000 shares of Preferred Stock Without Par Value which have been authorized. This class of preferred stock is to be issued in series by the Board of Directors, none of which are designated or outstanding as of March 31, 2025.
Common Stock — The Class A Common Stock and Class B Common Stock have substantially identical rights with respect to any dividends or distributions of cash or property declared on shares of common stock, and rank equally as to the right to receive proceeds on liquidation or dissolution of the Company after payment of the Company’s indebtedness and liquidation right to the holders of preferred shares. However, holders of Class B Common Stock retain a full vote per share, whereas the holders of Class A Common Stock have voting rights of 1/20th of one vote per share on all matters as to which shareholders of the Company are entitled to vote. During fiscal year 2025, there were 108 shares of Class B Common Stock issued in lieu of cash compensation under the Company's Profit Sharing Bonus Plan and 3,870 shares of Class A Common Stock issued under the Company's Equity Incentive Plan.
Unissued shares of common stock reserved for conversion privileges of designated non-participating preferred stock were 33,695 of both Class A and Class B as of March 31, 2025 and 2024. Additionally, there were 7,891 and 8,292 shares of Class A reserved for conversion of the Participating Preferred Stock as of March 31, 2025 and 2024, respectively.
Treasury Stock — During fiscal year 2025 the Company repurchased $11.6 million, or 194,370 shares of its Class A Common Stock and none of its Class B Common Stock. The majority of the shares were repurchased under the Company's stock repurchase program and a small portion of the shares were repurchased for purposes of funding the cash needs for transfers and payments in connection with the employer stock investment fund under the 401(k) plan. As of March 31, 2025, there is a total of $210.7 million, or 5,305,301 shares, of repurchased stock. These shares are not considered outstanding and the Company accounts for treasury stock under the cost method. The Company contributed 34,487 treasury shares with a historical cost of $1.0 million for the 401(k) match in fiscal year 2025 as described in Note 9, Retirement Plans.
11. Fair Value of Financial Instruments
Cash and cash equivalents, restricted cash, accounts receivable, refundable income taxes, accounts payable, note payable, income taxes payable, and accrued expenses are reflected in the Consolidated Balance Sheets at carrying value, which approximates fair value due to the short-term maturity of these instruments.
Utilizing the fair value hierarchy, the Company determines fair value of money market funds using Level 1 inputs of quoted prices in active markets. Fair value of commercial paper is determined by using Level 2 inputs of quoted prices for similar assets in active markets.
The carrying value and estimated fair values of the Company's long-term debt and finance obligation are summarized as follows (in thousands):
|
As of: |
||||||||
|
March 31, 2025 |
March 31, 2024 |
|||||||
|
Carrying value |
$ | 369,878 | $ | 604,786 | ||||
|
Estimated fair value |
$ | 364,276 | $ | 599,408 | ||||
The estimated fair value for long-term debt and finance obligation (classified as Level 2 in the fair value hierarchy) is determined by the quoted market prices for similar debt (comparable to the Company’s financial strength) or current rates offered to the Company for debt with the same maturities. Since quoted prices for identical instruments in active markets are not available (Level 1), the Company makes use of observable market-based inputs to calculate fair value, which is Level 2.
12. Segment Information
The Company conducts its business almost entirely in food packaging with two reportable segments: Vegetable and Fruit/Snack. The reportable segments reflect how the Company's Chief Executive Officer, who is the Chief Operating Decision Maker (“CODM”), allocates resources and evaluates performance, and how the Company's internal management financial reporting is structured. The Company's CODM evaluates the performance of these reportable segments with a focus on earnings (loss) before income taxes as the measure of segment profit or loss.
The Other category consists of the Company's non-food operations including revenue derived from the sale of cans, ends, seed, outside revenue from the Company's aircraft operations, and certain corporate items. These ancillary activities do not qualify as an operating segment and are not eligible for aggregation with one of the identified operating segments; therefore they are combined and presented within the “Other” category.
Earnings (loss) before income taxes is utilized by the CODM to assess the profitability of the business. The CODM uses this information in making key operational decisions, including but not limited to, approval of annual budgets, expanding into new markets or product categories, pursuing business acquisitions or divestures, and initiating major capital expenditures. Analysis of current and historical trends of segment performance, including consideration of known favorable or unfavorable factors that contributed to the financial results for a given period, may also be performed as part of the process. The Company’s business strategies are prioritized and assessed to determine how resources should be allocated to achieve the initiatives and the associated impact on segment performance.
Segment information is provided on a FIFO basis which is consistent with how financial information is prepared internally and provided to the CODM. The LIFO impact on earnings (loss) before income taxes and total assets is shown separately for purposes of reconciling to the GAAP financial statement measure shown on the Consolidated Statements of Net Earnings and Consolidated Balance Sheets.
The Company adopted ASU 2023-07 during the fiscal year ended March 31, 2025, the impact of which expanded the required segment disclosures including retrospective application for prior fiscal year amounts. The following table summarizes segment earnings (loss) before income taxes and significant segment expenses (in thousands):
|
Fruit and |
Subtotal |
LIFO |
||||||||||||||||||||||
|
Vegetable |
Snack |
Other |
(FIFO basis) |
Impact |
Total |
|||||||||||||||||||
|
Fiscal Year 2025: |
||||||||||||||||||||||||
|
Net sales (1) |
$ | 1,439,029 | $ | 107,373 | $ | 32,485 | $ | 1,578,887 | $ | - | $ | 1,578,887 | ||||||||||||
|
Cost of products sold |
1,282,833 | 87,492 | 23,887 | 1,394,212 | 34,474 | 1,428,686 | ||||||||||||||||||
|
Selling and advertising expense (2) |
30,842 | 2,680 | 428 | 33,950 | - | 33,950 | ||||||||||||||||||
|
General and administrative expense |
27,440 | 3,243 | 10,826 | 41,509 | - | 41,509 | ||||||||||||||||||
|
Other segment items (3) |
(3,214 | ) | - | (9,772 | ) | (12,986 | ) | - | (12,986 | ) | ||||||||||||||
|
Interest expense, net of interest income |
30,370 | 2,251 | 624 | 33,245 | - | 33,245 | ||||||||||||||||||
|
Earnings (loss) before income taxes |
$ | 70,758 | $ | 11,707 | $ | 6,492 | $ | 88,957 | $ | (34,474 | ) | $ | 54,483 | |||||||||||
|
Income taxes |
13,259 | |||||||||||||||||||||||
|
Net earnings |
$ | 41,224 | ||||||||||||||||||||||
|
Additional segment disclosures: |
||||||||||||||||||||||||
|
Depreciation and amortization (4) |
$ | 40,770 | $ | 3,388 | $ | 618 | $ | 44,776 | $ | - | $ | 44,776 | ||||||||||||
|
Capital expenditures (5) |
$ | 60,431 | $ | 1,117 | $ | - | $ | 61,548 | $ | - | $ | 61,548 | ||||||||||||
|
Total assets |
$ | 1,433,773 | $ | 104,666 | $ | 2,246 | $ | 1,540,685 | $ | (359,256 | ) | $ | 1,181,429 | |||||||||||
|
Fiscal Year 2024: |
||||||||||||||||||||||||
|
Net sales (1) |
$ | 1,325,618 | $ | 100,835 | $ | 32,150 | $ | 1,458,603 | $ | - | $ | 1,458,603 | ||||||||||||
|
Cost of products sold |
1,137,351 | 88,993 | 21,699 | 1,248,043 | 22,342 | 1,270,385 | ||||||||||||||||||
|
Selling and advertising expense (2) |
30,843 | 3,011 | 369 | 34,223 | - | 34,223 | ||||||||||||||||||
|
General and administrative expense |
30,331 | 3,011 | 13,644 | 46,986 | - | 46,986 | ||||||||||||||||||
|
Other segment items (3) |
2,634 | 209 | (12,853 | ) | (10,010 | ) | - | (10,010 | ) | |||||||||||||||
|
Interest expense, net of interest income |
31,607 | 2,347 | 66 | 34,020 | - | 34,020 | ||||||||||||||||||
|
Earnings (loss) before income taxes |
$ | 92,852 | $ | 3,264 | $ | 9,225 | $ | 105,341 | $ | (22,342 | ) | $ | 82,999 | |||||||||||
|
Income taxes |
19,681 | |||||||||||||||||||||||
|
Net earnings |
$ | 63,318 | ||||||||||||||||||||||
|
Additional segment disclosures: |
||||||||||||||||||||||||
|
Depreciation and amortization (4) |
$ | 39,364 | $ | 3,480 | $ | 634 | $ | 43,478 | $ | - | $ | 43,478 | ||||||||||||
|
Capital expenditures (5) |
$ | 42,089 | $ | 1,536 | $ | - | $ | 43,625 | $ | - | $ | 43,625 | ||||||||||||
|
Total assets |
$ | 1,604,449 | $ | 100,627 | $ | 3,703 | $ | 1,708,779 | $ | (324,782 | ) | $ | 1,383,997 | |||||||||||
|
Fiscal Year 2023: |
||||||||||||||||||||||||
|
Net sales (1) |
$ | 1,374,468 | $ | 104,156 | $ | 30,728 | $ | 1,509,352 | $ | - | $ | 1,509,352 | ||||||||||||
|
Cost of products sold |
1,151,397 | 100,272 | 21,753 | 1,273,422 | 131,611 | 1,405,033 | ||||||||||||||||||
|
Selling and advertising expense (2) |
34,861 | 3,227 | 387 | 38,475 | - | 38,475 | ||||||||||||||||||
|
General and administrative expense |
28,278 | 2,858 | 11,461 | 42,597 | - | 42,597 | ||||||||||||||||||
|
Other segment items (3) |
9,693 | 554 | (15,118 | ) | (4,871 | ) | - | (4,871 | ) | |||||||||||||||
|
Interest expense, net of interest income |
12,684 | 1,180 | 461 | 14,325 | - | 14,325 | ||||||||||||||||||
|
Earnings (loss) before income taxes |
$ | 137,555 | $ | (3,935 | ) | $ | 11,784 | $ | 145,404 | $ | (131,611 | ) | $ | 13,793 | ||||||||||
|
Income taxes |
4,562 | |||||||||||||||||||||||
|
Net earnings |
$ | 9,231 | ||||||||||||||||||||||
|
Additional segment disclosures: |
||||||||||||||||||||||||
|
Depreciation and amortization (4) |
$ | 37,359 | $ | 3,024 | $ | 558 | $ | 40,941 | $ | - | $ | 40,941 | ||||||||||||
|
Capital expenditures (5) |
$ | 57,593 | $ | 13,406 | $ | 806 | $ | 71,805 | $ | - | $ | 71,805 | ||||||||||||
|
Total assets |
$ | 1,415,857 | $ | 95,658 | $ | 3,646 | $ | 1,515,161 | $ | (302,440 | ) | $ | 1,212,721 | |||||||||||
The following footnotes should be read in connection with the segment disclosure table shown on the previous page:
|
(1) |
Information received by the CODM as part of net sales includes trade promotion costs representing amounts paid to retailers for shelf space, to obtain favorable display positions, and to offer temporary price reductions for the sale of the Company's products to consumers. |
|
(2) |
Information received by the CODM as part of selling and advertising expenses includes direct selling expenses such as brokerage costs, sales force employee compensation, and costs incurred to execute sales to customers. |
|
(3) |
Other segment items include plant restructuring, other operating (income) expense, net and other non-operating income, each of which are not considered to be significant segment expenses. These amounts are combined into one line for purposes of reconciling to the reported measure of earnings (loss) before income taxes. |
|
(4) |
Depreciation and amortization are required to be disclosed as both amounts are included in the reported measure of earnings (loss) before income taxes. The amounts are not considered to be significant segment expenses and therefore are shown separately as an additional segment disclosure. Depreciation and amortization are included within the line items for cost of products sold and general and administrative expense. |
|
(5) |
Capital expenditures represent fixed asset additions recorded during the respective fiscal year, regardless of payment timing. The total shown for each fiscal year reconciles to amounts reported on the Consolidated Statements of Cash Flows within the sections for net cash used in investing activities and supplemental noncash transaction information. |
The following table sets forth United States and international net sales (in thousands, except percentages):
|
Fiscal Year: |
||||||||||||
|
2025 |
2024 |
2023 |
||||||||||
|
Net sales: |
||||||||||||
|
United States |
$ | 1,492,266 | $ | 1,374,774 | $ | 1,408,710 | ||||||
|
International |
86,621 | 83,829 | 100,642 | |||||||||
|
Total net sales |
$ | 1,578,887 | $ | 1,458,603 | $ | 1,509,352 | ||||||
|
As a percentage of net sales: |
||||||||||||
|
United States |
94.5 | % | 94.3 | % | 93.3 | % | ||||||
|
International |
5.5 | % | 5.7 | % | 6.7 | % | ||||||
|
Total |
100.0 | % | 100.0 | % | 100.0 | % | ||||||
For fiscal years 2025, 2024 and 2023, one customer (Customer A) accounted for approximately 16%, 14%, and 14% of net sales, respectively. As of March 31, 2025 and March 31, 2024, Customer A accounted for approximately 24% and 25% of trade receivables, respectively. No other customers accounted for more than 10% of the Company’s net sales or trade receivables for the respective periods. The Company does not have any long-lived assets located outside of the United Sates.
13. Legal Proceedings, Other Contingencies, and Commitments
In the ordinary course of its business, the Company is made a party to certain legal proceedings seeking monetary damages, including proceedings involving product liability claims, workers’ compensation along with other employee claims, tort and other general liability claims, for which it carries insurance, as well as patent infringement and related litigation. The Company is in a highly regulated industry and is also periodically involved in government actions for regulatory violations and other matters surrounding the manufacturing of its products, including, but not limited to, environmental, employee, and product safety issues. While it is not feasible to predict or determine the ultimate outcome of these matters, the Company does not believe that an adverse decision in any of these legal proceedings would have a material impact on its financial position, results of operations, or cash flows.
In the normal course of its business, the Company has posted a surety bond and a surety-backed letter of credit which serve as collateral for its workers’ compensation policy. The primary purpose of these instruments is to indemnify the beneficiary should the Company be unable to fulfill its obligations for claims asserted under the workers’ compensation policy. Both the surety bond and the surety-backed letter of credit are automatically renewed annually, unless the issuer gives cancellation notice in advance. As of March 31, 2025, the available undrawn amount of the surety bond and the surety-backed letter of credit was $4.0 million and $13.8 million, respectively. The Company is not aware of any outstanding claims made against either of these instruments.
14. Related Party Transactions
During fiscal year 2025, approximately 2% of vegetables supplied to the Company were grown by a Director of Seneca Foods Corporation. The Company’s grower purchases from the Director were $2.8 million, $3.0 million, and $3.1 million in fiscal years 2025, 2024 and 2023, respectively, pursuant to a raw vegetable grower contract. The Chairman of the Audit Committee reviewed the relationship and determined that the contract was negotiated at arm's length and on no more favorable terms than to other growers in the marketplace.
The Company incurred expenses for charitable contributions to the Seneca Foods Foundation (the “Foundation”), a related party, in the amount of $0.5 million, $1.0 million and $0.5 million in fiscal years 2025, 2024 and 2023, respectively. The Foundation is a nonprofit entity that supports charitable activities by making grants to unrelated organizations or institutions and is managed by current employees of the Company. The three current trustees of the Foundation are either current members of the Company's Board of Directors or an immediate family member of a Company Director.
The Company maintains a liability for retirement arrangements to beneficiaries that have family relationships with two of the Company’s current Directors. As of March 31, 2025 and 2024, the liability for these benefits totaled $1.0 million and $1.0 million, respectively. Payments are made monthly over the beneficiary’s lifetime.
15. Asset Acquisition
On November 8, 2023, the Company executed an Asset Purchase Agreement and associated License Agreement with B&G Foods, Inc., (the “Seller”) to acquire certain assets from the Seller relating to its Green Giant® shelf-stable vegetable product line (the “transaction”). The acquired assets include inventory and an associated license which allows the Company to manufacture, market, distribute, and sell Green Giant® shelf-stable vegetable products within the United States in perpetuity. The purchase price was $55.2 million in cash and was funded from borrowings under the Company’s Revolver.
The transaction was accounted for as an asset acquisition in accordance with ASC 805, Business Combinations, because substantially all of the fair value of the gross assets acquired were concentrated in a singular asset, the acquired inventory, which was recorded at a value of $52.5 million. Additionally, a portion of the purchase price was used to settle preexisting liabilities of $2.7 million. The amount was comprised of $3.9 million of deferred revenue for which the associated performance obligation had not yet been performed by the Company for the Seller prior to the transaction date, offset by $1.2 million of accompanying deferred costs.
To the stockholders and the Board of Directors of Seneca Foods Corporation
Opinion on the Financial Statements
We have audited the accompanying consolidated balance sheets of Seneca Foods Corporation and subsidiaries (the “Company”) as of March 31, 2025 and 2024, the related consolidated statements of net earnings, comprehensive income, stockholders' equity, and cash flows, for the years then ended, and the related notes and the schedules listed in the Index at Item 15 (collectively referred to as the “financial statements”). In our opinion, the 2025 and 2024 financial statements present fairly, in all material respects, the financial position of the Company as of March 31, 2025 and 2024, and the results of its operations and its cash flows for the years then ended in conformity with accounting principles generally accepted in the United States of America.
The consolidated financial statements of the Company for the year ended March 31, 2023, before the effects of the retrospective adjustments to the disclosures for the adoption of Accounting Standards Update (“ASU”) 2023-07, Segment Reporting (Topic 280): Improvements to Reportable Segment Disclosures (ASU 2023-07), discussed in Notes 1 and 12 to the financial statements, were audited by predecessor auditors whose report, dated June 13, 2023 (except for Note 4, as to which the date is July 31, 2023 and except for Note 12, before the effects of the change in accounting described in Notes 1 and 12, as to which the date is June 13, 2024), expressed an unqualified opinion on those statements. We have also audited the adjustments to the 2023 consolidated financial statements to retrospectively apply the change in accounting for the adoption of ASU 2023-07 in 2025, as discussed in Notes 1 and 12 to the financial statements. Our procedures included (1) comparing the amounts of segment costs of product sold, segment selling and advertising expense, segment general and administrative expense, and other segment items for the adoption of ASU 2023-07 to the Company’s underlying accounting analysis and (2) recalculating the mathematical accuracy of the reconciliations of segment amounts to the consolidated financial statements. In our opinion, such retrospective adjustments are appropriate and have been properly applied. However, we were not engaged to audit, review, or apply any procedures to the 2023 consolidated financial statements of the Company other than with respect to these retrospective adjustments, and accordingly, we do not express an opinion or any other form of assurance on the 2023 consolidated financial statements taken as a whole.
We have also audited, in accordance with the standards of the Public Company Accounting Oversight Board (United States) (PCAOB), the Company’s internal control over financial reporting as of March 31, 2025, based on criteria established in Internal Control — Integrated Framework (2013) issued by the Committee of Sponsoring Organizations of the Treadway Commission and our report dated June 12, 2025, expressed an unqualified opinion on the Company’s internal control over financial reporting.
Basis for Opinion
These financial statements are the responsibility of the Company’s management. Our responsibility is to express an opinion on the Company’s financial statements based on our audits. We are a public accounting firm registered with the PCAOB and are required to be independent with respect to the Company in accordance with the U.S. federal securities laws and the applicable rules and regulations of the Securities and Exchange Commission and the PCAOB.
We conducted our audits in accordance with the standards of the PCAOB. Those standards require that we plan and perform the audit to obtain reasonable assurance about whether the financial statements are free of material misstatement, whether due to error or fraud. Our audits included performing procedures to assess the risks of material misstatement of the financial statements, whether due to error or fraud, and performing procedures that respond to those risks. Such procedures included examining, on a test basis, evidence regarding the amounts and disclosures in the financial statements. Our audits also included evaluating the accounting principles used and significant estimates made by management, as well as evaluating the overall presentation of the financial statements. We believe that our audits provide a reasonable basis for our opinion.
Critical Audit Matter
The critical audit matter communicated below is a matter arising from the current-period audit of the financial statements that was communicated or required to be communicated to the audit committee and that (1) relates to accounts or disclosures that are material to the financial statements and (2) involved our especially challenging, subjective, or complex judgments. The communication of critical audit matters does not alter in any way our opinion on the financial statements, taken as a whole, and we are not, by communicating the critical audit matter below, providing a separate opinion on the critical audit matter or on the accounts or disclosures to which it relates.
Inventories — Refer to Notes 1 and 4 to the financial statements
Critical Audit Matter Description
Substantially all inventories are stated at the lower of cost or market with cost determined using the last in, first out (“LIFO”) method. An actual valuation of inventory under the LIFO method is made at the end of each fiscal year based on inventory levels and costs at that time to adjust the inventory balance from First in, first out (“FIFO”) cost to LIFO cost. The excess of inventory valuation calculated using FIFO cost over LIFO cost amounted to $359.3 million. Management performs manual calculations using significant assumptions and judgments regarding inventory quantities and costs to estimate the amount of excess FIFO cost over LIFO cost.
We identified valuation of inventories at LIFO cost as a critical audit matter because of the significant assumptions, manual calculations, and judgments in the calculation of the excess of FIFO cost over LIFO cost, specifically due to the changes in current costs and quantities of materials. Auditing management’s calculations was complex and required a high degree of auditor judgement and subjectivity when performing audit procedures and evaluating the audit evidence obtained, due to the sensitivity of the calculation to quantity and price fluctuations.
How the Critical Audit Matter Was Addressed in the Audit
Our audit procedures related to the valuation of FIFO over LIFO inventories included the following, among others:
|
● |
We tested the effectiveness of the control over the calculation of the excess of FIFO cost over LIFO cost, including management's control over the key inputs of the calculation for inventory valuation. |
|
● |
We tested the completeness, accuracy, and relevance of the underlying data used in management’s calculation of the excess of FIFO cost over LIFO cost. |
|
● |
We tested the calculations and application of management’s methodologies related to the calculation of the excess of FIFO cost over LIFO cost. |
|
● |
We tested the mathematical accuracy of management’s manual calculation. |
Deloitte & Touche LLP
Rochester, NY
June 12, 2025
We have served as the Company's auditor since 2023.
To the Stockholders and Board of Directors
Seneca Foods Corporation
Opinion on the Financial Statements
We have audited, before the effects of the adjustments to retrospectively apply the change in accounting described in Notes 1 and 12, the accompanying consolidated statements of net earnings, comprehensive income, stockholders' equity, and cash flows for the year ended March 31, 2023, and the related notes and the schedule listed in the Index at Item 15 (collectively referred to as the “financial statements”). In our opinion, the financial statements referred to above present fairly, in all material respects, the results of the Company's operations and its cash flows for the year ended March 31, 2023, in conformity with accounting principles generally accepted in the United States of America.
We were not engaged to audit, review, or apply any procedures to the adjustments to retrospectively apply the change in accounting (as described in Notes 1 and 12) and, accordingly we do not express an opinion or any other form of assurance about whether such adjustments are appropriate and have been properly applied. Those adjustments were audited by the successor auditor.
Basis for Opinion
The Company's management is responsible for these financial statements. Our responsibility is to express an opinion on the Company’s financial statements based on our audit. We are a public accounting firm registered with the PCAOB and are required to be independent with respect to the Company in accordance with the U.S. federal securities laws and the applicable rules and regulations of the Securities and Exchange Commission and the PCAOB.
We conducted our audits in accordance with the standards of the PCAOB. Those standards require that we plan and perform the audit to obtain reasonable assurance about whether the financial statements are free of material misstatement, whether due to error or fraud. Our audit included performing procedures to assess the risks of material misstatement of the financial statements, whether due to error or fraud, and performing procedures that respond to those risks. Such procedures included examining, on a test basis, evidence regarding the amounts and disclosures in the financial statements. Our audit also included evaluating the accounting principles used and significant estimates made by management, as well as evaluating the overall presentation of the financial statements. We believe that our audit provides a reasonable basis for our opinion.
/s/ Plante Moran, P.C.
We served as the Company's auditor from 2019 to 2023.
Southfield, Michigan
June 13, 2023, except for Note 4, as to which the date is July 31, 2023 and except for Note 12, before the effects of the change in accounting described in Notes 1 and 12, as to which the date is June 13, 2024
Schedule II
VALUATION AND QUALIFYING ACCOUNTS
(In thousands)
Seneca Foods Corporation
|
Balance at |
Charged / |
Charged to |
Deductions |
Balance |
|||||||||||||||||
|
beginning |
(credited) |
other |
from |
at end |
|||||||||||||||||
|
of period |
to income |
accounts |
reserve |
of period |
|||||||||||||||||
|
Year-ended March 31, 2023: |
|||||||||||||||||||||
|
Allowance for doubtful accounts |
$ | 54 | $ | (20 | ) | $ | - | $ | - |
(a) |
$ | 34 | |||||||||
|
Income tax valuation allowance |
$ | 3,931 | $ | 1,076 | $ | - | $ | - | $ | 5,007 | |||||||||||
|
Year-ended March 31, 2024: |
|||||||||||||||||||||
|
Allowance for doubtful accounts |
$ | 34 | $ | 289 | $ | - | $ | 270 |
(a) |
$ | 53 | ||||||||||
|
Income tax valuation allowance |
$ | 5,007 | $ | (123 | ) | $ | - | $ | - | $ | 4,884 | ||||||||||
|
Year-ended March 31, 2025: |
|||||||||||||||||||||
|
Allowance for doubtful accounts |
$ | 53 | $ | (128 | ) | $ | - | $ | (146 | ) |
(a) |
$ | 71 | ||||||||
|
Income tax valuation allowance |
$ | 4,884 | $ | (1,165 | ) | $ | - | $ | - | $ | 3,719 | ||||||||||
(a) Accounts written off, net of recoveries.
Management’s Annual Report on Internal Control Over Financial Reporting
Our management is responsible for establishing and maintaining adequate internal control over the Company’s financial reporting (as defined in Rules 13a-15(f) and 15d-15(f) under the Exchange Act). Because of its inherent limitations, internal control over financial reporting may not prevent or detect all misstatements. Projections of any evaluation of effectiveness to future periods are subject to the risk that controls may become inadequate because of changes in conditions, or that the degree of compliance with the policies or procedures may deteriorate.
Our management assessed the effectiveness of the Company’s internal control over financial reporting as of March 31, 2025. In making this assessment, our management used the criteria set forth by the Committee of Sponsoring Organizations of the Treadway Commission (“COSO”) in Internal Control-Integrated Framework (2013). Based on our assessment, management believes that, as of March 31, 2025, our internal control over financial reporting is effective based on those criteria.
The Company’s independent registered public accounting firm, Deloitte & Touche LLP, has issued its report on the effectiveness of the Company’s internal control over financial reporting. Their report appears on the next page.
Report of Independent Registered Public Accounting Firm
To the stockholders and the Board of Directors of Seneca Foods Corporation
Opinion on Internal Control over Financial Reporting
We have audited the internal control over financial reporting of Seneca Foods Corporation and subsidiaries (the “Company”) as of March 31, 2025, based on criteria established in Internal Control — Integrated Framework (2013) issued by the Committee of Sponsoring Organizations of the Treadway Commission (COSO). In our opinion, the Company maintained, in all material respects, effective internal control over financial reporting as of March 31, 2025, based on criteria established in Internal Control — Integrated Framework (2013) issued by COSO.
We have also audited, in accordance with the standards of the Public Company Accounting Oversight Board (United States) (PCAOB), the consolidated financial statements as of and for the year ended March 31, 2025, of the Company and our report dated June 12, 2025, expressed an unqualified opinion on those financial statements.
Basis for Opinion
The Company’s management is responsible for maintaining effective internal control over financial reporting and for its assessment of the effectiveness of internal control over financial reporting, included in the accompanying Management’s Annual Report on Internal Control Over Financial Reporting. Our responsibility is to express an opinion on the Company’s internal control over financial reporting based on our audit. We are a public accounting firm registered with the PCAOB and are required to be independent with respect to the Company in accordance with the U.S. federal securities laws and the applicable rules and regulations of the Securities and Exchange Commission and the PCAOB.
We conducted our audit in accordance with the standards of the PCAOB. Those standards require that we plan and perform the audit to obtain reasonable assurance about whether effective internal control over financial reporting was maintained in all material respects. Our audit included obtaining an understanding of internal control over financial reporting, assessing the risk that a material weakness exists, testing and evaluating the design and operating effectiveness of internal control based on the assessed risk, and performing such other procedures as we considered necessary in the circumstances. We believe that our audit provides a reasonable basis for our opinion.
Definition and Limitations of Internal Control over Financial Reporting
A company’s internal control over financial reporting is a process designed to provide reasonable assurance regarding the reliability of financial reporting and the preparation of financial statements for external purposes in accordance with generally accepted accounting principles. A company’s internal control over financial reporting includes those policies and procedures that (1) pertain to the maintenance of records that, in reasonable detail, accurately and fairly reflect the transactions and dispositions of the assets of the company; (2) provide reasonable assurance that transactions are recorded as necessary to permit preparation of financial statements in accordance with generally accepted accounting principles, and that receipts and expenditures of the company are being made only in accordance with authorizations of management and directors of the company; and (3) provide reasonable assurance regarding prevention or timely detection of unauthorized acquisition, use, or disposition of the company’s assets that could have a material effect on the financial statements.
Because of its inherent limitations, internal control over financial reporting may not prevent or detect misstatements. Also, projections of any evaluation of effectiveness to future periods are subject to the risk that controls may become inadequate because of changes in conditions, or that the degree of compliance with the policies or procedures may deteriorate.
/s/ Deloitte & Touche LLP
Rochester, NY
June 12, 2025
Shareholder Information
Seneca Foods Corporation
The Company’s common stock is traded on The NASDAQ Global Select Market. The 5.3 million Class A outstanding shares and 1.6 million Class B outstanding shares are owned by 98 and 107 shareholders of record, as of March 31, 2025, respectively.
As of March 31, 2025, the most restrictive credit agreement limitation on the Company’s payment of dividends, to holders of Class A or Class B Common Stock is an annual total limitation of $50,000, reduced by aggregate annual dividend payments totaling $23,181 that the Company presently pays on two outstanding classes of preferred stock. Payment of dividends to common stockholders is made at the discretion of the Company’s Board of Directors and depends, among other factors, on earnings, capital requirements, and the operating and financial condition of the Company. The Company has not declared or paid a common dividend in many years.
Stock Performance Graph
The graph below compares the cumulative total shareholder return on the Company’s Class A Common Stock (SENEA) for the last five fiscal years ended March 31 with (1) the cumulative return on the S&P SmallCap 600 and (2) the cumulative return on the S&P Packaged Foods & Meats Index for this same time period. The graph assumes the investment of $100 on March 31, 2020 and reinvestment of all dividends. The common stock price performance shown on the graph only reflects the change in the Company’s SENEA price relative to the noted indices and is not necessarily indicative of future price performance.
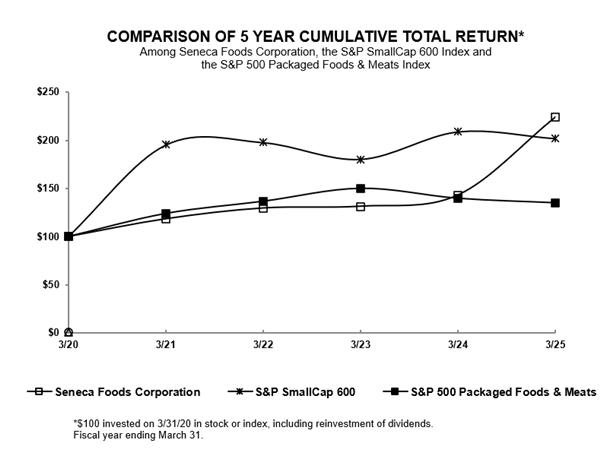
|
For the Fiscal Year Ended March 31, |
||||||||||||||||||||||||
|
2020 |
2021 |
2022 |
2023 |
2024 |
2025 |
|||||||||||||||||||
|
Seneca Foods Corporation |
$ | 100.00 | $ | 118.38 | $ | 129.56 | $ | 131.40 | $ | 143.04 | $ | 223.83 | ||||||||||||
|
S&P SmallCap 600 |
$ | 100.00 | $ | 195.33 | $ | 197.73 | $ | 180.30 | $ | 209.02 | $ | 201.95 | ||||||||||||
|
S&P Packaged Foods and Meats Index |
$ | 100.00 | $ | 124.03 | $ | 136.74 | $ | 150.26 | $ | 139.86 | $ | 135.16 | ||||||||||||
Corporate Information
Seneca Foods Corporation
|
Directors |
||
|
Kraig H. Kayser, Chairman |
John P. Gaylord |
Donald J. Stuart |
|
Former President and Chief Executive Officer |
President |
Managing Partner/Founder |
|
Seneca Foods Corporation |
Jacintoport Terminal Company |
Cadent Consulting Group |
|
Kathryn J. Boor, Ph.D. |
Linda K. Nelson |
Bruce E. Ware |
|
Dean of the Graduate School and Vice Provost |
Former Chief Financial Officer |
Chairman and Chief Executive Officer |
|
for Graduate Education at Cornell University |
Birds Eye Foods |
One America Bancorp Inc. |
|
Peter R. Call |
Paul L. Palmby |
Keith A. Woodward |
|
President |
President and Chief Executive Officer |
Former Chief Financial Officer |
|
My-T Acres, Inc. |
Seneca Foods Corporation |
Tennant Company |
|
Executive Officers |
||
|
Paul L. Palmby, President |
Timothy R. Nelson, Senior Vice President |
|
|
Chief Executive Officer |
Operations, President of Fruit and Snack |
|
|
Dean E. Erstad, Senior Vice President |
Michael S. Wolcott, Senior Vice President |
|
|
Sales and Marketing |
Chief Financial Officer and Treasurer |
|
|
Officers |
||
|
Carl A. Cichetti, Senior Vice President |
Aaron M. Girard, Senior Vice President |
Gregory R. Ide, Vice President |
|
Technology and Planning, Chief Information Officer |
Logistics |
Corporate Controller and Assistant Secretary |
|
John D. Exner, General Counsel |
Matt J. Henschler, Senior Vice President |
Julie A. Roloson, Senior Vice President |
|
Secretary |
Technical Services and Development |
Human Resources, Chief Administrative Officer |
|
Operations |
||
|
Jon A. Brekken, Vice President |
Leon Lindsay, Vice President |
James Quinlan, Vice President |
|
Western Vegetable Operations |
Strategic Sourcing |
Can Manufacturing |
|
Aimee Jo Schilling, Vice President |
Eric E. Martin, Vice President |
Mary Sagona, Vice President |
|
Human Resources |
Eastern Vegetable Operations |
Accounting |
|
Paul Hendrickson, Vice President |
Janelle Murphy, Vice President |
Benjamin M. Scherwitz, Vice President |
|
Process Excellence |
Procurement |
Technical Services |
|
Harry Henschler, Vice President |
Beth Newell, General Manager |
Joshua Studier, Vice President |
|
Safety |
Seneca Snack |
Accounting |
|
Richard Leppert, General Manager |
Timothy Nolan, Vice President |
Richard L. Waldorf, Vice President |
|
Seneca Flight |
Information Technology |
Customer Service |
|
Sales and Marketing Groups |
||
|
Carl B. Bowling, Vice President |
George E. Hopkins, III, Vice President |
Aaron L. Wadell, Vice President |
|
Branded Sales |
Private Label Retail |
E-Business |
|
Matt Brown, Vice President |
Kevin F. Lipps, Vice President |
|
|
Foodservice Dry Grocery |
International Sales |
|
|
David A. Carter, Vice President |
Victoria A. Ninneman, Vice President |
|
|
Marketing and National Accounts |
Industrial and Ingredient Sales |
|
|
Jesse Hayes, Vice President |
Courtney Schulis, Vice President |
|
|
Frozen Sales and Chain Accounts |
Glace Sales |
Exhibit 21
LIST OF SUBSIDIARIES
The following is a listing of significant subsidiaries 100% owned by Seneca Foods Corporation, directly or indirectly:
|
Name |
State |
|
|
Dundee Insurance Company, Inc. |
Utah |
|
|
Gray & Company |
Oregon |
|
|
Green Valley Foods LLC |
Delaware |
|
|
Marion Foods, Inc. |
New York |
|
| Portland Food Products Company | Oregon | |
|
Seneca Snack Company |
Washington |
|
EXHIBIT 23.1
Consent of Independent Registered Public Accounting Firm
We consent to the incorporation by reference in Registration Statement Nos. 333-12365, 333-145916, and 333-166846 on Form S-8 of our reports dated June 12, 2025, relating to the financial statements of Seneca Foods Corporation and its subsidiaries and the effectiveness of Seneca Foods Corporation’s internal control over financial reporting appearing in this Annual Report on Form 10-K for the year ended March 31, 2025.
/s/ Deloitte & Touche LLP
Rochester, New York
June 12, 2025
EXHIBIT 23.2
Consent of Independent Public Accounting Firm
We consent to the incorporation by reference in the registration statements (No. 333-12365, 333-145916 and 333-166846) on Form S-8 of Seneca Foods Corporation with respect to our report dated June 13, 2023, except for Note 4, as to which the date is July 31, 2023, and except for Note 12, before the effects of the change in accounting described in Notes 1 and 12, as to which the date is June 13, 2024, relating to the consolidated financial statements of Seneca Foods Corporation, which is included in this Form 10-K.
/s/ Plante Moran, P.C.
Southfield, Michigan
June 12, 2025
EXHIBIT 31.1
CERTIFICATION
I, Paul L. Palmby, certify that:
|
1. |
I have reviewed this annual report on Form 10-K of Seneca Foods Corporation; |
|
2. |
Based on my knowledge, this report does not contain any untrue statement of a material fact or omit to state a material fact necessary to make the statements made, in light of the circumstances under which such statements were made, not misleading with respect to the period covered by this report; |
|
3. |
Based on my knowledge, the financial statements, and other financial information included in this report, fairly present in all material respects the financial condition, results of operations and cash flows of the Registrant as of, and for, the periods presented in this report; |
|
4. |
The registrant's other certifying officer(s) and I are responsible for establishing and maintaining disclosure controls and procedures (as defined in Exchange Act Rules 13a-15(e) and 15d-15(e)) and internal control over financial reporting (as defined in Exchange Act Rules 13a-15(f) and 15d-15(f)) for the registrant and have: |
|
(a) |
Designed such disclosure controls and procedures, or caused such disclosure controls and procedures to be designed under our supervision, to ensure that material information relating to the Registrant, including its consolidated subsidiaries, is made known to us by others within those entities, particularly during the period in which this report is being prepared; |
|
(b) |
Designed such internal control over financial reporting, or caused such internal control over financial reporting to be designed under our supervision, to provide reasonable assurance regarding the reliability of financial reporting and the preparation of financial statements for external purposes in accordance with generally accepted accounting principles; |
|
(c) |
Evaluated the effectiveness of the Registrant’s disclosure controls and procedures and presented in this report our conclusions about the effectiveness of the disclosure controls and procedures, as of the end of the period covered by this report based on such evaluation; and |
|
(d) |
Disclosed in this report any change in the Registrant’s internal control over financial reporting that occurred during the Registrant’s most recent fiscal quarter (the Registrant’s fourth fiscal quarter in the case of an annual report) that has materially affected, or is reasonably likely to materially affect, the Registrant’s internal control over financial reporting; and |
|
5. |
The Registrant’s other certifying officer(s) and I have disclosed, based on our most recent evaluation of internal control over financial reporting, to the Registrant’s auditors and the audit committee of the Registrant’s board of directors (or persons performing the equivalent functions): |
|
(a) |
All significant deficiencies and material weaknesses in the design or operation of internal control over financial reporting which are reasonably likely to adversely affect the Registrant’s ability to record, process, summarize and report financial information; and |
|
(b) |
Any fraud, whether or not material, that involves management or other employees who have a significant role in the Registrant’s internal control over financial reporting. |
|
By: |
/s/ Paul L. Palmby |
||
|
Paul L. Palmby |
|||
|
President and Chief Executive Officer (Principal Executive Officer) |
|||
|
June 12, 2025 |
EXHIBIT 31.2
CERTIFICATION
I, Michael S. Wolcott, certify that:
|
1. |
I have reviewed this annual report on Form 10-K of Seneca Foods Corporation; |
|
2. |
Based on my knowledge, this report does not contain any untrue statement of a material fact or omit to state a material fact necessary to make the statements made, in light of the circumstances under which such statements were made, not misleading with respect to the period covered by this report; |
|
3. |
Based on my knowledge, the financial statements, and other financial information included in this report, fairly present in all material respects the financial condition, results of operations and cash flows of the Registrant as of, and for, the periods presented in this report; |
|
4. |
The registrant's other certifying officer(s) and I are responsible for establishing and maintaining disclosure controls and procedures (as defined in Exchange Act Rules 13a-15(e) and 15d-15(e)) and internal control over financial reporting (as defined in Exchange Act Rules 13a-15(f) and 15d-15(f)) for the registrant and have: |
|
(a) |
Designed such disclosure controls and procedures, or caused such disclosure controls and procedures to be designed under our supervision, to ensure that material information relating to the Registrant, including its consolidated subsidiaries, is made known to us by others within those entities, particularly during the period in which this report is being prepared; |
|
(b) |
Designed such internal control over financial reporting, or caused such internal control over financial reporting to be designed under our supervision, to provide reasonable assurance regarding the reliability of financial reporting and the preparation of financial statements for external purposes in accordance with generally accepted accounting principles; |
|
(c) |
Evaluated the effectiveness of the Registrant’s disclosure controls and procedures and presented in this report our conclusions about the effectiveness of the disclosure controls and procedures, as of the end of the period covered by this report based on such evaluation; and |
|
(d) |
Disclosed in this report any change in the Registrant’s internal control over financial reporting that occurred during the Registrant’s most recent fiscal quarter (the Registrant’s fourth fiscal quarter in the case of an annual report) that has materially affected, or is reasonably likely to materially affect, the Registrant’s internal control over financial reporting; and |
|
5. |
The Registrant’s other certifying officer(s) and I have disclosed, based on our most recent evaluation of internal control over financial reporting, to the Registrant’s auditors and the audit committee of the Registrant’s board of directors (or persons performing the equivalent functions): |
|
(a) |
All significant deficiencies and material weaknesses in the design or operation of internal control over financial reporting which are reasonably likely to adversely affect the Registrant’s ability to record, process, summarize and report financial information; and |
|
(b) |
Any fraud, whether or not material, that involves management or other employees who have a significant role in the Registrant’s internal control over financial reporting. |
|
By: |
/s/ Michael S. Wolcott |
||
|
Michael S. Wolcott |
|||
|
Senior Vice President, Chief Financial Officer and Treasurer (Principal Financial Officer) |
|||
|
June 12, 2025 |
EXHIBIT 32
CERTIFICATION PURSUANT TO
18. U.S.C. SECTION 1350,
AS ADOPTED PURSUANT TO
SECTION 906 OF THE SARBANES-OXLEY ACT OF 2002
In connection with the Annual Report of Seneca Foods Corporation (the "Registrant") on Form 10-K for the period ended March 31, 2025 as filed with the Securities and Exchange Commission on the date hereof (the "Report"), we, Paul L. Palmby, President, Chief Executive Officer, and Michael S. Wolcott, Chief Financial Officer, of the Registrant, certify, pursuant to 18 U.S.C. 1350, as adopted pursuant to 906 of the Sarbanes-Oxley Act of 2002, that, to our knowledge:
|
(1) |
The Report fully complies with the requirements of section 13(a) or 15(d) of the Securities Exchange Act of 1934; and |
|
(2) |
The information contained in the Report fairly presents, in all material respects, the financial condition and results of operations of the Registrant. |
|
By: |
/s/ Paul L. Palmby |
||
|
Paul L. Palmby |
|||
|
President and Chief Executive Officer |
|||
|
June 12, 2025 |
|||
|
By: |
/s/ Michael S. Wolcott |
||
|
Michael S. Wolcott |
|||
|
Senior Vice President, Chief Financial Officer and Treasurer |
|||
|
June 12, 2025 |