UNITED STATES
SECURITIES AND EXCHANGE COMMISSION
Washington, D.C. 20549
FORM 10-K
(Mark One)
| ☒ |
|
ANNUAL REPORT PURSUANT TO SECTION 13 OR 15(d) OF THE SECURITIES EXCHANGE ACT OF 1934 |
| For the fiscal year ended December 31, 2024 | ||
| or | ||
| ☐ | TRANSITION REPORT PURSUANT TO SECTION 13 OR 15(d) OF THE SECURITIES EXCHANGE ACT OF 1934 | |
| For the transition period from ___________ to ___________ | ||
Commission File Number: 001-38873
Palomar Holdings, Inc.
(Exact name of registrant as specified in its charter)
| Delaware |
|
83-3972551 |
| (State or other jurisdiction of incorporation or organization) |
|
(I.R.S. Employer Identification No.) |
| |
|
|
| 7979 Ivanhoe Avenue, Suite 500 La Jolla, California |
|
92037 |
| (Address of principal executive offices) |
|
(Zip Code) |
(619) 567-5290
Registrant’s telephone number, including area code)
Securities registered pursuant to Section 12(b) of the Act:
| Title of each class |
Trading Symbol(s) |
Name of each exchange on which registered |
| Common Stock, par value $0.0001 per share |
PLMR |
The Nasdaq Stock Market LLC |
Securities registered pursuant to section 12(g) of the Act: None
Indicate by check mark if the registrant is a well-known seasoned issuer, as defined in Rule 405 of the Securities Act. Yes ☒ No ☐
Indicate by check mark if the registrant is not required to file reports pursuant to Section 13 or 15(d) of the Securities Act. Yes ☐ No ☒
Indicate by check mark whether the registrant (1) has filed all reports required to be filed by Section 13 or 15(d) of the Securities Exchange Act of 1934 during the preceding 12 months (or for such shorter period that the registrant was required to file such reports), and (2) has been subject to such filing requirements for the past 90 days. Yes ☒ No ☐
Indicate by check mark whether the registrant has submitted electronically every Interactive Data File required to be submitted pursuant to Rule 405 of Regulation S-T (§ 232.405 of this chapter) during the preceding 12 months (or for such shorter period that the registrant was required to submit such files). Yes ☒ No ☐
Indicate by check mark whether the registrant is a large accelerated filer, an accelerated filer, a non-accelerated filer, smaller reporting company, or an emerging growth company. See the definitions of “large accelerated filer,” “accelerated filer,” “smaller reporting company,” and “emerging growth company” in Rule 12b-2 of the Exchange Act.
| Large accelerated filer ☒ |
Accelerated filer ☐ |
| Non-accelerated filer ☐ |
Smaller reporting company ☐ |
| Emerging growth company ☐ |
|
If an emerging growth company, indicate by check mark if the registrant has elected not to use the extended transition period for complying with any new or revised financial accounting standards provided pursuant to Section 13(a) of the Exchange Act. ☐
Indicate by check mark whether the registrant has filed a report on and attestation to its management’s assessment of the effectiveness of its internal control over financial reporting under Section 404(b) of the Sarbanes-Oxley Act (15 U.S.C. 7262(b)) by the registered public accounting firm that prepared or issued its audit report.☒
If securities are registered pursuant to Section 12(b) of the Act, indicate by check mark whether the financial statements of the registrant included in the filing reflect the correction of an error to previously issued financial statements. ☐
Indicate by check mark whether any of those error corrections are restatements that required a recovery analysis of incentive-based compensation received by any of the registrant’s executive officers during the relevant recovery period pursuant to §240.10D-1(b). ☐
Indicate by check mark whether the registrant is a shell company (as defined in Rule 12b-2 of the Act). Yes ☐ No ☒
Aggregate market value of shares of the registrant’s common stock held by non-affiliates as of June 30, 2024 was approximately $1,977,345,127
Number of shares of the registrant’s common shares outstanding at February 22, 2025: 26,677,622
DOCUMENTS INCORPORATED BY REFERENCE:
Portions of the registrant’s definitive proxy statement relating to its 2025 annual meeting of stockholders (the "2025 Proxy Statement") are incorporated by reference into Part III of this Annual Report on Form 10-K. The 2025 Proxy Statement will be filed with the Securities and Exchange Commission within 120 days after the end of the fiscal year covered by this Annual Report on Form 10-K.
| |
|
Page |
| |
|
|
| |
|
|
| |
|
|
| |
|
|
| Item 1C. | Cybersecurity | 51 |
| |
|
|
| |
|
|
| |
|
|
| |
|
|
| |
|
|
| |
|
|
| |
|
|
| |
|
|
| Management’s Discussion and Analysis of Financial Condition and Results of Operations |
||
| |
|
|
| |
|
|
| |
|
|
| Changes in and Disagreements with Accountants on Accounting and Financial Disclosure |
||
| |
|
|
| |
|
|
| |
|
|
| Disclosure Regarding Foreign Jurisdictions that Prevent Inspections |
||
| |
|
|
| |
|
|
| |
|
|
| |
|
|
| |
|
|
| Security Ownership of Certain Beneficial Owners and Management and Related Stockholder Matters |
||
| |
|
|
| Certain Relationships and Related Transactions, and Director Independence |
||
| |
|
|
| |
|
|
| |
|
|
| |
|
|
| |
|
|
Who We Are
We are a specialty insurance company that provides property and casualty insurance products to individuals and businesses. We use our underwriting and analytical expertise to provide innovative insurance products serving five categories: Earthquake, Inland Marine and Other Property, Casualty, Fronting, and Crop. We use proprietary data analytics and a modern technology platform to offer our customers flexible products with customized and granular pricing for both the admitted and excess and surplus lines (“E&S”) markets. Our insurance company subsidiaries, Palomar Specialty Insurance Company (“PSIC”) and Palomar Excess and Surplus Insurance Company (“PESIC”) carry an “A” rating from A.M. Best Company (“A.M. Best”), a leading rating agency for the insurance industry.
We distribute our products through multiple channels, including retail agents, program administrators, wholesale brokers, and partnerships with other insurance companies. Our business strategy is supported by a comprehensive risk transfer program with reinsurance coverage that we believe reduces earnings volatility and provides appropriate levels of protection from catastrophic events. Our management team combines decades of insurance industry experience across specialty underwriting, reinsurance, program administration, distribution, and analytics.
Founded in 2014, we have significantly grown our business and have generated attractive returns. We have organically increased gross written premiums from $16.6 million in our first year of operations to $1.5 billion for the year ended December 31, 2024, which reflects a compound annual growth rate of approximately 57%. We have also been profitable since 2016 and our net income growth since 2016 reflects a compound annual growth rate of 43%.
We seek to continuously grow our income by developing products in lines of business that harness our core competencies and where we believe we can generate attractive risk adjusted returns. In recent years, we have introduced several new products including Crop, Environmental Liability, and E&S Casualty. In January 2025, we completed the acquisition of First Indemnity of America ("FIA"), a New Jersey domiciled insurance carrier specializing in surety bonds for small to medium sized contractors primarily in the Northeast United States. These new products diversify our book of business and broaden our product portfolio. We believe that our market opportunity, distinctive products, and differentiated business model position us to grow our business profitably.
Our Business
Our management team founded our company to address unmet needs that we perceived to exist in certain specialty insurance markets. These markets have primarily been served by either large generalist insurance companies and state-managed entities applying “one-size-fits-all” pricing and policy forms across broad geographies. Our admitted products feature rates and policy forms approved by state insurance departments and are backed by state guaranty funds, providing a further level of security to policyholders. We believe that for our personal lines products, both our customers and distribution partners prefer the ease of use and security of admitted products with flexible coverages. We write surplus lines policies primarily for our commercial business. As the E&S market does not involve the same level of regulation and required approvals as the admitted market, our surplus lines products enable us to react quickly to changing market conditions.
We believe that we can generate superior risk-adjusted returns through the use of underwriting methods that apply a more granular approach to pricing than what is typically offered by standard carriers and that better reflect our customers' underlying risk. We believe this market acceptance and return potential is evidenced by the fact that we have quickly and profitably grown to become the 2nd largest earthquake insurer in the state of California and the 3rd largest earthquake insurer in the United States. We also continue to experience growth and profitability across our other lines of business.
Our five product lines include: Earthquake, Inland Marine and Other Property, Casualty, Fronting, and Crop. We seek to write a diverse mix of business by loss exposure, customer type and geography to capitalize on market opportunities, mitigate the potential impact of any single catastrophe event or shock loss, and reduce our cost of reinsurance.
We continue to develop new product offerings for lines of business that harness our core competencies and where we believe we can generate attractive risk-adjusted returns. Recent examples of our commitment to developing new products include the expansion of our Casualty and Crop insurance offerings. In January 2025, we completed the acquisition of FIA, a New Jersey domiciled insurance carrier specializing in surety bonds for small to medium sized contractors primarily in the Northeast United States. We believe these markets complement our existing product offerings and offer significant growth opportunities across both the admitted and E&S markets.
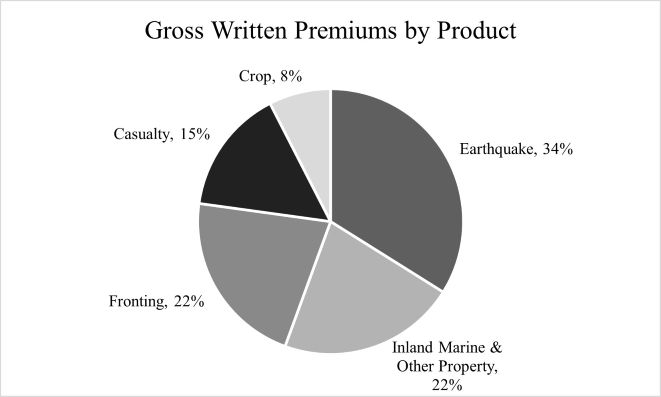
We seek to have a diversified business mix, anchored by our core earthquake offerings and we have made substantial progress diversifying our business by product, market, and geography. In 2014, our first year of operations, all our premiums were related to earthquake insurance. For the year ended December 31, 2024, 34% of our gross written premiums were related to earthquake insurance and non-earthquake related premiums grew 45% while earthquake related premiums grew 20% versus the prior year.
Our admitted insurance subsidiary, PSIC, is licensed in 44 states and we have the flexibility to write nationally through our surplus lines subsidiary, PESIC. California represents our largest current exposure with 43% of our gross written premiums for the year ended December 31, 2024. Our business strategy involves continuing to grow our core earthquake insurance business, extending the reach of Inland Marine and Other Property Products, and diversifying our book of business into uncorrelated products such as Casualty, Fronting and Crop. The following charts illustrate our business mix by product, state, and entity for the year ended December 31, 2024:
We employ a highly granular and analytical underwriting process to assess each insurance policy that we write, and we ensure that the risk characteristics of business assumed through our channel partnerships or written by program administrator partners are consistent with our underwriting of direct business. Our systems enable us to underwrite our personal lines business automatically within minutes by leveraging our proprietary modeling techniques to analyze data at the geocode or ZIP code level. With our commercial products, we balance automation with human expertise and controls to underwrite more complex risks. Because the data we collect through our underwriting process is highly granular, we can utilize detailed portfolio analytics to actively manage aggregation of policies and to ensure an appropriate dispersion of risks across our full portfolio. Similarly, our Casualty products are subject to extensive risk analysis, including review by experienced underwriters, thorough actuarial review, fostering broker relationships to obtain complete underwriting information, and accurately assessing and quantifying loss exposures to inform pricing, terms and conditions, limits, and attachment points.
Our Competitive Strengths
We believe that our competitive strengths include:
Focus on capturing market share and expanding underserved markets. We focus on specialty insurance markets that we believe are underserved, and where we believe we can capture market share and expand the market to new customers. In our target markets, there are few direct competitors who focus exclusively on specialty risks. With our specialized knowledge of these risks and our customized products, pricing and risk management, we believe we can serve these markets better than our competitors. Furthermore, we can expand our markets by creating products that attract insureds who previously had not obtained coverage. Our focus and expertise have enabled us to rapidly increase our market share; for example, we have grown to become the 2nd largest earthquake insurer in California and the 3rd largest earthquake insurer in the United States. In markets with similar characteristics, we are experiencing growth and profitability across our other lines of business. We believe that our focus on addressing the needs of underserved specialty markets provides us with a competitive advantage.
Differentiated products built with the customer in mind. We have invested significant time and resources into developing what we believe are innovative and unique product offerings to address customer needs within our target markets. Our products generally offer our customers flexible features that are not typical of standard products in our markets. By offering our customers the ability to manage pricing, coverage options, and deductibles, we believe we have created products that are attractive both to those who have existing coverages with our competitors, and to those who have not historically bought insurance in our target markets. Furthermore, since our admitted products have been approved by individual state regulators and are supported by proprietary pricing models, we believe that these products are not easily replicable, particularly by existing carriers who would face the burden of gathering data, building new models, and revising existing rates and policy forms with regulators.
Product offerings in both the admitted and E&S markets. We believe that our core capabilities can be applied to both the admitted as well as the E&S insurance markets. Admitted products are backed by state guarantee funds and, as a result, are subject to more regulation, as admitted insurance companies must receive approval for rates and policy forms from individual state regulators. Our admitted insurance company subsidiary, PSIC, is licensed to write business in 44 states. We primarily serve the personal lines insurance market through the sale of admitted insurance products as those risks tend to be more homogenous in nature and retail agents prefer the sale of admitted products. We offer E&S insurance products through our surplus lines insurance company subsidiary, PESIC, which is licensed to do business on a national basis. We primarily serve the commercial lines insurance market through the sale of E&S insurance products as those markets are better suited to the flexibility of rate and form available to E&S carriers. Having E&S offerings allows us to react quickly to changing market conditions and to accelerate the expansion of our business nationally as we do not have to go through the process of receiving required approvals from individual state regulators.
Analytically driven, disciplined and scalable underwriting. Our underwriting approach combines decades of specialized underwriting experience of our management team with sophisticated, customized modeling tools we have developed that utilize extensive geospatial and actuarial data across all our lines of business. Our proprietary models enable automated pricing of risks at the geocode or ZIP code level, in contrast to our competitors who we believe use less granular analytics and more manual underwriting processes. For example, our Residential Flood products underwrite risks at the distinct address level compared to broader pricing zones employed by alternative product offerings in the market. Our analytical pricing framework is embedded in all facets of our business and is incorporated into our filings, pricing, underwriting and risk management. We believe that our analytically-driven underwriting approach has been the foundation of our ability to generate attractive risk-adjusted underwriting margins.
Multi-channel distribution model. Our open architecture distribution framework allows us to attract and underwrite business from multiple channels. We work with a wide variety of retail agents, program administrators, and wholesale brokers. We serve over 25 insurance companies as a specialty partner either by issuing companion policies or providing reinsurance for in-force risks that fit our strict underwriting parameters. The breadth and flexibility of our distribution model allows us to generate premium from many different parts of the insurance ecosystem and to rapidly take advantage of changing market conditions.
Sophisticated and conservative risk transfer program. Our risk transfer program utilizes excess of loss, quota share and property per risk coverages for both our property and casualty products. We manage our exposure to catastrophe events through several risk mitigation strategies, including the purchase of reinsurance. We believe that our reinsurance program provides appropriate levels of protection and improves visibility into our earnings. Our current reinsurance program is designed to limit our net loss before tax from a single event to $20 million, equivalent to approximately 2.7% of our total stockholders’ equity as of December 31, 2024. At each reinsurance treaty renewal, we consider any plans to change the underlying insurance coverage we offer, our current capital, our risk appetite, and the cost and availability of reinsurance coverage, which may vary from time to time. Further, we buy program specific quota share reinsurance coverage for certain lines of business to mitigate the impact of attritional losses on underwriting results. In our quota share agreements, we cede a portion of our premiums to reinsurers and, in return, we also cede a proportionate amount of losses and receive ceding commissions from the reinsurers.
Emphasis on the use of technology and analytics across our business. We have built a proprietary operating platform that employs best practices derived from our management team’s extensive prior experience. Our technology platform is not burdened by outdated technology and processes which may be utilized by older insurance companies. In building our platform, we have emphasized automated processes that use granular data and analytics consistently across all aspects of our business. Our internally developed Palomar Automated Submission System (“PASS”) acts as our interface with retail agents and wholesale brokers. PASS serves as the conduit to our policy administration system that integrates policy issuance, underwriting, billing and portfolio analytics. Our platform enables us to rapidly quote and bind policies via automated processing, and to run detailed risk-management analytics for internal and external constituents including distribution partners, carrier partners and reinsurers. We believe that this real-time access to data and analytics provides us with an advantage in distributing our products, managing our risk, and purchasing reinsurance.
Highly experienced management team and board. Our management team is highly qualified, with an average of more than twenty years of relevant experience in insurance, reinsurance and capital markets. We are led by our Chairman and Chief Executive Officer, Mac Armstrong, who prior to founding Palomar was President of Arrowhead General Insurance Agency (“Arrowhead”). Many of our key management team members such as Mr. Armstrong, Jon Christianson, our President, Jon Knutzen, our Chief Risk Officer, and Chris Uchida, our Chief Financial Officer, have served in their roles for over five years and worked together prior to Palomar. We have also recently made key management hires in operations, technology, claims, people and talent, E&S Casualty, and Crop. These new management hires are insurance industry veterans with proven track records and deep industry knowledge. We believe their skills and experience will assist Palomar during our next phase of growth and expansion. In addition, our Board of Directors is comprised of accomplished industry veterans who bring decades of experience from prior roles with insurance and other companies.
Our Strategy
We believe that our approach will allow us to achieve our goals of both growing our business and generating attractive returns. Our strategy involves:
Expand our presence in existing markets. We compete in the United States property and casualty market that represented over $965 billion in total written premiums during 2023. By comparison, we generated $1.5 billion of gross written premiums for the year ended December 31, 2024. We believe that our differentiated product offerings will enable us to continue growing in our existing markets by (i) gaining market share from competitors who have less flexible product offerings; (ii) continuing to expand our strong distribution network; and (iii) increasing the total addressable market by providing attractive products to customers who previously elected not to purchase coverage. We continue to evaluate additional geographic markets and lines of business where we believe we can generate attractive risk-adjusted returns by harnessing our core competencies.
Maintain our distinctive combination of profitability and growth. Our analytically informed risk selection and disciplined underwriting guidelines enable us to identify segments of the market that are both underserved and mispriced. As a result, we are able to generate an attractive underwriting profit by expanding the addressable market and winning market share with our distinctive products. For the years ended December 31, 2024 and 2023, our return on equity (“ROE”) was 19.6% and 18.5%, and our adjusted ROE was 22.2% and 21.9%, respectively. As we seek premium growth, we intend to remain disciplined in our pricing, underwriting, and risk management processes, including closely managing our net probable maximum loss (“PML”), average annual loss (“AAL”), and spread of risk. We will remain focused on lines of business with attractive pricing dynamics and a favorable risk / return profile, and we will not participate in markets where we believe our business model cannot add incremental value.
Maintain a diversified book of business. We currently write a book of specialty insurance that is diversified by underlying loss exposure, customer type and geography. Our major product lines and exposures are uncorrelated, such that events contributing to a loss in one product line are unlikely to generate material losses in our other product lines. Furthermore, our Crop products are uncorrelated with the traditional P&C cycle, enhancing the diversification of our specialty product portfolio. The diversification of our book of business improves our risk-adjusted returns, insulates us from swings in any single insurance or reinsurance market, and allows us to capitalize on market shifts opportunistically. As we grow, we intend to maintain a diversified book of business and continually capitalize on these advantages.
Leverage our underwriting, analytics, and risk transfer acumen to generate fee income. We generate fee income through the use of quota share reinsurance treaties whereby third-party reinsurers pay us a ceding commission in order to access attractive pools of risk. Our Fronting and Crop products offer additional sources of fee income that we earn from program administrators and reinsurers seeking to access our licensed insurance companies. Our multi-channel distribution model produces attractive business that we aim to translate into a balanced mix of underwriting and fee income. As a result, we have an increasing number of partnerships where we write policies on behalf of other insurance and reinsurance companies who pay us a ceding commission to access the business. We believe these partnerships are an important validation of the intellectual property and expertise we have developed, and that this strategy enables us to scale our business more quickly and profitably and provides a growing and valuable fee stream to complement our profitable underwriting operations.
Continue to purchase conservative reinsurance coverage, while optimizing for risk-adjusted returns. We believe that protecting our earnings and balance sheet through the use of reinsurance is critical to our business and supports our ability to meet obligations to our policyholders and other constituents, and generate strong returns for our stockholders. We plan to maintain a conservative, robust reinsurance program to provide protection against severe or frequent losses. Our goal is to protect our earnings by constructing a reinsurance program that mitigates losses and ensures profitability in spite of potential shock losses or catastrophic activity. As we grow, we expect that we will benefit from increased scale and diversification of risk in our business, and we plan to optimize our reinsurance program continuously by adjusting terms, structure, pricing, and participants to maximize our risk-adjusted returns.
Continue to invest in proprietary technology assets that deepen our competitive advantage. We believe that the success of our business is centered upon our relentless commitment to using technology to improve our business. For example, we have dedicated software developers focused on building application programming interfaces (“APIs”), which enable seamless integration into the point-of-sale systems of our partner carriers and distribution partners. This integration increases the ease of use for our partners, embeds us within their systems, and facilitates real-time sharing of information between our distribution, underwriting, and risk management functions. We will continue to evaluate and invest in proprietary and third-party technology assets, which deepen our competitive advantage, strengthen our operations, and improve our returns.
History
We are an insurance holding company that was originally incorporated under the laws of the Cayman Islands in October 2013. In March 2019, we implemented a domestication pursuant to Section 388 of the Delaware General Corporation Law and became a Delaware corporation.
Our primary operating subsidiary, PSIC, is an insurance company domiciled in the state of Oregon and is an admitted insurer licensed to write business in 44 states as of December 31, 2024. PSIC was formed in February 2014. In August 2014, we incorporated Palomar Specialty Reinsurance Company Bermuda Ltd.(“PSRE”), a Bermuda-based reinsurance subsidiary that provides reinsurance support exclusively to PSIC and PESIC. In August 2015, we incorporated Prospect General Insurance Agency, Inc., now known as Palomar Insurance Agency, Inc., (“PIA”), to underwrite specialty insurance products on behalf of third-party insurance companies. During 2020, we received regulatory approval for and capitalized PESIC. PESIC is domiciled in the State of Arizona and licensed in Arizona to write surplus lines business on a nationwide basis across all our existing lines of business. During 2023, we formed Palomar Underwriters Exchange Organization, Inc. ("PUEO"), a Delaware incorporated management company that provides services by serving as the attorney-in-fact to Laulima Exchange (“Laulima”), a Hawaii domiciled reciprocal exchange.
Our Products
We provide personal and commercial specialty insurance products in our target markets. With the goal of giving customers better options, we designed an analytical framework to create flexible products with innovative coverages and pricing that we believe better reflects the underlying risk. Using this framework, we initially introduced Residential and Commercial Earthquake products in 2014 and have subsequently expanded our product portfolio to cover multiple specialty risks in the United States. We have grown our business by entering markets that demonstrated one or more of the following attributes: (i) have loss characteristics, including limited attritional losses, similar to our initial earthquake product, (ii) can benefit from our technology platform, data analytics and customer centric products, and/or (iii) allow us to leverage our existing underwriting talent, reinsurance expertise and/or distribution relationships.
Our lines of business include: Earthquake, Inland Marine and Other Property, Casualty, Fronting, and Crop. We aim to develop a diversified portfolio with exposure spread across geographic regions with limited correlation. Although our largest exposure is in the state of California, we write business across the United States. We tailor our risk participation to optimize our returns depending on the conditions of specific markets. In total, we are licensed as an admitted insurer in 44 total states. The following tables show gross written premiums (“GWP”) by state and product for the years ended December 31, 2024, 2023 and 2022.
| Year Ended December 31, |
||||||||||||||||||||||||
| 2024 |
2023 |
2022 |
||||||||||||||||||||||
| ($ in thousands) |
||||||||||||||||||||||||
| % of |
% of |
% of |
||||||||||||||||||||||
| Amount |
GWP |
Amount |
GWP |
Amount |
GWP |
|||||||||||||||||||
| State |
||||||||||||||||||||||||
| California |
$ | 668,635 | 43.4 | % | $ | 600,791 | 52.6 | % | $ | 418,809 | 47.5 | % | ||||||||||||
| Texas |
124,416 | 8.1 | % | 95,517 | 8.4 | % | 90,459 | 10.3 | % | |||||||||||||||
| Hawaii |
72,558 | 4.7 | % | 47,388 | 4.2 | % | 40,157 | 4.5 | % | |||||||||||||||
| Florida |
67,008 | 4.3 | % | 47,595 | 4.2 | % | 38,715 | 4.4 | % | |||||||||||||||
| Washington |
57,900 | 3.8 | % | 49,494 | 4.3 | % | 41,827 | 4.7 | % | |||||||||||||||
| New York |
38,919 | 2.5 | % | 18,424 | 1.6 | % | 12,510 | 1.5 | % | |||||||||||||||
| Oregon |
29,550 | 1.9 | % | 23,220 | 2.0 | % | 24,108 | 2.7 | % | |||||||||||||||
| Illinois |
20,901 | 1.4 | % | 22,340 | 2.0 | % | 17,368 | 2.0 | % | |||||||||||||||
| Other |
462,075 | 30.0 | % | 236,789 | 20.7 | % | 197,915 | 22.4 | % | |||||||||||||||
| Total Gross Written Premiums |
$ | 1,541,962 | 100.0 | % | $ | 1,141,558 | 100.0 | % | $ | 881,868 | 100.0 | % | ||||||||||||
| Year Ended December 31, |
||||||||||||||||||||||||
| 2024 |
2023 |
2022 |
||||||||||||||||||||||
| ($ in thousands) |
||||||||||||||||||||||||
| % of |
% of |
% of |
||||||||||||||||||||||
| Amount |
GWP |
Amount |
GWP |
Amount |
GWP |
|||||||||||||||||||
| Product (1) |
||||||||||||||||||||||||
| Earthquake |
$ | 522,864 | 33.9 | % | $ | 436,897 | 38.3 | % | $ | 345,480 | 39.2 | % | ||||||||||||
| Inland Marine and Other Property |
334,079 | 21.7 | % | 250,022 | 21.9 | % | 232,918 | 26.4 | % | |||||||||||||||
| Fronting |
333,188 | 21.6 | % | 352,141 | 30.8 | % | 223,249 | 25.3 | % | |||||||||||||||
| Casualty |
235,592 | 15.3 | % | 90,388 | 7.9 | % | 80,221 | 9.1 | % | |||||||||||||||
| Crop |
116,239 | 7.5 | % | 12,110 | 1.1 | % | — | — | % | |||||||||||||||
| Total Gross Written Premiums |
$ | 1,541,962 | 100.0 | % | $ | 1,141,558 | 100.0 | % | $ | 881,868 | 100.0 | % | ||||||||||||
(1) - Beginning in 2024, the Company has updated the categorization of its products to align with management's current strategy and view of the business. Prior year amounts have been reclassified for comparability purposes. The recategorization is for presentation purposes only and does not impact overall gross written premiums.
Our five product lines are summarized as follows:
Earthquake
We offer Residential and Commercial Earthquake products on both admitted and E&S basis. Our Residential Earthquake products insure against home damage, contents, appurtenant structures, and temporary housing costs following an earthquake. Our products are designed with flexibility, offering a variety of deductible options and customizable coverage limits. We aim to attract customers who haven't previously purchased earthquake insurance. Our pricing model, based on data from top catastrophe models, allows us to accurately assess and price risks at the ZIP code or geocode level. Unlike competitors who use broad pricing zones, we factor in regional differences like soil types, liquefaction risk, and proximity to fault lines. This approach helps us offer more precise rates and often provides rate relief, especially in low-risk areas with historically low earthquake insurance uptake. Our Commercial Earthquake products focus on providing coverage for benign commercial risks where the business interruption exposure is typically less than 15% of the total insured value (“TIV”). We attempt to avoid risks where the contents are hard to value or represent a disproportionate percentage of the value.
Inland Marine and Other Property
Our Inland Marine and Other Property products include Inland Marine, Hawaii Hurricane, Commercial All Risk, Excess National Property, Residential Flood, and other miscellaneous property products. These products are written on an admitted and on an E&S basis directly and through program administrators. Policy limits vary by product; however, our E&S offerings are designed to target larger limit business and do not directly compete with our admitted offerings. We believe the flexibility of these products enables us to compete in select market segments and price risk appropriately.
Casualty
We provide Casualty products on an admitted and E&S basis. We primarily focus on niche segments of the Casualty market including Real Estate Agent Errors and Omissions, Excess Liability, and Environmental Liability coverages written directly and through program administrators. We utilize experienced underwriters and thorough actuarial review to optimize our pricing, terms and conditions, limits, and attachment points.
In addition to our existing Casualty product offerings, we announced the launch of our E&S Casualty product at the end of 2024. The new product will focus on Primary & Excess Construction and Excess Liability lines of business. This new line of business further demonstrates our commitment to providing comprehensive insurance solutions that address evolving market needs. On January 1, 2025 we completed the acquisition of FIA, a New Jersey domiciled insurance carrier specializing in surety bonds for small to medium sized contractors primarily in the Northeast United States.
Fronting
Our Fronting products offer reinsurers, insurance carriers and managing general agents the ability to utilize our licensed admitted and E&S insurance companies to design and operate customized insurance programs. We issue insurance policies for other insurance companies that may not have the licensure, product suite or rating to serve their desired markets, or for programs supported by reinsurance or alternative capital providers. In addition, we enter fronting arrangements with program administrators that require a broadly licensed, highly rated carrier to conduct business in certain states.
Crop
Our Crop insurance products are comprised primarily of multi-peril crop insurance offered in connection with the U.S. Department of Agriculture's Risk Management Agency and designed to cover revenue shortfalls or production losses due to natural causes such as drought, hail, and wind. We currently write Crop insurance with the goal of minimizing exposure to any single region. We also offer Livestock and Private Product Crop solutions.
Marketing and Distribution
We market and distribute our products through a multi-channel, open architecture distribution model which includes retail agents, wholesale brokers, program administrators and carrier partnerships. We have well-defined underwriting criteria and have designed our distribution model to access our targeted risks through what we believe to be the most efficient channels.
Retail Agents: We primarily distribute our personal lines products through retail agents. We believe that retail agents are an important pillar of our distribution model due to the high retention rates and rate stability that we are able to achieve with policies sold through this channel. We provide agents with flexible products that are preferred by end consumers and are easier for agents to sell. In many cases, we provide agents with direct access to our policy management system that enables them to quote, bind and issue policies in a matter of minutes. We believe this ease of use and quick speed-to-quote serves as a competitive advantage.
Wholesale Brokers: We distribute our commercial lines products primarily through wholesale brokers. Wholesale brokers are an important channel for commercial insurance products as they control much of the premium in these segments. We target brokers with experience serving our target markets and with business plans consistent with our strategy and underwriting objectives. Brokers must demonstrate an ability to produce both the quality and quantity of business that we seek. To assist with this goal, our underwriters regularly visit with brokers to market and discuss the products we offer.
Program Administrators: Within select lines of business, we partner with program administrators to harness the efficiency and scale of their existing marketing and distribution infrastructures. In some cases, policies bound by our program administrators are pre-underwritten using pricing models that we have developed and are programmed into the policy administration system of those partners. For business that is not automatically underwritten, we set strict underwriting guidelines to which our partners must adhere. We audit the underwriting, systems, financial strength and reporting capabilities of all of our program administrators on a regular basis.
Carrier Partnerships: Given our unique specialty focus and underwriting expertise, we are a carrier of choice for other insurance companies seeking a specialty insurance partner to act as a fronting carrier, transfer certain classes of risk, satisfy insurance department mandatory offer requirements or provide a more comprehensive risk solution to their customers. As of December 31, 2024, we had partnerships with over 25 insurance companies. Several carriers invite us to provide a companion offer for residential earthquake insurance alongside their homeowners’ insurance policy offerings. Other carriers will direct their captive agents to our online system so that they may quote, bind and issue policies directly. Finally, we offer assumed reinsurance arrangements to carriers whereby we assume up to 100% of the underlying risk for specific classes of business in exchange for a ceding commission. Our assumed reinsurance treaties represent risks that we would ordinarily underwrite on a primary basis and/or that fit well within our risk tolerance, however, the cedant either (i) has already written these policies or (ii) the cedant wants to issue the policies on its paper but not retain any of the risk and as such prefers an assumed reinsurance partnership. We believe that our carrier partnerships with sophisticated industry participants speak to the value and quality of our products, service offering and systems. Furthermore, carrier partnerships are a highly scalable distribution model as they enable us to tap into a sizable customer base and to quickly build scale in new markets. With all partnerships, we review pricing at the policy level to ensure that the risk characteristics of both new and assumed business are consistent with our underwriting of direct business.
Underwriting
Our underwriting team combines comprehensive data analysis with experienced underwriting techniques to build a profitable, stable and diversified book of business. Our underwriting process involves securing an adequate level of underwriting information, classifying and evaluating each individual risk exposure, assessing the impact of the risk upon our existing portfolio, and pricing the risk accordingly. Our overarching underwriting philosophy is ‘to write what we know’ a straightforward approach that allows our underwriters to focus on business they understand and can process quickly without sacrificing diligence and attention to detail.
We develop our underwriting guidelines and pricing models for our property and casualty products through traditional underwriting metrics, management experience, and advanced data analytics. Our underwriters actively collaborate with our actuarial team to determine pricing and risk exposure. This analytical and underwriting expertise framework enables us to offer rate relief in low risk areas and to accurately price risks that are at higher risk.
Personal lines policies are issued via automated underwriting. Using our predefined underwriting guidelines, distribution partners can rapidly quote and bind accounts lower in limit via automated processing. We believe that automated underwriting of personal lines policies improves efficiency, reduces errors, and enhances the customer experience.
Since commercial lines risks involve additional complexity and do not lend themselves to highly automated underwriting, we combine robust risk analysis and data collection with underwriter expertise to evaluate individual risks and to quote business efficiently. We regularly audit data gathered during our underwriting process to determine the accuracy of rating information and risk pricing. For example, we often inspect properties as part of our underwriting process to discover any unrepaired damage and identify any other conditions that affect the insurability of the property. Similarly, our casualty products are subject to extensive risk analysis, including review by experienced underwriters, thorough actuarial review, fostering broker relationships to obtain complete underwriting information, and accurately assessing and quantifying loss exposures to inform pricing, terms and conditions, limits, and attachment points. Our underwriters bring specific line of business experience including underwriting expertise, distribution relationships and support from the reinsurance community while collaborating closely with our actuarial team on pricing. In addition, we continue to pursue the use of technology to streamline inspections and other components of the underwriting process.
We apply disciplined underwriting principles when selecting program administrator partners. We proactively engage with our program managers to create specific underwriting guidelines and techniques. We regularly conduct underwriting, claims and financial audits to ensure consistent execution upon underwriting guidelines, claims processing and compliance with regulatory requirements.
Ongoing risk management of our portfolio in aggregate is a critical component of our underwriting process. We use third-party catastrophe modeling software to evaluate our ongoing risk exposure. We regularly review the output of these models to evaluate the geographic spread of our risk, including the evaluation of AAL and PML by line of business and for the portfolio as a whole. This review enables us to monitor our exposure to correlated risks and optimize the design and pricing of our reinsurance program including the purchase of appropriate reinsurance coverage.
Claims Management
Claims are overseen by our in-house claims team, led by our Chief Claims Officer. To supplement our in-house team, we outsource part of our claims handling infrastructure to third-party administrators (“TPAs”). We currently contract with multiple TPAs to reduce our reliance on any single TPA, as well as to benefit from expertise of individual vendors in specific lines of business. Our Chief Claims Officer is responsible for overseeing our TPAs, including the management of catastrophe event preparation, loss reserves, claim evaluation, arbitration, mediation, and settlement. Claims are reported directly to us and the applicable TPA, which adheres to agreed upon service level standards.
In the case of a catastrophe event, our technology infrastructure and data analytics enable us to identify potentially affected policies immediately and begin assisting our customers by notifying our TPAs, our reinsurance partners and other potentially impacted parties. Contracting with a network of TPAs improves our ability to mobilize claims adjusters immediately to the areas where our customers are most affected and helps insulate us from the “demand surge” following a catastrophe event. To prepare for a potential catastrophe event, we run simulations and work closely with our TPAs to ensure there are dedicated desk and field adjusters to handle the volume of claims that would be expected in each loss scenario. Using each earthquake and hurricane scenario, we project losses and identify an individualized and optimal catastrophe response plan for each event.
We review claims files and claims reports from our TPAs for accuracy and reasonableness on an ongoing basis. We review all claims received from our TPAs to validate coverage, limits, and deductibles prior to making payment. In addition, we have certain managerial requirements of our TPAs around notification, reserve approval, payment management, correspondence with insureds, timeliness, regulatory compliance, and reports for all claims in excess of the claims analyst’s authority. We also monitor possible litigation and litigation trends associated with our claims.
Reinsurance
We purchase a significant amount of reinsurance from third parties that we believe enhances our business by reducing our exposure to potential catastrophe and attritional losses, limiting volatility in our underwriting performance, and providing us with greater visibility into our future earnings. Reinsurance involves transferring, or ceding, a portion of our risk exposure on policies that we write to another insurer, the reinsurer, in exchange for a premium.
We purchase several types of reinsurance, including catastrophe excess of loss (“XOL”), in which the reinsurer(s) agree to assume all or a portion of losses relating to a group of policies occurring in relation to specified events, subject to customary exclusions, in excess of a specified amount. In addition, we buy reinsurance coverage for specific lines of business on a quota share, property per risk, or a facultative basis. In quota share reinsurance, the reinsurer agrees to assume a specified percentage of the ceding company’s losses arising out of a defined class of business in exchange for a corresponding percentage of premiums, net of a ceding commission. Property per risk coverage is similar to catastrophe excess of loss except that the treaty applies in individual property losses rather than in the aggregate for all claims associated with a single catastrophic loss occurrence. Facultative coverage refers to a reinsurance contract on individual risks as opposed to a group or class of business. We use facultative reinsurance selectively to supplement limits or to cover risks or perils excluded from other reinsurance contracts.
We have a robust program utilizing a mix of traditional reinsurers and insurance linked securities. We currently purchase reinsurance from over 100 reinsurers, who either have an “A−” (Excellent) (Outlook Stable) or better financial strength rating by A.M. Best or post collateral. Our reinsurance contracts include special termination provisions that allow us to cancel and replace any participating reinsurer that is downgraded below a rating of “A−” (Excellent) (Outlook Stable) from A.M. Best, or whose surplus drops by more than 20%.
In addition to reinsurance from traditional reinsurers, we utilize collateralized protection via catastrophe bonds. We currently have $895 million of multi-year indemnity-based reinsurance coverage for earthquake events, all issued through Torrey Pines Re Ltd, a Bermuda-domiciled special purpose insurer. Our latest bond, a $420 million 144A issuance, became effective on June 1, 2024.
Our largest single XOL reinsurer, excluding Torrey Pines Re, comprises 9.14% of the total catastrophe XOL reinsurance limit we have in effect. The table below reflects the ratings of our largest individual reinsurers.
| Reinsurer Ratings |
A.M Best |
S&P |
||
| Torrey Pines Re, LTD |
Collateralized |
Collateralized |
||
| Ariel Re BDA, Ltd obo Lloyds Syndicate 1910 |
A+ |
AA- |
||
| Houston Casualty Company |
A++ |
A+ |
||
| Fidelis Insurance Bermuda |
A |
A- |
||
| Arch Reinsurance, Ltd. |
A+ |
A+ |
||
| Hannover Ruck |
A+ |
AA- |
||
| Swiss Reinsurance America |
A+ |
AA- |
||
| MS Amlin AG Bermuda |
A+ |
A+ |
||
| Lloyds Syndicate 1301 - Inigo | A+ | AA- | ||
| Lloyds Syndicate 1084 - Chaucer | A+ | AA- |
Catastrophe XOL Reinsurance Coverage
Our catastrophe event retention before any tax effect is currently $20 million for earthquake events and $15.5 million for hurricane events and all other perils. Our reinsurance coverage exhausts at $3.08 billion for earthquake events, $735 million for Hawaii hurricane events, and $117.5 million for continental U.S. hurricane events, providing coverage in excess of our 1:250 year peak zone PML and in excess of our A.M. Best threshold. In addition, we maintain reinsurance coverage equivalent to or better than the 1 in 250 year PML for our other lines. As of December 31, 2024, our first event retention represented approximately 2.7% of our stockholders’ equity.
In the event that multiple catastrophe events occur during a treaty period, many of our contracts include the right to reinstate reinsurance limits for potential future recoveries during the same contract year and preserve our limit for subsequent events. This feature for subsequent event coverage is known as a “reinstatement.”
To assess the sufficiency of our catastrophe XOL reinsurance coverage, we continuously quantify our exposure to catastrophes including earthquakes, hurricanes, tornadoes, and hailstorms. We evaluate and monitor the total policy limit insured for each peril and in each geographic region, and we use third-party catastrophe models to evaluate the AAL as well as the estimated PML at various intervals. Our PML modeling is consistent with standards established by A.M. Best and includes “demand surge,” and loss amplification. To protect against model bias, we perform probabilistic modeling as well as deterministic modeling using a variety of industry models including AIR Touchstone and RMS RiskLink for all perils and regions.
We believe our current reinsurance program provides coverage well in excess of our theoretical losses from any recorded historical event. The below table shows the PML from selected historical catastrophe events, all of which are less than the amount covered by our current catastrophe reinsurance program. Should an event equivalent to one of these historical events recur, our hypothetical net loss before any tax effect would be capped at our current net retention of $20.0 million for earthquake events or $15.5 million for hurricane events and all other perils.
| |
12/31/2024 |
|||
| Historical Event |
modeled PML |
|||
| |
($ millions) |
|||
| CA 1906 San Francisco M7.8 |
$2,177 | |||
| CA 1994 Northridge M6.7 |
1,624 | |||
| CA 1971 San Fernando M6.7 |
817 | |||
| CA 1868 Hayward M7.0 |
773 | |||
| NM 1811‑12 sequence M7.8 |
680 | |||
| HI 1992 Hurricane Iniki |
673 | |||
| NW 1949 Puget Sound M7.1 |
518 | |||
| CA 1857 Fort Tejon M7.9 |
465 | |||
| CA 1933 Long Beach M6.4 |
437 | |||
| NW 1965 Puget Sound M6.5 |
225 | |||
While we only select reinsurers whom we believe to have acceptable credit or a minimum A.M. Best rating of “A−”, if our reinsurers are unable to pay the claims for which they are responsible, we ultimately retain primary liability to our policyholders. In addition, at each reinsurance treaty renewal, we consider any plans to change the underlying insurance coverage we offer, our current capital, our risk appetite, and the cost and availability of reinsurance coverage, which may vary from time to time.
Program Specific Reinsurance Coverage
In addition to our catastrophe XOL coverage, we purchase reinsurance for specific programs in order to control our net exposure for any single risk, manage our exposure to attritional losses and improve our economics through ceding a portion of the risk to reinsurers in exchange for a ceding commission which generates fee income. We purchase program specific reinsurance, consisting primarily of quota share coverage, for certain lines of business with an attritional loss component such as Inland Marine and Casualty. We also utilize a combination of XOL and quota share reinsurance to provide coverage for our Flood, Inland Marine, and Crop products. Specific to our Crop portfolio, we purchase private reinsurance coverage which is applied to premiums and liabilities net of the inuring protection afforded by the Standard Reinsurance Agreement provided via the Federal Crop Insurance Corporation.
Technology
Our integrated technology systems form the backbone of our business as they enable us to offer quality and timely service to our policyholders and producers, communicate seamlessly with reinsurers and partner carriers, and run our business more efficiently and cost effectively. Our systems offer greater ease of use to distribution partners and provide seamless integration between our pricing models, quoting tools, policy administration systems and portfolio analytics databases. Our proprietary operating platform is based on applications licensed from multiple third-party software vendors. We have invested significantly in customizing, building on top of and extending these applications to increase automation and enhance efficiency. We have dedicated in-house software developers as well as external resources. Our internally developed PASS provides producers direct access to our retail and wholesale distributed products including Residential Earthquake, Hawaii Hurricane, and Residential Flood. PASS also serves as the administration system for select policy data and the access point for business written through direct personal lines partnerships. PASS enables the effective use of predefined underwriting, providing efficiency and optimization to our production partners and real-time transparency in underwriting and aggregate management. Our software development team develops programing interfaces where applicable so that partner carriers and distribution partners can seamlessly access our system.
Our pricing models are based on the most recent versions of catastrophe models from industry leading vendors and our internal expertise. For certain products where limited models are available, we have worked directly with the vendors to develop proprietary models. We update our pricing models as new versions are released, which mitigates our exposure to changes in our business following industry-wide model changes. For personal lines products issued through automated underwriting, our pricing models integrate directly into our policy administration system as well as the systems of program administrator partners. Since our commercial lines products do not lend themselves to highly automated underwriting, we have built a customized operating platform that our underwriters use to evaluate risk and to efficiently quote business. Our custom application platform seamlessly integrates policy administration, billing, and maintenance.
We emphasize the use of technology in our analytics and enterprise risk management (“ERM”) operations. Our data and analytics team, which reports to our Chief Technology Officer, uses multiple catastrophe modeling software applications to evaluate our ongoing risk exposure. Our data analytics enable us to provide timely reporting of our in-force portfolio to our reinsurers, TPAs and distribution partners on a regular basis and during severe weather events. This reporting combines content from the catastrophe models that we license with internally developed content. Event reporting is an element of our overall ERM framework which monitors our risks and ensures that we have appropriate controls and preparations are in place. Our technology infrastructure is designed to function through any major disruption, with all data stored offsite and employees provided with the resources to work remotely.
Reserves
When a claim is reported to us or when an event occurs, we establish loss reserves to cover our estimated ultimate losses under all insurance policies that we underwrite, and loss adjustment expenses relating to the investigation and settlement of policy claims. These reserves include estimates of the cost of the claims reported to us (case reserves) and estimates of the cost of claims that have been incurred but not yet reported (“IBNR”) and are net of estimated related salvage, subrogation recoverables and reinsurance recoverables. Reserves are estimates involving actuarial projections of the expected ultimate cost to settle and administer claims at a given time, but are not expected to represent precisely the ultimate liability. Estimates are based upon past loss experience modified for current trends as well as prevailing economic, legal and social conditions. Such estimates will also be based on facts and circumstances then known, but are subject to significant uncertainty based on the outcome of various factors, such as future events, future trends in claim severity, inflation and changes in the judicial interpretation of policy provisions relating to the determination of coverage.
When a claim is reported and investigated by a claims adjuster, we establish a case reserve for the estimated amount of the ultimate payment after an appropriate assessment of coverage, damages and other information as applicable. The estimate is based on general insurance reserving practices and on the claim adjuster’s experience and knowledge of the nature and value of the specific type of claim. Case reserves are revised periodically based on subsequent developments associated with each claim.
We establish IBNR reserves in accordance with industry practice to provide for (i) the estimated amount of future loss payments on incurred claims not yet reported, and (ii) potential development on reported claims. IBNR reserves are estimated based on generally accepted actuarial reserving techniques that consider quantitative loss experience data and, where appropriate, qualitative factors.
We regularly review our loss reserves using a variety of actuarial techniques. We also update the reserve estimates as historical loss experience develops, additional claims are reported and/or settled and new information becomes available. A reserve can be increased or decreased over time as claims move towards settlement, which can impact earnings in the form of either adverse development or reserve releases.
The following tables present the development of our loss reserves by accident year on a gross basis and net of reinsurance recoveries during each of the below calendar years:
| Gross Ultimate Loss and LAE |
||||||||||||||||||||||||||||
| Development- (Favorable) Unfavorable |
||||||||||||||||||||||||||||
| Calendar Year |
2021 to |
2022 to |
2023 to |
|||||||||||||||||||||||||
| Accident Year |
2021 |
2022 |
2023 |
2024 |
2022 |
2023 |
2024 |
|||||||||||||||||||||
| (in thousands) |
||||||||||||||||||||||||||||
| Prior |
$ | 450,570 | $ | 450,904 | $ | 417,234 | $ | 416,443 | $ | 334 | $ | (33,670 | ) | $ | (791 | ) | ||||||||||||
| 2022 |
200,765 | 198,635 | 182,660 | — | (2,130 | ) | (15,975 | ) | ||||||||||||||||||||
| 2023 |
334,520 | 308,049 | — | — | (26,471 | ) | ||||||||||||||||||||||
| 2024 |
537,646 | — | — | — | ||||||||||||||||||||||||
| $ | 334 | $ | (35,800 | ) | $ | (43,237 | ) | |||||||||||||||||||||
| Net Ultimate Loss and LAE |
||||||||||||||||||||||||||||
| Development- (Favorable) Unfavorable |
||||||||||||||||||||||||||||
| |
Calendar Year |
2021 to |
2022 to |
2023 to |
||||||||||||||||||||||||
| Accident Year |
2021 |
2022 |
2023 |
2024 |
2022 |
2023 |
2024 |
|||||||||||||||||||||
| (in thousands) |
||||||||||||||||||||||||||||
| Prior |
$ | 139,530 | $ | 141,913 | $ | 137,405 | $ | 139,173 | $ | 2,383 | $ | (4,508) | $ | 1,768 | ||||||||||||||
| 2022 |
76,289 | 83,026 | 80,551 | — | 6,737 | (2,475 | ) | |||||||||||||||||||||
| 2023 |
70,346 | 68,015 | — | — | (2,331 | ) | ||||||||||||||||||||||
| 2024 |
137,788 | — | — | — | ||||||||||||||||||||||||
| $ | 2,383 | $ | 2,229 | $ | (3,038 | ) | ||||||||||||||||||||||
Investments
Investment income is an important component of our earnings. We collect premiums and are required to hold a portion of these funds in reserves until claims are paid. We invest these reserves, primarily in fixed maturity investments. Our fixed maturity investment portfolio is primarily managed by an external investment advisory firm that is an experienced manager of insurance company assets, and operates under guidelines approved by our Board of Directors. We believe our investment strategy allows us to eliminate the expense of a treasury department while allowing our management to maintain oversight over the investment portfolio.
Our cash and invested assets consist of fixed maturity securities, short-term investments, cash and cash equivalents, mutual funds, exchange traded funds and equity securities. We also have one equity method investment and a small portion of our portfolio invested in limited partnerships, which are classified as other investments on our consolidated balance sheet. Our fixed maturity securities are classified as “available-for-sale” and are carried at fair value with unrealized gains and losses on these securities reported, net of tax, as a separate component of accumulated other comprehensive income (loss). Our equity investments are measured at fair value with changes in fair value recognized in net income. Fair value generally represents quoted market value prices for securities traded in the public market or prices analytically determined using bid or closing prices for securities not traded in the public marketplace. Our equity method investment is measured following the consolidation model, by increasing or decreasing the carrying amount of the investment to reflect our share of contributions, distributions, earnings, or losses. Our other investments are measured at estimated fair value utilizing a net asset value per share (or its equivalent) as a practical expedient. Short-term investments are reported at cost and include investments that are both readily convertible to known amounts of cash and have maturities of 12 months or less upon acquisition by us.
Our investment securities available totaled $987.7 million and $689.6 million at December 31, 2024 and 2023 respectively, and are summarized as follows:
| |
Fair |
% of Total |
||||||
| December 31, 2024 |
Value |
Fair Value |
||||||
| Fixed maturities: |
|
|
||||||
| U.S. Governments |
$ | 32,806 | 3.3 | % | ||||
| U.S. States, Territories, and Political Subdivisions |
9,778 | 1.0 | % | |||||
| Special revenue excluding mortgage/asset‑backed securities |
26,634 | 2.7 | % | |||||
| Corporate and other |
475,491 | 48.2 | % | |||||
| Mortgage/asset‑backed securities |
394,337 | 39.9 | % | |||||
| Total fixed maturities |
$ | 939,046 | 95.1 | % | ||||
| Equity securities |
40,529 | 4.1 | % | |||||
| Equity method investment |
2,277 | 0.2 | % | |||||
| Other investments |
5,863 | 0.6 | % | |||||
| Total investments |
$ | 987,715 | 100.0 | % | ||||
| |
Fair |
% of Total |
||||||
| December 31, 2023 |
Value |
Fair Value |
||||||
| Fixed maturities: |
|
|
||||||
| U.S. Governments |
$ | 39,420 | 5.7 | % | ||||
| U.S. States, Territories, and Political Subdivisions |
9,902 | 1.4 | % | |||||
| Special revenue excluding mortgage/asset‑backed securities |
29,511 | 4.3 | % | |||||
| Corporate and other |
300,239 | 43.5 | % | |||||
| Mortgage/asset‑backed securities |
264,727 | 38.4 | % | |||||
| Total fixed maturities |
$ | 643,799 | 93.3 | % | ||||
| Equity securities |
43,160 | 6.3 | % | |||||
| Equity method investment |
2,617 | 0.4 | % | |||||
| Total investments |
$ | 689,576 | 100.0 | % | ||||
Our primary investment focus is to preserve capital to support our insurance operations through investing primarily in high quality fixed maturity securities with a secondary focus on maximizing our risk-adjusted investment returns. Our investment policy is set by our Board of Directors, subject to the limits of applicable regulations.
Our investment policy imposes strict requirements for credit quality, with a minimum average credit quality of the portfolio being rated “A” or higher by Standard & Poor’s or the equivalent rating from another nationally recognized rating agency. Our investment policy also imposes restrictions on concentrations of securities by class and issuer and any new asset class must be approved by management and our Board of Directors. Given our existing exposure to property values, notably in the state of California, we have imposed restrictions on municipal obligations in the state of California and CMBS single issuers concentrated in the state of California. In addition, we allocate at least 2% of our investment portfolio to investments in green bonds- or fixed income investments tailored towards environmental solutions such as renewable energy, clean transportation, green building, and wastewater treatment – a commitment that is consistent with both our investment objectives and our company values.
Enterprise Risk Management (“ERM”)
We maintain a dedicated ERM function that is responsible for analyzing and reporting our risks, monitoring that risks remain within established tolerances, and monitoring, on an ongoing basis, that our ERM objectives are met. These objectives include ensuring proper risk controls are in place, risks are effectively identified, assessed, and managed, and key risks to which we are exposed are appropriately disclosed. Our ERM framework plays an important role in fostering our risk management culture and practices. We continue to enhance our ERM framework, which is guided by the Own Risk and Solvency Assessment (“ORSA”) model developed by the National Association of Insurance Commissioners (“NAIC”) and the National Institute of Standards and Technology (“NIST”) cybersecurity framework. These ongoing enhancements include the creation of an ERM Committee of the Board of Directors which is comprised of select board members and select members of executive management, creation and maintenance of a risk register, and regular reporting on risk management.
An additional important part of our ERM is business continuity, including in the circumstances of a catastrophe event. We have established a business continuity team made up of executive management with predefined roles and responsibilities in the event of an emergency response situation and a business continuity communication site where employees are directed to receive instructions that are tailored to various scenarios. We store all data offsite and ensure it is accessible remotely. Our communications, virtual file servers, underwriting and distribution systems, and claims portal are hosted in geographically diverse data centers domestically and globally. We maintain an additional office in Edina, Minnesota and purchase business continuity services to support our offices in the event of a disruptive event. The majority of our workforce is also equipped to work remotely should they be unable to access our offices.
Sustainability Matters
Our Board of Directors has established a Sustainability Committee which is comprised of various members of our Board. The Sustainability Committee oversees and provides guidance on the company’s strategies related to several factors, including community resiliency, health and safety, corporate social responsibility, governance, partner diversity, and public policy matters relevant to our business.
Specific duties of the Sustainability Committee include:
• Assisting the management team in setting general strategy relating to sustainability matters;
• Developing, implementing and monitoring initiatives and policies based on that strategy; and
• Overseeing communications with employees, investors and shareholders with respect to sustainability matters.
The Sustainability Committee meets on a quarterly basis to assess progress on sustainability matters and will continue to look for opportunities to integrate sustainability concerns in our strategy.
Environmental and Climate Change
Our economic model is closely tied to our coverages for natural disasters and catastrophes. We believe the existing scientific consensus that man-made changes to climate conditions are leading to increases in sea levels and global temperatures, and that the severity and frequency of weather-related natural disasters may increase relative to historical experience. We believe that this increase in severe weather, coupled with currently projected demographic trends in catastrophe-exposed regions, contributes to factors that will increase the average economic value of expected losses, increase the number of people exposed per year to natural disasters and in general exacerbate disaster risk, including risks to infrastructure, global supply chains and agricultural production. In addition to the impacts that environmental incidents have on our business, changes to law and regulation related to climate change could also directly affect our business, including state insurance regulations that could impact the Company’s ability to manage property exposures in areas vulnerable to significant climate driven losses, and possible new requirements that insurers integrate the financial risk of climate change into business operations and governance.
From an underwriting standpoint, we carefully consider the development and deployment of insurance products in coastal areas that may be impacted by rising sea levels, and we incorporate scenarios into our catastrophe modeling that involve elevated sea surface temperatures and other relevant data. Evidence of the Company’s commitment to the environment and combating climate change can be found in the Sustainability and Citizenship report available on our corporate website.
The company considers sustainability factors as part of its investment strategy and reviews individual investments to ensure congruence with company goals in this area. We have also made commitments to automate manual or paper-intensive processes and promote the paperless delivery of documents to our policyholders and producers. We will remain proactive in our efforts to evolve our business in response to our changing natural environment.
Competition
The specialty insurance industry is highly competitive. While we currently target specialty markets, some of our competitors have greater resources than we do. Our primary competitors include national specialty insurance companies, including Kinsale Capital Group, Inc., RLI Corp., Skyward Specialty Insurance Group, Inc. and W.R. Berkley. We also compete with Lloyd’s of London in some of our lines. In addition, we compete against state or other publicly managed enterprises including the California Earthquake Authority and the National Flood Insurance Program. We may also compete with new market entrants in the future. Competition is based on many factors, including the reputation and experience of the insurer, coverages offered, pricing and other terms and conditions, customer service, relationships with brokers and agents (including ease of doing business, service provided and commission rates paid), size and financial strength ratings, among other considerations.
Ratings
Our insurance company subsidiaries, PSIC and PESIC each has a rating of “A” (Excellent) (Outlook Stable) from A.M. Best, which rates insurance companies based on factors of concern to policyholders. A.M. Best currently assigns 16 ratings to insurance companies, which currently range from “A++” (Superior) to “F” for insurance companies that have been publicly placed in liquidation. “A” (Excellent) (Outlook Stable) is the third highest rating. In evaluating a company’s financial and operating performance, A.M. Best reviews the company’s profitability, leverage and liquidity, as well as its book of business, the adequacy and soundness of its reinsurance, the quality and estimated market value of its assets, the adequacy of its loss and loss expense reserves, the adequacy of its surplus, its capital structure, the experience and competence of its management and its market presence. A.M. Best’s ratings reflect its opinion of an insurance company’s financial strength, operating performance and ability to meet its obligations to policyholders. These evaluations are not directed to purchasers of an insurance company’s securities.
Laulima has a rating of "A" (Exceptional) from Demotech, which rates insurance companies on their financial stability.
Intellectual Property
We have registered our logo as a trademark in the United States. We will pursue additional trademark registrations and other intellectual property protection to the extent we believe it would be beneficial and cost effective.
Regulation
Insurance Regulation
We are regulated by insurance regulatory authorities in the states in which we operate. State insurance laws and regulations generally are designed to protect the interests of policyholders, consumers and claimants rather than stockholders or other investors. The nature and extent of state regulation varies by jurisdiction, and state insurance regulators generally have broad administrative power relating to, among other matters, setting capital and surplus requirements, licensing of insurers and insurance producers, review and approval of product forms and rates, establishing standards for reserve adequacy, prescribing statutory accounting methods and the form and content of statutory financial reports, regulating certain transactions with affiliates and prescribing types and amounts of investments.
Regulation of insurance companies constantly changes as governmental agencies and legislatures react to real or perceived issues. In recent years, the state insurance regulatory framework has come under increased federal scrutiny, and some state legislatures have considered or enacted laws that alter and, in many cases, increase, state authority to regulate insurance companies and insurance holding company systems. Further, the NAIC and some state insurance regulators are re-examining existing laws and regulations specifically focusing on issues relating to the solvency of insurance companies, interpretations of existing laws and the development of new laws. Although the federal government does not directly regulate the business of insurance, federal initiatives often affect the insurance industry in a variety of ways. In addition, the Federal Insurance Office (the "FIO") was established within the U.S. Department of the Treasury by the Dodd-Frank Wall Street Reform and Consumer Protection Act (the "Dodd-Frank Act") in July 2010 to monitor all aspects of the insurance industry, although FIO has no express regulatory authority over insurance companies or other insurance industry participants.
Insurance Holding Company Regulation
We operate as an insurance holding company system and are subject to the insurance holding company laws of the State of Oregon, the state in which Palomar Specialty Insurance Company is domiciled. Palomar Specialty Insurance Company is also commercially domiciled in California and, as a result, we are subject to the insurance holding company laws of California, as well. These statutes require that each insurance company in the system register with the insurance department of its state of domicile and furnish information concerning the operations of companies within the holding company system that may materially affect the operations, management or financial condition of the insurers within the system and domiciled in that state. These statutes also provide that all transactions among members of a holding company system must be fair and reasonable. Transactions between insurance subsidiaries and their parents and affiliates generally must be disclosed to the state regulators, and notice to or prior approval of the applicable state insurance regulator generally is required for any material or extraordinary transaction.
Human Capital
We believe our greatest asset is our talent. As of December 31, 2024, we employed 253 team members. During 2024, our workforce increased by approximately 19% compared to the prior year, and our turnover rate was approximately 8.5%.
Our business relies on our ability to attract and retain talented team members. To attract and retain talent, we strive to create a diverse, inclusive, and supportive workplace, with opportunities for our team members to develop in their careers. This is supported by competitive compensation, benefits and health and wellness programs, and by programs that build connections between our team members and their communities.
We are committed to following best-in-class sustainability practices, and we believe that our focus on sustainability fosters greater creativity and productivity, helps us serve our customers and partners more effectively, and ultimately benefits our shareholders and the communities in which we do business. As part of our sustainability efforts, we set diversity goals in our annual Sustainability & Citizenship report. In 2024, 40% of our team members identify as a member of a minority group, and 43% of our senior executive team identifies as a member of a minority group. Our commitment to sustainability further includes our focus on "D.I.C.E", defined as follows:
DIVERSITY – We are not all the same. Palomar celebrates our differences, and we identify opportunities for increased innovation and collaboration amongst diverse teams with diverse perspectives.
INCLUSION – Palomar appreciates and takes pride in the active involvement of every team member’s unique contribution within a culture that harmonizes our differences. Our team members understand their important contribution to the greater good and understand that what they do makes a difference, both for the company, and in the larger communities we serve.
COMMUNITY & ENGAGEMENT – Palomar’s commitment to diversity, equality and inclusion extends into the communities where we conduct business. We believe that every organization, regardless of size or scope, can make a meaningful difference on issues of community welfare, justice, and equality. Through our social, personal, and professional networks, we champion our values and actions. We partner with like-minded organizations to drive action and positive change.
EQUALITY – Palomar promotes a work environment where individuals are treated fairly, respectfully and have equal access to resources and opportunities for growth. We encourage our teammates to share ideas and collaborate to remove organizational boundaries, solve problems, and drive company growth.
Compensation, Health and Well Being
We offer fair, competitive compensation and benefits to support our team members overall well-being. Our compensation programs include base pay, annual incentive compensation and long-term equity-based compensation. In 2024, 100% of our workforce received equity awards and participated in our annual cash bonus plan, including all hourly personnel. We offer team members a comprehensive and leading benefits program that includes a holistic approach to health and wellness. We regularly benchmark programs to ensure our team has access to industry-leading benefits to address all aspects of well-being — physical and mental health, family care, financial support, and community engagement.
We believe in pay transparency and we include base pay ranges in all our job listings. Additionally, we voluntarily disclose our base pay ranges to all our internal employees for the roles they hold.
Talent Development
We provide numerous training opportunities for our team members, with a focus on personal and professional development. We utilize “Coaching for Performance” methodologies to manage performance, provide feedback and develop talent. Our talent development programs provide team members resources to achieve career goals and build leadership skills. We encourage all team members to take advantage of company supported learning opportunities that help broaden industry and functional knowledge to help them excel in their current roles as well as advance their overall career objectives. We believe in the dynamic allocation of talent, and therefore we encourage interested team members to explore functions outside their current role. To support this belief, we provide a $3,000 per annum tuition and/or certification reimbursement for ongoing development. Lastly, we have a methodical approach to talent development, offering organizational advancement and mentoring services to all team members regardless of position or title. In 2024, 28% of our workforce was promoted or moved into new positions.
During the third quarter of 2024, our team members completed an engagement survey, and we received an 85% response rate, and a 87% overall engagement score. Consistent with historical practice, we use the responses and learnings from this survey to inform our future talent management strategies. Additionally, the Company was voted one of the top places to work by the San Diego Union-Tribune for the third consecutive year.
Available Information
We file annual reports on Form 10-K, quarterly reports on Form 10-Q, current reports on Form 8-K and other information with the SEC. The SEC maintains an Internet web site that contains reports, proxy and information statements and other information regarding issuers, including us, that file electronically with the SEC. The address of that site is http://www.sec.gov. Our financial and other material information is routinely posted to and accessible on the Investors section of our website, available at www.plmr.com. Information that is contained in and can be accessed through our website or our social media is not incorporated into, and does not form a part of, this Annual Report on Form 10-K.
A description of the risks and uncertainties associated with our business is set forth below. You should carefully consider the risks and uncertainties described below, together with all of the other information in this Annual Report on Form 10-K, including the section titled “Management’s Discussion and Analysis of Financial Condition and Results of Operations” and our consolidated financial statements and related notes appearing elsewhere in this Annual Report on Form 10-K. The risks and uncertainties described below may not be the only ones we face. If any of the risks actually occur, our business, financial condition, results of operations and prospects could be materially and adversely affected. In that event, the market price of our common stock could decline. Additional risks and uncertainties of which we are unaware, or that we currently deem immaterial also may become important factors that affect us.
Summary Risk Factors
Our business is subject to numerous risks and uncertainties, these risks include, but are not limited to, the following:
Risks Related to Our Business and Industry:
| ● |
Claims arising from unpredictable and severe catastrophe events, including those caused by global climate change, could reduce or eliminate our earnings and stockholders' equity, and limit our ability to underwrite new insurance policies; |
| ● |
Our reinsurers may not pay claims on a timely basis, or at all, which may materially adversely affect our business, financial condition, and results of operations; |
| ● |
Our loss reserves are established based on estimates and may be inadequate to cover actual incurred losses which could have a material adverse impact on our results of operations and financial condition; |
| ● |
We may be unable to purchase third-party reinsurance or otherwise expand our catastrophe coverage in amounts we desire on commercially acceptable terms or on terms that adequately protect us, and this inability may materially adversely affect our business, financial condition and results of operations. |
| ● |
Our risk management and loss limitation methods, including estimates and models, may fail to adequately manage our exposure to losses from catastrophe events and our losses could be materially higher than our expectations; |
| ● |
Our business is concentrated in California and we are exposed more significantly to California loss activity and regulatory environments; |
| ● |
We rely on a select group of brokers and program administrators, and such relationships may not continue; |
| ● |
There is intense competition for business in our industry; |
| ● |
Volatility in crop prices, as a result of weather conditions or other events, could adversely impact our results of operations; |
Risks Related to the Economic Environment:
| ● |
Adverse economic factors, including recession, inflation, periods of high unemployment or lower economic activity could affect our growth and profitability; |
Risks Related to Technology:
| ● |
The failure of our information technology and telecommunications systems could adversely affect our business; |
| ● |
Security breaches or cyber-attacks could expose us to liability and damage our reputation and business; |
Risks Related to Laws and Regulations:
| ● |
We are subject to extensive regulation, which may adversely affect our ability to achieve our business objectives; |
| ● |
Unexpected changes in the interpretation of our coverage or provisions, including loss limitations and exclusions, in our policies could have a material adverse effect on our financial condition or results of operations; |
| ● |
We incur significant costs as a result of operating as a public company, and our management is required to devote substantial time to complying with public company regulations; and |
Risks Related to Ownership of our Common Stock:
| ● |
Our operating results and stock price may be volatile, or may decline regardless of our operating performance, and holders of our common stock could lose all or part of their investment. |
Risks Related to Our Business and Industry
Claims arising from unpredictable and severe catastrophe events, including those caused by global climate change, could reduce or eliminate our earnings and stockholders’ equity and limit our ability to underwrite new insurance policies.
Our insurance operations expose us to claims arising from unpredictable catastrophe events, such as earthquakes, hurricanes, windstorms, floods, wildfires, and other severe events. We have incurred significant losses from catastrophe events multiple times in our history and we may incur significant losses from future catastrophe events. The actual occurrence, frequency and magnitude of such events are uncertain. While there can be no certainty surrounding the timing and magnitude of earthquakes, some observers believe that significant shifts in the tectonic plates, including the San Andreas Fault, may occur in the future. Over the past several years, changing weather patterns and climatic conditions, such as global warming, have added to the unpredictability and frequency of natural disasters in certain parts of the world, including the markets in which we operate. Climate change may increase the frequency and severity of extreme weather events. This effect has led to conditions in the ocean and atmosphere, including warmer-than-average sea-surface temperatures and low wind shear that increase hurricane activity. Hurricane activity typically increases between June and November of each year, though the actual occurrence and magnitude of such events is uncertain. The occurrence of a natural disaster or other catastrophe loss could materially adversely affect our business, financial condition, and results of operations. These events could impact our business even where we do not have insured exposure, such as the 2025 California wildfires, as homes and businesses lost due to such events may cancel or not renew their policies with us which could adversely affect our business, financial condition, and results of operations. Additionally, any increased frequency and severity of such weather events, including hurricanes, could have a material adverse effect on our ability to predict, quantify, reinsure and manage catastrophe risk and may materially increase our losses resulting from such catastrophe events.
The extent of losses from catastrophes is a function of both the frequency and severity of the insured events and the total amount of insured exposure in the areas affected. The frequency and severity of catastrophes are inherently unpredictable and the occurrence of one catastrophe does not make the occurrence of another catastrophe more or less likely. Increases in the replacement cost of insured property due to higher material and labor costs, increases in concentrations of insured property, the effects of inflation, and changes in cyclical weather patterns may increase the severity of claims from catastrophe events in the future. Claims from catastrophe events could reduce our earnings and cause substantial volatility in our results of operations for any fiscal quarter or year, which could materially adversely affect our financial condition, possibly to the extent of eliminating our total stockholders’ equity. Our ability to underwrite new insurance policies could also be materially adversely impacted as a result of corresponding reductions in our capital. In addition, a natural disaster could materially impact the financial condition of our policyholders, resulting in loss of premiums.
Our reinsurance coverage currently exhausts at $3.08 billion for earthquake events, $735 million for Hawaii hurricane events, and $117.5 million for continental U.S. hurricane events, with coverage in excess of our estimated peak zone 1 in 250 year PML event and in excess of our A.M. Best threshold. Our catastrophe event retention is currently $20 million for earthquake events and $15.5 million for hurricane events and all other perils. In addition to our event retention, we may also incur additional reinsurance expenses upon a catastrophe event. While we only select reinsurers whom we believe to have acceptable credit, if our reinsurers are unable to pay the claims for which they are responsible, we retain primary liability. Our earthquake policies do not provide coverage for fire damage arising from an earthquake. Catastrophe events which cause our reinsurers to incur losses may increase the cost of reinsurance in future periods or make it more difficult to obtain reinsurance on commercially acceptable terms. While we believe our risk transfer program reduces exposure to catastrophe losses and earnings volatility, one or more severe catastrophe events could result in claims that exceed the limits of our reinsurance coverage.
Our reinsurers may not pay claims on a timely basis, or at all, which may materially adversely affect our business, financial condition, and results of operations.
Our ability to grow our business is dependent in part in our ability to secure reinsurance for a substantial portion of the risk associated with our policies. Although reinsurance makes the reinsurer liable to us to the extent the risk is transferred or ceded to the reinsurer, it does not relieve us (the ceding insurer) of our primary liability to our policyholders. While our current reinsurance program is designed to limit our risk retention, in the event of a major catastrophe, our reinsurers may not pay claims made by us on a timely basis, or they may not pay some or all these claims.
In addition, reinsurers may default in their financial obligations to us as the result of insolvency, lack of liquidity, operational failure, fraud, asserted defenses based on agreement wordings or the principle of utmost good faith, asserted deficiencies in the documentation of agreements, or other reasons. Any disputes with reinsurers regarding coverage under reinsurance contracts could be time consuming, costly, and uncertain of success. If a catastrophe event were to occur and our reinsurers were unable to satisfy their commitments to us, we may be unable to satisfy our policyholder liabilities which would adversely impact our results of operations and financial condition. We evaluate each reinsurance claim based on the facts of the case, historical experience with the reinsurer on similar claims and existing case law and consider including any amounts deemed uncollectible from the reinsurer in a reserve for uncollectible reinsurance. As of December 31, 2024, we had $395.2 million of aggregate reinsurance recoverables.
Our loss reserves are established based on estimates which may be inadequate to cover actual incurred losses and could have a material adverse impact on our results of operations and financial condition.
The reserve for losses and loss adjustment expenses represents our estimated ultimate cost of all reported and unreported losses and loss adjustment expenses incurred and unpaid at the balance sheet date. We seek to establish adequate reserves; however, our ultimate liability may be greater than our estimate.
The process of estimating the reserves for losses and loss adjustment expenses requires a high degree of judgment and is subject to several variables. Multiple actuarial methods are used to estimate the reserve for losses and loss adjustment expenses. These methods utilize, to varying degrees, the initial expected loss ratio, detailed statistical analysis of past claims reporting and payment patterns, claims frequency and severity, paid loss experience, industry loss experience, and changes in market conditions, policy forms, exclusions, and exposures.
We are subject to uncertainties which impact the adequacy of our reserves. For example, when we write “occurrence” policies, we are obligated to pay covered claims, up to the contractually agreed amount, for any covered loss that occurs while the policy is in force. Accordingly, claims may arise in years after a policy has lapsed. In addition, there may be significant reporting lags between the occurrence of an insured event and the time it is actually reported to us and additional lags between the time of reporting and final settlement of any claims. Consequently, estimates of loss associated with specified claims can increase as new information emerges, which could cause the reserves for the claim to become inadequate.
Our reserves are driven by several important factors, including litigation and regulatory trends, legislative activity, climate change, social and economic patterns, and claims inflation assumptions. Our reserve estimates reflect current inflation in legal claims’ settlements and assume we will not be subject to losses from significant new legal liability theories. Our reserve estimates assume that there will not be significant changes in the regulatory and legislative environment. The impact of potential changes in the regulatory or legislative environment is difficult to quantify in the absence of specific, significant new regulation or legislation. In the event of significant new regulation or legislation, we will attempt to quantify its impact on our business, but no assurance can be given that our attempt to quantify such inputs will be accurate or successful.
If our loss reserves should prove to be inadequate, we will be required to increase our reserves resulting in a reduction in our net income and stockholders’ equity in the period where the inadequacy is identified. Material increases to our reserves may impact our liquidity, our financial rating, and our ability to comply with debt covenants.
For further information on our loss reserving methodology, see “Management’s Discussion and Analysis-Critical Accounting Policies and Estimates- Reserve for Losses and Loss Adjustment Expenses”.
We may be unable to purchase third-party reinsurance or otherwise expand our catastrophe coverage in amounts we desire on commercially acceptable terms or on terms that adequately protect us, and this inability may materially adversely affect our business, financial condition and results of operations.
We purchase a significant amount of reinsurance from third parties that we believe enhances our business by reducing our exposure to potential catastrophe losses and reducing volatility in our underwriting performance, providing us with greater visibility into our future earnings. Reinsurance involves transferring, or ceding, a portion of our risk exposure on policies that we write to another insurer, the reinsurer, in exchange for a premium.
We buy multiple types of reinsurance including treaty excess of loss (“XOL”) coverage and program specific reinsurance coverage on a quota share, property per risk or a facultative basis. Treaty coverage refers to a reinsurance contract that is applied to a group or class of business where all the risks written meet the criteria for that class. Facultative coverage refers to a reinsurance contract on individual risks as opposed to a group or class of business. Our catastrophe XOL treaties are divided into multiple layers.
The reinsurance market historically has been a cyclical market characterized by periods of sufficient or excess capital (soft market cycle) as well as shortages of capital (hard market cycle). Market conditions have limited, and in some cases prevented, insurers from obtaining the types and amounts of reinsurance they consider adequate for their business needs. As a result, we may not be able to purchase reinsurance in the areas and for the amounts we desire or on terms we deem acceptable or at all. Hard market cycles may increase our cost of reinsurance, force us to increase our loss retention, or limit the amount of reinsurance we are able to purchase, all of which would have an adverse impact on our business and results of operations.
In addition to reinsurance purchased from traditional reinsurers, we have historically incorporated collateralized protection from the insurance linked securities market via catastrophe bonds. During the first quarter of 2021, we closed a $400 million 144A catastrophe bond which became effective June 1, 2021. The catastrophe bond was completed through Torrey Pines Re Pte. Ltd. (“Torrey Pines Re Pte.”). Torrey Pines Re Pte. is a special purpose reinsurance vehicle incorporated in Singapore that provides Palomar with indemnity-based reinsurance covering earthquake events through June 1, 2024. During the second quarter of 2022, we closed a $275 million 144A catastrophe bond which became effective June 1, 2022. This catastrophe bond was completed through Torrey Pines Re Ltd., a Bermuda-domiciled special purpose insurer that provides indemnity-based reinsurance covering earthquake events through June 1, 2025. During the second quarter of 2023, we also closed a $200 million 144A catastrophe bond which became effective June 1, 2023. This catastrophe bond was also completed through Torrey Pines Re Ltd and provides indemnity-based reinsurance covering earthquake events through June 1, 2026. During the second quarter of 2024, we also closed a $420 million 144A catastrophe bond which became effective June 1, 2024. This catastrophe bond was also completed through Torrey Pines Re Ltd and provides indemnity-based reinsurance covering earthquake events through June 1, 2027.
We may seek similar catastrophe bond offerings in the future. However, there can be no assurance that we will be able to complete such offerings on acceptable terms, if at all.
If we are unable to renew our expiring reinsurance contracts on acceptable terms or expand our reinsurance coverage through traditional reinsurers, catastrophe bonds, or otherwise, our loss exposure may increase, which would increase our potential losses related to catastrophe or non-catastrophe events. If we are unwilling to bear an increase in loss exposure, we may have to reduce our written premiums. These outcomes could adversely affect our business, financial condition, and results of operations.
In addition, as we grow our written premiums and enter new lines of business we will seek new types of reinsurance and will need to purchase reinsurance on commercially acceptable terms in order to reduce the risk associated with entering new lines of business. The inability to purchase appropriate reinsurance for new lines of business could negatively impact our ability to grow our written premiums and maintain our desired level of profitability.
Many reinsurance companies have begun to exclude certain coverages from, or alter terms in, our reinsurance contracts with them. As a result, we, like other insurance companies, write insurance policies which to some extent do not have the benefit of reinsurance protection. These gaps in reinsurance protection expose us to greater risk and greater potential losses.
We utilize several risk management and loss limitation methods, including relying on estimates and models. If these methods fail to adequately manage our exposure to losses from catastrophe events, our losses could be materially higher than our expectations, and our business, financial condition, and results of operations could be materially adversely affected.
Our approach to risk management relies on subjective variables that entail significant uncertainties. We manage our exposure to catastrophe losses by analyzing the probability of the occurrence of catastrophe events and their severity and impact on our underwriting and investment portfolio. We monitor and mitigate our exposure through a number of methods designed to minimize risk, including underwriting specialization, modeling and data systems, data quality control, strategic use of policy deductibles, regular review of aggregate exposure and probable maximum loss reports, which report the maximum amount of expected losses based on computer or actuarial modeling techniques. These estimates, models, data, and scenarios may not produce accurate predictions; consequently, we could incur losses both in the risks we underwrite and to the value of our investment portfolio due to the overall impact on financial markets from the occurrence of catastrophe events.
In addition, output from our risk modeling software is based on third-party data that we believe to be accurate and reliable. The estimates and assumptions we use are dependent on many variables, such as loss adjustment expenses, insurance to value, storm or earthquake intensity, building code compliance and demand surge, which is the temporary inflation of costs for building materials such as lumber and labor resulting from increased demand for rebuilding services in the aftermath of a catastrophe. Accordingly, if the estimates and assumptions used in our risk models are incorrect or if our risk models prove to be an inaccurate forecasting tool, the losses we incur from an actual catastrophe could be materially higher than our expectation of losses generated from modeled catastrophe scenarios, and our business, financial condition, and results of operations could be materially adversely affected. In addition, our third-party data providers may change the estimates or assumptions that we use in our risk models and/or their data may be inaccurate. Changes in these estimates or assumptions or the use of inaccurate third-party data could cause our actual losses to be materially higher than our current expectation of losses generated by modeled catastrophe scenarios, which in turn could materially adversely affect our business, financial condition, and results of operations.
We run many model simulations to understand the impact of these assumptions on a catastrophe’s loss potential. Furthermore, there are risks associated with catastrophe events, which are either poorly represented or not represented at all by catastrophe models. Each modeling assumption or un-modeled risk introduces uncertainty into probable maximum loss estimates that management must consider. These uncertainties can include, but are not limited to, the following:
| • |
The models do not address all the possible hazard characteristics of a catastrophe peril (e.g., the precise path and wind speed of a hurricane); |
| • |
The models may not accurately reflect the true frequency or severity of events; |
| • |
The models may not accurately reflect a risk’s vulnerability or susceptibility to damage for a given event characteristic; |
| • |
The models may not account for unusual or unprecedented catastrophe events; |
| • |
The models may not adequately consider the impact of inflation on the magnitude of modeled losses; |
| • |
The models may not accurately represent loss potential to insurance or reinsurance contract coverage limits, terms and conditions; and |
| • |
The models may not accurately reflect the impact on the economy of the area affected or the financial, judicial, political, or regulatory impacts on insurance claim payments during or following a catastrophe event. |
As a result of these factors and contingencies, our reliance on assumptions and data used to evaluate our entire risk portfolio and specifically to estimate a probable maximum loss is subject to a high degree of uncertainty that could result in actual losses that are materially different from our probable maximum loss estimates and could adversely impact our financial results.
A decline in our financial strength rating may adversely affect the amount of business we write and impact compliance with our debt covenants.
Participants in the insurance industry use ratings from independent ratings agencies, such as A.M. Best, as an important means of assessing the financial strength and quality of insurers. In setting its ratings, A.M. Best performs quantitative and qualitative analysis of a company’s balance sheet strength, operating performance and business profile. A.M. Best financial strength ratings range from “A++” (Superior) to “F” for insurance companies that have been publicly placed in liquidation. As of December 31, 2024, A.M. Best has assigned a financial strength rating of “A” (Excellent) (Outlook Stable) to our insurance company subsidiaries, Palomar Specialty Insurance Company (“PSIC”) and Palomar Excess and Surplus Insurance Company (“PESIC”). A.M. Best assigns ratings that are intended to provide an independent opinion of an insurance company’s ability to meet its obligations to policyholders and such ratings are not evaluations directed to investors and are not a recommendation to buy, sell or hold our common stock or any other securities we may issue. A.M. Best’s analysis includes comparisons to peers and industry standards as well as assessments of operating plans, philosophy and management. A.M. Best periodically reviews our financial strength rating and may revise it downward or revoke it at A.M. Best’s discretion based primarily on its analyses of our balance sheet strength (including capital adequacy and loss adjustment expense reserve adequacy), operating performance and business profile. Factors that could affect such analyses include, but are not limited to:
| • |
If we change our business practices from our organizational business plan in a manner that no longer supports A.M. Best’s rating; |
| • |
If unfavorable financial, regulatory or market trends affect us, including excess market capacity; |
| • |
If our losses exceed our loss reserves; |
| • |
If we have unresolved issues with government regulators; |
| • |
If we are unable to retain our senior management or other key personnel; |
| • |
If our investment portfolio incurs significant losses; or |
| • |
If A.M. Best alters its capital adequacy assessment methodology in a manner that would adversely affect our rating. |
These and other factors could result in a downgrade of our financial strength rating. A downgrade or withdrawal of our rating could result in any of the following consequences, among others:
| • |
Causing our current and future distribution partners and insureds to choose other, more highly-rated competitors; |
| • |
Increasing the cost or reducing the availability of reinsurance to us; |
| • |
Severely limiting or preventing us from writing new and renewal insurance contracts; or |
| • |
Causing us to be out of compliance with the financial covenants in our credit agreement. |
In addition, in view of the earnings and capital pressures experienced by many financial institutions, including insurance companies, it is possible that rating organizations will heighten the level of scrutiny that they apply to such institutions, will increase the frequency and scope of their credit reviews, will request additional information from the companies that they rate or will increase the capital and other requirements employed in the rating organizations’ models for maintenance of certain ratings levels. If our credit rating were to be downgraded, or general market conditions were to ascribe higher risk to our rating levels, our access to capital markets and the cost of any equity or debt financing will be negatively impacted. We can offer no assurance that our rating will remain at its current level. It is possible that such reviews of us may result in adverse ratings consequences, which could have a material adverse effect on our financial condition and results of operations.
We and our customers could be negatively and adversely impacted by pandemics, disease outbreaks and other public health crises.
The extent of the impact of a pandemic, disease outbreak or other public health crisis on our operational and financial performance depends on several factors, including the ultimate duration and severity of the event, the emergence and severity of variant strains, actions taken and restrictions imposed by the government and health officials in response, the effectiveness and adoption of vaccines and therapeutics, the ability for our customers to continue to pay premiums, contraction of the insurance and reinsurance markets, and the ability for reinsurers to satisfy claims, all of which are uncertain and cannot be predicted. While policy terms and conditions in the lines of business written by us would be expected to preclude coverage for virus-related claims, court decisions and governmental actions may challenge the validity of any exclusions or our interpretation of how such terms and conditions operate.
Global health crises have historically contributed to financial market volatility, supply chain disruptions, price inflation, and material and labor shortages, all of which may have a negative impact on our business. Furthermore, since our results of operations are partially dependent on the performance of our investment portfolio, a global health crisis' impact on the economy and financial markets could reduce our net investment income and result in realized investment losses in future periods. The macroeconomic effects of a global health crisis may persist for an indefinite period, even after it has subsided. We cannot anticipate all the ways in which global health crises could adversely impact our business in the future.
Our business is concentrated in California and, as a result, we are exposed more significantly to California loss activity and regulatory environments.
Our policyholders and insurance risks are currently concentrated in California, which generated 53% of our gross written premiums for the year ended December 31, 2023 and 43% for the year ended December 31, 2024. We are exposed to business, economic, political, judicial and regulatory risks due to this concentration that are greater than the risks faced by insurance companies with a lower concentration of their premiums in California. Any single, major catastrophe event, series of events or other condition causing significant losses in California could materially adversely affect our business, financial condition and results of operations. This may include catastrophes even where we do not insure against the loss, such as the 2025 California wildfires, as homes and businesses lost or damaged due to catastrophe may otherwise cancel our policies following such event. Additionally, unfavorable business, economic or regulatory conditions in California may result in a significant reduction of our premiums or increase our loss exposure. Changes to insurance-related laws or regulations in California could also have a negative impact on our business.
We could be adversely affected by the loss of one or more key executives or by an inability to attract and retain qualified personnel.
We depend on our ability to attract and retain experienced personnel and seasoned key executives who are knowledgeable about our business. The pool of talent from which we recruit is limited and may fluctuate based on market dynamics specific to our industry and independent of overall economic conditions. As such, higher demand for employees having the desired skills and expertise could lead to increased compensation expectations for existing and prospective personnel, making it difficult for us to retain and recruit key personnel and maintain labor costs at desired levels.
In particular, our future success is substantially dependent on the continued service of our Founder, Chief Executive Officer and Chairman, Mac Armstrong, and our Chief Financial Officer, Christopher Uchida. Should any of our key executives terminate their employment with us, or if we are unable to retain and attract talented personnel, we may be unable to maintain our current competitive position in the specialized markets in which we operate, which could adversely affect our results of operations.
We rely on a select group of brokers and program administrators, and such relationships may not continue.
The distribution networks of our products are multi-faceted and distinct to each line of business. Our relationship with our brokers or program administrators may be discontinued at any time. Even if the relationships do continue, they may not be on terms that are profitable for us. We distribute a significant portion of our Residential Earthquake, Commercial Earthquake, Hawaii Hurricane, and Fronting products through relationships with certain program administrators. Each of the products managed by the program administrators operates as a separate program that is governed by an independent, separately negotiated agreement with unique terms and conditions, including geographic scope, key person provisions, economics and exclusivity. These programs also feature separate managerial oversight and leadership, policy administration systems and retail agents originating policies.
For the year ended December 31, 2023, our largest program administrator distributed $394.1 million or 34.5% of our gross written premiums and our second largest program administrator distributed $152.4 million, or 13.3% of our gross written premiums. There were no other program administrators which distributed greater than 10% of our gross written premiums for the year ended December 31, 2023.
For the year ended December 31, 2024, our largest program administrator distributed $403.4 million or 26.2% of our gross written premiums. There were no other program administrators which distributed greater than 10% of our gross written premiums for the year ended December 31, 2024.
Our largest program administrator, Arrowhead General Insurance Agency, distributes our Value Select Residential Earthquake program, which represents the majority of our Residential Earthquake premium and is administered through a mutually exclusive agreement for the states of California, Oregon and Washington. The agreement remains in effect until terminated by either party upon 180 days’ prior written notice to the other party for cause. The termination of a relationship with one or more significant brokers or program administrators could result in lower gross written premiums and could have a material adverse effect on our results of operations or business prospects.
Because we provide our program administrators with specific quoting and binding authority, if any of them fail to comply with pre-established guidelines, our results of operations could be adversely affected.
We market and distribute certain of our insurance products through program administrators that have limited quoting and binding authority and that in turn sell our insurance products to insureds through retail agents and wholesale brokers. These program administrators can bind certain risks without our expressed approval. If any of these program administrators fail to comply with our underwriting guidelines and the terms of their appointments, we could be bound on a particular risk or number of risks that were not anticipated when we developed the insurance products or estimated losses and loss adjustment expenses. Such actions could adversely affect our results of operations.
Because our business depends on insurance brokers and program administrators, we are exposed to certain risks arising out of our reliance on these distribution channels that could adversely affect our results.
Certain premiums from policyholders, where the business is produced by brokers, are collected directly by the brokers and forwarded to our insurance subsidiaries. In certain jurisdictions, when the insured pays its policy premium to its broker for payment to us, the premium might be considered to have been paid under applicable insurance laws and regulations. Accordingly, the insured would no longer be liable to us for those amounts, whether or not we have actually received the premium from the broker. Consequently, we assume a degree of credit risk associated with the brokers with which we work. We review the financial condition of potential new brokers before we agree to transact business with them. Although the failure by any of our brokers to remit premiums to us has not been material to date, there may be instances where our brokers collect premiums but do not remit them to us and we may be required under applicable law to provide the coverage set forth in the policy despite the related premiums not being paid to us. Additionally, the loss or disruption of business from our agents and brokers or the failure or inability of these agents and brokers to successfully market our insurance products could have a material adverse effect on our business, financial condition, and results of operations.
Because the possibility of these events occurring depends in large part upon the financial condition and internal operations of our brokers, we regularly meet and communicate with our brokers, monitor broker behavior, and review broker financial information on an as-needed basis. If we are unable to collect premiums from our brokers in the future, our underwriting profits may decline, and our financial condition and results of operations could be materially and adversely affected.
Competition for business in our industry is intense.
We face competition from other specialty insurance companies, standard insurance companies and underwriting agencies that are larger than we are and that have greater financial, marketing, and other resources than we do. Some of these competitors also have longer operating history and more market recognition than we do in certain lines of business. In addition, we compete against state or other publicly managed enterprises including the California Earthquake Authority (“CEA”), the National Flood Insurance Program, and the Texas Wind Insurance Association. If the CEA decided to provide coverage to non-CEA member carriers or lessened the capital requirements for membership, we would face additional competition in our markets, and our operating results could be adversely affected. Furthermore, it may be difficult or prohibitively expensive for us to implement technology systems and processes that are competitive with the systems and processes of these larger companies.
Competition in the insurance industry is based on many factors, including price of coverage, the general reputation and perceived financial strength of the company, relationships with brokers, terms and conditions of products offered, ratings assigned by independent rating agencies, speed of claims payment, and the experience and reputation of the members of our underwriting team in the particular lines of insurance and reinsurance we seek to underwrite. In recent years, the insurance industry has undergone increasing consolidation, which may further increase competition.
Certain new, proposed or potential industry or legislative developments could further increase competition in our industry. For example, an increase in capital-raising by companies with whom we compete could result in new entrants to our markets and an excess of capital in the industry. Additionally, the possibility of federal regulatory reform of the insurance industry could increase competition from standard carriers.
We may not be able to continue to compete successfully in the insurance markets. Increased competition in these markets could result in a change in the supply and demand for insurance, affect our ability to price our products at risk-adequate rates and retain existing business, or underwrite new business on favorable terms. If this increased competition so limits our ability to transact business, our operating results could be adversely affected.
If actual renewals of our existing policies do not meet expectations, our written premium in future years and our future results of operations could be materially adversely affected.
Most of our insurance policies are written for a one-year term. In our financial forecasting process, we make assumptions about the rates of renewal of our prior year’s policies. The insurance and reinsurance industries have historically been cyclical businesses with intense competition, often based on price. If actual renewals do not meet expectations or if we choose not to write a renewal because of pricing conditions, our written premium in future years and our future operations would be materially adversely affected. In addition, the volume of fronting premiums written may vary significantly in future periods due to the timing of entering large fronting partnerships and terminations of large fronting partnerships.
Our failure to accurately and timely evaluate and pay claims could materially and adversely affect our business, financial condition, results of operations, and prospects.
We must accurately and timely evaluate and pay claims that are made under our policies. Many factors affect our ability to pay claims accurately and timely, including the training and experience of our claims representatives, including our third-party claims administrators (“TPAs”), the effectiveness of our management, our ability to develop or select and implement appropriate procedures and systems to support our claims functions and other factors. Our failure to evaluate and pay claims accurately and timely could lead to regulatory and administrative actions or material litigation, undermine our reputation in the marketplace and materially and adversely affect our business, financial condition, results of operations, and prospects.
In addition, if we do not manage our TPAs effectively, or if our TPAs are unable to effectively manage our volume of claims, our ability to manage our claims workload could be adversely affected. In addition to potentially requiring that growth be slowed in the affected markets, our business could suffer from decreased quality of claims work which, in turn, could adversely affect our results of operations.
We may act based on inaccurate or incomplete information regarding the accounts we underwrite.
We rely on information provided by insureds or their representatives when underwriting insurance policies. While we may make inquiries and take other steps to validate or supplement the information provided, we may make underwriting decisions based on incorrect or incomplete information. It is possible that we will misunderstand the nature or extent of the activities or facilities and the corresponding extent of the risks that we insure because of our reliance on inadequate or inaccurate information.
We may change our underwriting guidelines or our strategy without stockholder approval.
Our management has the authority to change our underwriting guidelines or our strategy without notice to our stockholders and without stockholder approval. As a result, we may make fundamental changes to our operations without stockholder approval, which could result in our pursuing a strategy or implementing underwriting guidelines that may be materially different from the strategy or underwriting guidelines described in our public filings.
Our employees could take excessive risks, which could negatively affect our financial condition and business.
As an insurance enterprise, we are in the business of binding certain risks. The employees who conduct our business, including executive officers and other members of management, underwriters, product managers and other employees, do so in part by making decisions and choices that involve exposing us to risk. These include decisions such as setting underwriting guidelines and standards, product design and pricing, determining which business opportunities to pursue, and other decisions. We endeavor, in the design and implementation of our compensation programs and practices, to avoid giving our employees incentives to take excessive risks. Employees may, however, take such risks regardless of the structure of our compensation programs and practices. Similarly, although we employ controls and procedures designed to monitor employees’ business decisions and prevent them from taking excessive risks, these controls and procedures may not be effective. If our employees take excessive risks, the impact of those risks could have a material adverse effect on our financial condition and business operations.
We may require additional capital in the future, which may not be available or may only be available on unfavorable terms.
Our future capital requirements depend on many factors, including our ability to write new business successfully and to establish premium rates and reserves at levels sufficient to cover losses. Many factors will affect the amount and timing of our capital needs, including our growth rate and profitability, our claims experience, the availability of reinsurance, market disruptions, and other unforeseeable developments. If we need to raise additional capital, equity or debt financing may not be available at all or only available on unfavorable terms. Equity financings would result in dilution to our stockholders. Debt financings could subject us to covenants that restrict our ability to freely operate our business. If we cannot obtain adequate capital on favorable terms or at all, we may not have sufficient funds to implement our operating plans and our business, financial condition or results of operations could be materially adversely affected.
We may not be able to manage our growth effectively.
We intend to grow our business in the future, which could require additional capital, technology development, and skilled personnel. To grow effectively, we must be able to meet our capital needs and expand our systems, technology, and internal controls effectively. We also must allocate our human resources optimally, including identifying, hiring, and retaining qualified employees, and effectively incorporating the components of any businesses we may acquire in our effort to achieve growth. The failure to manage our growth effectively could have a material adverse effect on our business, financial condition and results of operations.
We face risks associated with the evaluation of potential acquisitions, the integration of acquired businesses, and the introduction of new products, lines of business, and markets.
As part of our business strategy, we may make acquisitions, including acquisitions in lines of business that are natural adjacencies. For example, we recently completed the acquisition of FIA in January 2025. The success of our acquisition strategy is dependent upon our ability to identify appropriate acquisition targets, negotiate transactions on favorable terms, complete transactions, have adequate access to financing and the ability to finance acquisitions on acceptable terms, and successfully integrate them into our existing businesses. We may not realize the anticipated benefits of acquisitions we have completed or may complete in the future, and we may not be able to incorporate any acquired lines of business with our existing operations, or integrate personnel from the acquired businesses, in which case our business, financial condition and results of operations could be harmed.
If acquisitions are made, we may not realize the anticipated benefits of such acquisitions, including, but not limited to, revenue growth, operational efficiencies, or expected synergies. Many of the businesses and assets that we have acquired or may acquire have unaudited historical financial statements or records that have been, or will be, prepared by the management of such companies and have not been, or will not be, independently reviewed or audited. We cannot be certain that the financial statements or records of companies or assets we have acquired or may acquire would not, or will not, be materially different if such statements were independently reviewed or audited. If such statements were to be materially different, the tangible and intangible assets we acquire may be more susceptible to impairment charges, which could have a material adverse effect on us.
In addition, many of the businesses that we acquire and develop will likely have smaller scales of operations prior to the implementation of our growth strategy. If our growth continues, it may place a significant strain on our management team and on our operational and financial systems, procedures, and controls. If we are not able to manage the growing complexity of these businesses, including improving, refining, or revising our systems and operational practices, enlarging the scale and scope of the businesses, and integrating the new business into our culture and operations, our business may be adversely affected.
From time to time, either through acquisitions or internal development, we enter new distribution channels or lines of business or offer new products and services within existing lines of business. These new distribution channels, lines of business, or new products and services present additional risks, particularly in instances where the markets are not fully developed. Such risks include the investment of significant time and resources to recruit, hire, and retain personnel and develop the products, the risks involved with the management of the integration process and development of new processes and systems to accommodate complex programs, and the risk of financial guarantees and additional liabilities associated with these efforts.
Failure to manage these risks arising from acquisitions or development of new businesses could materially and adversely affect our business, results of operations, and financial condition.
Our operating results have in the past varied from quarter to quarter and may not be indicative of our long-term prospects.
Our operating results are subject to fluctuation and have historically varied from quarter to quarter. We expect our quarterly results to continue to fluctuate in the future due to a number of factors, including the general economic conditions in the markets where we operate, the frequency of occurrence and severity of catastrophe or other insured events, fluctuating interest rates, claims exceeding our loss reserves, competition in our industry, deviations from expected premium retention rates of our existing policies, volatility in investment performance, including gains and losses on our equity securities, and the cost of reinsurance coverage.
In addition, the insurance and reinsurance business historically has been a cyclical industry characterized by periods of intense price competition due to excess underwriting capacity (soft market cycle) as well as periods when shortages of capacity increase premium levels (hard market cycle). We expect our business and results of operations to be continuously impacted by these market cycles.
We seek to underwrite products and make investments to achieve favorable returns on tangible stockholders’ equity over the long term. Our opportunistic nature and focus on long‑term growth in tangible equity may result in fluctuations in gross written premiums, reinsurance expenses, loss expenses, and other underwriting expenses from period to period as we concentrate on underwriting contracts that we believe will generate better long‑term, rather than short‑term, results. Accordingly, our short‑term results of operations may not be indicative of our long‑term prospects.
Our Credit Agreement contains restrictions and covenants that limit our flexibility in operating our business and any debt borrowed under our Credit Agreement exposes us to additional risk and may adversely affect our financial condition and future financial results.
In December 2021, we entered into a Credit Agreement (the “Credit Agreement”) with certain lenders which provides a revolving credit facility of up to $100.0 million. Borrowings under the Credit Agreement may impact our business and financial condition by:
| • |
Requiring the dedication of a portion of our expected cash flows from operations to service our debt, thereby reducing the amount of expected cash flows available for other purposes, including investing, and paying claims and operating expenses and; |
| • |
Exposing us to interest rate risk since the interest rate in the credit agreement is a variable rate |
In addition, the Credit Agreement contains financial covenants, restrictions on indebtedness, liens, investments, mergers, dispositions, prepayment of other indebtedness and dividends and other distributions. The financial covenants in the Credit agreement require the Company not to exceed a maximum leverage ratio and maintain a minimum net worth at the end of each quarter. The Company’s insurance subsidiaries are also required to maintain a minimum Risk Based Capital Ratio at the end of each year and must always maintain a minimum AM Best Financial Strength rating. All of these covenants and restrictions impact how we operate our business and may limit our flexibility in planning for, or reacting to, changes in our business and industry. Our ability to comply with these covenants may be affected by events beyond our control. If we breach any of the covenants and do not obtain a waiver from the noteholders or lenders, then, subject to applicable cure periods, any outstanding debt may be declared immediately due and payable.
Volatility in crop prices, as a result of weather conditions or other events, could adversely impact our results of operations.
Weather conditions, including too much moisture (flooding or excessive rain), not enough moisture (droughts), and the level of crop prices in the commodities market heavily impact our crop insurance products. These factors are inherently unpredictable and could result in significant volatility in our operating results from one year to the next. Our results could also be negatively impacted by pests and plant disease. A large decline in the commodity prices of one or more of the major crops that we insure could have a material adverse effect on our results of operations or financial condition.
Risks Related to the Economic Environment
Adverse economic factors, including recession, inflation, periods of high unemployment or lower economic activity could result in the sale of fewer policies than expected or an increase in the frequency of claims and premium defaults, and even the falsification of claims, or a combination of these effects, which, in turn, could affect our growth and profitability.
Factors, such as general economic conditions, the volatility and strength of the capital markets, and inflation can affect the business and economic environment. These same factors affect our ability to generate revenue and profits. In an economic downturn that is characterized by higher unemployment, declining spending, and reduced corporate revenue, the demand for insurance products could be adversely affected, which directly affects our premium levels and profitability. Negative economic factors may also affect our ability to receive the appropriate rate for the risk we insure with our policyholders and may adversely affect the number of policies we can write, and our opportunities to underwrite profitable business. In an economic downturn, our customers may have less need for insurance coverage, cancel or cease payment on existing insurance policies, modify their coverage, or not renew the policies they hold with us. Existing policyholders may exaggerate or even falsify claims to obtain higher claims payments. These outcomes would reduce our underwriting profit to the extent these factors are not reflected in the rates we charge.
We underwrite a significant portion of our insurance in California. An economic downturn which particularly impacts California could have an adverse effect on our financial condition and results of operations.
Performance of our investment portfolio is subject to a variety of investment risks that may adversely affect our financial results.
Our results of operations depend, in part, on the performance of our investment portfolio. We seek to hold a diversified portfolio of investments that is managed by a professional investment advisory management firm in accordance with our investment policy and routinely reviewed by our Board of Directors. Our investments are subject to general economic conditions and market risks as well as risks inherent to particular securities.
Our primary market risk exposures relate to changes in interest rates and credit quality considerations. Future increases in interest rates could cause the values of our fixed maturity securities portfolios to decline, with the magnitude of the decline depending on the duration of securities included in our portfolio and the amount by which interest rates increase. Interest rate fluctuations can also impact the business and results of operations of the companies that issue fixed maturity securities and may cause a decline in fair value of their securities. Some fixed maturity securities have call or prepayment options, which create reinvestment risk in declining rate environments. Other fixed maturity securities, such as mortgage‑backed and asset‑backed securities, carry prepayment risk or, in a rising interest rate environment, may not prepay as quickly as expected.
The value of our investment portfolio is subject to the risk that certain investments may default or become impaired due to deterioration in the financial condition of one or more issuers of the securities we hold, or due to deterioration in the financial condition of an insurer that guarantees an issuer’s payments on such investments. Such deteriorations may be caused or magnified by interest rate fluctuations. Downgrades in the credit ratings of fixed maturities also have a significant negative effect on the market valuation of such securities.
Such factors could reduce our net investment income and result in realized investment losses. Our investment portfolio is subject to increased valuation uncertainties when investment markets are illiquid. The valuation of investments is more subjective when markets are illiquid, thereby increasing the risk that the estimated fair value (i.e., the carrying amount) of the securities we hold in our portfolio does not reflect prices at which actual transactions would occur.
We also invest in marketable equity securities. These securities are carried on the balance sheet at fair market value and are subject to potential losses and declines in market value based on the performance of equity markets. Our equity invested assets totaled $40.5 million as of December 31, 2024.
Risks for all types of securities are managed through the application of our investment policy, which establishes investment parameters that include but are not limited to, maximum percentages of investment in certain types of securities and minimum levels of credit quality, which we believe are within applicable guidelines established by the National Association of Insurance Commissioners (“NAIC”), the Oregon Division of Financial Regulation and the California and Arizona Departments of Insurance.
Although we seek to preserve our capital, we cannot be certain that our investment objectives will be achieved, and results may vary substantially over time. In addition, although we seek to employ investment strategies that are not correlated with our insurance and reinsurance exposures, losses in our investment portfolio may occur at the same time as underwriting losses and, therefore, exacerbate the adverse effect of the losses on us.
Our investment portfolio could also be adversely impacted by ratings downgrades, increased bankruptcies and credit spread widenings caused by economic downturns or other events. Severe economic downturns could cause impairments in our fixed income portfolio. In addition, declines in fixed income yields would result in decreases in net investment income from future investment activity, including re-investments.
We may, in certain circumstances, invest a small percentage of our investment portfolio in private companies or limited partnerships which we believe provide strategic opportunities. These types of investments are typically illiquid, and we have limited ability to take actions that protect or increase the value of this type of investment. Net losses from these investments or impairment of these investments may negatively impact our operating results.
We could be forced to sell investments to meet our liquidity requirements.
We invest the premiums we receive from our insureds until they are needed to pay policyholder claims. Consequently, we seek to manage the duration of our investment portfolio based on the duration of our losses and loss adjustment expense reserves to provide sufficient liquidity and avoid having to liquidate investments to fund claims. Risks such as inadequate losses and loss adjustment reserves, a significant catastrophe event, or unfavorable trends in litigation could potentially result in the need to sell investments to fund these liabilities. We may not be able to sell our investments at favorable prices or at all. Sales could result in significant realized losses depending on the conditions of the general market, interest rates, and credit issues with individual securities.
Risks Related to Technology
The failure of our information technology and telecommunications systems could adversely affect our business.
Our business is highly dependent upon our information technology and telecommunications systems, including our underwriting system. We rely on these systems to interact with brokers and insureds, to underwrite business, to prepare policies and process premiums, to perform actuarial and other modeling functions, to process claims and make claims payments, and to prepare internal and external financial statements and information. Some of these systems may include or rely on third-party systems not located on our premises or under our control. Events such as natural catastrophes, pandemics, cyber-attacks, terrorist attacks, industrial accidents or computer viruses may cause our systems to fail or be inaccessible for extended periods of time. While we have implemented business contingency plans and other reasonable plans to protect our systems, sustained or repeated system failures or service denials could severely limit our ability to write and process new and renewal business, provide customer service, pay claims in a timely manner or otherwise operate in the ordinary course of business.
A portion of our employees work remotely and outside of our primary offices on a regular basis. We believe remote work increases the need for our information technology and telecommunications systems to work properly and creates additional operational risk and difficulty should these systems fail.
Security breaches or cyber-attacks could expose us to liability and damage our reputation and business.
Our operations depend on the reliable and secure processing, storage, and transmission of confidential and other data and information in our computer systems and networks. Computer viruses, hackers, employee misconduct, and other external hazards could expose our systems to security breaches, cyber-attacks or other disruptions.
Cyberthreats are constantly evolving and becoming increasingly sophisticated and complex, making it increasingly difficult to detect and successfully defend against them. In addition, cyber-attackers (which may include individuals or groups, as well as sophisticated groups such as nation-state and state-sponsored attackers, which can deploy significant resources to plan and carry out exploits) also develop and deploy viruses, worms, credential stuffing attack tools and other malicious software programs, some of which may be specifically designed to attack our products, information systems or networks. Outside parties have in the past and may in the future attempt to fraudulently induce our employees or users of our products or services to disclose sensitive, personal or confidential information via illegal electronic spamming, phishing or other tactics.
While we have implemented security measures and employee training designed to protect against breaches of security and other interference with our systems and networks, our systems and networks may be, and at times are, subject to breaches or interference. Any such event may result in operational disruptions as well as unauthorized access to or the disclosure or loss of our proprietary information or our customers’ data and information, which in turn may result in legal claims, regulatory scrutiny and liability, reputational damage, the incurrence of costs to eliminate or mitigate further exposure, the loss of customers or affiliated advisors, reputational harm or other damage to our business. While we maintain insurance coverage that may, subject to policy terms and conditions, cover certain aspects of cyber risks, such insurance coverage may be insufficient to cover all losses.
In addition, the trend toward general public notification of such incidents could exacerbate the harm to our business, financial condition and results of operations. Even if we successfully protect our technology infrastructure and the confidentiality of sensitive data, we could suffer harm to our business and reputation if attempted security breaches are publicized. We cannot be certain that advances in criminal capabilities, discovery of new vulnerabilities, attempts to exploit vulnerabilities in our systems, data thefts, physical system or network break‑ins or inappropriate access, or other developments will not compromise or breach the technology or other security measures protecting the networks and systems used in connection with our business.
We employ third-party licensed software for use in our business, and the inability to maintain these licenses, problems with the software we license, or increases to the cost of software licenses could adversely affect our business.
Multiple areas of our business rely on certain third-party software obtained under licenses from other companies. We anticipate that we will continue to rely on such third-party software in the future. Unforeseen issues may arise in third-party software platforms which may have an adverse impact on our operations. Integration of new third-party software or modifications to our existing third-party software may require substantial investment of our time and resources. The inability to integrate or operate third-party software successfully or the inadequacy of third-party software may have a material adverse impact on our operations. In addition, the cost of third-party software is significant and we expect it to increase in the future. If we have issues with the functionality or expense of third-party software, we may not be able to find acceptable alternatives in a timely manner or at all. Many of the risks associated with the use of third-party software cannot be eliminated, and these risks could negatively affect our business.
Additionally, the software powering our technology systems incorporates software covered by open-source licenses. The terms of many open-source licenses have not been interpreted by U.S. courts, and there is a risk that the licenses could be construed in a manner that imposes unanticipated conditions or restrictions on our ability to operate our systems. In the event that portions of our proprietary software are determined to be subject to an open-source license, we could be required to publicly release the affected portions of our source code or re-engineer all or a portion of our technology systems, each of which could reduce or eliminate the value of our technology systems. Such risk could be difficult or impossible to eliminate and could adversely affect our business, financial condition, and results of operations.
Any control weakness or failure in cloud-based software could adversely affect our business.
We use cloud-based third-party software to host applications and for key financial and operational systems and we expect to expand their use in the future. We will increasingly rely on third-party software providers to maintain appropriate controls and safeguards to protect the integrity of our data and any information we transmit, including personal, personally identifiable, sensitive, confidential or proprietary information. While we conduct due diligence on these cloud providers with respect to their security and business controls, we may not have the visibility to effectively monitor the implementation and efficacy of these controls. If these controls do not operate effectively, we may not be able to rely on their software and cyber attackers may be able to exploit vulnerabilities, resulting in operational disruption, data loss, defects or a cybersecurity event. Migrating our software to the cloud increases the risk of operational disruption should internet service be interrupted. While we have implemented business contingency and other plans to facilitate continuous internet access, sustained or concurrent service denials or similar failures could limit our ability to write and process new and renewal business, provide customer service, pay claims in a timely manner, maintain our accounting function, or otherwise operate our business. Any such event or failure could have a material adverse effect on our business, financial condition and results of operations.
The growth and evolution of artificial intelligence may impact our business and operations
In the future, we may seek to deploy and/or further rely on technologies such as artificial intelligence or machine learning in operating our business. If we are unable to deploy this technology effectively or if our competitors are better able to deploy this technology our business may be adversely impacted. Our third-party software vendors and service providers are increasingly incorporating artificial intelligence into their processes and this may expose us to additional risks should they not be able to incorporate the technology effectively. The evolution and increased reliance on artificial intelligence may exacerbate our information technology and cybersecurity risks. Furthermore, regulations around artificial intelligence continue to evolve and we may be subject to increased regulation around artificial intelligence in the future.
Risks Related to Laws and Regulations
We are subject to extensive regulation, which may adversely affect our ability to achieve our business objectives. In addition, if we fail to comply with these regulations, we may be subject to penalties, including fines and suspensions, which may adversely affect our financial condition and results of operations.
PSIC is subject to extensive regulation in Oregon, its state of domicile, California, where it is commercially domiciled, and to a lesser degree, the other states in which it operates. PESIC is subject to extensive regulation in Arizona, its state of domicile, and to a lesser degree, the other states in which it writes business. Our Bermuda based reinsurance subsidiary, Palomar Specialty Reinsurance Company Bermuda Ltd. (“PSRE”), is subject to regulation in Bermuda.
Most insurance regulations are designed to protect the interests of insurance policyholders, as opposed to the interests of investors or stockholders. These regulations generally are administered by a department of insurance in each state and relate to, among other things, capital and surplus requirements, investment and underwriting limitations, affiliate transactions, dividend limitations, changes in control, solvency and a variety of other financial and non-financial aspects of our business. Significant changes in these laws and regulations could further limit our discretion or make it more expensive to conduct our business. State insurance regulators and the Bermuda Monetary Authority (the “BMA”), also conduct periodic examinations of the affairs of insurance and reinsurance companies and require the filing of annual and other reports relating to financial condition, holding company issues and other matters. These regulatory requirements may impose timing and expense constraints that could adversely affect our ability to achieve some or all our business objectives.
Our U.S. insurance subsidiaries are part of an “insurance holding company system” within the meaning of applicable California, Oregon and Arizona statutes and regulations. As a result of such status, certain transactions between our U.S. insurance subsidiaries and one or more of their affiliates, such as a tax sharing agreement or cost sharing arrangement, may not be effected unless the insurer has provided notice of that transaction to the California Department of Insurance, the Oregon Division of Financial Regulation, or the Arizona Department of Insurance, as applicable, at least 30 days prior to engaging in the transaction and the California Department of Insurance, the Oregon Division of Financial Regulation, or the Arizona Department of Insurance, as applicable, has not disapproved such transaction within the 30-day time period. These prior notification requirements may result in business delays and additional business expenses. If any of our U.S. insurance subsidiaries fail to file a required notification or fail to comply with other applicable insurance regulations in California, Oregon or Arizona, as applicable, we may be subject to significant fines and penalties and our working relationship with the California Department of Insurance, the Oregon Division of Financial Regulation, or the Arizona Department of Insurance, as applicable, may be impaired.
In addition, state insurance regulators have broad discretion to deny, suspend, or revoke licenses for various reasons, including the violation of regulations. In some instances, where there is uncertainty as to applicability, we follow practices based on our interpretations of regulations or practices that we believe generally to be followed by the industry. These practices may turn out to be different from the interpretations of regulatory authorities. If we do not have the requisite licenses and approvals or do not comply with applicable regulatory requirements, state insurance regulators could preclude or temporarily suspend us from carrying on some or all of our activities or could otherwise penalize us. This could adversely affect our ability to operate our business. Further, changes in the level of regulation of the insurance industry or changes in laws or regulations themselves or interpretations by regulatory authorities could interfere with our operations and require us to bear additional costs of compliance, which could adversely affect our ability to operate our business.
Our U.S. insurance subsidiaries are subject to risk-based capital requirements, based upon the “risk based capital model” adopted by the NAIC, and other minimum capital and surplus restrictions imposed under Arizona, Oregon and California law. These requirements establish the minimum amount of risk-based capital necessary for a company to support its overall business operations. It identifies property and casualty insurers that may be inadequately capitalized by looking at certain inherent risks of each insurer’s assets and liabilities and its mix of net written premium. Insurers falling below a calculated threshold may be subject to varying degrees of regulatory action, including supervision, rehabilitation or liquidation. Failure by any of our U.S. subsidiaries to maintain risk-based capital at the required levels could adversely affect their ability to maintain regulatory authority to conduct business.
PSRE is subject to regulation from the European Union. The European Union adopted the Economic Substance Act 2018 and the Economic Substance Regulations 2018 (together, the “ES Requirements”). As an insurance company, our Bermuda subsidiary conducts a relevant activity and is subject to the ES Requirements. As a result, our Bermuda subsidiary may be required to change or increase our business operations in Bermuda to meet these requirements.
Laulima is subject to regulation from the Hawaii Department of Commerce and Consumer Affairs, Hawaii Insurance Division which requires that Laulima comply with Hawaii Statutes and Insurance Code. If Laulima is unable to comply with the applicable insurance regulations in Hawaii, it may be subject to significant fines and penalties and its working relationship with the Hawaii Department of Commerce and Consumer Affairs, Hawaii Insurance Division may be impaired.
Unexpected changes in the interpretation of our coverage or provisions, including loss limitations and exclusions, in our policies could have a material adverse effect on our financial condition and results of operations.
There can be no assurances that specifically negotiated loss limitations or exclusions in our policies will be enforceable in the manner we intend. As industry practices and legal, judicial, social, and other conditions change, unexpected and unintended issues related to claims and coverage may emerge. For example, many of our policies limit the period during which a policyholder may bring a claim, which may be shorter than the statutory period under which such claims can be brought against our policyholders. While these limitations and exclusions help us assess and mitigate our loss exposure, it is possible that a court or regulatory authority or an executive action could nullify or void a limitation or exclusion, such as limitations on business interruption claims caused by pandemics or other crises, or legislation could be enacted modifying or barring the use of such limitations or exclusions. These types of governmental actions could result in higher than anticipated losses and loss adjustment expenses, which could have a material adverse effect on our financial condition or results of operations. In addition, court decisions, such as the 1995 Montrose decision in California could read policy exclusions narrowly so as to expand coverage, thereby requiring insurers to create and write new exclusions.
These issues may adversely affect our business by either broadening coverage beyond our underwriting intent or by increasing the frequency or severity of claims. In some instances, these changes may not become apparent until sometime after we have issued insurance contracts that are affected by the changes. As a result, the full extent of liability under our insurance contracts may not be known for many years after a contract is issued.
We may become subject to additional government or market regulation, including additional regulation around cybersecurity, which may have a material adverse impact on our business.
Our business could be adversely affected by changes in state laws, including those relating to asset and reserve valuation requirements, surplus requirements, limitations on investments and dividends, enterprise risk and risk-based capital requirements, and, at the federal level, by laws and regulations that may affect certain aspects of the insurance industry, including proposals for preemptive federal regulation. The U.S. federal government generally has not directly regulated the insurance industry except for certain areas of the market, such as insurance for flood, nuclear and terrorism risks. However, the federal government has undertaken initiatives or considered legislation in several areas that may affect the insurance industry, including tort reform, corporate governance and the taxation of reinsurance companies. In addition, the Bermuda reinsurance regulatory framework has become subject to increased scrutiny in many jurisdictions. As a result, the BMA has implemented and imposed additional requirements on the companies it regulates, which requirements could adversely impact the operations of PSRE.
Any government mandates and/or legislative changes related to mandated premium refunds or credits and extended premium grace periods, could have a material adverse effect on our results of operations and financial condition. Premium grace periods could significantly increase our expenses while decreasing our short-term revenues which would adversely impact our liquidity.
Additionally, in response to the growing threat of cyber-attacks in the insurance industry, cybersecurity regulations have been adopted, which, among other things, require insurance companies to establish and maintain a cybersecurity program and implement and maintain cybersecurity policies and procedures. On October 24, 2017, the NAIC adopted its Insurance Data Security Model Law, intended to serve as model legislation for states to enact in order to govern cybersecurity and data protection practices of insurers, insurance agents, and other licensed entities registered under state insurance laws. We are required to abide by the provisions of and file compliance certifications pertaining to this legislation.
We routinely transmit and receive personal, confidential and proprietary data and information by electronic means and are subject to numerous data privacy laws and regulations enacted in the jurisdictions in which we do business, including recent laws in California whose impact on our business are difficult to predict.
While we have implemented cybersecurity policies and procedures, there is no guarantee our policies and procedures will protect our systems against all attacks or comply with all provisions of these evolving regulations.
Changes in tax laws as a result of the enactment of tax legislation could impact our operations and profitability.
Any future tax legislation or changes to tax laws such as changing the corporate or personal tax rate or changes to allowed tax deductions could have a negative impact on our results of operations and profitability by causing us to incur additional tax expense or by having a financial impact on our policyholders.
If states increase the assessments that we are required to pay, our business, financial condition and results of operations would suffer.
Certain jurisdictions in which PSIC is admitted to transact business require property and casualty insurers doing business within that jurisdiction to participate in insurance guaranty associations. These organizations pay contractual benefits owed pursuant to insurance policies issued by impaired, insolvent or failed insurers. They levy assessments, up to prescribed limits, on all member insurers in a particular state based on the proportionate share of the premiums written by member insurers in the lines of business in which the impaired, insolvent or failed insurer is engaged. States may also assess admitted companies to fund their respective department of insurance operations. Some states permit member insurers to recover assessments paid through full or partial premium tax offset or in limited circumstances by surcharging policyholders.
PSIC is licensed to conduct insurance operations on an admitted basis in 44 states. As PSIC grows, its share of any assessments in each state in which it underwrites business on an admitted basis may increase. We cannot predict with certainty the amount of future assessments, because they depend on factors outside our control, such as insolvencies of other insurance companies as well as the occurrence of significant catastrophes. Assessments may be covered by our catastrophe XOL treaties and, to the extent we have experienced a net loss from an event in excess of our net retention, assessments would be recovered from our reinsurers with no additional expense to us. Although reinsurance makes the reinsurer liable to us to the extent the risk is transferred or ceded to the reinsurer, it does not relieve us (the ceding insurer) of our primary liability to our policyholders. Significant assessments could result in higher operating expenses and have a material adverse effect on our business, financial condition, or results of operations. In addition, while some states permit member insurers to recover assessments paid through full or partial premium tax offset or, in limited circumstances, by surcharging policyholders, there is no certainty that offsets or surcharges will be permitted in connection with any future assessments.
Because we are a holding company and substantially all our operations are conducted by our insurance subsidiaries, our ability to pay dividends depends on our ability to obtain cash dividends or other permitted payments from our insurance subsidiaries.
The continued operation and growth of our business will require substantial capital. We do not intend to declare and pay cash dividends on shares of our common stock in the foreseeable future. Because we are a holding company with no business operations of our own, our ability to pay dividends to stockholders largely depends on dividends and other distributions from our insurance subsidiaries, PSIC, PESIC and PSRE. State insurance laws, including the laws of Oregon, California, Arizona, and the laws of Bermuda restrict the ability of our subsidiaries to declare stockholder dividends. State insurance regulators require insurance companies to maintain specified levels of statutory capital and surplus. The maximum dividend distribution absent the approval or non‑disapproval of the insurance regulatory authority in Oregon, California and Arizona is limited by Oregon law at ORS 732.576, California law at Cal. Ins. Code 1215.5(g) and Arizona Revised Statute 20-481. Under Oregon statute, dividend payments from PSIC are further limited to that part of available policyholder surplus that is derived from net profits on our business. State insurance regulators have broad powers to prevent the reduction of statutory surplus to inadequate levels, and there is no assurance that dividends up to the maximum amounts calculated under any applicable formula would be permitted. Moreover, state insurance regulators that have jurisdiction over the payment of dividends by PSIC and PESIC may in the future adopt statutory provisions more restrictive than those currently in effect.
PSRE is highly regulated and is required to comply with various conditions before it is able to pay dividends or make distributions to us. Bermuda law, including the Insurance Act 1978, as amended (“Insurance Act”) and the Companies Act 1981, as amended (“Companies Act”) impose restrictions on PSRE’s ability to pay dividends to us based on solvency margins and surplus and capital requirements. These restrictions, and any other future restrictions adopted by the BMA, could have the effect, under certain circumstances, of significantly reducing dividends or other amounts payable to us by PSRE without affirmative approval of the BMA.
Any determination to pay dividends in the future will be at the discretion of our Board of Directors and will depend upon results of operations, financial condition, restrictions imposed by applicable law and other factors our Board of Directors deems relevant. Consequently, investors may need to sell all or part of their holdings of our common stock after price appreciation, which may never occur, as the only way to realize any future gains on their investment. Investors seeking immediate cash dividends should not purchase our common stock.
The effects of litigation on our business are uncertain and could have an adverse effect on our business.
As is typical in our industry, we continually face risks associated with litigation of various types, including disputes relating to insurance claims under our policies as well as other general commercial and corporate litigation. Although we are not currently involved in any material litigation with our customers, other members of the insurance industry are the target of class action lawsuits and other types of litigation, some of which involve claims for substantial or indeterminate amounts, and the outcomes of which are unpredictable. This litigation is based on a variety of issues, including insurance and claim settlement practices. We cannot predict with any certainty whether we will be involved in such litigation in the future or what impact such litigation would have on our business.
We rely on the use of credit scoring in pricing and underwriting certain of our insurance policies and any legal or regulatory requirements that restrict our ability to access credit score information could decrease the accuracy of our pricing and underwriting process and thus decrease our ability to be profitable.
We use credit scoring as a factor in pricing and underwriting decisions where allowed by state law. Consumer groups and regulators have questioned whether the use of credit scoring unfairly discriminates against some groups of people and are calling for laws and regulations to prohibit or restrict the use of credit scoring in underwriting and pricing. Laws or regulations that significantly curtail or regulate the use of credit scoring, if enacted in states in which we operate, could impact the integrity of our pricing and underwriting processes, which could, in turn, materially and adversely affect our business, financial condition, results of operations and prospects, and make it harder for us to be profitable over time.
Any failure to protect our intellectual property rights could impair our ability to protect our intellectual property, proprietary technology platform and brand, or we may be sued by third parties for alleged infringement of their proprietary rights.
Our success and ability to compete depend in part on our intellectual property, which includes our rights in our proprietary technology platform and our brand. We primarily rely on copyright, trade secret and trademark laws, and confidentiality agreements with our employees, customers, service providers, partners and others to protect our intellectual property rights. However, the steps we take to protect our intellectual property may be inadequate. Litigation brought to protect and enforce our intellectual property rights could be costly, time‑consuming and distracting to management and could result in the impairment or loss of portions of our intellectual property. Additionally, our efforts to enforce our intellectual property rights may be met with defenses, counterclaims and countersuits attacking the validity and enforceability and scope of our intellectual property rights. Our failure to secure, protect and enforce our intellectual property rights could adversely affect our brand and adversely impact our business.
Our success also depends in part on us not infringing on the intellectual property rights of others. Our competitors, as well as a number of other entities and individuals, may own or claim to own intellectual property relating to our industry. In the future, third parties may claim that we are infringing on their intellectual property rights, and we may be found to be infringing on such rights. Any claims or litigation could cause us to incur significant expenses and, if successfully asserted against us, could require that we pay substantial damages or ongoing royalty payments, prevent us from offering our services, or require that we comply with other unfavorable terms. Even if we were to prevail in such a dispute, any litigation could be costly and time‑consuming and divert the attention of our management and key personnel from our business operations.
Changes in accounting practices and future pronouncements may materially affect our reported financial results.
Developments in accounting practices may require us to incur considerable additional expenses to comply, particularly if we are required to prepare information relating to prior periods for comparative purposes or to apply the new requirements retroactively. Our consolidated financial statements are prepared in accordance with Generally Accepted Accounting Principles (“GAAP”). The impact of changes in GAAP cannot be predicted but may affect the calculation of net income, stockholders’ equity, and other relevant financial statement line items.
In addition to compliance with GAAP on a consolidated basis, PSIC, PESIC, PSRE and Laulima are required to comply with statutory accounting principles (“SAP”). SAP and various components of SAP are subject to constant review by the NAIC and its task forces and committees, as well as state insurance departments to address emerging issues and otherwise improve financial reporting. Various proposals are pending before committees and task forces of the NAIC, some of which, if enacted, could have negative effects on insurance industry participants. The NAIC continuously examines existing laws and regulations. We cannot predict whether or in what form such reforms will be enacted and, if so, whether the enacted reforms will positively or negatively affect us.
We incur significant costs as a public company, and our management is required to devote substantial time to complying with public company regulations.
As a public company, we incur certain legal, accounting, and other expenses that we would not incur as a private company. We are subject to the reporting requirements of the Exchange Act, which require, among other things, that we file with the SEC annual, quarterly, and current reports with respect to our business and financial condition and therefore we need to have the ability to prepare financial statements that comply with all SEC reporting requirements on a timely basis. In addition, we are subject to other reporting and corporate governance requirements, including certain requirements of and certain provisions of the Sarbanes‑Oxley Act and the regulations promulgated thereunder, which impose significant compliance obligations upon us. In particular, we must perform system and process evaluation and testing of our internal control over financial reporting to allow management and our independent registered public accounting firm to report on the effectiveness of our internal control over financial reporting, as required by Section 404 of the Sarbanes‑Oxley Act. Our compliance with Section 404 requires that we incur substantial accounting expense and expend significant management efforts. We must maintain accounting and finance staff and consultants with appropriate public company reporting, technical accounting, and internal control knowledge to satisfy the ongoing requirements of Section 404 and provide internal audit services.
The Sarbanes‑Oxley Act and the Dodd‑Frank Act, as well as new rules subsequently implemented by the SEC and Nasdaq, have increased regulation of, and imposed enhanced disclosure and corporate governance requirements on, public companies. We expect disclosure requirements to increase in the future and expand to areas such as climate change and greenhouse gas emissions. Our efforts to comply with these evolving laws, regulations and standards increases our operating costs and divert management’s time and attention from revenue‑generating activities.
These requirements also place significant additional demands on our finance and accounting staff and on our financial accounting and information systems. We must retain accounting and financial staff with appropriate public company reporting experience and technical accounting knowledge. Other expenses associated with being a public company include increased auditing, accounting and legal fees and expenses, investor relations expenses, increased directors’ fees and director and officer liability insurance costs, registrar and transfer agent fees and listing fees, as well as other expenses. As a public company, we are required, among other things, to:
| • |
prepare and file periodic reports and distribute other stockholder communications, in compliance with the federal securities laws and requirements of Nasdaq; |
| • |
define and expand the roles and the duties of our Board of Directors and its committees; |
| • |
institute comprehensive compliance and investor relations functions; and |
| • |
evaluate and maintain our system of internal control over financial reporting, and report on management’s assessment thereof, in compliance with rules and regulations of the SEC and the Public Company Accounting Oversight Board. |
We may not be successful in complying with these requirements, and compliance with them could materially adversely affect our business. These requirements increase our costs and may cause us to reduce costs in other areas of our business or increase the prices of our products or services. For example, these rules and regulations to make it more difficult and more expensive for us to obtain director and officer liability insurance. We cannot predict or estimate the amount or timing of additional costs we may incur to respond to these requirements. The impact of these requirements could also make it more difficult for us to attract and retain qualified persons to serve on our Board of Directors, our Board committees or as executive officers.
In addition, if we fail to implement and maintain the required controls with respect to our internal accounting and audit functions, our ability to report our results of operations on a timely and accurate basis could be impaired. If we do not implement the required controls in a timely manner or with adequate compliance, we may be subject to sanctions or investigation by regulatory authorities, such as the SEC or Nasdaq. Any such action could harm our reputation and the confidence of our investors and customers and could negatively affect our business and cause the price of our shares of common stock to decline.
We are required by Section 404 of the Sarbanes‑Oxley Act to evaluate the effectiveness of our internal control over financial reporting. If we are unable to achieve and maintain effective internal controls, our operating results and financial condition could be harmed and the market price of our common stock may be negatively affected.
As a public company with SEC reporting obligations, we are required to document and test our internal control procedures to satisfy the requirements of Section 404(b) of the Sarbanes‑Oxley Act, which requires annual assessments by management of the effectiveness of our internal control over financial reporting. We must implement and maintain substantial internal control systems and procedures to satisfy the reporting requirements under the Exchange Act.
During our assessments, we may identify deficiencies that we are unable to remediate in a timely manner. Testing and maintaining our internal control over financial reporting may also divert management’s attention from other matters that are important to the operation of our business. We may not be able to conclude on an ongoing basis that we have effective internal control over financial reporting in accordance with Section 404(b) of Sarbanes‑Oxley. If we conclude that our internal control over financial reporting is not effective, the cost and scope of remediation actions and their effect on our operations may be significant. Moreover, any material weaknesses or other deficiencies in our internal control over financial reporting may impede our ability to file timely and accurate reports with the SEC. Any of the above could cause investors to lose confidence in our reported financial information or our common stock listing on Nasdaq to be suspended or terminated, which could have a negative effect on the trading price of our common stock.
Applicable insurance laws may make it difficult to effect a change of control.
Under applicable Oregon, California and Arizona insurance laws and regulations, no person may acquire control of a domestic insurer until written approval is obtained from the state insurance commissioner following a public hearing on the proposed acquisition. Such approval would be contingent upon the state insurance commissioner’s consideration of a number of factors including, among others, the financial strength of the proposed acquiror, the acquiror’s plans for the future operations of the domestic insurer and any anti‑competitive results that may arise from the consummation of the acquisition of control. Oregon, California and Arizona insurance laws and regulations pertaining to changes of control apply to both the direct and indirect acquisition of ten percent or more of the voting stock of an insurer domiciled in that state. Accordingly, the acquisition of ten percent or more of our common stock would be considered an indirect change of control of Palomar Holdings, Inc. and would trigger the applicable change of control filing requirements under Oregon, California and Arizona insurance laws and regulations, absent a disclaimer of control filing and its acceptance by the Oregon, California and Arizona Insurance Departments. These requirements may discourage potential acquisition proposals and may delay, deter or prevent a change of control of Palomar Holdings, Inc., including through transactions that some or all of the stockholders of Palomar Holdings, Inc. might consider to be desirable.
Risks Related to Ownership of Our Common Stock
Future transactions where we raise capital may negatively affect our stock price.
We are currently a “Well-Known Seasoned Issuer” and may file automatic shelf registration statements at any time with the SEC. Sales of substantial amounts of shares of our common stock or other securities under our current or future shelf registration statements could lower the market price of our common stock and impair our ability to raise capital through the sale of equity securities.
Our operating results and stock price may be volatile, or may decline regardless of our operating performance, and holders of our common stock could lose all or part of their investment.
Our quarterly operating results are likely to fluctuate in the future as a publicly traded company. In addition, securities markets worldwide have experienced, and are likely to continue to experience, significant price and volume fluctuations. This market volatility, as well as general economic, market or political conditions, could subject the market price of our shares to wide price fluctuations regardless of our operating performance. Although we believe we have adequate sources of liquidity over the short- and long-term, the success of our operations, the global economic outlook, and the pace of sustainable growth in our markets, among other factors, could impact our business and liquidity. You should consider an investment in our common stock to be risky, and you should invest in our common stock only if you can withstand a significant loss and wide fluctuation in the market value of your investment. The market price of our common stock is likely to continue to be subject to significant fluctuations in response to the factors described in this “Risk Factors” section and other factors, many of which are beyond our control. Among the factors that could affect our stock price are:
| • |
market conditions in the broader stock market; |
| • |
actual or anticipated fluctuations in our quarterly financial and operating results; |
| • |
introduction of new products or services by us or our competitors; |
| • |
issuance of new or changed securities analysts’ reports or recommendations; |
| • |
results of operations that vary from expectations of securities analysis and investors; |
| • |
short sales, hedging and other derivative transactions in our common stock; |
| • |
guidance, if any, that we provide to the public, any changes in this guidance or our failure to meet this guidance; |
| • |
strategic actions by us or our competitors; |
| • |
announcement by us, our competitors or our acquisition targets; |
| • |
sales, or anticipated sales, of large blocks of our stock, including by our directors, executive officers and principal stockholders; |
| • |
additions or departures in our Board or Directors, senior management or other key personnel; |
| • |
regulatory, legal or political developments; |
| • |
public response to press releases or other public announcements by us or third parties, including our filings with the SEC; |
| • |
litigation and governmental investigations; |
| • |
changing economic conditions; |
| • |
changes in accounting principles; |
| • |
any indebtedness we may incur or securities we may issue in the future; |
| • |
default under agreements governing our indebtedness; |
| • |
exposure to capital and credit market risks that adversely affect our investment portfolio or our capital resources; |
| • |
changes in our credit ratings; |
| • |
changes in corporate tax rates; |
| • |
interest or exchange rate fluctuations; and |
| • |
other events or factors, including those from natural disasters, war, pandemics, acts of terrorism, cyber-attacks or responses to these events. |
The securities markets have from time to time experienced extreme price and volume fluctuations that often have been unrelated or disproportionate to the operating performance of particular companies. As a result of these factors, investors in our common stock may not be able to resell their shares at or above the price at which they purchased their shares. These broad market fluctuations, as well as general market, economic and political conditions, such as recessions, loss of investor confidence or interest rate changes, may negatively affect the market price of our common stock.
In addition, the stock markets, including Nasdaq, have experienced extreme price and volume fluctuations that have affected and continue to affect the market prices of equity securities of many companies. If any of the foregoing occurs, it could cause our stock price to fall and may expose us to securities class action litigation that, even if unsuccessful, could be costly to defend, divert management’s attention and resources or harm our business.
Anti‑takeover provisions in our organizational documents could delay a change in management and limit our share price.
Provisions of our certificate of incorporation and bylaws could make it more difficult for a third party to acquire control of us even if such a change in control would increase the value of our common stock and prevent attempts by our stockholders to replace or remove our current Board of Directors or management.
Our charter documents contain anti‑takeover provisions that will hinder takeover attempts and could reduce the market value of our common stock or prevent sale at a premium. Our anti‑takeover provisions:
| • |
permit the Board of Directors to establish the number of directors and fill any vacancies and newly created directorships; |
| • |
provide, through 2027, that our Board of Directors are classified into three classes with staggered, three year terms and that directors may only be removed for cause; |
| • |
require super-majority voting to amend provisions in our certificate of incorporation and bylaws; |
| • |
include blank-check preferred stock, the preference, rights and other terms of which may be set by the Board of Directors and could delay or prevent a transaction or a change in control that might involve a premium price for our common stock or otherwise benefit our stockholders; |
| • |
eliminate the ability of our stockholders to call special meetings of stockholders; |
| • |
specify that special meetings of our stockholders can be called only by our Board of Directors, the chairman of our Board of Directors, or our chief executive officer; |
| • |
prohibit stockholder action by other than unanimous written consent; |
| • |
provide that vacancies on our Board of Directors may be filled only by a majority of directors then in office, even though less than a quorum; |
| • |
prohibit cumulative voting in the election of directors; and |
| • |
establish advance notice requirements for nominations for election to our Board of Directors or for proposing matters that can be acted upon by stockholders at annual stockholder meetings. |
In addition, as a Delaware corporation, we are subject to Section 203 of the Delaware General Corporation Law. These provisions may prohibit large stockholders, in particular those owning 15% or more of our outstanding voting stock, from merging or combining with us for a period of time.
Our certificate of incorporation and bylaws provide that the Court of Chancery of the State of Delaware is the exclusive forum for substantially all disputes between us and our stockholders, which could limit our stockholders’ ability to obtain a favorable judicial forum for disputes with us or our directors, officers or employees.
Our certificate of incorporation and bylaws provide that the Court of Chancery of the State of Delaware is the exclusive forum for the following civil actions:
| • |
any derivative action or proceeding brought on our behalf; |
| • |
any action asserting a claim of breach of a fiduciary duty by any of our directors, officers, employees or agents or our stockholders; |
| • |
any action asserting a claim arising pursuant to any provision of the DGCL or our certificate of incorporation or bylaws or as to which the DGCL confers jurisdiction on the Court of Chancery of the State of Delaware; |
| • |
any action to interpret, apply, enforce or determine the validity of our certificate of incorporation or our bylaws; or |
| • |
any action asserting a claim governed by the internal affairs doctrine. |
However, this provision would not apply to suits brought to enforce a duty or liability created by the Exchange Act. Furthermore, this provision applies to Securities Act claims and Section 22 of the Securities Act creates concurrent jurisdiction for federal and state courts over all suits brought to enforce any duty or liability created by the Securities Act or the rules and regulations thereunder. Accordingly, there is uncertainty as to whether a court would enforce such provision, and our stockholders will not be deemed to have waived our compliance with the federal securities laws and the rules and regulations thereunder. This choice of forum provision, if enforced, may limit a stockholder’s ability to bring a claim in a judicial forum that it finds favorable for disputes with us or our directors, officers or other employees, which may discourage such lawsuits against us and our directors, officers and other employees, although our stockholders will not be deemed to have waived our compliance with federal securities laws and the rules and regulations thereunder. Alternatively, if a court were to find the choice of forum provision contained in our certificate of incorporation and bylaws to be inapplicable or unenforceable in an action, we may incur additional costs associated with resolving such action in other jurisdictions, which could have a material adverse effect on our business, financial condition or results of operations.
If securities or industry analysts do not publish research or publish inaccurate or unfavorable research about our business, our stock price and trading volume could decline.
The trading market for our common stock depends, in part, on the research and reports that securities or industry analysts publish about us or our business and our industry. If one or more of the analysts who cover us downgrades our common stock or publishes inaccurate or unfavorable research about our business, our stock price would likely decline. If one or more of these analysts ceases coverage of us or fails to publish reports on us regularly, demand for our common stock could decrease, which could cause our stock price and trading volume to decline.
SPECIAL NOTE REGARDING FORWARD-LOOKING STATEMENTS
This Annual Report on Form 10-K contains forward-looking statements within the meaning of the federal securities laws, which statements involve substantial risks and uncertainties. Forward-looking statements generally relate to future events or our future financial or operating performance. In some cases, you can identify forward-looking statements because they contain words such as “may”, “will”, “should”, “expects”, “plans”, “anticipates”, “could”, “intends”, “target”, “projects”, “contemplates”, “believes”, “estimates”, “predicts”, “would”, “potential” or “continue” or the negative of these words or other similar terms or expressions that concern our expectations, strategy, plans or intentions. These forward-looking statements include, among others, statements relating to our future financial performance, our business prospects and strategy, anticipated financial position, liquidity and capital needs and other similar matters. These forward-looking statements are based on management’s current expectations and assumptions about future events, which are inherently subject to uncertainties, risks and changes in circumstances that are difficult to predict.
Our actual results may differ materially from those expressed in, or implied by, the forward-looking statements included in this Annual Report on Form 10-K as a result of various factors, including, among others:
| ● |
claims arising from unpredictable and severe catastrophe events could reduce our earnings and stockholders’ equity and limit our ability to underwrite new insurance policies; |
| ● |
the inability to purchase third-party reinsurance or otherwise expand our catastrophe coverage in amounts that are commercially acceptable to us or on terms that adequately protect us; |
| ● |
the inherent uncertainty of models resulting in actual losses that are materially different than our estimates; |
| ● |
we and our customers could be negatively and adversely impacted by pandemics, disease outbreaks, and other public health crises; |
| ● |
a decline in our financial strength rating adversely affecting the amount of business we write; |
| ● |
reinsurance counterparty credit risk; |
| ● |
the concentration of our business in California and Texas; |
| ● |
the potential loss of one or more key executives or an inability to attract and retain qualified personnel adversely affecting our results of operations; |
| ● |
our reliance on a select group of brokers; |
| ● |
the failure of any of the loss limitations or exclusions we employ, or changes in other claims or coverage issues, having a material adverse effect on our financial condition or results of operations; |
| ● |
unexpected changes in the interpretation of our coverage or provisions; |
| ● |
adverse economic factors, including recession, inflation, periods of high unemployment or lower economic activity resulting in the sale of fewer policies than expected or an increase in frequency or severity of claims and premium defaults or both, affecting our growth and profitability; |
| ● |
the performance of our investment portfolio adversely affecting our financial results; |
| ● |
being forced to sell investments to meet our liquidity requirements; |
| ● |
extensive regulation adversely affecting our ability to achieve our business objectives or the failure to comply with these regulations adversely affecting our financial condition and results of operations; |
| ● |
we may become subject to additional government or market regulation; |
| ● |
the possibility that states could increase the assessments that Palomar Specialty Insurance Company is required to pay; |
| ● |
the ability to pay dividends being dependent on our ability to obtain cash dividends or other permitted payments from our insurance subsidiary; |
| ● |
fluctuation and variance in our operating results; |
| ● |
the possibility that we act based on inaccurate or incomplete information regarding the accounts we underwrite; |
| ● |
our employees, underwriters and other associates taking excessive risks; |
| ● |
our inability to obtain future additional capital or obtaining additional capital on unfavorable terms; |
| ● |
the failure of our information technology and telecommunications systems; |
| ● |
our inability to protect our trademarks or other intellectual property rights; |
| ● |
our inability to maintain, or errors in, our third-party and open source licensed software; |
| ● |
the inability to manage our growth effectively; |
| ● |
the intense competition for business in our industry; |
| ● |
the failure of renewals of our existing contracts to meet expectations could affect our written premiums in the future; |
| ● |
our inability to underwrite risks accurately and charge competitive yet profitable rates to our policyholders; |
| ● |
the effects of litigation having an adverse effect on our business; |
| ● |
changes in accounting practices; |
| ● |
our failure to accurately and timely pay claims; |
| ● |
legal or regulatory requirements that restrict our ability to access credit score information for purposes of pricing and underwriting our insurance policies; |
| ● |
increased costs as a result of being a public company; and |
| ● |
the failure to maintain effective internal controls in accordance with Sarbanes-Oxley. |
We have based the forward-looking statements contained in this Annual Report on Form 10-K primarily on our current expectations and projections about future events and trends that we believe may affect our business, financial condition, results of operations, prospects, business strategy and financial needs. The outcome of the events described in these forward-looking statements is subject to risks, uncertainties, assumptions and other factors described in the section captioned “Risk Factors” and elsewhere in this Annual Report on Form 10-K. These risks are not exhaustive. Other sections of this Annual Report on Form 10-K include additional factors that could adversely impact our business and financial performance. Furthermore, new risks and uncertainties emerge from time to time and it is not possible for us to predict all risks and uncertainties that could have an impact on the forward-looking statements contained in this Annual Report on Form 10-K. We cannot assure you that the results, events and circumstances reflected in the forward-looking statements will be achieved or occur, and actual results, events or circumstances could differ materially from those described in the forward-looking statements.
In addition, statements that “we believe” and similar statements reflect our beliefs and opinions on the relevant subject. These statements are based upon information available to us as of the date of this Annual Report on Form 10-K, and while we believe such information forms a reasonable basis for such statements, such information may be limited or incomplete, and our statements should not be read to indicate that we have conducted an exhaustive inquiry into, or review of, all potentially available relevant information. These statements are inherently uncertain and investors are cautioned not to unduly rely upon these statements.
You should read this Annual Report on Form 10-K and the documents that we reference in this Annual Report on Form 10-K and have filed as exhibits to this Annual Report on Form 10-K with the understanding that our actual future results, levels of activity, performance and achievements may be materially different from what we expect. We qualify all of our forward-looking statements by these cautionary statements.
The forward-looking statements made in this Annual Report on Form 10-K relate only to events as of the date on which such statements are made. We undertake no obligation to update any forward-looking statements after the date of this Annual Report on Form 10-K or to conform such statements to actual results or revised expectations, except as required by law.
Item 1B: Unresolved Staff Comments
None.
We recognize that our business operations depend on the reliable and secure processing, storage, and transmission of confidential and other data and information in our computer systems and networks. We also recognize the importance of protecting customer's data and digital assets in our care. Therefore, identifying and assessing cybersecurity risk is integrated into our overall risk management systems and processes. We have created a layered security posture leveraging people, process, and technology to protect our information systems and our customer’s data and digital assets. We maintain a suite of information security, privacy, and data protection related policies, standards, and procedures leveraging the National Institute of Standards and Technology (“NIST”) along with the COBIT 2019 framework to align with applicable laws, regulatory guidance, and industry best practices.
We employ an experienced security operations team that is responsible for the day-to-day assessment and management for material risks from cybersecurity threats. We require mandatory cybersecurity, privacy, and information handling training for all team members upon onboarding and on an annual basis thereafter. Additional role-based training is provided to the security, IT operations, and development teams. We also regularly communicate important cybersecurity updates to employees. To test the effectiveness of our training, a simulated phishing campaign is run monthly against all team members.
We leverage a variety of tools to protect information. These tools include but are not limited to multifactor authentication, firewalls, intrusion detection, vulnerability and penetration testing, central log management, endpoint protection and patch management systems. Our identity and access management systems include industry leading products leveraged through our internally developed best practices. We also leverage threat hunting services that actively monitor for anomalies on our network and escalate these anomalies to our security operations team. We continue to mature our threat hunting, proactively searching for and identifying malicious attacks, and testing our cybersecurity posture to further enhance our cybersecurity programs. Our threat hunting includes comprehensive risk analysis of our assets along with routine external penetration testing from third party providers. The Company also utilizes a third-party consultant to perform a cybersecurity risk assessment annually in which we measure the current state of our cybersecurity program using the NIST Cybersecurity Framework. The results of this assessment are used to identify possible gaps, risks, and areas requiring remediation.
With the assistance of outside consultants, we have developed cybersecurity incident monitoring and reporting procedures. These procedures begin with continuously monitoring network hardware and applications for cybersecurity breaches and continuously identifying and recording any cyber security events. If appropriate, cyber security events are escalated as incidents and our incident management plan and incident response team are activated. Our incident management plan focuses on containing, eradicating, recovering and following up as necessary from a cybersecurity incident. In addition, incidents are evaluated to determine materiality as well as business impact and reviewed for privacy impact. This evaluation may involve members of our Board of Directors, executive team as well as consultants such as our outside legal counsel and independent auditors. Our cybersecurity incident monitoring and reporting procedures are tested annually through a tabletop event involving the business and IT operations staff. A tabletop event is a role-playing exercise simulating a real cybersecurity event which aims to ensure the plans are still covering all relevant and critical services and stakeholders are prepared. We continuously make cybersecurity improvements based on lessons learned from the tabletop exercises, enterprise risk assessments, and penetration testing.
The ERM Committee of our Board of Directors is updated regularly on cybersecurity matters. The ERM Committee is comprised of select board members and select members of executive management and meets at least quarterly. During ERM meetings, our Chief Technology Officer and Head of Technology Engineering discuss key areas of cyber risk, and reviews key cybersecurity metrics and results of cybersecurity risk assessments and testing. In the event of a cybersecurity incident, our ERM Committee would also receive reports from our incident response team. The Board of Directors are briefed quarterly by the ERM Committee on cybersecurity matters that would include threats, policies, practices, and the roadmap being implemented to improve the security posture.
Our business strategy, results of operations and financial condition have not been materially affected by risks from cybersecurity threats, including as a result of previously identified cybersecurity incidents, but we cannot provide assurance that they will not be materially affected in the future by such risks or any future material incidents. For more information on our cybersecurity related risks, see Item 1A Risk Factors of this Annual Report on Form 10-K.
Our primary executive offices and insurance operations are located in La Jolla, California, which occupy approximately 22,000 square feet of office space for annual rent and rent-related operating payments of approximately $1.0 million with the lease expiring in 2034. We also have an office in Edina, Minnesota, which occupies 7,457 square feet of office space for annual rent and rent-related operating payments of approximately $0.2 million. The lease for this space expires in 2027.
We do not own any real property. We believe that our facilities are adequate for our current needs.
We are subject to routine legal proceedings in the normal course of operating our insurance business. We are not involved in any legal proceedings which reasonably could be expected to have a material adverse effect on our business, results of operations or financial condition.
Item 4. Mine Safety Disclosures
Not applicable.
Item 5. Market for the Registrant’s Common Equity, Related Stockholder Matters and Issuer Purchases of Equity Securities
Market information for Common Stock
Our common shares began trading on the NASDAQ Global Select Market under the symbol “PLMR” on April 17, 2019. Prior to that time, there was no public market for our common shares. As of February 22, 2025, there were approximately six holders of record of our common stock. Because most of our shares of common stock are held by brokers and other institutions on behalf of our stockholders, this number is not representative of our total stockholders.
Payment of Dividends
The continued operation and growth of our business will require substantial capital. We do not intend to declare and pay cash dividends on shares of our common stock in the foreseeable future. Because we are a holding company with no business operations of our own, our ability to pay dividends to stockholders largely depends on dividends and other distributions from our U.S. subsidiaries, PESIC and PSIC, and our Bermuda subsidiary, PSRE. State insurance laws, including the laws of Arizona, Oregon and California, and the laws of Bermuda restrict the ability these subsidiaries to declare stockholder dividends. State insurance regulators require insurance companies to maintain specified levels of statutory capital and surplus and restrict dividend payments. Dividend payments are further limited to that part of available policyholder surplus that is derived from net profits on our business. State insurance regulators have broad powers to prevent the reduction of statutory surplus to inadequate levels, and there is no assurance that dividends up to the maximum amounts calculated under any applicable formula would be permitted. Moreover, state insurance regulators may in the future adopt statutory provisions more restrictive than those currently in effect.
Our Bermuda reinsurance subsidiary is highly regulated and is required to comply with various conditions before it is able to pay dividends or make distributions to us. Bermuda law, including the Insurance Act 1978, as amended (“Insurance Act”) and the Companies Act 1981, as amended (“Companies Act”) impose restrictions on our Bermuda reinsurance subsidiary’s ability to pay dividends to us based on solvency margins and surplus and capital requirements. These restrictions, and any other future restrictions adopted by the BMA, could have the effect, under certain circumstances, of significantly reducing dividends or other amounts payable to us by our Bermuda reinsurance subsidiary without affirmative approval of the BMA.
Any determination to pay dividends in the future will be at the discretion of our Board of Directors and will depend upon results of operations, financial condition, restrictions imposed by applicable law and other factors our Board of Directors deems relevant. Consequently, investors may need to sell all or part of their holdings of our common stock after price appreciation, which may never occur, as the only way to realize any future gains on their investment. Investors seeking immediate cash dividends should not purchase our common stock.
Issuer Purchases of Equity Securities
In January 2022, Company's the Board of Directors approved a share repurchase program which replaced the existing program and authorized the repurchase of up to $100 million of outstanding shares of common stock. This program ended on March 31, 2024 and there were no share repurchases during the year ended December 31, 2024.
Performance Graph
The following performance graph compares the cumulative total shareholder return of an investment in (1) our common stock, (2) the cumulative total returns to the Nasdaq Composite Index and (3) the cumulative total returns to the Nasdaq Insurance Index, for the period from December 31, 2019 through December 31, 2024.
The graph assumes an initial investment of $100. Such returns are based on historical results and are not indicative of future performance.

| |
December 31, 2019 |
December 31, 2020 |
December 31, 2021 |
December 31, 2022 |
December 31, 2023 |
December 31, 2024 |
||||||||||||||||||
| Palomar Holdings, Inc |
$ | 100.00 | $ | 175.96 | $ | 128.28 | $ | 89.44 | $ | 109.92 | $ | 209.13 | ||||||||||||
| Nasdaq Composite Index |
$ | 100.00 | $ | 143.64 | $ | 174.36 | $ | 129.75 | $ | 167.30 | $ | 215.22 | ||||||||||||
| Nasdaq Insurance Index |
$ | 100.00 | $ | 100.95 | $ | 114.26 | $ | 104.75 | $ | 126.13 | $ | 156.55 | ||||||||||||
Item 7. Management’s Discussion and Analysis of Financial Condition and Results of Operations
The following discussion of our historical results of operations and our liquidity and capital resources should be read together with the consolidated financial statements and related notes that appear elsewhere in this Annual Report on Form 10-K. In addition to historical financial information, this Annual Report on Form 10-K contains “forward-looking statements.” You should review the “Special Note Regarding Forward-Looking Statements” and “Risk Factors” sections of this Annual Report on Form 10-K for factors and uncertainties that may cause our actual future results to be materially different from those in our forward-looking statements. Forward-looking statements in this Annual Report on Form 10-K are based on information available to us as of the date hereof, and we assume no obligation to update any such forward-looking statements.
Overview
We are a specialty insurance company that provides property and casualty insurance products to individuals and businesses. We use our underwriting and analytical expertise to provide innovative insurance products serving five categories: Earthquake, Inland Marine and Other Property, Casualty, Fronting, and Crop. We use proprietary data analytics and a modern technology platform to offer our customers flexible products with customized and granular pricing for both the admitted and excess and surplus lines (“E&S”) markets. Our insurance company subsidiaries, Palomar Specialty Insurance Company (“PSIC”) and Palomar Excess and Surplus Insurance Company (“PESIC”) carry an “A” rating from A.M. Best Company (“A.M. Best”), a leading rating agency for the insurance industry.
We distribute our products through multiple channels, including retail agents, program administrators, wholesale brokers, and partnerships with other insurance companies. Our business strategy is supported by a comprehensive risk transfer program with reinsurance coverage that we believe reduces earnings volatility and provides appropriate levels of protection from catastrophic events. Our management team combines decades of insurance industry experience across specialty underwriting, reinsurance, program administration, distribution, and analytics.
Founded in 2014, we have significantly grown our business and have generated attractive returns. We have organically increased gross written premiums from $16.6 million in our first year of operations to $1.5 billion for the year ended December 31, 2024, which reflects a compound annual growth rate of approximately 57%. We have also been profitable since 2016 and our net income growth since 2016 reflects a compound annual growth rate of 43%.
We seek to continuously grow our income by developing products in lines of business that harness our core competencies and where we believe we can generate attractive risk adjusted returns. In recent years, we have introduced several new products including Crop, Environmental Liability, and E&S Casualty. In January 2025, we completed the acquisition of First Indemnity of America ("FIA"), a New Jersey domiciled insurance carrier specializing in surety bonds for small to medium sized contractors primarily in the Northeast United States. These new products diversify our book of business and broaden our product portfolio. We believe that our market opportunity, distinctive products, and differentiated business model position us to grow our business profitably.
Components of Our Results of Operations
Gross Written Premiums
Gross written premiums are the amounts received or to be received for insurance policies written or assumed by us during a specific period of time without reduction for policy acquisition costs, reinsurance costs or other deductions. The volume of our gross written premiums in any given period is generally influenced by:
| ● |
Volume of new business submissions in existing products or partnerships; |
| ● |
Binding of new business submissions in existing products or partnerships into policies; |
| ● |
Entrance into new partnerships or the offering of new types of insurance products; |
| ● |
Exits from existing partnerships or reducing or ceasing to offer existing insurance products; |
| ● |
Renewal rates of existing policies; and |
| ● |
Average size and premium rate of bound policies. |
Our gross written premiums are also impacted when we assume unearned in-force premiums due to new partnerships or other business reasons. In periods where we assume a large volume of unearned premiums, our gross written premiums may increase significantly compared to prior periods and the increase may not be indicative of future trends. The majority of our Crop written premiums are recognized in the third quarter, as we receive the requisite reporting from insureds at that time.
Ceded Written Premiums
Ceded written premiums are the amount of gross written premiums ceded to reinsurers. We enter into reinsurance contracts to limit our exposure to potential losses and to provide additional capacity for growth. We cede premiums through excess of loss (“XOL”) agreements, quota share agreements, and fronting agreements. Ceded written premiums are earned pro-rata over the period of risk covered. The volume of our ceded written premiums is impacted by the amount of our gross written premiums and our decisions to increase or decrease limits or retention levels in our XOL agreements and co-participation levels in our quota share agreements. The volume of ceded written premiums is also impacted by the amount of premium we write under fronting agreements.
Our ceded written premiums can be impacted significantly in certain periods due to changes in quota share agreements. In periods where we modify a quota share agreement, ceded written premiums may increase or decrease significantly compared to prior periods and these fluctuations may not be indicative of future trends. Our XOL costs as a percentage of gross earned premiums also may vary each period due to changes of premium in-force during the XOL contract period or due to acceleration of XOL charges or the need to purchase additional reinsurance due to losses. In addition, the volume of premiums ceded in fronting agreements each period may vary due to the timing of entering new fronting partnerships and terminations of fronting partnerships.
Net Earned Premiums
Net earned premiums represent the earned portion of our gross written premiums, less the earned portion that is ceded to third-party reinsurers under our reinsurance agreements. The majority of our insurance policies have a term of one year and premiums are earned pro rata over the terms of the policies. Crop premiums are earned ratably over the risk period. The requisite reporting of Crop premiums is primarily received in the third quarter, after the start of the risk period, and earned premium is caught up to cover the period between the start of the risk period and receipt of reporting. Generally, this process results in most of the Crop earned premiums being recognized in the third quarter of each year.
Commission and Other Income
Commission and other income consists primarily of fees and commissions earned in conjunction with underwriting policies. Commission and other income are earned on the effective date of the underlying policy.
Losses and Loss Adjustment Expenses
Losses and loss adjustment expenses represent the costs incurred for losses, net of any losses ceded to reinsurers. These expenses are a function of the size and term of the insurance policies we write and the loss experience associated with the underlying coverage. Certain policies we write subject us to attritional losses such as building fires or casualty claims. In addition, many of the policies we write subject us to catastrophe losses. Catastrophe losses are certain losses resulting from events involving multiple claims and policyholders, including earthquakes, hurricanes, floods, convective storms, terrorist acts or other aggregating events. Our losses and loss adjustment expenses are generally affected by:
| ● |
The occurrence, frequency and severity of catastrophe events in the areas where we underwrite policies relating to these perils; |
| ● |
The occurrence, frequency and severity of non-catastrophe attritional losses; |
| ● |
The mix of business written by us; |
| ● |
The reinsurance agreements we have in place at the time of a loss; |
| ● |
The geographic location and characteristics of the policies we underwrite; |
| ● |
Changes in the legal or regulatory environment related to the business we write; |
| ● |
Trends in legal defense costs; |
| ● |
Inflation in housing and construction costs; and |
| ● |
Increases in amounts awarded by courts and juries. |
Losses and loss adjustment expenses are based on an actuarial analysis of the estimated losses, including losses incurred during the period and changes in estimates from prior periods. Losses and loss adjustment expenses may be paid out over multiple years.
Acquisition Expenses
Acquisition expenses are principally comprised of the commissions we pay retail agents, program administrators and wholesale brokers, net of ceding commissions and fronting fees we receive on business ceded under quota share and fronting reinsurance agreements. In addition, acquisition expenses include premium-related taxes and other fees. Acquisition expenses related to each policy we write are deferred and expensed pro rata over the term of the policy. We earn fronting fees in a manner consistent with the recognition of the earned premiums on the underlying insurance policies, on a pro rata basis over the terms of the policies.
Other Underwriting Expenses
Other underwriting expenses represent the general and administrative expenses of our insurance operations including employee salaries and benefits, software and technology costs, office rent, stock-based compensation, licenses and fees, and professional services fees such as legal, accounting, and actuarial services.
Interest Expense
Interest expense consists of the unused line fee, amortization of the commitment fee and interest incurred on borrowings from our credit agreement with U.S. Bank National Association and interest incurred on borrowings from our FHLB line of credit.
Net Investment Income
We earn investment income on our portfolio of invested assets. We invest primarily in investment grade fixed maturity securities, including U.S. government issues, state government issues, mortgage and asset-backed obligations, and corporate bonds with a small portion of our portfolio in equity securities, equity method investments, limited partnerships, and cash and cash equivalents. The principal factors that influence net investment income are the size of our investment portfolio, the yield on that portfolio, and investment management expenses. As measured by amortized cost, which excludes fair value fluctuations from changes in interest rates or other factors, the size of our investment portfolio is mainly a function of our invested capital along with premiums we receive from our insureds, less payments on policyholder claims and other operating expenses. Our balance of invested capital may be impacted in the future by repurchases of shares of our common stock or borrowings under our credit agreements.
Net Realized and Unrealized Gains and Losses on Investments
Net realized and unrealized gains and losses on investments are a function of the difference between the amount received by us on the sale of a security and the security’s cost-basis, mark-to-market adjustments, credit losses recognized in earnings, unrealized gains and losses on equity securities, and unrealized gains and losses on equity method and other investments. Unrealized gains and losses on fixed maturity securities are recognized as a component of other comprehensive income and do not impact our net income.
Income Tax Expense
Currently our income tax expense consists mainly of federal income taxes imposed on our operations. Our effective tax rates are dependent upon the components of pretax earnings and the related tax effects.
Key Financial and Operating Metrics
We discuss certain key financial and operating metrics, described below, which provide useful information about our business and the operational factors underlying our financial performance.
Underwriting revenue is a non-GAAP financial measure defined as total revenue, excluding net investment income and net realized and unrealized gains and losses on investments. See “Reconciliation of Non-GAAP Financial Measures” for a reconciliation of total revenue calculated in accordance with GAAP to underwriting revenue.
Underwriting income is a non-GAAP financial measure defined as income before income taxes excluding net investment income, net realized and unrealized gains and losses on investments and interest expense. See “Reconciliation of Non-GAAP Financial Measures” for a reconciliation of income before income taxes calculated in accordance with GAAP to underwriting income.
Adjusted net income is a non-GAAP financial measure defined as net income excluding the impact of certain items that may not be indicative of underlying business trends, operating results, or future outlook, net of tax impact. We calculate the tax impact only on adjustments which would be included in calculating our income tax expense using the estimated tax rate at which the company received a deduction for these adjustments. See “Reconciliation of Non-GAAP Financial Measures” for a reconciliation of net income calculated in accordance with GAAP to adjusted net income.
Annualized return on equity is net income expressed on an annualized basis as a percentage of average beginning and ending stockholders’ equity during the period.
Annualized adjusted return on equity is a non-GAAP financial measure defined as adjusted net income expressed on an annualized basis as a percentage of average beginning and ending stockholders’ equity during the period. See “Reconciliation of Non-GAAP Financial Measures” for a reconciliation of return on equity calculated using unadjusted GAAP numbers to adjusted return on equity.
Loss ratio, expressed as a percentage, is the ratio of losses and loss adjustment expenses, to net earned premiums.
Expense ratio, expressed as a percentage, is the ratio of acquisition and other underwriting expenses, net of commission and other income to net earned premiums.
Combined ratio is defined as the sum of the loss ratio and the expense ratio. A combined ratio under 100% generally indicates an underwriting profit. A combined ratio over 100% generally indicates an underwriting loss.
Adjusted combined ratio is a non-GAAP financial measure defined as the sum of the loss ratio and the expense ratio calculated excluding the impact of certain items that may not be indicative of underlying business trends, operating results, or future outlook. See “Reconciliation of Non-GAAP Financial Measures” for a reconciliation of combined ratio calculated using unadjusted GAAP numbers to adjusted combined ratio.
Diluted adjusted earnings per share is a non-GAAP financial measure defined as adjusted net income divided by the weighted-average common shares outstanding for the period, reflecting the dilution which could occur if equity-based awards are converted into common share equivalents as calculated using the treasury stock method. See “Reconciliation of Non-GAAP Financial Measures” for a reconciliation of diluted earnings per share calculated in accordance with GAAP to diluted adjusted earnings per share.
Catastrophe loss ratio is a non-GAAP financial measure defined as the ratio of catastrophe losses to net earned premiums. See “Reconciliation of Non-GAAP Financial Measures” for a reconciliation of loss ratio calculated using unadjusted GAAP numbers to catastrophe loss ratio.
Adjusted combined ratio excluding catastrophe losses is a non-GAAP financial measure defined as adjusted combined ratio excluding the impact of catastrophe losses. See “Reconciliation of Non-GAAP Financial Measures” for a reconciliation of combined ratio calculated using unadjusted GAAP numbers to adjusted combined ratio excluding catastrophe losses.
Adjusted underwriting income is a non-GAAP financial measure defined as underwriting income excluding the impact of certain items that may not be indicative of underlying business trends, operating results, or future outlook. See “Reconciliation of Non-GAAP Financial Measures” for a reconciliation of income before income taxes calculated in accordance with GAAP to adjusted underwriting income.
Tangible stockholders’ equity is a non-GAAP financial measure defined as stockholders’ equity less intangible assets. See “Reconciliation of Non-GAAP Financial Measures” for a reconciliation of stockholders’ equity calculated in accordance with GAAP to tangible stockholders’ equity.
Results of Operations
The following table summarizes our results for the years ended December 31, 2024 and 2023:
| Year Ended December 31, |
Percent |
|||||||||||||||
| 2024 |
2023 |
Change |
Change |
|||||||||||||
| ($ in thousands, except per share data) |
||||||||||||||||
| Gross written premiums |
$ | 1,541,962 | $ | 1,141,558 | $ | 400,404 | 35.1 | % | ||||||||
| Ceded written premiums |
(897,111 | ) | (731,531 | ) | (165,580 | ) | 22.6 | % | ||||||||
| Net written premiums |
644,851 | 410,027 | 234,824 | 57.3 | % | |||||||||||
| Net earned premiums |
510,687 | 345,913 | 164,774 | 47.6 | % | |||||||||||
| Commission and other income |
2,784 | 3,367 | (583 | ) | (17.3 | )% | ||||||||||
| Total underwriting revenue (1) |
513,471 | 349,280 | 164,191 | 47.0 | % | |||||||||||
| Losses and loss adjustment expenses |
134,759 | 72,592 | 62,167 | 85.6 | % | |||||||||||
| Acquisition expenses |
149,657 | 107,745 | 41,912 | 38.9 | % | |||||||||||
| Other underwriting expenses |
117,113 | 88,172 | 28,941 | 32.8 | % | |||||||||||
| Underwriting income (1) |
111,942 | 80,771 | 31,171 | 38.6 | % | |||||||||||
| Interest expense |
(1,138 | ) | (3,775 | ) | 2,637 | (69.9 | )% | |||||||||
| Net investment income |
35,824 | 23,705 | 12,119 | 51.1 | % | |||||||||||
| Net realized and unrealized gains on investments |
4,568 | 2,941 | 1,627 | 55.3 | % | |||||||||||
| Income before income taxes |
151,196 | 103,642 | 47,554 | 45.9 | % | |||||||||||
| Income tax expense |
33,623 | 24,441 | 9,182 | 37.6 | % | |||||||||||
| Net income |
117,573 | 79,201 | 38,372 | 48.4 | % | |||||||||||
| Adjustments: |
||||||||||||||||
| Net realized and unrealized gains on investments |
(4,568 | ) | (2,941 | ) | (1,627 | ) | 55.3 | % | ||||||||
| Expenses associated with transactions |
1,479 | 706 | 773 | 109.5 | % | |||||||||||
| Stock-based compensation expense |
16,685 | 14,913 | 1,772 | 11.9 | % | |||||||||||
| Amortization of intangibles |
1,558 | 1,481 | 77 | 5.2 | % | |||||||||||
| Expenses associated with catastrophe bond |
2,483 | 1,640 | 843 | 51.4 | % | |||||||||||
| Tax impact |
(1,699 | ) | (1,480 | ) | (219 | ) | 14.8 | % | ||||||||
| Adjusted net income (1) |
$ | 133,511 | $ | 93,520 | $ | 39,991 | 42.8 | % | ||||||||
| Key Financial and Operating Metrics |
||||||||||||||||
| Annualized return on equity |
19.6 | % | 18.5 | % | ||||||||||||
| Annualized adjusted return on equity (1) |
22.2 | % | 21.9 | % | ||||||||||||
| Loss ratio |
26.4 | % | 21.0 | % | ||||||||||||
| Expense ratio |
51.7 | % | 55.7 | % | ||||||||||||
| Combined ratio |
78.1 | % | 76.6 | % | ||||||||||||
| Adjusted combined ratio (1) |
73.7 | % | 71.2 | % | ||||||||||||
| Diluted earnings per share |
$ | 4.48 | $ | 3.13 | ||||||||||||
| Diluted adjusted earnings per share (1) |
$ | 5.09 | $ | 3.69 | ||||||||||||
| Catastrophe losses |
$ | 27,846 | $ | 3,442 | ||||||||||||
| Catastrophe loss ratio (1) |
5.5 | % | 1.0 | % | ||||||||||||
| Adjusted combined ratio excluding catastrophe losses (1) |
68.3 | % | 70.2 | % | ||||||||||||
| Adjusted underwriting income (1) |
$ | 134,147 | $ | 99,511 | $ | 34,636 | 34.8 | % | ||||||||
| (1) |
Indicates non-GAAP financial measure; see “Reconciliation of Non-GAAP Financial Measures” for a reconciliation of the non-GAAP financial measures to their most directly comparable financial measures prepared in accordance with GAAP. |
Gross Written Premiums
Gross written premiums were $1.5 billion for the year ended December 31, 2024 compared to $1.1 billion for the year ended December 31, 2023, an increase of $400.4 million, or 35.1%. Premium growth was primarily due to an increased volume of policies written across our lines of business which was driven by new business generated with existing partners, strong premium retention rates for existing business, expansion of our distribution footprint, and new partnerships.
The following table summarizes our gross written premiums by product and shows each product's percentage of total gross written premiums for each period:
| Year Ended December 31, |
||||||||||||||||||||||||
| 2024 |
2023 |
|||||||||||||||||||||||
| ($ in thousands) |
||||||||||||||||||||||||
| % of |
% of |
|||||||||||||||||||||||
| Amount |
GWP |
Amount |
GWP |
Change |
% Change |
|||||||||||||||||||
| Product (1) |
||||||||||||||||||||||||
| Earthquake |
$ | 522,864 | 33.9 | % | $ | 436,897 | 38.3 | % | $ | 85,967 | 19.7 | % | ||||||||||||
| Inland Marine and Other Property |
334,079 | 21.7 | % | 250,022 | 21.9 | % | 84,057 | 33.6 | % | |||||||||||||||
| Fronting |
333,188 | 21.6 | % | 352,141 | 30.8 | % | (18,953 | ) | (5.4 | )% | ||||||||||||||
| Casualty |
235,592 | 15.3 | % | 90,388 | 7.9 | % | 145,204 | 160.6 | % | |||||||||||||||
| Crop |
116,239 | 7.5 | % | 12,110 | 1.1 | % | 104,129 | 859.9 | % | |||||||||||||||
| Total Gross Written Premiums |
$ | 1,541,962 | 100.0 | % | $ | 1,141,558 | 100.0 | % | $ | 400,404 | 35.1 | % | ||||||||||||
(1) - Beginning in 2024, the Company has updated the categorization of its products to align with management's current strategy and view of the business. Prior year amounts have been reclassified for comparability purposes. The recategorization is for presentation purposes only and does not impact overall gross written premiums.
Fronting premiums represent premium where we subsequently cede the majority of the premium and risk in exchange for a fronting fee, which is our primary source of profit in the arrangement. The volume of fronting premiums written each period may vary due to the timing of entering new fronting partnerships and terminations of existing fronting partnerships. A large fronting partnership terminated in the third quarter of 2024, causing the decline in fronting premiums shown above.
The year ended December 31, 2024 was our first full year of offering Crop products, which led to the growth shown above. Crop premiums are primarily written and earned during the third quarter of each year.
The following table summarizes our gross written premiums by insurance subsidiary:
| Year Ended December 31, |
||||||||||||||||||||||||
| 2024 |
2023 |
|||||||||||||||||||||||
| ($ in thousands) |
||||||||||||||||||||||||
| % of |
% of |
|||||||||||||||||||||||
| Amount |
GWP |
Amount |
GWP |
Change |
% Change |
|||||||||||||||||||
| Subsidiary |
||||||||||||||||||||||||
| PSIC |
$ | 823,263 | 53.4 | % | $ | 653,809 | 57.3 | % | $ | 169,454 | 25.9 | % | ||||||||||||
| PESIC |
661,404 | 42.9 | % | 487,749 | 42.7 | % | 173,655 | 35.6 | % | |||||||||||||||
| Laulima |
57,295 | 3.7 | % | — | — | % | 57,295 | NM | ||||||||||||||||
| Total Gross Written Premiums |
$ | 1,541,962 | 100.0 | % | $ | 1,141,558 | 100.0 | % | $ | 400,404 | 35.1 | % |
||||||||||||
NM- Not meaningful
Ceded Written Premiums
Ceded written premiums increased $165.6 million, or 22.6%, to $897.1 million for the year ended December 31, 2024 from $731.5 million for the year ended December 31, 2023. The increase was primarily due to increased premiums ceded related to our Crop products as these products saw significant growth and we currently cede the majority of Crop premiums and risk to reinsurers. In addition, our XOL reinsurance expense increased due to growth in exposure and higher rates on XOL reinsurance.
Although our volume of ceded written premiums increased, ceded written premiums as a percentage of gross written premiums decreased to 58.2% for the year ended December 31, 2024 from 64.1% for the year ended December 31, 2023. This percentage decrease was driven by changes in our composition of business whereby premiums written in the current year were subject to lower quota share or XOL cession percentages compared to premiums written in the prior year.
Net Written Premiums
Net written premiums increased $234.8 million, or 57.3%, to $644.9 million for the year ended December 31, 2024 from $410.0 million for the year ended December 31, 2023. The increase was primarily due to an increase in gross written premiums, primarily in our Casualty and Earthquake products, partially offset by increased ceded written premiums.
Net Earned Premiums
Net earned premiums increased $164.8 million, or 47.6%, to $510.7 million for the year ended December 31, 2024 from $345.9 million for the year ended December 31, 2023 due primarily to the earning of increased gross written premiums offset by the earning of ceded written premiums under reinsurance agreements. The table below shows the amount of premiums we earned on a gross and net basis for each period presented:
| Year Ended |
||||||||||||||||
| December 31, |
||||||||||||||||
| |
2024 |
2023 |
Change |
% Change |
||||||||||||
| ($ in thousands) |
||||||||||||||||
| Gross earned premiums |
$ | 1,397,369 | $ | 1,015,722 | $ | 381,647 | 37.6 | % | ||||||||
| Ceded earned premiums |
(886,682 | ) | (669,809 | ) | (216,873 | ) | 32.4 | % | ||||||||
| Net earned premiums |
$ | 510,687 | $ | 345,913 | $ | 164,774 | 47.6 | % | ||||||||
| Net earned premium ratio |
36.5 | % | 34.1 | % | ||||||||||||
Our net earned premium ratio increased due to changes in our composition of business whereby premiums earned in the current period were subject to lower quota share or XOL cession percentages compared to premiums earned in the prior period.
Commission and Other Income
Commission and other income decreased $0.6 million, or 17.3%, to $2.8 million for the year ended December 31, 2024 from $3.4 million for the year ended December 31, 2023. The decrease was driven by a decrease in policy related fees driven by changes in the mix of business produced.
Losses and Loss Adjustment Expenses
Losses and loss adjustment expenses increased $62.2 million, or 85.6%, to $134.8 million for the year ended December 31, 2024 from $72.6 million for the year ended December 31, 2023.
Losses and loss adjustment expenses consisted of the following elements during the respective periods:
| Year Ended |
||||||||||||||||
| December 31, |
||||||||||||||||
| 2024 |
2023 |
Change |
% Change |
|||||||||||||
| ($ in thousands) |
||||||||||||||||
| Catastrophe losses |
$ | 27,846 | $ | 3,442 | $ | 24,404 | 709.0 | % | ||||||||
| Non-catastrophe losses |
106,913 | 69,150 | 37,763 | 54.6 | % | |||||||||||
| Total losses and loss adjustment expenses |
$ | 134,759 | $ | 72,592 | $ | 62,167 | 85.6 | % | ||||||||
| Catastrophe loss ratio |
5.5 | % | 1.0 | % | ||||||||||||
| Non-catastrophe loss ratio |
20.9 | % | 20.0 | % | ||||||||||||
| Total loss ratio |
26.4 | % | 21.0 | % | ||||||||||||
Catastrophe losses increased during the year ended December 31, 2024 due to higher frequency and severity of catastrophe events compared to the prior year. Catastrophe losses during the year ended December 31, 2024 were related to floods occurring during the first quarter, severe convective storms occurring during the second quarter, and Hurricanes Beryl, Debby, Helene and Milton which occurred during the third and fourth quarters. Catastrophe losses during the year ended December 31, 2023 were primarily related to floods occurring during the first quarter and severe convective storms occurring during the second quarter.
Non-catastrophe attritional losses increased due to a higher volume of premiums being subject to attritional losses, primarily driven by the growth in Casualty and Inland Marine and other Property premiums.
Acquisition Expenses
Acquisition expenses increased $41.9 million, or 38.9%, to $149.7 million for the year ended December 31, 2024 from $107.7 million for the year ended December 31, 2023. The increase was primarily due to higher commission expenses driven by higher gross earned premiums. This was partially offset by higher ceding commissions due to a higher volume of premiums subject to quota share arrangements.
Acquisition expenses as a percentage of gross earned premiums were 10.7% for the year ended December 31, 2024 compared to 10.6% for the year ended December 31, 2023. Acquisition expenses as a percentage of gross earned premiums slightly increased due to the higher commission expenses as a percentage of gross earned premiums due to changes in mix of business produced.
Other Underwriting Expenses
Other underwriting expenses increased $28.9 million, or 32.8%, to $117.1 million for the year ended December 31, 2024 from $88.2 million for the year ended December 31, 2023. The increase was primarily due to the Company incurring higher payroll, technology, and stock-based compensation expenses associated with growth of the Company.
Other underwriting expenses as a percentage of gross earned premiums were 8.4% for the year ended December 31, 2024 compared to 8.7% for the year ended December 31, 2023. Excluding the impact of expenses relating to transactions, stock-based compensation, amortization of intangibles, and catastrophe bonds, other underwriting expenses as a percentage of gross earned premiums were 6.8% for the year ended December 31, 2024 compared to 6.8% for the year ended December 31, 2023. This percentage was relatively consistent as adjusted operating expenses grew at approximately the same rate as gross earned premiums. Other underwriting expenses as a percentage of gross earned premiums may fluctuate period over period based on timing of certain expenses relative to premium growth.
Net Investment Income and Net Realized and Unrealized Gains (Losses) on Investments
Net investment income increased $12.1 million, or 51.1%, to $35.8 million for the year ended December 31, 2024 from $23.7 million for the year ended December 31, 2023. The increase was primarily due to a higher average balance of investments during the year ended December 31, 2024 and higher yields on invested assets.
The Company incurred $4.6 million of net realized and unrealized gains on investments for the year ended December 31, 2024 compared to $2.9 million of net realized and unrealized gains for the year ended December 31, 2023. In both periods, the balance was primarily driven by unrealized gains on our equity securities due to the general performance of equity security markets. Unrealized gains and losses on fixed maturity securities are recognized as a component of other comprehensive income and do not impact our net income.
The following table summarizes the components of our investment income for each period presented:
| Year Ended |
||||||||||||||||
| December 31, |
||||||||||||||||
| |
2024 |
2023 |
Change |
% Change |
||||||||||||
| |
($ in thousands) |
|||||||||||||||
| Interest income |
$ | 35,433 | $ | 23,349 | $ | 12,084 | 51.8 | % | ||||||||
| Dividend income |
1,075 | 871 | 204 | 23.4 | % | |||||||||||
| Investment management fees and expenses |
(684 | ) | (515 | ) | (169 | ) | 32.8 | % | ||||||||
| Net investment income |
35,824 | 23,705 | 12,119 | 51.1 | % | |||||||||||
| Net realized and unrealized gains on investments |
4,568 | 2,941 | 1,627 | 55.3 | % | |||||||||||
| Total |
$ | 40,392 | $ | 26,646 | $ | 13,746 | 51.6 | % | ||||||||
Income Tax Expense
Income tax expense increased $9.2 million, or 37.6%, to $33.6 million for the year ended December 31, 2024 compared to $24.4 million during the year ended December 31, 2023. For the year ended December 31, 2024 our effective tax rate was 22.2% and the difference between our tax effective tax rate and the statutory rate of 21% relates primarily to non-deductible executive compensation expense and state taxes, offset by the permanent component of employee stock options. For the year ended December 31, 2023, our effective tax rate was 23.6% and the difference between our tax rate and the statutory rate of 21% relates primarily to non-deductible executive compensation expense and state taxes, offset by the permanent component of employee stock options.
Reconciliation of Non-GAAP Financial Measures
Underwriting Revenue
We define underwriting revenue as total revenue excluding net investment income and net realized and unrealized gains and losses on investments. Underwriting revenue represents revenue generated by our underwriting operations and allows us to evaluate our underwriting performance without regard to investment income. We use this metric as we believe it gives our management and other users of our financial information useful insight into our underlying business performance. Underwriting revenue should not be viewed as a substitute for total revenue calculated in accordance with GAAP, and other companies may define underwriting revenue differently.
Total revenue calculated in accordance with GAAP reconciles to underwriting revenue as follows:
| |
Year Ended |
|||||||
| |
December 31, |
|||||||
| |
2024 |
2023 |
||||||
| |
(in thousands) |
|||||||
| Total revenue |
$ | 553,863 | $ | 375,926 | ||||
| Net investment income |
(35,824 | ) | (23,705 | ) | ||||
| Net realized and unrealized (gains) losses on investments |
(4,568 | ) | (2,941 | ) | ||||
| Underwriting revenue |
$ | 513,471 | $ | 349,280 | ||||
Underwriting Income and adjusted underwriting income
We define underwriting income as income before income taxes excluding net investment income, net realized and unrealized gains and losses on investments, and interest expense. Underwriting income represents the pre-tax profitability of our underwriting operations and allows us to evaluate our underwriting performance without regard to investment income. We use this metric as we believe it gives our management and other users of our financial information useful insight into our underlying business performance. Underwriting income should not be viewed as a substitute for pre-tax income calculated in accordance with GAAP, and other companies may define underwriting income differently.
We define adjusted underwriting income as underwriting income excluding the impact of certain items that may not be indicative of underlying business trends, operating results, or future outlook. We use this metric as we believe it gives our management and other users of our financial information useful insight into our underlying business performance. Adjusted underwriting income should not be viewed as a substitute for pre-tax income calculated in accordance with GAAP. Other companies may define adjusted underwriting income differently.
Income before income taxes calculated in accordance with GAAP reconciles to underwriting income and adjusted underwriting income as follows:
| |
Year Ended |
|||||||
| |
December 31, |
|||||||
| |
2024 |
2023 |
||||||
| |
(in thousands) |
|||||||
| Income before income taxes |
$ | 151,196 | $ | 103,642 | ||||
| Net investment income |
(35,824 | ) | (23,705 | ) | ||||
| Net realized and unrealized (gains) losses on investments |
(4,568 | ) | (2,941 | ) | ||||
| Interest expense |
1,138 | 3,775 | ||||||
| Underwriting income |
$ | 111,942 | $ | 80,771 | ||||
| Expenses associated with transactions |
1,479 | 706 | ||||||
| Stock-based compensation expense |
16,685 | 14,913 | ||||||
| Amortization of intangibles |
1,558 | 1,481 | ||||||
| Expenses associated with catastrophe bond |
2,483 | 1,640 | ||||||
| Adjusted underwriting income |
$ | 134,147 | $ | 99,511 | ||||
Adjusted Net Income
We define adjusted net income as net income excluding the impact of certain items that may not be indicative of underlying business trends, operating results, or future outlook, net of tax impact. We calculate the tax impact only on adjustments which would be included in calculating our income tax expense using the estimated tax rate at which the company received a deduction for these adjustments. We use adjusted net income as an internal performance measure in the management of our operations because we believe it gives our management and financial statement users useful insight into our results of operations and our underlying business performance. Adjusted net income does not reflect the overall profitably of our business and should not be viewed as a substitute for net income calculated in accordance with GAAP. Other companies may define adjusted net income differently.
Net income calculated in accordance with GAAP reconciles to adjusted net income as follows:
| |
Year Ended December 31, |
|||||||
| |
2024 |
2023 |
||||||
| |
(in thousands) |
|||||||
| Net income |
$ | 117,573 | $ | 79,201 | ||||
| Adjustments: |
||||||||
| Net realized and unrealized (gains) losses on investments |
(4,568 | ) | (2,941 | ) | ||||
| Expenses associated with transactions |
1,479 | 706 | ||||||
| Stock-based compensation expense |
16,685 | 14,913 | ||||||
| Amortization of intangibles |
1,558 | 1,481 | ||||||
| Expenses associated with catastrophe bond |
2,483 | 1,640 | ||||||
| Tax impact |
(1,699 | ) | (1,480 | ) | ||||
| Adjusted net income |
$ | 133,511 | $ | 93,520 | ||||
Adjusted Return on Equity
We define adjusted return on equity as adjusted net income expressed on an annualized basis as a percentage of average beginning and ending stockholders’ equity during the period. We use adjusted return on equity as an internal performance measure in the management of our operations because we believe it gives our management and financial statement users useful insight into our results of operations and our underlying business performance. Adjusted return on equity should not be viewed as a substitute for return on equity calculated using unadjusted GAAP numbers, and other companies may define adjusted return on equity differently.
Adjusted return on equity is calculated as follows:
| |
Year Ended December 31, |
|||||||
| |
2024 |
2023 |
||||||
| |
($ in thousands) |
|||||||
| Numerator: Adjusted net income |
$ | 133,511 | $ | 93,520 | ||||
| Denominator: Average stockholders' equity |
600,140 | 428,002 | ||||||
| Adjusted return on equity |
22.2 | % | 21.9 | % | ||||
Adjusted Combined Ratio
We define adjusted combined ratio as the sum of the loss ratio and the expense ratio calculated excluding the impact of certain items that may not be indicative of underlying business trends, operating results, or future outlook. We use adjusted combined ratio as an internal performance measure in the management of our operations because we believe it gives our management and financial statement users useful insight into our results of operations and our underlying business performance. Adjusted combined ratio should not be viewed as a substitute for combined ratio calculated using unadjusted GAAP numbers, and other companies may define adjusted combined ratio differently.
Adjusted combined ratio is calculated as follows:
| |
Year Ended December 31, |
|||||||
| |
2024 |
2023 |
||||||
| |
($ in thousands) |
|||||||
| Numerator: Sum of losses, loss adjustment expenses, underwriting, acquisition and other underwriting expenses, net of commission and other income |
$ | 398,745 | $ | 265,142 | ||||
| Denominator: Net earned premiums |
$ | 510,687 | $ | 345,913 | ||||
| Combined ratio |
78.1 | % | 76.6 | % | ||||
| Adjustments to numerator: |
||||||||
| Expenses associated with transactions |
(1,479 | ) | (706 | ) | ||||
| Stock-based compensation expense |
(16,685 | ) | (14,913 | ) | ||||
| Amortization of intangibles |
(1,558 | ) | (1,481 | ) | ||||
| Expenses associated with catastrophe bond |
(2,483 | ) | (1,640 | ) | ||||
| Adjusted combined ratio |
73.7 | % | 71.2 | % | ||||
Diluted adjusted earnings per share
We define diluted adjusted earnings per share as adjusted net income divided by the weighted-average common shares outstanding for the period, reflecting the dilution which could occur if equity-based awards are converted into common share equivalents as calculated using the treasury stock method. We use diluted adjusted earnings per share as an internal performance measure in the management of our operations because we believe it gives our management and financial statement users useful insight into our results of operations and our underlying business performance. Diluted adjusted earnings per share should not be viewed as a substitute for diluted earnings per share calculated in accordance with GAAP, and other companies may define diluted adjusted earnings per share differently.
Diluted adjusted earnings per share is calculated as follows:
| |
Year Ended December 31, |
|||||||
| |
2024 |
2023 |
||||||
| |
(in thousands except shares and per share data) |
|||||||
| Adjusted net income |
$ | 133,511 | $ | 93,520 | ||||
| Weighted-average common shares outstanding, diluted |
26,223,842 | 25,327,091 | ||||||
| Diluted adjusted earnings per share |
$ | 5.09 | $ | 3.69 | ||||
Catastrophe Loss Ratio
Catastrophe loss ratio is defined as the ratio of catastrophe losses to net earned premiums. Although we are inherently subject to catastrophe losses, the frequency and severity of catastrophe losses is unpredictable and their impact on our operating results may vary significantly between periods and obscure other trends in our business. Therefore, we are providing this metric because we believe it gives our management and other financial statement users useful insight into our results of operations and trends in our financial performance without the volatility caused by catastrophe losses. Catastrophe loss ratio should not be viewed as a substitute for loss ratio calculated using unadjusted GAAP numbers, and other companies may define catastrophe loss ratio differently.
Catastrophe loss ratio is calculated as follows:
| Year Ended December 31, |
||||||||
| 2024 |
2023 |
|||||||
| ($ in thousands) |
||||||||
| Numerator: Losses and loss adjustment expenses |
$ | 134,759 | $ | 72,592 | ||||
| Denominator: Net earned premiums |
$ | 510,687 | $ | 345,913 | ||||
| Loss ratio |
26.4 | % | 21.0 | % | ||||
| Numerator: Catastrophe losses |
$ | 27,846 | $ | 3,442 | ||||
| Denominator: Net earned premiums |
$ | 510,687 | $ | 345,913 | ||||
| Catastrophe loss ratio |
5.5 | % | 1.0 | % | ||||
Adjusted Combined Ratio Excluding Catastrophe Losses
Adjusted combined ratio excluding catastrophe losses is defined as adjusted combined ratio excluding the impact of catastrophe losses. Although we are inherently subject to catastrophe losses, the frequency and severity of catastrophe losses is unpredictable and their impact on our operating results may vary significantly between periods and obscure other trends in our business. Therefore, we are providing this metric because we believe it gives our management and other financial statement users useful insight into our results of operations and trends in our financial performance without the volatility caused by catastrophe losses. Adjusted combined ratio excluding catastrophe losses should not be viewed as a substitute for combined ratio calculated using unadjusted GAAP numbers, and other companies may define adjusted combined ratio excluding catastrophe losses differently.
Adjusted combined ratio excluding catastrophe losses is calculated as follows:
| Year Ended December 31, |
||||||||
| 2024 |
2023 |
|||||||
| ($ in thousands) |
||||||||
| Numerator: Sum of losses and loss adjustment expenses, acquisition expenses, and other underwriting expenses, net of commission and other income |
$ | 398,745 | $ | 265,142 | ||||
| Denominator: Net earned premiums |
$ | 510,687 | $ | 345,913 | ||||
| Combined ratio |
78.1 | % | 76.6 | % | ||||
| Adjustments to numerator: |
||||||||
| Expenses associated with transactions |
$ | (1,479 | ) | $ | (706 | ) | ||
| Stock-based compensation expense |
(16,685 | ) | (14,913 | ) | ||||
| Amortization of intangibles |
(1,558 | ) | (1,481 | ) | ||||
| Expenses associated with catastrophe bond |
(2,483 | ) | (1,640 | ) | ||||
| Catastrophe losses |
(27,846 | ) | (3,442 | ) | ||||
| Adjusted combined ratio excluding catastrophe losses |
68.3 | % | 70.2 | % | ||||
Tangible Stockholders’ Equity
We define tangible stockholders’ equity as stockholders’ equity less intangible assets. Our definition of tangible stockholders’ equity may not be comparable to that of other companies, and it should not be viewed as a substitute for stockholders’ equity calculated in accordance with GAAP. We use tangible stockholders’ equity internally to evaluate the strength of our balance sheet and to compare returns relative to this measure.
Stockholders’ equity calculated in accordance with GAAP reconciles to tangible stockholders’ equity as follows:
| |
December 31, |
|||||||
| |
2024 |
2023 |
||||||
| |
(in thousands) |
|||||||
| Stockholders’ equity |
$ | 729,030 | $ | 471,252 | ||||
| Intangible assets |
(13,242 | ) | (12,315 | ) | ||||
| Tangible stockholders’ equity |
$ | 715,788 | $ | 458,937 | ||||
Liquidity and Capital Resources
Sources and Uses of Funds
We operate as a holding company with no business operations of our own. Consequently, our ability to pay dividends to stockholders and pay taxes and administrative expenses is largely dependent on dividends or other distributions from our subsidiaries and affiliates, whose ability to pay us is highly regulated.
The Company’s U.S. insurance company subsidiaries, PSIC and PESIC are restricted by the statutes as to the amount of dividends that they may pay without prior approval by state insurance commissioners.
Under California and Oregon statute which govern PSIC, dividends paid in a consecutive twelve month period cannot exceed the greater of (i) 10% of an insurance company’s statutory policyholders’ surplus as of December 31 of the preceding year or (ii) 100% of its statutory net income for the preceding calendar year. Any dividends or distributions in excess of these amounts would require regulatory approval. In addition, under Oregon statute PSIC may only declare a dividend from earned surplus, which does not include contributed capital. Surplus arising from unrealized capital gains or revaluation of assets is not considered part of earned surplus. Based on the above restrictions, PSIC may pay a dividend or distribution of no greater than $99.6 million in 2025 without approval by the California and Oregon Insurance Commissioners. During October 2024, PSIC elected to pay a dividend of $95.0 million to its parent company.
Under Arizona statute which governs PESIC, dividends paid in a consecutive twelve month period cannot exceed the lesser of (i) 10% of an insurance company’s statutory policyholders’ surplus as of December 31 of the preceding year or (ii) 100% of its statutory net income for the preceding calendar year. Based on the above restrictions, PESIC may pay a dividend or distribution of no greater than $4.2 million in 2025 without approval of the Arizona Insurance Commissioner.
In addition to the above limitations, any dividend or distribution declared is also subject to state regulatory approval prior to payment. In the future, state insurance regulatory authorities may adopt statutory provisions and dividend limitations more restrictive than those currently in effect.
Insurance companies in the United States are also required by state law to maintain a minimum level of policyholder’s surplus. State insurance regulators have a risk-based capital standard designed to identify property and casualty insurers that may be inadequately capitalized based on inherent risks of the insurer’s assets and liabilities and its mix of net written premium. Insurers falling below a calculated threshold may be subject to varying degrees of regulatory action. As of December 31, 2024 and December 31, 2023, the total adjusted capital of PSIC and PESIC were in excess of their respective prescribed risk-based capital requirements.
Under the Insurance Act and related regulations, our Bermuda reinsurance subsidiary, PSRE, is required to maintain certain solvency and liquidity levels, which it maintained as of December 31, 2024 and December 31, 2023.
PSRE maintains a Class 3A license and thus must maintain a minimum liquidity ratio in which the value of its relevant assets is not less than 75% of the amount of its relevant liabilities for general business. Relevant assets include cash and cash equivalents, fixed maturity securities, accrued interest income, premiums receivable, losses recoverable from reinsurers, and funds withheld. The relevant liabilities include total general business insurance reserves and total other liabilities, less sundry liabilities. As of December 31, 2024 and December 31, 2023, we met the minimum liquidity ratio requirement.
Bermuda regulations limit the amount of dividends and return of capital paid by a regulated entity. A Class 3A insurer is prohibited from declaring or paying a dividend if it is in breach of its minimum solvency margin, its enhanced capital requirement, or its minimum liquidity ratio, or if the declaration or payment of such dividend would cause such a breach. If a Class 3A insurer has failed to meet its minimum solvency margin on the last day of any financial year, it will also be prohibited, without the approval of the Bermuda Monetary Authority (“BMA”), from declaring or paying any dividends during the next financial year. Furthermore, the Insurance Act limits the ability of PSRE to pay dividends or make capital distributions by stipulating certain margin and solvency requirements and by requiring approval from the BMA prior to a reduction of 15% or more of a Class 3A insurer’s total statutory capital as reported on its prior year statutory balance sheet. Moreover, an insurer must submit an affidavit to the BMA, sworn by at least two directors and the principal representative in Bermuda of the Class 3A insurer, at least seven days prior to payment of any dividend which would exceed 25% of that insurer’s total statutory capital and surplus as reported on its prior year statutory balance sheet. The affidavit must state that in the opinion of those swearing the declaration of such dividend has not caused the insurer to fail to meet its relevant margins.
Further, under the Companies Act, PSRE may only declare or pay a dividend, or make a distribution out of contributed surplus, if it has no reasonable grounds for believing that: (1) it is, or would after the payment be, unable to pay its liabilities as they become due or (2) the realizable value of its assets would be less than its liabilities.
Pursuant to Bermuda regulations, the maximum amount of dividends and return of capital available to be paid by a reinsurer is determined pursuant to a formula. Under this formula, the maximum amount of dividends and return of capital available from PSRE during 2025 is calculated to be approximately $4.2 million. However, this dividend amount is subject to annual enhanced solvency requirement calculations. There were no dividends declared or paid during the years ended December 31, 2024 and December 31, 2023 One of our insurance company subsidiaries, PSIC, is a member of the Federal Home Loan Bank of San Francisco (FHLB).
Membership allows PSIC access to collateralized advances, which may be used to support and enhance liquidity management. The amount of advances that may be taken is dependent on statutory admitted assets.
Cash Flows
Our primary sources of cash flow are written premiums, investment income, reinsurance recoveries, sales and redemptions of investments, and proceeds from offerings of debt and equity securities. We use our cash flows primarily to pay reinsurance premiums, operating expenses, losses and loss adjustment expenses, and income taxes.
Our cash flows from operations may differ substantially from our net income due to non-cash charges or due to changes in balance sheet accounts.
The timing of our cash flows from operating activities can also vary among periods due to the timing by which payments are made or received. Some of our payments and receipts, including loss settlements and subsequent reinsurance receipts, can be significant. Therefore, their timing can influence cash flows from operating activities in any given period. The potential for a large claim under an insurance or reinsurance contract means that our insurance subsidiaries may need to make substantial payments within relatively short periods of time, which would have a negative impact on our operating cash flows.
We generated positive cash flows from operations for the years ended December 31, 2024 and 2023. Management believes that cash receipts from premium, proceeds from investment sales and redemptions, and investment income and reinsurance recoveries, if necessary, are sufficient to cover cash outflows in the foreseeable future.
The following table summarizes our cash flows for the years ended December 31, 2024 and 2023:
| |
Year ended |
|||||||
| |
December 31, |
|||||||
| |
2024 |
2023 |
||||||
| |
($ in thousands) |
|||||||
| Cash provided by (used in): |
|
|
||||||
| Operating activities |
$ | 261,157 | $ | 116,106 | ||||
| Investing activities |
(306,244 | ) | (128,478 | ) | ||||
| Financing activities |
73,774 | (3,940 | ) | |||||
| Change in cash, cash equivalents, and restricted cash |
$ | 28,687 | $ | (16,312 | ) | |||
Our cash flow from operating activities has been positive in each of the last two years. Variations in operating cash flow between periods are primarily driven by variations in our gross and ceded written premiums and the volume and timing of premium receipts, claim payments, reinsurance payments, and reinsurance recoveries on paid losses. In addition, fluctuations in losses and loss adjustment expenses and other insurance operating expenses impact operating cash flow.
Cash used in investing activities for each of the last two years related primarily to purchases of fixed income and equity securities in excess of sales and maturities.
Cash provided by financing activities for the year ended December 31, 2024 related to the receipt of $115.7 million in proceeds from a stock offering, $7.0 million in proceeds from stock option exercises, $2.8 million in proceeds from policy holder contributions of surplus and $0.9 million in proceeds from our employee stock purchase plan, offset by $52.6 million in payments on our FHLB line of credit. Cash used in financing activities for the year ended December 31, 2023 related to the repurchase of $22.3 million of our common stock, offset by $16.2 million in proceeds from our FHLB line of credit, $1.2 million in proceeds from stock option exercises and $0.8 million in proceeds from our employee stock purchase plan.
We do not have any current plans for material capital expenditures other than current operating requirements. We believe that we will generate sufficient cash flows from operations to satisfy our liquidity requirements for at least the next 12 months and beyond. The key factor that will affect our future operating cash flows is the frequency and severity of catastrophic loss events. To the extent our future operating cash flows are insufficient to cover our net losses from catastrophic events, we had $1,068.3 million in cash and investment securities available at December 31, 2024. We also have the ability to access additional capital through pursuing third-party borrowings including our credit agreements, sales of our equity or debt securities, or entrance into a reinsurance arrangement.
Contractual Obligations and Commitments
The following table illustrates our contractual obligations and commercial commitments by due date as of December 31, 2024:
| |
Total |
Less Than One Year |
One Year to Less Than Three Years |
Three Years to Less Than Five Years |
More Than Five Years |
|||||||||||||||
| (in thousand) |
||||||||||||||||||||
| Reserves for losses and loss adjustment expenses |
$ | 503,382 | $ | 383,684 | $ | 67,713 | $ | 48,367 | $ | 3,618 | ||||||||||
| Operating lease obligations |
9,906 | 1,050 | 2,790 | 1,015 | 5,051 | |||||||||||||||
| Total |
$ | 233,602 | $ | 178,843 | $ | 30,321 | $ | 24,155 | $ | 283 | ||||||||||
The reserve for losses and loss adjustment expenses represents management’s estimate of the ultimate cost of settling losses. As more fully discussed in “—Critical Accounting Policies—Reserve for Losses and Loss Adjustment Expenses” below, the estimation of the reserve for losses and loss adjustment expenses is based on various complex and subjective judgments. Actual losses paid may differ, perhaps significantly, from the reserve estimates reflected in our consolidated financial statements. Similarly, the timing of payment of our estimated losses is not fixed and there may be significant changes in actual payment activity. The assumptions used in estimating the likely payments due by period are based on our historical claims payment experience and industry payment patterns, but due to the inherent uncertainty in the process of estimating the timing of such payments, there is a risk that the amounts paid can be significantly different from the amounts disclosed above.
The amounts in the above table represent our gross estimates of known liabilities as of December 31, 2024 and do not include any allowance for claims for future events within the time period specified. Accordingly, it is highly likely that the total amounts of obligations paid by us in the time periods shown will be greater than those indicated in the table.
Share repurchases
Our share repurchase program expired on March 31, 2024 and we did not make any share repurchases during the year ended December 31, 2024.
Credit Agreement
In December 2021, we entered into a Credit Agreement (the “Credit Agreement”) with U.S. Bank National Association which provides a revolving credit facility of up to $100 million through December 8, 2026. Interest on the credit facility accrues on each SOFR (as defined in the Credit Agreement) rate loan at the applicable SOFR (as defined in the Credit Agreement) plus 1.75% and on each base rate loan at the applicable Alternate Base Rate (as defined in the Credit Agreement) plus 0.75%. A loan may be either a SOFR rate loan or a base rate loan, at our discretion. Outstanding amounts under the Credit Agreement may be prepaid in full or in part at any time with no prepayment premium and may be reduced in full or in part at any time upon prior notice. Currently, $5.6 million of the borrowing capacity of the Credit Agreement is pledged as collateral and not able to be utilized.
As of December 31, 2024 we do not have any outstanding borrowings under the Credit Agreement, but we may seek to borrow under the Credit Agreement in the future.
Our PSIC subsidiary is a member of the Federal Home Loan Bank of San Francisco (“FHLB”). Membership in the FHLB provides PSIC access to collateralized advances, which can be drawn for general corporate purposes and used to enhance liquidity management. All borrowings are fully secured by a pledge of specific investment securities of PSIC and the borrowing capacity is equal to 10% of PSIC’s statutory admitted assets. All advances have predetermined term and the interest rate varies based on the term of the advance.
As of December 31, 2024, the Company did not have any borrowings outstanding through the FHLB line of credit.
Financial Condition
Stockholders’ Equity
At December 31, 2024 total stockholders’ equity was $729.0 million and tangible stockholders’ equity was $715.8 million, compared to total stockholders’ equity of $471.3 million and tangible stockholders’ equity of $458.9 million as of December 31, 2023. Stockholders’ equity increased primarily due to net income we earned for the period, stock offering proceeds, and activity related to stock-based compensation. Stock-based compensation expense is treated as an additional paid-in-capital and increases stockholders’ equity.
Tangible stockholders’ equity is a non-GAAP financial measure. See “Reconciliation of Non-GAAP Financial Measures” for a reconciliation of stockholders’ equity in accordance with GAAP to tangible stockholders’ equity.
Investment Portfolio
Our primary investment objectives are to maintain liquidity, preserve capital and generate a stable level of investment income. We purchase securities that we believe are attractive on a relative value basis and seek to generate returns in excess of predetermined benchmarks. Our Board of Directors approves our investment guidelines in compliance with applicable regulatory restrictions on asset type, quality and concentration. Our current investment guidelines allow us to invest in taxable and tax-exempt fixed maturities, as well as publicly traded mutual funds and common stock of individual companies. Our cash and invested assets consist of cash and cash equivalents, fixed maturity securities, and equity securities. As of December 31, 2024, the majority of our investment portfolio, or $939.0 million, was comprised of fixed maturity securities that are classified as available-for-sale and carried at fair value with unrealized gains and losses on these securities, net of applicable taxes, reported as a separate component of accumulated other comprehensive income. Also included in our investment portfolio were $40.5 million of equity securities. In addition, we maintained a non-restricted cash and cash equivalent balance of $80.5 million at December 31, 2024. Our fixed maturity securities, including cash equivalents, had a weighted average effective duration of 4.04 and 3.48 years and an average rating of A1/A+ and “Aa3/A+” at December 31, 2024 and December 31, 2023, respectively. Our fixed income investment portfolio had a book yield of 4.59% as of December 31, 2024, compared to 4.07% as of December 31, 2023.
At December 31, 2024 and December 31, 2023 the amortized cost and fair value on available-for-sale securities were as follows:
| December 31, 2024 |
Amortized Cost or Cost | Fair Value | % of Total Fair Value | |||||||||
| |
($ in thousands) |
|||||||||||
| Fixed maturities: |
|
|||||||||||
| U.S. Governments |
$ | 33,449 | $ | 32,806 | 3.5 | % | ||||||
| U.S. States, Territories, and Political Subdivisions |
10,606 | 9,778 | 1.0 | % | ||||||||
| Special revenue excluding mortgage/asset-backed securities |
30,283 | 26,634 | 2.8 | % | ||||||||
| Corporate and other |
492,395 | 475,491 | 50.6 | % | ||||||||
| Mortgage/asset-backed securities |
406,597 | 394,337 | 42.0 | % | ||||||||
| Total available-for-sale investments |
$ | 973,330 | $ | 939,046 | 100.0 | % | ||||||
| December 31, 2023 |
Amortized Cost or Cost | Fair Value | % of Total Fair Value | |||||||||
| |
($ in thousands) |
|||||||||||
| Fixed maturities: |
|
|
|
|||||||||
| U.S. Governments |
$ | 40,836 | $ | 39,420 | 6.1 | % | ||||||
| U.S. States, Territories, and Political Subdivisions |
10,641 | 9,902 | 1.5 | % | ||||||||
| Special revenue excluding mortgage/asset-backed securities |
32,513 | 29,511 | 4.6 | % | ||||||||
| Corporate and other |
316,590 | 300,239 | 46.6 | % | ||||||||
| Mortgage/asset-backed securities |
274,550 | 264,727 | 41.1 | % | ||||||||
| Total available-for-sale investments |
$ | 675,130 | $ | 643,799 | 100.0 | % | ||||||
The following tables provide the credit quality of investment securities as of December 31, 2024 and December 31, 2023:
| December 31, 2024 |
Estimated Fair Value | % of Total | ||||||
| ($ in thousands) |
||||||||
| Rating |
|
|
||||||
| AAA |
$ | 130,161 | 13.9 | % | ||||
| AA |
305,267 | 32.5 | % | |||||
| A |
254,890 | 27.1 | % | |||||
| BBB |
236,855 | 25.2 | % | |||||
| BB |
10,614 | 1.1 | % | |||||
| B |
1,258 | 0.1 | % | |||||
| CCC&Below |
1 | 0.0 | % | |||||
| |
$ | 939,046 | 100.0 | % | ||||
| December 31, 2023 |
Estimated Fair Value | % of Total | ||||||
| ($ in thousands) |
||||||||
| Rating |
|
|
||||||
| AAA |
$ | 98,823 | 15.4 | % | ||||
| AA |
211,354 | 32.8 | % | |||||
| A |
205,162 | 31.9 | % | |||||
| BBB |
119,016 | 18.5 | % | |||||
| BB |
5,869 | 0.9 | % | |||||
| B |
735 | 0.1 | % | |||||
| CCC&Below |
2,840 | 0.4 | % | |||||
| |
$ | 643,799 | 100.0 | % | ||||
The amortized cost and fair value of our available-for-sale investments in fixed maturity securities summarized by contractual maturity as of December 31, 2024 were as follows:
| December 31, 2024 |
Amortized Cost | Fair Value | % of Total Fair Value | |||||||||
| |
($ in thousands) |
|||||||||||
| Due within one year |
$ | 76,696 | $ | 76,089 | 8.1 | % | ||||||
| Due after one year through five years |
195,931 | 190,627 | 20.3 | % | ||||||||
| Due after five years through ten years |
192,924 | 183,560 | 19.5 | % | ||||||||
| Due after ten years |
101,182 | 94,433 | 10.1 | % | ||||||||
| Mortgage and asset-backed securities |
406,597 | 394,337 | 42.0 | % | ||||||||
| |
$ | 973,330 | $ | 939,046 | 100.0 | % | ||||||
Expected maturities may differ from contractual maturities because borrowers may have the right to call or prepay obligations. See “Critical Accounting Policies and Estimates- Investment Valuation and Fair Value” for discussion of investment valuation considerations.
Critical Accounting Policies and Estimates
We identified the accounting estimates below as critical to the understanding of our financial position and results of operations. Critical accounting estimates are defined as those estimates that are both important to the portrayal of our financial condition and results of operations and which require us to exercise significant judgment. We use significant judgment concerning future results and developments in applying these critical accounting estimates and in preparing our consolidated financial statements. These judgments and estimates affect the reported amounts of assets, liabilities, revenue and expenses and the disclosure of material contingent assets and liabilities. Actual results may differ materially from the estimates and assumptions used in preparing the consolidated financial statements. We evaluate our estimates regularly using information that we believe to be relevant. For a detailed discussion of our accounting policies, see the Notes to Consolidated Financial Statements included in this Annual Report on Form 10-K.
Reserve for Losses and Loss Adjustment Expenses
The reserve for losses and loss adjustment expenses represents our estimated ultimate cost of all reported and unreported losses and loss adjustment expenses incurred and unpaid at the balance sheet date. We do not discount this reserve. We seek to establish reserves that will ultimately prove to be adequate.
We categorize our reserves for unpaid losses and loss adjustment expenses into two types: case reserves and reserves for incurred but not yet reported losses (“IBNR”). Through our third-party administrators (“TPAs”), we generally are notified of losses by our insureds or their agents or brokers. Based on the information provided by the TPAs, we establish initial case reserves by estimating the ultimate losses from the claim, including administrative costs associated with the ultimate settlement of the claim. Our personnel use their knowledge of the specific claim along with internal and external experts, including underwriters and legal counsel, to estimate the expected ultimate losses.
We establish IBNR reserves to provide for (i) the estimated amount of future loss payments on incurred claims not yet reported, and (ii) potential development on reported claims. IBNR reserves are estimated based on generally accepted actuarial reserving techniques that consider quantitative loss experience data and, where appropriate, qualitative factors. We use statistical analysis to estimate the cost of losses and loss adjustment expenses related to IBNR. Those estimates are based on our historical information, industry information and practices, and estimates of trends that may affect the ultimate frequency of incurred but not reported claims and changes in ultimate claims severity.
We regularly review our reserve estimates and adjust them as necessary as experience develops or as new information becomes known to us. Such adjustments are included in current operations. During the loss settlement period, if we have indications that claims frequency or severity exceeds our initial expectations, we generally increase our reserves for losses and loss adjustment expenses. Conversely, when claims frequency and severity trends are more favorable than initially anticipated, we generally reduce our reserves for losses and loss adjustment expenses once we have sufficient data to confirm the validity of the favorable trends. Even after such adjustments, the ultimate liability may exceed or be less than the revised estimates. Accordingly, the ultimate settlement of losses and the related loss adjustment expenses may vary significantly from the estimate included in our consolidated financial statements.
The following tables summarize our gross and net reserves for unpaid losses and loss adjustment expenses at December 31, 2024 and 2023.
| |
December 31, 2024 |
|||||||||||||||
| |
Gross |
% of Total |
Net |
% of Total |
||||||||||||
| Loss and Loss Adjustment Reserves |
($ in thousands) |
|||||||||||||||
| Case reserves |
$ | 164,665 | 32.7 | % | $ | 40,731 | 26.2 | % | ||||||||
| IBNR |
338,717 | 67.3 | % | 114,568 | 73.8 | % | ||||||||||
| Total reserves |
$ | 503,382 | 100.0 | % | $ | 155,299 | 100.0 | % | ||||||||
| |
December 31, 2023 |
|||||||||||||||
| |
Gross |
% of Total |
Net |
% of Total |
||||||||||||
| Loss and Loss Adjustment Reserves |
|
|
|
|||||||||||||
| Case reserves |
$ | 124,170 | 36.3 | % | $ | 38,428 | 39.4 | % | ||||||||
| IBNR |
218,105 | 63.7 | % | 59,225 | 60.6 | % | ||||||||||
| Total reserves |
$ | 342,275 | 100.0 | % | $ | 97,653 | 100.0 | % | ||||||||
The process of estimating the reserves for losses and loss adjustment expenses requires a high degree of judgment and is subject to several variables. On a quarterly basis, we perform an analysis of our loss development and select the expected ultimate loss ratio for each of our product lines by exposure period. In our actuarial analysis, we use input from our TPAs and our underwriting departments, including premium pricing assumptions and historical experience. Multiple actuarial methods are used to estimate the reserve for losses and loss adjustment expenses. These methods utilize, to varying degrees, the initial expected loss ratio, detailed statistical analysis of past claims reporting and payment patterns, claims frequency and severity, paid loss experience, industry loss experience, and changes in market conditions, policy forms, exclusions, and exposures. The actuarial methods used to estimate loss reserves are:
| ● |
Reported and/or Paid Loss Development Methods—Ultimate losses are estimated based on historical reported and/or paid loss patterns. Reported losses are the sum of paid and case losses. Industry development patterns are substituted for historical development patterns when sufficient historical data is not available. |
| ● |
IBNR-to-Case Reserve Ratio Method—This method calculates ratios of IBNR to case reserves based on incurred and paid development factors from the development methods. Estimated IBNR equals the product of case reserves and the IBNR-to-case reserve ratio. These IBNR amounts are added to the reported-to-date amount to derive ultimate losses. |
| ● |
Reported Bornhuetter-Ferguson Severity Method—Under this method, ultimate losses are estimated as the sum of cumulative reported losses and estimated IBNR losses. IBNR losses are estimated based on expected average severity, estimated ultimate claim counts and the historical development patterns of reported losses. |
| ● |
Reported Bornhuetter Ferguson Pure Premium Method—Under this method, ultimate losses are estimated as the sum of cumulative reported losses and estimated IBNR losses. IBNR losses are estimated based on expected pure premium and on the historical development patterns of reported losses. |
The method(s) used vary based on the line of business and the nature of the loss event. Development patterns for catastrophic events are based on the time since event versus an accident quarter and year pattern used for non-catastrophic events. Considering each of the alternative ultimate estimates, we select an estimate of ultimate loss for each line of business.
Loss Adjustment Expense reserves are estimated based on the ratio of paid loss adjustment expense to paid loss, which is estimated separately by line of business as well as split by hurricane and excluding hurricane. We then apply this ratio to our estimated unpaid loss, by multiplying the ratio times 50% of loss case reserves and 100% of loss IBNR reserves. This is applied by line of business and accident year to arrive at estimated unpaid loss adjustment expense on a gross basis. We then add the estimated unpaid loss adjustment expense on a gross basis to the paid loss adjustment expense to calculate estimated ultimate loss adjustment expense.
On a quarterly basis, the leaders of our executive management, accounting, actuarial, and claims teams meet to review the recommendations made by our actuarial team and use their best judgment to determine the best estimate to be recorded for the reserve for losses and loss adjustment expenses on our balance sheet.
Our reserves are driven by several important factors, including litigation and regulatory trends, legislative activity, climate change, social and economic patterns and claims inflation assumptions. Our reserve estimates reflect current inflation in legal claims’ settlements and assume we will not be subject to losses from significant new legal liability theories. Our reserve estimates assume that there will not be significant changes in the regulatory and legislative environment. The impact of potential changes in the regulatory or legislative environment is difficult to quantify in the absence of specific, significant new regulation or legislation. In the event of significant new regulation or legislation, we will attempt to quantify its impact on our business, but no assurance can be given that our attempt to quantify such inputs will be accurate or successful.
The table below quantifies the impact of potential reserve deviations from our carried reserve at December 31, 2024. We applied sensitivity factors to incurred losses for the three most recent accident years and to the carried reserve for all prior accident years combined. We believe that potential changes such as these would not have a material impact on our liquidity.
| Net Ultimate LLAE |
December 31, 2024 |
Potential Impact on 2024 |
||||||||||||||||||||
| Sensitivity |
Accident Year |
Sensitivity Factor | Net Ultimate Incurred LLAE |
Net LLAE Reserve | Pre‑tax income | Stockholders’ Equity* |
||||||||||||||||
| (in thousands) |
||||||||||||||||||||||
| Sample increases |
2024 |
5.0 | % | $ | 137,788 | $ | 94,215 | $ | 6,889 | $ | 5,443 | |||||||||||
| 2023 |
2.5 | % | $ | 68,066 | $ | 31,171 | $ | 1,702 | $ | 1,344 | ||||||||||||
| Prior |
1.0 | % | $ | 219,724 | $ | 29,913 | $ | 2,197 | $ | 1,736 | ||||||||||||
| Sample decreases |
2024 |
(5.0 | )% | $ | 137,788 | $ | 94,215 | $ | (6,889 | ) | $ | (5,443 | ) | |||||||||
| 2023 |
(2.5 | )% | $ | 68,066 | $ | 31,171 | $ | (1,702 | ) | $ | (1,344 | ) | ||||||||||
| Prior |
(1.0 | )% | $ | 219,724 | $ | 29,913 | $ | (2,197 | ) | $ | (1,736 | ) | ||||||||||
| * |
Effective tax rate estimated to be 21% |
The amount by which estimated losses differ from those originally reported for a period is known as “development.” Development is unfavorable when the losses ultimately settle for more than the amount reserved or subsequent estimates indicate a basis for reserve increases on unresolved claims. Development is favorable when losses ultimately settle for less than the amount reserved, or subsequent estimates indicate a basis for reducing loss reserves on unresolved claims. We reflect favorable or unfavorable development of loss reserves in the results of operations in the period the estimates are changed.
The following tables present the development of our loss reserves by accident year on a gross basis and net of reinsurance recoveries during each of the below calendar years:
| Gross Ultimate Loss and LAE |
||||||||||||||||||||||||||||
| Development- (Favorable) Unfavorable |
||||||||||||||||||||||||||||
| Calendar Year |
2021 to | 2022 to | 2023 to | |||||||||||||||||||||||||
| Accident Year |
2021 |
2022 |
2023 |
2024 |
2022 |
2023 |
2024 |
|||||||||||||||||||||
| (in thousands) |
||||||||||||||||||||||||||||
| Prior |
$ | 450,570 | $ | 450,904 | $ | 417,234 | $ | 416,443 | $ | 334 | $ | (33,670 | ) | $ | (791 | ) | ||||||||||||
| 2022 |
200,765 | 198,635 | 182,660 | — | (2,130 | ) | (15,975 | ) | ||||||||||||||||||||
| 2023 |
334,520 | 308,049 | — | — | (26,471 | ) | ||||||||||||||||||||||
| 2024 |
537,646 | — | — | — | ||||||||||||||||||||||||
| $ | 334 | $ | (35,800 | ) | $ | (43,237 | ) | |||||||||||||||||||||
| Net Ultimate Loss and LAE |
||||||||||||||||||||||||||||
| Development- (Favorable) Unfavorable |
||||||||||||||||||||||||||||
| |
Calendar Year |
2021 to | 2022 to | 2023 to | ||||||||||||||||||||||||
| Accident Year |
2021 |
2022 |
2023 |
2024 |
2022 |
2023 |
2024 |
|||||||||||||||||||||
| (in thousands) |
||||||||||||||||||||||||||||
| Prior |
$ | 139,530 | $ | 141,913 | $ | 137,405 | $ | 139,173 | $ | 2,383 | $ | (4,508 | ) | $ | 1,768 | |||||||||||||
| 2022 |
76,289 | 83,026 | 80,551 | — | 6,737 | (2,475 | ) | |||||||||||||||||||||
| 2023 |
70,346 | 68,015 | — | — | (2,331 | ) | ||||||||||||||||||||||
| 2024 |
137,788 | — | — | — | ||||||||||||||||||||||||
| $ | 2,383 | $ | 2,229 | $ | (3,038 | ) | ||||||||||||||||||||||
During the year ended December 31, 2024, our total gross incurred losses for accident years 2023 and prior developed favorably by $43.2 million. The gross favorable development was due primarily to lower than anticipated severity of attritional losses in our Inland Marine and other property line of business. On a net basis, the development was favorable by $3.0 million due to the same reason.
During the year ended December 31, 2023, our total gross incurred losses for accident years 2022 and prior developed favorably by $35.8 million. The gross favorable development was due primarily to lower than anticipated severity of catastrophe losses, offset by higher than anticipated severity of attritional losses. On a net basis, the development was unfavorable by $2.2 million due to the effect of ceding gross favorable development under our catastrophe XOL reinsurance program and due to unfavorable development on lines of business subject to lower amounts of ceding.
During the year ended December 31, 2022, our total gross incurred losses for accident years 2021 and prior developed unfavorably by $0.3 million. The gross unfavorable development was due primarily to losses on certain 2020 Hurricanes emerging at a higher severity than expected, primarily in our special property lines of business. This was offset by favorable development on 2021 attritional and catastrophe losses. On a net basis, the development was unfavorable by $2.4 million due to the effect of ceding under our reinsurance program. The favorable 2021 development was subject to a higher amount of ceding versus the unfavorable 2020 development resulting in the net unfavorable development being higher than the gross amount.
Although we believe that our reserve estimates are reasonable, it is possible that our actual loss experience may not conform to our assumptions. Specifically, our actual ultimate loss ratio could differ from our initial expected loss ratio or our actual reporting and payment patterns could differ from our expected reporting and payment patterns, which are based on our own data and industry data. Accordingly, the ultimate settlement of losses and the related loss adjustment expenses may vary significantly from the estimates included in our financial statements. We regularly review our estimates and adjust them as necessary as experience develops or as new information becomes known to us. Such adjustments are included in the results of current operations.
Investment Valuation and Fair Value
We invest in a variety of investment grade fixed maturity securities, including U.S. government issues, state government issues, mortgage and asset-backed obligations, and corporate bonds. All of our investments in fixed maturity securities and equity securities are carried at fair value, defined as the price that we would receive upon selling an investment in an orderly transaction to an independent buyer in the principal or most advantageous market of the investment. Market participants are assumed to be independent, knowledgeable, able and willing to transact an exchange and not acting under duress.
In our disclosure of the fair value of our investments, we utilize a hierarchy based on the quality of inputs used to measure fair value. The hierarchy gives the highest priority to unadjusted quoted prices in active markets for identical assets or liabilities (Level 1 measurements) and the lowest priority to unobservable inputs (Level 3 measurements). Adjustments to transaction prices or quoted market prices may be required in illiquid or disorderly markets in order to estimate fair value. The three levels of the fair value hierarchy are described below:
Level 1—Unadjusted quoted prices are available in active markets for identical investments as of the reporting date.
Level 2—Pricing inputs are quoted prices for similar investments in active markets; quoted prices for identical or similar investments in inactive markets; or valuations based on models where the significant inputs are observable or can be corroborated by observable market data.
Level 3—Pricing inputs into models are unobservable for the investment. The unobservable inputs require significant management judgment or estimation.
We use independent pricing sources to obtain the estimated fair values of investments. The fair value is based on quoted market prices, where available. In cases where quoted market prices are not available, the fair value is based on a variety of valuation techniques depending on the type of investment. The fair values obtained from independent pricing sources are reviewed for reasonableness and any discrepancies are investigated for final valuation.
The fair value of our investments in fixed maturity securities is estimated using relevant inputs, including available market information, benchmark curves, benchmarking of like securities, sector groupings, and matrix pricing. An Option Adjusted Spread model is also used to develop prepayment and interest rate scenarios. These fair value measurements are estimated based on observable, objectively verifiable market information rather than market quotes; therefore, these investments are classified and disclosed in Level 2 of the hierarchy.
The fair value of our investments in equity securities is based on quoted prices available in active markets and classified and disclosed in Level 1 of the hierarchy.
Investment securities are subject to fluctuations in fair value due to changes in issuer-specific circumstances, such as credit rating, and changes in industry-specific circumstances, such as movements in credit spreads based on the market’s perception of industry risks. In addition, fixed maturities are subject to fluctuations in fair value due to changes in interest rates. As a result of these potential fluctuations, it is possible to have significant unrealized gains or losses on a security. Unrealized gains and losses on our fixed maturity securities are included in accumulated other comprehensive income as a separate component of total stockholders’ equity. Equity securities are carried at fair value with unrealized gains and losses included as a component of net income on the Company’s consolidated statement of income.
All financial assets, including available-for-sale securities are required to be presented at the net amount expected to be collected by means of an allowance for credit losses that is included in net income. Credit losses relating to available-for-sale debt securities are also required to be recorded through a reversible allowance for credit losses, but the allowance is limited to the amount by which fair value is less than amortized cost.
The Company reviews all securities with unrealized losses on a regular basis to assess whether the decline in the securities fair value necessitates the recognition of an allowance for credit losses. Factors considered in the review include the extent to which the fair value has been less than amortized cost, and current market interest rates and whether the unrealized loss is credit-driven or a result of changes in market interest rates. The Company also considers factors specific to the issuer including the general financial condition of the issuer, the issuers industry and future business prospects, any past failure of issuer to make scheduled interest or principal payments, and the payment structure of the investment and the issuers ability to make contractual payments on the investment.
The Company also considers whether it intends to sell the security or if it is more likely than not that it will be required to sell the security before recovery of its amortized cost. When assessing whether it intends to sell a fixed-maturity security or if it is likely to be required to sell a fixed-maturity security before recovery of its amortized cost, the Company evaluates facts and circumstances including, but not limited to, decisions to reposition the investment portfolio, potential sales of investments to meet cash flow needs, and potential sales of investments to capitalize on favorable pricing.
For fixed-maturity securities where a decline in fair value is below the amortized cost basis and the Company intends to sell the security, or it is more likely than not that the Company will be required to sell the security before recovery of its amortized cost, a credit-loss charge is recognized in net income based on the fair value of the security at the time of assessment. For fixed-maturity securities that the Company has the intent and ability to hold, the Company compares the estimated present value of the cash flows expected to be collected to the amortized cost of the security. The extent to which the estimated present value of the cash flows expected to be collected is less than the amortized cost of the security represents the credit-related portion of the impairment, which is recognized in net income through an allowance for credit losses. Any remaining decline in fair value represents the noncredit portion of the impairment, which is recognized in other comprehensive income.
The Company reports accrued interest receivable as a component of accrued investment income on its consolidated balance sheet which is presented separately from available-for-sale securities. The Company does not measure an allowance for credit losses on accrued interest receivable and instead would write off accrued interest receivable at the time an issuer defaults or is expected to default on payments.
The Company has one investment in a limited liability company which is accounted for under the equity method of accounting whereby the investment carrying amount is adjusted in subsequent periods to reflect the Company's share of earnings or losses. The Company also invests a small portion of its portfolio in limited partnerships, which are classified as other investments on its consolidated balance sheet. These investments are measured at estimated fair value utilizing a net asset value per share (or its equivalent) as a practical expedient.
Deferred Income Taxes
We account for taxes under the asset and liability method, under which we record deferred income taxes as assets or liabilities on our balance sheet to reflect the net tax effect of the temporary differences between the carrying amount of assets and liabilities for financial reporting purposes and their respective tax bases. Deferred tax assets and liabilities are measured by applying enacted tax rates in effect for the years in which such differences are expected to reverse.
Our deferred tax assets result from temporary differences primarily attributable to unearned premiums, net operating losses (“NOLs”), unrealized losses on investments and deferred compensation. Our deferred tax liabilities result primarily from deferred acquisition costs, internally developed software, and unrealized gains in the investment portfolio.
We recognize deferred tax assets when we determine that such assets are more-likely-than-not to be realized in future periods. In making such a determination, we consider all available evidence, including future reversals of existing taxable temporary differences, tax-planning strategies, projected future taxable income, projected future tax rates, and results of recent operations. On a quarterly basis, we review our deferred tax assets and, if we determine that it is more likely than not that some portion or all of the deferred tax assets will not be realized, we reduce our deferred tax asset with a valuation allowance. The assessment requires significant judgement and review of all positive and negative evidence to reach a conclusion that it is more likely than not that all or some of portion of the deferred tax asset will not be realized.
In assessing the need for a deferred tax asset valuation allowance, we are required to make certain judgments and assumptions about our future operations based on historical experience and information regarding reversals of existing temporary differences, carryback capacity, future taxable income and tax planning strategies. Recent events, including changes in market interest rates and significant financial market volatility have caused us to incur unrealized losses on investments which contributes to us having a net capital deferred tax asset in the amount of $5.3 million at December 31, 2024, as compared to a net capital deferred tax asset of $5.9 million at December 31, 2023. We are currently utilizing tax planning strategies in our assessment of the realizability of a portion of our net capital deferred tax asset at December 31, 2024. These tax planning strategies include the holding of fixed maturity securities that are currently in a net unrealized loss position for tax purposes until recovery or maturity, if needed, to avoid future expiring capital loss carryforwards.
As of December 31, 2024, we had a valuation allowance of $3.4 million relating to our state net operating loss carryforwards and the remainder of our deferred tax assets did not require a valuation allowance.
Recent Accounting Pronouncements
See “Note 2—Recent Accounting Pronouncements” in the Notes to Consolidated Financial Statements included in this Annual Report on Form 10-K for a discussion of accounting pronouncements recently adopted and recently issued accounting pronouncements not yet adopted and their potential impact to our financial statements.
Off-Balance Sheet Arrangements
We do not have any off-balance sheet arrangements (as defined by applicable regulations of the SEC) that are reasonably likely to have a current or future material effect on our financial condition, results of operations, liquidity, capital expenditures or capital resources.
Item 7A. Quantitative and Qualitative Disclosures About Market Risk
Market risk is the risk of economic losses due to adverse changes in the estimated fair value of a financial instrument as the result of changes in equity prices, interest rates, foreign currency exchange rates and commodity prices. Our consolidated balance sheets include assets and liabilities with estimated fair values that are subject to market risk. Our primary market risks have been equity price risk associated with investments in equity securities and interest rate risk associated with investments in fixed maturities. We do not have material exposure to foreign currency exchange rate risk or commodity risk.
Credit risk is the potential loss resulting from adverse changes in an issuer’s ability to repay its debt obligations. General concern exists about the number of municipalities experiencing financial difficulties in light of the adverse economic conditions experienced over the past several years. We manage the exposure to credit risk in our municipal bond portfolio by investing in high quality securities and by diversifying our holdings, which are typically either general obligation or revenue bonds related to essential products and services. We manage the exposure to credit risk in our corporate bond portfolio by investing in high quality securities and by diversifying our holdings.
We monitor our investment portfolio to ensure that credit risk does not exceed prudent levels. The majority of our investment portfolio is invested in high credit quality, investment grade fixed maturity securities. We also invest in higher yielding fixed maturities and equity securities. Our fixed maturity portfolio has an average rating by at least one nationally recognized rating organization of “AA−,” with approximately 73.5% rated “A−” or better. At December 31, 2024, 1.3% of our fixed maturity portfolio was unrated or rated below investment grade. Our fixed maturity portfolio includes some securities issued with financial guaranty insurance. We purchase fixed maturities based on our assessment of the credit quality of the underlying assets without regard to insurance.
Interest Rate Risk
We manage our exposure to interest rate risk through a disciplined asset/liability matching and capital management process. In the management of this risk, the characteristics of duration, credit and variability of cash flows are critical elements. We regularly assess these risks and balance them within the context of our liability and capital position.
As of December 31, 2024, the estimated fair value of our fixed maturities was $939.0 million. We estimate that a 100-basis point increase in interest rates would cause a 3.7% decline in the estimated fair value of our fixed maturities portfolio, while a 100-basis point decrease in interest rates would cause a 4.0% increase in the estimated fair value of that portfolio. The selected scenarios are not predictions of future events, but rather illustrate the effect that such events may have on the fair value of our fixed maturities portfolio.
Equity Price Risk
Equity risk represents the potential economic losses due to adverse changes in equity security prices. As of December 31, 2024, the estimated fair value of our equity securities was $40.5 million. Our equity securities consist primarily of exchange traded funds which seek to track the performance of the broader U.S. stock market. Therefore, the fair value of our equity securities will fluctuate with the value of the overall U.S. stock market and a large decline in the value of the U.S. stock market would cause a corresponding decline in the value of our equity securities.
Inflation
We establish our insurance premiums prior to knowing the amount of losses and loss adjustment expenses or the extent to which inflation may affect such amounts. We attempt to anticipate the potential impact of inflation in our pricing and our establishing of reserves for losses and loss adjustment expenses. Inflation in excess of the levels we have assumed could cause losses and loss adjustment expenses to be higher than we anticipated. Inflation assumptions also impact our reinsurance costs and the amount of reinsurance we must purchase to meet certain thresholds and higher inflation assumptions cause our reinsurance costs to increase.
Substantial future increases in inflation could also result in future increases in interest rates, which in turn are likely to result in a decline in the market value of the investment portfolio and cause unrealized losses or reductions in total stockholders’ equity.
Seasonality
Our Inland Marine and Other Property line of business exposes us to claims from seasonal weather events such as hurricanes and windstorms. The occurrence of such events typically increases between June and November of each year. As a result, we may experience increased losses in our Inland Marine and Other Property line of business during this period. We also write and earn the majority of our Crop premiums during the third quarter of each year.
Palomar Holdings, Inc. and Subsidiaries
INDEX TO CONSOLIDATED FINANCIAL STATEMENTS
| Index to Audited Consolidated Financial Statements of Palomar Holdings, Inc. and Subsidiaries as of December 31, 2024 and 2023 and for each of the Three Years Ended December 31, 2024, 2023 and 2022 |
|
| Report of Independent Registered Public Accounting Firm (PCAOB ID 42) |
|
| Consolidated Financial Statements |
|
| Consolidated Balance Sheets as of December 31, 2024 and 2023 |
|
| Consolidated Statements of Cash Flows for the three years ended December 31, 2024, 2023 and 2022 |
|
| Schedule II—Condensed Financial Information of Registrant—Parent Company only |
|
Schedules other than those listed are omitted for the reason that they are not required, are not applicable or that equivalent information has been included in the financial statements or notes thereto or elsewhere herein.
REPORT OF INDEPENDENT REGISTERED PUBLIC ACCOUNTING FIRM
To the Stockholders and the Board of Directors of Palomar Holdings, Inc.
Opinion on Internal Control Over Financial Reporting
We have audited Palomar Holdings, Inc. and subsidiaries’ internal control over financial reporting as of December 31, 2024, based on criteria established in Internal Control—Integrated Framework issued by the Committee of Sponsoring Organizations of the Treadway Commission (2013 framework) (the COSO criteria). In our opinion, Palomar Holdings, Inc. and subsidiaries (the Company) maintained, in all material respects, effective internal control over financial reporting as of December 31, 2024, based on the COSO criteria.
We also have audited, in accordance with the standards of the Public Company Accounting Oversight Board (United States) (PCAOB), the consolidated balance sheets of the Company as of December 31, 2024 and 2023, the related consolidated statements of income and comprehensive income, stockholders’ equity and cash flows for each of the three years in the period ended December 31, 2024, and the related notes and financial statement schedules listed in the Index at Item 15(a) and our report dated February 25, 2025 expressed an unqualified opinion thereon.
Basis for Opinion
The Company’s management is responsible for maintaining effective internal control over financial reporting and for its assessment of the effectiveness of internal control over financial reporting included in the accompanying Management’s Report on Internal Control over Financial Reporting. Our responsibility is to express an opinion on the Company’s internal control over financial reporting based on our audit. We are a public accounting firm registered with the PCAOB and are required to be independent with respect to the Company in accordance with the U.S. federal securities laws and the applicable rules and regulations of the Securities and Exchange Commission and the PCAOB.
We conducted our audit in accordance with the standards of the PCAOB. Those standards require that we plan and perform the audit to obtain reasonable assurance about whether effective internal control over financial reporting was maintained in all material respects.
Our audit included obtaining an understanding of internal control over financial reporting, assessing the risk that a material weakness exists, testing and evaluating the design and operating effectiveness of internal control based on the assessed risk, and performing such other procedures as we considered necessary in the circumstances. We believe that our audit provides a reasonable basis for our opinion.
Definition and Limitations of Internal Control Over Financial Reporting
A company’s internal control over financial reporting is a process designed to provide reasonable assurance regarding the reliability of financial reporting and the preparation of financial statements for external purposes in accordance with generally accepted accounting principles. A company’s internal control over financial reporting includes those policies and procedures that (1) pertain to the maintenance of records that, in reasonable detail, accurately and fairly reflect the transactions and dispositions of the assets of the company; (2) provide reasonable assurance that transactions are recorded as necessary to permit preparation of financial statements in accordance with generally accepted accounting principles, and that receipts and expenditures of the company are being made only in accordance with authorizations of management and directors of the company; and (3) provide reasonable assurance regarding prevention or timely detection of unauthorized acquisition, use, or disposition of the company’s assets that could have a material effect on the financial statements.
Because of its inherent limitations, internal control over financial reporting may not prevent or detect misstatements. Also, projections of any evaluation of effectiveness to future periods are subject to the risk that controls may become inadequate because of changes in conditions, or that the degree of compliance with the policies or procedures may deteriorate.
/s/ Ernst & Young LLP
San Francisco, California
February 25, 2025
REPORT OF INDEPENDENT REGISTERED PUBLIC ACCOUNTING FIRM
To the Stockholders and the Board of Directors of Palomar Holdings, Inc.
Opinion on the Financial Statements
We have audited the accompanying consolidated balance sheets of Palomar Holdings, Inc. and subsidiaries (the Company) as of December 31, 2024 and 2023, the related consolidated statements of income and comprehensive income, stockholders' equity and cash flows for each of the three years in the period ended December 31, 2024, and the related notes and financial statement schedules listed in the Index at Item 15(a) (collectively referred to as the “consolidated financial statements”). In our opinion, the consolidated financial statements present fairly, in all material respects, the financial position of the Company at December 31, 2024 and 2023, and the results of its operations and its cash flows for each of the three years in the period ended December 31, 2024, in conformity with U.S. generally accepted accounting principles.
We also have audited, in accordance with the standards of the Public Company Accounting Oversight Board (United States) (PCAOB), the Company's internal control over financial reporting as of December 31, 2024, based on criteria established in Internal Control—Integrated Framework issued by the Committee of Sponsoring Organizations of the Treadway Commission (2013 framework), and our report dated February 25, 2025 expressed an unqualified opinion thereon.
Basis for Opinion
These financial statements are the responsibility of the Company's management. Our responsibility is to express an opinion on the Company’s financial statements based on our audits. We are a public accounting firm registered with the PCAOB and are required to be independent with respect to the Company in accordance with the U.S. federal securities laws and the applicable rules and regulations of the Securities and Exchange Commission and the PCAOB.
We conducted our audits in accordance with the standards of the PCAOB. Those standards require that we plan and perform the audit to obtain reasonable assurance about whether the financial statements are free of material misstatement, whether due to error or fraud. Our audits included performing procedures to assess the risks of material misstatement of the financial statements, whether due to error or fraud, and performing procedures that respond to those risks. Such procedures included examining, on a test basis, evidence regarding the amounts and disclosures in the financial statements. Our audits also included evaluating the accounting principles used and significant estimates made by management, as well as evaluating the overall presentation of the financial statements. We believe that our audits provide a reasonable basis for our opinion.
Critical Audit Matter
The critical audit matter communicated below is a matter arising from the current period audit of the financial statements that was communicated or required to be communicated to the audit committee and that: (1) relates to accounts or disclosures that are material to the financial statements and (2) involved our especially challenging, subjective or complex judgments. The communication of the critical audit matter does not alter in any way our opinion on the consolidated financial statements, taken as a whole, and we are not, by communicating the critical audit matter below, providing a separate opinion on the critical audit matter or on the accounts or disclosures to which it relates.
| |
Valuation of Reserve for Losses and Loss Adjustment Expenses |
| Description of the Matter |
At December 31, 2024, the reserve for losses and loss adjustment expenses (LAE) is $503,382 (in thousands). As explained in Notes 2 and 9 to the consolidated financial statements, the reserve for losses and LAE represents management's best estimate for unpaid claims and claim adjustment expenses on reported losses and estimates of losses incurred but not reported (IBNR), net of salvage and subrogation recoveries. The liability is based on individual claims, case reserves and other estimates reported by policyholders, as well as management estimates of ultimate losses and loss adjustment expenses. Inherent in the estimates of ultimate losses and loss adjustment expenses are expected trends in claims severity and frequency and other factors that could vary significantly as claims are settled. IBNR reserves include an estimate for future loss payments on incurred claims not yet reported and for expected development on reported claims. There is significant uncertainty inherent in determining management’s best estimate of IBNR, which is sensitive to significant assumptions including the selection of actuarial methods and reported and paid loss emergence patterns.
Auditing management’s best estimate of IBNR reserves was complex due to the highly judgmental nature of the assumptions, including selection of actuarial methods and reported and paid loss emergence patterns, used in the valuation process. These assumptions have a significant effect on the valuation of reserves for IBNR claims.
|
| How We Addressed the Matter in Our Audit |
We obtained an understanding, evaluated the design and tested the operating effectiveness of the Company’s controls over the process for estimating IBNR reserves. This included, among other procedures, testing management review controls in place over the review and approval of methods and assumptions used in estimating IBNR reserves.
To test IBNR reserves, our audit procedures included, among others, testing the completeness and accuracy of the data used in the calculation by testing reconciliations of the underlying claims and policyholder data recorded in the source systems to the actuarial reserving calculations and comparing a sample of incurred and paid claims to source documentation. With the assistance of our actuarial specialists, we evaluated the Company’s selection and weighting of actuarial methods compared to methods used in prior periods and in the industry for the specific types of insurance. To evaluate the significant assumptions used by management, we compared the assumptions to current and historical claims trends and to current industry benchmarks. We compared the Company’s recorded reserves to a range of reasonable reserve estimates developed by our actuarial specialists based on independently selected methods and assumptions. We also compared the results of the reserve study prepared by the Company’s actuarial specialists to management’s recorded reserve. Additionally, we performed a hindsight analysis of the prior period estimates using subsequent claims development.
|
/s/ Ernst & Young LLP
We have served as the Company’s auditor since 2016
San Francisco, California
February 25, 2025
Palomar Holdings, Inc. and Subsidiaries
Consolidated Balance Sheets
(in thousands, except shares and par value data)
| |
December 31, 2024 |
December 31, 2023 |
||||||
| Assets |
|
|
||||||
| Investments: |
|
|
||||||
| Fixed maturity securities available for sale, at fair value (amortized cost: $973,330 in 2024; $675,130 in 2023) |
$ | 939,046 | $ | 643,799 | ||||
| Equity securities, at fair value (cost: $32,987 in 2024; $43,003 in 2023) |
40,529 | 43,160 | ||||||
| Equity method investment |
2,277 | 2,617 | ||||||
| Other investments |
5,863 | — | ||||||
| Total investments |
987,715 | 689,576 | ||||||
| Cash and cash equivalents |
80,438 | 51,546 | ||||||
| Restricted cash |
101 | 306 | ||||||
| Accrued investment income |
8,440 | 5,282 | ||||||
| Premium receivable |
305,724 | 261,972 | ||||||
| Deferred policy acquisition costs, net of ceding commissions and fronting fees |
94,881 | 60,990 | ||||||
| Reinsurance recoverable on paid losses and loss adjustment expenses |
47,076 | 32,172 | ||||||
| Reinsurance recoverable on unpaid losses and loss adjustment expenses |
348,083 | 244,622 | ||||||
| Ceded unearned premiums |
276,237 | 265,808 | ||||||
| Prepaid expenses and other assets |
91,086 | 72,941 | ||||||
| Deferred tax assets, net |
8,768 | 10,119 | ||||||
| Property and equipment, net |
429 | 373 | ||||||
| Goodwill and intangible assets, net |
13,242 | 12,315 | ||||||
| Total assets |
$ | 2,262,220 | $ | 1,708,022 | ||||
| Liabilities and stockholders' equity |
||||||||
| Liabilities: |
||||||||
| Accounts payable and other accrued liabilities |
$ | 70,079 | $ | 42,376 | ||||
| Reserve for losses and loss adjustment expenses |
503,382 | 342,275 | ||||||
| Unearned premiums |
741,692 | 597,103 | ||||||
| Ceded premium payable |
190,168 | 181,742 | ||||||
| Funds held under reinsurance treaty |
27,869 | 13,419 | ||||||
| Income taxes payable |
— | 7,255 | ||||||
| Borrowings from credit agreements |
— | 52,600 | ||||||
| Total liabilities |
1,533,190 | 1,236,770 | ||||||
| Stockholders' equity: |
||||||||
| Preferred stock, $0.0001 par value, 5,000,000 shares authorized as of December 31, 2024 and December 31, 2023, 0 shares issued and outstanding as of December 31, 2024 and December 31, 2023 |
— | — | ||||||
| Common stock, $0.0001 par value, 500,000,000 shares authorized, 26,529,402 and 24,772,987 shares issued and outstanding as of December 31, 2024 and December 31, 2023, respectively |
3 | 3 | ||||||
| Additional paid-in capital |
493,656 | 350,597 | ||||||
| Accumulated other comprehensive loss |
(26,845 | ) | (23,991 | ) | ||||
| Retained earnings |
262,216 | 144,643 | ||||||
| Total stockholders' equity |
729,030 | 471,252 | ||||||
| Total liabilities and stockholders' equity |
$ | 2,262,220 | $ | 1,708,022 | ||||
See accompanying notes.
Palomar Holdings, Inc. and Subsidiaries
Consolidated Statements of Income and Comprehensive Income
(in thousands, except shares and per share data)
| Year Ended December 31, |
|||||||||
| 2024 |
2023 |
2022 |
|||||||
| Revenues: |
|||||||||
| Gross written premiums |
$ | 1,541,962 | $ | 1,141,558 | $ | 881,868 | |||
| Ceded written premiums |
(897,111 | ) | (731,531 | ) | (524,575 | ) | |||
| Net written premiums |
644,851 | 410,027 | 357,293 | ||||||
| Change in unearned premiums |
(134,164 | ) | (64,114 | ) | (40,827 | ) | |||
| Net earned premiums |
510,687 | 345,913 | 316,466 | ||||||
| Net investment income |
35,824 | 23,705 | 13,877 | ||||||
| Net realized and unrealized gains (losses) on investments |
4,568 | 2,941 | (7,529 | ) | |||||
| Commission and other income |
2,784 | 3,367 | 4,272 | ||||||
| Total revenues |
553,863 | 375,926 | 327,086 | ||||||
| Expenses: |
|||||||||
| Losses and loss adjustment expenses |
134,759 | 72,592 | 78,672 | ||||||
| Acquisition expenses, net of ceding commissions and fronting fees |
149,657 | 107,745 | 110,771 | ||||||
| Other underwriting expenses |
117,113 | 88,172 | 69,219 | ||||||
| Interest expense |
1,138 | 3,775 | 873 | ||||||
| Total expenses |
402,667 | 272,284 | 259,535 | ||||||
| Income before income taxes |
151,196 | 103,642 | 67,551 | ||||||
| Income tax expense |
33,623 | 24,441 | 15,381 | ||||||
| Net income |
$ | 117,573 | $ | 79,201 | $ | 52,170 | |||
| Other comprehensive income, net: |
|||||||||
| Net unrealized gains (losses) on securities available for sale |
(2,854 | ) | 12,524 | (41,827 | ) | ||||
| Total comprehensive income |
$ | 114,719 | $ | 91,725 | $ | 10,343 | |||
| Per Share Data: |
|||||||||
| Basic earnings per share |
$ | 4.61 | $ | 3.19 | $ | 2.07 | |||
| Diluted earnings per share |
$ | 4.48 | $ | 3.13 | $ | 2.02 | |||
| Weighted-average common shares outstanding: |
|||||||||
| Basic |
25,520,343 | 24,822,004 | 25,243,397 | ||||||
| Diluted |
26,223,842 | 25,327,091 | 25,796,008 | ||||||
See accompanying notes.
Palomar Holdings, Inc. and Subsidiaries
Consolidated Statements of Stockholders’ Equity
(in thousands, except share data)
| Accumulated |
||||||||||||||||||||||||
| Number of |
Other |
|||||||||||||||||||||||
| Common |
Additional |
Comprehensive |
Total |
|||||||||||||||||||||
| Shares |
Common |
Paid-In |
Income |
Retained |
Stockholders' |
|||||||||||||||||||
| Outstanding |
Stock |
Capital |
(Loss) |
Earnings |
Equity |
|||||||||||||||||||
| Balance at December 31, 2021 |
25,428,929 | $ | 3 | $ | 318,902 | $ | 5,312 | $ | 69,952 | $ | 394,169 | |||||||||||||
| Other comprehensive loss, net of tax |
— | — | — | (41,827 | ) | — | (41,827 | ) | ||||||||||||||||
| Stock-based compensation |
— | — | 11,624 | — | — | 11,624 | ||||||||||||||||||
| Issuance of common stock via employee stock purchase plan |
13,990 | — | 760 | — | — | 760 | ||||||||||||||||||
| Issuance of common stock via equity incentive plan |
205,963 | — | 2,272 | — | — | 2,272 | ||||||||||||||||||
| Repurchases of common stock |
(621,415 | ) | — | — | — | (34,414 | ) | (34,414 | ) | |||||||||||||||
| Net income |
— | — | — | — | 52,170 | 52,170 | ||||||||||||||||||
| Balance at December 31, 2022 |
25,027,467 | $ | 3 | $ | 333,558 | $ | (36,515 | ) | $ | 87,708 | $ | 384,754 | ||||||||||||
| Other comprehensive income, net of tax |
— | — | — | 12,524 | — | 12,524 | ||||||||||||||||||
| Stock-based compensation |
— | — | 14,913 | — | — | 14,913 | ||||||||||||||||||
| Issuance of common stock via employee stock purchase plan |
17,080 | — | 799 | — | — | 799 | ||||||||||||||||||
| Issuance of common stock via equity incentive plan |
147,341 | — | 1,237 | — | — | 1,237 | ||||||||||||||||||
| Policy holder contribution to surplus |
— | — | 90 | — | — | 90 | ||||||||||||||||||
| Repurchases of common stock |
(418,901 | ) | — | — | — | (22,266 | ) | (22,266 | ) | |||||||||||||||
| Net income |
— | — | — | — | 79,201 | 79,201 | ||||||||||||||||||
| Balance at December 31, 2023 |
24,772,987 | $ | 3 | $ | 350,597 | $ | (23,991 | ) | $ | 144,643 | $ | 471,252 | ||||||||||||
| Other comprehensive loss, net of tax |
— | — | — | (2,854 | ) | — | (2,854 | ) | ||||||||||||||||
| Stock-based compensation |
— | — | 16,685 | — | — | 16,685 | ||||||||||||||||||
| Issuance of common stock in stock offering, net of offering costs |
1,380,000 | — | 115,724 | — | — | 115,724 | ||||||||||||||||||
| Issuance of common stock via employee stock purchase plan |
17,100 | — | 902 | — | — | 902 | ||||||||||||||||||
| Issuance of common stock via equity incentive plan |
359,315 | — | 6,990 | — | — | 6,990 | ||||||||||||||||||
| Policy holder contribution to surplus |
— | — | 2,758 | — | — | 2,758 | ||||||||||||||||||
| Net income |
— | — | — | — | 117,573 | 117,573 | ||||||||||||||||||
| Balance at December 31, 2024 |
26,529,402 | $ | 3 | $ | 493,656 | $ | (26,845 | ) | $ | 262,216 | $ | 729,030 | ||||||||||||
See accompanying notes.
Palomar Holdings, Inc. and Subsidiaries
Consolidated Statements of Cash Flows
(in thousands)
| Year Ended December 31, |
||||||||||||
| 2024 |
2023 |
2022 |
||||||||||
| Operating activities |
||||||||||||
| Net income |
$ | 117,573 | $ | 79,201 | $ | 52,170 | ||||||
| Adjustments to reconcile net income to net cash provided by operating activities: |
||||||||||||
| Stock-based compensation expense |
16,685 | 14,913 | 11,624 | |||||||||
| Depreciation and amortization expense |
5,106 | 4,503 | 4,115 | |||||||||
| Allowance for credit loss on fixed maturity securities |
— | — | 236 | |||||||||
| Net realized and unrealized losses (gains) on investments |
(4,568 | ) | (2,941 | ) | 7,529 | |||||||
| Amortization of premium on fixed maturity securities |
(945 | ) | (9 | ) | 1,607 | |||||||
| Deferred income tax expense |
2,110 | (2,826 | ) | (3,519 | ) | |||||||
| Changes in operating assets and liabilities: |
||||||||||||
| Accrued investment income |
(3,158 | ) | (1,505 | ) | (1,052 | ) | ||||||
| Premium receivable |
(43,752 | ) | (99,114 | ) | (74,846 | ) | ||||||
| Deferred policy acquisition costs |
(33,891 | ) | (4,250 | ) | (787 | ) | ||||||
| Reinsurance recoverables |
(118,365 | ) | (83,181 | ) | (36,298 | ) | ||||||
| Ceded unearned premiums |
(10,429 | ) | (61,724 | ) | (145,768 | ) | ||||||
| Prepaid expenses and other assets |
(15,704 | ) | (24,885 | ) | (4,017 | ) | ||||||
| Accounts payable and other accrued liabilities |
29,178 | 15,666 | 5,426 | |||||||||
| Reserve for losses and loss adjustment expenses |
161,107 | 110,860 | 58,049 | |||||||||
| Unearned premiums |
144,589 | 125,789 | 186,649 | |||||||||
| Ceded premiums payable |
8,426 | 35,615 | 108,667 | |||||||||
| Funds held under reinsurance treaty |
14,450 | 2,739 | (202 | ) | ||||||||
| Income taxes payable |
(7,255 | ) | 7,255 | — | ||||||||
| Net cash provided by operating activities |
261,157 | 116,106 | 169,583 | |||||||||
| Investing activities |
||||||||||||
| Purchases of property and equipment |
(243 | ) | (15 | ) | (313 | ) | ||||||
| Capitalized software costs |
(5,803 | ) | (6,744 | ) | (5,623 | ) | ||||||
| Purchases of fixed maturity securities |
(601,410 | ) | (233,770 | ) | (382,114 | ) | ||||||
| Purchases of equity securities |
(202 | ) | (945 | ) | (10,518 | ) | ||||||
| Purchase of equity method investment |
— | (3,000 | ) | — | ||||||||
| Sales and maturities of fixed maturity securities |
301,847 | 120,285 | 242,726 | |||||||||
| Sales of equity securities |
9,014 | 295 | — | |||||||||
| Change in securities receivable or payable, net |
(1,475 | ) | 950 | (950 | ) | |||||||
| Investments in limited partnerships |
(5,485 | ) | — | — | ||||||||
| Acquisitions, net of cash acquired |
— | (5,534 | ) | (15 | ) | |||||||
| Purchase of policy renewal rights |
(2,487 | ) | — | — | ||||||||
| Net cash used in investing activities |
(306,244 | ) | (128,478 | ) | (156,807 | ) | ||||||
| Financing activities |
||||||||||||
| Net (payments on) proceeds from line of credit |
(52,600 | ) | 16,200 | 36,400 | ||||||||
| Proceeds from common stock issued via employee stock purchase plan |
902 | 799 | 760 | |||||||||
| Proceeds from common stock issued via stock option exercises |
6,990 | 1,237 | 2,272 | |||||||||
| Policy holder contribution to surplus |
2,758 | 90 | — | |||||||||
| Repurchase of common stock |
— | (22,266 | ) | (34,415 | ) | |||||||
| Proceeds from stock offering, net of offering costs |
115,724 | — | — | |||||||||
| Net cash provided by (used in) financing activities |
73,774 | (3,940 | ) | 5,017 | ||||||||
| Net increase in cash, cash equivalents and restricted cash |
28,687 | (16,312 | ) | 17,793 | ||||||||
| Cash, cash equivalents and restricted cash at beginning of period |
51,852 | 68,164 | 50,371 | |||||||||
| Cash, cash equivalents and restricted cash at end of period |
$ | 80,539 | $ | 51,852 | $ | 68,164 | ||||||
| Supplementary cash flow information: |
||||||||||||
| Cash paid for income taxes |
$ | 38,454 | $ | 21,124 | $ | 18,890 | ||||||
| Cash paid for interest |
$ | 1,048 | $ | 3,682 | $ | 704 | ||||||
The following table summarizes our cash and cash equivalents and restricted cash within the consolidated balance sheets (in thousands):
| December 31, 2024 |
December 31, 2023 |
|||||||
| Cash and cash equivalents |
$ | 80,438 | $ | 51,546 | ||||
| Restricted cash |
101 | 306 | ||||||
| Cash and cash equivalents and restricted cash |
$ | 80,539 | $ | 51,852 | ||||
See accompanying notes.
Palomar Holdings, Inc. and Subsidiaries
Notes to Consolidated Financial Statements
1. Summary of Operations and Basis of Presentation
Summary of Operations
Palomar Holdings, Inc. (the “Company”) is a Delaware incorporated insurance holding company that was founded in 2014. The Company has several wholly owned subsidiaries including an Oregon domiciled insurance company, Palomar Specialty Insurance Company (“PSIC”), a Bermuda based reinsurance company, Palomar Specialty Reinsurance Company Bermuda Ltd. (“PSRE”), an Arizona domiciled surplus lines insurance company, Palomar Excess and Surplus Insurance Company (“PESIC”), a California domiciled property and casualty insurance agency, Palomar Insurance Agency, DBA Palomar General Insurance Agency (“PGIA”), and a Delaware incorporated management company, Palomar Underwriters Exchange Organization, Inc. ("PUEO").
PSIC is a property and casualty insurance company domiciled in the state of Oregon. PSIC is licensed to underwrite insurance on an admitted basis in 44 states in the United States, as of December 31, 2024, mainly through managing general insurance agencies, wholesale brokers, and independent agents.
PSRE is a Bermuda captive reinsurance company that has historically been used to reinsure certain premiums on a quota share basis exclusively for PSIC.
PESIC is an Arizona domiciled surplus lines insurance company. PESIC is licensed in Arizona to write surplus lines policies across all the Company’s lines of business and was formed and began writing policies in 2020.
PGIA is a property and casualty general insurance agency for PSIC, PESIC, and unaffiliated insurance carriers. As a general insurance agency, PGIA assists in developing insurance products, underwriting insurance policies, and receiving and disbursing funds from premium and loss transactions under contracts on behalf of insurance companies. PGIA earns commissions from the product development, marketing, and servicing of the insurance companies’ programs. PGIA also earns fee income from policyholder transactions.
PUEO is a Delaware corporation that was formed in 2023 and provides management services to Laulima Exchange ("Laulima"), a Hawaii domiciled reciprocal exchange, as its attorney-in-fact. Laulima was formed in 2023 and is comprised of an unincorporated association of Hawaii homeowners ("subscribers") that agree to insure one another.
The Company operates as an insurance holding company system and is subject to the insurance holding company laws of the States of Oregon and Arizona, the states in which PSIC and PESIC are domiciled. The Company is also commercially domiciled in California, making it subject to California insurance holding company laws. These statutes require that each insurance company in the system register with the insurance department of its state of domicile and furnish information concerning the operations of companies within the holding company system that may materially affect the operations, management or financial condition of the insurers within the system and domiciled in that state.
Segment Reporting
The Company has a single operating segment, the property and casualty insurance business. The Company's chief operating decision maker ("CODM") is the Chief Executive Officer. The significant segment expenses provided to the CODM are consistent with the categories shown in the Company's Consolidated Statements of Income and Comprehensive Income and there are no other segment items used by the CODM. The CODM reviews the Company's revenue, expenses and net income as reported under GAAP, which is the primary measure of segment profit or loss. The CODM reviews these measures, comparing them to prior periods and expectations, and makes resource allocation decisions based on the analysis. While the Company’s CODM also reviews the revenue streams attributable to individual products, operations are managed, resources are allocated, and financial performance is evaluated on a consolidated basis.
Basis of Presentation
The accompanying consolidated financial statements have been prepared in accordance with U.S. generally accepted accounting principles (“GAAP”) and include the accounts of the Company and its wholly-owned subsidiaries. The consolidated financial statements also include the accounts of Laulima, as Laulima is a variable interest entity ("VIE") for which the Company is the primary beneficiary. All intercompany balances and transactions have been eliminated in consolidation.
Use of Estimates
The preparation of financial statements in conformity with GAAP requires management to make estimates and assumptions that affect amounts reported in the consolidated financial statements and accompanying notes. Such estimates and assumptions could change in the future as more information becomes known, which could impact the amounts reported and disclosed herein. All revisions to accounting estimates are recognized in the period in which the estimates are revised. Significant estimates reflected in the Company’s consolidated financial statements include, but are not limited to, reserves for losses and loss adjustment expenses, reinsurance recoverables on unpaid losses, and the fair values of investments.
2. Significant Accounting Policies
Cash and Cash Equivalents
Cash and cash equivalents include time deposits and marketable securities with original maturities of three months or less at acquisition and are stated at cost, which approximates fair value. The Company maintains cash balances in federally insured financial institutions.
Restricted Cash
Restricted cash includes cash on deposit with reinsurance carriers. Restricted cash also includes cash held in a fiduciary capacity for the benefit of third-party insurance carriers.
Investments
All of the Company’s investments in fixed maturity securities are classified as available-for-sale and are carried at fair value.
Investment income consists primarily of interest and dividends. Interest income is recognized on an accrual basis. Premiums and discounts on mortgage-backed securities and asset-backed securities are amortized or accrued using the prospective method which considers anticipated prepayments at the date of purchase. To the extent that the estimated lives of such securities change as a result of changes in estimated prepayment rates, the adjustments are included in net investment income using the prospective method. Dividend income is recognized on the ex-dividend date. Net investment income represents investment income, net of expenses.
Unrealized gains and losses related to fixed maturity securities are included in accumulated other comprehensive income as a separate component of stockholders’ equity. Equity securities are carried at fair value with unrealized gains and losses included as a component of net income on the Company’s consolidated statement of income and comprehensive income. The Company uses the specific-identification method to determine the cost of fixed maturity securities sold and the first-in, first-out method for lots of equity securities sold. The Company has one investment in a limited liability company which is accounted for under the equity method of accounting whereby the investment carrying amount is adjusted in subsequent periods to reflect the Company's share of earnings or losses. Gains or losses from this equity method investment are recognized as a component of realized and unrealized gains or losses on investments in the Company's Statement of Income and Comprehensive Income. The Company also invests a small portion of its portfolio in limited partnerships, which are classified as other investments on the consolidated balance sheet. These investments are measured at estimated fair value utilizing a net asset value per share (or its equivalent) as a practical expedient. Gains or losses from other investments are recognized as a component of realized and unrealized gains or losses on investments in the Company's Statement of Income and Comprehensive Income.
The Company reviews all securities with unrealized losses on a quarterly basis to assess whether the decline in the securities fair value necessitates the recognition of an allowance for credit losses. Factors considered in the review include the extent to which the fair value has been less than amortized cost, and current market interest rates and whether the unrealized loss is credit-driven or a result of changes in market interest rates. The Company also considers factors specific to the issuer including the general financial condition of the issuer, the issuers industry and future business prospects, any past failure of issuer to make scheduled interest or principal payments, and the payment structure of the investment and the issuers ability to make contractual payments on the investment.
The Company also considers whether it intends to sell the security or if it is more likely than not that it will be required to sell the security before recovery of its amortized cost. When assessing whether it intends to sell a fixed-maturity security or if it is likely to be required to sell a fixed-maturity security before recovery of its amortized cost, the Company evaluates facts and circumstances including, but not limited to, decisions to reposition the investment portfolio, potential sales of investments to meet cash flow needs, and potential sales of investments to capitalize on favorable pricing.
For fixed-maturity securities where a decline in fair value is below the amortized cost basis and the Company intends to sell the security, or it is more likely than not that the Company will be required to sell the security before recovery of its amortized cost, a credit-loss charge is recognized in net income based on the fair value of the security at the time of assessment. For fixed-maturity securities that the Company has the intent and ability to hold, the Company compares the estimated present value of the cash flows expected to be collected to the amortized cost of the security. The extent to which the estimated present value of the cash flows expected to be collected is less than the amortized cost of the security represents the credit-related portion of the impairment, which is recognized in net income through an allowance for credit losses. Any remaining decline in fair value represents the noncredit portion of the impairment, which is recognized in other comprehensive income.
The Company reports accrued interest receivable as a component of accrued investment income on its consolidated balance sheet which is presented separately from available-for-sale securities. The Company does not measure an allowance for credit losses on accrued interest receivable and instead would write off accrued interest receivable at the time an issuer defaults or is expected to default on payments.
Fair Value
Fair value is defined as the price that the Company would receive upon selling an investment in an orderly transaction to an independent buyer in the principal or most advantageous market of the investment.
The three-tier hierarchy of inputs is summarized in the three broad levels listed below:
Level 1—Unadjusted quoted prices are available in active markets for identical investments as of the reporting date.
Level 2—Pricing inputs are quoted prices for similar investments in active markets; quoted prices for identical or similar investments in inactive markets; or valuation based on models where the significant inputs are observable or can be corroborated by observable market data.
Level 3—Pricing inputs into models are unobservable for the investment. The unobservable inputs require significant management judgment or estimation.
To measure fair value, the Company obtains quoted market prices for its investment securities from its outside investment managers. If a quoted market price is not available, the Company uses prices of similar securities. The fair values obtained from the outside investment managers are reviewed for reasonableness and any discrepancies are investigated for final valuation.
The fair value of the Company’s investments in fixed maturity securities is estimated using relevant inputs, including available market information, benchmark curves, benchmarking of like securities, sector groupings, and matrix pricing. An Option Adjusted Spread model is also used to develop prepayment and interest rate scenarios. Industry standard models are used to analyze and value securities with embedded options or prepayment sensitivities. These fair value measurements are estimated based on observable, objectively verifiable market information rather than market quotes; therefore, these investments are classified and disclosed in Level 2 of the hierarchy.
The fair value of the Company’s investments in equity securities is based on quoted prices available in active markets and classified and disclosed in Level 1 of the hierarchy.
Variable Interest Entities ("VIE")
A VIE is a legal entity that does not have sufficient equity at risk to finance its activities without additional financial support or is structured such that equity investors lack the ability to make significant decisions relating to the entity’s operations through voting rights or do not participate in the gains and losses of the entity. The Company consolidates VIEs in which the Company is deemed the primary beneficiary. The primary beneficiary is the entity that has both (1) the obligation to absorb losses or the right to receive benefits that could potentially be significant to the VIE and (2) the power to direct the activities of the VIE that most significantly affect that entity’s economic performance.
Concentration of Credit Risk
Financial instruments which potentially subject the Company to concentrations of credit risk consist principally of cash and cash equivalents, fixed maturity securities and reinsurance recoverables. The Company places its cash and cash equivalents with high credit quality financial institutions and its fixed maturity securities in securities of the U.S. government, U.S. government agencies, and high credit quality issuers of debt securities. The Company evaluates the financial condition of its reinsurers and reinsures its business with highly rated reinsurers and sometimes requires letters of credit or retains funds from reinsurers (see Note 10).
Premiums Receivable
Premiums receivable represent amounts due from policyholders, insurance agents, or program administrators for policies written. Generally, premiums are collected prior to providing risk coverage, minimizing the Company’s exposure to credit risk. Premiums receivable are short-term in nature and due within a year. The Company has established an allowance for uncollectible premiums related to its credit risk, which it reviews on a quarterly basis and adjusts as appropriate. The company considers the current economic environment, specific regulatory developments, and historic payment and cancelation trends by line of business and location when determining whether to record an allowance for uncollectible premiums.
The Company recorded an immaterial allowance for uncollectible premiums as of December 31, 2024 and December 31, 2023, and believes that all other amounts are collectable.
Earned Premiums
Gross premiums written are recorded at policy inception and are earned as revenue ratably over the term of the respective policies. Premiums written not yet recognized as revenue are reflected as unearned premiums on the balance sheet, or as advanced premiums if received prior to the policy effective date. Premiums written where cash is not yet received are recognized as premiums receivable.
A premium deficiency is recognized if the sum of expected losses and loss adjustment expenses, unamortized acquisition costs, and policy maintenance costs exceeds the remaining unearned premiums. A premium deficiency would first be recognized by charging any unamortized acquisition costs to expense to the extent required to eliminate the deficiency. If the premium deficiency were greater than unamortized acquisition costs, a liability would be accrued for the excess deficiency. The Company does not consider anticipated investment income when determining if a premium deficiency exists. There was no premium deficiency at December 31, 2024 or 2023.
Deferred Policy Acquisition Costs
The costs of successfully acquiring new business, principally commission expense and premium taxes, are deferred and amortized over the terms of the policies in force, net of any ceding commissions or fronting fees and are shown as acquisition expenses in the accompanying consolidated statements of income and comprehensive income.
Commission and Other Income
Commission and other income is comprised of commissions and fees earned in conjunction with underwriting policies. Commission and fee income is earned at the time the policy is written.
Property and Equipment
Property and equipment are capitalized and carried at cost less accumulated depreciation. Depreciation for property and equipment is calculated on a straight-line basis using useful lives of 3 to 5 years. Leasehold improvements and other fixed assets are capitalized and depreciated over the useful lives of the properties and equipment. Expenditure for maintenance and repairs are charged to operations as incurred. Upon disposition, the asset cost and related depreciation are removed from the accounts and the resulting gain or loss is included in the Company’s results of operations.
Capitalized Software
Costs associated with the implementation of certain internal systems are capitalized and carried at capitalized cost less accumulated amortization and are included as a component of prepaid expenses and other assets on the Company’s consolidated balance sheet. Costs capitalized include internal personnel costs, external developer costs, and interest. The implementation costs relate to systems built on software which the Company purchases under a cloud computing arrangement and accounts for as a service contract. As such, capitalized costs are amortized over the term of the service contract.
Intangible Assets and Goodwill
Intangible assets consist of both finite and indefinite lived assets. Finite lived intangible assets consist of customer relationships which are amortized over a period of 8 years. Indefinite lived intangible assets consist primarily of state licenses acquired upon formation of the Company. Goodwill was recognized as a result of a business acquisition during 2023. Intangible assets and goodwill are initially recognized and measured at fair value and are subsequently evaluated for impairment annually or more frequently if circumstances warrant. No impairments of intangible assets or goodwill were recognized for the years ended December 31, 2024, 2023 or 2022.
Impairment of Long-Lived Assets
Long-lived assets with finite lives are tested for impairment whenever recognized events or changes in circumstances indicate the carrying value of these assets may not be recoverable. If indicators of impairment are present, the fair value is calculated using estimated future cash flows expected to be generated from the use of those assets. An impairment loss is recognized only if the carrying amount of a long-lived asset or asset group is not recoverable and exceeds its fair value. The carrying amount of a long-lived asset or asset group is not recoverable if it exceeds the sum of the undiscounted cash flows expected to result from the use and eventual disposition of the asset or asset group. This assessment is based on the carrying amount of the asset or asset group at the date it is tested for recoverability. An impairment loss is measured as the amount by which the carrying amount of a long-lived asset or asset group exceeds its fair value. No impairments of long-lived assets were recognized for the years ended December 31, 2024, 2023 or 2022.
Reserve for Losses and Loss Adjustment Expenses
The reserve for unpaid losses and loss adjustment expenses includes estimates for unpaid claims and claim adjustment expenses on reported losses and estimates of losses incurred but not reported (“IBNR”), net of salvage and subrogation recoveries. The liability is based on individual claims, case reserves and other estimates reported by policyholders, as well as management estimates of ultimate losses and loss adjustment expenses. Inherent in the estimates of ultimate losses and loss adjustment expenses are expected trends in claims severity and frequency and other factors that could vary significantly as claims are settled.
The Company’s estimates of ultimate losses and loss adjustment expenses are based in part upon the estimation of claims resulting from natural disasters such as hurricanes and earthquakes. Estimation by management of the ultimate losses and loss adjustment expenses resulting from catastrophic events is inherently difficult because of the potential severity of property catastrophe claims. Therefore, the Company uses both proprietary and commercially available models, as well as historic claims experience, for purposes of providing an estimate of ultimate losses and loss adjustment expenses.
Reserves for IBNR are established in accordance with industry practice to provide for (i) the estimated amount of future loss payments on incurred claims not yet reported, and (ii) potential development on reported claims. IBNR reserves are estimated based on generally accepted actuarial reserving techniques that consider quantitative loss experience data and, where appropriate, qualitative factors.
Ultimate losses and loss adjustment expenses may vary materially from the amounts provided in the consolidated financial statements. Estimates of unpaid losses and loss adjustment expenses are reviewed regularly and, as experience develops and new information becomes known, the liabilities are adjusted as necessary. Such adjustments, if any, are reflected in operations in the period in which they become known and are accounted for as changes in estimates. The Company does not discount its liability for unpaid losses and loss adjustment expenses.
Reinsurance
The Company purchases excess of loss and quota share reinsurance to protect it against the impact of losses. The Company also writes premiums under fronting agreements where it cedes the majority of premium and risk to reinsurers in exchange for a fronting fee. Reinsurance premiums, commissions, and ceded unearned premiums are accounted for on bases consistent with the underlying terms of the reinsurance contracts and in proportion to the amount of insurance protection provided. The Company receives ceding commissions and fronting fees in connection with quota share and fronting reinsurance contracts. The ceding commissions and fronting fees are capitalized and amortized as a reduction of acquisition expenses. Amounts applicable to ceded unearned premiums are reported as assets in the accompanying consolidated balance sheets. Premiums earned and losses and loss adjustment expenses incurred are stated in the accompanying consolidated statements of income and comprehensive income net of amounts ceded to reinsurers.
Reinsurance recoverables represent balances due to the Company from its reinsurers for paid and unpaid losses and loss adjustment expenses. The Company is exposed to credit losses from reinsurers being unable to meet their obligations. The Company evaluates the financial condition of potential reinsurers and reinsures its business with highly rated reinsurers with a rating of “A-“ (Excellent) (Outlook Stable) or better from A.M. Best. Reinsurers who do not meet the Company’s rating criteria are required to post collateral. The Company reviews credit quality of its reinsurers on a quarterly basis. The Company’s reinsurance contracts also include special termination provisions that allow the Company to cancel and replace any participating reinsurer that is downgraded below a rating of “A−” from A.M. Best, or whose surplus drops by more than 20%. Historically, the Company has experienced minimal credit losses from reinsurance recoverables and did not have an allowance for uncollectible reinsurance recoverables as of December 31, 2024 or December 31, 2023.
Stock Based Compensation Expense
Stock-based compensation expense is recognized on a straight-line basis over the vesting period of awards. The Company does not apply a forfeiture rate to unvested awards and accounts for forfeitures as they occur. For stock option grants, the fair value of awards is estimated using the Black Scholes Model. The fair value of restricted stock units is determined using the closing price of the Company's common stock on the grant date. The fair value of performance stock units containing employee service or company financial performance-based conditions is determined using the closing price of the Company's common stock on the grant date. The fair value of performance stock units containing conditions based on performance of the Company’s stock is determined using a Monte Carlo simulation. All stock-based compensation is included in other underwriting expenses in the Company’s consolidated statements of income and comprehensive income.
Income Taxes
The Company is taxed as a property/casualty insurer for federal income tax purposes. Deferred income tax assets and liabilities are determined based on the difference between the financial statement and the tax bases of assets and liabilities, using enacted tax rates expected to be in effect during the year in which the basis differences reverse. The effect on deferred taxes of a change in tax rates is recognized in income in the period that includes the enactment date. Valuation allowances are established when necessary to reduce deferred tax assets to the amount expected to be realized.
The Company recognizes the tax benefit of uncertain tax positions where the position is more likely than not to be sustained assuming examination by taxing authorities. Based on its evaluation for the tax years ended December 31, 2024 and 2023, the Company has concluded that there are no significant uncertain tax positions requiring recognition in its financial statements. The Company recognizes interest and penalties related to uncertain tax positions, if any, as a component of income tax expense. The Company has not been assessed interest or penalties by any major tax jurisdictions for the respective tax years ended December 31, 2024, 2023, or 2022.
Earnings Per Share
Basic earnings per share is calculated by dividing net income by the weighted-average common shares outstanding for the period. Diluted earnings per share reflects the dilution which could occur if equity-based awards are converted into common share equivalents as calculated using the treasury stock method. When inclusion of additional common share equivalents increases the earnings per share or reduces the loss per share, the effect on earnings per share is anti-dilutive, and the diluted net earnings or net loss per share is computed excluding these common share equivalents.
Recently adopted accounting pronouncements
In November 2023, the FASB issued ASU No. 2023-07, Segment Reporting (Topic 280): Improvements to Reportable Segment Disclosures, which is intended to improve reportable segment disclosure requirements, primarily through enhanced disclosures about significant segment expenses, allowing financial statement users to better understand the components of a segment's profit or loss to assess potential future cash flows for each reportable segment and the entity as a whole. The amendments expand a public entity's segment disclosures by requiring disclosure of significant segment expenses that are regularly provided to the chief operating decision maker ("CODM"), clarifying when an entity may report one or more additional measures to assess segment performance, requiring enhanced interim disclosures, providing new disclosure requirements for entities with a single reportable segment, and requiring other new disclosures. ASU 2023-07 is effective for fiscal years beginning after December 15, 2023, and interim periods within fiscal years beginning after December 15, 2024. The Company adopted this guidance beginning with this Annual Report on Form 10-K and the adoption did not have a significant impact to the Company's required disclosures.
Recently issued accounting pronouncements not yet adopted
Income Statement Expenses
In November 2024, the FASB issued ASU 2024-03, Disaggregation of Income Statement Expenses, which will require disclosure of additional information about specific expense categories in the notes to financial statements for all public business entities. ASU 2024-03 is effective for annual reporting beginning with the fiscal year ending December 31, 2027, and for interim periods thereafter. Early adoption is permitted. The Company is currently evaluating the impact the adoption of this standard will have on its consolidated financial statements.
Income Taxes
In December 2023, the FASB issued ASU No. 2023-09, Income Taxes (Topic 740): Improvements to Income Tax Disclosures. ASU 2023-09 requires public business entities to disclose additional information with respect to the reconciliation of the effective tax rate to the statutory rate. Additionally, public business entities will need to disaggregate federal, state and foreign taxes paid in their financial statements. ASU 2023-09 is effective for public business entities for fiscal years, and interim periods within those fiscal years, beginning after December 15, 2024. The Company is currently evaluating the impact the adoption of this standard will have on its consolidated financial statements.
3. Investments
The Company’s available-for-sale investments are summarized as follows:
| December 31, 2024 |
Amortized Cost or Cost |
Gross Unrealized Gains |
Gross Unrealized Losses |
Allowance for Credit Losses |
Fair Value |
|||||||||||||||
| (in thousands) |
||||||||||||||||||||
| Fixed maturities: |
|
|
|
|
|
|||||||||||||||
| U.S. Governments |
$ | 33,449 | $ | 6 | $ | (649 | ) | $ | — | $ | 32,806 | |||||||||
| U.S. States, Territories, and Political Subdivisions |
10,606 | 29 | (857 | ) | — | 9,778 | ||||||||||||||
| Special revenue excluding mortgage/asset-backed securities |
30,283 | 85 | (3,734 | ) | — | 26,634 | ||||||||||||||
| Corporate and other |
492,395 | 1,689 | (18,349 | ) | (244 | ) | 475,491 | |||||||||||||
| Mortgage/asset-backed securities |
406,597 | 1,408 | (13,668 | ) | — | 394,337 | ||||||||||||||
| Total available-for-sale investments |
$ | 973,330 | $ | 3,217 | $ | (37,257 | ) | $ | (244 | ) | $ | 939,046 | ||||||||
| December 31, 2023 |
Amortized Cost or Cost |
Gross Unrealized Gains |
Gross Unrealized Losses |
Allowance for Credit Losses |
Fair Value |
|||||||||||||||
| (in thousands) |
||||||||||||||||||||
| Fixed maturities: |
|
|
|
|
|
|||||||||||||||
| U.S. Governments |
$ | 40,836 | $ | — | $ | (1,416 | ) | $ | — | $ | 39,420 | |||||||||
| U.S. States, Territories, and Political Subdivisions |
10,641 | 100 | (839 | ) | — | 9,902 | ||||||||||||||
| Special revenue excluding mortgage/asset-backed securities |
32,513 | 147 | (3,149 | ) | — | 29,511 | ||||||||||||||
| Corporate and other |
316,590 | 1,750 | (17,197 | ) | (904 | ) | 300,239 | |||||||||||||
| Mortgage/asset-backed securities |
274,550 | 1,879 | (11,702 | ) | — | 264,727 | ||||||||||||||
| Total available-for-sale investments |
$ | 675,130 | $ | 3,876 | $ | (34,303 | ) | $ | (904 | ) | $ | 643,799 | ||||||||
Security holdings in an unrealized loss position
As of December 31, 2024, the Company held 595 fixed maturity securities in an unrealized loss position with a total estimated fair value of $664.0 million and total gross unrealized losses of $37.3 million. As of December 31, 2023, the Company held 483 fixed maturity securities in an unrealized loss position with a total estimated fair value of $451.0 million and total gross unrealized losses of $34.3 million.
The aggregate fair value and gross unrealized losses of the Company’s investments aggregated by investment category and the length of time these individual securities have been in a continuous unrealized loss position as of December 31, 2024 and 2023, are as follows:
| |
Less Than 12 Months |
More Than 12 Months |
Total |
|||||||||||||||||||||
| |
Fair |
Unrealized |
Fair |
Unrealized |
Fair |
Unrealized |
||||||||||||||||||
| December 31, 2024 |
Value |
Losses |
Value |
Losses |
Value |
Losses |
||||||||||||||||||
| (in thousands) |
||||||||||||||||||||||||
| Fixed maturity securities: |
||||||||||||||||||||||||
| U.S. Governments |
$ | 16,507 | $ | (65 | ) | $ | 14,291 | $ | (584 | ) | $ | 30,798 | $ | (649 | ) | |||||||||
| U.S. States, Territories, and Political Subdivisions |
2,614 | (419 | ) | 5,076 | (438 | ) | 7,690 | (857 | ) | |||||||||||||||
| Special revenue excluding mortgage/asset-backed securities |
2,182 | (426 | ) | 21,733 | (3,308 | ) | 23,915 | (3,734 | ) | |||||||||||||||
| Corporate and other |
181,179 | (4,996 | ) | 176,531 | (13,353 | ) | 357,710 | (18,349 | ) | |||||||||||||||
| Mortgage/asset-backed securities |
152,287 | (2,820 | ) | 91,572 | (10,848 | ) | 243,859 | (13,668 | ) | |||||||||||||||
| Total |
$ | 354,769 | $ | (8,726 | ) | $ | 309,203 | $ | (28,531 | ) | $ | 663,972 | $ | (37,257 | ) | |||||||||
| |
Less Than 12 Months |
More Than 12 Months |
Total |
|||||||||||||||||||||
| |
Fair |
Unrealized |
Fair |
Unrealized |
Fair |
Unrealized |
||||||||||||||||||
| December 31, 2023 |
Value |
Losses |
Value |
Losses |
Value |
Losses |
||||||||||||||||||
| |
(in thousands) |
|||||||||||||||||||||||
| Fixed maturity securities: |
|
|
|
|
|
|
||||||||||||||||||
| U.S. Governments |
$ | 738 | $ | (1 | ) | $ | 38,063 | $ | (1,415 | ) | $ | 38,801 | $ | (1,416 | ) | |||||||||
| U.S. States, Territories, and Political Subdivisions |
— | — | 6,196 | (839 | ) | 6,196 | (839 | ) | ||||||||||||||||
| Special revenue excluding mortgage/asset-backed securities |
— | — | 26,736 | (3,149 | ) | 26,736 | (3,149 | ) | ||||||||||||||||
| Corporate and other |
28,872 | (480 | ) | 204,034 | (16,717 | ) | 232,906 | (17,197 | ) | |||||||||||||||
| Mortgage/asset-backed securities |
29,334 | (245 | ) | 117,016 | (11,457 | ) | 146,350 | (11,702 | ) | |||||||||||||||
| Total |
$ | 58,944 | $ | (726 | ) | $ | 392,045 | $ | (33,577 | ) | $ | 450,989 | $ | (34,303 | ) | |||||||||
The Company reviewed the above securities at each balance sheet date to consider whether it was necessary to recognize a credit loss related to any of these securities. An allowance for credit losses of $0.2 million and $0.9 million was recorded pertaining to one investment security as of December 31, 2024 and 2023, respectively. For the remaining securities, the Company determined that the fixed maturity securities’ unrealized losses were primarily the result of the interest rate environment and not the credit quality of the issuers. The Company does not intend to sell the investments and it is not more likely than not that the Company will be required to sell the investments before the recovery of their amortized cost basis.
Contractual maturities of available-for-sale fixed maturity securities
The amortized cost and fair value of fixed maturity securities at December 31, 2024, by contractual maturity, are shown below.
| |
Amortized |
Fair |
||||||
| |
Cost |
Value |
||||||
| |
(in thousands) |
|||||||
| Due within one year |
$ | 76,696 | $ | 76,089 | ||||
| Due after one year through five years |
195,931 | 190,627 | ||||||
| Due after five years through ten years |
192,924 | 183,560 | ||||||
| Due after ten years |
101,182 | 94,433 | ||||||
| Mortgage and asset-backed securities |
406,597 | 394,337 | ||||||
| |
$ | 973,330 | $ | 939,046 | ||||
Expected maturities may differ from contractual maturities because borrowers may have the right to call or prepay obligations.
Change in unrealized gains (losses) of investments
The following table presents the change in available-for-sale gross unrealized gains or losses by investment type:
| |
Year Ended December 31, |
|||||||||||
| |
2024 |
2023 |
2022 |
|||||||||
| |
(in thousands) |
|||||||||||
| Change in net unrealized gains (losses) |
|
|
|
|||||||||
| Fixed maturities |
$ | (2,953 | ) | $ | 15,185 | $ | (53,076 | ) | ||||
| Net increase (decrease) |
$ | (2,953 | ) | $ | 15,185 | $ | (53,076 | ) | ||||
Net investment income summary
Net investment income is summarized as follows:
| |
Year Ended December 31, |
|||||||||||
| |
2024 |
2023 |
2022 |
|||||||||
| |
(in thousands) |
|||||||||||
| Interest income |
$ | 35,433 | $ | 23,349 | $ | 13,631 | ||||||
| Dividend income |
1,075 | 871 | 739 | |||||||||
| Investment expense |
(684 | ) | (515 | ) | (493 | ) | ||||||
| Net investment income |
$ | 35,824 | $ | 23,705 | $ | 13,877 | ||||||
Net realized and unrealized investment gains and losses
The following table presents net realized and unrealized investment gains and losses:
| |
Year Ended |
|||||||||||
| |
December 31, |
|||||||||||
| |
2024 |
2023 |
2022 |
|||||||||
| |
(in thousands) |
|||||||||||
| Realized gains: |
||||||||||||
| Gains on sales of fixed maturity securities |
$ | 179 | $ | 89 | $ | 14 | ||||||
| Gains on sales of equity securities |
20 | — | — | |||||||||
| Total realized gains |
199 | 89 | 14 | |||||||||
| Realized losses: |
||||||||||||
| Losses on sales of fixed maturity securities |
(2,489 | ) | (32 | ) | (2,340 | ) | ||||||
| Losses on sales of equity securities |
— | — | — | |||||||||
| Total realized losses |
(2,489 | ) | (32 | ) | (2,340 | ) | ||||||
| Net realized investment gains (losses) |
(2,290 | ) | 57 | (2,326 | ) | |||||||
| Change in allowance for credit losses |
659 | (667 | ) | — | ||||||||
| Net unrealized gains (losses) on equity securities |
6,161 | 3,933 | (5,203 | ) | ||||||||
| Net unrealized losses on equity method investment |
(340 | ) | (382 | ) | — | |||||||
| Net unrealized gains on other investments |
378 | |||||||||||
| Net realized and unrealized gains (losses) on investments |
$ | 4,568 | $ | 2,941 | $ | (7,529 | ) | |||||
Proceeds from the sale of fixed maturity securities were $6.3 million, $10.1 million and $19.7 million for the years ended December 31, 2024, 2023 and 2022, respectively.
The Company places securities on statutory deposit with certain state agencies to retain the right to do business in those states. These securities are included in available-for-sale investments on the consolidated balance sheets. At December 31, 2024 and 2023, the carrying value of securities on deposit with state regulatory authorities was $9.9 million and $8.6 million, respectively.
The Company has investments in limited partnerships, recorded in the other investments line of the consolidated balance sheet. These investments are measured at estimated fair value utilizing a net asset value per share (or its equivalent) as a practical expedient. As of December 31, 2024 the Company had unfunded commitments to invest an additional $79.5 million in these limited partnerships.
4. Fair value measurements
The following tables present the Company’s fair value hierarchy for financial assets and liabilities measured at fair value on a recurring basis as of December 31, 2024 and 2023:
| December 31, 2024 |
Level 1 |
Level 2 |
Level 3 |
Total |
||||||||||||
| |
(in thousands) |
|||||||||||||||
| Assets: |
|
|
|
|
||||||||||||
| Fixed maturity securities |
|
|
|
|
||||||||||||
| U.S. Governments |
$ | — | $ | 32,806 | $ | — | $ | 32,806 | ||||||||
| U.S. States, Territories, and Political Subdivisions |
— | 9,778 | — | 9,778 | ||||||||||||
| Special revenue excluding mortgage/asset-backed securities |
— | 26,634 | — | 26,634 | ||||||||||||
| Corporate and other |
— | 475,491 | — | 475,491 | ||||||||||||
| Mortgage/asset-backed securities |
— | 394,337 | — | 394,337 | ||||||||||||
| Equity securities |
40,529 | — | — | 40,529 | ||||||||||||
| Cash, cash equivalents, and restricted cash |
80,539 | — | — | 80,539 | ||||||||||||
| Total assets |
$ | 121,068 | $ | 939,046 | $ | — | $ | 1,060,114 | ||||||||
| December 31, 2023 |
Level 1 |
Level 2 |
Level 3 |
Total |
||||||||||||
| |
(in thousands) |
|||||||||||||||
| Assets: |
|
|
|
|
||||||||||||
| Fixed maturity securities |
|
|
|
|
||||||||||||
| U.S. Governments |
$ | — | $ | 39,420 | $ | — | $ | 39,420 | ||||||||
| U.S. States, Territories, and Political Subdivisions |
— | 9,902 | — | 9,902 | ||||||||||||
| Special revenue excluding mortgage/asset-backed securities |
— | 29,511 | — | 29,511 | ||||||||||||
| Corporate and other |
— | 300,239 | — | 300,239 | ||||||||||||
| Mortgage/asset-backed securities |
— | 264,727 | — | 264,727 | ||||||||||||
| Equity securities |
43,160 | — | — | 43,160 | ||||||||||||
| Cash, cash equivalents, and restricted cash |
51,852 | — | — | 51,852 | ||||||||||||
| Total assets |
$ | 95,012 | $ | 643,799 | $ | — | $ | 738,811 | ||||||||
The carrying amounts of financial assets and liabilities reported in the accompanying consolidated balance sheet including cash and cash equivalents, restricted cash, receivables, reinsurance recoverable, and accounts payable and other accrued liabilities approximate fair value due to their short term-maturity. The carrying amount of the Company’s borrowings under the Federal Home Loan Bank (“FHLB”) line of credit approximates fair value as the Company borrows at a rate which is adjusted daily.
5. Policy Acquisition Costs
The following tables present the policy acquisition costs deferred and amortized over the terms of the policies in force:
| |
Year ended December 31, |
|||||||||||
| |
2024 |
2023 |
2022 |
|||||||||
| |
(in thousands) |
|||||||||||
| Deferred Policy Acquisition Costs: |
|
|
|
|||||||||
| Balance, beginning of year |
$ | 60,990 | $ | 56,740 | $ | 55,953 | ||||||
| Additions to deferred balance: |
|
|
|
|||||||||
| Direct commissions |
318,474 | 220,822 | 209,061 | |||||||||
| Ceding commissions and fronting fees |
(159,925 | ) | (123,911 | ) | (109,302 | ) | ||||||
| Premium taxes |
15,491 | 13,690 | 10,166 | |||||||||
| Total net additions |
174,040 | 110,601 | 109,925 | |||||||||
| Amortization of net policy acquisition costs |
(140,149 | ) | (106,351 | ) | (109,138 | ) | ||||||
| Balance, end of year |
$ | 94,881 | $ | 60,990 | $ | 56,740 | ||||||
| Acquisition expenses: |
||||||||||||
| Amortization of net policy acquisition costs |
$ | 140,149 | $ | 106,351 | $ | 109,138 | ||||||
| Period costs |
9,508 | 1,394 | 1,633 | |||||||||
| Total Acquisition expenses |
$ | 149,657 | $ | 107,745 | $ | 110,771 | ||||||
6. Intangible Assets and Goodwill
Intangible assets consist of the following:
| |
December 31, |
|||||||
| |
2024 |
2023 |
||||||
| |
(in thousands) |
|||||||
| Goodwill: |
||||||||
| Acquisitions |
$ | 3,755 | $ | 3,755 | ||||
| Indefinite-lived intangibles: |
||||||||
| State insurance licenses |
$ | 744 | $ | 744 | ||||
| Finite-lived intangibles: |
||||||||
| Customer relationships |
14,288 | 11,803 | ||||||
| Accumulated amortization on finite-lived intangibles |
(5,545 | ) | (3,987 | ) | ||||
| Total intangible assets |
$ | 13,242 | $ | 12,315 | ||||
State insurance licenses consist of licenses acquired at the inception of PSIC.
Customer relationships represents the fair value of acquired policy renewal rights which are amortized on a straight line over a period of 8 years. Amortization expense was $1.6 million for the year ended December 31, 2024 and $1.5 million for the year ended December 31, 2023.
7. Capitalized Assets
Capitalized software is included as a component of prepaid expenses and other assets in the Company’s consolidated balance sheet. The balances are as follows:
| Accumulated |
Net |
|||||||||||
| December 31, 2024 |
Cost |
Amortization |
Book Value |
|||||||||
| |
(in thousands) |
|||||||||||
| Capitalized Software |
$ | 30,690 | $ | (12,207 | ) | $ | 18,483 | |||||
| Accumulated |
Net |
|||||||||||
| December 31, 2023 |
Cost |
Amortization |
Book Value |
|||||||||
| |
(in thousands) |
|||||||||||
| Capitalized Software |
$ | 25,356 | $ | (9,079 | ) | $ | 16,277 | |||||
Amortization expense relating to capitalized software for the years ended December 31, 2024, 2023 and 2022 was $3.4 million, $2.8 million, and $2.6 million, respectively.
Property and Equipment consists of the following:
| Accumulated |
Net |
|||||||||||
| December 31, 2024 |
Cost |
Depreciation |
Book Value |
|||||||||
| |
(in thousands) |
|||||||||||
| Leasehold improvements |
$ | 879 | $ | (879 | ) | $ | — | |||||
| Computer hardware |
467 | (332 | ) | 135 | ||||||||
| Office equipment and furniture |
917 | (623 | ) | 294 | ||||||||
| Total |
$ | 2,263 | $ | (1,834 | ) | $ | 429 | |||||
| Accumulated |
Net |
|||||||||||
| December 31, 2023 |
Cost |
Depreciation |
Book Value |
|||||||||
| |
(in thousands) |
|||||||||||
| Leasehold improvements |
$ | 879 | $ | (811 | ) | $ | 68 | |||||
| Computer hardware |
418 | (272 | ) | 146 | ||||||||
| Office equipment and furniture |
724 | (565 | ) | 159 | ||||||||
| Total |
$ | 2,021 | $ | (1,648 | ) | $ | 373 | |||||
Depreciation expense for the years ended December 31, 2024, 2023 and 2022 was immaterial.
8. Leases
The Company has operating leases for office space used to conduct its insurance operations and administration activities. Operating lease right-of-use (“ROU”) assets are a component of prepaid expenses and other assets and operating lease liabilities are included in accounts payable and other accrued liabilities in the Company's consolidated balance sheets.
The Company determines whether an arrangement is a lease at its inception. Operating lease ROU assets and liabilities are recognized at the lease commencement date based on the estimated present value of lease payments over the lease term. To determine the present value of lease payments, the Company uses its incremental borrowing rate, which it calculates based on information available at the lease commencement date. For certain leases that contain options to extend, the options are included in lease liabilities only if the company is reasonably certain the option will be exercised. Variable lease costs such as parking are expensed in the period the obligation is incurred and are not included in the Company’s operating lease liability. The Company's lease agreements do not contain any residual value guarantees.
Operating lease costs for the years ended December 31, 2024, 2023 and 2022 were $0.8 million, $0.8 million and $0.8 million, respectively. Operating lease costs are comprised of rental expense for operating leases. Lease expense is recognized on a straight-line basis over the lease term and is included as a component of other underwriting expenses in the Company’s consolidated statements of income and comprehensive income.
The following tables provide supplementary information about the Company’s leases:
| Year ended December 31, 2024 |
($ in thousands) |
|||
| Operating cash outflows from operating leases |
$ | 882 | ||
| December 31, 2024 |
($ in thousands) |
|||
| Operating lease ROU assets |
$ | 7,639 | ||
| Operating lease liabilities |
$ | 7,764 | ||
| Weighted-average remaining lease term on operating leases (years) |
9.2 | |||
| Weighted-average discount rate on operating leases |
5.1 | % | ||
Future minimum lease payments as of December 31, 2024 are as follows:
| Years ending December 31, |
($ in thousands) |
|||
| 2025 |
1,050 | |||
| 2026 |
948 | |||
| 2027 |
856 | |||
| 2028 |
985 | |||
| 2029 |
1,014 | |||
| Thereafter |
5,053 | |||
| Total future minimum lease payments |
$ | 9,906 | ||
| Less: imputed interest |
(2,142 | ) | ||
| Total operating lease liability |
$ | 7,764 | ||
9. Reserve for Losses and Loss Adjustment Expenses
Loss and loss adjustment expenses reserves represent management’s best estimate of the ultimate cost of all reported and unreported losses incurred for the years ended December 31, 2024, 2023, and 2022. The Company does not discount loss and loss adjustment expense reserves. The reserves for unpaid losses and loss adjustment expenses are estimated using individual case-basis valuations and statistical analyses. Those estimates are subject to the effects of trends in loss severity and frequency.
In addition to case reserves, which are generally based on reported claims, the Company establishes reserves for incurred but not reported claims (“IBNR”). IBNR reserves are developed to provide for (i) the estimated amount of future loss payments on incurred claims not yet reported, and (ii) potential development on reported claims. IBNR reserves are estimated based on generally accepted actuarial reserving techniques that consider quantitative loss experience data and, where appropriate, qualitative factors. The Company uses statistical analysis to estimate the cost of losses and loss adjustment expenses related to IBNR. Those estimates are based on historical information, industry information and practices, and estimates of trends that may affect the ultimate frequency of incurred but not reported claims and changes in ultimate claims severity.
The Company regularly reviews its reserve estimates and adjusts them as necessary as experience develops or as new information becomes known. Such adjustments are included in current operations. During the loss settlement period, if there are indications that claims frequency or severity exceeds initial expectations, the Company generally increases its reserves for losses and loss adjustment expenses. Conversely, when claims frequency and severity trends are more favorable than initially anticipated, the Company generally reduces its reserves for losses and loss adjustment expenses once it has sufficient data to confirm the validity of the favorable trends. Even after such adjustments, the ultimate liability may exceed or be less than the revised estimates. Accordingly, the ultimate settlement of losses and the related loss adjustment expenses may vary significantly from the estimate included in the Company’s consolidated financial statements.
Although considerable variability is inherent in such estimates, management believes the reserves for losses and loss adjustment expenses are adequate. The estimates are continually reviewed and adjusted as necessary as experience develops or new information becomes known. Any adjustments to estimates are recorded in the current period.
The following table provides a reconciliation of the beginning and ending reserve balances for losses and LAE on a net of reinsurance basis to the gross amounts reported in the accompanying consolidated balance sheets:
| |
Year Ended December 31, |
|||||||||||
| |
2024 |
2023 |
2022 |
|||||||||
| |
(in thousands) |
|||||||||||
| Reserve for losses and loss adjustment expense, net of reinsurance recoverables at beginning of period |
$ | 97,653 | $ | 77,520 | $ | 45,419 | ||||||
| Add: Incurred losses and loss adjustment expenses, net of reinsurance, related to: |
||||||||||||
| Current year |
137,797 | 70,363 | 76,289 | |||||||||
| Prior years |
(3,038 | ) | 2,229 | 2,383 | ||||||||
| Total incurred |
134,759 | 72,592 | 78,672 | |||||||||
| Deduct: Loss and loss adjustment expense payments, net of reinsurance, related to: |
||||||||||||
| Current year |
43,582 | 19,631 | 21,802 | |||||||||
| Prior years |
33,531 | 32,828 | 24,769 | |||||||||
| Total payments |
77,113 | 52,459 | 46,571 | |||||||||
| Reserve for losses and loss adjustment expense net of reinsurance recoverables at end of period |
155,299 | 97,653 | 77,520 | |||||||||
| Add: Reinsurance recoverables on unpaid losses and loss adjustment expenses at end of period |
348,083 | 244,622 | 153,895 | |||||||||
| Reserve for losses and loss adjustment expenses gross of reinsurance recoverables on unpaid losses and loss adjustment expenses at end of period |
$ | 503,382 | $ | 342,275 | $ | 231,415 | ||||||
The foregoing reconciliation shows favorable net development of $3.0 million in 2024 and unfavorable net development of $2.2 million and $2.4 million in 2023 and 2022, respectively.
During 2024, the net favorable reserve development was primarily due to lower than anticipated severity of attritional losses in our Inland Marine and other property line of business.
During 2023, the net unfavorable reserve development was primarily due to the effect of ceding gross favorable development under our catastrophe XOL reinsurance program and due to unfavorable development on lines of business subject to lower amounts of ceding. During 2022, the net unfavorable reserve development was primarily attributable to prior year catastrophe events including certain 2020 Hurricanes, offset by favorable development related to 2021 attritional and catastrophe losses.
The Company compiles and aggregates its claims data by grouping the claims according to the year in which the claim occurred (“Accident Year”) when analyzing claim payment and emergence patterns and trends over time. For the purpose of defining claims frequency, the number of reported claims is by loss occurrence and includes claims that do not result in a liability or payment associated with them.
The following tables show information about the Company’s incurred and paid loss development as of December 31, 2024, net of reinsurance, as well as cumulative claim frequency, the total of IBNR liabilities included within the net incurred loss amounts and the average historical claims duration as of December 31, 2024. The loss information has been disaggregated so that losses that are expected to develop in a similar manner are grouped together. The information provided herein about incurred and paid accident year claims development for the years ended December 31, 2024 and prior is presented as unaudited supplementary information.
Incurred Losses and Allocated Loss Adjustment Expenses,
Net of Reinsurance Property Insurance (in thousands) (1)
| As of December 31, 2024 |
||||||||||||||||||||||||||||||||||||||||||||||||
| Year Ended December 31, |
Incurred but Not Reported |
Cumulative Number of |
||||||||||||||||||||||||||||||||||||||||||||||
| Accident Year |
2015 |
2016 |
2017 |
2018 |
2019 |
2020 |
2021 |
2022 |
2023 |
2024 |
Liabilities |
Claims |
||||||||||||||||||||||||||||||||||||
| 2015 |
$ | 2,678 | $ | 2,504 | $ | 2,329 | $ | 2,307 | $ | 2,320 | $ | 2,313 | $ | 2,316 | $ | 2,304 | $ | 2,324 | $ | 2,301 | $ | - | $ | 582 | ||||||||||||||||||||||||
| 2016 |
$ | 7,450 | 7,127 | 6,972 | 7,090 | 7,075 | 7,062 | 7,125 | 5,730 | 5,730 | - | 1,384 | ||||||||||||||||||||||||||||||||||||
| 2017 |
12,425 | 10,893 | 10,644 | 10,652 | 10,561 | 10,668 | 12,339 | 11,978 | - | 3,623 | ||||||||||||||||||||||||||||||||||||||
| 2018 |
8,163 | 8,103 | 7,939 | 7,950 | 7,941 | 8,010 | 7,978 | - | 1,197 | |||||||||||||||||||||||||||||||||||||||
| 2019 |
4,575 | 4,223 | 3,947 | 4,293 | 4,350 | 4,365 | - | 1,689 | ||||||||||||||||||||||||||||||||||||||||
| 2020 |
61,434 | 57,248 | 59,565 | 56,008 | 56,859 | 33 | 5,018 | |||||||||||||||||||||||||||||||||||||||||
| 2021 |
29,836 | 25,158 | 25,733 | 27,902 | 832 | 5,254 | ||||||||||||||||||||||||||||||||||||||||||
| 2022 |
42,887 | 44,943 | 42,358 | 3,249 | 4,162 | |||||||||||||||||||||||||||||||||||||||||||
| 2023 |
40,921 | 36,587 | 6,071 | 4,703 | ||||||||||||||||||||||||||||||||||||||||||||
| 2024 |
77,421 | 32,641 | 8,069 | |||||||||||||||||||||||||||||||||||||||||||||
| Total |
$ | 273,479 | $ | 42,826 | $ | 35,681 | ||||||||||||||||||||||||||||||||||||||||||
Cumulative Paid Losses and Allocated Loss Adjustment Expenses,
Net of Reinsurance Property Insurance (in thousands) (1)
| |
Year Ended December 31, |
|||||||||||||||||||||||||||||||||||||||
| Accident Year |
2015 |
2016 |
2017 |
2018 |
2019 |
2020 |
2021 |
2022 |
2023 |
2024 |
||||||||||||||||||||||||||||||
| 2015 |
$ | 1,125 | $ | 1,817 | $ | 2,109 | $ | 2,241 | $ | 2,300 | $ | 2,309 | $ | 2,316 | $ | 2,304 | $ | 2,324 | $ | 2,300 | ||||||||||||||||||||
| 2016 |
$ | 4,823 | 6,420 | 6,801 | 7,051 | 7,072 | 7,062 | 7,125 | 5,729 | 5,729 | ||||||||||||||||||||||||||||||
| 2017 |
9,102 | 10,719 | 10,639 | 10,640 | 10,560 | 10,636 | 12,339 | 11,978 | ||||||||||||||||||||||||||||||||
| 2018 |
4,409 | 7,889 | 7,931 | 7,943 | 7,943 | 7,999 | 7,978 | |||||||||||||||||||||||||||||||||
| 2019 |
2,179 | 3,510 | 3,757 | 4,170 | 4,345 | 4,365 | ||||||||||||||||||||||||||||||||||
| 2020 |
31,862 | 49,222 | 55,504 | 55,619 | 56,712 | |||||||||||||||||||||||||||||||||||
| 2021 |
11,355 | 22,500 | 24,408 | 26,466 | ||||||||||||||||||||||||||||||||||||
| 2022 |
12,647 | 30,042 | 35,271 | |||||||||||||||||||||||||||||||||||||
| 2023 |
14,226 | 26,378 | ||||||||||||||||||||||||||||||||||||||
| 2024 |
32,850 | |||||||||||||||||||||||||||||||||||||||
| Total |
$ | 210,027 | ||||||||||||||||||||||||||||||||||||||
| Reserve for losses and loss adjustment expense, net of reinsurance |
$ | 63,452 | ||||||||||||||||||||||||||||||||||||||
| (1) |
Data presented for these calendar years is required supplementary information, which is unaudited. |
Average Annual Percentage Payout of Incurred Claims by Age,
Net of Reinsurance Property Insurance (unaudited)
| Year 1 |
Year 2 |
Year 3 |
Year 4 |
Year 5 |
Year 6 |
Year 7 |
Year 8 (2) |
Year 9 |
Year 10 (2) |
|||||||||||||||||||||||||||||||
| Payout percentage |
52.22 | % | 32.26 | % | 6.89 | % | 3.90 | % | 1.36 | % | 0.40 | % | 3.84 | % | (9.30 | )% | 0.44 | % | (1.05 | )% | ||||||||||||||||||||
(2) Negative payout percentages are due to timing of reinsurance payments, allocations of reinsurance between different lines of business based on actual results, and allocation of reinsurance to different periods for reinsurance treaties in effect for multiple periods. These are primarily associated with larger recoveries from catastrophe events in earlier years of operation.
Incurred Losses and Allocated Loss Adjustment Expenses,
Net of Reinsurance Other Liability Occurrence (in thousands) (1)
| As of December 31, 2024 |
||||||||||||||||||||||||
| Incurred but Not Reported |
Cumulative Number of |
|||||||||||||||||||||||
| Accident Year |
2021 |
2022 |
2023 |
2024 |
Liabilities |
Claims |
||||||||||||||||||
| Prior |
$ | 109 | $ | 35 | $ | 46 | $ | 47 | $ | — | 7 | |||||||||||||
| 2021 |
2,138 | 1,641 | 2,172 | 2,428 | 1,063 | 27 | ||||||||||||||||||
| 2022 |
7,160 | 8,755 | 9,425 | 3,867 | 74 | |||||||||||||||||||
| 2023 |
5,005 | 8,335 | 3,235 | 111 | ||||||||||||||||||||
| 2024 |
21,811 | 20,011 | 267 | |||||||||||||||||||||
| Total |
$ | 42,046 | $ | 28,176 | 486 | |||||||||||||||||||
Cumulative Paid Losses and Allocated Loss Adjustment Expenses,
Net of Reinsurance Other Liability Occurrence (in thousands) (1)
| Accident Year |
2021 |
2022 |
2023 |
2024 |
||||||||||||
| Prior |
$ | 109 | $ | 35 | $ | 46 | $ | 47 | ||||||||
| 2021 |
141 | 347 | 653 | 906 | ||||||||||||
| 2022 |
746 | 1,603 | 3,445 | |||||||||||||
| 2023 |
372 | 1,146 | ||||||||||||||
| 2024 |
869 | |||||||||||||||
| Total |
$ | 6,413 | ||||||||||||||
| Reserve for losses and loss adjustment expense, net of reinsurance |
$ | 35,633 | ||||||||||||||
| (1) |
Data presented for these calendar years is required supplementary information, which is unaudited. |
Average Annual Percentage Payout of Incurred Claims by Age,
Net of Reinsurance Other Liability Occurrence (unaudited)
| Year 1 |
Year 2 |
Year 3 |
Year 4 |
|||||||||||||
| Payout percentage |
5.54 | % | 8.96 | % | 16.07 | % | 10.40 | % | ||||||||
Incurred Losses and Allocated Loss Adjustment Expenses,
Net of Reinsurance Other Liability Claims Made (in thousands) (1)
| As of December 31, 2024 |
||||||||||||||||||||||||||||
| Incurred but Not Reported |
Cumulative Number of |
|||||||||||||||||||||||||||
| Accident Year |
2020 |
2021 |
2022 |
2023 |
2024 |
Liabilities |
Claims |
|||||||||||||||||||||
| Prior |
$ | 48 | $ | 26 | $ | 7 | $ | — | $ | 286 | $ | 285 | 7 | |||||||||||||||
| 2021 |
3,429 | 3,299 | 2,928 | 2,252 | 1,231 | 109 | ||||||||||||||||||||||
| 2022 |
8,871 | 8,873 | 7,674 | 4,157 | 430 | |||||||||||||||||||||||
| 2023 |
12,580 | 12,110 | 7,144 | 956 | ||||||||||||||||||||||||
| 2024 |
18,503 | 10,785 | 1,324 | |||||||||||||||||||||||||
| Total |
$ | 40,825 | $ | 23,602 | 2,826 | |||||||||||||||||||||||
Cumulative Paid Losses and Allocated Loss Adjustment Expenses,
Net of Reinsurance Other Liability Claims Made (in thousands) (1)
| Accident Year |
2020 |
2021 |
2022 |
2023 |
2024 |
|||||||||||||||
| Prior |
$ | — | $ | — | $ | — | $ | — | $ | 1 | ||||||||||
| 2021 |
62 | 221 | 449 | 1,009 | ||||||||||||||||
| 2022 |
481 | 1,584 | 2,776 | |||||||||||||||||
| 2023 |
1,382 | 3,310 | ||||||||||||||||||
| 2024 |
4,168 | |||||||||||||||||||
| Total |
$ | 11,264 | ||||||||||||||||||
| Reserve for losses and loss adjustment expense, net of reinsurance |
$ | 29,561 | ||||||||||||||||||
| (1) |
Data presented for these calendar years is required supplementary information, which is unaudited. |
Average Annual Percentage Payout of Incurred Claims by Age,
Net of Reinsurance Other Liability Claims Made (unaudited)
| Year 1 |
Year 2 |
Year 3 |
Year 4 |
|||||||||||||
| Payout percentage |
10.74 | % | 12.45 | % | 12.83 | % | 24.85 | % | ||||||||
The reconciliation of the net incurred and paid claims development tables to the liability for claims and claim adjustment expenses in the consolidated balance sheets is as follows:
| 2024 |
||||
| (in thousands) |
||||
| Reserve for losses and loss adjustment expense, net of reinsurance recoverables: |
||||
| Property |
$ | 63,452 | ||
| Other liability occurrence |
35,633 | |||
| Other liability claims made |
29,561 | |||
| Reinsurance - Nonproportional assumed property (1) |
12,018 | |||
| Other |
14,635 | |||
| Total reserve for losses and loss adjustment expense, net of reinsurance recoverables |
155,299 | |||
| Reinsurance recoverable on unpaid claims: |
||||
| Property |
$ | 97,583 | ||
| Other liability occurrence |
20,074 | |||
| Other liability claims made |
73,875 | |||
| Other |
156,551 | |||
| Total reinsurance recoverable on unpaid claims |
348,083 | |||
| Total reserve for losses and loss adjustment expenses |
$ | 503,382 | ||
| (1) |
Reflects the Company’s share of Loss and Loss Adjustment Expense related to non-proportional assumed reinsurance business. This amount reflects gross and net reserves related to this treaty and the ultimate incurred amount reflects IBNR only. The Company does not have direct access to individual claim information underlying the assumed quota share arrangement. The Company does not use claim frequency information in the determination of loss reserves or for other internal purposes. Based on these considerations, the Company does not believe providing claims frequency information is practicable as it relates to this line of business. |
10. Reinsurance
The Company utilizes reinsurance in order to limit its exposure to losses and enable it to underwrite policies with sufficient limits to meet policyholder needs. The Company primarily utilizes excess of loss (XOL) and quota share reinsurance to protect against catastrophe and attritional losses. The Company also writes premiums under fronting agreements, whereby the majority of premium and risk is ceded to reinsurers and the Company receives a fronting fee.
In an XOL treaty, the Company retains losses for any occurrence up to a specified amount (its “retention”) and reinsurers assume any losses above that amount. As of December 31, 2024, the Company’s catastrophe event retention is $20 million for earthquake events and $15.5 million for hurricane events and all other perils. As of December 31, 2024, the Company’s reinsurance structure provides protection up to $3.08 billion for earthquake events, $735 million for Hawaii hurricane events, and $117.5 million for continental U.S. hurricane events.
In a quota share agreement, the Company transfers, or cedes, a portion of its premiums to reinsurers and, in return, the reinsurer must share an agreed upon portion of losses and pay a ceding commission to the Company. In a fronting agreement, the Company writes premium and then cedes the majority of the premium and risk in exchange for a fronting fee, which is the primary source of profit in the arrangement.
The following table shows ceded written premiums under fronting and quota share arrangements by line of business for the years ended December 31, 2024, 2023 and 2022:
| Year Ended December 31, |
||||||||||||
| 2024 |
2023 |
2022 |
||||||||||
| (in thousands) |
||||||||||||
| Fronting |
$ | 312,173 | $ | 339,376 | $ | 237,285 | ||||||
| Crop |
109,975 | 12,110 | — | |||||||||
| Inland Marine and Other Property |
103,863 | 108,409 | 84,045 | |||||||||
| Casualty |
86,120 | 36,677 | 23,398 | |||||||||
| Earthquake |
42,466 | 29,708 | 23,398 | |||||||||
| Total |
$ | 654,597 | $ | 526,280 | $ | 368,126 | ||||||
The Company recognizes ceded unearned premiums related to quota share agreements as an asset on its consolidated balance sheets. As of December 31, 2024 and 2023, ceded unearned premiums totaled $276.2 million and $265.8 million, respectively. The increase was driven primarily by premium growth in lines subject to fronting agreements or quota shares.
In addition to reinsurance purchased from traditional reinsurers, the Company has historically incorporated collateralized protection from the insurance linked securities market via catastrophe bonds. During the first quarter of 2021, the Company closed a $400 million 144A catastrophe bond that became effective June 1, 2021. The catastrophe bond was completed through Torrey Pines Re Pte. Ltd. (“Torrey Pines Re Pte.”). Torrey Pines Re Pte. is a special purpose reinsurance vehicle incorporated in Singapore that provides Palomar with indemnity-based reinsurance covering earthquake events through June 1, 2024. During the second quarter of 2022, the Company closed a $275 million 144A catastrophe bond that became effective June 1, 2022. This catastrophe bond was completed through Torrey Pines Re Ltd., a Bermuda-domiciled special purpose insurer that provides indemnity-based reinsurance covering earthquake events through June 1, 2025. During the second quarter of 2023, the Company also closed a $200 million 144A catastrophe bond that became effective June 1, 2023. This catastrophe bond was also completed through Torrey Pines Re Ltd and provides indemnity-based reinsurance covering earthquake events through June 1, 2026. During the second quarter of 2024, the Company also closed a $420 million 144A catastrophe bond which became effective June 1, 2024. This catastrophe bond was also completed through Torrey Pines Re Ltd and provides indemnity-based reinsurance covering earthquake events through June 1, 2027.
Written premiums ceded under these catastrophe bond agreements were $55.3 million, $42.7 million and $28.3 million for the years ended December 31, 2024, 2023 and 2022, respectively.
The effect of reinsurance on premiums written and earned and on losses and LAE incurred for the years ended December 31, 2024, 2023 and 2022, is as follows:
| 2024 |
2023 |
2022 |
||||||||||||||||||||||
| Written |
Earned |
Written |
Earned |
Written |
Earned |
|||||||||||||||||||
| (in thousands) |
||||||||||||||||||||||||
| Premiums Written and Earned: |
||||||||||||||||||||||||
| Direct |
$ | 1,403,383 | $ | 1,301,901 | $ | 1,083,804 | $ | 959,614 | $ | 816,387 | $ | 628,973 | ||||||||||||
| Assumed |
138,578 | 95,468 | 57,754 | 56,107 | 65,481 | 66,299 | ||||||||||||||||||
| Ceded |
(897,111 | ) | (886,682 | ) | (731,531 | ) | (669,808 | ) | (524,575 | ) | (378,806 | ) | ||||||||||||
| Net |
$ | 644,850 | $ | 510,687 | $ | 410,027 | $ | 345,913 | $ | 357,293 | $ | 316,466 | ||||||||||||
| 2024 |
||||||||||||
| Losses |
LAE |
Total |
||||||||||
| (in thousands) |
||||||||||||
| Losses and LAE Incurred: |
||||||||||||
| Direct |
$ | 367,276 | $ | 75,301 | $ | 442,577 | ||||||
| Assumed |
46,866 | 4,930 | 51,796 | |||||||||
| Ceded |
(305,336 | ) | (54,278 | ) | (359,614 | ) | ||||||
| Net |
$ | 108,806 | $ | 25,953 | $ | 134,759 | ||||||
| 2023 |
||||||||||||
| Losses |
LAE |
Total |
||||||||||
| (in thousands) |
||||||||||||
| Losses and LAE Incurred: |
||||||||||||
| Direct |
$ | 228,441 | $ | 60,834 | $ | 289,275 | ||||||
| Assumed |
19,799 | 1,789 | 21,588 | |||||||||
| Ceded |
(186,706 | ) | (51,565 | ) | (238,271 | ) | ||||||
| Net |
$ | 61,534 | $ | 11,058 | $ | 72,592 | ||||||
| 2022 |
||||||||||||
| Losses |
LAE |
Total |
||||||||||
| (in thousands) |
||||||||||||
| Losses and LAE Incurred: |
||||||||||||
| Direct |
$ | 133,517 | $ | 38,004 | $ | 171,521 | ||||||
| Assumed |
23,574 | 5,998 | 29,572 | |||||||||
| Ceded |
(91,261 | ) | (31,159 | ) | (122,421 | ) | ||||||
| Net |
$ | 65,829 | $ | 12,843 | $ | 78,672 | ||||||
The ceding of insurance does not legally discharge the Company from its primary liability for the full amount of the policy coverage, and therefore the Company will be required to pay the loss and bear collection risk if the reinsurer fails to meet its obligations under the reinsurance agreement. To minimize exposure to significant losses from reinsurance insolvencies, the Company evaluates the financial condition of its reinsurers and monitors concentrations of credit risk.
To reduce credit exposure to reinsurance recoverable balances, the Company obtains acceptable forms of collateral from certain reinsurers that are not authorized as reinsurers under U.S. state insurance regulations. In addition, under the terms of its reinsurance contracts, the Company may retain funds due from reinsurers as security for those recoverable balances. As of December 31, 2024 and 2023, the Company had retained $27.9 million and $13.4 million in funds from reinsurers, respectively. The Company is able to use the funds in the ordinary course of its business. The funds are held in cash and cash equivalents and investments with an offsetting liability on the accompanying consolidated balance sheets.
For the year ended December 31, 2024, reinsurance premiums ceded to the Company’s three largest reinsurers totaled $125.9 million, $67.9 million and $61.7 million, representing 28.5% of the total balance. For the year ended December 31, 2023, reinsurance premiums ceded to the Company’s three largest reinsurers totaled $152.4 million, $65.9 million and $47.4 million, representing 36.3% of the total balance. For the year ended December 31, 2022, reinsurance premiums ceded to the Company’s three largest reinsurers totaled $24.7 million, $22.9 million and $18.4 million, representing 23.9% of the total balance.
At December 31, 2024 reinsurance recoverable on unpaid losses by the Company’s three largest reinsurers were $137.0 million, $26.9 million and $24.4 million representing 47.7% of the total balance. At December 31, 2023 reinsurance recoverable on unpaid losses by the Company’s three largest reinsurers were $69.5 million, $29.8 million and $25.5 million representing 45.7% of the total balance. The Company seeks reinsurers that have an A.M. best rating of A− (excellent) or better or requires them to post collateral.
11. Credit Agreements
U.S. Bank Credit Agreement
In December 2021, the Company entered into a Credit Agreement (the “Credit Agreement”) with certain lenders which provides a revolving credit facility of up to $100.0 million (the “Revolving Loan”). The maturity of the facility is December 8, 2026. The Revolving Loan may be either a SOFR rate loan or a base rate loan, at the Company’s discretion. The Revolving Loan may be prepaid in full or in part at any time with no prepayment premium and may be reduced in full or in part at any time upon prior notice. Interest on the Revolving Loan accrues on each SOFR rate loan at the applicable SOFR (as defined in the Credit Agreement) plus 1.75% and on each base rate loan at the applicable Alternate Base Rate (as defined in the Credit Agreement) plus (ii) 0.75%. In addition, the Company paid a commitment fee of $0.3 million upon closing of the Credit Agreement and must pay an unused line fee of 0.25% per annum on any unborrowed amount under the Credit Agreement.
The Company’s obligations under the Credit Agreement are unsecured with a negative pledge against all assets of Palomar and its subsidiaries as described in the Credit Agreement. The Credit Agreement contains customary representations and warranties and customary affirmative and negative covenants, including, among other things, financial covenants, restrictions on indebtedness, liens, investments, mergers, dispositions, prepayment of other indebtedness and dividends and other distributions.
The financial covenants in the Credit agreement require the Company not to exceed a maximum leverage ratio and maintain a minimum net worth at the end of each quarter. The Company’s insurance subsidiaries are also required to maintain a minimum Risk Based Capital Ratio at the end of each year and must always maintain a minimum AM Best Financial Strength rating. As of December 31, 2024, the Company was in compliance with all covenants.
The Credit Agreement provides for events of default customary for revolving loans of this type, including but not limited to non-payment, breaches, or defaults in the performance of covenants, insolvency, bankruptcy and the occurrence of a material adverse effect on Palomar. During the existence of an event of default, all outstanding amounts of the Revolving Loan shall bear interest at a rate per annum equal to the rate otherwise applicable thereto plus 2.00%.
As of December 31, 2024 and 2023, there were no outstanding borrowings under this Credit Agreement. For the years ended December 31, 2024 and 2023, the Company incurred $0.3 million and $1.0 million, respectively, of interest related to borrowings and amortization of fees associated with the credit agreement.
FHLB Line of Credit
The Company’s PSIC subsidiary is a member of the Federal Home Loan Bank of San Francisco (“FHLB”). Membership in the FHLB provides PSIC access to collateralized advances, which can be drawn for general corporate purposes and used to enhance liquidity management. All borrowings are fully secured by a pledge of specific investment securities of PSIC and the borrowing capacity is currently equal to 10% of PSIC’s statutory admitted assets. All advances have a predetermined term and the interest rate varies based on the term of the advance.
As of December 31, 2024, there were no borrowings outstanding through the FHLB. Interest expense on the FHLB Line of Credit was $0.8 million for the year ended December 31, 2024. As of December 31, 2023, the Company had $52.6 million of borrowings outstanding through the FHLB line of credit. Interest expense on the FHLB Line of Credit was $2.8 million for the year ended December 31, 2023.
12. Stockholders’ Equity
As of December 31, 2024 and December 31, 2023, the Company has 5,000,000 preferred shares authorized with a par value of $0.0001 and no preferred shares issued and outstanding. As of December 31, 2024 and December 31, 2023, the Company has 500,000,000 common shares authorized and 26,529,402 and 24,772,987 common shares issued and outstanding, respectively, with a par value of $0.0001. Additional paid in capital is $493.7 million as of December 31, 2024 and $350.6 million as of December 31, 2023.
Common stock reserved for future issuance consists of the following as of December 31, 2024:
| Stock options outstanding under 2019 Equity Incentive Plan |
588,385 | |||
| Restricted stock units outstanding under 2019 Equity Incentive Plan |
320,411 | |||
| Performance stock units outstanding under 2019 Equity Incentive Plan |
460,450 | |||
| Shares authorized for future issuance under 2019 Equity Incentive Plan |
3,673,297 | |||
| Shares authorized for future issuance under 2019 Employee Stock Purchase Plan |
1,353,670 | |||
| Total |
6,396,213 |
The Company does not maintain a treasury stock account and issues new shares to settle employee stock purchases, exercises of stock options, and vestings of other types of equity awards.
The below table summarizes the Company’s stock-based compensation expense for each period presented:
| |
Year ended December 31, |
|||||||||||
| |
2024 |
2023 |
2022 |
|||||||||
| |
(in thousands) |
|||||||||||
| Stock-Based Compensation Expense |
$ | 16,685 | $ | 14,913 | $ | 11,624 | ||||||
Stock-based compensation expense is recognized on a straight-line basis over the vesting period of awards. The Company does not apply a forfeiture rate to unvested awards and accounts for forfeitures as they occur. All stock-based compensation is included in other underwriting expenses in the Company’s consolidated statements of income and comprehensive income.
2019 Equity Incentive Plan
On April 16, 2019, the Company’s 2019 Equity Incentive Plan (the “2019 Plan”) became effective. The 2019 Plan provides for the grant of stock options, stock appreciation rights, restricted stock, restricted stock units (“RSUs”), performance shares and units, and other cash-based or share-based awards. In addition, the 2019 Plan contains a mechanism through which the Company may adopt a deferred compensation arrangement in the future.
A total of 2,400,000 shares of common stock were initially authorized and reserved for issuance under the 2019 Plan. This reserve increases on January 1 of each year through 2029, by an amount equal to the smaller of: 3% of the number of shares of common stock issued and outstanding on the immediately preceding December 31, or an amount determined by the board of directors.
Stock Options
Recipients of stock options can purchase shares of the Company’s common stock at a price equal to the stock’s fair market value on the grant date, determined by the closing price of the Company's common stock on the grant date. Stock options vest over a period between two and four years with between 25% and 50% vesting on the first anniversary of the grant date and the remainder vesting monthly over the remaining period, subject to continued service to the Company. Stock options expire ten years after the grant date.
The following table summarizes stock option transactions for the year ended December 31, 2024:
| Number of |
Weighted-average exercise | Weighted average remaining contractual term | Aggregate intrinsic value | |||||||||||||
| shares |
price |
(in years) |
(in thousands) |
|||||||||||||
| Outstanding at January 1, 2024 |
807,685 | $ | 34.31 | — | $ | — | ||||||||||
| Options granted |
— | — | ||||||||||||||
| Options exercised |
(208,341 | ) | 33.54 | |||||||||||||
| Options canceled |
(10,959 | ) | 78.12 | |||||||||||||
| Outstanding at December 31, 2024 |
588,385 | $ | 33.76 | 4.85 | $ | 42,273 | ||||||||||
| Vested and Exercisable at December 31, 2024 |
583,792 | $ | 33.55 | 4.83 | $ | 42,063 | ||||||||||
The total intrinsic value of stock options exercised during the years ended December 31, 2024 and December 31, 2023 was $18.7 million and $3.5 million, respectively.
Restricted Stock Units
Restricted stock units are valued on their grant date and generally vest either on the first anniversary of the grant date or over a three-year period with one third vesting on each anniversary date, subject to continued service with the Company. The fair value of RSUs is determined using the closing price of the Company's common stock on the grant date.
The following table summarizes RSU transactions for the year ended December 31, 2024:
| Number of shares | Weighted-average grant date fair value | |||||||
| Non vested outstanding at January 1, 2024 |
332,077 | $ | 61.07 | |||||
| Granted |
145,835 | 69.82 | ||||||
| Vested |
(138,329 | ) | 61.99 | |||||
| Forfeited |
(19,172 | ) | 54.66 | |||||
| Non vested outstanding at December 31, 2024 |
320,411 | $ | 65.03 | |||||
As of December 31, 2024, the Company had approximately $14.9 million of total unrecognized stock-based compensation expense related to RSUs expected to be recognized over a weighted-average period of 1.6 years.
Performance Stock Units (“PSUs”)
The Company issues PSUs to employees with a combination of service, performance, and market conditions.
The majority of PSUs were issued via grants made to certain executives during 2021. These PSUs are earned based on the achievement of stock price milestones. If the Company’s stock price reaches and remains at certain milestones for 30 days, the PSUs shall become earned units and will vest upon completion of a requisite service period of approximately five years from the date of grant.
For other PSUs outstanding, vesting of PSUs requires a period of future service and the number of shares that vest depends on performance relative to predetermined targets of the Company’s Gross Written Premiums and Adjusted Return on Equity as set by the Compensation Committee. For PSU grants issued in years prior to 2023, the PSU’s performance period was the fiscal year of the grant. For PSU grants issued in 2023 and after, the PSU’s performance period is primarily a three-year period beginning with the grant date. At the end of the performance period, the actual results are measured against the predetermined targets to determine the number of PSUs to be earned as compensation. The earned PSUs are then subject to a required service period of approximately three years from the grant date before vesting and being issued as common stock.
The following table summarizes PSU transactions for the year ended December 31, 2024:
| Number of shares | Weighted-average grant date fair value | |||||||
| Non vested outstanding at January 1, 2024 |
423,621 | $ | 38.90 | |||||
| Granted |
57,012 | 65.78 | ||||||
| Vested |
(12,645 | ) | 96.74 | |||||
| Forfeited |
(7,538 | ) | 51.92 | |||||
| Non vested outstanding at December 31, 2024 |
460,450 | $ | 40.42 | |||||
The PSU grants above represent the number of shares that would vest based on achievement of all stock price milestones in the executive stock grants and the 100% achievement of the predetermined company performance conditions for the other PSU grants. The actual number of PSUs which will vest is subject to adjustment based on the Company’s actual stock price performance and financial performance relative to the predetermined targets and subject to recipient service requirements. As of December 31, 2024, the Company had approximately $9.4 million of total unrecognized stock-based compensation expense related to PSUs expected to be recognized over a weighted-average period of 1.7 years.
2021 Executive Stock Grants
During the year ended December 31, 2021, the Company granted 192,307 RSUs and 350,000 PSUs to various executives, including the Company’s CEO. The RSUs vest over a period of five years with one fifth vesting upon the first, second and third anniversary of the grants and the remainder vesting quarterly thereafter.
The PSUs are earned based on the achievement of stock price milestones. If the Company’s stock price reaches and remains at certain milestones for 30 days, the PSUs shall become earned units and will vest upon completion of a requisite service period. The Company’s CEO must remain as an employee through December 31, 2025, or as an employee and/or director through the fifth anniversary of the grant date the PSUs to vest. Other executives must remain as employees through December 31, 2026 for the PSUs to vest. As of December 31, 2024, 28,125 PSU shares have become earned units and will vest upon completion of the requisite service period.
2019 Employee Stock Purchase Plan
On April 16, 2019, the Company's 2019 Employee Stock Purchase Plan (“the 2019 ESPP”) became effective. A total of 240,000 shares of common stock are initially authorized and reserved for issuance under the 2019 ESPP. In addition, the 2019 ESPP provides for annual increases in the number of shares available for issuance on January 1 of each year through 2029, equal to the smaller of 240,000 shares of the Company’s common stock or such other amount as may be determined by the board of directors.
Under the 2019 ESPP, employees can purchase Company stock at a discount via payroll withholdings. The 2019 ESPP is administered through employee participation in discrete offering periods. During each discrete offering period employee funds are withheld, and the stock purchase occurs upon the conclusion of the offering period. The Company issued 17,100 and 17,080 shares pursuant to the ESPP during the years ended December 31, 2024 and December 31, 2023, respectively.
Share repurchases
The Company's share repurchase program expired on March 31, 2024. There were no share repurchases made during the year ended December 31, 2024.
13. Accumulated Other Comprehensive Income
Changes in accumulated other comprehensive income (loss) (“AOCI”) are as follows:
| Year Ended December 31, |
||||||||||||
| 2024 |
2023 |
2022 |
||||||||||
| (in thousands) |
||||||||||||
| Balance as of January 1 |
$ | (23,991 | ) | $ | (36,515 | ) | $ | 5,312 | ||||
| Other comprehensive (loss) income before reclassification |
(5,924 | ) | 15,913 | (55,270 | ) | |||||||
| Federal income tax benefit (expense) |
1,244 | (3,342 | ) | 11,607 | ||||||||
| Other comprehensive (loss) income before reclassification, net of tax |
(4,680 | ) | 12,571 | (43,663 | ) | |||||||
| Amounts reclassified from AOCI |
2,311 | (60 | ) | 2,325 | ||||||||
| Federal income tax (benefit) expense |
(485 | ) | 13 | (489 | ) | |||||||
| Amounts reclassified from AOCI, net of tax |
1,826 | (47 | ) | 1,836 | ||||||||
| Other comprehensive (loss) income |
(2,854 | ) | 12,524 | (41,827 | ) | |||||||
| Balance at end of period |
$ | (26,845 | ) | $ | (23,991 | ) | $ | (36,515 | ) | |||
14. Underwriting Information
The Company has a single reportable segment and offers specialty insurance products. Gross written premiums (“GWP”) by product are presented below:
| Year Ended December 31, |
||||||||||||||||||||||||
| 2024 |
2023 |
2022 |
||||||||||||||||||||||
| ($ in thousands) |
||||||||||||||||||||||||
| % of |
% of |
% of |
||||||||||||||||||||||
| Amount |
GWP |
Amount |
GWP |
Amount |
GWP |
|||||||||||||||||||
| Product (1) |
||||||||||||||||||||||||
| Earthquake |
$ | 522,864 | 33.9 | % | $ | 436,897 | 38.3 | % | $ | 345,480 | 39.2 | % | ||||||||||||
| Inland Marine and Other Property |
334,079 | 21.7 | % | 250,022 | 21.9 | % | 232,918 | 26.4 | % | |||||||||||||||
| Fronting |
333,188 | 21.6 | % | 352,141 | 30.8 | % | 223,249 | 25.3 | % | |||||||||||||||
| Casualty |
235,592 | 15.3 | % | 90,388 | 7.9 | % | 80,221 | 9.1 | % | |||||||||||||||
| Crop |
116,239 | 7.5 | % | 12,110 | 1.1 | % | — | — | % | |||||||||||||||
| Total Gross Written Premiums |
$ | 1,541,962 | 100.0 | % | $ | 1,141,558 | 100.0 | % | $ | 881,868 | 100.0 | % | ||||||||||||
(1)- Beginning in 2024, the Company has updated the categorization of its products to align with management's current strategy and view of the business. Prior year amounts have been reclassified for comparability purposes. The recategorization is for presentation purposes only and does not impact overall gross written premiums.
Gross written premiums by state are as follows:
| Year Ended December 31, |
||||||||||||||||||||||||
| 2024 |
2023 |
2022 |
||||||||||||||||||||||
| ($ in thousands) |
||||||||||||||||||||||||
| % of |
% of |
% of |
||||||||||||||||||||||
| Amount |
GWP |
Amount |
GWP |
Amount |
GWP |
|||||||||||||||||||
| State |
||||||||||||||||||||||||
| California |
$ | 668,635 | 43.4 | % | $ | 600,791 | 52.6 | % | $ | 418,809 | 47.5 | % | ||||||||||||
| Texas |
124,416 | 8.1 | % | 95,517 | 8.4 | % | 90,459 | 10.3 | % | |||||||||||||||
| Hawaii |
72,558 | 4.7 | % | 47,388 | 4.2 | % | 40,157 | 4.5 | % | |||||||||||||||
| Florida |
67,008 | 4.3 | % | 47,595 | 4.2 | % | 38,715 | 4.4 | % | |||||||||||||||
| Washington |
57,900 | 3.8 | % | 49,494 | 4.3 | % | 41,827 | 4.7 | % | |||||||||||||||
| New York |
38,919 | 2.5 | % | 18,424 | 1.6 | % | 12,510 | 1.5 | % | |||||||||||||||
| Oregon |
29,550 | 1.9 | % | 23,220 | 2.0 | % | 24,108 | 2.7 | % | |||||||||||||||
| Illinois |
20,901 | 1.4 | % | 22,340 | 2.0 | % | 17,368 | 2.0 | % | |||||||||||||||
| Other |
462,075 | 30.0 | % | 236,789 | 20.7 | % | 197,915 | 22.4 | % | |||||||||||||||
| Total Gross Written Premiums |
$ | 1,541,962 | 100.0 | % | $ | 1,141,558 | 100.0 | % | $ | 881,868 | 100.0 | % | ||||||||||||
Gross written premiums by insurance subsidiary are as follows:
| Year Ended December 31, |
||||||||||||||||||||||||
| 2024 |
2023 |
2022 |
||||||||||||||||||||||
| ($ in thousands) |
||||||||||||||||||||||||
| % of |
% of |
% of |
||||||||||||||||||||||
| Amount |
GWP |
Amount |
GWP |
Amount |
GWP |
|||||||||||||||||||
| Subsidiary |
||||||||||||||||||||||||
| PSIC |
$ | 823,263 | 53.4 | % | $ | 653,809 | 57.3 | % | $ | 489,720 | 55.5 | % | ||||||||||||
| PESIC |
661,404 | 42.9 | % | 487,749 | 42.7 | % | 392,148 | 44.5 | % | |||||||||||||||
| Laulima |
57,295 | 3.7 | % | — | — | % | — | — | % | |||||||||||||||
| Total Gross Written Premiums |
$ | 1,541,962 | 100.0 | % | $ | 1,141,558 | 100.0 | % | $ | 881,868 | 100.0 | % | ||||||||||||
The Company distributes a significant portion of its products through select program administrators. Each of the products managed by the program administrators operates as a separate program that is governed by an independent, separately negotiated agreement with unique terms and conditions, including geographic scope, key men provisions, economics and exclusivity. These programs also feature separate managerial oversight and leadership, policy administration systems and retail agents originating policies.
For the year ended December 31, 2024, our largest program administrator distributed $403.4 million or 26.2% of our gross written premiums. There were no other program administrators which distributed greater than 10% of our gross written premiums for the year ended December 31, 2024.
For the year ended December 31, 2023, our largest program administrator distributed $394.1 million or 34.5% of our gross written premiums and our second largest program administrator distributed $152.4 million, or 13.3% of our gross written premiums. There were no other program administrators which distributed greater than 10% of our gross written premiums for the year ended December 31, 2023.
For the year ended December 31, 2022, our largest program administrator distributed $322.4 million or 36.6% of our gross written premiums and our second largest program administrator distributed $95.1 million, or 10.8% of our gross written premiums. There were no other program administrators which distributed greater than 10% of our gross written premiums for the year ended December 31, 2022.
15. Retirement and Post-Employment Retirement Plans
For employees meeting certain eligibility requirements, the Company provides a defined contribution retirement plan under IRC Section 401(k). Under a safe-harbor plan, the Company contributes 3% of each participant’s gross wages regardless of the employee’s contribution. For the years ended December 31, 2024, 2023 and 2022 the Company’s contributions to the plan were $1.3 million, $0.9 million and $0.7 million, respectively.
16. Income Taxes
The components of the Company’s income tax expense (benefit) are as follows:
| December 31, |
||||||||||||
| 2024 |
2023 |
2022 |
||||||||||
| (in thousands) |
||||||||||||
| Current |
$ | 31,560 | $ | 27,267 | $ | 18,842 | ||||||
| Deferred |
2,063 | (2,826 | ) | (3,461 | ) | |||||||
| Income tax expense (benefit) |
$ | 33,623 | $ | 24,441 | $ | 15,381 | ||||||
As of December 31, 2024 and 2023, significant components of the Company’s deferred tax assets and liabilities were as follows:
| December 31, |
||||||||
| 2024 |
2023 |
|||||||
| (in thousands) |
||||||||
| Deferred tax assets: |
||||||||
| Losses and LAE reserve discount |
$ | 1,711 | $ | 942 | ||||
| State tax net operating losses |
3,372 | 3,486 | ||||||
| Deferred Intercompany |
605 | 656 | ||||||
| Unearned premiums |
19,550 | 13,895 | ||||||
| Capitalized organizational costs |
124 | 154 | ||||||
| Unrealized losses on investments |
5,134 | 5,829 | ||||||
| Deferred compensation |
2,533 | 2,425 | ||||||
| Lease Liability |
1,631 | 478 | ||||||
| Other |
2,230 | 1,223 | ||||||
| Total deferred tax assets |
$ | 36,890 | $ | 29,088 | ||||
| Deferred tax liabilities: |
||||||||
| Deferred acquisition costs |
$ | (19,929 | ) | $ | (12,128 | ) | ||
| Internally developed software |
(1,118 | ) | (1,276 | ) | ||||
| State deferred tax liability |
(1,216 | ) | (1,150 | ) | ||||
| Right-of-use Asset |
(1,604 | ) | (478 | ) | ||||
| Other |
(837 | ) | (451 | ) | ||||
| Total deferred tax liabilities |
(24,704 | ) | (15,483 | ) | ||||
| Net deferred tax asset (liability) before valuation allowance |
12,186 | 13,605 | ||||||
| Valuation allowance |
(3,372 | ) | (3,486 | ) | ||||
| Total net deferred tax assets (liabilities) |
$ | 8,814 | $ | 10,119 | ||||
The above valuation allowance relates to state net operating losses ("NOL") carryforwards. Due to the limited carryforward period these do not meet the “more likely than not” criteria and it is necessary to maintain a valuation allowance on these items. The amount of the deferred tax asset considered realizable, however, could be adjusted if estimates of future taxable income during the carryforward period change or if objective negative evidence in the form of cumulative losses is no longer present.
As of December 31, 2024, there is no federal net operating loss or tax credit carryforwards for tax purposes. The Company has $3.4 million of state NOLs (tax-effected, net of federal benefit) set to expire beginning in 2025 over various periods. There is $2.9 million of tax capital loss carryforwards which will begin to expire in 2030.
The following is a reconciliation of the statutory federal income tax rate to the Company’s effective tax rate for the tax years ended December 31, 2024, 2023 and 2022:
| Years Ended December 31, |
||||||||||||||||||||||||
| 2024 |
2023 |
2022 |
||||||||||||||||||||||
| ($ in thousands) |
||||||||||||||||||||||||
| Expense computed at federal tax rate |
$ | 31,750 | 21.00 | % | $ | 21,765 | 21.00 | % | $ | 14,186 | 21.00 | % | ||||||||||||
| Stock-based compensation |
429 | 0.28 | % | 1,523 | 1.47 | % | 153 | 0.23 | % | |||||||||||||||
| Dividend received deduction and tax‑exempt interest |
(90 | ) | (0.06 | )% | (96 | ) | (0.09 | )% | (101 | ) | (0.15 | )% | ||||||||||||
| Meals & entertainment, penalties & parking |
291 | 0.19 | % | 261 | 0.25 | % | 180 | 0.27 | % | |||||||||||||||
| State tax expense |
601 | 0.40 | % | 303 | 0.29 | % | 773 | 1.14 | % | |||||||||||||||
| Valuation allowance |
(113 | ) | (0.08 | )% | 416 | 0.40 | % | 191 | 0.28 | % | ||||||||||||||
| Other |
755 | 0.50 | % | 269 | 0.26 | % | (1 | ) | — | % | ||||||||||||||
| Income tax expense (benefit) |
$ | 33,623 | 22.23 | % | $ | 24,441 | 23.58 | % | $ | 15,381 | 22.77 | % | ||||||||||||
For the year ended December 31, 2024, the difference relates primarily to Section 162(m) limitations on executive compensation deductions and state taxes, offset by the permanent component of employee stock option exercises. For the year ended December 31, 2023, the difference relates primarily to Section 162(m) limitations on executive compensation deductions and state taxes. For the year ended December 31, 2022, the difference relates primarily to the permanent component of employee stock option exercises and state taxes.
As of December 31, 2024 and 2023, the Company had no uncertain tax positions that required either recognition or disclosure in the consolidated financial statements. This is not expected to change significantly during the next twelve months. The Company classifies interest and penalties, if any, related to the liability for unrecognized tax benefits as a component of the provision for income taxes. The Company’s federal income tax returns for 2021 through 2023 and state income tax returns for 2020 through 2023 remain subject to examination by the tax authorities. The 2024 income tax return is expected to be filed in 2025 and is subject to examination when filed.
Under Pillar Two/GloBE rules, certain countries have agreed to enact a jurisdictional-level minimum tax system with a minimum effective tax rate (ETR) of 15%. The Bermuda Corporate Income Tax Act of 2023 also established a 15% income tax regime. Companies with annual revenue above 750 million Euros will be within the scope of Pillar Two and the Bermuda CIT. As of December 31, 2024, Palomar is not within this revenue threshold and hence not an in-scope entity. Subsequent financial years will be assessed for these rules.
17. Earnings Per Share
The following table sets forth the computation of earnings per share of common stock:
| Year ended December 31, |
||||||||||||
| 2024 |
2023 |
2022 |
||||||||||
| (in thousands, except shares and per share data) |
||||||||||||
| Net income |
$ | 117,573 | $ | 79,201 | $ | 52,170 | ||||||
| Weighted average common shares outstanding: |
||||||||||||
| Basic |
25,520,343 | 24,822,004 | 25,243,397 | |||||||||
| Common Share equivalents |
703,499 | 505,087 | 552,611 | |||||||||
| Diluted |
26,223,842 | 25,327,091 | 25,796,008 | |||||||||
| Earnings per share: |
||||||||||||
| Basic |
$ | 4.61 | $ | 3.19 | $ | 2.07 | ||||||
| Diluted |
$ | 4.48 | $ | 3.13 | $ | 2.02 | ||||||
Common share equivalents relate to outstanding stock options, RSUs, and PSUs under the 2019 Plan and unpurchased shares under the 2019 ESPP and are calculated using the treasury stock method.
18. Statutory financial information
U.S.
U.S. state insurance laws and regulations prescribe accounting practices for determining statutory net income and capital and surplus for insurance companies. In addition, state regulators may permit statutory accounting practices that differ from prescribed practices. Statutory accounting practices (“SAP”) prescribed or permitted by regulatory authorities for the Company’s insurance subsidiaries differ from U.S. GAAP. The principal differences between SAP and GAAP as they relate to the financial statements of the Company’s insurance subsidiaries are (a) policy acquisition costs are expensed as incurred under SAP, whereas they are deferred and amortized under GAAP, (b) certain assets are not admitted for purposes of determining surplus under SAP, (c) investments in fixed income securities are carried at fair value under GAAP whereas such securities are carried at amortized cost under SAP, and (d) the criteria for recognizing net DTAs and the methodologies used to determine such amounts are different under SAP and GAAP.
Combined statutory net income and statutory capital surplus for the U.S. insurance subsidiaries, PSIC and PESIC as of December 31, 2024, 2023 and 2022 and for the years then ended are summarized as follows:
| December 31, |
||||||||||||
| 2024 |
2023 |
2022 |
||||||||||
| (in thousands) |
||||||||||||
| Statutory net income (loss) |
$ | 102,510 | $ | 97,391 | $ | 76,222 | ||||||
| Statutory capital and surplus |
451,719 | 439,264 | 314,508 | |||||||||
Risk-Based Capital (“RBC”) requirements promulgated by the NAIC require property/casualty insurers to maintain minimum capitalization levels determined based on formulas incorporating various business risks of the insurance subsidiaries. As of December 31, 2024 and 2023, the company’s capital and surplus exceeds its authorized control level.
Bermuda
Under the Bermuda Insurance Act, 1978 and related regulations, PSRE is required to maintain certain solvency and liquidity levels. The minimum statutory solvency margin required at December 31, 2024 and 2023 was approximately $1.2 million and $1.2 million, respectively. Actual statutory capital and surplus at December 31, 2024 and 2023 was $17.0 million and $16.1 million, respectively. PSRE had statutory net income of $0.4 million, $0.3 million and $0.2 million for 2024, 2023 and 2022, respectively.
PSRE had stockholders’ equity of $16.9 million and $16.3 million on a GAAP basis at December 31, 2024 and 2023, respectively. The principal difference between statutory capital and surplus and stockholders’ equity presented in accordance with GAAP is related to the valuation of investments. No dividends were paid in 2024 and 2023.
PSRE maintains a Class 3A license and thus must maintain a minimum liquidity ratio in which the value of its relevant assets is not less than 75.0% of the amount of its relevant liabilities for general business. Relevant assets include cash and cash equivalents, fixed maturity securities, accrued interest income, premiums receivable, losses recoverable from reinsurers, and funds withheld. The relevant liabilities include total general business insurance reserves and total other liabilities, less sundry liabilities. As of December 31, 2024 and 2023, the Company met the minimum liquidity ratio requirement.
19. Dividend Restrictions
U.S.
The Company’s U.S. insurance company subsidiaries, PSIC and PESIC are restricted by the statutes as to the amount of dividends that they may pay without prior approval by state insurance commissioners.
Under California and Oregon statute which govern PSIC, dividends paid in a consecutive twelve month period cannot exceed the greater of (i) 10% of an insurance company’s statutory policyholders’ surplus as of December 31 of the preceding year or (ii) 100% of its statutory net income for the preceding calendar year. Any dividends or distributions in excess of these amounts would require regulatory approval. In addition, under Oregon statute, PSIC may only declare a dividend from earned surplus, which does not include contributed capital. Surplus arising from unrealized capital gains or revaluation of assets is not considered part of earned surplus. Based on the above restrictions, PSIC may pay a dividend or distribution of no greater than $99.6 million in 2025 without approval by the California and Oregon Insurance Commissioners. During October 2024, PSIC elected to pay a dividend of $95.0 million to its parent company.
Under Arizona statute which governs PESIC, dividends paid in a consecutive twelve month period cannot exceed the lesser of (i) 10% of an insurance company’s statutory policyholders’ surplus as of December 31 of the preceding year or (ii) 100% of its statutory net income for the preceding calendar year. Based on the above restrictions, PESIC may pay a dividend or distribution of no greater than $4.2 million in 2025 without approval of the Arizona Insurance Commissioner.
In addition to the above limitations, any dividend or distribution declared is also subject to state regulatory approval prior to payment. In the future, state insurance regulatory authorities may adopt statutory provisions and dividend limitations more restrictive than those currently in effect.
Bermuda
Bermuda regulations limit the amount of dividends and return of capital paid by a regulated entity. A Class 3A insurer is prohibited from declaring or paying a dividend if it is in breach of its minimum solvency margin, its enhanced capital requirement, or its minimum liquidity ratio, or if the declaration or payment of such dividend would cause such a breach, or if there are reasonable grounds for believing there has been such a breach. Pursuant to Bermuda regulations, the maximum amount of dividends and return of capital available to be paid by a reinsurer is determined pursuant to a formula. Under this formula, the maximum amount of dividends and return of capital available to the Company from PSRE during 2024 is calculated to be approximately $4.2 million. However, this dividend amount is subject to annual enhanced solvency requirement calculations.
20. Commitments and Contingencies
Litigation
The Company is subject to legal proceedings arising from the normal conduct of its business. In the opinion of management, any ultimate liability that may arise from these proceedings will not have a material effect on the Company’s financial position.
Letters of Credit and Trusts
As of December 31, 2024, the Company has three irrevocable standby letters of credit for the benefit of ceding insurance companies to secure the unearned premium assumed by PSIC. The bank letters of credit amount to a total of $5.6 million and may renew if the Company continues to assume premium from these insurance companies. The letters of credit are collateralized by the Company’s Credit Agreement.
As of December 31, 2024, the Company has a Letter of Credit for the benefit of the State of California to secured unearned premium and loss reserves incurred in the Worker’s Compensation program. The letter of credit amounts to $75 million and are collateralized by the Company’s available-for-sale investments.
In addition, the Company has established six Regulation 114 Trust accounts for the benefit of ceding insurance companies to secure the unearned premium assumed by PSIC. As of December 31, 2024 the trust had a market value of $7.9 million.
21. Variable Interest Entities ("VIEs")
Laulima Insurance Exchange, a Hawaii domiciled reciprocal exchange (“Laulima”) is a consolidated VIE. Laulima was formed in 2023 as an insurance carrier organized as an unincorporated association.
The Company's PUEO entity manages the business operations of Laulima and receives a management fee for the services provided to Laulima. Upon formation of Laulima, PSIC provided capital of $15.0 million in the form of a contribution to the surplus note issued by Laulima, which remains outstanding as of December 31, 2024. The Company holds an interest in the form of this surplus note which is included in other liabilities on the Statement of Assets and Liabilities of Laulima. In addition, the Company provides quota share reinsurance on the property business of Laulima. The Company has determined that is has the ability to direct the activities that most significantly impact the economic performance of the Laulima and, as it has provided capital to Laulima, would absorb any expected losses which could be significant to Laulima. As such, the Company is deemed the primary beneficiary and consolidates the results of Laulima.
The Company does not own the equity of Laulima, which is owned by the policyholders. In the event of dissolution, policyholders would share any residual unassigned surplus but are not subject to assessment for any deficit in unassigned surplus of Laulima. The assets of Laulima can be used only to settle the obligations of Laulima and general creditors have no recourse to the Company.
The results of operations of Laulima are included in the Company’s consolidated statement of income and comprehensive income and Laulima generated $0.1 million of net loss in 2024 and $0.6 million of net loss in 2023. As of December 31, 2024, Laulima's assets totaled $51.0 million, primarily comprised of $18.5 million of cash and investments and $30.5 million of prepaid reinsurance premiums and are included in the Company's consolidated balance sheets. For the same year, Laulima's liabilities totaled $48.9 million and primarily include $30.5 million of unearned premiums and $15.0 million of surplus notes. As of December 31, 2023, Laulima's assets totaled $16.4 million, primarily comprised of $15.1 million of cash and investments, and are included in the Company's consolidated balance sheets. For the same year, Laulima's liabilities totaled $16.9 million and primarily include $15.0 million of surplus notes. The surplus notes are payable to PSIC and eliminate in consolidation for all years presented.
Note 22. Subsequent Events
On January 1, 2025, the Company acquired 100% of the outstanding voting stock of First Indemnity of America Insurance Company (“FIA”) for a purchase price of $29.3 million. FIA is a New Jersey domiciled insurance carrier that specializes in the underwriting of surety bonds for small to medium sized contractors primarily in the Northeast United States. FIA is licensed in 16 states and is rated "A-" by A.M. Best. To date, the initial accounting for the acquisition is incomplete due to the limited time since the closing date. The Company is still gathering the necessary information to provide such disclosures in future filings.
The Company has evaluated all other subsequent events from the balance sheet date through the date the financial statements were issued and has determined there are no additional events required to be disclosed.
Palomar Holdings, Inc. and Subsidiaries
Balance Sheets (Parent Company)
(In Thousands, except shares and par value data)
| December 31, 2024 |
December 31, 2023 |
|||||||
| Assets |
||||||||
| Investments: |
||||||||
| Fixed maturity securities available for sale, at fair value (amortized cost: $153,425 in 2024, $51,946 in 2023) |
$ | 147,467 | $ | 48,626 | ||||
| Equity securities, at fair value: (cost: $1,725 in 2024, $1,725 in 2023) |
2,182 | 1,835 | ||||||
| Equity method investment |
2,277 | 2,617 | ||||||
| Total investments |
151,926 | 53,078 | ||||||
| Cash and cash equivalents |
1,797 | 314 | ||||||
| Accrued investment income |
1,547 | 345 | ||||||
| Prepaid expenses and other assets |
— | 3,780 | ||||||
| Receivables from subsidiaries |
78,961 | 51,967 | ||||||
| Note receivable from subsidiary |
15,000 | 15,000 | ||||||
| Investment in subsidiaries |
580,535 | 530,690 | ||||||
| Total assets |
$ | 829,766 | $ | 655,174 | ||||
| Liabilities and Stockholders' equity |
||||||||
| Liabilities: |
||||||||
| Accounts payable and other liabilities |
$ | 12,396 | $ | 10,120 | ||||
| Payables to subsidiaries |
88,340 | 157,404 | ||||||
| Federal income tax payable |
— | 16,398 | ||||||
| Total liabilities |
100,736 | 183,922 | ||||||
| Stockholders' equity: |
||||||||
| Preferred stock, $0.0001 par value, 5,000,000 shares authorized as of December 31, 2024 and December 31, 2023, 0 shares issued and outstanding as of December 31, 2024 and December 31, 2023 |
— | — | ||||||
| Common stock, $0.0001 par value, 500,000,000 shares authorized, 26,529,402 and 24,772,987 shares issued and outstanding as of December 31, 2024 and December 31, 2023, respectively |
3 | 3 | ||||||
| Additional paid‑in capital |
493,656 | 350,597 | ||||||
| Accumulated other comprehensive income (loss) |
(26,845 | ) | (23,991 | ) | ||||
| Retained earnings |
262,216 | 144,643 | ||||||
| Total stockholders' equity |
729,030 | 471,252 | ||||||
| Total liabilities and stockholders' equity |
$ | 829,766 | $ | 655,174 | ||||
See accompanying notes.
Schedule II
Palomar Holdings, Inc. and Subsidiaries
Statements of Income (Parent Company)
(In Thousands)
| Year Ended December 31, |
||||||||||||
| 2024 |
2023 |
2022 |
||||||||||
| Revenues: |
||||||||||||
| Net investment income |
$ | 4,877 | $ | 1,699 | $ | 1,048 | ||||||
| Net realized and unrealized gains (losses) on investments |
23 | (209 | ) | (320 | ) | |||||||
| Total revenues |
4,900 | 1,490 | 728 | |||||||||
| Expenses: |
||||||||||||
| Other operating expenses |
48,251 | 39,347 | 33,292 | |||||||||
| Loss before income taxes |
(43,351 | ) | (37,857 | ) | (32,564 | ) | ||||||
| Income tax benefit |
(10,199 | ) | (7,953 | ) | (8,464 | ) | ||||||
| Loss before equity in net income of subsidiaries |
(33,152 | ) | (29,904 | ) | (24,100 | ) | ||||||
| Equity in net income of subsidiaries |
150,725 | 109,105 | 76,270 | |||||||||
| Net income |
117,573 | 79,201 | 52,170 | |||||||||
| Other comprehensive income: |
||||||||||||
| Net unrealized losses on securities available for sale |
(5,114 | ) | (2,505 | ) | (3,997 | ) | ||||||
| Equity in other comprehensive income (loss) of subsidiaries, net of taxes |
2,261 | 15,029 | (37,830 | ) | ||||||||
| Total comprehensive income |
$ | 114,720 | $ | 91,725 | $ | 10,343 | ||||||
See accompanying notes.
Schedule II
Palomar Holdings, Inc. and Subsidiaries
Statements of Cash Flows (Parent Company)
(In Thousands)
| Year Ended December 31, |
||||||||||||
| 2024 |
2023 |
2022 |
||||||||||
| Operating activities |
||||||||||||
| Net income |
$ | 117,573 | $ | 79,201 | $ | 52,170 | ||||||
| Adjustments to reconcile net income to net cash provided by operating activities: |
||||||||||||
| Equity in undistributed earnings of subsidiaries |
(150,725 | ) | (109,105 | ) | (76,270 | ) | ||||||
| Stock-based compensation expense |
10,513 | 10,426 | 8,820 | |||||||||
| Net realized and unrealized losses on investments |
(23 | ) | 209 | 320 | ||||||||
| Amortization of premium on fixed maturity securities |
172 | 189 | 347 | |||||||||
| Deferred income tax expense |
(15,640 | ) | 2,787 | 7,210 | ||||||||
| Dividend received from subsidiary |
95,000 | — | — | |||||||||
| Changes in operating assets and liabilities: |
(80,154 | ) | 37,777 | 36,449 | ||||||||
| Net cash provided by (used in) operating activities |
(23,284 | ) | 21,484 | 29,046 | ||||||||
| Investing activities |
||||||||||||
| Purchases of fixed maturity securities |
(114,611 | ) | (11,045 | ) | (9,807 | ) | ||||||
| Sales and maturities of fixed maturity securities |
13,004 | 9,232 | 8,488 | |||||||||
| Net cash provided by (used in) investing activities |
(101,607 | ) | (1,813 | ) | (1,319 | ) | ||||||
| Financing activities |
||||||||||||
| Proceeds from stock offering, net of offering costs |
115,724 | — | — | |||||||||
| Proceeds from common stock issued via equity incentive plans |
7,892 | 2,038 | 3,032 | |||||||||
| Policyholder contribution to surplus |
2,758 | 90 | — | |||||||||
| Repurchase of common stock |
— | (22,266 | ) | (34,415 | ) | |||||||
| Net cash provided by (used in) financing activities |
126,374 | (20,138 | ) | (31,383 | ) | |||||||
| Net (decrease) increase in cash and cash equivalents |
1,483 | (467 | ) | (3,656 | ) | |||||||
| Cash and cash equivalents at beginning of period |
314 | 781 | 4,437 | |||||||||
| Cash and cash equivalents at end of period |
$ | 1,797 | $ | 314 | $ | 781 | ||||||
| Supplementary cash flow information: |
||||||||||||
| Cash paid for income taxes |
$ | 38,454 | $ | 21,124 | $ | 18,890 | ||||||
| Cash paid for interest |
$ | 1,048 | $ | 3,682 | $ | 704 | ||||||
See accompanying notes.
Schedule II
1.Accounting Policies
Organization
Palomar Holdings, Inc. (“the Company”), is an insurance holding company that domesticated in Delaware in March 2019. Prior to domestication in Delaware, the Company was known as GC Palomar Holdings (“GCPH”), which was a Cayman Islands incorporated insurance holding company formed on October 4, 2013 when GC Palomar Investor LP (“GCPI”) acquired control of GCPH.
Basis of Presentation
The accompanying condensed financial statements have been prepared using the equity method. Under the equity method, the investment in consolidated subsidiaries is stated at cost plus equity in undistributed earnings of consolidated subsidiaries since the date of acquisition. These condensed financial statements should be read in conjunction with the Company’s consolidated financial statements.
Estimates and Assumptions
Preparation of the financial statements in conformity with GAAP requires management to make estimates and assumptions that affect the amounts reported in the financial statements and accompanying disclosures. Those estimates are inherently subject to change, and actual results may ultimately differ from those estimates.
Palomar Holdings, Inc. and Subsidiaries
Valuation and Qualifying Accounts
| Additions |
Deductions |
|||||||||||||||
| Balance at |
Amounts |
Amounts |
Balance at |
|||||||||||||
| Beginning |
Charged to |
Written |
End of |
|||||||||||||
| (in thousands) |
of Period |
Expense |
Off |
Period |
||||||||||||
| Year Ended December 31, 2024 |
||||||||||||||||
| Valuation Allowance for deferred tax assets |
$ | 3,486 | $ | — | $ | 114 | $ | 3,372 | ||||||||
| Valuation Allowance for premium receivable |
$ | 49 | $ | 30 | 16 | $ | 63 | |||||||||
| Year Ended December 31, 2023 |
||||||||||||||||
| Valuation Allowance for deferred tax assets |
$ | 3,070 | $ | 416 | $ | — | $ | 3,486 | ||||||||
| Valuation Allowance for premium receivable |
$ | 96 | $ | 42 | 89 | $ | 49 | |||||||||
Item 9. Changes in and Disagreements with Accountants on Accounting and Financial Disclosure
None.
Item 9A. Controls and Procedures
Evaluation of Disclosure Controls and Procedures
Our management, with the participation of our principal executive officer and our principal financial officer, evaluated, as of the end of the period covered by this Annual Report on Form 10-K, the effectiveness of our disclosure controls and procedures (as defined in Rules 13a-15(e) and 15d-15(e) under the Securities Exchange Act of 1934, as amended, or the Exchange Act). Based on that evaluation, our principal executive officer and principal financial officer have concluded that as of December 31, 2024, our disclosure controls and procedures were effective at the reasonable assurance level. Management recognizes that any controls and procedures, no matter how well designed and operated, can provide only reasonable assurance of achieving their objectives and our management necessarily applies its judgment in evaluating the cost-benefit relationship of possible controls and procedures.
Management’s Report on Internal Control over Financial Reporting
Our management is responsible for establishing and maintaining adequate internal control over financial reporting as defined in Rules 13a-15(f) and 15d-15(f) under the Securities Exchange Act of 1934, as amended. Our internal control over financial reporting is designed to provide reasonable assurance regarding the reliability of financial reporting and the preparation of financial statements for external purposes in accordance with generally accepted accounting principles in the United States of America. Our internal control over financial reporting includes those policies and procedures that:
(i) Pertain to the maintenance of records that, in reasonable detail, accurately and fairly reflect the transactions and dispositions of our assets;
(ii) Provide reasonable assurance that transactions are recorded as necessary to permit preparation of financial statements in accordance with generally accepted accounting principles, and that our receipts and expenditures are being made only in accordance with authorizations of our management and directors; and
(iii) Provide reasonable assurance regarding prevention or timely detection of unauthorized acquisition, use or disposition of our assets that could have a material effect on the financial statements.
Because of its inherent limitations, internal control over financial reporting may not prevent or detect misstatements. Also, projections of any evaluation of effectiveness to future periods are subject to the risk that controls may become inadequate because of changes in conditions, or that the degree of compliance with the policies or procedures may deteriorate.
Management assessed the effectiveness of our internal control over financial reporting as of December 31, 2024. In making this assessment, management used the framework in Internal Control-Integrated Framework (2013) issued by the Committee of Sponsoring Organizations of the Treadway Commission. Management’s assessment included an evaluation of the design of our internal control over financial reporting and testing of the operational effectiveness of its internal control over financial reporting. Management reviewed the results of its assessment with the audit committee of our board of directors.
Based on that assessment under the framework in Internal Control-Integrated Framework (2013), management concluded that the company’s internal control over financial reporting was effective as of December 31, 2024. Pursuant to Section 404(c) of the Sarbanes-Oxley Act, our independent registered public accounting firm has issued an attestation report on the effectiveness of our internal control over financial reporting for the year ended December 31, 2024, which is included above.
Changes in Internal Control over Financial Reporting
There were no changes in our internal control over financial reporting identified in connection with the evaluation required by Rule 13a-15(d) and 15d-15(d) of the Exchange Act that occurred during the quarter ended December 31, 2024 that have materially affected, or are reasonably likely to materially affect, our internal control over financial reporting.
Rule 10b5-1 Plans
On December 4, 2024, Mac Armstrong, the Company’s Chairman and Chief Executive Officer, entered a trading plan intended to satisfy the affirmative defense conditions of Rule 10b5-1c under the Exchange Act, providing for the sale of up to 65,000 shares of the Company’s common stock. Pursuant to this plan, Mr. Armstrong may sell shares beginning March 5, 2025 and ending February 15, 2026.
On December 10, 2024, Angela Grant, the Company’s Chief Legal Officer, entered a trading plan intended to satisfy the affirmative defense conditions of Rule 10b5-1c under the Exchange Act, providing for the exercise and sale of up to 297 shares of Company stock options and the sale of up to 2,071 shares of the Company’s common stock. Pursuant to this plan, Ms. Grant may sell shares beginning March 11, 2025 and ending August 31, 2025.
On December 13, 2024, Chris Uchida, the Company’s Chief Financial Officer, entered a trading plan intended to satisfy the affirmative defense conditions of Rule 10b5-1c under the Exchange Act, providing for the exercise and sale of up to 2,524 shares of Company stock options and the sale of up to 8,981 shares of the Company’s common stock. Pursuant to this plan, Mr. Uchida may sell shares beginning March 14, 2025 and ending August 31, 2025.
On December 13, 2024, Jon Christianson, the Company’s President, entered a trading plan intended to satisfy the affirmative defense conditions of Rule 10b5-1c under the Exchange Act, providing for the exercise and sale of up to 18,000 shares of Company stock options. Pursuant to this plan, Mr. Christianson may sell shares beginning March 14, 2025 and ending August 31, 2025.
There were no “non-Rule 10b5-1 trading arrangements” (as defined in Item 408 of Regulation S-K of the Exchange Act) adopted, modified or terminated during the fiscal year ended December 31, 2024 by our directors and Section 16 officers. Each of the Rule 10b5-1 trading arrangements are in accordance with our Insider Trading Policy and actual sale transactions made pursuant to such trading arrangements will be disclosed publicly in Section 16 filings with the SEC in accordance with applicable securities laws, rules and regulations.
Item 9C. Disclosure Regarding Foreign Jurisdictions that Prevent Inspections
Not applicable.
Item 10. Directors, Executive Officers and Corporate Governance
The information required by this item is incorporated herein by reference to our Proxy Statement with respect to our 2025 Annual Meeting of Stockholders to be filed with the SEC within 120 days of the end of the fiscal year covered by this Annual Report on Form 10-K.
Item 11. Executive Compensation
The information required by this item is incorporated herein by reference to our Proxy Statement with respect to our 2025 Annual Meeting of Stockholders to be filed with the SEC within 120 days of the end of the fiscal year covered by this Annual Report on Form 10-K.
Item 12. Security Ownership of Certain Beneficial Owners and Management and Related Stockholder Matters
The information required by this item is incorporated herein by reference to our Proxy Statement with respect to our 2025 Annual Meeting of Stockholders to be filed with the SEC within 120 days of the end of the fiscal year covered by this Annual Report on Form 10-K.
Item 13. Certain Relationships and Related Transaction and Director Independence
The information required by this item is incorporated herein by reference to our Proxy Statement with respect to our 2025 Annual Meeting of Stockholders to be filed with the SEC within 120 days of the end of the fiscal year covered by this Annual Report on Form 10-K.
Item 14. Principal Accounting Fees and Services Item 15.
The information required by this item is incorporated herein by reference to our Proxy Statement with respect to our 2025 Annual Meeting of Stockholders to be filed with the SEC within 120 days of the end of the fiscal year covered by this Annual Report on Form 10-K.
Exhibits and Financial Statement Schedules
(a) (1) and (2) Financial Statements and Financial Statement Schedules- All financial statement schedules are filed as part of this report under Item 8- Financial Statements.
(3) Exhibits
| Exhibit |
Exhibit Description |
|
| |
|
|
| 3.1 |
|
|
| 3.2 |
|
|
| 4.1 |
|
|
| 4.2 |
|
|
| 10.1+ |
|
|
| 10.2+ |
|
|
| 10.3+ | Executive Employment Agreement, dated January 1, 2025, by and between the Company and Mac Armstrong (incorporated by reference to Exhibit 10.1 to the Company’s Current Report on Form 8-K, filed with the SEC on December 30, 2024). | |
| 10.4+ |
|
|
| 10.5+ |
|
|
| 10.6† |
|
|
| 10.7+ |
|
|
| 10.8+ |
|
| Exhibit |
Exhibit Description |
|
| |
|
|
| 10.9+ |
|
|
| 10.10+ |
|
|
| 19 | Insider Trading Policy | |
| 21.1 |
|
|
| 23.1 |
|
Consent of Ernst & Young LLP, Independent Registered Public Accounting Firm. |
| 31.1 |
|
|
| 31.2 |
|
|
| 32.1* |
|
|
| 97 | Policy for Recovery of Erroneously Awarded Incentive Compensation (incorporated by reference to Exhibit 97 to the Company’s 2023 Annual Report on Form 10-K, filed with the SEC on February 23, 2024). | |
| 101.INS |
|
Inline XBRL Instance Document. |
| 101.SCH |
|
Inline XBRL Taxonomy Extension Schema Document. |
| 101.CAL |
|
Inline XBRL Taxonomy Extension Calculation Linkbase Document. |
| 101.DEF |
|
Inline XBRL Taxonomy Extension Definition Linkbase Document. |
| 101.LAB |
|
Inline XBRL Taxonomy Extension Labels Linkbase Document. |
| 101.PRE |
|
Inline XBRL Taxonomy Extension Presentation Linkbase Document. |
| 104 |
|
Cover Page Interactive Date File (embedded within the Inline XBRL document and contained in Exhibit 101) |
| + |
Management contract or compensatory plan or arrangement. |
| † |
Portions of this exhibit have been redacted in compliance with Regulation S-K Item 601(b)(10). |
| * |
This certification is deemed not filed for purposes of section 18 of the Exchange Act, or otherwise subject to the liability of that section, nor shall it be deemed incorporated by reference into any filing under the Securities Act or the Exchange Act. |
Item 16.
None.
SIGNATURES
Form 10-K Summary Pursuant to the requirements of Section 13 or 15(d) of the Securities Exchange Act of 1934, the registrant has duly caused this report to be signed on its behalf by the undersigned, thereunto duly authorized on February 25, 2025.
| |
Palomar Holdings, Inc. |
|
| |
|
|
| |
|
|
| By: | /s/ Mac Armstrong | |
| |
|
Mac Armstrong
POWER OF ATTORNEY |
POWER OF ATTORNEY
KNOW ALL PERSONS BY THESE PRESENTS, that each person whose signature appears below constitutes and appoints Mac Armstrong and T. Christopher Uchida, jointly and severally, his attorneys-in-fact, each with the power of substitution, for him or her in any and all capacities, to sign any amendments to this Report on Form 10-K, and to file the same, with exhibits thereto and other documents in connection therewith with the Securities and Exchange Commission, hereby ratifying and confirming all that each of said attorneys-in-fact, or his substitute or substitutes may do or cause to be done by virtue hereof.
Pursuant to the requirements of the Securities Exchange Act of 1934, this report has been signed below by the following persons on behalf of the registrant and in the capacities and on the dates indicated.
| Signature |
Title |
Date |
| |
|
|
| |
|
|
| /s/ Mac Armstrong | Chairman of the Board and Chief Executive Officer (Principal Executive Officer) | February 25, 2025 |
| Mac Armstrong |
|
|
| |
|
|
| |
|
|
| /s/ T. Christopher Uchida |
Chief Financial Officer (Principal Financial and Accounting Officer) |
February 25, 2025 |
| T. Christopher Uchida |
|
|
| |
|
|
| /s/ Daryl Bradley |
Director |
February 25, 2025 |
| Daryl Bradley | ||
| |
|
|
| /s/ Thomas Bradley | Director | February 25, 2025 |
| Thomas Bradley | ||
| |
|
|
| /s/ Catriona M. Fallon |
Director |
February 25, 2025 |
| Catriona M. Fallon | ||
| |
|
|
| |
|
|
| /s/ Daina Middleton |
Director |
February 25, 2025 |
| Daina Middleton |
| /s/ Martha Notaras |
Director |
February 25, 2025 |
| Martha Notaras | ||
| |
|
|
| |
|
|
| /s/ Richard H. Taketa |
Lead Independent Director |
February 25, 2025 |
| Richard H. Taketa |
Exhibit 19.1

PALOMAR HOLDINGS, INC.
INSIDER TRADING POLICY
|
1. |
Purpose of this Policy. The purchase, sale, or gifting of securities while possessing material non- public information or the disclosure of inside information to others who may trade in such securities is sometimes referred to as “insider trading” and is prohibited by federal and state securities laws. As an essential part of your work, you may have access to material non-public information about Palomar Holdings, Inc., its divisions and majority-owned or controlled subsidiaries (collectively, “Palomar”), including information about other companies with which Palomar does, or may do, business. Palomar has adopted this Insider Trading Policy (the “Policy”) to assist Palomar in preventing illegal insider trading and to avoid even the appearance of improper conduct on the part of any Palomar director, officer, employee or contractor. This Policy is designed to protect and further Palomar’s reputation for integrity and ethical conduct. However, the ultimate responsibility for complying with the securities laws, adhering to this Policy and avoiding improper transactions rest with you. It is imperative that you use your best judgment and that you ask questions where you are uncertain how to handle a particular situation. |
|
2. |
Policy Statement. This memorandum sets forth the Policy of Palomar regarding the trading in Palomar’s securities as described below and the disclosure or use of information concerning Palomar. Employees, consultants, contractors, officers, members of the Board of Directors and entities (such as trusts, limited partnerships and corporations) over which such individuals have or share voting control (individually referred to as a “person” and collectively referred to as “persons”) are prohibited, while aware of material non-public information, directly, or indirectly through family members or other persons or entities, from engaging in transactions involving Palomar securities, except as otherwise provided for under this Policy. |
|
3. |
Penalties for Insider Trading. The penalties for violating the insider trading laws include imprisonment, disgorgement of profits gained or losses avoided, and substantial civil and criminal fines. As of the effective date of this Policy, civil fines can reach up to three times the profit gained or loss avoided, and criminal fines can reach up to $5.0 million for individuals and $25.0 million for entities. Individuals and entities considered to be “control person” who knew or recklessly disregarded the fact that a “controlled person” was likely to engage in insider trading also may be civilly liable. As of the effective date of this Policy, the civil liability of “control persons” can be the greater of (i) $1.0 million or (iii) three times the amount of the profit gained or loss avoided. For this purpose, a “control person” is an entity or person who directly or indirectly controls another person, and could include Palomar, its directors and officers. Under some circumstances, individuals who trade on inside information may also be subjected to private civil lawsuits. Moreover, as the material non-public information of Palomar is the property of Palomar, trading on or tipping Palomar confidential information could result in serious employment sanctions, including dismissal.
You should be aware that the surveillance techniques of the stock markets and the Financial Industry Regulatory Authority, Inc. (“FINRA”) are becoming more sophisticated all the time, and the chance that authorities will detect and prosecute even a small insider trading violation is a significant one. |
| 7979 Ivanhoe Avenue, Suite 500, La Jolla, CA 92037 | PLMR.com |
|
4. |
Questions and Delivery of this Policy. To the extent you have any questions related to this Policy or the topics addressed hereby, please contact Palomar’s Compliance Officer (such person, the “Compliance Officer”).The Compliance Officer shall be the Chief Legal Officer of Palomar.
This Policy will be delivered to all existing persons covered by this Policy upon its adoption by Palomar, and to all new directors, employees, officers and where appropriate, contractors and consultants, at the commencement of their employment or association with Palomar. Thereafter, this Policy shall be distributed annually or posted on Palomar’s internal website where it is accessible to all regular full-time employees. All persons covered under this Policy must certify their understanding of, and intent to comply with, this Policy. A copy of the certification that all persons covered by this Policy must sign is attached hereto as Exhibit A. A copy of the executed certification shall be sent to the Compliance Officer or his or her designee. |
|
5. |
Companies Covered. In addition, the restrictions imposed by this Policy extend to transactions involving securities of other public companies, such as customers or suppliers of Palomar and companies with which Palomar may be negotiating major transactions, such as an acquisition, joint venture, collaboration, investment or sale. Information that is not material to Palomar may nevertheless be material to the other company. Therefore, a person who is aware of material non-public information about another public company, whether or not the person obtained the information in the course of working for or providing services to Palomar, is subject to restrictions on trading in securities of that company or communicating that information to others. |
|
6. |
Transactions Covered. “Trading” includes purchases, sales, gifting or otherwise disposing of securities such as stock, bonds, debentures, options, puts, calls and any other securities. Examples of the types of covered transactions include: |
|
(a) |
Open Market Transactions. A person is prohibited from trading, while aware of material non-public information, in any securities in the open market. |
|
(b) |
Stock Options. A person is prohibited, while aware of material non-public information, from selling in the open market (e.g., in a broker-assisted cashless exercise or any other market sale for the purpose of generating the cash needed to pay the exercise price or taxes or for any other purpose) any of the underlying shares of the stock option.
However, while aware of material non-public information about Palomar, a person may receive a stock option grant and grants of stock options may vest. In addition, a person may exercise a stock option while aware of material non-public information, but only if the person pays the exercise price and applicable taxes in cash or via a net exercise with Palomar (i.e., that does not involve a sale of shares in the market place) or if you deliver stock you hold in Palomar as payment for the exercise price, if such options allow for a net exercise. |
|
(c) |
Restricted Stock and Restricted Share Units. A person is prohibited, while aware of material non-public information, from selling in the open market any of the underlying shares of restricted stock or restricted share units awarded to that person.
However, while aware of material non-public information about Palomar, a person may receive an award of restricted stock or restricted share units. In addition, awards of restricted stock or restricted share units may vest while a person is aware of material non-public information, and Palomar may withhold shares to cover taxes due upon vesting or a person may sell shares solely pursuant to a restricted stock or restricted share unit award’s mandatory sale to cover withholding taxes provision with the remittance to the Company of any proceeds from such sale. |
| 7979 Ivanhoe Avenue, Suite 500, La Jolla, CA 92037 | PLMR.com |
|
7. |
No Trading by Others on a Person’s Behalf. When a person is prohibited from trading in Palomar securities because he or she is aware of material non-public information, he or she may not have a third party trade in securities on his or her behalf or disclose such information to any third party, other than on a need-to-know basis. Any trades made by a third party on behalf of a person will be attributed to that person. Thus, trades in Palomar shares held in street name in a person’s account or for his or her benefit at a brokerage firm are also prohibited if the person is otherwise prohibited from trading in Palomar securities. If a person invests in a “managed account” or arrangement (other than a Rule 10b5-1 plan discussed below), he or she should instruct the broker or advisor not to trade in Palomar securities on his or her behalf. |
|
8. |
No Tipping. When a person is prohibited from trading in Palomar securities because he or she is aware of material non-public information, he or she may not disclose material non-public information about Palomar to a third party unless the third party (i) owes a duty of confidence to Palomar (e.g., an attorney, auditor or investment banker retained by Palomar) or (ii) is subject to a confidentiality agreement in favor of Palomar in which the person has agreed or is obligated to keep the information confidential. If that third party trades in Palomar securities, the person who communicated the information (as well as the third party) may be held personally liable under federal (or state) law for violation of securities laws. This practice, known as “tipping,” violates the securities laws and also can result in the same civil and criminal penalties that apply to insider trading, whether or not the person personally derives any benefit from the third party’s actions. This prohibition includes giving trading advice without actually disclosing material non-public information, such as a general statement that, “I would sell now if I were you, but I can’t tell you why.” As with each of the prohibitions on trading while aware of material non-public information discussed in this Policy, the prohibition on tipping also applies to material non-public information regarding securities of other public companies. Regardless of whether a person covered by this Policy is aware of material non-public information, they are prohibited from posting messages about Palomar or its securities in internet chat rooms, bulletin boards, blogs or other similar means of electronic distribution, whether under actual or fictitious names. |
|
9. |
Persons Covered. The same restrictions on insider trading that apply to a person also apply to a person’s family members who reside with the person, anyone else who lives in his or her household, and any family members who do not live in his or her household but whose transactions in Palomar or other securities are directed by the person or are subject to his or her influence or control (such as parents or children who consult the person before they trade in Palomar or other securities). Every person is responsible to ensure that trading in any securities by any such third party complies with this Policy. |
|
10. |
Definition of Material Non-public Information. |
|
(a) |
Material Information. Information is material if there is a substantial likelihood that a reasonable investor would consider it important in making an investment decision (i.e., deciding whether to buy, hold or sell a security). Therefore, any information that could reasonably be expected to affect the price of the security is potentially material. Both positive and negative information can be material. Common examples of information that may be material are: |
|
(i) |
Projections of future earnings or losses; |
|
(ii) |
Earnings that are inconsistent with external guidance from Palomar or with market expectations; |
|
(iii) |
News of a pending or proposed merger, acquisition or tender offer; |
|
(iv) |
News of a significant sale of assets or the expansion or curtailment of operations (including a significant new contract or loss of business); |
|
(v) |
Significant changes in dividend policies or the declaration of a stock split; |
| 7979 Ivanhoe Avenue, Suite 500, La Jolla, CA 92037 | PLMR.com |
|
(vi) |
Significant changes in senior management or membership of the Board of Directors; |
|
(vii) |
Significant new products or discoveries; |
|
(viii) |
Significant regulatory actions, including receipt or denial of a significant regulatory application for clearance or approval of products; |
|
(ix) |
The gain or loss of, or a significant change to the terms of Palomar’s relationship with, a substantial customer or supplier; |
|
(x) |
The commencement of, or significant development regarding, any significant litigation; |
|
(xi) |
A decision by Palomar to borrow a significant amount of money; |
|
(xii) |
A decision by Palomar to offer securities in a public or private offering or repurchase or redeem any Palomar securities currently owned by the public; |
|
(xiii) |
A significant change in Palomar’s capital expenditure program; and |
|
(xiv) |
Significant shifts in operating or financial circumstances. |
The foregoing are merely examples and should not be treated as an all-inclusive list. There may be other developments not listed above that may be material as well.
The materiality of information is determined on a case-by-case basis in light of all the facts and circumstances. All securities transactions will be viewed after-the–fact with the benefit of hindsight. As a result, before engaging in any transaction, a person should carefully consider how regulators and others might view his or her transaction in hindsight.
|
(b) |
Non-public Information. “Non-public” information is information that Palomar, or another company if applicable has not released publicly, either by a press release or a filing with the U.S. Securities and Exchange Commission (the “SEC”) or is not otherwise available publicly. As a general rule, information is not considered to be “public” until the end of the second-trading day after an announcement by Palomar is broadly disseminated. Therefore, a person who was aware of the material information prior to its public release should not engage in any open market transactions in Palomar’s securities until at least the opening of trading on the NASDAQ Stock Exchange or other applicable national stock exchange (collectively, “Applicable Exchange”), as applicable, on the third-trading day after such information is publicly released (i.e., the next trading day after two full trading days has elapsed since the release of such information), whether through a report filed with the SEC or through major news wire services, or recognized news services. For example, if an announcement is made on a Monday before trading on the Applicable Exchange opens (i.e., before 9:00 a.m. (EST)), a person who was aware of the information in the announcement prior to its public release would not be able to trade until the opening of trading on the Applicable Exchange on Wednesday. If an announcement is made after trading on the Applicable Exchange closes on a Monday, but before trading on the Applicable Exchange opens on Tuesday (i.e., before 9:30 a.m. (EST)), such person would not be able to trade until the opening of trading on the Applicable Exchange on Thursday. |
| 7979 Ivanhoe Avenue, Suite 500, La Jolla, CA 92037 | PLMR.com |
|
11. |
Short-Term or Speculative Transactions. All persons covered by this Policy, including, Directors, Section 16 officers, employees, consultants, contractors and related entities are strictly prohibited from engaging in short-term or speculative transactions involving Palomar securities, such as publicly traded options, short sales, puts and calls, hedging, pledging and other monetization transactions, unless the Compliance Officer or one of his or her designees provides prior written approval. This prohibition also applies to holding Palomar securities in a margin account and “short sales against the box,” which are sales of Palomar securities where a person does not deliver the shares he or she owns to settle the transaction but instead delivers other shares that his or her broker has borrowed from others. All persons subject to this Policy must obtain the specific prior written authorization of the Compliance Officer before engaging in short-term or speculative transactions involving Palomar securities. |
|
12. |
Post-Employment Transactions. If a person is aware of material non-public information about Palomar when his or her employment terminates, this Policy’s restrictions on trading and communicating material non-public information will continue to apply. Such a person may not trade in Palomar securities until that information has become public or is no longer material. In addition, since stock options generally expire 90 days after termination, the person should refer to the stock option section above for guidance regarding exercising stock options that may expire while he or she is aware of material non-public information. A person also may contact the Compliance Officer or his or her designee to further discuss their alternatives in this circumstance. |
|
13. |
Blackout Period. Directors, Section 16 officers and certain other persons designated by the Compliance Officer (“Blackout Covered Individuals”) may not trade in securities in the open market during a no-trade period (“Blackout Period”). Each person designated by the Compliance Officer as a Blackout Covered Individual shall be notified of such designation, and Palomar shall maintain a list of all Blackout Covered Individuals. An exception to this prohibition may apply for transactions effected pursuant to a pre-approved Rule 10b5-1 plan as discussed below. The quarterly Blackout Period begins fifteen days prior to the end of every fiscal quarter and continues until the second-trading day after Palomar’s earnings for that quarter are publicly released. The Compliance Officer may impose additional Blackout Periods for all or some Blackout Covered Individuals and other employees when Palomar may be aware of material non- public information as the Compliance Officer deems necessary or appropriate. All Blackout Covered Individuals also are subject to all other restrictions in this Policy.
In addition, the Sarbanes-Oxley Act of 2002 prohibits all trades of Palomar securities by Directors and Section 16 officers of Palomar during a “pension fund blackout period.” A pension fund blackout period exists whenever 50% or more of the participants in a Palomar benefit plan are unable to conduct transactions in their Palomar common stock accounts for more than three (3) consecutive business days. These blackout periods typically occur when there is a change in the benefit plan’s trustee, record keeper or investment manager. Individuals that are subject to these blackout periods will be contacted when these periods are instituted from time to time. |
|
14. |
Pre-Clearance for Directors, Section 16 Officers and Section 16 Filings. |
|
(a) |
Each Director and Section 16 officer must obtain pre-clearance from the Compliance Officer or one of his or her designees before engaging in the following transactions (including any transactions by their immediate family members) in Palomar securities: purchases; sales; gifts; transactions in his or her 401(k) plan or deferred compensation plan; transactions in an IRA or Roth IRA; and for Section 16 officers, any other transactions that are required to be reported under Section 16 of the Securities Exchange Act of 1934, as amended. Such Director and Section 16 Officer must obtain pre- clearance in the manner set forth in Paragraph 15 below. |
| 7979 Ivanhoe Avenue, Suite 500, La Jolla, CA 92037 | PLMR.com |
|
(b) |
Each Director and Section 16 officer must file with the SEC a Form 3 within ten (10) days of becoming an insider to report his or her beneficial ownership of Palomar’s securities, including unvested options and restricted stock units. The Compliance Officer will prepare and manage the filing of the Form 3 for new Directors, if requested, and Section 16 officers. |
|
(c) |
SEC Form 4 must be filed within two (2) business days of a reportable transaction by all Directors and Section 16 officers. Directors and Section 16 officers may obtain the Form 4 from the Compliance Officer, and should have a signed power of attorney on file with the Compliance Officer prior to entering into any Section 16 transactions. The Compliance Officer will file the completed and signed Form 4 with the SEC electronically, unless instructed otherwise by the Director or Section 16 officer. Directors and Section 16 officers should notify the Compliance Officer if they wish to file the Form 4 themselves, to avoid duplicate filings. Palomar must disclose in its periodic reports filed with the SEC any transactions by Directors and Section 16 officers which were not timely reported. |
|
15. |
Pre-Clearance for Directors, Section 16 Officers and Other Insiders. |
|
(a) |
Insiders who are Directors, Section 16 Officers and other individuals designated by the Compliance Officer as “Covered Individual Requiring Pre-Clearance for Trades,” must obtain pre-clearance from the Compliance Officer or one of his or her designees before trading in Palomar securities. |
|
(b) |
The Covered Individual Requiring Pre-Clearance for Trades must notify the Compliance Officer of the amount and nature of the proposed trade(s) using the Pre-Clearance Request form attached in substantially the form hereto as Exhibit B. |
|
(c) |
If practicable, the Pre-Clearance Form should be submitted to the Compliance Officer at least two (2) business days prior to the date of the intended trade date. |
|
(d) |
The existence of this approval process does not obligate the Compliance Officer to approve any particular trade requested by a Covered Individual Requiring Pre-Clearance for Trades. From time to time, an event may occur that is material to Palomar and is known by only a few Directors or Executives. So long as the event remains material and non-public, the Compliance Officer may determine not to approve any transactions in Palomar’s securities. If a Covered Individual Requiring Pre-Clearance for Trades requests clearance to trade in Palomar’s securities during the pendency of such an event, the Compliance Officer may reject the trading request without disclosing the reason. |
|
(e) |
After receiving written clearance to engage in a trade by the Compliance Officer, a Covered Individual Requiring Pre-Clearance for Trades must complete the proposed trade within five (5) business days of the intended date disclosed on the Pre-Clearance Form or make a new trading request. |
|
(f) |
Each person designated by the Compliance Officer as a Covered Individual Requiring Pre-Clearance for Trades shall be notified of such designation, and Palomar shall maintain a list of all Covered Individual Requiring Pre-Clearance for Trades |
| 7979 Ivanhoe Avenue, Suite 500, La Jolla, CA 92037 | PLMR.com |
|
16. |
Rule 10b5-1 Plans. Under SEC Rule 10b5-1, a person may have an affirmative defense to insider trading liability for transactions in Palomar securities that are effected pursuant to a written contract or plan meeting certain requirements. In short, the rule presents an opportunity for a person to pre-arrange a sale or purchase of Palomar securities (including an option exercise), provided that, at the time the person establishes such a plan, he or she is not aware of material non-public information.
In order to satisfy Rule 10b5-1, a plan must: |
|
(a) |
Be documented in writing to instruct another person who is not aware of material non- public information to execute the transactions; |
|
(b) |
Be established in good faith and at a time when the person is not aware of material non- public information; and |
|
(c) |
Specify objective criteria (date, price threshold, etc.) used to determine the timing and terms of the purchase or sale, and otherwise not be subject to any influence or discretion from the person establishing the plan. |
In addition, for Directors and Section 16 officers, the first trade under the plan may not occur until the later of:
90 days after the plan’s adoption; or
Two business days after the filing of Palomar’s Form 10-Q or Form 10-K for the fiscal quarter in which the plan was adopted or modified.
For Other Covered Individuals, the first trade under the plan may not occur until 30 days after the plan’s adoption.
|
(d) |
Palomar requires pre-approval by the Compliance Officer or one of his or her designees of all Rule 10b5-1 plans relating to Palomar securities established by Directors, Section 16 officers and other Covered Individuals. Such Rule 10b5-1 plan must comply with the terms of the Palomar Holdings, Inc. Rule 10b5-1 Trading Plan Policy. |
|
17. |
Responsible party. Palomar’s Compliance Officer is responsible for administering this Policy. |
Updated: November 1, 2024
| 7979 Ivanhoe Avenue, Suite 500, La Jolla, CA 92037 | PLMR.com |
EXHIBIT A
CERTIFICATION
I hereby certify that:
|
• |
I have read and understand the Insider Trading Policy of Palomar Holdings, Inc. (the “Company”). |
|
• |
I understand that the Company’s Compliance Officer is available to answer any questions that I have regarding this Insider Trading Policy, or in his/her absence I should contact the Company’s Chief Executive Officer. |
|
• |
I will continue to comply with the Insider Trading Policy for as long as I am a director, officer, employee, consultant or contractor of the Company. |
|
• |
I understand that insider trading is a crime, may subject me to serious financial penalties and termination of employment, and is strictly prohibited by the Insider Trading Policy. |
| Signature | Date | |
| Printed Name (Please print legibly) | ||
| Title |
| 7979 Ivanhoe Avenue, Suite 500, La Jolla, CA 92037 | PLMR.com |
EXHIBIT B
PRE-CLEARANCE FORM
M E M O R A N D U M
|
To: |
[ ], Compliance Officer |
From:
|
Date: |
, 20 |
Subject: Proposed Transaction in Company Securities by Directors, Section 16 Officers, and other “Insider” Employees, Consultants and Contractors
This memorandum is to advise you that the undersigned intends to execute a transaction in the Company’s securities on , and does hereby request that the Company pre-clear the transaction as required by the Company’s Insider Trading Policy for directors, executive officers, senior management, and other “Insider” employees (the “Policy”).
The general nature of the transaction is as follows:
|
( ) |
Purchase up to shares of Palomar common stock (excludes the exercise of stock options to hold shares) |
|
( ) |
Sell up to shares Palomar common stock acquired through the Company’s Employee Stock Purchase Plan (the “ESPP”) |
|
( ) |
Sell up to shares of Palomar common stock acquired other than through the ESPP (includes the exercise of stock options with same day sales) |
|
( ) |
Other (please describe): |
I have reviewed and considered the Policy and I represent that am NOT in possession of any material non-public information (as defined in the Policy) about the Company and will not enter into the transaction if I come into possession of material non-public information about the Company between the date hereof and the proposed transaction execution date. Accordingly, I intend to trade securities only during an open window as described in the Policy.
I have read and understand the Policy and certify that the above transaction will not violate the Policy. I understand that certain types of transactions are prohibited and agree not to participate in these types of trades.
| 7979 Ivanhoe Avenue, Suite 500, La Jolla, CA 92037 | PLMR.com |
I agree to advise the Company promptly if, as a result of future developments, any of the foregoing information becomes inaccurate or incomplete in any respect. If I do not effect the above transaction within five (5) business days of the intended date disclosed on the Pre-Clearance Form, I agree to resubmit a new pre-clearance request. I also agree to report any stock trades to the Compliance Officer.
| Signature | |
| Print Name | |
| Date | |
| Approved by the Compliance Officer of Palomar Holdings, Inc.: | |
| Name | |
| Title | |
| Date | |
| 7979 Ivanhoe Avenue, Suite 500, La Jolla, CA 92037 | PLMR.com |
Exhibit 21.1
|
Legal Name |
Jurisdiction of Incorporation |
|
Palomar Insurance Holdings, Inc. |
Delaware |
|
Palomar Specialty Insurance Company |
Oregon |
|
Palomar Excess and Surplus Insurance Company |
Arizona |
|
Palomar Specialty Reinsurance Company Bermuda, Ltd. |
Bermuda |
|
Palomar Insurance Agency DBA Palomar General Insurance Agency |
California |
|
Palomar Underwriters Exchange Organization Inc. |
Delaware |
| Palomar Crop Insurance Services, Inc. | Delaware |
Exhibit 23.1
Consent of Independent Registered Public Accounting Firm
We consent to the incorporation by reference in the Registration Statements on Form S-3 (Nos. 333-239385 and 333-281377) of Palomar Holdings, Inc. and Subsidiaries, and Registration Statements on Form S-8 (Nos. 333-230908, 333-236957, 333-255860, 333-263002, 333-270155, and 333-277331) pertaining to the 2019 Equity Incentive Plan and 2019 Employee Stock Purchase Plan of Palomar Holdings, Inc. and Subsidiaries of our reports dated February 25, 2025, with respect to the consolidated financial statements of Palomar Holdings, Inc. and Subsidiaries and the effectiveness of internal control over financial reporting of Palomar Holdings, Inc. and Subsidiaries included in this Annual Report (Form 10-K) of Palomar Holdings, Inc. and Subsidiaries for the year ended December 31, 2024.
/s/ Ernst & Young LLP
San Francisco, California
February 25, 2025
Exhibit 31.1
Certification of Principal Executive Officer
Pursuant to Section 302 of the Sarbanes-Oxley Act of 2002
I, Mac Armstrong, certify that:
|
1. |
I have reviewed this Annual Report on Form 10-K of Palomar Holdings, Inc.; |
|
2. |
Based on my knowledge, this report does not contain any untrue statement of a material fact or omit to state a material fact necessary to make the statements made, in light of the circumstances under which such statements were made, not misleading with respect to the period covered by this report; |
|
3. |
Based on my knowledge, the financial statements, and other financial information included in this report, fairly present in all material respects the financial condition, results of operations and cash flows of the registrant as of, and for, the periods presented in this report; |
|
4. |
I am responsible for establishing and maintaining disclosure controls and procedures (as defined in Exchange Act Rules 13a-15(e) and 15d-15(e)) and internal control over financial reporting (as defined in Exchange Act Rules 13a-15(f) and 15d-15(f)) for the registrant and have: |
|
a. |
Designed such disclosure controls and procedures, or caused such disclosure controls and procedures to be designed under my supervision, to ensure that material information relating to the registrant is made known to me by others within those entities, particularly during the period in which this report is being prepared; |
|
b. |
Designed such internal control over financial reporting, or caused such internal control over financial reporting to be designed under my supervision, to provide reasonable assurance regarding the reliability of financial reporting and the preparation of financial statements for external purposes in accordance with generally accepted accounting principles; |
|
c. |
Evaluated the effectiveness of the registrant’s disclosure controls and procedures and presented in this report my conclusions about the effectiveness of the disclosure controls and procedures, as of the end of the period covered by this report based on such evaluation; and |
|
d. |
Disclosed in this report any change in the registrant’s internal control over financial reporting that occurred during the registrant’s most recent fiscal quarter (the registrant’s fourth fiscal quarter in the case of an annual report) that has materially affected, or is reasonably likely to materially affect, the registrant’s internal control over financial reporting; and |
|
5. |
I have disclosed, based on my most recent evaluation of internal control over financial reporting, to the registrant’s auditors and the audit committee of the registrant’s board of directors (or persons performing the equivalent functions): |
|
a. |
All significant deficiencies and material weaknesses in the design or operation of internal control over financial reporting which are reasonably likely to adversely affect the registrant’s ability to record, process, summarize and report financial information; and |
|
b. |
Any fraud, whether or not material, that involves management or other employees who have a significant role in the registrant’s internal control over financial reporting. |
|
Date: February 25, 2025 |
/s/ Mac Armstrong |
|
|
Mac Armstrong |
|
|
Chairman of the Board and Chief Executive Officer |
EXHIBIT 31.2
CERTIFICATION OF PRINCIPAL FINANCIAL OFFICER
PURSUANT TO SECTION 302 OF THE SARBANES-OXLEY ACT OF 2002
I, T. Christopher Uchida, certify that:
|
1. |
I have reviewed this Annual Report on Form 10-K of Palomar Holdings, Inc.; |
|
2. |
Based on my knowledge, this report does not contain any untrue statement of a material fact or omit to state a material fact necessary to make the statements made, in light of the circumstances under which such statements were made, not misleading with respect to the period covered by this report; |
|
3. |
Based on my knowledge, the financial statements, and other financial information included in this report, fairly present in all material respects the financial condition, results of operations and cash flows of the registrant as of, and for, the periods presented in this report; |
|
4. |
I am responsible for establishing and maintaining disclosure controls and procedures (as defined in Exchange Act Rules 13a-15(e) and 15d-15(e)) and internal control over financial reporting (as defined in Exchange Act Rules 13a-15(f) and 15d-15(f)) for the registrant and have: |
|
a. |
Designed such disclosure controls and procedures, or caused such disclosure controls and procedures to be designed under my supervision, to ensure that material information relating to the registrant is made known to me by others within those entities, particularly during the period in which this report is being prepared; |
|
b. |
Designed such internal control over financial reporting, or caused such internal control over financial reporting to be designed under my supervision, to provide reasonable assurance regarding the reliability of financial reporting and the preparation of financial statements for external purposes in accordance with generally accepted accounting principles; |
|
c. |
Evaluated the effectiveness of the registrant’s disclosure controls and procedures and presented in this report my conclusions about the effectiveness of the disclosure controls and procedures, as of the end of the period covered by this report based on such evaluation; and |
|
d. |
Disclosed in this report any change in the registrant’s internal control over financial reporting that occurred during the registrant’s most recent fiscal quarter (the registrant’s fourth fiscal quarter in the case of an annual report) that has materially affected, or is reasonably likely to materially affect, the registrant’s internal control over financial reporting; and |
|
5. |
I have disclosed, based on my most recent evaluation of internal control over financial reporting, to the registrant’s auditors and the audit committee of the registrant’s board of directors (or persons performing the equivalent functions): |
|
a. |
All significant deficiencies and material weaknesses in the design or operation of internal control over financial reporting which are reasonably likely to adversely affect the registrant’s ability to record, process, summarize and report financial information; and |
|
b. |
Any fraud, whether or not material, that involves management or other employees who have a significant role in the registrant’s internal control over financial reporting. |
|
Date: February 25, 2025 |
/s/ T. Christopher Uchida |
|
|
T. Christopher Uchida |
|
|
Chief Financial Officer |
EXHIBIT 32.1
CERTIFICATION PURSUANT TO 18 U.S.C. SECTION 1350, AS ADOPTED PURSUANT TO
SECTION 906 OF THE SARBANES-OXLEY ACT OF 2002
In connection with the Annual Report on Form 10-K of Palomar Holdings, Inc. (the “Company”) for the fiscal year ended December 31, 2024, as filed with the Securities and Exchange Commission on the date hereof (the “Report”), we, Mac Armstrong, as Chairman and Chief Executive Officer of the Company, and T. Christopher Uchida, Chief Financial Officer, hereby certify pursuant to Title 18, Chapter 63, Section 1350 of the United States Code, as adopted by Section 906 of the Sarbanes-Oxley Act of 2002, that to the best of our knowledge:
|
(1) |
the Report fully complies with the requirements of Section 13(a) or 15(d), as applicable, of the Securities Exchange Act of 1934, as amended; and |
|
(2) |
the information contained in the Report fairly presents, in all material respects, the financial condition and results of operations of the Company. |
|
Date: February 25, 2025 |
By: |
/s/ Mac Armstrong |
|
|
Name: |
Mac Armstrong |
|
|
Title: |
Chairman of the Board and Chief Executive Officer |
|
|
|
(Principal Executive Officer) |
|
|
|
|
|
Date: February 25, 2025 |
By: |
/s/ T. Christopher Uchida |
|
|
Name: |
T. Christopher Uchida |
|
|
Title: |
Chief Financial Officer |
|
|
|
(Principal Financial and Accounting Officer) |