|
Virginia
|
001-38817
|
81-2871064
|
|
(State or Other Jurisdiction
of Incorporation)
|
(Commission File Number)
|
(IRS Employer
Identification No.)
|
|
10089 Fairfax Boulevard, Fairfax, VA
|
22030
|
|
|
(Address of Principal Executive Offices)
|
(Zip Code)
|
|
☐
|
Written communications pursuant to Rule 425 under the Securities Act (17 CFR 230.425)
|
|
☐
|
Soliciting material pursuant to Rule 14a-12 under the Exchange Act (17 CFR 240.14a-12)
|
|
☐
|
Pre-commencement communications pursuant to Rule 14d-2(b) under the Exchange Act (17 CFR 240.14d-2(b))
|
|
☐
|
Pre-commencement communications pursuant to Rule 13e-4(c) under the Exchange Act (17 CFR 240.13e-4(c))
|
|
Title of each class
|
Trading
Symbol(s)
|
Name of each exchange on which registered
|
||
|
Common Stock
|
MNSB
|
The Nasdaq Stock Market LLC
|
||
|
Depositary Shares (each representing a 1/40th interest in a share of 7.50% Series A Fixed-Rate Non-Cumulative Perpetual Preferred Stock
|
MNSBP
|
The Nasdaq Stock Market LLC
|
|
Exhibit
Number
|
Description
|
|
|
99.1
|
||
| 99.2 | Investor Presentation dated July 29, 2024. | |
|
104
|
Cover Page Interactive Data File (embedded within the Inline XBRL document).
|
|
MAINSTREET BANCSHARES, INC
|
|||
|
Date: July 29, 2024
|
By:
|
/s/ Thomas J. Chmelik
|
|
|
Name: Thomas J. Chmelik
|
|||
|
Title: Chief Financial Officer
|
|||
Exhibit 99.1
|
PRESS RELEASE |
Contact: Debra Cope |
|
|
July 29, 2024 8:00 AM ET |
Director of Corporate Communications |
|
| Desk (703) 481-4599 | ||
| Mobile (202) 468-3184 |
MainStreet Bancshares Inc. Reports a Profitable Second Quarter
Rise in Core Deposits Fueled an Uptick in Loan Growth
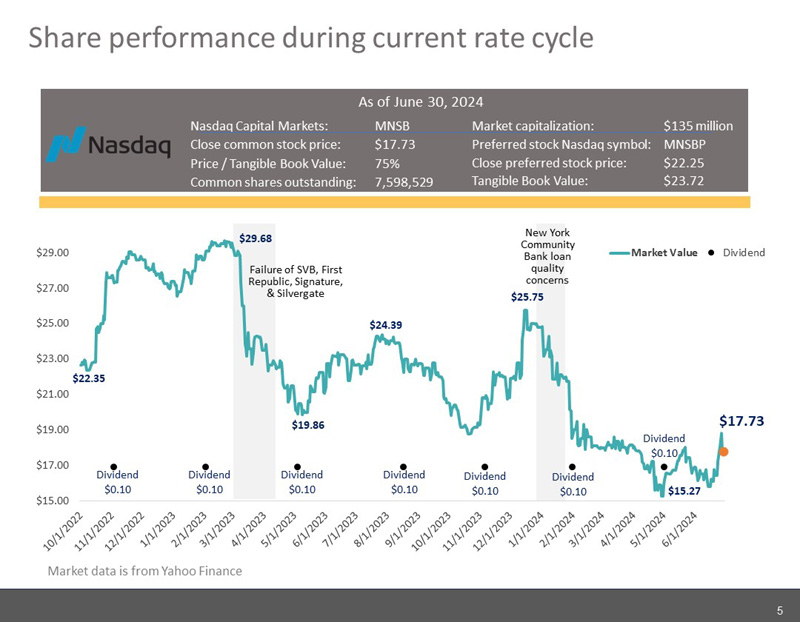
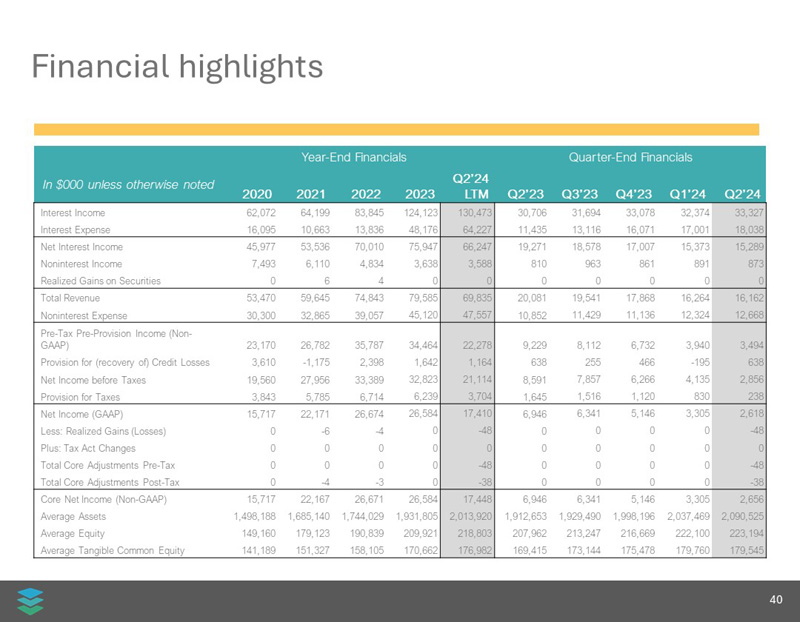
FAIRFAX, Va., July 29, 2024 /PRNewswire/ -- MainStreet Bancshares, Inc. (Nasdaq: MNSB & MNSBP), the holding company for MainStreet Bank, reported net income of $2.6 million for the second quarter of 2024.
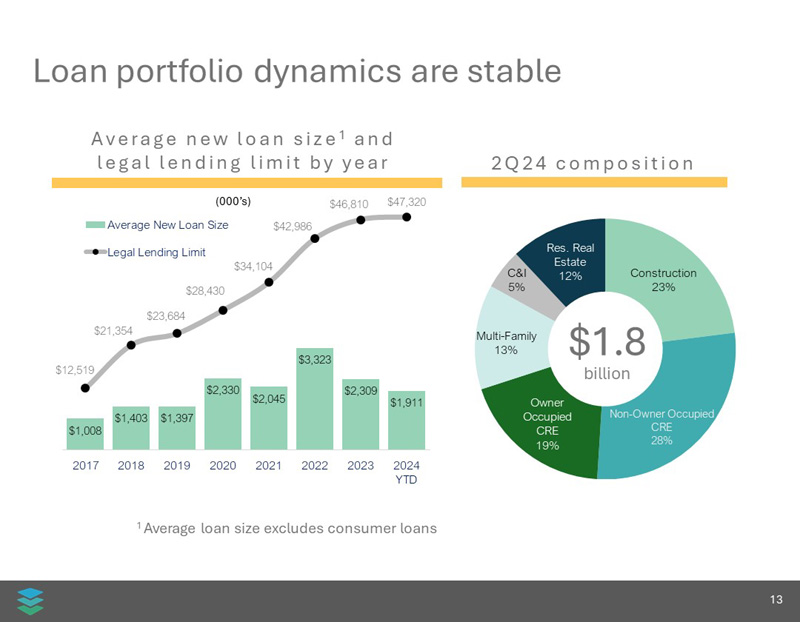
Total deposits reached $1.8 billion in the second quarter, an increase of 10.2% from the second quarter of 2023. Loan growth is up 8.6% over the same period, also reaching $1.8 billion.
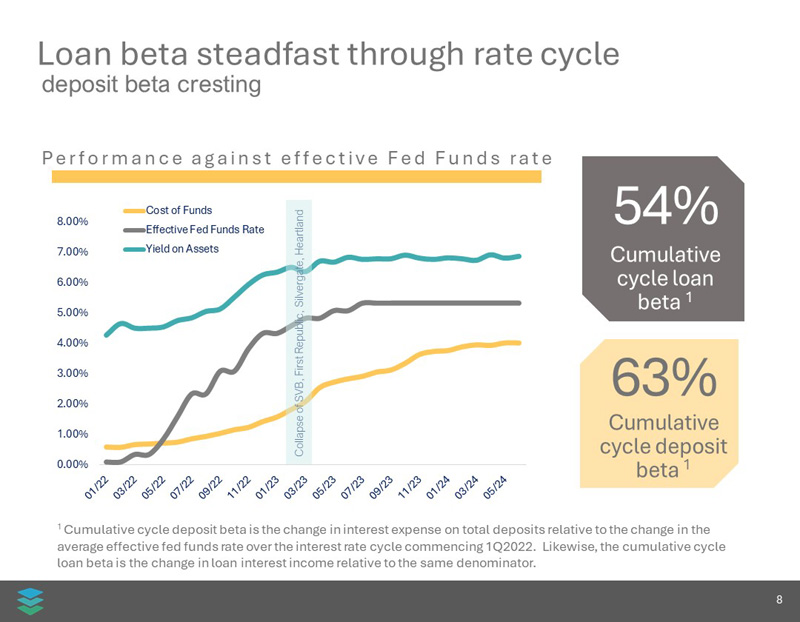
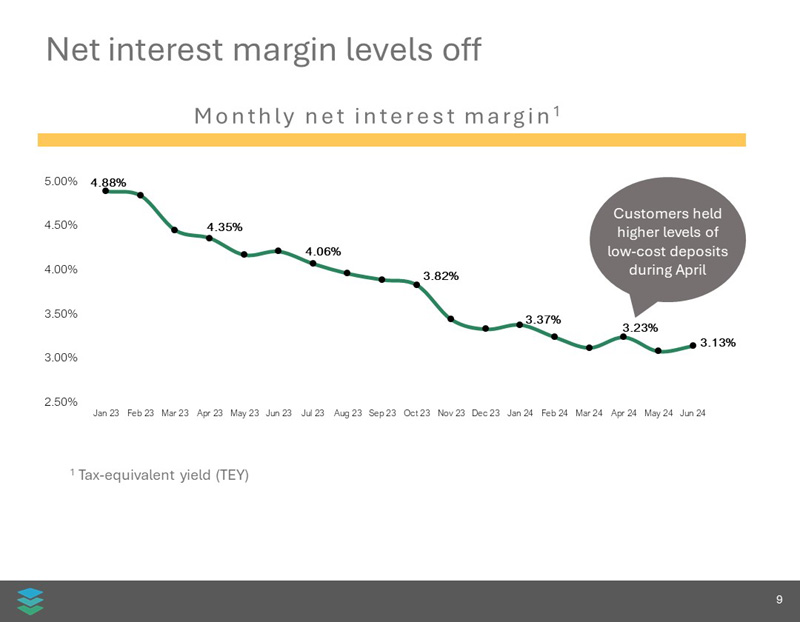
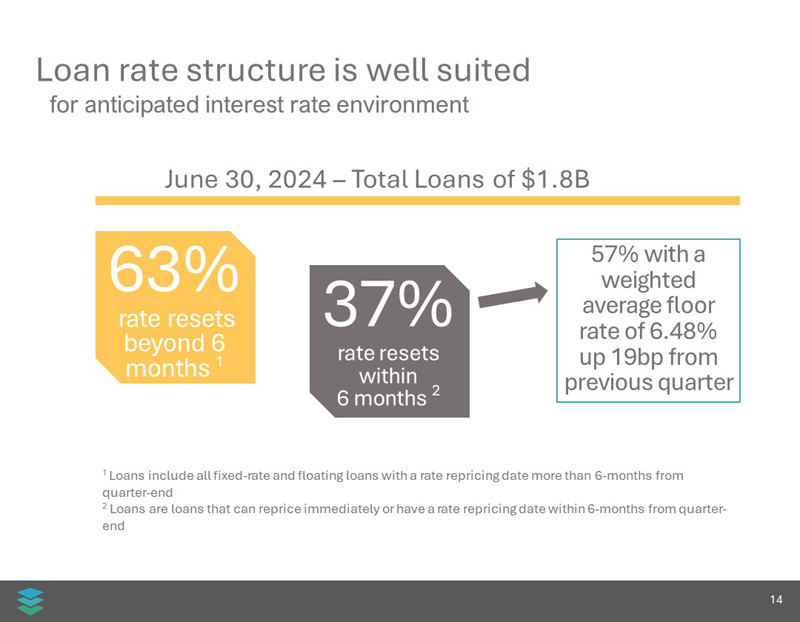
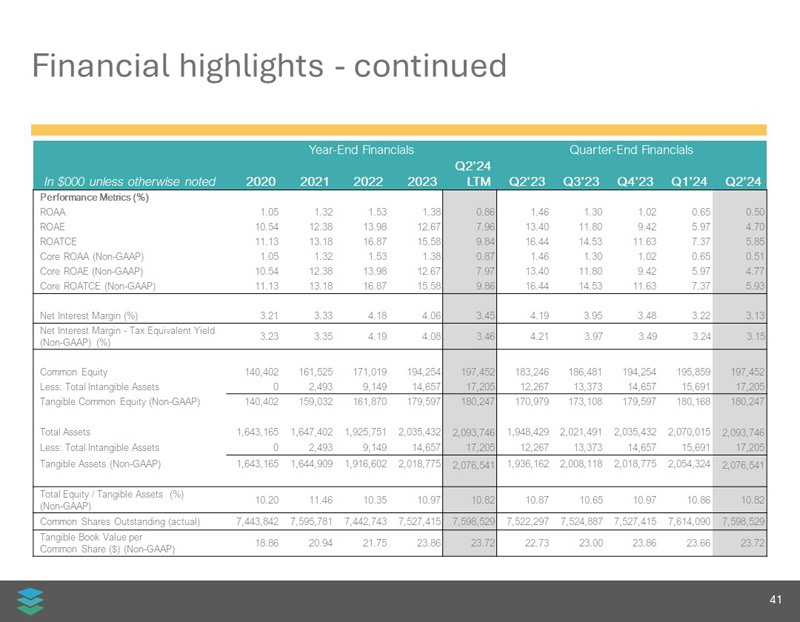
“We are now nine full quarters into the current interest rate cycle, and the entire industry has felt the effect of higher deposit costs. I’m happy to report that we experienced the softest impact this quarter, with our net interest margin settling in at a healthy 3.15%,” said Jeff W. Dick, Chairman and CEO of MainStreet Bancshares, Inc. and MainStreet Bank. “We see signs of an improving net interest margin going forward, but FOMC actions or other unforeseen externalities could affect momentum. Externalities aside, as our strategic initiatives start to bear fruit, we are confident and optimistic that the trail we have blazed to offer Banking as a Service (BaaS) will positively affect our net interest margin and our bottom line.”
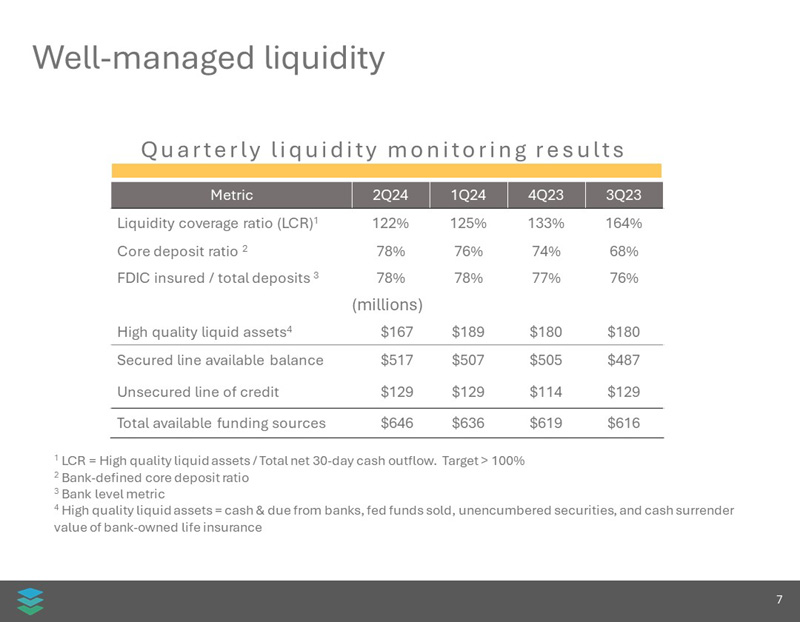
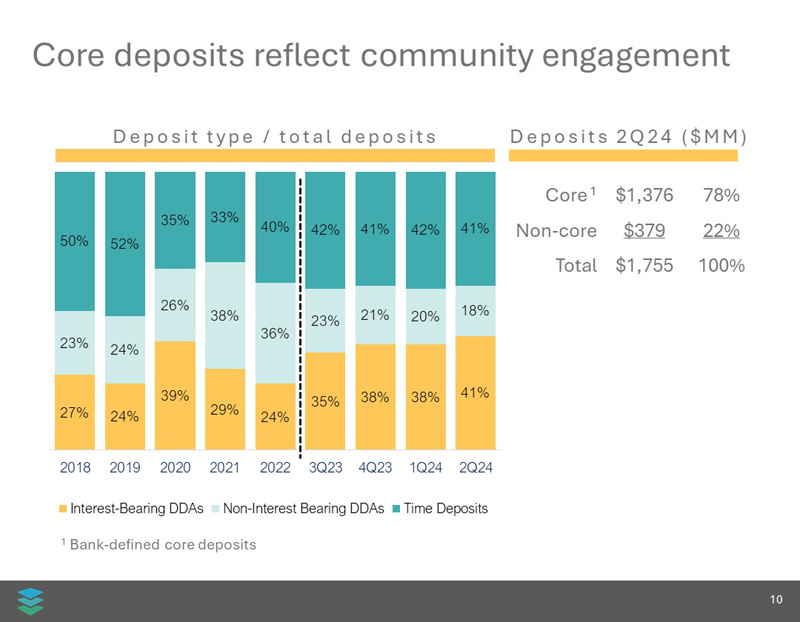
“We remain focused on caring for our customers and meeting their continuing banking and borrowing needs while judiciously adding promising new relationships,” said Abdul Hersiburane, President of MainStreet Bank. “We’ve built our core customer funding sources up to 78% of total deposits.”
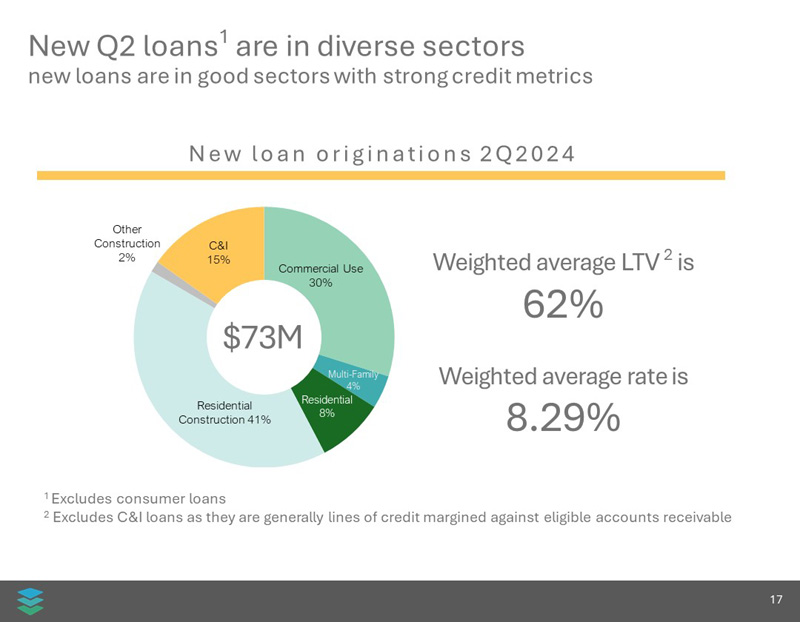
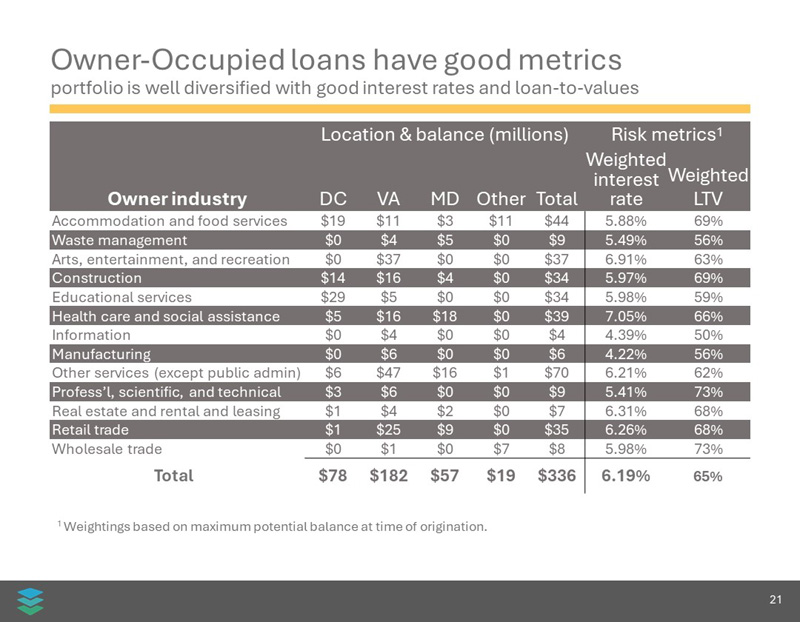
Loan growth in the second quarter was driven by a healthy rise in demand for commercial and industrial borrowing and in high-quality owner-occupied commercial real estate lending, a traditional area of strength for MainStreet Bank.
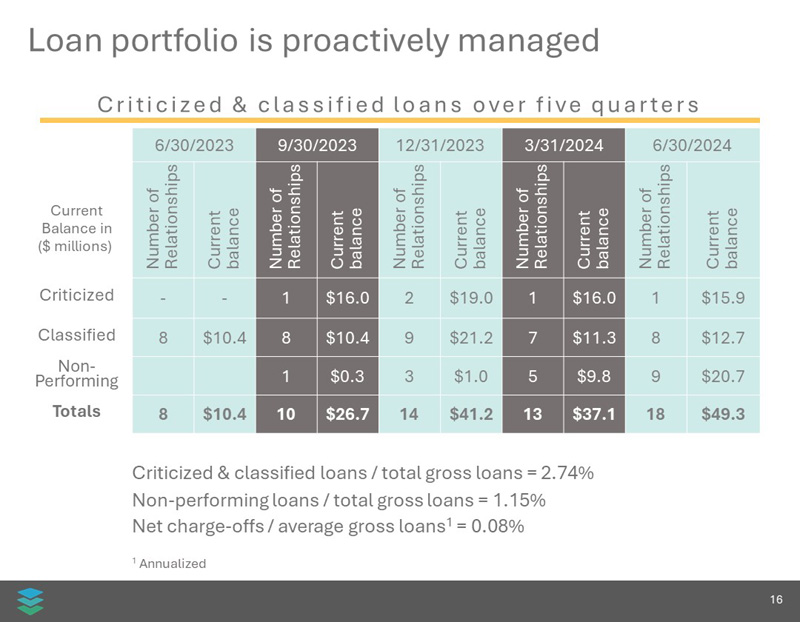
The Bank maintains a strong portfolio of earning assets, with very nominal AOCI exposure. The loan portfolio remains solid with net charge offs representing a mere eight basis points of average gross loans. Nonperforming assets account for 0.99% of total assets.
“We continue to carefully underwrite each loan opportunity and the lending team remains engaged with each borrower throughout their project lifecycle. If a borrower experiences a challenge, we work with them to face that challenge promptly and transparently,” said Tom Floyd, EVP and Chief Lending Officer at MainStreet Bank. “We have a meticulous understanding of our loan book and a rigorous risk management mindset.”
Banking-as-a-Service
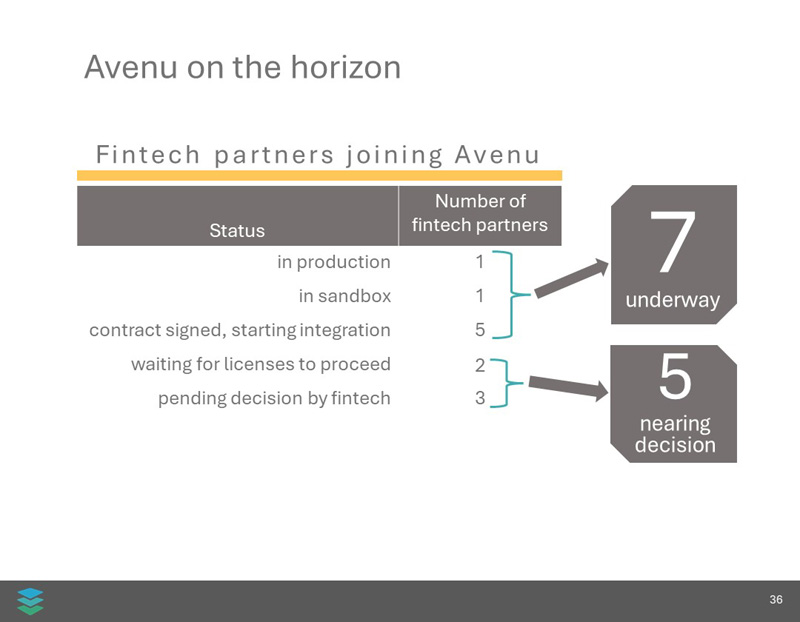
In recent months, the weaknesses of other embedded banking solutions have been exposed—to the detriment of banks, their fintech clients and their end-customers. The Avenu team digested all the lessons that could be learned from these weaknesses and is implementing final enhancements to ensure a scalable and compliance rich solution. Avenu is live and in limited production until the final enhancements are fully integrated.
Avenu
Avenu is the first and only embedded banking solution that connects our partners and their apps directly and seamlessly to our purpose-built Avenu core solution. We are not a sponsor bank without our own technology, and we are not a middleware software company without our own bank. We are Avenu, a leading financial technology company owned by an established community bank in the heart of Washington, D.C.
Avenu’s clients are fintechs, social media, application developers, money movers, and entrepreneurs. They all have one thing in common: They are innovating how money moves to solve real-world issues and help communities thrive. We are focused on servicing our community and creating long-term business relationships.
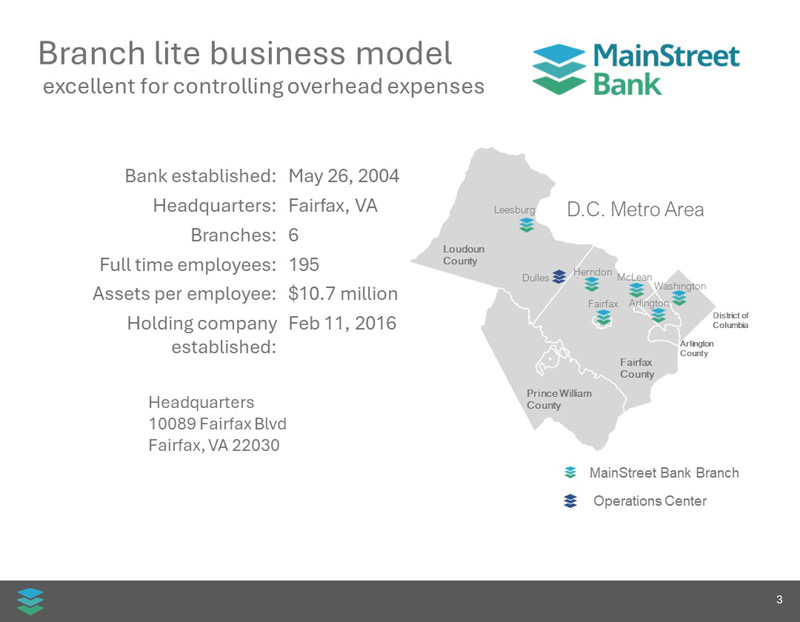
ABOUT MAINSTREET BANK: MainStreet operates six branches in Herndon, Fairfax, McLean, Leesburg, Clarendon, and Washington, D.C. MainStreet Bank has 55,000 free ATMs and a fully integrated online and mobile banking solution. The Bank is not restricted by a conventional branching system, as it can offer business customers the ability to Put Our Bank in Your Office®. With robust and easy-to-use online business banking technology, MainStreet has "put our bank" in thousands of businesses in the metropolitan area.
MainStreet Bank has a robust line of business and professional lending products, including government contracting lines of credit, commercial lines and term loans, residential and commercial construction, and commercial real estate. MainStreet also works with the SBA to offer 7A and 504 lending solutions. From sophisticated cash management to enhanced mobile banking and instant-issue Debit Cards, MainStreet Bank is always looking for ways to improve our customer's experience.
MainStreet Bank was the first community bank in the Washington, D.C., metropolitan area to offer a full online business banking solution. MainStreet Bank was also the first bank headquartered in the Commonwealth of Virginia to offer CDARS – a solution that provides multi-million-dollar FDIC insurance. Further information on the Bank can be obtained by visiting its website at mstreetbank.com.
This release contains forward-looking statements, including our expectations with respect to future events that are subject to various risks and uncertainties. The statements contained in this release that are not historical facts are forward-looking statements as defined in the Private Securities Litigation Reform Act of 1995. Words such as “may,” “will,” “could,” “should,” “expect,” “plan,” “project,” “intend,” “anticipate,” “believe,” “estimate,” “predict,” “potential,” “pursuant,” “target,” “continue,” and similar expressions are intended to identify such forward-looking statements. Factors that could cause actual results to differ materially from management's projections, forecasts, estimates and expectations include: fluctuation in market rates of interest and loan and deposit pricing, adverse changes in the overall national economy as well as adverse economic conditions in our specific market areas, future impacts of the novel coronavirus (COVID-19) outbreak, maintenance and development of well-established and valued client relationships and referral source relationships, and acquisition or loss of key production personnel. We caution readers that the list of factors above is not exclusive. The forward-looking statements are made as of the date of this release, and we may not undertake steps to update the forward-looking statements to reflect the impact of any circumstances or events that arise after the date the forward-looking statements are made. In addition, our past results of operations are not necessarily indicative of future performance.
 |
UNAUDITED CONSOLIDATED BALANCE SHEET INFORMATION
(In thousands)
|
June 30, 2024 |
March 31, 2024 |
December 31, 2023* |
September 30, 2023 |
June 30, 2023 |
||||||||||||||||
|
ASSETS |
||||||||||||||||||||
|
Cash and cash equivalents |
||||||||||||||||||||
|
Cash and due from banks |
$ | 41,697 | $ | 49,208 | $ | 53,581 | $ | 44,912 | $ | 67,700 | ||||||||||
|
Federal funds sold |
49,762 | 75,533 | 60,932 | 76,271 | 30,341 | |||||||||||||||
|
Total cash and cash equivalents |
91,459 | 124,741 | 114,513 | 121,183 | 98,041 | |||||||||||||||
|
Investment securities available for sale, at fair value |
57,605 | 58,699 | 59,928 | 56,726 | 60,579 | |||||||||||||||
|
Investment securities held to maturity, at amortized cost, net of allowance for credit losses of $0 for all periods |
16,036 | 17,251 | 17,275 | 17,565 | 17,590 | |||||||||||||||
|
Restricted equity securities, at amortized cost |
26,797 | 23,924 | 24,356 | 20,619 | 20,304 | |||||||||||||||
|
Loans, net of allowance for credit losses of $17,098, $16,531, $16,506, $15,626, and $16,047, respectively |
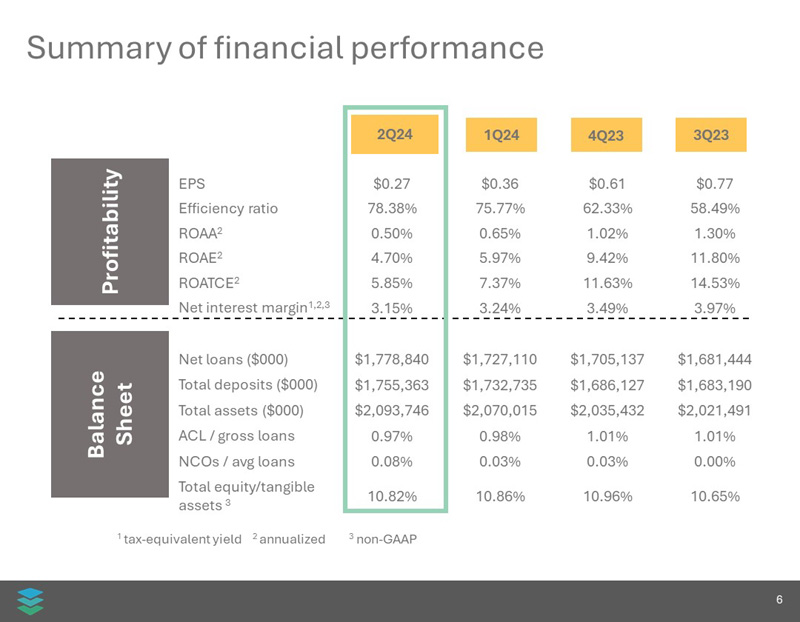
1,778,840 | 1,727,110 | 1,705,137 | 1,681,444 | 1,637,484 | |||||||||||||||
|
Premises and equipment, net |
13,787 | 14,081 | 13,944 | 14,275 | 14,427 | |||||||||||||||
|
Accrued interest and other receivables |
11,916 | 10,727 | 12,390 | 11,184 | 10,256 | |||||||||||||||
|
Computer software, net of amortization |
17,205 | 15,691 | 14,657 | 13,373 | 12,266 | |||||||||||||||
|
Bank owned life insurance |
38,901 | 38,609 | 38,318 | 38,035 | 37,763 | |||||||||||||||
|
Other assets |
41,200 | 39,182 | 34,914 | 47,087 | 40,641 | |||||||||||||||
|
Total Assets |
$ | 2,093,746 | $ | 2,070,015 | $ | 2,035,432 | $ | 2,021,491 | $ | 1,949,351 | ||||||||||
|
LIABILITIES AND STOCKHOLDERS’ EQUITY |
||||||||||||||||||||
|
Liabilities: |
||||||||||||||||||||
|
Non-interest bearing deposits |
$ | 314,636 | $ | 348,945 | $ | 364,606 | $ | 394,859 | $ | 388,992 | ||||||||||
|
Interest bearing demand deposits |
179,513 | 165,331 | 137,128 | 76,423 | 71,308 | |||||||||||||||
|
Savings and NOW deposits |
60,867 | 46,036 | 45,878 | 46,550 | 51,294 | |||||||||||||||
|
Money market deposits |
476,396 | 446,903 | 442,179 | 461,398 | 380,500 | |||||||||||||||
|
Time deposits |
723,951 | 725,520 | 696,336 | 703,960 | 701,289 | |||||||||||||||
|
Total deposits |
1,755,363 | 1,732,735 | 1,686,127 | 1,683,190 | 1,593,383 | |||||||||||||||
|
Federal funds purchased |
— | — | 15,000 | — | 30,000 | |||||||||||||||
|
Subordinated debt |
72,841 | 72,741 | 72,642 | 72,543 | 72,444 | |||||||||||||||
|
Other liabilities |
40,827 | 41,418 | 40,146 | 52,015 | 43,016 | |||||||||||||||
|
Total Liabilities |
1,869,031 | 1,846,894 | 1,813,915 | 1,807,748 | 1,738,843 | |||||||||||||||
|
Stockholders’ Equity: |
||||||||||||||||||||
|
Preferred stock |
27,263 | 27,263 | 27,263 | 27,263 | 27,263 | |||||||||||||||
|
Common stock |
29,452 | 29,514 | 29,198 | 29,188 | 29,177 | |||||||||||||||
|
Capital surplus |
66,392 | 65,940 | 65,985 | 65,407 | 64,768 | |||||||||||||||
|
Retained earnings |
109,651 | 108,334 | 106,549 | 102,694 | 97,646 | |||||||||||||||
|
Accumulated other comprehensive loss |
(8,043 | ) | (7,930 | ) | (7,478 | ) | (10,809 | ) | (8,346 | ) | ||||||||||
|
Total Stockholders’ Equity |
224,715 | 223,121 | 221,517 | 213,743 | 210,508 | |||||||||||||||
|
Total Liabilities and Stockholders’ Equity |
$ | 2,093,746 | $ | 2,070,015 | $ | 2,035,432 | $ | 2,021,491 | $ | 1,949,351 | ||||||||||
*Derived from audited financial statements
UNAUDITED CONSOLIDATED STATEMENTS OF INCOME INFORMATION
(In thousands, except share and per share data)
|
Year-to-Date |
Three Months Ended |
|||||||||||||||||||||||||||
|
June 30, 2024 |
June 30, 2023 |
June 30, 2024 |
March 31, 2024 |
December 31, 2023 |
September 30, 2023 |
June 30, 2023 |
||||||||||||||||||||||
|
INTEREST INCOME: |
||||||||||||||||||||||||||||
|
Interest and fees on loans |
$ | 62,034 | $ | 55,586 | $ | 31,546 | $ | 30,487 | $ | 30,849 | $ | 29,750 | $ | 28,855 | ||||||||||||||
|
Interest on investment securities |
||||||||||||||||||||||||||||
|
Taxable securities |
865 | 926 | 430 | 435 | 451 | 459 | 407 | |||||||||||||||||||||
|
Tax-exempt securities |
538 | 529 | 268 | 270 | 268 | 268 | 265 | |||||||||||||||||||||
|
Interest on federal funds sold |
2,264 | 2,311 | 1,083 | 1,182 | 1,510 | 1,217 | 1,179 | |||||||||||||||||||||
|
Total interest income |
65,701 | 59,352 | 33,327 | 32,374 | 33,078 | 31,694 | 30,706 | |||||||||||||||||||||
|
INTEREST EXPENSE: |
||||||||||||||||||||||||||||
|
Interest on interest bearing demand deposits |
4,032 | 594 | 2,172 | 1,860 | 1,058 | 240 | 251 | |||||||||||||||||||||
|
Interest on savings and NOW deposits |
347 | 255 | 190 | 157 | 146 | 145 | 147 | |||||||||||||||||||||
|
Interest on money market deposits |
10,816 | 4,129 | 5,638 | 5,178 | 5,639 | 4,156 | 2,926 | |||||||||||||||||||||
|
Interest on time deposits |
17,861 | 11,221 | 9,027 | 8,833 | 8,257 | 7,526 | 7,077 | |||||||||||||||||||||
|
Interest on federal funds purchased |
298 | 239 | 191 | 107 | 25 | 35 | 201 | |||||||||||||||||||||
|
Interest on Federal Home Loan Bank advances |
46 | 919 | — | 46 | 118 | 186 | 13 | |||||||||||||||||||||
|
Interest on subordinated debt |
1,640 | 1,632 | 820 | 820 | 828 | 828 | 820 | |||||||||||||||||||||
|
Total interest expense |
35,040 | 18,989 | 18,038 | 17,001 | 16,071 | 13,116 | 11,435 | |||||||||||||||||||||
|
Net interest income |
30,661 | 40,363 | 15,289 | 15,373 | 17,007 | 18,578 | 19,271 | |||||||||||||||||||||
|
Provision for (recovery of) credit losses |
443 | 921 | 638 | (195 | ) | 466 | 255 | 638 | ||||||||||||||||||||
|
Net interest income after provision for (recovery of) credit losses |
30,218 | 39,442 | 14,651 | 15,568 | 16,541 | 18,323 | 18,633 | |||||||||||||||||||||
|
NON-INTEREST INCOME: |
||||||||||||||||||||||||||||
|
Deposit account service charges |
959 | 1,125 | 490 | 469 | 510 | 514 | 535 | |||||||||||||||||||||
|
Bank owned life insurance income |
583 | 514 | 291 | 292 | 283 | 272 | 259 | |||||||||||||||||||||
|
Net loss on securities called or matured |
(48 | ) | — | (48 | ) | — | — | — | — | |||||||||||||||||||
|
Other non-interest income |
270 | 174 | 140 | 130 | 68 | 177 | 16 | |||||||||||||||||||||
|
Total non-interest income |
1,764 | 1,813 | 873 | 891 | 861 | 963 | 810 | |||||||||||||||||||||
|
NON-INTEREST EXPENSES: |
||||||||||||||||||||||||||||
|
Salaries and employee benefits |
14,972 | 14,216 | 7,484 | 7,488 | 7,129 | 6,924 | 6,595 | |||||||||||||||||||||
|
Furniture and equipment expenses |
1,875 | 1,270 | 940 | 935 | 804 | 713 | 772 | |||||||||||||||||||||
|
Advertising and marketing |
1,020 | 1,495 | 566 | 454 | 271 | 577 | 698 | |||||||||||||||||||||
|
Occupancy expenses |
849 | 912 | 415 | 435 | 397 | 375 | 426 | |||||||||||||||||||||
|
Outside services |
1,614 | 994 | 839 | 774 | 352 | 697 | 504 | |||||||||||||||||||||
|
Administrative expenses |
471 | 426 | 229 | 242 | 219 | 277 | 211 | |||||||||||||||||||||
|
Other operating expenses |
4,190 | 3,242 | 2,195 | 1,996 | 1,964 | 1,866 | 1,646 | |||||||||||||||||||||
|
Total non-interest expenses |
24,991 | 22,555 | 12,668 | 12,324 | 11,136 | 11,429 | 10,852 | |||||||||||||||||||||
|
Income before income tax expense |
6,991 | 18,700 | 2,856 | 4,135 | 6,266 | 7,857 | 8,591 | |||||||||||||||||||||
|
Income tax expense |
1,068 | 3,602 | 238 | 830 | 1,120 | 1,516 | 1,645 | |||||||||||||||||||||
|
Net income |
5,923 | 15,098 | 2,618 | 3,305 | 5,146 | 6,341 | 6,946 | |||||||||||||||||||||
|
Preferred stock dividends |
1,078 | 1,078 | 539 | 539 | 539 | 539 | 539 | |||||||||||||||||||||
|
Net income available to common shareholders |
$ | 4,845 | $ | 14,020 | $ | 2,079 | $ | 2,766 | $ | 4,607 | $ | 5,802 | $ | 6,407 | ||||||||||||||
|
Net income per common share, basic and diluted |
$ | 0.64 | $ | 1.86 | $ | 0.27 | $ | 0.36 | $ | 0.61 | $ | 0.77 | $ | 0.85 | ||||||||||||||
|
Weighted average number of common shares, basic and diluted |
7,610,188 | 7,519,949 | 7,608,389 | 7,611,990 | 7,527,327 | 7,524,332 | 7,522,764 | |||||||||||||||||||||
UNAUDITED LOAN, DEPOSIT AND BORROWING DETAIL
(In thousands)
|
June 30, 2024 |
March 31, 2024 |
June 30, 2023 |
Percentage Change |
|||||||||||||||||||||||||||||
|
$ Amount |
% of Total |
$ Amount |
% of Total |
$ Amount |
% of Total |
Last 3 Mos |
Last 12 Mos |
|||||||||||||||||||||||||
|
LOANS: |
||||||||||||||||||||||||||||||||
|
Construction and land development loans |
$ | 410,698 | 22.8 | % | $ | 408,903 | 23.4 | % | $ | 421,277 | 25.4 | % | 0.4 | % | -2.5 | % | ||||||||||||||||
|
Residential real estate loans |
449,700 | 25.0 | % | 451,991 | 25.8 | % | 410,550 | 24.7 | % | -0.5 | % | 9.5 | % | |||||||||||||||||||
|
Commercial real estate loans |
845,030 | 46.9 | % | 813,387 | 46.5 | % | 727,772 | 43.9 | % | 3.9 | % | 16.1 | % | |||||||||||||||||||
|
Commercial and industrial loans |
93,559 | 5.2 | % | 71,822 | 4.1 | % | 93,604 | 5.6 | % | 30.3 | % | 0.0 | % | |||||||||||||||||||
|
Consumer loans |
2,232 | 0.1 | % | 2,902 | 0.2 | % | 5,750 | 0.4 | % | -23.1 | % | -61.2 | % | |||||||||||||||||||
|
Total Gross Loans |
$ | 1,801,219 | 100.0 | % | $ | 1,749,005 | 100.0 | % | $ | 1,658,953 | 100.0 | % | 3.0 | % | 8.6 | % | ||||||||||||||||
|
Less: Allowance for credit losses |
(17,098 | ) | (16,531 | ) | (16,047 | ) | ||||||||||||||||||||||||||
|
Net deferred loan fees |
(5,281 | ) | (5,364 | ) | (5,422 | ) | ||||||||||||||||||||||||||
|
Net Loans |
$ | 1,778,840 | $ | 1,727,110 | $ | 1,637,484 | ||||||||||||||||||||||||||
|
DEPOSITS: |
||||||||||||||||||||||||||||||||
|
Non-interest bearing deposits |
$ | 314,636 | 17.9 | % | $ | 348,945 | 20.1 | % | $ | 388,992 | 24.4 | % | -9.8 | % | -19.1 | % | ||||||||||||||||
|
Interest-bearing deposits: |
||||||||||||||||||||||||||||||||
|
Demand deposits |
179,513 | 10.2 | % | 165,331 | 9.5 | % | 71,308 | 4.5 | % | 8.6 | % | 151.7 | % | |||||||||||||||||||
|
Savings and NOW deposits |
60,867 | 3.5 | % | 46,036 | 2.7 | % | 51,294 | 3.2 | % | 32.2 | % | 18.7 | % | |||||||||||||||||||
|
Money market accounts |
476,396 | 27.1 | % | 446,903 | 25.8 | % | 380,500 | 23.9 | % | 6.6 | % | 25.2 | % | |||||||||||||||||||
|
Certificates of deposit $250,000 or more |
473,827 | 27.0 | % | 467,892 | 27.0 | % | 406,583 | 25.5 | % | 1.3 | % | 16.5 | % | |||||||||||||||||||
|
Certificates of deposit less than $250,000 |
250,124 | 14.3 | % | 257,628 | 14.9 | % | 294,706 | 18.5 | % | -2.9 | % | -15.1 | % | |||||||||||||||||||
|
Total Deposits |
$ | 1,755,363 | 100.0 | % | $ | 1,732,735 | 100.0 | % | $ | 1,593,383 | 100.0 | % | 1.3 | % | 10.2 | % | ||||||||||||||||
|
BORROWINGS: |
||||||||||||||||||||||||||||||||
|
Federal funds purchased |
— | 0.0 | % | — | 0.0 | % | 30,000 | 29.3 | % | 0.0 | % | -100.0 | % | |||||||||||||||||||
|
Subordinated debt |
72,841 | 100.0 | % | 72,741 | 100.0 | % | 72,444 | 70.7 | % | 0.1 | % | 0.5 | % | |||||||||||||||||||
|
Total Borrowings |
$ | 72,841 | 100.0 | % | $ | 72,741 | 100.0 | % | $ | 102,444 | 100.0 | % | 0.1 | % | -28.9 | % | ||||||||||||||||
|
Total Deposits and Borrowings |
$ | 1,828,204 | $ | 1,805,476 | $ | 1,695,827 | 1.3 | % | 7.8 | % | ||||||||||||||||||||||
|
Core customer funding sources (1) |
$ | 1,376,991 | 75.3 | % | $ | 1,312,746 | 72.7 | % | $ | 1,184,958 | 69.9 | % | 4.9 | % | 16.2 | % | ||||||||||||||||
|
Brokered and listing service sources (2) |
378,372 | 20.7 | % | 419,989 | 23.3 | % | 408,425 | 24.1 | % | -9.9 | % | -7.4 | % | |||||||||||||||||||
|
Federal funds purchased |
— | 0.0 | % | — | 0.0 | % | 30,000 | 1.7 | % | 0.0 | % | -100.0 | % | |||||||||||||||||||
|
Subordinated debt (3) |
72,841 | 4.0 | % | 72,741 | 4.0 | % | 72,444 | 4.3 | % | 0.1 | % | 0.5 | % | |||||||||||||||||||
|
Total Funding Sources |
$ | 1,828,204 | 100.0 | % | $ | 1,805,476 | 100.0 | % | $ | 1,695,827 | 100.0 | % | 1.3 | % | 7.8 | % | ||||||||||||||||
|
(1) |
Includes ICS, CDARS, and reciprocal deposits maintained by customers, which represent sweep accounts tied to customer operating accounts |
|
(2) |
Consists of certificates of deposit (CD) through multiple listing services and multiple brokered deposit services, as well as ICS and CDARS one-way certificates of deposit and regional money market accounts. |
| Excludes $290.5 million in core deposits placed in reciprocal networks for FDIC insurance coverage that will be classified as brokered deposits on the call report in pursuant to rule 12 CFR 337.6(e) as of June 30, 2024. | |
|
(3) |
Subordinated debt obligation qualifies as Tier 2 capital at the holding company and Tier 1 capital at the Bank |
UNAUDITED AVERAGE BALANCE SHEETS, INTEREST AND RATES
(In thousands)
|
For the three months ended June 30, 2024 |
For the three months ended June 30, 2023 |
|||||||||||||||||||||||
|
Average Balance |
Interest Income/ Expense (3)(4) |
Average Yields/ Rate (annualized) (3)(4) |
Average Balance |
Interest Income/ Expense (3)(4) |
Average Yields/ Rate (annualized) (3)(4) |
|||||||||||||||||||
|
ASSETS: |
||||||||||||||||||||||||
|
Interest-earning assets: |
||||||||||||||||||||||||
|
Loans (1)(2) |
$ | 1,782,124 | $ | 31,546 | 7.10 | % | $ | 1,649,300 | $ | 28,855 | 7.02 | % | ||||||||||||
|
Securities: |
||||||||||||||||||||||||
|
Taxable |
55,323 | 430 | 3.12 | % | 54,270 | 407 | 3.01 | % | ||||||||||||||||
|
Tax-exempt |
36,717 | 339 | 3.71 | % | 37,876 | 335 | 3.55 | % | ||||||||||||||||
|
Federal funds and interest-bearing deposits |
84,705 | 1,083 | 5.13 | % | 87,608 | 1,179 | 5.40 | % | ||||||||||||||||
|
Total interest-earning assets |
$ | 1,958,869 | $ | 33,398 | 6.84 | % | $ | 1,829,054 | $ | 30,776 | 6.75 | % | ||||||||||||
|
Other assets |
131,656 | 83,599 | ||||||||||||||||||||||
|
Total assets |
$ | 2,090,525 | $ | 1,912,653 | ||||||||||||||||||||
|
Liabilities and Stockholders’ Equity: |
||||||||||||||||||||||||
|
Interest-bearing liabilities: |
||||||||||||||||||||||||
|
Interest-bearing demand deposits |
$ | 172,221 | $ | 2,172 | 5.06 | % | $ | 73,800 | $ | 251 | 1.36 | % | ||||||||||||
|
Savings and NOW deposits |
47,767 | 190 | 1.60 | % | 50,644 | 147 | 1.16 | % | ||||||||||||||||
|
Money market deposit accounts |
463,641 | 5,638 | 4.88 | % | 344,118 | 2,926 | 3.41 | % | ||||||||||||||||
|
Time deposits |
715,777 | 9,027 | 5.06 | % | 723,056 | 7,077 | 3.93 | % | ||||||||||||||||
|
Total interest-bearing deposits |
$ | 1,399,406 | $ | 17,027 | 4.88 | % | $ | 1,191,618 | $ | 10,401 | 3.50 | % | ||||||||||||
|
Federal funds purchased |
13,298 | 191 | 5.76 | % | 15,174 | 201 | 5.31 | % | ||||||||||||||||
|
FHLB advances |
— | — | — | 989 | 13 | 5.27 | % | |||||||||||||||||
|
Subordinated debt |
72,802 | 820 | 4.52 | % | 72,405 | 820 | 4.54 | % | ||||||||||||||||
|
Total interest-bearing liabilities |
$ | 1,485,506 | $ | 18,038 | 4.87 | % | $ | 1,280,186 | $ | 11,435 | 3.58 | % | ||||||||||||
|
Demand deposits and other liabilities |
381,825 | 424,505 | ||||||||||||||||||||||
|
Total liabilities |
$ | 1,867,331 | $ | 1,704,691 | ||||||||||||||||||||
|
Stockholders’ Equity |
223,194 | 207,962 | ||||||||||||||||||||||
|
Total Liabilities and Stockholders’ Equity |
$ | 2,090,525 | $ | 1,912,653 | ||||||||||||||||||||
|
Interest Rate Spread |
1.97 | % | 3.17 | % | ||||||||||||||||||||
|
Net Interest Income |
$ | 15,360 | $ | 19,341 | ||||||||||||||||||||
|
Net Interest Margin |
3.15 | % | 4.24 | % | ||||||||||||||||||||
|
(1) |
Includes loans classified as non-accrual |
|
(2) |
Total loan interest income includes amortization of deferred loan fees, net of deferred loan costs |
| (3) | Income and yields for all periods presented are reported on a tax-equivalent basis using the federal statutory rate of 21% |
|
(4) |
Refer to Appendix for reconciliation of non-GAAP measures |
UNAUDITED AVERAGE BALANCE SHEETS, INTEREST AND RATES
(In thousands)
|
For the six months ended June 30, 2024 |
For the six months ended June 30, 2023 |
|||||||||||||||||||||||
|
Average Balance |
Interest Income/ Expense (3)(4) |
Average Yields/ Rate (annualized) (3)(4) |
Average Balance |
Interest Income/ Expense (3)(4) |
Average Yields/ Rate (annualized) (3)(4) |
|||||||||||||||||||
|
ASSETS: |
||||||||||||||||||||||||
|
Interest-earning assets: |
||||||||||||||||||||||||
|
Loans (1)(2) |
$ | 1,755,443 | $ | 62,034 | 7.13 | % | $ | 1,624,664 | $ | 55,586 | 6.90 | % | ||||||||||||
|
Securities: |
||||||||||||||||||||||||
|
Taxable |
55,708 | 865 | 3.13 | % | 56,011 | 926 | 3.33 | % | ||||||||||||||||
|
Tax-exempt |
37,068 | 681 | 3.70 | % | 37,908 | 670 | 3.56 | % | ||||||||||||||||
|
Federal funds and interest-bearing deposits |
88,349 | 2,264 | 5.17 | % | 103,053 | 2,311 | 4.52 | % | ||||||||||||||||
|
Total interest-earning assets |
$ | 1,936,568 | $ | 65,844 | 6.86 | % | $ | 1,821,636 | $ | 59,493 | 6.59 | % | ||||||||||||
|
Other assets |
127,430 | 77,601 | ||||||||||||||||||||||
|
Total assets |
$ | 2,063,998 | $ | 1,899,237 | ||||||||||||||||||||
|
Liabilities and Stockholders’ Equity: |
||||||||||||||||||||||||
|
Interest-bearing liabilities: |
||||||||||||||||||||||||
|
Interest-bearing demand deposits |
$ | 159,234 | $ | 4,032 | 5.11 | % | $ | 78,568 | $ | 594 | 1.52 | % | ||||||||||||
|
Savings and NOW deposits |
45,993 | 347 | 1.52 | % | 51,290 | 255 | 1.00 | % | ||||||||||||||||
|
Money market deposit accounts |
448,647 | 10,816 | 4.86 | % | 284,906 | 4,129 | 2.92 | % | ||||||||||||||||
|
Time deposits |
712,898 | 17,861 | 5.05 | % | 698,384 | 11,221 | 3.24 | % | ||||||||||||||||
|
Total interest-bearing deposits |
$ | 1,366,772 | $ | 33,056 | 4.88 | % | $ | 1,113,148 | $ | 16,199 | 2.93 | % | ||||||||||||
|
Federal funds purchased |
10,386 | 298 | 5.79 | % | 9,103 | 239 | 5.29 | % | ||||||||||||||||
|
FHLB advances |
1,648 | 46 | 5.63 | % | 39,199 | 919 | 4.73 | % | ||||||||||||||||
|
Subordinated debt |
72,752 | 1,640 | 4.55 | % | 72,355 | 1,632 | 4.55 | % | ||||||||||||||||
|
Total interest-bearing liabilities |
$ | 1,451,558 | $ | 35,040 | 4.87 | % | $ | 1,233,805 | $ | 18,989 | 3.10 | % | ||||||||||||
|
Demand deposits and other liabilities |
389,792 | 460,632 | ||||||||||||||||||||||
|
Total liabilities |
$ | 1,841,350 | $ | 1,694,437 | ||||||||||||||||||||
|
Stockholders’ Equity |
222,648 | 204,800 | ||||||||||||||||||||||
|
Total Liabilities and Stockholders’ Equity |
$ | 2,063,998 | $ | 1,899,237 | ||||||||||||||||||||
|
Interest Rate Spread |
1.99 | % | 3.49 | % | ||||||||||||||||||||
|
Net Interest Income |
$ | 30,804 | $ | 40,504 | ||||||||||||||||||||
|
Net Interest Margin |
3.21 | % | 4.48 | % | ||||||||||||||||||||
|
(1) |
Includes loans classified as non-accrual |
|
(2) |
Total loan interest income includes amortization of deferred loan fees, net of deferred loan costs |
| (3) | Income and yields for all periods presented are reported on a tax-equivalent basis using the federal statutory rate of 21% |
|
(4) |
Refer to Appendix for reconciliation of non-GAAP measures |
UNAUDITED SUMMARY FINANCIAL DATA
(Dollars in thousands except per share data)
|
At or For the Three Months Ended |
At or For the Six Months Ended |
|||||||||||||||
|
June 30, |
June 30, |
|||||||||||||||
|
2024 |
2023 |
2024 |
2023 |
|||||||||||||
|
Per share Data and Shares Outstanding |
||||||||||||||||
|
Earnings per common share (basic and diluted) |
$ | 0.27 | $ | 0.85 | $ | 0.64 | $ | 1.86 | ||||||||
|
Book value per common share |
$ | 25.99 | $ | 24.36 | $ | 25.99 | $ | 24.36 | ||||||||
|
Tangible book value per common share(2) |
$ | 23.72 | $ | 22.73 | $ | 23.72 | $ | 22.73 | ||||||||
|
Weighted average common shares (basic and diluted) |
7,608,389 | 7,522,764 | 7,610,188 | 7,519,949 | ||||||||||||
|
Common shares outstanding at end of period |
7,598,529 | 7,522,297 | 7,598,529 | 7,522,297 | ||||||||||||
|
Performance Ratios |
||||||||||||||||
|
Return on average assets (annualized) |
0.50 | % | 1.46 | % | 0.58 | % | 1.60 | % | ||||||||
|
Return on average equity (annualized) |
4.70 | % | 13.40 | % | 5.36 | % | 14.87 | % | ||||||||
|
Return on average common equity (annualized) |
5.36 | % | 14.22 | % | 6.11 | % | 15.92 | % | ||||||||
|
Yield on earning assets (FTE) (2) (annualized) |
6.84 | % | 6.75 | % | 6.86 | % | 6.59 | % | ||||||||
|
Cost of interest bearing liabilities (annualized) |
4.87 | % | 3.58 | % | 4.87 | % | 3.10 | % | ||||||||
|
Net interest spread (FTE)(2) |
1.97 | % | 3.17 | % | 1.99 | % | 3.49 | % | ||||||||
|
Net interest margin (FTE)(2) (annualized) |
3.15 | % | 4.24 | % | 3.21 | % | 4.48 | % | ||||||||
|
Non-interest income as a percentage of average assets (annualized) |
0.17 | % | 0.17 | % | 0.17 | % | 0.19 | % | ||||||||
|
Non-interest expense to average assets (annualized) |
2.43 | % | 2.28 | % | 2.44 | % | 2.39 | % | ||||||||
|
Efficiency ratio(3) |
78.38 | % | 54.04 | % | 77.07 | % | 53.48 | % | ||||||||
|
Asset Quality |
||||||||||||||||
|
Allowance for credit losses (ACL) |
||||||||||||||||
|
Beginning balance, ACL - loans |
$ | 16,531 | $ | 15,435 | $ | 16,506 | $ | 14,114 | ||||||||
|
Add: recoveries |
6 | 1 | 8 | 12 | ||||||||||||
|
Less: charge-offs |
(370 | ) | (6 | ) | (511 | ) | (6 | ) | ||||||||
|
Add: provision for credit losses - loans |
931 | 617 | 1,095 | 1,032 | ||||||||||||
|
Add: current expected credit losses, nonrecurring adoption |
— | — | — | 895 | ||||||||||||
|
Ending balance, ACL - loans |
$ | 17,098 | $ | 16,047 | $ | 17,098 | $ | 16,047 | ||||||||
|
Beginning balance, reserve for unfunded commitment (RUC) |
$ | 650 | $ | 1,178 | $ | 1,009 | $ | — | ||||||||
|
Add: current expected credit losses, nonrecurring adoption |
— | — | — | 1,310 | ||||||||||||
|
Add: provision for unfunded commitments, net |
(293 | ) | 21 | (652 | ) | (111 | ) | |||||||||
|
Ending balance, RUC |
$ | 357 | $ | 1,199 | $ | 357 | $ | 1,199 | ||||||||
|
Total allowance for credit losses |
$ | 17,455 | $ | 17,246 | $ | 17,455 | $ | 17,246 | ||||||||
|
Allowance for credit losses on loans to total gross loans |
0.95 | % | 0.97 | % | 0.95 | % | 0.97 | % | ||||||||
|
Allowance for credit losses to total gross loans |
0.97 | % | 1.04 | % | 0.97 | % | 1.04 | % | ||||||||
|
Allowance for credit losses on loans to non-performing loans |
83 |
% | N/A |
83 |
% | N/A | ||||||||||
|
Net charge-offs (recoveries) to average gross loans (annualized) |
0.08 | % | 0.00 | % | 0.06 | % | 0.00 | % | ||||||||
|
Concentration Ratios |
||||||||||||||||
|
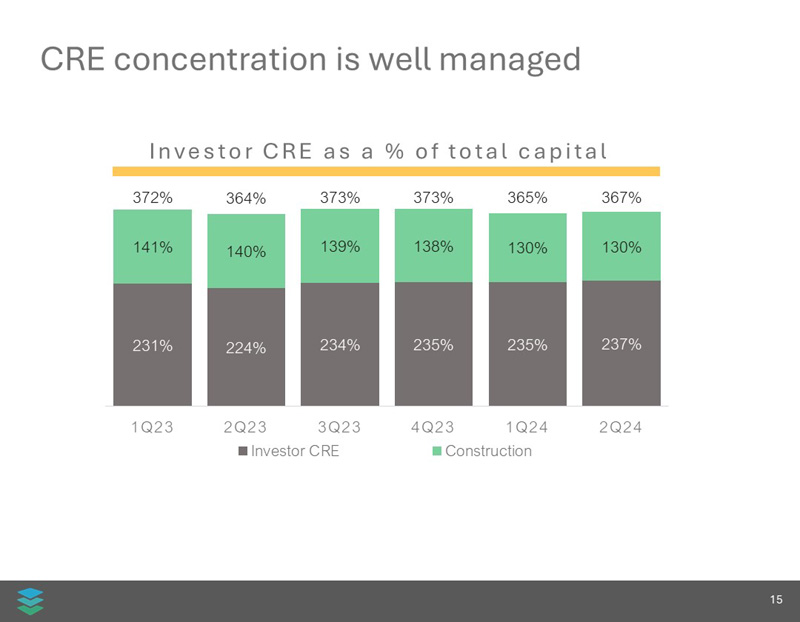
Commercial real estate loans to total capital (4) |
367.24 | % | 363.70 | % | 367.24 | % | 363.70 | % | ||||||||
|
Construction loans to total capital (5) |
130.19 | % | 139.59 | % | 130.19 | % | 139.59 | % | ||||||||
|
Non-performing Assets |
||||||||||||||||
|
Loans 30-89 days past due to total gross loans |
0.81 | % | 0.00 | % | 0.81 | % | 0.00 | % | ||||||||
|
Loans 90 days past due and accruing to total gross loans |
0.00 | % | 0.00 | % | 0.00 | % | 0.00 | % | ||||||||
|
Non-accrual loans to total gross loans |
1.15 | % | 0.00 | % | 1.15 | % | 0.00 | % | ||||||||
|
Other real estate owned |
$ | — | $ | — | $ | — | $ | — | ||||||||
|
Non-performing loans |
$ | 20,691 | $ | — | $ | 20,691 | $ | — | ||||||||
|
Non-performing assets to total assets |
0.99 | % | 0.00 | % | 0.99 | % | 0.00 | % | ||||||||
|
Regulatory Capital Ratios (Bank only) (1) |
||||||||||||||||
|
Total risk-based capital ratio |
16.78 | % | 16.79 | % | 16.78 | % | 16.79 | % | ||||||||
|
Tier 1 risk-based capital ratio |
15.85 | % | 15.83 | % | 15.85 | % | 15.83 | % | ||||||||
|
Leverage ratio |
14.22 | % | 14.81 | % | 14.22 | % | 14.81 | % | ||||||||
|
Common equity tier 1 ratio |
15.85 | % | 15.83 | % | 15.85 | % | 15.83 | % | ||||||||
|
Other information |
||||||||||||||||
|
Closing stock price |
$ | 17.73 | $ | 22.66 | $ | 17.73 | $ | 22.66 | ||||||||
|
Tangible equity / tangible assets (2) |
9.99 | % | 10.24 | % | 9.99 | % | 10.24 | % | ||||||||
|
Average tangible equity / average tangible assets (2) |
9.97 | % | 10.34 | % | 10.10 | % | 10.28 | % | ||||||||
|
Number of full time equivalent employees |
195 | 179 | 195 | 179 | ||||||||||||
|
Number of full service branch offices |
6 | 6 | 6 | 6 | ||||||||||||
|
(1) |
Regulatory capital ratios as of June 30, 2024 are preliminary |
|
(2) |
Refer to Appendix for reconciliation of non-GAAP measures |
|
(3) |
Efficiency ratio is calculated as non-interest expense as a percentage of net interest income and non-interest income |
|
(4) |
Commercial real estate includes only non-owner occupied, multifamily, and construction loans as a percentage of Bank capital |
|
(5) |
Construction loans as a percentage of Bank capital |
Unaudited Reconciliation of Certain Non-GAAP Financial Measures
(Dollars In thousands)
|
For the three months ended June 30, |
For the six months ended June 30, |
|||||||||||||||
|
2024 |
2023 |
2024 |
2023 |
|||||||||||||
|
Net interest margin (FTE) |
||||||||||||||||
|
Net interest income (GAAP) |
$ | 15,289 | $ | 19,271 | $ | 30,661 | $ | 40,363 | ||||||||
|
FTE adjustment on tax-exempt securities |
71 | 70 | 143 | 141 | ||||||||||||
|
Net interest income (FTE) (non-GAAP) |
15,360 | 19,341 | 30,804 | 40,504 | ||||||||||||
|
Average interest earning assets |
1,958,869 | 1,829,054 | 1,936,568 | 1,821,636 | ||||||||||||
|
Net interest margin (GAAP) |
3.13 | % | 4.23 | % | 3.19 | % | 4.47 | % | ||||||||
|
Net interest margin (FTE) (non-GAAP) |
3.15 | % | 4.24 | % | 3.21 | % | 4.48 | % | ||||||||
|
For the three months ended June 30, |
For the six months ended June 30, |
|||||||||||||||
|
2024 |
2023 |
2024 |
2023 |
|||||||||||||
|
Yield on earning assets (FTE) |
||||||||||||||||
|
Total interest income (GAAP) |
$ | 33,327 | $ | 30,706 | $ | 65,701 | $ | 59,352 | ||||||||
|
FTE adjustment on tax-exempt securities |
71 | 70 | 143 | 141 | ||||||||||||
|
Total interest income (FTE) (non-GAAP) |
33,398 | 30,776 | 65,844 | 59,493 | ||||||||||||
|
Average interest earning assets |
1,958,869 | 1,829,054 | 1,936,568 | 1,821,636 | ||||||||||||
|
Yield on earning assets (GAAP) |
6.82 | % | 6.73 | % | 6.84 | % | 6.57 | % | ||||||||
|
Yield on earning assets (FTE) (non-GAAP) |
6.84 | % | 6.75 | % | 6.86 | % | 6.59 | % | ||||||||
|
For the three months ended June 30, |
For the six months ended June 30, |
|||||||||||||||
|
2024 |
2023 |
2024 |
2023 |
|||||||||||||
|
Net interest spread (FTE) |
||||||||||||||||
|
Yield on earning assets (GAAP) |
6.82 | % | 6.73 | % |
6.84 |
% |
6.57 |
% | ||||||||
|
Yield on earning assets (FTE) (non-GAAP) |
6.84 | % | 6.75 | % |
6.86 |
% |
6.59 |
% | ||||||||
|
Yield on interest-bearing liabilities (GAAP) |
4.87 | % | 3.58 | % |
4.87 |
% | 3.10 | % | ||||||||
|
Net interest spread (GAAP) |
1.95 | % | 3.15 | % |
1.97 |
% |
3.47 |
% | ||||||||
|
Net interest spread (FTE) (non-GAAP) |
1.97 | % | 3.17 | % | 1.99 | % |
3.49 |
% | ||||||||
|
As of June 30, |
As of June 30, |
|||||||||||||||
|
2024 |
2023 |
2024 |
2023 |
|||||||||||||
|
Tangible common stockholders' equity |
||||||||||||||||
|
Total stockholders equity (GAAP) |
$ | 224,715 | $ | 210,508 | $ | 224,715 | $ | 210,508 | ||||||||
|
Less: intangible assets |
(17,205 | ) | (12,266 | ) | (17,205 | ) | (12,266 | ) | ||||||||
|
Tangible stockholders' equity (non-GAAP) |
207,510 | 198,242 | $ | 207,510 | $ | 198,242 | ||||||||||
|
Less: preferred stock |
(27,263 | ) | (27,263 | ) | (27,263 | ) | (27,263 | ) | ||||||||
|
Tangible common stockholders' equity (non-GAAP) |
180,247 | 170,979 | 180,247 | 170,979 | ||||||||||||
|
Common shares outstanding |
7,598,529 | 7,522,297 | 7,598,529 | 7,522,297 | ||||||||||||
|
Tangible book value per common share (non-GAAP) |
$ | 23.72 | $ | 22.73 | $ | 23.72 | $ | 22.73 | ||||||||
|
As of June 30, |
As of June 30, |
|||||||||||||||
|
2024 |
2023 |
2024 |
2023 |
|||||||||||||
|
Stockholders equity, adjusted |
||||||||||||||||
|
Total stockholders equity (GAAP) |
$ | 224,715 | $ | 210,508 | $ | 224,715 | $ | 210,508 | ||||||||
|
Less: intangible assets |
(17,205 | ) | (12,266 | ) | (17,205 | ) | (12,266 | ) | ||||||||
|
Total tangible stockholders equity (non-GAAP) |
207,510 | 198,242 | 207,510 | 198,242 | ||||||||||||
|
As of June 30, |
As of June 30, |
|||||||||||||||
|
2024 |
2023 |
2024 |
2023 |
|||||||||||||
|
Total tangible assets |
||||||||||||||||
|
Total assets (GAAP) |
$ | 2,093,746 | $ | 1,949,351 | $ | 2,093,746 | $ | 1,949,351 | ||||||||
|
Less: intangible assets |
(17,205 | ) | (12,266 | ) | (17,205 | ) | (12,266 | ) | ||||||||
|
Total tangible assets (non-GAAP) |
2,076,541 | 1,937,085 | 2,076,541 | 1,937,085 | ||||||||||||
|
For the three months ended June 30, |
For the six months ended June 30, |
|||||||||||||||
|
2024 |
2023 |
2024 |
2023 |
|||||||||||||
|
Average tangible stockholders' equity |
||||||||||||||||
|
Total average stockholders' equity (GAAP) |
$ | 223,194 | $ | 207,962 | $ | 222,648 | $ | 204,800 | ||||||||
|
Less: average intangible assets |
(16,386 | ) | (11,284 | ) | (15,732 | ) | (10,585 | ) | ||||||||
|
Total average tangible stockholders' equity (non-GAAP) |
206,808 | 196,678 | 206,916 | 194,215 | ||||||||||||
|
For the three months ended June 30, |
For the six months ended June 30, |
|||||||||||||||
|
2024 |
2023 |
2024 |
2023 |
|||||||||||||
|
Average tangible assets |
||||||||||||||||
|
Total average assets (GAAP) |
$ | 2,090,525 | $ | 1,912,653 | $ | 2,063,998 | $ | 1,899,237 | ||||||||
|
Less: average intangible assets |
(16,386 | ) | (11,284 | ) | (15,732 | ) | (10,585 | ) | ||||||||
|
Total average tangible assets (non-GAAP) |
2,074,139 | 1,901,369 | 2,048,266 | 1,888,652 | ||||||||||||
Exhibit 99.2