UNITED STATES
SECURITIES AND EXCHANGE COMMISSION
Washington, D.C. 20549
FORM 10-Q
| ☒ |
QUARTERLY REPORT PURSUANT TO SECTION 13 OR 15(d) OF THE SECURITIES EXCHANGE ACT OF 1934 |
|
|
For the quarterly period ended March 31, 2024 |
| OR | |
| ☐ |
TRANSITION REPORT PURSUANT TO SECTION 13 OR 15(d) OF THE SECURITIES EXCHANGE ACT OF 1934 |
Commission file number:001-34743
|
|

|
|
| HALLADOR ENERGY COMPANY (www.halladorenergy.com) | ||
| Colorado (State of incorporation) |
|
84-1014610 (IRS Employer Identification No.) |
|
|
|
|
| 1183 East Canvasback Drive, Terre Haute, Indiana (Address of principal executive offices) |
|
47802 (Zip Code) |
Registrant’s telephone number, including area code: 812.299.2800
| Securities registered pursuant to Section 12(b) of the Act: | ||||
| Title of each class |
|
Trading Symbol |
|
Name of each exchange on which registered |
| Common Shares, $.01 par value |
|
HNRG |
|
Nasdaq |
Indicate by check mark whether the registrant (1) has filed all reports required to be filed by Section 13 or 15(d) of the Securities Exchange Act of 1934 during the preceding 12 months (or for such shorter period that the registrant was required to file such reports), and (2) has been subject to such filing requirements for the past 90 days. Yes ☑ No ☐
Indicate by check mark whether the registrant has submitted electronically every Interactive Data File required to be submitted pursuant to Rule 405 of Regulations S-T (§ 232.405 of this chapter) during the preceding 12 months (or for such shorter period that the registrant was required to submit such files). Yes ☑ No ☐
Indicate by check mark whether the registrant is a large accelerated filer, an accelerated filer, a non-accelerated filer, a smaller reporting company, or an emerging growth company. See the definitions of "large accelerated filer," "accelerated filer," "smaller reporting company," and "emerging growth company" in Rule 12b-2 of the Exchange Act.
| Large accelerated filer ☐ |
|
Accelerated filer ☑ |
| Non-accelerated filer ☐ |
|
Smaller reporting company ☑ |
|
|
|
Emerging growth company ☐ |
If an emerging growth company, indicate by check mark if the registrant has elected not to use the extended transition period for complying with any new or revised financial accounting standards provided pursuant to Section 13(a) of the Exchange Act. ☐
Indicate by check mark whether the registrant is a shell company (as defined in Rule 12b-2 of the Exchange Act). Yes ☐ No ☑
As of May 1, 2024, we had 37,027,196 shares of common stock outstanding.
| ITEM 2. MANAGEMENT’S DISCUSSION AND ANALYSIS OF FINANCIAL CONDITION AND RESULTS OF OPERATIONS |
|
| ITEM 3. QUANTITATIVE AND QUALITATIVE DISCLOSURES ABOUT MARKET RISK |
|
| SIGNATURES | 28 |
PART I - FINANCIAL INFORMATION
ITEM 1. FINANCIAL STATEMENTS
Hallador Energy Company
Condensed Consolidated Balance Sheets
(in thousands, except per share data)
(unaudited)
| March 31, |
December 31, |
|||||||
| 2024 |
2023 |
|||||||
| ASSETS |
||||||||
| Current assets: |
||||||||
| Cash and cash equivalents |
$ | 1,635 | $ | 2,842 | ||||
| Restricted cash |
4,737 | 4,281 | ||||||
| Accounts receivable |
14,228 | 19,937 | ||||||
| Inventory |
29,688 | 23,075 | ||||||
| Parts and supplies |
40,360 | 38,877 | ||||||
| Prepaid expenses |
2,614 | 2,262 | ||||||
| Total current assets |
93,262 | 91,274 | ||||||
| Property, plant and equipment: |
||||||||
| Land and mineral rights |
115,486 | 115,486 | ||||||
| Buildings and equipment |
537,921 | 537,131 | ||||||
| Mine development |
161,669 | 158,642 | ||||||
| Finance lease right-of-use assets |
16,178 | 12,346 | ||||||
| Total property, plant and equipment |
831,254 | 823,605 | ||||||
| Less - accumulated depreciation, depletion and amortization |
(348,783 | ) | (334,971 | ) | ||||
| Total property, plant and equipment, net |
482,471 | 488,634 | ||||||
| Investment in Sunrise Energy |
2,562 | 2,811 | ||||||
| Other assets |
7,125 | 7,061 | ||||||
| Total assets |
$ | 585,420 | $ | 589,780 | ||||
| LIABILITIES AND STOCKHOLDERS' EQUITY |
||||||||
| Current liabilities: |
||||||||
| Current portion of bank debt, net |
$ | 24,438 | $ | 24,438 | ||||
| Notes payable - related party |
5,000 | — | ||||||
| Accounts payable and accrued liabilities |
47,125 | 62,908 | ||||||
| Current portion of lease financing |
4,958 | 3,933 | ||||||
| Deferred revenue |
41,242 | 23,062 | ||||||
| Contract liability - power purchase agreement and capacity payment reduction |
41,662 | 43,254 | ||||||
| Total current liabilities |
164,425 | 157,595 | ||||||
| Long-term liabilities: |
||||||||
| Bank debt, net |
49,343 | 63,453 | ||||||
| Convertible notes payable |
10,000 | 10,000 | ||||||
| Convertible notes payable - related party |
1,000 | 9,000 | ||||||
| Long-term lease financing |
9,701 | 8,157 | ||||||
| Deferred revenue |
5,434 | — | ||||||
| Deferred income taxes |
8,625 | 9,235 | ||||||
| Asset retirement obligations |
14,934 | 14,538 | ||||||
| Contract liability - power purchase agreement |
36,229 | 47,425 | ||||||
| Other |
1,871 | 1,789 | ||||||
| Total long-term liabilities |
137,137 | 163,597 | ||||||
| Total liabilities |
301,562 | 321,192 | ||||||
| Commitments and contingencies |
||||||||
| Stockholders' equity: |
||||||||
| Preferred stock, $.10 par value, 10,000 shares authorized; none issued |
— | — | ||||||
| Common stock, $.01 par value, 100,000 shares authorized; 36,534 and 34,052 issued and outstanding, as of March 31, 2024 and December 31, 2023, respectively |
365 | 341 | ||||||
| Additional paid-in capital |
144,490 | 127,548 | ||||||
| Retained earnings |
139,003 | 140,699 | ||||||
| Total stockholders’ equity |
283,858 | 268,588 | ||||||
| Total liabilities and stockholders’ equity |
$ | 585,420 | $ | 589,780 | ||||
See accompanying notes to the condensed consolidated financial statements.
Condensed Consolidated Statements of Operations
(in thousands, except per share data)
(unaudited)
| Three Months Ended March 31, |
||||||||
| 2024 |
2023 |
|||||||
| SALES AND OPERATING REVENUES: |
||||||||
| Electric sales |
$ | 58,755 | $ | 92,392 | ||||
| Coal sales |
49,630 | 94,602 | ||||||
| Other revenues |
1,287 | 1,340 | ||||||
| Total sales and operating revenues |
109,672 | 188,334 | ||||||
| EXPENSES: |
||||||||
| Operating expenses |
85,083 | 133,521 | ||||||
| Depreciation, depletion and amortization |
15,443 | 17,976 | ||||||
| Asset retirement obligations accretion |
399 | 451 | ||||||
| Exploration costs |
70 | 206 | ||||||
| General and administrative |
5,944 | 6,947 | ||||||
| Total operating expenses |
106,939 | 159,101 | ||||||
| INCOME FROM OPERATIONS |
2,733 | 29,233 | ||||||
| Interest expense (1) |
(3,937 | ) | (3,899 | ) | ||||
| Loss on extinguishment of debt |
(853 | ) | — | |||||
| Equity method investment (loss) income |
(249 | ) | 69 | |||||
| NET INCOME (LOSS) BEFORE INCOME TAXES |
(2,306 | ) | 25,403 | |||||
| INCOME TAX EXPENSE (BENEFIT): |
||||||||
| Current |
— | 432 | ||||||
| Deferred |
(610 | ) | 2,920 | |||||
| Total income tax expense (benefit) |
(610 | ) | 3,352 | |||||
| NET INCOME (LOSS) |
$ | (1,696 | ) | $ | 22,051 | |||
| NET INCOME (LOSS) PER SHARE: |
||||||||
| Basic |
$ | (0.05 | ) | $ | 0.67 | |||
| Diluted |
$ | (0.05 | ) | $ | 0.61 | |||
| WEIGHTED AVERAGE SHARES OUTSTANDING |
||||||||
| Basic |
34,816 | 32,983 | ||||||
| Diluted |
34,816 | 36,740 | ||||||
| (1) Interest Expense: |
||||||||
| Interest on bank debt |
$ | 2,805 | $ | 2,255 | ||||
| Other interest |
728 | 432 | ||||||
| Amortization: |
||||||||
| Amortization of debt issuance costs |
404 | 1,212 | ||||||
| Total amortization |
404 | 1,212 | ||||||
| Total interest expense |
$ | 3,937 | $ | 3,899 | ||||
See accompanying notes to the condensed consolidated financial statements.
Condensed Consolidated Statements of Cash Flows
(in thousands)
(unaudited)
| Three Months Ended March 31, |
||||||||
| 2024 |
2023 |
|||||||
| CASH FLOWS FROM OPERATING ACTIVITIES: |
||||||||
| Net income (loss) |
$ | (1,696 | ) | $ | 22,051 | |||
| Adjustments to reconcile net income to net cash provided by operating activities: |
||||||||
| Deferred income taxes |
(610 | ) | 2,920 | |||||
| Equity loss (income) – Sunrise Energy |
249 | (69 | ) | |||||
| Cash distribution - Sunrise Energy |
— | 625 | ||||||
| Depreciation, depletion, and amortization |
15,443 | 17,976 | ||||||
| Loss on extinguishment of debt |
853 | — | ||||||
| Loss (gain) on sale of assets |
(24 | ) | 21 | |||||
| Amortization of debt issuance costs |
404 | 1,212 | ||||||
| Asset retirement obligations accretion |
399 | 451 | ||||||
| Cash paid on asset retirement obligation reclamation |
(639 | ) | (365 | ) | ||||
| Stock-based compensation |
666 | 1,220 | ||||||
| Amortization of contract asset and contract liabilities |
(12,788 | ) | (15,569 | ) | ||||
| Other |
937 | 451 | ||||||
| Change in operating assets and liabilities: |
||||||||
| Accounts receivable |
5,709 | (3,269 | ) | |||||
| Inventory |
(6,613 | ) | (4,004 | ) | ||||
| Parts and supplies |
(1,483 | ) | (2,926 | ) | ||||
| Prepaid expenses |
(37 | ) | 389 | |||||
| Accounts payable and accrued liabilities |
(8,015 | ) | 2,009 | |||||
| Deferred revenue |
23,614 | 2,989 | ||||||
| Net cash provided by operating activities |
16,369 | 26,112 | ||||||
| CASH FLOWS FROM INVESTING ACTIVITIES: |
||||||||
| Capital expenditures |
(14,874 | ) | (13,482 | ) | ||||
| Proceeds from sale of equipment |
24 | 15 | ||||||
| Net cash used in investing activities |
(14,850 | ) | (13,467 | ) | ||||
| CASH FLOWS FROM FINANCING ACTIVITIES: |
||||||||
| Payments on bank debt |
(26,500 | ) | (27,013 | ) | ||||
| Payments on lease financing |
(1,238 | ) | — | |||||
| Borrowings of bank debt |
12,000 | 17,000 | ||||||
| Proceeds from sale and leaseback arrangement |
1,927 | — | ||||||
| Issuance of related party notes payable |
5,000 | — | ||||||
| Debt issuance costs |
(38 | ) | (1,600 | ) | ||||
| ATM offering |
6,580 | — | ||||||
| Taxes paid on vesting of RSUs |
(1 | ) | (1,109 | ) | ||||
| Net cash used in financing activities |
(2,270 | ) | (12,722 | ) | ||||
| Decrease in cash, cash equivalents, and restricted cash |
(751 | ) | (77 | ) | ||||
| Cash, cash equivalents, and restricted cash, beginning of period |
7,123 | 6,426 | ||||||
| Cash, cash equivalents, and restricted cash, end of period |
$ | 6,372 | $ | 6,349 | ||||
| CASH, CASH EQUIVALENTS, AND RESTRICTED CASH: |
||||||||
| Cash and cash equivalents |
$ | 1,635 | $ | 2,441 | ||||
| Restricted cash |
4,737 | 3,908 | ||||||
| $ | 6,372 | $ | 6,349 | |||||
| SUPPLEMENTAL CASH FLOW INFORMATION: |
||||||||
| Cash paid for interest |
$ | 3,083 | $ | 3,116 | ||||
| SUPPLEMENTAL NON-CASH FLOW INFORMATION: |
||||||||
| Change in capital expenditures included in accounts payable and prepaid expense |
$ | (5,290 | ) | $ | 120 | |||
| Stock issued on redemption of convertible notes and interest |
$ | 9,721 | $ | — | ||||
See accompanying notes to the condensed consolidated financial statements.
Condensed Consolidated Statements of Stockholders’ Equity
(in thousands)
(unaudited)
| Additional |
Total |
|||||||||||||||||||
| Common Stock Issued |
Paid-in |
Retained |
Stockholders' |
|||||||||||||||||
| Shares |
Amount |
Capital |
Earnings |
Equity |
||||||||||||||||
| Balance, December 31, 2023 |
34,052 | $ | 341 | $ | 127,548 | $ | 140,699 | $ | 268,588 | |||||||||||
| Stock-based compensation |
— | — | 666 | — | 666 | |||||||||||||||
| Stock issued on vesting of RSUs |
321 | 3 | (3 | ) | — | — | ||||||||||||||
| Taxes paid on vesting of RSUs |
(132 | ) | (1 | ) | — | — | (1 | ) | ||||||||||||
| Stock issued on redemption of convertible notes |
1,582 | 15 | 9,706 | — | 9,721 | |||||||||||||||
| Stock issued in ATM offering |
711 | 7 | 6,573 | — | 6,580 | |||||||||||||||
| Net loss |
— | — | — | (1,696 | ) | (1,696 | ) | |||||||||||||
| Balance, March 31, 2024 |
36,534 | $ | 365 | $ | 144,490 | $ | 139,003 | $ | 283,858 | |||||||||||
| Additional |
Total |
|||||||||||||||||||
| Common Stock Issued |
Paid-in |
Retained |
Stockholders' |
|||||||||||||||||
| Shares |
Amount |
Capital |
Earnings |
Equity |
||||||||||||||||
| Balance, December 31, 2022 |
32,983 | $ | 330 | $ | 118,788 | $ | 95,906 | $ | 215,024 | |||||||||||
| Stock-based compensation |
— | — | 1,220 | — | 1,220 | |||||||||||||||
| Stock issued on vesting of RSUs |
275 | 3 | (3 | ) | — | — | ||||||||||||||
| Taxes paid on vesting of RSUs |
(121 | ) | (1 | ) | (1,108 | ) | — | (1,109 | ) | |||||||||||
| Net income |
— | — | — | 22,051 | 22,051 | |||||||||||||||
| Balance, March 31, 2023 |
33,137 | $ | 332 | $ | 118,897 | $ | 117,957 | $ | 237,186 | |||||||||||
See accompanying notes to the condensed consolidated financial statements.
Notes to Condensed Consolidated Financial Statements
(unaudited)
| (1) |
GENERAL BUSINESS |
The interim financial data is unaudited; however, in our opinion, it includes all adjustments, consisting only of normal recurring adjustments necessary for a fair statement of the results for the interim periods. The condensed consolidated financial statements included herein have been prepared pursuant to the Securities and Exchange Commission’s (the "SEC") rules and regulations; accordingly, certain information and footnote disclosures normally included in generally accepted accounting principles ("GAAP") financial statements have been condensed or omitted.
The results of operations and cash flows for the three months ended March 31, 2024, are not necessarily indicative of the results to be expected for future quarters or for the year ending December 31, 2024.
Our organization and business, the accounting policies we follow, and other information are contained in the notes to our consolidated financial statements filed as part of our 2023 Annual Report on Form 10-K. This quarterly report should be read in conjunction with such Annual Report on Form 10-K.
The condensed consolidated financial statements include the accounts of Hallador Energy Company (hereinafter known as “we, us, or our”) and its wholly owned subsidiaries Sunrise Coal, LLC ("Sunrise"), Hallador Power Company, LLC ("Hallador Power"), as well as Sunrise and Hallador Power's wholly owned subsidiaries. All significant intercompany accounts and transactions have been eliminated.
We strategically view and manage our operations through two reportable segments: Electric Operations and Coal Operations. The remainder of our operations, which are not significant enough on a stand-alone basis to warrant treatment as an operating segment, are presented as "Corporate and Other and Eliminations" and primarily are comprised of unallocated corporate costs and activities, the elimination of coal sales from coal operations to electric operations, a 50% interest in Sunrise Energy, LLC, a private gas exploration company with operations in Indiana, which we account for using the equity method, and our wholly-owned subsidiary Summit Terminal LLC, a logistics transport facility located on the Ohio River.
The Electric Operations reportable segment includes electric power generation facilities of the Merom Power Plant.
The Coal Operations reportable segment includes current operating mining complexes Oaktown 1 and 2 underground mines, Prosperity surface mine, Freelandville surface mine, and Carlisle wash plant. On February 23, 2024, our Coal Operations Segment committed to a reorganization effort designed to strengthen its financial and operational efficiency and create significant operational savings and higher margins. For further information, see “Note 16 – Organizational Restructuring” below.
| (2) |
RECENT ACCOUNTING PRONOUNCEMENTS NOT YET ADOPTED |
In November 2023, the Financial Accounting Standards Board ("FASB") issued Accounting Standards Update ("ASU") 2023-07, Segment Reporting (Topic 280): Improvements to Reportable Segment Disclosures ("ASU 2023-07"). ASU 2023-07 primarily requires enhanced disclosures about significant segment expenses regularly provided to the chief operating decision maker ("CODM"), the amount and composition of other segment items, and the title and position of the CODM. ASU 2023-07 is effective for fiscal years beginning after December 15, 2023, and interim periods within fiscal years beginning after December 15, 2024, with early adoption permitted. We are currently evaluating the impact of adopting ASU 2023-07, but do not expect it to have a material effect on our consolidated financial statements.
In December 2023, the FASB issued ASU 2023-09, Income Taxes (Topic 740): Improvements to Income Tax Disclosures ("ASU 2023-09"). ASU 2023-09 primarily requires enhanced disclosures to (1) disclose specific categories in the rate reconciliation, (2) disclose the amount of income taxes paid and expensed disaggregated by federal, state, and foreign taxes, with further disaggregation by individual jurisdictions if certain criteria are met, and (3) disclose income (loss) from continuing operations before income tax (benefit) disaggregated between domestic and foreign. ASU 2023-09 is effective for fiscal years beginning after December 15, 2024, with early adoption permitted. We are currently evaluating the impact of adopting ASU 2023-09, but do not expect it to have a material effect on our consolidated financial statements.
| (3) |
LONG-LIVED ASSET IMPAIRMENTS |
Long-lived assets are reviewed for impairment whenever events or changes in circumstance indicate that the carrying amount of the assets may not be recoverable. For the three-month periods ended March 31, 2024 and March 31, 2023, there were no impairment charges recorded for long-lived assets.
| (4) |
INVENTORY |
Inventory is valued at a lower of cost or net realizable value (NRV). As of March 31, 2024, and December 31, 2023, coal inventory includes NRV adjustments of $1.3 million and $2.0 million, respectively.
| (5) |
BANK DEBT |
On March 13, 2023, we executed an amendment to our credit agreement with PNC Bank, National Association (in its capacity as administrative agent, "PNC"), administrative agent for our lenders under our credit agreement, which was accounted for as a debt modification. The primary purpose of the amendment was to convert $35.0 million of the outstanding balance on the revolver into a new term loan with a maturity of March 31, 2024, and extend the maturity date of the revolver to May 31, 2024. The amendment reduced the total capacity under the revolver to $85.0 million from $120.0 million, waived the maximum annual capital expenditure covenant for 2022, and increased the covenant for 2023 to $75.0 million.
On August 2, 2023, we executed an additional amendment to our credit agreement with PNC, which was accounted for as a debt extinguishment. The primary purpose of the amendment was to convert $65.0 million of the outstanding funded debt into a new term loan with a maturity of March 31, 2026, and enter into a revolver of $75.0 million with a maturity of July 31, 2026. The amendment increased the maximum annual capital expenditure limit to $100.0 million.
Bank debt was reduced by $14.5 million during the three months ended March 31, 2024. Under the terms of the August 2, 2023 amendment, bank debt is comprised of term debt ($58.5 million as of March 31, 2024) and a $75.0 million revolver ($18.5 million borrowed as of March 31, 2024). The term debt requires quarterly payments of $6.5 million in April 2024 through maturity. Our debt is recorded at amortized cost, which approximates fair value due to the variable interest rates in the agreement and is collateralized primarily by our assets.
Liquidity
As of March 31, 2024, we had an additional borrowing capacity of $37.9 million and total liquidity of $39.5 million. Our additional borrowing capacity is net of $18.6 million in outstanding letters of credit as of March 31, 2024, that were required to maintain surety bonds. Liquidity consists of our additional borrowing capacity and cash and cash equivalents.
Fees
Unamortized bank fees and other costs incurred in connection with the initial facility and subsequent amendments totaled $2.5 million as of December 31, 2022. During 2023, we recognized a loss on extinguishment of debt of $1.5 million for the write-off of unamortized loan fees related to the August 2, 2023 amendment to our credit agreement, which was accounted for as a debt extinguishment. Unamortized bank fees incurred with the March 13, 2023 and August 2, 2023 amendments totaled $1.6 million and $4.3 million, respectively. The remaining costs were deferred and are being amortized over the term of the loan. Unamortized costs as of March 31, 2024, and December 31, 2023, were $3.2 million and $3.6 million, respectively.
Bank debt, less debt issuance costs, is presented below (in thousands):
| March 31, |
December 31, |
|||||||
| 2024 |
2023 |
|||||||
| Current bank debt |
$ | 26,000 | $ | 26,000 | ||||
| Less unamortized debt issuance cost |
(1,562 | ) | (1,562 | ) | ||||
| Net current portion |
$ | 24,438 | $ | 24,438 | ||||
| Long-term bank debt |
$ | 51,000 | $ | 65,500 | ||||
| Less unamortized debt issuance cost |
(1,657 | ) | (2,047 | ) | ||||
| Net long-term portion |
$ | 49,343 | $ | 63,453 | ||||
| Total bank debt |
$ | 77,000 | $ | 91,500 | ||||
| Less total unamortized debt issuance cost |
(3,219 | ) | (3,609 | ) | ||||
| Net bank debt |
$ | 73,781 | $ | 87,891 | ||||
Covenants
The credit facility includes a Maximum Leverage Ratio (consolidated funded debt/trailing twelve months adjusted EBITDA), calculated as of the end of each fiscal quarter for the trailing twelve months, not to exceed 2.25 to 1.00.
As of March 31, 2024, our Leverage Ratio of 1.58 was in compliance with the requirements of the credit agreement.
The credit facility requires a Minimum Debt Service Coverage Ratio (consolidated adjusted EBITDA/annual debt service) calculated as of the end of each fiscal quarter for the trailing twelve months of 1.25 to 1.00 through the credit facility's maturity. As of March 31, 2024, our Debt Service Coverage Ratio of 2.88 was in compliance with the requirements of the credit agreement.
As of March 31, 2024, we were in compliance with all other covenants defined in the credit agreement.
Interest Rate
The interest rate on the facility ranges from SOFR plus 4.00% to SOFR plus 5.00%, depending on our Leverage Ratio. As of March 31, 2024, we were paying SOFR plus 4.50% on the outstanding bank debt which equates to an all in rate of 10.0%.
| (6) |
ACCOUNTS PAYABLE AND ACCRUED LIABILITIES (IN THOUSANDS) |
| March 31, |
December 31, |
|||||||
| 2024 |
2023 |
|||||||
| Accounts payable |
$ | 28,947 | $ | 43,636 | ||||
| Accrued property taxes |
3,458 | 2,987 | ||||||
| Accrued payroll |
4,620 | 6,575 | ||||||
| Workers' compensation reserve |
4,306 | 3,629 | ||||||
| Group health insurance |
2,200 | 2,300 | ||||||
| Asset retirement obligation - current portion |
1,514 | 2,150 | ||||||
| Other |
2,080 | 1,631 | ||||||
| Total accounts payable and accrued liabilities |
$ | 47,125 | $ | 62,908 | ||||
| (7) |
REVENUE |
Revenue from Contracts with Customers
We account for a contract with a customer when the parties have approved the contract and are committed to performing their respective obligations, the rights of each party are identified, payment terms are identified, the contract has commercial substance, and it is probable substantially all the consideration will be collected. We recognize revenue when we satisfy a performance obligation by transferring control of a good or service to a customer.
Electric operations
We concluded that for a Power Purchase Agreement (“PPA”) that is not determined to be a lease or derivative, the definition of a contract and the criteria in ASC 606, Revenue from Contracts with Customers ("ASC 606"), is met at the time a PPA is executed by the parties, as this is the point at which enforceable rights and obligations are established. Accordingly, we concluded that a PPA that is not determined to be a lease or derivative constitutes a valid contract under ASC 606.
We recognize revenue daily, based on an output method of capacity made available as part of any stand-ready obligations for contract capacity performance obligations and daily, based on an output method of MWh of electricity delivered.
For the delivered energy performance obligation in the PPA with Hoosier, we recognize revenue daily for actual delivered electricity plus the amortization of the contract liability as a result of the Asset Purchase Agreement with Hoosier. For delivered energy to all other customers, we recognize revenue daily for the actual delivered electricity.
Coal operations
Our coal revenue is derived from sales to customers of coal produced at our facilities. Our customers typically purchase coal directly from our mine sites where the sale occurs and where title, risk of loss, and control pass to the customer at that point. Our customers arrange for and bear the costs of transporting their coal from our mines to their plants or other specified discharge points. Our customers are typically domestic utility companies. Our coal sales agreements with our customers are fixed-priced, fixed-volume supply contracts, or include a pre-determined escalation in price for each year. Price re-opener and index provisions may allow either party to commence a renegotiation of the contract price at a pre-determined time. Price re-opener provisions may automatically set a new price based on the prevailing market price or, in some instances, require us to negotiate a new price, sometimes within specified ranges of prices. The terms of our coal sales agreements result from competitive bidding and extensive negotiations with customers. Consequently, the terms of these contracts vary by customer.
Coal sales agreements will typically contain coal quality specifications. With coal quality specifications in place, the raw coal sold by us to the customer at the delivery point must be substantially free of magnetic material and other foreign material impurities and crushed to a maximum size as set forth in the respective coal sales agreement. Price adjustments are made and billed in the month the coal sale was recognized based on quality standards that are specified in the coal sales agreement, such as Btu factor, moisture, ash, and sulfur content, and can result in either increases or decreases in the value of the coal shipped.
Disaggregation of Revenue
Revenue is disaggregated by revenue source for our electric operations and by primary geographic markets for our coal operations, as we believe this best depicts how the nature, amount, timing, and uncertainty of our revenue and cash flows are affected by economic factors.
Coal operations
For the three months ended March 31, 2024 and 2023, 36% and 52%, respectively, of our coal revenue was sold to outside third-party customers in the State of Indiana with the remainder sold to customers in Florida, North Carolina, Georgia, and Alabama.
Performance Obligations
Electric operations
We concluded that each megawatt-hour ("MWh") of delivered energy is capable of being distinct as a customer could benefit from each on its own by using/consuming it as a part of its operations. We also concluded that the stand-ready obligation to be available to provide electricity is capable of being distinct as each unit of capacity provides an economic benefit to the holder and could be sold by the customer.
During 2022, we entered into an Asset Purchase Agreement (“APA”) with Hoosier (“Hoosier APA”) in which Hallador Power shall sell, and Hoosier shall buy, at least 70% of the delivered energy quantities through 2025 at the contract price, which is $34.00 per MWh. We have remaining delivered energy obligations to Hoosier totaling $99.3 million through 2025 as of March 31, 2024. The agreement was amended August 31, 2023 to extend through 2028 with additional obligations to Hoosier of $186.6 million as of March 31, 2024.
In addition to delivered energy, under the Hoosier APA, Hallador Power shall provide a stand-ready obligation to provide electricity, also known as contract capacity. The contract capacity that Hallador Power shall provide to Hoosier is 917 megawatts (“MW”) for contract year one, and on average 300 MW for contract years two to four. Hoosier shall pay Hallador Power the capacity price of $5.80 per kilowatt month for the contract capacity. We have remaining capacity obligations to Hoosier through 2025 totaling $35.2 million as of March 31, 2024. The agreement was amended August 31, 2023 to extend through 2028 with additional capacity obligations to Hoosier of $60.9 million as of March 31, 2024.
We also have energy and capacity obligations outside of the Hoosier APA to customers through 2029 totaling $111.97 million and $163.51 million, respectively, as of March 31, 2024. We have $46.7 million of deferred revenue as of March 31, 2024, related to these obligations.
Coal operations
A performance obligation is a promise in a contract with a customer to provide distinct goods or services. Performance obligations are the unit of account for purposes of applying the revenue recognition standard and therefore determine when and how revenue is recognized. In most of our coal contracts, the customer contracts with us to provide coal that meets certain quality criteria. We consider each ton of coal a separate performance obligation and allocate the transaction price based on the base price per the contract, increased or decreased for quality adjustments.
We recognize revenue at a point in time as the customer does not have control over the asset at any point during the fulfillment of the contract. For substantially all of our customers, this is supported by the fact that title and risk of loss transfer to the customer upon loading of the truck or railcar at the mine. This is also the point at which physical possession of the coal transfers to the customer, as well as the right to receive substantially all benefits and the risk of loss in ownership of the coal.
We have remaining coal sales performance obligations relating to fixed priced contracts to third-party customers of approximately $270.2 million, which represents the average fixed prices on our committed contracts as of March 31, 2024. We expect to recognize approximately 47% of this coal sales revenue in 2024, with the remainder recognized through 2027.
We have remaining performance obligations relating to coal sales contracts with price reopeners of approximately $155.0 million, which represents our estimate of the expected reopener price on committed contracts as of March 31, 2024. We expect to recognize all of this coal sales revenue 2025 through 2027.
The coal tons used to determine the remaining performance obligations are subject to adjustment in instances of force majeure and exercise of customer options to either take additional tons or reduce tonnage if such an option exists in the customer contract.
Contract Balances
Under ASC 606, the timing of when a performance obligation is satisfied can affect the presentation of accounts receivable, contract assets, and contract liabilities. The main distinction between accounts receivable and contract assets is whether consideration is conditional on something other than the passage of time. A receivable is an entity’s right to consideration that is unconditional.
Under the typical payment terms of our contracts with customers, the customer pays us a base price for the coal, increased or decreased for any quality adjustments, electricity, or capacity. Amounts billed and due are recorded as trade accounts receivable and included in accounts receivable in our condensed consolidated balance sheets. As of January 1, 2023, accounts receivable for coal sales billed to customers was $16.3 million.
| (8) |
INCOME TAXES |
For the three months ended March 31, 2024 and 2023, we recorded income taxes using an estimated annual effective tax rate based upon projected annual income, forecasted permanent tax differences, discrete items, and statutory rates in states in which we operate. The effective tax rate for the three months ended March 31. 2024 and 2023, was ~26% and ~ 13%, respectively. Historically, our actual effective tax rates have differed from the statutory effective rate primarily due to the benefit received from statutory percentage depletion in excess of tax basis. The deduction for statutory percentage depletion does not necessarily change proportionately to changes in income (loss) before income taxes.
| STOCK COMPENSATION PLANS |
| Non-vested grants as of December 31, 2023 |
858,363 | |||
| Awarded - weighted average share price on award date was $8.41 |
1,500 | |||
| Vested - weighted average share price on vested date was $5.33 |
(321,419 | ) | ||
| Forfeited |
(28,000 | ) | ||
| Non-vested grants as of March 31, 2024 |
510,444 |
For the three months ended March 31, 2024 and 2023, our stock compensation was $0.7 million and $1.2 million, respectively.
Non-vested RSU grants will vest as follows:
| Vesting Year |
RSUs Vesting |
|||
| 2024 |
1,000 | |||
| 2025 |
509,444 | |||
| 510,444 | ||||
The outstanding RSUs have a value of $2.7 million based on the March 28, 2024 closing stock price of $5.33.
As of March 31, 2024, unrecognized stock compensation expense is $3.3 million, and we had 611,035 RSUs available for future issuance. RSUs are not allocated earnings and losses as they are considered non-participating securities.
| (10) |
LEASES |
During the fourth quarter of 2023, we entered into three finance leases which were accounted for as failed sale-leaseback transactions. During the three months ended March 31, 2024, we entered into two finance leases with the same terms that were also accounted for as failed sale-leaseback transactions. Finance lease assets are included in finance lease right-of-use assets on the condensed consolidated balance sheets and the associated finance lease liabilities are reflected within current portion of lease financing and long-term lease financing on the condensed consolidated balance sheets as applicable. Depreciation on our finance lease assets was $1.1 million for the three months ended March 31, 2024. Imputed interest expense on our lease liabilities was $0.3 million for the three months ended March 31, 2024. We deferred financing fees of $0.1 million at March 31, 2024 and December 31, 2023, respectively, in connection with entry into the finance leases. These deferred financing fees will be amortized on a straight-line basis over the term of the finance leases. We did not have finance leases during the three months ended March 31, 2023.
The following table (in thousands) relates to our leases:
| Three Months Ended March 31, |
||||||||
| 2024 |
2023 |
|||||||
| Operating lease information: |
||||||||
| Operating cash outflows from operating leases |
$ | 52 | $ | 52 | ||||
| Weighted average remaining lease term in years |
7.80 | 1.10 | ||||||
| Weighted average discount rate |
10.0 | % | 6.0 | % | ||||
| Finance lease information: |
||||||||
| Financing cash outflows from finance leases |
$ | 1,238 | — | |||||
| Proceeds from sale and leaseback arrangement |
$ | 1,927 | — | |||||
| Weighted average remaining lease term in years |
2.82 | — | ||||||
| Weighted average discount rate |
8.5 | % | — | % | ||||
Future minimum lease payments under non-cancellable leases as of March 31, 2024, were as follows:
| Operating |
Finance |
|||||||
| Leases |
Leases |
|||||||
| (In thousands) |
||||||||
| 2024 |
$ | 33 | $ | 4,569 | ||||
| 2025 |
88 | 6,092 | ||||||
| 2026 |
121 | 5,780 | ||||||
| 2027 |
124 | 241 | ||||||
| 2028 |
128 | — | ||||||
| Thereafter |
516 | — | ||||||
| Total minimum lease payments |
$ | 1,010 | $ | 16,682 | ||||
| Less imputed interest and deferred finance fees |
(335 | ) | (2,023 | ) | ||||
| Total lease liability |
$ | 675 | $ | 14,659 | ||||
As reflected within the following balance sheet line items:
| Three Months Ended March 31, |
For the Year Ended December 31, |
||||||||
| 2024 |
2023 |
||||||||
| (In thousands) |
|||||||||
| Operating lease assets |
Buildings and equipment |
$ | 675 | $ | 712 | ||||
| Operating lease liabilities: |
|||||||||
| Current operating lease liabilities |
Accounts payable and accrued liabilities |
$ | 52 | $ | 58 | ||||
| Non-current operating lease liabilities |
Other long-term liabilities |
623 | 654 | ||||||
| Total operating lease liability |
$ | 675 | $ | 712 | |||||
| Finance lease assets |
Finance lease right-of-use assets |
$ | 16,178 | $ | 12,346 | ||||
| Finance lease liabilities: |
|||||||||
| Current finance lease liabilities |
Current portion of lease financing |
$ | 4,958 | $ | 3,933 | ||||
| Non-current finance lease liabilities |
Long-term lease financing |
9,701 | 8,157 | ||||||
| Total finance lease liabilities |
$ | 14,659 | $ | 12,090 | |||||
As of March 31, 2024 and December 31, 2023, we had approximately $0.7 million, respectively, of right-of-use operating lease assets recorded within “buildings and equipment” on the condensed consolidated balance sheets.
| (11) |
SELF-INSURANCE |
We self-insure our non-leased underground mining equipment. Such equipment is allocated among seven mining units dispersed over eleven miles. The historical cost of such equipment was approximately $262.0 million as of March 31, 2024, and December 31, 2023.
Restricted cash of $4.7 million and $4.3 million as of March 31, 2024, and December 31, 2023, respectively, represents cash held and controlled by a third party and is restricted for future workers’ compensation claim payments.
| (12) |
FAIR VALUE MEASUREMENTS |
We account for certain assets and liabilities at fair value. The hierarchy below lists three levels of fair value based on the extent to which inputs used in measuring fair value are observable in the market. We categorize each of our fair value measurements in one of these three levels based on the lowest level input that is significant to the fair value measurement in its entirety. These levels are:
Level 1: Unadjusted quoted prices in active markets that are accessible at the measurement date for identical, unrestricted assets or liabilities. We consider active markets as those in which transactions for the assets or liabilities occur in sufficient frequency and volume to provide pricing information on an ongoing basis. We have no Level 1 instruments.
Level 2: Quoted prices in markets that are not active, or inputs that are observable, either directly or indirectly, for substantially the full term of the asset or liability. We have no Level 2 instruments.
Level 3: Measured based on prices or valuation models that require inputs that are both significant to the fair value measurement and less observable from objective sources (i.e., supported by little or no market activity). ARO liabilities use Level 3 non-recurring fair value measures.
| (13) |
EQUITY METHOD INVESTMENTS |
We own a 50% interest in Sunrise Energy, LLC, which owns gas reserves and gathering equipment with plans to develop and operate such reserves. Sunrise Energy, LLC, also plans to develop and explore for oil, natural gas, and coal-bed methane gas reserves on or near our underground coal reserves. The carrying value of the investment included in our condensed consolidated balance sheets as of March 31, 2024, and December 31, 2023, was $2.6 million and $2.8 million, respectively.
| (14) |
CONVERTIBLE NOTES |
On July 29, 2022, we issued $5.0 million of senior unsecured convertible notes (collectively, with the subsequent 2022 issuances, the ("Notes”)) to a related party affiliated with an independent member of our board of directors. The Note carries an interest rate of 8% per annum with a maturity date of December 29, 2028. For the period August 18, 2022, through August 17, 2024, the holder has the option to convert the Note into shares of the Company's common stock at a conversion price of $6.254. During the three months ended March 31, 2024, the holders of the $5.0 million senior unsecured convertible notes converted them into 799,488 shares of common stock of the Company and, in connection with such early conversion, we elected to pay interest through August 2025 with 112,570 shares of common stock on the conversion date. We recorded a loss on extinguishment of debt in the condensed consolidated statements of operations in the amount of $0.55 million during the three months ended March 31, 2024.
On August 8, 2022, we issued an additional $4.0 million of senior unsecured convertible notes to related parties affiliated with independent members of our board of directors. The Notes carry an interest rate of 8% per annum with a maturity date of December 29, 2028. For the period August 18, 2022, through August 17, 2024, the holder has the option to convert the Notes into shares of the Company's common stock at a conversion price of $6.254. Beginning August 8, 2025, we may elect to redeem the Note and the holder shall be obligated to surrender the Note at 100% of the outstanding principal balance together with any accrued unpaid interest. Upon receipt of the redemption notice from the Company, the holder may elect to convert the principal balance and accrued interest into the Company's common stock. During the three months ended March 31, 2024, the holders converted $3.0 million senior unsecured convertible notes into 479,693 shares of common stock of the Company and, in connection with such early conversion, we elected to pay interest through August 2025 with 67,542 shares of common stock on the conversion date. During the same period, the holders also converted accrued interest into 57,564 shares of the Company's common stock. We recorded a loss on extinguishment of debt in the condensed consolidated statements of operations in the amount of $0.30 million during the three months ended March 31, 2024.
On August 12, 2022, we issued an additional $10.0 million senior unsecured convertible note to an unrelated party. The Note carries an interest rate of 8% per annum with a maturity date of December 31, 2026. For the period August 18, 2022, through the maturity date, the holder has the option to convert the Note into shares of the Company's common stock at a conversion price of $6.15. Beginning August 12, 2025, we may elect to redeem the Note and the holder shall be obligated to surrender the Note at 100% of the outstanding principal balance together with any accrued unpaid interest. Upon receipt of the redemption notice from the Company, the holder may elect to convert the principal balance and accrued interest into the Company's common stock. During the three months ended March 31, 2024, the holder converted accrued interest into 65,041 shares of the Company's common stock.
The funds received from the issuance of the various Notes described above were used to provide additional working capital to the Company. The conversion price and number of shares of the Company's common stock issuable upon conversion of the above notes are subject to adjustment from time to time for any subdivision or consolidation of our shares of common stock and other standard dilutive events.
| (15) |
NOTES PAYABLE - RELATED PARTIES |
In March 2024, we issued unsecured promissory notes, having a 12-month maturity date and 12% per annum interest rate, to (i) Charles R. Wesley IV Revocable Trust (in which our director Charles R. Wesley IV has a pecuniary interest) in the principal amount of $2,000,000, (ii) Lubar Opportunities Fund I, LLC (in which are our director David J. Lubar has a pecuniary interest) in the principal amount of $2,500,000, and (iii) Hallador Alternative Investment Advisors LLC (in which our director David C. Hardie has a pecuniary interest) in the principal amount of $500,000.
At March 31, 2024, accrued interest associated with the notes payable – related party on the condensed consolidated balance sheets was $0.1 million.
| (16) |
ORGANIZATIONAL RESTRUCTURING |
On February 23, 2024, (the "Effective Date"), we committed to a reorganization effort in the Coal Operations Segment (the "Reorganization Plan") that included a workforce reduction of approximately 110 employees, or approximately 12% of the workforce. The reduction in workforce was communicated to employees on the Effective Date and implemented immediately, subject to certain administrative procedures. The Reorganization Plan is designed to strengthen our financial and operational efficiency and create significant operational savings and higher margins in our coal segment. This step will help to advance our transition from a company primarily focused on coal production to a more resilient and diversified integrated independent power producer ("IPP"). As part of this initiative, we substantially idled production at our higher cost surface mines, Prosperity Mine, and Freelandville Mine, with minimal production. We also focused our seven units of underground equipment on four units of our lowest cost production at our Oaktown Mine. In connection with the Reorganization Plan, we incurred an aggregate of $1.9 million one-time charges, of which $0.8 million were included in accounts payable and accrued liabilities in the condensed consolidated balance sheets and $1.1 million were included in operating expenses in the condensed consolidated statements of operations. The one-time charges were related to compensation, tax, professional, and insurance related expenses.
| (17) |
AT MARKET AGREEMENT |
On December 18, 2023, we entered into an At Market Issuance Sales Agreement (the “Sales Agreement”) with B. Riley Securities, Inc. (the “Agent”), pursuant to which we may issue and sell, from time to time, shares (the “Shares”) of our common stock, par value $0.01 per share (the “Common Stock”), with aggregate gross proceeds of up to $50.0 million through an “at-the-market” equity offering program under which the Agent will act as sales agent (the “ATM Program”). Under the Sales Agreement, each of us have the right, by giving five (5) days’ notice, to terminate the Sales Agreement in its sole discretion. The Agent may also terminate the Agreement, by notice to us, upon the occurrence of certain events described in the Sales Agreement.
During December 2023, we issued 794,000 shares of Common Stock under the ATM Program for net proceeds of $7.3 million. During the three months ended March 31, 2024, we issued 710,623 shares of Common Stock under the ATM Program for net proceeds of $6.6 million.
| (18) |
SEGMENTS OF BUSINESS |
As of March 31, 2024, our operations are divided into two primary reportable segments, the Electric Operations and Coal Operations segments. The remainder of our operations, which are not significant enough on a stand-alone basis to warrant treatment as an operating segment, are presented as "Corporate and Other and Eliminations" and primarily are comprised of unallocated corporate costs and activities, including a 50% interest in Sunrise Energy, LLC, which the Company accounts for using the equity method and our wholly-owned subsidiary Summit Terminal LLC, a logistics transport facility located on the Ohio River.
| Three Months Ended March 31, |
||||||||
| 2024 |
2023 |
|||||||
| (in thousands) |
||||||||
| Operating revenues |
||||||||
| Electric operations |
$ | 58,912 | $ | 92,494 | ||||
| Coal operations |
66,870 | 95,273 | ||||||
| Corporate and other and eliminations |
(16,110 | ) | 567 | |||||
| Consolidated operating revenues |
$ | 109,672 | $ | 188,334 | ||||
| Income (loss) from operations |
||||||||
| Electric operations |
$ | 15,247 | $ | 18,705 | ||||
| Coal operations |
(11,457 | ) | 13,088 | |||||
| Corporate and other and eliminations |
(1,057 | ) | (2,560 | ) | ||||
| Consolidated income (loss) from operations |
$ | 2,733 | $ | 29,233 | ||||
| Depreciation, depletion and amortization |
||||||||
| Electric operations |
$ | 4,697 | $ | 4,675 | ||||
| Coal operations |
10,728 | 13,275 | ||||||
| Corporate and other and eliminations |
18 | 26 | ||||||
| Consolidated depreciation, depletion and amortization |
$ | 15,443 | $ | 17,976 | ||||
| Assets |
||||||||
| Electric operations |
$ | 211,116 | $ | 218,132 | ||||
| Coal operations |
370,292 | 391,248 | ||||||
| Corporate and other and eliminations |
4,012 | 7,247 | ||||||
| Consolidated assets |
$ | 585,420 | $ | 616,627 | ||||
| Capital expenditures |
||||||||
| Electric operations |
$ | 6,242 | $ | 843 | ||||
| Coal operations |
8,632 | 12,639 | ||||||
| Corporate and other and eliminations |
— | — | ||||||
| Consolidated capital expenditures |
$ | 14,874 | $ | 13,482 | ||||
| (19) |
NET INCOME (LOSS) PER SHARE |
The following table (in thousands, except per share amounts) sets forth the computation of basic earnings per share for the periods presented:
| Three Months Ended March 31, |
||||||||
| 2024 |
2023 |
|||||||
| Basic earnings per common share: |
||||||||
| Net income (loss) - basic |
$ | (1,696 | ) | $ | 22,051 | |||
| Weighted average shares outstanding - basic |
34,816 | 32,983 | ||||||
| Basic earnings (loss) per common share |
$ | (0.05 | ) | $ | 0.67 | |||
| The following table (in thousands, except per share amounts) sets forth the computation of diluted net income (loss) per share: |
||||||||
| Three Months Ended March 31, |
||||||||
| 2024 |
2023 |
|||||||
| Diluted earnings per common share: |
||||||||
| Net income (loss) - basic |
$ | (1,696 | ) | $ | 22,051 | |||
| Add: Convertible Notes interest expense, net of tax |
— | 293 | ||||||
| Net income (loss) - diluted |
$ | (1,696 | ) | $ | 22,344 | |||
| Weighted average shares outstanding - basic |
34,816 | 32,983 | ||||||
| Add: Dilutive effects of if converted Convertible Notes |
— | 3,163 | ||||||
| Add: Dilutive effects of Restricted Stock Units |
— | 594 | ||||||
| Weighted average shares outstanding - diluted |
34,816 | 36,740 | ||||||
| Diluted net income (loss) per share |
$ | (0.05 | ) | $ | 0.61 | |||
ITEM 2. MANAGEMENT’S DISCUSSION AND ANALYSIS OF FINANCIAL CONDITION AND RESULTS OF OPERATIONS
THE FOLLOWING DISCUSSION UPDATES THE MD&A SECTION OF OUR 2023 ANNUAL REPORT ON FORM 10-K AND SHOULD BE READ IN CONJUNCTION THEREWITH.
Our condensed consolidated financial statements should be read in conjunction with this discussion. The following analysis includes a discussion of metrics on a per mega-watt hour (MWh) and a per ton basis as derived from the condensed consolidated financial statements, which are considered non-GAAP measurements. These metrics are significant factors in assessing our operating results and profitability.
Throughout the first quarter, we continued our progress on transitioning the focus of Hallador from a coal production company to an integrated independent power producer (“IPP”). During the first three months of 2024, our Electric Operation's revenue exceeded that of our Coal Operation's revenue. Additionally, we were successful in adding approximately $138.0 million in forward energy and capacity sales, growing our Electric Operation’s forward sales book to approximately $657.0 million as of March 31, 2024. This represents 44% of Hallador’s $1.5 billion in total forward energy, capacity, and coal sales through 2029 (on a segment basis). However, we truly believe future sales from our Electric Operations will soon eclipse our sales revenues from our Coal Operations. Since January, we have evaluated and continue to evaluate several major power and capacity sales opportunities, including one proposal that if contracted would result in more than a billion dollars’ worth of potential forward power sales. We continue to see strong indicators that demand, and pricing remain on an upward trend, and this direction is paramount to our ongoing evaluations of these sales opportunities. Monitoring the equity markets strengthens our belief that investors in other IPPs are also anticipating similar increases in power demand, demonstrated most clearly through the more than doubling of market capitalizations of several of those IPPs across the previous twelve months. In support of our expectation that Hallador Power sales will continue to exceed our traditional Sunrise Coal subsidiary, we anticipate changing Hallador's SIC code to 4911 (electric services) from 1220 (bituminous coal producer) in the future.
While we have seen continued weakness in spot power prices thus far in 2024, indicators for future power pricing appear much healthier. We believe these indicators are supported by both our forward power book pricing and the most recent future power curves. Additionally, natural gas future’s prices are in contango, meaning future gas prices exceed spot gas prices that have been depressing overall power prices for the last several quarters. As we discussed last quarter, the dynamics of the natural gas market paired with the non-standard mild weather throughout the Midwest impacted pricing and our power plant dispatch rates. Future prices seem to indicate easing on both these fronts which we view as a positive for our go-forward operations.
This quarter, we also launched a targeted request for proposal for power demand supporting new development at our Merom Power Plant. Reponses are due in mid-May, but early indications point to a high level of interest. The RFP is available on our website for any interested parties that did not already receive the information.
Our goal is for Hallador Power to generate approximately 1.5 million MWh on a quarterly basis, which equates to approximately 6 million MWh annually. During the first quarter, Hallador Power generated 816,000 MWh, or 54% of our target, despite an average price of $41.90. The favorable pricing is a result of experiencing sales prices as high as $250 per MWh for limited times during the quarter, balanced against several days of pricing below our variable cost to produce. These fluctuations led to an inconsistent dispatch schedule, which we expect to level out as we anticipate demand and pricing increases with seasonal weather changes and reduced gas stores.
During the first quarter, Hallador Power generated 816,000 MWh at the following cost structure (on a segment basis):
| In Millions |
Per MWh |
|||||||
| Revenue: |
||||||||
| Capacity |
$ | 11.80 | $ | 14.46 | ||||
| Delivered Energy and PPA |
47.00 | 57.60 | ||||||
| Total Electric Revenue |
$ | 58.80 | $ | 72.06 | ||||
| Operating Expense: |
||||||||
| Fixed Cost |
$ | 11.80 | $ | 14.46 | ||||
| Variable Cost |
26.00 | 31.86 | ||||||
| Total Electric Operating Expense |
$ | 37.80 | $ | 46.32 | ||||
| Margin: |
$ | 21.00 | $ | 25.74 | ||||
When forward selling capacity, we target annual sales of around $65 million to offset our fixed annual costs at the plant of approximately $60 million. Our forward sales table demonstrates that we have already sold a large portion of our future capacity, which we believe makes our forward capacity sales goals attainable.
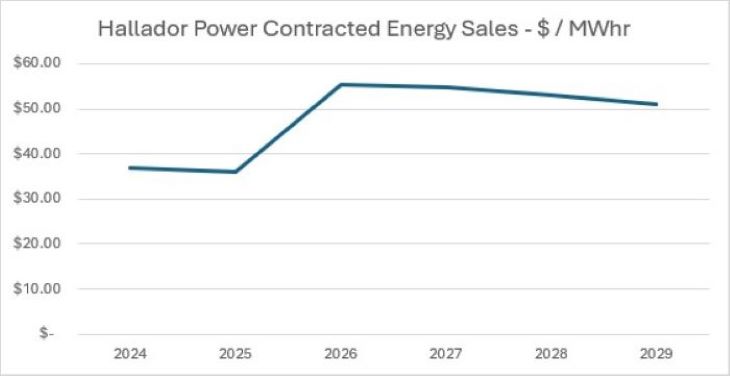
As a condition of acquiring the Merom Power Plant, we agreed to sell 1.66 million MWh of energy in 2024 and 1.60 million MWh in 2025 at $34 per MWh to the plant seller, representing 27% of our annual 6 million MWh goal. Since this original transaction, we have been successful in selling over 5 million MWh of energy to third parties at an average price of approximately $52 per MWh over the years 2024-2029 as illustrated in the table below.
During the first quarter, our variable costs were $31.88 per MWh. The low energy prices during the quarter necessitated that we run our plant at slower speeds resulting in more frequent than normal starts and stops to avoid selling below cost energy. Running in this manner is less fuel efficient than if we were able to consistently generate at a 6 million MWh pace, which could lower cost by as much as 10%.
On February 23, 2024, our Coal Operations Segment undertook an initiative designed to strengthen our financial and operational efficiency and to create significant operational savings and higher margins in our coal segment. This step helps to advance our transition from a company primarily focused on coal production to a more resilient and diversified IPP. As part of this initiative, we idled production at our higher cost Prosperity Mine, and substantially idled production at the Freelandville Mine with minimal production until reclamation is finished on approximately May 31, 2024. This should reduce our capital reinvestment for coal production in 2024 by approximately $10 million. We also focused our seven units of underground equipment on four units of our lowest cost production at our Oaktown Mine. As part of the initiative, we reduced our workforce by approximately 110 employees.
Mining costs for the quarter were $53.38 per ton. However, at Oaktown, we saw mining costs in March decrease into the low $30s on a per ton basis. While there are several factors that impacted this cost reduction, we continue to monitor operations and strategic initiatives to better understand the longevity of these favorable conditions.
Historically, Sunrise Coal has generated approximately six million tons of coal annually. Following the restructuring, we expect Sunrise to produce roughly 3.5 million tons of coal on an annualized basis for 2024. If market conditions warrant, our current operations are capable of producing at a 4.5 million ton annualized pace. In 2024, we have also secured supplemental coal from third party suppliers at favorable prices. This allows us to diversify self-production supply risk and provides us with additional flexibility in our sales portfolio. The optionality to obtain low-cost tons either internally or from third parties while capturing upward swings in the commodities markets for coal should further maximize margins while optimizing fuel costs at our Merom facility.
We continued our build out of what we consider to be a best-in-class management team as we welcomed Marjorie Hargrave as our new CFO with broad-based experience in power production and capital markets. Adding Marjorie to our previous hires over the last two years, including expertise within the positions of our President of Hallador Power, our Chief Legal Officer (with Data communications expertise), our SVP of Power Marketing, and a Manager of Environmental Engineering, will accelerate our continued development of Hallador’s operational and future power acquisition capabilities. These prospects and our strong future sales have us very excited about the future of our company.
OVERVIEW
| I. |
|
Q1 2024 Net Loss of $1.7 million. |
| a. | 1.2 million tons of coal were shipped at an average sales price of $54.40 on a segment basis during the quarter, with approximately 0.3 million tons of that being shipped to the Merom Power Plant for $16.4 million. This is a decline of 0.2 million tons of coal from Q4 2023, primarily due to decreased demand from a mild winter and low natural gas prices. The average sales price of coal was $55.64 per ton on a consolidated basis. |
| i. | The sales price for remaining tons to ship for 2024 is expected to average $50.65 per ton on a consolidated basis (not including coal shipped to Merom). |
| b. | In Q1 2024, Hallador's coal operating costs were $53.38 per ton on a segment basis, which represents a $0.41 per ton decrease from Q4 2023. This decrease is a result of the reduction in production of our higher cost surface mines. |
| c. |
We recorded coal margins for the quarter at $1.02 per ton on a segment basis. This is a decline of $7.97 per ton from Q4 2023 margins, due primarily to the reduction in contract average sales prices. |
| II. | Q1 2024 Activity |
| a. | Cash Flow & Debt |
| i. | During Q1 2024, our operating cash flow was $16.4 million, and we decreased our bank debt by $14.5 million. |
| ii. | As of March 31, 2024, our bank debt was $77.0 million, liquidity was $39.5 million, and our leverage ratio came in at 1.58X, within our covenant of 2.25X. |
| iii. | During Q1 2024, we issued unsecured one-year notes from related parties affiliated with certain members of the Board of Directors in the amount of $5.0 million. |
| iv. | An ATM raised $6.6 million through the issuance of 0.7 million shares of our common stock. |
| v. | We converted $8.0 million of senior unsecured convertible notes, including interest through August 2025 with 1,459,293 shares of our Company common stock. We converted $0.8 million of accrued interest with 122,605 shares of our Company's common stock. |
| b. | Power & Coal |
| i. | Power production was 0.8 million MWh for the quarter, an increase of 0.2 million from Q4 2023. |
| ii. | We initiated a Reorganization Plan in our Coal Operations designed to increase margins and adjust to current market conditions. Our production was 1.3 million tons for the quarter, 0.1 million less than Q4 2023. Approximately 0.3 million tons of that production were shipped to the Merom Power Plant in Q1 2024. |
| III. | Solid Forward Sales Position - Segment Basis, Before Intercompany Eliminations |
| 2024 |
2025 |
2026 |
2027 |
2028 |
2029 |
Total |
||||||||||||||||||||||
| Power |
||||||||||||||||||||||||||||
| Energy |
||||||||||||||||||||||||||||
| Contracted MWh (in millions) |
1.60 | 1.90 | 1.83 | 1.78 | 1.09 | 0.27 | 8.47 | |||||||||||||||||||||
| Contracted price per MWh |
$ | 37.02 | $ | 36.06 | $ | 55.37 | $ | 54.65 | $ | 52.98 | $ | 51.00 | ||||||||||||||||
| Contracted revenue (in millions) |
$ | 59.23 | $ | 68.51 | $ | 101.33 | $ | 97.28 | $ | 57.75 | $ | 13.77 | $ | 397.87 | ||||||||||||||
| % Energy Sold* |
27 | % | 32 | % | 31 | % | 30 | % | 18 | % | 5 | % | ||||||||||||||||
| Capacity |
||||||||||||||||||||||||||||
| Average monthly contracted capacity |
818 | 801 | 744 | 623 | 454 | 100 | ||||||||||||||||||||||
| % Capacity Contracted** |
106 | % | 82 | % | 77 | % | 64 | % | 47 | % | 10 | % | ||||||||||||||||
| Average contracted capacity price per MWd |
$ | 209 | $ | 198 | $ | 230 | $ | 226 | $ | 225 | $ | 230 | ||||||||||||||||
| Contracted capacity revenue (in millions) |
$ | 47.01 | $ | 57.89 | $ | 62.46 | $ | 51.39 | $ | 37.39 | $ | 3.47 | $ | 259.61 | ||||||||||||||
| Total Energy & Capacity Revenue |
||||||||||||||||||||||||||||
| Contracted Power Revenue (in millions) |
$ | 106.24 | $ | 126.40 | $ | 163.79 | $ | 148.67 | $ | 95.14 | $ | 17.24 | $ | 657.48 | ||||||||||||||
| Contracted Power Revenue per MWh* |
$ | 44.39 | $ | 47.76 | $ | 68.96 | $ | 68.00 | $ | 66.31 | $ | 56.62 | ||||||||||||||||
| 2024 average cost per MWh was $31.88 for the three months ended March 31, 2024 ($30.41 assuming intercompany sales of coal were sold at cost) |
||||||||||||||||||||||||||||
| 2024 Power Capex Budget (in millions) excluding ELG requirements |
$ | 18.00 | ||||||||||||||||||||||||||
| Coal |
||||||||||||||||||||||||||||
| Priced tons - 3rd party (in millions) |
2.48 | 1.78 | 0.50 | 0.50 | — | — | 5.26 | |||||||||||||||||||||
| Average price per ton - 3rd party |
$ | 50.65 | $ | 50.04 | $ | 55.50 | $ | 55.50 | $ | — | $ | — | ||||||||||||||||
| Priced tons (in millions) - Hallador Power |
1.20 | 2.30 | 2.30 | 2.30 | 2.30 | — | 10.40 | |||||||||||||||||||||
| Average price per ton - Hallador Power |
$ | 51.00 | $ | 51.00 | $ | 51.00 | $ | 51.00 | $ | 51.00 | $ | — | ||||||||||||||||
| Contracted coal revenue (in millions) |
$ | 186.81 | $ | 206.37 | $ | 145.05 | $ | 145.05 | $ | 117.30 | $ | — | $ | 800.58 | ||||||||||||||
| % Priced |
82 | % | 91 | % | 62 | % | 62 | % | 51 | % | 0 | % | ||||||||||||||||
| Committed & unpriced tons (in millions) - 3rd party |
— | 1.00 | 1.00 | 1.00 | — | — | 3.00 | |||||||||||||||||||||
| Committed & unpriced tons (in millions) - Hallador Power |
— | — | — | — | — | — | — | |||||||||||||||||||||
| Total contracted tons (in millions) |
3.68 | 5.08 | 3.80 | 3.80 | 2.30 | — | 18.66 | |||||||||||||||||||||
| % Coal Sold* |
82 | % | 113 | % | 84 | % | 84 | % | 51 | % | 0 | % | ||||||||||||||||
| Average cost per ton of coal was $53.38 for the three months ended March 31, 2024 |
||||||||||||||||||||||||||||
| 2024 Coal Capex Budget (in millions) |
$ | 25.00 | ||||||||||||||||||||||||||
| TOTAL CONTRACTED REVENUE (IN MILLIONS) |
$ | 293.05 | $ | 332.77 | $ | 308.84 | $ | 293.72 | $ | 212.44 | $ | 17.24 | $ | 1,458.06 | ||||||||||||||
| *Based on coal production capacity of 4.5 million tons and 6.0 million MWh annually. |
| **Based on a MISO accreditation of 769 MW per day through 2024, up to 971 MW per day for 2025. Accreditations are adjusted annually based on 3-year rolling performance metrics. |
LIQUIDITY AND CAPITAL RESOURCES
| I. |
Liquidity and Capital Resources |
| a. |
As set forth in our condensed consolidated statements of cash flows, cash provided by operations was $16.4 million and $26.1 million for the three months ended March 31, 2024 and 2023, respectively. |
|
|
i. |
Operating margins for electric, which we define as operating revenues less operating expenses on a segment basis, were $21.1 million. Operating margins were $22.1 million on a consolidated basis. |
| ii. | Operating margins from coal sales, which we define as coal sales less operating expenses, were $1.2 million on a segment basis, during the first three months of 2024, down from $28.9 million during the first three months of 2023. Tons shipped in the first three months of 2024 to the Merom Power Plant were sold at break-even, however due to timing of the usage of the coal in the Plant, we had negative operating margins of $1.2 million which were eliminated in consolidation. |
| 1. | Our operating margins from coal sales were $1.02 per ton on a segment basis in the first three months of 2024 compared to $17.07 in the first three months of 2023. |
| 2. | We shipped 1.2 million tons of coal in the first three months of 2024, with 0.3 million tons of that being shipped to the Merom Power Plant. |
| b. |
Our projected electric capital expenditure budget for the remainder of 2024 is $11.8 million. Our projected coal operations capital expenditure budget for the remainder of 2024 is $16.3 million, of which approximately one-half is anticipated for maintenance capex. |
|
|
c. |
We paid down bank debt of $14.5 million in the first three months of 2024. As of March 31, 2024, our bank debt was $77.0 million. |
|
|
d. |
In March of 2024, we issued unsecured promissory notes, having a 12-month maturity date and 12% per annum interest rate to related parties affiliated with certain members of our Board of Directors. The primary purpose of this issuance was to support liquidity and accelerate strategic initiatives. |
| e. |
We expect cash from operations generated primarily to fund our capital expenditures and our debt service. As of March 31, 2024, we also had an additional borrowing capacity of $37.9 million. |
| II. |
Material Off-Balance Sheet Arrangements |
| a. |
Other than our surety bonds for reclamation, we have no material off-balance sheet arrangements. We have recorded the present value of reclamation obligations of $16.4 million, including $5.4 million at Merom, presented as asset retirement obligations (“ARO”) and accounts payable and accrued liabilities in our accompanying condensed consolidated balance sheets. In the event we are not able to perform reclamation, we have surety bonds in place totaling $37.5 million to cover ARO. |
CAPITAL EXPENDITURES (capex)
For the first three months of 2024, capex was $14.9 million allocated as follows (in millions):
| Oaktown – maintenance capex |
$ | 5.7 | ||
| Oaktown – investment |
3.0 | |||
| Freelandville Mine |
— | |||
| Merom Plant |
6.2 | |||
| Other |
— | |||
| Capex per the Condensed Consolidated Statements of Cash Flows |
$ | 14.9 |
RESULTS OF OPERATIONS
Presentation of Segment Information
Our operations are divided into two primary reportable segments: Electric Operations and Coal Operations. The remainder of our operations, which are not significant enough on a stand-alone basis to warrant treatment as an operating segment, are presented as "Corporate and Other and Eliminations" within the Notes to the Condensed Consolidated Financial Statements and primarily are comprised of unallocated corporate costs and activities, including a 50% interest in Sunrise Energy, LLC, a private gas exploration company with operations in Indiana, which we account for using the equity method, and our wholly-owned subsidiary Summit Terminal LLC, a logistics transport facility located on the Ohio River.
Electric Operations
| Three Months Ended March 31, |
||||||||
| 2024 |
2023 |
|||||||
| (in thousands) |
||||||||
| OPERATING REVENUES: |
$ | 58,912 | $ | 92,494 | ||||
| EXPENSES: |
||||||||
| Operating expenses |
37,799 | 67,682 | ||||||
| Depreciation, depletion and amortization |
4,697 | 4,675 | ||||||
| Asset retirement obligations accretion |
111 | 153 | ||||||
| General and administrative |
1,058 | 1,279 | ||||||
| Total operating expenses |
43,665 | 73,789 | ||||||
| INCOME FROM OPERATIONS |
$ | 15,247 | $ | 18,705 | ||||
Operating revenues from electric operations decreased $33.6 million, or 36%, compared to the first quarter of 2023 due to reduced production of power as a result of a mild winter and decreased natural gas prices.
Operating expenses decreased $29.9 million, or 44%, compared to the first quarter of 2023 due to a decrease in production as well as costs related to the coal purchase agreement signed with Hoosier related to the Merom Acquisition in 2022. The coal purchase agreement included fixed prices which were below market prices at the date we entered into the agreement. As a result of the below-market contract, there were $17.8 million in additional operating expenses for coal purchased as a result of amortizing the contract asset during the first quarter of 2023.
Quarterly electric sales and cost data (in thousands, except per MWh data) are provided below. Fixed costs in the table are considered "non-GAAP" and are a component of operating expenses, the most comparable GAAP measure. We consider fixed costs to be costs associated with the plant whether or not the plant is in operation.
| 1st 2024 |
1st 2023 |
|||||||
| MWh sold |
816 | 1,262 | ||||||
| Capacity revenue |
$ | 11,773 | $ | 15,970 | ||||
| Delivered energy and PPA revenue |
46,982 | 76,422 | ||||||
| Total electric sales |
58,755 | 92,392 | ||||||
| Less amortization of contract liability |
(12,788 | ) | (33,347 | ) | ||||
| Total electric sales less amortization of contract liability |
$ | 45,967 | $ | 59,045 | ||||
| Average price/MWh of delivered energy and PPA revenue less amortization of contract liability |
$ | 41.90 | $ | 34.13 | ||||
| Operating expenses (on a segment basis) |
$ | 37,799 | $ | 67,682 | ||||
| Less fixed costs |
(11,782 | ) | (12,807 | ) | ||||
| Less amortization of contract asset |
— | (17,778 | ) | |||||
| Operating expenses less fixed costs and amortization of contract asset |
$ | 26,017 | $ | 37,097 | ||||
| Average variable cost/MWh of operating expenses less fixed costs and amortization of contract asset |
$ | 31.88 | $ | 29.40 | ||||
| Energy and PPA margin less fixed costs and amortization of contract asset and liabilities |
$ | 8,177 | $ | 5,978 | ||||
| Energy and PPA margin/MWh less fixed costs amortization of contract asset and liabilities |
$ | 10.02 | $ | 4.74 | ||||
Coal Operations
| Three Months Ended March 31, |
||||||||
| 2024 |
2023 |
|||||||
| (in thousands) |
||||||||
| OPERATING REVENUES: |
$ | 66,870 | $ | 95,273 | ||||
| EXPENSES: |
||||||||
| Operating expenses |
64,803 | 65,700 | ||||||
| Depreciation, depletion and amortization |
10,728 | 13,275 | ||||||
| Asset retirement obligations accretion |
288 | 298 | ||||||
| Exploration costs |
70 | 206 | ||||||
| General and administrative |
2,438 | 2,706 | ||||||
| Total operating expenses |
78,327 | 82,185 | ||||||
| (LOSS) INCOME FROM OPERATIONS |
$ | (11,457 | ) | $ | 13,088 | |||
Operating revenues from coal operations decreased $28.4 million, or 30%, from the first quarter of 2023 due to reductions in volume and average sales price for our coal. Our average sales price decreased $1.48 per ton and we sold 0.5 million tons less compared to the first quarter of 2023. Operating revenues for the first quarter of 2024 include $16.4 million in sales to the Merom plant which were eliminated in the consolidation.
Operating expenses increased by $14.57 per ton sold over the first quarter of 2023. This increase was due to one-time termination benefits of $1.1 million related to the Reorganization Plan disclosed in “Note 16 — Organizational Restructuring” to the Condensed Consolidated Financial Statements, the addition of the higher-cost Prosperity surface mine, poor temporary mining conditions at Oaktown, and continued significant inflationary pressures that have continued to elevate the costs.
Depreciation, depletion, and amortization decreased $2.5 million, or 19%, from the first quarter of 2023 due to decreases in coal production and the remaining useful lives of the mine development assets.
Quarterly coal sales and cost data on a segment basis are as follows (in thousands, except per ton data and wash plant recovery percentage):
| All Mines |
2nd 2023 |
3rd 2023 |
4th 2023 |
1st 2024 |
T4Qs |
|||||||||||||||
| Tons produced |
1,723 | 1,594 | 1,331 | 1,271 | 5,919 | |||||||||||||||
| Tons sold |
1,714 | 2,054 | 1,461 | 1,214 | 6,443 | |||||||||||||||
| Coal sales |
$ | 112,171 | $ | 134,400 | $ | 91,714 | $ | 66,036 | $ | 404,321 | ||||||||||
| Average price per ton |
$ | 65.44 | $ | 65.43 | $ | 62.77 | $ | 54.40 | $ | 62.75 | ||||||||||
| Wash plant recovery in % |
67 | % | 65 | % | 62 | % | 60 | % | ||||||||||||
| Operating costs |
$ | 71,168 | $ | 95,592 | $ | 78,581 | $ | 64,803 | $ | 310,144 | ||||||||||
| Average cost per ton |
$ | 41.52 | $ | 46.54 | $ | 53.79 | $ | 53.38 | $ | 48.14 | ||||||||||
| Margin |
$ | 41,003 | $ | 38,808 | $ | 13,133 | $ | 1,233 | $ | 94,177 | ||||||||||
| Margin per ton |
$ | 23.92 | $ | 18.89 | $ | 8.99 | $ | 1.02 | $ | 14.62 | ||||||||||
| Capex |
$ | 14,445 | $ | 11,570 | $ | 17,867 | $ | 8,632 | $ | 52,514 | ||||||||||
| Maintenance capex |
$ | 9,754 | $ | 7,938 | $ | 13,567 | $ | 8,085 | $ | 39,344 | ||||||||||
| Maintenance capex per ton |
$ | 5.69 | $ | 3.86 | $ | 9.29 | $ | 6.66 | $ | 6.11 | ||||||||||
| All Mines |
2nd 2022 |
3rd 2022 |
4th 2022 |
1st 2023 |
T4Qs |
|||||||||||||||
| Tons produced |
1,762 | 1,663 | 1,721 | 2,006 | 7,152 | |||||||||||||||
| Tons sold |
1,595 | 1,705 | 1,664 | 1,693 | 6,657 | |||||||||||||||
| Coal sales |
$ | 64,161 | $ | 83,563 | $ | 84,641 | $ | 94,602 | $ | 326,967 | ||||||||||
| Average price per ton |
$ | 40.23 | $ | 49.01 | $ | 50.87 | $ | 55.88 | $ | 49.12 | ||||||||||
| Wash plant recovery in % |
71 | % | 69 | % | 68 | % | 70 | % | ||||||||||||
| Operating costs |
$ | 50,776 | $ | 63,876 | $ | 67,319 | $ | 65,700 | $ | 247,671 | ||||||||||
| Average cost per ton |
$ | 31.83 | $ | 37.46 | $ | 40.46 | $ | 38.81 | $ | 37.20 | ||||||||||
| Margin |
$ | 13,385 | $ | 19,687 | $ | 17,322 | $ | 28,902 | $ | 79,296 | ||||||||||
| Margin per ton |
$ | 8.39 | $ | 11.55 | $ | 10.41 | $ | 17.07 | $ | 11.91 | ||||||||||
| Capex |
$ | 13,821 | $ | 15,096 | $ | 12,368 | $ | 12,639 | $ | 53,924 | ||||||||||
| Maintenance capex |
$ | 7,600 | $ | 6,625 | $ | 5,748 | $ | 7,778 | $ | 27,751 | ||||||||||
| Maintenance capex per ton |
$ | 4.76 | $ | 3.89 | $ | 3.45 | $ | 4.59 | $ | 4.17 | ||||||||||
Presentation of Consolidated Information
EARNINGS (LOSS) PER SHARE
| 2nd 2023 |
3rd 2023 |
4th 2023 |
1st 2024 |
|||||||||||||
| Basic |
$ | 0.51 | $ | 0.49 | $ | (0.31 | ) | $ | (0.05 | ) | ||||||
| Diluted |
$ | 0.47 | $ | 0.44 | $ | (0.31 | ) | $ | (0.05 | ) | ||||||
| 2nd 2022 |
3rd 2022 |
4th 2022 |
1st 2023 |
|||||||||||||
| Basic |
$ | (0.11 | ) | $ | 0.05 | $ | 0.91 | $ | 0.67 | |||||||
| Diluted |
$ | (0.11 | ) | $ | 0.05 | $ | 0.83 | $ | 0.61 | |||||||
INCOME TAXES
Our effective tax rate (ETR) is estimated at ~26% and ~13% for the three months ended March 31, 2024, and 2023, respectively. For the three months ended March 31, 2024, we recorded income taxes using an estimated annual effective tax rate based upon projected annual income, forecasted permanent tax differences, discrete items, and statutory rates in states in which we operate. Our ETR differs from the statutory rate due primarily to statutory depletion in excess of tax basis and changes in the valuation allowance. The deduction for statutory percentage depletion does not necessarily change proportionately to changes in income (loss) before income taxes.
RESTRICTED STOCK GRANTS
See “Item 1. Financial Statements - Note 9. Stock Compensation Plans” for a discussion of RSUs.
CRITICAL ACCOUNTING ESTIMATES
We believe that the estimates of coal reserves, asset retirement obligation liabilities, deferred tax accounts, valuation of inventory, and the estimates used in impairment analysis are our critical accounting estimates.
The reserve estimates are used in the depreciation, depletion, and amortization calculations and our internal cash flow projections. If these estimates turn out to be materially under or over-stated, our depreciation, depletion and amortization expense and impairment test may be affected. The process of estimating reserves is complex, requiring significant judgment in the evaluation of all available geological, geophysical, engineering and economic data. The reserve estimates are prepared by professional engineers, both internal and external, and are subject to change over time as more data becomes available. Changes in the reserves estimates from the prior year were nominal.
SMCRA and similar state statutes require, among other things, that surface disturbance be restored in accordance with specified standards and approved reclamation plans. SMCRA requires us to restore affected surface areas to approximate the original contours as contemporaneously as practicable with the completion of surface mining operations. Federal law and some states impose on mine operators the responsibility for replacing certain water supplies damaged by mining operations and repairing or compensating for damage to certain structures occurring on the surface as a result of mine subsidence, a consequence of longwall mining and possibly other mining operations.
Obligations are reflected at the present value of their future cash flows. We reflect accretion of the obligations for the period from the date they are incurred through the date they are extinguished. The ARO assets are amortized using the units-of-production method over estimated recoverable (proven and probable) reserves. We use credit-adjusted risk-free discount rates ranging from 7% to 10% to discount the obligation, inflation rates anticipated during the time to reclamation, and cost estimates prepared by its engineers inclusive of market risk premiums. Activities include reclamation of pit and support acreage at surface mines, sealing portals at underground mines, and reclamation of refuse areas and slurry ponds.
Accretion expense is recognized on the obligation through the expected settlement date. On at least an annual basis, we review our entire reclamation liability and make necessary adjustments for permit changes as granted by state authorities, changes in the timing and extent of reclamation activities, and revisions to cost estimates and productivity assumptions, to reflect current experience. Any difference between the recorded amount of the liability and the actual cost of reclamation will be recognized as a gain or loss when the obligation is settled.
We have analyzed our filing positions in all of the federal and state jurisdictions where we are required to file income tax returns, as well as all open tax years in these jurisdictions. We identified our federal tax return and our Indiana state tax return as “major” tax jurisdictions. We believe that our income tax filing positions and deductions would be sustained on audit and do not anticipate any adjustments that will result in a material change to our consolidated financial position. We have not taken any significant uncertain tax positions, and our tax provisions and returns are prepared by a large public accounting firm with significant experience in energy related industries. Changes to the estimates from reported amounts in the prior year were not significant.
Inventory is valued at a lower of cost or net realizable value (NRV). Anticipated utilization of low sulfur, higher-cost coal from our Freelandville, and Prosperity mines has the potential to create NRV adjustments as our estimated needs change. The NRV adjustments are subject to change as our costs may fluctuate due to higher or lower production and our NRV may fluctuate based on sales contracts we enter into from time to time. There were no significant changes to our NRV adjustment estimates from the prior year.
Long-lived assets used in operations are depreciated and assessed for impairment annually or whenever changes in facts and circumstances indicate a possible significant deterioration in future cash flows is expected to be generated by an asset group. For impairment assessments, management groups individual assets based on a judgmental assessment of the lowest level for which there are identifiable cash flows that are largely independent of the cash flows of other groups of assets. The determination of the lowest level of cash flows is largely based on nature of production, common infrastructure, common sales points, common regulation and management oversight to make such determinations. These determinations could impact the determination and measurement of a potential asset impairment. Management evaluates assets for impairment through an established process in which changes to significant assumptions such as prices, volumes and future development plans are reviewed. If, upon review, the sum of the undiscounted pre-tax cash flows is less than the carrying value of the asset group, the carrying value is written down to estimated fair value. Because there usually is a lack of quoted market prices for long-lived assets, the fair value of impaired assets is typically determined based on the present values of expected future cash flows using discount rates believed to be consistent with those used by principal market participants. The expected future cash flows used for impairment reviews and related fair value calculations are typically based on judgmental assessments of future volumes, commodity prices, operating costs and capital investment plans, considering all available information at the date of review. Changes to any of the market-based assumptions can significantly affect estimates of undiscounted and discounted pre-tax cash flows and impact the recognition and amount of impairments.
ITEM 3. QUANTITATIVE AND QUALITATIVE DISCLOSURES ABOUT MARKET RISK
No material changes from the disclosure in our 2023 Annual Report on Form 10-K.
ITEM 4. CONTROLS AND PROCEDURES
DISCLOSURE CONTROLS
We maintain a system of disclosure controls and procedures that are designed for the purpose of ensuring that information required to be disclosed in our SEC reports is recorded, processed, summarized, and reported within the time periods specified in the SEC’s rules and forms and that such information is accumulated and communicated to our CEO and CFO and as appropriate to allow timely decisions regarding required disclosure.
As of the end of the period covered by this report, we carried out an evaluation, under the supervision and with the participation of our CEO and CFO of the effectiveness of the design and operation of our disclosure controls and procedures. Based on that evaluation, our CEO and CFO concluded that our disclosure controls and procedures are effective.
There have been no changes to our internal control over financial reporting during the quarter ended March 31, 2024, that materially affected or are reasonably likely to materially affect our internal control over financial reporting.
ITEM 4. MINE SAFETY DISCLOSURES
See Exhibit 95.1 to this Form 10-Q for a listing of our mine safety violations.
| Exhibit No. |
Document |
|
| 31.1 | SOX 302 Certification - Chief Executive Officer | |
| 31.2 | SOX 302 Certification - Chief Financial Officer | |
| 32 |
||
| 95.1 |
||
| 101.INS |
Inline XBRL Instance Document |
|
| 101.SCH |
Inline XBRL Schema Document |
|
| 101.CAL |
Inline XBRL Calculation Linkbase Document |
|
| 101.LAB |
Inline XBRL Labels Linkbase Document |
|
| 101.PRE |
Inline XBRL Presentation Linkbase Document |
|
| 101.DEF |
Inline XBRL Definition Linkbase Document |
|
| 104 |
Cover Page Interactive Data File (embedded with the Inline XBRL document) |
Pursuant to the requirements of the Securities Exchange Act of 1934, the registrant has duly caused this report to be signed on its behalf by the undersigned thereunto duly authorized.
|
|
|
HALLADOR ENERGY COMPANY |
|
|
|
|
|
|
|
|
|
|
|
|
| Date: May 7, 2024 |
|
/s/ MARJORIE HARGRAVE |
|
|
|
Marjorie Hargrave, CFO (Principal Financial Officer and Principal Accounting Officer) |
|
|
|
|
Exhibit 31.1
CERTIFICATION
I, Brent K. Bilsland, certify that:
1. I have reviewed this quarterly report on Form 10-Q of Hallador Energy Company;
2. Based on my knowledge, this report does not contain any untrue statement of a material fact or omit to state a material fact necessary to make the statements made, in light of the circumstances under which such statements were made, not misleading with respect to the period covered by this report;
3. Based on my knowledge, the financial statements, and other financial information included in this report, fairly present in all material respects the financial condition, results of operations and cash flows of the registrant as of, and for, the periods presented in this report;
4. The registrant’s other certifying officers and I are responsible for establishing and maintaining disclosure controls and procedures (as defined in Exchange Act Rules 13a-15(e) and 15d-15(e)) and internal control over financial reporting (as defined in Exchange Act Rules 13a-15(f) and 15d-15(f)) for the registrant and have:
|
a) |
Designed such disclosure controls and procedures, or caused such disclosure controls and procedures to be designed under our supervision, to ensure that material information relating to the registrant, including its consolidated subsidiaries, is made known to us by others within those entities, particularly during the period in which this report is being prepared; |
|
b) |
Designed such internal control over financial reporting, or caused such internal control over financial reporting to be designed under our supervision, to provide reasonable assurance regarding the reliability of financial reporting and the preparation of financial statements for external purposes in accordance with generally accepted accounting principles; |
|
c) |
Evaluated the effectiveness of the registrant's disclosure controls and procedures and presented in this report our conclusions about the effectiveness of the disclosure controls and procedures, as of the end of the period covered by this report based on such evaluation; and |
|
d) |
Disclosed in this report any change in the registrant's internal control over financial reporting that occurred during the registrant's most recent fiscal quarter (the registrant's fourth fiscal quarter in the case of an annual report) that has materially affected, or is reasonably likely to materially affect, the registrant's internal control over financial reporting; and |
5. The registrant’s other certifying officers and I have disclosed, based on our most recent evaluation of internal control over financial reporting, to the registrant's auditors and the audit committee of the registrant's board of directors (or persons performing the equivalent function):
|
a) |
All significant deficiencies and material weaknesses in the design or operation of internal control over financial reporting which are reasonably likely to adversely affect the registrant's ability to record, process, summarize and report financial information; and |
|
b) |
Any fraud, whether or not material, that involves management or other employees who have a significant role in the registrant's internal control over financial reporting. |
| May 7, 2024 |
|
/s/ BRENT K. BILSLAND |
|
|
|
|
Brent K. Bilsland, Chairman, President and CEO |
|
Exhibit 31.2
CERTIFICATION
I, Marjorie Hargrave, certify that:
1. I have reviewed this quarterly report on Form 10-Q of Hallador Energy Company;
2. Based on my knowledge, this report does not contain any untrue statement of a material fact or omit to state a material fact necessary to make the statements made, in light of the circumstances under which such statements were made, not misleading with respect to the period covered by this report;
3. Based on my knowledge, the financial statements, and other financial information included in this report, fairly present in all material respects the financial condition, results of operations and cash flows of the registrant as of, and for, the periods presented in this report;
4. The registrant’s other certifying officers and I are responsible for establishing and maintaining disclosure controls and procedures (as defined in Exchange Act Rules 13a-15(e) and 15d-15(e)) and internal control over financial reporting (as defined in Exchange Act Rules 13a-15(f) and 15d-15(f)) for the registrant and have:
|
a) |
Designed such disclosure controls and procedures, or caused such disclosure controls and procedures to be designed under our supervision, to ensure that material information relating to the registrant, including its consolidated subsidiaries, is made known to us by others within those entities, particularly during the period in which this report is being prepared; |
|
b) |
Designed such internal control over financial reporting, or caused such internal control over financial reporting to be designed under our supervision, to provide reasonable assurance regarding the reliability of financial reporting and the preparation of financial statements for external purposes in accordance with generally accepted accounting principles; |
|
c) |
Evaluated the effectiveness of the registrant's disclosure controls and procedures and presented in this report our conclusions about the effectiveness of the disclosure controls and procedures, as of the end of the period covered by this report based on such evaluation; and |
|
d) |
Disclosed in this report any change in the registrant's internal control over financial reporting that occurred during the registrant's most recent fiscal quarter (the registrant's fourth fiscal quarter in the case of an annual report) that has materially affected, or is reasonably likely to materially affect, the registrant's internal control over financial reporting; and |
5. The registrant’s other certifying officers and I have disclosed, based on our most recent evaluation of internal control over financial reporting, to the registrant's auditors and the audit committee of the registrant's board of directors (or persons performing the equivalent function):
|
a) |
All significant deficiencies and material weaknesses in the design or operation of internal control over financial reporting which are reasonably likely to adversely affect the registrant's ability to record, process, summarize and report financial information; and |
|
b) |
Any fraud, whether or not material, that involves management or other employees who have a significant role in the registrant's internal control over financial reporting. |
| May 7, 2024 |
|
/s/ MARJORIE HARGRAVE |
|
|
|
|
Marjorie Hargrave, CFO |
|
Exhibit 32
CERTIFICATION PURSUANT TO SECTION 906 OF THE SARBANES-OXLEY ACT OF 2002
In connection with this Quarterly Report (the "Report"), of Hallador Energy Company (the "Company"), on Form 10-Q for the period ended March 31, 2024 as filed with the Securities and Exchange Commission on the date hereof the undersigned, in the capacities and date indicated below, each hereby certifies pursuant to 18 U.S.C. Section 1350, as adopted pursuant to Section 906 of the Sarbanes-Oxley Act of 2002, that to his knowledge:
|
(1) |
The Report fully complies with the requirements of Section 13(a) or 15(d) of the Securities Exchange Act of 1934; and |
|
(2) |
The information contained in the Report fairly presents, in all material respects, the financial condition and results of operations of the Company. |
| May 7, 2024 |
|
By: |
/s/ BRENT K. BILSLAND |
|
|
|
|
|
|
Brent K. Bilsland, Chairman, President and CEO |
||
|
|
|
|
|
||
|
|
|
|
|
||
|
|
|
By: |
/s/ MARJORIE HARGRAVE |
|
|
|
|
|
|
Marjorie Hargrave, CFO |
||
|
|
|
|
|
||
Exhibit 95.1
MINE SAFETY DISCLOSURES
Our principles at Sunrise Coal, LLC are safety, honesty, and compliance. We firmly believe that these values compose a dedicated workforce and with that, come high production. The core to this is our strong training programs that include accident prevention, workplace inspection and examination, emergency response and compliance. We work with the Federal and State regulatory agencies to help eliminate safety and health hazards from our workplace and increase safety and compliance awareness throughout the mining industry.
We are regulated by the Mine Safety and Health Administration (“MSHA”) under the Federal Mine Safety and Health Act of 1977 (“Mine Act”). MSHA inspects our mines on a regular basis and issues various citations and orders when it believes a violation has occurred under the Mine Act. We present information below regarding certain violations which MSHA has issued with respect to our mines. While assessing this information please consider that the number and cost of violations will vary depending on the MSHA inspector and can be contested and appealed, and in that process, are often reduced in severity and amount, and are sometimes dismissed.
The disclosures listed below are provided pursuant to the Dodd-Frank Act. We believe that the following disclosures comply with the requirements of the Dodd-Frank Act; however, it is possible that future SEC rule making may require disclosures to be filed in a different format than the following.
The table that follows outline required disclosures and citations/orders issued to us by MSHA during the 1st Quarter 2024. The citations and orders outlined below may differ from MSHA`s data retrieval system due to timing, special assessed citations, and other factors.
Definitions:
Section 104(a) Significant and Substantial Citations “S&S”: An alleged violation of a mining safety or health standard or regulation where there exists a reasonable likelihood that the hazard outlined will result in an injury or illness of a serious nature.
Section 104(b) Orders: Failure to abate a 104(a) citation within the period of time prescribed by MSHA. The result of which is an order of immediate withdraw of non-essential persons from the affected area until MSHA determines the violation has been corrected.
Section 104(d) Citations and Orders: An alleged unwarrantable failure to comply with mandatory health and safety standards.
Section 107(a) Orders: An order of withdraw for situations where MSHA has determined that an imminent danger exists.
Section 110(b)(2) Violations: An alleged flagrant violation issued by MSHA under section 110(b)(2) of the Mine Act.
Pattern or Potential Pattern of Violations: A pattern of violations of mandatory health or safety standards that are of such a nature as could have significantly and substantially contributed to the cause and effect of coal mine health or safety hazards under section 104(e) of the Mine Act or a potential to have such a pattern.
Contest of Citations, Orders, or Proposed Penalties: A contest proceeding may be filed with the Commission by the operator or miners/miner’s representative to challenge the issuance or penalty of a citation or order issued by MSHA.
MSHA Federal Mine ID#`s:
12-02465 – Carlisle Preparation Plant
12-02460 – Ace in the Hole Mine
12-02394 – Oaktown Fuels No. 1
12-02418 – Oaktown Fuels No. 2
12-02462 – Oaktown Fuels Preparation Plant
12-02249 – Prosperity Mine
12-02339 - Freelandville East, Center Pit Mine
1st Quarter 2024 |
||||||||||||||||||||||||
Section |
Section |
Section |
Section |
Section |
Proposed |
|||||||||||||||||||
104(a) |
104(b) |
104(d) |
107(a) |
110(b)(2) |
MSHA |
|||||||||||||||||||
Citations |
Orders |
Citations/Orders |
Orders |
Violations |
Assessments |
|||||||||||||||||||
(In thousands) |
||||||||||||||||||||||||
Mine ID# |
||||||||||||||||||||||||
12‐02465 |
— | — | — | — | — | $ | — | |||||||||||||||||
12‐02394 |
22 | — | — | — | — | $ | 19.30 | |||||||||||||||||
12‐02418 |
5 | — | — | — | — | $ | 8.70 | |||||||||||||||||
12‐02462 |
— | — | — | — | — | $ | — | |||||||||||||||||
12‐02249 |
— | — | — | — | — | $ | — | |||||||||||||||||
12-02339 |
— | — | — | — | — | $ | — | |||||||||||||||||
Section |
Section |
|||||||||||||||||||||||
104(e) |
104(e) |
Mining |
Legal |
Legal |
Legal |
|||||||||||||||||||
Notice |
POV |
Related |
Actions |
Actions |
Actions |
|||||||||||||||||||
Yes/No |
Yes/No |
Fatalities |
Pending |
Initiated |
Resolved |
|||||||||||||||||||
Mine ID# |
||||||||||||||||||||||||
12‐02465 |
No |
No |
— | — | — | — | ||||||||||||||||||
12‐02394 |
No |
No |
— | 1 | — | 1 | ||||||||||||||||||
12‐02418 |
No |
No |
— | 1 | — | — | ||||||||||||||||||
12‐02462 |
No |
No |
— | — | — | — | ||||||||||||||||||
12‐02249 |
No |
No |
— | — | — | — | ||||||||||||||||||
12-02339 |
No | No | — | — | — | — | ||||||||||||||||||
Contest of |
Contest |
Complaints |
Complaints |
Applications |
Appeals of |
|||||||||||||||||||
Citations/ |
of |
of |
of Discharge/ |
of Temp. |
Decisions/ |
|||||||||||||||||||
Orders |
Penalties |
Compensation |
Discrimination |
Relief |
Orders |
|||||||||||||||||||
Mine ID# |
||||||||||||||||||||||||
12‐02465 |
— | — | — | — | — | — | ||||||||||||||||||
12‐02460 |
— | — | — | — | — | — | ||||||||||||||||||
12‐02394 |
— | — | — | — | — | — | ||||||||||||||||||
12‐02418 |
— | — | — | — | — | — | ||||||||||||||||||
12‐02462 |
— | — | — | — | — | — | ||||||||||||||||||
12‐02249 |
— | — | — | — | — | — | ||||||||||||||||||
12-02339 |
— | — | — | — | — | — | ||||||||||||||||||