|
Ohio
|
01-13375
|
31-0888951
|
||
|
(State or Other
Jurisdiction of
Incorporation)
|
(Commission File Number)
|
(IRS Employer
Identification
No.)
|
|
10000 Alliance Road, Cincinnati, Ohio
|
45242
|
|
(Address of Principal Executive Offices)
|
(Zip Code)
|
|
☐
|
Written communications pursuant to Rule 425 under the Securities Act (17 CFR 230.425)
|
|
|
|
|
☐
|
Soliciting material pursuant to Rule 14a-12 under the Exchange Act (17 CFR 240.14a-12)
|
|
|
|
|
☐
|
Pre-commencement communications pursuant to Rule 14d-2(b) under the Exchange Act (17 CFR 240.14d-2(b))
|
|
|
|
|
☐
|
Pre-commencement communications pursuant to Rule 13e-4(c) under the Exchange Act (17 CFR 240.13e-4(c))
|
| Title of each class | Trading Symbol(s) | Name of each exchange on which registered |
| Common Stock, no par value | LYTS | NASDAQ |
|
ExhibitNo.
|
Description
|
|
|
99.1
|
||
|
99.2
|
||
|
104
|
Cover Page Interactive Data File (embedded within the Inline XBRL document)
|
|
LSI INDUSTRIES INC.
|
|
|
BY:/s/ James E. Galeese
|
|
|
James E. Galeese
|
|
|
Executive Vice President, Chief Financial Officer
|
|
Exhibit 99.1

LSI INDUSTRIES REPORTS FISCAL 2024 THIRD QUARTER RESULTS
AND DECLARES QUARTERLY CASH DIVIDEND
CINCINNATI, April 25, 2024 – LSI Industries Inc. (Nasdaq: LYTS, “LSI” or the “Company”) a leading U.S. based manufacturer of commercial lighting and display solutions, today reported financial results for the fiscal 2024 third quarter ended March 31, 2024.
FISCAL 2024 THIRD QUARTER RESULTS
|
● |
Net Sales of $108.2 million |
|
● |
Net Income of $5.4 million, or $0.18 per diluted share |
|
● |
Adjusted Net Income of $6.2 million, or $0.21 per diluted share |
|
● |
EBITDA of $10.1 million; Adjusted EBITDA $11.2 million or 10.4%/sales |
|
● |
Free Cash Flow of $11.2 million |
|
● |
Gross Margin rate increased 140 bps y/y |
|
● |
Net Debt $9.2 million; ratio of net debt to TTM Adjusted EBITDA of 0.2x |
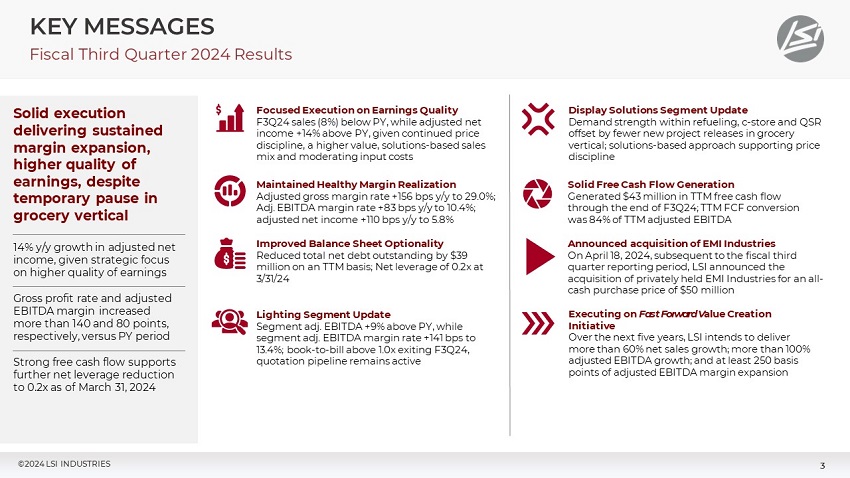
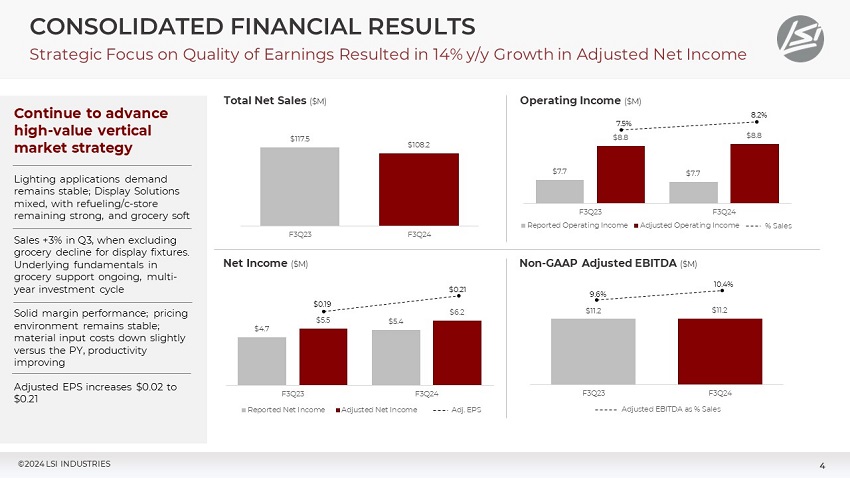
LSI continued to execute on its commercial expansion and operational excellence initiatives during the third quarter, as outlined in the Company’s Fast Forward Strategy, culminating in sustained, year-over-year growth in margin realization, net income, and operating cash flow.
The Company reported third quarter net income of $5.4 million or $0.18 per diluted share, versus $4.7 million or $0.16 per diluted share in the prior-year period. Third quarter sales of $108.2 million declined from prior-year levels largely due to ongoing lower demand in the grocery vertical market related to the delay in the proposed merger of two large industry participants.
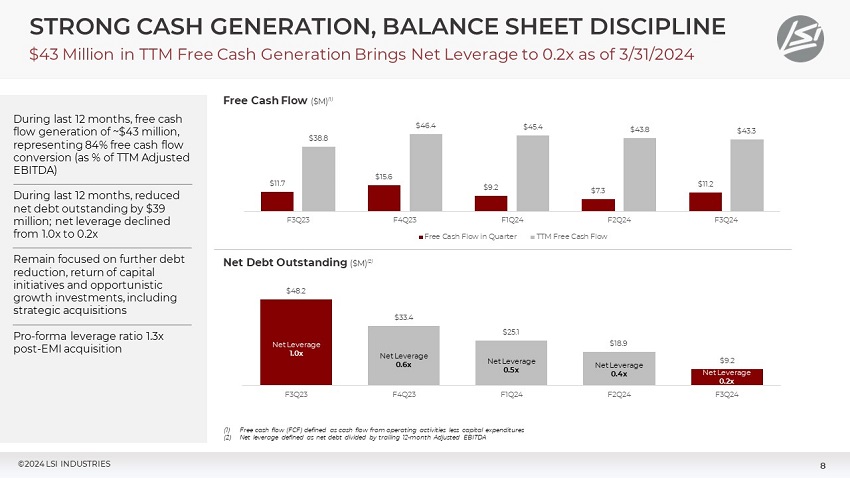
LSI reported Adjusted EBITDA of $11.2 million for the quarter, and the adjusted EBITDA margin rate improved 80 basis points to 10.4%, reflecting LSI’s focus on a higher value, solutions-based sales mix, continued price discipline, and moderating input costs. On a trailing twelve-month basis through the end of the third quarter 2024, LSI generated free cash flow of $43.3 million, including $11.2 million in the third quarter alone. As of March 31, 2024, the ratio of net debt to trailing twelve-month Adjusted EBITDA declined to 0.2x, versus 1.0x in the prior-year period.
On April 18, 2024, subsequent to the fiscal third quarter reporting period, LSI announced the acquisition of privately held EMI Industries (“EMI”) for an all-cash purchase price of $50 million. EMI is a leading manufacturer of standard and customized fixtures, displays, and food equipment for the convenience store, grocery, and restaurant industries. With the acquisition of EMI, LSI continues to build a premier commercial lighting and display solutions business in North America.
LSI funded the acquisition of EMI utilizing cash and availability under its existing credit facility. LSI anticipates that, pro-forma for the acquisition of EMI, its ratio of net debt outstanding to trailing twelve month adjusted EBITDA at the end of the fiscal third quarter was approximately 1.3x. LSI intends to significantly reduce net leverage within the business during the next 24 months, supported by anticipated growth in pro-forma free cash flow from the combined businesses. EMI financial results will be consolidated in LSI financial results beginning with the fiscal 2024 fourth quarter, reflecting a partial quarter impact.
The Company declared a regular cash dividend of $0.05 per share payable on May 14, 2024, to shareholders of record on May 6, 2024.
MANAGEMENT COMMENTARY
“Over the last several years, LSI has developed a leading fully integrated solutions-based platform within the commercial lighting and display solutions market,” stated James A. Clark, President, and Chief Executive Officer of LSI. “Our unique value proposition continues to build momentum across our key vertical markets, positioning LSI as a partner of choice for a growing, diverse base of customers across North America. Our third quarter results demonstrate further execution on this strategic focus, a performance that culminated in year-over-year growth in margin realization and profitability.”
“Having built a strong platform for organic growth, inorganic growth is also an important focus for us, first with our acquisition of JSI Store Fixtures in 2021, and now with our acquisition of EMI Industries. As we continue to scale our platform, we anticipate our business will become increasingly cash generative, positioning us to pursue additional opportunities that broaden our capabilities, enhance our sales mix, and expand our customer touchpoints.”
“Our diverse end-market exposure and solid execution was key during the third quarter, as certain verticals demonstrated robust or stable demand strength, while the grocery vertical remains unfavorably impacted by the proposed merger of two industry participants, and longer than expected regulatory review. While program refresh activity within grocery is below prior-year levels, we believe the underlying fundamentals of the grocery vertical remain compelling, given expectations for a multi-year refresh cycle across the industry over the coming years.”
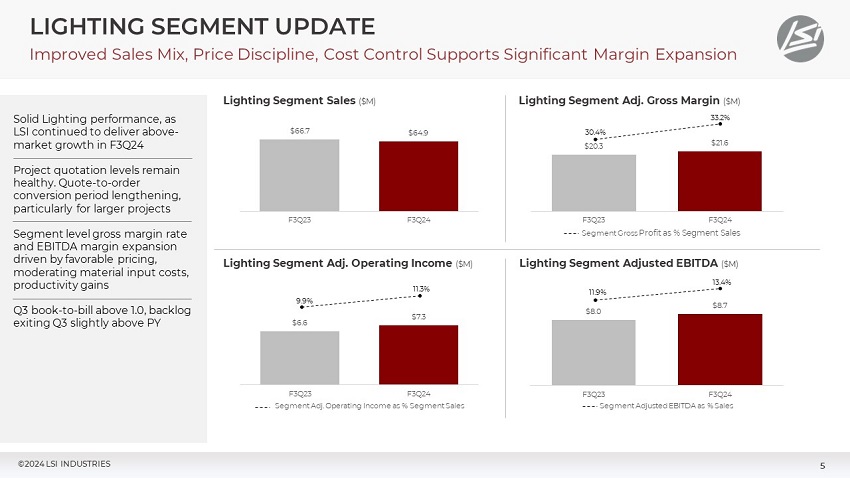
“Within our Lighting segment, demand conditions were steady during the third quarter, as our book-to-bill ratio finished above 1.0, and backlog increased on a sequential basis. While our quotation pipeline remains highly active, the order conversion period continues to lengthen, specifically for larger projects. Lighting segment adjusted operating income increased 11% during the third quarter, driven by a 280-basis point improvement in the gross margin rate. Multiple items contributed to our improved margin realization, including favorable mix, stable pricing, moderating material input costs, and plant productivity.”
“In the third quarter, we introduced an exciting new portfolio of lighting products targeting higher-value applications, including the Linear Area Light series of fixtures. The Linear Area Light expands our growing portfolio of architectural grade products, designed for a variety of outdoor pedestrian and parking applications where performance and aesthetics are critical. These include institutional applications such as schools and universities, city-beautification uses, as well as a wide range of general area lighting applications.”
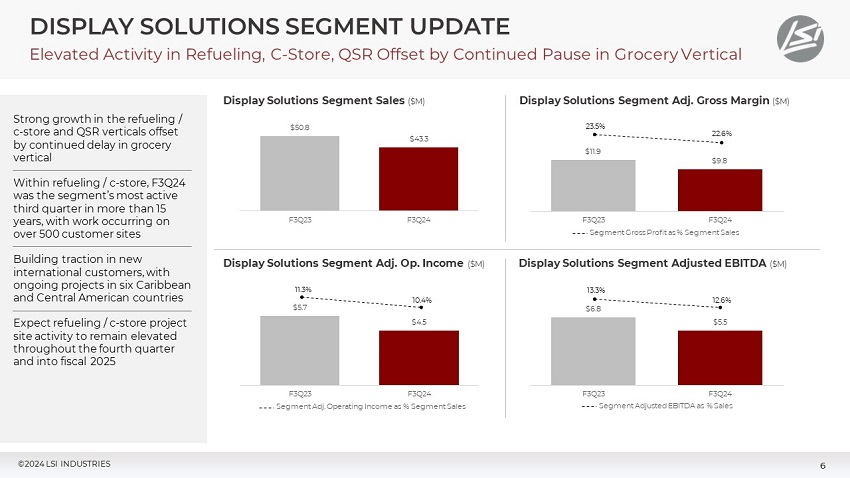
“In our Display Solutions segment, recent program awards generated strong growth in the refueling/c-store and QSR verticals, partially offsetting delayed activity in the grocery vertical,” continued Clark. “In the refueling/c-store segment our backlog of released and unreleased program activity with multiple oil companies, covering numerous brand banners, continues to grow. To that end, the third quarter, 2024 was our most active third quarter in over 15 years, with work occurring on over 500 customer sites. Site work content involved combinations of product, installation, and complete turnkey solutions, including program management. Building on our leading positions within North American markets, we are winning additional business in international markets, with ongoing customer projects in six Caribbean and Central American countries. We expect refueling/c-store project site activity to remain elevated throughout the fourth quarter and into fiscal 2025.”
“The addition of EMI is an excellent strategic fit for LSI, expanding our product and service capabilities for display solutions market applications, particularly in the c-store, grocery, and restaurant verticals. As we bring together our complementary products, services, and technologies, there are significant cross-selling opportunities that will enable us to be a single-source provider to more customers in more locations,” stated Clark. The business combination represents a major step forward in our ability to serve a growing portfolio of national retail chains, and capitalize on the ongoing, multi-year investment cycle occurring in these markets.”
Clark concluded, “We’re proud of what our team has accomplished the last several years, from advancing our positions in key vertical markets and expanding our product offering and capabilities, to increasing our value to customers and driving profitable growth, all of which has translated to a stronger, more competitive LSI. Looking ahead, we will continue to pursue leading positions within growing, high-value vertical markets that expand our capabilities and reach, generating profitable growth and driving long-term value creation for our shareholders.”
FISCAL 2024 THIRD QUARTER CONFERENCE CALL
A conference call will be held today at 11:00 A.M. ET to review the Company’s financial results and conduct a question-and-answer session.
A webcast of the conference call and accompanying presentation materials will be available in the Investor Relations section of LSI Industries’ website at www.lsicorp.com. Individuals can also participate by teleconference dial-in. To listen to a live broadcast, go to the site at least 15 minutes prior to the scheduled start time to register, download and install any necessary audio software.
Details of the conference call are as follows:
| Domestic Live: | 877-407-4018 |
| International Live: | 201-689-8471 |
To listen to a replay of the teleconference, which subsequently will be available through May 9, 2024:
| Domestic Replay: | 844-512-2921 |
| International Replay: | 412-317-6671 |
| Conference ID: | 13745799 |
ABOUT LSI INDUSTRIES
Headquartered in Cincinnati, LSI Industries (NASDAQ: LYTS) specializes in the creation of advanced lighting, graphics, and display solutions. The Company’s American-made products, which include lighting, print graphics, digital graphics, millwork, metal and refrigerated products, and custom displays, are engineered to elevate brands in competitive markets. With a workforce of approximately 1,900 employees and 16 facilities throughout North America, LSI is dedicated to providing top-quality solutions to its clients. Additional information about LSI is available at www.lsicorp.com.
FORWARD-LOOKING STATEMENTS
For details on the uncertainties that may cause our actual results to be materially different than those expressed in our forward-looking statements, visit https://investors.lsicorp.com as well as our Annual Reports on Form 10-K and Quarterly Reports on Form 10-Q which contain risk factors.
INVESTOR & MEDIA CONTACT
Noel Ryan, IRC
720.778.2415
LYTS@vallumadvisors.com
|
Three Months Ended |
(Unaudited) |
Nine Months Ended |
|||||||||||||||||||||
|
2024 |
2023 |
% Change |
(In thousands, except per share data) |
2024 |
2023 |
% Change |
|||||||||||||||||
| $ | 108,186 | $ | 117,470 | -8 | % |
Net sales |
$ | 340,632 | $ | 373,343 | -9 | % | |||||||||||
| 7,660 | 7,732 | -1 | % |
Operating income as reported |
26,507 | 26,791 | -1 | % | |||||||||||||||
| 1,021 | 968 | 5 | % |
Long-Term Performance Based Compensation |
3,195 | 2,521 | 27 | % | |||||||||||||||
| 141 | - | NM |
Severance costs and Restructuring costs |
529 | 46 | NM | |||||||||||||||||
| - | 75 | NM |
Consulting expense: Commercial Growth Initiatives |
19 | 864 | NM | |||||||||||||||||
| $ | 8,822 | $ | 8,775 | 1 | % |
Operating income as adjusted |
$ | 30,250 | $ | 30,222 | 0 | % | |||||||||||
| $ | 5,375 | $ | 4,669 | 15 | % |
Net income as reported |
$ | 19,309 | $ | 17,347 | 11 | % | |||||||||||
| $ | 6,243 | $ | 5,497 | 14 | % |
Net income as adjusted |
$ | 21,346 | $ | 20,200 | 6 | % | |||||||||||
| $ | 0.18 | $ | 0.16 | 13 | % |
Earnings per share (diluted) as reported |
$ | 0.64 | $ | 0.60 | 8 | % | |||||||||||
| $ | 0.21 | $ | 0.19 | 12 | % |
Earnings per share (diluted) as adjusted |
$ | 0.71 | $ | 0.70 | 2 | % | |||||||||||
|
(amounts in thousands) |
||||||||
|
March 31 |
June 30, |
|||||||
|
2024 |
2023 |
|||||||
|
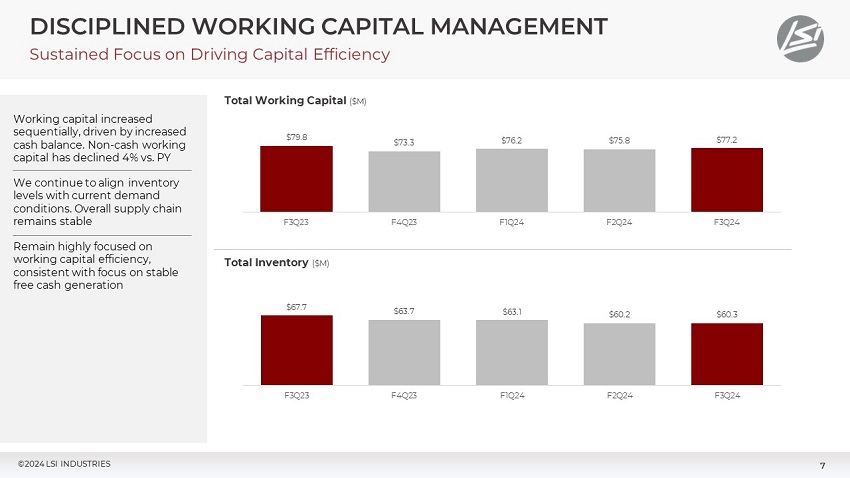
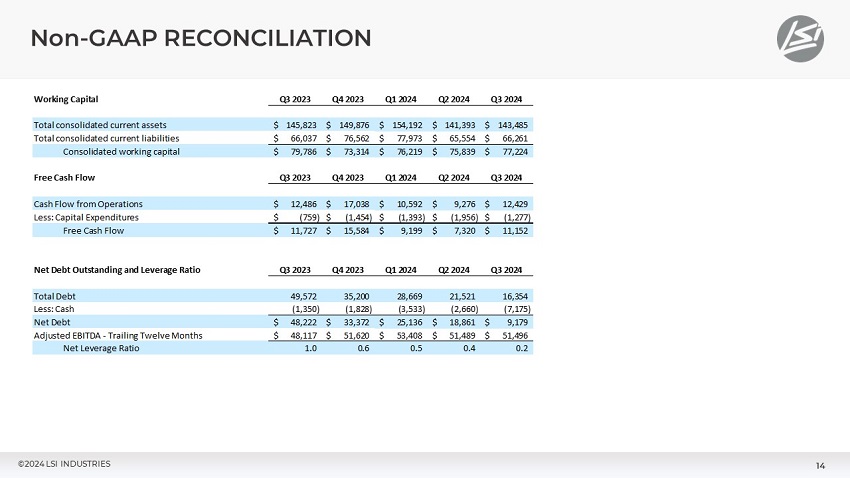
Working capital |
$ | 77,224 | $ | 73,314 | ||||
|
Total assets |
$ | 287,969 | $ | 296,149 | ||||
|
Long-term debt |
$ | 12,782 | $ | 31,629 | ||||
|
Other long-term liabilities |
$ | 10,489 | $ | 10,380 | ||||
|
Shareholders' equity |
$ | 198,437 | $ | 177,578 | ||||
Three Months Ended March 31, 2024, Results
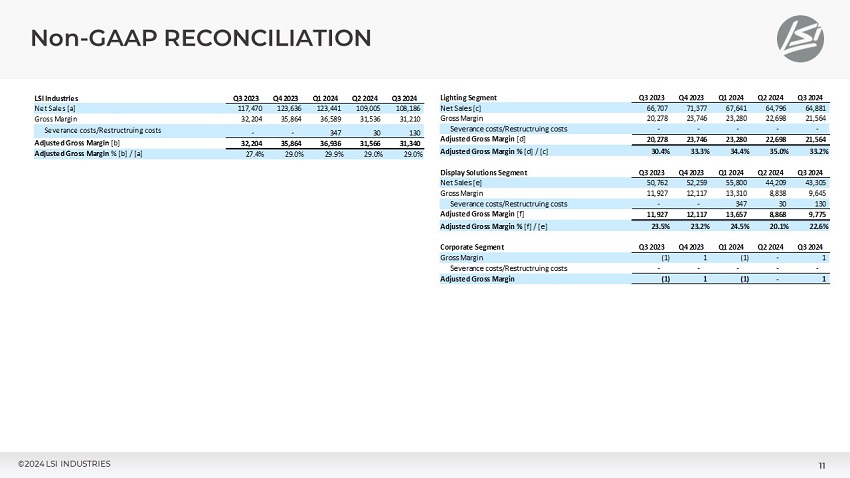
Net sales for the three months ended March 31, 2024, were $108.2 million, down 8% from the three months ended March 31, 2023, net sales of $117.5 million. Lighting Segment net sales of $64.9 million decreased 3% and Display Solutions Segment net sales of $43.3 million decreased 15% from last year’s third quarter net sales. Net income for the three months ended March 31, 2024, was $5.4 million, or $0.18 per share, compared to $4.7 million or $0.16 per share for the three months ended March 31, 2023. Earnings per share represents diluted earnings per share.
Nine Months Ended March 31, 2024, Results
Net sales for the nine months ended March 31, 2024, were $340.6 million, down 9% from the nine months ended March 31, 2023, net sales of $373.3 million. Lighting Segment net sales of $197.3 million decreased 2% and Display Solutions Segment net sales of $143.3 million decreased 17% from last year’s net sales. Net income for the nine months ended March 31, 2024, was $19.3 million, or $0.64 per share, compared to $17.3 million or $0.60 per share for the nine months ended March 31, 2023. Earnings per share represents diluted earnings per share.
Balance Sheet
The balance sheet at March 31, 2024, included current assets of $143.5 million, current liabilities of $66.3 million and working capital of $77.2 million, which includes cash of $7.2 million. The current ratio was 2.2 to 1. The balance sheet also included shareholders’ equity of $198.4 million and long-term debt of $12.8 million. It is the Company’s priority to continuously generate sufficient cash flow, coupled with an approved credit facility, to adequately fund operations.
Cash Dividend Actions
The Board of Directors declared a regular quarterly cash dividend of $0.05 per share in connection with the third quarter of fiscal 2024, payable May 14, 2024, to shareholders of record as of the close of business on May 6, 2024. The indicated annual cash dividend rate is $0.20 per share. The Board of Directors has adopted a policy regarding dividends which provides that dividends will be determined by the Board of Directors in its discretion based upon its evaluation of earnings both on a GAAP and non-GAAP basis, cash flow requirements, financial condition, debt levels, stock repurchases, future business developments and opportunities, and other factors deemed relevant by the Board.
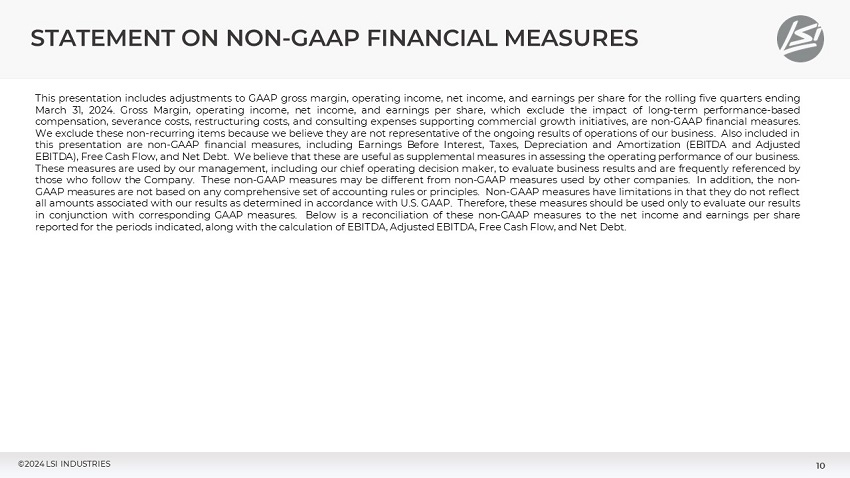
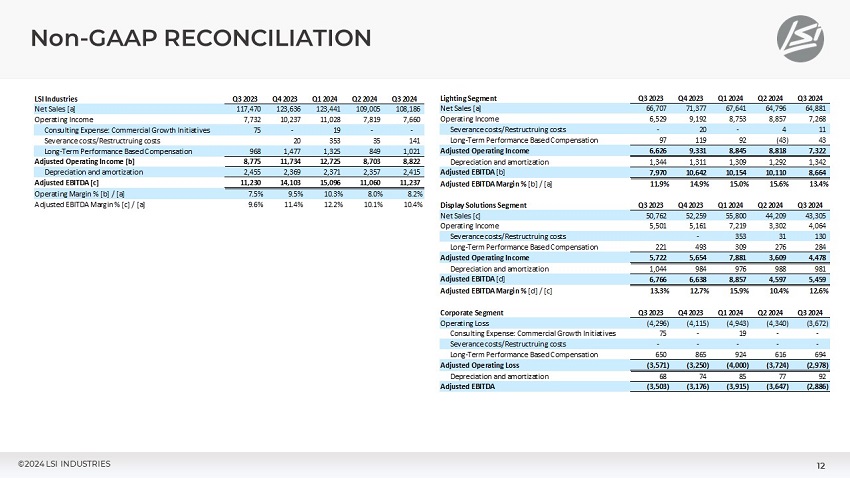
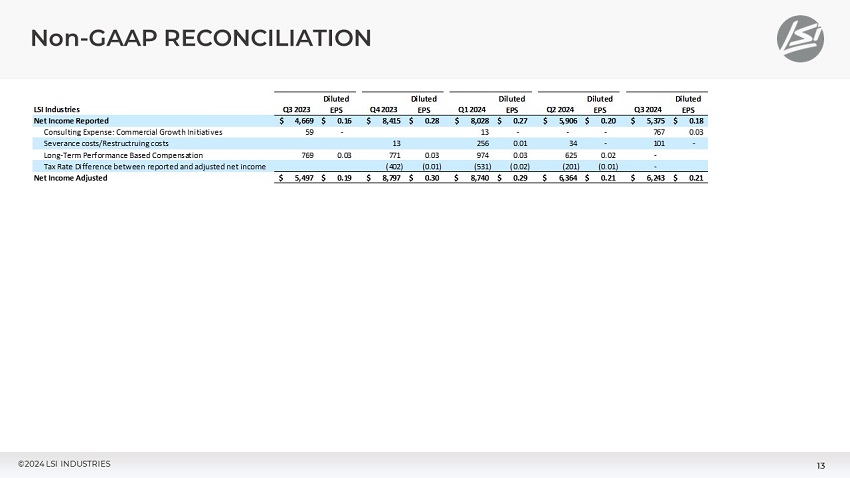
Non-GAAP Financial Measures
This press release includes adjustments to GAAP operating income, net income, and earnings per share for the three and nine months ended March 31, 2024, and 2023. Operating income, net income, and earnings per share, which exclude the impact of long-term performance based compensation expense, commercial growth initiative expense, and severance and restructuring costs, are non-GAAP financial measures. We exclude these items because we believe they are not representative of the ongoing results of operations of the business. Also included in this press release are non-GAAP financial measures, including Earnings Before Interest, Taxes, Depreciation and Amortization (EBITDA) and before long-term performance based compensation expense, commercial growth initiative expense, and severance and restructuring expense (Adjusted EBITDA), and Free Cash Flow. We believe that these are useful as supplemental measures in assessing the operating performance of our business. These measures are used by our management, including our chief operating decision maker, to evaluate business results, and are frequently referenced by those who follow the Company. These non-GAAP measures may be different from non-GAAP measures used by other companies. In addition, the non-GAAP measures are not based on any comprehensive set of accounting rules or principles. Non-GAAP measures have limitations, in that they do not reflect all amounts associated with our results as determined in accordance with U.S. GAAP. Therefore, these measures should be used only to evaluate our results in conjunction with corresponding GAAP measures. Below is a reconciliation of these non-GAAP measures to net income and earnings per share reported for the periods indicated along with the calculation of EBITDA, Adjusted EBITDA, Free Cash Flow, and Net Debt to Adjusted EBITDA.
|
Three Months Ended |
Nine Months Ended |
||||||||||||||||||||||||||||||
|
March 31 |
March 31 |
||||||||||||||||||||||||||||||
|
2024 |
2023 |
(In thousands, except per share data) |
2024 |
2023 |
|||||||||||||||||||||||||||
|
Diluted EPS |
Diluted EPS |
Reconciliation of net income to adjusted net income |
Diluted EPS |
Diluted EPS |
|||||||||||||||||||||||||||
| $ | 5,375 | $ | 0.18 | $ | 4,669 | $ | 0.16 |
Net income as reported |
$ | 19,309 | $ | 0.64 | $ | 17,347 | $ | 0.60 | |||||||||||||||
| 767 | 0.03 | 769 | 0.03 |
Long-Term Performance Based Compensation |
2,366 | 0.08 | 2,107 | 0.08 | |||||||||||||||||||||||
| - | - | 59 | - |
Consulting expense: Commercial Growth Initiatives |
13 | - | 708 | 0.02 | |||||||||||||||||||||||
| 101 | - | - | - |
Severance costs and Restructuring costs |
390 | 0.01 | 38 | - | |||||||||||||||||||||||
| - | - | - | - |
Tax rate difference between reported and adjusted net income |
(732 | ) | (0.02 | ) | - | - | |||||||||||||||||||||
| $ | 6,243 | $ | 0.21 | $ | 5,497 | $ | 0.19 |
Net income adjusted |
$ | 21,346 | $ | 0.71 | $ | 20,200 | $ | 0.70 | |||||||||||||||
|
Three Months Ended |
(Unaudited; In thousands) |
Nine Months Ended |
|||||||||||||||||||||
|
2024 |
2023 |
% Change |
Net Income to Adjusted EBITDA |
2024 |
2023 |
% Change |
|||||||||||||||||
| 5,375 | 4,669 | 15 | % |
Net income as reported |
19,309 | 17,347 | 11 | % | |||||||||||||||
| 2,076 | 2,257 |
Income Tax |
5,903 | 6,434 | |||||||||||||||||||
| 134 | 877 |
Interest expense, net |
1,153 | 2,924 | |||||||||||||||||||
| 75 | (71 | ) |
Other expense (income) |
142 | 86 | ||||||||||||||||||
| $ | 7,660 | $ | 7,732 | -1 | % |
Operating Income as reported |
$ | 26,507 | $ | 26,791 | -1 | % | |||||||||||
| 2,415 | 2,455 |
Depreciation and amortization |
7,143 | 7,295 | |||||||||||||||||||
| $ | 10,075 | $ | 10,187 | -1 | % |
EBITDA |
$ | 33,650 | $ | 34,086 | -1 | % | |||||||||||
| 1,021 | 968 |
Long-Term Performance Based Compensation |
3,195 | 2,521 | |||||||||||||||||||
| 141 | - |
Severance costs and Restructuring costs |
529 | 46 | |||||||||||||||||||
| - | 75 |
Consulting expense: Commercial Growth Initiatives |
19 | 864 | |||||||||||||||||||
| $ | 11,237 | $ | 11,230 | 0 | % |
Adjusted EBITDA |
$ | 37,393 | $ | 37,517 | 0 | % | |||||||||||
| 10.4 | % | 9.6 | % |
Adjusted EBITDA as a percentage of Sales |
11.0 | % | 10.0 | % | |||||||||||||||
|
Three Months Ended |
(Unaudited; In thousands) |
Nine Months Ended |
|||||||||||||||||||||
|
2024 |
2023 |
% Change |
Free Cash Flow |
2024 |
2023 |
% Change |
|||||||||||||||||
| $ | 12,429 | $ | 12,486 | NM |
Cash flow from operations |
$ | 32,297 | $ | 32,548 | NM | |||||||||||||
| (1,277 | ) | (759 | ) | 68 | % |
Capital expenditures |
(4,626 | ) | (1,754 | ) | 164 | % | |||||||||||
| $ | 11,152 | $ | 11,727 | NM |
Free cash flow |
$ | 27,671 | $ | 30,794 | NM | |||||||||||||
|
Net Debt to Adjusted EBITDA Ratio |
March 31 |
March 31 |
||||||
|
(amounts in thousands) |
2024 |
2023 |
||||||
|
Current Maturity of Debt |
$ | 3,571 | $ | 3,571 | ||||
|
Long-Term Debt |
12,782 | 46,002 | ||||||
|
Total Debt |
$ | 16,353 | $ | 49,573 | ||||
|
Less: Cash |
(7,175 | ) | (1,350 | ) | ||||
|
Net Debt |
$ | 9,178 | $ | 48,223 | ||||
|
Adjusted EBITDA - Trailing Twelve Months |
$ | 51,496 | $ | 48,117 | ||||
|
Net Debt to Adjusted EBITDA Ratio |
0.2 | 1.0 | ||||||
|
Three Months Ended |
(Unaudited) |
Nine Months Ended |
|||||||||||||
|
2024 |
2023 |
(In thousands, except per share data) |
2024 |
2023 |
|||||||||||
| $ | 108,186 | $ | 117,470 |
Net sales |
$ | 340,632 | $ | 373,343 | |||||||
| 76,846 | 85,266 |
Cost of products sold |
240,789 | 272,230 | |||||||||||
| 130 |
Severance costs and Restructuring costs |
508 | 31 | ||||||||||||
| 31,210 | 32,204 |
Gross profit |
99,335 | 101,082 | |||||||||||
| 23,538 | 24,397 |
Selling and administrative costs |
72,788 | 73,412 | |||||||||||
| 12 | - |
Severance costs and Restructuring costs |
21 | 15 | |||||||||||
| - | 75 |
Consulting expense: Commercial Growth Initiatives |
19 | 864 | |||||||||||
| 7,660 | 7,732 |
Operating Income |
26,507 | 26,791 | |||||||||||
| 75 | (71 | ) |
Other expense (income) |
142 | 86 | ||||||||||
| 134 | 877 |
Interest expense, net |
1,153 | 2,924 | |||||||||||
| 7,451 | 6,926 |
Income before taxes |
25,212 | 23,781 | |||||||||||
| 2,076 | 2,257 |
Income tax |
5,903 | 6,434 | |||||||||||
| $ | 5,375 | $ | 4,669 |
Net income |
$ | 19,309 | $ | 17,347 | |||||||
|
Weighted Average Common Shares Outstanding |
|||||||||||||||
| 29,163 | 28,306 |
Basic |
28,981 | 28,012 | |||||||||||
| 30,122 | 29,611 |
Diluted |
30,005 | 29,055 | |||||||||||
|
Earnings Per Share |
|||||||||||||||
| $ | 0.18 | $ | 0.16 |
Basic |
$ | 0.67 | $ | 0.62 | |||||||
| $ | 0.18 | $ | 0.16 |
Diluted |
$ | 0.64 | $ | 0.60 | |||||||
|
(amounts in thousands) |
||||||||
|
March 31 |
June 30 |
|||||||
|
2024 |
2023 |
|||||||
|
Current assets |
$ | 143,485 | $ | 149,876 | ||||
|
Property, plant and equipment, net |
26,105 | 25,431 | ||||||
|
Other assets |
118,379 | 120,842 | ||||||
|
Total assets |
$ | 287,969 | $ | 296,149 | ||||
|
Current maturities of long-term debt |
$ | 3,571 | $ | 3,571 | ||||
|
Other current liabilities |
62,690 | 72,991 | ||||||
|
Long-term debt |
12,782 | 31,629 | ||||||
|
Other long-term liabilities |
10,489 | 10,380 | ||||||
|
Shareholders' equity |
198,437 | 177,578 | ||||||
| $ | 287,969 | $ | 296,149 | |||||
Exhibit 99.2