| Michigan | 000-26719 | 38-3360865 |
|
(State or other jurisdiction
of incorporation)
|
(Commission File
Number)
|
(IRS Employer
Identification Number)
|
| 310 Leonard Street NW, Grand Rapids, Michigan | 49504 |
| (Address of principal executive offices) | (Zip Code) |
| Registrant's telephone number, including area code | 616-406-3000 |
|
Title of each class
|
Trading Symbol(s)
|
Name of each exchange on which registered
|
|
Common Stock
|
MBWM
|
The Nasdaq Stock Market LLC
|
|
Item 2.02
|
Results of Operations and Financial Condition.
|
|
Item 7.01
|
Regulation FD Disclosure.
|
|
Item 9.01
|
Financial Statements and Exhibits.
|
|
99.1
|
|
99.2
|
|
104
|
Cover Page Interactive Data File (embedded within the Inline XBRL document)
|
|
Mercantile Bank Corporation
|
|||
|
By:
|
/s/ Charles E. Christmas
|
||
|
Charles E. Christmas
|
|||
|
Executive Vice President, Chief
|
|||
| Financial Officer and Treasurer | |||
|
99.1
|
Press release of Mercantile Bank Corporation dated April 16, 2024, reporting financial results and earnings for the quarter ended March 31, 2024.
|
|
99.2
|
Mercantile Bank Corporation Conference Call & Webcast Presentation dated April 16, 2024.
|
|
104
|
Cover Page Interactive Data File (embedded within the Inline XBRL document)
|
Exhibit 99.1

Mercantile Bank Corporation Announces Robust First Quarter Results
Strong local deposit growth, sustained strength in asset quality metrics and noteworthy increases in several noninterest revenue streams highlight quarter
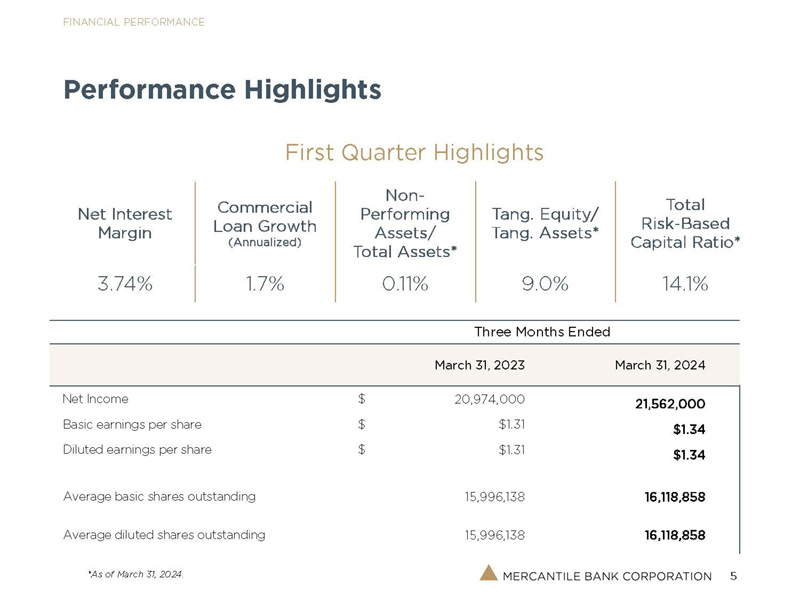
GRAND RAPIDS, Mich., April 16, 2024 – Mercantile Bank Corporation (NASDAQ: MBWM) ("Mercantile") reported net income of $21.6 million, or $1.34 per diluted share, for the first quarter of 2024, compared with net income of $21.0 million, or $1.31 per diluted share, for the first quarter of 2023.
“We are delighted to report another quarter of excellent financial results,” said Robert B. Kaminski, Jr., President and Chief Executive Officer of Mercantile. “Our strong operating performance during the first three months of 2024 reflected a healthy net interest margin and notable increases in treasury management fees, mortgage banking income, and interest rate swap income. The growth in local deposits during the quarter, which occurred despite a typical level of seasonal deposit withdrawals, reflects our continuing focus on expanding existing deposit relationships and attracting new deposit customers. As exhibited by ongoing loan portfolio expansion and strength in asset quality measures, our lending team continued to successfully meet the credit needs of standing customers and new clients while employing strong underwriting practices. We believe our consistently strong financial results and sound overall financial condition should allow us to effectively navigate through issues stemming from changing operating environments.”
First quarter highlights include:
|
● |
Significant increases in treasury management fee income and other noninterest revenue streams |
|
● |
Solid local deposit growth |
|
● |
Ongoing strength in commercial loan pipeline |
|
● |
Continuing low levels of nonperforming assets, past due loans, and loan charge-offs |
|
● |
Strong capital position |
Operating Results
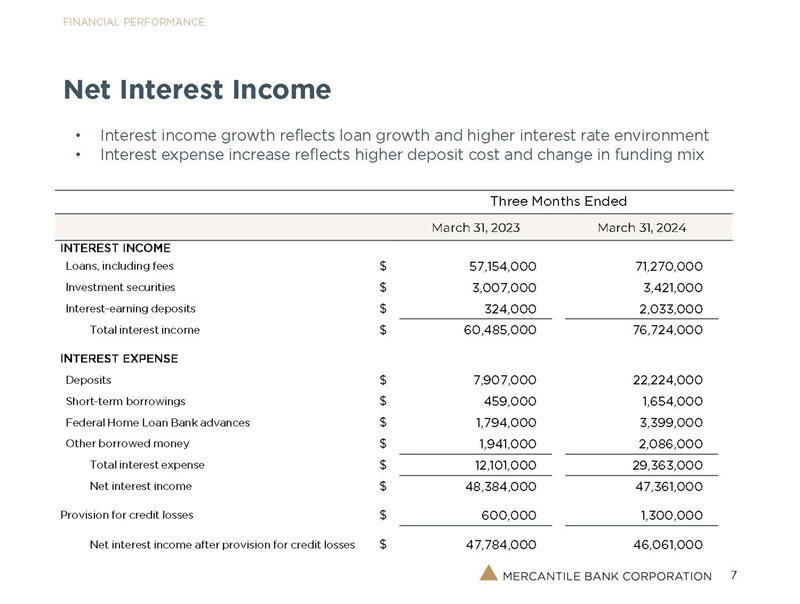
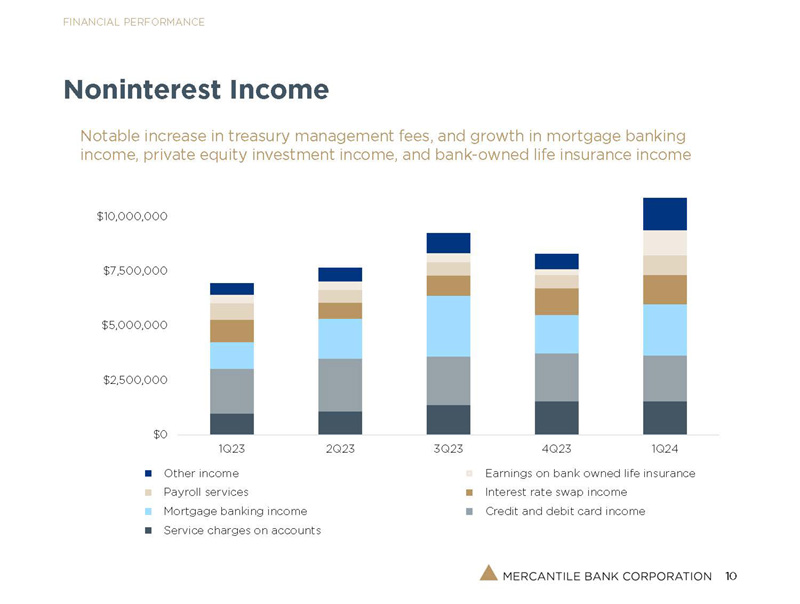
Total revenue, consisting of net interest income and noninterest income, was $58.2 million during the first quarter of 2024, up $2.9 million, or 5.2 percent, from $55.3 million during the prior-year first quarter. Net interest income during the first three months of 2024 was $47.4 million, down $1.0 million, or 2.1 percent, from $48.4 million during the respective 2023 period as increased yields on, along with growth in, earning assets were more than offset by a higher cost of funds. Noninterest income totaled $10.9 million during the first quarter of 2024, up $3.9 million, or 56.4 percent, from $7.0 million during the first quarter of 2023. The increase in noninterest income primarily reflected higher levels of treasury management fees and mortgage banking, bank owned life insurance, and interest rate swap income, along with revenue generated from an investment in a private equity fund.
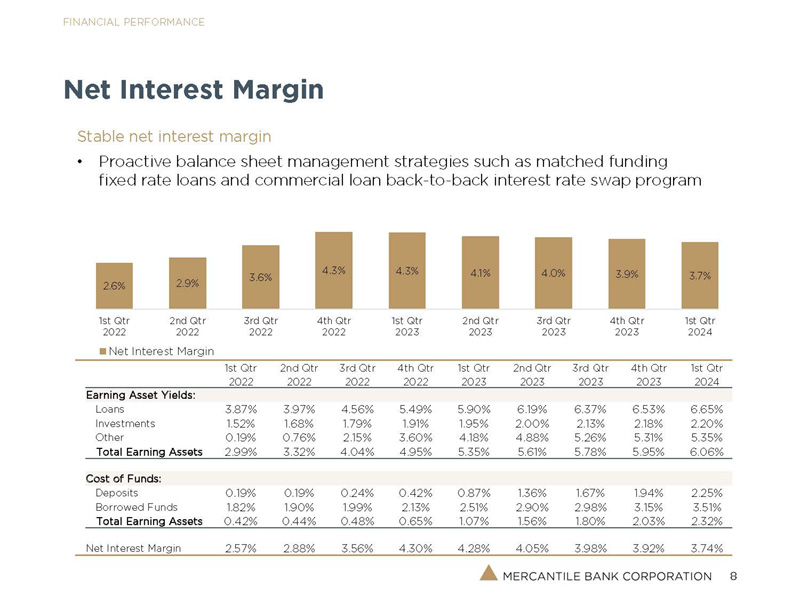
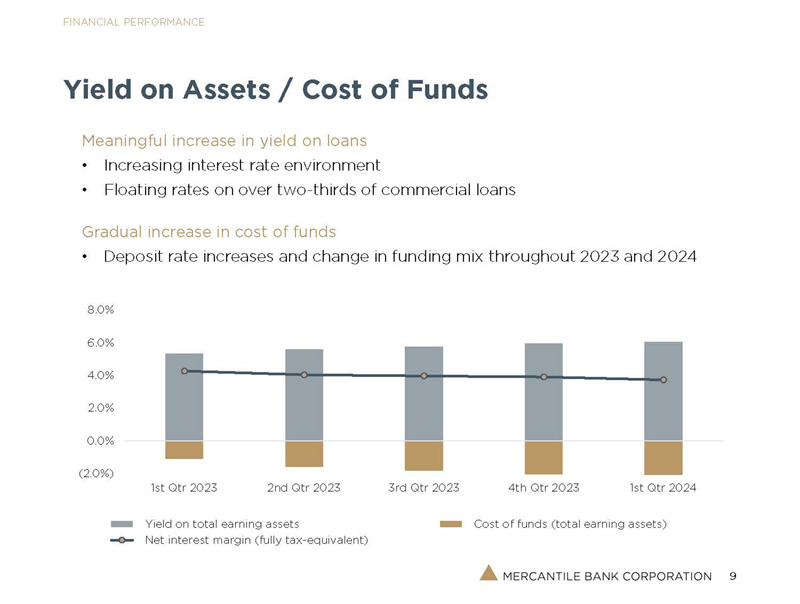
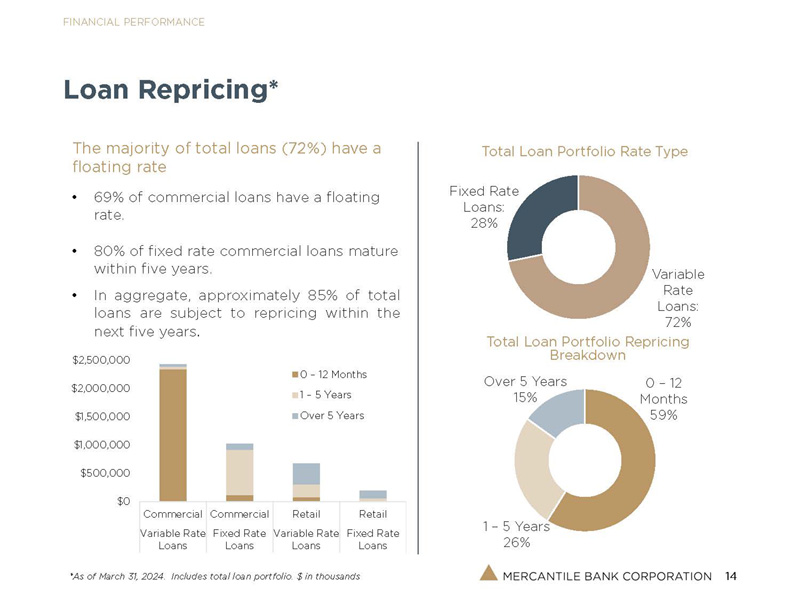
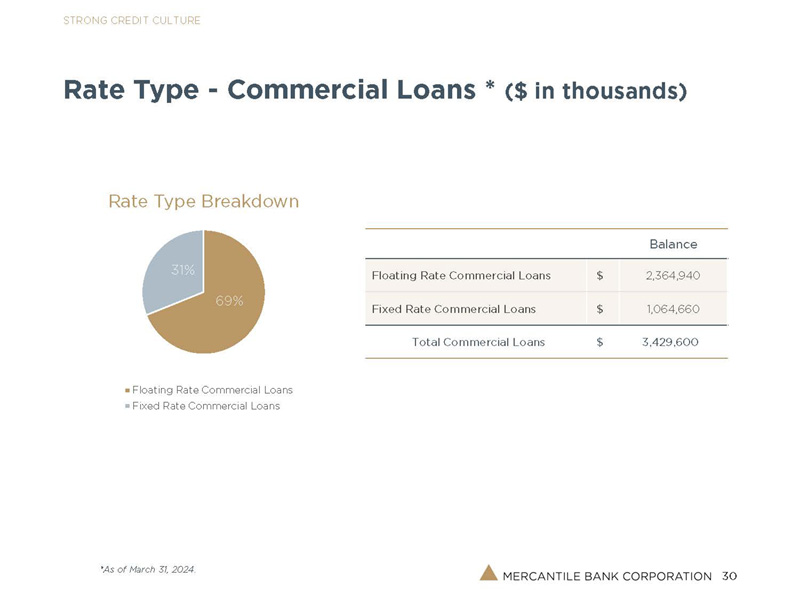
The net interest margin was 3.74 percent in the first quarter of 2024, down from 4.28 percent in the prior-year first quarter. The yield on average earning assets was 6.06 percent during the first three months of 2024, an increase from 5.35 percent during the respective 2023 period. The higher yield primarily resulted from an increased yield on loans. The yield on loans was 6.65 percent during the first quarter of 2024, up from 5.90 percent during the first quarter of 2023 mainly due to higher interest rates on variable-rate commercial loans resulting from the Federal Open Market Committee (“FOMC”) significantly raising the targeted federal funds rate in an effort to curb elevated inflation levels. The FOMC increased the targeted federal funds rate by 100 basis points during the period of February 2023 through July 2023, during which time average variable-rate commercial loans represented approximately 65 percent of average total commercial loans.
The cost of funds was 2.32 percent in the first quarter of 2024, up from 1.07 percent in the first quarter of 2023 primarily due to higher costs of deposits and borrowed funds, reflecting the impact of the rising interest rate environment. A change in funding mix, mainly consisting of a decrease in noninterest-bearing and lower-cost deposits and an increase in higher-cost money market accounts and time deposits stemming from deposit migration and new deposit relationships, also contributed to the increased cost of funds.
Mercantile recorded provisions for credit losses of $1.3 million and $0.6 million during the first quarters of 2024 and 2023, respectively. The provision expense recorded during the current-year first quarter primarily reflected an individual allocation for a nonperforming commercial loan relationship, allocations necessitated by net loan growth, and a change in a commercial loan environmental factor, which more than offset the impacts of an improved economic forecast and changes to the loan portfolio composition. The provision expense recorded during the first quarter of 2023 mainly reflected allocations necessitated by loan growth. The recording of net loan recoveries and ongoing strong loan quality metrics during both periods in large part mitigated additional reserves associated with the loan growth.
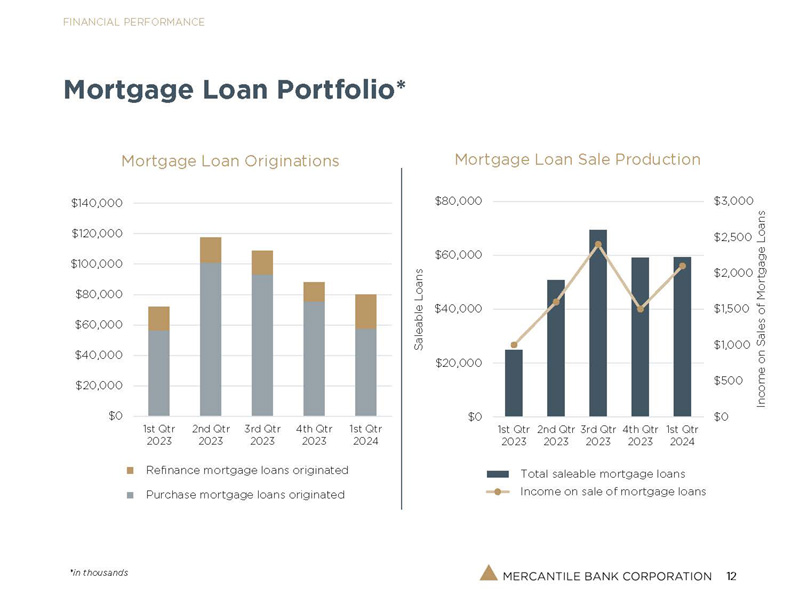
Noninterest income totaled $10.9 million during the first quarter of 2024, compared to $7.0 million during the first quarter of 2023. Noninterest income during the first three months of 2024 included bank owned life insurance claims totaling $0.7 million. Excluding these transactions, noninterest income increased $3.2 million, or 45.6 percent, in the first quarter of 2024 compared to the prior-year first quarter. The growth primarily stemmed from increases in all treasury management fee income categories, along with higher levels of mortgage banking and interest rate swap income and revenue associated with a private equity investment. The increase in treasury management fee income mainly resulted from the successful marketing of products and services to existing and new customers, while the higher level of mortgage banking income primarily resulted from an increased loan sold percentage, which increased from approximately 35 percent during the first quarter of 2023 to approximately 74 percent during the first quarter of 2024.
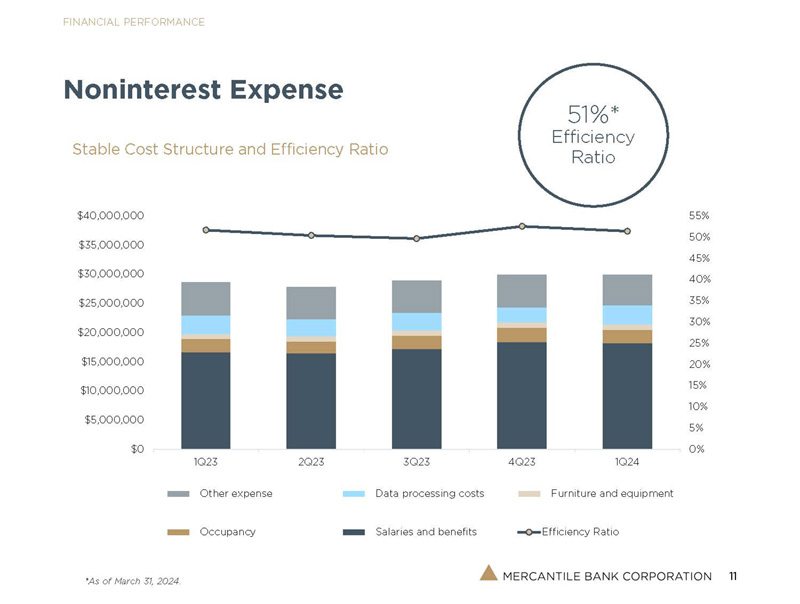
Noninterest expense totaled $29.9 million during the first quarter of 2024, compared to $28.6 million during the prior-year first quarter. Overhead costs during the first three months of 2024 included contributions to The Mercantile Bank Foundation (“Foundation”) totaling $0.7 million, while overhead costs during the respective 2023 period included a $0.4 million write-down of a former branch facility. The increase in noninterest expense primarily stemmed from larger salary and benefit costs, reflecting annual merit pay increases, market adjustments, lower residential mortgage loan deferred salary costs, higher payroll taxes, and increased health insurance claims.
Mr. Kaminski commented, “We are very pleased with the significant increases in all treasury management fee income categories, reflecting our sales team’s success in marketing products and services to existing customers and new clients, as well as the growth in mortgage banking and interest rate swap income. Although declining as expected due to an increased cost of funds, our net interest margin remained solid during the first quarter of 2024. We remain focused on operating in a cost-conscious manner and continually monitor our overhead cost structure to ascertain ways to operate more efficiently while continuing to provide our customers with products and services to meet their banking needs and our customary outstanding service.”
Balance Sheet
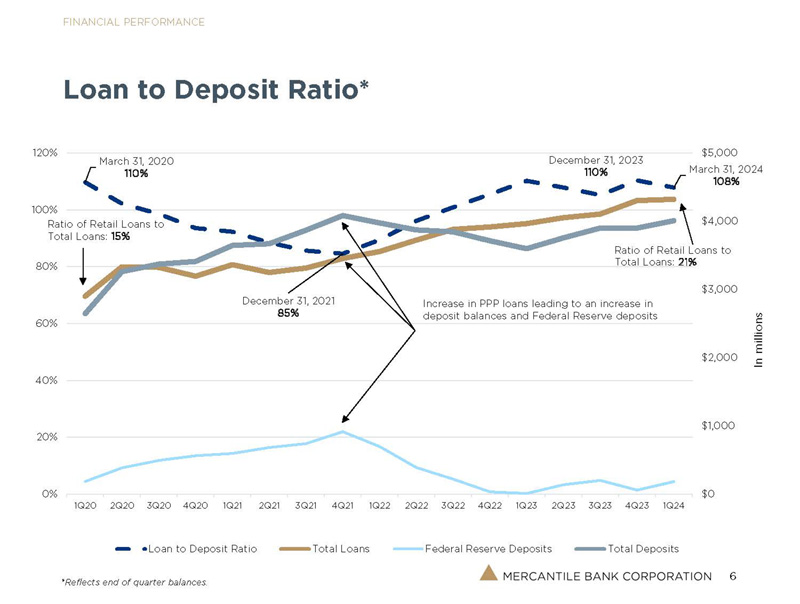
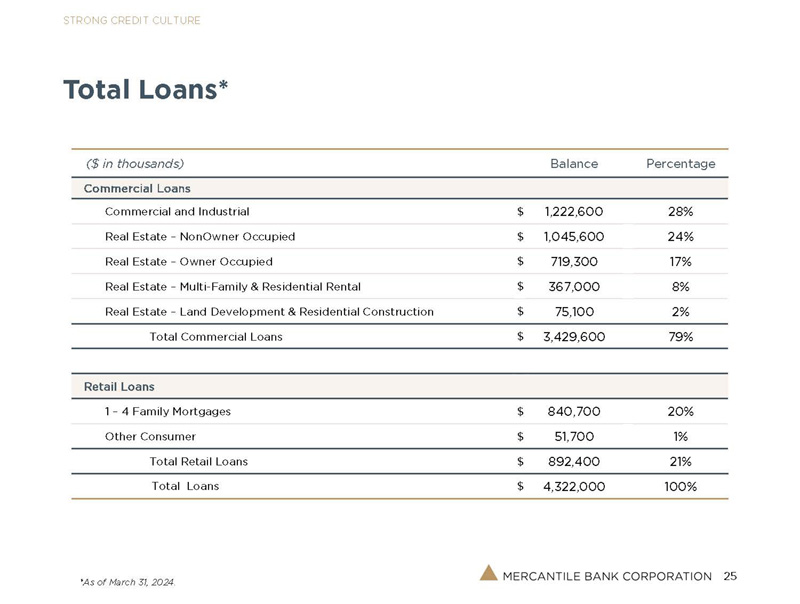
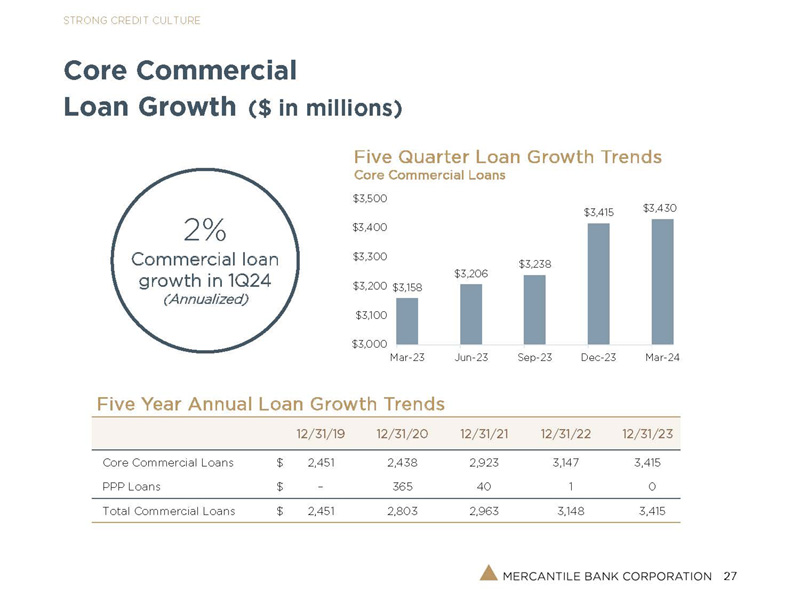
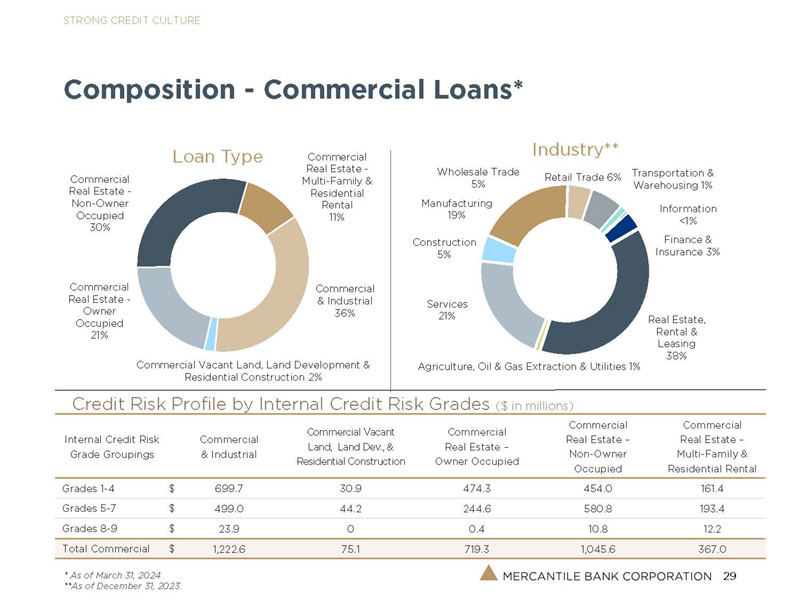
As of March 31, 2024, total assets were $5.47 billion, up $113 million from December 31, 2023, and $570 million from March 31, 2023. Total loans increased $18.2 million and $356 million during the three months and twelve months ended March 31, 2024, respectively. Commercial loans grew $14.3 million, or an annualized 1.7 percent, during the first quarter of 2024 and $272 million, or 8.6 percent, during the twelve months ended March 31, 2024. During the first three months of 2024, solid growth in commercial real estate and construction loans was largely offset by a reduction in commercial line of credit balances, primarily reflecting seasonal paydowns. The commercial loan portfolio growth during the first quarter of 2024 occurred despite the full payoffs and partial paydowns of certain larger relationships, which aggregated approximately $50 million during the period. The payoffs and paydowns primarily stemmed from customers using excess cash flows generated within their operations to make line of credit and unscheduled term loan principal paydowns, as well as from sales of assets. Residential mortgage loans increased $3.2 million and $83.6 million during the three months and twelve months ended March 31, 2024, respectively. Interest-earning deposits increased $124 million during the first quarter of 2024 and $174 million during the twelve months ended March 31, 2024, in large part reflecting a strategic initiative to enhance on-balance sheet liquidity.
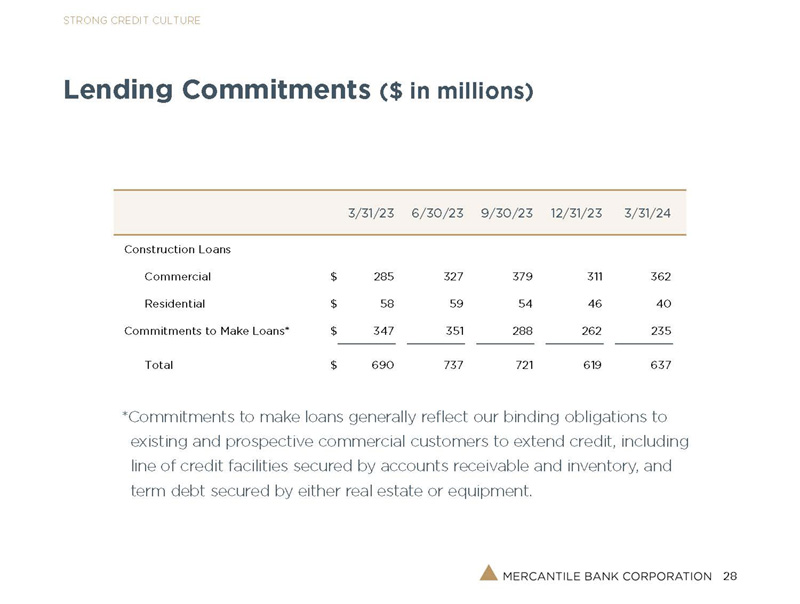
As of March 31, 2024, unfunded commitments on commercial construction and development loans, which are expected to be funded over the next 12 to 18 months, and residential construction loans, which are expected to be largely funded over the next 12 months, totaled approximately $345 million and $36 million, respectively.
Ray Reitsma, President of Mercantile Bank, noted, “We are pleased with the growth in commercial loans during the first quarter of 2024, especially when taking into consideration the notable level of full and partial paydowns and seasonal line of credit reductions that occurred during the period. Based on our strong loan pipeline and construction line availability, we believe commercial loan portfolio expansion will be solid in future periods. The residential mortgage loan portfolio exhibited a lower level of growth compared to prior quarters in part due to a strategic initiative to provide for an increased percentage of loans sold. We increased mortgage loan production despite ongoing market challenges, including the higher interest rate environment and limited inventory levels in our markets.”
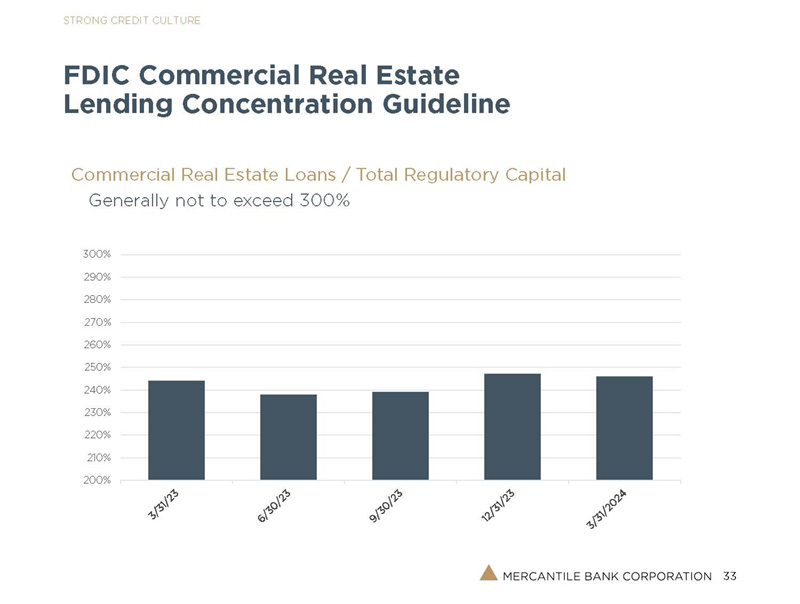
Commercial and industrial loans and owner-occupied commercial real estate loans together represented approximately 57 percent of total commercial loans as of March 31, 2024, a level that has remained relatively consistent with prior periods and in line with our expectations.
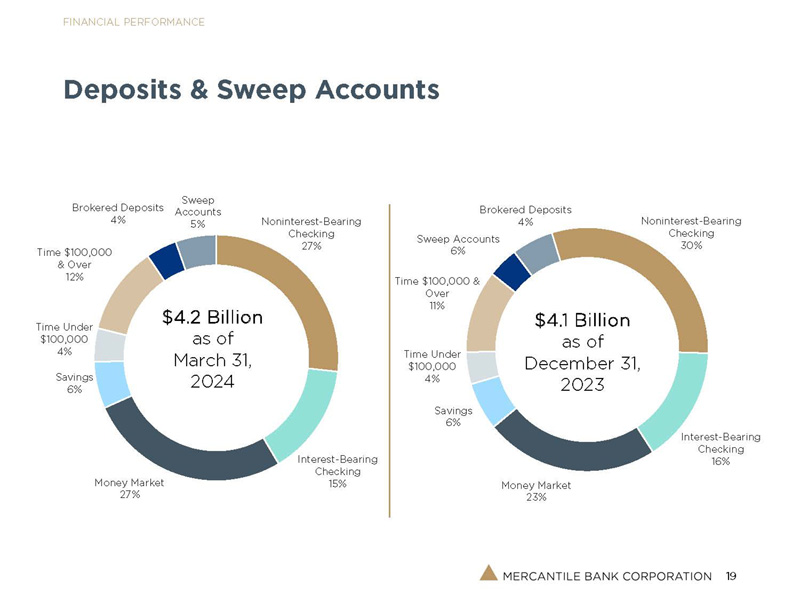
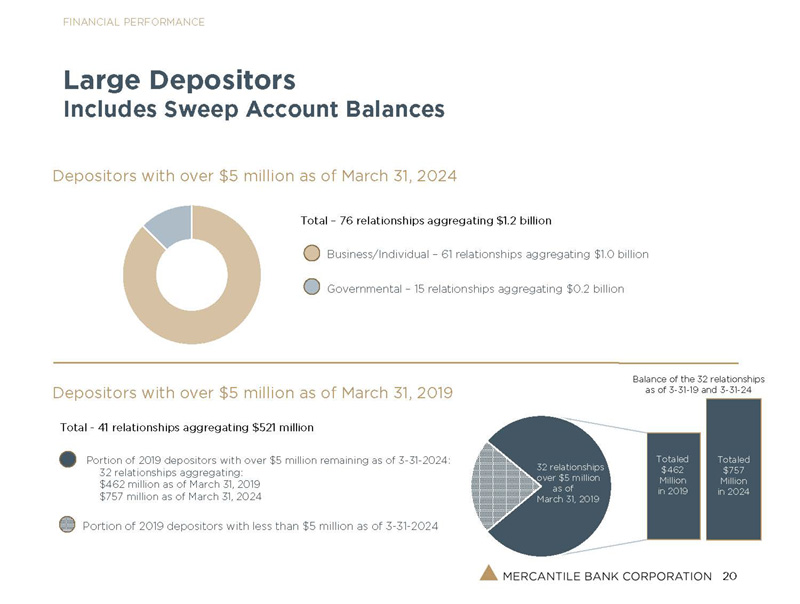
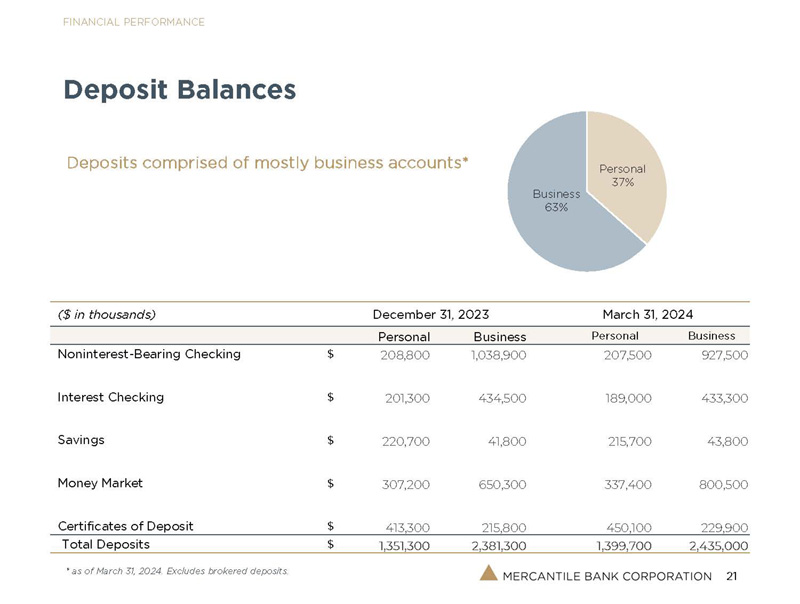
Total deposits equaled $4.01 billion as of March 31, 2024, representing increases of $107 million, or an annualized 11.0 percent, from December 31, 2023, and $410 million, or 11.4 percent, from March 31, 2023. Local deposits were up $102 million, or nearly 11 percent annualized, and $237 million, or approximately 7 percent, during the three months and twelve months ended March 31, 2024, respectively, while brokered deposits increased $4.7 million and $173 million during the respective periods. The increase in local deposits during the first quarter of 2024, which occurred despite the typical level of seasonal noninterest-bearing deposit withdrawals by customers to make bonus and tax payments and partnership distributions, in large part reflected new deposit relationships and growth in existing deposit relationships. Wholesale funds were $620 million, or approximately 13 percent of total funds, at March 31, 2024, compared to $636 million, or approximately 14 percent of total funds, at December 31, 2023, and $395 million, or approximately 9 percent of total funds, at March 31, 2023. Wholesale funds totaling $471 million were obtained during 2023 and the first three months of 2024 to increase on-balance sheet liquidity and offset loan growth, seasonal deposit withdrawals, and wholesale fund maturities. Noninterest-bearing checking accounts represented approximately 28 percent of total deposits as of March 31, 2024, which is similar to historical levels.
Asset Quality
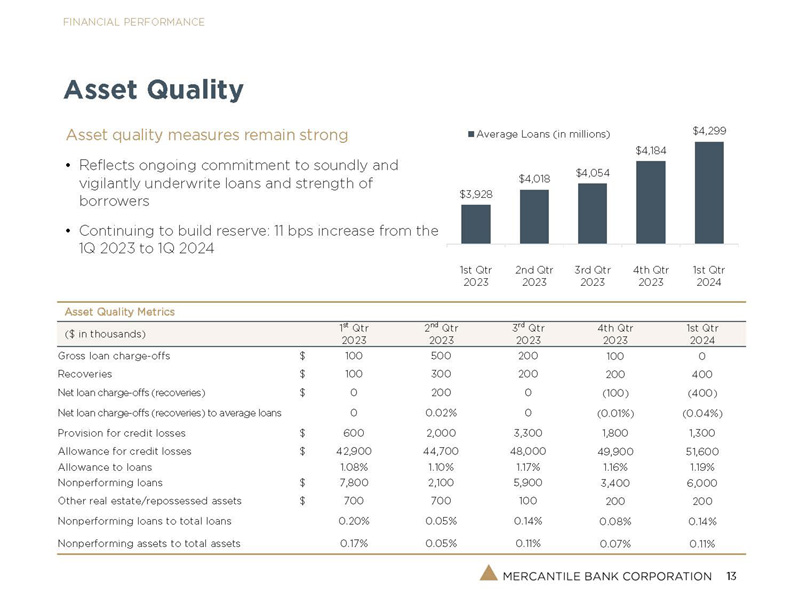
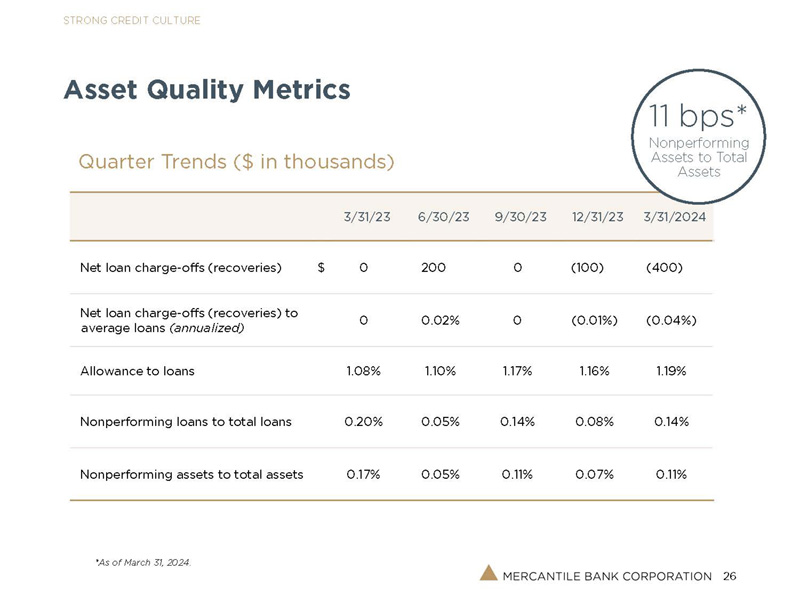
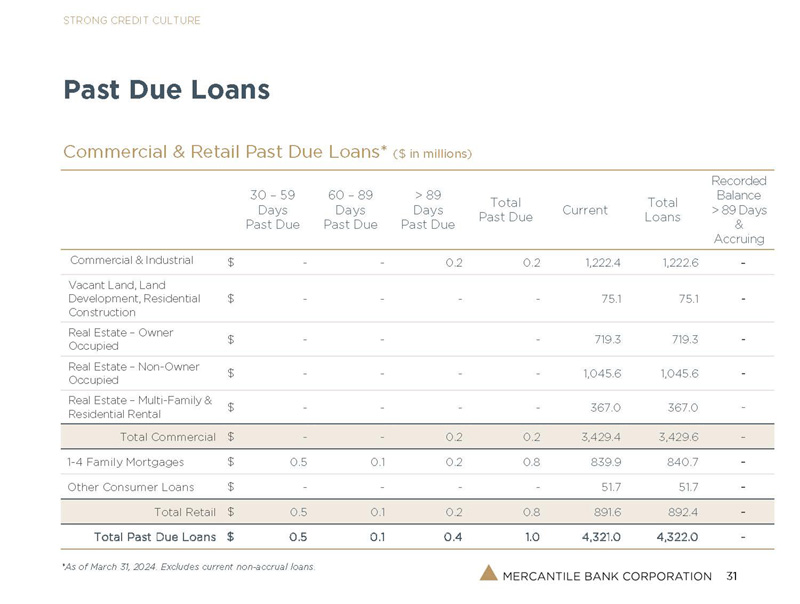
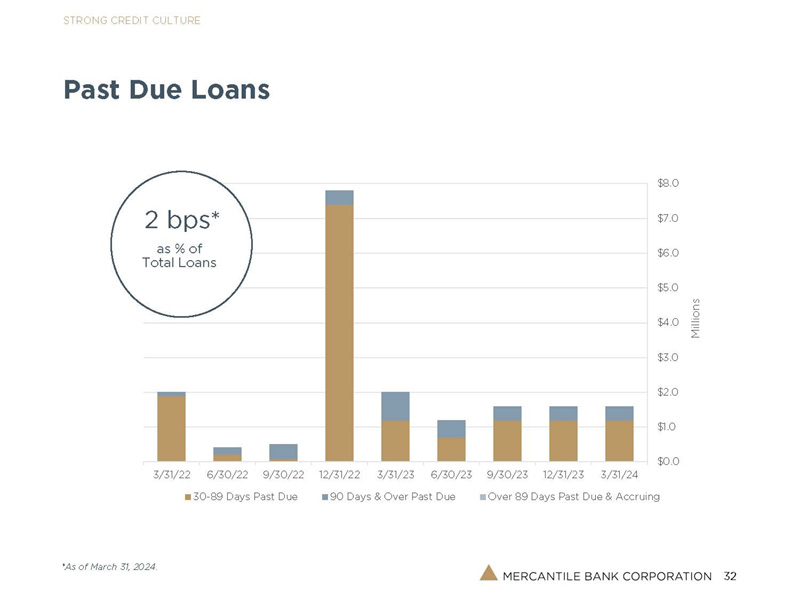
Nonperforming assets totaled $6.2 million, or 0.1 percent of total assets, at March 31, 2024, compared to $3.6 million, or less than 0.1 percent of total assets, at December 31, 2023, and $8.4 million, or 0.2 percent of total assets, at March 31, 2023. The level of past due loans remains nominal. During the first quarter of 2024, loan charge-offs were minimal, while recoveries of prior period loan charge-offs equaled $0.4 million, providing for net loan recoveries of $0.4 million, or an annualized 0.04 percent of average total loans.
Mr. Reitsma remarked, “Our asset quality metrics remained strong during the first quarter of 2024, reflecting our unwavering commitment to sound loan underwriting and our borrowers’ continued success in meeting the challenges arising from the current operating environment, including increased interest rates and the associated escalation in debt service requirements. The early identification and reporting of deteriorating commercial credit relationships and developing systemic or segment-specific credit issues remain a top priority, and we believe our ongoing devotion to this important credit monitoring tool will limit the impact of any detected credit weaknesses on our overall financial condition. We remain pleased with the performances of our residential mortgage loan and consumer loan portfolios, both of which continue to exhibit low delinquency and charge-off levels.”
Capital Position
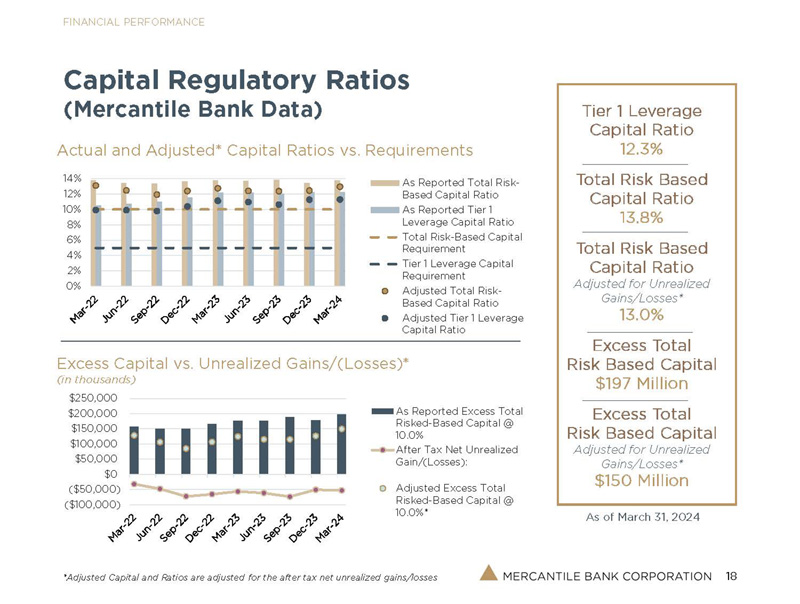
Shareholders’ equity totaled $537 million as of March 31, 2024, up $14.5 million from year-end 2023. Mercantile Bank maintained a “well-capitalized” position as of March 31, 2024, with a total risk-based capital ratio of 13.8 percent, compared to 13.4 percent as of December 31, 2023. At March 31, 2024, Mercantile Bank had approximately $196 million in excess of the 10 percent minimum regulatory threshold required to be categorized as a “well-capitalized” institution.
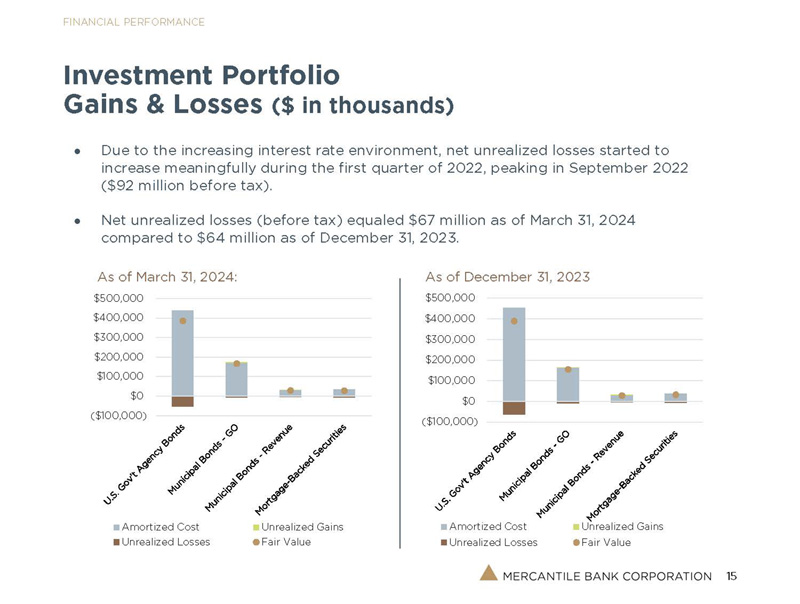
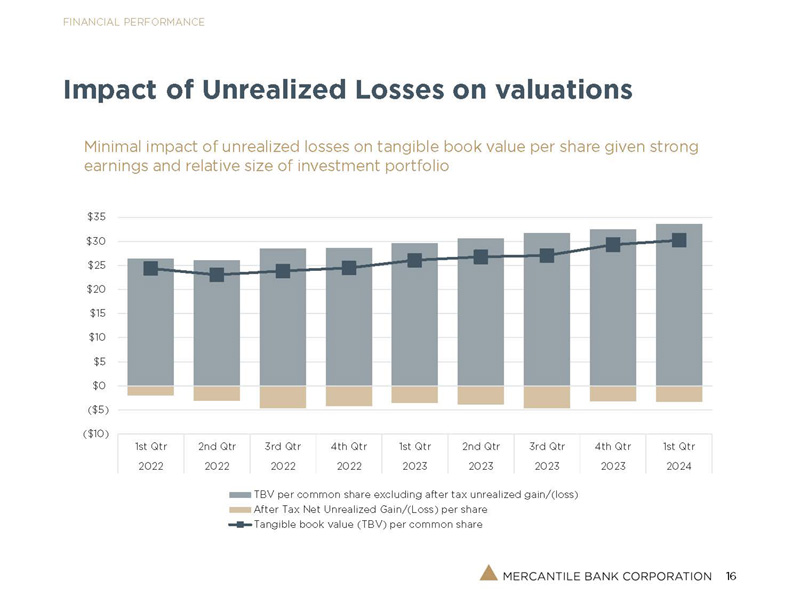
All of Mercantile’s investments are categorized as available-for-sale. As of March 31, 2024, the net unrealized loss on these investments totaled $67.1 million, resulting in an after-tax reduction to equity capital of $53.0 million. Although unrealized gains and losses on investments are excluded from regulatory capital ratio calculations, our excess capital over the minimum regulatory requirement to be considered a “well-capitalized” institution would approximate $150 million on an adjusted basis.
Mercantile reported 16,122,503 total shares outstanding at March 31, 2024.
Mr. Kaminski concluded, “Our sustained financial strength has enabled us to continue our regular cash dividend program and deliver meaningful cash returns to shareholders on their investments. As evidenced by our consistently strong capital levels, asset quality metrics, and operating performance, we have remained a steady and profitable performer. The growth during the first quarter reflects the ongoing success of our community banking philosophy and related focus on building mutually beneficial relationships with existing and new customers. We believe our sound overall financial condition and ongoing loan origination opportunities position us to produce solid operating results in future periods and effectively handle potential issues arising from shifting economic conditions and the current operating environment.”
Investor Presentation
Mercantile has prepared presentation materials that management intends to use during its previously announced first quarter 2024 conference call on Tuesday, April 16, 2024, at 10:00 a.m. Eastern Time, and from time to time thereafter in presentations about the company’s operations and performance. These materials, which are available for viewing in the Investor Relations section of Mercantile’s website at www.mercbank.com, have been furnished to the U.S. Securities and Exchange Commission concurrently with this press release.
About Mercantile Bank Corporation
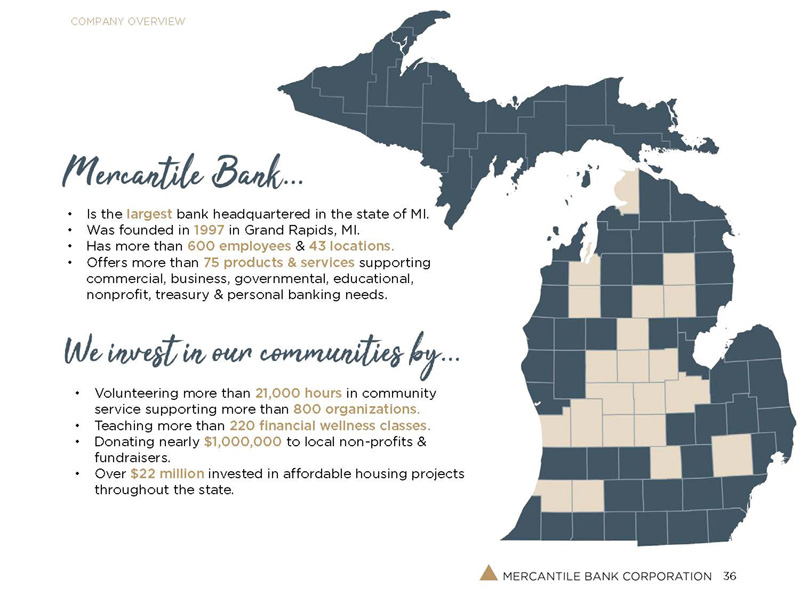
Based in Grand Rapids, Michigan, Mercantile Bank Corporation is the bank holding company for Mercantile Bank. Mercantile provides financial products and services in a professional and personalized manner designed to make banking easier for businesses, individuals, and governmental units. Distinguished by exceptional service, a knowledgeable staff, and a commitment to the communities it serves, Mercantile is one of the largest Michigan-based banks with assets of approximately $5.5 billion. Mercantile Bank Corporation's common stock is listed on the NASDAQ Global Select Market under the symbol "MBWM." For more information about Mercantile, visit www.mercbank.com, and follow us on Facebook, Instagram, and Twitter @MercBank and LinkedIn @merc-bank.
Forward-Looking Statements
This news release contains statements or information that may constitute forward-looking statements within the meaning of the Private Securities Litigation Reform Act of 1995. Forward-looking statements can be identified by words such as: “anticipate,” “intend,” “plan,” “goal,” “seek,” “believe,” “project,” “estimate,” “expect,” “strategy,” “future,” “likely,” “may,” “should,” “will,” and similar references to future periods. Any such statements are based on current expectations that involve a number of risks and uncertainties. Actual results may differ materially from the results expressed in forward-looking statements. Factors that might cause such a difference include changes in interest rates and interest rate relationships; increasing rates of inflation and slower growth rates or recession; significant declines in the value of commercial real estate; market volatility; demand for products and services; climate impacts; labor markets; the degree of competition by traditional and nontraditional financial services companies; changes in banking regulation or actions by bank regulators; changes in tax laws and other laws and regulations applicable to us; changes in prices, levies, and assessments; the impact of technological advances; potential cyber-attacks, information security breaches and other criminal activities; litigation liabilities; governmental and regulatory policy changes; the outcomes of existing or future contingencies; trends in customer behavior as well as their ability to repay loans; changes in local real estate values; damage to our reputation resulting from adverse publicity, regulatory actions, litigation, operational failures, and the failure to meet client expectations and other facts; the transition from LIBOR to SOFR; changes in the national and local economies; unstable political and economic environments; disease outbreaks, such as the COVID-19 pandemic or similar public health threats, and measures implemented to combat them; and other factors, including those expressed as risk factors, disclosed from time to time in filings made by Mercantile with the Securities and Exchange Commission. Mercantile undertakes no obligation to update or clarify forward-looking statements, whether as a result of new information, future events or otherwise. Investors are cautioned not to place undue reliance on any forward-looking statements contained herein.
FOR FURTHER INFORMATION:
| Robert B. Kaminski, Jr. | Charles Christmas |
| President and CEO | Executive Vice President and CFO |
| 616-726-1502 | 616-726-1202 |
| rkaminski@mercbank.com | cchristmas@mercbank.com |
|
Mercantile Bank Corporation |
|
First Quarter 2024 Results |
|
MERCANTILE BANK CORPORATION |
|
CONSOLIDATED BALANCE SHEETS |
|
(Unaudited) |
|
(dollars in thousands) |
MARCH 31, | DECEMBER 31, | MARCH 31, | |||||||||
|
2024 |
2023 |
2023 |
||||||||||
|
ASSETS |
||||||||||||
|
Cash and due from banks |
$ | 52,606 | $ | 70,408 | $ | 47,151 | ||||||
|
Interest-earning deposits |
184,625 | 60,125 | 10,787 | |||||||||
|
Total cash and cash equivalents |
237,231 | 130,533 | 57,938 | |||||||||
|
Securities available for sale |
609,153 | 617,092 | 619,973 | |||||||||
|
Federal Home Loan Bank stock |
21,513 | 21,513 | 17,721 | |||||||||
|
Mortgage loans held for sale |
14,393 | 18,607 | 3,821 | |||||||||
|
Loans |
4,322,006 | 4,303,758 | 3,965,528 | |||||||||
|
Allowance for credit losses |
(51,638 | ) | (49,914 | ) | (42,877 | ) | ||||||
|
Loans, net |
4,270,368 | 4,253,844 | 3,922,651 | |||||||||
|
Premises and equipment, net |
50,835 | 50,928 | 51,510 | |||||||||
|
Bank owned life insurance |
85,528 | 85,668 | 81,113 | |||||||||
|
Goodwill |
49,473 | 49,473 | 49,473 | |||||||||
|
Other assets |
127,459 | 125,566 | 91,674 | |||||||||
|
Total assets |
$ | 5,465,953 | $ | 5,353,224 | $ | 4,895,874 | ||||||
|
LIABILITIES AND SHAREHOLDERS' EQUITY |
||||||||||||
|
Deposits: |
||||||||||||
|
Noninterest-bearing |
$ | 1,134,995 | $ | 1,247,640 | $ | 1,376,782 | ||||||
|
Interest-bearing |
2,872,815 | 2,653,278 | 2,221,236 | |||||||||
|
Total deposits |
4,007,810 | 3,900,918 | 3,598,018 | |||||||||
|
Securities sold under agreements to repurchase |
228,618 | 229,734 | 227,453 | |||||||||
|
Federal funds purchased |
0 | 0 | 17,207 | |||||||||
|
Federal Home Loan Bank advances |
447,083 | 467,910 | 377,910 | |||||||||
|
Subordinated debentures |
49,815 | 49,644 | 49,130 | |||||||||
|
Subordinated notes |
89,057 | 88,971 | 88,714 | |||||||||
|
Accrued interest and other liabilities |
106,926 | 93,902 | 70,070 | |||||||||
|
Total liabilities |
4,929,309 | 4,831,079 | 4,428,502 | |||||||||
|
SHAREHOLDERS' EQUITY |
||||||||||||
|
Common stock |
296,065 | 295,106 | 291,516 | |||||||||
|
Retained earnings |
293,554 | 277,526 | 232,123 | |||||||||
|
Accumulated other comprehensive income/(loss) |
(52,975 | ) | (50,487 | ) | (56,267 | ) | ||||||
|
Total shareholders' equity |
536,644 | 522,145 | 467,372 | |||||||||
|
Total liabilities and shareholders' equity |
$ | 5,465,953 | $ | 5,353,224 | $ | 4,895,874 | ||||||
|
Mercantile Bank Corporation |
|
First Quarter 2024 Results |
|
MERCANTILE BANK CORPORATION |
|
CONSOLIDATED REPORTS OF INCOME |
|
(Unaudited) |
|
(dollars in thousands except per share data) |
THREE MONTHS ENDED |
THREE MONTHS ENDED |
||||||
|
March 31, 2024 |
March 31, 2023 |
|||||||
|
INTEREST INCOME |
||||||||
|
Loans, including fees |
$ | 71,270 | $ | 57,154 | ||||
|
Investment securities |
3,421 | 3,007 | ||||||
|
Interest-earning deposits |
2,033 | 324 | ||||||
|
Total interest income |
76,724 | 60,485 | ||||||
|
INTEREST EXPENSE |
||||||||
|
Deposits |
22,224 | 7,907 | ||||||
|
Short-term borrowings |
1,654 | 459 | ||||||
|
Federal Home Loan Bank advances |
3,399 | 1,794 | ||||||
|
Other borrowed money |
2,086 | 1,941 | ||||||
|
Total interest expense |
29,363 | 12,101 | ||||||
|
Net interest income |
47,361 | 48,384 | ||||||
|
Provision for credit losses |
1,300 | 600 | ||||||
|
Net interest income after provision for credit losses |
46,061 | 47,784 | ||||||
|
NONINTEREST INCOME |
||||||||
|
Service charges on accounts |
1,531 | 976 | ||||||
|
Mortgage banking income |
2,343 | 1,216 | ||||||
|
Credit and debit card income |
2,121 | 2,060 | ||||||
|
Interest rate swap income |
1,339 | 1,037 | ||||||
|
Payroll services |
896 | 746 | ||||||
|
Earnings on bank owned life insurance |
1,172 | 401 | ||||||
|
Other income |
1,466 | 515 | ||||||
|
Total noninterest income |
10,868 | 6,951 | ||||||
|
NONINTEREST EXPENSE |
||||||||
|
Salaries and benefits |
18,237 | 16,682 | ||||||
|
Occupancy |
2,289 | 2,289 | ||||||
|
Furniture and equipment |
929 | 822 | ||||||
|
Data processing costs |
3,289 | 3,162 | ||||||
|
Charitable foundation contributions |
703 | 10 | ||||||
|
Other expense |
4,497 | 5,634 | ||||||
|
Total noninterest expense |
29,944 | 28,599 | ||||||
|
Income before federal income tax expense |
26,985 | 26,136 | ||||||
|
Federal income tax expense |
5,423 | 5,162 | ||||||
|
Net Income |
$ | 21,562 | $ | 20,974 | ||||
|
Basic earnings per share |
$ | 1.34 | $ | 1.31 | ||||
|
Diluted earnings per share |
$ | 1.34 | $ | 1.31 | ||||
|
Average basic shares outstanding |
16,118,858 | 15,996,138 | ||||||
|
Average diluted shares outstanding |
16,118,858 | 15,996,138 | ||||||
|
Mercantile Bank Corporation |
|
First Quarter 2024 Results |
|
MERCANTILE BANK CORPORATION |
|
CONSOLIDATED FINANCIAL HIGHLIGHTS |
|
(Unaudited) |
|
Quarterly |
||||||||||||||||||||
|
(dollars in thousands except per share data) |
2024 |
2023 |
2023 |
2023 |
2023 |
|||||||||||||||
|
1st Qtr |
4th Qtr |
3rd Qtr |
2nd Qtr |
1st Qtr |
||||||||||||||||
|
EARNINGS |
||||||||||||||||||||
|
Net interest income |
$ | 47,361 | 48,649 | 48,961 | 47,551 | 48,384 | ||||||||||||||
|
Provision for credit losses |
$ | 1,300 | 1,800 | 3,300 | 2,000 | 600 | ||||||||||||||
|
Noninterest income |
$ | 10,868 | 8,300 | 9,246 | 7,645 | 6,951 | ||||||||||||||
|
Noninterest expense |
$ | 29,944 | 29,940 | 28,920 | 27,829 | 28,599 | ||||||||||||||
|
Net income before federal income |
||||||||||||||||||||
|
tax expense |
$ | 26,985 | 25,209 | 25,987 | 25,367 | 26,136 | ||||||||||||||
|
Net income |
$ | 21,562 | 20,030 | 20,855 | 20,357 | 20,974 | ||||||||||||||
|
Basic earnings per share |
$ | 1.34 | 1.25 | 1.30 | 1.27 | 1.31 | ||||||||||||||
|
Diluted earnings per share |
$ | 1.34 | 1.25 | 1.30 | 1.27 | 1.31 | ||||||||||||||
|
Average basic shares outstanding |
16,118,858 | 16,044,223 | 16,018,419 | 16,003,372 | 15,996,138 | |||||||||||||||
|
Average diluted shares outstanding |
16,118,858 | 16,044,223 | 16,018,419 | 16,003,372 | 15,996,138 | |||||||||||||||
|
PERFORMANCE RATIOS |
||||||||||||||||||||
|
Return on average assets |
1.61 | % | 1.52 | % | 1.60 | % | 1.64 | % | 1.75 | % | ||||||||||
|
Return on average equity |
16.41 | % | 16.04 | % | 17.07 | % | 17.23 | % | 18.76 | % | ||||||||||
|
Net interest margin (fully tax-equivalent) |
3.74 | % | 3.92 | % | 3.98 | % | 4.05 | % | 4.28 | % | ||||||||||
|
Efficiency ratio |
51.42 | % | 52.57 | % | 49.68 | % | 50.42 | % | 51.69 | % | ||||||||||
|
Full-time equivalent employees |
642 | 651 | 643 | 665 | 633 | |||||||||||||||
|
YIELD ON ASSETS / COST OF FUNDS |
||||||||||||||||||||
|
Yield on loans |
6.65 | % | 6.53 | % | 6.37 | % | 6.19 | % | 5.90 | % | ||||||||||
|
Yield on securities |
2.20 | % | 2.18 | % | 2.13 | % | 2.00 | % | 1.95 | % | ||||||||||
|
Yield on interest-earning deposits |
5.35 | % | 5.31 | % | 5.26 | % | 4.88 | % | 4.18 | % | ||||||||||
|
Yield on total earning assets |
6.06 | % | 5.95 | % | 5.78 | % | 5.61 | % | 5.35 | % | ||||||||||
|
Yield on total assets |
5.72 | % | 5.61 | % | 5.45 | % | 5.30 | % | 5.06 | % | ||||||||||
|
Cost of deposits |
2.25 | % | 1.94 | % | 1.67 | % | 1.36 | % | 0.87 | % | ||||||||||
|
Cost of borrowed funds |
3.51 | % | 3.15 | % | 2.98 | % | 2.90 | % | 2.51 | % | ||||||||||
|
Cost of interest-bearing liabilities |
3.27 | % | 2.96 | % | 2.69 | % | 2.37 | % | 1.72 | % | ||||||||||
|
Cost of funds (total earning assets) |
2.32 | % | 2.03 | % | 1.80 | % | 1.56 | % | 1.07 | % | ||||||||||
|
Cost of funds (total assets) |
2.19 | % | 1.91 | % | 1.70 | % | 1.48 | % | 1.01 | % | ||||||||||
|
MORTGAGE BANKING ACTIVITY |
||||||||||||||||||||
|
Total mortgage loans originated |
$ | 79,930 | 88,187 | 108,602 | 117,563 | 71,991 | ||||||||||||||
|
Purchase/construction mortgage loans originated |
$ | 57,668 | 75,365 | 93,520 | 100,941 | 56,728 | ||||||||||||||
|
Refinance mortgage loans originated |
$ | 22,262 | 12,822 | 15,082 | 16,622 | 15,263 | ||||||||||||||
|
Mortgage loans originated with intent to sell |
$ | 59,280 | 59,135 | 69,305 | 50,734 | 24,904 | ||||||||||||||
|
Income on sale of mortgage loans |
$ | 2,064 | 1,487 | 2,386 | 1,570 | 950 | ||||||||||||||
|
CAPITAL |
||||||||||||||||||||
|
Tangible equity to tangible assets |
8.99 | % | 8.91 | % | 8.33 | % | 8.43 | % | 8.61 | % | ||||||||||
|
Tier 1 leverage capital ratio |
10.88 | % | 10.84 | % | 10.64 | % | 10.73 | % | 10.66 | % | ||||||||||
|
Common equity risk-based capital ratio |
10.41 | % | 10.07 | % | 10.41 | % | 10.25 | % | 10.25 | % | ||||||||||
|
Tier 1 risk-based capital ratio |
11.33 | % | 10.99 | % | 11.38 | % | 11.24 | % | 11.27 | % | ||||||||||
|
Total risk-based capital ratio |
14.05 | % | 13.69 | % | 14.21 | % | 14.03 | % | 14.11 | % | ||||||||||
|
Tier 1 capital |
$ | 587,888 | 570,730 | 554,634 | 537,802 | 520,918 | ||||||||||||||
|
Tier 1 plus tier 2 capital |
$ | 729,410 | 710,905 | 692,252 | 671,323 | 652,509 | ||||||||||||||
|
Total risk-weighted assets |
$ | 5,190,106 | 5,192,970 | 4,872,424 | 4,784,428 | 4,623,631 | ||||||||||||||
|
Book value per common share |
$ | 33.29 | 32.38 | 30.16 | 29.89 | 29.21 | ||||||||||||||
|
Tangible book value per common share |
$ | 30.22 | 29.31 | 27.06 | 26.78 | 26.09 | ||||||||||||||
|
Cash dividend per common share |
$ | 0.35 | 0.34 | 0.34 | 0.33 | 0.33 | ||||||||||||||
|
ASSET QUALITY |
||||||||||||||||||||
|
Gross loan charge-offs |
$ | 15 | 53 | 243 | 461 | 106 | ||||||||||||||
|
Recoveries |
$ | 439 | 160 | 230 | 305 | 137 | ||||||||||||||
|
Net loan charge-offs (recoveries) |
$ | (424 | ) | (107 | ) | 13 | 156 | (31 | ) | |||||||||||
|
Net loan charge-offs to average loans |
(0.04 | %) | (0.01 | %) |
< 0.01% |
0.02 | % |
< (0.01%) |
||||||||||||
|
Allowance for credit losses |
$ | 51,638 | 49,914 | 48,008 | 44,721 | 42,877 | ||||||||||||||
|
Allowance to loans |
1.19 | % | 1.16 | % | 1.17 | % | 1.10 | % | 1.08 | % | ||||||||||
|
Nonperforming loans |
$ | 6,040 | 3,415 | 5,889 | 2,099 | 7,782 | ||||||||||||||
|
Other real estate/repossessed assets |
$ | 200 | 200 | 51 | 661 | 661 | ||||||||||||||
|
Nonperforming loans to total loans |
0.14 | % | 0.08 | % | 0.14 | % | 0.05 | % | 0.20 | % | ||||||||||
|
Nonperforming assets to total assets |
0.11 | % | 0.07 | % | 0.11 | % | 0.05 | % | 0.17 | % | ||||||||||
|
NONPERFORMING ASSETS - COMPOSITION |
||||||||||||||||||||
|
Residential real estate: |
||||||||||||||||||||
|
Land development |
$ | 1 | 1 | 1 | 2 | 8 | ||||||||||||||
|
Construction |
$ | 0 | 0 | 0 | 0 | 0 | ||||||||||||||
|
Owner occupied / rental |
$ | 3,370 | 3,095 | 1,913 | 1,793 | 1,952 | ||||||||||||||
|
Commercial real estate: |
||||||||||||||||||||
|
Land development |
$ | 0 | 0 | 0 | 0 | 0 | ||||||||||||||
|
Construction |
$ | 0 | 0 | 0 | 0 | 0 | ||||||||||||||
|
Owner occupied |
$ | 200 | 270 | 738 | 716 | 829 | ||||||||||||||
|
Non-owner occupied |
$ | 0 | 0 | 0 | 0 | 0 | ||||||||||||||
|
Non-real estate: |
||||||||||||||||||||
|
Commercial assets |
$ | 2,669 | 249 | 3,288 | 249 | 5,654 | ||||||||||||||
|
Consumer assets |
$ | 0 | 0 | 0 | 0 | 0 | ||||||||||||||
|
Total nonperforming assets |
$ | 6,240 | 3,615 | 5,940 | 2,760 | 8,443 | ||||||||||||||
|
NONPERFORMING ASSETS - RECON |
||||||||||||||||||||
|
Beginning balance |
$ | 3,615 | 5,940 | 2,760 | 8,443 | 7,728 | ||||||||||||||
|
Additions |
$ | 2,802 | 2,166 | 4,163 | 273 | 1,323 | ||||||||||||||
|
Return to performing status |
$ | 0 | 0 | 0 | 0 | (31 | ) | |||||||||||||
|
Principal payments |
$ | (177 | ) | (4,402 | ) | (166 | ) | (5,526 | ) | (515 | ) | |||||||||
|
Sale proceeds |
$ | 0 | (51 | ) | (661 | ) | 0 | 0 | ||||||||||||
|
Loan charge-offs |
$ | 0 | (38 | ) | (156 | ) | (430 | ) | (62 | ) | ||||||||||
|
Valuation write-downs |
$ | 0 | 0 | 0 | 0 | 0 | ||||||||||||||
|
Ending balance |
$ | 6,240 | 3,615 | 5,940 | 2,760 | 8,443 | ||||||||||||||
|
LOAN PORTFOLIO COMPOSITION |
||||||||||||||||||||
|
Commercial: |
||||||||||||||||||||
|
Commercial & industrial |
$ | 1,222,638 | 1,254,586 | 1,184,993 | 1,229,588 | 1,190,982 | ||||||||||||||
|
Land development & construction |
$ | 75,091 | 74,752 | 72,921 | 72,682 | 66,233 | ||||||||||||||
|
Owner occupied comm'l R/E |
$ | 719,338 | 717,667 | 671,083 | 659,201 | 630,186 | ||||||||||||||
|
Non-owner occupied comm'l R/E |
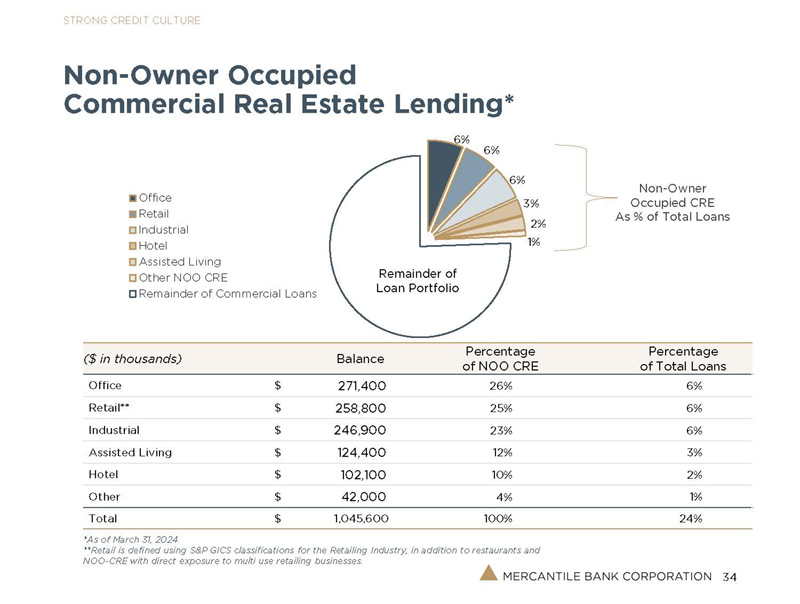
$ | 1,045,614 | 1,035,684 | 1,000,411 | 957,221 | 975,735 | ||||||||||||||
|
Multi-family & residential rental |
$ | 366,961 | 332,609 | 308,229 | 287,285 | 294,825 | ||||||||||||||
|
Total commercial |
$ | 3,429,642 | 3,415,298 | 3,237,637 | 3,205,977 | 3,157,961 | ||||||||||||||
|
Retail: |
||||||||||||||||||||
|
1-4 family mortgages |
$ | 840,653 | 837,407 | 816,849 | 795,661 | 757,006 | ||||||||||||||
|
Other consumer |
$ | 51,711 | 51,053 | 49,890 | 50,205 | 50,561 | ||||||||||||||
|
Total retail |
$ | 892,364 | 888,460 | 866,739 | 845,866 | 807,567 | ||||||||||||||
|
Total loans |
$ | 4,322,006 | 4,303,758 | 4,104,376 | 4,051,843 | 3,965,528 | ||||||||||||||
|
END OF PERIOD BALANCES |
||||||||||||||||||||
|
Loans |
$ | 4,322,006 | 4,303,758 | 4,104,376 | 4,051,843 | 3,965,528 | ||||||||||||||
|
Securities |
$ | 630,666 | 638,605 | 613,818 | 630,485 | 637,694 | ||||||||||||||
|
Interest-earning deposits |
$ | 184,625 | 60,125 | 201,436 | 138,663 | 10,787 | ||||||||||||||
|
Total earning assets (before allowance) |
$ | 5,137,297 | 5,002,488 | 4,919,630 | 4,820,991 | 4,614,009 | ||||||||||||||
|
Total assets |
$ | 5,465,953 | 5,353,224 | 5,251,012 | 5,137,587 | 4,895,874 | ||||||||||||||
|
Noninterest-bearing deposits |
$ | 1,134,995 | 1,247,640 | 1,309,672 | 1,371,633 | 1,376,782 | ||||||||||||||
|
Interest-bearing deposits |
$ | 2,872,815 | 2,653,278 | 2,591,063 | 2,385,156 | 2,221,236 | ||||||||||||||
|
Total deposits |
$ | 4,007,810 | 3,900,918 | 3,900,735 | 3,756,789 | 3,598,018 | ||||||||||||||
|
Total borrowed funds |
$ | 815,744 | 837,335 | 761,431 | 826,558 | 761,509 | ||||||||||||||
|
Total interest-bearing liabilities |
$ | 3,688,559 | 3,490,613 | 3,352,494 | 3,211,714 | 2,982,745 | ||||||||||||||
|
Shareholders' equity |
$ | 536,644 | 522,145 | 483,211 | 478,702 | 467,372 | ||||||||||||||
|
AVERAGE BALANCES |
||||||||||||||||||||
|
Loans |
$ | 4,299,163 | 4,184,070 | 4,054,279 | 4,017,690 | 3,928,329 | ||||||||||||||
|
Securities |
$ | 634,099 | 618,517 | 626,714 | 634,607 | 627,628 | ||||||||||||||
|
Interest-earning deposits |
$ | 150,234 | 118,996 | 208,932 | 64,958 | 31,081 | ||||||||||||||
|
Total earning assets (before allowance) |
$ | 5,083,496 | 4,921,583 | 4,889,925 | 4,717,255 | 4,587,038 | ||||||||||||||
|
Total assets |
$ | 5,384,675 | 5,224,238 | 5,180,847 | 4,988,413 | 4,855,877 | ||||||||||||||
|
Noninterest-bearing deposits |
$ | 1,175,884 | 1,281,201 | 1,359,238 | 1,361,901 | 1,491,477 | ||||||||||||||
|
Interest-bearing deposits |
$ | 2,790,308 | 2,600,703 | 2,466,834 | 2,278,877 | 2,184,406 | ||||||||||||||
|
Total deposits |
$ | 3,966,192 | 3,881,904 | 3,826,072 | 3,640,778 | 3,675,883 | ||||||||||||||
|
Total borrowed funds |
$ | 816,848 | 773,491 | 806,376 | 827,105 | 676,724 | ||||||||||||||
|
Total interest-bearing liabilities |
$ | 3,607,156 | 3,374,194 | 3,273,210 | 3,105,982 | 2,861,130 | ||||||||||||||
|
Shareholders' equity |
$ | 527,180 | 495,431 | 484,624 | 473,983 | 453,524 | ||||||||||||||
Exhibit 99.2