UNITED STATES
SECURITIES AND EXCHANGE COMMISSION
Washington, D.C. 20549
FORM 10-K
(Mark One)
| ☒ |
ANNUAL REPORT PURSUANT TO SECTION 13 OR 15(d) OF THE SECURITIES EXCHANGE ACT OF 1934 |
For the fiscal year ended December 31, 2023
OR
| ☐ |
TRANSITION REPORT PURSUANT TO SECTION 13 OR 15(d) OF THE SECURITIES EXCHANGE ACT OF 1934 FOR THE TRANSITION PERIOD FROM TO |
Commission File Number 001-38817
MainStreet Bancshares, Inc.
(Exact name of Registrant as specified in its Charter)
| Virginia |
81-2871064 |
| (State or other jurisdiction of incorporation or organization) |
(I.R.S. Employer Identification No.) |
| 10089 Fairfax Boulevard Fairfax, VA |
22030 |
| (Address of principal executive offices) |
(Zip Code) |
Registrant’s telephone number, including area code: (703) 481-4567
Securities registered pursuant to Section 12(b) of the Act:
| Title of each class |
Trading Symbol(s) |
Name of each exchange on which registered |
||
| Common Stock |
MNSB |
The Nasdaq Stock Market LLC |
||
| Depositary Shares (each representing a 1/40th |
MNSBP |
The Nasdaq Stock Market LLC |
Securities registered pursuant to Section 12(g) of the Act: None
Indicate by check mark if the Registrant is a well-known seasoned issuer, as defined in Rule 405 of the Securities Act. yes ☐ no ☒
Indicate by check mark if the Registrant is not required to file reports pursuant to Section 13 or 15(d) of the Act. yes ☐ no ☒
Indicate by check mark whether the Registrant: (1) has filed all reports required to be filed by Section 13 or 15(d) of the Securities Exchange Act of 1934 during the preceding 12 months (or for such shorter period that the Registrant was required to file such reports), and (2) has been subject to such filing requirements for the past 90 days. yes ☒ no ☐
Indicate by check mark whether the Registrant has submitted electronically every Interactive Data File required to be submitted pursuant to Rule 405 of Regulation S-T (§232.405 of this chapter) during the preceding 12 months (or for such shorter period that the Registrant was required to submit such files). yes ☒ no ☐
Indicate by check mark whether the registrant is a large accelerated filer, an accelerated filer, a non-accelerated filer, smaller reporting company, or an emerging growth company. See the definitions of “large accelerated filer,” “accelerated filer,” “smaller reporting company,” and “emerging growth company” in Rule 12b-2 of the Exchange Act.
| Large accelerated filer |
☐ |
Accelerated filer |
☐ |
|||
| Non-accelerated filer |
☒ |
Smaller reporting company |
☒ |
|||
| Emerging growth company |
☒ |
If an emerging growth company, indicate by check mark if the registrant has elected not to use the extended transition period for complying with any new or revised financial accounting standards provided pursuant to Section 13(a) of the Exchange Act. ☒
Indicate by check mark whether the registrant has filed a report on and attestation to its management’s assessment of the effectiveness of its internal control over financial reporting under Section 404(b) of the Sarbanes-Oxley Act (15 U.S.C. 7262(b)) by the registered public accounting firm that prepared or issued its audit report. ☐
If securities are registered pursuant to Section 12(b) of the Act, indicate by check mark whether the financial statements of the registrant included in the filing reflect the correction of an error to previously issued financial statements. ☐
Indicate by check mark whether any of those error corrections are restatements that required a recovery analysis of incentive-based compensation received by any of the registrant's executive officers during the relevant recovery period pursuant to section 240.10D-1(b). ☐
Indicate by check mark whether the Registrant is a shell company (as defined in Rule 12b-2 of the Exchange Act). yes ☐ no ☒
As of June 30, 2023, the last business day of the Registrant’s most recently completed second fiscal quarter, the aggregate market value of the shares of common equity held by non-affiliates of the Registrant, based on the closing price of the shares of common stock on The NASDAQ Stock Market, was $155,925,363. The number of shares of Registrant’s Common Stock outstanding as of March 18, 2024 was 7,614,090.
DOCUMENTS INCORPORATED BY REFERENCE:
The information required by Part III of this Annual Report on Form 10-K will be found in the Company’s definitive proxy statement for its 2023 Annual Meeting of Shareholders, to be filed pursuant to Regulation 14A under the Securities Exchange Act of 1934, and such information is incorporated herein by this reference.
| Auditor Firm ID: 613 |
Auditor Name: Yount, Hyde & Barbour, P.C. |
Auditor Location: Winchester, Virginia, USA |
INDEX
|
|
Page |
|
| PART I |
|
|
| Item 1. |
||
| Item 1A. |
||
| Item 1B. |
||
| Item 1C. | Cybersecurity | 31 |
| Item 2. |
||
| Item 3. |
||
| Item 4. |
||
|
|
||
| PART II |
||
| Item 5. |
33 | |
| Item 6. |
||
| Item 7. |
Management’s Discussion and Analysis of Financial Condition and Results of Operations |
|
| Item 7A. |
||
| Item 8. |
||
| Item 9. |
Changes in and Disagreements With Accountants on Accounting and Financial Disclosure |
|
| Item 9A. |
||
| Item 9B. |
||
| Item 9C. |
Disclosures Regarding Foreign Jurisdictions that Prevent Inspections |
|
|
|
||
| PART III |
||
| Item 10. |
||
| Item 11. |
||
| Item 12. |
Security Ownership of Certain Beneficial Owners and Management and Related Stockholder Matters |
|
| Item 13. |
Certain Relationships and Related Transactions, and Director Independence |
|
| Item 14. |
||
|
|
||
| PART IV |
||
| Item 15. |
||
| Item 16 |
||
Item 1. Business
As used herein, the “Company,” “we,” “our,” and “us” refer to MainStreet Bancshares, Inc., and the “Bank” refers to MainStreet Bank.
Overview
MainStreet Bancshares, Inc. is a bank holding company that owns 100% of MainStreet Bank and MainStreet Community Capital, LLC. On October 12, 2021, the Company filed an election to be a financial holding company with the Board of Governors of the Federal Reserve System (the “Federal Reserve”). The Company elected financial holding company status in order to engage in a broader range of financial activities than are permitted for bank holding companies generally. We emphasize providing responsive and personalized services to our clients. Due to the consolidation of financial institutions in our primary market area, we believe there is a significant opportunity for a local bank to provide a full range of financial services. By offering highly professional, personalized banking products and service delivery methods and employing advanced banking technologies, we seek to distinguish ourselves from larger, regional banks operating in our market area and are able to compete effectively with other community banks.
MainStreet Bancshares, Inc.
MainStreet Bancshares Inc. is a bank holding company incorporated under the laws of the Commonwealth of Virginia whose principal activity is the ownership and management of MainStreet Bank and MainStreet Community Capital, LLC. The Company is authorized to issue 10,000,000 shares of common stock, par value $4.00 per share. Additionally, the Company is authorized to issue 2,000,000 shares of preferred stock, par value $1.00 per share. There were 7,527,415, shares of common stock outstanding and 28,750 shares of 7.50% Series A Fixed-Rate Non-Cumulative Perpetual Preferred Stock outstanding at December 31, 2023. At that date, there were also outstanding 1,150,000 depositary shares, each representing a 1/40th interest in a share of the Company’s Series A Preferred Stock, with a liquidation preference of $1,000 per share (equivalent to $25 per depositary share).
The Company is a registered bank holding company which is governed under the Bank Holding Company Act of 1956, as amended (the “Bank Holding Act”), that has elected to be a financial holding company. As such, is subject to inspection, examination, and supervision by the Federal Reserve.
The Company’s executive offices are located at 10089 Fairfax Boulevard, Fairfax, Virginia. Our telephone number is (703) 481-4567, and our internet address is www.mstreetbank.com. The information contained on our website shall not be considered part of this Form 10-K, and the reference to our website does not constitute incorporation by reference of the information contained on the website.
MainStreet Bank
MainStreet Bank is a community commercial bank incorporated in and chartered by the Commonwealth of Virginia. The Bank is a member of the Federal Reserve Bank of Richmond, and its deposits are insured by the FDIC. The Bank opened for business on May 26, 2004, and is headquartered in Fairfax, Virginia. We currently operate six Bank branches; located in Herndon, Fairfax, McLean, Clarendon, and Leesburg, Virginia, and one in Washington D.C.
The Bank is a community bank focused on serving the borrowing, cash management and depository needs of retail customers, small to medium-sized businesses, and professionals. We believe we have a solid franchise that meets the financial needs of our clients and communities by providing an array of personalized products and services delivered by seasoned banking professionals with decisions made at the local level. We believe a significant customer base in our market prefers to do business with a local institution that has a local management team, a local Board of Directors and local founders and that this customer base may not be satisfied with the responsiveness of larger regional banks. By providing quality services, coupled with the opportunities provided by the economies in our market area, we have generated and expect to continue to generate organic growth.
We service Northern Virginia as well as the greater Washington, D.C. metropolitan area. Our goal is to deliver a customized and targeted mix of products and services that meets or exceeds customer expectations. To accomplish this goal, we have deployed a premium operating system that gives customers access to up-to-date banking technology. These systems and our skilled staff have allowed us to compete aggressively with larger financial institutions. We believe the combination of sophisticated technology and personal service sets us apart from our competition. We strive to be the leading community bank in our market.
We offer a full range of banking services to individuals, small to medium-sized businesses and professional service organizations through both traditional and electronic delivery. We were the first community bank in the Washington, D.C. metropolitan area to offer a full online business banking solution, including remote check scanners on a business customer’s desktop. We offer mobile banking apps for iPhones, iPads and Android devices that provide for remote deposit of checks. In addition, we were the first bank headquartered in the Commonwealth of Virginia to offer CDARS, the Certificate of Deposit Account Registry Service, an innovative deposit insurance solution that provides Federal Deposit Insurance Corporation (“FDIC”) insurance on deposits up to $50 million. We believe that enhanced electronic delivery systems and technology increase profitability through greater productivity and cost control, and allow us to offer new and better products and services.
Our products and services include: business and consumer checking, premium interest-bearing checking, business account analysis, savings, certificates of deposit and other depository services, as well as a broad array of commercial, real estate and consumer loans. Internet account access is available for all personal and business accounts, internet bill payment services are available on most accounts, and a robust online cash management system is available for business customers.
Avenu
On October 25, 2021, MainStreet Bancshares, Inc. formally introduced Avenu, a division of MainStreet Bank. Avenu will provide an embedded Banking as a Service (BaaS) solution that connects our partners (fintechs, application developers, money movers, and entrepreneurs) directly and seamlessly to our Software as a Service (SaaS) solution. Our transformational subledger combined with our high-touch compliance training goes beyond the industry standards to ensure that our Fintech partners will prosper. This division of MainStreet Bank will serve money service businesses, payment processers, and other clients who have a need to embed deposit gathering and payment processing in their mobile Apps. This division provides the Bank with valuable low-cost deposits and additional streams of fee income. Our SaaS software program will be deployed in the second quarter of 2024. Additional information can be found in our investor presentations filed quarterly.
MainStreet Community Capital, LLC
In September 2021, the Company created a community development entity (“CDE”) subsidiary, MainStreet Community Capital, LLC, a Virginia limited liability company, to apply for New Market Tax Credit (“NMTC”) allocations from the U.S. Department of Treasury’s Community Development Financial Institutions Fund. To promote development in economically distressed areas, the NMTC program was established under the Community Renewal Tax Relief Act of 2000 to provide tax incentives for capital investment in disadvantaged market areas that have not experienced economic expansion. The program establishes a tax credit for investment in a CDE and ongoing compliance with the program is accomplished through a governing board and an advisory board which maintains accountability to residents and businesses in the aforementioned disadvantaged areas. This CDE will be an intermediary vehicle for the provision of loans and investments in Low-Income Communities (“LICs”). In January 2022, the Community Development Financial Institutions Fund (“CDFI”) of the United States Department of the Treasury certified MainStreet Community Capital, LLC as a registered CDE. In December 2023, MainStreet Community Capital submitted an application to apply for the 2023 NMTC program allocation. Allocation awards are expected to be announced during the fourth quarter of 2024.
Emerging Growth Company Status
We qualify as an “emerging growth company” under the JOBS Act and as defined in Section 2(a) of the Securities Act of 1933. For as long as we are an emerging growth company, we may choose to take advantage of exemptions from various reporting requirements applicable to other public companies but not to emerging growth companies. See “Risk Factors—We are an emerging growth company, and any decision on our part to comply only with certain reduced reporting and disclosure requirements applicable to emerging growth companies could make our common stock less attractive to investors.”
As an emerging growth company:
| • |
we may present as few as two years of audited financial statements and two years of related management discussion and analysis of financial condition and results of operations, in contrast to other reporting companies which must provide audited financial statements for three fiscal years; |
| • |
we are exempt from the requirement to obtain an attestation and report from our auditors on management’s assessment of our internal control over financial reporting under the Sarbanes-Oxley Act of 2002; |
| • |
we are permitted to provide less extensive disclosure about our executive compensation arrangements, including recently adopted pay versus performance disclosures; and |
| • |
we are permitted to include less extensive narrative disclosures than required of other reporting companies, particularly with respect to executive compensation. |
In this Form 10-K we have elected to take advantage of the reduced disclosure requirements relating to executive compensation, and in the future we may take advantage of any or all of these exemptions for so long as we remain an emerging growth company. We will remain an emerging growth company until the earliest of (i) the end of the first fiscal year during which we have total annual gross revenues of $1.07 billion or more, (ii) the end of the fiscal year following the fifth anniversary of the completion of our initial registered public offering of common equity securities, which will be in December 31, 2024, (iii) the date on which we have, during the previous three-year period, issued more than $1.0 billion in non-convertible debt and (iv) the date on which we are deemed to be a “large accelerated filer” as defined in Rule 12b-2 under the Securities Exchange Act of 1934 (the “Exchange Act”).
In addition to the relief described above, the JOBS Act permits us an extended transition period for complying with new or revised accounting standards affecting public companies. We have elected not to take advantage of this extended transition period, which means that the financial statements included in this Form 10-K, as well as any financial statements that we file in the future, will be subject to all new or revised accounting standards generally applicable to public companies.
Nasdaq Listing
We were approved to list shares of our common stock on the Nasdaq Capital Market under our current symbol “MNSB” as of April 22, 2019. We were approved to list our depositary shares on the Nasdaq Capital Market under the symbol “MNSBP” as of September 16, 2020. Each depository share represents a 1/40th interest in a share of our 7.50% Series A Fixed-Rate Non-Cumulative Perpetual Preferred stock.
Our Business
As of December 31, 2023, MainStreet Bancshares, Inc. had total consolidated assets of $2.0 billion, total net loans of $1.7 billion, total deposits of $1.7 billion and total stockholders’ equity of $221.5 million, and total tangible equity to total tangible assets was 10.24%. For the years ended December 31, 2023 and 2022, our return on average assets was 1.38% and 1.53%, respectively, and our return on average equity was 12.66% and 13.98%, respectively.
We are focused on growing business relationships and building core deposits, loans and non-interest income. We believe that we have a solid franchise that meets the financial needs of our clients and communities by providing an array of personalized products and services delivered by seasoned banking professionals with decisions made at the local level. We strive to be the leading community bank in our markets.
We believe that our core lending and deposit business segments continue to perform well. For each of the fiscal years ended December 31, 2023 and December 31, 2022, our net charge-offs to average loans were 0.03% and 0.00%, respectively. As of December 31, 2023, we had $1.0 million in non-performing loans and non-performing assets to total assets was 0.05%.
Management believes that the Company is well positioned to build on its core performance to continue to grow profitably. Although we have successfully attracted new associates, providing depth and talent in key positions, additional employees and infrastructure are expected to be needed to manage the increasing customer relationships that would come with sustained growth.
We are a community-oriented financial institution. Our Bank offers a wide range of commercial and consumer loan and deposit products, as well as mortgage services to individuals, and small and medium sized businesses in our market. We seek to be the provider of choice for financial solutions to customers who value exceptional personalized service, local decision making, and modern banking technology. Our business involves attracting deposits from local businesses and individual customers and using these deposits to originate commercial, mortgage, and consumer loans in our market area. We also invest in securities consisting primarily of obligations of U.S. government sponsored entities, municipal obligations, mortgage-backed securities issued by Fannie Mae, Freddie Mac and Ginnie Mae, and the subordinated debt of other financial institutions. We also invest in NMTC funds that furthers our mission to provide opportunities to areas in need. The Company is the owner and beneficiary of bank owned life insurance (BOLI) policies on certain current and former Bank employees. These policies generate income and can be liquidated, if necessary, with associated tax costs.
The Federal Reserve and the Virginia State Corporation Commission, through its Bureau of Financial Institutions (the “Bureau”), regulate and monitor operations of the Company and the Bank. We are required to file with the FDIC quarterly financial condition and performance reports. The Federal Reserve and the Bureau conduct periodic onsite and offsite examinations. We must comply with a wide variety of reporting requirements and banking regulations. The laws and regulations governing us generally have been promulgated to protect depositors and the federal deposit insurance funds and not to protect shareholders. Additionally, we must bear the cost of compliance with the reporting and regulations; these costs can be significant and may have an effect on our financial performance.
Our Market Area. We consider our primary market area to be the northern Virginia counties of Arlington, Fairfax, Loudoun, and Prince William, and the cities of Fairfax, Alexandria, Falls Church, Manassas and Manassas Park, as well as Washington DC and the greater Washington, DC metropolitan area. Our headquarters is located approximately 15 miles west of Washington, D.C., in Fairfax County, Virginia.
According to the U.S. Census Bureau, the Washington, D.C. Metropolitan Statistical area (MSAs) includes three of the wealthiest counties in the United States, as well as six of the top 20 wealthiest counties. Median household income growth projections range from 5% to over 10% through 2029. Overall, the Washington D.C. MSA ranks ninth out of the largest 25 MSAs ranked by population estimates as of 2023 according to the Census Bureau. We expect our strategies to benefit from the continued growth in population and high income of our market area’s residents.
| Area |
Total Population as of 2024 (Actual) |
Population Change 2010-2024 |
Projected Population Change 2024-2029 |
Median Household Income 2024 |
Median Household Income Projected Change 2024-2029 |
Unemployment Rate as of November 2023 |
Unemployment Rate as of November 2022 |
|||||||||||||||||||||
| District of Columbia |
679,947 | -1.39 | % | 1.92 | % | $98,916 | 7.28 | % | 4.8 | % | 4.5 | % | ||||||||||||||||
| Arlington County |
239,054 | 0.17 | % | 1.77 | % | 134,727 | 6.37 | % | 2.2 | % | 2.1 | % | ||||||||||||||||
| Fairfax County |
1,141,875 | -0.73 | % | 0.86 | % | 142,822 | 5.55 | % | 2.5 | % | 2.5 | % | ||||||||||||||||
| Loudoun County |
442,613 | 5.14 | % | 6.31 | % | 143,652 | 5.68 | % | 2.6 | % | 2.5 | % | ||||||||||||||||
| Prince William County |
496,046 | 2.87 | % | 4.36 | % | 122,657 | 5.46 | % | 2.8 | % | 2.8 | % | ||||||||||||||||
| United States |
336,157,119 | 1.42 | % | 2.40 | % | 75,874 | 10.12 | % | 3.5 | % | 3.3 | % | ||||||||||||||||
|
Source: U.S. Bureau of Labor Statistics, S&P Global Market Intelligence |
The Washington, D.C. MSA is a desirable market for a broad range of companies in a variety of industries, including twenty-seven companies from the 2023 Fortune 500 list, and six of the United States’ largest 100 private companies, according to the 2023 Forbes list of largest private companies by revenue. According to the U.S Bureau of Labor Statistics, the Washington, D.C. MSA has a large and diversified economy. The following table provides an in-depth view of the distribution of employment within the Washington, D.C. MSA.
| Washington, D.C. MSA Employment by Sector |
Employment Sector by Percent |
||
| Mining, Lodging, and Construction |
4.9% |
||
| Manufacturing |
1.7% |
||
| Trade, Transportation, and Utilities |
11.7% |
||
| Information |
2.4% |
||
| Financial Activities |
4.5% |
||
| Professional and Business Services |
23.9% |
||
| Education and Health Services |
13.6% |
||
| Leisure and Hospitality |
9.5% |
||
| Other Services |
5.9% |
||
| Government |
21.6% |
|
Source: U.S. Bureau of Labor Statistics, Data as of November 2023 Note: Data is not seasonally adjusted |
As the home of the federal government, the broader Washington, D.C. region benefits from consistent population growth and remains well positioned to capitalize on any increase in government spending and infrastructure. Further, as banks in our market have experienced continued consolidation over the last few years, our opportunities to attract talented employees and capitalize on customer dislocation have improved. With its strong demographic characteristics, scale and robust economic activity we believe that the Washington, D.C. metropolitan area represents a strong geographic market for us to realize our continued growth strategies within our core business model.
The Company is active in community development activities that include support for affordable housing for low- or moderate-income (LMI) individuals, including multifamily rental housing, promoting economic development by financing small businesses or farms, revitalizing or stabilizing LMI geographies or designated disaster areas, and targeting support for community services to LMI individuals. The Company also makes qualified investments that target these initiatives within our geographic footprint. In addition, many of our employees and directors are involved in community activities as well as volunteer their time and expertise to local causes.
Competitive Strengths. We continually review our product and service offerings and based on these reviews may selectively add additional products and services to provide further diversification of our revenue sources and to capture our customers’ full banking relationships. We believe that the following business strengths have been instrumental to the success of our core operations and will enable us to continue profitable growth and to maximize value to our shareholders, while remaining fundamentally sound.
Community Banking Philosophy. We provide our clients with local decision making and individualized service coupled with products and services offered by our larger institutional competitors. As our business lenders, officers, and Bank directors are based in or reside in the communities we serve, we are able to maintain a high-level of involvement in local organizations and establish a strong understanding of the banking needs of the respective communities. We believe that our customer-centric business philosophy and sales approach enables us to build long-term relationships with desirable customers, which enhances the quality and stability of our funding and lending operations. Our mission and philosophy have positioned us well in the communities across our market area and have enabled us to attract and maintain a very talented and experienced management team.
Disciplined Credit Culture. We achieve our strong credit quality by adherence to sound underwriting and credit administration standards and by maintaining long-term customer relationships. All credit decisions between $250,000 and $750,000 require concurrence of the Chief Lending Officer and the Chief Credit Officer. Approvals of credits in excess of $750,000 require full consensus of the Officer’s Loan Committee. We maintain an independent loan review team, and senior management is actively involved with any credits requiring special attention.
Capital Position. The Bank exceeds the regulatory guidelines to be classified as “well capitalized.” Our capital position is strong and has consistently grown. At December 31, 2023, the Bank had a tier 1 leverage capital ratio of 14.66%, a common equity tier 1 risk-based capital ratio of 16.22%, a tier 1 risk-based capital ratio of 16.22%, and a total risk-based capital ratio of 17.18%. We believe that our capital position enhances our ability to grow organically because it enables the Bank to continue lending and to remain focused on our customers’ needs. For additional information, see Note 16 of Notes to Consolidated Financial Statements.
Technology. We have invested in the technology necessary to meet the developing demands of our commercial and retail customers. We utilize a strong core operating system that enables us to efficiently offer high-end deposit and loan products and have partnered with industry-leading internet banking, cash management, mobile banking, and application-based banking solutions to offer a complete banking experience to all customers, regardless of their preference. We participate in an international and nationwide automated teller machine network in order to offer our customers ATM transactions at over 55,000 locations in the United States, Canada, United Kingdom and Mexico.
Growth Opportunities. We believe that we can attract new customers and expand our total loans and deposits within our existing market areas through organic growth, online and mobile banking, strategic branching and possible acquisition opportunities. We expect our market will continue to create opportunities to attract new clients and, in some cases, may become the catalyst for mergers and acquisitions. We expect to grow our loan portfolio, open new branches and consider acquisitions only after rigorous due diligence and substantial quantitative analysis regarding the financial and capital impacts of any such transactions. We believe that maintaining our financial discipline will generate long-term shareholder value.
Lending Activities. The Bank’s primary market focus is on making loans to small businesses, professionals and other consumers in its local market area, along with various aspects of real estate finance. Owner-occupied and investment commercial real estate loans represent the largest segments of the Bank’s loan portfolio. The Bank’s primary lending activities are principally directed to its defined market area in Northern Virginia, as well as the greater Washington, D.C. metropolitan area.
We offer a diversified loan portfolio consisting primarily of commercial business and owner-occupied and investment commercial real estate loans with higher risk-adjusted returns, shorter maturities and more sensitivity to interest rate fluctuations, while still providing high quality loan products for single-family and multi-family residential borrowers.
Commercial Business Lending. Commercial loans are written for a variety of business purposes, including government contract receivables, plant and equipment, general working capital, contract administration and acquisition lending. Our client base is diverse, and we do not have a concentration of commercial business loans in any specific industry segment.
Commercial Real Estate Lending. We finance owner-occupied and investment commercial real estate. Our underwriting policies and processes focus on the client’s ability to repay the loan as well as an assessment of the underlying real estate. Risks inherent in managing a commercial real estate portfolio relate to sudden or gradual drops in property values as well as changes in the economic climate. We attempt to mitigate those risks by carefully underwriting loans of this type and by following appropriate loan-to-value standards. Commercial real estate loans represent the largest segment of the Bank’s loan portfolio. At December 31, 2023, approximately 16.3% of our loan portfolio related to owner occupied commercial real estate loans, and approximately 26.7% of our loan portfolio related to investment commercial real estate.
Real Estate Construction Lending. This segment of our portfolio is predominately residential in nature and is composed of loans with short durations. We offer real estate construction financing to customers that have in place a permanent loan “take-out,” either by the Bank or another institution. Our approach to this type of lending reduces our credit risk, yet offers a competitive product in the marketplace. We also offer construction financing to many local home builders. These loans are also short duration and carefully underwritten with an increased focus on the builder’s reputation and ability to deliver high quality homes on time and within budget.
We also stress test the construction lending portfolio based upon the percentage completion method by stressing the as-is and as-completed appraised values. For further details, see stress test methodology in the Management's Discussion and Analysis.
Residential Real Estate Lending. The Bank offers a variety of consumer-oriented residential real estate loans both for purchase and refinancing, most of which are brokered to the secondary market.
Consumer Installment Lending. We offer consumer loans including term loans and overdraft protection.
Credit Policies and Administration. The Bank has adopted a comprehensive lending policy, which includes a well-defined risk tolerance and stringent underwriting standards for all types of loans. Management believes that it employs experienced lending officers, secures appropriate collateral and carefully monitors the financial conditions of its borrowers.
In addition to normal repayment risks, all loans in the Bank’s portfolio are subject to the state of the economy and the related effects on the borrower and/or the real estate market. Generally, longer-term loans have periodic interest rate adjustments and/or call provisions. Senior management monitors the loan portfolio closely to minimize past due loans and swiftly address potential problem loans. In addition to the internal business processes employed in the credit administration area, the Bank engages an outside or independent credit review firm to review the loan portfolio annually. Results of the credit review are used to validate our internal loan ratings and to review independent commentary on specific loans and loan administration activities.
Lending Limit. As of December 31, 2023, our legal lending limit for loans to one borrower was approximately $46.8 million. The Bank “in-house” lending limit is 50% of the legal lending limit for all relationships unless the loan is owner occupied, 1 - 4 family/residential or a government contract line of credit. If owner occupied, 1 - 4 family or a government contractor, the “in-house” lending limit is 90% of the legal lending limit for "Good" rated credits; 85% for "Standard" rated credits and 75% for "Acceptable" rated credits. Our loan policy prescribes a sub-limit to certain borrowers based upon our determination of each borrower’s credit quality. We routinely participate loan amounts in excess of our policy limits to other financial institutions.
For additional information, see Note 1 and Note 5 of Notes to Consolidated Financial Statements.
Investments and Funding. The Bank balances its liquidity needs based on loan and deposit growth through the investment portfolio and purchased funds. It is the Bank’s goal to provide adequate liquidity to support the loan growth of the Bank. In the event the Bank has excess liquidity, investment securities are used to generate additional income. In the event deposit growth does not fully support the Bank’s loan growth, the Bank will utilize deposit listing services, borrowed funds, or incorporate a combination of sales of investment securities, federal funds and other purchased/borrowed funds in order to augment the Bank’s funding position.
The current investment policy authorizes the Bank to invest in debt securities issued by the United States Government, agencies of the United States Government, or United States Government-sponsored enterprises. The policy permits investments in mortgage-backed securities, including pass-through securities, issued and guaranteed by Fannie Mae, Freddie Mac and Ginnie Mae. The investment policy also permits investments in federal funds and deposits in other insured institutions. In addition, management is authorized to invest in investment grade state and municipal obligations, private mortgage-backed securities, the subordinated debt of other financial institutions and equity investments in funds designed to help LMI geographies. The Bank does not engage in any hedging or trading activities in its investment portfolio. The Company is also the owner and beneficiary of bank owned life insurance (BOLI) policies on certain current and former Bank employees. These policies generate income and can be liquidated, if necessary, with associated tax costs.
Generally accepted accounting principles require that, at the time of purchase, the Bank designate a security as “held-to-maturity,” “available-for-sale,” or “trading,” depending on our ability and intent to hold such security. Debt securities available for sale are reported at fair value, while debt securities held to maturity are reported at amortized cost. The Bank does not maintain a trading portfolio. Establishing a trading portfolio would require specific authorization by the Board of Directors.
The investment portfolio is actively managed and consists of investments classified as available-for-sale and held-to-maturity. Under the available-for sale classification, investment instruments may be sold as deemed appropriate by management. On a monthly basis, the investment portfolio is marked to market as required by ASC 320. Additionally, the investment portfolio is used to balance the Bank’s asset and liability position. The Bank invests in fixed rate or floating rate instruments as necessary to reduce interest rate risk exposure.
At December 31, 2023, the held-to-maturity portfolio, which is primarily composed of municipal securities and is carried at amortized cost, totaled $17.3 million. At that date, the available-for-sale portfolio, which is composed of U.S. Treasury securities, collateralized mortgage-backed securities, subordinated debt of other financial institutions and U.S. Government agency securities and is carried at fair value, totaled $59.9 million. For additional information, see Note 3 of Notes to Consolidated Financial Statements.
Subordinated Notes. In April of 2021, the Company completed an issuance and sale of $30 million in fixed-to-floating subordinated notes at an annual fixed interest rate of 3.75% until April 15, 2026. The net proceeds were used to fully call subordinated notes issued in 2016 and to support additional growth for other general business purposes. After April 15, 2026, the notes will have a floating interest rate based on three-month SOFR rate plus 302 basis points (3.02%) (computed on the basis of a 360-day year of twelve 30-day months) from and including April 15, 2026, to the maturity date or any early redemption date. Interest will be paid semi-annually, in arrears, on July 1 and January 1 of each year during the time that the notes remain outstanding through the fixed interest rate period or earlier redemption date. Interest will be paid quarterly, in arrears, on April 15, July 15, October 15 and January 15 throughout the floating interest rate period or earlier redemption date.
On March 1, 2022, the Company completed the issuance of $43.8 million in aggregate principal amount of fixed-to-floating rate subordinated notes in a private placement transaction to various accredited investors. The net proceeds of the offering have been and will be used to support growth and for other general business purposes. The notes have a maturity date of March 15, 2032, and have an annual fixed interest rate of 4.00% until March 15, 2027. Thereafter, the notes will have a floating interest rate based on three-month SOFR rate plus 233 basis points (2.33%) (computed on the basis of a 360-day year of twelve 30-day months) from and including March 15, 2027, to the maturity date or any early redemption date. Interest will be paid semi-annually, in arrears, on March 15 and September 15 of each year during the time that the notes remain outstanding through the fixed interest rate period or earlier redemption date. Interest will be paid quarterly, in arrears, on March 15, June 15, September 15 and December 15 throughout the floating interest rate period or earlier redemption date.
Deposit Activities. Deposits are the major source of funding for the Bank. The Bank offers a broad array of deposit products that include demand, NOW, money market and savings accounts as well as certificates of deposit. The Bank typically pays a competitive rate on the interest-bearing deposits. As a relationship-oriented organization, we seek generally to obtain deposit relationships with our loan clients.
We offer a full range of consumer and commercial deposit products, including on-line banking with bill pay, cash management, sweep accounts, wire transfer, check imaging, remote deposit capture and courier services.
As the Bank’s overall balance sheet positions dictate, we may become more or less competitive in our interest rate structure as our liquidity position changes. Additionally, we may use wholesale deposits through sources such as deposit listing services, school systems, government entities and other sources to augment our funding position.
We can also arrange for FDIC insurance for deposits up to $50 million through CDARS, the Certificate of Deposit Account Registry Service, which provides a convenient method for a depositor to enjoy full FDIC insurance on deposits up to $50 million through a single banking relationship.
For additional information on deposits, see Note 9 of Notes to Consolidated Financial Statements.
Banking-as-a-Service (BaaS). Beginning in 2016, the Board and management identified an opportunity for alternative sources of low-cost deposits and fee income. We determined that Financial Technology (“FinTech”) companies were making significant inroads into banking, and we expanded our strategic plan to include banking customers that require BaaS and other payment service solutions.
Consistent with our culture, we worked over the past seven years with a small group of clients in order to understand the risks associated with this business line. We developed an infrastructure to identify, measure, monitor and control the risks associated with FinTechs, providing BaaS, and payment systems in general. We designed and implemented comprehensive legal, strategic, procedural and policy documents to guide business opportunities.
Our subledger, combined with our high-touch compliance training, goes beyond the industry standards to ensure that our FinTech partners will operate successfully. We believe partnering with FinTechs will provide an opportunity to access untapped markets and will become a fresh source for growth in low-cost deposits and fee income.
We will continue to support the FinTech industry. Consumers in the United States express more confidence banking with FinTechs than traditional banks in many cases. As a business-focused community bank, we see FinTechs as a natural way for us to expand our footprint into consumer banking opportunities.
Competition. We face significant competition for the origination of loans and the attraction of deposits. Our competition for loans comes primarily from financial institutions in our market area and, to a lesser extent, from other financial service providers, such as mortgage companies and mortgage brokers. Competition for loans also comes from the increasing number of non-depository financial service companies entering the mortgage market, such as insurance companies, securities companies and specialty finance companies. Our most direct competition for deposits has historically come from other financial institutions operating in our market area. We also face competition for investors’ funds from money market funds, mutual funds and other corporate and government securities.
Board Leadership and Oversight
The Board of Directors combines the position of Chairman of the Board with the position of Chief Executive Officer, coupled with a Lead Independent Director position to further strengthen the Company's corporate governance structure. Terry Saeger serves as Vice Chairman of the Board and Lead Independent Director. The Board of Directors believes this provides an efficient and effective leadership model for the Company.
| ● |
Combining the Chairman of the Board and Chief Executive Officer positions promotes clear accountability, effective decision-making, and alignment on corporate strategy. Our Chief Executive Officer, who is a co‐ founder of the Bank, has always been the CEO and has served as Chairman since 2009. He has extensive knowledge of all aspects of our current business and operations and our prospects which he communicates to the Board. He is particularly focused on the development and execution of our current strategic plans and investments for future growth. |
| ● |
The Vice Chairman and Lead Independent Director provides a means for our independent Directors to meet and discuss all issues and concerns that arise on an ongoing basis. The Lead Independent Director can independently engage external resources as needed to follow-up on issues and concerns. The Lead Independent Director also acts as a liaison to the Chairman to follow-up and share concerns raised by the independent Directors. |
The Board of Directors also believes administration of its risk oversight function is enhanced by the Board's leadership structure. To assure effective independent oversight, the Board has adopted appropriate governance practices, including:
|
|
1. | The Lead Independent Director can call for executive sessions of the independent Directors as needed, |
|
|
2. | The independent Compensation Committee conducts performance evaluations of the Chairman of the Board and Chief Executive Officer, and works with management to evaluate risks posed by our compensation programs and limit unnecessary or excessive risks these programs may pose to the Company, and |
|
|
3. | The Nominating Committee is responsible for the selection and nomination of Directors and is made up exclusively of independent Directors. |
Risk Management
The Board of Directors is actively involved in oversight of risks that could affect the Company. This oversight is conducted in part through the Audit and Risk Committee of the Board of Directors, but the full Board of Directors has retained responsibility for general oversight of risks. The Chief Risk Officer and Chief Compliance Officer have reporting lines to the Audit and Risk Committee and are free to contact independent Directors whenever they feel the need to do so.
The Board of Directors satisfies this responsibility through full reports by the Audit and Risk Committee regarding its considerations and actions, regular reports directly from officers responsible for oversight of risks within the Company as well as through internal and external audits. The Audit and Risk Committee conducts an annual assessment of its performance and capabilities.
Risks relating to the direct operations of the Bank are further overseen by the Board of Directors of the Bank. The Board of Directors of the Bank also has additional committees that conduct risk oversight separate from the Company. Further, the Board of Directors oversees risks through the establishment of policies and procedures that are designed to guide daily operations in a manner consistent with applicable laws, regulations and risks acceptable to the organization.
Risk is inherent with every business, particularly financial institutions. We face a number of risks, including credit risk, interest rate risk, liquidity risk, operational risk, legal risk, strategic risk and reputation risk. Management is responsible for the day-to-day management of the risks the Company faces, while the Board has responsibility for the oversight of risk management. In its risk oversight role, the Board of Directors has the responsibility to satisfy itself that the risk management processes designed and implemented by management are adequate and functioning as designed. Senior management meets regularly to discuss strategy and risks facing the Company. Senior management attends the Board meetings and is available to address any questions or concerns raised by the Board on risk management and any other matters. The independent members of the Board provide independent oversight of the Company's management and affairs.
Environmental, Social, and Governance
At MainStreet Bancshares Inc., our overarching focus is to make a positive impact on the communities we serve. The Board and management are aligned regarding the growing importance of Environmental, Social and Governance (ESG) initiatives, and we believe that an emphasis on sustainability can strengthen risk management and enhance value. We are, in many ways, at the beginning of our ESG journey. As we look to the future, we recognize that ESG initiatives require a commitment to the long term, and making an impact requires a willingness to listen to, learn from, and work with stakeholders across our community. Fortunately, this approach is second nature to community banks; the challenge is to harness information. We are undertaking efforts to quantify how we make a tangible difference in the communities where we live, play and work.
Environmental
The Company has a goal of reducing its carbon emissions each year.
MainStreet Bank’s origins as a “branch-lite” financial institution mean that we have been and will continue to be part of the transition to a sustainable economy that is kinder to our environment because it is less dependent on carbon fuels. Most banks the Company’s size have 20+ branches. The Bank has six locations. The Company has adopted a strategy of Put Our Bank in Your Office®, which also allows customers to conduct business with us without traveling to the Bank. On average, more than 70% of daily transactions are processed by our customers without the need to come to the Bank. These changes were underway at the Bank long before COVID-19 forced behavioral patterns in our society to change. For business operators in particular, our remote banking solutions have reduced the need to make frequent visits to a branch bank to deposit cash and checks. This helps to reduce vehicular traffic in our already crowded market.
The Company has converted all lighting to LED, scheduled HVAC units for maximum efficiency during off-work hours, incorporated mini-split units for specific location heating and cooling, tinted windows to reduce cooling needs and increased the number of indoor plants to improve air quality.
The Company has also added charging stations to accommodate employees who drive electric vehicles and encourages the purchase of hybrid vehicles.
We recognize the growing environmental risks of electronic waste and have procedures in place to reduce our impact in this regard. For example, MainStreet Bank contracts with an asset disposal company to ensure that electronic assets, including monitors, security cameras, and batteries, are disposed of and recycled in an appropriate and environmentally sensitive manner.
We have long allowed and even encouraged our employees to telecommute. Approximately 13% of our employees work remotely full-time. All but our relatively lean team of branch staff are eligible to telecommute, and most do so at least a few days a month. These arrangements give us a broader and more diverse pool of applicants in recruiting, and also serve to reduce our employees’ carbon footprint.
In our lending portfolio, we seek opportunities to support energy efficiency and renewable energy.
Social
In 2022, the establishment of MainStreet Community Capital is another business initiative we have taken to support ESG initiatives in our communities. MainStreet Community Capital's focus is to invigorate distressed, low-income communities in the Washington, D.C., metropolitan area by providing capital and other financial services. These investments are intended to spur the creation of quality jobs and services in underserved areas. MainStreet Community Capital has earned its designation as a Community Development Entity (CDE) as defined under the U.S. Treasury Department's Community Development Financial Institution (CDFI) Fund. MainStreet Community Capital has applied to the CDFI Fund for an allocation of the New Markets Tax Credits , and plans to continue to do so annually.
Turning to our staff, as of December 31, 2023, the Company employed 186 full-time employees. None of our employees are represented by a collective bargaining agreement.
The Board and management are focused on maintaining a strong corporate culture. The Company’s goal is to always hire the most qualified individuals. The Company is located in a diversely populated geography, and the Company’s workforce effectively represents that diversity. We believe that a diverse workforce enhances our ability to serve our customers and our communities by enabling us to better understand their financial needs and to provide necessary and appropriate financial services.
Seventy-four percent of the Company’s employees self-identify as either female or ethnically diverse (defined as all Equal Employment Opportunity Commission classifications other than white). The Company is proud to have three veterans on its team as well.
Governance
As indicated in the discussion of Board Leadership and Oversight, the Company believes effective oversight by the Board of Directors is an essential element of a financially sound and well-managed bank. The Board establishes the Company’s risk philosophy, ensures that it has an appropriate risk-management framework, determines the overall business strategy, and monitors implementation of strategy.
To maintain the high caliber of our Board, the Company invests regularly in director education. Additionally, our directors establish and adhere to a rigorous Code of Ethics and Business Conduct. We seek highly qualified directors with skills needed for a forward-looking Board. The Company had a technology expert on the Board in 2011, well before it became a recommended practice for community banks.
At the Board level, the Company has seven independent directors, out of a total of ten. The total of ten includes one director who stepped down from management in March 2022 and thus will become an independent director in March 2025. Two of the independent directors self-identify as female, one self-identifies as an African-American male and one self-identifies as a Hispanic male. Three of the independent directors self-identify as white males.
Diversity is one factor taken into account when considering candidates to serve on the Board of Directors. The Board believes that diversity supports its goal of best serving the Company and our shareholders, customers and employees. The matrix below summarizes the self-identified diversity attributes of our Board members. The categories listed below have the meanings defined in Nasdaq Listing Rule 5605(f)(1).
| Board Size: |
||||||||||||||||||||
| Total Number of Directors |
10 |
|||||||||||||||||||
| Gender: |
Male |
Female |
Non-Binary |
Gender Undisclosed |
||||||||||||||||
| Number of directors based on gender identity |
8 | 2 | — | — | ||||||||||||||||
| Number of directors who identify in any of the categories below: |
||||||||||||||||||||
| African American or Black |
1 | — | — | — | ||||||||||||||||
| Alaskan Native or American Indian |
— | — | — | — | ||||||||||||||||
| Asian |
— | — | — | — | ||||||||||||||||
| Hispanic or Latinx |
1 | — | — | — | ||||||||||||||||
| Native Hawaiian or Pacific Islander |
— | — | — | — | ||||||||||||||||
| White |
6 | 2 | — | — | ||||||||||||||||
| Two or More Races or Ethnicities |
— | — | — | — | ||||||||||||||||
| LQBTQ+ |
— | |||||||||||||||||||
| Undisclosed |
— | |||||||||||||||||||
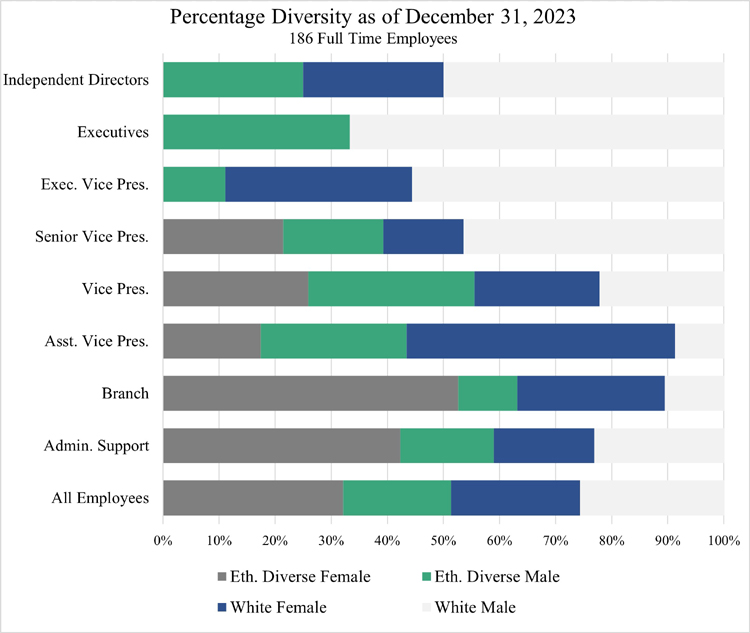
| Title |
Ethnically Diverse Female |
Ethnically Diverse Male |
White Female |
White Male |
| Independent Directors |
0.0% |
25.0% |
25.0% |
50.0% |
| Executives |
0.0% |
33.0% |
0.0% |
67.0% |
| Exec. Vice Pres. |
0.0% |
11.0% |
33.0% |
56.0% |
| Senior Vice Pres. |
21.0% |
18.0% |
14.0% |
46.0% |
| Vice Pres. |
26.0% |
30.0% |
22.0% |
22.0% |
| Asst. Vice Pres. |
17.0% |
26.0% |
48.0% |
9.0% |
| Branch |
53.0% |
11.0% |
26.0% |
11.0% |
| Admin. Support |
42.0% |
17.0% |
18.0% |
23.0% |
| All Employees |
32.0% |
19.0% |
23.0% |
26.0% |
The Company is focused on equal pay for equal work, and on developing all employees to reach their full potential. The Company realizes that hiring a diverse workforce that is representative of the diversity of the local population also allows us to better serve our marketplace.
| Employee Age Diversity |
|||||
| Age Group |
20 – 29 | 30 – 39 | 40 – 49 | 50 – 59 | 60 + |
| Number of Employees |
11 | 40 | 53 | 52 | 30 |
| Percentage of Total |
6% | 22% | 28% | 28% | 16% |
The age distribution of our employee base is also appropriately diversified.
The age distribution of our employees as denoted by generational categories.
| Employees by Generation |
||
| Pre Baby Booms |
0.5 | % |
| Baby Boomers |
15.6 | % |
| Generation X |
43.5 | % |
| Millennials |
34.4 | % |
| Generation Z |
6.0 | % |
The gender distribution of our employee base is diversified.
| Employees by Gender |
||
| Female |
54.8 | % |
| Male |
45.2 | % |
For the fiscal year ended December 31, 2023, we had 48 promotions. These promotions were distributed as follows:
| 2023 Promotions Diversity |
||
| Ethnically Diverse |
White |
|
| Female |
11 |
15 |
| Male |
13 |
9 |
The Company celebrates diversity throughout the year and fosters opportunities to learn about different cultures, religious practices, traits and differences. The Company finds that doing so brings out the best in the team as we grow together to exceed customer expectations and create shareholder value.
Supervision, Regulation and Other Factors
General. The Company is a bank holding company that has elected status as a financial holding company. As such, the Company is subject to extensive regulation under the Bank Holding Company Act of 1956 and to the examination and reporting requirements of the Federal Reserve. The Company is also subject to the rules and regulations of the SEC under the federal securities laws.
As a Virginia-chartered bank that is a member of the Federal Reserve System, the Bank is subject to regulation, supervision and examination by the Bureau and the Federal Reserve. State and federal laws also govern the activities in which the Bank engages, the investments that it makes and the aggregate amount of loans that may be granted to one borrower. The Bureau and the Federal Reserve also regulate the branching authority of the Bank. In addition, various consumer and compliance laws and regulations affect the Bank’s operations.
The earnings of the Company’s subsidiaries, and therefore the earnings of the Company, are affected by general economic conditions, management policies, changes in state and federal legislation and actions of various regulatory authorities, including those referred to above. The following description summarizes some of the significant state and federal and state laws to which the Company and the Bank are subject. To the extent that statutory or regulatory provisions or proposals are described, the description is qualified in its entirety by reference to the particular statutory or regulatory provisions or proposals.
The statutes, regulations and policies that govern our operations are under continuous review and are subject to amendment from time to time by Congress, the Virginia legislature and federal and state regulatory agencies. Any such future statutory or regulatory changes could adversely affect our operations and financial condition.
Regulation of the Bank. The Bank is subject to regulation and supervision by the Bureau and by the Federal Reserve, which regulation and supervision extends to all aspects of its operations, including but not limited to requirements concerning an allowance for credit losses, lending and mortgage operations, interest rates received on loans and paid on deposits, the payment of dividends to the Company, loans to officers and directors, mergers and acquisitions, capital adequacy, and the opening and closing of branches.
As a state-chartered bank that is a member of the Federal Reserve System, the Bank is subject to periodic examinations by the Bureau and by the Federal Reserve Bank of Richmond. In these examinations, the examiners assess compliance with state and federal banking regulations and the safety and soundness standards in such matters as loan underwriting and documentation, asset quality, earnings standards, internal controls and audit systems, interest rate risk exposure, and employee compensation and benefits.
The Bureau and the Federal Reserve have enforcement responsibility over the Bank and the authority to bring actions against the Bank and certain institution-affiliated parties, including officers, directors, and employees, for violations of laws or regulations and for engaging in unsafe and unsound practices. Formal enforcement actions include the issuance of a capital directive or cease and desist order, civil money penalties, removal of officers and/or directors, and receivership or conservatorship of the institution.
Insurance of Deposit Accounts. The FDIC insures deposits at federally insured financial institutions like the Bank. Deposit accounts in the Bank are insured by the FDIC generally up to a maximum of $250,000 per separately insured depositor and up to a maximum of $250,000 for self-directed retirement accounts.
The FDIC charges insured depository institutions assessments to maintain the Deposit Insurance Fund (the "DIF"). Assessment rates for small institutions (those with less than $10 billion in assets) are based on an institution’s weighted average CAMELS component ratings and certain financial ratios and are applied to the institution’s assessment base, which equals its average total assets minus its average tangible equity.
In October 2022, the FDIC adopted a final rule that increased the initial base deposit insurance assessment rate schedules uniformly by 2 basis points beginning with the first quarterly assessment period of 2023. The FDIC increased the insurance assessment rates in response to the 2020 decline in the DIF reserve ratio below the statutory minimum of 1.35% established by the Dodd-Frank Wall Street Reform and Consumer Protection Act (the “Dodd-Frank Act”), and the increased assessment is expected to improve the likelihood that the reserve ratio would be restored to 1.35% by September 30, 2028 prescribed under the FDIC’s restoration plan. The FDIC’s assessment rates effective January 1, 2023 (which are subject to certain adjustments) range from 3 to 16 basis points for institutions with CAMELS composite ratings of 1 or 2, 6 to 30 basis points for those with a CAMELS composite score of 3, and 16 to 30 basis points for those with CAMELS Composite scores of 4 or 5.
The FDIC has authority to increase insurance assessments. Any significant increases would have an adverse effect on the operating expenses and results of operations of the Bank. We cannot predict what the FDIC assessment rates will be in the future.
Insurance of deposits may be terminated by the FDIC upon a finding that an institution has engaged in unsafe or unsound practices, is in an unsafe or unsound condition to continue operations, or has violated any applicable law, regulation, rule, order or condition imposed by the FDIC. We do not know of any practice, condition or violation that may lead to termination of our deposit insurance.
Wholesale Deposits. The Company will refer to brokered deposits as wholesale deposits for the entirety of this filing. The Federal Deposit Insurance Act prohibits an insured depository institution from accepting wholesale deposits or offering interest rates on any deposits significantly higher than the prevailing rate in the bank’s normal market area or nationally (depending upon where the deposits are solicited), unless it is well-capitalized or is adequately capitalized and receives a waiver from the FDIC. A depository institution that is adequately capitalized and accepts wholesale deposits under a waiver from the FDIC may not pay an interest rate on any deposit in excess of national and local rate caps set by the FDIC and published on its website.
Regulatory Capital Requirements. The Bank is required to comply with applicable capital adequacy requirements adopted by the Federal Reserve and the other federal bank regulatory agencies (the “Basel III Capital Rules”). The Basel III Capital Rules apply to all depository institutions as well as to all top-tier bank and savings and loan holding companies that are not subject to the Federal Reserve’s Small Bank Holding Company Policy Statement. The capital requirements are quantitative measures established by regulation that require the Bank to maintain minimum amounts and ratios of capital. Failure to meet minimum capital requirements can initiate certain mandatory and possibly additional discretionary actions by bank regulators that, if undertaken, could have a direct material effect on the Company’s financial statements.
The Basel III Capital Rules require the maintenance of “Common Equity Tier 1” (“CET1”) capital, Tier 1 capital and Total capital to risk-weighted assets of at least 4.5%, 6% and 8%, respectively. The capital rules also establish a minimum leverage ratio of at least 4% Tier 1 capital to average consolidated assets. In addition to the above minimum requirements, the Basel III Capital Rules limits capital distributions and certain discretionary bonus payments if a banking organization does not hold a “capital conservation buffer” consisting of 2.5% of CET1 capital to risk-weighted assets above the amount necessary to meet its minimum risk-based capital requirements. The capital conservation buffer requirement effectively increases the minimum required risk-based capital ratios to 7% for CET1, 8.5% for Tier 1 capital and 10.5% for Total capital.
In determining the amount of risk-weighted assets for purposes of calculating risk-based capital ratios, a bank’s assets, including certain off-balance sheet assets (e.g., recourse obligations, direct credit substitutes and residual interests), are multiplied by a risk weight factor assigned by the capital regulations based on the risk deemed inherent in the type of asset. Higher levels of capital are required for asset categories believed to present greater risk. For example, a risk weight of 0% is assigned to cash and U.S. government securities, a risk weight of 50% is generally assigned to prudently underwritten first lien one- to four-family residential mortgages, a risk weight of 100% is assigned to commercial and consumer loans, a risk weight of 150% is assigned to non-residential mortgage loans that are 90 days past due or otherwise on non-accrual status, and a risk weight of between 0% to 600% is assigned to permissible equity interests, depending on certain specified factors.
Under applicable federal statute, the federal bank regulatory agencies are required to take “prompt corrective action” with respect to institutions that do not meet specified minimum capital requirements. For these purposes, the statute establishes five capital categories: well- capitalized, adequately capitalized, undercapitalized, significantly undercapitalized and critically undercapitalized. Under the implementing regulations, in order to be considered well-capitalized, a bank must have a ratio of CET1 capital to risk-weighted assets of 6.5%, a ratio of Tier 1 capital to risk-weighted assets of 8%, a ratio of total capital to risk-weighted assets of 10%, and a leverage ratio of 5%. In order to be considered adequately capitalized, a bank must have the minimum capital ratios required by the regulatory capital rule described above. Institutions with lower capital ratios are assigned to lower capital categories. Based on safety and soundness concerns, a bank may be assigned to a lower capital category than would otherwise apply based on its capital ratios. A bank that is not well-capitalized is subject to certain restrictions on wholesale deposits and interest rates on deposits. A bank that is not at least adequately capitalized is subject to numerous additional restrictions, and a guaranty by its holding company is required. A bank with a ratio of tangible equity to total assets of 2.0% or less is subject to the appointment of the FDIC as receiver if its capital level does not improve within 90 days.
As of December 31, 2023, the Bank was in compliance with all regulatory capital standards and qualified as “well-capitalized,” under the prompt correction action regulations. See Note 16 of Notes to Consolidated Financial Statements.
Transactions with Related Parties. The Bank is subject to the Federal Reserve’s Regulation W, which comprehensively implements the restrictions of Sections 23A and 23B of the Federal Reserve Act on transactions between a bank and its “affiliates.” The sole “affiliate” of the Bank, as defined in Regulation W, is the Company. Section 23A and the implementing provisions of Regulation W generally place limits on the amount of a bank’s loans or extensions of credit to, investments in, or certain other transactions with its affiliates, and on the amount of advances to third parties collateralized by the securities or obligations of affiliates. Section 23B and Regulation W generally require a bank’s transactions with affiliates to be on terms substantially the same, or at least as favorable to the bank, as those prevailing at the time for comparable transactions with non-affiliated companies.
The Bank is also subject to certain restrictions on extensions of credit to executive officers, directors, certain principal shareholders and their related interests. Such extensions of credit must be made on substantially the same terms, including interest rates and collateral, as those prevailing at the time for comparable transactions with third parties and must not involve more than the normal risk of repayment or present other unfavorable features.
Community Reinvestment Act and Fair Lending Laws. All insured depository institutions have a responsibility under the Community Reinvestment Act of 1977 (the “CRA”) and federal regulations thereunder to help meet the credit needs of their communities, including low- and moderate-income neighborhoods. In connection with its examination of a state-chartered Federal Reserve member bank like the Bank, the Federal Reserve is required to assess our record of meeting the credit needs of our entire community. The CRA requires the Bank’s record of compliance with the CRA to be taken into account in the evaluation of applications by the Bank or the Company for approval of an expansionary proposal, such as a merger or other acquisition of another bank or the opening of a new branch office. The Bank received an “Outstanding” CRA rating in its most recent assessment received on August 22, 2022 by the Federal Reserve.
In October 2023, the Federal Reserve, the Office of the Comptroller of the Currency, and the FDIC issued a final rule to strengthen and modernize the CRA regulations. Under the final rule a bank with assets of at least $600 million as of December 31 in both the prior two calendar years and less than $2 billion as of December 31 in either of the prior two calendar years will be an “intermediate bank,” and a bank with assets of at least $2 billion as of December 31 in both of the prior two calendar years will be a “large bank.” The agencies will evaluate large banks under four performance tests: the Retail Lending Test, the Retail Services and Products Test, the Community Development Financing Test, and the Community Development Services Test. The agencies will evaluate intermediate banks under the Retail Lending Test and either the current community development test, referred to in the final rule as the Intermediate Bank Community Development Test, or, at the bank’s option, the Community Development Financing Test. The applicability date for the majority of the provisions in the CRA regulations is January 1, 2026, and additional requirements will be applicable on January 1, 2027. Those regulations are not currently effective, and management has not determined the impact of the new regulations on the Bank.
In addition, the Equal Credit Opportunity Act and the Fair Housing Act prohibit lenders from discriminating in their lending practices on the basis of characteristics specified in those statutes. A failure to comply with the Equal Credit Opportunity Act or the Fair Housing Act could result in enforcement actions by a bank’s principal federal regulatory agency, as well as by other federal regulatory agencies or the Department of Justice.
Other Consumer Protection Laws. The Bank’s lending and deposit-taking operations are subject to numerous other federal and state laws designed to protect consumers. The Consumer Financial Protection Bureau (“CFPB”) issues regulations and standards under the federal consumer protection laws, which include, among others, the Home Mortgage Disclosure Act, the Real Estate Settlement Procedures Act, the Truth in Lending Act, the Electronic Fund Transfer Act, the Truth in Savings Act, the Fair Credit Reporting Act, and the Dodd-Frank Act’s prohibition on unfair, deceptive or abusive acts or practices. The Bank’s consumer financial products and services are subject to examination by the Federal Reserve for compliance with these and other CFPB regulations and standards.
In addition, customer privacy statutes and regulations limit the ability of the Bank to disclose nonpublic consumer information to non-affiliated third parties. These laws require us to provide notice to our customers regarding privacy policies and practices and to give our customers an option to prevent their non-public personal information from being shared with non-affiliated third parties or with our affiliates.
Cybersecurity. The federal bank regulatory agencies have adopted guidelines for establishing information security standards and cybersecurity programs for implementing safeguards under the supervision of a banking organization’s board of directors. This guidance, along with related regulatory materials, increasingly focus on risk management and processes related to information technology and the use of third parties in the provision of financial products and services. The federal bank regulatory agencies expect financial institutions to establish appropriate security controls and to ensure that their risk management processes address the risk posed by compromised customer credentials, and also expect financial institutions to maintain sufficient business continuity planning processes to ensure rapid recovery, resumption and maintenance of the institution’s operations after a cyberattack. If we fail to meet the expectations set forth in such regulatory guidance, we could be subject to various regulatory sanctions, including financial penalties.
In November 2021, the federal bank regulatory agencies issued a final rule to improve the sharing of information about cyber incidents that may affect the U.S. banking system. The rule, which became effective on May 1, 2022, requires a banking organization to notify its primary federal regulator within 36 hours of determining that a “computer-security incident” has materially affected – or is reasonably likely to materially affect – the viability of the banking organization’s operations, its ability to deliver banking products and services, or the stability of the financial sector. In addition, the rule requires a bank service provider to notify affected banking organization customers as soon as possible when the provider determines that it has experienced a computer-security incident that has materially affected or is reasonably likely to materially affect banking organization customers for four or more hours.
To date, neither the Company nor the Bank has experienced a significant compromise, significant data loss, or material financial losses related to cybersecurity attacks, but its systems and those of its customers and third-party service providers are under constant threat, and it is possible that the Company or the Bank could experience a significant event in the future. Risks and exposures related to cybersecurity attacks are expected to remain high for the foreseeable future due to the rapidly evolving nature and sophistication of these threats, as well as due to the expending use of Internet banking, mobile banking, and other technology-based products and services by the Company and the Bank and their customers.
Bank Secrecy Act / Anti-Money Laundering Laws. The Bank is subject to the Bank Secrecy Act and other anti-money laundering laws and regulations, including the USA PATRIOT Act of 2001 and the Anti-Money Laundering Act of 2020. These laws and regulations require the Bank to implement policies, procedures, and controls to detect, prevent, and report money laundering and terrorist financing and to verify the identity of their customers. Violations of these requirements can result in substantial civil and criminal sanctions. In addition, provisions of the USA PATRIOT Act require the federal financial institution regulatory agencies to consider the effectiveness of a financial institution's anti-money laundering activities when reviewing mergers and acquisitions.
Loans and Investments. State commercial banks have authority to originate and purchase any type of loan, including commercial, commercial real estate, residential mortgage or consumer loans. Aggregate loans by a state commercial bank to any single borrower or group of related borrowers are generally limited to 15% of the Bank’s capital stock, surplus and loan loss reserve.
Federal and state laws and regulations limit the Bank’s investment authority. Generally, a state member bank is prohibited from investing in corporate equity securities for its own account other than the equity securities of companies through which the bank conducts its business. Under federal and state regulations, a state member bank may invest in investment securities for its own account up to specified limits depending upon the type of security. “Investment securities” are generally defined as marketable obligations that are rated investment grade and not predominantly speculative in nature.
Commercial Real Estate Lending Concentrations. The federal banking agencies have issued guidance on sound risk management practices for concentrations in commercial real estate lending. The particular focus is on exposure to commercial real estate loans that are dependent on the cash flow from the real estate held as collateral and that are likely to be sensitive to conditions in the commercial real estate market (as opposed to real estate collateral held as a secondary source of repayment or as an abundance of caution). The purpose of the guidance is not to limit a bank’s commercial real estate lending but to guide banks in developing risk management practices and capital levels commensurate with the level and nature of real estate concentrations. The guidance directs the federal banking agencies to focus their supervisory resources on institutions that may have significant commercial real estate loan concentration risk. A bank that has experienced rapid growth in commercial real estate lending, has notable exposure to a specific type of commercial real estate loan, or is approaching or exceeding the following supervisory criteria may be identified for further supervisory analysis with respect to real estate concentration risk:
| • |
Total reported loans for construction, land development and other land represent 100% or more of the bank’s total regulatory capital; or |
| • |
Total commercial real estate loans (as defined in the guidance) represent 300% or more of the bank’s total regulatory capital and the outstanding balance of the bank’s commercial real estate loan portfolio has increased 50% or more during the prior 36 months. |
The guidance provides that the strength of an institution’s lending and risk management practices with respect to such concentrations will be taken into account in supervisory guidance on evaluation of capital adequacy.
Regulation of the Company. The Company is a bank holding company under the Bank Holding Company Act that has elected status as a financial holding company. As such, we are subject to regulation, supervision, and examination by the Federal Reserve. We are required to file quarterly reports with the Federal Reserve and provide such additional information as the Federal Reserve may require. The Federal Reserve has extensive enforcement authority over bank holding companies, including, among other things, the ability to assess civil money penalties, to issue cease and desist or removal orders and to require that a holding company divest subsidiaries (including its bank subsidiaries). In general, enforcement actions may be initiated for violations of law and regulations and unsafe or unsound practices. We are also required to file certain reports with, and otherwise comply with the rules and regulations of, the SEC.
Regulatory Capital Requirements. The federal regulatory capital rules apply to all depository institutions as well as to bank holding companies with consolidated assets of $3 billion or more. However, the regulatory capital requirements generally do not apply on a consolidated basis to a bank holding company with total consolidated assets of less than $3 billion unless the holding company: (1) is engaged in significant nonbanking activities either directly or through a nonbank subsidiary; (2) conducts significant off-balance sheet activities (including securitization and asset management or administration) either directly or through a nonbank subsidiary; or (3) has a material amount of debt or equity securities outstanding (other than trust preferred securities) that are registered with the SEC. The Federal Reserve may apply the regulatory capital standards at its discretion to any bank holding company, regardless of asset size, if such action is warranted for supervisory purposes.
Because the Company has total consolidated assets of less than $3 billion and does not engage in activities that would trigger application of the federal regulatory capital rules, it is not at present subject to consolidated capital requirements under such rules.
Acquisitions. Under the Bank Holding Company Act, we are required to obtain the prior approval of the Federal Reserve to acquire ownership or control of more than 5% of the voting shares or substantially all of the assets of any bank holding company or bank or merge or consolidate with another bank holding company. Federal law authorizes bank holding companies to make interstate acquisitions of banks without geographic limitation.
Permissible Activities. In general, the Bank Holding Company Act limits the activities of a bank holding company to those of banking, managing or controlling banks, or any other activity that the Federal Reserve has determined to be so closely related to banking or to managing or controlling banks that an exception is allowed for those activities. A bank holding company that qualifies and elects to be treated as a “financial holding company” may engage in a broad range of additional activities that are (i) financial in nature or incidental to such financial activities or (ii) complementary to a financial activity and do not pose a substantial risk to the safety and soundness of depository institutions or the financial system generally. These activities include securities underwriting and dealing, insurance agency and underwriting, and making merchant banking investments. On October 12, 2021, the Company filed an election to be treated as a financial holding company.
To maintain financial holding company status, a financial holding company and all of its depository institution subsidiaries must be “well capitalized” and “well managed” as defined under applicable Federal Reserve requirements. If a financial holding company ceases to meet these capital and management requirements, the Federal Reserve’s regulations provide that the financial holding company must enter into an agreement with the Federal Reserve to comply with all applicable capital and management requirements. Until the financial holding company returns to compliance, the Federal Reserve may impose limitations or conditions on the conduct of its activities, and the company may not commence any of the broader financial activities permissible for financial holding companies or acquire a company engaged in such financial activities without prior approval of the Federal Reserve. If the company does not return to compliance within 180 days, the Federal Reserve may require the financial holding company to divest its depository institution subsidiaries or to cease engaging in any activity that is financial in nature (or incident to such financial activity) or complementary to a financial activity. In order for a financial holding company to commence any new activity permitted by the Bank Holding Company Act or to acquire a company engaged in any new activity permitted by the Bank Holding Company Act, each insured depository institution subsidiary of the financial holding company must have received a rating of at least “satisfactory” in its most recent examination under the CRA. See “Regulation of the Bank-Community Reinvestment Act and Fair Lending Laws.”
Despite prior approval, the Federal Reserve may order a bank holding company or its subsidiaries to terminate any activity or to terminate ownership or control of any subsidiary when the Federal Reserve has reasonable cause to believe that a serious risk to the financial safety, soundness, or stability of any bank subsidiary of that bank holding company may result from such an activity.
Incentive Compensation. Federal banking agencies have issued guidance on incentive compensation policies intended to ensure that the incentive compensation policies of banking organizations do not undermine the safety and soundness of such organizations by encouraging excessive risk-taking. The guidance, which covers all employees that have the ability to materially affect the risk profile of an organization, is based upon the key principles that a banking organization’s incentive compensation arrangements should (i) provide incentives that do not encourage risk-taking beyond the organization’s ability to effectively identify and manage risks, (ii) be compatible with effective internal controls and risk management, and (iii) be supported by strong corporate governance, including active and effective oversight by the organization’s board of directors. In accordance with federal statute, the federal banking agencies prohibit incentive-based compensation arrangements that encourage inappropriate risk taking by covered financial institutions (generally institutions that have over $1 billion in assets) and are deemed to be excessive, or that may lead to material losses.
The Federal Reserve reviews, as part of its standard, risk-focused examination process, the incentive compensation arrangements of banking organizations (such as the Company) that are not “large, complex banking organizations.” These reviews are tailored to each organization based on the scope and complexity of the organization’s activities and the prevalence of incentive compensation arrangements. The findings of the supervisory initiatives will be included in reports of examination. Deficiencies are incorporated into the organization’s supervisory ratings, which can affect the organization’s ability to make acquisitions and take other actions. Enforcement actions may be taken against a banking organization if its incentive compensation arrangements, or related risk-management control or governance processes, pose a risk to the organization’s safety and soundness and the organization is not taking prompt and effective measures to correct the deficiencies. The scope and content of the U.S. banking regulators’ policies on executive compensation is likely to continue to evolve. It cannot be determined at this time whether compliance with such policies will adversely affect the Company’s ability to hire, retain and motivate its key employees.
In 2022, the SEC adopted a final rule directing national securities exchanges, including Nasdaq, to establish listing standards requiring listed companies to adopt policies providing for the recovery or “clawback” of excess incentive-based compensation earned by current or former executive officers during the three fiscal years preceding the date the listed company determines an accounting restatement is required. In June 2023, the SEC approved new listing standards for public companies, such as the Company, listed on Nasdaq. The new standards took effect on October 2, 2023, and require listed companies to adopt written clawback policies by December 1, 2023. On November 15, 2023, the Board of Directors of the Company adopted a Policy for Recovery of Erroneously Awarded Compensation (“Clawback Policy”), effective as of October 2, 2023. The Clawback Policy would be triggered by both “Big R” and “little r” restatements and apply to any incentive-based compensation that is granted, earned or vested based wholly or in part upon the attainment of a financial reporting measure. The Clawback Policy is filed as Exhibit 97.1 to this Annual Report on Form 10-K and is incorporated herein by reference.
Source of Strength. Under the Bank Holding Company Act, a bank holding company is required to act as a source of financial and managerial strength to each of its subsidiary banks and to commit resources to support each subsidiary bank. Under this source of strength doctrine, the Federal Reserve may require a bank holding company to make capital injections into a troubled subsidiary bank. The Federal Reserve may charge the bank holding company with engaging in unsafe and unsound practices if it fails to commit resources to such a subsidiary bank or if it undertakes actions that the Federal Reserve believes might jeopardize its ability to commit resources to such subsidiary bank. A capital injection may be required at times when the holding company does not have the resources to provide it.
In addition, any loans by a holding company to a subsidiary bank are subordinate in right of payment to deposits and to certain other indebtedness of such subsidiary bank. In the event of a bank holding company’s bankruptcy, the bankruptcy trustee will assume any commitment by the holding company to a federal bank regulatory agency to maintain the capital of a subsidiary bank. Moreover, the bankruptcy law provides that claims based on any such commitment will be entitled to a priority of payment over the claims of the institution’s general unsecured creditors, including the holders of its note obligations.
Dividends, Capital Distributions and Other Payments. There are various legal limitations applicable to the payment of dividends by the Bank to the Company, to the payment of dividends on capital stock and other distributions by the Company, and to the repurchase by the Company of its outstanding shares of capital stock. The Federal Reserve has issued guidance indicating that bank holding companies should generally pay dividends only if the company’s net income available to common shareholders over the past year has been sufficient to fully fund the dividends, and the prospective rate of earnings retention appears consistent with the company’s capital needs, asset quality and overall financial condition. The Federal Reserve’s guidance also states that a bank holding company should inform and consult with its regional Federal Reserve Bank in advance of declaring or paying a dividend that exceeds earnings for the period for which the dividend is being paid or that could result in a material adverse change to the organization’s capital structure. In addition, under Virginia law, the Company generally may not pay dividends or distributions to holders of common stock if it would be unable to pay its debts as they become due in the ordinary course of business or if its total assets would be less than the sum of its total liabilities plus the amount of the liquidation preference of any class of shares with superior rights than common stock.
As the majority of the Company’s revenues result from dividends paid to the Company by the Bank, the Company’s ability to pay dividends to our shareholders largely depends on the receipt of such dividends from the Bank. The Bank is subject to various laws and regulations limiting the amount of dividends that it can pay. Under Virginia law, without the permission of the Virginia State Corporation Commission, a state bank may not pay dividends, except from retained earnings. Under federal law applicable to state-chartered Federal Reserve member banks, a bank may not declare or pay a dividend without prior Federal Reserve approval if the total of all dividends declared during the calendar year, including the proposed dividend, exceeds the sum of the bank’s net income during the current calendar year and the retained net income of the prior two calendar years.
Bank regulatory agencies have the authority to prohibit the Bank or the Company from engaging in an unsafe or unsound practice in the conduct of their respective business. The payment of dividends, other capital distributions, or the repurchase of capital stock, depending on the financial condition of the Bank and/or the Company, could be deemed an unsafe or unsound practice.
No insured depository institution may pay a dividend if, after paying the dividend, the institution would be undercapitalized. In addition, as noted above, if the Bank does not maintain the capital conservation buffer required by applicable regulatory capital rules, its ability to pay dividends to the Company will be limited.
Future Regulation. From time to time, various legislative and regulatory initiatives are introduced in Congress and state legislatures, as well as by federal and state regulatory agencies. Such initiatives may include proposals to expand or contract the powers of bank holding companies and financial institutions or proposals to substantially change the regulatory system. Such initiatives could change banking statutes and our operating environment. If enacted or adopted, such initiatives could increase or decrease our cost of conducting business, limit or expand our permissible activities, or affect our competitive position. We cannot predict whether any such initiatives will be approved, and, if approved, the effect that they could have on our financial condition or results of operations.
Government Monetary Policies. Our results of operations are influenced by the monetary policies of regulatory authorities. Actions by the Federal Reserve impact market and general economic conditions. Federal Reserve policies can significantly affect market interest rates charged on loans or paid for deposits, as well as employment and inflation rates and investments. Federal Reserve monetary policies have had, and can be expected to continue to have, significant effects on financial institution results of operations.
Federal Securities Laws. The Company’s common stock and depositary shares (each representing a 1/40th interest in a share of 7.50% Series A Fixed-Rate Non-Cumulative Perpetual Preferred Stock) are registered under Section 12(b) of the Exchange Act, and the Company is subject to the periodic reporting and other requirements of the SEC under Section 12(b) of the Exchange Act and SEC regulations.
Our annual reports on Form 10-K, quarterly reports on Form 10-Q, and current reports on Form 8-K, and amendments to those reports, are available at no cost on our website, www.mstreetbank.com, as soon as reasonably practicable after we file, or furnish, such documents with the SEC. The information contained on our website is not part of this Annual Report on Form 10-K, nor incorporated by reference into this or any other SEC filing. Our SEC filings are also available at no cost through the SEC’s website at www.sec.gov.
This section highlights material risks that the Company currently faces. Any of the risks described below, along with management’s discussion and analysis and the consolidated financial statements and footnotes, could materially adversely affect our business, financial condition, and results of operations. Additional risks of which management currently is not aware or which management currently considers to not be material may also adversely affect our business, financial condition and results of operations. There is no assurance that this section describes all potential risks to which the Company may be exposed.
Risks Related to Our Business
Credit and Lending Risks
Our business, like that of most banking organizations, is highly susceptible to credit risk.
As a lender, the Bank is exposed to the risk that borrowers will be unable to repay their loans according to terms of the loan agreements and that the collateral securing payment of the loans (if any) may not be sufficient to assure repayment. Credit losses could have a material adverse effect on our business, financial condition, and results of operations.
We have significant exposure to risks associated with commercial and residential real estate.
A substantial portion of our loan portfolio consists of commercial and residential real estate-related loans, including construction and residential and commercial mortgage loans. As of December 31, 2023, we had approximately $282.1 million of owner-occupied and $461.8 million of investment commercial real estate loans outstanding, which represented approximately 16.3% and 26.7%, respectively, of our loan portfolio as of December 31, 2023. As of that same date, we had approximately $429.6 million of construction real estate loans and $474.6 million of residential real estate loans, which represented 24.9% and 27.5% respectively.
The adverse consequences from real estate-related credit risks tend to be cyclical and are often driven by local and national economic developments that are not controllable or entirely foreseeable by us or our borrowers. As a result:
| • |
we have a greater risk of loan defaults and losses in the event of economic weaknesses associated with commercial and residential real estate in our market area and nationally, which may have a negative effect on the ability of our borrowers to timely repay their loans or the value of collateral securing those loans; and |
| • |
loan concentrations and the associated risks related to commercial and residential real estate may pose additional regulatory credit risk concerns, including interest rate risk due to maturity considerations, liquidity risk due to funding considerations and risks to earnings and capital. |
During the ordinary course of our business, we may foreclose on and take title to properties securing certain loans, in which event we become exposed to the costs and risks inherent in the ownership of commercial and residential real estate, which could have an adverse effect on our business, financial condition and results of operations. The amount that we, as a mortgagee, may realize after a default is dependent upon factors outside of our control, including:
| • |
general or local economic conditions; |
| • |
environmental clean-up liabilities; |
| • |
neighborhood values; |
| • |
interest rates; |
| • |
real estate tax rates; |
| • |
operating expenses of the foreclosed properties; |
| • |
supply of and demand for rental units or properties; |
| • |
ability to obtain and maintain adequate occupancy of the properties; |
| • |
zoning laws; |
| • |
governmental rules, regulations and fiscal policies; and |
| • |
extreme weather conditions or other natural or man-made disasters. |
Certain expenditures associated with the ownership of real estate, principally real estate taxes and maintenance costs, may also adversely affect our operating expenses.
In recent years commercial real estate markets both nationally and locally have been adversely affected by the COVID-19 pandemic. Remote employee work opportunities during the pandemic have impacted, and may continue to impact, the occupancy of commercial properties. Weakness in our commercial real estate market could result in an increased delinquency rate and losses from these loans. We believe that the resilience of our market and borrowers provides an ability to adjust to and withstand such risks. However, increased losses from this portfolio could have an adverse effect on our business, financial condition and results of operations.
Commercial and industrial loans may expose us to greater financial and credit risk than other loans.
Commercial and industrial loans can involve a greater degree of financial and credit risk than other loans, including less collateral at liquidation. Any significant failure to pay on time by these customers would hurt our earnings. The increased financial and credit risks associated with these types of loans result from several factors, including the concentration of principal in a limited number of loans and borrowers, the size of loan balances, the effects of general economic conditions on income-producing properties and the increased difficulty of evaluating and monitoring these types of loans and factors outside the borrowers' control such as adverse financial conditions and governmental regulations. In addition, when underwriting a commercial or industrial loan, we may take a security interest in commercial real estate, and, in some instances upon a default by the borrower, we may foreclose on and take title to the property, which may lead to additional risks for us under applicable environmental laws described below.
The small-to-midsized businesses that we lend to may have fewer resources to weather adverse business developments, which may impair a borrower’s ability to repay a loan, and such impairment could have a material adverse effect on our business, financial condition and results of operations.
We focus our business development and marketing strategy primarily on small-to-midsized businesses. These businesses frequently have smaller market shares than their competition, may be more vulnerable to economic downturns, often need additional capital to expand or compete and may experience volatility in operating results, any of which may impair a borrower’s ability to repay a loan. In addition, the success of a small-to-midsized business often depends on the management skills, talents and efforts of one or two people or a small group of people, and the death, disability or resignation of one or more of these people could have an adverse impact on the business and its ability to repay its loan. If general economic conditions negatively impact the markets in which we operate and small-to-midsized businesses are adversely affected or our borrowers are otherwise harmed by adverse business developments, this, in turn, could have a material adverse effect on our business, financial condition and results of operations.
The borrowing needs of our customers may increase, especially during a challenging economic environment, which could result in increased borrowing against our contractual obligations to extend credit.
A commitment to extend credit is a formal agreement to lend funds to a customer as long as there is no violation of any condition established under the agreement. The actual borrowing needs of our customers under these credit commitments have historically been lower than the contractual amount of the commitments. A significant portion of these commitments expire without being drawn upon. Because of the credit profile of our customers, we typically have a substantial amount of total unfunded credit commitments, which is not reflected on our balance sheet. As of December 31, 2023, we had $359.4 million in unfunded credit commitments to our customers. Actual borrowing needs of our customers may exceed our expectations, especially during a challenging economic environment when our customers may be more dependent on our credit commitments due to the lack of available credit elsewhere, the increasing costs of credit, or the limited availability of financings from venture firms. This could adversely affect our liquidity, which could impair our ability to fund operations and meet obligations as they become due and could have a material adverse effect on our business, financial condition and results of operations.
Our allowance for credit losses may not be adequate to cover actual future losses.
Our success depends significantly on the quality of our assets, particularly loans. Like all financial institutions, we are exposed to the risk that our borrowers may not repay their loans according to their terms, and the collateral securing the payment of these loans may be insufficient to fully compensate us for the outstanding balance of the loan plus the costs to dispose of the collateral.
We maintain an allowance for credit losses ("ACL"), which includes the allowance for credit losses on loans, at a level we believe is adequate to absorb expected losses in our loan portfolio as of the corresponding balance sheet date. The process to determine the ACL uses models and assumptions that require us to make difficult and complex judgments that are often interrelated. This includes forecasting how borrowers will perform in changing and unprecedented economic conditions. The ability of our borrowers to repay their obligations will likely be impacted by changes in future economic conditions, which in turn could impact the accuracy of our loss forecasts and allowance estimates. There is also the possibility that we have failed or will fail to accurately identify the appropriate economic indicators, to accurately estimate the timing of future changes in economic conditions, or to estimate accurately the impacts of future changes in economic conditions to our borrowers, which similarly could impact the accuracy of our loss forecasts and allowance estimates.
If the models, estimates, and assumptions we use to establish reserves or the judgments we make in extending credit to our borrowers prove inaccurate in predicting future events, we may suffer unexpected losses. The ACL is our best estimate of expected credit losses; however, there is no guarantee that it will be sufficient to address credit losses, particularly if the economic outlook deteriorates significantly and quickly. In such an event, we may increase our ACL, which would reduce our earnings. Additionally, to the extent that economic conditions worsen, impacting our consumer and commercial borrowers or underlying collateral, and credit losses are worse than expected, as may be caused by persistent inflation, an economic recession or otherwise, we may increase our provision for credit losses, which could have an adverse effect on our results of operations and could negatively impact our financial condition.
Continuing deterioration in economic conditions, including inflation, a possible recession, higher interest rates, unresolved or new adverse effects of the COVID-19 pandemic, and unanticipated problem loans, may necessitate an increase in our allowance for credit losses. In addition, bank regulatory authorities may require an increase or future charge-offs based on their judgments which may differ from ours.
We may be required to increase our provisions for credit losses and to charge off loans in the future, which increases and charges could materially adversely affect us.
There is no precise method of predicting the timing of loan losses. We can give no assurance that our allowance for credit losses is or will be sufficient to absorb actual loan losses. We maintain an allowance for credit losses on loans, which is a reserve established through a provision for credit losses charged to expense, that represents management’s estimable and observable losses within the existing portfolio of loans. The level of the allowance reflects management’s evaluation of, among other factors, the status of specific individually evaluated loans, trends in historical loss experience, delinquency trends, credit concentrations and economic conditions within our market area. The determination of the appropriate level of the allowance for credit losses inherently involves a high degree of subjectivity and judgment and requires us to make significant estimates of current and expected future credit risks and future trends, any or all of which may undergo subsequent material changes. Changes in economic conditions affecting borrowers, new information regarding existing loans, identification of additional problem loans and other factors, both within and outside of our control, may require us to increase our allowance for credit losses. Increases in nonperforming loans have a significant impact on our allowance for loan losses.
In addition, bank regulatory agencies periodically review our allowance for credit losses and may require us to increase the provision for credit losses or to recognize further loan charge-offs, based on judgments that differ from those of management. If loan charge-offs in future periods exceed our allowance for credit losses, we will need to record additional provisions to increase our allowance for credit losses. Furthermore, growth in our loan portfolio would generally lead to an increase in the provision for credit losses. Generally, increases in our allowance for credit losses will result in a decrease in net income and stockholders’ equity, and may have a material adverse effect on our financial condition, results of operations and cash flows. Material additions to our allowance could also materially decrease our net income and, possibly, capital, and may have an adverse effect on our business.
Our credit standards and judgments and our ongoing process of credit assessment might not protect us from significant credit losses.
We extend credit to a variety of customers based on internally established standards, judgments and procedures. We manage credit risk through a program of underwriting standards, the review of certain credit decisions and an on-going process of assessment of the quality of the credit already extended. We avoid highly leveraged transactions as well as excessive industry and other concentrations. Our credit administration function employs risk management techniques to ensure that loans adhere to corporate policy and problem loans are promptly identified. While these procedures are designed to provide us with the information needed to implement policy adjustments where necessary, and to take proactive corrective actions, there can be no assurance that such measures will be effective in avoiding undue credit risk.
We are subject to environmental liability risk associated with our lending activities.
In the course of our business, we may purchase real estate, or we may foreclose on and take title to real estate. Although we exercise prudent due diligence when making loans, we could be subject to environmental liabilities with respect to these properties. We may be held liable to a governmental entity or to third parties for property damage, personal injury, investigation and clean-up costs incurred by these parties in connection with environmental contamination or may be required to investigate or clean up hazardous or toxic substances or chemical releases at a property. The costs associated with investigation or remediation activities could be substantial. In addition, if we are the owner or former owner of a contaminated site, we may be subject to common law claims by third parties based on damages and costs resulting from environmental contamination emanating from the property. Any significant environmental liabilities could cause an adverse effect on our business, financial condition and results of operations.
The implementation of the Current Expected Credit Loss accounting standard could require us to increase our allowance and future provisions for credit losses and may have a material adverse effect on our financial condition and results of operations.
Effective January 1, 2023, we were required to adopt the Financial Accounting Standards Board (the “FASB”) Accounting Standards Update 2016-13, Financial Instruments-Credit Losses (Topic 326), Measurement of Credit Losses on Financial Instruments, commonly referred to as “CECL.” Under CECL the allowance for credit losses methodology has been changed from an incurred loss concept to an expected loss concept, which is more dependent on future economic forecasts, assumptions and models than previous accounting standards and could result in increases in, and add volatility to, our allowance for credit losses and future provisions for credit losses. These forecasts, assumptions, and models are inherently uncertain and are based upon management’s reasonable judgments in light of currently available information. As a result, our allowance for credit losses may not be adequate to absorb actual credit losses, and, if not adequate, could materially and adversely affect our financial condition and results of operations.
We are subject to environmental liability risk associated with our lending activities.
In the course of our business, we may foreclose on and take title to real estate. Although we exercise prudent due diligence when making loans, we could be subject to environmental liabilities with respect to these properties. We may be held liable to a governmental entity or to third parties for property damage, personal injury, investigation and clean-up costs incurred by these parties in connection with environmental contamination or may be required to investigate or clean up hazardous or toxic substances or chemical releases at a property. The costs associated with investigation or remediation activities could be substantial. In addition, if we are the owner or former owner of a contaminated site, we may be subject to common law claims by third parties based on damages and costs resulting from environmental contamination emanating from the property. Any significant environmental liabilities could cause an adverse effect on our business, financial condition and results of operations.
Climate change could have a material negative impact on us.
Climate change could negatively impact our business, as well as the operations and activities of our customers. Climate change could present both immediate and long-term risks to our operations, and these risks could increase over time. Climate change could present multi-faceted risks, including operational risks from the physical effects of environmental events on our facilities and other assets, as well as those of our customers; potential credit risk from borrowers with significant exposure to environmental risk; and potential reputational risk from shareholder and public comments and concerns about our practices related to climate change and our relationships with customers and vendors who operate in environmentally sensitive industries. Our business, reputation and ability to attract and retain employees could also be harmed if our responses to climate change are negatively perceived.
Interest Rate Risks
Changes in interest rates may negatively affect our earnings, income and financial condition as well as the value of our assets.
Our earnings and cash flows depend substantially upon our net interest income. Net interest income is the difference between interest income earned on interest-earning assets, such as loans and investment securities, and interest expense paid on interest-bearing liabilities, such as deposits and borrowed funds. Interest rates are sensitive to many factors that are beyond our control, including general economic conditions, competition and policies of various governmental and regulatory agencies and, in particular, the policies of the Federal Reserve.
In an attempt to help the overall economy and in response to inflationary pressures, throughout 2022 and 2023 the Federal Reserve increased its targeted Fed Funds rate. The Federal Reserve also announced its intention to take other actions to mitigate growing signs of inflation. As the Federal Reserve continues its mission, overall interest rates have been impacted.
Changes in monetary policy, including rapid changes in interest rates, not only could influence the interest we receive on loans and investment securities and the amount of interest we pay on deposits and borrowings, but such changes could also affect: (1) our ability to originate loans and obtain deposits; (2) the fair value of our financial assets and liabilities, including our securities portfolio; and (3) the average duration of our interest-earning assets. Interest-earning assets may be more responsive to changes in interest rates than interest-bearing liabilities, or vice versa (repricing risk), individual interest rates or rate indices underlying various interest-earning assets and interest-bearing liabilities may not change in the same degree over a given time period (basis risk), and interest rate relationships may change across the spectrum of interest-earning asset and interest-bearing liability maturities (yield curve risk), including a prolonged flat or inverted yield curve environment. Higher interest payment obligations could also adversely affect certain borrowers, particularly our floating-rate borrowers. Substantial and prolonged increases in market interest rates could have a material adverse effect on our financial condition and results of operation.
Liquidity Risk
Liquidity risk could impair our ability to fund operations, meet our obligations as they become due, and jeopardize our financial condition.
Liquidity is essential to our business. An inability to raise funds through deposits, borrowings, the sale of loans and other sources could have a substantial negative effect on our liquidity. Our access to funding sources in amounts adequate to finance our activities, or on terms that are acceptable to us, could be impaired by factors that affect us specifically or the financial services industry or the economy in general. Factors that could detrimentally affect our access to liquidity sources include, among other things, a decrease in the level of our business activity as a result of a downturn in the markets in which our loans are concentrated and an adverse regulatory action against us. Our ability to borrow could also be impaired by factors that are not specific to us, such as a disruption in the financial markets or negative views and expectations about the prospects for the financial services industry.
Among other sources of funds, we rely heavily on deposits for funds to make loans and provide for our other liquidity needs. However, our loan demand has historically exceeded the rate at which we have been able to build core deposits for which there is substantial competition from a variety of different competitors, so we have relied on interest-sensitive deposits, including wholesale deposits, as sources of funds. Those deposits may not be as stable as other types of deposits and, in the future, depositors may not renew those deposits when they mature, or we may have to pay a higher rate of interest to attract or retain them or to replace them with other deposits or with funds from other sources. Not being able to attract deposits, or to retain or replace them as they mature, would adversely affect our liquidity. Paying higher deposit rates to attract, retain or replace those deposits could have a negative effect on our interest margin and operating results. A failure to maintain adequate liquidity could have a material adverse effect on our business, financial condition and results of operation.
Operational Risks
New lines of business, products, product enhancements or services may subject us to additional risks.
General. From time to time, we implement new lines of business, or offer new products and product enhancements as well as new services within our existing lines of business and we will continue to do so in the future. There are risks and uncertainties associated with these efforts, particularly in instances where the markets are not fully developed. In implementing, developing, or marketing new lines of business, products, product enhancements or services, we may invest significant time and resources, although we may not assign the appropriate level of resources or expertise necessary to make these new lines of business, products, product enhancements or services successful or to realize their expected benefits. Further, initial timetables for the introduction and development of new lines of business, products, product enhancements or services may not be achieved, and price and profitability targets may not prove feasible. External factors, such as compliance with regulations, competitive alternatives and shifting market preferences, may also impact the ultimate implementation of a new line of business or offerings of new products, product enhancements or services. Furthermore, any new line of business, product, product enhancement or service could have a significant impact on the effectiveness of our system of internal controls. Failure to successfully manage these risks in the development and implementation of new lines of business or offerings of new products, product enhancements or services could have an adverse impact on our business, financial condition or results of operations.
Payments Services. In 2016, we added a new funding source by way of facilitating payment services. We are continuing to identify and solicit new customers in need of these specialized services. The primary reasons for expanding into payment services are to secure an additional source of low-cost deposits and to capture additional fee income. A bank’s risks when dealing with a processor account are similar to risks from other activities in which customers conduct transactions through the bank on behalf of the customers’ clients. It is necessary for a bank to implement an adequate processor approval, monitoring and auditing program that extends beyond credit risk management and is conducted on an ongoing basis. When a bank is not able to identify and understand the nature and source of transactions processed through accounts, the bank’s risks and the likelihood of suspicious activity can increase. Without these precautions, a bank could be vulnerable to processing illicit or sanctioned transactions.
BaaS Software Solutions. In 2021, the Company began development of a proprietary BaaS software solution, Avenu, which provides an embedded banking solution that connects our partners (fintechs, application developers, money movers, and entrepreneurs) directly and seamlessly to our Software as a Service (SaaS) solution. Developing and deploying a software program may add additional risk, including cybersecurity, compliance, financial, and reputational concerns.
We face risks related to our operational, technological and organizational infrastructure.
Our ability to grow and compete is dependent on the Company’s ability to build or acquire the necessary operational and technological infrastructure and to manage the cost of that infrastructure as we expand. In our case, operational risk can manifest itself in many ways, such as errors related to failed or inadequate processes, faulty or disabled computer systems, fraud by employees or outside persons and exposure to external events. As discussed below, we are dependent on our operational infrastructure to help manage these risks. In addition, we are heavily dependent on the strength and capability of our technology systems that the Company uses both to interface with customers and to manage internal financial and other systems. Our ability to develop and deliver new products that meet the needs of our existing customers and attract new ones depends on the functionality of our technology systems. Additionally, our ability to run our business in compliance with applicable laws and regulations is dependent on these infrastructures.
We continuously monitor our operational and technological capabilities and make modifications and improvements as circumstances warrant. In some instances, the Company may build and maintain these capabilities itself. We outsource many of these functions to third parties. These third parties may experience errors or disruptions that could adversely impact the Company and over which it may have limited control. We also face risk from the integration of new infrastructure platforms and/or new third-party providers of such platforms into the Company’s existing businesses.
Many of our larger competitors have substantially greater resources to invest in technological improvements. As a result, they may be able to offer additional or superior technologies compared to those that we will be able to provide, which could put us at a competitive disadvantage. Accordingly, we may lose customers seeking new technology-driven products and services to the extent we are unable to compete effectively.
A failure or a breach of our operational systems or infrastructure, or those of third party service providers, could disrupt our business, result in the unauthorized disclosure of confidential or proprietary information, damage our reputation and cause financial losses.
Operations Risk. Our business is dependent on our ability to process, store and transmit, on a daily basis, a number of transactions. These transactions, as well as the information technology services we provide to clients, often must adhere to client-specific guidelines, as well as legal and regulatory standards. Developing and maintaining our operational systems and infrastructure is challenging, particularly as a result of rapidly evolving legal and regulatory requirements and technological shifts. Our financial, accounting, data processing or other operating systems and facilities may fail to operate properly or become disabled as a result of events that are wholly or partially beyond the Company’s control, such as a spike in transaction volume, cyber-attack or other unforeseen catastrophic events, which may adversely affect our ability to process these transactions or provide services.
In addition, our operations rely on the secure processing, storage and transmission of confidential, proprietary and other information on our computer systems, networks. and cloud infrastructure. Although we take protective measures to maintain the confidentiality, integrity, and availability of our and our clients’ information across all geographic and product lines, and endeavor to modify these protective measures as circumstances warrant, the nature of the threats continues to evolve. As a result, our computer systems, software, and networks may be vulnerable to unauthorized access, loss or destruction of data (including confidential and proprietary client information), account takeovers, unavailability of service, computer viruses or other malicious code, cyber-attacks and other events that could have an adverse security impact. Despite the defensive measures we take to manage our internal technological and operational infrastructure, these threats may originate externally from third parties such as foreign governments, organized crime and other hackers, and outsource or infrastructure-support providers and application developers or may originate internally from within our organization. Given the increasingly high volume of our transactions, certain errors may be repeated or compounded before they can be discovered and rectified.
We also face the risk of operational disruption, failure, termination or capacity constraints of any of the third parties that facilitate our business activities, including exchanges, clearing agents, clearing houses or other financial intermediaries. Such parties could also be the source of an attack on, or breach of, our operational systems, data or infrastructure. In addition, as interconnectivity with our clients grows, we increasingly face the risk of operational failure with respect to our clients’ systems.
Vendor Support Risk. As discussed below, we rely on external vendors to support our operations. We also rely on vendors to provide part of the services we deliver to customers. While we have a vendor management program policy in place and believe we have selected our vendors appropriately, we cannot directly control their employees or their operating environments. A breach or failure of a chosen vendor could have a material adverse impact on our operating environment. Replacing a chosen vendor could also result in a significant delay and expense.
Internet Risk. Our services and technology solutions rely on internet communications. Computers connected to the internet are vulnerable to many types of threats by cyber criminals. Although none of these types of attacks have had a material impact on our business to date, we anticipate that the efforts to attack our systems, and those of our customers and vendors, will grow in complexity and volume. As such, we have developed an incident response plan to coordinate the efforts following the identification of an attack.
Failure to maintain a secure computing environment, stay up to date on security vulnerabilities or deploy adequate technologies to protect against attacks, may subject our information and systems to security breaches that could compromise confidential information and damage our reputation and business. We rely on industry-standard encryption and authentication security systems to provide the security required to protect our data. Periodically our systems are subjected to scans, exploitations and audits by a qualified independent third party to evaluate the effectiveness of our security controls and system configurations.
Cyber criminals may attempt to trick employees, customers or vendors through phishing schemes or other methods to disclose sensitive information. Employees receive annual security training and are periodically assessed through simulated attack tools to assist with behavior shaping and coaching against social engineering threats.
If one or more of these events occurs, it could potentially jeopardize the confidential, proprietary and other information processed and stored in, and transmitted through, the Company’s computer systems and networks, or otherwise cause interruptions or malfunctions in our, as well as our clients’ or other third parties’ operations, which could result in damage to our reputation, substantial costs, regulatory penalties and/or client dissatisfaction or loss.
Potential costs of a cyber incident may include, but would not be limited to, remediation costs, increased protection costs, lost revenue from the unauthorized use of proprietary information or the loss of current and/or future customers, and litigation.
Insurance Risk. We maintain an insurance policy through the Company’s blanket bond at the maximum of currently available limits. However, we cannot assure you that this policy would be sufficient to cover all financial losses, damages, and penalties, including lost revenues, should the Company experience any one or more of our or a third party’s systems failing or experiencing attack.
A cyber-attack or other security incident, including one that results in the theft, loss, manipulation, or misuse of information (including personal information), or the disabling of systems and access to information critical to business operations, may result in increased costs, reductions in revenue, reputational damage, legal exposure and business disruptions.
A “deep fake” incident, which involves synthetic media that is created using artificial intelligence to create realistic images, videos, or audio recordings of people that appear to be real but are not. This technology has the potential to be used for malicious purposes, such as spreading misinformation or impersonating individuals. Deep fakes could have a material impact on the Company in a number of ways, including:
| ● |
Loss of reputation - deep fakes could be used to damage a company's reputation by creating false or misleading content that is attributed to the company, |
| ● |
Financial losses - deep fakes could be used to manipulate the stock market by creating false or misleading information about a company's financial performance, and |
| ● |
Legal liability - deep fakes could expose companies to legal liability for defamation, copyright infringement, or other claims. |
Our ability to provide our products and services, many of which are internet-based, and communicate with our customers, depends upon the management and safeguarding of information systems and infrastructure, networks, software, data, technology, methodologies and business secrets, including those of our service providers. Our products and services involve the collection, authentication, management, usage, storage, transmission and eventual destruction of sensitive and confidential information, including personal information, regarding our customers and their accounts, our employees, our partners and other third parties with which we do business. We also have arrangements in place with third parties through which we share and receive information about their customers who are or may become our customers. The financial services industry, including the Company, is particularly at risk because of the use of and reliance on digital banking products and other digital services, including mobile banking products, such as mobile payments, and other internet- and cloud-based products and applications, and the development of additional remote connectivity solutions, which increase cybersecurity risks and exposure.
Technologies, systems, networks, and other devices of the Bank as well as those of our employees, service providers, partners and other third parties with whom we interact, have been and may continue to be the subject of cyber-attacks and other security incidents, including computer viruses, hacking, malware, ransomware, supply chain attacks, vulnerabilities, credential stuffing, or phishing or other forms of social engineering. Such cyber-attacks and other security incidents are designed to lead to various harmful outcomes, such as unauthorized transactions in the Bank’s accounts, unauthorized or unintended access to or release, gathering, monitoring, disclosure, loss, destruction, corruption, disablement, encryption, misuse, modification or other processing of confidential or sensitive information (including personal information), intellectual property, software, methodologies or business secrets, disruption, sabotage or degradation of service, systems or networks, or other damage. These threats may derive from, among other things, error, fraud or malice on the part of our employees, insiders, or third parties or may result from accidental technological failure or design flaws. Any of these parties may also attempt to fraudulently induce employees, service providers, customers, partners or other third-party users of our systems or networks to disclose confidential or sensitive information (including personal information) in order to gain access to our systems, networks or data or that of our customers, partners, or third parties with whom we interact, or to unlawfully obtain monetary benefit through misdirected or otherwise improper payment. For instance, any party that obtains our confidential or sensitive information (including personal information) through a cyber-attack or other security incident may use this information for ransom, to be paid by us or a third party, as part of a fraudulent activity that is part of a broader criminal activity, or for other illicit purposes.
Cyber and information security risks for financial institutions like us continue to increase due to the proliferation of new technologies, the industry-wide shift to reliance upon the internet to conduct financial transactions, and the increased sophistication and activities of malicious actors, organized crime, perpetrators of fraud, hackers, terrorists, activists, extremist parties, formal and informal instrumentalities of foreign governments, state-sponsored actors and other external parties. In addition, our customers access our products and services using personal devices that are necessarily external to our security control systems. There has also been a significant proliferation of consumer information available on the internet resulting from breaches of third-party entities, including personal information, log-in credentials and authentication data. This threat could include the risk of unauthorized account access, data loss and fraud. The use of artificial intelligence, “bots” or other automation software can increase the velocity and efficacy of these types of attacks. We will likely face an increasing number of attempted cyber-attacks as we expand our mobile and other internet-based products and services, as well as our usage of mobile and cloud technologies and as we provide more of these services to a greater number of banking customers.
The methods and techniques employed by malicious actors change frequently, are increasingly sophisticated and often are not fully recognized or understood until after they have occurred, and some techniques could occur and persist for an extended period of time before being detected and remediated. We may also be unable to hire, develop and retain talent that keeps pace with the rapidly changing cyber threat landscape, and which are capable of preventing, detecting, mitigating or remediating these risks. Although we seek to maintain a robust suite of authentication and layered information security controls, any one or combination of these controls could fail to prevent, detect, mitigate or remediate these risks in a timely manner.
A disruption or breach, including as a result of a cyber-attack or media reports of perceived security vulnerabilities at the Bank or at our service providers, could result in legal and financial exposure, regulatory intervention, litigation, remediation costs, card reissuance, supervisory liability, damage to our reputation or loss of confidence in the security of our systems, products and services that could adversely affect our business. There can be no assurance that unauthorized access or cyber incidents will not occur or that we will not suffer material losses in the future. If future attacks are successful or if customers are unable to access their accounts online for other reasons, it could adversely impact our ability to service customer accounts or loans, complete financial transactions for our customers or otherwise operate any of our businesses or services. In addition, a breach or attack affecting one of our service providers or other third parties with which we interact could harm our business even if we do not control the service that is attacked.
Further, our ability to monitor our service providers’ cybersecurity practices is limited. Although the agreements that we have in place with our service providers generally include requirements relating to cybersecurity and data privacy, we cannot guarantee that such agreements will prevent a cyber incident impacting our systems or information or enable us to obtain adequate or any reimbursement from our service providers in the event we should suffer any such incidents.
In addition, the increasing prevalence and the evolution of cyber-attacks and other efforts to breach or disrupt our systems or networks or those of our customers, service providers, partners or other third parties with which we interact has led, and will likely continue to lead, to increased costs to us with respect to preventing, detecting, mitigating and remediating these risks, as well as any related attempted fraud. In order to address ongoing and future risks, we must expend resources to support protective security measures, investigate and remediate any vulnerabilities of our information systems and infrastructure and invest in new technology designed to mitigate security risks. Further, high profile cyber incidents at the Bank or other financial institutions could lead to a general loss of customer confidence in financial institutions that could negatively affect us, including harming the market perception of the effectiveness of our security measures or the global financial system in general, which could result in reduced use of our financial products. We have insurance against some cyber risks and attacks; nonetheless, our insurance coverage may not be sufficient to offset the impact of a material loss event (including if our insurer denies coverage as to any particular claim in the future), and such insurance may increase in cost or cease to be available on commercially reasonable terms, or at all, in the future.
We rely on third party service providers to provide key components of our business infrastructure, and a failure of these parties to perform for any reason could disrupt our operations.
Third parties provide key components of our business infrastructure such as data processing, internet connections, network access, cloud computing access, core application processing, statement production and account analysis. Our business depends on the successful and uninterrupted functioning of our information technology and telecommunications systems and third-party servicers. The failure of these systems, or the termination of a third-party software license or service agreement on which any of these systems is based, could interrupt our operations. Because our information technology and telecommunications systems interface with and depend on third-party systems, we could experience service denials if demand for such services exceeds capacity or such third-party systems fail or experience interruptions. Replacing vendors or addressing other issues with our third-party service providers could entail significant delay and expense. If we are unable to efficiently replace ineffective service providers, or if we experience a significant, sustained or repeated system failure or service denial, it could compromise our ability to operate effectively, damage our reputation, result in a loss of customer business, and subject us to additional regulatory scrutiny and possible financial liability, any of which could have an adverse effect on our business, financial condition and results of operations.
Reputational risk and social factors may impact our results.
Our ability to originate and maintain accounts is highly dependent upon consumer and other external perceptions, whether or not true, of our business practices and/or our financial health. Adverse perceptions could damage our reputation in both the customer and funding markets, leading to difficulties in generating and maintaining accounts as well as in financing them. Adverse developments with respect to the consumer or other external perceptions regarding the practices of our competitors, or our industry as a whole, may also adversely impact our reputation. In addition, adverse reputational impacts on third parties with whom we have important relationships may also adversely impact our reputation. Adverse impacts on our reputation, or the reputation of our industry, may also result in greater regulatory and/or legislative scrutiny, which may lead to laws or regulations that may change or constrain the manner in which the Company engages with its customers and the products the Company offers. Adverse reputational impacts or events may also increase our litigation risk. We carefully monitor internal and external developments for areas of potential reputational risk and have established governance structures to assist in evaluating such risks in our business practices and decisions.
We could be subject to losses, regulatory action or reputational harm due to fraudulent and negligent acts on the part of loan applicants, our employees and vendors.
In deciding whether to extend credit or enter into other transactions with clients and counterparties, and the terms of any such transaction, we may rely on information furnished by or on behalf of clients and counterparties, including financial statements, property appraisals, title information, employment and income documentation, account information and other financial information. We may also rely on representations of clients and counterparties as to the accuracy and completeness of that information and, with respect to financial statements, on reports of independent auditors. Any such misrepresentation or incorrect or incomplete information, whether fraudulent or inadvertent, may not be detected prior to funding. In addition, one or more of our employees or vendors could cause a significant operational breakdown or failure, either as a result of human error or where an individual purposefully sabotages or fraudulently manipulates our loan documentation, operations or systems. Whether a misrepresentation is made by the applicant or another third party, we generally bear the risk of loss associated with the misrepresentation. A loan subject to a material misrepresentation is typically unsellable or subject to repurchase if it is sold prior to detection of the misrepresentation. The sources of the misrepresentations may also be difficult to locate, and we may be unable to recover any of the monetary losses we may suffer as a result of the misrepresentations. Any of these developments could have an adverse effect on our business, financial condition and results of operations.
We are subject to claims and litigation pertaining to intellectual property.
Banking and other financial services companies, such as ours, rely on technology companies to provide information technology products and services necessary to support their day-to-day operations. Technology companies frequently enter into litigation based on allegations of patent infringement or other violations of intellectual property rights. In addition, patent holding companies seek to monetize patents they have purchased or otherwise obtained. Competitors of our vendors, or other individuals or companies, may from time to time claim to hold intellectual property sold to us by our vendors. Such claims may increase in the future as the financial services sector becomes more reliant on information technology vendors. The plaintiffs in these actions frequently seek injunctions and substantial damages.
Regardless of the scope or validity of such patents or other intellectual property rights, or the merits of any claims by potential or actual litigants, we may have to engage in protracted litigation. Such litigation is often expensive, time-consuming, disruptive to our operations and distracting to management. If we are found to infringe one or more patents or other intellectual property rights, we may be required to pay substantial damages or royalties to a third party. In certain cases, we may consider entering into licensing agreements for disputed intellectual property, although no assurance can be given that such licenses can be obtained on acceptable terms or that litigation will not occur. These licenses may also significantly increase our operating expenses. If legal matters related to intellectual property claims were resolved against us or settled, we could be required to make payments in amounts that could have an adverse effect on our business, financial condition and results of operations. As described below these competitors include banks, other financial institution and non-banks offering services and products previously only provided by banks.
The decreased soundness of other financial institutions could adversely affect us.
Our ability to engage in routine funding transactions could be adversely affected by the actions and commercial soundness of other financial institutions. Financial services institutions are interrelated as a result of trading, clearing, counterparty or other relationships. We have exposure to many different industries and counterparties, and we routinely execute transactions with counterparties in the financial industry. As a result, defaults by, or even rumors or questions about, one or more financial services institutions, or the financial services industry generally, have led in the past to market-wide liquidity problems and could lead to losses or defaults by us or by other institutions. Many of these transactions expose us to credit risk in the event of default of our counterparty or client. In addition, our credit risk may be exacerbated when the collateral that we hold cannot be realized upon or is liquidated at prices insufficient to recover the full amount of the loan. We cannot assure you that any such losses would not materially and adversely affect our business, financial condition or results of operations.
COVID-19 and its variants have not been completely eliminated.
The Company has resumed pre-COVID-19 pandemic business activities, and our employees have returned to the office. The Bank’s branch offices are open and operating during normal business hours. To protect the health of its customers and employees, the Company continues to take precautions. Those actions have not impaired our ability to conduct business and fully serve our customers. While the adverse impacts of the COVID-19 pandemic have dissipated, COVID-19 and its variants have not been completely eliminated. New variants could adversely disrupt our future operations.
The re-emergence of widespread health emergencies or pandemics, such as coronavirus, could lead to quarantines, business shutdowns, increases in unemployment, labor shortages, disruptions to supply chains, and overall economic instability. Events such as these may become more common in the future and could cause significant damage such as disrupt power and communication services, impact the stability of our facilities and result in additional expenses, impair the ability of our borrowers to repay their loans, reduce the value of collateral securing the repayment of our loans, which could result in the loss of revenue. While we have established and regularly test disaster recovery procedures, the occurrence of any such event could have a material adverse effect on our business, operations and financial condition.
Strategic Risks
Strong competition within our market area could reduce our profits and slow growth.
We face strong competition in making loans, attracting deposits and hiring and retaining experienced employees from various competitors, many of which are larger and have greater financial resources than the Company. Price competition for loans and deposits may result in our charging lower interest rates on loans and paying higher interest rates on deposits, thereby reducing our net interest income. Price competition also may limit our ability to originate loans and adversely affect our growth and profitability. Competition makes it more difficult and costly to attract and retain qualified employees.
Our financial performance will be negatively affected if we are unable to execute our growth strategy.
Our stated growth strategy is to grow organically and supplement that growth with select acquisitions, if available. Our success depends primarily on generating loans and deposits of acceptable risk and expense. There can be no assurance that we will be successful in continuing our organic, or internal, growth strategy. Our ability to identify appropriate markets for expansion, recruit and retain qualified personnel, and fund growth at reasonable cost, depends upon prevailing economic conditions, maintenance of sufficient capital, competitive factors, changes in banking laws, and other factors.
We cannot be certain as to our ability to manage increased levels of assets and liabilities without increased expenses and higher levels of nonperforming assets. We may be required to make additional investments in equipment and personnel to manage higher asset levels and loan balances, which may adversely affect earnings, shareholder returns, and our efficiency ratio. Increases in operating expenses or nonperforming assets may decrease our earnings and the value of the Company’s capital stock.
We may face increasing deposit-pricing pressures, which may, among other things, reduce our profitability.
Deposit pricing pressures may result from competition as well as changes to the interest rate environment. Current economic conditions have intensified competition for deposits. The competition has had an impact on interest rates paid to attract deposits as well as fees charged on deposit products. In addition to the competitive pressures from other depository institutions, we face heightened competition from non-depository financial products such as securities and other alternative investments.
Furthermore, technology and other market changes have made it more convenient for bank customers to transfer funds for investing purposes. Bank customers also have greater access to deposit vehicles that facilitate spreading deposit balances among different depository institutions to maximize FDIC insurance coverage. In addition to competitive forces, we also are at risk from market forces as they affect interest rates. It is not uncommon when interest rates transition from a low interest rate environment to a rising rate environment, for deposit and other funding costs to rise in advance of yields on earning assets. In order to keep deposits required for funding purposes, it may be necessary to raise deposit rates without commensurate increases in asset pricing in the short term.
Prior to 2022, it has been the policy of the Federal Reserve to maintain interest rates at historically low levels through its targeted federal funds rate and the purchase of mortgage-backed securities. As a result, market rates on the loans we have originated and the yields on securities we have purchased have been at historically low levels. As discussed above, rates are fluctuating, and due to a number of factors including changes in monetary policies of the Federal Reserve, will likely continue to fluctuate.
External and Market-Related Risks
Changes in general business, economic and political conditions, especially in our market area, could adversely affect our growth and earnings.
Our success depends, to a certain extent, upon general business economic and political conditions, local and national, as well as governmental monetary policies. Conditions such as inflation, recession, unemployment, changes in interest rates, money supply and other factors beyond our control may adversely affect our asset quality, deposit levels and loan demand and, therefore our growth and earnings. In addition, there are continuing concerns related to, among other things, the level of U.S. government debt and fiscal actions that may be taken to address that debt, a potential resurgence of economic and political tensions with or between other countries may have a destabilizing effect on financial markets and economic activity. Economic pressure on consumers, businesses and overall economic uncertainty may result in changes in spending, borrowing, and saving habits. These economic conditions and other negative developments in the domestic or international credit markets and economies may significantly affect the markets in which we do business. Adverse changes in the economy may also have a negative effect on the ability of our borrowers to make timely repayments of their loans, which would have an adverse impact on our earnings.
Inflationary pressures and rising prices may affect our results of operations and financial condition.
Inflation began to rise sharply at the beginning of 2022 and remained at an elevated level through the present time. Small to medium-sized businesses may be impacted more during periods of high inflation as they are not able to leverage economies of scale to mitigate cost pressures compared to larger businesses. Consequently, the ability of our business customers to repay their loans may deteriorate, and in some cases this deterioration may occur quickly, which would adversely impact our results of operations and financial condition. Furthermore, a prolonged period of inflation could cause wages and other costs to the Company to increase, which could adversely affect our results of operations and financial condition.
If we do not adjust to rapid changes in the financial services industry, our financial performance may suffer.
We face substantial competition for customer relationships, as well as other sources of funding in the communities we serve. Competing providers include other banks, savings institutions and trust companies, insurance companies, mortgage banking operations, credit unions, finance companies, title companies, money market funds and other financial and nonfinancial companies which offer products functionally equivalent to those available at the Bank. Many competing providers have greater financial resources than we do and offer services within and outside the market areas we serve. In addition to this challenge of attracting and retaining customers for traditional banking services, our competitors include securities dealers, brokers, mortgage bankers, investment advisors and finance and insurance companies who seek to offer one-stop financial services to their customers that may include services that financial institutions have not been able or allowed to offer to their customers in the past. The increasingly competitive environment is primarily a result of changes in regulation, changes in technology and product delivery systems and the accelerating pace of consolidation among financial service providers. If we are unable to adjust both to increased competition for traditional banking services and changing customer needs and preferences, our financial performance and your investment in our capital stock could be adversely affected.
The results of mainstream media and social media contagion and speculation resulting from externalities could have a broad impact on the banking system and have an adverse effect on us.
The results of poorly executed decisions in a financial institution of significant size can negatively impact other financial institutions, despite the quality of leadership and decision making of the other financial institutions or their ability to effectively identify, measure, manage and control risk.
Misinformed or inaccurate reporting regarding an incident or incidents can impact the broader banking industry. Any adverse financial market or economic condition could be reported in a way to exert downward pressure on the price of financial institution securities and could negatively impact credit availability for certain issuers without regard to their underlying financial strength.
This contagion risk can also occur when a perceived lack of trust in the banking system spreads throughout the industry based upon the results of a few poorly managed larger financial institutions.
Our stock price may be negatively impacted by unrelated bank failures and negative customer confidence in financial institutions.
On March 9, 2023, Silvergate Bank, La Jolla, California, announced its decision to voluntarily liquidate its assets and wind down operations; on March 10, 2023, Silicon Valley Bank, Santa Clara, California, was closed by the California Department of Financial Protection and Innovation (the “DFPI”); on March 12, 2023, Signature Bank, New York, New York was closed by the New York State Department of Financial Services; and on May 1, 2023, First Republic Bank, San Francisco, California, was closed by the DFPI. In each case the FDIC was appointed receiver for the failed institution. These banks had elevated levels of uninsured deposits, which may be less likely to remain at a bank over time and are a less stable funding source than insured deposits. These failures led to volatility and declines in the market for bank securities and less confidence in financial institutions.
These events have led to a greater focus by institutions, investors and regulators on the on-balance sheet liquidity of and funding sources for financial institutions, the composition of their deposits, including the amount of uninsured deposits, the amount of accumulated other comprehensive loss, capital levels and interest rate risk management.
Additional required capital may not be available.
We are required by federal regulatory authorities to maintain adequate levels of capital to support our operations. In addition, we may elect to raise additional capital to support our business or to finance acquisitions, if any, or we may otherwise elect or be required to raise additional capital. Our ability to raise additional capital, if needed, will depend on conditions in the capital markets, economic conditions and a number of other factors, many of which are outside of our control, and on our financial performance. Accordingly, there can be no assurance that we can raise additional capital if needed or on terms acceptable to us. If we cannot raise additional capital when needed, it may have a material adverse effect on our financial condition, results of operations and prospects.
Compliance and Regulatory Risks
We operate in a highly regulated environment, and we may be adversely affected by changes in laws and regulations.
We are subject to extensive regulation, supervision and examination by the Federal Reserve, our primary federal regulator, the Virginia Bureau of Financial Institutions, our chartering authority and the FDIC, as insurer of our deposits. Such regulation and supervision govern the activities in which we may engage, and are intended primarily for the protection of the insurance fund and the depositors and borrowers of the Bank rather than for holders of our common stock. Various consumers and compliance laws also affect our operations.
Regulatory authorities have extensive discretion in their supervisory and enforcement activities, including the imposition of restrictions on our operations, the classification of our assets and determination of the level of our allowance for credit losses. Any change in such regulation and oversight, whether in the form of regulatory policy, regulations, legislation or supervisory action, may have a material impact on our operations. The earnings of the Bank, and therefore the earnings of the Company, are affected by changes in federal and state legislation and actions of various regulatory authorities.
Risks Associated with Our Common Stock
The market price for the Company’s common stock price may be volatile.
The market price of our common stock may be highly volatile, which may make it difficult for you to resell your shares at the volume, prices and times desired. There are many factors that may impact the market price and trading volume of our common stock, including, without limitation:
| • |
actual or anticipated fluctuations in our operating results, financial condition or asset quality; |
| • |
operating results that vary from the expectations of management, securities analysts and investors; |
| • |
changes in expectations as to our future financial performance; |
| • |
operating and stock price performance of companies that investors deem comparable to us; |
| • |
future issuances of our common stock or other securities; |
| • |
changes in general economic or business conditions; |
| • |
changes in the credit, mortgage and housing markets, the markets for securities relating to mortgages or housing, and developments with respect to financial institutions generally; |
| • |
proposed or adopted changes in laws, regulations or policies affecting us; |
| • |
significant acquisitions or business combinations, strategic partnerships, joint ventures or capital commitments by or involving our competitors or us; and |
| • |
other economic, competitive, governmental, regulatory and technological factors affecting our operations, pricing, products and services. |
The Company depends on the Bank for dividends, distributions and other payments.
There can be no assurance of whether or when we may pay dividends in the future. Cash available to pay dividends to our shareholders is derived primarily, if not entirely, from dividends paid to us from the Bank. The ability of the Bank to pay dividends to us as well as our ability to pay dividends to our shareholders is limited by regulatory and legal restrictions and the need to maintain sufficient consolidated capital. We may also decide to limit the payment of dividends even when we have the legal ability to pay them in order to retain capital for use in our business. Further, any lenders making loans to us may impose financial covenants that may be more restrictive than regulatory requirements with respect to the payment of dividends.
We are prohibited from paying dividends on our common stock if the required payments on our subordinated debentures have not been made. Additionally, dividends on our common stock could be adversely impacted if dividend payments on our preferred stock have not been made.
Although we have paid cash dividends on shares of our common stock in the past, we may not pay cash dividends on shares of our common stock in the future.
Holders of shares of our common stock are only entitled to receive such dividends as our Board of Directors may declare out of funds legally available for such purpose. We have a history of paying dividends to our shareholders. However, future cash dividends will depend upon our results of operations, financial condition, cash requirements, the need to maintain adequate capital levels, the need to comply with safe and sound banking practices as well as meet regulatory expectations, and other factors, including the ability of the Bank to make distributions to us, which ability may be restricted by statutory, contractual or other constraints. There can be no assurance that we will continue to pay dividends even if the necessary financial and regulatory conditions are met and if sufficient cash is available for distribution.
Our common stock is subordinate to our existing and future preferred stock and to our subordinated notes.
The Company has outstanding preferred stock that is senior to the common stock and could adversely affect the ability of the Company to declare or pay dividends or distributions of common stock. In addition, the terms of the Company’s outstanding fixed-to-floating rate subordinated notes prohibit it from declaring or paying any dividends, or purchasing, acquiring, or making a liquidation payment with respect to, its capital stock, during an event of default under the subordinated note purchase agreement. Furthermore, if the Company experiences a material deterioration in its financial condition, liquidity, capital, results of operations or risk profile, the Company’s regulators may not permit it to make future payments on its preferred stock, thereby preventing the payment of dividends on the common stock.
We are an emerging growth company, and any decision on our part to comply only with certain reduced reporting and disclosure requirements applicable to emerging growth companies could make our common stock less attractive to investors.
We are an emerging growth company, and, for as long as we continue to be an emerging growth company, we may choose to take advantage of exemptions from various reporting requirements applicable to other public companies but not to emerging growth companies, including, but not limited to, reduced disclosure obligations regarding executive compensation in our periodic reports and proxy statements, and exemptions from the requirements of holding a nonbinding advisory vote on executive compensation and stockholder approval of any golden parachute payments not previously approved. As an emerging growth company, we also are not subject to Section 404(b) of the Sarbanes Oxley Act of 2002, which would require that our independent auditors review and attest as to the effectiveness of our internal control over financial reporting. In this Form 10-K, we have elected to take advantage of the reduced disclosure requirements relating to executive compensation, and in the future we may take advantage of any or all of these exemptions for so long as we remain an emerging growth company. In addition to the relief described above, the JOBS Act permits us an extended transition period for complying with new or revised accounting standards affecting public companies. We have elected not to take advantage of this extended transition period, which means that the financial statements included in this Form 10-K, as well as any financial statements that we file in the future, will be subject to all new or revised accounting standards generally applicable to public companies.
We will cease to be an emerging growth company upon the earliest of: (i)the first fiscal year after our annual gross revenues are $1.07 billion or more; (ii)the date on which we have, during the previous three-year period, issued more than $1.0 billion in non-convertible debt securities; or (iii)the end of any fiscal year in which the market value of our common stock held by non-affiliates exceeded $700 million as of the end of the second quarter of that fiscal year, or five years after completing our initial public offering. Investors may find our common stock less attractive because we choose to rely on these exemptions. If some investors find our common stock less attractive as a result of our choices to reduce disclosure, there may be a less active trading market for our common stock and the price of our common stock may be more volatile.
General Risk Factors
We will depend on our management team to implement our business strategy and execute successful operations, and we could be harmed by the loss of their services.
We are dependent upon the services of the members of our senior management team who direct our strategy and operations. Members of our senior management team, as well as commercial lending specialists who possess expertise in our markets and key business relationships, could be difficult to replace. The loss of these persons, or our inability to hire additional qualified personnel, could impact our ability to implement our business strategy and could have a material adverse effect on our results of operations and our ability to compete in our markets.
We may not be able to attract and retain skilled people.
Our success depends, in large part, on our ability to attract and retain key people. Competition for the best people in most activities in which we engage can be intense, and we may not be able to retain or hire the people we want or need. In order to attract and retain qualified employees, we must compensate our employees at market levels. If we are unable to continue to attract and retain qualified employees, or do so at rates necessary to maintain our competitive position, our performance, including our competitive position, could suffer, and, in turn, adversely affect our business, financial condition and results of operations. The number of experienced banking professionals in our markets may not be the same as in certain other markets.
We may be subject to increased litigation which could result in legal liability and damage to our reputation.
We may be named from time to time as a defendant in litigation relating to our business and activities. Litigation may include claims for substantial compensatory or punitive damages or claims for indeterminate amounts of damages. We are also involved from time to time in other reviews, investigations and proceedings (both formal and informal) by governmental and self- regulatory agencies regarding our business. These matters also could result in adverse judgments, settlements, fines, penalties, injunctions or other relief.
In addition, in recent years, a number of judicial decisions have upheld the right of borrowers to sue lending institutions on the basis of various evolving legal theories, collectively termed “lender liability.” Generally, lender liability is founded on the premise that a lender has either violated a duty, whether implied or contractual, of good faith and fair dealing owed to the borrower or has assumed a degree of control over the borrower resulting in the creation of a fiduciary duty owed to the borrower or its other creditors or shareholders.
Substantial legal liability or significant regulatory action against the Company could materially adversely affect its business, financial condition or results of operations, or cause significant harm to our reputation.
Our reported financial results depend on management’s selection of accounting methods and certain assumptions and estimates.
Our accounting policies and assumptions are fundamental to the Company’s reported financial condition and results of operations. Management must exercise judgment in selecting and applying many of these accounting policies and methods so that they comply with generally accepted accounting principles and reflect management’s judgment of the most appropriate manner to report our financial condition and results. In some cases, management must select the accounting policy or method to apply from two or more alternatives, any of which may be reasonable under the circumstances, yet may result in the Company’s reporting materially different results than would have been reported under an alternative method.
The obligations associated with being a public company require significant resources and management attention.
As a public company, we face increased legal, accounting, administrative and other costs and expenses that we have not previously incurred, particularly after we are no longer an emerging growth company. We are subject to the reporting requirements of the Exchange Act, which requires that we file annual, quarterly and current reports with respect to our business and financial condition and proxy and other information statements, and the applicable rules and regulations implemented by the SEC, the Sarbanes-Oxley Act, the Dodd-Frank Act, the PCAOB and the Nasdaq Stock Market, each of which imposes additional reporting and other obligations on public companies.
As a public company, we are required to:
| • |
prepare and distribute periodic reports, proxy statements and other shareholder communications in compliance with the federal securities laws and rules; |
| • |
expand the roles and duties of our board of directors and committees thereof; |
| • |
institute more comprehensive financial reporting and disclosure compliance procedures; |
| • |
involve and retain to a greater degree outside counsel and accountants in the activities listed above; |
| • |
enhance our investor relations function; |
| • |
establish new internal policies, including those relating to trading in our securities and disclosure controls and procedures; |
| • |
retain additional personnel; |
| • |
comply with Nasdaq Stock Market listing standards; and |
| • |
comply with applicable requirements of the Sarbanes-Oxley Act. |
We expect these rules and regulations and changes in laws, regulations and standards relating to corporate governance and public disclosure, which have created uncertainty for public companies, to increase legal and financial compliance costs and make some activities more time consuming and costly. These laws, regulations and standards are subject to varying interpretations, in many cases due to their lack of specificity, and, as a result, their application in practice may evolve over time as new guidance is provided by regulatory and governing bodies. This could result in continuing uncertainty regarding compliance matters and higher costs necessitated by ongoing revisions to disclosure and governance practices. Our investment in compliance with existing and evolving regulatory requirements will result in increased administrative expenses and a diversion of management’s time and attention from revenue-generating activities to compliance activities, which could have an adverse effect on our business, financial condition and results of operations. These increased costs could require us to divert a significant amount of money that we could otherwise use to expand our business and achieve our strategic objectives.
Item 1B. Unresolved Staff Comments
None.
The Company recognizes the critical importance of identifying, assessing and managing material risks from cybersecurity threats and is committed to implementing and maintaining a comprehensive information security program to manage such risks and safeguard its systems and data.
The Company’s Board of Directors has ultimate oversight of cybersecurity-related risks and it is assisted in this role by the Technology Committee and the Audit & Risk Committee. Processes for identifying, assessing, and managing cybersecurity-related risks are integrated into the Company’s overall enterprise risk management process, which is overseen by the Audit & Risk Committee. The Audit & Risk Committee is responsible for monitoring risks that are being taken by the Company, understanding the enterprise-wide effect of those risks and reporting such risks to the Board. In fulfilling this role, the Technology Committee has primary oversight responsibility over management’s efforts to manage and mitigate cybersecurity-related risk and reviews and approves the Company’s cybersecurity strategy for protecting the Company’s information assets and technology platforms. The Audit & Risk Committee oversees the Company’s Internal Audit Department, which conducts reviews and assessments related to information security. Management provides periodic reports to the Technology Committee and the Audit & Risk Committee, both of which provide reports of their meetings to the full Board. These reports to the Board and its Committees address the threat environment, vulnerability assessments, specific cyber incidents and management’s efforts to monitor, detect and prevent cyber threats.
The Company’s information security program is primarily administered at the management level by the Information Security Department, which is led by the Company’s Chief Information Officer (CIO), and is supported by Chief Information Security Officer (CISO), and the Information Technology Department, which is led by the Company’s Chief Technology Officer (CTO). The Company’s Information Security Department is responsible for day-to-day management of the Company’s information security program, including data loss prevention, access control, threat monitoring, incident response and employee education and training. The Information Security Department also maintains policies related to cybersecurity and data security that provide the required governance for the information security program. Additionally, the Company’s Information Technology Department maintains policies that govern technical aspects of the Company’s information security program. Each policy is reviewed and approved by the Board at least annually. The Information Security team maintains and runs the Company’s security operations center and is responsible for cybersecurity event management and maintaining security tooling. The Company also maintains an Information Technology Management Committee, which is comprised of representatives from the Information Security, Information Technology, Enterprise Risk, Operations, and members of executive management. This committee meets at least quarterly to discuss and review the Company’s information security program and receives qualitative and quantitative update reports from the Information Security Department, Internal Audit Department, and Information Technology Department.
The Company engages third party assessors, consultants and auditors in connection with its information security program, including to conduct external penetration testing, independent audits and risk assessments. The Company also utilizes third party service providers in the ordinary course of business. The Information Security Department performs information security assessments for third party service providers that store or process Company confidential data. These information security assessments include a review of any systems and organization control reports, proof of the vendor’s independent testing of their data protection controls, as well as a review of any exceptions noted and assessment of management responses, results of vulnerability and penetration testing, incident response processes and third party data protection controls (which can include, but is not limited to: access reviews and controls, backups, monitoring, encryption standards and disaster recovery). The review of these areas is taken into account in order to provide an overall information security conclusion and risk rating for the vendor.
As a regulated financial institution, the Company is also subject to financial privacy laws and its cybersecurity practices are subject to oversight by the federal banking agencies. For additional information, see Item 1A – Risk Factors.
Although the Company has not, as of the date of this Annual Report on Form 10-K, experienced a cybersecurity threat or incident that materially affected its business strategy, results of operations or financial condition, there can be no guarantee that the Company will not experience such an incident in the future.
As of December 31, 2023, the net book value of our office properties was $11.4 million, and the net book value of our furniture, fixtures and equipment was $2.2 million. The following table sets forth information regarding our offices.
| Net Book Value |
|||||||
| Leased or |
Year Acquired |
of Real |
|||||
| Location |
Owned |
or Leased |
Property |
||||
| (In thousands) |
|||||||
| Headquarters: |
|||||||
| 10089 Fairfax Blvd. |
|||||||
| Fairfax, VA 22030 |
Owned |
2010 |
$7,260 | ||||
| Other Properties: |
|||||||
| Herndon Branch |
|||||||
| 727 Elden Street |
Leased |
2004 |
— | ||||
| Herndon, VA 20170 |
|||||||
| Operations Center |
|||||||
| 22980 Shaw Road |
Leased |
2021 |
— | ||||
| Sterling, VA, 20166 |
|||||||
| McLean Branch |
|||||||
| 1354 Old Chain Bridge Road |
Owned |
2014 |
1,320 | ||||
| McLean, VA 22101 |
|||||||
| Clarendon Branch |
|||||||
| 1000 N. Highland Street |
Owned |
2009 |
513 | ||||
| Arlington, VA 22201 |
|||||||
| Leesburg Branch |
|||||||
| 307 E. Market Street |
Owned |
2017 |
2,273 | ||||
| Leesburg, VA 20176 |
|||||||
| Washington D.C. Branch |
|||||||
| 1130 Connecticut Avenue, N.W. |
Leased |
2019 |
— | ||||
| Washington , D.C. 20036 |
We believe that current facilities are adequate to meet our present and foreseeable needs, subject to possible future expansion. See Note 7 of Notes to the December 31, 2023, Consolidated Financial Statements, for additional disclosures related to the Company’s properties.
From time to time, we are a party to various litigation matters incidental to our ordinary conduct of our business. Management believes that none of these legal proceedings, individually or in the aggregate, will have a material adverse impact on the results of operations or financial condition of the Company.
Item 4. Mine Safety Disclosures Our common stock is traded on the Nasdaq Capital Market under the symbol “MNSB.” At December 31, 2023, the Company had approximately 227 shareholders of record.
Not Applicable
Item 5. Market for Registrant’s Common Equity, Related Stockholder Matters and Issuer Purchases of Equity Securities
Common Stock
This total does not reflect shares held in nominee or “street name” accounts through various firms.
Dividends
Holders of our common stock are only entitled to receive dividends when, as and if declared by the Board of Directors out of funds legally available for dividends. As the Company is a financial holding company and does not engage directly in business activities of a material nature, its ability to pay dividends on its common stock will depend, in large part, upon the receipt of dividends from the Bank. Any future determination relating to our dividend policy will be made by the Board of Directors and will depend on a number of factors, including general and economic conditions, industry standards, our financial condition and operating results, our available cash and current and anticipated cash needs, capital requirements, our ability to service debt obligations senior to our common stock, banking regulations, contractual, legal, tax and regulatory restrictions, and limitations on the payment of dividends by the Company to its shareholders or by the Bank, and such other factors as the Board of Directors may deem relevant. During the fiscal year ended December 31, 2023, the Company declared and paid four cash dividends.
Holders of the common stock are subject to priority dividend rights of any holders of preferred stock then outstanding. There were 28,750 shares of preferred stock outstanding at December 31, 2023.
A discussion of applicable regulatory restrictions on dividends by the Company and the Bank is provided in Item 1 (“Business”) under “Dividends, Capital Distributions, and Other Payments.”
Securities Authorized For Issuance Under Equity Compensation Plans
The following table provides information concerning securities authorized for issuance under equity compensation plans, the weighted average price of such securities and the number of securities remaining available for future issuance, as of December 31, 2023.
| Equity Compensation Plan Category |
Number of securities to be issued upon exercise of outstanding options, warrants and rights |
Weighted- average exercise price of outstanding options, warrants and rights (1) |
Number of securities remaining and available for future issuance (2) |
|||||||||
| Plans approved by shareholders |
228,300 | $ | — | 188,397 | ||||||||
| Plans not approved by shareholders |
— | — | — | |||||||||
| Total |
228,300 | $ | — | 188,397 | ||||||||
| (1) |
Restricted stock shares were not included when calculating the weighted-average exercise price. |
| (2) |
Remaining shares available for issuance include 188,397 shares under the 2019 Equity Incentive Plan (“2019 Plan”). Shares remaining to be issued subsequent to December 31, 2023 under the 2019 Plan can be issued either as a restricted stock grant or upon exercise of stock options. |
Unregistered Sales and Issuer Repurchases of Common Stock
Unregistered Sales of Common Stock
Set forth below is information concerning sales of common stock by the Company during the past 3 years that were not registered under the Securities Act.
In 2019, the Board of Directors of the Bank and the Bank’s shareholders approved the MainStreet Bank 2019 Equity Incentive Plan (the “2019 Plan”), to provide officers, other selected employees and directors with additional incentives to promote growth and performance. The terms and conditions of the 2019 Plan were subsequently converted into and deemed to be the terms and conditions of a substantially identical Company incentive compensation plan. To date, a total of 461,603 shares of restricted common stock have been awarded under the 2019 Plan. During 2023, (117,408) shares of restricted common stock vested from shares issued under both the 2019 Plan and the Bank's 2016 Equity Incentive Plan ("2016 Plan"). See Note 18 of Notes to Consolidated Financial Statements. In August 2019, the Company registered with the SEC, on Form S-8, the shares of common stock that would then be issuable under the 2019 Plan. As a result of the stockholders’ approval of the 2019 Plan, no additional awards were made under the 2016 Plan. All awards that were then outstanding under the 2016 Plan remained outstanding in accordance with their terms.
Repurchases of Common Stock
On May 18, 2022, the Company announced that the Board of Directors had authorized a plan to repurchase up to $7.5 million of the Company’s outstanding common stock in open market transactions or privately negotiated transactions, including pursuant to a trading plan in accordance with Rule 10b-18 under the Securities Exchange Act of 1934. The new stock repurchase program replaces the Company’s previous program. During the year ended December 31, 2023, the Company repurchased 8,000 shares under this plan.
The Company did not repurchase common stock during the fourth quarter of 2023.
| (Dollars in thousands, except for per share amounts) |
Total Number of Shares Purchased |
Average Price Paid per Share |
Total Number of Shares Purchased as Part of Publicly Announced Plans or Programs |
Maximum Number (or Approximate Dollar Value) of Shares that May Yet be Purchased Under the Plans or Programs |
||||||||||||
| October 1, 2023 - October 31, 2023 |
— | $ | — | — | $ | 4,506 | ||||||||||
| November 1, 2023 - November 30, 2023 |
— | $ | — | — | $ | 4,506 | ||||||||||
| December 1, 2023 - December 31, 2023 |
— | $ | — | — | $ | 4,506 | ||||||||||
| Total |
— | — | $ | 4,506 | ||||||||||||
Preferred Stock and Depositary Shares
On September 15, 2020, the Company closed its underwritten public offering of 1,000,000 depositary shares, each representing 1/40th of a share of 7.50% Series A Fixed-Rate Non-Cumulative Perpetual Preferred Stock, par value $1.00 per share (the “Series A Preferred Stock”). On September 25, 2020, the Company completed the sale of an additional 150,000 depositary shares pursuant to the underwriters’ full exercise of their over-allotment option to purchase additional depositary shares.
Trading the depositary shares on the Nasdaq Capital Market commenced on September 16, 2020, under the symbol “MNSBP.”
The Board of Directors declared a quarterly cash dividend on the outstanding shares of the Series A Preferred Stock each quarter in agreement with the depositary share offering. Each declared cash dividend equated to approximately $0.47 per depositary share, or $18.75 per share of Series A Preferred Stock outstanding.
Item 7. Management’s Discussion and Analysis of Financial Condition and Results of Operations
The purpose of this discussion is to focus on significant changes in the financial condition and results of operations of the Company during the years ended December 31, 2023 and 2022. The following discussion supplements and provides information about the major components of the results of operations, financial condition, liquidity and capital resources of the Company. This discussion and analysis should be read in conjunction with the accompanying consolidated financial statements.
Forward-Looking Statements
This Annual Report on Form 10-K contains certain forward-looking statements and information relating to the Company within the meaning of the Private Securities Litigation Reform Act of 1995 that are based on the beliefs of management as well as assumptions made by and information currently available to management. Forward-looking statements can be identified by the fact that they do not relate strictly to historical or current facts. They often include words like “believe,” “expect,” “anticipate,” “estimate,” and “intend” or future or conditional verbs such as “will,” “should,” “could,” or “may” and similar expressions or the negative thereof. Important factors that could cause actual results to differ materially from those in the forward–looking statements included herein include, but are not limited to:
| • |
general economic conditions, either nationally or in our market area, that are worse than expected; |
| • |
competition among depository and other financial institutions, particularly intensified competition for deposits; |
| • |
inflation and an interest rate environment that may reduce our margins or reduce the fair value of financial instruments; |
| • |
adverse changes in the securities markets; |
| • |
changes in laws or government regulations or policies affecting financial institutions, including changes in regulatory structure and in regulatory fees and capital requirements; |
| • |
our ability to enter new markets successfully and capitalize on growth opportunities; |
| • |
our ability to successfully integrate acquired entities; |
| • |
changes in consumer spending, borrowing and savings habits; |
| • |
changes in accounting policies and practices; |
| • |
changes in our organization, compensation and benefit plans; |
| • |
our ability to attract and retain key employees; |
| • |
changes in our financial condition or results of operations that reduce capital; |
| • |
changes in the financial condition or future prospects of issuers of securities that we own; |
| • |
the concentration of our business in the Northern Virginia as well as the greater Washington, DC metropolitan area and the effect of changes in the economic, political and environmental conditions on this market; |
| • |
adequacy of our allowance for credit losses; |
| • |
deterioration of our asset quality; |
| • |
cyber threats, attacks or events |
| • |
reliance on third parties for key services |
| • |
future performance of our loan portfolio with respect to recently originated loans; |
| • |
additional risks related to new lines of business, products, product enhancements or services; |
| • |
results of examination of us by our regulators, including the possibility that our regulators may require us to increase our allowance for credit losses or to write-down assets or take other supervisory action; |
| • |
the effectiveness of our internal controls over financial reporting and our ability to remediate any future material weakness in our internal controls over financial reporting; |
| • |
liquidity, interest rate and operational risks associated with our business; |
| • |
implications of our status as a smaller reporting company and as an emerging growth company; and |
| • |
a work stoppage, forced quarantine, or other interruption or the unavailability of key employees. |
Should one or more of these risks or uncertainties materialize or should underlying assumptions prove incorrect, actual results may vary materially from those described herein. We caution readers not to place undue reliance on forward-looking statements. The Company disclaims any obligation to revise or update any forward-looking statements contained in this Form 10-K to reflect future events or developments. The discussion of the critical accounting policies and analysis set forth below is intended to supplement and highlight information contained in the accompanying Consolidated Financial Statements and the selected financial data presented elsewhere in this Form 10-K.
Critical Accounting Policies
The accounting and financial reporting policies of the Company conform to accounting principles generally accepted in the United States of America and to general practices within the banking industry. Accordingly, the financial statements require certain estimates, judgments, and assumptions, which are believed to be reasonable, based upon the information available. These estimates and assumptions affect the reported amounts of assets and liabilities at the date of the financial statements and the reported amounts of income and expenses during the periods presented. Critical accounting policies comprise those that management believes are the most critical to aid in fully understanding and evaluating our reported financial results. These policies require numerous estimates or economic assumptions that may prove inaccurate or may be subject to variations which may significantly affect our reported results and financial condition for the current period or in future periods.
The accounting principles followed by the Company and the methods of applying these principles conform with accounting principles generally accepted in the United States of America and with general practices within the banking industry. The Company’s critical accounting policies relate to (1) the allowance for credit losses, (2) fair value of financial instruments, and (3) derivative financial instruments. These critical accounting policies require the use of estimates, assumptions and judgments which are based on information available as of the date of the financial statements. Accordingly, as this information changes, future financial statements could reflect the use of different estimates, assumptions and judgments. Certain determinations inherently have a greater reliance on the use of estimates, assumptions and judgments and, as such, have a greater possibility of producing results that could be materially different than originally reported.
Allowance for Credit Losses: On January 1, 2023, the Company adopted ASU 2016-13 Financial Instruments – Credit Losses (Topic 326): Measurement of Credit Losses on Financial Instruments (ASC 326). This standard replaced the incurred loss methodology with an expected loss methodology that is referred to as the current expected credit loss (“CECL”) methodology. CECL requires an estimate of credit losses for the remaining estimated life of the financial asset using historical experience, current conditions, and reasonable and supportable forecasts and generally applies to financial assets measured at amortized cost, including loan receivables and held-to-maturity debt securities, and some off-balance sheet credit exposures such as unfunded commitments to extend credit. Financial assets measured at amortized cost will be presented at the net amount expected to be collected by using an allowance for credit losses. See Note 1. Organization, Basis of Presentation, Summary of Significant Accounting Policies, and Impact of Recently Issued Accounting Pronouncements for a more detailed description of methodology and impact of adoption.
Fair Value of Financial Instruments: A portion of the Company’s assets and liabilities is carried at fair value, with changes in fair value recorded either in earnings or accumulated other comprehensive income (loss). These include investment securities available for sale and interest rate loan swaps on qualifying commercial loans. Periodically, the estimation of fair value also affects investment securities held to maturity when it is determined that the Company should record an allowance for credit losses on a security. Fair value determination is also relevant for certain other assets such as other real estate owned, which is recorded at the lower of the recorded balance or fair value, less estimated costs to sell. The determination of fair value also impacts certain other assets that are periodically evaluated for impairment using fair value estimates, including individually evaluated loans.
Fair value is generally based upon quoted market prices, when available. If such quoted market prices are not available, fair value is based upon internally developed models that primarily use observable market-based parameters as inputs. Valuation adjustments may be made to ensure that financial instruments are recorded at fair value. These adjustments may include amounts to reflect counterparty credit quality and the Company’s creditworthiness, among other things, as well as other unobservable parameters. Any such valuation adjustments are applied consistently over time. While management believes the Company’s valuation methodologies are appropriate and consistent with other market participants, the use of different methodologies or assumptions to determine the fair value of certain financial instruments could result in a different estimate of fair value at the reporting date.
See Note 20, Fair Value Presentation, in Notes to Consolidated Financial Statements for a detailed discussion of determining fair value, including pricing validation processes.
Derivative Financial Instruments: The Bank recognizes derivative financial instruments at fair value as either other assets or other liabilities in the consolidated statement of financial condition. The Bank’s derivative financial instruments include interest rate swaps with certain qualifying commercial loan customers and dealer counterparties. Because the interest rate swaps with loan customers and dealer counterparties are not designated as hedging instruments, adjustments to reflect unrealized gains and losses resulting from changes in fair value of these instruments are reported as non-interest income or non-interest expense, as applicable. The Bank’s interest rate swaps with loan customers and dealer counterparties are described more fully in Note 19 in the December 31, 2023, Consolidated Financial Statements.
Selected Financial Data
The following table sets forth summarized historical consolidated financial information for each of the periods indicated. This information should be read together with the accompanying consolidated financial statements included in this Form 10-K. The historical information indicated as of and for the years ended December 31, 2023,and 2022 has been derived from the Company's audited consolidated financial statements for the years ended December 31, 2023, and 2022. Historical results set forth below and elsewhere in this Form 10-K are not necessarily indicative of future performance
| At December 31, |
||||||||
| 2023 |
2022 |
|||||||
| (In thousands) |
||||||||
| Selected Financial Condition Data: |
||||||||
| Total assets |
$ | 2,035,432 | $ | 1,925,751 | ||||
| Total cash and cash equivalents |
114,513 | 130,600 | ||||||
| Total investment securities |
77,203 | 80,273 | ||||||
| Loans receivable, net |
1,705,137 | 1,579,950 | ||||||
| Bank-owned life insurance |
38,318 | 37,249 | ||||||
| Premises and equipment, net |
13,944 | 14,709 | ||||||
| Computer software, net of amortization |
14,657 | 9,149 | ||||||
| Total deposits |
1,686,127 | 1,512,889 | ||||||
| FHLB advances |
— | 100,000 | ||||||
| Federal funds purchased |
15,000 | — | ||||||
| Subordinated debt |
72,642 | 72,245 | ||||||
| Allowance for credit losses on off-balance sheet credit exposure |
1,009 | — | ||||||
| Total stockholders’ equity |
221,517 | 198,282 | ||||||
| For the year ended December 31, |
||||||||
| 2023 |
2022 |
|||||||
| (In thousands) |
||||||||
| Selected Operating Data: |
||||||||
| Interest income |
$ | 124,123 | $ | 83,845 | ||||
| Interest expense |
48,176 | 13,836 | ||||||
| Net interest income |
75,947 | 70,009 | ||||||
| Provision for credit losses |
1,642 | 2,398 | ||||||
| Net interest income after provision for credit losses |
74,305 | 67,611 | ||||||
| Total non-interest income |
3,638 | 4,834 | ||||||
| Total non-interest expenses |
45,119 | 39,057 | ||||||
| Income before income taxes |
32,824 | 33,388 | ||||||
| Income tax expense |
6,239 | 6,714 | ||||||
| Net income |
26,585 | 26,674 | ||||||
| Less: Preferred stock dividends |
2,156 | 2,156 | ||||||
| Net income available to common shareholders |
$ | 24,429 | $ | 24,518 | ||||
| Basic and diluted earnings per common share |
$ | 3.25 | $ | 3.26 | ||||
| At or For the Years Ended December 31, |
||||||||
| 2023 |
2022 |
|||||||
| Performance Ratios: |
||||||||
| Return on average assets |
1.38 | % | 1.53 | % | ||||
| Return on average equity |
12.66 | % | 13.98 | % | ||||
| Interest rate spread |
2.95 | % | 3.66 | % | ||||
| Net interest margin (1) |
4.08 | % | 4.19 | % | ||||
| Efficiency ratio (2) |
56.69 | % | 52.19 | % | ||||
| Non-interest expense to average assets |
2.34 | % | 2.24 | % | ||||
| Average interest-earning assets to average interest-bearing liabilities |
143.43 | % | 164.68 | % | ||||
| Per share Data and Shares Outstanding |
||||||||
| Earnings per common share (basic and diluted) |
$ | 3.25 | $ | 3.26 | ||||
| Book value per common share |
$ | 25.81 | $ | 22.98 | ||||
| Dividends per common share |
$ | 0.40 | $ | 0.25 | ||||
| Tangible book value per common share |
$ | 23.86 | $ | 21.75 | ||||
| Market value per common share |
$ | 24.81 | $ | 27.49 | ||||
| Weighted average common shares (basic and diluted) |
7,522,913 | 7,529,382 | ||||||
| Common shares outstanding at end of period |
7,527,415 | 7,442,743 | ||||||
| Capital Ratios (Bank) |
||||||||
| Common equity tier 1(CET1) capital to risk-weighted assets |
16.22 | % | 15.47 | % | ||||
| Total risk-based capital to risk-weighted assets |
17.18 | % | 16.27 | % | ||||
| Tier 1 capital to risk-weighted assets |
16.22 | % | 15.47 | % | ||||
| Tier 1 capital to average assets |
14.66 | % | 15.05 | % | ||||
| Asset Quality Ratios |
||||||||
| Allowance for credit losses on loans as a percentage of total loans |
0.96 | % | 0.88 | % | ||||
| Allowance for credit losses on loans as a percentage of non-performing loans |
16.44 | N/A | ||||||
| Net charge-offs to average outstanding loans during the period |
0.03 | % | 0.00 | % | ||||
| Non-performing loans as a percentage of total loans |
0.06 | % | 0.00 | % | ||||
| Non-performing assets as a percentage of total assets |
0.05 | % | 0.00 | % | ||||
| Other Data: |
||||||||
| Common equity / total assets |
9.54 | % | 8.88 | % | ||||
| Tangible equity / tangible assets |
10.24 | % | 9.87 | % | ||||
| Average tangible equity to average tangible assets |
10.31 | % | 10.66 | % | ||||
| Number of offices |
6 | 6 | ||||||
| Number of full-time equivalent employees |
186 | 168 | ||||||
| (1) |
Non-GAAP; refer to Item 7 “Management’s Discussion and Analysis of Financial Condition and Results of Operations” section “Non-GAAP Measures” of this Form 10-K. |
| (2) | Efficiency ratio is calculated as non-interest expense as a percentage of net interest income and non-interest income. |
Analysis of Results of Operations for the Years Ended December 31, 2023 and 2022
Net Income
The following table sets forth the principal components of net income for the periods indicated.
| For the Year Ended December 31, |
||||||||||||
| 2023 |
2022 |
% Change |
||||||||||
| (In thousands) |
||||||||||||
| Interest income |
$ | 124,123 | $ | 83,845 | 48.04 | % | ||||||
| Interest expense |
48,176 | 13,836 | 248.19 | % | ||||||||
| Net interest income |
75,947 | 70,009 | 8.48 | % | ||||||||
| Provision for credit losses |
1,642 | 2,398 | -31.53 | % | ||||||||
| Net interest income after provision |
74,305 | 67,611 | 9.90 | % | ||||||||
| Non-interest income |
3,638 | 4,834 | -24.74 | % | ||||||||
| Non-interest expense |
45,119 | 39,057 | 15.52 | % | ||||||||
| Net income before income taxes |
32,824 | 33,388 | -1.69 | % | ||||||||
| Income tax expense |
6,239 | 6,714 | -7.07 | % | ||||||||
| Net income |
26,585 | 26,674 | -0.33 | % | ||||||||
| Less: Preferred stock dividends |
2,156 | 2,156 | 0.00 | % | ||||||||
| Net income available to common shareholders |
$ | 24,429 | $ | 24,518 | -0.36 | % | ||||||
Net income for the year ended December 31, 2023, was $26.6 million, a decrease of $0.1 million, or 0.3% compared to $26.7 million earned during the year ended December 31, 2022. The decrease in net income was due to increases in interest expense of $34.3 million and an increase of non-interest expenses of $6.1 million compared to the same period in the prior year. Despite increases in interest expense, net interest income increased $5.9 million, primarily driven by increased volume of loans and increase in interest rates.
Net Interest Income and Net Interest Margin
Net interest income is the principal component of the Company’s income stream and represents the difference, or spread, between interest and fee income generated from earning assets and the interest expense paid on deposits and borrowed funds. Net interest margin, stated as a percentage, is the yield obtained by dividing the difference between interest income generated on earning assets and the interest expense paid on all funding sources by average earning assets. Fluctuations in interest rates as well as changes in the volume and mix of earning assets and interest-bearing liabilities can impact net interest income and net interest margin.
Net interest income before provision for or recovery of credit losses totaled $75.9 million for the year ended December 31, 2023, compared to $70.0 million for the year ended December 31, 2022. The increase in net interest income was driven by an increase in loan production and increase in interest rates on variable rate credits and loans that repriced during the year ended December 31, 2023.
The net interest margin was 4.08% for the year ended December 31, 2023, compared to 4.19% for the year ended December 31, 2022, on a fully tax equivalent basis. The decrease in net interest margin primarily resulted from an increase of interest expense on our interest bearing liabilities that outpaced the increase in interest income. The primary drivers of increased interest expense came from money market and time deposits. The increase in the federal funds target rate impacted our maturing wholesale deposits that had to reprice in a higher interest rate environment, which increased margin pressure on our loan portfolio and other interest earning assets. Management made efforts to replace these deposits with callable wholesale deposits, allowing more optionality for future rate movements.
The yield for the year ended December 31, 2023 for the loan portfolio was 7.00% compared to 5.47% for the year ended December 31, 2022. The increase primarily reflects the maturity of lower yielding loans and higher yields on new and variable rate loans based on higher interest rates during the year. The Federal Reserve increased its targeted benchmark interest rate to a range of 525 - 550 basis points in 2023, which impacted yields obtained on new loans throughout the year.
For the year ended December 31, 2023, the yield on the taxable investment securities portfolio was 2.67% compared to 2.20% for the year ended December 31, 2022. For the year ended December 31, 2023, the yield on the tax-exempt investment securities portfolio was 3.57% compared to 3.48% for the year ended December 31, 2022. The increase in both categories was primarily due to rates on variable securities increasing with the current rate environment and lower yields on investment securities maturing during the period.
The rate paid on interest bearing deposits increased to 3.61% during the year ended December 31, 2023, from 1.14% during the year ended December 31, 2022. This increase was a result of higher rates paid on all outstanding deposits in conjunction with the increasing rate environment throughout the year.
The rate paid on FHLB borrowings and federal funds purchased for the year ended December 31, 2023 was 4.90% and 5.36%, respectively, compared to the prior year of 1.45% for FHLB borrowings and no interest paid on federal funds purchased.
The following table sets forth the major components of net interest income and the related yields and rates for the year ended December 31, 2023, compared to the year ended December 31, 2022.
Average Balances, Net Interest Income, Yields Earned and Rates Paid
The following table shows for the periods indicated the total dollar amount of interest from average interest-earning assets and the resulting yields, as well as the interest expense on average interest-bearing liabilities, expressed both in dollars and rates, and the net interest margin. All average balances are based on daily balances.
| For the Year Ended December 31, |
||||||||||||||||||||||||
| 2023 |
2022 |
|||||||||||||||||||||||
| Average Balance |
Interest Income/ Expense (5) |
Yield/ Cost (5) |
Average Balance |
Interest Income/ Expense (5) |
Yield/ Cost (5) |
|||||||||||||||||||
| (Dollars in thousands) |
||||||||||||||||||||||||
| Interest-earning assets: |
||||||||||||||||||||||||
| Loans (1) |
$ | 1,659,179 | $ | 116,184 | 7.00 | % | $ | 1,442,716 | $ | 78,872 | 5.47 | % | ||||||||||||
| Investment securities |
||||||||||||||||||||||||
| Taxable |
68,815 | 1,836 | 2.67 | % | 72,809 | 1,603 | 2.20 | % | ||||||||||||||||
| Tax-exempt |
37,810 | 1,348 | 3.57 | % | 38,528 | 1,339 | 3.48 | % | ||||||||||||||||
| Federal funds and interest-bearing deposits |
103,840 | 5,038 | 4.85 | % | $ | 122,596 | 2,312 | 1.89 | % | |||||||||||||||
| Total interest-earning assets |
$ | 1,869,644 | $ | 124,406 | 6.65 | % | 1,676,649 | $ | 84,126 | 5.02 | % | |||||||||||||
| Non-interest-earning assets |
62,161 | 67,380 | ||||||||||||||||||||||
| Total assets |
$ | 1,931,805 | $ | 1,744,029 | ||||||||||||||||||||
| Interest-bearing liabilities: |
||||||||||||||||||||||||
| Interest-bearing demand deposits |
$ | 83,087 | $ | 1,892 | 2.28 | % | $ | 85,566 | $ | 601 | 0.70 | % | ||||||||||||
| Money market deposits |
365,815 | 13,924 | 3.81 | % | 137,066 | 1,547 | 1.13 | % | ||||||||||||||||
| Savings and NOW deposits |
49,565 | 546 | 1.10 | % | 63,401 | 203 | 0.32 | % | ||||||||||||||||
| Time deposits |
702,034 | 27,003 | 3.85 | % | 642,918 | 8,202 | 1.28 | % | ||||||||||||||||
| Total interest-bearing deposits |
$ | 1,200,501 | $ | 43,365 | 3.61 | % | $ | 928,951 | $ | 10,553 | 1.14 | % | ||||||||||||
| Federal funds purchased |
5,583 | 299 | 5.36 | % | 2 | — | 1.59 | % | ||||||||||||||||
| Federal Home Loan Bank advances |
24,959 | 1,224 | 4.90 | % | 23,986 | 347 | 1.45 | % | ||||||||||||||||
| Subordinated debt |
72,455 | 3,288 | 4.54 | % | 65,176 | 2,936 | 4.50 | % | ||||||||||||||||
| Total interest-bearing liabilities |
$ | 1,303,498 | $ | 48,176 | 3.70 | % | $ | 1,018,115 | $ | 13,836 | 1.36 | % | ||||||||||||
| Non-interest-bearing liabilities: |
||||||||||||||||||||||||
| Demand deposits and other liabilities |
418,386 | 535,075 | ||||||||||||||||||||||
| Total liabilities |
$ | 1,721,884 | $ | 1,553,190 | ||||||||||||||||||||
| Stockholders’ Equity |
209,921 | 190,839 | ||||||||||||||||||||||
| Total liabilities and Stockholders’ equity |
$ | 1,931,805 | $ | 1,744,029 | ||||||||||||||||||||
| Net interest income |
$ | 76,230 | $ | 70,290 | ||||||||||||||||||||
| Interest rate spread (2) |
2.95 | % | 3.66 | % | ||||||||||||||||||||
| Net interest-earning assets (3) |
$ | 566,146 | $ | 658,534 | ||||||||||||||||||||
| Net interest margin (4) |
4.08 | % | 4.19 | % | ||||||||||||||||||||
| Average interest-earning assets to average interest-bearing liabilities |
143.43 | % | 164.68 | % | ||||||||||||||||||||
| (1) |
Includes loans classified as non-accrual. |
| (2) |
Interest rate spread represents the difference between the average yield on average interest–earning assets and the average cost of average interest-bearing liabilities. |
| (3) |
Net interest earning assets represent total average interest–earning assets less total interest–bearing liabilities. |
| (4) |
Net interest margin represents net interest income divided by total average interest-earning assets. |
| (5) |
Income and yields for all periods are reported on a tax-equivalent basis using the federal statutory rate of 21%. Non-GAAP; refer to Item 7 “Management’s Discussion and Analysis of Financial Condition and Results of Operations” section “Non-GAAP Measures” of this Form 10-K. |
Rate/ Volume Analysis
The following table presents the effects of changing rates and volumes on net interest income for the periods indicated. The rate column shows the effects attributable to changes in rate (changes in rate multiplied by prior volume). The volume column shows the effects attributable to changes in volume (changes in volume multiplied by prior rate). The net column represents the sum of the prior columns. For purposes of this table, changes attributable to both rate and volume, which cannot be segregated, have been allocated proportionately, based on the changes due to rate and the changes due to volume.
| For the Twelve Months Ended |
||||||||||||
| December 31, 2023 and 2022 |
||||||||||||
| Increase (Decrease) Due to |
Total Increase |
|||||||||||
| Volume |
Rate |
(Decrease) |
||||||||||
| (In thousands) |
||||||||||||
| Interest-earning assets: |
||||||||||||
| Loans |
$ | 13,027 | $ | 24,285 | $ | 37,312 | ||||||
| Investment securities |
(129 | ) | 371 | 242 | ||||||||
| Federal funds and interest-bearing deposits |
(402 | ) | 3,128 | 2,726 | ||||||||
| Total interest-bearing assets |
$ | 12,496 | $ | 27,784 | $ | 40,280 | ||||||
| Interest-bearing liabilities: |
||||||||||||
| Interest-bearing demand deposits |
$ | (18 | ) | $ | 1,309 | $ | 1,291 | |||||
| Money market deposit accounts |
5,113 | 7,264 | 12,377 | |||||||||
| Savings and NOW deposits |
(53 | ) | 396 | 343 | ||||||||
| Time deposits |
824 | 17,977 | 18,801 | |||||||||
| Total deposits |
$ | 5,866 | $ | 26,946 | $ | 32,812 | ||||||
| Federal funds purchased |
299 | — | 299 | |||||||||
| Federal Home Loan Bank advances |
15 | 862 | 877 | |||||||||
| Subordinated debt |
326 | 26 | 352 | |||||||||
| Total interest-bearing liabilities |
6,506 | 27,834 | 34,340 | |||||||||
| Change in net interest income |
$ | 5,990 | $ | (50 | ) | $ | 5,940 | |||||
Provision for Credit Losses
We establish a provision for credit losses, which is charged to operations, in order to maintain the allowance for credit losses at a level we consider necessary to absorb expected credit losses that are both probable and reasonably estimated at the balance sheet date. In determining the level of the allowance for credit and off-balance sheet losses, we consider past and current loss experience, evaluations of real estate collateral, current and future economic conditions, volume and type of lending, adverse situations that may affect a borrower’s ability to repay a loan and the levels of non-performing loans. The amount of the allowance is based on estimates, and actual losses may vary from such estimates as more information becomes available or economic conditions change.
This evaluation is inherently subjective, as it requires estimates that are susceptible to significant revision as circumstances change as more information becomes available. The allowance for credit losses on loans is assessed on a monthly basis and provisions are made for credit losses on loans as required in order to maintain the allowance. The allowance for off-balance sheet credit is assessed quarterly and provisions are made to maintain the allowance.
The provision for credit losses on loans decreased to a loan loss provision of $1.9 million for the year ended December 31, 2023, compared to the prior year which ended at loan loss provision of $2.4 million. The provision for credit losses on off-balance sheet exposure was a net recovery of $301 from the original establishment of $1.3 million upon the adoption of CECL. The decrease in provision for credit losses on loans was primarily driven by loan growth as well as increasing qualitative factors within our model assumptions for increased levels of past dues and potential weaknesses in underlying collateral for certain asset classes. The recovery of credit losses for off-balance sheet exposure was driven by fluctuations in our revolving credit line utilization rates as of December 31, 2023. Loan originations decreased $152.3 million, which totaled $599.9 million for the year ended December 31, 2022 compared to loan originations of $447.6 million for the year ended December 31, 2023. Non-performing loans were $21,000 at December 31, 2022 and $1.0 million at December 31, 2023.
On September 22, 2022, the Company completed the sale of a loan note for a customer that had stopped making payments and declared bankruptcy. The Company incurred a loss of $211,000 on this transaction that was properly accounted for in its Statement of Income as a loss on the sale of a loan. This credit had previously identified weaknesses and deemed to be of substandard quality with an appropriate reserve allocation. We determined that the best course of action was to sell the note at a discount to an interested party. Had the loan sale not occurred, the Company would have recorded a specific allocation to the provision for loan losses and proceeded with an orderly liquidation of collateral.
During the year ended December 31, 2023, substandard loans increased $11.7 million for a balance of $21.2 million. During the year ended December 31, 2023, special mention loans increased $19.0 million to $19.0 million. During the year ended December 31, 2023, watch list loans increased $33.7 million to $58.7 million. Management does not believe any significant loss exposure currently exists in these loans. During the year ended December 31, 2023, there was $468,000 in charge-offs recorded and recoveries of $22,000 were received. During the year ended December 31, 2022, there were no charge-offs recorded and recoveries received of $19,000.
Non-Interest Income
Our primary sources of non-interest income are service charges on deposit accounts, such as interchange fees and statement fees, income earned on bank owned life insurance, fees earned from executing interest rate swaps on commercial loans, and gains realized on the sale of the guaranteed portion of Small Business Administration (“SBA”) loans.
The following table presents, for the periods indicated, the major categories of non-interest income:
| For the Year Ended December 31, |
||||||||||||
| 2023 |
2022 |
% Change |
||||||||||
| (In thousands) |
||||||||||||
| Non-interest income |
||||||||||||
| Deposit account service charges |
$ | 2,149 | $ | 2,420 | -11.20 | % | ||||||
| Bank owned life insurance income |
1,069 | 1,008 | 6.05 | % | ||||||||
| Loan swap fee income |
— | 619 | -100.00 | % | ||||||||
| Net gain on called held-to-maturity securities |
— | 4 | -100.00 | % | ||||||||
| Net gain (loss) on sale of loans |
— | (168 | ) | -100.00 | % | |||||||
| Other fee income |
420 | 951 | -55.84 | % | ||||||||
| Total non-interest income |
$ | 3,638 | $ | 4,834 | -24.74 | % | ||||||
Non-interest income decreased $1.2 million, or 24.7%, to $3.6 million for the year ended December 31, 2023 from $4.8 million for the year ended December 31, 2022. The decrease in non-interest income was primarily due to a decrease in swap fee income and mortgage origination fees decreasing $379,000 for the year ended December 31, 2023. The Company did not recognize any fees on interest rate swaps for commercial loans for the year ended December 31, 2023 down from $619,000 for the year ended December 31, 2022. The Company also recognized $251,000 in planned operating losses in other fee income related to two New Market Tax Credit investments during the year ended December 31, 2023. Bank owned life insurance income increased $61,000 for the year ended December 31, 2023, compared to the year ended December 31, 2022, due to the rising rate environment throughout 2023. The deposit service fees decreased $271,000 for the year ended December 31, 2023, as compared to the same period in 2022, due to a decrease in customer activity.
Non-Interest Expense
Generally, non-interest expense is composed of all employee expenses and costs associated with operating our facilities, obtaining and retaining customer relationships and providing bank services. The largest component of non-interest expense is salaries and employee benefits. Non-interest expense also includes operational expenses, such as occupancy and equipment expenses, professional fees, advertising expenses and other general and administrative expenses, including FDIC assessments, communications, travel, meals, training, supplies and postage. The following table presents, for the periods indicated, the major categories of non-interest expense:
| For the Year Ended December 31, |
||||||||||||
| 2023 |
2022 |
% Change |
||||||||||
| (In thousands) |
||||||||||||
| Non-interest expense |
||||||||||||
| Salaries and employee benefits |
$ | 28,267 | $ | 23,801 | 18.76 | % | ||||||
| Furniture and equipment expenses |
2,787 | 2,786 | 0.04 | % | ||||||||
| Advertising and marketing |
2,343 | 2,304 | 1.69 | % | ||||||||
| Occupancy expenses |
1,684 | 1,471 | 14.48 | % | ||||||||
| Outside services |
2,044 | 2,075 | -1.49 | % | ||||||||
| Franchise tax |
1,835 | 1,430 | 28.32 | % | ||||||||
| FDIC insurance |
1,131 | 637 | 77.55 | % | ||||||||
| Data processing |
1,328 | 1,303 | 1.92 | % | ||||||||
| Administrative expenses |
922 | 872 | 5.73 | % | ||||||||
| Other operating expenses |
2,778 | 2,378 | 16.82 | % | ||||||||
| Total non-interest expense |
$ | 45,119 | $ | 39,057 | 15.52 | % | ||||||
Non-interest expense increased $6.1 million or 15.5% to $45.1 million for the year ended December 31, 2023 from $39.1 million for the year ended December 31, 2022 primarily as a result of increases in salary and employee benefits of $4.5 million, FDIC insurance of $494,000 and Franchise tax of $405,000. Salaries and employee benefits expense increased by $4.5 million to $28.3 million for the year ended December 31, 2023 from $23.8 million for the year ended December 31, 2022 primarily as a result of increasing our personnel team members by 18 employees. FDIC insurance increased $494,000, or 77.6%, to $1.1 million for the year ended December 31, 2023 from $637,000 for the year ended December 31, 2022. While the Company was not included in the special assessment directly related to four bank failures, the FDIC is increasing the reserve ratio within its insurance fund. Franchise tax expense increased $405,000, or 28.3%, to $1.8 million for the year ended December 31, 2023, due to consistent growth of the Company's capital and earnings profile. Many of the non-interest expense categories remained consistent for the year ended December 31, 2023 compared to the year ended December 31, 2022 as management continues to exercise judicious expense controls.
Income Tax Expense
Income tax expense decreased $475,000, or 7.1%, to $6.2 million for the year ended December 31, 2023 from $6.7 million for the year ended December 31, 2022. The decrease in federal income tax expense for the year ended December 31, 2023 compared to the same period a year earlier was driven by continued investments in projects that provide tax credit incentives and further the mission of our community development entity. The Company is able to apply and claim a research and development tax credit for its associated work in developing a software platform. The Company has invested in projects that generate tax credits through the Low Income Housing Tax Credits ("LIHTC") program as well as NMTC projects. As a result of tax regulation, the Company has included assessments in income tax expense for state tax liabilities during 2023. For the year ended December 31, 2023, the Bank had an effective tax rate of 19.0%, compared to effective federal tax rate of 20.1% for the year ended December 31, 2022.
Avenu, a division of MainStreet Bank
Analysis of Results of Operations for the Year Ended December 31, 2023
Net Income
The following table sets forth the principal components of net income (loss) for the Avenu division of MainStreet Bank for the periods indicated. All amounts set forth are included in the Results of Operations for the Year Ended December 31, 2023 and 2022 for MainStreet Bancshares, Inc. unless indicated otherwise.
| For the Year Ended December 31, |
||||||||||||
| 2023 |
2022 |
% Change |
||||||||||
| (In thousands) |
||||||||||||
| Income Statement |
||||||||||||
| Service charge income |
$ | 707 | $ | 912 | -22.48 | % | ||||||
| Other income |
161 | 94 | 71.28 | % | ||||||||
| Income from deposits (1) |
2,261 | 1,097 | 106.11 | % | ||||||||
| Total income |
3,129 | 2,103 | 48.79 | % | ||||||||
| Salaries and employee benefits |
1,415 | 1,178 | 20.12 | % | ||||||||
| Outside services |
676 | 544 | 24.26 | % | ||||||||
| Compliance expenses |
162 | 209 | -22.49 | % | ||||||||
| Other operating expenses |
825 | 605 | 36.36 | % | ||||||||
| Total expense |
3,078 | 2,536 | 21.37 | % | ||||||||
| Net income (loss) before taxes |
$ | 51 | (433 | ) | -111.78 | % | ||||||
| (1) |
Determined by funds transfer pricing of non-interest bearing deposits using the weighted average Effective Fed Funds Rate during fiscal year ended December 31, 2023 and 2022. |
For the year ended December 31, 2023, the Avenu division recorded net income of $51,000. As the Company develops the software and ramps up the resources needed to operate a new division, elevated levels of non-interest expenses are anticipated. The Avenu division held $45.0 million in average non-interest bearing deposits which provides tremendous value to the Company, while simultaneously establishing a new division. Avenu is developing a comprehensive hosted BaaS software platform that will provide Fintechs with a subledger integrated within a regulatory compliant framework, easily connectable application programming interfaces ("APIs"), and access to banking payment networks. The Avenu team will deploy the platform in 2024.
Comparison of Statements of Financial Condition at December 31, 2023 and at December 31, 2022
Total Assets
Total assets increased $109.7 million, or 5.7%, to $2.0 billion at December 31, 2023 from $1.9 billion at December 31, 2022. The increase was primarily the result of increases of $127.5 million in gross loans receivable, $5.5 million in computer software, and $2.8 million in accrued interest receivables. These increases were offset by a decrease in available-for-sale securities of $2.7 million and a decrease of $5.0 in other assets, which was primarily impacted by fluctuations in market value of our executed loan swaps.
Investment Securities
We use our securities portfolio to provide a source of liquidity, provide an appropriate return on funds invested, manage interest rate risk, meet collateral requirements, assist in achieving Community Reinvestment Act (CRA) objectives, and meet regulatory capital and liquidity requirements. Our investment policy is established and reviewed annually by the Board of Directors. We are permitted under federal law to invest in various types of liquid assets, including United States Government obligations, securities of various federal agencies and of state and municipal governments, mortgage-backed securities, time deposits of federally insured institutions, subordinated debt of other financial institutions, equity securities, certain bankers’ acceptances and federal funds.
Our investment objectives are to maintain high asset quality, to provide and maintain liquidity, to establish an acceptable level of interest rate and credit risk, to provide an alternate source of low-risk investments when demand for loans is weak and to generate a favorable return. The Board of Directors has the overall responsibility for the investment portfolio, including approval of our investment policy. The Board of Directors is also responsible for implementation of the investment policy and monitoring investment performance. The Board of Directors reviews the status of the investment portfolio on a quarterly basis, or more frequently if warranted.
Generally accepted accounting principles require that, at the time of purchase, we designate a security as held to maturity, available-for-sale, or trading, depending on our ability and intent to hold such security. Debt securities available for sale are reported at fair value, while debt securities held to maturity are reported at amortized cost. We do not maintain a trading portfolio. Establishing a trading portfolio would require specific authorization by the Board of Directors.
The total investment securities portfolio, including both investment securities available for sale and investment securities held to maturity, was $77.2 million at December 31, 2023, a decrease of $3.1 million compared with December 31, 2022. At December 31, 2023, the investment securities portfolio includes $59.9 million of investment securities available for sale and $17.3 million of investment securities held to maturity compared to $62.6 million of investment securities available for sale and $17.6 million of investment securities held to maturity at December 31, 2022.
The Company did not sell any securities within the investment portfolio for the year ended December 31, 2023 or 2022.
For available-for-sale securities, management evaluates all investments in an unrealized loss position on a quarterly basis, and more frequently when economic or market conditions warrant such evaluation. If the Company has the intent to sell the security, or it is more likely than not that the Company will be required to sell the security, the security is written down to fair value, and the entire loss is recorded in earnings.
Portfolio Maturities and Yields. The composition and maturities of the investment securities portfolio at December 31, 2023, are summarized in the following table. Maturities are based on the final contractual payment date, and do not reflect the effect of scheduled principal repayments, prepayments, or early redemptions that may occur. Adjustable-rate mortgage-backed securities are included in the period in which interest rates are next scheduled to adjust. The Company does invest in both taxable and non-taxable municipal securities. No material changes occurred in the non-taxable security portfolio for the year ended December 31, 2023.
| More than One Year |
More than Five Years |
More than |
||||||||||||||||||||||||||||||||||||||||||
| One Year or Less |
through Five Years |
through Ten Years |
Ten Years |
Total |
||||||||||||||||||||||||||||||||||||||||
| Weighted |
Weighted |
Weighted |
Weighted |
Weighted |
||||||||||||||||||||||||||||||||||||||||
| Amortized |
Average |
Amortized |
Average |
Amortized |
Average |
Amortized |
Average |
Amortized |
Fair |
Average |
||||||||||||||||||||||||||||||||||
| Cost |
Yield (1) |
Cost |
Yield (1) |
Cost |
Yield (1) |
Cost |
Yield (1) |
Cost |
Value |
Yield (1) |
||||||||||||||||||||||||||||||||||
| (Dollars in thousands) |
||||||||||||||||||||||||||||||||||||||||||||
| Securities available for sale: |
||||||||||||||||||||||||||||||||||||||||||||
| Collateralized Mortgage Securities |
$ | — | — | $ | — | — | $ | 714 | 2.49 | % | $ | 22,732 | 1.50 | % | $ | 23,446 | $ | 19,515 | 1.53 | % | ||||||||||||||||||||||||
| Subordinated Debt |
— | — | — | — | 9,970 | 3.89 | % | — | — | 9,970 | 8,467 | 3.89 | % | |||||||||||||||||||||||||||||||
| Municipal Securities |
||||||||||||||||||||||||||||||||||||||||||||
| Taxable |
— | — | 1,000 | 3.42 | % | 1,425 | 1.55 | % | 8,224 | 2.44 | % | 10,649 | 8,307 | 2.41 | % | |||||||||||||||||||||||||||||
| Tax-exempt |
— | — | — | — | 1,871 | 4.41 | % | 20,797 | 3.41 | % | 22,668 | 20,742 | 3.49 | % | ||||||||||||||||||||||||||||||
| U.S. Government Agencies |
— | — | — | — | 74 | 6.79 | % | 2,858 | 7.21 | % | 2,932 | 2,897 | 7.20 | % | ||||||||||||||||||||||||||||||
| Total |
$ | — | — | $ | 1,000 | 3.42 | % | $ | 14,054 | 3.67 | % | $ | 54,611 | 2.67 | % | $ | 69,665 | $ | 59,928 | 2.88 | % | |||||||||||||||||||||||
| Securities held to maturity: |
||||||||||||||||||||||||||||||||||||||||||||
| Municipal Securities |
||||||||||||||||||||||||||||||||||||||||||||
| Tax-exempt |
$ | 319 | 3.56 | % | $ | 2,825 | 3.75 | % | $ | 5,218 | 4.00 | % | $ | 6,413 | 3.80 | % | $ | 14,775 | $ | 14,673 | 3.86 | % | ||||||||||||||||||||||
| Subordinated Debt |
— | — | 500 | 9.08 | % | 2,000 | 5.38 | % | — | — | 2,500 | 2,490 | 6.12 | % | ||||||||||||||||||||||||||||||
| Total Securities |
$ | 319 | 3.56 | % | $ | 3,325 | 4.55 | % | $ | 7,218 | 4.38 | % | $ | 6,413 | 3.80 | % | $ | 17,275 | $ | 17,163 | 4.18 | % | ||||||||||||||||||||||
| (1) |
Yields are reported on a taxable equivalent basis using the statutory federal corporate tax rate of 21% |
Weighted average yield is calculated as the tax-equivalent yield on a pro rata basis for each security based on its relative amortized cost.
Loan Portfolio
Our primary source of income is derived from interest earned on loans. Our loan portfolio consists of loans secured by real estate as well as commercial business loans and consumer loans, substantially all of which are secured by corresponding deposits at the Bank. Our loan customers primarily consist of small- to medium-sized businesses, professionals, real estate investors, small residential builders and individuals. Our owner occupied and investment commercial real estate loans, residential construction loans and commercial business loans provide us with higher risk-adjusted returns, shorter maturities and more sensitivity to interest rate fluctuations, and are complemented by our relatively lower risk residential real estate loans to individuals. Our lending activities are principally directed to our market area consisting of the Washington, D.C. and Northern Virginia metropolitan areas.
Loan Portfolio Maturities and Yields. The following table summarizes the scheduled repayments of our loan portfolio at December 31, 2023. Demand loans, having no stated repayment schedule or maturity, and overdraft loans are reported as being due in one year or less. Maturities are based on the final contractual payment date and do not reflect the impact of prepayments and scheduled principal amortization.
| As of December 31, 2023 |
||||||||||||||||||||
| Single-Family |
Multi-Family |
Farmland |
Owner Occupied |
Non-owner Occupied |
||||||||||||||||
| (In thousands) |
||||||||||||||||||||
| Amounts due in: |
||||||||||||||||||||
| One year or less |
$ | 23,826 | $ | 92,540 | $ | — | $ | 11,175 | $ | 101,916 | ||||||||||
| After one year through two years |
16,407 | 652 | — | 2,339 | 16,166 | |||||||||||||||
| After two years through three years |
12,985 | 1,419 | — | 10,030 | 29,756 | |||||||||||||||
| After three years through five years |
45,766 | 125,852 | — | 80,483 | 97,808 | |||||||||||||||
| After five years through ten years |
92,147 | 49,275 | 78 | 168,299 | 195,719 | |||||||||||||||
| After ten years through fifteen years |
873 | 1,302 | 67 | 8,536 | 20,410 | |||||||||||||||
| After fifteen years |
11,413 | — | — | 1,190 | — | |||||||||||||||
| Total |
$ | 203,417 | $ | 271,040 | $ | 145 | $ | 282,052 | $ | 461,775 | ||||||||||
| Construction and Land Development |
Commercial and Industrial |
Consumer |
Total Loan Portfolio Maturities |
|||||||||||||
| Amounts due in: |
(In thousands) |
|||||||||||||||
| One year or less |
$ | 150,042 | $ | 14,558 | $ | 1,320 | $ | 395,377 | ||||||||
| After one year through two years |
36,728 | 7,549 | 1,060 | 80,901 | ||||||||||||
| After two years through three years |
31,070 | 9,723 | 921 | 95,904 | ||||||||||||
| After three years through five years |
67,480 | 19,772 | 309 | 437,470 | ||||||||||||
| After five years through ten years |
111,732 | 20,961 | — | 638,211 | ||||||||||||
| After ten years through fifteen years |
27,281 | 280 | — | 58,749 | ||||||||||||
| After fifteen years |
5,304 | 2,572 | — | 20,479 | ||||||||||||
| Total |
$ | 429,637 | $ | 75,415 | $ | 3,610 | $ | 1,727,091 | ||||||||
The following table sets forth our fixed and adjustable-rate loans at December 31, 2023, that are contractually due after December 31, 2023.
| Due After December 31, 2023 |
||||||||||||
| Fixed |
Adjustable |
|||||||||||
| Rates |
Rates |
Total |
||||||||||
| (In thousands) |
||||||||||||
| Residential real estate: |
||||||||||||
| Single family |
$ | 102,189 | $ | 101,228 | $ | 203,417 | ||||||
| Multifamily |
184,371 | 86,669 | 271,040 | |||||||||
| Farmland |
145 | — | 145 | |||||||||
| Commercial real estate: |
||||||||||||
| Owner occupied |
162,049 | 120,003 | 282,052 | |||||||||
| Non-owner occupied |
151,599 | 310,176 | 461,775 | |||||||||
| Construction and land development |
92,055 | 337,582 | 429,637 | |||||||||
| Commercial – non-real estate: |
||||||||||||
| Commercial and industrial |
50,393 | 25,022 | 75,415 | |||||||||
| Consumer – non-real estate: |
||||||||||||
| Unsecured |
271 | — | 271 | |||||||||
| Secured |
3,268 | 71 | 3,339 | |||||||||
| Totals |
$ | 746,340 | $ | 980,751 | $ | 1,727,091 | ||||||
The following table shows our loan originations, participations, purchases, sales and repayment activities for the periods indicated.
| Years Ended December 31, |
||||||||
| 2023 |
2022 |
|||||||
| (In thousands) |
||||||||
| Total loans at beginning of year: |
$ | 1,599,592 | $ | 1,358,935 | ||||
| Loans originated: |
||||||||
| Real estate loans: |
||||||||
| Residential real estate: |
||||||||
| Single family |
63,096 | 48,488 | ||||||
| Multifamily |
43,884 | 78,061 | ||||||
| Farmland |
— | — | ||||||
| Commercial real estate: |
||||||||
| Owner occupied |
70,900 | 71,869 | ||||||
| Non-owner occupied |
56,385 | 126,244 | ||||||
| Construction and land development |
189,132 | 232,322 | ||||||
| Commercial – non-real estate: |
||||||||
| Commercial and industrial |
23,879 | 39,977 | ||||||
| Consumer – non-real estate: |
||||||||
| Unsecured |
271 | 1,984 | ||||||
| Secured |
81 | 973 | ||||||
| Total loans originated: |
447,628 | 599,918 | ||||||
| Loan principal repayments: |
||||||||
| Principal repayments |
320,129 | 359,261 | ||||||
| Net loan activity |
127,499 | 240,657 | ||||||
| Total loans at the end of year |
$ | 1,727,091 | $ | 1,599,592 | ||||
Loans, net of unearned income, totaled $1.7 billion at December 31, 2023, an increase of $127.5 million from December 31, 2022. The increase in total loans was primarily driven by growth in the overall loan portfolio, with increases in multifamily residential real estate, as well as in construction and land development credits.
A significant portion of the loan portfolio consists of commercial, construction and commercial real estate loans, primarily made in the Washington, D.C. metropolitan area and secured by real estate or other collateral in that market. Although these loans are made to a diversified pool of unrelated borrowers across numerous businesses, adverse developments in the Washington, D.C. metropolitan real estate market could have an adverse impact on this portfolio of loans and the Company’s income and financial position. While our basic market area is the Washington, D.C. metropolitan area, the Bank has made loans outside that market area where the applicant is an existing customer, and the nature and quality of such loans was consistent with the Company's lending policies.
The federal banking Agencies issued guidance in 2006 which addresses institutions’ with increased concentrations of commercial real estate (CRE) loans. The guidance does not establish specific CRE lending limits; rather, it promotes sound risk management practices and appropriate levels of capital that will enable institutions to continue to pursue CRE lending in a safe and sound manner. In developing this guidance, the Agencies recognized that different types of CRE lending present different levels of risk, and that consideration should be given to the lower risk profiles and historically superior performance of certain types of CRE, such as well-structured multifamily housing finance, when compared to others, such as speculative office space construction. As discussed under “CRE Concentration Assessments,” institutions are encouraged to segment their CRE portfolios to acknowledge these distinctions for risk management purposes. The guidance focuses on those CRE loans for which the cash flow from the real estate is the primary source of repayment rather than loans to a borrower for which real estate collateral is taken as a secondary source of repayment or through an abundance of caution. Thus, for the purposes of the guidance, CRE loans include those loans with risk profiles sensitive to the condition of the general CRE market (for example, market demand, changes in capitalization rates, vacancy rates, or rents). CRE loans are land development and construction loans (including 1- to 4-family residential and commercial construction loans) and other land loans. CRE loans also include loans secured by multifamily property, and nonfarm nonresidential property where the primary source of repayment is derived from rental income associated with the property (that is, loans for which 50 percent or more of the source of repayment comes from third party, nonaffiliated, rental income) or the proceeds of the sale, refinancing, or permanent financing of the property. Excluded from the scope of this Guidance are loans secured by nonfarm nonresidential properties where the primary source of repayment is the cash flow from the ongoing operations and activities conducted by the party, or affiliate of the party, who owns the property.
As part of their ongoing supervisory monitoring processes, the Agencies use certain criteria to identify institutions that are potentially exposed to significant CRE concentration risk. An institution that has experienced rapid growth in CRE lending, has notable exposure to a specific type of CRE, or is approaching or exceeds the following supervisory criteria may be identified for further supervisory analysis of the level and nature of its CRE concentration risk:
| 1. |
Total reported loans for construction, land development, and other land represent 100 percent or more of the institution’s total risk-based capital; or |
| 2. |
Total commercial real estate loans as defined in this guidance represent 300 percent or more of the institution’s total risk-based capital, and the outstanding balance of the institution’s commercial real estate loan portfolio has increased by 50 percent or more during the prior 36 months. |
The Agencies use the criteria as a preliminary step to identify institutions that may have CRE concentration risk. Because regulatory reports capture a broad range of CRE loans with varying risk characteristics, the supervisory monitoring criteria do not constitute limits on an institution’s lending activity but rather serve as high-level indicators to identify institutions potentially exposed to CRE concentration risk.
The Company holds a concentration in commercial real estate loans. As of December 31, 2023, construction, land development and other land loans represented 137.7% of consolidated risk-based capital. Total commercial real estate loans as defined by the Agency guidance represented 372.5% of consolidated risk-based capital. During the prior 36 months, the Company has experienced an increase in its commercial real estate portfolio by 55%.
The management team has extensive experience in underwriting commercial real estate loans and has implemented and continues to maintain heightened risk management procedures and strong underwriting criteria with respect to its commercial real estate portfolio. The Board of Directors has established internal maximum limits on CRE as an asset class overall as well as sub limits within CRE by property class, to better manage and control the exposure to property classes during periods of changing economic conditions. The Board of Directors also has minimum targets for regulatory capital ratios that are in excess of well capitalized ratios.
Our risk management process begins with a robust underwriting program. The underwriting and risk rating of all loans is completed by an underwriting team that is independent of the originating lender(s). The underwriting analysis of commercial real estate loans includes pre-origination stress testing utilizing the portfolio stress testing methods to fully understand the potential exposure before we originate the credit. Once originated, each loan receives ongoing quarterly stress tests to evaluate the risk profile over the life of the credit.
We stress test earning assets on a quarterly basis and measure the results against the Bank's risk-based capital. For commercial loans, residential real estate loans, owner-occupied commercial real estate loans and consumer installment loans, we multiply the total outstanding amount for each loan category by our highest quarter historical loss for that category as a surrogate in order to calculate a stressed loss.
For our non-owner occupied commercial real estate loans, we use three separate methodologies in our stress test. If a property fails more than one of the three tests, we extend the test with the highest exposure value and add an additional 10% for selling costs.
| • |
An immediate and sustained 3.0% increase in interest rates, |
| • |
An immediate and sustained 5.0% increase in vacancy rates, and |
| • |
An immediate and sustained 2.0% change in the capitalization rate, or “cap rate.” |
We stress test the construction lending portfolio by applying exponential discounting (using a "k factor" of 2) to each project based upon its percentage of completion. The project is stressed using the as-is and as-complete appraised values and assumes 10% selling costs.
For all other loans, we utilize the Bank's historic loss rates or if not available, the average loss rates of UBPR Group 4 banks, for bank owned life insurance we utilize default rates from S&P Global ratings, and for securities we obtain an independent fair market value and if it is less than the book value, we subtract the fair market value from the book value to determine the stress loss. For The following table shows the Company's earning assets and the results of the stress test performed for the periods indicated.
| December 31, 2023 |
||||||||||||
| Outstanding Balance |
Stress Test Results (1) |
Stressed Loss Percent |
||||||||||
| (Dollars in thousands) |
||||||||||||
| Earning Asset Component |
||||||||||||
| Construction |
$ | 429,637 | $ | (4,606 | ) | (1.07 | )% | |||||
| Non-Owner Occupied CRE |
732,815 | (7,635 | ) | (1.04 | )% | |||||||
| All Other Loans |
564,639 | (11,994 | ) | (2.12 | )% | |||||||
| HTM Loans |
17,275 | (88 | ) | (0.51 | )% | |||||||
| AFS Securities |
69,665 | (7,478 | ) | (10.73 | )% | |||||||
| Swap Portfolio |
— | — | — | |||||||||
| Bank Owned Life Insurance |
38,318 | (39 | ) | (0.10 | )% | |||||||
| Total |
$ | 1,852,349 | $ | (31,840 | ) | (1.72 | )% | |||||
| (1) Net tax effective loss at the statutory rate of 21% |
| December 31, 2022 |
||||||||||||
| Outstanding Balance |
Stress Test Results (1) |
Stressed Loss Percent |
||||||||||
| (Dollars in thousands) |
||||||||||||
| Earning Asset Component (2) |
||||||||||||
| Construction |
$ | 393,783 | $ | (3,773 | ) | (0.96 | )% | |||||
| Non-Owner Occupied CRE |
687,978 | (7,939 | ) | (1.15 | )% | |||||||
| All Other Loans |
517,831 | (11,216 | ) | (2.17 | )% | |||||||
| Total |
$ | 1,599,592 | $ | (22,928 | ) | (1.43 | )% | |||||
| (1) Net tax effective loss at the statutory rate of 21% |
| (2) The Company began stressing all earning assets beginning March 31, 2023. |
| December 31, 2023 Bank Capital Adequacy Ratios Pre- and Post-Stress (Tax-Effective) |
||||||||||||||||||||
| Well Capitalized with Buffer |
Bank Minimum Target |
As of December 31, 2023 |
Post Stress, Low Estimate |
Post Stress, High Estimate |
||||||||||||||||
| Community Bank Leverage Ratio |
8.00 | % | 8.50 | % | 14.66 | % | 13.74 | % | 13.59 | % | ||||||||||
| Leverage Ratio |
5.00 | % | 8.00 | % | 14.66 | % | 13.74 | % | 13.59 | % | ||||||||||
| Total Risk-Based Capital |
10.00 | % | 11.50 | % | 17.18 | % | 16.17 | % | 16.00 | % | ||||||||||
| Tier 1 Risk-Based Capital |
8.00 | % | 9.50 | % | 16.22 | % | 15.20 | % | 15.04 | % | ||||||||||
| Common Equity Tier 1 Risk-Based Capital |
6.50 | % | 8.00 | % | 16.22 | % | 14.79 | % | 14.62 | % | ||||||||||
| December 31, 2022 Bank Capital Adequacy Ratios Pre- and Post-Stress (Tax-Effective) |
||||||||||||||||||||
| Well Capitalized with Buffer |
Bank Minimum Target |
As of December 31, 2022 |
Post Stress, Low Estimate |
Post Stress, High Estimate |
||||||||||||||||
| Community Bank Leverage Ratio |
8.00 | % | 8.50 | % | 15.05 | % | 13.63 | % | 13.44 | % | ||||||||||
| Leverage Ratio |
7.50 | % | 8.00 | % | 15.05 | % | 13.63 | % | 13.44 | % | ||||||||||
| Total Risk-Based Capital |
10.50 | % | 11.50 | % | 16.27 | % | 14.82 | % | 14.63 | % | ||||||||||
| Tier 1 Risk-Based Capital |
8.50 | % | 9.50 | % | 15.47 | % | 14.01 | % | 13.82 | % | ||||||||||
| Common Equity Tier 1 Risk-Based Capital |
7.00 | % | 8.00 | % | 15.47 | % | 14.01 | % | 13.82 | % | ||||||||||
The Company employs an external loan review firm to conduct ongoing reviews of the loan portfolio. During the year ended December 31, 2023, the independent external loan review firm reviewed approximately 55% of the entire portfolio by outstanding dollar balance. The external review did not identify any material underwriting or ongoing portfolio management concerns.
The following two tables break down the December 31, 2023 and December 31, 2022 non-owner occupied CRE portfolio balances by showing the current balance in each sub-category and location. The tables also display very favorable weighted average interest rates and weighted average loan-to-values for both periods. The weighted average occupancy percentages are also broadly favorable for both periods.
| December 31, 2023 |
||||||||||||||||||||||||||||||||
| (Dollars in thousands) |
||||||||||||||||||||||||||||||||
| Non-Owner Occupied CRE (2) |
Location |
Weighted Average Rate |
Weighted Average Loan-to-Value (1) |
Weighted Average Occupancy % |
||||||||||||||||||||||||||||
| DC | MD | VA | Other | Total | ||||||||||||||||||||||||||||
| Multifamily |
$ | 246,153 | $ | 7,357 | $ | 17,530 | $ | — | $ | 271,040 | 6.27 | % | 64 | % | 81 | % | ||||||||||||||||
| Office: |
||||||||||||||||||||||||||||||||
| Mixed use |
9,445 | 2,729 | 4,395 | — | 16,569 | 6.65 | % | 36 | % | 87 | % | |||||||||||||||||||||
| Medical |
— | 22,428 | 15,297 | 499 | 38,224 | 5.61 | % | 43 | % | 69 | % | |||||||||||||||||||||
| Office |
— | 1,892 | 6,386 | — | 8,278 | 6.64 | % | 43 | % | 87 | % | |||||||||||||||||||||
| Office to Residential Conversion |
— | — | 21,550 | — | 21,550 | 9.50 | % | 48 | % | 85 | % | |||||||||||||||||||||
| Hospitality |
— | 60,530 | 73,677 | — | 134,207 | 6.77 | % | 60 | % | 54 | % | |||||||||||||||||||||
| Retail/Commercial |
60,133 | 42,084 | 94,400 | 11,977 | 208,594 | 6.06 | % | 44 | % | 80 | % | |||||||||||||||||||||
| Industrial |
753 | 14,007 | 7,809 | 6,015 | 28,584 | 7.29 | % | 63 | % | 96 | % | |||||||||||||||||||||
| Other |
— | — | — | 5,769 | 5,769 | 6.00 | % | 60 | % | 0 | % | |||||||||||||||||||||
| Total Non-Owner Occupied CRE |
316,484 | 151,027 | 241,044 | 24,260 | 732,815 | 6.46 | % | 57 | % | 71 | % | |||||||||||||||||||||
| Construction and Land Development |
||||||||||||||||||||||||||||||||
| Multifamily |
103,608 | — | 11,060 | 14,563 | 129,231 | 8.44 | % | 62 | % | N/A | ||||||||||||||||||||||
| 1-4 family |
95,764 | — | 54,947 | — | 150,711 | 8.99 | % | 63 | % | N/A | ||||||||||||||||||||||
| Office |
1,328 | — | — | — | 1,328 | 4.85 | % | 79 | % | N/A | ||||||||||||||||||||||
| Retail/Commercial |
17,798 | — | — | — | 17,798 | 9.13 | % | 72 | % | N/A | ||||||||||||||||||||||
| Raw land |
— | 3,690 | 15,457 | 8,000 | 27,147 | 8.00 | % | 36 | % | N/A | ||||||||||||||||||||||
| Hospitality |
— | 7,070 | — | — | 7,070 | 9.50 | % | 63 | % | N/A | ||||||||||||||||||||||
| Industrial |
25,110 | — | 1,477 | 7,458 | 34,045 | 7.27 | % | 51 | % | N/A | ||||||||||||||||||||||
| Mixed use |
9,511 | — | 15,730 | — | 25,241 | 9.17 | % | 68 | % | N/A | ||||||||||||||||||||||
| Other |
1,757 | 23,081 | 12,228 | — | 37,066 | 9.00 | % | 54 | % | N/A | ||||||||||||||||||||||
| Total Construction and Land Development |
254,876 | 33,841 | 110,899 | 30,021 | 429,637 | 8.66 | % | 60 | % | N/A | ||||||||||||||||||||||
| Total Construction, Land Development, and Non-Owner Occupied CRE |
$ | 571,360 | $ | 184,868 | $ | 351,943 | $ | 54,281 | $ | 1,162,452 | 7.39 | % | 60 | % | N/A | |||||||||||||||||
| (1) |
Loan-to-value is based on maximum potential outstanding at time of origination |
| (2) | Non-owner occupied includes multifamily call code 1D |
| December 31, 2022 |
||||||||||||||||||||||||||||||||
| (Dollars in thousands) |
||||||||||||||||||||||||||||||||
| Non-Owner Occupied CRE (2) |
Location |
Weighted Average Rate |
Weighted Average Loan-to-Value (1) |
Weighted Average Occupancy % |
||||||||||||||||||||||||||||
| DC | MD | VA | Other | Total | ||||||||||||||||||||||||||||
| Multifamily |
$ | 186,774 | $ | 7,459 | $ | 21,391 | — | $ | 215,624 | 5.36 | % | 74 | % | 86 | % | |||||||||||||||||
| Office: |
||||||||||||||||||||||||||||||||
| Mixed use |
2,473 | 3,239 | 7,497 | — | 13,209 | 5.74 | % | 66 | % | 77 | % | |||||||||||||||||||||
| Medical |
— | 22,670 | 15,840 | 782 | 39,292 | 5.42 | % | 54 | % | 92 | % | |||||||||||||||||||||
| Office |
4,585 | 1,892 | 8,292 | — | 14,769 | 6.75 | % | 52 | % | 73 | % | |||||||||||||||||||||
| Office to Residential Conversion |
— | — | 21,550 | — | 21,550 | 8.50 | % | 52 | % | 85 | % | |||||||||||||||||||||
| Hospitality |
— | 61,492 | 82,939 | — | 144,431 | 5.56 | % | 61 | % | 57 | % | |||||||||||||||||||||
| Retail/Commercial |
40,170 | 40,498 | 108,427 | 12,200 | 201,295 | 5.33 | % | 58 | % | 73 | % | |||||||||||||||||||||
| Industrial |
11,083 | 7,202 | 7,154 | 6,188 | 31,627 | 5.69 | % | 64 | % | 88 | % | |||||||||||||||||||||
| Other |
— | — | — | 6,181 | 6,181 | 6.00 | % | 60 | % | 100 | % | |||||||||||||||||||||
| Total Non-Owner Occupied CRE |
245,085 | 144,452 | 273,090 | 25,351 | 687,978 | 5.58 | % | 59 | % | 77 | % | |||||||||||||||||||||
| Construction and Land Development |
||||||||||||||||||||||||||||||||
| Multifamily |
174,208 | — | 977 | 3,443 | 178,628 | 7.81 | % | 69 | % | N/A | ||||||||||||||||||||||
| 1-4 family |
50,489 | 4,269 | 48,744 | — | 103,502 | 8.38 | % | 66 | % | N/A | ||||||||||||||||||||||
| Office: |
||||||||||||||||||||||||||||||||
| Mixed use |
6,290 | — | — | — | 6,290 | 7.85 | % | 62 | % | N/A | ||||||||||||||||||||||
| Medical |
— | 6,926 | — | — | 6,926 | 7.25 | % | 54 | % | N/A | ||||||||||||||||||||||
| Office |
2,214 | — | — | — | 2,214 | 8.00 | % | 27 | % | N/A | ||||||||||||||||||||||
| Data center |
20,383 | — | — | — | 20,383 | 7.25 | % | 54 | % | N/A | ||||||||||||||||||||||
| Retail/Commercial |
16,425 | 1,232 | — | — | 17,657 | 8.22 | % | 68 | % | N/A | ||||||||||||||||||||||
| Raw land |
— | 3,690 | 12,690 | 8,000 | 24,380 | 6.97 | % | 33 | % | N/A | ||||||||||||||||||||||
| Hospitality |
— | 1,451 | — | — | 1,451 | 8.50 | % | 63 | % | N/A | ||||||||||||||||||||||
| Industrial |
— | — | 864 | — | 864 | 4.75 | % | 75 | % | N/A | ||||||||||||||||||||||
| Other |
7,823 | 1,528 | 22,137 | — | 31,488 | 7.90 | % | 61 | % | N/A | ||||||||||||||||||||||
| Total Construction and Land Development |
277,832 | 19,096 | 85,412 | 11,443 | 393,783 | 7.92 | % | 65 | % | N/A | ||||||||||||||||||||||
| Total Construction, Land Development, and Non-Owner Occupied CRE |
$ | 522,917 | $ | 163,548 | $ | 358,502 | $ | 36,794 | $ | 1,081,761 | 6.57 | % | 64 | % | N/A | |||||||||||||||||
| (1) |
Loan-to-value is based on maximum potential outstanding at time of origination |
| (2) | Non-owner occupied includes multifamily call code 1D |
The Company also underwrites and originates owner-occupied commercial real estate loans. These loans are typically term loans made to support properties that rely upon the operations of the business occupying the property for repayment. The Agencies specifically excluded owner-occupied commercial real estate from their concentration guidance, as the primary source of repayment is the cash flow from the ongoing operations and activities conducted by the party, or affiliate of the party, who owns the property.
The following two tables depict a well-diversified portfolio of owner-occupied commercial real estate as of December 31, 2023 and December 31, 2022. The properties are distributed nicely among the Company's footprint. This loan segment continues to perform very well and is supported by strong loan-to-values (LTVs). The following table sets forth our owner-occupied CRE portfolio by the business industry groups that occupy the properties for the periods indicated.
| December 31, 2023 |
||||||||||||||||||||||||||||
| (Dollars in thousands) |
||||||||||||||||||||||||||||
| Owner Occupied CRE |
Location |
Weighted Average Rate |
Weighted Average Loan-to-Value (1) |
|||||||||||||||||||||||||
| DC | MD | VA | Other | Total | ||||||||||||||||||||||||
| Accommodation and food services |
$ | 17,925 | $ | 2,995 | $ | 12,186 | $ | 5,605 | $ | 38,711 | 5.68 | % | 69 | % | ||||||||||||||
| Administrative and support |
— | 4,500 | 4,557 | — | 9,057 | 5.49 | % | 56 | % | |||||||||||||||||||
| Arts and recreation |
— | — | 37,127 | — | 37,127 | 6.14 | % | 62 | % | |||||||||||||||||||
| Construction services |
5,173 | 4,035 | 16,278 | — | 25,486 | 5.23 | % | 73 | % | |||||||||||||||||||
| Education services |
29,169 | — | 5,581 | — | 34,750 | 5.86 | % | 61 | % | |||||||||||||||||||
| Health care |
4,810 | 993 | 16,836 | 139 | 22,778 | 5.43 | % | 76 | % | |||||||||||||||||||
| Manufacturing |
— | — | 6,218 | — | 6,218 | 5.33 | % | 91 | % | |||||||||||||||||||
| Religious and other |
6,141 | 8,047 | 32,305 | 946 | 47,439 | 5.78 | % | 66 | % | |||||||||||||||||||
| Professional, scientific, tech services |
2,908 | — | 10,474 | — | 13,382 | 5.06 | % | 75 | % | |||||||||||||||||||
| Real estate and rental leasing |
— | 2,281 | 1,168 | — | 3,449 | 6.55 | % | 62 | % | |||||||||||||||||||
| Retail trade |
894 | 6,692 | 25,249 | 2,670 | 35,505 | 5.83 | % | 69 | % | |||||||||||||||||||
| Wholesale trade |
— | 184 | 837 | 7,129 | 8,150 | 5.98 | % | 73 | % | |||||||||||||||||||
| Total Owner Occupied CRE |
$ | 67,020 | $ | 29,727 | $ | 168,816 | $ | 16,489 | $ | 282,052 | 5.73 | % | 68 | % | ||||||||||||||
| December 31, 2022 |
||||||||||||||||||||||||||||
| (Dollars in thousands) |
||||||||||||||||||||||||||||
| Owner Occupied CRE |
Location |
Weighted Average Rate |
Weighted Average Loan-to-Value (1) |
|||||||||||||||||||||||||
| DC | MD | VA | Other | Total | ||||||||||||||||||||||||
| Accommodation and food services |
$ | 17,715 | $ | 3,059 | $ | 11,155 | $ | 4,310 | $ | 36,239 | 5.34 | % | 71 | % | ||||||||||||||
| Administrative and support |
— | 1,018 | 1,393 | — | 2,411 | 5.55 | % | 55 | % | |||||||||||||||||||
| Arts and recreation |
— | 2,001 | 37,916 | — | 39,917 | 5.96 | % | 65 | % | |||||||||||||||||||
| Construction services |
8,494 | — | 21,680 | — | 30,174 | 5.23 | % | 61 | % | |||||||||||||||||||
| Education services |
— | — | 5,736 | — | 5,736 | 5.34 | % | 67 | % | |||||||||||||||||||
| Health care |
854 | 1,024 | 13,271 | 143 | 15,292 | 5.03 | % | 72 | % | |||||||||||||||||||
| Manufacturing |
— | — | 6,525 | — | 6,525 | 5.32 | % | 91 | % | |||||||||||||||||||
| Religious and other |
3,627 | 3,032 | 31,882 | — | 38,541 | 4.87 | % | 6 | % | |||||||||||||||||||
| Professional, scientific, tech services |
2,972 | — | 11,332 | — | 14,304 | 4.96 | % | 75 | % | |||||||||||||||||||
| Real estate and rental leasing |
— | 2,661 | 1,191 | — | 3,852 | 5.73 | % | 62 | % | |||||||||||||||||||
| Retail trade |
921 | 4,915 | 25,723 | 2,733 | 34,292 | 5.49 | % | 69 | % | |||||||||||||||||||
| Wholesale trade |
— | 219 | 872 | — | 1,091 | 5.50 | % | 70 | % | |||||||||||||||||||
| Total Owner Occupied CRE |
$ | 34,583 | $ | 17,929 | $ | 168,676 | $ | 7,186 | $ | 228,374 | 5.40 | % | 68 | % | ||||||||||||||
The risk profile of real estate properties within our market can vary depending upon location. Therefore, we have disaggregated our stress testing of construction projects further by segmenting the loans into two groupings, those inside a 15-mile radius of Washington, D.C. and those outside that radius. For example, during the 2009 recession, the peak-to-trough drop in property values inside the beltway was less than 10% (CoreLogic, 2019). The Board determined that loans made inside a 15-mile radius of Washington, D.C. carry less geographic risk than those made outside of that radius.
The graphic below is a geopoint map that depicts all construction loans, non-owner occupied CRE loans, and owner-occupied CRE loans, with a majority of all loan types concentrated within a 15-mile radius of Washington, D.C.
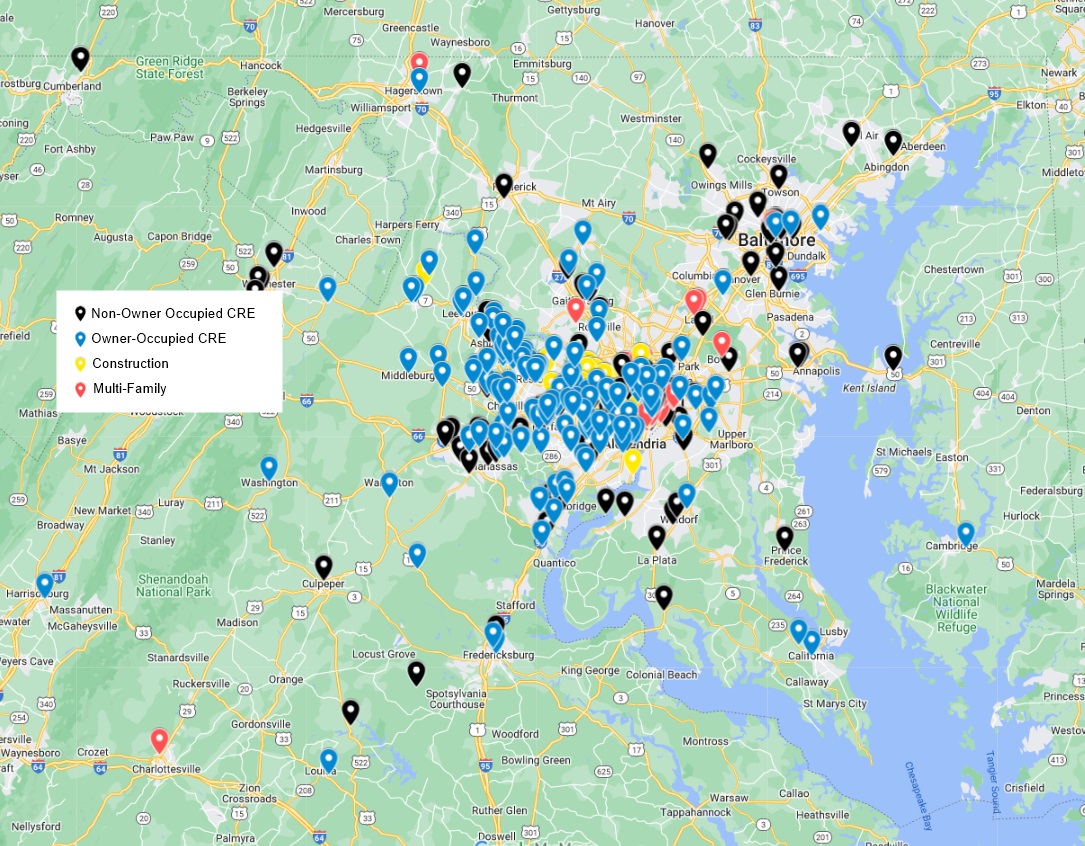
Asset Quality
The Company’s asset quality remained strong during the year ended December 31, 2023. Nonperforming assets, which includes nonaccrual loans, accruing loans 90 days past due, and other real estate owned totaled $1,004,000 at December 31, 2023, and $21,000 at December 31, 2022.
A loan’s past due status is based on the contractual due date of the most delinquent payment due. All loans which are 30 or more days past due at the end of the month are reported to the Board of Directors. Commercial loans are generally placed on nonaccrual status when the collection of principal or interest is 90 days or more past due, or earlier, if collection is uncertain based on an evaluation of the net realizable value of the collateral and the financial strength of the borrower. Consumer loans are generally placed on nonaccrual status when the collection of principal or interest is 120 days or more past due, or earlier, if collection is uncertain based on an evaluation of the net realizable value of the collateral and the financial strength of the borrower. Loans greater than 90 days past due may remain on accrual status if management determines it has adequate collateral to cover the principal and interest. For those loans that are carried on nonaccrual status, payments are first applied to principal outstanding. A loan may be returned to accrual status if the borrower has demonstrated a sustained period of repayment performance in accordance with the contractual terms of the loan and there is reasonable assurance the borrower will continue to make payments as agreed.
The Company may identify loans for potential restructure primarily through direct communication with the borrower and evaluation of the borrower’s financial statements, revenue projections, tax returns, and credit reports. Even if the borrower is not presently in default, management will consider the likelihood that cash flow shortages, adverse economic conditions and negative trends may result in a payment default in the near future.
As a percentage of total assets, nonperforming assets were 0.05% at December 31, 2023, compared with 0.00% at December 31, 2022. As of December 31, 2023, the Company had $1.0 million in loans on nonaccrual status.
See Note 1, Organization, Basis of Presentation, and Impact of Recently Issued Accounting Pronouncements and Note 5, Allowance for Credit Losses, in Notes to Consolidated Financial Statements for further information on the Company’s credit grade categories, which are derived from standard regulatory rating definitions.
The following table summarizes asset quality information at December 31, 2023, and December 31, 2022.
| December 31, |
December 31, |
|||||||
| 2023 |
2022 |
|||||||
| (Dollars in thousands) |
||||||||
| Non-accrual loans: |
||||||||
| Residential real estate |
||||||||
| Single family |
$ | 851 | $ | — | ||||
| Commercial and industrial |
149 | — | ||||||
| Total non-accrual loans |
1,000 | — | ||||||
| Loans accruing past 90 days: |
||||||||
| Commercial and industrial |
— | 15 | ||||||
| Consumer non real estate - secured |
4 | 6 | ||||||
| Total non-performing loans |
1,004 | 21 | ||||||
| Total non-performing assets |
$ | 1,004 | $ | 21 | ||||
| Ratios: |
||||||||
| Total non-performing loans to gross loans receivable |
0.06 | % | 0.00 | % | ||||
| Total non-performing loans to total assets |
0.05 | % | 0.00 | % | ||||
| Total non-accrual loans to gross loans receivable |
0.05 | % | 0.00 | % | ||||
Interest income that would have been recorded for the years ended December 31, 2023 and 2022 had non-accruing loans been current according to their original terms was $133,092 and $0, respectively.
Occasionally, the Company modifies loans by providing principal forgiveness on certain of its real estate loans. When principal forgiveness is provided, the amortized cost basis of the asset is written off against the allowance for credit losses. The amount of the principal forgiveness is deemed to be uncollectible; therefore, that portion of the loan is written off, resulting in a reduction of the amortized cost basis and a corresponding adjustment to the allowance for credit losses.
In some cases, the Company will modify a certain loan by providing multiple types of concessions. Typically, one type of concession, such as a term extension, is granted initially. If the borrower continues to experience financial difficulty, another concession, such as principal forgiveness, may be granted.
The Company further describes loans that were modified during the year ended December 31, 2023 in Note 5 of Notes to Consolidated Financial Statements.
Analysis and Determination of the Allowance for Credit Loss on Loans. The allowance for credit losses on loans is maintained at a level which, in management’s judgment, is adequate to absorb probable and estimable future credit losses in the loan portfolio. The amount of the allowance is based on management’s evaluation of the collectability of the loan portfolio, including the nature of the portfolio, credit concentrations, trends in historical loss experience, specific individually evaluated loans, and current and future economic conditions. Allowances for individually evaluated loans are generally determined based on collateral values. Because of uncertainties associated with regional economic conditions, collateral values, and future cash flows on individually evaluated loans, it is reasonably possible that management’s estimate of probable credit losses inherent in the loan portfolio and the related allowance may change materially in the near-term. The allowance is increased by a provision for credit losses on loans which is charged to expense and reduced by full and partial charge-offs, net of recoveries. Changes in the allowance relating to individually evaluated loans are charged or credited to the provision for credit losses on loans. Management’s periodic evaluation of the adequacy of the allowance is based on various factors, including, but not limited to, management’s ongoing review and grading of loans, facts and issues related to specific loans, historical loan losses on loan pools, the fair value of the underlying collateral, current and future economic conditions and other qualitative and quantitative factors which could affect potential credit losses. An integral part of their examination process, the Federal Reserve Board will periodically review our allowance for credit losses, and as a result of such reviews, we may have to adjust our allowance for credit losses.
On January 1, 2023, the Company adopted ASU 2016-13 Financial Instruments - Credit Losses (Topic 326): Measurement of Credit Losses on Financial Instruments, as amended, which replaces the incurred loss methodology with an expected loss methodology that is referred to as the current expected credit loss (CECL) methodology. The measurement of expected credit losses under the CECL methodology is applicable to financial assets measured at amortized cost, including loan receivables and held-to-maturity debt securities. It also applies to off-balance sheet credit exposures not accounted for as insurance (loan commitments, standby letters of credit, financial guarantees, and other similar instruments) and net investments in leases recognized by the lessor in accordance with Topic 842 on leases. In addition, ASC 326 made changes to the accounting for available-for-sale debt securities. One such change is to require credit losses to be presented as an allowance rather than as a write-down on available-for-sale debt securities management does not intend to sell or believes that is not more likely than not they will be required to sell.
The Company adopted ASC 326 and all the subsequent amendments there to effective January 1, 2023 using the modified retrospective method for all financial assets measured at amortized cost, and off-balance-sheet credit exposures. Results for reporting periods beginning after January 1, 2023 are presented under ASC 326 while prior periods amounts continue to be reported in accordance with previously applicable GAAP. The Company recorded a net decrease to retained earnings of $1.7 million, net of taxes, as of January 1, 2023 for the cumulative effect of adopting ASC 326. The transition adjustment includes an increase in allowance for credit losses of $2.2 million and an increase in net deferred tax assets of $506,000.
See Note 1, Organization, Basis of Presentation, and Impact of Recently Issued Accounting Pronouncements and Note 5, Allowance for Credit Losses, in Notes to Consolidated Financial Statements for further information on the Company’s adoption of ASC 326.
The following table sets forth activity in our allowance for credit losses on loans for the periods indicated.
| For the Year Ended December 31, |
For the Year Ended December 31, |
|||||||
| 2023 |
2022 |
|||||||
| (Dollars in thousands) |
||||||||
| Balance at beginning of year |
$ | 14,114 | $ | 11,697 | ||||
| Current expected credit losses, nonrecurring adoption |
895 | — | ||||||
| Charge-offs: |
||||||||
| Commercial and industrial |
(462 | ) | — | |||||
| Consumer |
(6 | ) | — | |||||
| Total charge-offs |
(468 | ) | — | |||||
| Recoveries: |
||||||||
| Residential real estate |
7 | — | ||||||
| Consumer |
15 | 19 | ||||||
| Total recoveries |
22 | 19 | ||||||
| Net (charge-offs) recoveries |
(446 | ) | 19 | |||||
| Provision for credit losses - loans |
1,943 | 2,398 | ||||||
| Balance at end of period |
$ | 16,506 | $ | 14,114 | ||||
| Ratios: |
||||||||
| Net charge offs to average loans outstanding |
0.03 | % | 0.00 | % | ||||
| Allowance for credit losses on loans to non-performing loans at end of period |
16.44 | N/A | ||||||
| Allowance for credit losses on loans to gross loans at end of period |
0.96 | % | 0.88 | % | ||||
The following table summarizes our net charge-off activity by loan segment for the periods indicated.
| At December 31, |
||||||||||||||||||||||||||||||||
| 2023 |
2022 |
|||||||||||||||||||||||||||||||
| (Dollars in thousands) |
Charge-offs |
Recoveries |
Net charge-offs |
Net charge-offs to average loans |
Charge-offs |
Recoveries |
Net charge-offs |
Net charge-offs to average loans |
||||||||||||||||||||||||
| Real Estate: |
||||||||||||||||||||||||||||||||
| Residential |
$ | — | $ | 7 | $ | 7 | 0.0 | % | $ | — | $ | — | $ | — | 0.0 | % | ||||||||||||||||
| Commercial |
(462 | ) | — | (462 | ) | (0.5 | )% | — | — | — | 0.0 | % | ||||||||||||||||||||
| Consumer |
(6 | ) | 15 | 9 | 0.1 | % | (19 | ) | — | (19 | ) | (0.1 | )% | |||||||||||||||||||
| Total |
$ | (468 | ) | $ | 22 | $ | (446 | ) | (0.0 | )% | $ | (19 | ) | $ | — | $ | (19 | ) | (0.0 | )% | ||||||||||||
At December 31, 2023, our allowance for credit losses on loans represented 0.96% of total loans and we had only $1.0 million in non-performing loans. The allowance for credit losses on loans increased to $16.5 million at December 31, 2023 from $14.1 million at December 31, 2022 as a direct result of adopting the CECL accounting standard and normal credit provisions in conjunction with loan growth throughout the year. There were $446,000 in net loan charge-offs and $19,000 in net loan recoveries during the years ended December 31, 2023 and December 31, 2022, respectively.
Allocation of Allowance for Credit Losses on Loans. The following table sets forth the allowance for credit losses on loans allocated by loan category and the percent of the allowance in each category to the total allocated allowance on credit losses for loans at the dates indicated. The allowance for credit losses on loans allocated to each category is not necessarily indicative of future losses in any particular category and does not restrict the use of the allowance to absorb losses in other categories.
| At December 31, |
||||||||||||||||||||||||
| 2023 |
2022 |
|||||||||||||||||||||||
| (Dollars in thousands) |
Allowance for Credit Losses - Loans |
Percent of Allowance in Each Category to Total Allocated Allowance |
Percent of Loans in Each Category to Total Loans |
Allowance for Loan Losses |
Percent of Allowance in Each Category to Total Allocated Allowance |
Percent of Loans in Each Category to Total Loans |
||||||||||||||||||
| Residential Real Estate: |
||||||||||||||||||||||||
| Single family |
$ | 1,510 | 9.1 | % | 11.8 | % | $ | 1,240 | 8.8 | % | 11.2 | % | ||||||||||||
| Multifamily |
1,084 | 6.6 | % | 15.7 | % | 906 | 6.4 | % | 13.5 | % | ||||||||||||||
| Commercial Real Estate: |
||||||||||||||||||||||||
| Owner occupied |
3,393 | 20.6 | % | 16.3 | % | 2,102 | 14.9 | % | 14.3 | % | ||||||||||||||
| Non-owner occupied |
5,495 | 33.3 | % | 26.7 | % | 5,057 | 35.8 | % | 29.5 | % | ||||||||||||||
| Construction and Land Development |
3,575 | 21.7 | % | 24.9 | % | 3,347 | 23.7 | % | 24.6 | % | ||||||||||||||
| Commercial – Non Real Estate: |
||||||||||||||||||||||||
| Commercial and industrial |
1,435 | 8.7 | % | 4.4 | % | 1,418 | 10.0 | % | 6.1 | % | ||||||||||||||
| Consumer – Non Real Estate: |
||||||||||||||||||||||||
| Secured |
14 | 0.1 | % | 0.2 | % | 44 | 0.4 | % | 0.8 | % | ||||||||||||||
| Total |
$ | 16,506 | 100.0 | % | 100.0 | % | $ | 14,114 | 100.0 | % | 100.0 | % | ||||||||||||
Funding Activities
Deposits are the primary source of funds for lending and investing activities and their cost is the largest category of interest expense. The Company also utilizes wholesale deposits as a funding source in addition to customer deposits. Scheduled payments, as well as prepayments, and maturities from portfolios of loans and investment securities also provide a stable source of funds. FHLB advances, other secured borrowings, federal funds purchased, and other short-term borrowed funds, as well as longer-term debt issued through the capital markets, all provide supplemental liquidity sources. The Company’s funding activities are monitored and governed through the Company’s asset/liability management process
Deposits
Total deposits increased by $173.2 million from December 31, 2022 to December 31, 2023. Wholesale deposits, which are included in the table below, totaled $433.0 million and $355.6 million at December 31, 2023, and December 31, 2022, respectively. The following table presents the Company’s average deposits segregated by major category for the year ended December 31, 2023:
| At December 31, |
||||||||||||||||||||||||
| 2023 |
2022 |
|||||||||||||||||||||||
| Average Balance |
Percent |
Weighted Average Rate |
Average Balance |
Percent |
Weighted Average Rate |
|||||||||||||||||||
| (Dollars in thousands) |
||||||||||||||||||||||||
| Deposit type: |
||||||||||||||||||||||||
| Interest-bearing demand |
$ | 83,087 | 5.12 | % | 2.28 | % | $ | 85,566 | 5.85 | % | 0.70 | % | ||||||||||||
| Money market |
365,815 | 22.56 | % | 3.81 | % | $ | 137,066 | 9.37 | % | 1.13 | % | |||||||||||||
| Savings and NOW |
49,565 | 3.06 | % | 1.10 | % | $ | 63,401 | 4.33 | % | 0.32 | % | |||||||||||||
| Time deposits |
702,034 | 43.29 | % | 3.85 | % | $ | 642,918 | 43.94 | % | 1.28 | % | |||||||||||||
| Interest-bearing deposits |
1,200,501 | 74.03 | % | 3.61 | % | 928,951 | 63.48 | % | 1.14 | % | ||||||||||||||
| Non-interest bearing demand |
421,177 | 25.97 | % | 534,338 | 36.52 | % | ||||||||||||||||||
| Total deposits |
$ | 1,621,678 | 100.00 | % | 2.67 | % | $ | 1,463,289 | 100.00 | % | 0.72 | % | ||||||||||||
The pronounced shift from non-interest bearing demand deposits into money market demand and time deposits was driven by market conditions emanating from the large-bank failures in the first half of 2023. In order for us to maintain the customer relationships, we needed to shift the deposits into accounts where we could provide excess FDIC insurance coverage. We also gained in money market demand and time deposits as customers brought additional funds into the Company.
The Company uses wholesale deposits as a funding source in addition to customer deposits. Wholesale deposits provide a diversified and stable source of funding during times of market volatility. As of December 31, 2023, the Company had $433.0 million of total wholesale deposit funding sources, an increase of $77.5 million compared to December 31, 2022, which totaled $355.6 million.
Given the interest rate environment and strategic initiatives, the Company replaced maturing lower yielding wholesale CDs with higher market rate CDs. The replacement CDs include call options at our discretion if economic conditions changed. The Company also utilized additional wholesale demand deposits to provide liquidity and more effectively balance our interest rate sensitivity. During the year ended December 31, 2023, total wholesale deposit funding accounted for approximately 33% of our interest expense.
The following table presents the Company's total wholesale deposit composition, concentrations, current rate and remaining duration, if applicable as of December 31, 2023.
| As of December 31, |
||||||||||||||||||||||||||||||||
| 2023 |
2022 |
|||||||||||||||||||||||||||||||
| (Dollars in thousands) |
||||||||||||||||||||||||||||||||
| Wholesale Money Market Deposits Accounts (MMDA) |
Percent % |
Weighted Average Rate |
Weighted Remaining Maturity (in months) |
Percent % |
Weighted Average Rate |
Weighted Remaining Maturity (in months) |
||||||||||||||||||||||||||
| Wholesale MMDAs |
$ | 120,536 | 27.8 | % | 5.75 | % | N/A | $ | 31,036 | 8.7 | % | 4.36 | % | N/A | ||||||||||||||||||
| Wholesale Time Deposits |
||||||||||||||||||||||||||||||||
| CDARS one-way |
— | — | — | — | 240 | 0.1 | % | 2.77 | % | 12 | ||||||||||||||||||||||
| Listing Service CDs (1) |
34,481 | 8.0 | % | 4.86 | % | 5 | 37,985 | 10.7 | % | 1.54 | % | 9 | ||||||||||||||||||||
| Wholesale CDs: |
||||||||||||||||||||||||||||||||
| Term |
148,906 | 34.4 | % | 4.32 | % | 7 | 286,293 | 79.4 | % | 1.69 | % | 7 | ||||||||||||||||||||
| Term with Call Option (2) |
129,083 | 29.8 | % | 5.22 | % | 30 | — | — | — | — | ||||||||||||||||||||||
| Total Wholesale CDs |
277,989 | 286,293 | ||||||||||||||||||||||||||||||
| Total wholesale deposits |
$ | 433,006 | 100.0 | % | $ | 355,554 | 100.0 | % | ||||||||||||||||||||||||
| (1) |
Listing service CDs are excluded from being classified as wholesale deposits, per FDIC call report instructions |
| (2) | Average weighted call date is April 2024 |
Regulatory Defined Wholesale Deposits
Each quarter the Bank files a bank call report with the FDIC, which has a specific way it defines wholesale brokered deposits. As of December 31, 2023, the Company had $398.5 million of wholesale deposits outstanding, as defined by FDIC, an increase of $81 million from December 31, 2022. In addition, pursuant to rule 12 CFR 337.6(e), well-capitalized and well-rated institutions are not required to treat reciprocal deposits as wholesale deposits up to the lesser of 20 percent of their total liabilities or $5 billion. Reciprocal core deposits exceeding this threshold must be reported additionally as wholesale deposits for call report purposes only. As of December 31, 2023, the Company additionally reported $176.3 million in reciprocal deposits considered wholesale for call report purposes only, bringing regulatory defined wholesale deposits to $574.8 million as of December 31, 2023. As of December 31, 2023, all of the Company's reciprocal deposits were core deposits from customers who placed their deposits in the reciprocal network for additional FDIC insurance coverage.
At December 31, 2023, the Company had $387.8 million in total deposits in excess of the FDIC insurance limit of $250,000.
Certificates of deposit in amounts in excess of the FDIC insurance limit of $250,000 totaled approximately $99.9 million. The following table sets forth the maturity of these certificates as of December 31, 2023.
| December 31, 2023 |
||||
| (In thousands) |
||||
| Maturity period: |
||||
| Three months or less |
$ | 22,824 | ||
| Over three through six months |
9,461 | |||
| Over six through twelve months |
38,848 | |||
| Over twelve months through three years |
28,762 | |||
| Over three years |
— | |||
| Total |
$ | 99,895 | ||
The following table sets forth all of our time deposits classified by interest rate as of the dates indicated.
| At December 31, |
||||||||
| 2023 |
2022 |
|||||||
| (In thousands) |
||||||||
| Interest Rate Range: |
||||||||
| 0.01 – 0.99% |
$ | 6,354 | $ | 260,427 | ||||
| 1.00 – 1.99% |
71,544 | 94,188 | ||||||
| 2.00 – 2.99% |
74,245 | 129,629 | ||||||
| 3.00 – 3.99% |
40,392 | 119,059 | ||||||
| 4.00 – 4.99% |
123,178 | 4,838 | ||||||
| 5.00 and greater |
380,623 | — | ||||||
| Total |
$ | 696,336 | $ | 608,141 | ||||
The following table sets forth by interest rate ranges information concerning the maturities of our certificates of deposit as of December 31, 2023.
| Period to Maturity |
||||||||||||||||||||||||
| Less Than or Equal to One Year |
More Than One to Two Years |
More Than Two to Three Years |
More Than Three Years |
Total |
Percent of Total Certificate Accounts |
|||||||||||||||||||
| (Dollars in thousands) |
||||||||||||||||||||||||
| Interest Rate Range: |
||||||||||||||||||||||||
| 0.01 – 0.99% |
$ | 5,766 | $ | 587 | $ | 1 | $ | — | $ | 6,354 | 0.9 | % | ||||||||||||
| 1.00 – 1.99% |
4,009 | 67,535 | — | — | 71,544 | 10.3 | % | |||||||||||||||||
| 2.00 – 2.99% |
73,205 | 1,039 | 1 | — | 74,245 | 10.7 | % | |||||||||||||||||
| 3.00 – 3.99% |
37,562 | 2,330 | 500 | — | 40,392 | 5.8 | % | |||||||||||||||||
| 4.00 – 4.99% |
121,832 | 1,056 | 290 | — | 123,178 | 17.7 | % | |||||||||||||||||
| 5.00 and greater |
221,328 | 40,766 | 43,698 | 74,831 | 380,623 | 54.7 | % | |||||||||||||||||
| Total |
$ | 463,702 | $ | 113,313 | $ | 44,490 | $ | 74,831 | $ | 696,336 | 100.0 | % | ||||||||||||
Borrowed Funds
We may obtain advances from the Federal Home Loan Bank of Richmond upon the security of the common stock we own in that bank and certain of our residential and commercial mortgage loans, provided certain standards related to creditworthiness have been met. These advances are made pursuant to several credit programs, each of which has its own interest rate and range of maturities. Federal Home Loan Bank advances are generally available to meet seasonal and other withdrawals of deposit accounts and to permit increased lending.
At December 31, 2023 and 2022, we were permitted to borrow up to an aggregate total of $504.8 million and $465.0 million, respectively, from the Federal Home Loan Bank of Richmond. There were Federal Home Loan Bank borrowings outstanding of $0 and $100.0 million at December 31, 2023, and December 31, 2022, respectively. Additionally, we had credit availability of $114.0 million with correspondent banks for short-term liquidity needs, if necessary. Borrowings were $15.0 million and $0 outstanding at December 31, 2023 and 2022, respectively, under this facility.
Liquidity and Capital Resources
Liquidity is the ability of the Company to convert assets into cash or cash equivalents without significant loss and to raise additional funds by increasing liabilities. Liquidity management involves maintaining the Company’s ability to meet the day-to-day cash flow requirements of its customers, whether they are depositors wishing to withdraw funds or borrowers requiring funds to meet their credit needs. Without proper liquidity management, the Company would not be able to perform the primary function of a financial intermediary and would, therefore, not be able to meet the needs of the communities it serves.
The Company assesses liquidity needs on a daily basis using a sophisticated monitoring system that identifies daily sources and uses for a rolling 30-day period. The Company also assesses liquidity needs under various scenarios of market conditions, asset growth and changes in credit ratings. The assessment includes liquidity stress testing which measures various sources and uses of funds under the different scenarios. The assessment provides regular monitoring of unused borrowing capacity and available sources of contingent liquidity to prepare for unexpected liquidity needs and to cover unanticipated events that could affect liquidity.
The asset portion of the balance sheet provides liquidity primarily through unencumbered debt securities available for sale, loan principal and interest payments, maturities and prepayments of investment securities held to maturity and, to a lesser extent, sales of investment debt securities available for sale. Other short-term investments such as federal funds sold and maturing interest-bearing deposits with other banks, are additional sources of liquidity.
The liability portion of the balance sheet provides liquidity through various customers’ interest-bearing and noninterest-bearing deposit accounts and through FHLB and other borrowings. Wholesale deposits, federal funds purchased, and other short-term borrowings are additional sources of liquidity and, basically, represent the Company’s incremental borrowing capacity. These sources of liquidity are used as necessary to fund asset growth and meet short-term liquidity needs.
In addition to the Company’s financial performance and condition, liquidity may be impacted by the Company’s structure as a bank holding company that is a separate legal entity from the Bank. The Company requires cash for various operating needs that could include payment of dividends to its stockholders, the servicing of debt, and the payment of general corporate expenses. The primary source of liquidity for the Company is dividends paid by the Bank. Applicable federal and state statutes and regulations impose restrictions on the amount of dividends that may be paid by the Bank. In addition to the formal statutes and regulations, regulatory authorities also consider the adequacy of the Bank’s total capital in relation to its assets, deposits and other such items. Any future dividends must be set forth in the Company's capital plans before any dividends can be paid.
The Company’s ability to raise funding at competitive prices is affected by the rating agencies’ views of the Company’s credit quality, liquidity, capital and earnings. Management is rated by an independent rating agency annually and is provided with independent current outlook for the Company.
The Board of Director's and the Asset Liability Committee (ALCO) are responsible for establishing and monitoring our liquidity targets and strategies in order to ensure that sufficient liquidity exists for meeting the borrowing needs and deposit withdrawals of our customers as well as unanticipated contingencies. We believe that we have enough sources of liquidity to satisfy our short and long-term liquidity needs as of December 31, 2023.
We monitor and adjust our investments in liquid assets based upon our assessment of: (1) expected loan demand; (2) expected deposit flows; (3) yields available on interest-earning deposits and securities; and (4) the objectives of our asset/liability management program. Excess liquid assets are invested generally in interest-earning deposits and short-and intermediate-term securities.
While maturities and scheduled amortization of loans and securities are predictable sources of funds, deposit flows and loan prepayments are greatly influenced by general interest rates, economic conditions, and competition. Our most liquid assets are cash and cash equivalents, which include federal funds sold and interest-earning deposits in other banks. The levels of these assets are dependent on our operating, financing, lending and investing activities during any given period. At December 31, 2023, cash and cash equivalents totaled $114.5 million. Securities classified as available-for-sale, which provide additional sources of liquidity, totaled $59.9 million at December 31, 2023.
Our cash flows are comprised of three primary classifications: cash flows from operating activities, investing activities, and financing activities. Net cash provided by operating activities was $31.6 million and $33.5 million for the twelve months ended December 31, 2023, and December 31, 2022, respectively. Net cash used in investing activities, which consists primarily of disbursements for loan originations and the purchase of securities, offset by principal collections on loans and proceeds from maturing securities, was $130.7 million and $228.7 million for the twelve months ended December 31, 2023, and December 31, 2022, respectively. There were no sales of available-for-sale debt securities in 2023 or 2022. Net cash provided by financing activities was $83.0 million and $232.6 million for the twelve months ended December 31, 2023 and 2022, respectively, which consisted primarily of increases in interest bearing deposits and federal funds purchased for the twelve months ended December 31, 2023. There were repayments of $100.0 million to the Federal Home Loan Bank for year ended 2023.
We are committed to maintaining a strong liquidity position. We monitor our liquidity position on a daily basis. We anticipate that we will have sufficient funds to meet our current funding commitments. Certificates of deposit due within one year of December 31, 2023, totaled $463.7 million of total deposits. If these deposits do not remain with us, we will be required to seek other sources of funds in the normal course of business, including other deposits and Federal Home Loan Bank advances. Depending on market conditions, we may be required to pay higher rates on such deposits or borrowings than we currently pay. We believe, however, based on past experience that a significant portion of such deposits will remain with us. We have the ability to attract and retain deposits by adjusting the interest rates offered. Management believes that the current sources of liquidity are adequate to meet the Company’s requirements and plans for continued growth.
Regulatory Capital
The Bank is subject to various regulatory capital requirements administered by the federal banking agencies. Failure to meet minimum capital requirements can initiate certain mandatory and possible additional discretionary actions by regulators that, if undertaken, could have a direct material effect on the Company’s consolidated financial statements. Under capital adequacy guidelines and the regulatory framework for prompt corrective action, the Bank must meet specific capital guidelines that involve quantitative measures of assets, liabilities, and certain off-balance sheet items as calculated under regulatory accounting practices. The capital amounts and classifications are also subject to qualitative judgments by the regulators about components, risk weightings and other factors.
The federal regulatory capital rules apply to all depository institutions as well as to bank holding companies with consolidated assets of $3 billion or more. However, the regulatory capital requirements generally do not apply on a consolidated basis to a bank holding company with total consolidated assets of less than $3 billion unless the holding company: (1) is engaged in significant nonbanking activities either directly or through a nonbank subsidiary; (2) conducts significant off-balance sheet activities (including securitization and asset management or administration) either directly or through a nonbank subsidiary; or (3) has a material amount of debt or equity securities outstanding (other than trust preferred securities) that are registered with the Securities and Exchange Commission. The Federal Reserve may apply the regulatory capital standards at its discretion to any bank holding company, regardless of asset size, if such action is warranted for supervisory purposes.
Because the Company has total consolidated assets of less than $3 billion and does not engage in activities that would trigger application of the federal regulatory capital rules, it is not at present subject to consolidated capital requirements under such rules.
The Basel III Capital Rules, a comprehensive capital framework for U.S. banking organizations, became effective for the Bank on January 1, 2015 (subject to a phase-in period for certain provisions). Under the Basel III rules, the Bank must hold a capital conservation buffer above the adequately capitalized risk-based capital ratios. The capital conservation buffer was phased in from 0.0% for 2015 to 2.50% by 2019. The capital conservation buffer for 2023 and 2022 is 2.50%. Quantitative measures established by regulation to ensure capital adequacy require the Bank to maintain minimum amounts and ratios of Total capital, Common Equity Tier 1 capital, and Tier 1 capital (as defined in the regulations) to risk weighted assets (as defined), and of Tier 1 capital (as defined) to average assets (as defined). Management believes, as of December 31, 2023, the Bank meets all capital adequacy requirements to which it is subject.
As of December 31, 2023 and 2022, the most recent notification from the Federal Reserve Bank of Richmond categorized the Bank as well capitalized under the regulatory framework for prompt corrective action. To be categorized as well capitalized, the Bank must maintain minimum total risk-based, Common Equity Tier 1 risk-based, Tier 1 risk-based, and Tier 1 leverage ratios as set forth in the following table. There are no conditions or events since that notification that management believes have changed the Bank’s category.
The Bank’s actual regulatory capital amounts and ratios as of December 31, 2023 and 2022 are presented in the table below.
| Actual |
Capital Adequacy Purposes |
To Be Well Capitalized Under the Prompt Corrective Action Provision |
||||||||||||||||||||||
| (Dollars in thousands) |
Amount |
Ratio |
Amount |
Ratio |
Amount |
Ratio |
||||||||||||||||||
| As of December 31, 2023 |
||||||||||||||||||||||||
| Total capital (to risk-weighted assets) |
$ | 312,069 | 17.18 | % | $ | 145,300 | ≥ 8.0% | $ | 181,625 | ≥ 10.0% | ||||||||||||||
| Common equity tier 1 capital (to risk-weighted assets) |
$ | 294,553 | 16.22 | % | $ | 81,731 | ≥ 4.5% | $ | 118,056 | ≥ 6.5% | ||||||||||||||
| Tier 1 capital (to risk-weighted assets) |
$ | 294,553 | 16.22 | % | $ | 108,975 | ≥ 6.0% | $ | 145,300 | ≥ 8.0% | ||||||||||||||
| Tier 1 capital (to average assets) |
$ | 294,553 | 14.66 | % | $ | 80,375 | ≥ 4.0% | $ | 100,469 | ≥ 5.0% | ||||||||||||||
| As of December 31, 2022 |
||||||||||||||||||||||||
| Total capital (to risk-weighted assets) |
$ | 286,572 | 16.27 | % | $ | 140,929 | ≥ 8.0% | $ | 176,161 | ≥ 10.0% | ||||||||||||||
| Common equity tier 1 capital (to risk-weighted assets) |
$ | 272,458 | 15.47 | % | $ | 79,272 | ≥ 4.5% | $ | 114,504 | ≥ 6.5% | ||||||||||||||
| Tier 1 capital (to risk-weighted assets) |
$ | 272,458 | 15.47 | % | $ | 105,696 | ≥ 6.0% | $ | 140,929 | ≥ 8.0% | ||||||||||||||
| Tier 1 capital (to average assets) |
$ | 272,458 | 15.05 | % | $ | 72,435 | ≥ 4.0% | $ | 90,544 | ≥ 5.0% | ||||||||||||||
Non-GAAP Measures
In reporting the results of December 31, 2023, the Company has provided supplemental performance measures on an operating basis. These measures are a supplement to GAAP used to prepare the Company’s financial statements and should not be considered in isolation or as a substitute for comparable measures calculated in accordance with GAAP. In addition, the Company’s non-GAAP measures may not be comparable to non-GAAP measures of other companies. The Company uses the non-GAAP measures discussed herein in its analysis of the Company’s performance.
Net interest margin on a fully tax equivalent (FTE) basis, provides valuable additional insight into the net interest margin and the impact that investments in tax-exempt securities have on our financial metrics. The entire FTE adjustment is attributable to the interest tax effect on tax-exempt securities, using the statutory federal income tax rate of 21%.
The Company believes that tangible common stockholders' equity, excluding intangible assets, is a meaningful supplement to GAAP financial measures and useful to investors because it provides an additional measure to calculate the book value of our common shares by removing the value of a subjective portion of our balance sheet.
The following table reconciles these non-GAAP measures from their respective GAAP basis measures for the years ended December 31,
| For the year ended December 31, |
||||||||
| (Dollars in thousands) |
2023 |
2022 |
||||||
| Net interest margin (FTE) |
||||||||
| Net interest income (GAAP) |
$ | 75,947 | $ | 70,009 | ||||
| FTE adjustment on tax-exempt securities |
283 | 281 | ||||||
| Net interest income (FTE) (non-GAAP) |
76,230 | 70,290 | ||||||
| Average interest earning assets |
$ | 1,869,644 | 1,676,649 | |||||
| Net interest margin (GAAP) |
4.06 | % | 4.18 | % | ||||
| Net interest margin (FTE) (non-GAAP) |
4.08 | % | 4.19 | % | ||||
| Stockholders' equity, adjusted |
||||||||
| Total stockholders' equity (GAAP) |
$ | 221,517 | $ | 198,282 | ||||
| Less: preferred stock |
(27,263 | ) | (27,263 | ) | ||||
| Total common stockholders' equity (GAAP) |
194,254 | 171,019 | ||||||
| Less: intangible assets |
14,657 | 9,149 | ||||||
| Tangible common stockholders' equity (non-GAAP) |
179,597 | 161,870 | ||||||
| Shares outstanding |
7,527,415 | 7,442,743 | ||||||
| Tangible book value per common share (non-GAAP) |
$ | 23.86 | $ | 21.75 | ||||
| Yield on earning assets (FTE) |
||||||||
| Total interest income |
124,123 | 83,845 | ||||||
| FTE adjustment on tax-exempt securities |
283 | 281 | ||||||
| Total interest income (FTE) (non-GAAP) |
124,406 | 84,126 | ||||||
| Average interest earning assets |
1,869,644 | 1,676,649 | ||||||
| Yield on earning assets (GAAP) |
6.64 | % | 5.00 | % | ||||
| Yield on earning assets (FTE) (non-GAAP) |
6.65 | % | 5.02 | % | ||||
| Net interest spread (FTE) |
||||||||
| Yield on earning assets (GAAP) |
6.64 | % | 5.00 | % | ||||
| Yield on earning assets (FTE) (non-GAAP) |
6.65 | % | 5.02 | % | ||||
| Yield on interest-bearing liabilities |
3.70 | % | 1.36 | % | ||||
| Net interest spread (GAAP) |
2.94 | % | 3.64 | % | ||||
| Net interest spread (FTE) (non-GAAP) |
2.95 | % | 3.66 | % | ||||
Item 7A. Quantitative and Qualitative Disclosures about Market Risk
Market Risk Management
The effective management of market risk is essential to achieving the Company’s strategic financial objectives. As a financial institution, the Company’s most significant market risk exposure is interest rate risk in its balance sheet; however, market risk also includes product liquidity risk, price risk and volatility risk in the Company’s lines of business. The primary objectives of market risk management are to minimize any adverse effect that changes in market risk factors may have on net interest income, and to offset the risk of price changes for certain assets recorded at fair value.
Interest Rate Market Risk
The Company’s net interest income and the fair value of its financial instruments are influenced by changes in the level of interest rates. The Company manages its exposure to fluctuations in interest rates through policies established by its Asset/Liability Committee. The Asset/Liability Committee meets regularly and has responsibility for approving asset/liability management policies, formulating strategies to improve balance sheet positioning and/or earnings and reviewing the interest rate sensitivity of the Company.
We estimate what our net interest income would be for a 12-month period. We then calculate what the net interest income would be for the same period under different interest rate assumptions. These estimates require certain assumptions to be made, including loan and mortgage-related investment prepayment speeds, reinvestment rates, and deposit maturity and decay rates. These assumptions are inherently uncertain. As a result, no simulation model can precisely predict the impact of changes in interest rates on our net interest income.
The table below sets forth, as of December 31, 2023, the calculation of the estimated changes in our net interest income that would result from changes in market interest rates over one year if we take no action from our current plan.
| Basis Point Change in |
Net Interest Income |
Year 1 Change |
|
| Interest Rates |
Year 1 Forecast |
From Level |
|
| (Dollars in thousands) |
|||
| +400 | $92,535 | 13.39 | % |
| +300 | $90,605 | 11.03 | % |
| +200 | $87,899 | 7.71 | % |
| +100 | $85,257 | 4.47 | % |
| Level | $81,606 | — | |
| -100 | $79,000 | -3.19 | % |
| -200 | $77,003 | -5.64 | % |
| -300 | $77,484 | -5.05 | % |
| -400 | $77,651 | -4.85 | % |
Economic Value of Equity (“EVE”). We analyze the sensitivity of our financial condition to changes in interest rates through our economic value of equity model. This analysis measures the difference between predicted changes in the fair value of our assets and predicted changes in the present value of our liabilities assuming various changes in current interest rates. The table below represents an analysis of our interest rate risk as measured by the estimated changes in our economic value of equity, resulting from an instantaneous and sustained parallel shift in the yield curve at December 31, 2023.
| Estimated Increase |
EVE as a Percentage of Fair |
||||||||||||||||||||
| (Decrease) EVE |
Value of Assets(3) |
||||||||||||||||||||
| Basis Point |
Increase |
||||||||||||||||||||
| Change in |
Estimated |
EVE |
(Decrease) |
||||||||||||||||||
| Interest Rates(1) |
EVE(2) |
Amount |
Percent |
Ratio(4) |
Basis Points |
||||||||||||||||
| (Dollars in thousands) |
|||||||||||||||||||||
| +400 | $ | 294,780 | $ | (27,244 | ) | (8.46 | )% | (1.56 | )% | (25 | ) | ||||||||||
| +300 | $ | 310,606 | $ | (11,418 | ) | (3.55 | )% | 1.54 | % | 25 | |||||||||||
| +200 | $ | 320,330 | $ | (1,693 | ) | (0.53 | )% | 2.75 | % | 44 | |||||||||||
| +100 | $ | 324,404 | $ | 2,381 | 0.74 | % | 2.29 | % | 36 | ||||||||||||
| Level | $ | 322,023 | $ | — | — | — | — | ||||||||||||||
| -100 | $ | 310,856 | $ | (11,168 | ) | (3.47 | )% | (4.72 | )% | (75 | ) | ||||||||||
| -200 | $ | 298,600 | $ | (23,424 | ) | (7.27 | )% | (9.72 | )% | (155 | ) | ||||||||||
| -300 | $ | 285,318 | $ | (36,705 | ) | (11.40 | )% | (15.01 | )% | (239 | ) | ||||||||||
| -400 | $ | 270,550 | $ | (51,473 | ) | (15.98 | )% | (20.67 | )% | (329 | ) | ||||||||||
| (1) |
Assumes an immediate uniform change in interest rates at all maturities. |
| (2) |
EVE is the fair value of expected cash flows from assets, less fair value of the expected cash flows arising from our liabilities adjusted for the value of off-balance sheet contracts. |
| (3) |
Fair value of assets represents the amount at which an asset could be exchanged between knowledgeable and willing parties in an arms-length transaction. |
| (4) |
EVE Ratio represents EVE divided by the fair value of assets. |
Market Interest Rate Shift
The financial statements and related data presented herein have been prepared in accordance with generally accepted accounting principles in the United States of America which require the measurement of financial position and operating results in terms of historical dollars without considering changes in relative purchasing power of money over time due to inflation.
The majority of assets and liabilities of a financial institution are monetary in nature; therefore, a financial institution differs greatly from most commercial and industrial companies, which have significant investments in fixed assets or inventories that are greatly impacted by inflation. However, inflation does have an important impact on the growth of total assets in the banking industry and the resulting need to increase equity capital at higher than normal rates in order to maintain an appropriate equity-to-assets ratio. Inflation also affects other expenses that tend to rise during periods of general inflation.
Management believes the most significant potential impact of inflation on financial results is a direct result of the Company’s ability to manage the impact of changes in interest rates. Management attempts to maintain a balanced position between rate-sensitive assets and liabilities in order to minimize the impact of interest rate fluctuations on net interest income. However, this goal can be difficult to completely achieve in times of rapidly changing interest rates and is one of many factors considered in determining the Company’s interest rate positioning. The Company is asset sensitive as of December 31, 2023. Refer to the Net Interest Income Sensitivity table for additional details on the Company’s interest rate sensitivity.
The Bank also uses derivative financial instruments to manage risk to the Bank associated with changing interest rates, and to assist customers with their risk management objectives. The Bank enters into interest rate swaps with certain qualifying commercial loan customers to meet their interest rate risk management needs. The net result of these interest rate swaps is that the customer pays a fixed rate of interest and the Bank receives a floating rate thus allowing the Bank another tool to further manage the interest rate risk for certain products. These back-to-back loan swaps qualify as financial derivatives with fair values reported in “Other assets” and “Other liabilities” in the Consolidated Statement of Financial Condition.
We believe that our current interest rate exposure is manageable and does not indicate any significant exposure to interest rate changes.
Item 8. Financial Statements and Supplementary Data

REPORT OF INDEPENDENT REGISTERED PUBLIC ACCOUNTING FIRM
To the Stockholders and the Board of Directors
MainStreet Bancshares, Inc.
Fairfax, Virginia
Opinion on the Financial Statements
We have audited the accompanying consolidated statements of financial condition of MainStreet Bancshares, Inc. and Subsidiary (the Company) as of December 31, 2023 and 2022, the related consolidated statements of income, comprehensive income, stockholders' equity and cash flows for the years then ended, and the related notes to the consolidated financial statements (collectively, the financial statements). In our opinion, the financial statements present fairly, in all material respects, the financial position of the Company as of December 31, 2023 and 2022, and the results of its operations and its cash flows for the years then ended, in conformity with accounting principles generally accepted in the United States of America.
Adoption of New Accounting Standard
As discussed in Notes 1 and 5 to the consolidated financial statements, the Company changed its method of accounting for the allowance for credit losses effective January 1, 2023, due to the adoption of Accounting Standards Update 2016-13, Financial Instruments – Credit Losses (Topic 326), Measurement of Credit Losses on Financial Instruments, including all related amendments.
Basis for Opinion
These financial statements are the responsibility of the Company’s management. Our responsibility is to express an opinion on the Company’s financial statements based on our audits. We are a public accounting firm registered with the Public Company Accounting Oversight Board (United States) (PCAOB) and are required to be independent with respect to the Company in accordance with U.S. federal securities laws and the applicable rules and regulations of the Securities and Exchange Commission and the PCAOB.
We conducted our audits in accordance with the standards of the PCAOB. Those standards require that we plan and perform the audits to obtain reasonable assurance about whether the financial statements are free of material misstatement, whether due to error or fraud. The Company is not required to have, nor were we engaged to perform, an audit of its internal control over financial reporting. As part of our audits, we are required to obtain an understanding of internal control over financial reporting but not for the purpose of expressing an opinion on the effectiveness of the Company’s internal control over financial reporting. Accordingly, we express no such opinion.
Our audits included performing procedures to assess the risks of material misstatement of the financial statements, whether due to error or fraud, and performing procedures that respond to those risks. Such procedures included examining, on a test basis, evidence regarding the amounts and disclosures in the financial statements. Our audits also included evaluating the accounting principles used and significant estimates made by management, as well as evaluating the overall presentation of the financial statements. We believe that our audits provide a reasonable basis for our opinion.
/s/ YOUNT, HYDE & BARBOUR, P.C.
We have served as the Company's auditor since 2008.
Owings Mills, Maryland
March 20, 2024
Item 8 – Financial Statements and Supplementary Data
Consolidated Financial Statements
Consolidated Statements of Financial Condition as of December 31, 2023 and December 31, 2022 (Dollars in thousands, except per share data)
| At December 31, 2023 |
At December 31, 2022 |
|||||||
| Assets |
||||||||
| Cash and due from banks |
$ | 53,581 | $ | 48,931 | ||||
| Federal funds sold |
60,932 | 81,669 | ||||||
| Cash and cash equivalents |
114,513 | 130,600 | ||||||
| Investment securities available-for-sale, at fair value |
59,928 | 62,631 | ||||||
| Investment securities held-to-maturity, at amortized cost, net of allowance for credit losses of $0 and $0, respectively. |
17,275 | 17,642 | ||||||
| Restricted securities, at amortized cost |
24,356 | 24,325 | ||||||
| Loans, net of allowance for credit losses of $16,506 and $14,114, respectively |
1,705,137 | 1,579,950 | ||||||
| Premises and equipment, net |
13,944 | 14,709 | ||||||
| Accrued interest and other receivables |
12,390 | 9,581 | ||||||
| Computer software, net of amortization |
14,657 | 9,149 | ||||||
| Bank owned life insurance |
38,318 | 37,249 | ||||||
| Other assets |
34,914 | 39,915 | ||||||
| Total Assets |
$ | 2,035,432 | $ | 1,925,751 | ||||
| Liabilities and Stockholders’ Equity |
||||||||
| Liabilities |
||||||||
| Non-interest bearing deposits |
$ | 364,606 | $ | 550,690 | ||||
| Interest bearing demand deposits |
137,128 | 80,099 | ||||||
| Savings and NOW deposits |
45,878 | 51,419 | ||||||
| Money market deposits |
442,179 | 222,540 | ||||||
| Time deposits |
696,336 | 608,141 | ||||||
| Total deposits |
1,686,127 | 1,512,889 | ||||||
| Federal funds purchased |
15,000 | — | ||||||
| Federal Home Loan Bank advances |
— | 100,000 | ||||||
| Subordinated debt, net |
72,642 | 72,245 | ||||||
| Allowance for credit losses on off-balance sheet credit exposure |
1,009 | — | ||||||
| Other liabilities |
39,137 | 42,335 | ||||||
| Total Liabilities |
1,813,915 | 1,727,469 | ||||||
| Commitments and contingencies (Note 13) |
||||||||
| Stockholders’ Equity |
||||||||
| Preferred stock, $1.00 par value, 2,000,000 shares authorized non-cumulative perpetual; 28,750 issued and outstanding as of December 31, 2023 and December 31, 2022 |
27,263 | 27,263 | ||||||
| Common stock, $4.00 par value, 10,000,000 shares authorized; issued and outstanding 7,527,415 shares (including 228,300 nonvested shares) for December 31, 2023 and 7,442,743 shares (including 259,036 nonvested shares) for December 31, 2022 |
29,198 | 28,736 | ||||||
| Capital surplus |
65,985 | 63,999 | ||||||
| Retained earnings |
106,549 | 86,830 | ||||||
| Accumulated other comprehensive income (loss) |
(7,478 | ) | (8,546 | ) | ||||
| Total Stockholders’ Equity |
221,517 | 198,282 | ||||||
| Total Liabilities and Stockholders’ Equity |
$ | 2,035,432 | $ | 1,925,751 | ||||
See Notes to the Consolidated Financial Statements
Consolidated Statements of Income for the Years Ended December 31, 2023 and 2022 (Dollars in thousands, except per share data).
| For the Year Ended December 31, |
||||||||
| 2023 |
2022 |
|||||||
| Interest Income |
||||||||
| Interest and fees on loans |
$ | 116,184 | $ | 78,872 | ||||
| Interest and dividends on investments securities |
||||||||
| U.S. government agencies and corporations |
— | 37 | ||||||
| Mortgage-backed securities |
395 | 438 | ||||||
| Tax-exempt obligations of states and political subdivisions |
1,065 | 1,058 | ||||||
| Taxable obligations of states and political subdivisions |
256 | 254 | ||||||
| Other |
1,185 | 874 | ||||||
| Interest on federal funds sold |
5,038 | 2,312 | ||||||
| Total Interest Income |
124,123 | 83,845 | ||||||
| Interest Expense |
||||||||
| Interest on interest bearing DDA deposits |
1,892 | 601 | ||||||
| Interest on savings and NOW deposits |
546 | 203 | ||||||
| Interest on money market deposits |
13,924 | 1,547 | ||||||
| Interest on time deposits |
27,003 | 8,202 | ||||||
| Interest on federal fund purchases |
299 | — | ||||||
| Interest on Federal Home Loan Bank advances |
1,224 | 347 | ||||||
| Interest on subordinated debt |
3,288 | 2,936 | ||||||
| Total Interest Expense |
48,176 | 13,836 | ||||||
| Net Interest Income |
75,947 | 70,009 | ||||||
| Provision For Credit Losses - Loans |
1,943 | 2,398 | ||||||
| Recovery of Credit Losses - Off-Balance Sheet Credit Exposure |
(301 | ) | — | |||||
| Net interest income after provision for (recovery of) credit losses |
74,305 | 67,611 | ||||||
| Non-Interest Income |
||||||||
| Deposit account service charges |
2,149 | 2,420 | ||||||
| Bank owned life insurance income |
1,069 | 1,008 | ||||||
| Loan swap fee income |
— | 619 | ||||||
| Net gain on held-to-maturity securities |
— | 4 | ||||||
| Net loss on sale of loans |
— | (168 | ) | |||||
| Other fee income |
420 | 951 | ||||||
| Total Non-Interest Income |
3,638 | 4,834 | ||||||
| Non-Interest Expense |
||||||||
| Salaries and employee benefits |
28,267 | 23,801 | ||||||
| Furniture and equipment expenses |
2,787 | 2,786 | ||||||
| Advertising and marketing |
2,343 | 2,304 | ||||||
| Occupancy expenses |
1,684 | 1,471 | ||||||
| Outside services |
2,044 | 2,075 | ||||||
| Franchise tax |
1,835 | 1,430 | ||||||
| FDIC insurance |
1,131 | 637 | ||||||
| Data processing |
1,328 | 1,303 | ||||||
| Administrative expenses |
922 | 872 | ||||||
| Other real estate expenses, net |
— | 38 | ||||||
| Other operating expenses |
2,778 | 2,340 | ||||||
| Total Non-Interest Expense |
45,119 | 39,057 | ||||||
| Income before income taxes |
32,824 | 33,388 | ||||||
| Income Tax Expense |
6,239 | 6,714 | ||||||
| Net Income |
$ | 26,585 | $ | 26,674 | ||||
| Preferred Stock Dividends |
2,156 | 2,156 | ||||||
| Net Income available to common shareholders |
$ | 24,429 | $ | 24,518 | ||||
| Earnings per common share: |
||||||||
| Basic |
$ | 3.25 | $ | 3.26 | ||||
| Diluted |
$ | 3.25 | $ | 3.26 | ||||
See Notes to the Consolidated Financial Statements
Consolidated Statements of Comprehensive Income for the Years Ended December 31, 2023 and 2022 (Dollars in thousands)
| For the Year Ended December 31, |
||||||||
| 2023 |
2022 |
|||||||
| Comprehensive Income, net of taxes |
||||||||
| Net Income |
$ | 26,585 | $ | 26,674 | ||||
| Other comprehensive gain (loss), net of tax expense (benefit): |
||||||||
| Unrealized gains (losses) on available for sale securities arising during the period (net of tax expense (benefit), $309 and ($2.6 million), respectively) |
1,062 | (8,759 | ) | |||||
| Add: reclassification adjustment for amortization of unrealized losses on securities transferred from available for sale to held to maturity (net of tax, $2 and $4, respectively) |
6 | 16 | ||||||
| Other comprehensive gain (loss) |
1,068 | (8,743 | ) | |||||
| Comprehensive Income |
$ | 27,653 | $ | 17,931 | ||||
See Notes to the Consolidated Financial Statements
Consolidated Statements of Stockholders’ Equity for the Years Ended December 31, 2023 and 2022 (Dollars in thousands).
| Accumulated Other |
||||||||||||||||||||||||
| Preferred |
Common |
Capital |
Retained |
Comprehensive |
||||||||||||||||||||
| Stock |
Stock |
Surplus |
Earnings |
Income (Loss) |
Total |
|||||||||||||||||||
| Balance, December 31, 2022 |
$ | 27,263 | $ | 28,736 | $ | 63,999 | $ | 86,830 | $ | (8,546 | ) | $ | 198,282 | |||||||||||
| Cumulative change in accounting principle (Note 3) |
— | — | — | (1,699 | ) | — | (1,699 | ) | ||||||||||||||||
| Vesting of restricted stock |
— | 470 | (470 | ) | — | — | — | |||||||||||||||||
| Stock based compensation expense |
— | — | 2,491 | — | — | 2,491 | ||||||||||||||||||
| Common stock repurchased |
— | (8 | ) | (35 | ) | — | — | (43 | ) | |||||||||||||||
| Dividends on preferred stock - ($0.47 per depositary share) |
— | — | — | (2,156 | ) | — | (2,156 | ) | ||||||||||||||||
| Dividends on common stock - ($0.40 per share) |
— | — | — | (3,011 | ) | — | (3,011 | ) | ||||||||||||||||
| Net income |
— | — | — | 26,585 | — | 26,585 | ||||||||||||||||||
| Other comprehensive gain |
— | — | — | — | 1,068 | 1,068 | ||||||||||||||||||
| Balance, December 31, 2023 |
$ | 27,263 | $ | 29,198 | $ | 65,985 | $ | 106,549 | $ | (7,478 | ) | $ | 221,517 | |||||||||||
| Accumulated Other |
||||||||||||||||||||||||
| Preferred |
Common |
Capital |
Retained |
Comprehensive |
||||||||||||||||||||
| Stock |
Stock |
Surplus |
Earnings |
Income (Loss) |
Total |
|||||||||||||||||||
| Balance, December 31, 2021 |
$ | 27,263 | $ | 29,466 | $ | 67,668 | $ | 64,194 | $ | 197 | $ | 188,788 | ||||||||||||
| Vesting of restricted stock |
— | 407 | (407 | ) | — | — | — | |||||||||||||||||
| Stock based compensation expense |
— | — | 2,519 | — | — | 2,519 | ||||||||||||||||||
| Common stock repurchased |
— | (1,137 | ) | (5,781 | ) | — | — | (6,918 | ) | |||||||||||||||
| Dividends on preferred stock - ($0.47 per depositary share) |
— | — | — | (2,156 | ) | — | (2,156 | ) | ||||||||||||||||
| Dividends on common stock - ($0.25 per share) |
— | — | — | (1,882 | ) | — | (1,882 | ) | ||||||||||||||||
| Net income |
— | — | — | 26,674 | — | 26,674 | ||||||||||||||||||
| Other comprehensive loss |
— | — | — | — | (8,743 | ) | (8,743 | ) | ||||||||||||||||
| Balance, December 31, 2022 |
$ | 27,263 | $ | 28,736 | $ | 63,999 | $ | 86,830 | $ | (8,546 | ) | $ | 198,282 | |||||||||||
See Notes to the Consolidated Financial Statements
Consolidated Statements of Cash Flows (Dollars in thousands)
| Year Ended December 31, |
2023 |
2022 |
||||||
| Cash Flows from Operating Activities |
||||||||
| Net income |
$ | 26,585 | $ | 26,674 | ||||
| Adjustments to reconcile net income to net cash provided by operating activities: |
||||||||
| Depreciation, amortization, and accretion, net |
2,268 | 2,083 | ||||||
| Amortization of right-of-use assets |
477 | 496 | ||||||
| Deferred income tax benefit |
(191 | ) | (894 | ) | ||||
| Loss on sale of other real estate owned |
— | 4 | ||||||
| Loss on valuation of other real estate owned |
— | 70 | ||||||
| Loss on loans held for sale |
— | 168 | ||||||
| Loss on New Market Tax Credit investment operations |
251 | — | ||||||
| Gain on disposal of premises and equipment |
(129 | ) | — | |||||
| Gain on called held-to-maturity securities |
— | (4 | ) | |||||
| Provision for credit losses, net |
1,642 | 2,398 | ||||||
| Stock based compensation expense |
2,491 | 2,519 | ||||||
| Income from bank owned life insurance |
(1,069 | ) | (1,008 | ) | ||||
| Subordinated debt amortization expense |
397 | 328 | ||||||
| Change in: |
||||||||
| Accrued interest receivable and other receivables |
(2,803 | ) | (1,861 | ) | ||||
| Other assets |
4,912 | (22,407 | ) | |||||
| Other liabilities |
(3,198 | ) | 24,978 | |||||
| Net cash provided by operating activities |
31,633 | 33,544 | ||||||
| Cash Flows from Investing Activities |
||||||||
| Activity in available-for-sale securities: |
||||||||
| Payments |
3,696 | 6,634 | ||||||
| Maturities, sales, called, refunded |
— | 245,000 | ||||||
| Purchases |
— | (226,215 | ) | |||||
| Activity in held-to-maturity securities: |
||||||||
| Maturities, called, refunded |
265 | 2,595 | ||||||
| Purchases of equity securities |
(4,174 | ) | (3,916 | ) | ||||
| Purchases of restricted investment in bank stock |
(7,059 | ) | (9,123 | ) | ||||
| Redemption of restricted investment in bank stock |
10,425 | 4,125 | ||||||
| Net increase in loan portfolio |
(128,025 | ) | (240,756 | ) | ||||
| Proceeds from sale of other real estate owned |
— | 701 | ||||||
| Proceeds from sale of premises and equipment |
129 | — | ||||||
| Purchases of premises and equipment |
(497 | ) | (1,125 | ) | ||||
| Computer software developed |
(5,508 | ) | (6,656 | ) | ||||
| Net cash used in investing activities |
(130,748 | ) | (228,736 | ) | ||||
| Cash Flows from Financing Activities |
||||||||
| Net increase (decrease) in non-interest deposits |
(186,084 | ) | 20,012 | |||||
| Net increase in interest bearing demand, savings, and time deposits |
359,322 | 80,914 | ||||||
| Net increase (decrease) in Federal Home Loan Bank advances |
(100,000 | ) | 100,000 | |||||
| Net increase in federal funds purchased |
15,000 | — | ||||||
| Net increase in subordinated debt |
— | 42,623 | ||||||
| Repurchase of common stock |
(43 | ) | (6,918 | ) | ||||
| Cash dividends paid on preferred stock |
(2,156 | ) | (2,156 | ) | ||||
| Cash dividends paid on common stock |
(3,011 | ) | (1,882 | ) | ||||
| Net cash provided by financing activities |
83,028 | 232,593 | ||||||
| Increase (decrease) in Cash and Cash Equivalents |
(16,087 | ) | 37,401 | |||||
| Cash and Cash Equivalents, beginning of period |
130,600 | 93,199 | ||||||
| Cash and Cash Equivalents, end of period |
$ | 114,513 | $ | 130,600 | ||||
| Supplementary Disclosure of Cash Flow Information |
||||||||
| Cash paid during the period for interest |
$ | 45,534 | $ | 12,639 | ||||
| Cash paid during the period for income taxes |
$ | 7,280 | $ | 6,381 | ||||
| Transfers from loans receivable to loans held for sale, at carrying value |
$ | — | $ | 715 | ||||
| Net unrealized gain (loss) on securities available-for-sale |
$ | 1,371 | $ | (11,373 | ) | |||
See Notes to the Consolidated Financial Statements
MAINSTREET BANCSHARES, INC. AND SUBSIDIARY
Notes to Unaudited Consolidated Financial Statements
Note 1. Organization, Basis of Presentation and Impact of Recently Issued Accounting Pronouncements
Organization
MainStreet Bancshares Inc. (the “Company”) is a bank holding company incorporated under the laws of the Commonwealth of Virginia whose principal activity is the ownership and management of MainStreet Bank. On May 18, 2016, the stockholders of MainStreet Bank (the “Bank”) approved a Reorganization Agreement and Plan of Share Exchange (“Reorganization”) whereby the Bank would reorganize into a holding company structure. The Plan of Share Exchange called for each outstanding share of Bank common stock to be automatically converted into and exchanged for one share of the Company’s common stock, and the common stockholders of the Bank would become the common stockholders of the Company on the effective date of the Reorganization. On October 12, 2021, the Company filed an election with the Federal Reserve Board to be a financial holding company in order to engage in a broader range of financial activities than are permitted for bank holding companies generally. The Company is authorized to issue 10,000,000 shares of common stock with a par value of $4.00 per share. Additionally, the Company is authorized to issue 2,000,000 shares of preferred stock at a par value $1.00 per share. There are currently 28,750 shares of preferred stock outstanding.
On July 15, 2016, the Reorganization became effective, and the Bank became a wholly-owned subsidiary of the Company. The holding company is regulated under the Bank Holding Company Act of 1956, as amended, and is subject to inspection, examination, and supervision by the Federal Reserve Board.
On April 18, 2019, the Company completed the registration of its common stock with the Securities Exchange Commission through its filing of a General Form for Registration of Securities on Form 10 (“Form 10”), pursuant to Section 12(b) of the Securities Exchange Act of 1934. The Company is considered an “emerging growth company” under the Jumpstart Our Business Startups Act of 2012, or the “JOBS Act,” and as defined in Section 2(a) of the Securities Act of 1933, as amended, or the “Securities Act.” We are also a “smaller reporting company” as defined in Exchange Act Rule 12b-2. As such, we may elect to comply with certain reduced public company reporting requirements in future reports that we file with the Securities and Exchange Commission, or the “SEC.”
We were approved to list shares of our common stock on the Nasdaq Capital Market under our current symbol “MNSB” as of April 22, 2019. We were approved to list depositary shares of preferred stock on the Nasdaq Capital Market on the symbol “MNSBP” as of September 16, 2020. Each depositary share represents a 1/40th interest in a share of 7.50% Series A Fixed-Rate Non-Cumulative Perpetual Preferred Stock.
In August 2021, the Company created a community development entity (“CDE”) subsidiary, MainStreet Community Capital, LLC, a Virginia limited liability company to promote development in economically distressed areas. This CDE will be an intermediary vehicle for the provision of loans and investments in Low-Income Communities (“LICs”). In January 2022, the Community Development Financial Institutions Fund (“CDFI”) of the United States Department of the Treasury certified MainStreet Community Capital, LLC as a registered CDE.
MainStreet Bank is headquartered in Fairfax, Virginia where it also operates a branch. The Bank was incorporated on March 28, 2003, and received its charter from the Bureau of Financial Institutions of the Commonwealth of Virginia (the “Bureau”) on March 16, 2004. The Bank commenced regular operations on May 26, 2004, and is supervised by the Bureau and the Federal Reserve Bank of Richmond. The Bank is a member of the Federal Reserve System and the Federal Deposit Insurance Corporation. The Bank places special emphasis on serving the needs of individuals, and small and medium-sized businesses and professionals in the Washington, D.C. metropolitan area.
Basis of Presentation
The accompanying financial statements have been prepared in conformity with accounting principles generally accepted in the United States of America (“US GAAP”) as applicable to a smaller reporting company.
Principles of Consolidation – The consolidated financial statements include accounts of the Company and its wholly-owned subsidiaries, the Bank and MainStreet Community Capital, LLC. All significant intercompany transactions and balances have been eliminated in consolidation.
Cash and cash equivalents – For the purpose of presentation in the Consolidated Statements of Cash Flows, the Bank has defined cash and cash equivalents as those amounts included in the statement of financial condition captions “Cash and due from banks” and “Federal funds sold.”
Investment securities – The Bank’s investment debt securities are classified as either held to maturity, available for sale or trading. At December 31, 2023 and December 31, 2022, the Bank held approximately $17.3 million and $17.6 million, respectively, in securities classified as held to maturity. The Bank held no securities classified as trading.
Debt securities which are not classified as held to maturity or trading are classified as securities available for sale (AFS). Debt securities available for sale are reported at fair value. Any unrealized gain or loss, net of applicable income taxes, is reported as a separate addition to or reduction from stockholders’ equity. Gains and losses arising from the sale of debt securities available for sale are recognized based on the specific identification method on a trade-date basis and included in results of operations.
Debt securities held to maturity includes securities purchased with the ability and positive intent to hold to maturity. Debt securities are stated at historical cost adjusted for amortization of premiums and accretion of discount, and net of any allowance for credit losses. The Company measures expected credit losses on held-to-maturity (HTM) securities on a collective basis by major security type and credit ratings. Accrued interest receivable on these securities are excluded from the estimate of credit losses. For HTM securities, the Company evaluates the credit risk of its securities on at least a quarterly basis. The Company estimates expected credit losses on HTM debt securities on an individual basis using security-level credit ratings. The primary indicators of credit quality for the Company’s HTM portfolio are security type and credit rating, which is influenced by a number of factors including obligor cash flow, geography, seniority, and others. The adoption of CECL had an insignificant impact on the Company's held-to-maturity securities portfolio.
Purchase premiums and discounts are amortized using the interest method over the term or first call date of each security. A HTM or an AFS debt security that management does not intend to sell, for which there has been a value impairment deemed by management, an allowance for credit losses is established and written down. An AFS security that management does intend to sell or more likely than not will be required to sell, that is in an unrealized loss position shall be written down to its fair value with a charge to current operations.
Restricted equity securities consist of the Federal Reserve Bank and Federal Home Loan Bank of Atlanta (“FHLB”) stock in the amount of $5.2 million and $1.3 million respectively, as of December 31, 2023, compared to $4.8 million and $5.1 million, respectively, as of December 31, 2022. Restricted equity securities also consisted of $126,800 in Community Bankers Bank stock at December 31, 2023 and December 31, 2022. This restricted stock is recorded at cost because its ownership is restricted and it lacks a market for resale. The Bank is required to maintain Federal Reserve Bank stock at a level of 6% of capital and surplus. The FHLB requires the Bank to maintain stock, at a minimum, in an amount equal to 4.5% of outstanding borrowings and 0.20% of total assets. When evaluating restricted stock for impairment, its value is based on ultimate recoverability of the par value rather than by recognizing temporary declines in value. The Bank does not consider these investments to be impaired at December 31, 2023 or December 31, 2022 and no previous impairment has been recognized as of December 31, 2023. Restricted equities include $8.2 million in Low-Income Housing Tax Credits (“LIHTC”) that are carried at amortized cost through the proportional amortization method. Restricted equities also include $6.4 million of nonmarketable securities as of December 31, 2023 that do not qualify for equity method accounting. As of December 31, 2022 restricted equities include $6.7 million in LIHTC and $6.1 million of nonmarketable securities that do not qualify for equity method accounting. These investments are recorded at cost because the ownership is restricted and lacks a market for resale.
Loans - The Bank makes commercial and consumer loans to customers. Our recorded investment in loans that management has the intent and ability to hold for the foreseeable future, or until maturity or pay-off, generally are reported at their unpaid principal balances adjusted for charge-offs, unearned discounts, any deferred fees or costs on originated loans, and the allowance for credit losses on loans. Interest on loans is credited to operations based on the principal amount outstanding. Loan fees and origination costs are deferred and the net amount is amortized as an adjustment of the related loan’s yield using the effective interest method. The Bank is amortizing these amounts over the contractual life of the related loans.
A loan’s past due status is based on the contractual due date of the most delinquent payment due. All loans which are 30 or more days past due at the end of the month are reported to the Board of Directors. Commercial loans are generally placed on nonaccrual status when the collection of principal or interest is 90 days or more past due, or earlier, if collection is uncertain based on an evaluation of the net realizable value of the collateral and the financial strength of the borrower. Consumer loans are generally placed on nonaccrual status when the collection of principal or interest is 120 days or more past due, or earlier, if collection is uncertain based on an evaluation of the net realizable value of the collateral and the financial strength of the borrower. Loans greater than 90 days past due may remain on accrual status if management determines it has adequate collateral to cover the principal and interest. For those loans that are carried on nonaccrual status, payments are first applied to principal outstanding. A loan may be returned to accrual status if the borrower has demonstrated a sustained period of repayment performance in accordance with the contractual terms of the loan and there is reasonable assurance the borrower will continue to make payments as agreed. It is Bank policy to charge-off loans whose collectability is sufficiently questionable and can no longer be justified as an asset on the statement of financial condition. To determine if a loan should be charged-off, all possible sources of repayment are analyzed, including: (1) the potential for future cash flow, (2) the value of the Bank’s collateral, and (3) the strength of co-makers or guarantors. All principal and previously accrued interest is charged to the allowance for credit losses. All future payments received on the loan are credited to the allowance for credit losses as a recovery. These policies are applied consistently across our loan portfolio.
The Company designates individually evaluated loans on nonaccrual status as collateral-dependent loans, as well as other loans that management of the Company designates as having higher risk. Collateral-dependent loans are loans for which the repayment is expected to be provided substantially through the operation or sale of the collateral and the borrower is experiencing financial difficulty. These loans do not share common risk characteristics and are not included within the collectively evaluated loans for determining the allowance for credit losses. Under CECL, for collateral-dependent loans, the Company has adopted the practical expedient to measure the allowance for credit losses based on the fair value of collateral. The allowance for credit losses is calculated on an individual loan basis based on the shortfall between the fair value of the loan's collateral, which is adjusted for liquidation costs/discounts, and amortized cost. If the fair value of the collateral exceeds the amortized cost, no allowance is required.
Allowance for Credit Losses - see discussion of allowance for credit loss presentation under Recently Adopted Accounting Policies.
Other Real Estate Owned (“OREO”) - Assets acquired through, or in lieu of, loan foreclosure are held for sale and are initially recorded at fair value less costs to sell at the date of foreclosure, establishing a new cost basis. Any required initial write-downs are charged to allowance for credit losses. Subsequent to foreclosure, management periodically performs valuations of the foreclosed assets based on updated appraisals, general market conditions, and recent sales of like properties, length of time the properties have been held and our ability and intention with regard to continued ownership of the properties. The Bank may incur additional write-downs of foreclosed assets to fair value less costs to sell if valuations indicate a further deterioration in market values. Revenue and expenses from operations and changes in the valuation allowance are included in net expenses from foreclosed assets and improvements are capitalized.
Interest income on loans – Interest on loans is accrued and credited to income on daily balances of the principal amount outstanding. The accrual of interest on loans is discontinued when, in the opinion of management, there is an indication that the borrower may be unable to meet payments as they become due. Upon such discontinuance, all unpaid accrued interest is reversed.
Generally, the Bank will return a loan to accrual status when all delinquent interest and principal becomes current and remains current for six consecutive months under the terms of the loan agreement or the loan is well-secured or in process of collection. Upon returning to accrual status, interest payments applied to the principal balance of a loan while in nonaccrual status are recognized as a yield adjustment over the remaining life.
Loan origination and commitment fees and certain related direct costs - Loan origination and commitment fees charged by the Bank and certain direct loan origination costs are deferred and the net amount is amortized as a yield adjustment. The Bank amortizes these net amounts over the life of the related loans or, in the case of demand loans, over the estimated life. Net fees related to standby letters of credit are recognized over the commitment period.
Premises and equipment – Land is carried at cost. Premises and equipment are stated at cost, less accumulated depreciation and amortization computed principally on the straight-line basis over the estimated useful life of each asset, which ranges from 3 to 39 years. Leasehold improvements are amortized over the shorter of the related lease term or the estimated useful lives of the improvements. Construction in progress includes assets which will be reclassified and depreciated once placed into service.
Computer software development - The Company capitalizes new product development costs incurred for software to be sold from the point at which technological feasibility has been established through the point at which the product is ready for general availability. Software development costs that are capitalized are evaluated annually for impairment and are assigned an estimated economic life based on the type of product, market characteristics, and maturity of the market for that particular product. These costs are amortized on a straight-line basis. All of this amortization expense is included within components of operating income.
Income taxes – The Bank uses an asset and liability approach in financial accounting and reporting for income taxes. Deferred income tax assets and liabilities are computed for differences between the financial statement and tax bases of assets and liabilities that will result in taxable or deductible amounts in the future. The principal items relate primarily to differences between the allowance for credit losses, deferred loan fees, and accumulated depreciation and amortization. Valuation allowances are established when necessary to reduce deferred tax assets to the amount expected to be realized. Income tax expense (benefit) is the tax payable or refundable for the period plus or minus the change during the period in deferred tax assets and liabilities.
When tax returns are filed, it is highly certain that some positions taken would be sustained upon examination by the taxing authorities, while others are subject to uncertainty about the merits of the position taken or the amount of the position that would be ultimately sustained. The benefit of a tax position is recognized in the financial statements in the period during which, based on all available evidence, management believes it is more likely than not that the position will be sustained upon examination, including the resolution of appeals or litigation processes, if any. Tax positions taken are not offset or aggregated with other positions. Tax positions that meet the more-likely-than-not recognition threshold are measured as the largest amount of tax benefit that is more than 50% likely of being realized upon settlement with the applicable taxing authority. The portion of the benefits associated with tax positions taken that exceeds the amount measured as described above is reflected as a liability for unrecognized tax benefits in the accompanying balance sheet along with any associated interest and penalties that would be payable to the taxing authorities upon examination. As of December 31, 2023, and December 31, 2022, there were no such liabilities recorded.
Interest and penalties associated with unrecognized tax benefits, if any, would be classified as additional income taxes in the statement of income.
Comprehensive income – Accounting principles generally require that recognized revenue, expenses, gains and losses be included in net income. Although, certain changes in assets and liabilities, such as unrealized gains and losses on available for sale securities, are reported as a separate component of the equity section of the balance sheet, such items, along with net income, are components of comprehensive income.
Stock compensation plans – Stock compensation accounting guidance (FASB ASC 718, “Compensation – Stock Compensation”) requires that the compensation cost relating to share-based payment transactions be recognized in financial statements. That cost will be measured based on the grant date fair value of the equity or liability instruments issued.
The stock compensation accounting guidance requires that compensation cost for all stock awards be calculated and recognized over the employees’ service period, generally defined as the vesting period. For awards with graded-vesting, compensation cost is recognized on a straight-line basis over the requisite service period for the entire award. A Black-Sholes model is used to estimate the fair value of stock options, while the market price of the Company’s common stock at the date of grant is used for restricted stock awards. No stock options were granted during 2023 and 2022.
Earnings per common share – Earnings per common share has been determined under the provisions of FASB ASC 260, “Earnings Per Share” and has been computed based on the weighted average common shares outstanding during the year ended December 31, (7,522,913 for 2023 and 7,529,382 for 2022). Diluted earnings per share reflect additional potential common shares that would have been outstanding if dilutive potential common shares had been issued, as well as any adjustment to income that would result from the assumed issuance.
The only potential dilutive stock of the Bank as defined in FASB ASC 260 would be stock options granted to various directors, officers, and employees of the Bank. There were no such options outstanding during the years ended December 31, 2023 or December 31, 2022. Restricted stock is included in the computation of basic earnings per share as the holder is entitled to full benefits of a stockholder during the vesting period and is thus considered a participating security.
Off-balance sheet instruments – In the ordinary course of business, the Bank has entered into off-balance sheet financial instruments consisting of commitments to extend credit, commercial letters of credit, and standby letters of credit. Such financial instruments are recorded in the financial statements when they are funded, or related fees are incurred or received.
Advertising and marketing expense – Advertising and marketing costs are expensed as incurred.
Use of estimates – The preparation of financial statements in conformity with accounting principles generally accepted in the United States of America, requires management to make estimates and assumptions that affect the reported amounts of assets and liabilities at the date of the financial statements and the reported amounts of income and expenses during the reporting period. Actual results could differ from the estimates.
The Company’s critical accounting policies relate to (1) the allowance for credit losses, (2) fair value of financial instruments, and (3) derivative financial instruments. These critical accounting policies require the use of estimates, assumptions and judgments which are based on information available as of the date of the financial statements. Accordingly, as this information changes, future financial statements could reflect the use of different estimates, assumptions and judgments. Certain determinations inherently have a greater reliance on the use of estimates, assumptions and judgments and, as such, have a greater possibility of producing results that could be materially different than originally reported. In connection with the determination of the allowances for credit losses on loans, management obtains independent appraisals for significant properties.
Fair value of financial instruments – Fair values of financial instruments are estimated using relevant market information and other assumptions, as more fully disclosed in Note 20. Fair value estimates involve uncertainties and matters of significant judgment. Changes in assumptions or in market conditions could significantly affect the estimates.
Derivative Financial Instruments – The Bank recognizes derivative financial instruments at fair value as either an other asset or other liability in the consolidated statement of financial condition. The Bank’s derivative financial instruments include interest rate swaps with certain qualifying commercial loan customers and dealer counterparties. Because the interest rate swaps with loan customers and dealer counterparties are not designated as hedging instruments, adjustments to reflect unrealized gains and losses resulting from changes in fair value of these instruments are reported as noninterest income or noninterest expense, as applicable. The Bank’s interest rate swaps with loan customers and dealer counterparties are described more fully in Note 19.
Transfers of financial assets – Transfers of financial assets are accounted for as sales, when control over the assets has been surrendered. Control over transferred assets is deemed to be surrendered when (1) the assets have been isolated from the Bank – put presumptively beyond reach of the transferor and its creditors, even in bankruptcy or other receivership, (2) the transferee obtains the right (free of conditions that constrain it from taking advantage of that right) to pledge or exchange the transferred assets, and (3) the Bank does not maintain effective control over the transferred assets through an agreement to repurchase them before their maturity or the ability to unilaterally cause the holder to return specific assets.
Revenue Recognition - Most revenue associated with the Company’s financial instruments, including interest income and gains/losses on investment securities, derivatives and sales of financial instruments are outside the scope of ASC Topic 606. The Company’s services that fall within the scope of ASC Topic 606 are presented within noninterest income and are recognized as revenue. A description of the primary revenue streams accounted for under ASC Topic 606 follows:
Deposit Account Service Charges. The Company earns fees from its deposit customers for overdraft and account maintenance services. Overdraft fees are recognized when the overdraft occurs. Account maintenance fees, which relate primarily to monthly maintenance, are earned over the course of a month, representing the period over which the company satisfies the performance obligation.
Other Service Charges and Fees. The Company earns fees from its customers for transaction-based services. Such services include safe deposit box, ATM, stop payment, wire transfer, mortgage origination and interest rate swap fees. In each case, these service charges and fees are recognized in income at the time or within the same period that the Company’s performance obligation is satisfied.
Interchange Income. The Company earns interchange fees from debit and credit cardholder transactions conducted through various payment networks. Interchange fees from cardholder transactions represent a percentage of the underlying transaction value and are recognized daily, concurrently with the transaction processing services.
Recently Adopted Accounting Policies
Adoption of New Accounting Standards: On January 1, 2023, the Company adopted ASU 2016-13 Financial Instruments - Credit Losses (Topic 326): Measurement of Credit Losses on Financial Instruments, as amended, which replaces the incurred loss methodology with an expected loss methodology that is referred to as the current expected credit loss (CECL) methodology. The measurement of expected credit losses under the CECL methodology is applicable to financial assets measured at amortized cost, including loan receivables and held-to-maturity debt securities. It also applies to off-balance sheet credit exposures not accounted for as insurance (loan commitments, standby letters of credit, financial guarantees, and other similar instruments) and net investments in leases recognized by the lessor in accordance with Topic 842 on leases. In addition, ASC 326 made changes to the accounting for available-for-sale debt securities. One such changes is to require credit losses to be presented as an allowance rather than as a write-down on available-for-sale debt securities management does not intend to sell or believes that is more likely than not they will be required to sell.
The Company adopted ASC 326 and all the subsequent amendments thereto effective January 1, 2023 using the modified retrospective method for all financial assets measured at amortized cost, and off-balance-sheet credit exposures. Results for reporting periods beginning after January 1, 2023 are presented under ASC 326 while prior periods amounts continue to be reported in accordance with previously applicable GAAP. The Company recorded a net decrease to retained earnings of $1.7 million as of January 1, 2023 for the cumulative effect of adopting ASC 326. The transition adjustment includes an increase in allowance for credit losses of $2.2 million and an increase in net deferred tax assets of $506,000.
The Company adopted ASC 326 using the prospective transition approach for debt securities for which other-than-temporary impairment had been recognized prior to January 1, 2023. As of December 31, 2022, the Company did not have any other-than-temporarily impaired investment securities. Therefore, upon adoption of ASC 326, the Company determined that an allowance for credit losses on available-for-sale securities was not deemed material.
The following table illustrates the impact of ASC 326.
| January 1, 2023 |
||||||||||||
| (Dollars in thousands) |
As Reported Under ASC 326 |
Pre-ASC 326 Adoption |
Impact of ASC 326 Adoption |
|||||||||
| Assets: |
||||||||||||
| Allowance for Credit Losses |
||||||||||||
| Residential Real Estate |
$ | 2,205 | $ | 2,146 | $ | 59 | ||||||
| Commercial Real Estate |
7,773 | 7,159 | 614 | |||||||||
| Construction and Land Development |
3,366 | 3,347 | 19 | |||||||||
| Commercial & Industrial |
1,590 | 1,418 | 172 | |||||||||
| Consumer |
75 | 44 | 31 | |||||||||
| Total Allowance for Credit Losses on Loans |
$ | 15,009 | $ | 14,114 | $ | 895 | ||||||
| Liabilities: |
||||||||||||
| Allowance for Credit Losses Off-Balance Sheet Credit Exposure |
1,310 | — | 1,310 | |||||||||
| Total Allowance for Credit Losses |
$ | 16,319 | $ | 14,114 | $ | 2,205 | ||||||
The Company elected not to measure an allowance for credit losses for accrued interest receivable and instead elected to reverse interest income on loans or securities that are placed on nonaccrual status, which is generally when the instrument is 90 days past due, or earlier if the Company believes the collection of interest is doubtful. The Company has concluded that this policy results in the timely reversal of uncollectible interest.
Allowance for Credit Losses (ACL) - Loans
The allowance for credit losses on loans is a valuation account that is deducted from the loans' amortized cost basis to present the net amount expected to be collected on the loans. Loans are charged off against the allowance when management believes the uncollectability of a loan balance is confirmed. Expected recoveries do not exceed the aggregate of amounts previously charged-off. Accrued interest receivable is excluded from the estimate of credit losses.
The allowance for credit losses represents management's estimate of lifetime credit losses inherent in the loans as of the balance sheet date. Management estimates the allowance balance using relevant available information, from internal and external sources, relating to past events, current conditions, and reasonable and supportable forecasts. Historical credit loss experience provides the basis for the estimation of expected credit losses. Adjustments to historical loss information are made for differences in current loan-specific risk characteristics such as differences in underwriting standards, portfolio mix, delinquency levels, concentrations or term as well as for changes in environmental conditions, such as changes in unemployment rates, property values or vacancy rates, consumer price index and projected federal funds target rate and future unemployment rates.
The allowance for credit losses on loans is measured on a collective (pool) basis when similar risk characteristics exist. The Company has identified the following portfolio segments and measures the allowance for credit losses on loans using the following methods: Portfolio segments are grouped in homogenous pools that mirror the loan pools described in Federal Financial Institutions Examination Council Call Report however we are able to group these pools into the following segments:
| • |
Commercial real estate loans carry risks of the client’s ability to repay the loan from the cash flow derived from the underlying real estate. Risks inherent in managing a commercial real estate portfolio relate to sudden or gradual drops in property values as well as changes in the economic climate. Real estate security diminishes risks only to the extent that a market exists for the subject collateral. These risks are attempted to be mitigated by carefully underwriting loans of this type and by following appropriate loan-to-value standards |
| • |
Construction loans and land improvement carry risks that the project will not be finished according to schedule, the project will not be finished according to budget and the value of the collateral may, at any point in time, be less than the principal amount of the loan. Construction loans also bear the risk that the general contractor, who may or may not be a loan customer, may be unable to finish the construction project as planned because of financial pressure unrelated to the project. |
| • |
Residential real estate mortgage loans, including equity lines of credit, carry risks associated with the continued creditworthiness of the borrower and the changes in the value of the collateral. |
| • |
Commercial and industrial loans carry risks associated with the successful operation of a business or a real estate project, in addition to other risks associated with the ownership of real estate, because the repayment of these loans may be dependent upon the profitability and cash flows of the business or project. In addition, there is risk associated with the value of collateral other than real estate which may depreciate over time and cannot be appraised with as much precision. |
| • |
Consumer secured loans (indirect lending) carry risks associated with the continued creditworthiness of the borrower and the value of the collateral (e.g., rapidly depreciating assets such as automobiles). These risks are attempted to be mitigated by following appropriate loan-to-value standards and an experienced management team for this type of portfolio. |
| • |
Consumer unsecured loans carry risks associated with the continued credit-worthiness of the borrower. Consumer unsecured loans are more likely to be immediately adversely affected by job loss, divorce, illness or personal bankruptcy. |
For each homogenous loan pool, the Company elected to use the Weighted Average Remaining Life (“WARM”) methodology for calculating historical and future loss reserves. The WARM methodology calculates the average annual historical charge-off rate of a homogenous loan pool and multiplies that rate by the pool's remaining life to estimate the allowance for credit losses. Quantitative assumptions included are below:
Remaining life - For amortizing assets, the remaining life is calculated by taking the contractual life and adjusting it by any expected scheduled payments as well as prepayments. An important assumption in the calculation of remaining life is an “exit event” which would be deemed as the end of life of a loan. Examples of exit events included in our model are: 1). A change in maturity date of 90 days or more and 2). A loan changing its loan pool classification.
Loss Rate - Loss rates are calculated quarterly and aggregated to determine an annual loss rate. Our methodology uses actual Company data utilizing a straight average over the time periods included. Recoveries are netted against charge-offs and loss rates are floored at 0% with no ability to have “negative” loss rates.
Loss Rate Lookback - By utilizing the WARM method, management is also evaluating future economic conditions. Using historical loan portfolio performance data in certain economic conditions, gives us an idea of how to adjust for potential credit exposure in similar future environments. While subject to change at each quarterly meeting, we have elected to make our base case scenario for future economic environments. This evaluation will be subject to change given the circumstances evaluated at each quarter.
Historical Losses - Quantitative loss estimation models have been developed based largely on call report data from 2004 through the current period and the economic conditions during the same time period. Within our historical losses calculation, the Company projects out the loss environment for the subsequent two quarters, based largely on the preceding four quarters. After that period, the historical loss percentage reverts back to the lifetime historical mean over a four quarter progression.
Additionally, the allowance for credit losses on loans calculation includes subjective adjustments for qualitative risk factors that are likely to cause estimated credit losses to differ from historical experience. These qualitative adjustments may increase or reduce reserve levels and include adjustments for lending management experience and risk tolerance, loan review and audit results, asset quality and portfolio trends, loan portfolio growth, industry concentrations, trends in underlying collateral, external factors and economic conditions not already captured.
Loans that do not share risk characteristics are evaluated on an individual basis. When management determines that foreclosure is probable and the borrower is experiencing financial difficulty, the expected credit losses are based on the fair value of collateral at the reporting dated unadjusted for selling costs as appropriate.
Allowance for Credit Losses - Off-Balance Sheet Credit Exposures
The Company estimates expected credit losses over the contractual period in which the Company is exposed to credit risk via a contractual obligation to extend credit, unless that obligation is unconditionally cancellable by the Company. The allowance for credit losses on off-balance sheet credit exposures is adjusted through credit loss expense. The estimate includes consideration of the likelihood that funding will occur and an estimate of expected credit losses on commitments expected to be funded over its estimated life. The Company classified off-balance sheet exposure in similar pools as the funded loan portfolio and determined that qualitative and quantitative risk factors assessed to the funded loan pool are also evident for the unfunded loan pool of similar type, adjusted for likelihood of funding and any other relevant metrics. The allowance for unfunded commitments is identified separately on the Company’s consolidated statement of financial condition.
Allowance for Credit Losses - Held-to-Maturity Securities
The Company measures expected credit losses on held-to-maturity (HTM) securities on a collective basis by major security type and credit ratings. Accrued interest receivable on these securities are excluded from the estimate of credit losses. For HTM securities, the Company evaluates the credit risk of its securities on at least a quarterly basis. The Company estimates expected credit losses on HTM debt securities on an individual basis using security-level credit ratings. The primary indicators of credit quality for the Company’s HTM portfolio are security type and credit rating, which is influenced by a number of factors including obligor cash flow, geography, seniority, and others. The adoption of CECL had an insignificant impact on the Company's held-to-maturity securities portfolio.
Governance
The Company’s Allowance Committee, contains representatives from both the Company’s finance and credit teams, is responsible for approving the Company’s estimate of expected credit losses. The Allowance Committee considers the quantitative model results and qualitative factors when approving the final ACL. The Company’s ACL model is subject to the Company’s model risk management standards.
In December 2022, the Financial Accounting Standards Board (FASB) issued ASU 2022-06, “Reference Rate Reform (Topic 848): Deferral of the Sunset Date of Topic 848.” ASU 2022-06 extends the period of time preparers can utilize the reference rate reform relief guidance in Topic 848. The objective of the guidance in Topic 848 is to provide relief during the temporary transition period, so the FASB included a sunset provision within Topic 848 based on expectations of when the London Interbank Offered Rate (LIBOR) would cease being published. In 2021, the UK Financial Conduct Authority (FCA) delayed the intended cessation date of certain tenors of USD LIBOR to June 30, 2023. The Company's adopted ASU 2022-06 as of June 30, 2023 and it did not have a material impact on its consolidated financial statements.
Impact of Recently Issued Accounting Pronouncements
During June 2016, the Financial Accounting Standards Board (FASB) issued Accounting Standards Update (ASU) 2016-13, “Financial Instruments – Credit Losses (Topic 326): Measurement of Credit Losses on Financial Instruments.” The ASU, as amended, requires an entity to measure expected credit losses for financial assets carried at amortized cost based on historical experience, current conditions, and reasonable and supportable forecasts. Among other things, the ASU also amended the impairment model for available for sale securities and addressed purchased financial assets with deterioration. The Company adopted ASU 2016-13 as of January 1, 2023 in accordance with the required implementation date and recorded the impact of adoption to retained earnings, net of deferred income taxes, as required by the standard. The adjustment recorded at adoption was not significant to the overall allowance for credit losses or shareholders’ equity as compared to December 31, 2022 and consisted of adjustments to the allowance for credit losses on loans as well as an adjustment to the Company’s reserve for unfunded loan commitments. Subsequent to adoption, the Company will record adjustments to its allowances for credit losses and reserves for unfunded commitments through the provision for credit losses in the consolidated statements of income.
The Company is utilizing a third-party model to tabulate its estimate of current expected credit losses, using a weighted average remaining life methodology. In accordance with ASC 326, the Company has segmented its loan portfolio based on similar risk characteristics which included call report codes and other attributes that significant to the Company. The Company primarily utilizes average remaining portfolio life and Federal Reserve Economic Data for its reasonable and supportable forecasting of current expected credit losses. To further adjust the allowance for credit losses for expected losses not already included within the quantitative component of the calculation, the Company may consider the following qualitative adjustment factors: lending practices, national/local economics, portfolio composition, employee experience, credit quality indicators, underlying collateral, concentrations and other external factors. The Company’s CECL implementation process was overseen by the Allowance for Credit Losses Committee and included an assessment of data availability and gap analysis, data collection, consideration and analysis of multiple loss estimation methodologies, an assessment of relevant qualitative factors and correlation analysis of multiple potential loss drivers and their impact on the Company’s historical loss experience.
In March 2023, the Financial Accounting Standards Board (FASB) issued ASU 2023-02, “Investments—Equity Method and Joint Ventures (Topic 323): Accounting for Investments in Tax Credit Structures Using the Proportional Amortization Method.” These amendments allow reporting entities to elect to account for qualifying tax equity investments using the proportional amortization method, regardless of the program giving rise to the related income tax credits. The ASU is effective for public business entities for fiscal years beginning after December 15, 2023, including interim periods within those fiscal years. Early adoption is permitted for all entities in any interim period. The Company does not expect the adoption of ASU 2023-02 to have a material impact on its consolidated financial statements.
In October 2023, the Financial Accounting Standards Board (FASB) issued ASU 2023-06, “Disclosure Improvements: Codification Amendments in Response to the SEC’s Disclosure Update and Simplification Initiative.” This ASU incorporates certain U.S. Securities and Exchange Commission (SEC) disclosure requirements into the FASB Accounting Standards Codification. The amendments in the ASU are expected to clarify or improve disclosure and presentation requirements of a variety of Codification Topics, allow users to more easily compare entities subject to the SEC’s existing disclosures with those entities that were not previously subject to the requirements, and align the requirements in the Codification with the SEC’s regulations. For entities subject to the SEC’s existing disclosure requirements and for entities required to file or furnish financial statements with or to the SEC in preparation for the sale of or for purposes of issuing securities that are not subject to contractual restrictions on transfer, the effective date for each amendment will be the date on which the SEC removes that related disclosure from its rules. For all other entities, the amendments will be effective two years later. However, if by June 30, 2027, the SEC has not removed the related disclosure from its regulations, the amendments will be removed from the Codification and not become effective for any entity. The Company does not expect the adoption of ASU 2023-06 to have a material impact on its consolidated financial statements.
In December 2023, the Financial Accounting Standards Board (FASB) issued ASU 2023-09, “Income Taxes (Topic 740): Improvements to Income Tax Disclosures.” The amendments in this ASU require an entity to disclose specific categories in the rate reconciliation and provide additional information for reconciling items that meet a quantitative threshold, which is greater than five percent of the amount computed by multiplying pretax income by the entity’s applicable statutory rate, on an annual basis. Additionally, the amendments in this ASU require an entity to disclose the amount of income taxes paid (net of refunds received) disaggregated by federal, state, and foreign taxes and the amount of income taxes paid (net of refunds received) disaggregated by individual jurisdictions that are equal to or greater than five percent of total income taxes paid (net of refunds received). Lastly, the amendments in this ASU require an entity to disclose income (or loss) from continuing operations before income tax expense (or benefit) disaggregated between domestic and foreign and income tax expense (or benefit) from continuing operations disaggregated by federal, state, and foreign. This ASU is effective for annual periods beginning after December 15, 2024. Early adoption is permitted. The amendments should be applied on a prospective basis; however, retrospective application is permitted. The Company does not expect the adoption of ASU 2023-06 to have a material impact on its consolidated financial statements.
Note 2. Restrictions on Cash
On March 15, 2020, the Federal Reserve reduced reserve requirement ratios to zero percent effective March 26, 2020. This action eliminated reserve requirements for all depository institutions. Prior to the change, reserve requirement ratios on net transactions accounts differed based on the amount of net transactions accounts at the depository institution.
A certain amount of net transaction accounts, known as the "reserve requirement exemption amount," was subject to a reserve requirement ratio of zero percent. Net transaction account balances above the reserve requirement exemption amount and up to a specified amount, known as the "low reserve tranche," were subject to a reserve requirement ratio of 3 percent. Net transaction account balances above the low reserve tranche were subject to a reserve requirement ratio of 10 percent. The reserve requirement exemption amount and the low reserve tranche are indexed each year pursuant to formulas specified in the Federal Reserve Act
Note 3. Investment Securities
Investment securities available-for-sale was comprised of the following:
| December 31, 2023 |
||||||||||||||||
| (Dollars in thousands) |
Amortized Cost |
Gross Unrealized Gains |
Gross Unrealized Losses |
Fair Value |
||||||||||||
| Collateralized Mortgage Backed |
$ | 23,446 | $ | — | $ | (3,931 | ) | $ | 19,515 | |||||||
| Subordinated Debt |
9,970 | — | (1,503 | ) | 8,467 | |||||||||||
| Municipal Securities |
||||||||||||||||
| Taxable |
10,649 | — | (2,342 | ) | 8,307 | |||||||||||
| Tax-exempt |
22,668 | 23 | (1,949 | ) | 20,742 | |||||||||||
| U.S. Governmental Agencies |
2,932 | 3 | (38 | ) | 2,897 | |||||||||||
| Total |
$ | 69,665 | $ | 26 | $ | (9,763 | ) | $ | 59,928 | |||||||
Investment securities held-to-maturity was comprised of the following:
| December 31, 2023 |
||||||||||||||||
| (Dollars in thousands) |
Amortized Cost |
Gross Unrealized Gains |
Gross Unrealized Losses |
Fair Value |
||||||||||||
| Municipal Securities |
||||||||||||||||
| Tax-exempt |
$ | 14,775 | $ | 19 | $ | (121 | ) | $ | 14,673 | |||||||
| Subordinated Debt |
2,500 | — | (10 | ) | 2,490 | |||||||||||
| Total |
$ | 17,275 | $ | 19 | $ | (131 | ) | $ | 17,163 | |||||||
Investment securities available-for-sale was comprised of the following:
| December 31, 2022 |
||||||||||||||||
| (Dollars in thousands) |
Amortized Cost |
Gross Unrealized Gains |
Gross Unrealized Losses |
Fair Value |
||||||||||||
| Collateralized Mortgage Backed |
26,801 | — | (4,574 | ) | 22,227 | |||||||||||
| Subordinated Debt |
9,970 | — | (1,143 | ) | 8,827 | |||||||||||
| Municipal Securities |
||||||||||||||||
| Taxable |
10,675 | — | (2,709 | ) | 7,966 | |||||||||||
| Tax-exempt |
22,823 | 10 | (2,658 | ) | 20,175 | |||||||||||
| U.S. Governmental Agencies |
3,470 | 2 | (36 | ) | 3,436 | |||||||||||
| Total |
$ | 73,739 | $ | 12 | $ | (11,120 | ) | $ | 62,631 | |||||||
Investment securities held-to-maturity was comprised of the following:
| December 31, 2022 |
||||||||||||||||
| (Dollars in thousands) |
Amortized Cost |
Gross Unrealized Gains |
Gross Unrealized Losses |
Fair Value |
||||||||||||
| Municipal Securities |
||||||||||||||||
| Tax-exempt |
$ | 15,142 | $ | 35 | $ | (237 | ) | $ | 14,940 | |||||||
| Subordinated Debt |
2,500 | — | — | 2,500 | ||||||||||||
| Total |
$ | 17,642 | $ | 35 | $ | (237 | ) | $ | 17,440 | |||||||
Credit Quality Indicators and Allowance for Credit Losses - Held-to-Maturity (HTM)
For HTM securities, the Company evaluates the credit risk of its securities on at least a quarterly basis. The Company estimates expected credit losses on HTM debt securities on an individual basis using security-level credit ratings. The Company’s HTM securities ACL was immaterial at December 31, 2023. The primary indicators of credit quality for the Company’s HTM portfolio are security type and credit rating, which is influenced by a number of factors including obligor cash flow, geography, seniority, and others. The majority of the Company’s HTM securities with credit risk are obligations of states and political subdivisions.
The following table presents the amortized cost of HTM securities as of December 31, 2023 and December 31, 2022 by security type and credit rating according to Moody's and Standard and Poor's:
| (Dollars in thousands) |
Municipal Securities |
Subordinated Debt |
Total HTM securities |
|||||||||
| December 31, 2023 |
||||||||||||
| Credit Rating: |
||||||||||||
| AAA/AA/A |
$ | 14,775 | $ | — | $ | 14,775 | ||||||
| Not Rated - Non Agency |
— | 2,500 | $ | 2,500 | ||||||||
| Total |
$ | 14,775 | $ | 2,500 | $ | 17,275 | ||||||
| December 31, 2022 |
||||||||||||
| Credit Rating: |
||||||||||||
| AAA/AA/A |
$ | 15,142 | $ | — | $ | 15,142 | ||||||
| Not Rated - Non Agency |
— | 2,500 | 2,500 | |||||||||
| Total |
$ | 15,142 | $ | 2,500 | $ | 17,642 | ||||||
At December 31, 2023, the Company had no securities held-to-maturity that were past due 30 days or more as to principal or interest payments. The Company had no securities held-to-maturity classified as nonaccrual for the year ended December 31, 2023.
The scheduled maturities of securities available-for-sale and held-to-maturity at December 31, 2023 were as follows:
| December 31, 2023 |
||||||||||||||||
| Available-for-Sale |
Held-to-Maturity |
|||||||||||||||
| (Dollars in thousands) |
Amortized Cost |
Fair Value |
Amortized Cost |
Fair Value |
||||||||||||
| Due in one year or less |
$ | — | $ | — | $ | 318 | $ | 315 | ||||||||
| Due from one to five years |
1,000 | 976 | 3,325 | 3,314 | ||||||||||||
| Due from after five to ten years |
14,054 | 12,222 | 7,218 | 7,188 | ||||||||||||
| Due after ten years |
54,611 | 46,730 | 6,414 | 6,346 | ||||||||||||
| Total |
$ | 69,665 | $ | 59,928 | $ | 17,275 | $ | 17,163 | ||||||||
Securities with a fair value of $16.1 million and $3.6 million at December 31, 2023 and December 31, 2022, respectively, were pledged as collateral to secure public funds, loans swaps, and funding through the bank term funding program. The Company has not drawn upon or utilized the bank term funding program.
As of December 31, 2023 and December 31, 2022, there were no holdings of securities of any one issuer, other than U.S. Government and its agencies, in an amount greater than 10% of shareholders' equity
There were no securities sold from the available-for-sale portfolio during the years ended December 31, 2023 and 2022.
The following tables summarize the fair value and unrealized losses at December 31, 2023 and December 31, 2022, aggregated by investment category and length of time that individual securities have been in a continuous loss position:
| December 31, 2023 |
||||||||||||||||||||||||
| Less than 12 Months |
12 Months or Longer |
Total |
||||||||||||||||||||||
| (Dollars in thousands) |
Estimated Fair Value |
Unrealized Loss |
Estimated Fair Value |
Unrealized Loss |
Estimated Fair Value |
Unrealized Loss |
||||||||||||||||||
| Available-for-sale: |
||||||||||||||||||||||||
| Collateralized Mortgage Backed |
$ | — | $ | — | $ | 19,440 | $ | (3,931 | ) | $ | 19,440 | $ | (3,931 | ) | ||||||||||
| Subordinated Debt |
— | — | 7,717 | (1,503 | ) | 7,717 | (1,503 | ) | ||||||||||||||||
| Municipal Securities |
||||||||||||||||||||||||
| Taxable |
— | — | 8,307 | (2,342 | ) | 8,307 | (2,342 | ) | ||||||||||||||||
| Tax-exempt |
1,986 | (34 | ) | 16,510 | (1,915 | ) | 18,496 | (1,949 | ) | |||||||||||||||
| U.S Governmental Agencies |
1,515 | (1 | ) | 845 | (37 | ) | 2,360 | (38 | ) | |||||||||||||||
| Total |
$ | 3,501 | $ | (35 | ) | $ | 52,819 | $ | (9,728 | ) | $ | 56,320 | $ | (9,763 | ) | |||||||||
| December 31, 2022 |
||||||||||||||||||||||||
| Less than 12 Months |
12 Months or Longer |
Total |
||||||||||||||||||||||
| (Dollars in thousands) |
Fair Value |
Unrealized Loss |
Fair Value |
Unrealized Loss |
Fair Value |
Unrealized Loss |
||||||||||||||||||
| Available-for-sale: |
||||||||||||||||||||||||
| Collateralized Mortgage Backed |
$ | 2,021 | $ | (151 | ) | $ | 20,206 | $ | (4,423 | ) | $ | 22,227 | $ | (4,574 | ) | |||||||||
| Subordinated Debt |
3,357 | (393 | ) | 4,720 | (750 | ) | 8,077 | (1,143 | ) | |||||||||||||||
| Municipal Securities |
||||||||||||||||||||||||
| Taxable |
1,377 | (198 | ) | 6,589 | (2,511 | ) | 7,966 | (2,709 | ) | |||||||||||||||
| Tax-exempt |
11,028 | (838 | ) | 7,663 | (1,820 | ) | 18,691 | (2,658 | ) | |||||||||||||||
| U.S Government Agencies |
1,768 | (2 | ) | 1,018 | (34 | ) | 2,786 | (36 | ) | |||||||||||||||
| Total |
$ | 19,551 | $ | (1,582 | ) | $ | 40,196 | $ | (9,538 | ) | $ | 59,747 | $ | (11,120 | ) | |||||||||
The factors considered in evaluating securities for impairment include whether the Bank intends to sell the security, whether it is more likely than not that the Bank will be required to sell the security before recovery of its amortized cost basis, and whether the Bank expects to recover the security’s entire amortized cost basis. These unrealized losses are primarily attributable to current financial market conditions for these types of investments, particularly changes in interest rates, causing bond prices to decline, and are not attributable to credit deterioration.
At December 31, 2023, there were five municipal securities with a fair value of $2.0 million and one U.S. government agency security with a fair value of $1.5 million in an unrealized loss position of less than 12 months. At December 31, 2023, there were seven U.S. government agencies with fair values totaling approximately $845,000, twenty-four collateralized mortgage backed securities with a fair value totaling $19.4 million, twenty-one subordinated debt securities with fair values of $7.7 million, eleven taxable municipal securities with a fair value of $8.3 million and thirty-seven tax-exempt municipal securities with a fair value of $16.5 million that were in an unrealized loss position of more than 12 months. There were no securities sold during 2023 or 2022.
All municipal securities originally purchased as available for sale were transferred to held to maturity during 2013. The unrealized loss on the securities transferred to held to maturity is being amortized over the expected life of the securities. The unamortized, unrealized loss, before tax, at December 31, 2023 and December 31, 2022 was $0 and $8,228, respectively.
For held-to-maturity securities, an allowance for credit losses is required to absorb estimated lifetime credit losses. The Company has assessed the risk of credit loss and has determined that no allowance for credit losses for held-to-maturity securities was necessary as of December 31, 2023 and 2022. The evaluation of credit risk includes consideration of the credit ratings of the issuers, the effects of interest rate changes since purchase and observable market information such as issuer-specific credit spreads.
Note 4. Loans Receivable
Loans receivable were comprised of the following:
| (Dollars in thousands) |
December 31, 2023 |
December 31, 2022 |
||||||
| Residential Real Estate: |
||||||||
| Single family |
$ | 203,417 | $ | 178,615 | ||||
| Multifamily |
271,040 | 215,624 | ||||||
| Farmland |
145 | 155 | ||||||
| Commercial Real Estate: |
||||||||
| Owner-occupied |
282,052 | 228,374 | ||||||
| Non-owner occupied |
461,775 | 472,354 | ||||||
| Construction and Land Development |
429,637 | 393,783 | ||||||
| Commercial – Non Real-Estate: |
||||||||
| Commercial & industrial |
75,415 | 97,351 | ||||||
| Consumer – Non Real Estate: |
||||||||
| Unsecured |
271 | 1,984 | ||||||
| Secured |
3,339 | 11,352 | ||||||
| Total Gross Loans |
1,727,091 | 1,599,592 | ||||||
| Less: unearned fees |
(5,448 | ) | (5,528 | ) | ||||
| Less: allowance for loan losses |
(16,506 | ) | (14,114 | ) | ||||
| Net Loans |
$ | 1,705,137 | $ | 1,579,950 | ||||
The unsecured consumer loans above include $271,000 and $2.0 million of overdrafts reclassified as loans for the years ended December 31, 2023 and December 31, 2022, respectively.
There were nonaccrual loans of $1.0 million and $0 as of December 31, 2023 and December 31, 2022, respectively The following tables present the segments of the loan portfolio summarized by aging categories as of December 31, 2023 and December 31, 2022:
| December 31, 2023 |
||||||||||||||||||||||||
| (Dollars in thousands) |
30-59 Days Past Due |
60-89 Days Past Due |
Greater than 90 Days Past Due and Still Accruing |
Nonaccrual |
Current Loans |
Total Loans Receivable |
||||||||||||||||||
| Residential Real Estate: |
||||||||||||||||||||||||
| Single Family |
$ | — | $ | — | $ | — | $ | 149 | $ | 203,268 | $ | 203,417 | ||||||||||||
| Multifamily |
— | — | — | — | 271,040 | 271,040 | ||||||||||||||||||
| Farmland |
— | — | — | — | 145 | 145 | ||||||||||||||||||
| Commercial Real Estate: |
||||||||||||||||||||||||
| Owner occupied |
— | — | — | — | 282,052 | 282,052 | ||||||||||||||||||
| Non-owner occupied |
— | — | — | — | 461,775 | 461,775 | ||||||||||||||||||
| Construction & Land Development |
— | — | — | — | 429,637 | 429,637 | ||||||||||||||||||
| Commercial – Non Real Estate: |
||||||||||||||||||||||||
| Commercial & industrial |
— | — | — | 851 | 74,564 | 75,415 | ||||||||||||||||||
| Consumer – Non Real Estate: |
||||||||||||||||||||||||
| Unsecured |
— | — | — | — | 271 | 271 | ||||||||||||||||||
| Secured |
25 | — | 4 | — | 3,310 | 3,339 | ||||||||||||||||||
| Total |
$ | 25 | $ | — | $ | 4 | $ | 1,000 | $ | 1,726,062 | $ | 1,727,091 | ||||||||||||
| December 31, 2022 |
||||||||||||||||||||||||
| (Dollars in thousands) |
30-59 Days Past Due |
60-89 Days Past Due |
Greater than 90 Days Past Due and Still Accruing |
Nonaccrual |
Current Loans |
Total Loans Receivable |
||||||||||||||||||
| Residential Real Estate: |
||||||||||||||||||||||||
| Single Family |
$ | — | $ | — | $ | — | $ | — | $ | 178,615 | $ | 178,615 | ||||||||||||
| Multifamily |
— | — | — | — | 215,624 | 215,624 | ||||||||||||||||||
| Farmland |
— | — | — | — | 155 | 155 | ||||||||||||||||||
| Commercial Real Estate: |
||||||||||||||||||||||||
| Owner occupied |
— | — | — | — | 228,374 | 228,374 | ||||||||||||||||||
| Non-owner occupied |
— | — | — | — | 472,354 | 472,354 | ||||||||||||||||||
| Construction & Land Development |
— | — | — | — | 393,783 | 393,783 | ||||||||||||||||||
| Commercial – Non Real Estate: |
||||||||||||||||||||||||
| Commercial & industrial |
— | — | 15 | — | 97,336 | 97,351 | ||||||||||||||||||
| Consumer – Non Real Estate: |
||||||||||||||||||||||||
| Unsecured |
— | — | — | — | 1,984 | 1,984 | ||||||||||||||||||
| Secured |
11 | 12 | 6 | — | 11,323 | 11,352 | ||||||||||||||||||
| Total |
$ | 11 | $ | 12 | $ | 21 | $ | — | $ | 1,599,548 | $ | 1,599,592 | ||||||||||||
Note 5. Allowance for Credit Losses
The following tables summarize the activity in the allowance for credit losses by loan class for the twelve months ended December 31, 2023 and 2022:
Allowance for Credit Losses By Portfolio Segment
For the twelve months ended December 31, 2023
| Real Estate |
||||||||||||||||||||||||
| Residential |
Commercial |
Construction |
Commercial |
Consumer |
Total |
|||||||||||||||||||
| Beginning Balance, prior to adoption of ASC 326 |
$ | 2,146 | $ | 7,159 | $ | 3,347 | $ | 1,418 | $ | 44 | $ | 14,114 | ||||||||||||
| Impact of adopting ASC 326 |
59 | 614 | 19 | 172 | 31 | 895 | ||||||||||||||||||
| Charge-offs |
— | — | — | (462 | ) | (6 | ) | (468 | ) | |||||||||||||||
| Recoveries |
7 | — | — | — | 15 | 22 | ||||||||||||||||||
| Provision (recovery) |
382 | 1,115 | 209 | 307 | (70 | ) | 1,943 | |||||||||||||||||
| Ending Balance |
$ | 2,594 | $ | 8,888 | $ | 3,575 | $ | 1,435 | $ | 14 | $ | 16,506 | ||||||||||||
Allowance for Loan Losses By Portfolio Segment
For the twelve months ended December 31, 2022
| Real Estate |
||||||||||||||||||||||||
| Residential |
Commercial |
Construction |
Commercial |
Consumer |
Total |
|||||||||||||||||||
| Beginning Balance |
$ | 1,672 | $ | 5,689 | $ | 2,697 | $ | 1,540 | $ | 99 | $ | 11,697 | ||||||||||||
| Charge-offs |
— | — | — | - | 19 | 19 | ||||||||||||||||||
| Provision (recovery) |
474 | 1,470 | 650 | (122 | ) | (74 | ) | 2,398 | ||||||||||||||||
| Ending Balance |
$ | 2,146 | $ | 7,159 | $ | 3,347 | $ | 1,418 | $ | 44 | $ | 14,114 | ||||||||||||
| Ending Balance: |
||||||||||||||||||||||||
| Individually evaluated for Impairment |
$ | — | $ | — | $ | — | $ | — | $ | — | $ | — | ||||||||||||
| Collectively evaluated for Impairment |
$ | 2,146 | $ | 7,159 | $ | 3,347 | $ | 1,418 | $ | 44 | $ | 14,114 | ||||||||||||
The Company maintains a general allowance for credit losses based on evaluating known and inherent risks in the loan portfolio, including management’s continuing analysis of the factors underlying the quality of the loan portfolio. These factors include changes in the size and composition of the loan portfolio, actual loan loss experience, and current and anticipated economic conditions. The reserve is an estimate based upon factors and trends identified by management at the time the financial statements are prepared.
The following table summarizes information in regard to impaired loans by loan portfolio class as of December 31, 2022:
| December 31, 2022 |
||||||||||||
| (Dollars in thousands) |
Recorded |
Unpaid |
Related |
|||||||||
| With no related allowance recorded |
||||||||||||
| Residential Real Estate: |
||||||||||||
| Single family |
$ | 149 | $ | 149 | $ | — | ||||||
| Total |
$ | 149 | $ | 149 | $ | — | ||||||
The following table presents additional information regarding the impaired loans for the year ended December 31, 2022.
| December 31, 2022 |
||||||||
| (Dollars in thousands) |
Average |
Interest |
||||||
| With no related allowance recorded |
||||||||
| Residential Real Estate: |
||||||||
| Single family |
$ | 149 | $ | 15 | ||||
| Total |
$ | 149 | $ | 15 | ||||
The following table is a summary of the Company’s nonaccrual loans by major categories for the periods indicated.
| CECL |
Incurred Loss |
|||||||||||||||
| December 31, 2023 |
December 31, 2022 |
|||||||||||||||
| (Dollars in thousands) |
Nonaccrual Loans with No Allowance |
Nonaccrual Loans with an Allowance |
Total Nonaccrual Loans |
Nonaccrual Loans |
||||||||||||
| Residential Real Estate: |
||||||||||||||||
| Single Family |
$ | 149 | $ | — | $ | 149 | $ | — | ||||||||
| Commercial & industrial |
851 | — | 851 | — | ||||||||||||
| Total |
$ | 1,000 | $ | — | $ | 1,000 | $ | — | ||||||||
The Company recognized $57,792 of interest income on nonaccrual loans during the year ended December 31, 2023.
The following table represents the accrued interest receivables written off by reversing interest income during the year ended December 31, 2023:
| (Dollars in thousands) |
For the Year Ended December 31, 2023 |
|||
| Residential Real Estate: |
||||
| Single Family |
$ | 5 | ||
| Commercial & industrial |
128 | |||
| Total |
$ | 133 | ||
The Company has certain loans for which repayment is dependent upon the operation or sale of collateral, as the borrower is experiencing financial difficulty. The underlying collateral can vary based upon the type of loan. The following provides more detail about the types of collateral that secure collateral-dependent loans:
| • |
Commercial real estate loans can be secured by either owner-occupied commercial real estate or non-owner-occupied investment commercial real estate. Typically, owner-occupied commercial real estate loans are secured by office buildings, warehouses, manufacturing facilities and other commercial and industrial properties occupied by operating companies. Non-owner-occupied commercial real estate loans are generally secured by office buildings and complexes, retail facilities, multifamily complexes, land under development, industrial properties, as well as other commercial or industrial real estate. |
| • |
Residential real estate mortgage loans, including equity lines of credit, are typically secured by first mortgages, and in some cases could be secured by a second mortgage. |
| • |
Home equity lines of credit are generally secured by second mortgages on residential real estate property. |
| • |
Consumer loans are generally secured by automobiles, motorcycles, recreational vehicles and other personal property. Some consumer loans are unsecured and have no underlying collateral. |
The following table details the amortized cost of collateral dependent loans:
| (Dollars in thousands) |
As of December 31, 2023 |
|||
| Residential Real Estate: |
||||
| Single Family |
$ | 346 | ||
| Commercial Real Estate: |
||||
| Owner occupied |
1,120 | |||
| Commercial & industrial |
851 | |||
| Total |
$ | 2,317 | ||
The allowance for credit losses incorporates an estimate of lifetime expected credit losses and is recorded on each asset upon asset origination or acquisition. The starting point for the estimate of the allowance for credit losses is historical loss information, which includes losses from modifications of receivables to borrowers experiencing financial difficulty. The Company uses a weighted average remaining life model to determine the allowance for credit losses. An assessment of whether a borrower is experiencing financial difficulty is made on the date of a modification.
Because the effect of most modifications made to borrowers experiencing financial difficulty is already included in the allowance for credit losses because of the measurement methodologies used to estimate the allowance, a change to the allowance for credit losses is generally not recorded upon modification. Occasionally, the Company modifies loans by providing principal forgiveness on certain loans. When principal forgiveness is provided, the amortized cost basis of the asset is written off against the allowance for credit losses. The amount of the principal forgiveness is deemed to be uncollectible; therefore, that portion of the loan is written off, resulting in a reduction of the amortized cost basis and a corresponding adjustment to the allowance for credit losses.
In some cases, the Company will modify a certain loan by providing multiple types of concessions. Typically, one type of concession, such as a term extension, is granted initially. If the borrower continues to experience financial difficulty, another concession, such as principal forgiveness, may be granted.
The following table shows the amortized cost basis as of December 31, 2023 of the loans modified to borrowers experiencing financial difficulty, disaggregated by class of loans and type of concession granted and describes the financial effect of the modifications made to borrowers experiencing financial difficulty:
| Term Extension |
||||||
| December 31, 2023 |
||||||
| (Dollars in thousands) |
Amortized Cost Basis |
% of Total Loan Type |
Financial Effect |
|||
| Commercial Real Estate: |
||||||
| Non-owner occupied |
$ 16,000 |
3.5% |
Extended term on interest only payments for six months. |
|||
| Commercial & industrial |
315 | 0.4% |
Extended term for three months. |
|||
| Total |
$ | 16,315 | ||||
The Company categorizes loans into risk categories based on relevant information about the ability of borrowers to service their debt such as: current financial information, historical payment experience, credit documentation, public information, and current economic trends, among other factors. Credit quality risk ratings include regulatory classifications of Pass, Watch, Special Mention, Substandard, Doubtful and Loss. Loans classified as Pass have quality metrics to support that the loan will be repaid according to the terms established. Loans classified as Watch have similar characteristics as Pass loans with some emerging signs of financial weaknesses that should be monitored closer. Loans classified as Special Mention have potential weaknesses that deserve management’s close attention. If uncorrected, the potential weaknesses may result in deterioration of prospects for repayment. Loans classified substandard have a well-defined weakness or weaknesses that jeopardize the liquidation of the debt. They include loans that are inadequately protected by the current net worth and paying capacity of the obligor or of the collateral pledged, if any. Loans classified doubtful have all the weaknesses inherent in loans classified substandard with the added characteristic that collection or liquidation in full, on the basis of current conditions and facts, is highly improbable. Loans classified as a loss are considered uncollectible and are charged to the allowance for loan losses. Loans not classified are rated pass.
The following table presents the risk category of loans by credit quality indicators by year of origination as of December 31, 2023:
| Term Loans Amortized Cost Basis by Origination Year |
||||||||||||||||||||||||||||||||
| December 31, 2023 |
||||||||||||||||||||||||||||||||
| (Dollars in thousands) |
2023 |
2022 |
2021 |
2020 |
2019 |
Prior |
Revolving Loans |
Total |
||||||||||||||||||||||||
| Residential Real Estate - Single Family |
||||||||||||||||||||||||||||||||
| Pass |
$ | 49,803 | $ | 17,502 | $ | 26,434 | $ | 33,134 | $ | 20,610 | $ | 20,542 | $ | 33,217 | $ | 201,242 | ||||||||||||||||
| Watch |
298 | — | — | 1,319 | — | — | — | 1,617 | ||||||||||||||||||||||||
| Special Mention |
— | — | — | — | — | — | — | — | ||||||||||||||||||||||||
| Substandard |
— | — | — | — | 409 | — | 149 | 558 | ||||||||||||||||||||||||
| Total Residential Real Estate - Single Family |
$ | 50,101 | $ | 17,502 | $ | 26,434 | $ | 34,453 | $ | 21,019 | $ | 20,542 | $ | 33,366 | $ | 203,417 | ||||||||||||||||
| Current period gross write-offs |
$ | — | $ | — | $ | — | $ | — | $ | — | $ | — | $ | — | $ | — | ||||||||||||||||
| Residential Real Estate - Multifamily |
||||||||||||||||||||||||||||||||
| Pass |
$ | 28,346 | $ | 81,180 | $ | 60,156 | $ | 39,286 | $ | 27,270 | $ | 10,797 | $ | 24,005 | $ | 271,040 | ||||||||||||||||
| Watch |
— | — | — | — | — | — | — | — | ||||||||||||||||||||||||
| Special Mention |
— | — | — | — | — | — | — | — | ||||||||||||||||||||||||
| Substandard |
— | — | — | — | — | — | — | — | ||||||||||||||||||||||||
| Total Residential Real Estate - Multifamily |
$ | 28,346 | $ | 81,180 | $ | 60,156 | $ | 39,286 | $ | 27,270 | $ | 10,797 | $ | 24,005 | $ | 271,040 | ||||||||||||||||
| Current period gross write-offs |
$ | — | $ | — | $ | — | $ | — | $ | — | $ | — | $ | — | $ | — | ||||||||||||||||
| Residential Real Estate - Farmland |
||||||||||||||||||||||||||||||||
| Pass |
$ | — | $ | — | $ | — | $ | — | $ | — | $ | 145 | $ | — | $ | 145 | ||||||||||||||||
| Watch |
— | — | — | — | — | — | — | — | ||||||||||||||||||||||||
| Special Mention |
— | — | — | — | — | — | — | — | ||||||||||||||||||||||||
| Substandard |
— | — | — | — | — | — | — | — | ||||||||||||||||||||||||
| Total Residential Real Estate - Farmland |
$ | — | $ | — | $ | — | $ | — | $ | — | $ | 145 | $ | — | $ | 145 | ||||||||||||||||
| Current period gross write-offs |
$ | — | $ | — | $ | — | $ | — | $ | — | $ | — | $ | — | $ | — | ||||||||||||||||
| Commercial Real Estate - Owner Occupied |
||||||||||||||||||||||||||||||||
| Pass |
$ | 70,476 | $ | 55,222 | $ | 43,576 | $ | 39,621 | $ | 32,044 | $ | 37,360 | $ | 1,391 | $ | 279,690 | ||||||||||||||||
| Watch |
— | — | — | — | — | — | 1,242 | 1,242 | ||||||||||||||||||||||||
| Special Mention |
— | — | — | — | — | — | — | — | ||||||||||||||||||||||||
| Substandard |
— | — | — | — | 1,120 | — | — | 1,120 | ||||||||||||||||||||||||
| Total Commercial Real Estate - Owner Occupied |
$ | 70,476 | $ | 55,222 | $ | 43,576 | $ | 39,621 | $ | 33,164 | $ | 37,360 | $ | 2,633 | $ | 282,052 | ||||||||||||||||
| Current period gross write-offs |
$ | — | $ | — | $ | — | $ | — | $ | — | $ | — | $ | — | $ | — | ||||||||||||||||
| Commercial Real Estate - Non-Owner Occupied |
||||||||||||||||||||||||||||||||
| Pass |
$ | 23,091 | $ | 101,617 | $ | 51,291 | $ | 47,732 | $ | 17,827 | $ | 131,347 | $ | 32,122 | $ | 405,027 | ||||||||||||||||
| Watch |
— | — | — | 960 | 12,768 | 19,282 | — | 33,010 | ||||||||||||||||||||||||
| Special Mention |
— | — | — | 16,000 | — | — | — | 16,000 | ||||||||||||||||||||||||
| Substandard |
— | — | — | — | 7,738 | — | — | 7,738 | ||||||||||||||||||||||||
| Total Commercial Real Estate - Non-Owner Occupied |
$ | 23,091 | $ | 101,617 | $ | 51,291 | $ | 64,692 | $ | 38,333 | $ | 150,629 | $ | 32,122 | $ | 461,775 | ||||||||||||||||
| Current period gross write-offs |
$ | — | $ | — | $ | — | $ | — | $ | — | $ | — | $ | — | $ | — | ||||||||||||||||
| Construction & Land Development |
||||||||||||||||||||||||||||||||
| Pass |
$ | 6,158 | $ | 32,544 | $ | 13,612 | $ | 2,455 | $ | — | $ | 8,118 | $ | 333,417 | $ | 396,304 | ||||||||||||||||
| Watch |
258 | — | — | — | — | — | 22,272 | 22,530 | ||||||||||||||||||||||||
| Special Mention |
— | — | — | — | — | — | — | — | ||||||||||||||||||||||||
| Substandard |
— | 1,454 | — | — | — | — | 9,349 | 10,803 | ||||||||||||||||||||||||
| Total Construction & Land Development |
$ | 6,416 | $ | 33,998 | $ | 13,612 | $ | 2,455 | $ | — | $ | 8,118 | $ | 365,038 | $ | 429,637 | ||||||||||||||||
| Current period gross write-offs |
$ | — | $ | — | $ | — | $ | — | $ | — | $ | — | $ | — | $ | — | ||||||||||||||||
| Commercial & Industrial |
||||||||||||||||||||||||||||||||
| Pass |
$ | 10,150 | $ | 5,271 | $ | 13,530 | $ | 3,495 | $ | 1,230 | $ | 10,132 | $ | 27,299 | $ | 71,107 | ||||||||||||||||
| Watch |
— | — | — | — | — | 334 | — | 334 | ||||||||||||||||||||||||
| Special Mention |
— | — | — | — | — | — | 2,997 | 2,997 | ||||||||||||||||||||||||
| Substandard |
— | — | — | — | 536 | 353 | 88 | 977 | ||||||||||||||||||||||||
| Total Commercial & Industrial |
$ | 10,150 | $ | 5,271 | $ | 13,530 | $ | 3,495 | $ | 1,766 | $ | 10,819 | $ | 30,384 | $ | 75,415 | ||||||||||||||||
| Current period gross write-offs |
$ | — | $ | — | $ | — | $ | — | $ | 261 | $ | 201 | $ | — | $ | 462 | ||||||||||||||||
| Consumer - Unsecured |
||||||||||||||||||||||||||||||||
| Pass |
$ | — | $ | — | $ | — | $ | — | $ | — | $ | — | $ | 271 | $ | 271 | ||||||||||||||||
| Watch |
— | — | — | — | — | — | — | — | ||||||||||||||||||||||||
| Special Mention |
— | — | — | — | — | — | — | — | ||||||||||||||||||||||||
| Substandard |
— | — | — | — | — | — | — | — | ||||||||||||||||||||||||
| Total Consumer - Unsecured |
$ | — | $ | — | $ | — | $ | — | $ | — | $ | — | $ | 271 | $ | 271 | ||||||||||||||||
| Current period gross write-offs |
$ | — | $ | — | $ | — | $ | — | $ | — | $ | — | $ | — | $ | — | ||||||||||||||||
| Consumer - Secured |
||||||||||||||||||||||||||||||||
| Pass |
$ | 55 | $ | 252 | $ | 3 | $ | 51 | $ | 1,400 | $ | 1,497 | $ | 81 | $ | 3,339 | ||||||||||||||||
| Watch |
— | — | — | — | — | — | — | — | ||||||||||||||||||||||||
| Special Mention |
— | — | — | — | — | — | — | — | ||||||||||||||||||||||||
| Substandard |
— | — | — | — | — | — | — | — | ||||||||||||||||||||||||
| Total Consumer - Secured |
$ | 55 | $ | 252 | $ | 3 | $ | 51 | $ | 1,400 | $ | 1,497 | $ | 81 | $ | 3,339 | ||||||||||||||||
| Current period gross write-offs |
$ | — | $ | — | $ | — | $ | — | $ | — | $ | 6 | $ | — | $ | 6 | ||||||||||||||||
| Total |
||||||||||||||||||||||||||||||||
| Pass |
$ | 188,079 | $ | 293,588 | $ | 208,602 | $ | 165,774 | $ | 100,381 | $ | 219,938 | $ | 451,803 | $ | 1,628,165 | ||||||||||||||||
| Watch |
556 | — | — | 2,279 | 12,768 | 19,616 | 23,514 | 58,733 | ||||||||||||||||||||||||
| Special Mention |
— | — | — | 16,000 | — | — | 2,997 | 18,997 | ||||||||||||||||||||||||
| Substandard |
— | 1,454 | — | — | 9,803 | 353 | 9,586 | 21,196 | ||||||||||||||||||||||||
| Total loans |
$ | 188,635 | $ | 293,588 | $ | 208,602 | $ | 168,053 | $ | 113,149 | $ | 239,560 | $ | 475,317 | $ | 1,727,091 | ||||||||||||||||
| Current period gross write-offs |
$ | — | $ | — | $ | — | $ | — | $ | 261 | $ | 207 | $ | — | $ | 468 | ||||||||||||||||
The following table presents the risk category of loans by credit quality indicators as of December 31, 2022:
| December 31, 2022 |
||||||||||||||||||||||||
| (Dollars in thousands) |
Pass |
Watch |
Special Mention |
Substandard |
Doubtful |
Total |
||||||||||||||||||
| Residential Real Estate: |
||||||||||||||||||||||||
| Single Family |
$ | 178,172 | $ | — | $ | — | $ | 443 | $ | — | $ | 178,615 | ||||||||||||
| Multifamily |
215,624 | — | — | — | — | 215,624 | ||||||||||||||||||
| Farmland |
155 | — | — | — | — | 155 | ||||||||||||||||||
| Commercial Real Estate: |
— | |||||||||||||||||||||||
| Owner occupied |
227,231 | — | — | 1,143 | — | 228,374 | ||||||||||||||||||
| Non-owner occupied |
439,537 | 24,897 | — | 7,920 | — | 472,354 | ||||||||||||||||||
| Construction & Land Development |
393,783 | — | — | — | — | 393,783 | ||||||||||||||||||
| Commercial – Non Real Estate: |
— | |||||||||||||||||||||||
| Commercial & industrial |
97,246 | 97 | — | 8 | — | 97,351 | ||||||||||||||||||
| Consumer – Non Real Estate: |
— | |||||||||||||||||||||||
| Unsecured |
1,984 | — | — | — | — | 1,984 | ||||||||||||||||||
| Secured |
11,352 | — | — | — | — | 11,352 | ||||||||||||||||||
| Total |
$ | 1,565,084 | $ | 24,994 | $ | — | $ | 9,514 | $ | — | $ | 1,599,592 | ||||||||||||
The Company maintains an allowance for off-balance sheet credit exposures such as unfunded balances for existing lines of credit, commitments to extend future credit, as well as both standby and commercial letters of credit when there is a contractual obligation to extend credit and when this extension of credit is not unconditionally cancellable (i.e., the commitment cannot be canceled at any time). The allowance for off-balance sheet credit exposures is adjusted as a provision for credit loss expense. The estimate includes consideration of the likelihood that funding will occur, which is based on a historical funding study derived from internal information, and an estimate of expected credit losses on commitments expected to be funded over its estimated life, which are the same loss rates that are used in computing the allowance for credit losses on loans, and are discussed in Note 1. The allowance for credit losses for unfunded loan commitments of $1.0 million at December 31, 2023, is separately classified on the balance sheet within Other Liabilities.
The following table presents the balance and activity in the allowance for credit losses for unfunded loan commitments for the year ended December 31, 2023.
| (Dollars in thousands) |
Total Allowance for Credit Losses on Off-Balance Sheet Credit Exposure |
|||
| Balance, December 31, 2022 |
$ |
— | ||
| Adjustment to allowance for off-balance sheet credit losses upon adoption of ASU 2016-13 |
1,310 | |||
| Recovery of off-balance sheet credit losses, net |
(301 | ) | ||
| Balance, December 31, 2023 |
$ | 1,009 | ||
Note 6. Related Party Transactions
The Bank grants loans and letters of credit to its executive officers, directors and their affiliated entities. Such loans are made in the ordinary course of business on substantially the same terms and conditions, including interest rates and collateral, as those prevailing at the same time for comparable transactions with unrelated persons, and, in the opinion of management, do not involve more than normal risk or present other unfavorable features.
The aggregate amount of such loans outstanding at December 31, 2023 was approximately $280,957 compared to $556,240 at December 31, 2022. During 2023, new loans and line of credit advances to such related parties was approximately $74,589 compared to $4,900 during 2022. Repayments on loans to directors and officers were $349,872 and $91,300 during 2023 and 2022, respectively. The Bank maintains deposit accounts with some of its executive officers, directors and their affiliated entities. Such deposit accounts at December 31, 2023 and December 31, 2022 amounted to approximately $2.2 million and $2.1 million, respectively.
Note 7. Premises and Equipment
Premises and equipment are summarized as follows at December 31:
| (Dollars in thousands) |
2023 |
2022 |
||||||
| Cost |
||||||||
| Building |
$ | 13,005 | $ | 13,005 | ||||
| Land |
2,856 | 2,856 | ||||||
| Leasehold improvements |
1,091 | 1,091 | ||||||
| Furniture, fixtures and equipment |
4,500 | 4,300 | ||||||
| Computer software and equipment |
1,931 | 1,856 | ||||||
| 23,383 | 23,108 | |||||||
| Less accumulated depreciation |
(9,439 | ) | (8,399 | ) | ||||
| Premises and equipment, net |
$ | 13,944 | $ | 14,709 | ||||
Depreciation and amortization charged to operations were $1.3 million and $1.3 million during the years ended December 31, 2023 and December 31, 2022, respectively.
Note 8. Intangible Assets
The carrying amount of computer software developed was $14.7 million and $9.1 at December 31, 2023 and December 31, 2022, respectively. The following table presents the changes in the carrying amount of computer software developed during the years ended December 31, 2023 and 2022.
| Years Ended |
||||||||||||||||
| December 31, 2023 |
December 31, 2022 |
|||||||||||||||
| (Dollars in thousands) |
Gross Carrying Amount |
Accumulated Amortization | Gross Carrying Amount |
Accumulated Amortization | ||||||||||||
| Amortizable intangible assets: |
||||||||||||||||
| Computer software |
$ | 14,657 | $ | — | $ | 9,149 | $ | — | ||||||||
| Total |
$ | 14,657 | $ | — | $ | 9,149 | $ | — | ||||||||
The Company is still in the stage of computer software where costs are capitalized. Capitalization ceases when the software is substantially complete and ready for its intended use. At that time the intangible asset will be amortized on a straight-line bases over the estimated useful life of the asset. As of December 31, 2023, the Company has not recorded any amortization on its intangible computer software. The Company expects to put the software into service in the first quarter of 2024.
Note 9. Deposits
Time deposits in denominations of $250,000 or more totaled approximately $445.6 million and $374.8 million at December 31, 2023 and 2022, respectively.
At December 31, 2023, maturities of time deposits are as follows:
| (Dollars in thousands) |
Year ended December 31, |
|||
| 2024 |
$ | 463,702 | ||
| 2025 |
113,313 | |||
| 2026 |
44,490 | |||
| 2027 |
74,831 | |||
| Thereafter |
— | |||
| Total |
$ | 696,336 | ||
Wholesale deposits, as defined by the FDIC and pursuant to rule 12 CFR 337.6(e), totaled approximately $574.9 million and $324.2 million at December 31, 2023 and December 31, 2022, respectively.
Note 10. Borrowed Funds
The Bank also has a credit availability agreement with the FHLB based on a percentage of total assets. As of December 31, 2023, the credit availability with FHLB is approximately $504.6 million. This credit availability agreement provides the Bank with access to a myriad of advance products offered by the FHLB. The rate of interest charged is based on market conditions. At December 31, 2023, there were commercial real estate, residential 1-4 and multi-family loans totaling $1.5 billion used to collateralize FHLB advances.
The Company did not have any outstanding FHLB advances at December 31, 2023.
The average balance on FHLB advances for the years ended December 31, 2023 and December 31, 2022 was approximately $25.0 million and $24.0 million, respectively. The weighted average interest rate paid during the year ended December 31, 2023 and 2022 was 4.90% and 1.45%, respectively. The weighted average interest rate paid at December 31, 2023 and 2022 was 0% and 4.31%, respectively
The Company had $15.0 million outstanding on its unsecured federal funds lines at December 31, 2023.
The average balance on unsecured borrowing lines for the years ended December 31, 2023 and December 31, 2022 was approximately $5.6 million and $2,000, respectively. The weighted average interest rate paid during the year ended December 31, 2023 and 2022 was 5.36% and 1.59%, respectively. The weighted average interest rate paid at December 31, 2023 and 2022 was 5.65% and 0%, respectively, as there were no outstanding borrowings at December 31, 2022.
Note 11. Income Taxes
The Company files tax returns in the U.S. federal jurisdiction and required states. With few exceptions, the Bank is no longer subject to tax examination by tax authorities for years prior to 2019.
The Commonwealth of Virginia assesses a Bank Franchise Tax on banks instead of a state income tax. The Bank Franchise Tax expense is reported in non-interest expense and the tax’s calculation is unrelated to taxable income.
The provision for income taxes consists of the following components:
| (Dollars in thousands) |
2023 |
2022 |
||||||
| Current expense |
$ | 6,430 | $ | 7,608 | ||||
| Deferred (benefit) |
(191 | ) | (894 | ) | ||||
| Total |
$ | 6,239 | $ | 6,714 | ||||
Income tax expense for the years ended December 31, 2023 and 2022 differed from the federal statutory rate applied to income before income taxes for the following reasons:
| Year ended December 31, |
||||||||
| (Dollars in thousands) |
2023 |
2022 |
||||||
| Computed “expected” income tax expense |
$ | 6,893 | $ | 7,012 | ||||
| Increase (decrease)in income taxes resulting from: |
||||||||
| Tax exempt Interest |
(136 | ) | (200 | ) | ||||
| BOLI Income |
(225 | ) | (211 | ) | ||||
| Low Income Housing Investment |
386 | 130 | ||||||
| State Income Taxes |
649 | 637 | ||||||
| Restricted Stock Adjustment |
(100 | ) | (119 | ) | ||||
| Federal tax credits |
(1,317 | ) | (472 | ) | ||||
| Other Adjustments |
89 | (63 | ) | |||||
| Total |
$ | 6,239 | $ | 6,714 | ||||
The tax effects of temporary differences result in deferred tax assets and liabilities as presented below:
| December 31, |
||||||||
| (Dollars in thousands) |
2023 |
2022 |
||||||
| Deferred tax assets: |
||||||||
| Allowance for credit losses |
$ | 3,798 | $ | 3,238 | ||||
| Restricted stock |
533 | 511 | ||||||
| Net loan fees |
1,253 | 1,268 | ||||||
| Right-of-use liability |
1,588 | 1,705 | ||||||
| Accrued compensation |
638 | 403 | ||||||
| Unrealized losses on securities available-for-sale |
2,240 | 2,555 | ||||||
| Other |
320 | 42 | ||||||
| Gross deferred tax assets |
10,370 | 9,722 | ||||||
| Deferred tax liabilities: |
||||||||
| Depreciation |
253 | 378 | ||||||
| Prepaid expense |
12 | 11 | ||||||
| Right-of-use Asset |
1,429 | 1,534 | ||||||
| Internally developed software costs |
527 | 153 | ||||||
| Other |
215 | 95 | ||||||
| Gross deferred tax liabilities |
2,436 | 2,171 | ||||||
| Net deferred tax asset |
$ | 7,934 | $ | 7,551 | ||||
Note 12. Earnings Per Common Share
Basic earnings per share excludes dilution and is computed by dividing net income available to common stockholders by the weighted average number of common shares outstanding for the period. Diluted earnings per share reflects the potential dilution that could occur if securities or other contracts to issue common stock were exercised or converted into common stock or resulted in the issuance of common stock which then shared in the earnings of the Bank. There were no such potentially dilutive securities outstanding in 2023 or 2022.
The weighted average number of shares used in the calculation of basic and diluted earnings per share includes unvested restricted shares of the Company’s common stock outstanding. Applicable guidance requires that outstanding unvested share-based payment awards that contain voting rights and rights to non-forfeitable dividends participate in undistributed earnings with common stockholders.
| For the Year Ended December 31, |
||||||||
| (Dollars in thousands) |
2023 |
2022 |
||||||
| Net income |
$ | 26,585 | $ | 26,674 | ||||
| Preferred stock dividends |
(2,156 | ) | (2,156 | ) | ||||
| Net income available to common shareholders |
$ | 24,429 | $ | 24,518 | ||||
| Weighted average number of shares issued, basic and diluted |
7,522,913 | 7,529,382 | ||||||
| Earnings per common share: |
||||||||
| Basic and diluted earnings per common share |
$ | 3.25 | $ | 3.26 | ||||
Note 13. Commitments and Contingencies
The Bank’s financial statements do not reflect various commitments and contingent liabilities which arise in the normal course of business and which involve elements of credit risk, interest risk and liquidity risk. These commitments and contingent liabilities are commitments to extend credit and standby letters of credit.
The amounts of loan commitments and standby letters of credit are set forth in the following table as of December 31, 2023 and 2022:
| December 31, |
||||||||
| (Dollars in thousands) |
2023 |
2022 |
||||||
| Loan commitments |
$ | 359,373 | $ | 435,751 | ||||
| Standby letters of credit |
$ | 471 | $ | — | ||||
Commitments to extend credit and standby letters of credit all include exposure to some credit loss in the event of nonperformance of the customer. The Bank’s credit policies and procedures for credit commitments and financial guarantees are the same as those for extensions of credit that are recorded on the statements of financial condition. Because these instruments have fixed maturity dates, and because many of them expire without being drawn upon, they do not generally present any significant liquidity risk to the Bank. The Bank has not incurred any losses on commitments in 2023 or 2022.
During 2020, the Bank made a commitment of $5.0 million to the Housing Equity Fund of Virginia XXIV, L.L.C. This commitment will be funded through capital calls from the fund and we expect our investment to be fully funded by December 31, 2025.
During 2020, the Bank made a commitment of $2.0 million to the Washington Housing Initiative Impact Pool, LLC. This commitment will be funded through capital calls from the fund. As of December 31, 2023, approximately $1.4 million has been deployed, with a remaining unfunded balance of approximately $600,000.
During 2022, the Bank made a commitment of $2.0 million to the VCDC Equity Fund 26, LLC. This commitment will be funded through capital calls from the fund and we expect our investment to be fully funded by December 31, 2028.
During 2023, the Bank made a commitment of $2.0 million to the VCDC Equity Fund 27, LLC. This commitment will be funded through capital calls from the fund and we expect our investment to be fully funded by December 31, 2029.
From time to time, we are a party to various litigation matters incidental to our ordinary conduct of our business. Management believes that none of these legal proceedings, individually or in the aggregate, will have a material adverse impact on the results of operations or financial condition of the Company.
Note 14. Leases
The right-of-use assets and lease liabilities are included in other assets and other liabilities, respectively, in the Consolidated Statements of Financial Condition.
Lease liabilities represent the Company’s obligation to make lease payments and are presented at each reporting date as the net present value of the remaining contractual cash flows. Cash flows are discounted at the Company’s incremental borrowing rate in effect at the commencement date of the lease. The incremental borrowing rate was equal to the rate of borrowing from the FHLB that aligned with the term of the lease contract. Right-of-use assets represent the Company’s right to use the underlying asset for the lease term and are calculated as the sum of the lease liability and if applicable, prepaid rent, initial direct costs and any incentives received from the lessor.
The Company’s long-term lease agreements are classified as operating leases. Certain of these leases offer the option to extend the lease term and the Company has included such extensions in its calculation of the lease liabilities to the extent the options are reasonably assured of being exercised. The lease agreements do not provide for residual value guarantees and have no restrictions or covenants that would impact dividends or require incurring additional financial obligations.
Information regarding the Company's leases as of and for the years ended December 31, 2023 and 2022 were as follows:
| As of December 31, |
||||||||
| (Dollars in thousands) |
2023 |
2022 |
||||||
| Lease liabilities |
$ | 6,902 | $ | 7,342 | ||||
| Right-of-use assets |
$ | 6,211 | $ | 6,688 | ||||
| Weighted-average remaining lease term – operating leases (in months). |
155.9 | 162.9 | ||||||
| Weighted-average discount rate – operating leases |
2.80 | % | 2.80 | % | ||||
| For the year ended December 31, |
||||||||
| (Dollars in thousands) |
2023 |
2022 |
||||||
| Lease Cost |
||||||||
| Operating lease cost |
$ | 677 | $ | 677 | ||||
| Total lease costs |
$ | 677 | $ | 677 | ||||
| Cash paid for amounts included in measurement of lease liabilities |
$ | 639 | $ | 623 | ||||
The Company is the lessor for three operating leases. One lease is extended on a month-to-month basis while two of these leases have arrangements for over twelve months with an option to extend the lease terms. The lease agreements do not provide for residual value guarantees and have no restrictions or covenants that would impact dividends or require incurring additional financial obligations. Total rent income on these operating leases is approximately $7,500 per month.
As of December 31, 2023, all of the Company’s lease obligations are classified as operating leases. The Company does not have any finance lease obligations.
A maturity analysis of operating lease liabilities and reconciliation of the undiscounted cash flows to the total of operating lease liabilities as of December 31, 2023 is as follows:
| (Dollars in thousands) |
||||
| 2024 |
$ | 654 | ||
| 2025 |
671 | |||
| 2026 |
689 | |||
| 2027 |
587 | |||
| 2028 |
594 | |||
| Thereafter |
4,967 | |||
| Total undiscounted cash flows |
8,162 | |||
| Discount |
(1,260 | ) | ||
| Lease liabilities |
$ | 6,902 |
Note 15. Significant Concentrations of Credit Risk
Substantially all the Bank’s loans, commitments and standby letters of credit have been granted to customers located in the greater Washington, D.C. Metropolitan Area. The concentrations of credit by type of loan are set forth in Note 4.
The Bank maintains its cash and federal funds sold in correspondent bank deposit accounts. The amount on deposit at December 31, 2023 exceeded the insurance limits of the Federal Deposit Insurance Corporation by $61.8 million. The Bank has not experienced any losses in such accounts and believes it is not exposed to any significant credit risks.
Note 16. Regulatory Matters
Information presented for December 31, 2023 and December 31, 2022, reflects the Basel III capital requirements that became effective January 1, 2015 for the Bank. Under these capital requirements and the regulatory framework for prompt corrective action, the Bank must meet specific capital guidelines that involve quantitative measures of the Bank’s assets, liabilities and certain off-balance-sheet items as calculated under regulatory accounting practices. The Bank’s capital amounts and classifications are also subject to qualitative judgments by regulators about components, risk- weightings and other factors.
The Basel III Capital Rules, a comprehensive capital framework for U.S. banking organizations, became effective for the Bank on January 1, 2015 (subject to a phase-in period for certain provisions). Under the Basel III rules, the Bank must hold a capital conservation buffer above the adequately capitalized risk-based capital ratios. The capital conservation buffer for 2022 and 2023 is 2.50%. Quantitative measures established by regulation to ensure capital adequacy require the Bank to maintain minimum amounts and ratios of Total capital, Common Equity Tier 1 capital, and Tier 1 capital (as defined in the regulations) to risk weighted assets (as defined), and of Tier 1 capital (as defined) to average assets (as defined). Management believes, as of December 31, 2023, the Bank meets all capital adequacy requirements to which it is subject.
The Bank’s actual capital amounts and ratios are presented in the table (dollars in thousands):
| Actual |
Capital Adequacy Purposes |
To Be Well Capitalized Under the Prompt Corrective Action Provision |
||||||||||||||||||||||
| (Dollars in thousands) |
Amount |
Ratio |
Amount |
Ratio |
Amount |
Ratio |
||||||||||||||||||
| As of December 31, 2023 |
||||||||||||||||||||||||
| Total capital (to risk-weighted assets) |
$ 312,069 |
17.18% |
$ 145,300 |
≥ 8.0% |
$ 181,625 |
≥ 10.0% |
||||||||||||||||||
| Common equity tier 1 capital (to risk-weighted assets) |
$ 294,553 |
16.22% |
$ 81,731 |
≥ 4.5% |
$ 118,056 |
≥ 6.5% |
||||||||||||||||||
| Tier 1 capital (to risk-weighted assets) |
$ 294,553 |
16.22% |
$ 108,975 |
≥ 6.0% |
$ 145,300 |
≥ 8.0% |
||||||||||||||||||
| Tier 1 capital (to average assets) |
$ 294,553 |
14.66% |
$ 80,375 |
≥ 4.0% |
$ 100,469 |
≥ 5.0% |
||||||||||||||||||
| As of December 31, 2022 |
||||||||||||||||||||||||
| Total capital (to risk-weighted assets) |
$ 286,572 |
16.27% |
$ 140,929 |
≥ 8.0% |
$ 176,161 |
≥ 10.0% |
||||||||||||||||||
| Common equity tier 1 capital (to risk-weighted assets) |
$ 272,458 |
15.47% |
$ 79,272 |
≥ 4.5% |
$ 114,504 |
≥ 6.5% |
||||||||||||||||||
| Tier 1 capital (to risk-weighted assets) |
$ 272,458 |
15.47% |
$ 105,696 |
≥ 6.0% |
$ 140,929 |
≥ 8.0% |
||||||||||||||||||
| Tier 1 capital (to average assets) |
$ 272,458 |
15.05% |
$ 72,435 |
≥ 4.0% |
$ 90,544 |
≥ 5.0% |
||||||||||||||||||
Note 17. Defined Contribution Benefit Plan
The Bank adopted a 401(k) defined contribution plan on October 1, 2004, which is administered by Principal Investments. Participants have the right to contribute up to a maximum of 15% of pretax annual compensation or the maximum allowed by the Internal Revenue Code, whichever is less. The Bank began making a matching contribution to the plan on January 1, 2010. The Bank matches dollar for dollar up to 5% up to the employee contribution of 5%. The total amount the Bank matched during 2023 and 2022 was $901,513 and $616,721, respectively.
Note 18. Stock Based Compensation Plan
ASC Topic 718, Compensation – Stock Compensation, requires the Company to recognize expense related to the fair value of share-based compensation awards in net income. Total compensation expense for restricted stock recorded for the years ended December 31, 2023 and December 31, 2022 were $2.5 million and $2.5 million, respectively.
On July 17, 2019, the Board of Directors of the Company adopted, and the Company’s shareholders subsequently approved, the MainStreet Bank 2019 Equity Incentive Plan (the “2019 Plan”), to provide officers, other selected employees and directors of the Company with additional incentives to promote the growth and performance of the Company. During the year ended December 31, 2023, there were 90,686 restricted shares awarded, 4,014 restricted shares were forfeited, and no stock options were awarded under the 2019 Plan. The restricted shares awarded during 2023 vest equally on an annual basis over a three, five, or ten year period. As a result of the stockholders’ approval of the 2019 Plan, no additional awards have been or will be made under the Company’s 2016 Plan, although all awards that were outstanding under the 2016 Plan as of July 17, 2019 remained outstanding in accordance with their terms.
A summary of the status of the Bank’s nonvested restricted stock shares as of December 31, 2023 and changes during the year ended December 31, 2023 is presented below:
| Nonvested Restricted Stock Shares |
Shares |
Weighted Average Grant Date Fair Value |
||||||
| Nonvested at January 1, 2023 |
259,036 | $ | 22.05 | |||||
| Granted |
90,686 | 26.44 | ||||||
| Vested |
(117,408 | ) | 21.28 | |||||
| Forfeited |
(4,014 | ) | 24.35 | |||||
| Nonvested at December 31, 2023 |
228,300 | $ | 24.15 | |||||
As of December 31, 2023, there was $3.9 million of total unrecognized compensation cost related to nonvested restricted stock awards. The cost is expected to be recognized over approximately five years. The total fair value of shares vested during the years ended December 31, 2023 and 2022 was $2.9 million and $2.0 million, respectively.
Note 19. Derivatives and Risk Management Activities
The Bank uses derivative financial instruments (or “derivatives”) primarily to assist customers with their risk management objectives. The Bank classifies these items as free standing derivatives consisting of customer accommodation interest rate loan swaps (or “interest rate loan swaps”). The Bank enters into interest rate swaps with certain qualifying commercial loan customers to meet their interest rate risk management needs. The Bank simultaneously enters into interest rate swaps with dealer counterparties, with identical notional amounts and terms. The net result of these interest rate swaps is that the customer pays a fixed rate of interest and the Bank receives a floating rate. These back-to-back interest rate loan swaps qualify as financial derivatives with fair values reported in “Other assets” and “Other liabilities” in the consolidated financial statements. Changes in fair value are recorded in other noninterest expense and net to zero because of the identical amounts and terms of the interest rate loan swaps.
The following tables summarize key elements of the Banks’s derivative instruments as of December 31, 2023 and December 31, 2022.
| December 31, 2023 |
||||||||||||||||||||
| Customer-related interest rate contracts |
||||||||||||||||||||
| (Dollars in thousands) |
Notional Amount |
Positions |
Assets |
Liabilities |
Collateral Pledges | |||||||||||||||
| Matched interest rate swap with borrower |
$ | 224,008 | 42 | — | $ | 18,569 | $ | — | ||||||||||||
| Matched interest rate swap with counterparty |
$ | 224,008 | 42 | $ | 18,569 | — | $ | — | ||||||||||||
| December 31, 2022 |
||||||||||||||||||||
| Customer-related interest rate contracts |
||||||||||||||||||||
| (Dollars in thousands) |
Notional Amount |
Positions |
Assets |
Liabilities |
Collateral Pledges | |||||||||||||||
| Matched interest rate swap with borrower |
$ | 245,717 | 44 | — | $ | 23,896 | $ | 3,034 | ||||||||||||
| Matched interest rate swap with counterparty |
$ | 245,717 | 44 | $ | 23,896 | — | $ | 3,034 | ||||||||||||
The Company is able to recognize fee income upon execution of the interest rate swap contract. Interest rate swap fee income for the twelve months ended December 31, 2023 and 2022 were $0 and $619,000, respectively.
Note 20. Fair Value Presentation
In accordance with FASB ASC 820, “Fair Value Measurements and Disclosure”, the Bank uses fair value measurements to record fair value adjustments to certain assets and liabilities and to determine fair value disclosures. The fair value of a financial instrument is the price that would be received to sell an asset or paid to transfer a liability (“an exit price”) in the principal or most advantageous market for the asset or liability in an orderly transaction between market participants at the measurement date. Fair value is best determined based upon quoted market prices. However, in many instances, there are no quoted market prices for the Bank’s various financial instruments. In cases where quoted market prices are not available, fair values are based on estimates using present value or other valuation techniques. Those techniques are significantly affected by the assumptions used, including the discount rate and estimates of future cash flows. Accordingly, the fair value estimates may not be realized in an immediate settlement of the instrument.
The fair value guidance provides a consistent definition of fair value, which focuses on exit price in the principal or most advantageous market for the asset or liability in an orderly transaction (that is, not a forced liquidation or distressed sale) between market participants at the measurement date under current market conditions. If there has been a significant decrease in the volume and level of activity for the asset or liability, a change in valuation technique or the use of multiple valuation techniques may be appropriate. In such instances, determining the price at which willing market participants would transact at the measurement date under current market conditions depends on the facts and circumstances and requires the use of significant judgment. The fair value is a reasonable point within the range that is the most representative of fair value under current market conditions.
In accordance with the guidance, a hierarchy of valuation techniques is based on whether the inputs to those valuation techniques are observable or unobservable. Observable inputs reflect market data obtained from independent sources, while unobservable inputs reflect the Bank’s market assumptions. The three levels of the fair value hierarchy under FASB ASC 820 based on these two types of inputs are as follows:
Level 1 –Valuation is based on quoted prices in active markets for identical assets and liabilities that the reporting entity has the ability to access at the measurement date.
Level 2 –Valuation is based on observable inputs including quoted prices in active markets for similar assets and liabilities, quoted prices for identical or similar assets and liabilities in less active markets, and model-based valuation techniques for which significant assumptions can be derived primarily from or corroborated by observable data in the market.
Level 3 –Valuation is based on model-based techniques that use one or more significant inputs or assumptions that are unobservable in the market.
The following describes the valuation techniques used by the Bank to measure certain financial assets and liabilities recorded at fair value on a recurring basis in the financial statements:
Securities available for sale
Securities available for sale are recorded at fair value on a recurring basis. Fair value measurement is based upon quoted market prices, when available (Level 1). If quoted market prices are not available, fair values are measured utilizing independent valuation techniques of identical or similar securities for which significant assumptions are derived primarily from or corroborated by observable market data. Third party vendors compile prices from various sources and may determine the fair value of identical or similar securities by using pricing models that consider observable market data (Level 2). In certain cases where there is limited activity or less transparency around inputs to the valuation, securities are classified within Level 3 of the valuation hierarchy. As of December 31, 2023 and December 31, 2022, the Bank’s entire portfolio of available for sale securities are considered to be Level 2 securities, with the exception of one subordinated debt security, which is considered to be a level 3 security.
Derivative asset (liability) – interest rate swaps on loans
As discussed in “Note 19: Derivatives and Risk Management Activities”, the Bank recognizes interest rate swaps at fair value on a recurring basis. The Bank has contracted with a third party vendor to provide valuations for these interest rate swaps using standard valuation techniques and therefore classifies such interest rate swaps as Level 2.
The following tables provide the fair value for assets required to be measured and reported at fair value on a recurring basis as of December 31, 2023 and December 31, 2022:
| December 31, 2023 |
||||||||||||||||
| (Dollars in thousands) |
Level 1 |
Level 2 |
Level 3 |
Total |
||||||||||||
| Assets: |
||||||||||||||||
| Investment securities available-for-sale: |
||||||||||||||||
| Collateralized Mortgage Backed |
$ | — | $ | 19,515 | $ | — | $ | 19,515 | ||||||||
| Subordinated Debt |
— | 8,217 | 250 | 8,467 | ||||||||||||
| Municipal Securities |
||||||||||||||||
| Taxable |
— | 8,307 | — | 8,307 | ||||||||||||
| Tax-exempt |
— | 20,742 | — | 20,742 | ||||||||||||
| U.S. Government Agencies |
— | 2,897 | — | 2,897 | ||||||||||||
| Derivative asset – interest rate swap on loans |
— | 18,569 | — | 18,569 | ||||||||||||
| Total |
$ | — | $ | 78,247 | $ | 250 | $ | 78,497 | ||||||||
| Liabilities: |
||||||||||||||||
| Derivative liability – interest rate swap on loans |
— | 18,569 | — | 18,569 | ||||||||||||
| Total |
$ | — | $ | 18,569 | $ | — | $ | 18,569 | ||||||||
| December 31, 2022 |
||||||||||||||||
| (Dollars in thousands) |
Level 1 |
Level 2 |
Level 3 |
Total |
||||||||||||
| Assets: |
||||||||||||||||
| Investment securities available-for-sale: |
||||||||||||||||
| Collateralized Mortgage Backed |
$ | — | $ | 22,227 | $ | — | $ | 22,227 | ||||||||
| Subordinated Debt |
— | 8,577 | 250 | 8,827 | ||||||||||||
| Municipal Securities |
||||||||||||||||
| Taxable |
— | 7,966 | — | 7,966 | ||||||||||||
| Tax-exempt |
— | 20,175 | — | 20,175 | ||||||||||||
| U.S. Government Agencies |
— | 3,436 | — | 3,436 | ||||||||||||
| Derivative asset – interest rate swap on loans |
— | 23,896 | — | 23,896 | ||||||||||||
| Total |
$ | — | $ | 86,277 | $ | 250 | $ | 86,527 | ||||||||
| Liabilities: |
||||||||||||||||
| Derivative liability – interest rate swap on loans |
— | 23,896 | — | 23,896 | ||||||||||||
| Total |
$ | — | $ | 23,896 | $ | — | $ | 23,896 | ||||||||
| Reconciliation of Level 3 Inputs |
||||
| Dollars in thousands |
Subordinated Debt |
|||
| December 31, 2022 fair value |
$ | 250 | ||
| December 31, 2023 fair value |
$ | 250 | ||
Certain assets are measured at fair value on a nonrecurring basis in accordance with GAAP. Adjustments to the fair value of these assets usually result from the application of lower-of-cost-or-market accounting or write-downs of individual assets.
The following describes the valuation techniques used by the Bank to measure certain assets recorded at fair value on a nonrecurring basis in the financial statements:
Individually evaluated
Loans are individually evaluated when, in the judgment of management based on current information and events, it is probable that all amounts due according to the contractual terms of the loan agreement will not be collected when due. The measurement of loss associated with individually evaluated loans can be based on either the observable market price of the loan or the fair value of the collateral. Collateral may be in the form of real estate or business assets including equipment, inventory, and accounts receivable. The vast majority of the collateral is real estate. The value of real estate collateral is determined utilizing an income or market valuation approach based on an appraisal conducted by an independent, licensed appraiser outside of the Bank using observable market data (Level 2). However, if the collateral value is significantly adjusted due to differences in the comparable properties, or is discounted by the Bank because of marketability, then the fair value is considered Level 3. The value of business equipment is based upon an outside appraisal if deemed significant, or the net book value on the applicable business’ financial statements if not considered significant. Likewise, values for inventory and accounts receivables collateral are based on financial statement balances or aging reports (Level 3). Individually evaluated loans allocated to the Allowance for Credit Losses are measured at fair value on a nonrecurring basis. Any fair value adjustments are recorded in the period incurred as provision for credit losses on the Consolidated Statements of Income.
Other real estate owned
Other real estate owned (“OREO”) is measured at fair value less cost to sell, based on an appraisal conducted by an independent, licensed appraiser outside of the Bank. If the collateral value is significantly adjusted due to differences in the comparable properties, or is discounted by the Bank because of marketability, then the fair value is considered Level 3. OREO is measured at fair value on a nonrecurring basis. Any initial fair value adjustment is charged against the Allowance for Credit Losses. Subsequent fair value adjustments are recorded in the period incurred and included in other non-interest expense on the Consolidated Statements of Income.
The Bank did not have any other real estate owned assets or individually evaluated loans measured at fair value as of December 31, 2023 and December 31, 2022.
Fair Value of Financial Instruments
FASB ASC 825, Financial Instruments, requires disclosure about fair value of financial instruments, including those financial assets and financial liabilities that are not required to be measured and reported at fair value on a recurring or nonrecurring basis. ASC 825 excludes certain financial instruments and all nonfinancial instruments from its disclosure requirements. Accordingly, the aggregate fair value amounts presented may not necessarily represent the underlying fair value of the Company. Additionally, in accordance with ASU 2016-01, the Company uses the exit price notion, rather than the entry price notion, in calculating the fair values of financial instruments not measured at fair value on a recurring basis.
The following tables reflect the carrying amounts and estimated fair values of the Company’s financial instruments whether or not recognized on the Consolidated Statements of Financial Condition at fair value.
| December 31, 2023 |
Carrying |
Estimated |
Quoted Prices in Active Markets for Identical Assets |
Significant Other Observable Inputs |
Significant Unobservable Inputs |
|||||||||||||||
| (Dollars in thousands) |
Amount |
Fair Value |
Level 1 |
Level 2 |
Level 3 |
|||||||||||||||
| Assets: |
||||||||||||||||||||
| Cash and cash equivalents |
$ | 114,513 | $ | 114,513 | $ | 114,513 | $ | — | $ | — | ||||||||||
| Restricted equity securities |
24,356 | 24,356 | — | 24,356 | — | |||||||||||||||
| Securities: |
||||||||||||||||||||
| Available for sale |
59,928 | 59,928 | — | 59,928 | — | |||||||||||||||
| Held to maturity |
17,275 | 17,163 | — | 17,163 | — | |||||||||||||||
| Loans, net |
1,705,137 | 1,701,418 | — | — | 1,701,418 | |||||||||||||||
| Derivative asset – interest rate swap on loans |
18,569 | 18,569 | — | 18,569 | — | |||||||||||||||
| Bank owned life insurance |
38,318 | 38,318 | — | 38,318 | — | |||||||||||||||
| Accrued interest receivable |
10,725 | 10,725 | — | 10,725 | — | |||||||||||||||
| Liabilities: |
||||||||||||||||||||
| Deposits |
$ | 1,686,127 | $ | 1,685,487 | $ | — | $ | 989,791 | $ | 695,696 | ||||||||||
| Subordinated debt, net |
72,642 | 56,513 | — | 56,513 | — | |||||||||||||||
| Federal funds purchased |
15,000 | 14,968 | — | — | 14,968 | |||||||||||||||
| Derivative liability – interest rate swaps on loans |
18,569 | 18,569 | — | 18,569 | — | |||||||||||||||
| Accrued interest payable |
2,845 | 2,845 | — | 2,845 | — | |||||||||||||||
| December 31, 2022 |
Carrying |
Estimated |
Quoted Prices in Active Markets for Identical Assets |
Significant Other Observable Inputs |
Significant Unobservable Inputs |
|||||||||||||||
| (Dollars in thousands) |
Amount |
Fair Value |
Level 1 |
Level 2 |
Level 3 |
|||||||||||||||
| Assets: |
||||||||||||||||||||
| Cash and cash equivalents |
$ | 130,600 | $ | 130,600 | $ | 130,600 | $ | — | $ | — | ||||||||||
| Restricted equity securities |
24,325 | 24,325 | — | 24,325 | — | |||||||||||||||
| Securities: |
||||||||||||||||||||
| Available for sale |
62,631 | 62,631 | — | 62,631 | — | |||||||||||||||
| Held to maturity |
17,642 | 17,440 | — | 17,440 | — | |||||||||||||||
| Loans, net |
1,579,950 | 1,584,533 | — | — | 1,584,533 | |||||||||||||||
| Derivative asset – interest rate swap on loans |
23,896 | 23,896 | — | 23,896 | — | |||||||||||||||
| Bank owned life insurance |
37,249 | 37,249 | — | 37,249 | — | |||||||||||||||
| Accrued interest receivable |
8,779 | 8,779 | — | 8,779 | — | |||||||||||||||
| Liabilities: |
||||||||||||||||||||
| Deposits |
$ | 1,512,889 | $ | 1,503,869 | $ | — | $ | 904,748 | $ | 599,121 | ||||||||||
| Subordinated debt, net |
72,245 | 64,235 | — | 64,235 | — | |||||||||||||||
| Advances from the FHLB |
100,000 | 99,983 | 99,983 | |||||||||||||||||
| Derivative liability – interest rate swaps on loans |
23,896 | 23,896 | — | 23,896 | — | |||||||||||||||
| Accrued interest payable |
896 | 896 | — | 896 | — | |||||||||||||||
Fair value estimates are made at a specific point in time, based on relevant market information and information about the financial instrument. These estimates do not reflect any premium or discount that could result from offering for sale at one time the Bank’s entire holdings of a particular financial instrument. Because no market exists for a significant portion of the Bank’s financial instruments, fair value estimates are based on judgments regarding future expected loss experience, current economic conditions, risk characteristics of various financial instruments and other factors. These estimates are subjective in nature and involve uncertainties and matters of significant judgment, and therefore, cannot be determined with precision. Changes in assumptions could significantly affect the estimates.
Fair value estimates are based on existing on-balance sheet and off-balance sheet financial instruments without attempting to estimate the value of anticipated future business and the value of assets and liabilities that are not considered financial instruments. Significant assets that are not considered financial assets include deferred income taxes and bank premises and equipment. In addition, the tax ramifications related to the realization of the unrealized gains and losses can have a significant effect on fair value estimates and have not been considered in the estimates.
The above information should not be interpreted as an estimate of the fair value of the entire Company since a fair value calculation is only provided for a limited portion of the Company’s assets and liabilities. Due to a wide range of valuation techniques and the degree of subjectivity used in making the estimates, comparisons between the Company’s disclosures and those of other companies may not be meaningful. There were no changes in methodologies or transfers between levels at December 31, 2023 from December 31, 2022.
Note 21. Other Real Estate Owned
At December 31, 2023 and 2022, did not have other real estate owned. Expenses applicable to other real estate owned during the years ended December 31, 2023 and 2022 include the following:
| (Dollars in thousands) |
2023 |
2022 |
||||||
| Net loss on sales of real estate |
$ | — | $ | 4 | ||||
| Loss on valuation, net |
— | 70 | ||||||
| Operating expenses (income), net of rental income |
— | (36 | ) | |||||
| Balance, end of year |
$ | — | $ | 38 | ||||
As of December 31, 2023, there were no real estate loans in the process of foreclosure.
Note 22. Accumulated Other Comprehensive Loss
The following table presents the cumulative balances of the components of accumulated other comprehensive loss net of deferred taxes, as of December 31, 2023 and December 31, 2022:
| (Dollars in thousands) |
2023 |
2022 |
||||||
| Unrealized gain on securities |
$ | (9,737 | ) | $ | (11,108 | ) | ||
| Unrealized loss on securities transferred to HTM |
(6 | ) | (8 | ) | ||||
| Tax effect |
2,265 | 2,570 | ||||||
| Total accumulated other comprehensive loss |
$ | (7,478 | ) | $ | (8,546 | ) | ||
Note 23. Capital
On September 15, 2020, the Company issued 1,000,000 depositary shares, each representing a 1/40th interest in a share of the Company’s Fixed Rate Series A Noncumulative Perpetual Preferred Stock, par value $1.00 per share, with a liquidation preference of $1,000 per share (equivalent to $25 per depositary share). Dividends will accrue on the depositary shares at a fixed rate equal to 7.50% per annum. On September 25, 2020, the Company completed the sale of an additional 150,000 depositary shares, pursuant to the underwriters’ full exercise of their over-allotment option to purchase additional depositary shares.
On October 22, 2020, the Board of Directors of the Company authorized a common stock repurchase program to repurchase up to $17.0 million of the Company’s common stock at the discretion of management. The new common stock repurchase program replaced the Company’s previous repurchase plan which was authorized on September 18, 2019. The Company repurchased approximately $12.8 million of common stock during the year ended December 31, 2020 and $4.0 million of common stock during the year ended December 31, 2022, under this plan. The Company did not repurchase any common stock during the year ended December 31, 2021.
On May 18, 2022, the Board of Directors of the Company authorized a common stock repurchase program to repurchase up to $7.5 million of the Company’s common stock at the discretion of management. The new common stock repurchase program replaced the Company’s previous repurchase plan which was authorized on October 22, 2020. The Company repurchased approximately $43,000 and $3.0 million of common stock during the years ended December 31, 2023 and December 31, 2022, respectively.
Note 24. Subordinated Notes
On April 6, 2021, the Company completed the issuance of $30.0 million in aggregate principal amount of fixed-to-floating rate subordinated notes in a private placement transaction to various accredited investors. The net proceeds of the offering are intended to retire the subordinated debt issued in 2016, to support growth and be used for other general business purposes. The notes have a maturity date of April 15, 2031 and have an annual fixed interest rate of 3.75% until April 15, 2026. Thereafter, the notes will have a floating interest rate based on three-month SOFR rate plus 302 basis points (3.02%) (computed on the basis of a 360-day year of twelve 30-day months) from and including April 15, 2026 to the maturity date or any early redemption date. Interest will be paid semi-annually, in arrears, on April 15 and October 15 of each year during the time that the notes remain outstanding through the fixed interest rate period or earlier redemption date. Interest will be paid quarterly, in arrears, on April 15, July 15, October 15 and January 15 throughout the floating interest rate period or earlier redemption date.
On March 1, 2022, the Company completed the issuance of $43.8 million in aggregate principal amount of fixed-to-floating rate subordinated notes in a private placement transaction to various accredited investors. The net proceeds of the offering will be used to support growth and for other general business purposes. The notes have a maturity date of March 15, 2032 and have an annual fixed interest rate of 4.00% until March 15, 2027. Thereafter, the notes will have a floating interest rate based on three-month SOFR rate plus 233 basis points (2.33%) (computed on the basis of a 360-day year of twelve 30-day months) from and including March 15, 2027 to the maturity date or any early redemption date. Interest will be paid semi-annually, in arrears, on March 15 and September 15 of each year during the time that the notes remain outstanding through the fixed interest rate period or earlier redemption date. Interest will be paid quarterly, in arrears, on March 15, June 15, September 15 and December 15 throughout the floating interest rate period or earlier redemption date.
Note 25. Condensed Parent Company Financial Statements
Condensed financial statements pertaining only to the Company are presented below. The investment in subsidiary is accounted for using the equity method of accounting.
The payment of dividends by the subsidiary is restricted by various regulatory limitations. Banking regulations also prohibit extensions of credit to the parent company unless appropriately secured by assets.
Condensed Parent Company Only
Condensed Balance Sheet
(Dollars in thousands)
| December 31, |
2023 |
2022 |
||||||
| ASSETS |
||||||||
| Cash on deposit with subsidiary |
$ | 3,616 | $ | 5,077 | ||||
| Restricted securities, at cost |
3,123 | 1,430 | ||||||
| Investment in subsidiary |
287,075 | 263,912 | ||||||
| Other assets |
1,190 | 124 | ||||||
| Total Assets |
$ | 295,004 | $ | 270,543 | ||||
| Liabilities: |
||||||||
| Other liabilities |
$ | 845 | $ | 16 | ||||
| Subordinated debt, net of debt issuance costs |
72,642 | 72,245 | ||||||
| Stockholders’ equity |
221,517 | 198,282 | ||||||
| Total Liabilities and Stockholders’ Equity |
$ | 295,004 | $ | 270,543 | ||||
Condensed Statement of Income
(Dollars in thousands)
| For the Year Ended December 31, |
2023 |
2022 |
||||||
| Income |
||||||||
| Dividends from subsidiary |
$ | 5,166 | $ | 4,038 | ||||
| Expenses |
||||||||
| Subordinated debt interest expense |
3,288 | 2,936 | ||||||
| Non-interest expense |
42 | 26 | ||||||
| Total expenses |
3,330 | 2,962 | ||||||
| Undistributed earnings of subsidiary |
23,546 | 24,797 | ||||||
| Net income before income taxes |
$ | 25,382 | $ | 25,873 | ||||
| Income tax benefit |
(1,203 | ) | (801 | ) | ||||
| Net income |
$ | 26,585 | $ | 26,674 | ||||
| Less: preferred stock dividends |
(2,156 | ) | (2,156 | ) | ||||
| Net income available to common shareholders |
$ | 24,429 | $ | 24,518 | ||||
Condensed Statement of Cash Flows
(Dollars in thousands)
| Year Ended December 31, |
2023 |
2022 |
||||||
| CASH FLOWS FROM OPERATING ACTIVITIES: |
||||||||
| Net income |
$ | 26,585 | $ | 26,674 | ||||
| Adjustments to reconcile net income to net cash provided by operating activities: |
||||||||
| Equity in undistributed earnings of subsidiary |
(23,546 | ) | (24,797 | ) | ||||
| Stock based compensation |
2,491 | 2,519 | ||||||
| Subordinated debt amortization expense |
397 | 328 | ||||||
| Decrease (increase) in other assets |
(1,063 | ) | 2,014 | |||||
| Increase (decrease) in other liabilities |
829 | (274 | ) | |||||
| Net cash provided by operating activities |
5,693 | 6,464 | ||||||
| CASH FLOWS FROM INVESTING ACTIVITIES: |
||||||||
| Purchase of restricted equities |
(1,944 | ) | (1,430 | ) | ||||
| Investment in bank subsidiary |
— | (32,000 | ) | |||||
| Net cash used in investing activities |
(1,944 | ) | (33,430 | ) | ||||
| CASH FLOWS FROM FINANCING ACTIVITIES: |
||||||||
| Repurchase of common stock |
(43 | ) | (6,918 | ) | ||||
| Cash dividends paid on preferred stock |
(2,156 | ) | (2,156 | ) | ||||
| Cash dividend paid on common stock |
(3,011 | ) | (1,882 | ) | ||||
| Net increase in subordinated debt |
— | 42,623 | ||||||
| Net cash provided by (used in) financing activities |
(5,210 | ) | 31,667 | |||||
| NET INCREASE (DECREASE) IN CASH AND CASH EQUIVALENTS |
(1,461 | ) | 4,701 | |||||
| CASH AND CASH EQUIVALENTS, BEGINNING OF YEAR |
5,077 | 376 | ||||||
| CASH AND CASH EQUIVALENTS, END OF YEAR |
$ | 3,616 | $ | 5,077 | ||||
Item 9. Changes in and Disagreements with Accountants on Accounting and Financial Disclosure
None.
Item 9A. Controls and Procedures
Disclosure Controls and Procedures. Our management, with the participation of our Chief Executive Officer and Chief Financial Officer, evaluated the effectiveness of our disclosure controls and procedures (as defined in Rules 13a-15(e) and 15d-15(e) under the Securities Exchange Act of 1934 (the “Exchange Act”)) as of December 31, 2023. Based on their evaluation of the Company’s disclosure controls and procedures, the Company’s Chief Executive Officer and Chief Financial Officer have concluded that our disclosure controls and procedures designed to ensure that information required to be disclosed by the Company in reports that it files or submits under the Exchange Act is recorded, processed, summarized and reported within the time periods specified in the Securities and Exchange Commission rules and regulations are designed and operating in an effective manner.
Management’s Report on Internal Control over Financial Reporting. Management of the Company is also responsible for establishing and maintaining adequate internal control over financial reporting (as defined in Rule 13a‑15(f) under the Exchange Act). Because of its inherent limitations, internal control over financial reporting may not prevent or detect misstatements. Therefore, even those systems determined to be effective can provide only reasonable assurance with respect to financial statement preparation and presentation.
Management, including the Company’s principal executive and principal financial officer, assessed the effectiveness of the Company’s internal control over financial reporting as of December 31, 2023. In making this assessment, management used the criteria set forth by the Committee of Sponsoring Organizations of the Treadway Commission (COSO) in Internal Control – Integrated Framework (2013). Based on our assessment, we believe that, as of December 31, 2023, the Company’s internal control over financial reporting was effective based on those criteria.
The Company’s annual report does not include an attestation report of the Company’s independent registered public accounting firm, Yount, Hyde, & Barbour. P.C. (YHB), regarding internal control over financial reporting. Management’s report was not subject to attestation by YHB pursuant to rules of the Securities and Exchange Commission that permit the Company to provide only management’s report in its annual report.
The 2023 consolidated financial statements have been audited by the independent registered public accounting firm of Yount, Hyde, & Barbour. P.C. Personnel from YHB were given unrestricted access to all financial records and related data, including minutes of all meetings of the Board of Directors and Committees thereof. Management believes that all representation made to the independent auditors were valid and appropriate. The resulting report from YHB accompanies the consolidated financial statements.
Changes in Internal Controls. There were no changes in the Company’s internal control over financial reporting during the Company’s fourth quarter ended December 31, 2023 that have materially affected, or are reasonably likely to materially affect, the Company’s internal control over financial reporting.
None.
Item 9C. Disclosure Regarding Foreign Jurisdictions that Prevent Inspections.
None.
Part III
Item 10. Directors, Executive Officers and Corporate Governance
The information required by this Item with respect to our directors, executive officers, and certain corporate governance practices is contained in our Proxy Statement for our 2024 Annual Meeting of Shareholders (the “Proxy Statement”) or is an amendment to this Form 10-K to be filed with the SEC within 120 days after the end of the Company’s fiscal year ended December 31, 2023. Such information is incorporated herein by reference.
Item 11. Executive Compensation
The information required by this Item is incorporated herein by reference to our Proxy Statement or is an amendment to this Form 10-K to be filed with the SEC within 120 days after the end of the Company’s fiscal year ended December 31, 2023.
Item 12. Security Ownership of Certain Beneficial Owners and Management and Related Stockholder Matters
The information required by this Item regarding security ownership of certain beneficial owners and management is incorporated by reference to our Proxy Statement or is an amendment to this Form 10-K to be filed with the SEC within 120 days after the end of the Company’s fiscal year ended December 31, 2023.
Item 13. Certain Relationships and Related Transactions, and Director Independence
The information required by this Item is incorporated herein by reference to our Proxy Statement or is an amendment to this Form 10-K to be filed with the SEC within 120 days after the end of the Company’s fiscal year ended December 31, 2023.
Item 14. Principal Accountant Fees and Services Item 15.
The information required by this Item is incorporated herein by reference to our Proxy Statement or is an amendment to this Form 10-K to be filed with the SEC within 120 days after the end of the Company’s fiscal year ended December 31, 2023.
Exhibits and Financial Statement Schedules
| Exhibit Number |
Description |
|
| 2.1 |
||
| 3.1 |
||
| 3.2 |
||
| 4.1 |
||
| 4.2 |
||
| 4.3 |
||
| 4.4 |
||
| 4.5 |
||
| 4.6 |
||
| 10.1 |
||
| 10.2 |
||
| 10.3 |
||
| 10.4 |
||
| 10.5 |
||
| 10.6 |
||
| 10.7 |
||
| 10.8 |
||
| 10.9 | Form of Indemnification Agreement with each of Jeff W. Dick, Thomas J. Chmelik and Abdul Hersiburane (incorporated by reference to Exhibit 10.1 to the Company's Form 8-K filed on November 21, 2022) | |
| 10.10 | Form of Restricted Stock Award Agreement (incorporated by reference to Exhibit 10.10 to the Company’s Form 10-K filed on March 23, 2023). | |
| 21.1 |
||
| 23.1 |
||
| 31.1 |
||
| 31.2 |
||
| 32.0 |
||
| 97.1 | Policy Relating to the Recovery of Erroneously Awarded Compensation | |
| 101.INS |
Inline XBRL Instance Document: The XBRL Instance Document does not appear in the Interactive Data File because its XBRL tags are embedded within the Inline XBRL document |
|
| 101.SCH |
Inline XBRL Taxonomy Extension Schema |
|
| 101.CAL |
Inline XBRL Taxonomy Extension Calculation Linkbase |
|
| 101.DEF |
Inline XBRL Taxonomy Extension Definition Linkbase |
|
| 101.LAB |
Inline XBRL Taxonomy Extension Label Linkbase |
|
| 101.PRE |
Inline XBRL Taxonomy Extension Presentation Linkbase |
|
| 101 |
The following materials from the Company’s Annual Report on Form 10-K for the year ended December 31, 2023 formatted in Inline XBRL, filed herewith: (i) the Consolidated Balance Sheets, (ii) the Consolidated Statements of Income, (iii) the Consolidated Statements of Comprehensive Income, (iv) the Consolidated Statements of Stockholders’ Equity, (v) the Consolidated Statements of Cash Flows and (vi) the Notes to Consolidated Financial Statements |
|
| 104 |
Cover Page Interactive Data File: The cover page XBRL tags are embedded within the Inline XBRL document and are contained within the Exhibit 101. |
Item 16. Form 10-K Summary Pursuant to the requirements of Section 13 or 15(d) of the Securities Exchange Act of 1934, the Registrant has duly caused this report to be signed on its behalf by the undersigned thereunto duly authorized.
Not Applicable
| MAINSTREET BANCHSHARES, INC |
||||
| (Registrant) |
||||
| Date: March 20, 2024 |
By: |
/s/ Jeff W. Dick |
||
| Jeff W. Dick |
||||
| Chairman & Chief Executive Officer |
||||
| (Principal Executive Officer) |
Pursuant to the requirements of the Securities Exchange Act of 1934, this report has been signed by the following persons on behalf of the Registrant and in the capacities and on the dates indicated.
| Date: March 20, 2024 | By: |
/s/ Jeff W. Dick |
||
| Jeff W. Dick |
||||
| Chairman & Chief Executive Officer |
||||
| (Principal Executive Officer) |
||||
| Date: March 20, 2024 | /s/ Thomas J. Chmelik |
|||
| Thomas J. Chmelik |
||||
| Senior Executive Vice President and |
||||
| Chief Financial Officer and Director |
||||
| (Principal Financial Officer) |
||||
| Date: March 20, 2024 | /s/ Richard A. Vari |
|||
| Richard A. Vari |
||||
| Senior Vice President and Chief Accounting Officer | ||||
| (Principal Accounting Officer) | ||||
| Date: March 20, 2024 | /s/ Charles C. Brockett |
|||
| Charles C. Brockett |
||||
| Director |
||||
| Date: March 20, 2024 | /s/ Paul Thomas Haddock |
|||
| Paul Thomas Haddock |
||||
| Director |
||||
| Date: March 20, 2024 | /s/ Patsy I. Rust |
|||
| Patsy I. Rust |
||||
| Director |
||||
| Date: March 20, 2024 | /s/ Terry M. Saeger |
|||
| Terry M. Saeger |
||||
| Director |
||||
| Date: March 20, 2024 | /s/ Elizabeth S. Bennett |
|||
| Elizabeth S. Bennett |
||||
| Director |
||||
| Date: March 20, 2024 | /s/ Darrell Green |
|||
| Darrell Green |
||||
| Director |
||||
| Date: March 20, 2024 | /s/ Russell Echlov |
|||
| Russell Echlov |
||||
| Director |
||||
| Date: March 20, 2024 | /s/ Rafael DeLeon |
|||
| Rafael DeLeon |
||||
| Director |
EXHIBIT 21.1
Subsidiaries of the Registrant
Parent
MainStreet Bancshares, Inc.
| State or Other Jurisdiction of Incorporation | ||||
|
Subsidiaries |
|
Percentage Ownership |
||
|
MainStreet Bank |
Virginia |
100% |
||
|
MainStreet Community Capital, LLC |
Virginia |
100% |
Exhibit 23.1
CONSENT OF INDEPENDENT REGISTERED PUBLIC ACCOUNTING FIRM
We consent to the incorporation by reference in the Registration Statements on Form S-3 (No. 333-241000) and Form S-8 (No. 333-256477, 333-233077 and 333-233078) of MainStreet Bancshares, Inc. of our report dated March 20, 2024, relating to the consolidated financial statements of MainStreet Bancshares, Inc., appearing in the Annual Report on Form 10-K of MainStreet Bancshares, Inc. for the year ended December 31, 2023.
/s/ YOUNT, HYDE & BARBOUR, P.C.
Owings Mills, Maryland
Exhibit 31.1
Certification
I, Jeff W. Dick, certify that:
|
1. |
I have reviewed this annual report on Form 10-K of MainStreet Bancshares, Inc.; |
|
2. |
Based on my knowledge, this report does not contain any untrue statement of a material fact or omit to state a material fact necessary to make the statements made, in light of the circumstances under which such statements were made, not misleading with respect to the period covered by this report; |
|
3. |
Based on my knowledge, the financial statements, and other financial information included in this report, fairly present in all material respects the financial condition, results of operations and cash flows of the registrant as of, and for, the periods presented in this report; |
|
4. |
The registrant’s other certifying officer and I are responsible for establishing and maintaining disclosure controls and procedures (as defined in Exchange Act Rules 13a-15(e) and 15d-15(e)) for the registrant and have: |
|
(a) |
Designed such disclosure controls and procedures, or caused such disclosure controls and procedures to be designed under our supervision, to ensure that material information relating to the registrant, including its consolidated subsidiaries, is made known to us by others within those entities, particularly during the period in which this report is being prepared; |
|
(b) |
Designed such internal control over financial reporting, or caused such internal control over financial reporting to be designed under our supervision, to provide reasonable assurance regarding the reliability of financial reporting and the preparation of financial statements for external purposes in accordance with generally accepted accounting principles; |
|
(c) |
Evaluated the effectiveness of the registrant’s disclosure controls and procedures and presented in this report our conclusions about the effectiveness of the disclosure controls and procedures, as of the end of the period covered by this report, based on such evaluation; and |
|
(d) |
Disclosed in this report any change in the registrant’s internal control over financial reporting that occurred during the registrant’s most recent fiscal quarter (the registrant’s fourth fiscal quarter in the case of an annual report) that has materially affected, or is reasonably likely to materially affect, the registrant’s internal control over financial reporting; and |
|
5. |
The registrant’s other certifying officer and I have disclosed, based on our most recent evaluation of internal control over financial reporting, to the registrant’s auditors and the audit committee of the registrant’s board of directors (or persons performing the equivalent functions): |
|
(a) |
All significant deficiencies and material weaknesses in the design or operation of internal control over financial reporting which are reasonably likely to adversely affect the registrant’s ability to record, process, summarize and report financial information; and |
|
(b) |
Any fraud, whether or not material, that involves management or other employees who have a significant role in the registrant’s internal control over financial reporting. |
|
Dated: March 20, 2024 |
/s/ Jeff W. Dick |
|||
|
Jeff W. Dick |
||||
|
Chairman and Chief Executive Officer |
||||
|
(principal executive officer) |
Exhibit 31.2
Certification
I, Thomas J. Chmelik, certify that:
|
1. |
I have reviewed this annual report on Form 10-K of MainStreet Bancshares, Inc.; |
|
2. |
Based on my knowledge, this report does not contain any untrue statement of a material fact or omit to state a material fact necessary to make the statements made, in light of the circumstances under which such statements were made, not misleading with respect to the period covered by this report; |
|
3. |
Based on my knowledge, the financial statements, and other financial information included in this report, fairly present in all material respects the financial condition, results of operations and cash flows of the registrant as of, and for, the periods presented in this report; |
|
4. |
The registrant’s other certifying officer and I are responsible for establishing and maintaining disclosure controls and procedures (as defined in Exchange Act Rules 13a-15(e) and 15d-15(e))) for the registrant and have: |
|
(a) |
Designed such disclosure controls and procedures, or caused such disclosure controls and procedures to be designed under our supervision, to ensure that material information relating to the registrant, including its consolidated subsidiaries, is made known to us by others within those entities, particularly during the period in which this report is being prepared; |
|
(b) |
Designed such internal control over financial reporting, or caused such internal control over financial reporting to be designed under our supervision, to provide reasonable assurance regarding the reliability of financial reporting and the preparation of financial statements for external purposes in accordance with generally accepted accounting principles; |
|
(c) |
Evaluated the effectiveness of the registrant’s disclosure controls and procedures and presented in this report our conclusions about the effectiveness of the disclosure controls and procedures, as of the end of the period covered by this report, based on such evaluation; and |
|
(d) |
Disclosed in this report any change in the registrant’s internal control over financial reporting that occurred during the registrant’s most recent fiscal quarter (the registrant’s fourth fiscal quarter in the case of an annual report) that has materially affected, or is reasonably likely to materially affect, the registrant’s internal control over financial reporting; and |
|
5. |
The registrant’s other certifying officer and I have disclosed, based on our most recent evaluation of internal control over financial reporting, to the registrant’s auditors and the audit committee of the registrant’s board of directors (or persons performing the equivalent functions): |
|
(a) |
All significant deficiencies and material weaknesses in the design or operation of internal control over financial reporting which are reasonably likely to adversely affect the registrant’s ability to record, process, summarize and report financial information; and |
|
(b) |
Any fraud, whether or not material, that involves management or other employees who have a significant role in the registrant’s internal control over financial reporting. |
|
Dated: March 20, 2024 |
/s/ Thomas J. Chmelik |
|||
|
Thomas J. Chmelik |
||||
|
Senior Executive Vice President and Chief Financial Officer |
||||
|
(principal financial officer) |
Exhibit 32.0
CERTIFICATION PURSUANT TO
18 U.S.C. SECTION 1350,
AS ADOPTED PURSUANT TO
SECTION 906 OF THE SARBANES-OXLEY ACT OF 2002
In connection with the annual report on Form 10-K of MainStreet Bancshares, Inc. (the “Company”) for the fiscal year ended December 31, 2023 as filed with the Securities and Exchange Commission (the “Report”), I hereby certify, pursuant to 18 U.S.C. Section 1350, as adopted pursuant to Section 906 of the Sarbanes-Oxley Act of 2002, that:
|
1. |
The Report fully complies with the requirements of Section 13(a) or 15(d) of the Securities Exchange Act of 1934, as amended; and |
|
2. |
The information contained in the Report fairly presents, in all material respects, the financial condition and results of operations of the Company as of and for the period covered by the Report. |
|
By: |
/s/ Jeff W. Dick |
|
|
Jeff W. Dick |
||
|
Chairman and Chief Executive Officer |
||
|
(principal executive officer) March 20, 2024 |
|
By: |
/s/ Thomas J. Chmelik |
|
|
Thomas J. Chmelik |
||
|
Senior Executive Vice President and |
||
|
Chief Financial Officer |
||
|
(principal financial officer) |
||
| March 20, 2024 |
Exhibit 97.1
MAINSTREET BANCSHARES, INC.
Policy for the
Recovery of Erroneously Awarded Compensation
The Board of Directors (the “Board”) of MainStreet Bancshares, Inc. (the “Company”) has determined that it is in the best interests of the Company and its shareholders to adopt this Policy for the Recovery of Erroneously Awarded Compensation (this “Policy”), which provides for the recovery of certain incentive compensation in the event of an Accounting Restatement (as defined below). This Policy is designed to comply with, and shall be interpreted to be consistent with, Section 10D of the Securities Exchange Act of 1934, as amended (the “Exchange Act”), Rule 10D-1 under the Exchange Act (“Rule 10D-1”) and Listing Rule 5608 (“Recovery of Erroneously Awarded Compensation”) of the corporate governance rules of The Nasdaq Stock Market (“Nasdaq”).
As required by Rule 10D-1, Listing Rule 5608 requires the Company to adopt a compensation recovery policy as set forth in such Rule, comply with such policy and provide related compensation recovery disclosures required by Listing Rule 5608 and in applicable filings with the U.S. Securities and Exchange Commission (the “SEC”) in order for any security of the Company to remain listed on Nasdaq. Capitalized terms not otherwise defined herein have the meanings set forth in Section 2 hereof. Equity awards that vest exclusively upon completion of a specified employment period, without any performance condition, and bonus awards that are discretionary or based on subjective goals or goals unrelated to Financial Reporting Measures, do not constitute Incentive-Based Compensation under Listing Rule 5608.
|
1. |
Administration |
Except as specifically set forth herein, this Policy shall be administered by the [Compensation Committee] of the Board (the “Committee”), unless the Board determines to administer this Policy itself. The Committee is authorized to recover any amount owed from any Covered Executive by exercising its sole and absolute discretion in the manner in which such recovery is accomplished, to interpret and construe this Policy, and to make all determinations necessary, appropriate or advisable to administer and cause the Company to comply with, this Policy, in each case to the extent permitted under Listing Rule 5608 and in compliance with (or pursuant to an exemption from the application of) Section 409A of the Code. Any determination made by the Committee pursuant to this Policy shall be final, conclusive and binding on all affected individuals and need not be uniform with respect to each Covered Executive. The Committee is authorized to consult with the full Board, the Audit Committee of the Board, or any other committee of the Board if and to the extent it deems necessary or appropriate to administer and cause the Company to comply with this Policy. Any action or inaction by the Committee with respect to a Covered Executive under this Policy in no way limits the Committee’s actions or decisions not to act with respect to any other Covered Executive under this Policy or under any similar policy, agreement or arrangement, nor shall any such action or inaction serve as a waiver of any rights that the Company may have against any Covered Executive other than as set forth in this Policy.
|
2. |
Definitions |
As used in this Policy, the following definitions shall apply:
|
(a) |
“Accounting Restatement” means an accounting restatement of the Company’s financial statements due to the material noncompliance of the Company with any financial reporting requirement under the securities laws, including any required accounting restatement to correct an error in previously issued financial statements (i) that is material to the previously issued financial statements (commonly referred to as a “Big R” restatement), or (ii) that would result in a material misstatement if the error were not corrected in the current period or left uncorrected in the current period (commonly referred to as a “little r” restatement). For the avoidance of doubt, under existing accounting standards and guidance as of the Effective Date, including U.S. Generally Accepted Accounting Principles, when an error that originated in previously issued financial statements is corrected in the current-period financial statements (commonly referred to as an “out-of-pocket adjustment”) and (i) the error is immaterial to the previously issued financial statements and (ii) the correction of the error is immaterial to the current period, such out-of-pocket adjustment is not an Accounting Restatement. |
|
(b) |
“Clawback Period” means, with respect to any Accounting Restatement, the three completed fiscal years of the Company immediately preceding the Restatement Date, including any applicable transition period that results from a change in the Company’s fiscal year within or immediately following those three completed fiscal years. A transition period between the last day of the Company’s previous fiscal year and the first day of its new fiscal year that comprises a period of nine to twelve months shall be deemed a completed fiscal year. |
|
(c) |
“Code” means the U.S. Internal Revenue Code of 1986, as amended. Any reference to a section of the Code or regulation thereunder includes such section or regulation, any valid regulation or other official guidance promulgated under such section, and any comparable provision of any future legislation or regulation amending, supplementing, or superseding such section or regulation. |
|
(d) |
“Committee” has the meaning set forth in Section 1 hereof. |
|
(e) |
“Covered Executives” means the Company’s president, principal financial officer, principal accounting officer (or if there is no such accounting officer, the controller), any vice-president of the Company in charge of a principal business unit, division, or function (such as sales, administration or finance), any other officer who performs a policy- making function, or any other person who performs similar policy-making functions for the Company. An executive officer of the Company’s parent or subsidiary is deemed a “Covered Executive” if the executive officer performs such policy-making functions for the Company. “Policy-making function” is not intended to include policy-making functions that are not significant. |
|
(f) |
“Effective Date” means October 2, 2023. |
|
(g) |
“Erroneously Awarded Compensation” has the meaning set forth in Section 4 of this Policy. |
|
(h) |
“Financial Reporting Measures” means measures that are determined and presented in accordance with the accounting principles used in preparing the Company’s financial statements, and any measures that are derived wholly or in part from such measures. Stock price and total shareholder return (and any measures that are derived wholly or in part from stock price or total shareholder return) shall, for purposes of this Policy, be considered Financial Reporting Measures. For the avoidance of doubt, a Financial Reporting Measure need not have been presented within the Company’s financial statements or included in a filing with the SEC. |
|
(i) |
“Incentive-Based Compensation” means any compensation that is granted, earned or vested based wholly or in part upon the attainment of a Financial Reporting Measure. |
|
(j) |
“Restatement Date” shall mean the earlier to occur of (i) the date the Board, a committee of the Board or the officer(s) of the Company authorized to take such action if Board action is not required, concludes, or reasonably should have concluded, that the Company is required to prepare an Accounting Restatement, or (ii) the date a court, regulator or other legally authorized body directs the Company to prepare an Accounting Restatement, in each case regardless of, if, or when the restated financial statements are publicly disseminated or filed with the SEC. |
|
3. |
Covered Executives; Incentive-Based Compensation |
This Policy applies to all Incentive-Based Compensation received by a person: (a) on or after the Effective Date (even if approved, awarded, granted or paid prior to the Effective Date); (b) after beginning service as a Covered Executive; (c) who served as a Covered Executive at any time during the performance period for such Incentive-Based Compensation; (d) while the Company had a class of securities listed on a national securities exchange or a national securities association; and (e) during the Clawback Period.
For purposes of this Policy, Incentive-Based Compensation will be deemed to be “received” in the Company’s fiscal period during which the Financial Reporting Measure specified in the Incentive-Based Compensation award is attained, even if the payment or grant of the Incentive-Based Compensation occurs after the end of that period. For the avoidance of doubt, Incentive-Based Compensation that is subject to both a Financial Reporting Measure vesting condition and a service-based vesting condition shall be considered received when the relevant Financial Reporting Measure is achieved, even if the Incentive-Based Compensation continues to be subject to the service-based vesting condition.
|
4. |
Required Recovery of Erroneously Awarded Compensation in the Event of an Accounting Restatement |
In the event of an Accounting Restatement, the Company must recover, reasonably promptly, Erroneously Awarded Compensation, in amounts determined pursuant to this Policy and in accordance with Rule 10D-1 and Listing Rule 5608, as follows:
|
(a) |
For purposes of this Policy, “Erroneously Awarded Compensation” means, in the event of an Accounting Restatement, the amount of Incentive-Based Compensation received that exceeds the amount of Incentive-Based Compensation that otherwise would have been received had it been determined based on the restated amounts in such Accounting Restatement, computed without regard to any taxes paid by the relevant Covered Executive. |
|
(i) |
With respect to Incentive-Based Compensation based on stock price or total shareholder return, where the amount of Erroneously Awarded Compensation is not subject to mathematical recalculation directly from the information in an Accounting Restatement: |
|
A. |
the amount of Erroneously Awarded Compensation must be based on a reasonable estimate of the effect of the Accounting Restatement on the stock price or total shareholder return, as applicable, upon which the Incentive-Based Compensation was received; and |
|
B. |
the Company must maintain documentation of the determination of that reasonable estimate and provide such documentation to Nasdaq. |
|
(ii) |
With respect to any compensation plans or programs that take into account Incentive-Based Compensation, the amount of Erroneously Awarded Compensation subject to recovery hereunder includes, but is not limited to, the amount contributed to any notional account based on Erroneously Awarded Compensation and any earnings accrued to date on that notional amount. |
|
(b) |
After an Accounting Restatement, the Committee shall promptly determine the amount of any Erroneously Awarded Compensation received by each Covered Executive and shall promptly provide written notice to each Covered Executive by email, certified mail or overnight mail of the amount of any Erroneously Awarded Compensation and a demand for repayment or return of such compensation. |
|
(c) |
The Committee shall have discretion to determine the appropriate means of recovering Erroneously Awarded Compensation based on the particular facts and circumstances. Notwithstanding the foregoing, except as set forth in Section 5 below, in no event may the Company accept an amount that is less than the amount of Erroneously Awarded Compensation in satisfaction of a Covered Executive’s obligations hereunder. |
|
(d) |
To the extent that the Covered Executive has already reimbursed the Company for any Erroneously Awarded Compensation, the Committee may credit such reimbursed amount against the amount of Erroneously Awarded Compensation that is subject to recovery under this Policy. |
|
(e) |
To the extent that a Covered Executive fails to repay all Erroneously Awarded Compensation to the Company when due, the Company shall take all reasonable and appropriate actions to recover such Erroneously Awarded Compensation from the applicable Covered Executive. The applicable Covered Executive shall be required to reimburse the Company for any and all expenses reasonably incurred (including legal fees) by the Company in recovering such Erroneously Awarded Compensation in accordance with the immediately preceding sentence. Such recovery and reimbursement may include such Erroneously Awarded Compensation and reasonably incurred expenses against any amounts due from the Company or its subsidiaries to the Covered Executive. |
|
(f) |
The Company’s obligation to recover Erroneously Awarded Compensation is not dependent on, if, or when the Company files restated financial statements. |
|
(g) |
Recovery under this Policy with respect to a Covered Executive shall not require any finding that such Covered Executive engaged in misconduct or was responsible for any error that caused or contributed to the Accounting Restatement. |
|
(h) |
Any action by the Company to recover Erroneously Awarded Compensation under this Policy from a Covered Executive shall not, whether alone or in combination with any other action, event or condition, be deemed (i) “good reason” for resignation or to serve as a basis for a claim of constructive termination under any benefits or compensation arrangement applicable to such Covered Executive, or (ii) to constitute a breach of a contract or other arrangement to which such Covered Executive is party. |
|
5. |
Method of Recovery |
The Committee shall determine, in its sole and absolute discretion, the timing and method for promptly recouping Erroneously Awarded Compensation hereunder, which may include without limitation (a) seeking reimbursement of all or part of any cash or equity-based award, (b) cancelling prior cash or equity-based awards, whether vested or unvested or paid or unpaid, (c) cancelling or offsetting against base salary and/or any planned future cash or equity-based awards, (d) forfeiture of deferred compensation, subject to compliance with Section 409A of the Code, and (e) any other method that does not contravene any applicable law, including without limitation Section 409A of the Code.
The Company is authorized and directed pursuant to this Policy to recover Erroneously Awarded Compensation in compliance with this Policy unless the Committee or, in the absence of the Committee, a majority of the independent directors (as defined under Listing Rule 5605(a)(2) of Nasdaq) serving on the Board, has determined in good faith that recovery would be impracticable solely for one or more the following limited reasons, and subject to the following procedural and disclosure requirements.
|
(a) |
The direct expense paid to a third party to assist in enforcing this Policy would exceed the amount to be recovered. Before concluding that it would be impracticable to recover any amount of Erroneously Awarded Compensation based on the expense of enforcement, the Committee must make a reasonable attempt to recover such Erroneously Awarded Compensation, document such reasonable attempt to recover, and provide that documentation to Nasdaq; |
|
(b) |
Recovery would violate home country law where that law was adopted prior to November 28, 2022. Before concluding that it would be impracticable to recover any amount of Erroneously Awarded Compensation based on violation of home country law, the Committee must obtain an opinion of home country counsel, acceptable to Nasdaq, that recovery would result in such a violation, and must provide such opinion to Nasdaq; or |
|
(c) |
Recovery would likely cause an otherwise tax-qualified retirement plan, under which benefits are broadly available to employees of the Company, to fail to meet the requirements of 26 U.S.C. §401(a)(13) or 26 U.S.C. §411(a) and regulations thereunder. |
|
6. |
No Indemnification of Covered Executives Against Loss of Erroneously Awarded Compensation |
Notwithstanding the terms of any indemnification or insurance policy or any contractual arrangement with any Covered Executive that provides or may be interpreted to provide to the contrary, the Company shall not indemnify any Covered Executive against the loss of any Erroneously Awarded Compensation, including any payment or reimbursement for the cost of third-party insurance purchased by any Covered Executive to fund potential clawback obligations under this Policy.
|
7. |
Committee Indemnification |
Any members of the Committee, and any other members of the Board who assist in the administration of this Policy, shall not be personally liable for any action, determination or interpretation made with respect to this Policy and shall be fully indemnified by the Company to the fullest extent permitted under any charter, bylaw, similar organizational document, contract, policy or law applicable to the Company with respect to any such action, determination or interpretation. The foregoing sentence shall not limit any other rights to indemnification of the members of the Board under any charter, bylaw, similar organizational document, contract, policy or law applicable to the Company.
|
8. |
Effective Date |
This Policy shall be effective as of the Effective Date. Subject to applicable law, the Committee may affect recovery under this Policy from any amount of compensation approved, awarded, granted, payable or paid to the Covered Executive prior to, on or after the Effective Date.
|
9. |
Other Recovery Rights; Company Claims |
The Board intends that this Policy shall be applied to the fullest extent of the law. Any right of recovery by the Company under this Policy is in addition to, and not in lieu of, any other remedies or rights of recovery that may be available to the Company under applicable law, including Section 304 of the Sarbanes-Oxley Act of 2002, government regulation, or stock exchange listing requirement or pursuant to the terms of any similar policy in any employment agreement, equity award agreement, or other agreement, policy or plan of the Company and any other legal or equitable remedies available to the Company. Notwithstanding the foregoing, unless otherwise required by applicable law, any amounts recovered under any other such recovery or clawback rights that would be recoverable under this Policy shall count toward any required recovery under this Policy and vice versa.
Nothing contained in this Policy, and no recoupment or recovery as contemplated by this Policy, shall limit any claims, damages or other legal or equitable remedies the Company or any of its affiliates may have against a Covered Executive arising out of or resulting from any actions or omissions by the Covered Executive.
|
10. |
Amendment; Termination |
The Board may amend, modify, supplement, rescind or replace all or any portion of this Policy at any time and from time to time in its discretion, and shall amend this Policy as it deems necessary to comply with applicable law or any rules or standards adopted by Nasdaq or other national securities exchange on which the Company’s securities are listed.
|
11. |
Acknowledgement of Binding Effect |
As a condition to continued employment, each Covered Executive shall sign and deliver to the Company, within [30 calendar days] following, as applicable, the later of (a) the Effective Date of this Policy, (b) the date of the Covered Executive’s receipt of notice by the Board of its adoption of this Policy, or (c) the date the individual becomes a Covered Executive, the Acknowledgement Form attached hereto as Exhibit A, pursuant to which the Covered Executive agrees to be bound by, and to comply with, the terms and conditions of this Policy. Even if the Covered Executive fails to execute or deliver to the Company the attached Acknowledgement Form, this Policy shall be binding on such Covered Executive,
|
12. |
Severability |
The provisions in this Policy are intended to be interpreted and applied to the fullest extent of applicable law, consistent with Rule 10D-1, Listing Rule 5608 and any related rules and regulations adopted by the SEC. To the extent that any provision of this Policy is found to be invalid, illegal or unenforceable under any applicable law, such provision shall be applied to the maximum extent permitted, and shall automatically be deemed amended in a manner consistent with its objectives to the extent necessary to conform to any limitations required under applicable law.
|
13. |
Successors |
This Policy shall be binding and enforceable against all Covered Executives and their beneficiaries, heirs, executors, administrators or other legal representatives.
|
14. |
Governing Law; Jurisdiction and Forum; Waiver of Jury Trial |
|
(a) |
This Policy and all rights and obligations hereunder shall be governed by, and construed and enforced in accordance with, Section 10 of the Exchange Act, Rule 10D-1 and Listing Rule 5608, and to the extent applicable, the laws of the Commonwealth of Virginia, excluding any choice of law rules or principles that may direct the application of laws of another jurisdiction. |
|
(b) |
All actions arising out of or relating to this Policy shall be heard and determined in a state court of the County of Fairfax, Commonwealth of Virginia, or if such court declines to exercise jurisdiction, or if subject matter jurisdiction over the matter that is the subject of any such legal action or proceeding is vested exclusively in the United States federal courts, in a United States District Court for the Eastern District of Virginia. |
|
(c) |
The Company and each Covered Executive: (i) waives trial by jury in any action, proceeding, or counterclaim arising out of or in any way connected with this Policy or the administration thereof, and (ii) agrees to refrain from seeking a jury trial in any lawsuit, proceeding, counterclaim or any other litigation procedure based upon, or arising out of, this Policy. |
|
15. |
Required Policy-Related Filings and Disclosures |
A copy of this Policy and any amendments thereto will be filed with the SEC as an exhibit to the Company’s Annual Report on Form 10-K. In addition, the Company shall file all disclosures with respect to this Policy in accordance with the requirements of the federal securities laws and regulations thereunder, including disclosures required by the SEC.
EXHIBIT A
MAINSTREET BANCSHARES, INC.
POLICY FOR THE
RECOVERY OF ERRONEOUSLY AWARDED COMPENSATION
ACKNOWLEDGEMENT FORM
By signing below, the undersigned acknowledges and confirms that the undersigned has received and reviewed a copy of the MainStreet Bancshares, Inc. Policy for the Recovery of Erroneously Awarded Compensation (as it may be amended, restated, supplemented or otherwise modified from time to time, the “Policy”). Capitalized terms used but not otherwise defined in this Acknowledgement Form (this “Acknowledgement Form”) shall have the meanings ascribed to such terms in the Policy.
By signing this Acknowledgement Form, the undersigned further acknowledges and agrees that:
|
● |
the undersigned is and will continue to be subject to the Policy; |
|
● |
the Policy will apply both during and after the undersigned’s employment with the Company; |
|
● |
in the event of any inconsistency between the Policy and the terms of any employment or indemnification agreement to which the undersigned is a party, or the terms of any compensation plan, program or agreement under which any compensation has been granted, awarded, earned or paid, the terms of the Policy shall govern, and all such agreements, plans and programs shall be deemed to have incorporated the terms of this Policy, as applicable; |
|
● |
the undersigned will abide by the terms of the Policy, including, without limitation, by returning any Erroneously Awarded Compensation to the Company to the extent required by, and in a manner permitted by, the Policy; and |
|
● |
the Policy shall be binding and enforceable against the undersigned and the undersigned’s beneficiaries, heirs, executors, administrators and other legal representatives. |
Covered Executive
Signature
Printed Name
Date