|
Florida
|
001-05869
|
11-1385670
|
|
(State or other jurisdiction
of incorporation) |
(Commission
File Number) |
(IRS Employer
Identification No.) |
|
|
||
|
200 Central Avenue, Suite 2000, St. Petersburg, Florida
(Address of principal executive offices)
|
33701
(Zip Code)
|
|
| ☐ | Written communications pursuant to Rule 425 under the Securities Act (17 CFR 230 .425) | |
| ☐ | Soliciting material pursuant to Rule 14a-12 under the Exchange Act (17 CFR 240.14a-12) | |
| ☐ |
Pre-commencement communications pursuant to Rule 14d-2(b) under the Exchange Act (17 CFR 240.14d-2(b))
|
|
☐
|
Pre-commencement communications pursuant to Rule 13e-4(c) under the Exchange Act (17 CFR 240.13e-4(c))
|
|
Title of each class
|
Trading Symbol(s)
|
Name of each exchange on which registered
|
|
Common Stock
|
SGC
|
NASDAQ
|
|
SUPERIOR GROUP OF COMPANIES, INC.
By: /s/ Michael Koempel
Michael Koempel
Chief Financial Officer
|
Exhibit 99.1
 |
FOR IMMEDIATE RELEASE |
| A NASDAQ Listed Company: SGC |
SUPERIOR GROUP OF COMPANIES REPORTS FOURTH QUARTER RESULTS
| – Total net sales of $147.2 million versus $148.6 million in prior year fourth quarter – | ||
| – Net income of $3.6 million versus net income of $2.2 million in prior year fourth quarter – | ||
| – EBITDA of $9.9 million versus adjusted $3.5 million in prior year fourth quarter – | ||
| – Provides full-year outlook – |
ST. PETERSBURG, Fla. – March 13, 2024 – Superior Group of Companies, Inc. (NASDAQ: SGC) (the “Company”), today announced its fourth quarter 2023 results.
“We capped off 2023 with our best quarter of the year, delivering sequential improvement, stronger profitability and continued positive cash flow along with a substantially improved balance sheet,” said Michael Benstock, Chief Executive Officer. “Underlying fundamentals are moving in the right direction, consistent with what we saw through much of 2023. With our strong retention and new client wins, we are optimistic that we will continue to drive improved performance and consistently solid results. All three of our attractive end markets are growing and highly fragmented, and we believe our stronger financial position will enable us to take additional market share and enhance shareholder value in 2024 and beyond.”
Fourth Quarter Results
For the fourth quarter ended December 31, 2023, net sales decreased 0.9% to $147.2 million compared to fourth quarter 2022 net sales of $148.6 million. Pretax income was $4.2 million compared to $1.2 million in the fourth quarter of 2022. Net income was $3.6 million or $0.22 per diluted share compared to $2.2 million or $0.14 per diluted share for the fourth quarter of 2022.
In the prior year fourth quarter, the Company realized a pre-tax, non-operating gain of $3.4 million. On an adjusted basis, which excludes the prior year’s pre-tax, non-operating gain, this quarter’s net income of $3.6 million or $0.22 per diluted share compares to a net loss of $0.9 million or $0.06 per diluted share for the prior year. At the conclusion of this press release is a reconciliation of reported to adjusted results, including a description of significant items.
2024 Full-Year Outlook
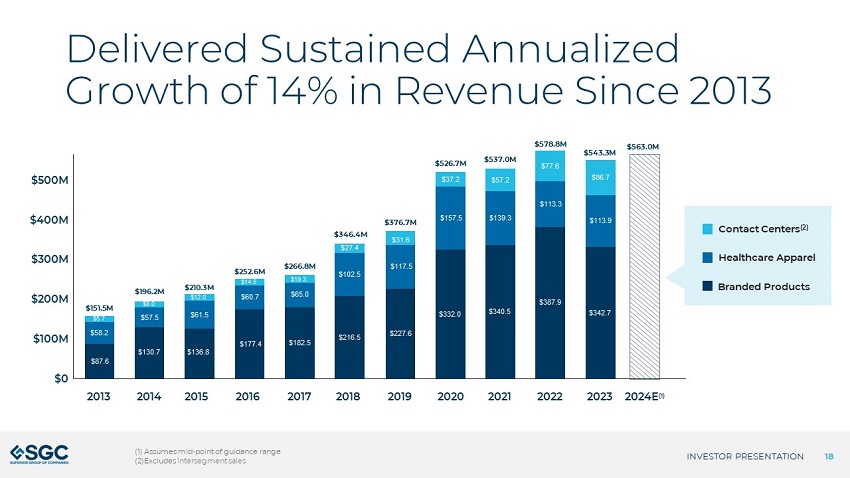
The Company is forecasting full year 2024 sales to be $558 million to $568 million versus 2023 sales of $543 million, and forecasting earnings per share to be $0.61 to $0.68, compared to $0.54 diluted adjusted earnings per share in 2023.
Webcast and Conference Call
The Company will host a webcast and conference call at 5:00 pm Eastern Time today. The live webcast and archived replay can be accessed in the investor relations section of the Company's website at https://ir.superiorgroupofcompanies.com/Presentations. Interested individuals may also join the teleconference by dialing 1-844-861-5505 for U.S. dialers and 1-412-317-6586 for International dialers. The Canadian Toll-Free number is 1-866-605-3852. Please ask to be joined to the Superior Group of Companies call. A telephone replay of the teleconference will be available through March 27, 2024. To access the replay, dial 1-877-344-7529 in the United States or 1-412-317-0088 from international locations. Canadian dialers can access the replay at 855-669-9658. Please reference conference number 2106897 for replay access.
Disclosure Regarding Forward Looking Statements
Certain matters discussed in this press release are “forward-looking statements” intended to qualify for the safe harbors from liability established by the Private Securities Litigation Reform Act of 1995. These forward-looking statements can generally be identified by use of the words “may,” “will,” “should,” “could,” “expect,” “anticipate,” “estimate,” “believe,” “intend,” “project,” “potential,” or “plan” or the negative of these words or other variations on these words or comparable terminology. Forward-looking statements in this press release may include, without limitation: (1) projections of revenue, income, and other items relating to our financial position and results of operations, including short-term and long-term plans for cash, (2) statements of our plans, objectives, strategies, goals and intentions, (3) statements regarding the capabilities, capacities, market position and expected development of our business operations, and (4) statements of expected industry and general economic trends.
Such forward-looking statements are subject to certain risks and uncertainties that may materially adversely affect the anticipated results. Such risks and uncertainties include, but are not limited to, the following: the impact of competition; uncertainties related to supply disruptions, inflationary environment (including with respect to the cost of finished goods and raw materials and shipping costs), employment levels (including labor shortages), and general economic and political conditions in the areas of the world in which the Company operates or from which it sources its supplies or the areas of the United States of America (“U.S.” or “United States”) in which the Company’s customers are located; changes in the healthcare, retail chain, food service, transportation and other industries where uniforms and service apparel are worn; our ability to identify suitable acquisition targets, discover liabilities associated with such businesses during the diligence process, successfully integrate any acquired businesses, or successfully manage our expanding operations; the price and availability of raw materials; attracting and retaining senior management and key personnel; the effect of the Company’s material weakness in internal control over financial reporting; the Company’s ability to successfully remediate its material weakness in internal control over financial reporting and to maintain effective internal control over financial reporting; and other factors described in the Company’s filings with the Securities and Exchange Commission, including those described in the “Risk Factors” section of our Annual Report on Form 10-K for the fiscal year ended December 31, 2023. Shareholders, potential investors and other readers are urged to consider these factors carefully in evaluating the forward-looking statements made herein and are cautioned not to place undue reliance on such forward-looking statements. The forward-looking statements made herein are only made as of the date of this press release and we disclaim any obligation to publicly update such forward-looking statements to reflect subsequent events or circumstances, except as may be required by law.
About Superior Group of Companies, Inc. (SGC):
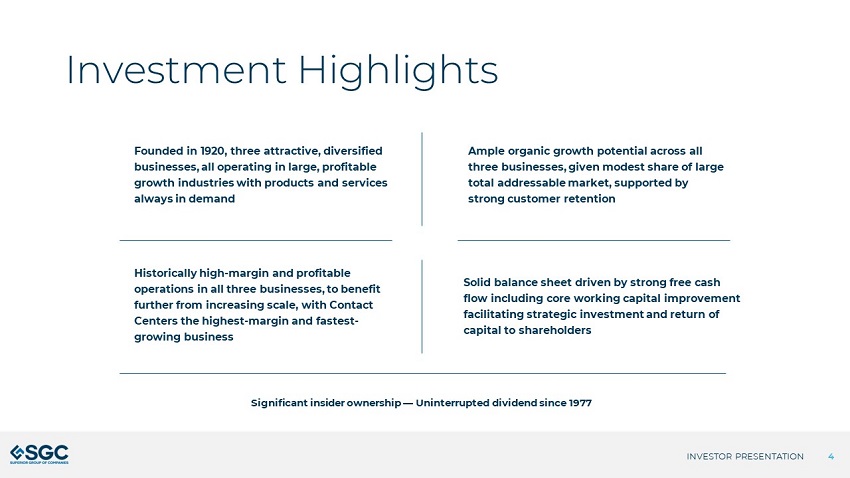
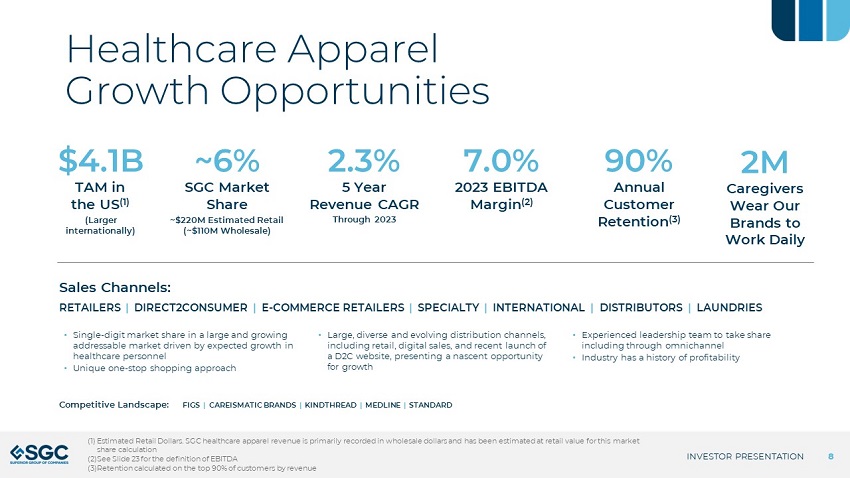
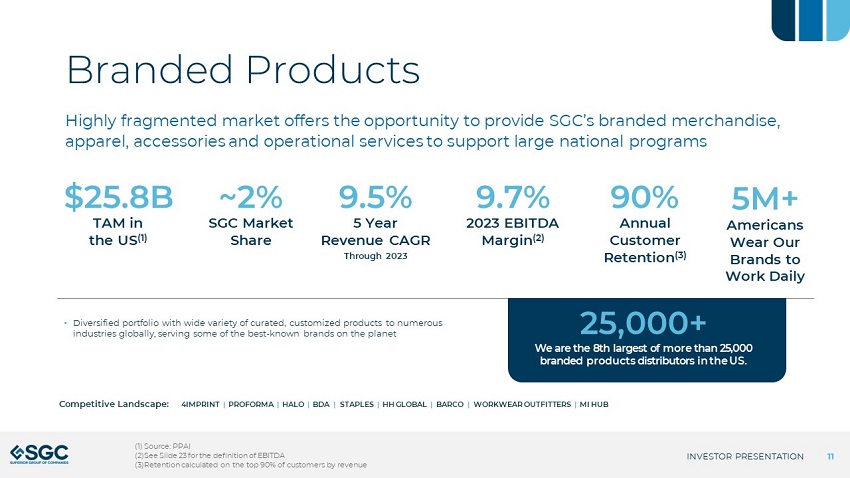
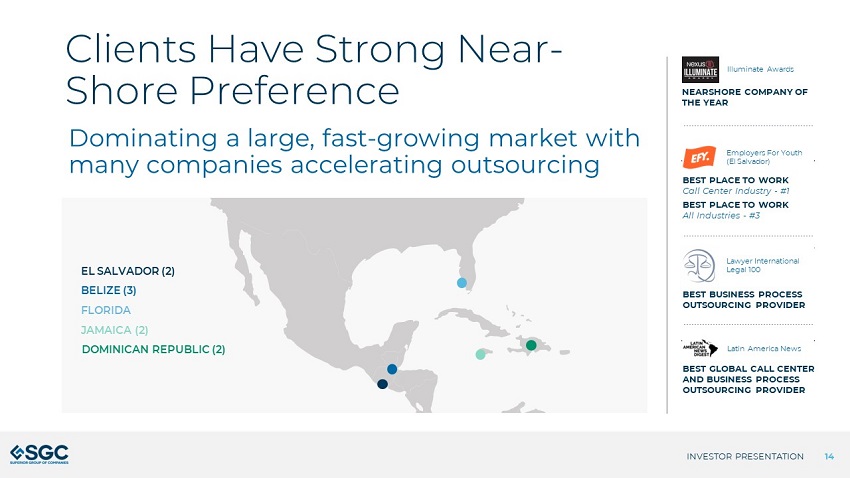
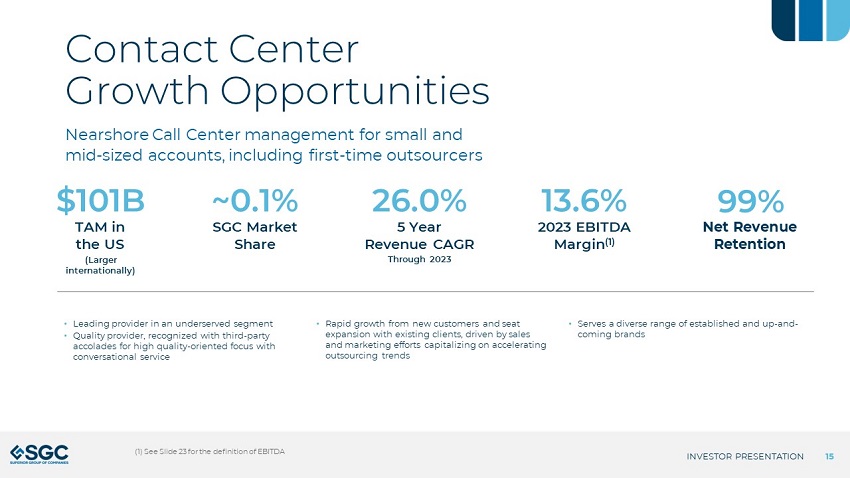
Established in 1920, Superior Group of Companies is comprised of three attractive business segments each serving large, fragmented and growing addressable markets. Across Healthcare Apparel, Branded Products and Contact Centers, each segment enables businesses to create extraordinary brand engagement experiences for their customers and employees. SGC’s commitment to service, quality, advanced technology, and omnichannel commerce provides unparalleled competitive advantages. We are committed to enhancing shareholder value by continuing to pursue a combination of organic growth and strategic acquisitions. For more information, visit www.superiorgroupofcompanies.com.
Investor Relations Contact:
Investors@Superiorgroupofcompanies.com
Comparative figures are as follows:
SUPERIOR GROUP OF COMPANIES, INC. AND SUBSIDIARIES
CONDENSED CONSOLIDATED STATEMENTS OF OPERATIONS
(Unaudited)
(In thousands, except shares and per share data)
|
Three Months Ended December 31, |
Years Ended December 31, |
|||||||||||||||
|
2023 |
2022 |
2023 |
2022 |
|||||||||||||
|
Net sales |
$ | 147,241 | $ | 148,613 | $ | 543,302 | $ | 578,831 | ||||||||
|
Costs and expenses: |
||||||||||||||||
|
Cost of goods sold |
91,596 | 103,805 | 339,755 | 385,472 | ||||||||||||
|
Selling and administrative expenses |
49,198 | 44,322 | 183,205 | 176,320 | ||||||||||||
|
Goodwill impairment charge |
- | - | - | 45,918 | ||||||||||||
|
Intangible assets impairment charge |
- | - | - | 5,581 | ||||||||||||
|
Other periodic pension costs |
213 | 532 | 855 | 2,116 | ||||||||||||
|
Interest expense |
2,060 | 2,218 | 9,718 | 4,894 | ||||||||||||
| 143,067 | 150,877 | 533,533 | 620,301 | |||||||||||||
|
Gain on sale of property, plant and equipment |
- | 3,435 | - | 3,435 | ||||||||||||
|
Income (loss) before income tax expense |
4,174 | 1,171 | 9,769 | (38,035 | ) | |||||||||||
|
Income tax expense (benefit) |
617 | (1,023 | ) | 997 | (6,065 | ) | ||||||||||
|
Net income (loss) |
$ | 3,557 | $ | 2,194 | $ | 8,772 | $ | (31,970 | ) | |||||||
|
Net income (loss) per share: |
||||||||||||||||
|
Basic |
$ | 0.22 | $ | 0.14 | $ | 0.55 | $ | (2.03 | ) | |||||||
|
Diluted |
$ | 0.22 | $ | 0.14 | $ | 0.54 | $ | (2.03 | ) | |||||||
|
Weighted average shares outstanding during the period: |
||||||||||||||||
|
Basic |
16,010,006 | 15,841,296 | 15,968,199 | 15,764,859 | ||||||||||||
|
Diluted |
16,238,736 | 16,075,494 | 16,159,308 | 15,764,859 | ||||||||||||
|
Cash dividends per common share |
$ | 0.14 | $ | 0.14 | $ | 0.56 | $ | 0.54 | ||||||||
SUPERIOR GROUP OF COMPANIES, INC. AND SUBSIDIARIES
CONDENSED CONSOLIDATED BALANCE SHEETS
(Unaudited)
(In thousands, except share and par value data)
|
December 31, |
||||||||
|
2023 |
2022 |
|||||||
|
ASSETS |
||||||||
|
Current assets: |
||||||||
|
Cash and cash equivalents |
$ | 19,896 | $ | 17,722 | ||||
|
Accounts receivable, less allowance for doubtful accounts of $4,237 and $7,622, respectively |
103,494 | 104,813 | ||||||
|
Accounts receivable - other |
307 | 3,326 | ||||||
|
Inventories |
98,067 | 124,976 | ||||||
|
Contract assets |
48,715 | 52,980 | ||||||
|
Prepaid expenses and other current assets |
8,881 | 14,166 | ||||||
|
Total current assets |
279,360 | 317,983 | ||||||
|
Property, plant and equipment, net |
46,890 | 51,392 | ||||||
|
Operating lease right-of-use assets |
17,909 | 9,113 | ||||||
|
Deferred tax asset |
12,356 | 10,718 | ||||||
|
Intangible assets, net |
51,160 | 55,753 | ||||||
|
Other assets |
14,775 | 11,982 | ||||||
|
Total assets |
$ | 422,450 | $ | 456,941 | ||||
|
LIABILITIES AND SHAREHOLDERS’ EQUITY |
||||||||
|
Current liabilities: |
||||||||
|
Accounts payable |
$ | 50,520 | $ | 42,060 | ||||
|
Other current liabilities |
43,978 | 38,646 | ||||||
|
Current portion of long-term debt |
4,688 | 3,750 | ||||||
|
Current portion of acquisition-related contingent liabilities |
1,403 | 736 | ||||||
|
Total current liabilities |
100,589 | 85,192 | ||||||
|
Long-term debt |
88,789 | 151,567 | ||||||
|
Long-term pension liability |
13,284 | 12,864 | ||||||
|
Long-term acquisition-related contingent liabilities |
557 | 2,245 | ||||||
|
Long-term operating lease liabilities |
12,809 | 3,936 | ||||||
|
Other long-term liabilities |
8,784 | 8,538 | ||||||
|
Total liabilities |
224,812 | 264,342 | ||||||
|
Commitments and contingencies |
||||||||
|
Shareholders’ equity: |
||||||||
|
Preferred stock, $.001 par value - authorized 300,000 shares (none issued) |
- | - | ||||||
|
Common stock, $.001 par value - authorized 50,000,000 shares, issued and outstanding - 16,564,712 and 16,376,683 shares, respectively |
16 | 16 | ||||||
|
Additional paid-in capital |
77,443 | 72,615 | ||||||
|
Retained earnings |
122,464 | 122,979 | ||||||
|
Accumulated other comprehensive income (loss), net of tax: |
||||||||
|
Pensions |
(1,122 | ) | (1,113 | ) | ||||
|
Foreign currency translation adjustment |
(1,163 | ) | (1,898 | ) | ||||
|
Total shareholders’ equity |
197,638 | 192,599 | ||||||
|
Total liabilities and shareholders’ equity |
$ | 422,450 | $ | 456,941 | ||||
SUPERIOR GROUP OF COMPANIES, INC. AND SUBSIDIARIES
CONDENSED CONSOLIDATED STATEMENTS OF CASH FLOWS
(Unaudited)
(In thousands)
|
Years Ended December 31, |
||||||||
|
2023 |
2022 |
|||||||
|
CASH FLOWS FROM OPERATING ACTIVITIES |
||||||||
|
Net income (loss) |
$ | 8,772 | $ | (31,970 | ) | |||
|
Adjustments to reconcile net income (loss) to net cash provided by (used in) operating activities: |
||||||||
|
Depreciation and amortization |
13,995 | 13,004 | ||||||
|
Goodwill impairment charge |
- | 45,918 | ||||||
|
Intangible assets impairment charge |
- | 5,581 | ||||||
|
Inventory write-downs |
2,346 | 13,569 | ||||||
|
Provision for bad debts - accounts receivable |
539 | 2,891 | ||||||
|
Share-based compensation expense |
3,787 | 4,289 | ||||||
|
Deferred income tax benefit |
(1,635 | ) | (12,352 | ) | ||||
|
Gain on sale of property, plant and equipment |
- | (3,435 | ) | |||||
|
Change in fair value of acquisition-related contingent liabilities |
(189 | ) | (450 | ) | ||||
|
Change in fair value of written put options |
489 | (1,565 | ) | |||||
|
Changes in assets and liabilities, net of acquisition of businesses: |
||||||||
|
Accounts receivable |
1,051 | 680 | ||||||
|
Accounts receivable - other |
3,019 | 1,347 | ||||||
|
Contract assets |
4,310 | (15,092 | ) | |||||
|
Inventories |
24,672 | (15,898 | ) | |||||
|
Prepaid expenses and other current assets |
5,496 | 5,225 | ||||||
|
Other assets |
(2,012 | ) | 1,858 | |||||
|
Accounts payable and other current liabilities |
13,310 | (14,614 | ) | |||||
|
Payment of acquisition-related contingent liabilities |
(279 | ) | (3,346 | ) | ||||
|
Long-term pension liability |
407 | 2,190 | ||||||
|
Other long-term liabilities |
851 | (434 | ) | |||||
|
Net cash provided by (used in) operating activities |
78,929 | (2,604 | ) | |||||
|
CASH FLOWS FROM INVESTING ACTIVITIES |
||||||||
|
Additions to property, plant and equipment |
(4,963 | ) | (11,018 | ) | ||||
|
Proceeds from disposals of property, plant and equipment |
- | 4,795 | ||||||
|
Acquisition of businesses |
- | (11,202 | ) | |||||
|
Other investments |
(545 | ) | - | |||||
|
Net cash used in investing activities |
(5,508 | ) | (17,425 | ) | ||||
|
CASH FLOWS FROM FINANCING ACTIVITIES |
||||||||
|
Proceeds from borrowings of debt |
6,000 | 332,143 | ||||||
|
Repayment of debt |
(67,750 | ) | (292,773 | ) | ||||
|
Debt issuance costs |
(300 | ) | (869 | ) | ||||
|
Payment of cash dividends |
(9,188 | ) | (8,653 | ) | ||||
|
Payment of acquisition-related contingent liabilities |
(553 | ) | (1,416 | ) | ||||
|
Proceeds received on exercise of stock options |
175 | 728 | ||||||
|
Tax withholdings on vesting of restricted shares and performance based shares and on exercise of stock rights |
- | (314 | ) | |||||
|
Net cash provided by (used in) financing activities |
(71,616 | ) | 28,846 | |||||
|
Effect of currency exchange rates on cash |
369 | (30 | ) | |||||
|
Net increase in cash and cash equivalents |
2,174 | 8,787 | ||||||
|
Cash and cash equivalents balance, beginning of year |
17,722 | 8,935 | ||||||
|
Cash and cash equivalents balance, end of year |
$ | 19,896 | $ | 17,722 | ||||
SUPERIOR GROUP OF COMPANIES, INC. AND SUBSIDIARIES
NON-GAAP FINANCIAL MEASURES
(Unaudited)
(In thousands, except shares and per share data)
|
Three Months Ended December 31, |
Years Ended December 31, |
|||||||||||||||
|
2023 |
2022 |
2023 |
2022 |
|||||||||||||
|
Net income (loss) |
$ | 3,557 | $ | 2,194 | $ | 8,772 | $ | (31,970 | ) | |||||||
|
Interest expense |
2,060 | 2,218 | 9,718 | 4,894 | ||||||||||||
|
Income tax expense (benefit) |
617 | (1,023 | ) | 997 | (6,065 | ) | ||||||||||
|
Depreciation and amortization |
3,664 | 3,500 | 13,995 | 13,004 | ||||||||||||
|
Goodwill impairment charge |
- | - | - | 45,918 | ||||||||||||
|
Intangible assets impairment charge |
- | - | - | 5,581 | ||||||||||||
|
Gain on sale of property, plant and equipment |
- | (3,435 | ) | - | (3,435 | ) | ||||||||||
|
Adjusted EBITDA(1) |
$ | 9,898 | $ | 3,454 | $ | 33,482 | $ | 27,927 | ||||||||
|
Net income (loss) |
$ | 3,557 | $ | 2,194 | $ | 8,772 | $ | (31,970 | ) | |||||||
|
Adjustment for items: |
||||||||||||||||
|
Goodwill impairment charge |
- | - | - | 45,918 | ||||||||||||
|
Intangible assets impairment charge |
- | - | - | 5,581 | ||||||||||||
|
Gain on sale of property, plant and equipment |
- | (3,435 | ) | - | (3,435 | ) | ||||||||||
|
Tax impact of adjustments(2) |
- | 324 | - | (6,061 | ) | |||||||||||
|
Adjusted net income (loss)(3) |
$ | 3,557 | $ | (917 | ) | $ | 8,772 | $ | 10,033 | |||||||
|
Diluted net income (loss) per share |
$ | 0.22 | $ | 0.14 | $ | 0.54 | $ | (2.03 | ) | |||||||
|
Adjustment for items, after-tax, per diluted share |
- | (0.20 | ) | - | 2.65 | |||||||||||
|
Diluted adjusted net income (loss) per share(3) |
$ | 0.22 | $ | (0.06 | ) | $ | 0.54 | $ | 0.62 | |||||||
|
Weighted average shares outstanding during the period: |
||||||||||||||||
|
Diluted, as reported |
16,238,736 | 16,075,494 | 16,159,308 | 15,764,859 | ||||||||||||
|
Diluted, as adjusted(4) |
16,238,736 | 15,841,296 | 16,159,308 | 16,165,240 | ||||||||||||
(1) Adjusted EBITDA, which is a non-GAAP financial measure, is defined as net income (loss) excluding interest expense, income tax expense, depreciation and amortization expense, impairment charges and the other items described in the following sentence. The Company believes Adjusted EBITDA is an important measure of operating performance because it allows management, investors and others to evaluate and compare the Company’s core operating results from period to period by removing (i) the impact of the Company’s capital structure (interest expense from outstanding debt), (ii) tax consequences, (iii) asset base (depreciation and amortization), (iv) the non-cash charges from asset impairments and (v) gains or losses on the sale of property, plant and equipment. The Company uses Adjusted EBITDA internally to monitor operating results and to evaluate the performance of its business. In addition, the compensation committee has used Adjusted EBITDA in evaluating certain components of executive compensation, including performance-based annual incentive programs. Adjusted EBITDA is not a measure of financial performance under GAAP and should not be considered in isolation or as an alternative to net income (loss), cash flows from operating activities or any other measure determined in accordance with GAAP. The items excluded to calculate Adjusted EBITDA are significant components in understanding and assessing the Company’s results of operations. The presentation of the Company’s Adjusted EBITDA may change from time to time, including as a result of changed business conditions, new accounting pronouncements or otherwise. If the presentation changes, the Company undertakes to disclose any change between periods and the reasons underlying that change. The Company’s Adjusted EBITDA may not be comparable to a similarly titled measure of another company because other entities may not calculate Adjusted EBITDA in the same manner.
(2) The tax impact of adjustments includes the tax effect of each separate adjustment based on the statutory tax rate for the jurisdiction(s) in which the adjustment was taxable or deductible, and the tax effect of items that relate to tax specific financial transactions.
(3) Adjusted net income (loss) and diluted adjusted net income (loss) per share, which are non-GAAP measures, are defined as net income (loss) and net income (loss) per share, excluding the impacts of impairment charges and gains or losses on the sale of property, plant and equipment. Management believes adjusted net income (loss) and diluted adjusted net income (loss) per share provides useful information to investors because it allows management, investors and others to evaluate and compare our operating results from period to period by removing the impact of impairment charges and gains or losses on the sale of property, plant and equipment that are not reflective of our core business.
(4) Diluted weighted average shares outstanding used to calculate diluted adjusted net loss per share excludes shares of common stock of 234,198 for the three months ended December 31, 2022, as the Company recognized an adjusted net loss and their inclusion would have been antidilutive. Diluted weighted average shares outstanding used to calculate diluted adjusted net income per share includes shares of common stock of 400,381 for the year ended December 31, 2022. These shares were excluded from diluted weighted average shares outstanding used to calculate diluted net income (loss) per share, as the Company recognized a net loss and their inclusion would have been antidilutive.
SUPERIOR GROUP OF COMPANIES, INC. AND SUBSIDIARIES
SUPPLEMENTAL INFORMATION - REPORTABLE SEGMENTS
(Unaudited)
(In thousands)
|
Branded Products |
Healthcare Apparel |
Contact Centers |
Intersegment Eliminations |
Other |
Total |
|||||||||||||||||||
|
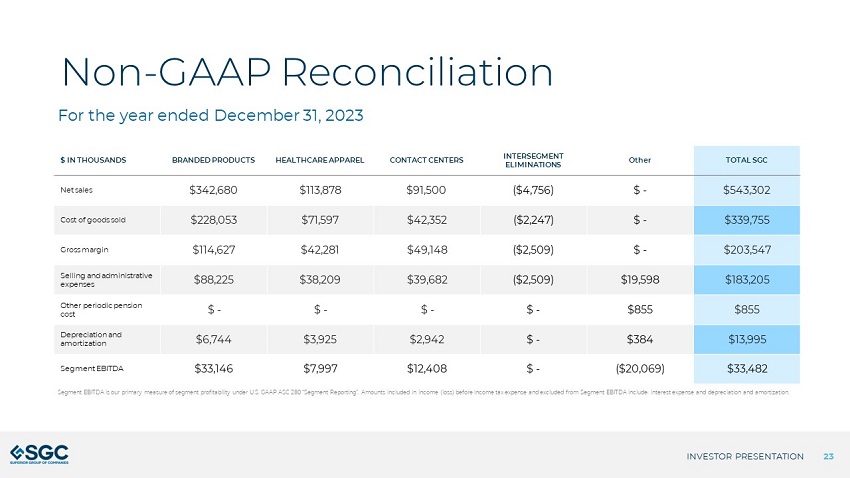
For the Year Ended December 31, 2023: |
||||||||||||||||||||||||
|
Net sales |
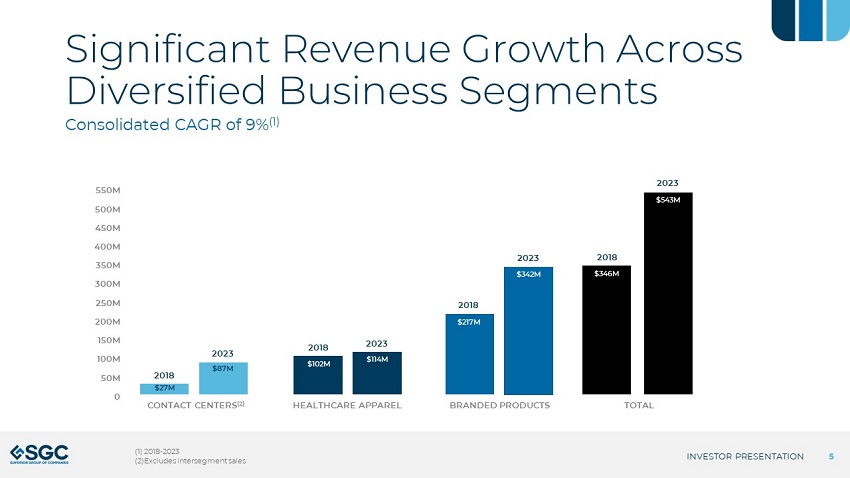
$ | 342,680 | $ | 113,878 | $ | 91,500 | $ | (4,756 | ) | $ | - | $ | 543,302 | |||||||||||
|
Cost of goods sold |
228,053 | 71,597 | 42,352 | (2,247 | ) | - | 339,755 | |||||||||||||||||
|
Gross margin |
114,627 | 42,281 | 49,148 | (2,509 | ) | - | 203,547 | |||||||||||||||||
|
Selling and administrative expenses |
88,225 | 38,209 | 39,682 | (2,509 | ) | 19,598 | 183,205 | |||||||||||||||||
|
Other periodic pension cost |
- | - | - | - | 855 | 855 | ||||||||||||||||||
|
Add: Depreciation and amortization |
6,744 | 3,925 | 2,942 | - | 384 | 13,995 | ||||||||||||||||||
|
Segment Adjusted EBITDA(1) |
$ | 33,146 | $ | 7,997 | $ | 12,408 | $ | - | $ | (20,069 | ) | $ | 33,482 | |||||||||||
|
Branded Products |
Healthcare Apparel |
Contact Centers |
Intersegment Eliminations |
Other |
Total |
|||||||||||||||||||
|
For the Year Ended December 31, 2022: |
||||||||||||||||||||||||
|
Net sales |
$ | 387,931 | $ | 113,321 | $ | 84,218 | $ | (6,639 | ) | $ | - | $ | 578,831 | |||||||||||
|
Cost of goods sold |
273,134 | 80,719 | 34,439 | (2,820 | ) | - | 385,472 | |||||||||||||||||
|
Gross margin |
114,797 | 32,602 | 49,779 | (3,819 | ) | - | 193,359 | |||||||||||||||||
|
Selling and administrative expenses |
90,118 | 39,295 | 33,631 | (3,819 | ) | 17,095 | 176,320 | |||||||||||||||||
|
Other periodic pension cost |
- | - | - | - | 2,116 | 2,116 | ||||||||||||||||||
|
Add: Depreciation and amortization |
6,465 | 3,946 | 2,373 | - | 220 | 13,004 | ||||||||||||||||||
|
Segment Adjusted EBITDA(1) |
$ | 31,144 | $ | (2,747 | ) | $ | 18,521 | $ | - | $ | (18,991 | ) | $ | 27,927 | ||||||||||
|
Branded Products |
Healthcare Apparel |
Contact Centers |
Intersegment Eliminations |
Other |
Total |
|||||||||||||||||||
|
For the Three Months Ended December 31, 2023: |
||||||||||||||||||||||||
|
Net sales |
$ | 97,725 | $ | 28,003 | $ | 22,565 | $ | (1,052 | ) | $ | - | $ | 147,241 | |||||||||||
|
Cost of goods sold |
63,561 | 17,725 | 10,807 | (497 | ) | - | 91,596 | |||||||||||||||||
|
Gross margin |
34,164 | 10,278 | 11,758 | (555 | ) | - | 55,645 | |||||||||||||||||
|
Selling and administrative expenses |
24,392 | 9,748 | 10,180 | (555 | ) | 5,433 | 49,198 | |||||||||||||||||
|
Other periodic pension cost |
- | - | - | - | 213 | 213 | ||||||||||||||||||
|
Add: Depreciation and amortization |
1,918 | 911 | 732 | - | 103 | 3,664 | ||||||||||||||||||
|
Segment Adjusted EBITDA(1) |
$ | 11,690 | $ | 1,441 | $ | 2,310 | $ | - | $ | (5,543 | ) | $ | 9,898 | |||||||||||
|
Branded Products |
Healthcare Apparel |
Contact Centers |
Intersegment Eliminations |
Other |
Total |
|||||||||||||||||||
|
For the Three Months Ended December 31, 2022: |
||||||||||||||||||||||||
|
Net sales |
$ | 102,040 | $ | 26,426 | $ | 21,415 | $ | (1,268 | ) | $ | - | $ | 148,613 | |||||||||||
|
Cost of goods sold |
70,712 | 24,653 | 9,001 | (561 | ) | - | 103,805 | |||||||||||||||||
|
Gross margin |
31,328 | 1,773 | 12,414 | (707 | ) | - | 44,808 | |||||||||||||||||
|
Selling and administrative expenses |
22,300 | 9,246 | 9,337 | (707 | ) | 4,146 | 44,322 | |||||||||||||||||
|
Other periodic pension cost |
- | - | - | - | 532 | 532 | ||||||||||||||||||
|
Add: Depreciation and amortization |
1,769 | 1,004 | 676 | - | 51 | 3,500 | ||||||||||||||||||
|
Segment Adjusted EBITDA(1) |
$ | 10,797 | $ | (6,469 | ) | $ | 3,753 | $ | - | $ | (4,627 | ) | $ | 3,454 | ||||||||||
(1) Segment Adjusted EBITDA is our primary measure of segment profitability under U.S. GAAP ASC 280 “Segment Reporting”. Amounts included in income (loss) before income tax expense and excluded from Segment Adjusted EBITDA include: interest expense, depreciation and amortization expense, impairment charges and the other items not tied to the operational performance of the segment. Total Segment Adjusted EBITDA is a non-GAAP financial measure. Please see reconciliation of Adjusted EBITDA included in the Non-GAAP Financial Measures table above.
Exhibit 99.2