UNITED STATES
SECURITIES AND EXCHANGE COMMISSION
Washington, D.C. 20549
FORM 10-K
(Mark One)
| ☒ |
ANNUAL REPORT PURSUANT TO SECTION 13 OR 15(d) OF THE SECURITIES EXCHANGE ACT OF 1934 |
For the fiscal year ended December 2, 2023
OR
| ☐ |
TRANSITION REPORT PURSUANT TO SECTION 13 OR 15(d) OF THE SECURITIES EXCHANGE ACT OF 1934 |
For the transition period from _____________ to _____________
Commission file number: 001-09225
H.B. FULLER COMPANY
(Exact name of registrant as specified in its charter)
| Minnesota | 41-0268370 |
| (State or other jurisdiction of | (I.R.S. Employer |
| incorporation or organization) | Identification No.) |
| 1200 Willow Lake Boulevard, St. Paul, Minnesota | 55110-5101 |
| (Address of principal executive offices) | (Zip Code) |
Registrant’s telephone number, including area code: (651) 236-5900
Securities registered pursuant to Section 12(b) of the Act:
| Title of each class |
Trading Symbol |
Name of each exchange on which registered |
| Common Stock, par value $1.00 |
FUL |
New York Stock Exchange |
Securities registered pursuant to Section 12(g) of the Act: none
Indicate by check mark if the registrant is a well-known seasoned issuer, as defined in Rule 405 of the Securities Act. ☒ Yes ☐ No
Indicate by check mark if the registrant is not required to file reports pursuant to Section 13 or Section 15(d) of the Act. ☐ Yes ☒ No
Indicate by check mark whether the registrant (1) has filed all reports required to be filed by Section 13 or 15(d) of the Securities Exchange Act of 1934 during the preceding 12 months (or for such shorter period that the registrant was required to file such reports), and (2) has been subject to such filing requirements for the past 90 days. ☒ Yes ☐ No
Indicate by check mark whether the registrant has submitted electronically every Interactive Data File required to be submitted pursuant to Rule 405 of Regulation S-T during the preceding 12 months (or for such shorter period that the registrant was required to submit and post such files). ☒ Yes ☐ No
Indicate by check mark whether the registrant is a large accelerated filer, an accelerated filer, a non-accelerated filer, or a smaller reporting company. See the definitions of “large accelerated filer”, “accelerated filer”, “smaller reporting company” or “emerging growth company” in Rule 12b-2 of the Exchange Act. (Check one):
| Large accelerated filer ☒ | Accelerated filer ☐ |
| Non-accelerated filer ☐ | Smaller reporting company ☐ |
| Emerging growth company ☐ |
If an emerging growth company, indicate by check mark if the registrant has elected not to use the extended transition period for complying with any new or revised financial accounting standards provided pursuant to Section 13(a) of the Exchange Act. ☐
Indicate by check mark whether the registrant has filed a report on and attestation to its management’s assessment of the effectiveness of its internal control over financial reporting under Section 404(b) of the Sarbanes-Oxley Act (15 U.S.C. 7262(b)) by the registered public accounting firm that prepared or issued its audit report. ☒
If securities are registered pursuant to Section 12(b) of the Act, indicate by check mark whether the financial statements of the registrant included in the filing reflect the correction of an error to previously issued financial statements. ☐
Indicate by check mark whether any of those error corrections are restatements that required a recovery analysis of incentive-based compensation received by any of the registrant’s executive officers during the relevant recovery period pursuant to § 240.10D-1(b). ☐
Indicate by check mark whether the registrant is a shell company (as defined in Rule 12b-2 of the Act). ☐ Yes ☒ No
The aggregate market value of the Common Stock, par value $1.00 per share, held by non-affiliates of the registrant as of June 3, 2023 was approximately $3,600,724,541 (based on the closing price of such stock as quoted on the New York Stock Exchange of $67.10 on such date).
The number of shares outstanding of the Registrant’s Common Stock, par value $1.00 per share, was 54,207,966 as of January 17, 2024.
DOCUMENTS INCORPORATED BY REFERENCE
Part III incorporates information by reference to portions of the registrant’s Proxy Statement for the Annual Meeting of Shareholders to be held on April 11, 2024.
H.B. FULLER COMPANY
2023 Annual Report on Form 10-K
PART I
H.B. Fuller Company was founded in 1887 and incorporated as a Minnesota corporation in 1915. Our stock is traded on the New York Stock Exchange (“NYSE”) under the ticker symbol FUL. As used herein, “H.B. Fuller,” “we," “us,” “our,” “management” or “company” includes H.B. Fuller and its subsidiaries unless otherwise indicated. Where we refer to 2023, 2022 and 2021 herein, the reference is to our fiscal years ended December 2, 2023, December 3, 2022, and November 27, 2021, respectively.
We are a leading worldwide formulator, manufacturer and marketer of adhesives, sealants and other specialty chemical products. Sales operations span 35 countries in North America, Europe, Latin America, Asia Pacific, India, the Middle East and Africa. Industrial adhesives represent our core product offering, which help improve the performance of our customers’ products or improve their manufacturing processes. Customers use our adhesives products in manufacturing common consumer and industrial goods, including food and beverage containers, disposable diapers, medical products, windows, doors, appliances, sportswear, footwear, multi-wall bags, water filtration products, insulation, textiles, automobiles, recreational vehicles, buses, trucks and trailers, marine products, solar energy systems, electronics and products for the aerospace and defense industries. In addition, we have established a variety of product offerings for residential, commercial and industrial construction markets, including sealing and waterproofing solutions for airports, roads, highways, bridges and utilities; pressure-sensitive adhesives, tapes and sealants for the commercial roofing industry; and level-setting products, ready-to-use grouts, mortars, and pressure sensitive adhesives that enable contractors and do-it-yourself consumers to quickly install flooring and tiling applications more reliably and efficiently. We also provide our customers with technical support and unique solutions designed to address their specific needs.
We have three reportable segments: Hygiene, Health and Consumable Adhesives, Engineering Adhesives and Construction Adhesives. See Management’s Discussion and Analysis of Financial Condition and Results of Operations (the “MD&A”) in Item 7 of this Annual Report for a description of our segment operating results.
Non-U.S. Operations
The principal markets, products and methods of distribution outside the United States vary with each of our regional operations generally maintaining integrated business units that contain dedicated supplier networks, manufacturing, logistics and sales organizations. The vast majority of the products sold within any region are produced within the region, and the respective regions do not import significant amounts of product from other regions. As of December 2, 2023, we had sales offices and manufacturing plants in 25 countries outside the United States and satellite sales offices in another 9 countries.
We have a Code of Business Conduct and detailed Core Policies that we apply across all of our operations around the world. These policies represent a set of common values that apply to all employees and all of our business dealings. We have adopted policies and processes, and conduct employee training, intended to ensure compliance with various economic sanctions and export controls, including the regulations of the U.S. Treasury Department’s Office of Foreign Assets Control (“OFAC”). We do not conduct any business in the following countries that are subject to U.S. economic sanctions: Cuba, Iran, North Korea, Syria and the Crimea region of the Ukraine.
Competition
Many of our markets are highly competitive. However, we compete effectively due to the quality and breadth of our adhesives, sealants and specialty chemical portfolio and the experience and expertise of our commercial organizations. Within the adhesives and other specialty chemical markets, we believe few suppliers have comparable global reach and corresponding ability to deliver quality and consistency to multinational customers. Our competition is made up generally of two types of companies: (1) similar multinational suppliers and (2) regional or specialty suppliers that typically compete in only one region or within a narrow geographic area within a region. The multinational competitors typically maintain a broad product offering and range of technology, while regional or specialty companies tend to have limited or more focused product ranges and technology.
Principal competitive factors in the sale of adhesives and other specialty chemicals are product performance, supply assurance, technical service, quality, price and customer service.
Customers
We have cultivated strong, integrated relationships with a diverse set of customers worldwide. Our customers are among the technology and market leaders in consumer goods, construction and industrial markets. We pride ourselves on long-term, collaborative customer relationships and a diverse portfolio of customers in which no single customer accounted for more than 10 percent of consolidated net revenue.
Our leading customers include manufacturers of food and beverages, hygiene products, clothing, major appliances, electronics, automobiles, aerospace and defense products, solar energy systems, filters, construction materials, wood flooring, furniture, cabinetry, windows, doors, tissue and towel, corrugation, tube winding, packaging, and tapes and labels.
Our products are delivered directly to customers primarily from our manufacturing and distribution facilities, with additional deliveries made through distributors and retailers.
Human Capital Resources and Management
Employees and Labor Relations
As of December 2, 2023, we have approximately 7,200 employees in 45 countries, including approximately 2,600 employees based in the U.S. Approximately 450 U.S. employees are subject to collective bargaining agreements with various unions. Approximately 750 employees in foreign countries are subject to collective bargaining agreements. Overall, we consider our employee relations to be good.
Health and Safety
The health and safety of our employees and anyone who enters our workplace is important, and we believe that nothing we do is worth getting hurt for. We have a strong environmental, health and safety program that focuses on implementing policies and training programs, as well as performing self-audits to enhance workplace safety.
Competitive Pay and Benefits
Our primary compensation strategy is “Pay for Performance”, which supports a culture of accountability and performance. Our compensation guiding principles are to structure compensation that is simple, aligned and balanced. We believe that these principles are strongly aligned with the strategic priorities of our business and our objective to deliver value for our shareholders.
We are committed to fair pay and strive to be externally competitive while ensuring internal equity across our organization. We conduct global pay equity assessments and compensation reviews, and when necessary, we take action to address areas of concern.
Quality, affordable health care is the foundation of the comprehensive benefits package we offer our employees. It is one of the tools we use to recruit and retain, and it is seen as the preferred benefit by most employees. Employees in the United States earning below $54,000 each year have 100% of their individual medical premiums covered by the Company in the form of a medical premium reimbursement.
Results-Driven, Collaborative Culture
Our purpose is connecting what matters for all stakeholders and we go about this by winning the right way through our core values. We expect employees to act with integrity and hold each other accountable for our actions. We value our global team’s diverse perspectives, backgrounds and experiences. We make daily, conscious choices to excel, by always bringing passion and creativity to our work, and by striving for innovation ethically and fairly. Our worldwide network of culture champions supports our focus on being At Our Best. Our communication on goals, targets and performance is frequent and transparent. We continue to leverage flexible work options available to employees who don't need our facilities to perform their jobs and this continues to enhance connections across the company, as well as with customers and external partners. This supports our desire to be first and fastest in finding solutions for customers and improving our overall effectiveness. Finally, we continue to take great pride in our focus on giving back to the communities in which we operate through the giving efforts of the H.B. Fuller Foundation and the thousands of employee volunteer hours each year.
Inclusion and Diversity
As a global company, we currently have employees present in 45 countries around the world. We place strong value on collaboration and we believe that working together leads to better outcomes for our customers. This extends to the way we treat each other as team members. We strive to create an environment where innovative ideas can flourish by demonstrating respect for each other and valuing the diverse opinions, background and viewpoints of employees. We believe that diversity in our teams leads to new ideas, helps us solve problems and allows us to better connect with our global customer base.
We are taking specific actions to foster inclusion and diversity into our culture. Learning resources have been implemented to support greater awareness and understanding of the behaviors expected from employees. We have introduced employee networking groups, an expanded and enhanced mentoring program and focused development programs with the goal of creating meaningful opportunities for employees. We have adjusted our recruiting practices to ensure we are getting the right level of exposure to diverse candidates.
Talent Development
We recognize how important it is for our colleagues to develop and progress in their careers. We provide a variety of resources to help our colleagues grow in their current roles and build new skills, including online development resources focused on specific business imperatives with access to hundreds of online courses in our learning management system. We have implemented an innovative delivery method for leadership training to drive experiential learning and to increase access to leaders around the world. Individual development planning is a part of our annual goal setting process and people managers are expected to have regular discussions with employees to measure progress and make needed adjustments. We focus on getting employees into roles with greater responsibility and opportunities for advancement that are also aligned with their career path to facilitate development and maximize potential. Finally, we provide ambitious employees with short-term opportunities in unique assignments in addition to their current roles. These assignments support the employees’ development while also supporting company initiatives that are required to be resourced with talented employees.
Raw Materials
We use several principal raw materials in our manufacturing processes, including tackifying resins, polymers, synthetic rubbers, vinyl acetate monomer and plasticizers. We generally avoid sole source supplier arrangements for raw materials.
The majority of our raw materials are petroleum/natural gas-based derivatives, therefore the cost of crude oil and natural gas can impact the cost of our raw materials. Under normal conditions, raw materials are available on the open market. Prices and availability are subject to supply and demand market mechanisms. Raw material costs, including costs for unique or specialty chemicals used in the manufacturing of our products, are primarily determined by the balance of supply against the aggregate demand from the adhesives industry and other industries that use the same raw material streams.
Patents, Trademarks and Licenses
Much of the technology we use in our products and manufacturing processes is available in the public domain. For technology not available in the public domain, we rely on trade secrets and patents when appropriate to protect our competitive position. We also license some patented technology from other sources. Our business is not materially dependent upon licenses or similar rights or on any single patent or group of related patents.
We enter into agreements with many employees to protect rights to technology and intellectual property. Confidentiality commitments also are routinely obtained from customers, suppliers and others to safeguard proprietary information.
We own numerous trademarks and service marks in various countries. Trademarks, such as H.B. Fuller®, Swift®, Advantra®, Clarity®, Earthic™, Sesame®, TEC®, Foster®, Rakoll®, Rapidex®, Full-Care®, Thermonex®, Silaprene®, Eternabond®, Cilbond®, HydroArmor®, Ködispace®, Weld Mount® and TONSAN® are important in marketing products. Many of our trademarks and service marks are registered. U.S. trademark registrations are for a term of ten years and are renewable every ten years as long as the trademarks are used in the regular course of trade.
Research and Development
Our investment in research and development creates new and innovative adhesive technology platforms, enhances product performance, ensures a competitive cost structure and leverages available raw materials. New product development is a key research and development outcome, providing higher-value solutions to existing customers or meeting new customers’ needs. Projects are developed in local laboratories in each region, where we understand our customer base the best. Platform developments are coordinated globally through our network of laboratories.
Through designing and developing new polymers and new formulations, we expect to continue to grow in our current markets. We also develop new applications for existing products and technologies, and improve manufacturing processes to enhance productivity and product quality. Research and development efforts are closely aligned to customer needs. We foster open innovation, seek supplier-driven new technology and use relationships with academic and other institutions to enhance our capabilities.
As climate change and other sustainability concerns become more prevalent, governmental and non-governmental organizations, customers and investors are increasingly focusing on these issues. We continue to monitor our markets to ensure we are developing the adhesives and sealants to support our customers’ responses to changing consumer demand, new product designs and upcoming regulatory and sustainability efforts. We invest significantly in innovation, research and expertise, which are crucial for the continuous extraction of value from our business strategy. This also facilitates the creation of new high-performance solutions that enable customers to improve their products and processes to better achieve their sustainability programs.
Regulatory Compliance
We comply with applicable federal, state, local and foreign laws and regulations relating to environmental protection and workers' safety, including those required by the U.S. Environmental Protection Agency (the “EPA”) and the European Union’s ("EU") Registration, Evaluation, Authorization and Restriction of Chemicals (“REACH”) regulation. This includes regular review of and upgrades to environmental, health and safety policies, practices and procedures as well as improved production methods to minimize our facilities’ outgoing waste, based on evolving societal standards and increased environmental understanding. Expenditures to comply with environmental regulations over the next two years are estimated to be approximately $21.4 million, including approximately $0.9 million of capital expenditures. See additional disclosure under Item 3. Legal Proceedings.
Various legislation, regulations and international accords pertaining to climate change have been implemented or are being considered for implementation, particularly as they relate to the reduction of greenhouse gas emissions, such as the EU's Corporate Sustainability Reporting Directive ("CSRD"), California’s Climate Corporate Data Accountability Act and Climate Related Financial Risk Act, and similar regulations under consideration by the Securities and Exchange Commission ("SEC"). These laws may directly impact the Company, however we have not determined the extent of potential disclosures or other reporting requirements. We continue to monitor the development and implementation of such legislation and regulations. We also continue to regularly report our sustainability efforts and metrics under the Global Reporting Initiative (“GRI”) framework and report our goals and progress in our annual Sustainability Report.
The Foreign Corrupt Practices Act (the “FCPA”) prohibits bribery of government officials to benefit business interests. We operate and sell our products in countries that are rated as high-risk for corruption, which creates the risk of unauthorized conduct by our employees, customs brokers, distributors or other third party intermediaries that could be in violation of the FCPA or similar local regulations. We comply with the FCPA’s requirements to make and keep accurate books and records that accurately and fairly reflect our transactions and to devise and maintain an adequate system of internal accounting controls.
We are also subject to and comply with increasingly complex privacy and data protection laws and regulations in the United States and other jurisdictions. This includes the EU’s General Data Protection Regulation (“GDPR”), which enforces rules relating to the protection of processing and movement of personal data. The interpretation and enforcement of such regulations are continuously evolving and there may be uncertainty with respect to how to comply with them. Noncompliance with GDPR and other data protection laws could result in damage to our reputation and payment of monetary penalties.
Seasonality
Our operating segments have historically had lower net revenue in winter months, which is primarily our first fiscal quarter, mainly due to international holidays and the seasonal decline in construction and consumer spending activities.
Information About Our Executive Officers
The following table shows the name, age and business experience for the past five years of the executive officers as of January 16, 2024. Unless otherwise noted, the positions described are positions with the company or its subsidiaries.
| Name |
Age |
Positions |
Period Served |
|
|
|
|
|
| Celeste B. Mastin |
55 |
President and Chief Executive Officer Executive Vice President and Chief Operating Officer Chief Executive Officer, PetroChoice Lubrication Solutions (leading lubricant distributor, providing solutions across the industrial, commercial and passenger vehicle customer segments) |
December 2022 - Present March - December 2022 2018 - 2022
|
|
|
|
|
|
| Zhiwei Cai |
61 |
Executive Vice President, Engineering Adhesives |
August 2019 - Present |
| Senior Vice President, Engineering Adhesives | February 2016 - August 2019 | ||
| Heather A. Campe |
50 |
Senior Vice President, International Growth | December 2021 - Present |
| Senior Vice President, Global Hygiene, Health and Consumable Adhesives | August 2019 - November 2021 | ||
| Senior Vice President, Americas Adhesives | October 2016 - August 2019 | ||
| John J. Corkrean |
58 |
Executive Vice President and Chief Financial Officer |
May 2016 - Present |
| James J. East | 59 | Executive Vice President, Hygiene, Health and Consumable Adhesives | December 2022 - Present |
| Senior Vice President, Hygiene, Health and Consumable Adhesives | October 2021 - December 2022 | ||
| Vice President, Engineering Adhesives Americas and Global Director Automotive | April 2018 - October 2021 |
| Traci L. Jensen |
57 |
Executive Vice President and Chief Administrative Officer |
December 2022 - Present |
| Vice President, Global Business Process Improvement | December 2019 - December 2022 | ||
| Senior Vice President, Global Construction Products | July 2016 - December 2019 | ||
| M. Shahbaz Malik |
56 |
Senior Vice President, Construction Adhesives |
December 2019 - Present |
| Vice President and Business Leader, North America Distribution, Masonite International Corporation (global residential doors business) | 2018 - 2019 | ||
| Gregory O. Ogunsanya | 49 | Senior Vice President, General Counsel and Corporate Secretary | October 2023 - Present |
| Vice President, Assistant General Counsel, Securities and Governance, Stanley Black & Decker Inc. | June 2022 - September 2023 | ||
| Vice President Legal, Stanley Industrial, a division of Stanley Black & Decker, Inc. (the world’s largest tool company) | October 2020 - June 2022 | ||
| Vice President and Deputy General Counsel, Safety and Productivity Solutions, Honeywell International, Inc. | November 2019 - October 2020 | ||
| Vice President and General Counsel, Industrial Safety, Honeywell International, Inc. (advanced technology company that manufactures aerospace and automotive products; residential, commercial, and industrial control systems; specialty chemicals and plastics; and engineered materials) | October 2018 - November 2019 | ||
| Nathaniel D. Weaver |
48 |
Senior Vice President, Human Resources |
December 2022 - Present |
| Vice President, Human Resources | March 2020 - December 2022 | ||
| Director, Human Resources | 2017 - March 2020 |
The Board of Directors elects the executive officers annually.
Available Information
For more information about us, visit our website at: www.hbfuller.com.
We file annual, quarterly and current reports, proxy statements and other information with the SEC via EDGAR. Our SEC filings are available free of charge to the public on the SEC website at www.sec.gov and on our website as soon as reasonably practicable after they have been filed with or furnished to the SEC.
As a global manufacturer of adhesives, sealants and other specialty chemical products, we operate in a business environment that is subject to various risks and uncertainties. Below are the most significant factors that could adversely affect our business, financial condition and results of operations.
Strategic and Operational Risks
Increases in prices and declines in the availability of raw materials have adversely affected, and could continue to erode, our profit margins, and could negatively impact our operating results.
In 2023, raw material costs made up approximately 75 percent of our cost of sales. Based on 2023 financial results, a hypothetical one percent change in our raw material costs would have resulted in a change in net income of approximately $13.3 million or $0.24 per diluted share. Accordingly, changes in the cost of raw materials, due to scarcity, supplier disruptions, inflation and for other reasons, can significantly impact our earnings. Raw materials needed to manufacture products are obtained from a number of suppliers and many of the raw materials are petroleum and natural gas based derivatives. Under normal market conditions, these raw materials are generally available on the open market from a variety of producers. While alternate supplies of most key raw materials are available, supplier production outages may lead to strained supply-demand situations for certain raw materials. The substitution of key raw materials requires us to identify new supply sources, reformulate and re-test and may require seeking re-approval from our customers using those products. From time to time, the prices and availability of these raw materials may fluctuate, which could impair our ability to procure necessary materials, or increase the cost of manufacturing products. If the prices of raw materials increase in a short period of time, we may be unable to pass these increases on to our customers in a timely manner and could experience reductions to our profit margins.
We are at risk of cyber-attacks or other security breaches that could compromise sensitive business information, undermine our ability to operate effectively and expose us to liability, which could cause our business and reputation to suffer.
Increasingly, companies are subject to a wide variety of attacks on their networks on an ongoing basis. In addition to traditional computer “hackers,” malicious code (such as viruses and worms), phishing attempts, ransomware, employee theft or misuse, and denial of service attacks, sophisticated nation-state and nation-state supported actors engage in intrusions and attacks (including advanced persistent threat intrusions) and add to the risks to internal networks, cloud deployed enterprise and customer-facing environments and the information they store and process. Despite significant efforts to create security barriers to such threats, it is virtually impossible for us to entirely mitigate these risks. We, and our third-party software and service providers, have experienced and will continue to experience security threats and attacks from a variety of sources.
As part of our business, we store our data, including intellectual property, and certain data about our employees, customers and vendors in our information technology systems. Our security measures may be breached as a result of third-party action, including intentional misconduct by computer hackers, employee error, malfeasance or otherwise. Third parties may attempt to fraudulently induce employees or customers into disclosing sensitive information such as usernames, passwords, or other information to gain access to our customers' data or our data, including our intellectual property and other confidential business information, or our information technology systems. In addition, given their size and complexity, our information systems could be vulnerable to service interruptions or to security breaches from inadvertent or intentional actions by our employees, third-party vendors and/or business partners, or from cyber-attacks by malicious third parties attempting to gain unauthorized access to our products, systems or confidential information.
We are subject to increasingly complex and evolving laws, regulations and customer-imposed controls, that govern privacy and cybersecurity. These laws and regulations have been adopted by multiple agencies at the federal and state level, as well as in foreign jurisdictions, and the regimes have not been harmonized. Our failure to comply with these regulatory regimes may result in significant liabilities or penalties.
If a third party gained unauthorized access to our data, including any data regarding our employees, customers or vendors, the security breach could expose us to risks. Such unauthorized access and a failure to effectively recover from breaches could compromise confidential information, disrupt our business, harm our reputation, result in the loss of customer confidence, business and assets (including trade secrets and other intellectual property), result in regulatory proceedings and legal claims, and have a negative impact on our financial results.
Our business and operations have been, and may in the future, be adversely affected by epidemics, pandemics, outbreaks of disease and other adverse public health developments.
Epidemics, pandemics, outbreaks of novel diseases and other adverse public health developments in countries and states where we operate may arise at any time. Such developments, including the COVID-19 pandemic, have had, and in the future may have, an adverse effect on our business, financial condition and results of operations. These effects include a potentially negative impact on the availability of our key personnel, labor shortages and increased turnover, temporary closures of our facilities or facilities of our business partners, customers, suppliers, third-party service providers or other vendors, and interruption of domestic and global supply chains, distribution channels and liquidity and capital or financial markets. In particular, restrictions on or disruptions of transportation, port closures or increased border controls or closures, or other impacts on domestic and global supply chains or distribution channels, could increase our costs for raw materials and commodity costs, increase demand for raw materials and commodities from competing purchasers, limit our ability to meet customer demand or otherwise have a material adverse effect on our business, financial condition and results of operations or cash flows. Precautionary measures that we may take in the future intended to limit the impact of any epidemic, pandemic, disease outbreak or other public health development, may result in additional costs. In addition, such epidemics, pandemics, disease outbreaks or other public health developments may adversely affect economies and financial markets throughout the world, such as the effect that COVID-19 has had on world economies and financial markets, which may affect our ability to obtain additional financing for our businesses and demand for our products and services. The extent to which major public health issues impact our business and our financial results in the future will depend on future developments, which are highly uncertain and cannot be predicted. As a result, it is not possible to predict the overall future impact of major public health issues on our business, liquidity, capital resources and financial results.
We experience substantial competition in each of the operating segments and geographic areas in which we operate.
Our wide variety of products are sold in numerous markets, each of which is highly competitive. Our competitive position in markets is, in part, subject to external factors. For example, supply and demand for certain of our products is driven by end-use markets and worldwide capacities which, in turn, impact demand for and pricing of our products. Many of our direct competitors are part of large multinational companies and may have more resources than we do. Any increase in competition may result in lost market share or reduced prices, which could result in reduced profit margins. This may impair the ability to grow or even to maintain current levels of revenues and earnings. While we have an extensive customer base, loss of certain top customers could adversely affect our financial condition and results of operations until such business is replaced, and no assurances can be made that we would be able to regain or replace any lost customers.
Failure to develop and/or acquire new products and protect our intellectual property could negatively impact our future performance and growth.
Ongoing innovation and product development are important factors in our competitiveness, as is acquisition of new technologies. Failure to create and/or acquire new products and generate new ideas could negatively impact our ability to grow and deliver strong financial results. We may face difficulties marketing products produced using new technologies including, but not limited to, sustainable adhesives, which may adversely impact our sales and financial results. Failure of the products to work as predicted could lead to liability and damage to our reputation.
We continually apply for and obtain U.S. and foreign patents to protect the results of our research for use in our operations and licensing. We are party to a number of patent licenses and other technology agreements. We rely on patents, confidentiality agreements and internal security measures to protect our intellectual property. Failure to protect this intellectual property could negatively affect our future performance and growth.
Our operations may present health and safety risks.
Notwithstanding our emphasis on the safety of our employees and contractors and the precautions we take related to health and safety, we may be unable to avoid safety incidents relating to our operations that result in injuries or deaths. Certain safety incidents may result in legal or regulatory action that could result in increased expenses or reputational damage. We maintain workers' compensation insurance to address the risk of incurring material liabilities for injuries or deaths, but there can be no assurance that the insurance coverage will be adequate or will continue to be available on terms acceptable to us, or at all, which could result in material liabilities to us for any injuries or deaths. Changes to federal, state and local employee health and safety regulations, and legislative, regulatory or societal responses to safety incidents may result in heightened regulations or public scrutiny that may increase our compliance costs or result in reputational damage.
A failure in our information technology systems could negatively impact our business.
We rely on information technology to record and process transactions, manage our business and maintain the financial accuracy of our records. Our computer systems are subject to damage or interruption from various sources, including power outages, computer and telecommunications failures, computer viruses, security breaches, vandalism, catastrophic events and human error. Interruptions of our computer systems could disrupt our business, for example by leading to plant downtime and/or power outages and could result in the loss of business and cause us to incur additional expense.
We are in the process of implementing a global Enterprise Resource Planning (“ERP”) system, including upgrading to SAP S/4HANA® which is anticipated to occur at the beginning of fiscal 2025, that we refer to as Project ONE, which will upgrade and standardize our information system. Implementation of Project ONE began in our North America adhesives business in 2014 and, through 2023, we completed implementation of this system in various parts of our business including Latin America (except Brazil), Australia and various other businesses in North America and Europe, India, Middle East and Africa (EIMEA). During 2024 and beyond, we will continue implementation in North America; Europe, India, the Middle East and Africa ("EIMEA"); Brazil and Asia Pacific.
Any delays or other failure to achieve our implementation goals may adversely impact our financial results. In addition, the failure to either deliver the application on time or anticipate the necessary readiness and training needs could lead to business disruption and loss of business. Failure or abandonment of any part of the ERP system could result in a write-off of part or all of the costs that have been capitalized on the project.
Risks associated with acquisitions could have an adverse effect on us and the inability to execute organizational restructuring may affect our results.
As part of our growth strategy, we have made, and will likely continue to make, acquisitions of complementary businesses or products. The ability to grow through acquisitions depends upon our ability to identify, negotiate, complete and integrate suitable acquisitions. If we fail to successfully integrate acquisitions into our existing business, our results of operations and our cash flows could be adversely affected. Our acquisition strategy also involves other risks and uncertainties, including distraction of management from current operations, greater than expected liabilities and expenses, inadequate return on capital, unidentified issues not discovered in our investigations and evaluations of those strategies and acquisitions, and difficulties implementing and maintaining consistent standards, controls, procedures, policies and systems. Future acquisitions could result in additional debt and other liabilities, and increased interest expense, restructuring charges and amortization expense related to intangible assets.
Our growth strategy depends in part on our ability to further penetrate markets outside the United States, where there is the potential for significant economic and political disruptions. Our operations in these markets may be subject to greater risks than those faced by our operations in the United States, including political and economic instability, project delay or abandonment due to unanticipated government actions, inadequate investment in infrastructure, undeveloped property rights and legal systems, unfamiliar regulatory environments, relationships with local partners, language and cultural differences and increased difficulty recruiting, training and retaining qualified employees.
In addition, our profitability is dependent on our ability to drive sustainable productivity improvements such as cost savings through organizational restructuring. Delays or unexpected costs may prevent us from realizing the full operational and financial benefits of such restructuring initiatives and may potentially disrupt our operations.
Macroeconomic Risks
Uncertainties in foreign economic, political, regulatory and social conditions and fluctuations in foreign currency may adversely affect our results.
Approximately 56 percent, or $2.0 billion, of our net revenue was generated outside the United States in 2023. International operations could be adversely affected by changes in economic, political, regulatory, and social conditions, especially in Brazil, Russia, China, the Middle East, including Turkey and Egypt, and other developing or emerging markets where we do business. An economic downturn in the businesses or geographic areas in which we sell our products could reduce demand for these products and result in a decrease in sales volume that could have a negative impact on our results of operations. Product demand often depends on end-use markets. Economic conditions that reduce consumer confidence or discretionary spending may reduce product demand. Challenging economic conditions may also impair the ability of our customers to pay for products they have purchased, and as a result, our reserves for doubtful accounts and write-offs of accounts receivable may increase. In addition, trade protection measures, anti-bribery and anti-corruption regulations, restrictions on repatriation of earnings and cash, currency controls implemented by foreign governments, differing intellectual property rights and changes in legal and regulatory requirements that restrict the sales of products or increase costs could adversely affect our results of operations.
Fluctuations and volatility in exchange rates between the U.S. dollar and other currencies could potentially result in increases or decreases in net revenue, cost of raw materials and earnings and may adversely affect the value of our assets outside the United States. In 2023, the change in foreign currencies negatively impacted our net revenue by approximately $88.5 million. In 2023, we spent approximately $1.9 billion for raw materials worldwide of which approximately $1.0 billion was purchased outside the United States. Based on 2023 financial results, a hypothetical one percent change in our cost of sales due to foreign currency rate changes would have resulted in a change in net income of approximately $9.4 million or $0.17 per diluted share. Although we utilize risk management tools, including hedging, as appropriate, to mitigate market fluctuations in foreign currencies, any changes in strategy in regard to risk management tools can also affect revenue, expenses and results of operations and there can be no assurance that such measures will result in cost savings or that all market fluctuation exposure will be eliminated.
Distressed financial markets may result in dramatic deflation of financial asset valuations and high interest rates may disrupt the availability of capital.
Adverse equity market conditions and volatility in the credit markets could have a negative impact on the value of our pension trust assets, our future estimated pension liabilities and other postretirement benefit plans. In addition, we could be required to provide increased pension plan funding. As a result, our financial results could be negatively impacted.
In a rising interest rate environment, more costly debt and reduced access to capital markets may affect our ability to invest in strategic growth initiatives such as acquisitions. In addition, the reduced credit availability could limit our customers’ ability to invest in their businesses, refinance maturing debt obligations, or meet their ongoing working capital needs. If these customers do not have sufficient access to the financial markets, demand for our products may decline.
The military conflicts between Russia and Ukraine and Israel and Hamas, and the global response to these events, could adversely impact our revenues, gross margins and financial results.
The U.S. government and other nations have imposed significant restrictions on most companies’ ability to do business in Russia as a result of the military conflict between Russia and Ukraine. Increases in energy demand and supply disruptions caused by the Russia and Ukraine conflict have resulted in significantly higher energy prices, particularly in Europe. Further, in October 2023, a military conflict commenced between Israel and Hamas. It is not possible to predict the broader or longer-term consequences of these conflicts, which could include further sanctions, embargoes, regional instability, energy shortages, geopolitical shifts and adverse effects on macroeconomic conditions, security conditions, currency exchange rates and financial markets. Such geopolitical instability and uncertainty could have a negative impact on our ability to sell to, ship products to, collect payments from, and support customers in certain regions based on trade restrictions, embargoes and export control law restrictions, and logistics restrictions including closures of air space, and could increase the costs, risks and adverse impacts from these new challenges. We may also be the subject of increased cyber-attacks. While the countries involved in these conflicts do not constitute a material portion of our business, a significant escalation or expansion of economic disruption or the conflicts' current scope could have a material adverse effect on our results of operations.
Catastrophic events could disrupt our operations or the operations of our suppliers or customers, having a negative impact on our financial results.
Unexpected events, including global pandemics, natural disasters and severe weather events, fires or explosions at our facilities or those of our suppliers, acts of war or terrorism, supply disruptions or breaches of security of our information technology systems could increase the cost of doing business or otherwise harm our operations, our customers and our suppliers. Such events could reduce demand for our products or make it difficult or impossible for us to receive raw materials from suppliers and deliver products to our customers.
Legal and Regulatory Risks
The impact of changing laws or regulations or the manner of interpretation or enforcement of existing laws or regulations could adversely impact our financial performance and restrict our ability to operate our business or execute our strategies.
New laws or regulations, or changes in existing laws or regulations or the manner of their interpretation or enforcement, could increase our cost of doing business and restrict our ability to operate our business or execute our strategies. In addition, compliance with laws and regulations is complicated by our substantial global footprint, which will require significant and additional resources to ensure compliance with applicable laws and regulations in the various countries where we conduct business.
Our global operations expose us to trade and economic sanctions and other restrictions imposed by the U.S., the EU and other governments and organizations. The U.S. Departments of Justice, Commerce, State, Homeland Security, and Treasury and other federal agencies and authorities have a broad range of civil and criminal penalties they may seek to impose against corporations and individuals for violations of economic sanctions laws, export control laws, the FCPA and other federal statutes and regulations, including those established by the OFAC. Under these laws and regulations, as well as other anti-corruption laws, anti-money-laundering laws, export control laws, customs laws, sanctions laws and other laws governing our operations, various government agencies may require export licenses, may seek to impose modifications to business practices, including cessation of business activities in sanctioned countries or with sanctioned persons or entities and modifications to compliance programs, including import restrictions, which may increase compliance costs, and may subject us to fines, penalties and other sanctions. A violation of these laws, regulations, policies or procedures could adversely impact our business, results of operations and financial condition.
Although we have implemented policies and procedures in these areas, we cannot assure that our policies and procedures are sufficient or that directors, officers, employees, representatives, manufacturers, suppliers and agents have not engaged and will not engage in conduct in violation of such policies and procedures.
Costs and expenses resulting from compliance with environmental laws and regulations may negatively impact our operations and financial results.
We are subject to numerous environmental laws and regulations that impose various environmental controls on us or otherwise relate to environmental protection, the sale and export of certain chemicals or hazardous materials, and various health and safety matters. The costs of complying with these laws and regulations can be significant and may increase as applicable requirements and their enforcement become more stringent and new rules are implemented. Adverse developments and/or periodic settlements could negatively impact our results of operations and cash flows. See Item 3. Legal Proceedings for a discussion of current environmental matters.
Climate change, or legal, regulatory or market measures to address climate change, may materially adversely affect our financial condition and business operations.
Climate change resulting from increased concentrations of carbon dioxide and other greenhouse gases in the atmosphere could present risks to our future operations from natural disasters and extreme weather conditions, such as hurricanes, tornadoes, earthquakes, wildfires or flooding. Such extreme weather conditions could pose physical risks to our facilities and disrupt operation of our supply chain and may increase operational costs. The impacts of climate change on global water resources may result in water scarcity, which could in the future impact our ability to access sufficient quantities of water in certain locations and result in increased costs. Concern over climate change continues to result in new legal or regulatory requirements designed to mitigate the effects of climate change on the environment, such as the EU's CSRD, California’s Climate Corporate Data Accountability Act and Climate Related Financial Risk Act, and similar regulations under consideration by the SEC. We are experiencing increased compliance burdens and costs to meet the regulatory obligations and these regulatory obligations may adversely affect raw material sourcing, manufacturing operations and the distribution of our products.
Our business exposes us to potential product liability, warranty, and tort claims, and recalls, which may negatively impact our operations, financial results, and reputation.
The development, manufacture and sale of adhesives, sealants, and other specialty chemical products by us, including products produced for the medical device, automotive, food and beverage, aerospace and defense, construction, and hygiene products end markets, involves a risk of exposure to product liability, warranty, and tort claims, product recalls, product seizures and related adverse publicity. A product liability, warranty, or tort claim or judgment against us could also result in substantial and unexpected expenditures, affect customer confidence in our products, and divert management's attention from other responsibilities. Although we maintain product liability insurance, there can be no assurance that the level of coverage is adequate, that coverage will apply, or that we will be able to continue to maintain our existing insurance or obtain comparable insurance at a reasonable cost, if at all. We also have contracting policies and controls in place to limit our exposure to third party claims, though we might not always be able to limit our exposure to those claims.
We have lawsuits and claims against us with uncertain outcomes.
Our operations from time to time are parties to or targets of lawsuits, claims, investigations and proceedings, including product liability, personal injury, asbestos, patent and intellectual property, commercial, contract, environmental, antitrust, health and safety, and employment matters, which are handled and defended in the ordinary course of business. The results of any future litigation or settlement of such lawsuits and claims are inherently unpredictable, but such outcomes could be adverse and material in amount. See Item 3. Legal Proceedings for a discussion of current litigation.
The Company’s effective tax rate could be volatile and materially change as a result of the adoption of new tax legislation and other factors.
A change in tax laws is one of many factors that impact the Company’s effective tax rate. The U.S. Congress and other government agencies in jurisdictions where the Company does business have had an extended focus on issues related to the taxation of multinational corporations. As a result, the tax laws in the U.S. and other countries in which the Company does business could change, and any such changes could adversely impact our effective tax rate, financial condition and results of operations.
The Organization for Economic Co-operation and Development ("OECD"), an international association of 38 countries including the United States, finalized and adopted numerous changes to long-standing tax principles. Certain of these changes become effective for the Company in 2025 and will likely increase tax uncertainty and may adversely affect our provision for income taxes.
Additional income tax expense or exposure to additional income tax liabilities could have a negative impact on our financial results.
We are subject to income tax laws and regulations in the United States and various foreign jurisdictions. Significant judgment is required in evaluating and estimating our provision and accruals for these taxes. Our income tax liabilities are dependent upon the location of earnings among these different jurisdictions. Our income tax provision and income tax liabilities could be adversely affected by the jurisdictional mix of earnings, changes in valuation of deferred tax assets and liabilities and changes in tax laws and regulations. In the ordinary course of our business, we are also subject to continuous examinations of our income tax returns by tax authorities. Although we believe our tax estimates are reasonable, the final results of any tax examination or related litigation could be materially different from our related historical income tax provisions and accruals. Adverse developments in an audit, examination or litigation related to previously filed tax returns, or in the relevant jurisdiction’s tax laws, regulations, administrative practices, principles and interpretations could have a material effect on our results of operations and cash flows in the period or periods for which that development occurs, as well as for prior and subsequent periods. The decision to repatriate foreign earnings could result in higher withholding taxes.
Financial Risks
We may be required to record impairment charges on our goodwill or long-lived assets.
Weak demand may cause underutilization of our manufacturing capacity or elimination of product lines; contract terminations or customer shutdowns may force sale or abandonment of facilities and equipment; or other events associated with weak economic conditions or specific product or customer events may require us to record an impairment on tangible assets, such as facilities and equipment, as well as intangible assets, such as intellectual property or goodwill, which would have a negative impact on our financial results.
Our current indebtedness could have a negative impact on our liquidity or restrict our activities.
Our current indebtedness contains various covenants that limit our ability to engage in specified types of transactions. Our overall leverage and the terms of our financing arrangements could:
| ● |
limit our ability to obtain additional financing in the future for working capital, capital expenditures and acquisitions, even when necessary to maintain adequate liquidity, particularly if any ratings assigned to our debt securities by rating organizations were revised downward; |
| ● |
make it more difficult to satisfy our obligations under the terms of our indebtedness; |
| ● |
limit our ability to refinance our indebtedness on terms acceptable to us or at all; |
| ● |
limit our flexibility to plan for and adjust to changing business and market conditions in the industries in which we operate and increase our vulnerability to general adverse economic and industry conditions; |
| ● |
require us to dedicate a substantial portion of our cash flow to make interest and principal payments on our debt, thereby limiting the availability of our cash flow to fund future acquisitions, working capital, business activities and other general corporate requirements; |
| ● |
subject us to higher levels of indebtedness than our competitors, which may cause a competitive disadvantage and may reduce our flexibility in responding to increased competition; and |
| ● |
expose us to interest rate risk since a portion of our debt obligations are at variable rates. This could negatively impact our earnings, cash flows and our ability to grow. For example, a one percentage point increase in the average interest rate on our floating rate debt at December 2, 2023 would increase future interest expense by approximately $5.3 million per year. |
In addition, the restrictive covenants require us to maintain specified financial ratios and satisfy other financial condition tests. Our ability to meet those financial ratios and tests will depend on our ongoing financial and operating performance, which, in turn, will be subject to economic conditions and to financial, market and competitive factors, many of which are beyond our control. A breach of any of these covenants could result in a default under the instruments governing our indebtedness.
Item 1B.
None.
Unresolved Staff Comments Principal executive offices and central research facilities are located in the St. Paul, Minnesota area. These facilities are company-owned. Manufacturing operations are carried out at 36 plants located throughout the United States and at 45 plants located in 25 other countries. In addition, numerous sales and service offices are located throughout the world. We believe that the properties owned or leased are suitable and adequate for our business. Operating capacity varies by product line, but additional production capacity is available for most product lines by increasing the number of shifts worked. The following is a list of our manufacturing plants as of December 2, 2023 (each of the listed properties are owned by us, unless otherwise specified):
| Segment |
Segment |
||||
| Hygiene, Health and Consumable Adhesives |
Engineering Adhesives |
||||
| Argentina | Buenos Aires2 |
France | Surbourg | ||
| Australia |
Dandenong South | Germany |
Wunstorf | ||
| Australia |
Sydney1 |
Germany | Nienburg | ||
| Brazil |
Sorocaba2 |
Germany |
Langelsheim1 | ||
| Brazil |
Curitiba1 |
Germany |
Pirmasens | ||
| Brazil |
Guarulhos |
Italy |
Pianezze | ||
| Chile |
Santiago |
People's Republic of China |
Beijing | ||
| Colombia |
Rionegro |
People's Republic of China | Chongqing1 | ||
| Egypt | 6th of October City - 3rd Industrial Zone2 | People's Republic of China | Nanjing - ShanXu Road | ||
| Egypt |
6th of October City - CPC Industrial Park |
People's Republic of China |
Nanjing - Xinjinhu Road1 | ||
| Finland | Valkeakoski1 | People's Republic of China | Suzhou | ||
| France |
Blois |
` |
People's Republic of China |
Yantai |
|
| Germany | Luneburg | Portugal | Mindelo |
||
| Germany | Frankfurt - Kilianstädter1 | United Kingdom | Preston1 | ||
| Germany | Frankfurt - Vibeler1 | United States | California - Irvine1 | ||
| Greece | Lamia | United States | California - Wilmington1 | ||
| India | Pune | United States | Connecticut - Enfield1 | ||
| Indonesia | Mojokerto | United States |
Georgia - Norcross1 | ||
| Kenya | Nairobi1 | United States |
Georgia - Ball Ground1 | ||
| Malaysia | Selangor | United States |
Illinois - Frankfort - Corsair | ||
| New Zealand | Auckland1 | United States |
Illinois - Frankfort - West Drive |
||
| People's Republic of China | Guangzhou | United States |
Indiana - South Bend | ||
| Philippines | Manila | United States | Massachusetts - Peabody1 | ||
| Sweden | Landskrona | United States |
Michigan - Grand Rapids | ||
| United Kingdom | Dukinfield | United States | Minnesota - Fridley | ||
| United Kingdom | Milton Keynes1 | United States | Minnesota - Maple Grove1 | ||
| United States | Georgia - Covington | United States |
New Hampshire - Raymond1 | ||
| United States | California - Roseville | United States | Ohio - Bellevue1 | ||
| United States |
Georgia - Tucker |
|
|||
| United States |
Illinois - Seneca | Construction Adhesives |
|||
| United States | Kentucky - Paducah | Belgium | Antwerp | ||
| United States |
Ohio - Blue Ash | Canada |
Ontario - Toronto1 |
||
| United States | Minnesota - Vadnais Heights | Mexico | Coahuila1 | ||
| United States | New York - Syracuse1 | United Arab Emirates | Ras Al-Khaimah1 | ||
| United States | North Carolina - Charlotte | United Kingdom | Kirby in Ashfield | ||
| United States | North Carolina - Hudson | United Kingdom | Mansfield1 | ||
| United States | South Carolina - Simpsonville | United Kingdom | Staffordshire | ||
| United States | Texas - Mesquite | United Kingdom | Tibshelf1 | ||
| United States | Washington - Vancouver | United States |
California - La Mirada |
||
| United States | Florida - Gainesville | ||||
|
|
United States |
Georgia - Dalton |
|||
|
|
|
United States |
Illinois - Aurora |
||
|
|
|
United States |
Michigan - Michigan Center |
||
|
|
|
United States |
New Jersey - Edison |
||
| United States |
Ohio - Chagrin Falls |
||||
| United States |
Texas - Houston |
||||
| United States |
Texas - Mansfield |
||||
1 Leased Property
2 Idle Property
Environmental Matters
From time to time, we become aware of compliance matters relating to, or receive notices from, federal, state or local entities regarding possible or alleged violations of environmental, health or safety laws and regulations. Also, from time to time, we are identified as a potentially responsible party (“PRP”) under the Comprehensive Environmental Response, Compensation and Liability Act (“CERCLA”) and/or similar state laws that impose liability for costs relating to the clean up of contamination resulting from past spills, disposal or other release of hazardous substances. We are also subject to similar laws in some of the countries where current and former facilities are located. Our environmental, health and safety department monitors compliance with applicable laws on a global basis.
Currently, we are involved in various environmental investigations, clean up activities and administrative proceedings and lawsuits. In particular, we are currently deemed a PRP in conjunction with numerous other parties, in a number of government enforcement actions associated with landfills and/or hazardous waste sites. As a PRP, we may be required to pay a share of the costs of investigation and clean up of these sites.
We are also engaged in environmental remediation and monitoring efforts at a number of current and former operating facilities. To the extent we can reasonably estimate the amount of our probable liabilities for environmental matters, we establish a financial provision. It is reasonably possible that we may have additional liabilities related to these known environmental matters. However, the full extent of our future liability for environmental matters is difficult to predict because of uncertainty as to the cost of investigation and clean up of the sites, our responsibility for such hazardous substances and the number of and financial condition of other potentially responsible parties.
While uncertainties exist with respect to the amounts and timing of the ultimate environmental liabilities, based on currently available information, we have concluded that these matters, individually or in the aggregate, will not have a material adverse effect on our results of operations, financial condition or cash flow. However, adverse developments and/or periodic settlements could negatively impact the results of operations or cash flows in one or more future periods.
Other Legal Proceedings
From time to time and in the ordinary course of business, we are a party to, or a target of, lawsuits, claims, investigations and proceedings, including product liability, personal injury, asbestos, contract, patent and intellectual property, environmental, health and safety, tax and employment matters. While we are unable to predict the outcome of these matters, we have concluded, based upon currently available information, that the ultimate resolution of any pending matter, individually or in the aggregate, will not have a material adverse effect on our results of operations, financial condition or cash flow. However, adverse developments and/or periodic settlements could negatively impact the results of operations or cash flows in one or more future periods.
For additional information regarding environmental matters and other legal proceedings, see Note 14 to the Consolidated Financial Statements.
Item 4. Mine Safety Disclosures Item 5.
Not applicable.
Part II.
Market for Registrant's Common Equity, Related Stockholder Matters and Issuer Purchases of Equity Securities
Our common stock is traded on the New York Stock Exchangeunder the symbol FUL. As of January 17, 2024, there were 1,268 common shareholders of record for our common stock.
Issuer Purchases of Equity Securities
Information on our purchases of equity securities during the fourth quarter of 2023 is as follows:
| Total Number of |
Approximate Dollar |
|||||||||||||||
| Shares |
Value of Shares that |
|||||||||||||||
| Total |
Purchased as |
may yet be |
||||||||||||||
| Number of |
Average |
Part of a Publicly |
Purchased Under the |
|||||||||||||
| Shares |
Price Paid |
Announced Plan |
Plan or Program |
|||||||||||||
| Period |
Purchased1 |
per Share |
or Program |
(thousands) |
||||||||||||
| September 3, 2023 - October 7, 2023 |
16 | $ | 68.61 | - | $ | 300,000 | ||||||||||
| October 8, 2023 - November 4, 2023 |
70 | $ | 65.93 | - | $ | 300,000 | ||||||||||
| November 5, 2023 - December 2,2023 |
8 | $ | 75.41 | - | $ | 300,000 | ||||||||||
1 The total number of shares purchased are shares withheld to satisfy the employees' withholding taxes upon vesting of restricted stock. Repurchases of common stock are made to support our stock-based employee compensation plans and for other corporate purposes. Upon vesting of restricted stock awarded to employees, shares are withheld to cover the employees' minimum withholding taxes.
On April 7, 2022, the Board of Directors authorized a new share repurchase program of up to $300.0 million of our outstanding common shares for a period of up to five years. Under the program, we are authorized to repurchase shares for cash on the open market, from time to time, in privately negotiated transactions or block transactions, or through an accelerated repurchase agreement. The timing of such repurchases is dependent on price, market conditions and applicable regulatory requirements. Upon repurchase of the shares, we reduce our common stock for the par value of the shares with the excess being applied against additional paid in capital. This authorization replaces the April 6, 2017 authorization to repurchase shares.
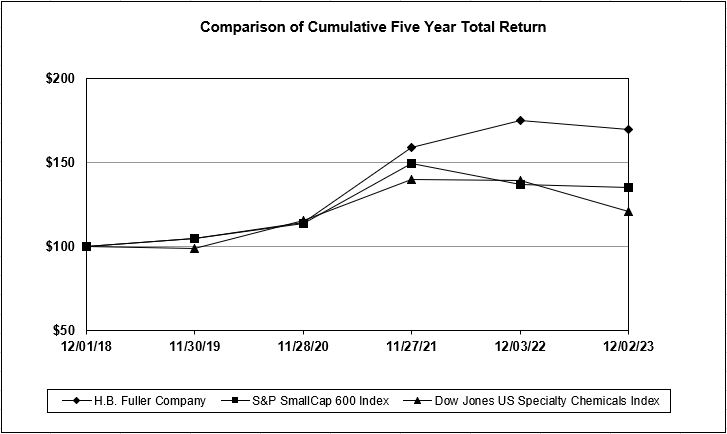
Total Shareholder Return Graph
The line graph below compares the cumulative total shareholder return on our common stock for the last five fiscal years with cumulative total return on the S&P Small Cap 600 Index and Dow Jones U.S. Specialty Chemicals Index. This graph assumes a $100 investment in each of H.B. Fuller, the S&P Small Cap 600 Index and the Dow Jones U.S. Specialty Chemicals Index at the close of trading on December 1, 2018, and also assumes the reinvestment of all dividends.
Item 6. Selected Financial Data
Reserved.
Item 7. Management's Discussion and Analysis of Financial Condition and Results of Operations
Overview
H.B. Fuller Company is a global formulator, manufacturer and marketer of adhesives and other specialty chemical products. We have three reportable segments: Hygiene, Health and Consumable Adhesives, Engineering Adhesives and Construction Adhesives.
The Hygiene, Health and Consumable Adhesives operating segment manufactures and supplies adhesives products in the assembly, packaging, converting, nonwoven and hygiene, health and beauty, flexible packaging, graphic arts and envelope markets. The Engineering Adhesives operating segment provides high-performance adhesives to the transportation, electronics, clean energy, aerospace and defense, performance wood, insulating glass, textile, appliance and heavy machinery markets. The Construction Adhesives operating segment manufactures and provides specialty adhesives, sealants, tapes, mortars, grouts, and application devices for commercial building roofing systems, heavy infrastructure projects, road/highway/airport transportation applications, telecom/5G utilities, industrial LNG plants, building envelope applications, HVAC insulation systems, and for both residential and commercial flooring underlayment solutions.
Total Company
When reviewing our financial statements, it is important to understand how certain external factors impact us. These factors include:
| ● |
Changes in the prices of our raw materials that are primarily derived from refining crude oil and natural gas, |
| ● |
Global supply of and demand for raw materials, |
| ● |
Economic growth rates, and |
| ● |
Currency exchange rates compared to the U.S. dollar. |
We purchase thousands of raw materials, the majority of which are petroleum/natural gas derivatives. The price of these derivatives impacts the cost of our raw materials. However, the supply of and demand for key raw materials has a greater impact on our costs. As demand increases in high-growth areas, the supply of key raw materials may tighten, resulting in certain materials being put on allocation. Natural disasters, such as hurricanes, also can have an impact as key raw material producers are shut down for extended periods of time. We continually monitor capacity utilization figures, market supply and demand conditions, feedstock costs and inventory levels, as well as derivative and intermediate prices, which affect our raw materials. With approximately 75 percent of our cost of sales accounted for by raw materials, our financial results are extremely sensitive to changing costs in this area.
The pace of economic growth directly impacts certain industries to which we supply products. For example, adhesives-related revenues from durable goods customers in areas such as appliances, furniture and other woodworking applications tend to fluctuate with the overall economic activity. In business components such as Construction Adhesives and insulating glass in Engineering Adhesives, revenues tend to move with more specific economic indicators such as housing starts and other construction-related activity.
The movement of foreign currency exchange rates as compared to the U.S. dollar impacts the translation of the foreign entities’ financial statements into U.S. dollars. As foreign currencies weaken against the U.S. dollar, our revenues and costs decrease as the foreign currency-denominated financial statements translate into fewer U.S. dollars. The fluctuations of the Euro, Chinese renminbi, British pound sterling, Egyptian pound, Turkish lira, Brazilian real, Canadian dollar, Australian dollar and Mexican peso against the U.S. dollar have the largest impact on our financial results as compared to all other currencies. In 2023, currency fluctuations had a negative impact on net revenue of approximately $88.5 million as compared to 2022.
Key financial results andtransactions for 2023 included the following:
| ● |
Net revenue decreased 6.4 percent from 2022 primarily driven by an 8.4 percent decrease in sales volume and a 2.4 percent decrease due to currency fluctuations, partially offset by a 3.3 percent increase due to acquisitions and 2.9 percent increase in product pricing. Additionally, in 2022, we had a 53-week year compared to a 52-week year in 2023, and 2023 revenue was lower by 1.8 percent due to the extra week in 2022. |
| ● |
Gross profit margin increased to 28.7 percent in 2023 from 25.7 percent in 2022, due to an increase in product pricing and lower raw material costs partially offset by the impact of lower sales volume. |
| ● |
Cash flow generated by operating activities was $378.4 million in 2023 as compared to $256.5 million in 2022. |
Our total year organic revenue growth, which we define as the combined variances from sales volume and product pricing, decreased 5.5 percent for 2023 compared to 2022 due to a decrease in sales volume, partially offset by an increase in product pricing.
In 2023, our diluted earnings per share was $2.59 compared to $3.26 in 2022. The lower earnings per share in 2023 compared to 2022 was primarily due to lower net revenue, higher operating costs, interest expense and income tax expense, partially offset by lower raw material costs.
Information pertaining to fiscal year 2021 was included in the Company’s Annual Report on Form 10-K for the year ended December 3, 2022, under Part II, Item 7 “Management’s Discussion and Analysis of Financial Position and Results of Operations,” which was filed with the SEC on January 24, 2023.
Project ONE
In December 2012, our Board of Directors approved a multi-year project to replace and enhance our existing core information technology platforms. The scope for this project includes most of the basic transaction processing for the company including customer orders, procurement, manufacturing and financial reporting. The project envisions harmonized business processes for all of our operating segments supported with one standard software configuration. The execution of this project, which we refer to as Project ONE, is being supported by internal resources and consulting services. Implementation of Project ONE began in our North America adhesives business in 2014 and, through 2023, we completed implementation of this system in various parts of our business including Latin America (except Brazil), Australia, and various other businesses in North America and EIMEA. During 2024 and beyond, we will continue implementation in North America, EIMEA, Brazil and Asia Pacific.
Total expenditures for Project ONE are estimated to be $240 to $260 million, of which 60-65% is expected to be capital expenditures. Our total project-to-date expenditures are approximately $200 million, of which approximately $120 million are capital expenditures. Given the complexity of the implementation, the total investment to complete the project may exceed our estimate.
Restructuring Plans
During the second and third quarters of 2023, the Company approved restructuring plans (the “Plans”) related to organizational changes and other actions to optimize operations and integrate acquired businesses. In implementing the Plans, the Company currently expects to incur costs of approximately $39.1 million to $44.1 million ($30.4 million to $34.4 million after-tax), which include (i) cash expenditures of approximately $28.4 million to $29.6 million ($22.0 million to $23.0 million after-tax) for severance and related employee costs globally and (ii) other restructuring costs related to the streamlining of processes and the payment of anticipated income taxes in certain jurisdictions related to the Plans. We have incurred costs of $27.0 million under the Plans as of December 2, 2023. The Plans began to be implemented in the second quarter of fiscal year 2023 and are currently expected to be completed during fiscal year 2026. The restructuring costs will be spread across the next several fiscal quarters as the measures are implemented with the majority of the charges recognized and cash payments occurring in fiscal 2023 and 2024.
Critical Accounting Policies and Significant Estimates
Management’s discussion and analysis of our results of operations and financial condition are based upon the Consolidated Financial Statements, which have been prepared in accordance with accounting principles generally accepted in the United States of America. The preparation of these financial statements requires us to make estimates and judgments that affect the reported amounts of assets, liabilities, revenues and expenses and related disclosure of contingent assets and liabilities. We believe the critical accounting policies and areas that require the most significant judgments and estimates to be used in the preparation of the Consolidated Financial Statements relate to goodwill impairment; pension and other postretirement assumptions; long-lived assets recoverability; valuation of product, environmental and other litigation liabilities; valuation of deferred tax assets and accuracy of tax contingencies; and valuation of acquired assets and liabilities.
Goodwill
Goodwill is the excess of cost of an acquired entity over the amounts assigned to assets acquired and liabilities assumed in a purchase business combination. Goodwill is allocated to our reporting units, which are our operating segments or one level below our operating segments (the component level). Reporting units are determined by the discrete financial information available for the component and whether it is regularly reviewed by segment management. Components are aggregated into a single reporting unit if they share similar economic characteristics. Our reporting units are as follows: Hygiene, Health and Consumable Adhesives, Engineering Adhesives and Construction Adhesives.
We evaluate our goodwill for impairment annually at the beginning of the fourth quarter or earlier upon the occurrence of substantive unfavorable changes in economic conditions, industry trends, costs, cash flows, or ongoing declines in market capitalization. The quantitative impairment test requires judgment, including the identification of reporting units, the assignment of assets, liabilities and goodwill to reporting units, and the determination of fair value of each reporting unit. The impairment test requires the comparison of the fair value of each reporting unit with its carrying amount, including goodwill. In performing the impairment test, we determined the fair value of our reporting units through the income approach by using discounted cash flow (“DCF”) analyses. Determining fair value requires the Company to make judgments about appropriate forecasted revenue and related revenue growth rate, the earnings before interest, taxes, depreciation and amortization ("EBITDA") margins rate and the weighted average cost of capital. The cash flows employed in the DCF analysis for each reporting unit are based on the reporting unit's budget, long-term business plan and recent operating performance. Discount rate assumptions are based on an assessment of the risk inherent in the future cash flows of the respective reporting unit and market conditions. Given the inherent uncertainty in determining the assumptions underlying a DCF analysis, actual results may differ from those used in our valuations. In assessing the reasonableness of the determined fair values, we also reconciled the aggregate determined fair value of the Company to the Company's market capitalization, which, at the date of our 2023 impairment test, included a 26 percent control premium.
For the 2023 impairment test, the fair value of the reporting units exceeded the respective carrying values by 8 percent to 140 percent. Significant assumptions used in the DCF analysis included discount rates that ranged from 10.1 percent to 12.3 percent and long-term revenue growth rates. The Construction Adhesives reporting unit, with $432.8 million of goodwill assigned to it as of December 2, 2023, exceeded the respective carrying value by 8 percent. An increase in the discount rate of 10 basis points or a decrease in the long-term growth rates of 10 percent would result in the fair value of the Construction Adhesives reporting unit falling below its carrying value. The Engineering Adhesives and Hygiene, Health and Consumable Adhesives reporting units had significant fair value in excess of carrying value.
Management will continue to monitor these reporting units for changes in the business environment that could impact recoverability. The recoverability of goodwill is dependent upon the continued growth of cash flows from our business activities. If the economy or business environment falter and we are unable to achieve our assumed revenue growth rates or profit margin percentages, our projections used would need to be remeasured, which could impact the carrying value of our goodwill in one or more of our reporting units. Most significantly, for our Construction Adhesives reporting unit, a decrease in the planned volume revenue growth would negatively impact the fair value of the reporting unit and the calculation of excess carrying value.
See Note 5 to the Consolidated Financial Statements for further information regarding goodwill.
Pension and Other Postretirement Plan Assumptions
We sponsor defined-benefit pension plans in both the U.S. and non-U.S. entities. Also in the U.S., we sponsor other postretirement plans for health care and life insurance benefits. Expenses and liabilities for the pension plans and other postretirement plans are actuarially calculated. These calculations are based on our assumptions related to the discount rate, expected return on assets, projected salary increases and health care cost trend rates. Note 10 to the Consolidated Financial Statements includes disclosure of assumptions employed in these measurements for both the non-U.S. and U.S. plans.
The discount rate assumption is determined using an actuarial yield curve approach, which results in a discount rate that reflects the characteristics of the plan. The approach identifies a broad population of corporate bonds that meet the quality and size criteria for the particular plan. We use this approach rather than a specific index that has a certain set of bonds that may or may not be representative of the characteristics of our particular plan. A higher discount rate reduces the present value of the pension obligations. The discount rate for the U.S. pension plan was 5.66 percent at December 2, 2023, 5.36 percent at December 3, 2022 and 2.76 percent at November 27, 2021. Net periodic pension cost for a given fiscal year is based on assumptions developed at the end of the previous fiscal year. A discount rate change of 0.5 percentage points at December 2, 2023 would impact U.S. pension and other postretirement plan (income) expense by $0.1 million (pre-tax) in fiscal 2024. Discount rates for non-U.S. plans are determined in a manner consistent with the U.S. plans.
The expected long-term rate of return on plan assets assumption for the U.S. pension plan was 7.75 percent in 2023, 7.00 percent in 2022 and 7.25 percent in 2021. Our expected long-term rate of return on U.S. plan assets was based on our target asset allocation assumption of 55 percent equities and 45 percent fixed-income. Management, in conjunction with our external financial advisors, determines the expected long-term rate of return on plan assets by considering the expected future returns and volatility levels for each asset class that are based on historical returns and forward looking observations. For 2023, the expected long-term rate of return on the target equities allocation was 8.50 percent and the expected long-term rate of return on the target fixed-income allocation was 5.60 percent. The total plan rate of return assumption included an estimate of the effect of diversification and the plan expense. A change of 0.5 percentage points for the expected return on assets assumption would impact U.S. net pension and other postretirement plan expense by approximately $2.3 million (pre-tax).
Management, in conjunction with our external financial advisors, uses the actual historical rates of return of the asset categories to assess the reasonableness of the expected long-term rate of return on plan assets. The most recent 10-year and 20-year historical equity returns are shown in the table below. Our expected rate of return on our total portfolio is consistent with the historical patterns observed over longer time frames.
| Total |
Fixed |
|||||||||||
| U.S. Pension Plan Historical Actual Rates of Return |
Portfolio |
Equities |
Income |
|||||||||
| 10-year period |
5.4 | % | 6.9 | % | 3.4 | % | ||||||
| 20-year period |
6.5 | % | 7.1 | % | 5.5 | %* |
||||||
* Beginning in 2022, our target allocation migrated from 60 percent equities and 40 percent fixed-income to 55 percent equities and 45 percent fixed income. The historical actual rate of return for the fixed income of 5.5 percent is since inception (17 years, 11 months).
The expected long-term rate of return on plan assets assumption for non-U.S. pension plans was a weighted-average of 5.02 percent in 2023 compared to 3.49 percent in 2022 and 6.15 percent in 2021. The expected long-term rate of return on plan assets assumption used in each non-U.S. plan is determined on a plan-by-plan basis for each local jurisdiction and is based on expected future returns for the investment mix of assets currently in the portfolio for that plan. Management, in conjunction with our external financial advisors, develops expected rates of return for each plan, considers expected long-term returns for each asset category in the plan, reviews expectations for inflation for each local jurisdiction, and estimates the effect of active management of the plan’s assets. Our largest non-U.S. pension plans are in the United Kingdom and Germany. The expected long-term rate of return on plan assets for the United Kingdom was 4.50 percent and the expected long-term rate of return on plan assets for Germany was 5.50 percent. Management, in conjunction with our external financial advisors, uses actual historical returns of the asset portfolio to assess the reasonableness of the expected rate of return for each plan.
The projected salary increase assumption is based on historic trends and comparisons to the external market. Higher rates of increase result in higher pension expenses. As this rate is also a long-term expected rate, it is less likely to change on an annual basis. Under the U.S. pension plan, the compensation amount was locked-in as of May 31, 2011 and thus the benefit no longer includes compensation increases. Projected salary increase assumptions for non-U.S. plans are determined in a manner consistent with the U.S. plans.
Recoverability of Long-Lived Assets
The assessment of the recoverability of long-lived assets reflects our assumptions and estimates. Factors that we must estimate when performing impairment tests include sales volume, prices, inflation, currency exchange rates, tax rates and capital spending. Significant judgment is involved in estimating these factors, and they include inherent uncertainties. The measurement of the recoverability of these assets is dependent upon the accuracy of the assumptions used in making these estimates and how the estimates compare to the eventual future operating performance of the specific businesses to which the assets are attributed.
Judgments made by us include the expected useful lives of long-lived assets. The ability to realize undiscounted cash flows in excess of the carrying amounts of such assets is affected by factors such as the ongoing maintenance and improvement of the assets, changes in economic conditions and changes in operating performance.
Product, Environmental and Other Litigation Liabilities
As disclosed in Item 3. Legal Proceedings and in Note 1 and Note 14 to the Consolidated Financial Statements, we are subject to various claims, lawsuits and other legal proceedings. Reserves for loss contingencies associated with these matters are established when it is determined that a liability is probable and the amount can be reasonably estimated. The assessment of the probable liabilities is based on the facts and circumstances known at the time that the financial statements are being prepared. For cases in which it is determined that a liability is probable but only a range for the potential loss exists, the minimum amount of the range is recorded and subsequently adjusted as better information becomes available.
For cases in which insurance coverage is available, the gross amount of the estimated liabilities is accrued, and a receivable is recorded for any probable estimated insurance recoveries. A discussion of environmental, product and other litigation liabilities is disclosed in Item 3. Legal Proceedings and Note 14 to the Consolidated Financial Statements.
Based upon currently available facts, we do not believe that the ultimate resolution of any pending legal proceeding, individually or in the aggregate, will have a material adverse effect on our long-term financial condition. However, adverse developments and/or periodic settlements could negatively affect our results of operations or cash flows in one or more future quarters.
Income Tax Accounting
As part of the process of preparing the Consolidated Financial Statements, we are required to estimate income taxes in each of the jurisdictions in which we operate. The process involves estimating actual current tax expense along with assessing temporary differences resulting from differing treatment of items for book and tax purposes. These temporary differences result in deferred tax assets and liabilities, which are included in the Consolidated Balance Sheets. We record a valuation allowance to reduce our deferred tax assets to the amount that is more-likely-than-not to be realized. We have considered future taxable income and ongoing tax planning strategies in assessing the need for the valuation allowance. Increases in the valuation allowance result in additional expense to be reflected within the tax provision in the Consolidated Statements of Income. The valuation allowance to reduce deferred tax assets totaled $15.6 million as of December 2, 2023, and $14.4 million as of December 3, 2022.
We recognize tax benefits for tax positions for which it is more-likely-than-not that the tax position will be sustained by the applicable tax authority at the largest amount of tax benefit that is greater than fifty percent likely of being realized upon ultimate settlement. We do not recognize a financial statement benefit for a tax position that does not meet the more-likely-than-not threshold. We believe that our liabilities for income taxes reflect the most likely outcome. It is difficult to predict the final outcome or the timing of the resolution of any particular tax position. Future changes in judgment related to the resolution of tax positions will impact earnings in the quarter of such change. We adjust our income tax liabilities related to tax positions in light of changing facts and circumstances. Settlement with respect to a tax position would usually require cash. Based upon our analysis of tax positions taken on prior year returns and expected tax positions to be taken for the current year tax returns, we have identified gross uncertain tax positions of $14.3 million as of December 2, 2023 and $17.6 million as of December 3, 2022.
We have not recorded U.S. deferred income taxes for certain of our non-U.S. subsidiaries undistributed earnings as such amounts are intended to be indefinitely reinvested outside of the U.S. Should we change our business strategies related to these non-U.S. subsidiaries, additional U.S. tax liabilities could be incurred. It is not practical to estimate the amount of these additional tax liabilities. See Note 11 to the Consolidated Financial Statements for further information on income tax accounting.
Acquisition Accounting
As we enter into business combinations, we perform acquisition accounting requirements including the following:
| ● |
Identifying the acquirer, |
| ● |
Determining the acquisition date, |
| ● |
Recognizing and measuring the identifiable assets acquired and the liabilities assumed, and |
| ● |
Recognizing and measuring goodwill or a gain from a bargain purchase. |
We complete valuation procedures and record the resulting fair value of the acquired assets and assumed liabilities based upon the valuation of the business enterprise and the tangible and intangible assets acquired. Enterprise value allocation methodology requires management to make assumptions and apply judgment to estimate the fair value of assets acquired and liabilities assumed. If estimates or assumptions used to complete the enterprise valuation and estimates of the fair value of the acquired assets and assumed liabilities significantly differed from assumptions made, the resulting difference could materially affect the fair value of net assets.
The calculation of the fair value of the tangible assets, including property, plant and equipment, utilizes the cost approach, which computes the cost to replace the asset, less accrued depreciation resulting from physical deterioration, functional obsolescence and external obsolescence. The calculation of the fair value of the identified intangible assets are determined using cash flow models following the income approach or a discounted market-based methodology approach. Significant inputs include estimated revenue growth rates, gross margins, operating expenses, and estimated attrition, royalty and discount rates. Goodwill is recorded as the difference in the fair value of the acquired assets and assumed liabilities and the purchase price.
Results of Operations
Net revenue
| ($ in millions) |
2023 |
2022 |
2023 vs 2022 |
|||||||||
| Net revenue |
$ | 3,510.9 | $ | 3,749.2 | (6.4 | )% | ||||||
We review variances in net revenue in terms of changes related to sales volume and product pricing (referred to as organic revenue growth), business acquisitions and divestitures (M&A) and changes in foreign currency exchange rates. The following table shows the net revenue variance analysis for fiscal 2023 compared to fiscal 2022:
| 2023 vs 2022 |
||||
| Organic revenue growth |
(5.5 | )% | ||
| Extra week in 2022 (53-week year) |
(1.8 | )% | ||
| M&A |
3.3 | % | ||
| Currency |
(2.4 | )% | ||
| Net revenue growth |
(6.4 | )% | ||
Organic revenue decreased 5.5 percent in 2023 compared to 2022 and consisted of an 11.0 percent decrease in Construction Adhesives, a 5.1 percent decrease in Hygiene, Health and Consumable Adhesives and a 4.2 percent decrease in Engineering Adhesives. The decrease is driven by a decrease in sales volume, partially offset by an increase in product pricing. The 3.3 percent increase from M&A is due to acquisitions that occurred during the year. The negative 2.4 percent currency impact was primarily driven by a weaker Egyptian pound, Chinese renminbi, Turkish lira and Argentinian peso offset by a stronger Euro and Mexican peso compared to the U.S. dollar. Additionally, net revenue in 2023 was lower than 2022 by 1.8 percent from an additional week of revenue in 2022 as it was a 53-week fiscal year compared to a 52-week fiscal year in 2023.
Cost of sales
| ($ in millions) |
2023 |
2022 |
2023 vs 2022 |
|||||||||
| Cost of sales |
$ | 2,502.0 | $ | 2,785.5 | (10.2 | )% | ||||||
| Percent of net revenue |
71.3 | % | 74.3 | % | ||||||||
Cost of sales in 2023 compared to 2022 decreased 300 basis points as a percentage of net revenue. Lower raw material costs and higher product pricing partially offset by the impact of lower sales volume led to the decrease.
Gross profit
| ($ in millions) |
2023 |
2022 |
2023 vs 2022 |
|||||||||
| Gross profit |
$ | 1,008.9 | $ | 963.7 | 4.7 | % | ||||||
| Percent of net revenue |
28.7 | % | 25.7 | % | ||||||||
Gross profit in 2023 increased 4.7 percent and gross profit margin increased 300 basis points compared to 2022. The increase in gross profit margin was primarily due to lower raw material costs and higher product pricing partially offset by the impact of lower sales volume.
Selling, general and administrative (SG&A) expenses
| ($ in millions) |
2023 |
2022 |
2023 vs 2022 |
|||||||||
| SG&A |
$ | 653.8 | $ | 641.0 | 2.0 | % | ||||||
| Percent of net revenue |
18.6 | % | 17.1 | % | ||||||||
SG&A expenses for 2023 increased $12.8 million, or 2.0 percent compared to 2022. The increase is due to higher restructuring and acquisition project costs and the impact of acquisitions. SG&A expenses as a percent of revenue increased by 150 basis points compared to the prior year due to lower net revenue and higher restructuring and acquisition project costs.
Other income, net
| ($ in millions) |
2023 |
2022 |
||||||
| Other income, net |
$ | 9.8 | $ | 12.9 | ||||
Other income, net in 2023 included $20.3 million of net defined benefit pension benefits and $1.2 of other income, partially offset by $11.6 million of currency transaction losses and a $0.1 million loss on disposal of assets. Other income, net in 2022 included $26.8 million of net defined benefit pension benefits and a $1.4 million gain on disposal of assets, partially offset by $12.9 million of currency transaction losses and $2.4 of other expense. The $26.8 million of net defined benefit pension benefits for 2022 included a $3.3 million settlement loss related to the termination of our Canadian defined benefit pension plan.
Interest expense
| ($ in millions) |
2023 |
2022 |
||||||
| Interest expense |
$ | 134.6 | $ | 91.5 | ||||
Interest expense was $134.6 million and $91.5 million in 2023 and 2022, respectively, and was higher primarily due to higher debt balances and higher interest rates. We capitalized $1.8 million and $1.5 million of interest expense in 2023 and 2022, respectively.
Interest income
| ($ in millions) |
2023 |
2022 |
||||||
| Interest income |
$ | 3.9 | $ | 7.8 | ||||
Interest income in 2023 and 2022 was $3.9 million and $7.8 million, respectively, consisting primarily of interest on cross-currency swap activity and other miscellaneous interest income.
Income tax expense:
| ($ in millions) |
2023 |
2022 |
||||||
| Income tax expense |
$ | 93.5 | $ | 77.2 | ||||
| Effective tax rate |
39.9 | % | 30.6 | % | ||||
Income tax expense of $93.5 million in 2023 includes $26.1 million of discrete tax expense, primarily related to the impact of withholding tax recorded on earnings that are no longer permanently reinvested, as well as other various U.S. and foreign tax matters. Excluding the discrete tax expense of $26.1 million, the overall effective tax rate was 28.8 percent.
Income tax expense of $77.2 million in 2022 includes $9.3 million of discrete tax expense, primarily related to the revaluation of cross-currency swap agreements due to depreciation of the Euro versus the U.S. dollar and several foreign discrete items, offset in part by U.S. tax benefit for state deferred tax rate change and excess tax benefit for stock compensation. Excluding the discrete tax expense of $9.3 million, the overall effective tax rate was 26.9 percent.
The increase in the overall effective tax rate for 2023 compared to 2022, excluding the impact of discrete items, is primarily due to the change in the mix of earnings across jurisdictions, as well as the impact of withholding tax recorded on current earnings that will not be permanently invested.
Income from equity method investments
| ($ in millions) |
2023 |
2022 |
||||||
| Income from equity method investments |
$ | 4.4 | $ | 5.7 | ||||
The income from equity method investments relates to our 50 percent ownership of the Sekisui-Fuller joint venture in Japan. The lower income for 2023 compared to 2022 is due to the unfavorable impact of the weakening of the Japanese yen against the U.S. dollar and lower net income in our joint venture.
Net income attributable to H.B. Fuller
| ($ in millions) |
2023 |
2022 |
2023 vs 2022 |
|||||||||
| Net income attributable to H.B. Fuller |
$ | 144.9 | $ | 180.3 | (19.6 | )% | ||||||
| Percent of net revenue |
4.1 | % | 4.8 | % | ||||||||
Net income attributable to H.B. Fuller was $144.9 million in 2023 compared to $180.3 million in 2022. Diluted earnings per share were $2.59 per share in 2023 and $3.26 per share in 2022.
Operating Segment Results
We are required to report segment information in the same way that we internally organize our business for assessing performance and making decisions regarding allocation of resources. For segment evaluation by the chief operating decision maker, segment operating income is defined as gross profit less SG&A expenses. Inter-segment revenues are recorded at cost plus a markup for administrative costs. Corporate expenses, other than those included in Corporate Unallocated, are allocated to each operating segment.
We have three reportable segments: Hygiene, Health and Consumable Adhesives, Engineering Adhesives and Construction Adhesives. The tables below provide certain information regarding the net revenue and segment operating income of each of our operating segments. Corporate Unallocated includes business acquisition and integration costs, organizational restructuring charges and project costs related to the implementation of Project ONE.
Net Revenue by Segment
| 2023 |
2022 |
|||||||||||||||
| Net |
% of |
Net |
% of |
|||||||||||||
| ($ in millions) |
Revenue |
Total |
Revenue |
Total |
||||||||||||
| Hygiene, Health and Consumable Adhesives |
$ | 1,601.5 | 46 | % | $ | 1,695.9 | 45 | % | ||||||||
| Engineering Adhesives |
1,428.7 | 41 | % | 1,532.7 | 41 | % | ||||||||||
| Construction Adhesives |
480.7 | 13 | % | 520.6 | 14 | % | ||||||||||
| Total |
$ | 3,510.9 | 100 | % | $ | 3,749.2 | 100 | % | ||||||||
Segment Operating Income (Loss)
| 2023 |
2022 |
|||||||||||||||
| Operating |
% of |
Operating |
% of |
|||||||||||||
| ($ in millions) |
Income (Loss) |
Total |
Income (Loss) |
Total |
||||||||||||
| Hygiene, Health and Consumable Adhesives |
$ | 215.1 | 61 | % | $ | 165.8 | 51 | % | ||||||||
| Engineering Adhesives |
187.3 | 53 | % | 168.8 | 52 | % | ||||||||||
| Construction Adhesives |
6.0 | 1 | % | 23.0 | 8 | % | ||||||||||
| Segment total |
408.4 | 115 | % | 357.6 | 111 | % | ||||||||||
| Corporate Unallocated |
(53.3 | ) | (15 | )% | (34.9 | ) | (11 | )% | ||||||||
| Total |
$ | 355.1 | 100 | % | $ | 322.7 | 100 | % | ||||||||
The following table provides a reconciliation of segment operating income to income before income taxes and income from equity method investments, as reported in the Consolidated Statements of Income.
| ($ in millions) |
2023 |
2022 |
||||||
| Segment operating income |
$ | 355.1 | $ | 322.7 | ||||
| Other income, net |
9.8 | 12.9 | ||||||
| Interest expense |
(134.6 | ) | (91.5 | ) | ||||
| Interest income |
3.9 | 7.8 | ||||||
| Income before income taxes and income from equity method investments |
$ | 234.2 | $ | 251.9 | ||||
Hygiene, Health and Consumable Adhesives
| ($ in millions) |
2023 |
2022 |
2023 vs 2022 |
|||||||||
| Net revenue |
$ | 1,601.5 | $ | 1,695.9 | (5.6 | )% | ||||||
| Segment operating income |
$ | 215.1 | $ | 165.8 | 29.7 | % | ||||||
| Segment profit margin % |
13.4 | % | 9.8 | % | ||||||||
The following tables provide details of Hygiene, Health and Consumable Adhesives net revenue variances:
| 2023 vs 2022 |
||||
| Organic revenue growth |
(5.1 | )% | ||
| Extra week in 2022 (53-week year) |
(1.8 | )% | ||
| M&A |
4.6 | % | ||
| Currency |
(3.3 | )% | ||
| Net revenue growth |
(5.6 | )% | ||
Net revenue decreased 5.6 percent in 2023 compared to 2022. The decrease in organic revenue growth was attributable to a decrease in sales volume, partially offset by an increase in product pricing. The 4.6 percent increase in net revenue from M&A was due to acquisitions of Lemtapes in the first quarter of 2023, Beardow Adams in the second quarter of 2023 and Adhezion in the third quarter of 2023. The negative currency effect was due to a weaker Egyptian pound, Turkish lira, Argentinian peso and Chinese renminbi offset by a stronger Mexican peso and Euro compared to the U.S. dollar. Additionally, net revenue in 2023 was lower than 2022 by 1.8 percent from an additional week of revenue in 2022 as it was a 53-week fiscal year compared to a 52-week fiscal year in 2023. As a percentage of net revenue, gross margin increased due to lower raw material costs and higher product pricing partially offset by the impact of lower sales volume. SG&A expenses as a percentage of net revenue increased due to the impact of acquisitions and lower net revenue. Segment operating income increased 29.7 percent and segment operating margin as a percentage of net revenue increased 360 basis points in 2023 as compared to 2022.
Engineering Adhesives
| ($ in millions) |
2023 |
2022 |
2023 vs 2022 |
|||||||||
| Net revenue |
$ | 1,428.7 | $ | 1,532.7 | (6.8 | )% | ||||||
| Segment operating income |
$ | 187.3 | $ | 168.8 | 11.0 | % | ||||||
| Segment profit margin % |
13.1 | % | 11.0 | % | ||||||||
The following tables provide details of Engineering Adhesives net revenue variances:
| 2023 vs 2022 |
||||
| Organic revenue growth |
(4.2 | )% | ||
| Extra week in 2022 (53-week year) |
(1.8 | )% | ||
| M&A |
1.2 | % | ||
| Currency |
(2.0 | )% | ||
| Net revenue growth |
(6.8 | )% | ||
Net revenue decreased 6.8 percent in 2023 compared to 2022. The decrease in organic revenue growth was attributable to a decrease in sales volume, partially offset by a slight increase in product pricing. The 1.2 percent increase in net revenue from M&A was due to the acquisitions of ZKLT in the third quarter of 2022 and Aspen in the first quarter of 2023. The negative currency effect was due to a weaker Chinese renminbi and Turkish lira partially offset by a stronger Euro compared to the U.S. dollar. Additionally, net revenue in 2023 was lower than 2022 by 1.8 percent from an additional week of revenue in 2022 as it was a 53-week fiscal year compared to a 52-week fiscal year in 2023. As a percentage of net revenue, gross margin increased due to lower raw material costs and higher product pricing partially offset by the impact of lower sales volume. SG&A expenses as a percentage of net revenue increased due to lower net revenue. Segment operating income increased 11.0 percent and segment operating margin as a percentage of net revenue increased 210 basis points in 2023 as compared to 2022.
Construction Adhesives
| ($ in millions) |
2023 |
2022 |
2023 vs 2022 |
|||||||||
| Net revenue |
$ | 480.7 | $ | 520.6 | (7.7 | )% | ||||||
| Segment operating income |
$ | 6.0 | $ | 23.0 | (73.9 | )% | ||||||
| Segment profit margin % |
1.2 | % | 4.4 | % | ||||||||
The following tables provide details of Construction Adhesives net revenue variances:
| 2023 vs 2022 |
||||
| Organic revenue growth |
(11.0 | )% | ||
| Extra week in 2022 (53-week year) |
(1.6 | )% | ||
| M&A |
5.4 | % | ||
| Currency |
(0.5 | )% | ||
| Net revenue growth |
(7.7 | )% | ||
Net revenue decreased 7.7 percent in 2023 compared to 2022. The decrease in organic revenue growth was attributable to a decrease in sales volume, partially offset by an increase in product pricing. The 5.4 percent increase in net revenue from M&A was due to the acquisitions of GSSI in the fourth quarter of 2022, XChem in the third quarter of 2023 and Sanglier in the fourth quarter of 2023. The negative currency effect was due to a weaker Australian dollar and Canadian dollar offset by a stronger Euro compared to the U.S. dollar. Additionally, net revenue in 2023 was lower than 2022 by 1.6 percent from an additional week of revenue in 2022 as it was a 53-week fiscal year compared to a 52-week fiscal year in 2023. As a percentage of net revenue, gross margin decreased slightly primarily due to the impact of lower sales volume partially offset by higher product pricing and lower raw material costs. SG&A expenses as a percentage of net revenue increased due to the impact of acquisitions and lower net revenue. Segment operating income decreased 73.9 percent and segment operating margin as a percentage of net revenue decreased 320 basis points in 2023 as compared to 2022.
Corporate Unallocated
| ($ in millions) |
2023 |
2022 |
2023 vs 2022 |
|||||||||
| Segment operating loss |
$ | (53.3 | ) | $ | (34.9 | ) | 52.7 | % | ||||
| Segment profit margin % |
NMP |
NMP |
||||||||||
NMP = Non-meaningful percentage
Corporate Unallocated includes acquisition and integration-related charges, restructuring-related charges and costs related to the implementation of Project ONE.
Segment operating loss increased 52.7 percent in 2023 reflecting higher restructuring and acquisition project costs compared to 2022.
Financial Condition, Liquidity and Capital Resources
Total cash and cash equivalents as of December 2, 2023 were $179.5 million compared to $79.9 million as of December 3, 2022. Total long and short-term debt was $1,838.4 million as of December 2, 2023 and $1,765.1 million as of December 3, 2022.
We believe that cash flows from operating activities will be adequate to meet our short-term and long-term liquidity and capital expenditure needs. In addition, we believe we have the ability to obtain both short-term and long-term debt to meet our financing needs for the foreseeable future. Cash available in the United States has historically been sufficient and we expect it will continue to be sufficient to fund U.S. operations, U.S. capital spending and U.S. pension and other postretirement benefit contributions in addition to funding U.S. acquisitions, dividend payments, debt service and share repurchases as needed. For those international earnings considered to be reinvested indefinitely, we currently have no intention to, and plans do not indicate a need to, repatriate these funds for U.S. operations.
Our credit agreements include restrictive covenants that, if not met, could lead to a renegotiation of our credit lines and a significant increase in our cost of financing. At December 2, 2023, we were in compliance with all covenants of our contractual obligations as shown in the following table:
| Covenant |
Debt Instrument |
Measurement |
Result as of December 2, 2023 |
| Secured Total Indebtedness / TTM1 EBITDA |
Revolving Facility and Term Loan A Facility |
Not greater than 4.752 |
2.1 |
| TTM1 EBITDA / Consolidated Interest Expense | Revolving Facility and Term Loan A Facility | Not less than 2.0 | 4.6 |
| 1 | TTM = trailing 12 months |
| 2 | The Maximum Secured Leverage Ratio prior to June 1, 2024, shall be 4.75 to 1.00 and will step down to 4.50 to 1.00 with respect to quarters ending after June 1, 2024 |
| EBITDA for covenant purposes is defined as consolidated net income, plus (i) interest expense, (ii) expense for taxes paid or accrued, (iii) depreciation and amortization, (iv) certain non-cash impairment losses, (v) extraordinary non-cash losses incurred other than in the ordinary course of business, (vi) nonrecurring extraordinary non-cash restructuring charges and the non-cash impact of purchase accounting, (vii) any non-cash charge for the excess of rent expense over actual cash rent paid due to the use of straight-line rent, non-cash charge pursuant to any management equity plan, stock option plan or any other management or employee benefit, (viii) any non-cash finance charges in respect of any pension liabilities or other provisions and income (loss) attributable to deferred compensation plans, (ix) any non-recurring or unusual cash restructuring charges and operating improvements, (x) cost savings initiative and cost synergies related to acquisitions within 12 months, (xi) non-capitalized charges relating to the Company’s SAP implementation, (xii) fees, costs, expenses and charges incurred in connection with the financing, (xiii) fees, costs, expenses, make-whole or penalty payments and other similar items arising out of acquisitions, investments and dispositions, the incurrence, issuance, repayment or refinancing of indebtedness and any issuance of equity interests; minus, non-recurring or unusual non-cash gains incurred not in the ordinary course of business. Provided that the aggregate amounts that may be added back for any period pursuant to clauses (ix), (x) and (xi) shall not exceed 15% of EBITDA for such period (calculated prior to giving effect to all addbacks and adjustments). For Secured Total Indebtedness / TTM EBITDA ratio, TTM EBITDA is adjusted for the pro forma results from Material Acquisitions and Material Divestitures, both as defined in the Second Amended and Restated Credit Agreement, as if the acquisition or divestiture occurred at the beginning of the calculation period. The full definition is set forth in the Second Amended and Restated Credit Agreement the Company filed as an exhibit to its 8-K filing dated February 21, 2023. |
| Consolidated Interest Expense for covenant purposes is defined as the interest expense (including without limitation to the portion of capital lease obligations that constitutes imputed interest in accordance with GAAP) of the Company and its subsidiaries calculated on a consolidated basis for such period with respect to all outstanding indebtedness allocable to such period in accordance with GAAP, including net costs (or benefits) under Interest Rate Swap Agreements and commissions, discounts and other fees and charges with respect to letters of credit and the interest component of all Attributable Receivables Indebtedness. |
We believe we have the ability to meet all of our contractual obligations and commitments in fiscal 2024.
Net Financial Assets (Liabilities)
| ($ in millions) |
2023 |
2022 |
||||||
| Financial assets: |
||||||||
| Cash and cash equivalents |
$ | 179.5 | $ | 79.9 | ||||
| Foreign exchange contracts |
13.5 | 10.3 | ||||||
| Interest rate swaps |
3.6 | - | ||||||
| Financial liabilities: |
||||||||
| Notes payable |
(1.8 | ) | (28.9 | ) | ||||
| Long-term debt |
(1,836.6 | ) | (1,736.3 | ) | ||||
| Foreign exchange contracts |
(5.0 | ) | (4.6 | ) | ||||
| Interest rate swaps |
(41.6 | ) | (42.5 | ) | ||||
| Net investment hedges |
(72.6 | ) | (54.0 | ) | ||||
| Net financial liabilities |
$ | (1,761.1 | ) | $ | (1,776.1 | ) | ||
Of the $179.5 million in cash and cash equivalents as of December 2, 2023, $152.9 million was held outside the U.S. Of the $152.9 million of cash held outside the U.S., earnings on $136.0 million are indefinitely reinvested outside of the U.S. It is not practical for us to determine the U.S. tax implications of the repatriation of these funds.
There are no contractual or regulatory restrictions on the ability of consolidated and unconsolidated subsidiaries to transfer funds in the form of cash dividends, loans or advances to us. Our credit facilities have the following restrictions related to investments and general limitations: 1) a credit facility limitation restricting investments, loans, advances or capital contributions from Loan Parties to non-Loan Parties in excess of $150.0 million, 2) a credit facility limitation that provides total investments, loans, advances or guarantees not otherwise permitted in the credit agreement for all subsidiaries shall not exceed $150.0 million in the aggregate, 3) a credit facility limitation that provides total investments, dividends, and distributions shall not exceed the Available Amount defined in these agreements, all three of which do not apply when our secured leverage ratio is below 4.0x, and 4) typical statutory restrictions, which prohibit distributions in excess of net capital or similar tests. Additionally, we have taken the income tax position that the majority of our cash in non-U.S. locations is indefinitely reinvested.
Debt Outstanding and Debt Capacity
Notes Payable
Notes payable were $1.8 million at December 2, 2023 and $28.9 million at December 3, 2022. These amounts primarily represented various foreign subsidiaries’ short-term borrowings that were not part of committed lines. The current weighted-average interest rates on these short-term borrowings were approximately 10.75 percent in 2023 and 16.2 percent in 2022.
Long-Term Debt
Long-term debt consists of a senior secured term loan (“Term Loan A”) with an aggregate principal amount of $500.0 million and a senior secured term loan (“Term Loan B”) with an aggregate principal amount of $800.0 million. Interest on Term Loan A is payable at the Secured Overnight Financing Rate ("SOFR") plus an adjustment of 0.10 percent and an interest rate spread of 1.50 percent (6.95 percent at December 2, 2023). The interest rate spread is based on a secured leverage grid. Term Loan A matures on February 15, 2028. At December 2, 2023, a balance of $487.5 million was outstanding on Term Loan A. Interest on Term Loan B is payable at SOFR plus an interest rate spread of 2.25 percent with a SOFR floor of 0.50 percent (7.60 percent at December 2, 2023). Term Loan B matures on February 15, 2030. At December 2, 2023, a balance of $796.0 million was outstanding on Term Loan B. On January 12, 2023, we entered into an interest rate swap agreement (amended on February 28, 2023) to convert $400,000 of our variable rate 1-month SOFR to a fixed rate of 3.7260. On March 16, 2023, we entered into interest rate swap agreements to convert $300,000 of our 1-month SOFR rate debt to a fixed rate of 3.7210 percent and to convert $100,000 of our 1-month SOFR rate debt to a fixed rate of 3.8990 percent.
Long-term debt also consists of 10-year unsecured public notes (“10-year Public Notes”) with an aggregate principal amount of $300.0 million due February 15, 2027 with a fixed coupon of 4.00 percent and 8-year unsecured public notes (“8-year Public Notes”) with an aggregate principal amount of $300.0 million due October 15, 2028 with a fixed coupon of 4.25 percent. We currently have no intention to prepay the Public Notes. On February 12, 2021, we entered into an interest rate swap agreement to convert our 8-year Public Notes to a variable interest rate of 1-month LIBOR plus 3.28 percent. See Note 12 to the Consolidated Financial Statements for further discussion of this interest rate swap.
Interest payable on our long-term debt totaled $1.7 million as of December 2, 2023.
Revolving Credit Facility
We have a revolving credit agreement with a consortium of financial institutions at December 2, 2023. This revolving credit agreement creates a secured multi-currency revolving credit facility that we can draw upon to repay existing indebtedness, finance working capital needs, finance acquisitions and for general corporate purposes up to a maximum of $700.0 million. Interest on the revolving credit facility is payable at SOFR plus an adjustment of 0.10 percent and an interest rate spread of 1.50 percent (6.95 percent at December 2, 2023). A facility fee of 20 basis points of the unused commitment under the revolving credit facility is payable quarterly. The interest rate spread and the facility fee are based on a secured leverage grid. At December 2, 2023, there was no balance outstanding on the Revolving Credit Facility. The Revolving Credit Facility matures on February 15, 2028.
We are subject to mandatory prepayments in the first quarter of each fiscal year equal to 50 percent of Excess Cash Flow, as defined in our debt agreement, of the prior fiscal year less any voluntary prepayments made during that fiscal year. The Excess Cash Flow Percentage shall be reduced to 25 percent when our Secured Leverage Ratio is below 4.25:1.00 and to 0 percent when our Secured Leverage Ratio is below 3.75:1.00.
Goodwill and Other Intangible Assets
As of December 2, 2023, goodwill totaled $1,486.5 million (31.5 percent of total assets) and other intangible assets, net of accumulated amortization, totaled $729.1 million (15.4 percent of total assets).
The components of goodwill and other identifiable intangible assets, net of amortization, by segment are as follows:
| 2023 |
||||||||||||||||
| Hygiene, Health |
||||||||||||||||
| and Consumable |
Engineering |
Construction |
||||||||||||||
| ($ in millions) |
Adhesives |
Adhesives |
Adhesives |
Total |
||||||||||||
| Goodwill |
$ | 402.6 | $ | 651.1 | $ | 432.8 | $ | 1,486.5 | ||||||||
| Purchased technology and patents |
41.7 | 28.9 | 14.5 | 85.1 | ||||||||||||
| Customer relationships |
126.8 | 226.9 | 250.6 | 604.3 | ||||||||||||
| Tradenames |
11.6 | 13.6 | 10.2 | 35.4 | ||||||||||||
| Other finite-lived intangible assets |
1.5 | - | 2.4 | 3.9 | ||||||||||||
| Indefinite-lived intangible assets |
- | 0.5 | - | 0.5 | ||||||||||||
| 2022 |
||||||||||||||||
| Hygiene, Health |
||||||||||||||||
| and Consumable |
Engineering |
Construction |
||||||||||||||
| ($ in millions) |
Adhesives |
Adhesives |
Adhesives |
Total |
||||||||||||
| Goodwill |
$ | 329.0 | $ | 637.9 | $ | 425.7 | $ | 1,392.6 | ||||||||
| Purchased technology and patents |
5.7 | 31.5 | 15.1 | 52.3 | ||||||||||||
| Customer relationships |
105.8 | 228.5 | 281.3 | 615.6 | ||||||||||||
| Tradenames |
4.5 | 14.6 | 9.8 | 28.9 | ||||||||||||
| Other finite-lived intangible assets |
1.9 | 0.1 | 2.8 | 4.8 | ||||||||||||
| Indefinite-lived intangible assets |
- | 0.5 | - | 0.5 | ||||||||||||
Selected Metrics of Liquidity and Capital Resources
Key metrics we monitor are net working capital as a percent of annualized net revenue, trade receivables days sales outstanding (DSO), inventory days on hand, free cash flow after dividends and debt capitalization ratio.
| December 2, |
December 3, |
|||||||
| 2023 |
2022 |
|||||||
| Net working capital as a percentage of annualized net revenue1 |
16.1 | % | 16.6 | % | ||||
| Trade receivables DSO (in days)2 |
58 | 62 | ||||||
| Inventory days on hand (in days)3 |
67 | 71 | ||||||
| Trade accounts payable DPO (in days)4 |
64 | 64 | ||||||
| Free cash flow after dividends5 |
$ | 215.9 | $ | 87.3 | ||||
| Debt capitalization ratio6 |
51.1 | % | 52.3 | % | ||||
1 Net working capital (trade receivables, net of allowance for doubtful accounts plus inventory minus trade payables) divided by annualized net revenue (current quarter, multiplied by 4).
2 Trade receivables net of allowance for doubtful accounts multiplied by 91 (13 weeks) and divided by the net revenue for the quarter.
3 Total inventory multiplied by 91 and divided by cost of sales (excluding delivery costs) for the quarter.
4 Trade accounts payable multiplied by 91 (13 weeks) and divided by the net revenue for the quarter.
5 Net cash provided by operating activities less purchased property, plant and equipment and dividends paid. See reconciliation to net cash provided by operating activities to free cash flow after dividends below.
6 Total debt divided by (total debt plus total stockholders’ equity).
Free cash flow after dividends, a non-GAAP financial measure, is defined as net cash provided by operating activities less purchased property, plant and equipment and dividends paid. Free cash flow after dividends is an integral financial measure used by the Company to assess its ability to generate cash in excess of its operating needs, therefore, the Company believes this financial measure provides useful information to investors. The following table reflects the manner in which free cash flow after dividends is determined and provides a reconciliation of free cash flow after dividends to net cash provided by operating activities, the most directly comparable financial measure calculated and reported in accordance with U.S. GAAP.
Reconciliation of “Net cash provided by operating activities” to "Free cash flow after dividends"
| ($ in millions) |
2023 |
2022 |
||||||
| Net cash provided by operating activities |
$ | 378.4 | $ | 256.5 | ||||
| Less: Purchased property, plant and equipment |
119.1 | 130.0 | ||||||
| Less: Dividends paid |
43.4 | 39.2 | ||||||
| Free cash flow after dividends |
$ | 215.9 | $ | 87.3 | ||||
Summary of Cash Flows
Cash Flows from Operating Activities
| ($ in millions) |
2023 |
2022 |
||||||
| Net cash provided by operating activities |
$ | 378.4 | $ | 256.5 | ||||
Net income including non-controlling interest was $145.0 million in 2023 and $180.4 million in 2022. Depreciation and amortization expense totaled $159.8 million in 2023 compared to $147.0 million in 2022. The higher depreciation and amortization expense in 2023 is related to the assets acquired in our business acquisitions.
Changes in net working capital (trade receivables, inventory and trade payables) accounted for a source of cash of $83.5 million compared to a use of cash of $103.2 million in 2023 and 2022, respectively. Following is an assessment of each of the net working capital components:
| ● |
Trade Receivables, net – Changes in trade receivables resulted in a $68.7 million source of cash in 2023 compared to a $24.8 million use of cash in 2022. The source of cash in 2023 compared to a use of cash in 2022 was related to higher collections in the current year compared to the prior year. The DSO was 58 days at December 2, 2023 and 62 days at December 3, 2022. |
| ● |
Inventory – Changes in inventory resulted in a $72.6 million source of cash in 2023 compared to a $55.8 million use of cash in 2022. The source of cash in 2023, compared to the use of cash in 2022 is due to lower inventory purchases at lower prices in 2023 compared to the prior year. Inventory days on hand were 67 days at the end of 2023 compared to 71 days at the end of 2022. |
| ● |
Trade Payables – Changes in trade payables resulted in a $57.8 million and $22.6 million use of cash in 2023 and 2022, respectively. The higher use of cash in 2023 compared to 2022 reflects higher payments on trade payables in the current year compared to the prior year. The DPO was 64 days at both the end of 2023 and 2022. |
Contributions to our pension and other postretirement benefit plans were $4.3 million and $3.0 million in 2023 and 2022, respectively. Income taxes payable resulted in a $41.2 million source of cash and a $12.9 million use of cash in 2023 and 2022, respectively. Other assets resulted in a $7.9 million use of cash and a $46.5 million source of cash in 2023 and 2022, respectively. The use of cash in 2023 compared to a source of cash in 2022 is primarily driven by a smaller decrease in pension and post-retirement assets related to the year-end pension valuation compared to the prior year and an increase in derivative assets in 2023 compared to a decrease in 2022. Accrued compensation was a $13.8 million use of cash and a $1.1 million source of cash in 2023 and 2022, respectively, relating to lower accruals for our employee incentive plans in 2023. Other liabilities resulted in a $22.9 million and $4.1 million source of cash in 2023 and 2022, respectively. The higher source of cash in 2023 compared to 2022 was due to an increase in hedging liabilities from interest rate swap activity in 2023 compared to the prior year. Other operating activity was a $28.0 million use of cash and a $6.2 million source of cash in 2023 and 2022, respectively. Other operating activity includes equity adjustments related to year-end pension valuations and valuation adjustments for our derivatives.
Cash Flows Used In Investing Activities
| ($ in millions) |
2023 |
2022 |
||||||
| Net cash used in investing activities |
$ | (319.2 | ) | $ | (375.3 | ) | ||
Purchases of property, plant and equipment were $119.1 million in 2023 compared to $130.0 million in 2022. The lower purchases in 2023 reflect the timing of capital projects and expenditures related to growth initiatives. Proceeds from the sale of property, plant and equipment were $5.0 million in 2023 compared to $1.6 million in 2022. We paid cash, net of cash acquired, of $205.1 million and $250.8 million for purchased businesses in 2023 and 2022, respectively.
Cash Flows From Financing Activities
| ($ in millions) |
2023 |
2022 |
||||||
| Net cash provided by financing activities |
$ | 35.1 | $ | 160.3 | ||||
In 2023, we received $2,233.3 million in proceeds and repaid $2,126.5 million of long-term debt including borrowings and repayments on our revolving credit facility and in 2022, we received $335.0 million in proceeds and repaid $159.5 million of long-term debt. See Note 7 to the Consolidated Financial Statements for further discussion of debt borrowings and repayments. Debt issuance costs of $10.2 million were paid in 2023 compared to $0.6 million paid in 2022. Cash paid for dividends were $43.4 million and $39.2 million in 2023 and 2022, respectively. Cash generated from the exercise of stock options was $14.6 million and $30.1 million in 2023 and 2022, respectively. Indirect repurchases of common stock through a net-settlement feature related to statutory minimum tax withholding upon vesting of restricted stock were $2.6 million in 2023 compared to $4.0 million in 2022. There were no repurchases from our share repurchase program in 2023 and 2022.
We expect 2024 capital expenditures to be approximately $140.0 million.
Forward-Looking Statements and Risk Factors
The Private Securities Litigation Reform Act of 1995 provides a safe harbor for forward-looking statements. This Annual Report on Form 10-K contains forward-looking statements within the meaning of the Private Securities Litigation Reform Act of 1995. These statements may be identified by the use of words like "plan," "expect," "aim," "believe," "project," "anticipate," "intend," "estimate," "will," "should," "could" (including the negative or variations thereof) and other expressions that indicate future events and trends. These plans and expectations are based upon certain underlying assumptions, including those mentioned with the specific statements. Such assumptions are in turn based upon internal estimates and analyses of current market conditions and trends, our plans and strategies, economic conditions and other factors. These plans and expectations and the assumptions underlying them are necessarily subject to risks and uncertainties inherent in projecting future conditions and results. Actual results could differ materially from expectations expressed in the forward-looking statements if one or more of the underlying assumptions and expectations proves to be inaccurate or is unrealized. In addition to the factors described in this report, Item 1A. Risk Factors identifies some of the important factors that could cause our actual results to differ materially from those in any such forward-looking statements. In order to comply with the terms of the safe harbor, we have identified these important factors which could affect our financial performance and could cause our actual results for future periods to differ materially from the anticipated results or other expectations expressed in the forward-looking statements. These factors should be considered, together with any similar risk factors or other cautionary language that may be made elsewhere in this Annual Report on Form 10-K.
The list of important factors in Item 1A. Risk Factors does not necessarily present the risk factors in order of importance. This disclosure, including that under Forward-Looking Statements and Risk Factors, and other forward-looking statements and related disclosures made by us in this report and elsewhere from time to time, represents our best judgment as of the date the information is given. We do not undertake responsibility for updating any of such information, whether as a result of new information, future events, or otherwise, except as required by law. Investors are advised, however, to consult any further public company disclosures (such as in filings with the SEC or in our press releases) on related subjects.
Item 7A. Quantitative and Qualitative Disclosures about Market Risk
Market Risk
We are exposed to various market risks, including changes in interest rates, foreign currency rates and prices of raw materials. Market risk is the potential loss arising from adverse changes in market rates and prices, such as interest rates and foreign currency exchange rates.
Our financial performance may be negatively affected by unfavorable economic conditions. Recessionary economic conditions may have an adverse impact on our sales volumes, pricing levels and profitability. As domestic and international economic conditions change, trends in discretionary consumer spending also become unpredictable and subject to reductions due to uncertainties about the future. A general reduction in consumer discretionary spending due to a recession in the domestic and international economies, or uncertainties regarding future economic prospects, could have a material adverse effect on our results of operations.
Interest Rate Risk
Exposure to changes in interest rates results primarily from borrowing activities used to fund operations. Committed floating rate credit facilities are used to fund a portion of operations. We believe that probable near-term changes in interest rates would not materially affect financial condition, results of operations or cash flows. The annual impact on interest expense of a one-percentage point interest rate change on the outstanding balance of our variable rate debt, net of interest rate swap derivatives as of December 2, 2023, would have resulted in a change in net income of approximately $5.3 million or $0.09 per diluted share.
Foreign Exchange Risk
As a result of being a global enterprise, there is exposure to market risks from changes in foreign currency exchange rates. Our operating results, financial condition and net investment in foreign subsidiaries are subject to both currency translation and currency transaction risk. Approximately 56 percent of net revenue was generated outside of the United States in 2023. Principal foreign currency exposures relate to the Euro, Chinese renminbi, British pound sterling, Egyptian pound, Turkish lira, Brazilian real, Canadian dollar, Australian dollar and Mexican peso.
We enter into cross border transactions through importing and exporting goods to and from different countries and locations. These transactions generate foreign exchange risk as they create assets, liabilities and cash flows in currencies other than their functional currency. This also applies to services provided and other cross border agreements among subsidiaries. Our objective is to balance, where possible, non-functional currency denominated assets to non-functional currency denominated liabilities to have a natural hedge and minimize foreign exchange impacts.
In the event a natural hedge is not available, we take steps to minimize risks from foreign currency exchange rate fluctuations through normal operating and financing activities and, when deemed appropriate, through the use of derivative instruments. We do not enter into any speculative positions with regard to derivative instruments.
Based on 2023 financial results, a hypothetical one percent change in our cost of sales due to foreign currency rate changes would have resulted in a change in net income attributable to H.B. Fuller of approximately $9.4 million or $0.17 per diluted share. Based on 2023 financial results and foreign currency balance sheet positions as of December 2, 2023, a hypothetical overall 10 percent change in the U.S. dollar would have resulted in a change in net income of approximately $16.7 million or $0.30 per diluted share.
Raw Materials
The principal raw materials used to manufacture products include resins, polymers, synthetic rubbers, vinyl acetate monomer and plasticizers. We generally avoid sole source supplier arrangements for raw materials. While alternate supplies of most key raw materials are available, unplanned supplier production outages may lead to strained supply-demand situations for several key raw materials such as ethylene and propylene, several polymers and other petroleum derivatives such as waxes.
The purchase of raw materials is our largest expenditure. Our objective is to purchase raw materials that meet both our quality standards and production needs at the lowest total cost. Most raw materials are purchased on the open market or under contracts that limit the frequency but not the magnitude of price increases. In some cases, however, the risk of raw material price changes is managed by strategic sourcing agreements which limit price increases to increases in supplier feedstock costs, while requiring decreases as feedstock costs decline. The leverage of having substitute raw materials approved for use wherever possible is used to minimize the impact of possible price increases. Based on 2023 financial results, a hypothetical one percent change in our raw material costs would have resulted in a change in net income of approximately $13.3 million or $0.24 per diluted share.
Recently Issued Accounting Pronouncements
See Note 1 to the Consolidated Financial Statements for information concerning new accounting standards and the impact of the implementation of these standards on our financial statements.
Item 8. Financial Statements and Supplementary Data
Report of Independent Registered Public Accounting Firm
To the Stockholders and the Board of Directors of H.B. Fuller Company
Opinion on the Financial Statements
We have audited the accompanying consolidated balance sheets of H.B. Fuller Company and subsidiaries (the Company) as of December 2, 2023 and December 3, 2022, the related consolidated statements of income, comprehensive income, total equity and cash flows for each of the three years in the period ended December 2, 2023, and the related notes (collectively referred to as the “consolidated financial statements”). In our opinion, the consolidated financial statements present fairly, in all material respects, the financial position of the Company at December 2, 2023 and December 3, 2022, and the results of its operations and its cash flows for each of the three years in the period ended December 2, 2023, in conformity with U.S. generally accepted accounting principles.
We also have audited, in accordance with the standards of the Public Company Accounting Oversight Board (United States) (PCAOB), the Company's internal control over financial reporting as of December 2, 2023, based on criteria established in Internal Control-Integrated Framework issued by the Committee of Sponsoring Organizations of the Treadway Commission (2013 framework) and our report dated January 24, 2024, expressed an unqualified opinion thereon.
Basis for Opinion
These financial statements are the responsibility of the Company's management. Our responsibility is to express an opinion on the Company’s financial statements based on our audits. We are a public accounting firm registered with the PCAOB and are required to be independent with respect to the Company in accordance with the U.S. federal securities laws and the applicable rules and regulations of the Securities and Exchange Commission and the PCAOB.
We conducted our audits in accordance with the standards of the PCAOB. Those standards require that we plan and perform the audit to obtain reasonable assurance about whether the financial statements are free of material misstatement, whether due to error or fraud. Our audits included performing procedures to assess the risks of material misstatement of the financial statements, whether due to error or fraud, and performing procedures that respond to those risks. Such procedures included examining, on a test basis, evidence regarding the amounts and disclosures in the financial statements. Our audits also included evaluating the accounting principles used and significant estimates made by management, as well as evaluating the overall presentation of the financial statements. We believe that our audits provide a reasonable basis for our opinion.
Critical Audit Matter
The critical audit matter communicated below is a matter arising from the current period audit of the consolidated financial statements that was communicated or required to be communicated to the audit committee and that: (1) relates to accounts or disclosures that are material to the financial statements and (2) involved our especially challenging, subjective or complex judgments. The communication of the critical audit matter does not alter in any way our opinion on the consolidated financial statements, taken as a whole, and we are not, by communicating the critical audit matter below, providing a separate opinion on the critical audit matter or on the account or disclosure to which it relates.
Valuation of Goodwill for the Construction Adhesives reporting unit
Description of the Matter
At December 2, 2023, the Company had goodwill of approximately $432.8 million related to the Construction Adhesives reporting unit. As discussed in the notes to the consolidated financial statements, the Company performs goodwill impairment testing on an annual basis as of the beginning of the fourth quarter, and between annual tests if an event occurs or circumstances change that would more likely than not reduce the fair value of a reporting unit below its carrying amount.
Auditing management’s goodwill impairment test for the Construction Adhesives reporting unit was complex and judgmental due to the significant estimation required in determining the fair value of the reporting unit. In particular, the Company estimates fair value using the income approach which is sensitive to certain assumptions, such as forecasted revenue and related revenue growth rate, the earnings before interest, taxes, depreciation and amortization (EBITDA) margins rate, and the weighted average cost of capital which are affected by management’s business plans and expectations about future market or economic conditions.
How We Addressed the Matter in Our Audit
We obtained an understanding, evaluated the design, and tested the operating effectiveness of controls over the Company's goodwill impairment review process, including controls over management’s review of the significant assumptions described above.
To test the estimated fair value of the Construction Adhesive reporting unit, we performed audit procedures that included, among others, assessing the valuation methodology used by management and testing the significant assumptions discussed above, as well as the underlying data used by the Company in its analysis. For example, we compared the significant assumptions used by management in the prospective financial information to current industry, market and economic trends as well as other relevant factors. We assessed the reasonableness of the forecasted future revenue growth rate and EBITDA margins rate by comparing the forecasts to historical results. We involved our valuation specialists to assist in our evaluation of the valuation models, methodologies and significant assumptions used by the Company, specifically the weighted average cost of capital.
/s/ Ernst & Young LLP
We have served as the Company’s auditor since 2019.
Minneapolis, Minnesota
January 24, 2024
Report of Independent Registered Public Accounting Firm
To the Stockholders and the Board of Directors of H.B. Fuller Company
Opinion on Internal Control Over Financial Reporting
We have audited H.B. Fuller Company and subsidiaries’ internal control over financial reporting as of December 2, 2023, based on criteria established in Internal Control—Integrated Framework issued by the Committee of Sponsoring Organizations of the Treadway Commission (2013 framework) (the COSO criteria). In our opinion, H.B. Fuller Company and subsidiaries (the Company) maintained, in all material respects, effective internal control over financial reporting as of December 3, 2023, based on the COSO criteria.
We also have audited, in accordance with the standards of the Public Company Accounting Oversight Board (United States) (PCAOB), the consolidated balance sheets of the Company as of December 2, 2023 and December 3, 2022, the related consolidated statements of income, comprehensive income, total equity and cash flows for each of the three years in the period ended December 2, 2023, and the related notes, and our report dated January 24, 2024 expressed an unqualified opinion thereon.
Basis for Opinion
The Company’s management is responsible for maintaining effective internal control over financial reporting and for its assessment of the effectiveness of internal control over financial reporting included in the accompanying Management’s Report on Internal Control over Financial Reporting. Our responsibility is to express an opinion on the Company’s internal control over financial reporting based on our audit. We are a public accounting firm registered with the PCAOB and are required to be independent with respect to the Company in accordance with the U.S. federal securities laws and the applicable rules and regulations of the Securities and Exchange Commission and the PCAOB.
We conducted our audit in accordance with the standards of the PCAOB. Those standards require that we plan and perform the audit to obtain reasonable assurance about whether effective internal control over financial reporting was maintained in all material respects.
Our audit included obtaining an understanding of internal control over financial reporting, assessing the risk that a material weakness exists, testing and evaluating the design and operating effectiveness of internal control based on the assessed risk, and performing such other procedures as we considered necessary in the circumstances. We believe that our audit provides a reasonable basis for our opinion.
Definition and Limitations of Internal Control Over Financial Reporting
A company’s internal control over financial reporting is a process designed to provide reasonable assurance regarding the reliability of financial reporting and the preparation of financial statements for external purposes in accordance with generally accepted accounting principles. A company’s internal control over financial reporting includes those policies and procedures that (1) pertain to the maintenance of records that, in reasonable detail, accurately and fairly reflect the transactions and dispositions of the assets of the company; (2) provide reasonable assurance that transactions are recorded as necessary to permit preparation of financial statements in accordance with generally accepted accounting principles, and that receipts and expenditures of the company are being made only in accordance with authorizations of management and directors of the company; and (3) provide reasonable assurance regarding prevention or timely detection of unauthorized acquisition, use, or disposition of the company’s assets that could have a material effect on the financial statements.
Because of its inherent limitations, internal control over financial reporting may not prevent or detect misstatements. Also, projections of any evaluation of effectiveness to future periods are subject to the risk that controls may become inadequate because of changes in conditions, or that the degree of compliance with the policies or procedures may deteriorate.
/s/ Ernst & Young LLP
Minneapolis, Minnesota
January 24, 2024
CONSOLIDATED STATEMENTS OF INCOME
H.B. Fuller Company and Subsidiaries
(In thousands, except per share amounts)
| Fiscal Years |
||||||||||||
| December 2, |
December 3, |
November 27, |
||||||||||
| 2023 |
2022 |
2021 |
||||||||||
| Net revenue |
$ | 3,510,934 | $ | 3,749,183 | $ | 3,278,031 | ||||||
| Cost of sales |
(2,502,037 | ) | (2,785,484 | ) | (2,432,709 | ) | ||||||
| Gross profit |
1,008,897 | 963,699 | 845,322 | |||||||||
| Selling, general and administrative expenses |
(653,760 | ) | (640,981 | ) | (592,710 | ) | ||||||
| Other income, net |
9,682 | 12,952 | 32,855 | |||||||||
| Interest expense |
(134,602 | ) | (91,521 | ) | (78,092 | ) | ||||||
| Interest income |
3,943 | 7,779 | 9,476 | |||||||||
| Income before income taxes and income from equity method investments |
234,160 | 251,928 | 216,851 | |||||||||
| Income tax expense |
(93,529 | ) | (77,186 | ) | (63,033 | ) | ||||||
| Income from equity method investments |
4,357 | 5,665 | 7,657 | |||||||||
| Net income including non-controlling interest |
144,988 | 180,407 | 161,475 | |||||||||
| Net income attributable to non-controlling interest |
(82 | ) | (94 | ) | (82 | ) | ||||||
| Net income attributable to H.B. Fuller |
$ | 144,906 | $ | 180,313 | $ | 161,393 | ||||||
| Earnings per share attributable to H.B. Fuller common stockholders: |
||||||||||||
| Basic |
$ | 2.67 | $ | 3.37 | $ | 3.05 | ||||||
| Diluted |
$ | 2.59 | $ | 3.26 | $ | 2.97 | ||||||
| Weighted-average common shares outstanding: |
||||||||||||
| Basic |
54,332 | 53,580 | 52,887 | |||||||||
| Diluted |
55,958 | 55,269 | 54,315 | |||||||||
| Dividends declared per common share |
$ | 0.805 | $ | 0.738 | $ | 0.665 | ||||||
See accompanying Notes to Consolidated Financial Statements.
CONSOLIDATED STATEMENTS OF COMPREHENSIVE INCOME
H.B. Fuller Company and Subsidiaries
(In thousands)
| Fiscal Years |
||||||||||||
| December 2, |
December 3, |
November 27, |
||||||||||
| 2023 |
2022 |
2021 |
||||||||||
| Net income including non-controlling interest |
$ | 144,988 | $ | 180,407 | $ | 161,475 | ||||||
| Other comprehensive income (loss) |
||||||||||||
| Foreign currency translation |
17,322 | (131,806 | ) | (26,294 | ) | |||||||
| Defined benefit pension plans adjustment, net of tax |
792 | (15,063 | ) | 48,181 | ||||||||
| Interest rate swaps, net of tax |
4,472 | 9,924 | 15,179 | |||||||||
| Cash-flow hedges, net of tax |
- | (3,483 | ) | (4,486 | ) | |||||||
| Net investment hedges, net of tax |
(14,107 | ) | (40,743 | ) | - | |||||||
| Other comprehensive income (loss) |
8,479 | (181,171 | ) | 32,580 | ||||||||
| Comprehensive income (loss) |
153,467 | (764 | ) | 194,055 | ||||||||
| Less: Comprehensive income attributable to non-controlling interest |
84 | 33 | 50 | |||||||||
| Comprehensive income (loss) attributable to H.B. Fuller |
$ | 153,383 | $ | (797 | ) | $ | 194,005 | |||||
See accompanying Notes to Consolidated Financial Statements.
CONSOLIDATED BALANCE SHEETS
H.B. Fuller Company and Subsidiaries
(In thousands, except share and per share amounts)
| December 2, |
December 3, |
|||||||
| 2023 |
2022 |
|||||||
| Assets |
||||||||
| Current assets: |
||||||||
| Cash and cash equivalents |
$ | 179,453 | $ | 79,910 | ||||
| Trade receivables, net |
577,932 | 607,365 | ||||||
| Inventories |
442,040 | 491,781 | ||||||
| Other current assets |
112,678 | 120,319 | ||||||
| Total current assets |
1,312,103 | 1,299,375 | ||||||
| Property, plant and equipment, net |
824,655 | 733,667 | ||||||
| Goodwill |
1,486,512 | 1,392,627 | ||||||
| Other intangibles, net |
729,140 | 702,092 | ||||||
| Other assets |
371,165 | 335,868 | ||||||
| Total assets |
$ | 4,723,575 | $ | 4,463,629 | ||||
| Liabilities, non-controlling interest and total equity |
||||||||
| Current liabilities: |
||||||||
| Notes payable |
$ | 1,841 | $ | 28,860 | ||||
| Trade payables |
439,700 | 460,669 | ||||||
| Accrued compensation |
95,680 | 108,328 | ||||||
| Income taxes payable |
47,688 | 18,530 | ||||||
| Other accrued expenses |
107,902 | 89,345 | ||||||
| Total current liabilities |
692,811 | 705,732 | ||||||
| Long-term debt, net of current maturities |
1,836,590 | 1,736,256 | ||||||
| Accrued pension liabilities |
50,189 | 52,561 | ||||||
| Other liabilities |
388,072 | 358,286 | ||||||
| Total liabilities |
2,967,662 | 2,852,835 | ||||||
| Commitments and contingencies (Note 14) |
||||||||
| Equity: |
||||||||
| H.B. Fuller stockholders' equity: |
||||||||
| Preferred stock (no shares outstanding) Shares authorized – 10,045,900 |
- | - | ||||||
| Common stock, par value $1.00 per share, Shares authorized – 160,000,000, Shares outstanding – 54,092,987 and 53,676,576 for 2023 and 2022, respectively |
54,093 | 53,677 | ||||||
| Additional paid-in capital |
301,485 | 266,491 | ||||||
| Retained earnings |
1,842,507 | 1,741,359 | ||||||
| Accumulated other comprehensive loss |
(442,880 | ) | (451,357 | ) | ||||
| Total H.B. Fuller stockholders' equity |
1,755,205 | 1,610,170 | ||||||
| Non-controlling interest |
708 | 624 | ||||||
| Total equity |
1,755,913 | 1,610,794 | ||||||
| Total liabilities, non-controlling interest and total equity |
$ | 4,723,575 | $ | 4,463,629 | ||||
See accompanying Notes to Consolidated Financial Statements.
CONSOLIDATED STATEMENTS OF TOTAL EQUITY
H.B. Fuller Company and Subsidiaries
(In thousands)
| H.B. Fuller Company Shareholders |
||||||||||||||||||||||||
| Accumulated |
||||||||||||||||||||||||
| Additional |
Other |
Non- |
||||||||||||||||||||||
| Common |
Paid-in |
Retained |
Comprehensive |
Controlling |
||||||||||||||||||||
| Stock |
Capital |
Earnings |
Income (Loss) |
Interest |
Total |
|||||||||||||||||||
| Balance at November 28, 2020 |
$ | 51,907 | $ | 157,867 | $ | 1,474,406 | $ | (302,859 | ) | $ | 541 | $ | 1,381,862 | |||||||||||
| Comprehensive income |
- | - | 161,393 | 32,612 | 50 | 194,055 | ||||||||||||||||||
| Dividends |
- | - | (35,198 | ) | - | - | (35,198 | ) | ||||||||||||||||
| Stock option exercises |
741 | 31,584 | - | - | - | 32,325 | ||||||||||||||||||
| Share-based compensation plans other, net |
181 | 26,817 | - | - | - | 26,998 | ||||||||||||||||||
| Repurchases of common stock |
(51 | ) | (2,631 | ) | - | - | - | (2,682 | ) | |||||||||||||||
| Balance at November 27, 2021 |
$ | 52,778 | $ | 213,637 | $ | 1,600,601 | $ | (270,247 | ) | $ | 591 | $ | 1,597,360 | |||||||||||
| Comprehensive income (loss) |
- | - | 180,313 | (181,110 | ) | 33 | (764 | ) | ||||||||||||||||
| Dividends |
- | - | (39,555 | ) | - | - | (39,555 | ) | ||||||||||||||||
| Stock option exercises |
658 | 29,464 | - | - | - | 30,122 | ||||||||||||||||||
| Share-based compensation plans other, net |
296 | 27,284 | - | - | - | 27,580 | ||||||||||||||||||
| Repurchases of common stock |
(55 | ) | (3,894 | ) | - | - | - | (3,949 | ) | |||||||||||||||
| Balance at December 3, 2022 |
$ | 53,677 | $ | 266,491 | $ | 1,741,359 | $ | (451,357 | ) | $ | 624 | $ | 1,610,794 | |||||||||||
| Comprehensive income |
- | - | 144,906 | 8,477 | 84 | 153,467 | ||||||||||||||||||
| Dividends |
- | - | (43,758 | ) | - | - | (43,758 | ) | ||||||||||||||||
| Stock option exercises |
314 | 14,304 | - | - | - | 14,618 | ||||||||||||||||||
| Share-based compensation plans other, net |
140 | 23,219 | - | - | - | 23,359 | ||||||||||||||||||
| Repurchases of common stock |
(38 | ) | (2,529 | ) | - | - | - | (2,567 | ) | |||||||||||||||
| Balance at December 2, 2023 |
$ | 54,093 | $ | 301,485 | $ | 1,842,507 | $ | (442,880 | ) | $ | 708 | $ | 1,755,913 | |||||||||||
CONSOLIDATED STATEMENTS of CASH FLOWS
H.B. Fuller Company and Subsidiaries
(In thousands)
| Fiscal Years |
||||||||||||
| December 2, |
December 3, |
November 27, |
||||||||||
| 2023 |
2022 |
2021 |
||||||||||
| Cash flows from operating activities: |
||||||||||||
| Net income including non-controlling interest |
$ | 144,988 | $ | 180,407 | $ | 161,475 | ||||||
| Adjustments to reconcile net income including non-controlling interest to net cash provided by operating activities: |
||||||||||||
| Depreciation |
80,327 | 72,593 | 72,106 | |||||||||
| Amortization |
79,514 | 74,383 | 71,068 | |||||||||
| Deferred income taxes |
(25,114 | ) | (15,230 | ) | 16,192 | |||||||
| Income from equity method investments, net of dividends received |
1,259 | (9 | ) | 2,776 | ||||||||
| Loss (gain) on sale of assets |
59 | (1,195 | ) | 648 | ||||||||
| Share-based compensation |
19,911 | 24,368 | 22,366 | |||||||||
| Pension and other postretirement benefit plan contributions |
(4,346 | ) | (3,009 | ) | (3,840 | ) | ||||||
| Pension and other postretirement benefit plan income |
(18,591 | ) | (24,021 | ) | (28,662 | ) | ||||||
| Debt issuance cost write-off |
2,689 | - | - | |||||||||
| Loss on fair value adjustment on contingent consideration liabilities |
2,893 | - | 2,300 | |||||||||
| Change in assets and liabilities, net of effects of acquisitions: |
||||||||||||
| Trade receivables, net |
68,721 | (24,753 | ) | (124,849 | ) | |||||||
| Inventories |
72,576 | (55,772 | ) | (135,351 | ) | |||||||
| Other assets |
(7,927 | ) | 46,499 | (79,097 | ) | |||||||
| Trade payables |
(57,752 | ) | (22,629 | ) | 176,337 | |||||||
| Accrued compensation |
(13,836 | ) | 1,135 | 27,741 | ||||||||
| Other accrued expenses |
(3,070 | ) | 6,303 | 1,186 | ||||||||
| Income taxes payable |
41,190 | (12,873 | ) | (4,137 | ) | |||||||
| Other liabilities |
22,918 | 4,104 | (73,508 | ) | ||||||||
| Other |
(28,011 | ) | 6,213 | 108,566 | ||||||||
| Net cash provided by operating activities |
378,398 | 256,514 | 213,317 | |||||||||
| Cash flows from investing activities: |
||||||||||||
| Purchased property, plant and equipment |
(119,137 | ) | (129,964 | ) | (96,089 | ) | ||||||
| Purchased businesses, net of cash acquired |
(205,093 | ) | (250,807 | ) | (5,445 | ) | ||||||
| Proceeds from sale of property, plant and equipment |
5,029 | 1,556 | 2,896 | |||||||||
| Cash received from government grant |
- | 3,928 | 5,800 | |||||||||
| Cash outflow related to government grant |
- | - | (1,822 | ) | ||||||||
| Net cash used in investing activities |
(319,201 | ) | (375,287 | ) | (94,660 | ) | ||||||
| Cash flows from financing activities: |
||||||||||||
| Proceeds from issuance of long-term debt |
2,233,300 | 335,000 | - | |||||||||
| Repayment of long-term debt |
(2,126,450 | ) | (159,500 | ) | (156,500 | ) | ||||||
| Payment of debt issue costs |
(10,214 | ) | (600 | ) | - | |||||||
| Net (payment on) proceeds from notes payable |
(28,674 | ) | 3,455 | 9,346 | ||||||||
| Dividends paid |
(43,395 | ) | (39,207 | ) | (34,859 | ) | ||||||
| Contingent consideration payment |
(1,477 | ) | (5,000 | ) | (1,700 | ) | ||||||
| Proceeds from stock options exercised |
14,619 | 30,122 | 32,325 | |||||||||
| Repurchases of common stock |
(2,567 | ) | (3,950 | ) | (2,682 | ) | ||||||
| Net cash provided by (used in) financing activities |
35,142 | 160,320 | (154,070 | ) | ||||||||
| Effect of exchange rate changes on cash and cash equivalents |
5,204 | (23,423 | ) | (3,335 | ) | |||||||
| Net change in cash and cash equivalents |
99,543 | 18,124 | (38,748 | ) | ||||||||
| Cash and cash equivalents at beginning of year |
79,910 | 61,786 | 100,534 | |||||||||
| Cash and cash equivalents at end of year |
$ | 179,453 | $ | 79,910 | $ | 61,786 | ||||||
| Supplemental disclosure of cash flow information: |
||||||||||||
| Dividends paid with company stock |
$ | 363 | $ | 348 | $ | 339 | ||||||
| Cash paid for interest, net of amount capitalized of $1,769, $1,518, and $905 for the years ended December 2, 2023, December 3, 2022 and November 27, 2021, respectively |
$ | 136,959 | $ | 83,527 | $ | 62,753 | ||||||
| Cash paid for income taxes, net of refunds |
$ | 71,261 | $ | 73,449 | $ | 72,955 | ||||||
See accompanying Notes to Consolidated Financial Statements.
NOTES TO CONSOLIDATED FINANCIAL STATEMENTS
H.B. Fuller Company and Subsidiaries
(In thousands, except share and per share amounts)
Note 1: Nature of Business and Summary of Significant Accounting Policies
Nature of Business
H.B. Fuller Company and our subsidiaries formulate, manufacture and market specialty adhesives, sealants, coatings, polymers, tapes, encapsulants, additives and other specialty chemical products globally, with sales operations in 35 countries in North America, Europe, Latin America, Asia Pacific, India, the Middle East and Africa.
We have three reportable segments: Hygiene, Health and Consumable Adhesives, Engineering Adhesives and Construction Adhesives. In 2023, as a percentage of total net revenue by operating segment, Hygiene, Health and Consumable Adhesives accounted for 46 percent, Engineering Adhesives 41 percent and Construction Adhesives 13 percent.
Our Hygiene, Health and Consumable Adhesives operating segment produces and supplies a full range of specialty industrial adhesives such as thermoplastic, thermoset, reactive, water-based and solvent-based products for applications in various markets, including packaging (food and beverage containers, flexible packaging, consumer goods, package integrity and re-enforcement, and non-durable goods), converting (corrugation, folding carton, tape and label, paper converting, envelopes, books, multi-wall bags, sacks, and tissue and towel), nonwoven and hygiene (disposable diapers, feminine care and medical garments) and health and beauty.
Our Engineering Adhesives operating segment produces and supplies high performance industrial adhesives such as reactive, light cure, two-part liquids, polyurethane, silicone, film and fast cure products to the durable assembly (appliances and filters), performance wood (windows, doors and wood flooring) and textile (footwear and sportswear), transportation, electronics, clean energy, aerospace and defense, appliance, heavy machinery and insulating glass markets.
Our Construction Adhesives operating segment includes products used for tile setting (adhesives, grouts, mortars, sealers and levelers), the commercial roofing industry (pressure-sensitive adhesives, tapes and sealants) and heating, ventilation and air conditioning and insulation applications (duct sealants, weather barriers and fungicidal coatings and block fillers). This operating segment also includes caulks and sealants for the consumer market and professional trade, sold through retailers, primarily in Australia.
Principles of Consolidation
The Consolidated Financial Statements include the accounts of H.B. Fuller Company and its wholly-owned and majority-owned subsidiaries. All significant intercompany transactions and accounts have been eliminated. Investments in affiliated companies in which we exercise significant influence, but which we do not control, are accounted for in the Consolidated Financial Statements under the equity method of accounting. As such, consolidated net income includes our equity portion in current earnings of such companies, after elimination of intercompany profits. Investments in which we do not exercise significant influence (generally less than a 20 percent ownership interest) are accounted for using the measurement alternative.
Our 50 percent ownership in Sekisui-Fuller Company, Ltd., our Japan joint venture, is accounted for under the equity method of accounting as we do not exercise control over the investee. In fiscal years 2023, 2022 and 2021, this equity method investment was not significant as defined in Regulation S-X under the Securities Exchange Act of 1934. As such, financial information as of December 2, 2023, December 3, 2022, and November 27, 2021 for Sekisui-Fuller Company, Ltd. is not required.
Our fiscal year ends on the Saturday closest to November 30. Fiscal year-end dates were December 2, 2023, December 3, 2022, and November 27, 2021 for 2023, 2022 and 2021, respectively. Every five or six years we have a 53rd week in our fiscal year. 2022 was a 53-week year.
Use of Estimates
Preparation of the Consolidated Financial Statements in conformity with U.S. generally accepted accounting principles (“U.S. GAAP”) requires us to make estimates and assumptions that affect the amounts reported in the financial statements and accompanying notes. Actual results could differ from those estimates.
Revenue Recognition
We sell a variety of adhesives, sealants and other specialty chemical products to a diverse customer base. The vast majority of our arrangements contain a single performance obligation to transfer manufactured goods to the customer as governed by an individual purchase order.
We recognize revenue at the amount of consideration to which we expect to be entitled in exchange for transferring the promised goods to the customer. The transaction price includes an estimation of any variable amounts of consideration to which we will be entitled. The most common forms of variable consideration within our arrangements are customer rebates, which are recorded as a reduction to revenue at the time of the initial sale using the expected value method. The expected value method is the sum of probability-weighted amounts in a range of possible consideration amounts and is based on a consideration of historical, current and forecast information. Changes in estimates are updated each reporting period. There are no material instances where variable consideration is constrained and not recorded at the initial time of sale. Product returns are recorded as a reduction to revenue based on historical experience and anticipated sales returns that occur in the normal course of business. We primarily have assurance-type warranties that do not result in separate performance obligations. We have elected to present revenue net of sales and other similar taxes.
We recognize revenue when control of goods is transferred to the customer. For the vast majority of our arrangements, control transfers at a point in time either upon shipment or upon delivery of the goods to the customer. The timing of transfer of control is determined considering the timing of the transfer of legal title, physical possession, and risks and rewards of goods to the customer.
We record shipping and handling revenue in net revenue and outbound shipping and handling costs in cost of goods sold. The majority of our shipping and handling activities are performed prior to transfer of control of the goods to the customer. For those arrangements where we provide shipping and handling services after control of the goods has transferred to the customer, we have elected the practical expedient allowed under Financial Accounting Standards Board (“FASB”) Accounting Standard Codification (“ASC”) Topic 606 to account for these activities as a fulfillment cost rather than as a separate performance obligation.
Provisions for sales returns are estimated based on historical experience and are adjusted for known returns, if material. Customer incentive programs (primarily volume purchase rebates) and arrangements such as cooperative advertising, slotting fees and buy-downs are recorded as a reduction of net revenue in accordance with ASC 606. Customer incentives recorded in the Consolidated Statements of Income as a reduction of net revenue were $35,896, $50,146 and $33,441 in 2023, 2022 and 2021, respectively.
For certain products, consigned inventory is maintained at customer locations. For this inventory, revenue is recognized in the period that the inventory is consumed. Sales to distributors require a distribution agreement or purchase order. As a normal practice, distributors do not have a right of return.
Cost of Sales
Cost of sales includes raw materials, container costs, direct labor, manufacturing overhead, freight costs and other less significant indirect costs related to the production of our products.
Selling, General and Administrative Expenses
Selling, general and administrative (“SG&A”) expenses include sales and marketing, research and development, technical and customer service, finance, legal, human resources, general management and similar expenses.
Income Taxes
The income tax provision is computed based on income before income from equity method investments included in the Consolidated Statement of Income. The asset and liability approach is used to recognize deferred tax assets and liabilities for the expected future tax consequences of temporary differences between the carrying amounts and the tax bases of assets and liabilities. Enacted statutory tax rates applicable to future years are applied to differences between the financial statement carrying amounts and the tax basis of existing assets and liabilities. The effect on deferred taxes of a change in tax rates is recognized in income in the period that includes the enactment date. Valuation allowances reduce deferred tax assets when it is not more-likely-than-not that a tax benefit will be realized. See Note 11 for further information.
Acquisition Accounting
As we enter into business combinations, we perform acquisition accounting requirements including the following:
|
|
● |
Identifying the acquirer, |
|
|
● |
Determining the acquisition date, |
|
|
● |
Recognizing and measuring the identifiable assets acquired and the liabilities assumed, and |
|
|
● |
Recognizing and measuring goodwill or a gain from a bargain purchase |
We complete valuation procedures and record the resulting fair value of the acquired assets and assumed liabilities based upon the valuation of the business enterprise and the tangible and intangible assets acquired. Enterprise value allocation methodology requires management to make assumptions and apply judgment to estimate the fair value of assets acquired and liabilities assumed. If estimates or assumptions used to complete the enterprise valuation and estimates of the fair value of the acquired assets and assumed liabilities significantly differed from assumptions made, the resulting difference could materially affect the fair value of net assets.
The calculation of the fair value of the tangible assets, including property, plant and equipment, utilizes the cost approach, which computes the cost to replace the asset, less accrued depreciation resulting from physical deterioration, functional obsolescence and external obsolescence. The calculation of the fair value of the identified intangible assets is determined using cash flow models following the income approach or a discounted market-based methodology approach. Significant inputs include estimated revenue growth rates, gross margins, operating expenses and estimated attrition, royalty and discount rates. Goodwill is recorded as the difference in the fair value of the acquired assets and assumed liabilities and the purchase price.
Cash Equivalents
Cash equivalents are highly liquid instruments with an original maturity of three months or less. We review cash and cash equivalent balances on a bank by bank basis to identify book overdrafts. Book overdrafts occur when the amount of outstanding checks exceed the cash deposited at a given bank. Book overdrafts, if any, are included in trade payables in our Consolidated Balance Sheets and in operating activities in our Consolidated Statements of Cash Flows.
Restrictions on Cash
There were no restrictions on cash as of December 2, 2023 or December 3, 2022. There are no contractual or regulatory restrictions on the ability of consolidated and unconsolidated subsidiaries to transfer funds to us, except for typical statutory restrictions which prohibit distributions in excess of net capital or similar tests. The majority of our cash in non-U.S. locations is considered indefinitely reinvested.
Trade Receivables and Allowances
Trade receivables are recorded at the invoiced amount and do not bear interest. Allowances are maintained for doubtful accounts, credits related to pricing or quantities shipped and early payment discounts. The allowance for doubtful accounts includes an estimate of future uncollectible receivables based on the aging of the receivable balance and our collection experience. The allowance also includes specific customer accounts when it is probable that the full amount of the receivable will not be collected. Current expectations of future credit losses using market and industry data are considered in the specific customer accounts. See Note 4 for further information.
Inventories
Inventories are recorded at cost (not in excess of net realizable value) as determined by the weighted-average cost method and are valued at the lower of cost or net realizable value.
Investments
Investments with a value of $9,334 and $8,957 represent the cash surrender value of life insurance contracts as of December 2, 2023 and December 3, 2022, respectively. These assets are held to primarily support supplemental pension plans and are recorded in other assets in the Consolidated Balance Sheets. The corresponding gain or loss associated with these contracts is reported in earnings each period as a component of selling, general and administrative expenses.
Equity Investments
Investments in an entity where we own less than 20% of the voting stock of the entity and do not exercise significant influence over operating and financial policies of the entity are accounted for using the measurement alternative at cost less impairment plus or minus observable price changes in orderly transactions. We have a policy in place to review our investments at least annually, to evaluate the accounting method and identify observable price changes that could indicate impairment. If we believe that an impairment exists, it is our policy to calculate the fair value of the investment and recognize as impairment any amount by which the carrying value exceeds the fair value of the investment. We recognized impairment of $303 for the year ended December 3, 2022 and did not have any impairment of our equity investments for the years ended December 2, 2023 and November 27, 2021. The book value of the equity investments was $1,362 as of both December 2, 2023 and December 3, 2022.
Property, Plant and Equipment
Property, plant and equipment are carried at cost and depreciated over the useful lives of the assets using the straight-line method. Estimated useful lives range from 20 to 40 years for buildings and improvements, 3 to 20 years for machinery and equipment, and the shorter of the lease or expected life for leasehold improvements. Fully depreciated assets are retained in property and accumulated depreciation accounts until removed from service. Upon disposal, assets and related accumulated depreciation are removed. Upon sale of an asset, the difference between the proceeds and remaining net book value is charged or credited to other income, net on the Consolidated Statements of Income. Expenditures that add value or extend the life of the respective assets are capitalized, while expenditures that are typical recurring repairs and maintenance are expensed as incurred. Interest costs associated with construction and implementation of property, plant and equipment of $1,769, $1,518 and $905 were capitalized in 2023, 2022 and 2021, respectively.
Goodwill
We evaluate our goodwill for impairment annually at the beginning of the fourth quarter or earlier upon the occurrence of substantive unfavorable changes in economic conditions, industry trends, costs, cash flows or ongoing declines in market capitalization. The quantitative impairment test requires judgment, including the identification of reporting units, the assignment of assets, liabilities and goodwill to reporting units, and the determination of fair value of each reporting unit. The impairment test requires the comparison of the fair value of each reporting unit with its carrying amount, including goodwill. In performing the impairment test, we determined the fair value of our reporting units through the income approach by using discounted cash flow (“DCF”) analyses. Determining fair value requires the company to make judgments about appropriate discount rates, perpetual growth rates and the amount and timing of expected future cash flows. The cash flows employed in the DCF analysis for each reporting unit are based on the reporting unit's budget, long-term business plan and recent operating performance. Discount rate assumptions are based on an assessment of the risk inherent in the future cash flows of the respective reporting unit and market conditions. If the estimated fair value of a reporting unit exceeds its carrying value, goodwill is considered to not be impaired. If the carrying value exceeds estimated fair value, an impairment charge is recorded for any excess of the carrying value over the estimated fair value. Based on the analysis performed for our fiscal 2023 annual impairment test, there were no indications of impairment for any of our reporting units. See Note 5 for further information.
Intangible Assets
Intangible assets include patents, customer lists, technology, trademarks and other intangible assets acquired from independent parties and are amortized on a straight-line basis with estimated useful lives ranging from 3 to 20 years. The straight-line method of amortization of these assets reflects an appropriate allocation of the costs of the intangible assets to earnings in proportion to the amount of economic benefits obtained in each reporting period.
Impairment of Long-Lived Assets
Our long-lived assets are tested for impairment whenever events or circumstances indicate that a carrying amount of an asset (asset group) may not be recoverable. An impairment loss would be measured and recognized when the carrying amount of an asset (asset group) exceeds the estimated undiscounted future cash flows expected to result from the use of the asset (asset group) and its eventual disposition. The impairment loss to be recorded would be the excess of the asset's carrying value over its fair value. Fair value is generally determined using a DCF analysis or other valuation technique. Costs related to internally developed intangible assets are expensed as incurred.
Foreign Currency Translation
Assets and liabilities of non-U.S. functional currency entities are translated to U.S. dollars at period-end exchange rates, and the resulting gains and losses arising from the translation of those net assets are recorded as a cumulative translation adjustment, a component of accumulated other comprehensive income (loss) in stockholders' equity. Revenues and expenses are translated using average exchange rates during the year. Foreign currency transaction gains and losses are included in other income, net in the Consolidated Statements of Income.
We consider a subsidiary’s sales price drivers, currency denomination of sales transactions and inventory purchases to be the primary indicators in determining a foreign subsidiary’s functional currency. Our subsidiaries in certain European countries have a functional currency different than their local currency. All other foreign subsidiaries, which are located in North America, Latin America, Europe, India, the Middle East and Africa ("EIMEA") and Asia Pacific, have the same local and functional currency.
Pension and Other Postretirement Benefits
We sponsor defined-benefit pension plans in both the U.S. and non-U.S. entities. Also in the U.S., we sponsor other postretirement plans for health care and life insurance benefits. Expenses and liabilities for the pension plans and other postretirement plans are actuarially calculated. These calculations are based on our assumptions related to the discount rate, expected return on assets, projected salary increases, health care cost trend rates and mortality rates. The discount rate assumption is determined using an actuarial yield curve approach, which results in a discount rate that reflects the characteristics of the plan. The approach identifies a broad population of corporate bonds that meet the quality and size criteria for the particular plan. We use this approach rather than a specific index that has a certain set of bonds that may or may not be representative of the characteristics of our particular plan. Our expected long-term rate of return on U.S. plan assets was based on our target asset allocation assumption of 55 percent equities and 45 percent fixed income. Management, in conjunction with our external financial advisors, determines the expected long-term rate of return on plan assets by considering the expected future returns and volatility levels for each asset class that are based on historical returns and forward-looking observations. The expected long-term rate of return on plan assets assumption used in each non-U.S. plan is determined on a plan-by-plan basis for each local jurisdiction and is based on expected future returns for the investment mix of assets currently in the portfolio for that plan. Management, in conjunction with our external financial advisors, develops expected rates of return for each plan, considers expected long-term returns for each asset category in the plan, reviews expectations for inflation for each local jurisdiction, and estimates the impact of active management of the plan’s assets. Note 10 includes disclosure of assumptions employed in these measurements for both the non-U.S. and U.S. plans.
Asset Retirement Obligations
We recognize asset retirement obligations ("ARO") in the period in which we have an existing legal obligation associated with the retirement of a tangible long-lived asset, and the amount can be reasonably estimated. The ARO is recognized at fair value when the liability is incurred. Upon initial recognition of a liability, that cost is capitalized as part of the related long-lived asset and depreciated on a straight-line basis over the remaining estimated useful life of the related asset. We have recognized a liability related to special handling of asbestos related materials in certain facilities for which we have plans or expectation of plans to undertake a major renovation or demolition project that would require the removal of asbestos or have plans or expectation of plans to exit a facility. In addition, we have determined that we have facilities with some level of asbestos that will require abatement action in the future. Once the probability and timeframe of an action are determined, we apply certain assumptions to determine the related liability and asset. These assumptions include the use of inflation rates, the use of credit adjusted risk-free discount rates and the estimation of costs to handle asbestos related materials. The recorded liability is required to be adjusted for changes resulting from the passage of time and/or revisions to the timing or the amount of the original estimate. The asset retirement obligation liability was $3,147 and $2,888 at December 2, 2023 and December 3, 2022, respectively.
Environmental Costs
Environmental expenditures that relate to current operations are expensed or capitalized as appropriate. Expenditures that relate to an existing condition caused by past operations, and which do not contribute to current or future revenue generation, are expensed. Liabilities are recorded when environmental assessments are made, or remedial efforts are probable, and the costs can be reasonably estimated. The timing of these accruals is generally no later than the completion of feasibility studies.
Contingent Consideration Liability
Concurrent with business acquisitions, we enter into agreements that require us to pay the sellers a certain amount based upon a formula related to the entity’s financial results. The change in fair value of the contingent consideration liability is recorded in SG&A expenses in the Consolidated Statements of Income.
Share-based Compensation
We have various share-based compensation programs which provide for equity awards, including non-qualified stock options, incentive stock options, restricted stock units, performance awards and deferred compensation. We use the straight-line attribution method to recognize compensation expense associated with share-based awards based on the fair value on the date of grant, net of the estimated forfeiture rate. Expense is recognized over the requisite service period related to each award, which is the period between the grant date and the earlier of the award’s stated vesting term or the date the employee is eligible for early retirement based on the terms of the plan. The fair value of stock options is estimated using the Black-Scholes option pricing model. All of our stock compensation expense is recorded in SG&A expenses in the Consolidated Statements of Income. See Note 9 for additional information.
Earnings per Share
Basic earnings per share is calculated by dividing net income attributable to H.B. Fuller by the weighted-average number of common shares outstanding during the applicable period. Diluted earnings per share is based upon the weighted-average number of common and common equivalent shares outstanding during the applicable period. The difference between basic and diluted earnings per share is attributable to share-based compensation awards. We use the treasury stock method to calculate the effect of outstanding awards, which computes total employee proceeds as the sum of (a) the amount the employee must pay upon exercise of the award and (b) the amount of unearned share-based compensation costs attributed to future services. Share-based compensation awards for which total employee proceeds exceed the average market price over the applicable period have an antidilutive effect on earnings per share, and accordingly, are excluded from the calculation of diluted earnings per share. The computations for basic and diluted earnings per share are as follows:
| (in thousands, except per share data) |
2023 |
2022 |
2021 |
|||||||||
| Net income attributable to H.B. Fuller |
$ | 144,906 | $ | 180,313 | $ | 161,393 | ||||||
| Weighted-average common shares – basic |
54,332 | 53,580 | 52,887 | |||||||||
| Equivalent shares from share-based compensation plans |
1,626 | 1,689 | 1,428 | |||||||||
| Weighted-average common and common equivalent shares – diluted |
55,958 | 55,269 | 54,315 | |||||||||
| Basic earnings per share |
$ | 2.67 | $ | 3.37 | $ | 3.05 | ||||||
| Diluted earnings per share |
$ | 2.59 | $ | 3.26 | $ | 2.97 | ||||||
Share-based compensation awards for 1,089,054, 707,197 and 1,535,503 shares for 2023, 2022 and 2021, respectively, were excluded from the diluted earnings per share calculation because they were antidilutive.
Financial Instruments and Derivatives
As a part of our ongoing operations, we are exposed to market risks such as changes in foreign currency exchange rates and interest rates. To manage these risks, we may enter into derivative transactions pursuant to our established policies.
Our objective is to balance, where possible, non-functional currency denominated assets to non-functional currency denominated liabilities to have a natural hedge and minimize foreign exchange impacts. We minimize risks from foreign currency exchange rate fluctuations through normal operating and financing activities and, when deemed appropriate, through the use of derivative instruments. Derivatives consisted primarily of forward currency contracts used to manage foreign currency denominated assets and liabilities. For derivative instruments outstanding that were not designated as hedges for accounting purposes, the gains and losses related to mark-to-market adjustments were recognized as other income or expense in the income statement during the periods the derivative instruments were outstanding. To manage exposure to currency rate movements on expected cash flows, the company may enter into cross-currency swap agreements.
The company manages interest expense using a mix of fixed and floating rate debt. To manage exposure to interest rate movements and to reduce borrowing costs, the company may enter into interest rate swap agreements.
Changes in the fair values of derivatives are recorded in net earnings or other comprehensive income, based on the type of derivative, and whether the instrument is designated and effective as a hedge transaction. Gains or losses on derivative instruments reported in accumulated other comprehensive income (loss) are reclassified to earnings in the period the hedged item affects earnings. Any ineffectiveness is recognized in earnings in the current period. We maintain master netting arrangements that allow us to net settle contracts with the same counterparties; we do not elect to offset amounts in our Consolidated Balance Sheet. These arrangements generally do not call for collateral. We do not enter into any speculative positions with regard to derivative instruments. See Note 12 for further information regarding our financial instruments.
Purchase of Company Common Stock
Under the Minnesota Business Corporation Act, repurchased stock is included in authorized shares, but is not included in shares outstanding. The excess of the repurchase cost over par value is charged to additional paid-in capital. When additional paid-in capital is exhausted, the excess reduces retained earnings. We indirectly repurchased 113,868, 49,869 and 47,481 shares of common stock in 2023, 2022 and 2021, respectively, through a net-settlement feature in connection with the statutory minimum tax withholding related to vesting of restricted stock.
New Accounting Pronouncements
In December 2023, the FASB issued ASU No. 2023-09, Income Taxes (Topic 740): Improvements to Income Tax Disclosures. This ASU requires entities to provide additional information in the rate reconciliation and additional disclosures about income taxes paid. This guidance requires public entities to disclose in their rate reconciliation table additional categories of information about federal, state, and foreign income taxes and to provide more details about the reconciling items in some categories if the items meet a quantitative threshold. Our effective date of this ASU is our fiscal year ending November 28, 2026. We are evaluating the effect that this guidance will have on our Consolidated Financial Statements.
In November 2023, the FASB issued ASU No. 2023-07, Segment Reporting (Topic 280): Improvements to Reportable Segment Disclosures. This ASU requires enhanced disclosures regarding significant segment expenses and other segment items. The guidance requires public entities to provide in interim periods all disclosures about a reportable segment's profit or loss and assets that are currently required annually. Our effective date of this ASU is our fiscal year ending November 29, 2025. We are evaluating the effect that this guidance will have on our Consolidated Financial Statements.
In September 2022, the FASB issued ASU No. 2022-04, Liabilities - Supplier Finance Programs (Subtopic 405-50): Disclosure of Supplier Finance Program Obligations. This ASU requires that a buyer in a supplier finance program disclose sufficient information about the program to allow a user of the financial statements to understand the program's nature, activity during the period, changes from period to period, and potential magnitude. To achieve that objective, the buyer should disclose qualitative and quantitative information about its supplier finance programs. Our effective date of this ASU is our fiscal year ending December 1, 2024. We are evaluating the effect that this guidance will have on our Consolidated Financial Statements.
Recently issued accounting standards or pronouncements not disclosed above have been excluded as they are not relevant to the company.
Note 2: Acquisitions
Sanglier Ltd.
On September 8, 2023, we acquired the assets of Sanglier Ltd. (“Sanglier”) for a base purchase price of 13,339 British pound sterling, or approximately $16,632 which was funded through existing cash. This includes a holdback amount of 2,100 British pound sterling that will be paid on the 18-month anniversary of the closing date. Sanglier, headquartered in Mansfield, United Kingdom, is a manufacturer and filler of sprayable (aerosol and cannister) industrial adhesives. The acquisition of Sanglier expands our innovation capabilities and product portfolio across the United Kingdom and Europe transforming adhesives applications to enable sprayable delivery providing end users with an opportunity to greatly improve labor efficiency. The acquisition fair value measurement was preliminary as of December 2, 2023 and includes intangible assets of $10,695 and other net assets of $5,937. Sanglier is included in our Construction Adhesives operating segment.
Adhezion Biomedical LLC
On June 23, 2023, we acquired Adhezion Biomedical LLC (“Adhezion”) for a base purchase price of $80,802 which was funded through borrowings on our credit facility. This includes a holdback amount of $780 that will be paid on the 12-month anniversary of the closing date. The agreement includes a payment of contingent consideration up to $15,000 following the completion of certain performance goals and conditions. Adhezion, headquartered in Wyomissing, Pennsylvania, is a manufacturer of cyanoacrylate-based healthcare adhesives and infection prevention products. The acquisition of Adhezion positions us for expansion in the healthcare adhesives industry and creates a solid, unique platform from which to scale and innovate in the healthcare adhesives industry. The acquisition fair value measurement was preliminary as of December 2, 2023 and includes intangible assets of $38,500, goodwill of $38,389 and other net assets of $3,913. Goodwill represents expected synergies from combining Adhezion with our existing business. As of December 2, 2023, the amount of goodwill that is deductible for tax purposes is $25,702. Adhezion is included in our Hygiene, Health and Consumable Adhesives operating segment.
XChem International LLC
On June 12, 2023, we acquired XChem International LLC ("XChem") for a base purchase price of approximately $14,591 which was funded through borrowings on our credit facility. This includes a holdback amount of $1,650 that will be paid on the 18-month anniversary of the closing date. XChem, headquartered in Ras Al-Khaimah, United Arab Emirates, is a manufacturer of adhesives and sealants for construction-related applications. The acquisition of XChem provides our construction adhesives global business with additional manufacturing presence for certain brands outside the U.S. and broadens our construction adhesives portfolio of highly specified applications and diversifies it toward both non-U.S. and infrastructure-oriented markets. The acquisition fair value measurement was preliminary as of December 2, 2023 and includes intangible assets of $4,400, goodwill of $4,783 and other net assets of $5,408. Goodwill represents expected synergies from combining XChem with our existing business. Goodwill is not deductible for tax purposes. XChem is included in our Construction Adhesives operating segment.
Beardow Adams Holdings Ltd.
On May 1, 2023, we acquired Beardow Adams Holdings Ltd. (“Beardow Adams”) for a total purchase price of 80,738 British pound sterling, or approximately $100,885, which was funded through borrowings on our credit facility. This includes a holdback amount of 8,000 British pound sterling that will be paid on the 18-month anniversary of the closing date. Beardow Adams, based in the United Kingdom, develops and manufactures adhesives, sealants and coatings, principally in the fields of packaging and related applications. The acquisition of Beardow Adams is expected to accelerate profitable growth in many of our core end markets and generate business synergies through better raw material pricing, production optimization and an expanded distribution platform. The acquisition fair value measurement was preliminary as of December 2, 2023 and includes intangible assets of $37,611, goodwill of $25,674 and other net assets of $37,600. Goodwill represents expected synergies from combining Beardow Adams with our existing business. As of December 2, 2023, the amount of goodwill that is deductible for tax purposes is $2,998. The remaining goodwill is not deductible for tax purposes. Beardow Adams is included in our Hygiene, Health and Consumable Adhesives operating segment.
Aspen Research Corporation
On January 31, 2023, we acquired the assets of Aspen Research Corporation (“Aspen”) for a total purchase price of $9,761, which was funded through existing cash. This includes a holdback amount of $500 that will be paid on the 18-month anniversary of the closing date. Aspen, located in Maple Grove, Minnesota, is a contract research organization that develops and manufactures innovative solutions for some of the adhesives used in our insulating glass market. Aspen is known for their superior understanding of materials science, engineering and analytical testing and specializes in custom materials manufacturing for chemicals and adhesives products. The acquisition of Aspen is expected to expand our Engineering Adhesives footprint in North America and strengthen our capabilities in the insulating glass market, in addition to bringing additive continuous flow, process manufacturing capabilities that we plan to leverage. The acquisition fair value measurement was final as of December 2, 2023 and includes intangible assets of $4,900, goodwill of $3,832 and other net assets of $1,029. Goodwill represents expected synergies from combining Aspen with our existing business. Goodwill is deductible for tax purposes. Aspen is included in our Engineering Adhesives operating segment.
Lemtapes Oy
On December 15, 2022, we acquired Lemtapes Oy (“Lemtapes”) for a total purchase price of $8,922 Euro, or approximately $9,482 which was funded through existing cash. This includes a holdback amount of 850 Euro that will be paid on the 18-month anniversary of the closing date. Lemtapes, located in Valkeakoski, Finland, is a solutions provider of ecological, innovative tapes and adhesives for the packaging and plywood industries. The acquisition of Lemtapes is expected to reinforce our strategic position in Europe, especially for our adhesives coated solutions products. This acquisition will also accelerate our growth strategy of fast-growing, high margin businesses while adding technology capabilities and strong customer relationships. The acquisition fair value measurement was final as of December 2, 2023 and includes intangible assets of $5,526, goodwill of $3,028 and other net assets of $928. Goodwill represents expected synergies from combining Lemtapes with our existing business. Goodwill is not deductible for tax purposes. Lemtapes is included in our Hygiene, Health and Consumable Adhesives operating segment.
GSSI Sealants
On October 24, 2022, we acquired GSSI Sealants, Inc. ("GSSI") for a total purchase price of $7,701, which was funded through existing cash. This includes a holdback amount of $1,050 that was paid on the 12-month anniversary of the closing date. In addition, we recorded a liability for contingent consideration of $870, to be paid following the completion of certain performance goals and conditions. GSSI, headquartered in Houston, Texas, is a manufacturer of premier elastomeric butyl rubber sealant tapes. The acquisition of GSSI is expected to support our strategy to expand our Construction Adhesives business selectively via high margin applications. The acquisition fair value measurement was final as of September 2, 2023 and includes intangible assets of $3,400, goodwill of $1,123 and other net assets of $3,178. Goodwill represents expected synergies from combining GSSI with our existing business. Goodwill is not deductible for tax purposes. See Note 13 for further discussion of the fair value of the contingent consideration. GSSI is included in our Construction Adhesives operating segment.
ZKLT Polymer Co.
On August 16, 2022, we acquired ZKLT Polymer Co., Ltd. ("ZKLT") for a base purchase price of 143,965 Chinese renminbi, or approximately $21,260, which was funded through existing cash. This includes a holdback of 27,000 Chinese renminbi, or approximately $3,987, half of which was paid on the 12-month anniversary of the closing date and half to be paid on the 18-month anniversary of the closing date. In addition, we recorded a liability for contingent consideration of 30,000 Chinese renminbi, or approximately $4,132, which was paid in the fourth quarter of 2023 following the completion of certain performance goals and conditions. ZKLT, headquartered in Chongquin City, China, is a manufacturer of liquid adhesives primarily for the automotive market. The acquisition of ZKLT is expected to add unique technology, strong customer relationships and a strategic manufacturing location to further strengthen our presence in central China. The acquisition fair value measurement was final as of September 2, 2023 and includes intangible assets of $5,183, goodwill of $5,992 and other net assets of $10,085. Goodwill represents expected synergies from combining ZKLT with our existing business. Goodwill is not deductible for tax purposes. See Note 13 for further discussion of the fair value of the contingent consideration. ZKLT is included in our Engineering Adhesives operating segment.
Fourny NV
On January 11, 2022, we acquired Fourny NV ("Fourny") for a base purchase price of 12,867 Euro, or approximately $14,627, which was funded through existing cash. The agreement required us to pay an additional holdback amount 18 months following the date of acquisition and during the three months ended September 2, 2023 we paid $3,060. Fourny, headquartered in Willebroek, Belgium, is a manufacturer of construction adhesives. Fourny is expected to enhance our position in key high-value, high-margin markets in Europe. The acquisition fair value measurement was final as of December 3, 2022 and includes intangible assets of $10,117, goodwill of $6,455 and other net assets of $1,391. Goodwill represents expected synergies from combining Fourny with our existing business. Goodwill is not deductible for tax purposes. Fourny is included in our Construction Adhesives operating segment.
All acquisitions, individually and in the aggregate, are not material and therefore pro forma financial information is not provided.
Note 3: Restructuring Actions
During fiscal year 2023, the Company approved restructuring plans (the "Plans") related to organizational changes and other actions to optimize operations and integrate acquired businesses. The Plans began to be implemented in the second quarter of fiscal year 2023 and are currently expected to be completed during fiscal year 2026, with the majority of the charges recognized and cash payments occurring in fiscal 2023 and 2024. In implementing the Plans, the Company currently expects to incur pre-tax costs of approximately $39,100 to $44,100 for severance and related employee costs globally, other restructuring costs related to the streamlining of processes and the payment of anticipated income taxes in certain jurisdictions related to the Plans.
The following table summarizes the pre-tax distribution of charges under these restructuring plans by income statement classification:
| December 2, 2023 |
December 3, 2022 |
November 27, 2021 |
||||||||||
| Cost of sales |
$ | 15,012 | $ | (152 | ) | $ | (188 | ) | ||||
| Selling, general and administrative |
9,575 | (297 | ) | 975 | ||||||||
| $ | 24,587 | $ | (449 | ) | $ | 787 | ||||||
The restructuring charges are all recorded in Corporate Unallocated for segment reporting purposes.
A summary of the restructuring liability is presented below:
| Employee- |
||||||||||||||||
| Related |
Asset-Related |
Other |
Total |
|||||||||||||
| Balance at November 27, 2021 |
$ | 1,095 | $ | - | $ | - | $ | 1,095 | ||||||||
| Expense incurred |
(449 | ) | - | - | (449 | ) | ||||||||||
| Non-cash charges |
- | - | - | 0 | ||||||||||||
| Cash payments |
(529 | ) | - | - | (529 | ) | ||||||||||
| Foreign currency translation |
(60 | ) | - | - | (60 | ) | ||||||||||
| Balance at December 3, 2022 |
$ | 57 | $ | - | $ | - | $ | 57 | ||||||||
| Expense incurred |
22,731 | 1,369 | 487 | 24,587 | ||||||||||||
| Non-cash charges |
- | (1,369 | ) | (453 | ) | (1,822 | ) | |||||||||
| Cash payments |
(9,802 | ) | - | (34 | ) | (9,836 | ) | |||||||||
| Foreign currency translation |
(1,263 | ) | - | - | (1,263 | ) | ||||||||||
| Balance at December 2, 2023 |
$ | 11,723 | $ | - | $ | - | $ | 11,723 | ||||||||
Non-cash charges include accelerated depreciation resulting from the cessation of use of certain long-lived assets, the recording of a provision related to the discontinuance of certain products and lease termination payments. Restructuring liabilities have been classified as a component of other accrued expenses on the Consolidated Balance Sheets.
Note 4: Supplemental Financial Statement Information
Statement of Income Information
Additional details of income statement amounts for 2023, 2022 and 2021 are as follows:
| 2023 |
2022 |
2021 |
||||||||||
| Foreign currency transaction losses, net |
$ | (11,615 | ) | $ | (12,935 | ) | $ | (5,962 | ) | |||
| Gain (loss) on disposal of assets |
(58 | ) | 1,416 | (648 | ) | |||||||
| Net periodic pension benefit |
20,246 | 26,787 | 32,070 | |||||||||
| Other, net |
1,109 | (2,316 | ) | 7,395 | ||||||||
| Total other income, net |
$ | 9,682 | $ | 12,952 | $ | 32,855 | ||||||
| Research and development expenses (included in SG&A expenses) |
$ | 48,640 | $ | 44,853 | $ | 39,344 | ||||||
Balance Sheet Information
Additional details of balance sheet amounts as of December 2, 2023 and December 3, 2022 are as follows:
| 2023 |
2022 |
|||||||
| Inventories |
||||||||
| Raw materials |
$ | 206,140 | $ | 237,071 | ||||
| Finished goods |
235,900 | 254,710 | ||||||
| Total inventories |
$ | 442,040 | $ | 491,781 | ||||
| Other current assets |
||||||||
| Other receivables |
$ | 40,760 | $ | 36,338 | ||||
| Prepaid income taxes |
12,327 | 27,169 | ||||||
| Prepaid taxes other than income taxes |
34,455 | 29,322 | ||||||
| Prepaid expenses |
25,136 | 27,490 | ||||||
| Total other current assets |
$ | 112,678 | $ | 120,319 | ||||
| Property, plant and equipment |
||||||||
| Land |
$ | 91,320 | $ | 84,320 | ||||
| Buildings and improvements |
447,428 | 405,037 | ||||||
| Machinery and equipment |
1,058,916 | 957,371 | ||||||
| Construction in progress |
157,371 | 133,010 | ||||||
| Total, at cost |
1,755,035 | 1,579,738 | ||||||
| Accumulated depreciation |
(930,380 | ) | (846,071 | ) | ||||
| Net property, plant and equipment |
$ | 824,655 | $ | 733,667 | ||||
| Other assets |
||||||||
| Investments in company owned life insurance |
$ | 9,334 | $ | 8,957 | ||||
| Equity method investments |
37,562 | 42,143 | ||||||
| Equity investments |
1,362 | 1,362 | ||||||
| Long-term deferred income taxes |
42,949 | 39,048 | ||||||
| Prepaid pension costs |
92,323 | 86,616 | ||||||
| Postretirement other than pension asset |
113,431 | 98,848 | ||||||
| Operating lease right-of-use assets |
47,433 | 32,440 | ||||||
| Other long-term receivables |
14,013 | 9,262 | ||||||
| Other long-term assets |
12,758 | 17,192 | ||||||
| Total other assets |
$ | 371,165 | $ | 335,868 | ||||
| Other accrued expenses |
||||||||
| Taxes other than income taxes |
$ | 22,497 | $ | 14,642 | ||||
| Miscellaneous services |
8,319 | 7,092 | ||||||
| Customer rebates |
17,938 | 24,915 | ||||||
| Interest |
5,819 | 7,498 | ||||||
| Product liability |
175 | 154 | ||||||
| Contingent consideration liability |
1,370 | 1,977 | ||||||
| Current operating lease liabilities |
11,277 | 9,794 | ||||||
| Current obligations of finance leases |
16,184 | 1,541 | ||||||
| Accrued expenses |
24,323 | 21,732 | ||||||
| Total other accrued expenses |
$ | 107,902 | $ | 89,345 | ||||
| Other liabilities |
||||||||
| Asset retirement obligations |
$ | 3,147 | $ | 2,888 | ||||
| Long-term deferred income taxes |
176,385 | 183,190 | ||||||
| Long-term income tax liability |
19,225 | 22,202 | ||||||
| Long-term deferred compensation |
9,884 | 9,957 | ||||||
| Postretirement other than pension |
1,893 | 2,021 | ||||||
| Noncurrent operating lease liabilities |
36,879 | 23,421 | ||||||
| Environmental liabilities |
2,563 | 3,064 | ||||||
| Net investment hedge liabilities |
72,589 | 54,046 | ||||||
| Other long-term liabilities |
65,507 | 57,497 | ||||||
| Total other liabilities |
$ | 388,072 | $ | 358,286 | ||||
Additional details on the trade receivables allowance for doubtful accounts, credits related to pricing or quantities shipped and early payment discounts for 2023, 2022 and 2021 are as follows:
| 2023 |
2022 |
2021 |
||||||||||
| Balance at beginning of year |
$ | 10,939 | $ | 9,935 | $ | 12,905 | ||||||
| Charged to expenses and other adjustments |
1,224 | 1,794 | (546 | ) | ||||||||
| Write-offs |
(1,522 | ) | (851 | ) | (2,278 | ) | ||||||
| Foreign currency translation effect |
439 | 61 | (146 | ) | ||||||||
| Balance at end of year |
$ | 11,080 | $ | 10,939 | $ | 9,935 | ||||||
Statement of Comprehensive Income Information
The following tables provides details of total comprehensive income (loss):
| December 2, 2023 |
||||||||||||||||
| Non-controlling |
||||||||||||||||
| H.B. Fuller Stockholders |
Interest |
|||||||||||||||
| Pretax |
Tax |
Net |
Net |
|||||||||||||
| Net income attributable to H.B. Fuller and non-controlling interests |
- | - | $ | 144,906 | $ | 82 | ||||||||||
| Other comprehensive income (loss) |
||||||||||||||||
| Foreign currency translation adjustment1 |
$ | 17,320 | - | 17,320 | 2 | |||||||||||
| Defined benefit pension plans adjustment2 |
1,554 | (762 | ) | 792 | - | |||||||||||
| Interest rate swap3 |
5,932 | (1,460 | ) | 4,472 | - | |||||||||||
| Net investment hedges3 |
(18,555 | ) | 4,448 | (14,107 | ) | - | ||||||||||
| Other comprehensive income (loss) |
$ | 6,251 | $ | 2,226 | $ | 8,477 | $ | 2 | ||||||||
| Comprehensive income |
$ | 153,383 | $ | 84 | ||||||||||||
| December 3, 2022 |
||||||||||||||||
| Non-controlling |
||||||||||||||||
| H.B. Fuller Stockholders |
Interest |
|||||||||||||||
| Pretax |
Tax |
Net |
Net |
|||||||||||||
| Net income attributable to H.B. Fuller and non-controlling interests |
- | - | $ | 180,313 | $ | 94 | ||||||||||
| Other comprehensive income (loss) |
||||||||||||||||
| Foreign currency translation adjustment1 |
$ | (131,745 | ) | - | (131,745 | ) | (61 | ) | ||||||||
| Defined benefit pension plans adjustment2 |
(18,881 | ) | 3,818 | (15,063 | ) | - | ||||||||||
| Interest rate swap3 |
13,148 | (3,224 | ) | 9,924 | - | |||||||||||
| Other cash flow hedges3 |
(3,536 | ) | 53 | (3,483 | ) | - | ||||||||||
| Net investment hedges3 |
(54,040 | ) | 13,297 | (40,743 | ) | - | ||||||||||
| Other comprehensive income |
$ | (195,054 | ) | $ | 13,944 | $ | (181,110 | ) | $ | (61 | ) | |||||
| Comprehensive income |
$ | (797 | ) | $ | 33 | |||||||||||
| November 27, 2021 |
||||||||||||||||
| Non-controlling |
||||||||||||||||
| H.B. Fuller Stockholders |
Interest |
|||||||||||||||
| Pretax |
Tax |
Net |
Net |
|||||||||||||
| Net income attributable to H.B. Fuller and non-controlling interests |
- | - | $ | 161,393 | $ | 82 | ||||||||||
| Other comprehensive income (loss) |
||||||||||||||||
| Foreign currency translation adjustment1 |
$ | (26,262 | ) | - | (26,262 | ) | (32 | ) | ||||||||
| Defined benefit pension plans adjustment2 |
64,912 | (16,731 | ) | 48,181 | - | |||||||||||
| Interest rate swap3 |
20,109 | (4,930 | ) | 15,179 | - | |||||||||||
| Other cash flow hedges3 |
(4,554 | ) | 68 | (4,486 | ) | - | ||||||||||
| Other comprehensive (loss) income |
$ | 54,205 | $ | (21,593 | ) | $ | 32,612 | $ | (32 | ) | ||||||
| Comprehensive income |
$ | 194,005 | $ | 50 | ||||||||||||
1 Income taxes are not provided for foreign currency translation relating to indefinite investments in international subsidiaries.
2 Loss reclassified from accumulated other comprehensive income (loss) into earnings as part of net periodic cost related to pension and other postretirement benefit plans is reported in cost of sales and SG&A expenses.
3 Loss reclassified from accumulated other comprehensive income (loss) into earnings is reported in other income, net.
Statement of Total Equity Information
Components of accumulated other comprehensive income (loss) are as follows:
| December 2, 2023 |
||||||||||||
| Non- |
||||||||||||
| H.B. Fuller |
controlling |
|||||||||||
| Total |
Stockholders |
Interests |
||||||||||
| Foreign currency translation adjustment |
$ | (246,736 | ) | $ | (246,692 | ) | $ | (44 | ) | |||
| Defined benefit pension plans adjustment, net of taxes of $66,982 |
(127,469 | ) | (127,469 | ) | - | |||||||
| Interest rate swap, net of taxes of ($1,460) |
4,472 | 4,472 | - | |||||||||
| Net investment hedges, net of taxes of $17,744 |
(54,850 | ) | (54,850 | ) | - | |||||||
| Reclassification of AOCI tax effects |
(18,341 | ) | (18,341 | ) | - | |||||||
| Total accumulated other comprehensive loss |
$ | (442,924 | ) | $ | (442,880 | ) | $ | (44 | ) | |||
| December 3, 2022 |
||||||||||||
| Non- |
||||||||||||
| H.B. Fuller |
controlling |
|||||||||||
| Total |
Stockholders |
Interests |
||||||||||
| Foreign currency translation adjustment |
$ | (264,054 | ) | $ | (264,012 | ) | $ | (42 | ) | |||
| Defined benefit pension plans adjustment, net of taxes of $67,744 |
(128,261 | ) | (128,261 | ) | - | |||||||
| Net investment hedges, net of taxes of $13,297 |
(40,743 | ) | (40,743 | ) | - | |||||||
| Reclassification of AOCI tax effects |
(18,341 | ) | (18,341 | ) | - | |||||||
| Total accumulated other comprehensive loss |
$ | (451,399 | ) | $ | (451,357 | ) | $ | (42 | ) | |||
| November 27, 2021 |
||||||||||||
| Non- |
||||||||||||
| H.B. Fuller |
controlling |
|||||||||||
| Total |
Stockholders |
Interests |
||||||||||
| Foreign currency translation adjustment |
$ | (132,370 | ) | $ | (132,267 | ) | $ | (103 | ) | |||
| Defined benefit pension plans adjustment, net of taxes of $63,925 |
(113,198 | ) | (113,198 | ) | - | |||||||
| Interest rate swap, net of taxes of $3,224 |
(9,924 | ) | (9,924 | ) | - | |||||||
| Cash flow hedges, net of taxes of ($53) |
3,483 | 3,483 | - | |||||||||
| Reclassification of AOCI tax effects |
(18,341 | ) | (18,341 | ) | - | |||||||
| Total accumulated other comprehensive loss |
$ | (270,350 | ) | $ | (270,247 | ) | $ | (103 | ) | |||
Note 5: Goodwill and Other Intangible Assets
Goodwill balances by reportable segment consisted of the following:
| Hygiene, Health |
||||||||||||||||
| and Consumable |
Engineering |
Construction |
||||||||||||||
| Adhesives |
Adhesives |
Adhesives |
Total |
|||||||||||||
| As of December 3, 2022 |
$ | 328,962 | $ | 637,910 | $ | 425,755 | $ | 1,392,627 | ||||||||
| Acquisitions |
67,523 | 5,983 | 6,179 | 79,685 | ||||||||||||
| Foreign currency translation effect |
6,113 | 7,252 | 835 | 14,200 | ||||||||||||
| As of December 2, 2023 |
$ | 402,598 | $ | 651,145 | $ | 432,769 | $ | 1,486,512 | ||||||||
We evaluate our goodwill for impairment annually at the beginning of the fourth quarter or earlier upon the occurrence of substantive unfavorable changes in economic conditions, industry trends, costs, cash flows, or ongoing declines in market capitalization. The quantitative impairment test requires judgment, including the identification of reporting units, the assignment of assets, liabilities and goodwill to reporting units, and the determination of fair value of each reporting unit. The impairment test requires the comparison of the fair value of each reporting unit with its carrying amount, including goodwill. In performing the impairment test, we determined the fair value of our reporting units through the income approach by using DCF analyses. Determining fair value requires the company to make judgments about appropriate discount rates, perpetual growth rates and the amount and timing of expected future cash flows. The cash flows employed in the DCF analysis for each reporting unit are based on the reporting unit's budget, long-term business plan and recent operating performance. Discount rate assumptions are based on an assessment of the risk inherent in the future cash flows of the respective reporting unit and market conditions. Based on the analysis performed during the fourth quarter of 2023, there were no indications of impairment for any of our reporting units.
Balances of amortizable identifiable intangible assets, excluding goodwill and other non-amortizable intangible assets, are as follows:
| Purchased |
||||||||||||||||||||
| Technology |
Customer |
|||||||||||||||||||
| Amortizable Intangible Assets |
and Patents |
Relationships |
Tradename |
All Other |
Total |
|||||||||||||||
| As of December 2, 2023 |
||||||||||||||||||||
| Original cost |
$ | 144,763 | $ | 986,470 | $ | 58,484 | $ | 10,911 | $ | 1,200,628 | ||||||||||
| Accumulated amortization |
(59,631 | ) | (382,220 | ) | (23,099 | ) | (7,012 | ) | (471,962 | ) | ||||||||||
| Net identifiable intangibles |
$ | 85,132 | $ | 604,250 | $ | 35,385 | $ | 3,899 | $ | 728,666 | ||||||||||
| Weighted-average useful lives (in years) |
13 | 16 | 13 | 13 | 16 | |||||||||||||||
| As of December 3, 2022 |
||||||||||||||||||||
| Original cost |
$ | 118,727 | $ | 1,004,008 | $ | 50,324 | $ | 11,053 | $ | 1,184,112 | ||||||||||
| Accumulated amortization |
(66,433 | ) | (388,394 | ) | (21,401 | ) | (6,251 | ) | (482,479 | ) | ||||||||||
| Net identifiable intangibles |
$ | 52,294 | $ | 615,614 | $ | 28,923 | $ | 4,802 | $ | 701,633 | ||||||||||
| Weighted-average useful lives (in years) |
13 | 17 | 13 | 13 | 16 | |||||||||||||||
Amortization expense with respect to amortizable intangible assets was $79,514, $74,383 and $71,068 in 2023, 2022 and 2021, respectively.
Estimated aggregate amortization expense based on the current carrying value of amortizable intangible assets for the next five fiscal years are as follows:
| Fiscal Year |
2024 |
2025 |
2026 |
2027 |
2028 |
Thereafter |
||||||||||||||||||
| Amortization Expense |
$77,288 | $77,678 | $70,957 | $67,652 | $67,356 | $367,735 | ||||||||||||||||||
The above amortization expense forecast is an estimate. Actual amounts may change from such estimated amounts due to fluctuations in foreign currency exchange rates, additional intangible asset acquisitions, potential impairment, accelerated amortization or other events.
Non-amortizable intangible assets as of December 2, 2023 and December 3, 2022 were $474 and $459, respectively, and relate to trademarks and trade names. The change in non-amortizable assets in 2023 compared to 2022 was due to changes in foreign currency exchange rates.
Note 6: Leases
As a lessee, the company leases office, manufacturing and warehouse space, and equipment. Certain lease agreements include rental payments adjusted annually based on changes in an inflation index. Our leases do not contain material residual value guarantees or material restrictive covenants. Lease expense is recognized on a straight-line basis over the lease term. We determine if an arrangement is a lease upon inception. A contract is or contains a lease if the contract conveys the right to control the use of an identified asset for a period of time in exchange for consideration. The right to control the use of an asset includes the right to obtain substantially all of the economic benefits of the underlying asset and the right to direct how and for what purpose the asset is used.
Operating lease and finance lease right-of-use assets and liabilities are recognized at commencement date based on the present value of lease payments over the lease term. The discount rate used to calculate present value is the company’s incremental borrowing rate. We determine the incremental borrowing rate for each lease based primarily on its lease term and the economic environment of the applicable country or region.
Certain leases include one or more options to renew, with terms that can extend the lease term up to five years. We include options to renew the lease as part of the right-of-use lease asset and liability when it is reasonably certain we will exercise the option. In addition, certain leases contain termination options with an associated penalty. In general, the company is not reasonably certain to exercise such options.
For the measurement and classification of lease agreements, we group lease and non-lease components into a single lease component for all underlying asset classes. Variable lease payments primarily include payments for non-lease components, such as maintenance costs, payments for leased assets used beyond their non-cancelable lease term as adjusted for contractual options to terminate or renew, and payments for non-components such as sales tax. Certain leases contain immaterial variable lease payments based on usage.
The components of lease expense are as follows:
| December 2, 2023 |
December 3, 2022 |
|||||||
| Operating lease cost |
$ | 13,883 | $ | 12,026 | ||||
| Finance lease cost: |
||||||||
| Amortization of assets |
2,045 | 1,535 | ||||||
| Interest on lease liabilities |
1,077 | 261 | ||||||
| Variable lease cost |
8,554 | 6,481 | ||||||
| Total net lease cost |
$ | 25,559 | $ | 20,303 | ||||
Supplemental balance sheet information related to leases is as follows:
| Location on |
|||||||||
| Balance Sheet |
December 2, 2023 |
December 3, 2022 |
|||||||
| Operating leases: |
|||||||||
| Operating lease right-of-use assets |
Other assets |
$ | 47,433 | $ | 32,440 | ||||
| Current operating lease liabilities |
Other accrued expenses |
11,277 | 9,794 | ||||||
| Noncurrent operating lease liabilities |
Other liabilities |
36,879 | 23,421 | ||||||
| Total operating lease liabilities |
$ | 48,156 | $ | 33,215 | |||||
| Finance leases: |
|||||||||
| Equipment right-of-use assets |
Property, plant and equipment |
$ | 11,681 | $ | 11,150 | ||||
| Building right-of-use asset |
Property, plant and equipment |
$ | 14,230 | $ | - | ||||
| Current obligations of finance leases |
Other accrued expenses |
$ | 16,184 | $ | 1,541 | ||||
| Finance leases, net of current obligations |
Other liabilities |
6,534 | 7,507 | ||||||
| Total finance lease liabilities |
$ | 22,718 | $ | 9,048 | |||||
As of December 2, 2023, the weighted average remaining lease term is 9.4 years and the weighted average discount rate is 4.2% for the company's operating lease agreements. The weighted average remaining lease term is 4.0 years and the weighted average discount rate is 5.9% for the company's finance lease agreements.
Supplemental information related to leases is as follows:
| December 2, 2023 |
December 3, 2022 |
|||||||
| Cash paid amounts included in the measurement of lease liabilities: |
||||||||
| Operating cash flows from operating leases |
$ | 11,745 | $ | 15,209 | ||||
| Operating cash flows from finance leases |
1,077 | 261 | ||||||
| Financing cash flows from finance leases |
268 | 607 | ||||||
| Non-cash investing and financing activities - |
||||||||
| additions to right-of-use assets obtained from: |
||||||||
| New operating lease liabilities |
$ | 26,687 | $ | 15,442 | ||||
| New finance lease liabilities |
15,015 | 1,258 | ||||||
Maturities of lease liabilities are as follows:
| December 2, 2023 |
||||||||
| Fiscal Year |
Finance Leases |
Operating Leases |
||||||
| 2024 |
$ | 16,535 | $ | 12,993 | ||||
| 2025 |
1,618 | 9,452 | ||||||
| 2026 |
1,441 | 7,085 | ||||||
| 2027 |
1,151 | 5,126 | ||||||
| 2028 |
684 | 3,505 | ||||||
| 2029 and beyond |
2,376 | 18,869 | ||||||
| Total |
23,805 | 57,031 | ||||||
| Less: amounts representing interest |
(1,087 | ) | (8,875 | ) | ||||
| Present value of future minimum payments |
22,718 | 48,156 | ||||||
| Less: current obligations |
(16,184 | ) | (11,277 | ) | ||||
| Noncurrent lease liabilities |
$ | 6,534 | $ | 36,879 | ||||
Note 7: Notes Payable, Long-Term Debt and Lines of Credit
Notes Payable
Notes payable were $1,841 and $28,860 at December 2, 2023 and December 3, 2022, respectively. This amount primarily represents various foreign subsidiaries’ other short-term borrowings that were not part of committed lines. The weighted-average interest rates on short-term borrowings outstanding at December 2, 2023 were approximately 10.75 percent, 16.2 percent in 2022 and 8.1 percent in 2021. Fair values of these short-term obligations approximate their carrying values due to their short maturity. There were no funds drawn from the short-term committed lines at December 2, 2023.
Long-Term Debt
| Weighted-Average |
Fiscal Year |
Balance at |
Balance at |
|||||||||||||
| Interest Rate at |
Maturity |
December 2, |
December 3, |
|||||||||||||
| Long-Term Debt |
December 2, 2023 |
Date |
2023 |
2022 |
||||||||||||
| Revolving credit facility |
6.95 | % | 2028 | $ | - | $ | 175,500 | |||||||||
| Term Loan A1 |
6.95 | % | 2028 | 487,500 | - | |||||||||||
| Term Loan B2 |
7.60 | % | 2030 | 796,000 | 1,001,150 | |||||||||||
| Public Notes3 |
4.00 | % | 2027 | 300,000 | 300,000 | |||||||||||
| Public Notes4 |
4.25 | % | 2028 | 300,000 | 300,000 | |||||||||||
| Other, including debt issuance cost and discount |
(46,910 | ) | (40,394 | ) | ||||||||||||
| Total debt |
$ | 1,836,590 | $ | 1,736,256 | ||||||||||||
| Less: current maturities |
- | - | ||||||||||||||
| Total long-term debt, excluding current maturities |
$ | 1,836,590 | $ | 1,736,256 | ||||||||||||
1 Term Loan A, due on February 15, 2028, $500,000 variable rate at the Secured Overnight Financing Rate ("SOFR") plus an adjustment of 0.10 percent and an interest rate spread of 1.50 percent based on a leverage grid (6.95 percent at December 2, 2023).
2 Term Loan B, due on February 15, 2030, $800,000 variable rate at the SOFR plus 2.25 percent with a SOFR floor of 0.50 percent (7.60 percent at December 2, 2023).
3 Public Notes, due February 15, 2027, $300,000 4.00 percent fixed.
4 Public Notes, due October 15, 2028, $300,000 4.25 percent fixed; swapped to a floating rate as detailed below.
On February 15, 2023, we entered into a credit agreement with a consortium of financial institutions (“Second Amended and Restated Credit Agreement”) which replaces our existing revolving credit agreement under the amended and restated revolving credit agreement dated October 20, 2020 and also replaces our secured term loan credit agreement dated October 20, 2017. The Second Amended and Restated Credit Agreement provides for a new senior secured term loan A facility in an aggregate principal amount of $500,000 (“Term Loan A”), a new senior secured term loan B facility in an aggregate principal amount of $800,000 (“Term Loan B”) and amendments to and extension of our existing senior secured revolving credit facility with an aggregate commitment in the amount of $700,000 (“Revolving Credit Facility”). A portion of the proceeds of the combined facilities, (the “Credit Facilities”) was used to pay off the existing term loan and revolver. Additionally, we wrote off $2,689 of debt issuance costs related to this payoff which was recorded in interest expense for the year ended December 2, 2023. The Credit Facilities will generally be used to finance working capital needs and acquisitions, and for general corporate purposes. All of our obligations under the Credit Facilities are secured by a first-lien security interest in substantially all personal property and material real property of the Company and its material U.S. subsidiaries, and are guaranteed by all of the Company’s material U.S. subsidiaries.
Term Loans
Interest on Term Loan A is payable at a rate of SOFR plus an adjustment of 0.10 percent and an interest rate spread of 1.50 percent (6.95 percent at December 2, 2023). The interest rate spread is based on a secured leverage grid. Term Loan A matures on February 15, 2028. At December 2, 2023, a balance of $487,500 was outstanding on the Term Loan A. On August 16, 2023, we amended the Term Loan B agreement to an interest rate of SOFR plus an interest rate spread of 2.25 percent with a SOFR floor of 0.50 percent (7.60 percent at December 2, 2023). Term Loan B matures on February 15, 2030. At December 2, 2023, a balance of $796,000 was outstanding on the Term Loan B.
On January 12, 2023, we entered into an interest rate swap agreement to convert $400,000 of our variable rate 1-month LIBOR rate debt to a fixed rate of 3.6895 percent. On February 28, 2023, after entering into the Second Amended and Restated Credit Agreement, we amended the interest rate swap agreement to 1-month SOFR and a fixed rate of 3.7260 in accordance with the practical expedients included in ASC 848, Reference Rate Reform. See Note 12 for further discussion of this interest rate swap.
On March 16, 2023, we entered into an interest rate swap agreement to convert $300,000 of our 1-month SOFR rate debt to a fixed rate of 3.7210 percent and to convert $100,000 of our 1-month SOFR rate debt to a fixed rate of 3.8990 percent. See Note 12 for further discussion of this interest rate swap.
Public Notes
On February 14, 2017, we issued $300,000 aggregate principal of 10-year unsecured public notes (“10-year Public Notes”) due February 15, 2027 with a fixed coupon of 4.00 percent. Proceeds from this debt issuance were used to repay $138,000 outstanding under the revolving credit facility at that time and prepay $158,750 of our Term Loan A under the credit agreement at that time. On February 14, 2017, we entered into an interest rate swap agreement to convert $150,000 of the 10-year Public Notes to a variable interest rate of 1-month LIBOR plus 1.86 percent and on May 1, 2020, we terminated the swap. See Note 12 for further discussion of this interest rate swap.
On October 20, 2020, we issued $300,000 aggregate principal of 8-year unsecured public notes (“8-year Public Notes”) due October 15, 2028 with a fixed coupon of 4.25 percent. Proceeds from this debt issuance were used to prepay $300,000 of our Term Loan B at that time. On February 12, 2021, we entered into interest rate swap agreements to convert our 8-year Public Notes to a variable interest rate of 1-month LIBOR plus 3.28 percent. See Note 12 for further discussion of these interest rate swaps.
The Public Notes are senior unsecured obligations of the company and will rank equally with the company’s other unsecured and unsubordinated debt from time to time outstanding.
Fair Value of Long-Term Debt
Long-term debt had an estimated fair value of $1,785,199 and $1,713,257 as of December 2, 2023 and December 3, 2022, respectively. The fair value of long-term debt is based on quoted market prices for the same or similar issues or on the current rates offered for debt of similar maturities. The estimated fair value of these long-term obligations is not necessarily indicative of the amount that would be realized in a current market exchange.
Long-term Debt Maturities
Maturities of long-term debt for the next five fiscal years are as follows:
| Fiscal Year |
2024 |
2025 |
2026 |
2027 |
2028 |
Thereafter |
||||||||||||||||||
| Long-term debt obligations |
$ | - | $ | - | $ | - | $ | 300,000 | $ | 787,500 | $ | 796,000 | ||||||||||||
Revolving Credit Facility
Interest on the Revolving Credit Facility is payable at SOFR plus an adjustment of 0.10 percent and an interest rate spread of 1.50 percent (6.95 percent at December 2, 2023). A facility fee of 20 basis points of the unused commitment under the Revolving Credit Facility is payable quarterly. The interest rate spread and the facility fee are based on a secured leverage grid. At December 2, 2023, there was no balance outstanding on the Revolving Credit Facility. The Revolving Credit Facility matures on February 15, 2028.
As of December 2, 2023, amounts related to our revolving credit facility was as follows:
| Committed |
Drawn |
Unused |
||||||||||
| Revolving credit facility |
$ | 700,000 | $ | - | $ | 690,032 | ||||||
The secured, multi-currency revolving credit facility can be drawn upon for general corporate purposes up to a maximum of $700,000, less issued letters of credit. At December 2, 2023, letters of credit reduced the available amount under the revolving credit facility by $9,968.
Covenants and Other
Under the Second Amended and Restated Credit Agreement, the Revolving Credit Facility and Term Loan A are subject to certain covenants and restrictions. For these facilities, we are required to maintain a secured leverage ratio, as defined in the agreement, no greater than 4.75 to 1.00 for our fiscal quarters ending on or prior to June 1, 2024 and then 4.50 to 1.00 thereafter. We are also required to maintain an interest coverage ratio of not less than 2.00 to 1.00.
Restrictive covenants include, but are not limited to, limitations on secured and unsecured borrowings, interest coverage, intercompany transfers and investments, third party investments, dispositions of assets, leases, liens, dividends and distributions, and contains a maximum total debt to trailing twelve months EBITDA requirement. Certain covenants become less restrictive after meeting leverage or other financial ratios. In addition, we cannot be a member of any consolidated group as defined for income tax purposes other than with our subsidiaries.
We are subject to mandatory prepayments in the first quarter of each fiscal year equal to 50 percent of Excess Cash Flow, as defined in the Second Amended and Restated Credit Agreement, of the prior fiscal year less any voluntary prepayments made during that fiscal year. The Excess Cash Flow Percentage shall be reduced to 25 percent when our Secured Leverage Ratio is below 4.25:1.00 and to 0 percent when our Secured Leverage Ratio is below 3.75:1.00.
The principal balance of the Term Loan B loans will be repayable in equal quarterly installments in an aggregate annual amount equal to 1 percent of the original principal amount thereof, with the balance due at maturity on February 15, 2030. The principal balance of the Term Loan A loans will be repayable in quarterly installments as follows: (i) with respect to the first eight fiscal quarters ended after the effective date of the Second Amended and Restated Credit Agreement, 1.25 percent of the aggregate principal amount of the original principal of the Term Loan A loans, (ii) with respect to the eight fiscal quarters ended after the end of the period set forth in the preceding clause (i), 1.875 percent of the aggregate principal amount of the original principal amount of the Term Loan A loans, and (iii) thereafter, 2.5 percent of the original principal amount of the Term Loan A loans, with the balance due at maturity on February 15, 2028.
The Indenture under which the Public Notes have been issued contains covenants imposing certain limitations on the ability of the company to incur liens or enter into sales and leaseback transactions. It also provides for customary events of default (subject in certain cases to customary grace and cure periods), which include among other things nonpayment, breach of covenants in the Indenture and certain events of bankruptcy and insolvency. If an event of default occurs and is continuing with respect to the Public Notes, the Trustee or holders of at least 25% in principal amount outstanding of the Public Notes may declare the principal and the accrued and unpaid interest, if any, on all of the outstanding Public Notes to be due and payable. These covenants and events of default are subject to a number of important qualifications, limitations and exceptions that are described in the Indenture.
Note 8: Stockholders' Equity
Preferred Stock
The Board of Directors is authorized to issue up to 10,045,900 shares of preferred stock that may be issued in one or more series and with such stated value and terms as the Board of Directors may determine.
Common Stock
There were 160,000,000 shares of common stock with a par value of $1.00 authorized and 54,092,987 and 53,676,576 shares issued and outstanding at December 2, 2023 and December 3, 2022, respectively.
On April 7, 2022, the Board of Directors authorized a new share repurchase program of up to $300,000 of our outstanding common shares for a period of up to five years. Under the program, we are authorized to repurchase shares for cash on the open market, from time to time, in privately negotiated transactions or block transactions, or through an accelerated repurchase agreement. The timing of such repurchases is dependent on price, market conditions and applicable regulatory requirements. Upon repurchase of the shares, we reduce our common stock for the par value of the shares with the excess being applied against additional paid-in capital. This authorization replaces the April 6, 2017 authorization to repurchase shares. We did not repurchase any shares during 2023, 2022 and 2021 under our share repurchase program. Up to $300,000 of our outstanding common shares may still be repurchased under the current share repurchase program.
| Common Shares Outstanding |
2023 |
2022 |
2021 |
|||||||||
| Beginning balance |
53,676,576 | 52,777,753 | 51,906,663 | |||||||||
| Stock options exercised |
314,832 | 657,789 | 740,731 | |||||||||
| Deferred compensation paid |
102,108 | 118,429 | 19,895 | |||||||||
| Restricted units vested |
113,339 | 172,474 | 157,945 | |||||||||
| Shares withheld for taxes |
(113,868 | ) | (49,869 | ) | (47,481 | ) | ||||||
| Ending balance |
54,092,987 | 53,676,576 | 52,777,753 | |||||||||
Note 9: Accounting for Share-Based Compensation
Overview
We have various share-based compensation programs, which provide for equity awards including non-qualified stock options, incentive stock options, restricted stock units, performance awards and deferred compensation. These equity awards fall under several plans and are described below.
Share-based Compensation Plans
We currently grant stock options and restricted stock units under equity compensation and deferred compensation plans.
Stock options are granted to officers and key employees at prices not less than the fair market value at the date of grant. Non-qualified stock options are generally exercisable beginning one year from the date of grant in cumulative yearly amounts of 33.3 percent. Incentive stock options are based on certain performance-based criteria and are generally exercisable at a stated date when the performance criteria is measured. Stock options generally have a contractual term of 10 years. Options exercised represent newly issued shares.
Restricted stock awards are nonvested stock-based awards that include grants of restricted stock units. Restricted stock awards are independent of option grants and are subject to forfeiture if employment terminates prior to the release of the restrictions. Time-based restricted stock awards generally vest beginning one year from the date of grant or 33.3 percent per year for three years, depending on the grant. Performance-based restricted stock awards vest three years from the date of grant. During the vesting period, ownership of the shares cannot be transferred.
Restricted stock units have dividend equivalent rights equal to the cash dividend paid on restricted stock shares. However, restricted stock units do not have voting rights of common stock and are not considered issued and outstanding upon grant. Restricted stock units become newly issued shares when vested. The dividend equivalent rights for restricted stock units are forfeitable.
We expense the cost, which is the grant date fair market value, of the restricted stock units ratably over the period during which the restrictions lapse. The grant date fair value is our closing stock price on the date of grant.
We are required to recognize compensation expense when an employee is eligible to retire. We consider employees eligible to retire at age 55 and after 10 years of service. Awards granted to retirement-eligible employees are forfeited if the retirement-eligible employees retire prior to 180 days after the grant. Accordingly, the related compensation expense is recognized during the 180 day period for awards granted to retirement-eligible employees or over the period from the grant date to the date retirement eligibility is achieved, if less than the stated vesting period.
2020 Master Incentive Plan
This plan allows for granting of awards to any employee, officer, non-employee director, consultant, independent contractor or advisor providing services to us or any of our affiliates, or any person to whom an offer of employment or engagement with us or any of our affiliates has been made. The plan permits granting of (a) stock options; (b) stock appreciation rights; (c) restricted stock and restricted stock units; (d) performance awards; (e) dividend equivalents; (f) other awards based on our common stock, including shares for amounts employees or non-employee directors deferred under the deferred compensation plans. There were 3,413,652 common shares available for grant as of December 2, 2023.
2018 Master Incentive Plan
This plan allows for granting of awards to employees. The plan permits granting of (a) stock options; (b) stock appreciation rights; (c) restricted stock and restricted stock units; (d) performance awards; (e) dividend equivalents; (f) other awards based on our common stock, including shares for amounts employees deferred under the Key Employee Deferred Compensation Plan.
Year 2016 Master Incentive Plan
This plan allows for granting of awards to employees. The plan permits granting of (a) stock options; (b) stock appreciation rights; (c) restricted stock awards; (d) performance awards; (e) dividend equivalents; and (f) other awards based on our common stock, including shares for amounts employees deferred under the Key Employee Deferred Compensation Plan.
2009 Directors’ Stock Incentive Plan
This plan permits granting of (a) shares for amounts non-employee directors defer under the Directors’ Deferred Compensation Plan and (b) discretionary grants of restricted stock, stock options, stock appreciation rights, performance awards and other stock awards.
Directors' Deferred Compensation Plan
This plan allows non-employee directors to defer all or a portion of their retainer and meeting fees in a number of investment choices, including units representing shares of our common stock. We provide a 10 percent match on deferred compensation invested in these units. These units are required to be paid out in our common stock.
Key Employee Deferred Compensation Plan
This plan allows key employees to defer a portion of their eligible compensation in a number of investment choices, including units representing shares of company common stock. We provide a 10 percent match on deferred compensation invested in these units.
Grant-Date Fair Value
We use the Black-Scholes option-pricing model to calculate the grant-date fair value of stock option awards. The fair value of options granted during 2023, 2022 and 2021 were calculated using the following assumptions:
| 2023 |
2022 |
2021 |
||||||||||
| Expected life (in years) |
5.00 | 5.00 | 5.00 | |||||||||
| Weighted-average expected volatility |
35.28 | % | 33.35 | % | 32.50 | % | ||||||
| Expected volatility range |
35.09-35.69 | % | 33.33-34.34 | % | 32.48% - 32.94% | |||||||
| Risk-free interest rate |
3.48-4.72 | % | 1.53-4.06 | % | 0.39% - 1.20% | |||||||
| Weighted-average expected dividend |
1.20 | % | 0.95 | % | 1.26 | % | ||||||
| Expected dividend yield range |
1.13-1.22 | % | 0.94-1.23 | % | 0.92% - 1.27% | |||||||
| Weighted-average fair value of grants |
$ | 22.41 | $ | 20.91 | $ | 13.29 | ||||||
Expected life – We use historical employee exercise and option expiration data to estimate the expected life assumption for the Black-Scholes grant-date valuation. We believe that this historical data is currently the best estimate of the expected term of a new option. We use a weighted-average expected life for all awards.
Expected volatility – Volatility is calculated using our stock’s historical volatility for the same period of time as the expected life. We have no reason to believe that its future volatility will differ from the past.
Risk-free interest rate – The rate is based on the U.S. Treasury yield curve in effect at the time of the grant for the same period of time as the expected life.
Expected dividend yield – The calculation is based on the total expected annual dividend payout divided by the closing stock price on the date of grant.
Expense
We use the straight-line attribution method to recognize share-based compensation expense for option awards and restricted stock units with graded and cliff vesting. Incentive stock options and performance awards are based on certain performance-based metrics and the expense is adjusted quarterly, based on our projections of the achievement of those metrics. The amount of share-based compensation expense recognized during a period is based on the value of the portion of the awards that are ultimately expected to vest. The expense is recognized over the requisite service period, which for us is the period between the grant date and the earlier of the award’s stated vesting term or the date the employee is eligible for early vesting based on the terms of the plans.
Total share-based compensation expense was $19,911, $24,368 and $22,366 for 2023, 2022 and 2021, respectively. All share-based compensation was recorded as SG&A expense.
As of December 2, 2023, $7,526 of unrecognized compensation costs related to unvested stock option awards is expected to be recognized over a weighted-average period of 0.9 years. Unrecognized compensation costs related to unvested restricted stock units was $8,940 which is expected to be recognized over a weighted-average period of 0.68 years.
Stock Option Activity
The stock option activity for the years ended December 2, 2023, December 3, 2022, and November 27, 2021 is summarized below:
| Weighted- |
||||||||
| Average |
||||||||
| Options |
Exercise Price |
|||||||
| Outstanding at November 28, 2020 |
5,545,915 | $ | 47.34 | |||||
| Granted |
1,237,094 | 53.33 | ||||||
| Exercised |
(740,731 | ) | 43.64 | |||||
| Forfeited or cancelled |
(1,069,886 | ) | 56.33 | |||||
| Outstanding at November 27, 2021 |
4,972,392 | $ | 47.45 | |||||
| Granted |
549,458 | 72.75 | ||||||
| Exercised |
(657,789 | ) | 45.79 | |||||
| Forfeited or cancelled |
(40,991 | ) | 61.31 | |||||
| Outstanding at December 3, 2022 |
4,823,070 | $ | 50.42 | |||||
| Granted |
471,975 | 68.27 | ||||||
| Exercised |
(314,832 | ) | 46.43 | |||||
| Forfeited or cancelled |
(38,328 | ) | 63.52 | |||||
| Outstanding at December 2, 2023 |
4,941,885 | $ | 52.28 | |||||
The fair value of options granted during 2023, 2022 and 2021 was $10,577, $5,400 and $17,250, respectively. Total intrinsic value of options exercised during 2023, 2022 and 2021 was $8,015, $16,877 and $15,261, respectively. For options outstanding at December 2, 2023, the weighted-average remaining contractual life was 5.6 years and the aggregate intrinsic value was $121,640. There were 3,926,049 options exercisable at December 2, 2023, with a weighted-average remaining contractual life of 4.9 years and an aggregate intrinsic value of $108,853. Intrinsic value is the difference between our closing stock price on the respective trading day and the exercise price, multiplied by the number of options exercised. Proceeds received from option exercises during the year ended December 2, 2023, December 3, 2022, and November 27, 2021 were $14,619, $30,122 and $32,325, respectively. The company’s actual tax benefits realized for the tax deductions related to the exercise of stock options for 2023, 2022 and 2021 was $1,885, $3,687 and $3,874, respectively.
Restricted Stock Unit Activity
The nonvested restricted stock unit activity for the years ended December 2, 2023, December 3, 2022, and November 27, 2021 is summarized below:
| Weighted- |
||||||||||||
| Weighted- |
Average |
|||||||||||
| Average |
Remaining |
|||||||||||
| Grant |
Contractual |
|||||||||||
| Date Fair |
Life |
|||||||||||
| Units |
Value |
(in Years) |
||||||||||
| Nonvested at November 28, 2020 |
432,349 | $ | 46.22 | 0.8 | ||||||||
| Granted |
356,779 | 54.49 | 3.2 | |||||||||
| Vested |
(157,945 | ) | 48.69 | - | ||||||||
| Forfeited |
(78,818 | ) | 47.79 | 0.8 | ||||||||
| Nonvested at November 27, 2021 |
$ | 552,365 | $ | 50.63 | 1.9 | |||||||
| Granted |
179,603 | 67.92 | 3.2 | |||||||||
| Vested |
(172,474 | ) | 46.74 | - | ||||||||
| Forfeited |
(68,374 | ) | 45.83 | 0.1 | ||||||||
| Nonvested at December 3, 2022 |
$ | 491,120 | $ | 58.98 | 0.7 | |||||||
| Granted |
187,185 | 63.32 | 2.2 | |||||||||
| Vested |
(113,339 | ) | 53.83 | - | ||||||||
| Forfeited |
(36,276 | ) | 44.48 | 0.2 | ||||||||
| Nonvested at December 2, 2023 |
$ | 528,690 | $ | 62.61 | 0.7 | |||||||
Total fair value of restricted stock units vested during 2023, 2022, and 2021 was $6,101, $8,062 and $7,691, respectively. The total fair value of nonvested restricted stock at December 2, 2023 was $33,101.
We indirectly repurchased 37,715, 55,081 and 50,799 shares during 2023, 2022 and 2021, respectively, through a net-settlement feature in connection with the statutory minimum tax withholding related to vesting of restricted stock. The company’s actual tax benefits realized for the tax deductions related to the restricted stock vested for 2023, 2022 and 2021 was $1,396, $2,569 and $1,439, respectively.
Deferred Compensation Activity
Deferred compensation units are fully vested at the date of contribution. The deferred compensation units outstanding for the years ended December 2, 2023, December 3, 2022, and November 27, 2021 is summarized below:
| Non-employee |
||||||||||||
| Directors |
Employees |
Total |
||||||||||
| Units outstanding November 28, 2020 |
455,265 | 44,553 | 499,818 | |||||||||
| Participant contributions |
13,036 | 10,487 | 23,523 | |||||||||
| Company match contributions1 |
20,118 | 1,049 | 21,167 | |||||||||
| Payouts |
(19,895 | ) | (7,728 | ) | (27,623 | ) | ||||||
| Units outstanding November 27, 2021 |
468,524 | 48,361 | 516,885 | |||||||||
| Participant contributions |
89,054 | 12,985 | 102,039 | |||||||||
| Company match contributions1 |
26,843 | 1,299 | 28,142 | |||||||||
| Payouts |
(118,429 | ) | (6,073 | ) | (124,502 | ) | ||||||
| Units outstanding December 3, 2022 |
465,992 | 56,572 | 522,564 | |||||||||
| Participant contributions |
13,187 | 12,219 | 25,406 | |||||||||
| Company match contributions1 |
18,899 | 1,222 | 20,121 | |||||||||
| Payouts |
(102,108 | ) | (6,826 | ) | (108,934 | ) | ||||||
| Units outstanding December 2, 2023 |
395,970 | 63,187 | 459,157 | |||||||||
1 The non-employee directors’ company match includes 17,580, 17,937 and 18,814 deferred compensation units paid as discretionary awards to all non-employee directors in 2023, 2022 and 2021, respectively.
The fair value of non-employee directors’ company matches for 2023, 2022 and 2021 was $172, $172 and $163, respectively. The fair value of the non-employee directors’ discretionary award was $1,200, $1,080 and $1,215 for 2023, 2022 and 2021, respectively. The fair value of employee company matches was $79, $86 and $61 for 2023, 2022 and 2021, respectively.
Note 10: Pension and Postretirement Benefits
Defined Contribution Plan
All U.S. employees have the option of contributing up to 75 percent of their pre-tax earnings to a 401(k) plan, subject to IRS limitations. We match up to the first 4 percent of each employee's pre-tax earnings, based on the employee’s contributions. All U.S. employees are eligible for a separate annual non-discretionary retirement contribution to the 401(k) plan of 1 percent of pay, that is invested based on the election of the individual participant. The 1 percent contribution is in addition to our 4 percent matching contribution described above and is in lieu of participation in our defined benefit pension plan. The total contribution to the 401(k) plan for 2023 was $14,221 which included the cost of the 4 percent company match of $9,853 and the additional 1 percent contribution of $4,368. The total contributions to the 401(k) plan were $12,113 and $12,488 in 2022 and 2021, respectively.
All U.S. employees are eligible to receive an annual discretionary non-elective contribution to the 401(k) plan of up to 3 percent based on achieving the company’s earnings per share target. This discretionary contribution is in addition to the contributions described above. There was no discretionary non-elective contribution for 2023 and a discretionary non-elective contribution of $950 was accrued for 2022.
The defined contribution plan liability recorded in the Consolidated Balance Sheets was $11,626 and $12,263 in 2023 and 2022, respectively, for the U.S. Plan and several statutorily required non-U.S. Plans.
Defined Benefit Plans
Noncontributory defined benefit pension plans cover all U.S. employees employed prior to January 1, 2007. Benefits for these plans are based primarily on each employee’s years of service and average compensation. During 2011, we made significant changes to our U.S. pension plan. The changes included: benefits under the plan were locked-in using service and salary as of May 31, 2011, participants no longer earn benefits for future service and salary as they had in the past, affected participants receive a three percent increase to the locked-in benefit for every year they continue to work for us and we are making a retirement contribution of three percent of eligible compensation to the 401(k) Plan for those participants. The funding policy is consistent with the funding requirements of federal law and regulations. Plan assets consist principally of listed equity securities and bonds. During 2020, we amended the U.S. pension plan to add a program for eligible employees to take a lump sum distribution. No amounts were paid under this program in 2023 or 2022. Other U.S. postretirement benefits are funded through a Voluntary Employees' Beneficiaries Association Trust.
Health care and life insurance benefits are provided for eligible retired employees and their eligible dependents. These benefits are provided through various insurance companies and health care providers. Costs are accrued during the years the employee renders the necessary service.
Certain non-U.S. subsidiaries provide pension benefits for their employees consistent with local practices and regulations. These plans are primarily defined benefit plans covering substantially all employees upon completion of a specified period of service. Benefits for these plans are generally based on years of service and annual compensation.
Following is a reconciliation of the beginning and ending balances of the benefit obligation and fair value of plan assets as of December 2, 2023 and December 3, 2022:
| Pension Benefits |
Other Postretirement |
|||||||||||||||||||||||
| U.S. Plans |
Non-U.S. Plans |
Benefits |
||||||||||||||||||||||
| 2023 |
2022 |
2023 |
2022 |
2023 |
2022 |
|||||||||||||||||||
| Change in projected benefit obligation |
||||||||||||||||||||||||
| Benefit obligation at beginning of year |
$ | 269,874 | $ | 361,212 | $ | 154,850 | $ | 238,400 | $ | 24,173 | $ | 31,262 | ||||||||||||
| Service cost |
- | - | 1,670 | 2,765 | - | - | ||||||||||||||||||
| Interest cost |
13,901 | 9,653 | 5,726 | 2,893 | 1,205 | 748 | ||||||||||||||||||
| Participant contributions |
- | - | - | - | 232 | 296 | ||||||||||||||||||
| Actuarial gain1 |
(7,298 | ) | (80,296 | ) | (12,435 | ) | (57,159 | ) | (611 | ) | (5,395 | ) | ||||||||||||
| Curtailments |
- | - | - | 231 | - | - | ||||||||||||||||||
| Settlement payments |
(141 | ) | (200 | ) | (252 | ) | (7,988 | ) | - | - | ||||||||||||||
| Benefits paid |
(20,946 | ) | (20,495 | ) | (7,663 | ) | (8,370 | ) | (2,866 | ) | (2,738 | ) | ||||||||||||
| Foreign currency translation effect |
- | - | 4,900 | (15,922 | ) | - | - | |||||||||||||||||
| Benefit obligation at end of year |
255,390 | 269,874 | 146,796 | 154,850 | 22,133 | 24,173 | ||||||||||||||||||
| Change in plan assets |
||||||||||||||||||||||||
| Fair value of plan assets at beginning of year |
326,786 | 409,811 | 141,908 | 216,623 | 120,782 | 135,701 | ||||||||||||||||||
| Actual return on plan assets |
12,811 | (63,562 | ) | (5,545 | ) | (45,328 | ) | 15,160 | (12,613 | ) | ||||||||||||||
| Employer contributions |
1,228 | 1,232 | 1,744 | 1,640 | 145 | 136 | ||||||||||||||||||
| Participant contributions |
- | - | - | - | 232 | 296 | ||||||||||||||||||
| Settlement payments |
(141 | ) | (200 | ) | - | - | - | - | ||||||||||||||||
| Benefits paid2 |
(20,946 | ) | (20,495 | ) | (7,663 | ) | (8,369 | ) | (2,866 | ) | (2,738 | ) | ||||||||||||
| Foreign currency translation effect |
- | - | 4,178 | (22,658 | ) | - | - | |||||||||||||||||
| Fair value of plan assets at end of year |
319,738 | 326,786 | 134,622 | 141,908 | 133,453 | 120,782 | ||||||||||||||||||
| Plan assets in excess of (less than) benefit obligation as of year end |
$ | 64,348 | $ | 56,912 | $ | (12,174 | ) | $ | (12,942 | ) | $ | 111,320 | $ | 96,608 | ||||||||||
1 Actuarial gain in 2023 and 2022 for the U.S. Plans is primarily due to assumption changes. Actuarial gain in 2023 and 2022 for the Non-U.S. Plans are due to both assumption changes and plan experience.
2 Amount excludes benefit payments made from sources other than plan assets.
| Amounts in accumulated other comprehensive income (loss) that have not been recognized as components of net periodic benefit cost |
Pension Benefits |
Other Postretirement |
||||||||||||||||||||||
| U.S. Plans |
Non-U.S. Plans |
Benefits |
||||||||||||||||||||||
| 2023 |
2022 |
2023 |
2022 |
2023 |
2022 |
|||||||||||||||||||
| Unrecognized actuarial loss (gain) |
$ | 143,522 | $ | 137,351 | $ | 49,128 | $ | 49,306 | $ | (14,442 | ) | $ | (8,530 | ) | ||||||||||
| Unrecognized prior service cost |
- | - | 1,196 | 1,219 | - | - | ||||||||||||||||||
| Ending balance |
$ | 143,522 | $ | 137,351 | $ | 50,324 | $ | 50,525 | $ | (14,442 | ) | $ | (8,530 | ) | ||||||||||
| Pension Benefits |
Other Postretirement |
|||||||||||||||||||||||
| U.S. Plans |
Non-U.S. Plans |
Benefits |
||||||||||||||||||||||
| 2023 |
2022 |
2023 |
2022 |
2023 |
2022 |
|||||||||||||||||||
| Statement of financial position as of fiscal year-end |
||||||||||||||||||||||||
| Non-current assets |
$ | 76,677 | $ | 69,826 | $ | 15,635 | $ | 16,790 | $ | 113,431 | $ | 98,848 | ||||||||||||
| Accrued benefit cost |
||||||||||||||||||||||||
| Current liabilities |
(1,239 | ) | (1,248 | ) | (1,464 | ) | (1,727 | ) | (218 | ) | (218 | ) | ||||||||||||
| Non-current liabilities |
(11,089 | ) | (11,666 | ) | (26,345 | ) | (28,006 | ) | (1,893 | ) | (2,021 | ) | ||||||||||||
| Ending balance |
$ | 64,349 | $ | 56,912 | $ | (12,174 | ) | $ | (12,943 | ) | $ | 111,320 | $ | 96,609 | ||||||||||
The accumulated benefit obligation of the U.S. pension and other postretirement plans was $273,197 at December 2, 2023 and $289,049 at December 3, 2022. The accumulated benefit obligation of the non-U.S. pension plans was $141,402 at December 2, 2023 and $148,927 at December 3, 2022.
The following amounts relate to pension plans with accumulated benefit obligations in excess of plan assets as of December 2, 2023 and December 3, 2022:
| Pension Benefits and Other Postretirement Benefits |
||||||||||||||||
| U.S. Plans |
Non-U.S. Plans |
|||||||||||||||
| 2023 |
2022 |
2023 |
2022 |
|||||||||||||
| Accumulated benefit obligation |
$ | 12,329 | $ | 12,914 | $ | 35,034 | $ | 36,820 | ||||||||
| Fair value of plan assets |
- | - | 9,700 | 9,617 | ||||||||||||
The following amounts relate to pension plans with projected benefit obligations in excess of plan assets as of December 2, 2023 and December 3, 2022:
| Pension Benefits and Other Postretirement Benefits |
||||||||||||||||
| U.S. Plans |
Non-U.S. Plans |
|||||||||||||||
| 2023 |
2022 |
2023 |
2022 |
|||||||||||||
| Projected benefit obligation |
$ | 12,329 | $ | 12,914 | $ | 37,510 | $ | 39,350 | ||||||||
| Fair value of plan assets |
- | - | $ | 9,700 | 9,617 | |||||||||||
Information about the expected cash flows is as follows:
| Pension Benefits |
Other |
||||||||||||
| Non-U.S. |
Postretirement |
||||||||||||
| U.S. Plans |
Plans |
Benefits |
|||||||||||
| Employer contributions |
|||||||||||||
| 2024 |
$ | - | $ | 5 | $ | - | |||||||
| Expected benefit payments |
|||||||||||||
| 2024 |
21,330 | 8,387 | 2,723 | ||||||||||
| 2025 |
21,351 | 8,470 | 2,622 | ||||||||||
| 2026 |
21,251 | 8,651 | 2,512 | ||||||||||
| 2027 |
21,168 | 8,948 | 2,382 | ||||||||||
| 2028- 2033 | 121,219 | 53,787 | 11,487 | ||||||||||
The components of our net period defined benefit pension and postretirement benefit costs other than service cost are presented as non-operating expenses and service cost is presented in operating expenses.
Components of net periodic benefit cost and other supplemental information for the years ended December 2, 2023, December 3, 2022, and November 27, 2021 are as follows:
| Pension Benefits |
Other |
|||||||||||||||||||||||||||||||||||
| U.S. Plans |
Non-U.S. Plans |
Postretirement Benefits |
||||||||||||||||||||||||||||||||||
| Net periodic cost (benefit) |
2023 |
2022 |
2021 |
2023 |
2022 |
2021 |
2023 |
2022 |
2021 |
|||||||||||||||||||||||||||
| Service cost |
$ | - | $ | - | $ | - | $ | 1,670 | $ | 2,765 | $ | 3,280 | $ | - | $ | - | $ | 21 | ||||||||||||||||||
| Interest cost |
13,901 | 9,653 | 9,299 | 5,726 | 2,893 | 2,941 | 1,205 | 748 | 822 | |||||||||||||||||||||||||||
| Expected return on assets |
(28,821 | ) | (29,018 | ) | (31,123 | ) | (7,027 | ) | (6,465 | ) | (12,348 | ) | (9,859 | ) | (11,084 | ) | (8,945 | ) | ||||||||||||||||||
| Amortization: |
||||||||||||||||||||||||||||||||||||
| Prior service (benefit) cost |
- | (3 | ) | (3 | ) | 62 | 63 | 69 | - | - | - | |||||||||||||||||||||||||
| Actuarial loss (gain) |
2,541 | 4,132 | 3,198 | 1,993 | 2,411 | 4,053 | - | (3,445 | ) | 73 | ||||||||||||||||||||||||||
| Settlement charge |
- | - | - | 19 | 3,329 | - | - | - | - | |||||||||||||||||||||||||||
| Net periodic (benefit) cost |
$ | (12,379 | ) | $ | (15,237 | ) | $ | (18,629 | ) | $ | 2,443 | $ | 4,996 | $ | (2,005 | ) | $ | (8,654 | ) | $ | (13,781 | ) | $ | (8,029 | ) | |||||||||||
| Pension Benefits |
Other |
|||||||||||||||||||||||||||||||||||
| U.S. Plans |
Non-U.S. Plans |
Postretirement Benefits |
||||||||||||||||||||||||||||||||||
| Weighted-average assumptions used to determine benefit obligations |
2023 |
2022 |
2021 |
2023 |
2022 |
2021 |
2023 |
2022 |
2021 |
|||||||||||||||||||||||||||
| Discount rate |
5.66 | % | 5.36 | % | 2.75 | % | 4.37 | % | 3.70 | % | 1.27 | % | 5.61 | % | 5.29 | % | 2.51 | % | ||||||||||||||||||
| Rate of compensation increase1 |
0.00 | % | 0.00 | % | 0.00 | % | 1.82 | % | 1.83 | % | 1.48 | % | N/A | N/A | N/A | |||||||||||||||||||||
| Weighted-average assumptions used to determine net costs for years ended |
2023 |
2022 |
2021 |
2023 |
2022 |
2021 |
2023 |
2022 |
2021 |
|||||||||||||||||||||||||||
| Discount rate |
5.36 | % | 2.75 | % | 2.50 | % | 3.71 | % | 1.29 | % | 1.19 | % | 5.29 | % | 2.51 | % | 2.19 | % | ||||||||||||||||||
| Expected return on plan assets |
7.75 | % | 7.00 | % | 7.24 | % | 5.02 | % | 3.49 | % | 6.15 | % | 8.25 | % | 8.25 | % | 8.25 | % | ||||||||||||||||||
| Rate of compensation increase1 |
0.00 | % | 0.00 | % | 0.00 | % | 1.82 | % | 1.68 | % | 1.67 | % | 0.00 | % | 0.00 | % | 0.00 | % | ||||||||||||||||||
1 Under the U.S. pension plan, the compensation amount was locked-in as of May 31, 2011 and thus the benefit no longer includes compensation increases.
The discount rate assumption is determined using an actuarial yield curve approach, which results in a discount rate that reflects the characteristics of the plan. The approach identifies a broad population of corporate bonds that meet the quality and size criteria for the particular plan. We use this approach rather than a specific index that has a certain set of bonds that may or may not be representative of the characteristics of our particular plan. A higher discount rate reduces the present value of the pension obligations. The discount rate for the U.S. pension plan was 5.66 percent at December 2, 2023, 5.36 percent at December 3, 2022 and 2.76 percent at November 27, 2021. Net periodic pension cost for a given fiscal year is based on assumptions developed at the end of the previous fiscal year. A discount rate change of 0.5 percentage points at December 2, 2023 would impact U.S. pension and other postretirement plan (income) expense by approximately $149 (pre-tax) in fiscal 2024. Discount rates for non-U.S. plans are determined in a manner consistent with the U.S. plans.
For the U.S. pension plan, we adopted the Adjusted Pri-2012 base mortality table projected generationally using scale MP-2021.
The expected long-term rate of return on plan assets assumption for the U.S. pension plan was 7.75 percent in 2023, 7.00 percent in 2022 and 7.25 percent in 2021. Our expected long-term rate of return on U.S. plan assets was based on our target asset allocation assumption of 55 percent equities and 45 percent fixed-income. Management, in conjunction with our external financial advisors, determines the expected long-term rate of return on plan assets by considering the expected future returns and volatility levels for each asset class that are based on historical returns and forward-looking observations. For 2023, the expected long-term rate of return on the target equities allocation was 8.50 percent and the expected long-term rate of return on the target fixed-income allocation was 5.60 percent. The total plan rate of return assumption included an estimate of the effect of diversification and the plan expense. A change of 0.5 percentage points for the expected return on assets assumption would impact U.S. net pension and other postretirement plan expense by approximately $2,266 (pre-tax).
Management, in conjunction with our external financial advisors, uses the actual historical rates of return of the asset categories to assess the reasonableness of the expected long-term rate of return on plan assets.
The expected long-term rate of return on plan assets assumption for non-U.S. pension plans was a weighted-average of 5.02 percent in 2023 compared to 3.49 percent in 2022 and 6.15 percent in 2021. The expected long-term rate of return on plan assets assumption used in each non-U.S. plan is determined on a plan-by-plan basis for each local jurisdiction and is based on expected future returns for the investment mix of assets currently in the portfolio for that plan. Management, in conjunction with our external financial advisors, develops expected rates of return for each plan, considers expected long-term returns for each asset category in the plan, reviews expectations for inflation for each local jurisdiction, and estimates the effect of active management of the plan’s assets. Our largest non-U.S. pension plans are in the United Kingdom and Germany. The expected long-term rate of return on plan assets for the United Kingdom was 4.50 percent and the expected long-term rate of return on plan assets for Germany was 5.50 percent. Management, in conjunction with our external financial advisors, uses actual historical returns of the asset portfolio to assess the reasonableness of the expected rate of return for each plan.
| Assumed health care trend rates |
2023 |
2022 |
2021 |
|||||||||
| Health care cost trend rate assumed for next year |
6.25 | % | 6.50 | % | 6.50 | % | ||||||
| Rate to which the cost trend rate is assumed to decline (the ultimate trend rate) |
5.75 | % | 5.75 | % | 5.00 | % | ||||||
| Fiscal year that the rate reaches the ultimate trend rate |
2026 | 2026 | 2028 | |||||||||
The asset allocation for the company’s U.S. and non-U.S. pension plans at the end of 2023 and 2022 follows.
| U.S. Pension Plans |
Non-U.S. Pension Plans |
Other Postretirement Plans |
||||||||||||||||||||||||||||||||||
| Percentage of |
Percentage of |
Percentage of |
||||||||||||||||||||||||||||||||||
| Plan Assets at |
Plan Assets at |
Plan Assets at |
||||||||||||||||||||||||||||||||||
| Target |
Year-End |
Target |
Year-End |
Target |
Year-End |
|||||||||||||||||||||||||||||||
| Asset Category |
2023 |
2023 |
2022 |
2023 |
2023 |
2022 |
2023 |
2023 |
2022 |
|||||||||||||||||||||||||||
| Equities |
55.0 | % | 53.8 | % | 53.1 | % | 21.0 | % | 22.0 | % | 25.5 | % | 0.0 | % | 0.0 | % | 0.0 | % | ||||||||||||||||||
| Fixed income |
45.0 | % | 44.9 | % | 45.8 | % | 79.0 | % | 77.2 | % | 70.0 | % | 0.0 | % | 0.0 | % | 0.0 | % | ||||||||||||||||||
| Insurance |
0.0 | % | 0.0 | % | 0.1 | % | 0.0 | % | 0.0 | % | 0.0 | % | 100.0 | % | 99.5 | % | 98.9 | % | ||||||||||||||||||
| Cash1 |
0.0 | % | 1.3 | % | 1.0 | % | 0.0 | % | 0.8 | % | 4.5 | % | 0.0 | % | 0.5 | % | 1.1 | % | ||||||||||||||||||
| Total |
100 | % | 100 | % | 100 | % | 100 | % | 100 | % | 100 | % | 100 | % | 100 | % | 100 | % | ||||||||||||||||||
Plan Asset Management
Plan assets are held in trust and invested in mutual funds, separately managed accounts and other commingled investment vehicles holding U.S. and non-U.S. equity securities, fixed income securities and other investment classes. We employ a total return approach whereby a mix of equities and fixed income investments are used to maximize the long-term return of plan assets for a prudent level of risk. Futures and options may also be used to enhance risk-adjusted long-term returns while improving portfolio diversification and duration. Risk management is accomplished through diversification across asset classes, utilization of multiple investment managers and general plan-specific investment policies. Risk tolerance is established through careful consideration of the plan liabilities, plan funded status and our assessment of our overall liquidity position. This asset allocation policy mix is reviewed annually and actual versus target allocations are monitored regularly and rebalanced on an as-needed basis. Plan assets are invested using a combination of active and passive investment strategies. Passive, or “indexed” strategies, attempt to mimic rather than exceed the investment performance of a market benchmark. The plans’ active investment strategies employ multiple investment management firms which in aggregate cover a range of investment styles and approaches. Performance is monitored and compared to relevant benchmarks on a regular basis.
The U.S. pension plans consist of two plans: a pension plan and a supplemental executive retirement plan (“SERP”). There were no assets in the SERP in 2023 and 2022. Consequently, all of the data disclosed in the asset allocation table for the U.S. pension plans pertain to our U.S. pension plan.
During 2023, we maintained our assets within the allowed ranges of the target asset allocation mix of 55 percent equities and 45 percent fixed income plus or minus 5 percent and continued our focus to reduce volatility of plan assets in future periods and to more closely match the duration of the assets with the duration of the liabilities of the plan.
The non-U.S. pension plans consist of all the pension plans administered outside the U.S., principally consisting of plans in Germany and the United Kingdom. During 2023, we maintained our assets for the non-U.S. pension plans at the specific target asset allocation mix determined for each plan plus or minus the allowed rate and continued our focus to reduce volatility of plan assets in future periods and to more closely match the duration of the assets with the duration of the liabilities of the individual plans. We plan to maintain the portfolios at their respective target asset allocations in 2024.
Other postretirement benefits plans consist of two U.S. plans: a retiree medical health care plan and a group term life insurance plan. There were no assets in the group term life insurance plan for 2023 and 2022. Consequently, all of the data disclosed in the asset allocation table for other postretirement plans pertain to our retiree medical health care plan. Our investment strategy for other postretirement benefit plans is to own insurance policies that maintain an asset allocation nearly completely in equities. These equities are invested in a passive portfolio indexed to the S&P 500.
Fair Value of Plan Assets
The following table presents plan assets categorized within a three-level fair value hierarchy as described in Note 13.
| December 2, 2023 |
||||||||||||||||
| U.S. Pension Plans |
Level 1 |
Level 2 |
Level 3 |
Total Assets |
||||||||||||
| Equities |
$ | - | $ | 172,166 | $ | - | $ | 172,166 | ||||||||
| Fixed income |
- | 129,044 | - | 129,044 | ||||||||||||
| Cash |
4,054 | - | - | 4,054 | ||||||||||||
| Total categorized in the fair value hierarchy |
4,054 | 301,210 | - | 305,264 | ||||||||||||
| Other investments measured at NAV1 |
- | - | - | 14,474 | ||||||||||||
| Total |
$ | 4,054 | $ | 301,210 | $ | - | $ | 319,738 | ||||||||
| Non-U.S. Pension Plans |
Level 1 |
Level 2 |
Level 3 |
Total Assets |
||||||||||||
| Equities |
$ | 29,601 | $ | - | $ | - | $ | 29,601 | ||||||||
| Fixed income |
40,686 | - | 726 | 41,412 | ||||||||||||
| Cash |
1,137 | - | - | 1,137 | ||||||||||||
| Total categorized in the fair value hierarchy |
71,424 | - | 726 | 72,150 | ||||||||||||
| Other investments measured at NAV1 | 62,472 | |||||||||||||||
| Total |
$ | 71,424 | $ | - | $ | 726 | $ | 134,622 | ||||||||
| Other Postretirement Benefits |
Level 1 |
Level 2 |
Level 3 |
Total Assets |
||||||||||||
| Insurance |
$ | - | $ | - | $ | 132,754 | $ | 132,754 | ||||||||
| Cash |
699 | - | - | 699 | ||||||||||||
| Total |
$ | 699 | $ | - | $ | 132,754 | $ | 133,453 | ||||||||
| December 3, 2022 |
||||||||||||||||
| U.S. Pension Plans |
Level 1 |
Level 2 |
Level 3 |
Total Assets |
||||||||||||
| Equities |
$ | - | $ | 152,084 | $ | 21,525 | $ | 173,609 | ||||||||
| Fixed income |
- | 126,114 | 23,547 | 149,661 | ||||||||||||
| Insurance |
- | - | 179 | 179 | ||||||||||||
| Cash |
3,337 | - | - | 3,337 | ||||||||||||
| Total categorized in the fair value hierarchy |
3,337 | 278,198 | 45,251 | 326,786 | ||||||||||||
| Non-U.S. Pension Plans |
Level 1 |
Level 2 |
Level 3 |
Total Assets |
||||||||||||
| Equities |
$ | 28,422 | $ | - | $ | - | $ | 28,422 | ||||||||
| Fixed income |
41,515 | - | 703 | 42,218 | ||||||||||||
| Cash |
491 | - | - | 491 | ||||||||||||
| Total categorized in the fair value hierarchy |
70,428 | - | 703 | 71,131 | ||||||||||||
| Other investments measured at NAV1 |
70,777 | |||||||||||||||
| Total |
$ | 70,428 | $ | - | $ | 703 | $ | 141,908 | ||||||||
| Other Postretirement Benefits |
Level 1 |
Level 2 |
Level 3 |
Total Assets |
||||||||||||
| Insurance |
$ | - | $ | - | $ | 119,446 | $ | 119,446 | ||||||||
| Cash |
1,336 | - | - | 1,336 | ||||||||||||
| Total |
$ | 1,336 | $ | - | $ | 119,446 | $ | 120,782 | ||||||||
1 In accordance with ASC Topic 820-10, Fair Value Measurement, certain investments that are measured at NAV (Net Asset Value per share) (or its equivalent) practical expedient have not been classified in the fair value hierarchy. The fair value amounts represented in this table are intended to permit reconciliation of the fair value hierarchy to the amounts presented in the statement of financial position.
The definitions of fair values of our pension and other postretirement benefit plan assets at December 2, 2023 and December 3, 2022 by asset category are as follows:
Equities—Primarily publicly traded common stock for purposes of total return and to maintain equity exposure consistent with policy allocations. Investments include: (i) U.S. and non-U.S. equity securities and mutual funds valued at closing prices from national exchanges; and (ii) commingled funds valued at unit values or net asset values provided by the investment managers, which are based on the fair value of the underlying investments. Funds valued at net asset value have various investment strategies including seeking maximum total returns consistent with prudent investment management, seeking current income consistent with preservation of capital and daily liquidity and seeking to approximate the risk and return characterized by a specific index fund. There are no restrictions for redeeming holdings out of these funds and the funds have no unfunded commitments.
Fixed income—Primarily corporate and government debt securities for purposes of total return and managing fixed income exposure to policy allocations. Investments include (i) mutual funds valued at closing prices from national exchanges, (ii) corporate and government debt securities valued at closing prices from national exchanges, (iii) commingled funds valued at unit values or net asset value provided by the investment managers, which are based on the fair value of the underlying investments, and (iv) an annuity contract, the value of which is determined by the provider and represents the amount the plan would receive if the contract were cashed out at year-end.
Insurance—Insurance contracts for purposes of funding postretirement medical benefits. Fair values are the cash surrender values as determined by the providers which are the amounts the plans would receive if the contracts were cashed out at year end.
Cash–Cash balances on hand, accrued income and pending settlements of transactions for purposes of handling plan payments. Fair values are the cash balances as reported by the Trustees of the plans.
The following is a roll forward of the Level 3 investments of our pension and postretirement benefit plan assets during the years ended December 2, 2023 and December 3, 2022:
| Fixed Income |
||||||||
| U.S. Pension Plans |
2023 |
2022 |
||||||
| Level 3 balance at beginning of year |
$ | 45,251 | $ | 186 | ||||
| Net transfers (out of)/into level 3 |
(45,072 | ) | $ | 16,564 | ||||
| Purchases, sales, issuances and settlements, net |
(179 | ) | 28,501 | |||||
| Level 3 balance at end of year |
$ | - | $ | 45,251 | ||||
| Fixed Income |
||||||||
| Non-U.S. Pension Plans |
2023 |
2022 |
||||||
| Level 3 balance at beginning of year |
$ | 703 | $ | 749 | ||||
| Net transfers into level 3 |
- | 7 | ||||||
| Net losses |
- | (1 | ) | |||||
| Currency change effect |
23 | (52 | ) | |||||
| Level 3 balance at end of year |
$ | 726 | $ | 703 | ||||
| Insurance |
||||||||
| Other Postretirement Benefits |
2023 |
2022 |
||||||
| Level 3 balance at beginning of year |
$ | 119,446 | $ | 135,484 | ||||
| Net transfers out of level 3 |
- | (1,992 | ) | |||||
| Purchases, sales, issuances and settlements, net |
(1,144 | ) | (1,122 | ) | ||||
| Net gains/(losses) |
14,452 | (12,924 | ) | |||||
| Level 3 balance at end of year |
$ | 132,754 | $ | 119,446 | ||||
Note 11: Income Taxes
| Income before income taxes and income from equity method investments |
2023 |
2022 |
2021 |
|||||||||
| United States |
$ | 15,276 | $ | 63,718 | $ | 14,989 | ||||||
| Non-U.S. |
218,885 | 188,210 | 201,862 | |||||||||
| Total |
$ | 234,161 | $ | 251,928 | $ | 216,851 | ||||||
| Components of the provision for income tax expense (benefit) |
2023 |
2022 |
2021 |
|||||||||
| Current: |
||||||||||||
| U.S. federal |
$ | 18,347 | $ | 12,181 | $ | 10,310 | ||||||
| State |
5,529 | 3,389 | 2,265 | |||||||||
| Non-U.S. |
87,449 | 63,750 | 57,801 | |||||||||
| 111,325 | 79,320 | 70,376 | ||||||||||
| Deferred: |
||||||||||||
| U.S. federal |
(100 | ) | 8,150 | (6,891 | ) | |||||||
| State |
(4,111 | ) | (1,767 | ) | (350 | ) | ||||||
| Non-U.S. |
(13,585 | ) | (8,517 | ) | (102 | ) | ||||||
| (17,796 | ) | (2,134 | ) | (7,343 | ) | |||||||
| Total |
$ | 93,529 | $ | 77,186 | $ | 63,033 | ||||||
| Reconciliation of effective income tax |
2023 |
2022 |
2021 |
|||||||||
| Tax at statutory U.S. federal income tax rate |
$ | 49,174 | $ | 52,760 | $ | 45,539 | ||||||
| State income taxes, net of federal benefit |
1,137 | 1,252 | 1,444 | |||||||||
| Foreign dividend repatriation1 |
21,730 | 2,596 | 1,104 | |||||||||
| Foreign operations |
12,558 | 1,868 | 19,673 | |||||||||
| Executive compensation over $1.0 million |
784 | 2,847 | 2,507 | |||||||||
| Non-U.S. stock option expense |
730 | 525 | 575 | |||||||||
| Change in valuation allowance |
725 | 3,187 | (9,572 | ) | ||||||||
| Research and development tax credit |
(1,400 | ) | (927 | ) | (993 | ) | ||||||
| Foreign-derived intangible income |
(2,665 | ) | (2,786 | ) | (2,617 | ) | ||||||
| Global intangible low-taxed income |
2,345 | 1,890 | 2,334 | |||||||||
| Provision to return |
1,336 | 840 | 1,122 | |||||||||
| Cross currency swap |
- | 7,020 | 3,931 | |||||||||
| Contingency reserve |
5,951 | 5,909 | (2,139 | ) | ||||||||
| Other |
1,124 | 205 | 125 | |||||||||
| Total income tax expense |
$ | 93,529 | $ | 77,186 | $ | 63,033 | ||||||
1 Foreign dividend repatriation line includes impact of withholding tax recorded on earnings that are no longer permanently reinvested.
| Deferred income tax balances at each year-end related to: |
2023 |
2022 |
||||||
| Deferred tax assets: |
||||||||
| Pension and other post-retirement benefit plans |
$ | 5,306 | $ | 6,752 | ||||
| Employee benefit costs |
27,672 | 25,196 | ||||||
| Foreign tax credit carryforward |
6,538 | 7,884 | ||||||
| Tax loss carryforwards |
25,894 | 22,948 | ||||||
| Leases |
12,716 | 8,538 | ||||||
| Hedging activity |
18,638 | 13,299 | ||||||
| Interest deduction limitation |
37,519 | 17,736 | ||||||
| Other |
33,022 | 28,840 | ||||||
| Gross deferred tax assets |
167,305 | 131,193 | ||||||
| Less: valuation allowance |
(15,595 | ) | (14,424 | ) | ||||
| Total net deferred tax assets |
151,710 | 116,769 | ||||||
| Deferred tax liability: |
||||||||
| Depreciation and amortization |
(209,266 | ) | (215,219 | ) | ||||
| Pension and other post-retirement benefit plans |
(41,444 | ) | (37,362 | ) | ||||
| Undistributed earnings of non-U.S. subsidiaries |
(21,926 | ) | - | |||||
| Leases |
(12,510 | ) | (8,329 | ) | ||||
| Total deferred tax liability |
(285,146 | ) | (260,910 | ) | ||||
| Net deferred tax liability |
$ | (133,436 | ) | $ | (144,141 | ) | ||
The difference between the change in the deferred tax liability on the balance sheet and the deferred tax provision is primarily related to the defined benefit pension plan adjustment and hedges recorded in accumulated other comprehensive income (loss) offset by liabilities established in purchase accounting.
Valuation allowances primarily relate to foreign net operating loss carryforwards and branch foreign tax credit carryforwards where the future potential benefits do not meet the more-likely-than-not realization test. The increase in the valuation allowance is primarily related to a decrease in foreign net operating losses for which the Company does not expect to receive a full tax benefit.
Deferred tax assets and liabilities are measured using the currently enacted tax rates that apply to taxable income in effect for the years in which those deferred tax assets and liabilities are expected to be realized or settled. We record a valuation allowance to reduce deferred tax assets to the amount that is believed more-likely-than-not to be realized. We believe it is more-likely-than-not that reversal of deferred tax liabilities and forecasted income will be sufficient to fully recover the net deferred tax assets not already offset by a valuation allowance. In the event that all or part of the gross deferred tax assets are determined not to be realizable in the future, an adjustment to the valuation allowance would be charged to earnings in the period such determination is made.
U.S. income taxes have not been provided on approximately $1,154,354 of undistributed earnings of non-U.S. subsidiaries. We intend to indefinitely reinvest these undistributed earnings. Cash available in the United States has historically been sufficient and we expect it will continue to be sufficient to fund U.S. cash flow requirements. In the event these earnings are later distributed to the U.S., such distributions would likely result in additional U.S. tax.
While non-U.S. operations have been profitable overall, there are cumulative tax losses of $81,655 in various countries. These tax losses can be carried forward to offset the income tax liabilities on future income in these countries. Cumulative tax losses of $60,269 can be carried forward indefinitely, while the remaining $21,386 of tax losses must be utilized during 2024 to 2041.
The U.S. has a branch foreign tax credit carryforward of $4,465. A valuation allowance has been recorded against this foreign tax credit carryforward to reflect that this amount is not more-likely-than-not to be realized.
The table below sets forth the changes to our gross unrecognized tax benefit as a result of uncertain tax positions, excluding accrued interest. We do not anticipate that the total unrecognized tax benefits will change significantly within the next twelve months.
| 2023 |
2022 |
|||||||
| Balance at beginning of year |
$ | 17,582 | $ | 13,281 | ||||
| Tax positions related to the current year: |
||||||||
| Additions |
723 | 469 | ||||||
| Tax positions related to prior years: |
||||||||
| Additions |
5,658 | 5,885 | ||||||
| Reductions |
(965 | ) | (1,019 | ) | ||||
| Settlements |
(8,156 | ) | - | |||||
| Lapses in applicable statutes of limitation |
(588 | ) | (1,034 | ) | ||||
| Balance at end of year |
$ | 14,254 | $ | 17,582 | ||||
Included in the balance of unrecognized tax benefits as of December 2, 2023 and December 3, 2022 are potential benefits of $10,338 and $12,663 respectively, that, if recognized, would affect the effective tax rate.
We report accrued interest and penalties related to unrecognized tax benefits in income tax expense. For the year ended December 2, 2023, we recognized a net benefit for interest and penalties of $824 relating to unrecognized tax benefits and had net accumulated accrued interest and penalties of $6,708 as of December 2, 2023. For the year ended December 3, 2022, we recognized a net benefit for interest and penalties of $2,760 relating to unrecognized tax benefits and had net accumulated accrued interest and penalties of $6,275 as of December 3, 2022.
We are subject to U.S. federal income tax as well as income tax in numerous state and foreign jurisdictions. We are no longer subject to U.S. federal tax examination for years prior to 2020 or Swiss income tax examination for years prior to 2020. During the second quarter of 2016, H.B. Fuller (China) Adhesives, Ltd. was notified of a transfer pricing audit covering the calendar years 2005 through 2014. We are in various stages of examination and appeal in other foreign jurisdictions. Although the final outcomes of these examinations cannot currently be determined, we believe that we have recorded adequate liabilities with respect to these examinations.
Note 12: Financial Instruments
Overview
As a result of being a global enterprise, foreign currency exchange rates and fluctuations in those rates may affect the Company's net investment in foreign subsidiaries and our earnings, cash flows and financial position are exposed to foreign currency risk from foreign currency denominated receivables and payables.
We use foreign currency forward contracts, cross-currency swaps, interest rate swaps and net investment hedges to manage risks associated with foreign currency exchange rates and interest rates. We do not hold derivative financial instruments of a speculative nature or for trading purposes. We record derivatives as assets and liabilities on the balance sheet at fair value. Changes in fair value are recognized immediately in earnings unless the derivative qualifies and is designated as a hedge. Cash flows from derivatives are classified in the Consolidated Statement of Cash Flows in the same category as the cash flows from the items subject to designated hedge or undesignated (economic) hedge relationships. The company evaluates hedge effectiveness at inception and on an ongoing basis. If a derivative is no longer expected to be effective, hedge accounting is discontinued. Hedge ineffectiveness, if any, is recorded in earnings.
We are exposed to credit risk in the event of nonperformance of counterparties for foreign currency forward exchange contracts and interest rate swap agreements. We select investment-grade multinational banks and financial institutions as counterparties for derivative transactions and monitor the credit quality of each of these banks on a periodic basis as warranted. We do not anticipate nonperformance by any of these counterparties, and valuation allowances, if any, are de minimis.
Cash Flow Hedges
On January 12, 2023, we entered into an interest rate swap agreement to convert $400,000 of our variable rate 1-month LIBOR rate debt to a fixed rate of 3.6895 percent that matures on January 12, 2028. On February 28, 2023, after refinancing our debt, we amended the interest rate swap agreement to our 1-month SOFR rate debt to a fixed rate of 3.7260 in accordance with the practical expedients included in ASC 848, Reference Rate Reform. The combined fair value of the interest rate swap was an asset of $2,458 at December 2, 2023 and was included in other assets in the Consolidated Balance Sheets. The swap was designated for hedge accounting treatment as a cash flow hedge. We are applying the hypothetical derivative method to assess hedge effectiveness for this interest rate swap. Changes in the fair value of a hypothetically perfect swap with terms that match the critical terms of our variable rate debt are compared with the change in the fair value of the swap.
On March 16, 2023, we entered into an interest rate swap agreement to convert $300,000 of our 1-month SOFR rate debt to a fixed rate of 3.7210 percent that matures on February 15, 2028. The combined fair value of the interest rate swap was an asset of $1,174 at December 2, 2023 and was included in other assets in the Consolidated Balance Sheets. The swap was designated for hedge accounting treatment as a cash flow hedge. We are applying the hypothetical derivative method to assess hedge effectiveness for this interest rate swap. Changes in the fair value of a hypothetically perfect swap with terms that match the critical terms of our variable rate debt are compared with the change in the fair value of the swaps.
On March 16, 2023, we entered into an interest rate swap agreement to convert $100,000 of our 1-month SOFR rate debt to a fixed rate of 3.8990 percent that matures on February 15, 2028. The combined fair value of the interest rate swap was a liability of $63 at December 2, 2023 and was included in other liabilities in the Consolidated Balance Sheets. The swap was designated for hedge accounting treatment as a cash flow hedge. We are applying the hypothetical derivative method to assess hedge effectiveness for these interest rate swaps. Changes in the fair value of a hypothetically perfect swap with terms that match the critical terms of our variable rate debt are compared with the change in the fair value of the swaps.
The amounts of pretax gains (losses) recognized in comprehensive income related to derivative instruments designated as cash flow hedges are as follows:
| December 2, 2023 |
December 3, 2022 |
November 27, 2021 |
||||||||||
| Cross-currency swap contracts |
$ | - | $ | (3,536 | ) | $ | (4,554 | ) | ||||
| Interest rate swap contracts |
$ | 5,932 | $ | 13,148 | $ | 20,109 | ||||||
| Net investment hedges |
$ | (18,555 | ) | $ | (54,040 | ) | - | |||||
Fair Value Hedges
On February 12, 2021, we entered into interest rate swap agreements to convert our $300,000 Public Notes that were issued on October 20, 2020 to a variable interest rate of 1-month LIBOR plus 3.28 percent. On June 30, 2023, 1-month LIBOR rates ceased to exist and the IBOR Fallbacks Protocol published by the International Swaps and Derivatives Association ("ISDA") took effect as outlined in the interest rate swap agreement. As a result, the interest rate swap agreements were converted to Overnight SOFR plus 3.28 percent. We applied the practical expedients included in ASC 848, Reference Rate Reform. See Note 7 for further discussion on the issuance of our Public Notes. These interest rate swap agreements mature on October 15, 2028. The combined fair value of the interest rate swaps was a liability of $41,532 at December 2, 2023, and was included in other liabilities in the Consolidated Balance Sheets. The swaps were designated for hedge accounting treatment as fair value hedges. We apply the short cut method and assume hedge effectiveness. Changes in the fair value of a hypothetically perfect swap with terms that match the critical terms of our $300,000 fixed rate Public Notes are compared with the change in the fair value of the swaps.
On February 14, 2017, we entered into an interest rate swap agreement to convert $150,000 of our $300,000 Public Notes that were issued on February 14, 2017 to a variable interest rate of 1-month LIBOR plus 1.86 percent. The swap was designated for hedge accounting treatment as a fair value hedge. We applied the hypothetical derivative method to assess hedge effectiveness for this interest rate swap. Changes in the fair value of a hypothetically perfect swap with terms that match the critical terms of our $150,000 fixed rate Public Notes are compared with the change in the fair value of the swap. On May 1, 2020, we terminated the swap agreement. Upon termination, we received $15,808 in cash. The remaining swap liability will be accounted for as a discount on long-term debt and will be amortized to interest expense over the remaining life of the Public Notes of seven years.
Net Investment Hedges
On October 17, 2022, we entered into a float-to-float cross-currency interest rate swap agreement with a notional amount of €307,173 maturing in October 2028. On October 20, 2022, we entered into fixed-to-fixed cross-currency interest rate swap agreements for a total notional amount of €300,000 with tranches maturing in August 2025, August 2026 and February 2027. On June 30, 2023, 1-month LIBOR rates ceased to exist and the IBOR Fallbacks Protocol published by the International Swaps and Derivatives Association (ISDA) took effect as outlined in the interest rate swap agreement. As a result, the 1-month LIBOR leg of the float-to-float agreement was converted to Overnight SOFR plus 3.28 percent. On July 17, 2023, we amended the 1-month EURIBOR leg of the float-to-float agreement to Overnight ESTR plus 3.2195 percent. We applied the practical expedients included in ASC 848, Reference Rate Reform. As of December 2, 2023, the combined fair value of the swaps was a liability of $72,589 and was included in other liabilities in the Consolidated Balance Sheets. The cross-currency interest rate swaps hedge a portion of the Company’s investment in Euro denominated foreign subsidiaries.
The swaps are designated as net investment hedges for accounting treatment. The net gains or losses attributable to changes in spot exchange rates are recorded in the cumulative translation adjustment within other comprehensive income (loss). The gains or losses are reclassified into earnings upon a liquidation event or deconsolidation of the foreign subsidiary. Any ineffective portions of net investment hedges are reclassified from accumulated other comprehensive income (loss) into earnings during the period of change. The amount in accumulated other comprehensive income (loss) related to net investment hedge cross-currency swaps was a loss of $54,850 as of December 2, 2023. The amounts of pretax loss recognized in comprehensive income related to the net investment hedge was $18,712 in 2023. As of December 2, 2023, we did not reclassify any gains or losses into earnings from net investment hedges and we do not expect to reclassify any such gain or loss into earnings within the next twelve months. No amounts related to net investment hedges have been excluded from the assessment of hedge effectiveness.
Derivatives Not Designated As Hedging Instruments
The company uses foreign currency forward contracts to offset its exposure to the change in value of certain foreign currency denominated assets and liabilities held at foreign subsidiaries that are remeasured at the end of each period. Although the contracts are effective economic hedges, they are not designated as accounting hedges. Foreign currency forward contracts are recorded as assets and liabilities on the balance sheet at fair value. Changes in the value of these derivatives are recognized immediately in earnings, thereby offsetting the current earnings effect of the related foreign currency denominated assets and liabilities. See Note 13 for fair value amounts of these derivative instruments.
As of December 2, 2023, we had forward foreign currency contracts maturing between December 4, 2023 and May 13, 2024. The mark-to-market effect associated with these contracts was largely offset by the underlying transaction gains and losses resulting from the foreign currency exposures for which these contracts relate.
The amounts of pretax gains (losses) recognized in other income, net related to derivative instruments not designated as hedging instruments are as follows:
| December 2, 2023 |
December 3, 2022 |
November 27, 2021 |
||||||||||
| Foreign currency forward contracts |
$ | 8,497 | $ | 5,711 | $ | (357 | ) | |||||
Concentrations of credit risk with respect to trade accounts receivable are limited due to the large number of entities in the customer base and their dispersion across many different industries and countries. As of December 2, 2023, there were no significant concentrations of credit risk.
Note 13: Fair Value Measurements
Overview
Estimates of fair value for financial assets and liabilities are based on the framework established in the accounting guidance for fair value measurements. The framework defines fair value, provides guidance for measuring fair value and requires certain disclosures. The framework discusses valuation techniques, such as the market approach (comparable market prices), the income approach (present value of future income or cash flow) and the cost approach (cost to replace the service capacity of an asset or replacement cost). The framework utilizes a fair value hierarchy that prioritizes the inputs to valuation techniques used to measure fair value into three broad levels. The following is a brief description of those three levels:
| ● |
Level 1: Observable inputs such as quoted prices (unadjusted) in active markets for identical assets or liabilities. |
| ● |
Level 2: Inputs other than quoted prices that are observable for the asset or liability, either directly or indirectly. These include quoted prices for similar assets or liabilities in active markets and quoted prices for identical or similar assets or liabilities in markets that are not active. |
| ● |
Level 3: Unobservable inputs that reflect management’s assumptions, and include situations where there is little, if any, market activity for the asset or liability. |
Balances Measured at Fair Value on a Recurring Basis
The following table presents information about our financial assets and liabilities that are measured at fair value on a recurring basis as of December 2, 2023 and December 3, 2022, and indicates the fair value hierarchy of the valuation techniques utilized to determine such fair value.
| Fair Value Measurements |
||||||||||||||||
| Using: |
||||||||||||||||
| December 2, |
||||||||||||||||
| Description |
2023 |
Level 1 |
Level 2 |
Level 3 |
||||||||||||
| Assets: |
||||||||||||||||
| Marketable securities |
$ | 19,314 | $ | 19,314 | $ | - | $ | - | ||||||||
| Foreign exchange contract assets |
13,501 | - | 13,501 | - | ||||||||||||
| Interest rate swaps, cash flow hedge assets |
3,632 | $ | - | 3,632 | $ | - | ||||||||||
| Liabilities: |
||||||||||||||||
| Foreign exchange contract liabilities |
$ | 5,004 | $ | - | $ | 5,004 | $ | - | ||||||||
| Interest rate swaps, cash flow hedge liabilities |
63 | $ | - | 63 | $ | - | ||||||||||
| Interest rate swaps, fair value hedge liabilities |
41,532 | $ | - | 41,532 | $ | - | ||||||||||
| Net investment hedge liability |
72,589 | - | 72,589 | - | ||||||||||||
| Contingent consideration liability |
1,370 | - | - | 1,370 | ||||||||||||
| Fair Value Measurements |
||||||||||||||||
| Using: |
||||||||||||||||
| December 3, |
||||||||||||||||
| Description |
2022 |
Level 1 |
Level 2 |
Level 3 |
||||||||||||
| Assets: |
||||||||||||||||
| Marketable securities |
$ | 4,013 | $ | 4,013 | $ | - | $ | - | ||||||||
| Foreign exchange contract assets |
10,282 | - | 10,282 | - | ||||||||||||
| Liabilities: |
||||||||||||||||
| Foreign exchange contract liabilities |
$ | 4,570 | $ | - | $ | 4,570 | $ | - | ||||||||
| Cross-currency cash flow hedge liabilities |
42,542 | - | 42,542 | - | ||||||||||||
| Interest rate swaps, cash flow hedge liabilities |
54,046 | - | 54,046 | - | ||||||||||||
| Contingent consideration liability |
1,977 | - | - | 1,977 | ||||||||||||
The valuation of our contingent consideration liability related to the acquisitions of GSSI and TissueSeal was $870 and $500, respectively, as of December 2, 2023. As of December 2, 2023, the agreement provisions for the ZKLT contingent consideration were met, and as a result, $4,132 was paid during 2023. Adjustments to the fair value of contingent consideration are recorded to selling, general and administrative expenses in the Statement of Income. See Note 2 for further discussion regarding our acquisitions.
| Contingent consideration liability |
2023 |
|||
| Level 3 balance at beginning of year |
$ | 1,977 | ||
| Fair value adjustment |
3,763 | |||
| Payment of contingent consideration |
(4,132 | ) | ||
| Mark to market adjustment |
(238 | ) | ||
| Level 3 balance at end of year |
$ | 1,370 | ||
Balances Measured at Fair Value on a Nonrecurring Basis
We measure certain assets and liabilities at fair value on a nonrecurring basis. These assets include intangible assets acquired in an acquisition. The identified intangible assets of customer relationships, technology and tradenames acquired in connection with our acquisitions were measured using unobservable (Level 3) inputs. The fair value of the intangible assets was calculated using either the income or cost approach. Significant inputs include estimated revenue growth rates, gross margins, operating expenses, attrition rate, royalty rate and discount rate.
See Note 2 for further discussion regarding our acquisitions.
See Note 7 for discussion regarding the fair value of debt.
Note 14: Commitments and Contingencies
Environmental Matters
From time to time, we become aware of compliance matters relating to, or receive notices from, federal, state or local entities regarding possible or alleged violations of environmental, health or safety laws and regulations. We review the circumstances of each individual site, considering the number of parties involved, the level of potential liability or our contribution relative to the other parties, the nature and magnitude of the hazardous substances involved, the method and extent of remediation, the estimated legal and consulting expense with respect to each site and the time period over which any costs would likely be incurred. Also, from time to time, we are identified as a potentially responsible party (“PRP”) under the Comprehensive Environmental Response, Compensation and Liability Act ("CERCLA") and/or similar state laws that impose liability for costs relating to the clean up of contamination resulting from past spills, disposal or other release of hazardous substances. We are also subject to similar laws in some of the countries where current and former facilities are located. Our environmental, health and safety department monitors compliance with applicable laws on a global basis. To the extent we can reasonably estimate the amount of our probable liabilities for environmental matters, we establish an undiscounted financial provision. We recorded liabilities of $5,034 and $5,754 as of December 2, 2023 and December 3, 2022, respectively, for probable and reasonably estimable environmental remediation costs. Of the amount reserved, $2,301 and $2,789 as of December 2, 2023 and December 3, 2022, respectively, is attributable to a facility we own in Simpsonville, South Carolina as a result of our Royal Adhesives acquisition that is a designated site under CERCLA.
Currently we are involved in various environmental investigations, clean up activities and administrative proceedings and lawsuits. In particular, we are currently deemed a PRP in conjunction with numerous other parties, in a number of government enforcement actions associated with landfills and/or hazardous waste sites. As a PRP, we may be required to pay a share of the costs of investigation and clean up of these sites. In addition, we are engaged in environmental remediation and monitoring efforts at a number of current and former operating facilities. While uncertainties exist with respect to the amounts and timing of the ultimate environmental liabilities, based on currently available information, we have concluded that these matters, individually or in the aggregate, will not have a material adverse effect on our results of operations, financial condition or cash flow.
Other Legal Proceedings
From time to time and in the ordinary course of business, we are a party to, or a target of, lawsuits, claims, investigations and proceedings, including product liability, personal injury, contract, patent and intellectual property, environmental, health and safety, tax and employment matters. While we are unable to predict the outcome of these matters, we have concluded, based upon currently available information, that the ultimate resolution of any pending matter, individually or in the aggregate, including the asbestos litigation described in the following paragraphs, will not have a material adverse effect on our results of operations, financial condition or cash flow.
We have been named as a defendant in lawsuits in which plaintiffs have alleged injury due to products containing asbestos manufactured more than 35 years ago. The plaintiffs generally bring these lawsuits against multiple defendants and seek damages (both actual and punitive) in very large amounts. In many cases, plaintiffs are unable to demonstrate that they have suffered any compensable injuries or that the injuries suffered were the result of exposure to products manufactured by us. We are typically dismissed as a defendant in such cases without payment. If the plaintiff presents evidence indicating that compensable injury occurred as a result of exposure to our products, the case is generally settled for an amount that reflects the seriousness of the injury, the length, intensity and character of exposure to products containing asbestos, the number and solvency of other defendants in the case, and the jurisdiction in which the case has been brought.
A significant portion of the defense costs and settlements in asbestos-related litigation is paid by third parties, including indemnification pursuant to the provisions of a 1976 agreement under which we acquired a business from a third party. Currently, this third party is defending and paying settlement amounts, under a reservation of rights, in most of the asbestos cases tendered to the third party.
In addition to the indemnification arrangements with third parties, we have insurance policies that generally provide coverage for asbestos liabilities, including defense costs. Historically, insurers have paid a significant portion of our defense costs and settlements in asbestos-related litigation. However, certain of our insurers are insolvent. We have entered into cost-sharing agreements with our insurers that provide for the allocation of defense costs and settlements and judgments in asbestos-related lawsuits. These agreements require, among other things, that we fund a share of settlements and judgments allocable to years in which the responsible insurer is insolvent.
A summary of the number of and settlement amounts for asbestos-related lawsuits and claims is as follows:
| Year Ended |
Year Ended |
Year Ended |
||||||||||
| December 2, |
December 3, |
November 27, |
||||||||||
| 2023 |
2022 |
2021 |
||||||||||
| Lawsuits and claims settled |
9 | 7 | 2 | |||||||||
| Settlement amounts |
$ | 4,200 | $ | 296 | $ | 85 | ||||||
| Insurance payments received or expected to be received |
$ | 2,379 | $ | 195 | $ | 55 | ||||||
We do not believe that it would be meaningful to disclose the aggregate number of asbestos-related lawsuits filed against us because relatively few of these lawsuits are known to involve exposure to asbestos-containing products that we manufactured. Rather, we believe it is more meaningful to disclose the number of lawsuits that are settled and result in a payment to the plaintiff. To the extent we can reasonably estimate the amount of our probable liabilities for pending asbestos-related claims, we establish a financial provision and a corresponding receivable for insurance recoveries.
Based on currently available information, we have concluded that the resolution of any pending matter, including asbestos-related litigation, individually or in the aggregate, will not have a material adverse effect on our results of operations, financial condition or cash flow.
Note 15: Segments
We are required to report segment information in the same way that we internally organize our business for assessing performance and making decisions regarding allocation of resources. Revenue and operating income of each of our segments are regularly reviewed by our chief operating decision maker to make decisions about resources to be allocated to the segments and assess their performance. Segment operating income is identified as gross profit less SG&A expenses. Corporate expenses, other than those included in Corporate Unallocated, are allocated to each operating segment. Consistent with our internal management reporting, Corporate Unallocated amounts include business acquisition and integration costs, organizational restructuring charges and project costs associated with our implementation of Project ONE. Corporate assets are not allocated to the operating segments. Inter-segment revenues are recorded at cost plus a markup for administrative costs.
We have three reportable segments: Hygiene, Health and Consumable Adhesives, Engineering Adhesives and Construction Adhesives. The business components within each operating segment are managed to maximize the results of the overall operating segment rather than the results of any individual business component of the operating segment. Results of individual components of each operating segment are subject to numerous allocations of segment-wide costs that may or may not have been focused on that particular component for a particular reporting period. The costs for these allocated resources are not tracked on a “where-used” basis as financial performance is assessed at the total operating segment level.
Reportable operating segment financial information for all periods presented is as follows:
| 2023 |
2022 |
2021 |
||||||||||
| Net revenue |
||||||||||||
| Hygiene, Health and Consumable Adhesives |
$ | 1,601,487 | $ | 1,695,934 | $ | 1,472,756 | ||||||
| Engineering Adhesives |
1,428,744 | 1,532,639 | 1,371,756 | |||||||||
| Construction Adhesives |
480,703 | 520,610 | 433,519 | |||||||||
| Total |
$ | 3,510,934 | $ | 3,749,183 | $ | 3,278,031 | ||||||
| Segment operating income (loss) |
||||||||||||
| Hygiene, Health and Consumable Adhesives |
$ | 215,088 | $ | 165,786 | $ | 138,366 | ||||||
| Engineering Adhesives |
187,346 | 168,873 | 135,913 | |||||||||
| Construction Adhesives |
5,961 | 22,989 | 14,148 | |||||||||
| Total segment |
408,395 | 357,648 | 288,427 | |||||||||
| Corporate Unallocated1 |
(53,258 | ) | (34,930 | ) | (35,815 | ) | ||||||
| Total |
$ | 355,137 | $ | 322,718 | $ | 252,612 | ||||||
| Depreciation and amortization |
||||||||||||
| Hygiene, Health and Consumable Adhesives |
$ | 53,398 | $ | 46,374 | $ | 45,919 | ||||||
| Engineering Adhesives |
63,143 | 58,307 | 61,082 | |||||||||
| Construction Adhesives |
41,915 | 41,713 | 35,002 | |||||||||
| Corporate Unallocated1 |
1,384 | 582 | 1,171 | |||||||||
| Total |
$ | 159,840 | $ | 146,976 | $ | 143,174 | ||||||
| Total assets2 |
||||||||||||
| Hygiene, Health and Consumable Adhesives |
$ | 1,661,122 | $ | 1,488,277 | ||||||||
| Engineering Adhesives |
1,627,715 | 1,610,015 | ||||||||||
| Construction Adhesives |
990,296 | 987,610 | ||||||||||
| Corporate |
444,442 | 377,727 | ||||||||||
| Total |
$ | 4,723,575 | $ | 4,463,629 | ||||||||
| Capital expenditures |
||||||||||||
| Hygiene, Health and Consumable Adhesives |
$ | 67,933 | $ | 110,877 | ||||||||
| Engineering Adhesives |
14,888 | (2,302 | ) | |||||||||
| Construction Adhesives |
4,540 | (5,772 | ) | |||||||||
| Corporate |
31,776 | 27,161 | ||||||||||
| Total |
$ | 119,137 | $ | 129,964 | ||||||||
1 Consistent with our internal management reporting, Corporate Unallocated amounts in the tables above include net revenue and charges that are not allocated to the Company’s reportable segments.
2 Segment assets include primarily inventory, accounts receivable, property, plant and equipment, goodwill, intangible assets and other miscellaneous assets. Corporate assets include primarily corporate property, plant and equipment, deferred tax assets, certain investments and other assets.
Reconciliation of segment operating income to income before income taxes and income from equity method investments:
| 2023 |
2022 |
2021 |
||||||||||
| Segment operating income |
$ | 355,137 | $ | 322,718 | $ | 252,612 | ||||||
| Other income, net |
9,682 | 12,952 | 32,855 | |||||||||
| Interest expense |
(134,602 | ) | (91,521 | ) | (78,092 | ) | ||||||
| Interest income |
3,943 | 7,779 | 9,476 | |||||||||
| Income before income taxes and income from equity method investments |
$ | 234,160 | $ | 251,928 | $ | 216,851 | ||||||
Financial information about geographic areas
| Net Revenue |
||||||||||||
| 2023 |
2022 |
2021 |
||||||||||
| United States |
$ | 1,551,846 | $ | 1,692,903 | $ | 1,421,623 | ||||||
| China |
430,948 | 462,587 | 433,998 | |||||||||
| Germany |
393,029 | 419,141 | 409,193 | |||||||||
| Countries with more than 10 percent of total |
2,375,823 | 2,574,631 | 2,264,814 | |||||||||
| All other countries with less than 10 percent of total |
1,135,111 | 1,174,552 | 1,013,217 | |||||||||
| Total |
$ | 3,510,934 | $ | 3,749,183 | $ | 3,278,031 | ||||||
| Property, Plant and Equipment, net |
||||||||||||
| 2023 |
2022 |
2021 |
||||||||||
| United States |
$ | 425,765 | $ | 375,353 | $ | 331,864 | ||||||
| Germany |
114,266 | 107,903 | 120,548 | |||||||||
| China |
110,061 | 101,563 | 96,300 | |||||||||
| All other countries with less than 10 percent of total |
174,563 | 148,848 | 146,655 | |||||||||
| Total |
$ | 824,655 | $ | 733,667 | $ | 695,367 | ||||||
We view the following disaggregation of net revenue by geographic region as useful to understanding the composition of revenue recognized during the respective reporting periods:
| December 2, 2023 |
||||||||||||||||||||
| Hygiene, Health and Consumable |
Engineering |
Construction |
Corporate |
|||||||||||||||||
| Adhesives |
Adhesives |
Adhesives |
Unallocated |
Total |
||||||||||||||||
| Americas |
$ | 919,024 | $ | 577,751 | $ | 363,517 | $ | - | $ | 1,860,292 | ||||||||||
| EIMEA |
476,397 | 460,327 | 85,738 | - | 1,022,462 | |||||||||||||||
| Asia Pacific |
206,066 | 390,666 | 31,448 | - | 628,180 | |||||||||||||||
| $ | 1,601,487 | $ | 1,428,744 | $ | 480,703 | $ | - | $ | 3,510,934 | |||||||||||
| December 3, 2022 |
||||||||||||||||||||
| Hygiene, Health and Consumable |
Engineering |
Construction |
Corporate |
|||||||||||||||||
| Adhesives |
Adhesives |
Adhesives |
Unallocated |
Total |
||||||||||||||||
| Americas |
$ | 1,003,179 | $ | 630,484 | $ | 411,951 | $ | - | $ | 2,045,614 | ||||||||||
| EIMEA |
471,299 | 478,573 | 78,773 | - | 1,028,645 | |||||||||||||||
| Asia Pacific |
221,456 | 423,582 | 29,886 | - | 674,924 | |||||||||||||||
| $ | 1,695,934 | $ | 1,532,639 | $ | 520,610 | $ | - | $ | 3,749,183 | |||||||||||
| November 27, 2021 |
||||||||||||||||||||
| Hygiene, Health and Consumable |
Engineering |
Construction |
Corporate |
|||||||||||||||||
| Adhesives |
Adhesives |
Adhesives |
Unallocated |
Total |
||||||||||||||||
| Americas |
$ | 826,172 | $ | 504,626 | $ | 384,576 | $ | - | $ | 1,715,374 | ||||||||||
| EIMEA |
425,324 | 470,466 | 22,156 | - | 917,946 | |||||||||||||||
| Asia Pacific |
221,260 | 396,664 | 26,787 | - | 644,711 | |||||||||||||||
| $ | 1,472,756 | $ | 1,371,756 | $ | 433,519 | $ | - | $ | 3,278,031 | |||||||||||
Item 9. Changes in and Disagreements with Accountants on Accounting and Financial Disclosure
Not applicable.
Item 9A. Controls and Procedures
Disclosure Controls and Procedures
As of the end of the period covered by this report, management conducted an evaluation, under the supervision and with the participation of our President and Chief Executive Officer and Executive Vice President, Chief Financial Officer, of our disclosure controls and procedures (as defined in Rules 13a-15(e) and 15d-15(e) under the Securities Exchange Act of 1934 (“Exchange Act”)). Based on its evaluation, our management concluded that, as of December 2, 2023, our disclosure controls and procedures were effective (1) to ensure that information required to be disclosed by us in reports that we file or submit under the Exchange Act is recorded, processed, summarized and reported, within the time periods specified in the SEC’s rules and forms and (2) to ensure that information require to be disclosed by us in the reports that we file or submit under the Exchange Act is accumulated and communicated to us, including our principal executive and principal financial officers, as appropriate to allow timely decisions regarding required disclosure.
Management's Report on Internal Control over Financial Reporting
Our management is responsible for establishing and maintaining adequate internal control over financial reporting. Our internal control over financial reporting is a process designed to provide reasonable assurance regarding the reliability of financial reporting and the preparation of financial statements for external purposes in accordance with accounting principles generally accepted in the United States. Because of its inherent limitations, internal control over financial reporting may not prevent or detect misstatements. Therefore, even those systems determined to be effective can provide only reasonable assurance of achieving their control objectives.
Our management assessed the effectiveness of our internal control over financial reporting as of December 2, 2023. In making this assessment, we used the criteria set forth by the Committee of Sponsoring Organizations of the Treadway Commission (COSO) in Internal Control – Integrated Framework (2013 Framework). Based on its assessment, management concluded that, as of December 2, 2023, the Company’s internal control over financial reporting was effective. Ernst and Young LLP, an independent registered public accounting firm, has issued an attestation report on our internal control over financial reporting as of December 2, 2023, which is included elsewhere in this Form 10-K.
Changes in Internal Control over Financial Reporting
There were no changes in our internal control over financial reporting (as defined in Rule 13a-15(f) under the Exchange Act) during our most recently completed fiscal quarter that have materially affected or are reasonably likely to materially affect our internal control over financial reporting.
Rule 10b5-1 Plan Adoptions and Modifications
None.
Item 9C. Disclosure Regarding Foreign Jurisdictions that Prevent Inspections.
None.
PART III
Item 10. Directors, Executive Officers and Corporate Governance
The information under the headings “Proposal 1 - Election of Directors”, “Delinquent Section 16(a) Reports” and “Corporate Governance - Audit Committee” contained in the company's Proxy Statement for the Annual Meeting of Shareholders to be held on April 11, 2024 (the “2024 Proxy Statement”) is incorporated herein by reference.
The information contained at the end of Item 1. hereof under the heading “Information About Our Executive Officers” is incorporated herein by reference.
Since the date of our 2023 Proxy Statement, there have been no material changes to the procedures by which shareholders may recommend nominees to our Board of Directors.
The company has a code of business conduct applicable to all of its directors and employees, including its principal executive officer, principal financial officer, principal accounting officer, controller and other employees performing similar functions. A copy of the code of business conduct is available under the Investor Relations section of the company’s website at www.hbfuller.com. The company intends to disclose on its website information with respect to any amendment to or waiver from a provision of its code of business conduct that applies to its principal executive officer, principal financial officer, principal accounting officer, controller and other employees performing similar functions within four business days following the date of such amendment or waiver.
Item 11. Executive Compensation
The information under the headings “Executive Compensation,” “Director Compensation” and “CEO Pay Ratio Disclosure” contained in the 2024 Proxy Statement is incorporated herein by reference.
Item 12. Security Ownership of Certain Beneficial Owners and Management and Related Stockholder Matters
The information under the headings “Security Ownership of Certain Beneficial Owners and Management” and "Equity Compensation Plan Information" contained in the 2024 Proxy Statement is incorporated herein by reference.
Equity Compensation Plan Information
| (c) |
||||||||||||
| Number of securities |
||||||||||||
| (a) |
(b) |
remaining available for |
||||||||||
| Number of securities |
Weighted-average |
future issuance under |
||||||||||
| to be issued upon |
exercise price |
equity compensation |
||||||||||
| exercise of outstanding |
of outstanding |
plans (excluding |
||||||||||
| options, warrants |
options, warrants |
securities reflected |
||||||||||
| Period |
and rights |
and rights |
in column (a)) |
|||||||||
| Equity compensation plans approved by security holders |
5,470,575 | 1 |
$ | 53.27 | 2 |
3,413,652 | 3 |
|||||
| Equity compensation plans not approved by security holders |
- | N/A | - | |||||||||
| Total |
5,470,575 | $ | 47.77 | 3,413,652 | ||||||||
1 Consists of outstanding stock options to acquire 4,941,885 shares of common stock, 283,714 outstanding time-based restricted stock units and 244,976 outstanding performance-based restricted stock units granted under the Company's equity compensation plans.
2 Consists of the weighted average exercise price of stock options granted under the Company's equity compensation plans.
3 Number of shares of common stock remaining available for future issuance under the Second Amended and Restated H.B. Fuller Company 2020 Master Incentive Plan.
Item 13. Certain Relationships and Related Transactions and Director Independence
The information under the headings “Certain Relationships and Related Transactions” and “Corporate Governance - Director Independence” contained in the 2024 Proxy Statement is incorporated herein by reference.
Item 14. Principal Accountant Fees and Services
The information under the heading “Fees Paid to Independent Registered Public Accounting Firm” contained in the 2024 Proxy Statement is incorporated herein by reference.
PART IV
Item 15. Exhibits and Financial Statement Schedules
| (a) |
Documents filed as part of this report: |
| 1. |
Consolidated Financial Statements |
|
| Consolidated Statements of Income for the fiscal years ended December 2, 2023, December 3, 2022, and November 27, 2021. | ||
| Consolidated Statements of Comprehensive Income for the fiscal years ended December 2, 2023, December 3, 2022, and November 27, 2021. | ||
| Consolidated Balance Sheets as of December 2, 2023 and December 3, 2022. | ||
| Consolidated Statements of Total Equity for the fiscal years ended December 2, 2023, December 3, 2022, and November 27, 2021. | ||
| Consolidated Statements of Cash Flows for the fiscal years ended December 2, 2023, December 3, 2022, and November 27, 2021. | ||
| Notes to Consolidated Financial Statements | ||
| Report of Independent Registered Public Accounting Firm (PCAOB ID: 42) |
| 2. |
Financial Statement Schedules |
|
| All financial statement schedules are omitted as the required information is inapplicable or the information is presented in the consolidated financial statements or related notes. |
| 3. |
Exhibits |
| Item |
Incorporation by Reference |
|||
| 3.1 |
Restated Articles of Incorporation of H.B. Fuller Company, as amended |
Exhibit 3.1 to the Quarterly Report on Form 10-Q for the quarter ended September 2, 2006. |
||
| 3.2 |
Exhibit 3.1 to the Current Report on Form 8-K dated December 2, 2015. |
|||
| 3.3 | Statement of Cancellation, dated October 13, 2016 | Exhibit 3.1 to the Current Report on Form 8-K dated October 12, 2016. | ||
| 4.1 |
Form of Certificate for common stock, par value $1.00 per share |
Exhibit 4.1 to the Current Report on Form 10-Q dated March 30, 2023. |
||
| 4.2 |
Indenture, dated February 14, 2017, between H.B. Fuller Company and U.S. Bank National Association, as Trustee | Exhibit 4.1 to the Current Report on Form 8-K dated February 9, 2017. |
||
| 4.3 |
Exhibit 4.2 to the Current Report on Form 8-K dated February 9, 2017. |
|||
| 4.4 |
Exhibit 4.6 to the Current Report on Form 10-K dated January 31, 2018. |
|||
| 4.5 |
Exhibit 4.1 to the Current Report on Form 8-K dated October 20, 2020. |
|||
| 4.6 |
Form of Global Note representing the 4.000% Notes due 2027 (included in Exhibit 4.3) |
Exhibit 4.2 to the Current Report on Form 8-K dated February 9, 2017. |
||
| 4.7 |
Form of Global Note representing the 4.250% Notes due 2028 (included in Exhibit 4.5) |
Exhibit 4.1 to the Current Report on Form 8-K dated October 20, 2020. |
||
| 4.8 |
Exhibit 4.8 to the Annual Report on Form 10-K dated January 24, 2020. |
| 10.6 |
Second Declaration of Amendment dated May 31, 2011 to the H.B. Fuller Company Supplemental Executive Retirement Plan II - 2008 | Exhibit 10.1 to the Quarterly Report on Form 10-Q for the quarter ended May 28, 2011. |
| 10.7 |
Exhibit 10.9 to the Annual Report on Form 10-K for the year ended November 27, 2021. |
|||
| *10.8 |
H.B. Fuller Company Executive Benefit Trust dated October 25, 1993 between H.B. Fuller Company and U.S. Bank, National Association, as Trustee, as amended, relating to the H.B. Fuller Company Supplemental Executive Retirement Plan | Exhibit 10(k) to the Annual Report on Form 10-K for the year ended November 29, 1997. | ||
| *10.9 |
Amendments to H.B. Fuller Company Executive Benefit Trust, dated October 1, 1997 and March 2, 1998, between H.B. Fuller Company and First Trust National Association, as Trustee, relating to the H.B. Fuller Company Supplemental Executive Retirement Plan | Exhibit 10(k) to the Annual Report on Form 10-K405 for the year ended November 28, 1998, | ||
| *10.42 |
Fourth Amendment of the H.B. Fuller Company Defined Contribution Restoration Plan (As Amended and Restated Effective January 1, 2008) | Exhibit 10.43 to the Annual Report on Form 10-K for the year ended November 28, 2020. | ||
| *10.43 |
Fifth Amendment to the H.B. Fuller Company Defined Contribution Restoration Plan (As Amended and Restated Effective January 1, 2008) | Exhibit 10.40 to the Annual Report on Form 10-K for the year ended November 27, 2021. | ||
| *10.44 |
H.B. Fuller Company Directors’ Deferred Compensation Plan (2008 Amendment and Restatement) | Exhibit 10.22 to the Annual Report on Form 10-K for the year ended November 29, 2008. |
| *10.45 |
First Amendment of H.B. Fuller Company Directors’ Deferred Compensation Plan (2008 Amendment and Restatement) | Exhibit 10.23 to the Annual Report on Form 10-K for the year ended November 29, 2008. | ||
| *10.46 |
H.B. Fuller Company 2009 Director Stock Incentive Plan | Exhibit 10.2 to the Quarterly Report on Form 10-Q for the quarter ended May 30, 2009. | ||
| *10.47 | H.B. Fuller Company Management Short-Term Incentive Plan for Executive Officers | Filed herewith. | ||
| *10.48 | H.B. Fuller Company 2013 Master Incentive Plan | Annex B to the H.B. Fuller Company Proxy Statement on Schedule 14A filed with the Securities and Exchange Commission on February 27, 2013. | ||
| *10.49 | H.B. Fuller Company 2016 Master Incentive Plan | Annex B to the H.B. Fuller Company Proxy Statement on Schedule 14A filed with the Securities and Exchange Commission on February 24, 2016. | ||
| *10.50 | H.B. Fuller Company 2018 Master Incentive Plan | Annex B to the H.B. Fuller Company Proxy Statement on Schedule 14A filed with the Securities and Exchange Commission on February 28, 2018. | ||
| *10.51 | Amended and Restated H.B. Fuller Company 2020 Master Incentive Plan | Annex B to the H.B. Fuller Company Proxy Statement on Schedule 14A filed with the Securities and Exchange Commission on February 24, 2021. | ||
| *10.52 | Second Amended and Restated H.B. Fuller Company 2020 Master Incentive Plan | Annex B to the H.B. Fuller Company Proxy Statement on Schedule 14A filed with the Securities and Exchange Commission on February 22, 2023. | ||
| 21 |
||||
| 23.1 |
||||
| 24 |
||||
| 31.1 |
| 31.2 |
||||
| 32.1 |
||||
| 32.2 |
||||
| 97.1 | Executive and Key Manager Compensation Recovery Policy | Filed herewith. | ||
| 101 |
The following materials from the H.B. Fuller Company Annual Report on Form 10-K for the fiscal year ended December 2, 2023 formatted in Inline Extensible Business Reporting Language (Inline XBRL): (i) the Consolidated Statements of Income, (ii) the Consolidated Statements of Comprehensive Income, (iii) the Consolidated Balance Sheets, (iv) the Consolidated Statements of Total Equity, (v) the Consolidated Statements of Cash Flows and (vi) the Notes to Consolidated Financial Statements. |
|||
| 104 |
Cover Page Interactive Data File (formatted in Inline XBRL and contained in Exhibit 101) |
|||
| * Asterisked items are management contracts or compensatory plans or arrangements required to be filed. |
||||
| (b) |
See Exhibit Index and Exhibits attached to this Form 10-K. |
Item 16. Form 10-K Summary Pursuant to the requirements of Section 13 or 15(d) of the Securities Exchange Act of 1934, the registrant has duly caused this report to be signed on its behalf by the undersigned, thereunto duly authorized.
None
|
|
H.B. FULLER COMPANY |
|
|
|
|
|
|
|
|
|
By: |
/s/ Celeste B. Mastin |
|
| Dated: January 24, 2024 |
|
CELESTE B. MASTIN |
|
|
|
|
President and Chief Executive Officer |
|
Pursuant to the requirements of the Securities Exchange Act of 1934, this report has been signed below by the following persons on behalf of the registrant and in the capacities and on the dates indicated:
| Signature |
Title |
||||
|
/s/ Celeste B. Mastin |
President and Chief Executive Officer and Director |
||||
| CELESTE B. MASTIN |
(Principal Executive Officer) |
||||
|
/s/ John J. Corkrean |
Executive Vice President, Chief Financial Officer |
||||
| JOHN J. CORKREAN | (Principal Financial Officer) | ||||
| /s/ Robert J. Martsching | Vice President, Controller | ||||
| ROBERT J. MARTSCHING | (Principal Accounting Officer) | ||||
|
|
|
||||
| * | Director | ||||
| DANIEL L. FLORNESS | |||||
| * | Director | ||||
| THOMAS W. HANDLEY | |||||
| * | Director | ||||
| MICHAEL J. HAPPE | |||||
| * | Director | ||||
| RUTH S. KIMMELSHUE | |||||
| * | Director | ||||
| CHARLES T. LAUBER | |||||
| * | Director | ||||
| LEE R. MITAU | |||||
| * | Director | ||||
| TERESA J. RASMUSSEN | |||||
| * | Director | ||||
| SRILATA A. ZAHEER | |||||
| * by /s/ Gregory O. Ogunsanya | |||||
| GREGORY O. OGUNSANYA, Attorney in Fact | |||||
| Dated: January 24, 2024 |
Exhibit 10.16
SEVERANCE AGREEMENT
THIS SEVERANCE AGREEMENT (the “Agreement”) is made this _____ day of _______________, 20 (the “Effective Date”), by and between H.B. Fuller Company, a Minnesota corporation (the “Company”), and _______________ (the “Executive”).
W I T N E S S E T H:
WHEREAS, the Company desires to continue to employ the Executive in accordance with the terms and conditions stated in this Agreement;
WHEREAS, the Executive is a key member of the management of the Company and is expected to devote substantial skill and effort to the affairs of the Company, and the Company desires to recognize the significant personal contribution that the Executive makes, and is expected to continue to make, to further the best interests of the Company and its shareholders;
WHEREAS, it is desirable and in the best interests of the Company and its shareholders to continue to obtain the benefits of the Executive’s services and attention to the affairs of the Company;
WHEREAS, the Company and the Executive are parties to a Change in Control Agreement dated as of ______________, and as may be amended from time to time (the “Change in Control Agreement”), which provides the Executive the opportunity to receive certain benefits upon termination of the Executive’s employment under certain conditions during a limited period following a change in control;
WHEREAS, the Company desires to provide the Executive the opportunity to receive certain benefits when, in the absence of a Change in Control, Executive’s employment is terminated by the Company without Cause or by the Executive for Good Reason, according to the terms, conditions and obligations set forth below;
WHEREAS, the Executive understands that the Executive’s receipt of the benefits provided for in this Agreement depends on, among other things, the Executive’s willingness to agree to and abide by the non-disclosure, [non-competition,] non-solicitation, and other covenants contained in Exhibit A attached to this Agreement (the “Non-Disclosure Agreement”) and Executive’s execution of a release of claims in favor of the Company upon termination;
WHEREAS, it is desirable and in the best interests of the Company and its shareholders to protect confidential, proprietary and trade secret information of the Company, to prevent unfair competition by former Executives of the Company following separation of their employment with the Company and to secure cooperation from former Executives with respect to matters related to their employment with the Company; and
WHEREAS, the Executive understands that nothing in this Agreement limits the Company’s right to terminate the Executive’s employment at any time and for any reason,
NOW, THEREFORE, in consideration of the Executive’s employment with the Company, the compensation and benefits payable in connection with such employment, and the foregoing premises and other good and valuable consideration, the receipt and adequacy of which are hereby acknowledged, the Executive and the Company agree as follows:
1. Definitions. The capitalized terms used in this Agreement have the following meanings:
(a) “Affiliated Organization” means a business entity that is treated as a single employer with the Company under the rules of section 414(b) and (c) of the Code, including the eighty percent (80%) standard therein.
(b) “Annual Cash Compensation” means an amount equal to the sum of: (A) the Executive’s annual base salary in effect as of the Date of Termination plus (B) the amount of the annual target bonus opportunity of the Executive, pursuant to the bonus plan described in Section 3(b) below, for the fiscal year of the Company in which the Date of Termination occurs.
(c) “Board” means the Board of Directors of the Company, including any authorized committee of the Board.
(d) “Cause” means:
(i) any act by the Executive that is materially inimical to the best interests of the Company and that constitutes common law fraud, a felony or other gross malfeasance of duty on the part of the Executive;
(ii) any material disloyalty or dishonesty by the Executive related to or connected with the Executive’s employment by the Company or otherwise likely to cause material harm to the Company or its reputation;
(iii) a willful and material violation by the Executive of the Company’s written policies or codes of conduct;
(iv) wrongful appropriation by the Executive of Company funds or property or other material breach of the Executive’s fiduciary duties to the Company; or
(v) the willful and material breach by the Executive of this Agreement, the Non-Disclosure Agreement, or any other written agreement between the Company and the Executive.
(e) “Change in Control” has the meaning prescribed for such term in the Change in Control Agreement.
(f) “Code” means the Internal Revenue Code of 1986, as amended. Any reference to a specific provision of the Code will include a reference to such provision as it may be amended from time to time and to any successor provision.
(g) “Company” means the Company as defined in the first sentence of this Agreement and any successor to its business and/or assets which assumes or agrees to perform this Agreement by operation of law, assignment or otherwise. If at any time during the Term of this Agreement the Executive is employed by an Affiliated Organization, the term “Company” as used in this Agreement shall in addition include such Affiliated Organization. In such event, the Company agrees that it shall pay or provide, or shall cause such Affiliated Organization to pay or provide, any amounts or benefits due the Executive pursuant to this Agreement.
(h) “Date of Termination” means the date of the Executive’s “separation from service” with the Company (including all Affiliated Organizations, as applicable), within the meaning of section 409A(a)(2)(A)(i) of the Code.
(i) “Disability” means leaving active employment and qualifying for and receiving disability benefits under the Company’s long-term disability plan or, if not elected or eligible under the Company’s long-term disability plan, the Executive qualifies for disability benefits under the federal Social Security Act.
(j) “Good Reason” means the occurrence of any of the following without the Executive’s consent:
(i) A material reduction of the Executive’s base salary (unless such reduction is part of an across-the-board uniformly applied reduction affecting all senior executives of the Company);
(ii) A material diminution in the Executive’s authority and duties; provided, however, that a change of the individual or officer to whom the Executive reports, in and of itself, would not constitute diminution; or
(iii) a required change of the Executive’s principal work location of fifty (50) or more miles.
Notwithstanding the above, the occurrence of any of the events described above will not constitute Good Reason unless (A) the Executive gives the Company written notice within ninety (90) days after the initial occurrence of any of such event that the Executive believes that such event constitutes Good Reason and describing the details of such event, (B) the Company thereafter fails to cure any such event within thirty (30) days after receipt of such notice, and (C) the Executive’s Date of Termination as a result of such event occurs within 180 days after the initial occurrence of such event.
(k) “Protected Period” has the meaning prescribed for such term in the Change in Control Agreement.
(l) “Term” means the period commencing on the Effective Date and ending on the last business day of the Company’s fiscal year ending in 20[__], provided that such period will be automatically extended for successive one-year periods ending on the last business day of each subsequent fiscal year, unless either party gives written notice of non-renewal to the other party at least six (6) months prior to the last business day of the Company’s fiscal year 20[__], or the last business day of each subsequent fiscal year, as the case may be, that such party elects not to extend the Term under this Agreement.
2. Position and Duties. During employment with the Company, the Executive will perform such duties and responsibilities as the Company may assign from time to time. Executive will serve the Company faithfully and to the best of the Executive’s ability and will devote full working time, attention, and efforts to the business and affairs of the Company. Executive will follow and comply with applicable policies and procedures adopted by the Company from time to time, including without limitation policies relating to business ethics, conflict of interest, non-discrimination, confidentiality and protection of trade secrets, and insider trading. Executive will not engage in other employment or other material business activity, except as approved in writing by the Board. It shall not be a violation of this Agreement for the Executive to (i) serve on corporate, civic or charitable boards or committees or (ii) manage personal investments, so long as such activities do not materially interfere with the performance of the Executive’s responsibilities to the Company. Executive hereby represents and confirms that the Executive is under no contractual or legal commitments that would prevent the Executive from fulfilling Executive’s duties and responsibilities as set forth in this Agreement.
3. Compensation. During employment with the Company, the Executive will be provided with the following compensation and benefits:
(a) Base Salary. The Company will pay to the Executive for services provided hereunder a base salary at a rate determined from time to time by the Board, which base salary will be paid in accordance with the Company’s normal payroll policies and procedures.
(b) Incentive Compensation. Executive will be eligible to participate in an annual cash bonus plan of the Company as designated by the Board, in accordance with the terms and conditions of such plan as may be in effect from time to time.
(c) Employee Benefits. Executive will be entitled to participate in all employee benefit plans and programs generally available to executive employees of the Company, as determined by the Company and to the extent that the Executive meets the eligibility requirements for each individual plan or program. Executive’s participation in any plan or program will be subject to the provisions, rules, and regulations of, or applicable to, the plan or program. The Company provides no assurance as to the adoption or continuation of any particular employee benefit plan or program.
(d) Expenses. The Company will reimburse the Executive for all reasonable and necessary out-of-pocket business, travel, and entertainment expenses incurred by the Executive in the performance of duties and responsibilities to the Company during the Executive’s employment. Such reimbursement shall be subject to the Company’s normal policies and procedures for expense verification, documentation, and reimbursement.
4. Termination of Employment. Executive shall at all times be an employee at will, and either the Company or the Executive may terminate Executive’s employment with or without Cause at any time, with or without advance notice, subject to the obligations of the parties under this Agreement.
5. Payments Upon Involuntary Termination. If the Executive’s Date of Termination occurs during the Term, and if such separation from service (A) is involuntary at the initiative of the Company for any reason other than Cause or Disability or at the initiative of the Executive for Good Reason, and (B) does not occur during a Protected Period, then, in addition to such compensation that has been earned but not paid to the Executive as of the Date of Termination, the Company will provide to the Executive the severance benefits set forth in this Section 5, subject to the conditions in Section 6.
(a) Separation Pay.
(i) The Company will pay to the Executive an amount equal to [for CEO add: two times] the Executive’s Annual Cash Compensation, payable to the Executive in equal installments in accordance with the Company’s regular payroll practices and schedule over the [twelve (12)] [for CEO: twenty-four (24)] month period following the Date of Termination, but in no event shall such amount paid under this Section 5(a)(i) exceed the lesser of (A) $660,000.00 or (B) two (2) times the Executive’s annualized compensation based upon the annual rate of pay for services to the Company for the calendar year prior to the calendar year in which the Date of Termination occurs (adjusted for any increase during that year that was expected to continue indefinitely if the Executive had not separated from service). The separation pay under this Section 5(a)(i) is intended to constitute a “separation pay plan due to involuntary separation from service” under Treas. Reg. § 1.409A-1(b)(9)(iii).
(ii) In the event that the amount payable to the Executive under Section 5(a)(i) is limited by Section 5(a)(i)(A) or (B) above, then the Company will also pay to the Executive a lump sum payment equal to the difference between (A) [for CEO add: two times] the Executive’s Annual Cash Compensation and (B) the amount payable under Section 5(a)(i). Such payment will be paid to the Executive in a lump sum on the earlier of: (x) the date that is six (6) months after the Date of Termination, or (y) the date of Executive’s death.
(b) Continued Benefits. If the Executive (and/or the Executive’s covered dependents) is eligible and properly elects to continue group medical and/or dental insurance coverage, as in place immediately prior to the Date of Termination, the Company will continue to pay the Company’s portion of any such premiums or costs of coverage until the earlier of (A) [twelve (12)] [for CEO: eighteen (18)] months after the Date of Termination, or (B) the date the Executive (and the Executive’s covered dependents) is provided such form of coverage by a subsequent employer. All such Company-provided medical and/or dental insurance premiums, or costs of coverage, will be paid directly to the insurance carrier or other provider by the Company and the Executive shall make arrangements with the Company to pay: (i) the Executive’s portion of such coverage in an amount equal to such portion that the Executive would pay if actively employed by the Company, and (ii) any amounts due for federal, state and local income and employment taxes as the Company shall determine are required or authorized to be withheld and/or paid on amounts paid pursuant to this Paragraph 5. Notwithstanding the foregoing, Company will use reasonable efforts to withhold any federal, state and local income and employment taxes owed by Executive under this Paragraph 5 from other amounts paid to Executive under this Agreement.
(c) Outplacement Services. For a period of up to one year following the Date of Termination, the Company will provide to the Executive executive-level outplacement services from a provider selected by the Company, with a total cost not to exceed $20,000.00. The Company shall pay (or, at its option, reimburse the Executive) for such services within ten days after its receipt of a statement from the service provider; provided that in no event shall reimbursements be paid to the Executive after the last day of the Executive’s third taxable year following the taxable year in which the Date of Termination occurs. The Executive shall not be eligible to receive cash in lieu of outplacement services.
6. Termination Payment Conditions. Notwithstanding anything above to the contrary, the Company will not be obligated to provide any benefits to the Executive under Section 5 hereof unless: (a) the Executive has signed a release of claims in favor of the Company and its affiliates and related entities, and their directors, officers, insurers, employees and agents, in a form prescribed by the Company (which release will not include any claims the Executive may have to indemnification or advancement of expenses with respect to the Executive’s actions as an officer or director of the Company); (b) all applicable rescission periods provided by law for releases of claims have expired and the Executive has not rescinded the release of claims; and (c) the Executive is in strict compliance with the terms of this Agreement, the Non-Disclosure Agreement and any other written agreements between the Company and the Executive as of the dates of such payments.
7. Other Terminations. If Executive’s Date of Termination occurs:
(a) by reason of Executive’s abandonment of employment or resignation from employment for any reason other than Good Reason;
(b) by reason of termination of Executive’s employment by the Company for Cause;
(c) because of Executive’s death or Disability;
(d) upon or following expiration of the Term; or
(e) during a Protected Period,
then the Company will pay to Executive, or Executive’s beneficiary or Executive’s estate, as the case may be, such compensation that has been earned but not paid to Executive as of the Date of Termination, payable pursuant to the Company’s normal payroll practices and procedures, and the Executive shall not be entitled to any additional compensation or benefits provided under this Agreement. In no event shall the Executive be entitled to payments in connection with any separation from service under both this Agreement and under the Change in Control Agreement.
8. Restrictive Covenants. At the same time as the Executive signs this Agreement, the Executive will sign the Non-Disclosure Agreement attached hereto as Exhibit A, among other things in consideration of the payments and benefits provided to the Executive pursuant to this Agreement.
9. Successors. This Agreement shall not be assignable, in whole or in part, by either party without the written consent of the other party, except that the Company may, without the consent of the Executive, assign or delegate all or any portion of its rights and obligations under this Agreement to any corporation or other business entity (i) with which the Company may merge or consolidate, (ii) to which the Company may sell or transfer all or substantially all of its assets or capital stock, or (iii) that is or becomes an Affiliated Organization. Any such current or future successor to which any right or obligation has been assigned or delegated shall be deemed to be the “Company” for purposes of such rights or obligations of this Agreement. In the event of the Executive’s death after the Executive has become eligible for any payments under Section 5 of this Agreement, all amounts payable to the Executive thereunder shall be paid to a beneficiary designated by the Executive in the form established by the Company or, if no such beneficiary is designated, then to the Executive’s estate, heirs or representatives.
10. Miscellaneous.
(a) Tax Withholding. The Company may withhold from any amounts payable under this Agreement such federal, state and local income and employment taxes as the Company shall determine are required or authorized to be withheld pursuant to any applicable law or regulation.
(b) Section 409A. This Agreement is intended to satisfy the requirements of sections 409A(a)(2), (3) and (4) of the Code, including current and future guidance and regulations interpreting such provisions, and should be interpreted accordingly.
(c) Governing Law. All matters relating to the interpretation, construction, application, validity, and enforcement of this Agreement will be governed by the laws of the State of Minnesota without giving effect to any choice or conflict of law provision or rule, whether of the State of Minnesota or any other jurisdiction, that would cause the application of laws of any jurisdiction other than the State of Minnesota.
(d) Jurisdiction and Venue. The Executive and the Company consent to jurisdiction of the courts of the State of Minnesota and/or the United States District Court, District of Minnesota, for the purpose of resolving all issues of law, equity, or fact arising out of or in connection with this Agreement. Any action involving claims of a breach of this Agreement must be brought in such courts. Each party consents to personal jurisdiction over such party in the state and/or federal courts of Minnesota and hereby waives any defense of lack of personal jurisdiction. Venue, for the purpose of all such suits, will be in Ramsey County, State of Minnesota.
(e) Waiver of Jury Trial. To the extent permitted by law, the Executive and the Company waive any and all rights to a jury trial with respect to any dispute arising out of or relating to this Agreement.
(f) Notice. Notices and all other communications provided for in the Agreement shall be in writing and shall be deemed to have been duly given when personally delivered, sent by reliable overnight courier or mailed by United States registered mail (or its equivalent for overseas delivery), return receipt requested, postage prepaid, and addressed as follows:
If to the Company:
H.B. Fuller Company
P.O. Box 64683
St. Paul, MN 55164-0683
Attention: General Counsel
If to the Executive, to the Executive’s
most recent address on file with the Company
or to such other address as either party may have furnished to the other in writing in accordance herewith, except that notices of change of address shall be effective only upon receipt.
(g) Modifications; Waiver. No provision of this Agreement may be modified, waived or discharged unless such waiver, modification or discharge is agreed to in writing signed by the Executive and the Company. No waiver by either party hereto at any time of any breach by the other party of, or compliance with, any condition or provision of this Agreement to be performed by such other party shall be deemed a waiver of similar or dissimilar provisions or conditions at the same or at any prior or subsequent time.
(h) Entire Agreement. This Agreement, the Change in Control Agreement, and the Non-Disclosure Agreement constitute the entire understandings and agreements between the Company and the Executive with regard to payments and benefits upon a termination of the Executive’s employment or other separation from service with the Company. This Agreement supersedes and renders null and void all prior agreements, offer letters, plans, programs or other undertakings between the parties with regard to such subject matter (other than those specifically referenced herein), whether written or oral.
IN WITNESS WHEREOF, the parties have executed this Agreement as of the date first above written.
| H.B. FULLER COMPANY | ||
| By: | ||
| As its: | ||
| [The Executive] | ||
EXHIBIT A
TO SEVERANCE AGREEMENT
NON-DISCLOSURE AND [NON-COMPETITION][NON-SOLICITATION]
H.B. Fuller Company
H.B. Fuller’s continuing growth offers opportunity and security to all employees. This growth is dependent on specialized knowledge not generally known to other companies in the areas of research, technical service, production, marketing and management.
H.B. Fuller spends great amounts of money to obtain and use this specialized knowledge in the form of equipment, study and personnel. By far the largest contribution to this knowledge comes from our people.
This knowledge is only useful, obviously, when it remains with H.B. Fuller. Once the specialized information is generally known it eliminates any advantage to the company or to H.B. Fuller employees.
In other words, all H.B. Fuller employees have a common interest and responsibility in seeing that no one single employee uses this specialized information outside of the company to the detriment of the rest of the employees.
To help protect you and other employees, this Non-Disclosure and [Non-Competition][Non-Solicitation Agreement] points out our common responsibility.
We ask that you read it very carefully before signing.
| By: | |||
| President and Chief Executive Officer |
H.B. Fuller Company
NON-DISCLOSURE AND [NON-COMPETITION][NON-SOLICITATION AGREEMENT]
I am employed by or desire to be employed by H.B. Fuller in a capacity in which I may receive or contribute Confidential Information. To protect such Confidential Information, as well as H.B. Fuller’s other legitimate business interests, and in consideration of such employment or continued employment, the wages and benefits provided to me, being given access to Confidential Information, my rights under the Severance Agreement dated __________ , 20__, and the other consideration set forth in this Agreement, H.B. Fuller and I agree as follows:
|
A. |
DEFINITIONS |
In this Agreement the following definitions shall apply:
|
1. |
"H.B. Fuller" means H.B. Fuller Company and any of its existing or future subsidiaries, partnerships, joint ventures and affiliates. |
|
2. |
"CONFIDENTIAL INFORMATION" means all confidential information of H.B. Fuller including, but not limited to, the following: |
|
● |
All Trade Secrets |
|
● |
Product formulas, designs and specifications |
|
● |
Product and production know how, technologies and concepts |
|
● |
new Product ideas |
|
● |
testing methods, know how, techniques, concepts and results |
|
● |
customer lists including identities of existing and potential customers, identities of contacts or possible contacts at customers and prospective customers regardless of who at H.B. Fuller compiled such information |
|
● |
customer purchasing histories, pricing and other contract terms, product preferences, buying habits, business plans, Product plans and expectations |
|
● |
other information disclosed by customers and prospective customers to H.B. Fuller a) where disclosure of such information may be harmful to a customer or prospective customer; b) that the customer or prospective customer has informed H.B. Fuller is not to be disclosed to third parties; or c) where there is an expectation created through any means that H.B. Fuller will keep such information confidential |
|
● |
marketing studies, methods, plans and strategies |
|
● |
business relationships, contracts, methods, models, analyses, plans and strategies |
|
● |
new business ideas |
|
● |
financial and accounting information including budgets, forecasts, projections, costs, prices, margins, profits and sales |
|
● |
supplier and potential supplier identity, sales history, pricing and other contract terms, business plans, and production plans |
|
● |
other information disclosed by suppliers and prospective suppliers to H.B. Fuller a) where disclosure of such information may be harmful to a supplier or prospective supplier; b) that the supplier or prospective supplier has informed H.B. Fuller is not to be disclosed to third parties; or c) where there is an expectation of confidentiality created through any means that H.B. Fuller will keep such information confidential |
|
● |
software ideas and programs |
|
● |
computer user identifiers, access codes and passwords and the like |
|
● |
any other information which H.B. Fuller has an obligation to keep confidential |
Information shall be considered Confidential Information regardless of the means, media or format in which it is maintained or communicated. Confidential Information shall not include information the entirety of which is now or subsequently becomes generally and publicly known, other than as a direct or indirect result of the breach of this Agreement by me or a breach of a confidentiality obligation owed to H.B. Fuller by any third party.
3. ["CONFLICTING PRODUCT" means any Product of any person or organization (other than H.B. Fuller), that resemble, or competes with an H.B. Fuller Product (a) with which I was involved or upon which I have worked during the term of my work for H.B. Fuller; or (b) that I have sold or been authorized to sell during my last two (2) years of my work with H.B. Fuller; or (c) for which I may have solicited or assisted in the solicitation of sales during the last two (2) years of my employment by H.B. Fuller; or (d) about which I acquired Confidential Information at any time through my work with H.B. Fuller.][Reserved.]
4. "INVENTIONS" means all formulas, processes, practices, methods, discoveries, improvements, ideas, devices, designs, apparatuses and works of authorship, whether or not patentable or copyrightable.
5. “PRODUCT” means any product, process, equipment, concept or service (in existence or under development).
6. "TRADE SECRETS" may include Confidential Information, and means, without limitation, information, including any formula, pattern, compilation, program, device, method, figure, or process that derives actual or potential independent economic value from not being generally known to the public or to other persons who can obtain economic value from its disclosure; and is the subject of efforts that are reasonable under the circumstances to maintain its secrecy.
|
B. |
EMPLOYEE'S OBLIGATIONS TO H.B. FULLER |
1. FULL-TIME COMMITMENT. I will devote my full-time and energy to furthering H.B. Fuller’s business. I will not pursue any other business activity without H.B. Fuller’s written consent if such business activity would otherwise violate this Agreement or any of H.B. Fuller's policies on conflicts of interest or outside employment including H.B. Fuller's Code of Ethics.
2. WORK PRODUCT AND INVENTIONS.
(a) I agree that H.B. Fuller owns and shall continue to be the sole proprietor, in all countries, of all Inventions that I may learn of, have access to, have a part in developing, first conceive, or first reduce to practice (alone or jointly with others) (i) during my work with H.B. Fuller, whether or not during normal work time or at H.B. Fuller's premises; (ii) at any time after termination of my employment with H.B. Fuller that relate directly to H.B. Fuller’s business or actual or anticipated research about which I became aware at anytime; (iii) at any time after termination of my H.B. Fuller employment if based on Confidential Information; and/or (iv) at any time after termination of my H.B. Fuller employment that result from any of my work for H.B. Fuller. I agree to promptly disclose such Inventions to H.B. Fuller, and I hereby assign all right, title, and interest I may have in such Inventions to H.B. Fuller without charge to H.B. Fuller. In the absence of clear and convincing proof to the contrary, all Inventions conceived by me or first reduced to practice within one year after termination of H.B. Fuller employment that directly relate to H.B. Fuller business or demonstrably anticipated research will be considered to be Inventions to be disclosed to and owned by H.B. Fuller.
(b) I agree to deliver to H.B. Fuller accounts and records of all such Inventions set forth above in Section 2(a), and to execute all documents and oaths and to do such other acts as may be necessary or desirable in H.B. Fuller's opinion to obtain, maintain, reissue, extend, or enforce patents or copyrights (including without limitation design patents or other applicable registrations) and to vest, perfect, affirm, and record the entire right, title, and interest in H.B. Fuller to such patents, copyrights and Inventions in all countries. I agree to assist in these regards without any obligation by H.B. Fuller to provide me with further compensation, royalties or payments (without charge but at no expense to myself).
(c) This Agreement does not obligate me to assign to H.B. Fuller any Invention developed entirely on my own time without the use of any H.B. Fuller equipment, supplies, facility or Confidential Information and (1) which does not relate (i) directly to H.B. Fuller business or (ii) to H.B. Fuller’s actual or demonstrably anticipated research or development; or (2) which does not result from any work performed by me for H.B. Fuller.
(d) I will promptly document all research according to H.B. Fuller policy, including H.B. Fuller's policy in the laboratory notebooks assigned to me.
3. CONFIDENTIAL INFORMATION.
All Confidential Information disclosed to me or to which I have access during the period of my employment, which I have a reasonable basis to believe is Confidential Information, or which is treated or designated by H.B. Fuller as being Confidential Information, shall be presumed to be Confidential Information.
(a) I acknowledge that H.B. Fuller has taken reasonable measures to preserve the secrecy of its Confidential Information, including, but not limited to, requiring me to execute this Agreement.
(b) I acknowledge that all of the items comprising Confidential Information are confidential, whether or not H.B. Fuller specifically labels such information as confidential or internally restricts access to such information. I acknowledge that H.B. Fuller may have separate policies in effect from time to time regarding protection of its Confidential Information. I agree to abide by these policies even if they more broadly define Confidential Information than this Agreement otherwise does or provide additional instructions on my use or disclosure of Confidential Information.
(c) I agree that Confidential Information, even though it may have been or may be developed or otherwise acquired by me, is the exclusive property of H.B. Fuller to be held by me in fiduciary capacity and solely for H.B. Fuller’s benefit. I agree that I will not at any time, either during or after my employment with H.B. Fuller, reveal, report, publish, transfer or otherwise disclose to any person or entity, or use, any Confidential Information, without the written consent of H.B. Fuller, except for the benefit of H.B. Fuller in connection with my employment consistent with H.B. Fuller's policies. I agree to stop using any Confidential Information after the termination of my H.B. Fuller employment. I also agree to refrain from any acts or omissions that would reduce the value of any Confidential Information, and to take and comply with reasonable security measures to prevent any accidental or intentional disclosure or misappropriation.
(d) I understand that nothing in this Agreement in any way prohibits or is intended to restrict or impede, and shall not be interpreted or understood as restricting or impeding, me from exercising my rights under federal labor law. I further understand that nothing in this Agreement prohibits me from reporting any possible violations of federal or state law or regulation to any government agency or entity, including, but not limited to, the Department of Justice and the Securities and Exchange Commission, or making any other disclosures that are protected under the whistleblower provisions of federal or state law or regulation. I understand that I am not required to notify H.B. Fuller that I will make or have made such reports or disclosures.
(e) Notwithstanding the above restrictions, pursuant to the Defend Trade Secrets Act of 2016, 18 U.S.C. 1836, I understand that I shall not be held criminally or civilly liable under any federal or state trade secret law for the disclosure of a trade secret that is made in confidence to a federal, state, or local government official, either directly or indirectly, or to an attorney, and is made solely for the purpose of reporting or investigating a suspected violation of law. The same immunity will be provided for the disclosure of a trade secret that is made in a complaint or other document filed in a lawsuit or other proceeding, if such filing is made under seal. An individual who files a lawsuit for retaliation by an employer for reporting a suspected violation of law may disclose the trade secret to the individual’s attorney and use the trade secret information in the court proceeding if the individual files any document containing the trade secret under seal and does not disclose the trade secret, except pursuant to court order.
4. [NON-COMPETITION AND] NON-SOLICITATION
In consideration of my employment (including future employment) by H.B. Fuller and the payments and benefits provided to me in compensation for my services, all increases in payments and benefits and promotions over the course of my employment by H.B. Fuller, my rights under the Severance Agreement, and in further consideration of my being given access to Confidential Information and H.B. Fuller's other obligations as set forth in this Agreement, I agree that:
(a) During the term of my employment and for twenty-four (24) months after termination (for any reason and by either party) of my employment with H.B. Fuller:
(1) Before accepting employment with a potential employer or beginning work as a consultant or independent contractor (i) in an industry in which H.B. Fuller competes, (ii) with an entity that uses H.B. Fuller Products, or (iii) with an entity that supplies Products to H.B. Fuller, I will provide the potential employer or party engaging my services with a copy of this Agreement;
(2) I will not directly or indirectly identify, contact, make sales calls on, make introductions to, accept business from, provide services, assistance or consulting to, any entity or person who at any time within the two (2) year period prior to my employment termination (i) was a customer of H.B. Fuller with whom I had direct or indirect contact; (ii) was identified as a prospective customer of H.B. Fuller by me, at my direction or by another H.B. Fuller employee or contractor; (iii) was a customer or prospective customer to whom I directly or indirectly rendered assistance of any kind; or (iv) was a customer whose account I supervised or serviced for H.B. Fuller;
(3) I will not encourage any H.B. Fuller customer or prospective customer to divert, terminate, limit, adversely modify, or fail to enter into any actual or potential business with H.B. Fuller;
(4) I will not make statements, publicly or otherwise, that disparage H.B. Fuller, its Products or its conduct or that are otherwise adverse to H.B. Fuller’s interests
(5) [I will not serve in any capacity or have interest in, whether as an owner, employee, consultant, or otherwise, any entity, organization or person engaged in the development, use, production or sale of any Conflicting Product, where I will be in a position where performance of my job duties or my obligations would likely result in use or disclosure of Confidential Information or where the entity or organization has requested or required my use or disclosure of Confidential Information.][Reserved.]
(b) During the term of my employment and for twenty-four (24) months after termination (for any reason and by either party) of my employment with H.B. Fuller I will not hire or induce, attempt to induce, or in any way assist or act in concert with any other person or organization in hiring, inducing or attempting to induce any employee, agent or consultant of H.B. Fuller to terminate such employee's, agent’s or consultant’s relationship with H.B. Fuller.
5. RETURN OF H.B. FULLER PROPERTY
I agree that no later than five (5) days after the termination of my H.B. Fuller employment for any reason, I will return all Confidential Information, any other information related to H.B. Fuller’s business or my H.B. Fuller work and all other H.B. Fuller property to H.B. Fuller that is in my possession or control, regardless of the format or location of such information. This includes all documents, computers and electronic storage devices such as flash drives, pdas, cds, dvds, floppy discs, keys, credit cards and software that belong to H.B. Fuller. Prior to the termination of my employment, I will advise H.B. Fuller as to whether I have used any computers or other electronic storage device in my possession or control (other than those belonging to H.B. Fuller) to access, store or transmit Confidential Information or H.B. Fuller property and will make such computers or other electronic storage devices available to H.B. Fuller to allow H.B. Fuller to search for and permanently delete any such Confidential Information and other H.B. Fuller property that may still exist on such devices.
I further agree that I will cooperate with H.B. Fuller in the transition of my duties and responsibilities for H.B. Fuller, and will participate in interviews or other meetings or proceedings without subpoena, at the request of H.B. Fuller, with any investigations or litigation relating to matters about which I have knowledge by virtue of my employment by or service to H.B. Fuller.
|
C. |
OTHER PROVISIONS |
1. I understand that I am free at any time to leave the employment of H.B. Fuller and, subject to the limitations set forth in this Agreement, to accept any job that utilizes my general education and skills.
2. I understand that these covenants are not intended to limit my post-termination employment in any industry or for any employer producing a product or providing a service different from H.B. Fuller's. I acknowledge and represent that I have substantial experience and knowledge such that I can readily obtain employment that does not violate these covenants.
3. I represent and agree that I am aware of my right to discuss any and all aspects of this Agreement with my own attorney, that I have carefully read and fully understand all the provisions of this Agreement, and that I am voluntarily entering into this Agreement.
4. I acknowledge that H.B. Fuller has not asked or required me to, and I agree that I will not, violate the terms of any prior employment, confidentiality, non-competition or similar agreements to which I have been a party. The only such agreements to which I have been a party are as follows (copies of which I agree to provide H.B. Fuller as available):
(If none, please specify)
5. I agree not to disclose to H.B. Fuller, directly or indirectly, confidential information I have obtained from a third party under an obligation of secrecy, except with the specific consent of that third party.
6. I agree that during and at any time after my employment with H.B. Fuller has ended that, upon written request by H.B. Fuller, I will execute an affidavit under oath acknowledging my compliance with this Agreement and my commitment to ongoing compliance with the Agreement. I understand that it shall be deemed a breach of this Agreement if I refuse to execute the requested affidavit and will subject me to the remedies for breach set forth in Section C.9 below.
7. My obligations under this Agreement shall be binding on my heirs, executors, administrators and assigns.
8. If any dispute arises under this Agreement, I agree that this Agreement will be interpreted and construed under the laws of [State]. I also agree that all disputes arising out of or relating to this Agreement shall be brought, if at all, in a court located in Minnesota to the exclusion of the courts of any other state or jurisdiction. I agree that any court located in Minnesota has jurisdiction over me in connection with any such disputes, regardless whether H.B. Fuller or I bring the claim or action.
9. I acknowledge and agree that the scope of Sections B and C is reasonable as to both time and extent of customer and other restrictions, that the provisions of the Agreement are reasonable and necessary for the protection of H.B. Fuller in its employment of me and its furnishing to me Confidential Information, and that any actual or threatened violation of this Agreement by me may subject me to discipline under H.B. Fuller's discipline policies and will cause H.B. Fuller irreparable harm for which it will be entitled to (a) temporary and permanent injunctive relief without the necessity of proving actual damages, (b) money damages insofar as they can be determined, and (c) all related costs and reasonable attorneys' fees. I further agree to waive any requirement for the posting of a bond or other security by H.B. Fuller. No claim, demand, action or cause of action that I may have against the Company shall constitute a defense to enforcement of this Agreement. In the event of a breach of any of the terms of this Agreement, the period of any restriction shall automatically be tolled and extended by the period I am in violation of the Agreement until such breach or violation has been cured to the satisfaction of H.B. Fuller.
10. The parties agree that if any provision of this Agreement is void or unenforceable for any reason, the remaining provisions will remain in full force and effect. If any particular provision of this Agreement adjudicated to be invalid or unenforceable, the parties specifically authorize the court making such determination to edit the invalid or unenforceable provision to allow this Agreement, and its provisions, to be valid and enforceable to the fullest extent allowed by law or public policy. I expressly stipulate that this Agreement shall be construed in a manner that renders its provisions valid and enforceable to the maximum extent (not exceeding its express terms) possible under applicable law.
11. The terms of this Agreement that relate to periods, activities, obligations, rights or remedies will survive termination of my employment with H.B. Fuller and will govern all rights, disputes, claims or causes of action arising out of or in any way related to this Agreement.
12. This Agreement, the Severance Agreement to which it is an exhibit, and the other documents referenced and incorporated in the Severance Agreement (including without limitation the Change in Control Agreement) supersedes, and hereby renders null and void, any previous agreement between me and H.B. Fuller relating to post-employment use or disclosure of confidential information, or my employment after my employment by H.B. Fuller ends. This Agreement applies during my entire tenure with H.B. Fuller regardless of subsequent changes in position or compensation; and cannot be amended or altered, nor any portion waived, except in writing signed by both parties. This Agreement is ancillary to my employment with H.B. Fuller and is not intended to govern aspects of that employment relationship not covered herein. The obligations in this Agreement are unconditional and do not depend on the performance or non-performance by H.B. Fuller of any terms, duties or obligations not specifically set forth in this Agreement.
13. I understand that my rights and obligations under this Agreement are not assignable or delegable by me. I agree that this Agreement is fully assignable by H.B. Fuller.
14. I will assert no patent or other rights against H.B. Fuller based on Inventions made by me prior to the date of this Agreement, except for rights under those Inventions described at the top of the next page:
DO NOT WRITE ANYTHING CONFIDENTIAL
(Provide only a general description of such Inventions. If this will require disclosure of information you believe is confidential, consult the H.B. Fuller Human Resources Department before completing.)
I UNDERSTAND THIS AGREEMENT IS A CONTRACT. I ALSO UNDERSTAND THAT MY EMPLOYMENT RELATIONSHIP WITH H.B. FULLER IS “AT-WILL.” THAT IS, H.B. FULLER OR I CAN TERMINATE MY EMPLOYMENT AT ANY TIME, WITH OR WITHOUT CAUSE, AND WITH OR WITHOUT NOTICE. I FURTHER UNDERSTAND THAT ANY EMPLOYMENT POLICIES, HANDBOOKS, OR OTHER SUCH MATERIALS THAT MAY BE DISTRIBUTED OR OTHERWISE COMMUNICATED TO ME DURING THE COURSE OF MY EMPLOYMENT SHALL NOT BE CONSTRUED AS A CONTRACT.
| ACCEPTED at Vadnais Heights, Minnesota by H.B. Fuller Company. | ||||
| By | ||||
| Employee Name (please print) | ||||
| Its | ||||
| Employee Signature | ||||
| Date | Date | |||
 |
Exhibit 10.47 Rewards – Compensation Management Short-Term Incentive – Executive Officers (STI) Plan |
|
Purpose |
The STI plan provides an annual performance-based cash bonus opportunity for eligible employees. This is intended to achieve a number of goals including: |
||
| ● | Emphasizing the Company’s commitment to competitive compensation practices; | ||
| ● | Driving a high performance culture; | ||
| ● | Assuring accountability; | ||
| ● | Focusing on results, not activity; and | ||
| ● | Reinforcing the importance of measurable and aligned goals and objectives. | ||
| Eligibility | These guidelines apply to Executive Officers. | ||
| To receive payment under the STI Plan, the participant must be actively employed as of November 30. | |||
| Plan Design | The plan design is based on the following financial metrics. | ||
| ● | EBITDA | ||
| ● | Net Revenue | ||
| ● | Earnings Per Share | ||
| Each participant’s plan design will be based on the participant’s position. Details of the design are as follows: | |||
| ● | Corporate/Global | ||
|
Weighting Per Metric |
|||||||||
|
EPS |
HBF Net Revenue |
HBF EBITDA |
|||||||
| 30 | % | 35 | % | 35 | % | ||||
| ● | Operating Segment |
|
Weighting Per Metric |
|||||||||
|
EPS |
Operating Segment Net Revenue |
Operating Segment EBITDA |
|||||||
| 30 | % | 35 | % | 35 | % | ||||
|
Exhibit 10.47 Rewards – Compensation Management Short-Term Incentive – Executive Officers (STI) Plan |
| Target | |||||
| ● | Each metric will have a target level of performance. Payout will be determined for each metric based on performance relative to target. The target levels of performance will be established at the beginning of each fiscal year. | ||||
| Threshold | |||||
| ● | Threshold performance levels will be established for each metric as follows: | ||||
| o | Net Revenue: 90% of target | ||||
| o | EBITDA: 80% of target | ||||
| o | EPS: 80% of target | ||||
| ● | Payout at the threshold level of performance will be 50% of the target allocated to that metric. | ||||
| Superior | |||||
| ● | Superior performance levels will be established for each metric as follows: | ||||
| o | Net Revenue: 110% of target | ||||
| o | EBITDA: 120% of target | ||||
| o | EPS: 120% of target | ||||
| ● | Payout at the superior level of performance will be 200% of the target allocated to that metric. | ||||
| See Appendix for payout schedule. | |||||
| Payment | Payment will be made in cash, subject to taxes and deductions as applicable. | ||||
| Payment will be made as close as possible to January 31 following the conclusion of the relevant Plan Year, but will be made no later than March 15th of the calendar year following the Plan Year. | |||||
|
Participant Status Changes |
If a participant begins employment with the company during the Plan Year, bonus potential will be pro-rated for the time the participant was employed during the Plan Year. If a participant transfers jobs and changes plan design standards, potential bonus will be pro-rated for the time spent in each job. |
||||
|
Exhibit 10.47 Rewards – Compensation Management Short-Term Incentive – Executive Officers (STI) Plan |
| Administration | Participants may direct questions about the STI Plan to their local management or human resources representatives. | ||||
| The Compensation Committee of the Board of Directors shall make a certification decision with respect to performance of financial metrics and consider extraordinary circumstances that may have positively or negatively impacted the achievement of the objectives. The STI Plan is a discretionary bonus plan and shall not be construed as a contract. The Board or management in their discretion, reserves the right at any time to enhance, diminish or terminate all or any portion of any compensation plan or program, on a collective or individual basis. | |||||
| Payments under the STI Plan are subject to the Company’s Executive and Key Manager Compensation Recovery Policy and any other compensation recovery policies the Company may adopt in the future to conform to the Dodd-Frank Wall Street Reform and Consumer Protection Act of 2010 (or any other applicable law) and any applicable rules and regulations of the Securities and Exchange Commission or applicable stock exchange. | |||||
| Relevant Terms | Actively Employed - A full-time or part-time employee on the Company payroll. It excludes any employee who has been terminated from employment with the Company – voluntarily or involuntarily –prior to November 30. | ||||
| Company - H.B. Fuller Company and its wholly owned subsidiaries. | |||||
| Eligible Earnings – To be determined by region/country. | |||||
| Payment - The cash reward payable after conclusion of the Plan Year. | |||||
| Plan Year – The relevant Company fiscal year. | |||||
| Short Term Incentive (STI) Plan - The program described herein. May also be referred to as “STIP” or “STI Plan”. | |||||
|
Exhibit 10.47 Rewards – Compensation Management Short-Term Incentive – Executive Officers (STI) Plan |
| Appendix |
|
STIP Payment Schedule for EPS, |
STIP Payment schedule for |
|||||||||||||||
|
EBITDA |
Net Revenue |
|||||||||||||||
|
Metric Performance
|
Payout (as % of target) |
Metric Performance |
Payout (as % of target) |
|||||||||||||
| 120 | % | 200.0 | % | 110 | % | 200 | % | |||||||||
| 119 | % | 195.0 | % | 109 | % | 190 | % | |||||||||
| 118 | % | 190.0 | % | 108 | % | 180 | % | |||||||||
| 117 | % | 185.0 | % | 107 | % | 170 | % | |||||||||
| 116 | % | 180.0 | % | 106 | % | 160 | % | |||||||||
| 115 | % | 175.0 | % | 105 | % | 150 | % | |||||||||
| 114 | % | 170.0 | % | 104 | % | 140 | % | |||||||||
| 113 | % | 165.0 | % | 103 | % | 130 | % | |||||||||
| 112 | % | 160.0 | % | 102 | % | 120 | % | |||||||||
| 111 | % | 155.0 | % | 101 | % | 110 | % | |||||||||
| 110 | % | 150.0 | % | 100 | % | 100 | % | |||||||||
| 109 | % | 145.0 | % | 99 | % | 95 | % | |||||||||
| 108 | % | 140.0 | % | 98 | % | 90 | % | |||||||||
| 107 | % | 135.0 | % | 97 | % | 85 | % | |||||||||
| 106 | % | 130.0 | % | 96 | % | 80 | % | |||||||||
| 105 | % | 125.0 | % | 95 | % | 75 | % | |||||||||
| 104 | % | 120.0 | % | 94 | % | 70 | % | |||||||||
| 103 | % | 115.0 | % | 93 | % | 65 | % | |||||||||
| 102 | % | 110.0 | % | 92 | % | 60 | % | |||||||||
| 101 | % | 105.0 | % | 91 | % | 55 | % | |||||||||
| 100 | % | 100.0 | % | 90 | % | 50 | % | |||||||||
| 99 | % | 97.5 | % | |||||||||||||
| 98 | % | 95.0 | % | |||||||||||||
| 97 | % | 92.5 | % | |||||||||||||
| 96 | % | 90.0 | % | |||||||||||||
| 95 | % | 87.5 | % | |||||||||||||
| 94 | % | 85.0 | % | |||||||||||||
| 93 | % | 82.5 | % | |||||||||||||
| 92 | % | 80.0 | % | |||||||||||||
| 91 | % | 77.5 | % | |||||||||||||
| 90 | % | 75.0 | % | |||||||||||||
| 89 | % | 72.5 | % | |||||||||||||
| 88 | % | 70.0 | % | |||||||||||||
| 87 | % | 67.5 | % | |||||||||||||
| 86 | % | 65.0 | % | |||||||||||||
| 85 | % | 62.5 | % | |||||||||||||
| 84 | % | 60.0 | % | |||||||||||||
| 83 | % | 57.5 | % | |||||||||||||
| 82 | % | 55.0 | % | |||||||||||||
| 81 | % | 52.5 | % | |||||||||||||
| 80 | % | 50.0 | % | |||||||||||||
| ● | Payout is calculated for each incremental increase in performance (straight line interpolation). | ||||
|
Exhibit 10.47 Rewards – Compensation Management Short-Term Incentive – Executive Officers (STI) Plan |
| Calculation Guidelines | |||||
| Total Company Metrics | |||||
| Company EPS | |||||
| The adjusted EPS as disclosed in the Company’s earnings release. | |||||
| HBF Net Revenue | |||||
| ● | Net revenue as disclosed in the Company’s earnings release. | ||||
| ● | Basis of targets is US dollars. Actual results are adjusted to conform with budgeted exchange rates. | ||||
| ● | Unbudgeted acquisitions and divestitures are excluded from the calculation. | ||||
| HBF EBITDA (Consolidated) | |||||
| ● | Adjusted Net Income plus adjusted Income Tax Expense plus Interest Expense, net, plus Depreciation Expense plus Amortization Expense. | ||||
| ● | Basis of targets is US dollars. Actual results are adjusted to conform with budgeted exchange rates. | ||||
| ● | Unbudgeted acquisitions and divestitures are excluded from the calculation. | ||||
| Operating Segment Metrics | |||||
| Net Revenue | |||||
| ● | Net revenue of the operating segment as disclosed in the Company’s earnings release. | ||||
| ● | Basis of targets is US dollars. Actual results are adjusted to conform with budgeted exchange rates. | ||||
| ● | Unbudgeted acquisitions and divestitures are excluded from the calculation. | ||||
| Segment EBITDA | |||||
| ● | Segment Operating Income plus Depreciation Expense plus Amortization Expense, plus Non-Operating Pension Expense or Income, plus Reported Sekisui Fuller Joint Venture Equity Earnings as reported on the consolidated Company P&L (if applicable), as reported in the Company’s earnings release | ||||
| ● | Basis of targets is US dollars. Actual results are adjusted to conform with budgeted exchange rates | ||||
| ● | Unbudgeted acquisitions and divestitures are excluded from the calculation. | ||||
Exhibit 21
|
Subsidiaries |
State or Other Jurisdiction of Organization |
|
ADCO Europe Holding GmbH |
Germany |
|
ADCO Global, Inc. |
Delaware |
|
ADCO Products, LLC |
Delaware |
|
Adhezion Biomedical, LLC |
Delaware |
|
Apollo Chemicals Limited |
United Kingdom |
|
Apollo Construction Solutions Limited 2 |
United Kingdom |
|
Apollo Roofing Solutions Limited 2 |
United Kingdom |
|
Asfaltos Y Pegamentos S. de R.L. de C.V. |
Mexico |
|
Bacon Acquisitions, LLC |
Oklahoma |
| Beardow Adams A.B. | Sweden |
| Beardow Adams do Brasil Adhesives Ltda | Brazil |
| Beardow Adams GmbH | Germany |
| Beardow Adams Holdings Ltd | United Kingdom |
| Beardow Adams Hot Melt Werk GmbH | Germany |
| Beardow Adams OY | Finland |
| Beardow Adams S.A.S. | Colombia |
| Beardow Adams Singapore Pte Ltd | Singapore |
| Beardow and Adams (Adhesives) Limited | United Kingdom |
| BeardowAdams, Inc. | North Carolina |
|
Chemical Supply Corporation, S.A. |
Panama |
|
Chongqing ZKLT Polymer Materials Co., Ltd. |
China |
|
Chongqing ZKLT Polymer Materials Co., Ltd. (Beijing Branch) |
China |
|
Cyberbond CS s.r.o. Cyberbond Group |
Czech Republic |
|
Cyberbond Europe GmbH |
Germany |
|
Datac Adhesives Limited |
United Kingdom |
|
Engent, Inc. |
Georgia |
|
Eternabond, LLC |
Delaware |
|
Fourny NV |
Belgium |
|
Gabaldo Holdings Ltd |
Cyprus |
|
H.B. Fuller (Barbados) I SRL |
Barbados |
|
H.B. Fuller (China) Adhesives Ltd. |
China |
|
H.B. Fuller (Guangzhou) Adhesives Co., Ltd. |
China |
|
H.B. Fuller (Nanjing) Chemical Co., Ltd. |
China |
|
H.B. Fuller (New Zealand) Limited |
New Zealand |
|
H.B. Fuller (Philippines), Inc. |
Philippines |
|
H.B. Fuller (Shanghai) Co. Ltd. |
China |
|
H.B. Fuller (Suzhou) Advanced Material Co., Ltd. |
China |
|
H.B. Fuller (Thailand) Co., Ltd. |
Thailand |
|
H.B. Fuller (Vietnam) Company Limited |
Vietnam |
|
H.B. Fuller (YanTai) Advanced Materials Co., Ltd. |
China |
|
H.B. Fuller Adhesive Systems LLC |
Oklahoma |
|
H.B. Fuller Adhesives Deutschland GmbH |
Germany |
|
H.B. Fuller Adhesives France SAS |
France |
|
H.B. Fuller Adhesives Hong Kong Limited |
Hong Kong SAR |
|
H.B. Fuller Adhesives Italia S.r.L. |
Italy |
|
H.B. Fuller Adhesives Malaysia Sdn. Bhd. |
Malaysia |
|
H.B. Fuller Adhesives Mauritius Ltd. |
Mauritius |
|
H.B. Fuller Adhesives S.A.E. |
Egypt |
|
H.B. Fuller Argentina, S.A.I.C. |
Argentina |
|
H.B. Fuller Austria GesmbH |
Austria |
|
H.B. Fuller Belgie BVBA |
Belgium |
|
H.B. Fuller Benelux B.V. |
Netherlands |
|
H.B. Fuller Brasil, Ltda. |
Brazil |
|
H.B. Fuller Brasil, Ltda. - Branch office Curitiba Purana |
Brazil |
|
H.B. Fuller Canada (partnership) |
Canada |
|
H.B. Fuller Canada Holding Co. |
Canada |
|
H.B. Fuller Canada Investment Co. |
Canada |
|
H.B. Fuller Centroamerica, S.A. |
Costa Rica |
|
H.B. Fuller Chemie GmbH |
Germany |
|
H.B. Fuller Chile SpA |
Chile |
|
H.B. Fuller Colombia S.A.S. |
Colombia |
|
H.B. Fuller Company Australia Pty. Ltd. |
Australia |
|
H.B. Fuller Company Australia Pty. Ltd. (New Zealand Branch) 2 |
New Zealand |
|
H.B. Fuller Construction Products Inc. |
Minnesota |
|
H.B. Fuller Deutschland GmbH |
Germany |
|
H.B. Fuller Deutschland Holding GmbH |
Germany |
|
H.B. Fuller Deutschland Produktions GmbH |
Germany |
|
H.B. Fuller Egymelt, a limited liability company |
Egypt |
|
H.B. Fuller Egypt Investment LLC |
Egypt |
|
H.B. Fuller Egypt Trade LLC |
Egypt |
|
H.B. Fuller Europe GmbH |
Switzerland |
|
H.B. Fuller Finance (Ireland) Unlimited Company |
Ireland |
|
H.B. Fuller Finance Luxembourg S.a.r.l. |
Luxembourg |
|
H.B. Fuller France |
France |
|
H.B. Fuller Greece S.A.I.C. |
Greece |
|
H.B. Fuller Guatemala, S.A.2 |
Guatemala |
|
H.B. Fuller India Adhesives Private Limited |
India |
|
H.B. Fuller Industrial Inc. |
Delaware |
|
H.B. Fuller International Holdings Corp. |
Delaware |
|
H.B. Fuller International Holdings Corp. (Hong Kong Branch) |
Hong Kong SAR |
|
H.B. Fuller International Holdings Corp. (Vietnam Branch) |
Vietnam |
|
H.B. Fuller Italia s.r.l. |
Italy |
|
H.B. Fuller Japan G.K. |
Japan |
|
H.B. Fuller Kenya Limited |
Kenya |
|
H.B. Fuller Kimya Sanayi Ticaret Anonim Sirketi |
Turkey |
|
H.B. Fuller Korea Co., Ltd. |
Korea, Republic Of |
|
H.B. Fuller Latin America Adhesives S.A. |
Panama |
|
H.B. Fuller Latin America Shared Services, S.R. Ltda |
Costa Rica |
|
H.B. Fuller Lebanon S.A.R.L.1 |
Lebanon |
|
H.B. Fuller Luxembourg Group S.a.r.l. |
Luxembourg |
|
H.B. Fuller Luxembourg Holdings S.a.r.l. |
Luxembourg |
|
H.B. Fuller Mexico, S.A. de C.V. |
Mexico |
|
H.B. Fuller Namekagon Ltd. |
United Kingdom |
|
H.B. Fuller Netherlands Holding B.V. |
Netherlands |
|
H.B. Fuller Pension Trustees Limited |
United Kingdom |
|
H.B. Fuller Poland Sp.Z.o.o. |
Poland |
|
H.B. Fuller Portugal - SGPS, Lda. |
Portugal |
|
H.B. Fuller Portugal, Produtos Quimicos, S.A. |
Portugal |
|
H.B. Fuller Royal Luxembourg Holdings S.a.r.l. |
Luxembourg |
|
H.B. Fuller Rus Ltd. |
Russian Federation |
|
H.B. Fuller Singapore Pte. Ltd. |
Singapore |
|
H.B. Fuller Sverige AB |
Sweden |
|
H.B. Fuller Taiwan Co., Ltd. |
Taiwan, Province of China |
|
H.B. Fuller U.K. Holding Limited |
United Kingdom |
|
H.B. Fuller U.K. Limited |
United Kingdom |
|
H.B. Fuller U.K. Manufacturing Limited |
United Kingdom |
|
H.B. Fuller UK Sales Ltd. |
United Kingdom |
|
H.B. Fuller Uruguay, S.A. 2 |
Uruguay |
|
H.B. Fuller Venezuela, C.A.1 |
Venezuela |
|
H.B. Fuller, Isar-Rakoll, S.A. |
Portugal |
|
HB Fuller Espana, S.L.U. |
Spain |
|
HB Fuller Middle East FZE |
United Arab Emirates |
|
HB Fuller South Africa (Pty) Ltd |
South Africa |
|
HBF Realty Corporation |
Philippines |
|
Koemmerling (Nanjing) Advanced Materials Co. Ltd. |
China |
|
Koemmerling (Nanjing) Advanced Materials Co. Ltd. (Beijing Branch) |
China |
|
Koemmerling Hong Kong Limited |
Hong Kong SAR |
|
Kömmerling Chemische Fabrik GmbH |
Germany |
|
Kommerling UK Limited |
United Kingdom |
|
Lemtapes OY |
Finland |
|
Nine Sticks BV |
Belgium |
|
PT H.B. Fuller Indonesia |
Indonesia |
|
PT. HBFuller Adhesives Indonesia |
Indonesia |
|
Resistol, S.A 2 |
Guatemala |
|
Royal Acquisition Corp. |
Delaware |
|
Royal Adhesives & Sealants Canada Ltd. |
Canada |
|
Royal Adhesives and Sealants, LLC |
Delaware |
|
Royal Holdings, Inc. |
Delaware |
|
Seneca Polymer Co. |
Minnesota |
|
Simpsonville Polymer Co. |
Delaware |
|
Simpsonville Properties LLC |
Delaware |
|
Tonsan Adhesive, Inc. |
China |
|
Tonsan Suzhou Adhesive Co., Ltd. |
China |
|
Willimmo NV |
Belgium |
| XChem International LLC | United Arab Emirates |
|
Joint Ventures |
|
|
Sekisui-Fuller Co. Ltd. |
Japan |
|
1 Inactive entities |
|
| 2 To be liquidated |
Exhibit 23
Consent of Independent Registered Public Accounting Firm
We consent to the incorporation by reference in the Registration Statements on Form S-8 (Nos. 333-50005, 333-89453, 333-48420, 333-135772, 333-151841, 333-158610, 333-191549, 333-212344, 333-224570, 333-237949, 333-257508, 333-263817 and 333-273007) of H.B. Fuller Company of our reports dated January 24, 2024, with respect to the consolidated financial statements of H.B. Fuller Company, and the effectiveness of internal control over financial reporting of H.B. Fuller Company, included in this Annual Report (Form 10-K) of H.B. Fuller Company for the year ended December 2, 2023.
/s/ Ernst and Young LLP
Minneapolis, Minnesota
January 24, 2024
Exhibit 24
POWER OF ATTORNEY
KNOW ALL MEN BY THESE PRESENTS, that the undersigned directors of H.B. FULLER COMPANY, a Minnesota corporation, which proposes to file with the Securities and Exchange Commission, Washington, D.C. 20549, under the provisions of the Securities Exchange Act of 1934, as amended, a Form 10‑K Annual Report for the Company's fiscal year ended December 2, 2023, hereby constitute and appoint CELESTE B. MASTIN, JOHN J. CORKREAN AND GREGORY O. OGUNSANYA his or her true and lawful attorneys‑in‑fact and agents, and each of them, with full power to act without the other, for him or her and in his or her name, place and stead to sign and file such Annual Report, and any and all amendments, exhibits and other documents in connection herewith, with power, where appropriate, to affix the corporate seal of said Company thereto, and to attest said seal with the Securities and Exchange Commission and with the appropriate office of any state, hereby granting unto said attorneys‑in‑fact and agents, and each of them, full power and authority to do and perform any and all acts and things requisite and necessary to be done in and about the premises, as fully to all intents and purposes as he or she might do in person, hereby ratifying and confirming all that said attorneys‑in‑fact and agents, or either of them, may lawfully do or cause to be done by virtue hereof.
IN WITNESS WHEREOF, the undersigned have hereunto set their hands as of the 24th day of January 2024.
| /s/ Daniel L. Florness | /s/ Celeste B. Mastin | |
| DANIEL L. FLORNESS | CELESTE B. MASTIN | |
| Director | Director | |
| /s/ Thomas W. Handley | /s/ Lee R. Mitau | |
| THOMAS W. HANDLEY | LEE R. MITAU | |
| Director | Director | |
| /s/ Michael J. Happe | /s/ Teresa J. Rasmussen | |
| MICHAEL J. HAPPE | TERESA J. RASMUSSEN | |
| Director | Director | |
| /s/ Ruth S. Kimmelshue | /s/ Srilata A. Zaheer | |
| RUTH S. KIMMELSHUE | SRILATA A. ZAHEER | |
| Director | Director | |
| /s/ Charles T. Lauber | ||
| CHARLES T. LAUBER | ||
| Director | ||
Exhibit 31.1
CERTIFICATIONS
I, Celeste B. Mastin, certify that:
|
1. |
I have reviewed this report on Form 10-K of H.B. Fuller Company; |
|
2. |
Based on my knowledge, this report does not contain any untrue statement of a material fact or omit to state a material fact necessary to make the statements made, in light of the circumstances under which such statements were made, not misleading with respect to the period covered by this report; |
|
3. |
Based on my knowledge, the financial statements, and other financial information included in this report, fairly present in all material respects the financial condition, results of operations and cash flows of the registrant as of, and for, the periods presented in this report; |
|
4. |
The registrant's other certifying officer and I are responsible for establishing and maintaining disclosure controls and procedures (as defined in Exchange Act Rules 13a-15(e) and 15d-15(e)) and internal control over financial reporting (as defined in Exchange Act Rules 13a-15(f) and 15d–15(f)) for the registrant and have: |
|
a) |
Designed such disclosure controls and procedures, or caused such disclosure controls and procedures to be designed under our supervision, to ensure that material information relating to the registrant, including its consolidated subsidiaries, is made known to us by others within those entities, particularly during the period in which this annual report is being prepared; |
|
b) |
Designed such internal control over financial reporting, or caused such internal control over financial reporting to be designed under our supervision, to provide reasonable assurance regarding the reliability of financial reporting and the preparation of financial statements for external purposes in accordance with generally accepted accounting principles; |
|
c) |
Evaluated the effectiveness of the registrant's disclosure controls and procedures and presented in this report our conclusions about the effectiveness of the disclosure controls and procedures, as of the end of the period covered by this report based on such evaluation; and |
|
d) |
Disclosed in this report any change in the registrant’s internal control over financial reporting that occurred during the registrant’s most recent fiscal quarter (the registrant’s fourth fiscal quarter in the case of an annual report) that has materially affected, or is reasonably likely to materially affect, the registrant’s internal control over financial reporting; and |
|
5. |
The registrant's other certifying officer and I have disclosed, based on our most recent evaluation of internal control over financial reporting, to the registrant's auditors and the audit committee of the registrant's board of directors (or persons performing the equivalent functions): |
|
a) |
All significant deficiencies and material weaknesses in the design or operation of internal control over financial reporting which are reasonably likely to adversely affect the registrant's ability to record, process, summarize and report financial information; and |
|
b) |
Any fraud, whether or not material, that involves management or other employees who have a significant role in the registrant's internal control over financial reporting. |
Date: January 24, 2024
/s/ Celeste B. Mastin
Celeste B. Mastin
President and Chief Executive Officer
Exhibit 31.2
CERTIFICATIONS
I, John J. Corkrean, certify that:
1. I have reviewed this report on Form 10-K of H.B. Fuller Company;
|
2. |
Based on my knowledge, this report does not contain any untrue statement of a material fact or omit to state a material fact necessary to make the statements made, in light of the circumstances under which such statements were made, not misleading with respect to the period covered by this report; |
|
3. |
Based on my knowledge, the financial statements, and other financial information included in this report, fairly present in all material respects the financial condition, results of operations and cash flows of the registrant as of, and for, the periods presented in this report; |
|
4. |
The registrant's other certifying officer and I are responsible for establishing and maintaining disclosure controls and procedures (as defined in Exchange Act Rules 13a-15(e) and 15d-15(e)) and internal control over financial reporting (as defined in Exchange Act Rules 13a-15(f) and 15d–15(f)) for the registrant and have: |
|
a) |
Designed such disclosure controls and procedures, or caused such disclosure controls and procedures to be designed under our supervision, to ensure that material information relating to the registrant, including its consolidated subsidiaries, is made known to us by others within those entities, particularly during the period in which this annual report is being prepared; |
|
b) |
Designed such internal control over financial reporting, or caused such internal control over financial reporting to be designed under our supervision, to provide reasonable assurance regarding the reliability of financial reporting and the preparation of financial statements for external purposes in accordance with generally accepted accounting principles; |
|
c) |
Evaluated the effectiveness of the registrant's disclosure controls and procedures and presented in this report our conclusions about the effectiveness of the disclosure controls and procedures, as of the end of the period covered by this report based on such evaluation; and |
|
d) |
Disclosed in this report any change in the registrant’s internal control over financial reporting that occurred during the registrant’s most recent fiscal quarter (the registrant’s fourth fiscal quarter in the case of an annual report) that has materially affected, or is reasonably likely to materially affect, the registrant’s internal control over financial reporting; and |
|
5. |
The registrant's other certifying officer and I have disclosed, based on our most recent evaluation of internal control over financial reporting, to the registrant's auditors and the audit committee of the registrant's board of directors (or persons performing the equivalent functions): |
|
a) |
All significant deficiencies and material weaknesses in the design or operation of internal control over financial reporting which are reasonably likely to adversely affect the registrant's ability to record, process, summarize and report financial information; and |
|
b) |
Any fraud, whether or not material, that involves management or other employees who have a significant role in the registrant's internal control over financial reporting. |
Date: January 24, 2024
/s/ John J. Corkrean
John J. Corkrean
Executive Vice President, Chief Financial Officer
Exhibit 32.1
CERTIFICATION
I, Celeste B. Mastin, in connection with the Annual Report of H.B. Fuller Company on Form 10-K for the fiscal year ended December 2, 2023 (the “Report”), hereby certify that:
|
(a) |
the Report fully complies with the requirements of section 13(a) or 15(d) of the Securities Exchange Act of 1934, and |
|
(b) |
the information contained in the Report fairly presents, in all material respects, the financial condition and results of operations of H.B. Fuller Company. |
Date: January 24, 2024
/s/ Celeste B. Mastin
Celeste B. Mastin
President and Chief Executive Officer
Exhibit 32.2
CERTIFICATION
I, John J. Corkrean, in connection with the Annual Report of H.B. Fuller Company on Form 10-K for the fiscal year ended December 2, 2023 (the “Report”), hereby certify that:
|
(a) |
the Report fully complies with the requirements of section 13(a) or 15(d) of the Securities Exchange Act of 1934, and |
|
(b) |
the information contained in the Report fairly presents, in all material respects, the financial condition and results of operations of H.B. Fuller Company. |
Date: January 24, 2024
/s/ John J. Corkrean
John J. Corkrean
Executive Vice President, Chief Financial Officer
Exhibit 97.1
| SUBJECT | Effective: October 2, 2023 |
Executive and Key Manager Compensation Recovery Policy
POLICY
Consistent with the core values of H.B. Fuller Company ("Company"), the Compensation Committee of the Board of Directors (the “Compensation Committee”) has determined that it is appropriate to recover incentive-based compensation to the extent that it was received based on erroneous financial information reported under securities laws, regardless of misconduct, or to the extent that it was received under certain other circumstances involving misconduct.
Pursuant to this Policy, the Compensation Committee will recoup erroneously awarded incentive-based compensation from any current or former executive officer or key manager if the Company is required to prepare an accounting restatement of Company financial statements filed with the Securities and Exchange Commission (“SEC”) due to the material noncompliance of the Company with any financial reporting requirements under U.S. securities laws, including any required accounting restatement to correct an error in previously issued financial statements that is material to the previously issued financial statements, or that would result in a material misstatement if the error were corrected in the current period or left uncorrected in the current period (a “restatement”), and a lower payment would have been made to the executive officer or key manager based upon the restated financial results.
In any such case, the Compensation Committee will require the executive officer or key manager to reasonably promptly reimburse the Company for all incentive-based compensation received during the three completed fiscal years immediately preceding the date that the Company is required to prepare the restatement (and during any transition period that results from a change in the Company’s fiscal year within or immediately following those three completed fiscal years, unless the transition period is deemed a completed fiscal year) (the “recovery period”), to the extent that incentive-based compensation exceeds the amount of incentive-based compensation that otherwise would have been received had it been determined based on the restated amounts, computed without regard to any taxes paid. The determination of the time when the Company is “required” to prepare a restatement shall be made in accordance with applicable SEC and New York Stock Exchange (“NYSE”) rules and regulations.
For incentive-based compensation based on stock price or total shareholder return, where the amount of erroneously awarded compensation is not subject to mathematical recalculation directly from the information in a restatement, the Compensation Committee will calculate the amount to be reimbursed based on a reasonable estimate of the effect of the restatement on the stock price or shareholder return upon which the incentive-based compensation was received. The Compensation Committee will maintain documentation of that reasonable estimate and provide such documentation to the NYSE.
Incentive-based compensation otherwise subject to reimbursement under this Policy as a result of a restatement will not be subject to reimbursement if the Compensation Committee determines that recovery would be impracticable for one or more of the following reasons:
|
(i) |
after the Company makes a reasonable attempt to recover the amount of incentive-based compensation subject to reimbursement, the Compensation Committee (a) concludes that the direct expense paid to a third party to assist in recovering the amount subject to reimbursement would exceed the amount to be reimbursed, (b) documents the reasonable attempt(s) to recover, and (c) provides that documentation to the NYSE; |
|
(ii) |
the Company obtains an opinion of home country counsel acceptable to the NYSE that recovery would violate home country law that was adopted prior to November 28, 2022 and provides that opinion to the NYSE; or |
|
(iii) |
recovery would likely cause an otherwise tax-qualified retirement plan, under which benefits are broadly available to the Company’s employees, to fail to meet the requirements of 26 U.S.C. 401(a)(13) or 26 U.S.C. 411(a) and regulations thereunder. |
In other circumstances not involving a restatement, the Compensation Committee may also recoup incentive-based compensation from any current or former executive officer or key manager if the Compensation Committee determines that the executive officer or key manager engaged in intentional misconduct in performing his or her duties as an executive officer or key manager of the Company. In any such case, to the fullest extent permitted by law, the Compensation Committee may require the executive officer or key manager to reimburse the Company for all or a portion of any incentive-based compensation received during any fiscal year in which the executive officer’s or key manager’s intentional misconduct occurred. This fiscal year will be considered a “recovery period.”
The Compensation Committee may exercise discretion in determining the means of promptly recovering excess incentive-based compensation. For example, the Compensation Committee may seek direct repayment from the executive officer or key manager of any amounts to be recovered pursuant to this Policy. In addition, to the extent permitted by applicable law, amounts to be repaid under this Policy may be recovered by other methods, including but not limited to, offsetting amounts against prior or future incentive-based compensation awards (whether or not deferred), withholding outstanding equity awards, withholding future equity awards, collecting after-tax proceeds from the sale of underlying shares and collecting after-tax proceeds of deferred compensation payouts under the Key Employee Deferred Compensation Plan.
Any determination made by the Compensation Committee under this Policy shall be final, binding and conclusive on all parties.
This Policy does not preclude the Company from taking any other action to enforce an executive officer’s or key manager’s obligations to the Company, including termination of employment or institution of civil or criminal proceedings.
Additionally, it is the intent of this Policy to comply and be interpreted in accordance with the compensation recovery requirements of the Dodd-Frank Wall Street Reform and Consumer Protection Act and related SEC and NYSE rules and regulations. This Policy may be modified to the degree that it does not comply with the rules and regulations promulgated by the SEC and the NYSE, as amended from time to time.
SCOPE
All current and former executive officers and key managers of the Company are subject to this Policy. However, the Compensation Committee has the discretion to waive all or any part of this Policy with respect to any current or former key manager for any particular restatement. Incentive-based compensation, which may include awards granted in connection with an executive officer’s or key manager’s hiring, appointment or promotion, is subject to this Policy as long as the person served as an executive officer or key manager at any point during the performance period applicable to the incentive-based compensation. Incentive-based compensation received while a person is not an executive officer or key manager is not subject to this Policy.
This Policy is in addition to the requirements of Section 304 of the Sarbanes-Oxley Act of 2002 that are applicable to the Company’s Chief Executive Officer and Chief Financial Officer.
EFFECTIVE DATE
The effective date of this Policy is October 2, 2023. This Policy applies to incentive-based compensation received by executive officers and key managers on or after the effective date that results from attainment of a financial reporting measure based on or derived from financial information for any fiscal period ending on or after the effective date. Incentive-based compensation received by executive officers and key managers prior to the effective date remains subject to the Company’s prior Executive and Key Manager Compensation Clawback Policy approved by the Compensation Committee on November 28, 2012.
DEFINITIONS
“Executive officer” shall mean executive officers designated by the Board of Directors as officers for purposes of Section 16 of the Securities Exchange Act of 1934, as amended, including anyone who served in such capacity at any time during a recovery period.
“Key manager” shall mean an employee of the Company who is at grade level 32 or above, including anyone who served in such capacity at any time during a recovery period.
“Financial reporting measures” shall mean measures that are determined and presented in accordance with the accounting principles (including GAAP and non-GAAP financial measures) used in preparing the Company’s financial statements, and any measures that are derived wholly or in part from such measures. Stock price and total shareholder return are also financial reporting measures.
“Incentive-based compensation” shall mean any compensation that is granted, earned, or vested based wholly or in part upon the attainment of a financial reporting measure, including bonuses or awards under the Company’s short and long-term incentive plans, grants and awards under the Company’s equity incentive plans, and contributions under the Company’s deferred compensation plans. Incentive-based compensation does not include awards that are granted, earned and vested without regard to attainment of financial reporting measures, such as time-vesting awards, discretionary awards and awards based on subjective standards, strategic measures or operational measures.
Incentive-based compensation is deemed to be “received” in the Company’s fiscal period during which the financial reporting measure specified in the incentive-based compensation award is attained, even if the payment or grant of the incentive-based compensation occurs after the end of that period.
INDEMNITY
Subject to applicable law, the Company will not indemnify any executive officer or key manager against the loss of any erroneously awarded incentive-based compensation, nor will the Company advance any costs to any executive officer or key manager in connection with any action to obtain incentive-based compensation that was recovered pursuant to this Policy.